UNITED STATES
SECURITIES AND EXCHANGE COMMISSION
Washington, D.C. 20549
FORM N-CSR
CERTIFIED SHAREHOLDER REPORT OF REGISTERED
MANAGEMENT INVESTMENT COMPANIES
Investment Company Act file number | 811-00852 |
|
FPA PARAMOUNT FUND, INC. |
(Exact name of registrant as specified in charter) |
|
11601 WILSHIRE BLVD., STE. 1200 LOS ANGELES, CALIFORNIA | | 90025 |
(Address of principal executive offices) | | (Zip code) |
|
(Name and Address of Agent for Service) | Copy to: |
| |
J. RICHARD ATWOOD, PRESIDENT FPA PARAMOUNT FUND, INC. 11601 WILSHIRE BLVD., STE. 1200 LOS ANGELES, CALIFORNIA 90025 | MARK D. PERLOW, ESQ. DECHERT LLP ONE BUSH STREET, STE. 1600 SAN FRANCISCO, CA 94104 |
|
Registrant’s telephone number, including area code: | (310) 473-0225 | |
|
Date of fiscal year end: | September 30 | |
|
Date of reporting period: | September 30, 2016 | |
| | | | | | | | | |
Item 1: Report to Shareholders.

Distributor:
UMB DISTRIBUTION SERVICES, LLC
235 West Galena Street
Milwaukee, Wisconsin 53212
FPA PARAMOUNT FUND, INC.
LETTER TO SHAREHOLDERS
Dear Fellow Shareholders,
Portfolio performance
Fiscal 2016
For the last twelve months, the Fund gained 13.19% compared to an increase of 11.96% for the MSCI All Country World NR Index (the "Index"). Microsoft, Samsung, and Joy Global were the top performance contributors for the fiscal year. We believe Microsoft benefitted from demonstrating success in the transition of its software business model from license sales to subscriptions. As discussed later in this letter, in July Joy Global announced it would be acquired by Komatsu. G4S, Fugro, and Michael Page lagged and were the largest detractors of performance in the period.1 In the second quarter letter, we wrote that G4S has gone through significant challenges, a change in management and a difficult turnaround. Finally, we believe Michael Page's recruitment services business has been pressured by tepid job growth and the overhang from the UK Brexit vote.
Third Quarter 2016
During the third quarter of 2016, the Fund gained 6.11% compared to an increase of 5.30% for the Index. 2016 year-to-date, the Fund returned 9.25% versus 6.60% for the Index. Hastened by the global financial crisis, over the last few years, we noticed companies with low volatility factors outperforming the broader market. Much as we appreciate the quality characteristics of many of these businesses, as their multiples expanded meaningfully over the last several years, we found very few attractive valuation opportunities among them. Instead, we have owned what we believe are high-quality industrial, technology and consumer discretionary businesses that were more out of favor and often had cyclical exposures. In our first two Commentaries of the 2016, we observed that the Fund's outperformance in those periods was led by a rebound in these types of unpopular companies. The third quarter of 2016 was different. Many of our previously shunned holdings again performed well, but this time, so did most of our other holdings too. Illustrating the broad-based performance, more than 75% of the Fund's positions had positive returns. Perhaps this favorable breadth is unsurprising in a period when the S&P 500 reached its all-time high.
When evaluating comparisons to the Index, the geographic weightings of the Fund's holdings are also worth considering. As we build the portfolio, we purposely ignore the benchmark composition. We commit to typically having a minimum of 20% of total assets in U.S. companies and 20% of total assets in non-U.S. companies. The locations of the remaining positions are then solely based on where we find opportunities. At quarter end, 25% of the Fund's assets were invested in U.S. companies.2 This compares to the Index weighting of about 50% U.S. companies. We are pleased with the Fund's year-to-date performance given its lower U.S. exposure compared to the Index, as the MSCI U.S. Index has gained 7.82%, compared to the MSCI EU Index's gain of 0.02%.
1 Represents the percentage of the issuer's share price change from 9/30/15 to 9/30/16. The percentage price change does not equate with the performance of the holding in the Fund's portfolio. In addition, key performers are presented gross of investment management fees, transactions costs, and Fund operating expenses, which if included, would reduce the returns presented. As of 09/30/16, the key performers and corresponding position sizes were as follows: Microsoft: 3.21%; Samsung: 1.04%; Joy Global: 3.09%; G4S: 0.0%; Fugro: 3.81%; Michael Page: 0.0%.
2 The non-U.S. portion is made up of European companies (about 51% of Fund assets), Asia-Pacific companies (about 10% of Fund assets), with the balance in other regions and cash.
1
FPA PARAMOUNT FUND, INC.
LETTER TO SHAREHOLDERS
Continued
As always, we end the performance discussion by repeating our belief that it is important for shareholders and future investors to understand that we seek to continuously increase the Fund's discount to intrinsic value. We do this by purchasing companies we believe are undervalued and selling ones that become fully valued. Doing so with a concentrated portfolio means the Fund's performance will be lumpy. We will tolerate short-term volatility because we believe increasing discounts to intrinsic value create the best chances for long-term outperformance.
Key performers
Our worst-performing holding this quarter was Aggreko, which was down 26.39% (in U.S. currency).3 Based in the UK, the company is the world's leading provider of temporary power solutions. The group owns and manages a fleet of generators the size of shipping containers that are available for rent across a global network of service depots. Generators are typically used in emergency situations, for special events, and to complement or substitute for permanent power. Developed countries often use Aggreko's solutions to manage the inherent volatility of renewable energy sources, and to make up for under-investments in infrastructure. Developing countries, including many sub-Saharan Africa states that lack the resources to access permanent power, typically require the service to satisfy their growing needs for electricity.
As a result, a significant portion of Aggreko's business is pegged to emerging markets, where demand is sensitive to fluctuations in commodity prices and currency exchanges rates. In the last couple of years, the economic environment in these countries has proven difficult because of the steep decline in oil prices, the strengthening of the U.S. dollar, the subsequent weakening in economic growth and the dramatic geopolitical dislocation. The group also has some exposure to mining, and has historically generated more than 10% of its revenues from Oil & Gas — two sectors that are experiencing sharp down cycles. This series of cyclical headwinds has put negative pressure on the company's short-term operating performance, and subsequently on its share price.
The Fund first invested in the group in 2012. In December of that year, Aggreko's market value fell sharply by over 20%. In our opinion, the decline was likely related to competitor APR Energy's aggressive investment in turbines, economic weakness in Europe, a pullback in U.S. remote military operations, and reduced demand from Japan as nuclear power slowly came back on line. We believed APR's strategy was flawed and ill-fated. We also considered many of the aforementioned challenges to be cyclical rather than structural in nature, as well as both predictable and quantifiable, and we thought the correction in the group's share price to be overdone. While we were concerned about slowing economic growth in emerging markets and the resulting increased competitive pressure, we trusted that management would gracefully manoeuver through the downturn. With a ubiquitous asset base and a worldwide network, Aggreko can choose to deploy capital when and where growth opportunities exist and offer high returns, thus building enterprise value. Alternatively, the company can pull back on spending when demand is weak to improve asset utilization and maximize free cash flow.
Unfortunately, an unexpected change in leadership meant that management is now willing to accept lower returns in order to drive top-line growth. Mounting evidence of this new strategy caused us to adjust downward several of our assumptions about Aggreko's intrinsic value, although we still consider the business of high enough quality to own.
3 Worst performer based on the percentage of Aggreko's share price change from 6/30/16 to 9/30/16 in U.S. currency. This share price change does not equate with the performance of the holding in the Fund's portfolio. As of 9/30/16, Aggreko represented 1.42% of the Fund's total assets.
2
FPA PARAMOUNT FUND, INC.
LETTER TO SHAREHOLDERS
Continued
From a business fundamental standpoint, we remain interested in being shareholders of Aggreko, so long as the share price presents us with an appropriate margin of safety. Any potential increase in the position however would have to be dictated by the discount to intrinsic value that the stock offers relative to that of our other portfolio holdings.
U.S.-based eBay gained about 40.5% (in U.S. currency) during the quarter and was the Fund's best-performing holding this quarter.4 The company operates the leading online marketplace (ebay.com) for buying and selling unique items. Despite its strong position online, for several years eBay's business has been under pressure from several issues. First, a security breach required users to reset passwords and second, changes to Google's search engine algorithms caused eBay's listings to fall noticeably down the search rankings. We believe that these issues led to a decline in traffic to the ebay.com website. Growth in buyers and transaction values accelerated this quarter for the first time in two years, which validated the series of technical fixes undertaken by the company to address these issues. In addition to eBay's self-help initiatives, overall consumer spending continues to shift from store-based retail sales to online and mobile sales, and we believe the company is well positioned to capture a portion of those online sales. Despite the recent positive performance, we believe the shares are reasonably priced, trading at a 7% FCF yield5.
Company news
There was important news at Joy Global during the quarter. Based in the U.S., Joy is a leading global manufacturer of mining equipment. We first bought Joy shares at the end of 2013, when the company was starting to experience a sharp downturn in its end markets, and the share price had fallen more than 40% from its peak. Despite fears that the economic pressure on its customers would limit new equipment sales, we believed most of Joy's mining systems installed around the world would remain in service over the long term. In addition, since customers run the company's equipment under harsh conditions, we expected Joy to capture the ongoing higher-margin equipment service and replacement parts business. But the downturn over the last two years was more severe than we anticipated, so even the aftermarket parts and service sales were very negatively impacted. Management responded to the downturn by reducing operating expenses, eliminating growth capital spending and reducing working capital.
That was the backdrop leading up to July 21, when the company announced that it was being acquired by Komatsu of Japan. As a result, Joy shareholders will receive $28.30 in cash per Joy share at the close of the deal in the first half of next year.
From Komatsu's point of view, we can see why the deal makes strategic sense. The two companies compete head on with Caterpillar (CAT). Unlike CAT, which has its own dealer network, Komatsu and Joy mostly sell directly to customers. The Joy and Komatsu product lines are largely complimentary, with little direct overlap. Since we believe Joy has maintained its leading market share for sophisticated customers during the downturn, the combination strengthens Komatsu to take on CAT.
Looking at it from Joy's perspective, we need to evaluate how they handled two of the cardinal rules of running a cyclical industrial business. Rule number one is never take on excess financial leverage. When the industry cycle eventually turns down and negative operating leverage takes profitability with it, you don't want to be beholden to your creditors. Rule number two is to sell assets late in the cycle [when there are signs the party
4 Represents the percentage of eBay's share price change from 6/30/16 to 9/30/16. The percentage price change does not equate with the performance of the holding in the Fund's portfolio.
5 FCF, or Free Cash Flow, is calculated as operating cash flow minus capital expenditures.
3
FPA PARAMOUNT FUND, INC.
LETTER TO SHAREHOLDERS
Continued
is coming to an end], and to buy assets early in the cycle [during the hangover phase]. Joy's management stayed true to the first rule, but while precisely timing the cycle peaks and troughs is only possible in hindsight, it appears to us the company is violating rule number two.
At the time of the announcement, Joy's shares were down more than 75% from their peak, despite almost doubling year to date. The takeout price represents a multiple of 1.5x times sales, which compares to the 2.0x sales CAT paid for Bucyrus in 2010 at the peak. Whether or not this turns out to be a fair price for Joy's shareholders will depend on the pace of recovery in the mining industry in the years ahead. We suspect five years from now, however, Komatsu will be congratulated on the deal for both its strategic merits and the price paid, and our frustration with Joy management for selling at the bottom of the cycle will be justified.
Regardless, because Komatsu is paying all cash, we don't get to participate in the future results, whatever they are. Instead, our sell price is locked in, which means that barring another offer, which we don't expect, we have suffered a permanent impairment on the position. The size of the loss is mitigated by the lower-cost purchases we made in second half of last year, but not by enough to keep the total position from being impaired.
Even though we vet the management team of every company before investing, our experience with Joy will serve as a reminder of the importance of management. This is true in all environments, but especially crucial during difficult stretches. The old adage about taking care with whom you share a foxhole certainly has applied in this case, as we think management made an expedient decision that transfers long-term value from Joy to Komatsu shareholders.
Portfolio activity
Coming off the Brexit6-induced declines at the end of last quarter, the equity markets rebounded to begin the third quarter, and then maintained those levels throughout the period. Along the way, as previously noted, several major indices reached all-time highs. Price increases for several of our holdings reduced their margins of safety and caused us to exit the positions. These included Sodexo and Danone. Sodexo, based in France, is a leading global provider of on-premise food-service operations. Danone, also based in France, is the world's leading producer of fresh dairy products. They also operate a strong baby food business, a fast-growing medical nutrition business and a good water business. Not only had the stock reached fair value in this case, but the company had also become yet another example of large institutional businesses being lured into taking on financial leverage to make large, questionable acquisitions. In July, Danone announced the purchase of Silk soymilk producer Whitewave for $13 billion (over a quarter of the Danone's market cap). Whitewave reported sales of $944 million and operating profit of $375 million in fiscal year 2015, implying an acquisition multiple of 35x last year's profits.
Despite the broad-based market appreciation, we still found several companies under pressure, which gave us the chance to make new purchases, including Britvic and Mednax. Based in the UK, Britvic is a leading soft drinks company with a strong portfolio of proprietary brands, and operations in Great Britain, Ireland, northern Europe, France, the U.S. and Brazil. In our opinion, the shares have been under pressure because of its unpopular decision to delist a high sugar-added product, a weak trading environment no longer offset by weak commodity prices, and higher labor cost inflation from the new National Living Wage in the UK. Based in the U.S., Mednax is the largest employer of hospital-based doctors specializing in neonatology and anesthesiology. Worries about recent organic growth weakness have weighed on the shares, which provided our entry point.
6 Brexit refers to the June 23, 2016, referendum whereby British citizens voted to exit the European Union.
4
FPA PARAMOUNT FUND, INC.
LETTER TO SHAREHOLDERS
Continued
We also increased or trimmed existing positions as necessary during the third quarter to optimize the portfolio's overall discount to intrinsic value. Our cash balance ended at a little less than 10%, which is similar to last quarter.
Portfolio profile
We owned 43 companies at the end of the quarter, which remains within the range of the 25 to 50 businesses that we would expect to own at any given time. The top ten holdings represented about 35% of Fund assets, and position sizes are based on the relative discount to intrinsic value of each stock. That means the largest weightings correspond to the largest discounts.
Most of the positions are in large-cap companies (median approximately $8 billion), including several businesses that are considered mega-caps7. That's partly a function of our mandate, which focuses on companies with market caps in excess of $2 billion. Companies domiciled in Europe and the U.S. continue to dominate our portfolio, with Asia-Pacific and a few emerging market investments making up the balance. Where a company is domiciled is largely irrelevant to us, however, since many of our holdings are large companies that conduct business on a global scale. That means they often generate significant amounts of their cash outside their home countries, rendering traditional country classifications less useful.
Team update
At the beginning of the fourth quarter, we welcomed a new team member, John Madden, who joined us from NWQ Investments. John has worked as an international equity analyst for the last five years, and earned a bachelor's degree in economics at the University of Notre Dame.
We thank you, as always, for your confidence, and we look forward to continuing to serve your interests as shareholders of the FPA Paramount Fund.
Respectfully submitted,

| | 
| |
Gregory Herr
Portfolio Manager | | Pierre O. Py
Portfolio Manager | |
October 10, 2016 | | | |
7 Large-cap refers to companies with a market capitalization value of more than $10 billion. Mega-cap refers to the biggest companies in the investment universe, as measured by market capitalization. While there is no exact definition of the term, mega-cap generally refers to companies with a market cap exceeding $100 billion.
5
FPA PARAMOUNT FUND, INC.
LETTER TO SHAREHOLDERS
Continued
Performance data quoted in this letter represents past performance and neither indicates nor guarantees future performance. The discussions of Fund investments represent the views of the Fund's managers at the time of this report and are subject to change without notice. References to individual securities are for informational purposes only and should not be construed as recommendations to purchase or sell individual securities. While the Fund's managers believe that the Fund's holdings are value stocks, there can be no assurance that others will consider them as such. Further, investing in value stocks presents the risk that value stocks may fall out of favor with investors and underperform growth stocks during given periods.
The MSCI World Index is a free float-adjusted market capitalization weighted index that is designed to measure the equity market performance of developed markets. The MSCI World Index consists of the following 24 developed market country indices: Australia, Austria, Belgium, Canada, Denmark, Finland, France, Germany, Greece, Hong Kong, Ireland, Israel, Italy, Japan, Netherlands, New Zealand, Norway, Portugal, Singapore, Spain, Sweden, Switzerland, the United Kingdom, and the United States. Individuals cannot invest directly in an Index.
FUND RISKS
Investments in mutual funds carry risks and investors may lose principal value. Stock markets are volatile and can decline significantly in response to adverse issuer, political, regulatory, market, or economic developments. The funds may purchase foreign securities which are subject to interest rate, currency exchange rate, economic and political risks: this may be enhanced when investing in emerging markets. Small and mid-cap stocks involve greater risks and they can fluctuate in price more than larger company stocks. Groups of stocks, such as value and growth, go in and out of favor which may cause certain funds to underperform other equity funds.
FORWARD LOOKING STATEMENT DISCLOSURE
As mutual fund managers, one of our responsibilities is to communicate with shareholders in an open and direct manner. Insofar as some of our opinions and comments in our letters to shareholders are based on our current expectations, they are considered "forward-looking statements" which may or may not prove to be accurate over the long term. While we believe we have a reasonable basis for our comments and we have confidence in our opinions, actual results may differ materially from those we anticipate. You can identify forward-looking statements by words such as "believe," "expect," "may," "anticipate," and other similar expressions when discussing prospects for particular portfolio holdings and/or the markets, generally. We cannot, however, assure future results and disclaim any obligation to update or alter any forward-looking statements, whether as a result of new information, future events, or otherwise. Further, information provided in this report should not be construed as a recommendation to purchase or sell any particular security.
6
FPA PARAMOUNT FUND, INC.
HISTORICAL PERFORMANCE
(Unaudited)
Change in Value of a $10,000 Investment in FPA Paramount Fund, Inc. vs. MSCI AWCI from October 1, 2006 to September 30, 2016
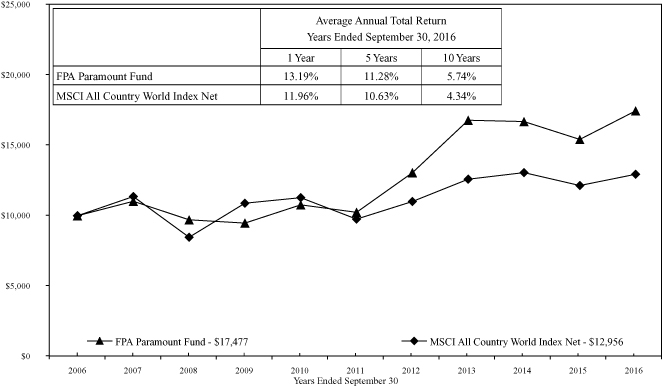
The MSCI All Country World NR Index is a float-adjusted market capitalization index that is designed to measure the combined equity market performance of developed and emerging markets. This index does not reflect any commissions or fees which would be incurred by an investor purchasing the stocks it represents. The performance of the Fund and of the Index is computed on a total return basis, which includes reinvestment of all distributions.
A new strategy for FPA Paramount Fund, Inc. was implemented beginning on September 1, 2013. The returns above include performance of the previous managers prior to that date.
Past performance is no guarantee of future results, and current performance may be higher or lower than the performance shown. This data represents past performance, and investors should understand that investment returns and principal values fluctuate, so that when you redeem your investment it may be worth more or less than its original cost. Current month-end performance data can be obtained by visiting the website at www.fpafunds.com or by calling toll-free, 1-800-982-4372. As of the most recent prospectus, the expense ratio is 1.29% (see notes to financial statements). Information regarding the Fund's redemption fees can be found on page 15 and 19.
The Prospectus details the Fund's objective and policies, charges, and other matters of interest to prospective investors. Please read the prospectus carefully before investing. The Prospectus may be obtained by visiting the website at www.fpafunds.com, by email at crm@fpafunds.com, toll-free by calling 1-800-982-4372 or by contacting the Fund in writing.
7
FPA PARAMOUNT FUND, INC.
PORTFOLIO SUMMARY
September 30, 2016
Common Stocks | | | | | 90.6 | % | |
Apparel, Footwear & Acc Design | | | 10.8 | % | | | | | |
Professional Services | | | 8.8 | % | | | | | |
Infrastructure Software | | | 7.5 | % | | | | | |
Construction & Mining Machinery | | | 6.9 | % | | | | | |
Advertising & Marketing | | | 6.3 | % | | | | | |
Oil & Gas Services & Equipment | | | 5.6 | % | | | | | |
Internet Media | | | 4.0 | % | | | | | |
Other Common Stocks | | | 3.7 | % | | | | | |
Flow Control Equipment | | | 3.7 | % | | | | | |
Other Commercial Services | | | 3.1 | % | | | | | |
Beverages | | | 3.0 | % | | | | | |
Communications Equipment | | | 2.9 | % | | | | | |
Health Care Services | | | 2.9 | % | | | | | |
Jewelry & Watch Stores | | | 2.8 | % | | | | | |
Entertainment Content | | | 2.5 | % | | | | | |
Specialty Apparel Stores | | | 2.4 | % | | | | | |
Application Software | | | 2.0 | % | | | | | |
Industrial Distribution & Rental | | | 2.0 | % | | | | | |
Aircraft & Parts | | | 1.8 | % | | | | | |
Home & Office Furnishings | | | 1.8 | % | | | | | |
Rubber & Plastic | | | 1.8 | % | | | | | |
Security Services | | | 1.7 | % | | | | | |
Semiconductor Manufacturing | | | 1.0 | % | | | | | |
Packaged Food | | | 1.0 | % | | | | | |
E-Commerce Discretionary | | | 0.6 | % | | | | | |
Short-term Investments | | | | | 9.5 | % | |
Other Assets and Liabilities, Net | | | | | (0.1 | )% | |
Net Assets | | | | | 100.0 | % | |
8
FPA PARAMOUNT FUND, INC.
PORTFOLIO OF INVESTMENTS
September 30, 2016
COMMON STOCKS | | Shares | | Fair Value | |
APPAREL, FOOTWEAR & ACC DESIGN — 10.8% | |
Burberry Group plc (Britain) | | | 185,000 | | | $ | 3,301,189 | | |
Cie Financiere Richemont SA (Switzerland) | | | 54,880 | | | | 3,346,998 | | |
Prada SpA (Italy) | | | 1,991,800 | | | | 6,396,662 | | |
Swatch Group AG (The) (Switzerland) | | | 10,700 | | | | 3,033,314 | | |
| | | $ | 16,078,163 | | |
PROFESSIONAL SERVICES — 8.8% | |
Adecco Group AG (Switzerland) | | | 45,500 | | | $ | 2,564,638 | | |
Pagegroup plc (Britain) | | | 1,779,022 | | | | 7,720,004 | | |
Robert Half International, Inc. | | | 73,500 | | | | 2,782,710 | | |
| | | $ | 13,067,352 | | |
INFRASTRUCTURE SOFTWARE — 7.5% | |
Microsoft Corporation | | | 83,100 | | | $ | 4,786,560 | | |
Oracle Corporation | | | 160,900 | | | | 6,320,152 | | |
| | | $ | 11,106,712 | | |
CONSTRUCTION & MINING MACHINERY — 6.9% | |
Joy Global, Inc. | | | 165,900 | | | $ | 4,602,066 | | |
Metso OYJ (Finland) | | | 120,000 | | | | 3,501,891 | | |
Sandvik AB (Sweden) | | | 192,210 | | | | 2,115,020 | | |
| | | $ | 10,218,977 | | |
ADVERTISING & MARKETING — 6.3% | |
DKSH Holding AG (Switzerland) | | | 49,000 | | | $ | 3,604,606 | | |
Omnicom Group, Inc. | | | 33,000 | | | | 2,805,000 | | |
Publicis Groupe SA (France) | | | 40,030 | | | | 3,028,980 | | |
| | | $ | 9,438,586 | | |
OIL & GAS SERVICES & EQUIPMENT — 5.6% | |
Fugro NV (CVA) (Netherlands)* | | | 351,275 | | | $ | 5,683,329 | | |
ShawCor, Ltd. (Canada) | | | 109,500 | | | | 2,701,715 | | |
| | | $ | 8,385,044 | | |
INTERNET MEDIA — 4.0% | |
Alphabet, Inc. (Class C)* | | | 4,500 | | | $ | 3,497,805 | | |
Baidu, Inc. (ADR) (China)* | | | 13,500 | | | | 2,457,945 | | |
| | | $ | 5,955,750 | | |
FLOW CONTROL EQUIPMENT — 3.7% | |
Rotork plc (Britain) | | | 607,330 | | | $ | 1,660,665 | | |
Sulzer AG (Switzerland) | | | 36,784 | | | | 3,851,257 | | |
| | | $ | 5,511,922 | | |
9
FPA PARAMOUNT FUND, INC.
PORTFOLIO OF INVESTMENTS (Continued)
September 30, 2016
COMMON STOCKS — Continued | | Shares | | Fair Value | |
OTHER COMMERCIAL SERVICES — 3.1% | |
ALS, Ltd. (Australia) | | | 994,621 | | | $ | 4,572,246 | | |
BEVERAGES — 3.0% | |
Britvic plc (Britain) | | | 360,610 | | | $ | 2,819,367 | | |
Diageo plc (Britain) | | | 57,400 | | | | 1,644,140 | | |
| | | $ | 4,463,507 | | |
COMMUNICATIONS EQUIPMENT — 2.9% | |
Cisco Systems, Inc. | | | 89,100 | | | $ | 2,826,252 | | |
Samsung Electronics Co. Ltd. (South Korea) | | | 1,060 | | | | 1,544,168 | | |
| | | $ | 4,370,420 | | |
HEALTH CARE SERVICES — 2.9% | |
Laboratory Corp. of America Holdings* | | | 20,400 | | | $ | 2,804,592 | | |
MEDNAX, Inc.* | | | 23,570 | | | | 1,561,512 | | |
| | | $ | 4,366,104 | | |
JEWELRY & WATCH STORES — 2.8% | |
Signet Jewelers, Ltd. | | | 56,500 | | | $ | 4,210,945 | | |
ENTERTAINMENT CONTENT — 2.5% | |
Twenty-First Century Fox, Inc. (Class B) | | | 150,000 | | | $ | 3,711,000 | | |
SPECIALTY APPAREL STORES — 2.4% | |
Hugo Boss AG (Germany) | | | 65,500 | | | $ | 3,625,777 | | |
APPLICATION SOFTWARE — 2.0% | |
SAP SE (Germany) | | | 33,150 | | | $ | 3,031,643 | | |
INDUSTRIAL DISTRIBUTION & RENTAL — 2.0% | |
Aggreko plc (Britain) | | | 240,047 | | | $ | 2,959,421 | | |
AIRCRAFT & PARTS — 1.8% | |
Meggitt plc (Britain) | | | 461,590 | | | $ | 2,694,163 | | |
HOME & OFFICE FURNISHINGS — 1.8% | |
Howden Joinery Group plc (Britain) | | | 477,430 | | | $ | 2,674,811 | | |
10
FPA PARAMOUNT FUND, INC.
PORTFOLIO OF INVESTMENTS (Continued)
September 30, 2016
COMMON STOCKS — Continued | | Shares or
Principal
Amount | | Fair Value | |
RUBBER & PLASTIC — 1.8% | |
Ansell, Ltd. (Australia) | | | 148,300 | | | $ | 2,618,129 | | |
SECURITY SERVICES — 1.7% | |
Prosegur Cia de Seguridad SA (Spain) | | | 370,360 | | | $ | 2,585,390 | | |
SEMICONDUCTOR MANUFACTURING — 1.0% | |
Taiwan Semiconductor Manufacturing Co., Ltd. (ADR) (Taiwan) | | | 50,720 | | | $ | 1,551,525 | | |
PACKAGED FOOD — 1.0% | |
Nestle SA (Switzerland) | | | 19,100 | | | $ | 1,508,214 | | |
E-COMMERCE DISCRETIONARY — 0.6% | |
eBay, Inc.* | | | 24,900 | | | $ | 819,210 | | |
OTHER COMMON STOCKS — 3.7% | | $ | 5,581,739 | | |
| TOTAL COMMON STOCKS — 90.6% (Cost $142,042,946) | | $ | 135,106,750 | | |
| TOTAL INVESTMENT SECURITIES — 90.6% (Cost $142,042,946) | | $ | 135,106,750 | | |
SHORT-TERM INVESTMENTS — 9.5% | |
State Street Bank Repurchase Agreement — 0.03% 10/3/2016
(Dated 9/30/2016, repurchase price of $14,155,035 collateralized by
$12,750,000 principal amount U.S. Treasury Note —
2.875% 2045, fair value $14,439,375) | | $ | 14,155,000 | | | $ | 14,155,000 | | |
| TOTAL SHORT-TERM INVESTMENTS (Cost $14,155,000) | | $ | 14,155,000 | | |
| TOTAL INVESTMENTS — 100.1% (Cost $156,197,946) | | $ | 149,261,750 | | |
Other Assets and Liabilities, net — (0.1)% | | | (211,828 | ) | |
NET ASSETS — 100.0% | | $ | 149,049,922 | | |
* Non-income producing security.
As permitted by U.S. Securities and Exchange Commission regulations, "Other" Common Stocks include holdings in their first year of acquisition that have not previously been publicly disclosed.
See accompanying Notes to Financial Statements.
11
FPA PARAMOUNT FUND, INC.
STATEMENT OF ASSETS AND LIABILITIES
September 30, 2016
ASSETS | |
Investment securities — at fair value (identified cost $142,042,946) | | $ | 135,106,750 | | |
Short-term investments — at amortized cost (maturities 60 days or less) | | | 14,155,000 | | |
Foreign currencies — at fair value (identified cost $57,932) | | | 57,903 | | |
Cash | | | 335 | | |
Receivable for: | |
Dividends and interest | | | 783,131 | | |
Capital Stock sold | | | 1,448 | | |
Prepaid expenses and other assets | | | 26 | | |
Total assets | | | 150,104,593 | | |
LIABILITIES | |
Payable for: | |
Investment securities purchased | | | 819,021 | | |
Advisory fees | | | 53,198 | | |
Capital Stock repurchased | | | 48,420 | | |
| Accrued expenses and other liabilities | | | 134,032 | | |
Total liabilities | | | 1,054,671 | | |
NET ASSETS | | $ | 149,049,922 | | |
SUMMARY OF SHAREHOLDERS' EQUITY | |
Capital Stock — par value $0.25 per share; authorized
100,000,000 shares; outstanding 8,587,831 shares | | $ | 2,146,958 | | |
Additional Paid-in Capital | | | 159,664,848 | | |
Accumulated net realized loss on investments | | | (7,281,222 | ) | |
| Undistributed net investment income | | | 1,467,873 | | |
Net unrealized depreciation | | | (6,948,535 | ) | |
NET ASSETS | | $ | 149,049,922 | | |
NET ASSET VALUE | |
Offering and redemption price per share | | $ | 17.36 | | |
See accompanying Notes to Financial Statements.
12
FPA PARAMOUNT FUND, INC.
STATEMENT OF OPERATIONS
For the Year Ended September 30, 2016
INVESTMENT INCOME | |
Dividends (net of foreign taxes withheld of $337,798) | | $ | 3,631,544 | | |
Interest | | | 3,375 | | |
Total investment income | | | 3,634,919 | | |
EXPENSES | |
Advisory fees | | | 1,503,019 | | |
Legal fees | | | 185,337 | | |
Director fees and expenses | | | 112,831 | | |
Transfer agent fees and expenses | | | 78,319 | | |
Reports to shareholders | | | 65,065 | | |
Audit and tax services fees | | | 54,323 | | |
| Custodian fees | | | 26,748 | | |
Filing fees | | | 12,241 | | |
Administrative services fees | | | 7,529 | | |
Professional fees | | | 7,446 | | |
Other | | | 92,301 | | |
| Total expenses | | | 2,145,159 | | |
| Reimbursement from Adviser | | | (203,046 | ) | |
Net expenses | | | 1,942,113 | | |
Net investment income | | | 1,692,806 | | |
NET REALIZED AND UNREALIZED GAIN (LOSS) | |
Net realized gain (loss) on: | |
Investments | | | (3,398,821 | ) | |
Foreign currency transactions | | | (219,860 | ) | |
Net change in unrealized appreciation (depreciation) of: | |
Investments | | | 20,587,971 | | |
Translation of foreign currency denominated amounts | | | 1,168 | | |
Net realized and unrealized gain | | | 16,970,458 | | |
NET INCREASE IN NET ASSETS RESULTING FROM OPERATIONS | | $ | 18,663,264 | | |
See accompanying Notes to Financial Statements.
13
FPA PARAMOUNT FUND, INC.
STATEMENTS OF CHANGES IN NET ASSETS
| | | Year Ended
September 30, 2016 | | Year Ended
September 30, 2015 | |
INCREASE (DECREASE) IN NET ASSETS | |
Operations: | |
Net investment income | | $ | 1,692,806 | | | $ | 948,910 | | |
Net realized loss | | | (3,618,681 | ) | | | (3,906,714 | ) | |
Net change in unrealized appreciation (depreciation) | | | 20,589,139 | | | | (10,322,747 | ) | |
Net increase (decrease) in net assets resulting from operations | | | 18,663,264 | | | | (13,280,551 | ) | |
Distributions to shareholders from: | |
Net investment income | | | (798,849 | ) | | | (2,820,477 | ) | |
Net realized capital gains | | | — | | | | (5,979,410 | ) | |
Total distributions | | | (798,849 | ) | | | (8,799,887 | ) | |
Capital Stock transactions: | |
Proceeds from Capital Stock sold | | | 5,361,647 | | | | 9,053,411 | | |
Proceeds from shares issued to shareholders upon
reinvestment of dividends and distributions | | | 517,894 | | | | 8,359,632 | | |
Cost of Capital Stock repurchased | | | (28,327,480 | )* | | | (145,627,208 | )* | |
Net decrease from Capital Stock transactions | | | (22,447,939 | ) | | | (128,214,165 | ) | |
Total change in net assets | | | (4,583,524 | ) | | | (150,294,603 | ) | |
NET ASSETS | |
Beginning of Year | | | 153,633,446 | | | | 303,928,049 | | |
End of Year | | $ | 149,049,922 | | | $ | 153,633,446 | | |
CHANGE IN CAPITAL STOCK OUTSTANDING | |
Shares of Capital Stock sold | | | 334,429 | | | | 543,599 | | |
Shares issued to shareholders upon reinvestment of
dividends and distributions | | | 33,113 | | | | 498,785 | | |
Shares of Capital Stock repurchased | | | (1,741,533 | ) | | | (8,474,309 | ) | |
Change in Capital Stock outstanding | | | (1,373,991 | ) | | | (7,431,925 | ) | |
* Net of redemption fees of $637 and $10,177 for the year ended September 30, 2016 and year ended September 30, 2015, respectively.
See accompanying Notes to Financial Statements.
14
FPA PARAMOUNT FUND, INC.
FINANCIAL HIGHLIGHTS
Selected Data for Each Share of Capital Stock Outstanding Throughout Each Year
| | | Year Ended September 30, | |
| | | 2016 | | 2015 | | 2014 | | 2013 | | 2012 | |
Per share operating performance: | |
Net asset value at beginning of year | | $ | 15.42 | | | $ | 17.47 | | | $ | 25.68 | | | $ | 20.00 | | | $ | 15.68 | | |
Income from investment operations: | |
Net investment income* | | $ | 0.18 | | | $ | 0.08 | | | $ | 0.16 | | | $ | 0.03 | | | | — | ** | |
Net realized and unrealized gain (loss)
on investment securities | | | 1.84 | | | | (1.35 | ) | | | (0.01 | ) | | | 5.69 | | | $ | 4.32 | | |
Total from investment operations | | $ | 2.02 | | | $ | (1.27 | ) | | $ | 0.15 | | | $ | 5.72 | | | $ | 4.32 | | |
Less distributions: | |
Dividends from net investment income | | $ | (0.08 | ) | | $ | (0.25 | ) | | | — | | | $ | (0.03 | ) | | | — | | |
Distributions from net realized
capital gains | | | — | | | | (0.53 | ) | | $ | (8.36 | ) | | | (0.01 | ) | | | — | | |
Total distributions | | $ | (0.08 | ) | | $ | (0.78 | ) | | $ | (8.36 | ) | | $ | (0.04 | ) | | | — | | |
Redemption fees | | | — | ** | | | — | ** | | | — | ** | | | — | ** | | | — | ** | |
Net asset value at end of year | | $ | 17.36 | | | $ | 15.42 | | | $ | 17.47 | | | $ | 25.68 | | | $ | 20.00 | | |
Total investment return*** | | | 13.19 | % | | | (7.63 | )% | | | (0.55 | )% | | | 28.64 | % | | | 27.55 | % | |
Ratios/supplemental data: | |
Net assets, end of year (in $000's) | | $ | 149,050 | | | $ | 153,633 | | | $ | 303,928 | | | $ | 326,045 | | | $ | 259,158 | | |
Ratio of expenses of average net assets: | |
Before reimbursement from Adviser | | | 1.43 | % | | | 1.32 | % | | | 1.22 | % | | | 0.92 | % | | | 0.94 | % | |
After reimbursement from Adviser | | | 1.29 | % | | | 1.30 | % | | | 1.06 | % | | | 0.92 | % | | | 0.94 | % | |
Ratio of net investment income to
average net assets: | |
Before reimbursement from
Adviser | | | 0.99 | % | | | 0.46 | % | | | 0.76 | % | | | 0.13 | % | | | 0.01 | % | |
After reimbursement from
Adviser | | | 1.13 | % | | | 0.48 | % | | | 0.92 | % | | | 0.13 | % | | | 0.01 | % | |
Portfolio turnover rate | | | 52 | % | | | 38 | % | | | 113 | % | | | 19 | % | | | 6 | % | |
* Per share amount is based on average shares outstanding.
** Rounds to less than $0.01 per share.
*** Return is based on net asset value per share, adjusted for reinvestment of distributions.
See accompanying Notes to Financial Statements.
15
FPA PARAMOUNT FUND, INC.
NOTES TO FINANCIAL STATEMENTS
September 30, 2016
NOTE 1 — Significant Accounting Policies
FPA Paramount Fund, Inc. (the "Fund") is registered under the Investment Company Act of 1940, as a non-diversified, open-end management investment company. The Fund's primary investment objective is a high total investment return, including capital appreciation and income. The Fund qualifies as an investment company pursuant to Financial Accounting Standards Codification (ASC) No. 946, Financial Services — Investment Companies. The following is a summary of significant accounting policies consistently followed by the Fund in the preparation of its financial statements.
A. Security Valuation
The Fund's investments are reported at fair value as defined by accounting principles generally accepted in the United States of America, ("U.S. GAAP"). The Fund generally determines its net asset value as of approximately 4:00 p.m. New York time each day the New York Stock Exchange is open. Further discussion of valuation methods, inputs and classifications can be found under Disclosure of Fair Value Measurements.
B. Securities Transactions and Related Investment Income
Securities transactions are accounted for on the date the securities are purchased or sold. Dividend income and distributions to shareholders are recorded on the ex-dividend date. Interest income and expenses are recorded on an accrual basis. The books and records of the Fund are maintained in U.S. dollars as follows: (1) the foreign currency market value of investment securities, and other assets and liabilities stated in foreign currencies, are translated using the daily spot rate; and (2) purchases, sales, income and expenses are translated at the rate of exchange prevailing on the respective dates of such transactions. The resultant exchange gains and losses are included in net realized or net unrealized gain (loss) in the statement of operations.
C. Use of Estimates
The preparation of the financial statements in accordance with U.S. GAAP requires management to make estimates and assumptions that affect the amounts reported. Actual results could differ from those estimates.
NOTE 2 — Risk Considerations
Investing in the Fund may involve certain risks including, but not limited to, those described below.
Market Risk: Because the values of the Fund's investments will fluctuate with market conditions, so will the value of your investment in the Fund. You could lose money on your investment in the Fund or the Fund could underperform other investments.
Common Stocks and Foreign Securities: The prices of common stocks and other securities held by the Fund may decline in response to certain events taking place around the world, including; those directly involving companies whose securities are owned by the Fund; conditions affecting the general economy; overall market changes; local, regional or global political, social or economic instability; and currency, interest rate and commodity price fluctuations. Since the Fund invests in foreign securities, it will be subject to risks not typically associated with domestic securities. Foreign investments, especially those of companies in emerging markets, can be riskier less liquid, harder to value, and more volatile than investments in the United States. Adverse political and economic developments or changes in the value of foreign currency can make it more difficult for the Fund to value the securities. Differences in tax and accounting standards, difficulties in obtaining information about foreign companies, restrictions on receiving investment proceeds from a foreign country, confiscatory foreign tax laws, and potential difficulties in enforcing contractual obligations, can all add to the risk and volatility
16
FPA PARAMOUNT FUND, INC.
NOTES TO FINANCIAL STATEMENTS
Continued
of foreign investments. The financial problems in global economies over the past several years, including the European sovereign debt crisis, may continue to cause high volatility in global financial markets.
Risks Associated with Non-Diversification: The Fund is non-diversified, which generally means that it may invest a greater percentage of its total assets in the securities of fewer issuers than a "diversified" fund. This increases the risk that a change in the value of any one investment held by the Fund could affect the overall value of the Fund more than it would affect that of a diversified fund holding a greater number of investments. Accordingly, the Fund's value will likely be more volatile than the value of a more diversified fund.
Repurchase Agreements: Repurchase agreements permit the Fund to maintain liquidity and earn income over periods of time as short as overnight. Repurchase agreements held by the Fund are fully collateralized by U.S. Government securities, or securities issued by U.S. Government agencies, or securities that are within the three highest credit categories assigned by established rating agencies (Aaa, Aa, or A by Moody's or AAA, AA or A by Standard & Poor's) or, if not rated by Moody's or Standard & Poor's, are of equivalent investment quality as determined by the Adviser. Such collateral is in the possession of the Fund's custodian. The collateral is evaluated daily to ensure its market value equals or exceeds the current market value of the repurchase agreements including accrued interest. In the event of default on the obligation to repurchase, the Fund has the right to liquidate the collateral and apply the proceeds in satisfaction of the obligation.
The Fund may enter into repurchase agreements, under the terms of a Master Repurchase Agreement ("MRA"). The MRA permits the Fund, under certain circumstances including an event of default (such as bankruptcy or insolvency), to offset payables and/or receivables under the MRA with collateral held and/or posted to the counterparty and create one single net payment due to or from the Fund. However, bankruptcy or insolvency laws of a particular jurisdiction may impose restrictions on or prohibitions against such a right of offset in the event of a MRA counterparty's bankruptcy or insolvency. Pursuant to the terms of the MRA, the Fund receives securities as collateral with a market value in excess of the repurchase price to be received by the Fund upon the maturity of the repurchase transaction. Upon a bankruptcy or insolvency of the MRA counterparty, the Fund recognizes a liability with respect to such excess collateral to reflect the Fund's obligation under bankruptcy law to return the excess to the counterparty. Repurchase agreements outstanding at the end of the period are listed in the Fund's Portfolio of Investments.
NOTE 3 — Purchases and Sales of Investment Securities
Cost of purchases of investment securities (excluding short-term investments) aggregated $70,766,481 for the year ended September 30, 2016. The proceeds and cost of securities sold resulting in net realized losses of $3,398,821 aggregated $94,796,601 and $98,195,422, respectively, for the year ended September 30, 2016. Realized gains or losses are based on the specific identification method.
NOTE 4 — Federal Income Tax
No provision for federal income tax is required because the Fund has elected to be taxed as a "regulated investment company" under the Internal Revenue Code (the "Code") and intends to maintain this qualification and to distribute each year to its shareholders, in accordance with the minimum distribution requirements of the Code, its taxable net investment income and taxable net realized gains on investments.
17
FPA PARAMOUNT FUND, INC.
NOTES TO FINANCIAL STATEMENTS
Continued
Distributions paid to shareholders are based on net investment income and net realized gains determined on a tax reporting basis, which may differ from financial reporting. For federal income tax purposes, the Fund had the following components of distributable earnings at September 30, 2016:
| Undistributed Ordinary Income | | $ | 1,467,873 | | |
The tax status of distributions paid during the fiscal years ended September 30, 2016 and 2015 were as follows:
| | | 2016 | | 2015 | |
Dividends from ordinary income | | $ | 798,849 | | | $ | 5,828,007 | | |
| Distributions from long-term capital gains | | | — | | | | 2,971,880 | | |
The Fund utilizes the provisions of federal income tax laws that provide for the carryforward of capital losses for prior years, offsetting such losses against any future realized capital gains. Under the Regulated Investment Company Act of 2010 (the "Act"), net capital losses recognized for fiscal years beginning after December 22, 2010 may be carried forward indefinitely, and their character is retained as short-term and/or long-term losses. Previously, net capital losses were carried forward for eight years and treated as short-term losses. As a transition rule, the Act requires that post-enactment net capital losses be used before pre-enactment net capital losses.
As of September 30, 2016, the post enactment accumulated losses were $6,992,086.
The cost of investment securities held at September 30, 2016, was $142,332,082 for federal income tax purposes. Gross unrealized appreciation and depreciation for all investments (excluding short-term investments) at September 30, 2016, for federal income tax purposes was $11,632,215 and $18,857,547, respectively resulting in net unrealized depreciation of $7,225,332. As of and during the year ended September 30, 2016, the Fund did not have any liability for unrecognized tax benefits. The Fund recognizes interest and penalties, if any, related to unrecognized tax benefits as income tax expense in the Statement of Operations. During the year, the Fund did not incur any interest or penalties. The Fund is not subject to examination by U.S. federal tax authorities for years ended on or before September 30, 2012 or by state tax authorities for years ended on or before September 30, 2011.
During the year ended September 30, 2016, the Fund reclassified $219,860 from Accumulated Realized Loss to Net Investment Loss, to align financial reporting with tax reporting. The permanent book/tax differences arose principally from differing book/tax treatment of foreign currency gains and losses.
NOTE 5 — Advisory Fees and Other Affiliated Transactions
Pursuant to an Investment Advisory Agreement (the "Agreement") approved by shareholders on November 15, 2013 advisory fees were paid by the Fund to First Pacific Advisors, LLC (the "Adviser"). Under the terms of this Agreement, the Fund pays the Adviser a monthly fee calculated at the annual rate of 1% of the Fund's average daily net assets. In addition, the Adviser contractually agreed to reimburse expenses in excess of 1.29% of the average net assets of the Fund (excluding brokerage fees and commissions, interest, taxes, shareholder service
18
FPA PARAMOUNT FUND, INC.
NOTES TO FINANCIAL STATEMENTS
Continued
fees, fees and expenses of other funds in which the Fund invests, and extraordinary expenses) through January 31, 2017.
For the year ended September 30, 2016, the Fund paid aggregate fees and expenses of $112,831 to all Directors who are not affiliated persons of the Adviser. Certain officers of the Fund are also officers of the Adviser.
NOTE 6 — Redemption Fees
A redemption fee of 2% applies to redemptions within 90 days of purchase. For the year ended September 30, 2016, the Fund collected $637 in redemption fees. The impact of these fees is less than $0.01 per share.
NOTE 7 — Disclosure of Fair Value Measurements
The Fund uses the following methods and inputs to establish the fair value of its assets and liabilities. Use of particular methods and inputs may vary over time based on availability and relevance as market and economic conditions evolve.
Equity securities are generally valued each day at the official closing price of, or the last reported sale price on, the exchange or market on which such securities principally are traded, as of the close of business on that day. If there have been no sales that day, equity securities are generally valued at the last available bid price. Securities that are unlisted and fixed-income and convertible securities listed on a national securities exchange for which the over-the-counter ("OTC") market more accurately reflects the securities' value in the judgment of the Fund's officers, are valued at the most recent bid price. Events occurring after the close of trading on non-U.S. exchanges may result in adjustments to the valuation of foreign securities to reflect their fair value as of the close of regular trading on the NYSE. The Fund may utilize an independent fair valuation service in adjusting the valuations of foreign securities. Short-term corporate notes with maturities of 60 days or less at the time of purchase are valued at amortized cost.
Securities for which representative market quotations are not readily available or are considered unreliable by the Adviser are valued as determined in good faith under procedures adopted by the authority of the Fund's Board of Directors. Various inputs may be reviewed in order to make a good faith determination of a security's value. These inputs include, but are not limited to, the type and cost of the security; contractual or legal restrictions on resale of the security; relevant financial or business developments of the issuer; actively traded similar or related securities; conversion or exchange rights on the security; related corporate actions; significant events occurring after the close of trading in the security; and changes in overall market conditions. Fair valuations and valuations of investments that are not actively trading involve judgment and may differ materially from valuations of investments that would have been used had greater market activity occurred.
The Fund classifies its assets based on three valuation methodologies. Level 1 values are based on quoted market prices in active markets for identical assets. Level 2 values are based on significant observable market inputs, such as quoted prices for similar assets and quoted prices in inactive markets or other market observable inputs as noted above including spreads, cash flows, financial performance, prepayments, defaults, collateral, credit enhancements, and interest rate volatility. Certain foreign securities may be fair valued using an independent pricing service that considers the correlation of the trading patterns of the foreign security to the intraday trading in the U.S. markets and are categorized in Level 2 of the fair value hierarchy. Level 3 values are based on significant unobservable inputs that reflect the Fund's determination of assumptions that market participants might reasonably use in valuing the assets. The valuation levels are not necessarily an indication of the risk associated with investing
19
FPA PARAMOUNT FUND, INC.
NOTES TO FINANCIAL STATEMENTS
Continued
in those securities. The following table presents the valuation levels of the Fund's investments as of September 30, 2016:
Investments | | Level 1 | | Level 2 | | Level 3 | | Total | |
Common Stocks | |
Apparel, Footwear & Acc Design | | | — | | | $ | 16,078,163 | | | | — | | | $ | 16,078,163 | | |
Professional Services | | $ | 2,782,710 | | | | 10,284,642 | | | | — | | | | 13,067,352 | | |
Infrastructure Software | | | 11,106,712 | | | | — | | | | — | | | | 11,106,712 | | |
Construction & Mining Machinery | | | 4,602,066 | | | | 5,616,911 | | | | — | | | | 10,218,977 | | |
Advertising & Marketing | | | 2,805,000 | | | | 6,633,586 | | | | — | | | | 9,438,586 | | |
Oil & Gas Services & Equipment | | | 2,701,715 | | | | 5,683,329 | | | | — | | | | 8,385,044 | | |
Internet Media | | | 5,955,750 | | | | — | | | | — | | | | 5,955,750 | | |
Flow Control Equipment | | | — | | | | 5,511,922 | | | | — | | | | 5,511,922 | | |
Other Commercial Services | | | — | | | | 4,572,246 | | | | — | | | | 4,572,246 | | |
Beverages | | | — | | | | 4,463,507 | | | | — | | | | 4,463,507 | | |
| Communications Equipment | | | 2,826,252 | | | | 1,544,168 | | | | — | | | | 4,370,420 | | |
Health Care Services | | | 4,366,104 | | | | — | | | | — | | | | 4,366,104 | | |
Jewelry & Watch Stores | | | 4,210,945 | | | | — | | | | — | | | | 4,210,945 | | |
Entertainment Content | | | 3,711,000 | | | | — | | | | — | | | | 3,711,000 | | |
Specialty Apparel Stores | | | — | | | | 3,625,777 | | | | — | | | | 3,625,777 | | |
Application Software | | | — | | | | 3,031,643 | | | | — | | | | 3,031,643 | | |
Industrial Distribution & Rental | | | — | | | | 2,959,421 | | | | — | | | | 2,959,421 | | |
Aircraft & Parts | | | — | | | | 2,694,163 | | | | — | | | | 2,694,163 | | |
Home & Office Furnishings | | | — | | | | 2,674,811 | | | | — | | | | 2,674,811 | | |
Rubber & Plastic | | | — | | | | 2,618,129 | | | | — | | | | 2,618,129 | | |
Security Services | | | — | | | | 2,585,390 | | | | — | | | | 2,585,390 | | |
Semiconductor Manufacturing | | | 1,551,525 | | | | — | | | | — | | | | 1,551,525 | | |
Packaged Food | | | — | | | | 1,508,214 | | | | — | | | | 1,508,214 | | |
E-Commerce Discretionary | | | 819,210 | | | | — | | | | — | | | | 819,210 | | |
Other Common Stocks | | | 735,745 | | | | 4,845,994 | | | | — | | | | 5,581,739 | | |
Short-Term Investment | | | — | | | | 14,155,000 | | | | — | | | | 14,155,000 | | |
| | | $ | 48,174,734 | | | $ | 101,087,016 | | | | — | | | $ | 149,261,750 | | |
Transfers of investments between different levels of the fair value hierarchy are recorded at market value as of the end of the reporting period. There were transfers of $86,932,016 from Level 1 to Level 2 during the period ended September 30, 2016. The transfers between Level 1 and Level 2 of the fair value hierarchy during the period ended September 30, 2016, were due to changes in valuation of international equity securities from the exchange closing price to the fair value price.
20
FPA PARAMOUNT FUND, INC.
NOTES TO FINANCIAL STATEMENTS
Continued
NOTE 8 — Line of Credit
The Fund, along with FPA U.S. Value Fund, Inc. (another mutual fund managed by the Adviser) for the period October 1, 2015 through February 17, 2016, and along with FPA International Value Fund (another mutual fund managed by the Adviser) since February 26, 2016, has collectively entered into an agreement that enables them to participate in a $50 million unsecured line of credit with State Street Bank and Trust. Borrowings will be made solely to temporarily finance the repurchase of Capital Stock. Interest is charged to each Fund based on its borrowings at a rate per annum equal to the Overnight LIBOR Rate plus 1.25%. In addition, the Fund and FPA International Value Fund pay a combined commitment fee of 0.25% per annum on any unused portion of the line of credit.
For the year ended September 30, 2016, the Fund had no borrowings under the agreement.
NOTE 9 — Collateral Requirements
FASB Accounting Standards Update No. 2011-11, Disclosures about Offsetting Assets and Liabilities requires disclosures to make financial statements that are prepared under U.S. GAAP more comparable to those prepared under International Financial Reporting Standards. Under this guidance the Fund discloses both gross and net information about instruments and transactions eligible for offset such as instruments and transactions subject to an agreement similar to a master netting arrangement. In addition, the Fund discloses collateral received and posted in connection with master netting agreements or similar arrangements.
The following table presents the Fund's repurchase agreements by counterparty net of amounts available for offset under an ISDA Master agreement or similar agreements and net of the related collateral received or pledged by the Fund as of September 30, 2016, are as follows:
Counterparty | | Gross Assets
in the Statement of
Assets and Liabilities | | Collateral
Received | | Assets (Liabilities)
Available for Offset | | Net Amount
of Assets* | |
State Street Bank
and Trust Company | | $ | 14,155,000 | | | $ | 14,155,000 | ** | | | — | | | | — | | |
* Represents the net amount receivable from the counterparty in the event of default.
** Collateral with a value of $14,439,375 has been received in connection with a master repurchase agreement. Excess of collateral received from the individual master repurchase agreement is not shown for financial reporting purposes.
21
FPA PARAMOUNT FUND, INC.
REPORT OF INDEPENDENT REGISTERED
PUBLIC ACCOUNTING FIRM
TO THE SHAREHOLDERS AND
BOARD OF DIRECTORS OF FPA PARAMOUNT FUND, INC.
We have audited the accompanying statement of assets and liabilities of FPA Paramount Fund, Inc. (the "Fund"), including the portfolio of investments, as of September 30, 2016, the related statement of operations for the year then ended, the statements of changes in net assets for each of the two years in the period then ended, and the financial highlights for each of the five years in the period then ended. These financial statements and financial highlights are the responsibility of the Fund's management. Our responsibility is to express an opinion on these financial statements and financial highlights based on our audits.
We conducted our audits in accordance with the standards of the Public Company Accounting Oversight Board (United States). Those standards require that we plan and perform the audit to obtain reasonable assurance about whether the financial statements and financial highlights are free of material misstatement. The Fund is not required to have, nor were we engaged to perform, an audit of its internal control over financial reporting. Our audits included consideration of internal control over financial reporting as a basis for designing audit procedures that are appropriate in the circumstances, but not for the purpose of expressing an opinion on the effectiveness of the Fund's internal control over financial reporting. Accordingly, we express no such opinion. An audit also includes examining, on a test basis, evidence supporting the amounts and disclosures in the financial statements, assessing the accounting principles used and significant estimates made by management, as well as evaluating the overall financial statement presentation. Our procedures included confirmation of securities owned as of September 30, 2016, by correspondence with the custodian and brokers; where replies were not received from brokers, we performed other auditing procedures. We believe that our audits provide a reasonable basis for our opinion.
In our opinion, such financial statements and financial highlights referred to above present fairly, in all material respects, the financial position of FPA Paramount Fund, Inc. as of September 30, 2016, the results of its operations for the year then ended, the changes in its net assets for each of the two years in the period then ended, and the financial highlights for each of the five years in the period then ended in conformity with accounting principles generally accepted in the United States of America.

Los Angeles, California
November 18, 2016
22
FPA PARAMOUNT FUND, INC.
APPROVAL OF INVESTMENT ADVISORY AGREEMENT
(Unaudited)
Approval of the Advisory Agreement. At a meeting of the Board of Directors held on August 8, 2016, the Directors approved the continuation of the advisory agreement between the Fund and the Adviser for an additional one-year period through September 30, 2017, on the recommendation of the Independent Directors, who met in executive session on August 8, 2016 prior to the Board meeting to review and discuss the proposed continuation of the advisory agreement. The following paragraphs summarize the material information and factors considered by the Board and the Independent Directors, as well as the Directors' conclusions relative to such factors.
Nature, Extent and Quality of Services. The Board and the Independent Directors considered information provided by the Adviser in response to their requests, as well as information provided throughout the year regarding the Adviser and its staffing in connection with the Fund, including the Fund's portfolio managers and the senior analysts on their team, the scope of services supervised and provided by the Adviser, and the absence of any significant service problems reported to the Board. The Board and the Independent Directors noted the experience, length of service and the outstanding reputation of the Fund's portfolio managers, Gregory A. Herr, who has managed the Fund since 2011, Pierre O. Py, who has managed the Fund since 2011, and Jason Dempsey, who joined the Adviser in 2013. The Board and the Independent Directors noted increased allocations to non-U.S. securities increases the complexity of the services to be provided by FPA, which would incur additional costs and responsibilities for researching and trading securities, overseeing service providers and other matters, and they noted the nature, extent and quality of these services provided by FPA to other Funds that invest in non-U.S. securities. The Board and the Independent Directors concluded that the nature, extent and quality of services provided by the Adviser, including if the proposed strategy and team were implemented, would benefit the Fund and its shareholders.
Investment Performance. The Board and the Independent Directors reviewed the overall investment performance of the Fund. The Directors also received information from an independent consultant, Morningstar, regarding the Fund's performance relative to a peer group of global multi-cap core funds and global multi-cap growth funds selected by Morningstar (the "Peer Group"). The Board and the Independent Directors discussed the Fund's relative investment performance when compared to the Peer Group. The Board and the Independent Directors noted the Fund underperformed its Peer Group for the three- and five-year periods ending March 31, 2016 but had outperformed the Peer Group for the one-year and 10-year periods ending March 31, 2016. In addition, the Fund outperformed the Fund's benchmark, MSCI all Country World Index for the one-, five- and ten-year period ending March 31, 2016 but underperformed the Index for the three-year period ending March 31, 2016. They also noted that Morningstar continued to give the Fund a "Neutral" Analyst Rating. The Board and the Independent Directors concluded that the Adviser's continued management of the Fund should benefit the Fund and its shareholders.
Advisory Fees and Fund Expenses; Comparison with Peer Group and Institutional Fees. The Board and the Independent Directors considered information provided by the Adviser regarding the Fund's advisory fees and total expense levels, noting that the Adviser is waiving a portion of the Fund's advisory fee in order to maintain a maximum limit of the Fund's expense ratio. The Board and the Independent Directors reviewed comparative information regarding fees and expenses for the Peer Group. The Board and the Independent Directors noted that the Fund's advisory fees and overall expense ratio were above the average of those for the Peer Group. They noted that FPA believed that the fee was competitive within the industry for similar global funds and recognized the increased complexity of managing a global fund. In addition, the Directors noted that the fee rate charged to the Fund is the same as the fee rate proposed to be charged by the Adviser on the institutional accounts
23
FPA PARAMOUNT FUND, INC.
APPROVAL OF INVESTMENT ADVISORY AGREEMENT
Continued (Unaudited)
managed in a similar style by the portfolio managers, although they recognized FPA did not currently have any such accounts. The Board and the Independent Directors noted that the advisory fee is consistent with advisory fees charged by FPA to another Fund investing in non-U.S. securities, and they noted that FPA had initially proposed this consistency to create a proper alignment of internal incentives for the portfolio management team. The Board and the Independent Directors concluded that the continued payment of advisory fees and expenses by the Fund to the Adviser was fair and reasonable and should continue to benefit the Fund and its shareholders.
Adviser Profitability and Costs. The Board and the Independent Directors considered information provided by the Adviser regarding the Adviser's costs in providing services to the Fund, the profitability of the Adviser and the benefits to the Adviser from its relationship to the Fund. They reviewed and considered the Adviser's representations regarding its assumptions and methods of allocating certain costs, such as personnel costs, which constitute the Adviser's largest operating cost, over-head and trading costs with respect to the provision of investment advisory services. Although the Board was not provided with information relating to individuals' compensation levels or amounts, the Independent Directors discussed with the Adviser the process through which individuals' compensation is determined and then reviewed by the management committee of the Adviser, as well as the Adviser's methods for determining that the compensation levels are at appropriate levels to attract and retain the personnel necessary to provide high quality professional investment advice. In evaluating the Adviser's profitability, they considered a portion of the compensation of the Adviser's principals that could be deemed a form of profit, and they excluded certain distribution and marketing-related expenses. The Board and the Independent Directors recognized that the Adviser is entitled under the law to earn a reasonable level of profits for the services that it provides to the Fund. The Board and the Independent Directors concluded that the Adviser's level of profitability from its relationship with the Fund did not indicate that the Adviser's compensation was unreasonable or excessive.
Economies of Scale and Sharing of Economies of Scale. The Board and the Independent Directors considered whether there have been economies of scale with respect to the management of the Fund, whether the Fund has appropriately benefited from any economies of scale, and whether the proposed fee rate is reasonable in relation to the Fund's asset levels and any economies of scale that may exist. The Board and the Independent Directors considered the Adviser's representation that its internal costs of providing investment management services to the Fund have significantly increased in recent years as a result of a number of factors, including the Adviser's substantial investment in additional professional resources: staffing. The Board and the Independent Directors considered information regarding the Adviser's representation that such increased costs have also included a significant investment in; (1) the portfolio management team, analyst, traders and other investment personnel who assist with the management of the Fund; (2) as well as investing in new compliance, operations, and administrative personnel; (3) in information technology, portfolio accounting and trading systems; and (4) in office space, each of which enhances the quality of services provided to the Fund. They considered the Adviser's representation that it would invest in additional investment analysts supporting the investment team and strategy when appropriate. The Board and the Independent Directors also considered that the Adviser had foregone the reimbursement for providing financial services that it had previously received from the Fund. The Board and the Independent Directors also considered the Adviser's willingness to close funds to new investors when it believed that a fund may have limited capacity to grow or that it otherwise would benefit fund shareholders.
The Board and the Independent Directors recognized that the advisory fee rate schedule for the Fund does not have breakpoints. They considered that many mutual funds have breakpoints in the advisory fee structure as
24
FPA PARAMOUNT FUND, INC.
APPROVAL OF INVESTMENT ADVISORY AGREEMENT
Continued (Unaudited)
a means by which to share in the benefits of potential economies of scale as a fund's assets grow. They also considered that not all funds have breakpoints in their fee structures and that breakpoints are not the exclusive means of sharing potential economies of scale. The Board and the Independent Directors considered the Adviser's statement that it believes that breakpoints currently were no longer appropriate for the Fund given the ongoing investments the Adviser is making in its business and its proposed investments for the benefit of the Fund, uncertainties regarding the direction of the economy, rising inflation, increasing costs for personnel and systems, and growth or contraction in the Fund's assets, all of which could negatively impact the profitability of the Adviser. The Board and the Independent Trustees concluded that the Fund is benefitting from the ongoing investments made by the Adviser in its team of personnel serving the Fund and in the Adviser's service infrastructure, and that in light of these investments, the addition of breakpoints to the Fund's advisory fee structure was not warranted at current asset levels.
Ancillary Benefits. The Board and the Independent Directors considered other actual and potential benefits to the Adviser from managing the Fund, including the acquisition and use of research services with commissions generated by the Fund, in concluding that the contractual advisory and other fees are fair and reasonable for the Fund. They noted that the Adviser does not have any affiliates that benefit from the Adviser's relationship to the Fund.
Conclusions. The Board and the Independent Directors determined that the Fund continues to benefit from the services of the Adviser's portfolio management team. In addition, the Board and the Independent Directors agreed that the Fund continues to receive high quality services from the Adviser. The Board and the Independent Directors concluded that the current advisory fee rate is reasonable and fair to the Fund and its shareholders in light of the nature and quality of the services currently provided by the Adviser and the Adviser's profitability and costs. The Board and the Independent Directors also stated their intention to continue monitoring the factors relevant to the Adviser's compensation, such as changes in the Fund's asset levels, changes in portfolio management personnel and the cost and quality of the services provided by the Adviser to the Fund. On the basis of the foregoing, and without assigning particular weight to any single factor, none of which was dispositive, the Board and the Independent Directors concluded that it would be in the best interests of the Fund to continue to be advised and managed by the Adviser and determined to approve the continuation of the current Advisory Agreement for another one-year period through September 30, 2017.
25
FPA PARAMOUNT FUND, INC.
RESULTS OF THE SPECIAL MEETING
(Unaudited)
Results of the Special Meeting of Shareholders:
The Special Meeting of Shareholders was held on May 9, 2016 in Los Angeles, California. The voting results for the proposal considered at the Special Meeting of Shareholders is as follows:
Election of Directors. The shareholders of the Fund elected J. Richard Atwood, Mark L. Lipson, Alfred E. Osborne, Jr., A. Robert Pisano, Patrick B. Purcell and Allan M. Rudnick to serve on the Board of Directors.
FPA Paramount Fund, Inc. | | Total Shares Voted For: | | Total Shares Withheld: | |
J. Richard Atwood | | | 6,624,765 | | | | 188,810 | | |
Mark L. Lipson | | | 6,603,965 | | | | 209,610 | | |
Alfred E. Osborne, Jr. | | | 6,594,395 | | | | 219,180 | | |
A. Robert Pisano | | | 6,598,482 | | | | 215,093 | | |
Patrick B. Purcell | | | 6,601,551 | | | | 212,024 | | |
Allan M. Rudnick | | | 6,581,679 | | | | 231,896 | | |
26
FPA PARAMOUNT FUND, INC.
SHAREHOLDER EXPENSE EXAMPLE
September 30, 2016 (Unaudited)
Fund Expenses
Mutual fund shareholders generally incur two types of costs: (1) transaction costs, and (2) ongoing costs, including advisory and administrative fees; shareholder service fees; and other Fund expenses. The Example is intended to help you understand your ongoing costs (in dollars) of investing in the Fund and to compare these costs with the ongoing costs of investing in other mutual funds. The Example is based on an investment of $1,000 invested at the beginning of the year and held for the entire year.
Actual Expenses
The information in the table under the heading "Actual Performance" provides information about actual account values and actual expenses. You may use the information in this column, together with the amount you invested, to estimate the expenses that you paid over the period. Simply divide your account value by $1,000 (for example, an $8,600 account value divided by $1,000= 8.6), then multiply the result by the number in the first column in the row entitled "Expenses Paid During Period" to estimate the expenses you paid on your account during this period.
Hypothetical Example for Comparison Purposes
The information in the table under the heading "Hypothetical Performance (5% return before expenses)" provides information about hypothetical account values and hypothetical expenses based on the Fund's actual expense ratio and an assumed rate of return of 5% per year before expenses, which is not the Fund's actual return. The hypothetical account values and expenses may not be used to estimate the actual ending account balance or expenses you paid for the period. You may use this information to
compare the ongoing costs of investing in the Fund and other funds. To do so, compare this 5% hypothetical example with the 5% hypothetical examples that appear in the shareholder reports of other funds.
Please note that the expenses shown in the table are meant to highlight your ongoing costs only and do not reflect any transactional costs. Therefore, the information under the heading "Hypothetical Performance (5% return before expenses)" is useful in comparing ongoing costs only, and will not help you determine the relative total costs of owning different funds. In addition, if these transactional costs were included, your costs would have been higher. Even though the Fund does not charge transaction fees, if you purchase shares through a broker, the broker may charge you a fee. You should evaluate other mutual funds' transaction fees and any applicable broker fees to assess the total cost of ownership for comparison purposes.
| | | Actual
Performance | | Hypothetical
Performance
(5% return
before
expenses) | |
Beginning Account Value
March 31, 2016 | | $ | 1,000.00 | | | $ | 1,000.00 | | |
Ending Account Value
September 30, 2016 | | $ | 1,041.40 | | | $ | 1,018.55 | | |
Expenses Paid During
Period* | | $ | 6.58 | | | $ | 6.51 | | |
* Expenses are equal to the Fund's annualized expense ratio of 1.29%, multiplied by the average account value over the period and prorated for the six-months ended September 30, 2016 (183/366 days).
27
FPA PARAMOUNT FUND, INC.
DIRECTOR AND OFFICER INFORMATION
(Unaudited)
| Name and Year of Birth | | Position(s)
With Fund
Years Served | | Principal Occupation(s)
During the Past 5 Years | | Portfolios in
Fund Complex
Overseen | | Other
Directorships | |
Allan M. Rudnick – 1940† | | Director and Chairman*
Years Served: 4 | | Private Investor. Formerly, Co-Founder, Chief Executive Officer, Chairman and Chief Investment Officer of Kayne Anderson Rudnick Investment Management from 1989 to 2007. | | | 7 | | | | |
Sandra Brown – 1955† | | Director*
Years Served: <1 | | Consultant. Formerly Chair of the Board, CEO and President of Transmerica Financial Advisers, Inc., and Chair of the Board and President of Transamerica Securities Sales Corp. from 1999 to 2009. | | | 7 | | | | |
Mark L. Lipson – 1949† | | Director*
Years Served: 1 | | Consultant. ML2Advisors, LLC. Former member of the Management Committee and Western Region Head at Bessemer Trust Company from 2007 to 2014. | | | 7 | | | | |
Alfred E. Osborne, Jr. – 1944† | | Director*
Years Served: 3 | | Senior Associate Dean of the John E. Anderson School of Management at UCLA. | | | 7 | | | Wedbush, Inc., Nuverra Environmental Solutions, Inc., and Kaiser Aluminun, Inc. | |
A. Robert Pisano – 1943† | | Director*
Years Served: 4 | | Consultant. Formerly President and Chief Operating Officer of the Motion Picture Association of America, Inc. from 2005 to 2011. | | | 7 | | | Entertainment Partners, Resources Global Professionals | |
Patrick B. Purcell – 1943† | | Director*
Years Served: 4 | | Retired. Formerly Executive Vice President, Chief Financial and Administrative Officer of Paramount Pictures from 1983 to 1998. | | | 7 | | | | |
J. Richard Atwood – 1960 | | Director* and President
Years Served: 19 | | Managing Partner of the Adviser. | | | 7 | | | | |
Gregory A. Herr – 1972 | | Portfolio Manager
Years Served: 5 | | Managing Director of the Adviser since 2013 and Vice President and Analyst of the Adviser from 2007 to 2012. | | | | | |
Pierre O. Py – 1976 | | Portfolio Manager
Years Served: 5 | | Managing Director of the Adviser since 2013. Formerly Vice President of the Adviser since 2011. Formerly an international research analyst at Harris Associates LP from 2005 to 2010. | | | | | |
Leora R. Weiner – 1970 | | Chief Compliance Officer
Years Served: 2 | | Managing Director and General Counsel of the Adviser since 2014. Formerly Managing Director, General Counsel and Chief Compliance Officer of Tradewinds Global Investors, LLC from 2008 to 2014. | | | | | |
28
FPA PARAMOUNT FUND, INC.
DIRECTOR AND OFFICER INFORMATION
Continued (Unaudited)
| Name and Year of Birth | | Position(s)
With Fund
Years Served | | Principal Occupation(s)
During the Past 5 Years | | Portfolios in
Fund Complex
Overseen | | Other
Directorships | |
E. Lake Setzler – 1967 | | Treasurer
Years Served: 2 | | Senior Vice President and Controller of the Adviser. | | | | | |
Francine S. Hayes – 1967 | | Secretary
Years Served: 1 | | Vice President and Senior Counsel of State Street Bank and Trust Company | | | | | |
* Directors serve until their resignation, removal or retirement.
† Audit Committee member
The Statement of Additional Information includes additional information about the Directors and is available, without charge, upon request by calling (800) 982-4372.
29
FPA PARAMOUNT FUND, INC.
(Unaudited)
INVESTMENT ADVISER
First Pacific Advisors, LLC
11601 Wilshire Boulevard, Suite 1200
Los Angeles, CA 90025
TRANSFER & SHAREHOLDER SERVICE AGENT
UMB Fund Services, Inc.
P.O. Box 2175
Milwaukee, WI 53201-2175
or
235 West Galena Street
Milwaukee, WI 53212-3948
(800) 638-3060
CUSTODIAN AND ADMINISTRATOR
State Street Bank and Trust Company
Boston, Massachusetts
TICKER SYMBOL: FPRAX
CUSIP: 302546106
DISTRIBUTOR
UMB Distribution Services, LLC
235 West Galena Street
Milwaukee, Wisconsin 53212-3948
LEGAL COUNSEL
Dechert LLP
San Francisco, California
INDEPENDENT REGISTERED PUBLIC ACCOUNTING FIRM
Deloitte & Touche LLP
Los Angeles, California
This report has been prepared for the information of shareholders of FPA PARAMOUNT FUND, INC., and is not authorized for distribution to prospective investors unless preceded or accompanied by an effective prospectus.
The Fund's complete proxy voting record for the 12 months ended June 30, 2016 is available without charge, upon request by calling (800) 982-4372 and on the SEC's website at www.sec.gov.
The Fund's schedule of portfolio holdings, filed the first and third quarter of the Fund's fiscal year on Form N-Q with the SEC, is available on the SEC's website at www.sec.gov. Form N-Q is available at the SEC's Public Reference Room in Washington, D.C., and information on the operations of the Public Reference Room may be obtained by calling (202) 551-8090. To obtain Form N-Q from the Fund, shareholders can call (800) 982-4372.
Additional information about the Fund is available online at www.fpafunds.com. This information includes, among other things, holdings, top sectors, and performance, and is updated on or about the 15th business day after the end of each quarter.
Item 2. Code of Ethics.
(a) The registrant has adopted a code of ethics that applies to the registrant’s principal executive and financial officers.
(b) Not applicable.
(c) The registrant has made no material changes to its code of ethics.
(d) During the period covered by this report, there were not any implicit or explicit waivers to the provisions of the code of ethics adopted in 2(a).
(e) Not applicable.
(f) A copy of the registrant’s code of ethics is filed as an exhibit to this Form N-CSR.
Item 3. Audit Committee Financial Expert.
The registrant’s board of directors has determined that Patrick B. Purcell, who is a member of the registrant’s audit committee and board of directors, is an “audit committee financial expert” and is “independent,” as those terms are defined in Item 3(a)(2) of Form N-CSR. This designation will not increase the designee’s duties, obligations or liability as compared to his duties, obligations or liability as a member of the audit committee and of the board of directors. This designation does not affect the duties, obligations or liability of any other member of the audit committee or the board of directors.
Item 4. Principal Accountant Fees and Services.
| | | | 2015 | | 2016 | |
(a) | | Audit Fees | | $ | 39,500 | | $ | 40,883 | |
(b) | | Audit Related Fees | | $ | -0- | | $ | -0- | |
(c) | | Tax Fees(1) | | $ | 8,600 | | $ | 8,901 | |
(d) | | All Other Fees | | $ | -0- | | $ | -0- | |
(1)Fees with respect of preparation of tax returns.
(e)(1) The audit committee shall pre-approve all audit and permissible non-audit services that the committee considers compatible with maintaining the independent auditors’ independence. The pre-approval requirement will extend to all non-audit services provided to the registrant, the adviser, and any entity controlling, controlled by, or under common control with the adviser that provides ongoing services to the registrant, if the engagement relates directly to the operations and financial reporting of the registrant; provided, however, that an engagement of the registrant’s independent auditors to perform attest services for the registrant, the adviser or its affiliates required by generally accepted auditing standards to complete the examination of the registrant’s financial statements (such as an examination conducted in accordance with Statement on Auditing Standards Number 70 issued by the American Institute of Certified Public Accountants), will be deem pre-approved if:
(i) the registrant’s independent auditors inform the audit committee of the engagement,
(ii) the registrant’s independent auditors advise the audit committee at least annually that the performance of this engagement will not impair the independent auditor’s independence with respect to the registrant, and
(iii) the audit committee receives a copy of the independent auditor’s report prepared in connection with such services.
The committee may delegate to one or more committee members the authority to review and pre-approve audit and permissible non-audit services. Actions taken under any such delegation will be reported to the full committee at its next meeting.
(e)(2) 100% of the services provided to the registrant described in paragraphs (b) — (d) of this Item were pre-approved by the audit committee pursuant to paragraph (e)(1) of this Item. There were no services provided to the investment adviser or any entity controlling, controlled by or under common control with the adviser described in paragraphs (b) — (d) of this Item that were required to be pre-approved by the audit committee.
(f) All services performed on the engagement to audit the registrant’s financial statements for the most recent fiscal year end were performed by the principal accountant’s full-time, permanent employees.
(g) None.
(h) Not applicable.
Item 5. Audit Committee of Listed Registrants.
Not applicable.
Item 6. Investments.
(a) Schedule of Investments is included as a part of the report to shareholders filed under Item 1 of this Form N-CSR.
(b) Not applicable.
Item 7. Disclosure of Proxy Voting Policies and Procedures for Closed-End Management Investment Companies.
Not applicable.
Item 8. Portfolio Managers of Closed-End Management Investment Companies.
Not applicable.
Item 9. Purchases of Equity Securities by Closed-End Management Investment Company and Affiliated Purchasers.
Not applicable.
Item 10. Submission of Matters to a Vote of Security Holders.
There have been no material changes to the procedures by which the shareholders may recommend nominees to the registrant’s board of directors.
Item 11. Controls and Procedures.
(a) The principal executive officer and principal financial officer of the registrant have concluded that the registrant’s disclosure controls and procedures (as defined in Rule 30a-3(c) under the Investment Company Act of 1940) are effective based on their evaluation of the disclosure controls and procedures as of a date within 90 days of the filing date of this report.
(b) There have been no significant changes in the registrant’s internal controls over financial reporting (as defined in Rule 30a-3(d) under the Investment Company Act of 1940) that occurred during the registrant’s second fiscal quarter of the period covered by this report that have materially affected, or is reasonably likely to materially affect, the registrant’s internal controls over financial reporting.
Item 12. Exhibits.
(a)(1) Code of ethics as applies to the registrant’s principal executive and financial officers is attached hereto.
(a)(2) The certifications required by Rule 30a-2(a) under the Investment Company Act of 1940 are attached hereto.
(a)(3) Not applicable.
(b) The certifications required by Rule 30a-2(b) under the Investment Company Act of 1940 and Section 906 of the Sarbanes-Oxley Act of 2002 are attached hereto.
SIGNATURES
Pursuant to the requirements of the Securities Exchange Act of 1934 and the Investment Company Act of 1940, the registrant has duly caused this report to be signed on its behalf by the undersigned, thereunto duly authorized.
FPA PARAMOUNT FUND, INC. | |
| |
| |
By: | /s/ J. Richard Atwood | |
| J. Richard Atwood | |
| President (principal executive officer) | |
| | |
Date: | December 5, 2016 | |
Pursuant to the requirements of the Securities Exchange Act of 1934 and the Investment Company Act of 1940, this report has been signed below by the following persons on behalf of the registrant and in the capacities and on the dates indicated.
By: | /s/ J. Richard Atwood | |
| J. Richard Atwood | |
| President (principal executive officer) | |
| | |
Date: | December 5, 2016 | |
| | |
| | |
By: | /s/ E. Lake Setzler III | |
| E. Lake Setzler III | |
| Treasurer (principal financial officer) | |
| | |
Date: | December 5, 2016 | |