UNITED STATES
SECURITIES AND EXCHANGE COMMISSION
Washington, D.C. 20549
FORM N-CSR
CERTIFIED SHAREHOLDER REPORT OF REGISTERED
MANAGEMENT INVESTMENT COMPANIES
Investment Company Act file number | 811-00852 |
|
FPA PARAMOUNT FUND, INC. |
(Exact name of registrant as specified in charter) |
|
11601 WILSHIRE BLVD., STE. 1200 LOS ANGELES, CALIFORNIA | | 90025 |
(Address of principal executive offices) | | (Zip code) |
|
J. RICHARD ATWOOD, PRESIDENT FPA PARAMOUNT FUND, INC. 11601 WILSHIRE BLVD., STE. 1200 LOS ANGELES, CALIFORNIA 90025 | Copy to: MARK D. PERLOW, ESQ. DECHERT LLP ONE BUSH STREET, STE. 1600 SAN FRANCISCO, CA 94104 |
(Name and address of agent for service) |
|
Registrant’s telephone number, including area code: | (310) 473-0225 | |
|
Date of fiscal year end: | September 30 | |
|
Date of reporting period: | September 30, 2017 | |
| | | | | | | | | |
Item 1: Report to Shareholders.

Distributor:
UMB DISTRIBUTION SERVICES, LLC
235 West Galena Street
Milwaukee, Wisconsin 53212
FPA PARAMOUNT FUND, INC.
LETTER TO SHAREHOLDERS
Dear Fellow Shareholders,
Portfolio performance
Fiscal 2017
For the last twelve months, the Fund gained 23.92% compared to an increase of 18.65% for the MSCI All Country World NR Index (the "Index"). Page Group, Britvic, and Worldpay Group were the top performance contributors for the fiscal year.1 Page Group and Britvic are several of the UK companies we owned that rebounded from the selloff following the 2016 UK Brexit vote. As discussed later in this letter, Worldpay received a takeover offer that significantly boosted its share price. Mednax, Publicis Groupe and Aggreko lagged and were the largest detractors to performance in the period.2 Mednax, also discussed later in this letter, has suffered from declining patient volumes and lower reimbursement levels. Publicis has experienced a slowdown in client advertising spending, and concerns about competitive pressures from shifts in technology. Aggreko has struggled with weak demand for its temporary power services, particularly in developing market countries.
Third Quarter 2017
During the third quarter of 2017, the Fund gained 6.13% (in U.S. currency) compared to an increase of 5.18% for the MSCI All Country World Index (Net) (the "Index"). Since the start of 2017, the Fund gained 21.64% (in U.S. currency) compared to an increase of 17.25% for the MSCI All Country World Index (Net) (the "Index").
In addition to Worldpay, several groups of companies contributed positively to performance. For lack of a better description, across various sectors and geographies, we own a number of companies whose results were under pressure when we acquired them. These include Baidu, Hugo Boss and Philips, which all contributed with positive performance in the quarter. As noted previously, we also own several UK companies that are continuing to rebound from the 2016 Brexit selloff. Primary laggards in the quarter included Mednax, Twenty-First Century Fox and Publicis Groupe.
While we are pleased with the third quarter outcome, we continue to believe short-term performance is not the best way to judge results. As value investors, we seek to buy businesses at a discount. Stock prices can, and often do, decline after purchases. We also know that market sentiment toward an industry, or even a specific company, often shifts significantly from one year to the next. It typically takes several years for discounts to our estimates to unwind. That is why we advocate evaluating the Fund's performance over longer periods, ideally over a market cycle.
1 Best performers based on the percentage of the issuer's share price change from 10/1/16 to 9/30/17 in U.S. currency. This share price change does not equate with the performance of the holding in the Fund's portfolio. As of 9/30/17, position sizes as follows: PageGroup: 2.7%; Britvic 2.8%; and Worldpay Goup 2.1%.
2 Worst performers based on the percentage of the issuer's share price change from 10/1/16 to 9/30/17 in U.S. currency. This share price change does not equate with the performance of the holding in the Fund's portfolio. As of 9/30/17, position sizes as follows: Mednax: 1.4%; Publicis Groupe: 1.8%; and Aggreko 0%.
1
FPA PARAMOUNT FUND, INC.
LETTER TO SHAREHOLDERS
Continued
Key performers
Our worst-performing holding this quarter was Mednax, which declined 28.6% (in U.S. currency).3 Based in the U.S., Mednax is the largest employer of hospital-based doctors specializing in neonatology and anesthesiology. Recent business performance has been weak as patient volumes declined and the reimbursement mix shifted from commercial to government payors. With labor costs for the business relatively fixed in the short term, this has led to margin compression for the group. While the business model makes it difficult to reduce the expense base in the short term, if volume and pricing trends do not pick up again by the end of the year, we will expect management to make the necessary changes to protect long-term profitability. We remain invested in Mednax, as we believe the company continues to benefit from scale advantages, has limited capital needs, produces triple-digit operating returns on capital employed, and trades at a high-single-digit free cash flow yield.
Our best-performing holding this quarter was Worldpay, which was up 33.40% (in U.S. currency).4 Based in the UK, Worldpay is a leading global provider of payment processing services. During the quarter, the company announced that it agreed to be purchased by the U.S. merchant acquirer, Vantiv. We have trimmed our Worldpay position based on its reduced discount to our estimate of intrinsic value.
Portfolio activity
We made several new purchases in the third quarter, including O'Reilly Automotive, Compagnie de Saint Gobain, and Scout24.
Based in the U.S., O'Reilly is a leading auto aftermarket parts provider to both do-it-yourself customers and commercial mechanics. O'Reilly was a long-held position earlier in the Fund's history. After not owning the company for the last several years because of unattractive valuation, we re-established a positon as a broad industry slowdown weighed on the shares. Based in France, Saint Gobain is one of the world's leading manufacturers of glass products and high-performance building materials. The group also operates a retail building distribution business. Based in Germany, Scout24 operates the country's leading online real estate classified advertising portal and several automotive classified portals across Europe.
During the quarter, we also added to existing positions in Ansell, Shawcor, Allied Irish, Ashtead and Alicorp. The last three are positions we established last quarter.
We also liquidated several positions during the period. Patterson Companies, based in the U.S., is a leading distributor of dental and veterinary supplies. Based in Germany, Hugo Boss is a world-leading brand in both formal and casual clothing, as well as fashion accessories, primarily for men. IMI, based in the UK, is an engineering company that manufactures equipment used to control the precise movement of fluids. Richemont, based in Switzerland, owns luxury brands including Cartier, Piaget, Baume & Mercier and Montblanc. In each case, the share prices had reached their estimated intrinsic values, and were sold.
3 Worst performer based on the percentage of Mednax's share price change from 6/30/17 to 9/30/17 in U.S. currency. This share price change does not equate with the performance of the holding in the Fund's portfolio. As of 9/30/17, Mednax represented 1.4% of the Fund's total assets.
4 Best performer based on the percentage of Worldpay's share price change from 6/30/17 to 9/30/17 in U.S. currency. This share price change does not equate with the performance of the holding in the Fund's portfolio. As of 9/30/17, Worldpay represented 2.1% of the Fund's total assets.
2
FPA PARAMOUNT FUND, INC.
LETTER TO SHAREHOLDERS
Continued
Portfolio Profile
We owned 46 disclosed companies on September 30, which remains within the range of the 25 to 50 businesses that we would expect to own at any given time. Our cash balance was about 11% at the end of the quarter.
In terms of geographic weightings, we commit to typically having a minimum of 20% of assets in U.S. companies and 20% in non-U.S. companies. The locations of the remaining positions are then based solely on where we find opportunities. At quarter end, about 21% of the Fund's assets were invested in companies domiciled in the U.S. The non-U.S. portion was made up of companies domiciled in Europe (about 61%) and in the Asia-Pacific (about 7%), with the balance in other regions and cash. It's worth noting that the 21% weighting in the U.S. is the lowest since we began managing the Fund. Finding high-quality companies in the U.S. has never been an issue. The low current weighting is a reflection of the lack of attractive valuation opportunities among those quality businesses. Where a company is domiciled is largely irrelevant to us, however, since many of our holdings are large companies that conduct business on a global scale. That means they often generate significant amounts of their cash outside their home countries, rendering traditional country classifications less useful.
Most of the Fund's positions are in large-cap companies (with a weighted average capitalization of approximately $74 billion), including several businesses that are considered mega-caps. That's partly a function of our mandate, which focuses on companies with market caps in excess of $2 billion.
We thank you, as always, for your confidence, and look forward to continuing to serve your interests as shareholders of the Fund.
Respectfully submitted,

| | 
| |
Gregory Herr | | Pierre O. Py | |
Portfolio Manager | | Portfolio Manager | |
September 30, 2017 | | | |
3
FPA PARAMOUNT FUND, INC.
LETTER TO SHAREHOLDERS
Continued
Performance data quoted in this letter represents past performance and neither indicates nor guarantees future performance. The discussions of Fund investments represent the views of the Fund's managers at the time of this report and are subject to change without notice. References to individual securities are for informational purposes only and should not be construed as recommendations to purchase or sell individual securities. While the Fund's managers believe that the Fund's holdings are value stocks, there can be no assurance that others will consider them as such. Further, investing in value stocks presents the risk that value stocks may fall out of favor with investors and underperform growth stocks during given periods.
The MSCI World Index is a free float-adjusted market capitalization weighted index that is designed to measure the equity market performance of developed markets. The MSCI World Index consists of the following 24 developed market country indices: Australia, Austria, Belgium, Canada, Denmark, Finland, France, Germany, Greece, Hong Kong, Ireland, Israel, Italy, Japan, Netherlands, New Zealand, Norway, Portugal, Singapore, Spain, Sweden, Switzerland, the United Kingdom, and the United States. Individuals cannot invest directly in an Index.
FUND RISKS
Investments in mutual funds carry risks and investors may lose principal value. Stock markets are volatile and can decline significantly in response to adverse issuer, political, regulatory, market, or economic developments. The funds may purchase foreign securities which are subject to interest rate, currency exchange rate, economic and political risks: this may be enhanced when investing in emerging markets. Small and mid-cap stocks involve greater risks and they can fluctuate in price more than larger company stocks. Groups of stocks, such as value and growth, go in and out of favor which may cause certain funds to underperform other equity funds.
FORWARD LOOKING STATEMENT DISCLOSURE
As mutual fund managers, one of our responsibilities is to communicate with shareholders in an open and direct manner. Insofar as some of our opinions and comments in our letters to shareholders are based on our current expectations, they are considered "forward-looking statements" which may or may not prove to be accurate over the long term. While we believe we have a reasonable basis for our comments and we have confidence in our opinions, actual results may differ materially from those we anticipate. You can identify forward-looking statements by words such as "believe," "expect," "may," "anticipate," and other similar expressions when discussing prospects for particular portfolio holdings and/or the markets, generally. We cannot, however, assure future results and disclaim any obligation to update or alter any forward-looking statements, whether as a result of new information, future events, or otherwise. Further, information provided in this report should not be construed as a recommendation to purchase or sell any particular security.
4
FPA PARAMOUNT FUND, INC.
HISTORICAL PERFORMANCE
Change in Value of a $10,000 Investment in FPA Paramount Fund, Inc. vs. MSCI AWCI from October 1, 2007 to September 30, 2017
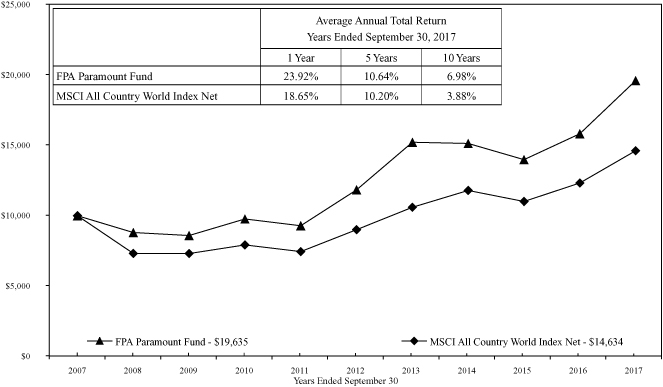
The MSCI All Country World NR Index is a float-adjusted market capitalization index that is designed to measure the combined equity market performance of developed and emerging markets. This index does not reflect any commissions or fees which would be incurred by an investor purchasing the stocks it represents. The performance of the Fund and of the Index is computed on a total return basis, which includes reinvestment of all distributions.
A new strategy for FPA Paramount Fund, Inc. was implemented beginning on September 1, 2013. The returns above include performance of the previous managers prior to that date. Past performance is no guarantee of future results, and current performance may be higher or lower than the performance shown. This data represents past performance, and investors should understand that investment returns and principal values fluctuate, so that when you redeem your investment it may be worth more or less than its original cost. Current month-end performance data can be obtained by visiting the website at www.fpafunds.com or by calling toll-free, 1-800-982-4372. As of the most recent prospectus, the expense ratio is 1.29% (see notes to financial statements). Information regarding the Fund's redemption fees can be found on page 15.
The Prospectus details the Fund's objective and policies, charges, and other matters of interest to prospective investors. Please read the prospectus carefully before investing. The Prospectus may be obtained by visiting the website at www.fpafunds.com, by email at crm@fpafunds.com, toll-free by calling 1-800-982-4372 or by contacting the Fund in writing.
5
FPA PARAMOUNT FUND, INC.
PORTFOLIO SUMMARY
September 30, 2017
Common Stocks | | | | | | | 88.5 | % | |
Packaged Food | | | 6.9 | % | | | | | |
Beverages | | | 5.7 | % | | | | | |
Infrastructure Software | | | 5.7 | % | | | | | |
Other Common Stocks | | | 4.5 | % | | | | | |
Industrial Distribution & Rental | | | 4.3 | % | | | | | |
Application Software | | | 4.2 | % | | | | | |
Health Care Services | | | 4.0 | % | | | | | |
Professional Services | | | 3.7 | % | | | | | |
Internet Media | | | 3.4 | % | | | | | |
Advertising & Marketing | | | 3.4 | % | | | | | |
Banks | | | 2.9 | % | | | | | |
Communications Equipment | | | 2.8 | % | | | | | |
Food & Drug Stores | | | 2.8 | % | | | | | |
Large Pharma | | | 2.6 | % | | | | | |
Airlines | | | 2.6 | % | | | | | |
Security Services | | | 2.3 | % | | | | | |
Entertainment Content | | | 2.2 | % | | | | | |
Rubber & Plastic | | | 2.2 | % | | | | | |
Consumer Finance | | | 2.2 | % | | | | | |
Automotive Retailers | | | 2.0 | % | | | | | |
Oil & Gas Services & Equipment | | | 1.9 | % | | | | | |
Medical Equipment | | | 1.8 | % | | | | | |
Flow Control Equipment | | | 1.6 | % | | | | | |
Aircraft & Parts | | | 1.6 | % | | | | | |
Other Spec Retail — Discretionary | | | 1.6 | % | | | | | |
Mass Merchants | | | 1.6 | % | | | | | |
Home & Office Furnishings | | | 1.6 | % | | | | | |
Apparel, Footwear & Acc Design | | | 1.4 | % | | | | | |
Containers & Packaging | | | 1.3 | % | | | | | |
Other Commercial Services | | | 1.3 | % | | | | | |
Internet Based Services | | | 1.3 | % | | | | | |
Jewelry & Watch Stores | | | 1.1 | % | | | | | |
Short-term Investments | | | | | 11.2 | % | |
Other Assets And Liabilities, Net | | | | | 0.3 | % | |
Net Assets | | | | | 100.0 | % | |
6
FPA PARAMOUNT FUND, INC.
PORTFOLIO OF INVESTMENTS
September 30, 2017
COMMON STOCKS | | Shares | | Fair Value | |
PACKAGED FOOD — 6.9% | |
Alicorp SAA (Peru) | | | 1,676,890 | | | $ | 4,761,907 | | |
Danone SA (France) | | | 32,930 | | | | 2,583,119 | | |
Nestle SA (Switzerland) | | | 55,690 | | | | 4,664,077 | | |
| | | $ | 12,009,103 | | |
BEVERAGES — 5.7% | |
Britvic plc (Britain) | | | 473,098 | | | $ | 4,789,500 | | |
Carlsberg A/S (B Shares) (Denmark) | | | 28,490 | | | | 3,117,667 | | |
Diageo plc (Britain) | | | 63,240 | | | | 2,078,710 | | |
| | | $ | 9,985,877 | | |
INFRASTRUCTURE SOFTWARE — 5.7% | |
Microsoft Corporation | | | 60,310 | | | $ | 4,492,492 | | |
Oracle Corporation | | | 112,160 | | | | 5,422,936 | | |
| | | $ | 9,915,428 | | |
INDUSTRIAL DISTRIBUTION & RENTAL — 4.3% | |
Ashtead Group plc (Britain) | | | 199,078 | | | $ | 4,799,091 | | |
Compagnie de Saint-Gobain (France) | | | 45,560 | | | | 2,714,985 | | |
| | | $ | 7,514,076 | | |
APPLICATION SOFTWARE — 4.2% | |
Amadeus IT Group SA (Spain) | | | 71,190 | | | $ | 4,626,830 | | |
SAP SE (Germany) | | | 25,340 | | | | 2,776,006 | | |
| | | $ | 7,402,836 | | |
HEALTH CARE SERVICES — 4.0% | |
Essilor International SA (France) | | | 16,470 | | | $ | 2,039,053 | | |
Laboratory Corp. of America Holdings* | | | 16,560 | | | | 2,500,063 | | |
MEDNAX, Inc.* | | | 56,570 | | | | 2,439,299 | | |
| | | $ | 6,978,415 | | |
PROFESSIONAL SERVICES — 3.7% | |
Adecco Group AG (Switzerland) | | | 21,490 | | | $ | 1,673,306 | | |
Pagegroup plc (Britain) | | | 707,622 | | | | 4,721,153 | | |
| | | $ | 6,394,459 | | |
INTERNET MEDIA — 3.4% | |
Alphabet, Inc. (Class C)* | | | 3,834 | | | $ | 3,677,228 | | |
Baidu, Inc. (ADR) (China)* | | | 8,822 | | | | 2,185,121 | | |
| | | $ | 5,862,349 | | |
ADVERTISING & MARKETING — 3.4% | |
DKSH Holding AG (Switzerland) | | | 32,514 | | | $ | 2,765,041 | | |
Publicis Groupe SA (France) | | | 44,340 | | | | 3,096,639 | | |
| | | $ | 5,861,680 | | |
BANKS — 2.9% | |
Allied Irish Banks plc (Ireland) | | | 834,700 | | | $ | 5,016,516 | | |
7
FPA PARAMOUNT FUND, INC.
PORTFOLIO OF INVESTMENTS (Continued)
September 30, 2017
COMMON STOCKS — Continued | | Shares | | Fair Value | |
COMMUNICATIONS EQUIPMENT — 2.8% | |
Cisco Systems, Inc. | | | 57,630 | | | $ | 1,938,097 | | |
Scout24 AG (Germany)** | | | 73,170 | | | | 2,992,196 | | |
| | | $ | 4,930,293 | | |
FOOD & DRUG STORES — 2.8% | |
CVS Health Corporation | | | 25,000 | | | $ | 2,033,000 | | |
Empire Co. Ltd. (Canada) | | | 157,730 | | | | 2,791,167 | | |
| | | $ | 4,824,167 | | |
LARGE PHARMA — 2.6% | |
Novo Nordisk A/S (B Shares) (Denmark) | | | 43,100 | | | $ | 2,060,449 | | |
Sanofi (France) | | | 25,580 | | | | 2,539,875 | | |
| | | $ | 4,600,324 | | |
AIRLINES — 2.6% | |
Ryanair Holdings plc (Ireland)* | | | 237,040 | | | $ | 4,572,173 | | |
SECURITY SERVICES — 2.3% | |
Prosegur Cia de Seguridad SA (Spain) | | | 532,617 | | | $ | 3,984,737 | | |
ENTERTAINMENT CONTENT — 2.2% | |
Twenty-First Century Fox, Inc. (Class B) | | | 150,000 | | | $ | 3,868,500 | | |
RUBBER & PLASTIC — 2.2% | |
Ansell, Ltd. (Australia) | | | 215,962 | | | $ | 3,774,245 | | |
CONSUMER FINANCE — 2.2% | |
Worldpay Group plc (Britain)** | | | 687,390 | | | $ | 3,748,886 | | |
AUTOMOTIVE RETAILERS — 2.0% | |
O'Reilly Automotive, Inc.* | | | 16,000 | | | $ | 3,445,920 | | |
OIL & GAS SERVICES & EQUIPMENT — 1.9% | |
ShawCor, Ltd. (Canada) | | | 147,050 | | | $ | 3,253,897 | | |
MEDICAL EQUIPMENT — 1.8% | |
Koninklijke Philips NV (Netherlands) | | | 77,380 | | | $ | 3,194,539 | | |
FLOW CONTROL EQUIPMENT — 1.6% | |
Sulzer AG (Switzerland) | | | 24,314 | | | $ | 2,872,434 | | |
8
FPA PARAMOUNT FUND, INC.
PORTFOLIO OF INVESTMENTS (Continued)
September 30, 2017
COMMON STOCKS — Continued | | Shares | | Fair Value | |
AIRCRAFT & PARTS — 1.6% | |
Meggitt plc (Britain) | | | 408,380 | | | $ | 2,851,063 | | |
OTHER SPEC RETAIL — DISCRETIONARY — 1.6% | |
Luxottica Group SpA (Italy) | | | 49,980 | | | $ | 2,793,486 | | |
MASS MERCHANTS — 1.6% | |
Dollar General Corporation | | | 34,280 | | | $ | 2,778,394 | | |
HOME & OFFICE FURNISHINGS — 1.6% | |
Howden Joinery Group plc (Britain) | | | 470,340 | | | $ | 2,716,400 | | |
APPAREL, FOOTWEAR & ACC DESIGN — 1.4% | |
Swatch Group AG (The) (Switzerland) | | | 5,885 | | | $ | 2,447,956 | | |
CONTAINERS & PACKAGING — 1.3% | |
Brambles, Ltd. (Australia) | | | 325,490 | | | $ | 2,297,829 | | |
OTHER COMMERCIAL SERVICES — 1.3% | |
ALS, Ltd. (Australia) | | | 371,880 | | | $ | 2,281,115 | | |
INTERNET BASED SERVICES — 1.3% | |
Priceline Group, Inc. (The)* | | | 1,200 | | | $ | 2,196,984 | | |
JEWELRY & WATCH STORES — 1.1% | |
Signet Jewelers, Ltd. | | | 28,020 | | | $ | 1,864,731 | | |
OTHER COMMON STOCKS — 4.5% | | $ | 7,809,864 | | |
| TOTAL COMMON STOCKS — 88.5% (Cost $129,838,592) | | $ | 154,048,676 | | |
| TOTAL INVESTMENT SECURITIES — 88.5% (Cost $129,838,592) | | $ | 154,048,676 | | |
9
FPA PARAMOUNT FUND, INC.
PORTFOLIO OF INVESTMENTS (Continued)
September 30, 2017
| | | Principal
Amount | | Fair Value | |
SHORT-TERM INVESTMENTS | |
State Street Bank Repurchase Agreement — 0.12% 10/2/2017
(Dated 09/29/2017, repurchase price of $19,487,195 collateralized by
$19,580,000 principal amount U.S. Treasury Notes —
2.25% 2024, fair value $19,879,848) | | $ | 19,487,000 | | | $ | 19,487,000 | | |
| TOTAL SHORT-TERM INVESTMENTS — 11.2% (Cost $19,487,000) | | $ | 19,487,000 | | |
| TOTAL INVESTMENTS — 99.7% (Cost $149,325,592) | | $ | 173,535,676 | | |
Other Assets and Liabilities, net — 0.3% | | | 594,873 | | |
NET ASSETS — 100.0% | | $ | 174,130,549 | | |
* Non-income producing security.
** Restricted securities. These restricted securities constituted 3.87% of total net assets at September 30, 2017, most of which are considered liquid by the Adviser. These securities are not registered and may not be sold to the public. There are legal and/or contractual restrictions on resale. The Fund does not have the right to demand that such securities be registered. The values of these securities are determined by valuations provided by pricing services, brokers, dealers, market makers, or in good faith under policies adopted by authority of the Fund's Board of Directors.
As permitted by U.S. Securities and Exchange Commission regulations, "Other" Common Stocks include holdings in their first year of acquisition that have not previously been publicly disclosed.
See accompanying Notes to Financial Statements.
10
FPA PARAMOUNT FUND, INC.
PORTFOLIO OF INVESTMENTS —
RESTRICTED SECURITIES
September 30, 2017
Issuer | | Acquisition
Date(s) | | Cost | | Fair Value | | Fair
Value as a %
of Net Assets | |
Scout24 AG | | 09/05/2017,
09/06/2017 | | $ | 2,975,993
| | | $ | 2,992,196
| | | | 1.72
| % | |
Worldpay Group plc
| | 03/28/2017,
03/29/2017,
04/07/2017,
04/13/2017,
04/18/2017,
04/25/2017,
04/27/2017,
06/26/2017,
09/15/2017 | | | 2,611,134
| | | | 3,748,886
| | | | 2.15
| % | |
TOTAL RESTRICTED SECURITIES | | | | $ | 5,587,127 | | | $ | 6,741,082 | | | | 3.87 | % | |
See accompanying Notes to Financial Statements.
11
FPA PARAMOUNT FUND, INC.
STATEMENT OF ASSETS AND LIABILITIES
September 30, 2017
ASSETS | |
Investment securities — at fair value (identified cost $129,838,592) | | $ | 154,048,676 | | |
Short-term investments — repurchase agreement — at amortized cost
(maturities 60 days or less) | | | 19,487,000 | | |
Foreign currencies at fair value (identified cost $28,188) | | | 28,117 | | |
| Cash | | | 867,028 | | |
Receivable for: | |
Dividends and interest | | | 843,704 | | |
Capital Stock sold | | | 11,586 | | |
Prepaid expenses and other assets | | | 208 | | |
| Total assets | | | 175,286,319 | | |
LIABILITIES | |
Payable for: | |
| Investment securities purchased | | | 866,416 | | |
Advisory fees | | | 122,410 | | |
Capital Stock repurchased | | | 5,121 | | |
Accrued expenses and other liabilities | | | 161,823 | | |
| Total liabilities | | | 1,155,770 | | |
NET ASSETS | | $ | 174,130,549 | | |
SUMMARY OF SHAREHOLDERS' EQUITY | |
Capital Stock — par value $0.25 per share; authorized 100,000,000 shares;
outstanding 8,173,870 shares | | $ | 2,043,468 | | |
Additional Paid-in Capital | | | 152,083,186 | | |
Accumulated net realized loss on investments | | | (4,847,207 | ) | |
| Undistributed net investment income | | | 629,087 | | |
Unrealized appreciation of investments | | | 24,222,015 | | |
NET ASSETS | | $ | 174,130,549 | | |
NET ASSET VALUE | |
Offering and redemption price per share | | $ | 21.30 | | |
See accompanying Notes to Financial Statements.
12
FPA PARAMOUNT FUND, INC.
STATEMENT OF OPERATIONS
For the Year Ended September 30, 2017
INVESTMENT INCOME | |
Dividends (net of foreign taxes withheld of $225,676) | | $ | 2,691,654 | | |
Interest | | | 11,818 | | |
Total investment income | | | 2,703,472 | | |
EXPENSES | |
Advisory fees | | | 1,585,609 | | |
Legal fees | | | 203,362 | | |
Director fees and expenses | | | 135,836 | | |
Reports to shareholders | | | 86,778 | | |
Transfer agent fees and expenses | | | 74,345 | | |
Audit and tax services fees | | | 46,569 | | |
Filing fees | | | 44,562 | | |
Custodian fees | | | 33,983 | | |
Administrative services fees | | | 8,072 | | |
Professional fees | | | 7,294 | | |
Other | | | 54,591 | | |
Total expenses | | | 2,281,001 | | |
Reimbursement from Adviser | | | (235,023 | ) | |
Net expenses | | | 2,045,978 | | |
Net investment income | | | 657,494 | | |
NET REALIZED AND UNREALIZED GAIN (LOSS) | |
Net realized gain (loss) on: | |
Investments | | | 2,434,015 | | |
Foreign currency transactions | | | (17,928 | ) | |
Net change in unrealized appreciation (depreciation) of: | |
Investments | | | 31,146,238 | | |
Translation of foreign currency denominated amounts | | | 24,312 | | |
Net realized and unrealized gain | | | 33,586,637 | | |
NET INCREASE IN NET ASSETS RESULTING FROM OPERATIONS | | $ | 34,244,131 | | |
See accompanying Notes to Financial Statements.
13
FPA PARAMOUNT FUND, INC.
STATEMENT OF CHANGES IN NET ASSETS
| | | Year Ended
September 30, 2017 | | Year Ended
September 30, 2016 | |
INCREASE (DECREASE) IN NET ASSETS | |
Operations: | |
Net investment income | | $ | 657,494 | | | $ | 1,692,806 | | |
Net realized gain (loss) | | | 2,416,087 | | | | (3,618,681 | ) | |
Net change in unrealized appreciation | | | 31,170,550 | | | | 20,589,139 | | |
Net increase in net assets resulting from operations | | | 34,244,131 | | | | 18,663,264 | | |
Distributions to shareholders from: | |
Net investment income | | | (1,478,352 | ) | | | (798,849 | ) | |
Total distributions | | | (1,478,352 | ) | | | (798,849 | ) | |
Capital Stock transactions: | |
Proceeds from Capital Stock sold | | | 5,680,836 | | | | 5,361,647 | | |
Proceeds from shares issued to shareholders upon reinvestment
of dividends and distributions | | | 911,695 | | | | 517,894 | | |
Cost of Capital Stock repurchased | | | (14,277,683 | )* | | | (28,327,480 | )* | |
Net decrease from Capital Stock transactions | | | (7,685,152 | ) | | | (22,447,939 | ) | |
Total change in net assets | | | 25,080,627 | | | | (4,583,524 | ) | |
NET ASSETS | |
Beginning of Year | | | 149,049,922 | | | | 153,633,446 | | |
End of Year | | $ | 174,130,549 | | | $ | 149,049,922 | | |
CHANGE IN CAPITAL STOCK OUTSTANDING | |
Shares of Capital Stock sold | | | 291,380 | | | | 334,429 | | |
Shares issued to shareholders upon reinvestment of
dividends and distributions | | | 52,156 | | | | 33,113 | | |
Shares of Capital Stock repurchased | | | (757,497 | ) | | | (1,741,533 | ) | |
Change in Capital Stock outstanding | | | (413,961 | ) | | | (1,373,991 | ) | |
* Net of redemption fees of $1 and $637 for the year ended September 30, 2017 and year ended September 30, 2016, respectively.
See accompanying Notes to Financial Statements.
14
FPA PARAMOUNT FUND, INC.
FINANCIAL HIGHLIGHTS
Selected Data for Each Share of Capital Stock Outstanding Throughout Each Year
| | | Year Ended September 30, | |
| | | 2017 | | 2016 | | 2015 | | 2014 | | 2013 | |
Per share operating performance: | |
Net asset value at beginning of year | | $ | 17.36 | | | $ | 15.42 | | | $ | 17.47 | | | $ | 25.68 | | | $ | 20.00 | | |
Income from investment operations: | |
| Net investment income* | | | 0.08 | | | | 0.18 | | | | 0.08 | | | | 0.16 | | | | 0.03 | | |
Net realized and unrealized gain (loss)
on investment securities | | | 4.04 | | | | 1.84 | | | | (1.35 | ) | | | (0.01 | ) | | | 5.69 | | |
| Total from investment operations | | | 4.12 | | | | 2.02 | | | | (1.27 | ) | | | 0.15 | | | | 5.72 | | |
Less distributions: | |
Dividends from net investment income | | | (0.18 | ) | | | (0.08 | ) | | | (0.25 | ) | | | — | | | | (0.03 | ) | |
Distributions from net realized
capital gains | | | — | | | | — | | | | (0.53 | ) | | | (8.36 | ) | | | (0.01 | ) | |
| Total distributions | | | (0.18 | ) | | | (0.08 | ) | | | (0.78 | ) | | | (8.36 | ) | | | (0.04 | ) | |
Redemption fees | | | — | ** | | | — | ** | | | — | ** | | | — | ** | | | — | ** | |
Net asset value at end of year | | $ | 21.30 | | | $ | 17.36 | | | $ | 15.42 | | | $ | 17.47 | | | $ | 25.68 | | |
Total investment return*** | | | 23.92 | % | | | 13.19 | % | | | (7.63 | )% | | | (0.55 | )% | | | 28.64 | % | |
Ratios/supplemental data: | |
Net assets, end of year (in $000's) | | $ | 174,131 | | | $ | 149,050 | | | $ | 153,633 | | | $ | 303,928 | | | $ | 326,045 | | |
Ratio of expenses of average net assets: | |
Before reimbursement from Adviser | | | 1.44 | % | | | 1.43 | % | | | 1.32 | % | | | 1.22 | % | | | 0.92 | % | |
After reimbursement from Adviser | | | 1.29 | % | | | 1.29 | % | | | 1.30 | % | | | 1.06 | % | | | 0.92 | % | |
Ratio of net investment income to average
net assets: | |
Before reimbursement from Adviser | | | 0.27 | % | | | 0.99 | % | | | 0.46 | % | | | 0.76 | % | | | 0.13 | % | |
After reimbursement from Adviser | | | 0.41 | % | | | 1.13 | % | | | 0.48 | % | | | 0.92 | % | | | 0.13 | % | |
Portfolio turnover rate | | | 72 | % | | | 52 | % | | | 38 | % | | | 113 | % | | | 19 | % | |
* Per share amount is based on average shares outstanding.
** Rounds to less than $0.01 per share.
*** Return is based on net asset value per share, adjusted for reinvestment of distributions, and does not reflect deduction of the sales charge.
See accompanying Notes to Financial Statements.
15
FPA PARAMOUNT FUND, INC.
NOTES TO FINANCIAL STATEMENTS
September 30, 2017
NOTE 1 — Significant Accounting Policies
FPA Paramount Fund, Inc. (the "Fund") is registered under the Investment Company Act of 1940, as a non-diversified, open-end management investment company. The Fund's primary investment objective is high total investment return, including capital appreciation and income. The Fund qualifies as an investment company pursuant to Financial Accounting Standard Board (FASB) Accounting Standards Codification (ASC) No. 946, Financial Services — Investment Companies. The following is a summary of significant accounting policies consistently followed by the Fund in the preparation of its financial statements.
A. Security Valuation
The Fund's investments are reported at fair value as defined by accounting principles generally accepted in the United States of America, ("U.S. GAAP"). The Fund generally determines its net asset value as of approximately 4:00 p.m. New York time each day the New York Stock Exchange is open. Further discussion of valuation methods, inputs and classifications can be found under Disclosure of Fair Value Measurements.
B. Securities Transactions and Related Investment Income
Securities transactions are accounted for on the date the securities are purchased or sold. Dividend income and distributions to shareholders are recorded on the ex-dividend date. Interest income and expenses are recorded on an accrual basis. The books and records of the Fund are maintained in U.S. dollars as follows: (1) the foreign currency market value of investment securities, and other assets and liabilities stated in foreign currencies, are translated using the daily spot rate; and (2) purchases, sales, income and expenses are translated at the rate of exchange prevailing on the respective dates of such transactions. The resultant exchange gains and losses are included in net realized or net unrealized gain (loss) in the statement of operations.
C. Use of Estimates
The preparation of the financial statements in accordance with U.S. GAAP requires management to make estimates and assumptions that affect the amounts reported. Actual results could differ from those estimates.
D. Recent Accounting Pronouncements
In March 2017, the FASB issued Accounting Standards Update (ASU) No. 2017-08, Receivables — Nonrefundable Fees and Other Costs (Subtopic 310-20). The amendments in this update shorten the amortization period for certain callable debt securities held at a premium. Specifically, the amendments require the premium to be amortized to the earliest call date. The amendments do not require an accounting change for securities held at a discount; the discount continues to be amortized to maturity. For public entities this update will be effective for fiscal years beginning after December 15, 2018, and for interim periods within those fiscal years. The Adviser is currently evaluating the impact of this new guidance on the Funds' financial statements.
NOTE 2 — Risk Considerations
Investing in the Fund may involve certain risks including, but not limited to, those described below.
Market Risk: Because the values of the Fund's investments will fluctuate with market conditions, so will the value of your investment in the Fund. You could lose money on your investment in the Fund or the Fund could underperform other investments.
Common Stocks and other Securities: The prices of common stocks and other securities held by the Fund may decline in response to certain events taking place around the world, including; those directly involving
16
FPA PARAMOUNT FUND, INC.
NOTES TO FINANCIAL STATEMENTS
Continued
companies whose securities are owned by the Fund; conditions affecting the general economy; overall market changes; local, regional or global political, social or economic instability; and currency, interest rate and commodity price fluctuations. Since the Fund invests in foreign securities, it will be subject to risks not typically associated with domestic securities. Foreign investments, especially those of companies in emerging markets, can be riskier less liquid, harder to value, and more volatile than investments in the United States. Adverse political and economic developments or changes in the value of foreign currency can make it more difficult for the Fund to value the securities. Differences in tax and accounting standards, difficulties in obtaining information about foreign companies, restrictions on receiving investment proceeds from a foreign country, confiscatory foreign tax laws, and potential difficulties in enforcing contractual obligations, can all add to the risk and volatility of foreign investments. The financial problems in global economies over the past several years, including the European sovereign debt crisis, may continue to cause high volatility in global financial markets.
Risks Associated with Non-Diversification: The Fund is non-diversified, which generally means that it may invest a greater percentage of its total assets in the securities of fewer issuers than a "diversified" fund. This increases the risk that a change in the value of any one investment held by the Fund could affect the overall value of the Fund more than it would affect that of a diversified fund holding a greater number of investments. Accordingly, the Fund's value will likely be more volatile than the value of a more diversified fund.
Repurchase Agreements: Repurchase agreements permit the Fund to maintain liquidity and earn income over periods of time as short as overnight. Repurchase agreements held by the Fund are fully collateralized by U.S. Government securities, or securities issued by U.S. Government agencies, or securities that are within the three highest credit categories assigned by established rating agencies (Aaa, Aa, or A by Moody's or AAA, AA or A by Standard & Poor's) or, if not rated by Moody's or Standard & Poor's, are of equivalent investment quality as determined by the Adviser. Such collateral is in the possession of the Fund's custodian. The collateral is evaluated daily to ensure its market value equals or exceeds the current market value of the repurchase agreements including accrued interest. In the event of default on the obligation to repurchase, the Fund has the right to liquidate the collateral and apply the proceeds in satisfaction of the obligation.
The Fund may enter into repurchase agreements, under the terms of a Master Repurchase Agreement ("MRA"). The MRA permits the Fund, under certain circumstances including an event of default (such as bankruptcy or insolvency), to offset payables and/or receivables under the MRA with collateral held and/or posted to the counterparty and create one single net payment due to or from the Fund. However, bankruptcy or insolvency laws of a particular jurisdiction may impose restrictions on or prohibitions against such a right of offset in the event of a MRA counterparty's bankruptcy or insolvency. Pursuant to the terms of the MRA, the Fund receives securities as collateral with a market value in excess of the repurchase price to be received by the Fund upon the maturity of the repurchase transaction. Upon a bankruptcy or insolvency of the MRA counterparty, the Fund recognizes a liability with respect to such excess collateral to reflect the Fund's obligation under bankruptcy law to return the excess to the counterparty. Repurchase agreements outstanding at the end of the period are listed in the Fund's Portfolio of Investments.
NOTE 3 — Purchases and Sales of Investment Securities
Cost of purchases of investment securities (excluding short-term investments) aggregated $103,042,287 for the year ended September 30, 2017. The proceeds and cost of securities sold resulting in net realized gains of $2,434,015 aggregated $117,680,908 and $115,246,893, respectively, for the year ended September 30, 2017. Realized gains or losses are based on the specific identification method.
17
FPA PARAMOUNT FUND, INC.
NOTES TO FINANCIAL STATEMENTS
Continued
NOTE 4 — Federal Income Tax
No provision for federal income tax is required because the Fund has elected to be taxed as a "regulated investment company" under the Internal Revenue Code (the "Code") and intends to maintain this qualification and to distribute each year to its shareholders, in accordance with the minimum distribution requirements of the Code, its taxable net investment income and taxable net realized gains on investments.
Distributions paid to shareholders are based on net investment income and net realized gains determined on a tax reporting basis, which may differ from financial reporting. For federal income tax purposes, the Fund had the following components of distributable earnings at September 30, 2017:
| Undistributed Ordinary Income | | $ | 629,087 | | |
The tax status of distributions paid during the fiscal years ended September 30, 2017 and 2016 were as follows:
| | | 2017 | | 2016 | |
Dividends from ordinary income | | $ | 1,478,352 | | | $ | 798,849 | | |
Distributions from long-term capital gains | | | — | | | | — | | |
The Fund utilizes the provisions of federal income tax laws that provide for the carryforward of capital losses for prior years, offsetting such losses against any future realized capital gains. Under the Regulated Investment Company Act of 2010 (the "Act"), net capital losses recognized for fiscal years beginning after December 22, 2010 may be carried forward indefinitely, and their character is retained as short-term and/or long-term losses. Previously, net capital losses were carried forward for eight years and treated as short-term losses. As a transition rule, the Act requires that post-enactment net capital losses be used before pre-enactment net capital losses.
As of September 30, 2017, the post enactment accumulated losses were $4,531,509 and there were no pre-enactment losses.
The cost of investment securities held at September 30, 2017, was $130,154,290 for federal income tax purposes. Gross unrealized appreciation and depreciation for all investments (excluding short-term investments) at September 30, 2017, for federal income tax purposes was $26,789,008 and $2,894,622, respectively resulting in net unrealized appreciation of $23,894,386. As of and during the year ended September 30, 2017, the Fund did not have any liability for unrecognized tax benefits. The Fund recognizes interest and penalties, if any, related to unrecognized tax benefits as income tax expense in the Statement of Operations. During the year, the Fund did not incur any interest or penalties. The Fund is not subject to examination by U.S. federal tax authorities for years ended on or before September 30, 2012 or by state tax authorities for years ended on or before September 30, 2011.
During the year ended September 30, 2017, the Fund reclassified $17,928 from Accumulated Realized Loss to Net Investment Loss, to align financial reporting with tax reporting. The permanent book/tax differences arose principally from differing book/tax treatment of foreign currency gains and losses.
NOTE 5 — Advisory Fees and Other Affiliated Transactions
Pursuant to an Investment Advisory Agreement (the "Agreement") approved by shareholders on November 15, 2013 advisory fees were paid by the Fund to First Pacific Advisors, LLC (the "Adviser"). Under the terms of this Agreement, the Fund pays the Adviser a monthly fee calculated at the annual rate of 1% of the Fund's average
18
FPA PARAMOUNT FUND, INC.
NOTES TO FINANCIAL STATEMENTS
Continued
daily net assets. The Adviser has contractually agreed to reimburse expenses in excess of 1.29% of the average net assets of the Fund (excluding brokerage fees and commissions, interest, taxes, shareholder service fees, fees and expenses of other funds in which the Fund invests, and extraordinary expenses) through January 31, 2018.
For the year ended September 30, 2017, the Fund paid aggregate fees and expenses of $135,836 to all Directors who are not affiliated persons of the Adviser. Certain officers of the Fund are also officers of the Adviser.
NOTE 6 — Redemption Fees
Effective June 26, 2017, the Board of Directors of the Fund approved the removal of the 2% redemption fee. Prior to that date, a redemption fee of 2% applied to redemptions within 90 days of purchase. For the year ended September 30, 2017, the Fund collected $1 in redemption fees. The impact of these fees is less than $0.01 per share.
NOTE 7 — Disclosure of Fair Value Measurements
The Fund uses the following methods and inputs to establish the fair value of its assets and liabilities. Use of particular methods and inputs may vary over time based on availability and relevance as market and economic conditions evolve.
Equity securities are generally valued each day at the official closing price of, or the last reported sale price on, the exchange or market on which such securities principally are traded, as of the close of business on that day. If there have been no sales that day, equity securities are generally valued at the last available bid price. Securities that are unlisted and fixed-income and convertible securities listed on a national securities exchange for which the over-the-counter (OTC) market more accurately reflects the securities' value in the judgment of the Fund's officers, are valued at the most recent bid price. Events occurring after the close of trading on non-U.S. exchanges may result in adjustments to the valuation of foreign securities to reflect their fair value as of the close of regular trading on the NYSE. The Fund may utilize an independent fair valuation service in adjusting the valuations of foreign securities. Short-term corporate notes with maturities of 60 days or less at the time of purchase are valued at amortized cost.
Securities for which representative market quotations are not readily available or are considered unreliable by the Adviser are valued as determined in good faith under procedures adopted by the authority of the Fund's Board of Directors. Various inputs may be reviewed in order to make a good faith determination of a security's value. These inputs include, but are not limited to, the type and cost of the security; contractual or legal restrictions on resale of the security; relevant financial or business developments of the issuer; actively traded similar or related securities; conversion or exchange rights on the security; related corporate actions; significant events occurring after the close of trading in the security; and changes in overall market conditions. Fair valuations and valuations of investments that are not actively trading involve judgment and may differ materially from valuations of investments that would have been used had greater market activity occurred.
The Fund classifies its assets based on three valuation methodologies. Level 1 values are based on quoted market prices in active markets for identical assets. Level 2 values are based on significant observable market inputs, such as quoted prices for similar assets and quoted prices in inactive markets or other market observable inputs as noted above including spreads, cash flows, financial performance, prepayments, defaults, collateral, credit enhancements, and interest rate volatility. Level 3 values are based on significant unobservable inputs that reflect the Fund's determination of assumptions that market participants might reasonably use in valuing the assets. The valuation levels are not necessarily an indication of the risk associated with investing in those securities.
19
FPA PARAMOUNT FUND, INC.
NOTES TO FINANCIAL STATEMENTS
Continued
The valuation levels are not necessarily an indication of the risk associated with investing in those securities. The following table presents the valuation levels of the Fund's investments as of September 30, 2017:
Investments | | Level 1 | | Level 2 | | Level 3 | | Total | |
Common Stocks | |
Packaged Food | | $ | 12,009,103 | | | | — | | | | — | | | $ | 12,009,103 | | |
Beverages | | | 9,985,877 | | | | — | | | | — | | | | 9,985,877 | | |
Infrastructure Software | | | 9,915,428 | | | | — | | | | — | | | | 9,915,428 | | |
Industrial Distribution & Rental | | | 7,514,076 | | | | — | | | | — | | | | 7,514,076 | | |
Application Software | | | 7,402,836 | | | | — | | | | — | | | | 7,402,836 | | |
Health Care Services | | | 6,978,415 | | | | — | | | | — | | | | 6,978,415 | | |
Professional Services | | | 6,394,459 | | | | — | | | | — | | | | 6,394,459 | | |
Internet Media | | | 5,862,349 | | | | — | | | | — | | | | 5,862,349 | | |
Advertising & Marketing | | | 5,861,680 | | | | — | | | | — | | | | 5,861,680 | | |
Banks | | | 5,016,516 | | | | — | | | | — | | | | 5,016,516 | | |
Communications Equipment | | | 4,930,293 | | | | — | | | | — | | | | 4,930,293 | | |
Food & Drug Stores | | | 4,824,167 | | | | — | | | | — | | | | 4,824,167 | | |
Large Pharma | | | 4,600,324 | | | | — | | | | — | | | | 4,600,324 | | |
Airlines | | | 4,572,173 | | | | — | | | | — | | | | 4,572,173 | | |
Security Services | | | 3,984,737 | | | | — | | | | — | | | | 3,984,737 | | |
Entertainment Content | | | 3,868,500 | | | | — | | | | — | | | | 3,868,500 | | |
Rubber & Plastic | | | 3,774,245 | | | | — | | | | — | | | | 3,774,245 | | |
Consumer Finance | | | 3,748,886 | | | | — | | | | — | | | | 3,748,886 | | |
Automotive Retailers | | | 3,445,920 | | | | — | | | | — | | | | 3,445,920 | | |
Oil & Gas Services & Equipment | | | 3,253,897 | | | | — | | | | — | | | | 3,253,897 | | |
Medical Equipment | | | 3,194,539 | | | | — | | | | — | | | | 3,194,539 | | |
Flow Control Equipment | | | 2,872,434 | | | | — | | | | — | | | | 2,872,434 | | |
Aircraft & Parts | | | 2,851,063 | | | | — | | | | — | | | | 2,851,063 | | |
Other Spec Retail — Discretionary | | | 2,793,486 | | | | — | | | | — | | | | 2,793,486 | | |
Mass Merchants | | | 2,778,394 | | | | — | | | | — | | | | 2,778,394 | | |
Home & Office Furnishings | | | 2,716,400 | | | | — | | | | — | | | | 2,716,400 | | |
Apparel, Footwear & Acc Design | | | 2,447,956 | | | | — | | | | — | | | | 2,447,956 | | |
Containers & Packaging | | | 2,297,829 | | | | — | | | | — | | | | 2,297,829 | | |
Other Commercial Services | | | 2,281,115 | | | | — | | | | — | | | | 2,281,115 | | |
Internet Based Services | | | 2,196,984 | | | | — | | | | — | | | | 2,196,984 | | |
Jewelry & Watch Stores | | | 1,864,731 | | | | — | | | | — | | | | 1,864,731 | | |
Other Common Stocks | | | 7,809,864 | | | | — | | | | — | | | | 7,809,864 | | |
Short-Term Investment | | | — | | | $ | 19,487,000 | | | | — | | | | 19,487,000 | | |
| | | $ | 154,048,676 | | | $ | 19,487,000 | | | | — | | | $ | 173,535,676 | | |
20
FPA PARAMOUNT FUND, INC.
NOTES TO FINANCIAL STATEMENTS
Continued
Transfers of investments between different levels of the fair value hierarchy are recorded at market value as of the end of the reporting period. Transfers of investments between different levels of the fair value hierarchy are recorded at market value as of the end of the reporting period. There were transfers of $50,610,048 from Level 2 to Level 1 during the year ended September 30, 2017. The transfers between Level 1 and Level 2 of the fair value hierarchy during the year ended September 30, 2017, were due to changes in valuation of international equity securities from the exchange closing price to the fair value price.
NOTE 8 — Line of Credit
The Fund, along with FPA International Value Fund (another mutual fund managed by the Adviser) has collectively entered into an agreement that enables them to participate in a $50 million unsecured line of credit with State Street Bank and Trust. Borrowings will be made solely to temporarily finance the repurchase of Capital Stock. Interest is charged to each Fund based on its borrowings at a rate per annum equal to the Overnight LIBOR Rate plus 1.25%. In addition, the Fund and FPA International Value Fund pay a combined commitment fee of 0.25% per annum on any unused portion of the line of credit.
For the year ended September 30, 2017, the Fund had no borrowings under the agreement.
NOTE 9 — Collateral Requirements
FASB ASU No. 2011-11, Disclosures about Offsetting Assets and Liabilities, requires disclosures to make financial statements that are prepared under U.S. GAAP more comparable to those prepared under International Financial Reporting Standards. Under this guidance the Fund discloses both gross and net information about instruments and transactions eligible for offset such as instruments and transactions subject to an agreement similar to a master netting arrangement. In addition, the Fund discloses collateral received and posted in connection with master netting agreements or similar arrangements.
The following table presents the Fund's repurchase agreements by counterparty net of amounts available for offset under an ISDA Master agreement or similar agreements and net of the related collateral received or pledged by the Fund as of September 30, 2017, are as follows:
Counterparty | | Gross Assets
in the Statement of
Assets and Liabilities | | Collateral
Received | | Assets (Liabilities)
Available for Offset | | Net Amount
of Assets* | |
State Street Bank
and Trust Company | | $ | 19,487,000 | | | $ | 19,487,000 | ** | | | — | | | | — | | |
* Represents the net amount receivable from the counterparty in the event of default.
** Collateral with a value of $19,879,848 has been received in connection with a master repurchase agreement. Excess of collateral received from the individual master repurchase agreement is not shown for financial reporting purposes.
21
FPA PARAMOUNT FUND, INC.
REPORT OF INDEPENDENT REGISTERED
PUBLIC ACCOUNTING FIRM
TO THE SHAREHOLDERS AND
BOARD OF DIRECTORS OF FPA PARAMOUNT FUND, INC.
We have audited the accompanying statement of assets and liabilities of FPA Paramount Fund, Inc. (the "Fund"), including the portfolio of investments, as of September 30, 2017, the related statement of operations for the year then ended, the statements of changes in net assets for each of the two years in the period then ended, and the financial highlights for each of the five years in the period then ended. These financial statements and financial highlights are the responsibility of the Fund's management. Our responsibility is to express an opinion on these financial statements and financial highlights based on our audits.
We conducted our audits in accordance with the standards of the Public Company Accounting Oversight Board (United States). Those standards require that we plan and perform the audit to obtain reasonable assurance about whether the financial statements and financial highlights are free of material misstatement. The Fund is not required to have, nor were we engaged to perform, an audit of its internal control over financial reporting. Our audits included consideration of internal control over financial reporting as a basis for designing audit procedures that are appropriate in the circumstances, but not for the purpose of expressing an opinion on the effectiveness of the Fund's internal control over financial reporting. Accordingly, we express no such opinion. An audit also includes examining, on a test basis, evidence supporting the amounts and disclosures in the financial statements, assessing the accounting principles used and significant estimates made by management, as well as evaluating the overall financial statement presentation. Our procedures included confirmation of securities owned as of September 30, 2017, by correspondence with the custodian and brokers; where replies were not received from brokers, we performed other auditing procedures. We believe that our audits provide a reasonable basis for our opinion.
In our opinion, such financial statements and financial highlights referred to above present fairly, in all material respects, the financial position of FPA Paramount Fund, Inc. as of September 30, 2017, the results of its operations for the year then ended, the changes in its net assets for each of the two years in the period then ended, and the financial highlights for each of the five years in the period then ended in conformity with accounting principles generally accepted in the United States of America.
Los Angeles, California
November 20, 2017
22
FPA PARAMOUNT FUND, INC.
SHAREHOLDER EXPENSE EXAMPLE
September 30, 2017 (Unaudited)
Fund Expenses
Mutual fund shareholders generally incur two types of costs: (1) transaction costs, and (2) ongoing costs, including advisory and administrative fees; shareholder service fees; and other Fund expenses. The Example is intended to help you understand your ongoing costs (in dollars) of investing in the Fund and to compare these costs with the ongoing costs of investing in other mutual funds. The Example is based on an investment of $1,000 invested at the beginning of the year and held for the entire year.
Actual Expenses
The information in the table under the heading "Actual Performance" provides information about actual account values and actual expenses. You may use the information in this column, together with the amount you invested, to estimate the expenses that you paid over the period. Simply divide your account value by $1,000 (for example, an $8,600 account value divided by $1,000 = 8.6), then multiply the result by the number in the first column in the row entitled "Expenses Paid During Period" to estimate the expenses you paid on your account during this period.
Hypothetical Example for Comparison Purposes
The information in the table under the heading "Hypothetical Performance (5% return before expenses)" provides information about hypothetical account values and hypothetical expenses based on the Fund's actual expense ratio and an assumed rate of return of 5% per year before expenses, which is not the Fund's actual return. The hypothetical account values and expenses may not be used to estimate the actual ending account balance or expenses you paid
for the period. You may use this information to compare the ongoing costs of investing in the Fund and other funds. To do so, compare this 5% hypothetical example with the 5% hypothetical examples that appear in the shareholder reports of other funds.
Please note that the expenses shown in the table are meant to highlight your ongoing costs only and do not reflect any transactional costs. Therefore, the information under the heading "Hypothetical Performance (5% return before expenses)" is useful in comparing ongoing costs only, and will not help you determine the relative total costs of owning different funds. In addition, if these transactional costs were included, your costs would have been higher. Even though the Fund does not charge transaction fees, if you purchase shares through a broker, the broker may charge you a fee. You should evaluate other mutual funds' transaction fees and any applicable broker fees to assess the total cost of ownership for comparison purposes.
| | | Actual
Performance | | Hypothetical
Performance
(5% return
before
expenses) | |
Beginning Account Value
March 31, 2017 | | $ | 1,000.00 | | | $ | 1,000.00 | | |
Ending Account Value
September 30, 2017 | | $ | 1,131.80 | | | $ | 1,018.59 | | |
Expenses Paid During
Period* | | $ | 6.90 | | | $ | 6.45 | | |
* Expenses are equal to the Fund's annualized expense ratio of 1.29%, multiplied by the average account value over the period and prorated for the six-months ended September 30, 2017 (183/365 days).
23
FPA PARAMOUNT FUND, INC.
APPROVAL OF INVESTMENT ADVISORY AGREEMENT
(Unaudited)
Approval of the Advisory Agreement. At a meeting of the Board of Directors held on August 14, 2017, the Directors approved the continuation of the advisory agreement between the Fund and the Adviser for an additional one-year period through September 30, 2018, on the recommendation of the Independent Directors, who met in executive session on August 14, 2017 prior to the Board meeting to review and discuss the proposed continuation of the advisory agreement. The following paragraphs summarize the material information and factors considered by the Board and the Independent Directors, as well as the Directors' conclusions relative to such factors.
Nature, Extent and Quality of Services. The Board and the Independent Directors considered information provided by the Adviser in response to their requests, as well as information provided throughout the year regarding the Adviser and its staffing in connection with the Fund, including the Fund's portfolio managers and the senior analysts on their team, the scope of services supervised and provided by the Adviser, and the absence of any significant service problems reported to the Board. The Board and the Independent Directors noted the experience, length of service and the outstanding reputation of the Fund's portfolio managers, Gregory A. Herr and Pierre O. Py, who have each served as portfolio manager of the Fund since 2011. The Board and the Independent Directors concluded that the nature, extent and quality of services provided by the Adviser, including if the proposed strategy and team were implemented, would benefit the Fund and its shareholders.
Investment Performance. The Board and the Independent Directors reviewed the overall investment performance of the Fund. The Directors also received information from an independent consultant, Morningstar, regarding the Fund's performance relative to a peer group of global multi-cap core funds and global multi-cap growth funds selected by Morningstar (the "Peer Group"). The Board and the Independent Directors discussed the Fund's relative investment performance when compared to the Peer Group. The Board and the Independent Directors noted the Fund underperformed its Peer Group median for the one-, three- and five-year periods ending March 31, 2017 but had outperformed the Peer Group median for the ten-year period ending March 31, 2017. In addition, the Fund underperformed the Fund's benchmark, MSCI all Country World Index for the one-, three- and five-year period ending March 31, 2017 but outperformed the Index for the ten-year period ending March 31, 2017. The Board and the Independent Directors concluded that the Adviser's continued management of the Fund should benefit the Fund and its shareholders.
Advisory Fees and Fund Expenses; Comparison with Peer Group and Institutional Fees. The Board and the Independent Directors considered information provided by the Adviser regarding the Fund's advisory fees and total expense levels, noting that the Adviser is waiving a portion of the Fund's advisory fee in order to maintain a maximum limit of the Fund's expense ratio. The Board and the Independent Directors reviewed comparative information regarding fees and expenses for the Peer Group. The Board and the Independent Directors noted that the Fund's advisory fees and overall expense ratio were above the average of those for the Peer Group. They noted that FPA believed that the fee was competitive within the industry for similar global funds and recognized the increased complexity of managing a global fund. In addition, the Directors noted that the fee rate charged to the Fund is the same as the fee rate proposed to be charged by the Adviser on the institutional accounts managed in a similar style by the portfolio managers, although they recognized FPA did not currently have any such accounts. The Board and the Independent Directors noted that the advisory fee is consistent with advisory fees charged by FPA to another Fund investing in non-U.S. securities, and they noted that FPA had initially proposed this consistency to create a proper alignment of internal incentives for the portfolio management team. The Board and the Independent Directors concluded that the continued payment of advisory fees and expenses by the Fund to the Adviser was fair and reasonable and should continue to benefit the Fund and its shareholders.
24
FPA PARAMOUNT FUND, INC.
APPROVAL OF INVESTMENT ADVISORY AGREEMENT
Continued (Unaudited)
Adviser Profitability and Costs. The Board and the Independent Directors considered information provided by the Adviser regarding the Adviser's costs in providing services to the Fund, the profitability of the Adviser and the benefits to the Adviser from its relationship to the Fund. They reviewed and considered the Adviser's representations regarding its assumptions and methods of allocating certain costs, such as personnel costs, which constitute the Adviser's largest operating cost, over-head and trading costs with respect to the provision of investment advisory services. The Independent Directors discussed with the Adviser the general process through which individuals' compensation is determined and then reviewed by the management committee of the Adviser, as well as the Adviser's methods for determining that the compensation levels are at appropriate levels to attract and retain the personnel necessary to provide high quality professional investment advice. In evaluating the Adviser's profitability, they considered a portion of the compensation of the Adviser's principals that could be deemed a form of profit, and they excluded certain distribution and marketing-related expenses. The Board and the Independent Directors recognized that the Adviser is entitled under the law to earn a reasonable level of profits for the services that it provides to the Fund. The Board and the Independent Directors concluded that the Adviser's level of profitability from its relationship with the Fund did not indicate that the Adviser's compensation was unreasonable or excessive.
Economies of Scale and Sharing of Economies of Scale. The Board and the Independent Directors considered whether there have been economies of scale with respect to the management of the Fund, whether the Fund has appropriately benefited from any economies of scale, and whether the proposed fee rate is reasonable in relation to the Fund's asset levels and any economies of scale that may exist. The Board and the Independent Directors considered the Adviser's representation that its internal costs of providing investment management services to the Fund have significantly increased in recent years as a result of a number of factors, including the Adviser's substantial investment in additional professional resources: staffing. The Board and the Independent Directors considered information regarding the Adviser's representation that such increased costs have also included a significant investment in: (1) the portfolio management team, analyst, traders and other investment personnel who assist with the management of the Fund; (2) new compliance, operations, and administrative personnel; (3) information technology, portfolio accounting and trading systems; and (4) office space, each of which enhances the quality of services provided to the Fund. They considered the Adviser's representation that it would invest in additional investment analysts supporting the investment team and strategy when appropriate. The Board and the Independent Directors also considered that the Adviser had foregone the reimbursement for providing certain financial services that it had previously received from the Fund. The Board and the Independent Directors also considered the Adviser's willingness to close funds to new investors when it believed that a fund may have limited capacity to grow or that it otherwise would benefit fund shareholders.
The Board and the Independent Directors recognized that the advisory fee rate schedule for the Fund does not have breakpoints. They considered that many mutual funds have breakpoints in the advisory fee structure as a means by which to share in the benefits of potential economies of scale as a fund's assets grow. They also considered that not all funds have breakpoints in their fee structures and that breakpoints are not the exclusive means of sharing potential economies of scale. The Board and the Independent Directors considered the Adviser's statement that it believes that breakpoints are not appropriate for the Fund given the ongoing investments the Adviser is making in its business and its proposed investments for the benefit of the Fund, uncertainties regarding the direction of the economy, rising inflation, increasing costs for personnel and systems, and growth or contraction in the Fund's assets, all of which could negatively impact the profitability of the Adviser. The Board and the Independent Directors also noted that the Adviser has contractually agreed to reimburse the Fund for Total Annual
25
FPA PARAMOUNT FUND, INC.
APPROVAL OF INVESTMENT ADVISORY AGREEMENT
Continued (Unaudited)
Fund Operating Expenses in excess of 1.29% of the average daily net assets of the Fund (excluding brokerage fees and commissions, interest, taxes, shareholder service fees, fees and expenses of other funds in which the Fund invests, and extraordinary expenses) through January 31, 2018. The Board and the Independent Trustees concluded that the Fund is benefitting from the ongoing investments made by the Adviser in its team of personnel serving the Fund and in the Adviser's service infrastructure, and that in light of these investments, the addition of breakpoints to the Fund's advisory fee structure was not warranted at current asset levels.
Ancillary Benefits. The Board and the Independent Directors considered other actual and potential benefits to the Adviser from managing the Fund, including the acquisition and use of research services with commissions generated by the Fund, in concluding that the contractual advisory and other fees are fair and reasonable for the Fund. They noted that the Adviser does not have any affiliates that benefit from the Adviser's relationship to the Fund.
Conclusions. The Board and the Independent Directors determined that the Fund continues to benefit from the services of the Adviser's portfolio management team. In addition, the Board and the Independent Directors agreed that the Fund continues to receive high quality services from the Adviser. The Board and the Independent Directors concluded that the current advisory fee rate is reasonable and fair to the Fund and its shareholders in light of the nature and quality of the services currently provided by the Adviser and the Adviser's profitability and costs. The Board and the Independent Directors also noted their intention to continue monitoring the factors relevant to the Adviser's compensation, such as changes in the Fund's asset levels, changes in portfolio management personnel and the cost and quality of the services provided by the Adviser to the Fund. On the basis of the foregoing, and without assigning particular weight to any single factor, none of which was dispositive, the Board and the Independent Directors concluded that it would be in the best interests of the Fund to continue to be advised and managed by the Adviser and determined to approve the continuation of the current Advisory Agreement for another one-year period through September 30, 2018.
26
FPA PARAMOUNT FUND, INC.
DIRECTOR AND OFFICER INFORMATION
(Unaudited)
Name, Address(1)
and Year of Birth | | Position(s)
With Fund
Years Served | | Principal Occupation(s)
During the Past 5 Years | | Portfolios in
Fund Complex
Overseen | | Other
Directorships
During the
Past 5 Years | |
Independent Directors | | | | | | | | | |
Allan M. Rudnick – 1940† | | Director and Chairman*
Years Served: 5 | | Private Investor. Formerly Co-Founder, Chief Executive Officer, Chairman and Chief Investment Officer of Kayne Anderson Rudnick Investment Management from 1989 to 2007. | | | 7 | | | | |
Sandra Brown – 1955† | | Director*
Years Served: 1 | | Consultant. Formerly CEO and President of Transamerica Financial Advisers, Inc., 1999 to 2009; President, Transamerica Securities Sales Corp. 1998 to 2009; VP, Bank of America Mutual Fund Administration 1990 to 1998. | | | 7 | | | | |
Mark L. Lipson – 1949† | | Director*
Years Served: 2 | | Consultant. ML2Advisors, LLC. Formerly Managing Director, Bessemer Trust (2007-2014) and US Trust (2003-2006); Founder, Chairman and CEO of the Northstar Mutual Funds (1993-2001). | | | 7 | | | | |
Alfred E. Osborne, Jr. – 1944† | | Director*
Years Served: 4 | | Senior Associate Dean of the John E. Anderson School of Management at UCLA. | | | 7 | | | Wedbush, Inc., Nuverra Environmental Solutions, Inc., and Kaiser Aluminun, Inc. | |
A. Robert Pisano – 1943† | | Director*
Years Served: 5 | | Consultant. Formerly President and Chief Operating Officer of the Motion Picture Association of America, Inc. from 2005 to 2011. | | | 7 | | | Entertainment Partners and Resources Global Professionals | |
Patrick B. Purcell – 1943† | | Director*
Years Served: 5 | | Retired. Formerly Executive Vice President, Chief Financial and Administrative Officer of Paramount Pictures from 1983 to 1998. | | | 7 | | | | |
Interested Director(2) | | | | | | | | | |
J. Richard Atwood – 1960 | | Director* and President
Years Served: 20 | | Managing Partner of the Adviser. | | | 7 | | | | |
27
FPA PARAMOUNT FUND, INC.
DIRECTOR AND OFFICER INFORMATION
Continued (Unaudited)
Name, Address(1)
and Year of Birth | | Position(s)
With Fund
Years Served | | Principal Occupation(s)
During the Past 5 Years | | Portfolios in
Fund Complex
Overseen | | Other
Directorships
During the
Past 5 Years | |
Officers | | | | | | | | | |
Gregory A. Herr – 1972 | | Portfolio Manager
Years Served: 6 | | Managing Director of the Adviser since 2013 and Vice President and Analyst of the Adviser from 2007 to 2012. | | | | | |
Pierre O. Py – 1976 | | Portfolio Manager
Years Served: 6 | | Managing Director of the Adviser since 2013. Formerly Vice President of the Adviser since 2011. Formerly an international research analyst at Harris Associates LP from 2005 to 2010. | | | | | |
David C. Lebisky – 1972 | | Chief Compliance Officer
Years Served: <1 | | President of Lebisky Compliance Consulting LLC (since October 2015). Consultant, Duff & Phelps Compliance Consulting (since 2016). Senior Consultant, Freeh Group International Solutions, LLC (a global risk management firm) (since 2015). Formerly, Director of Regulatory Administration, Scotia Institutional Investments US, LP (2010 to 2014). | | | | | | | |
E. Lake Setzler – 1967 | | Treasurer
Years Served: 10 | | Senior Vice President and Controller of the Adviser. | | | | | |
Francine S. Hayes – 1967 | | Secretary
Years Served: 2 | | Vice President and Senior Counsel of State Street Bank and Trust Company | | | | | |
(1) The address for each Director and each Officer (except Ms. Hayes) is 11601 Wilshire Boulevard, Suite 1200, Los Angeles, California 90025. Ms. Hayes' address is State Street Bank and Trust Company, One Lincoln Street, Boston, Massachusetts 02111.
(2) "Interested person" within the meaning of the 1940 Act by virtue of his affiliation with the Fund's Adviser.
* Directors serve until their resignation, removal or retirement.
† Audit Committee member
The Statement of Additional Information includes additional information about the Directors and is available, without charge, upon request by calling (800) 982-4372.
28
(This page has been left blank intentionally.)
FPA PARAMOUNT FUND, INC.
(Unaudited)
INVESTMENT ADVISER
First Pacific Advisors, LLC
11601 Wilshire Boulevard, Suite 1200
Los Angeles, CA 90025
TRANSFER & SHAREHOLDER
SERVICE AGENT
UMB Fund Services, Inc.
P.O. Box 2175
Milwaukee, WI 53201-2175
or
235 West Galena Street
Milwaukee, WI 53212-3948
(800) 638-3060
CUSTODIAN AND ADMINISTRATOR
State Street Bank and Trust Company
Boston, Massachusetts
TICKER SYMBOL: FPRAX
CUSIP: 302546106
DISTRIBUTOR
UMB Distribution Services, LLC
235 West Galena Street
Milwaukee, Wisconsin 53212-3948
LEGAL COUNSEL
Dechert LLP
San Francisco, California
INDEPENDENT REGISTERED PUBLIC ACCOUNTING FIRM
Deloitte & Touche LLP
Los Angeles, California
This report has been prepared for the information of shareholders of FPA PARAMOUNT FUND, INC., and is not authorized for distribution to prospective investors unless preceded or accompanied by an effective prospectus. The financial information included in this report has been taken from the records of the Fund without examination by independent auditors.
The Fund's complete proxy voting record for the 12 months ended June 30, 2017 is available without charge, upon request by calling (800) 982-4372 and on the SEC's website at www.sec.gov.
The Fund's schedule of portfolio holdings, filed the first and third quarter of the Fund's fiscal year on Form N-Q with the SEC, is available on the SEC's website at www.sec.gov. Form N-Q is available at the SEC's Public Reference Room in Washington, D.C., and information on the operations of the Public Reference Room may be obtained by calling (202) 551-8090. To obtain Form N-Q from the Fund, shareholders can call (800) 982-4372.
Additional information about the Fund is available online at www.fpafunds.com. This information includes, among other things, holdings, top sectors, and performance, and is updated on or about the 15th business day after the end of each quarter.
Item 2. Code of Ethics.
(a) The registrant has adopted a code of ethics that applies to the registrant’s principal executive and financial officers.
(b) Not applicable.
(c) During the period covered by this report, there were no amendments to the provisions of the code of ethics adopted in 2(a) above.
(d) During the period covered by this report, there were not any implicit or explicit waivers to the provisions of the code of ethics adopted in 2(a).
(e) Not applicable.
(f) A copy of the registrant’s code of ethics is filed as an exhibit to this Form N-CSR.
Item 3. Audit Committee Financial Expert.
The registrant’s board of directors has determined that Patrick B. Purcell, who is a member of the registrant’s audit committee and board of directors, is an “audit committee financial expert” and is “independent,” as those terms are defined in this Item. This designation will not increase the designee’s duties, obligations or liability as compared to his duties, obligations or liability as a member of the audit committee and of the board of directors. This designation does not affect the duties, obligations or liability of any other member of the audit committee or the board of directors.
Item 4. Principal Accountant Fees and Services.
| | 2016 | | 2017 | |
(a) Audit Fees | | $ | 40,883 | | $ | 41,905 | |
(b) Audit Related Fees | | $ | -0- | | $ | -0- | |
(c) Tax Fees(1) | | $ | 8,901 | | $ | 9,124 | |
(d) All Other Fees | | $ | -0- | | $ | -0- | |
(1) Tax Fees are for preparation of the Fund’s tax return(s).
(e)(1) The audit committee shall pre-approve all audit and permissible non-audit services that the committee considers compatible with maintaining the independent auditors’ independence. The pre-approval requirement will extend to all non-audit services provided to the registrant, the adviser, and any entity controlling, controlled by, or under common control with the adviser that provides ongoing services to the registrant, if the engagement relates directly to the operations and financial reporting of the registrant; provided, however, that an engagement of the registrant’s independent auditors to perform attest services for the registrant, the adviser or its affiliates required by generally accepted auditing standards to complete the examination of the registrant’s financial statements (such as an examination conducted in accordance with Statement on Standards for Attestation Engagements Number 16, or a Successor Statement, issued by the American Institute of Certified Public Accountants), will be deem pre-approved if:
(i) the registrant’s independent auditors inform the audit committee of the engagement,
(ii) the registrant’s independent auditors advise the audit committee at least annually that the performance of this engagement will not impair the independent auditor’s independence with respect to the registrant, and
(iii) the audit committee receives a copy of the independent auditor’s report prepared in connection with such services. The committee may delegate to one or more committee members the authority to review and pre-approve audit and permissible non-audit services. Actions taken under any such delegation will be reported to the full committee at its next meeting.
(e)(2) 0% of the services provided to the registrant described in paragraphs b—d of this Item were approved by the Audit Committee pursuant to paragraph (c)(7)(i)(C) of Rule 2-01 of Regulation S-X. There were no services provided to the investment adviser or any entity controlling, controlled by or under common control with the adviser described in paragraphs (b) — (d) of this Item that were required to be pre-approved by the audit committee.
(f) All services performed on the engagement to audit the registrant’s financial statements for the most recent fiscal year end were performed by the principal accountant’s full-time, permanent employees.
(g) None.
(h) Not applicable.
Item 5. Audit Committee of Listed Registrants.
Not applicable.
Item 6. Investments.
(a) Schedule of Investments is included as a part of the report to shareholders filed under Item 1 of this Form N-CSR.
(b) Not applicable.
Item 7. Disclosure of Proxy Voting Policies and Procedures for Closed-End Management Investment Companies.
Not applicable.
Item 8. Portfolio Managers of Closed-End Management Investment Companies.
Not applicable.
Item 9. Purchases of Equity Securities by Closed-End Management Investment Company and Affiliated Purchasers.
Not applicable.
Item 10. Submission of Matters to a Vote of Security Holders.
There have been no material changes to the procedures by which the shareholders may recommend nominees to the registrant’s board of directors.
Item 11. Controls and Procedures.
(a) The principal executive officer and principal financial officer of the registrant have concluded that the registrant’s disclosure controls and procedures (as defined in Rule 30a-3(c) under the Investment Company Act of 1940) are effective based on their evaluation of the disclosure controls and procedures as of a date within 90 days of the filing date of this report.
(b) There have been no significant changes in the registrant’s internal controls over financial reporting (as defined in Rule 30a-3(d) under the Investment Company Act of 1940) that occurred during the registrant’s second fiscal quarter of the period covered by this report that have materially affected, or is reasonably likely to materially affect, the registrant’s internal controls over financial reporting.
Item 12. Disclosure of Securities Lending Activities for Closed-End Management Investment Companies.
Not applicable.
Item 13. Exhibits.
(a)(1) Code of ethics as applies to the registrant’s principal executive and financial officers is attached hereto.
(a)(2) The certifications required by Rule 30a-2(a) under the Investment Company Act of 1940 are attached hereto.
(a)(3) Not applicable.
(b) The certifications required by Rule 30a-2(b) under the Investment Company Act of 1940 and Section 906 of the Sarbanes-Oxley Act of 2002 are attached hereto.
SIGNATURES
Pursuant to the requirements of the Securities Exchange Act of 1934 and the Investment Company Act of 1940, the registrant has duly caused this report to be signed on its behalf by the undersigned, thereunto duly authorized.
FPA PARAMOUNT FUND, INC. | |
| |
| |
By: | /s/ J. Richard Atwood | |
| J. Richard Atwood | |
| President (principal executive officer) | |
| |
Date: December 6, 2017 | |
Pursuant to the requirements of the Securities Exchange Act of 1934 and the Investment Company Act of 1940, this report has been signed below by the following persons on behalf of the registrant and in the capacities and on the dates indicated.
By: | /s/ J. Richard Atwood | |
| J. Richard Atwood | |
| President (principal executive officer) | |
| |
Date: December 6, 2017 | |
| |
| |
By: | /s/ E. Lake Setzler III | |
| E. Lake Setzler III | |
| Treasurer (principal financial officer) | |
| |
Date: December 6, 2017 | |