Notes to financial statements
Delaware Select Growth Fund
1. Significant Accounting Policies (continued)
calculating realized gains and losses on the sale of investment securities are those of the specific securities sold. Dividend income is recorded on the ex-dividend date and interest income is recorded on the accrual basis. Taxable non-cash dividends are recorded as dividend income. Foreign dividends are also recorded on the ex-dividend date or as soon after the ex-dividend date that the Fund is aware of such dividends, net of all non-rebatable tax withholdings. Withholding taxes on foreign dividends have been recorded in accordance with the Fund’s understanding of the applicable country’s tax rules and rates. The Fund declares and pays dividends from net investment income and distributions from net realized gain on investments, if any, annually.
Subject to seeking best execution, the Fund may direct certain security trades to brokers who have agreed to rebate a portion of the related brokerage commission to the Fund in cash. Such commission rebates are included in realized gain on investments in the accompanying financial statements and totaled $38,327 for the year ended April 30, 2009. In general, best execution refers to many factors, including the price paid or received for a security, the commission charged, the promptness and reliability of execution, the confidentiality and placement accorded the order, and other factors affecting the overall benefit obtained by the Fund on the transaction.
The Fund receives earnings credits from its custodian when positive cash balances are maintained, which are used to offset custody fees. The expense paid under this arrangement is included in custodian fees on the statement of operations with the corresponding expense offset shown as “expense paid indirectly.”
2. Investment Management, Administration Agreements and Other Transactions with Affiliates
In accordance with the terms of its investment management agreement, the Fund pays Delaware Management Company (DMC), a series of Delaware Management Business Trust and the investment manager, an annual fee which is calculated daily at the rate of 0.75% on the first $500 million of average daily net assets of the Fund, 0.70% on the next $500 million, 0.65% on the next $1.5 billion, and 0.60% on average daily net assets in excess of $2.5 billion.
Effective September 1, 2008, DMC has contractually agreed to waive that portion, if any, of its management fee and reimburse the Fund to the extent necessary to ensure that total annual operating expenses (excluding any 12b-1 plan expenses, taxes, interest, inverse floater program expenses, brokerage fees, certain insurance costs, and non-routine expenses or costs including, but not limited to, those relating to reorganizations, litigation, conducting shareholder meetings, and liquidations (collectively, “non-routine expenses”)) do not exceed 1.25% of average daily net assets of the Fund through August 31, 2009. For purposes of this waiver and reimbursement, non-routine expenses may also include such additional costs and expenses, as may be agreed upon from time to time by the Fund’s Board and DMC. These expense waivers and reimbursements apply only to expenses paid directly by the Fund. Prior to September 1, 2008, DMC had contractually agreed to waive its management fee to the extent necessary to ensure that total annual operating expenses do not exceed 1.23% of the Fund’s average daily net assets.
32
Delaware Service Company, Inc. (DSC), an affiliate of DMC, provides fund accounting and financial administration oversight services to the Fund. For these services, the Fund pays DSC fees based on the aggregate daily net assets of the Delaware Investments® Family of Funds at the following annual rate: 0.0050% of the first $30 billion; 0.0045% of the next $10 billion; 0.0040% of the next $10 billion; and 0.0025% of aggregate average daily net assets in excess of $50 billion. The fees payable to DSC under the service agreement described above are allocated among all Funds in the Delaware Investments Family of Funds on a relative net asset value basis. For the year ended April 30, 2009, the Fund was charged $10,668 for these services.
DSC also provides dividend disbursing and transfer agency services. The Fund pays DSC a monthly fee based on the number of shareholder accounts for dividend disbursing and transfer agent services.
Pursuant to a distribution agreement and distribution plan, the Fund pays DDLP, the distributor and an affiliate of DMC, an annual distribution and service fee not to exceed 0.25% of the average daily net assets of the Class A shares, 1.00% of the average daily net assets of the Class B and C shares and 0.60% of the average daily net assets of Class R shares. Institutional Class shares pay no distribution and service expenses. DDLP has contracted to limit the Class R shares’ 12b-1 fees through August 31, 2009 to no more than 0.50% of average daily net assets.
At April 30, 2009, the Fund had liabilities payable to affiliates as follows:
| Investment management fee payable to DMC | $ | 73,830 |
| Dividend disbursing, transfer agent and fund accounting | | |
| oversight fees and other expenses payable to DSC | | 116,570 |
| Distribution fees payable to DDLP | | 54,331 |
| Other expenses payable to DMC and affiliates* | | 4,516 |
*DMC, as part of its administrative services, pays operating expenses on behalf of the Fund and is reimbursed on a periodic basis. Such expenses include items such as printing of shareholder reports, fees for audit, legal and tax services, registration fees and trustees’ fees.
As provided in the investment management agreement, the Fund bears the cost of certain legal and tax services, including internal legal and tax services provided to the Fund by DMC and/or its affiliates’ employees. For the year ended April 30, 2009, the Fund was charged $16,680 for internal legal and tax services provided by DMC and/or its affiliates’ employees.
For the year ended April 30, 2009, DDLP earned $16,749 for commissions on sales of the Fund’s Class A shares. For the year ended April 30, 2009, DDLP received gross CDSC commissions of $2,673, $34,506 and $2,926 on redemption of the Fund’s Class A, Class B and Class C shares, respectively, and these commissions were entirely used to offset up-front commissions previously paid by DDLP to broker-dealers on sales of those shares.
Trustees’ fees include expenses accrued by the Fund for each Trustee’s retainer and meeting fees. Certain officers of DMC, DSC and DDLP are officers and/or Trustees of the Trust. These officers and Trustees are paid no compensation by the Fund.
33
Notes to financial statements
Delaware Select Growth Fund
3. Investments
For the year ended April 30, 2009, the Fund made purchases of $141,659,662 and sales of $155,411,876 of investment securities other than short-term investments.
At April 30, 2009, the cost of investments for federal income tax purposes was $248,162,348. At April 30, 2009, net unrealized depreciation was $17,973,730, of which $16,083,262 related to unrealized appreciation of investments and $34,056,992 related to unrealized depreciation of investments.
Effective May 1, 2008, the Fund adopted Financial Accounting Standard No. 157, Fair Value Measurements (FAS 157). FAS 157 defines fair value as the price that the Fund would receive to sell an asset or pay to transfer a liability in an orderly transaction between market participants at the measurement date under current market conditions. FAS 157 also establishes a framework for measuring fair value, and a three level hierarchy for fair value measurements based upon the transparency of inputs to the valuation of an asset or liability. Inputs may be observable or unobservable and refer broadly to the assumptions that market participants would use in pricing the asset or liability. Observable inputs reflect the assumptions market participants would use in pricing the asset or liability based on market data obtained from sources independent of the reporting entity. Unobservable inputs reflect the reporting entity’s own assumptions about the assumptions that market participants would use in pricing the asset or liability developed based on the best information available under the circumstances. The Fund’s investment in its entirety is assigned a level based upon the observability of the inputs which are significant to the overall valuation. The three-tier hierarchy of inputs is summarized below.
Level 1 – Inputs are quoted prices in active markets
Level 2 – Inputs are observable, directly or indirectly
Level 3 – Inputs are unobservable and reflect assumptions on the part of the reporting entity
The following table summarizes the valuation of the Fund investments by the FAS 157 fair value hierarchy levels as of April 30, 2009:
| | | Securities |
| Level 1 | | $ | 198,165,472 |
| Level 2 | | | 32,023,047 |
| Level 3 | | | 99 |
| Total | | $ | 230,188,618 |
34
The following is a reconciliation of investments in which significant unobservable inputs (Level 3) were used in determining fair value:
| | Securities |
| Balance as of 4/30/08 | | $ | 53,379 | |
| Net change in unrealized appreciation/depreciation | | | (53,280 | ) |
| Balance as of 4/30/09 | | $ | 99 | |
| Net change in unrealized appreciation/depreciation | | | | |
| from investments still held as of 4/30/09 | | $ | (53,280 | ) |
4. Dividend and Distribution Information
Income and long-term capital gain distributions are determined in accordance with federal income tax regulations, which may differ from U.S. generally accepted accounting principles. Additionally, distributions from net gains on foreign currency transactions and net short-term gains on sales of investment securities are treated as ordinary income for federal income tax purposes. There were no dividends and distributions paid for the years ended April 30, 2009 and 2008.
5. Components of Net Assets on a Tax Basis
As of April 30, 2009, the components of net assets on a tax basis were as follows:
| Shares of beneficial interest | | $ | 840,611,745 | |
| Post-October currency losses | | | (38,325 | ) |
| Post-October losses | | | (43,874,213 | ) |
| *Capital loss carryforwards | | | (583,734,939 | ) |
| Unrealized depreciation of investments | | | | |
| and foreign currencies | | | (17,973,351 | ) |
| Net assets | | $ | 194,990,917 | |
*The amount of this loss which can be utilized in subsequent years may be subject to an annual limitation in accordance with the Internal Revenue Code due to the Fund merger with Delaware Technology and Innovation Fund in March 2004.
The differences between book basis and tax basis components of net assets are primarily attributable to tax deferral of losses on wash sales.
Post-October losses represent losses realized on investment and foreign currency transactions from November 1, 2008 through April 30, 2009 that, in accordance with federal income tax regulations, the Fund has elected to defer and treat as having arisen in the following year.
35
Notes to financial statements
Delaware Select Growth Fund
5. Components of Net Assets on a Tax Basis (continued)
For financial reporting purposes, capital accounts are adjusted to reflect the tax character of permanent book/tax differences. Reclassifications are primarily due to tax treatment of net operating losses, and gain (loss) on foreign currency transactions. Results of operations and net assets were not affected by these reclassifications. For the year ended April 30, 2009, the Fund recorded the following reclassifications:
| Accumulated net investment loss | | $ | 800,690 | |
| Accumulated net realized loss | | | 114,773 | |
| Paid-in capital | | | (915,463 | ) |
For federal income tax purposes capital loss carryforwards may be carried forward and applied against future capital gains. Capital loss carryforwards remaining at April 30, 2009 will expire as follows: $357,796,276 expires in 2010, $185,917,705 expires in 2011, $18,530,411 expires in 2012, and $21,490,547 expires in 2017.
6. Capital Shares
Transactions in capital stock shares were as follows:
| | | Year Ended |
| | | 4/30/09 | | 4/30/08 |
| Shares sold: | | | | | | |
| Class A | | 1,557,580 | | | 1,644,208 | |
| Class B | | 17,122 | | | 33,090 | |
| Class C | | 111,377 | | | 224,444 | |
| Class R | | 4,546 | | | 5,054 | |
| Institutional Class | | 1,968,498 | | | 363,001 | |
| | | 3,659,123 | | | 2,269,797 | |
| Shares repurchased: | | | | | | |
| Class A | | (1,651,316 | ) | | (1,788,833 | ) |
| Class B | | (1,618,162 | ) | | (2,455,770 | ) |
| Class C | | (579,812 | ) | | (812,255 | ) |
| Class R | | (15,373 | ) | | (11,501 | ) |
| Institutional Class | | (575,418 | ) | | (707,019 | ) |
| | | (4,440,081 | ) | | (5,775,378 | ) |
| Net decrease | | (780,958 | ) | | (3,505,581 | ) |
For the years ended April 30, 2009 and 2008, 1,015,729 Class B shares were converted to 910,682 Class A shares valued at $20,207,902 and 1,120,511 Class B shares were converted to 1,010,784 Class A shares valued at $28,223,330, respectively. The respective amounts are included in Class B redemptions and Class A subscriptions in the table above and the statements of changes in net assets.
36
7. Line of Credit
The Fund, along with certain other funds in the Delaware Investments® Family of Funds (Participants), was a participant in a $225,000,000 revolving line of credit with The Bank of New York Mellon (BNY Mellon) to be used for temporary or emergency purposes as an additional source of liquidity to fund redemptions of investor shares. Under the agreement, the Participants were charged an annual commitment fee, which was allocated across the Participants on the basis of each Participant’s allocation of the entire facility. Participants were permitted to borrow up to a maximum of one third of their net assets under the agreement. The agreement expired on November 18, 2008.
Effective November 18, 2008, the Fund, along with the other Participants, entered into an amendment to the agreement with BNY Mellon for a $35,000,000 revolving line of credit. The agreement, as amended, is to be used as described above and operates in substantially the same manner as the original agreement. The agreement, as amended, expires on November 17, 2009. The Fund had no amounts outstanding as of April 30, 2009 or at any time during the year then ended.
8. Foreign Currency Exchange Contracts
The Fund may enter into foreign currency exchange contracts as a way of managing foreign exchange rate risk. The Fund may enter into these contracts to fix the U.S. dollar value of a security that it has agreed to buy or sell for the period between the date the trade was entered into and the date the security is delivered and paid for. The Fund may also use these contracts to hedge the U.S. dollar value of securities it already owns that are denominated in foreign currencies. The change in value is recorded as an unrealized gain or loss. When the contract is closed, a realized gain or loss is recorded equal to the difference between the value of the contract at the time it was opened and the value at the time it was closed.
The use of foreign currency exchange contracts does not eliminate fluctuations in the underlying prices of the securities, but does establish a rate of exchange that can be achieved in the future. Although foreign currency exchange contracts limit the risk of loss due to a decline in the value of the hedged currency, they also limit any potential gain that might result should the value of the currency increase. In addition, the Fund could be exposed to risks if the counterparties to the contracts are unable to meet the terms of their contracts.
37
Notes to financial statements
Delaware Select Growth Fund
9. Securities Lending
The Fund, along with other funds in the Delaware Investments® Family of Funds, may lend its securities pursuant to a security lending agreement (Lending Agreement) with BNY Mellon. With respect to each loan, if the aggregate market value of securities collateral held plus cash collateral received on any business day is less than the aggregate market value of the securities which are the subject of such loan, the borrower will be notified to provide additional collateral not less than the applicable collateral requirements. Cash collateral received is generally invested in the Mellon GSL DBT II Collateral Fund (Collective Trust) established by BNY Mellon for the purpose of investment on behalf of clients participating in its securities lending programs. The Collective Trust may invest in fixed income securities, with a weighted average maturity not to exceed 90 days, rated in one of the top three tiers by Standard & Poor’s Ratings Group or Moody’s Investors Service, Inc. or repurchase agreements collateralized by such securities. The Collective Trust seeks to maintain a net asset value per unit of $1.00, but there can be no assurance that it will always be able to do so. At April 30, 2009, the Collective Trust held only cash and assets with a maturity of one business day or less (Cash/Overnight Assets). The Fund may incur investment losses as a result of investing securities lending collateral in the Collective Trust. This could occur if an investment in the Collective Trust defaulted or if it were necessary to liquidate assets in the Collective Trust to meet returns on outstanding security loans at a time when the Collective Trust’s net asset value per unit was less than $1.00. Under those circumstances, the Fund may not receive an amount from the Collective Trust that is equal in amount to the collateral the Fund would be required to return to the borrower of the securities and the Fund would be required to make up for this shortfall. Effective April 20, 2009, BNY Mellon transferred the assets of the Collective Trust other than the Cash/Overnight Assets to the BNY Mellon SL DBT II Liquidating Fund (Liquidating Fund), effectively bifurcating the collateral investment pool. The Fund’s exposure to the Liquidating Fund is expected to decrease as the Liquidating Fund’s assets mature or are sold. In October, 2008, BNY Mellon transferred certain distressed securities from the Collective Trust into the Mellon GSL Reinvestment Trust II. The Fund can also accept U.S. government securities and letters of credit (non-cash collateral) in connection with securities loans. In the event of default or bankruptcy by the lending agent, realization and/or retention of the collateral may be subject to legal proceedings. In the event the borrower fails to return loaned securities and the collateral received is insufficient to cover the value of the loaned securities and provided such collateral shortfall is not the result of investment losses, the lending agent has agreed to pay the amount of the shortfall to the Fund, or at the discretion of the lending agent, replace the loaned securities. The Fund continues to record dividends or interest, as applicable, on the securities loaned and are subject to change in value of the securities loaned that may occur during the term of the loan. The Fund has the right under the Lending Agreement to recover the securities from the borrower on demand. With respect to security loans collateralized by non-cash collateral, the Fund receives loan premiums paid by the borrower. With respect to security loans collateralized by cash collateral, the earnings from the collateral investments are shared among the Fund, the security lending agent and the borrower. The Fund records security lending income net of allocations to the security lending agent and the borrower.
38
At April 30, 2009, the value of the securities on loan was $33,034,640, for which cash collateral was received and invested in accordance with the Lending Agreement. Such investments are presented on the statement of net assets under the caption “Securities Lending Collateral.”
10. Credit and Market Risk
The Fund invests a significant portion of its assets in small- and mid-sized companies and may be subject to certain risks associated with ownership of securities of such companies. Investments in small- or mid-sized companies may be more volatile than investments in larger companies for a number of reasons, which include more limited financial resources or a dependence on narrow product lines.
The Fund may invest up to 15% of its net assets in illiquid securities, which may include securities with contractual restrictions on resale, securities exempt from registration under Rule 144A of the Securities Act of 1933, as amended, and other securities which may not be readily marketable. The relative illiquidity of these securities may impair the Fund from disposing of them in a timely manner and at a fair price when it is necessary or desirable to do so. While maintaining oversight, the Fund’s Board has delegated to DMC the day-to-day functions of determining whether individual securities are liquid for purposes of the Fund’s limitation on investments in illiquid assets. Securities eligible for resale pursuant to Rule 144A, which are determined to be liquid, are not subject to the Fund’s 15% limit on investments in illiquid securities. At April 30, 2009, there were no Rule 144A securities and no securities have been determined to be illiquid under the Fund’s Liquidity Procedures.
11. Contractual Obligations
The Fund enters into contracts in the normal course of business that contain a variety of indemnifications. The Fund’s maximum exposure under these arrangements is unknown. However, the Fund has not had prior claims or losses pursuant to these contracts. Management has reviewed the Fund’s existing contracts and expects the risk of loss to be remote.
39
Report of independent
registered public accounting firm
To the Shareholders and Board of Trustees
Voyageur Mutual Funds III — Delaware Select Growth Fund
We have audited the accompanying statement of net assets of Delaware Select Growth Fund (one of the series constituting the Voyageur Mutual Funds III) (the “Fund”) as of April 30, 2009, and the related statement of operations for the year then ended, the statements of changes in net assets for each of the two years in the period then ended, and the financial highlights for each of the five years in the period then ended. These financial statements and financial highlights are the responsibility of the Fund’s management. Our responsibility is to express an opinion on these financial statements and financial highlights based on our audits.
We conducted our audits in accordance with the standards of the Public Company Accounting Oversight Board (United States). Those standards require that we plan and perform the audit to obtain reasonable assurance about whether the financial statements and financial highlights are free of material misstatement. We were not engaged to perform an audit of the Fund’s internal control over financial reporting. Our audits included consideration of internal control over financial reporting as a basis for designing audit procedures that are appropriate in the circumstances, but not for the purpose of expressing an opinion on the effectiveness of the Fund’s internal control over financial reporting. Accordingly, we express no such opinion. An audit also includes examining, on a test basis, evidence supporting the amounts and disclosures in the financial statements and financial highlights, assessing the accounting principles used and significant estimates made by management, and evaluating the overall financial statement presentation. Our procedures included confirmation of securities owned as of April 30, 2009, by correspondence with the custodian and brokers or by other appropriate auditing procedures where replies from brokers were not received. We believe that our audits provide a reasonable basis for our opinion.
In our opinion, the financial statements and financial highlights referred to above present fairly, in all material respects, the financial position of the Delaware Select Growth Fund series of Voyageur Mutual Funds III at April 30, 2009, the results of its operations for the year then ended, the changes in its net assets for each of the two years in the period then ended, and its financial highlights for each of five years in the period then ended, in conformity with U.S. generally accepted accounting principles.

Philadelphia, Pennsylvania
June 17, 2009
40
Other Fund information
(Unaudited)
Delaware Select Growth Fund
Fund management
Christopher M. Ericksen, CFA
Vice President, Portfolio Manager, Equity Analyst
Christopher M. Ericksen joined Delaware Investments in April 2005 as a portfolio manager on the firm’s Focus Growth Equity team, which is responsible for large-cap growth, all-cap growth, and one smid-cap growth portfolio. He was most recently a portfolio manager at Transamerica Investment Management, where he also managed institutional separate accounts. Before joining Transamerica in 2004, he was a vice president at Goldman Sachs. During his 10 years there, he worked in investment banking as well as investment management. Ericksen received his bachelor’s degree from Carnegie Mellon University, with majors in industrial management, economics, and political science.
Christopher J. Bonavico, CFA
Vice President, Senior Portfolio Manager, Equity Analyst
Christopher J. Bonavico, who joined Delaware Investments in April 2005, is a senior portfolio manager on the firm’s Focus Growth Equity team. This team is responsible for large-cap growth, all-cap growth, and one smid-cap growth portfolio. He was most recently a principal and portfolio manager at Transamerica Investment Management, where he managed sub-advised funds and institutional separate accounts. Before joining Transamerica in 1993, he was a research analyst for Salomon Brothers. Bonavico received his bachelor’s degree in economics from the University of Delaware.
Kenneth F. Broad, CFA
Vice President, Senior Portfolio Manager, Equity Analyst
Kenneth F. Broad, who joined Delaware Investments in April 2005, is a senior portfolio manager on the firm’s Focus Growth Equity team. This team is responsible for large-cap growth, all-cap growth, and one smid-cap growth product. Most recently, he was a principal and portfolio manager at Transamerica Investment Management, where he also managed sub-advised funds and institutional separate accounts. Before joining Transamerica in 2000, he was a portfolio manager with The Franklin Templeton Group and was a consultant in the business valuation and merger and acquisition group at KPMG Peat Marwick. He received an MBA from the University of California at Los Angeles and his bachelor’s degree in economics from Colgate University.
Patrick G. Fortier, CFA
Vice President, Portfolio Manager, Equity Analyst
Patrick G. Fortier, who joined Delaware Investments in April 2005, is a portfolio manager on the Focus Growth Equity team. This team is responsible for large-cap growth, all-cap growth, and one smid-cap growth portfolio. He was most recently a portfolio manager at Transamerica Investment Management. Before joining Transamerica in 2000, he worked for OLDE Equity Research as an equity analyst. Fortier received his bachelor’s degree in finance from the University of Kentucky.
41
Other Fund information
(Unaudited)
Delaware Select Growth Fund
Gregory M. Heywood, CFA
Vice President, Portfolio Manager, Equity Analyst
Gregory M. Heywood, who joined Delaware Investments in April 2005, is a portfolio manager and analyst on the firm’s Focus Growth Equity team. This team is responsible for large-cap growth, all-cap growth, and one smid-cap growth portfolio. He was most recently a research analyst at Transamerica Investment Management. Before joining Transamerica in 2004, he worked as a senior analyst for Wells Capital Management from 2003 to 2004 and Montgomery Asset Management from 1996 to 2003, where he was responsible for emerging market equity research. From 1993 to 1995, he was an analyst at Globalvest Management and Valuevest Management, where he researched emerging market and developed international market companies. Heywood received a bachelor’s degree in economics and an MBA in finance from the University of California at Berkeley.
Daniel J. Prislin, CFA
Vice President, Senior Portfolio Manager, Equity Analyst
Daniel J. Prislin joined Delaware Investments in April 2005 as a senior portfolio manager on the firm’s Focus Growth Equity team, which is responsible for large-cap growth, all-cap growth, and one smid-cap growth portfolio. He was most recently a principal and portfolio manager at Transamerica Investment Management, where he also managed sub-advised funds and institutional separate accounts. Prior to joining Transamerica in 1998, he was a portfolio manager with The Franklin Templeton Group. Prislin received an MBA and bachelor’s degree in business administration from the University of California at Berkeley.
Jeffrey S. Van Harte, CFA
Senior Vice President, Chief Investment Officer – Focus Growth Equity
Jeffrey S. Van Harte is the chief investment officer for the Focus Growth Equity team, responsible for large-cap growth, all-cap growth, and one smid-cap growth portfolio. Prior to joining Delaware Investments in April 2005, he was a principal and executive vice president at Transamerica Investment Management. Van Harte has been managing portfolios and separate accounts for more than 20 years. Before becoming a portfolio manager, Van Harte was a securities analyst and trader for Transamerica Investment Services, which he joined in 1980. Van Harte received his bachelor’s degree in finance from California State University at Fullerton.
42
Board of trustees/directors and officers addendum
Delaware Investments® Family of Funds
A mutual fund is governed by a Board of Trustees/Directors (“Trustees”), which has oversight responsibility for the management of a fund’s business affairs. Trustees establish procedures and oversee and review the performance of the investment manager, the distributor, and others who perform services for the fund. The independent fund trustees, in particular, are advocates
| Name, Address, | | Position(s) | | Length of |
| and Birth Date | | Held with Fund(s) | | Time Served |
| Interested Trustees | | | | |
| |
| Patrick P. Coyne1 | | Chairman, President, | | Chairman and Trustee |
| 2005 Market Street | | Chief Executive Officer, | | since August 16, 2006 |
| Philadelphia, PA 19103 | | and Trustee | | |
| April 1963 | | | | President and |
| | | | Chief Executive Officer |
| | | | since August 1, 2006 |
| |
| |
| |
| |
| |
| |
| |
| |
| |
| |
| |
| |
| Independent Trustees | | | | |
| |
| Thomas L. Bennett | | Trustee | | Since March 2005 |
| 2005 Market Street | | | | |
| Philadelphia, PA 19103 | | | | |
| October 1947 | | | | |
| |
| |
| |
| |
| |
| |
| |
| |
| |
| |
| |
1 Patrick P. Coyne is considered to be an “Interested Trustee” because he is an executive officer of the Fund’s(s’) investment advisor.
44
for shareholder interests. Each trustee has served in that capacity since he or she was elected to or appointed to the Board of Trustees, and will continue to serve until his or her retirement or the election of a new trustee in his or her place. The following is a list of the Trustees and Officers with certain background and related information.
| | Number of Portfolios in | | |
| Principal Occupation(s) | | Fund Complex Overseen | | Other Directorships |
| During Past 5 Years | | by Trustee or Officer | | Held by Trustee or Officer |
| |
| |
| Patrick P. Coyne has served in | | 83 | | Director |
| various executive capacities | | | | Kaydon Corp. |
| at different times at | | | | |
| Delaware Investments.2 | | | | Board of Governors Member |
| | | | Investment Company |
| | | | Institute (ICI) |
| | | | (2007–Present) |
| |
| | | | Member of Investment Committee |
| | | | Cradle of Liberty Council, BSA |
| | | | (November 2007–Present) |
| |
| | | | Finance Committee Member |
| | | | St. John Vianney |
| | | | Roman Catholic Church |
| | | | (2007–Present) |
| | | | | |
| |
| |
| Private Investor | | 83 | | Director |
| (March 2004–Present) | | | | Bryn Mawr Bank Corp. (BMTC) |
| | | | | (April 2007–Present) |
| Investment Manager | | | | |
| Morgan Stanley & Co. | | | | Chairman of |
| (January 1984–March 2004) | | | | Investment Committee |
| | | | Pennsylvania Academy of |
| | | | Fine Arts (2007–Present) |
| | | | Trustee (2004–Present) |
| |
2 Delaware Investments is the marketing name for Delaware Management Holdings, Inc. and its subsidiaries, including the Fund’s(s’) investment advisor, principal underwriter, and its transfer agent.
45
Board of trustees/directors and officers addendum
Delaware Investments® Family of Funds
| Name, Address, | | Position(s) | | Length of |
| and Birth Date | | Held with Fund(s) | | Time Served |
| Independent Trustees (continued) | | | | |
| |
| Thomas L. Bennett | | | | |
| (continued) | | | | |
| |
| |
| |
| |
| John A. Fry | | Trustee | | Since January 2001 |
| 2005 Market Street | | | | |
| Philadelphia, PA 19103 | | | | |
| May 1960 | | | | |
| |
| |
| |
| |
| Anthony D. Knerr | | Trustee | | Since April 1990 |
| 2005 Market Street | | | | |
| Philadelphia, PA 19103 | | | | |
| December 1938 | | | | |
| |
| |
| Lucinda S. Landreth | | Trustee | | Since March 2005 |
| 2005 Market Street | | | | |
| Philadelphia, PA 19103 | | | | |
| June 1947 | | | | |
| |
| Ann R. Leven | | Trustee | | Since October 1989 |
| 2005 Market Street | | | | |
| Philadelphia, PA 19103 | | | | |
| November 1940 | | | | |
| |
| Thomas F. Madison | | Trustee | | Since May 19973 |
| 2005 Market Street | | | | |
| Philadelphia, PA 19103 | | | | |
| February 1936 | | | | |
| | | | | |
| | | | | |
| |
3 In 1997, several funds managed by Voyageur Fund Managers, Inc. (the “Voyageur Funds”) were incorporated into the Delaware Investments Family of Funds. Mr. Madison served as a director of the Voyageur Funds from 1993 until 1997.
46
| | Number of Portfolios in | | |
| Principal Occupation(s) | | Fund Complex Overseen | | Other Directorships |
| During Past 5 Years | | by Trustee or Officer | | Held by Trustee or Officer |
| |
|
| | | | Investment Committee and |
| | | | Governance Committee |
| | | | Member |
| | | | Pennsylvania Horticultural |
| | | | Society |
| | | | (February 2006–Present) |
| |
| President | | 83 | | Director |
| Franklin & Marshall College | | | | Community Health Systems |
| (June 2002–Present) | | | | |
| | | | | |
| Executive Vice President | | | | |
| University of Pennsylvania | | | | |
| (April 1995–June 2002) | | | | |
| |
| Founder and | | 83 | | None |
| Managing Director | | | | |
| Anthony Knerr & Associates | | | | |
| (Strategic Consulting) | | | | |
| (1990–Present) | | | | |
| |
| Chief Investment Officer | | 83 | | None |
| Assurant, Inc. (Insurance) | | | | |
| (2002–2004) | | | | |
| |
| |
| Consultant | | 83 | | None |
| ARL Associates | | | | |
| (Financial Planning) | | | | |
| (1983–Present) | | | | |
| |
| President and | | 83 | | Director and Chair of |
| Chief Executive Officer | | | | Compensation Committee, |
| MLM Partners, Inc. | | | | Governance Committee |
| (Small Business Investing | | | | Member |
| and Consulting) | | | | CenterPoint Energy |
| (January 1993–Present) | | | | |
| |
47
Board of trustees/directors and officers addendum
Delaware Investments® Family of Funds
| Name, Address, | | Position(s) | | Length of |
| and Birth Date | | Held with Fund(s) | | Time Served |
| Independent Trustees (continued) | | | | |
| |
| Thomas F. Madison | | | | |
| (continued) | | | | |
| |
| |
| |
| |
| |
| |
| |
| |
| |
| |
| |
| |
| |
| |
| |
| |
| |
| |
| |
| Janet L. Yeomans | | Trustee | | Since April 1999 |
| 2005 Market Street | | | | |
| Philadelphia, PA 19103 | | | | |
| July 1948 | | | | |
| |
| |
| |
| |
| J. Richard Zecher | | Trustee | | Since March 2005 |
| 2005 Market Street | | | | |
| Philadelphia, PA 19103 | | | | |
| July 1940 | | | | |
| | | | | |
| | | | | |
| | | | | |
| | | | | |
| | | | | |
| |
48
| | Number of Portfolios in | | |
| Principal Occupation(s) | | Fund Complex Overseen | | Other Directorships |
| During Past 5 Years | | by Trustee or Officer | | Held by Trustee or Officer |
| |
| |
| | | | Lead Director and Chair of |
| | | | Audit and Governance |
| | | | Committees, Member of |
| | | | Compensation Committee |
| | | | Digital River, Inc. |
| |
| | | | Director and Chair of |
| | | | Governance Committee, |
| | | | Audit Committee |
| | | | Member |
| | | | Rimage Corporation |
| |
| | | | Director and Chair of |
| | | | the Compensation Committee |
| | | | Spanlink Communications |
| |
| | | | Lead Director and Chair of |
| | | | Compensation and |
| | | | Governance Committees |
| | | | Valmont Industries, Inc. |
| |
| Vice President and Treasurer | | 83 | | None |
| (January 2006–Present) | | | | |
| Vice President — Mergers & Acquisitions | | | | |
| (January 2003–January 2006), and | | | | |
| Vice President | | | | |
| (July 1995–January 2003) | | | | |
| 3M Corporation | | | | |
| |
| Founder | | 83 | | Director and Audit |
| Investor Analytics | | | | Committee Member |
| (Risk Management) | | | | Investor Analytics |
| (May 1999–Present) | | | | |
| | | | | |
| Founder | | | | |
| Sutton Asset Management | | | | |
| (Hedge Fund) | | | | |
| (September 1996–Present) | | | | |
| |
49
Board of trustees/directors and officers addendum
Delaware Investments® Family of Funds
| Name, Address, | | Position(s) | | Length of |
| and Birth Date | | Held with Fund(s) | | Time Served |
| Officers | | | | |
| | | | | |
| David F. Connor | | Vice President, | | Vice President since |
| 2005 Market Street | | Deputy General | | September 2000 |
| Philadelphia, PA 19103 | | Counsel, and Secretary | | and Secretary since |
| December 1963 | | | | October 2005 |
| |
| |
| Daniel V. Geatens | | Vice President | | Treasurer |
| 2005 Market Street | | and Treasurer | | since October 25, 2007 |
| Philadelphia, PA 19103 | | | | |
| October 1972 | | | | |
| |
| David P. O’Connor | | Senior Vice President, | | Senior Vice President, |
| 2005 Market Street | | General Counsel, | | General Counsel, and |
| Philadelphia, PA 19103 | | and Chief Legal Officer | | Chief Legal Officer |
| February 1966 | | | | since October 2005 |
| |
| Richard Salus | | Senior Vice President | | Chief Financial Officer |
| 2005 Market Street | | and Chief Financial Officer | | since November 2006 |
| Philadelphia, PA 19103 | | | | |
| October 1963 | | | | |
| |
4 David F. Connor, Daniel V. Geatens, David P. O’Connor, and Richard Salus serve in similar capacities for the six portfolios of the Optimum Fund Trust, which have the same investment advisor, principal underwriter, and transfer agent as the registrant.
50
| | Number of Portfolios in | | |
| Principal Occupation(s) | | Fund Complex Overseen | | Other Directorships |
| During Past 5 Years | | by Trustee or Officer | | Held by Trustee or Officer |
| |
| |
| David F. Connor has served as | | 83 | | None4 |
| Vice President and Deputy | | | | |
| General Counsel of | | | | |
| Delaware Investments | | | | |
| since 2000. | | | | |
| |
| Daniel V. Geatens has served | | 83 | | None4 |
| in various capacities at | | | | |
| different times at | | | | |
| Delaware Investments. | | | | |
| |
| David P. O’Connor has served in | | 83 | | None4 |
| various executive and legal | | | | |
| capacities at different times | | | | |
| at Delaware Investments. | | | | |
| |
| Richard Salus has served in | | 83 | | None4 |
| various executive capacities | | | | |
| at different times at | | | | |
| Delaware Investments. | | | | |
| |
The Statement of Additional Information for the Fund(s) includes additional information about the Trustees and Officers and is available, without charge, upon request by calling 800 523-1918.
51
About the organization
This annual report is for the information of Delaware Select Growth Fund shareholders, but it may be used with prospective investors when preceded or accompanied by a current prospectus for Delaware Select Growth Fund and the Delaware Investments® Fund profile for the most recently completed calendar quarter. These documents are available at www.delawareinvestments.com. The prospectus sets forth details about charges, expenses, investment objectives, and operating policies of the investment company. You should read the prospectus carefully before you invest. The figures in this report represent past results that are not a guarantee of future results. The return and principal value of an investment in the investment company will fluctuate so that shares, when redeemed, may be worth more or less than their original cost.
| Board of trustees | |
| |
| Patrick P. Coyne | Ann R. Leven |
| Chairman, President, and | Consultant |
| Chief Executive Officer | ARL Associates |
| Delaware Investments Family of Funds | New York, NY |
| Philadelphia, PA | |
| | Thomas F. Madison |
| Thomas L. Bennett | President and Chief Executive Officer |
| Private Investor | MLM Partners, Inc. |
| Rosemont, PA | Minneapolis, MN |
| |
| John A. Fry | Janet L. Yeomans |
| President | Vice President and Treasurer |
| Franklin & Marshall College | 3M Corporation |
| Lancaster, PA | St. Paul, MN |
| |
| Anthony D. Knerr | J. Richard Zecher |
| Founder and Managing Director | Founder |
| Anthony Knerr & Associates | Investor Analytics |
| New York, NY | Scottsdale, AZ |
| |
| Lucinda S. Landreth | |
| Former Chief Investment Officer | |
| Assurant, Inc. | |
| Philadelphia, PA | |
52
| Affiliated officers | Contact information |
| | |
| David F. Connor | Investment manager |
| Vice President, Deputy General Counsel, and | Delaware Management Company, a series of |
| Secretary | Delaware Management Business Trust |
| Delaware Investments® Family of Funds | Philadelphia, PA |
| Philadelphia, PA | |
| | National distributor |
| Daniel V. Geatens | Delaware Distributors, L.P. |
| Vice President and Treasurer | Philadelphia, PA |
| Delaware Investments Family of Funds | |
| Philadelphia, PA | Shareholder servicing, dividend disbursing, |
| | and transfer agent |
| David P. O’Connor | Delaware Service Company, Inc. |
| Senior Vice President, General Counsel, | 2005 Market Street |
| and Chief Legal Officer | Philadelphia, PA 19103-7094 |
| Delaware Investments Family of Funds | |
| Philadelphia, PA | For shareholders |
| | 800 523-1918 |
| Richard Salus | |
| Senior Vice President and | For securities dealers and financial |
| Chief Financial Officer | institutions representatives only |
| Delaware Investments Family of Funds | 800 362-7500 |
| Philadelphia, PA | |
| | Web site |
| | www.delawareinvestments.com |
Delaware Investments is the marketing name of Delaware Management Holdings, Inc. and its subsidiaries.
The Fund files its complete schedule of portfolio holdings with the Securities and Exchange Commission for the first and third quarters of each fiscal year on Form N-Q. The Fund’s Forms N-Q, as well as a description of the policies and procedures that the Fund uses to determine how to vote proxies (if any) relating to portfolio securities are available without charge (i) upon request, by calling 800 523-1918; and (ii) on the Commission’s Web site at www.sec.gov. In addition, a description of the policies and procedures that the Fund uses to determine how to vote proxies (if any) relating to portfolio securities and the Fund’s Schedule of Investments are available without charge on the Fund’s Web site at www.delawareinvestments.com. The Fund’s Forms N-Q may be reviewed and copied at the Commission’s Public Reference Room in Washington, D.C.; information on the operation of the Public Reference Room may be obtained by calling 800 SEC-0330.
Information (if any) regarding how the Fund voted proxies relating to portfolio securities during the most recently disclosed 12-month period ended June 30 is available without charge (i) through the Fund’s Web site at www.delawareinvestments.com; and (ii) on the Commission’s Web site at www.sec.gov.
53
| | |
 |  |
| |
| |
|
| |
| |
| |
| |
| |
| |
| Annual report |
| |
Delaware Large Cap Core Fund |
| |
| April 30, 2009 |
Table of contents
| Portfolio management review | | 1 |
| | | |
| Performance summary | | 4 |
| | | |
| Disclosure of Fund expenses | | 6 |
| | | |
| Sector allocation and top 10 holdings | | 8 |
| | | |
| Statement of net assets | | 10 |
| | | |
| Statement of operations | | 15 |
| | | |
| Statements of changes in net assets | | 16 |
| | | |
| Financial highlights | | 18 |
| | | |
| Notes to financial statements | | 22 |
| | | |
| Report of independent registered public accounting firm | | 31 |
| | | |
| Other Fund information | | 32 |
| | | |
| Board of trustees/directors and officers addendum | | 34 |
| | | |
| About the organization | | 42 |
Funds are not FDIC insured and are not guaranteed. It is possible to lose the principal amount invested.
Mutual fund advisory services provided by Delaware Management Company, a series of Delaware Management
Business Trust, which is a registered investment advisor.
© 2009 Delaware Distributors, L.P.
All third-party trademarks cited are the property of their respective owners.
| Portfolio management review |
| Delaware Large Cap Core Fund | May 12, 2009 |
| Performance preview (for period ended April 30, 2009) |
| Delaware Large Cap Core Fund (Class A shares) | | 1-year return | | -36.04% |
| S&P 500 Index (benchmark) | | 1-year return | | -35.31% |
For complete, annualized performance for Delaware Large Cap Core Fund, please see the table on page 4.
The performance of Class A shares excludes the applicable sales charge and reflects the reinvestment of all distributions.
Economic and market environment
The issues that concerned investors at the start of the annual period were vastly different and significantly milder than the global macroeconomic troubles that worried them toward the middle and end of the fiscal year. During the first several months of the reporting period, for example, investors grew uneasy about rising inflationary concerns at the time, fueled primarily by increases in global commodity prices including peak oil prices. Investors feared that rising prices would affect consumer spending in the United States and abroad.
As the fiscal year progressed, however, an entirely different and more severe set of worries came into focus; these worries remained prevalent through the rest of the period. Specifically, economic activity and employment declined in the face of a near failure in the global financial system, deflating housing prices, and the crisis in the credit markets. Economic concerns, as well as issues of consumer and investor confidence, were amplified by the September 2008 failure of the once-highly-respected investment bank Lehman Brothers, along with the near failures, mergers or acquisitions of a host of other financial institutions.
The U.S. economy often achieved record-setting levels of weakness during the reporting period. The following events were notable:
- Consumer confidence dropped to an all-time low.
- The S&P/Case-Shiller 20-City Home Price Index™, a closely watched index that tracks home prices in 20 major U.S. cities, recorded its steepest drop since the inception of the index.
- The unemployment rate in the United States climbed to 8.9%.
- Among manufacturers, factory orders excluding transportation (which economists use to strip out volatility) experienced their largest percentage drop in the report’s history. (Source: Dow Jones.)
Confronted with the unprecedented suddenness and severity of these events, fiscal and monetary policy makers responded in similarly dramatic fashion. The Federal Reserve lowered interest rates to essentially zero during the period and simultaneously employed a wide range of less traditional tools to restore the flow of credit in the U.S. economy.
Some economic clouds began to recede as the period drew to a close; stock markets showed signs of life and mitigated some of the period’s earlier losses. But the displacement caused by massive deleveraging among financial institutions hardly appeared to be over, and continued strains from the economic recession are likely to remain significant for some time. The major recession
The views expressed are current as of April 30, 2009, and are subject to change.
Data for this portfolio management review were provided by Bloomberg unless otherwise noted.
1
Portfolio management review
Delaware Large Cap Core Fund
has resulted in extremely low valuations of equities relative to other asset classes. Increasing corporate earnings could be a telltale sign of economic recovery that may renew consumer and investor confidence.
In all, the S&P 500 Index declined by 35.31% during the period.
Fund positioning and investment strategy
We manage the Fund using a “bottom up” approach, meaning that we base individual investment decisions primarily on the merits and financial attributes of an individual company, rather than focusing solely on the health of its broader industry or sector. In accordance with this approach, we generally emphasized companies that we believed had exposure to traditionally defensive end markets (those that perform well during economic downturns) during the period because we anticipated that the economy and earnings would continue to deteriorate because of the difficulties in the credit markets. Specifically, we sought companies within the large-capitalization universe that had low debt levels, as well as those we believed would be able to maintain positive free cash flow despite the slowing economic conditions.
Notable sectors and stocks
Viewing the Fund from a sector perspective, we maintained an overweight position in the healthcare sector versus the benchmark throughout the period. This position was based on both the long-term secular growth opportunities we believe exist for healthcare companies (as a result of an aging population as well as new therapies and medical technologies) and the defensive characteristics of the sector within what was a poor equity market. We also maintained an overweight position in the technology sector during much of the reporting period, when we found companies with attractive valuations, good earnings growth potential, and strong financial quality. However, we reduced the Fund’s position to a weight equal to that of the benchmark at the end of calendar 2008 because of concerns that some technology company earnings would weaken as the economy fell deeper into recession in the fourth quarter.
Biotechnology firm Genentech was notable in its contribution to the Fund during the period. Genentech’s stock price rose nearly 40% after the Swiss pharmaceutical company Roche paid $95 per share (in cash) to purchase the 40% of Genentech that it did not already own. We sold Genentech’s stock during the period in an effort to take profits on this holding. Clothing retailer American Eagle Outfitters also was notable in its contribution to the Fund. The company’s stock rose by approximately 65% from what we believed was an initially depressed valuation level. We remained positive about the stock’s prospects because we felt that the market failed to reflect both the company’s move to a more discount-oriented pricing strategy and anecdotal evidence of improved same-store sales. We maintained our position in American Eagle Outfitters at the end of the period.
Textron and Bank of America were among the Fund’s largest detractors during the period. Textron is a multi-industry company with a global network of aircraft, defense, industrial, and finance businesses. The company’s stock price declined, we believe, based on investor apprehension that its financing arm would be unable to
2
gain government support for certain of its commercial paper liabilities. Meanwhile, Bank of America was at the center of the maelstrom within the financial sector during the period. This company’s stock declined severely in the face of what we saw as investor concern that the company would be unable to raise additional capital, given that the credit markets had almost entirely frozen for parts of the period. We sold the Fund’s positions in both of these stocks during the period.
| | | Nasdaq symbols | | CUSIPs | |
| Class A | | | DDCAX | | | 246118582 | |
| Institutional Class | | | DDCIX | | | 246118558 | |
3
| Performance summary | |
| Delaware Large Cap Core Fund | April 30, 2009 |
The performance data quoted represent past performance; past performance does not guarantee future results. Investment return and principal value will fluctuate so your shares, when redeemed, may be worth more or less than their original cost. Please obtain the performance data for the most recent month end by calling 800 523-1918 or visiting our Web site at www.delawareinvestments.com/performance. Current performance may be lower or higher than the performance data quoted.
You should consider the investment objectives, risks, charges, and expenses of the investment company carefully before investing. The Delaware Large Cap Core Fund prospectus contains this and other important information about the investment company. Please request a prospectus through your financial advisor or by calling 800 523-1918 or visiting our Web site at www.delawareinvestments.com. Read the prospectus carefully before you invest or send money.
| Fund performance | Average annual total returns through April 30, 2009 |
| | 1 year | | Lifetime |
| Class A (Est. Aug. 31, 2006) | | | | |
| Excluding sales charge | | -36.04% | | -12.07% |
| Including sales charge | | -39.69% | | -14.01% |
| Institutional Class (Est. Aug. 31, 2006) | | | | |
| Excluding sales charge | | -36.04% | | -12.07% |
| Including sales charge | | -36.04% | | -12.07% |
Class C and R shares had not commenced operations as of April 30, 2009.
Returns reflect the reinvestment of all distributions and any applicable sales charges as noted in the following paragraphs.
Expense limitations were in effect for certain classes during the periods shown in the Fund performance chart and in the “Performance of a $10,000 investment” chart. The current expenses for each class are listed on the “Fund expense ratios” chart. (Note that all charts and graphs referred to in the “Performance summary” section of this report are found on pages 4 through 5.) Performance would have been lower had the expense limitation not been in effect.
The Fund offers Class A, C, R, and Institutional Class shares. Class A shares are sold with a maximum front-end sales charge of up to 5.75%, and have an annual distribution and service fee of up to 0.25% of average daily net assets.
Institutional Class shares were first made available Aug. 31, 2006, and are available without sales or asset-based distribution charges only to certain eligible institutional accounts.
The “Fund performance” table and the “Performance of a $10,000 investment” graph do not reflect the deduction of taxes the shareholder would pay on Fund distributions or redemptions of Fund shares.
4
The Fund’s expense ratios, as described in the most recent prospectus, are disclosed in the following “Fund expense ratios” table. Delaware Investments has agreed to waive certain fees from Sept. 1, 2008, until such time as the waivers are discontinued. Please see the most recent prospectus for additional information on these fee waivers and/or reimbursements.
| Fund expense ratios | Class A | | | Class C | | | Class R | | | Institutional Class |
| Total annual operating expenses | 3.03 | % | | 3.78 | % | | 3.38 | % | | 2.78% |
| (without fee waivers) | | | | | | | | | | |
| Net expenses | 0.95 | % | | 0.95 | % | | 0.95 | % | | 0.95% |
| (including fee waivers, if any) | | | | | | | | | | |
| Type of waiver | Voluntary | | Voluntary | | Voluntary | | Voluntary |
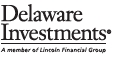
Performance of a $10,000 investment
Aug. 31, 2006 (Fund’s inception) through April 30, 2009
| Aug. 31, 2006 (Fund’s inception) through April 30, 2009 | Starting value | Ending value |
| | S&P 500 Index | | $10,000 | | | $7,095 | |
| | Delaware Large Cap Core Fund — Class A Shares | | $9,425 | | | $6,688 | |
The chart assumes $10,000 invested in the Fund on Aug. 31, 2006, and includes the effect of a 5.75% front-end sales charge and the reinvestment of all distributions. Please note additional details on these fees in the “Performance summary” section of this report, which includes pages 4 through 5.
The chart also assumes $10,000 invested in the S&P 500 Index as of Aug. 31, 2006. The S&P 500 Index measures the performance of 500 mostly large-cap stocks weighted by market value, and is often used to represent performance of the U.S. stock market.
An index is unmanaged and does not reflect the costs of operating a mutual fund, such as the costs of buying, selling, and holding securities. You cannot invest directly in an index.
Past performance is not a guarantee of future results.
Performance of other Fund classes will vary due to different charges and expenses.
5
Disclosure of Fund expenses
For the period November 1, 2008 to April 30, 2009
As a shareholder of the Fund, you incur two types of costs: (1) transaction costs, including sales charges (loads) on purchase payments, reinvested dividends, or other distributions; redemption fees; and exchange fees; and (2) ongoing costs, including management fees; distribution and/or service (12b-1) fees; and other Fund expenses. This example is intended to help you understand your ongoing costs (in dollars) of investing in the Fund and to compare these costs with the ongoing costs of investing in other mutual funds.
The example is based on an investment of $1,000 invested at the beginning of the period and held for the entire period November 1, 2008 to April 30, 2009.
Actual expenses
The first section of the table shown, “Actual Fund Return,” provides information about actual account values and actual expenses. You may use the information in this section of the table, together with the amount you invested, to estimate the expenses that you paid over the period. Simply divide your account value by $1,000 (for example, an $8,600 account value divided by $1,000 = 8.6), then multiply the result by the number in the first section under the heading entitled “Expenses Paid During Period” to estimate the expenses you paid on your account during this period.
Hypothetical example for comparison purposes
The second section of the table shown, “Hypothetical 5% Return,” provides information about hypothetical account values and hypothetical expenses based on the Fund’s actual expense ratio and an assumed rate of return of 5% per year before expenses, which is not the Fund’s actual return. The hypothetical account values and expenses may not be used to estimate the actual ending account balance or expenses you paid for the period. You may use this information to compare the ongoing costs of investing in the Fund and other funds. To do so, compare this 5% hypothetical example with the 5% hypothetical examples that appear in the shareholder reports of the other funds.
Please note that the expenses shown in the table are meant to highlight your ongoing costs only and do not reflect any transactional costs, such as sales charges (loads), redemption fees, or exchange fees. Therefore, the second section of the table is useful in comparing ongoing costs only, and will not help you determine the relative total costs of owning different funds. In addition, if these transactional costs were included, your costs would have been higher. The Fund’s expenses shown in the table reflect fee waivers in effect. The expenses shown in the table assume reinvestment of all dividends and distributions.
6
Delaware Large Cap Core Fund
Expense analysis of an investment of $1,000
| Beginning | | Ending | | | | Expenses |
| Account | | Account Value | | Annualized | | Paid During Period |
| 11/1/08 | | 4/30/09 | | Expense Ratio | | 11/1/08 to |
| | | | | | | | | | | | | | | 4/30/09* |
| Actual Fund return | | | | | | | | | | | | | | | | | | |
| Class A | | $ | 1,000.00 | | | | $905.90 | | | | 0.95 | % | | | | $ | 4.49 | |
| Institutional Class | | | 1,000.00 | | | | 905.90 | | | | 0.95 | % | | | | | 4.49 | |
| Hypothetical 5% return (5% return before expenses) | | | | | | | | | | | |
| Class A | | $ | 1,000.00 | | | | $1,020.08 | | | | 0.95 | % | | | | $ | 4.76 | |
| Institutional Class | | | 1,000.00 | | | | 1,020.08 | | | | 0.95 | % | | | | | 4.76 | |
*“Expenses Paid During Period” are equal to the Fund’s annualized expense ratio, multiplied by the average account value over the period, multiplied by 181/365 (to reflect the one-half year period).
7
| Sector allocation and top 10 holdings |
| Delaware Large Cap Core Fund | As of April 30, 2009 |
Sector designations may be different than the sector designations presented in other Fund materials. The sector designations may represent the investment manager’s internal sector classifications which may result in the sector designations for one Fund being different than another Fund’s sector designations.
| Sector | Percentage of net assets |
| Common Stock | | 99.32% | | |
| Basic Materials | | 5.04% | | |
| Business Services | | 1.07% | | |
| Capital Goods | | 9.04% | | |
| Communication Services | | 3.11% | | |
| Consumer Discretionary | | 2.44% | | |
| Consumer Services | | 3.30% | | |
| Consumer Staples | | 11.21% | | |
| Energy | | 12.71% | | |
| Financials | | 9.44% | | |
| Health Care | | 14.85% | | |
| Media | | 1.95% | | |
| Real Estate | | 0.44% | | |
| Technology | | 19.55% | | |
| Transportation | | 1.55% | | |
| Utilities | | 3.62% | | |
| Repurchase Agreement | | 2.10% | | |
| Securities Lending Collateral | | 0.00% | | |
| Total Value of Securities | | 101.42% | | |
| Obligation to Return Securities Lending Collateral | | (0.03% | ) | |
| Liabilities Net of Receivables and Other Assets | | (1.39% | ) | |
| Total Net Assets | | 100.00% | | |
8
Holdings are for informational purposes only and are subject to change at any time. They are not a recommendation to buy, sell, or hold any security.
| Top 10 holdings | Percentage of net assets |
| Procter & Gamble | | 3.22 | % | |
| Exxon Mobil | | 3.04 | % | |
| Microsoft | | 2.82 | % | |
| Occidental Petroleum | | 2.68 | % | |
| Johnson & Johnson | | 2.68 | % | |
| Hewlett-Packard | | 2.55 | % | |
| Wal-Mart Stores | | 2.51 | % | |
| PepsiCo | | 2.44 | % | |
| Apple | | 2.29 | % | |
| Verizon Communications | | 2.13 | % | |
9
| Statement of net assets |
| Delaware Large Cap Core Fund | April 30, 2009 |
| | | Number of shares | | Value |
| Common Stock – 99.32% | | | | | |
| Basic Materials – 5.04% | | | | | |
| | Alcoa | | 710 | | $ | 6,440 |
| Cytec Industries | | 440 | | | 8,738 |
| Lubrizol | | 410 | | | 17,720 |
| Monsanto | | 210 | | | 17,827 |
| †Owens-Illinois | | 870 | | | 21,220 |
| | | | | | 71,945 |
| | |
| Business Services – 1.07% | | | | | |
| DeVry | | 170 | | | 7,235 |
| Republic Services | | 380 | | | 7,980 |
| | | | | | 15,215 |
| | |
| Capital Goods – 9.04% | | | | | |
| Boeing | | 380 | | | 15,219 |
| Fluor | | 350 | | | 13,255 |
| General Electric | | 1,620 | | | 20,493 |
| Goodrich | | 440 | | | 19,483 |
| Honeywell International | | 370 | | | 11,548 |
| Lockheed Martin | | 100 | | | 7,853 |
| Rockwell Collins | | 190 | | | 7,287 |
| Roper Industries | | 190 | | | 8,662 |
| United Technologies | | 410 | | | 20,024 |
| †URS | | 120 | | | 5,287 |
| | | | | | | 129,111 |
| | |
| Communication Services – 3.11% | | | | | |
| †MetroPCS Communications | | 820 | | | 14,014 |
| Verizon Communications | | 1,000 | | | 30,340 |
| | | | | | 44,354 |
| |
| Consumer Discretionary – 2.44% | | | | | |
| American Eagle Outfitters | | 980 | | | 14,524 |
| †Urban Outfitters | | 1,040 | | | 20,269 |
| | | | | | 34,793 |
| |
| Consumer Services – 3.30% | | | | | |
| Burger King Holdings | | 1,220 | | | 19,935 |
| McDonald’s | | 510 | | | 27,178 |
| | | | | | 47,113 |
10
| | | Number of shares | | Value |
| Common Stock (continued) | | | | |
| Consumer Staples – 11.21% | | | | | |
| | CVS Caremark | | 790 | | $ | 25,106 |
| †Jarden | | 910 | | | 18,291 |
| PepsiCo | | 700 | | | 34,832 |
| Procter & Gamble | | 930 | | | 45,979 |
| Wal-Mart Stores | | 710 | | | 35,784 |
| | | | | | 159,992 |
| |
| Energy – 12.71% | | | | | |
| Chevron | | 380 | | | 25,118 |
| EOG Resources | | 210 | | | 13,331 |
| EQT | | 320 | | | 10,762 |
| Exxon Mobil | | 650 | | | 43,336 |
| †Nabors Industries | | 630 | | | 9,582 |
| †National Oilwell Varco | | 440 | | | 13,323 |
| Occidental Petroleum | | 680 | | | 38,277 |
| Schlumberger | | 400 | | | 19,596 |
| St. Mary Land & Exploration | | 460 | | | 8,220 |
| | | | | | 181,545 |
| | | | | | |
| Financials – 9.44% | | | | | |
| Berkley (W.R.) | | 370 | | | 8,847 |
| Capital One Financial | | 440 | | | 7,366 |
| Goldman Sachs Group | | 130 | | | 16,705 |
| JPMorgan Chase | | 850 | | | 28,049 |
| †Nasdaq OMX Group | | 600 | | | 11,538 |
| PNC Financial Services Group | | 170 | | | 6,749 |
| Prudential Financial | | 360 | | | 10,397 |
| Travelers Companies | | 390 | | | 16,045 |
| U.S. Bancorp | | 600 | | | 10,932 |
| Wells Fargo | | 910 | | | 18,209 |
| | | | | | 134,837 |
| |
| Health Care – 14.85% | | | | | |
| Abbott Laboratories | | 470 | | | 19,670 |
| †Amgen | | 400 | | | 19,388 |
| †Celgene | | 190 | | | 8,117 |
| †Express Scripts Class A | | 230 | | | 14,713 |
| †Gen-Probe | | 160 | | | 7,706 |
| †Gilead Sciences | | 580 | | | 26,563 |
11
Statement of net assets
Delaware Large Cap Core Fund
| | | Number of shares | | Value |
| Common Stock (continued) | | | | |
| Health Care (continued) | | | | | |
| | Johnson & Johnson | | 730 | | $ | 38,222 |
| Medtronic | | 480 | | | 15,360 |
| Merck | | 750 | | | 18,180 |
| †Thermo Fisher Scientific | | 270 | | | 9,472 |
| UnitedHealth Group | | 640 | | | 15,053 |
| Wyeth | | 460 | | | 19,504 |
| | | | | | 211,948 |
| |
| Media – 1.95% | | | | | |
| Comcast Class A | | 1,240 | | | 19,170 |
| †Viacom Class B | | 450 | | | 8,658 |
| | | | | | | 27,828 |
| |
| Real Estate – 0.44% | | | | | |
| Simon Property Group | | 122 | | | 6,295 |
| | | | | | 6,295 |
| | |
| Technology – 19.55% | | | | | |
| Accenture Class A | | 220 | | | 6,475 |
| †Apple | | 260 | | | 32,716 |
| Applied Materials | | 930 | | | 11,355 |
| †Cisco Systems | | 1,290 | | | 24,923 |
| †EMC 1,450 | | 18,169 | | | |
| †Google Class A | | 70 | | | 27,718 |
| Hewlett-Packard | | 1,010 | | | 36,339 |
| Intel | | 1,600 | | | 25,248 |
| †McAfee | | 330 | | | 12,388 |
| Microsoft | | 1,990 | | | 40,316 |
| †NetApp | | 500 | | | 9,150 |
| QUALCOMM | | 590 | | | 24,969 |
| †Symantec | | 540 | | | 9,315 |
| | | | | | 279,081 |
| | | | | | |
| Transportation – 1.55% | | | | | |
| Norfolk Southern | | 620 | | | 22,122 |
| | | | | | 22,122 |
12
| | | Number of shares | | Value |
| Common Stock (continued) | | | | |
| Utilities – 3.62% | | | | | | |
| | Exelon | | 340 | | $ | 15,684 | |
| Sempra Energy | | 480 | | | 22,090 | |
| Wisconsin Energy | | 350 | | | 13,986 | |
| | | | | | 51,760 | |
| Total Common Stock (cost $1,740,619) | | | | | 1,417,939 | |
| | | Principal amount | | | | |
| Repurchase Agreement* – 2.10% | | | | | | |
| BNP Paribas 0.15%, dated 4/30/09, to be | | | | | | |
| repurchased on 5/1/09, repurchase price $30,000 | | | | | | |
| (collateralized by U.S. Government obligations, | | | | | | |
| 6/24/09-9/24/09; with market value $30,630) | $ | 30,000 | | | 30,000 | |
| Total Repurchase Agreement (cost $30,000) | | | | | 30,000 | |
| | |
| Total Value of Securities Before Securities | | | | | | |
| Lending Collateral – 101.42% | | | | | | |
| (cost $1,770,619) | | | | | 1,447,939 | |
| | | Number of shares | | | | |
| Securities Lending Collateral** – 0.00% | | | | | | |
| Investment Company | | | | | | |
| †Mellon GSL Reinvestment Trust II | | 394 | | | | 0 | |
| Total Securities Lending Collateral (cost $394) | | | | | | 0 | |
| |
| Total Value of Securities – 101.42% | | | | | | |
| (cost $1,771,013) | | | | | 1,447,939 | |
| |
| Obligation to Return Securities | | | | | | |
| Lending Collateral** – (0.03%) | | | | | (394 | ) |
| |
| Liabilities Net of Receivables | | | | | | |
| and Other Assets – (1.39%) | | | | | (19,839 | ) |
| |
| Net Assets Applicable to 253,789 | | | | | | |
| Shares Outstanding – 100.00% | | | | $ | 1,427,706 | |
13
Statement of net assets
Delaware Large Cap Core Fund
| Net Asset Value – Delaware Large Cap Core Fund | | | | |
| | Class A ($9,594 / 1,705 Shares) | | | | $5.63 | |
| Net Asset Value – Delaware Large Cap Core Fund | | | | |
| Institutional Class ($1,418,112 / 252,084 Shares) | | | | $5.63 | |
| |
| |
| Components of Net Assets at April 30, 2009: | | | | |
| Shares of beneficial interest (unlimited authorization - no par) | | $ | 2,166,676 | |
| Undistributed net investment income | | | 3,324 | |
| Accumulated net realized loss investments | | | (419,221 | ) |
| Net unrealized depreciation of investments | | | (323,073 | ) |
| Total net assets | | $ | 1,427,706 | |
| |
| |
| †Non income producing security. |
| *See Note 1 in “Notes to financial statements.” |
| **See Note 8 in “Notes to financial statements.” |
| | |
| Net Asset Value and Offering Price Per Share – | | | | |
| | Delaware Large Cap Core Fund | | | | |
| Net asset value Class A (A) | | | | $5.63 | |
| Sales charge (5.75% of offering price) (B) | | | | 0.34 | |
| Offering price | | | | $5.97 | |
| (A) | | Net asset value per share, as illustrated, is the amount which would be paid upon redemption or repurchase of shares. |
|
| (B) | | See the current prospectus for purchases of $50,000 or more. |
See accompanying notes
14
| Statement of operations | |
| Delaware Large Cap Core Fund | Year Ended April 30, 2009 |
| Investment Income: | | | | | | | |
| Dividends | | $ | 35,957 | | | | |
| Interest | | | 515 | | | | |
| Security lending income | | | 176 | | $ | 36,648 | |
| |
| Expenses: | | | | | | | |
| Audit and tax fees | | | 11,251 | | | | |
| Management fees | | | 11,082 | | | | |
| Dues and services | | | 1,935 | | | | |
| Pricing fees | | | 1,512 | | | | |
| Accounting and administration expenses | | | 682 | | | | |
| Legal fees | | | 432 | | | | |
| Custodian fees | | | 280 | | | | |
| Dividend disbursing and transfer agent fees and expenses | | | 231 | | | | |
| Trustees’ fees | | | 114 | | | | |
| Reports and statements to shareholders | | | 53 | | | | |
| Insurance fees | | | 51 | | | | |
| Distribution expenses - Class A | | | 32 | | | | |
| Consulting fees | | | 30 | | | | |
| Trustees’ expenses | | | 10 | | | | |
| Taxes (other than taxes on income) | | | 7 | | | 27,702 | |
| Less fees waived | | | | | | (11,339 | ) |
| Less expenses paid indirectly | | | | | | (60 | ) |
| Less waived distribution expenses - Class A | | | | | | (32 | ) |
| Total operating expenses | | | | | | 16,271 | |
| Net Investment Income | | | | | | 20,377 | |
| |
| |
| Net Realized and Unrealized Loss on Investments: | | | | | | | |
| Net realized loss on investments | | | | | | (354,223 | ) |
| Net change in unrealized appreciation/depreciation of investments | | | | | | (472,102 | ) |
| Net Realized and Unrealized Loss on Investments | | | | | | (826,325 | ) |
| |
| Net Decrease in Net Assets Resulting from Operations | | | | | $ | (805,948 | ) |
See accompanying notes
15
Statements of changes in net assets
Delaware Large Cap Core Fund
| | Year Ended |
| | 4/30/09 | | 4/30/08 |
| Increase (Decrease) in Net Assets from Operations: | | | | | | | | |
| Net investment income | | $ | 20,377 | | | $ | 17,879 | |
| Net realized loss on investments | | | (354,223 | ) | | | (4,644 | ) |
| Net change in unrealized | | | | | | | | |
| appreciation/depreciation of investments | | | (472,102 | ) | | | (93,484 | ) |
| Net decrease in net assets resulting from operations | | | (805,948 | ) | | | (80,249 | ) |
| |
| Dividends and Distributions to Shareholders from: | | | | | | | | |
| Net investment income: | | | | | | | | |
| Class A | | | (148 | ) | | | (196 | ) |
| Institutional Class | | | (21,906 | ) | | | (16,081 | ) |
| |
| Net realized gain on investments: | | | | | | | | |
| Class A | | | — | | | | (1,060 | ) |
| Institutional Class | | | — | | | | (97,634 | ) |
| | | | (22,054 | ) | | | (114,971 | ) |
| |
| Capital Share Transactions: | | | | | | | | |
| Proceeds from shares sold: | | | | | | | | |
| Class A | | | 163 | | | | 33,592 | |
| Institutional Class | | | 87 | | | | — | |
| |
| Net asset value of shares issued upon reinvestment | | | | | | | | |
| of dividends and distributions: | | | | | | | | |
| Class A | | | 148 | | | | 1,256 | |
| Institutional Class | | | 21,906 | | | | 113,715 | |
| | | | 22,304 | | | | 148,563 | |
16
| | | Year Ended |
| | | 4/30/09 | | 4/30/08 |
| Capital Share Transactions (continued): | | | | | | | | |
| Cost of shares repurchased: | | | | | | | | |
| Class A | | $ | (17,473 | ) | | $ | (12,694 | ) |
| Institutional Class | | | — | | | | (1 | ) |
| | | | (17,473 | ) | | | (12,695 | ) |
| Increase in net assets derived from capital share transactions | | | 4,831 | | | | 135,868 | |
| Net Decrease in Net Assets | | | (823,171 | ) | | | (59,352 | ) |
| |
| Net Assets: | | | | | | | | |
| Beginning of year | | | 2,250,877 | | | | 2,310,229 | |
| End of year (including undistributed net investment | | | | | | | | |
| income of $3,324 and $4,894, respectively) | | $ | 1,427,706 | | | $ | 2,250,877 | |
See accompanying notes
17
Financial highlights
Delaware Large Cap Core Fund Class A
Selected data for each share of the Fund outstanding throughout each period were as follows:
| Net asset value, beginning of period |
| |
| Income (loss) from investment operations: |
| Net investment income2 |
| Net realized and unrealized gain (loss) on investments |
| Total from investment operations |
| |
| Less dividends and distributions: |
| Net investment income |
| Net realized gain on investments |
| Total dividends and distributions |
| |
| Net asset value, end of period |
| |
| Total return3 |
| |
| Ratios and supplemental data: |
| Net assets, end of period (000 omitted) |
| Ratio of expenses to average net assets |
| Ratio of expenses to average net assets |
| prior to fees waived and expense paid indirectly |
| Ratio of net investment income to average net assets |
| Ratio of net investment income (loss) to average net assets |
| prior to fees waived and expense paid indirectly |
| Portfolio turnover |
1 Date of commencement of operations; ratios and portfolio turnover have been annualized and total return has not been annualized. |
2 The average shares outstanding method has been applied for per share information. |
3 Total investment return is based on the change in net asset value of a share during the period and assumes reinvestment of dividends and distributions at net asset value and does not refl ect the impact of a sales charge. Total investment return refl ects waivers by the manager and distributor. Performance would have been lower had the waivers not been in effect. |
See accompanying notes
18
| Year Ended | | 8/31/061 | |
| 4/30/09 | | 4/30/08 | | to | |
| | | | | | 4/30/07 | |
| $8.930 | | | $9.700 | | | $8.500 | | |
| | |
| | |
| 0.081 | | | 0.073 | | | 0.039 | | |
| (3.293 | ) | | (0.368 | ) | | 1.216 | | |
| | (3.212 | ) | | (0.295 | ) | | 1.255 | | |
| | |
| | |
| (0.088 | ) | | (0.067 | ) | | (0.025 | ) | |
| — | | | (0.408 | ) | | (0.030 | ) | |
| (0.088 | ) | | (0.475 | ) | | (0.055 | ) | |
| | |
| $5.630 | | | $8.930 | | | $9.700 | | |
| | |
| (36.04% | ) | | (3.36% | ) | | 14.81% | | |
| | |
| | |
| $10 | | | $32 | | | $14 | | |
| 0.95% | | | 0.95% | | | 0.96% | | |
| | |
| 1.87% | | | 3.03% | | | 5.27% | | |
| 1.20% | | | 0.77% | | | 0.64% | | |
| | | | | | | | | | |
| 0.28% | | | (1.31% | ) | | (3.67% | ) | |
| | 38% | | | 30% | | | 30% | | |
19
Financial highlights
Delaware Large Cap Core Fund Institutional Class
Selected data for each share of the Fund outstanding throughout each period were as follows:
| Net asset value, beginning of period |
| |
| Income (loss) from investment operations: |
| Net investment income2 |
| Net realized and unrealized gain (loss) on investments |
| Total from investment operations |
| |
| Less dividends and distributions: |
| Net investment income |
| Net realized gain on investments |
| Total dividends and distributions |
| |
| Net asset value, end of period |
| |
| Total return3 |
| |
| Ratios and supplemental data: |
| Net assets, end of period (000 omitted) |
| Ratio of expenses to average net assets |
| Ratio of expenses to average net assets |
| prior to fees waived and expense paid indirectly |
| Ratio of net investment income to average net assets |
| Ratio of net investment income (loss) to average net assets |
| prior to fees waived and expense paid indirectly |
| Portfolio turnover |
1 Date of commencement of operations; ratios and portfolio turnover have been annualized and total return has not been annualized. |
2 The average shares outstanding method has been applied for per share information. |
3 Total investment return is based on the change in net asset value of a share during the period and assumes reinvestment of dividends and distributions at net asset value. Total investment return refl ects a waiver by the manager. Performance would have been lower had the waiver not been in effect. |
See accompanying notes
20
| Year Ended | | 8/31/061 | | |
| 4/30/09 | | | 4/30/08 | | | to | | |
| | | | | | | 4/30/07 | | |
| $8.930 | | | $9.700 | | | $8.500 | | |
| | | |
| | | |
| 0.081 | | | 0.073 | | | 0.039 | | |
| (3.293 | ) | | (0.368 | ) | | 1.216 | | |
| (3.212 | ) | | (0.295 | ) | | 1.255 | | |
| | | |
| | | |
| (0.088 | ) | | (0.067 | ) | | (0.025 | ) | |
| — | | | (0.408 | ) | | (0.030 | ) | |
| (0.088 | ) | | (0.475 | ) | | (0.055 | ) | |
| | | |
| $5.630 | | | $8.930 | | | $9.700 | | |
| | | |
| (36.04% | ) | | (3.36% | ) | | 14.81% | | |
| | | |
| | | |
| $1,418 | | | $2,219 | | | $2,296 | | |
| 0.95% | | | 0.95% | | | 0.96% | | |
| | | |
| 1.62% | | | 2.78% | | | 5.02% | | |
| 1.20% | | | 0.77% | | | 0.64% | | |
| | | |
| 0.53% | | | (1.06% | ) | | (3.42% | ) | |
| 38% | | | 30% | | | 30% | | |
21
| Notes to financial statements | |
| Delaware Large Cap Core Fund | April 30, 2009 |
Voyageur Mutual Funds III (Trust) is organized as a Delaware statutory trust and offers two series, Delaware Large Cap Core Fund and Delaware Select Growth Fund. These financial statements and the related notes pertain to Delaware Large Cap Core Fund (Fund). The Trust is an open-end investment company. The Fund is considered diversified under the Investment Company Act of 1940, as amended, and offers Class A, Class C, Class R and Institutional Class shares. Class A shares are sold with a maximum front-end sales charge of 5.75%. Class A share purchases of $1,000,000 or more will incur a contingent deferred sales charge (CDSC) of 1% if redeemed during the first year and 0.50% during the second year, provided that Delaware Distributors, L.P. (DDLP) paid a financial advisor a commission on the purchase of those shares. Class C shares are sold with a CDSC of 1%, if redeemed during the first 12 months. Class R and Institutional Class shares are not subject to a sales charge and are offered for sale only to certain eligible investors. As of April 30, 2009, Class C and Class R have not commenced operations.
The investment objective of the Fund is to seek long-term capital appreciation.
1. Significant Accounting Policies
The following accounting policies are in accordance with U.S. generally accepted accounting principles and are consistently followed by the Fund.
Security Valuation — Equity securities, except those traded on the Nasdaq Stock Market, Inc. (Nasdaq), are valued at the last quoted sales price as of the time of the regular close of the New York Stock Exchange (NYSE) on the valuation date. Securities traded on the Nasdaq are valued in accordance with the Nasdaq Official Closing Price, which may not be the last sales price. If on a particular day an equity security does not trade, then the mean between the bid and ask prices will be used. Investment companies are valued at net asset value per share. Generally, other securities and assets for which market quotations are not readily available are valued at fair value as determined in good faith under the direction of the Fund’s Board of Trustees (Board). In determining whether market quotations are readily available or fair valuation will be used, various factors will be taken into consideration, such as market closures or suspension of trading in a security. The Fund may use fair value pricing more frequently for securities traded primarily in non-U.S. markets because, among other things, most foreign markets close well before the Fund values its securities at 4:00 p.m. Eastern time. The earlier close of these foreign markets gives rise to the possibility that significant events, including broad market moves, government actions or pronouncements, aftermarket trading, or news events may have occurred in the interim. To account for this, the Fund may frequently value foreign securities using fair value prices based on third-party vendor modeling tools (international fair value pricing).
Federal Income Taxes — No provision for federal income taxes has been made as the Fund intends to continue to qualify for federal income tax purposes as a regulated investment company under Subchapter M of the Internal Revenue Code of 1986, as amended, and make the requisite distributions to shareholders. The Fund evaluates tax positions taken or expected to be taken in the course of preparing the Fund’s tax returns to determine whether the tax positions are “more-likely-than-not” of being sustained by the applicable tax authority. Tax positions not deemed to
22
meet the more-likely-than-not threshold are recorded as a tax benefit or expense in the current year. The Fund did not record any tax benefit or expense in the current period.
Class Accounting — Investment income, common expenses and realized and unrealized gain (loss) on investments are allocated to the various classes of the Fund on the basis of daily net assets of each class. Distribution expenses relating to a specific class are charged directly to that class.
Repurchase Agreements — The Fund may invest in a pooled cash account along with other members of the Delaware Investments® Family of Funds pursuant to an exemptive order issued by the Securities and Exchange Commission. The aggregate daily balance of the pooled cash account is invested in repurchase agreements secured by obligations of the U.S. government. The respective collateral is held by the Fund’s custodian bank until the maturity of the respective repurchase agreements. Each repurchase agreement is at least 102% collateralized. However, in the event of default or bankruptcy by the counterparty to the agreement, realization of the collateral may be subject to legal proceedings.
Use of Estimates — The preparation of financial statements in conformity with U.S. generally accepted accounting principles requires management to make estimates and assumptions that affect the reported amounts of assets and liabilities at the date of the financial statements and the reported amounts of revenues and expenses during the reporting period. Actual results could differ from those estimates.
Other — Expenses directly attributable to the Fund are charged directly to the Fund. Other expenses common to various funds within the Delaware Investments Family of Funds are generally allocated amongst such funds on the basis of average net assets. Management fees and some other expenses are paid monthly. Security transactions are recorded on the date the securities are purchased or sold (trade date) for financial reporting purposes. Costs used in calculating realized gains and losses on the sale of investment securities are those of the specific securities sold. Dividend income is recorded on the ex-dividend date and interest income is recorded on the accrual basis. The Fund declares and pays dividends from net investment income and distributions from net realized gain on investments, if any, annually.
The Fund receives earnings credits from its custodian when positive cash balances are maintained, which are used to offset custody fees. The expense paid under this arrangement is included in custodian fees on the statement of operations with the corresponding expense offset shown as “expense paid indirectly.”
23
Notes to financial statements
Delaware Large Cap Core Fund
2. Investment Management, Administration Agreements and Other Transactions with Affiliates
In accordance with the terms of its investment management agreement, the Fund pays Delaware Management Company (DMC), a series of Delaware Management Business Trust and the investment manager, an annual fee which is calculated daily at the rate of 0.65% on the first $500 million of average daily net assets of the Fund, 0.60% on the next $500 million, 0.55% on the next $1.5 billion and 0.50% on average daily net assets in excess of $2.5 billion.
DMC has voluntarily agreed to waive all or a portion, if any, of its management fees and reimburse the Fund to the extent necessary to ensure that total annual operating expenses (excluding any 12b-1 plan expenses, taxes, interest, inverse floater program expenses, brokerage fees, certain insurance costs, and non-routine expenses or costs, including, but not limited to, those relating to reorganizations, litigation, conducting shareholder meetings, and liquidations, (collectively “non-routine expenses”)) do not exceed 0.95% of the Fund’s average daily net assets. This waiver and expense limitation may be discontinued at any time because they are voluntary. For purposes of these waivers and reimbursements, non-routine expenses may also include such additional costs and expenses, as may be agreed upon from time to time by the Fund’s Board and DMC. These expenses waivers and reimbursements apply only to expenses paid directly by the Fund.
Delaware Service Company, Inc. (DSC), an affiliate of DMC, provides fund accounting and financial administration oversight services to the Fund. For these services, the Fund pay DSC fees based on the aggregate daily net assets of the Delaware Investments® Family of Funds at the following annual rate: 0.0050% of the first $30 billion; 0.0045% of the next $10 billion; 0.0040% of the next $10 billion; and 0.0025% of aggregate average daily net assets in excess of $50 billion. The fees payable to DSC under the service agreement described above will be allocated among all Funds in the Delaware Investments Family of Funds on a relative net asset value basis. For the year ended April 30, 2009, the Fund was charged $85 for these services.
DSC also provides dividend disbursing and transfer agency services. The Fund pays DSC a monthly fee based on the number of shareholder accounts for dividend disbursing and transfer agent services.
Pursuant to a distribution agreement and distribution plan, the Fund pays DDLP, the distributor and an affiliate of DMC, an annual distribution and service fee not to exceed 0.25% of the average daily net assets of the Class A shares, 1.00% of the average daily net assets of Class C shares and 0.60% of the average daily net assets of Class R shares. Institutional Class shares pay no distribution and services expenses. DDLP has voluntarily agreed to waive such distribution and service fees until such time as the waivers are discontinued.
At April 30, 2009, the Fund had liabilities payable to affiliates as follows:
| Investment management fee payable to DMC | | $ | 8,214 |
| Dividend disbursing, transfer agent and fund accounting | | | |
| oversight fees and other expenses payable to DSC | | | 24 |
| Other expenses payable to DMC and affiliates* | | | 176 |
24
*DMC, as part of its administrative services, pays operating expenses on behalf of the Fund and is reimbursed on a periodic basis. Such expenses include items such as printing of shareholder reports, fees for audit, legal and tax services, registration fees and trustees’ fees.
As provided in the investment management agreement, the Fund bears the cost of certain legal and tax services, including internal legal and tax services provided to the Fund by DMC and/or its affiliates’ employees. For the year ended April 30 2009, the Fund was charged $133 for internal legal and tax services provided by DMC and/or its affiliates’ employees.
Trustees’ fees include expenses accrued by the Fund for each Trustee’s retainer and meeting fees. Certain officers of DMC, DSC and DDLP are officers and/or Trustees of the Trust. These officers and Trustees are paid no compensation by the Fund.
3. Investments
For the year ended April 30, 2009, the Fund made purchases of $703,076 and sales of $652,633 of investment securities other than short-term investments.
At April 30, 2009, the cost of investments for federal income tax purposes was $1,772,159. At April 30, 2009, net unrealized depreciation was $324,220, of which $39,389 related to unrealized appreciation of investments and $363,609 related to unrealized depreciation of investments.
Effective May 1, 2008, the Fund adopted Financial Accounting Standard No. 157, Fair Value Measurements (FAS 157). FAS 157 defines fair value as the price that the Fund would receive to sell an asset or pay to transfer a liability in an orderly transaction between market participants at the measurement date under current market conditions. FAS 157 also establishes a framework for measuring fair value, and a three level hierarchy for fair value measurements based upon the transparency of inputs to the valuation of an asset or liability. Inputs may be observable or liability based on market data obtained from sources independent of the reporting entity. Unobservable inputs reflect the reporting entity’s own assumptions about the assumptions that market participants would use in pricing the asset or liability developed based on the best information available under the circumstances. The Fund’s investment in its entirety is assigned a level based upon the observability of the inputs which are significant to the overall valuation. The three-tier hierarchy of inputs is summarized below.
Level 1 – Inputs are quoted prices in active markets
Level 2 – Inputs are observable, directly or indirectly
Level 3 – Inputs are unobservable and reflect assumptions on the part of the reporting entity
25
Notes to financial statements
Delaware Large Cap Core Fund
3. Investments (continued)
The following table summarizes the valuation of the Fund investments by the FAS 157 fair value hierarchy levels as of April 30, 2009:
| | Securities |
| Level 1 | | $ | 1,447,939 |
| Level 2 | | | - |
| Level 3 | | | - |
| Total | | $ | 1,447,939 |
There were no Level 2 securities at the beginning or end of the period.
The following is a reconciliation of investments in which significant unobservable inputs (Level 3) were used in determining fair value:
| Securities | |
| Balance as of 4/30//08 | | $ | - | |
| Net change in unrealized | | | | |
| appreciation/depreciation | | | (394 | ) |
| Net transfers in and/or out of Level 3 | | | 394 | |
| Balance as of 4/30/09 | | $ | - | |
| | | | | |
| Net change in unrealized | | | | |
| appreciation/depreciation from | | | | |
| investments still held as of 4/30/09 | | $ | (394 | ) |
4. Dividend and Distribution Information
Income and long-term capital gain distributions are determined in accordance with federal income tax regulations, which may differ from U.S. generally accepted accounting principles. Additionally, distributions from net short-term gains on sales of investment securities are treated as ordinary income for federal income tax purposes. The tax character of dividends and distributions paid during the years ended April 30, 2009 and 2008 were as follows:
| | Year Ended |
| | 4/30/09 | | 4/30/08 |
| Ordinary income | | $ | 21,947 | | $ | 93,715 |
| Long-tem capital gain | | | 107 | | | 21,256 |
| Total | | $ | 22,054 | | $ | 114,971 |
26
5. Components of Net Assets on a Tax Basis
As of April 30, 2009, the components of net assets on a tax basis were as follows:
| Shares of beneficial interest | | $ | 2,166,676 | |
| Undistributed ordinary income | | | 3,324 | |
| Post-October losses | | | (203,792 | ) |
| Capital loss carryforwards | | | (214,282 | ) |
| Unrealized depreciation of investments | | | (324,220 | ) |
| Net assets | | $ | 1,427,706 | |
The difference between book basis and tax basis components of net assets is primarily attributable to tax deferral of losses on wash sales.
Post-October losses represent losses realized on investment transaction from November 1, 2008 through April 30, 2009 that, in accordance with federal income tax regulations, the Fund has elected to defer and treat as having arisen in the following year.
For financial reporting purposes, capital accounts are adjusted to reflect the tax character of permanent book/tax differences. Reclassifications are primarily due to tax treatment of dividend distributions. Results of operations and net assets were not affected by these reclassifications. For the year ended April 30, 2009, the Fund recorded the following reclassifications:
| Undistributed net investment income | | $ | 107 | |
| Accumulated net realized loss | | | (107 | ) |
For federal income tax purposes, capital loss carryforwards may be carried forward and applied against future capital gains. Capital loss carryforwards remaining at April 30, 2009 will expire as follows: $214,282 expires in 2017.
27
6. Capital Shares
Transactions in capital stock shares were as follows:
| | Year Ended |
| | 4/30/09 | | 4/30/08 |
| Shares sold: | | | | | | |
| Class A | | 29 | | | 3,499 | |
| Institutional Class | | — | | | 1 | |
| |
| Shares issued upon reinvestment of dividends and distributions: | | | | | | |
| Class A | | 24 | | | 130 | |
| Institutional Class | | 3,594 | | | 11,769 | |
| | 3,647 | | | 15,399 | |
| | | | | | | |
| Shares repurchased: | | | | | | |
| Class A | | (1,931 | ) | | (1,489 | ) |
| | (1,931 | ) | | (1,489 | ) |
| Net increase | | 1,716 | | | 13,910 | |
7. Line of Credit
The Fund, along with certain other funds in the Delaware Investments® Family of Funds (Participants), was a participant in a $225,000,000 revolving line of credit with The Bank of New York Mellon (BNY Mellon) to be used for temporary or emergency purposes as an additional source of liquidity to fund redemptions of investor shares. Under the agreement, the Participants were charged an annual commitment fee, which was allocated across the Participants on the basis of each Participant’s allocation of the entire facility. Participants were permitted to borrow up to a maximum of one third of their net assets under the agreement. The agreement expired on November 18, 2008.
Effective November 18, 2008, the Fund, along with the other Participants, entered into an amendment to the agreement with BNY Mellon for a $35,000,000 revolving line of credit. The agreement, as amended, is to be used as described above and operates in substantially the same manner as the original agreement. The agreement, as amended, expires on November 17, 2009. The Fund had no amounts outstanding as of April 30, 2009, or at any time during the year then ended.
28
8. Securities Lending
The Fund, along with other funds in the Delaware Investments® Family of Funds, may lend its securities pursuant to a security lending agreement (Lending Agreement) with BNY Mellon. With respect to each loan, if the aggregate market value of securities collateral held plus cash collateral received on any business day is less than the aggregate market value of the securities which are the subject of such loan, the borrower will be notified to provide additional collateral not less than the applicable collateral requirements. Cash collateral received is generally invested in the Mellon GSL DBT II Collateral Fund (Collective Trust) established by BNY Mellon for the purpose of investment on behalf of clients participating in its securities lending programs. The Collective Trust may invest in fixed income securities, with a weighted average maturity not to exceed 90 days, rated in one of the top three tiers by Standard & Poor’s Ratings Group or Moody’s Investors Service, Inc. or repurchase agreements collateralized by such securities. The Collective Trust seeks to maintain a net asset value per unit of $1.00, but there can be no assurance that it will always be able to do so. At April 30, 2009, the Collective Trust held only cash and assets with a maturity of one business day or less (Cash/Overnight Assets). The Fund may incur investment losses as a result of investing securities lending collateral in the Collective Trust. This could occur if an investment in the Collective Trust defaulted or if it were necessary to liquidate assets in the Collective Trust to meet returns on outstanding security loans at a time when the Collective Trust’s net asset value per unit was less than $1.00. Under those circumstances, the Fund may not receive an amount from the Collective Trust that is equal in amount to the collateral the Fund would be required to return to the borrower of the securities and the Fund would be required to make up for this shortfall. The Fund can also accept U.S. government securities and letters of credit (non-cash collateral) in connection with securities loans. In the event of default or bankruptcy by the lending agent, realization and/or retention of the collateral may be subject to legal proceedings. In the event the borrower fails to return loaned securities and the collateral received is insufficient to cover the value of the loaned securities and provided such collateral shortfall is not the result of investment losses, the lending agent has agreed to pay the amount of the shortfall to the Fund, or at the discretion of the lending agent, replace the loaned securities. The Fund continues to record dividends or interest, as applicable, on the securities loaned and are subject to change in value of the securities loaned that may occur during the term of the loan. The Fund has the right under the Lending Agreement to recover the securities from the borrower on demand. With respect to security loans collateralized by non-cash collateral, the Fund receives loan premiums paid by the borrower. With respect to security loans collateralized by cash collateral, the earnings from the collateral investments are shared among the Fund, the security lending agent and the borrower. The Fund records security lending income net of allocations to the security lending agent and the borrower. There were no securities on loan at April 30, 2009.
29
9. Credit and Market Risk
The Fund may invest up to 15% of its net assets in illiquid securities, which may include securities with contractual restrictions on resale, securities exempt from registration under Rule 144A of the Securities Act of 1933, as amended, and other securities which may not be readily marketable. The relative illiquidity of these securities may impair the Fund from disposing of them in a timely manner and at a fair price when it is necessary or desirable to do so. While maintaining oversight, the Fund’s Board has delegated to DMC the day-to-day functions of determining whether individual securities are liquid for purposes of the Fund’s limitation on investments in illiquid assets. Securities eligible for resale pursuant to Rule 144A, which are determined to be liquid, are not subject to the Fund’s 15% limit on investment in illiquid assets. As of April 30, 2009, there were no Rule 144A securities and no securities have been determined to be illiquid under the Fund’s Liquidity Procedures.
10. Contractual Obligations
The Fund enters into contracts in the normal course of business that contain a variety of indemnifications. The Fund’s maximum exposure under these arrangements is unknown. However, the Fund has not had prior claims or losses pursuant to these contracts. Management has reviewed the Fund’s existing contracts and expects the risk of loss to be remote.
11. Tax Information (Unaudited)
The information set forth below is for the Fund’s fiscal year as required by federal income tax laws. Shareholders, however, must report distributions on a calendar year basis for income tax purposes, which may include distributions for portions of two fiscal years of a fund. Accordingly, the information needed by shareholders for income tax purposes will be sent to them in January of each year. Please consult your tax advisor for proper treatment of this information.
| (A) | | (B) | | | | |
| Long-Term | | Ordinary | | | | |
| Capital Gains | | Income | | Total | | (C) |
| Distributions | | Distributions* | | Distributions | | Qualifying |
| (Tax Basis) | | (Tax Basis) | | (Tax Basis) | | Dividends1 |
| 0.49% | | 99.51% | | 100.00% | | 92.24% |
(A) and (B) are based on a percentage of the Fund’s total distributions.
(C) is based on percentage of the Fund’s ordinary income distributions.
1Qualifying dividends represent dividends which qualify for the corporate dividends received deduction.
*For the fiscal year ended April 30, 2009, certain dividends paid by the Fund may be subject to a maximum tax rate of 15%, as provided for by the Jobs and Growth Tax Relief Reconciliation Act of 2003. The Fund intends to designate up to a maximum amount of $21,947 to be taxed at a maximum rate of 15%. Complete information will be computed and reported in conjunction with your 2008 or 2009 Form 1099-DIV.
30
Report of independent
registered public accounting firm
To the Shareholders and Board of Trustees
Voyageur Mutual Funds III – Delaware Large Cap Core Fund
We have audited the accompanying statement of net assets of Delaware Large Cap Core Fund (one of the series constituting Voyageur Mutual Funds III) (the “Fund”) as of April 30, 2009, and the related statement of operations for the year then ended, the statements of changes in net assets for each of the two years then ended, and the financial highlights for the two years then ended and the period from August 31, 2006 (commencement of operations) to April 30, 2007. These financial statements and financial highlights are the responsibility of the Fund’s management. Our responsibility is to express an opinion on these financial statements and financial highlights based on our audit.
We conducted our audit in accordance with the standards of the Public Company Accounting Oversight Board (United States). Those standards require that we plan and perform the audit to obtain reasonable assurance about whether the financial statements and financial highlights are free of material misstatement. We were not engaged to perform an audit of the Fund’s internal control over financial reporting. Our audit included consideration of internal control over financial reporting as a basis for designing audit procedures that are appropriate in the circumstances, but not for the purpose of expressing an opinion on the effectiveness of the Fund’s internal control over financial reporting. Accordingly, we express no such opinion. An audit also includes examining, on a test basis, evidence supporting the amounts and disclosures in the financial statements and financial highlights, assessing the accounting principles used and significant estimates made by management, and evaluating the overall financial statement presentation. Our procedures included confirmation of securities owned as of April 30, 2009, by correspondence with the custodian and brokers or by other appropriate auditing procedures where replies from brokers were not received. We believe that our audit provides a reasonable basis for our opinion.
In our opinion, the financial statements and financial highlights referred to above present fairly, in all material respects, the financial position of the Delaware Large Cap Core Fund series of Voyageur Mutual Funds III at April 30, 2009, the results of its operations for the year then ended, the changes in net assets for each of the two years in the period then ended, and its financial highlights for each of the two years then ended and the period from August 31, 2006 (commencement of operations) to April 30, 2007, in conformity with U.S. generally accepted accounting principles.

June 17, 2009
31
Other Fund information
(Unaudited)
Delaware Large Cap Core Fund
Fund management
Christopher S. Adams, CFA
Vice President, Portfolio Manager, Senior Equity Analyst
Christopher S. Adams is a portfolio manager on the firm’s Core Equity team. He also performs analysis and research to support the portfolio management function. From 1995 to 1998, he served as the firm’s vice president, strategic planning. Prior to joining Delaware Investments in 1995, Adams had approximately 10 years of experience in the financial services industry in the U.S. and U.K., including positions with Coopers & Lybrand, The Sumitomo Bank, Bank of America, and Lloyds Bank. Adams holds both bachelor’s and master’s degrees in history and economics from Oxford University, England, and received an MBA with dual concentrations in finance and insurance/risk management from The Wharton School of the University of Pennsylvania. He is a past president of the CFA Society of Philadelphia.
Francis X. Morris
Senior Vice President, Chief Investment Officer – Core Equity
Francis X. Morris joined Delaware Investments in 1997 and is currently the chief investment officer for Core Equity investments. He is also a member of the firm’s asset allocation committee, which is responsible for building and managing multi-asset class portfolios. Prior to joining the firm, Morris served as vice president and director of equity research at PNC Asset Management. He received a bachelor’s degree from Providence College and holds an MBA from Widener University. Morris is a past president of the CFA Society of Philadelphia and is a member of the CFA Institute. In addition, he is a former officer of the National Association of Petroleum Investment Analysts.
Donald G. Padilla, CFA
Vice President, Portfolio Manager, Senior Equity Analyst
Donald G. Padilla joined Delaware Investments in 1994 and is a portfolio manager on the firm’s Core Equity team. He also performs analysis and research to support the portfolio management function. Padilla joined Delaware Investments as an assistant controller in the firm’s treasury function, responsible for managing corporate cash investments, developing financial models, and overseeing the financial operations of the Lincoln Life 401(k) annuities segment. Prior to joining Delaware Investments, he held various positions at The Vanguard Group. Padilla holds a bachelor’s degree in accounting from Lehigh University, and he is a member of the CFA Society of Philadelphia.
Michael S. Morris, CFA
Vice President, Portfolio Manager, Senior Equity Analyst
Michael S. Morris, who joined Delaware Investments in 1999, is a portfolio manager on the firm’s Core Equity team. He also performs analysis and research to support the portfolio management function. Prior to joining the firm, he worked as a senior equity analyst at Newbold’s Asset Management, covering financial stocks. Morris began his investment career in 1993 at Ohio Casualty. He earned his bachelor’s degree in finance from Indiana University and an MBA from The Wharton School of the University of Pennsylvania. He is a member of the Bank and Financial Analysts Association.
32
Board of trustees/directors and officers addendum
Delaware Investments® Family of Funds
A mutual fund is governed by a Board of Trustees/Directors (“Trustees”), which has oversight responsibility for the management of a fund’s business affairs. Trustees establish procedures and oversee and review the performance of the investment manager, the distributor, and others who perform services for the fund. The independent fund trustees, in particular, are advocates
| Name, Address, | | Position(s) | | Length of |
| and Birth Date | | Held with Fund(s) | | Time Served |
| Interested Trustees | | | | |
| |
| Patrick P. Coyne1 | | Chairman, President, | | Chairman and Trustee |
| 2005 Market Street | | Chief Executive Officer, | | since August 16, 2006 |
| Philadelphia, PA 19103 | | and Trustee | | |
| April 1963 | | | | President and |
| | | | Chief Executive Officer |
| | | | since August 1, 2006 |
| |
| |
| |
| |
| |
| |
| |
| |
| |
| |
| |
| |
| Independent Trustees | | | | |
| |
| Thomas L. Bennett | | Trustee | | Since March 2005 |
| 2005 Market Street | | | | |
| Philadelphia, PA 19103 | | | | |
| October 1947 | | | | |
| |
| |
| |
| |
| |
| |
| |
| |
| |
| |
| |
1 Patrick P. Coyne is considered to be an “Interested Trustee” because he is an executive officer of the Fund’s(s’) investment advisor.
34
for shareholder interests. Each trustee has served in that capacity since he or she was elected to or appointed to the Board of Trustees, and will continue to serve until his or her retirement or the election of a new trustee in his or her place. The following is a list of the Trustees and Officers with certain background and related information.
| | Number of Portfolios in | | |
| Principal Occupation(s) | | Fund Complex Overseen | | Other Directorships |
| During Past 5 Years | | by Trustee or Officer | | Held by Trustee or Officer |
| |
| |
| Patrick P. Coyne has served in | | 83 | | Director |
| various executive capacities | | | | Kaydon Corp. |
| at different times at | | | | |
| Delaware Investments.2 | | | | Board of Governors Member |
| | | | Investment Company |
| | | | Institute (ICI) |
| | | | (2007–Present) |
| |
| | | | Member of Investment Committee |
| | | | Cradle of Liberty Council, BSA |
| | | | (November 2007–Present) |
| |
| | | | Finance Committee Member |
| | | | St. John Vianney |
| | | | Roman Catholic Church |
| | | | (2007–Present) |
| | | | | |
| |
| |
| Private Investor | | 83 | | Director |
| (March 2004–Present) | | | | Bryn Mawr Bank Corp. (BMTC) |
| | | | | (April 2007–Present) |
| Investment Manager | | | | |
| Morgan Stanley & Co. | | | | Investment Committee |
| (January 1984–March 2004) | | | | Pennsylvania Academy of |
| | | | Fine Arts (2007–Present) |
| | | | Trustee (2004–Present) |
| |
2 Delaware Investments is the marketing name for Delaware Management Holdings, Inc. and its subsidiaries, including the Fund’s(s’) investment advisor, principal underwriter, and its transfer agent.
35
Board of trustees/directors and officers addendum
Delaware Investments® Family of Funds
| Name, Address, | | Position(s) | | Length of |
| and Birth Date | | Held with Fund(s) | | Time Served |
| Independent Trustees (continued) | | | | |
| |
| Thomas L. Bennett | | | | |
| (continued) | | | | |
| |
| |
| |
| |
| John A. Fry | | Trustee | | Since January 2001 |
| 2005 Market Street | | | | |
| Philadelphia, PA 19103 | | | | |
| May 1960 | | | | |
| |
| |
| |
| |
| Anthony D. Knerr | | Trustee | | Since April 1990 |
| 2005 Market Street | | | | |
| Philadelphia, PA 19103 | | | | |
| December 1938 | | | | |
| |
| |
| Lucinda S. Landreth | | Trustee | | Since March 2005 |
| 2005 Market Street | | | | |
| Philadelphia, PA 19103 | | | | |
| June 1947 | | | | |
| |
| Ann R. Leven | | Trustee | | Since October 1989 |
| 2005 Market Street | | | | |
| Philadelphia, PA 19103 | | | | |
| November 1940 | | | | |
| |
| Thomas F. Madison | | Trustee | | Since May 19973 |
| 2005 Market Street | | | | |
| Philadelphia, PA 19103 | | | | |
| February 1936 | | | | |
| | | | | |
| | | | | |
| |
3 In 1997, several funds managed by Voyageur Fund Managers, Inc. (the “Voyageur Funds”) were incorporated into the Delaware Investments Family of Funds. Mr. Madison served as a director of the Voyageur Funds from 1993 until 1997.
36
| | Number of Portfolios in |
| Principal Occupation(s) | | Fund Complex Overseen | | Other Directorships |
| During Past 5 Years | | by Trustee or Officer | | Held by Trustee or Officer |
| |
|
| | | | Investment Committee and |
| | | | Governance Committee |
| | | | Member |
| | | | Pennsylvania Horticultural |
| | | | Society |
| | | | (February 2006–Present) |
| |
| President | | 83 | | Director |
| Franklin & Marshall College | | | | Community Health Systems |
| (June 2002–Present) | | | | |
| | | | | |
| Executive Vice President | | | | |
| University of Pennsylvania | | | | |
| (April 1995–June 2002) | | | | |
| |
| Founder and | | 83 | | None |
| Managing Director | | | | |
| Anthony Knerr & Associates | | | | |
| (Strategic Consulting) | | | | |
| (1990–Present) | | | | |
| |
| Chief Investment Officer | | 83 | | None |
| Assurant, Inc. (Insurance) | | | | |
| (2002–2004) | | | | |
| |
| |
| Consultant | | 83 | | None |
| ARL Associates | | | | |
| (Financial Planning) | | | | |
| (1983–Present) | | | | |
| |
| President and | | 83 | | Director and Chair of |
| Chief Executive Officer | | | | Compensation Committee, |
| MLM Partners, Inc. | | | | Governance Committee |
| (Small Business Investing | | | | Member |
| and Consulting) | | | | CenterPoint Energy |
| (January 1993–Present) | | | | |
| |
37
Board of trustees/directors and officers addendum
Delaware Investments® Family of Funds
| Name, Address, | | Position(s) | | Length of |
| and Birth Date | | Held with Fund(s) | | Time Served |
| Independent Trustees (continued) | | | | |
| |
| Thomas F. Madison | | | | |
| (continued) | | | | |
| |
| |
| |
| |
| |
| |
| |
| |
| |
| |
| |
| |
| |
| |
| |
| |
| |
| |
| |
| Janet L. Yeomans | | Trustee | | Since April 1999 |
| 2005 Market Street | | | | |
| Philadelphia, PA 19103 | | | | |
| July 1948 | | | | |
| |
| |
| |
| |
| J. Richard Zecher | | Trustee | | Since March 2005 |
| 2005 Market Street | | | | |
| Philadelphia, PA 19103 | | | | |
| July 1940 | | | | |
| | | | | |
| | | | | |
| | | | | |
| | | | | |
| | | | | |
| |
38
| | Number of Portfolios in | | |
| Principal Occupation(s) | | Fund Complex Overseen | | Other Directorships |
| During Past 5 Years | | by Trustee or Officer | | Held by Trustee or Officer |
| |
| |
| | | | Lead Director and Chair of |
| | | | Audit and Governance |
| | | | Committees, Member of |
| | | | Compensation Committee |
| | | | Digital River, Inc. |
| |
| | | | Director and Chair of |
| | | | Governance Committee, |
| | | | Audit Committee |
| | | | Member |
| | | | Rimage Corporation |
| |
| | | | Director and Chair of |
| | | | the Compensation Committee |
| | | | Spanlink Communications |
| |
| | | | Lead Director and Chair of |
| | | | Compensation and |
| | | | Governance Committees |
| | | | Valmont Industries, Inc. |
| |
| Vice President and Treasurer | | 83 | | None |
| (January 2006–Present) | | | | |
| Vice President — Mergers & Acquisitions | | | | |
| (January 2003–January 2006), and | | | | |
| Vice President | | | | |
| (July 1995–January 2003) | | | | |
| 3M Corporation | | | | |
| |
| Founder | | 83 | | Director and Audit |
| Investor Analytics | | | | Committee Member |
| (Risk Management) | | | | Investor Analytics |
| (May 1999–Present) | | | | |
| | | | | |
| Founder | | | | |
| Sutton Asset Management | | | | |
| (Hedge Fund) | | | | |
| (September 1996–Present) | | | | |
| |
39
Board of trustees/directors and officers addendum
Delaware Investments® Family of Funds
| Name, Address, | | Position(s) | | Length of |
| and Birth Date | | Held with Fund(s) | | Time Served |
| Officers | | | | |
| | | | | |
| David F. Connor | | Vice President, | | Vice President since |
| 2005 Market Street | | Deputy General | | September 2000 |
| Philadelphia, PA 19103 | | Counsel, and Secretary | | and Secretary since |
| December 1963 | | | | October 2005 |
| |
| |
| Daniel V. Geatens | | Vice President | | Treasurer |
| 2005 Market Street | | and Treasurer | | since October 25, 2007 |
| Philadelphia, PA 19103 | | | | |
| October 1972 | | | | |
| |
| David P. O’Connor | | Senior Vice President, | | Senior Vice President, |
| 2005 Market Street | | General Counsel, | | General Counsel, and |
| Philadelphia, PA 19103 | | and Chief Legal Officer | | Chief Legal Officer |
| February 1966 | | | | since October 2005 |
| |
| Richard Salus | | Senior Vice President | | Chief Financial Officer |
| 2005 Market Street | | and Chief Financial Officer | | since November 2006 |
| Philadelphia, PA 19103 | | | | |
| October 1963 | | | | |
| |
4 David F. Connor, Daniel V. Geatens, David P. O’Connor, and Richard Salus serve in similar capacities for the six portfolios of the Optimum Fund Trust, which have the same investment advisor, principal underwriter, and transfer agent as the registrant.
40
| | Number of Portfolios in | | |
| Principal Occupation(s) | | Fund Complex Overseen | | Other Directorships |
| During Past 5 Years | | by Trustee or Officer | | Held by Trustee or Officer |
| |
| |
| David F. Connor has served as | | 83 | | None4 |
| Vice President and Deputy | | | | |
| General Counsel of | | | | |
| Delaware Investments | | | | |
| since 2000. | | | | |
| |
| Daniel V. Geatens has served | | 83 | | None4 |
| in various capacities at | | | | |
| different times at | | | | |
| Delaware Investments. | | | | |
| |
| David P. O’Connor has served in | | 83 | | None4 |
| various executive and legal | | | | |
| capacities at different times | | | | |
| at Delaware Investments. | | | | |
| |
| Richard Salus has served in | | 83 | | None4 |
| various executive capacities | | | | |
| at different times at | | | | |
| Delaware Investments. | | | | |
| |
The Statement of Additional Information for the Fund(s) includes additional information about the Trustees and Officers and is available, without charge, upon request by calling 800 523-1918.
41
About the organization
This annual report is for the information of Delaware Large Cap Core Fund shareholders, but it may be used with prospective investors when preceded or accompanied by a current prospectus for Delaware Large Cap Core Fund, which is available at www.delawareinvestments.com. The prospectus sets forth details about charges, expenses, investment objectives, and operating policies of the investment company. You should read the prospectus carefully before you invest. The figures in this report represent past results that are not a guarantee of future results. The return and principal value of an investment in the investment company will fluctuate so that shares, when redeemed, may be worth more or less than their original cost. For most recent performance, please call 800 523-1918.
| Board of trustees | |
| |
| Patrick P. Coyne | Ann R. Leven |
| Chairman, President, and | Consultant |
| Chief Executive Officer | ARL Associates |
| Delaware Investments® Family of Funds | New York, NY |
| Philadelphia, PA | |
| Thomas F. Madison |
| Thomas L. Bennett | President and Chief Executive Officer |
| Private Investor | MLM Partners, Inc. |
| Rosemont, PA | Minneapolis, MN |
| |
| John A. Fry | Janet L. Yeomans |
| President | Vice President and Treasurer |
| Franklin & Marshall College | 3M Corporation |
| Lancaster, PA | St. Paul, MN |
| |
| Anthony D. Knerr | J. Richard Zecher |
| Founder and Managing Director | Founder |
| Anthony Knerr & Associates | Investor Analytics |
| New York, NY | Scottsdale, AZ |
| |
| Lucinda S. Landreth | |
| Former Chief Investment Officer | |
| Assurant, Inc. | |
| Philadelphia, PA | |
42
| Affiliated officers | Contact information |
| |
| David F. Connor | Investment manager |
| Vice President, Deputy General Counsel, and | Delaware Management Company, a series of |
| Secretary | Delaware Management Business Trust |
| Delaware Investments® Family of Funds | Philadelphia, PA |
| Philadelphia, PA | |
| National distributor |
| Daniel V. Geatens | Delaware Distributors, L.P. |
| Vice President and Treasurer | Philadelphia, PA |
| Delaware Investments Family of Funds | |
| Philadelphia, PA | Shareholder servicing, dividend disbursing, |
| and transfer agent |
| David P. O’Connor | Delaware Service Company, Inc. |
| Senior Vice President, General Counsel, | 2005 Market Street |
| and Chief Legal Officer | Philadelphia, PA 19103-7094 |
| Delaware Investments Family of Funds | |
| Philadelphia, PA | For shareholders |
| 800 523-1918 |
| Richard Salus | |
| Senior Vice President and | For securities dealers and financial |
| Chief Financial Officer | institutions representatives only |
| Delaware Investments Family of Funds | 800 362-7500 |
| Philadelphia, PA | |
| Web site |
| www.delawareinvestments.com |
Delaware Investments is the marketing name of Delaware Management Holdings, Inc. and its subsidiaries.
The Fund files its complete schedule of portfolio holdings with the Securities and Exchange Commission for the first and third quarters of each fiscal year on Form N-Q. The Fund’s Forms N-Q, as well as a description of the policies and procedures that the Fund uses to determine how to vote proxies (if any) relating to portfolio securities are available without charge (i) upon request, by calling 800 523-1918; and (ii) on the Commission’s Web site at www.sec.gov. In addition, a description of the policies and procedures that the Fund uses to determine how to vote proxies (if any) relating to portfolio securities and the Fund’s Schedule of Investments are available without charge on the Fund’s Web site at www.delawareinvestments.com. The Fund’s Forms N-Q may be reviewed and copied at the Commission’s Public Reference Room in Washington, D.C.; information on the operation of the Public Reference Room may be obtained by calling 800 SEC-0330.
Information (if any) regarding how the Fund voted proxies relating to portfolio securities during the most recently disclosed 12-month period ended June 30 is available without charge (i) through the Fund’s Web site at www.delawareinvestments.com; and (ii) on the Commission’s Web site at www.sec.gov.
43
Item 2. Code of Ethics
The registrant has adopted a code of ethics that applies to the registrant’s principal executive officer, principal financial officer, principal accounting officer or controller, or persons performing similar functions, regardless of whether these individuals are employed by the registrant or a third party. A copy of the registrant’s Code of Business Ethics has been posted on the Delaware Investments Internet Web site at www.delawareinvestments.com. Any amendments to the Code of Business Ethics, and information on any waiver from its provisions granted by the registrant, will also be posted on this Web site within five business days of such amendment or waiver and will remain on the Web site for at least 12 months.
Item 3. Audit Committee Financial Expert
The registrant’s Board of Trustees/Directors has determined that each member of the registrant’s Audit Committee is an audit committee financial expert, as defined below. For purposes of this item, an “audit committee financial expert” is a person who has the following attributes:
a. An understanding of generally accepted accounting principles and financial statements;
b. The ability to assess the general application of such principles in connection with the accounting for estimates, accruals, and reserves;
c. Experience preparing, auditing, analyzing, or evaluating financial statements that present a breadth and level of complexity of accounting issues that are generally comparable to the breadth and complexity of issues that can reasonably be expected to be raised by the registrant’s financial statements, or experience actively supervising one or more persons engaged in such activities;
d. An understanding of internal controls and procedures for financial reporting; and
e. An understanding of audit committee functions.
An “audit committee financial expert” shall have acquired such attributes through:
a. Education and experience as a principal financial officer, principal accounting officer, controller, public accountant, or auditor or experience in one or more positions that involve the performance of similar functions;
b. Experience actively supervising a principal financial officer, principal accounting officer, controller, public accountant, auditor, or person performing similar functions;
c. Experience overseeing or assessing the performance of companies or public accountants with respect to the preparation, auditing, or evaluation of financial statements; or
d. Other relevant experience.
The registrant’s Board of Trustees/Directors has also determined that each member of the registrant’s Audit Committee is independent. In order to be “independent” for purposes of this item, the Audit Committee member may not: (i) other than in his or her capacity as a member of the Board of Trustees/Directors or any committee thereof, accept directly or indirectly any consulting, advisory or other compensatory fee from the issuer; or (ii) be an “interested person” of the registrant as defined in Section 2(a)(19) of the Investment Company Act of 1940.
The names of the audit committee financial experts on the registrant’s Audit Committee are set forth below:
Thomas L. Bennett 1
John A. Fry
Thomas F. Madison
J. Richard Zecher
Item 4. Principal Accountant Fees and Services
(a) Audit fees.
The aggregate fees billed for services provided to the registrant by its independent auditors for the audit of the registrant’s annual financial statements and for services normally provided by the independent auditors in connection with statutory and regulatory filings or engagements were $29,400 for the fiscal year ended April 30, 2009.
_______________________
1 The instructions to Form N-CSR require disclosure on the relevant experience of persons who qualify as audit committee financial experts based on “other relevant experience.” The Board of Trustees/Directors has determined that Mr. Bennett qualifies as an audit committee financial expert by virtue of his education, Chartered Financial Analyst designation, and his experience as a credit analyst, portfolio manager and the manager of other credit analysts and portfolio managers.
The aggregate fees billed for services provided to the registrant by its independent auditors for the audit of the registrant’s annual financial statements and for services normally provided by the independent auditors in connection with statutory and regulatory filings or engagements were $30,600 for the fiscal year ended April 30, 2008.
(b) Audit-related fees.
The aggregate fees billed by the registrant’s independent auditors for services relating to the performance of the audit of the registrant’s financial statements and not reported under paragraph (a) of this Item were $0 for the fiscal year ended April 30, 2009.
The aggregate fees billed by the registrant’s independent auditors for services relating to the performance of the audit of the financial statements of the registrant’s investment adviser and other service providers under common control with the adviser and that relate directly to the operations or financial reporting of the registrant were $19,074 for the registrant’s fiscal year ended April 30, 2009. The percentage of these fees relating to services approved by the registrant’s Audit Committee pursuant to the de minimis exception from the pre-approval requirement in Rule 2-01(c)(7)(i)(C) of Regulation S-X was 0%. These audit-related services were as follows: issuance of report concerning transfer agent’s system of internal accounting control pursuant to Rule 17Ad-13 of the Securities Exchange Act.
The aggregate fees billed by the registrant’s independent auditors for services relating to the performance of the audit of the registrant’s financial statements and not reported under paragraph (a) of this Item were $0 for the registrant’s fiscal year ended April 30, 2008.
The aggregate fees billed by the registrant’s independent auditors for services relating to the performance of the audit of the financial statements of the registrant’s investment adviser and other service providers under common control with the adviser and that relate directly to the operations or financial reporting of the registrant were $19,074 for the registrant’s fiscal year ended April 30, 2008. The percentage of these fees relating to services approved by the registrant’s Audit Committee pursuant to the de minimis exception from the pre-approval requirement in Rule 2-01(c)(7)(i)(C) of Regulation S-X was 0%. These audit-related services were as follows: issuance of report concerning transfer agent’s system of internal accounting control pursuant to Rule 17Ad-13 of the Securities Exchange Act.
(c) Tax fees.
The aggregate fees billed by the registrant’s independent auditors for tax-related services provided to the registrant were $7,900 for the fiscal year ended April 30, 2009. The percentage of these fees relating to services approved by the registrant’s Audit Committee pursuant to the de minimis exception from the pre-approval requirement in Rule 2-01(c)(7)(i)(C) of Regulation S-X was 0%. These tax-related services were as follows: review of income tax returns and review of annual excise distribution calculations.
The aggregate fees billed by the registrant’s independent auditors for tax-related services provided to the registrant’s investment adviser and other service providers under common control with the adviser and that relate directly to the operations or financial reporting of the registrant were $0 for the registrant’s fiscal year ended April 30, 2009.
The aggregate fees billed by the registrant’s independent auditors for tax-related services provided to the registrant were $9,000 for the fiscal year ended April 30, 2008. The percentage of these fees relating to services approved by the registrant’s Audit Committee pursuant to the de minimis exception from the pre-approval requirement in Rule 2-01(c)(7)(i)(C) of Regulation S-X was 0%. These tax-related services were as follows: review of income tax returns and review of annual excise distribution calculations.
The aggregate fees billed by the registrant’s independent auditors for tax-related services provided to the registrant’s adviser and other service providers under common control with the adviser and that relate directly to the operations or financial reporting of the registrant were $0 for the registrant’s fiscal year ended April 30, 2008.
(d) All other fees.
The aggregate fees billed for all services provided by the independent auditors to the registrant other than those set forth in paragraphs (a), (b) and (c) of this Item were $0 for the fiscal year ended April 30, 2009.
The aggregate fees billed for all services other than those set forth in paragraphs (b) and (c) of this Item provided by the registrant’s independent auditors to the registrant’s adviser and other service providers under common control with the adviser and that relate directly to the operations or financial reporting of the registrant were $0 for the registrant’s fiscal year ended April 30, 2009.
The aggregate fees billed for all services provided by the independent auditors to the registrant other than those set forth in paragraphs (a), (b) and (c) of this Item were $0 for the fiscal year ended April 30, 2008.
The aggregate fees billed for all services other than those set forth in paragraphs (b) and (c) of this Item provided by the registrant’s independent auditors to the registrant’s adviser and other service providers under common control with the adviser and that relate directly to the operations or financial reporting of the registrant were $0 for the registrant’s fiscal year ended April 30, 2008.
(e) The registrant’s Audit Committee has established pre-approval policies and procedures as permitted by Rule 2-01(c)(7)(i)(B) of Regulation S-X (the “Pre-Approval Policy”) with respect to services provided by the registrant’s independent auditors. Pursuant to the Pre-Approval Policy, the Audit Committee has pre-approved the services set forth in the table below with respect to the registrant up to the specified fee limits. Certain fee limits are based on aggregate fees to the registrant and other registrants within the Delaware Investments Family of Funds.
| Service | Range of Fees |
| Audit Services | |
Statutory audits or financial audits for new Funds | up to $25,000 per Fund |
| Services associated with SEC registration statements (e.g., Form N-1A, Form N-14, etc.), periodic reports and other documents filed with the SEC or other documents issued in connection with securities offerings (e.g., comfort letters for closed-end Fund offerings, consents), and assistance in responding to SEC comment letters | up to $10,000 per Fund |
| Consultations by Fund management as to the accounting or disclosure treatment of transactions or events and/or the actual or potential impact of final or proposed rules, standards or interpretations by the SEC, FASB, or other regulatory or standard-setting bodies (Note: Under SEC rules, some consultations may be considered “audit-related services” rather than “audit services”) | up to $25,000 in the aggregate |
| Audit-Related Services | |
| Consultations by Fund management as to the accounting or disclosure treatment of transactions or events and /or the actual or potential impact of final or proposed rules, standards or interpretations by the SEC, FASB, or other regulatory or standard-setting bodies (Note: Under SEC rules, some consultations may be considered “audit services” rather than “audit-related services”) | up to $25,000 in the aggregate |
| Tax Services | |
| U.S. federal, state and local and international tax planning and advice (e.g., consulting on statutory, regulatory or administrative developments, evaluation of Funds’ tax compliance function, etc.) | up to $25,000 in the aggregate |
| U.S. federal, state and local tax compliance (e.g., excise distribution reviews, etc.) | up to $5,000 per Fund |
| Review of federal, state, local and international income, franchise and other tax returns | up to $5,000 per Fund |
Under the Pre-Approval Policy, the Audit Committee has also pre-approved the services set forth in the table below with respect to the registrant’s investment adviser and other entities controlling, controlled by or under common control with the investment adviser that provide ongoing services to the registrant (the “Control Affiliates”) up to the specified fee limit. This fee limit is based on aggregate fees to the investment adviser and its Control Affiliates.
| Service | Range of Fees |
| Non-Audit Services | |
| Services associated with periodic reports and other documents filed with the SEC and assistance in responding to SEC comment letters | up to $10,000 in the aggregate |
The Pre-Approval Policy requires the registrant’s independent auditors to report to the Audit Committee at each of its regular meetings regarding all services initiated since the last such report was rendered, including those services authorized by the Pre-Approval Policy.
(f) Not applicable.
(g) The aggregate non-audit fees billed by the registrant’s independent auditors for services rendered to the registrant and to its investment adviser and other service providers under common control with the adviser were $259,902 and $263,362 for the registrant’s fiscal years ended April 30, 2009 and April 30, 2008, respectively.
(h) In connection with its selection of the independent auditors, the registrant’s Audit Committee has considered the independent auditors’ provision of non-audit services to the registrant’s investment adviser and other service providers under common control with the adviser that were not required to be pre-approved pursuant to Rule 2-01(c)(7)(ii) of Regulation S-X. The Audit Committee has determined that the independent auditors’ provision of these services is compatible with maintaining the auditors’ independence.
Item 5. Audit Committee of Listed Registrants
Not applicable.
Item 6. Investments
(a) Included as part of report to shareholders filed under Item 1 of this Form N-CSR.
(b) Divestment of securities in accordance with Section 13(c) of the Investment Company Act of 1940.
Not applicable.
Item 7. Disclosure of Proxy Voting Policies and Procedures for Closed-End Management Investment Companies
Not applicable.
Item 8. Portfolio Managers of Closed-End Management Investment Companies
Not applicable.
Item 9. Purchases of Equity Securities by Closed-End Management Investment Company and Affiliated Purchasers
Not applicable.
Item 10. Submission of Matters to a Vote of Security Holders Not applicable.
Item 11. Controls and Procedures
The registrant’s principal executive officer and principal financial officer have evaluated the registrant’s disclosure controls and procedures within 90 days of the filing of this report and have concluded that they are effective in providing reasonable assurance that the information required to be disclosed by the registrant in its reports or statements filed under the Securities Exchange Act of 1934 is recorded, processed, summarized and reported within the time periods specified in the rules and forms of the Securities and Exchange Commission.
There were no significant changes in the registrant’s internal control over financial reporting that occurred during the second fiscal quarter of the period covered by the report to stockholders included herein (i.e., the registrant’s fourth fiscal quarter) that have materially affected, or are reasonably likely to materially affect, the registrant’s internal control over financial reporting.
Item 12. Exhibits
(a) (1) Code of Ethics
Not applicable.
(2) Certifications of Principal Executive Officer and Principal Financial Officer pursuant to Rule 30a-2 under the Investment Company Act of 1940 are attached hereto as Exhibit 99.CERT.
(3) Written solicitations to purchase securities pursuant to Rule 23c-1 under the Securities Exchange Act of 1934.
Not applicable.
(b) Certifications pursuant to Section 906 of the Sarbanes-Oxley Act of 2002 are furnished herewith as Exhibit 99.906CERT.
SIGNATURES
Pursuant to the requirements of the Securities Exchange Act of 1934 and the Investment Company Act of 1940, the registrant has duly caused this report to be signed on its behalf, by the undersigned, thereunto duly authorized.
| Name of Registrant: |
| |
| PATRICK P. COYNE | |
| By: | Patrick P. Coyne |
| Title: | Chief Executive Officer |
| Date: | July 6, 2009 |
Pursuant to the requirements of the Securities Exchange Act of 1934 and the Investment Company Act of 1940, this report has been signed below by the following persons on behalf of the registrant and in the capacities and on the dates indicated.
| PATRICK P. COYNE | |
| By: | Patrick P. Coyne |
| Title: | Chief Executive Officer |
| Date: | July 6, 2009 |
| |
| |
| RICHARD SALUS | |
| By: | Richard Salus |
| Title: | Chief Financial Officer |
| Date: | July 6, 2009 |