UNITED STATES SECURITIES AND EXCHANGE COMMISSION
Washington, D.C. 20549
FORM N-CSR
CERTIFIED SHAREHOLDER REPORT OF REGISTERED
MANAGEMENT INVESTMENT COMPANIES
Investment Company Act file number: 811-04547
Exact name of registrant as specified in charter:
Voyageur Mutual Funds III
Address of principal executive offices:
2005 Market Street
Philadelphia, PA 19103
Name and address of agent for service:
David F. Connor, Esq.
2005 Market Street
Philadelphia, PA 19103
Registrant’s telephone number, including area code: (800) 523-1918
Date of fiscal year end: April 30
Date of reporting period: October 31, 2010
Item 1. Reports to Stockholders

Semiannual report Delaware Select Growth Fund October 31, 2010 Growth equity mutual fund |
This semiannual report is for the information of Delaware Select Growth Fund shareholders, but it may be used with prospective investors when preceded or accompanied by a current prospectus for Delaware Select Growth Fund. The figures in the semiannual report for Delaware Select Growth Fund represent past results, which are not a guarantee of future results. The return and principal value of an investment in the Fund will fluctuate so that shares, when redeemed, may be worth more or less than their original cost. Current performance may be higher or lower than the performance data quoted. You should consider the investment objectives, risks, charges, and expenses of the Fund carefully before investing. The Delaware Select Growth Fund prospectus contains this and other important information about the Fund. Prospectuses for all open-end funds in the Delaware Investments® Family of Funds are available from your financial advisor, online at www.delawareinvestments.com, or by phone at 800 523-1918. Please read the prospectus carefully before you invest or send money. |
You can obtain shareholder reports and prospectuses online instead of in the mail.
Visit www.delawareinvestments.com/edelivery. |
Experience Delaware Investments
Delaware Investments is committed to the pursuit of consistently superior asset management and unparalleled client service. We believe in our investment processes, which seek to deliver consistent results, and in convenient services that help add value for our clients.
If you are interested in learning more about creating an investment plan, contact your financial advisor.
You can learn more about Delaware Investments or obtain a prospectus for Delaware Select Growth Fund at www.delawareinvestments.com.
Manage your investments online
- 24-hour access to your account information
- Obtain share prices
- Check your account balance and recent transactions
- Request statements or literature
- Make purchases and redemptions
Delaware Management Holdings, Inc., and its subsidiaries (collectively known by the marketing name of Delaware Investments) are wholly owned subsidiaries of Macquarie Group Limited, a global provider of banking, financial, advisory, investment and funds management services.
Investments in Delaware Select Growth Fund are not and will not be deposits with or liabilities of Macquarie Bank Limited ABN 46 008 583 542 and its holding companies, including their subsidiaries or related companies (Macquarie Group), and are subject to investment risk, including possible delays in repayment and loss of income and capital invested. No Macquarie Group company guarantees or will guarantee the performance of the Fund, the repayment of capital from the Fund, or any particular rate of return.
| Table of contents | |
| Performance summary | 1 |
| Disclosure of Fund expenses | 4 |
| Sector allocation and top 10 holdings | 6 |
| Statement of net assets | 7 |
| Statement of operations | 12 |
| Statements of changes in net assets | 14 |
| Financial highlights | 16 |
| Notes to financial statements | 26 |
| Other Fund information | 38 |
| About the organization | 39 |
Unless otherwise noted, views expressed herein are current as of Oct. 31, 2010, and are subject to change.
Funds are not FDIC insured and are not guaranteed. It is possible to lose the principal amount invested.
Mutual fund advisory services provided by Delaware Management Company, a series of Delaware Management Business Trust, which is a registered investment advisor. Delaware Investments, a member of Macquarie Group, refers to Delaware Management Holdings, Inc. and its subsidiaries, including the Fund’s distributor, Delaware Distributors, L.P. Macquarie Group refers to Macquarie Group Limited and its subsidiaries and affiliates worldwide.
© 2010 Delaware Management Holdings, Inc.
All third-party trademarks cited are the property of their respective owners.
Performance summary
Delaware Select Growth Fund | October 31, 2010 |
The performance data quoted represent past performance; past performance does not guarantee future results. Investment return and principal value will fluctuate so your shares, when redeemed, may be worth more or less than their original cost. Please obtain the performance data current for the most recent month end by calling 800 523-1918 or visiting our Web site at www.delawareinvestments.com/performance. Current performance may be lower or higher than the performance data quoted.
Carefully consider the Fund’s investment objectives, risk factors, charges, and expenses before investing. This and other information can be found in the Fund’s prospectus and, if available, its summary prospectus, which may be obtained by visiting www.delawareinvestments.com or calling 800 523-1918. Investors should read the prospectus and, if available, the summary prospectus carefully before investing.
| Fund performance | | Average annual total returns through October 31, 2010 |
| | | 1 year | | 5 years | | 10 years | | Lifetime |
| Class A (Est. May 16, 1994) | | | | | | | | |
| Excluding sales charge | | +32.19% | | +3.98% | | -2.10% | | n/a |
| Including sales charge | | +24.58% | | +2.76% | | -2.68% | | n/a |
| Class B (Est. April 16, 1996) | | | | | | | | |
| Excluding sales charge | | +31.16% | | +3.20% | | -2.70% | | n/a |
| Including sales charge | | +27.16% | | +2.80% | | -2.70% | | n/a |
| Class C (Est. May 20, 1994) | | | | | | | | |
| Excluding sales charge | | +31.15% | | +3.20% | | -2.83% | | n/a |
| Including sales charge | | +30.15% | | +3.20% | | -2.83% | | n/a |
| Class R (Est. June 2, 2003) | | | | | | | | |
| Excluding sales charge | | +31.83% | | +3.72% | | n/a | | +6.76% |
| Including sales charge | | +31.83% | | +3.72% | | n/a | | +6.76% |
| Institutional Class (Est. Aug. 28, 1997) | | | | | | | | |
| Excluding sales charge | | +32.50% | | +4.24% | | -1.86% | | n/a |
| Including sales charge | | +32.50% | | +4.24% | | -1.86% | | n/a |
Returns reflect the reinvestment of all distributions and any applicable sales charges as noted in the following paragraphs.
Performance for Class B and C shares, excluding sales charges, assumes either that contingent deferred sales charges did not apply or that the investment was not redeemed.
Expense limitations were in effect for certain classes during the periods shown in the “Fund performance” chart and in the “Performance of a $10,000 investment” chart. The current expenses for each class are listed on the “Fund expense ratios” chart. (Note that all charts and graphs referred to in the “Performance summary” section of this report are found on pages 1 through 3.) Performance would have been lower had the expense limitations not been in effect.
The Fund offers Class A, B, C, R, and Institutional Class shares.
1
Performance summary
Delaware Select Growth Fund
Class A shares are sold with a maximum front-end sales charge of up to 5.75%, and have an annual distribution and service fee of up to 0.25% of average daily net assets.
Class B shares may only be purchased through dividend reinvestment and certain permitted exchanges as described in the prospectus. Please see the prospectus for additional information on Class B purchase and sales charges. Class B shares have a contingent deferred sales charge that declines from 4.00% to zero depending on the period of time the shares are held.
Class B shares will automatically convert to Class A shares on a quarterly basis approximately eight years after purchase. They are also subject to an annual distribution and service fee of up to 1.00% of average daily net assets.
Ten-year performance figures for Class B shares reflect conversion to Class A shares after approximately eight years.
Class C shares are sold with a contingent deferred sales charge of 1.00% if redeemed during the first 12 months. They are also subject to an annual distribution and service fee of up to 1.00% of average daily net assets.
Class R shares are available only for certain retirement plan products. They are sold without a sales charge and have an annual distribution and service fee of up to 0.60% of average daily net assets, which has been limited contractually to 0.50% from Aug. 28, 2010, through Aug. 28, 2011.
Institutional Class shares are available without sales or asset-based distribution charges only to certain eligible institutional accounts.
The “Fund performance” table and the “Performance of a $10,000 investment” graph do not reflect the deduction of taxes the shareholder would pay on Fund distributions or redemptions of Fund shares.
The Fund’s expense ratios, as described in the most recent prospectus, are disclosed in the following “Fund expense ratios” chart. Delaware Investments has agreed to reimburse certain expenses and/or waive certain fees in order to prevent total fund operating expenses from exceeding 1.24% of the Fund’s average daily net assets from Aug. 28, 2010, through Aug. 28, 2011. Please see the most recent prospectus and any applicable supplement(s) for additional information on these fee waivers and/or reimbursements.
| Fund expense ratios | Class A | | Class B | | Class C | | Class R | | Institutional Class |
| Total annual operating expenses | 1.73% | | 2.48% | | 2.48% | | 2.08% | | 1.48% |
| (without fee waivers) | | | | | | | | | |
| Net expenses | 1.49% | | 2.24% | | 2.24% | | 1.74% | | 1.24% |
| (including fee waivers, if any) | | | | | | | | | |
| Type of waiver | Contractual | | Contractual | | Contractual | | Contractual | | Contractual |
2
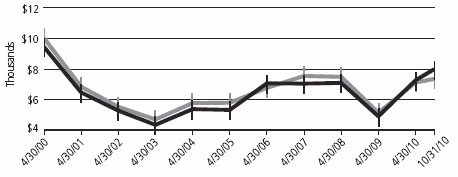
Performance of a $10,000 investment
April 30, 2000, through October 31, 2010
| For period beginning April 30, 2000, through October 31, 2010 | Starting value | Ending value |
| | Delaware Select Growth Fund — Class A shares | $9,425 | $7,961 |
| | Russell 3000® Growth Index | $10,000 | $7,330 |
The chart assumes $10,000 invested in the Fund on April 30, 2000, and includes the effect of a 5.75% front-end sales charge and the reinvestment of all distributions. Please note additional details on these fees in the “Performance summary” section of this report, which includes pages 1 through 3.
The chart also assumes $10,000 invested in the Russell 3000 Growth Index as of April 30, 2000.
The Russell 3000 Growth Index measures the performance of the broad growth segment of the U.S. equity universe. It includes those Russell 3000 companies with higher price-to-book ratios and higher forecasted growth values.
An index is unmanaged and does not reflect the costs of operating a mutual fund, such as the costs of buying, selling, and holding securities. You cannot invest directly in an index. Past performance is not a guarantee of future results.
Performance of other Fund classes will vary due to different charges and expenses.
The “Fund performance” chart and the “Performance of a $10,000 investment” graph do not reflect the deduction of taxes the shareholders would pay on Fund distributions or redemptions of Fund shares.
| | | Nasdaq symbols | | CUSIPs | |
| Class A | | | DVEAX | | | 928931104 | |
| Class B | | | DVEBX | | | 928931849 | |
| Class C | | | DVECX | | | 928931203 | |
| Class R | | | DFSRX | | | 928931740 | |
| Institutional Class | | | VAGGX | | | 928931757 | |
3
Disclosure of Fund expenses
For the six-month period from May 1, 2010 to October 31, 2010
As a shareholder of the Fund, you incur two types of costs: (1) transaction costs, including sales charges (loads) on purchase payments, reinvested dividends, or other distributions; redemption fees; and exchange fees; and (2) ongoing costs, including management fees; distribution and/or service (12b-1) fees; and other Fund expenses. This example is intended to help you understand your ongoing costs (in dollars) of investing in the Fund and to compare these costs with the ongoing costs of investing in other mutual funds.
The example is based on an investment of $1,000 invested at the beginning of the period and held for the entire six-month period from May 1, 2010 to October 31, 2010.
Actual expenses
The first section of the table shown, “Actual Fund return,” provides information about actual account values and actual expenses. You may use the information in this section of the table, together with the amount you invested, to estimate the expenses that you paid over the period. Simply divide your account value by $1,000 (for example, an $8,600 account value divided by $1,000 = 8.6), then multiply the result by the number in the first section under the heading entitled “Expenses Paid During Period” to estimate the expenses you paid on your account during this period.
Hypothetical example for comparison purposes
The second section of the table shown, “Hypothetical 5% return,” provides information about hypothetical account values and hypothetical expenses based on the Fund’s actual expense ratio and an assumed rate of return of 5% per year before expenses, which is not the Fund’s actual return. The hypothetical account values and expenses may not be used to estimate the actual ending account balance or expenses you paid for the period. You may use this information to compare the ongoing costs of investing in the Fund and other funds. To do so, compare this 5% hypothetical example with the 5% hypothetical examples that appear in the shareholder reports of the other funds.
Please note that the expenses shown in the table are meant to highlight your ongoing costs only and do not reflect any transactional costs, such as sales charges (loads), redemption fees, or exchange fees. Therefore, the second section of the table is useful in comparing ongoing costs only, and will not help you determine the relative total costs of owning different funds. In addition, if these transactional costs were included, your costs would have been higher. The Fund’s expenses shown in the table reflect fee waivers in effect. The expenses shown in the table assume reinvestment of all dividends and distributions.
4
Delaware Select Growth Fund
Expense analysis of an investment of $1,000
| | | Beginning | | Ending | | | | Expenses |
| | | Account Value | | Account Value | | Annualized | | Paid During Period |
| | | 5/1/10 | | 10/31/10 | | Expense Ratio | | 5/1/10 to 10/31/10* |
| Actual Fund return | | | | | | | | | | | | | | | | | | | | |
| Class A | | | $ | 1,000.00 | | | | $ | 1,099.10 | | | | 1.53 | % | | | | $ | 8.10 | |
| Class B | | | | 1,000.00 | | | | | 1,094.90 | | | | 2.28 | % | | | | | 12.04 | |
| Class C | | | | 1,000.00 | | | | | 1,094.70 | | | | 2.28 | % | | | | | 12.04 | |
| Class R | | | | 1,000.00 | | | | | 1,097.70 | | | | 1.78 | % | | | | | 9.41 | |
| Institutional Class | | | | 1,000.00 | | | | | 1,100.30 | | | | 1.28 | % | | | | | 6.78 | |
| Hypothetical 5% return (5% return before expenses) | | | | | | | | | | | |
| Class A | | | $ | 1,000.00 | | | | $ | 1,017.49 | | | | 1.53 | % | | | | $ | 7.78 | |
| Class B | | | | 1,000.00 | | | | | 1,013.71 | | | | 2.28 | % | | | | | 11.57 | |
| Class C | | | | 1,000.00 | | | | | 1,013.71 | | | | 2.28 | % | | | | | 11.57 | |
| Class R | | | | 1,000.00 | | | | | 1,016.23 | | | | 1.78 | % | | | | | 9.05 | |
| Institutional Class | | | | 1,000.00 | | | | | 1,018.75 | | | | 1.28 | % | | | | | 6.51 | |
*“Expenses Paid During Period” are equal to the Fund’s annualized expense ratio, multiplied by the average account value over the period, multiplied by 184/365 (to reflect the one-half year period).
5
Sector allocation and top 10 holdings
Delaware Select Growth Fund | As of October 31, 2010 |
Sector designations may be different than the sector designations presented in other Fund materials. The sector designations may represent the investment manager’s internal sector classifications, which may result in the sector designations for one fund being different than another fund’s sector designations.
| Sector | Percentage of net assets |
| Common Stock² | 97.32 | % |
| Consumer Discretionary | 19.95 | % |
| Consumer Staples | 4.56 | % |
| Energy | 4.17 | % |
| Financial Services | 15.86 | % |
| Healthcare | 15.77 | % |
| Materials & Processing | 2.93 | % |
| Producer Durables | 1.03 | % |
| Technology | 31.80 | % |
| Utilities | 1.25 | % |
| Preferred Stock | 2.34 | % |
| Discount Note | 0.61 | % |
| Securities Lending Collateral | 12.17 | % |
| Total Value of Securities | 112.44 | % |
| Obligation to Return Securities Lending Collateral | (12.53 | %) |
| Receivables and Other Assets Net of Liabilities | 0.09 | % |
| Total Net Assets | 100.00 | % |
²Narrow industries are utilized for compliance purposes for diversification whereas broad sectors are used for financial reporting.
Holdings are for informational purposes only and are subject to change at any time. They are not a recommendation to buy, sell, or hold any security.
| Top 10 holdings | Percentage of net assets |
| Apple | 8.55 | % |
| priceline.com | 4.43 | % |
| MasterCard Class A | 4.26 | % |
| Apollo Group Class A | 3.68 | % |
| Peet’s Coffee & Tea | 3.63 | % |
| Strayer Education | 3.61 | % |
| Polycom | 3.58 | % |
| Medco Health Solutions | 3.33 | % |
| Allergan | 3.32 | % |
| IntercontinentalExchange | 3.15 | % |
6
| Statement of net assets |
| Delaware Select Growth Fund | October 31, 2010 (Unaudited) |
| | | Number of shares | | Value |
| Common Stock – 97.32%² | | | | |
| Consumer Discretionary – 19.95% | | | | |
| † | Apollo Group Class A | 419,300 | | $ | 15,715,364 |
| † | DineEquity | 56,600 | | | 2,515,870 |
| | Intertek Group | 92,300 | | | 2,741,666 |
| † | Interval Leisure Group | 364,300 | | | 5,227,705 |
| | Lowe’s | 292,300 | | | 6,234,759 |
| | LVMH Moet Hennessy Louis Vuitton | 9,200 | | | 1,441,690 |
| *† | NetFlix | 16,650 | | | 2,888,775 |
| | NIKE Class B | 39,150 | | | 3,188,376 |
| † | priceline.com | 50,200 | | | 18,915,862 |
| * | Ritchie Bros Auctioneers | 135,900 | | | 2,878,362 |
| | Staples | 87,800 | | | 1,797,266 |
| * | Strayer Education | 110,150 | | | 15,402,275 |
| * | Weight Watchers International | 185,600 | | | 6,215,744 |
| | | | | | 85,163,714 |
| Consumer Staples – 4.56% | | | | |
| *† | Peet’s Coffee & Tea | 404,600 | | | 15,475,950 |
| *† | Whole Foods Market | 100,400 | | | 3,990,900 |
| | | | | | 19,466,850 |
| Energy – 4.17% | | | | |
| * | Core Laboratories | 78,795 | | | 6,127,887 |
| | Energy Transfer Equity | 45,000 | | | 1,760,400 |
| | EOG Resources | 103,750 | | | 9,930,950 |
| | | | | | 17,819,237 |
| Financial Services – 15.86% | | | | |
| † | Affiliated Managers Group | 103,700 | | | 8,877,757 |
| | Bank of New York Mellon | 56,906 | | | 1,426,064 |
| | BM&F Bovespa | 94,600 | | | 788,519 |
| † | CB Richard Ellis Group Class A | 130,600 | | | 2,396,510 |
| | CME Group | 28,150 | | | 8,153,648 |
| | Heartland Payment Systems | 275,300 | | | 3,931,284 |
| † | IntercontinentalExchange | 117,225 | | | 13,465,636 |
| | MasterCard Class A | 75,800 | | | 18,196,547 |
| † | MSCI Class A | 125,900 | | | 4,513,515 |
| † | optionsXpress Holdings | 82,800 | | | 1,322,316 |
| * | Visa Class A | 59,100 | | | 4,619,847 |
| | | | | | 67,691,643 |
7
Statement of net assets
Delaware Select Growth Fund
| | | Number of shares | | Value |
| Common Stock (continued) | | | | |
| Healthcare – 15.77% | | | | |
| † | ABIOMED | 169,500 | | $ | 1,747,545 |
| | Allergan | 195,900 | | | 14,185,119 |
| *† | athenahealth | 150,900 | | | 6,031,473 |
| † | Gilead Sciences | 213,800 | | | 8,481,446 |
| † | Medco Health Solutions | 270,450 | | | 14,206,739 |
| | Novo Nordisk ADR | 74,700 | | | 7,828,560 |
| * | Perrigo | 198,958 | | | 13,107,353 |
| | Techne | 28,100 | | | 1,711,852 |
| | | | | | 67,300,087 |
| Materials & Processing – 2.93% | | | | |
| * | BHP Billiton ADR | 18,750 | | | 1,548,563 |
| | Monsanto | 9,400 | | | 558,548 |
| | Newmont Mining | 65,200 | | | 3,968,724 |
| | Syngenta ADR | 116,300 | | | 6,440,694 |
| | | | | | 12,516,529 |
| Producer Durables – 1.03% | | | | |
| | Expeditors International Washington | 66,200 | | | 3,267,632 |
| | Nalco Holding | 39,418 | | | 1,110,799 |
| | | | | | 4,378,431 |
| Technology – 31.80% | | | | |
| † | Adobe Systems | 296,700 | | | 8,352,105 |
| † | Apple | 121,250 | | | 36,480,487 |
| † | Crown Castle International | 292,400 | | | 12,608,288 |
| | Ctrip.com International ADR | 80,200 | | | 4,176,014 |
| † | FLIR Systems | 55,800 | | | 1,553,472 |
| † | Google Class A | 9,450 | | | 5,792,756 |
| † | Intuit | 190,100 | | | 9,124,800 |
| † | Polycom | 452,700 | | | 15,292,205 |
| | QUALCOMM | 235,000 | | | 10,605,550 |
| *† | SBA Communications Class A | 147,500 | | | 5,790,850 |
| † | Teradata | 144,700 | | | 5,695,392 |
| *† | VeriFone Systems | 250,132 | | | 8,461,966 |
| *† | VeriSign | 339,850 | | | 11,809,788 |
| | | | | | 135,743,673 |
| Utilities – 1.25% | | | | |
| * | j2 Global Communications | 201,800 | | | 5,317,430 |
| | | | | | 5,317,430 |
| Total Common Stock (cost $333,520,919) | | | | 415,397,594 |
8
| | | Number of shares | | | Value | |
| Preferred Stock – 2.34% | | | | | |
| =† | MiaSole Series F | 2,310,286 | | $ | 10,000,073 | |
| Total Preferred Stock (cost $10,000,073) | | | | 10,000,073 | |
| | | | | | | |
| | | Principal amount | | | | |
| ≠Discount Note – 0.61% | | | | | |
| | Federal Home Loan Bank 0.10% 11/1/10 | $2,614,023 | | | 2,614,023 | |
| Total Discount Note (cost $2,614,023) | | | | 2,614,023 | |
| | |
| Total Value of Securities Before Securities | | | | | |
| | Lending Collateral – 100.27% (cost $346,135,015) | | | | 428,011,690 | |
| | | | | | | |
| | | Number of shares | | | | |
| Securities Lending Collateral** – 12.17% | | | | | |
| | Investment Companies | | | | | |
| | Delaware Investments Collateral Fund No. 1 | 50,193,112 | | | 50,193,112 | |
| | BNY Mellon SL DBT II Liquidating Fund | 1,714,659 | | | 1,664,659 | |
| | @†Mellon GSL Reinvestment Trust II | 1,569,222 | | | 81,129 | |
| Total Securities Lending Collateral (cost $53,476,993) | | | | 51,938,900 | |
| | |
| Total Value of Securities – 112.44% | | | | | |
| | (cost $399,612,008) | | | | 479,950,590 | © |
| Obligation to Return Securities | | | | | |
| | Lending Collateral** – (12.53%) | | | | (53,476,993 | ) |
| Receivables and Other Assets | | | | | |
| | Net of Liabilities – 0.09% | | | | 375,075 | |
| Net Assets Applicable to 14,246,571 | | | | | |
| | Shares Outstanding – 100.00% | | | $ | 426,848,672 | |
9
Statement of net assets
Delaware Select Growth Fund
| | | | |
| Net Asset Value – Delaware Select Growth Fund | | | |
| Class A ($241,037,403 / 7,846,608 Shares) | | | $30.72 | |
| Net Asset Value – Delaware Select Growth Fund | | | |
| Class B ($31,987,409 / 1,179,753 Shares) | | | $27.11 | |
| Net Asset Value – Delaware Select Growth Fund | | | |
| Class C ($64,402,010 / 2,401,183 Shares) | | | $26.82 | |
| Net Asset Value – Delaware Select Growth Fund | | | |
| Class R ($4,115,860 / 136,689 Shares) | | | $30.11 | |
| Net Asset Value – Delaware Select Growth Fund | | | |
| Institutional Class ($85,305,990 / 2,682,338 Shares) | | | $31.80 | |
| |
| Components of Net Assets at October 31, 2010: | | | |
| Shares of beneficial interest (unlimited authorization – no par) | $ | 642,774,832 | |
| Accumulated net realized loss on investments | | (296,264,742 | ) |
| Net unrealized appreciation of investments | | | |
| and foreign currencies | | 80,338,582 | |
| Total net assets | $ | 426,848,672 | |
| ² | Narrow industries are utilized for compliance purposes for diversification whereas broad sectors are used for financial reporting. |
| † | Non income producing security. |
| © | Includes $53,461,395 of securities loaned. |
| * | Fully or partially on loan. |
| ** | See Note 10 in “Notes to financial statements.” |
| ≠ | The rate shown is the effective yield at the time of purchase. |
| = | Security is being fair valued in accordance with the Fund’s fair valuation policy. At October 31, 2010, the aggregate amount of fair valued securities was $10,000,073, which represented 2.34% of the Fund’s net assets. See Note 1 in “Notes to financial statements.” |
| @ | Illiquid security. At October 31, 2010, the aggregate amount of illiquid securities was $81,129, which represented 0.02% of the Fund’s net assets. See Note 11 in “Notes to financial statements.” |
ADR — American Depositary Receipts
10
| | | |
| Net Asset Value and Offering Price Per Share – | | |
| Delaware Select Growth Fund | | |
| Net asset value Class A (A) | | $30.72 |
| Sales charge (5.75% of offering price) (B) | | 1.87 |
| Offering price | | $32.59 |
| (A) | | Net asset value per share, as illustrated, is the amount which would be paid upon redemption or repurchase of shares. |
| (B) | | See the current prospectus for purchase of $50,000 or more. |
See accompanying Notes, which are an integral part of the financial statements.
11
| Statement of operations |
| Delaware Select Growth Fund | Six Months Ended October 31, 2010 (Unaudited) |
| Investment Income: | | | | | | | |
| Dividends | $ | 515,263 | | | | | |
| Securities lending income | | 312,140 | | | | | |
| Interest | | 2,546 | | | | | |
| Foreign tax withheld | | (25,322 | ) | | $ | 804,627 | |
| |
| Expenses: | | | | | | | |
| Management fees | | 944,998 | | | | | |
| Dividend disbursing and transfer agent fees and expenses | | 593,878 | | | | | |
| Distribution expenses – Class A | | 184,492 | | | | | |
| Distribution expenses – Class B | | 68,886 | | | | | |
| Distribution expenses – Class C | | 149,217 | | | | | |
| Distribution expenses – Class R | | 2,994 | | | | | |
| Accounting and administration expenses | | 49,785 | | | | | |
| Legal fees | | 43,024 | | | | | |
| Reports and statements to shareholders | | 42,647 | | | | | |
| Registration fees | | 41,950 | | | | | |
| Dues and services | | 25,040 | | | | | |
| Consulting fees | | 23,723 | | | | | |
| Audit and tax | | 16,686 | | | | | |
| Custodian fees | | 7,143 | | | | | |
| Insurance fees | | 7,119 | | | | | |
| Trustees’ fees | | 4,787 | | | | | |
| Pricing fees | | 2,223 | | | | | |
| Trustees’ expenses | | 381 | | | | 2,208,973 | |
| Less fees waived | | | | | | (192,241 | ) |
| Less expense paid indirectly | | | | | | (1,249 | ) |
| Less waived distribution expenses – Class R | | | | | | (499 | ) |
| Total operating expenses | | | | | | 2,014,984 | |
| Net Investment Loss | | | | | | (1,210,357 | ) |
12
| Net Realized and Unrealized Gain (Loss) on Investments | | | |
| and Foreign Currencies: | | | |
| Net realized gain (loss) on: | | | |
| Investments | $ | 19,652,432 | |
| Foreign currencies | | (59,017 | ) |
| Foreign currency contracts | | (22,436 | ) |
| Net realized gain | | 19,570,979 | |
| Net change in unrealized appreciation/depreciation of | | | |
| investments and foreign currencies | | 7,910,071 | |
| Net Realized and Unrealized Gain on Investments | | | |
| and Foreign Currencies | | 27,481,050 | |
| |
| Net Increase in Net Assets Resulting from Operations | $ | 26,270,693 | |
See accompanying Notes, which are an integral part of the financial statements.
13
Statements of changes in net assets
Delaware Select Growth Fund
| | Six Months | | Year |
| | Ended | | Ended |
| | 10/31/10 | | 4/30/10 |
| | (Unaudited) | | | | |
| Increase (Decrease) in Net Assets from Operations: | | | | | | | |
| Net investment loss | $ | (1,210,357 | ) | | $ | (2,429,980 | ) |
| Net realized gain on investments and | | | | | | | |
| foreign currencies | | 19,570,979 | | | | 38,783,458 | |
| Net change in unrealized appreciation/depreciation | | | | | | | |
| of investments and foreign currencies | | 7,910,071 | | | | 63,092,292 | |
| Net increase in net assets resulting from operations | | 26,270,693 | | | | 99,445,770 | |
| |
| Capital Share Transactions: | | | | | | | |
| Proceeds from shares sold: | | | | | | | |
| Class A | | 8,652,842 | | | | 18,629,185 | |
| Class B | | 118,230 | | | | 206,648 | |
| Class C | | 1,042,241 | | | | 1,799,685 | |
| Class R | | 937,756 | | | | 252,368 | |
| Institutional Class | | 27,176,294 | | | | 90,342,397 | |
| |
| Net assets from merger*: | | | | | | | |
| Class A | | 82,721,925 | | | | — | |
| Class B | | 19,198,198 | | | | — | |
| Class C | | 33,357,785 | | | | — | |
| Class R | | 2,388,873 | | | | — | |
| Institutional Class | | 3,408,127 | | | | — | |
| | | 179,002,271 | | | | 111,230,283 | |
14
| | Six Months | | Year |
| | Ended | | Ended |
| | 10/31/10 | | 4/30/10 |
| | (Unaudited) | | |
| Capital Share Transactions (continued): | | | | | |
| Cost of shares repurchased: | | | | | | | |
| Class A | $ | (15,177,174 | ) | | $ | (26,291,216 | ) |
| Class B | | (3,653,251 | ) | | | (11,280,764 | ) |
| Class C | | (2,528,094 | ) | | | (5,500,832 | ) |
| Class R | | (152,395 | ) | | | (405,510 | ) |
| Institutional Class | | (5,901,136 | ) | | | (113,200,890 | ) |
| | | (27,412,050 | ) | | | (156,679,212 | ) |
| Increase (decrease) in net assets derived from | | | | | | | |
| capital share transactions | | 151,590,221 | | | | (45,448,929 | ) |
| Net Increase in Net Assets | | 177,860,914 | | | | 53,996,841 | |
| | | | | | | | |
| Net Assets: | | | | | | | |
| Beginning of period | | 248,987,758 | | | | 194,990,917 | |
| End of period (including accumulated net investment | | | | | | | |
| loss of $— and $92,972 respectively) | $ | 426,848,672 | | | $ | 248,987,758 | |
*See note 7 in “Notes to financial statements.”
See accompanying Notes, which are an integral part of the financial statements.
15
Financial highlights
Delaware Select Growth Fund Class A
Selected data for each share of the Fund outstanding throughout each period were as follows:
| Net asset value, beginning of period |
| |
| Income (loss) from investment operations: |
| Net investment loss2 |
| Net realized and unrealized gain (loss) on investments and foreign currencies |
| Total from investment operations |
| |
| Net asset value, end of period |
| |
| Total return3 |
| |
| Ratios and supplemental data: |
| Net assets, end of period (000 omitted) |
| Ratio of expenses to average net assets |
| Ratio of expenses to average net assets |
| prior to fees waived and expense paid indirectly |
| Ratio of net investment loss to average net assets |
| Ratio of net investment loss to average net assets |
| prior to fees waived and expense paid indirectly |
| Portfolio turnover |
1 Ratios have been annualized and total return and portfolio turnover have not been annualized. |
2 The average shares outstanding method has been applied for per share information. |
3 Total investment return is based on the change in net asset value of a share during the period and assumes reinvestment of dividends and distributions at net asset value and does not reflect the impact of a sales charge. Total investment return during all of the periods shown reflects a waiver by the manager. Performance would have been lower had the waiver not been in effect. |
See accompanying Notes, which are an integral part of the financial statements.
16
| | Six Months Ended | | | Year Ended | |
| | 10/31/101 | | | 4/30/10 | | 4/30/09 | | 4/30/08 | | 4/30/07 | | 4/30/06 | |
| | (Unaudited) | | | | | | | | | | | | | | | | | |
| | | $27.950 | | | | $18.860 | | | $27.300 | | | $27.110 | | | $27.180 | | | $20.470 | | |
| | | | | | | | | | | | | | | | | | | | | |
| | | | | | | | | | | | | | | | | | | | | |
| | | (0.122 | ) | | | (0.209 | ) | | (0.041 | ) | | (0.119 | ) | | (0.193 | ) | | (0.086 | ) | |
| | | 2.892 | | | | 9.299 | | | (8.399 | ) | | 0.309 | | | 0.123 | | | 6.796 | | |
| | | 2.770 | | | | 9.090 | | | (8.440 | ) | | 0.190 | | | (0.070 | ) | | 6.710 | | |
| | | | | | | | | | | | | | | | | | | | | |
| | | $30.720 | | | | $27.950 | | | $18.860 | | | $27.300 | | | $27.110 | | | $27.180 | | |
| | | | | | | | | | | | | | | | | | | | | |
| | | 9.91% | | | | 48.20% | | | (30.92% | ) | | 0.70% | | | (0.26% | ) | | 32.78% | | |
| | | | | | | | | | | | | | | | | | | | | |
| | | | | | | | | | | | | | | | | | | | | |
| | | $241,037 | | | | $150,016 | | | $106,919 | | | $157,366 | | | $160,170 | | | $187,319 | | |
| | | 1.53% | | | | 1.50% | | | 1.49% | | | 1.48% | | | 1.50% | | | 1.55% | | |
| | | | | | | | | | | | | | | | | | | | | |
| | | 1.68% | | | | 1.73% | | | 1.85% | | | 1.62% | | | 1.64% | | | 1.70% | | |
| | | (0.89% | ) | | | (0.89% | ) | | (0.20% | ) | | (0.42% | ) | | (0.77% | ) | | (0.35% | ) | |
| | | | | | | | | | | | | | | | | | | | | |
| | | (1.04% | ) | | | (1.12% | ) | | (0.56% | ) | | (0.56% | ) | | (0.91% | ) | | (0.50% | ) | |
| | | 28% | | | | 49% | | | 66% | | | 61% | | | 51% | | | 124% | | |
17
Financial highlights
Delaware Select Growth Fund Class B
Selected data for each share of the Fund outstanding throughout each period were as follows:
| Net asset value, beginning of period |
| |
| Income (loss) from investment operations: |
| Net investment loss2 |
| Net realized and unrealized gain (loss) on investments and foreign currencies |
| Total from investment operations |
| |
| Net asset value, end of period |
| |
| Total return3 |
| |
| Ratios and supplemental data: |
| Net assets, end of period (000 omitted) |
| Ratio of expenses to average net assets |
| Ratio of expenses to average net assets |
| prior to fees waived and expense paid indirectly |
| Ratio of net investment loss to average net assets |
| Ratio of net investment loss to average net assets |
| prior to fees waived and expense paid indirectly |
| Portfolio turnover |
1 Ratios have been annualized and total return and portfolio turnover have not been annualized. |
2 The average shares outstanding method has been applied for per share information. |
3 Total investment return is based on the change in net asset value of a share during the period and assumes reinvestment of dividends and distributions at net asset value and does not reflect the impact of a sales charge. Total investment return during all of the periods shown reflects a waiver by the manager. Performance would have been lower had the waiver not been in effect. |
See accompanying Notes, which are an integral part of the financial statements.
18
| | Six Months Ended | | | Year Ended | |
| | 10/31/101 | | | 4/30/10 | | 4/30/09 | | 4/30/08 | | 4/30/07 | | 4/30/06 | |
| | (Unaudited) | | | | | | | | | | | | | | | | | |
| | | $24.760 | | | | $16.830 | | | $24.550 | | | $24.560 | | | $24.810 | | | $18.820 | | |
| | | | | | | | | | | | | | | | | | | | | |
| | | | | | | | | | | | | | | | | | | | | |
| | | (0.211 | ) | | | (0.355 | ) | | (0.182 | ) | | (0.304 | ) | | (0.365 | ) | | (0.252 | ) | |
| | | 2.561 | | | | 8.285 | | | (7.538 | ) | | 0.294 | | | 0.115 | | | 6.242 | | |
| | | 2.350 | | | | 7.930 | | | (7.720 | ) | | (0.010 | ) | | (0.250 | ) | | 5.990 | | |
| | | | | | | | | | | | | | | | | | | | | |
| | | $27.110 | | | | $24.760 | | | $16.830 | | | $24.550 | | | $24.560 | | | $24.810 | | |
| | | | | | | | | | | | | | | | | | | | | |
| | | 9.49% | | | | 47.12% | | | (31.45% | ) | | (0.04% | ) | | (1.01% | ) | | 31.83% | | |
| | | | | | | | | | | | | | | | | | | | | |
| | | | | | | | | | | | | | | | | | | | | |
| | | $31,988 | | | | $15,012 | | | $19,222 | | | $67,344 | | | $126,866 | | | $199,863 | | |
| | | 2.28% | | | | 2.25% | | | 2.24% | | | 2.23% | | | 2.25% | | | 2.30% | | |
| | | | | | | | | | | | | | | | | | | | | |
| | | 2.43% | | | | 2.48% | | | 2.60% | | | 2.37% | | | 2.39% | | | 2.45% | | |
| | | (1.64% | ) | | | (1.64% | ) | | (0.95% | ) | | (1.17% | ) | | (1.52% | ) | | (1.10% | ) | |
| | | | | | | | | | | | | | | | | | | | | |
| | | (1.79% | ) | | | (1.87% | ) | | (1.31% | ) | | (1.31% | ) | | (1.66% | ) | | (1.25% | ) | |
| | | 28% | | | | 49% | | | 66% | | | 61% | | | 51% | | | 124% | | |
19
Financial highlights
Delaware Select Growth Fund Class C
Selected data for each share of the Fund outstanding throughout each period were as follows:
| Net asset value, beginning of period |
| |
| Income (loss) from investment operations: |
| Net investment loss2 |
| Net realized and unrealized gain (loss) on investments and foreign currencies |
| Total from investment operations |
| |
| Net asset value, end of period |
| |
| Total return3 |
| |
| Ratios and supplemental data: |
| Net assets, end of period (000 omitted) |
| Ratio of expenses to average net assets |
| Ratio of expenses to average net assets |
| prior to fees waived and expense paid indirectly |
| Ratio of net investment loss to average net assets |
| Ratio of net investment loss to average net assets |
| prior to fees waived and expense paid indirectly |
| Portfolio turnover |
1 Ratios have been annualized and total return and portfolio turnover have not been annualized. |
2 The average shares outstanding method has been applied for per share information. |
3 Total investment return is based on the change in net asset value of a share during the period and assumes reinvestment of dividends and distributions at net asset value and does not reflect the impact of a sales charge. Total investment return during all of the periods shown reflects a waiver by the manager. Performance would have been lower had the waiver not been in effect. |
See accompanying Notes, which are an integral part of the financial statements.
20
| | Six Months Ended | | | Year Ended | |
| | 10/31/101 | | | 4/30/10 | | 4/30/09 | | 4/30/08 | | 4/30/07 | | 4/30/06 | |
| | (Unaudited) | | | | | | | | | | | | | | | | | |
| | | $24.500 | | | | $16.650 | | | $24.290 | | | $24.300 | | | $24.540 | | | $18.620 | | |
| | | | | | | | | | | | | | | | | | | | | |
| | | | | | | | | | | | | | | | | | | | | |
| | | (0.210 | ) | | | (0.357 | ) | | (0.173 | ) | | (0.302 | ) | | (0.362 | ) | | (0.251 | ) | |
| | | 2.530 | | | | 8.207 | | | (7.467 | ) | | 0.292 | | | 0.122 | | | 6.171 | | |
| | | 2.320 | | | | 7.850 | | | (7.640 | ) | | (0.010 | ) | | (0.240 | ) | | 5.920 | | |
| | | | | | | | | | | | | | | | | | | | | |
| | | $26.820 | | | | $24.500 | | | $16.650 | | | $24.290 | | | $24.300 | | | $24.540 | | |
| | | | | | | | | | | | | | | | | | | | | |
| | | 9.47% | | | | 47.15% | | | (31.45% | ) | | (0.04% | ) | | (0.98% | ) | | 31.79% | | |
| | | | | | | | | | | | | | | | | | | | | |
| | | | | | | | | | | | | | | | | | | | | |
| | | $64,402 | | | | $29,502 | | | $23,030 | | | $44,972 | | | $59,271 | | | $84,458 | | |
| | | 2.28% | | | | 2.25% | | | 2.24% | | | 2.23% | | | 2.25% | | | 2.30% | | |
| | | | | | | | | | | | | | | | | | | | | |
| | | 2.43% | | | | 2.48% | | | 2.60% | | | 2.37% | | | 2.39% | | | 2.45% | | |
| | | (1.64% | ) | | | (1.64% | ) | | (0.95% | ) | | (1.17% | ) | | (1.52% | ) | | (1.10% | ) | |
| | | | | | | | | | | | | | | | | | | | | |
| | | (1.79% | ) | | | (1.87% | ) | | (1.31% | ) | | (1.31% | ) | | (1.66% | ) | | (1.25% | ) | |
| | | 28% | | | | 49% | | | 66% | | | 61% | | | 51% | | | 124% | | |
21
Financial highlights
Delaware Select Growth Fund Class R
Selected data for each share of the Fund outstanding throughout each period were as follows:
| Net asset value, beginning of period |
| |
| Income (loss) from investment operations: |
| Net investment loss2 |
| Net realized and unrealized gain (loss) on investments and foreign currencies |
| Total from investment operations |
| |
| Net asset value, end of period |
| |
| Total return3 |
| |
| Ratios and supplemental data: |
| Net assets, end of period (000 omitted) |
| Ratio of expenses to average net assets |
| Ratio of expenses to average net assets |
| prior to fees waived and expense paid indirectly |
| Ratio of net investment loss to average net assets |
| Ratio of net investment loss to average net assets |
| prior to fees waived and expense paid indirectly |
| Portfolio turnover |
1 Ratios have been annualized and total return and portfolio turnover have not been annualized. |
2 The average shares outstanding method has been applied for per share information. |
3 Total investment return is based on the change in net asset value of a share during the period and assumes reinvestment of dividends and distributions at net asset value. Total investment return during all of the periods shown reflects waivers by the manager and/or distributor. Performance would have been lower had the waivers not been in effect. |
See accompanying Notes, which are an integral part of the financial statements.
22
| | Six Months Ended | | Year Ended | |
| | 10/31/101 | | | 4/30/10 | | 4/30/09 | | 4/30/08 | | 4/30/07 | | 4/30/06 | |
| | (Unaudited) | | | | | | | | | | | | | | | | | |
| | | $27.430 | | | | $18.550 | | | $26.930 | | | $26.810 | | | $26.940 | | | $20.340 | | |
| | | | | | | | | | | | | | | | | | | | | |
| | | | | | | | | | | | | | | | | | | | | |
| | | (0.157 | ) | | | (0.265 | ) | | (0.092 | ) | | (0.188 | ) | | (0.257 | ) | | (0.154 | ) | |
| | | 2.837 | | | | 9.145 | | | (8.288 | ) | | 0.308 | | | 0.127 | | | 6.754 | | |
| | | 2.680 | | | | 8.880 | | | (8.380 | ) | | 0.120 | | | (0.130 | ) | | 6.600 | | |
| | | | | | | | | | | | | | | | | | | | | |
| | | $30.110 | | | | $27.430 | | | $18.550 | | | $26.930 | | | $26.810 | | | $26.940 | | |
| | | | | | | | | | | | | | | | | | | | | |
| | | 9.77% | | | | 47.87% | | | (31.12% | ) | | 0.45% | | | (0.48% | ) | | 32.45% | | |
| | | | | | | | | | | | | | | | | | | | | |
| | | | | | | | | | | | | | | | | | | | | |
| | | $4,116 | | | | $807 | | | $671 | | | $1,266 | | | $1,432 | | | $1,485 | | |
| | | 1.78% | | | | 1.75% | | | 1.74% | | | 1.73% | | | 1.75% | | | 1.82% | | |
| | | | | | | | | | | | | | | | | | | | | |
| | | 2.03% | | | | 2.08% | | | 2.20% | | | 1.97% | | | 1.99% | | | 2.05% | | |
| | | (1.14% | ) | | | (1.14% | ) | | (0.45% | ) | | (0.67% | ) | | (1.02% | ) | | (0.62% | ) | |
| | | | | | | | | | | | | | | | | | | | | |
| | | (1.39% | ) | | | (1.47% | ) | | (0.91% | ) | | (0.91% | ) | | (1.26% | ) | | (0.85% | ) | |
| | | 28% | | | | 49% | | | 66% | | | 61% | | | 51% | | | 124% | | |
23
Financial highlights
Delaware Select Growth Fund Institutional Class
Selected data for each share of the Fund outstanding throughout each period were as follows:
| Net asset value, beginning of period |
| |
| Income (loss) from investment operations: |
| Net investment income (loss)2 |
| Net realized and unrealized gain (loss) on investments and foreign currencies |
| Total from investment operations |
| |
| Net asset value, end of period |
| |
| Total return3 |
| |
| Ratios and supplemental data: |
| Net assets, end of period (000 omitted) |
| Ratio of expenses to average net assets |
| Ratio of expenses to average net assets |
| prior to fees waived and expense paid indirectly |
| Ratio of net investment income (loss) to average net assets |
| Ratio of net investment loss to average net assets |
| prior to fees waived and expense paid indirectly |
| Portfolio turnover |
1 Ratios have been annualized and total return and portfolio turnover have not been annualized. |
2 The average shares outstanding method has been applied for per share information. |
3 Total investment return is based on the change in net asset value of a share during the period and assumes reinvestment of dividends and distributions at net asset value. Total investment return during all of the periods shown reflects a waiver by the manager. Performance would have been lower had the waiver not been in effect. |
See accompanying Notes, which are an integral part of the financial statements.
24
| | Six Months Ended | | Year Ended | |
| | 10/31/101 | | | 4/30/10 | | 4/30/09 | | 4/30/08 | | 4/30/07 | | | 4/30/06 | |
| | (Unaudited) | | | | | | | | | | | | | | | | | |
| | | $28.900 | | | | $19.450 | | | $28.090 | | | $27.820 | | | $27.820 | | | $20.900 | | |
| | | | | | | | | | | | | | | | | | | | | |
| | | | | | | | | | | | | | | | | | | | | |
| | | (0.088 | ) | | | (0.150 | ) | | 0.010 | | | (0.048 | ) | | (0.128 | ) | | (0.024 | ) | |
| | | 2.988 | | | | 9.600 | | | (8.650 | ) | | 0.318 | | | 0.128 | | | 6.944 | | |
| | | 2.900 | | | | 9.450 | | | (8.640 | ) | | 0.270 | | | 0.000 | | | 6.920 | | |
| | | | | | | | | | | | | | | | | | | | | |
| | | $31.800 | | | | $28.900 | | | $19.450 | | | $28.090 | | | $27.820 | | | $27.820 | | |
| | | | | | | | | | | | | | | | | | | | | |
| | | 10.03% | | | | 48.59% | | | (30.76% | ) | | 0.97% | | | 0.00% | | | 33.11% | | |
| | | | | | | | | | | | | | | | | | | | | |
| | | | | | | | | | | | | | | | | | | | | |
| | | $85,306 | | | | $53,651 | | | $45,149 | | | $26,079 | | | $35,399 | | | $46,152 | | |
| | | 1.28% | | | | 1.25% | | | 1.24% | | | 1.23% | | | 1.25% | | | 1.30% | | |
| | | | | | | | | | | | | | | | | | | | | |
| | | 1.43% | | | | 1.48% | | | 1.60% | | | 1.37% | | | 1.39% | | | 1.45% | | |
| | | (0.64% | ) | | | (0.64% | ) | | 0.05% | | | (0.17% | ) | | (0.52% | ) | | (0.10% | ) | |
| | | | | | | | | | | | | | | | | | | | | |
| | | (0.79% | ) | | | (0.87% | ) | | (0.31% | ) | | (0.31% | ) | | (0.66% | ) | | (0.25% | ) | |
| | | 28% | | | | 49% | | | 66% | | | 61% | | | 51% | | | 124% | | |
25
| Notes to financial statements |
| Delaware Select Growth Fund | October 31, 2010 (Unaudited) |
Voyageur Mutual Funds III (Trust) is organized as a Delaware statutory trust and offers two series: Delaware Large Cap Core Fund and Delaware Select Growth Fund. These financial statements and the related notes pertain to Delaware Select Growth Fund (Fund). The Trust is an open-end investment company. The Fund is considered diversified under the Investment Company Act of 1940, as amended, and offers Class A, Class B, Class C, Class R and Institutional Class shares. Class A shares are sold with a maximum front-end sales charge of up to 5.75%. Class A share purchases of $1,000,000 or more will incur a contingent deferred sales charge (CDSC) of 1% if redeemed during the first year and 0.50% during the second year, provided that Delaware Distributors, L.P. (DDLP) paid a financial advisor a commission on the purchase of those shares. Class B shares may be purchased only through dividend reinvestment and certain permitted exchanges. Prior to Jun e 1, 2007, Class B shares were sold with a CDSC that declined from 4% to zero depending upon the period of time the shares were held. Class B shares will automatically convert to Class A shares on a quarterly basis approximately eight years after purchase. Class C shares are sold with a CDSC of 1%, if redeemed during the first twelve months. Class R and Institutional Class shares are not subject to a sales charge and are offered for sale exclusively to certain eligible investors.
The investment objective of the Fund is to seek long-term capital appreciation, which the Fund attempts to achieve by investing primarily in equity securities of companies the manager believes have the potential for sustainable free cash flow growth.
1. Significant Accounting Policies
The following accounting policies are in accordance with U.S. generally accepted accounting principles (U.S. GAAP) and are consistently followed by the Fund.
Security Valuation — Equity securities, except those traded on the Nasdaq Stock Market, Inc. (Nasdaq), are valued at the last quoted sales price as of the time of the regular close of the New York Stock Exchange (NYSE) on the valuation date. Securities traded on the Nasdaq are valued in accordance with the Nasdaq Official Closing Price, which may not be the last sales price. If on a particular day an equity security does not trade, then the mean between the bid and ask prices will be used. Securities listed on a foreign exchange are valued at the last quoted sales price on the valuation date. Investment company securities are valued at net asset value per share. Short-term debt securities are valued at market value. Generally, other securities and assets for which market quotations are not readily available are valued at fair value as determined in good faith under the direction of the Fund’s Board of Trustees (Board). In determining whether market quotations are readily available or fair valuation will be used, various factors will be taken into consideration, such as market closures or suspension of trading in a security. The Fund may use fair value pricing more frequently for securities traded primarily in non-U.S. markets because, among other things, most foreign markets close well before the Fund values its securities generally at 4:00 p.m. Eastern time. The earlier close of these foreign markets gives rise to the possibility that significant events, including broad market moves, government actions or pronouncements, aftermarket
26
trading, or news events may have occurred in the interim. To account for this, the Fund may frequently value foreign securities using fair value prices based on third-party vendor modeling tools (international fair value pricing).
Federal Income Taxes — No provision for federal income taxes has been made as the Fund intends to continue to qualify for federal income tax purposes as a regulated investment company under Subchapter M of the Internal Revenue Code of 1986, as amended, and make the requisite distributions to shareholders. The Fund evaluates tax positions taken or expected to be taken in the course of preparing the Fund’s tax returns to determine whether the tax positions are “more-likely-than-not” of being sustained by the applicable tax authority. Tax positions not deemed to meet the more-likely-than-not threshold are recorded as a tax benefit or expense in the current year. Management has analyzed the Fund’s tax positions taken on federal income tax returns for all open tax years (April 30, 2007 – April 30 , 2010), and has concluded that no provision for federal income tax is required in the Fund’s financial statements.
Class Accounting — Investment income, common expenses and realized and unrealized gain (loss) on investments are allocated to the various classes of the Fund on the basis of daily net assets of each class. Distribution expenses relating to a specific class are charged directly to that class.
Foreign Currency Transactions — Transactions denominated in foreign currencies are recorded at the prevailing exchange rates on the valuation date in accordance with the Fund’s prospectus. The value of all assets and liabilities denominated in foreign currencies is translated into U.S. dollars at the exchange rate of such currencies against the U.S. dollar daily. Transaction gains or losses resulting from changes in exchange rates during the reporting period or upon settlement of the foreign currency transaction are reported in operations for the current period. The Fund does not isolate that portion of realized gains and losses on investments which are due to changes in foreign exchange rates from that which are due to changes in market prices. Such changes are included with the net realized and unrealized gain or loss on investments. The Fund reports certain foreign currency related transactions as components of realized gains (losses) for financial reporting purposes, whereas such components are treated as ordinary income (loss) for federal income tax purposes.
Use of Estimates — The preparation of financial statements in conformity with U.S. GAAP requires management to make estimates and assumptions that affect the reported amounts of assets and liabilities and disclosure of contingent assets and liabilities at the date of the financial statements and the reported amounts of revenues and expenses during the reporting period. Actual results could differ from those estimates and such differences could be material.
Other — Expenses directly attributable to the Fund are charged directly to the Fund. Other expenses common to various funds within the Delaware Investments® Family of Funds are generally allocated amongst such funds on the basis of average net assets. Management fees
27
Notes to financial statements
Delaware Select Growth Fund
1. Significant Accounting Policies (continued)
and some other expenses are paid monthly. Security transactions are recorded on the date the securities are purchased or sold (trade date) for financials reporting purposes. Costs used in calculating realized gains and losses on the sale of investment securities are those of the specific securities sold. Dividend income is recorded on the ex-dividend date and interest income is recorded on the accrual basis. Taxable non-cash dividends are recorded as dividend income. Foreign dividends are also recorded on the ex-dividend date or as soon after the ex-dividend date that the Fund is aware of such dividends, net of all non-rebatable tax withholdings. Withholding taxes on foreign dividends have been recorded in accordance with the Fund’s understanding of the applicable country’s tax rules and rates. The Fund declares and pays dividends from net investment income and distributions from net realized gain on investments, if any, annual ly. Such dividends and distributions, if any, are recorded on the ex-dividend date.
Subject to seeking best execution, the Fund may direct certain security trades to brokers who have agreed to rebate a portion of the related brokerage commission to the Fund in cash. Such commission rebates are included in realized gain on investments in the accompanying financial statements and totaled $2,941 for the six months ended October 31, 2010. In general, best execution refers to many factors, including the price paid or received for a security, the commission charged, the promptness and reliability of execution, the confidentiality and placement accorded the order, and other factors affecting the overall benefit obtained by the Fund on the transaction.
The Fund may receive earnings credits from its custodian when positive cash balances are maintained, which are used to offset custody fees. There were no earnings credits for the six months ended October 31, 2010.
The Fund receives earnings credits from its transfer agent when positive cash balances are maintained, which may be used to offset transfer agent fees. The expense paid under this arrangement is included in dividend disbursing and transfer agent fees and expenses on the statement of operations with the corresponding expense offset shown as “expense paid indirectly.” For the six months ended October 31, 2010, the Fund earned $ 1,249 under this agreement.
2. Investment Management, Administration Agreements and Other Transactions with Affiliates
In accordance with the terms of its investment management agreement, the Fund pays Delaware Management Company (DMC), a series of Delaware Management Business Trust and the investment manager, an annual fee which is calculated daily at the rate of 0.75% on the first $500 million of average daily net assets of the Fund, 0.70% on the next $500 million, 0.65% on the next $1.5 billion, and 0.60% on average daily net assets in excess of $2.5 billion.
28
Effective August 28, 2010, DMC has contractually agreed to waive that portion, if any, of its management fee and reimburse the Fund to the extent necessary to prevent total annual fund operating expenses (excluding any 12b-1 plan expenses, taxes, interest, inverse floater program expenses, short sale and dividend interest expenses, brokerage fees, certain insurance costs, and nonroutine expenses or costs, including, but not limited to, those relating to reorganizations, litigation, conducting shareholder meetings, and liquidations) from exceeding 1.24% of the Fund’s average daily net assets through October 24, 2011. Prior to August 28, 2010, DMC had voluntarily agreed to waive its management fees to the extent necessary to ensure that total annual expenses (excluding any 12b-1 plan expenses, taxes, interest, inverse floater program expenses, brokerage fees, certain insurance costs, and nonroutine expenses or costs including, but not limited to, those relating to reorganizations, litigation, conducting shareholder meetings, and liquidations) did not exceed 1.25% of average daily net assets of the Fund. These waivers and reimbursements may only be terminated by agreement of the Manager and the Fund.
Delaware Service Company, Inc. (DSC), an affiliate of DMC, provides fund accounting and financial administration oversight services to the Fund. For these services, the Fund pay DSC fees based on the aggregate daily net assets of the Delaware Investments® Family of Funds at the following annual rate: 0.0050% of the first $30 billion; 0.0045% of the next $10 billion; 0.0040% of the next $10 billion; and 0.0025% of aggregate average daily net assets in excess of $50 billion. The fees payable to DSC under the service agreement described above are allocated among all Funds in the Delaware Investments® Family of Funds on a relative net asset value basis. For the six months ended October 31, 2010, the Fund was charged $ 6,279 for these services.
DSC also provides dividend disbursing and transfer agency services. The Fund pays DSC a monthly fee based on the number of shareholder accounts for dividend disbursing and transfer agent services.
Pursuant to a distribution agreement and distribution plan, the Fund pays DDLP, the distributor and an affiliate of DMC, an annual distribution and service fee not to exceed 0.25% of the average daily net assets of the Class A shares, 1.00% of the average daily net assets of the Class B and C shares and 0.60% of the average daily net assets of the Class R shares. Institutional Class shares pay no distribution and service expenses. DDLP has contracted to limit the Class R shares’ 12b-1 fees through August 28, 2011 to no more than 0.50% of average daily net assets.
At October 31, 2010, the Fund had liabilities payable to affiliates as follows:
| Investment management fee payable to DMC | | $286,275 |
| Dividend disbursing, transfer agent and fund accounting | | |
| oversight fees and other expenses payable to DSC | | 61,001 |
| Distribution fees payable to DDLP | | 132,608 |
| Other expenses payable to DMC and affiliates* | | 26,151 |
* DMC, as part of its administrative services, pays operating expenses on behalf of the Fund and is reimbursed on a periodic basis. Such expenses include items such as printing of shareholder reports, fees for audit, legal and tax services, registration fees and trustees’ fees.
29
Notes to financial statements
Delaware Select Growth Fund
2. Investment Management, Administration Agreements and Other Transactions with Affiliates (continued)
As provided in the investment management agreement, the Fund bears the cost of certain legal and tax services, including internal legal and tax services provided to the Fund by DMC and/or its affiliates’ employees. For the six months ended October 31, 2010, the Fund was charged $1,868 for internal legal and tax services provided by DMC and/or its affiliates’ employees.
For the six months ended October 31, 2010, DDLP earned $6,369 for commissions on sales of the Fund’s Class A shares. For the six months ended October 31, 2010, DDLP received gross CDSC commissions of $—, $5,083 and $705 on redemption of the Fund’s Class A, Class B and Class C shares, respectively, and these commissions were entirely used to offset up-front commissions previously paid by DDLP to broker/dealers on sales of those shares.
Trustees’ fees include expenses accrued by the Fund for each Trustee’s retainer and meeting fees. Certain officers of DMC, DSC and DDLP are officers and/or Trustees of the Trust. These officers and Trustees are paid no compensation by the Fund.
3. Investments
For the six months ended October 31, 2010, the Fund made purchases of $89,086,628 and sales of $73,651,488 of investment securities other than short-term investments.
At October 31, 2010, the cost of investments for federal income tax purposes has been estimated since final tax characteristics cannot be determined until fiscal year end. At October 31, 2010, the cost of investments was $402,047,005. At October 31, 2010, net unrealized appreciation was $77,903,585, of which $89,588,610 related to unrealized appreciation of investments and $11,685,025 related to unrealized depreciation of investments.
U.S. GAAP defines fair value as the price that the Fund would receive to sell an asset or pay to transfer a liability in an orderly transaction between market participants at the measurement date under current market conditions. A three level hierarchy for fair value measurements has been established based upon the transparency of inputs to the valuation of an asset or liability. Inputs may be observable or unobservable and refer broadly to the assumptions that market participants would use in pricing the asset or liability. Observable inputs reflect the assumptions market participants would use in pricing the asset or liability based on market data obtained from sources independent of the reporting entity. Unobservable inputs reflect the reporting entity’s own assumptions about the assumptions that market participants would use in pricing the asset or liability developed based on the best information available under the circumstance s. The Fund’s investment in its entirety is assigned a level based upon the observability of the inputs which are significant to the overall valuation. The three level hierarchy of inputs is summarized below.
30
| Level 1 – | inputs are quoted prices in active markets for identical investments (i.e. equity securities, open-end investment companies, futures contracts, options contracts) |
| | |
| Level 2 – | other observable inputs (including, but not limited to: quoted prices for similar assets or liabilities in markets that are active, quoted prices for identical or similar assets or liabilities in markets that are not active, inputs other than quoted prices that are observable for the assets or liabilities (such as interest rates, yield curves, volatilities, prepayment speeds, loss severities, credit risks and default rates) or other market-corroborated inputs) (i.e. debt securities, government securities, swap contracts, foreign currency exchange contracts, foreign securities utilizing international fair value pricing) |
| | |
| Level 3 – | inputs are significant unobservable inputs (including the Fund’s own assumptions used to determine the fair value of investments) (i.e. broker-quoted securities, fair valued securities) |
The following table summarizes the valuation of the Fund’s investments by fair value hierarchy levels as of October 31, 2010:
| | | Level 1 | | Level 2 | | Level 3 | | Total |
| Common Stock | | $ | 415,397,594 | | $ | — | | $ | — | | $ | 415,397,594 |
| Preferred Stock | | | | | | | | | 10,000,073 | | | 10,000,073 |
| Short-Term | | | — | | | 2,614,023 | | | — | | | 2,614,023 |
| Securities Lending Collateral | | | — | | | 51,857,771 | | | 81,129 | | | 51,938,900 |
| Total | | $ | 415,397,594 | | $ | 54,471,794 | | $ | 10,081,202 | | $ | 479,950,590 |
The following is a reconciliation of investments in which significant unobservable inputs (Level 3) were used in determining fair value:
| | | | | Securities | | | | |
| | | Preferred | | Lending | | | | |
| | | Stock | | Collateral | | Total |
| Balance as of 4/30/10 | | $ | — | | $ | 42,011 | | | $ | 42,011 | |
| Purchases | | | 10,000,073 | | | — | | | | 10,000,073 | |
| Transfers into Level 3 | | | — | | | 580,728 | | | | 580,728 | |
| Net change in unrealized appreciation/depreciation | | | — | | | (541,610 | ) | | | (541,610 | ) |
| Balance as of 10/31/10 | | $ | 10,000,073 | | $ | 81,129 | | | $ | 10,081,202 | |
| | | | | | | | | | | | |
| Net change in unrealized appreciation/depreciation | | | | | | | | | | | |
| from investments still held as of 10/31/10 | | $ | — | | $ | 39,118 | | | $ | 39,118 | |
In January 2010, the Financial Accounting Standards Board issued an Accounting Standards Update, Improving Disclosures about Fair Value Measurements, which introduced new disclosure requirements and clarified certain existing disclosure requirements around fair value measurements currently presented above. The new disclosures and clarifications of existing disclosures are generally effective for the Fund’s fiscal year ending April 30, 2011 and interim periods therein. During the six months period ended October 31, 2010, the Fund
31
Notes to financial statements
Delaware Select Growth Fund
3. Investments (continued)
made transfers out of Level 1 investments into Level 2 investments in the amount of $50,193,112, based on management’s decision to classify the Delaware Investments Collateral Fund No. 1 as a Level 2 investment. Management has classified the Delaware Investments Collateral Fund No. 1 as a Level 2 investment because the price is not quoted in an active market or listed on a public exchange. The Delaware Investments Collateral Fund No. 1 is priced daily for investors in such Fund. During the six months ended October 31, 2010, transfers into Level 3 investments in the amount of $580,728 were made due to the Fund merger with Delaware Growth Equity Fund on October 22, 2010.
4. Dividend and Distribution Information
Income and long-term capital gain distributions are determined in accordance with federal income tax regulations, which may differ from U.S. GAAP. Additionally, distributions from net gains on foreign currency transactions and net short-term gains on sales of investment securities are treated as ordinary income for federal income tax purposes. There were no dividends and distributions paid for the six months ended October 31, 2010 and the year ended April 30, 2010.
5. Components of Net Assets on a Tax Basis
The components of net assets are estimated since final tax characteristics cannot be determined until fiscal year end. As of October 31, 2010, the estimated components of net assets on a tax basis were as follows:
| Shares of beneficial interest | | $ | 642,774,832 | |
| Realized gains 5/1/10 - 10/31/10 | | | 19,107,303 | |
| *Capital loss carryforwards as of 4/30/10 | | | (312,937,048 | ) |
| Unrealized appreciation of investments | | | | |
| and foreign currencies | | | 77,903,585 | |
| Net assets | | $ | 426,848,672 | |
*This amount includes $79,158,433 of capital loss carryforwards from the Fund’s merger with Delaware Growth Equity Fund on October 22, 2010. See note 7.
The difference between book basis and tax basis components of net assets is primarily attributable to tax deferral of losses on wash sales.
For financial reporting purposes, capital accounts are adjusted to reflect the tax character of permanent book/tax differences. Reclassifications are primarily due to tax treatment of net operating losses and gain (loss) on foreign currency transactions. Results of operations and net assets were not affected by these reclassifications. For the six months ended October 31, 2010, the Fund recorded an estimate of these differences since final tax characteristics cannot be determined until fiscal year end.
32
| Accumulated net investment loss | | $ | 1,303,329 | |
| Accumulated net realized loss | | | 81,453 | |
| Paid-in capital | | | (1,384,782 | ) |
For federal income tax purposes, capital loss carryforwards of $312,937,048 may be carried forward and applied against future capital gains. Capital loss carryforwards remaining at April 30, 2010 will expire as follows: $185,917,705 expires in 2011, $18,530,411 expires in 2012, $68,111,595 expires in 2016, $32,537,385 expires in 2017 and $7,839,952 expires in 2018.
For the six months ended October 31, 2010, the Fund had $19,107,303 of capital gains, which may reduce the capital loss carryforwards.
6. Capital Shares
Transactions in capital shares were as follows:
| | | Six Months | | Year |
| | | Ended | | Ended |
| | | 10/31/10 | | 4/30/10 |
| Shares sold: | | | | | | |
| Class A | | 306,907 | | | 799,379 | |
| Class B | | 4,938 | | | 9,629 | |
| Class C | | 42,913 | | | 86,267 | |
| Class R | | 32,711 | | | 10,157 | |
| Institutional Class | | 924,636 | | | 3,745,535 | |
| | | | | | | |
| Shares from merger*: | | | | | | |
| Class A | | 2,723,804 | | | — | |
| Class B | | 716,083 | | | — | |
| Class C | | 1,257,835 | | | — | |
| Class R | | 80,244 | | | — | |
| Institutional Class | | 108,401 | | | — | |
| | | 6,198,472 | | | 4,650,967 | |
| | | | | | | |
| Shares repurchased: | | | | | | |
| Class A | | (551,513 | ) | | (1,102,488 | ) |
| Class B | | (147,508 | ) | | (545,493 | ) |
| Class C | | (103,972 | ) | | (265,058 | ) |
| Class R | | (5,679 | ) | | (16,910 | ) |
| Institutional Class | | (207,135 | ) | | (4,210,692 | ) |
| | | (1,015,807 | ) | | (6,140,641 | ) |
| Net increase (decrease) | | 5,182,665 | | | (1,489,674 | ) |
* See Note 7.
33
Notes to financial statements
Delaware Select Growth Fund
6. Capital Shares (continued)
For the six months ended October 31, 2010 and the year ended April 30, 2010, 92,905 Class B shares were converted to 82,173 Class A shares valued at $2,313,431 and 363,005 Class B shares were converted to 322,972 Class A shares valued at $7,518,237, respectively. The respective amounts are included in Class B redemptions and Class A subscriptions in the table on the previous page and the statements of changes in net assets.
7. Fund Merger
Effective October 22, 2010, the Fund acquired all of the assets and assumed all of the liabilities of the Delaware Growth Equity Fund (Acquired Fund), an open-end investment company, in exchange for the shares of the Fund (Acquiring Fund) pursuant to a Plan and Agreement of Reorganization (Reorganization). The shareholders of the Acquired Fund received shares of the respective class of the Acquiring Fund equal to the aggregate net asset value of their share in the Acquired Fund prior to the Reorganization.
The Reorganization was treated as a non-taxable event and, accordingly, the Acquiring Fund’s basis in securities acquired reflected historical cost basis as of the date of transfer. The net assets, net unrealized appreciation and accumulated net realized loss of the Acquired Fund as of the close of business on October 22, 2010, were as follows:
| Net assets | | $ | 141,074,908 | |
| Accumulated net realized loss | | | (80,224,466 | ) |
| Net unrealized appreciation | | | 22,458,953 | |
8. Line of Credit
The Fund, along with certain other funds in the Delaware Investments® Family of Funds (Participants), was a participant in a $35,000,000 revolving line of credit with The Bank of New York Mellon (BNY Mellon) to be used for temporary or emergency purposes as an additional source of liquidity to fund redemptions of investor shares. Under the agreement, the Participants were charged an annual commitment fee, which was allocated across the Participants on the basis of each Participant’s allocation of the entire facility. The Participants were permitted to borrow up to a maximum of one third of their net assets under the agreement. The Fund had no amounts outstanding as of October 31, 2010 or at any time during the period then ended. The agreement expired on November 16, 2010.
Effective as of November 16, 2010, the Fund along with the other Participants entered into an amendment to the agreement with BNY Mellon for a $50,000,000 revolving line of credit. The agreement as amended is to be used as described above and operates in substantially the same manner as the original agreement. The agreement as amended expires on November 15, 2011.
34
9. Derivatives
U.S. GAAP requires enhanced disclosures that enable investors to understand: 1) how and why an entity uses derivatives, 2) how they are accounted for, and 3) how they affect an entity’s results of operations and financial position.
Foreign Currency Exchange Contracts — The Fund may enter into foreign currency exchange contracts as a way of managing foreign exchange rate risk. The Fund may enter into these contracts to fix the U.S. dollar value of a security that it has agreed to buy or sell for the period between the date the trade was entered into and the date the security is delivered and paid for. The Fund may also use these contracts to hedge the U.S. dollar value of securities it already owns that are denominated in foreign currencies. The change in value is recorded as an unrealized gain or loss. When the contract is closed, a realized gain or loss is recorded equal to the difference between the value of the contract at the time it was opened and the value at the time it was closed.
The use of foreign currency exchange contracts does not eliminate fluctuations in the underlying prices of the securities, but does establish a rate of exchange that can be achieved in the future. Although foreign currency exchange contracts limit the risk of loss due to an unfavorable change of the hedged currency, they also limit any potential gain that might result should the value of the currency change favorably. In addition, the Fund could be exposed to risks if the counterparties to the contracts are unable to meet the terms of their contracts. The Fund’s maximum risk of loss from counterparty credit risk is the value of its currency exchanged with the counterparty. The risk is generally mitigated by having a netting arrangement between the Fund and the counterparty and by the posting of collateral by the counterparty to the Fund to cover the Fund’s exposure to the counterparty. No foreign currency exchange contracts wer e outstanding at October 31, 2010.
10. Securities Lending
The Fund, along with other funds in the Delaware Investments® Family of Funds, may lend its securities pursuant to a security lending agreement (Lending Agreement) with BNY Mellon. With respect to each loan, if on any business day the aggregate market value of securities collateral plus cash collateral held is less than the aggregate market value of the securities which are the subject of such loan, the borrower will be notified to provide additional collateral by the end of the following business day which, together with the collateral already held, will be not less than the applicable collateral requirements for such security loan. If the aggregate market value of securities collateral and cash collateral held with respect to a security loan exceeds the applicable collateral requirement, upon the request of the borrower BNY Mellon must return enough collateral to the borr ower by the end of the following business day to reduce the value of the remaining collateral to the applicable collateral requirement for such security loan. As a result of the foregoing, the value of the collateral held with respect to a loaned security may be temporarily more or less than the value of the security on loan.
35
Notes to financial statements
Delaware Select Growth Fund
10. Securities Lending (continued)
Cash collateral received is generally invested in the Delaware Investments Collateral Fund No. 1 (the “Collective Trust”) established by BNY Mellon for the purpose of investment on behalf of funds managed by DMC that participate in BNY Mellon’s securities lending program. The Collective Trust may invest in U.S. government securities and high quality corporate debt, asset-backed and other money market securities and in repurchase agreements collateralized by such securities, provided that the Collective Trust will generally have a dollar-weighted average portfolio maturity of 60 days or less. The Collective Trust seeks to maintain a net asset value per unit of $1.00, but there can be no assurance that it will always be able to do so. The Fund may incur investment losses as a result of investing securities lending collateral in the Collective Trust or another collateral investment pool. This could occur if an investment in a collateral investment pool defaulted or if it were necessary to liquidate assets in the collateral investment pool to meet returns on outstanding security loans at a time when the collateral investment pool’s net asset value per unit was less than $1.00. Under those circumstances, the Fund may not receive an amount from the collateral investment pool that is equal in amount to the collateral the Fund would be required to return to the borrower of the securities and the Fund would be required to make up this shortfall. Effective April 20, 2009, BNY Mellon transferred the assets of the Fund’s previous collateral investment pool other than cash and assets with a maturity of one business day or less to the BNY Mellon SL DBT II Liquidating Fund (the “Liquidating Fund”), effectively bifurcating the previous collateral investment pool. The Fund’s exposure to the Liquidating Fund is expected to decrease as the Liquidating Fund’s assets mature or are sold. In October 2008, BNY Me llon transferred certain distressed securities from the previous collateral investment pool into the Mellon GSL Reinvestment Trust II. The Fund can also accept U.S. government securities and letters of credit (non-cash collateral) in connection with securities loans. In the event of default or bankruptcy by the lending agent, realization and/or retention of the collateral may be subject to legal proceedings. In the event the borrower fails to return loaned securities and the collateral received is insufficient to cover the value of the loaned securities and provided such collateral shortfall is not the result of investment losses, the lending agent has agreed to pay the amount of the shortfall to the Fund, or at the discretion of the lending agent, replace the loaned securities. The Fund continues to record dividends or interest, as applicable, on the securities loaned and is subject to change in value of the securities loaned that may occur during the term of the loan. The Fund has the right under the Lendi ng Agreement to recover the securities from the borrower on demand. With respect to security loans collateralized by non-cash collateral, the Fund receives loan premiums paid by the borrower. With respect to security loans collateralized by cash collateral, the earnings from the collateral investments are shared among the Fund, the security lending agent and the borrower. The Fund records security lending income net of allocations to the security lending agent and the borrower.
At October 31, 2010, the value of securities on loan was $53,461,395, for which cash collateral was received and invested in accordance with the Lending Agreement. At October 31, 2010, the value of invested collateral was $51,938,900. Such investments are presented on the statement of net assets under the caption “Securities Lending Collateral”.
36
11. Credit and Market Risk
The Fund invests a significant portion of its assets in small- and mid-sized companies and may be subject to certain risks associated with ownership of securities of such companies. Investments in small- or mid-sized companies may be more volatile than investments in larger companies for a number of reasons, which include more limited financial resources or a dependence on narrow product lines.
Some countries in which the Fund may invest require governmental approval for the repatriation of investment income, capital or the proceeds of sales of securities by foreign investors. In addition, if there is deterioration in a country’s balance of payments or for other reasons, a country may impose temporary restrictions on foreign capital remittances abroad.
The securities exchanges of certain foreign markets are substantially smaller, less liquid and more volatile than the major securities markets in the United States. Consequently, acquisition and disposition of securities by the Fund may be inhibited. In addition, a significant portion of the aggregate market value of equity securities listed on the major securities exchanges in emerging markets are held by a smaller number of investors. This may limit the number of shares available for acquisition or disposition by the Fund.
The Fund may invest up to 15% of its net assets in illiquid securities, which may include securities with contractual restrictions on resale, securities exempt from registration under Rule 144A of the Securities Act of 1933, as amended, and other securities which may not be readily marketable. The relative illiquidity of these securities may impair the Fund from disposing of them in a timely manner and at a fair price when it is necessary or desirable to do so. While maintaining oversight, the Fund’s Board has delegated to DMC the day-today functions of determining whether individual securities are liquid for purposes of the Fund’s limitation on investments in illiquid assets. Securities eligible for resale pursuant to Rule 144A, which are determined to be liquid, are not subject to the Fund’s 15% limit on investments in illiquid securities. As of October 31, 2010, there were no Rule 144A securities. Illiquid securities h ave been identified on the statement of net assets.
12. Contractual Obligations
The Fund enters into contracts in the normal course of business that contain a variety of indemnifications. The Fund’s maximum exposure under these arrangements is unknown. However, the Fund has not had prior claims or losses pursuant to these contracts. Management has reviewed the Fund’s existing contracts and expects the risk of loss to be remote.
13. Subsequent Events
Management has determined no material events or transactions occurred subsequent to October 31, 2010 that would require recognition or disclosure in the Fund’s financial statements.
37
Other Fund information
(Unaudited)
Delaware Select Growth Fund
Change in Independent Registered Public Accounting Firm
Due to independence matters under the Securities and Exchange Commission’s auditor independence rules relating to the January 4, 2010 acquisition of Delaware Investments (including DMC, DDLP and DSC) by Macquarie Group, Ernst & Young LLP (“E&Y”) has resigned as the independent registered public accounting firm for Voyageur Mutual Funds III (the Trust) effective June 28, 2010. At a meeting held on February 18, 2010, the Board of Trustees of the Trust, upon recommendation of the Audit Committee, selected PricewaterhouseCoopers LLC (“PwC”) to serve as the independent registered public accounting firm for the Trust for the fiscal year ending April 30, 2011. During the fiscal years ended April 30, 2010 and 2009, E&Y’s audit reports on the financial statements of the Trust did not contain any adverse opinion or disclaimer of opinion, nor were they qualified or modified as to uncertainty, audit scop e, or accounting principles. In addition, there were no disagreements between the Trust and E&Y on accounting principles, financial statements disclosures or audit scope, which, if not resolved to the satisfaction of E&Y, would have caused them to make reference to the disagreement in their reports. Neither the Trust nor anyone on its behalf has consulted with PwC at any time prior to their selection with respect to the application of accounting principles to a specified transaction, either completed or proposed or the type of audit opinion that might be rendered on the Trust’s financial statements.
38
About the organization
| Board of trustees |
Patrick P. Coyne
Chairman, President, and
Chief Executive Officer
Delaware Investments®
Family of Funds
Philadelphia, PA Thomas L. Bennett
Private Investor
Rosemont, PA John A. Fry
President
Drexel University
Philadelphia, PA | Anthony D. Knerr
Founder and Managing
Director
Anthony Knerr &
Associates
New York, NY Lucinda S. Landreth
Former Chief Investment
Officer
Assurant, Inc.
Philadelphia, PA | Ann R. Leven
Consultant
ARL Associates
New York, NY Thomas F. Madison
President and
Chief Executive Officer
MLM Partners, Inc.
Minneapolis, MN | Janet L. Yeomans
Vice President and
Treasurer
3M Corporation
St. Paul, MN J. Richard Zecher
Founder
Investor Analytics
Scottsdale, AZ |
| | | | |
| Affiliated officers |
David F. Connor
Vice President, Deputy
General Counsel, and
Secretary
Delaware Investments
Family of Funds
Philadelphia, PA | Daniel V. Geatens
Vice President and
Treasurer
Delaware Investments
Family of Funds
Philadelphia, PA | David P. O’Connor
Senior Vice President,
General Counsel,
and Chief Legal Officer
Delaware Investments
Family of Funds
Philadelphia, PA | Richard Salus
Senior Vice President and
Chief Financial Officer
Delaware Investments
Family of Funds
Philadelphia, PA |
This semiannual report is for the information of Delaware Select Growth Fund shareholders, but it may be used with prospective investors when preceded or accompanied by a current prospectus for Delaware Select Growth Fund and the Delaware Investments Fund fact sheet for the most recently completed calendar quarter. These documents are available at www.delawareinvestments.com. The prospectus sets forth details about charges, expenses, investment objectives, and operating policies of the investment company. You should read the prospectus carefully before you invest. The figures in this report represent past results that are not a guarantee of future results. The return and principal value of an investment in the investment company will fluctuate so that shares, when redeemed, may be worth more or less than their original cost. |
Delaware Investments is the marketing name of Delaware Management Holdings, Inc. and its subsidiaries. The Fund files its complete schedule of portfolio holdings with the Securities and Exchange Commission (SEC) for the first and third quarters of each fiscal year on Form N-Q. The Fund’s Forms N-Q, as well as a description of the policies and procedures that the Fund uses to determine how to vote proxies (if any) relating to portfolio securities are available without charge (i) upon request, by calling 800 523-1918; and (ii) on the SEC’s Web site at www.sec.gov. In addition, a description of the policies and procedures that the Fund uses to determine how to vote proxies (if any) relating to portfolio securities and the Fund’s Schedule of Investments are available without charge on the Fund’s Web site at www.delawareinvestments.com. The Fund’s Forms N-Q may be reviewed and copied at the SEC’s Public Reference Room in Washington, D.C.; information on the operation of the Public Reference Room may be obtaine d by calling 800 SEC-0330. Information (if any) regarding how the Fund voted proxies relating to portfolio securities during the most recently disclosed 12-month period ended June 30 is available without charge (i) through the Fund’s Web site at www.delawareinvestments.com; and (ii) on the SEC’s Web site at www.sec.gov. |
39
Semiannual report Delaware Large Cap Core Fund October 31, 2010 Core equity mutual fund |
This semiannual report is for the information of Delaware Large Cap Core Fund shareholders, but it may be used with prospective investors when preceded or accompanied by a current prospectus for Delaware Large Cap Core Fund. The figures in the semiannual report for Delaware Large Cap Core Fund represent past results, which are not a guarantee of future results. The return and principal value of an investment in the Fund will fluctuate so that shares, when redeemed, may be worth more or less than their original cost. Current performance may be higher or lower than the performance data quoted. The Fund is available only to certain residents of certain states.
You should consider the investment objectives, risks, charges, and expenses of the Fund carefully before investing. The Delaware Large Cap Core Fund prospectus contains this and other important information about the Fund. Prospectuses for all open-end funds in the Delaware Investments® Family of Funds are available from your financial advisor, online at www.delawareinvestments.com, or by phone at 800 523-1918. Please read the prospectus carefully before you invest or send money.
|
You can obtain shareholder reports and prospectuses online instead of in the mail.
Visit www.delawareinvestments.com/edelivery. |
Experience Delaware Investments
Delaware Investments is committed to the pursuit of consistently superior asset management and unparalleled client service. We believe in our investment processes, which seek to deliver consistent results, and in convenient services that help add value for our clients.
If you are interested in learning more about creating an investment plan, contact your financial advisor.
You can learn more about Delaware Investments or obtain a prospectus for Delaware Large Cap Core Fund at www.delawareinvestments.com.
Manage your investments online
- 24-hour access to your account information
- Obtain share prices
- Check your account balance and recent transactions
- Request statements or literature
- Make purchases and redemptions
Delaware Management Holdings, Inc., and its subsidiaries (collectively known by the marketing name of Delaware Investments) are wholly owned subsidiaries of Macquarie Group Limited, a global provider of banking, financial, advisory, investment and funds management services.
Investments in Delaware Large Cap Core Fund are not and will not be deposits with or liabilities of Macquarie Bank Limited ABN 46 008 583 542 and its holding companies, including their subsidiaries or related companies (Macquarie Group), and are subject to investment risk, including possible delays in repayment and loss of income and capital invested. No Macquarie Group company guarantees or will guarantee the performance of the Fund, the repayment of capital from the Fund, or any particular rate of return.
| Table of contents | |
| Disclosure of Fund expenses | 1 |
| Sector allocation and top 10 holdings | 3 |
| Statement of net assets | 4 |
| Statement of operations | 8 |
| Statements of changes in net assets | 9 |
| Financial highlights | 10 |
| Notes to financial statements | 14 |
| Other Fund information | 23 |
| About the organization | 24 |
Unless otherwise noted, views expressed herein are current as of Oct. 31, 2010, and are subject to change.
Funds are not FDIC insured and are not guaranteed. It is possible to lose the principal amount invested.
Mutual fund advisory services provided by Delaware Management Company, a series of Delaware Management Business Trust, which is a registered investment advisor. Delaware Investments, a member of Macquarie Group, refers to Delaware Management Holdings, Inc. and its subsidiaries, including the Fund’s distributor, Delaware Distributors, L.P. Macquarie Group refers to Macquarie Group Limited and its subsidiaries and affiliates worldwide.
© 2010 Delaware Management Holdings, Inc.
All third-party trademarks cited are the property of their respective owners.
Disclosure of Fund expenses
For the six-month period May 1, 2010 to October 31, 2010
As a shareholder of the Fund, you incur two types of costs: (1) transaction costs, including sales charges (loads) on purchase payments, reinvested dividends, or other distributions; redemption fees; and exchange fees; and (2) ongoing costs, including management fees; distribution and/or service (12b-1) fees; and other Fund expenses. This example is intended to help you understand your ongoing costs (in dollars) of investing in the Fund and to compare these costs with the ongoing costs of investing in other mutual funds.
The example is based on an investment of $1,000 invested at the beginning of the period and held for the entire six-month period from May 1, 2010 to October 31, 2010.
Actual expenses
The first section of the table shown, “Actual Fund return,” provides information about actual account values and actual expenses. You may use the information in this section of the table, together with the amount you invested, to estimate the expenses that you paid over the period. Simply divide your account value by $1,000 (for example, an $8,600 account value divided by $1,000 = 8.6), then multiply the result by the number in the first section under the heading entitled “Expenses Paid During Period” to estimate the expenses you paid on your account during this period.
Hypothetical example for comparison purposes
The second section of the table shown, “Hypothetical 5% return,” provides information about hypothetical account values and hypothetical expenses based on the Fund’s actual expense ratio and an assumed rate of return of 5% per year before expenses, which is not the Fund’s actual return. The hypothetical account values and expenses may not be used to estimate the actual ending account balance or expenses you paid for the period. You may use this information to compare the ongoing costs of investing in the Fund and other funds. To do so, compare this 5% hypothetical example with the 5% hypothetical examples that appear in the shareholder reports of the other funds.
Please note that the expenses shown in the table are meant to highlight your ongoing costs only and do not reflect any transactional costs, such as sales charges (loads), redemption fees, or exchange fees. Therefore, the second section of the table is useful in comparing ongoing costs only, and will not help you determine the relative total costs of owning different funds. In addition, if these transactional costs were included, your costs would have been higher. The Fund’s expenses shown in the table reflect fee waivers in effect. The expenses shown in the table assume reinvestment of all dividends and distributions.
1
Disclosure of Fund expenses
Delaware Large Cap Core Fund
Expense analysis of an investment of $1,000
| | Beginning | | Ending | | | | Expenses |
| | Account Value | | Account Value | | Annualized | | Paid During Period |
| | 5/1/10 | | 10/31/10 | | Expense Ratio | | 5/1/10 to 10/31/10* |
| Actual Fund return | | | | | | | | | | | | | |
| Class A | $ | 1,000.00 | | | $ | 977.60 | | | 0.95% | | $ | 4.74 | |
| Institutional Class | | 1,000.00 | | | | 976.30 | | | 0.95% | | | 4.73 | |
| Hypothetical 5% return (5% return before expenses) | | | | | | | |
| Class A | $ | 1,000.00 | | | $ | 1,020.42 | | | 0.95% | | $ | 4.84 | |
| Institutional Class | | 1,000.00 | | | | 1,020.42 | | | 0.95% | | | 4.84 | |
*“Expenses Paid During Period” are equal to the Fund’s annualized expense ratio, multiplied by the average account value over the period, multiplied by 184/365 (to reflect the one-half year period).
2
| Sector allocation and top 10 holdings |
| Delaware Large Cap Core Fund | | | | As of October 31, 2010 |
Sector designations may be different than the sector designations presented in other Fund materials. The sector designations may represent the investment manager’s internal sector classifications, which may result in the sector designations for one fund being different than another fund’s sector designations.
| Sector | Percentage of net assets |
| Common Stock | | 98.87% | |
| Basic Materials | | 6.14% | |
| Capital Goods | | 9.95% | |
| Communication Services | | 2.81% | |
| Consumer Discretionary | | 5.55% | |
| Consumer Services | | 2.45% | |
| Consumer Staples | | 7.02% | |
| Energy | | 13.85% | |
| Financials | | 11.78% | |
| Healthcare | | 12.30% | |
| Media | | 2.77% | |
| Technology | | 20.18% | |
| Transportation | | 2.93% | |
| Utilities | | 1.14% | |
| Discount Note | | 1.49% | |
| Total Value of Securities | | 100.36% | |
| Liabilities Net of Receivables and Other Assets | | (0.36% | ) |
| Total Net Assets | | 100.00% | |
Holdings are for informational purposes only and are subject to change at any time. They are not a recommendation to buy, sell, or hold any security.
| Top 10 holdings | Percentage of net assets |
| Apple | | 3.54% | |
| Exxon Mobil | | 3.37% | |
| Microsoft | | 3.18% | |
| Google Class A | | 3.03% | |
| Procter & Gamble | | 2.99% | |
| Pfizer | | 2.76% | |
| United Technologies | | 2.64% | |
| Merck | | 2.22% | |
| Schlumberger | | 2.07% | |
| UnitedHealth Group | | 2.05% | |
3
| Statement of net assets | |
| Delaware Large Cap Core Fund | | October 31, 2010 (Unaudited) |
| | | Number of shares | | Value |
| Common Stock – 98.87% | | | | |
| Basic Materials – 6.14% | | | | |
| | Agrium | 110 | | $ | 9,736 |
| | Alcoa | 960 | | | 12,605 |
| | Celanese Class A | 640 | | | 22,816 |
| † | Owens-Illinois | 730 | | | 20,462 |
| | Temple-Inland | 800 | | | 16,576 |
| | United States Steel | 400 | | | 17,116 |
| | | | | | 99,311 |
| Capital Goods – 9.95% | | | | |
| | Caterpillar | 250 | | | 19,650 |
| | Cummins | 100 | | | 8,810 |
| | Fluor | 330 | | | 15,903 |
| | General Electric | 1,500 | | | 24,030 |
| | Honeywell International | 620 | | | 29,208 |
| | Lincoln Electric Holdings | 180 | | | 10,757 |
| | Lockheed Martin | 140 | | | 9,981 |
| | United Technologies | 570 | | | 42,618 |
| | | | | | 160,957 |
| Communication Services – 2.81% | | | | |
| | AT&T | 1,080 | | | 30,780 |
| | Qwest Communications International | 2,220 | | | 14,652 |
| | | | | | 45,432 |
| Consumer Discretionary – 5.55% | | | | |
| | Guess | 390 | | | 15,179 |
| † | Kohl’s | 310 | | | 15,872 |
| | Macy’s | 590 | | | 13,948 |
| | Nordstrom | 450 | | | 17,330 |
| | Phillips-Van Heusen | 320 | | | 19,628 |
| | Target | 150 | | | 7,791 |
| | | | | | 89,748 |
| Consumer Services – 2.45% | | | | |
| † | Alaska Air Group | 150 | | | 7,920 |
| | Starbucks | 790 | | | 22,500 |
| † | WMS Industries | 210 | | | 9,162 |
| | | | | | 39,582 |
4
| | | Number of shares | | Value |
| Common Stock (continued) | | | | |
| Consumer Staples – 7.02% | | | | |
| | Colgate-Palmolive | 190 | | $ | 14,653 |
| | CVS Caremark | 780 | | | 23,494 |
| | Jarden | 470 | | | 15,068 |
| | Kimberly-Clark | 190 | | | 12,035 |
| | Procter & Gamble | 760 | | | 48,312 |
| | | | | | 113,562 |
| Energy – 13.85% | | | | |
| | Chevron | 400 | | | 33,044 |
| | ConocoPhillips | 350 | | | 20,790 |
| | EOG Resources | 80 | | | 7,658 |
| | EQT | 180 | | | 6,739 |
| | Exxon Mobil | 820 | | | 54,506 |
| | Marathon Oil | 340 | | | 12,094 |
| | National Oilwell Varco | 290 | | | 15,590 |
| | Noble | 340 | | | 11,740 |
| | Occidental Petroleum | 360 | | | 28,307 |
| | Schlumberger | 480 | | | 33,547 |
| | | | | | 224,015 |
| Financials – 11.78% | | | | |
| | AFLAC | 420 | | | 23,474 |
| | American Express | 260 | | | 10,780 |
| | Bank of America | 1,940 | | | 22,194 |
| | Bank of New York Mellon | 660 | | | 16,540 |
| | Capital One Financial | 290 | | | 10,808 |
| † | IntercontinentalExchange | 160 | | | 18,379 |
| | JPMorgan Chase | 800 | | | 30,104 |
| | Prudential Financial | 540 | | | 28,393 |
| | Wells Fargo | 1,140 | | | 29,731 |
| | | | | | 190,403 |
| Healthcare – 12.30% | | | | |
| † | Amgen | 420 | | | 24,020 |
| † | Celgene | 250 | | | 15,518 |
| † | Express Scripts Class A | 500 | | | 24,260 |
| † | Gilead Sciences | 540 | | | 21,422 |
| | Merck | 990 | | | 35,917 |
| | Pfizer | 2,564 | | | 44,613 |
| | UnitedHealth Group | 920 | | | 33,166 |
| | | | | | 198,916 |
5
Statement of net assets
Delaware Large Cap Core Fund
| | | Number of shares | | Value | |
| Common Stock (continued) | | | | | | |
| Media – 2.77% | | | | | | |
| | Time Warner Cable | | 340 | | $ | 19,676 | |
| | Viacom Class B | | 650 | | | 25,083 | |
| | | | | | | 44,759 | |
| Technology – 20.18% | | | | | | |
| † | Apple | | 190 | | | 57,164 | |
| † | Cisco Systems | | 1,380 | | | 31,505 | |
| † | EMC | | 1,360 | | | 28,574 | |
| † | Google Class A | | 80 | | | 49,039 | |
| | Hewlett-Packard | | 560 | | | 23,554 | |
| | Intel | | 1,280 | | | 25,690 | |
| | Microsoft | | 1,930 | | | 51,414 | |
| † | NetApp | | 450 | | | 23,963 | |
| † | ON Semiconductor | | 1,500 | | | 11,505 | |
| | QUALCOMM | | 530 | | | 23,919 | |
| | | | | | | 326,327 | |
| Transportation – 2.93% | | | | | | |
| | Norfolk Southern | | 500 | | | 30,745 | |
| | Union Pacific | | 190 | | | 16,659 | |
| | | | | | | 47,404 | |
| Utilities – 1.14% | | | | | | |
| | American Electric Power | | 490 | | | 18,346 | |
| | | | | | | 18,346 | |
| Total Common Stock (cost $1,446,082) | | | | | 1,598,762 | |
| | | | | | | |
| | | Principal amount | | | | |
| ≠Discount Note – 1.49% | | | | | |
| | Federal Home Loan Bank 0.10% 11/1/10 | | $24,000 | | | 24,000 | |
| Total Discount Note (cost $24,000) | | | | | 24,000 | |
| | |
| Total Value of Securities – 100.36% | | | | | | |
| | (cost $1,470,082) | | | | | 1,622,762 | |
| Liabilities Net of Receivables | | | | | | |
| | and Other Assets – (0.36%) | | | | | (5,793 | ) |
| Net Assets Applicable to 218,022 | | | | | | |
| | Shares Outstanding – 100.00% | | | | $ | 1,616,969 | |
6
| | | | | |
| Net Asset Value – Delaware Large Cap Core Fund | | | | |
| Class A ($11,506 / 1,551 Shares) | | | | $7.42 | |
| Net Asset Value – Delaware Large Cap Core Fund | | | | |
| Institutional Class ($1,605,463 / 216,471 Shares) | | | | $7.42 | |
| | | | | |
| Components of Net Assets at October 31, 2010: | | | | |
| Shares of beneficial interest (unlimited authorization – no par) | | $ | 1,929,037 | |
| Undistributed net investment income | | | 5,110 | |
| Accumulated net realized loss on investments | | | (469,858 | ) |
| Net unrealized appreciation of investments | | | 152,680 | |
| Total net assets | | $ | 1,616,969 | |
| † | Non income producing security. |
| ≠ | The rate shown is the effective yield at the time of purchase. |
| Net Asset Value and Offering Price Per Share – | | | |
| Delaware Large Cap Core Fund | | | |
| Net asset value Class A (A) | | $ | 7.42 |
| Sales charge (5.75% of offering price) (B) | | | 0.45 |
| Offering price | | $ | 7.87 |
| (A) | Net asset value per share, as illustrated, is the amount which would be paid upon redemption or repurchase of shares. |
| (B) | See the current prospectus for purchases of $50,000 or more. |
See accompanying Notes, which are an integral part of the financial statements.
7
| Statement of operations |
| Delaware Large Cap Core Fund | Six Months Ended October 31, 2010 (Unaudited) |
| Investment Income: | | | | | | | |
| Dividends | | $ | 12,454 | | | | |
| Interest | | | 5 | | $ | 12,459 | |
| | | | | | | | |
| Expenses: | | | | | | | |
| Reports and statements to shareholders | | | 5,469 | | | | |
| Management fees | | | 4,998 | | | | |
| Audit and tax fees | | | 4,663 | | | | |
| Dividend disbursing and transfer agent fees and expenses | | | 3,635 | | | | |
| Dues and services | | | 2,391 | | | | |
| Registration fees | | | 1,585 | | | | |
| Pricing fees | | | 680 | | | | |
| Accounting and administration expenses | | | 304 | | | | |
| Legal fees | | | 209 | | | | |
| Custodian fees | | | 172 | | | | |
| Insurance fees | | | 75 | | | | |
| Trustees’ fees | | | 42 | | | | |
| Consulting fees | | | 26 | | | | |
| Distribution expenses – Class A | | | 14 | | | | |
| Trustees’ expenses | | | 3 | | | 24,266 | |
| Less fees waived | | | | | | (16,903 | ) |
| Less waived distribution expenses – Class A | | | | | | (14 | ) |
| Total operating expenses | | | | | | 7,349 | |
| Net Investment Income | | | | | | 5,110 | |
| | | | | | | | |
| Net Realized and Unrealized Gain (Loss) on Investments: | | | | | | | |
| Net realized gain on investments | | | | | | 52,389 | |
| Net change in unrealized appreciation/depreciation of investments | | | | | | (97,537 | ) |
| Net Realized and Unrealized Loss on Investments | | | | | | (45,148 | ) |
| | | | | | | | |
| Net Decrease in Net Assets Resulting from Operations | | | | | $ | (40,038 | ) |
See accompanying Notes, which are an integral part of the financial statements.
8
Statements of changes in net assets
Delaware Large Cap Core Fund
| | | Six Months | | Year |
| | | Ended | | Ended |
| | | 10/31/10 | | 4/30/10 |
| | | (Unaudited) | | | | |
| Increase (Decrease) in Net Assets from Operations: | | | | | | | | |
| Net investment income | | $ | 5,110 | | | $ | 8,706 | |
| Net realized gain (loss) on investments | | | 52,389 | | | | (103,026 | ) |
| Net change in unrealized appreciation/depreciation | | | | | | | | |
| of investments | | | (97,537 | ) | | | 573,290 | |
| Net increase (decrease) in net assets resulting from operations | | | (40,038 | ) | | | 478,970 | |
| | | | | | | | | |
| Dividends and Distributions to Shareholders from: | | | | | | | | |
| Net investment income: | | | | | | | | |
| Class A | | | — | | | | (89 | ) |
| Institutional Class | | | — | | | | (12,568 | ) |
| | | | — | | | | (12,657 | ) |
| | | | | | | | | |
| Capital Share Transactions: | | | | | | | | |
| Proceeds from shares sold: | | | | | | | | |
| Class A | | | — | | | | 19,779 | |
| | | | | | | | | |
| Net asset value of shares issued upon reinvestment | | | | | | | | |
| of dividends and distributions: | | | | | | | | |
| Class A | | | — | | | | 89 | |
| Institutional Class | | | — | | | | 12,568 | |
| | | | — | | | | 32,436 | |
| Cost of shares repurchased: | | | | | | | | |
| Class A | | | (18,484 | ) | | | (964 | ) |
| Institutional Class | | | — | | | | (250,000 | ) |
| | | | (18,484 | ) | | | (250,964 | ) |
| Decrease in net assets derived from capital share transactions | | | (18,484 | ) | | | (218,528 | ) |
| Net Increase (Decrease) in Net Assets | | | (58,522 | ) | | | 247,785 | |
| | | | | | | | | |
| Net Assets: | | | | | | | | |
| Beginning of period | | | 1,675,491 | | | | 1,427,706 | |
| End of period (including undistributed net investment income | | | | | | | | |
| of $5,110 and $0, respectively) | | $ | 1,616,969 | | | $ | 1,675,491 | |
See accompanying Notes, which are an integral part of the financial statements.
9
Financial highlights
Delaware Large Cap Core Fund Class A
Selected data for each share of the Fund outstanding throughout each period were as follows:
| Net asset value, beginning of period |
| |
| Income (loss) from investment operations: |
| Net investment income3 |
| Net realized and unrealized gain (loss) on investments |
| Total from investment operations |
| |
| Less dividends and distributions from: |
| Net investment income |
| Net realized gain on investments |
| Total dividends and distributions |
| |
| Net asset value, end of period |
| |
| Total return4 |
| |
| Ratios and supplemental data: |
| Net assets, end of period (000 omitted) |
| Ratio of expenses to average net assets |
| Ratio of expenses to average net assets |
| prior to fees waived and expense paid indirectly |
| Ratio of net investment income to average net assets |
| Ratio of net investment income (loss) to average net assets |
| prior to fees waived and expense paid indirectly |
| Portfolio turnover |
1 Ratios have been annualized and portfolio turnover and total return have not been annualized.
2 Date of commencement of operations; ratios and portfolio turnover have been annualized and total return has not been annualized.
3 The average shares outstanding method has been applied for per share information.
4 Total investment return is based on the change in net asset value of a share during the period and assumes reinvestment of dividends and distributions at net asset value and does not reflect the impact of a sales charge. Total investment return during all of the periods shown reflects waivers by the manager and distributor. Performance would have been lower had the waivers not been in effect.
See accompanying Notes, which are an integral part of the financial statements.
10
| | Six Months Ended | | | | | | | | | | | | | 8/31/062 | |
| | 10/31/101 | | | Year Ended | | | to | |
| | (Unaudited) | | | 4/30/10 | | 4/30/09 | | 4/30/08 | | | 4/30/07 | |
| | | $7.590 | | | | $5.630 | | | $8.930 | | | $9.700 | | | | $8.500 | | |
| | | | | | | | | | | | | | | | | | | |
| | | | | | | | | | | | | | | | | | | |
| | | 0.023 | | | | 0.038 | | | 0.081 | | | 0.073 | | | | 0.039 | | |
| | | (0.193 | ) | | | 1.978 | | | (3.293 | ) | | (0.368 | ) | | | 1.216 | | |
| | | (0.170 | ) | | | 2.016 | | | (3.212 | ) | | (0.295 | ) | | | 1.255 | | |
| | | | | | | | | | | | | | | | | | | |
| | | | | | | | | | | | | | | | | | | |
| | | — | | | | (0.056 | ) | | (0.088 | ) | | (0.067 | ) | | | (0.025 | ) | |
| | | — | | | | — | | | — | | | (0.408 | ) | | | (0.030 | ) | |
| | | — | | | | (0.056 | ) | | (0.088 | ) | | (0.475 | ) | | | (0.055 | ) | |
| | | | | | | | | | | | | | | | | | | |
| | | $7.420 | | | | $7.590 | | | $5.630 | | | $8.930 | | | | $9.700 | | |
| | | | | | | | | | | | | | | | | | | |
| | | (2.24% | ) | | | 35.93% | | | (36.04% | ) | | (3.36% | ) | | | 14.81% | | |
| | | | | | | | | | | | | | | | | | | |
| | | | | | | | | | | | | | | | | | | |
| | | $12 | | | | $31 | | | $10 | | | $32 | | | | $14 | | |
| | | 0.95% | | | | 0.95% | | | 0.95% | | | 0.95% | | | | 0.96% | | |
| | | | | | | | | | | | | | | | | | | |
| | | 3.40% | | | | 3.05% | | | 1.87% | | | 3.03% | | | | 5.27% | | |
| | | 0.67% | | | | 0.56% | | | 1.20% | | | 0.77% | | | | 0.64% | | |
| | | | | | | | | | | | | | | | | | | |
| | | (1.78% | ) | | | (1.54% | ) | | 0.28% | | | (1.31% | ) | | | (3.67% | ) | |
| | | 22% | | | | 65% | | | 38% | | | 30% | | | | 30% | | |
11
Financial highlights
Delaware Large Cap Core Fund Institutional Class
Selected data for each share of the Fund outstanding throughout each period were as follows:
| Net asset value, beginning of period |
| |
| Income (loss) from investment operations: |
| Net investment income3 |
| Net realized and unrealized gain (loss) on investments |
| Total from investment operations |
| |
| Less dividends and distributions from: |
| Net investment income |
| Net realized gain on investments |
| Total dividends and distributions |
| |
| Net asset value, end of period |
| |
| Total return4 |
| |
| Ratios and supplemental data: |
| Net assets, end of period (000 omitted) |
| Ratio of expenses to average net assets |
| Ratio of expenses to average net assets |
| prior to fees waived and expense paid indirectly |
| Ratio of net investment income to average net assets |
| Ratio of net investment income (loss) to average net assets |
| prior to fees waived and expense paid indirectly |
| Portfolio turnover |
1 Ratios have been annualized and portfolio turnover and total return have not been annualized.
2 Date of commencement of operations; ratios and portfolio turnover have been annualized and total return has not been annualized.
3 The average shares outstanding method has been applied for per share information.
4 Total investment return is based on the change in net asset value of a share during the period and assumes reinvestment of dividends and distributions at net asset value. Total investment return during all of the periods shown reflects a waiver by the manager. Performance would have been lower had the waiver not been in effect.
See accompanying Notes, which are an integral part of the financial statements.
12
| | Six Months Ended | | | | | | | | | | | | | 8/31/062 | |
| | 10/31/101 | | | Year Ended | | | to | |
| | (Unaudited) | | | 4/30/10 | | 4/30/09 | | 4/30/08 | | | 4/30/07 | |
| | | $7.600 | | | | $5.630 | | | $8.930 | | | $9.700 | | | | $8.500 | | |
| | | | | | | | | | | | | | | | | | | |
| | | | | | | | | | | | | | | | | | | |
| | | 0.023 | | | | 0.038 | | | 0.081 | | | 0.073 | | | | 0.039 | | |
| | | (0.203 | ) | | | 1.988 | | | (3.293 | ) | | (0.368 | ) | | | 1.216 | | |
| | | (0.180 | ) | | | 2.026 | | | (3.212 | ) | | (0.295 | ) | | | 1.255 | | |
| | | | | | | | | | | | | | | | | | | |
| | | | | | | | | | | | | | | | | | | |
| | | — | | | | (0.056 | ) | | (0.088 | ) | | (0.067 | ) | | | (0.025 | ) | |
| | | — | | | | — | | | — | | | (0.408 | ) | | | (0.030 | ) | |
| | | — | | | | (0.056 | ) | | (0.088 | ) | | (0.475 | ) | | | (0.055 | ) | |
| | | | | | | | | | | | | | | | | | | |
| | | $7.420 | | | | $7.600 | | | $5.630 | | | $8.930 | | | | $9.700 | | |
| | | | | | | | | | | | | | | | | | | |
| | | (2.37% | ) | | | 36.11% | | | (36.04% | ) | | (3.36% | ) | | | 14.81% | | |
| | | | | | | | | | | | | | | | | | | |
| | | | | | | | | | | | | | | | | | | |
| | | $1,605 | | | | $1,644 | | | $1,418 | | | $2,219 | | | | $2,296 | | |
| | | 0.95% | | | | 0.95% | | | 0.95% | | | 0.95% | | | | 0.96% | | |
| | | | | | | | | | | | | | | | | | | |
| | | 3.15% | | | | 2.80% | | | 1.62% | | | 2.78% | | | | 5.02% | | |
| | | 0.67% | | | | 0.56% | | | 1.20% | | | 0.77% | | | | 0.64% | | |
| | | | | | | | | | | | | | | | | | | |
| | | (1.53% | ) | | | (1.29% | ) | | 0.53% | | | (1.06% | ) | | | (3.42% | ) | |
| | | 22% | | | | 65% | | | 38% | | | 30% | | | | 30% | | |
13
| Notes to financial statements |
| Delaware Large Cap Core Fund | October 31, 2010 (Unaudited) |
Voyageur Mutual Funds III (Trust) is organized as a Delaware statutory trust and offers two series, Delaware Large Cap Core Fund and Delaware Select Growth Fund. These financial statements and the related notes pertain to Delaware Large Cap Core Fund (Fund). The Trust is an open-end investment company. The Fund is considered diversified under the Investment Company Act of 1940, as amended, and offers Class A, Class C, Class R and Institutional Class shares. Class A shares are sold with a maximum front-end sales charge of up to 5.75%. Class A share purchases of $1,000,000 or more will incur a contingent deferred sales charge (CDSC) of 1% if redeemed during the first year and 0.50% during the second year, provided that Delaware Distributors, L.P. (DDLP) paid a financial advisor a commission on the purchase of those shares. Class C shares are sold with a CDSC of 1%, if redeemed during the first twelve months. Class R and Institutional Class s hares are not subject to a sales charge and are offered for sale only to certain eligible investors. As of October 31, 2010, Class C and Class R have not commenced operations.
The investment objective of the Fund is to seek long-term capital appreciation.
1. Significant Accounting Policies
The following accounting policies are in accordance with U.S. generally accepted accounting principles (U.S. GAAP) and are consistently followed by the Fund.
Security Valuation — Equity securities, except those traded on the Nasdaq Stock Market, Inc. (Nasdaq), are valued at the last quoted sales price as of the time of the regular close of the New York Stock Exchange (NYSE) on the valuation date. Securities traded on the Nasdaq are valued in accordance with the Nasdaq Official Closing Price, which may not be the last sales price. If on a particular day an equity security does not trade, then the mean between the bid and ask prices will be used. Short-term debt securities are valued at market value. Investment company securities are valued at net asset value per share. Generally, other securities and assets for which market quotations are not readily available are valued at fair value as determined in good faith under the direction of the Fund’s Board of Trustees (Board) . In determining whether market quotations are readily available or fair valuation will be used, various factors will be taken into consideration, such as market closures or suspension of trading in a security. The Fund may use fair value pricing more frequently for securities traded primarily in non-U.S. markets because, among other things, most foreign markets close well before the Fund values its securities generally at 4:00 p.m. Eastern time. The earlier close of these foreign markets gives rise to the possibility that significant events, including broad market moves, government actions or pronouncements, aftermarket trading, or news events may have occurred in the interim. To account for this, the Fund may frequently value foreign securities using fair value prices based on third-party vendor modeling tools (international fair value pricing).
14
Federal Income Taxes — No provision for federal income taxes has been made as the Fund intends to continue to qualify for federal income tax purposes as a regulated investment company under Subchapter M of the Internal Revenue Code of 1986, as amended, and make the requisite distributions to shareholders. The Fund evaluates tax positions taken or expected to be taken in the course of preparing the Fund’s tax returns to determine whether the tax positions are “more-likely-than-not” of being sustained by the applicable tax authority. Tax positions not deemed to meet the more-likely-than-not threshold are recorded as a tax benefit or expense in the current year. Management has analyzed the Fund’s tax positions taken on federal income tax returns for all open tax years (April 30, 2007 – April 30 , 2010), and has concluded that no position for federal income tax is required in the Fund’s financial statements.
Class Accounting — Investment income, common expenses and realized and unrealized gain (loss) on investments are allocated to the various classes of the Fund on the basis of daily net assets of each class. Distribution expenses relating to a specific class are charged directly to that class.
Use of Estimates — The preparation of financial statements in conformity with U.S. GAAP requires management to make estimates and assumptions that affect the reported amounts of assets and liabilities and disclosure of contingent assets and liabilities at the date of the financial statements and the reported amounts of revenues and expenses during the reporting period. Actual results could differ from those estimates and the differences could be material.
Other — Expenses directly attributable to the Fund are charged directly to the Fund. Other expenses common to various funds within the Delaware Investments® Family of Funds are generally allocated amongst such funds on the basis of average net assets. Management fees and some other expenses are paid monthly. Security transactions are recorded on the date the securities are purchased or sold (trade date) for financial reporting purposes. Costs used in calculating realized gains and losses on the sale of investment securities are those of the specific securities sold. Dividend income is recorded on the ex-dividend date and interest income is recorded on the accrual basis. The Fund declares and pays dividends from net investment income and distributions from net realized gain on investments, if any, annually. Such dividends and distributions, if any, are recorded on the ex-dividend date.
The Fund may receive earnings credits from its custodian when positive cash balances are maintained, which are used to offset custody fees. There were no earnings credits for the six months ended October 31, 2010.
The Fund may receive earnings credits from its transfer agent when positive cash balances are maintained, which may be used to offset transfer agent fees. There were no earnings credits for the six months ended October 31, 2010.
15
Notes to financial statements
Delaware Large Cap Core Fund
2. Investment Management, Administration Agreements and Other Transactions with Affiliates
In accordance with the terms of its investment management agreement, the Fund pays Delaware Management Company (DMC), a series of Delaware Management Business Trust and the investment manager, an annual fee which is calculated daily at the rate of 0.65% on the first $500 million of average daily net assets of the Fund, 0.60% on the next $500 million, 0.55% on the next $1.5 billion and 0.50% on average daily net assets in excess of $2.5 billion.
DMC has voluntarily agreed to waive all or a portion, if any, of its management fees and reimburse the Fund to the extent necessary to ensure that total annual operating expenses (excluding any 12b-1 plan expenses, taxes, interest, inverse floater program expenses, short sale and dividend interest expenses, brokerage fees, certain insurance costs, and nonroutine expenses or costs, including, but not limited to, those relating to reorganizations, litigation, conducting shareholder meetings, and liquidations, (collectively, nonroutine expenses)), do not exceed 0.95% of the Fund’s average daily net assets. This waiver and expense limitation may be discontinued at any time because it is voluntary. For purposes of this waiver and reimbursement, nonroutine expenses may also include such additional costs and expenses, as may be agreed upon from time to time by the Fund’s Board and DMC. This expense waiver and reimbursement applies onl y to expenses paid directly by the Fund.
Delaware Service Company, Inc. (DSC), an affiliate of DMC, provides fund accounting and financial administration oversight services to the Fund. For these services, the Fund pays DSC fees based on the aggregate daily net assets of the Delaware Investments® Family of Funds at the following annual rate: 0.0050% of the first $30 billion; 0.0045% of the next $10 billion; 0.0040% of the next $10 billion; and 0.0025% of aggregate average daily net assets in excess of $50 billion. The fees payable to DSC under the service agreement described above will be allocated among all Funds in the Delaware Investments® Family of Funds on a relative net asset value basis. For the six months ended October 31, 2010, the Fund was charged $38 for these services.
DSC also provides dividend disbursing and transfer agency services. The Fund pays DSC a monthly fee based on the number of shareholder accounts for dividend disbursing and transfer agent services.
Pursuant to a distribution agreement and distribution plan, the Fund pays DDLP, the distributor and an affiliate of DMC, an annual distribution and service fee not to exceed 0.25% of the average daily net assets of the Class A shares, 1.00% of the average daily net assets of Class C shares and 0.60% of the average daily net assets of Class R shares. Institutional Class shares pay no distribution and services expenses. DDLP has voluntarily agreed to waive such distribution and service fees until such time as the waivers are discontinued.
16
At October 31, 2010, the Fund had receivables due from or liabilities payable to affiliates as follows:
| Receivable from DMC under limitation agreement | | $3,080 | |
| Dividend disbursing, transfer agent and fund accounting | | | |
| oversight fees and other expenses payable to DSC | | (13 | ) |
| Other expenses payable to DMC and affiliates* | | (508 | ) |
*DMC, as part of its administrative services, pays operating expenses on behalf of the Fund and is reimbursed on a periodic basis. Such expenses include items such as printing of shareholder reports, fees for audit, legal and tax services, registration fees and trustees’ fees.
As provided in the investment management agreement, the Fund bears the cost of certain legal and tax services, including internal legal and tax services provided to the Fund by DMC and/or its affiliates’ employees. For the six months ended October 31 2010, the Fund was charged $9 for internal legal and tax services provided by DMC and/or its affiliates’ employees.
Trustees’ fees include expenses accrued by the Fund for each Trustee’s retainer and meeting fees. Certain officers of DMC, DSC and DDLP are officers and/or Trustees of the Trust. These officers and Trustees are paid no compensation by the Fund.
3. Investments
For the six months ended October 31, 2010, the Fund made purchases of $339,206 and sales of $346,602 of investment securities other than short-term investments.
At October 31, 2010, the cost of investments for federal income tax purposes has been estimated since the final tax characteristics cannot be determined until fiscal year end. At October 31, 2010, the cost of investments was $1,476,844. At October 31, 2010, the net unrealized appreciation was $145,918, of which $195,216 related to unrealized appreciation of investments and $49,298 related to unrealized depreciation of investments.
U.S. GAAP defines fair value as the price that the Fund would receive to sell an asset or pay to transfer a liability in an orderly transaction between market participants at the measurement date under current market conditions. A three level hierarchy for fair value measurements has been established based upon the transparency of inputs to the valuation of an asset or liability. Inputs may be observable or unobservable and refer broadly to the assumptions that market participants would use in pricing the asset or liability. Observable inputs reflect the assumptions market participants would use in pricing the asset or liability based on market data obtained from sources independent of the reporting entity. Unobservable inputs reflect the reporting entity’s own assumptions about the assumptions that market participants would use in pricing the asset or liability developed based on the best information available under the circumstance s. The Fund’s
17
Notes to financial statements
Delaware Large Cap Core Fund
3. Investments (continued)
investment in its entirety is assigned a level based upon the observability of the inputs which are significant to the overall valuation. The three level hierarchy of inputs is summarized below.
| Level 1 | – | inputs are quoted prices in active markets for identical investments ( e.g. equity securities, open-end investment companies, futures contracts, options contracts) |
| | | |
| Level 2 | – | other observable inputs (including, but not limited to: quoted prices for similar assets or liabilities in markets that are active, quoted prices for identical or similar assets or liabilities in markets that are not active, inputs other than quoted prices that are observable for the assets or liabilities (such as interest rates, yield curves, volatilities, prepayment speeds, loss severities, credit risks and default rates) or other market-corroborated inputs) ( e.g. debt securities, government securities, swap contracts, foreign currency exchange contracts, foreign securities utilizing international fair value pricing) |
| | | |
| Level 3 | – | inputs are significant unobservable inputs (including the Fund’s own assumptions used to determine the fair value of investments) (e.g. broker-quoted securities, fair valued securities) |
The following table summarizes the valuation of the Fund’s investments by fair value hierarchy levels as of October 31, 2010:
| | | Level 1 | | Level 2 | | Total |
| Common Stock | | $ | 1,598,762 | | $ | — | | $ | 1,598,762 |
| Short-Term | | | — | | | 24,000 | | | 24,000 |
| Total | | $ | 1,598,762 | | $ | 24,000 | | $ | 1,622,762 |
There were no Level 3 securities at the beginning or end of the period.
In January 2010, the Financial Accounting Standards Board issued an Accounting Standards Update, Improving Disclosures about Fair Value Measurements, which introduced new disclosure requirements and clarified certain existing disclosure requirements around fair value measurements currently presented above. The new disclosures and clarifications of existing disclosures are generally effective for the Fund’s fiscal year ending April 30, 2011 and interim periods therein. During the six months ended October 31, 2010, there were no transfers between Level 1 investments, Level 2 investments or Level 3 investments that had a material impact to the Fund.
18
4. Dividend and Distribution Information
Income and long-term capital gain distributions are determined in accordance with federal income tax regulations, which may differ from U.S. GAAP. Additionally, distributions from net short-term gains on sales of investment securities are treated as ordinary income for federal income tax purposes. There were no dividends and distributions paid for the six months ended October 31, 2010. The tax character of dividends and distributions paid during the year ended April 30, 2010 was as follows:
| | | Year |
| | | Ended |
| | | 4/30/10 |
| Ordinary Income | | $ | 12,030 |
| Return of capital | | | 627 |
| Total | | $ | 12,657 |
5. Components of Net Assets on a Tax Basis
The components of net assets are estimated since the final tax characteristics cannot be determined until fiscal year end. As of October 31, 2010, the estimated components of net assets on a tax basis were as follows:
| Shares of beneficial interest | | $ | 1,929,037 | |
| Undistributed ordinary income | | | 5,110 | |
| Realized gains 5/1/10 – 10/31/10 | | | 52,589 | |
| Capital loss carryforwards as of 4/30/10 | | | (515,685 | ) |
| Unrealized appreciation of investments | | | 145,918 | |
| Net assets | | $ | 1,616,969 | |
The difference between book basis and tax basis components of net assets is primarily attributable to tax deferral of losses on wash sales.
For federal income tax purposes, at April 30, 2010, capital loss carryforwards of $515,685 may be carried forward and applied against future capital gains. Such capital loss carryforwards will expire as follows: $214,282 expires in 2017 and $301,403 expires in 2018.
For the six months ended October 31, 2010, the Fund had capital gains of $52,589, which may decrease the capital loss carryforwards.
19
Notes to financial statements
Delaware Large Cap Core Fund
6. Capital Shares
Transactions in capital shares were as follows:
| | | Six Months | | Year |
| | | Ended | | Ended |
| | | 10/31/10 | | 4/30/10 |
| Shares sold: | | | | | | |
| Class A | | — | | | 2,576 | |
| | | | | | | |
| Shares issued upon reinvestment of dividends and distributions: | | | | | | |
| Class A | | — | | | 13 | |
| Institutional Class | | — | | | 1,868 | |
| | | — | | | 4,457 | |
| | | | | | | |
| Shares repurchased: | | | | | | |
| Class A | | (2,575 | ) | | (168 | ) |
| Institutional Class | | — | | | (37,481 | ) |
| | | (2,575 | ) | | (37,649 | ) |
| Net decrease | | (2,575 | ) | | (33,192 | ) |
7. Line of Credit
The Fund, along with certain other funds in the Delaware Investments® Family of Funds (Participants), was a participant in a $35,000,000 revolving line of credit with The Bank of New York Mellon (BNY Mellon) to be used for temporary or emergency purposes as an additional source of liquidity to fund redemptions of investor shares. Under the agreement, the Participants were charged an annual commitment fee, which was allocated across the Participants on the basis of each Participant’s allocation of the entire facility. The Participants were permitted to borrow up to a maximum of one third of their net assets under the agreement. The agreement expired on November 16, 2010.
Effective as of November 16, 2010, the Fund along with the other Participants entered into an amendment to the agreement with BNY Mellon for a $50,000,000 revolving line of credit. The agreement as amended is to be used as described above and operates in substantially the same manner as the original agreement. The agreement as amended expires on November 15, 2011. The Fund had no amounts outstanding as of October 31, 2010, or at any time during the period then ended.
8. Securities Lending
The Fund, along with other funds in the Delaware Investments® Family of Funds, may lend its securities pursuant to a security lending agreement (Lending Agreement) with BNY Mellon. With respect to each loan, if on any business day the aggregate market value of securities collateral plus cash collateral held is less than the aggregate market value of the securities which are the
20
subject of such loan, the borrower will be notified to provide additional collateral by the end of the following business day which, together with the collateral already held, will be not less than the applicable collateral requirements for such security loan. If the aggregate market value of securities collateral and cash collateral held with respect to a security loan exceeds the applicable collateral requirement, upon request of the borrower BNY Mellon must return enough collateral to the borrower by the end of the following business day to reduce the value of the remaining collateral to the applicable collateral requirement for such security loan. As a result of the foregoing, the value of the collateral held with respect to a loaned security may be temporarily more or less than the value of the security on loan. Cash collateral received is generally invested in the Delaware Investments Collateral Fund No. 1 (Collective Trust) establis hed by BNY Mellon for the purpose of investment on behalf of funds managed by DMC that participate in BNY Mellon’s securities lending program. The Collective Trust may invest in U.S. government securities and high quality corporate debt, asset-backed and other money market securities and in repurchase agreement collateralized by such securities, provided that the Collective Trust will generally have a dollar-weighted average portfolio maturity of 60 days or less. The Collective Trust seeks to maintain a net asset value per unit of $1.00, but there can be no assurance that it will always be able to do so. The Fund may incur investment losses as a result of investing securities lending collateral in the Collective Trust. This could occur if an investment in the Collective Trust defaulted or if it were necessary to liquidate assets in the Collective Trust to meet returns on outstanding security loans at a time when the Collective Trust’s net asset value per unit was less than $1.00. Under those circ umstances, the Fund may not receive an amount from the Collective Trust that is equal in amount to the collateral the Fund would be required to return to the borrower of the securities and the Fund would be required to make up for this shortfall. The Fund can also accept U.S. government securities and letters of credit (non-cash collateral) in connection with securities loans. In the event of default or bankruptcy by the lending agent, realization and/or retention of the collateral may be subject to legal proceedings. In the event the borrower fails to return loaned securities and the collateral received is insufficient to cover the value of the loaned securities and provided such collateral shortfall is not the result of investment losses, the lending agent has agreed to pay the amount of the shortfall to the Fund, or at the discretion of the lending agent, replace the loaned securities. The Fund continues to record dividends or interest, as applicable, on the securities loaned and is subject to change in v alue of the securities loaned that may occur during the term of the loan. The Fund has the right under the Lending Agreement to recover the securities from the borrower on demand. With respect to security loans collateralized by non-cash collateral, the Fund receives loan premiums paid by the borrower. With respect to security loans collateralized by cash collateral, the earnings from the collateral investments are shared among the Fund, the security lending agent and the borrower. The Fund records security lending income net of allocations to the security lending agent and the borrower. The Fund had no securities out on loan as of October 31, 2010.
21
Notes to financial statements
Delaware Large Cap Core Fund
9. Credit and Market Risk
The Fund may invest up to 15% of its net assets in illiquid securities, which may include securities with contractual restrictions on resale, securities exempt from registration under Rule 144A of the Securities Act of 1933, as amended, and other securities which may not be readily marketable. The relative illiquidity of these securities may impair the Fund from disposing of them in a timely manner and at a fair price when it is necessary or desirable to do so. While maintaining oversight, the Fund’s Board has delegated to DMC the day-to-day functions of determining whether individual securities are liquid for purposes of the Fund’s limitation on investments in illiquid assets. Securities eligible for resale pursuant to Rule 144A, which are determined to be liquid, are not subject to the Fund’s 15% limit on investment in illiquid assets. As of October 31, 2010, there were no Rule 144A securities and no securities have bee n determined to be illiquid under the Fund’s Liquidity Procedures.
10. Contractual Obligations
The Fund enters into contracts in the normal course of business that contain a variety of indemnifications. The Fund’s maximum exposure under these arrangements is unknown. However, the Fund has not had any prior claims or losses pursuant to these contracts. Management has reviewed the Fund’s existing contracts and expects the risk of loss to be remote.
11. Subsequent Event
Management has determined no material events or transactions occurred subsequent to October 31, 2010 that would require recognition or disclosure in the Fund’s financial statements.
22
Other Fund information
Delaware Large Cap Core Fund
Change in Independent Registered Public Accounting Firm
Due to independence matters under the Securities and Exchange Commission’s auditor independence rules relating to the January 4, 2010 acquisition of Delaware Investments (including DMC, DDLP and DSC) by Macquarie Group, Ernst & Young LLP (“E&Y”) has resigned as the independent registered public accounting firm for Voyageur Mutual Funds III (the “Trust”) effective June 28, 2010. At a meeting held on February 18, 2010, the Board of Trustees of the Trust, upon recommendation of the Audit Committee, selected PricewaterhouseCoopers LLC (“PwC”) to serve as the independent registered public accounting firm for the Trust for the fiscal year ending April 30, 2011. During the fiscal years ended April 30, 2010 and 2009, E&Y’s audit reports on the financial statements of the Trust did not contain any adverse opinion or disclaimer of opinion, nor were they qualified or modified as to uncertain ty, audit scope, or accounting principles. In addition, there were no disagreements between the Trust and E&Y on accounting principles, financial statements disclosures or audit scope, which, if not resolved to the satisfaction of E&Y, would have caused them to make reference to the disagreement in their reports. Neither the Trust nor anyone on its behalf has consulted with PwC at any time prior to their selection with respect to the application of accounting principles to a specified transaction, either completed or proposed or the type of audit opinion that might be rendered on the Trust’s financial statements.
23
About the organization
| Board of trustees |
| |
Patrick P. Coyne
Chairman, President, and
Chief Executive Officer
Delaware Investments®
Family of Funds
Philadelphia, PA Thomas L. Bennett
Private Investor
Rosemont, PA John A. Fry
President
Drexel University
Philadelphia, PA | Anthony D. Knerr
Founder and Managing
Director
Anthony Knerr &
Associates
New York, NY Lucinda S. Landreth
Former Chief Investment
Officer
Assurant, Inc.
Philadelphia, PA | Ann R. Leven
Consultant
ARL Associates
New York, NY Thomas F. Madison
President and
Chief Executive Officer
MLM Partners, Inc.
Minneapolis, MN | Janet L. Yeomans
Vice President and
Treasurer
3M Corporation
St. Paul, MN J. Richard Zecher
Founder
Investor Analytics
Scottsdale, AZ |
| | | | |
| Affiliated officers |
| |
David F. Connor
Vice President, Deputy
General Counsel, and
Secretary
Delaware Investments
Family of Funds
Philadelphia, PA | Daniel V. Geatens
Vice President and
Treasurer
Delaware Investments
Family of Funds
Philadelphia, PA | David P. O’Connor
Senior Vice President,
General Counsel,
and Chief Legal Officer
Delaware Investments
Family of Funds
Philadelphia, PA | Richard Salus
Senior Vice President and
Chief Financial Officer
Delaware Investments
Family of Funds
Philadelphia, PA |
This semiannual report is for the information of Delaware Large Cap Core Fund shareholders, but it may be used with prospective investors when preceded or accompanied by a current prospectus for Delaware Large Cap Core Fund, which is available at www.delawareinvestments.com. The prospectus sets forth details about charges, expenses, investment objectives, and operating policies of the investment company. You should read the prospectus carefully before you invest. The figures in this report represent past results that are not a guarantee of future results. The return and principal value of an investment in the investment company will fluctuate so that shares, when redeemed, may be worth more or less than their original cost. For the most recent performance, please call 800 523-1918. |
Delaware Investments is the marketing name of Delaware Management Holdings, Inc. and its subsidiaries. The Fund files its complete schedule of portfolio holdings with the Securities and Exchange Commission (SEC) for the first and third quarters of each fiscal year on Form N-Q. The Fund’s Forms N-Q, as well as a description of the policies and procedures that the Fund uses to determine how to vote proxies (if any) relating to portfolio securities are available without charge (i) upon request, by calling 800 523-1918; and (ii) on the SEC’s Web site at www.sec.gov. In addition, a description of the policies and procedures that the Fund uses to determine how to vote proxies (if any) relating to portfolio securities and the Fund’s Schedule of Investments are available without charge on the Fund’s Web site at www.delawareinvestments.com. The Fund’s Forms N-Q may be reviewed and copied at the SEC’s Public Reference Room in Washington, D.C.; information on the operation of the Public Reference Room may be obtained by calling 800 SEC-0330. Information (if any) regarding how the Fund voted proxies relating to portfolio securities during the most recently disclosed 12-month period ended June 30 is available without charge (i) through the Fund’s Web site at www.delawareinvestments.com; and (ii) on the SEC’s Web site at www.sec.gov. |
24
Item 2. Code of Ethics
Not applicable.
Item 3. Audit Committee Financial Expert
Not applicable.
Item 4. Principal Accountant Fees and Services
Not applicable.
Item 5. Audit Committee of Listed Registrants
Not applicable.
Item 6. Investments
(a) Included as part of report to shareholders filed under Item 1 of this Form N-CSR.
(b) Divestment of securities in accordance with Section 13(c) of the Investment Company Act of 1940.
Not applicable.
Item 7. Disclosure of Proxy Voting Policies and Procedures for Closed-End Management Investment Companies
Not applicable.
Item 8. Portfolio Managers of Closed-End Management Investment Companies
Not applicable.
Item 9. Purchases of Equity Securities by Closed-End Management Investment Companies and Affiliated Purchasers
Not applicable.
Item 10. Submission of Matters to a Vote of Security Holders
Not applicable.
Item 11. Controls and Procedures
The registrant’s principal executive officer and principal financial officer have evaluated the registrant’s disclosure controls and procedures within 90 days of the filing of this report and have concluded that they are effective in providing reasonable assurance that the information required to be disclosed by the registrant in its reports or statements filed under the Securities Exchange Act of 1934 is recorded, processed, summarized and reported within the time periods specified in the rules and forms of the Securities and Exchange Commission.
There were no significant changes in the registrant’s internal control over financial reporting that occurred during the second fiscal quarter of the period covered by the report to stockholders included herein (i.e., the registrant’s second fiscal quarter) that have materially affected, or are reasonably likely to materially affect, the registrant’s internal control over financial reporting.
Item 12. Exhibits
(a) (1) Code of Ethics
Not applicable.
(2) Certifications of Principal Executive Officer and Principal Financial Officer pursuant to Rule 30a-2 under the Investment Company Act of 1940 are attached hereto as Exhibit 99.CERT.
(3) Written solicitations to purchase securities pursuant to Rule 23c-1 under the Securities Exchange Act of 1934.
Not applicable.
(b) Certifications pursuant to Section 906 of the Sarbanes-Oxley Act of 2002 are furnished herewith as Exhibit 99.906CERT.
SIGNATURES
Pursuant to the requirements of the Securities Exchange Act of 1934 and the Investment Company Act of 1940, the registrant has duly caused this report to be signed on its behalf, by the undersigned, thereunto duly authorized.
| Name of Registrant: |
| |
| PATRICK P. COYNE |
| By: | Patrick P. Coyne |
| Title: | Chief Executive Officer |
| Date: | January 6, 2011 |
Pursuant to the requirements of the Securities Exchange Act of 1934 and the Investment Company Act of 1940, this report has been signed below by the following persons on behalf of the registrant and in the capacities and on the dates indicated.
| PATRICK P. COYNE |
| By: | Patrick P. Coyne |
| Title: | Chief Executive Officer |
| Date: | January 6, 2011 |
| |
| RICHARD SALUS |
| By: | Richard Salus |
| Title: | Chief Financial Officer |
| Date: | January 6, 2011 |