Washington, D.C. 20549
Item 1. Reports to Stockholders

Annual report Delaware Select Growth Fund
April 30, 2011 U.S. growth equity mutual fund |
Carefully consider the Fund’s investment objectives, risk factors, charges, and expenses before investing. This and other information can be found in the Fund’s prospectus and, if available, its summary prospectus, which may be obtained by visiting www.delawareinvestments.com or calling 800 523-1918. Investors should read the prospectus and, if available, the summary prospectus carefully before investing. |
You can obtain shareholder reports and prospectuses online instead of in the mail.
Visit www.delawareinvestments.com/edelivery. |
Experience Delaware Investments
Delaware Investments is committed to the pursuit of consistently superior asset management and unparalleled client service. We believe in our investment processes, which seek to deliver consistent results, and in convenient services that help add value for our clients.
If you are interested in learning more about creating an investment plan, contact your financial advisor.
You can learn more about Delaware Investments or obtain a prospectus for Delaware Select Growth Fund at www.delawareinvestments.com.
Manage your investments online
- 24-hour access to your account information
- Obtain share prices
- Check your account balance and recent transactions
- Request statements or literature
- Make purchases and redemptions
Delaware Management Holdings, Inc. and its subsidiaries (collectively known by the marketing name of Delaware Investments) are wholly owned subsidiaries of Macquarie Group Limited, a global provider of banking, financial, advisory, investment and funds management services.
Investments in Delaware Select Growth Fund are not and will not be deposits with or liabilities of Macquarie Bank Limited ABN 46 008 583 542 and its holding companies, including their subsidiaries or related companies (Macquarie Group), and are subject to investment risk, including possible delays in repayment and loss of income and capital invested. No Macquarie Group company guarantees or will guarantee the performance of the Fund, the repayment of capital from the Fund, or any particular rate of return.
| Table of contents | | |
| Portfolio management review | | 1 |
| Performance summary | | 4 |
| Disclosure of Fund expenses | | 8 |
| Security type/sector allocation and | | |
| top 10 equity holdings | | 10 |
| Statement of net assets | | 12 |
| Statement of operations | | 18 |
| Statements of changes in net assets | | 20 |
| Financial highlights | | 22 |
| Notes to financial statements | | 32 |
| Report of independent registered | | |
| public accounting firm | | 45 |
| Other Fund information | | 46 |
| Board of trustees/directors and | | |
| officers addendum | | 48 |
| About the organization | | 58 |
Unless otherwise noted, views expressed herein are current as of April 30, 2011, and subject to change.
Funds are not FDIC insured and are not guaranteed. It is possible to lose the principal amount invested.
Mutual fund advisory services provided by Delaware Management Company, a series of Delaware Management Business Trust, which is a registered investment advisor. Delaware Investments, a member of Macquarie Group, refers to Delaware Management Holdings, Inc. and its subsidiaries, including the Fund’s distributor, Delaware Distributors, L.P. Macquarie Group refers to Macquarie Group Limited and its subsidiaries and affiliates worldwide.
© 2011 Delaware Management Holdings, Inc.
All third-party trademarks cited are the property of their respective owners.
| Portfolio management review |
| Delaware Select Growth Fund | May 10, 2011 |
| Performance preview (for the year ended April 30, 2011) | | | | |
| Delaware Select Growth Fund (Class A shares) | | 1-year return | | +31.41% |
| Russell 3000® Growth Index (benchmark) | | 1-year return | | +21.62% |
Past performance does not guarantee future results.
For complete, annualized performance for Delaware Select Growth Fund, please see the table on page 4.
The performance of Class A shares excludes the applicable sales charge and reflects the reinvestment of all distributions. Index performance returns do not reflect any management fees, transaction costs, or expenses. Indices are unmanaged and one cannot invest directly in an index. |
As the Fund’s fiscal year got under way, equities markets demonstrated that economic recoveries can be volatile for investors. Major market indices saw significant volatility, and officially fell into “market correction” territory for several months. Investor sentiment grew particularly uneasy with the massive expansion of government debt across the developed world. Many investors focused keenly on a slowly evolving series of sovereign debt crises across southern Europe, as markets around the globe reacted almost daily to news from Greece, Portugal, and Spain (among other countries). Within this environment, many investors simply fled the typical risk assets.
Beginning in early September 2010, and continuing through the end of the Fund’s fiscal year, however, investor sentiment started to improve as the global economy showed slow but steady signs of gaining traction. Though equity markets remained volatile during this period, the U.S. stock market managed to notch strong gains as investors cheered signs of renewed manufacturing activity and improved consumer confidence. During this period, many investors seemed to turn their focus away from the sovereign debt concerns that had occupied their attention in previous months. Instead, they looked to improving corporate earnings and focused on the Federal Reserve’s November 2010 announcement that it would engage in a second round of quantitative easing, commonly called QE2. The plan involved the Fed purchasing up to $600 billion of Treasury notes and bonds in order to accelerate economic growth in the United States.
A second major policy announcement occurred in early December when President Obama announced that he had negotiated a compromise agreement with Congressional Republicans to extend the Bush-era tax cuts that included stimulus measures like keeping unemployment benefits in place for the long-term unemployed, cutting payroll taxes for all workers, and maintaining tax breaks on dividends and capital gains while lowering the estate tax. Equity investors largely celebrated this “double dose” of stimulus, believing that it could provide a firmer footing under what was a slowly improving U.S. economy.
Amid these improvements, however, the economy continued to face a series of headwinds. For example, many employers remained reluctant to add to payrolls throughout the fiscal year, and unemployment continued to hover near 9%. Issues such as sharp increases in food and energy prices and a still-slow housing market also nagged many investors during the period. At the same time, political turmoil in the Middle East and North Africa, along with the tragic
1
Portfolio management review
Delaware Select Growth Fund
earthquake, tsunami, and subsequent nuclear crisis in Japan added to investors’ sense of uncertainty as the Fund’s fiscal year came to a close. (Source: Dow Jones.)
Within the Fund
For its fiscal year ended April 30, 2011, Delaware Select Growth Fund (Class A shares) returned +31.41% at net asset value and +23.84% at maximum offer price (both figures reflect all distributions reinvested). The Fund outperformed its benchmark, the Russell 3000 Growth Index, which advanced +21.62% for the same period. For the complete annualized performance of Delaware Select Growth Fund, please see the table on page 4.
Priceline was the strongest contributor to the Fund’s overall return. The company’s “name your own price” model became more popular during the uncertain economic times, as bargain basement shoppers looked for travel discounts. Though the domestic online travel industry has become increasingly competitive, the company has continued to experience strong growth and recently beat analysts’ profit forecasts. Some investors grew nervous about the company’s European operations when the sovereign debt crisis emerged in 2010 — however, we chose to add shares on the weakness. This decision resulted in a significant contribution to the Fund’s performance.
Weight Watchers International was another strong contributor to the Fund. We believe the company’s offerings fit in well with the growing need for weight management products and services. The company’s move to include more online customers was also a positive development — we have been encouraged in recent years to see the company’s mix of customers broaden beyond physical meetings. Further, Weight Watchers has improved its balance sheet by significantly reducing its debt position.
Another contributor to the Fund was VeriFone Systems. This manufacturer of payment terminals benefited from several developments in the electronic payments ecosystem. First, the company’s revenues bounced back with the broader recovery in consumer spending because many of its terminals are located in retail and restaurant locations. Second, the company is participating in an upgrade cycle driven by customer and merchant demand for more secure payment networks to battle fraud. And finally, we believe the company is well positioned to participate in the emerging industry of mobile payment systems (using smartphones for electronic payment transactions).
Both of our education stocks, Apollo Group and Strayer Education, detracted from Fund performance during the Fund’s fiscal year. The stocks suffered along with the rest of the education industry, because of increased scrutiny on federal loans that help finance education. We believe the regulation risk is overstated by the markets and that valuations are attractive for both stocks as a result. In the case of Apollo — a relatively new position in the Fund — we believe senior management changes made in recent years, together with corresponding internal process improvements, should bear fruit for the company as it looks to re-emerge as a leaner entity with a keener focus on profitable growth. We initiated the position in the Fund when education stocks broadly sold off.
2
Finally, IntercontinentalExchange also detracted from Fund performance as its futures exchanges and clearing houses faced ongoing uncertainties in the enhanced regulatory environment for derivatives. Trading for these complex and sophisticated securities was lackluster early in the fiscal year as many investors tried to make heads or tails of the expanded rules. For the Fund’s fiscal year, the company’s stock enjoyed a positive return, though it lagged many of the Fund’s other holdings and the benchmark. We continued to hold the stock in the Fund as of the end of the fiscal year.
It’s important to note that, regardless of the economic outcome, we remain consistent in our long-term investment philosophy: We want to own what we view as strong secular growth companies, with solid business models and competitive positions that have the potential to deliver shareholder value in a variety of market environments.
3
| Performance summary |
| Delaware Select Growth Fund | April 30, 2011 |
The performance data quoted represent past performance; past performance does not guarantee future results. Investment return and principal value will fluctuate so your shares, when redeemed, may be worth more or less than their original cost. Please obtain the performance data current for the most recent month end by calling 800 523-1918 or visiting our Web site at www.delawareinvestments.com/performance. Current performance may be lower or higher than the performance data quoted.
| Fund performance1,2 | | Average annual total returns through April 30, 2011 |
| | | 1 year | | 5 years | | 10 years | | Lifetime |
| Class A (Est. May 16, 1994) | | | | | | | | |
| Excluding sales charge | | +31.41% | | +6.21% | | +3.97% | | n/a |
| Including sales charge | | +23.84% | | +4.96% | | +3.35% | | n/a |
| Class B (Est. April 16, 1996) | | | | | | | | |
| Excluding sales charge | | +30.45% | | +5.42% | | +3.34% | | n/a |
| Including sales charge | | +26.45% | | +5.05% | | +3.34% | | n/a |
| Class C (Est. May 20, 1994) | | | | | | | | |
| Excluding sales charge | | +30.41% | | +5.42% | | +3.19% | | n/a |
| Including sales charge | | +29.41% | | +5.42% | | +3.19% | | n/a |
| Class R (Est. June 2, 2003) | | | | | | | | |
| Excluding sales charge | | +31.10% | | +5.95% | | n/a | | +8.74% |
| Including sales charge | | +31.10% | | +5.95% | | n/a | | +8.74% |
| Institutional Class shares (Est. Aug. 28, 1997) | | | | | | |
| Excluding sales charge | | +31.73% | | +6.47% | | +4.22% | | n/a |
| Including sales charge | | +31.73% | | +6.47% | | +4.22% | | n/a |
1 Returns reflect the reinvestment of all distributions and are presented both with and without the applicable sales charges described below. Returns do not reflect the deduction of taxes the shareholder would pay on Fund distributions or redemptions of Fund shares.
Expense limitations were in effect for certain classes during some or all of the periods shown in the “Fund performance” chart. The current expenses for each class are listed on the “Fund expense ratios” table below. Performance would have been lower had expense limitations not been in effect.
Class A shares are sold with a maximum front-end sales charge of up to 5.75%, and have an annual distribution and service fee of up to 0.25% of average daily net assets. Performance for Class A shares, excluding sales charges, assumes that no front-end sales charge applied.
Class B shares may only be purchased through dividend reinvestment and certain permitted exchanges as described in the prospectus. Please see the prospectus for additional information on Class B shares. Class B shares have a contingent deferred sales charge that declines from 4.00%
4
to zero depending on the period of time the shares are held. They are also subject to an annual distribution and service fee of up to 1.00% of average daily net assets. Class B shares will automatically convert to Class A shares on a quarterly basis approximately eight years after purchase. Ten-year and lifetime performance figures for Class B shares reflect conversion to Class A shares after approximately eight years.
Class C shares are sold with a contingent deferred sales charge of 1.00% if redeemed during the first 12 months. They are also subject to an annual distribution and service fee of up to 1.00% of average daily net assets.
Performance for Class B and C shares, excluding sales charges, assumes either that contingent deferred sales charges did not apply or that the investment was not redeemed.
Class R shares are only available for certain retirement plan products. They are sold without a sales charge and have an annual distribution and service fee of up to 0.60% of average daily net assets, which has been limited contractually to 0.50% from Aug. 27, 2010, through Aug. 28, 2011.
Institutional Class shares are available without sales or asset-based distribution charges only to certain eligible institutional accounts.
Instances of high double-digit returns are unusual, cannot be sustained, and were primarily achieved during favorable market conditions.
The “Fund performance” table and the “Performance of a $10,000 investment” graph do not reflect the deduction of taxes the shareholder would pay on Fund distributions or redemptions of Fund shares.
2 The Fund’s expense ratios, as described in the most recent prospectus, are disclosed in the following “Fund expense ratios” table. Delaware Investments has agreed to reimburse certain expenses and/or waive certain fees in order to prevent total fund operating expenses from exceeding 1.24% of the Fund’s average daily net assets from Aug. 27, 2010, through Aug. 28, 2011. Please see the most recent prospectus and any applicable supplement(s) for additional information on these fee waivers and/or reimbursements.
| Fund expense ratios | | Class A | | Class B | | Class C | | Class R | | Institutional Class |
| Total annual operating expenses | | 1.73% | | 2.48% | | 2.48% | | 2.08% | | 1.48% |
| (without fee waivers) | | | | | | | | | | |
| Net expenses | | 1.49% | | 2.24% | | 2.24% | | 1.74% | | 1.24% |
| (including fee waivers, if any) | | | | | | | | | | |
| Type of waiver | | Contractual | | Contractual | | Contractual | | Contractual | | Contractual |
5
Performance summary
Delaware Select Growth Fund
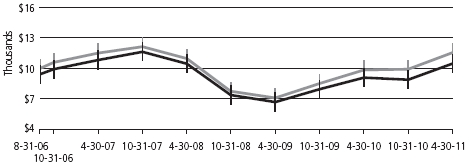
Performance of a $10,000 investment1
Average annual total returns from April 30, 2001, through April 30, 2011
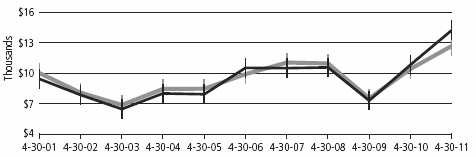
| For period beginning April 30, 2001, through April 30, 2011 | Starting value | Ending value |
| | Delaware Select Growth Fund — Class A Shares | $9,425 | $14,199 |
| | Russell 3000 Growth Index | $10,000 | $12,650 |
1 The “Performance of $10,000 investment” graph assumes $10,000 invested in Class A shares of the Fund on April 30, 2001, and includes the effect of a 5.75% front-end sales charge and the reinvestment of all distributions. The graph does not reflect the deduction of taxes the shareholders would pay on Fund distributions or redemptions of Fund shares. Expense limitations were in effect for some or all of the periods shown. Performance would have been lower had expense limitations not been in effect. Current expenses are listed in the “Fund expense ratios” table on page 5. Please note additional details on pages 4 through 6.
The chart also assumes $10,000 invested in the Russell 3000 Growth Index as of April 30, 2001. The Russell 3000 Growth Index measures the performance of the broad growth segment of the U.S. equity universe. It includes those Russell 3000 companies with higher price-to-book ratios and higher forecasted growth values.
Index performance returns do not reflect any management fees, transaction costs, or expenses. Indices are unmanaged and one cannot invest directly in an index. Past performance is not a guarantee of future results.
Performance of other Fund classes will vary due to different charges and expenses.
| | | Nasdaq symbols | | CUSIPs | |
| Class A | | | DVEAX | | | 928931104 | |
| Class B | | | DVEBX | | | 928931849 | |
| Class C | | | DVECX | | | 928931203 | |
| Class R | | | DFSRX | | | 928931740 | |
| Institutional Class | | | VAGGX | | | 928931757 | |
6
Disclosure of Fund expenses
For the six-month period from November 1, 2010 to April 30, 2011
As a shareholder of the Fund, you incur two types of costs: (1) transaction costs, including sales charges (loads) on purchase payments, reinvested dividends, or other distributions; redemption fees; and exchange fees; and (2) ongoing costs, including management fees; distribution and/or service (12b-1) fees; and other Fund expenses. This example is intended to help you understand your ongoing costs (in dollars) of investing in the Fund and to compare these costs with the ongoing costs of investing in other mutual funds.
The example is based on an investment of $1,000 invested at the beginning of the period and held for the entire six-month period from November 1, 2010 to April 30, 2011.
Actual expenses
The first section of the table shown, “Actual Fund return,” provides information about actual account values and actual expenses. You may use the information in this section of the table, together with the amount you invested, to estimate the expenses that you paid over the period. Simply divide your account value by $1,000 (for example, an $8,600 account value divided by $1,000 = 8.6), then multiply the result by the number in the first section under the heading entitled “Expenses Paid During Period” to estimate the expenses you paid on your account during this period.
Hypothetical example for comparison purposes
The second section of the table shown, “Hypothetical 5% return,” provides information about hypothetical account values and hypothetical expenses based on the Fund’s actual expense ratio and an assumed rate of return of 5% per year before expenses, which is not the Fund’s actual return. The hypothetical account values and expenses may not be used to estimate the actual ending account balance or expenses you paid for the period. You may use this information to compare the ongoing costs of investing in the Fund and other funds. To do so, compare this 5% hypothetical example with the 5% hypothetical examples that appear in the shareholder reports of the other funds.
Please note that the expenses shown in the table are meant to highlight your ongoing costs only and do not reflect any transactional costs, such as sales charges (loads), redemption fees, or exchange fees. Therefore, the second section of the table is useful in comparing ongoing costs only, and will not help you determine the relative total costs of owning different funds. In addition, if these transactional costs were included, your costs would have been higher. The Fund’s expenses shown in the table reflect fee waivers in effect. The expenses shown in the table assume reinvestment of all dividends and distributions.
8
Delaware Select Growth Fund
Expense analysis of an investment of $1,000
| | | Beginning | | Ending | | | | Expenses |
| | | Account Value | | Account Value | | Annualized | | Paid During Period |
| | | 11/1/10 | | 4/30/11 | | Expense Ratio | | 11/1/10 to 4/30/11* |
| Actual Fund return | | | | | | | | | | | | | | | | | |
| Class A | | | $ | 1,000.00 | | | | $ | 1,195.60 | | | 1.49% | | | $ | 8.11 | |
| Class B | | | | 1,000.00 | | | | | 1,191.50 | | | 2.24% | | | | 12.17 | |
| Class C | | | | 1,000.00 | | | | | 1,191.30 | | | 2.24% | | | | 12.17 | |
| Class R | | | | 1,000.00 | | | | | 1,194.30 | | | 1.74% | | | | 9.47 | |
| Institutional Class | | | | 1,000.00 | | | | | 1,197.20 | | | 1.24% | | | | 6.76 | |
| Hypothetical 5% return (5% return before expenses) | | | | | | | | |
| Class A | | | $ | 1,000.00 | | | | $ | 1,017.41 | | | 1.49% | | | $ | 7.45 | |
| Class B | | | | 1,000.00 | | | | | 1,013.69 | | | 2.24% | | | | 11.18 | |
| Class C | | | | 1,000.00 | | | | | 1,013.69 | | | 2.24% | | | | 11.18 | |
| Class R | | | | 1,000.00 | | | | | 1,016.17 | | | 1.74% | | | | 8.70 | |
| Institutional Class | | | | 1,000.00 | | | | | 1,018.65 | | | 1.24% | | | | 6.21 | |
*“Expenses Paid During Period” are equal to the Fund’s annualized expense ratio, multiplied by the average account value over the period, multiplied by 181/365 (to reflect the one-half year period).
9
| Security type/sector allocation and | |
| top 10 equity holdings | |
| Delaware Select Growth Fund | As of April 30, 2011 |
Sector designations may be different than the sector designations presented in other Fund materials. The sector designations may represent the investment manager’s internal sector classifications, which may result in the sector designations for one fund being different than another fund’s sector designations.
| Security type/sector | Percentage of net assets |
| Common Stock² | 96.15 | % |
| Consumer Discretionary | 24.74 | % |
| Consumer Staples | 4.04 | % |
| Energy | 4.43 | % |
| Financial Services | 15.15 | % |
| Healthcare | 13.15 | % |
| Materials & Processing | 4.67 | % |
| Producer Durables | 2.09 | % |
| Technology | 26.54 | % |
| Utilities | 1.34 | % |
| Preferred Stock | 2.02 | % |
| Short-Term Investments | 2.18 | % |
| Securities Lending Collateral | 16.67 | % |
| Total Value of Securities | 117.02 | % |
| Obligation to Return Securities Lending Collateral | (16.98 | %) |
| Other Liabilities Net of Receivables and Other Assets | (0.04 | %) |
| Total Net Assets | 100.00 | % |
²Narrow industries are utilized for compliance purposes for diversification whereas broad sectors are used for financial reporting.
10
Holdings are for informational purposes only and are subject to change at any time. They are not a recommendation to buy, sell, or hold any security.
| Top 10 equity holdings | Percentage of net assets |
| Apple | 8.36 | % |
| MasterCard Class A | 4.69 | % |
| priceline.com | 4.44 | % |
| Apollo Group Class A | 3.83 | % |
| Medco Health Solutions | 3.19 | % |
| Polycom | 3.12 | % |
| Peet’s Coffee & Tea | 3.12 | % |
| Perrigo | 3.03 | % |
| Allergan | 2.99 | % |
| Weight Watchers International | 2.86 | % |
11
| Statement of net assets | |
| Delaware Select Growth Fund | April 30, 2011 |
| | | Number of shares | | Value |
| Common Stock – 96.15%² | | | | |
| Consumer Discretionary – 24.74% | | | | |
| *† | Apollo Group Class A | 474,750 | | $ | 19,004,243 |
| *† | Ctrip.com International ADR | 268,800 | | | 13,095,936 |
| † | DineEquity | 56,600 | | | 2,828,302 |
| | Intertek Group | 87,900 | | | 3,120,098 |
| † | Interval Leisure Group | 252,300 | | | 4,054,461 |
| *† | ITT Educational Services | 171,550 | | | 12,305,282 |
| | Lowe’s | 283,400 | | | 7,439,250 |
| | LVMH Moet Hennessy Louis Vuitton | 20,775 | | | 3,731,726 |
| * | NIKE Class B | 35,050 | | | 2,885,316 |
| *† | priceline.com | 40,230 | | | 22,006,212 |
| * | Ritchie Bros Auctioneers | 106,300 | | | 3,324,001 |
| * | Staples | 87,800 | | | 1,856,092 |
| * | Strayer Education | 103,300 | | | 12,796,804 |
| | Weight Watchers International | 182,400 | | | 14,181,600 |
| | | | | | 122,629,323 |
| Consumer Staples – 4.04% | | | | |
| *† | Peet’s Coffee & Tea | 332,700 | | | 15,463,896 |
| | Whole Foods Market | 72,300 | | | 4,537,548 |
| | | | | | 20,001,444 |
| Energy – 4.43% | | | | |
| * | Core Laboratories | 65,695 | | | 6,305,406 |
| * | Energy Transfer Equity | 45,000 | | | 2,068,650 |
| * | EOG Resources | 106,950 | | | 12,075,725 |
| | Williams | 45,000 | | | 1,492,650 |
| | | | | | 21,942,431 |
| Financial Services – 15.15% | | | | |
| † | Affiliated Managers Group | 47,900 | | | 5,224,932 |
| | Bank of New York Mellon | 56,906 | | | 1,647,998 |
| | BM&FBovespa | 443,200 | | | 3,325,830 |
| *† | CB Richard Ellis Group Class A | 114,300 | | | 3,052,953 |
| | CME Group | 26,850 | | | 7,941,425 |
| | Heartland Payment Systems | 235,500 | | | 4,700,580 |
| † | IntercontinentalExchange | 115,225 | | | 13,867,329 |
| | MasterCard Class A | 84,300 | | | 23,257,526 |
| *† | MSCI Class A | 135,100 | | | 4,791,997 |
| * | Visa Class A | 93,300 | | | 7,288,596 |
| | | | | | 75,099,166 |
12
| | | Number of shares | | Value |
| Common Stock (continued) | | | | |
| Healthcare – 13.15% | | | | |
| † | ABIOMED | 126,000 | | $ | 2,189,880 |
| * | Allergan | 186,250 | | | 14,818,050 |
| *† | athenahealth | 86,000 | | | 3,975,780 |
| † | Gilead Sciences | 109,850 | | | 4,266,574 |
| † | Medco Health Solutions | 266,250 | | | 15,796,612 |
| | Novo Nordisk ADR | 71,200 | | | 9,070,168 |
| * | Perrigo | 166,458 | | | 15,041,145 |
| | | | | | 65,158,209 |
| Materials & Processing – 4.67% | | | | |
| * | BHP Billiton ADR | 18,750 | | | 1,898,250 |
| | Brasil Brokers Participacoes | 827,200 | | | 4,478,170 |
| | Freeport-McMoRan Copper & Gold | 89,700 | | | 4,936,191 |
| | Monsanto | 9,400 | | | 639,576 |
| | Newmont Mining | 65,200 | | | 3,821,372 |
| | Syngenta ADR | 104,500 | | | 7,392,330 |
| | | | | | 23,165,889 |
| Producer Durables – 2.09% | | | | |
| * | Caterpillar | 36,100 | | | 4,166,301 |
| | Expeditors International Washington | 66,200 | | | 3,592,674 |
| | Nalco Holding | 89,300 | | | 2,608,453 |
| | | | | | 10,367,428 |
| Technology – 26.54% | | | | |
| *† | Adobe Systems | 282,700 | | | 9,484,585 |
| † | Apple | 118,950 | | | 41,421,959 |
| † | Crown Castle International | 288,700 | | | 12,373,682 |
| * | FLIR Systems | 61,800 | | | 2,176,596 |
| † | Google Class A | 10,700 | | | 5,821,870 |
| *† | Intuit | 148,000 | | | 8,222,880 |
| † | Polycom | 258,500 | | | 15,466,055 |
| | QUALCOMM | 228,400 | | | 12,982,256 |
| † | SBA Communications Class A | 147,500 | | | 5,697,925 |
| † | Teradata | 121,850 | | | 6,813,852 |
| *† | VeriFone Systems | 101,432 | | | 5,560,502 |
| | VeriSign | 149,500 | | | 5,525,520 |
| | | | | | 131,547,682 |
13
Statement of net assets
Delaware Select Growth Fund
| | | | Number of shares | | Value |
| Common Stock (continued) | | | | | | |
| Utilities – 1.34% | | | | | | |
| *† | j2 Global Communications | | | 225,100 | | $ | 6,631,446 |
| | | | | | | | 6,631,446 |
| Total Common Stock (cost $343,095,567) | | | | | | 476,543,018 |
| | |
| Preferred Stock – 2.02% | | | | | | |
| =† | MiaSole Series F | | | 2,310,286 | | | 10,000,073 |
| Total Preferred Stock (cost $10,000,073) | | | | | | 10,000,073 |
| | |
| | | | Principal amount | | | |
| ≠Short-Term Investments – 2.18% | | | | | | |
| Discount Notes – 2.18% | | | | | | |
| | Federal Home Loan Bank | | | | | | |
| | 0.001% 5/2/11 | | $ | 8,869,784 | | | 8,869,784 |
| | 0.03% 5/3/11 | | | 89,830 | | | 89,830 |
| | 0.037% 5/23/11 | | | 114,983 | | | 114,982 |
| | 0.04% 5/9/11 | | | 1,566,885 | | | 1,566,882 |
| | 0.05% 5/16/11 | | | 89,830 | | | 89,830 |
| | 0.06% 6/7/11 | | | 85,339 | | | 85,338 |
| Total Short-Term Investments (cost $10,816,641) | | | | | | 10,816,646 |
| | |
| Total Value of Securities Before Securities | | | | | | |
| | Lending Collateral – 100.35% (cost $363,912,281) | | | | | | 497,359,737 |
| | |
| | | | Number of shares | | | |
| Securities Lending Collateral** – 16.67% | | | | | | |
| | Investment Companies | | | | | | |
| | BNY Mellon SL DBT II Liquidating Fund | | | 1,026,573 | | | 997,007 |
| | Delaware Investments Collateral Fund No. 1 | | | 81,634,400 | | | 81,634,400 |
| | @†Mellon GSL Reinvestment Trust II | | | 1,489,816 | | | 0 |
| Total Securities Lending Collateral (cost $84,150,789) | | | | | | 82,631,407 |
14
| | | | |
| Total Value of Securities – 117.02% | | | |
| (cost $448,063,070) | $ | 579,991,144 | © |
| Obligation to Return Securities | | | |
| Lending Collateral** – (16.98%) | | (84,150,789 | ) |
| Other Liabilities Net of Receivables | | | |
| and Other Assets – (0.04%) | | (208,948 | ) |
| Net Assets Applicable to 13,791,961 | | | |
| Shares Outstanding – 100.00% | $ | 495,631,407 | |
| |
| Net Asset Value – Delaware Select Growth Fund | | | |
| Class A ($267,562,594 / 7,284,464 Shares) | | | $36.73 | |
| Net Asset Value – Delaware Select Growth Fund | | | |
| Class B ($31,712,913 / 981,827 Shares) | | | $32.30 | |
| Net Asset Value – Delaware Select Growth Fund | | | |
| Class C ($71,800,389 / 2,247,147 Shares) | | | $31.95 | |
| Net Asset Value – Delaware Select Growth Fund | | | |
| Class R ($4,607,302 / 128,125 Shares) | | | $35.96 | |
| Net Asset Value – Delaware Select Growth Fund | | | |
| Institutional Class ($119,948,209 / 3,150,398 Shares) | | | $38.07 | |
| |
| Components of Net Assets at April 30, 2011: | | | |
| Shares of beneficial interest (unlimited authorization – no par) | $ | 492,719,881 | |
| Accumulated net investment loss | | (185,549 | ) |
| Accumulated net realized loss on investments | | (128,830,769 | ) |
| Net unrealized appreciation of investments and foreign currencies | | 131,927,844 | |
| Total net assets | $ | 495,631,407 | |
15
Statement of net assets
Delaware Select Growth Fund
| | |
| ² | Narrow industries are utilized for compliance purposes for diversification whereas broad sectors are used for financial reporting. |
| † | Non income producing security. |
| * | Fully or partially on loan. |
| = | Security is being fair valued in accordance with the Fund’s fair valuation policy. At April 30, 2011, the aggregate amount of fair valued securities was $10,000,073, which represented 2.02% of the Fund’s net assets. See Note 1 in “Notes to financial statements.” |
| ** | See Note 10 in “Notes to financial statements.” |
| ≠ | The rate shown is the effective yield at the time of purchase. |
| @ | Illiquid security. At April 30, 2011, the aggregate amount of illiquid securities was $0, which represented 0.00% of the Fund’s net assets. See Note 11 in “Notes to financial statements.” |
| © | Includes $82,340,722 of securities loaned. |
ADR — American Depositary Receipts
| Net Asset Value and Offering Price Per Share – | | |
| Delaware Select Growth Fund | | |
| Net asset value Class A (A) | $ | 36.73 |
| Sales charges (5.75% of offering price) (B) | | 2.24 |
| Offering price | $ | 38.97 |
| (A) | | Net asset value per share, as illustrated, is the amount which would be paid upon redemption or repurchase of shares. |
| (B) | | See the current prospectus for purchase of $50,000 or more. |
See accompanying notes, which are an integral part of the financial statements.
16
| Statement of operations | |
| Delaware Select Growth Fund | Year Ended April 30, 2011 |
| Investment Income: | | | | | | | |
| Dividends | $ | 3,234,446 | | | | | |
| Securities lending income | | 599,170 | | | | | |
| Interest | | 16,645 | | | | | |
| Foreign tax withheld | | (56,583 | ) | | $ | 3,793,678 | |
| |
| Expenses: | | | | | | | |
| Management fees | | 2,662,388 | | | | | |
| Dividend disbursing and transfer agent fees and expenses | | 1,472,334 | | | | | |
| Distribution expenses – Class A | | 502,306 | | | | | |
| Distribution expenses – Class B | | 227,862 | | | | | |
| Distribution expenses – Class C | | 483,192 | | | | | |
| Distribution expenses – Class R | | 17,123 | | | | | |
| Reports and statements to shareholders | | 163,171 | | | | | |
| Accounting and administration expenses | | 139,906 | | | | | |
| Legal fees | | 95,596 | | | | | |
| Registration fees | | 80,499 | | | | | |
| Dues and services | | 31,203 | | | | | |
| Audit and tax | | 28,894 | | | | | |
| Trustees’ fees | | 18,533 | | | | | |
| Custodian fees | | 15,253 | | | | | |
| Insurance fees | | 15,045 | | | | | |
| Pricing fees | | 6,474 | | | | | |
| Consulting fees | | 4,914 | | | | | |
| Trustees’ expenses | | 2,045 | | | | 5,966,738 | |
| Less fees waived | | | | | | (245,129 | ) |
| Less expense paid indirectly | | | | | | (2,692 | ) |
| Less waived distribution expenses – Class R | | | | | | (2,854 | ) |
| Total operating expenses | | | | | | 5,716,063 | |
| Net Investment Loss | | | | | | (1,922,385 | ) |
18
| Net Realized and Unrealized Gain (Loss) on Investments | | | |
| and Foreign Currencies: | | | |
| Net realized gain (loss) on: | | | |
| Investments | $ | 51,022,529 | |
| Foreign currencies | | (236,804 | ) |
| Foreign currency exchange contracts | | (8,875 | ) |
| Net realized gain | | 50,776,850 | |
| Net change in unrealized appreciation/depreciation of | | | |
| investments and foreign currencies | | 59,499,333 | |
| Net Realized and Unrealized Gain on Investments | | | |
| and Foreign Currencies | | 110,276,183 | |
| |
| Net Increase in Net Assets Resulting from Operations | $ | 108,353,798 | |
See accompanying notes, which are an integral part of the financial statements.
19
Statements of changes in net assets
Delaware Select Growth Fund
| | Year Ended |
| | 4/30/11 | | 4/30/10 |
| Increase (Decrease) in Net Assets from Operations: | | | | | | | |
| Net investment loss | $ | (1,922,385 | ) | | $ | (2,429,980 | ) |
| Net realized gain on investments and | | | | | | | |
| foreign currencies | | 50,776,850 | | | | 38,783,458 | |
| Net change in unrealized appreciation/depreciation | | | | | | | |
| of investments and foreign currencies | | 59,499,333 | | | | 63,092,292 | |
| Net increase in net assets resulting from operations | | 108,353,798 | | | | 99,445,770 | |
| |
| Capital Share Transactions: | | | | | | | |
| Proceeds from shares sold: | | | | | | | |
| Class A | | 28,801,020 | | | | 18,629,185 | |
| Class B | | 246,675 | | | | 206,648 | |
| Class C | | 4,870,828 | | | | 1,799,685 | |
| Class R | | 2,326,802 | | | | 252,368 | |
| Institutional Class | | 52,556,873 | | | | 90,342,397 | |
| |
| Net assets from merger*: | | | | | | | |
| Class A | | 82,721,925 | | | | — | |
| Class B | | 19,198,198 | | | | — | |
| Class C | | 33,357,785 | | | | — | |
| Class R | | 2,388,873 | | | | — | |
| Institutional Class | | 3,408,127 | | | | — | |
| | | 229,877,106 | | | | 111,230,283 | |
20
| | Year Ended |
| | 4/30/11 | | 4/30/10 |
| Capital Share Transactions (continued): | | | | | | | |
| Cost of shares repurchased: | | | | | | | |
| Class A | $ | (54,500,106 | ) | | $ | (26,291,216 | ) |
| Class B | | (9,619,554 | ) | | | (11,280,764 | ) |
| Class C | | (10,754,776 | ) | | | (5,500,832 | ) |
| Class R | | (1,896,421 | ) | | | (405,510 | ) |
| Institutional Class | | (14,816,398 | ) | | | (113,200,890 | ) |
| | | (91,587,255 | ) | | | (156,679,212 | ) |
| Increase (decrease) in net assets derived from | | | | | | | |
| capital share transactions | | 138,289,851 | | | | (45,448,929 | ) |
| Net Increase in Net Assets | | 246,643,649 | | | | 53,996,841 | |
| |
| Net Assets: | | | | | | | |
| Beginning of year | | 248,987,758 | | | | 194,990,917 | |
| End of year (including accumulated net investment | | | | | | | |
| loss of $185,549 and $92,972 respectively) | $ | 495,631,407 | | | $ | 248,987,758 | |
*See note 7 in “Notes to financial statements.”
See accompanying notes, which are an integral part of the financial statements.
21
Financial highlights
Delaware Select Growth Fund Class A
Selected data for each share of the Fund outstanding throughout each period were as follows:
| Net asset value, beginning of period |
| |
| Income (loss) from investment operations: |
| Net investment loss1 |
| Net realized and unrealized gain (loss) on investments and foreign currencies |
| Total from investment operations |
| |
| Net asset value, end of period |
| |
| Total return2 |
| |
| Ratios and supplemental data: |
| Net assets, end of period (000 omitted) |
| Ratio of expenses to average net assets |
| Ratio of expenses to average net assets |
| prior to fees waived and expense paid indirectly |
| Ratio of net investment loss to average net assets |
| Ratio of net investment loss to average net assets |
| prior to fees waived and expense paid indirectly |
| Portfolio turnover |
1 The average shares outstanding method has been applied for per share information. |
2 Total investment return is based on the change in net asset value of a share during the period and assumes reinvestment of dividends and distributions at net asset value and does not reflect the impact of a sales charge. Total investment return during all of the periods shown reflects a waiver by the manager. Performance would have been lower had the waiver not been in effect. |
See accompanying notes, which are an integral part of the financial statements.
22
| | Year Ended | |
| | | 4/30/11 | | 4/30/10 | | 4/30/09 | | 4/30/08 | | 4/30/07 | |
| | | $27.950 | | | $18.860 | | | $27.300 | | | $27.110 | | | $27.180 | | |
| | | |
| | | | | | | | | | | | | | | | | |
| | | (0.139 | ) | | (0.209 | ) | | (0.041 | ) | | (0.119 | ) | | (0.193 | ) | |
| | | 8.919 | | | 9.299 | | | (8.399 | ) | | 0.309 | | | 0.123 | | |
| | | 8.780 | | | 9.090 | | | (8.440 | ) | | 0.190 | | | (0.070 | ) | |
| | | |
| | | $36.730 | | | $27.950 | | | $18.860 | | | $27.300 | | | $27.110 | | |
| | | |
| | | 31.41% | | | 48.20% | | | (30.92% | ) | | 0.70% | | | (0.26% | ) | |
| | | |
| | | |
| | | $267,563 | | | $150,016 | | | $106,919 | | | $157,366 | | | $160,170 | | |
| | | 1.51% | | | 1.50% | | | 1.49% | | | 1.48% | | | 1.50% | | |
| | | | | | | | | | | | | | | | | |
| | | 1.58% | | | 1.73% | | | 1.85% | | | 1.62% | | | 1.64% | | |
| | | (0.45% | ) | | (0.89% | ) | | (0.20% | ) | | (0.42% | ) | | (0.77% | ) | |
| | | | | | | | | | | | | | | | | |
| | | (0.52% | ) | | (1.12% | ) | | (0.56% | ) | | (0.56% | ) | | (0.91% | ) | |
| | | 41% | | | 49% | | | 66% | | | 61% | | | 51% | | |
23
Financial highlights
Delaware Select Growth Fund Class B
Selected data for each share of the Fund outstanding throughout each period were as follows:
| Net asset value, beginning of period |
| |
| Income (loss) from investment operations: |
| Net investment loss1 |
| Net realized and unrealized gain (loss) on investments and foreign currencies |
| Total from investment operations |
| |
| Net asset value, end of period |
| |
| Total return2 |
| |
| Ratios and supplemental data: |
| Net assets, end of period (000 omitted) |
| Ratio of expenses to average net assets |
| Ratio of expenses to average net assets |
| prior to fees waived and expense paid indirectly |
| Ratio of net investment loss to average net assets |
| Ratio of net investment loss to average net assets |
| prior to fees waived and expense paid indirectly |
| Portfolio turnover |
1 The average shares outstanding method has been applied for per share information. |
2 Total investment return is based on the change in net asset value of a share during the period and assumes reinvestment of dividends and distributions at net asset value and does not reflect the impact of a sales charge. Total investment return during all of the periods shown reflects a waiver by the manager. Performance would have been lower had the waiver not been in effect. |
See accompanying notes, which are an integral part of the financial statements.
24
| | | Year Ended | |
| | | 4/30/11 | | 4/30/10 | | 4/30/09 | | 4/30/08 | | 4/30/07 | |
| | | $24.760 | | | $16.830 | | | $24.550 | | | $24.560 | | | $24.810 | | |
| | | | | | | | | | | | | | | | | |
| | |
| | | (0.333 | ) | | (0.355 | ) | | (0.182 | ) | | (0.304 | ) | | (0.365 | ) | |
| | | 7.873 | | | 8.285 | | | (7.538 | ) | | 0.294 | | | 0.115 | | |
| | | 7.540 | | | 7.930 | | | (7.720 | ) | | (0.010 | ) | | (0.250 | ) | |
| | |
| | | $32.300 | | | $24.760 | | | $16.830 | | | $24.550 | | | $24.560 | | |
| | |
| | | 30.45% | | | 47.12% | | | (31.45% | ) | | (0.04% | ) | | (1.01% | ) | |
| | | | | | | | | | | | | | | | | |
| | | | | | | | | | | | | | | | | |
| | | $31,713 | | | $15,012 | | | $19,222 | | | $67,344 | | | $126,866 | | |
| | | 2.26% | | | 2.25% | | | 2.24% | | | 2.23% | | | 2.25% | | |
| | | | | | | | | | | | | | | | | |
| | | 2.33% | | | 2.48% | | | 2.60% | | | 2.37% | | | 2.39% | | |
| | | (1.20% | ) | | (1.64% | ) | | (0.95% | ) | | (1.17% | ) | | (1.52% | ) | |
| | | | | | | | | | | | | | | | | |
| | | (1.27% | ) | | (1.87% | ) | | (1.31% | ) | | (1.31% | ) | | (1.66% | ) | |
| | | 41% | | | 49% | | | 66% | | | 61% | | | 51% | | |
25
Financial highlights
Delaware Select Growth Fund Class C
Selected data for each share of the Fund outstanding throughout each period were as follows:
| Net asset value, beginning of period |
| |
| Income (loss) from investment operations: |
| Net investment loss1 |
| Net realized and unrealized gain (loss) on investments and foreign currencies |
| Total from investment operations |
| |
| Net asset value, end of period |
| |
| Total return2 |
| |
| Ratios and supplemental data: |
| Net assets, end of period (000 omitted) |
| Ratio of expenses to average net assets |
| Ratio of expenses to average net assets |
| prior to fees waived and expense paid indirectly |
| Ratio of net investment loss to average net assets |
| Ratio of net investment loss to average net assets |
| prior to fees waived and expense paid indirectly |
| Portfolio turnover |
1 The average shares outstanding method has been applied for per share information. |
2 Total investment return is based on the change in net asset value of a share during the period and assumes reinvestment of dividends and distributions at net asset value and does not reflect the impact of a sales charge. Total investment return during all of the periods shown reflects a waiver by the manager. Performance would have been lower had the waiver not been in effect. |
See accompanying notes, which are an integral part of the financial statements.
26
| | | Year Ended | |
| | | 4/30/11 | | 4/30/10 | | 4/30/09 | | 4/30/08 | | 4/30/07 | |
| | | $24.500 | | | $16.650 | | | $24.290 | | | $24.300 | | | $24.540 | | |
| | |
| | |
| | | (0.329 | ) | | (0.357 | ) | | (0.173 | ) | | (0.302 | ) | | (0.362 | ) | |
| | | 7.779 | | | 8.207 | | | (7.467 | ) | | 0.292 | | | 0.122 | | |
| | | 7.450 | | | 7.850 | | | (7.640 | ) | | (0.010 | ) | | (0.240 | ) | |
| | |
| | | $31.950 | | | $24.500 | | | $16.650 | | | $24.290 | | | $24.300 | | |
| | |
| | | 30.41% | | | 47.15% | | | (31.45% | ) | | (0.04% | ) | | (0.98% | ) | |
| | | | | | | | | | | | | | | | | |
| | |
| | | $71,800 | | | $29,502 | | | $23,030 | | | $44,972 | | | $59,271 | | |
| | | 2.26% | | | 2.25% | | | 2.24% | | | 2.23% | | | 2.25% | | |
| | | | | | | | | | | | | | | | | |
| | | 2.33% | | | 2.48% | | | 2.60% | | | 2.37% | | | 2.39% | | |
| | | (1.20% | ) | | (1.64% | ) | | (0.95% | ) | | (1.17% | ) | | (1.52% | ) | |
| | | | | | | | | | | | | | | | | |
| | | (1.27% | ) | | (1.87% | ) | | (1.31% | ) | | (1.31% | ) | | (1.66% | ) | |
| | | 41% | | | 49% | | | 66% | | | 61% | | | 51% | | |
27
Financial highlights
Delaware Select Growth Fund Class R
Selected data for each share of the Fund outstanding throughout each period were as follows:
| Net asset value, beginning of period |
| |
| Income (loss) from investment operations: |
| Net investment loss1 |
| Net realized and unrealized gain (loss) on investments and foreign currencies |
| Total from investment operations |
| |
| Net asset value, end of period |
| |
| Total return2 |
| |
| Ratios and supplemental data: |
| Net assets, end of period (000 omitted) |
| Ratio of expenses to average net assets |
| Ratio of expenses to average net assets |
| prior to fees waived and expense paid indirectly |
| Ratio of net investment loss to average net assets |
| Ratio of net investment loss to average net assets |
| prior to fees waived and expense paid indirectly |
| Portfolio turnover |
1 The average shares outstanding method has been applied for per share information. |
2 Total investment return is based on the change in net asset value of a share during the period and assumes reinvestment of dividends and distributions at net asset value. Total investment return during all of the periods shown reflects waivers by the manager and distributor. Performance would have been lower had the waivers not been in effect. |
See accompanying notes, which are an integral part of the financial statements.
28
| | | Year Ended | |
| | | 4/30/11 | | 4/30/10 | | 4/30/09 | | 4/30/08 | | 4/30/07 | |
| | | $27.430 | | | $18.550 | | | $26.930 | | | $26.810 | | | $26.940 | | |
| | |
| | |
| | | (0.222 | ) | | (0.265 | ) | | (0.092 | ) | | (0.188 | ) | | (0.257 | ) | |
| | | 8.752 | | | 9.145 | | | (8.288 | ) | | 0.308 | | | 0.127 | | |
| | | 8.530 | | | 8.880 | | | (8.380 | ) | | 0.120 | | | (0.130 | ) | |
| | |
| | | $35.960 | | | $27.430 | | | $18.550 | | | $26.930 | | | $26.810 | | |
| | |
| | | 31.10% | | | 47.87% | | | (31.12% | ) | | 0.45% | | | (0.48% | ) | |
| | |
| | |
| | | $4,607 | | | $807 | | | $671 | | | $1,266 | | | $1,432 | | |
| | | 1.76% | | | 1.75% | | | 1.74% | | | 1.73% | | | 1.75% | | |
| | | | | | | | | | | | | | | | | |
| | | 1.93% | | | 2.08% | | | 2.20% | | | 1.97% | | | 1.99% | | |
| | | (0.70% | ) | | (1.14% | ) | | (0.45% | ) | | (0.67% | ) | | (1.02% | ) | |
| | | | | | | | | | | | | | | | | |
| | | (0.87% | ) | | (1.47% | ) | | (0.91% | ) | | (0.91% | ) | | (1.26% | ) | |
| | | 41% | | | 49% | | | 66% | | | 61% | | | 51% | | |
29
Financial highlights
Delaware Select Growth Fund Institutional Class
Selected data for each share of the Fund outstanding throughout each period were as follows:
| Net asset value, beginning of period |
| |
| Income (loss) from investment operations: |
| Net investment income (loss)1 |
| Net realized and unrealized gain (loss) on investments and foreign currencies |
| Total from investment operations |
| |
| Net asset value, end of period |
| |
| Total return2 |
| |
| Ratios and supplemental data: |
| Net assets, end of period (000 omitted) |
| Ratio of expenses to average net assets |
| Ratio of expenses to average net assets |
| prior to fees waived and expense paid indirectly |
| Ratio of net investment income (loss) to average net assets |
| Ratio of net investment loss to average net assets |
| prior to fees waived and expense paid indirectly |
| Portfolio turnover |
1 The average shares outstanding method has been applied for per share information. |
2 Total investment return is based on the change in net asset value of a share during the period and assumes reinvestment of dividends and distributions at net asset value. Total investment return during all of the periods shown reflects a waiver by the manager. Performance would have been lower had the waiver not been in effect. |
See accompanying notes, which are an integral part of the financial statements.
30
| | |
| | | Year Ended | |
| | | 4/30/11 | | 4/30/10 | | 4/30/09 | | 4/30/08 | | 4/30/07 | |
| | | $28.900 | | | $19.450 | | | $28.090 | | | $27.820 | | | $27.820 | | |
| | |
| | |
| | | (0.063 | ) | | (0.150 | ) | | 0.010 | | | (0.048 | ) | | (0.128 | ) | |
| | | 9.233 | | | 9.600 | | | (8.650 | ) | | 0.318 | | | 0.128 | | |
| | | 9.170 | | | 9.450 | | | (8.640 | ) | | 0.270 | | | 0.000 | | |
| | |
| | | $38.070 | | | $28.900 | | | $19.450 | | | $28.090 | | | $27.820 | | |
| | |
| | | 31.73% | | | 48.59% | | | (30.76% | ) | | 0.97% | | | 0.00% | | |
| | |
| | |
| | | $119,948 | | | $53,651 | | | $45,149 | | | $26,079 | | | $35,399 | | |
| | | 1.26% | | | 1.25% | | | 1.24% | | | 1.23% | | | 1.25% | | |
| | | | | | | | | | | | | | | | | |
| | | 1.33% | | | 1.48% | | | 1.60% | | | 1.37% | | | 1.39% | | |
| | | (0.20% | ) | | (0.64% | ) | | 0.05% | | | (0.17% | ) | | (0.52% | ) | |
| | | | | | | | | | | | | | | | | |
| | | (0.27% | ) | | (0.87% | ) | | (0.31% | ) | | (0.31% | ) | | (0.66% | ) | |
| | | 41% | | | 49% | | | 66% | | | 61% | | | 51% | | |
31
| Notes to financial statements | |
| Delaware Select Growth Fund | | April 30, 2011 |
Voyageur Mutual Funds III (Trust) is organized as a Delaware statutory trust and offers two series: Delaware Large Cap Core Fund and Delaware Select Growth Fund. These financial statements and the related notes pertain to Delaware Select Growth Fund (Fund). The Trust is an open-end investment company. The Fund is considered diversified under the Investment Company Act of 1940, as amended, and offers Class A, Class B, Class C, Class R and Institutional Class shares. Class A shares are sold with a maximum front-end sales charge of up to 5.75%. Class A share purchases of $1,000,000 or more will incur a contingent deferred sales charge (CDSC) of 1% if redeemed during the first year and 0.50% during the second year, provided that Delaware Distributors, L.P. (DDLP) paid a financial advisor a commission on the purchase of those shares. Class B shares may be purchased only through dividend reinvestment and certain permitted exchanges. Prior to June 1, 2007, Class B shares were sold with a CDSC that declined from 4% to zero depending upon the period of time the shares were held. Class B shares will automatically convert to Class A shares on a quarterly basis approximately eight years after purchase. Class C shares are sold with a CDSC of 1%, if redeemed during the first twelve months. Class R and Institutional Class shares are not subject to a sales charge and are offered for sale exclusively to certain eligible investors.
The investment objective of the Fund is to seek long-term capital appreciation, which the Fund attempts to achieve by investing primarily in equity securities of companies the manager believes have the potential for sustainable free cash flow growth.
1. Significant Accounting Policies
The following accounting policies are in accordance with U.S. generally accepted accounting principles (U.S. GAAP) and are consistently followed by the Fund.
Security Valuation — Equity securities, except those traded on the Nasdaq Stock Market, Inc. (Nasdaq), are valued at the last quoted sales price as of the time of the regular close of the New York Stock Exchange (NYSE) on the valuation date. Securities traded on the Nasdaq are valued in accordance with the Nasdaq Official Closing Price, which may not be the last sales price. If on a particular day an equity security does not trade, then the mean between the bid and ask prices will be used. Securities listed on a foreign exchange are valued at the last quoted sales price on the valuation date. Short-term debt securities are valued at market value. U.S. government and agency securities are valued at the mean between the bid and ask prices. Investment company securities are valued at net asset value per share. Generally, other securities and assets for which market quotations are not readily available are valued at fair value as determined in good faith under the direction of the Fund’s Board of Trustees (Board). In determining whether market quotations are readily available or fair valuation will be used, various factors will be taken into consideration, such as market closures or suspension of trading in a security. The Fund may use fair value pricing more frequently for securities traded primarily in non-U.S. markets because, among other things, most foreign markets close well before the Fund values its securities generally as of 4:00 p.m. Eastern time. The earlier close of these foreign markets gives rise to the possibility
32
that significant events, including broad market moves, government actions or pronouncements, aftermarket trading, or news events may have occurred in the interim. To account for this, the Fund may frequently value foreign securities using fair value prices based on third-party vendor modeling tools (international fair value pricing).
Federal Income Taxes — No provision for federal income taxes has been made as the Fund intends to continue to qualify for federal income tax purposes as a regulated investment company under Subchapter M of the Internal Revenue Code of 1986, as amended, and make the requisite distributions to shareholders. The Fund evaluates tax positions taken or expected to be taken in the course of preparing the Fund’s tax returns to determine whether the tax positions are “more-likely-than-not” of being sustained by the applicable tax authority. Tax positions not deemed to meet the more-likely-than-not threshold are recorded as a tax benefit or expense in the current year. Management has analyzed the Fund’s tax positions taken on federal income tax returns for all open tax years (April 30, 2008 – April 30, 2011), and has concluded that no provision for federal income tax is required in the Fund’s financial statements.
Class Accounting — Investment income, common expenses and realized and unrealized gain (loss) on investments are allocated to the various classes of the Fund on the basis of daily net assets of each class. Distribution expenses relating to a specific class are charged directly to that class.
Foreign Currency Transactions — Transactions denominated in foreign currencies are recorded at the prevailing exchange rates on the valuation date in accordance with the Fund’s prospectus. The value of all assets and liabilities denominated in foreign currencies is translated into U.S. dollars at the exchange rate of such currencies against the U.S. dollar daily. Transaction gains or losses resulting from changes in exchange rates during the reporting period or upon settlement of the foreign currency transaction are reported in operations for the current period. The Fund generally does not isolate that portion of realized gains and losses on investments which are due to changes in foreign exchange rates from that which are due to changes in market prices. The changes are included with the net realized and unrealized gain or loss on investments. The Fund reports certain foreign currency related transactions as components of realized gains (losses) for financial reporting purposes, whereas such components are treated as ordinary income (loss) for federal income tax purposes.
Repurchase Agreements — The Fund may invest in a pooled cash account along with other members of the Delaware Investments® Family of Funds pursuant to an exemptive order issued by the Securities and Exchange Commission. The aggregate daily balance of the pooled cash account is invested in repurchase agreements secured by obligations of the U.S government. The respective collateral is held by the Fund’s custodian bank until the maturity of the respective repurchase agreements. Each repurchase agreement is at least 102% collateralized. However, in the event of default or bankruptcy by the counterparty to the agreement, realization of the collateral may be subject to legal proceedings. At April 30, 2011, the Fund held no investments in repurchase agreements.
33
Notes to financial statements
Delaware Select Growth Fund
1. Significant Accounting Policies (continued)
Use of Estimates — The preparation of financial statements in conformity with U.S. GAAP requires management to make estimates and assumptions that affect the reported amounts of assets and liabilities and disclosure of contingent assets and liabilities at the date of the financial statements and the reported amounts of revenues and expenses during the reporting period. Actual results could differ from those estimates and the differences could be material.
Other — Expenses directly attributable to the Fund are charged directly to the Fund. Other expenses common to various funds within the Delaware Investments® Family of Funds are generally allocated amongst such funds on the basis of average net assets. Management fees and some other expenses are paid monthly. Security transactions are recorded on the date the securities are purchased or sold (trade date) for financial reporting purposes. Costs used in calculating realized gains and losses on the sale of investment securities are those of the specific securities sold. Dividend income is recorded on the ex-dividend date and interest income is recorded on the accrual basis. Taxable non-cash dividends are recorded as dividend income. Foreign dividends are also recorded on the ex-dividend date or as soon after the ex-dividend date that the Fund is aware of such dividends, net of all non-rebatable tax withholdings. Withholding taxes on foreign dividends have been recorded in accordance with the Fund’s understanding of the applicable country’s tax rules and rates. The Fund declares and pays dividends from net investment income and distributions from net realized gain on investments, if any, annually. Dividends and distributions, if any, are recorded on the ex-dividend date. The Fund may distribute income dividends and capital gains more frequently, if necessary for tax purposes.
Subject to seeking best execution, the Fund may direct certain security trades to brokers who have agreed to rebate a portion of the related brokerage commission to the Fund in cash. Such commission rebates are included in realized gain on investments in the accompanying financial statements and totaled $7,522 for the year ended April 30, 2011. In general, best execution refers to many factors, including the price paid or received for a security, the commission charged, the promptness and reliability of execution, the confidentiality and placement accorded the order, and other factors affecting the overall benefit obtained by the Fund on the transaction.
The Fund may receive earnings credits from its custodian when positive cash balances are maintained, which are used to offset custody fees. There were no earnings credits for the year ended April 30, 2011.
The Fund receives earnings credits from its transfer agent when positive cash balances are maintained, which are used to offset transfer agent fees. The expense paid under this arrangement is included in dividend disbursing and transfer agent fees and expenses on the statement of operations with the corresponding expense offset shown as “expense paid indirectly.” For the year ended April 30, 2011, the Fund earned $2,692 under this agreement.
34
2. Investment Management, Administration Agreements and Other Transactions with Affiliates
In accordance with the terms of its investment management agreement, the Fund pays Delaware Management Company (DMC), a series of Delaware Management Business Trust and the investment manager, an annual fee which is calculated daily at the rate of 0.75% on the first $500 million of average daily net assets of the Fund, 0.70% on the next $500 million, 0.65% on the next $1.5 billion, and 0.60% on average daily net assets in excess of $2.5 billion.
Effective August 27, 2010, DMC has contractually agreed to waive that portion, if any, of its management fee and reimburse the Fund to the extent necessary to prevent total annual fund operating expenses (excluding any 12b-1 plan expenses, taxes, interest, inverse floater program expenses, short sale and dividend interest expenses, brokerage fees, certain insurance costs, and nonroutine expenses or costs, including, but not limited to, those relating to reorganizations, litigation, conducting shareholder meetings, and liquidations) from exceeding 1.24% of the Fund’s average daily net assets through October 24, 2011. Prior to August 27, 2010, DMC had voluntarily agreed to waive its management fees to the extent necessary to ensure that total annual expenses (excluding any 12b-1 plan expenses, taxes, interest, inverse floater program expenses, brokerage fees, certain insurance costs, and nonroutine expenses or costs including, but not limited to, those relating to reorganizations, litigation, conducting shareholder meetings, and liquidations) did not exceed 1.25% of average daily net assets of the Fund. These waivers and reimbursements may only be terminated by agreement of the Manager and the Fund.
Delaware Service Company, Inc. (DSC), an affiliate of DMC, provides fund accounting and financial administration oversight services to the Fund. For these services, the Fund pays DSC fees based on the aggregate daily net assets of the Delaware Investments® Family of Funds at the following annual rate: 0.0050% of the first $30 billion; 0.0045% of the next $10 billion; 0.0040% of the next $10 billion; and 0.0025% of aggregate average daily net assets in excess of $50 billion. The fees payable to DSC under the service agreement described above are allocated among all Funds in the Delaware Investments® Family of Funds on a relative net asset value basis. For the year ended April 30, 2011, the Fund was charged $17,627 for these services.
DSC also provides dividend disbursing and transfer agency services. The Fund pays DSC a monthly fee based on the number of shareholder accounts for dividend disbursing and transfer agent services.
Pursuant to a distribution agreement and distribution plan, the Fund pays DDLP, the distributor and an affiliate of DMC, an annual distribution and service fee not to exceed 0.25% of the average daily net assets of the Class A shares, 1.00% of the average daily net assets of the Class B and Class C shares and 0.60% of the average daily net assets of the Class R shares. Institutional Class shares pay no distribution and service expenses. DDLP has contracted to limit the Class R shares’ 12b-1 fees through August 28, 2011 to no more than 0.50% of average daily net assets.
35
Notes to financial statements
Delaware Select Growth Fund
2. Investment Management, Administration Agreements and Other Transactions with Affiliates (continued)
At April 30, 2011, the Fund had liabilities payable to affiliates as follows:
| Investment management fee payable to DMC | $ | 299,780 |
| Dividend disbursing, transfer agent and fund accounting | | |
| oversight fees and other expenses payable to DSC | | 62,152 |
| Distribution fees payable to DDLP | | 139,451 |
| Other expenses payable to DMC and affiliates* | | 26,931 |
* DMC, as part of its administrative services, pays operating expenses on behalf of the Fund and is reimbursed on a periodic basis. Expenses include items such as printing of shareholder reports, fees for audit, legal and tax services, registration fees and trustees’ fees.
As provided in the investment management agreement, the Fund bears the cost of certain legal and tax services, including internal legal and tax services provided to the Fund by DMC and/or its affiliates’ employees. For the year ended April 30, 2011, the Fund was charged $2,869 for internal legal and tax services provided by DMC and/or its affiliates’ employees.
For the year ended April 30, 2011, DDLP earned $26,706 for commissions on sales of the Fund’s Class A shares. For the year ended April 30, 2011, DDLP received gross CDSC commissions of $0, $25,532 and $1,375 on redemption of the Fund’s Class A, Class B and Class C shares, respectively, and these commissions were entirely used to offset up-front commissions previously paid by DDLP to broker/dealers on sales of those shares.
Trustees’ fees include expenses accrued by the Fund for each Trustee’s retainer and meeting fees. Certain officers of DMC, DSC and DDLP are officers and/or Trustees of the Trust. These officers and Trustees are paid no compensation by the Fund.
3. Investments
For the year ended April 30, 2011, the Fund made purchases of $144,930,494 and sales of $150,846,903 of investment securities other than short-term investments.
At April 30, 2011, the cost of investments for federal income tax purposes was $449,874,496. At April 30, 2011, net unrealized appreciation was $130,116,648, of which $139,298,481 related to unrealized appreciation of investments and $9,181,833 related to unrealized depreciation of investments.
U.S. GAAP defines fair value as the price that the Fund would receive to sell an asset or pay to transfer a liability in an orderly transaction between market participants at the measurement date under current market conditions. A three level hierarchy for fair value measurements has been established based upon the transparency of inputs to the valuation of an asset or liability. Inputs may be observable or unobservable and refer broadly to the assumptions that market participants would use in pricing the asset or liability. Observable inputs reflect the assumptions market participants would use in pricing the asset or liability based on market data obtained from sources independent of the reporting entity. Unobservable inputs reflect the reporting entity’s own
36
assumptions about the assumptions that market participants would use in pricing the asset or liability developed based on the best information available under the circumstances. The Fund’s investment in its entirety is assigned a level based upon the observability of the inputs which are significant to the overall valuation. The three level hierarchy of inputs is summarized below.
| Level 1 | – | inputs are quoted prices in active markets for identical investments (e.g., equity securities, open-end investment companies, futures contracts, options contracts) |
| | | |
| Level 2 | – | other observable inputs (including, but not limited to: quoted prices for similar assets or liabilities in markets that are active, quoted prices for identical or similar assets or liabilities in markets that are not active, inputs other than quoted prices that are observable for the assets or liabilities (such as interest rates, yield curves, volatilities, prepayment speeds, loss severities, credit risks and default rates) or other market-corroborated inputs) (e.g., debt securities, government securities, swap contracts, foreign currency exchange contracts, foreign securities utilizing international fair value pricing) |
| | | |
| Level 3 | – | inputs are significant unobservable inputs (including the Fund’s own assumptions used to determine the fair value of investments) (e.g., broker-quoted securities, fair valued securities) |
The following table summarizes the valuation of the Fund’s investments by fair value hierarchy levels as of April 30, 2011:
| | Level 1 | | Level 2 | | Level 3 | | Total |
| Common Stock | $ | 476,543,018 | | $ | — | | $ | — | | $ | 476,543,018 |
| Preferred Stock | | — | | | — | | | 10,000,073 | | | 10,000,073 |
| Short-Term Investments | | — | | | 10,816,646 | | | — | | | 10,816,646 |
| Securities Lending Collateral | | — | | | 82,631,407 | | | — | | | 82,631,407 |
| Total | $ | 476,543,018 | | $ | 93,448,053 | | $ | 10,000,073 | | $ | 579,991,144 |
The following is a reconciliation of investments in which significant unobservable inputs (Level 3) were used in determining fair value:
| | | | | Securities | | | | |
| | Preferred | | Lending | | | | |
| | Stock | | Collateral | | Total |
| Balance as of 4/30/10 | $ | — | | $ | 42,011 | | | $ | 42,011 | |
| Purchases | | 10,000,073 | | | 580,728 | * | | | 10,580,801 | |
| Sales | | — | | | (79,405 | ) | | | (79,405 | ) |
| Net change in unrealized appreciation/depreciation | | — | | | (543,334 | ) | | | (543,334 | ) |
| Balance as of 4/30/11 | $ | 10,000,073 | | $ | — | | | $ | 10,000,073 | |
| Net change in unrealized appreciation/depreciation | | | | | | | | | | |
| on investments still held as of 4/30/11 | $ | — | | $ | (63,317 | ) | | $ | (63,317 | ) |
*Securities were received as part of the Fund Merger with Delaware Growth Equity Fund on October 22, 2010. See Note 7.
37
Notes to financial statements
Delaware Select Growth Fund
3. Investments (continued)
During the year ended April 30, 2011, there were no transfers between Level 1 investments, Level 2 investments or Level 3 investments that had a material impact to the Fund. This does not include transfers between Level 1 investments and Level 2 investments due to the Fund utilizing international fair value pricing during the year.
4. Dividend and Distribution Information
Income and long-term capital gain distributions are determined in accordance with federal income tax regulations, which may differ from U.S. GAAP. Additionally, distributions from net gains on foreign currency transactions and net short-term gains on sales of investment securities are treated as ordinary income for federal income tax purposes. There were no dividends and distributions paid for the years ended April 30, 2011 and 2010.
5. Components of Net Assets on a Tax Basis
As of April 30, 2011, the components of net assets on a tax basis were as follows:
| Shares of beneficial interest | $ | 492,719,881 | |
| Post-October currency losses | | (185,549 | ) |
| *Capital loss carryforwards | | (127,019,343 | ) |
| Unrealized appreciation of investments | | | |
| and foreign currencies | | 130,116,418 | |
| Net assets | $ | 495,631,407 | |
*The amount of this loss which can be utilized in subsequent years is subject to an annual limitation in accordance with the Internal Revenue Code due to the Fund merger with Delaware Growth Equity Fund on October 22, 2010. See Note 7.
The difference between book basis and tax basis components of net assets is primarily attributable to tax deferral of losses on wash sales.
Post-October currency losses represent losses realized on foreign currency transactions from November 1, 2010 through April 30, 2011 that, in accordance with federal income tax regulations, the Fund has elected to defer and treat as having arisen in the following year.
For financial reporting purposes, capital accounts are adjusted to reflect the tax character of permanent book/tax differences. Reclassifications are primarily due to tax treatment of net operating losses, capital loss carryforward expired and gain (loss) on foreign currency transactions. Results of operations and net assets were not affected by these reclassifications. For the year ended April 30, 2011, the Fund recorded the reclassifications as follows:
| Accumulated net investment loss | $ | 1,829,808 | |
| Accumulated net realized loss | | 136,309,555 | |
| Paid-in capital | | (138,139,363 | ) |
38
For federal income tax purposes, capital loss carryforwards may be carried forward and applied against future capital gains. In 2011, $49,853,829 was utilized and $136,063,876 expired. Capital loss carryforwards remaining at April 30, 2011 will expire as follows: $18,530,411 expires in 2012, $68,111,595 expires in 2016, $32,537,385 expires in 2017 and $7,839,952 expires in 2018.
6. Capital Shares
Transactions in capital shares were as follows:
| | | Year Ended |
| | | 4/30/11 | | 4/30/10 |
| Shares sold: | | | | | | |
| Class A | | 909,753 | | | 799,379 | |
| Class B | | 9,368 | | | 9,629 | |
| Class C | | 172,362 | | | 86,267 | |
| Class R | | 75,891 | | | 10,157 | |
| Institutional Class | | 1,650,110 | | | 3,745,535 | |
| |
| Shares from merger*: | | | | | | |
| Class A | | 2,723,804 | | | — | |
| Class B | | 716,083 | | | — | |
| Class C | | 1,257,835 | | | — | |
| Class R | | 80,244 | | | — | |
| Institutional Class | | 108,401 | | | — | |
| | | 7,703,851 | | | 4,650,967 | |
| | | | | | | |
| Shares repurchased: | | | | | | |
| Class A | | (1,716,503 | ) | | (1,102,488 | ) |
| Class B | | (349,864 | ) | | (545,493 | ) |
| Class C | | (387,457 | ) | | (265,058 | ) |
| Class R | | (57,423 | ) | | (16,910 | ) |
| Institutional Class | | (464,549 | ) | | (4,210,692 | ) |
| | | (2,975,796 | ) | | (6,140,641 | ) |
| Net increase (decrease) | | 4,728,055 | | | (1,489,674 | ) |
*See Note 7
For the years ended April 30, 2011 and 2010, 169,653 Class B shares were converted to 149,782 Class A shares valued at $4,566,472 and 363,005 Class B shares were converted to 322,972 Class A shares valued at $7,518,237, respectively. The respective amounts are included in Class B redemptions and Class A subscriptions in the table above and the statements of changes in net assets.
39
Notes to financial statements
Delaware Select Growth Fund
7. Fund Merger
On October 22, 2010, the Fund acquired all of the assets of the Delaware Growth Equity Fund (Acquired Fund), an open-end investment company, in exchange for the shares of the Fund (Acquiring Fund) pursuant to a Plan and Agreement of Reorganization (Reorganization). The shareholders of the Acquired Fund received shares of the respective class of the Acquiring Fund equal to the aggregate net asset value of their share in the Acquired Fund prior to the Reorganization, as shown in the following table:
| | | Acquiring | | Acquired | | | |
| | | Fund | | Fund | | | |
| | | Shares | | Shares | | Value |
| Class A | | 2,723,804 | | 5,262,114 | | $ | 82,721,925 |
| Class B | | 716,083 | | 1,320,132 | | | 19,198,198 |
| Class C | | 1,257,835 | | 2,294,132 | | | 33,357,785 |
| Class R | | 80,244 | | 153,925 | | | 2,388,873 |
| Institutional Class | | 108,401 | | 211,333 | | | 3,408,127 |
The Reorganization was treated as a non-taxable event and, accordingly, the Acquired Fund’s basis in securities acquired reflected historical cost basis as of the date of transfer. The net assets, net unrealized appreciation and accumulated net realized loss of the Acquired Fund as of the close of business on October 22, 2010, were as follows:
| Net assets | $ | 141,074,908 | |
| Accumulated net realized loss | | (80,224,466 | ) |
| Net unrealized appreciation | | 22,458,953 | |
The net assets of the Acquiring Fund before the acquisition were $281,943,240. The net assets of the Acquiring Fund immediately following the acquisition were $423,018,148.
Assuming that the acquisition had been completed on May 1, 2010, the beginning of the Acquiring Fund’s reporting period, the Acquiring Fund’s pro forma results of operations for the year ended April 30, 2011, are as follows:
| Net investment income | $ | (2,413,934 | ) |
| Net realized gain on investments | | 54,656,909 | |
| Change in unrealized appreciation | | 81,575,306 | |
| Net increase in net assets resulting from operations | | 133,818,281 | |
Because the combined investment portfolios have been managed as a single integrated portfolio since the acquisition was completed, it is not practicable to separate the amounts of revenue and earnings of the Acquired Fund that have been included in the Fund’s statement of operations since October 22, 2010.
40
8. Line of Credit
The Fund, along with certain other funds in the Delaware Investments® Family of Funds (Participants), was a participant in a $35,000,000 revolving line of credit with The Bank of New York Mellon (BNY Mellon) to be used for temporary or emergency purposes as an additional source of liquidity to fund redemptions of investor shares. Under the agreement, the Participants were charged an annual commitment fee, which was allocated across the Participants on the basis of each Participant’s allocation of the entire facility. The Participants were permitted to borrow up to a maximum of one third of their net assets under the agreement. The agreement expired on November 16, 2010.
Effective as of November 16, 2010, the Fund along with the other Participants entered into an amendment to the agreement with BNY Mellon for a $50,000,000 revolving line of credit. The agreement as amended is to be used as described above and operates in substantially the same manner as the original agreement. The agreement as amended expires on November 15, 2011. The Fund had no amounts outstanding as of April 30, 2011 or at any time during the year then ended.
9. Derivatives
U.S. GAAP requires enhanced disclosures that enable investors to understand: 1) how and why an entity uses derivatives; 2) how they are accounted for; and 3) how they affect an entity’s results of operations and financial position.
Foreign Currency Exchange Contracts — The Fund may enter into foreign currency exchange contracts as a way of managing foreign exchange rate risk. The Fund may enter into these contracts to fix the U.S. dollar value of a security that it has agreed to buy or sell for the period between the date the trade was entered into and the date the security is delivered and paid for. The Fund may also use these contracts to hedge the U.S. dollar value of securities it already owns that are denominated in foreign currencies. The change in value is recorded as an unrealized gain or loss. When the contract is closed, a realized gain or loss is recorded equal to the difference between the value of the contract at the time it was opened and the value at the time it was closed.
The use of foreign currency exchange contracts does not eliminate fluctuations in the underlying prices of the securities, but does establish a rate of exchange that can be achieved in the future. Although foreign currency exchange contracts limit the risk of loss due to an unfavorable change in the value of the hedged currency, they also limit any potential gain that might result should the value of the currency change favorably. In addition, the Fund could be exposed to risks if the counterparties to the contracts are unable to meet the terms of their contracts. The Fund’s maximum risk of loss from counterparty credit risk is the value of its currency exchanged with the counterparty. The risk is generally mitigated by having a netting arrangement between the Fund and the counterparty and by the posting of collateral by the counterparty to the Fund to cover the Fund’s exposure to the counterparty. There were no foreign currency exchange contracts outstanding at April 30, 2011.
41
Notes to financial statements
Delaware Select Growth Fund
10. Securities Lending
The Fund, along with other funds in the Delaware Investments® Family of Funds, may lend its securities pursuant to a security lending agreement (Lending Agreement) with BNY Mellon. With respect to each loan, if on any business day the aggregate market value of securities collateral plus cash collateral held is less than the aggregate market value of the securities which are the subject of such loan, the borrower will be notified to provide additional collateral by the end of the following business day which, together with the collateral already held, will be not less than the applicable collateral requirements for such security loan. If the aggregate market value of securities collateral and cash collateral held with respect to a security loan exceeds the applicable collateral requirement, upon the request of the borrower, BNY Mellon must return enough collateral to the borrower by the end of the following business day to reduce the value of the remaining collateral to the applicable collateral requirement for such security loan. As a result of the foregoing, the value of the collateral held with respect to a loaned security may be temporarily more or less than the value of the security on loan.
Cash collateral received is generally invested in the Delaware Investments Collateral Fund No. 1 (Collective Trust) established by BNY Mellon for the purpose of investment on behalf of funds managed by DMC, that participate in BNY Mellon’s securities lending program. The Collective Trust may invest in U.S. government securities and high quality corporate debt, asset-backed and other money market securities and in repurchase agreements collateralized by such securities, provided that the Collective Trust will generally have a dollar-weighted average portfolio maturity of 60 days or less. The Collective Trust seeks to maintain a net asset value per unit of $1.00, but there can be no assurance that it will always be able to do so. The Fund may incur investment losses as a result of investing securities lending collateral in the Collective Trust or another collateral investment pool. This could occur if an investment in a collateral investment pool defaulted or if it were necessary to liquidate assets in the collateral investment pool to meet returns on outstanding security loans at a time when the collateral investment pool’s net asset value per unit was less than $1.00. Under those circumstances, the Fund may not receive an amount from the collateral investment pool that is equal in amount to the collateral the Fund would be required to return to the borrower of the securities and the Fund would be required to make up for this shortfall. Effective April 20, 2009, BNY Mellon transferred the assets of the Fund’s previous collateral investment pool other than cash and assets with a maturity of one business day or less to the BNY Mellon SL DBT II Liquidating Fund (Liquidating Fund), effectively bifurcating the previous collateral investment pool. The Fund’s exposure to the Liquidating Fund is expected to decrease as the Liquidating Fund’s assets mature or are sold. In October 2008, BNY Mellon transferred certain distressed securities from the previous collateral investment pool into the Mellon GSL Reinvestment Trust II. The Fund can also accept U.S. government securities and letters of credit (non-cash collateral) in connection with securities loans. In the event of default or bankruptcy by the lending agent, realization and/or retention of the collateral may be subject to legal proceedings. In the event the borrower fails to return loaned securities and the collateral received is insufficient to cover the value of the loaned securities and provided such collateral shortfall is not the result of investment losses, the lending agent has agreed to pay the amount of
42
the shortfall to the Fund, or at the discretion of the lending agent, replace the loaned securities. The Fund continues to record dividends or interest, as applicable, on the securities loaned and is subject to change in value of the securities loaned that may occur during the term of the loan. The Fund has the right under the Lending Agreement to recover the securities from the borrower on demand. With respect to security loans collateralized by non-cash collateral, the Fund receives loan premiums paid by the borrower. With respect to security loans collateralized by cash collateral, the earnings from the collateral investments are shared among the Fund, the security lending agent and the borrower. The Fund records security lending income net of allocations to the security lending agent and the borrower.
At April 30, 2011, the value of the securities on loan was $82,340,722, for which cash collateral was received and invested in accordance with the Lending Agreement. At April 30, 2011, the value of invested collateral was $82,631,407. These investments are presented on the statement of net assets under the caption “Securities Lending Collateral.”
11. Credit and Market Risk
The Fund invests a significant portion of its assets in small- and mid-sized companies and may be subject to certain risks associated with ownership of securities of such companies. Investments in small- or mid-sized companies may be more volatile than investments in larger companies for a number of reasons, which include more limited financial resources or a dependence on narrow product lines.
Some countries in which the Fund may invest require governmental approval for the repatriation of investment income, capital or the proceeds of sales of securities by foreign investors. In addition, if there is deterioration in a country’s balance of payments or for other reasons, a country may impose temporary restrictions on foreign capital remittances abroad.
The securities exchanges of certain foreign markets are substantially smaller, less liquid and more volatile than the major securities markets in the United States. Consequently, acquisition and disposition of securities by the Fund may be inhibited. In addition, a significant portion of the aggregate market value of equity securities listed on the major securities exchanges in emerging markets is held by a smaller number of investors. This may limit the number of shares available for acquisition or disposition by the Fund.
The Fund may invest up to 15% of its net assets in illiquid securities, which may include securities with contractual restrictions on resale, securities exempt from registration under Rule 144A of the Securities Act of 1933, as amended, and other securities which may not be readily marketable. The relative illiquidity of these securities may impair the Fund from disposing of them in a timely manner and at a fair price when it is necessary or desirable to do so. While maintaining oversight, the Fund’s Board has delegated to DMC, the day-to-day functions of determining whether individual securities are liquid for purposes of the Fund’s limitation on investments in illiquid assets. Securities eligible for resale pursuant to Rule 144A, which are determined to be liquid, are not subject to the Fund’s 15% limit on investments in illiquid securities. As of April 30, 2011, there were no Rule 144A securities. Illiquid securities have been identified on the statement of net assets.
43
Notes to financial statements
Delaware Select Growth Fund
12. Contractual Obligations
The Fund enters into contracts in the normal course of business that contain a variety of indemnifications. The Fund’s maximum exposure under these arrangements is unknown. However, the Fund has not had prior claims or losses pursuant to these contracts. Management has reviewed the Fund’s existing contracts and expects the risk of loss to be remote.
13. Subsequent Events
Management has determined no material events or transactions occurred subsequent to April 30, 2011 that would require recognition or disclosure in the Fund’s financial statements.
44
Report of independent
registered public accounting firm
To the Board of Trustees of Voyageur Mutual Funds III Trust
and the Shareholders of Delaware Select Growth Fund:
In our opinion, the accompanying statement of net assets and the related statements of operations and of changes in net assets and the financial highlights present fairly, in all material respects, the financial position of Delaware Select Growth Fund (one of a series constituting the Voyageur Mutual Funds III Trust, hereafter referred to as the “Fund”) at April 30, 2011, and the results of its operations, the changes in its net assets and the financial highlights for the year then ended, in conformity with accounting principles generally accepted in the United States of America. These financial statements and financial highlights (hereafter referred to as “financial statements”) are the responsibility of the Fund’s management; our responsibility is to express an opinion on these financial statements based on our audit. We conducted our audit of these financial statements in accordance with the standards of the Public Company Accounting Oversight Board (United States). Those standards require that we plan and perform the audit to obtain reasonable assurance about whether the financial statements are free of material misstatement. An audit includes examining, on a test basis, evidence supporting the amounts and disclosures in the financial statements, assessing the accounting principles used and significant estimates made by management, and evaluating the overall financial statement presentation. We believe that our audit, which included confirmation of securities at April 30, 2011 by correspondence with the custodian and brokers, provides a reasonable basis for our opinion. The statement of changes in net assets for the year ended April 30, 2010 and the financial highlights for each of the four years in the period ended April 30, 2010 were audited by other independent accountants whose report dated June 18, 2010 expressed an unqualified opinion on those statements.
PricewaterhouseCoopers LLP
Philadelphia, Pennsylvania
June 16, 2011
45
Other Fund information
(Unaudited)
Delaware Select Growth Fund
Change in Independent Registered Public Accounting Firm
Due to independence matters under the Securities and Exchange Commission’s auditor independence rules relating to the January 4, 2010 acquisition of Delaware Investments (including DMC, DDLP and DSC) by Macquarie Group, Ernst & Young LLP (E&Y) has resigned as the independent registered public accounting firm for Voyageur Mutual Funds III (the Trust) effective June 28, 2010. At a meeting held on February 18, 2010, the Board of Trustees of the Trust, upon recommendation of the Audit Committee, selected PricewaterhouseCoopers LLC (PwC) to serve as the independent registered public accounting firm for the Trust for the fiscal year ending April 30, 2011. During the fiscal years ended April 30, 2010 and 2009, E&Y’s audit reports on the financial statements of the Trust did not contain any adverse opinion or disclaimer of opinion, nor were they qualified or modified as to uncertainty, audit scope, or accounting principles. In addition, there were no disagreements between the Trust and E&Y on accounting principles, financial statements disclosures or audit scope, which, if not resolved to the satisfaction of E&Y, would have caused them to make reference to the disagreement in their reports. Neither the Trust nor anyone on its behalf has consulted with PwC at any time prior to their selection with respect to the application of accounting principles to a specified transaction, either completed or proposed or the type of audit opinion that might be rendered on the Trust’s financial statements.
46
Board of trustees/directors and officers addendum
Delaware Investments® Family of Funds
A mutual fund is governed by a Board of Trustees/Directors (“Trustees”), which has oversight responsibility for the management of a fund’s business affairs. Trustees establish procedures and oversee and review the performance of the investment manager, the distributor, and others who perform services for the fund. The independent fund trustees, in particular, are advocates
| Name, Address, | | Position(s) | | Length of |
| and Birth Date | | Held with Fund(s) | | Time Served |
| Interested Trustees | | | | |
| | | | | |
| Patrick P. Coyne1 | | Chairman, President, | | Chairman and Trustee |
| 2005 Market Street | | Chief Executive Officer, | | since August 16, 2006 |
| Philadelphia, PA 19103 | | and Trustee | | |
| April 1963 | | | | President and |
| | | | | Chief Executive Officer |
| | | | | since August 1, 2006 |
| | | | | |
| | | | | |
| | | | | |
| | | | | |
| | | | | |
| | | | | |
| | | | | |
| | | | | |
| | | | | |
| | | | | |
| | | | | |
| | | | | |
| | | | | |
| | | | | |
| | | | | |
| | | | | |
| | | | | |
| | | | | |
1 Patrick P. Coyne is considered to be an “Interested Trustee” because he is an executive officer of the Fund’s(s’) investment advisor.
48
for shareholder interests. Each trustee has served in that capacity since he or she was elected to or appointed to the Board of Trustees, and will continue to serve until his or her retirement or the election of a new trustee in his or her place. The following is a list of the Trustees and Officers with certain background and related information.
| | | Number of Portfolios in | | |
| Principal Occupation(s) | | Fund Complex Overseen | | Other Directorships |
| During Past 5 Years | | by Trustee or Officer | | Held by Trustee or Officer |
| |
| |
| Patrick P. Coyne has served in | | 77 | | Director |
| various executive capacities | | | | Kaydon Corp. |
| at different times at | | | | |
| Delaware Investments.2 | | | | Board of Governors Member |
| | | | | Investment Company |
| | | | | Institute (ICI) |
| | | | | |
| | | | | Finance Committee Member |
| | | | | St. John Vianney Roman |
| | | | | Catholic Church |
| |
| | | | | Board of Trustees |
| | | | | Agnes Irwin School |
| |
| | | | | Member of Investment |
| | | | | Committee |
| | | | | Cradle of Liberty Council, |
| | | | | BSA |
| | | | | (2007 – 2010) |
| | | | | |
| |
| | | | | |
| | | | | |
| |
2 Delaware Investments is the marketing name for Delaware Management Holdings, Inc. and its subsidiaries, including the Fund’s(s’) investment advisor, principal underwriter, and its transfer agent.
49
Board of trustees/directors and officers addendum
Delaware Investments® Family of Funds
| Name, Address, | | Position(s) | | Length of |
| and Birth Date | | Held with Fund(s) | | Time Served |
| Independent Trustees | | | | |
| |
| Thomas L. Bennett | | Trustee | | Since March 2005 |
| 2005 Market Street | | | | |
| Philadelphia, PA 19103 | | | | |
| October 1947 | | | | |
| |
| |
| |
| |
| |
| |
| |
| |
| |
| |
| John A. Fry | | Trustee | | Since January 2001 |
| 2005 Market Street | | | | |
| Philadelphia, PA 19103 | | | | |
| May 1960 | | | | |
| |
| |
| |
| |
| |
| |
| |
| |
| |
| |
| Anthony D. Knerr | | Trustee | | Since April 1990 |
| 2005 Market Street | | | | |
| Philadelphia, PA 19103 | | | | |
| December 1938 | | | | |
| |
| |
| Lucinda S. Landreth | | Trustee | | Since March 2005 |
| 2005 Market Street | | | | |
| Philadelphia, PA 19103 | | | | |
| June 1947 | | | | |
| |
50
| | | Number of Portfolios in | | |
| Principal Occupation(s) | | Fund Complex Overseen | | Other Directorships |
| During Past 5 Years | | by Trustee or Officer | | Held by Trustee or Officer |
| | | | | |
| |
| Private Investor | | 77 | | Director |
| (March 2004–Present) | | | | Bryn Mawr Bank Corp. (BMTC) |
| | | | | (2007 – 2011) |
| | | | | |
| Investment Manager | | | | Chairman of Investment |
| Morgan Stanley & Co. | | | | Committee |
| (January 1984–March 2004) | | | | Pennsylvania Academy of |
| | | | | Fine Arts |
| | | | | |
| | | | | Investment Committee and |
| | | | | Governance Committee |
| | | | | Member |
| | | | | Pennsylvania Horticultural |
| | | | | Society |
| |
| President | | 77 | | Board of Governors Member — |
| Drexel University | | | | NASDAQ OMX PHLX LLC |
| (August 2010–Present) | | | | |
| | | | | Director |
| President | | | | Community Health Systems |
| Franklin & Marshall College | | | | |
| (July 2002–July 2010) | | | | Director — Ecore |
| | | | | International |
| Executive Vice President | | | | (2009 – 2010) |
| University of Pennsylvania | | | | |
| (April 1995–June 2002) | | | | Director — Allied |
| | | | | Barton Securities Holdings |
| | | | | (2005 – 2008) |
| |
| Founder and | | 77 | | None |
| Managing Director | | | | |
| Anthony Knerr & Associates | | | | |
| (Strategic Consulting) | | | | |
| (1990–Present) | | | | |
| |
| Chief Investment Officer | | 77 | | None |
| Assurant, Inc. (Insurance) | | | | |
| (2002–2004) | | | | |
| | | | | |
| |
51
Board of trustees/directors and officers addendum
Delaware Investments® Family of Funds
| Name, Address, | | Position(s) | | Length of |
| and Birth Date | | Held with Fund(s) | | Time Served |
| Independent Trustees (continued) | | | | |
| |
| Ann R. Leven | | Trustee | | Since October 1989 |
| 2005 Market Street | | | | |
| Philadelphia, PA 19103 | | | | |
| November 1940 | | | | |
| |
| |
| |
| |
| |
| |
| Thomas F. Madison | | Trustee | | Since May 19973 |
| 2005 Market Street | | | | |
| Philadelphia, PA 19103 | | | | |
| February 1936 | | | | |
| |
| |
| |
| |
| |
| |
| |
| |
| | | | | |
| | | | | |
| | | | | |
| | | | | |
| |
| |
| |
| | | | | |
| | | | | |
| | | | | |
| | | | | |
| | | | | |
| | | | | |
| | | | | |
| | | | | |
| |
3 In 1997, several funds managed by Voyageur Fund Managers, Inc. (the “Voyageur Funds”) were incorporated into the Delaware Investments Family of Funds. Mr. Madison served as a director of the Voyageur Funds from 1993 until 1997.
52
| | | Number of Portfolios in | | |
| Principal Occupation(s) | | Fund Complex Overseen | | Other Directorships |
| During Past 5 Years | | by Trustee or Officer | | Held by Trustee or Officer |
| | | | | |
| |
| Consultant | | 77 | | Director and Audit |
| ARL Associates | | | | Committee Chair – |
| (Financial Planning) | | | | Systemax Inc. |
| (1983–Present) | | | | (2001 – 2009) |
| | | | | |
| | | | | Director and Audit |
| | | | | Committee Chairperson – |
| | | | | Andy Warhol Foundation |
| | | | | (1999 – 2007) |
| |
| President and | | 77 | | Director and Chair of |
| Chief Executive Officer | | | | Compensation Committee, |
| MLM Partners, Inc. | | | | Governance Committee |
| (Small Business Investing | | | | Member |
| and Consulting) | | | | CenterPoint Energy |
| (January 1993–Present) | | | | |
| | | | | Lead Director and Chair of |
| | | | | Audit and Governance |
| | | | | Committees, Member of |
| | | | | Compensation Committee |
| �� | | | | Digital River, Inc. |
| | | | | |
| | | | | Director and Chair of |
| | | | | Governance Committee, |
| | | | | Audit Committee |
| | | | | Member |
| | | | | Rimage Corporation |
| | | | | |
| | | | | Director and Chair of |
| | | | | Compensation Committee |
| | | | | Spanlink Communications |
| | | | | |
| | | | | Lead Director and Member of |
| | | | | Compensation and |
| | | | | Governance Committees |
| | | | | Valmont Industries, Inc. |
| | | | | (1987 – 2010) |
| |
53
Board of trustees/directors and officers addendum
Delaware Investments® Family of Funds
| Name, Address, | | Position(s) | | Length of |
| and Birth Date | | Held with Fund(s) | | Time Served |
| Independent Trustees (continued) | | | | |
| |
| Thomas F. Madison | | | | |
| 2005 Market Street | | | | |
| Philadelphia, PA 19103 | | | | |
| February 1936 | | | | |
| |
| Janet L. Yeomans | | Trustee | | Since April 1999 |
| 2005 Market Street | | | | |
| Philadelphia, PA 19103 | | | | |
| July 1948 | | | | |
| |
| |
| |
| |
| J. Richard Zecher | | Trustee | | Since March 2005 |
| 2005 Market Street | | | | |
| Philadelphia, PA 19103 | | | | |
| July 1940 | | | | |
| |
| |
| | | | | |
| | | | | |
| | | | | |
| | | | | |
| | | | | |
| | | | | |
| | | | | |
| | | | | |
| | | | | |
| | | | | |
| | | | | |
| | | | | |
| | | | | |
| | | | | |
| |
54
| | | Number of Portfolios in | | |
| Principal Occupation(s) | | Fund Complex Overseen | | Other Directorships |
| During Past 5 Years | | by Trustee or Officer | | Held by Trustee or Officer |
| | | | | |
| |
| | | | | Director |
| | | | | Banner Health |
| | | | | (1996 – 2007) |
| | | | | |
| |
| Vice President and Treasurer | | 77 | | Director |
| (January 2006–Present) | | | | Okabena Company |
| Vice President — Mergers & Acquisitions | | | | |
| (January 2003–January 2006), and | | | | |
| Vice President | | | | |
| (July 1995–January 2003) | | | | |
| 3M Corporation | | | | |
| |
| Founder | | 77 | | Director and Audit |
| Investor Analytics | | | | Committee Member |
| (Risk Management) | | | | Investor Analytics |
| (May 1999–Present) | | | | |
| | | | | |
| Founder | | | | Director |
| Sutton Asset Management | | | | Oxigene, Inc. |
| (Hedge Fund) | | | | (2003 – 2008) |
| (September 1996–Present) | | | | |
| | | | | |
| | | | | |
| | | | | |
| | | | | |
| | | | | |
| | | | | |
| | | | | |
| | | | | |
| | | | | |
| | | | | |
| | | | | |
| |
55
Board of trustees/directors and officers addendum
Delaware Investments® Family of Funds
| Name, Address, | | Position(s) | | Length of |
| and Birth Date | | Held with Fund(s) | | Time Served |
| Officers | | | | |
| | | | | |
| David F. Connor | | Vice President, | | Vice President since |
| 2005 Market Street | | Deputy General | | September 2000 |
| Philadelphia, PA 19103 | | Counsel, and Secretary | | and Secretary since |
| December 1963 | | | | October 2005 |
| |
| |
| Daniel V. Geatens | | Vice President | | Treasurer |
| 2005 Market Street | | and Treasurer | | since October 2007 |
| Philadelphia, PA 19103 | | | | |
| October 1972 | | | | |
| |
| David P. O’Connor | | Senior Vice President, | | Senior Vice President, |
| 2005 Market Street | | General Counsel, | | General Counsel, and |
| Philadelphia, PA 19103 | | and Chief Legal Officer | | Chief Legal Officer |
| February 1966 | | | | since October 2005 |
| |
| Richard Salus | | Senior Vice President | | Chief Financial Officer |
| 2005 Market Street | | and Chief Financial Officer | | since November 2006 |
| Philadelphia, PA 19103 | | | | |
| October 1963 | | | | |
| |
The Statement of Additional Information for the Fund(s) includes additional information about the Trustees and Officers and is available, without charge, upon request by calling 800 523-1918.
56
| | | Number of Portfolios in | | |
| Principal Occupation(s) | | Fund Complex Overseen | | Other Directorships |
| During Past 5 Years | | by Trustee or Officer | | Held by Trustee or Officer |
| |
| |
| David F. Connor has served as | | 77 | | None4 |
| Vice President and Deputy | | | | |
| General Counsel of | | | | |
| Delaware Investments | | | | |
| since 2000. | | | | |
| |
| Daniel V. Geatens has served | | 77 | | None4 |
| in various capacities at | | | | |
| different times at | | | | |
| Delaware Investments. | | | | |
| |
| David P. O’Connor has served in | | 77 | | None4 |
| various executive and legal | | | | |
| capacities at different times | | | | |
| at Delaware Investments. | | | | |
| |
| Richard Salus has served in | | 77 | | None4 |
| various executive capacities | | | | |
| at different times at | | | | |
| Delaware Investments. | | | | |
| |
4 David F. Connor, Daniel V. Geatens, David P. O’Connor, and Richard Salus serve in similar capacities for the six portfolios of the Optimum Fund Trust, which have the same investment advisor, principal underwriter, and transfer agent as the registrant.
57
About the organization
| Board of trustees |
Patrick P. Coyne
Chairman, President, and
Chief Executive Officer
Delaware Investments®
Family of Funds
Philadelphia, PA Thomas L. Bennett
Private Investor
Rosemont, PA John A. Fry
President
Drexel University
Philadelphia, PA | Anthony D. Knerr
Founder and Managing
Director
Anthony Knerr &
Associates
New York, NY Lucinda S. Landreth
Former Chief Investment
Officer
Assurant, Inc.
Philadelphia, PA | Ann R. Leven
Consultant
ARL Associates
New York, NY Thomas F. Madison
President and
Chief Executive Officer
MLM Partners, Inc.
Minneapolis, MN | Janet L. Yeomans
Vice President and
Treasurer
3M Corporation
St. Paul, MN J. Richard Zecher
Founder
Investor Analytics
Scottsdale, AZ |
| | | | |
| Affiliated officers |
David F. Connor
Vice President, Deputy
General Counsel, and
Secretary
Delaware Investments
Family of Funds
Philadelphia, PA | Daniel V. Geatens
Vice President and
Treasurer
Delaware Investments
Family of Funds
Philadelphia, PA | David P. O’Connor
Senior Vice President,
General Counsel,
and Chief Legal Officer
Delaware Investments
Family of Funds
Philadelphia, PA | Richard Salus
Senior Vice President and
Chief Financial Officer
Delaware Investments
Family of Funds
Philadelphia, PA |
This annual report is for the information of Delaware Select Growth Fund shareholders, but it may be used with prospective investors when preceded or accompanied by a current prospectus for Delaware Select Growth Fund and the Delaware Investments Fund fact sheet for the most recently completed calendar quarter. These documents are available at www.delawareinvestments.com. The prospectus sets forth details about charges, expenses, investment objectives, and operating policies of the investment company. You should read the prospectus carefully before you invest. The figures in this report represent past results that are not a guarantee of future results. The return and principal value of an investment in the investment company will fluctuate so that shares, when redeemed, may be worth more or less than their original cost. |
Delaware Investments is the marketing name of Delaware Management Holdings, Inc. and its subsidiaries. The Fund files its complete schedule of portfolio holdings with the Securities and Exchange Commission (SEC) for the first and third quarters of each fiscal year on Form N-Q. The Fund’s Forms N-Q, as well as a description of the policies and procedures that the Fund uses to determine how to vote proxies (if any) relating to portfolio securities are available without charge (i) upon request, by calling 800 523-1918; and (ii) on the SEC’s Web site at www.sec.gov. In addition, a description of the policies and procedures that the Fund uses to determine how to vote proxies (if any) relating to portfolio securities and the Fund’s Schedule of Investments are available without charge on the Fund’s Web site at www.delawareinvestments.com. The Fund’s Forms N-Q may be reviewed and copied at the SEC’s Public Reference Room in Washington, D.C.; information on the operation of the Public Reference Room may be obtained by calling 800 SEC-0330. Information (if any) regarding how the Fund voted proxies relating to portfolio securities during the most recently disclosed 12-month period ended June 30 is available without charge (i) through the Fund’s Web site at www.delawareinvestments.com; and (ii) on the SEC’s Web site at www.sec.gov. |
Annual report Delaware Large Cap Core Fund
April 30, 2011 U.S. core equity mutual fund |
The Fund is available only to certain residents of certain states. Carefully consider the Fund’s investment objectives, risk factors, charges, and expenses before investing. This and other information can be found in the Fund’s prospectus and, if available, its summary prospectus, which may be obtained by visiting www.delawareinvestments.com or calling 800 523-1918. Investors should read the prospectus and, if available, the summary prospectus carefully before investing. |
You can obtain shareholder reports and prospectuses online instead of in the mail.
Visit www.delawareinvestments.com/edelivery. |
Experience Delaware Investments
Delaware Investments is committed to the pursuit of consistently superior asset management and unparalleled client service. We believe in our investment processes, which seek to deliver consistent results, and in convenient services that help add value for our clients.
If you are interested in learning more about creating an investment plan, contact your financial advisor.
You can learn more about Delaware Investments or obtain a prospectus for Delaware Large Cap Core Fund at www.delawareinvestments.com.
| Manage your investments online |
- 24-hour access to your account information
- Obtain share prices
- Check your account balance and recent transactions
- Request statements or literature
- Make purchases and redemptions
|
Delaware Management Holdings, Inc. and its subsidiaries (collectively known by the marketing name of Delaware Investments) are wholly owned subsidiaries of Macquarie Group Limited, a global provider of banking, financial, advisory, investment and funds management services.
Investments in Delaware Large Cap Core Fund are not and will not be deposits with or liabilities of Macquarie Bank Limited ABN 46 008 583 542 and its holding companies, including their subsidiaries or related companies (Macquarie Group), and are subject to investment risk, including possible delays in repayment and loss of income and capital invested. No Macquarie Group company guarantees or will guarantee the performance of the Fund, the repayment of capital from the Fund, or any particular rate of return.
| Table of contents | |
| Portfolio management review | 1 |
| Performance summary | 4 |
| Disclosure of Fund expenses | 8 |
| Security type/sector allocation and | |
| top 10 equity holdings | 10 |
| Statement of net assets | 11 |
| Statement of operations | 15 |
| Statements of changes in net assets | 16 |
| Financial highlights | 18 |
| Notes to financial statements | 22 |
| Report of independent registered | |
| public accounting firm | 31 |
| Other Fund information | 32 |
| Board of trustees/directors and | |
| officers addendum | 34 |
| About the organization | 44 |
Unless otherwise noted, views expressed herein are current as of April 30, 2011, and subject to change.
Funds are not FDIC insured and are not guaranteed. It is possible to lose the principal amount invested.
Mutual fund advisory services provided by Delaware Management Company, a series of Delaware Management Business Trust, which is a registered investment advisor. Delaware Investments, a member of Macquarie Group, refers to Delaware Management Holdings, Inc. and its subsidiaries, including the Fund’s distributor, Delaware Distributors, L.P. Macquarie Group refers to Macquarie Group Limited and its subsidiaries and affiliates worldwide.
© 2011 Delaware Management Holdings, Inc.
All third-party trademarks cited are the property of their respective owners.
| Portfolio management review |
| Delaware Large Cap Core Fund | May 10, 2011 |
| Performance preview (for the year ended April 30, 2011) | | | | |
| Delaware Large Cap Core Fund (Class A shares) | | 1-year return | | +15.12% |
| S&P 500 Index (benchmark) | | 1-year return | | +17.22% |
Past performance does not guarantee future results.
For complete, annualized performance for Delaware Large Cap Core Fund, please see the table on page 4. The performance of Class A shares excludes the applicable sales charge and reflects the reinvestment of all distributions. Index performance returns do not reflect any management fees, transaction costs, or expenses. Indices are unmanaged and one cannot invest directly in an index. |
U.S. and global stocks posted favorable returns during the Fund’s fiscal year ended April 30, 2011, despite a number of serious challenges, including the following:
- the Gulf of Mexico oil spill
- a European debt crisis
- persistently high U.S. unemployment figures
- spiking oil prices
In the face of these challenges, the U.S. economy continued to recover steadily from recessionary lows. In the first quarter of the 2011 calendar year, the economy turned in its seventh consecutive quarter of growth based on gross domestic product — the primary measure of the economy’s production of goods and services.
Against this positive economic backdrop, corporate America fared well, realizing strong profits and generating substantial cash that many companies returned to shareholders in the form of share buybacks or corporate dividends. Another plus for the stock market was the Federal Reserve Board’s active role in stimulating the economy through another substantial round of monetary policy, adding significant amounts of money into the economy. As liquidity increased and interest rates on “safe” assets such as U.S. Treasurys declined, many investors became more willing to hold riskier assets such as commodities and equities — providing a big tailwind to the stock market.
Throughout the Fund’s fiscal year, we continued to follow our core stock-selection process, which we rely on in all types of market conditions. Our approach is bottom up — we use our comprehensive research process to choose investments based on their individual business fundamentals. We use this approach to help identify companies we believe have stable balance sheets, favorable long-term earnings growth potential, and attractive prices.
1
Portfolio management review
Delaware Large Cap Core Fund
For its fiscal year ended April 30, 2011, Delaware Large Cap Core Fund (Class A shares with distributions reinvested) returned +15.12% at net asset value and +8.55% at maximum offer price. In comparison, the Fund’s benchmark, the S&P 500 Index, returned +17.22% during the same period. For the complete annualized performance of Delaware Large Cap Core Fund, please see the table on page 4.
We continued to keep the Fund’s sector weightings reasonably close to those of the benchmark in an attempt to manage portfolio risk. However, we did modestly add to the Fund’s exposure to cyclical stocks, which we believed could potentially benefit from further improvement in the global economy. For example, we added new holdings in media conglomerate CBS and U.S. automaker Ford Motor. We felt both stocks had the potential to turn in favorable earnings growth as economic activity continued to strengthen.
Recently, we began looking for opportunities in the healthcare and consumer staples sectors; valuations were attractive relative to the broad market, given that these groups showed only modest gains during the stock market’s latest rally. We should emphasize that, although we pay close attention to sector allocations in an attempt to manage the portfolio’s risk, we only buy stocks within a particular sector if they meet the Fund’s investment parameters.
Underperformance in consumer staples and technology
The Fund’s underperformance relative to its benchmark during the fiscal year was primarily the result of disappointing performance in the consumer staples sector, followed by lackluster returns in the basic materials sector. Within basic materials, Owens-Illinois, a leading maker of glass bottles for food and drinks, declined significantly during the Fund’s fiscal year. We initially invested in the stock because we believed the company had the potential to generate improved sales in the stronger economy. Unfortunately, this did not happen, and its shares declined as a result. That said, we believe the drop in the company’s shares was overly exaggerated, and as a result we selectively added to the Fund’s position at various times during its fiscal year.
The technology sector was another source of weakness, with three of the industry’s largest companies — networking products company Cisco Systems, computer and peripherals manufacturer Hewlett-Packard (HP), and software giant Microsoft — hampering the Fund’s performance during the fiscal year. All three companies struggled in a market environment that favored smaller technology stocks over their larger counterparts. Other factors weighed on how the stocks performed as well. Specifically, Cisco encountered several big challenges (many investors became concerned about the company’s organizational complexity and its ability to respond to market needs) and the company lowered its growth forecast during the fiscal year. HP and Microsoft were both negatively affected by the ongoing emergence of tablet computing as a competitive threat to their main businesses. These and other trends led us to make the cautious decision to sell the Fund’s stake in HP, although we still held a strategically reduced position in Cisco. With Microsoft, we believe the selloff of the company’s shares was excessive given the company’s core strengths, and we were remaining patient with the Fund’s investment at the end of the Fund’s fiscal year.
2
Strong stock selection from healthcare and media
Security selection in capital goods was strong, as were results in the media sector — most notably a position in Viacom. This leading media company generated robust earnings as a result of renewed advertising demand that stemmed from the domestic economic rebound and improved television ratings, especially from its MTV network (source: Bloomberg).
Other helpful sectors included transportation and healthcare. UnitedHealth Group was one of the Fund’s strongest contributors. As the largest managed care company in the United States, UnitedHealth had fallen out of favor with many investors who feared that 2010 healthcare reform legislation would negatively affect profitability in the managed care industry. Consequently, the company’s valuation declined sharply, which we believe provided a good opportunity to add to the Fund’s investment. Recently, the stock has performed relatively well, in part because investors’ fears of the legislation’s effect on the healthcare industry began to dissipate. (Source: Dow Jones.)
Elsewhere, telecommunications service provider Qwest Communications was a strong performer, profiting from a number of improvements to its business backdrop. The stock also benefited from the company’s merger with rival CenturyLink, which formally acquired Qwest toward the end of the Fund’s fiscal year. As CenturyLink’s shares rose during much of 2010, they also lifted Qwest’s performance. Given the stock’s strong performance and the company’s merger with CenturyLink, we completely sold the Fund’s position as we felt there was limited upside going forward. Another notable holding was NetApp in the technology sector. NetApp provides data storage solutions and it benefited from the increased demand for these services.
Throughout the Fund’s fiscal year, we continued to follow our core stock-selection process, which we rely on in all types of market conditions. Our approach is bottom up — we use our comprehensive research process to choose investments based on their individual business fundamentals. We use this approach to help identify companies we believe have stable balance sheets, favorable long-term earnings growth potential, and attractive prices.
3
| Performance summary |
| Delaware Large Cap Core Fund | April 30, 2011 |
The performance data quoted represent past performance; past performance does not guarantee future results. Investment return and principal value will fluctuate so your shares, when redeemed, may be worth more or less than their original cost. Please obtain the performance data current for the most recent month end by calling 800 523-1918 or visiting our Web site at www.delawareinvestments.com/performance. Current performance may be lower or higher than the performance data quoted.
| Fund performance1,2 | | Average annual total returns through April 30, 2011 |
| | | 1 year | | 3 years | | Lifetime |
| Class A (Est. Aug. 31, 2006) | | | | | | |
| Excluding sales charge | | +15.12% | | +0.03% | | +2.27% |
| Including sales charge | | +8.55% | | -1.91% | | +0.98% |
| Institutional Class shares (Est. Aug. 31, 2006) | | | | |
| Excluding sales charge | | +15.12% | | +0.03% | | +2.27% |
| Including sales charge | | +15.12% | | +0.03% | | +2.27% |
Class C and R shares had not commenced operations as of April 30, 2011.
1 Returns reflect the reinvestment of all distributions and are presented both with and without the applicable sales charges described below. Returns do not reflect the deduction of taxes the shareholder would pay on Fund distributions or redemptions of Fund shares.
Expense limitations were in effect for certain classes during some or all of the periods shown in the “Fund performance” chart. The current expenses for each class are listed on the “Fund expense ratios” table below. Performance would have been lower had expense limitations not been in effect.
Class A shares are sold with a maximum front-end sales charge of up to 5.75%, and have an annual distribution and service fee of up to 0.25% of average daily net assets. Performance for Class A shares, excluding sales charges, assumes that no front-end sales charge applied.
Class C and R shares are available only for certain retirement plan products. They are sold without a sales charge and have an annual distribution and service fee of up to 1.00% and 0.50%, respectively, of average daily net assets, but such fees are currently subject to a voluntary waiver, which may be terminated or modified at any time. No Class C or R shares were available during the periods shown.
Institutional Class shares are available without sales or asset-based distribution charges only to certain eligible institutional accounts.
The “Fund performance” table and the “Performance of a $10,000 investment” graph do not reflect the deduction of taxes the shareholder would pay on Fund distributions or redemptions of Fund shares.
4
2 The Fund’s expense ratios, as described in the most recent prospectus, are disclosed in the following “Fund expense ratios” table. Delaware Investments has agreed to reimburse certain expenses and/or waive certain fees in order to prevent total fund operating expenses from exceeding 0.95% of the Fund’s average daily net assets from Aug. 27, 2010, until the voluntary cap is discontinued. Please see the most recent prospectus and any applicable supplement(s) for additional information on these fee waivers and/or reimbursements.
| Fund expense ratios | | Class A | | Class C | | Class R | | Institutional Class |
| Total annual operating expenses | | 3.05% | | 3.80% | | 3.30% | | 2.80% |
| (without fee waivers) | | | | | | | | |
| Net expenses | | 0.95% | | 0.95% | | 0.95% | | 0.95% |
| (including fee waivers, if any) | | | | | | | | |
| Type of waiver | | Voluntary | | Voluntary | | Voluntary | | Voluntary |
5
Performance summary
Delaware Large Cap Core Fund
Performance of a $10,000 investment1
Average annual total returns from Aug. 31, 2006 (Fund’s inception), through April 30, 2011
| For period beginning Aug. 31, 2006, through April 30, 2011 | Starting value | Ending value |
| | S&P 500 Index | $10,000 | $11,544 |
| | Delaware Large Cap Core Fund — Class A Shares | $9,425 | $10,466 |
1 The “Performance of $10,000 investment” graph assumes $10,000 invested in Class A shares of the Fund on Aug. 31, 2006, and includes the effect of a 5.75% front-end sales charge and the reinvestment of all distributions. The graph does not reflect the deduction of taxes the shareholders would pay on Fund distributions or redemptions of Fund shares. Expense limitations were in effect for some or all of the periods shown. Performance would have been lower had expense limitations not been in effect. Current expenses are listed in the “Fund expense ratios” table on page 5. Please note additional details on pages 4 through 6.
The chart also assumes $10,000 invested in the S&P 500 Index as of Aug. 31, 2006. The S&P 500 Index measures the performance of 500 mostly large-cap stocks weighted by market value, and is often used to represent performance of the U.S. stock market.
Index performance returns do not reflect any management fees, transaction costs, or expenses. Indices are unmanaged and one cannot invest directly in an index. Past performance is not a guarantee of future results.
Performance of other Fund classes will vary due to different charges and expenses.
| | | Nasdaq symbols | | CUSIPs | |
| Class A | | | DDCAX | | | 246118582 | |
| Institutional Class | | | DDCIX | | | 246118558 | |
6
Disclosure of Fund expenses
For the six-month period from November 1, 2010 to April 30, 2011
As a shareholder of the Fund, you incur two types of costs: (1) transaction costs, including sales charges (loads) on purchase payments, reinvested dividends, or other distributions; redemption fees; and exchange fees; and (2) ongoing costs, including management fees; distribution and/or service (12b-1) fees; and other Fund expenses. This example is intended to help you understand your ongoing costs (in dollars) of investing in the Fund and to compare these costs with the ongoing costs of investing in other mutual funds.
The example is based on an investment of $1,000 invested at the beginning of the period and held for the entire six-month period from November 1, 2010 to April 30, 2011.
Actual expenses
The first section of the table shown, “Actual Fund return,” provides information about actual account values and actual expenses. You may use the information in this section of the table, together with the amount you invested, to estimate the expenses that you paid over the period. Simply divide your account value by $1,000 (for example, an $8,600 account value divided by $1,000 = 8.6), then multiply the result by the number in the first section under the heading entitled “Expenses Paid During Period” to estimate the expenses you paid on your account during this period.
Hypothetical example for comparison purposes
The second section of the table shown, “Hypothetical 5% return,” provides information about hypothetical account values and hypothetical expenses based on the Fund’s actual expense ratio and an assumed rate of return of 5% per year before expenses, which is not the Fund’s actual return. The hypothetical account values and expenses may not be used to estimate the actual ending account balance or expenses you paid for the period. You may use this information to compare the ongoing costs of investing in the Fund and other funds. To do so, compare this 5% hypothetical example with the 5% hypothetical examples that appear in the shareholder reports of the other funds.
Please note that the expenses shown in the table are meant to highlight your ongoing costs only and do not reflect any transactional costs, such as sales charges (loads), redemption fees, or exchange fees. Therefore, the second section of the table is useful in comparing ongoing costs only, and will not help you determine the relative total costs of owning different funds. In addition, if these transactional costs were included, your costs would have been higher. The Fund’s expenses shown in the table reflect fee waivers in effect. The expenses shown in the table assume reinvestment of all dividends and distributions.
8
Delaware Large Cap Core Fund
Expense analysis of an investment of $1,000
| | | Beginning | | Ending | | | | | Expenses |
| | | Account Value | | Account Value | | Annualized | | Paid During Period |
| | | 11/1/10 | | 4/30/11 | | Expense Ratio | | 11/1/10 to 4/30/11* |
| Actual Fund return | | | | | | | | | | | | | | | |
| Class A | | $ | 1,000.00 | | | $ | 1,177.60 | | | 0.95 | % | | $ | 5.13 | |
| Institutional Class | | | 1,000.00 | | | | 1,177.60 | | | 0.95 | % | | | 5.13 | |
| Hypothetical 5% return (5% return before expenses) | | | | | | | | |
| Class A | | $ | 1,000.00 | | | $ | 1,020.08 | | | 0.95 | % | | $ | 4.76 | |
| Institutional Class | | | 1,000.00 | | | | 1,020.08 | | | 0.95 | % | | | 4.76 | |
*“Expenses Paid During Period” are equal to the Fund’s annualized expense ratio, multiplied by the average account value over the period, multiplied by 181/365 (to reflect the one-half year period).
9
| Security type/sector allocation and | |
| top 10 equity holdings | |
| Delaware Large Cap Core Fund | As of April 30, 2011 |
Sector designations may be different than the sector designations presented in other Fund materials. The sector designations may represent the investment manager’s internal sector classifications, which may result in the sector designations for one fund being different than another fund’s sector designations.
| Security type/sector | Percentage of net assets |
| Common Stock | 99.29 | % |
| Basic Materials | 5.00 | % |
| Business Services | 0.75 | % |
| Capital Goods | 10.31 | % |
| Communication Services | 3.22 | % |
| Consumer Discretionary | 3.92 | % |
| Consumer Staples | 8.56 | % |
| Credit Cyclicals | 1.04 | % |
| Energy | 13.03 | % |
| Financials | 12.41 | % |
| Healthcare | 11.54 | % |
| Media | 5.26 | % |
| Technology | 21.26 | % |
| Transportation | 2.99 | % |
| Short-Term Investments | 1.33 | % |
| Total Value of Securities | 100.62 | % |
| Liabilities Net of Receivables and Other Assets | (0.62 | %) |
| Total Net Assets | 100.00 | % |
Holdings are for informational purposes only and are subject to change at any time. They are not a recommendation to buy, sell, or hold any security.
| Top 10 equity holdings | Percentage of net assets |
| Exxon Mobil | 3.79 | % |
| Apple | 3.47 | % |
| Procter & Gamble | 2.83 | % |
| Pfizer | 2.82 | % |
| United Technologies | 2.68 | % |
| Microsoft | 2.64 | % |
| Google Class A | 2.57 | % |
| Merck | 2.26 | % |
| EMC | 2.02 | % |
| JPMorgan Chase | 2.01 | % |
10
| Statement of net assets | |
| Delaware Large Cap Core Fund | April 30, 2011 |
| | | | Number of shares | | Value |
| Common Stock – 99.29% | | | | | |
| Basic Materials – 5.00% | | | | | |
| | Agrium | | 150 | | $ | 13,565 |
| | Celanese Class A | | 740 | | | 36,941 |
| | Cliffs Natural Resources | | 120 | | | 11,246 |
| | Eastman Chemical | | 140 | | | 15,015 |
| † | Owens-Illinois | | 620 | | | 18,395 |
| | | | | | | 95,162 |
| Business Services – 0.75% | | | | | |
| | Towers Watson Class A | | 250 | | | 14,340 |
| | | | | | | 14,340 |
| Capital Goods – 10.31% | | | | | |
| | Caterpillar | | 250 | | | 28,853 |
| | Cummins | | 140 | | | 16,825 |
| | Deere | | 210 | | | 20,475 |
| | Fluor | | 330 | | | 23,080 |
| | Honeywell International | | 620 | | | 37,963 |
| | Lockheed Martin | | 230 | | | 18,228 |
| | United Technologies | | 570 | | | 51,060 |
| | | | | | | 196,484 |
| Communication Services – 3.22% | | | | | |
| | AT&T | | 1,220 | | | 37,966 |
| | Vodafone Group ADR | | 800 | | | 23,296 |
| | | | | | | 61,262 |
| Consumer Discretionary – 3.92% | | | | | |
| | Kohl’s | | 310 | | | 16,340 |
| | Macy’s | | 950 | | | 22,714 |
| | Nordstrom | | 450 | | | 21,398 |
| | Target | | 290 | | | 14,239 |
| | | | | | | 74,691 |
| Consumer Staples – 8.56% | | | | | |
| | CVS Caremark | | 980 | | | 35,515 |
| | General Mills | | 490 | | | 18,904 |
| | Jarden | | 470 | | | 17,103 |
| | Kimberly-Clark | | 290 | | | 19,157 |
| | Procter & Gamble | | 830 | | | 53,868 |
| | Starbucks | | 510 | | | 18,457 |
| | | | | | | 163,004 |
11
Statement of net assets
Delaware Large Cap Core Fund
| | | | Number of shares | | Value |
| Common Stock (continued) | | | | | |
| Credit Cyclicals – 1.04% | | | | | |
| † | Ford Motor | | 1,280 | | $ | 19,802 |
| | | | | | | 19,802 |
| Energy – 13.03% | | | | | |
| | Chevron | | 220 | | | 24,077 |
| | Exxon Mobil | | 820 | | | 72,159 |
| | Marathon Oil | | 450 | | | 24,318 |
| | National Oilwell Varco | | 240 | | | 18,406 |
| † | Newfield Exploration | | 340 | | | 24,072 |
| | Noble | | 270 | | | 11,613 |
| | Occidental Petroleum | | 330 | | | 37,716 |
| | Schlumberger | | 400 | | | 35,900 |
| | | | | | | 248,261 |
| Financials – 12.41% | | | | | |
| | AFLAC | | 420 | | | 23,600 |
| | American Express | | 260 | | | 12,761 |
| | Bank of New York Mellon | | 660 | | | 19,114 |
| | Capital One Financial | | 470 | | | 25,723 |
| | Goldman Sachs Group | | 200 | | | 30,202 |
| † | IntercontinentalExchange | | 160 | | | 19,256 |
| | JPMorgan Chase | | 840 | | | 38,329 |
| | Prudential Financial | | 540 | | | 34,247 |
| | Wells Fargo | | 1,140 | | | 33,185 |
| | | | | | | 236,417 |
| Healthcare – 11.54% | | | | | |
| † | Amgen | | 360 | | | 20,466 |
| † | Celgene | | 300 | | | 17,664 |
| † | Express Scripts Class A | | 500 | | | 28,370 |
| † | Gilead Sciences | | 540 | | | 20,974 |
| | Merck | | 1,200 | | | 43,140 |
| | Pfizer | | 2,564 | | | 53,741 |
| | UnitedHealth Group | | 720 | | | 35,446 |
| | | | | | | 219,801 |
| Media – 5.26% | | | | | |
| | CBS Class B | | 720 | | | 18,158 |
| | Comcast Class A | | 1,190 | | | 29,215 |
| | Time Warner Cable | | 250 | | | 19,533 |
| | Viacom Class B | | 650 | | | 33,253 |
| | | | | | | 100,159 |
12
| | | | Number of shares | | Value |
| Common Stock (continued) | | | | | | | |
| Technology – 21.26% | | | | | | | |
| | Accenture Class A | | | 250 | | $ | 14,283 | |
| † | Apple | | | 190 | | | 66,163 | |
| † | Check Point Software Technologies | | | 460 | | | 25,268 | |
| | Cisco Systems | | | 1,060 | | | 18,614 | |
| † | EMC | | | 1,360 | | | 38,542 | |
| | Expedia | | | 580 | | | 14,517 | |
| † | Google Class A | | | 90 | | | 48,969 | |
| | Intel | | | 1,280 | | | 29,683 | |
| | Microsoft | | | 1,930 | | | 50,219 | |
| † | NetApp | | | 370 | | | 19,233 | |
| † | ON Semiconductor | | | 2,020 | | | 21,230 | |
| | QUALCOMM | | | 610 | | | 34,672 | |
| † | Yahoo | | | 1,330 | | | 23,608 | |
| | | | | | | | 405,001 | |
| Transportation – 2.99% | | | | | | | |
| | Norfolk Southern | | | 500 | | | 37,340 | |
| | Union Pacific | | | 190 | | | 19,659 | |
| | | | | | | | 56,999 | |
| Total Common Stock (cost $1,515,923) | | | | | | 1,891,383 | |
| | | | | | | |
| | | Principal amount | | | | |
| ≠Short-Term Investments – 1.33% | | | | | �� | |
| Discount Notes – 1.33% | | | | | | | |
| | Federal Home Loan Bank | | | | | | | |
| | 0.001% 5/2/11 | | | $21,398 | | | 21,399 | |
| | 0.03% 5/3/11 | | | 59 | | | 59 | |
| | 0.037% 5/23/11 | | | 76 | | | 76 | |
| | 0.04% 5/9/11 | | | 3,651 | | | 3,651 | |
| | 0.05% 5/16/11 | | | 59 | | | 59 | |
| | 0.06% 6/7/11 | | | 56 | | | 56 | |
| Total Short-Term Investments (cost $25,300) | | | | | | 25,300 | |
| | | | | | | | |
| Total Value of Securities – 100.62% | | | | | | | |
| | (cost $1,541,223) | | | | | | 1,916,683 | |
| Liabilities Net of Receivables | | | | | | | |
| | and Other Assets – (0.62%) | | | | | | (11,776 | ) |
| Net Assets Applicable to 219,282 | | | | | | | |
| | Shares Outstanding – 100.00% | | | | | $ | 1,904,907 | |
13
Statement of net assets
Delaware Large Cap Core Fund
| | | | | |
| Net Asset Value – Delaware Large Cap Core Fund | | | |
| | Class A ($14,063 / 1,619 Shares) | | | $8.69 | |
| Net Asset Value – Delaware Large Cap Core Fund | | | |
| | Institutional Class ($1,890,844 / 217,663 Shares) | | | $8.69 | |
| | | | | | |
| Components of Net Assets at April 30, 2011: | | | |
| Shares of beneficial interest (unlimited authorization – no par) | | $1,939,119 | |
| Undistributed net investment income | | 1,772 | |
| Accumulated net realized loss on investments | | (411,444 | ) |
| Net unrealized appreciation of investments | | 375,460 | |
| Total net assets | | $1,904,907 | |
†Non income producing security.
≠The rate shown is the effective yield at the time of purchase.
ADR — American Depositary Receipts
| Net Asset Value and Offering Price Per Share – | | | |
| | Delaware Large Cap Core Fund | | | |
| Net asset value Class A (A) | $ | 8.69 | |
| Sales charge (5.75% of offering price) (B) | | 0.53 | |
| Offering price | $ | 9.22 | |
| (A) | | Net asset value per share, as illustrated, is the amount which would be paid upon redemption or repurchase of shares. |
| (B) | | See the current prospectus for purchases of $50,000 or more. |
See accompanying notes, which are an integral part of the financial statements.
14
| Statement of operations | |
| Delaware Large Cap Core Fund | Year Ended April 30, 2011 |
| Investment Income: | | | | | | | |
| Dividends | | $ | 27,122 | | | | |
| Interest | | | 13 | | $ | 27,135 | |
| | | | | | | | |
| Expenses: | | | | | | | |
| Reports and statements to shareholders | | | 14,960 | | | | |
| Audit and tax | | | 11,080 | | | | |
| Management fees | | | 10,747 | | | | |
| Dividend disbursing and transfer agent fees and expenses | | | 7,273 | | | | |
| Registration fees | | | 4,795 | | | | |
| Dues and services | | | 3,499 | | | | |
| Pricing fees | | | 1,297 | | | | |
| Accounting and administration expenses | | | 652 | | | | |
| Custodian fees | | | 416 | | | | |
| Legal fees | | | 399 | | | | |
| Insurance fees | | | 131 | | | | |
| Trustees’ fees | | | 89 | | | | |
| Consulting fees | | | 34 | | | | |
| Distribution expenses – Class A | | | 30 | | | | |
| Trustees’ expenses | | | 6 | | | 55,408 | |
| Less fees waived | | | | | | (39,608 | ) |
| Less waived distribution expenses – Class A | | | | | | (30 | ) |
| Total operating expenses | | | | | | 15,770 | |
| Net Investment Income | | | | | | 11,365 | |
| | | | | | | | |
| Net Realized and Unrealized Gain on Investments: | | | | | | | |
| Net realized gain on investments | | | | | | 110,803 | |
| Net change in unrealized appreciation/depreciation of investments | | | | | | 125,243 | |
| Net Realized and Unrealized Gain on Investments | | | | | | 236,046 | |
| | | | | | | | |
| Net Increase in Net Assets Resulting from Operations | | | | | $ | 247,411 | |
See accompanying notes, which are an integral part of the financial statements.
15
Statements of changes in net assets
Delaware Large Cap Core Fund
| | | Year Ended |
| | | 4/30/11 | | 4/30/10 |
| Increase (Decrease) in Net Assets from Operations: | | | | | | | | |
| Net investment income | | $ | 11,365 | | | $ | 8,706 | |
| Net realized gain (loss) on investments | | | 110,803 | | | | (103,026 | ) |
| Net change in unrealized appreciation/depreciation | | | | | | | | |
| of investments | | | 125,243 | | | | 573,290 | |
| Net increase in net assets resulting from operations | | | 247,411 | | | | 478,970 | |
| | | | | | | | | |
| Dividends and Distributions to Shareholders from: | | | | | | | | |
| Net investment income: | | | | | | | | |
| Class A | | | (68 | ) | | | (89 | ) |
| Institutional Class | | | (9,525 | ) | | | (12,568 | ) |
| | | | (9,593 | ) | | | (12,657 | ) |
| Capital Share Transactions: | | | | | | | | |
| Proceeds from shares sold: | | | | | | | | |
| Class A | | | 489 | | | | 19,779 | |
| | | | | | | | | |
| Net asset value of shares issued upon reinvestment | | | | | | | | |
| of dividends and distributions: | | | | | | | | |
| Class A | | | 68 | | | | 89 | |
| Institutional Class | | | 9,525 | | | | 12,568 | |
| | | | 10,082 | | | | 32,436 | |
| Cost of shares repurchased: | | | | | | | | |
| Class A | | | (18,484 | ) | | | (964 | ) |
| Institutional Class | | | — | | | | (250,000 | ) |
| | | | (18,484 | ) | | | (250,964 | ) |
| Decrease in net assets derived from capital share transactions | | | (8,402 | ) | | | (218,528 | ) |
| Net Increase in Net Assets | | | 229,416 | | | | 247,785 | |
| | | | | | | | | |
| Net Assets: | | | | | | | | |
| Beginning of year | | | 1,675,491 | | | | 1,427,706 | |
| End of year (including undistributed net investment income | | | | | | | | |
| of $1,772 and $-, respectively) | | $ | 1,904,907 | | | $ | 1,675,491 | |
See accompanying notes, which are an integral part of the financial statements.
16
Financial highlights
Delaware Large Cap Core Fund Class A
Selected data for each share of the Fund outstanding throughout each period were as follows:
| Net asset value, beginning of period |
| |
| Income (loss) from investment operations: |
| Net investment income2 |
| Net realized and unrealized gain (loss) on investments |
| Total from investment operations |
| |
| Less dividends and distributions from: |
| Net investment income |
| Net realized gain on investments |
| Total dividends and distributions |
| |
| Net asset value, end of period |
| |
| Total return3 |
| |
| Ratios and supplemental data: |
| Net assets, end of period (000 omitted) |
| Ratio of expenses to average net assets |
| Ratio of expenses to average net assets |
| prior to fees waived and expense paid indirectly |
| Ratio of net investment income to average net assets |
| Ratio of net investment income (loss) to average net assets |
| prior to fees waived and expenses paid indirectly |
| Portfolio turnover |
1 Date of commencement of operations; ratios and portfolio turnover have been annualized and total return has not been annualized. |
2 The average shares outstanding method has been applied for per share information. |
3 Total investment return is based on the change in net asset value of a share during the period and assumes reinvestment of dividends and distributions at net asset value and does not reflect the impact of a sales charge. Total investment return during all of the periods shown reflects waivers by the manager and distributor. Performance would have been lower had the waivers not been in effect. |
See accompanying notes, which are an integral part of the financial statements.
18
| | | | | | | | | | | | | | | | | 8/31/061 | |
| | | | | | Year Ended | | | | | | | | to | |
| | | 4/30/11 | | 4/30/10 | | 4/30/09 | | | 4/30/08 | | | 4/30/07 | |
| | | $7.590 | | | $5.630 | | | $8.930 | | | | $9.700 | | | | | $8.500 | | |
| | | | | | | | | | | | | | | | | | | | |
| | | | | | | | | | | | | | | | | | | | |
| | | 0.052 | | | 0.038 | | | 0.081 | | | | 0.073 | | | | | 0.039 | | |
| | | 1.092 | | | 1.978 | | | (3.293 | ) | | | (0.368 | ) | | | | 1.216 | | |
| | | 1.144 | | | 2.016 | | | (3.212 | ) | | | (0.295 | ) | | | | 1.255 | | |
| | | | | | | | | | | | | | | | | | | | |
| | | | | | | | | | | | | | | | | | | | |
| | | (0.044 | ) | | (0.056 | ) | | (0.088 | ) | | | (0.067 | ) | | | | (0.025 | ) | |
| | | — | | | — | | | — | | | | (0.408 | ) | | | | (0.030 | ) | |
| | | (0.044 | ) | | (0.056 | ) | | (0.088 | ) | | | (0.475 | ) | | | | (0.055 | ) | |
| | | | | | | | | | | | | | | | | | | | |
| | | $8.690 | | | $7.590 | | | $5.630 | | | | $8.930 | | | | | $9.700 | | |
| | | | | | | | | | | | | | | | | | | | |
| | | 15.12% | | | 35.93% | | | (36.04% | ) | | | (3.36% | ) | | | | 14.81% | | |
| | | | | | | | | | | | | | | | | | | | |
| | | | | | | | | | | | | | | | | | | | |
| | | $14 | | | $31 | | | $10 | | | | $32 | | | | | $14 | | |
| | | 0.95% | | | 0.95% | | | 0.95% | | | | 0.95% | | | | | 0.96% | | |
| | | | | | | | | | | | | | | | | | | | |
| | | 3.60% | | | 3.05% | | | 1.87% | | | | 3.03% | | | | | 5.27% | | |
| | | 0.69% | | | 0.56% | | | 1.20% | | | | 0.77% | | | | | 0.64% | | |
| | | | | | | | | | | | | | | | | | | | |
| | | (1.96% | ) | | (1.54% | ) | | 0.28% | | | | (1.31% | ) | | | | (3.67% | ) | |
| | | 46% | | | 65% | | | 38% | | | | 30% | | | | | 30% | | |
19
Financial highlights
Delaware Large Cap Core Fund Institutional Class
Selected data for each share of the Fund outstanding throughout each period were as follows:
| Net asset value, beginning of period |
| |
| Income (loss) from investment operations: |
| Net investment income2 |
| Net realized and unrealized gain (loss) on investments |
| Total from investment operations |
| |
| Less dividends and distributions from: |
| Net investment income |
| Net realized gain on investments |
| Total dividends and distributions |
| |
| Net asset value, end of period |
| |
| Total return3 |
| |
| Ratios and supplemental data: |
| Net assets, end of period (000 omitted) |
| Ratio of expenses to average net assets |
| Ratio of expenses to average net assets |
| prior to fees waived and expense paid indirectly |
| Ratio of net investment income to average net assets |
| Ratio of net investment income (loss) to average net assets |
| prior to fees waived and expenses paid indirectly |
| Portfolio turnover |
1 Date of commencement of operations; ratios and portfolio turnover have been annualized and total return has not been annualized. |
2 The average shares outstanding method has been applied for per share information. |
3 Total investment return is based on the change in net asset value of a share during the period and assumes reinvestment of dividends and distributions at net asset value. Total investment return during all of the periods shown reflects a waiver by the manager. Performance would have been lower had the waiver not been in effect. |
See accompanying notes, which are an integral part of the financial statements.
20
| | | | | | | | | | | | | | | | | | | | 8/31/061 | |
| | | | | | | | Year Ended | | | | | | | | to | |
| | | 4/30/11 | | 4/30/10 | | 4/30/09 | | 4/30/08 | | | 4/30/07 | |
| | | | $7.600 | | | | $5.630 | | | | $8.930 | | | | $9.700 | | | | | $8.500 | | |
| | | | | | | | | | | | | | | | | | | | | | | |
| | | | | | | | | | | | | | | | | | | | | | | |
| | | | 0.052 | | | | 0.038 | | | | 0.081 | | | | 0.073 | | | | | 0.039 | | |
| | | | 1.082 | | | | 1.988 | | | | (3.293 | ) | | | (0.368 | ) | | | | 1.216 | | |
| | | | 1.134 | | | | 2.026 | | | | (3.212 | ) | | | (0.295 | ) | | | | 1.255 | | |
| | | | | | | | | | | | | | | | | | | | | | | |
| | | | | | | | | | | | | | | | | | | | | | | |
| | | | (0.044 | ) | | | (0.056 | ) | | | (0.088 | ) | | | (0.067 | ) | | | | (0.025 | ) | |
| | | | — | | | | — | | | | — | | | | (0.408 | ) | | | | (0.030 | ) | |
| | | | (0.044 | ) | | | (0.056 | ) | | | (0.088 | ) | | | (0.475 | ) | | | | (0.055 | ) | |
| | | | | | | | | | | | | | | | | | | | | | | |
| | | | $8.690 | | | | $7.600 | | | | $5.630 | | | | $8.930 | | | | | $9.700 | | |
| | | | | | | | | | | | | | | | | | | | | | | |
| | | | 15.12% | | | | 36.11% | | | | (36.04% | ) | | | (3.36% | ) | | | | 14.81% | | |
| | | | | | | | | | | | | | | | | | | | | | | |
| | | | | | | | | | | | | | | | | | | | | | | |
| | | | $1,891 | | | | $1,644 | | | | $1,418 | | | | $2,219 | | | | | $2,296 | | |
| | | | 0.95% | | | | 0.95% | | | | 0.95% | | | | 0.95% | | | | | 0.96% | | |
| | | | | | | | | | | | | | | | | | | | | | | |
| | | | 3.35% | | | | 2.80% | | | | 1.62% | | | | 2.78% | | | | | 5.02% | | |
| | | | 0.69% | | | | 0.56% | | | | 1.20% | | | | 0.77% | | | | | 0.64% | | |
| | | | | | | | | | | | | | | | | | | | | | | |
| | | | (1.71% | ) | | | (1.29% | ) | | | 0.53% | | | | (1.06% | ) | | | | (3.42% | ) | |
| | | | 46% | | | | 65% | | | | 38% | | | | 30% | | | | | 30% | | |
21
| Notes to financial statements | | |
| Delaware Large Cap Core Fund | April 30, 2011 |
Voyageur Mutual Funds III (Trust) is organized as a Delaware statutory trust and offers two series: Delaware Large Cap Core Fund and Delaware Select Growth Fund. These financial statements and the related notes pertain to Delaware Large Cap Core Fund (Fund). The Trust is an open-end investment company. The Fund is considered diversified under the Investment Company Act of 1940, as amended, and offers Class A, Class C, Class R and Institutional Class shares. Class A shares are sold with a maximum front-end sales charge of up to 5.75%. Class A share purchases of $1,000,000 or more will incur a contingent deferred sales charge (CDSC) of 1% if redeemed during the first year and 0.50% during the second year, provided that Delaware Distributors, L.P. (DDLP) paid a financial advisor a commission on the purchase of those shares. Class C shares are sold with a CDSC of 1%, if redeemed during the first twelve months. Class R and Institutional Class shares are not subject to a sales charge and are offered for sale exclusively to certain eligible investors. As of April 30, 2011, Class C and Class R have not commenced operations.
The investment objective of the Fund is to seek long-term capital appreciation.
1. Significant Accounting Policies
The following accounting policies are in accordance with U.S. generally accepted accounting principles (U.S. GAAP) and are consistently followed by the Fund.
Security Valuation — Equity securities, except those traded on the Nasdaq Stock Market, Inc. (Nasdaq), are valued at the last quoted sales price as of the time of the regular close of the New York Stock Exchange (NYSE) on the valuation date. Securities traded on the Nasdaq are valued in accordance with the Nasdaq Official Closing Price, which may not be the last sales price. If on a particular day an equity security does not trade, then the mean between the bid and ask prices will be used. Short-term debt securities are valued at market value. U.S. Government and agency securities are valued at the mean between the bid and ask prices. Generally, other securities and assets for which market quotations are not readily available are valued at fair value as determined in good faith under the direction of the Fund’s Board of Trustees (Board). In determining whether market quotations are readily available or fair valuation will be used, various factors will be taken into consideration, such as market closures or suspension of trading in a security. The Fund may use fair value pricing more frequently for securities traded primarily in non-U.S. markets because, among other things, most foreign markets close well before the Fund values its securities generally as of 4:00 p.m. Eastern time. The earlier close of these foreign markets gives rise to the possibility that significant events, including broad market moves, government actions or pronouncements, aftermarket trading, or news events may have occurred in the interim. To account for this, the Fund may frequently value foreign securities using fair value prices based on third-party vendor modeling tools (international fair value pricing).
Federal Income Taxes — No provision for federal income taxes has been made as the Fund intends to continue to qualify for federal income tax purposes as a regulated investment company under Subchapter M of the Internal Revenue Code of 1986, as amended, and make the requisite distributions to shareholders. The Fund evaluates tax positions taken or expected to be taken in the course of preparing the Fund’s tax returns to determine whether the tax positions are
22
“more-likely-than-not” of being sustained by the applicable tax authority. Tax positions not deemed to meet the more-likely-than-not threshold are recorded as a tax benefit or expense in the current year. Management has analyzed the Fund’s tax positions taken on federal income tax returns for all open tax years (April 30, 2008 – April 30, 2011), and has concluded that no position for federal income tax is required in the Fund’s financial statements.
Class Accounting — Investment income, common expenses and realized and unrealized gain (loss) on investments are allocated to the various classes of the Fund on the basis of daily net assets of each class. Distribution expenses relating to a specific class are charged directly to that class.
Repurchase Agreements — The Fund may invest in a pooled cash account along with other members of the Delaware Investments® Family of Funds pursuant to an exemptive order issued by the Securities and Exchange Commission. The aggregate daily balance of the pooled cash account is invested in repurchase agreements secured by obligations of the U.S government. The respective collateral is held by the Fund’s custodian bank until the maturity of the respective repurchase agreements. Each repurchase agreement is at least 102% collateralized. However, in the event of default or bankruptcy by the counterparty to the agreement, realization of the collateral may be subject to legal proceedings. At April 30, 2011, the Fund held no investments in repurchase agreements.
Use of Estimates — The preparation of financial statements in conformity with U.S. GAAP requires management to make estimates and assumptions that affect the reported amounts of assets and liabilities and disclosure of contingent assets and liabilities at the date of the financial statements and the reported amounts of revenues and expenses during the reporting period. Actual results could differ from those estimates and the differences could be material.
Other — Expenses directly attributable to the Fund are charged directly to the Fund. Other expenses common to various funds within the Delaware Investments Family of Funds are generally allocated amongst such funds on the basis of average net assets. Management fees and some other expenses are paid monthly. Security transactions are recorded on the date the securities are purchased or sold (trade date) for financial reporting purposes. Costs used in calculating realized gains and losses on the sale of investment securities are those of the specific securities sold. Dividend income is recorded on the ex-dividend date and interest income is recorded on the accrual basis. The Fund declares and pays dividends from net investment income and distributions from net realized gain on investments, if any, annually. Dividends and distributions, if any, are recorded on the ex-dividend date. The Fund may distribute income dividends and capital gains more frequently, if necessary for tax purposes.
The Fund may receive earnings credits from its custodian when positive cash balances are maintained, which are used to offset custody fees. There were no earnings credits for the year ended April 30, 2011.
The Fund may receive earnings credits from its transfer agent when positive cash balances are maintained, which may be used to offset transfer agent fees. There were no earnings credits for the year ended April 30, 2011.
23
Notes to financial statements
Delaware Large Cap Core Fund
2. Investment Management, Administration Agreements and Other Transactions with Affiliates
In accordance with the terms of its investment management agreement, the Fund pays Delaware Management Company (DMC), a series of Delaware Management Business Trust and the investment manager, an annual fee which is calculated daily at the rate of 0.65% on the first $500 million of average daily net assets of the Fund, 0.60% on the next $500 million, 0.55% on the next $1.5 billion and 0.50% on average daily net assets in excess of $2.5 billion.
DMC has voluntarily agreed to waive all or a portion, if any, of its management fees and reimburse the Fund to the extent necessary to ensure that total annual operating expenses (excluding any 12b-1 plan and certain other expenses) do not exceed 0.95% of the Fund’s average daily net assets until such time as the voluntary expense cap is discontinued. This waiver and expense limitation may be discontinued at any time because it is voluntary. This expense waiver and reimbursement apply only to expenses paid directly by the Fund.
Delaware Service Company, Inc. (DSC), an affiliate of DMC, provides fund accounting and financial administration oversight services to the Fund. For these services, the Fund pays DSC fees based on the aggregate daily net assets of the Delaware Investments® Family of Funds at the following annual rate: 0.0050% of the first $30 billion; 0.0045% of the next $10 billion; 0.0040% of the next $10 billion; and 0.0025% of aggregate average daily net assets in excess of $50 billion. The fees payable to DSC under the service agreement described above are allocated among all Funds in the Delaware Investments® Family of Funds on a relative net asset value basis. For the year ended April 30, 2011, the Fund was charged $82 for these services.
DSC also provides dividend disbursing and transfer agency services. The Fund pays DSC a monthly fee based on the number of shareholder accounts for dividend disbursing and transfer agent services.
Pursuant to a distribution agreement and distribution plan, the Fund pays DDLP, the distributor and an affiliate of DMC, an annual distribution and service fee not to exceed 0.25% of the average daily net assets of the Class A shares, 1.00% of the average daily net assets of Class C shares and 0.60% of the average daily net assets of Class R shares. Institutional Class shares pay no distribution and services expenses. DDLP has voluntarily agreed to waive all distribution and service fees. The distributor’s waivers may be discontinued at any time because they are voluntary.
24
At April 30, 2011, the Fund had receivables due from or liabilities payable to affiliates as follows:
| Receivable from DMC under limitation agreement | | $4,267 | |
| Dividend disbursing, transfer agent and fund accounting | | | |
| oversight fees and other expenses payable to DSC | | (14 | ) |
| Other expenses payable to DMC and affiliates* | | (502 | ) |
*DMC, as part of its administrative services, pays operating expenses on behalf of the Fund and is reimbursed on a periodic basis. Expenses include items such as printing of shareholder reports, fees for audit, legal and tax services, registration fees and trustees’ fees.
As provided in the investment management agreement, the Fund bears the cost of certain legal and tax services, including internal legal and tax services provided to the Fund by DMC and/or its affiliates’ employees. For the year ended April 30 2011, the Fund was charged $13 for internal legal and tax services provided by DMC and/or its affiliates’ employees.
For the year ended April 30, 2011, DDLP earned $4 for commissions on sales of the Fund’s Class A shares.
Trustees’ fees include expenses accrued by the Fund for each Trustee’s retainer and meeting fees. Certain officers of DMC, DSC and DDLP are officers and/or Trustees of the Trust. These officers and Trustees are paid no compensation by the Fund.
3. Investments
For the year ended April 30, 2011, the Fund made purchases of $768,008 and sales of $763,924 of investment securities other than short-term investments.
At April 30, 2011, the cost of investments for federal income tax purposes was $1,550,472. At April 30, 2011, net unrealized appreciation was $366,211, of which $394,773 related to unrealized appreciation of investments and $28,562 related to unrealized depreciation of investments.
U.S. GAAP defines fair value as the price that the Fund would receive to sell an asset or pay to transfer a liability in an orderly transaction between market participants at the measurement date under current market conditions. A three level hierarchy for fair value measurements has been established based upon the transparency of inputs to the valuation of an asset or liability. Inputs may be observable or unobservable and refer broadly to the assumptions that market participants would use in pricing the asset or liability. Observable inputs reflect the assumptions market participants would use in pricing the asset or liability based on market data obtained from sources independent of the reporting entity. Unobservable inputs reflect the reporting entity’s own assumptions about the assumptions that market participants would use in pricing the asset or liability developed based on the best information available under the circumstances. The Fund’s
25
Notes to financial statements
Delaware Large Cap Core Fund
3. Investments (continued)
investment in its entirety is assigned a level based upon the observability of the inputs which are significant to the overall valuation. The three level hierarchy of inputs is summarized below.
| Level 1 – | | inputs are quoted prices in active markets for identical investments (e.g., equity securities, open-end investment companies, futures contracts, options contracts) |
| | | |
| Level 2 – | | other observable inputs (including, but not limited to: quoted prices for similar assets or liabilities in markets that are active, quoted prices for identical or similar assets or liabilities in markets that are not active, inputs other than quoted prices that are observable for the assets or liabilities (such as interest rates, yield curves, volatilities, prepayment speeds, loss severities, credit risks and default rates) or other market-corroborated inputs) (e.g., debt securities, government securities, swap contracts, foreign currency exchange contracts, foreign securities utilizing international fair value pricing) |
| | | |
| Level 3 – | | inputs are significant unobservable inputs (including the Fund’s own assumptions used to determine the fair value of investments) (e.g., broker-quoted securities, fair valued securities) |
The following table summarizes the valuation of the Fund’s investments by fair value hierarchy levels as of April 30, 2011:
| | Level 1 | | Level 2 | | Total |
| Common Stock | $ | 1,891,383 | | $ | — | | $ | 1,891,383 |
| Short-Term Investments | | — | | | 25,300 | | | 25,300 |
| Total | $ | 1,891,383 | | $ | 25,300 | | $ | 1,916,683 |
There were no unobservable inputs used to value investments at the beginning or end of the year.
During the year ended April 30, 2011, there were no transfers between Level 1 investments, Level 2 investments or Level 3 investments that had a material impact to the Fund.
4. Dividend and Distribution Information
Income and long-term capital gain distributions are determined in accordance with federal income tax regulations, which may differ from U.S. GAAP. Additionally, distributions from net short-term gains on sales of investment securities are treated as ordinary income for federal income tax purposes. The tax character of dividends and distributions paid during the years ended April 30, 2011 and 2010 was as follows:
| | Year Ended |
| | 4/30/11 | | 4/30/10 |
| Ordinary Income | $ | 9,593 | | $ | 12,030 |
| Return of capital | | — | | | 627 |
| Total | $ | 9,593 | | $ | 12,657 |
26
5. Components of Net Assets on a Tax Basis
As of April 30, 2011, the components of net assets on a tax basis were as follows:
| Shares of beneficial interest | $ | 1,939,119 | |
| Undistributed ordinary income | | 1,772 | |
| Capital loss carryforwards | | (402,195 | ) |
| Unrealized appreciation of investments | | 366,211 | |
| Net assets | $ | 1,904,907 | |
The difference between book basis and tax basis components of net assets is primarily attributable to tax deferral of losses on wash sales.
For federal income tax purposes, capital loss carryforwards may be carried forward and applied against future capital gains. $113,490 was utilized in 2011. Capital loss carryforwards remaining at April 30, 2011 will expire as follows: $100,792 expires in 2017 and $301,403 expires in 2018.
6. Capital Shares
Transactions in capital shares were as follows:
| | Year Ended |
| | 4/30/11 | | 4/30/10 |
| Shares sold: | | | | | |
| Class A | 59 | | | 2,576 | |
| | | | | | |
| Shares issued upon reinvestment of dividends and distributions: | | | | | |
| Class A | 8 | | | 13 | |
| Institutional Class | 1,192 | | | 1,868 | |
| | 1,259 | | | 4,457 | |
| | | | | | |
| Shares repurchased: | | | | | |
| Class A | (2,574 | ) | | (168 | ) |
| Institutional Class | — | | | (37,481 | ) |
| | (2,574 | ) | | (37,649 | ) |
| Net decrease | (1,315 | ) | | (33,192 | ) |
As of April 30, 2011, management believes the following shareholders held of record 5% or more of the outstanding shares of each Class of the Trust. Management has no knowledge of beneficial ownership.
The Manager and its affiliates may provide the initial seed capital in connection with the creation of a Delaware Investments product, such as the Delaware Large Cap Core Fund. To the extent that the Manager or its affiliates maintain such seed capital in a Delaware Investments product, the Manager or its affiliates may engage in a total return swap or other hedge on its investment for
27
Notes to financial statements
Delaware Large Cap Core Fund
6. Capital Shares (continued)
the sole purpose of limiting the volatility of earnings of the Manager and its corporate parents. Neither the Manager nor its affiliates seek to profit by hedging the seed-capital investments in the Delaware Investments products, and the total return swap or other hedge is not expected to have any effect on the investment performance of any Delaware Investments product.
| Fund Name | | Class | | Shareholder Name and Address | | Total Shares | | Percentage |
| Delaware Large Cap | | A | | Bruce A. Green & | | 1,178.637 | | 72.81% |
| Core Fund Class A | | | | Lynn H. Green JT WROS | | | | |
| | | | | Nashville TN 37221 | | | | |
| Delaware Large Cap | | A | | Craig P. Brown | | 378.017 | | 23.35% |
| Core Fund Class A | | | | Ardmore PA 19003 | | | | |
| Delaware Large Cap | | I | | DMH Corp. | | 217,660.871 | | 100.00% |
| Core Fund Class I | | | | Attn. Rick Salus | | | | |
| | | | | 2005 Market St. Fl. 9 | | | | |
| | | | | Philadelphia PA 19103-7007 | | | | |
7. Line of Credit
The Fund, along with certain other funds in the Delaware Investments® Family of Funds (Participants), was a participant in a $35,000,000 revolving line of credit with The Bank of New York Mellon (BNY Mellon) to be used for temporary or emergency purposes as an additional source of liquidity to fund redemptions of investor shares. Under the agreement, the Participants are charged an annual commitment fee, which was allocated across the Participants on the basis of each Participant’s allocation of the entire facility. The Participants were permitted to borrow up to a maximum of one third of their net assets under the agreement. The line of credit expired on November 16, 2010.
Effective as of November 16, 2010, the Fund along with the other Participants entered into an amendment to the agreement with BNY Mellon for a $50,000,000 revolving line of credit. The agreement as amended is to be used as described above and operates in substantially the same manner as the original agreement. The new line of credit under the agreement as amended expires on November 15, 2011. The Fund had no amounts outstanding as of April 30, 2011, or at any time during the year then ended.
8. Securities Lending
The Fund, along with other funds in the Delaware Investments Family of Funds, may lend its securities pursuant to a security lending agreement (Lending Agreement) with BNY Mellon. With respect to each loan, if on any business day the aggregate market value of securities collateral plus cash collateral held is less than the aggregate market value of the securities which are the subject of such loan, the borrower will be notified to provide additional collateral by the end of the following business day which, together with the collateral already held, will be not less than the applicable collateral requirements for such security loan. If the aggregate market value of securities
28
collateral and cash collateral held with respect to a security loan exceeds the applicable collateral requirement, upon request of the borrower BNY Mellon must return enough collateral to the borrower by the end of the following business day to reduce the value of the remaining collateral to the applicable collateral requirement for such security loan. As a result of the foregoing, the value of the collateral held with respect to a loaned security may be temporarily more or less than the value of security on loan. Cash collateral received is generally invested in the Delaware Investments Collateral Fund No. 1 (Collective Trust) established by BNY Mellon for the purpose of investment on behalf of funds managed by DMC that participate in BNY Mellon’s securities lending program. The Collective Trust may invest in U.S. government securities and high quality corporate debt, asset-backed and other money market securities and in repurchase agreement collateralized by such securities, provided that the Collective Trust will generally have a dollar-weighted average portfolio maturity of 60 days or less. The Collective Trust seeks to maintain a net asset value per unit of $1.00, but there can be no assurance that it will always be able to do so. The Fund may incur investment losses as a result of investing securities lending collateral in the Collective Trust. This could occur if an investment in the Collective Trust defaulted or if it were necessary to liquidate assets in the Collective Trust to meet returns on outstanding security loans at a time when the Collective Trust’s net asset value per unit was less than $1.00. Under those circumstances, the Fund may not receive an amount from the Collective Trust that is equal in amount to the collateral the Fund would be required to return to the borrower of the securities and the Fund would be required to make up for this shortfall. The Fund can also accept U.S. government securities and letters of credit (non-cash collateral) in connection with securities loans. In the event of default or bankruptcy by the lending agent, realization and/or retention of the collateral may be subject to legal proceedings. In the event the borrower fails to return loaned securities and the collateral received is insufficient to cover the value of the loaned securities and provided such collateral shortfall is not the result of investment losses, the lending agent has agreed to pay the amount of the shortfall to the Fund, or at the discretion of the lending agent, replace the loaned securities. The Fund continues to record dividends or interest, as applicable, on the securities loaned and is subject to change in value of the securities loaned that may occur during the term of the loan. The Fund has the right under the Lending Agreement to recover the securities from the borrower on demand. With respect to security loans collateralized by non-cash collateral, the Fund receives loan premiums paid by the borrower. With respect to security loans collateralized by cash collateral, the earnings from the collateral investments are shared among the Fund, the security lending agent and the borrower. The Fund records security lending income net of allocations to the security lending agent and the borrower. The Fund had no securities out on loan as of April 30, 2011.
9. Credit and Market Risk
The Fund may invest up to 15% of its net assets in illiquid securities, which may include securities with contractual restrictions on resale, securities exempt from registration under Rule 144A of the Securities Act of 1933, as amended, and other securities which may not be readily marketable. The relative illiquidity of these securities may impair the Fund from disposing of them in a timely manner and at a
29
Notes to financial statements
Delaware Large Cap Core Fund
9. Credit and Market Risk (continued)
fair price when it is necessary or desirable to do so. While maintaining oversight, the Fund’s Board has delegated to DMC the day-to-day functions of determining whether individual securities are liquid for purposes of the Fund’s limitation on investments in illiquid assets. Securities eligible for resale pursuant to Rule 144A, which are determined to be liquid, are not subject to the Fund’s 15% limit on investment in illiquid securities. As of April 30, 2011, there were no Rule 144A securities and no securities have been determined to be illiquid under the Fund’s Liquidity Procedures.
10. Contractual Obligations
The Fund enters into contracts in the normal course of business that contain a variety of indemnifications. The Fund’s maximum exposure under these arrangements is unknown. However, the Fund has not had prior claims or losses pursuant to these contracts. Management has reviewed the Fund’s existing contracts and expects the risk of loss to be remote.
11. Subsequent Events
Management has determined no material events or transactions occurred subsequent to April 30, 2011 that would require recognition or disclosure in the Fund’s financial statements.
12. Tax Information (Unaudited)
The information set forth below is for the Fund’s fiscal year as required by federal income tax laws. Shareholders, however, must report distributions on a calendar year basis for income tax purposes, which may include distributions for portions of two fiscal years of a fund. Accordingly, the information needed by shareholders for income tax purposes will be sent to them in January of each year. Please consult your tax advisor for proper treatment of this information.
For the fiscal year ended April 30, 2011, the Fund designates distributions paid during the year as follows:
| (A) Ordinary Income Distributions (Tax Basis)* | 100 | % |
| (B) Qualifying Dividends1 | 100 | % |
(A) is based on a percentage of the Fund’s total distributions.
(B) is based on percentage of the Fund’s ordinary income distributions.
1 Qualifying dividends represent dividends which qualify for the corporate dividends received deduction.
*For the fiscal year ended April 30, 2011, certain dividends paid by the Fund may be subject to a maximum tax rate of 15%, as provided for by the Jobs and Growth Tax Relief Reconciliation Act of 2003. The Fund intends to designate up to a maximum amount of $11,365 to be taxed at a maximum rate of 15%. Complete information will be computed and reported in conjunction with your 2010 or 2011 Form 1099-DIV.
30
Report of independent
registered public accounting firm
To the Board of Trustees of Voyageur Mutual Funds III Trust
and the Shareholders of Delaware Large Cap Core Fund:
In our opinion, the accompanying statement of net assets and the related statements of operations and of changes in net assets and the financial highlights present fairly, in all material respects, the financial position of Delaware Large Cap Core Fund (one of a series constituting the Voyageur Mutual Funds III Trust, hereafter referred to as the “Fund”) at April 30, 2011, and the results of its operations, the changes in its net assets and the financial highlights for the year then ended, in conformity with accounting principles generally accepted in the United States of America. These financial statements and financial highlights (hereafter referred to as “financial statements”) are the responsibility of the Fund’s management; our responsibility is to express an opinion on these financial statements based on our audit. We conducted our audit of these financial statements in accordance with the standards of the Public Company Accounting Oversight Board (United States). Those standards require that we plan and perform the audit to obtain reasonable assurance about whether the financial statements are free of material misstatement. An audit includes examining, on a test basis, evidence supporting the amounts and disclosures in the financial statements, assessing the accounting principles used and significant estimates made by management, and evaluating the overall financial statement presentation. We believe that our audit, which included confirmation of securities at April 30, 2011 by correspondence with the custodian and brokers, provides a reasonable basis for our opinion. The statement of changes in net assets for the year ended April 30, 2010 and the financial highlights for the three years ended April 30, 2010 and the period ended April 30, 2007 were audited by other independent accountants whose report dated June 18, 2010 expressed an unqualified opinion on those statements.
PricewaterhouseCoopers LLP
Philadelphia, Pennsylvania
June 16, 2011
31
Other Fund information
(Unaudited)
Delaware Large Cap Core Fund
Change in Independent Registered Public Accounting Firm
Due to independence matters under the Securities and Exchange Commission’s auditor independence rules relating to the January 4, 2010 acquisition of Delaware Investments (including DMC, DDLP and DSC) by Macquarie Group, Ernst & Young LLP (E&Y) has resigned as the independent registered public accounting firm for Voyageur Mutual Funds III (the Trust) effective June 28, 2010. At a meeting held on February 18, 2010, the Board of Trustees of the Trust, upon recommendation of the Audit Committee, selected PricewaterhouseCoopers LLP ( PwC) to serve as the independent registered public accounting firm for the Trust for the fiscal year ending April 30, 2011. During the fiscal years ended April 30, 2010 and 2009, E&Y’s audit reports on the financial statements of the Trust did not contain any adverse opinion or disclaimer of opinion, nor were they qualified or modified as to uncertainty, audit scope, or accounting principles. In addition, there were no disagreements between the Trust and E&Y on accounting principles, financial statements disclosures or audit scope, which, if not resolved to the satisfaction of E&Y, would have caused them to make reference to the disagreement in their reports. Neither the Trust nor anyone on its behalf has consulted with PwC at any time prior to their selection with respect to the application of accounting principles to a specified transaction, either completed or proposed or the type of audit opinion that might be rendered on the Trust’s financial statements.
32
Board of trustees/directors and officers addendum
Delaware Investments® Family of Funds
A mutual fund is governed by a Board of Trustees/Directors (“Trustees”), which has oversight responsibility for the management of a fund’s business affairs. Trustees establish procedures and oversee and review the performance of the investment manager, the distributor, and others who perform services for the fund. The independent fund trustees, in particular, are advocates
| Name, Address, | | Position(s) | | Length of |
| and Birth Date | | Held with Fund(s) | | Time Served |
| Interested Trustees |
| |
| Patrick P. Coyne1 | | Chairman, President, | | Chairman and Trustee |
| 2005 Market Street | | Chief Executive Officer, | | since August 16, 2006 |
| Philadelphia, PA 19103 | | and Trustee | | |
| April 1963 | | | | President and |
| | | | | Chief Executive Officer |
| | | | | since August 1, 2006 |
| | | | | |
| | | | | |
| | | | | |
| | | | | |
| | | | | |
| | | | | |
| | | | | |
| | | | | |
| | | | | |
| | | | | |
| | | | | |
| | | | | |
| | | | | |
| | | | | |
1 Patrick P. Coyne is considered to be an “Interested Trustee” because he is an executive officer of the Fund’s(s’) investment advisor.
34
for shareholder interests. Each trustee has served in that capacity since he or she was elected to or appointed to the Board of Trustees, and will continue to serve until his or her retirement or the election of a new trustee in his or her place. The following is a list of the Trustees and Officers with certain background and related information.
| | | Number of Portfolios in | | |
| Principal Occupation(s) | | Fund Complex Overseen | | Other Directorships |
| During Past 5 Years | | by Trustee or Officer | | Held by Trustee or Officer |
| |
| |
| Patrick P. Coyne has served in | | 77 | | Director |
| various executive capacities | | | | Kaydon Corp. |
| at different times at | | | | |
| Delaware Investments.2 | | | | Board of Governors Member |
| | | | | Investment Company |
| | | | | Institute (ICI) |
| |
| | | | | Finance Committee Member |
| | | | | St. John Vianney Roman |
| | | | | Catholic Church |
| |
| | | | | Board of Trustees |
| | | | | Agnes Irwin School |
| |
| | | | | Member of Investment |
| | | | | Committee |
| | | | | Cradle of Liberty Council, |
| | | | | BSA |
| | | | | (2007 – 2010) |
| | | | | |
2 Delaware Investments is the marketing name for Delaware Management Holdings, Inc. and its subsidiaries, including the Fund’s(s’) investment advisor, principal underwriter, and its transfer agent.
35
Board of trustees/directors and officers addendum
Delaware Investments® Family of Funds
| Name, Address, | | Position(s) | | Length of |
| and Birth Date | | Held with Fund(s) | | Time Served |
| Independent Trustees | | | | |
| |
| Thomas L. Bennett | | Trustee | | Since March 2005 |
| 2005 Market Street | | | | |
| Philadelphia, PA 19103 | | | | |
| October 1947 | | | | |
| |
| |
| |
| |
| |
| |
| |
| |
| |
| |
| John A. Fry | | Trustee | | Since January 2001 |
| 2005 Market Street | | | | |
| Philadelphia, PA 19103 | | | | |
| May 1960 | | | | |
| |
| |
| |
| |
| |
| |
| |
| |
| Anthony D. Knerr | | Trustee | | Since April 1990 |
| 2005 Market Street | | | | |
| Philadelphia, PA 19103 | | | | |
| December 1938 | | | | |
| |
| |
| Lucinda S. Landreth | | Trustee | | Since March 2005 |
| 2005 Market Street | | | | |
| Philadelphia, PA 19103 | | | | |
| June 1947 | | | | |
| |
36
| | | Number of Portfolios in | | |
| Principal Occupation(s) | | Fund Complex Overseen | | Other Directorships |
| During Past 5 Years | | by Trustee or Officer | | Held by Trustee or Officer |
| | | | | |
| |
| Private Investor | | 77 | | Director |
| (March 2004–Present) | | | | Bryn Mawr Bank Corp. (BMTC) |
| | | | | (2007 – 2011) |
| Investment Manager | | | | |
| Morgan Stanley & Co. | | | | Chairman of Investment |
| (January 1984–March 2004) | | | | Committee |
| | | | | Pennsylvania Academy of |
| | | | | Fine Arts |
| | | | | |
| | | | | Investment Committee and |
| | | | | Governance Committee |
| | | | | Member |
| | | | | Pennsylvania Horticultural |
| | | | | Society |
| |
| President | | 77 | | Board of Governors Member — |
| Drexel University | | | | NASDAQ OMX PHLX LLC |
| (August 2010–Present) | | | | |
| | | | | Director |
| President | | | | Community Health Systems |
| Franklin & Marshall College | | | | |
| (July 2002–July 2010) | | | | Director — Ecore |
| | | | | International |
| Executive Vice President | | | | (2009 – 2010) |
| University of Pennsylvania | | | | |
| (April 1995–June 2002) | | | | Director — Allied |
| | | | | Barton Securities Holdings |
| | | | | (2005 – 2008) |
| |
| Founder and | | 77 | | None |
| Managing Director | | | | |
| Anthony Knerr & Associates | | | | |
| (Strategic Consulting) | | | | |
| (1990–Present) | | | | |
| |
| Chief Investment Officer | | 77 | | None |
| Assurant, Inc. (Insurance) | | | | |
| (2002–2004) | | | | |
| | | | | |
| |
37
Board of trustees/directors and officers addendum
Delaware Investments® Family of Funds
| Name, Address, | | Position(s) | | Length of |
| and Birth Date | | Held with Fund(s) | | Time Served |
| Independent Trustees (continued) | | | | |
| |
| Ann R. Leven | | Trustee | | Since October 1989 |
| 2005 Market Street | | | | |
| Philadelphia, PA 19103 | | | | |
| November 1940 | | | | |
| |
| |
| |
| |
| |
| |
| Thomas F. Madison | | Trustee | | Since May 19973 |
| 2005 Market Street | | | | |
| Philadelphia, PA 19103 | | | | |
| February 1936 | | | | |
| |
| |
| |
| |
| |
| |
| |
| |
| | | | | |
| | | | | |
| | | | | |
| | | | | |
| |
| |
| |
| | | | | |
| | | | | |
| | | | | |
| | | | | |
| | | | | |
| | | | | |
| | | | | |
| | | | | |
| |
3 In 1997, several funds managed by Voyageur Fund Managers, Inc. (the “Voyageur Funds”) were incorporated into the Delaware Investments Family of Funds. Mr. Madison served as a director of the Voyageur Funds from 1993 until 1997.
38
| | | Number of Portfolios in | | |
| Principal Occupation(s) | | Fund Complex Overseen | | Other Directorships |
| During Past 5 Years | | by Trustee or Officer | | Held by Trustee or Officer |
| | | | | |
| |
| Consultant | | 77 | | Director and Audit |
| ARL Associates | | | | Committee Chair – |
| (Financial Planning) | | | | Systemax Inc. |
| (1983–Present) | | | | (2001 – 2009) |
| | | | | |
| | | | | Director and Audit |
| | | | | Committee Chairperson – |
| | | | | Andy Warhol Foundation |
| | | | | (1999 – 2007) |
| |
| President and | | 77 | | Director and Chair of |
| Chief Executive Officer | | | | Compensation Committee, |
| MLM Partners, Inc. | | | | Governance Committee |
| (Small Business Investing | | | | Member |
| and Consulting) | | | | CenterPoint Energy |
| (January 1993–Present) | | | | |
| | | | | Lead Director and Chair of |
| | | | | Audit and Governance |
| | | | | Committees, Member of |
| | | | | Compensation Committee |
| | | | | Digital River, Inc. |
| | | | | |
| | | | | Director and Chair of |
| | | | | Governance Committee, |
| | | | | Audit Committee |
| | | | | Member |
| | | | | Rimage Corporation |
| | | | | |
| | | | | Director and Chair of |
| | | | | Compensation Committee |
| | | | | Spanlink Communications |
| | | | | |
| | | | | Lead Director and Member of |
| | | | | Compensation and |
| | | | | Governance Committees |
| | | | | Valmont Industries, Inc. |
| | | | | (1987 – 2010) |
| |
39
Board of trustees/directors and officers addendum
Delaware Investments® Family of Funds
| Name, Address, | | Position(s) | | Length of |
| and Birth Date | | Held with Fund(s) | | Time Served |
| Independent Trustees (continued) | | | | |
| |
| Thomas F. Madison | | | | |
| 2005 Market Street | | | | |
| Philadelphia, PA 19103 | | | | |
| February 1936 | | | | |
| |
| Janet L. Yeomans | | Trustee | | Since April 1999 |
| 2005 Market Street | | | | |
| Philadelphia, PA 19103 | | | | |
| July 1948 | | | | |
| |
| |
| |
| |
| J. Richard Zecher | | Trustee | | Since March 2005 |
| 2005 Market Street | | | | |
| Philadelphia, PA 19103 | | | | |
| July 1940 | | | | |
| |
| |
| | | | | |
| | | | | |
| | | | | |
| | | | | |
| | | | | |
| | | | | |
| | | | | |
| | | | | |
| | | | | |
| | | | | |
| | | | | |
| | | | | |
| | | | | |
| | | | | |
| |
40
| | | Number of Portfolios in | | |
| Principal Occupation(s) | | Fund Complex Overseen | | Other Directorships |
| During Past 5 Years | | by Trustee or Officer | | Held by Trustee or Officer |
| | | | | |
| |
| | | | | Director |
| | | | | Banner Health |
| | | | | (1996 – 2007) |
| | | | | |
| |
| Vice President and Treasurer | | 77 | | Director |
| (January 2006–Present) | | | | Okabena Company |
| Vice President — Mergers & Acquisitions | | | | |
| (January 2003–January 2006), and | | | | |
| Vice President | | | | |
| (July 1995–January 2003) | | | | |
| 3M Corporation | | | | |
| |
| Founder | | 77 | | Director and Audit |
| Investor Analytics | | | | Committee Member |
| (Risk Management) | | | | Investor Analytics |
| (May 1999–Present) | | | | |
| | | | | |
| Founder | | | | Director |
| Sutton Asset Management | | | | Oxigene, Inc. |
| (Hedge Fund) | | | | (2003 – 2008) |
| (September 1996–Present) | | | | |
| | | | | |
| | | | | |
| | | | | |
| | | | | |
| | | | | |
| | | | | |
| | | | | |
| | | | | |
| | | | | |
| | | | | |
| | | | | |
| |
41
Board of trustees/directors and officers addendum
Delaware Investments® Family of Funds
| Name, Address, | | Position(s) | | Length of |
| and Birth Date | | Held with Fund(s) | | Time Served |
| Officers | | | | |
| | | | | |
| David F. Connor | | Vice President, | | Vice President since |
| 2005 Market Street | | Deputy General | | September 2000 |
| Philadelphia, PA 19103 | | Counsel, and Secretary | | and Secretary since |
| December 1963 | | | | October 2005 |
| |
| |
| Daniel V. Geatens | | Vice President | | Treasurer |
| 2005 Market Street | | and Treasurer | | since October 2007 |
| Philadelphia, PA 19103 | | | | |
| October 1972 | | | | |
| |
| David P. O’Connor | | Senior Vice President, | | Senior Vice President, |
| 2005 Market Street | | General Counsel, | | General Counsel, and |
| Philadelphia, PA 19103 | | and Chief Legal Officer | | Chief Legal Officer |
| February 1966 | | | | since October 2005 |
| |
| Richard Salus | | Senior Vice President | | Chief Financial Officer |
| 2005 Market Street | | and Chief Financial Officer | | since November 2006 |
| Philadelphia, PA 19103 | | | | |
| October 1963 | | | | |
| |
The Statement of Additional Information for the Fund(s) includes additional information about the Trustees and Officers and is available, without charge, upon request by calling 800 523-1918.
42
| | | Number of Portfolios in | | |
| Principal Occupation(s) | | Fund Complex Overseen | | Other Directorships |
| During Past 5 Years | | by Trustee or Officer | | Held by Trustee or Officer |
| |
| |
| David F. Connor has served as | | 77 | | None4 |
| Vice President and Deputy | | | | |
| General Counsel of | | | | |
| Delaware Investments | | | | |
| since 2000. | | | | |
| |
| Daniel V. Geatens has served | | 77 | | None4 |
| in various capacities at | | | | |
| different times at | | | | |
| Delaware Investments. | | | | |
| |
| David P. O’Connor has served in | | 77 | | None4 |
| various executive and legal | | | | |
| capacities at different times | | | | |
| at Delaware Investments. | | | | |
| |
| Richard Salus has served in | | 77 | | None4 |
| various executive capacities | | | | |
| at different times at | | | | |
| Delaware Investments. | | | | |
| |
4 David F. Connor, Daniel V. Geatens, David P. O’Connor, and Richard Salus serve in similar capacities for the six portfolios of the Optimum Fund Trust, which have the same investment advisor, principal underwriter, and transfer agent as the registrant.
43
About the organization
| Board of trustees |
Patrick P. Coyne
Chairman, President, and
Chief Executive Officer
Delaware Investments®
Family of Funds
Philadelphia, PA Thomas L. Bennett
Private Investor
Rosemont, PA John A. Fry
President
Drexel University
Philadelphia, PA | Anthony D. Knerr
Founder and Managing
Director
Anthony Knerr &
Associates
New York, NY Lucinda S. Landreth
Former Chief Investment
Officer
Assurant, Inc.
Philadelphia, PA | Ann R. Leven
Consultant
ARL Associates
New York, NY Thomas F. Madison
President and
Chief Executive Officer
MLM Partners, Inc.
Minneapolis, MN | Janet L. Yeomans
Vice President and
Treasurer
3M Corporation
St. Paul, MN J. Richard Zecher
Founder
Investor Analytics
Scottsdale, AZ |
| | | | |
| Affiliated officers |
David F. Connor
Vice President, Deputy
General Counsel, and
Secretary
Delaware Investments
Family of Funds
Philadelphia, PA | Daniel V. Geatens
Vice President and
Treasurer
Delaware Investments
Family of Funds
Philadelphia, PA | David P. O’Connor
Senior Vice President,
General Counsel,
and Chief Legal Officer
Delaware Investments
Family of Funds
Philadelphia, PA | Richard Salus
Senior Vice President and
Chief Financial Officer
Delaware Investments
Family of Funds
Philadelphia, PA |
This annual report is for the information of Delaware Large Cap Core Fund shareholders, but it may be used with prospective investors when preceded or accompanied by a current prospectus for Delaware Large Cap Core Fund and the Delaware Investments Fund fact sheet for the most recently completed calendar quarter. These documents are available at www.delawareinvestments.com.
The prospectus sets forth details about charges, expenses, investment objectives, and operating policies of the investment company. You should read the prospectus carefully before you invest. The figures in this report represent past results that are not a guarantee of future results. The return and principal value of an investment in the investment company will fluctuate so that shares, when redeemed, may be worth more or less than their original cost. |
| Delaware Investments is the marketing name of Delaware Management Holdings, Inc. and its subsidiaries. |
The Fund files its complete schedule of portfolio holdings with the Securities and Exchange Commission (SEC) for the first and third quarters of each fiscal year on Form N-Q. The Fund’s Forms N-Q, as well as a description of the policies and procedures that the Fund uses to determine how to vote proxies (if any) relating to portfolio securities are available without charge (i) upon request, by calling 800 523-1918; and (ii) on the SEC’s Web site at www.sec.gov. In addition, a description of the policies and procedures that the Fund uses to determine how to vote proxies (if any) relating to portfolio securities and the Fund’s Schedule of Investments are available without charge on the Fund’s Web site at www.delawareinvestments.com. The Fund’s Forms N-Q may be reviewed and copied at the SEC’s Public Reference Room in Washington, D.C.; information on the operation of the Public Reference Room may be obtained by calling 800 SEC-0330.
Information (if any) regarding how the Fund voted proxies relating to portfolio securities during the most recently disclosed 12-month period ended June 30 is available without charge (i) through the Fund’s Web site at www.delawareinvestments.com; and (ii) on the SEC’s Web site at www.sec.gov.
44
Item 2. Code of Ethics
The registrant has adopted a code of ethics that applies to the registrant’s principal executive officer, principal financial officer, principal accounting officer or controller, or persons performing similar functions, regardless of whether these individuals are employed by the registrant or a third party. A copy of the registrant’s Code of Business Ethics has been posted on the Delaware Investments Internet Web site at www.delawareinvestments.com. Any amendments to the Code of Business Ethics, and information on any waiver from its provisions granted by the registrant, will also be posted on this Web site within five business days of such amendment or waiver and will remain on the Web site for at least 12 months.
Item 3. Audit Committee Financial Expert
The registrant’s Board of Trustees/Directors has determined that each member of the registrant’s Audit Committee is an audit committee financial expert, as defined below. For purposes of this item, an “audit committee financial expert” is a person who has the following attributes:
a. An understanding of generally accepted accounting principles and financial statements;
b. The ability to assess the general application of such principles in connection with the accounting for estimates, accruals, and reserves;
c. Experience preparing, auditing, analyzing, or evaluating financial statements that present a breadth and level of complexity of accounting issues that are generally comparable to the breadth and complexity of issues that can reasonably be expected to be raised by the registrant’s financial statements, or experience actively supervising one or more persons engaged in such activities;
d. An understanding of internal controls and procedures for financial reporting; and
e. An understanding of audit committee functions.
An “audit committee financial expert” shall have acquired such attributes through:
a. Education and experience as a principal financial officer, principal accounting officer, controller, public accountant, or auditor or experience in one or more positions that involve the performance of similar functions;
b. Experience actively supervising a principal financial officer, principal accounting officer, controller, public accountant, auditor, or person performing similar functions;
c. Experience overseeing or assessing the performance of companies or public accountants with respect to the preparation, auditing, or evaluation of financial statements; or
d. Other relevant experience.
The registrant’s Board of Trustees/Directors has also determined that each member of the registrant’s Audit Committee is independent. In order to be “independent” for purposes of this item, the Audit Committee member may not: (i) other than in his or her capacity as a member of the Board of Trustees/Directors or any committee thereof, accept directly or indirectly any consulting, advisory or other compensatory fee from the issuer; or (ii) be an “interested person” of the registrant as defined in Section 2(a)(19) of the Investment Company Act of 1940.
The names of the audit committee financial experts on the registrant’s Audit Committee are set forth below:
John A. Fry
Thomas F. Madison
Janet L. Yeomans
Item 4. Principal Accountant Fees and Services
(a) Audit fees.
The aggregate fees billed for services provided to the registrant by its independent auditors for the audit of the registrant’s annual financial statements and for services normally provided by the independent auditors in connection with statutory and regulatory filings or engagements were $28,300 for the fiscal year ended April 30, 2011.
The aggregate fees billed for services provided to the registrant by its independent auditors for the audit of the registrant’s annual financial statements and for services normally provided by the independent auditors in connection with statutory and regulatory filings or engagements were $27,676 for the fiscal year ended April 30, 2010.
(b) Audit-related fees.
The aggregate fees billed by the registrant’s independent auditors for services relating to the performance of the audit of the registrant’s financial statements and not reported under paragraph (a) of this Item were $0 for the fiscal year ended April 30, 2011.
The aggregate fees billed by the registrant’s independent auditors for services relating to the performance of the audit of the financial statements of the registrant’s investment adviser and other service providers under common control with the adviser and that relate directly to the operations or financial reporting of the registrant were $593,000 for the registrant’s fiscal year ended April 30, 2011. The percentage of these fees relating to services approved by the registrant’s Audit Committee pursuant to the de minimis exception from the pre-approval requirement in Rule 2-01(c)(7)(i)(C) of Regulation S-X was 0%. These audit-related services were as follows: audit procedures performed for both the reporting up on Delaware balances for consolidation into the parent company, Macquarie. Also, included are the fees for each of the statutory audits performed on the advisor and its affiliates/subsidiaries.
The aggregate fees billed by the registrant’s independent auditors for services relating to the performance of the audit of the registrant’s financial statements and not reported under paragraph (a) of this Item were $0 for the fiscal year ended April 30, 2010.
The aggregate fees billed by the registrant’s independent auditors for services relating to the performance of the audit of the financial statements of the registrant’s investment adviser and other service providers under common control with the adviser and that relate directly to the operations or financial reporting of the registrant were $19,074 for the registrant’s fiscal year ended April 30, 2010. The percentage of these fees relating to services approved by the registrant’s Audit Committee pursuant to the de minimis exception from the pre-approval requirement in Rule 2-01(c)(7)(i)(C) of Regulation S-X was 0%. These audit-related services were as follows: issuance of report concerning transfer agent’s system of internal accounting control pursuant to Rule 17Ad-13 of the Securities Exchange Act.
(c) Tax fees.
The aggregate fees billed by the registrant’s independent auditors for tax-related services provided to the registrant were $5,100 for the fiscal year ended April 30, 2011. The percentage of these fees relating to services approved by the registrant’s Audit Committee pursuant to the de minimis exception from the pre-approval requirement in Rule 2-01(c)(7)(i)(C) of Regulation S-X was 0%. These tax-related services were as follows: review of income tax returns and review of annual excise distribution calculations.
The aggregate fees billed by the registrant’s independent auditors for tax-related services provided to the registrant’s investment adviser and other service providers under common control with the adviser and that relate directly to the operations or financial reporting of the registrant were $10,000 for the registrant’s fiscal year ended April 30, 2011. The percentage of these fees relating to services approved by the registrant’s Audit Committee pursuant to the de minimis exception from the pre-approval requirement in Rule 2-01(c)(7)(i)(C) of Regulation S-X was 0%. These tax-related services were as follows: state and local tax services.
The aggregate fees billed by the registrant’s independent auditors for tax-related services provided to the registrant were $7,700 for the fiscal year ended April 30, 2010. The percentage of these fees relating to services approved by the registrant’s Audit Committee pursuant to the de minimis exception from the pre-approval requirement in Rule 2-01(c)(7)(i)(C) of Regulation S-X was 0%. These tax-related services were as follows: review of income tax returns and review of annual excise distribution calculations.
The aggregate fees billed by the registrant’s independent auditors for tax-related services provided to the registrant’s adviser and other service providers under common control with the adviser and that relate directly to the operations or financial reporting of the registrant were $0 for the registrant’s fiscal year ended April 30, 2010.
(d) All other fees.
The aggregate fees billed for all services provided by the independent auditors to the registrant other than those set forth in paragraphs (a), (b) and (c) of this Item were $0 for the fiscal year ended April 30, 2011.
The aggregate fees billed for all services other than those set forth in paragraphs (b) and (c) of this Item provided by the registrant’s independent auditors to the registrant’s adviser and other service providers under common control with the adviser and that relate directly to the operations or financial reporting of the registrant were $0 for the registrant’s fiscal year ended April 30, 2011.
The aggregate fees billed for all services provided by the independent auditors to the registrant other than those set forth in paragraphs (a), (b) and (c) of this Item were $0 for the fiscal year ended April 30, 2010.
The aggregate fees billed for all services other than those set forth in paragraphs (b) and (c) of this Item provided by the registrant’s independent auditors to the registrant’s adviser and other service providers under common control with the adviser and that relate directly to the operations or financial reporting of the registrant were $0 for the registrant’s fiscal year ended April 30, 2010.
(e) The registrant’s Audit Committee has established pre-approval policies and procedures as permitted by Rule 2-01(c)(7)(i)(B) of Regulation S-X (the “Pre-Approval Policy”) with respect to services provided by the registrant’s independent auditors. Pursuant to the Pre-Approval Policy, the Audit Committee has pre-approved the services set forth in the table below with respect to the registrant up to the specified fee limits. Certain fee limits are based on aggregate fees to the registrant and other registrants within the Delaware Investments Family of Funds.
| Service | Range of Fees |
| Audit Services | |
| Statutory audits or financial audits for new Funds | up to $25,000 per Fund |
| Services associated with SEC registration statements (e.g., Form N-1A, Form N-14, etc.), periodic reports and other documents filed with the SEC or other documents issued in connection with securities offerings (e.g., comfort letters for closed-end Fund offerings, consents), and assistance in responding to SEC comment letters | up to $10,000 per Fund |
| Consultations by Fund management as to the accounting or disclosure treatment of transactions or events and/or the actual or potential impact of final or proposed rules, standards or interpretations by the SEC, FASB, or other regulatory or standard-setting bodies (Note: Under SEC rules, some consultations may be considered “audit-related services” rather than “audit services”) | up to $25,000 in the aggregate |
| Audit-Related Services | |
| Consultations by Fund management as to the accounting or disclosure treatment of transactions or events and /or the actual or potential impact of final or proposed rules, standards or interpretations by the SEC, FASB, or other regulatory or standard-setting bodies (Note: Under SEC rules, some consultations may be considered “audit services” rather than “audit-related services”) | up to $25,000 in the aggregate |
| Tax Services | |
| U.S. federal, state and local and international tax planning and advice (e.g., consulting on statutory, regulatory or administrative developments, evaluation of Funds’ tax compliance function, etc.) | up to $25,000 in the aggregate |
| U.S. federal, state and local tax compliance (e.g., excise distribution reviews, etc.) | up to $5,000 per Fund |
| Review of federal, state, local and international income, franchise and other tax returns | up to $5,000 per Fund |
Under the Pre-Approval Policy, the Audit Committee has also pre-approved the services set forth in the table below with respect to the registrant’s investment adviser and other entities controlling, controlled by or under common control with the investment adviser that provide ongoing services to the registrant (the “Control Affiliates”) up to the specified fee limit. This fee limit is based on aggregate fees to the investment adviser and its Control Affiliates.
| Service | Range of Fees |
| Non-Audit Services | |
| Services associated with periodic reports and other documents filed with the SEC and assistance in responding to SEC comment letters | up to $10,000 in the aggregate |
The Pre-Approval Policy requires the registrant’s independent auditors to report to the Audit Committee at each of its regular meetings regarding all services initiated since the last such report was rendered, including those services authorized by the Pre-Approval Policy.
(f) Not applicable.
(g) The aggregate non-audit fees billed by the registrant’s independent auditors for services rendered to the registrant and to its investment adviser and other service providers under common control with the adviser were $25,000 and $207,414 for the registrant’s fiscal years ended April 30, 2011 and April 30, 2010, respectively.
(h) In connection with its selection of the independent auditors, the registrant’s Audit Committee has considered the independent auditors’ provision of non-audit services to the registrant’s investment adviser and other service providers under common control with the adviser that were not required to be pre-approved pursuant to Rule 2-01(c)(7)(ii) of Regulation S-X. The Audit Committee has determined that the independent auditors’ provision of these services is compatible with maintaining the auditors’ independence.
Item 5. Audit Committee of Listed Registrants
Not applicable.
Item 6. Investments
(a) Included as part of report to shareholders filed under Item 1 of this Form N-CSR.
(b) Divestment of securities in accordance with Section 13(c) of the Investment Company Act of 1940.
Not applicable.
Item 7. Disclosure of Proxy Voting Policies and Procedures for Closed-End Management Investment Companies
Not applicable.
Item 8. Portfolio Managers of Closed-End Management Investment Companies
Not applicable.
Item 9. Purchases of Equity Securities by Closed-End Management Investment Company and Affiliated Purchasers
Not applicable.
Item 10. Submission of Matters to a Vote of Security Holders
Not applicable.
Item 11. Controls and Procedures
The registrant’s principal executive officer and principal financial officer have evaluated the registrant’s disclosure controls and procedures within 90 days of the filing of this report and have concluded that they are effective in providing reasonable assurance that the information required to be disclosed by the registrant in its reports or statements filed under the Securities Exchange Act of 1934 is recorded, processed, summarized and reported within the time periods specified in the rules and forms of the Securities and Exchange Commission.
There were no significant changes in the registrant’s internal control over financial reporting that occurred during the second fiscal quarter of the period covered by the report to stockholders included herein (i.e., the registrant’s fourth fiscal quarter) that have materially affected, or are reasonably likely to materially affect, the registrant’s internal control over financial reporting.
Item 12. Exhibits
(a) (1) Code of Ethics
Not applicable.
(2) Certifications of Principal Executive Officer and Principal Financial Officer pursuant to Rule 30a-2 under the Investment Company Act of 1940 are attached hereto as Exhibit 99.CERT.
(3) Written solicitations to purchase securities pursuant to Rule 23c-1 under the Securities Exchange Act of 1934.
Not applicable.
(b) Certifications pursuant to Section 906 of the Sarbanes-Oxley Act of 2002 are furnished herewith as Exhibit 99.906CERT.
SIGNATURES
Pursuant to the requirements of the Securities Exchange Act of 1934 and the Investment Company Act of 1940, the registrant has duly caused this report to be signed on its behalf, by the undersigned, thereunto duly authorized.
Name of Registrant: Voyageur Mutual Funds III
| Patrick P. Coyne |
| By: | Patrick P. Coyne |
| Title: | Chief Executive Officer |
| Date: | July 5, 2011 |
Pursuant to the requirements of the Securities Exchange Act of 1934 and the Investment Company Act of 1940, this report has been signed below by the following persons on behalf of the registrant and in the capacities and on the dates indicated.
| Patrick P. Coyne |
| By: | Patrick P. Coyne |
| Title: | Chief Executive Officer |
| Date: | July 5, 2011 |
| |
| |
| Richard Salus |
| By: | Richard Salus |
| Title: | Chief Financial Officer |
| Date: | July 5, 2011 |