UNITED STATES SECURITIES AND EXCHANGE COMMISSION
Washington, D.C. 20549
FORM N-CSR
CERTIFIED SHAREHOLDER REPORT OF REGISTERED MANAGEMENT
INVESTMENT COMPANIES
| Investment Company Act file number: | | 811-04547 |
| | | |
| Exact name of registrant as specified in charter: | | Voyageur Mutual Funds III |
| | | |
| Address of principal executive offices: | | 2005 Market Street |
| | | Philadelphia, PA 19103 |
| | |
| Name and address of agent for service: | | David F. Connor, Esq. |
| | | 2005 Market Street |
| | | Philadelphia, PA 19103 |
| | |
| Registrant’s telephone number, including area code: | | (800) 523-1918 |
| | |
| Date of fiscal year end: | | October 31 |
| | |
| Date of reporting period: | | October 31, 2013 |
Item 1. Reports to Stockholders

Annual report Delaware Large Cap Core Fund October 31, 2013 U.S. core equity mutual fund |
Carefully consider the Fund’s investment objectives, risk factors, charges, and expenses before investing. This and other information can be found in the Fund’s prospectus and its summary prospectus, which may be obtained by visiting delawareinvestments.com or calling 800 523-1918. Investors should read the prospectus and the summary prospectus carefully before investing. |
You can obtain shareholder reports and prospectuses online instead of in the mail.
Visit delawareinvestments.com/edelivery. |
Experience Delaware Investments
Delaware Investments is committed to the pursuit of consistently superior asset management and unparalleled client service. We believe in our investment processes, which seek to deliver consistent results, and in convenient services that help add value for our clients.
If you are interested in learning more about creating an investment plan, contact your financial advisor.
You can learn more about Delaware Investments or obtain a prospectus for Delaware Large Cap Core Fund at delawareinvestments.com.
Manage your investments online
- 24-hour access to your account information
- Obtain share prices
- Check your account balance and recent transactions
- Request statements or literature
- Make purchases and redemptions
Delaware Management Holdings, Inc. and its subsidiaries (collectively known by the marketing name of Delaware Investments) are wholly owned subsidiaries of Macquarie Group Limited, a global provider of banking, financial, advisory, investment and funds management services.
Investments in Delaware Large Cap Core Fund are not and will not be deposits with or liabilities of Macquarie Bank Limited ABN 46 008 583 542 and its holding companies, including their subsidiaries or related companies (Macquarie Group), and are subject to investment risk, including possible delays in repayment and loss of income and capital invested. No Macquarie Group company guarantees or will guarantee the performance of the Fund, the repayment of capital from the Fund, or any particular rate of return.
| Table of contents | |
| Portfolio management review | 1 |
| Performance summary | 4 |
| Disclosure of Fund expenses | 8 |
| Security type/sector allocation and | |
| top 10 equity holdings | 10 |
| Schedule of investments | 12 |
| Statement of assets and liabilities | 15 |
| Statements of operations | 16 |
| Statements of changes in net assets | 17 |
| Financial highlights | 18 |
| Notes to financial statements | 22 |
| Report of independent registered | |
| public accounting firm | 31 |
| Other Fund information | 32 |
| Board of trustees/directors and | |
| officers addendum | 36 |
| About the organization | 44 |
Unless otherwise noted, views expressed herein are current as of Oct. 31, 2013, and subject to change.
Funds are not FDIC insured and are not guaranteed. It is possible to lose the principal amount invested.
Mutual fund advisory services provided by Delaware Management Company, a series of Delaware Management Business Trust, which is a registered investment advisor. Delaware Investments, a member of Macquarie Group, refers to Delaware Management Holdings, Inc. and its subsidiaries, including the Fund’s distributor, Delaware Distributors, L.P. Macquarie Group refers to Macquarie Group Limited and its subsidiaries and affiliates worldwide.
© 2013 Delaware Management Holdings, Inc.
All third-party marks cited are the property of their respective owners.
| Portfolio management review |
| Delaware Large Cap Core Fund | November 12, 2013 |
| Performance preview (for the six-month period from May 1, 2013, through |
| October 31, 2013) | | | | |
| Delaware Large Cap Core Fund (Class A shares) | six-month return | | +12.33 | % |
| S&P 500® Index (benchmark) | six-month return | | +11.14 | % |
Past performance does not guarantee future results.
For complete, annualized performance for Delaware Large Cap Core Fund, please see the table on page 4.
The performance of Class A shares excludes the applicable sales charge and reflects the reinvestment of all distributions. Index performance returns do not reflect any management fees, transaction costs, or expenses. Indices are unmanaged and one cannot invest directly in an index. |
On May 23, 2013, the Board approved changing the Fund’s fiscal year from April 30 to October 31. This change will be effective for the period ended Oct. 31, 2013. Therefore, the managers’ commentary below applies to the partial year between May 1, 2013 and Oct. 31, 2013. In future editions of the Fund’s annual report, the managers’ commentary will report on the Fund’s entire fiscal year.
During the six-month period ended Oct. 31, 2013, the market pushed upward on the heels of generally positive economic data. The only significant pullback in stock prices occurred in late spring and early summer 2013, when Fed Chairman Ben Bernanke intimated that the central bank’s aggressive asset purchase program could be scaled back, or “tapered,” by the end of the year and concluded altogether by mid-2014. However, after bond yields greatly increased, the rally in equities resumed on the premise that any Fed taper would come later rather than sooner. That bullish assumption was proven correct when policy makers decided in September, and reaffirmed in October, to maintain the pace of bond-buying at $85 billion per month.
During the first two weeks of October, the U.S. federal government entered a shutdown after Congress failed to enact legislation to appropriate funds for fiscal 2014.
Regular government operations resumed on October 17 after an interim appropriations bill was signed into law. As a result of the shutdown, a number of key economic indicators were not calculated or published in October 2013, but it didn’t seem to hamper the positive momentum in the market.
U.S. economic growth, measured as the change in gross domestic product (GDP), has remained in the 2-3% range, which is healthy, in our view, although there is room to improve. The Fed’s periodic “beige book,” a summary of economic conditions, reported that “national economic activity continued to expand at a modest to moderate pace.”
Within the Fund
For the six-month period between May 1, 2013 and Oct. 31, 2013, Delaware Large Cap Core Fund (Class A shares with all distributions reinvested) returned +12.33% at net asset value and +5.89% at maximum offer price. In comparison, the Fund’s benchmark, the S&P 500 Index, returned +11.14% during the same period. For complete, annualized performance of Delaware Large Cap Core Fund, please see the table on page 4.
The positive effects of stock selection in the consumer staples and healthcare sectors contributed to the Fund’s performance versus
1
Portfolio management review
Delaware Large Cap Core Fund
the index. Certain sector allocations likewise had a positive effect; for instance, the Fund maintained a zero weight to utilities, which was one of the weakest sectors in the index — this contributed to the Fund’s relative return during the fiscal period. On the other hand, stock selection in the capital goods, technology, and consumer discretionary sectors detracted the most from the Fund’s performance against the index.
In the consumer discretionary sector, Target was the Fund’s weakest performer during the period. Shares increased steadily during the first months of the period until the company reported second-quarter earnings, which reflected disciplined cost management and effective execution of strategy, offset by lower-than-expected comparable-store sales. The company opened more than 40 new stores in Canada and is in the process of learning from the new operations, and refining operations where necessary. Target increased its dividend and continued to use excess cash to buy back stock. We continue to hold the stock in the Fund because it has a competitive online presence that we believe should help revenue, in addition to increasing the company’s dividend and to buying back stock.
Within the technology sector, Accenture detracted the most from Fund returns. In June 2013, the stock sold off after the company reported fiscal third quarter earnings. Net revenues were lower in two major regions: Europe, Middle East, and Africa (known collectively as EMEA) and Asia Pacific. In addition, the company lowered its earnings outlook for the full year. The stock recovered slightly in the months between the third- and fourth- quarter earnings announcements. The company’s board of directors approved an increase in its dividend and approved an additional share repurchase authority. We continue to own the stock — fiscal fourth quarter results were reported in September and set a record for annual revenues, earnings per share, operating margin, and new bookings, reasons that provide us continued conviction in the stock.
In capital goods, Deere detracted from the Fund’s performance. Global financial pressures as well as adverse weather patterns increased caution for its outlook. Management indicated that sales’ forecasts were up modestly, but believes the year-over-year comparisons will be difficult because commodity prices have fallen. Despite the commodity pricing difficulties, we are a long-term believer in the growth of the global farming business going forward and therefore continue to own the stock.
In consumer staples, Starbucks was a leading contributor to the Fund’s relative performance during the fiscal period. The stock continued to appreciate, posting solid growth both in the United States and globally with respect to comparable-store sales. Furthermore, the continued rollout of bakery products has provided the company with healthy diversification benefits and an increase in consumer ticket size.
The healthcare sector also contributed to Fund performance during the period. The top two contributors in this sector were Celgene and Gilead Sciences. Celgene advanced on strong financial results and promising revenue growth projections based on healthy sales of existing drugs and a strong pipeline of data from trials. Meanwhile, shares of Gilead Sciences rose steadily as the company posted increased revenue and product sales. The company
2
continues to expand into new markets by gaining regulatory approvals in Europe and Japan. Gilead also has a healthy pipeline of drugs in Phase 3 clinical trials.
Healthcare was the Fund’s largest sector overweight compared to the index at the close of the fiscal period. Most of the Fund’s exposure was in biotechnology and pharmaceuticals. The Fund had no exposure to two high-dividend-yielding sectors — real estate investment trusts (REITs) and utilities — when the six-month period began in May 2013. Our decision to avoid these groups stemmed from a belief that they had become overvalued following a period of historically low interest rates in which investors pursued high yielding equities. After the Fed’s comments in May 2013, these sectors took a hard hit, and we took advantage of this downturn by adding to REITs, but not utilities. The Fund is underweight financials; however, it is exposed to what we believe are the stronger areas of the sector: insurance, banks, and specialized financial institutions such as those that focus on asset management or trading.
As we enter the Fund’s new fiscal year, we believe our research-driven, stock-by-stock investment process should help us identify companies that have the potential to perform competitively for the Fund’s shareholders, even under challenging economic conditions.
3
| Performance summary | |
| Delaware Large Cap Core Fund | October 31, 2013 |
The performance data quoted represent past performance; past performance does not guarantee future results. Investment return and principal value will fluctuate so your shares, when redeemed, may be worth more or less than their original cost. Please obtain the performance data current for the most recent month end by calling 800 523-1918 or visiting our website at delawareinvestments.com/performance. Current performance may be lower or higher than the performance data quoted.
| Fund and benchmark performance1,2 | | Average annual total returns through October 31, 2013 |
| | 6 months | | 1 year | | 3 years | | 5 years | | Lifetime |
| Class A (Est. Aug. 31, 2006) | | | | | | | | | | | | | | | |
| Excluding sales charge | | +12.33 | % | | +25.52 | % | | +16.51 | % | | +13.74 | % | | +5.73 | % |
| Including sales charge | | +5.89 | % | | +18.32 | % | | +14.24 | % | | +12.42 | % | | +4.86 | % |
| Institutional Class (Est. Aug. 31, 2006) | | | | | | | | | | | | | | | |
| Excluding sales charge | | +12.33 | % | | +25.52 | % | | +16.51 | % | | +13.74 | % | | +5.73 | % |
| Including sales charge | | +12.33 | % | | +25.52 | % | | +16.51 | % | | +13.74 | % | | +5.73 | % |
| S&P 500 Index | | +11.14 | % | | +27.18 | % | | +16.56 | % | | +15.17 | % | | +6.50 | % |
Class C and R shares had not commenced operations as of Oct. 31, 2013.
1 Returns reflect the reinvestment of all distributions and are presented both with and without the applicable sales charges described below. Returns do not reflect the deduction of taxes the shareholder would pay on Fund distributions or redemptions of Fund shares.
Expense limitations were in effect for certain classes during some or all of the periods shown in the “Fund performance” chart. Expenses for each class are listed on the “Fund expense ratios” table on page 5. Performance would have been lower had expense limitations not been in effect.
Class A shares are sold with a maximum front-end sales charge of 5.75%, and have an annual distribution and service fee of 0.25% of average daily net assets, but such fees are currently subject to a voluntary waiver, which may be terminated or modified at any time. Prior to Oct. 1, 2013, Class A shares had an annual distribution and service fee of 0.30% of average daily net assets. This fee was contractually limited to 0.25% during the period from May 1, 2013 until Oct. 1, 2013. Performance for Class A shares, excluding sales charges, assumes that no front-end sales charge applied.
Class C and R shares are available only for certain retirement plan products. They are sold without a sales charge and have an annual distribution and service fee of up to 1.00% and 0.50%, respectively, of average daily net assets, but such fees are currently subject to a voluntary waiver, which may be terminated or modified at any time. Prior to Oct. 1, 2013, Class R shares had an annual distribution and service fee of 0.60%. This fee was contractually limited to 0.50% during the period from May 1, 2013 until Oct. 1, 2013. No Class C or R shares were available during the periods shown.
Institutional Class shares are available without sales or asset-based distribution charges only to certain eligible institutional accounts.
The “Fund performance” table and the “Performance of a $10,000 investment” graph do not reflect the deduction of taxes the shareholder would pay on Fund distributions or redemptions of Fund shares.
4
2 The Fund’s expense ratios, as described in the most recent prospectus, are disclosed in the following “Fund expense ratios” table. Delaware Management Company has agreed to reimburse certain expenses and/or waive certain fees in order to prevent total fund operating expenses (excluding any 12b-1 plan, taxes, interest, inverse floater program expenses, short sale and dividend interest expenses, brokerage fees, certain insurance costs, acquired fund fees and expenses, and nonroutine expenses or costs, including, but not limited to, those relating to reorganizations, litigation, conducting shareholder meetings, and liquidations (collectively nonroutine expenses)) from exceeding 0.95% of the Fund’s average daily net assets from May 1, 2013, until the waiver cap is discontinued. In addition, the Fund’s distributor has voluntarily agreed to waive all 12b-1 fees. Please see the most recent prospectus and any applicable supplement(s) for additional information on these fee waivers and/or reimbursements.
| Fund expense ratios | | Class A | | Class C | | Class R | | Institutional Class |
| Total annual operating expenses | | 2.32% | | 3.07% | | 2.57% | | 2.07% |
| (without fee waivers) | | | | | | | | |
| Net expenses | | 0.95% | | 0.95% | | 0.95% | | 0.95% |
| (including fee waivers, if any) | | | | | | | | |
| Type of waiver | | Voluntary | | Voluntary | | Voluntary | | Voluntary |
5
Performance summary
Delaware Large Cap Core Fund
Performance of a $10,000 investment1
Average annual total returns from Aug. 31, 2006 (Fund’s inception) through Oct. 31, 2013
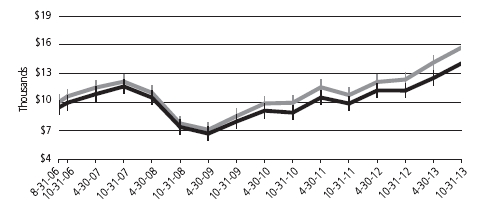
| For period beginning Aug. 31, 2006, through Oct. 31, 2013 | | Starting value | | Ending value |
| | S&P 500 Index | | | $10,000 | | | | $15,711 | |
| | Delaware Large Cap Core Fund — Class A shares | | | $9,425 | | | | $14,055 | |
1 The “Performance of a $10,000 investment” graph assumes $10,000 invested in Class A shares of the Fund on Aug. 31, 2006, and includes the effect of a 5.75% front-end sales charge and the reinvestment of all distributions. The graph does not reflect the deduction of taxes the shareholders would pay on Fund distributions or redemptions of Fund shares. Expense limitations were in effect for some or all of the periods shown. Performance would have been lower had expense limitations not been in effect. Expenses are listed in the “Fund expense ratios” table on page 5. Please note additional details on pages 4 through 6.
The chart also assumes $10,000 invested in the S&P 500 Index as of Aug. 31, 2006. The S&P 500 Index measures the performance of 500 mostly large-cap stocks weighted by market value, and is often used to represent performance of the U.S. stock market.
Index performance returns do not reflect any management fees, transaction costs, or expenses. Indices are unmanaged and one cannot invest directly in an index. Past performance is not a guarantee of future results.
Performance of other Fund classes will vary due to different charges and expenses.
| | Nasdaq symbols | | CUSIPs | |
| Class A | | | DDCAX | | | 246118582 | |
| Institutional Class | | | DDCIX | | | 246118558 | |
6
Disclosure of Fund expenses
For the six-month period from May 1, 2013 to October 31, 2013 (Unaudited)
As a shareholder of the Fund, you incur two types of costs: (1) transaction costs, including sales charges (loads) on purchase payments, reinvested dividends, or other distributions; redemption fees; and exchange fees; and (2) ongoing costs, including management fees; distribution and/or service (12b-1) fees; and other Fund expenses. This example is intended to help you understand your ongoing costs (in dollars) of investing in the Fund and to compare these costs with the ongoing costs of investing in other mutual funds.
The example is based on an investment of $1,000 invested at the beginning of the period and held for the entire six-month period from May 1, 2013 to Oct. 31, 2013.
Actual expenses
The first section of the table shown, “Actual Fund return,” provides information about actual account values and actual expenses. You may use the information in this section of the table, together with the amount you invested, to estimate the expenses that you paid over the period. Simply divide your account value by $1,000 (for example, an $8,600 account value divided by $1,000 = 8.6), then multiply the result by the number in the first section under the heading entitled “Expenses Paid During Period” to estimate the expenses you paid on your account during this period.
Hypothetical example for comparison purposes
The second section of the table shown, “Hypothetical 5% return,” provides information about hypothetical account values and hypothetical expenses based on the Fund’s actual expense ratio and an assumed rate of return of 5% per year before expenses, which is not the Fund’s actual return. The hypothetical account values and expenses may not be used to estimate the actual ending account balance or expenses you paid for the period. You may use this information to compare the ongoing costs of investing in the Fund and other funds. To do so, compare this 5% hypothetical example with the 5% hypothetical examples that appear in the shareholder reports of the other funds.
Please note that the expenses shown in the table are meant to highlight your ongoing costs only and do not reflect any transactional costs, such as sales charges (loads), redemption fees, or exchange fees. Therefore, the second section of the table is useful in comparing ongoing costs only, and will not help you determine the relative total costs of owning different funds. In addition, if these transactional costs were included, your costs would have been higher. The Fund’s expenses shown in the table reflect fee waivers in effect. The expenses shown in the table assume reinvestment of all dividends and distributions.
8
Delaware Large Cap Core Fund
Expense analysis of an investment of $1,000
| | Beginning | | Ending | | | | | | | Expenses |
| | Account Value | | Account Value | | Annualized | | Paid During Period |
| | 5/1/13 | | 10/31/13 | | Expense Ratio | | 5/1/13 to 10/31/13* |
| Actual Fund return† | | | | | | | | | | | | | | | | | | | | |
| Class A | | | $ | 1,000.00 | | | | $ | 1,123.30 | | | | 0.95 | % | | | | $ | 5.08 | |
| Institutional Class | | | | 1,000.00 | | | | | 1,123.30 | | | | 0.95 | % | | | | | 5.08 | |
| Hypothetical 5% return (5% return before expenses) | | | | | | | | | | | |
| Class A | | | $ | 1,000.00 | | | | $ | 1,020.42 | | | | 0.95 | % | | | | $ | 4.84 | |
| Institutional Class | | | | 1,000.00 | | | | | 1,020.42 | | | | 0.95 | % | | | | | 4.84 | |
*“Expenses Paid During Period” are equal to the Fund’s annualized expense ratio, multiplied by the average account value over the period, multiplied by 184/365 (to reflect the one-half year period).
†Because actual returns reflect only the most recent six-month period, the returns shown may differ significantly from fiscal year returns.
9
Security type/sector allocation and
top 10 equity holdings |
| Delaware Large Cap Core Fund | As of October 31, 2013 (Unaudited) |
Sector designations may be different than the sector designations presented in other Fund materials. The sector designations may represent the investment manager’s internal sector classifications, which may result in the sector designations for one fund being different than another fund’s sector designations.
| Security type/sector | Percentage of net assets |
| Common Stock | 99.73 | % |
| Basic Materials | 4.98 | % |
| Business Services | 1.14 | % |
| Capital Goods | 9.69 | % |
| Communication Services | 3.17 | % |
| Consumer Discretionary | 6.09 | % |
| Consumer Services | 1.02 | % |
| Consumer Staples | 8.48 | % |
| Credit Cyclical | 1.41 | % |
| Energy | 10.72 | % |
| Financials | 13.59 | % |
| Healthcare | 15.29 | % |
| Media | 4.25 | % |
| Real Estate | 0.65 | % |
| Technology | 17.83 | % |
| Transportation | 1.42 | % |
| Short-Term Investments | 0.78 | % |
| Total Value of Securities | 100.51 | % |
| Liabilities Net of Receivables and Other Assets | (0.51 | %) |
| Total Net Assets | 100.00 | % |
10
Holdings are for informational purposes only and are subject to change at any time. They are not a recommendation to buy, sell, or hold any security.
| Top 10 equity holdings | Percentage of net assets |
| United Technologies | 3.53 | % |
| Pfizer | 3.12 | % |
| Apple | 3.06 | % |
| Chevron | 3.00 | % |
| Comcast Special Class A | 2.88 | % |
| Schlumberger | 2.75 | % |
| Procter & Gamble | 2.34 | % |
| QUALCOMM | 2.34 | % |
| JPMorgan Chase | 2.30 | % |
| Honeywell International | 2.27 | % |
11
| Schedule of investments | |
| Delaware Large Cap Core Fund | October 31, 2013 |
| | | Number of shares | | Value |
| Common Stock – 99.73% | | | | |
| Basic Materials – 4.98% | | | | |
| Celanese Series A | 300 | | $ | 16,803 |
| Eastman Chemical | 430 | | | 33,880 |
| Huntsman | 1,140 | | | 26,471 |
| International Paper | 420 | | | 18,736 |
| MeadWestvaco | 900 | | | 31,365 |
| | | | | 127,255 |
| Business Services – 1.14% | | | | |
| Nielsen Holdings | 740 | | | 29,186 |
| | | | | 29,186 |
| Capital Goods – 9.69% | | | | |
| Deere | 340 | | | 27,826 |
| Eaton | 460 | | | 32,458 |
| General Electric | 1,500 | | | 39,210 |
| Honeywell International | 670 | | | 58,109 |
| United Technologies | 850 | | | 90,312 |
| | | | | 247,915 |
| Communication Services – 3.17% | | | | |
| American Tower | 430 | | | 34,121 |
| AT&T | 1,300 | | | 47,060 |
| | | | | 81,181 |
| Consumer Discretionary – 6.09% | | | | |
| DSW Class A | 270 | | | 23,671 |
| Macy’s | 1,160 | | | 53,487 |
| Nordstrom | 680 | | | 41,120 |
| Target | 580 | | | 37,578 |
| | | | | 155,856 |
| Consumer Services – 1.02% | | | | |
| McDonald’s | 270 | | | 26,060 |
| | | | | 26,060 |
| Consumer Staples – 8.48% | | | | |
| CVS Caremark | 760 | | | 47,318 |
| General Mills | 590 | | | 29,748 |
| Kimberly-Clark | 260 | | | 28,080 |
| Procter & Gamble | 740 | | | 59,754 |
| Starbucks | 640 | | | 51,872 |
| | | | | 216,772 |
12
| | | Number of shares | | Value |
| Common Stock (continued) | | | | |
| Credit Cyclical – 1.41% | | | | |
| Ford Motor | 2,110 | | $ | 36,102 |
| | | | | 36,102 |
| Energy – 10.72% | | | | |
| Chevron | 640 | | | 76,774 |
| EOG Resources | 220 | | | 39,248 |
| Exxon Mobil | 450 | | | 40,329 |
| Marathon Oil | 1,350 | | | 47,601 |
| Schlumberger | 750 | | | 70,290 |
| | | | | 274,242 |
| Financials – 13.59% | | | | |
| AFLAC | 870 | | | 56,533 |
| BlackRock | 150 | | | 45,122 |
| | Capital One Financial | 590 | | | 40,515 |
| Citigroup | 740 | | | 36,097 |
| † | IntercontinentalExchange | 160 | | | 30,837 |
| JPMorgan Chase | 1,140 | | | 58,755 |
| Prudential Financial | 380 | | | 30,928 |
| Wells Fargo | 1,140 | | | 48,667 |
| | | | | 347,454 |
| Healthcare – 15.29% | | | | |
| † | Celgene | 390 | | | 57,911 |
| † | Express Scripts Holding | 650 | | | 40,638 |
| † | Gilead Sciences | 800 | | | 56,792 |
| Merck | 1,080 | | | 48,697 |
| Pfizer | 2,597 | | | 79,676 |
| Thermo Fisher Scientific | 460 | | | 44,979 |
| UnitedHealth Group | 720 | | | 49,147 |
| Zoetis | 420 | | | 13,297 |
| | | | | 391,137 |
| Media – 4.25% | | | | |
| Comcast Special Class A | 1,590 | | | 73,617 |
| Viacom Class B | 420 | | | 34,982 |
| | | | | 108,599 |
| Real Estate – 0.65% | | | | |
| National Retail Properties | 480 | | | 16,512 |
| | | | | 16,512 |
13
Schedule of investments
Delaware Large Cap Core Fund
| | | Number of shares | | | Value |
| Common Stock (continued) | | | | | |
| Technology – 17.83% | | | | | |
| Accenture Class A | | 490 | | $ | 36,015 |
| Apple | | 150 | | | 78,352 |
| Avago Technologies | | 430 | | | 19,535 |
| † | Citrix Systems | | 290 | | | 16,466 |
| EMC | | 1,810 | | | 43,567 |
| † | Fortinet | | 1,880 | | | 37,807 |
| † | Google Class A | | 30 | | | 30,917 |
| Intel | | 740 | | | 18,078 |
| Microsoft | | 1,600 | | | 56,560 |
| QUALCOMM | | 860 | | | 59,744 |
| † | Salesforce.com | | 500 | | | 26,680 |
| Texas Instruments | | 770 | | | 32,402 |
| | | | | | 456,123 |
| Transportation – 1.42% | | | | | |
| Union Pacific | | 240 | | | 36,336 |
| | | | | | 36,336 |
| Total Common Stock (cost $1,767,376) | | | | | 2,550,730 |
| |
| | Principal amount | | | |
| Short-Term Investments – 0.78% | | | | | |
| ≠Discount Note – 0.22% | | | | | |
| Federal Home Loan Bank 0.065% 11/6/13 | $ | 5,642 | | | 5,642 |
| | | | | | 5,642 |
| ≠U.S. Treasury Obligation – 0.56% | | | | | |
| U.S. Treasury Bill 0.053% 11/14/13 | | 14,440 | | | 14,440 |
| | | | | | 14,440 |
| Total Short-Term Investments (cost $20,081) | | | | | 20,082 |
| | |
| Total Value of Securities – 100.51% | | | | | |
| (cost $1,787,457) | | | | $ | 2,570,812 |
| |
†Non income producing security. |
≠The rate shown is the effective yield at the time of purchase. |
See accompanying notes, which are an integral part of the financial statements.
14
| Statement of assets and liabilities |
| Delaware Large Cap Core Fund | | | October 31, 2013 |
| Assets: | | | |
| | Investments, at value1 | $ | 2,550,730 | |
| Short-term investments, at value2 | | 20,082 | |
| Dividends receivable | | 2,973 | |
| Receivable from investment manager | | 15,231 | |
| Total assets | | 2,589,016 | |
| |
| Liabilities: | | | |
| Cash overdraft | | 6,551 | |
| Other affiliates payable | | 76 | |
| Trustees’ fees payable | | 7 | |
| Other accrued expenses | | 24,678 | |
| Total liabilities | | 31,312 | |
| |
| Total Net Assets | $ | 2,557,704 | |
| |
| Net Assets Consist of: | | | |
| Paid-in capital | $ | 1,979,045 | |
| | Undistributed net investment income | | 13,371 | |
| Accumulated net realized loss on investments | | (218,067 | ) |
| Net unrealized appreciation of investments | | 783,355 | |
| Total Net Assets | $ | 2,557,704 | |
| |
| 1Investments, at cost | $ | 1,767,376 | |
| 2Short-term investments, at cost | | 20,081 | |
| |
| Net Asset Value | | | |
| |
| Class A | | | |
| Net assets | $ | 18,198 | |
| Shares of beneficial interest outstanding, unlimited authorization, no par | | 1,593 | |
| Net asset value per share | $ | 11.43 | |
| Sales charge | | 5.75% | |
| Offering price per share, equal to net asset value per share/(1 - sales charge) | $ | 12.13 | |
| |
| Institutional Class | | | |
| Net assets | $ | 2,539,506 | |
| Shares of beneficial interest outstanding, unlimited authorization, no par | | 222,230 | |
| Net asset value per share | $ | 11.43 | |
See accompanying notes, which are an integral part of the financial statements.
15
Statements of operations
Delaware Large Cap Core Fund
| | 5/1/13 to | | Year Ended |
| | 10/31/13* | | 4/30/13 |
| Investment Income: | | | | | | | |
| | Dividends | $ | 25,216 | | | $ | 40,984 | |
| Interest | | 20 | | | | 104 | |
| Foreign tax withheld | | (22 | ) | | | — | |
| | | 25,214 | | | | 41,088 | |
| Expenses: | | | | | | | |
| Audit and tax | | 20,066 | | | | 11,060 | |
| Management fees | | 7,951 | | | | 13,441 | |
| Reports and statements to shareholders | | 7,892 | | | | 8,172 | |
| Registration fees | | 4,112 | | | | 4,060 | |
| Dues and services | | 1,129 | | | | 2,255 | |
| Pricing fees | | 784 | | | | 1,481 | |
| | Dividend disbursing and transfer agent fees and expenses | | 511 | | | | 851 | |
| Accounting and administration expenses | | 474 | | | | 803 | |
| Legal fees | | 173 | | | | 316 | |
| Custodian fees | | 155 | | | | 147 | |
| Trustees’ fees | | 58 | | | | 92 | |
| Insurance | | 36 | | | | 63 | |
| Distribution expenses – Class A | | 22 | | | | 39 | |
| Consulting fees | | 17 | | | | 40 | |
| Trustees’ expenses | | 7 | | | | 12 | |
| | | 43,387 | | | | 42,832 | |
| Less fees waived | | (31,749 | ) | | | (23,146 | ) |
| Less waived distribution expenses – Class A | | (22 | ) | | | (39 | ) |
| Less expense paid indirectly | | — | | | | (1 | ) |
| Total operating expenses | | 11,616 | | | | 19,646 | |
| Net Investment Income | | 13,598 | | | | 21,442 | |
| |
| Net Realized and Unrealized Gain: | | | | | | | |
| Net realized gain on investments | | 61,619 | | | | 56,999 | |
| Net change in unrealized appreciation (depreciation) of investments | | 204,696 | | | | 159,708 | |
| Net Realized and Unrealized Gain | | 266,315 | | | | 216,707 | |
| |
| Net Increase in Net Assets Resulting from Operations | $ | 279,913 | | | $ | 238,149 | |
*During the period ended Oct. 31, 2013, the Fund changed its fiscal year end from April to October.
See accompanying notes, which are an integral part of the financial statements.
16
Statements of changes in net assets
Delaware Large Cap Core Fund
| | 5/1/13 | | | | | | | | |
| | to | | Year Ended |
| | | 10/31/13* | | 4/30/13 | | 4/30/12 |
| Increase in Net Assets from Operations: | | | | | | | | | | | |
| Net investment income | $ | 13,598 | | | $ | 21,442 | | | $ | 16,987 | |
| Net realized gain | | 61,619 | | | | 56,999 | | | | 74,759 | |
| Net change in unrealized | | | | | | | | | | | |
| appreciation (depreciation) | | 204,696 | | | | 159,708 | | | | 43,491 | |
| Net increase in net assets resulting | | | | | | | | | | | |
| from operations | | 279,913 | | | | 238,149 | | | | 135,237 | |
| |
| Dividends and Distributions to | | | | | | | | | | | |
| Shareholders from: | | | | | | | | | | | |
| Net investment income: | | | | | | | | | | | |
| Class A | | (40 | ) | | | (136 | ) | | | (113 | ) |
| | Institutional Class | | (5,542 | ) | | | (18,911 | ) | | | (15,686 | ) |
| | | (5,582 | ) | | | (19,047 | ) | | | (15,799 | ) |
| Capital Share Transactions: | | | | | | | | | | | |
| Net asset value of shares issued upon | | | | | | | | | | | |
| reinvestment of dividends and distributions: | | | | | | | | | | | |
| Class A | | 40 | | | | 136 | | | | 113 | |
| Institutional Class | | 5,542 | | | | 18,911 | | | | 15,686 | |
| | | 5,582 | | | | 19,047 | | | | 15,799 | |
| |
| Cost of shares redeemed: | | | | | | | | | | | |
| Class A | | — | | | | — | | | | (502 | ) |
| | | — | | | | — | | | | (502 | ) |
| Increase in net assets derived from | | | | | | | | | | | |
| capital share transactions | | 5,582 | | | | 19,047 | | | | 15,297 | |
| Net Increase in Net Assets | | 279,913 | | | | 238,149 | | | | 134,735 | |
| |
| Net Assets: | | | | | | | | | | | |
| Beginning of period | | 2,277,791 | | | | 2,039,642 | | | | 1,904,907 | |
| End of period (including undistributed net | | | | | | | | | | | |
| investment income of $13,371, $5,355 | | | | | | | | | | | |
| and $2,960, respectively) | $ | 2,557,704 | | | $ | 2,277,791 | | | $ | 2,039,642 | |
*During the period ended Oct. 31, 2013, the Fund changed its fiscal year end from April to October.
See accompanying notes, which are an integral part of the financial statements.
17
Financial highlights
Delaware Large Cap Core Fund Class A
Selected data for each share of the Fund outstanding throughout each period were as follows:
| Net asset value, beginning of period |
| |
| Income (loss) from investment operations: |
| Net investment income2 |
| Net realized and unrealized gain (loss) |
| Total from investment operations |
| |
| Less dividends and distributions from: |
| Net investment income |
| Total dividends and distributions |
| |
| Net asset value, end of period |
| |
| Total return3 |
| |
| Ratios and supplemental data: |
| Net assets, end of period (000 omitted) |
| Ratio of expenses to average net assets |
| Ratio of expenses to average net assets |
| prior to fees waived |
| Ratio of net investment income to average net assets |
| Ratio of net investment income (loss) to average net assets |
| prior to fees waived |
| Portfolio turnover |
1 During the period ended Oct. 31, 2013, the Fund changed its fiscal year end from April to October. Ratios have been annualized and portfolio turnover and total return have not been annualized. |
2 The average shares outstanding method has been applied for per share information. |
3 Total investment return is based on the change in net asset value of a share during the period and assumes reinvestment of dividends and distributions at net asset value and does not reflect the impact of a sales charge. Total investment return during all of the periods shown reflects waivers by the manager and distributor. Performance would have been lower had the waivers not been in effect. |
See accompanying notes, which are an integral part of the financial statements.
18
| 5/1/13 | | | | | | | | | | | | | | | | |
| to | | | | | | | | | Year Ended | | | | | | | |
| 10/31/131 | | | 4/30/13 | | | 4/30/12 | | | 4/30/11 | | | 4/30/10 | | | 4/30/09 | |
| | $10.200 | | | | $ 9.220 | | | $ 8.690 | | | $ 7.590 | | | $ 5.630 | | | $ 8.930 | |
| | | |
| | | |
| | 0.061 | | | | 0.097 | | | 0.077 | | | 0.052 | | | 0.038 | | | 0.081 | |
| | 1.194 | | | | 0.969 | | | 0.525 | | | 1.092 | | | 1.978 | | | (3.293 | ) |
| | 1.255 | | | | 1.066 | | | 0.602 | | | 1.144 | | | 2.016 | | | (3.212 | ) |
| | | |
| | | |
| | (0.025 | ) | | | (0.086 | ) | | (0.072 | ) | | (0.044 | ) | | (0.056 | ) | | (0.088 | ) |
| | (0.025 | ) | | | (0.086 | ) | | (0.072 | ) | | (0.044 | ) | | (0.056 | ) | | (0.088 | ) |
| | | |
| | $11.430 | | | | $10.200 | | | $ 9.220 | | | $ 8.690 | | | $ 7.590 | | | $ 5.630 | |
| | | |
| | 12.33% | | | | 11.68% | | | 7.04% | | | 15.12% | | | 35.93% | | | (36.04% | ) |
| | | |
| | | |
| | $18 | | | | $16 | | | $15 | | | $14 | | | $31 | | | $10 | |
| | 0.95% | | | | 0.95% | | | 0.95% | | | 0.95% | | | 0.95% | | | 0.95% | |
| | | |
| | 3.80% | | | | 2.32% | | | 2.93% | | | 3.60% | | | 3.05% | | | 1.87% | |
| | 1.11% | | | | 1.04% | | | 0.92% | | | 0.69% | | | 0.56% | | | 1.20% | |
| | | |
| | (1.74% | ) | | | (0.33% | ) | | (1.06% | ) | | (1.96% | ) | | (1.54% | ) | | 0.28% | |
| | 9% | | | | 21% | | | 41% | | | 46% | | | 65% | | | 38% | |
19
Financial highlights
Delaware Large Cap Core Fund Institutional Class
Selected data for each share of the Fund outstanding throughout each period were as follows:
| Net asset value, beginning of period |
| |
| Income (loss) from investment operations: |
| Net investment income2 |
| Net realized and unrealized gain (loss) |
| Total from investment operations |
| |
| Less dividends and distributions from: |
| Net investment income |
| Total dividends and distributions |
| |
| Net asset value, end of period |
| |
| Total return3 |
| |
| Ratios and supplemental data: |
| Net assets, end of period (000 omitted) |
| Ratio of expenses to average net assets |
| Ratio of expenses to average net assets |
| prior to fees waived |
| Ratio of net investment income to average net assets |
| Ratio of net investment income (loss) to average net assets |
| prior to fees waived |
| Portfolio turnover |
1 During the period ended Oct. 31, 2013, the Fund changed its fiscal year end from April to October. Ratios have been annualized and portfolio turnover and total return have not been annualized. |
2 The average shares outstanding method has been applied for per share information. |
3 Total investment return is based on the change in net asset value of a share during the period and assumes reinvestment of dividends and distributions at net asset value. Total investment return during all of the periods shown reflects a waiver by the manager. Performance would have been lower had the waiver not been in effect. |
See accompanying notes, which are an integral part of the financial statements.
20
| | 5/1/13 | | | | | | | | | | | | | | | | | |
| | to | | | Year Ended |
| | 10/31/131 | | | | 4/30/13 | | | 4/30/12 | | | 4/30/11 | | | 4/30/10 | | | 4/30/09 | |
| | $10.200 | | | | $ 9.220 | | | $ 8.690 | | | $ 7.600 | | | $ 5.630 | | | $ 8.930 | |
| | | |
| | | |
| | 0.061 | | | | 0.097 | | | 0.077 | | | 0.052 | | | 0.038 | | | 0.081 | |
| | 1.194 | | | | 0.969 | | | 0.525 | | | 1.082 | | | 1.988 | | | (3.293 | ) |
| | 1.255 | | | | 1.066 | | | 0.602 | | | 1.134 | | | 2.026 | | | (3.212 | ) |
| | | |
| | | |
| | (0.025 | ) | | | (0.086 | ) | | (0.072 | ) | | (0.044 | ) | | (0.056 | ) | | (0.088 | ) |
| | (0.025 | ) | | | (0.086 | ) | | (0.072 | ) | | (0.044 | ) | | (0.056 | ) | | (0.088 | ) |
| | | |
| | $11.430 | | | | $10.200 | | | $ 9.220 | | | $ 8.690 | | | $ 7.600 | | | $ 5.630 | |
| | | |
| | 12.33% | | | | 11.68% | | | 7.04% | | | 15.12% | | | 36.11% | | | (36.04% | ) |
| | | |
| | | |
| | $2,540 | | | | $2,262 | | | $2,025 | | | $1,891 | | | $1,644 | | | $1,418 | |
| | 0.95% | | | | 0.95% | | | 0.95% | | | 0.95% | | | 0.95% | | | 0.95% | |
| | | |
| | 3.55% | | | | 2.07% | | | 2.68% | | | 3.35% | | | 2.80% | | | 1.62% | |
| | 1.11% | | | | 1.04% | | | 0.92% | | | 0.69% | | | 0.56% | | | 1.20% | |
| | | |
| | (1.49% | ) | | | (0.08% | ) | | (0.81% | ) | | (1.71% | ) | | (1.29% | ) | | 0.53% | |
| | 9% | | | | 21% | | | 41% | | | 46% | | | 65% | | | 38% | |
21
| Notes to financial statements | |
| Delaware Large Cap Core Fund | October 31, 2013 |
Voyageur Mutual Funds III (Trust) is organized as a Delaware statutory trust and offers two series: Delaware Large Cap Core Fund and Delaware Select Growth Fund. These financial statements and the related notes pertain to Delaware Large Cap Core Fund (Fund). The Trust is an open-end investment company. The Fund is considered diversified under the Investment Company Act of 1940, as amended, and offers Class A, Class C, Class R and Institutional Class shares. Class A shares are sold with a maximum front-end sales charge of 5.75%. Class A share purchases of $1,000,000 or more will incur a contingent deferred sales charge (CDSC) of 1% if redeemed during the first year and 0.50% during the second year, provided that Delaware Distributors, L.P. (DDLP) paid a financial advisor a commission on the purchase of those shares. Class C shares are sold with a CDSC of 1%, if redeemed during the first twelve months. Class R and Institutional Class shares are not subject to a sales charge and are offered for sale exclusively to certain eligible investors. As of Oct. 31, 2013, Class C and Class R have not commenced operations.
The investment objective of the Fund is to seek long-term capital appreciation.
In May 2013, the Fund’s Board of Trustees (Board) approved changing the Fund’s fiscal year-end from April 30 to October 31, effective Oct. 31, 2013.
1. Significant Accounting Policies
The following accounting policies are in accordance with U.S. generally accepted accounting principles (U.S. GAAP) and are consistently followed by the Fund.
Security Valuation — Equity securities, except those traded on the Nasdaq Stock Market, Inc. (Nasdaq), are valued at the last quoted sales price as of the time of the regular close of the New York Stock Exchange on the valuation date. Securities traded on the Nasdaq are valued in accordance with the Nasdaq Official Closing Price, which may not be the last sales price. If on a particular day an equity security does not trade, then the mean between the bid and ask prices will be used, which approximates fair value. U.S. government and agency securities are valued at the mean between the bid and ask prices, which approximates fair value. Generally, other securities and assets for which market quotations are not readily available are valued at fair value as determined in good faith under the direction of the Fund’s Board.
Federal & Foreign Income Taxes — No provision for federal income taxes has been made as the Fund intends to continue to qualify for federal income tax purposes as a regulated investment company under Subchapter M of the Internal Revenue Code of 1986, as amended, and make the requisite distributions to shareholders. The Fund evaluates tax positions taken or expected to be taken in the course of preparing the Fund’s tax returns to determine whether the tax positions are “more-likely-than-not” of being sustained by the applicable tax authority. Tax positions not deemed to meet the “more-likely-than-not” threshold are recorded as a tax benefit or expense in the current year. Management has analyzed the Fund’s tax positions taken on all open federal
22
income tax years (April 30, 2010–Oct. 31, 2013), and has concluded that no position for federal income tax is required in the Fund’s financial statements. In regard to foreign taxes only, the Fund has open tax years in certain foreign countries it invests in that may date back to the inception of the Fund. The Fund changed its fiscal year end from April to October, effective Oct. 31, 2013.
Class Accounting — Investment income, common expenses and realized and unrealized gain (loss) on investments are allocated to the various classes of the Fund on the basis of daily net assets of each class. Distribution expenses relating to a specific class are charged directly to that class.
Repurchase Agreements — The Fund may purchase certain U.S. government securities subject to the counterparty’s agreement to repurchase them at an agreed upon date and price. The counterparty will be required on a daily basis to maintain the value of the collateral subject to the agreement at not less than the repurchase price (including accrued interest). The agreements are conditioned upon the collateral being deposited under the Federal Reserve book-entry system with the Fund’s custodian or a third-party sub-custodian. In the event of default or bankruptcy by the other party to the agreement, retention of the collateral may be subject to legal proceedings. At Oct. 31, 2013, the Fund held no investments in repurchase agreements.
Use of Estimates — The preparation of financial statements in conformity with U.S. GAAP requires management to make estimates and assumptions that affect the fair value of investments, the reported amounts of assets and liabilities and disclosure of contingent assets and liabilities at the date of the financial statements and the reported amounts of revenues and expenses during the reporting period. Actual results could differ from those estimates and the differences could be material.
Other — Expenses directly attributable to the Fund are charged directly to the Fund. Other expenses common to various funds within the Delaware Investments® Family of Funds are generally allocated among such funds on the basis of average net assets. Management fees and some other expenses are paid monthly. Security transactions are recorded on the date the securities are purchased or sold (trade date) for financial reporting purposes. Costs used in calculating realized gains and losses on the sale of investment securities are those of the specific securities sold. Dividend income is recorded on the ex-dividend date and interest income is recorded on the accrual basis. Foreign dividends are also recorded on the ex-dividend date or as soon after the ex-dividend date that the Fund is aware of such dividends, net of all tax withholdings, a portion of which may be reclaimable. Withholding taxes and reclaims on foreign dividends have been recorded in accordance with the Fund’s understanding of the applicable country’s tax rules and rates. The Fund declares and pays distributions from net investment income and net realized gain on investments, if any, at least annually. Dividends and distributions, if any, are recorded on the ex-dividend date. The Fund may distribute more frequently, if necessary for tax purposes.
23
Notes to financial statements
Delaware Large Cap Core Fund
1. Significant Accounting Policies (continued)
The Fund may receive earnings credits from its custodian when positive cash balances are maintained, which are used to offset custody fees. There were no earnings credits for the period May 1, 2013 to Oct. 31, 2013 and year ended April 30, 2013.
The Fund receives earnings credits from its transfer agent when positive cash balances are maintained, which are used to offset transfer agent fees. If the amount earned is greater than one dollar, the expense paid under this arrangement is included in dividend disbursing and transfer agent fees and expenses and appears on the statements of operations with the corresponding expense offset shown as “expense paid indirectly.” For the period May 1, 2013 to Oct. 31, 2013 and year ended April 30, 2013, the Fund earned $ 0 and $1, respectively, under this agreement.
2. Investment Management, Administration Agreements and Other Transactions with Affiliates
In accordance with the terms of its investment management agreement, the Fund pays Delaware Management Company (DMC), a series of Delaware Management Business Trust and the investment manager, an annual fee which is calculated daily at the rate of 0.65% on the first $500 million of average daily net assets of the Fund, 0.60% on the next $500 million, 0.55% on the next $1.5 billion and 0.50% on average daily net assets in excess of $2.5 billion.
DMC has voluntarily agreed to waive that portion, if any, of its management fee and reimburse the Fund to the extent necessary to ensure that total annual operating expenses (excluding any 12b-1 plan expenses, taxes, interest, inverse floater program expenses, short sale and dividend interest expenses, brokerage fees, certain insurance costs, acquired Fund fees and expenses, and nonroutine expenses or costs including, but not limited to, those relating to reorganizations, litigation, conducting shareholder meetings, and liquidations (collectively, nonroutine expenses)), do not exceed 0.95% of the Fund’s average daily net assets from May 1, 2013 until such time as the voluntary expense cap is discontinued. For purposes of this waiver and reimbursement, nonroutine expenses may also include such additional costs and expenses, as may be agreed upon from time to time by the Fund’s Board and DMC. This expense waiver and reimbursement may be discontinued at any time because it is voluntary and apply only to expenses paid directly by the Fund.
Delaware Service Company, Inc. (DSC), an affiliate of DMC, provides fund accounting and financial administration oversight services to the Fund. For these services, the Fund pays DSC fees based on the aggregate daily net assets of the Delaware Investments® Family of Funds at the following annual rate: 0.0050% of the first $30 billion; 0.0045% of the next $10 billion; 0.0040% of the next $10 billion; and 0.0025% of aggregate average daily net assets in excess of $50 billion. The fees payable to DSC under the service agreement described above are allocated among all Funds in the Delaware Investments Family of Funds on a relative net asset value basis. For the period May 1, 2013 to Oct. 31, 2013 and year ended April 30, 2013, the Fund was charged $59 and $101, respectively, for these services.
24
DSC is also the transfer agent and dividend disbursing agent of the Fund. For these services, the Fund pays DSC fees based on the aggregate daily net assets of the retail funds within the Delaware Investments Family of Funds at the following annual rate: 0.025% of the first $20 billion; 0.020% of the next $5 billion; 0.015% of the next $5 billion; and 0.013% of average daily net assets in excess of $30 billion. Pursuant to a sub-transfer agency agreement between DSC and BNY Mellon Investment Servicing (US) Inc. (BNYMIS), BNYMIS provides certain sub-transfer agency services to the Fund. Sub-transfer agency fees are passed on to and paid directly by the Fund. These amounts are included in the statements of operations as dividend disbursing and transfer agent fees and expenses. For the period May 1, 2013 to Oct. 31, 2013 and year ended April 30, 2013, the amounts charged by DSC and BNYMIS were $271 and $240, and $464 and $387, respectively.
Pursuant to a distribution agreement and distribution plan, the Fund pays DDLP, the distributor and an affiliate of DMC, an annual distribution and service fee of 0.25% of the average daily net assets of the Class A shares and 1.00% of the average daily net assets of the Class C shares. Effective Oct. 1, 2013, the Fund pays DDLP an annual distribution and service fees of 0.50% of the average daily net assets of the Class R shares. DDLP has voluntarily agreed to waive all distribution and service fees. The distributor’s waivers may be discontinued at any time because it is voluntary. Prior to Oct. 1, 2013, the Fund paid DDLP an annual distribution and service fee of 0.30% and 0.60%, respectively, of the average daily net assets of the Class A and Class R shares, respectively. For the period May 1, 2013 to Oct. 1, 2013 the distribution and service fees for Class A and Class R were contractually limited to 0.25% and 0.50% of the classes’ average daily net assets. Institutional Class shares pay no distribution and service expenses.
As provided in the investment management agreement, the Fund bears the cost of certain legal services, including internal legal services provided to the Fund by DMC and/or its affiliates’ employees. For the period May 1, 2013 to Oct. 31, 2013 and year ended April 30, 2013, the Fund was charged $58 and $113, respectively, for internal legal services provided by DMC and/or its affiliates’ employees.
For the period May 1, 2013 to Oct. 31, 2013 and year ended April 30, 2013, DDLP earned $ 0 and $156, respectively, for commissions of sales of the Fund’s Class A shares.
Trustees’ fees include expenses accrued by the Fund for each Trustee’s retainer and meeting fees. Certain officers of DMC, DSC and DDLP are officers and/or Trustees of the Trust. These officers and Trustees are paid no compensation by the Fund.
3. Investments
For the period May 1, 2013 to Oct. 31, 2013, the Fund made purchases of $335,842 and sales of $ 198,856 of investment securities other than short-term investments.
At Oct. 31, 2013, the cost of investments for federal income tax purposes was $1,794,810. At Oct. 31, 2013, net unrealized appreciation was $ 776,002, of which $ 789,878 related to unrealized appreciation of investments and $ 13,876 related to unrealized depreciation of investments.
U.S. GAAP defines fair value as the price that the Fund would receive to sell an asset or pay to transfer a liability in an orderly transaction between market participants at the measurement date under current market conditions. A three level hierarchy for fair value measurements has
25
Notes to financial statements
Delaware Large Cap Core Fund
3. Investments (continued)
been established based upon the transparency of inputs to the valuation of an asset or liability. Inputs may be observable or unobservable and refer broadly to the assumptions that market participants would use in pricing the asset or liability. Observable inputs reflect the assumptions market participants would use in pricing the asset or liability based on market data obtained from sources independent of the reporting entity. Unobservable inputs reflect the reporting entity’s own assumptions about the assumptions that market participants would use in pricing the asset or liability developed based on the best information available under the circumstances. The Fund’s investment in its entirety is assigned a level based upon the observability of the inputs which are significant to the overall valuation. The three level hierarchy of inputs is summarized below.
| Level 1 – | inputs are quoted prices in active markets for identical investments (e.g., equity securities, open-end investment companies, futures contracts, exchange-traded options contracts) |
| |
Level 2 – | other observable inputs (including, but not limited to: quoted prices for similar assets or liabilities in markets that are active, quoted prices for identical or similar assets or liabilities in markets that are not active, inputs other than quoted prices that are observable for the assets or liabilities (such as interest rates, yield curves, volatilities, prepayment speeds, loss severities, credit risks and default rates) or other market-corroborated inputs) (e.g., debt securities, government securities, swap contracts, foreign currency exchange contracts, foreign securities utilizing international fair value pricing, broker-quoted securities, fair valued securities) |
| |
Level 3 – | inputs are significant unobservable inputs (including the Fund’s own assumptions used to determine the fair value of investments) (e.g., broker-quoted securities, fair valued securities) |
Level 3 investments are valued using significant unobservable inputs. The Fund may also use an income-based valuation approach in which the anticipated future cash flows of the investment are discounted to calculate fair value. Discounts may also be applied due to the nature or duration of any restrictions on the disposition of the investments. Valuations may also be based upon current market prices of securities that are comparable in coupon, rating, maturity and industry. The derived value of a Level 3 investment may not represent the value which is received upon disposition and this could impact the results of operations.
The following table summarizes the valuation of the Fund’s investments by fair value hierarchy levels as of Oct. 31, 2013:
| | Level 1 | | Level 2 | | Total |
| Common Stock | | $ | 2,550,730 | | $ | — | | $ | 2,550,730 |
| Short-Term Investments | | | — | | | 20,082 | | | 20,082 |
| Total | | $ | 2,550,730 | | $ | 20,082 | | $ | 2,570,812 |
26
During the period May 1, 2013 to Oct. 31, 2013, there were no transfers between Level 1 investments, Level 2 investments or Level 3 investments that had a significant impact to the Fund. The Fund’s policy is to recognize transfers between levels at the beginning of the reporting period.
4. Dividend and Distribution Information
Income and long-term capital gain distributions are determined in accordance with federal income tax regulations, which may differ from U.S. GAAP. Additionally, distributions from net short-term gains on sales of investment securities are treated as ordinary income for federal income tax purposes. The tax character of dividends and distributions paid during the period May 1, 2013 to Oct. 31, 2013 and years ended April 30, 2013, and 2012 was as follows:
| | 5/1/13 to | | Year Ended |
| | 10/31/13 | | 4/30/13 | | 4/30/12 |
| Ordinary income | | $5,582 | | $19,047 | | $15,799 |
5. Components of Net Assets on a Tax Basis
As of Oct. 31, 2013, the components of net assets on a tax basis were as follows:
| Shares of beneficial interest | | $ | 1,979,045 | |
| Undistributed ordinary income | | | 13,371 | |
| Capital loss carryforwards | | | (210,714 | ) |
| Unrealized appreciation | | | 776,002 | |
| Net assets | | $ | 2,557,704 | |
The difference between book basis and tax basis components of net assets is primarily attributable to tax deferral of losses on wash sales.
For federal income tax purposes, capital loss carryforwards may be carried forward and applied against future capital gains. $ 61,619 was utilized in 2013. Capital loss carryforwards remaining at Oct. 31, 2013, if not utilized in future years, will expire as follows: $ 210,714 expires in 2017.
On Dec. 22, 2010, the Regulated Investment Company Modernization Act of 2010 (Act) was enacted, which changed various technical rules governing the tax treatment of regulated investment companies. The changes were generally effective for taxable years beginning after the date of enactment. Under the Act, the Fund is permitted to carry forward capital losses incurred in taxable years beginning after the date of enactment for an unlimited period. However, any losses incurred during those future taxable years will be required to be utilized prior to the losses incurred in pre-enactment taxable years, which carry an expiration date. As a result of this ordering rule, pre-enactment capital loss carryforwards may be more likely to expire unused. Additionally, post-enactment capital loss carryforwards will retain their character as either short-term or long-term capital losses rather than being considered all short-term as permitted under previous regulation.
27
Notes to financial statements
Delaware Large Cap Core Fund
6. Capital Shares
Transactions in capital shares were as follows:
| | 5/1/2013 | | | | | |
| | to | | Year Ended |
| | 10/31/2013 | | 4/30/13 | | 4/30/12 |
| Shares issued upon reinvestment of dividends and distributions: | | | | | | | |
| Class A | | 4 | | 15 | | 14 | |
| Institutional Class | | 539 | | 2,093 | | 1,935 | |
| | 543 | | 2,108 | | 1,949 | |
| |
| Shares redeemed: | | | | | | | |
| Class A | | — | | — | | (59 | ) |
| | — | | — | | (59 | ) |
| Net increase | | 543 | | 2,108 | | 1,890 | |
The Manager and its affiliates may provide the initial seed capital in connection with the creation of a Delaware Investments product, such as the Delaware Large Cap Core Fund. At Oct. 31, 2013, 2 shareholders owned 1,589 Class A shares, which represented 99.83% of the total Class A shares and Delaware Investments owned 100.00% of the Institutional Class shares.
7. Line of Credit
The Fund, along with certain other funds in the Delaware Investments® Family of Funds (Participants), was a participant in a $125,000,000 revolving line of credit to be used for temporary or emergency purposes as an additional source of liquidity to fund redemptions of investor shares. Under the agreement, the Participants were charged an annual commitment fee, which was allocated across the Participants on the basis of each Participant’s allocation of the entire facility. The Participants were permitted to borrow up to a maximum of one third of their net assets under the agreement. Each Participant was individually, and not jointly, liable for its particular advances, if any, under the line of credit. The line of credit under the agreement expired on Nov. 12, 2013.
On Nov. 12, 2013, the Fund, along with the other Participants, entered into an amendment to the agreement for a $225,000,000 revolving line of credit. The line of credit is to be used as described above and operates in substantially the same manner as the original agreement. The line of credit available under the agreement expires on Nov. 10, 2014.
The Fund had no amounts outstanding as of Oct. 31, 2013 or at any time during the period then ended.
28
8. Securities Lending
The Fund, along with other funds in the Delaware Investments® Family of Funds, may lend its securities pursuant to a security lending agreement (Lending Agreement) with The Bank of New York Mellon (BNY Mellon). At the time a security is loaned, the borrower must post collateral equal to the required percentage of the market value of the loaned security, including any accrued interest. The required percentage is: (i) 102% with respect to U.S. securities and foreign securities that are denominated and payable in U.S. dollars; and (ii) 105% with respect to foreign securities. With respect to each loan, if on any business day the aggregate market value of securities collateral plus cash collateral held is less than the aggregate market value of the securities which are the subject of such loan, the borrower will be notified to provide additional collateral by the end of the following business day which, together with the collateral already held, will be not less than the applicable initial collateral requirements for such security loan. If the aggregate market value of securities collateral and cash collateral held with respect to a security loan exceeds the applicable initial collateral requirement, upon the request of the borrower BNY Mellon must return enough collateral to the borrower by the end of the following business day to reduce the value of the remaining collateral to the applicable initial collateral requirement for such security loan. As a result of the foregoing, the value of the collateral held with respect to a loaned security may be temporarily more or less than the value of the security on loan.
Cash collateral received is generally invested in the Delaware Investments Collateral Fund No. 1 (Collective Trust) established by BNY Mellon for the purpose of investment on behalf of funds managed by DMC that participate in BNY Mellon’s securities lending program. The Collective Trust may invest in U.S. government securities and high-quality corporate debt, asset-backed and other money market securities and in repurchase agreements collateralized by such securities, provided that the Collective Trust will generally have a dollar-weighted average portfolio maturity of 60 days or less. The Fund can also accept U.S. government securities and letters of credit (non-cash collateral) in connection with securities loans. In the event of default or bankruptcy by the lending agent, realization and/or retention of the collateral may be subject to legal proceedings. In the event the borrower fails to return loaned securities and the collateral received is insufficient to cover the value of the loaned securities and provided such collateral shortfall is not the result of investment losses, the lending agent has agreed to pay the amount of the shortfall to the Fund or, at the discretion of the lending agent, replace the loaned securities. The Fund continues to record dividends or interest, as applicable, on the securities loaned and is subject to changes in value of the securities loaned that may occur during the term of the loan. The Fund has the right under the Lending Agreement to recover the securities from the borrower on demand. With respect to security loans collateralized by non-cash collateral, the Fund receive loan premiums paid by the borrower. With respect to security loans collateralized by cash collateral, the earnings from the collateral investments are shared among the Fund, the security lending agent and the borrower. The Fund records security lending income net of allocations to the security lending agent and the borrower.
29
Notes to financial statements
Delaware Large Cap Core Fund
8. Securities Lending (continued)
The Collective Trust used for the investment of cash collateral received from borrowers of securities seeks to maintain a net asset value per unit of $1.00, but there can be no assurance that it will always be able to do so. The Fund may incur investment losses as a result of investing securities lending collateral in the Collective Trust. This could occur if an investment in the Collective Trust defaulted or if it were necessary to liquidate assets in the Collective Trust to meet returns on outstanding security loans at a time when the Collective Trust’s net asset value per unit was less than $1.00. Under those circumstances, the Fund may not receive an amount from the Collective Trust that is equal in amount to the collateral the Fund would be required to return to the borrower of the securities and the Fund would be required to make up for this shortfall. During the period ended Oct. 31, 2013, the Fund had no securities out on loan.
9. Credit and Market Risk
The Fund may invest up to 15% of its net assets in illiquid securities, which may include securities with contractual restrictions on resale, securities exempt from registration under Rule 144A of the Securities Act of 1933, as amended, and other securities which may not be readily marketable. The relative illiquidity of these securities may impair the Fund from disposing of them in a timely manner and at a fair price when it is necessary or desirable to do so. While maintaining oversight, the Fund’s Board has delegated to DMC the day-to-day functions of determining whether individual securities are liquid for purposes of the Fund’s limitation on investments in illiquid securities. Securities eligible for resale pursuant to Rule 144A, which are determined to be liquid, are not subject to the Fund’s 15% limit on investment in illiquid securities. As of Oct. 31, 2013, there were no Rule 144A securities and no securities have been determined to be illiquid under the Fund’s Liquidity Procedures.
10. Contractual Obligations
The Fund enters into contracts in the normal course of business that contain a variety of indemnifications. The Fund’s maximum exposure under these arrangements is unknown. However, the Fund has not had prior claims or losses pursuant to these contracts. Management has reviewed the Fund’s existing contracts and expects the risk of loss to be remote.
11. Subsequent Events
Except as described in Note 7, management has determined that no material events or transactions occurred subsequent to Oct. 31, 2013 that would require recognition or disclosure in the Fund’s financial statements.
30
Report of independent
registered public accounting firm
To the Board of Trustees of Voyageur Mutual Funds III
and the Shareholders of Delaware Large Cap Core Fund:
In our opinion, the accompanying statement of assets and liabilities, including the schedule of investments, and the related statements of operations and of changes in net assets and the financial highlights present fairly, in all material respects, the financial position of Delaware Large Cap Core Fund (one of the series constituting Voyageur Mutual Funds III, hereafter referred to as the “Fund”) at October 31, 2013, the results of its operations for the six months ended October 31, 2013 and the year ended April 30, 2013, the changes in its net assets for the six months ended October 31, 2013 and each of the two years in the period ended April 30, 2013 and the financial highlights for the six months ended October 31, 2013 and the three years in the period ended April 30, 2013, in conformity with accounting principles generally accepted in the United States of America. These financial statements and financial highlights (hereafter referred to as “financial statements”) are the responsibility of the Fund’s management; our responsibility is to express an opinion on these financial statements based on our audits. We conducted our audits of these financial statements in accordance with the standards of the Public Company Accounting Oversight Board (United States). Those standards require that we plan and perform the audit to obtain reasonable assurance about whether the financial statements are free of material misstatement. An audit includes examining, on a test basis, evidence supporting the amounts and disclosures in the financial statements, assessing the accounting principles used and significant estimates made by management, and evaluating the overall financial statement presentation. We believe that our audits, which included confirmation of securities at October 31, 2013 by correspondence with the custodian, provide a reasonable basis for our opinion. The financial highlights for each of the two years in the period ended April 30, 2010 were audited by other independent accountants whose report dated June 18, 2010 expressed an unqualified opinion on those statements.
PricewaterhouseCoopers LLP
Philadelphia, Pennsylvania
December 19, 2013
31
Other Fund information
(Unaudited)
Delaware Large Cap Core Fund
Tax Information
The information set forth below is for the Fund’s fiscal year as required by federal income tax laws. Shareholders, however, must report distributions on a calendar year basis for income tax purposes, which may include distributions for portions of two fiscal years of a fund. Accordingly, the information needed by shareholders for income tax purposes will be sent to them in January of each year. Please consult your tax advisor for proper treatment of this information.
All disclosures are based on financial information available as of the date of this annual report and, accordingly are subject to change. For any and all items requiring reporting, it is the intention of the Fund to report the maximum amount permitted under the Internal Revenue Code and the regulations thereunder.
For the fiscal year ended Oct. 31, 2013, the Fund reports distributions paid during the year as follows:
| (A) Ordinary income distributions (Tax Basis)* | 100.00 | % |
| (B) Qualifying dividends1 | 100.00 | % |
| (A) | is based on a percentage of the Fund’s total distributions. |
| (B) | is based on percentage of the Fund’s ordinary income distributions. |
| 1 | Qualifying dividends represent dividends which qualify for the corporate dividends received deduction. |
| * | For the fiscal year ended Oct. 31, 2013, certain dividends paid by the Fund may be subject to a maximum tax rate of 15%, as provided for by the Jobs and Growth Tax Relief Reconciliation Act of 2003, and as extended by Tax Relief, Unemployment Insurance Reauthorizations and Job Creation Act of 2010 and by the American Taxpayer Relief Act of 2012. The Fund intends to report up to a maximum percentage of 100% to be taxed at a maximum rate of 15%. Complete information will be computed and reported in conjunction with your 2013 Form 1099-DIV. |
Board consideration of Delaware Large Cap Core Fund investment advisory agreement
At a meeting held on Aug. 20-22, 2013 (the “Annual Meeting”), the Board of Trustees (the “Board”), including a majority of disinterested or independent Trustees, approved the renewal of the Investment Advisory Agreement for Delaware Large Cap Core Fund (the “Fund”). In making its decision, the Board considered information furnished at regular quarterly Board meetings, including reports detailing Fund performance, investment strategies and expenses, as well as information prepared specifically in connection with the renewal of the investment advisory and sub-advisory contracts. Information furnished specifically in connection with the renewal of the Investment Advisory Agreement with Delaware Management Company (“DMC”) included materials provided by DMC and its affiliates (“Delaware Investments”) concerning, among other things, the nature, extent and quality of services provided to the Fund, the costs of such services to the Fund, economies of scale and the financial condition and profitability of Delaware Investments. In addition, in connection with the Annual Meeting, reports were provided to the Trustees in May 2013 and included reports provided by Lipper, Inc., an independent statistical compilation organization (“Lipper”). The Lipper reports compared the Fund’s investment performance and expenses with those of other comparable mutual funds.
32
The Independent Trustees reviewed and discussed the Lipper reports with independent legal counsel to the Independent Trustees. The Board requested and received information regarding DMC’s policy with respect to advisory fee levels and its breakpoint philosophy; the structure of portfolio manager compensation; the investment manager’s profitability; comparative client fee information; and any constraints or limitations on the availability of securities for certain investment styles, which had in the past year inhibited, or which were likely in the future to inhibit, DMC’s ability to invest fully in accordance with Fund policies.
In considering information relating to the approval of the Fund’s advisory agreement, the Independent Trustees received assistance and advice from and met separately with independent legal counsel to the Independent Trustees. Although the Board gave attention to all information furnished, the following discussion identifies, under separate headings, the primary factors taken into account by the Board during its contract renewal considerations.
Nature, Extent and Quality of Service. The Board considered the services provided by Delaware Investments to the Fund and its shareholders. In reviewing the nature, extent and quality of services, the Board considered reports furnished to it throughout the year, which covered matters such as the relative performance of the Fund, compliance of portfolio managers with the investment policies, strategies and restrictions for the Fund, compliance by DMC and Delaware Distributors, L.P. (together, “Management”) personnel with the Code of Ethics adopted throughout the Delaware Investments® Family of Funds complex and adherence to fair value pricing procedures as established by the Board. The Board was pleased with the current staffing of the Fund’s investment advisor and the emphasis placed on research in the investment process. The Board recognized DMC’s recent receipt of several industry distinctions. The Board gave favorable consideration to DMC’s efforts to control expenditures while maintaining service levels committed to fund matters. The Board noted that in July 2011 Management implemented measures to reduce overall costs and improve transfer agent and shareholder servicing functions through outsourcing. The Board noted the benefits provided to Fund shareholders through each shareholder’s ability to exchange an investment in one Delaware Investments fund for the same class of shares in another Delaware Investments fund without a sales charge, to reinvest Fund dividends into additional shares of the Fund or into additional shares of other Delaware Investments funds and the privilege to combine holdings in other Delaware Investments funds to obtain a reduced sales charge. The Board was satisfied with the nature, extent and quality of the overall services provided by Delaware Investments.
Investment Performance. The Board placed significant emphasis on the investment performance of the Fund in view of the importance of investment performance to shareholders. Although the Board gave appropriate consideration to performance reports and discussions with portfolio managers at Investment Committee meetings throughout the year, the Board gave particular weight to the Lipper reports furnished for the Annual Meeting. The Lipper reports prepared for the Fund showed the investment performance of its Class A shares in comparison to a group of similar funds as selected by Lipper (the “Performance Universe”). A fund with the best performance ranked first, and a fund with the poorest performance ranked last. The highest/best
33
Other Fund information
(Unaudited)
Delaware Large Cap Core Fund
Board consideration of Delaware Large Cap Core Fund investment advisory agreement (continued)
performing 25% of funds in the Performance Universe make up the first quartile; the next 25%, the second quartile; the next 25%, the third quartile; and the poorest/worst performing 25% of funds in the Performance Universe make up the fourth quartile. Comparative annualized performance for the Fund was shown for the past one-, three- and five-year periods ended March 31, 2013. The Board’s objective is that the Fund’s performance for the periods considered be at or above the median of its Performance Universe. The following paragraph summarizes the performance results for the Fund and the Board’s view of such performance.
The Performance Universe for the Fund consisted of the Fund and all retail and institutional large-cap core funds as selected by Lipper. The Lipper report comparison showed that the Fund’s total return for the one-year period was in the fourth quartile of its Performance Universe. The report further showed that the Fund’s total return for the three- and five- year periods was in the second quartile and third quartile, respectively, of its Performance Universe. The Board determined that the Fund’s performance results were mixed. In evaluating the Fund’s performance, the Board considered the numerous investment and performance reports delivered by Management personnel to the Board’s Investments Committee. The Board was satisfied that Management was taking action to improve Fund performance and to meet the Board’s performance objective.
Comparative Expenses. The Board considered expense comparison data for the Delaware Investments® Family of Funds. Management provided the Board with information on pricing levels and fee structures for the Fund as of its most recently completed fiscal year. The Board also focused on the comparative analysis of effective management fees and total expense ratios of the Fund versus effective management fees and expense ratios of a group of similar funds as selected by Lipper (the “Expense Group”). In reviewing comparative costs, the Fund’s contractual management fee and the actual management fee incurred by the Fund were compared with the contractual management fees (assuming all funds in the Expense Group were similar in size to the Fund) and actual management fees (as reported by each fund) within the Expense Group, taking into account any applicable breakpoints and fee waivers. The Fund’s total expenses were also compared with those of its Expense Group. The Lipper total expenses, for comparative consistency, were shown by Lipper for Class A shares and comparative total expenses including 12b-1 and non 12b-1 service fees. The Board considered fees paid to Delaware Investments for non-management services. The Board’s objective is to limit the Fund’s total expense ratio to be competitive with that of the Expense Group. The following paragraph summarizes the expense results for the Fund and the Board’s view of such expenses.
The expense comparisons for the Fund showed that its contractual management fee and total expenses were in the quartile with the lowest expenses of its Expense Group. The Board was satisfied with the contractual management fee and total expenses of the Fund in comparison to those of its Expense Group as shown in the Lipper report.
34
Management Profitability. The Board considered the level of profits realized by Delaware Investments in connection with the operation of the Fund. In this respect, the Board reviewed the Investment Management Profitability Analysis that addressed the overall profitability of Delaware Investments’ business in providing management and other services to each of the individual funds and the Delaware Investments® Family of Funds as a whole. Specific attention was given to the methodology followed in allocating costs for the purpose of determining profitability. Management stated that the level of profits of Delaware Investments, to a certain extent, reflects recent operational cost savings and efficiencies initiated by Delaware Investments. The Board considered Delaware Investments’ efforts to improve services provided to fund shareholders and to meet additional regulatory and compliance requirements resulting from recent industry-wide Securities and Exchange Commission initiatives. The Board also considered the extent to which Delaware Investments might derive ancillary benefits from fund operations, including the potential for procuring additional business as a result of the prestige and visibility associated with its role as service provider to the Delaware Investments Family of Funds and the benefits from allocation of fund brokerage to improve trading efficiencies. The Board found that the management fees were reasonable in light of the services rendered and the level of profitability of Delaware Investments.
Economies of Scale. The Trustees considered whether economies of scale are realized by Delaware Investments as the Fund’s assets increase and the extent to which any economies of scale are reflected in the level of management fees charged. The Trustees reviewed the standardized advisory fee pricing and structure, approved by the Board and shareholders, which includes breakpoints. Breakpoints in the advisory fee occur when the advisory fee rate is reduced on assets in excess of specified levels. Breakpoints result in a lower advisory fee than would otherwise be the case on all assets when the asset levels specified are exceeded. The Board noted that the fee under the Fund’s management contract fell within the standard structure. Although the Fund has not reached a size at which it can take advantage of breakpoints, the Board recognized that the fee was structured so that when the Fund grows, economies of scale may be shared.
35
Board of trustees/directors and officers addendum
Delaware Investments® Family of Funds
A mutual fund is governed by a Board of Trustees/Directors (“Trustees”), which has oversight responsibility for the management of a fund’s business affairs. Trustees establish procedures and oversee and review the performance of the investment manager, the distributor, and others who perform services for the fund. The independent fund trustees, in particular, are advocates
| Name, Address, | | Position(s) | | Length of |
| and Birth Date | | Held with Fund(s) | | Time Served |
| Interested Trustees | | | | |
| Patrick P. Coyne1 | | Chairman, President, | | Chairman and Trustee |
| 2005 Market Street | | Chief Executive Officer, | | since August 16, 2006 |
| Philadelphia, PA 19103 | | and Trustee | | |
| April 1963 | | | | President and |
| | | | Chief Executive Officer |
| | | | since August 1, 2006 |
| |
| Independent Trustees | | | | |
| Thomas L. Bennett | | Trustee | | Since March 2005 |
| 2005 Market Street | | | | |
| Philadelphia, PA 19103 | | | | |
| October 1947 | | | | |
| Joseph W. Chow | | Trustee | | Since January 2013 |
| 2005 Market Street | | | | |
| Philadelphia, PA 19103 | | | | |
| January 1953 | | | | |
| |
| John A. Fry | | Trustee | | Since January 2001 |
| 2005 Market Street | | | | |
| Philadelphia, PA 19103 | | | | |
| May 1960 | | | | |
| |
| |
| |
| Anthony D. Knerr | | Trustee | | Since April 1990 |
| 2005 Market Street | | | | |
| Philadelphia, PA 19103 | | | | |
| December 1938 | | | | |
1 Patrick P. Coyne is considered to be an “Interested Trustee” because he is an executive officer of the Fund’s(s’) investment advisor.
36
for shareholder interests. Each trustee has served in that capacity since he or she was elected to or appointed to the Board of Trustees, and will continue to serve until his or her retirement or the election of a new trustee in his or her place. The following is a list of the Trustees and Officers with certain background and related information.
| | Number of Portfolios in | | |
| Principal Occupation(s) | | Fund Complex Overseen | | Other Directorships |
| During Past 5 Years | | by Trustee or Officer | | Held by Trustee or Officer |
| |
| Patrick P. Coyne has served in | | 70 | | Director and Audit |
| various executive capacities | | | | Committee Member |
| at different times at | | | | Kaydon Corp. |
| Delaware Investments.2 | | | | |
| | | | Board of Governors Member |
| | | | Investment Company |
| | | | Institute (ICI) |
| |
| Private Investor | | 70 | | Director |
| (March 2004–Present) | | | | Bryn Mawr Bank Corp. (BMTC) |
| | | | (2007–2011) |
| |
| Executive Vice President | | 70 | | Director and Audit Committee |
| (Emerging Economies Strategies, | | | | Member — Hercules |
| Risk and Corporate Administration) | | | | Technology Growth |
| State Street Corporation | | | | Capital, Inc. |
| (July 2004–March 2011) | | | | |
| President | | 70 | | Director — Hershey Trust |
| Drexel University | | | | |
| (August 2010–Present) | | | | Director and Audit |
| | | | Committee Member |
| President | | | | Community Health Systems |
| Franklin & Marshall College | | | | |
| (July 2002–July 2010) | | | | |
| Managing Director | | 70 | | None |
| AKA Strategy | | | | |
| (Strategic Consulting) | | | | |
| (1990–Present) | | | | |
2 Delaware Investments is the marketing name for Delaware Management Holdings, Inc. and its subsidiaries, including the Fund’s(s’) investment advisor, principal underwriter, and its transfer agent.
37
Board of trustees/directors and officers addendum
Delaware Investments® Family of Funds
| Name, Address, | | Position(s) | | Length of |
| and Birth Date | | Held with Fund(s) | | Time Served |
| Independent Trustees (continued) | | | | |
| Lucinda S. Landreth | | Trustee | | Since March 2005 |
| 2005 Market Street | | | | |
| Philadelphia, PA 19103 | | | | |
| June 1947 | | | | |
| Frances A. Sevilla-Sacasa | | Trustee | | Since September 2011 |
| 2005 Market Street | | | | |
| Philadelphia, PA 19103 | | | | |
| January 1956 | | | | |
| |
| |
| |
| |
| |
| |
| |
| |
| |
| |
| |
| |
| |
| Thomas K. Whitford | | Trustee | | Since January 2013 |
| 2005 Market Street | | | | |
| Philadelphia, PA 19103 | | | | |
| March 1956 | | | | |
| | | | | |
| | | | | |
| | | | | |
| | | | | |
| | | | | |
| | | | | |
38
| | Number of Portfolios in | | |
| Principal Occupation(s) | | Fund Complex Overseen | | Other Directorships |
| During Past 5 Years | | by Trustee or Officer | | Held by Trustee or Officer |
| |
| Private Investor | | 70 | | None |
| (2004–Present) | | | | |
| |
| |
| Chief Executive Officer — | | 70 | | Trust Manager and |
| Banco Itaú Europa | | | | Audit Committee |
| International | | | | Member — Camden |
| (April 2012–Present) | | | | Property Trust |
| |
| Executive Advisor to Dean | | | | |
| (August 2011–March 2012) | | | | |
| and Interim Dean | | | | |
| (January 2011–July 2011) — | | | | |
| University of Miami School of | | | | |
| Business Administration | | | | |
| |
| President — U.S. Trust, | | | | |
| Bank of America Private | | | | |
| Wealth Management | | | | |
| (Private Banking) | | | | |
| (July 2007–December 2008) | | | | |
| Vice Chairman | | 70 | | None |
| (2010–April 2013) | | | | |
| Chief Administrative | | | | |
| Officer (2008–2010) | | | | |
| and Executive Vice | | | | |
| President and Chief | | | | |
| Administrative Officer | | | | |
| (2007–2009) — | | | | |
| PNC Financial | | | | |
| Services Group | | | | |
39
Board of trustees/directors and officers addendum
Delaware Investments® Family of Funds
| Name, Address, | | Position(s) | | Length of |
| and Birth Date | | Held with Fund(s) | | Time Served |
| Independent Trustees (continued) | | | | |
| Janet L. Yeomans | | Trustee | | Since April 1999 |
| 2005 Market Street | | | | |
| Philadelphia, PA 19103 | | | | |
| July 1948 | | | | |
| |
| |
| |
| |
| |
| |
| J. Richard Zecher | | Trustee | | Since March 2005 |
| 2005 Market Street | | | | |
| Philadelphia, PA 19103 | | | | |
| July 1940 | | | | |
| | | | | |
| | | | | |
| | | | | |
| | | | | |
| | | | | |
40
| | Number of Portfolios in | | |
| Principal Occupation(s) | | Fund Complex Overseen | | Other Directorships |
| During Past 5 Years | | by Trustee or Officer | | Held by Trustee or Officer |
| |
| Vice President and Treasurer | | 70 | | Director, Audit |
| (January 2006–July 2012) | | | | Committee Member and |
| Vice President — Mergers & Acquisitions | | | | Investment Committee |
| (January 2003–January 2006), and | | | | Member |
| Vice President and Treasurer | | | | Okabena Company |
| (July 1995–January 2003) | | | | |
| 3M Corporation | | | | Chair — 3M |
| | | | Investment Management |
| | | | Company |
| | | | (2005–2012) |
| Founder | | 70 | | Director and Compensation |
| Investor Analytics | | | | Committee Member |
| (Risk Management) | | | | Investor Analytics |
| (May 1999–Present) | | | | |
| | | | Director — P/E Investments |
| Founder | | | | |
| P/E Investments | | | | |
| (Hedge Fund) | | | | |
| (September 1996–Present) | | | | |
41
Board of trustees/directors and officers addendum
Delaware Investments® Family of Funds
| Name, Address, | | Position(s) | | Length of |
| and Birth Date | | Held with Fund(s) | | Time Served |
| Officers | | | | |
| David F. Connor | | Senior Vice President, | | Senior Vice President, |
| 2005 Market Street | | Deputy General | | Deputy General Counsel |
| Philadelphia, PA 19103 | | Counsel, and Secretary | | since May 2013; |
| December 1963 | | | | Vice President, Deputy |
| | | | General Counsel |
| | | | September 2000– |
| | | | May 2013; Secretary since |
| | | | October 2005 |
| Daniel V. Geatens | | Vice President | | Treasurer |
| 2005 Market Street | | and Treasurer | | since October 2007 |
| Philadelphia, PA 19103 | | | | |
| October 1972 | | | | |
| David P. O’Connor | | Executive Vice President, | | Executive Vice President |
| 2005 Market Street | | General Counsel | | since February 2012; |
| Philadelphia, PA 19103 | | and Chief Legal Officer | | Senior Vice President |
| February 1966 | | | | October 2005– |
| | | | February 2012; |
| | | | General Counsel and |
| | | | Chief Legal Officer |
| | | | since October 2005 |
| Richard Salus | | Senior Vice President | | Chief Financial Officer |
| 2005 Market Street | | and Chief Financial Officer | | since November 2006 |
| Philadelphia, PA 19103 | | | | |
| October 1963 | | | | |
The Statement of Additional Information for the Fund(s) includes additional information about the Trustees and Officers and is available, without charge, upon request by calling 800 523-1918.
42
| | Number of Portfolios in | | |
| Principal Occupation(s) | | Fund Complex Overseen | | Other Directorships |
| During Past 5 Years | | by Trustee or Officer | | Held by Trustee or Officer |
| |
| David F. Connor has served as | | 70 | | None3 |
| Deputy General Counsel of | | | | |
| Delaware Investments | | | | |
| since 2000. | | | | |
| |
| |
| |
| |
| Daniel V. Geatens has served | | 70 | | None3 |
| in various capacities at | | | | |
| different times at | | | | |
| Delaware Investments. | | | | |
| David P. O’Connor has served in | | 70 | | None3 |
| various executive and legal | | | | |
| capacities at different times | | | | |
| at Delaware Investments. | | | | |
| |
| |
| |
| |
| Richard Salus has served in | | 70 | | None3 |
| various executive capacities | | | | |
| at different times at | | | | |
| Delaware Investments. | | | | |
3 David F. Connor, Daniel V. Geatens, David P. O’Connor, and Richard Salus serve in similar capacities for the six portfolios of the Optimum Fund Trust, which have the same investment advisor, principal underwriter, and transfer agent as the registrant.
43
About the organization
Board of trustees |
Patrick P. Coyne
Chairman, President, and
Chief Executive Officer
Delaware Investments®
Family of Funds
Philadelphia, PA Thomas L. Bennett
Private Investor
Rosemont, PA | Joseph W. Chow
Former Executive Vice
President
State Street Corporation
Brookline, MA John A. Fry
President
Drexel University
Philadelphia, PA Anthony D. Knerr
Founder and Managing
Director
AKA Strategy
New York, NY | Lucinda S. Landreth
Former Chief Investment
Officer
Assurant, Inc.
Philadelphia, PA Frances A. Sevilla-Sacasa
Chief Executive Officer
Banco Itaú Europa
International
Miami, FL | Thomas K. Whitford
Former Vice Chairman
PNC Financial Services Group
Pittsburgh, PA Janet L. Yeomans
Former Vice President and
Treasurer
3M Corporation
St. Paul, MN J. Richard Zecher
Founder
Investor Analytics
Scottsdale, AZ |
| | | | |
Affiliated officers |
David F. Connor
Senior Vice President,
Deputy General Counsel,
and Secretary
Delaware Investments
Family of Funds
Philadelphia, PA | Daniel V. Geatens
Vice President and
Treasurer
Delaware Investments
Family of Funds
Philadelphia, PA | David P. O’Connor
Executive Vice President,
General Counsel,
and Chief Legal Officer
Delaware Investments
Family of Funds
Philadelphia, PA | Richard Salus
Senior Vice President and
Chief Financial Officer
Delaware Investments
Family of Funds
Philadelphia, PA |
This annual report is for the information of Delaware Large Cap Core Fund shareholders, but it may be used with prospective investors when preceded or accompanied by the Delaware Investments Fund fact sheet for the most recently completed calendar quarter. These documents are available at delawareinvestments.com.
Delaware Investments is the marketing name of Delaware Management Holdings, Inc. and its subsidiaries.The Fund files its complete schedule of portfolio holdings with the Securities and Exchange Commission (SEC) for the first and third quarters of each fiscal year on Form N-Q. The Fund’s Forms N-Q, as well as a description of the policies and procedures that the Fund uses to determine how to vote proxies (if any) relating to portfolio securities are available without charge (i) upon request, by calling 800 523-1918; and (ii) on the SEC’s website at sec.gov. In addition, a description of the policies and procedures that the Fund uses to determine how to vote proxies (if any) relating to portfolio securities and the Fund’s Schedule of Investments are available without charge on the Fund’s website at delawareinvestments.com. The Fund’s Forms N-Q may be reviewed and copied at the SEC’s Public Reference Room in Washington, D.C.; information on the operation of the Public Reference Room may be obtained by calling 800 SEC-0330.
Information (if any) regarding how the Fund voted proxies relating to portfolio securities during the most recently disclosed 12-month period ended June 30 is available without charge (i) through the Fund’s website at delawareinvestments.com; and (ii) on the SEC’s website at sec.gov.
44
Annual report Delaware Select Growth Fund October 31, 2013 U.S. growth equity mutual fund |
Carefully consider the Fund’s investment objectives, risk factors, charges, and expenses before investing. This and other information can be found in the Fund’s prospectus and its summary prospectus, which may be obtained by visiting delawareinvestments.com or calling 800 523-1918. Investors should read the prospectus and the summary prospectus carefully before investing. |
You can obtain shareholder reports and prospectuses online instead of in the mail.
Visit delawareinvestments.com/edelivery. |
Experience Delaware Investments
Delaware Investments is committed to the pursuit of consistently superior asset management and unparalleled client service. We believe in our investment processes, which seek to deliver consistent results, and in convenient services that help add value for our clients.
If you are interested in learning more about creating an investment plan, contact your financial advisor.
You can learn more about Delaware Investments or obtain a prospectus for Delaware Select Growth Fund at delawareinvestments.com.
Manage your investments online
- 24-hour access to your account information
- Obtain share prices
- Check your account balance and recent transactions
- Request statements or literature
- Make purchases and redemptions
Delaware Management Holdings, Inc. and its subsidiaries (collectively known by the marketing name of Delaware Investments) are wholly owned subsidiaries of Macquarie Group Limited, a global provider of banking, financial, advisory, investment and funds management services.
Investments in Delaware Select Growth Fund are not and will not be deposits with or liabilities of Macquarie Bank Limited ABN 46 008 583 542 and its holding companies, including their subsidiaries or related companies (Macquarie Group), and are subject to investment risk, including possible delays in repayment and loss of income and capital invested. No Macquarie Group company guarantees or will guarantee the performance of the Fund, the repayment of capital from the Fund, or any particular rate of return.
| Table of contents | |
| Portfolio management review | 1 |
| Performance summary | 3 |
| Disclosure of Fund expenses | 6 |
| Security type/sector allocation and | |
| top 10 equity holdings | 8 |
| Schedule of investments | 9 |
| Statement of assets and liabilities | 14 |
| Statement of operations | 16 |
| Statements of changes in net assets | 18 |
| Financial highlights | 20 |
| Notes to financial statements | 30 |
| Report of independent registered | |
| public accounting firm | 42 |
| Other Fund information | 43 |
| Board of trustees/directors and | |
| officers addendum | 46 |
| About the organization | 54 |
Unless otherwise noted, views expressed herein are current as of Oct. 31, 2013, and subject to change.
Funds are not FDIC insured and are not guaranteed. It is possible to lose the principal amount invested.
Mutual fund advisory services provided by Delaware Management Company, a series of Delaware Management Business Trust, which is a registered investment advisor. Delaware Investments, a member of Macquarie Group, refers to Delaware Management Holdings, Inc. and its subsidiaries, including the Fund’s distributor, Delaware Distributors, L.P. Macquarie Group refers to Macquarie Group Limited and its subsidiaries and affiliates worldwide.
© 2013 Delaware Management Holdings, Inc.
All third-party marks cited are the property of their respective owners.
| Portfolio management review |
| Delaware Select Growth Fund | | November 12, 2013 |
| Performance preview (for the six-month period from May 1, 2013, through |
| October 31, 2013) | | | |
| Delaware Select Growth Fund (Class A shares) | six-month return | | +12.70% |
| Russell 3000® Growth Index (benchmark) | six-month return | | +13.37% |
Past performance does not guarantee future results.
For complete, annualized performance for Delaware Select Growth Fund, please see the table on page 3.
The performance of Class A shares excludes the applicable sales charge and reflects the reinvestment of all distributions. Index performance returns do not reflect any management fees, transaction costs, or expenses. Indices are unmanaged and one cannot invest directly in an index. |
On May 23, 2013, the Board approved changing the Fund’s fiscal year from April 30 to October 31. This change will be effective for the period ended Oct. 31, 2013. Therefore, the managers’ commentary below applies to the partial year between May 1, 2013, and Oct. 31, 2013. In future editions of the Fund’s annual report, the managers’ commentary will report on the Fund’s entire fiscal year.
At the start of the six-month period ended Oct. 31, 2013, U.S. equity markets made small gains, experiencing much volatility along the way. This volatility spiked in mid-June, when Federal Reserve Chairman Ben Bernanke said that the Fed could begin to taper its quantitative easing (QE) program later in 2013 and could complete it by mid-2014. Markets around the globe reacted rather strongly to the statement, losing many of the modest gains from earlier in 2013. Despite investors’ focus on the Fed, the U.S. economy continued to experience moderate momentum.
The final few months of the Fund’s fiscal period were filled with a series of market-moving news events, which included, in part: the City of Detroit filing for bankruptcy, the United States engaging in the Syrian chemical weapons saga, the Fed tipping off investors that it would begin to taper its QE program, then surprising investors with its decision not to begin tapering at that time, and finally, as the period ended, the federal government shutting down many of its nonessential activities. U.S. equities reacted to these events with several notable swoons during this period, but ultimately continued their advance, amid a rebound in international developed and emerging market stocks.
Fund performance
For the six-month period ended Oct. 31, 2013, Delaware Select Growth Fund (Class A shares) returned +12.70% at net asset value and +6.23% at maximum offer price (both figures reflect all distributions reinvested). For the same period, the Russell 3000 Growth Index returned +13.37%. For complete, annualized performance of Delaware Select Growth Fund, please see the table on page 3.
Yelp was the Fund’s strongest contributor to performance during the fiscal period. The company hosts an online database of user-generated reviews of local businesses. The company continued to make key partnerships that, in turn, have increased user traffic and growth. Additionally, we think the company could stand to benefit widely from the proliferation of wireless and streaming technologies that help to make Yelp’s services
1
Portfolio management review
Delaware Select Growth Fund
even more accessible. As the network effect of this business continues to grow, we believe there continues to be meaningful growth potential for this company.
EOG Resources also contributed to performance during the fiscal period. The company is engaged in crude oil and natural gas exploration, development, and production in major basins in the U.S., Canada, Trinidad, the United Kingdom, Argentina, and China. Most notably, the stock provides exposure to the North American shale oil and gas industry, which we view as an attractive secular growth area in the energy sector. It’s important to note that although the stock can, at times, be affected by fluctuations in the price of oil and natural gas, we don’t think that the company’s long-term intrinsic business value is dependent solely on commodity prices. Rather, we think that the company’s management team has a unique capital allocation discipline relative to other energy companies that could increase its potential to perform and add value through a variety of commodity prices and economic environments.
K12 detracted from the Fund’s performance during the fiscal period. Investors have grown concerned about the company’s ability to continue its growth trajectory. Late in the period, the company lowered its guidance for fiscal year 2014 based, in part, on lower-than-expected enrollment rates due to issues at its enrollment centers. We think this was a transitory execution mistake by the company and is not indicative of a general slowing demand environment for its products and services. We believe this technology-based provider of education products can continue to participate in the secular growth of complementary services within education, such as online and advanced courses and other materials that enhance the traditional classroom teaching experience.
Sally Beauty Holdings also detracted from the Fund’s performance, as traffic appeared to weaken from customers who weren’t members of Sally Beauty a low-fee loyalty program to receive discount pricing. We think the company has a relatively steady growth business because of aging demographics and the relatively low level of discretionary income necessary for beauty enhancement and maintenance for its target customer base. However, we do have some concerns about the company’s ability to drive existing and new customer store traffic through the use of its loyalty cards programs. Sally Beauty Holdings has since launched new initiatives to address these customer segments. In any event, we think the stock is invested appropriately in the Fund’s portfolio to help mitigate this risk.
Regardless of the economic outcome, we remain consistent in our long-term investment philosophy: We want to own what we view as strong secular-growth companies with solid business models and competitive positions that we believe can grow market share and have the potential to deliver shareholder value in a variety of market environments.
2
| Performance summary | |
| Delaware Select Growth Fund | October 31, 2013 |
The performance data quoted represent past performance; past performance does not guarantee future results. Investment return and principal value will fluctuate so your shares, when redeemed, may be worth more or less than their original cost. Please obtain the performance data current for the most recent month end by calling 800 523-1918 or visiting our website at delawareinvestments.com/performance. Current performance may be lower or higher than the performance data quoted.
| Fund and benchmark performance1,2 | Average annual total returns through October 31, 2013 |
| | 6 months | | 1 year | | 5 years | | 10 years | |
| Class A (Est. May 16, 1994) | | | | | | | | | |
| Excluding sales charge | | +12.70% | | +24.62% | | +22.64% | | +9.38% | |
| Including sales charge | | +6.23% | | +17.45% | | +21.19% | | +8.73% | |
| Class B (Est. April 16, 1996) | | | | | | | | | |
| Excluding sales charge | | +12.28% | | +23.69% | | +21.74% | | +8.72% | |
| Including sales charge | | +8.28% | | +19.69% | | +21.53% | | +8.72% | |
| Class C (Est. May 20, 1994) | | | | | | | | | |
| Excluding sales charge | | +12.28% | | +23.69% | | +21.74% | | +8.56% | |
| Including sales charge | | +11.28% | | +22.69% | | +21.74% | | +8.56% | |
| Class R (Est. June 2, 2003) | | | | | | | | | |
| Excluding sales charge | | +12.55% | | +24.32% | | +22.34% | | +9.09% | |
| Including sales charge | | +12.55% | | +24.32% | | +22.34% | | +9.09% | |
| Institutional Class (Est. Aug. 28, 1997) | | | | | | | | | |
| Excluding sales charge | | +12.82% | | +24.92% | | +22.96% | | +9.65% | |
| Including sales charge | | +12.82% | | +24.92% | | +22.96% | | +9.65% | |
| Russell 3000 Growth Index | | +13.37% | | +29.16% | | +17.65% | | +7.82% | |
1 Returns reflect the reinvestment of all distributions and are presented both with and without the applicable sales charges described below. Returns do not reflect the deduction of taxes the shareholder would pay on Fund distributions or redemptions of Fund shares.
Expense limitations were in effect for certain classes during some or all of the periods shown in the “Fund performance” chart. Expenses for each class are listed on the “Fund expense ratios” table on page 4. Performance would have been lower had expense limitations not been in effect.
Class A shares are sold with a maximum front-end sales charge of 5.75%, and have an annual distribution and service fee of 0.25% of average daily net assets. Prior to Oct. 1, 2013, Class A shares had an annual distribution and service fee of 0.30% of daily net assets. This fee was contractually limited to 0.25% during the period from May 1, 2013 until Oct. 1, 2013. Performance for Class A shares, excluding sales charges, assumes that no front-end sales charge applied.
Class B shares may be purchased only through dividend reinvestment and certain permitted exchanges as described in the prospectus.
3
Performance summary
Delaware Select Growth Fund
Please see the prospectus for additional information on Class B shares. Class B shares have a contingent deferred sales charge that declines from 4.00% to zero depending on the period of time the shares are held. They are also subject to an annual distribution and service fee of 1.00% of average daily net assets. Class B shares will automatically convert to Class A shares on a quarterly basis approximately eight years after purchase. Ten-year and lifetime performance figures for Class B shares reflect conversion to Class A shares after approximately eight years.
Class C shares are sold with a contingent deferred sales charge of 1.00% if redeemed during the first 12 months. They are also subject to an annual distribution and service fee of 1.00% of average daily net assets.
Performance for Class B and C shares, excluding sales charges, assumes either that contingent deferred sales charges did not apply or that the investment was not redeemed.
Class R shares are available only for certain retirement plan products. They are sold without a sales charge and have an annual distribution and service fee of 0.50% of average daily net assets. Prior to Oct. 1, 2013, Class R shares were subject to an annual distribution and service fee of 0.60%. This fee was contractually limited to 0.50% from May 1, 2013 until Oct. 1, 2013.
Institutional Class shares are available without sales or asset-based distribution charges only to certain eligible institutional accounts.
The “Fund performance” table and the “Performance of a $10,000 investment” graph do not reflect the deduction of taxes the shareholder would pay on Fund distributions or redemptions of Fund shares.
Investments in small and/or medium-sized companies typically exhibit greater risk and higher volatility than larger, more established companies.
International investments entail risks not ordinarily associated with U.S. investments including fluctuation in currency values, differences in accounting principles, or economic or political instability in other nations. Investing in emerging markets can be riskier than investing in established foreign markets due to increased volatility and lower trading volume.
2 The Fund’s expense ratios, as described in the most recent prospectus, are disclosed in the following “Fund expense ratios” table.
| Fund expense ratios | | Class A | | Class B | | Class C | | Class R | | Institutional Class |
| Total annual operating expenses | | 1.27% | | 2.02% | | 2.02% | | 1.52% | | 1.02% |
| (without fee waivers) | | | | | | | | | | |
| Net expenses | | 1.27% | | 2.02% | | 2.02% | | 1.52% | | 1.02% |
| (including fee waivers, if any) | | | | | | | | | | |
| Type of waiver | | n/a | | n/a | | n/a | | n/a | | n/a |
4
Performance of a $10,000 investment1
Average annual total returns from Oct. 31, 2003, through Oct. 31, 2013
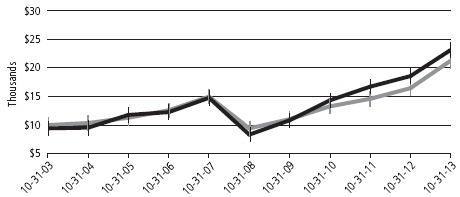
| For period beginning Oct. 31, 2003 through Oct. 31, 2013 | | Starting value | | Ending value |
| | Delaware Select Growth Fund — Class A shares | | $9,425 | | | $23,108 |
| | Russell 3000 Growth Index | | $10,000 | | | $21,229 |
1 The “Performance of a $10,000 investment” graph assumes $10,000 invested in Class A shares of the Fund on Oct. 31, 2003, and includes the effect of a 5.75% front-end sales charge and the reinvestment of all distributions. The graph does not reflect the deduction of taxes the shareholders would pay on Fund distributions or redemptions of Fund shares. Expense limitations were in effect for some or all of the periods shown. Performance would have been lower had expense limitations not been in effect. Expenses are listed in the “Fund expense ratios” table on page 4. Please note additional details on pages 3 through 5.
The chart also assumes $10,000 invested in the Russell 3000 Growth Index as of Oct. 31, 2003. The Russell 3000 Growth Index measures the performance of the broad growth segment of the U.S. equity universe. It includes those Russell 3000 companies with higher price-to-book ratios and higher forecasted growth values.
Index performance returns do not reflect any management fees, transaction costs, or expenses. Indices are unmanaged and one cannot invest directly in an index. Past performance is not a guarantee of future results.
Performance of other Fund classes will vary due to different charges and expenses.
| | Nasdaq symbols | | CUSIPs | |
| Class A | | DVEAX | | 928931104 | |
| Class B | | DVEBX | | 928931849 | |
| Class C | | DVECX | | 928931203 | |
| Class R | | DFSRX | | 928931740 | |
| Institutional Class | | VAGGX | | 928931757 | |
5
Disclosure of Fund expenses
For the six-month period from May 1, 2013 to October 31, 2013 (Unaudited)
As a shareholder of the Fund, you incur two types of costs: (1) transaction costs, including sales charges (loads) on purchase payments, reinvested dividends, or other distributions; redemption fees; and exchange fees; and (2) ongoing costs, including management fees; distribution and/or service (12b-1) fees; and other Fund expenses. This example is intended to help you understand your ongoing costs (in dollars) of investing in the Fund and to compare these costs with the ongoing costs of investing in other mutual funds.
The example is based on an investment of $1,000 invested at the beginning of the period and held for the entire six-month period from May 1, 2013 to Oct. 31, 2013.
Actual expenses
The first section of the table shown, “Actual Fund return,” provides information about actual account values and actual expenses. You may use the information in this section of the table, together with the amount you invested, to estimate the expenses that you paid over the period. Simply divide your account value by $1,000 (for example, an $8,600 account value divided by $1,000 = 8.6), then multiply the result by the number in the first section under the heading entitled “Expenses Paid During Period” to estimate the expenses you paid on your account during this period.
Hypothetical example for comparison purposes
The second section of the table shown, “Hypothetical 5% return,” provides information about hypothetical account values and hypothetical expenses based on the Fund’s actual expense ratio and an assumed rate of return of 5% per year before expenses, which is not the Fund’s actual return. The hypothetical account values and expenses may not be used to estimate the actual ending account balance or expenses you paid for the period. You may use this information to compare the ongoing costs of investing in the Fund and other funds. To do so, compare this 5% hypothetical example with the 5% hypothetical examples that appear in the shareholder reports of the other funds.
Please note that the expenses shown in the table are meant to highlight your ongoing costs only and do not reflect any transactional costs, such as sales charges (loads), redemption fees, or exchange fees. Therefore, the second section of the table is useful in comparing ongoing costs only, and will not help you determine the relative total costs of owning different funds. In addition, if these transactional costs were included, your costs would have been higher. The Fund’s expenses shown in the table reflect fee waivers in effect. The expenses shown in the table assume reinvestment of all dividends and distributions.
6
Delaware Select Growth Fund
Expense analysis of an investment of $1,000
| | Beginning | | Ending | | | | Expenses |
| | Account Value | | Account Value | | Annualized | | Paid During Period |
| | 5/1/13 | | 10/31/13 | | Expense Ratio | | 5/1/13 to 10/31/13* |
| Actual Fund return† | | | | | | | | | | | | | | | |
| Class A | | $ | 1,000.00 | | | $ | 1,127.00 | | | 1.25% | | | $ | 6.70 | |
| Class B | | | 1,000.00 | | | | 1,123.00 | | | 2.00% | | | | 10.70 | |
| Class C | | | 1,000.00 | | | | 1,123.00 | | | 2.00% | | | | 10.70 | |
| Class R | | | 1,000.00 | | | | 1,125.70 | | | 1.50% | | | | 8.04 | |
| Institutional Class | | | 1,000.00 | | | | 1,128.70 | | | 1.00% | | | | 5.37 | |
| Hypothetical 5% return (5% return before expenses) | | | | | | | | |
| Class A | | $ | 1,000.00 | | | $ | 1,018.90 | | | 1.25% | | | $ | 6.36 | |
| Class B | | | 1,000.00 | | | | 1,015.12 | | | 2.00% | | | | 10.16 | |
| Class C | | | 1,000.00 | | | | 1,015.12 | | | 2.00% | | | | 10.16 | |
| Class R | | | 1,000.00 | | | | 1,017.64 | | | 1.50% | | | | 7.63 | |
| Institutional Class | | | 1,000.00 | | | | 1,020.16 | | | 1.00% | | | | 5.09 | |
*“Expenses Paid During Period” are equal to the Fund’s annualized expense ratio, multiplied by the average account value over the period, multiplied by 184/365 (to reflect the one-half year period).
†Because actual returns reflect only the most recent six-month period, the returns shown may differ significantly from fiscal year returns.
7
Security type/sector allocation and
top 10 equity holdings
| Delaware Select Growth Fund | As of October 31, 2013 (Unaudited) |
Sector designations may be different than the sector designations presented in other Fund materials. The sector designations may represent the investment manager’s internal sector classifications, which may result in the sector designations for one fund being different than another fund’s sector designations.
| Security type/sector | Percentage of net assets |
| Common Stock² | 95.33 | % |
| Consumer Discretionary | 22.16 | % |
| Consumer Staples | 1.21 | % |
| Energy | 8.60 | % |
| Financial Services | 16.75 | % |
| Healthcare | 8.83 | % |
| Materials & Processing | 0.37 | % |
| Producer Durables | 4.84 | % |
| Technology | 31.23 | % |
| Utilities | 1.34 | % |
| Warrant | 0.92 | % |
| Short-Term Investments | 2.64 | % |
| Total Value of Securities | 98.89 | % |
| Receivables and Other Assets Net of Liabilities | 1.11 | % |
| Total Net Assets | 100.00 | % |
²Narrow industries are utilized for compliance purposes for diversification whereas broad sectors are used for financial reporting.
Holdings are for informational purposes only and are subject to change at any time. They are not a recommendation to buy, sell, or hold any security.
| Top 10 equity holdings | Percentage of net assets |
| DineEquity | 4.15 | % |
| Microsoft | 4.11 | % |
| EOG Resources | 3.49 | % |
| NeuStar Class A | 3.35 | % |
| QUALCOMM | 3.35 | % |
| Adobe Systems | 3.26 | % |
| Commonwealth REIT | 3.04 | % |
| Crown Castle International | 2.90 | % |
| Celgene | 2.82 | % |
| K12 | 2.73 | % |
8
| Schedule of investments | |
| Delaware Select Growth Fund | October 31, 2013 |
| | | Number of shares | | Value |
| ²Common Stock – 95.33% | | | | |
| Consumer Discretionary – 22.16% | | | | |
| DineEquity | 547,153 | | $ | 44,904,848 |
| Disney (Walt) | 70,000 | | | 4,801,300 |
| † | Dunkin’ Brands Group | 150,575 | | | 7,179,416 |
| † | eBay | 299,425 | | | 15,782,692 |
| HomeAway | 51,325 | | | 1,521,786 |
| Inditex | 24,225 | | | 3,980,164 |
| Intercontinental Hotels Group | 87,025 | | | 2,535,446 |
| † | Interval Leisure Group | 90,500 | | | 2,196,435 |
| K12 | 1,612,550 | | | 29,477,414 |
| † | L Brands | 466,225 | | | 29,190,347 |
| Liberty Interactive Class A | 774,550 | | | 20,881,868 |
| NIKE Class B | 32,600 | | | 2,469,776 |
| † | Pearson | 1,113,494 | | | 23,282,032 |
| † | priceline.com | 23,130 | | | 24,375,088 |
| † | Sally Beauty Holdings | 742,814 | | | 19,550,864 |
| † | Shutterstock | 95,850 | | | 6,786,180 |
| Ulta Salon Cosmetics & Fragrance | 5,025 | | | 647,471 |
| | | | | 239,563,127 |
| Consumer Staples – 1.21% | | | | |
| Walgreen | 220,175 | | | 13,043,167 |
| | | | | 13,043,167 |
| Energy – 8.60% | | | | |
| Core Laboratories | 79,720 | | | 14,925,178 |
| EOG Resources | 211,650 | | | 37,758,360 |
| Kinder Morgan | 767,572 | | | 27,102,967 |
| † | Pioneer Natural Resources | 9,975 | | | 2,042,681 |
| Plains GP Holdings | 364,750 | | | 8,130,278 |
| Williams | 85,000 | | | 3,035,350 |
| | | | | 92,994,814 |
| Financial Services – 16.75% | | | | |
| † | Affiliated Managers Group | 74,175 | | | 14,645,112 |
| † | BM&FBovespa | 668,700 | | | 3,770,309 |
| CBRE Group | 276,750 | | | 6,428,903 |
| CME Group | 81,275 | | | 6,031,418 |
| Commonwealth REIT | 1,348,300 | | | 32,858,070 |
| † | Heartland Payment Systems | 243,050 | | | 9,831,373 |
9
Schedule of investments
Delaware Select Growth Fund
| | | Number of shares | | Value |
| ²Common Stock (continued) | | | | |
| Financial Services (continued) | | | | |
| IntercontinentalExchange | 61,925 | | $ | 11,934,805 |
| Japan Exchange Group | 534,600 | | | 12,325,840 |
| † | MasterCard Class A | 39,660 | | | 28,440,185 |
| MSCI | 379,675 | | | 15,479,350 |
| † | Progressive | 401,675 | | | 10,431,500 |
| RE/MAX Holdings | 117,225 | | | 3,305,745 |
| Visa Class A | 130,025 | | | 25,572,017 |
| | | | | 181,054,627 |
| Healthcare – 8.83% | | | | |
| ABIOMED | 670,150 | | | 16,070,197 |
| † | Allergan | 198,575 | | | 17,992,881 |
| † | athenahealth | 57,575 | | | 7,686,838 |
| † | Celgene | 205,450 | | | 30,507,271 |
| Hologic | 410,275 | | | 9,186,057 |
| Novo Nordisk ADR | 52,025 | | | 8,671,007 |
| Perrigo | 38,425 | | | 5,298,423 |
| | | | | 95,412,674 |
| Materials & Processing – 0.37% | | | | |
| Newmont Mining | 60,200 | | | 1,641,052 |
| Syngenta ADR | 29,975 | | | 2,420,481 |
| | | | | 4,061,533 |
| Producer Durables – 4.84% | | | | |
| Caterpillar | 89,100 | | | 7,427,376 |
| Edenred | 300,459 | | | 10,209,655 |
| Expeditors International of Washington | 182,566 | | | 8,268,414 |
| Experian Group | 104,475 | | | 2,127,510 |
| Graco | 81,375 | | | 6,287,033 |
| Intertek Group | 93,850 | | | 5,014,120 |
| Kone Class B | 114,381 | | | 10,087,530 |
| Localiza Rent a Car | 179,175 | | | 2,919,527 |
| | | | | 52,341,165 |
10
| | | Number of shares | | Value |
| ²Common Stock (continued) | | | | | |
| Technology – 31.23% | | | | | |
| Adobe Systems | | 650,600 | | $ | 35,262,520 |
| Apple | | 23,725 | | | 12,392,754 |
| ARM Holdings ADR | | 35,000 | | | 1,651,650 |
| † | Crown Castle International | | 412,100 | | | 31,327,842 |
| † | Ellie Mae | | 313,350 | | | 9,055,815 |
| † | Google Class A | | 25,160 | | | 25,929,393 |
| Intuit | | 244,125 | | | 17,432,966 |
| † | Microsoft | | 1,258,300 | | | 44,480,904 |
| † | NeuStar Class A | | 787,975 | | | 36,183,812 |
| NIC | | 400,875 | | | 9,869,543 |
| † | QUALCOMM | | 521,250 | | | 36,211,238 |
| † | Teradata | | 385,875 | | | 17,005,511 |
| † | VeriFone Systems | | 1,271,354 | | | 28,808,882 |
| VeriSign | | 157,775 | | | 8,564,027 |
| Yahoo | | 90,000 | | | 2,963,700 |
| Yelp | | 301,625 | | | 20,435,094 |
| | | | | | 337,575,651 |
| Utilities – 1.34% | | | | | |
| j2 Global | | 263,400 | | | 14,481,732 |
| | | | | | 14,481,732 |
| Total Common Stock (cost $753,309,760) | | | | | 1,030,528,490 |
| |
| Warrant – 0.92% | | | | | |
| † | Kinder Morgan CW17 | | | | | |
| strike price $40.00, expiration date 5/25/17 | | 2,317,716 | | | 9,919,824 |
| Total Warrant (cost $5,217,104) | | | | | 9,919,824 |
| |
| | Principal amount | | | |
| Short-Term Investments – 2.64% | | | | | |
| ≠Discount Notes – 0.47% | | | | | |
| Federal Home Loan Bank | | | | | |
| 0.025% 11/15/13 | $ | 474,549 | | | 474,547 |
| 0.05% 12/27/13 | | 927 | | | 927 |
| 0.065% 11/6/13 | | 4,592,034 | | | 4,592,030 |
| | | | | | 5,067,504 |
11
Schedule of investments
Delaware Select Growth Fund
| Principal amount | | Value |
| Short-Term Investments (continued) | | | | | |
| Repurchase Agreements – 0.83% | | | | | |
| Bank of America 0.06%, dated 10/31/13, to be | | | | | |
| repurchased on 11/1/13, repurchase price | | | | | |
| $2,252,427 (collateralized by U.S. government | | | | | |
| obligations 0.625%-1.625% 7/15/14-1/15/15; | | | | | |
| market value $2,297,472) | $ | 2,252,423 | | $ | 2,252,423 |
| BNP Paribas 0.08%, dated 10/31/13, to be | | | | | |
| repurchased on 11/1/13, repurchase price | | | | | |
| $6,774,592 (collateralized by U.S. government | | | | | |
| obligations 0.25%-3.875% 12/15/13-8/15/40; | | | | | |
| market value $6,910,068) | | 6,774,577 | | | 6,774,577 |
| | | | | | 9,027,000 |
| ≠U.S. Treasury Obligations – 1.34% | | | | | |
| U.S. Treasury Bills | | | | | |
| 0.02% 12/19/13 | | 1,235,120 | | | 1,235,068 |
| 0.033% 1/23/14 | | 2,068,721 | | | 2,068,553 |
| 0.053% 11/14/13 | | 8,685,585 | | | 8,685,541 |
| 0.065% 4/24/14 | | 2,482,465 | | | 2,481,534 |
| | | | | | 14,470,696 |
| Total Short-Term Investments (cost $28,565,222) | | | | | 28,565,200 |
| |
| Total Value of Securities – 98.89% | | | | | |
| (cost $787,092,086) | | | | $ | 1,069,013,514 |
| ² | Narrow industries are utilized for compliance purposes for diversification whereas broad sectors are used for financial reporting. |
| † | Non income producing security. |
| ≠ | The rate shown is the effective yield at the time of purchase. |
Summary of abbreviations:
ADR — American Depositary Receipt
REIT — Real Estate Investment Trust
See accompanying notes, which are an integral part of the financial statements.
12
| Statement of assets and liabilities | |
| Delaware Select Growth Fund | October 31, 2013 |
| Assets: | | |
| Investments, at value1 | $ | 1,040,448,314 |
| Short-term investments, at value2 | | 28,565,200 |
| Cash | | 148,978 |
| Receivable for securities sold | | 19,981,523 |
| Dividends and interest receivable | | 920,681 |
| Receivable for fund shares sold | | 1,796,958 |
| Total assets | | 1,091,861,654 |
| |
| Liabilities: | | |
| Payable for securities purchased | | 8,222,826 |
| Payable for fund shares redeemed | | 1,362,900 |
| Investment management fees payable | | 652,611 |
| Distribution fees payable to affiliates | | 217,200 |
| Trustees’ fees payable | | 2,996 |
| Other affiliates payable | | 60,576 |
| Other accrued expenses | | 358,837 |
| Total liabilities | | 10,877,946 |
| |
| Total Net Assets | $ | 1,080,983,708 |
| |
| 1Investments, at cost | $ | 758,526,864 |
| 2Short-term investments, at cost | | 28,565,222 |
| |
| Net Assets Consist of: | | |
| Paid-in capital | $ | 783,288,613 |
| Undistributed net realized gain on investments | | 15,771,019 |
| Net unrealized appreciation of investments and foreign currencies | | 281,924,076 |
| Total Net Assets | $ | 1,080,983,708 |
14
| Net Asset Value | | |
| |
| Class A | | |
| Net assets | $ | 489,286,280 |
| Shares of beneficial interest outstanding, unlimited authorization, no par | | 9,864,966 |
| Net asset value per share | $ | 49.60 |
| Sales charge | | 5.75% |
| Offering price per share, equal to net asset value per share/(1 - sales charge) | $ | 52.63 |
| |
| Class B | | |
| Net assets | $ | 11,235,404 |
| Shares of beneficial interest outstanding, unlimited authorization, no par | | 262,492 |
| Net asset value per share | $ | 42.80 |
| |
| Class C | | |
| Net assets | $ | 115,635,355 |
| Shares of beneficial interest outstanding, unlimited authorization, no par | | 2,730,848 |
| Net asset value per share | $ | 42.34 |
| |
| Class R | | |
| Net assets | $ | 18,680,932 |
| Shares of beneficial interest outstanding, unlimited authorization, no par | | 387,144 |
| Net asset value per share | $ | 48.25 |
| |
| Institutional Class | | |
| Net assets | $ | 446,145,737 |
| Shares of beneficial interest outstanding, unlimited authorization, no par | | 8,623,710 |
| Net asset value per share | $ | 51.73 |
See accompanying notes, which are an integral part of the financial statements.
15
Statement of operations
Delaware Select Growth Fund
| 5/1/13 | | Year |
| to | | Ended |
| 10/31/13* | | 4/30/13 |
| Investment Income: | | | | | | | |
| Dividends | $ | 5,510,062 | | | $ | 9,980,938 | |
| Securities lending income | | 1,047 | | | | 595,404 | |
| Interest | | 6,540 | | | | 180,500 | |
| Foreign tax withheld | | (70,218 | ) | | | (264,084 | ) |
| | | 5,447,431 | | | | 10,492,758 | |
| Expenses: | | | | | | | |
| Management fees | | 3,713,775 | | | | 6,311,672 | |
| Distribution expenses – Class A | | 598,037 | | | | 1,033,509 | |
| Distribution expenses – Class B | | 67,048 | | | | 193,964 | |
| Distribution expenses – Class C | | 563,985 | | | | 1,083,618 | |
| Distribution expenses – Class R | | 48,263 | | | | 61,339 | |
| Dividend disbursing and transfer agent fees and expenses | | 932,499 | | | | 1,692,527 | |
| Accounting and administration expenses | | 198,966 | | | | 336,398 | |
| Registration fees | | 86,326 | | | | 136,700 | |
| Reports and statements to shareholders | | 62,160 | | | | 140,775 | |
| Legal fees | | 55,233 | | | | 90,933 | |
| Custodian fees | | 25,229 | | | | 45,611 | |
| Trustees’ fees | | 24,086 | | | | 38,017 | |
| Audit and tax | | 21,140 | | | | 39,620 | |
| Insurance | | 7,667 | | | | 12,243 | |
| Dues and services | | 6,764 | | | | 12,271 | |
| Consulting fees | | 4,032 | | | | 9,486 | |
| Pricing fees | | 3,201 | | | | 5,766 | |
| Trustees’ expenses | | 1,568 | | | | 2,500 | |
| | | 6,419,979 | | | | 11,246,949 | |
| Less waived distribution expenses – Class R | | (6,767 | ) | | | (10,223 | ) |
| Less expense paid indirectly | | (460 | ) | | | (1,761 | ) |
| Total operating expenses | | 6,412,752 | | | | 11,234,965 | |
| Net Investment Loss | | (965,321 | ) | | | (742,207 | ) |
16
| 5/1/13 | | Year |
| to | | Ended |
| 10/31/13* | | 4/30/13 |
| Net Realized and Unrealized Gain (Loss): | | | | | | | |
| Net realized gain (loss) on: | | | | | | | |
| Investments | $ | 67,382,377 | | | $ | 27,621,381 | |
| Foreign currencies | | 29,082 | | | | (135,561 | ) |
| Foreign currency exchange contracts | | (108,533 | ) | | | (82,413 | ) |
| Net realized gain | | 67,302,926 | | | | 27,403,407 | |
| Net change in unrealized appreciation (depreciation) of: | | | | | | | |
| Investments | | 56,026,998 | | | | 51,293,571 | |
| Foreign currencies | | (6,906 | ) | | | 9,897 | |
| Net change in unrealized appreciation (depreciation) | | 56,020,092 | | | | 51,303,468 | |
| Net Realized and Unrealized Gain | | 123,323,018 | | | | 78,706,875 | |
| |
| Net Increase in Net Assets Resulting from Operations | $ | 122,357,697 | | | $ | 77,964,668 | |
*During the period ended Oct. 31, 2013, the Fund changed its fiscal year end from April to October.
See accompanying notes, which are an integral part of the financial statements.
17
Statements of changes in net assets
Delaware Select Growth Fund
| | 5/1/13 | | Year | | Year |
| | to | | Ended | | Ended |
| | 10/31/13* | | 4/30/13 | | 4/30/12 |
| Increase (Decrease) in Net Assets | | | | | | | | | | | | |
| from Operations: | | | | | | | | | | | | |
| Net investment loss | | $ | (965,321 | ) | | $ | (742,207 | ) | | $ | (3,285,530 | ) |
| Net realized gain | | | 67,302,926 | | | | 27,403,407 | | | | 25,562,463 | |
| Net change in unrealized | | | | | | | | | | | | |
| appreciation (depreciation) | | | 56,020,092 | | | | 51,303,468 | | | | 42,672,672 | |
| Net increase in net assets resulting | | | | | | | | | | | | |
| from operations | | | 122,357,697 | | | | 77,964,668 | | | | 64,949,605 | |
| |
| Capital Share Transactions: | | | | | | | | | | | | |
| Proceeds from shares sold: | | | | | | | | | | | | |
| Class A | | | 38,390,794 | | | | 167,465,075 | | | | 146,892,525 | |
| Class B | | | 34,863 | | | | 51,136 | | | | 142,252 | |
| Class C | | | 2,767,596 | | | | 14,253,901 | | | | 41,802,908 | |
| Class R | | | 6,248,260 | | | | 7,537,369 | | | | 6,150,134 | |
| Institutional Class | | | 80,689,197 | | | | 244,103,444 | | | | 161,797,165 | |
| | | 128,130,710 | | | | 433,410,925 | | | | 356,784,984 | |
| Cost of shares redeemed: | | | | | | | | | | | | |
| Class A | | | (69,896,815 | ) | | | (125,285,078 | ) | | | (62,290,416 | ) |
| Class B | | | (5,702,166 | ) | | | (10,281,457 | ) | | | (9,411,497 | ) |
| Class C | | | (9,250,903 | ) | | | (21,729,850 | ) | | | (12,787,585 | ) |
| Class R | | | (3,019,236 | ) | | | (4,282,240 | ) | | | (2,105,979 | ) |
| Institutional Class | | | (52,708,212 | ) | | | (149,958,269 | ) | | | (59,536,585 | ) |
| | | | (140,577,332 | ) | | | (311,536,894 | ) | | | (146,132,062 | ) |
| Increase (decrease )in net assets derived | | | | | | | | | | | | |
| from capital share transactions | | | (12,446,622 | ) | | | 121,874,031 | | | | 210,652,922 | |
| Net Increase in Net Assets | | | 109,911,075 | | | | 199,838,699 | | | | 275,602,527 | |
| |
| Net Assets: | | | | | | | | | | | | |
| Beginning of period | | | 971,072,633 | | | | 771,233,934 | | | | 495,631,407 | |
| End of period (including accumulated net | | | | | | | | | | | | |
| investment loss of $—, $337,089, and | | | | | | | | | | | | |
| $1,100,717, respectively) | | $ | 1,080,983,708 | | | $ | 971,072,633 | | | $ | 771,233,934 | |
*During the period ended Oct. 31, 2013, the Fund changed its fiscal year end from April to October.
See accompanying notes, which are an integral part of the financial statements.
18
Financial highlights
Delaware Select Growth Fund Class A
Selected data for each share of the Fund outstanding throughout each period were as follows:
| Net asset value, beginning of period |
| |
| Income (loss) from investment operations: |
| Net investment loss2 |
| Net realized and unrealized gain (loss) |
| Total from investment operations |
| |
| Net asset value, end of period |
| |
| Total return3 |
| |
| Ratios and supplemental data: |
| Net assets, end of period (000 omitted) |
| Ratio of expenses to average net assets |
| Ratio of expenses to average net assets |
| prior to fees waived |
| Ratio of net investment loss to average net assets |
| Ratio of net investment loss to average net assets |
| prior to fees waived |
| Portfolio turnover |
1 During the period ended Oct. 31, 2013, the Fund changed its fiscal year end from April to October. Ratios have been annualized and portfolio turnover and total return have not been annualized.
2 The average shares outstanding method has been applied for per share information.
3 Total investment return is based on the change in net asset value of a share during the period and assumes reinvestment of dividends and distributions at net asset value and does not reflect the impact of a sales charge. Total investment return during some of the periods shown reflects a waiver by the manager. Performance would have been lower had the waiver not been in effect.
See accompanying notes, which are an integral part of the financial statements.
20
| 5/1/13 | | | | | | | | | | | | | | | | |
| to | | Year Ended | |
| 10/31/131 | | 4/30/13 | | 4/30/12 | | 4/30/11 | | 4/30/10 | | 4/30/09 | |
| $44.010 | | | $40.730 | | | $36.730 | | | $27.950 | | | $18.860 | | | $27.300 | | |
| | | |
| | | |
| (0.045 | ) | | (0.025 | ) | | (0.194 | ) | | (0.139 | ) | | (0.209 | ) | | (0.041 | ) | |
| 5.635 | | | 3.305 | | | 4.194 | | | 8.919 | | | 9.299 | | | (8.399 | ) | |
| 5.590 | | | 3.280 | | | 4.000 | | | 8.780 | | | 9.090 | | | (8.440 | ) | |
| | | |
| $49.600 | | | $44.010 | | | $40.730 | | | $36.730 | | | $27.950 | | | $18.860 | | |
| | | |
| 12.70% | | | 8.05% | | | 10.89% | | | 31.41% | | | 48.20% | | | (30.92% | ) | |
| | | |
| | | |
| $489,286 | | | $463,627 | | | $386,254 | | | $267,563 | | | $150,016 | | | $106,919 | | |
| 1.25% | | | 1.27% | | | 1.35% | | | 1.51% | | | 1.50% | | | 1.49% | | |
| | | |
| 1.25% | | | 1.27% | | | 1.35% | | | 1.58% | | | 1.73% | | | 1.85% | | |
| (0.19% | ) | | (0.06% | ) | | (0.53% | ) | | (0.45% | ) | | (0.89% | ) | | (0.20% | ) | |
| | | |
| | (0.19% | ) | | (0.06% | ) | | (0.53% | ) | | (0.52% | ) | | (1.12% | ) | | (0.56% | ) | |
| 20% | | | 38% | | | 25% | | | 41% | | | 49% | | | 66% | | |
21
Financial highlights
Delaware Select Growth Fund Class B
Selected data for each share of the Fund outstanding throughout each period were as follows:
| Net asset value, beginning of period |
| |
| Income (loss) from investment operations: |
| Net investment loss2 |
| Net realized and unrealized gain (loss) |
| Total from investment operations |
| |
| Net asset value, end of period |
| |
| Total return3 |
| |
| Ratios and supplemental data: |
| Net assets, end of period (000 omitted) |
| Ratio of expenses to average net assets |
| Ratio of expenses to average net assets |
| prior to fees waived |
| Ratio of net investment loss to average net assets |
| Ratio of net investment loss to average net assets |
| prior to fees waived |
| Portfolio turnover |
1 During the period ended Oct. 31, 2013, the Fund changed its fiscal year end from April to October. Ratios have been annualized and portfolio turnover and total return have not been annualized.
2 The average shares outstanding method has been applied for per share information.
3 Total investment return is based on the change in net asset value of a share during the period and assumes reinvestment of dividends and distributions at net asset value and does not reflect the impact of a sales charge. Total investment return during some of the periods shown reflects a waiver by the manager. Performance would have been lower had the waiver not been in effect.
See accompanying notes, which are an integral part of the financial statements.
22
| 5/1/13 | | | |
| to | | Year Ended | |
| 10/31/131 | | 4/30/13 | | 4/30/12 | | 4/30/11 | | 4/30/10 | | 4/30/09 | |
| $38.120 | | | $35.550 | | | $32.300 | | | $24.760 | | | $16.830 | | | $24.550 | | |
| | | | |
| | | | |
| (0.191 | ) | | (0.285 | ) | | (0.408 | ) | | (0.333 | ) | | (0.355 | ) | | (0.182 | ) | |
| 4.871 | | | 2.855 | | | 3.658 | | | 7.873 | | | 8.285 | | | (7.538 | ) | |
| 4.680 | | | 2.570 | | | 3.250 | | | 7.540 | | | 7.930 | | | (7.720 | ) | |
| | | | |
| $42.800 | | | $38.120 | | | $35.550 | | | $32.300 | | | $24.760 | | | $16.830 | | |
| | | | |
| 12.28% | | | 7.23% | | | 10.06% | | | 30.45% | | | 47.12% | | | (31.45% | ) | |
| | | | |
| | | | |
| $11,236 | | | $15,328 | | | $24,562 | | | $31,713 | | | $15,012 | | | $19,222 | | |
| 2.00% | | | 2.02% | | | 2.10% | | | 2.26% | | | 2.25% | | | 2.24% | | |
| | | | |
| 2.00% | | | 2.02% | | | 2.10% | | | 2.33% | | | 2.48% | | | 2.60% | | |
| (0.94% | ) | | (0.81% | ) | | (1.28% | ) | | (1.20% | ) | | (1.64% | ) | | (0.95% | ) | |
| | | | |
| (0.94% | ) | | (0.81% | ) | | (1.28% | ) | | (1.27% | ) | | (1.87% | ) | | (1.31%) | | |
| 20% | | | 38% | | | 25% | | | 41% | | | 49% | | | 66% | | |
23
Financial highlights
Delaware Select Growth Fund Class C
Selected data for each share of the Fund outstanding throughout each period were as follows:
| Net asset value, beginning of period |
| |
| Income (loss) from investment operations: |
| Net investment loss2 |
| Net realized and unrealized gain (loss) |
| Total from investment operations |
| |
| Net asset value, end of period |
| |
| Total return3 |
| |
| Ratios and supplemental data: |
| Net assets, end of period (000 omitted) |
| Ratio of expenses to average net assets |
| Ratio of expenses to average net assets |
| prior to fees waived |
| Ratio of net investment loss to average net assets |
| Ratio of net investment loss to average net assets |
| prior to fees waived |
| Portfolio turnover |
1 During the period ended Oct. 31, 2013, the Fund changed its fiscal year end from April to October. Ratios have been annualized and portfolio turnover and total return have not been annualized.
2 The average shares outstanding method has been applied for per share information.
3 Total investment return is based on the change in net asset value of a share during the period and assumes reinvestment of dividends and distributions at net asset value and does not reflect the impact of a sales charge. Total investment return during some of the periods shown reflects a waiver by the manager. Performance would have been lower had the waiver not been in effect.
See accompanying notes, which are an integral part of the financial statements.
24
| 5/1/13 | | | | | | | | | | | | | | | | |
| to | | Year Ended | |
| 10/31/131 | | 4/30/13 | | 4/30/12 | | 4/30/11 | | 4/30/10 | | 4/30/09 | |
| $37.710 | | | $35.170 | | | $31.950 | | | $24.500 | | | $16.650 | | | $24.290 | | |
| | | |
| | | |
| (0.189 | ) | | (0.282 | ) | | (0.406 | ) | | (0.329 | ) | | (0.357 | ) | | (0.173 | ) | |
| 4.819 | | | 2.822 | | | 3.626 | | | 7.779 | | | 8.207 | | | (7.467 | ) | |
| 4.630 | | | 2.540 | | | 3.220 | | | 7.450 | | | 7.850 | | | (7.640 | ) | |
| | | |
| $42.340 | | | $37.710 | | | $35.170 | | | $31.950 | | | $24.500 | | | $16.650 | | |
| | | |
| 12.28% | | | 7.22% | | | 10.08% | | | 30.41% | | | 47.15% | | | (31.45% | ) | |
| | | |
| | | |
| $115,635 | | | $109,164 | | | $108,994 | | | $71,800 | | | $29,502 | | | $23,030 | | |
| 2.00% | | | 2.02% | | | 2.10% | | | 2.26% | | | 2.25% | | | 2.24% | | |
| | | |
| 2.00% | | | 2.02% | | | 2.10% | | | 2.33% | | | 2.48% | | | 2.60% | | |
| (0.94% | ) | | (0.81% | ) | | (1.28% | ) | | (1.20% | ) | | (1.64% | ) | | (0.95% | ) | |
| | | |
| (0.94% | ) | | (0.81% | ) | | (1.28% | ) | | (1.27% | ) | | (1.87% | ) | | (1.31% | ) | |
| 20% | | | 38% | | | 25% | | | 41% | | | 49% | | | 66% | | |
25
Financial highlights
Delaware Select Growth Fund Class R
Selected data for each share of the Fund outstanding throughout each period were as follows:
| Net asset value, beginning of period |
| |
| Income (loss) from investment operations: |
| Net investment loss2 |
| Net realized and unrealized gain (loss) |
| Total from investment operations |
| |
| Net asset value, end of period |
| |
| Total return3 |
| |
| Ratios and supplemental data: |
| Net assets, end of period (000 omitted) |
| Ratio of expenses to average net assets |
| Ratio of expenses to average net assets |
| prior to fees waived |
| Ratio of net investment loss to average net assets |
| Ratio of net investment loss to average net assets |
| prior to fees waived |
| Portfolio turnover |
1 During the period ended Oct. 31, 2013, the Fund changed its fiscal year end from April to October. Ratios have been annualized and portfolio turnover and total return have not been annualized.
2 The average shares outstanding method has been applied for per share information.
3 Total investment return is based on the change in net asset value of a share during the period and assumes reinvestment of dividends and distributions at net asset value. Total investment return during all of the periods shown reflects waivers by the manager and/or distributor. Performance would have been lower had the waivers not been in effect.
See accompanying notes, which are an integral part of the financial statements.
26
| 5/1/13 | | | | | | | | | | | | | | | | |
| to | | Year Ended | |
| 10/31/131 | | 4/30/13 | | 4/30/12 | | 4/30/11 | | 4/30/10 | | 4/30/09 | |
| $42.870 | | | $39.770 | | | $35.960 | | | $27.430 | | | $18.550 | | | $26.930 | | |
| | | |
| | | |
| (0.101 | ) | | (0.124 | ) | | (0.282 | ) | | (0.222 | ) | | (0.265 | ) | | (0.092 | ) | |
| 5.481 | | | 3.224 | | | 4.092 | | | 8.752 | | | 9.145 | | | (8.288 | ) | |
| 5.380 | | | 3.100 | | | 3.810 | | | 8.530 | | | 8.880 | | | (8.380 | ) | |
| | | |
| $48.250 | | | $42.870 | | | $39.770 | | | $35.960 | | | $27.430 | | | $18.550 | | |
| | | |
| 12.55% | | | 7.79% | | | 10.60% | | | 31.10% | | | 47.87% | | | (31.12% | ) | |
| | | |
| | | |
| $18,681 | | | $13,428 | | | $9,294 | | | $4,607 | | | $807 | | | $671 | | |
| 1.50% | | | 1.52% | | | 1.60% | | | 1.76% | | | 1.75% | | | 1.74% | | |
| | | |
| 1.58% | | | 1.62% | | | 1.70% | | | 1.93% | | | 2.08% | | | 2.20% | | |
| (0.44% | ) | | (0.31% | ) | | (0.78% | ) | | (0.70% | ) | | (1.14% | ) | | (0.45% | ) | |
| | | |
| (0.56% | ) | | (0.41% | ) | | (0.88% | ) | | (0.87% | ) | | (1.47% | ) | | (0.91% | ) | |
| 20% | | | 38% | | | 25% | | | 41% | | | 49% | | | 66% | | |
27
Financial highlights
Delaware Select Growth Fund Institutional Class
Selected data for each share of the Fund outstanding throughout each period were as follows:
| Net asset value, beginning of period |
| |
| Income (loss) from investment operations: |
| Net investment income (loss)2 |
| Net realized and unrealized gain (loss) |
| Total from investment operations |
| |
| Net asset value, end of period |
| |
| Total return3 |
| |
| Ratios and supplemental data: |
| Net assets, end of period (000 omitted) |
| Ratio of expenses to average net assets |
| Ratio of expenses to average net assets |
| prior to fees waived |
| Ratio of net investment income (loss) to average net assets |
| Ratio of net investment income (loss) to average net assets |
| prior to fees waived |
| Portfolio turnover |
1 During the period ended Oct. 31, 2013, the Fund changed its fiscal year end from April to October. Ratios have been annualized and portfolio turnover and total return have not been annualized.
2 The average shares outstanding method has been applied for per share information.
3 Total investment return is based on the change in net asset value of a share during the period and assumes reinvestment of dividends and distributions at net asset value. Total investment return during some of the periods shown reflects a waiver by the manager. Performance would have been lower had the waiver not been in effect.
See accompanying notes, which are an integral part of the financial statements.
28
| 5/1/13 | | | | | | | | | | | | | | | | |
| to | | Year Ended |
| 10/31/131 | | 4/30/13 | | 4/30/12 | | 4/30/11 | | 4/30/10 | | 4/30/09 | |
| $45.850 | | | $42.320 | | | $38.070 | | | $28.900 | | | $19.450 | | | $28.090 | | |
| | |
| | |
| | 0.015 | | | 0.079 | | | (0.107 | ) | | (0.063 | ) | | (0.150 | ) | | 0.010 | | |
| 5.865 | | | 3.451 | | | 4.357 | | | 9.233 | | | 9.600 | | | (8.650 | ) | |
| 5.880 | | | 3.530 | | | 4.250 | | | 9.170 | | | 9.450 | | | (8.640 | ) | |
| | |
| $51.730 | | | $45.850 | | | $42.320 | | | $38.070 | | | $28.900 | | | $19.450 | | |
| | |
| 12.82% | | | 8.34% | | | 11.16% | | | 31.73% | | | 48.59% | | | (30.76% | ) | |
| | |
| | |
| $446,146 | | | $369,526 | | | $242,130 | | | $119,948 | | | $53,651 | | | $45,149 | | |
| 1.00% | | | 1.02% | | | 1.10% | | | 1.26% | | | 1.25% | | | 1.24% | | |
| | |
| 1.00% | | | 1.02% | | | 1.10% | | | 1.33% | | | 1.48% | | | 1.60% | | |
| 0.06% | | | 0.19% | | | (0.28% | ) | | (0.20% | ) | | (0.64% | ) | | 0.05% | | |
| | |
| 0.06% | | | 0.19% | | | (0.28% | ) | | (0.27% | ) | | (0.87% | ) | | (0.31% | ) | |
| 20% | | | 38% | | | 25% | | | 41% | | | 49% | | | 66% | | |
29
| Notes to financial statements | |
| Delaware Select Growth Fund | October 31, 2013 |
Voyageur Mutual Funds III (Trust) is organized as a Delaware statutory trust and offers two series: Delaware Large Cap Core Fund and Delaware Select Growth Fund. These financial statements and the related notes pertain to Delaware Select Growth Fund (Fund). The Trust is an open-end investment company. The Fund is considered diversified under the Investment Company Act of 1940, as amended, and offers Class A, Class B, Class C, Class R and Institutional Class shares. Class A shares are sold with a maximum front-end sales charge of 5.75%. Class A share purchases of $1,000,000 or more will incur a contingent deferred sales charge (CDSC) of 1.00% if redeemed during the first year and 0.50% during the second year, provided that Delaware Distributors, L.P. (DDLP) paid a financial advisor a commission on the purchase of those shares. Class B shares may be purchased only through dividend reinvestment and certain permitted exchanges. Prior to June 1, 2007, Class B shares were sold with a CDSC that declined from 4.00% to zero depending upon the period of time the shares were held. Class B shares will automatically convert to Class A shares on a quarterly basis approximately eight years after purchase. Class C shares are sold with a CDSC of 1.00%, if redeemed during the first twelve months. Class R and Institutional Class shares are not subject to a sales charge and are offered for sale exclusively to certain eligible investors.
The investment objective of the Fund is to seek long-term capital appreciation, which the Fund attempts to achieve by investing primarily in equity securities of companies the manager believes have long-term capital appreciation potential and are expected to grow faster than the U.S. economy.
In May 2013, the Fund’s Board of Trustees (Board) approved changing the Fund’s fiscal year-end from April 30 to October 31, effective Oct. 31, 2013.
1. Significant Accounting Policies
The following accounting policies are in accordance with U.S. generally accepted accounting principles (U.S. GAAP) and are consistently followed by the Fund.
Security Valuation — Equity securities, except those traded on the Nasdaq Stock Market, Inc. (Nasdaq), are valued at the last quoted sales price as of the time of the regular close of the New York Stock Exchange on the valuation date. Securities traded on the Nasdaq are valued in accordance with the Nasdaq Official Closing Price, which may not be the last sales price. If on a particular day an equity security does not trade, then the mean between the bid and ask prices will be used, which approximates fair value. Securities listed on a foreign exchange are normally valued at the last quoted sales price on the valuation date. U.S. government and agency securities are valued at the mean between the bid and ask prices, which approximates fair value. Investment company securities are valued at net asset value per share, as reported by the underlying investment company. Foreign currency exchange contracts and forward foreign cross currency exchange contracts are valued at the mean between the bid and ask prices, which approximates fair value. Interpolated values are derived when the settlement date of the contract is an interim date for which quotations are not available. Generally, other securities and assets for which market quotations are not readily available are valued at fair value as determined in good faith under the direction of the Fund’s Board of Trustees (Board). In determining whether market quotations are
30
readily available or fair valuation will be used, various factors will be taken into consideration, such as market closures or suspension of trading in a security. The Fund may use fair value pricing more frequently for securities traded primarily in non-U.S. markets because, among other things, most foreign markets close well before the Fund values its securities, generally as of 4:00 p.m. Eastern time. The earlier close of these foreign markets gives rise to the possibility that significant events, including broad market moves, government actions or pronouncements, aftermarket trading, or news events may have occurred in the interim. To account for this, the Fund may frequently value foreign securities using fair value prices based on third-party vendor modeling tools (international fair value pricing).
Federal & Foreign Income Taxes — No provision for federal income taxes has been made as the Fund intends to continue to qualify for federal income tax purposes as a regulated investment company under Subchapter M of the Internal Revenue Code of 1986, as amended, and make the requisite distributions to shareholders. The Fund evaluates tax positions taken or expected to be taken in the course of preparing the Fund’s tax returns to determine whether the tax positions are “more-likely-than-not” of being sustained by the applicable tax authority. Tax positions not deemed to meet the “more-likely-than-not” threshold are recorded as a tax benefit or expense in the current year. Management has analyzed the Fund’s tax positions taken for all open federal income tax years (April 30, 2010–Oct. 31, 2013), and has concluded that no provision for federal income tax is required in the Fund’s financial statements. In regard to foreign taxes only, the Fund has open tax years in certain foreign countries it invests in that may date back to the inception date of the Fund.
Class Accounting — Investment income, common expenses and realized and unrealized gain (loss) on investments are allocated to the various classes of the Fund on the basis of daily net assets of each class. Distribution expenses relating to a specific class are charged directly to that class.
Foreign Currency Transactions — Transactions denominated in foreign currencies are recorded at the prevailing exchange rates on the valuation date in accordance with the Fund’s prospectus. The value of all assets and liabilities denominated in foreign currencies is translated daily into U.S. dollars at the exchange rate of such currencies against the U.S. dollar. Transaction gains or losses resulting from changes in exchange rates during the reporting period or upon settlement of the foreign currency transaction are reported in operations for the current period. The Fund generally does not bifurcate that portion of realized gains and losses on investments which is due to changes in foreign exchange rates from that which is due to changes in market prices. The changes are included with the net realized and unrealized gain or loss on investments. The Fund reports foreign capital gain taxes and foreign currency related transactions as components of realized gains (losses) for financial reporting purposes, whereas such components are treated as ordinary income (loss) for federal income tax purposes.
Repurchase Agreements — The Fund may purchase certain U.S. government securities subject to the counterparty’s agreement to repurchase them at an agreed upon date and price. The counterparty will be required on a daily basis to maintain the value of the collateral subject to the
31
Notes to financial statements
Delaware Select Growth Fund
1. Significant Accounting Policies (continued)
agreement at not less than the repurchase price (including accrued interest). The agreements are conditioned upon the collateral being deposited under the Federal Reserve book-entry system with the Fund’s custodian or a third party sub-custodian. In the event of default or bankruptcy by the other party to the agreement, retention of the collateral may be subject to legal proceedings. All open repurchase agreements as of the date of this report were entered into on Oct. 31, 2013.
Use of Estimates — The preparation of financial statements in conformity with U.S. GAAP requires management to make estimates and assumptions that affect the fair value of investments, the reported amounts of assets and liabilities and disclosure of contingent assets and liabilities at the date of the financial statements and the reported amounts of revenues and expenses during the reporting period. Actual results could differ from those estimates and the differences could be material.
Other — Expenses directly attributable to the Fund are charged directly to the Fund. Other expenses common to various funds within the Delaware Investments® Family of Funds are generally allocated among such funds on the basis of average net assets. Management fees and some other expenses are paid monthly. Security transactions are recorded on the date the securities are purchased or sold (trade date) for financial reporting purposes. Costs used in calculating realized gains and losses on the sale of investment securities are those of the specific securities sold. Dividend income is recorded on the ex-dividend date and interest income is recorded on the accrual basis. Taxable non-cash dividends are recorded as dividend income. Foreign dividends are also recorded on the ex-dividend date or as soon after the ex-dividend date that the Fund is aware of such dividends, net of all tax withholdings, a portion of which may be reclaimable. Withholding taxes and reclaims on foreign dividends have been recorded in accordance with the Fund’s understanding of the applicable country’s tax rules and rates. The Fund declares and pays distributions from net investment income and net realized gain on investments, if any, at least annually, and may distribute more frequently, if necessary for tax purposes. Dividends and distributions, if any, are recorded on the ex-dividend date.
Subject to seeking best execution, the Fund may direct certain security trades to brokers who have agreed to rebate a portion of the related brokerage commission to the Fund in cash. Such commission rebates are included in realized gain on investments in the accompanying financial statements and totaled $191 for the period ended Oct. 31, 2013. In general, best execution refers to many factors, including the price paid or received for a security, the commission charged, the promptness and reliability of execution, the confidentiality and placement accorded the order, and other factors affecting the overall benefit obtained by the Fund on the transaction.
The Fund may receive earnings credits from its custodian when positive cash balances are maintained, which are used to offset custody fees. There were no earnings credits for the period May 1, 2013 to Oct. 31, 2013 and year ended April 30, 2013.
32
The Fund receives earnings credits from its transfer agent when positive cash balances are maintained, which are used to offset transfer agent fees. If the amount earned is greater than one dollar, the expense paid under this arrangement is included in dividend disbursing and transfer agent fees and expenses on the statement of operations with the corresponding expense offset shown as “expense paid indirectly.” For the period May 1, 2013 to Oct. 31, 2013 and year ended April 30, 2013, the Fund earned $460 and $1,761, respectively, under this agreement.
2. Investment Management, Administration Agreements and Other Transactions with Affiliates
In accordance with the terms of its investment management agreement, the Fund pays Delaware Management Company (DMC), a series of Delaware Management Business Trust and the investment manager, an annual fee which is calculated daily at the rate of 0.75% on the first $500 million of average daily net assets of the Fund, 0.70% on the next $500 million, 0.65% on the next $1.5 billion, and 0.60% on average daily net assets in excess of $2.5 billion.
Delaware Service Company, Inc. (DSC), an affiliate of DMC, provides fund accounting and financial administration oversight services to the Fund. For these services, the Fund pays DSC fees based on the aggregate daily net assets of the Delaware Investments® Family of Funds at the following annual rate: 0.0050% of the first $30 billion; 0.0045% of the next $10 billion; 0.0040% of the next $10 billion; and 0.0025% of aggregate average daily net assets in excess of $50 billion. The fees payable to DSC under the service agreement described above are allocated among all Funds in the Delaware Investments Family of Funds on a relative net asset value basis. For the period May 1, 2013 to Oct. 31, 2013 and year ended April 30, 2013, the Fund was charged $ 24,861 and $42,113, respectively, for these services.
DSC is also the transfer agent and dividend disbursing agent of the Fund. For these services, the Fund pays DSC fees based on the aggregate daily net assets of the retail funds within the Delaware Investments Family of Funds at the following annual rate: 0.025% of the first $20 billion; 0.020% of the next $5 billion; 0.015% of the next $5 billion; and 0.013% on average daily net assets in excess of $30 billion. Pursuant to a sub-transfer agency agreement between DSC and BNY Mellon Investment Servicing (US) Inc. (BNYMIS), BNYMIS provides certain sub-transfer agency services to the Fund. Sub-transfer agency fees are passed on to and paid directly by the Fund. These amounts are included in the statements of operations as dividend disbursing and transfer agent fees and expenses. For the period May 1, 2013 to Oct. 31, 2013 and year ended April 30, 2013, the amounts charged by DSC and BNYMIS were $274,137 and $658,362, and $1,353,191 and $339,336, respectively.
Pursuant to a distribution agreement and distribution plan, the Fund pays DDLP, the distributor and an affiliate of DMC, an annual distribution and service fee of 0.25% of the average daily net assets of the Class A shares and 1.00% of the average daily net assets of the Class B and Class C shares. Effective Oct. 1, 2013, the Fund pays DDLP distribution and service fees of 0.50% of the average daily net assets of the Class R shares. Prior to Oct. 1, 2013, the Fund paid DDLP an annual distribution and service fee of 0.60% of the average daily net assets of the Class R shares.
33
Notes to financial statements
Delaware Select Growth Fund
2. Investment Management, Administration Agreements and Other Transactions with Affiliates (continued)
For the period from May 1, 2013 to Oct. 1, 2013, the distribution and service fee for Class R were contractually limited to 0.50% of the class average daily net assets. Institutional Class shares pay no distribution and service expenses.
As provided in the investment management agreement, the Fund bears the cost of certain legal and tax services, including internal legal and tax services provided to the Fund by DMC and/or its affiliates’ employees. For the period May 1, 2013 to Oct. 31, 2013 and year ended April 30, 2013, the Fund was charged $ 16,765 and $24,809 for internal legal and tax services provided by DMC and/or its affiliates’ employees.
For the period May 1, 2013 to Oct. 31, 2013 and year ended April 30, 2013, DDLP earned $9,792 and $72,944, respectively, for commissions on sales of the Fund’s Class A shares. For the period May 1, 2013 to Oct. 31, 2013 and year ended April 30, 2013, DDLP received gross CDSC commissions on redemptions of the Fund’s Class A, Class B and Class C shares, respectively, and these commissions were entirely used to offset up-front commissions previously paid by DDLP to broker/dealers on sales of those shares. The amounts received were as follows:
| | Period May 1, 2013 | | Year Ended |
| | to Oct. 31, 2013 | | April 31, 2013 |
| Class A | | | $ | — | | | | $ | 27,282 | |
| Class B | | | | 3 | | | | | 2,055 | |
| Class C | | | | 3,295 | | | | | 26,431 | |
Trustees’ fees include expenses accrued by the Fund for each Trustee’s retainer and meeting fees. Certain officers of DMC, DSC and DDLP are officers and/or Trustees of the Trust. These officers and Trustees are paid no compensation by the Fund.
3. Investments
For the period May 1, 2013 to Oct. 31, 2013, the Fund made purchases of $198,350,685 and sales of $ 223,998,213 of investment securities other than short-term investments.
At Oct. 31, 2013, the cost of investments for federal income tax purposes was $ 788,503,837. At Oct. 31, 2013, net unrealized appreciation was $ 280,509,677, of which $299,313,270 related to unrealized appreciation of investments and $ 18,803,593 related to unrealized depreciation of investments.
U.S. GAAP defines fair value as the price that the Fund would receive to sell an asset or pay to transfer a liability in an orderly transaction between market participants at the measurement date under current market conditions. A three-level hierarchy for fair value measurements has been established based upon the transparency of inputs to the valuation of an asset or liability. Inputs may be observable or unobservable and refer broadly to the assumptions that market participants would use in pricing the asset or liability. Observable inputs reflect the assumptions market participants would use in pricing the asset or liability based on market data obtained from
34
sources independent of the reporting entity. Unobservable inputs reflect the reporting entity’s own assumptions about the assumptions that market participants would use in pricing the asset or liability developed based on the best information available under the circumstances. The Fund’s investment in its entirety is assigned a level based upon the observability of the inputs which are significant to the overall valuation. The three-level hierarchy of inputs is summarized below.
| Level 1 – | inputs are quoted prices in active markets for identical investments (e.g., equity securities, open-end investment companies, futures contracts, exchange-traded options contracts) |
| | |
| Level 2 – | other observable inputs (including, but not limited to: quoted prices for similar assets or liabilities in markets that are active, quoted prices for identical or similar assets or liabilities in markets that are not active, inputs other than quoted prices that are observable for the assets or liabilities (such as interest rates, yield curves, volatilities, prepayment speeds, loss severities, credit risks and default rates) or other market-corroborated inputs) (e.g., debt securities, government securities, swap contracts, foreign currency exchange contracts, foreign securities utilizing international fair value pricing, broker-quoted securities, fair valued securities) |
| | |
| Level 3 – | inputs are significant unobservable inputs (including the Fund’s own assumptions used to determine the fair value of investments) (e.g., broker-quoted securities, fair valued securities) |
Level 3 investments are valued using significant unobservable inputs. The Fund may also use an income-based valuation approach in which the anticipated future cash flows of the investment are discounted to calculate fair value. Discounts may also be applied due to the nature or duration of any restrictions on the disposition of the investments. Valuations may also be based upon current market prices of securities that are comparable in coupon, rating, maturity and industry. The derived value of a Level 3 investment may not represent the value which is received upon disposition and this could impact the results of operations.
The following table summarizes the valuation of the Fund’s investments by fair value hierarchy levels as of Oct. 31, 2013:
| | Level 1 | | Level 2 | | Total |
| Common Stock | | $ | 1,030,528,490 | | $ | — | | $ | 1,030,528,490 |
| Warrant | | | 9,919,824 | | | — | | | 9,919,824 |
| Short-Term Investments | | | — | | | 28,565,200 | | | 28,565,200 |
| Total | | $ | 1,040,448,314 | | $ | 28,565,200 | | $ | 1,069,013,514 |
During the period May 1, 2013 to Oct. 31, 2013, there were no transfers between Level 1 investments, Level 2 investments or Level 3 investments that had a significant impact to the Fund. This does not include transfers between Level 1 investments and Level 2 investments due to the Fund utilizing international fair value pricing during the period. In accordance with the Fair Valuation Procedures described in Note 1, international fair value pricing uses other observable
35
Notes to financial statements
Delaware Select Growth Fund
3. Investments (continued)
market-based inputs in place of the closing exchange price due to the events occurring after the close of the exchange or market on which the investment is principally traded, causing a change in classification between levels. The Fund’s policy is to recognize transfers between levels at the beginning of the reporting period.
4. Dividend and Distribution Information
Income and long-term capital gain distributions are determined in accordance with federal income tax regulations, which may differ from U.S. GAAP. Additionally, distributions from net gains on foreign currency transactions and net short-term gains on sales of investment securities are treated as ordinary income for federal income tax purposes. There were no dividends and distributions paid for the period May 1, 2013 to Oct. 31, 2013 or years ended April 30, 2013 and 2012.
5. Components of Net Assets on a Tax Basis
As of Oct. 31, 2013, the components of net assets on a tax basis were as follows:
| Shares of beneficial | | $ | 783,288,613 | |
| Undistributed realized gains | | | 38,954,874 | |
| Capital loss carryforwards* | | | (21,772,104 | ) |
| Unrealized appreciation and foreign currencies | | | 280,512,325 | |
| Net assets | | $ | 1,080,983,708 | |
*The amount of this loss which can be utilized is subject to an annual limitation in accordance with the Internal Revenue Code due to the Fund merger with Delaware Growth Equity Fund on Oct. 22, 2010.
The difference between book basis and tax basis components of net assets is primarily attributable to tax deferral of losses on wash sales.
For financial reporting purposes, capital accounts are adjusted to reflect the tax character of permanent book/tax differences. Reclassifications are primarily due to partial write off of capital loss carryforwards, tax treatment of net operating losses and gain (loss) on foreign currency transactions. Results of operations and net assets were not affected by these reclassifications. For the period May 1, 2013 to Oct. 31, 2013, the Fund recorded the following reclassifications:
| Accumulated net investment loss | | $ | 1,302,410 | |
| Undistributed net realized gain on investments | | | 2,886,841 | |
| Paid-in capital | | | (4,189,251 | ) |
For federal income tax purposes, capital loss carryforwards may be carried forward and applied against future capital gains. $28,645,154 was utilized in October 2013. Additionally, $2,807,390 was written off in October 2013. Capital loss carryforwards remaining at Oct. 31, 2013 will expire as follows: $10,725,266 expires in 2015 and $11,046,838 expires in 2016.
36
On Dec. 22, 2010, the Regulated Investment Company Modernization Act of 2010 (Act) was enacted, which changed various technical rules governing the tax treatment of regulated investment companies. The changes are generally effective for taxable years beginning after the date of enactment. Under the Act, the Fund is permitted to carry forward capital losses incurred in taxable years beginning after the date of enactment for an unlimited period. However, any losses incurred during those future taxable years will be required to be utilized prior to the losses incurred in pre-enactment taxable years, which carry an expiration date. As a result of this ordering rule, pre-enactment capital loss carryforwards may be more likely to expire unused. Additionally, post-enactment capital loss carryforwards will retain their character as either short-term or long-term capital losses rather than being considered all short-term as permitted under previous regulation.
6. Capital Shares
Transactions in capital shares were as follows:
| 5/1/13 | | Year | | Year |
| to | | Ended | | Ended |
| 10/31/13 | | 4/30/13 | | 4/30/12 |
| Shares sold: | | | | | | | | |
| Class A | 833,177 | | | 4,141,291 | | | 3,907,362 | |
| Class B | 870 | | | 1,424 | | | 4,238 | |
| Class C | 69,251 | | | 420,846 | | | 1,256,211 | |
| Class R | 140,225 | | | 188,960 | | | 164,882 | |
| Institutional Class | 1,657,906 | | | 5,865,039 | | | 4,159,635 | |
| 2,701,429 | | | 10,617,560 | | | 9,492,328 | |
| Shares redeemed: | | | | | | | | |
| Class A | (1,503,326 | ) | | (3,089,492 | ) | | (1,708,510 | ) |
| Class B | (140,454 | ) | | (290,297 | ) | | (295,116 | ) |
| Class C | (232,992 | ) | | (625,602 | ) | | (404,013 | ) |
| Class R | (66,333 | ) | | (109,369 | ) | | (59,346 | ) |
| Institutional Class | (1,094,431 | ) | | (3,525,607 | ) | | (1,589,230 | ) |
| (3,037,536 | ) | | (7,640,367 | ) | | (4,056,215 | ) |
| Net increase (decrease) | (336,107 | ) | | 2,977,193 | | | 5,436,113 | |
For the period May 1, 2013 to Oct. 31, 2013 and years ended April 30, 2013 and 2012, 36,184 Class B shares were converted to 31,287 Class A shares valued at $1,464,263, 108,442 Class B shares were converted to 94,300 Class A shares valued at $3,846,650 and 128,473 Class B shares were converted to 112,579 Class A shares valued at $4,051,940, respectively. The respective amounts are included in Class B redemptions and Class A subscriptions in the table above and the statements of changes in net assets.
37
Notes to financial statements
Delaware Select Growth Fund
7. Line of Credit
The Fund, along with certain other funds in the Delaware Investments® Family of Funds (Participants), was a participant in a $125,000,000 revolving line of credit to be used for temporary or emergency purposes as an additional source of liquidity to fund redemptions of investor shares. Under the agreement, the Participants were charged an annual commitment fee, which was allocated across the Participants on the basis of each Participant’s allocation of the entire facility. The Participants were permitted to borrow up to a maximum of one third of their net assets under the agreement. Each Participant was individually, and not jointly, liable for its particular advances, if any, under the line of credit. The line of credit under the agreement expired on Nov. 12, 2013.
On Nov. 12, 2013, the Fund, along with the other Participants, entered into an amendment to the agreement for a $225,000,000 revolving line of credit. The line of credit is to be used as described above and operates in substantially the same manner as the original agreement. The line of credit available under the agreement expires on Nov. 10, 2014.
The Fund had no amounts outstanding as of Oct. 31, 2013 or at any time during the period then ended.
8. Derivatives
U.S. GAAP requires disclosures that enable investors to understand: 1) how and why an entity uses derivatives; 2) how they are accounted for; and 3) how they affect an entity’s results of operations and financial position.
Foreign Currency Exchange Contracts — The Fund may enter into foreign currency exchange contracts and foreign cross currency exchange contracts as a way of managing foreign exchange rate risk. The Fund may enter into these contracts to fix the U.S. dollar value of a security that it has agreed to buy or sell for the period between the date the trade was entered into and the date the security is delivered and paid for. The Fund may also use these contracts to hedge the U.S. dollar value of securities it already owns that are denominated in foreign currencies. The change in value is recorded as an unrealized gain or loss. When the contract is closed, a realized gain or loss is recorded equal to the difference between the value of the contract at the time it was opened and the value at the time it was closed.
The use of foreign currency exchange contracts and foreign cross currency exchange contracts does not eliminate fluctuations in the underlying prices of the securities, but does establish a rate of exchange that can be achieved in the future. Although foreign currency exchange contracts and foreign cross currency exchange contracts limit the risk of loss due to an unfavorable change in the value of the hedged currency, they also limit any potential gain that might result should the value of the currency change favorably. In addition, the Fund could be exposed to risks if the counterparties to the contracts are unable to meet the terms of their contracts. The Fund’s maximum risk of loss from counterparty credit risk is the value of its currency exchanged with the counterparty. The risk is generally mitigated by having a netting arrangement between the Fund and the counterparty and by the posting of collateral by the counterparty to the Fund to cover the Fund’s exposure to the counterparty. No foreign currency exchange contracts were outstanding at Oct. 31, 2013.
38
At Oct. 31, 2013, the Fund had foreign currency risk, which is disclosed in the statement of operations.
Derivatives Generally. The table below summarizes the average balance of derivative holdings by the Fund during the period ended Oct. 31, 2013.
| | Long | | Short |
| | Derivative | | Derivative |
| | Volume | | Volume |
| Foreign currency exchange contracts (average cost) | | $171,879 | | $207,767 |
9. Securities Lending
The Fund, along with other funds in the Delaware Investments® Family of Funds, may lend its securities pursuant to a security lending agreement (Lending Agreement) with The Bank of New York Mellon (BNY Mellon). At the time a security is loaned, the borrower must post collateral equal to the required percentage of the market value of the loaned security, including any accrued interest. The required percentage is: (i) 102% with respect to U.S. securities and foreign securities that are denominated and payable in U.S. dollars; and (ii) 105% with respect to foreign securities. With respect to each loan, if on any business day the aggregate market value of securities collateral plus cash collateral held is less than the aggregate market value of the securities which are the subject of such loan, the borrower will be notified to provide additional collateral by the end of the following business day which, together with the collateral already held, will be not less than the applicable initial collateral requirements for such security loan. If the aggregate market value of securities collateral and cash collateral held with respect to a security loan exceeds the applicable initial collateral requirement, upon request of the borrower BNY Mellon must return enough collateral to the borrower by the end of the following business day to reduce the value of the remaining collateral to the applicable initial collateral requirement for such security loan. As a result of the foregoing, the value of the collateral held with respect to a loaned security may be temporarily more or less than the value of the security on loan.
Cash collateral received is generally invested in the Delaware Investments Collateral Fund No. 1 (Collective Trust) established by BNY Mellon for the purpose of investment on behalf of funds managed by DMC that participate in BNY Mellon’s securities lending program. The Collective Trust may invest in U.S. government securities and high quality corporate debt, asset-backed and other money market securities and in repurchase agreements collateralized by such securities, provided that the Collective Trust will generally have a dollar-weighted average portfolio maturity of 60 days or less. The Fund can also accept U.S. government securities and letters of credit (non-cash collateral) in connection with securities loans. In the event of default or bankruptcy by the lending agent, realization and/or retention of the collateral may be subject to legal proceedings. In the event the borrower fails to return loaned securities and the collateral received is insufficient to cover the value of the loaned securities and provided such collateral shortfall is not the result of investment losses, the lending agent has agreed to pay the amount of the shortfall to the Fund or, at the discretion of the lending agent, replace the loaned securities. The Fund continues to record dividends or interest, as applicable, on the securities loaned and is subject to changes in value of
39
Notes to financial statements
Delaware Select Growth Fund
9. Securities Lending (continued)
the securities loaned that may occur during the term of the loan. The Fund has the right under the Lending Agreement to recover the securities from the borrower on demand. With respect to security loans collateralized by non-cash collateral, the Fund receives loan premiums paid by the borrower. With respect to security loans collateralized by cash collateral, the earnings from the collateral investments are shared among the Fund, the security lending agent and the borrower. The Fund records security lending income net of allocations to the security lending agent and the borrower.
The Collective Trust used for the investment of cash collateral received from borrowers of securities seeks to maintain a net asset value per unit of $1.00, but there can be no assurance that it will always be able to do so. The Fund may incur investment losses as a result of investing securities lending collateral in the Collective Trust. This could occur if an investment in a Collective Trust defaulted or if it were necessary to liquidate assets in the Collective Trust to meet returns on outstanding security loans at a time when the Collective Trust’s net asset value per unit was less than $1.00. Under those circumstances, the Fund may not receive an amount from the Collective Trust that is equal in amount to the collateral the Fund would be required to return to the borrower of the securities and the Fund would be required to make up for this shortfall. During the period ended Oct. 31, 2013, the Fund had no securities out on loan.
10. Credit and Market Risk
The Fund invests a significant portion of its assets in small- and mid-sized companies and may be subject to certain risks associated with ownership of securities of such companies. Investments in small- or mid-sized companies may be more volatile than investments in larger companies for a number of reasons, which include more limited financial resources or a dependence on narrow product lines.
Some countries in which the Fund may invest require governmental approval for the repatriation of investment income, capital or the proceeds of sales of securities by foreign investors. In addition, if there is deterioration in a country’s balance of payments or for other reasons, a country may impose temporary restrictions on foreign capital remittances abroad.
The securities exchanges of certain foreign markets are substantially smaller, less liquid and more volatile than the major securities markets in the United States. Consequently, acquisition and disposition of securities by the Fund may be inhibited. In addition, a significant portion of the aggregate market value of equity securities listed on the major securities exchanges in emerging markets is held by a smaller number of investors. This may limit the number of shares available for acquisition or disposition by the Fund.
The Fund may invest up to 15% of its net assets in illiquid securities, which may include securities with contractual restrictions on resale, securities exempt from registration under Rule 144A of the Securities Act of 1933, as amended, and other securities which may not be readily marketable. The relative illiquidity of these securities may impair the Fund from disposing of them in a timely
40
manner and at a fair price when it is necessary or desirable to do so. While maintaining oversight, the Fund’s Board has delegated to DMC, the day-to-day functions of determining whether individual securities are liquid for purposes of the Fund’s limitation on investments in illiquid securities. Securities eligible for resale pursuant to Rule 144A, which are determined to be liquid, are not subject to the Fund’s 15% limit on investments in illiquid securities. As of Oct. 31, 2013, there were no Rule 144A securities and no securities have been determined to be illiquid under the Fund’s Liquidity Procedures.
11. Contractual Obligations
The Fund enters into contracts in the normal course of business that contain a variety of indemnifications. The Fund’s maximum exposure under these arrangements is unknown. However, the Fund has not had prior claims or losses pursuant to these contracts. Management has reviewed the Fund’s existing contracts and expects the risk of loss to be remote.
12. Subsequent Events
Except as described in Note 7, management has determined that no material events or transactions occurred subsequent to Oct. 31, 2013 that would require recognition or disclosure in the Fund’s financial statements.
41
Report of independent
registered public accounting firm
To the Board of Trustees of Voyageur Mutual Funds III
and the Shareholders of Delaware Select Growth Fund:
In our opinion, the accompanying statement of assets and liabilities, including the schedule of investments, and the related statements of operations and of changes in net assets and the financial highlights present fairly, in all material respects, the financial position of Delaware Select Growth Fund (one of the series constituting Voyageur Mutual Funds III, hereafter referred to as the “Fund”) at October 31, 2013, the results of its operations for the six months ended October 31, 2013 and the year ended April 30, 2013, the changes in its net assets for the six months ended October 31, 2013 and each of the two years in the period ended April 30, 2013 and the financial highlights for the six months ended October 31, 2013 and the three years in the period ended April 30, 2013, in conformity with accounting principles generally accepted in the United States of America. These financial statements and financial highlights (hereafter referred to as “financial statements”) are the responsibility of the Fund’s management; our responsibility is to express an opinion on these financial statements based on our audits. We conducted our audits of these financial statements in accordance with the standards of the Public Company Accounting Oversight Board (United States). Those standards require that we plan and perform the audit to obtain reasonable assurance about whether the financial statements are free of material misstatement. An audit includes examining, on a test basis, evidence supporting the amounts and disclosures in the financial statements, assessing the accounting principles used and significant estimates made by management, and evaluating the overall financial statement presentation. We believe that our audits, which included confirmation of securities at October 31, 2013 by correspondence with the custodian and brokers, provide a reasonable basis for our opinion. The financial highlights for each of the two years in the period ended April 30, 2010 were audited by other independent accountants whose report dated June 18, 2010 expressed an unqualified opinion on those statements.
PricewaterhouseCoopers LLP
Philadelphia, Pennsylvania
December 19, 2013
42
Other Fund information
(Unaudited)
Delaware Select Growth Fund
Board consideration of Delaware Select Growth Fund investment advisory agreement
At a meeting held on August 20-22, 2013 (the “Annual Meeting”), the Board of Trustees (the “Board”), including a majority of disinterested or independent Trustees, approved the renewal of the Investment Advisory Agreement for Delaware Select Growth Fund (the “Fund”). In making its decision, the Board considered information furnished at regular quarterly Board meetings, including reports detailing Fund performance, investment strategies and expenses, as well as information prepared specifically in connection with the renewal of the investment advisory and sub-advisory contracts. Information furnished specifically in connection with the renewal of the Investment Advisory Agreement with Delaware Management Company (“DMC”) included materials provided by DMC and its affiliates (“Delaware Investments”) concerning, among other things, the nature, extent and quality of services provided to the Fund, the costs of such services to the Fund, economies of scale and the financial condition and profitability of Delaware Investments. In addition, in connection with the Annual Meeting, reports were provided to the Trustees in May 2013 and included reports provided by Lipper, Inc., an independent statistical compilation organization (“Lipper”). The Lipper reports compared the Fund’s investment performance and expenses with those of other comparable mutual funds. The Independent Trustees reviewed and discussed the Lipper reports with independent legal counsel to the Independent Trustees. The Board requested and received information regarding DMC’s policy with respect to advisory fee levels and its breakpoint philosophy; the structure of portfolio manager compensation; the investment manager’s profitability; comparative client fee information; and any constraints or limitations on the availability of securities for certain investment styles, which had in the past year inhibited, or which were likely in the future to inhibit, DMC’s ability to invest fully in accordance with Fund policies.
In considering information relating to the approval of the Fund’s advisory agreement, the Independent Trustees received assistance and advice from and met separately with independent legal counsel to the Independent Trustees. Although the Board gave attention to all information furnished, the following discussion identifies, under separate headings, the primary factors taken into account by the Board during its contract renewal considerations.
Nature, Extent and Quality of Service. The Board considered the services provided by Delaware Investments to the Fund and its shareholders. In reviewing the nature, extent and quality of services, the Board considered reports furnished to it throughout the year, which covered matters such as the relative performance of the Fund, compliance of portfolio managers with the investment policies, strategies and restrictions for the Fund, compliance by DMC and Delaware Distributors, L.P. (together, “Management”) personnel with the Code of Ethics adopted throughout the Delaware Investments Family of Funds complex and adherence to fair value pricing procedures as established by the Board. The Board was pleased with the current staffing of the Fund’s investment advisor and the emphasis placed on research in the investment process. The Board recognized DMC’s recent receipt of several industry distinctions. The Board gave favorable consideration to DMC’s efforts to control expenditures while maintaining service levels committed to fund matters. The Board noted that in July 2011 Management implemented measures to reduce overall costs and improve transfer agent and shareholder servicing functions through outsourcing. The Board noted the benefits provided to Fund shareholders through each shareholder’s ability to exchange an investment
43
Other Fund information
(Unaudited)
Delaware Select Growth Fund
Board consideration of Delaware Select Growth Fund investment advisory agreement (continued)
in one Delaware Investments fund for the same class of shares in another Delaware Investments fund without a sales charge, to reinvest Fund dividends into additional shares of the Fund or into additional shares of other Delaware Investments funds and the privilege to combine holdings in other Delaware Investments funds to obtain a reduced sales charge. The Board was satisfied with the nature, extent and quality of the overall services provided by Delaware Investments.
Investment Performance. The Board placed significant emphasis on the investment performance of the Fund in view of the importance of investment performance to shareholders. Although the Board gave appropriate consideration to performance reports and discussions with portfolio managers at Investment Committee meetings throughout the year, the Board gave particular weight to the Lipper reports furnished for the Annual Meeting. The Lipper reports prepared for the Fund showed the investment performance of its Class A shares in comparison to a group of similar funds as selected by Lipper (the “Performance Universe”). A fund with the best performance ranked first, and a fund with the poorest performance ranked last. The highest/best performing 25% of funds in the Performance Universe make up the first quartile; the next 25%, the second quartile; the next 25%, the third quartile; and the poorest/worst performing 25% of funds in the Performance Universe make up the fourth quartile. Comparative annualized performance for the Fund was shown for the past one-, three-, five- and ten-year periods ended March 31, 2013. The Board’s objective is that the Fund’s performance for the periods considered be at or above the median of its Performance Universe. The following paragraph summarizes the performance results for the Fund and the Board’s view of such performance.
The Performance Universe for the Fund consisted of the Fund and all retail and institutional multi-cap growth funds as selected by Lipper. The Lipper report comparison showed that the Fund’s total return for the one-year period was in the third quartile of its Performance Universe. The report further showed that the Fund’s total return for the three-, five- and ten-year periods was in the first quartile of its Performance Universe. The Board was satisfied with performance.
Comparative Expenses. The Board considered expense comparison data for the Delaware Investments Family of Funds. Management provided the Board with information on pricing levels and fee structures for the Fund as of its most recently completed fiscal year. The Board also focused on the comparative analysis of effective management fees and total expense ratios of the Fund versus effective management fees and expense ratios of a group of similar funds as selected by Lipper (the “Expense Group”). In reviewing comparative costs, the Fund’s contractual management fee and the actual management fee incurred by the Fund were compared with the contractual management fees (assuming all funds in the Expense Group were similar in size to the Fund) and actual management fees (as reported by each fund) within the Expense Group, taking into account any applicable breakpoints and fee waivers. The Fund’s total expenses were also compared with those of its Expense Group. The Lipper total expenses, for comparative consistency, were shown by Lipper for Class A shares and comparative total expenses including 12b-1 and non 12b-1 service fees. The Board considered fees paid to Delaware Investments for non-management services. The
44
Board’s objective is to limit the Fund’s total expense ratio to be competitive with that of the Expense Group. The following paragraph summarizes the expense results for the Fund and the Board’s view of such expenses.
The expense comparisons for the Fund showed that its actual management fee was in the quartile with the lowest expenses of its Expense Group and its total expenses were in the quartile with the second highest expenses of its Expense Group. The Board gave favorable consideration to the Fund’s management fee, but noted that the Fund’s total expenses were not in line with the Board’s objective. In evaluating the total expenses, the Board considered various initiatives implemented by Management, such as the outsourcing of certain transfer agency services, which had created an opportunity for a further reduction in expenses. The Board was satisfied with Management’s efforts to improve the Fund’s total expense ratio and to bring it in line with the Board’s objective.
Management Profitability. The Board considered the level of profits realized by Delaware Investments in connection with the operation of the Fund. In this respect, the Board reviewed the Investment Management Profitability Analysis that addressed the overall profitability of Delaware Investments’ business in providing management and other services to each of the individual funds and the Delaware Investments Family of Funds as a whole. Specific attention was given to the methodology followed in allocating costs for the purpose of determining profitability. Management stated that the level of profits of Delaware Investments, to a certain extent, reflects recent operational cost savings and efficiencies initiated by Delaware Investments. The Board considered Delaware Investments’ efforts to improve services provided to fund shareholders and to meet additional regulatory and compliance requirements resulting from recent industry-wide Securities and Exchange Commission initiatives. The Board also considered the extent to which Delaware Investments might derive ancillary benefits from fund operations, including the potential for procuring additional business as a result of the prestige and visibility associated with its role as service provider to the Delaware Investments Family of Funds and the benefits from allocation of fund brokerage to improve trading efficiencies. The Board found that the management fees were reasonable in light of the services rendered and the level of profitability of Delaware Investments.
Economies of Scale. The Trustees considered whether economies of scale are realized by Delaware Investments as the Fund’s assets increase and the extent to which any economies of scale are reflected in the level of management fees charged. The Trustees reviewed the standardized advisory fee pricing and structure, approved by the Board and shareholders, which includes breakpoints. Breakpoints in the advisory fee occur when the advisory fee rate is reduced on assets in excess of specified levels. Breakpoints result in a lower advisory fee than would otherwise be the case on all assets when the asset levels specified are exceeded. The Board noted that the fee under the Fund’s management contract fell within the standard structure. The Board also noted that the Fund’s assets exceeded the first breakpoint level. The Board believed that, given the extent to which economics of scale might be realized by the advisor and its affiliates, the schedule of fees under the Investment Management Agreement provides a sharing of benefits with the Fund and its shareholders.
45
Board of trustees/directors and officers addendum
Delaware Investments® Family of Funds
A mutual fund is governed by a Board of Trustees/Directors (“Trustees”), which has oversight responsibility for the management of a fund’s business affairs. Trustees establish procedures and oversee and review the performance of the investment manager, the distributor, and others who perform services for the fund. The independent fund trustees, in particular, are advocates
| Name, Address, | | Position(s) | | Length of |
| and Birth Date | | Held with Fund(s) | | Time Served |
| Interested Trustees | | | | |
| Patrick P. Coyne1 | | Chairman, President, | | Chairman and Trustee |
| 2005 Market Street | | Chief Executive Officer, | | since August 16, 2006 |
| Philadelphia, PA 19103 | | and Trustee | | |
| April 1963 | | | | President and |
| | | | Chief Executive Officer |
| | | | since August 1, 2006 |
| |
| Independent Trustees | | | | |
| Thomas L. Bennett | | Trustee | | Since March 2005 |
| 2005 Market Street | | | | |
| Philadelphia, PA 19103 | | | | |
| October 1947 | | | | |
| Joseph W. Chow | | Trustee | | Since January 2013 |
| 2005 Market Street | | | | |
| Philadelphia, PA 19103 | | | | |
| January 1953 | | | | |
| |
| John A. Fry | | Trustee | | Since January 2001 |
| 2005 Market Street | | | | |
| Philadelphia, PA 19103 | | | | |
| May 1960 | | | | |
| |
| |
| |
| Anthony D. Knerr | | Trustee | | Since April 1990 |
| 2005 Market Street | | | | |
| Philadelphia, PA 19103 | | | | |
| December 1938 | | | | |
1 Patrick P. Coyne is considered to be an “Interested Trustee” because he is an executive officer of the Fund’s(s’) investment advisor.
46
for shareholder interests. Each trustee has served in that capacity since he or she was elected to or appointed to the Board of Trustees, and will continue to serve until his or her retirement or the election of a new trustee in his or her place. The following is a list of the Trustees and Officers with certain background and related information.
| | Number of Portfolios in | | |
| Principal Occupation(s) | | Fund Complex Overseen | | Other Directorships |
| During Past 5 Years | | by Trustee or Officer | | Held by Trustee or Officer |
| |
| Patrick P. Coyne has served in | | 70 | | Director and Audit |
| various executive capacities | | | | Committee Member |
| at different times at | | | | Kaydon Corp. |
| Delaware Investments.2 | | | | |
| | | | Board of Governors Member |
| | | | Investment Company |
| | | | Institute (ICI) |
| |
| Private Investor | | 70 | | Director |
| (March 2004–Present) | | | | Bryn Mawr Bank Corp. (BMTC) |
| | | | (2007–2011) |
| |
| Executive Vice President | | 70 | | Director and Audit Committee |
| (Emerging Economies Strategies, | | | | Member — Hercules |
| Risk and Corporate Administration) | | | | Technology Growth |
| State Street Corporation | | | | Capital, Inc. |
| (July 2004–March 2011) | | | | |
| President | | 70 | | Director — Hershey Trust |
| Drexel University | | | | |
| (August 2010–Present) | | | | Director and Audit |
| | | | Committee Member |
| President | | | | Community Health Systems |
| Franklin & Marshall College | | | | |
| (July 2002–July 2010) | | | | |
| Managing Director | | 70 | | None |
| AKA Strategy | | | | |
| (Strategic Consulting) | | | | |
| (1990–Present) | | | | |
2 Delaware Investments is the marketing name for Delaware Management Holdings, Inc. and its subsidiaries, including the Fund’s(s’) investment advisor, principal underwriter, and its transfer agent.
47
Board of trustees/directors and officers addendum
Delaware Investments® Family of Funds
| Name, Address, | | Position(s) | | Length of |
| and Birth Date | | Held with Fund(s) | | Time Served |
| Independent Trustees (continued) | | | | |
| Lucinda S. Landreth | | Trustee | | Since March 2005 |
| 2005 Market Street | | | | |
| Philadelphia, PA 19103 | | | | |
| June 1947 | | | | |
| Frances A. Sevilla-Sacasa | | Trustee | | Since September 2011 |
| 2005 Market Street | | | | |
| Philadelphia, PA 19103 | | | | |
| January 1956 | | | | |
| |
| |
| |
| |
| |
| |
| |
| |
| |
| |
| |
| |
| |
| Thomas K. Whitford | | Trustee | | Since January 2013 |
| 2005 Market Street | | | | |
| Philadelphia, PA 19103 | | | | |
| March 1956 | | | | |
| | | | | |
| | | | | |
| | | | | |
| | | | | |
| | | | | |
| | | | | |
48
| | Number of Portfolios in | | |
| Principal Occupation(s) | | Fund Complex Overseen | | Other Directorships |
| During Past 5 Years | | by Trustee or Officer | | Held by Trustee or Officer |
| |
| Private Investor | | 70 | | None |
| (2004–Present) | | | | |
| |
| |
| Chief Executive Officer — | | 70 | | Trust Manager and |
| Banco Itaú Europa | | | | Audit Committee |
| International | | | | Member — Camden |
| (April 2012–Present) | | | | Property Trust |
| |
| Executive Advisor to Dean | | | | |
| (August 2011–March 2012) | | | | |
| and Interim Dean | | | | |
| (January 2011–July 2011) — | | | | |
| University of Miami School of | | | | |
| Business Administration | | | | |
| |
| President — U.S. Trust, | | | | |
| Bank of America Private | | | | |
| Wealth Management | | | | |
| (Private Banking) | | | | |
| (July 2007–December 2008) | | | | |
| Vice Chairman | | 70 | | None |
| (2010–April 2013) | | | | |
| Chief Administrative | | | | |
| Officer (2008–2010) | | | | |
| and Executive Vice | | | | |
| President and Chief | | | | |
| Administrative Officer | | | | |
| (2007–2009) — | | | | |
| PNC Financial | | | | |
| Services Group | | | | |
49
Board of trustees/directors and officers addendum
Delaware Investments® Family of Funds
| Name, Address, | | Position(s) | | Length of |
| and Birth Date | | Held with Fund(s) | | Time Served |
| Independent Trustees (continued) | | | | |
| Janet L. Yeomans | | Trustee | | Since April 1999 |
| 2005 Market Street | | | | |
| Philadelphia, PA 19103 | | | | |
| July 1948 | | | | |
| |
| |
| |
| |
| |
| |
| J. Richard Zecher | | Trustee | | Since March 2005 |
| 2005 Market Street | | | | |
| Philadelphia, PA 19103 | | | | |
| July 1940 | | | | |
| | | | | |
| | | | | |
| | | | | |
| | | | | |
| | | | | |
50
| | Number of Portfolios in | | |
| Principal Occupation(s) | | Fund Complex Overseen | | Other Directorships |
| During Past 5 Years | | by Trustee or Officer | | Held by Trustee or Officer |
| |
| Vice President and Treasurer | | 70 | | Director, Audit |
| (January 2006–July 2012) | | | | Committee Member and |
| Vice President — Mergers & Acquisitions | | | | Investment Committee |
| (January 2003–January 2006), and | | | | Member |
| Vice President and Treasurer | | | | Okabena Company |
| (July 1995–January 2003) | | | | |
| 3M Corporation | | | | Chair — 3M |
| | | | Investment Management |
| | | | Company |
| | | | (2005–2012) |
| Founder | | 70 | | Director and Compensation |
| Investor Analytics | | | | Committee Member |
| (Risk Management) | | | | Investor Analytics |
| (May 1999–Present) | | | | |
| | | | Director — P/E Investments |
| Founder | | | | |
| P/E Investments | | | | |
| (Hedge Fund) | | | | |
| (September 1996–Present) | | | | |
51
Board of trustees/directors and officers addendum
Delaware Investments® Family of Funds
| Name, Address, | | Position(s) | | Length of |
| and Birth Date | | Held with Fund(s) | | Time Served |
| Officers | | | | |
| David F. Connor | | Senior Vice President, | | Senior Vice President, |
| 2005 Market Street | | Deputy General | | Deputy General Counsel |
| Philadelphia, PA 19103 | | Counsel, and Secretary | | since May 2013; |
| December 1963 | | | | Vice President, Deputy |
| | | | General Counsel |
| | | | September 2000– |
| | | | May 2013; Secretary since |
| | | | October 2005 |
| Daniel V. Geatens | | Vice President | | Treasurer |
| 2005 Market Street | | and Treasurer | | since October 2007 |
| Philadelphia, PA 19103 | | | | |
| October 1972 | | | | |
| David P. O’Connor | | Executive Vice President, | | Executive Vice President |
| 2005 Market Street | | General Counsel | | since February 2012; |
| Philadelphia, PA 19103 | | and Chief Legal Officer | | Senior Vice President |
| February 1966 | | | | October 2005– |
| | | | February 2012; |
| | | | General Counsel and |
| | | | Chief Legal Officer |
| | | | since October 2005 |
| Richard Salus | | Senior Vice President | | Chief Financial Officer |
| 2005 Market Street | | and Chief Financial Officer | | since November 2006 |
| Philadelphia, PA 19103 | | | | |
| October 1963 | | | | |
The Statement of Additional Information for the Fund(s) includes additional information about the Trustees and Officers and is available, without charge, upon request by calling 800 523-1918.
52
| | Number of Portfolios in | | |
| Principal Occupation(s) | | Fund Complex Overseen | | Other Directorships |
| During Past 5 Years | | by Trustee or Officer | | Held by Trustee or Officer |
| |
| David F. Connor has served as | | 70 | | None3 |
| Deputy General Counsel of | | | | |
| Delaware Investments | | | | |
| since 2000. | | | | |
| |
| |
| |
| |
| Daniel V. Geatens has served | | 70 | | None3 |
| in various capacities at | | | | |
| different times at | | | | |
| Delaware Investments. | | | | |
| David P. O’Connor has served in | | 70 | | None3 |
| various executive and legal | | | | |
| capacities at different times | | | | |
| at Delaware Investments. | | | | |
| |
| |
| |
| |
| Richard Salus has served in | | 70 | | None3 |
| various executive capacities | | | | |
| at different times at | | | | |
| Delaware Investments. | | | | |
3 David F. Connor, Daniel V. Geatens, David P. O’Connor, and Richard Salus serve in similar capacities for the six portfolios of the Optimum Fund Trust, which have the same investment advisor, principal underwriter, and transfer agent as the registrant.
53
About the organization
Board of trustees |
Patrick P. Coyne
Chairman, President, and
Chief Executive Officer
Delaware Investments®
Family of Funds
Philadelphia, PA Thomas L. Bennett
Private Investor
Rosemont, PA | Joseph W. Chow
Former Executive Vice
President
State Street Corporation
Brookline, MA John A. Fry
President
Drexel University
Philadelphia, PA Anthony D. Knerr
Founder and Managing
Director
AKA Strategy
New York, NY | Lucinda S. Landreth
Former Chief Investment
Officer
Assurant, Inc.
Philadelphia, PA Frances A. Sevilla-Sacasa
Chief Executive Officer
Banco Itaú Europa
International
Miami, FL | Thomas K. Whitford
Former Vice Chairman
PNC Financial Services Group
Pittsburgh, PA Janet L. Yeomans
Former Vice President and
Treasurer
3M Corporation
St. Paul, MN J. Richard Zecher
Founder
Investor Analytics
Scottsdale, AZ |
| | | | |
Affiliated officers |
David F. Connor
Senior Vice President,
Deputy General Counsel,
and Secretary
Delaware Investments
Family of Funds
Philadelphia, PA | Daniel V. Geatens
Vice President and
Treasurer
Delaware Investments
Family of Funds
Philadelphia, PA | David P. O’Connor
Executive Vice President,
General Counsel,
and Chief Legal Officer
Delaware Investments
Family of Funds
Philadelphia, PA | Richard Salus
Senior Vice President and
Chief Financial Officer
Delaware Investments
Family of Funds
Philadelphia, PA |
This annual report is for the information of Delaware Select Growth Fund shareholders, but it may be used with prospective investors when preceded or accompanied by the Delaware Investments Fund fact sheet for the most recently completed calendar quarter. These documents are available at delawareinvestments.com.
Delaware Investments is the marketing name of Delaware Management Holdings,Inc. and its subsidiaries.
The Fund files its complete schedule of portfolio holdings with the Securities and Exchange Commission (SEC) for the first and third quarters of each fiscal year on Form N-Q. The Fund’s Forms N-Q, as well as a description of the policies and procedures that the Fund uses to determine how to vote proxies (if any) relating to portfolio securities are available without charge (i) upon request, by calling 800 523-1918; and (ii) on the SEC’s website at sec.gov. In addition, a description of the policies and procedures that the Fund uses to determine how to vote proxies (if any) relating to portfolio securities and the Fund’s Schedule of Investments are available without charge on the Fund’s website at delawareinvestments.com. The Fund’s Forms N-Q may be reviewed and copied at the SEC’s Public Reference Room in Washington, D.C.; information on the operation of the Public Reference Room may be obtained by calling 800 SEC-0330.
Information (if any) regarding how the Fund voted proxies relating to portfolio securities during the most recently disclosed 12-month period ended June 30 is available without charge (i) through the Fund’s website at delawareinvestments.com; and (ii) on the SEC’s website at sec.gov.
54
Item 2. Code of Ethics
The registrant has adopted a code of ethics that applies to the registrant’s principal executive officer, principal financial officer, principal accounting officer or controller, or persons performing similar functions, regardless of whether these individuals are employed by the registrant or a third party. A copy of the registrant’s Code of Business Ethics has been posted on the Delaware Investments Internet Web site at www.delawareinvestments.com. Any amendments to the Code of Business Ethics, and information on any waiver from its provisions granted by the registrant, will also be posted on this Web site within five business days of such amendment or waiver and will remain on the Web site for at least 12 months.
Item 3. Audit Committee Financial Expert
The registrant’s Board of Trustees/Directors has determined that certain members of the registrant’s Audit Committee are audit committee financial experts, as defined below. For purposes of this item, an “audit committee financial expert” is a person who has the following attributes:
a. An understanding of generally accepted accounting principles and financial statements;
b. The ability to assess the general application of such principles in connection with the accounting for estimates, accruals, and reserves;
c. Experience preparing, auditing, analyzing, or evaluating financial statements that present a breadth and level of complexity of accounting issues that are generally comparable to the breadth and complexity of issues that can reasonably be expected to be raised by the registrant’s financial statements, or experience actively supervising one or more persons engaged in such activities;
d. An understanding of internal controls and procedures for financial reporting; and
e. An understanding of audit committee functions.
An “audit committee financial expert” shall have acquired such attributes through:
a. Education and experience as a principal financial officer, principal accounting officer, controller, public accountant, or auditor or experience in one or more positions that involve the performance of similar functions;
b. Experience actively supervising a principal financial officer, principal accounting officer, controller, public accountant, auditor, or person performing similar functions;
c. Experience overseeing or assessing the performance of companies or public accountants with respect to the preparation, auditing, or evaluation of financial statements; or
d. Other relevant experience.
The registrant’s Board of Trustees/Directors has also determined that each member of the registrant’s Audit Committee is independent. In order to be “independent” for purposes of this item, the Audit Committee member may not: (i) other than in his or her capacity as a member of the Board of Trustees/Directors or any committee thereof, accept directly or indirectly any consulting, advisory or other compensatory fee from the issuer; or (ii) be an “interested person” of the registrant as defined in Section 2(a)(19) of the Investment Company Act of 1940.
The names of the audit committee financial experts on the registrant’s Audit Committee are set forth below:
Thomas L. Bennett1
John A. Fry
Frances A. Sevilla-Sacasa
Janet L. Yeomans
Item 4. Principal Accountant Fees and Services
(a) Audit fees.
The aggregate fees billed for services provided to the registrant by its independent auditors for the audit of the registrant’s annual financial statements and for services normally provided by the independent auditors in connection with statutory and regulatory filings or engagements were $45,670 for the period ended October 31, 2013.2
The aggregate fees billed for services provided to the registrant by its independent auditors for the audit of the registrant’s annual financial statements and for services normally provided by the independent auditors in connection with statutory and regulatory filings or engagements were $42,250 for the fiscal year ended April 30, 2013.
____________________
1 The instructions to Form N-CSR require disclosure on the relevant experience of persons who qualify as audit committee financial experts based on “other relevant experience.” The Board of Trustees/Directors has determined that Mr. Bennett qualifies as an audit committee financial expert by virtue of: his education and Chartered Financial Analyst designation; his experience as a credit analyst, portfolio manager and the manager of other credit analysts and portfolio managers; and his prior service on the audit committees of public companies.
2 On May 23, 2013, the registrant’s Board of Trustee/Directors approved a proposal to change the Fund’s fiscal year end from April 30 to October 31. This change was effective for the period ending October 31, 2013.
(b) Audit-related fees.
The aggregate fees billed by the registrant’s independent auditors for services relating to the performance of the audit of the registrant’s financial statements and not reported under paragraph (a) of this Item were $0 for the fiscal year ended October 31, 2013.
The aggregate fees billed by the registrant’s independent auditors for services relating to the performance of the audit of the financial statements of the registrant’s investment adviser and other service providers under common control with the adviser and that relate directly to the operations or financial reporting of the registrant were $618,000 for the registrant’s fiscal year ended October 31, 2013. The percentage of these fees relating to services approved by the registrant’s Audit Committee pursuant to the de minimis exception from the pre-approval requirement in Rule 2-01(c)(7)(i)(C) of Regulation S-X was 0%. These audit-related services were as follows: year end audit procedures; group reporting and subsidiary statutory audits.
The aggregate fees billed by the registrant’s independent auditors for services relating to the performance of the audit of the registrant’s financial statements and not reported under paragraph (a) of this Item were $0 for the fiscal year ended April 30, 2013.
The aggregate fees billed by the registrant’s independent auditors for services relating to the performance of the audit of the financial statements of the registrant’s investment adviser and other service providers under common control with the adviser and that relate directly to the operations or financial reporting of the registrant were $565,000 for the registrant’s fiscal year ended April 30, 2013. The percentage of these fees relating to services approved by the registrant’s Audit Committee pursuant to the de minimis exception from the pre-approval requirement in Rule 2-01(c)(7)(i)(C) of Regulation S-X was 0%. These audit-related services were as follows: year end audit procedures; group reporting and subsidiary statutory audits.
(c) Tax fees.
The aggregate fees billed by the registrant’s independent auditors for tax-related services provided to the registrant were $9,000 for the fiscal year ended October 31, 2013. The percentage of these fees relating to services approved by the registrant’s Audit Committee pursuant to the de minimis exception from the pre-approval requirement in Rule 2-01(c)(7)(i)(C) of Regulation S-X was 0%. These tax-related services were as follows: review of income tax returns and review of annual excise distribution calculations.
The aggregate fees billed by the registrant’s independent auditors for tax-related services provided to the registrant’s investment adviser and other service providers under common control with the adviser and that relate directly to the operations or financial reporting of the registrant were $0 for the registrant’s fiscal year ended October 31, 2013.
The aggregate fees billed by the registrant’s independent auditors for tax-related services provided to the registrant were $8,460 for the fiscal year ended April 30, 2013. The percentage of these fees relating to services approved by the registrant’s Audit Committee pursuant to the de minimis exception from the pre-approval requirement in Rule 2-01(c)(7)(i)(C) of Regulation S-X was 0%. These tax-related services were as follows: review of income tax returns and review of annual excise distribution calculations.
The aggregate fees billed by the registrant’s independent auditors for tax-related services provided to the registrant’s investment adviser and other service providers under common control with the adviser and that relate directly to the operations or financial reporting of the registrant were $0 for the registrant’s fiscal year ended April 30, 2013.
(d) All other fees.
The aggregate fees billed for all services provided by the independent auditors to the registrant other than those set forth in paragraphs (a), (b) and (c) of this Item were $0 for the fiscal year ended October 31, 2013.
The aggregate fees billed for all services other than those set forth in paragraphs (b) and (c) of this Item provided by the registrant’s independent auditors to the registrant’s adviser and other service providers under common control with the adviser and that relate directly to the operations or financial reporting of the registrant were $0 for the registrant’s fiscal year ended October 31, 2013.
The aggregate fees billed for all services provided by the independent auditors to the registrant other than those set forth in paragraphs (a), (b) and (c) of this Item were $0 for the fiscal year ended April 30, 2013.
The aggregate fees billed for all services other than those set forth in paragraphs (b) and (c) of this Item provided by the registrant’s independent auditors to the registrant’s adviser and other service providers under common control with the adviser and that relate directly to the operations or financial reporting of the registrant were $0 for the registrant’s fiscal year ended April 30, 2013.
(e) The registrant’s Audit Committee has established pre-approval policies and procedures as permitted by Rule 2-01(c)(7)(i)(B) of Regulation S-X (the “Pre-Approval Policy”) with respect to services provided by the registrant’s independent auditors. Pursuant to the Pre-Approval Policy, the Audit Committee has pre-approved the services set forth in the table below with respect to the registrant up to the specified fee limits. Certain fee limits are based on aggregate fees to the registrant and other registrants within the Delaware Investments Family of Funds.
| Service | Range of Fees |
| Audit Services | |
Statutory audits or financial audits for new Funds | up to $40,000 per Fund |
Services associated with SEC registration statements (e.g., Form N-1A, Form N-14, etc.), periodic reports and other documents filed with the SEC or other documents issued in connection with securities offerings (e.g., comfort letters for closed-end Fund offerings, consents), and assistance in responding to SEC comment letters | up to $10,000 per Fund |
Consultations by Fund management as to the accounting or disclosure treatment of transactions or events and/or the actual or potential impact of final or proposed rules, standards or interpretations by the SEC, FASB, or other regulatory or standard-setting bodies (Note: Under SEC rules, some consultations may be considered “audit-related services” rather than “audit services”) | up to $25,000 in the aggregate |
Audit-Related Services | |
Consultations by Fund management as to the accounting or disclosure treatment of transactions or events and /or the actual or potential impact of final or proposed rules, standards or interpretations by the SEC, FASB, or other regulatory or standard-setting bodies (Note: Under SEC rules, some consultations may be considered “audit services” rather than “audit-related services”) | up to $25,000 in the aggregate |
Tax Services | |
U.S. federal, state and local and international tax planning and advice (e.g., consulting on statutory, regulatory or administrative developments, evaluation of Funds’ tax compliance function, etc.) | up to $25,000 in the aggregate |
U.S. federal, state and local tax compliance (e.g., excise distribution reviews, etc.) | up to $5,000 per Fund |
Review of federal, state, local and international income, franchise and other tax returns | up to $5,000 per Fund |
Under the Pre-Approval Policy, the Audit Committee has also pre-approved the services set forth in the table below with respect to the registrant’s investment adviser and other entities controlling, controlled by or under common control with the investment adviser that provide ongoing services to the registrant (the “Control Affiliates”) up to the specified fee limit. This fee limit is based on aggregate fees to the investment adviser and its Control Affiliates.
| Service | Range of Fees |
| Non-Audit Services | |
Services associated with periodic reports and other documents filed with the SEC and assistance in responding to SEC comment letters | up to $10,000 in the aggregate |
The Pre-Approval Policy requires the registrant’s independent auditors to report to the Audit Committee at each of its regular meetings regarding all services initiated since the last such report was rendered, including those services authorized by the Pre-Approval Policy.
(f) Not applicable.
(g) The aggregate non-audit fees billed by the registrant’s independent auditors for services rendered to the registrant and to its investment adviser and other service providers under common control with the adviser were $7,732,970 and $10,584,953 for the registrant’s fiscal years ended October 31, 2013 and April 30, 2013, respectively.
(h) In connection with its selection of the independent auditors, the registrant’s Audit Committee has considered the independent auditors’ provision of non-audit services to the registrant’s investment adviser and other service providers under common control with the adviser that were not required to be pre-approved pursuant to Rule 2-01(c)(7)(ii) of Regulation S-X. The Audit Committee has determined that the independent auditors’ provision of these services is compatible with maintaining the auditors’ independence.
Item 5. Audit Committee of Listed Registrants
Not applicable.
Item 6. Investments
(a) Included as part of report to shareholders filed under Item 1 of this Form N-CSR.
(b) Divestment of securities in accordance with Section 13(c) of the Investment Company Act of 1940.
Not applicable.
Item 7. Disclosure of Proxy Voting Policies and Procedures for Closed-End Management Investment Companies
Not applicable.
Item 8. Portfolio Managers of Closed-End Management Investment Companies
Not applicable.
Item 9. Purchases of Equity Securities by Closed-End Management Investment Company and Affiliated Purchasers
Not applicable.
Item 10. Submission of Matters to a Vote of Security Holders
Not applicable.
Item 11. Controls and Procedures
The registrant’s principal executive officer and principal financial officer have evaluated the registrant’s disclosure controls and procedures within 90 days of the filing of this report and have concluded that they are effective in providing reasonable assurance that the information required to be disclosed by the registrant in its reports or statements filed under the Securities Exchange Act of 1934 is recorded, processed, summarized and reported within the time periods specified in the rules and forms of the Securities and Exchange Commission.
There were no significant changes in the registrant’s internal control over financial reporting that occurred during the second fiscal quarter of the period covered by the report to stockholders included herein (i.e., the registrant’s fourth fiscal quarter) that have materially affected, or are reasonably likely to materially affect, the registrant’s internal control over financial reporting.
Item 12. Exhibits
| (a) | | (1) Code of Ethics |
| | |
| | Not applicable. |
| | |
| | (2) Certifications of Principal Executive Officer and Principal Financial Officer pursuant to Rule 30a-2 under the Investment Company Act of 1940 are attached hereto as Exhibit 99.CERT. |
| | |
| | (3) Written solicitations to purchase securities pursuant to Rule 23c-1 under the Securities Exchange Act of 1934. |
| | |
| | Not applicable. |
| | |
| (b) | | Certifications pursuant to Section 906 of the Sarbanes-Oxley Act of 2002 are furnished herewith as Exhibit 99.906CERT. |
SIGNATURES
Pursuant to the requirements of the Securities Exchange Act of 1934 and the Investment Company Act of 1940, the registrant has duly caused this report to be signed on its behalf, by the undersigned, thereunto duly authorized.
Name of Registrant: VOYAGEUR MUTUAL FUNDS III
| /s/ PATRICK P. COYNE |
| By: | Patrick P. Coyne |
| Title: | Chief Executive Officer |
| Date: �� | January 7, 2014 |
Pursuant to the requirements of the Securities Exchange Act of 1934 and the Investment Company Act of 1940, this report has been signed below by the following persons on behalf of the registrant and in the capacities and on the dates indicated.
| /s/ PATRICK P. COYNE |
| By: | Patrick P. Coyne |
| Title: | Chief Executive Officer |
| Date: | January 7, 2014 |
| /s/ RICHARD SALUS |
| By: | Richard Salus |
| Title: | Chief Financial Officer |
| Date: | January 7, 2014 |