UNITED STATES SECURITIES AND EXCHANGE COMMISSION
Washington, D.C. 20549
FORM N-CSR
CERTIFIED SHAREHOLDER REPORT OF REGISTERED MANAGEMENT
INVESTMENT COMPANIES
| Investment Company Act file number: | | 811-04547 |
| | | |
| Exact name of registrant as specified in charter: | | Voyageur Mutual Funds III |
| | | |
| Address of principal executive offices: | | 2005 Market Street |
| | Philadelphia, PA 19103 |
| | | |
| Name and address of agent for service: | | David F. Connor, Esq. |
| | 2005 Market Street |
| | Philadelphia, PA 19103 |
| | | |
| Registrant’s telephone number, including area code: | | (800) 523-1918 |
| | | |
| Date of fiscal year end: | | April 30 |
| | | |
| Date of reporting period: | | April 30, 2012 |
Item 1. Reports to Stockholders

Annual report Delaware Large Cap Core Fund
April 30, 2012 U.S. core equity mutual fund |
The Fund is available only to certain residents of certain states. Carefully consider the Fund’s investment objectives, risk factors, charges, and expenses before investing. This and other information can be found in the Fund’s prospectus and, if available, its summary prospectus, which may be obtained by visiting www.delawareinvestments.com or calling 800 523-1918. Investors should read the prospectus and, if available, the summary prospectus carefully before investing. |
You can obtain shareholder reports and prospectuses online instead of in the mail.
Visit www.delawareinvestments.com/edelivery. |
Experience Delaware Investments
Delaware Investments is committed to the pursuit of consistently superior asset management and unparalleled client service. We believe in our investment processes, which seek to deliver consistent results, and in convenient services that help add value for our clients.
If you are interested in learning more about creating an investment plan, contact your financial advisor.
You can learn more about Delaware Investments or obtain a prospectus for Delaware Large Cap Core Fund at www.delawareinvestments.com.
Manage your investments online
- 24-hour access to your account information
- Obtain share prices
- Check your account balance and recent transactions
- Request statements or literature
- Make purchases and redemptions
Delaware Management Holdings, Inc. and its subsidiaries (collectively known by the marketing name of Delaware Investments) are wholly owned subsidiaries of Macquarie Group Limited, a global provider of banking, financial, advisory, investment and funds management services.
Investments in Delaware Large Cap Core Fund are not and will not be deposits with or liabilities of Macquarie Bank Limited ABN 46 008 583 542 and its holding companies, including their subsidiaries or related companies (Macquarie Group), and are subject to investment risk, including possible delays in repayment and loss of income and capital invested. No Macquarie Group company guarantees or will guarantee the performance of the Fund, the repayment of capital from the Fund, or any particular rate of return.
| Table of contents | |
| Portfolio management review | 1 |
| Performance summary | 4 |
| Disclosure of Fund expenses | 8 |
| Security type/sector allocation and | |
| top 10 equity holdings | 10 |
| Statement of net assets | 12 |
| Statement of operations | 16 |
| Statements of changes in net assets | 17 |
| Financial highlights | 18 |
| Notes to financial statements | 22 |
| Report of independent registered | |
| public accounting firm | 32 |
| Other Fund information | 33 |
| Board of trustees/directors and | |
| officers addendum | 34 |
| About the organization | 44 |
Unless otherwise noted, views expressed herein are current as of April 30, 2012, and subject to change.
Funds are not FDIC insured and are not guaranteed. It is possible to lose the principal amount invested.
Mutual fund advisory services provided by Delaware Management Company, a series of Delaware Management Business Trust, which is a registered investment advisor. Delaware Investments, a member of Macquarie Group, refers to Delaware Management Holdings, Inc. and its subsidiaries, including the Fund’s distributor, Delaware Distributors, L.P. Macquarie Group refers to Macquarie Group Limited and its subsidiaries and affiliates worldwide.
© 2012 Delaware Management Holdings, Inc.
All third-party marks cited are the property of their respective owners.
| Portfolio management review |
| Delaware Large Cap Core Fund | | May 8, 2012 |
| Performance preview (for the year ended April 30, 2012) |
| Delaware Large Cap Core Fund (Class A shares) | 1-year return | | +7.04% |
| S&P 500® Index (benchmark) | 1-year return | | +4.76% |
Past performance does not guarantee future results.
For complete, annualized performance for Delaware Large Cap Core Fund, please see the table on page 4.
The performance of Class A shares excludes the applicable sales charge and reflects the reinvestment of all distributions. Index performance returns do not reflect any management fees, transaction costs, or expenses. Indices are unmanaged and one cannot invest directly in an index.
In a volatile year for equities, the broad U.S. stock market, as measured by the S&P 500 Index, finished the Fund’s fiscal year ended April 30, 2012, in modestly positive territory.
As the fiscal year was getting under way, however, investors might not have been expecting this outcome, given the serious macroeconomic challenges that began to develop in spring 2011:
- The sovereign debt crisis in Europe resurfaced, centered in Greece once again, and threatened to spill into more-influential European economies including Italy and Spain (and perhaps the United States and the global economy as well).
- Several lackluster economic reports renewed concerns about decelerating U.S. economic growth.
- In China, questions remained about whether the country’s economy would orchestrate a so-called “soft landing,” or whether a harder landing would have serious negative consequences for the global economy.
These conditions led to a tough start for stock prices, but by early October 2011 the stage was set for stronger performance. Improving employment reports and housing market data suggested that the U.S. economic recovery was on relatively firmer ground, while easier monetary policy became nearly universal around the world.
Perhaps most importantly from the overall perspective of investors, in late 2011 the European Central Bank implemented a plan to make loans directly to European banks, which increased the market’s confidence that a near-term banking crisis had been averted. Combined with relatively healthy U.S. corporate earnings, stock prices rebounded nicely off their previous lows and generally rose during the rest of the fiscal year. (Source: Bloomberg.)
Fund performance
For its fiscal year ended April 30, 2012, Delaware Large Cap Core Fund (Class A shares) returned +7.04% at net asset value and +0.89% at maximum offer price (both figures reflect all distributions reinvested). In comparison, the Fund’s benchmark, the S&P 500 Index, rose 4.76% during the same period. For the complete annualized performance of Delaware Large Cap Core Fund, please see the table on page 4.
1
Portfolio management review
Delaware Large Cap Core Fund
Strength in the technology and consumer discretionary sectors
The Fund’s significant outperformance versus the benchmark index was driven primarily by stock selection in the technology sector and, to a lesser extent, the consumer discretionary sector.
Much of the technology sector’s relative outperformance came from the strong results of consumer electronics and personal computer manufacturer Apple, in which the Fund held an overweight position. The stock advanced more than 66% during the fiscal year, as Apple continued to benefit from strong revenue growth in its major product categories, especially the iPhone mobile device and the iPad tablet. Despite the company’s soaring share price, we still held the stock at the end of the Fund’s fiscal year, considering Apple attractively valued relative to its projected earnings growth. The Fund’s leading contributor in both the consumer discretionary sector and overall was retailer Macy’s. In our view, the company’s skillful business execution has allowed it to successfully increase its market share and generate favorable sales growth, which we believe has been recognized by investors.
Challenges in the energy sector
In contrast, the biggest detractor from Fund returns was stock selection in the energy sector, most notably independent energy producer Newfield Exploration. The shares struggled after earnings were pressured by declining production levels and a partial shift in the company’s exploration business from gas to oil amid historically low natural gas prices. Despite the rough year for Newfield, whose shares lost nearly half of their value, we maintained the Fund’s position in the stock, given the company’s long-term potential and inexpensive valuation compared to its peers.
Another energy sector underperformer was Hess. The global integrated energy company’s shares were hampered by news of disappointing energy production from North Dakota’s Bakken shale region. At the end of the Fund’s fiscal year, we continued to see potential in the stock and believed Hess remained positioned to see better production results in the future.
Applying our bottom-up approach
As we do in all types of market conditions, we maintained a stock-by-stock focus on companies we believed were in competitive positions and exhibited reasonable valuations, good long-term growth prospects, and effective management teams.
One area in which the Fund remained overweight during its fiscal year was the technology sector — specifically, we saw opportunity in the software industry. The Fund was also overweight in basic materials, investing in certain chemical companies that we believed could potentially benefit from low natural gas prices. Natural gas is a key raw material in chemical production, and the lower raw material costs could provide a good backdrop for earnings growth. On the other hand, the Fund remained underweight in financial stocks during its fiscal year, even as relatively low valuations in the sector prompted us to consider investment opportunities in financial companies appearing to offer, in our view, improving performance prospects at a reasonable price.
2
Elsewhere, we modestly increased the Fund’s exposure to underpriced cyclical stocks during the course of its fiscal year, as the 2011 summer selloff created an attractive entry point for many of these names. New holdings that we initiated positions in include eBay, a leading e-commerce and payments company and Dow Chemical Company, a diversified manufacturer. We sold CBS during the fiscal year as it performed relatively well and reached our price target. Management at CBS did an excellent job of exceeding expectations on revenues and earnings, while returning more cash to shareholders via buybacks and dividends. Recently, we also began looking at healthcare and consumer staples stocks, where valuations appear increasingly attractive to us relative to the broad market.
All of these changes took place at the margins of the Fund’s portfolio, and we believe the Fund’s strong performance during its fiscal year stemmed largely from the overall consistency of the sector allocations. We intend to continue our rigorous approach to stock selection, seeking to deliver competitive long-term performance.
3
| Performance summary | |
| Delaware Large Cap Core Fund | April 30, 2012 |
The performance data quoted represent past performance; past performance does not guarantee future results. Investment return and principal value will fluctuate so your shares, when redeemed, may be worth more or less than their original cost. Please obtain the performance data current for the most recent month end by calling 800 523-1918 or visiting our website at www.delawareinvestments.com/performance. Current performance may be lower or higher than the performance data quoted.
| Fund performance1,2 | Average annual total returns through April 30, 2012 |
| 1 year | | 3 years | | 5 years | | Lifetime | |
| Class A (Est. Aug. 31, 2006) | | | | | | | | |
| Excluding sales charge | +7.04% | | +18.76% | | +0.70% | | +3.10% | |
| Including sales charge | +0.89% | | +16.46% | | -0.49% | | +2.02% | |
| Institutional Class (Est. Aug. 31, 2006) | | | | | | | | |
| Excluding sales charge | +7.04% | | +18.76% | | +0.70% | | +3.10% | |
| Including sales charge | +7.04% | | +18.76% | | +0.70% | | +3.10% | |
Class C and R shares had not commenced operations as of April 30, 2012.
1 Returns reflect the reinvestment of all distributions and are presented both with and without the applicable sales charges described below. Returns do not reflect the deduction of taxes the shareholder would pay on Fund distributions or redemptions of Fund shares.
Expense limitations were in effect for certain classes during some or all of the periods shown in the “Fund performance” chart. The current expenses for each class are listed on the “Fund expense ratios” table on page 5. Performance would have been lower had expense limitations not been in effect.
Class A shares are sold with a maximum front-end sales charge of up to 5.75%, and have an annual distribution and service fee of up to 0.25% of average daily net assets. Performance for Class A shares, excluding sales charges, assumes that no front-end sales charge applied.
Class C and R shares are available only for certain retirement plan products. They are sold without a sales charge and have an annual distribution and service fee of up to 1.00% and 0.60%, respectively, of average daily net assets, but such fees are currently subject to a voluntary waiver, which may be terminated or modified at any time. No Class C or R shares were available during the periods shown.
Institutional Class shares are available without sales or asset-based distribution charges only to certain eligible institutional accounts.
The “Fund performance” table and the “Performance of a $10,000 investment” graph do not reflect the deduction of taxes the shareholder would pay on Fund distributions or redemptions of Fund shares.
4
2 The Fund’s expense ratios, as described in the most recent prospectus, are disclosed in the following “Fund expense ratios” table. Delaware Investments has agreed to reimburse certain expenses and/or waive certain fees in order to prevent total fund operating expenses from exceeding 0.95% of the Fund’s average daily net assets from Aug. 26, 2011, until the voluntary cap is discontinued. Please see the most recent prospectus and any applicable supplement(s) for additional information on these fee waivers and/or reimbursements.
| Fund expense ratios | Class A | | Class C | | Class R | | Institutional Class | |
| Total annual operating expenses | 3.60% | | 4.35% | | 3.95% | | 3.35% | |
| (without fee waivers) | | | | | | | | |
| Net expenses | 0.95% | | 0.95% | | 0.95% | | 0.95% | |
| (including fee waivers, if any) | | | | | | | | |
| Type of waiver | Voluntary | | Voluntary | | Voluntary | | Voluntary | |
5
Performance summary
Delaware Large Cap Core Fund
Performance of a $10,000 investment1
Average annual total returns from Aug. 31, 2006 (Fund’s inception) through April 30, 2012
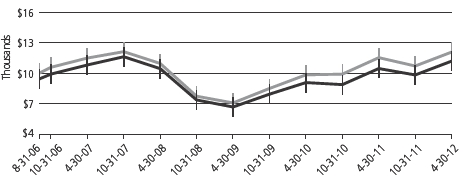
| For period beginning Aug. 31, 2006, through April 30, 2012 | Starting value | | Ending value |
| S&P 500 Index | $10,000 | | | $12,093 |
| Delaware Large Cap Core Fund — Class A shares | $9,425 | | | $11,203 |
1 The “Performance of a $10,000 investment” graph assumes $10,000 invested in Class A shares of the Fund on Aug. 31, 2006, and includes the effect of a 5.75% front-end sales charge and the reinvestment of all distributions. The graph does not reflect the deduction of taxes the shareholders would pay on Fund distributions or redemptions of Fund shares. Expense limitations were in effect for some or all of the periods shown. Performance would have been lower had expense limitations not been in effect. Current expenses are listed in the “Fund expense ratios” table on page 5. Please note additional details on pages 4 through 6.
The chart also assumes $10,000 invested in the S&P 500 Index as of Aug. 31, 2006. The S&P 500 Index measures the performance of 500 mostly large-cap stocks weighted by market value, and is often used to represent performance of the U.S. stock market.
Index performance returns do not reflect any management fees, transaction costs, or expenses. Indices are unmanaged and one cannot invest directly in an index. Past performance is not a guarantee of future results.
Performance of other Fund classes will vary due to different charges and expenses.
| | Nasdaq symbols | | CUSIPs | |
| Class A | | | DDCAX | | | 246118582 | |
| Institutional Class | | | DDCIX | | | 246118558 | |
6
Disclosure of Fund expenses
For the six-month period from November 1, 2011 to April 30, 2012
As a shareholder of the Fund, you incur two types of costs: (1) transaction costs, including sales charges (loads) on purchase payments, reinvested dividends, or other distributions; redemption fees; and exchange fees; and (2) ongoing costs, including management fees; distribution and/or service (12b-1) fees; and other Fund expenses. This example is intended to help you understand your ongoing costs (in dollars) of investing in the Fund and to compare these costs with the ongoing costs of investing in other mutual funds.
The example is based on an investment of $1,000 invested at the beginning of the period and held for the entire six-month period from November 1, 2011 to April 30, 2012.
Actual expenses
The first section of the table shown, “Actual Fund return,” provides information about actual account values and actual expenses. You may use the information in this section of the table, together with the amount you invested, to estimate the expenses that you paid over the period. Simply divide your account value by $1,000 (for example, an $8,600 account value divided by $1,000 = 8.6), then multiply the result by the number in the first section under the heading entitled “Expenses Paid During Period” to estimate the expenses you paid on your account during this period.
Hypothetical example for comparison purposes
The second section of the table shown, “Hypothetical 5% return,” provides information about hypothetical account values and hypothetical expenses based on the Fund’s actual expense ratio and an assumed rate of return of 5% per year before expenses, which is not the Fund’s actual return. The hypothetical account values and expenses may not be used to estimate the actual ending account balance or expenses you paid for the period. You may use this information to compare the ongoing costs of investing in the Fund and other funds. To do so, compare this 5% hypothetical example with the 5% hypothetical examples that appear in the shareholder reports of the other funds.
Please note that the expenses shown in the table are meant to highlight your ongoing costs only and do not reflect any transactional costs, such as sales charges (loads), redemption fees, or exchange fees. Therefore, the second section of the table is useful in comparing ongoing costs only, and will not help you determine the relative total costs of owning different funds. In addition, if these transactional costs were included, your costs would have been higher. The Fund’s expenses shown in the table reflect fee waivers in effect. The expenses shown in the table assume reinvestment of all dividends and distributions.
8
Delaware Large Cap Core Fund
Expense analysis of an investment of $1,000
| | Beginning | | Ending | | | | | Expenses |
| | Account Value | | Account Value | | Annualized | | Paid During Period |
| | 11/1/11 | | 4/30/12 | | Expense Ratio | | 11/1/11 to 4/30/12* |
| Actual Fund return | | | | | | | | | | | | | | | |
| Class A | | $ | 1,000.00 | | | $ | 1,138.70 | | | 0.95 | % | | $ | 5.05 | |
| Institutional Class | | | 1,000.00 | | | | 1,138.70 | | | 0.95 | % | | | 5.05 | |
| Hypothetical 5% return (5% return before expenses) | | | | | | | | |
| Class A | | $ | 1,000.00 | | | $ | 1,020.14 | | | 0.95 | % | | $ | 4.77 | |
| Institutional Class | | | 1,000.00 | | | | 1,020.14 | | | 0.95 | % | | | 4.77 | |
*“Expenses Paid During Period” are equal to the Fund’s annualized expense ratio, multiplied by the average account value over the period, multiplied by 182/366 (to reflect the one-half year period).
9
Security type/sector allocation and
top 10 equity holdings |
| Delaware Large Cap Core Fund | As of April 30, 2012 |
Sector designations may be different than the sector designations presented in other Fund materials. The sector designations may represent the investment manager’s internal sector classifications, which may result in the sector designations for one fund being different than another fund’s sector designations.
| Security type/sector | Percentage of net assets |
| Common Stock | 98.69 | % |
| Basic Materials | 4.15 | % |
| Business Services | 1.03 | % |
| Capital Goods | 9.25 | % |
| Communication Services | 3.05 | % |
| Consumer Discretionary | 5.47 | % |
| Consumer Services | 0.96 | % |
| Consumer Staples | 8.98 | % |
| Credit Cyclicals | 1.52 | % |
| Energy | 11.43 | % |
| Financials | 9.40 | % |
| Healthcare | 13.54 | % |
| Media | 3.19 | % |
| Technology | 24.45 | % |
| Transportation | 2.27 | % |
| Short-Term Investments | 2.12 | % |
| Total Value of Securities | 100.81 | % |
| Liabilities Net of Receivables and Other Assets | (0.81 | %) |
| Total Net Assets | 100.00 | % |
10
Holdings are for informational purposes only and are subject to change at any time. They are not a recommendation to buy, sell, or hold any security.
| Top 10 equity holdings | Percentage of net assets |
| Apple | 7.16 | % |
| Pfizer | 3.22 | % |
| Microsoft | 3.03 | % |
| United Technologies | 2.60 | % |
| Schlumberger | 2.58 | % |
| Merck | 2.48 | % |
| QUALCOMM | 2.44 | % |
| Chevron | 2.35 | % |
| Procter & Gamble | 2.31 | % |
| CVS Caremark | 2.14 | % |
11
| Statement of net assets |
| Delaware Large Cap Core Fund | April 30, 2012 |
| | | | Number of shares | | Value |
| Common Stock – 98.69% | | | | | |
| Basic Materials – 4.15% | | | | | |
| Allegheny Technologies | | 490 | | $ | 21,041 |
| Celanese Series A | | 520 | | | 25,198 |
| | Cliffs Natural Resources | | 260 | | | 16,188 |
| Eastman Chemical | | 410 | | | 22,128 |
| | | | | | 84,555 |
| Business Services – 1.03% | | | | | |
| Towers Watson Class A | | 320 | | | 20,928 |
| | | | | | 20,928 |
| Capital Goods – 9.25% | | | | | |
| Caterpillar | | 410 | | | 42,136 |
| Deere | | 390 | | | 32,120 |
| Fluor | | 360 | | | 20,790 |
| Honeywell International | | 670 | | | 40,642 |
| United Technologies | | 650 | | | 53,066 |
| | | | | | 188,754 |
| Communication Services – 3.05% | | | | | |
| AT&T | | 1,220 | | | 40,150 |
| Vodafone Group ADR | | 790 | | | 21,986 |
| | | | | | 62,136 |
| Consumer Discretionary – 5.47% | | | | | |
| DSW Class A | | 180 | | | 10,127 |
| Macy’s | | 1,020 | | | 41,840 |
| Nordstrom | | 550 | | | 30,723 |
| Target | | 500 | | | 28,970 |
| | | | | | 111,660 |
| Consumer Services – 0.96% | | | | | |
| McDonald’s | | 200 | | | 19,490 |
| | | | | | 19,490 |
| Consumer Staples – 8.98% | | | | | |
| CVS Caremark | | 980 | | | 43,728 |
| General Mills | | 590 | | | 22,945 |
| Jarden | | 470 | | | 19,707 |
| Kimberly-Clark | | 260 | | | 20,402 |
| Procter & Gamble | | 740 | | | 47,093 |
| Starbucks | | 510 | | | 29,264 |
| | | | | | 183,139 |
12
| | | | Number of shares | | Value |
| Common Stock (continued) | | | | | |
| Credit Cyclicals – 1.52% | | | | | |
| Ford Motor | | 2,740 | | $ | 30,907 |
| | | | | | | 30,907 |
| Energy – 11.43% | | | | | |
| Chevron | | 450 | | | 47,953 |
| Exxon Mobil | | 410 | | | 35,399 |
| Hess | | 580 | | | 30,241 |
| † | Newfield Exploration | | 340 | | | 12,206 |
| † | Noble | | 790 | | | 30,067 |
| Occidental Petroleum | | 270 | | | 24,629 |
| Schlumberger | | 710 | | | 52,640 |
| | | | | | 233,135 |
| Financials – 9.40% | | | | | |
| AFLAC | | 420 | | | 18,917 |
| BlackRock | | 100 | | | 19,158 |
| Capital One Financial | | 390 | | | 21,637 |
| † | IntercontinentalExchange | | 160 | | | 21,286 |
| JPMorgan Chase | | 860 | | | 36,963 |
| Prudential Financial | | 590 | | | 35,719 |
| Wells Fargo | | 1,140 | | | 38,110 |
| | | | | | 191,790 |
| Healthcare – 13.54% | | | | | |
| † | Celgene | | 470 | | | 34,273 |
| † | Express Scripts | | 650 | | | 36,264 |
| † | Gilead Sciences | | 470 | | | 24,445 |
| Merck | | 1,290 | | | 50,620 |
| Pfizer | | 2,864 | | | 65,671 |
| Thermo Fisher Scientific | | 440 | | | 24,486 |
| UnitedHealth Group | | 720 | | | 40,428 |
| | | | | | 276,187 |
| Media – 3.19% | | | | | |
| Comcast Special Class A | | 1,390 | | | 41,464 |
| Viacom Class B | | 510 | | | 23,659 |
| | | | | | 65,123 |
13
Statement of net assets
Delaware Large Cap Core Fund
| | | | Number of shares | | Value |
| Common Stock (continued) | | | | | | |
| Technology – 24.45% | | | | | | |
| Accenture Class A | | | 460 | | $ | 29,877 |
| † | Apple | | | 250 | | | 146,059 |
| | Avago Technologies | | | 560 | | | 19,309 |
| † | Citrix Systems | | | 140 | | | 11,986 |
| † | Cognizant Technology Solutions Class A | | | 390 | | | 28,595 |
| † | Dell | | | 950 | | | 15,552 |
| † | eBay | | | 310 | | | 12,726 |
| † | EMC | | | 1,360 | | | 38,366 |
| † | Google Class A | | | 70 | | | 42,366 |
| Intel | | | 930 | | | 26,412 |
| Microsoft | | | 1,930 | | | 61,799 |
| QUALCOMM | | | 780 | | | 49,795 |
| † | Symantec | | | 960 | | | 15,859 |
| | | | | | | 498,701 |
| Transportation – 2.27% | | | | | | |
| Hunt (J.B.) Transport | | | 350 | | | 19,366 |
| Union Pacific | | | 240 | | | 26,985 |
| | | | | | | 46,351 |
| Total Common Stock (cost $1,593,905) | | | | | | 2,012,856 |
| |
| | | Principal amount | | | |
| Short-Term Investments – 2.12% | | | | | | |
| ≠Discount Notes – 0.55% | | | | | | |
| Federal Home Loan Bank | | | | | | |
| 0.11% 5/25/12 | | $ | 8,323 | | | 8,323 |
| 0.115% 6/29/12 | | | 3,046 | | | 3,046 |
| | | | | | | 11,369 |
| Repurchase Agreements – 1.57% | | | | | | |
| Bank of America 0.17%, dated 4/30/12, to be | | | | | | |
| repurchased on 5/1/12, repurchase price $7,882 | | | | | | |
| (collateralized by U.S. government obligations | | | | | | |
| 2.25%-4.125% 1/31/15-5/15/15; market value $8,040) | | | 7,882 | | | 7,882 |
| BNP Paribas 0.17%, dated 4/30/12, to be repurchased on | | | | | | |
| 5/1/12, repurchase price $24,118 (collateralized by | | | | | | |
| U.S. government obligations 0.00%-2.375% | | | | | | |
| 7/26/12-10/31/16; market value $24,600) | | | 24,118 | | | 24,118 |
| | | | | | | 32,000 |
| Total Short-Term Investments (cost $43,369) | | | | | | 43,369 |
14
| | | | | |
| Total Value of Securities – 100.81% | | | | |
| (cost $1,637,274) | | $ | 2,056,225 | |
| Liabilities Net of Receivables | | | | |
| and Other Assets – (0.81%) | | | (16,583 | ) |
| Net Assets Applicable to 221,172 | | | | |
| Shares Outstanding – 100.00% | | $ | 2,039,642 | |
| |
| Net Asset Value – Delaware Large Cap Core Fund | | | | |
| Class A ($14,513 / 1,574 Shares) | | | | $9.22 | |
| Net Asset Value – Delaware Large Cap Core Fund | | | | |
| Institutional Class ($2,025,129 / 219,598 Shares) | | | | $9.22 | |
| | |
| Components of Net Assets at April 30, 2012: | | | | |
| Shares of beneficial interest (unlimited authorization – no par) | | $ | 1,954,416 | |
| Undistributed net investment income | | | 2,960 | |
| Accumulated net realized loss on investments | | | (336,685 | ) |
| Net unrealized appreciation on investments | | | 418,951 | |
| Total net assets | | $ | 2,039,642 | |
†Non income producing security.
≠The rate shown is the effective yield at the time of purchase.
| Net Asset Value and Offering Price Per Share – | | | | |
| Delaware Large Cap Core Fund | | | | |
| Net asset value Class A (A) | | $ | 9.22 | |
| Sales charge (5.75% of offering price) (B) | | | 0.56 | |
| Offering price | | $ | 9.78 | |
| (A) | Net asset value per share, as illustrated, is the amount which would be paid upon redemption or repurchase of shares. |
| (B) | See the current prospectus for purchases of $50,000 or more. |
ADR — American Depositary Receipt
See accompanying notes, which are an integral part of the financial statements.
15
| Statement of operations | |
| Delaware Large Cap Core Fund | Year Ended April 30, 2012 |
| Investment Income: | | | | | | | | |
| Dividends | | $ | 34,521 | | | | | |
| Interest | | | 27 | | | | | |
| Foreign tax withheld | | | (12 | ) | | $ | 34,536 | |
| |
| Expenses: | | | | | | | | |
| Reports and statements to shareholders | | | 15,565 | | | | | |
| Management fees | | | 12,008 | | | | | |
| Audit and tax | | | 10,103 | | | | | |
| Registration fees | | | 3,905 | | | | | |
| Dividend disbursing and transfer agent fees and expenses | | | 2,717 | | | | | |
| Dues and services | | | 2,209 | | | | | |
| Pricing fees | | | 1,526 | | | | | |
| Accounting and administration expenses | | | 726 | | | | | |
| Custodian fees | | | 367 | | | | | |
| Legal fees | | | 229 | | | | | |
| Trustees’ fees | | | 96 | | | | | |
| Insurance fees | | | 33 | | | | | |
| Distribution expenses – Class A | | | 33 | | | | | |
| Consulting fees | | | 28 | | | | | |
| Trustees’ expenses | | | 11 | | | | 49,556 | |
| Less fees waived | | | | | | | (31,974 | ) |
| Less waived distribution expenses – Class A | | | | | | | (33 | ) |
| Total operating expenses | | | | | | | 17,549 | |
| Net Investment Income | | | | | | | 16,987 | |
| |
| Net Realized and Unrealized Gain: | | | | | | | | |
| Net realized gain on investments | | | | | | | 74,759 | |
| Net change in unrealized appreciation of investments | | | | | | | 43,491 | |
| Net Realized and Unrealized Gain | | | | | | | 118,250 | |
| |
| Net Increase in Net Assets Resulting from Operations | | | | | | $ | 135,237 | |
See accompanying notes, which are an integral part of the financial statements.
16
Statements of changes in net assets
Delaware Large Cap Core Fund
| | Year Ended |
| | 4/30/12 | | 4/30/11 |
| Increase in Net Assets from Operations: | | | | | | | | |
| Net investment income | | $ | 16,987 | | | $ | 11,365 | |
| Net realized gain | | | 74,759 | | | | 110,803 | |
| Net change in unrealized appreciation | | | 43,491 | | | | 125,243 | |
| Net increase in net assets resulting from operations | | | 135,237 | | | | 247,411 | |
| |
| Dividends and Distributions to Shareholders from: | | | | | | | | |
| Net investment income: | | | | | | | | |
| Class A | | | (113 | ) | | | (68 | ) |
| Institutional Class | | | (15,686 | ) | | | (9,525 | ) |
| | | | (15,799 | ) | | | (9,593 | ) |
| Capital Share Transactions: | | | | | | | | |
| Proceeds from shares sold: | | | | | | | | |
| Class A | | | — | | | | 489 | |
| |
| Net asset value of shares issued upon reinvestment | | | | | | | | |
| of dividends and distributions: | | | | | | | | |
| Class A | | | 113 | | | | 68 | |
| Institutional Class | | | 15,686 | | | | 9,525 | |
| | | | 15,799 | | | | 10,082 | |
| Cost of shares repurchased: | | | | | | | | |
| Class A | | | (502 | ) | | | (18,484 | ) |
| | | | (502 | ) | | | (18,484 | ) |
| Increase (decrease) in net assets derived from capital | | | | | | | | |
| share transactions | | | 15,297 | | | | (8,402 | ) |
| Net Increase in Net Assets | | | 134,735 | | | | 229,416 | |
| |
| Net Assets: | | | | | | | | |
| Beginning of year | | | 1,904,907 | | | | 1,675,491 | |
| End of year (including undistributed net investment income | | | | | | | | |
| of $2,960 and $1,772, respectively) | | $ | 2,039,642 | | | $ | 1,904,907 | |
See accompanying notes, which are an integral part of the financial statements.
17
Financial highlights
Delaware Large Cap Core Fund Class A
Selected data for each share of the Fund outstanding throughout each period were as follows:
| Net asset value, beginning of period |
| |
| Income (loss) from investment operations: |
| Net investment income1 |
| Net realized and unrealized gain (loss) |
| Total from investment operations |
| |
| Less dividends and distributions from: |
| Net investment income |
| Net realized gain on investments |
| Total dividends and distributions |
| |
| Net asset value, end of period |
| |
| Total return2 |
| |
| Ratios and supplemental data: |
| Net assets, end of period (000 omitted) |
| Ratio of expenses to average net assets |
| Ratio of expenses to average net assets |
| prior to fees waived and expense paid indirectly |
| Ratio of net investment income to average net assets |
| Ratio of net investment income (loss) to average net assets |
| prior to fees waived and expense paid indirectly |
| Portfolio turnover |
1 The average shares outstanding method has been applied for per share information. |
2 Total investment return is based on the change in net asset value of a share during the period and assumes reinvestment of dividends and distributions at net asset value and does not reflect the impact of a sales charge. Total investment return during all of the periods shown reflects waivers by the manager and distributor. Performance would have been lower had the waivers not been in effect. |
See accompanying notes, which are an integral part of the financial statements.
18
| Year Ended |
| 4/30/12 | | 4/30/11 | | 4/30/10 | | 4/30/09 | | 4/30/08 | |
| $8.690 | | | $7.590 | | | $5.630 | | | $8.930 | | | $9.700 | | |
| | |
| | |
| 0.077 | | | 0.052 | | | 0.038 | | | 0.081 | | | 0.073 | | |
| 0.525 | | | 1.092 | | | 1.978 | | | (3.293 | ) | | (0.368 | ) | |
| 0.602 | | | 1.144 | | | 2.016 | | | (3.212 | ) | | (0.295 | ) | |
| | |
| | |
| (0.072 | ) | | (0.044 | ) | | (0.056 | ) | | (0.088 | ) | | (0.067 | ) | |
| | — | | | — | | | — | | | — | | | (0.408 | ) | |
| | (0.072 | ) | | (0.044 | ) | | (0.056 | ) | | (0.088 | ) | | (0.475 | ) | |
| | |
| $9.220 | | | $8.690 | | | $7.590 | | | $5.630 | | | $8.930 | | |
| | |
| 7.04% | | | 15.12% | | | 35.93% | | | (36.04% | ) | | (3.36% | ) | |
| | |
| | |
| $15 | | | $14 | | | $31 | | | $10 | | | $32 | | |
| 0.95% | | | 0.95% | | | 0.95% | | | 0.95% | | | 0.95% | | |
| | |
| 2.93% | | | 3.60% | | | 3.05% | | | 1.87% | | | 3.03% | | |
| 0.92% | | | 0.69% | | | 0.56% | | | 1.20% | | | 0.77% | | |
| | |
| (1.06% | ) | | (1.96% | ) | | (1.54% | ) | | 0.28% | | | (1.31% | ) | |
| 41% | | | 46% | | | 65% | | | 38% | | | 30% | | |
19
Financial highlights
Delaware Large Cap Core Fund Institutional Class
Selected data for each share of the Fund outstanding throughout each period were as follows:
| Net asset value, beginning of period |
| |
| Income (loss) from investment operations: |
| Net investment income1 |
| Net realized and unrealized gain (loss) |
| Total from investment operations |
| |
| Less dividends and distributions from: |
| Net investment income |
| Net realized gain on investments |
| Total dividends and distributions |
| |
| Net asset value, end of period |
| |
| Total return2 |
| |
| Ratios and supplemental data: |
| Net assets, end of period (000 omitted) |
| Ratio of expenses to average net assets |
| Ratio of expenses to average net assets |
| prior to fees waived and expense paid indirectly |
| Ratio of net investment income to average net assets |
| Ratio of net investment income (loss) to average net assets |
| prior to fees waived and expense paid indirectly |
| Portfolio turnover |
1 The average shares outstanding method has been applied for per share information. |
2 Total investment return is based on the change in net asset value of a share during the period and assumes reinvestment of dividends and distributions at net asset value. Total investment return during all of the periods shown reflects a waiver by the manager. Performance would have been lower had the waiver not been in effect. |
See accompanying notes, which are an integral part of the financial statements.
20
| Year Ended |
| 4/30/12 | | 4/30/11 | | 4/30/10 | | 4/30/09 | | 4/30/08 | |
| $8.690 | | | $7.600 | | | $5.630 | | | $8.930 | | | $9.700 | | |
| | |
| | |
| 0.077 | | | 0.052 | | | 0.038 | | | 0.081 | | | 0.073 | | |
| 0.525 | | | 1.082 | | | 1.988 | | | (3.293 | ) | | (0.368 | ) | |
| 0.602 | | | 1.134 | | | 2.026 | | | (3.212 | ) | | (0.295 | ) | |
| | |
| | |
| (0.072 | ) | | (0.044 | ) | | (0.056 | ) | | (0.088 | ) | | (0.067 | ) | |
| �� | | | — | | | — | | | — | | | (0.408 | ) | |
| (0.072 | ) | | (0.044 | ) | | (0.056 | ) | | (0.088 | ) | | (0.475 | ) | |
| | |
| $9.220 | | | $8.690 | | | $7.600 | | | $5.630 | | | $8.930 | | |
| | |
| 7.04% | | | 15.12% | | | 36.11% | | | (36.04% | ) | | (3.36% | ) | |
| | |
| | |
| $2,025 | | | $1,891 | | | $1,644 | | | $1,418 | | | $2,219 | | |
| 0.95% | | | 0.95% | | | 0.95% | | | 0.95% | | | 0.95% | | |
| | |
| 2.68% | | | 3.35% | | | 2.80% | | | 1.62% | | | 2.78% | | |
| 0.92% | | | 0.69% | | | 0.56% | | | 1.20% | | | 0.77% | | |
| | |
| (0.81% | ) | | (1.71% | ) | | (1.29% | ) | | 0.53% | | | (1.06% | ) | |
| 41% | | | 46% | | | 65% | | | 38% | | | 30% | | |
21
| Notes to financial statements | |
| Delaware Large Cap Core Fund | | April 30, 2012 |
Voyageur Mutual Funds III (Trust) is organized as a Delaware statutory trust and offers two series: Delaware Large Cap Core Fund and Delaware Select Growth Fund. These financial statements and the related notes pertain to Delaware Large Cap Core Fund (Fund). The Trust is an open-end investment company. The Fund is considered diversified under the Investment Company Act of 1940, as amended, and offers Class A, Class C, Class R and Institutional Class shares. Class A shares are sold with a maximum front-end sales charge of up to 5.75%. Class A share purchases of $1,000,000 or more will incur a contingent deferred sales charge (CDSC) of 1% if redeemed during the first year and 0.50% during the second year, provided that Delaware Distributors, L.P. (DDLP) paid a financial advisor a commission on the purchase of those shares. Class C shares are sold with a CDSC of 1%, if redeemed during the first twelve months. Class R and Institutional Class shares are not subject to a sales charge and are offered for sale exclusively to certain eligible investors. As of April 30, 2012, Class C and Class R have not commenced operations.
The investment objective of the Fund is to seek long-term capital appreciation.
1. Significant Accounting Policies
The following accounting policies are in accordance with U.S. generally accepted accounting principles (U.S. GAAP) and are consistently followed by the Fund.
Security Valuation — Equity securities, except those traded on the Nasdaq Stock Market, Inc. (Nasdaq), are valued at the last quoted sales price as of the time of the regular close of the New York Stock Exchange (NYSE) on the valuation date. Securities traded on the Nasdaq are valued in accordance with the Nasdaq Official Closing Price, which may not be the last sales price. If on a particular day an equity security does not trade, then the mean between the bid and ask prices will be used, which approximates fair value. Short-term debt securities are valued using the evaluated mean. U.S. government and agency securities are valued at the mean between the bid and ask prices, which approximates fair value. Generally, other securities and assets for which market quotations are not readily available are valued at fair value as determined in good faith under the direction of the Fund’s Board of Trustees (Board). In determining whether market quotations are readily available or fair valuation will be used, various factors will be taken into consideration, such as market closures or suspension of trading in a security. The Fund may use fair value pricing more frequently for securities traded primarily in non-U.S. markets because, among other things, most foreign markets close well before the Fund values its securities, generally as of 4:00 p.m. Eastern time. The earlier close of these foreign markets gives rise to the possibility that significant events, including broad market moves, government actions or pronouncements, aftermarket trading, or news events may have occurred in the interim. To account for this, the Fund may frequently value foreign securities using fair value prices based on third-party vendor modeling tools (international fair value pricing).
Federal Income Taxes — No provision for federal income taxes has been made as the Fund intends to continue to qualify for federal income tax purposes as a regulated investment company under Subchapter M of the Internal Revenue Code of 1986, as amended, and make the requisite distributions to shareholders. The Fund evaluates tax positions taken or expected to be taken in
22
the course of preparing the Fund’s tax returns to determine whether the tax positions are “more-likely-than-not” of being sustained by the applicable tax authority. Tax positions not deemed to meet the more-likely-than-not threshold are recorded as a tax benefit or expense in the current year. Management has analyzed the Fund’s tax positions taken on federal income tax returns for all open tax years (April 30, 2009–April 30, 2012), and has concluded that no position for federal income tax is required in the Fund’s financial statements.
Class Accounting — Investment income, common expenses and realized and unrealized gain (loss) on investments are allocated to the various classes of the Fund on the basis of daily net assets of each class. Distribution expenses relating to a specific class are charged directly to that class.
Repurchase Agreements — The Fund may purchase certain U.S. government securities subject to the counterparty’s agreement to repurchase them at an agreed upon date and price. The counterparty will be required on a daily basis to maintain the value of the collateral subject to the agreement at not less than the repurchase price (including accrued interest). The agreements are conditioned upon the collateral being deposited under the Federal Reserve book-entry system with the Fund’s custodian or a third party sub-custodian. In the event of default or bankruptcy by the other party to the agreement, retention of the collateral may be subject to legal proceedings. All open repurchase agreements as of the date of this report were entered into on April 30, 2012.
Use of Estimates — The preparation of financial statements in conformity with U.S. GAAP requires management to make estimates and assumptions that affect the fair value of investments, the reported amounts of assets and liabilities and disclosure of contingent assets and liabilities at the date of the financial statements and the reported amounts of revenues and expenses during the reporting period. Actual results could differ from those estimates and the differences could be material.
Other — Expenses directly attributable to the Fund are charged directly to the Fund. Other expenses common to various funds within the Delaware Investments® Family of Funds are generally allocated amongst such funds on the basis of average net assets. Management fees and some other expenses are paid monthly. Security transactions are recorded on the date the securities are purchased or sold (trade date) for financial reporting purposes. Costs used in calculating realized gains and losses on the sale of investment securities are those of the specific securities sold. Dividend income is recorded on the ex-dividend date and interest income is recorded on the accrual basis. The Fund declares and pays dividends from net investment income and distributions from net realized gain on investments, if any, annually. The Fund may distribute income dividends and capital gains more frequently, if necessary for tax purposes. Dividends and distributions, if any, are recorded on the ex-dividend date.
The Fund may receive earnings credits from its custodian when positive cash balances are maintained, which are used to offset custody fees. There were no earnings credits for the year ended April 30, 2012.
23
Notes to financial statements
Delaware Large Cap Core Fund
1. Significant Accounting Policies (continued)
The Fund may receive earnings credits from its transfer agent when positive cash balances are maintained, which are used to offset transfer agent fees. There were no earnings credits for the year ended April 30, 2012.
2. Investment Management, Administration Agreements and Other Transactions with Affiliates
In accordance with the terms of its investment management agreement, the Fund pays Delaware Management Company (DMC), a series of Delaware Management Business Trust and the investment manager, an annual fee which is calculated daily at the rate of 0.65% on the first $500 million of average daily net assets of the Fund, 0.60% on the next $500 million, 0.55% on the next $1.5 billion and 0.50% on average daily net assets in excess of $2.5 billion.
DMC has voluntarily agreed to waive all or a portion, if any, of its management fees and reimburse the Fund to the extent necessary to ensure that total annual operating expenses (excluding any 12b-1 plan and certain other expenses) do not exceed 0.95% of the Fund’s average daily net assets until such time as the voluntary expense cap is discontinued. This waiver and reimbursement may be discontinued at any time because it is voluntary. This waiver and reimbursement applies only to expenses paid directly by the Fund.
Delaware Service Company, Inc. (DSC), an affiliate of DMC, provides fund accounting and financial administration oversight services to the Fund. For these services, the Fund pays DSC fees based on the aggregate daily net assets of the Delaware Investments® Family of Funds at the following annual rate: 0.0050% of the first $30 billion; 0.0045% of the next $10 billion; 0.0040% of the next $10 billion; and 0.0025% of aggregate average daily net assets in excess of $50 billion. The fees payable to DSC under the service agreement described above are allocated among all Funds in the Delaware Investments® Family of Funds on a relative net asset value basis. For the year ended April 30, 2012, the Fund was charged $91 for these services.
DSC also provides dividend disbursing and transfer agency services. Effective July 18, 2011, the Fund pays DSC a monthly asset-based fee for these services. Prior to July 18, 2011, the Fund paid DSC a monthly fee based on the number of shareholder accounts for dividend disbursing and transfer agent services.
Pursuant to a distribution agreement and distribution plan, the Fund pays DDLP, the distributor and an affiliate of DMC, an annual distribution and service fee not to exceed 0.25% of the average daily net assets of the Class A shares, 1.00% of the average daily net assets of Class C shares and 0.60% of the average daily net assets of Class R shares. Institutional Class shares pay no distribution and services expenses. DDLP has voluntarily agreed to waive all distribution and service fees. The distributor’s waivers may be discontinued at any time because it is voluntary.
24
At April 30, 2012, the Fund had liabilities payable to affiliates as follows:
| Investment Management fees payable to DMC | $ | 867 |
| Dividend disbursing, transfer agent and fund accounting | | |
| oversight fees and other expenses payable to DSC | | 46 |
| Other expenses payable to DMC and affiliates* | | 9 |
*DMC, as part of its administrative services, pays operating expenses on behalf of the Fund and is reimbursed on a periodic basis. Expenses include items such as printing of shareholder reports, fees for audit, legal and tax services, registration fees and trustees’ fees.
As provided in the investment management agreement, the Fund bears the cost of certain legal and tax services, including internal legal and tax services provided to the Fund by DMC and/or its affiliates’ employees. For the year ended April 30, 2012, the Fund was charged $ 55 for internal legal and tax services provided by DMC and/or its affiliates’ employees.
Trustees’ fees include expenses accrued by the Fund for each Trustee’s retainer and meeting fees. Certain officers of DMC, DSC and DDLP are officers and/or Trustees of the Trust. These officers and Trustees are paid no compensation by the Fund.
3. Investments
For the year ended April 30, 2012, the Fund made purchases of $758,993 and sales of $755,472 of investment securities other than short-term investments.
At April 30, 2012, the cost of investments for federal income tax purposes was $1,645,279. At April 30, 2012, net unrealized appreciation was $410,946, of which $447,989 related to unrealized appreciation of investments and $37,043 related to unrealized depreciation of investments.
U.S. GAAP defines fair value as the price that the Fund would receive to sell an asset or pay to transfer a liability in an orderly transaction between market participants at the measurement date under current market conditions. A three level hierarchy for fair value measurements has been established based upon the transparency of inputs to the valuation of an asset or liability. Inputs may be observable or unobservable and refer broadly to the assumptions that market participants would use in pricing the asset or liability. Observable inputs reflect the assumptions market participants would use in pricing the asset or liability based on market data obtained from sources independent of the reporting entity. Unobservable inputs reflect the reporting entity’s own assumptions about the assumptions that market participants would use in pricing the asset or liability developed based on the best information available under the circumstances. The Fund’s investment in its entirety is assigned a level based upon the observability of the inputs which are significant to the overall valuation. The three level hierarchy of inputs is summarized below.
| Level 1 | – | inputs are quoted prices in active markets for identical investments (e.g., equity securities, open-end investment companies, futures contracts, options contracts) |
25
Notes to financial statements
Delaware Large Cap Core Fund
3. Investments (continued)
| Level 2 | – | other observable inputs (including, but not limited to: quoted prices for similar assets or liabilities in markets that are active, quoted prices for identical or similar assets or liabilities in markets that are not active, inputs other than quoted prices that are observable for the assets or liabilities (such as interest rates, yield curves, volatilities, prepayment speeds, loss severities, credit risks and default rates) or other market-corroborated inputs) (e.g., debt securities, government securities, swap contracts, foreign currency exchange contracts, foreign securities utilizing international fair value pricing, broker-quoted securities, fair value securities) |
| | | |
| Level 3 | – | inputs are significant unobservable inputs (including the Fund’s own assumptions used to determine the fair value of investments) (e.g., broker-quoted securities, fair valued securities) |
The following table summarizes the valuation of the Fund’s investments by fair value hierarchy levels as of April 30, 2012:
| | Level 1 | | Level 2 | | Total |
| Common Stock | | $ | 2,012,856 | | $ | — | | $ | 2,012,856 |
| Short-Term Investments | | | — | | | 43,369 | | | 43,369 |
| Total | | $ | 2,012,856 | | $ | 43,369 | | $ | 2,056,225 |
There were no unobservable inputs used to value investments at the beginning or end of the year. During the year ended April 30, 2012, there were no transfers between Level 1 investments, Level 2 investments or Level 3 investments that had a material impact to the Fund. The Fund’s policy is to recognize transfers between levels at the beginning of the reporting period.
In May 2011, the Financial Accounting Standards Board (FASB) issued ASU No. 2011-04 modifying Topic 820, Fair Value Measurements and Disclosures. ASU No. 2011-04 requires reporting entities to disclose i) the amounts of any transfers between Level 1 and Level 2, and the reasons for the transfers, ii) for Level 3 fair value measurements, iii) quantitative information about significant unobservable inputs used, iv) a description of the valuation processes used by the reporting entity and v) a narrative description of the sensitivity of the fair value measurement to changes in unobservable inputs if a change in those inputs might result in a significantly higher or lower fair value measurement. The effective date of ASU No. 2011-04 is for interim and annual periods beginning after December 15, 2011. Management is currently evaluating the implications of this guidance and the impact it will have on the financial statement amounts and footnote disclosures, if any.
26
4. Dividend and Distribution Information
Income and long-term capital gain distributions are determined in accordance with federal income tax regulations, which may differ from U.S. GAAP. Additionally, distributions from net short-term gains on sales of investment securities are treated as ordinary income for federal income tax purposes. The tax character of dividends and distributions paid during the years ended April 30, 2012 and 2011 was as follows:
| Year Ended |
| 4/30/12 | | 4/30/11 |
| Ordinary income | $15,799 | | $9,593 |
5. Components of Net Assets on a Tax Basis
As of April 30, 2012, the components of net assets on a tax basis were as follows:
| Shares of beneficial interest | $ | 1,954,416 | |
| Undistributed ordinary income | | 2,960 | |
| Qualified late year ordinary loss deferral | | (15,013 | ) |
| Capital loss carryforwards | | (313,667 | ) |
| Unrealized appreciation | | 410,946 | |
| Net assets | $ | 2,039,642 | |
The difference between book basis and tax basis components of net assets is primarily attributable to tax deferral of losses on wash sales.
For federal income tax purposes, capital loss carryforwards may be carried forward and applied against future capital gains. $88,528 was utilized in 2012. Capital loss carryforwards remaining at April 30, 2012, if not utilized in future years, will expire as follows: $12,264 expires in 2017 and $301,403 expires in 2018.
On December 22, 2010, the Regulated Investment Company Modernization Act of 2010 (the Act) was enacted, which changed various technical rules governing the tax treatment of regulated investment companies. The changes are generally effective for taxable years beginning after the date of enactment. Under the Act, the Fund will be permitted to carry forward capital losses incurred in taxable years beginning after the date of enactment for an unlimited period. However, any losses incurred during those future taxable years will be required to be utilized prior to the losses incurred in pre-enactment taxable years, which carry an expiration date. As a result of this ordering rule, pre-enactment capital loss carryforwards may be more likely to expire unused. Additionally, post-enactment capital loss carryforwards will retain their character as either short-term or long-term capital losses rather than being considered all short-term as permitted under previous regulation.
27
Notes to financial statements
Delaware Large Cap Core Fund
6. Capital Shares
| | Year Ended |
| | 4/30/12 | | 4/30/11 |
| Shares sold: | | | | | | |
| Class A | | — | | | 59 | |
| |
| Shares issued upon reinvestment of dividends and distributions: | | | | | | |
| Class A | | 14 | | | 8 | |
| Institutional Class | | 1,935 | | | 1,192 | |
| | | 1,949 | | | 1,259 | |
| |
| Shares repurchased: | | | | | | |
| Class A | | (59 | ) | | (2,574 | ) |
| | | (59 | ) | | (2,574 | ) |
| |
| Net increase (decrease) | | 1,890 | | | (1,315 | ) |
As of April 30, 2012, management believes the following shareholders held of record 5% or more of the outstanding shares of each Class of the Trust. Management has no knowledge of beneficial ownership.
The Manager and its affiliates may provide the initial seed capital in connection with the creation of a Delaware Investments® product, such as the Delaware Large Cap Core Fund. To the extent that the Manager or its affiliates maintain such seed capital in a Delaware Investments product, the Manager or its affiliates may engage in a total return swap or other hedge on its investment for the sole purpose of limiting the volatility of earnings of the Manager and its corporate parents. Neither the Manager nor its affiliates seek to profit by hedging the seed-capital investments in the Delaware Investments products, and the total return swap or other hedge is not expected to have any effect on the investment performance of any Delaware Investments product.
| Fund Name | | Class | | Shareholder Name and Address | | Total Shares | | Percentage |
| Delaware Large Cap | | A | | Bruce A. Green & | | 1,189.114 | | 75.56 | % |
| Core Fund Class A | | | | Lynn H. Green JT WROS | | | | | |
| | | | Nashville TN 37221 | | | | | |
| Delaware Large Cap | | A | | Craig P. Brown | | 381.377 | | 24.23 | % |
| Core Fund Class A | | | | Ardmore PA 19003 | | | | | |
| Delaware Large Cap | | I | | Delaware Management | | 219,595.672 | | 100.00 | % |
| Core Fund Class I | | | | Holdings Corporation* | | | | | |
| | | | 2005 Market St. Fl. 9 | | | | | |
| | | | Philadelphia PA 19103-7094 | | | | | |
*Affiliated party.
28
7. Line of Credit
The Fund, along with certain other funds in the Delaware Investments® Family of Funds (Participants), was a participant in a $50,000,000 revolving line of credit to be used for temporary or emergency purposes as an additional source of liquidity to fund redemptions of investor shares. Under the agreement, the Participants were charged an annual commitment fee, which was allocated across the Participants on the basis of each Participant’s allocation of the entire facility. The Participants were permitted to borrow up to a maximum of one third of their net assets under the agreement. On August 1, 2011, the Fund, along with other Participants, entered into an amendment to the agreement for a $100,000,000 revolving line of credit. The line of credit under the agreement expired on November 15, 2011.
On November 15, 2011, the Fund, along with the other Participants, entered into an amendment to the agreement for a $125,000,000 revolving line of credit. The agreement is to be used as described above and operates in substantially the same manner as the original agreement. The agreement expires on November 13, 2012. The Fund had no amounts outstanding as of April 30, 2012, or at any time during the year then ended.
8. Securities Lending
The Fund, along with other funds in the Delaware Investments® Family of Funds, may lend its securities pursuant to a security lending agreement (Lending Agreement) with The Bank of New York Mellon (BNY Mellon). At the time a security is loaned, the borrower must post collateral equal to the required percentage of the market value of the loaned security, including any accrued interest. The required percentage is: (i) 102% with respect to U.S. securities and foreign securities that are denominated and payable in U.S. dollars; and (ii) 105% with respect to foreign securities. With respect to each loan, if on any business day the aggregate market value of securities collateral plus cash collateral held is less than the aggregate market value of the securities which are the subject of such loan, the borrower will be notified to provide additional collateral by the end of the following business day which, together with the collateral already held, will be not less than the applicable initial collateral requirements for such security loan. If the aggregate market value of securities collateral and cash collateral held with respect to a security loan exceeds the applicable initial collateral requirement, upon request of the borrower BNY Mellon must return enough collateral to the borrower by the end of the following business day to reduce the value of the remaining collateral to the applicable initial collateral requirement for such security loan. As a result of the foregoing, the value of the collateral held with respect to a loaned security may be temporarily more or less than the value of the security on loan.
Cash collateral received is generally invested in the Delaware Investments Collateral Fund No. 1 (Collective Trust) established by BNY Mellon for the purpose of investment on behalf of funds managed by DMC that participate in BNY Mellon’s securities lending program. The Collective Trust may invest in U.S. government securities and high quality corporate debt, asset-backed and other money market securities and in repurchase agreements collateralized by such securities, provided that the Collective Trust will generally have a dollar-weighted average portfolio maturity
29
Notes to financial statements
Delaware Large Cap Core Fund
8. Securities Lending (continued)
of 60 days or less. The Fund can also accept U.S. government securities and letters of credit (non-cash collateral) in connection with securities loans. In the event of default or bankruptcy by the lending agent, realization and/or retention of the collateral may be subject to legal proceedings. In the event the borrower fails to return loaned securities and the collateral received is insufficient to cover the value of the loaned securities and provided such collateral shortfall is not the result of investment losses, the lending agent has agreed to pay the amount of the shortfall to the Fund or, at the discretion of the lending agent, replace the loaned securities. The Fund continues to record dividends or interest, as applicable, on the securities loaned and is subject to changes in value of the securities loaned that may occur during the term of the loan. The Fund has the right under the Lending Agreement to recover the securities from the borrower on demand. With respect to security loans collateralized by non-cash collateral, the Fund receives loan premiums paid by the borrower. With respect to security loans collateralized by cash collateral, the earnings from the collateral investments are shared among the Fund, the security lending agent and the borrower. The Fund records security lending income net of allocations to the security lending agent and the borrower.
The Collective Trust used for the investment of cash collateral received from borrowers of securities seeks to maintain a net asset value per unit of $1.00, but there can be no assurance that it will always be able to do so. The Fund may incur investment losses as a result of investing securities lending collateral in the Collective Trust or another collateral investment pool. This could occur if an investment in a collateral investment pool defaulted or if it were necessary to liquidate assets in the collateral investment pool to meet returns on outstanding security loans at a time when the collateral investment pool’s net asset value per unit was less than $1.00. Under those circumstances, the Fund may not receive an amount from the collateral investment pool that is equal in amount to the collateral the Fund would be required to return to the borrower of the securities and the Fund would be required to make up this shortfall. During the year ended April 30, 2012, the Fund had no securities out on loan.
9. Credit and Market Risk
The Fund may invest up to 15% of its net assets in illiquid securities, which may include securities with contractual restrictions on resale, securities exempt from registration under Rule 144A of the Securities Act of 1933, as amended, and other securities which may not be readily marketable. The relative illiquidity of these securities may impair the Fund from disposing of them in a timely manner and at a fair price when it is necessary or desirable to do so. While maintaining oversight, the Fund’s Board has delegated to DMC the day-to-day functions of determining whether individual securities are liquid for purposes of the Fund’s limitation on investments in illiquid securities. Securities eligible for resale pursuant to Rule 144A, which are determined to be liquid, are not subject to the Fund’s 15% limit on investment in illiquid securities. As of April 30, 2012, there were no Rule 144A securities and no securities have been determined to be illiquid under the Fund’s Liquidity Procedures.
30
10. Contractual Obligations
The Fund enters into contracts in the normal course of business that contain a variety of indemnifications. The Fund’s maximum exposure under these arrangements is unknown. However, the Fund has not had prior claims or losses pursuant to these contracts. Management has reviewed the Fund’s existing contracts and expects the risk of loss to be remote.
11. Subsequent Events
Management has determined that no material events or transactions occurred subsequent to April 30, 2012 that would require recognition or disclosure in the Fund’s financial statements.
12. Tax Information (Unaudited)
The information set forth below is for the Fund’s fiscal year as required by federal income tax laws. Shareholders, however, must report distributions on a calendar year basis for income tax purposes, which may include distributions for portions of two fiscal years of a fund. Accordingly, the information needed by shareholders for income tax purposes will be sent to them in January of each year. Please consult your tax advisor for proper treatment of this information.
All designations are based on financial information available as of the date of this annual report and, accordingly are subject to change. For any and all items requiring designation, it is the intention of the Fund to designate the maximum amount permitted under the Internal Revenue Code and the regulations thereunder.
For the fiscal year ended April 30, 2012, the Fund designates distributions paid during the year as follows:
| (A) | Ordinary Income distributions (Tax Basis)* | 100 | % |
| (B) | Long-term capital gain distributions (Tax Basis) | 0 | % |
| Total distributions (Tax Basis) | 100 | % |
| (C) | Qualifying dividends1 | 100 | % |
(A) and (B) are based on a percentage of the Fund’s total distributions. (C) is based on percentage of the Fund’s ordinary income distributions.
1 Qualifying dividends represent dividends which qualify for the corporate dividends received deduction.
*For the fiscal year ended April 30, 2012, certain dividends paid by the Fund may be subject to a maximum tax rate of 15%, as provided for by the Jobs and Growth Tax Relief Reconciliation Act of 2003, and as extended by Tax Relief Unemployment Insurance Reauthorization and Job Creation Act of 2010. The Fund intends to designate up to 100% to be taxed at a maximum rate of 15%. Complete information will be computed and reported in conjunction with your 2012 Form 1099-DIV.
31
Report of independent
registered public accounting firm
To the Board of Trustees of Voyageur Mutual Funds III Trust
and the Shareholders of Delaware Large Cap Core Fund:
In our opinion, the accompanying statement of net assets, and the related statements of operations and of changes in net assets and the financial highlights present fairly, in all material respects, the financial position of Delaware Large Cap Core Fund (one of a series constituting the Voyageur Mutual Funds III Trust, hereafter referred to as the “Fund”) at April 30, 2012, the results of its operations for the year then ended and the changes in its net assets and the financial highlights for each of the two years in the period then ended, in conformity with accounting principles generally accepted in the United States of America. These financial statements and financial highlights (hereafter referred to as “financial statements”) are the responsibility of the Fund’s management; our responsibility is to express an opinion on these financial statements based on our audit. We conducted our audit of these financial statements in accordance with the standards of the Public Company Accounting Oversight Board (United States). Those standards require that we plan and perform the audit to obtain reasonable assurance about whether the financial statements are free of material misstatement. An audit includes examining, on a test basis, evidence supporting the amounts and disclosures in the financial statements, assessing the accounting principles used and significant estimates made by management, and evaluating the overall financial statement presentation. We believe that our audit, which included confirmation of securities at April 30, 2012 by correspondence with the custodian and brokers, provides a reasonable basis for our opinion. The financial highlights for each of the three years in the period ended April 30, 2010 were audited by other independent accountants whose report dated June 18, 2010 expressed an unqualified opinion on those statements.
PricewaterhouseCoopers LLP
Philadelphia, Pennsylvania
June 18, 2012
32
Other Fund information
(Unaudited)
Delaware Large Cap Core Fund
Change in Independent Registered Public Accounting Firm
Due to independence matters under the Securities and Exchange Commission’s auditor independence rules relating to the January 4, 2010 acquisition of Delaware Investments (including DMC, DDLP and DSC) by Macquarie Group, Ernst & Young LLP (E&Y) has resigned as the independent registered public accounting firm for Voyageur Mutual Funds III (the Trust) effective June 28, 2010. At a meeting held on February 18, 2010, the Board of Trustees of the Trust, upon recommendation of the Audit Committee, selected PricewaterhouseCoopers LLP (PwC) to serve as the independent registered public accounting firm for the Trust for the fiscal year ending April 30, 2011. During the fiscal years ended April 30, 2010 and 2009, E&Y’s audit reports on the financial statements of the Trust did not contain any adverse opinion or disclaimer of opinion, nor were they qualified or modified as to uncertainty, audit scope, or accounting principles. In addition, there were no disagreements between the Trust and E&Y on accounting principles, financial statements disclosures or audit scope, which, if not resolved to the satisfaction of E&Y, would have caused them to make reference to the disagreement in their reports. Neither the Trust nor anyone on its behalf has consulted with PwC at any time prior to their selection with respect to the application of accounting principles to a specified transaction, either completed or proposed or the type of audit opinion that might be rendered on the Trust’s financial statements.
33
Board of trustees/directors and officers addendum
Delaware Investments® Family of Funds
A mutual fund is governed by a Board of Trustees/Directors (“Trustees”), which has oversight responsibility for the management of a fund’s business affairs. Trustees establish procedures and oversee and review the performance of the investment manager, the distributor, and others who perform services for the fund. The independent fund trustees, in particular, are advocates
| Name, Address, | | Position(s) | | Length of |
| and Birth Date | | Held with Fund(s) | | Time Served |
| Interested Trustees | | | | |
| | | | | |
| Patrick P. Coyne1 | | Chairman, President, | | Chairman and Trustee |
| 2005 Market Street | | Chief Executive Officer, | | since August 16, 2006 |
| Philadelphia, PA 19103 | | and Trustee | | |
| April 1963 | | | | President and |
| | | | | Chief Executive Officer |
| | | | | since August 1, 2006 |
| | | | | |
| | | | | |
| | | | | |
| | | | | |
| | | | | |
| | | | | |
| | | | | |
| | | | | |
| | | | | |
| | | | | |
| | | | | |
| | | | | |
| | | | | |
| | | | | |
| | | | | |
| | | | | |
| | | | | |
| | | | | |
1 Patrick P. Coyne is considered to be an “Interested Trustee” because he is an executive officer of the Fund’s(s’) investment advisor.
34
for shareholder interests. Each trustee has served in that capacity since he or she was elected to or appointed to the Board of Trustees, and will continue to serve until his or her retirement or the election of a new trustee in his or her place. The following is a list of the Trustees and Officers with certain background and related information.
| Number of Portfolios in | |
| Principal Occupation(s) | Fund Complex Overseen | Other Directorships |
| During Past 5 Years | by Trustee or Officer | Held by Trustee or Officer |
| |
| |
| Patrick P. Coyne has served in | 73 | Director and Audit |
| various executive capacities | | Committee Member |
| at different times at | | Kaydon Corp. |
| Delaware Investments.2 | | |
| | Board of Governors Member |
| | Investment Company |
| | Institute (ICI) |
| |
| | Finance Committee Member |
| | St. John Vianney Roman |
| | Catholic Church |
| |
| | Board of Trustees |
| | Agnes Irwin School |
| |
| | Member of Investment |
| | Committee |
| | Cradle of Liberty Council, |
| | BSA |
| | (2007–2010) |
| | |
| | |
| | |
2 Delaware Investments is the marketing name for Delaware Management Holdings, Inc. and its subsidiaries, including the Fund’s(s’) investment advisor, principal underwriter, and its transfer agent.
35
Board of trustees/directors and officers addendum
Delaware Investments® Family of Funds
| Name, Address, | | Position(s) | | Length of |
| and Birth Date | | Held with Fund(s) | | Time Served |
| Independent Trustees | | | | |
| | | | | |
| Thomas L. Bennett | | Trustee | | Since March 2005 |
| 2005 Market Street | | | | |
| Philadelphia, PA 19103 | | | | |
| October 1947 | | | | |
| |
| |
| |
| |
| |
| |
| |
| |
| |
| |
| |
| John A. Fry | | Trustee | | Since January 2001 |
| 2005 Market Street | | | | |
| Philadelphia, PA 19103 | | | | |
| May 1960 | | | | |
| | | | | |
| |
| |
| |
| |
| |
| |
| |
| |
| |
| |
| |
| |
| Anthony D. Knerr | | Trustee | | Since April 1990 |
| 2005 Market Street | | | | |
| Philadelphia, PA 19103 | | | | |
| December 1938 | | | | |
| |
| Lucinda S. Landreth | | Trustee | | Since March 2005 |
| 2005 Market Street | | | | |
| Philadelphia, PA 19103 | | | | |
| June 1947 | | | | |
| |
36
| | Number of Portfolios in | | |
| Principal Occupation(s) | | Fund Complex Overseen | | Other Directorships |
| During Past 5 Years | | by Trustee or Officer | | Held by Trustee or Officer |
| |
| |
| Private Investor | | 73 | | Chairman of Investment |
| (March 2004–Present) | | | | Committee |
| | | | Pennsylvania Academy of |
| Investment Manager | | | | Fine Arts |
| Morgan Stanley & Co. | | | | |
| (January 1984–March 2004) | | | | Investment Committee and |
| | | | Governance Committee |
| | | | Member |
| | | | Pennsylvania Horticultural |
| | | | Society |
| |
| | | | Director |
| | | | Bryn Mawr Bank Corp. (BMTC) |
| | | | (2007–2011) |
| |
| President | | 73 | | Board of Governors Member — |
| Drexel University | | | | NASDAQ OMX PHLX LLC |
| (August 2010–Present) | | | | |
| | | | Director and Audit |
| President | | | | Committee Member |
| Franklin & Marshall College | | | | Community Health Systems |
| (July 2002–July 2010) | | | | |
| | | | Director — U.S. SQUASH |
| |
| | | | Director — Ecore |
| | | | International |
| | | | (2009–2010) |
| |
| | | | Director — Allied |
| | | | Barton Securities Holdings |
| | | | (2005–2008) |
| |
| Managing Director | | 73 | | None |
| Anthony Knerr & Associates | | | | |
| (Strategic Consulting) | | | | |
| (1990–Present) | | | | |
| |
| Chief Investment Officer | | 73 | | None |
| Assurant, Inc. (Insurance) | | | | |
| (2002–2004) | | | | |
| | | | | |
| |
37
Board of trustees/directors and officers addendum
Delaware Investments® Family of Funds
| Name, Address, | | Position(s) | | Length of |
| and Birth Date | | Held with Fund(s) | | Time Served |
| Independent Trustees (continued) | | | | |
| | | | | |
| Ann R. Leven | | Trustee | | Since October 1989 |
| 2005 Market Street | | | | |
| Philadelphia, PA 19103 | | | | |
| November 1940 | | | | |
| | | | | |
| |
| |
| |
| |
| |
| Frances A. Sevilla-Sacasa | | Trustee | | Since September 2011 |
| 2005 Market Street | | | | |
| Philadelphia, PA 19103 | | | | |
| January 1956 | | | | |
| | | | | |
| | | | | |
| | | | | |
| | | | | |
| | | | | |
| | | | | |
| | | | | |
| | | | | |
| | | | | |
| | | | | |
| | | | | |
| | | | | |
| | | | | |
| | | | | |
| | | | | |
| | | | | |
| | | | | |
| | | | | |
| | | | | |
| | | | | |
| | | | | |
| | | | | |
| | | | | |
| | | | | |
| | | | | |
| |
38
| | Number of Portfolios in | | |
| Principal Occupation(s) | | Fund Complex Overseen | | Other Directorships |
| During Past 5 Years | | by Trustee or Officer | | Held by Trustee or Officer |
| |
| |
| Consultant | | 73 | | Director and Audit |
| ARL Associates | | | | Committee Chair |
| (Financial Planning) | | | | Systemax Inc. |
| (1983–Present) | | | | (2001–2009) |
| |
| | | | Director and Audit |
| | | | Committee Chairperson |
| | | | Andy Warhol Foundation |
| | | | (1999–2007) |
| |
| Chief Executive Officer — | | 73 | | Trust Manager — Camden |
| Banco Itaú Europa | | | | Property Trust |
| International | | | | (since August 2011) |
| (since April 2012) | | | | |
| | | | | Board of Trustees |
| Executive Advisor to Dean | | | | Thunderbird School of |
| (August 2011–March 2012) | | | | Global Management |
| and Interim Dean | | | | (2007–2011) |
| (January 2011–July 2011) — | | | | |
| University of Miami School of | | | | Board of Trustees |
| Business Administration | | | | Carrollton School of the |
| | | | Sacred Heart |
| President — U.S. Trust, | | | | (since 2001) |
| Bank of America Private | | | | |
| Wealth Management | | | | Board Member |
| (Private Banking) | | | | Foreign Policy Association |
| (July 2007–December 2008) | | | | (since 2006) |
| |
| President and Director | | | | Board of Trustees |
| (November 2005–June 2007) and | | | | Georgetown Preparatory School |
| Chief Executive Officer | | | | (2005–2011) |
| (April 2007–June 2007) — | | | | |
| U.S. Trust Company | | | | Board of Governors |
| (Private Banking) | | | | Miami City Ballet |
| | | | (2000–2011) |
| |
| | | | Board of Trustees |
| | | | St. Thomas University |
| | | | (2005–2011) |
| |
39
Board of trustees/directors and officers addendum
Delaware Investments® Family of Funds
| Name, Address, | | Position(s) | | Length of |
| and Birth Date | | Held with Fund(s) | | Time Served |
| Independent Trustees (continued) | | | | |
| | | | | |
| Janet L. Yeomans | | Trustee | | Since April 1999 |
| 2005 Market Street | | | | |
| Philadelphia, PA 19103 | | | | |
| July 1948 | | | | |
| |
| |
| |
| |
| J. Richard Zecher | | Trustee | | Since March 2005 |
| 2005 Market Street | | | | |
| Philadelphia, PA 19103 | | | | |
| July 1940 | | | | |
| | | | | |
| | | | | |
| | | | | |
| | | | | |
| | | | | |
40
| | Number of Portfolios in | | |
| Principal Occupation(s) | | Fund Complex Overseen | | Other Directorships |
| During Past 5 Years | | by Trustee or Officer | | Held by Trustee or Officer |
| |
| |
| Vice President and Treasurer | | 73 | | Director and Audit |
| (January 2006–Present) | | | | Committee Member |
| Vice President — Mergers & Acquisitions | | | | Okabena Company |
| (January 2003–January 2006), and | | | | |
| Vice President and Treasurer | | | | Chair — 3M |
| (July 1995–January 2003) | | | | Investment Management |
| 3M Corporation | | | | Company |
| |
| Founder | | 73 | | Director and Compensation |
| Investor Analytics | | | | Committee Member |
| (Risk Management) | | | | Investor Analytics |
| (May 1999–Present) | | | | |
| | | | | Director |
| Founder | | | | Oxigene, Inc. |
| Sutton Asset Management | | | | (2003–2008) |
| (Hedge Fund) | | | | |
| (September 1996–Present) | | | | |
41
Board of trustees/directors and officers addendum
Delaware Investments® Family of Funds
| Name, Address, | | Position(s) | | Length of |
| and Birth Date | | Held with Fund(s) | | Time Served |
| Officers | | | | |
| | | | | |
| David F. Connor | | Vice President, | | Vice President since |
| 2005 Market Street | | Deputy General | | September 2000 |
| Philadelphia, PA 19103 | | Counsel, and Secretary | | and Secretary since |
| December 1963 | | | | October 2005 |
| |
| |
| Daniel V. Geatens | | Vice President | | Treasurer |
| 2005 Market Street | | and Treasurer | | since October 2007 |
| Philadelphia, PA 19103 | | | | |
| October 1972 | | | | |
| |
| David P. O’Connor | | Executive Vice President, | | Executive Vice President |
| 2005 Market Street | | General Counsel | | since February 2012; |
| Philadelphia, PA 19103 | | and Chief Legal Officer | | Senior Vice President |
| February 1966 | | | | October 2005– |
| | | | February 2012; |
| | | | General Counsel and |
| | | | Chief Legal Officer |
| | | | since October 2005 |
| |
| Richard Salus | | Senior Vice President | | Chief Financial Officer |
| 2005 Market Street | | and Chief Financial Officer | | since November 2006 |
| Philadelphia, PA 19103 | | | | |
| October 1963 | | | | |
| |
The Statement of Additional Information for the Fund(s) includes additional information about the Trustees and Officers and is available, without charge, upon request by calling 800 523-1918.
42
| | Number of Portfolios in | | |
| Principal Occupation(s) | | Fund Complex Overseen | | Other Directorships |
| During Past 5 Years | | by Trustee or Officer | | Held by Trustee or Officer |
| |
| |
| David F. Connor has served as | | 73 | | None3 |
| Vice President and Deputy | | | | |
| General Counsel of | | | | |
| Delaware Investments | | | | |
| since 2000. | | | | |
| |
| Daniel V. Geatens has served | | 73 | | None3 |
| in various capacities at | | | | |
| different times at | | | | |
| Delaware Investments. | | | | |
| |
| David P. O’Connor has served in | | 73 | | None3 |
| various executive and legal | | | | |
| capacities at different times | | | | |
| at Delaware Investments. | | | | |
| |
| |
| |
| |
| |
| Richard Salus has served in | | 73 | | None3 |
| various executive capacities | | | | |
| at different times at | | | | |
| Delaware Investments. | | | | |
| |
3 David F. Connor, Daniel V. Geatens, David P. O’Connor, and Richard Salus serve in similar capacities for the six portfolios of the Optimum Fund Trust, which have the same investment advisor, principal underwriter, and transfer agent as the registrant.
43
About the organization
| Board of trustees | | | |
Patrick P. Coyne
Chairman, President, and
Chief Executive Officer
Delaware Investments®
Family of Funds
Philadelphia, PA
Thomas L. Bennett
Private Investor
Rosemont, PA
John A. Fry
President
Drexel University
Philadelphia, PA | Anthony D. Knerr
Founder and Managing
Director
Anthony Knerr &
Associates
New York, NY
Lucinda S. Landreth
Former Chief Investment
Officer
Assurant, Inc.
Philadelphia, PA | Ann R. Leven
Consultant
ARL Associates
New York, NY
Frances A.
Sevilla-Sacasa
Chief Executive Officer
Banco Itaú Europa
International
Miami, FL
| Janet L. Yeomans
Vice President and
Treasurer
3M Corporation
St. Paul, MN
J. Richard Zecher
Founder
Investor Analytics
Scottsdale, AZ
|
| | | | |
| Affiliated officers | | | |
David F. Connor
Vice President, Deputy
General Counsel, and
Secretary
Delaware Investments
Family of Funds
Philadelphia, PA | Daniel V. Geatens
Vice President and
Treasurer
Delaware Investments
Family of Funds
Philadelphia, PA | David P. O’Connor
Executive Vice President,
General Counsel
and Chief Legal Officer
Delaware Investments
Family of Funds
Philadelphia, PA | Richard Salus
Senior Vice President and
Chief Financial Officer
Delaware Investments
Family of Funds
Philadelphia, PA |
| This annual report is for the information of Delaware Large Cap Core Fund shareholders, but it may be used with prospective investors when preceded or accompanied by the Delaware Investments Fund fact sheet for the most recently completed calendar quarter. These documents are available at www.delawareinvestments.com. |
| Delaware Investments is the marketing name of Delaware Management Holdings, Inc. and its subsidiaries. |
The Fund files its complete schedule of portfolio holdings with the Securities and Exchange Commission (SEC) for the first and third quarters of each fiscal year on Form N-Q. The Fund’s Forms N-Q, as well as a description of the policies and procedures that the Fund uses to determine how to vote proxies (if any) relating to portfolio securities are available without charge (i) upon request, by calling 800 523-1918; and (ii) on the SEC’s website at www.sec.gov. In addition, a description of the policies and procedures that the Fund uses to determine how to vote proxies (if any) relating to portfolio securities and the Fund’s Schedule of Investments are available without charge on the Fund’s website at www.delawareinvestments.com. The Fund’s Forms N-Q may be reviewed and copied at the SEC’s Public Reference Room in Washington, D.C.; information on the operation of the Public Reference Room may be obtained by calling 800 SEC-0330.
Information (if any) regarding how the Fund voted proxies relating to portfolio securities during the most recently disclosed 12-month period ended June 30 is available without charge (i) through the Fund’s website at www.delawareinvestments.com; and (ii) on the SEC’s website at www.sec.gov.
44
Annual report Delaware Select Growth Fund April 30, 2012 U.S. growth equity mutual fund |
Carefully consider the Fund’s investment objectives, risk factors, charges, and expenses before investing. This and other information can be found in the Fund’s prospectus and, if available, its summary prospectus, which may be obtained by visiting www.delawareinvestments.com or calling 800 523-1918. Investors should read the prospectus and, if available, the summary prospectus carefully before investing. |
You can obtain shareholder reports and prospectuses online instead of in the mail.
Visit www.delawareinvestments.com/edelivery. |
Experience Delaware Investments
Delaware Investments is committed to the pursuit of consistently superior asset management and unparalleled client service. We believe in our investment processes, which seek to deliver consistent results, and in convenient services that help add value for our clients.
If you are interested in learning more about creating an investment plan, contact your financial advisor.
You can learn more about Delaware Investments or obtain a prospectus for Delaware Select Growth Fund at www.delawareinvestments.com.
Manage your investments online
- 24-hour access to your account information
- Obtain share prices
- Check your account balance and recent transactions
- Request statements or literature
- Make purchases and redemptions
Delaware Management Holdings, Inc. and its subsidiaries (collectively known by the marketing name of Delaware Investments) are wholly owned subsidiaries of Macquarie Group Limited, a global provider of banking, financial, advisory, investment and funds management services.
Investments in Delaware Select Growth Fund are not and will not be deposits with or liabilities of Macquarie Bank Limited ABN 46 008 583 542 and its holding companies, including their subsidiaries or related companies (Macquarie Group), and are subject to investment risk, including possible delays in repayment and loss of income and capital invested. No Macquarie Group company guarantees or will guarantee the performance of the Fund, the repayment of capital from the Fund, or any particular rate of return.
| Table of contents | | |
| Portfolio management review | | 1 |
| Performance summary | | 3 |
| Disclosure of Fund expenses | | 6 |
| Security type/sector allocation and | | |
| top 10 equity holdings | | 8 |
| Statement of net assets | | 10 |
| Statement of operations | | 16 |
| Statements of changes in net assets | | 18 |
| Financial highlights | | 20 |
| Notes to financial statements | | 30 |
| Report of independent registered | | |
| public accounting firm | | 44 |
| Other Fund information | | 45 |
| Board of trustees/directors and | | |
| officers addendum | | 46 |
| About the organization | | 56 |
Unless otherwise noted, views expressed herein are current as of April 30, 2012, and subject to change.
Funds are not FDIC insured and are not guaranteed. It is possible to lose the principal amount invested.
Mutual fund advisory services provided by Delaware Management Company, a series of Delaware Management Business Trust, which is a registered investment advisor. Delaware Investments, a member of Macquarie Group, refers to Delaware Management Holdings, Inc. and its subsidiaries, including the Fund’s distributor, Delaware Distributors, L.P. Macquarie Group refers to Macquarie Group Limited and its subsidiaries and affiliates worldwide.
© 2012 Delaware Management Holdings, Inc.
All third-party marks cited are the property of their respective owners.
| Portfolio management review | |
| Delaware Select Growth Fund | May 8, 2012 |
| Performance preview (for the year ended April 30, 2012) | | | | |
| Delaware Select Growth Fund (Class A shares) | | 1-year return | | +10.89% |
| Russell 3000® Growth Index (benchmark) | | 1-year return | | +6.26% |
Past performance does not guarantee future results.
For complete, annualized performance for Delaware Select Growth Fund, please see the table on page 3. The performance of Class A shares excludes the applicable sales charge and reflects the reinvestment of all distributions.
Index performance returns do not reflect any management fees, transaction costs, or expenses. Indices are unmanaged and one cannot invest directly in an index. |
At the beginning of the Fund’s fiscal year that ended April 30, 2012, the financial markets responded to a clear pause in economic growth, and market activity largely centered on predominantly negative news reports regarding the continued sovereign debt crises across the euro zone. These events, combined with a slowing economic environment across Europe, the United States, and even many emerging economies, took a significant toll on investors during the period.
As the fiscal year progressed, significant volatility continued for equity markets, generally experiencing opposing “up-down-up” months. On the whole, however, the positive months of October and December of 2011 were much more significant than the negative month of November. The S&P 500® Index finished the 2011 calendar year with a quarterly gain of nearly 12%, while the Dow Jones Industrial Average generated a return of almost 13%. The strong equity returns largely came on the back of optimistic economic indicators (in the U.S., at least) that emerged during this period. For example, jobless claims recorded new lows for this current recovery, and manufacturing and consumer demand statistics firmed. Housing reports continued to reflect generally stable conditions, though at very weak levels.
As the fiscal year came to a close (more specifically, the last three months), most major U.S. market indices notched healthy, double-digit returns. Unlike earlier in the fiscal year, domestic investors did not have to contend with major geopolitical or macroeconomic shocks, and economic activity showed reasonably positive signs during this period — consumer confidence, employment, and manufacturing data, for example, all showed considerable improvements.
For its fiscal year ended April 30, 2012, Delaware Select Growth Fund (Class A shares) returned +10.89% at net asset value and +4.52% at maximum offer price (both figures reflect all distributions reinvested). The Fund outperformed its benchmark, the Russell 3000 Growth Index, which advanced 6.26% for the same period. For the complete annualized performance of Delaware Select Growth Fund, please see the table on page 3.
Several stocks contributed to performance. Apple was the Fund’s strongest contributor during the fiscal year as the company reported stellar earnings. Investors were generally encouraged that Apple customers who have chosen the iOS ecosystem seem likely to stick with it across product generations, rather than abandoning it for the next “hot” device. In addition, investors
1
Portfolio management review
Delaware Select Growth Fund
were also pleased to see the company beginning to return capital to shareholders in the form of dividends, and other capital allocation decisions.
MasterCard was also a contributor to performance. In June 2011, the Federal Reserve released its final recommendations for debit card interchange rates and network exclusivity rules, all of which were more favorable than the original recommendations it made in December 2010. Those original recommendations, and increased government scrutiny over the credit card networks as a result of the financial overhaul legislation, had weighed on this stock for most of the Fund’s fiscal year. We have felt that MasterCard’s competitive position would allow it to potentially avoid the heavy pricing pressure that many investors feared. Because of this belief, we increased the Fund’s position in the stock during last December’s significant selloff. With the recent release of the Fed’s final recommendations, we believe many of the key elements of uncertainty have become clearer and investors may now get back to focusing on company fundamentals, which we believe are stronger.
In terms of detractors, Ctrip.com International lagged during the fiscal year. The company reported disappointing results for the fourth quarter of 2011, as well as disappointing earnings guidance in the near term, due to its response to a competitor’s aggressive pricing tactics in the hotel booking business. While this competitive response is likely to hurt margins in the near term, we agree with company management that taking some near-term decrease in margin is worth the ultimate goal of maintaining, or possibly increasing, market share. We believe Ctrip.com has the size, competitive position, and balance-sheet strength to outlast pricing strategies like this which, in our opinion, will ultimately give way to more rational pricing decisions in the industry. We continue to hold the stock in the Fund.
Polycom was another detractor during the Fund’s fiscal year. After many months of strong fundamental momentum and stock appreciation, recent periods have been more difficult for the company. Polycom is experiencing some growth pains and lowered margin guidance going forward as it spends more money on building support and service capabilities behind a large market opportunity. We are holding the stock with the basic thesis of wanting to own one of the key players in videoconferencing, which we believe may be a long-term secular growth industry.
Regardless of the economic outcome, we remain consistent in our long-term investment philosophy: We want to own what we view as strong secular-growth companies with solid business models and competitive positions that we believe can grow market share and have the potential to deliver shareholder value in a variety of market environments.
2
| Performance summary | |
| Delaware Select Growth Fund | April 30, 2012 |
The performance data quoted represent past performance; past performance does not guarantee future results. Investment return and principal value will fluctuate so your shares, when redeemed, may be worth more or less than their original cost. Please obtain the performance data current for the most recent month end by calling 800 523-1918 or visiting our website at www.delawareinvestments.com/performance. Current performance may be lower or higher than the performance data quoted.
| Fund performance1,2 | | Average annual total returns through April 30, 2012 |
| | 1 year | | 5 years | | 10 years | | Lifetime | |
| Class A (Est. May 16, 1994) | | | | | | | | | |
| Excluding sales charge | | +10.89% | | +8.48% | | +7.22% | | n/a | |
| Including sales charge | | +4.52% | | +7.21% | | +6.58% | | n/a | |
| Class B (Est. April 16, 1996) | | | | | | | | | |
| Excluding sales charge | | +10.06% | | +7.68% | | +6.57% | | n/a | |
| Including sales charge | | +6.06% | | +7.34% | | +6.57% | | n/a | |
| Class C (Est. May 20, 1994) | | | | | | | | | |
| Excluding sales charge | | +10.08% | | +7.67% | | +6.42% | | n/a | |
| Including sales charge | | +9.08% | | +7.67% | | +6.42% | | n/a | |
| Class R (Est. June 2, 2003) | | | | | | | | | |
| Excluding sales charge | | +10.60% | | +8.21% | | n/a | | +8.95% | |
| Including sales charge | | +10.60% | | +8.21% | | n/a | | +8.95% | |
| Institutional Class (Est. Aug. 28, 1997) | | | | | | | | | |
| Excluding sales charge | | +11.16% | | +8.75% | | +7.48% | | n/a | |
| Including sales charge | | +11.16% | | +8.75% | | +7.48% | | n/a | |
1 Returns reflect the reinvestment of all distributions and are presented both with and without the applicable sales charges described below. Returns do not reflect the deduction of taxes the shareholder would pay on Fund distributions or redemptions of Fund shares.
Expense limitations were in effect for certain classes during some or all of the periods shown in the “Fund performance” chart. The current expenses for each class are listed on the “Fund expense ratios” table on page 4. Performance would have been lower had expense limitations not been in effect.
Class A shares are sold with a maximum front-end sales charge of up to 5.75%, and have an annual distribution and service fee of up to 0.25% of average daily net assets. Performance for Class A shares, excluding sales charges, assumes that no front-end sales charge applied.
Class B shares may be purchased only through dividend reinvestment and certain permitted exchanges as described in the prospectus. Please see the prospectus for additional information on Class B shares. Class B shares have a contingent deferred sales charge that declines from 4.00% to zero depending on
3
Performance summary
Delaware Select Growth Fund
the period of time the shares are held. They are also subject to an annual distribution and service fee of up to 1.00% of average daily net assets. Class B shares will automatically convert to Class A shares on a quarterly basis approximately eight years after purchase. Ten-year and lifetime performance figures for Class B shares reflect conversion to Class A shares after approximately eight years.
Class C shares are sold with a contingent deferred sales charge of 1.00% if redeemed during the first 12 months. They are also subject to an annual distribution and service fee of up to 1.00% of average daily net assets.
Performance for Class B and C shares, excluding sales charges, assumes either that contingent deferred sales charges did not apply or that the investment was not redeemed.
Class R shares are available only for certain retirement plan products. They are sold without a sales charge and have an annual distribution and service fee of up to 0.60% of average daily net assets, which has been limited contractually to 0.50% from Aug. 26, 2011, through Aug. 28, 2012. In connection with the closure of the Fund to new investors, this waiver has been extended until Aug. 28, 2013 or, if longer, until the Fund is offered to all new investors.
Institutional Class shares are available without sales or asset-based distribution charges only to certain eligible institutional accounts.
The “Fund performance” table and the “Performance of a $10,000 investment” graph do not reflect the deduction of taxes the shareholder would pay on Fund distributions or redemptions of Fund shares.
Investments in small and/or medium-sized companies typically exhibit greater risk and higher volatility than larger, more established companies.
International investments entail risks not ordinarily associated with U.S. investments including fluctuation in currency values, differences in accounting principles, or economic or political instability in other nations. Investing in emerging markets can be riskier than investing in established foreign markets due to increased volatility and lower trading volume.
2 The Fund’s expense ratios, as described in the most recent prospectus, are disclosed in the following “Fund expense ratios” table. Delaware Investments has agreed to reimburse certain expenses and/or waive certain fees in order to prevent total fund operating expenses (excluding certain fees and expenses) from exceeding 1.24% of the Fund’s average daily net assets from Aug. 26, 2011, through Aug. 28, 2012. Please see the most recent prospectus and any applicable supplement(s) for additional information on these fee waivers and/or reimbursements.
| Fund expense ratios | Class A | | Class B | | Class C | | Class R | | Institutional Class |
| Total annual operating expenses | 1.58% | | 2.33% | | 2.33% | | 1.93% | | 1.33% |
| (without fee waivers) | | | | | | | | | |
| Net expenses | 1.49% | | 2.24% | | 2.24% | | 1.74% | | 1.24% |
| (including fee waivers, if any) | | | | | | | | | |
| Type of waiver | Contractual | | Contractual | | Contractual | | Contractual | | Contractual |
4
Performance of a $10,000 investment1
Average annual total returns from April 30, 2002, through April 30, 2012

| For period beginning April 30, 2002, through April 30, 2012 | | Starting value | Ending value |
| | Delaware Select Growth Fund — Class A shares | | $9,425 | $19,213 |
| | Russell 3000 Growth Index | | $10,000 | $16,653 |
1 The “Performance of a $10,000 investment” graph assumes $10,000 invested in Class A shares of the Fund on April 30, 2002, and includes the effect of a 5.75% front-end sales charge and the reinvestment of all distributions. The graph does not reflect the deduction of taxes the shareholders would pay on Fund distributions or redemptions of Fund shares. Expense limitations were in effect for some or all of the periods shown. Performance would have been lower had expense limitations not been in effect. Current expenses are listed in the “Fund expense ratios” table on page 4. Please note additional details on pages 3 through 5.
The chart also assumes $10,000 invested in the Russell 3000 Growth Index as of April 30, 2002. The Russell 3000 Growth Index measures the performance of the broad growth segment of the U.S. equity universe. It includes those Russell 3000 companies with higher price-to-book ratios and higher forecasted growth values.
The Dow Jones Industrial Average is an often-quoted market indicator that comprises 30 widely held blue-chip stocks.
The S&P 500 Index measures the performance of 500 mostly large-cap stocks weighted by market value, and is often used to represent performance of the U.S. stock market.
Index performance returns do not reflect any management fees, transaction costs, or expenses. Indices are unmanaged and one cannot invest directly in an index. Past performance is not a guarantee of future results.
Performance of other Fund classes will vary due to different charges and expenses.
| | Nasdaq symbols | | CUSIPs | |
| Class A | | DVEAX | | 928931104 | |
| Class B | | DVEBX | | 928931849 | |
| Class C | | DVECX | | 928931203 | |
| Class R | | DFSRX | | 928931740 | |
| Institutional Class | | VAGGX | | 928931757 | |
5
Disclosure of Fund expenses
For the six-month period from November 1, 2011 to April 30, 2012
As a shareholder of the Fund, you incur two types of costs: (1) transaction costs, including sales charges (loads) on purchase payments, reinvested dividends, or other distributions; redemption fees; and exchange fees; and (2) ongoing costs, including management fees; distribution and/or service (12b-1) fees; and other Fund expenses. This example is intended to help you understand your ongoing costs (in dollars) of investing in the Fund and to compare these costs with the ongoing costs of investing in other mutual funds.
The example is based on an investment of $1,000 invested at the beginning of the period and held for the entire six-month period from November 1, 2011 to April 30, 2012.
Actual expenses
The first section of the table shown, “Actual Fund return,” provides information about actual account values and actual expenses. You may use the information in this section of the table, together with the amount you invested, to estimate the expenses that you paid over the period. Simply divide your account value by $1,000 (for example, an $8,600 account value divided by $1,000 = 8.6), then multiply the result by the number in the first section under the heading entitled “Expenses Paid During Period” to estimate the expenses you paid on your account during this period.
Hypothetical example for comparison purposes
The second section of the table shown, “Hypothetical 5% return,” provides information about hypothetical account values and hypothetical expenses based on the Fund’s actual expense ratio and an assumed rate of return of 5% per year before expenses, which is not the Fund’s actual return. The hypothetical account values and expenses may not be used to estimate the actual ending account balance or expenses you paid for the period. You may use this information to compare the ongoing costs of investing in the Fund and other funds. To do so, compare this 5% hypothetical example with the 5% hypothetical examples that appear in the shareholder reports of the other funds.
Please note that the expenses shown in the table are meant to highlight your ongoing costs only and do not reflect any transactional costs, such as sales charges (loads), redemption fees, or exchange fees. Therefore, the second section of the table is useful in comparing ongoing costs only, and will not help you determine the relative total costs of owning different funds. In addition, if these transactional costs were included, your costs would have been higher. The Fund’s expenses shown in the table reflect fee waivers in effect. The expenses shown in the table assume reinvestment of all dividends and distributions.
6
Delaware Select Growth Fund
Expense analysis of an investment of $1,000
| | Beginning | | Ending | | | | | | Expenses |
| | Account Value | | Account Value | | Annualized | | Paid During Period |
| | 11/1/11 | | 4/30/12 | | Expense Ratio | | 11/1/11 to 4/30/12* |
| Actual Fund return | | | | | | | | | | | | | | | | |
| Class A | | $ | 1,000.00 | | | $ | 1,136.40 | | | | 1.29% | | | $ | 6.85 | |
| Class B | | | 1,000.00 | | | | 1,132.50 | | | | 2.04% | | | | 10.82 | |
| Class C | | | 1,000.00 | | | | 1,132.30 | | | | 2.04% | | | | 10.82 | |
| Class R | | | 1,000.00 | | | | 1,135.00 | | | | 1.54% | | | | 8.17 | |
| Institutional Class | | | 1,000.00 | | | | 1,137.90 | | | | 1.04% | | | | 5.53 | |
| Hypothetical 5% return (5% return before expenses) | | | | | | | | | |
| Class A | | $ | 1,000.00 | | | $ | 1,018.45 | | | | 1.29% | | | $ | 6.47 | |
| Class B | | | 1,000.00 | | | | 1,014.72 | | | | 2.04% | | | | 10.22 | |
| Class C | | | 1,000.00 | | | | 1,014.72 | | | | 2.04% | | | | 10.22 | |
| Class R | | | 1,000.00 | | | | 1,017.21 | | | | 1.54% | | | | 7.72 | |
| Institutional Class | | | 1,000.00 | | | | 1,019.69 | | | | 1.04% | | | | 5.22 | |
*“Expenses Paid During Period” are equal to the Fund’s annualized expense ratio, multiplied by the average account value over the period, multiplied by 182/366 (to reflect the one-half year period).
7
Security type/sector allocation and
top 10 equity holdings |
| Delaware Select Growth Fund | As of April 30, 2012 |
Sector designations may be different than the sector designations presented in other Fund materials. The sector designations may represent the investment manager’s internal sector classifications, which may result in the sector designations for one fund being different than another fund’s sector designations.
| Security type/sector | Percentage of net assets |
| ²Common Stock | 87.30 | % |
| Consumer Discretionary | 16.63 | % |
| Consumer Staples | 2.17 | % |
| Energy | 7.35 | % |
| Financial Services | 12.69 | % |
| Healthcare | 8.57 | % |
| Industrials | 3.57 | % |
| Materials & Processing | 2.79 | % |
| Producer Durables | 5.12 | % |
| Technology | 27.63 | % |
| Utilities | 0.78 | % |
| Convertible Bond | 0.69 | % |
| Preferred Stock | 0.81 | % |
| Warrant | 0.63 | % |
| Short-Term Investments | 10.46 | % |
| Securities Lending Collateral | 0.16 | % |
| Total Value of Securities | 100.05 | % |
| Obligation to Return Securities Lending Collateral | (0.35 | %) |
| Receivables and Other Assets Net of Other Liabilities | 0.30 | % |
| Total Net Assets | 100.00 | % |
²Narrow industries are utilized for compliance purposes for diversification whereas broad sectors are used for financial reporting.
8
Holdings are for informational purposes only and are subject to change at any time. They are not a recommendation to buy, sell, or hold any security.
| Top 10 equity holdings | Percentage of net assets |
| Apple | 9.66 | % |
| MasterCard Class A | 4.32 | % |
| K12 | 3.49 | % |
| Crown Castle International | 2.92 | % |
| Adobe Systems | 2.92 | % |
| El Paso | 2.76 | % |
| priceline.com | 2.72 | % |
| DineEquity | 2.48 | % |
| Weight Watchers International | 2.39 | % |
| EOG Resources | 2.30 | % |
9
| Statement of net assets |
| Delaware Select Growth Fund | April 30, 2012 |
| | | | Number of shares | | Value |
| ²Common Stock – 87.30% | | | | | |
| Consumer Discretionary – 16.63% | | | | | |
| † | Apollo Group Class A | | 365,600 | | $ | 12,876,432 |
| *† | Ctrip.com International ADR | | 289,250 | | | 6,268,048 |
| † | DineEquity | | 393,700 | | | 19,125,946 |
| Interval Leisure Group | | 247,400 | | | 4,275,072 |
| *† | K12 | | 1,054,200 | | | 26,882,099 |
| * | LVMH Moet Hennessy Louis Vuitton | | 20,775 | | | 3,441,998 |
| NIKE Class B | | 35,050 | | | 3,921,044 |
| † | priceline.com | | 27,530 | | | 20,945,375 |
| Staples | | 146,700 | | | 2,259,180 |
| * | Strayer Education | | 99,467 | | | 9,815,404 |
| Weight Watchers International | | 242,425 | | | 18,414,603 |
| | | | | | 128,225,201 |
| Consumer Staples – 2.17% | | | | | |
| Danone | | 76,263 | | | 5,366,065 |
| *† | Peet’s Coffee & Tea | | 136,600 | | | 10,493,612 |
| Walgreen | | 25,900 | | | 908,054 |
| | | | | | 16,767,731 |
| Energy – 7.35% | | | | | |
| Core Laboratories | | 52,795 | | | 7,231,859 |
| El Paso | | 718,500 | | | 21,317,895 |
| EOG Resources | | 161,500 | | | 17,734,315 |
| * | Kinder Morgan | | 210,200 | | | 7,546,180 |
| Williams | | 85,000 | | | 2,892,550 |
| | | | | | 56,722,799 |
| Financial Services – 12.69% | | | | | |
| † | Affiliated Managers Group | | 55,000 | | | 6,249,100 |
| BM&FBovespa | | 528,100 | | | 2,950,589 |
| † | CBRE Group Class A | | 159,700 | | | 3,003,957 |
| CME Group | | 23,050 | | | 6,127,151 |
| Heartland Payment Systems | | 231,000 | | | 7,038,570 |
| † | IntercontinentalExchange | | 93,225 | | | 12,402,654 |
| MasterCard Class A | | 73,610 | | | 33,291,595 |
| † | MSCI Class A | | 106,900 | | | 3,911,471 |
| Progressive | | 506,500 | | | 10,788,450 |
| Visa Class A | | 98,300 | | | 12,088,934 |
| | | | | | 97,852,471 |
10
| | | | Number of shares | | Value |
| ²Common Stock (continued) | | | | | |
| Healthcare – 8.57% | | | | | |
| † | ABIOMED | | 258,600 | | $ | 6,291,738 |
| Allergan | | 171,350 | | | 16,449,600 |
| † | athenahealth | | 81,800 | | | 5,926,410 |
| | Covidien | | 171,100 | | | 9,449,853 |
| † | Express Scripts | | 31,600 | | | 1,762,964 |
| Novo Nordisk ADR | | 84,000 | | | 12,349,680 |
| Perrigo | | 132,158 | | | 13,863,374 |
| | | | | | 66,093,619 |
| Industrials – 3.57% | | | | | |
| Edenred | | 282,009 | | | 9,008,637 |
| Intertek Group | | 87,900 | | | 3,588,273 |
| Kone Class B | | 197,106 | | | 12,198,887 |
| Outotec | | 51,247 | | | 2,754,440 |
| | | | | | 27,550,237 |
| Materials & Processing – 2.79% | | | | | |
| BHP Billiton ADR | | 22,950 | | | 1,705,185 |
| Freeport-McMoRan Copper & Gold | | 100,000 | | | 3,830,000 |
| Newmont Mining | | 154,000 | | | 7,338,100 |
| Syngenta ADR | | 124,000 | | | 8,683,720 |
| | | | | | 21,557,005 |
| Producer Durables – 5.12% | | | | | |
| Caterpillar | | 74,200 | | | 7,625,534 |
| † | Crown Castle International | | 397,900 | | | 22,525,119 |
| Expeditors International of Washington | | 86,200 | | | 3,448,000 |
| Graco | | 110,200 | | | 5,874,762 |
| | | | | | 39,473,415 |
| Technology – 27.63% | | | | | |
| † | Adobe Systems | | 670,100 | | | 22,488,556 |
| † | Apple | | 127,550 | | | 74,519,812 |
| ARM Holdings ADR | | 32,000 | | | 810,560 |
| † | BMC Software | | 136,400 | | | 5,627,864 |
| FLIR Systems | | 43,400 | | | 974,764 |
| † | Google Class A | | 24,935 | | | 15,091,410 |
| Intuit | | 238,300 | | | 13,814,251 |
| † | NeuStar Class A | | 230,600 | | | 8,382,310 |
| *† | OpenTable | | 56,300 | | | 2,518,299 |
| † | Polycom | | 840,700 | | | 11,156,089 |
11
Statement of net assets
Delaware Select Growth Fund
| | | | Number of shares | | Value |
| ²Common Stock (continued) | | | | | | |
| Technology (continued) | | | | | | |
| QUALCOMM | | | 233,300 | | $ | 14,893,872 |
| † | RPX | | | 25,500 | | | 440,640 |
| † | SBA Communications Class A | | | 116,300 | | | 6,249,962 |
| † | Teradata | | | 133,850 | | | 9,340,053 |
| † | VeriFone Systems | | | 148,432 | | | 7,071,300 |
| † | VeriSign | | | 207,400 | | | 8,526,214 |
| *† | Yelp | | | 488,550 | | | 11,168,253 |
| | | | | | | 213,074,209 |
| Utilities – 0.78% | | | | | | |
| * | j2 Global | | | 231,900 | | | 5,989,977 |
| | | | | | | 5,989,977 |
| Total Common Stock (cost $488,302,960) | | | | | | 673,306,664 |
| |
| | | Principal amount | | | |
| Convertible Bond – 0.69% | | | | | | |
| =@ | MiaSole 10.00% 2/6/13 | | $ | 5,312,901 | | | 5,312,901 |
| Total Convertible Bond (cost $5,312,901) | | | | | | 5,312,901 |
| |
| | | Number of shares | | | |
| Preferred Stock – 0.81% | | | | | | |
| =@† | MiaSole Series F | | | 3,465,429 | | | 6,265,496 |
| Total Preferred Stock (cost $15,000,109) | | | | | | 6,265,496 |
| |
| Warrant – 0.63% | | | | | | |
| † | Kinder Morgan CW17 | | | 2,133,700 | | | 4,886,173 |
| Total Warrant (cost $5,047,550) | | | | | | 4,886,173 |
| |
| | | Principal amount | | | |
| Short-Term Investments – 10.46% | | | | | | |
| ≠Discount Notes – 2.73% | | | | | | |
| Federal Home Loan Bank | | | | | | |
| 0.11% 5/25/12 | | $ | 15,396,253 | | | 15,395,946 |
| 0.115% 6/29/12 | | | 5,635,029 | | | 5,634,476 |
| | | | | | | 21,030,422 |
12
| | | | Principal amount | | Value | |
| Short-Term Investments (continued) | | | | | | | |
| Repurchase Agreements – 7.73% | | | | | | | |
| Bank of America 0.17%, dated 4/30/12, to be | | | | | | | |
| repurchased on 5/1/12, repurchase price | | | | | | | |
| $14,685,056 (collateralized by U.S. government | | | | | | | |
| obligations 2.25%-4.125% 1/31/15-5/15/15; | | | | | | | |
| market value $14,978,687) | | $ | 14,684,987 | | $ | 14,684,987 | |
| |
| BNP Paribas 0.17%, dated 4/30/12, to be | | | | | | | |
| repurchased on 5/1/12, repurchase price | | | | | | | |
| | $44,933,225 (collateralized by U.S. government | | | | | | | |
| obligations 0.00%-2.375% 7/26/12-10/31/16; | | | | | | | |
| market value $45,831,673) | | | 44,933,013 | | | 44,933,013 | |
| | | | | | | 59,618,000 | |
| Total Short-Term Investments (cost $80,647,091) | | | | | | 80,648,422 | |
| |
| Total Value of Securities Before Securities | | | | | | | |
| Lending Collateral – 99.89% (cost $594,310,611) | | | | | | 770,419,656 | |
| |
| | | Number of shares | | | | |
| **Securities Lending Collateral – 0.16% | | | | | | | |
| Investment Companies | | | | | | | |
| BNY Mellon SL DBT II Liquidating Fund | | | 726,088 | | | 707,718 | |
| Delaware Investments Collateral Fund No. 1 | | | 502,212 | | | 502,212 | |
| @†Mellon GSL Reinvestment Trust II | | | 1,489,816 | | | 0 | |
| Total Securities Lending Collateral | | | | | | | |
| (cost $2,718,116) | | | | | | 1,209,930 | |
| |
| Total Value of Securities – 100.05% | | | | | | | |
| (cost $597,028,727) | | | | | | 771,629,586 | © |
| **Obligation to Return Securities | | | | | | | |
| Lending Collateral – (0.35%) | | | | | | (2,718,116 | ) |
| Receivables and Other Assets | | | | | | | |
| Net of Other Liabilities – 0.30% | | | | | | 2,322,464 | « |
| Net Assets Applicable to 19,228,074 | | | | | | | |
| Shares Outstanding – 100.00% | | | | | $ | 771,233,934 | |
13
Statement of net assets
Delaware Select Growth Fund
| | | | |
| Net Asset Value – Delaware Select Growth Fund | | | |
| Class A ($386,254,193 / 9,483,316 Shares) | | | $40.73 | |
| Net Asset Value – Delaware Select Growth Fund | | | |
| Class B ($24,561,972 / 690,949 Shares) | | | $35.55 | |
| Net Asset Value – Delaware Select Growth Fund | | | |
| Class C ($108,993,568 / 3,099,345 Shares) | | | $35.17 | |
| Net Asset Value – Delaware Select Growth Fund | | | |
| Class R ($9,293,693 / 233,661 Shares) | | | $39.77 | |
| Net Asset Value – Delaware Select Growth Fund | | | |
| Institutional Class ($242,130,508 / 5,720,803 Shares) | | | $42.32 | |
| |
| Components of Net Assets at April 30, 2012: | | | |
| Shares of beneficial interest (unlimited authorization – no par) | $ | 679,774,264 | |
| Accumulated net investment loss | | (1,100,717 | ) |
| Accumulated net realized loss on investments | | (82,040,129 | ) |
| Net unrealized appreciation of investments and foreign currencies | | 174,600,516 | |
| Total net assets | $ | 771,233,934 | |
| ² | Narrow industries are utilized for compliance purposes for diversification whereas broad sectors are used for financial reporting. |
| † | Non income producing security. |
| * | Fully or partially on loan. |
| = | Security is being fair valued in accordance with the Fund’s fair valuation policy. At April 30, 2012, the aggregate value of fair valued securities was $11,578,397, which represented 1.50% of the Fund’s net assets. See Note 1 in “Notes to financial statements.” |
| ≠ | The rate shown is the effective yield at the time of purchase. |
| ** | See Note 10 in “Notes to financial statements” for additional information on securities lending collateral. |
| @ | Illiquid security. At April 30, 2012, the aggregate value of illiquid securities was $11,578,397 which represented 1.50% of the Fund’s net assets. See Note 11 in “Notes to financial statements.” |
| © | Includes $2,688,872 of securities loaned. |
| « | Includes foreign currency valued at $32,531 with a cost of $32,874. |
14
| | | |
| Net Asset Value and Offering Price Per Share – | | |
| Delaware Select Growth Fund | | |
| Net asset value Class A (A) | $ | 40.73 |
| Sales charges (5.75% of offering price) (B) | | 2.48 |
| Offering price | $ | 43.21 |
| (A) | | Net asset value per share, as illustrated, is the amount which would be paid upon redemption or repurchase of shares. |
| (B) | | See the current prospectus for purchase of $50,000 or more. |
ADR — American Depositary Receipt
See accompanying notes, which are an integral part of the financial statements.
15
| Statement of operations | |
| Delaware Select Growth Fund | Year Ended April 30, 2012 |
| Investment Income: | | | | | | | | |
| Dividends | | $ | 4,105,557 | | | | | |
| Securities lending income | | | 318,013 | | | | | |
| Interest | | | 141,517 | | | | | |
| Foreign tax withheld | | | (99,866 | ) | | $ | 4,465,221 | |
| |
| Expenses: | | | | | | | | |
| Management fees | | | 4,050,301 | | | | | |
| Distribution expenses – Class A | | | 725,954 | | | | | |
| Distribution expenses – Class B | | | 265,804 | | | | | |
| Distribution expenses – Class C | | | 750,189 | | | | | |
| Distribution expenses – Class R | | | 32,287 | | | | | |
| Dividend disbursing and transfer agent fees and expenses | | | 1,323,605 | | | | | |
| Accounting and administration expenses | | | 213,454 | | | | | |
| Registration fees | | | 107,652 | | | | | |
| Reports and statements to shareholders | | | 101,336 | | | | | |
| Legal fees | | | 72,235 | | | | | |
| Custodian fees | | | 27,587 | | | | | |
| Audit and tax | | | 27,547 | | | | | |
| Trustees’ fees | | | 27,192 | | | | | |
| Dues and services | | | 14,067 | | | | | |
| Insurance fees | | | 6,395 | | | | | |
| Pricing fees | | | 5,446 | | | | | |
| Consulting fees | | | 4,431 | | | | | |
| Trustees’ expenses | | | 1,491 | | | | 7,756,973 | |
| Less waived distribution expenses – Class R | | | | | | | (5,381 | ) |
| Less expense paid indirectly | | | | | | | (841 | ) |
| Total operating expenses | | | | | | | 7,750,751 | |
| Net Investment Loss | | | | | | | (3,285,530 | ) |
16
| Net Realized and Unrealized Gain (Loss): | | | | |
| Net realized gain (loss) on: | | | | |
| Investments | | $ | 25,636,578 | |
| Foreign currencies | | | 386 | |
| Foreign currency exchange contracts | | | (74,501 | ) |
| Net realized gain | | | 25,562,463 | |
| Net change in unrealized appreciation (depreciation) on: | | | | |
| Investments | | | 42,672,785 | |
| Foreign currencies | | | (113 | ) |
| Net change in unrealized appreciation | | | 42,672,672 | |
| Net Realized and Unrealized Gain | | | 68,235,135 | |
| |
| Net Increase in Net Assets Resulting from Operations | | $ | 64,949,605 | |
See accompanying notes, which are an integral part of the financial statements.
17
Statements of changes in net assets
Delaware Select Growth Fund
| | Year Ended |
| | 4/30/12 | | 4/30/11 |
| Increase (Decrease) in Net Assets from Operations: | | | | | | | | |
| Net investment loss | | $ | (3,285,530 | ) | | $ | (1,922,385 | ) |
| Net realized gain | | | 25,562,463 | | | | 50,776,850 | |
| Net change in unrealized appreciation | | | 42,672,672 | | | | 59,499,333 | |
| Net increase in net assets resulting from operations | | | 64,949,605 | | | | 108,353,798 | |
| |
| Capital Share Transactions: | | | | | | | | |
| Proceeds from shares sold: | | | | | | | | |
| Class A | | | 146,892,525 | | | | 28,801,020 | |
| Class B | | | 142,252 | | | | 246,675 | |
| Class C | | | 41,802,908 | | | | 4,870,828 | |
| Class R | | | 6,150,134 | | | | 2,326,802 | |
| Institutional Class | | | 161,797,165 | | | | 52,556,873 | |
| |
| Net assets from merger*: | | | | | | | | |
| Class A | | | — | | | | 82,721,925 | |
| Class B | | | — | | | | 19,198,198 | |
| Class C | | | — | | | | 33,357,785 | |
| Class R | | | — | | | | 2,388,873 | |
| Institutional Class | | | — | | | | 3,408,127 | |
| | | 356,784,984 | | | | 229,877,106 | |
18
| | Year Ended |
| | 4/30/12 | | 4/30/11 |
| Capital Share Transactions (continued): | | | | | | | | |
| Cost of shares repurchased: | | | | | | | | |
| Class A | | $ | (62,290,416 | ) | | $ | (54,500,106 | ) |
| Class B | | | (9,411,497 | ) | | | (9,619,554 | ) |
| Class C | | | (12,787,585 | ) | | | (10,754,776 | ) |
| Class R | | | (2,105,979 | ) | | | (1,896,421 | ) |
| Institutional Class | | | (59,536,585 | ) | | | (14,816,398 | ) |
| | | (146,132,062 | ) | | | (91,587,255 | ) |
| Increase in net assets derived from | | | | | | | | |
| capital share transactions | | | 210,652,922 | | | | 138,289,851 | |
| Net Increase in Net Assets | | | 275,602,527 | | | | 246,643,649 | |
| |
| Net Assets: | | | | | | | | |
| Beginning of year | | | 495,631,407 | | | | 248,987,758 | |
| End of year (including accumulated net investment | | | | | | | | |
| loss of $1,100,717 and $185,549, respectively) | | $ | 771,233,934 | | | $ | 495,631,407 | |
*See note 7 in “Notes to financial statements.”
See accompanying notes, which are an integral part of the financial statements.
19
Financial highlights
Delaware Select Growth Fund Class A
Selected data for each share of the Fund outstanding throughout each period were as follows:
| |
| Net asset value, beginning of period |
| |
| Income (loss) from investment operations: |
| Net investment loss1 |
| Net realized and unrealized gain (loss) |
| Total from investment operations |
| |
| Net asset value, end of period |
| |
| Total return2 |
| |
| Ratios and supplemental data: |
| Net assets, end of period (000 omitted) |
| Ratio of expenses to average net assets |
| Ratio of expenses to average net assets |
| prior to fees waived and expense paid indirectly |
| Ratio of net investment loss to average net assets |
| Ratio of net investment loss to average net assets |
| prior to fees waived and expense paid indirectly |
| Portfolio turnover |
1 The average shares outstanding method has been applied for per share information. |
2 Total investment return is based on the change in net asset value of a share during the period and assumes reinvestment of dividends and distributions at net asset value and does not reflect the impact of a sales charge. Total investment return during some of the periods shown reflects a waiver by the manager. Performance would have been lower had the waiver not been in effect. |
See accompanying notes, which are an integral part of the financial statements.
20
| Year Ended | |
| | 4/30/12 | | 4/30/11 | | 4/30/10 | | 4/30/09 | | 4/30/08 | |
| | $36.730 | | | $27.950 | | | $18.860 | | | $27.300 | | | $27.110 | | |
| | |
| | |
| | (0.194 | ) | | (0.139 | ) | | (0.209 | ) | | (0.041 | ) | | (0.119 | ) | |
| | 4.194 | | | 8.919 | | | 9.299 | | | (8.399 | ) | | 0.309 | | |
| | 4.000 | | | 8.780 | | | 9.090 | | | (8.440 | ) | | 0.190 | | |
| | |
| | $40.730 | | | $36.730 | | | $27.950 | | | $18.860 | | | $27.300 | | |
| | |
| | 10.89% | | | 31.41% | | | 48.20% | | | (30.92% | ) | | 0.70% | | |
| | |
| | |
| | $386,254 | | | $267,563 | | | $150,016 | | | $106,919 | | | $157,366 | | |
| | 1.35% | | | 1.51% | | | 1.50% | | | 1.49% | | | 1.48% | | |
| | | | | | | | | | | | | | | | |
| | 1.35% | | | 1.58% | | | 1.73% | | | 1.85% | | | 1.62% | | |
| | (0.53% | ) | | (0.45% | ) | | (0.89% | ) | | (0.20% | ) | | (0.42% | ) | |
| | | | | | | | | | | | | | | | |
| | (0.53% | ) | | (0.52% | ) | | (1.12% | ) | | (0.56% | ) | | (0.56% | ) | |
| | 25% | | | 41% | | | 49% | | | 66% | | | 61% | | |
21
Financial highlights
Delaware Select Growth Fund Class B
Selected data for each share of the Fund outstanding throughout each period were as follows:
| |
| Net asset value, beginning of period |
| |
| Income (loss) from investment operations: |
| Net investment loss1 |
| Net realized and unrealized gain (loss) |
| Total from investment operations |
| |
| Net asset value, end of period |
| |
| Total return2 |
| |
| Ratios and supplemental data: |
| Net assets, end of period (000 omitted) |
| Ratio of expenses to average net assets |
| Ratio of expenses to average net assets |
| prior to fees waived and expense paid indirectly |
| Ratio of net investment loss to average net assets |
| Ratio of net investment loss to average net assets |
| prior to fees waived and expense paid indirectly |
| Portfolio turnover |
1 The average shares outstanding method has been applied for per share information. |
2 Total investment return is based on the change in net asset value of a share during the period and assumes reinvestment of dividends and distributions at net asset value and does not reflect the impact of a sales charge. Total investment return during some of the periods shown reflects a waiver by the manager. Performance would have been lower had the waiver not been in effect. |
See accompanying notes, which are an integral part of the financial statements.
22
| | Year Ended | |
| | 4/30/12 | | 4/30/11 | | 4/30/10 | | 4/30/09 | | 4/30/08 | |
| $32.300 | | | $24.760 | | | $16.830 | | | $24.550 | | | $24.560 | | |
| | |
| | |
| (0.408 | ) | | (0.333 | ) | | (0.355 | ) | | (0.182 | ) | | (0.304 | ) | |
| 3.658 | | | 7.873 | | | 8.285 | | | (7.538 | ) | | 0.294 | | |
| 3.250 | | | 7.540 | | | 7.930 | | | (7.720 | ) | | (0.010 | ) | |
| | |
| $35.550 | | | $32.300 | | | $24.760 | | | $16.830 | | | $24.550 | | |
| | |
| 10.06% | | | 30.45% | | | 47.12% | | | (31.45% | ) | | (0.04% | ) | |
| | |
| | |
| $24,562 | | | $31,713 | | | $15,012 | | | $19,222 | | | $67,344 | | |
| 2.10% | | | 2.26% | | | 2.25% | | | 2.24% | | | 2.23% | | |
| | | | | | | | | | | | | | | | |
| 2.10% | | | 2.33% | | | 2.48% | | | 2.60% | | | 2.37% | | |
| (1.28% | ) | | (1.20% | ) | | (1.64% | ) | | (0.95% | ) | | (1.17% | ) | |
| | | | | | | | | | | | | | | | |
| (1.28% | ) | | (1.27% | ) | | (1.87% | ) | | (1.31% | ) | | (1.31% | ) | |
| 25% | | | 41% | | | 49% | | | 66% | | | 61% | | |
23
Financial highlights
Delaware Select Growth Fund Class C
Selected data for each share of the Fund outstanding throughout each period were as follows:
| |
| Net asset value, beginning of period |
| |
| Income (loss) from investment operations: |
| Net investment loss1 |
| Net realized and unrealized gain (loss) |
| Total from investment operations |
| |
| Net asset value, end of period |
| |
| Total return2 |
| |
| Ratios and supplemental data: |
| Net assets, end of period (000 omitted) |
| Ratio of expenses to average net assets |
| Ratio of expenses to average net assets |
| prior to fees waived and expense paid indirectly |
| Ratio of net investment loss to average net assets |
| Ratio of net investment loss to average net assets |
| prior to fees waived and expense paid indirectly |
| Portfolio turnover |
1 The average shares outstanding method has been applied for per share information. |
2 Total investment return is based on the change in net asset value of a share during the period and assumes reinvestment of dividends and distributions at net asset value and does not reflect the impact of a sales charge. Total investment return during some of the periods shown reflects a waiver by the manager. Performance would have been lower had the waiver not been in effect. |
See accompanying notes, which are an integral part of the financial statements.
24
| | Year Ended | |
| | 4/30/12 | | 4/30/11 | | 4/30/10 | | 4/30/09 | | 4/30/08 | |
| | $31.950 | | | $24.500 | | | $16.650 | | | $24.290 | | | $24.300 | | |
| | | |
| | | |
| | (0.406 | ) | | (0.329 | ) | | (0.357 | ) | | (0.173 | ) | | (0.302 | ) | |
| | 3.626 | | | 7.779 | | | 8.207 | | | (7.467 | ) | | 0.292 | | |
| | 3.220 | | | 7.450 | | | 7.850 | | | (7.640 | ) | | (0.010 | ) | |
| | | |
| | $35.170 | | | $31.950 | | | $24.500 | | | $16.650 | | | $24.290 | | |
| | |
| | | 10.08% | | | 30.41% | | | 47.15% | | | (31.45% | ) | | (0.04% | ) | |
| | | |
| | | |
| | $108,994 | | | $71,800 | | | $29,502 | | | $23,030 | | | $44,972 | | |
| | 2.10% | | | 2.26% | | | 2.25% | | | 2.24% | | | 2.23% | | |
| | | | | | | | | | | | | | | | | |
| | 2.10% | | | 2.33% | | | 2.48% | | | 2.60% | | | 2.37% | | |
| | (1.28% | ) | | (1.20% | ) | | (1.64% | ) | | (0.95% | ) | | (1.17% | ) | |
| | | | | | | | | | | | | | | | |
| | (1.28% | ) | | (1.27% | ) | | (1.87% | ) | | (1.31% | ) | | (1.31% | ) | |
| | 25% | | | 41% | | | 49% | | | 66% | | | 61% | | |
25
Financial highlights
Delaware Select Growth Fund Class R
Selected data for each share of the Fund outstanding throughout each period were as follows:
| |
| Net asset value, beginning of period |
| |
| Income (loss) from investment operations: |
| Net investment loss1 |
| Net realized and unrealized gain (loss) |
| Total from investment operations |
| |
| Net asset value, end of period |
| |
| Total return2 |
| |
| Ratios and supplemental data: |
| Net assets, end of period (000 omitted) |
| Ratio of expenses to average net assets |
| Ratio of expenses to average net assets |
| prior to fees waived and expense paid indirectly |
| Ratio of net investment loss to average net assets |
| Ratio of net investment loss to average net assets |
| prior to fees waived and expense paid indirectly |
| Portfolio turnover |
1 The average shares outstanding method has been applied for per share information. |
2 Total investment return is based on the change in net asset value of a share during the period and assumes reinvestment of dividends and distributions at net asset value. Total investment return during all of the periods shown reflects waivers by the manager and/or distributor. Performance would have been lower had the waivers not been in effect. |
See accompanying notes, which are an integral part of the financial statements.
26
| | Year Ended | |
| | | 4/30/12 | | 4/30/11 | | 4/30/10 | | 4/30/09 | | 4/30/08 | |
| | | $35.960 | | | $27.430 | | | $18.550 | | | $26.930 | | | $26.810 | | |
| | |
| | | | | | | | | | | | | | | | | | |
| | | (0.282 | ) | | (0.222 | ) | | (0.265 | ) | | (0.092 | ) | | (0.188 | ) | |
| | | 4.092 | | | 8.752 | | | 9.145 | | | (8.288 | ) | | 0.308 | | |
| | | 3.810 | | | 8.530 | | | 8.880 | | | (8.380 | ) | | 0.120 | | |
| | |
| | | $39.770 | | | $35.960 | | | $27.430 | | | $18.550 | | | $26.930 | | |
| | |
| | | 10.60% | | | 31.10% | | | 47.87% | | | (31.12% | ) | | 0.45% | | |
| | |
| | | | | | | | | | | | | | | | | | |
| | | $9,294 | | | $4,607 | | | $807 | | | $671 | | | $1,266 | | |
| | | 1.60% | | | 1.76% | | | 1.75% | | | 1.74% | | | 1.73% | | |
| | | | | | | | | | | | | | | | | | |
| | | 1.70% | | | 1.93% | | | 2.08% | | | 2.20% | | | 1.97% | | |
| | | (0.78% | ) | | (0.70% | ) | | (1.14% | ) | | (0.45% | ) | | (0.67% | ) | |
| | | | | | | | | | | | | | | | | | |
| | | (0.88% | ) | | (0.87% | ) | | (1.47% | ) | | (0.91% | ) | | (0.91% | ) | |
| | | 25% | | | 41% | | | 49% | | | 66% | | | 61% | | |
27
Financial highlights
Delaware Select Growth Fund Institutional Class
Selected data for each share of the Fund outstanding throughout each period were as follows:
| Net asset value, beginning of period |
| |
| Income (loss) from investment operations: |
| Net investment income (loss)1 |
| Net realized and unrealized gain (loss) |
| Total from investment operations |
| |
| Net asset value, end of period |
| |
| Total return2 |
| |
| Ratios and supplemental data: |
| Net assets, end of period (000 omitted) |
| Ratio of expenses to average net assets |
| Ratio of expenses to average net assets |
| prior to fees waived and expense paid indirectly |
| Ratio of net investment income (loss) to average net assets |
| Ratio of net investment loss to average net assets |
| prior to fees waived and expense paid indirectly |
| Portfolio turnover |
1 The average shares outstanding method has been applied for per share information. |
2 Total investment return is based on the change in net asset value of a share during the period and assumes reinvestment of dividends and distributions at net asset value. Total investment return during some of the periods shown reflects a waiver by the manager. Performance would have been lower had the waiver not been in effect. |
See accompanying notes, which are an integral part of the financial statements.
28
| Year Ended | |
| | 4/30/12 | | 4/30/11 | | 4/30/10 | | 4/30/09 | | 4/30/08 | |
| | $38.070 | | | $28.900 | | | $19.450 | | | $28.090 | | | $27.820 | | |
| | | |
| | | |
| | (0.107 | ) | | (0.063 | ) | | (0.150 | ) | | 0.010 | | | (0.048 | ) | |
| | 4.357 | | | 9.233 | | | 9.600 | | | (8.650 | ) | | 0.318 | | |
| | 4.250 | | | 9.170 | | | 9.450 | | | (8.640 | ) | | 0.270 | | |
| | | |
| | $42.320 | | | $38.070 | | | $28.900 | | | $19.450 | | | $28.090 | | |
| | | |
| | 11.16% | | | 31.73% | | | 48.59% | | | (30.76% | ) | | 0.97% | | |
| | | |
| | | | | | | | | | | | | | | | | |
| | $242,130 | | | $119,948 | | | $53,651 | | | $45,149 | | | $26,079 | | |
| | 1.10% | | | 1.26% | | | 1.25% | | | 1.24% | | | 1.23% | | |
| | | | | | | | | | | | | | | | | |
| | 1.10% | | | 1.33% | | | 1.48% | | | 1.60% | | | 1.37% | | |
| | (0.28% | ) | | (0.20% | ) | | (0.64% | ) | | 0.05% | | | (0.17% | ) | |
| | | | | | | | | | | | | | | | | |
| | (0.28% | ) | | (0.27% | ) | | (0.87% | ) | | (0.31% | ) | | (0.31% | ) | |
| | 25% | | | 41% | | | 49% | | | 66% | | | 61% | | |
29
| Notes to financial statements |
| Delaware Select Growth Fund | April 30, 2012 |
Voyageur Mutual Funds III (Trust) is organized as a Delaware statutory trust and offers two series: Delaware Large Cap Core Fund and Delaware Select Growth Fund. These financial statements and the related notes pertain to Delaware Select Growth Fund (Fund). The Trust is an open-end investment company. The Fund is considered diversified under the Investment Company Act of 1940, as amended, and offers Class A, Class B, Class C, Class R and Institutional Class shares. Class A shares are sold with a maximum front-end sales charge of up to 5.75%. Class A share purchases of $1,000,000 or more will incur a contingent deferred sales charge (CDSC) of 1% if redeemed during the first year and 0.50% during the second year, provided that Delaware Distributors, L.P. (DDLP) paid a financial advisor a commission on the purchase of those shares. Class B shares may be purchased only through dividend reinvestment and certain permitted exchanges. Prior to June 1, 2007, Class B shares were sold with a CDSC that declined from 4% to zero depending upon the period of time the shares were held. Class B shares will automatically convert to Class A shares on a quarterly basis approximately eight years after purchase. Class C shares are sold with a CDSC of 1%, if redeemed during the first twelve months. Class R and Institutional Class shares are not subject to a sales charge and are offered for sale exclusively to certain eligible investors.
The investment objective of the Fund is to seek long-term capital appreciation, which the Fund attempts to achieve by investing primarily in equity securities of companies the manager believes have the potential for sustainable free cash flow growth.
1. Significant Accounting Policies
The following accounting policies are in accordance with U.S. generally accepted accounting principles (U.S. GAAP) and are consistently followed by the Fund.
Security Valuation — Equity securities, except those traded on the Nasdaq Stock Market, Inc. (Nasdaq), are valued at the last quoted sales price as of the time of the regular close of the New York Stock Exchange (NYSE) on the valuation date. Securities traded on the Nasdaq are valued in accordance with the Nasdaq Official Closing Price, which may not be the last sales price. If on a particular day an equity security does not trade, then the mean between the bid and ask prices will be used, which approximates fair value. Securities listed on a foreign exchange are normally valued at the last quoted sales price on the valuation date. Short-term debt securities are valued using the evaluated mean. U.S. government and agency securities are valued at the mean between the bid and ask prices, which approximates fair value. Debt securities are valued based upon valuations provided by an independent pricing service or broker and reviewed by management. To the extent current market prices are not available, the pricing service may take into account developments related to the specific security, as well as transactions in comparable securities. Valuations for fixed income securities utilize matrix systems, which reflect such factors as security prices, yields, maturities, and ratings, and are supplemented by dealer and exchange quotations. Foreign currency exchange contracts are valued at the mean between the bid and ask prices, which approximates fair value. Interpolated values are derived when the settlement date
30
of the contract is an interim date for which quotations are not available. Investment company securities are valued at net asset value per share. Generally, other securities and assets for which market quotations are not readily available are valued at fair value as determined in good faith under the direction of the Fund’s Board of Trustees (Board). In determining whether market quotations are readily available or fair valuation will be used, various factors will be taken into consideration, such as market closures or suspension of trading in a security. The Fund may use fair value pricing more frequently for securities traded primarily in non-U.S. markets because, among other things, most foreign markets close well before the Fund values its securities, generally as of 4:00 p.m. Eastern time. The earlier close of these foreign markets gives rise to the possibility that significant events, including broad market moves, government actions or pronouncements, aftermarket trading, or news events may have occurred in the interim. To account for this, the Fund may frequently value foreign securities using fair value prices based on third-party vendor modeling tools (international fair value pricing).
Federal Income Taxes — No provision for federal income taxes has been made as the Fund intends to continue to qualify for federal income tax purposes as a regulated investment company under Subchapter M of the Internal Revenue Code of 1986, as amended, and make the requisite distributions to shareholders. The Fund evaluates tax positions taken or expected to be taken in the course of preparing the Fund’s tax returns to determine whether the tax positions are “more-likely-than-not” of being sustained by the applicable tax authority. Tax positions not deemed to meet the more-likely-than-not threshold are recorded as a tax benefit or expense in the current year. Management has analyzed the Fund’s tax positions taken on federal income tax returns for all open tax years (April 30, 2009–April 30, 2012), and has concluded that no provision for federal income tax is required in the Fund’s financial statements.
Class Accounting — Investment income, common expenses and realized and unrealized gain (loss) on investments are allocated to the various classes of the Fund on the basis of daily net assets of each class. Distribution expenses relating to a specific class are charged directly to that class.
Foreign Currency Transactions — Transactions denominated in foreign currencies are recorded at the prevailing exchange rates on the valuation date in accordance with the Fund’s prospectus. The value of all assets and liabilities denominated in foreign currencies is translated into U.S. dollars at the exchange rate of such currencies against the U.S. dollar daily. Transaction gains or losses resulting from changes in exchange rates during the reporting period or upon settlement of the foreign currency transaction are reported in operations for the current period. The Fund generally does not isolate that portion of realized gains and losses on investments which is due to changes in foreign exchange rates from that which is due to changes in market prices. The changes are included with the net realized and unrealized gain or loss on investments. The Fund reports certain foreign currency related transactions as components of realized gains (losses) for financial reporting purposes, whereas such components are treated as ordinary income (loss) for federal income tax purposes.
31
Notes to financial statements
Delaware Select Growth Fund
1. Significant Accounting Policies (continued)
Repurchase Agreements — The Fund may purchase certain U.S. government securities subject to the counterparty’s agreement to repurchase them at an agreed upon date and price. The counterparty will be required on a daily basis to maintain the value of the collateral subject to the agreement at not less than the repurchase price (including accrued interest). The agreements are conditioned upon the collateral being deposited under the Federal Reserve book-entry system with the Fund’s custodian or a third-party sub-custodian. In the event of default or bankruptcy by the other-party to the agreement, retention of the collateral may be subject to legal proceedings. All open repurchase agreements as of the date of this report were entered into April 30, 2012.
Use of Estimates — The preparation of financial statements in conformity with U.S. GAAP requires management to make estimates and assumptions that affect the fair value of investments, the reported amounts of assets and liabilities and disclosure of contingent assets and liabilities at the date of the financial statements and the reported amounts of revenues and expenses during the reporting period. Actual results could differ from those estimates and the differences could be material.
Other — Expenses directly attributable to the Fund are charged directly to the Fund. Other expenses common to various funds within the Delaware Investments® Family of Funds are generally allocated amongst such funds on the basis of average net assets. Management fees and some other expenses are paid monthly. Security transactions are recorded on the date the securities are purchased or sold (trade date) for financial reporting purposes. Costs used in calculating realized gains and losses on the sale of investment securities are those of the specific securities sold. Dividend income is recorded on the ex-dividend date and interest income is recorded on the accrual basis. Taxable non-cash dividends are recorded as dividend income. Foreign dividends are also recorded on the ex-dividend date or as soon after the ex-dividend date that the Fund is aware of such dividends, net of all non-rebatable tax withholdings. Withholding taxes on foreign dividends have been recorded in accordance with the Fund’s understanding of the applicable country’s tax rules and rates. The Fund declares and pays dividends from net investment income and distributions from net realized gain on investments, if any, annually. The Fund may distribute income dividends and capital gains more frequently, if necessary for tax purposes. Dividends and distributions, if any, are recorded on the ex-dividend date.
Subject to seeking best execution, the Fund may direct certain security trades to brokers who have agreed to rebate a portion of the related brokerage commission to the Fund in cash. Such commission rebates are included in realized gain on investments in the accompanying financial statements and totaled $1,878 for the year ended April 30, 2012. In general, best execution refers to many factors, including the price paid or received for a security, the commission charged, the promptness and reliability of execution, the confidentiality and placement accorded the order, and other factors affecting the overall benefit obtained by the Fund on the transaction.
The Fund may receive earnings credits from its custodian when positive cash balances are maintained, which are used to offset custody fees. There were no earnings credits for the year ended April 30, 2012.
32
The Fund receives earnings credits from its transfer agent when positive cash balances are maintained, which are used to offset transfer agent fees. The expense paid under this arrangement is included in dividend disbursing and transfer agent fees and expenses on the statement of operations with the corresponding expense offset shown as “expense paid indirectly.” For the year ended April 30, 2012, the Fund earned $841 under this agreement.
2. Investment Management, Administration Agreements and Other Transactions with Affiliates
In accordance with the terms of its investment management agreement, the Fund pays Delaware Management Company (DMC), a series of Delaware Management Business Trust and the investment manager, an annual fee which is calculated daily at the rate of 0.75% on the first $500 million of average daily net assets of the Fund, 0.70% on the next $500 million, 0.65% on the next $1.5 billion, and 0.60% on average daily net assets in excess of $2.5 billion.
DMC has contractually agreed to waive that portion, if any, of its management fee and reimburse the Fund to the extent necessary to ensure that total annual operating expenses (excluding any 12b-1 plan expenses, taxes, interest, short sale and dividend interest expenses, brokerage fees, certain insurance costs, and nonroutine expenses or costs, including, but not limited to, those relating to reorganizations, litigation, conducting shareholder meetings, and liquidations) do not exceed 1.24% of the Fund’s average daily net assets through August 28, 2012. This waiver and reimbursement may be terminated only by agreement of the Fund’s Board and DMC. This expense waiver and reimbursement applies only to expenses paid directly by the Fund.
Delaware Service Company, Inc. (DSC), an affiliate of DMC, provides fund accounting and financial administration oversight services to the Fund. For these services, the Fund pays DSC fees based on the aggregate daily net assets of the Delaware Investments® Family of Funds at the following annual rate: 0.0050% of the first $30 billion; 0.0045% of the next $10 billion; 0.0040% of the next $10 billion; and 0.0025% of aggregate average daily net assets in excess of $50 billion. The fees payable to DSC under the service agreement described above are allocated among all Funds in the Delaware Investments Family of Funds on a relative net asset value basis. For the year ended April 30, 2012, the Fund was charged $26,823 for these services.
DSC also provides dividend disbursing and transfer agency services. Effective July 18, 2011, the Fund pays DSC a monthly asset-based fee for these services. Prior to July 18, 2011, the Fund paid DSC a monthly fee based on the number of shareholder accounts for dividend disbursing and transfer agent services.
Pursuant to a distribution agreement and distribution plan, the Fund pays DDLP, the distributor and an affiliate of DMC, an annual distribution and service fee not to exceed 0.25% of the average daily net assets of the Class A shares, 1.00% of the average daily net assets of the Class B and Class C shares and 0.60% of the average daily net assets of the Class R shares. Institutional Class shares pay no distribution and service expenses. DDLP has contracted to limit the Class R shares’ 12b-1 fees through August 28, 2012 to no more than 0.50% of average daily net assets.
33
Notes to financial statements
Delaware Select Growth Fund
2. Investment Management, Administration Agreements and Other Transactions with Affiliates (continued)
At April 30, 2012, the Fund had liabilities payable to affiliates as follows:
| Investment management fees payable to DMC | | $ | 451,262 |
| Dividend disbursing, transfer agent and fund accounting | | | |
| oversight fees and other expenses payable to DSC | | | 17,142 |
| Distribution fees payable to DDLP | | | 185,360 |
| Other expenses payable to DMC and affiliates* | | | 14,243 |
*DMC, as part of its administrative services, pays operating expenses on behalf of the Fund and is reimbursed on a periodic basis. Expenses include items such as printing of shareholder reports, fees for audit, legal and tax services, registration fees and trustees’ fees.
As provided in the investment management agreement, the Fund bears the cost of certain legal and tax services, including internal legal and tax services provided to the Fund by DMC and/or its affiliates’ employees. For the year ended April 30, 2012, the Fund was charged $16,898 for internal legal and tax services provided by DMC and/or its affiliates’ employees.
For the year ended April 30, 2012, DDLP earned $131,062 for commissions on sales of the Fund’s Class A shares. For the year ended April 30, 2012, DDLP received gross CDSC commissions of $90, $13,624 and $8,233 on redemption of the Fund’s Class A, Class B and Class C shares, respectively, and these commissions were entirely used to offset up-front commissions previously paid by DDLP to broker/dealers on sales of those shares.
Trustees’ fees include expenses accrued by the Fund for each Trustee’s retainer and meeting fees. Certain officers of DMC, DSC and DDLP are officers and/or Trustees of the Trust. These officers and Trustees are paid no compensation by the Fund.
3. Investments
For the year ended April 30, 2012, the Fund made purchases of $266,129,928 and sales of $131,026,820 of investment securities other than short-term investments.
At April 30, 2012, the cost of investments for federal income tax purposes was $598,794,523. At April 30, 2012, net unrealized appreciation was $172,835,063, of which $204,573,828 related to unrealized appreciation of investments and $31,738,765 related to unrealized depreciation of investments.
U.S. GAAP defines fair value as the price that the Fund would receive to sell an asset or pay to transfer a liability in an orderly transaction between market participants at the measurement date under current market conditions. A three level hierarchy for fair value measurements has been established based upon the transparency of inputs to the valuation of an asset or liability. Inputs may be observable or unobservable and refer broadly to the assumptions that market participants would use in pricing the asset or liability. Observable inputs reflect the assumptions
34
market participants would use in pricing the asset or liability based on market data obtained from sources independent of the reporting entity. Unobservable inputs reflect the reporting entity’s own assumptions about the assumptions that market participants would use in pricing the asset or liability developed based on the best information available under the circumstances. The Fund’s investment in its entirety is assigned a level based upon the observability of the inputs which are significant to the overall valuation. The three level hierarchy of inputs is summarized below.
| Level 1 | – | inputs are quoted prices in active markets for identical investments (e.g., equity securities, open-end investment companies, futures contracts, options contracts) |
| | | |
| Level 2 | – | other observable inputs (including, but not limited to: quoted prices for similar assets or liabilities in markets that are active, quoted prices for identical or similar assets or liabilities in markets that are not active, inputs other than quoted prices that are observable for the assets or liabilities (such as interest rates, yield curves, volatilities, prepayment speeds, loss severities, credit risks and default rates) or other market-corroborated inputs) (e.g., debt securities, government securities, swap contracts, foreign currency exchange contracts, foreign securities utilizing international fair value pricing, broker-quoted securities, fair valued securities) |
| | | |
| Level 3 | – | inputs are significant unobservable inputs (including the Fund’s own assumptions used to determine the fair value of investments) (e.g., broker-quoted securities, fair valued securities) |
Level 3 investments are valued using significant unobservable inputs, including related or comparable assets or liabilities, recent transactions, market multiples, book values, and other relevant information for the investment to determine the fair value of the investment. The Fund may also use an income-based valuation approach in which the anticipated future cash flows of the investment are discounted to calculate fair value. Discounts may also be applied due to the nature or duration of any restrictions on the disposition of the investments. Valuations may also be based upon current market prices of securities that are comparable in coupon, rating, maturity and industry. The derived value of a Level 3 investment may not represent the value which is received upon disposition and this could impact the results of operations.
The following table summarizes the valuation of the Fund’s investments by fair value hierarchy levels as of April 30, 2012:
| | Level 1 | | Level 2 | | Level 3 | | Total |
| Common Stock | | $ | 673,306,664 | | $ | — | | $ | — | | $ | 673,306,664 |
| Corporate Debt | | | — | | | — | | | 5,312,901 | | | 5,312,901 |
| Other | | | 4,886,173 | | | — | | | 6,265,496 | | | 11,151,669 |
| Short-Term Investments | | | — | | | 80,648,422 | | | — | | | 80,648,422 |
| Securities Lending Collateral | | | — | | | 1,209,930 | | | — | | | 1,209,930 |
| Total | | $ | 678,192,837 | | $ | 81,858,352 | | $ | 11,578,397 | | $ | 771,629,586 |
35
Notes to financial statements
Delaware Select Growth Fund
3. Investments (continued)
The following is a reconciliation of investments in which significant unobservable inputs (Level 3) were used in determining fair value:
| | Corporate | | | | | | | | |
| | Debt | | Other | | Total |
| Balance as of 4/30/11 | | $ | — | | $ | 10,000,073 | | | $ | 10,000,073 | |
| Purchases | | | 5,312,901 | | | 5,000,036 | | | | 10,312,937 | |
| Net change in unrealized appreciation (depreciation) | | | — | | | (8,734,613 | ) | | | (8,734,613 | ) |
| Balance as of 4/30/12 | | $ | 5,312,901 | | $ | 6,265,496 | | | $ | 11,578,397 | |
| |
| Net change in unrealized appreciation (depreciation) | | | | | | | | | | | |
| on Level 3 investments still held as of 4/30/12 | | $ | — | | $ | (8,734,613 | ) | | $ | (8,734,613 | ) |
During the year ended April 30, 2012, there were no transfers between Level 1 investments, Level 2 investments or Level 3 investments that had a material impact to the Fund. This does not include transfers between Level 1 investments and Level 2 investments due to the Fund utilizing international fair value pricing during the year. International fair value pricing uses other observable market-based inputs in place of the closing exchange price due to the events occurring after the close of the exchange or market on which the investment is principally traded in accordance with the fair valuation procedures described in Note 1, causing a change in classification between levels. The Fund’s policy is to recognize transfers between levels at the beginning of the reporting period.
In May 2011, the Financial Accounting Standards Board (FASB) issued ASU No. 2011-04 modifying Topic 820, Fair Value Measurements and Disclosures. ASU No. 2011-04 requires reporting entities to disclose i) the amounts of any transfers between Level 1 and Level 2, and the reasons for the transfers, ii) for Level 3 fair value measurements, iii) quantitative information about significant unobservable inputs used, iv) a description of the valuation processes used by the reporting entity and v) a narrative description of the sensitivity of the fair value measurement to changes in unobservable inputs if a change in those inputs might result in a significantly higher or lower fair value measurement. The effective date of ASU No. 2011-04 is for interim and annual periods beginning after December 15, 2011. Management is currently evaluating the implications of this guidance and the impact it will have on the financial statement amounts and footnote disclosures, if any.
4. Dividend and Distribution Information
Income and long-term capital gain distributions are determined in accordance with federal income tax regulations, which may differ from U.S. GAAP. Additionally, distributions from net gains on foreign currency transactions and net short-term gains on sales of investment securities are treated as ordinary income for federal income tax purposes. There were no dividends and distributions paid for the years ended April 30, 2012 and 2011.
36
5. Components of Net Assets on a Tax Basis
As of April 30, 2012, the components of net assets on a tax basis were as follows:
| Shares of beneficial interest | | $ | 679,774,264 | |
| Qualified late year ordinary losses | | | (1,100,717 | ) |
| *Capital loss carryforwards | | | (80,274,333 | ) |
| Unrealized appreciation of investments | | | | |
| and foreign currencies | | | 172,834,720 | |
| Net assets | | $ | 771,233,934 | |
*The amount of this loss which can be utilized in subsequent years is subject to an annual limitation in accordance with the Internal Revenue Code due to the Fund merger with Delaware Growth Equity Fund on October 22, 2010. See Note 7.
The difference between book basis and tax basis components of net assets is primarily attributable to tax deferral of losses on wash sales.
Qualified late year losses represent losses realized on investments and foreign currency transactions from November 1, 2011 through April 30, 2012 that, in accordance with federal income tax regulations, the Fund has elected to defer and treat as having arisen in the following year.
For financial reporting purposes, capital accounts are adjusted to reflect the tax character of permanent book/tax differences. Reclassifications are primarily due to tax treatment of net operating losses and gain (loss) on foreign currency transactions. Results of operations and net assets were not affected by these reclassifications. For the year ended April 30, 2012, the Fund recorded the reclassifications as follows:
| Accumulated net investment loss | | $ | 2,370,362 | |
| Accumulated net realized loss | | | 21,228,177 | |
| Paid-in capital | | | (23,598,539 | ) |
For federal income tax purposes, capital loss carryforwards may be carried forward and applied against future capital gains. $25,590,948 was utilized in 2012. Capital loss carryforwards remaining at April 30, 2012 will expire as follows: $39,896,996 expires in 2016, $32,537,385 expires in 2017 and $7,839,952 expires in 2018.
On December 22, 2010, the Regulated Investment Company Modernization Act of 2010 (the Act) was enacted, which changed various technical rules governing the tax treatment of regulated investment companies. The changes are generally effective for taxable years beginning after the date of enactment. Under the Act, the Fund will be permitted to carry forward capital losses incurred in taxable years beginning after the date of enactment for an unlimited period. However, any losses incurred during those future taxable years will be required to be utilized prior to the losses incurred in pre-enactment taxable years, which carry an expiration date. As a result of this ordering rule, pre-enactment capital loss carryforwards may be more likely to expire unused. Additionally, post-enactment capital loss carryforwards will retain their character as either short-term or long-term capital losses rather than being considered all short-term as permitted under previous regulation.
37
Notes to financial statements
Delaware Select Growth Fund
6. Capital Shares
Transactions in capital shares were as follows:
| | Year Ended |
| | 4/30/12 | | 4/30/11 |
| Shares sold: | | | | | | |
| Class A | | 3,907,362 | | | 909,753 | |
| Class B | | 4,238 | | | 9,368 | |
| Class C | | 1,256,211 | | | 172,362 | |
| Class R | | 164,882 | | | 75,891 | |
| Institutional Class | | 4,159,635 | | | 1,650,110 | |
| |
| Shares from merger*: | | | | | | |
| Class A | | — | | | 2,723,804 | |
| Class B | | — | | | 716,083 | |
| Class C | | — | | | 1,257,835 | |
| Class R | | — | | | 80,244 | |
| Institutional Class | | — | | | 108,401 | |
| | | 9,492,328 | | | 7,703,851 | |
| Shares repurchased: | | | | | | |
| Class A | | (1,708,510 | ) | | (1,716,503 | ) |
| Class B | | (295,116 | ) | | (349,864 | ) |
| Class C | | (404,013 | ) | | (387,457 | ) |
| Class R | | (59,346 | ) | | (57,423 | ) |
| Institutional Class | | (1,589,230 | ) | | (464,549 | ) |
| | | (4,056,215 | ) | | (2,975,796 | ) |
| Net increase | | 5,436,113 | | | 4,728,055 | |
*See Note 7
For the years ended April 30, 2012 and 2011, 128,473 Class B shares were converted to 112,579 Class A shares valued at $4,051,940 and 169,653 Class B shares were converted to 149,782 Class A shares valued at $4,566,472, respectively. The respective amounts are included in Class B redemptions and Class A subscriptions in the table above and the statements of changes in net assets.
38
7. Fund Merger
On October 22, 2010, the Fund acquired all of the assets of the Delaware Growth Equity Fund (Acquired Fund), an open-end investment company, in exchange for shares of the Fund (Acquiring Fund) pursuant to a Plan and Agreement of Reorganization (Reorganization). The shareholders of the Acquired Fund received shares of the respective class of the Acquiring Fund equal to the aggregate net asset value of their share in the Acquired Fund prior to the Reorganization, as shown in the following table:
| | Acquiring | | Acquired | | | |
| | Fund | | Fund | | | |
| | Shares | | Shares | | Value |
| Class A | | 2,723,804 | | 5,262,114 | | $ | 82,721,925 |
| Class B | | 716,083 | | 1,320,132 | | | 19,198,198 |
| Class C | | 1,257,835 | | 2,294,132 | | | 33,357,785 |
| Class R | | 80,244 | | 153,925 | | | 2,388,873 |
| Institutional Class | | 108,401 | | 211,333 | | | 3,408,127 |
The Reorganization was treated as a non-taxable event and, accordingly, the Acquired Fund’s basis in securities acquired reflected historical cost basis as of the date of transfer. The net assets, net unrealized appreciation and accumulated net realized loss of the Acquired Fund as of the close of business on October 22, 2010, were as follows:
| Net assets | | $ | 141,074,908 | |
| Accumulated net realized loss | | | (80,224,466 | ) |
| Net unrealized appreciation | | | 22,458,953 | |
The net assets of the Acquiring Fund before the acquisition were $281,943,240. The net assets of the Acquiring Fund immediately following the acquisition were $423,018,148.
Assuming that the acquisition had been completed on May 1, 2010, the beginning of the Acquiring Fund’s reporting period, the Acquiring Fund’s pro forma results of operations for the year ended April 30, 2011, were as follows:
| Net investment income | | $ | (2,413,934 | ) |
| Net realized gain on investments | | | 54,656,909 | |
| Change in unrealized appreciation | | | 81,575,306 | |
| Net increase in net assets resulting from operations | | | 133,818,281 | |
Because the combined investment portfolios have been managed as a single integrated portfolio since the acquisition was completed, it is not practicable to separate the amounts of revenue and earnings of the Acquired Fund that have been included in the Fund’s statement of operations since October 22, 2010.
39
Notes to financial statements
Delaware Select Growth Fund
8. Line of Credit
The Fund, along with certain other funds in the Delaware Investments® Family of Funds (Participants), was a participant in a $50,000,000 revolving line of credit to be used for temporary or emergency purposes as an additional source of liquidity to fund redemptions of investor shares. Under the agreement, the Participants were charged an annual commitment fee, which was allocated across the Participants on the basis of each Participant’s allocation of the entire facility. The Participants were permitted to borrow up to a maximum of one third of their net assets under the agreement. The Fund, along with the other Participants, entered into amendments to the agreement for a $100,000,000 revolving line of credit on August 1, 2011. The line of credit under the agreement as amended expired on November 15, 2011.
On November 15, 2011, the Fund, along with the other Participants, entered into an agreement for a $125,000,000 revolving line of credit. The agreement is to be used as described above and operates in substantially the same manner as the original agreement. The agreement expires on November 13, 2012. The Fund had no amounts outstanding as of April 30, 2012, or at any time during the year then ended.
9. Derivatives
U.S. GAAP requires disclosures that enable investors to understand: 1) how and why an entity uses derivatives; 2) how they are accounted for; and 3) how they affect an entity’s results of operations and financial position.
Foreign Currency Exchange Contracts — The Fund may enter into foreign currency exchange contracts as a way of managing foreign exchange rate risk. The Fund may enter into these contracts to fix the U.S. dollar value of a security that it has agreed to buy or sell for the period between the date the trade was entered into and the date the security is delivered and paid for. The Fund may also use these contracts to hedge the U.S. dollar value of securities it already owns that are denominated in foreign currencies. The change in value is recorded as an unrealized gain or loss. When the contract is closed, a realized gain or loss is recorded equal to the difference between the value of the contract at the time it was opened and the value at the time it was closed.
The use of foreign currency exchange contracts does not eliminate fluctuations in the underlying prices of the securities, but does establish a rate of exchange that can be achieved in the future. Although foreign currency exchange contracts limit the risk of loss due to an unfavorable change in the value of the hedged currency, they also limit any potential gain that might result should the value of the currency change favorably. In addition, the Fund could be exposed to risks if the counterparties to the contracts are unable to meet the terms of their contracts. The Fund’s maximum risk of loss from counterparty credit risk is the value of its currency exchanged with the counterparty. The risk is generally mitigated by having a netting arrangement between the Fund and the counterparty and by the posting of collateral by the counterparty to the Fund to cover the Fund’s exposure to the counterparty. There were no foreign currency exchange contracts outstanding at April 30, 2012.
40
Derivatives Generally. The table below summarizes the average balance of derivative holdings by the Fund during the year ended April 30, 2012. The average balance of derivatives held is generally similar to the volume of derivative activity for the year ended April 30, 2012.
For the year ended April 30, 2012, the Fund’s average volume of derivative activities is as follows:
| | Asset | | Liability |
| | Derivative | | Derivative |
| | Volume | | Volume |
| Foreign currency exchange contracts (average cost) | | $140,781 | | $24,264 |
10. Securities Lending
The Fund, along with other funds in the Delaware Investments® Family of Funds, may lend its securities pursuant to a security lending agreement (Lending Agreement) with The Bank of New York Mellon (BNY Mellon). At the time a security is loaned, the borrower must post collateral equal to the required percentage of the market value of the loaned security, including any accrued interest. The required percentage is: (i) 102% with respect to U.S. securities and foreign securities that are denominated and payable in U.S. dollars; and (ii) 105% with respect to foreign securities. With respect to each loan, if on any business day the aggregate market value of securities collateral plus cash collateral held is less than the aggregate market value of the securities which are the subject of such loan, the borrower will be notified to provide additional collateral by the end of the following business day which, together with the collateral already held, will be not less than the applicable initial collateral requirements for such security loan. If the aggregate market value of securities collateral and cash collateral held with respect to a security loan exceeds the applicable initial collateral requirement, upon the request of the borrower BNY Mellon must return enough collateral to the borrower by the end of the following business day to reduce the value of the remaining collateral to the applicable initial collateral requirement for such security loan. As a result of the foregoing, the value of the collateral held with respect to a loaned security may be temporarily more or less than the value of the security on loan.
Cash collateral received is generally invested in the Delaware Investments Collateral Fund No. 1 (Collective Trust) established by BNY Mellon for the purpose of investment on behalf of funds managed by DMC that participate in BNY Mellon’s securities lending program. The Collective Trust may invest in U.S. government securities and high quality corporate debt, asset-backed and other money market securities and in repurchase agreements collateralized by such securities, provided that the Collective Trust will generally have a dollar-weighted average portfolio maturity of 60 days or less. Effective April 20, 2009, BNY Mellon transferred the assets of the Fund’s previous collateral investment pool other than cash and assets with a maturity of one business day or less to the BNY Mellon SL DBT II Liquidating Fund (Liquidating Fund), effectively bifurcating the previous collateral investment pool. The Fund’s exposure to the Liquidating Fund is expected to decrease as the Liquidating Fund’s assets mature or are sold. In October 2008, BNY Mellon transferred certain distressed securities from the previous collateral investment pool into the Mellon GSL Reinvestment Trust II. The Fund can also accept U.S. government securities and
41
Notes to financial statements
Delaware Select Growth Fund
10. Securities Lending (continued)
letters of credit (non-cash collateral) in connection with securities loans. In the event of default or bankruptcy by the lending agent, realization and/or retention of the collateral may be subject to legal proceedings. In the event the borrower fails to return loaned securities and the collateral received is insufficient to cover the value of the loaned securities and provided such collateral shortfall is not the result of investment losses, the lending agent has agreed to pay the amount of the shortfall to the Fund, or at the discretion of the lending agent, replace the loaned securities. The Fund continues to record dividends or interest, as applicable, on the securities loaned and is subject to changes in value of the securities loaned that may occur during the term of the loan. The Fund has the right under the Lending Agreement to recover the securities from the borrower on demand. With respect to security loans collateralized by non-cash collateral, the Fund receives loan premiums paid by the borrower. With respect to security loans collateralized by cash collateral, the earnings from the collateral investments are shared among the Fund, the security lending agent and the borrower. The Fund records security lending income net of allocations to the security lending agent and the borrower.
The Collective Trust used for the investment of cash collateral received from borrowers of securities seeks to maintain a net asset value per unit of $1.00, but there can be no assurance that it will always be able to do so. The Fund may incur investment losses as a result of investing securities lending collateral in the Collective Trust or another collateral investment pool. This could occur if an investment in a collateral investment pool defaulted or if it were necessary to liquidate assets in the collateral investment pool to meet returns on outstanding security loans at a time when the collateral investment pool’s net asset value per unit was less than $1.00. Under those circumstances, the Fund may not receive an amount from the collateral investment pool that is equal in amount to the collateral the Fund would be required to return to the borrower of the securities and the Fund would be required to make up for this shortfall.
At April 30, 2012, the value of securities on loan was $2,688,872, for which cash collateral was received and invested in accordance with the Lending Agreement. At April 30, 2012, the value of invested collateral was $1,209,930. These investments are presented on the statement of net assets under the caption “Securities Lending Collateral”.
11. Credit and Market Risk
The Fund invests a significant portion of its assets in small- and mid-sized companies and may be subject to certain risks associated with ownership of securities of such companies. Investments in small- or mid-sized companies may be more volatile than investments in larger companies for a number of reasons, which include more limited financial resources or a dependence on narrow product lines.
Some countries in which the Fund may invest require governmental approval for the repatriation of investment income, capital or the proceeds of sales of securities by foreign investors. In addition, if there is deterioration in a country’s balance of payments or for other reasons, a country may impose temporary restrictions on foreign capital remittances abroad.
42
The securities exchanges of certain foreign markets are substantially smaller, less liquid and more volatile than the major securities markets in the United States. Consequently, acquisition and disposition of securities by the Fund may be inhibited. In addition, a significant portion of the aggregate market value of equity securities listed on the major securities exchanges in emerging markets is held by a smaller number of investors. This may limit the number of shares available for acquisition or disposition by the Fund.
The Fund may invest up to 15% of its net assets in illiquid securities, which may include securities with contractual restrictions on resale, securities exempt from registration under Rule 144A of the Securities Act of 1933, as amended, and other securities which may not be readily marketable. The relative illiquidity of these securities may impair the Fund from disposing of them in a timely manner and at a fair price when it is necessary or desirable to do so. While maintaining oversight, the Fund’s Board has delegated to DMC the day-to-day functions of determining whether individual securities are liquid for purposes of the Fund’s limitation on investments in illiquid securities. Securities eligible for resale pursuant to Rule 144A, which are determined to be liquid, are not subject to the Fund’s 15% limit on investments in illiquid securities. As of April 30, 2012, there were no Rule 144A securities. Illiquid securities have been identified on the statement of net assets.
12. Contractual Obligations
The Fund enters into contracts in the normal course of business that contain a variety of indemnifications. The Fund’s maximum exposure under these arrangements is unknown. However, the Fund has not had prior claims or losses pursuant to these contracts. Management has reviewed the Fund’s existing contracts and expects the risk of loss to be remote.
13. Subsequent Events
Management has determined that no material events or transactions occurred subsequent to April 30, 2012 that would require recognition or disclosure in the Fund’s financial statements.
43
Report of independent
registered public accounting firm
To the Board of Trustees of Voyageur Mutual Funds III Trust
and the Shareholders of Delaware Select Growth Fund:
In our opinion, the accompanying statement of net assets and the related statements of operations and of changes in net assets and the financial highlights present fairly, in all material respects, the financial position of Delaware Select Growth Fund (one of a series constituting the Voyageur Mutual Funds III Trust, hereafter referred to as the “Fund”) at April 30, 2012, the results of its operations for the year then ended, the changes in its net assets and the financial highlights for each of the two years in the period then ended, in conformity with accounting principles generally accepted in the United States of America. These financial statements and financial highlights (hereafter referred to as “financial statements”) are the responsibility of the Fund’s management; our responsibility is to express an opinion on these financial statements based on our audit. We conducted our audit of these financial statements in accordance with the standards of the Public Company Accounting Oversight Board (United States). Those standards require that we plan and perform the audit to obtain reasonable assurance about whether the financial statements are free of material misstatement. An audit includes examining, on a test basis, evidence supporting the amounts and disclosures in the financial statements, assessing the accounting principles used and significant estimates made by management, and evaluating the overall financial statement presentation. We believe that our audit, which included confirmation of securities at April 30, 2012 by correspondence with the custodian and brokers, provides a reasonable basis for our opinion. The financial highlights for each of the three years in the period ended April 30, 2010 were audited by other independent accountants whose report dated June 18, 2010 expressed an unqualified opinion on those statements.
PricewaterhouseCoopers LLP
Philadelphia, Pennsylvania
June 18, 2012
44
Other Fund information
(Unaudited)
Delaware Select Growth Fund
Change in Independent Registered Public Accounting Firm
Due to independence matters under the Securities and Exchange Commission’s auditor independence rules relating to the January 4, 2010 acquisition of Delaware Investments (including DMC, DDLP and DSC) by Macquarie Group, Ernst & Young LLP (E&Y) has resigned as the independent registered public accounting firm for Voyageur Mutual Funds III (the Trust) effective June 28, 2010. At a meeting held on February 18, 2010, the Board of Trustees of the Trust, upon recommendation of the Audit Committee, selected PricewaterhouseCoopers LLP (PwC) to serve as the independent registered public accounting firm for the Trust for the fiscal year ending April 30, 2011. During the fiscal years ended April 30, 2010 and 2009, E&Y’s audit reports on the financial statements of the Trust did not contain any adverse opinion or disclaimer of opinion, nor were they qualified or modified as to uncertainty, audit scope, or accounting principles. In addition, there were no disagreements between the Trust and E&Y on accounting principles, financial statements disclosures or audit scope, which, if not resolved to the satisfaction of E&Y, would have caused them to make reference to the disagreement in their reports. Neither the Trust nor anyone on its behalf has consulted with PwC at any time prior to their selection with respect to the application of accounting principles to a specified transaction, either completed or proposed, or the type of audit opinion that might be rendered on the Trust’s financial statements.
45
Board of trustees/directors and officers addendum
Delaware Investments® Family of Funds
A mutual fund is governed by a Board of Trustees/Directors (“Trustees”), which has oversight responsibility for the management of a fund’s business affairs. Trustees establish procedures and oversee and review the performance of the investment manager, the distributor, and others who perform services for the fund. The independent fund trustees, in particular, are advocates
| Name, Address, | | Position(s) | | Length of |
| and Birth Date | | Held with Fund(s) | | Time Served |
| Interested Trustees | | | | |
| | | | | |
| Patrick P. Coyne1 | | Chairman, President, | | Chairman and Trustee |
| 2005 Market Street | | Chief Executive Officer, | | since August 16, 2006 |
| Philadelphia, PA 19103 | | and Trustee | | |
| April 1963 | | | | President and |
| | | | | Chief Executive Officer |
| | | | | since August 1, 2006 |
| | | | | |
| | | | | |
| | | | | |
| | | | | |
| | | | | |
| | | | | |
| | | | | |
| | | | | |
| | | | | |
| | | | | |
| | | | | |
| | | | | |
| | | | | |
| | | | | |
| | | | | |
| | | | | |
| | | | | |
| | | | | |
1 Patrick P. Coyne is considered to be an “Interested Trustee” because he is an executive officer of the Fund’s(s’) investment advisor.
46
for shareholder interests. Each trustee has served in that capacity since he or she was elected to or appointed to the Board of Trustees, and will continue to serve until his or her retirement or the election of a new trustee in his or her place. The following is a list of the Trustees and Officers with certain background and related information.
| Number of Portfolios in | |
| Principal Occupation(s) | Fund Complex Overseen | Other Directorships |
| During Past 5 Years | by Trustee or Officer | Held by Trustee or Officer |
| |
| |
| Patrick P. Coyne has served in | 73 | Director and Audit |
| various executive capacities | | Committee Member |
| at different times at | | Kaydon Corp. |
| Delaware Investments.2 | | |
| | Board of Governors Member |
| | Investment Company |
| | Institute (ICI) |
| |
| | Finance Committee Member |
| | St. John Vianney Roman |
| | Catholic Church |
| |
| | Board of Trustees |
| | Agnes Irwin School |
| |
| | Member of Investment |
| | Committee |
| | Cradle of Liberty Council, |
| | BSA |
| | (2007–2010) |
| | |
| | |
| | |
2 Delaware Investments is the marketing name for Delaware Management Holdings, Inc. and its subsidiaries, including the Fund’s(s’) investment advisor, principal underwriter, and its transfer agent.
47
Board of trustees/directors and officers addendum
Delaware Investments® Family of Funds
| Name, Address, | Position(s) | Length of |
| and Birth Date | Held with Fund(s) | Time Served |
| Independent Trustees | | |
| | | |
| Thomas L. Bennett | Trustee | Since March 2005 |
| 2005 Market Street | | |
| Philadelphia, PA 19103 | | |
| October 1947 | | |
| | | |
| |
| |
| |
| |
| |
| |
| |
| |
| |
| |
| John A. Fry | Trustee | Since January 2001 |
| 2005 Market Street | | |
| Philadelphia, PA 19103 | | |
| May 1960 | | |
| |
| |
| |
| |
| |
| |
| |
| |
| |
| |
| |
| |
|
| Anthony D. Knerr | Trustee | Since April 1990 |
| 2005 Market Street | | |
| Philadelphia, PA 19103 | | |
| December 1938 | | |
| | | |
| Lucinda S. Landreth | Trustee | Since March 2005 |
| 2005 Market Street | | |
| Philadelphia, PA 19103 | | |
| June 1947 | | |
| | | |
48
| Number of Portfolios in | |
| Principal Occupation(s) | Fund Complex Overseen | Other Directorships |
| During Past 5 Years | by Trustee or Officer | Held by Trustee or Officer |
| |
| |
| Private Investor | 73 | Chairman of Investment |
| (March 2004–Present) | | Committee |
| | Pennsylvania Academy of |
| Investment Manager | | Fine Arts |
| Morgan Stanley & Co. | | |
| (January 1984–March 2004) | | Investment Committee and |
| | Governance Committee |
| | Member |
| | Pennsylvania Horticultural |
| | Society |
| |
| | Director |
| | Bryn Mawr Bank Corp. (BMTC) |
| | (2007–2011) |
| | | |
| | |
| President | 73 | Board of Governors Member — |
| Drexel University | | NASDAQ OMX PHLX LLC |
| (August 2010–Present) | | |
| | Director and Audit |
| President | | Committee Member |
| Franklin & Marshall College | | Community Health Systems |
| (July 2002–July 2010) | | |
| | Director — U.S. SQUASH |
| |
| | Director — Ecore |
| | International |
| | (2009–2010) |
| |
| | Director — Allied |
| | Barton Securities Holdings |
| | (2005–2008) |
| | | |
| Managing Director | 73 | None |
| Anthony Knerr & Associates | | |
| (Strategic Consulting) | | |
| (1990–Present) | | |
| | | |
| Chief Investment Officer | 73 | None |
| Assurant, Inc. (Insurance) | | |
| (2002–2004) | | |
| | | |
| | | |
49
Board of trustees/directors and officers addendum
Delaware Investments® Family of Funds
| Name, Address, | Position(s) | Length of |
| and Birth Date | Held with Fund(s) | Time Served |
| Independent Trustees (continued) | | |
| | | |
| Ann R. Leven | Trustee | Since October 1989 |
| 2005 Market Street | | |
| Philadelphia, PA 19103 | | |
| November 1940 | | |
| |
| |
|
| Frances A. Sevilla-Sacasa | Trustee | Since September 2011 |
| 2005 Market Street | | |
| Philadelphia, PA 19103 | | |
| January 1956 | | |
| | |
50
| Number of Portfolios in | |
| Principal Occupation(s) | Fund Complex Overseen | Other Directorships |
| During Past 5 Years | by Trustee or Officer | Held by Trustee or Officer |
| |
| |
| Consultant | 73 | Director and Audit |
| ARL Associates | | Committee Chair |
| (Financial Planning) | | Systemax Inc. |
| (1983–Present) | | (2001–2009) |
| |
| | Director and Audit |
| | Committee Chairperson |
| | Andy Warhol Foundation |
| | (1999–2007) |
| | | |
| Chief Executive Officer — | 73 | Trust Manager — Camden |
| Banco Itaú Europa | | Property Trust |
| International | | (since August 2011) |
| (since April 2012) | | |
| | Board of Trustees |
| Executive Advisor to Dean | | Thunderbird School of |
| (August 2011–March 2012) | | Global Management |
| and Interim Dean | | (2007–2011) |
| (January 2011–July 2011) — | | |
| University of Miami School of | | Board of Trustees |
| Business Administration | | Carrollton School of the |
| | Sacred Heart |
| President — U.S. Trust, | | (since 2001) |
| Bank of America Private | | |
| Wealth Management | | Board Member |
| (Private Banking) | | Foreign Policy Association |
| (July 2007–December 2008) | | (since 2006) |
| |
| President and Director | | Board of Trustees |
| (November 2005–June 2007) and | | Georgetown Preparatory School |
| Chief Executive Officer | | (2005–2011) |
| (April 2007–June 2007) — | | |
| U.S. Trust Company | | Board of Governors |
| (Private Banking) | | Miami City Ballet |
| | (2000–2011) |
| |
| | Board of Trustees |
| | St. Thomas University |
| | (2005–2011) |
| | |
51
Board of trustees/directors and officers addendum
Delaware Investments® Family of Funds
| Name, Address, | Position(s) | Length of |
| and Birth Date | Held with Fund(s) | Time Served |
| Independent Trustees (continued) | | |
| | | |
| Janet L. Yeomans | Trustee | Since April 1999 |
| 2005 Market Street | | |
| Philadelphia, PA 19103 | | |
| July 1948 | | |
| |
| |
|
| J. Richard Zecher | Trustee | Since March 2005 |
| 2005 Market Street | | |
| Philadelphia, PA 19103 | | |
| July 1940 | | |
52
| Number of Portfolios in | |
| Principal Occupation(s) | Fund Complex Overseen | Other Directorships |
| During Past 5 Years | by Trustee or Officer | Held by Trustee or Officer |
| |
| |
| Vice President and Treasurer | 73 | Director and Audit |
| (January 2006–Present) | | Committee Member |
| Vice President — Mergers & Acquisitions | | Okabena Company |
| (January 2003–January 2006), and | | |
| Vice President and Treasurer | | Chair — 3M |
| (July 1995–January 2003) | | Investment Management |
| 3M Corporation | | Company |
| | | |
| Founder | 73 | Director and Compensation |
| Investor Analytics | | Committee Member |
| (Risk Management) | | Investor Analytics |
| (May 1999–Present) | | |
| | | Director |
| Founder | | Oxigene, Inc. |
| Sutton Asset Management | | (2003–2008) |
| (Hedge Fund) | | |
| (September 1996–Present) | | |
53
Board of trustees/directors and officers addendum
Delaware Investments® Family of Funds
| Name, Address, | Position(s) | Length of |
| and Birth Date | Held with Fund(s) | Time Served |
| Officers | | |
| | | |
| David F. Connor | Vice President, | Vice President since |
| 2005 Market Street | Deputy General | September 2000 |
| Philadelphia, PA 19103 | Counsel, and Secretary | and Secretary since |
| December 1963 | | October 2005 |
| | | |
| |
| Daniel V. Geatens | Vice President | Treasurer |
| 2005 Market Street | and Treasurer | since October 2007 |
| Philadelphia, PA 19103 | | |
| October 1972 | | |
| | | |
| David P. O’Connor | Executive Vice President, | Executive Vice President |
| 2005 Market Street | General Counsel | since February 2012; |
| Philadelphia, PA 19103 | and Chief Legal Officer | Senior Vice President |
| February 1966 | | October 2005– |
| | February 2012; |
| | General Counsel and |
| | Chief Legal Officer |
| | since October 2005 |
| | | |
| Richard Salus | Senior Vice President | Chief Financial Officer |
| 2005 Market Street | and Chief Financial Officer | since November 2006 |
| Philadelphia, PA 19103 | | |
| October 1963 | | |
| | | |
The Statement of Additional Information for the Fund(s) includes additional information about the Trustees and Officers and is available, without charge, upon request by calling 800 523-1918.
54
| Number of Portfolios in | |
| Principal Occupation(s) | Fund Complex Overseen | Other Directorships |
| During Past 5 Years | by Trustee or Officer | Held by Trustee or Officer |
| |
| |
| David F. Connor has served as | 73 | None3 |
| Vice President and Deputy | | |
| General Counsel of | | |
| Delaware Investments | | |
| since 2000. | | |
| | | |
| Daniel V. Geatens has served | 73 | None3 |
| in various capacities at | | |
| different times at | | |
| Delaware Investments. | | |
| | | |
| David P. O’Connor has served in | 73 | None3 |
| various executive and legal | | |
| capacities at different times | | |
| at Delaware Investments. | | |
| |
| |
| |
| |
| |
| Richard Salus has served in | 73 | None3 |
| various executive capacities | | |
| at different times at | | |
| Delaware Investments. | | |
| | | |
3 David F. Connor, Daniel V. Geatens, David P. O’Connor, and Richard Salus serve in similar capacities for the six portfolios of the Optimum Fund Trust, which have the same investment advisor, principal underwriter, and transfer agent as the registrant.
55
About the organization
| Board of trustees | | | |
Patrick P. Coyne
Chairman, President, and
Chief Executive Officer
Delaware Investments®
Family of Funds
Philadelphia, PA
Thomas L. Bennett
Private Investor
Rosemont, PA
John A. Fry
President
Drexel University
Philadelphia, PA | Anthony D. Knerr
Founder and Managing
Director
Anthony Knerr &
Associates
New York, NY
Lucinda S. Landreth
Former Chief Investment
Officer
Assurant, Inc.
Philadelphia, PA | Ann R. Leven
Consultant
ARL Associates
New York, NY
Frances A.
Sevilla-Sacasa
Chief Executive Officer
Banco Itaú Europa
International
Miami, FL
| Janet L. Yeomans
Vice President and
Treasurer
3M Corporation
St. Paul, MN
J. Richard Zecher
Founder
Investor Analytics
Scottsdale, AZ
|
| | | | |
| Affiliated officers | | | |
David F. Connor
Vice President, Deputy
General Counsel, and
Secretary
Delaware Investments
Family of Funds
Philadelphia, PA | Daniel V. Geatens
Vice President and
Treasurer
Delaware Investments
Family of Funds
Philadelphia, PA | David P. O’Connor
Executive Vice President,
General Counsel
and Chief Legal Officer
Delaware Investments
Family of Funds
Philadelphia, PA | Richard Salus
Senior Vice President and
Chief Financial Officer
Delaware Investments
Family of Funds
Philadelphia, PA |
| This annual report is for the information of Delaware Select Growth Fund shareholders, but it may be used with prospective investors when preceded or accompanied by the Delaware Investments Fund fact sheet for the most recently completed calendar quarter. These documents are available at www.delawareinvestments.com. |
| Delaware Investments is the marketing name of Delaware Management Holdings, Inc. and its subsidiaries. |
The Fund files its complete schedule of portfolio holdings with the Securities and Exchange Commission (SEC) for the first and third quarters of each fiscal year on Form N-Q. The Fund’s Forms N-Q, as well as a description of the policies and procedures that the Fund uses to determine how to vote proxies (if any) relating to portfolio securities are available without charge (i) upon request, by calling 800 523-1918; and (ii) on the SEC’s website at www.sec.gov. In addition, a description of the policies and procedures that the Fund uses to determine how to vote proxies (if any) relating to portfolio securities and the Fund’s Schedule of Investments are available without charge on the Fund’s website at www.delawareinvestments.com. The Fund’s Forms N-Q may be reviewed and copied at the SEC’s Public Reference Room in Washington, D.C.; information on the operation of the Public Reference Room may be obtained by calling 800 SEC-0330.
Information (if any) regarding how the Fund voted proxies relating to portfolio securities during the most recently disclosed 12-month period ended June 30 is available without charge (i) through the Fund’s website at www.delawareinvestments.com; and (ii) on the SEC’s website at www.sec.gov.
56
Item 2. Code of Ethics
The registrant has adopted a code of ethics that applies to the registrant’s principal executive officer, principal financial officer, principal accounting officer or controller, or persons performing similar functions, regardless of whether these individuals are employed by the registrant or a third party. A copy of the registrant’s Code of Business Ethics has been posted on the Delaware Investments Internet Web site at www.delawareinvestments.com. Any amendments to the Code of Business Ethics, and information on any waiver from its provisions granted by the registrant, will also be posted on this Web site within five business days of such amendment or waiver and will remain on the Web site for at least 12 months.
Item 3. Audit Committee Financial Expert
The registrant’s Board of Trustees/Directors has determined that certain members of the registrant’s Audit Committee are audit committee financial experts, as defined below. For purposes of this item, an “audit committee financial expert” is a person who has the following attributes:
a. An understanding of generally accepted accounting principles and financial statements;
b. The ability to assess the general application of such principles in connection with the accounting for estimates, accruals, and reserves;
c. Experience preparing, auditing, analyzing, or evaluating financial statements that present a breadth and level of complexity of accounting issues that are generally comparable to the breadth and complexity of issues that can reasonably be expected to be raised by the registrant’s financial statements, or experience actively supervising one or more persons engaged in such activities;
d. An understanding of internal controls and procedures for financial reporting; and
e. An understanding of audit committee functions.
An “audit committee financial expert” shall have acquired such attributes through:
a. Education and experience as a principal financial officer, principal accounting officer, controller, public accountant, or auditor or experience in one or more positions that involve the performance of similar functions;
b. Experience actively supervising a principal financial officer, principal accounting officer, controller, public accountant, auditor, or person performing similar functions;
c. Experience overseeing or assessing the performance of companies or public accountants with respect to the preparation, auditing, or evaluation of financial statements; or
d. Other relevant experience.
The registrant’s Board of Trustees/Directors has also determined that each member of the registrant’s Audit Committee is independent. In order to be “independent” for purposes of this item, the Audit Committee member may not: (i) other than in his or her capacity as a member of the Board of Trustees/Directors or any committee thereof, accept directly or indirectly any consulting, advisory or other compensatory fee from the issuer; or (ii) be an “interested person” of the registrant as defined in Section 2(a)(19) of the Investment Company Act of 1940.
The names of the audit committee financial experts on the registrant’s Audit Committee are set forth below:
Thomas L. Bennett1
John A. Fry
Frances A. Sevilla-Sacasa
Janet L. Yeomans
Item 4. Principal Accountant Fees and Services
(a) Audit fees.
The aggregate fees billed for services provided to the registrant by its independent auditors for the audit of the registrant’s annual financial statements and for services normally provided by the independent auditors in connection with statutory and regulatory filings or engagements were $31,868 for the fiscal year ended April 30, 2012.
____________________
1 The instructions to Form N-CSR require disclosure on the relevant experience of persons who qualify as audit committee financial experts based on “other relevant experience.” The Board of Trustees/Directors has determined that Mr. Bennett qualifies as an audit committee financial expert by virtue of: his education and Chartered Financial Analyst designation; his experience as a credit analyst, portfolio manager and the manager of other credit analysts and portfolio managers; and his prior service on the audit committees of public companies.
The aggregate fees billed for services provided to the registrant by its independent auditors for the audit of the registrant’s annual financial statements and for services normally provided by the independent auditors in connection with statutory and regulatory filings or engagements were $28,300 for the fiscal year ended April 30, 2011.
(b) Audit-related fees.
The aggregate fees billed by the registrant’s independent auditors for services relating to the performance of the audit of the registrant’s financial statements and not reported under paragraph (a) of this Item were $0 for the fiscal year ended April 30, 2012.
The aggregate fees billed by the registrant’s independent auditors for services relating to the performance of the audit of the financial statements of the registrant’s investment adviser and other service providers under common control with the adviser and that relate directly to the operations or financial reporting of the registrant were $293,000 for the registrant’s fiscal year ended April 30, 2012. The percentage of these fees relating to services approved by the registrant’s Audit Committee pursuant to the de minimis exception from the pre-approval requirement in Rule 2-01(c)(7)(i)(C) of Regulation S-X was 0%. These audit-related services were as follows: year end audit procedures; reporting up and subsidiary statutory audits.
The aggregate fees billed by the registrant’s independent auditors for services relating to the performance of the audit of the registrant’s financial statements and not reported under paragraph (a) of this Item were $0 for the fiscal year ended April 30, 2011.
The aggregate fees billed by the registrant’s independent auditors for services relating to the performance of the audit of the financial statements of the registrant’s investment adviser and other service providers under common control with the adviser and that relate directly to the operations or financial reporting of the registrant were $593,000 for the registrant’s fiscal year ended April 30, 2011. The percentage of these fees relating to services approved by the registrant’s Audit Committee pursuant to the de minimis exception from the pre-approval requirement in Rule 2-01(c)(7)(i)(C) of Regulation S-X was 0%. These audit-related services were as follows: audit procedures performed for both the reporting up on Delaware balances for consolidation into the parent company, Macquarie. Also, included are the fees for each of the statutory audits performed on the advisor and its affiliates/subsidiaries.
(c) Tax fees.
The aggregate fees billed by the registrant’s independent auditors for tax-related services provided to the registrant were $6,200 for the fiscal year ended April 30, 2012. The percentage of these fees relating to services approved by the registrant’s Audit Committee pursuant to the de minimis exception from the pre-approval requirement in Rule 2-01(c)(7)(i)(C) of Regulation S-X was 0%. These tax-related services were as follows: review of income tax returns and review of annual excise distribution calculations.
The aggregate fees billed by the registrant’s independent auditors for tax-related services provided to the registrant’s investment adviser and other service providers under common control with the adviser and that relate directly to the operations or financial reporting of the registrant were $0 for the registrant’s fiscal year ended April 30, 2012.
The aggregate fees billed by the registrant’s independent auditors for tax-related services provided to the registrant were $5,100 for the fiscal year ended April 30, 2011. The percentage of these fees relating to services approved by the registrant’s Audit Committee pursuant to the de minimis exception from the pre-approval requirement in Rule 2-01(c)(7)(i)(C) of Regulation S-X was 0%. These tax-related services were as follows: review of income tax returns and review of annual excise distribution calculations.
The aggregate fees billed by the registrant’s independent auditors for tax-related services provided to the registrant’s investment adviser and other service providers under common control with the adviser and that relate directly to the operations or financial reporting of the registrant were $10,000 for the registrant’s fiscal year ended April 30, 2011. The percentage of these fees relating to services approved by the registrant’s Audit Committee pursuant to the de minimis exception from the pre-approval requirement in Rule 2-01(c)(7)(i)(C) of Regulation S-X was 0%. These tax-related services were as follows: state and local tax services.
(d) All other fees.
The aggregate fees billed for all services provided by the independent auditors to the registrant other than those set forth in paragraphs (a), (b) and (c) of this Item were $0 for the fiscal year ended April 30, 2012.
The aggregate fees billed for all services other than those set forth in paragraphs (b) and (c) of this Item provided by the registrant’s independent auditors to the registrant’s adviser and other service providers under common control with the adviser and that relate directly to the operations or financial reporting of the registrant were $0 for the registrant’s fiscal year ended April 30, 2012.
The aggregate fees billed for all services provided by the independent auditors to the registrant other than those set forth in paragraphs (a), (b) and (c) of this Item were $0 for the fiscal year ended April 30, 2011.
The aggregate fees billed for all services other than those set forth in paragraphs (b) and (c) of this Item provided by the registrant’s independent auditors to the registrant’s adviser and other service providers under common control with the adviser and that relate directly to the operations or financial reporting of the registrant were $0 for the registrant’s fiscal year ended April 30, 2011.
(e) The registrant’s Audit Committee has established pre-approval policies and procedures as permitted by Rule 2-01(c)(7)(i)(B) of Regulation S-X (the “Pre-Approval Policy”) with respect to services provided by the registrant’s independent auditors. Pursuant to the Pre-Approval Policy, the Audit Committee has pre-approved the services set forth in the table below with respect to the registrant up to the specified fee limits. Certain fee limits are based on aggregate fees to the registrant and other registrants within the Delaware Investments Family of Funds.
| Service | Range of Fees |
| Audit Services | |
| Statutory audits or financial audits for new Funds | up to $25,000 per Fund |
| Services associated with SEC registration statements (e.g., Form N-1A, Form N-14, etc.), periodic reports and other documents filed with the SEC or other documents issued in connection with securities offerings (e.g., comfort letters for closed-end Fund offerings, consents), and assistance in responding to SEC comment letters | up to $10,000 per Fund |
| Consultations by Fund management as to the accounting or disclosure treatment of transactions or events and/or the actual or potential impact of final or proposed rules, standards or interpretations by the SEC, FASB, or other regulatory or standard-setting bodies (Note: Under SEC rules, some consultations may be considered “audit-related services” rather than “audit services”) | up to $25,000 in the aggregate |
| Audit-Related Services | |
| Consultations by Fund management as to the accounting or disclosure treatment of transactions or events and /or the actual or potential impact of final or proposed rules, standards or interpretations by the SEC, FASB, or other regulatory or standard-setting bodies (Note: Under SEC rules, some consultations may be considered “audit services” rather than “audit-related services”) | up to $25,000 in the aggregate |
| Tax Services | |
| U.S. federal, state and local and international tax planning and advice (e.g., consulting on statutory, regulatory or administrative developments, evaluation of Funds’ tax compliance function, etc.) | up to $25,000 in the aggregate |
| U.S. federal, state and local tax compliance (e.g., excise distribution reviews, etc.) | up to $5,000 per Fund |
| Review of federal, state, local and international income, franchise and other tax returns | up to $5,000 per Fund |
Under the Pre-Approval Policy, the Audit Committee has also pre-approved the services set forth in the table below with respect to the registrant’s investment adviser and other entities controlling, controlled by or under common control with the investment adviser that provide ongoing services to the registrant (the “Control Affiliates”) up to the specified fee limit. This fee limit is based on aggregate fees to the investment adviser and its Control Affiliates.
| Service | Range of Fees |
| Non-Audit Services | |
| Services associated with periodic reports and other documents filed with the SEC and assistance in responding to SEC comment letters | up to $10,000 in the aggregate |
The Pre-Approval Policy requires the registrant’s independent auditors to report to the Audit Committee at each of its regular meetings regarding all services initiated since the last such report was rendered, including those services authorized by the Pre-Approval Policy.
(f) Not applicable.
(g) The aggregate non-audit fees billed by the registrant’s independent auditors for services rendered to the registrant and to its investment adviser and other service providers under common control with the adviser were $10,901,705 and $25,000 for the registrant’s fiscal years ended April 30, 2012 and April 30, 2011, respectively.
(h) In connection with its selection of the independent auditors, the registrant’s Audit Committee has considered the independent auditors’ provision of non-audit services to the registrant’s investment adviser and other service providers under common control with the adviser that were not required to be pre-approved pursuant to Rule 2-01(c)(7)(ii) of Regulation S-X. The Audit Committee has determined that the independent auditors’ provision of these services is compatible with maintaining the auditors’ independence.
Item 5. Audit Committee of Listed Registrants
Not applicable.
Item 6. Investments
(a) Included as part of report to shareholders filed under Item 1 of this Form N-CSR.
(b) Divestment of securities in accordance with Section 13(c) of the Investment Company Act of 1940.
Not applicable.
Item 7. Disclosure of Proxy Voting Policies and Procedures for Closed-End Management Investment Companies
Not applicable.
Item 8. Portfolio Managers of Closed-End Management Investment Companies
Not applicable.
Item 9. Purchases of Equity Securities by Closed-End Management Investment Company and Affiliated Purchasers
Not applicable.
Item 10. Submission of Matters to a Vote of Security Holders
Not applicable.
Item 11. Controls and Procedures
The registrant’s principal executive officer and principal financial officer have evaluated the registrant’s disclosure controls and procedures within 90 days of the filing of this report and have concluded that they are effective in providing reasonable assurance that the information required to be disclosed by the registrant in its reports or statements filed under the Securities Exchange Act of 1934 is recorded, processed, summarized and reported within the time periods specified in the rules and forms of the Securities and Exchange Commission.
There were no significant changes in the registrant’s internal control over financial reporting that occurred during the second fiscal quarter of the period covered by the report to stockholders included herein (i.e., the registrant’s fourth fiscal quarter) that have materially affected, or are reasonably likely to materially affect, the registrant’s internal control over financial reporting.
Item 12. Exhibits
(a) (1) Code of Ethics
Not applicable.
(2) Certifications of Principal Executive Officer and Principal Financial Officer pursuant to Rule 30a-2 under the Investment Company Act of 1940 are attached hereto as Exhibit 99.CERT.
(3) Written solicitations to purchase securities pursuant to Rule 23c-1 under the Securities Exchange Act of 1934.
Not applicable.
(b) Certifications pursuant to Section 906 of the Sarbanes-Oxley Act of 2002 are furnished herewith as Exhibit 99.906CERT.
SIGNATURES
Pursuant to the requirements of the Securities Exchange Act of 1934 and the Investment Company Act of 1940, the registrant has duly caused this report to be signed on its behalf, by the undersigned, thereunto duly authorized.
Name of Registrant: VOYAGEUR MUTUAL FUNDS III
| /s/ PATRICK P. COYNE |
| By: | Patrick P. Coyne |
| Title: | Chief Executive Officer |
| Date: | July 2, 2012 |
Pursuant to the requirements of the Securities Exchange Act of 1934 and the Investment Company Act of 1940, this report has been signed below by the following persons on behalf of the registrant and in the capacities and on the dates indicated.
| /s/ PATRICK P. COYNE |
| By: | Patrick P. Coyne |
| Title: | Chief Executive Officer |
| Date: | July 2, 2012 |
| |
| /s/ RICHARD SALUS |
| By: | Richard Salus |
| Title: | Chief Financial Officer |
| Date: | July 2, 2012 |