UNITED STATES SECURITIES AND EXCHANGE COMMISSION
Washington, D.C. 20549
FORM N-CSR
CERTIFIED SHAREHOLDER REPORT OF REGISTERED MANAGEMENT
INVESTMENT COMPANIES
INVESTMENT COMPANIES
Investment Company Act file number: 811-04547
Exact name of registrant as specified in charter:
Voyageur Mutual Funds III
Voyageur Mutual Funds III
Address of principal executive offices:
2005 Market Street
Philadelphia, PA 19103
2005 Market Street
Philadelphia, PA 19103
Name and address of agent for service:
David F. Connor, Esq.
2005 Market Street
Philadelphia, PA 19103
David F. Connor, Esq.
2005 Market Street
Philadelphia, PA 19103
Registrant’s telephone number, including area code: (800) 523-1918
Date of fiscal year end: April 30
Date of reporting period: April 30, 2010
Item 1. Reports to Stockholders
Annual report Delaware Select Growth Fund April 30, 2010 Growth equity mutual fund |
This annual report is for the information of Delaware Select Growth Fund shareholders, but it may be used with prospective investors when preceded or accompanied by a current prospectus for Delaware Select Growth Fund. The figures in the annual report for Delaware Select Growth Fund represent past results, which are not a guarantee of future results. The return and principal value of an investment in the Fund will fluctuate so that shares, when redeemed, may be worth more or less than their original cost. Current performance may be higher or lower than the performance data quoted. You should consider the investment objectives, risks, charges, and expenses of the Fund carefully before investing. The Delaware Select Growth Fund prospectus contains this and other important information about the Fund. Prospectuses for all open-end funds in the Delaware Investments® Family of Funds are available from your financial advisor, online at www.delawareinvestments.com, or by phone at 800 523-1918. Please read the prospectus carefully before you invest or send money. |
| You can obtain shareholder reports and prospectuses online instead of in the mail. Visit www.delawareinvestments.com/edelivery. |
Experience Delaware Investments
Delaware Investments is committed to the pursuit of consistently superior asset management and unparalleled client service. We believe in our investment processes, which seek to deliver consistent results, and in convenient services that help add value for our clients.
If you are interested in learning more about creating an investment plan, contact your financial advisor.
You can learn more about Delaware Investments or obtain a prospectus for Delaware Select Growth Fund at www.delawareinvestments.com.
Manage your investments online
- 24-hour access to your account information
- Obtain share prices
- Check your account balance and recent transactions
- Request statements or literature
- Make purchases and redemptions
On January 4, 2010, Delaware Management Holdings, Inc., and its subsidiaries (collectively known by the marketing name of Delaware Investments) were sold by a subsidiary of Lincoln National Corporation to Macquarie Group Limited, a global provider of banking, financial, advisory, investment and funds management services. Please see your Fund’s prospectus and any supplements thereto for more complete information.
Investments in Delaware Select Growth Fund are not and will not be deposits with or liabilities of Macquarie Bank Limited ABN 46 008 583 542 and its holding companies, including their subsidiaries or related companies (Macquarie Group), and are subject to investment risk, including possible delays in repayment and loss of income and capital invested. No Macquarie Group company guarantees or will guarantee the performance of the Fund, the repayment of capital from the Fund, or any particular rate of return.
| Table of contents | |
| Portfolio management review | 1 |
| Performance summary | 4 |
| Disclosure of Fund expenses | 7 |
| Sector allocation and top 10 holdings | 9 |
| Statement of net assets | 10 |
| Statement of operations | 14 |
| Statements of changes in net assets | 16 |
| Financial highlights | 18 |
| Notes to financial statements | 28 |
| Report of independent registered public accounting firm | 39 |
| Other Fund information | 40 |
| Board of trustees/directors and officers addendum | 50 |
| About the organization | 60 |
Unless otherwise noted, views expressed herein are current as of April 30, 2010, and are subject to change.
Funds are not FDIC insured and are not guaranteed. It is possible to lose the principal amount invested.
Mutual fund advisory services provided by Delaware Management Company, a series of Delaware Management Business Trust, which is a registered investment advisor. Delaware Investments, a member of Macquarie Group, refers to Delaware Management Holdings, Inc. and its subsidiaries, including the Fund’s distributor Delaware Distributors, L.P. Macquarie Group refers to Macquarie Group Limited and its subsidiaries and affiliates worldwide.
© 2010 Delaware Management Holdings, Inc.
All third-party trademarks cited are the property of their respective owners.
| Portfolio management review | |
| Delaware Select Growth Fund | May 11, 2010 |
| Performance preview (for the period ended April 30, 2010) | ||||
| Delaware Select Growth Fund (Class A shares) | 1-year return | +48.20% | ||
| Russell 3000® Growth Index (benchmark) | 1-year return | +38.69% |
Past performance does not guarantee future results.
For complete, annualized performance for Delaware Select Growth Fund please see the table on page 4.
The performance of Class A shares excludes the applicable sales charge and reflects the reinvestment of all distributions.
For complete, annualized performance for Delaware Select Growth Fund please see the table on page 4.
The performance of Class A shares excludes the applicable sales charge and reflects the reinvestment of all distributions.
Index performance returns do not reflect any management fees, transaction costs, or expenses. Indices are unmanaged and one cannot invest directly in an index.
What a difference a year makes. At the end of the Fund’s previous fiscal year (April 30, 2009), many investors did not know what to make of the equity market rally that began in the prior month. After all, the economy was still mired in recession and a stimulus package had recently been enacted; consumer activity was lackluster at best and unemployment figures continued to rise. Cautious optimism among investors, however, was supported in time by early signs of an economic recovery and helped stocks in the second calendar quarter of 2009, which became the best quarter for the S&P 500 Index since 1998. (Source: Bloomberg.) Please see page 6 for a description of the S&P 500 Index.
Previously down-and-out sectors like financials led the charge in the stock market. The technology sector also enjoyed a bit of a rebound as signs of a recovery prompted analysts to predict significant investment in information technology. Confidence seemed to return to corporate boardrooms, as initial public offerings and merger and acquisition proposals began to make some headlines. A “new and improved” General Motors emerged from bankruptcy protection in time to participate in the federal government’s cash-for-clunkers program, which took effect in August 2009 and increased auto sales nationally.
Given the severity of the recent recession, however, plenty of concerns remained throughout the Fund’s fiscal year. While employment data trends improved, unemployment remained high as many companies were hesitant to add new employees; the U.S. housing rebound in the second half of the year remained muted at best, despite government incentives; and a European debt crisis, in which the European Union and International Monetary Fund bailed out Greece, rattled stock markets in April 2010 and threatened the nascent global economic recovery. (Source: Bloomberg.)
Within the Fund
For its fiscal year ended April 30, 2010, Delaware Select Growth Fund (Class A shares) returned +48.20% at net asset value and +39.68% at maximum offer price (both figures reflect all distributions reinvested). The Fund outperformed its benchmark, the Russell 3000 Growth Index, which advanced +38.69% for the same period. For the complete annualized performance of Delaware Select Growth Fund, please see the table on page 4.
1
Portfolio management review
Delaware Select Growth Fund
Delaware Select Growth Fund
It was another year in which macroeconomic and geopolitical factors greatly affected the markets. Despite the occasionally volatile macroeconomic environment, our stock selection process remained bottom-up. Rather than turn defensive or try to position the Fund to benefit from a turn in the economy, we held true to our philosophy and continued to seek what we viewed as high-quality companies with good competitive positions that we believed could outperform the benchmark index regardless of the market cycle.
Apple was the Fund’s largest holding, and its stock price more than doubled during the 12-month period. While the iPhone exceeded all expectations in terms of sales and profitability, its popularity also drove successes for some of the company’s traditional product lines, such as Mac desktops and laptops. Additionally, the recently launched iPad sold more than one million units in its initial month and helped push Apple’s stock price to an all-time high.
Netflix was another significant holding. The company continued growing its subscriber base and dominating its market for mail-order DVDs and online movie and television packages. Its management team also had the foresight to recognize the evolution of the digital content market and has forged distribution partnerships with manufacturers of televisions, DVD players, and game consoles, and with other relevant industry leaders like Microsoft.
During the fiscal year, Heartland Payment Systems advanced more than 120%. Heartland has continued to deliver solid operating performance after overcoming a high-profile security breach last year that interrupted its growth trajectory. The company agreed to a settlement with Visa regarding that breach, which seemed to further ease investors’ minds on that particular issue. We wrote about these circumstances in this space last year, expressing our confidence in the company’s ability to resolve the issues.
Detractors from performance included biotech company Gilead Sciences, which in December 2009 received news of a failed clinical trial involving a potential cardiovascular treatment. While some investors worried about Gilead’s existing drug pipeline and prospects for future growth, we chose to hang on to the stock and remain confident in the company’s leading competitive position within the field of HIV care and prevention.
Weight Watchers International appeared to continue to frustrate many investors. The diet plan specialist rose to a 52-week high in February 2010 as it enhanced its profitable food licensing and online operations. However, a poor earnings report did not sit well with investors. While we have generally been pleased with the company’s ability to shift its revenue mix toward licensing and online product offerings — both of which carry high margins and recurring revenues — we have been concerned with the lack of improvement in its core meeting attendance business. We believe the lack of growth in this core business is mostly attributable to the economic environment, and continue to hold what we believe to be a cash-generative and attractively valued company.
Finally, athenahealth posted disappointing performance toward the end of the fiscal period. In late February 2010, the company delayed its earnings release and ultimately restated earnings from a prior period. While the
2
restatement was relatively small, the incident created enough investor uncertainty to cause a selloff in the stock. We remain confident, however, that the company’s medical billing solution can help it continue to increase market share.
Among financial stocks, we have long advocated investing in transaction-oriented companies as opposed to institutions that operate businesses dependent on interest rate “spreads” (such as most banks, for instance). Two exchanges, IntercontinentalExchange and CME Group, have been core holdings in the Fund. We believe investors tended to associate the companies with other financials during the market downturn, despite having very different business models. During the Fund’s fiscal year, both companies benefited from increased trading volume as the markets began to rebound. Some investors became concerned as the government looked to tighten regulations on derivatives markets, though others view both companies as integral players in the future evolution and transparency of these markets. For the 12-month period, both stocks were solid performers.
Cautious optimism
Many investors are now wondering if the equity market has come too far, too fast. In our view, the magnitude and duration of the equity market rally of the last year may be based more on expectations for continued improvement than on current fundamentals. At some point, corporate earnings must reflect meaningful revenue growth and not just prior cost cutting. Additionally, much of the economic recovery has been the result of government intervention. We believe that, as these stimulus measures wind down, the markets must prove they can thrive without ongoing fiscal assistance. Our sense is that equity investors may become impatient or disappointed with inconsistent economic data if there isn’t a return to meaningful revenue growth across the economy.
Regardless of the economic outlook, we remain consistent in our long-term investment philosophy: We want to own strong secular-growth companies with solid business models and competitive positions that we believe can grow market share and deliver shareholder value in a variety of market environments.
3
| Performance summary | |
| Delaware Select Growth Fund | April 30, 2010 |
The performance data quoted represent past performance; past performance does not guarantee future results. Investment return and principal value will fluctuate so your shares, when redeemed, may be worth more or less than their original cost. Please obtain the performance data current for the most recent month end by calling 800 523-1918 or visiting our Web site at www.delawareinvestments.com/performance. Current performance may be lower or higher than the performance data quoted.
You should consider the investment objectives, risks, charges, and expenses of the investment company carefully before investing. The Delaware Select Growth Fund prospectus contains this and other important information about the investment company. Please request a prospectus through your financial advisor or by calling 800 523-1918 or visiting our Web site at www.delawareinvestments.com. Read the prospectus carefully before you invest or send money.
| Fund performance | Average annual total returns through April 30, 2010 | ||||||
| 1 year | 5 years | 10 years | Lifetime | ||||
| Class A (Est. March 16, 1994) | |||||||
| Excluding sales charge | +48.20% | +6.43% | -2.60% | +9.27% | |||
| Including sales charge | +39.68% | +5.17% | -3.17% | +8.87% | |||
| Class B (Est. April 16, 1996) | |||||||
| Excluding sales charge | +47.12% | +5.63% | -3.19% | +8.38% | |||
| Including sales charge | +43.12% | +5.26% | -3.19% | +8.38% | |||
| Class C (Est. May 20, 1994) | |||||||
| Excluding sales charge | +47.15% | +5.63% | -3.33% | +8.45% | |||
| Including sales charge | +46.15% | +5.63% | -3.33% | +8.45% | |||
| Class R (Est. June 2, 2003) | |||||||
| Excluding sales charge | +47.87% | +6.15% | n/a | +5.84% | |||
| Including sales charge | +47.87% | +6.15% | n/a | +5.84% | |||
| Institutional Class (Est. Aug. 28, 1997) | |||||||
| Excluding sales charge | +48.59% | +6.70% | -2.36% | +9.49% | |||
| Including sales charge | +48.59% | +6.70% | -2.36% | +9.49% | |||
Returns reflect the reinvestment of all distributions and any applicable sales charges as noted in the following paragraphs.
Performance for Class B and C shares, excluding sales charges, assumes either that contingent deferred sales charges did not apply or that the investment was not redeemed.
Expense limitations were in effect for certain classes during the periods shown in the “Fund performance” chart and in the “Performance of a $10,000 investment” chart. The current expenses for each class are listed on the “Fund expense ratios” chart. (Note that all charts and graphs referred to in the “Performance summary” section of this report are found on pages 4 through 6.) Performance would have been lower had the expense limitations not been in effect.
4
The Fund offers Class A, B, C, R, and Institutional Class shares.
Class A shares are sold with a maximum front-end sales charge of up to 5.75%, and have an annual distribution and service fee of up to 0.25% of average daily net assets.
Class B shares may only be purchased through dividend reinvestment and certain permitted exchanges as described in the prospectus. Please see the prospectus for additional information on Class B purchase and sales charges. Class B shares have a contingent deferred sales charge that declines from 4.00% to zero depending on the period of time the shares are held.
Class B shares will automatically convert to Class A shares on a quarterly basis approximately eight years after purchase. They are also subject to an annual distribution and service fee of up to 1.00% of average daily net assets.
Ten-year and lifetime performance figures for Class B shares reflect conversion to Class A shares after approximately eight years.
Class C shares are sold with a contingent deferred sales charge of 1.00% if redeemed during the first 12 months. They are also subject to an annual distribution and service fee of up to 1.00% of average daily net assets.
Class R shares were first made available June 2, 2003, and are available only for certain retirement plan products. They are sold without a sales charge and have an annual distribution and service fee of up to 0.60% of average daily net assets, which has been limited contractually to 0.50% from Sept. 1, 2009, through Aug. 31, 2010.
Institutional Class shares were first made available Aug. 28, 1997, and are available without sales or asset-based distribution charges only to certain eligible institutional accounts.
The “Fund performance” table and the “Performance of a $10,000 investment” graph do not reflect the deduction of taxes the shareholder would pay on Fund distributions or redemptions of Fund shares.
Instances of high double-digit returns are unusual, cannot be sustained, and were primarily achieved during favorable market conditions.
The Fund’s expense ratios, as described in the most recent prospectus, are disclosed in the following “Fund expense ratios” chart. Delaware Investments has agreed to (1) voluntarily waive all or a portion of its investment advisory fees and/or reimburse certain expenses (excluding certain expenses) to prevent total annual fund operating expenses from exceeding 1.25% of the Fund’s average daily net assets from Sept. 1, 2009, until the voluntary cap is discontinued; and (2) contractually limit the Class R shares distribution and service fees from Sept. 1, 2009, through Aug. 31, 2010, to 0.50%. Please see the most recent prospectus or supplements thereto for additional information on these fee waivers and/or reimbursements.
| Fund expense ratios | Class A | Class B | Class C | Class R | Institutional Class | |||||
| Total annual operating expenses | 1.85% | 2.60% | 2.60% | 2.20% | 1.60% | |||||
| (without fee waivers) | ||||||||||
| Net expenses | 1.50% | 2.25% | 2.25% | 1.75% | 1.25% | |||||
| (including fee waivers, if any) | ||||||||||
| Type of waiver | Voluntary | Voluntary | Voluntary | Voluntary | Voluntary | |||||
| and contractual | ||||||||||
5
Performance summary
Delaware Select Growth Fund
Delaware Select Growth Fund
Performance of a $10,000 Investment
Average annual total returns from April 30, 2000, through April 30, 2010
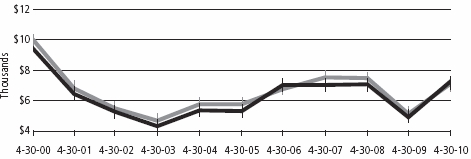
| For period beginning April 30, 2000, through April 30, 2010 | Starting value | Ending value | ||
| Delaware Select Growth Fund — Class A Shares | $9,425 | $7,243 | ||
| Russell 3000 Growth Index | $10,000 | $7,098 | ||
The chart assumes $10,000 invested in the Fund on April 30, 2000, and includes the effect of a 5.75% front-end sales charge and the reinvestment of all distributions. Please note additional details on these fees in the “Performance summary” section of this report, which includes pages 4 through 6.
The chart also assumes $10,000 invested in the Russell 3000 Growth Index as of April 30, 2000.
The Russell 3000 Growth Index measures the performance of the broad growth segment of the U.S. equity universe. It includes those Russell 3000 companies with higher price-to-book ratios and higher forecasted growth values.
The S&P 500 Index, mentioned on page 1, measures the performance of 500 mostly large-cap stocks weighted by market value, and is often used to represent performance of the U.S. stock market.
An index is unmanaged and does not reflect the costs of operating a mutual fund, such as the costs of buying, selling, and holding securities. You cannot invest directly in an index. Past performance is not a guarantee of future results.
Performance of other Fund classes will vary due to different charges and expenses.
The “Fund performance” chart and the “Performance of a $10,000 investment” graph do not reflect the deduction of taxes the shareholders would pay on Fund distributions or redemptions of Fund shares.
| Stock symbols and CUSIP numbers | |||||||
| Nasdaq symbols | CUSIPs | ||||||
| Class A | DVEAX | 928931104 | |||||
| Class B | DVEBX | 928931849 | |||||
| Class C | DVECX | 928931203 | |||||
| Class R | DFSRX | 928931740 | |||||
| Institutional Class | VAGGX | 928931757 | |||||
6
Disclosure of Fund expenses
For the period November 1, 2009 to April 30, 2010
For the period November 1, 2009 to April 30, 2010
As a shareholder of the Fund, you incur two types of costs: (1) transaction costs, including sales charges (loads) on purchase payments, reinvested dividends, or other distributions; redemption fees; and exchange fees; and (2) ongoing costs, including management fees; distribution and/or service (12b-1) fees; and other Fund expenses. This example is intended to help you understand your ongoing costs (in dollars) of investing in the Fund and to compare these costs with the ongoing costs of investing in other mutual funds.
The example is based on an investment of $1,000 invested at the beginning of the period and held for the entire period from November 1, 2009 to April 30, 2010.
Actual expenses
The first section of the table shown, “Actual Fund return,” provides information about actual account values and actual expenses. You may use the information in this section of the table, together with the amount you invested, to estimate the expenses that you paid over the period. Simply divide your account value by $1,000 (for example, an $8,600 account value divided by $1,000 = 8.6), then multiply the result by the number in the first section under the heading entitled “Expenses Paid During Period” to estimate the expenses you paid on your account during this period.
Hypothetical example for comparison purposes
The second section of the table shown, “Hypothetical 5% return,” provides information about hypothetical account values and hypothetical expenses based on the Fund’s actual expense ratio and an assumed rate of return of 5% per year before expenses, which is not the Fund’s actual return. The hypothetical account values and expenses may not be used to estimate the actual ending account balance or expenses you paid for the period. You may use this information to compare the ongoing costs of investing in the Fund and other funds. To do so, compare this 5% hypothetical example with the 5% hypothetical examples that appear in the shareholder reports of the other funds.
Please note that the expenses shown in the table are meant to highlight your ongoing costs only and do not reflect any transactional costs, such as sales charges (loads), redemption fees, or exchange fees. Therefore, the second section of the table is useful in comparing ongoing costs only, and will not help you determine the relative total costs of owning different funds. In addition, if these transactional costs were included, your costs would have been higher. The Fund’s expenses shown in the table reflect fee waivers in effect.
7
Disclosure of Fund expenses
Delaware Select Growth Fund
Expense analysis of an investment of $1,000
Expense analysis of an investment of $1,000
| Beginning | Ending | Expenses | ||||||||||||
| Account Value | Account Value | Annualized | Paid During Period | |||||||||||
| 11/1/09 | 4/30/10 | Expense Ratio | 11/1/09 to 4/30/10* | |||||||||||
| Actual Fund return | ||||||||||||||
| Class A | $1,000.00 | $1,202.70 | 1.50% | $ | 8.19 | |||||||||
| Class B | 1,000.00 | 1,197.90 | 2.25% | 12.26 | ||||||||||
| Class C | 1,000.00 | 1,198.10 | 2.25% | 12.26 | ||||||||||
| Class R | 1,000.00 | 1,201.00 | 1.75% | 9.55 | ||||||||||
| Institutional Class | 1,000.00 | 1,204.20 | 1.25% | 6.83 | ||||||||||
| Hypothetical 5% return (5% return before expenses) | ||||||||||||||
| Class A | $1,000.00 | $1,017.36 | 1.50% | $ | 7.50 | |||||||||
| Class B | 1,000.00 | 1,013.64 | 2.25% | 11.23 | ||||||||||
| Class C | 1,000.00 | 1,013.64 | 2.25% | 11.23 | ||||||||||
| Class R | 1,000.00 | 1,016.12 | 1.75% | 8.75 | ||||||||||
| Institutional Class | 1,000.00 | 1,018.60 | 1.25% | 6.26 | ||||||||||
*“Expenses Paid During Period” are equal to the Fund’s annualized expense ratio, multiplied by the average account value over the period, multiplied by 181/365 (to reflect the one-half year period).
8
| Sector allocation and top 10 holdings | |
| Delaware Select Growth Fund | As of April 30, 2010 |
Sector designations may be different than the sector designations presented in other Fund materials. The sector designations may represent the investment manager’s internal sector classifications, which may result in the sector designations for one fund being different than another fund’s sector designations.
| Sector | Percentage of net assets | |
| Common Stock² | 96.80 | % |
| Consumer Discretionary | 17.54 | % |
| Consumer Staples | 5.11 | % |
| Energy | 4.92 | % |
| Financial Services | 15.63 | % |
| Health Care | 19.03 | % |
| Materials & Processing | 4.68 | % |
| Producer Durables | 0.65 | % |
| Technology | 27.91 | % |
| Utilities | 1.33 | % |
| Discount Note | 3.92 | % |
| Securities Lending Collateral | 19.10 | % |
| Total Value of Securities | 119.82 | % |
| Obligation to Return Securities Lending Collateral | (19.50 | %) |
| Liabilities Net of Receivables and Other Assets | (0.32 | %) |
| Total Net Assets | 100.00 | % |
²Narrow industries are utilized for compliance purposes for diversification whereas broad sectors are used for financial reporting.
Holdings are for informational purposes only and are subject to change at any time. They are not a recommendation to buy, sell, or hold any security.
| Top 10 holdings | Percentage of net assets | |
| Apple | 7.88 | % |
| Peet’s Coffee & Tea | 4.20 | % |
| Allergan | 3.49 | % |
| Gilead Sciences | 3.39 | % |
| IntercontinentalExchange | 3.36 | % |
| NetFlix | 3.23 | % |
| VeriSign | 3.07 | % |
| Perrigo | 3.05 | % |
| CME Group | 2.92 | % |
| EOG Resources | 2.81 | % |
9
| Statement of net assets | |
| Delaware Select Growth Fund | April 30, 2010 |
| Number of shares | Value | ||||
| Common Stock – 96.80%² | |||||
| Consumer Discretionary – 17.54% | |||||
| † | DineEquity | 41,200 | $ | 1,694,556 | |
| † | eBay | 22,200 | 528,582 | ||
| ± | Intertek Group | 64,534 | 1,466,367 | ||
| † | Interval Leisure Group | 237,500 | 3,512,625 | ||
| Lowe’s | 239,900 | 6,506,088 | |||
| Natura Cosmeticos | 246,800 | 5,240,639 | |||
| *† | NetFlix | 81,500 | 8,049,755 | ||
| NIKE Class B | 23,000 | 1,745,930 | |||
| *† | priceline.com | 26,625 | 6,977,081 | ||
| * | Ritchie Bros Auctioneers | 90,000 | 2,106,000 | ||
| * | Staples | 55,200 | 1,298,856 | ||
| * | Strayer Education | 5,100 | 1,239,912 | ||
| * | Weight Watchers International | 124,800 | 3,315,936 | ||
| 43,682,327 | |||||
| Consumer Staples – 5.11% | |||||
| *† | Peet’s Coffee & Tea | 264,000 | 10,459,680 | ||
| *† | Whole Foods Market | 58,300 | 2,274,866 | ||
| 12,734,546 | |||||
| Energy – 4.92% | |||||
| * | Core Laboratories | 35,000 | 5,246,150 | ||
| * | EOG Resources | 62,375 | 6,993,485 | ||
| 12,239,635 | |||||
| Financial Services – 15.63% | |||||
| † | Affiliated Managers Group | 31,000 | 2,609,580 | ||
| Bank of New York Mellon | 103,781 | 3,230,703 | |||
| *† | CB Richard Ellis Group Class A | 175,200 | 3,034,464 | ||
| CME Group | 22,150 | 7,274,282 | |||
| * | Heartland Payment Systems | 158,300 | 2,909,554 | ||
| † | IntercontinentalExchange | 71,825 | 8,376,949 | ||
| * | MasterCard Class A | 17,950 | 4,452,318 | ||
| † | optionsXpress Holdings | 147,100 | 2,611,025 | ||
| Schwab (Charles) | 16,700 | 322,143 | |||
| * | Visa Class A | 45,300 | 4,087,419 | ||
| 38,908,437 | |||||
| Health Care – 19.03% | |||||
| *† | ABIOMED | 129,100 | 1,244,524 | ||
| Allergan | 136,500 | 8,693,684 | |||
| *† | athenahealth | 159,700 | 4,634,494 | ||
10
| Number of shares | Value | |||||
| Common Stock (continued) | ||||||
| Health Care (continued) | ||||||
| † | Gilead Sciences | 212,650 | $ | 8,435,826 | ||
| † | Medco Health Solutions | 110,250 | 6,495,930 | |||
| Novo Nordisk ADR | 74,900 | 6,149,290 | ||||
| * | Perrigo | 124,558 | 7,601,775 | |||
| Techne | 21,100 | 1,397,875 | ||||
| UnitedHealth Group | 90,100 | 2,730,931 | ||||
| 47,384,329 | ||||||
| Materials & Processing – 4.68% | ||||||
| * | BHP Billiton ADR | 17,650 | 1,284,744 | |||
| Monsanto | 29,700 | 1,872,882 | ||||
| * | Newmont Mining | 40,700 | 2,282,456 | |||
| * | Praxair | 12,000 | 1,005,240 | |||
| Syngenta ADR | 102,850 | 5,194,953 | ||||
| 11,640,275 | ||||||
| Producer Durables – 0.65% | ||||||
| * | Expeditors International Washington | 36,400 | 1,482,936 | |||
| ±† | Hansen Transmissions International | 88,206 | 135,207 | |||
| 1,618,143 | ||||||
| Technology – 27.91% | ||||||
| † | Adobe Systems | 115,200 | 3,869,568 | |||
| † | Apple | 75,125 | 19,616,640 | |||
| *† | Crown Castle International | 181,100 | 6,854,635 | |||
| † | Google Class A | 8,265 | 4,342,762 | |||
| † | Intuit | 131,800 | 4,765,888 | |||
| QUALCOMM | 144,500 | 5,597,930 | ||||
| † | Research in Motion | 27,000 | 1,922,130 | |||
| *† | SBA Communications Class A | 98,800 | 3,494,556 | |||
| *† | Sybase | 32,980 | 1,430,672 | |||
| † | Symantec | 120,600 | 2,022,462 | |||
| † | Teradata | 108,900 | 3,165,723 | |||
| *† | VeriFone Holdings | 249,732 | 4,752,400 | |||
| * | VeriSign | 280,550 | 7,650,599 | |||
| 69,485,965 | ||||||
| Utilities – 1.33% | ||||||
| *† | j2 Global Communications | 137,800 | 3,318,224 | |||
| 3,318,224 | ||||||
| Total Common Stock (cost $190,045,754) | 241,011,881 | |||||
11
Statement of net assets
Delaware Select Growth Fund
Delaware Select Growth Fund
| Principal amount | Value | |||||
| ≠Discount Note – 3.92% | ||||||
| Federal Home Loan Bank 0.06% 5/3/10 | $ | 9,755,058 | $ | 9,755,025 | ||
| Total Discount Note (cost $9,755,025) | 9,755,025 | |||||
| Total Value of Securities Before Securities | ||||||
| Lending Collateral – 100.72% (cost $199,800,779) | 250,766,906 | |||||
| Number of shares | ||||||
| Securities Lending Collateral** – 19.10% | ||||||
| Investment Companies | ||||||
| Mellon GSL DBT II Collateral Fund | 43,060,659 | 43,060,659 | ||||
| BNY Mellon SL DBT II Liquidating Fund | 4,511,427 | 4,461,801 | ||||
| @†Mellon GSL Reinvestment Trust II | 988,494 | 42,011 | ||||
| Total Securities Lending Collateral (cost $48,560,580) | 47,564,471 | |||||
| Total Value of Securities – 119.82% | ||||||
| (cost $248,361,359) | 298,331,377 | © | ||||
| Obligation to Return Securities | ||||||
| Lending Collateral** – (19.50%) | (48,560,580 | ) | ||||
| Liabilities Net of Receivables | ||||||
| and Other Assets – (0.32%) | (783,039 | ) | ||||
| Net Assets Applicable to 9,063,906 | ||||||
| Shares Outstanding – 100.00% | $ | 248,987,758 | ||||
| Net Asset Value – Delaware Select Growth Fund | ||||||
| Class A ($150,016,139 / 5,367,410 Shares) | $27.95 | |||||
| Net Asset Value – Delaware Select Growth Fund | ||||||
| Class B ($15,011,424 / 606,240 Shares) | $24.76 | |||||
| Net Asset Value – Delaware Select Growth Fund | ||||||
| Class C ($29,502,208 / 1,204,407 Shares) | $24.50 | |||||
| Net Asset Value – Delaware Select Growth Fund | ||||||
| Class R ($806,850 / 29,413 Shares) | $27.43 | |||||
| Net Asset Value – Delaware Select Growth Fund | ||||||
| Institutional Class ($53,651,137 / 1,856,436 Shares) | $28.90 | |||||
12
| Components of Net Assets at April 30, 2010: | |||
| Shares of beneficial interest (unlimited authorization – no par) | $ | 434,803,880 | |
| Accumulated net investment loss | (92,972 | ) | |
| Accumulated net realized loss on investments | (235,692,708 | ) | |
| Net unrealized appreciation of investments | |||
| and foreign currencies | 49,969,558 | ||
| Total net assets | $ | 248,987,758 |
| ² | Narrow industries are utilized for compliance purposes for diversification whereas broad sectors are used for financial reporting. |
| † | Non income producing security. |
| © | Includes $48,081,040 of securities loaned. |
| * | Fully or partially on loan. |
| ** | See Note 9 in “Notes to financial statements.” |
| ≠ | The rate shown is the effective yield at the time of purchase. |
| ± | Security is being valued based on international fair value pricing. At April 30, 2010, the aggregate amount of international fair value priced securities was $1,601,574, which represented 0.64% of the Fund’s net assets. See Note 1 in “Notes to financial statements.” |
| @ | Illiquid security. At April 30, 2010, the aggregate amount of illiquid securities was $42,011, which represented 0.02% of the Fund’s net assets. See Note 10 in “Notes to financial statements.” |
ADR — American Depositary Receipts
| Net Asset Value and Offering Price Per Share – | ||
| Delaware Select Growth Fund | ||
| Net asset value Class A (A) | $ | 27.95 |
| Sales charges (5.75% of offering price) (B) | 1.71 | |
| Offering price | $ | 29.66 |
| (A) | Net asset value per share, as illustrated, is the amount which would be paid upon redemption or repurchase of shares. |
| (B) | See the current prospectus for purchase of $50,000 or more. |
See accompanying notes
13
| Statement of operations | |
| Delaware Select Growth Fund | Year Ended April 30, 2010 |
| Investment Income: | ||||||||
| Dividends | $ | 1,457,560 | ||||||
| Securities lending income | 166,045 | |||||||
| Interest | 6,600 | |||||||
| Foreign tax withheld | (51,833 | ) | $ | 1,578,372 | ||||
| Expenses: | ||||||||
| Management fees | 1,940,968 | |||||||
| Dividend disbursing and transfer agent fees and expenses | 1,455,239 | |||||||
| Distribution expenses – Class A | 329,600 | |||||||
| Distribution expenses – Class B | 172,859 | |||||||
| Distribution expenses – Class C | 267,797 | |||||||
| Distribution expenses – Class R | 4,648 | |||||||
| Reports and statements to shareholders | 120,433 | |||||||
| Accounting and administration expenses | 103,275 | |||||||
| Registration fees | 68,730 | |||||||
| Legal fees | 58,800 | |||||||
| Audit and tax | 25,522 | |||||||
| Trustees’ fees | 15,626 | |||||||
| Custodian fees | 14,053 | |||||||
| Insurance fees | 5,317 | |||||||
| Pricing fees | 4,579 | |||||||
| Dues and services | 4,253 | |||||||
| Consulting fees | 2,877 | |||||||
| Trustees’ expenses | 1,086 | 4,595,662 | ||||||
| Less fees waived | (586,536 | ) | ||||||
| Less waived distribution expenses – Class R | (774 | ) | ||||||
| Total operating expenses | 4,008,352 | |||||||
| Net Investment Loss | (2,429,980 | ) |
14
| Net Realized and Unrealized Gain (Loss) on Investments | |||
| and Foreign Currencies: | |||
| Net realized gain (loss) on: | |||
| Investments | $ | 38,970,785 | |
| Foreign currencies | (187,327 | ) | |
| Net realized gain | 38,783,458 | ||
| Net change in unrealized appreciation/depreciation of | |||
| investments and foreign currencies | 63,092,292 | ||
| Net Realized and Unrealized Gain on Investments | |||
| and Foreign Currencies | 101,875,750 | ||
| Net Increase in Net Assets Resulting from Operations | $ | 99,445,770 |
See accompanying notes
15
Statements of changes in net assets
Delaware Select Growth Fund
Delaware Select Growth Fund
| Year Ended | ||||||||
| 4/30/10 | 4/30/09 | |||||||
| Increase (Decrease) in Net Assets from Operations: | ||||||||
| Net investment loss | $ | (2,429,980 | ) | $ | (835,340 | ) | ||
| Net realized gain (loss) on investments and | ||||||||
| foreign currencies | 38,783,458 | (68,399,378 | ) | |||||
| Net change in unrealized appreciation/depreciation | ||||||||
| of investments and foreign currencies | 63,092,292 | (22,025,813 | ) | |||||
| Net increase (decrease) in net assets resulting | ||||||||
| from operations | 99,445,770 | (91,260,531 | ) | |||||
| Capital Share Transactions: | ||||||||
| Proceeds from shares sold: | ||||||||
| Class A | 18,629,185 | 33,119,294 | ||||||
| Class B | 206,648 | 344,304 | ||||||
| Class C | 1,799,685 | 1,986,293 | ||||||
| Class R | 252,368 | 96,447 | ||||||
| Institutional Class | 90,342,397 | 39,439,327 | ||||||
| 111,230,283 | 74,985,665 | |||||||
| Cost of shares repurchased: | ||||||||
| Class A | (26,291,216 | ) | (31,669,576 | ) | ||||
| Class B | (11,280,764 | ) | (31,483,335 | ) | ||||
| Class C | (5,500,832 | ) | (10,282,576 | ) | ||||
| Class R | (405,510 | ) | (283,229 | ) | ||||
| Institutional Class | (113,200,890 | ) | (12,042,543 | ) | ||||
| (156,679,212 | ) | (85,761,259 | ) | |||||
| Decrease in net assets derived from capital | ||||||||
| share transactions | (45,448,929 | ) | (10,775,594 | ) | ||||
| Net Increase (Decrease) in Net Assets | 53,996,841 | (102,036,125 | ) | |||||
| Net Assets: | ||||||||
| Beginning of year | 194,990,917 | 297,027,042 | ||||||
| End of year (including accumulated net investment | ||||||||
| loss of $92,972 and $38,325 respectively) | $ | 248,987,758 | $ | 194,990,917 | ||||
See accompanying notes
16
Financial highlights
Delaware Select Growth Fund Class A
Delaware Select Growth Fund Class A
Selected data for each share of the Fund outstanding throughout each period were as follows:
| Net asset value, beginning of period |
| Income (loss) from investment operations: |
| Net investment loss1 |
| Net realized and unrealized gain (loss) on investments and foreign currencies |
| Total from investment operations |
| Net asset value, end of period |
| Total return2 |
| Ratios and supplemental data: |
| Net assets, end of period (000 omitted) |
| Ratio of expenses to average net assets |
| Ratio of expenses to average net assets |
| prior to fees waived and expense paid indirectly |
| Ratio of net investment loss to average net assets |
| Ratio of net investment loss to average net assets |
| prior to fees waived and expense paid indirectly |
| Portfolio turnover |
1 The average shares outstanding method has been applied for per share information.
2 Total investment return is based on the change in net asset value of a share during the period and assumes reinvestment of dividends and distributions at net asset value and does not reflect the impact of a sales charge. Total investment return during all periods shown reflects a waiver by the manager. Performance would have been lower had the waiver not been in effect.
See accompanying notes
18
| Year Ended | ||||||||||||||||
| 4/30/10 | 4/30/09 | 4/30/08 | 4/30/07 | 4/30/06 | ||||||||||||
| $18.860 | $27.300 | $27.110 | $27.180 | $20.470 | ||||||||||||
| (0.209 | ) | (0.041 | ) | (0.119 | ) | (0.193 | ) | (0.086 | ) | |||||||
| 9.299 | (8.399 | ) | 0.309 | 0.123 | 6.796 | |||||||||||
| 9.090 | (8.440 | ) | 0.190 | (0.070 | ) | 6.710 | ||||||||||
| $27.950 | $18.860 | $27.300 | $27.110 | $27.180 | ||||||||||||
| 48.20% | (30.92% | ) | 0.70% | (0.26% | ) | 32.78% | ||||||||||
| $150,016 | $106,919 | $157,366 | $160,170 | $187,319 | ||||||||||||
| 1.50% | 1.49% | 1.48% | 1.50% | 1.55% | ||||||||||||
| 1.73% | 1.85% | 1.62% | 1.64% | 1.70% | ||||||||||||
| (0.89% | ) | (0.20% | ) | (0.42% | ) | (0.77% | ) | (0.35% | ) | |||||||
| (1.12% | ) | (0.56% | ) | (0.56% | ) | (0.91% | ) | (0.50% | ) | |||||||
| 49% | 66% | 61% | 51% | 124% | ||||||||||||
19
Financial highlights
Delaware Select Growth Fund Class B
Delaware Select Growth Fund Class B
Selected data for each share of the Fund outstanding throughout each period were as follows:
| Net asset value, beginning of period |
| Income (loss) from investment operations: |
| Net investment loss1 |
| Net realized and unrealized gain (loss) on investments and foreign currencies |
| Total from investment operations |
| Net asset value, end of period |
| Total return2 |
| Ratios and supplemental data: |
| Net assets, end of period (000 omitted) |
| Ratio of expenses to average net assets |
| Ratio of expenses to average net assets |
| prior to fees waived and expense paid indirectly |
| Ratio of net investment loss to average net assets |
| Ratio of net investment loss to average net assets |
| prior to fees waived and expense paid indirectly |
| Portfolio turnover |
1 The average shares outstanding method has been applied for per share information.
2 Total investment return is based on the change in net asset value of a share during the period and assumes reinvestment of dividends and distributions at net asset value and does not reflect the impact of a sales charge. Total investment return during all periods shown reflects a waiver by the manager. Performance would have been lower had the waiver not been in effect.
See accompanying notes
20
| Year Ended | ||||||||||||||||
| 4/30/10 | 4/30/09 | 4/30/08 | 4/30/07 | 4/30/06 | ||||||||||||
| $16.830 | $24.550 | $24.560 | $24.810 | $18.820 | ||||||||||||
| (0.355 | ) | (0.182 | ) | (0.304 | ) | (0.365 | ) | (0.252 | ) | |||||||
| 8.285 | (7.538 | ) | 0.294 | 0.115 | 6.242 | |||||||||||
| 7.930 | (7.720 | ) | (0.010 | ) | (0.250 | ) | 5.990 | |||||||||
| $24.760 | $16.830 | $24.550 | $24.560 | $24.810 | ||||||||||||
| 47.12% | (31.45% | ) | (0.04% | ) | (1.01% | ) | 31.83% | |||||||||
| $15,012 | $19,222 | $67,344 | $126,866 | $199,863 | ||||||||||||
| 2.25% | 2.24% | 2.23% | 2.25% | 2.30% | ||||||||||||
| 2.48% | 2.60% | 2.37% | 2.39% | 2.45% | ||||||||||||
| (1.64% | ) | (0.95% | ) | (1.17% | ) | (1.52% | ) | (1.10% | ) | |||||||
| (1.87% | ) | (1.31% | ) | (1.31% | ) | (1.66% | ) | (1.25% | ) | |||||||
| 49% | 66% | 61% | 51% | 124% | ||||||||||||
21
Financial highlights
Delaware Select Growth Fund Class C
Delaware Select Growth Fund Class C
Selected data for each share of the Fund outstanding throughout each period were as follows:
| Net asset value, beginning of period |
| Income (loss) from investment operations: |
| Net investment loss1 |
| Net realized and unrealized gain (loss) on investments and foreign currencies |
| Total from investment operations |
| Net asset value, end of period |
| Total return2 |
| Ratios and supplemental data: |
| Net assets, end of period (000 omitted) |
| Ratio of expenses to average net assets |
| Ratio of expenses to average net assets |
| prior to fees waived and expense paid indirectly |
| Ratio of net investment loss to average net assets |
| Ratio of net investment loss to average net assets |
| prior to fees waived and expense paid indirectly |
| Portfolio turnover |
1 The average shares outstanding method has been applied for per share information.
2 Total investment return is based on the change in net asset value of a share during the period and assumes reinvestment of dividends and distributions at net asset value and does not reflect the impact of a sales charge. Total investment return during all periods shown reflects a waiver by the manager. Performance would have been lower had the waiver not been in effect.
See accompanying notes
22
| Year Ended | ||||||||||||||||
| 4/30/10 | 4/30/09 | 4/30/08 | 4/30/07 | 4/30/06 | ||||||||||||
| $16.650 | $24.290 | $24.300 | $24.540 | $18.620 | ||||||||||||
| (0.357 | ) | (0.173 | ) | (0.302 | ) | (0.362 | ) | (0.251 | ) | |||||||
| 8.207 | (7.467 | ) | 0.292 | 0.122 | 6.171 | |||||||||||
| 7.850 | (7.640 | ) | (0.010 | ) | (0.240 | ) | 5.920 | |||||||||
| $24.500 | $16.650 | $24.290 | $24.300 | $24.540 | ||||||||||||
| 47.15% | (31.45% | ) | (0.04% | ) | (0.98% | ) | 31.79% | |||||||||
| $29,502 | $23,030 | $44,972 | $59,271 | $84,458 | ||||||||||||
| 2.25% | 2.24% | 2.23% | 2.25% | 2.30% | ||||||||||||
| 2.48% | 2.60% | 2.37% | 2.39% | 2.45% | ||||||||||||
| (1.64% | ) | (0.95% | ) | (1.17% | ) | (1.52% | ) | (1.10% | ) | |||||||
| (1.87% | ) | (1.31% | ) | (1.31% | ) | (1.66% | ) | (1.25% | ) | |||||||
| 49% | 66% | 61% | 51% | 124% | ||||||||||||
23
Financial highlights
Delaware Select Growth Fund Class R
Delaware Select Growth Fund Class R
Selected data for each share of the Fund outstanding throughout each period were as follows:
| Net asset value, beginning of period |
| Income (loss) from investment operations: |
| Net investment loss1 |
| Net realized and unrealized gain (loss) on investments and foreign currencies |
| Total from investment operations |
| Net asset value, end of period |
| Total return2 |
| Ratios and supplemental data: |
| Net assets, end of period (000 omitted) |
| Ratio of expenses to average net assets |
| Ratio of expenses to average net assets |
| prior to fees waived and expense paid indirectly |
| Ratio of net investment loss to average net assets |
| Ratio of net investment loss to average net assets |
| prior to fees waived and expense paid indirectly |
| Portfolio turnover |
1 The average shares outstanding method has been applied for per share information. |
2 Total investment return is based on the change in net asset value of a share during the period and assumes reinvestment of dividends and distributions at net asset value. Total investment return during all periods shown reflects waivers by the manager and/or distributor. Performance would have been lower had the waivers not been in effect. |
See accompanying notes
24
| Year Ended | ||||||||||||||||
| 4/30/10 | 4/30/09 | 4/30/08 | 4/30/07 | 4/30/06 | ||||||||||||
| $18.550 | $26.930 | $26.810 | $26.940 | $20.340 | ||||||||||||
| (0.265 | ) | (0.092 | ) | (0.188 | ) | (0.257 | ) | (0.154 | ) | |||||||
| 9.145 | (8.288 | ) | 0.308 | 0.127 | 6.754 | |||||||||||
| 8.880 | (8.380 | ) | 0.120 | (0.130 | ) | 6.600 | ||||||||||
| $27.430 | $18.550 | $26.930 | $26.810 | $26.940 | ||||||||||||
| 47.87% | (31.12% | ) | 0.45% | (0.48% | ) | 32.45% | ||||||||||
| $807 | $671 | $1,266 | $1,432 | $1,485 | ||||||||||||
| 1.75% | 1.74% | 1.73% | 1.75% | 1.82% | ||||||||||||
| 2.08% | 2.20% | 1.97% | 1.99% | 2.05% | ||||||||||||
| (1.14% | ) | (0.45% | ) | (0.67% | ) | (1.02% | ) | (0.62% | ) | |||||||
| (1.47% | ) | (0.91% | ) | (0.91% | ) | (1.26% | ) | (0.85% | ) | |||||||
| 49% | 66% | 61% | 51% | 124% | ||||||||||||
25
Financial highlights
Delaware Select Growth Fund Institutional Class
Delaware Select Growth Fund Institutional Class
Selected data for each share of the Fund outstanding throughout each period were as follows:
| Net asset value, beginning of period |
| Income (loss) from investment operations: |
| Net investment income (loss)1 |
| Net realized and unrealized gain (loss) on investments and foreign currencies |
| Total from investment operations |
| Net asset value, end of period |
| Total return2 |
| Ratios and supplemental data: |
| Net assets, end of period (000 omitted) |
| Ratio of expenses to average net assets |
| Ratio of expenses to average net assets |
| prior to fees waived and expense paid indirectly |
| Ratio of net investment income (loss) to average net assets |
| Ratio of net investment loss to average net assets |
| prior to fees waived and expense paid indirectly |
| Portfolio turnover |
1 The average shares outstanding method has been applied for per share information. |
2 Total investment return is based on the change in net asset value of a share during the period and assumes reinvestment of dividends and distributions at net asset value. Total investment return during all periods shown reflects a waiver by the manager. Performance would have been lower had the waiver not been in effect. |
See accompanying notes
26
| Year Ended | ||||||||||||||||
| 4/30/10 | 4/30/09 | 4/30/08 | 4/30/07 | 4/30/06 | ||||||||||||
| $19.450 | $28.090 | $27.820 | $27.820 | $20.900 | ||||||||||||
| (0.150 | ) | 0.010 | (0.048 | ) | (0.128 | ) | (0.024 | ) | ||||||||
| 9.600 | (8.650 | ) | 0.318 | 0.128 | 6.944 | |||||||||||
| 9.450 | (8.640 | ) | 0.270 | 0.000 | 6.920 | |||||||||||
| $28.900 | $19.450 | $28.090 | $27.820 | $27.820 | ||||||||||||
| 48.59% | (30.76% | ) | 0.97% | 0.00% | 33.11% | |||||||||||
| $53,651 | $45,149 | $26,079 | $35,399 | $46,152 | ||||||||||||
| 1.25% | 1.24% | 1.23% | 1.25% | 1.30% | ||||||||||||
| 1.48% | 1.60% | 1.37% | 1.39% | 1.45% | ||||||||||||
| (0.64% | ) | 0.05% | (0.17% | ) | (0.52% | ) | (0.10% | ) | ||||||||
| (0.87% | ) | (0.31% | ) | (0.31% | ) | (0.66% | ) | (0.25% | ) | |||||||
| 49% | 66% | 61% | 51% | 124% | ||||||||||||
27
| Notes to financial statements | |
| Delaware Select Growth Fund | April 30, 2010 |
Voyageur Mutual Funds III (Trust) is organized as a Delaware statutory trust and offers two series: Delaware Large Cap Core Fund and Delaware Select Growth Fund. These financial statements and the related notes pertain to Delaware Select Growth Fund (Fund). The Trust is an open-end investment company. The Fund is considered diversified under the Investment Company Act of 1940, as amended, and offers Class A, Class B, Class C, Class R and Institutional Class shares. Class A shares are sold with a maximum front-end sales charge of up to 5.75%. Class A share purchases of $1,000,000 or more will incur a contingent deferred sales charge (CDSC) of 1% if redeemed during the first year and 0.50% during the second year, provided that Delaware Distributors, L.P. (DDLP) paid a financial advisor a commission on the purchase of those shares. Class B shares may be purchased only through dividend reinvestment and certain permitted exchanges. Prior to June 1, 2007, Class B shares were sold with a CDSC that declined from 4% to zero depending upon the period of time the shares were held. Class B shares will automatically convert to Class A shares on a quarterly basis approximately eight years after purchase. Class C shares are sold with a CDSC of 1%, if redeemed during the first twelve months. Class R and Institutional Class shares are not subject to a sales charge and are offered for sale exclusively to certain eligible investors.
The investment objective of the Fund is to seek long-term capital appreciation, which the Fund attempts to achieve by investing primarily in equity securities of companies the manager believes have the potential for sustainable free cash flow growth.
1. Significant Accounting Policies
The following accounting policies are in accordance with U.S. generally accepted accounting principles (U.S. GAAP) and are consistently followed by the Fund.
Security Valuation — Equity securities, except those traded on the Nasdaq Stock Market, Inc. (Nasdaq), are valued at the last quoted sales price as of the time of the regular close of the New York Stock Exchange (NYSE) on the valuation date. Securities traded on the Nasdaq are valued in accordance with the Nasdaq Official Closing Price, which may not be the last sales price. If on a particular day an equity security does not trade, then the mean between the bid and ask prices will be used. Securities listed on a foreign exchange are valued at the last quoted sales price on the valuation date. Investment companies are valued at net asset value per share. Short-term debt securities are valued at market value. Foreign currency exchange contracts are valued at the mean between the bid and ask prices. Interpolated values are derived when the settlement date of the contract is an interim date for which quotations are not available. Generally, other securities and assets for which market quotations are not readily available are valued at fair value as determined in good faith under the direction of the Fund’s Board of Trustees (Board). In determining whether market quotations are readily available or fair valuation will be used, various factors will be taken into consideration, such as market closures or suspension of trading in a security. The Fund may use fair value pricing more frequently for securities traded primarily in non-U.S. markets because, among other things, most foreign markets close well before the Fund values its securities
28
at 4:00 p.m. Eastern time. The earlier close of these foreign markets gives rise to the possibility that significant events, including broad market moves, government actions or pronouncements, aftermarket trading, or news events may have occurred in the interim. To account for this, the Fund may frequently value foreign securities using fair value prices based on third-party vendor modeling tools (international fair value pricing).
Federal Income Taxes — No provision for federal income taxes has been made as the Fund intends to continue to qualify for federal income tax purposes as a regulated investment company under Subchapter M of the Internal Revenue Code of 1986, as amended, and make the requisite distributions to shareholders. The Fund evaluates tax positions taken or expected to be taken in the course of preparing the Fund’s tax returns to determine whether the tax positions are “more-likely-than-not” of being sustained by the applicable tax authority. Tax positions not deemed to meet the more-likely-than-not threshold are recorded as a tax benefit or expense in the current year. Management has analyzed the Fund’s tax positions taken on federal income tax returns for all open tax years (April 30, 2007 – April 30, 2010), and has concluded that no provision for federal income tax is required in the Fund’s financial statements.
Class Accounting — Investment income, common expenses and realized and unrealized gain (loss) on investments are allocated to the various classes of the Fund on the basis of daily net assets of each class. Distribution expenses relating to a specific class are charged directly to that class.
Repurchase Agreements — The Fund may invest in a pooled cash account along with other members of the Delaware Investments® Family of Funds pursuant to an exemptive order issued by the Securities and Exchange Commission. The aggregate daily balance of the pooled cash account is invested in repurchase agreements secured by obligations of the U.S. government. The respective collateral is held by the Fund’s custodian bank until the maturity of the respective repurchase agreements. Each repurchase agreement is at least 102% collateralized. However, in the event of default or bankruptcy by the counterparty to the agreement, realization of the collateral may be subject to legal proceedings. At April 30, 2010, the Fund held no investments in repurchase agreements.
Foreign Currency Transactions — Transactions denominated in foreign currencies are recorded at the prevailing exchange rates on the valuation date. The value of all assets and liabilities denominated in foreign currencies is translated into U.S. dollars at the exchange rate of such currencies against the U.S. dollar daily. Transaction gains or losses resulting from changes in exchange rates during the reporting period or upon settlement of the foreign currency transaction are reported in operations for the current period. The Fund does not isolate that portion of realized gains and losses on investments which are due to changes in foreign exchange rates from that which are due to changes in market prices. The Fund reports certain foreign currency related transactions as components of realized gains (losses) for financial reporting purposes, whereas such components are treated as ordinary income (loss) for federal income tax purposes.
29
Notes to financial statements
Delaware Select Growth Fund
Delaware Select Growth Fund
1. Significant Accounting Policies (continued)
Use of Estimates — The preparation of financial statements in conformity with U.S. GAAP requires management to make estimates and assumptions that affect the reported amounts of assets and liabilities at the date of the financial statements and the reported amounts of revenues and expenses during the reporting period. Actual results could differ from those estimates.
Other — Expenses directly attributable to the Fund are charged directly to the Fund. Other expenses common to various funds within the Delaware Investments® Family of Funds are generally allocated amongst such funds on the basis of average net assets. Management fees and some other expenses are paid monthly. Security transactions are recorded on the date the securities are purchased or sold (trade date) for financials reporting purposes. Costs used in calculating realized gains and losses on the sale of investment securities are those of the specific securities sold. Dividend income is recorded on the ex-dividend date and interest income is recorded on the accrual basis. Taxable non-cash dividends are recorded as dividend income. Foreign dividends are also recorded on the ex-dividend date or as soon after the ex-dividend date that the Fund is aware of such dividends, net of all non-rebatable tax withholdings. Withholding taxes on foreign dividends have been recorded in accordance with the Fund’s understanding of the applicable country’s tax rules and rates. The Fund declares and pays dividends from net investment income and distributions from net realized gain on investments, if any, annually.
Subject to seeking best execution, the Fund may direct certain security trades to brokers who have agreed to rebate a portion of the related brokerage commission to the Fund in cash. Such commission rebates are included in realized gain on investments in the accompanying financial statements and totaled $37,247 for the year ended April 30, 2010. In general, best execution refers to many factors, including the price paid or received for a security, the commission charged, the promptness and reliability of execution, the confidentiality and placement accorded the order, and other factors affecting the overall benefit obtained by the Fund on the transaction.
The Fund receives earnings credits from its custodian when positive cash balances are maintained, which are used to offset custody fees. There were no earnings credits for the year ended April 30, 2010.
On July 1, 2009, the Financial Accounting Standards Board (FASB) issued the FASB Accounting Standards Codification (Codification). The Codification became the single source of authoritative nongovernmental U.S. GAAP, superseding existing literature of the FASB, American Institute of Certified Public Accountants, Emerging Issues Task Force and other sources. The Codification is effective for interim and annual periods ending after September 15, 2009. The Fund adopted the Codification for the year ended April 30, 2010. There was no impact to financial statements as the Codification requirements are disclosure-only in nature.
30
2. Investment Management, Administration Agreements and Other Transactions with Affiliates
In accordance with the terms of its investment management agreement, the Fund pays Delaware Management Company (DMC), a series of Delaware Management Business Trust and the investment manager, an annual fee which is calculated daily at the rate of 0.75% on the first $500 million of average daily net assets of the Fund, 0.70% on the next $500 million, 0.65% on the next $1.5 billion, and 0.60% on average daily net assets in excess of $2.5 billion.
Effective September 1, 2009, DMC has voluntarily agreed to waive that portion, if any, of its management fee and reimburse the Fund to the extent necessary to ensure that total annual operating expenses (excluding any 12b-1 plan expenses, taxes, interest, inverse floater program expenses, short sale and dividend interest expenses, brokerage fees, certain insurance costs, and nonroutine expenses or costs including, but not limited to, those relating to reorganizations, litigation, conducting shareholder meetings, and liquidations) do not exceed 1.25% of average daily net assets of the Fund until such time as the waiver is discontinued. This expense waiver and reimbursement applies only to expenses paid directly by the Fund, and may be discontinued at any time because it is voluntary. Prior to September 1, 2009, DMC had contractually agreed to waive its management fee to the extent necessary to ensure that total annual operating expenses (excluding any 12b-1 plan expenses, taxes, interest, inverse floater program expenses, short sale and dividend interest expenses, brokerage fees, certain insurance costs, and nonroutine expenses or costs including, but not limited to, those relating to reorganizations, litigation, conducting shareholder meetings, and liquidations) did not exceed 1.25% of the Fund’s average daily net assets.
Delaware Service Company, Inc. (DSC), an affiliate of DMC, provides fund accounting and financial administration oversight services to the Fund. For these services, the Fund pays DSC fees based on the aggregate daily net assets of the Delaware Investments® Family of Funds at the following annual rate: 0.0050% of the first $30 billion; 0.0045% of the next $10 billion; 0.0040% of the next $10 billion; and 0.0025% of aggregate average daily net assets in excess of $50 billion. The fees payable to DSC under the service agreement described above are allocated among all Funds in the Delaware Investments Family of Funds on a relative net asset value basis. For the year ended April 30, 2010, the Fund was charged $12,940 for these services.
DSC also provides dividend disbursing and transfer agency services. The Fund pays DSC a monthly fee based on the number of shareholder accounts for dividend disbursing and transfer agent services.
Pursuant to a distribution agreement and distribution plan, the Fund pays DDLP, the distributor and an affiliate of DMC, an annual distribution and service fee not to exceed 0.25% of the average daily net assets of the Class A shares, 1.00% of the average daily net assets of the Class B and C shares and 0.60% of the average daily net assets of the Class R shares. Institutional Class shares pay no distribution and service expenses. DDLP has contracted to limit the Class R shares 12b-1 fees through August 31, 2010 to no more than 0.50% of average daily net assets.
31
Notes to financial statements
Delaware Select Growth Fund
Delaware Select Growth Fund
2. Investment Management, Administration Agreements and Other Transactions with Affiliates (continued)
At April 30, 2010, the Fund had liabilities payable to affiliates as follows:
| Investment management fee payable to DMC | $ | 74,813 |
| Dividend disbursing, transfer agent and fund accounting | ||
| oversight fees and other expenses payable to DSC | 47,116 | |
| Distribution fees payable to DDLP | 68,173 | |
| Other expenses payable to DMC and affiliates* | 41,515 |
*DMC, as part of its administrative services, pays operating expenses on behalf of the Fund and is reimbursed on a periodic basis. Such expenses include items such as printing of shareholder reports, fees for audit, legal and tax services, registration fees and trustees’ fees.
As provided in the investment management agreement, the Fund bears the cost of certain legal and tax services, including internal legal and tax services provided to the Fund by DMC and/or its affiliates’ employees. For the year ended April 30, 2010, the Fund was charged $ 17,461 for internal legal and tax services provided by DMC and/or its affiliates’ employees.
For the year ended April 30, 2010, DDLP earned $18,822 for commissions on sales of the Fund’s Class A shares. For the year ended April 30, 2010, DDLP received gross CDSC commissions of $-, $13,041 and $2,078 on redemption of the Fund’s Class A, Class B and Class C shares, respectively, and these commissions were entirely used to offset up-front commissions previously paid by DDLP to broker/dealers on sales of those shares.
Trustees’ fees include expenses accrued by the Fund for each Trustee’s retainer and meeting fees. Certain officers of DMC, DSC and DDLP are officers and/or Trustees of the Trust. These officers and Trustees are paid no compensation by the Fund.
3. Investments
For the year ended April 30, 2010, the Fund made purchases of $119,890,671 and sales of $170,282,327 of investment securities other than short-term investments.
At April 30, 2010, the cost of investments for federal income tax purposes was $250,275,452. At April 30, 2010, net unrealized appreciation was $48,055,925, of which $55,077,914 related to unrealized appreciation of investments and $7,021,989 related to unrealized depreciation of investments.
U.S. GAAP defines fair value as the price that the Fund would receive to sell an asset or pay to transfer a liability in an orderly transaction between market participants at the measurement date under current market conditions. A three level hierarchy for fair value measurements has been established based upon the transparency of inputs to the valuation of an asset or liability. Inputs may be observable or unobservable and refer broadly to the assumptions that market
32
participants would use in pricing the asset or liability. Observable inputs reflect the assumptions market participants would use in pricing the asset or liability based on market data obtained from sources independent of the reporting entity. Unobservable inputs reflect the reporting entity’s own assumptions about the assumptions that market participants would use in pricing the asset or liability developed based on the best information available under the circumstances. The Fund’s investment in its entirety is assigned a level based upon the observability of the inputs which are significant to the overall valuation. The three level hierarchy of inputs is summarized below.
Level 1 – inputs are quoted prices in active markets
Level 2 – inputs are observable, directly or indirectly
Level 3 – inputs are unobservable and reflect assumptions on the part of the reporting entity
The following table summarizes the valuation of the Fund’s investments by fair value hierarchy levels as of April 30, 2010:
| Level 1 | Level 2 | Level 3 | Total | ||||||||
| Common Stock | $ | 239,410,307 | $ | 1,601,574 | $ | — | $ | 241,011,881 | |||
| Short-Term | — | 9,755,025 | — | 9,755,025 | |||||||
| Securities Lending Collateral | 43,060,659 | 4,461,801 | 42,011 | 47,564,471 | |||||||
| Total | $ | 282,470,966 | $ | 15,818,400 | $ | 42,011 | $ | 298,331,377 | |||
The following is a reconciliation of investments in which significant unobservable inputs (Level 3) were used in determining fair value:
| Securities | ||
| Lending | ||
| Collateral | ||
| Balance as of 4/30/09 | $ | 99 |
| Net change in unrealized appreciation/depreciation | 41,912 | |
| Balance as of 4/30/10 | $ | 42,011 |
| Net change in unrealized appreciation/depreciation from | ||
| investments still held as of 4/30/10 | $ | 41,912 |
In January 2010, the FASB issued an Accounting Standards Update, Improving Disclosures about Fair Value Measurements, which introduces new disclosure requirements and clarifies certain existing disclosure requirements around fair value measurements currently presented above. The new disclosures and clarifications of existing disclosures are generally effective for the Fund’s year ending April 30, 2011 and interim periods therein. Management is evaluating the impact of this update on its current disclosures.
33
Notes to financial statements
Delaware Select Growth Fund
Delaware Select Growth Fund
4. Dividend and Distribution Information
Income and long-term capital gain distributions are determined in accordance with federal income tax regulations, which may differ from U.S. GAAP. Additionally, distributions from net gains on foreign currency transactions and net short-term gains on sales of investment securities are treated as ordinary income for federal income tax purposes. There were no dividends and distributions paid for the years ended April 30, 2010 and 2009.
5. Components of Net Assets on a Tax Basis
As of April 30, 2010, the components of net assets on a tax basis were as follows:
| Shares of beneficial interest | $ | 434,803,880 | |
| Post-October currency losses | (92,972 | ) | |
| Capital loss carryforwards | (233,778,615 | ) | |
| Unrealized appreciation of investments | |||
| and foreign currencies | 48,055,465 | ||
| Net assets | $ | 248,987,758 |
The differences between book basis and tax basis components of net assets are primarily attributable to tax deferral of losses on wash sales.
Post-October currency losses represent losses realized on foreign currency transactions from November 1, 2009 through April 30, 2010 that, in accordance with federal income tax regulations, the Fund has elected to defer and treat as having arisen in the following year.
For financial reporting purposes, capital accounts are adjusted to reflect the tax character of permanent book/tax differences. Reclassifications are primarily due to tax treatment of net operating losses, gain (loss) on foreign currency transactions and capital loss carryforward expiration. Results of operations and net assets were not affected by these reclassifications. For the year ended April 30, 2010, the Fund recorded the following reclassifications:
| Accumulated net investment loss | $ | 2,375,333 | |
| Accumulated net realized gain | 357,983,603 | ||
| Paid-in capital | (360,358,936 | ) |
For federal income tax purposes, at April 30, 2010, capital loss carryforwards of $233,778,615 may be carried forward and applied against future capital gains. $357,796,276 expired in 2010. Capital loss carryforwards remaining at April 30, 2010 will expire as follows: $185,917,705 expires in 2011, $18,530,411 expires in 2012, $21,490,547 expires in 2017 and $7,839,952 expires in 2018.
34
6. Capital Shares
Transactions in capital stock shares were as follows:
| Year Ended | |||||
| 4/30/10 | 4/30/09 | ||||
| Shares sold: | |||||
| Class A | 799,379 | 1,557,580 | |||
| Class B | 9,629 | 17,122 | |||
| Class C | 86,267 | 111,377 | |||
| Class R | 10,157 | 4,546 | |||
| Institutional Class | 3,745,535 | 1,968,498 | |||
| 4,650,967 | 3,659,123 | ||||
| Shares repurchased: | |||||
| Class A | (1,102,488 | ) | (1,651,316 | ) | |
| Class B | (545,493 | ) | (1,618,162 | ) | |
| Class C | (265,058 | ) | (579,812 | ) | |
| Class R | (16,910 | ) | (15,373 | ) | |
| Institutional Class | (4,210,692 | ) | (575,418 | ) | |
| (6,140,641 | ) | (4,440,081 | ) | ||
| Net decrease | (1,489,674 | ) | (780,958 | ) | |
For the years ended April 30, 2010 and 2009, 363,005 Class B shares were converted to 322,972 Class A shares valued at $7,518,237 and 1,015,729 Class B shares were converted to 910,682 Class A shares valued at $20,207,902, respectively. The respective amounts are included in Class B redemptions and Class A subscriptions in the table above and the statements of changes in net assets.
7. Line of Credit
The Fund, along with certain other funds in the Delaware Investments® Family of Funds (Participants), participates in a $35,000,000 revolving line of credit with The Bank of New York Mellon (BNY Mellon) to be used for temporary or emergency purposes as an additional source of liquidity to fund redemptions of investor shares. Under the agreement, the Participants are charged an annual commitment fee, which is allocated across the Participants on the basis of each Participant’s allocation of the entire facility. The Participants may borrow up to a maximum of one third of their net assets under the agreement. The agreement expires on November 16, 2010. The Fund had no amounts outstanding as of April 30, 2010 or at any time during the year then ended.
8. Derivatives
U.S. GAAP requires enhanced disclosures that enable investors to understand: 1) how and why an entity uses derivatives, 2) how they are accounted for, and 3) how they affect an entity’s results of operations and financial position.
35
Notes to financial statements
Delaware Select Growth Fund
Delaware Select Growth Fund
8. Derivatives (continued)
Foreign Currency Exchange Contracts — The Fund may enter into foreign currency exchange contracts as a way of managing foreign exchange rate risk. The Fund may enter into these contracts to fix the U.S. dollar value of a security that it has agreed to buy or sell for the period between the date the trade was entered into and the date the security is delivered and paid for. The Fund may also use these contracts to hedge the U.S. dollar value of securities it already owns that are denominated in foreign currencies. The change in value is recorded as an unrealized gain or loss. When the contract is closed, a realized gain or loss is recorded equal to the difference between the value of the contract at the time it was opened and the value at the time it was closed.
The use of foreign currency exchange contracts does not eliminate fluctuations in the underlying prices of the securities, but does establish a rate of exchange that can be achieved in the future. Although foreign currency exchange contracts limit the risk of loss due to a decline in the value of the hedged currency, they also limit any potential gain that might result should the value of the currency increase. In addition, the Fund could be exposed to risks if the counterparties to the contracts are unable to meet the terms of their contracts. The Fund’s maximum risk of loss from counterparty credit risk is the value of its currency exchanged with the counterparty. The risk is generally mitigated by having a netting arrangement between the Fund and the counterparty and by the posting of collateral by the counterparty to the Fund to cover the Fund’s exposure to the counterparty. No foreign currency exchange contracts were outstanding at April 30, 2010.
9. Securities Lending
The Fund, along with other funds in the Delaware Investments® Family of Funds, may lend its securities pursuant to a security lending agreement (Lending Agreement) with BNY Mellon. With respect to each loan, if the aggregate market value of securities collateral held plus cash collateral received on any business day is less than the aggregate market value of the securities which are the subject of such loan, the borrower will be notified to provide additional collateral not less than the applicable collateral requirements. Cash collateral received is generally invested in the BNY Mellon Securities Lending Overnight Fund (Collective Trust) established by BNY Mellon for the purpose of investment on behalf of clients participating in its securities lending programs. The Collective Trust may only hold cash and high quality assets with a maturity of one business day or less (Cash/Overnight Assets). The Fund also has cash collateral invested in the BNY Mellon SL DBT II Liquidating Fund (Liquidating Fund), which generally holds the portfolio securities of the Fund’s previous cash collateral pool other than its Cash/Overnight Assets. The Liquidating Fund invests in fixed income securities, with a weighted average maturity not to exceed 90 days, rated in one of the top three tiers by Standard & Poor’s Ratings Group or Moody’s Investors Service, Inc. or repurchase agreements collateralized by such securities. The Fund will not make additional investments of cash collateral in the Liquidating Fund; the Fund’s exposure to the Liquidating Fund is expected to decrease as the Liquidating Fund’s assets mature or are sold. Both the Collective Trust and the Liquidating Fund seek to maintain a net asset value per unit of $1.00, but there can be no assurance that they will always be able to do so. The Fund may incur investment losses as a result of investing securities lending collateral in the Collective Trust and
36
the Liquidating Fund. This could occur if an investment in the Collective Trust or the Liquidating Fund defaulted or if it were necessary to liquidate assets in the Collective Trust or the Liquidating Fund to meet returns on outstanding security loans at a time when their net asset value per unit was less than $1.00. Under those circumstances, the Fund may not receive an amount from the Collective Trust or the Liquidating Fund that is equal in amount to the collateral the Fund would be required to return to the borrower of the securities and the Fund would be required to make up for this shortfall. In October 2008, BNY Mellon transferred certain distressed securities from the Collective Trust into the Mellon GSL Reinvestment Trust II. The Fund can also accept U.S. government securities and letters of credit (non-cash collateral) in connection with securities loans. In the event of default or bankruptcy by the lending agent, realization and/or retention of the collateral may be subject to legal proceedings. In the event the borrower fails to return loaned securities and the collateral received is insufficient to cover the value of the loaned securities and provided such collateral shortfall is not the result of investment losses, the lending agent has agreed to pay the amount of the shortfall to the Fund, or at the discretion of the lending agent, replace the loaned securities. The Fund continues to record dividends or interest, as applicable, on the securities loaned and is subject to change in value of the securities loaned that may occur during the term of the loan. The Fund has the right under the Lending Agreement to recover the securities from the borrower on demand. With respect to security loans collateralized by non-cash collateral, the Fund receives loan premiums paid by the borrower. With respect to security loans collateralized by cash collateral, the earnings from the collateral investments are shared among the Fund, the security lending agent and the borrower. The Fund records security lending income net of allocations to the security lending agent and the borrower.
At April 30, 2010, the value of securities on loan was $48,081,040, for which the Fund received collateral, comprised of non-cash collateral valued at $602,552, and cash collateral of $48,560,580. At April 30, 2010, the value of invested collateral was $47,564,471. Investments purchased with cash collateral are presented on the statement of net assets under the caption “Securities Lending Collateral”.
10. Credit and Market Risk
The Fund invests a significant portion of its assets in small- and mid-sized companies and may be subject to certain risks associated with ownership of securities of such companies. Investments in small- or mid-sized companies may be more volatile than investments in larger companies for a number of reasons, which include more limited financial resources or a dependence on narrow product lines.
Some countries in which the Fund may invest require governmental approval for the repatriation of investment income, capital or the proceeds of sales of securities by foreign investors. In addition, if there is deterioration in a country’s balance of payments or for other reasons, a country may impose temporary restrictions on foreign capital remittances abroad.
The securities exchanges of certain foreign markets are substantially smaller, less liquid and more volatile than the major securities markets in the United States. Consequently, acquisition and
37
Notes to financial statements
Delaware Select Growth Fund
Delaware Select Growth Fund
10. Credit and Market Risk (continued)
disposition of securities by the Fund may be inhibited. In addition, a significant portion of the aggregate market value of equity securities listed on the major securities exchanges in emerging markets are held by a smaller number of investors. This may limit the number of shares available for acquisition or disposition by the Fund.
The Fund may invest up to 15% of its net assets in illiquid securities, which may include securities with contractual restrictions on resale, securities exempt from registration under Rule 144A of the Securities Act of 1933, as amended, and other securities which may not be readily marketable. The relative illiquidity of these securities may impair the Fund from disposing of them in a timely manner and at a fair price when it is necessary or desirable to do so. While maintaining oversight, the Fund’s Board has delegated to DMC the day-to-day functions of determining whether individual securities are liquid for purposes of the Fund’s limitation on investments in illiquid assets. Securities eligible for resale pursuant to Rule 144A, which are determined to be liquid, are not subject to the Fund’s 15% limit on investments in illiquid securities. As of April 30, 2010, there were no Rule 144A securities. Illiquid securities have been identified on the statement of net assets.
11. Contractual Obligations
The Fund enters into contracts in the normal course of business that contain a variety of indemnifications. The Fund’s maximum exposure under these arrangements is unknown. However, the Fund has not had prior claims or losses pursuant to these contracts. Management has reviewed the Fund’s existing contracts and expects the risk of loss to be remote.
12. Sale of Delaware Investments to Macquarie Group
On August 18, 2009, Lincoln National Corporation (former parent company of Delaware Investments) and Macquarie Group (Macquarie) entered into an agreement pursuant to which Delaware Investments, including DMC, DDLP and DSC, would be acquired by Macquarie, an Australia-based global provider of banking, financial, advisory, investment and funds management services (Transaction). The Transaction was completed on January 4, 2010. DMC, DDLP and DSC are now wholly owned subsidiaries of Macquarie.
The Transaction resulted in a change of control of DMC which, in turn, caused the termination of the investment management agreement between DMC and the Fund. On January 4, 2010, the new investment management agreement between DMC and the Fund that was approved by the shareholders became effective.
13. Subsequent Events
Management has determined no material events or transactions occurred subsequent to April 30, 2010 that would require recognition or disclosure in the Fund’s financial statements.
38
Report of independent
registered public accounting firm
registered public accounting firm
To the Shareholders and Board of Trustees
Voyageur Mutual Funds III — Delaware Select Growth Fund
Voyageur Mutual Funds III — Delaware Select Growth Fund
We have audited the accompanying statement of net assets of Delaware Select Growth Fund (one of the series constituting the Voyageur Mutual Funds III) (the “Fund”), including the schedule of investments, as of April 30, 2010, and the related statement of operations for the year then ended, the statements of changes in net assets for each of the two years in the period then ended, and the financial highlights for each of the five years in the period then ended. These financial statements and financial highlights are the responsibility of the Fund’s management. Our responsibility is to express an opinion on these financial statements and financial highlights based on our audits.
We conducted our audits in accordance with the standards of the Public Company Accounting Oversight Board (United States). Those standards require that we plan and perform the audit to obtain reasonable assurance about whether the financial statements and financial highlights are free of material misstatement. We were not engaged to perform an audit of the Fund’s internal control over financial reporting. Our audits included consideration of internal control over financial reporting as a basis for designing audit procedures that are appropriate in the circumstances, but not for the purpose of expressing an opinion on the effectiveness of the Fund’s internal control over financial reporting. Accordingly, we express no such opinion. An audit also includes examining, on a test basis, evidence supporting the amounts and disclosures in the financial statements and financial highlights, assessing the accounting principles used and significant estimates made by management, and evaluating the overall financial statement presentation. Our procedures included confirmation of securities owned as of April 30, 2010, by correspondence with the custodian and brokers or by other appropriate auditing procedures where replies from brokers were not received. We believe that our audits provide a reasonable basis for our opinion.
In our opinion, the financial statements and financial highlights referred to above present fairly, in all material respects, the financial position of the Delaware Select Growth Fund series of Voyageur Mutual Funds III at April 30, 2010, the results of its operations for the year then ended, the changes in its net assets for each of the two years in the period then ended, and its financial highlights for each of five years in the period then ended, in conformity with U.S. generally accepted accounting principles.

June 18, 2010
39
Other Fund information
(Unaudited)
Delaware Select Growth Fund
(Unaudited)
Delaware Select Growth Fund
Proxy Results
At Joint Special Meetings of Shareholders of Voyageur Mutual Funds III (the “Trust”), on behalf of each of Delaware Select Growth Fund and Delaware Large Cap Core Fund (each, a “Fund” and collectively, the “Funds”), held on November 12, 2009 and reconvened on December 4, 2009 and March 16, 2010, the shareholders of each Fund voted to (i) elect a Board of Trustees for the Trust; and to (ii) approve a new investment advisory agreement between the Trust, on behalf of the Funds, and Delaware Management Company. At the meeting, the following people were elected to serve as Independent Trustees: Thomas L. Bennett, John A. Fry, Anthony D. Knerr, Lucinda S. Landreth, Ann R. Leven, Thomas F. Madison, Janet L. Yeomans, and J. Richard Zecher. In addition, Patrick P. Coyne was elected to serve as an Interested Trustee.
The following proposals were submitted for a vote of the shareholders:
1. To elect a Board of Trustees for the Trust.
| % of | % of | % of | % of | |||||||||
| Outstanding | Shares | Outstanding | Shares | |||||||||
| Shares Voted For | Shares | Voted | Shares Withheld | Shares | Voted | |||||||
| Thomas L. Bennett | 5,951,878.103 | 52.566 | 96.407 | 221,820.564 | 1.959 | 3.593 | ||||||
| Patrick P. Coyne | 5,947,780.541 | 52.530 | 96.341 | 225,918.126 | 1.995 | 3.659 | ||||||
| John A. Fry | 5,953,366.709 | 52.579 | 96.431 | 220,331.958 | 1.946 | 3.569 | ||||||
| Anthony D. Knerr | 5,949,464.062 | 52.545 | 96.368 | 224,234.605 | 1.980 | 3.632 | ||||||
| Lucinda S. Landreth | 5,947,680.260 | 52.529 | 96.339 | 226,018.407 | 1.996 | 3.661 | ||||||
| Ann R. Leven | 5,944,458.918 | 52.501 | 96.287 | 229,239.749 | 2.024 | 3.713 | ||||||
| Thomas F. Madison | 5,950,241.466 | 52.552 | 96.380 | 223,457.201 | 1.973 | 3.620 | ||||||
| Janet L. Yeomans | 5,945,062.090 | 52.506 | 96.297 | 228,636.577 | 2.019 | 3.703 | ||||||
| J. Richard Zecher | 5,949,694.673 | 52.547 | 96.372 | 224,003.994 | 1.978 | 3.628 |
| 2. | To approve a new investment advisory agreement between the Trust, on behalf of the Delaware Select Growth Fund, and Delaware Management Company. |
| Delaware Select Growth Fund | |||
| Shares Voted For | 4,033,542.850 | ||
| Percentage of Outstanding Shares | 36.319% | ||
| Percentage of Shares Voted | 69.940% | ||
| Shares Voted Against | 99,779.424 | ||
| Percentage of Outstanding Shares | 0.898% | ||
| Percentage of Shares Voted | 1.730% | ||
| Shares Abstained | 131,517.304 | ||
| Percentage of Outstanding Shares | 1.185% | ||
| Percentage of Shares Voted | 2.281% | ||
| Broker Non-Votes | 1,502,340.145 | ||
40
Board Consideration of New Investment Advisory Agreement
At a meeting held on September 3, 2009 (the “Meeting”), the Board of Trustees of the Delaware Investments® Family of Funds (the “Board”), including the independent Trustees, unanimously approved a new investment advisory agreement between each registrant on behalf of each series (each, a “Fund” and together, the “Funds”) and Delaware Management Company (“DMC”) in connection with the sale of Delaware Investments’ advisory business to Macquarie Bank Limited (the “Macquarie Group”) (the “Transaction”). In making its decision, the Board considered information furnished specifically in connection with the approval of the new investment advisory agreements with DMC (the “New Investment Advisory Agreements”) which included extensive materials about the Transaction and matters related to the proposed approvals. To assist the Board in considering the New Investment Advisory Agreements, Macquarie Group provided materials and information about Macquarie Group, including detailed written responses to the questions posed by the independent Trustees. DMC also provided materials and information about the Transaction, including detailed written responses to the questions posed by the independent Trustees.
At the Meeting, the Trustees discussed the Transaction with DMC management and with key Macquarie Group representatives. The Meeting included discussions of the strategic rationale for the Transaction and Macquarie Group’s general plans and intentions regarding the Funds and DMC. The Board members also inquired about the plans for, and anticipated roles and responsibilities of, key employees and officers of Delaware Management Holdings Inc. and DMC in connection with the Transaction.
In connection with the Trustees’ review of the New Investment Advisory Agreements for the Funds, DMC and/or Macquarie Group emphasized that:
- They expected that there would be no adverse changes as a result of the Transaction, in the nature, quality, or extent of services currently provided to the Funds and their shareholders, including investment management, distribution, or other shareholder services.
- No material changes in personnel or operations were contemplated in the operation of DMC under Macquarie Group as a result of the Transaction and no material changes were currently contemplated in connection with third party service providers to the Funds.
- Macquarie Group had no intention to cause DMC to alter the voluntary expense waivers and reimbursements currently in effect for the Funds.
- Under the agreement between Macquarie Group and Lincoln National Corporation (“LNC”) (the “Transaction Agreement”), Macquarie Group has agreed to conduct, and to cause its affiliates to conduct, their respective businesses in compliance with the conditions of Section 15(f) of the Investment Company Act of 1940 (the “1940 Act”) with respect to the Funds, to the extent within its control, including maintaining Board composition of at least 75% of the Board members qualifying as independent Trustees and not imposing any “unfair burden” on the Funds for at least two years from the closing of the Transaction (the “Closing”).
41
Other Fund information
(Unaudited)
Delaware Select Growth Fund
(Unaudited)
Delaware Select Growth Fund
Board Consideration of New Investment Advisory Agreement (continued)
In addition to the information provided by DMC and Macquarie Group as described above, the Trustees also considered all other factors they believed to be relevant to evaluating the New Investment Advisory Agreements, including the specific matters discussed below. In their deliberations, the Trustees did not identify any particular information that was controlling, and different Trustees may have attributed different weights to the various factors. However, for each Fund, the Trustees determined that the overall arrangements between the Fund and DMC, as provided in the respective New Investment Advisory Agreement, including the proposed advisory fee and the related administration arrangements between the Fund and DMC, were fair and reasonable in light of the services to be performed, expenses incurred, and such other matters as the Trustees considered relevant. Factors evaluated included:
- The potential for expanding distribution of Fund shares through access to Macquarie Group’s existing distribution channels;
- Delaware Investments’ acquisition of an exclusive wholesaling sales force from a subsidiary of LNC;
- The reputation, financial strength, and resources of Macquarie Group as well as its historic and ongoing commitment to the asset management business in Australia as well as other parts of the world;
- The terms and conditions of the New Investment Advisory Agreements, including that each Fund’s total contractual fee rate under the New Investment Advisory Agreement will remain the same;
- The Board’s full annual review (or initial approval) of the current investment advisory agreements at their in-person meeting in May 2009 as required by the 1940 Act and its determination that (i) DMC had the capabilities, resources, and personnel necessary to provide the satisfactory advisory and administrative services currently provided to each Fund and (ii) the advisory and/or management fees paid by each Fund, taking into account any applicable fee waivers and breakpoints, represented reasonable compensation to DMC in light of the services provided, the costs to DMC of providing those services, economies of scale, and the fees and other expenses paid by similar funds and such other matters that the Board considered relevant in the exercise of its reasonable judgment;
- The portfolio management teams for the Funds are not currently expected to change as a result of the Transaction;
- LNC and Macquarie Group were expected to execute a reimbursement agreement pursuant to which LNC and Macquarie Group would agree to pay (or reimburse) all reasonable out-of-pocket costs and expenses of the Funds in connection with the Board’s consideration of the Transaction, the New Investment Advisory Agreements and related agreements, and all costs related to the proxy solicitation (the “Expense Agreement”);
42
- The likelihood that Macquarie Group would invest additional amounts in Delaware Investments, including DMC, which could result in increased assets under management, which in turn would allow some Funds the potential opportunity to achieve economies of scale and lower fees payable by Fund shareholders; and
- The compliance and regulatory history of Macquarie Group and its affiliates.
In making their decision relating to the approval of each Fund’s New Investment Advisory Agreement, the independent Trustees gave attention to all information furnished. The following discussion, however, identifies the primary factors taken into account by the Trustees and the conclusions reached in approving the New Investment Advisory Agreements.
Nature, Extent, and Quality of Service. The Trustees considered the services historically provided by DMC to the Funds and their shareholders. In reviewing the nature, extent, and quality of services, the Board considered that the New Investment Advisory Agreements would be substantially similar to the current investment advisory agreements between the Funds and DMC (the “Current Investment Advisory Agreements”), and therefore, considered the many reports furnished to them throughout 2008 and 2009 at regular Board meetings covering matters such as the relative performance of the Funds; compliance of portfolio managers with the investment policies, strategies, and restrictions for the Funds; the compliance of management personnel with the code of ethics adopted throughout the Delaware Investments Family of Funds complex; and the adherence to fair value pricing procedures as established by the Board. The Trustees were pleased with the current staffing of DMC and the emphasis placed on research and risk management in the investment process. Favorable consideration was given to DMC’s efforts to maintain expenditures and, in some instances, increase financial and human resources committed to Fund matters.
The Board also considered the transfer agent and shareholder services that would continue to be provided to Fund shareholders by DMC’s affiliate, Delaware Service Company, Inc. (“DSC”). The Trustees noted, in particular, DSC’s commitment to maintain a high level of service as well as DMC’s expenditures to improve the delivery of shareholder services. The Board was assured that shareholders would continue to receive the benefits provided to Fund shareholders by being part of the Delaware Investments Family of Funds, including each shareholder’s ability to exchange an investment in one Delaware Investments Fund for the same class of shares in another Delaware Investments Fund without a sales charge, to reinvest Fund dividends into additional shares of any of the Funds, and the privilege to combine holdings in other Funds to obtain a reduced sales charge.
Based on the information provided by DMC and Macquarie Group, including that Macquarie Group and DMC currently expected no material changes as a result of the Transaction in (i) personnel or operations of DMC or (ii) third party service providers to the Funds, the Board concluded that the satisfactory nature, extent, and quality of services currently provided to the Funds and their shareholders were very likely to continue under the New Investment Advisory Agreements. Moreover, the Board concluded that the Funds would probably benefit from the
43
Other Fund information
(Unaudited)
Delaware Select Growth Fund
(Unaudited)
Delaware Select Growth Fund
Board Consideration of New Investment Advisory Agreement (continued)
expanded distribution resources that would become available to Delaware Investments following the Transaction. The Board also concluded that it was very unlikely that any “unfair burden” would be imposed on any of the Funds for the first two years following the Closing as a result of the Transaction. Consequently, the Board concluded that it did not expect the Transaction to result in any adverse changes in the nature, quality, or extent of services (including investment management, distribution or other shareholder services) currently provided to the Funds and their shareholders.
Investment Performance. The Board considered the overall investment performance of DMC and the Funds. The Trustees placed significant emphasis on the investment performance of the Funds in view of its importance to shareholders. Although the Trustees gave appropriate consideration to performance reports and discussions with portfolio managers at Board meetings throughout the year, the Trustees gave particular weight to their review of investment performance in connection with the approval of the Current Investment Advisory Agreements at the Board meeting held in May 2009. At that meeting, the Trustees reviewed reports prepared by Lipper, Inc., an independent statistical compilation organization (“Lipper”), which showed each Fund’s investment performance as of December 31, 2008 in comparison to a group of funds selected by Lipper as being similar to the Fund (the “Performance Universe”). During the May 2009 agreement review process, the Trustees observed the significant improvements to relative investment performance of the Funds compared to the Funds’ performance as of December 31, 2007.
At their meeting on September 3, 2009, the Trustees, including the independent Trustees in consultation with their independent counsel, reviewed the investment performance of each Fund. The Trustees compared the performance of each Fund relative to that of its respective Performance Universe for the 1-, 3-, 5-, and 10-year periods ended June 30, 2009 and compared its relative investment performance against the corresponding relative investment performance of each Fund for such time periods ended December 31, 2008, to the extent applicable. As of June 30, 2009, 30 of the Funds had investment performance relative to that of the respective Performance Universe that was better than the corresponding relative investment performance at December 31, 2008 for all applicable time periods. At June 30, 2009, an additional 6 Funds had investment performance relative to that of their respective Performance Universe that was better than the corresponding relative investment performance at December 31, 2008 for a majority of the applicable time periods. At June 30, 2009, 15 additional Funds had investment performance relative to that of their respective Performance Universe that was better than the corresponding relative performance at December 31, 2008 and only 29 Funds had poorer relative investment performance at June 30, 2009 compared to that at December 31, 2008.
The Board therefore concluded that the investment performance of the Funds, on an aggregate basis, had continued to improve relative to their respective Performance Universe since the data reviewed at the May 2009 meeting. Based on information provided by DMC and Macquarie Group, the Board concluded that neither the Transaction nor the New Investment Advisory Agreement would likely have an adverse effect on the investment performance of any Fund because (i) DMC
44
and Macquarie Group did not currently expect the Transaction to cause any material change to the Funds’ portfolio management teams responsible for investment performance, which the Board found to be satisfactory and improving; and (ii) as discussed in more detail below, the Funds’ expenses were not expected to increase as a result of the Transaction.
Comparative Expenses. The Trustees also considered expense comparison data for the Funds previously provided in May 2009. At that meeting, DMC had provided the Board with information on pricing levels and fee structures for the Funds and comparative funds. The Trustees focused on the comparative analysis of the effective management fees and total expense ratios of each Fund versus the effective management fees and expense ratios of a group of funds selected by Lipper as being similar to each Fund (the “Expense Group”). In reviewing comparative costs, each Fund’s contractual management fee and the actual management fee incurred by the Fund were compared with the contractual management fees (assuming all funds in the Expense Group were similar in size to the Fund) and actual management fees (as reported by each fund) of other funds within the Expense Group, taking into account any applicable breakpoints and fee limitations. Each Fund’s total expenses were also compared with those of its Expense Group. The Trustees also considered fees paid to Delaware Investments for nonmanagement services. At the September 3, 2009 meeting, DMC advised the Board that the more recent comparative expenses for the Funds remained consistent with the previous review in May 2009 and, consequently, the Trustees concluded that expenses of the Funds were satisfactory.
The Board also considered the Expense Agreement under negotiation in evaluating Fund expenses. The Trustees expected that the Expense Agreement would provide that LNC and Macquarie Group would pay or reimburse the Trusts for all reasonable out-of-pocket costs and expenses in connection with the Transaction and the consideration of the New Investment Advisory Agreements (subject to certain limited exceptions).
Based on information provided by DMC and Macquarie Group, the Board concluded that neither the Transaction nor the New Investment Advisory Agreements likely would have an adverse effect on the Funds’ expenses because (i) each Fund’s contractual fee rates under the New Investment Advisory Agreement would remain the same; (ii) under the Expense Agreement, the Funds would be reimbursed for all reasonable out-of-pocket costs and expenses in connection with the Transaction and the related proxy solicitation (subject to certain limited exceptions); and (iii) the expense ratios of certain Funds might decline as a result of the possible increased investment in Delaware Investments by Macquarie Group, as discussed below under “Economies of Scale.”
Management Profitability. At their meeting on September 3, 2009, the Board evaluated DMC’s profitability in connection with the operation of the Funds. The Board had previously considered DMC’s profitability in connection with the operation of the Funds at its May 2009 meeting. At that meeting, the Board reviewed an analysis that addressed the overall profitability of Delaware Investments’ business in providing management and other services to each of the Funds and the Delaware Investments Family of Funds as a whole. Specific attention was given to the methodology followed in allocating costs for the purpose of determining profitability.
45
Other Fund information
(Unaudited)
Delaware Select Growth Fund
(Unaudited)
Delaware Select Growth Fund
Board Consideration of New Investment Advisory Agreement (continued)
At the May 2009 meeting, representatives of DMC had stated that the level of profits of DMC, to a certain extent, reflect operational cost savings and efficiencies initiated by Delaware Investments (including DMC and its affiliates that provide services to the Funds). The Board considered Delaware Investments’ efforts to improve services provided to Fund shareholders and to meet additional regulatory and compliance requirements resulting from recent industry-wide U.S. Securities and Exchange Commission initiatives. At that meeting, the Board found that the management fees were reasonable in light of the services rendered and the level of profitability of DMC. At the September 3, 2009 meeting, DMC advised the Board that DMC did not expect the Transaction to affect materially the profitability of Delaware Investments compared to the level of profitability considered during the May 2009 review. Moreover, the Trustees reviewed pro forma balance sheets of certain key companies in Delaware Investments as of June 30, 2009 (which were provided by Macquarie Group and DMC in response to the Trustees’ requests) and evaluated the projections of Delaware Investments’ capitalization following the Transaction for purposes of evaluating the financial ability of Delaware Investments to continue to provide the nature, extent, and quality of services as it had under the Current Investment Advisory Agreement.
Based on information provided by DMC and Macquarie Group, the Board concluded that DMC and Delaware Investments would be sufficiently capitalized following the Transaction to continue the same level and quality of services to the Funds under the New Investment Advisory Agreements as was the case under the Current Investment Advisory Agreements. The Board also concluded that Macquarie Group had sufficient financial strength and resources, as well as an ongoing commitment to a global asset management business, to continue investing in Delaware Investments, including DMC, to the extent that Macquarie Group determined it was appropriate. Finally, because services and costs were expected to be substantially the same (and DMC had represented that, correspondingly, profitability would be about the same), under the New Investment Advisory Agreements as under the Current Investment Advisory Agreements, the Trustees concluded that the profitability of Delaware Investments would not result in an inequitable charge on the Funds or their shareholders. Accordingly, the Board concluded that the fees charged under the New Investment Advisory Agreements would be reasonable in light of the services to be provided and the expected profitability of DMC.
Economies of Scale. The Trustees considered whether economies of scale would be realized by Delaware Investments as each Fund’s assets increase and the extent to which any economies of scale would be reflected in the management fees charged. The Trustees took into account DMC’s practice of maintaining the competitive nature of management fees based on its analysis of fees charged by comparable funds. DMC management believed, and the Board agreed, that the Funds were priced with breakpoints and relatively low management fees to reflect potential economies of scale to Fund shareholders.
46
The Board also acknowledged Macquarie Group’s statement that the Transaction would not by itself immediately provide additional economies of scale given Macquarie Group’s limited presence in the U.S. mutual fund market. Nonetheless, the Trustees concluded that additional economies of scale could potentially be achieved in the future if DMC were owned by Macquarie Group as a result of Macquarie Group’s willingness to invest further in Delaware Investments if appropriate opportunities arise. The Board further concluded that potential economies of scale could be achieved as a result of Delaware Investments’ expanded distribution capabilities arising from the Transaction, as well as opportunities that might arise from Macquarie Group’s global asset management business.
Fall-Out Benefits. The Board acknowledged that DMC would continue to benefit from soft dollar arrangements using portfolio brokerage of each Fund that invests in equity securities and that DMC’s profitability would likely be somewhat lower without the benefit of practices with respect to allocating Fund portfolio brokerage for brokerage and research services. The Board also considered that Macquarie Group and Delaware Investments may derive reputational, strategic, and other benefits from their association with the Delaware Investments Family of Funds, including service relationships with DMC, DSC, and Delaware Distributors, L.P., and evaluated the extent to which Delaware Investments might derive ancillary benefits from Fund operations, including the potential for procuring additional business as a result of the prestige and visibility associated with its role as service provider to the Delaware Investments Family of Funds and the benefits from allocation of Fund brokerage to improve trading efficiencies. However, the Board concluded that (i) any such benefits under the New Investment Advisory Agreements would not be dissimilar from those existing under the Current Investment Advisory Agreements; (ii) such benefits did not impose a cost or burden on the Funds or their shareholders; and (iii) such benefits would probably have an indirectly beneficial effect on the Funds and their shareholders because of the added importance that DMC and Macquarie Group might attach to the Funds as a result of the fall-out benefits that the Funds conveyed.
Board Review of Macquarie Group. The Trustees reviewed detailed information supplied by Macquarie Group about its operations as well as other information regarding Macquarie Group provided by independent legal counsel to the independent Trustees. Based on this review, the Trustees concluded that Delaware Investments would continue to have the financial ability to maintain the high quality of services required by the Funds. The Trustees noted that there would be a limited transition period during which some services previously provided by LNC to Delaware Investments would continue to be provided by LNC after the Closing, and concluded that this arrangement would help minimize disruption in Delaware Investments’ provision of services to the Funds following the Transaction.
The Board considered Macquarie Group’s support for Delaware Investments’ plans for Fund distribution by transferring wholesalers from Lincoln Financial Distributors, Inc., LNC’s retail distributor, to Delaware Investments, and Macquarie Group’s current intention to leave the Funds’ other service providers in place. The Board also considered Macquarie Group’s current strategic plans to increase its asset management activities, one of its core businesses, particularly in North
47
Other Fund information
(Unaudited)
Delaware Select Growth Fund
(Unaudited)
Delaware Select Growth Fund
Board Consideration of New Investment Advisory Agreement (continued)
America, and its statement that its acquisition of DMC is an important component of this strategic growth and the establishment of a significant presence in the United States. Based in part on the information provided by DMC and Macquarie Group, the Board concluded that Macquarie Group’s acquisition of Delaware Investments could potentially enhance the nature, quality, and extent of services provided to the Funds and their shareholders.
Conclusion. The Board concluded that the advisory fee rate under each New Investment Advisory Agreement was reasonable in relation to the services provided and that execution of the New Investment Advisory Agreement would be in the best interests of the shareholders. For each Fund, the Trustees noted that they had concluded in their most recent advisory agreement continuance considerations in May 2009 that the management fees and total expense ratios were at acceptable levels in light of the quality of services provided to the Funds and in comparison to those of the Funds’ respective peer groups; that the advisory fee schedule would not be increased and would stay the same for all of the Funds; that the total expense ratio had not changed materially since that determination; and that DMC had represented that the overall expenses for each Fund were not expected to be adversely affected by the Transaction. The Trustees also noted, with respect to the Funds that currently had the benefit of voluntary fee limitations, that Macquarie Group had no present intention to cause DMC to alter any voluntary expense limitations or reimbursements currently in effect. On that basis, the Trustees concluded that the total expense ratios and proposed advisory fees for the Funds anticipated to result from the Transaction were acceptable. In approving each New Investment Advisory Agreement, the Board stated that it anticipated reviewing the continuance of the New Investment Advisory Agreement in advance of the expiration of the initial two-year period.
Change in Independent Registered Public Accounting Firm
Due to independence matters under the Securities and Exchange Commission’s auditor independence rules relating to the January 4, 2010 acquisition of Delaware Investments (including DMC, DDLP and DSC) by Macquarie Group, Ernst & Young LLP (“E&Y”) will resign as the independent registered public accounting firm for Voyageur Mutul Funds III (the “Fund”) effective June 28, 2010. At a meeting held on February 18, 2010, the Board of Trustees of the Fund, upon recommendation of the Audit Committee, selected PricewaterhouseCoopers LLC (“PwC”) to serve as the independent registered public accounting firm for the Fund for the fiscal year ending April 30, 2011. During the fiscal years ended 2010 and 2009, E&Y’s audit reports on the financial statements of the Fund did not contain any adverse opinion or disclaimer of opinion, nor were they qualified or modified as to uncertainty, audit scope, or accounting principles. In addition, there were no disagreements between the Fund and E&Y on accounting principles, financial statements disclosures or audit scope, which, if not resolved to the satisfaction of E&Y, would have caused them to make reference to the disagreement in their reports. Neither the Fund nor anyone on its behalf has consulted with PwC at any time prior to their selection with respect to the application of accounting principles to a specified transaction, either completed or proposed or the type of audit opinion that might be rendered on the Fund’s financial statements.
48
Board of trustees/directors and officers addendum
Delaware Investments® Family of Funds
Delaware Investments® Family of Funds
A mutual fund is governed by a Board of Trustees/Directors (“Trustees”), which has oversight responsibility for the management of a fund’s business affairs. Trustees establish procedures and oversee and review the performance of the investment manager, the distributor, and others who perform services for the fund. The independent fund trustees, in particular, are advocates
| Name, Address, | Position(s) | Length of | ||
| and Birth Date | Held with Fund(s) | Time Served | ||
| Interested Trustees | ||||
| Patrick P. Coyne1 | Chairman, President, | Chairman and Trustee | ||
| 2005 Market Street | Chief Executive Officer, | since August 16, 2006 | ||
| Philadelphia, PA 19103 | and Trustee | |||
| April 1963 | President and | |||
| Chief Executive Officer | ||||
| since August 1, 2006 | ||||
1 Patrick P. Coyne is considered to be an “Interested Trustee” because he is an executive officer of the Fund’s(s’) investment advisor.
50
for shareholder interests. Each trustee has served in that capacity since he or she was elected to or appointed to the Board of Trustees, and will continue to serve until his or her retirement or the election of a new trustee in his or her place. The following is a list of the Trustees and Officers with certain background and related information.
| Number of Portfolios in | ||||
| Principal Occupation(s) | Fund Complex Overseen | Other Directorships | ||
| During Past 5 Years | by Trustee or Officer | Held by Trustee or Officer | ||
| Patrick P. Coyne has served in | 79 | Director | ||
| various executive capacities | Kaydon Corp. | |||
| at different times at | ||||
| Delaware Investments.2 | Board of Governors Member | |||
| Investment Company | ||||
| Institute (ICI) | ||||
| Finance Committee Member | ||||
| St. John Vianney Roman | ||||
| Catholic Church | ||||
| Board of Trustees | ||||
| Agnes Irwin School | ||||
| Member of Investment | ||||
| Committee | ||||
| Cradle of Liberty Council, | ||||
| BSA | ||||
| (2007 – 2010) | ||||
2 Delaware Investments is the marketing name for Delaware Management Holdings, Inc. and its subsidiaries, including the Fund’s(s’) investment advisor, principal underwriter, and its transfer agent.
51
Board of trustees/directors and officers addendum
Delaware Investments® Family of Funds
Delaware Investments® Family of Funds
| Name, Address, | Position(s) | Length of | ||
| and Birth Date | Held with Fund(s) | Time Served | ||
| Independent Trustees | ||||
| Thomas L. Bennett | Trustee | Since March 2005 | ||
| 2005 Market Street | ||||
| Philadelphia, PA 19103 | ||||
| October 1947 | ||||
| John A. Fry | Trustee | Since January 2001 | ||
| 2005 Market Street | ||||
| Philadelphia, PA 19103 | ||||
| May 1960 | ||||
| Anthony D. Knerr | Trustee | Since April 1990 | ||
| 2005 Market Street | ||||
| Philadelphia, PA 19103 | ||||
| December 1938 | ||||
| Lucinda S. Landreth | Trustee | Since March 2005 | ||
| 2005 Market Street | ||||
| Philadelphia, PA 19103 | ||||
| June 1947 | ||||
52
| Number of Portfolios in | ||||
| Principal Occupation(s) | Fund Complex Overseen | Other Directorships | ||
| During Past 5 Years | by Trustee or Officer | Held by Trustee or Officer | ||
| Private Investor | 79 | Director | ||
| (March 2004–Present) | Bryn Mawr Bank Corp. (BMTC) | |||
| Investment Manager | Chairman of Investment | |||
| Morgan Stanley & Co. | Committee | |||
| (January 1984–March 2004) | Pennsylvania Academy of | |||
| Fine Arts | ||||
| Investment Committee and | ||||
| Governance Committee | ||||
| Member | ||||
| Pennsylvania Horticultural | ||||
| Society | ||||
| President | 79 | Director | ||
| Franklin & Marshall College | Community Health Systems | |||
| (July 2002–Present) | ||||
| Director | ||||
| Ecore International | ||||
| Executive Vice President | Director — Allied | |||
| University of Pennsylvania | Barton Securities Holdings | |||
| (April 1995–June 2002) | (2005 – 2008) | |||
| Founder and | 79 | None | ||
| Managing Director | ||||
| Anthony Knerr & Associates | ||||
| (Strategic Consulting) | ||||
| (1990–Present) | ||||
| Chief Investment Officer | 79 | None | ||
| Assurant, Inc. (Insurance) | ||||
| (2002–2004) | ||||
53
Board of trustees/directors and officers addendum
Delaware Investments® Family of Funds
Delaware Investments® Family of Funds
| Name, Address, | Position(s) | Length of | ||
| and Birth Date | Held with Fund(s) | Time Served | ||
| Independent Trustees (continued) | ||||
| Ann R. Leven | Trustee | Since October 1989 | ||
| 2005 Market Street | ||||
| Philadelphia, PA 19103 | ||||
| November 1940 | ||||
| Thomas F. Madison | Trustee | Since May 19973 | ||
| 2005 Market Street | ||||
| Philadelphia, PA 19103 | ||||
| February 1936 | ||||
3 In 1997, several funds managed by Voyageur Fund Managers, Inc. (the “Voyageur Funds”) were incorporated into the Delaware Investments Family of Funds. Mr. Madison served as a director of the Voyageur Funds from 1993 until 1997.
54
| Number of Portfolios in | ||||
| Principal Occupation(s) | Fund Complex Overseen | Other Directorships | ||
| During Past 5 Years | by Trustee or Officer | Held by Trustee or Officer | ||
| Consultant | 79 | Director and Audit | ||
| ARL Associates | Committee Chair – | |||
| (Financial Planning) | Systemax Inc. | |||
| (1983–Present) | (2001 – 2009) | |||
| Director and Audit | ||||
| Committee Chairperson – | ||||
| Andy Warhol Foundation | ||||
| (1999 – 2007) | ||||
| President and | 79 | Director and Chair of | ||
| Chief Executive Officer | Compensation Committee, | |||
| MLM Partners, Inc. | Governance Committee | |||
| (Small Business Investing | Member | |||
| and Consulting) | CenterPoint Energy | |||
| (January 1993–Present) | ||||
| Lead Director and Chair of | ||||
| Audit and Governance | ||||
| Committees, Member of | ||||
| Compensation Committee | ||||
| Digital River, Inc. | ||||
| Director and Chair of | ||||
| Governance Committee, | ||||
| Audit Committee | ||||
| Member | ||||
| Rimage Corporation | ||||
| Director and Chair of | ||||
| Compensation Committee | ||||
| Spanlink Communications | ||||
| Lead Director and Member of | ||||
| Compensation and | ||||
| Governance Committees | ||||
| Valmont Industries, Inc. | ||||
| (1987 – 2010) | ||||
55
Board of trustees/directors and officers addendum
Delaware Investments® Family of Funds
Delaware Investments® Family of Funds
| Name, Address, | Position(s) | Length of | ||
| and Birth Date | Held with Fund(s) | Time Served | ||
| Independent Trustees (continued) | ||||
| Thomas F. Madison | ||||
| 2005 Market Street | ||||
| Philadelphia, PA 19103 | ||||
| February 1936 | ||||
| Janet L. Yeomans | Trustee | Since April 1999 | ||
| 2005 Market Street | ||||
| Philadelphia, PA 19103 | ||||
| July 1948 | ||||
| J. Richard Zecher | Trustee | Since March 2005 | ||
| 2005 Market Street | ||||
| Philadelphia, PA 19103 | ||||
| July 1940 | ||||
56
| Number of Portfolios in | ||||
| Principal Occupation(s) | Fund Complex Overseen | Other Directorships | ||
| During Past 5 Years | by Trustee or Officer | Held by Trustee or Officer | ||
| Director | ||||
| Banner Health | ||||
| (1996 – 2007) | ||||
| Vice President and Treasurer | 79 | Director | ||
| (January 2006–Present) | Okabena Company | |||
| Vice President — Mergers & Acquisitions | ||||
| (January 2003–January 2006), and | ||||
| Vice President | ||||
| (July 1995–January 2003) | ||||
| 3M Corporation | ||||
| Founder | 79 | Director and Audit | ||
| Investor Analytics | Committee Member | |||
| (Risk Management) | Investor Analytics | |||
| (May 1999–Present) | ||||
| Founder | Director | |||
| Sutton Asset Management | Oxigene, Inc. | |||
| (Hedge Fund) | (2003 – 2008) | |||
| (September 1996–Present) | ||||
57
Board of trustees/directors and officers addendum
Delaware Investments® Family of Funds
Delaware Investments® Family of Funds
| Name, Address, | Position(s) | Length of | ||
| and Birth Date | Held with Fund(s) | Time Served | ||
| Officers | ||||
| David F. Connor | Vice President, | Vice President since | ||
| 2005 Market Street | Deputy General | September 2000 | ||
| Philadelphia, PA 19103 | Counsel, and Secretary | and Secretary since | ||
| December 1963 | October 2005 | |||
| Daniel V. Geatens | Vice President | Treasurer | ||
| 2005 Market Street | and Treasurer | since October 25, 2007 | ||
| Philadelphia, PA 19103 | ||||
| October 1972 | ||||
| David P. O’Connor | Senior Vice President, | Senior Vice President, | ||
| 2005 Market Street | General Counsel, | General Counsel, and | ||
| Philadelphia, PA 19103 | and Chief Legal Officer | Chief Legal Officer | ||
| February 1966 | since October 2005 | |||
| Richard Salus | Senior Vice President | Chief Financial Officer | ||
| 2005 Market Street | and Chief Financial Officer | since November 2006 | ||
| Philadelphia, PA 19103 | ||||
| October 1963 | ||||
The Statement of Additional Information for the Fund(s) includes additional information about the Trustees and Officers and is available, without charge, upon request by calling 800 523-1918.
58
| Number of Portfolios in | ||||
| Principal Occupation(s) | Fund Complex Overseen | Other Directorships | ||
| During Past 5 Years | by Trustee or Officer | Held by Trustee or Officer | ||
| David F. Connor has served as | 79 | None4 | ||
| Vice President and Deputy | ||||
| General Counsel of | ||||
| Delaware Investments | ||||
| since 2000. | ||||
| Daniel V. Geatens has served | 79 | None4 | ||
| in various capacities at | ||||
| different times at | ||||
| Delaware Investments. | ||||
| David P. O’Connor has served in | 79 | None4 | ||
| various executive and legal | ||||
| capacities at different times | ||||
| at Delaware Investments. | ||||
| Richard Salus has served in | 79 | None4 | ||
| various executive capacities | ||||
| at different times at | ||||
| Delaware Investments. | ||||
4 David F. Connor, Daniel V. Geatens, David P. O’Connor, and Richard Salus serve in similar capacities for the six portfolios of the Optimum Fund Trust, which have the same investment advisor, principal underwriter, and transfer agent as the registrant.
59
About the organization
| Board of trustees | |||
Patrick P. Coyne Chairman, President, and Chief Executive Officer Delaware Investments® Family of Funds Philadelphia, PA Thomas L. Bennett Private Investor Rosemont, PA John A. Fry President Franklin & Marshall College Lancaster, PA | Anthony D. Knerr Founder and Managing Director Anthony Knerr & Associates New York, NY Lucinda S. Landreth Former Chief Investment Officer Assurant, Inc. Philadelphia, PA | Ann R. Leven Consultant ARL Associates New York, NY Thomas F. Madison President and Chief Executive Officer MLM Partners, Inc. Minneapolis, MN | Janet L. Yeomans Vice President and Treasurer 3M Corporation St. Paul, MN J. Richard Zecher Founder Investor Analytics Scottsdale, AZ |
| Affiliated officers | |||
David F. Connor Vice President, Deputy General Counsel, and Secretary Delaware Investments Family of Funds Philadelphia, PA | Daniel V. Geatens Vice President and Treasurer Delaware Investments Family of Funds Philadelphia, PA | David P. O’Connor Senior Vice President, General Counsel, and Chief Legal Officer Delaware Investments Family of Funds Philadelphia, PA | Richard Salus Senior Vice President and Chief Financial Officer Delaware Investments Family of Funds Philadelphia, PA |
This annual report is for the information of Delaware Select Growth Fund shareholders, but it may be used with prospective investors when preceded or accompanied by a current prospectus for Delaware Select Growth Fund and the Delaware Investments Fund fact sheet for the most recently completed calendar quarter. These documents are available at www.delawareinvestments.com. The prospectus sets forth details about charges, expenses, investment objectives, and operating policies of the investment company. You should read the prospectus carefully before you invest. The figures in this report represent past results that are not a guarantee of future results. The return and principal value of an investment in the investment company will fluctuate so that shares, when redeemed, may be worth more or less than their original cost. |
Delaware Investments is the marketing name of Delaware Management Holdings, Inc. and its subsidiaries. The Fund files its complete schedule of portfolio holdings with the Securities and Exchange Commission (SEC) for the first and third quarters of each fiscal year on Form N-Q. The Fund’s Forms N-Q, as well as a description of the policies and procedures that the Fund uses to determine how to vote proxies (if any) relating to portfolio securities are available without charge (i) upon request, by calling 800 523-1918; and (ii) on the SEC’s Web site at www.sec.gov. In addition, a description of the policies and procedures that the Fund uses to determine how to vote proxies (if any) relating to portfolio securities and the Fund’s Schedule of Investments are available without charge on the Fund’s Web site at www.delawareinvestments.com. The Fund’s Forms N-Q may be reviewed and copied at the SEC’s Public Reference Room in Washington, D.C.; information on the operation of the Public Reference Room may be obtained by calling 800 SEC-0330. Information (if any) regarding how the Fund voted proxies relating to portfolio securities during the most recently disclosed 12-month period ended June 30 is available without charge (i) through the Fund’s Web site at www.delawareinvestments.com; and (ii) on the SEC’s Web site at www.sec.gov. |
60
Annual report Delaware Large Cap Core Fund April 30, 2010 Core equity mutual fund |
This annual report is for the information of Delaware Large Cap Core Fund shareholders, but it may be used with prospective investors when preceded or accompanied by a current prospectus for Delaware Large Cap Core Fund. The figures in the annual report for Delaware Large Cap Core Fund represent past results, which are not a guarantee of future results. The return and principal value of an investment in the Fund will fluctuate so that shares, when redeemed, may be worth more or less than their original cost. Current performance may be higher or lower than the performance data quoted. This Fund is available only to certain residents of certain states. You should consider the investment objectives, risks, charges, and expenses of the Fund carefully before investing. The Delaware Large Cap Core Fund prospectus contains this and other important information about the Fund. Prospectuses for all open-end funds in the Delaware Investments® Family of Funds are available from your financial advisor, online at www.delawareinvestments.com, or by phone at 800 523-1918. Please read the prospectus carefully before you invest or send money. |
You can obtain shareholder reports and prospectuses online instead of in the mail. Visit www.delawareinvestments.com/edelivery. |
Experience Delaware Investments
Delaware Investments is committed to the pursuit of consistently superior asset management and unparalleled client service. We believe in our investment processes, which seek to deliver consistent results, and in convenient services that help add value for our clients.
If you are interested in learning more about creating an investment plan, contact your financial advisor.
You can learn more about Delaware Investments or obtain a prospectus for Delaware Large Cap Core Fund at www.delawareinvestments.com.
| Manage your investments online |
|
On January 4, 2010, Delaware Management Holdings, Inc., and its subsidiaries (collectively known by the marketing name of Delaware Investments) were sold by a subsidiary of Lincoln National Corporation to Macquarie Group Limited, a global provider of banking, financial, advisory, investment and funds management services. Please see your Fund’s prospectus and any supplements thereto for more complete information.
Investments in Delaware Large Cap Core Fund are not and will not be deposits with or liabilities of Macquarie Bank Limited ABN 46 008 583 542 and its holding companies, including their subsidiaries or related companies (Macquarie Group), and are subject to investment risk, including possible delays in repayment and loss of income and capital invested. No Macquarie Group company guarantees or will guarantee the performance of the Fund, the repayment of capital from the Fund, or any particular rate of return.
| Table of contents | |
| Portfolio management review | 1 |
| Performance summary | 4 |
| Disclosure of Fund expenses | 8 |
| Sector allocation and top 10 holdings | 10 |
| Statement of net assets | 11 |
| Statement of operations | 15 |
| Statements of changes in net assets | 16 |
| Financial highlights | 18 |
| Notes to financial statements | 22 |
| Report of independent registered public accounting firm | 31 |
| Other Fund information | 32 |
| Board of trustees/directors and officers addendum | 42 |
| About the organization | 52 |
Unless otherwise noted, views expressed herein are current as of April 30, 2010, and are subject to change.
Funds are not FDIC insured and are not guaranteed. It is possible to lose the principal amount invested.
Mutual fund advisory services provided by Delaware Management Company, a series of Delaware Management Business Trust, which is a registered investment advisor. Delaware Investments, a member of Macquarie Group, refers to Delaware Management Holdings, Inc. and its subsidiaries, including the Fund’s distributor Delaware Distributors, L.P. Macquarie Group refers to Macquarie Group Limited and its subsidiaries and affiliates worldwide.
© 2010 Delaware Management Holdings, Inc.
All third-party trademarks cited are the property of their respective owners.
| Portfolio management review | |
| Delaware Large Cap Core Fund | May 11, 2010 |
| Performance preview | ||||
| Delaware Large Cap Core Fund (Class A shares) | 1-year return | +35.93% | ||
| S&P 500 Index (benchmark) | 1-year return | +38.84% |
Past performance does not guarantee future results. For complete, annualized performance for Delaware Large Cap Core Fund please see the table on page 4. The performance of Class A shares excludes the applicable sales charge and reflects the reinvestment of all distributions. Index performance returns do not reflect any management fees, transaction costs, or expenses. Indices are unmanaged and one cannot invest directly in an index. |
The U.S. stock market rose steadily during the Fund’s fiscal year ended April 30, 2010, interrupted only by several brief retreats. When the period began in May 2009, stock prices had already begun to rally off of their early March 2009 lows.
- Although the economy started the fiscal period still in the midst of a severe recession, it became apparent as the period unfolded that a worst-case scenario — a depression — was increasingly less likely.
- The Federal Reserve kept its target short-term interest rate near 0%, enabling companies and individuals to borrow funds at low interest rates.
- The Fed also bought hundreds of billions of dollars in agency mortgage-backed securities, generally providing a crutch to financial firms as well as the broader housing market.
- For its part, the federal government continued to inject stimulus funds into the economy, helping to buoy, and eventually boost, gross domestic product figures during the year.
Growth with high unemployment
As the period progressed, evidence of an improving economy mounted. U.S. gross domestic product — a measure of economic growth — fell 0.7% in the spring of 2009 but turned positive in the third quarter of 2009. By the final three months of 2009, GDP growth was up 5.6% — the fastest expansion for the U.S. economy in six years — followed by an estimated 3.2% for the first three months of 2010. (Source: U.S. Commerce Department.) Growth was driven by an uptick in business spending as well as a more free-spending consumer. Consumer spending typically makes up approximately two-thirds of the domestic economy, so increased consumer spending during the period provided a notable boost to economic growth.
As investors became more optimistic about the economy, they seemed eager to buy stocks. With the exception of several brief periods of retrenchment, stocks rose during the fiscal period. Smaller, more speculative stocks generally did better than their larger, higher-quality counterparts as many investors seemed to prefer less-safe opportunities that they believed offered the potential for greater gains.
Despite the positive economic trends, unemployment remained a notable soft spot. According to the U.S. Labor Department, the jobless rate finished April 2010 at 9.9%. While it was below the peak level of 10.2% the previous October, it was one full percentage point higher than at the start of the Fund’s fiscal year in May 2009 — indicating that significant economic challenges remained.
1
Portfolio management review
Delaware Large Cap Core Fund
Delaware Large Cap Core Fund
Portfolio shifts
For its fiscal year ended April 30, 2010, Delaware Large Cap Core Fund (Class A shares with distributions reinvested) returned +35.93% at net asset value and +28.19% at maximum offer price. In comparison, the Fund’s benchmark, the S&P 500 Index, returned +38.84% during the same period.
Like many investors at the start of the period, we had concerns about the health of the global economy. Yet, we also saw many fundamentally solid businesses that, in our view, had good long-term performance prospects and appeared to be undervalued by the market, especially in the early part of the reporting period. By following our bottom-up approach to stock selection — meaning we choose investments based on their individual characteristics uncovered through our thorough research process — we invested in businesses that we believed had stable balance sheets, offered the potential for healthy long-term earnings prospects, and were selling for unusually attractive prices.
In many cases, we bought stocks of companies we believed were positioned to take advantage of a recovering economy. For example, we added to our holdings in basic materials and energy, two sectors that have historically benefited from rising commodity prices and recovery in industrial demand. We also added to our technology exposure as we believed improving corporate and consumer spending would provide a boost to technology revenue growth.
Later in the period, stock valuations had risen substantially and were no longer reflecting an extremely distressed economic environment. Because we remained optimistic about the potential for further economic improvement and earnings growth, we maintained the Fund’s relative overweighting in cyclical sectors such as basic materials, energy, and consumer discretionary. We also looked for opportunities to purchase stocks of companies that had not fully participated in the market rally despite having an attractive earnings growth profile over the coming years.
Financials, healthcare, technology lagged
Compared with the Fund’s benchmark index, stock selection in the financial sector was the biggest drag on performance. Specifically, a lack of exposure to shares of Bank of America (which we added to the Fund in April 2010) had the largest negative impact on returns. These shares along with a number of other damaged financial franchises rallied significantly during the second quarter of 2009 as economic and capital markets conditions saw signs of improvement and investors’ risk appetite re-emerged. On the positive side, we did experience solid results from several other stocks in the financial sector, most notably consumer-finance company Capital One Financial and diversified financial-services provider Prudential Financial.
The healthcare and technology sectors were two additional sources of underperformance relative to the benchmark index. Biopharmaceuticals maker Gilead Sciences detracted from performance the most, while shares of QUALCOMM, a manufacturer of chips for mobile communications devices, fell after the company forecasted weaker-than-expected earnings. We held both stocks at the end of the period as both companies trade at attractive valuations and offer solid earnings growth potential over the next few years.
2
Commodity and consumer gains
On the positive side, the basic materials sector provided the strongest contribution to our relative performance. In particular, we benefited from positions in steelmaker United States Steel and chemical manufacturer Dow Chemical. The materials sector had been hit hard during the market’s downturn, but more recently an improving economy boosted commodity prices and industrial demand — a primary reason for the earnings growth of United States Steel, Dow Chemical, and other stocks within this sector. Energy companies benefited from higher commodity prices as well, and Occidental Petroleum was the Fund’s top relative performer in that group during the past year.
The consumer discretionary sector was an additional source of gains for the Fund. While this group performed poorly as the recession tightened its grip in early 2009, it began to bounce back as investors’ optimism about the economy improved and consumer spending increased. Our top-performing stock in this sector was retailer Urban Outfitters, a well-managed company, in our opinion, that took market share from many of its competitors during the fiscal year.
3
| Performance summary | |
| Delaware Large Cap Core Fund | April 30, 2010 |
The performance data quoted represent past performance; past performance does not guarantee future results. Investment return and principal value will fluctuate so your shares, when redeemed, may be worth more or less than their original cost. Please obtain the performance data current for the most recent month end by calling 800 523-1918 or visiting our Web site at www.delawareinvestments.com/performance. Current performance may be lower or higher than the performance data quoted.
You should consider the investment objectives, risks, charges, and expenses of the investment company carefully before investing. The Delaware Large Cap Core Fund prospectus contains this and other important information about the investment company. Please request a prospectus through your financial advisor or by calling 800 523-1918 or visiting our Web site at www.delawareinvestments.com. Read the prospectus carefully before you invest or send money.
| Fund performance | Average annual total returns through April 30, 2010 | |||||||||||
| 1 year | 3 years | Lifetime | ||||||||||
| Class A (Est. Aug. 31, 2006) | ||||||||||||
| Excluding sales charge | +35.93% | -5.64% | -0.98% | |||||||||
| Including sales charge | +28.19% | -7.48% | -2.57% | |||||||||
| Institutional Class (Est. Aug. 31, 2006) | ||||||||||||
| Excluding sales charge | +36.11% | -5.64% | -0.98% | |||||||||
| Including sales charge | +36.11% | -5.64% | -0.98% | |||||||||
Class C and R shares had not commenced operations as of April 30, 2010.
Returns reflect the reinvestment of all distributions and any applicable sales charges as noted in the following paragraphs.
Expense limitations were in effect for certain classes during the periods shown in the “Fund performance” chart and in the “Performance of a $10,000 investment” chart. The current expenses for each class are listed on the “Fund expense ratios” chart. (Note that all charts and graphs referred to in the “Performance summary” section of this report are found on pages 4 through 6.) Performance would have been lower had the expense limitations not been in effect.
The Fund offers Class A and Institutional Class shares.
Class A shares are sold with a maximum front-end sales charge of up to 5.75%, and have an annual distribution and service fee of up to 0.25% of average daily net assets.
Class C and R shares are available only for certain retirement plan products. They are sold without a sales charge and have an annual distribution and service fee of up to 1.00% and 0.60%, respectively, of average daily net assets, but such fees are currently subject to a voluntary waiver, which may be terminated or modified at any time. No Class C or R shares were available during the periods shown.
Institutional Class shares were first made available Aug. 31, 2006, and are available without sales or asset-based distribution charges only to certain eligible institutional accounts.
4
The “Fund performance” table and the “Performance of a $10,000 investment” graph do not reflect the deduction of taxes the shareholder would pay on Fund distributions or redemptions of Fund shares.
The Fund’s expense ratios, as described in the most recent prospectus, are disclosed in the following “Fund expense ratios” chart. Delaware Investments has voluntarily agreed to reimburse certain expenses and/or waive certain fees in order to prevent total fund operating expenses from exceeding 0.95% of the Fund’s average daily net assets. Please see the most recent prospectus and any applicable supplements thereto for additional information on these fee waivers and/or reimbursements.
| Fund expense ratios | Class A | Class C | Class R | Institutional Class | |||
| Total annual operating expenses | 1.87% | 2.62% | 2.22% | 1.62% | |||
| (without fee waivers) | |||||||
| Net expenses | 0.95% | 0.95% | 0.95% | 0.95% | |||
| (including fee waivers, if any) | |||||||
| Type of waiver | Voluntary | Voluntary | Voluntary | Voluntary |
5
Performance summary
Performance of a $10,000 investment
Average annual total returns from Aug. 31, 2006 (Fund’s inception), through April 30, 2010
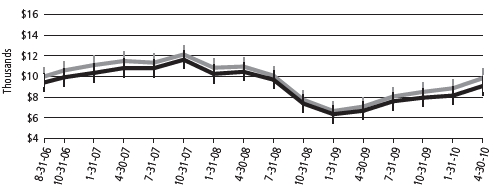
| For period beginning Aug. 31, 2006 (Fund’s inception), through April 30, 2010 | ||||
| Starting value | Ending value | |||
| S&P 500 Index | $10,000 | $9,848 | ||
| Delaware Large Cap Core Fund — Class A shares | $ 9,425 | $9,091 | ||
The chart assumes $10,000 invested in the Fund on Aug. 31, 2006, and includes the effect of a 5.75% front-end sales charge and the reinvestment of all distributions. Please note additional details on these fees in the “Performance summary” section of this report, which includes pages 4 through 6.
The chart also assumes $10,000 invested in the S&P 500 Index as of Aug. 31, 2006.
The S&P 500 Index measures the performance of 500 mostly large-cap stocks weighted by market value, and is often used to represent performance of the U.S. stock market.
An index is unmanaged and does not reflect the costs of operating a mutual fund, such as the costs of buying, selling, and holding securities. You cannot invest directly in an index. Past performance is not a guarantee of future results.
Performance of other Fund classes will vary due to different charges and expenses.
The “Fund performance” chart and the “Performance of a $10,000 investment” graph do not reflect the deduction of taxes the shareholders would pay on Fund distributions or redemptions of Fund shares.
| Nasdaq symbols | CUSIPs | ||||||
| Class A | DDCAX | 246118582 | |||||
| Institutional Class | DDCIX | 246118558 | |||||
6
Disclosure of Fund expenses
For the period November 1, 2009 to April 30, 2010
For the period November 1, 2009 to April 30, 2010
As a shareholder of the Fund, you incur two types of costs: (1) transaction costs, including sales charges (loads) on purchase payments, reinvested dividends, or other distributions; redemption fees; and exchange fees; and (2) ongoing costs, including management fees; distribution and/or service (12b-1) fees; and other Fund expenses. This example is intended to help you understand your ongoing costs (in dollars) of investing in the Fund and to compare these costs with the ongoing costs of investing in other mutual funds.
The example is based on an investment of $1,000 invested at the beginning of the period and held for the entire period from November 1, 2009 to April 30, 2010.
Actual expenses
The first section of the table shown, “Actual Fund return,” provides information about actual account values and actual expenses. You may use the information in this section of the table, together with the amount you invested, to estimate the expenses that you paid over the period. Simply divide your account value by $1,000 (for example, an $8,600 account value divided by $1,000 = 8.6), then multiply the result by the number in the first section under the heading entitled “Expenses Paid During Period” to estimate the expenses you paid on your account during this period.
Hypothetical example for comparison purposes
The second section of the table shown, “Hypothetical 5% return,” provides information about hypothetical account values and hypothetical expenses based on the Fund’s actual expense ratio and an assumed rate of return of 5% per year before expenses, which is not the Fund’s actual return. The hypothetical account values and expenses may not be used to estimate the actual ending account balance or expenses you paid for the period. You may use this information to compare the ongoing costs of investing in the Fund and other funds. To do so, compare this 5% hypothetical example with the 5% hypothetical examples that appear in the shareholder reports of the other funds.
Please note that the expenses shown in the table are meant to highlight your ongoing costs only and do not reflect any transactional costs, such as sales charges (loads), redemption fees, or exchange fees. Therefore, the second section of the table is useful in comparing ongoing costs only, and will not help you determine the relative total costs of owning different funds. In addition, if these transactional costs were included, your costs would have been higher. The Fund’s expenses shown in the table reflect fee waivers in effect. The expenses shown in the table assume reinvestment of all dividends and distributions.
8
Delaware Large Cap Core Fund
Expense analysis of an investment of $1,000
Expense analysis of an investment of $1,000
| Beginning | Ending | Expenses | |||||
| Account Value | Account Value | Annualized | Paid During Period | ||||
| 11/1/09 | 4/30/10 | Expense Ratio | 4/30/10* | ||||
| Actual Fund return | |||||||
| Class A | $1,000.00 | $1,142.90 | 0.95% | $5.05 | |||
| Institutional Class | 1,000.00 | 1,142.90 | 0.95% | 5.05 | |||
| Hypothetical 5% return (5% return before expenses) | |||||||
| Class A | $1,000.00 | $1,020.08 | 0.95% | $4.76 | |||
| Institutional Class | 1,000.00 | 1,020.08 | 0.95% | 4.76 | |||
*“Expenses Paid During Period” are equal to the Fund’s annualized expense ratio, multiplied by the average account value over the period, multiplied by 181/365 (to reflect the one-half year period).
9
| Sector allocation and top 10 holdings | |
| Delaware Large Cap Core Fund | As of April 30, 2010 |
Sector designations may be different than the sector designations presented in other Fund materials. The sector designations may represent the investment manager’s internal sector classifications, which may result in the sector designations for one fund being different than another fund’s sector designations.
| Sector | Percentage of net assets | |
| Common Stock | 98.55 | % |
| Basic Materials | 5.77 | % |
| Capital Goods | 8.32 | % |
| Communication Services | 0.80 | % |
| Consumer Discretionary | 6.82 | % |
| Consumer Services | 1.82 | % |
| Consumer Staples | 5.55 | % |
| Energy | 13.77 | % |
| Financials | 14.73 | % |
| Health Care | 11.97 | % |
| Media | 3.27 | % |
| Technology | 22.44 | % |
| Transportation | 3.29 | % |
| Discount Note | 0.72 | % |
| Total Value of Securities | 99.27 | % |
| Receivables and Other Assets Net of Liabilities | 0.73 | % |
| Total Net Assets | 100.00 | % |
Holdings are for informational purposes only and are subject to change at any time. They are not a recommendation to buy, sell, or hold any security.
| Top 10 holdings | Percentage of net assets | |
| Exxon Mobil | 3.60 | % |
| Microsoft | 3.52 | % |
| Wells Fargo | 2.89 | % |
| Hewlett-Packard | 2.82 | % |
| Procter & Gamble | 2.75 | % |
| Apple | 2.65 | % |
| United Technologies | 2.64 | % |
| Bank of America | 2.58 | % |
| JPMorgan Chase | 2.54 | % |
| Google Class A | 2.51 | % |
10
| Statement of net assets | |
| Delaware Large Cap Core Fund | April 30, 2010 |
| Number of shares | Value | ||||||
| Common Stock – 98.55% | |||||||
| Basic Materials – 5.77% | |||||||
| Alcoa | 1,350 | $ | 18,144 | ||||
| Dow Chemical | 750 | 23,123 | |||||
| † | Owens-Illinois | 870 | 30,832 | ||||
| United States Steel | 450 | 24,597 | |||||
| 96,696 | |||||||
| Capital Goods – 8.32% | |||||||
| Fluor | 330 | 17,437 | |||||
| Goodrich | 290 | 21,512 | |||||
| Honeywell International | 620 | 29,431 | |||||
| Lincoln Electric Holdings | 250 | 14,985 | |||||
| Lockheed Martin | 140 | 11,885 | |||||
| United Technologies | 590 | 44,221 | |||||
| 139,471 | |||||||
| Communication Services – 0.80% | |||||||
| Qwest Communications International | 2,570 | 13,441 | |||||
| 13,441 | |||||||
| Consumer Discretionary – 6.82% | |||||||
| † | Alaska Air Group | 220 | 9,110 | ||||
| Guess | 510 | 23,394 | |||||
| † | Kohl’s | 240 | 13,198 | ||||
| Nordstrom | 450 | 18,599 | |||||
| Phillips-Van Heusen | 380 | 23,944 | |||||
| † | Urban Outfitters | 695 | 26,068 | ||||
| 114,313 | |||||||
| Consumer Services – 1.82% | |||||||
| † | WMS Industries | 610 | 30,512 | ||||
| 30,512 | |||||||
| Consumer Staples – 5.55% | |||||||
| CVS Caremark | 620 | 22,897 | |||||
| Jarden | 750 | 24,090 | |||||
| Procter & Gamble | 740 | 45,998 | |||||
| 92,985 | |||||||
| Energy – 13.77% | |||||||
| Chevron | 360 | 29,318 | |||||
| ConocoPhillips | 300 | 17,757 | |||||
| Devon Energy | 220 | 14,813 | |||||
| EOG Resources | 130 | 14,576 | |||||
11
Statement of net assets
Delaware Large Cap Core Fund
Delaware Large Cap Core Fund
| Number of shares | Value | ||||||
| Common Stock (continued) | |||||||
| Energy (continued) | |||||||
| EQT | 180 | $ | 7,828 | ||||
| Exxon Mobil | 890 | 60,386 | |||||
| National Oilwell Varco | 260 | 11,448 | |||||
| Noble | 360 | 14,216 | |||||
| Occidental Petroleum | 350 | 31,031 | |||||
| Schlumberger | 410 | 29,282 | |||||
| 230,655 | |||||||
| Financials – 14.73% | |||||||
| AFLAC | 470 | 23,951 | |||||
| Bank of America | 2,420 | 43,149 | |||||
| Bank of New York Mellon | 760 | 23,659 | |||||
| Capital One Financial | 250 | 10,853 | |||||
| JPMorgan Chase | 1,000 | 42,580 | |||||
| Prudential Financial | 540 | 34,322 | |||||
| † | TD AmeriTrade Holding | 1,000 | 20,020 | ||||
| Wells Fargo | 1,460 | 48,340 | |||||
| 246,874 | |||||||
| Health Care – 11.97% | |||||||
| † | Amgen | 410 | 23,518 | ||||
| † | Celgene | 290 | 17,966 | ||||
| † | Express Scripts Class A | 390 | 39,050 | ||||
| † | Gilead Sciences | 540 | 21,422 | ||||
| Merck | 990 | 34,690 | |||||
| Pfizer | 2,224 | 37,184 | |||||
| UnitedHealth Group | 880 | 26,673 | |||||
| 200,503 | |||||||
| Media – 3.27% | |||||||
| Time Warner Cable | 490 | 27,563 | |||||
| † | Viacom Class B | 770 | 27,204 | ||||
| 54,767 | |||||||
| Technology – 22.44% | |||||||
| † | Apple | 170 | 44,390 | ||||
| † | Cisco Systems | 1,290 | 34,727 | ||||
| † | EMC | 1,810 | 34,408 | ||||
| † | Google Class A | 80 | 42,035 | ||||
| Hewlett-Packard | 910 | 47,293 | |||||
| Intel | 1,610 | 36,756 | |||||
| † | McAfee | 300 | 10,425 | ||||
12
| Number of shares | Value | ||||||||
| Common Stock (continued) | |||||||||
| Technology (continued) | |||||||||
| Microsoft | 1,930 | $ | 58,943 | ||||||
| † | NetApp | 650 | 22,536 | ||||||
| † | ON Semiconductor | 1,500 | 11,910 | ||||||
| QUALCOMM | 840 | 32,542 | |||||||
| 375,965 | |||||||||
| Transportation – 3.29% | |||||||||
| Norfolk Southern | 470 | 27,885 | |||||||
| Union Pacific | 360 | 27,238 | |||||||
| 55,123 | |||||||||
| Total Common Stock (cost $1,401,088) | 1,651,305 | ||||||||
| Principal amount | |||||||||
| ≠Discount Note – 0.72% | |||||||||
| Federal Home Loan Bank 0.06% 5/3/10 | $ | 12,000 | 12,000 | ||||||
| Total Discount Note (cost $12,000) | 12,000 | ||||||||
| Total Value of Securities – 99.27% | |||||||||
| (cost $1,413,088) | 1,663,305 | ||||||||
| Receivables and Other Assets | |||||||||
| Net of Liabilities – 0.73% | 12,186 | ||||||||
| Net Assets Applicable to 220,597 | |||||||||
| Shares Outstanding – 100.00% | $ | 1,675,491 | |||||||
| Net Asset Value – Delaware Large Cap Core Fund | |||||||||
| Class A ($31,329 / 4,126 Shares) | $7.59 | ||||||||
| Net Asset Value – Delaware Large Cap Core Fund | |||||||||
| Institutional Class ($1,644,162 / 216,471 Shares) | $7.60 | ||||||||
| Components of Net Assets at April 30, 2010: | |||||||||
| Shares of beneficial interest (unlimited authorization - no par) | $ | 1,947,521 | |||||||
| Accumulated net realized loss on investments | (522,247 | ) | |||||||
| Net unrealized appreciation of investments | 250,217 | ||||||||
| Total net assets | $ | 1,675,491 | |||||||
†Non income producing security.
≠The rate shown is the effective yield at the time of purchase.
13
Statement of net assets
Delaware Large Cap Core Fund
Delaware Large Cap Core Fund
| Net Asset Value and Offering Price Per Share — | |||
| Delaware Large Cap Core Fund | |||
| Net asset value Class A (A) | $7.59 | ||
| Sales charge (5.75% of offering price) (B) | 0.46 | ||
| Offering price | $8.05 | ||
| (A) | Net asset value per share, as illustrated, is the amount which would be paid upon redemption or repurchase of shares. | |
| (B) | See the current prospectus for purchases of $50,000 or more. |
See accompanying notes
14
| Statement of operations | |
| Delaware Large Cap Core Fund | Year Ended April 30, 2010 |
| Investment Income: | ||||||||
| Dividends | $ | 23,471 | ||||||
| Interest | 18 | |||||||
| Security lending income | (2 | ) | $ | 23,487 | ||||
| Expenses: | ||||||||
| Audit and tax fees | 10,861 | |||||||
| Management fees | 10,113 | |||||||
| Reports and statements to shareholders | 8,159 | |||||||
| Dividend disbursing and transfer agent fees and expenses | 6,353 | |||||||
| Registration fees | 2,846 | |||||||
| Dues and services | 1,707 | |||||||
| Pricing fees | 1,353 | |||||||
| Legal fees | 768 | |||||||
| Accounting and administration expenses | 621 | |||||||
| Custodian fees | 587 | |||||||
| Trustees’ fees | 95 | |||||||
| Insurance fees | 47 | |||||||
| Distribution expenses - Class A | 28 | |||||||
| Consulting fees | 28 | |||||||
| Trustees’ expenses | 11 | 43,577 | ||||||
| Less fees waived | (28,768 | ) | ||||||
| Less waived distribution expenses - Class A | (28 | ) | ||||||
| Total operating expenses | 14,781 | |||||||
| Net Investment Income | 8,706 | |||||||
| Net Realized and Unrealized Gain (Loss) on Investments: | ||||||||
| Net realized loss on investments | (103,026 | ) | ||||||
| Net change in unrealized appreciation/depreciation of investments | 573,290 | |||||||
| Net Realized and Unrealized Gain on Investments | 470,264 | |||||||
| Net Increase in Net Assets Resulting from Operations | $ | 478,970 | ||||||
See accompanying notes
15
Statements of changes in net assets
Delaware Large Cap Core Fund
Delaware Large Cap Core Fund
| Year Ended | ||||||||
| 4/30/10 | 4/30/09 | |||||||
| Increase (Decrease) in Net Assets from Operations: | ||||||||
| Net investment income | $ | 8,706 | $ | 20,377 | ||||
| Net realized loss on investments | (103,026 | ) | (354,223 | ) | ||||
| Net change in unrealized appreciation/depreciation | ||||||||
| of investments | 573,290 | (472,102 | ) | |||||
| Net increase (decrease) in net assets resulting from operations | 478,970 | (805,948 | ) | |||||
| Dividends and Distributions to Shareholders from: | ||||||||
| Net investment income: | ||||||||
| Class A | (89 | ) | (148 | ) | ||||
| Institutional Class | (12,568 | ) | (21,906 | ) | ||||
| (12,657 | ) | (22,054 | ) | |||||
| Capital Share Transactions: | ||||||||
| Proceeds from shares sold: | ||||||||
| Class A | 19,779 | 163 | ||||||
| Institutional Class | — | 87 | ||||||
| Net asset value of shares issued upon reinvestment | ||||||||
| of dividends and distributions: | ||||||||
| Class A | 89 | 148 | ||||||
| Institutional Class | 12,568 | 21,906 | ||||||
| 32,436 | 22,304 | |||||||
| Cost of shares repurchased: | ||||||||
| Class A | (964 | ) | (17,473 | ) | ||||
| Institutional Class | (250,000 | ) | — | |||||
| (250,964 | ) | (17,473 | ) | |||||
| Increase (decrease) in net assets derived from | ||||||||
| capital share transactions | (218,528 | ) | 4,831 | |||||
| Net Increase (Decrease) in Net Assets | 247,785 | (823,171 | ) | |||||
| Net Assets: | ||||||||
| Beginning of year | 1,427,706 | 2,250,877 | ||||||
| End of year (including undistributed net investment | ||||||||
| income of $- and $3,324, respectively) | $ | 1,675,491 | $ | 1,427,706 | ||||
See accompanying notes
16
Financial highlights
Delaware Large Cap Core Fund Class A
Delaware Large Cap Core Fund Class A
Selected data for each share of the Fund outstanding throughout each period were as follows:
| Net asset value, beginning of period |
| Income (loss) from investment operations: |
| Net investment income2 |
| Net realized and unrealized gain (loss) on investments |
| Total from investment operations |
| Less dividends and distributions from: |
| Net investment income |
| Net realized gain on investments |
| Total dividends and distributions |
| Net asset value, end of period |
| Total return3 |
| Ratios and supplemental data: |
| Net assets, end of period (000 omitted) |
| Ratio of expenses to average net assets |
| Ratio of expenses to average net assets |
| prior to fees waived and expense paid indirectly |
| Ratio of net investment income to average net assets |
| Ratio of net investment income (loss) to average net assets |
| prior to fees waived and expense paid indirectly |
| Portfolio turnover |
1 Date of commencement of operations; ratios and portfolio turnover have been annualized and total return has not been annualized. |
2 The average shares outstanding method has been applied for per share information. |
3 Total investment return is based on the change in net asset value of a share during the period and assumes reinvestment of dividends and distributions at net asset value and does not reflect the impact of a sales charge. Total investment return during all of the periods shown reflects waivers by the manager and distributor. Performance would have been lower had the waivers not been in effect. |
See accompanying notes
18
| 8/31/061 | |||||||||||||
| Year Ended | to | ||||||||||||
| 4/30/10 | 4/30/09 | 4/30/08 | 4/30/07 | ||||||||||
| $5.630 | $8.930 | $9.700 | $8.500 | ||||||||||
| 0.038 | 0.081 | 0.073 | 0.039 | ||||||||||
| 1.978 | (3.293 | ) | (0.368 | ) | 1.216 | ||||||||
| 2.016 | (3.212 | ) | (0.295 | ) | 1.255 | ||||||||
| (0.056 | ) | (0.088 | ) | (0.067 | ) | (0.025 | ) | ||||||
| — | — | (0.408 | ) | (0.030 | ) | ||||||||
| (0.056 | ) | (0.088 | ) | (0.475 | ) | (0.055 | ) | ||||||
| $7.590 | $5.630 | $8.930 | $9.700 | ||||||||||
| 35.93% | (36.04% | ) | (3.36% | ) | 14.81% | ||||||||
| $31 | $10 | $32 | $14 | ||||||||||
| 0.95% | 0.95% | 0.95% | 0.96% | ||||||||||
| 3.05% | 1.87% | 3.03% | 5.27% | ||||||||||
| 0.56% | 1.20% | 0.77% | 0.64% | ||||||||||
| (1.54% | ) | 0.28% | (1.31% | ) | (3.67% | ) | |||||||
| 65% | 38% | 30% | 30% | ||||||||||
19
Financial highlights
Delaware Large Cap Core Fund Institutional Class
Delaware Large Cap Core Fund Institutional Class
Selected data for each share of the Fund outstanding throughout each period were as follows:
| Net asset value, beginning of period |
| Income (loss) from investment operations: |
| Net investment income2 |
| Net realized and unrealized gain (loss) on investments |
| Total from investment operations |
| Less dividends and distributions from: |
| Net investment income |
| Net realized gain on investments |
| Total dividends and distributions |
| Net asset value, end of period |
| Total return3 |
| Ratios and supplemental data: |
| Net assets, end of period (000 omitted) |
| Ratio of expenses to average net assets |
| Ratio of expenses to average net assets |
| prior to fees waived and expense paid indirectly |
| Ratio of net investment income to average net assets |
| Ratio of net investment income (loss) to average net assets |
| prior to fees waived and expense paid indirectly |
| Portfolio turnover |
1 Date of commencement of operations; ratios and portfolio turnover have been annualized and total return has not been annualized.
2 The average shares outstanding method has been applied for per share information.
3 Total investment return is based on the change in net asset value of a share during the period and assumes reinvestment of dividends and distributions at net asset value. Total investment return during all of the periods shown reflects a waiver by the manager. Performance would have been lower had the waiver not been in effect.
See accompanying notes
20
| 8/31/061 | ||||||||||||
| Year Ended | to | |||||||||||
| 4/30/10 | 4/30/09 | 4/30/08 | 4/30/07 | |||||||||
| $5.630 | $8.930 | $9.700 | $8.500 | |||||||||
| 0.038 | 0.081 | 0.073 | 0.039 | |||||||||
| 1.988 | (3.293 | ) | (0.368 | ) | 1.216 | |||||||
| 2.026 | (3.212 | ) | (0.295 | ) | 1.255 | |||||||
| (0.056 | ) | (0.088 | ) | (0.067 | ) | (0.025 | ) | |||||
| — | — | (0.408 | ) | (0.030 | ) | |||||||
| (0.056 | ) | (0.088 | ) | (0.475 | ) | (0.055 | ) | |||||
| $7.600 | $5.630 | $8.930 | $9.700 | |||||||||
| 36.11% | (36.04% | ) | (3.36% | ) | 14.81% | |||||||
| $1,644 | $1,418 | $2,219 | $2,296 | |||||||||
| 0.95% | 0.95% | 0.95% | 0.96% | |||||||||
| 2.80% | 1.62% | 2.78% | 5.02% | |||||||||
| 0.56% | 1.20% | 0.77% | 0.64% | |||||||||
| (1.29% | ) | 0.53% | (1.06% | ) | (3.42% | ) | ||||||
| 65% | 38% | 30% | 30% | |||||||||
21
| Notes to financial statements | |
| Delaware Large Cap Core Fund | April 30, 2010 |
Voyageur Mutual Funds III (Trust) is organized as a Delaware statutory trust and offers two series, Delaware Large Cap Core Fund and Delaware Select Growth Fund. These financial statements and the related notes pertain to Delaware Large Cap Core Fund (Fund). The Trust is an open-end investment company. The Fund is considered diversified under the Investment Company Act of 1940, as amended, and offers Class A, Class C, Class R and Institutional Class shares. Class A shares are sold with a maximum front-end sales charge of up to 5.75%. Class A share purchases of $1,000,000 or more will incur a contingent deferred sales charge (CDSC) of 1% if redeemed during the first year and 0.50% during the second year, provided that Delaware Distributors, L.P. (DDLP) paid a financial advisor a commission on the purchase of those shares. Class C shares are sold with a CDSC of 1%, if redeemed during the first 12 months. Class R and Institutional Class shares are not subject to a sales charge and are offered for sale only to certain eligible investors. As of April 30, 2010, Class C and Class R have not commenced operations.
The investment objective of the Fund is to seek long-term capital appreciation.
1. Significant Accounting Policies
The following accounting policies are in accordance with U.S. generally accepted accounting principles (U.S. GAAP) and are consistently followed by the Fund.
Security Valuation — Equity securities, except those traded on the Nasdaq Stock Market, Inc. (Nasdaq), are valued at the last quoted sales price as of the time of the regular close of the New York Stock Exchange (NYSE) on the valuation date. Securities traded on the Nasdaq are valued in accordance with the Nasdaq Official Closing Price, which may not be the last sales price. If on a particular day an equity security does not trade, then the mean between the bid and ask prices will be used. Short term debt securities are valued at market value. Investment companies are valued at net asset value per share. Generally, other securities and assets for which market quotations are not readily available are valued at fair value as determined in good faith under the direction of the Fund’s Board of Trustees (Board). In determining whether market quotations are readily available or fair valuation will be used, various factors will be taken into consideration, such as market closures or suspension of trading in a security. The Fund may use fair value pricing more frequently for securities traded primarily in non-U.S. markets because, among other things, most foreign markets close well before the Fund values its securities at 4:00 p.m. Eastern time. The earlier close of these foreign markets gives rise to the possibility that significant events, including broad market moves, government actions or pronouncements, aftermarket trading, or news events may have occurred in the interim. To account for this, the Fund may frequently value foreign securities using fair value prices based on third-party vendor modeling tools (international fair value pricing).
Federal Income Taxes — No provision for federal income taxes has been made as the Fund intends to continue to qualify for federal income tax purposes as a regulated investment company under Subchapter M of the Internal Revenue Code of 1986, as amended, and make the requisite distributions to shareholders. The Fund evaluates tax positions taken or expected to be taken in the course of preparing the Fund’s tax returns to determine whether the tax positions are “more-likely-than-not” of being sustained by the applicable tax authority. Tax positions not deemed to meet the more-likely-
22
than-not threshold are recorded as a tax benefit or expense in the current year. Management has analyzed the Fund’s tax positions taken on federal income tax returns for all open tax years (April 30, 2007 – April 30, 2010), and has concluded that no position for federal income tax is required in the Fund’s financial statements.
Class Accounting — Investment income, common expenses and realized and unrealized gain (loss) on investments are allocated to the various classes of the Fund on the basis of daily net assets of each class. Distribution expenses relating to a specific class are charged directly to that class.
Repurchase Agreements — The Fund may invest in a pooled cash account along with other members of the Delaware Investments® Family of Funds pursuant to an exemptive order issued by the Securities and Exchange Commission. The aggregate daily balance of the pooled cash account is invested in repurchase agreements secured by obligations of the U.S. government. The respective collateral is held by the Fund’s custodian bank until the maturity of the respective repurchase agreements. Each repurchase agreement is at least 102% collateralized. However, in the event of default or bankruptcy by the counterparty to the agreement, realization of the collateral may be subject to legal proceedings. At April 30, 2010, the Fund held no investments in repurchase agreements.
Use of Estimates — The preparation of financial statements in conformity with U.S. GAAP requires management to make estimates and assumptions that affect the reported amounts of assets and liabilities at the date of the financial statements and the reported amounts of revenues and expenses during the reporting period. Actual results could differ from those estimates.
Other — Expenses directly attributable to the Fund are charged directly to the Fund. Other expenses common to various funds within the Delaware Investments Family of Funds are generally allocated amongst such funds on the basis of average net assets. Management fees and some other expenses are paid monthly. Security transactions are recorded on the date the securities are purchased or sold (trade date) for financial reporting purposes. Costs used in calculating realized gains and losses on the sale of investment securities are those of the specific securities sold. Dividend income is recorded on the ex-dividend date and interest income is recorded on the accrual basis. The Fund declares and pays dividends from net investment income and distributions from net realized gain on investments, if any, annually.
The Fund may receive earnings credits from its custodian when positive cash balances are maintained, which are used to offset custody fees. There were no earnings credits for the year ended April 30, 2010.
On July 1, 2009, the Financial Accounting Standards Board (FASB) issued the FASB Accounting Standards Codification (Codification). The Codification became the single source of authoritative nongovernmental U.S. GAAP, superseding existing literature of the FASB, American Institute of Certified Public Accountants, Emerging Issues Task Force and other sources. The Codification is effective for interim and annual periods ending after September 15, 2009. The Fund adopted the Codification for the year ended April 30, 2010. There was no impact to financial statements as the Codification requirements are disclosure-only in nature.
23
Notes to financial statements
Delaware Large Cap Core Fund
Delaware Large Cap Core Fund
2. Investment Management, Administration Agreements and Other Transactions with Affiliates
In accordance with the terms of its investment management agreement, the Fund pays Delaware Management Company (DMC), a series of Delaware Management Business Trust and the investment manager, an annual fee which is calculated daily at the rate of 0.65% on the first $500 million of average daily net assets of the Fund, 0.60% on the next $500 million, 0.55% on the next $1.5 billion and 0.50% on average daily net assets in excess of $2.5 billion.
DMC has voluntarily agreed to waive all or a portion, if any, of its management fees and reimburse the Fund to the extent necessary to ensure that total annual operating expenses (excluding any 12b-1 plan expenses, taxes, interest, inverse floater program expenses, short sale and dividend interest expenses, brokerage fees, certain insurance costs, and nonroutine expenses or costs, including, but not limited to, those relating to reorganizations, litigation, conducting shareholder meetings, and liquidations, (collectively, nonroutine expenses)), do not exceed 0.95% of the Fund’s average daily net assets. This waiver and expense limitation may be discontinued at any time because they are voluntary. For purposes of these waivers and reimbursements, non-routine expenses may also include such additional costs and expenses, as may be agreed upon from time to time by the Fund’s Board and DMC. These expenses waivers and reimbursements apply only to expenses paid directly by the Fund.
Delaware Service Company, Inc. (DSC), an affiliate of DMC, provides fund accounting and financial administration oversight services to the Fund. For these services, the Fund pay DSC fees based on the aggregate daily net assets of the Delaware Investments® Family of Funds at the following annual rate: 0.0050% of the first $30 billion; 0.0045% of the next $10 billion; 0.0040% of the next $10 billion; and 0.0025% of aggregate average daily net assets in excess of $50 billion. The fees payable to DSC under the service agreement described above will be allocated among all Funds in the Delaware Investments Family of Funds on a relative net asset value basis. For the year ended April 30, 2010, the Fund was charged $78 for these services.
DSC also provides dividend disbursing and transfer agency services. The Fund pays DSC a monthly fee based on the number of shareholder accounts for dividend disbursing and transfer agent services.
Pursuant to a distribution agreement and distribution plan, the Fund pays DDLP, the distributor and an affiliate of DMC, an annual distribution and service fee not to exceed 0.25% of the average daily net assets of the Class A shares, 1.00% of the average daily net assets of Class C shares and 0.60% of the average daily net assets of Class R shares. Institutional Class shares pay no distribution and services expenses. DDLP has voluntarily agreed to waive such distribution and service fees until such time as the waivers are discontinued.
24
At April 30, 2010, the Fund had receivables due from or liabilities payable to affiliates as follows:
| Receivable from DMC under limitation agreement | $400 | ||
| Dividend disbursing, transfer agent and fund accounting | |||
| oversight fees and other expenses payable to DSC | (15 | ) | |
| Other expenses payable to DMC and affiliates* | (495 | ) |
* DMC, as part of its administrative services, pays operating expenses on behalf of the Fund and is reimbursed on a periodic basis. Such expenses include items such as printing of shareholder reports, fees for audit, legal and tax services, registration fees and trustees’ fees.
As provided in the investment management agreement, the Fund bears the cost of certain legal and tax services, including internal legal and tax services provided to the Fund by DMC and/or its affiliates’ employees. For the year ended April 30 2010, the Fund was charged $106 for internal legal and tax services provided by DMC and/or its affiliates’ employees.
Trustees’ fees include expenses accrued by the Fund for each Trustee’s retainer and meeting fees. Certain officers of DMC, DSC and DDLP are officers and/or Trustees of the Trust. These officers and Trustees are paid no compensation by the Fund.
3. Investments
For the year ended April 30, 2010, the Fund made purchases of $991,356 and sales of $1,228,254 of investment securities other than short-term investments.
At April 30, 2010, the cost of investments for federal income tax purposes was $1,419,650. At April 30, 2010, the net unrealized appreciation was $243,655, of which $272,121 related to unrealized appreciation of investments and $28,466 related to unrealized depreciation of investments.
U.S. GAAP defines fair value as the price that the Fund would receive to sell an asset or pay to transfer a liability in an orderly transaction between market participants at the measurement date under current market conditions. A three level hierarchy for fair value measurements has been established based upon the transparency of inputs to the valuation of an asset or liability. Inputs may be observable or unobservable and refer broadly to the assumptions that market participants would use in pricing the asset or liability. Observable inputs reflect the assumptions market participants would use in pricing the asset or liability based on market data obtained from sources independent of the reporting entity. Unobservable inputs reflect the reporting entity’s own assumptions about the assumptions that market participants would use in pricing the asset or liability developed based on the best information available under the circumstances. The Fund’s investment in its entirety is assigned a level based upon the observability of the inputs which are significant to the overall valuation. The three-tier hierarchy of inputs is summarized below.
Level 1 – inputs are quoted prices in active markets
Level 2 – inputs are observable, directly or indirectly
Level 3 – inputs are unobservable and reflect assumptions on the part of the reporting entity
Level 2 – inputs are observable, directly or indirectly
Level 3 – inputs are unobservable and reflect assumptions on the part of the reporting entity
25
Notes to financial statements
Delaware Large Cap Core Fund
Delaware Large Cap Core Fund
3. Investments (continued)
The following table summarizes the valuation of the Fund’s investments by fair value hierarchy levels as of April 30, 2010:
| Level 1 | Level 2 | Total | |||||||
| Common Stock | $ | 1,651,305 | $ | — | $ | 1,651,305 | |||
| Short-Term Investments | — | 12,000 | 12,000 | ||||||
| Total | $ | 1,651,305 | $ | 12,000 | $ | 1,663,305 | |||
There were no Level 3 securities at the beginning or end of the year.
In January 2010, the FASB issued an Accounting Standards Update, Improving Disclosures about Fair Value Measurements, which introduces new disclosure requirements and clarifies certain existing disclosure requirements around fair value measurements currently presented above. The new disclosures and clarifications of existing disclosures are generally effective for the Fund’s year ending April 30, 2011 and interim periods therein. Management is evaluating the impact of this update on its current disclosures.
4. Dividend and Distribution Information
Income and long-term capital gain distributions are determined in accordance with federal income tax regulations, which may differ from U.S. GAAP. Additionally, distributions from net short-term gains on sales of investment securities are treated as ordinary income for federal income tax purposes. The tax character of dividends and distributions paid during the years ended April 30, 2010 and 2009 was as follows:
| Year Ended | ||||||
| 4/30/10 | 4/30/09 | |||||
| Ordinary income | $ | 12,030 | $ | 21,947 | ||
| Long-term capital gain | — | 107 | ||||
| Return of capital | 627 | — | ||||
| Total | $ | 12,657 | $ | 22,054 | ||
5. Components of Net Assets on a Tax Basis
As of April 30, 2010, the components of net assets on a tax basis were as follows:
| Shares of beneficial interest | $ | 1,947,521 | |
| Capital loss carryforwards | (515,685 | ) | |
| Unrealized appreciation of investments | 243,655 | ||
| Net assets | $ | 1,675,491 |
The difference between book basis and tax basis components of net assets is primarily attributable to tax deferral of losses on wash sales.
26
For financial reporting purposes, capital accounts are adjusted to reflect the tax character of permanent book/tax differences. Reclassifications are primarily due to tax treatment of dividends and distributions. Results of operations and net assets were not affected by these reclassifications. For the year ended April 30, 2010, the Fund recorded the following reclassifications:
| Undistributed net investment income | $627 | ||
| Paid-in capital | (627 | ) |
For federal income tax purposes, capital loss carryforwards may be carried forward and applied against future capital gains. Such capital loss carryforwards remaining at April 30, 2010 will expire as follows: $214,282 expires in 2017 and $301,403 expires in 2018.
6. Capital Shares
Transactions in capital shares were as follows:
| Year | |||||
| Ended | |||||
| 4/30/10 | 4/30/09 | ||||
| Shares sold: | |||||
| Class A | 2,576 | 29 | |||
| Shares issued upon reinvestment of dividends and distributions: | |||||
| Class A | 13 | 24 | |||
| Institutional Class | 1,868 | 3,594 | |||
| 4,457 | 3,647 | ||||
| Shares repurchased: | |||||
| Class A | (168 | ) | (1,931 | ) | |
| Institutional Class | (37,481 | ) | — | ||
| (37,649 | ) | (1,931 | ) | ||
| Net increase (decrease) | (33,192 | ) | 1,716 | ||
7. Line of Credit
The Fund, along with certain other funds in the Delaware Investments® Family of Funds (Participants), participates in a $35,000,000 revolving line of credit with The Bank of New York Mellon (BNY Mellon) to be used for temporary or emergency purposes as an additional source of liquidity to fund redemptions of investor shares. Under the agreement, the Participants are charged an annual commitment fee, which is allocated across the Participants on the basis of each Participant’s allocation of the entire facility. The Participants may borrow up to a maximum of one third of their net assets under the agreement. The agreement expires on November 16, 2010. The Fund had no amounts outstanding as of April 30, 2010, or at any time during the year then ended.
27
8. Securities Lending
The Fund, along with other funds in the Delaware Investments® Family of Funds, may lend its securities pursuant to a security lending agreement (Lending Agreement) with BNY Mellon. With respect to each loan, if the aggregate market value of securities collateral held plus cash collateral received on any business day is less than the aggregate market value of the securities which are the subject of such loan, the borrower will be notified to provide additional collateral not less than the applicable collateral requirements. Cash collateral received is generally invested in the BNY Mellon Securities Lending Overnight Fund (Collective Trust) established by BNY Mellon for the purpose of investment on behalf of clients participating in its securities lending programs. The Collective Trust may only hold cash and high quality assets with a maturity of one business day or less (Cash/Overnight Assets). The Collective Trust seeks to maintain a net asset value per unit of $1.00, but there can be no assurance that it will always be able to do so. The Fund may incur investment losses as a result of investing securities lending collateral in the Collective Trust. This could occur if an investment in the Collective Trust defaulted or if it were necessary to liquidate assets in the Collective Trust to meet returns on outstanding security loans at a time when their net asset value per unit was less than $1.00. Under those circumstances, the Fund may not receive an amount from the Collective Trust that is equal in amount to the collateral the Fund would be required to return to the borrower of the securities and the Fund would be required to make up for this shortfall. The Fund can also accept U.S. government securities and letters of credit (non-cash collateral) in connection with securities loans. In the event of default or bankruptcy by the lending agent, realization and/or retention of the collateral may be subject to legal proceedings. In the event the borrower fails to return loaned securities and the collateral received is insufficient to cover the value of the loaned securities and provided such collateral shortfall is not the result of investment losses, the lending agent has agreed to pay the amount of the shortfall to the Fund, or at the discretion of the lending agent, replace the loaned securities. The Fund continues to record dividends or interest, as applicable, on the securities loaned and is subject to change in value of the securities loaned that may occur during the term of the loan. The Fund has the right under the Lending Agreement to recover the securities from the borrower on demand. With respect to security loans collateralized by non-cash collateral, the Fund receives loan premiums paid by the borrower. With respect to security loans collateralized by cash collateral, the earnings from the collateral investments are shared among the Fund, the security lending agent and the borrower. The Fund records security lending income net of allocations to the security lending agent and the borrower. The Fund had no securities out on loan as of April 30, 2010.
9. Credit and Market Risk
The Fund may invest up to 15% of its net assets in illiquid securities, which may include securities with contractual restrictions on resale, securities exempt from registration under Rule 144A of the Securities Act of 1933, as amended, and other securities which may not be readily marketable. The relative illiquidity of these securities may impair the Fund from disposing of them in a timely manner and at a fair price when it is necessary or desirable to do so. While maintaining oversight, the Fund’s Board has delegated to DMC the day-to-day functions of determining whether individual securities are liquid for purposes of the Fund’s limitation on investments in illiquid assets. Securities eligible
28
for resale pursuant to Rule 144A, which are determined to be liquid, are not subject to the Fund’s 15% limit on investment in illiquid assets. As of April 30, 2010, there were no Rule 144A securities and no securities have been determined to be illiquid under the Fund’s Liquidity Procedures.
10. Contractual Obligations
The Fund enters into contracts in the normal course of business that contain a variety of indemnifications. The Fund’s maximum exposure under these arrangements is unknown. However, the Fund has not had prior claims or losses pursuant to these contracts. Management has reviewed the Fund’s existing contracts and expects the risk of loss to be remote.
11. Sale of Delaware Investments to Macquarie Group
On August 18, 2009, Lincoln National Corporation (former parent company of Delaware Investments) and Macquarie Group (Macquarie) entered into an agreement pursuant to which Delaware Investments, including DMC, DDLP and DSC, would be acquired by Macquarie, an Australia-based global provider of banking, financial, advisory, investment and funds management services (Transaction). The Transaction was completed on January 4, 2010. DMC, DDLP and DSC are now wholly owned subsidiaries of Macquarie.
The Transaction resulted in a change of control of DMC which, in turn, caused the termination of the investment management agreement between DMC and the Fund. On January 4, 2010, the new investment management agreement between DMC and the Fund that was approved by the shareholders became effective.
12. Tax Information (Unaudited)
The information set forth below is for the Fund’s fiscal year as required by federal income tax laws. Shareholders, however, must report distributions on a calendar year basis for income tax purposes, which may include distributions for portions of two fiscal years of a fund. Accordingly, the information needed by shareholders for income tax purposes will be sent to them in January of each year. Please consult your tax advisor for proper treatment of this information.
| (A) | Long-Term Capital Gains Distributions (Tax Basis) | — | ||
| (B) | Ordinary Income Distributions* (Tax Basis) | 95.05 | % | |
| (C) | Return of Capital (Tax Basis) | 4.95 | % | |
| Total Distributions (Tax Basis) | 100.00 | % | ||
| (D) | Qualifying Dividends1 | 100.00 | % | |
(A), (B) and (C) are based on a percentage of the Fund’s total distributions.
(D)) is based on percentage of the Fund’s ordinary income distributions.
1 Qualifying dividends represent dividends which qualify for the corporate dividends received deduction.
(D)) is based on percentage of the Fund’s ordinary income distributions.
1 Qualifying dividends represent dividends which qualify for the corporate dividends received deduction.
* For the fiscal year ended April 30, 2010, certain dividends paid by the Fund may be subject to a maximum tax rate of 15%, as provided for by the Jobs and Growth Tax Relief Reconciliation Act of 2003. The Fund intends to designate up to a maximum amount of $12,030 to be taxed at a maximum rate of 15%. Complete information will be computed and reported in conjunction with your 2009 or 2010 Form 1099-DIV.
29
13. Subsequent Event
Management has determined no material events or transactions occurred subsequent to April 30, 2010 that would require recognition or disclosure in the Fund’s financial statements.
30
Report of independent
registered public accounting firm
registered public accounting firm
To the Shareholders and Board of Trustees
Voyageur Mutual Funds III — Delaware Large Cap Core Fund
We have audited the accompanying statement of net assets of Delaware Large Cap Core Fund (one of the series constituting Voyageur Mutual Funds III) (the “Fund”), including the schedule of investments, as of April 30, 2010, and the related statement of operations for the year then ended, the statements of changes in net assets for each of the two years then ended, and the financial highlights for the three years then ended and the period from August 31, 2006 (commencement of operations) to April 30, 2007. These financial statements and financial highlights are the responsibility of the Fund’s management. Our responsibility is to express an opinion on these financial statements and financial highlights based on our audit.
We conducted our audit in accordance with the standards of the Public Company Accounting Oversight Board (United States). Those standards require that we plan and perform the audit to obtain reasonable assurance about whether the financial statements and financial highlights are free of material misstatement. We were not engaged to perform an audit of the Fund’s internal control over financial reporting. Our audit included consideration of internal control over financial reporting as a basis for designing audit procedures that are appropriate in the circumstances, but not for the purpose of expressing an opinion on the effectiveness of the Fund’s internal control over financial reporting. Accordingly, we express no such opinion. An audit also includes examining, on a test basis, evidence supporting the amounts and disclosures in the financial statements and financial highlights, assessing the accounting principles used and significant estimates made by management, and evaluating the overall financial statement presentation. Our procedures included confirmation of securities owned as of April 30, 2010, by correspondence with the custodian and brokers or by other appropriate auditing procedures where replies from brokers were not received. We believe that our audit provides a reasonable basis for our opinion.
In our opinion, the financial statements and financial highlights referred to above present fairly, in all material respects, the financial position of the Delaware Large Cap Core Fund series of Voyageur Mutual Funds III at April 30, 2010, the results of its operations for the year then ended, the changes in net assets for each of the two years in the period then ended, and its financial highlights for each of the three years then ended and the period from August 31, 2006 (commencement of operations) to April 30, 2007, in conformity with U.S. generally accepted accounting principles.
Philadelphia, Pennsylvania
June 18, 2010
31
Other Fund information
(Unaudited)
Delaware Large Cap Core Fund
Proxy Results
At Joint Special Meetings of Shareholders of Voyageur Mutual Funds III (the “Trust”), on behalf of Delaware Large Cap Core Fund (the “Fund”), held on November 12, 2009 and reconvened on March 16, 2010, the shareholders of the Fund voted to (i) elect a Board of Trustees for the Trust; and to (ii) approve a new investment advisory agreement between the Trust, on behalf of the Fund, and Delaware Management Company. At the meeting, the following people were elected to serve as Independent Trustees: Thomas L. Bennett, John A. Fry, Anthony D. Knerr, Lucinda S. Landreth, Ann R. Leven, Thomas F. Madison, Janet L. Yeomans, and J. Richard Zecher. In addition, Patrick P. Coyne was elected to serve as an Interested Trustee.
The following proposals were submitted for a vote of the shareholders:
1. To elect a Board of Trustees for the Trust.
| % of | % of | % of | % of | |||||||||
| Outstanding | Shares | Outstanding | Shares | |||||||||
| Shares Voted For | Shares | Voted | Shares Withheld | Shares | Voted | |||||||
| Thomas L. Bennett | 5,951,878.103 | 52.566 | 96.407 | 221,820.564 | 1.959 | 3.593 | ||||||
| Patrick P. Coyne | 5,947,780.541 | 52.530 | 96.341 | 225,918.126 | 1.995 | 3.659 | ||||||
| John A. Fry | 5,953,366.709 | 52.579 | 96.431 | 220,331.958 | 1.946 | 3.569 | ||||||
| Anthony D. Knerr | 5,949,464.062 | 52.545 | 96.368 | 224,234.605 | 1.980 | 3.632 | ||||||
| Lucinda S. Landreth | 5,947,680.260 | 52.529 | 96.339 | 226,018.407 | 1.996 | 3.661 | ||||||
| Ann R. Leven | 5,944,458.918 | 52.501 | 96.287 | 229,239.749 | 2.024 | 3.713 | ||||||
| Thomas F. Madison | 5,950,241.466 | 52.552 | 96.380 | 223,457.201 | 1.973 | 3.620 | ||||||
| Janet L. Yeomans | 5,945,062.090 | 52.506 | 96.297 | 228,636.577 | 2.019 | 3.703 | ||||||
| J. Richard Zecher | 5,949,694.673 | 52.547 | 96.372 | 224,003.994 | 1.978 | 3.628 |
| 2. | To approve a new investment advisory agreement between the Trust, on behalf of the Delaware Large Cap Core Fund, and Delaware Management Company. |
| Delaware Large Cap Core Fund | |||
| Shares Voted For | 216,375.984 | ||
| Percentage of Outstanding Shares | 99.828 | % | |
| Percentage of Shares Voted | 100.00 | % | |
| Shares Voted Against | .000 | ||
| Percentage of Outstanding Shares | .000 | % | |
| Percentage of Shares Voted | .000 | % | |
| Shares Abstained | .000 | ||
| Percentage of Outstanding Shares | .000 | % | |
| Percentage of Shares Voted | .000 | % | |
| Broker Non-Votes | N/A | ||
32
Board Consideration of New Investment Advisory Agreement
At a meeting held on September 3, 2009 (the “Meeting”), the Board of Trustees of the Delaware Investments® Family of Funds (the “Board”), including the independent Trustees, unanimously approved a new investment advisory agreement between each registrant on behalf of each series (each, a “Fund” and together, the “Funds”) and Delaware Management Company (“DMC”) in connection with the sale of Delaware Investments’ advisory business to Macquarie Bank Limited (the “Macquarie Group”) (the “Transaction”). In making its decision, the Board considered information furnished specifically in connection with the approval of the new investment advisory agreements with DMC (the “New Investment Advisory Agreements”) which included extensive materials about the Transaction and matters related to the proposed approvals. To assist the Board in considering the New Investment Advisory Agreements, Macquarie Group provided materials and information about Macquarie Group, including detailed written responses to the questions posed by the independent Trustees. DMC also provided materials and information about the Transaction, including detailed written responses to the questions posed by the independent Trustees.
At the Meeting, the Trustees discussed the Transaction with DMC management and with key Macquarie Group representatives. The Meeting included discussions of the strategic rationale for the Transaction and Macquarie Group’s general plans and intentions regarding the Funds and DMC. The Board members also inquired about the plans for, and anticipated roles and responsibilities of, key employees and officers of Delaware Management Holdings Inc. and DMC in connection with the Transaction.
In connection with the Trustees’ review of the New Investment Advisory Agreements for the Funds, DMC and/or Macquarie Group emphasized that:
- They expected that there would be no adverse changes as a result of the Transaction, in the nature, quality, or extent of services currently provided to the Funds and their shareholders, including investment management, distribution, or other shareholder services.
- No material changes in personnel or operations were contemplated in the operation of DMC under Macquarie Group as a result of the Transaction and no material changes were currently contemplated in connection with third party service providers to the Funds.
- Macquarie Group had no intention to cause DMC to alter the voluntary expense waivers and reimbursements currently in effect for the Funds.
- Under the agreement between Macquarie Group and Lincoln National Corporation (“LNC”) (the “Transaction Agreement”), Macquarie Group has agreed to conduct, and to cause its affiliates to conduct, their respective businesses in compliance with the conditions of Section 15(f) of the Investment Company Act of 1940 (the “1940 Act”) with respect to the Funds, to the extent within its control, including maintaining Board composition of at least 75% of the Board members qualifying as independent Trustees and not imposing any “unfair burden” on the Funds for at least two years from the closing of the Transaction (the “Closing”).
33
Other Fund information
(Unaudited)
Delaware Large Cap Core Fund
In addition to the information provided by DMC and Macquarie Group as described above, the Trustees also considered all other factors they believed to be relevant to evaluating the New Investment Advisory Agreements, including the specific matters discussed below. In their deliberations, the Trustees did not identify any particular information that was controlling, and different Trustees may have attributed different weights to the various factors. However, for each Fund, the Trustees determined that the overall arrangements between the Fund and DMC, as provided in the respective New Investment Advisory Agreement, including the proposed advisory fee and the related administration arrangements between the Fund and DMC, were fair and reasonable in light of the services to be performed, expenses incurred, and such other matters as the Trustees considered relevant. Factors evaluated included:
- The potential for expanding distribution of Fund shares through access to Macquarie Group’s existing distribution channels;
- Delaware Investments’ acquisition of an exclusive wholesaling sales force from a subsidiary of LNC;
- The reputation, financial strength, and resources of Macquarie Group as well as its historic and ongoing commitment to the asset management business in Australia as well as other parts of the world;
- The terms and conditions of the New Investment Advisory Agreements, including that each Fund’s total contractual fee rate under the New Investment Advisory Agreement will remain the same;
- The Board’s full annual review (or initial approval) of the current investment advisory agreements at their in-person meeting in May 2009 as required by the 1940 Act and its determination that (i) DMC had the capabilities, resources, and personnel necessary to provide the satisfactory advisory and administrative services currently provided to each Fund and (ii) the advisory and/ or management fees paid by each Fund, taking into account any applicable fee waivers and breakpoints, represented reasonable compensation to DMC in light of the services provided, the costs to DMC of providing those services, economies of scale, and the fees and other expenses paid by similar funds and such other matters that the Board considered relevant in the exercise of its reasonable judgment;
- The portfolio management teams for the Funds are not currently expected to change as a result of the Transaction;
- LNC and Macquarie Group were expected to execute a reimbursement agreement pursuant to which LNC and Macquarie Group would agree to pay (or reimburse) all reasonable out-of-pocket costs and expenses of the Funds in connection with the Board’s consideration of the Transaction, the New Investment Advisory Agreements and related agreements, and all costs related to the proxy solicitation (the “Expense Agreement”);
- The likelihood that Macquarie Group would invest additional amounts in Delaware Investments, including DMC, which could result in increased assets under management, which in turn would allow some Funds the potential opportunity to achieve economies of scale and lower fees payable by Fund shareholders; and
34
- The compliance and regulatory history of Macquarie Group and its affiliates.
In making their decision relating to the approval of each Fund’s New Investment Advisory Agreement, the independent Trustees gave attention to all information furnished. The following discussion, however, identifies the primary factors taken into account by the Trustees and the conclusions reached in approving the New Investment Advisory Agreements.
Nature, Extent, and Quality of Service. The Trustees considered the services historically provided by DMC to the Funds and their shareholders. In reviewing the nature, extent, and quality of services, the Board considered that the New Investment Advisory Agreements would be substantially similar to the current investment advisory agreements between the Funds and DMC (the “Current Investment Advisory Agreements”), and therefore, considered the many reports furnished to them throughout 2008 and 2009 at regular Board meetings covering matters such as the relative performance of the Funds; compliance of portfolio managers with the investment policies, strategies, and restrictions for the Funds; the compliance of management personnel with the code of ethics adopted throughout the Delaware Investments® Family of Funds complex; and the adherence to fair value pricing procedures as established by the Board. The Trustees were pleased with the current staffing of DMC and the emphasis placed on research and risk management in the investment process. Favorable consideration was given to DMC’s efforts to maintain expenditures and, in some instances, increase financial and human resources committed to Fund matters.
The Board also considered the transfer agent and shareholder services that would continue to be provided to Fund shareholders by DMC’s affiliate, Delaware Service Company, Inc. (“DSC”). The Trustees noted, in particular, DSC’s commitment to maintain a high level of service as well as DMC’s expenditures to improve the delivery of shareholder services. The Board was assured that shareholders would continue to receive the benefits provided to Fund shareholders by being part of the Delaware Investments Family of Funds, including each shareholder’s ability to exchange an investment in one Delaware Investments Fund for the same class of shares in another Delaware Investments Fund without a sales charge, to reinvest Fund dividends into additional shares of any of the Funds, and the privilege to combine holdings in other Funds to obtain a reduced sales charge.
Based on the information provided by DMC and Macquarie Group, including that Macquarie Group and DMC currently expected no material changes as a result of the Transaction in (i) personnel or operations of DMC or (ii) third party service providers to the Funds, the Board concluded that the satisfactory nature, extent, and quality of services currently provided to the Funds and their shareholders were very likely to continue under the New Investment Advisory Agreements. Moreover, the Board concluded that the Funds would probably benefit from the expanded distribution resources that would become available to Delaware Investments following the Transaction. The Board also concluded that it was very unlikely that any “unfair burden” would be imposed on any of the Funds for the first two years following the Closing as a result of the Transaction. Consequently, the Board concluded that it did not expect the Transaction to result in any adverse changes in the nature, quality, or extent of services (including investment management, distribution or other shareholder services) currently provided to the Funds and their shareholders.
35
Other Fund information
(Unaudited)
Delaware Large Cap Core Fund
Investment Performance. The Board considered the overall investment performance of DMC and the Funds. The Trustees placed significant emphasis on the investment performance of the Funds in view of its importance to shareholders. Although the Trustees gave appropriate consideration to performance reports and discussions with portfolio managers at Board meetings throughout the year, the Trustees gave particular weight to their review of investment performance in connection with the approval of the Current Investment Advisory Agreements at the Board meeting held in May 2009. At that meeting, the Trustees reviewed reports prepared by Lipper, Inc., an independent statistical compilation organization (“Lipper”), which showed each Fund’s investment performance as of December 31, 2008 in comparison to a group of funds selected by Lipper as being similar to the Fund (the “Performance Universe”). During the May 2009 agreement review process, the Trustees observed the significant improvements to relative investment performance of the Funds compared to the Funds’ performance as of December 31, 2007.
At their meeting on September 3, 2009, the Trustees, including the independent Trustees in consultation with their independent counsel, reviewed the investment performance of each Fund. The Trustees compared the performance of each Fund relative to that of its respective Performance Universe for the 1-, 3 , 5-, and 10-year periods ended June 30, 2009 and compared its relative investment performance against the corresponding relative investment performance of each Fund for such time periods ended December 31, 2008, to the extent applicable. As of June 30, 2009, 30 of the Funds had investment performance relative to that of the respective Performance Universe that was better than the corresponding relative investment performance at December 31, 2008 for all applicable time periods. At June 30, 2009, an additional 6 Funds had investment performance relative to that of their respective Performance Universe that was better than the corresponding relative investment performance at December 31, 2008 for a majority of the applicable time periods. At June 30, 2009, 15 additional Funds had investment performance relative to that of their respective Performance Universe that was better than the corresponding relative performance at December 31, 2008 and only 29 Funds had poorer relative investment performance at June 30, 2009 compared to that at December 31, 2008.
The Board therefore concluded that the investment performance of the Funds, on an aggregate basis, had continued to improve relative to their respective Performance Universe since the data reviewed at the May 2009 meeting. Based on information provided by DMC and Macquarie Group, the Board concluded that neither the Transaction nor the New Investment Advisory Agreement would likely have an adverse effect on the investment performance of any Fund because (i) DMC and Macquarie Group did not currently expect the Transaction to cause any material change to the Funds’ portfolio management teams responsible for investment performance, which the Board found to be satisfactory and improving; and (ii) as discussed in more detail below, the Funds’ expenses were not expected to increase as a result of the Transaction.
Comparative Expenses. The Trustees also considered expense comparison data for the Funds previously provided in May 2009. At that meeting, DMC had provided the Board with information on pricing levels and fee structures for the Funds and comparative funds. The Trustees focused on the comparative analysis of the effective management fees and total expense ratios of each Fund versus
36
the effective management fees and expense ratios of a group of funds selected by Lipper as being similar to each Fund (the “Expense Group”). In reviewing comparative costs, each Fund’s contractual management fee and the actual management fee incurred by the Fund were compared with the contractual management fees (assuming all funds in the Expense Group were similar in size to the Fund) and actual management fees (as reported by each fund) of other funds within the Expense Group, taking into account any applicable breakpoints and fee limitations. Each Fund’s total expenses were also compared with those of its Expense Group. The Trustees also considered fees paid to Delaware Investments for nonmanagement services. At the September 3, 2009 meeting, DMC advised the Board that the more recent comparative expenses for the Funds remained consistent with the previous review in May 2009 and, consequently, the Trustees concluded that expenses of the Funds were satisfactory.
The Board also considered the Expense Agreement under negotiation in evaluating Fund expenses. The Trustees expected that the Expense Agreement would provide that LNC and Macquarie Group would pay or reimburse the Trusts for all reasonable out-of-pocket costs and expenses in connection with the Transaction and the consideration of the New Investment Advisory Agreements (subject to certain limited exceptions).
Based on information provided by DMC and Macquarie Group, the Board concluded that neither the Transaction nor the New Investment Advisory Agreements likely would have an adverse effect on the Funds’ expenses because (i) each Fund’s contractual fee rates under the New Investment Advisory Agreement would remain the same; (ii) under the Expense Agreement, the Funds would be reimbursed for all reasonable out-of-pocket costs and expenses in connection with the Transaction and the related proxy solicitation (subject to certain limited exceptions); and (iii) the expense ratios of certain Funds might decline as a result of the possible increased investment in Delaware Investments by Macquarie Group, as discussed below under “Economies of Scale.”
Management Profitability. At their meeting on September 3, 2009, the Board evaluated DMC’s profitability in connection with the operation of the Funds. The Board had previously considered DMC’s profitability in connection with the operation of the Funds at its May 2009 meeting. At that meeting, the Board reviewed an analysis that addressed the overall profitability of Delaware Investments’ business in providing management and other services to each of the Funds and the Delaware Investments® Family of Funds as a whole. Specific attention was given to the methodology followed in allocating costs for the purpose of determining profitability.
At the May 2009 meeting, representatives of DMC had stated that the level of profits of DMC, to a certain extent, reflect operational cost savings and efficiencies initiated by Delaware Investments (including DMC and its affiliates that provide services to the Funds). The Board considered Delaware Investments’ efforts to improve services provided to Fund shareholders and to meet additional regulatory and compliance requirements resulting from recent industry-wide U.S. Securities and Exchange Commission initiatives. At that meeting, the Board found that the management fees were reasonable in light of the services rendered and the level of profitability of DMC. At the September 3, 2009 meeting, DMC advised the Board that DMC did not expect the Transaction to affect materially
37
Other Fund information
(Unaudited)
Delaware Large Cap Core Fund
the profitability of Delaware Investments compared to the level of profitability considered during the May 2009 review. Moreover, the Trustees reviewed pro forma balance sheets of certain key companies in Delaware Investments as of June 30, 2009 (which were provided by Macquarie Group and DMC in response to the Trustees’ requests) and evaluated the projections of Delaware Investments’ capitalization following the Transaction for purposes of evaluating the financial ability of Delaware Investments to continue to provide the nature, extent, and quality of services as it had under the Current Investment Advisory Agreement.
Based on information provided by DMC and Macquarie Group, the Board concluded that DMC and Delaware Investments would be sufficiently capitalized following the Transaction to continue the same level and quality of services to the Funds under the New Investment Advisory Agreements as was the case under the Current Investment Advisory Agreements. The Board also concluded that Macquarie Group had sufficient financial strength and resources, as well as an ongoing commitment to a global asset management business, to continue investing in Delaware Investments, including DMC, to the extent that Macquarie Group determined it was appropriate. Finally, because services and costs were expected to be substantially the same (and DMC had represented that, correspondingly, profitability would be about the same), under the New Investment Advisory Agreements as under the Current Investment Advisory Agreements, the Trustees concluded that the profitability of Delaware Investments would not result in an inequitable charge on the Funds or their shareholders. Accordingly, the Board concluded that the fees charged under the New Investment Advisory Agreements would be reasonable in light of the services to be provided and the expected profitability of DMC.
Economies of Scale. The Trustees considered whether economies of scale would be realized by Delaware Investments as each Fund’s assets increase and the extent to which any economies of scale would be reflected in the management fees charged. The Trustees took into account DMC’s practice of maintaining the competitive nature of management fees based on its analysis of fees charged by comparable funds. DMC management believed, and the Board agreed, that the Funds were priced with breakpoints and relatively low management fees to reflect potential economies of scale to Fund shareholders.
The Board also acknowledged Macquarie Group’s statement that the Transaction would not by itself immediately provide additional economies of scale given Macquarie Group’s limited presence in the U.S. mutual fund market. Nonetheless, the Trustees concluded that additional economies of scale could potentially be achieved in the future if DMC were owned by Macquarie Group as a result of Macquarie Group’s willingness to invest further in Delaware Investments if appropriate opportunities arise. The Board further concluded that potential economies of scale could be achieved as a result of Delaware Investments’ expanded distribution capabilities arising from the Transaction, as well as opportunities that might arise from Macquarie Group’s global asset management business.
Fall-Out Benefits. The Board acknowledged that DMC would continue to benefit from soft dollar arrangements using portfolio brokerage of each Fund that invests in equity securities and that DMC’s profitability would likely be somewhat lower without the benefit of practices with respect to
38
allocating Fund portfolio brokerage for brokerage and research services. The Board also considered that Macquarie Group and Delaware Investments may derive reputational, strategic, and other benefits from their association with the Delaware Investments® Family of Funds, including service relationships with DMC, DSC, and Delaware Distributors, L.P., and evaluated the extent to which Delaware Investments might derive ancillary benefits from Fund operations, including the potential for procuring additional business as a result of the prestige and visibility associated with its role as service provider to the Delaware Investments Family of Funds and the benefits from allocation of Fund brokerage to improve trading efficiencies. However, the Board concluded that (i) any such benefits under the New Investment Advisory Agreements would not be dissimilar from those existing under the Current Investment Advisory Agreements; (ii) such benefits did not impose a cost or burden on the Funds or their shareholders; and (iii) such benefits would probably have an indirectly beneficial effect on the Funds and their shareholders because of the added importance that DMC and Macquarie Group might attach to the Funds as a result of the fall-out benefits that the Funds conveyed.
Board Review of Macquarie Group. The Trustees reviewed detailed information supplied by Macquarie Group about its operations as well as other information regarding Macquarie Group provided by independent legal counsel to the independent Trustees. Based on this review, the Trustees concluded that Delaware Investments would continue to have the financial ability to maintain the high quality of services required by the Funds. The Trustees noted that there would be a limited transition period during which some services previously provided by LNC to Delaware Investments would continue to be provided by LNC after the Closing, and concluded that this arrangement would help minimize disruption in Delaware Investments’ provision of services to the Funds following the Transaction.
The Board considered Macquarie Group’s support for Delaware Investments’ plans for Fund distribution by transferring wholesalers from Lincoln Financial Distributors, Inc., LNC’s retail distributor, to Delaware Investments, and Macquarie Group’s current intention to leave the Funds’ other service providers in place. The Board also considered Macquarie Group’s current strategic plans to increase its asset management activities, one of its core businesses, particularly in North America, and its statement that its acquisition of DMC is an important component of this strategic growth and the establishment of a significant presence in the United States. Based in part on the information provided by DMC and Macquarie Group, the Board concluded that Macquarie Group’s acquisition of Delaware Investments could potentially enhance the nature, quality, and extent of services provided to the Funds and their shareholders.
Conclusion. The Board concluded that the advisory fee rate under each New Investment Advisory Agreement was reasonable in relation to the services provided and that execution of the New Investment Advisory Agreement would be in the best interests of the shareholders. For each Fund, the Trustees noted that they had concluded in their most recent advisory agreement continuance considerations in May 2009 that the management fees and total expense ratios were at acceptable levels in light of the quality of services provided to the Funds and in comparison to those of the Funds’ respective peer groups; that the advisory fee schedule would not be increased and would stay the same
39
Other Fund information
(Unaudited)
Delaware Large Cap Core Fund
for all of the Funds; that the total expense ratio had not changed materially since that determination; and that DMC had represented that the overall expenses for each Fund were not expected to be adversely affected by the Transaction. The Trustees also noted, with respect to the Funds that currently had the benefit of voluntary fee limitations, that Macquarie Group had no present intention to cause DMC to alter any voluntary expense limitations or reimbursements currently in effect. On that basis, the Trustees concluded that the total expense ratios and proposed advisory fees for the Funds anticipated to result from the Transaction were acceptable. In approving each New Investment Advisory Agreement, the Board stated that it anticipated reviewing the continuance of the New Investment Advisory Agreement in advance of the expiration of the initial two-year period.
Change in Independent Registered Public Accounting Firm
Due to independence matters under the Securities and Exchange Commission’s auditor independence rules relating to the January 4, 2010 acquisition of Delaware Investments (including DMC, DDLP and DSC) by Macquarie Group, Ernst & Young LLP (“E&Y”) will resign as the independent registered public accounting firm for Voyageur Mutual Funds III (the “Fund”) effective June 28, 2010. At a meeting held on February 18, 2010, the Board of Trustees of the Fund, upon recommendation of the Audit Committee, selected PricewaterhouseCoopers LLC (“PwC”) to serve as the independent registered public accounting firm for the Fund for the fiscal year ending April 30, 2011. During the fiscal years ended April 30, 2010 and 2009, E&Y’s audit reports on the financial statements of the Fund did not contain any adverse opinion or disclaimer of opinion, nor were they qualified or modified as to uncertainty, audit scope, or accounting principles. In addition, there were no disagreements between the Fund and E&Y on accounting principles, financial statements disclosures or audit scope, which, if not resolved to the satisfaction of E&Y, would have caused them to make reference to the disagreement in their reports. Neither the Fund nor anyone on its behalf has consulted with PwC at any time prior to their selection with respect to the application of accounting principles to a specified transaction, either completed or proposed or the type of audit opinion that might be rendered on the Fund’s financial statements.
40
Board of trustees/directors and officers addendum
Delaware Investments® Family of Funds
Delaware Investments® Family of Funds
A mutual fund is governed by a Board of Trustees/Directors (“Trustees”), which has oversight responsibility for the management of a fund’s business affairs. Trustees establish procedures and oversee and review the performance of the investment manager, the distributor, and others who perform services for the fund. The independent fund trustees, in particular, are advocates
| Name, Address, | Position(s) | Length of | ||
| and Birth Date | Held with Fund(s) | Time Served | ||
| Interested Trustees | ||||
| Patrick P. Coyne1 | Chairman, President, | Chairman and Trustee | ||
| 2005 Market Street | Chief Executive Officer, | since August 16, 2006 | ||
| Philadelphia, PA 19103 | and Trustee | |||
| April 1963 | President and | |||
| Chief Executive Officer | ||||
| since August 1, 2006 | ||||
1 Patrick P. Coyne is considered to be an “Interested Trustee” because he is an executive officer of the Fund’s(s’) investment advisor.
42
for shareholder interests. Each trustee has served in that capacity since he or she was elected to or appointed to the Board of Trustees, and will continue to serve until his or her retirement or the election of a new trustee in his or her place. The following is a list of the Trustees and Officers with certain background and related information.
| Number of Portfolios in | ||||
| Principal Occupation(s) | Fund Complex Overseen | Other Directorships | ||
| During Past 5 Years | by Trustee or Officer | Held by Trustee or Officer | ||
| Patrick P. Coyne has served in | 79 | Director | ||
| various executive capacities | Kaydon Corp. | |||
| at different times at | ||||
| Delaware Investments.2 | Board of Governors Member | |||
| Investment Company | ||||
| Institute (ICI) | ||||
| Finance Committee Member | ||||
| St. John Vianney Roman | ||||
| Catholic Church | ||||
| Board of Trustees | ||||
| Agnes Irwin School | ||||
| Member of Investment | ||||
| Committee | ||||
| Cradle of Liberty Council, | ||||
| BSA | ||||
| (2007 – 2010) | ||||
2 Delaware Investments is the marketing name for Delaware Management Holdings, Inc. and its subsidiaries, including the Fund’s(s’) investment advisor, principal underwriter, and its transfer agent.
43
Board of trustees/directors and officers addendum
Delaware Investments® Family of Funds
Delaware Investments® Family of Funds
| Name, Address, | Position(s) | Length of | ||
| and Birth Date | Held with Fund(s) | Time Served | ||
| Independent Trustees | ||||
| Thomas L. Bennett | Trustee | Since March 2005 | ||
| 2005 Market Street | ||||
| Philadelphia, PA 19103 | ||||
| October 1947 | ||||
| John A. Fry | Trustee | Since January 2001 | ||
| 2005 Market Street | ||||
| Philadelphia, PA 19103 | ||||
| May 1960 | ||||
| Anthony D. Knerr | Trustee | Since April 1990 | ||
| 2005 Market Street | ||||
| Philadelphia, PA 19103 | ||||
| December 1938 | ||||
| Lucinda S. Landreth | Trustee | Since March 2005 | ||
| 2005 Market Street | ||||
| Philadelphia, PA 19103 | ||||
| June 1947 | ||||
44
| Number of Portfolios in | ||||
| Principal Occupation(s) | Fund Complex Overseen | Other Directorships | ||
| During Past 5 Years | by Trustee or Officer | Held by Trustee or Officer | ||
| Private Investor | 79 | Director | ||
| (March 2004–Present) | Bryn Mawr Bank Corp. (BMTC) | |||
| Investment Manager | Chairman of Investment | |||
| Morgan Stanley & Co. | Committee | |||
| (January 1984–March 2004) | Pennsylvania Academy of | |||
| Fine Arts | ||||
| Investment Committee and | ||||
| Governance Committee | ||||
| Member | ||||
| Pennsylvania Horticultural | ||||
| Society | ||||
| President | 79 | Director | ||
| Franklin & Marshall College | Community Health Systems | |||
| (July 2002–Present) | ||||
| Director | ||||
| Ecore International | ||||
| Executive Vice President | Director — Allied | |||
| University of Pennsylvania | Barton Securities Holdings | |||
| (April 1995–June 2002) | (2005 – 2008) | |||
| Founder and | 79 | None | ||
| Managing Director | ||||
| Anthony Knerr & Associates | ||||
| (Strategic Consulting) | ||||
| (1990–Present) | ||||
| Chief Investment Officer | 79 | None | ||
| Assurant, Inc. (Insurance) | ||||
| (2002–2004) | ||||
45
Board of trustees/directors and officers addendum
Delaware Investments® Family of Funds
Delaware Investments® Family of Funds
| Name, Address, | Position(s) | Length of | ||
| and Birth Date | Held with Fund(s) | Time Served | ||
| Independent Trustees (continued) | ||||
| Ann R. Leven | Trustee | Since October 1989 | ||
| 2005 Market Street | ||||
| Philadelphia, PA 19103 | ||||
| November 1940 | ||||
| Thomas F. Madison | Trustee | Since May 19973 | ||
| 2005 Market Street | ||||
| Philadelphia, PA 19103 | ||||
| February 1936 | ||||
3 In 1997, several funds managed by Voyageur Fund Managers, Inc. (the “Voyageur Funds”) were incorporated into the Delaware Investments Family of Funds. Mr. Madison served as a director of the Voyageur Funds from 1993 until 1997.
46
| Number of Portfolios in | ||||
| Principal Occupation(s) | Fund Complex Overseen | Other Directorships | ||
| During Past 5 Years | by Trustee or Officer | Held by Trustee or Officer | ||
| Consultant | 79 | Director and Audit | ||
| ARL Associates | Committee Chair – | |||
| (Financial Planning) | Systemax Inc. | |||
| (1983–Present) | (2001 – 2009) | |||
| Director and Audit | ||||
| Committee Chairperson – | ||||
| Andy Warhol Foundation | ||||
| (1999 – 2007) | ||||
| President and | 79 | Director and Chair of | ||
| Chief Executive Officer | Compensation Committee, | |||
| MLM Partners, Inc. | Governance Committee | |||
| (Small Business Investing | Member | |||
| and Consulting) | CenterPoint Energy | |||
| (January 1993–Present) | ||||
| Lead Director and Chair of | ||||
| Audit and Governance | ||||
| Committees, Member of | ||||
| Compensation Committee | ||||
| Digital River, Inc. | ||||
| Director and Chair of | ||||
| Governance Committee, | ||||
| Audit Committee | ||||
| Member | ||||
| Rimage Corporation | ||||
| Director and Chair of | ||||
| Compensation Committee | ||||
| Spanlink Communications | ||||
| Lead Director and Member of | ||||
| Compensation and | ||||
| Governance Committees | ||||
| Valmont Industries, Inc. | ||||
| (1987 – 2010) | ||||
47
Board of trustees/directors and officers addendum
Delaware Investments® Family of Funds
Delaware Investments® Family of Funds
| Name, Address, | Position(s) | Length of | ||
| and Birth Date | Held with Fund(s) | Time Served | ||
| Independent Trustees (continued) | ||||
| Thomas F. Madison | ||||
| 2005 Market Street | ||||
| Philadelphia, PA 19103 | ||||
| February 1936 | ||||
| Janet L. Yeomans | Trustee | Since April 1999 | ||
| 2005 Market Street | ||||
| Philadelphia, PA 19103 | ||||
| July 1948 | ||||
| J. Richard Zecher | Trustee | Since March 2005 | ||
| 2005 Market Street | ||||
| Philadelphia, PA 19103 | ||||
| July 1940 | ||||
48
| Number of Portfolios in | ||||
| Principal Occupation(s) | Fund Complex Overseen | Other Directorships | ||
| During Past 5 Years | by Trustee or Officer | Held by Trustee or Officer | ||
| Director | ||||
| Banner Health | ||||
| (1996 – 2007) | ||||
| Vice President and Treasurer | 79 | Director | ||
| (January 2006–Present) | Okabena Company | |||
| Vice President — Mergers & Acquisitions | ||||
| (January 2003–January 2006), and | ||||
| Vice President | ||||
| (July 1995–January 2003) | ||||
| 3M Corporation | ||||
| Founder | 79 | Director and Audit | ||
| Investor Analytics | Committee Member | |||
| (Risk Management) | Investor Analytics | |||
| (May 1999–Present) | ||||
| Founder | Director | |||
| Sutton Asset Management | Oxigene, Inc. | |||
| (Hedge Fund) | (2003 – 2008) | |||
| (September 1996–Present) | ||||
49
Board of trustees/directors and officers addendum
Delaware Investments® Family of Funds
Delaware Investments® Family of Funds
| Name, Address, | Position(s) | Length of | ||
| and Birth Date | Held with Fund(s) | Time Served | ||
| Officers | ||||
| David F. Connor | Vice President, | Vice President since | ||
| 2005 Market Street | Deputy General | September 2000 | ||
| Philadelphia, PA 19103 | Counsel, and Secretary | and Secretary since | ||
| December 1963 | October 2005 | |||
| Daniel V. Geatens | Vice President | Treasurer | ||
| 2005 Market Street | and Treasurer | since October 25, 2007 | ||
| Philadelphia, PA 19103 | ||||
| October 1972 | ||||
| David P. O’Connor | Senior Vice President, | Senior Vice President, | ||
| 2005 Market Street | General Counsel, | General Counsel, and | ||
| Philadelphia, PA 19103 | and Chief Legal Officer | Chief Legal Officer | ||
| February 1966 | since October 2005 | |||
| Richard Salus | Senior Vice President | Chief Financial Officer | ||
| 2005 Market Street | and Chief Financial Officer | since November 2006 | ||
| Philadelphia, PA 19103 | ||||
| October 1963 | ||||
The Statement of Additional Information for the Fund(s) includes additional information about the Trustees and Officers and is available, without charge, upon request by calling 800 523-1918.
50
| Number of Portfolios in | ||||
| Principal Occupation(s) | Fund Complex Overseen | Other Directorships | ||
| During Past 5 Years | by Trustee or Officer | Held by Trustee or Officer | ||
| David F. Connor has served as | 79 | None4 | ||
| Vice President and Deputy | ||||
| General Counsel of | ||||
| Delaware Investments | ||||
| since 2000. | ||||
| Daniel V. Geatens has served | 79 | None4 | ||
| in various capacities at | ||||
| different times at | ||||
| Delaware Investments. | ||||
| David P. O’Connor has served in | 79 | None4 | ||
| various executive and legal | ||||
| capacities at different times | ||||
| at Delaware Investments. | ||||
| Richard Salus has served in | 79 | None4 | ||
| various executive capacities | ||||
| at different times at | ||||
| Delaware Investments. | ||||
4 David F. Connor, Daniel V. Geatens, David P. O’Connor, and Richard Salus serve in similar capacities for the six portfolios of the Optimum Fund Trust, which have the same investment advisor, principal underwriter, and transfer agent as the registrant.
51
About the organization
| Board of trustees | |||
Patrick P. Coyne Chairman, President, and Chief Executive Officer Delaware Investments® Family of Funds Philadelphia, PA Thomas L. Bennett Private Investor Rosemont, PA John A. Fry President Franklin & Marshall College Lancaster, PA | Anthony D. Knerr Founder and Managing Director Anthony Knerr & Associates New York, NY Lucinda S. Landreth Former Chief Investment Officer Assurant, Inc. Philadelphia, PA | Ann R. Leven Consultant ARL Associates New York, NY Thomas F. Madison President and Chief Executive Officer MLM Partners, Inc. Minneapolis, MN | Janet L. Yeomans Vice President and Treasurer 3M Corporation St. Paul, MN J. Richard Zecher Founder Investor Analytics Scottsdale, AZ |
| Affiliated officers | |||
David F. Connor Vice President, Deputy General Counsel, and Secretary Delaware Investments Family of Funds Philadelphia, PA | Daniel V. Geatens Vice President and Treasurer Delaware Investments Family of Funds Philadelphia, PA | David P. O’Connor Senior Vice President, General Counsel, and Chief Legal Officer Delaware Investments Family of Funds Philadelphia, PA | Richard Salus Senior Vice President and Chief Financial Officer Delaware Investments Family of Funds Philadelphia, PA |
This annual report is for the information of Delaware Large Cap Core Fund shareholders, but it may be used with prospective investors when preceded or accompanied by a current prospectus for Delaware Large Cap Core Fund, which is available at www.delawareinvestments.com. The prospectus sets forth details about charges, expenses, investment objectives, and operating policies of the investment company. You should read the prospectus carefully before you invest. The figures in this report represent past results that are not a guarantee of future results. The return and principal value of an investment in the investment company will fluctuate so that shares, when redeemed, may be worth more or less than their original cost. For the most recent performance, please call 800 523-1918. |
Delaware Investments is the marketing name of Delaware Management Holdings, Inc. and its subsidiaries. The Fund files its complete schedule of portfolio holdings with the Securities and Exchange Commission (SEC) for the first and third quarters of each fiscal year on Form N-Q. The Fund’s Forms N-Q, as well as a description of the policies and procedures that the Fund uses to determine how to vote proxies (if any) relating to portfolio securities are available without charge (i) upon request, by calling 800 523-1918; and (ii) on the SEC’s Web site at www.sec.gov. In addition, a description of the policies and procedures that the Fund uses to determine how to vote proxies (if any) relating to portfolio securities and the Fund’s Schedule of Investments are available without charge on the Fund’s Web site at www.delawareinvestments.com. The Fund’s Forms N-Q may be reviewed and copied at the SEC’s Public Reference Room in Washington, D.C.; information on the operation of the Public Reference Room may be obtained by calling 800 SEC-0330. Information (if any) regarding how the Fund voted proxies relating to portfolio securities during the most recently disclosed 12-month period ended June 30 is available without charge (i) through the Fund’s Web site at www.delawareinvestments.com; and (ii) on the SEC’s Web site at www.sec.gov. |
52
Item 2. Code of Ethics
The registrant has adopted a code of ethics that applies to the registrant’s principal executive officer, principal financial officer, principal accounting officer or controller, or persons performing similar functions, regardless of whether these individuals are employed by the registrant or a third party. A copy of the registrant’s Code of Business Ethics has been posted on the Delaware Investments Internet Web site at www.delawareinvestments.com. Any amendments to the Code of Business Ethics, and information on any waiver from its provisions granted by the registrant, will also be posted on this Web site within five business days of such amendment or waiver and will remain on the Web site for at least 12 months.
Item 3. Audit Committee Financial Expert
The registrant’s Board of Trustees/Directors has determined that each member of the registrant’s Audit Committee is an audit committee financial expert, as defined below. For purposes of this item, an “audit committee financial expert” is a person who has the following attributes:
a. An understanding of generally accepted accounting principles and financial statements;
b. The ability to assess the general application of such principles in connection with the accounting for estimates, accruals, and reserves;
c. Experience preparing, auditing, analyzing, or evaluating financial statements that present a breadth and level of complexity of accounting issues that are generally comparable to the breadth and complexity of issues that can reasonably be expected to be raised by the registrant’s financial statements, or experience actively supervising one or more persons engaged in such activities;
d. An understanding of internal controls and procedures for financial reporting; and
e. An understanding of audit committee functions.
An “audit committee financial expert” shall have acquired such attributes through:
a. Education and experience as a principal financial officer, principal accounting officer, controller, public accountant, or auditor or experience in one or more positions that involve the performance of similar functions;
b. Experience actively supervising a principal financial officer, principal accounting officer, controller, public accountant, auditor, or person performing similar functions;
c. Experience overseeing or assessing the performance of companies or public accountants with respect to the preparation, auditing, or evaluation of financial statements; or
d. Other relevant experience.
The registrant’s Board of Trustees/Directors has also determined that each member of the registrant’s Audit Committee is independent. In order to be “independent” for purposes of this item, the Audit Committee member may not: (i) other than in his or her capacity as a member of the Board of Trustees/Directors or any committee thereof, accept directly or indirectly any consulting, advisory or other compensatory fee from the issuer; or (ii) be an “interested person” of the registrant as defined in Section 2(a)(19) of the Investment Company Act of 1940.
The names of the audit committee financial experts on the registrant’s Audit Committee are set forth below:
Thomas L. Bennett 1
John A. Fry
Thomas F. Madison
Janet L. Yeomans
J. Richard Zecher
John A. Fry
Thomas F. Madison
Janet L. Yeomans
J. Richard Zecher
Item 4. Principal Accountant Fees and Services
(a) Audit fees.
The aggregate fees billed for services provided to the registrant by its independent auditors for the audit of the registrant’s annual financial statements and for services normally provided by the independent auditors in connection with statutory and regulatory filings or engagements were $27,676 for the fiscal year ended April 30, 2010.
____________________
1 The instructions to Form N-CSR require disclosure on the relevant experience of persons who qualify as audit committee financial experts based on “other relevant experience.” The Board of Trustees/Directors has determined that Mr. Bennett qualifies as an audit committee financial expert by virtue of his education, Chartered Financial Analyst designation, and his experience as a credit analyst, portfolio manager and the manager of other credit analysts and portfolio managers.
1 The instructions to Form N-CSR require disclosure on the relevant experience of persons who qualify as audit committee financial experts based on “other relevant experience.” The Board of Trustees/Directors has determined that Mr. Bennett qualifies as an audit committee financial expert by virtue of his education, Chartered Financial Analyst designation, and his experience as a credit analyst, portfolio manager and the manager of other credit analysts and portfolio managers.
The aggregate fees billed for services provided to the registrant by its independent auditors for the audit of the registrant’s annual financial statements and for services normally provided by the independent auditors in connection with statutory and regulatory filings or engagements were $29,400 for the fiscal year ended April 30, 2009.
(b) Audit-related fees.
The aggregate fees billed by the registrant’s independent auditors for services relating to the performance of the audit of the registrant’s financial statements and not reported under paragraph (a) of this Item were $0 for the fiscal year ended April 30, 2010.
The aggregate fees billed by the registrant’s independent auditors for services relating to the performance of the audit of the financial statements of the registrant’s investment adviser and other service providers under common control with the adviser and that relate directly to the operations or financial reporting of the registrant were $19,074 for the registrant’s fiscal year ended April 30, 2010. The percentage of these fees relating to services approved by the registrant’s Audit Committee pursuant to the de minimis exception from the pre-approval requirement in Rule 2-01(c)(7)(i)(C) of Regulation S-X was 0%. These audit-related services were as follows: issuance of report concerning transfer agent’s system of internal accounting control pursuant to Rule 17Ad-13 of the Securities Exchange Act.
The aggregate fees billed by the registrant’s independent auditors for services relating to the performance of the audit of the registrant’s financial statements and not reported under paragraph (a) of this Item were $0 for the fiscal year ended April 30, 2009.
The aggregate fees billed by the registrant’s independent auditors for services relating to the performance of the audit of the financial statements of the registrant’s investment adviser and other service providers under common control with the adviser and that relate directly to the operations or financial reporting of the registrant were $19,074 for the registrant’s fiscal year ended April 30, 2009. The percentage of these fees relating to services approved by the registrant’s Audit Committee pursuant to the de minimis exception from the pre-approval requirement in Rule 2-01(c)(7)(i)(C) of Regulation S-X was 0%. These audit-related services were as follows: issuance of report concerning transfer agent’s system of internal accounting control pursuant to Rule 17Ad-13 of the Securities Exchange Act.
(c) Tax fees.
The aggregate fees billed by the registrant’s independent auditors for tax-related services provided to the registrant were $7,700 for the fiscal year ended April 30, 2010. The percentage of these fees relating to services approved by the registrant’s Audit Committee pursuant to the de minimis exception from the pre-approval requirement in Rule 2-01(c)(7)(i)(C) of Regulation S-X was 0%. These tax-related services were as follows: review of income tax returns and review of annual excise distribution calculations.
The aggregate fees billed by the registrant’s independent auditors for tax-related services provided to the registrant’s investment adviser and other service providers under common control with the adviser and that relate directly to the operations or financial reporting of the registrant were $0 for the registrant’s fiscal year ended April 30, 2010.
The aggregate fees billed by the registrant’s independent auditors for tax-related services provided to the registrant were $7,900 for the fiscal year ended April 30, 2009. The percentage of these fees relating to services approved by the registrant’s Audit Committee pursuant to the de minimis exception from the pre-approval requirement in Rule 2-01(c)(7)(i)(C) of Regulation S-X was 0%. These tax-related services were as follows: review of income tax returns and review of annual excise distribution calculations.
The aggregate fees billed by the registrant’s independent auditors for tax-related services provided to the registrant’s adviser and other service providers under common control with the adviser and that relate directly to the operations or financial reporting of the registrant were $0 for the registrant’s fiscal year ended April 30, 2009.
(d) All other fees.
The aggregate fees billed for all services provided by the independent auditors to the registrant other than those set forth in paragraphs (a), (b) and (c) of this Item were $0 for the fiscal year ended April 30, 2010.
The aggregate fees billed for all services other than those set forth in paragraphs (b) and (c) of this Item provided by the registrant’s independent auditors to the registrant’s adviser and other service providers under common control with the adviser and that relate directly to the operations or financial reporting of the registrant were $0 for the registrant’s fiscal year ended April 30, 2010.
The aggregate fees billed for all services provided by the independent auditors to the registrant other than those set forth in paragraphs (a), (b) and (c) of this Item were $0 for the fiscal year ended April 30, 2009.
The aggregate fees billed for all services other than those set forth in paragraphs (b) and (c) of this Item provided by the registrant’s independent auditors to the registrant’s adviser and other service providers under common control with the adviser and that relate directly to the operations or financial reporting of the registrant were $0 for the registrant’s fiscal year ended April 30, 2009.
(e) The registrant’s Audit Committee has established pre-approval policies and procedures as permitted by Rule 2-01(c)(7)(i)(B) of Regulation S-X (the “Pre-Approval Policy”) with respect to services provided by the registrant’s independent auditors. Pursuant to the Pre-Approval Policy, the Audit Committee has pre-approved the services set forth in the table below with respect to the registrant up to the specified fee limits. Certain fee limits are based on aggregate fees to the registrant and other registrants within the Delaware Investments Family of Funds.
| Service | Range of Fees | |
| Audit Services | ||
| Statutory audits or financial audits for new Funds | up to $25,000 per Fund | |
| Services associated with SEC registration statements (e.g., Form N-1A, Form N-14, etc.), periodic reports and other documents filed with the SEC or other documents issued in connection with securities offerings (e.g., comfort letters for closed-end Fund offerings, consents), and assistance in responding to SEC comment letters | up to $10,000 per Fund | |
| Consultations by Fund management as to the accounting or disclosure treatment of transactions or events and/or the actual or potential impact of final or proposed rules, standards or interpretations by the SEC, FASB, or other regulatory or standard-setting bodies (Note: Under SEC rules, some consultations may be considered “audit-related services��� rather than “audit services”) | up to $25,000 in the aggregate | |
| Audit-Related Services | ||
| Consultations by Fund management as to the accounting or disclosure treatment of transactions or events and /or the actual or potential impact of final or proposed rules, standards or interpretations by the SEC, FASB, or other regulatory or standard-setting bodies (Note: Under SEC rules, some consultations may be considered “audit services” rather than “audit-related services”) | up to $25,000 in the aggregate | |
| Tax Services | ||
| U.S. federal, state and local and international tax planning and advice (e.g., consulting on statutory, regulatory or administrative developments, evaluation of Funds’ tax compliance function, etc.) | up to $25,000 in the aggregate | |
| U.S. federal, state and local tax compliance (e.g., excise distribution reviews, etc.) | up to $5,000 per Fund | |
| Review of federal, state, local and international income, franchise and other tax returns | up to $5,000 per Fund |
Under the Pre-Approval Policy, the Audit Committee has also pre-approved the services set forth in the table below with respect to the registrant’s investment adviser and other entities controlling, controlled by or under common control with the investment adviser that provide ongoing services to the registrant (the “Control Affiliates”) up to the specified fee limit. This fee limit is based on aggregate fees to the investment adviser and its Control Affiliates.
| Service | Range of Fees | |
| Non-Audit Services | ||
| Services associated with periodic reports and other documents filed with the SEC and assistance in responding to SEC comment letters | up to $10,000 in the aggregate |
The Pre-Approval Policy requires the registrant’s independent auditors to report to the Audit Committee at each of its regular meetings regarding all services initiated since the last such report was rendered, including those services authorized by the Pre-Approval Policy.
(f) Not applicable.
(g) The aggregate non-audit fees billed by the registrant’s independent auditors for services rendered to the registrant and to its investment adviser and other service providers under common control with the adviser were $207,414 and $257,014 for the registrant’s fiscal years ended April 30, 2010 and April 30, 2009, respectively.
(h) In connection with its selection of the independent auditors, the registrant’s Audit Committee has considered the independent auditors’ provision of non-audit services to the registrant’s investment adviser and other service providers under common control with the adviser that were not required to be pre-approved pursuant to Rule 2-01(c)(7)(ii) of Regulation S-X. The Audit Committee has determined that the independent auditors’ provision of these services is compatible with maintaining the auditors’ independence.
Item 5. Audit Committee of Listed Registrants
Not applicable.
Item 6. Investments
(a) Included as part of report to shareholders filed under Item 1 of this Form N-CSR.
(b) Divestment of securities in accordance with Section 13(c) of the Investment Company Act of 1940.
Not applicable.
Item 7. Disclosure of Proxy Voting Policies and Procedures for Closed-End Management Investment Companies
Not applicable.
Item 8. Portfolio Managers of Closed-End Management Investment Companies
Not applicable.
Item 9. Purchases of Equity Securities by Closed-End Management Investment Company and Affiliated Purchasers
Not applicable.
Item 10. Submission of Matters to a Vote of Security Holders
Not applicable.
Item 11. Controls and Procedures
The registrant’s principal executive officer and principal financial officer have evaluated the registrant’s disclosure controls and procedures within 90 days of the filing of this report and have concluded that they are effective in providing reasonable assurance that the information required to be disclosed by the registrant in its reports or statements filed under the Securities Exchange Act of 1934 is recorded, processed, summarized and reported within the time periods specified in the rules and forms of the Securities and Exchange Commission.
There were no significant changes in the registrant’s internal control over financial reporting that occurred during the second fiscal quarter of the period covered by the report to stockholders included herein (i.e., the registrant’s fourth fiscal quarter) that have materially affected, or are reasonably likely to materially affect, the registrant’s internal control over financial reporting.
Item 12. Exhibits
(a) (1) Code of Ethics
Not applicable.
(2) Certifications of Principal Executive Officer and Principal Financial Officer pursuant to Rule 30a-2 under the Investment Company Act of 1940 are attached hereto as Exhibit 99.CERT.
(3) Written solicitations to purchase securities pursuant to Rule 23c-1 under the Securities Exchange Act of 1934.
Not applicable.
(b) Certifications pursuant to Section 906 of the Sarbanes-Oxley Act of 2002 are furnished herewith as Exhibit 99.906CERT.
SIGNATURES
Pursuant to the requirements of the Securities Exchange Act of 1934 and the Investment Company Act of 1940, the registrant has duly caused this report to be signed on its behalf, by the undersigned, thereunto duly authorized.
Name of Registrant: Voyageur Mutual Funds III
| PATRICK P. COYNE | |
| By: | Patrick P. Coyne |
| Title: | Chief Executive Officer |
| Date: | July 7, 2010 |
Pursuant to the requirements of the Securities Exchange Act of 1934 and the Investment Company Act of 1940, this report has been signed below by the following persons on behalf of the registrant and in the capacities and on the dates indicated.
| PATRICK P. COYNE | |
| By: | Patrick P. Coyne |
| Title: | Chief Executive Officer |
| Date: | July 7, 2010 |
| RICHARD SALUS | |
| By: | Richard Salus |
| Title: | Chief Financial Officer |
| Date: | July 7, 2010 |