UNITED STATES SECURITIES AND EXCHANGE COMMISSION
Washington, D.C. 20549
FORM N-CSR
CERTIFIED SHAREHOLDER REPORT OF REGISTERED MANAGEMENT
INVESTMENT COMPANIES
| Investment Company Act file number: | | 811-04547 |
| | | |
| Exact name of registrant as specified in charter: | | Voyageur Mutual Funds III |
| | | |
| Address of principal executive offices: | | 2005 Market Street |
| | Philadelphia, PA 19103 |
| | | |
| Name and address of agent for service: | | David F. Connor, Esq. |
| | 2005 Market Street |
| | Philadelphia, PA 19103 |
| | | |
| Registrant’s telephone number, including area code: | | (800) 523-1918 |
| | | |
| Date of fiscal year end: | | October 31 |
| | | |
| Date of reporting period: | | October 31, 2016 |
Item 1. Reports to Stockholders

Annual report
U.S. equity mutual fund
Delaware Select Growth Fund
October 31, 2016
Carefully consider the Fund’s investment objectives, risk factors, charges, and expenses before investing. This and other information can be found in the Fund’s prospectus and its summary prospectus, which may be obtained by visiting delawareinvestments.com/literature or calling 800 523-1918. Investors should read the prospectus and the summary prospectus carefully before investing.
You can obtain shareholder reports and prospectuses online instead of in the mail.
Visit delawareinvestments.com/edelivery.
Experience Delaware Investments
Delaware Investments is committed to the pursuit of consistently superior asset management and unparalleled client service. We believe in our investment processes, which seek to deliver consistent results, and in convenient services that help add value for our clients.
If you are interested in learning more about creating an investment plan, contact your financial advisor.
You can learn more about Delaware Investments or obtain a prospectus for Delaware Select Growth Fund at delawareinvestments.com/literature.
Manage your investments online
| ● | | 24-hour access to your account information |
| ● | | Check your account balance and recent transactions |
| ● | | Request statements or literature |
| ● | | Make purchases and redemptions |
Delaware Management Holdings, Inc. and its subsidiaries (collectively known by the marketing name of Delaware Investments) are wholly owned subsidiaries of Macquarie Group Limited, a global provider of banking, financial, advisory, investment and funds management services.
Neither Delaware Investments nor its affiliates referred to in this document are authorized deposit-taking institutions for the purpose of the Banking Act 1959 (Commonwealth of Australia). The obligations of these entities do not represent deposits or other liabilities of Macquarie Bank Limited (MBL), a subsidiary of Macquarie Group Limited and an affiliate of Delaware Investments. MBL does not guarantee or otherwise provide assurance in respect of the obligations of these entities, unless noted otherwise. The fund is governed by U.S laws and regulations.
Table of contents
Unless otherwise noted, views expressed herein are current as of Oct. 31, 2016, and subject to change for events occurring after such date.
The Fund is not FDIC insured and is not guaranteed. It is possible to lose the principal amount invested.
Mutual fund advisory services provided by Delaware Management Company, a series of Delaware Management Business Trust, which is a registered investment advisor. Delaware Investments, a member of Macquarie Group, refers to Delaware Management Holdings, Inc. and its subsidiaries, including the Fund’s distributor, Delaware Distributors, L.P. Macquarie Group refers to Macquarie Group Limited and its subsidiaries and affiliates worldwide.
© 2016 Delaware Management Holdings, Inc.
All third-party marks cited are the property of their respective owners.
Portfolio management review
| | | | |
Delaware Select Growth Fund | | | November 8, 2016 | |
Performance preview (for the year ended October 31, 2016)
| | | | | | |
Delaware Select Growth Fund (Institutional Class shares) | | 1-year return | | | -1.37% | |
Delaware Select Growth Fund (Class A shares) | | 1-year return | | | -1.63% | |
Russell 3000® Growth Index (benchmark) | | 1-year return | | | +2.08% | |
Past performance does not guarantee future results.
For complete, annualized performance for Delaware U.S. Growth Fund, please see the table on page 4.
Institutional Class shares are available without sales or asset-based distribution charges only to certain eligible accounts. The performance of Class A shares excludes the applicable sales charge. Both Institutional class shares and Class A shares reflect the reinvestment of all distributions.
Please see page 6 for a description of the index. Index performance returns do not reflect any management fees, transaction costs, or expenses. Indices are unmanaged and one cannot invest directly in an index.
Jackson Square Partners, LLC (JSP), a U.S. registered investment advisor, is the sub-advisor to the Fund. As sub-advisor, JSP is responsible for day-to-day management of the Fund’s assets. Although JSP serves as sub-advisor, the investment manager, Delaware Management Company (DMC), a series of Delaware Management Business Trust, has ultimate responsibility for all investment advisory services.
Shifting monetary policies around the world and fluctuating oil and commodity prices dominated the fiscal year ended Oct. 31, 2016. At the onset of the period in the United States, the Federal Reserve took center stage when its long-anticipated federal funds rate hike – the first since June 2006 – was implemented in mid-December 2015. The Fed left the federal funds target rate range stand at 0.25% to 0.50% during its July and September meetings, however, and as global concerns picked up, Fed Chairwoman Janet Yellen took a wait-and-watch stance toward additional money supply changes. At the end of the Fund’s fiscal year, there was strong consensus among investors that borrowing costs might move higher before year end, but that monetary policy would remain accommodative for the foreseeable future.
At the same time, to calm shaky international asset markets, the European Central Bank (ECB) and the Bank of England (BOE) aggressively purchased assets within their own regions. “Brexit,” Britain’s vote to leave the European Union (EU), created increased uncertainty but European markets bounced back in midsummer upon news that BOE’s quantitative easing program would continue. Toward fall, policy meetings among the Fed, ECB, and Bank of Japan led to positive outcomes for international bond markets. Equity markets in developed countries outside the U.S. suffered from a series of substantial swings during the fiscal year. In the end, the MSCI EAFE Index (net) fell 3.23% for the period.
During the Fund’s fiscal year, U.S. economic data continued to paint a picture of steady job gains, well contained inflation, and robust housing and retail sales, offset by flat wage growth, a slower manufacturing outlook, and declining consumer and business sentiment. The economy rebounded in the fall. The real gross domestic product (GDP) – a measure of national economic output – had increased at an annual rate of 3.2% by Oct. 31, 2016, reflecting strong export growth and an increase in consumer spending (source: Bureau of Economic Analysis). Stocks fell in
1
Portfolio management review
Delaware Select Growth Fund
October, however, amid concerns about tighter global monetary policy and uncertainty in advance of a fierce presidential election with surefire financial implications. Still, large-cap stocks ended the period net positive, as the S&P 500® Index rose 4.51%.
On the political front, the U.S. is far from alone. In 2017, France, Germany, and the Netherlands will all hold elections, the results of which are likely to affect the health of the EU as it struggles to make sense of its changing landscape.
Oil and commodity prices, meanwhile, suffered from weakened demand and worldwide overproduction. The price of a barrel continued its downward spiral throughout the first three months of the fiscal year. Prices vacillated for the remainder of the period, and landed just north of $43 a barrel, which represented a marked improvement from February’s low of $34, but was still a substantial slide from June’s high of $53 (not to mention the high of more than $90 back in 2014).
China struggled through slowing growth in midwinter. Despite a growing national deficit and a continued slide in currency valuation, China’s economy then rebounded sharply, benefiting from a trifecta of fiscal stimulus, monetary stimulus, and currency devaluation.
Within the Fund
For the fiscal year ended Oct. 31, 2016, Delaware Select Growth Fund Institutional Class shares returned -1.37%. The Fund’s Class A shares returned -1.63% at net asset value and -7.30% at maximum offer price. These figures reflect all distributions reinvested. During the same period, the Fund’s benchmark, the Russell 3000 Growth Index, returned +2.08%. For complete, annualized performance of Delaware Select Growth Fund, please see the table on page 4.
Strong relative performance in the information technology and real estate sectors was unable to
overcome weak relative performance in the healthcare and financials sectors.
Shutterstock contributed to performance during the period. The company reported relatively strong financial results as well as an increase in paid downloads year over year. Growth of first-time users and uploaded images were at record highs. The company also announced an image-licensing deal with Google’s digital and mobile-advertising products that will provide Google’s users with integrated access to Shutterstock’s image library. We believe Shutterstock provides an attractive alternative to traditional licensed digital image and sound providers by providing a pure-pricing model and transparent terms at a significantly lower cost compared to existing companies. Image-and-sound licensing has historically been very expensive and often under excessively complex terms; therefore we feel Shutterstock should be able to gain considerable market share.
Abiomed also added to performance. The company received premarket approval for its Impella 2.5 product, which can be used during angioplasty procedures. The product was originally on the market in 2008 but reclassified in 2012 as a higher-risk device, requiring Abiomed to go through the full premarket Food and Drug Administration (FDA) approval process. The FDA stated that the device may permit longer and more thorough procedures while reducing patient risk. We believe there is additional room for sales expansion in the U.S. The company is likewise seeking approval in Japan.
Valeant Pharmaceuticals International detracted from performance during the period. There were multiple factors involved but they centered mainly on questions over Valeant’s ability to file its 10-K on time, thereby avoiding a technical default on its debt obligations. While the company did avoid technical default, we sold out of the position given the negative change of the company’s long-term fundamentals.
2
LendingClub also detracted from performance. In the spring, CEO Renaud Laplanche was asked to step down because of his investments in a LendingClub customer prior to suggesting that same investment for LendingClub. The company was later served with a grand jury subpoena from the U.S. Justice Department due to “control deficiencies.” While an increasingly competitive environment had made it more difficult for LendingClub in the past year, these recent concerns could shake investor confidence and threaten the lending base. However, we believe investments into the business over the long term
should help position the company to benefit widely from the shift from local banks toward an online commoditized marketplace for lending needs.
Regardless of the economic outcome, we remain consistent in our long-term investment philosophy: We want to own what we view as strong secular-growth companies with solid business models and competitive positions that we believe can grow market share and have the potential to deliver shareholder value in a variety of market environments.
3
Performance summary
| | |
| Delaware Select Growth Fund | | October 31, 2016 |
The performance data quoted represent past performance; past performance does not guarantee future results. Investment return and principal value will fluctuate so your shares, when redeemed, may be worth more or less than their original cost. Please obtain the performance data current for the most recent month end by calling 800 523-1918 or visiting our website at delawareinvestments.com/performance. Current performance may be lower or higher than the performance data quoted.
| | | | | | | | |
| Fund and benchmark performance1,2 | | Average annual total returns through October 31, 2016 |
| | | 1 year | | 5 years | | 10 years | | Lifetime |
Class A (Est. May 16, 1994) | | | | | | | | |
Excluding sales charge | | -1.63% | | +8.81% | | +7.60% | | +9.73% |
Including sales charge | | -7.30% | | +7.53% | | +6.96% | | +9.44% |
Class C (Est. May 20, 1994) | | | | | | | | |
Excluding sales charge | | -2.36% | | +8.00% | | +6.79% | | +8.91% |
Including sales charge | | -3.10% | | +8.00% | | +6.79% | | +8.91% |
Class R (Est. June 2, 2003) | | | | | | | | |
Excluding sales charge | | -1.87% | | +8.54% | | +7.32% | | +8.12% |
Including sales charge | | -1.87% | | +8.54% | | +7.32% | | +8.12% |
Institutional Class (Est. Aug. 28, 1997) | | | | | | | | |
Excluding sales charge | | -1.37% | | +9.09% | | +7.87% | | +7.54% |
Including sales charge | | -1.37% | | +9.09% | | +7.87% | | +7.54% |
Russell 3000 Growth Index | | +2.08% | | +13.47% | | +8.11% | | +5.80%* |
*The benchmark lifetime return is for Institutional Class share comparison only and is calculated using the last business day in the month of the Fund’s Institutional Class inception date.
1 Returns reflect the reinvestment of all distributions and are presented both with and without the applicable sales charges described below. Returns do not reflect the deduction of taxes the shareholder would pay on Fund distributions or redemptions of Fund shares.
Expense limitations were in effect for certain classes during some or all of the periods shown in the “Fund and benchmark performance” table. Expenses for each class are listed on the “Fund expense ratios” table on page 5. Performance would have been lower had expense limitations not been in effect.
Institutional Class shares are available without sales or asset-based distribution charges only to certain eligible accounts.
Class A shares are sold with a maximum front-end sales charge of 5.75%, and have an annual distribution and service fee of 0.25% of average daily net assets. Performance for Class A shares, excluding sales charges, assumes that no front-end sales charge applied.
Class C shares are sold with a contingent deferred sales charge of 1.00% if redeemed during the first 12 months. They are also subject to an annual distribution and service fee of 1.00% of average daily net assets. Performance for C shares, excluding sales charges, assumes either that contingent deferred sales charges did not apply or that the investment was not redeemed.
Class R shares are available only for certain retirement plan products. They are sold without a sales charge and have an annual distribution and service fee of 0.50% of average daily net assets.
4
2 The Fund’s expense ratios, as described in the most recent prospectus, are disclosed in the following “Fund expense ratios” table. Delaware Management Company has agreed to reimburse certain expenses and/or waive certain fees in order to prevent total annual fund operating expenses (excluding any 12b-1 fees, acquired fund fees and expenses, taxes, interest, short sale and dividend interest expenses, brokerage fees, certain insurance costs, and nonroutine expenses or costs, including, but not limited to, those relating to reorganizations, litigation, conducting shareholder meetings, and liquidations) from exceeding 1.00% of the Fund’s average daily net assets during the period from Feb. 26, 2016 through Oct. 31, 2016.* Please see the most recent prospectus and any applicable supplement(s) for additional information on these fee waivers and/or reimbursements.
| | | | | | | | |
| Fund expense ratios | | Class A | | Class C | | Class R | | Institutional Class |
Total annual operating expenses (without fee waivers) | | 1.23% | | 1.98% | | 1.48% | | 0.98% |
Net expenses (including fee waivers, if any) | | 1.23% | | 1.98% | | 1.48% | | 0.98% |
Type of waiver | | Contractual | | Contractual | | Contractual | | Contractual |
*The aggregate contractual waiver period covering this report is from Feb. 26, 2016, through Feb. 28, 2017.
5
Performance summary
Delaware Select Growth Fund
Performance of a $10,000 investment1
Average annual total returns from Oct. 31, 2006 through Oct. 31, 2016
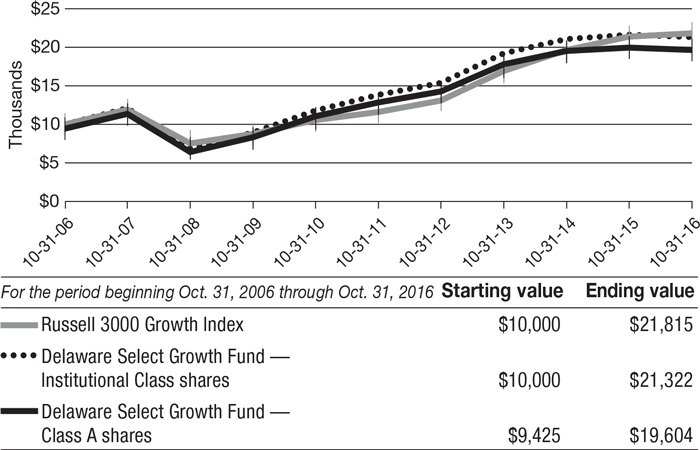
1 The “Performance of a $10,000 investment” graph assumes $10,000 invested in Institutional Class and Class A shares of the Fund on Oct. 31, 2006, and includes the effect of a 5.75% front-end sales charge (for Class A shares) and the reinvestment of all distributions. The graph does not reflect the deduction of taxes the shareholders would pay on Fund distributions or redemptions of Fund shares. Expense limitations were in effect for some or all of the periods shown. Performance would have been lower had expense limitations not been in effect. Expenses are listed in the “Fund expense ratios” table on page 5. Please note additional details on pages 4 through 7.
The graph also assumes $10,000 invested in the Russell 3000 Growth Index as of Oct. 31, 2006. The Russell 3000 Growth Index measures the performance of the broad growth segment of the U.S. equity universe. It includes those Russell
3000 companies with higher price-to-book ratios and higher forecasted growth values.
The MSCI EAFE (Europe, Australasia, FarEast) Index, mentioned on page 1, is a free float-adjusted market capitalization weighted index designed to measure equity market performance of developed markets, excluding the United States and Canada. Index “net” return approximates the minimum possible dividend reinvestment, after deduction of withholding tax at the highest possible rate.
The MSCI Emerging Markets Index, mentioned on page 2, measures equity market performance across emerging market countries worldwide. Index “net” return approximates the minimum possible dividend reinvestment, after deduction of withholding tax at the highest possible rate.
6
The S&P 500 Index, mentioned on page 2, measures the performance of 500 mostly large-cap stocks weighted by market value, and is often used to represent performance of the U.S. stock market.
Index performance returns do not reflect any management fees, transaction costs, or expenses. Indices are unmanaged and one cannot invest directly in an index. Past performance is not a guarantee of future results.
Russell Investment Group is the source and owner of the trademarks, service marks, and copyrights related to the Russell Indexes. Russell® is a trademark of Russell Investment Group.
Performance of other Fund classes will vary due to different charges and expenses.
| | | | | | |
| | | Nasdaq symbols | | CUSIPs | | |
Class A | | DVEAX | | 928931104 | | |
Class C | | DVECX | | 928931203 | | |
Class R | | DFSRX | | 928931740 | | |
Institutional Class | | VAGGX | | 928931757 | | |
7
Disclosure of Fund expenses
For the six-month period from May 1, 2016 to October 31, 2016 (Unaudited)
As a shareholder of the Fund, you incur two types of costs: (1) transaction costs, including sales charges (loads) on purchase payments, reinvested dividends, or other distributions; redemption fees; and exchange fees; and (2) ongoing costs, including management fees; distribution and/or service (12b-1) fees; and other Fund expenses. This example is intended to help you understand your ongoing costs (in dollars) of investing in the Fund and to compare these costs with the ongoing costs of investing in other mutual funds.
The example is based on an investment of $1,000 invested at the beginning of the period and held for the entire six-month period from May 1, 2016 to Oct. 31, 2016.
Actual expenses
The first section of the table shown, “Actual Fund return,” provides information about actual account values and actual expenses. You may use the information in this section of the table, together with the amount you invested, to estimate the expenses that you paid over the period. Simply divide your account value by $1,000 (for example, an $8,600 account value divided by $1,000 = 8.6), then multiply the result by the number in the first section under the heading entitled “Expenses Paid During Period” to estimate the expenses you paid on your account during this period.
Hypothetical example for comparison purposes
The second section of the table shown, “Hypothetical 5% return,” provides information about hypothetical account values and hypothetical expenses based on the Fund’s actual expense ratio and an assumed rate of return of 5% per year before expenses, which is not the Fund’s actual return. The hypothetical account values and expenses may not be used to estimate the actual ending account balance or expenses you paid for the period. You may use this information to compare the ongoing costs of investing in the Fund and other funds. To do so, compare this 5% hypothetical example with the 5% hypothetical examples that appear in the shareholder reports of the other funds.
Please note that the expenses shown in the table are meant to highlight your ongoing costs only and do not reflect any transactional costs, such as sales charges (loads), redemption fees, or exchange fees. Therefore, the second section of the table is useful in comparing ongoing costs only, and will not help you determine the relative total costs of owning different funds. In addition, if these transactional costs were included, your costs would have been higher. The Fund’s expenses shown in the table reflect fee waivers in effect. The expenses shown in the table assume reinvestment of all dividends and distributions.
8
Delaware Select Growth Fund
Expense analysis of an investment of $1,000
| | | | | | | | |
| | | Beginning
Account Value
5/1/16 | | Ending
Account Value
10/31/16 | | Annualized
Expense Ratio | | Expenses
Paid During Period
5/1/16 to 10/31/16* |
Actual Fund return† |
Class A | | $1,000.00 | | $1,046.40 | | 1.25% | | $6.43 |
Class C | | 1,000.00 | | 1,042.20 | | 2.00% | | 10.27 |
Class R | | 1,000.00 | | 1,045.10 | | 1.50% | | 7.71 |
Institutional Class | | 1,000.00 | | 1,047.90 | | 1.00% | | 5.15 |
|
Hypothetical 5% return (5% return before expenses) |
Class A | | $1,000.00 | | $1,018.85 | | 1.25% | | $6.34 |
Class C | | 1,000.00 | | 1,015.08 | | 2.00% | | 10.13 |
Class R | | 1,000.00 | | 1,017.60 | | 1.50% | | 7.61 |
Institutional Class | | 1,000.00 | | 1,020.11 | | 1.00% | | 5.08 |
| * | “Expenses Paid During Period” are equal to the Fund’s annualized expense ratio, multiplied by the average account value over the period, multiplied by 184/366 (to reflect the one-half year period). |
| † | Because actual returns reflect only the most recent six-month period, the returns shown may differ significantly from fiscal year returns. |
9
Security type / sector allocation and top 10 equity holdings
| | |
| Delaware Select Growth Fund | | As of October 31, 2016 (Unaudited) |
Sector designations may be different than the sector designations presented in other Fund materials. The sector designations may represent the investment manager’s internal sector classifications.
| | | | |
| Security type / sector | | Percentage of net assets | |
Common Stocks² | | | 101.11% | |
Consumer Discretionary | | | 17.35% | |
Consumer Staples | | | 0.50% | |
Energy | | | 1.41% | |
Financial Services | | | 6.06% | |
Healthcare | | | 18.04% | |
Industrials | | | 2.43% | |
Real Estate | | | 6.12% | |
Technology | | | 49.20% | |
Total Value of Securities | | | 101.11% | |
Liabilities Net of Receivables and Other Assets | | | (1.11%) | |
Total Net Assets | | | 100.00% | |
| ² | Narrow industries are utilized for compliance purposes for diversification whereas broad sectors are used for financial reporting. |
To monitor compliance with the Fund’s concentration guidelines as described in the Fund’s prospectus and statement of additional information, the Technology sector (as disclosed herein for financial reporting purposes) is subdivided into a variety of “industries” (in accordance with the requirements of the Investment Company Act of 1940). The Technology sector consisted of commercial services, computers, financial services, Internet, machinery-diversified, semiconductors, and software. As of Oct. 31, 2016 such amounts, as a percentage of total net assets, were 4.95%, 2.01%, 3.98%, 21.59%, 1.52%, 5.68%, and 9.47%, respectively. The percentage in any such single industry will comply with the Fund’s concentration policy even if the percentage in the “Technology sector” for financial reporting purposes may exceed 25%.
10
Holdings are for informational purposes only and are subject to change at any time. They are not a recommendation to buy, sell, or hold any security.
| | |
| Top 10 equity holdings | | Percentage of net assets |
PayPal Holdings | | 4.95% |
Microsoft | | 4.89% |
Celgene | | 4.69% |
Biogen | | 4.13% |
Allergan | | 3.79% |
QUALCOMM | | 3.67% |
Symantec | | 3.35% |
Alphabet Class A | | 2.81% |
eBay | | 2.67% |
Alphabet Class C | | 2.48% |
11
| | | | |
| Schedule of investments | | | |
| Delaware Select Growth Fund | | | October 31, 2016 | |
| | | | | | | | |
| | | Number of shares | | | | Value (U.S. $) | |
| |
Common Stock – 101.11%² | | | | | | | | |
| |
Consumer Discretionary – 17.35% | | | | | | | | |
DineEquity @ | | | 100,969 | | | $ | 7,986,648 | |
Discovery Communications Class A † | | | 53,477 | | | | 1,396,285 | |
Discovery Communications Class C † | | | 60,215 | | | | 1,511,999 | |
Dollar General | | | 73,564 | | | | 5,082,537 | |
Dunkin’ Brands Group | | | 202,442 | | | | 9,790,095 | |
L Brands | | | 155,084 | | | | 11,195,514 | |
Liberty Global Class A † | | | 61,473 | | | | 2,004,020 | |
Liberty Global Class C † | | | 181,336 | | | | 5,766,485 | |
Liberty Interactive Corp. QVC Group Class A † | | | 451,233 | | | | 8,343,298 | |
Liberty TripAdvisor Holdings Class A † | | | 514,524 | | | | 11,422,433 | |
Sally Beauty Holdings † | | | 432,222 | | | | 11,211,838 | |
Signet Jewelers | | | 5,009 | | | | 407,031 | |
Start Today | | | 106,635 | | | | 1,875,035 | |
TripAdvisor † | | | 120,208 | | | | 7,751,012 | |
Zalando 144A #† | | | 4,126 | | | | 181,127 | |
| | | | | | | | |
| | | | | | | 85,925,357 | |
| | | | | | | | |
Consumer Staples – 0.50% | | | | | | | | |
Walgreens Boots Alliance | | | 29,787 | | | | 2,464,279 | |
| | | | | | | | |
| | | | | | | 2,464,279 | |
| | | | | | | | |
Energy – 1.41% | | | | | | | | |
Core Laboratories | | | 2,355 | | | | 228,364 | |
EOG Resources | | | 4,061 | | | | 367,196 | |
Kinder Morgan | | | 312,415 | | | | 6,382,638 | |
| | | | | | | | |
| | | | | | | 6,978,198 | |
| | | | | | | | |
Financial Services – 6.06% | | | | | | | | |
Affiliated Managers Group † | | | 45,928 | | | | 6,092,809 | |
Charles Schwab | | | 25,807 | | | | 818,082 | |
Intercontinental Exchange | | | 20,165 | | | | 5,452,414 | |
LendingClub † | | | 1,364,140 | | | | 6,725,210 | |
LendingTree † | | | 44,678 | | | | 3,567,538 | |
MSCI Class A | | | 37,288 | | | | 2,990,125 | |
WisdomTree Investments | | | 508,330 | | | | 4,361,471 | |
| | | | | | | | |
| | | | | | | 30,007,649 | |
| | | | | | | | |
Healthcare – 18.04% | | | | | | | | |
ABIOMED † | | | 28,576 | | | | 3,000,194 | |
Allergan † | | | 89,849 | | | | 18,773,050 | |
athenahealth † | | | 39,930 | | | | 4,125,568 | |
Biogen † | | | 73,080 | | | | 20,475,554 | |
Bristol-Myers Squibb | | | 107,378 | | | | 5,466,614 | |
Celgene † | | | 227,259 | | | | 23,221,325 | |
DENTSPLY SIRONA | | | 65,942 | | | | 3,796,281 | |
12
| | | | | | | | |
| | | Number of shares | | | | Value (U.S. $) | |
| |
Common Stock² (continued) | | | | | | | | |
| |
Healthcare (continued) | | | | | | | | |
Novo Nordisk ADR | | | 102,035 | | | $ | 3,626,324 | |
Quintiles IMS Holdings † | | | 96,145 | | | | 6,897,442 | |
| | | | | | | | |
| | | | | | | 89,382,352 | |
| | | | | | | | |
Industrials – 2.43% | | | | | | | | |
Expeditors International of Washington | | | 53,240 | | | | 2,740,263 | |
Experian | | | 34,185 | | | | 658,182 | |
IHS Markit † | | | 79,908 | | | | 2,939,815 | |
Manitowoc Foodservice † | | | 68,928 | | | | 1,041,502 | |
Nielsen Holdings | | | 103,668 | | | | 4,667,133 | |
| | | | | | | | |
| | | | | | | 12,046,895 | |
| | | | | | | | |
Real Estate – 6.12% | | | | | | | | |
Crown Castle International | | | 88,306 | | | | 8,034,963 | |
Equinix | | | 8,436 | | | | 3,014,014 | |
Equity Commonwealth † | | | 346,031 | | | | 10,453,597 | |
Outfront Media | | | 410,934 | | | | 8,839,190 | |
| | | | | | | | |
| | | | | | | 30,341,764 | |
| | | | | | | | |
Technology – 49.20% | | | | | | | | |
Alphabet Class A † | | | 17,189 | | | | 13,921,371 | |
Alphabet Class C † | | | 15,676 | | | | 12,298,449 | |
Baidu ADR † | | | 15,259 | | | | 2,698,707 | |
eBay † | | | 463,451 | | | | 13,212,988 | |
Electronic Arts † | | | 123,046 | | | | 9,661,572 | |
Ellie Mae † | | | 14,565 | | | | 1,542,288 | |
Facebook Class A † | | | 77,666 | | | | 10,173,469 | |
Intuit | | | 28,187 | | | | 3,065,054 | |
j2 Global | | | 115,000 | | | | 8,182,250 | |
Logitech International Class R | | | 201,679 | | | | 4,881,221 | |
Mastercard Class A | | | 84,385 | | | | 9,030,883 | |
MercadoLibre | | | 7,143 | | | | 1,200,096 | |
Microsoft | | | 403,984 | | | | 24,206,721 | |
NIC † | | | 33,742 | | | | 774,379 | |
NXP Semiconductors † | | | 100,015 | | | | 10,001,500 | |
Pandora Media † | | | 1,067,849 | | | | 12,098,729 | |
Paycom Software † | | | 34,461 | | | | 1,782,668 | |
PayPal Holdings † | | | 588,483 | | | | 24,516,202 | |
QUALCOMM | | | 264,387 | | | | 18,168,675 | |
Quotient Technology † | | | 113,350 | | | | 1,201,510 | |
Scout24 144A #† | | | 192,724 | | | | 6,645,186 | |
Shutterstock † | | | 101,067 | | | | 5,961,942 | |
Symantec | | | 662,660 | | | | 16,586,380 | |
Tencent Holdings | | | 215,988 | | | | 5,731,422 | |
VeriFone Systems † | | | 327,400 | | | | 5,068,152 | |
13
Schedule of investments
Delaware Select Growth Fund
| | | | | | | | |
| | | Number of shares | | | Value (U.S. $) | |
| |
Common Stock² (continued) | | | | | | | | |
| |
Technology (continued) | | | | | | | | |
Visa Class A | | | 110,710 | | | $ | 9,134,682 | |
Yelp † | | | 135,696 | | | | 4,431,831 | |
Zebra Technologies † | | | 114,565 | | | | 7,542,960 | |
| | | | | | | | |
| | | | | | | 243,721,287 | |
| | | | | | | | |
Total Common Stock (cost $481,510,882) | | | | | | | 500,867,781 | |
| | | | | | | | |
| | |
Total Value of Securities – 101.11% (cost $481,510,882) | | | | | | $ | 500,867,781 | |
| | | | | | | | |
| # | Security exempt from registration under Rule 144A of the Securities Act of 1933, as amended. At Oct. 31, 2016, the aggregate value of Rule 144A securities was $6,826,313, which represents 1.38% of the Fund’s net assets. See Note 10 in “Notes to financial statements.” |
| @ | Illiquid security. At Oct. 31, 2016, the aggregate value of illiquid securities was $7,986,648, which represents 1.61% of the Fund’s net assets. See Note 10 in “Notes to financial statements.” |
| ² | Narrow industries are utilized for compliance purposes for diversification whereas broad sectors are used for financial reporting. |
| † | Non-income-producing security. |
ADR – American Depositary Receipt
See accompanying notes, which are an integral part of the financial statements.
14
| | | | |
| Statement of assets and liabilities | | | |
Delaware Select Growth Fund | | | October 31, 2016 | |
| | | | |
Assets: | | | | |
Investments, at value1 | | $ | 500,867,781 | |
Foreign currencies, at value2 | | | 1,902 | |
Receivable for securities sold | | | 5,708,733 | |
Receivable for fund shares sold | | | 174,312 | |
Foreign tax reclaims receivable | | | 174,186 | |
Dividends and interest receivable | | | 102,066 | |
| | | | |
Total assets | | | 507,028,980 | |
| | | | |
Liabilities: | | | | |
Cash overdraft | | | 7,869,477 | |
Payable for securities purchased | | | 1,940,935 | |
Payable for fund shares redeemed | | | 1,050,551 | |
Investment management fees payable to affiliates | | | 355,483 | |
Distribution fees payable to affiliates | | | 114,320 | |
Dividend disbursing and transfer agent fees and expenses payable to affiliates | | | 8,800 | |
Audit and tax fees payable | | | 5,158 | |
Accounting and administration expenses payable to affiliates | | | 2,049 | |
Trustees’ fees and expenses payable | | | 1,528 | |
Legal fees payable to affiliates | | | 716 | |
Reports and statements to shareholders expenses payable to affiliates | | | 210 | |
Other accrued expenses | | | 322,219 | |
| | | | |
Total liabilities | | | 11,671,446 | |
| | | | |
Total Net Assets | | $ | 495,357,534 | |
| | | | |
| |
Net Assets Consist of: | | | | |
Paid-in capital | | $ | 416,583,794 | |
Accumulated net investment loss | | | (1,861,137 | ) |
Accumulated net realized gain on investments | | | 61,282,053 | |
Net unrealized appreciation of investments | | | 19,356,899 | |
Net unrealized depreciation of foreign currencies | | | (4,075 | ) |
| | | | |
Total Net Assets | | $ | 495,357,534 | |
| | | | |
15
Statement of assets and liabilities
Delaware Select Growth Fund
| | | | |
Net Asset Value | | | | |
Class A: | | | | |
Net assets | | $ | 253,026,876 | |
Shares of beneficial interest outstanding, unlimited authorization, no par | | | 6,715,719 | |
Net asset value per share | | $ | 37.68 | |
Sales charge | | | 5.75 | % |
Offering price per share, equal to net asset value per share / (1 – sales charge) | | $ | 39.98 | |
| |
Class C: | | | | |
Net assets | | $ | 60,814,305 | |
Shares of beneficial interest outstanding, unlimited authorization, no par | | | 2,103,476 | |
Net asset value per share | | $ | 28.91 | |
| |
Class R: | | | | |
Net assets | | $ | 11,487,082 | |
Shares of beneficial interest outstanding, unlimited authorization, no par | | | 319,607 | |
Net asset value per share | | $ | 35.94 | |
| |
Institutional Class: | | | | |
Net assets | | $ | 170,029,271 | |
Shares of beneficial interest outstanding, unlimited authorization, no par | | | 4,221,710 | |
Net asset value per share | | $ | 40.27 | |
| | | | |
1Investments, at cost | | $ | 481,510,882 | |
2Foreign currencies, at cost | | | 1,938 | |
See accompanying notes, which are an integral part of the financial statements.
16
This page intentionally left blank.
| | | | |
| Statement of operations | | | |
Delaware Select Growth Fund | | | Year ended October 31, 2016 | |
| | | | |
Investment Income: | | | | |
Dividends | | $ | 6,381,328 | |
Interest | | | 5,785 | |
Foreign tax withheld | | | (55,768 | ) |
| | | | |
| | | 6,331,345 | |
| | | | |
Expenses: | | | | |
Management fees | | | 4,853,751 | |
Distribution expenses – Class A | | | 730,454 | |
Distribution expenses – Class C | | | 706,087 | |
Distribution expenses – Class R | | | 72,318 | |
Dividend disbursing and transfer agent fees and expenses | | | 1,212,813 | |
Accounting and administration expenses | | | 212,423 | |
Reports and statements to shareholders and expenses | | | 115,714 | |
Custodian fees | | | 91,838 | |
Legal fees | | | 86,274 | |
Registration fees | | | 74,471 | |
Audit and tax fees | | | 45,733 | |
Trustees’ fees and expenses | | | 34,234 | |
Other | | | 35,033 | |
| | | | |
| | | 8,271,143 | |
Less expenses waived | | | (98,550 | ) |
Less expense paid indirectly | | | (1,311 | ) |
| | | | |
Total operating expenses | | | 8,171,282 | |
| | | | |
Net Investment Loss | | | (1,839,937 | ) |
| | | | |
| |
Net Realized and Unrealized Gain (Loss): | | | | |
Net realized gain (loss) on: | | | | |
Investments | | | 71,914,058 | |
Foreign currencies | | | (65,351 | ) |
Foreign currency exchange contracts | | | 44,711 | |
| | | | |
Net realized gain | | | 71,893,418 | |
| | | | |
Net change in unrealized appreciation (depreciation) of: | | | | |
Investments | | | (91,584,417 | ) |
Foreign currencies | | | (2,940 | ) |
Foreign currency exchange contracts | | | (560 | ) |
| | | | |
Net change in unrealized appreciation (depreciation) | | | (91,587,917 | ) |
| | | | |
Net Realized and Unrealized Loss | | | (19,694,499 | ) |
| | | | |
Net Decrease in Net Assets Resulting from Operations | | $ | (21,534,436 | ) |
| | | | |
See accompanying notes, which are an integral part of the financial statements.
18
This page intentionally left blank.
Statements of changes in net assets
Delaware Select Growth Fund
| | | | | | | | |
| | | Year ended | |
| | | 10/31/16 | | | 10/31/15 | |
Increase (Decrease) in Net Assets from Operations: | | | | | | | | |
Net investment income (loss) | | $ | (1,839,937 | ) | | $ | 1,337,545 | |
Net realized gain | | | 71,893,418 | | | | 177,648,022 | |
Net change in unrealized depreciation | | | (91,587,917 | ) | | | (148,805,356 | ) |
| | | | | | | | |
Net increase (decrease) in net assets resulting from operations | | | (21,534,436 | ) | | | 30,180,211 | |
| | | | | | | | |
| | |
Dividends and Distributions to Shareholders from: | | | | | | | | |
Net investment income: | | | | | | | | |
Class A | | | — | | | | (679,599 | ) |
Institutional Class | | | — | | | | (1,935,116 | ) |
| | |
Net realized gain: | | | | | | | | |
Class A | | | (69,639,770 | ) | | | (43,650,573 | ) |
Class C | | | (21,232,699 | ) | | | (13,198,781 | ) |
Class R | | | (3,949,084 | ) | | | (2,240,709 | ) |
Institutional Class | | | (77,673,402 | ) | | | (51,773,331 | ) |
| | | | | | | | |
| | | (172,494,955 | ) | | | (113,478,109 | ) |
| | | | | | | | |
| | |
Capital Share Transactions: | | | | | | | | |
Proceeds from shares sold: | | | | | | | | |
Class A | | | 12,927,492 | | | | 18,783,415 | |
Class C | | | 4,121,048 | | | | 3,880,047 | |
Class R | | | 2,387,329 | | | | 4,498,501 | |
Institutional Class | | | 34,739,904 | | | | 64,564,182 | |
| | |
Net asset value of shares based upon reinvestment of dividends and distributions: | | | | | | | | |
Class A | | | 67,748,768 | | | | 42,847,794 | |
Class C | | | 17,451,337 | | | | 10,647,302 | |
Class R | | | 3,949,067 | | | | 2,240,700 | |
Institutional Class | | | 76,548,510 | | | | 52,889,229 | |
| | | | | | | | |
| | | 219,873,455 | | | | 200,351,170 | |
| | | | | | | | |
20
| | | | | | | | |
| | | Year ended | |
| | | 10/31/16 | | | 10/31/15 | |
Capital Share Transactions (continued): | | | | | | | | |
Cost of shares redeemed: | | | | | | | | |
Class A | | $ | (100,493,308 | ) | | $ | (81,570,389 | ) |
Class C | | | (25,225,932 | ) | | | (17,512,119 | ) |
Class R | | | (9,190,749 | ) | | | (6,173,999 | ) |
Institutional Class | | | (273,602,687 | ) | | | (154,750,371 | ) |
| | | | | | | | |
| | | (408,512,676 | ) | | | (260,006,878 | ) |
| | | | | | | | |
| | |
Decrease in net assets derived from capital share transactions | | | (188,639,221 | ) | | | (59,655,708 | ) |
| | | | | | | | |
Net Decrease in Net Assets | | | (382,668,612 | ) | | | (142,953,606 | ) |
| | |
Net Assets: | | | | | | | | |
Beginning of year | | | 878,026,146 | | | | 1,020,979,752 | |
| | | | | | | | |
End of year | | $ | 495,357,534 | | | $ | 878,026,146 | |
| | | | | | | | |
Accumulated net investment loss/distributions in excess of net investment income | | $ | (1,861,137 | ) | | $ | (560 | ) |
| | | | | | | | |
See accompanying notes, which are an integral part of the financial statements.
21
Financial highlights
Delaware Select Growth Fund Class A
Selected data for each share of the Fund outstanding throughout each period were as follows:
|
|
Net asset value, beginning of period |
|
Income (loss) from investment operations: |
|
Net investment income (loss)2 |
Net realized and unrealized gain (loss) |
Total from investment operations |
|
|
Less dividends and distributions from: |
|
Net investment income |
Net realized gain |
Total dividends and distributions |
|
|
Net asset value, end of period |
|
|
Total return3 |
|
|
Ratios and supplemental data: |
|
Net assets, end of period (000 omitted) |
Ratio of expenses to average net assets |
Ratio of expenses to average net assets prior to fees waived |
|
Ratio of net investment income (loss) to average net assets |
Ratio of net investment income (loss) to average net assets prior to fees waived |
|
Portfolio turnover |
|
| 1 | During the period ended Oct. 31, 2013, the Fund changed its fiscal year end from April to October. Ratios have been annualized and portfolio turnover and total return have not been annualized. |
| 2 | The average shares outstanding method has been applied for per share information. |
| 3 | Total investment return is based on the change in net asset value of a share during the period and assumes reinvestment of dividends and distributions at net asset value and does not reflect the impact of a sales charge. Total investment return during some of the periods shown reflects a waiver by the manager. Performance would have been lower had the waiver not been in effect. |
See accompanying notes, which are an integral part of the financial statements.
22
| | | | | | | | | | | | | | | | | | | | | | | | |
| | | | | | | | | | | | 5/1/13 | | | | | | | |
| | | | | | | Year ended | | | | | | | | to | | | | Year ended | |
| | | 10/31/16 | | | | 10/31/15 | | | | 10/31/14 | | | | 10/31/131 | | | | 4/30/13 | | | | 4/30/12 | |
| |
| | $ | 47.820 | | | $ | 52.440 | | | $ | 49.600 | | | $ | 44.010 | | | $ | 40.730 | | | $ | 36.730 | |
| | | | | | |
| | | (0.114 | ) | | | 0.047 | | | | (0.056 | ) | | | (0.045 | ) | | | (0.025 | ) | | | (0.194 | ) |
| | | (0.306 | ) | | | 1.202 | | | | 4.673 | | | | 5.635 | | | | 3.305 | | | | 4.194 | |
| | | | | | | | | | | | | | | | | | | | | | | | |
| | | (0.420 | ) | | | 1.249 | | | | 4.617 | | | | 5.590 | | | | 3.280 | | | | 4.000 | |
| | | | | | | | | | | | | | | | | | | | | | | | |
| | | | | | |
| | | — | | | | (0.090 | ) | | | — | | | | — | | | | — | | | | — | |
| | | (9.720 | ) | | | (5.779 | ) | | | (1.777 | ) | | | — | | | | — | | | | — | |
| | | | | | | | | | | | | | | | | | | | | | | | |
| | | (9.720 | ) | | | (5.869 | ) | | | (1.777) | | | | — | | | | — | | | | — | |
| | | | | | | | | | | | | | | | | | | | | | | | |
| | | | | | |
| | $ | 37.680 | | | $ | 47.820 | | | $ | 52.440 | | | $ | 49.600 | | | $ | 44.010 | | | $ | 40.730 | |
| | | | | | | | | | | | | | | | | | | | | | | | |
| | | (1.63% | ) | | | 2.31% | | | | 9.53% | | | | 12.70% | | | | 8.05% | | | | 10.89% | |
| | | | | | |
| | $ | 253,027 | | | $ | 348,846 | | | $ | 402,000 | | | $ | 489,286 | | | $ | 463,627 | | | $ | 386,254 | |
| | | 1.26% | | | | 1.25% | | | | 1.25% | | | | 1.25% | | | | 1.27% | | | | 1.35% | |
| | | | | | |
| | | 1.28% | | | | 1.25% | | | | 1.25% | | | | 1.25% | | | | 1.27% | | | | 1.35% | |
| | | (0.30% | ) | | | 0.09% | | | | (0.12% | ) | | | (0.19% | ) | | | (0.06% | ) | | | (0.53% | ) |
| | | | | | |
| | | (0.32% | ) | | | 0.09% | | | | (0.12% | ) | | | (0.19% | ) | | | (0.06% | ) | | | (0.53% | ) |
| | | 33% | | | | 46% | | | | 41% | | | | 20% | | | | 38% | | | | 25% | |
| |
23
Financial highlights
Delaware Select Growth Fund Class C
Selected data for each share of the Fund outstanding throughout each period were as follows:
|
|
Net asset value, beginning of period |
|
Income (loss) from investment operations: |
|
Net investment loss2 |
|
Net realized and unrealized gain (loss) |
|
Total from investment operations |
|
|
Less dividends and distributions from: |
|
Net realized gain |
|
Total dividends and distributions |
|
|
Net asset value, end of period |
|
|
Total return3 |
|
|
Ratios and supplemental data: |
|
Net assets, end of period (000 omitted) |
|
Ratio of expenses to average net assets |
|
Ratio of expenses to average net assets prior to fees waived |
|
Ratio of net investment loss to average net assets |
|
Ratio of net investment loss to average net assets prior to fees waived |
|
Portfolio turnover |
|
|
| 1 | During the period ended Oct. 31, 2013, the Fund changed its fiscal year end from April to October. Ratios have been annualized and portfolio turnover and total return have not been annualized. |
| 2 | The average shares outstanding method has been applied for per share information. |
| 3 | Total investment return is based on the change in net asset value of a share during the period and assumes reinvestment of dividends and distributions at net asset value and does not reflect the impact of a sales charge. Total investment return during some of the periods shown reflects a waiver by the manager. Performance would have been lower had the waiver not been in effect. |
See accompanying notes, which are an integral part of the financial statements.
24
| | | | | | | | | | | | | | | | | | | | | | | | |
| | | | | | | | | | | | 5/1/13 | | | | | | | |
| | | | | | | Year ended | | | | | | | | to | | | | Year ended | |
| | | 10/31/16 | | | | 10/31/15 | | | | 10/31/14 | | | | 10/31/131 | | | | 4/30/13 | | | | 4/30/12 | |
| |
| | $ | 39.130 | | | $ | 44.160 | | | $ | 42.340 | | | $ | 37.710 | | | $ | 35.170 | | | $ | 31.950 | |
| | | | | | |
| | | (0.309 | ) | | | (0.270 | ) | | | (0.370 | ) | | | (0.189 | ) | | | (0.282 | ) | | | (0.406 | ) |
| | | (0.191 | ) | | | 1.019 | | | | 3.967 | | | | 4.819 | | | | 2.822 | | | | 3.626 | |
| | | | | | | | | | | | | | | | | | | | | | | | |
| | | (0.500 | ) | | | 0.749 | | | | 3.597 | | | | 4.630 | | | | 2.540 | | | | 3.220 | |
| | | | | | | | | | | | | | | | | | | | | | | | |
| | | | | | |
| | | (9.720 | ) | | | (5.779 | ) | | | (1.777 | ) | | | — | | | | — | | | | — | |
| | | | | | | | | | | | | | | | | | | | | | | | |
| | | (9.720 | ) | | | (5.779 | ) | | | (1.777 | ) | | | — | | | | — | | | | — | |
| | | | | | | | | | | | | | | | | | | | | | | | |
| | | | | | |
| | $ | 28.910 | | | $ | 39.130 | | | $ | 44.160 | | | $ | 42.340 | | | $ | 37.710 | | | $ | 35.170 | |
| | | | | | | | | | | | | | | | | | | | | | | | |
| | | | | | |
| | | (2.36% | ) | | | 1.52% | | | | 8.71% | | | | 12.28% | | | | 7.22% | | | | 10.08% | |
| | | | | | |
| | $ | 60,815 | | | $ | 87,833 | | | $ | 101,991 | | | $ | 115,635 | | | $ | 109,164 | | | $ | 108,994 | |
| | | 2.01% | | | | 2.00% | | | | 2.00% | | | | 2.00% | | | | 2.02% | | | | 2.10% | |
| | | | | | |
| | | 2.03% | | | | 2.00% | | | | 2.00% | | | | 2.00% | | | | 2.02% | | | | 2.10% | |
| | | (1.05% | ) | | | (0.66% | ) | | | (0.87% | ) | | | (0.94% | ) | | | (0.81% | ) | | | (1.28% | ) |
| | | | | | |
| | | (1.07% | ) | | | (0.66% | ) | | | (0.87% | ) | | | (0.94% | ) | | | (0.81% | ) | | | (1.28% | ) |
| | | 33% | | | | 46% | | | | 41% | | | | 20% | | | | 38% | | | | 25% | |
| |
25
Financial highlights
Delaware Select Growth Fund Class R
Selected data for each share of the Fund outstanding throughout each period were as follows:
|
|
Net asset value, beginning of period |
|
Income (loss) from investment operations: |
|
Net investment loss2 |
|
Net realized and unrealized gain (loss) |
|
Total from investment operations. |
|
|
Less dividends and distributions from: |
|
Net realized gain |
|
Total dividends and distributions |
|
|
Net asset value, end of period |
|
|
Total return3 |
|
|
Ratios and supplemental data: |
|
Net assets, end of period (000 omitted) |
|
Ratio of expenses to average net assets |
|
Ratio of expenses to average net assets prior to fees waived |
|
Ratio of net investment loss to average net assets |
|
Ratio of net investment loss to average net assets prior to fees waived |
|
Portfolio turnover |
|
|
| 1 | During the period ended Oct. 31, 2013, the Fund changed its fiscal year end from April to October. Ratios have been annualized and portfolio turnover and total return have not been annualized. |
| 2 | The average shares outstanding method has been applied for per share information. |
| 3 | Total investment return is based on the change in net asset value of a share during the period and assumes reinvestment of dividends and distributions at net asset value. Total investment return during some of the periods shown reflects waivers by the manager and/or distributor. Performance would have been lower had the waivers not been in effect. |
See accompanying notes, which are an integral part of the financial statements.
26
| | | | | | | | | | | | | | | | | | | | | | | | |
| | | | | | | | | | | | 5/1/13 | | | | | | | |
| | | | | | | Year ended | | | | | | | | to | | | | Year ended | |
| | | 10/31/16 | | | | 10/31/15 | | | | 10/31/14 | | | | 10/31/131 | | | | 4/30/13 | | | | 4/30/12 | |
| |
| | $ | 46.150 | | | $ | 50.830 | | | $ | 48.250 | | | $ | 42.870 | | | $ | 39.770 | | | $ | 35.960 | |
| | | | | | |
| | | (0.200 | ) | | | (0.075 | ) | | | (0.184 | ) | | | (0.101 | ) | | | (0.124 | ) | | | (0.282 | ) |
| | | (0.290 | ) | | | 1.174 | | | | 4.541 | | | | 5.481 | | | | 3.224 | | | | 4.092 | |
| | | | | | | | | | | | | | | | | | | | | | | | |
| | | (0.490 | ) | | | 1.099 | | | | 4.357 | | | | 5.380 | | | | 3.100 | | | | 3.810 | |
| | | | | | | | | | | | | | | | | | | | | | | | |
| | | | | | |
| | | (9.720 | ) | | | (5.779 | ) | | | (1.777 | ) | | | — | | | | — | | | | — | |
| | | | | | | | | | | | | | | | | | | | | | | | |
| | | (9.720 | ) | | | (5.779 | ) | | | (1.777 | ) | | | — | | | | — | | | | — | |
| | | | | | | | | | | | | | | | | | | | | | | | |
| | | | | | |
| | $ | 35.940 | | | $ | 46.150 | | | $ | 50.830 | | | $ | 48.250 | | | $ | 42.870 | | | $ | 39.770 | |
| | | | | | | | | | | | | | | | | | | | | | | | |
| | | | | | |
| | | (1.87% | ) | | | 2.02% | | | | 9.26% | | | | 12.55% | | | | 7.79% | | | | 10.60% | |
| | | | | | |
| | $ | 11,487 | | | $ | 18,766 | | | $ | 20,022 | | | $ | 18,681 | | | $ | 13,428 | | | $ | 9,294 | |
| | | 1.51% | | | | 1.50% | | | | 1.50% | | | | 1.50% | | | | 1.52% | | | | 1.60% | |
| | | | | | |
| | | 1.53% | | | | 1.50% | | | | 1.50% | | | | 1.58% | | | | 1.62% | | | | 1.70% | |
| | | (0.55% | ) | | | (0.16% | ) | | | (0.37% | ) | | | (0.44% | ) | | | (0.31% | ) | | | (0.78% | ) |
| | | | | | |
| | | (0.57% | ) | | | (0.16% | ) | | | (0.37% | ) | | | (0.56% | ) | | | (0.41% | ) | | | (0.88% | ) |
| | | 33% | | | | 46% | | | | 41% | | | | 20% | | | | 38% | | | | 25% | |
| |
27
Financial highlights
Delaware Select Growth Fund Institutional Class
Selected data for each share of the Fund outstanding throughout each period were as follows:
|
|
Net asset value, beginning of period |
|
Income (loss) from investment operations: |
|
Net investment income (loss)2 |
|
Net realized and unrealized gain (loss) |
|
Total from investment operations |
|
|
Less dividends and distributions from: |
|
Net investment income |
|
Net realized gain |
|
Total dividends and distributions |
|
|
Net asset value, end of period |
|
|
Total return3 |
|
|
Ratios and supplemental data: |
|
Net assets, end of period (000 omitted) |
|
Ratio of expenses to average net assets |
|
Ratio of expenses to average net assets prior to fees waived |
|
Ratio of net investment income (loss) to average net assets |
|
Ratio of net investment income (loss) to average net assets prior to fees waived |
|
Portfolio turnover |
|
|
| 1 | During the period ended Oct. 31, 2013, the Fund changed its fiscal year end from April to October. Ratios have been annualized and portfolio turnover and total return have not been annualized. |
| 2 | The average shares outstanding method has been applied for per share information. |
| 3 | Total investment return is based on the change in net asset value of a share during the period and assumes reinvestment of dividends and distributions at net asset value. Total investment return during some of the periods shown reflects a waiver by the manager. Performance would have been lower had the waiver not been in effect. |
See accompanying notes, which are an integral part of the financial statements.
28
| | | | | | | | | | | | | | | | | | | | | | | | |
| | | | | | | | | | | | 5/1/13 | | | | | | | |
| | | | | | | Year ended | | | | | | | | to | | | | Year ended | |
| | | 10/31/16 | | | | 10/31/15 | | | | 10/31/14 | | | | 10/31/131 | | | | 4/30/13 | | | | 4/30/12 | |
| |
| | $ | 50.350 | | | $ | 54.920 | | | $ | 51.730 | | | $ | 45.850 | | | $ | 42.320 | | | $ | 38.070 | |
| | | | | | |
| | | (0.020 | ) | | | 0.181 | | | | 0.065 | | | | 0.015 | | | | 0.079 | | | | (0.107 | ) |
| | | (0.340 | ) | | | 1.244 | | | | 4.902 | | | | 5.865 | | | | 3.451 | | | | 4.357 | |
| | | | | | | | | | | | | | | | | | | | | | | | |
| | | (0.360 | ) | | | 1.425 | | | | 4.967 | | | | 5.880 | | | | 3.530 | | | | 4.250 | |
| | | | | | | | | | | | | | | | | | | | | | | | |
| | | | | | |
| | | — | | | | (0.216 | ) | | | — | | | | — | | | | — | | | | — | |
| | | (9.720 | ) | | | (5.779 | ) | | | (1.777 | ) | | | — | | | | — | | | | — | |
| | | | | | | | | | | | | | | | | | | | | | | | |
| | | (9.720 | ) | | | (5.995 | ) | | | (1.777 | ) | | | — | | | | — | | | | — | |
| | | | | | | | | | | | | | | | | | | | | | | | |
| | | | | | |
| | $ | 40.270 | | | $ | 50.350 | | | $ | 54.920 | | | $ | 51.730 | | | $ | 45.850 | | | $ | 42.320 | |
| | | | | | | | | | | | | | | | | | | | | | | | |
| | | | | | |
| | | (1.37% | ) | | | 2.54% | | | | 9.80% | | | | 12.82% | | | | 8.34% | | | | 11.16% | |
| | | | | | |
| | $ | 170,029 | | | $ | 422,581 | | | $ | 496,967 | | | $ | 446,146 | | | $ | 369,526 | | | $ | 242,130 | |
| | | 1.01% | | | | 1.00% | | | | 1.00% | | | | 1.00% | | | | 1.02% | | | | 1.10% | |
| | | | | | |
| | | 1.03% | | | | 1.00% | | | | 1.00% | | | | 1.00% | | | | 1.02% | | | | 1.10% | |
| | | (0.05% | ) | | | 0.34% | | | | 0.13% | | | | 0.06% | | | | 0.19% | | | | (0.28% | ) |
| | | | | | |
| | | (0.07% | ) | | | 0.34% | | | | 0.13% | | | | 0.06% | | | | 0.19% | | | | (0.28% | ) |
| | | 33% | | | | 46% | | | | 41% | | | | 20% | | | | 38% | | | | 25% | |
| |
29
Notes to financial statements
Delaware Select Growth Fund | October 31, 2016 |
Voyageur Mutual Funds III (Trust) is organized as a Delaware statutory trust and offers one series: Delaware Select Growth Fund. The Trust is an open-end investment company. The Fund is considered diversified under the Investment Company Act of 1940 (1940 Act), as amended, and offers Class A, Class C, Class R, and Institutional Class shares. Class A shares are sold with a maximum front-end sales charge of 5.75%. Class A share purchases of $1,000,000 or more will incur a contingent deferred sales charge (CDSC) instead of a front-end sales charge of 1.00% if redeemed during the first year and 0.50% during the second year, provided that Delaware Distributors, L.P. (DDLP) paid a financial advisor a commission on the purchase of those shares. Class C shares are sold with a CDSC of 1.00%, if redeemed during the first 12 months. Class R and Institutional Class shares are not subject to a sales charge and are offered for sale exclusively to certain eligible investors.
The investment objective of the Fund is to seek long-term capital appreciation, which the Fund attempts to achieve by investing primarily in equity securities of companies the manager believes have long-term capital appreciation potential and are expected to grow faster than the U.S. economy.
1. Significant Accounting Policies
The following accounting policies are in accordance with U.S. generally accepted accounting principles (U.S. GAAP) and are consistently followed by the Fund.
Security Valuation – Equity securities, except those traded on the Nasdaq Stock Market LLC (Nasdaq), are valued at the last quoted sales price as of the time of the regular close of the New York Stock Exchange on the valuation date. Equity securities traded on the Nasdaq are valued in accordance with the Nasdaq Official Closing Price, which may not be the last sales price. If, on a particular day, an equity security does not trade, the mean between the bid and ask prices will be used, which approximates fair value. Securities listed on a foreign exchange are normally valued at the last quoted sales price on the valuation date. U.S. government and agency securities are valued at the mean between the bid and ask prices, which approximates fair value. Foreign currency exchange contracts and foreign cross currency exchange contracts are valued at the mean between the bid and ask prices, which approximates fair value. Interpolated values are derived when the settlement date of the contract is an interim date for which quotations are not available. Generally, other securities and assets for which market quotations are not readily available are valued at fair value as determined in good faith under the direction of the Trust’s Board of Trustees (Board). In determining whether market quotations are readily available or fair valuation will be used, various factors will be taken into consideration, such as market closures or suspension of trading in a security. The Fund may use fair value pricing more frequently for securities traded primarily in non-U.S. markets because, among other things, most foreign markets close well before the Fund values its securities, generally as of 4:00 p.m. Eastern time. The earlier close of these foreign markets gives rise to the possibility that significant events, including broad market moves, government actions or pronouncements, aftermarket trading, or news events may have occurred in the interim. Whenever such a significant event occurs, the Fund may value foreign securities using fair value prices based on third-party vendor modeling tools (international fair value pricing).
Federal and Foreign Income Taxes – No provision for federal income taxes has been made as the Fund intends to continue to qualify for federal income tax purposes as a regulated investment company under Subchapter M of the Internal Revenue Code of 1986, as amended, and make the requisite distributions to shareholders. The Fund evaluates tax positions taken or expected to be
30
taken in the course of preparing the Fund’s tax returns to determine whether the tax positions are “more-likely-than-not” of being sustained by the applicable tax authority. Tax positions not deemed to meet the “more-likely-than-not” threshold are recorded as a tax benefit or expense in the current year. Management has analyzed the Fund’s tax positions taken for all open federal income tax years (Oct. 31, 2013–Oct. 31, 2016), and has concluded that no provision for federal income tax is required in the Fund’s financial statements. In regard to foreign taxes only, the Fund has open tax years in certain foreign countries in which it invests in that may date back to the inception of the Fund.
Class Accounting – Investment income, common expenses, and realized and unrealized gain (loss) on investments are allocated to the various classes of the Fund on the basis of daily net assets of each class. Distribution expenses relating to a specific class are charged directly to that class.
Repurchase Agreements – The Fund may purchase certain U.S. government securities subject to the counterparty’s agreement to repurchase them at an agreed upon date and price. The counterparty will be required on a daily basis to maintain the value of the collateral subject to the agreement at not less than the repurchase price (including accrued interest). The agreements are conditioned upon the collateral being deposited under the Federal Reserve book-entry system with the Fund’s custodian or a third-party sub-custodian. In the event of default or bankruptcy by the other party to the agreement, retention of the collateral may be subject to legal proceedings. At Oct. 30, 2016, the Fund held no investments in repurchase agreements.
Foreign Currency Transactions – Transactions denominated in foreign currencies are recorded at the prevailing exchange rates on the valuation date in accordance with the Fund’s prospectus. The value of all assets and liabilities denominated in foreign currencies is translated daily into U.S. dollars at the exchange rate of such currencies against the U.S. dollar. Transaction gains or losses resulting from changes in exchange rates during the reporting period or upon settlement of the foreign currency transaction are reported in operations for the current period. The Fund generally does not bifurcate that portion of realized gains and losses on investments which is due to changes in foreign exchange rates from that which is due to changes in market prices. These gains and losses are included on the “Statement of operations” under “Net realized and unrealized gain (loss) on investments.” The Fund reports certain foreign currency related transactions as components of realized gains (losses) for financial reporting purposes, whereas such components are treated as ordinary income (loss) for federal income tax purposes.
Use of Estimates – The Fund is an investment company whose financial statements are prepared in conformity with U.S. GAAP. Therefore, the Fund follows the accounting and reporting guidelines for investment companies. The preparation of financial statements in conformity with U.S. GAAP requires management to make estimates and assumptions that affect the fair value of investments, the reported amounts of assets and liabilities and disclosure of contingent assets and liabilities at the date of the financial statements, and the reported amounts of revenues and expenses during the reporting period. Actual results could differ from those estimates and the differences could be material.
Other – Expenses directly attributable to the Fund are charged directly to the Fund. Other expenses common to various funds within the Delaware Investments® Family of Funds are generally allocated among such funds on the basis of average net assets. Management fees and some other expenses are
31
Notes to financial statements
Delaware Select Growth Fund
1. Significant Accounting Policies (continued)
paid monthly. Security transactions are recorded on the date the securities are purchased or sold (trade date) for financial reporting purposes. Costs used in calculating realized gains and losses on the sale of investment securities are those of the specific securities sold. Dividend income is recorded on the ex-dividend date and interest income is recorded on the accrual basis. Discounts and premiums on debt securities are accreted or amortized to interest income, respectively, over the lives of the respective securities using the effective interest method. Taxable non-cash dividends are recorded as dividend income. Foreign dividends are also recorded on the ex-dividend date or as soon after the ex-dividend date that the Fund is aware of such dividends, net of all tax withholdings, a portion of which may be reclaimable. Withholding taxes and reclaims on foreign dividends have been recorded in accordance with the Fund’s understanding of the applicable country’s tax rules and rates. The Fund declares and pays dividends from net investment income and distributions from net realized gain on investments, if any, annually. The Fund may distribute more frequently, if necessary for tax purposes. Dividends and distributions, if any, are recorded on the ex-dividend date.
Subject to seeking best execution, the Fund may direct certain security trades to brokers who have agreed to rebate a portion of the related brokerage commission to the Fund in cash. In general, best execution refers to many factors, including the price paid or received for a security, the commission charged, the promptness and reliability of execution, the confidentiality and placement accorded the order, and other factors affecting the overall benefit obtained by the Fund on the transaction. There were no commission rebates for the year ended Oct. 31, 2016.
The Fund may receive earnings credits from its custodian when positive cash balances are maintained, which may be used to offset custody fees. There were no such earnings credits for the year ended Oct. 31, 2016.
The Fund receives earnings credits from its transfer agent when positive cash balances are maintained, which may be used to offset transfer agent fees. If the amount earned is greater than $1.00, the expense paid under this arrangement is included on the “Statement of operations” under “Dividend disbursing and transfer agent fees and expenses” with the corresponding expense offset shown under “Less expense paid indirectly.” For the year ended Oct. 31, 2016, the Fund earned $1,311 under this agreement.
2. Investment Management, Administration Agreements, and Other Transactions with Affiliates
In accordance with the terms of its investment management agreement, the Fund pays Delaware Management Company (DMC), a series of Delaware Management Business Trust and the investment manager, an annual fee which is calculated daily at the rate of 0.75% on the first $500 million of average daily net assets of the Fund, 0.70% on the next $500 million, 0.65% on the next $1.5 billion, and 0.60% on average daily net assets in excess of $2.5 billion.
DMC has contractually agreed to waive that portion if any, of its management fee and/or pay/reimburse the Fund to the extent necessary to ensure that total annual fund operating expenses (excluding any distributions and service (12b-1) fees, taxes, acquired funds fees and expenses, taxes, interest, short sale and dividend interest expenses, brokerage fees, certain insurance costs, and nonroutine expenses or costs, including, but not limited to those relating to reorganizations, litigation, conducting shareholder
32
meetings, and liquidations) do not exceed 1.00% of the Fund’s average daily net assets from Feb. 26, 2016 through Oct. 31, 2016.* For purposes of this waiver and reimbursement, nonroutine expenses may also include such additional costs and expenses as may be agreed upon from time to time by the Fund’s Board and DMC. This expense waiver and reimbursement may only be terminated by agreement of DMC and the Fund.
Jackson Square Partners, LLC (JSP), a related party of DMC, furnishes investment sub-advisory services to the Fund. Effective June 1, 2016, for these services, DMC, not the Fund, pays JSP fees based on the aggregate average daily net assets of the Fund at the following annual rate: 0.450% of the first $500 million; 0.420% of the next $500 million; 0.390% of the next $1.5 billion; and 0.360% of aggregate average daily net assets in excess of $2.5 billion. Prior to June 1, 2016, DMC paid JSP fees based on the aggregate average daily net assets of the Fund at the following annual rate: 0.375% of the first $500 million; 0.350% of the next $500 million; 0.325% of the next $1.5 billion; and 0.300% of aggregate average daily net assets in excess of $2.5 billion.
Delaware Investments Fund Services Company (DIFSC), an affiliate of DMC, provides fund accounting and financial administration oversight services to the Fund. For these services, DIFSC’s fees are calculated based on the aggregate daily net assets of the Delaware Investments® Family of Funds at the following annual rate: 0.0050% of the first $30 billion; 0.0045% of the next $10 billion; 0.0040% of the next $10 billion; and 0.0025% of aggregate average daily net assets in excess of $50 billion. The fees payable to DIFSC under the service agreement described above are allocated among all funds in the Delaware Investments Family of Funds on a relative net asset value (NAV) basis. For the year ended Oct. 31, 2016, the Fund was charged $31,205 for these services. This amount is included on the “Statement of operations” under “Accounting and administration expenses.”
DIFSC is also the transfer agent and dividend disbursing agent of the Fund. For these services, DIFSC’s fees are calculated based on the aggregate daily net assets of the retail funds within the Delaware Investments Family of Funds at the following annual rate: 0.025% of the first $20 billion; 0.020% of the next $5 billion; 0.015% of the next $5 billion; and 0.013% of average daily net assets in excess of $30 billion. The fees payable to DIFSC under the service agreement described above are allocated among all retail funds in the Delaware Investments Family of Funds on a relative NAV basis. This amount is included on the “Statement of operations” under “Dividend disbursing and transfer agent fees and expenses.” For the year ended Oct. 31, 2016, the Fund was charged $136,234 for these services. Pursuant to a sub-transfer agency agreement between DIFSC and BNY Mellon Investment Servicing (US) Inc. (BNYMIS), BNYMIS provides certain sub-transfer agency services to the Fund. Sub-transfer agency fees are paid by the Fund and are also included on the “Statement of operations” under “Dividend disbursing and transfer agent fees and expenses.”
Pursuant to a distribution agreement and distribution plan, the Fund pays DDLP, the distributor and an affiliate of DMC, an annual 12b-1 fee of 0.25% of the average daily net assets of the Class A shares, 1.00% of the average daily net assets of the Class C shares, and 0.50% of the average daily net assets of the Class R shares. Institutional Class shares pay no distribution and service fees.
33
Notes to financial statements
Delaware Select Growth Fund
2. Investment Management, Administration Agreements, and Other Transactions with Affiliates (continued)
As provided in the investment management agreement, the Fund bears a portion of the cost of resources shared with DMC, including the cost of internal personnel of DMC and/or its affiliates that provide legal, tax, and regulatory reporting services to the Fund. For the year ended Oct. 31, 2016, the Fund was charged $19,511 for internal legal, tax, and regulatory reporting services provided by DMC and/or its affiliates’ employees. This amount is included on the “Statement of operations” under “Legal fees.”
For the year ended Oct. 31, 2016, DDLP earned $10,259 for commissions on sales of the Fund’s Class A shares. For the year ended Oct. 31, 2016, DDLP received gross CDSC commissions of $1,280 on redemptions of the Fund’s Class C shares, and these commissions were entirely used to offset up-front commissions previously paid by DDLP to broker/dealers on sales of those shares.
Trustees’ fees include expenses accrued by the Fund for each Trustee’s retainer and meeting fees. Certain officers of DMC, DIFSC, and DDLP are officers and/or Trustees of the Trust. These officers and Trustees are paid no compensation by the Fund.
Cross trades for the year ended Oct. 31, 2016 were executed by the Fund pursuant to procedures adopted by the Board designed to ensure compliance with Rule 17a-7 under the 1940 Act. Cross trading is the buying or selling of portfolio securities between funds of investment companies, or between a fund of an investment company and another entity, that are or could be considered affiliates by virtue of having a common investment advisor (or affiliated investment advisors), common directors/trustees and/or common officers. At its regularly scheduled meetings, the Board reviews such transactions for compliance with the procedures adopted by the Board. Pursuant to these procedures, for the year ended Oct. 31, 2016, the Fund engaged in securities sales of $280,597 which resulted in net realized gain of $194.
*The aggregate contractual waiver period covering this report is from Feb. 26, 2016 through Feb. 28, 2017.
3. Investments
For the year ended Oct. 31, 2016, the Fund made purchases and sales of investment securities other than short-term investments as follows:
| | | | |
Purchases | | $ | 218,075,324 | |
Sales | | | 571,976,896 | |
At Oct. 31, 2016, the cost and unrealized appreciation (depreciation) of investments for federal income tax purposes were as follows:
| | | | |
Cost of investments | | $ | 484,237,803 | |
| | | | |
Aggregate unrealized appreciation of investments | | $ | 84,531,530 | |
Aggregate unrealized depreciation of investments | | | (67,901,552 | ) |
| | | | |
Net unrealized appreciation of investments | | $ | 16,629,978 | |
| | | | |
U.S. GAAP defines fair value as the price that the Fund would receive to sell an asset or pay to transfer a liability in an orderly transaction between market participants at the measurement date under current market conditions. A three-level hierarchy for fair value measurements has been established based upon
34
the transparency of inputs to the valuation of an asset or liability. Inputs may be observable or unobservable and refer broadly to the assumptions that market participants would use in pricing the asset or liability. Observable inputs reflect the assumptions market participants would use in pricing the asset or liability based on market data obtained from sources independent of the reporting entity. Unobservable inputs reflect the reporting entity’s own assumptions about the assumptions that market participants would use in pricing the asset or liability based on the best information available under the circumstances. The Fund’s investment in its entirety is assigned a level based upon the observability of the inputs which are significant to the overall valuation. The three-level hierarchy of inputs is summarized below.
| | | | |
| | |
Level 1 | | – | | Inputs are quoted prices in active markets for identical investments. (Examples: equity securities, open-end investment companies, futures contracts, exchange-traded options contracts) |
| | |
Level 2 | | – | | Other observable inputs, including, but not limited to: quoted prices for similar assets or liabilities in markets that are active, quoted prices for identical or similar assets or liabilities in markets that are not active, inputs other than quoted prices that are observable for the assets or liabilities (such as interest rates, yield curves, volatilities, prepayment speeds, loss severities, credit risks, and default rates) or other market-corroborated inputs. (Examples: debt securities, government securities, swap contracts, foreign currency exchange contracts, foreign securities utilizing international fair value pricing, broker-quoted securities, fair valued securities) |
| | |
Level 3 | | – | | Significant unobservable inputs, including the Fund’s own assumptions used to determine the fair value of investments. (Examples: broker-quoted securities, fair valued securities) |
Level 3 investments are valued using significant unobservable inputs. The Fund may also use an income-based valuation approach in which the anticipated future cash flows of the investment are discounted to calculate fair value. Discounts may also be applied due to the nature or duration of any restrictions on the disposition of the investments. Valuations may also be based upon current market prices of securities that are comparable in coupon, rating, maturity, and industry. The derived value of a Level 3 investment may not represent the value which is received upon disposition and this could impact the results of operations.
The following table summarizes the valuation of the Fund’s investments by fair value hierarchy levels as of Oct. 31, 2016:
| | |
Securities | | Level 1 |
Common Stock | | $500,867,781 |
| | |
Total Value of Securities | | $500,867,781 |
| | |
During the year ended Oct. 31, 2016, there were no transfers between Level 1 investments, Level 2 investments, or Level 3 investments that had a significant impact to the Fund. This does not include transfers between Level 1 investments and Level 2 investments due to the Fund utilizing international fair value pricing during the period. In accordance with the fair valuation procedures described in Note 1, international fair value pricing of securities in the Fund occurs when market volatility exceeds an established rolling threshold. If the threshold is exceeded on a given date, then prices of international securities (those that traded on exchanges that close at a different time than the time that
35
Notes to financial statements
Delaware Select Growth Fund
3. Investments (continued)
the Fund’s NAV is determined) are established using a separate pricing feed from a third party vendor designed to establish a price for each such security as of the time that the Fund’s NAV value is determined. Further, international fair value pricing uses other observable market-based inputs in place of the closing exchange price due to the events occurring after the close of the exchange or market on which the investment is principally traded, causing a change in classification between levels. The Fund’s policy is to recognize transfers between levels at the beginning of the reporting period.
A reconciliation of Level 3 investments is presented when the Fund has a significant amount of Level 3 investments at the beginning, interim, or end of the period in relation to net assets. During the year ended Oct. 31, 2016, there were no Level 3 investments.
4. Dividend and Distribution Information
Income and long-term capital gain distributions are determined in accordance with federal income tax regulations, which may differ from U.S. GAAP. Additionally, distributions from net gains on foreign currency transactions and net short-term gains on sales of investment securities are treated as ordinary income for federal income tax purposes. The tax character of dividends and distributions paid during the years ended Oct. 31, 2016 and 2015 was as follows:
| | | | | | | | |
| | | Year ended | |
| | | 10/31/16 | | | 10/31/15 | |
Ordinary income | | $ | — | | | $ | 230,960 | |
Long-term capital gains | | | 172,494,955 | | | | 113,247,149 | |
| | | | | | | | |
Total | | $ | 172,494,955 | | | $ | 113,478,109 | |
| | | | | | | | |
5. Components of Net Assets on a Tax Basis
As of Oct. 31, 2016, the components of net assets on a tax basis were as follow:
| | | | |
Shares of beneficial interest | | $ | 416,583,794 | |
Undistributed long-term capital gain | | | 64,008,974 | |
Qualified late year loss deferrals | | | (1,861,137 | ) |
Unrealized appreciation of investments and foreign currencies | | | 16,625,903 | |
| | | | |
Net assets | | $ | 495,357,534 | |
| | | | |
The difference between book basis and tax basis components of net assets is primarily attributable to tax deferral of losses on wash sales.
Qualified late year ordinary losses represent losses realized on investment transactions from Jan.1, 2016 through Oct. 31, 2016, that in accordance with federal income tax regulations, the Fund has elected to defer and treat as having arisen in the following fiscal year.
For financial reporting purposes, capital accounts are adjusted to reflect the tax character of permanent book/tax differences. Reclassifications are primarily due to gain (loss) on foreign currency transactions. Results of operations and net assets were not affected by these reclassifications. For the year ended
36
Oct. 31, 2016 the Fund recorded the following reclassifications:
| | | | |
Accumulated net investment loss | | $ | (20,640 | ) |
Accumulated net realized gain on investments | | | 20,640 | |
For federal income tax purposes, capital loss carryforwards may be carried forward and applied against future capital gains. $5,614,782 was utilized in 2016.
On Dec. 22, 2010, the Regulated Investment Company Modernization Act of 2010 (Act) was enacted, which changed various technical rules governing the tax treatment of regulated investment companies. The changes were generally effective for taxable years beginning after the date of enactment. Under the Act, the Fund is permitted to carry forward capital losses incurred in taxable years beginning after the date of enactment for an unlimited period. However, any losses incurred during those future taxable years will be required to be utilized prior to the losses incurred in pre-enactment taxable years, which carry an expiration date. As a result of this ordering rule, pre-enactment capital loss carryforwards may be more likely to expire unused. Additionally, post-enactment capital loss carryforwards will retain their character as either short-term or long-term capital losses rather than being considered all short-term as permitted under previous regulation. At Oct. 31, 2016, there were no capital loss carryforwards under the Act.
6. Capital Shares
Transactions in capital shares were as follows:
| | | | | | | | |
| | | Year ended | |
| | | 10/31/16 | | | 10/31/15 | |
Shares sold: | | | | | | | | |
Class A | | | 343,019 | | | | 377,163 | |
Class C | | | 136,854 | | | | 96,493 | |
Class R | | | 66,478 | | | | 93,138 | |
Institutional Class | | | 844,697 | | | | 1,233,335 | |
Shares issued upon reinvestment of dividends and distributions: | | | | | | | | |
Class A | | | 1,731,380 | | | | 890,075 | |
Class C | | | 577,286 | | | | 268,467 | |
Class R | | | 105,534 | | | | 48,125 | |
Institutional Class | | | 1,833,936 | | | | 1,045,655 | |
| | | | | | | | |
| | | 5,639,184 | | | | 4,052,451 | |
| | | | | | | | |
Shares redeemed: | | | | | | | | |
Class A | | | (2,654,184 | ) | | | (1,637,654 | ) |
Class C | | | (855,066 | ) | | | (430,203 | ) |
Class R | | | (259,081 | ) | | | (128,458 | ) |
Institutional Class | | | (6,849,376 | ) | | | (2,936,008 | ) |
| | | | | | | | |
| | | (10,617,707 | ) | | | (5,132,323 | ) |
| | | | | | | | |
Net decrease | | | (4,978,523 | ) | | | (1,079,872 | ) |
| | | | | | | | |
37
Notes to financial statements
Delaware Select Growth Fund
6. Capital Shares (continued)
Certain shareholders may exchange shares of one class of shares for another class in the same Fund. For the years ended Oct. 31, 2016 and 2015, the Fund had the following exchange transactions. These exchange transactions are included as subscriptions and redemptions in the table on the previous page and on the “Statements of changes in net assets.”
| | | | | | | | |
| Exchange Redemptions | | | | Year ended Oct. 31, 2016
Exchange Subscriptions | | |
Class A Shares | | Class C Shares | | | | Institutional Class Shares | | Value |
6,903 | | 324 | | | | 6,716 | | $276,940 |
Exchange Redemptions | | Year ended Oct. 31, 2015 Exchange Subscriptions | | |
Class A Shares | | Class C Shares | | Class A Shares | | Institutional Class Shares | | Value |
178 | | 4,124 | | 72 | | 3,313 | | $168,349 |
7. Line of Credit
The Fund, along with certain other funds in the Delaware Investments® Family of Funds (Participants), was a participant in a $275,000,000 revolving line of credit intended to be used for temporary or emergency purposes as an additional source of liquidity to fund redemptions of investor shares. Under the agreement, the Participants were charged an annual commitment fee of 0.08%, which was allocated across the Participants on the basis of relative net assets of each Participant’s allocation of the entire facility. The Participants were permitted to borrow up to a maximum of one-third of their net assets under the agreement. Each Participant was individually, and not jointly, liable for its particular advances, if any, under the line of credit. The line of credit available under the agreement expired on Nov. 9, 2015.
On Nov. 9, 2015, the Fund, along with the other Participants, entered into an amendment to the agreement for a $155,000,000 revolving line of credit. The line of credit was to be used as described above and operates in substantially the same manner as the original agreement with the exception of the annual commitment fee. Under the amendment to the agreement, the Participants were charged an annual commitment fee of 0.10%, which was allocated across the Participants on the basis of relative net assets of each Participant’s allocation of the entire facility. The line of credit available under the agreement expired on Nov. 7, 2016.
The Fund had no amounts outstanding as of Oct. 31, 2016 or at any time during the year then ended.
8. Derivatives
U.S. GAAP requires disclosures that enable investors to understand: (1) how and why an entity uses derivatives; (2) how they are accounted for; and (3) how they affect an entity’s results of operations and financial position.
38
Foreign Currency Exchange Contracts — The Fund may enter into foreign currency exchange contracts and foreign cross currency exchange contracts as a way of managing foreign exchange rate risk. The Fund may enter into these contracts to fix the U.S. dollar value of a security that it has agreed to buy or sell for the period between the date the trade was entered into and the date the security is delivered and paid for. The Fund may also use these contracts to hedge the U.S. dollar value of securities it already owns that are denominated in foreign currencies. In addition, the Fund may enter into these contracts to facilitate or expedite the settlement of portfolio transactions. The change in value is recorded as an unrealized gain or loss. When the contract is closed, a realized gain or loss is recorded equal to the difference between the value of the contract at the time it was opened and the value at the time it was closed.
The use of foreign currency exchange contracts and foreign cross currency exchange contracts does not eliminate fluctuations in the underlying prices of the securities, but does establish a rate of exchange that can be achieved in the future. Although foreign currency exchange contracts and foreign cross currency exchange contracts limit the risk of loss due to an unfavorable change in the value of the hedged currency, they also limit any potential gain that might result should the value of the currency change favorably. In addition, the Fund could be exposed to risks if the counterparties to the contracts are unable to meet the terms of their contracts. The Fund’s maximum risk of loss from counterparty credit risk is the value of its currency exchanged with the counterparty. The risk is generally mitigated by having a netting arrangement between the Fund and the counterparty and by the posting of collateral by the counterparty to the Fund to cover the Fund’s exposure to the counterparty. No foreign currency exchange contracts were outstanding at Oct. 31, 2016.
During the year ended Oct. 31, 2016, the Fund entered into foreign currency exchange contracts to facilitate or expedite the settlement of portfolio transactions.
During the year ended Oct. 31, 2016, the Fund experienced net realized gains or losses attributable to foreign currency holdings which is disclosed as “Net realized gain (loss) on foreign currency exchange contracts” on the “Statement of operations.”
Derivatives Generally. The table below summarizes the average balance of derivative holdings by the Fund during the year ended Oct. 31, 2016.
| | | | |
| | | Long Derivative | | Short Derivative |
| | | Volume | | Volume |
Foreign currency exchange contracts (average cost) | | $37,308 | | $187,266 |
9. Securities Lending
The Fund, along with other funds in the Delaware Investments® Family of Funds, may lend its securities pursuant to a security lending agreement (Lending Agreement) with The Bank of New York Mellon (BNY Mellon). At the time a security is loaned, the borrower must post collateral equal to the required percentage of the market value of the loaned security, including any accrued interest. The required percentage is: (1) 102% with respect to U.S. securities and foreign securities that are denominated and payable in U.S. dollars; and (2) 105% with respect to foreign securities. With respect to each loan, if on any business day the aggregate market value of securities collateral plus cash collateral held is less than the aggregate market value of the securities which are the subject of such loan, the borrower will
39
Notes to financial statements
Delaware Select Growth Fund
9. Securities Lending (continued)
be notified to provide additional collateral by the end of the following business day which, together with the collateral already held, will be not less than the applicable initial collateral requirements for such security loan. If the aggregate market value of securities collateral and cash collateral held with respect to a security loan exceeds the applicable initial collateral requirement, upon the request of the borrower, BNY Mellon must return enough collateral to the borrower by the end of the following business day to reduce the value of the remaining collateral to the applicable initial collateral requirement for such security loan. As a result of the foregoing, the value of the collateral held with respect to a loaned security on any particular day may be more or less than the value of the security on loan.
Prior to Dec. 29, 2015, cash collateral received was generally invested in the Delaware Investments Collateral Fund No. 1 (Collective Trust), a pooled account established by BNY Mellon for the use of funds managed by DMC that participate in BNY Mellon’s securities lending program. The Collective Trust sought to maintain a NAV per unit of $1.00.
On Dec. 29, 2015, the assets in the Collective Trust were transferred to a series of individual separate accounts, each corresponding to a Fund. The investment guidelines permit each separate account to hold certain securities that would be considered eligible securities for a money market fund. Cash collateral received is generally invested in government securities; certain obligations issued by government sponsored enterprises; repurchase agreements collateralized by U.S. Treasury securities; obligations issued by the central government of any Organization for Economic Cooperation and Development (OECD) country or its agencies, instrumentalities or establishments; obligations of supranational organizations, commercial paper, notes, bonds and other debt obligations; certificates of deposit, time deposits and other bank obligations; and asset-backed securities.
In the event of default or bankruptcy by the lending agent, realization and/or retention of the collateral may be subject to legal proceedings. In the event the borrower fails to return loaned securities and the collateral received is insufficient to cover the value of the loaned securities and provided such collateral shortfall is not the result of investment losses, the lending agent has agreed to pay the amount of the shortfall to the Fund or, at the discretion of the lending agent, replace the loaned securities. The Fund continues to record dividends or interest, as applicable, on the securities loaned and is subject to changes in value of the securities loaned that may occur during the term of the loan. The Fund has the right under the Lending Agreement to recover the securities from the borrower on demand. With respect to security loans collateralized by non-cash collateral, the Fund receives loan premiums paid by the borrower. With respect to security loans collateralized by cash collateral, the earnings from the collateral investments are shared among the Fund, the security lending agent, and the borrower. The Fund records security lending income net of allocations to the security lending agent and the borrower.
The Fund may incur investment losses as a result of investing securities lending collateral. This could occur if an investment in the collateral investment account defaulted or became impaired. Under those circumstances, the value of a Fund’s cash collateral account may be less than the amount the Fund would be required to return to the borrowers of the securities and the Fund would be required to make up for this shortfall.
During the year ended Oct. 31, 2016, the Fund had no securities out on loan.
40
10. Credit and Market Risk
The Fund invests a significant portion of its assets in small- and mid-sized companies and may be subject to certain risks associated with ownership of securities of such companies. Investments in small- or mid-sized companies may be more volatile than investments in larger companies for a number of reasons, which include more limited financial resources or a dependence on narrow product lines.
Some countries in which the Fund may invest require governmental approval for the repatriation of investment income, capital, or the proceeds of sales of securities by foreign investors. In addition, if there is deterioration in a country’s balance of payments or for other reasons, a country may impose temporary restrictions on foreign capital remittances abroad.
The securities exchanges of certain foreign markets are substantially smaller, less liquid, and more volatile than the major securities markets in the United States. Consequently, acquisition and disposition of securities by the Fund may be inhibited. In addition, a significant portion of the aggregate market value of equity securities listed on the major securities exchanges in emerging markets is held by a smaller number of investors. This may limit the number of shares available for acquisition or disposition by the Fund.
The Fund may invest up to 15% of its net assets in illiquid securities, which may include securities with contractual restrictions on resale, securities exempt from registration under Rule 144A promulgated under the Securities Act of 1933, as amended, and other securities which may not be readily marketable. The relative illiquidity of these securities may impair the Fund from disposing of them in a timely manner and at a fair price when it is necessary or desirable to do so. While maintaining oversight, the Fund’s Board has delegated to DMC, the day-to-day functions of determining whether individual securities are liquid for purposes of the Fund’s limitation on investments in illiquid securities. Securities eligible for resale pursuant to Rule 144A, which are determined to be liquid, are not subject to the Fund’s 15% limit on investments in illiquid securities. Rule 144A and illiquid securities have been identified on the “Schedule of investments.” When monitoring compliance with the Fund’s illiquid limit, certain holdings that are common to multiple clients of the investment manager may be aggregated and considered illiquid in the aggregate solely for monitoring purposes. For purposes of determining illiquidity for financial reporting purposes, only the holdings of this Fund will be considered.
11. Contractual Obligations
The Fund enters into contracts in the normal course of business that contain a variety of indemnifications. The Fund’s maximum exposure under these arrangements is unknown. However, the Fund has not had prior claims or losses pursuant to these contracts. Management has reviewed the Fund’s existing contracts and expects the risk of loss to be remote.
12. Subsequent Events
On Nov. 7, 2016, the Fund, along with the other Participants, entered into an amendment to the agreement for a $155,000,000 revolving line of credit. The line of credit is to be used as described in Note 7 and operates in substantially the same manner as the original agreement, with the exception of the annual commitment fee. Under the amendment to the agreement, the Participants are charged an annual commitment fee of 0.15%, which is allocated across the Participants on the basis of relative net
41
Notes to financial statements
Delaware Select Growth Fund
12. Subsequent Events (continued)
assets of each Participant’s allocation of the entire facility. The line of credit available under the agreement expires on Nov. 6, 2017.
Management has determined that no other material events or transactions occurred subsequent to Oct. 31, 2016 that would require recognition or disclosure in the Fund’s financial statements.
42
Report of Independent
Registered Public Accounting Firm
To the Board of Trustees of Voyageur Mutual Funds III
and the Shareholders of Delaware Select Growth Fund:
In our opinion, the accompanying statement of assets and liabilities, including the schedule of investments, and the related statements of operations and of changes in net assets and the financial highlights present fairly, in all material respects, the financial position of Delaware Select Growth Fund (constituting Voyageur Mutual Funds III, hereafter referred to as the “Fund”) as of October 31, 2016, the results of its operations for the year then ended, the changes in its net assets for each of the two years in the period then ended and the financial highlights for each of the periods indicated, in conformity with accounting principles generally accepted in the United States of America. These financial statements and financial highlights (hereafter referred to as “financial statements”) are the responsibility of the Fund’s management. Our responsibility is to express an opinion on these financial statements based on our audits. We conducted our audits of these financial statements in accordance with the standards of the Public Company Accounting Oversight Board (United States). Those standards require that we plan and perform the audit to obtain reasonable assurance about whether the financial statements are free of material misstatement. An audit includes examining, on a test basis, evidence supporting the amounts and disclosures in the financial statements, assessing the accounting principles used and significant estimates made by management, and evaluating the overall financial statement presentation. We believe that our audits, which included confirmation of securities as of October 31, 2016 by correspondence with the custodian and brokers, provide a reasonable basis for our opinion.
PricewaterhouseCoopers LLP
Philadelphia, Pennsylvania
December 21, 2016
43
Other Fund information (Unaudited)
Delaware Select Growth Fund
Tax Information
The information set forth below is for the Fund’s fiscal year as required by federal income tax laws. Shareholders, however, must report distributions on a calendar year basis for income tax purposes, which may include distributions for portions of two fiscal years of the Fund. Accordingly, the information needed by shareholders for income tax purposes will be sent to them in January of each year. Please consult your tax advisor for proper treatment of this information.
All disclosures are based on financial information available as of the date of this annual report and, accordingly are subject to change. For any and all items requiring reporting, it is the intention of the Fund to report the maximum amount permitted under the Internal Revenue Code and the regulations thereunder.
For the fiscal year ended Oct. 31, 2016, the Fund reports distributions paid during the year as follows:
| | | | |
(A) Long-Term Capital Gain Distributions (Tax Basis) | | | 100.00 | % |
(A) is based on a percentage of the Fund’s total distributions.
44
Board consideration of Delaware Select Growth Fund investment sub-advisory agreement
At a meeting of the Board of Trustees held on May 16–18, 2016 (the “May Meeting”), the Board of Trustees, including a majority of disinterested or Independent Trustees, (the “Board”) approved a new sub-advisory agreement with Jackson Square Partners (“JSP”) for the Delaware Select Growth Fund (the “Fund”). In reaching the decision to approve the sub-advisory agreement with JSP, the Board considered and reviewed information provided by JSP, including its personnel, operations, and financial condition. The Board also reviewed material furnished by Delaware Management Company (“DMC”), including: a memorandum from DMC reviewing the terms of the sub-advisory agreement; the proposed sub-advisory fees and the various services proposed to be provided by JSP; information concerning JSP’s organizational structure and the experience of its investment management personnel; copies of JSP’s Form ADV, compliance policies and procedures, and its Code of Ethics; and a copy of the proposed JSP sub-advisory agreement.
In considering such information and materials, the Independent Trustees received assistance and advice from and met separately with independent legal counsel. The materials prepared by Management specifically in connection with the approval of the sub-advisory agreement were provided to the Independent Trustees in advance of the May Meeting. Although attention was given to all information furnished, the following discussion addressed some primary factors relevant to the Board’s decision. This discussion of the information and factors considered by the Board is not intended to be exhaustive, but rather summarizes certain factors considered by the Board.
Nature, extent, and quality of service. The Board considered the services provided by JSP to the Fund and its shareholders. In reviewing the nature, extent, and quality of services, the Board took account of reports furnished to it throughout the year at regular Board meetings covering matters such as relative performance of the Fund; compliance of portfolio managers with the investment policies, strategies, and restrictions for the Fund; the compliance of JSP personnel with its Code of Ethics; and adherence to fair value pricing procedures as established by the Board. The Board was pleased with the current staffing of JSP and the emphasis placed on research in the investment process. The Board was satisfied with the nature, extent, and quality of the overall services provided by JSP.
Investment performance. The Board placed significant emphasis on the investment performance of the Fund in view of the importance of investment performance to shareholders. Although the Board gave appropriate consideration to performance reports and discussions with portfolio managers at Investment Committee meetings, the Board gave particular weight to the Broadridge Financial Solutions (“Broadridge”) reports furnished for the May Meeting. The Broadridge reports prepared for the Fund showed the investment performance of its Class A shares in comparison to a group of similar funds as selected by Broadridge (the “Performance Universe”). A fund with the best performance ranked first, and a fund with the poorest performance ranked last. The highest/best performing 25% of funds in the Performance Universe make up the first quartile; the next 25%, the second quartile; the next 25%, the third quartile; and the poorest/worst performing 25% of funds in the Performance Universe make up the fourth quartile. Comparative annualized performance for the Fund was shown for the past 1-, 3-, 5-, and 10-year periods, to the extent applicable, ended Jan. 31, 2016. The Board’s objective is that the Fund’s performance for the periods considered be at or above the median of its Performance Universe.
45
Other Fund information (Unaudited)
Delaware Select Growth Fund
Board consideration of Delaware Select Growth Fund investment sub-advisory agreement (continued)
The Performance Universe for the Fund consisted of the Fund and all retail and institutional multi-cap growth funds as selected by Broadridge. The Broadridge report comparison showed that the Fund’s total return for the 1-year period was in the third quartile of its Performance Universe. The report further showed that the Fund’s total return for the 3-year period was in the fourth quartile of its Performance Universe and the Fund’s total return for the 5- and 10-year periods was in the second quartile of its Performance Universe. In evaluating the Fund’s performance, the Board considered the Fund’s longer-term performance results, which were strong. Overall, the Board was satisfied with performance.
Comparative expenses. The Board considered expense comparison data for the Delaware Investments® Family of Funds. Management provided the Board with information on pricing levels and fee structures for the Fund as of its most recently completed fiscal year. The Board also focused on the comparative analysis of effective management fees and total expense ratios of the Fund versus effective management fees and expense ratios of a group of similar funds as selected by Broadridge (the “Expense Group”). In reviewing comparative costs, the Fund’s contractual management fee and the actual management fee incurred by the Fund were compared with the contractual management fees (assuming all funds in the Expense Group were similar in size to the Fund) and actual management fees (as reported by each fund) within the Expense Group, taking into account any applicable breakpoints and fee waivers. The Fund’s total expenses were also compared with those of its Expense Group. The Lipper total expenses, for comparative consistency, were shown by Broadridge for Class A shares and comparative total expenses including 12b-1 and non-12b-1 service fees. The Board considered fees paid to DMC for non-management services. The Board’s objective is to limit the Fund’s total expense ratio to be competitive with that of the Expense Group.
The expense comparisons for the Fund showed that its actual management fee was in the quartile with the second lowest expenses of its Expense Group and its total expenses were in the quartile with the second highest expenses of its Expense Group. The Board gave favorable consideration to the Fund’s management fee, but noted that the Fund’s total expenses were not in line with the Board’s objective. In evaluating the total expenses, the Board considered various initiatives implemented by Management, such as the negotiation of lower fees for fund accounting services, which had created an opportunity for a further reduction in expenses. The Board was satisfied with Management’s efforts to improve the Fund’s total expense ratio and to bring it in line with the Board’s objective.
Management profitability. Trustees were also given available information on profits being realized in relation to the services being provided to the Fund or in relation to JSP’s overall investment advisory business, but believed such information to be of limited relevance because the sub-advisory fees are paid by DMC out of its management fee, and changes in the level of sub-advisory fees have no impact on Fund expenses. The Board was also provided information on potential fall-out benefits derived or to be derived by JSP in connection with its relationship to the Fund, such as reputational enhancement, soft dollar arrangements or commissions paid to affiliated broker/dealers, as applicable.
46
Board consideration of Delaware Select Growth Fund investment sub-advisory agreement
At a meeting held on Aug. 16–18, 2016 (the “Annual Meeting”), the Board, including a majority of disinterested or Independent Trustees, approved the renewal of the Investment Advisory Agreement for the Fund. In making its decision, the Board considered information furnished at regular quarterly Board meetings, including reports detailing Fund performance, investment strategies, and expenses, as well as information prepared specifically in connection with the renewal of the investment advisory and sub-advisory contracts. Information furnished specifically in connection with the renewal of the Investment Management Agreement with DMC included materials provided by DMC and its affiliates (“Delaware Investments”) concerning, among other things, the nature, extent, and quality of services provided to the Fund; the costs of such services to the Fund; economies of scale; and the investment manager’s financial condition and profitability. In addition, in connection with the Annual Meeting, reports were provided to the Trustees in May 2016 and included reports provided by Broadridge. The Broadridge reports compared the Fund’s investment performance and expenses with those of other comparable mutual funds. The Independent Trustees reviewed and discussed the Broadridge reports with independent legal counsel to the Independent Trustees. In addition to the information noted above, the Board also requested and received information regarding DMC’s policy with respect to advisory fee levels and its breakpoint philosophy; the structure of portfolio manager compensation; comparative client fee information; and any constraints or limitations on the availability of securities for certain investment styles, which had in the past year inhibited, or which were likely in the future to inhibit, the investment manager’s ability to invest fully in accordance with Fund policies.
In considering information relating to the approval of the Fund’s advisory agreement, the Independent Trustees received assistance and advice from and met separately with independent legal counsel to the Independent Trustees. Although the Board gave attention to all information furnished, the following discussion identifies, under separate headings, the primary factors taken into account by the Board during its contract renewal considerations.
Nature, extent, and quality of service. The Board considered the services provided by DMC to the Fund and its shareholders. In reviewing the nature, extent, and quality of services, the Board considered reports furnished to it throughout the year, which covered matters such as the relative performance of the Fund; compliance of portfolio managers with the investment policies, strategies and restrictions for the Fund; compliance by DMC and Delaware Distributors, L.P. (together, “Management”) personnel with the Code of Ethics adopted throughout the Delaware Investments® Family of Funds complex; and adherence to fair value pricing procedures as established by the Board. The Board was pleased with the current staffing of the Fund’s investment advisor and the emphasis placed on research in the investment process. The Board recognized DMC’s receipt of several industry distinctions during the past several years. The Board gave favorable consideration to DMC’s efforts to control expenditures while maintaining service levels committed to Fund matters. The Board also noted the benefits provided to Fund shareholders through each shareholder’s ability to exchange an investment in one Delaware Investments fund for the same class of shares in another Delaware Investments fund without a sales charge, to reinvest Fund dividends into additional shares of the Fund or into additional shares of other Delaware Investments funds, and the privilege to combine holdings in other Delaware Investments funds to obtain a reduced sales charge. The Board was satisfied with the nature, extent, and quality of the overall services provided by DMC.
47
Other Fund information (Unaudited)
Delaware Select Growth Fund
Board consideration of Delaware Select Growth Fund investment sub-advisory agreement (continued)
Investment performance. The Board placed significant emphasis on the investment performance of the Fund in view of the importance of investment performance to shareholders. Although the Board gave appropriate consideration to performance reports and discussions with portfolio managers at Investment Committee meetings throughout the year, the Board gave particular weight to the Broadridge reports furnished for the Annual Meeting. The Broadridge reports prepared for the Fund showed the investment performance of its Class A shares in comparison to the Performance Universe. A fund with the best performance ranked first, and a fund with the poorest performance ranked last. The highest/best performing 25% of funds in the Performance Universe make up the first quartile; the next 25%, the second quartile; the next 25%, the third quartile; and the poorest/worst performing 25% of funds in the Performance Universe make up the fourth quartile. Comparative annualized performance for the Fund was shown for the past 1-, 3-, 5-, and 10-year periods, to the extent applicable, ended Jan. 31, 2016. The Board’s objective is that the Fund’s performance for the periods considered be at or above the median of its Performance Universe.
The Performance Universe for the Fund consisted of the Fund and all retail and institutional multi-cap growth funds as selected by Broadridge. The Broadridge report comparison showed that the Fund’s total return for the 1-year period was in the third quartile of its Performance Universe. The report further showed that the Fund’s total return for the 3-year period was in the fourth quartile of its Performance Universe and the Fund’s total return for the 5- and 10-year periods was in the second quartile of its Performance Universe. In evaluating the Fund’s performance, the Board considered the Fund’s longer-term performance results, which were strong. Overall, the Board was satisfied with performance.
Comparative expenses. The Board considered expense comparison data for the Delaware Investments® Family of Funds. Management provided the Board with information on pricing levels and fee structures for the Fund as of its most recently completed fiscal year. The Board also focused on the comparative analysis of effective management fees and total expense ratios of the Fund versus effective management fees and expense ratios of the Expense Group. In reviewing comparative costs, the Fund’s contractual management fee and the actual management fee incurred by the Fund were compared with the contractual management fees (assuming all funds in the Expense Group were similar in size to the Fund) and actual management fees (as reported by each fund) within the Expense Group, taking into account any applicable breakpoints and fee waivers. The Fund’s total expenses were also compared with those of its Expense Group. The Broadridge total expenses, for comparative consistency, were shown by Broadridge for Class A shares and comparative total expenses including 12b-1 and non-12b-1 service fees. The Board’s objective is to limit the Fund’s total expense ratio to be competitive with that of the Expense Group.
The expense comparisons for the Fund showed that its actual management fee was in the quartile with the second lowest expenses of its Expense Group and its total expenses were in the quartile with the second highest expenses of its Expense Group. The Board gave favorable consideration to the Fund’s management fee, but noted that the Fund’s total expenses were not in line with the Board’s objective. In evaluating the total expenses, the Board considered various initiatives implemented by Management, such as the negotiation of lower fees for fund accounting services, which had created an opportunity for a further reduction in expenses. The Board was satisfied with Management’s efforts to improve the Fund’s total expense ratio and to bring it in line with the Board’s objective.
48
Management profitability. The Board considered the level of profits realized by DMC in connection with the operation of the Fund. In this respect, the Board reviewed the Investment Management Profitability Analysis that addressed the overall profitability of DMC’s business in providing management and other services to each of the individual funds and the Delaware Investments Family of Funds as a whole. Specific attention was given to the methodology followed in allocating costs for the purpose of determining profitability. Management stated that the level of profits of DMC, to a certain extent, reflects recent operational cost savings and efficiencies initiated by DMC. The Board considered DMC’s efforts to improve services provided to fund shareholders and to meet additional regulatory and compliance requirements resulting from recent industry-wide Securities and Exchange Commission initiatives. The Board also considered the extent to which DMC might derive ancillary benefits from fund operations, including the potential for procuring additional business as a result of the prestige and visibility associated with its role as service provider to the Delaware Investments Family of Funds and the benefits from allocation of fund brokerage to improve trading efficiencies. The Board found that the management fees were reasonable in light of the services rendered and the level of profitability of DMC.
Economies of scale. The Trustees considered whether economies of scale are realized by DMC as the Fund’s assets increase and the extent to which any economies of scale are reflected in the level of management fees charged. The Trustees reviewed the standardized advisory fee pricing and structure, approved by the Board and shareholders, which includes breakpoints, and which applies to most funds in the Delaware Investments® Family of Funds complex. Breakpoints in the advisory fee occur when the advisory fee rate is reduced on assets in excess of specified levels. Breakpoints result in a lower advisory fee than would otherwise be the case in the absence of breakpoints, when the asset levels specified in the breakpoints are exceeded. The Board noted that the fee under the Fund’s management contract fell within the standardized fee pricing structure. The Board also noted that, as of May 31, 2016, the Fund’s assets exceeded the first breakpoint level. The Board believed that, given the extent to which economies of scale might be realized by the advisor and its affiliates, the schedule of fees under the Investment Management Agreement provides a sharing of benefits with the Fund and its shareholders.
49
Board of trustees / directors and officers addendum
Delaware Investments® Family of Funds
A mutual fund is governed by a Board of Trustees/Directors (“Trustees”), which has oversight responsibility for the management of a fund’s business affairs. Trustees establish procedures and oversee and review the performance of the investment manager, the distributor, and others who perform services for the fund. The independent fund trustees, in particular, are advocates
| | | | |
Name, Address,
and Birth Date | | Position(s)
Held with Fund(s) | | Length of
Time Served |
Interested Trustee |
Shawn K. Lytle1, 3 | | President, | | Trustee since |
2005 Market Street | | Chief Executive Officer, | | September 2015 |
Philadelphia, PA 19103 | | and Trustee | | |
February 1970 | | | | President and |
| | | | Chief Executive Officer |
| | | | since August 2015 |
| | | | |
Independent Trustees |
Thomas L. Bennett | | Chairman and Trustee | | Trustee since |
2005 Market Street | | | | March 2005 |
Philadelphia, PA 19103 | | | | |
October 1947 | | | | Chairman since |
| | | | | March 2015 |
Ann D. Borowiec | | Trustee | | Since March 2015 |
2005 Market Street | | | | |
Philadelphia, PA 19103 | | | | |
November 1958 | | | | |
| | | | | |
Joseph W. Chow | | Trustee | | Since January 2013 |
2005 Market Street | | | | |
Philadelphia, PA 19103 | | | | |
January 1953 | | | | |
| 1 | Shawn K. Lytle is considered to be an “Interested Trustee“ because he is an executive officer of the Fund’s(s’) investment advisor. |
50
for shareholder interests. Each trustee has served in that capacity since he or she was elected to or appointed to the Board of Trustees, and will continue to serve until his or her retirement or the election of a new trustee in his or her place. The following is a list of the Trustees and Officers with certain background and related information.
| | | | |
Principal Occupation(s)
During the Past Five Years | | Number of Portfolios in
Fund Complex Overseen
by Trustee or Officer | | Other Directorships
Held by Trustee or Officer |
| | | | |
Shawn K. Lytle has served as | | 62 | | Trustee — UBS |
President of | | | | Relationship Funds, |
Delaware Investments2 | | | | SMA Relationship |
since June 2015 and was the | | | | Trust, and UBS Funds |
Regional Head of Americas for | | | | (May 2010–April 2015) |
UBS Global Asset | | | | |
Management from | | | | |
2010 through 2015. | | | | |
| | | | |
Private Investor | | 62 | | Director — |
(March 2004–Present) | | | | Bryn Mawr Bank Corp. (BMTC) |
| | | | | (2007–2011) |
Chief Executive Officer | | 62 | | None |
Private Wealth Management | | | | |
(2011–2013) and | | | | |
Market Manager, | | | | |
New Jersey Private | | | | |
Bank (2005–2011) — | | | | |
J.P. Morgan Chase & Co. | | | | |
Executive Vice President | | 62 | | Director and Audit Committee |
(Emerging Economies | | | | Member — Hercules |
Strategies, Risks, and | | | | Technology Growth |
Corporate Administration) | | | | Capital, Inc. |
State Street Corporation | | | | (2004–2014) |
(July 2004–March 2011) | | | | |
| 2 | Delaware Investments is the marketing name for Delaware Management Holdings, Inc. and its subsidiaries, including the Fund’s(s’) investment advisor, principal underwriter, and its transfer agent. |
51
Board of trustees / directors and officers addendum
Delaware Investments® Family of Funds
| | | | | | |
Name, Address,
and Birth Date | | Position(s)
Held with Fund(s) | | Length of
Time Served | |
Independent Trustees (continued) | | | | | | |
John A. Fry | | Trustee | | | Since January 2001 | |
2005 Market Street | | | | | | |
Philadelphia, PA 19103 | | | | | | |
May 1960 | | | | | | |
| | | | | | | |
Lucinda S. Landreth | | Trustee | | | Since March 2005 | |
2005 Market Street | | | | | | |
Philadelphia, PA 19103 | | | | | | |
June 1947 | | | | | | |
Frances A. Sevilla-Sacasa | | Trustee | | | Since September 2011 | |
2005 Market Street | | | | | | |
Philadelphia, PA 19103 | | | | | | |
January 1956 | | | | | | |
52
| | | | | | |
Principal Occupation(s)
During the Past Five Years | | Number of Portfolios in
Fund Complex Overseen
by Trustee or Officer | | Other Directorships
Held by Trustee or Officer | |
| | | | | | |
President — | | 62 | | | Director, Audit | |
Drexel University | | | | | and Governance Committee | |
(August 2010–Present) | | | | | Member — Community | |
| | | | | Health Systems | |
President — | | | | | | |
Franklin & Marshall College | | | | | Director — Drexel | |
(July 2002–July 2010) | | | | | Morgan & Co. | |
| | | | | | |
| | | | | Director, Audit Committee | |
| | | | | Member — vTv | |
| | | | | | Therapeutics LLC | |
Private Investor | | 62 | | | None | |
(2004–Present) | | | | | | |
| | | | | | | |
Chief Executive Officer — | | 62 | | | Trust Manager and | |
Banco Itaú | | | | | Audit Committee | |
International | | | | | Member — Camden | |
(April 2012–Present) | | | | | Property Trust | |
| | | | | | |
Executive Advisor to Dean | | | | | | |
(August 2011–March 2012)and Interim Dean | | | | | | |
(January 2011–July 2011) — | | | | | | |
University of Miami School of | | | | | | |
Business Administration | | | | | | |
| | | | | | |
President — U.S. Trust, | | | | | | |
Bank of America Private | | | | | | |
Wealth Management | | | | | | |
(Private Banking) | | | | | | |
(July 2007–December 2008) | | | | | | |
53
Board of trustees / directors and officers addendum
Delaware Investments® Family of Funds
| | | | | | |
Name, Address,
and Birth Date | | Position(s)
Held with Fund(s) | | Length of
Time Served | |
Independent Trustees (continued) | | | | | | |
Thomas K. Whitford | | Trustee | | | Since January 2013 | |
2005 Market Street | | | | | | |
Philadelphia, PA 19103 | | | | | | |
March 1956 | | | | | | |
| | | | | | | |
Janet L. Yeomans | | Trustee | | | Since April 1999 | |
2005 Market Street | | | | | | |
Philadelphia, PA 19103 | | | | | | |
July 1948 | | | | | | |
54
| | | | | | |
Principal Occupation(s)
During the Past Five Years | | Number of Portfolios in
Fund Complex Overseen
by Trustee or Officer | | Other Directorships
Held by Trustee or Officer | |
| | | | | | |
Vice Chairman | | 62 | | | Director — HSBC Finance | |
(2010–April 2013) and | | | | | Corporation and HSBC | |
Chief Administrative | | | | | North America Holdings Inc. | |
Officer (2008–2010) — | | | | | | |
PNC Financial | | | | | Director — | |
Services Group | | | | | HSBC Bank | |
| | | | | | | |
Vice President and Treasurer | | 62 | | | Director, Personnel and | |
(January 2006–July 2012), | | | | | Compensation Committee | |
Vice President — | | | | | Chair, Audit Committee | |
Mergers & Acquisitions | | | | | Member and Governance | |
(January 2003–January 2006), | | | | | Committee Member — | |
and Vice President | | | | | Okabena Company | |
and Treasurer | | | | | | |
(July 1995–January 2003) — | | | | | | |
3M Company | | | | | | |
55
Board of trustees / directors and officers addendum
Delaware Investments® Family of Funds
| | | | | | |
Name, Address,
and Birth Date | | Position(s)
Held with Fund(s) | | Length of
Time Served | |
Officers | | | | | | |
David F. Connor | | Senior Vice President, | | | Senior Vice President | |
2005 Market Street | | General Counsel, | | | since May 2013; | |
Philadelphia, PA 19103 | | and Secretary | | | General Counsel | |
December 1963 | | | | | since May 2015; | |
| | | | | Secretary since | |
| | | | | October 2005 | |
| | | | | | | |
Daniel V. Geatens | | Vice President | | | Treasurer since October 2007 | |
2005 Market Street | | and Treasurer | | | | |
Philadelphia, PA 19103 | | | | | | |
October 1972 | | | | | | |
| | | | | | | |
Richard Salus | | Senior Vice President | | | Chief Financial Officer | |
2005 Market Street | | and Chief Financial Officer | | | since November 2006 | |
Philadelphia, PA 19103 | | | | | | |
October 1963 | | | | | | |
The Statement of Additional Information for the Fund(s) includes additional information about the Trustees and Officers and is available, without charge, upon request by calling 800 523-1918.
56
| | | | |
Principal Occupation(s)
During the Past Five Years | | Number of Portfolios in
Fund Complex Overseen
by Trustee or Officer | | Other Directorships
Held by Trustee or Officer |
| | | | |
David F. Connor has served in various capacities at
different times at
Delaware Investments. | | 62 | | None3 |
| | | | | |
Daniel V. Geatens has served
in various capacities at
different times at
Delaware Investments. | | 62 | | None3 |
| | | | | |
Richard Salus has served
in various capacities at
different times at
Delaware Investments. | | 62 | | None3 |
| 3 | Shawn K. Lytle, David F. Connor, Daniel V. Geatens, and Richard Salus serve in similar capacities for the six portfolios of the Optimum Fund Trust, which have the same investment advisor, principal underwriter, and transfer agent as the registrant. |
57
About the organization
| | | | | | | | | | |
Board of trustees | | | | | | | | | | |
Shawn K. Lytle | | Ann D. Borowiec | | | John A. Fry | | | | Frances A. | |
President and | | Former Chief Executive | | | President | | | | Sevilla-Sacasa | |
Chief Executive Officer | | Officer | | | Drexel University | | | | Chief Executive Officer | |
Delaware Investments® | | Private Wealth Management | | | Philadelphia, PA | | | | Banco Itaú | |
Family of Funds | | J.P. Morgan Chase & Co. | | | Lucinda S. Landreth Former Chief Investment Officer Assurant, Inc. New York, NY | | | | International | |
Philadelphia, PA | | New York, NY | | | | Miami, FL | |
Thomas L. Bennett Chairman of the Board Delaware Investments Family of Funds Private Investor Rosemont, PA | | Joseph W. Chow Former Executive Vice President State Street Corporation Boston, MA | | | | Thomas K. Whitford Former Vice Chairman PNC Financial Services Group Pittsburgh, PA Janet L. Yeomans Former Vice President and Treasurer 3M Corporation St. Paul, MN | |
Affiliated officers | | | | | | | | | | |
| | | |
David F. Connor | | Daniel V. Geatens | | | Richard Salus | | | | | |
Senior Vice President, | | Vice President and | | | Senior Vice President and | | | | | |
General Counsel, | | Treasurer | | | Chief Financial Officer | | | | | |
and Secretary | | Delaware Investments | | | Delaware Investments | | | | | |
Delaware Investments | | Family of Funds | | | Family of Funds | | | | | |
Family of Funds | | Philadelphia, PA | | | Philadelphia, PA | | | | | |
Philadelphia, PA | | | | | | | | | | |
This annual report is for the information of Delaware Select Growth Fund shareholders, but it may be used with prospective investors when preceded or accompanied by the Delaware Investments Fund fact sheet for the most recently completed calendar quarter. These documents are available at delawareinvestments.com/literature.
Delaware Investments is the marketing name of Delaware Management Holdings, Inc. and its subsidiaries.
The Fund files its complete schedule of portfolio holdings with the Securities and Exchange Commission (SEC) for the first and third quarters of each fiscal year on Form N-Q. The Fund’s Forms N-Q, as well as a description of the policies and procedures that the Fund uses to determine how to vote proxies (if any) relating to portfolio securities are available without charge (i) upon request, by calling 800 523-1918; and (ii) on the SEC’s website at sec.gov. In addition, a description of the policies and procedures that the Fund uses to determine how to vote proxies (if any) relating to portfolio securities and the Schedule of Investments included in the Fund’s most recent Form N-Q are available without charge on the Fund’s website at delawareinvestments.com/literature. The Fund’s Forms N-Q may be reviewed and copied at the SEC’s Public Reference Room in Washington, D.C.; information on the operation of the Public Reference Room may be obtained by calling 800 SEC-0330.
Information (if any) regarding how the Fund voted proxies relating to portfolio securities during the most recently disclosed 12-month period ended June 30 is available without charge (i) through the Fund’s website at delawareinvestments.com/proxy; and (ii) on the SEC’s website at sec.gov.
58
Item 2. Code of Ethics
The registrant has adopted a code of ethics that applies to the registrant’s principal executive officer, principal financial officer, principal accounting officer or controller, or persons performing similar functions, regardless of whether these individuals are employed by the registrant or a third party. A copy of the registrant’s Code of Business Ethics has been posted on the Delaware Investments Internet Web site at www.delawareinvestments.com. Any amendments to the Code of Business Ethics, and information on any waiver from its provisions granted by the registrant, will also be posted on this Web site within five business days of such amendment or waiver and will remain on the Web site for at least 12 months.
Item 3. Audit Committee Financial Expert
The registrant’s Board of Trustees/Directors has determined that certain members of the registrant’s Audit Committee are audit committee financial experts, as defined below. For purposes of this item, an “audit committee financial expert” is a person who has the following attributes:
a. An understanding of generally accepted accounting principles and financial statements;
b. The ability to assess the general application of such principles in connection with the accounting for estimates, accruals, and reserves;
c. Experience preparing, auditing, analyzing, or evaluating financial statements that present a breadth and level of complexity of accounting issues that are generally comparable to the breadth and complexity of issues that can reasonably be expected to be raised by the registrant’s financial statements, or experience actively supervising one or more persons engaged in such activities;
d. An understanding of internal controls and procedures for financial reporting; and
e. An understanding of audit committee functions.
An “audit committee financial expert” shall have acquired such attributes through:
a. Education and experience as a principal financial officer, principal accounting officer, controller, public accountant, or auditor or experience in one or more positions that involve the performance of similar functions;
b. Experience actively supervising a principal financial officer, principal accounting officer, controller, public accountant, auditor, or person performing similar functions;
c. Experience overseeing or assessing the performance of companies or public accountants with respect to the preparation, auditing, or evaluation of financial statements; or
d. Other relevant experience.
The registrant’s Board of Trustees/Directors has also determined that each member of the registrant’s Audit Committee is independent. In order to be “independent” for purposes of this item, the Audit Committee member may not: (i) other than in his or her capacity as a member of the Board of Trustees/Directors or any committee thereof, accept directly or indirectly any consulting, advisory or other compensatory fee from the issuer; or (ii) be an “interested person” of the registrant as defined in Section 2(a)(19) of the Investment Company Act of 1940.
The names of the audit committee financial experts on the registrant’s Audit Committee are set forth below:
Ann D. Borowiec
Joseph W. Chow
Lucinda S. Landreth1
Thomas K. Whitford
Item 4. Principal Accountant Fees and Services
(a) Audit fees.
PricewaterhouseCoopers LLP (“PwC”), the Independent Accountant to the series portfolios of Voyageur Mutual Funds III (“Fund”), has advised the Audit Committee of the Board of Trustees of the Funds (“Audit Committee”) that, as of the date of the filing of this Annual Report on Form N-CSR, it is in discussions with the staff of the Securities and Exchange Commission (“SEC Staff”), or the SEC, regarding the interpretation and application of Rule 2-01(c)(1)(ii)(A) of Regulation S-X, or the Loan Rule.
The Loan Rule prohibits accounting firms, such as PwC, from having certain financial relationships with their audit clients and affiliated entities. Specifically, the Loan Rule provides, in relevant part, that an accounting firm generally would not be independent if it receives a loan from a lender that is a “record or beneficial owner of more than ten percent of the audit client’s equity securities.” Under the SEC Staff’s interpretation of the Loan Rule, based on information provided to us by PwC, some of PwC’s relationships with its lenders who also own shares of one or more funds within the Delaware Investments Family of Funds investment company complex implicate the Loan Rule, calling into question PwC’s independence with respect to the Fund. PwC believes that, in light of the facts of these lending relationships, its ability to exercise objective judgment with respect to the audit of the Fund has not been impaired.
The Audit Committee has considered the lending relationships described by PwC and has concluded that (1) the lending relationships did not affect PwC’s application of objective judgment in conducting its audits and issuing reports on the Fund’s financial statements; and (2) a reasonable investor with knowledge of the lending relationships described by PwC would reach the same conclusion. In making this determination, the Audit Committee considered, among other things, PwC’s description of the relevant lending relationships and PwC’s representation that its objectivity was not impaired in conducting its audit of the Fund’s financial statements. In connection with this determination, PwC advised the Audit Committee that it believes PwC is independent and it continues to have discussions with the SEC Staff.
____________________
1 The instructions to Form N-CSR require disclosure on the relevant experience of persons who qualify as audit committee financial experts based on “other relevant experience.” The Board of Trustees/Directors has determined that Ms. Landreth qualifies as an audit committee financial expert by virtue of her experience as a financial analyst, her Chartered Financial Analyst (CFA) designation, and her service as an audit committee chairperson for a non-profit organization.
If the SEC were ultimately to determine that PwC was not independent with respect to the Fund for certain time periods, the Fund’s filings with the SEC that contains the Fund’s financial statements for such periods would be non-compliant with the applicable securities laws. If the SEC determines that PwC was not independent, among other things, the Fund could be required to have independent audits conducted on the Fund’s previously audited financial statements by another registered public accounting firm for the affected periods. The time involved to conduct such independent audits may impair the Fund’s ability to issue shares. Any of the foregoing possible outcomes potentially could have a material adverse effect on the Fund.
The aggregate fees billed for services provided to the registrant by its independent auditors for the audit of the registrant’s annual financial statements and for services normally provided by the independent auditors in connection with statutory and regulatory filings or engagements were $30,140 for the fiscal year ended October 31, 2016.
The aggregate fees billed for services provided to the registrant by its independent auditors for the audit of the registrant’s annual financial statements and for services normally provided by the independent auditors in connection with statutory and regulatory filings or engagements were $28,990 for the fiscal year ended October 31, 2015.
(b) Audit-related fees.
The aggregate fees billed by the registrant’s independent auditors for services relating to the performance of the audit of the registrant’s financial statements and not reported under paragraph (a) of this Item were $0 for the fiscal year ended October 31, 2016.
The aggregate fees billed by the registrant’s independent auditors for services relating to the performance of the audit of the financial statements of the registrant’s investment adviser and other service providers under common control with the adviser and that relate directly to the operations or financial reporting of the registrant were $667,000 for the registrant’s fiscal year ended October 31, 2016. The percentage of these fees relating to services approved by the registrant’s Audit Committee pursuant to the de minimis exception from the pre-approval requirement in Rule 2-01(c)(7)(i)(C) of Regulation S-X was 0%. These audit-related services were as follows: year end audit procedures; group reporting and subsidiary statutory audits.
The aggregate fees billed by the registrant’s independent auditors for services relating to the performance of the audit of the registrant’s financial statements and not reported under paragraph (a) of this Item were $0 for the fiscal year ended October 31, 2015.
The aggregate fees billed by the registrant’s independent auditors for services relating to the performance of the audit of the financial statements of the registrant’s investment adviser and other service providers under common control with the adviser and that relate directly to the operations or financial reporting of the registrant were $612,000 for the registrant’s fiscal year ended October 31, 2015. The percentage of these fees relating to services approved by the registrant’s Audit Committee pursuant to the de minimis exception from the pre-approval requirement in Rule 2-01(c)(7)(i)(C) of Regulation S-X was 0%. These audit-related services were as follows: year end audit procedures; group reporting and subsidiary statutory audits.
(c) Tax fees.
The aggregate fees billed by the registrant’s independent auditors for tax-related services provided to the registrant were $5,158 for the fiscal year ended October 31, 2016. The percentage of these fees relating to services approved by the registrant’s Audit Committee pursuant to the de minimis exception from the pre-approval requirement in Rule 2-01(c)(7)(i)(C) of Regulation S-X was 0%. These tax-related services were as follows: review of income tax returns and review of annual excise distribution calculations.
The aggregate fees billed by the registrant’s independent auditors for tax-related services provided to the registrant’s investment adviser and other service providers under common control with the adviser and that relate directly to the operations or financial reporting of the registrant were $0 for the registrant’s fiscal year ended October 31, 2016.
The aggregate fees billed by the registrant’s independent auditors for tax-related services provided to the registrant were $5,158 for the fiscal year ended October 31, 2015. The percentage of these fees relating to services approved by the registrant’s Audit Committee pursuant to the de minimis exception from the pre-approval requirement in Rule 2-01(c)(7)(i)(C) of Regulation S-X was 0%. These tax-related services were as follows: review of income tax returns and review of annual excise distribution calculations.
The aggregate fees billed by the registrant’s independent auditors for tax-related services provided to the registrant’s investment adviser and other service providers under common control with the adviser and that relate directly to the operations or financial reporting of the registrant were $0 for the registrant’s fiscal year ended October 31, 2015.
(d) All other fees.
The aggregate fees billed for all services provided by the independent auditors to the registrant other than those set forth in paragraphs (a), (b) and (c) of this Item were $0 for the fiscal year ended October 31, 2016.
The aggregate fees billed for all services other than those set forth in paragraphs (b) and (c) of this Item provided by the registrant’s independent auditors to the registrant’s adviser and other service providers under common control with the adviser and that relate directly to the operations or financial reporting of the registrant were $0 for the registrant’s fiscal year ended October 31, 2016. The percentage of these fees relating to services approved by the registrant’s Audit Committee pursuant to the de minimis exception from the pre-approval requirement in Rule 2-01(c)(7)(i)(C) of Regulation S-X was 0%.
The aggregate fees billed for all services provided by the independent auditors to the registrant other than those set forth in paragraphs (a), (b) and (c) of this Item were $0 for the fiscal year ended October 31, 2015.
The aggregate fees billed for all services other than those set forth in paragraphs (b) and (c) of this Item provided by the registrant’s independent auditors to the registrant’s adviser and other service providers under common control with the adviser and that relate directly to the operations or financial reporting of the registrant were $0 for the registrant’s fiscal year ended October 31, 2015. The percentage of these fees relating to services approved by the registrant’s Audit Committee pursuant to the de minimis exception from the pre-approval requirement in Rule 2-01(c)(7)(i)(C) of Regulation S-X was 0%.
(e) The registrant’s Audit Committee has established pre-approval policies and procedures as permitted by Rule 2-01(c)(7)(i)(B) of Regulation S-X (the “Pre-Approval Policy”) with respect to services provided by the registrant’s independent auditors. Pursuant to the Pre-Approval Policy, the Audit Committee has pre-approved the services set forth in the table below with respect to the registrant up to the specified fee limits. Certain fee limits are based on aggregate fees to the registrant and other registrants within the Delaware Investments Family of Funds.
| Service | Range of Fees |
| Audit Services | |
Statutory audits or financial audits for new Funds | up to $40,000 per Fund |
Services associated with SEC registration statements (e.g., Form N-1A, Form N-14, etc.), periodic reports and other documents filed with the SEC or other documents issued in connection with securities offerings (e.g., comfort letters for closed-end Fund offerings, consents), and assistance in responding to SEC comment letters | up to $10,000 per Fund |
Consultations by Fund management as to the accounting or disclosure treatment of transactions or events and/or the actual or potential impact of final or proposed rules, standards or interpretations by the SEC, FASB, or other regulatory or standard-setting bodies (Note: Under SEC rules, some consultations may be considered “audit-related services” rather than “audit services”) | up to $25,000 in the aggregate |
Audit-Related Services | |
Consultations by Fund management as to the accounting or disclosure treatment of transactions or events and /or the actual or potential impact of final or proposed rules, standards or interpretations by the SEC, FASB, or other regulatory or standard-setting bodies (Note: Under SEC rules, some consultations may be considered “audit services” rather than “audit-related services”) | up to $25,000 in the aggregate |
Tax Services | |
U.S. federal, state and local and international tax planning and advice (e.g., consulting on statutory, regulatory or administrative developments, evaluation of Funds’ tax compliance function, etc.) | up to $25,000 in the aggregate |
U.S. federal, state and local tax compliance (e.g., excise distribution reviews, etc.) | up to $5,000 per Fund |
Review of federal, state, local and international income, franchise and other tax returns | up to $5,000 per Fund |
Under the Pre-Approval Policy, the Audit Committee has also pre-approved the services set forth in the table below with respect to the registrant’s investment adviser and other entities controlling, controlled by or under common control with the investment adviser that provide ongoing services to the registrant (the “Control Affiliates”) up to the specified fee limit. This fee limit is based on aggregate fees to the investment adviser and its Control Affiliates.
| Service | Range of Fees |
| Non-Audit Services | |
| Services associated with periodic reports and other documents filed with the SEC and assistance in responding to SEC comment letters | up to $10,000 in the aggregate |
The Pre-Approval Policy requires the registrant’s independent auditors to report to the Audit Committee at each of its regular meetings regarding all services initiated since the last such report was rendered, including those services authorized by the Pre-Approval Policy.
(f) Not applicable.
(g) The aggregate non-audit fees billed by the registrant’s independent auditors for services rendered to the registrant and to its investment adviser and other service providers under common control with the adviser were $8,665,000 and $11,111,212 for the registrant’s fiscal years ended October 31, 2016 and October 31, 2015, respectively.
(h) In connection with its selection of the independent auditors, the registrant’s Audit Committee has considered the independent auditors’ provision of non-audit services to the registrant’s investment adviser and other service providers under common control with the adviser that were not required to be pre-approved pursuant to Rule 2-01(c)(7)(ii) of Regulation S-X. The Audit Committee has determined that the independent auditors’ provision of these services is compatible with maintaining the auditors’ independence.
Item 5. Audit Committee of Listed Registrants
Not applicable.
Item 6. Investments
(a) Included as part of report to shareholders filed under Item 1 of this Form N-CSR.
(b) Divestment of securities in accordance with Section 13(c) of the Investment Company Act of 1940.
Not applicable.
Item 7. Disclosure of Proxy Voting Policies and Procedures for Closed-End Management Investment Companies
Not applicable.
Item 8. Portfolio Managers of Closed-End Management Investment Companies
Not applicable.
Item 9. Purchases of Equity Securities by Closed-End Management Investment Company and Affiliated Purchasers
Not applicable.
Item 10. Submission of Matters to a Vote of Security Holders
Not applicable.
Item 11. Controls and Procedures
The registrant’s principal executive officer and principal financial officer have evaluated the registrant’s disclosure controls and procedures within 90 days of the filing of this report and have concluded that they are effective in providing reasonable assurance that the information required to be disclosed by the registrant in its reports or statements filed under the Securities Exchange Act of 1934 is recorded, processed, summarized and reported within the time periods specified in the rules and forms of the Securities and Exchange Commission.
There were no significant changes in the registrant’s internal control over financial reporting that occurred during the second fiscal quarter of the period covered by the report to stockholders included herein (i.e., the registrant’s fourth fiscal quarter) that have materially affected, or are reasonably likely to materially affect, the registrant’s internal control over financial reporting.
Item 12. Exhibits
(a) (1) Code of Ethics
Not applicable.
(2) Certifications of Principal Executive Officer and Principal Financial Officer pursuant to Rule 30a-2 under the Investment Company Act of 1940 are attached hereto as Exhibit 99.CERT.
(3) Written solicitations to purchase securities pursuant to Rule 23c-1 under the Securities Exchange Act of 1934.
Not applicable.
(b) Certifications pursuant to Section 906 of the Sarbanes-Oxley Act of 2002 are furnished herewith as Exhibit 99.906CERT.
SIGNATURES
Pursuant to the requirements of the Securities Exchange Act of 1934 and the Investment Company Act of 1940, the registrant has duly caused this report to be signed on its behalf, by the undersigned, thereunto duly authorized.
VOYAGEUR MUTUAL FUNDS III
| /s/ SHAWN K. LYTLE |
| By: | Shawn K. Lytle |
| Title: | President and Chief Executive Officer |
| Date: | January 5, 2017 |
Pursuant to the requirements of the Securities Exchange Act of 1934 and the Investment Company Act of 1940, this report has been signed below by the following persons on behalf of the registrant and in the capacities and on the dates indicated.
| /s/ SHAWN K. LYTLE |
| By: | Shawn K. Lytle |
| Title: | President and Chief Executive Officer |
| Date: | January 5, 2017 |
| |
| /s/ RICHARD SALUS |
| By: | Richard Salus |
| Title: | Chief Financial Officer |
| Date: | January 5, 2017 |