Item 1. Reports to Stockholders
US equity mutual fund
Delaware Select Growth Fund
October 31, 2018
Carefully consider the Fund’s investment objectives, risk factors, charges, and expenses before investing. This and other information can be found in the Fund’s prospectus and its summary prospectus, which may be obtained by visiting delawarefunds.com/literature or calling 800 523-1918. Investors should read the prospectus and the summary prospectus carefully before investing.
You can obtain shareholder reports and prospectuses online instead of in the mail.
Visit delawarefunds.com/edelivery.

Experience Delaware Funds® by Macquarie
Macquarie Investment Management (MIM) is a global asset manager with offices throughout the United States, Europe, Asia, and Australia. We are active managers who prioritize autonomy and accountability at the investment team level in pursuit of opportunities that matter for our clients. Delaware Funds is one of the longest-standing mutual fund families, with more than 75 years in existence.
If you are interested in learning more about creating an investment plan, contact your financial advisor.
You can learn more about Delaware Funds or obtain a prospectus for Delaware Select Growth Fund at delawarefunds.com/literature.
Manage your account online
| • | | Check your account balance and transactions |
| • | | View statements and tax forms |
| • | | Make purchases and redemptions |
Visit delawarefunds.com/account-access.
Macquarie Asset Management (MAM) offers a diverse range of products including securities investment management, infrastructure and real asset management, and fund and equity-based structured products. MIM is the marketing name for certain companies comprising the asset management division of Macquarie Group. This includes the following registered investment advisers: Macquarie Investment Management Business Trust (MIMBT), Macquarie Funds Management Hong Kong Limited, Macquarie Investment Management Austria Kapitalanlage AG, Macquarie Investment Management Global Limited, Macquarie Investment Management Europe Limited, and Macquarie Capital Investment Management LLC.
The Fund is distributed by Delaware Distributors, L.P. (DDLP), an affiliate of MIMBT and Macquarie Group Limited.
Other than Macquarie Bank Limited (MBL), none of the entities noted are authorized deposit-taking institutions for the purposes of the Banking Act 1959 (Commonwealth of Australia). The obligations of these entities do not represent deposits or other liabilities of MBL. MBL does not guarantee or otherwise provide assurance in respect of the obligations of these entities, unless noted otherwise. The Fund is governed by US laws and regulations.
Table of contents
Unless otherwise noted, views expressed herein are current as of Oct. 31, 2018, and subject to change for events occurring after such date.
The Fund is not FDIC insured and is not guaranteed. It is possible to lose the principal amount invested.
Advisory services provided by Delaware Management Company, a series of MIMBT, a US registered investment advisor.
All third-party marks cited are the property of their respective owners.
© 2018 Macquarie Management Holdings, Inc.
| | | | |
| Portfolio management review | | | | |
| Delaware Select Growth Fund | | | November 13, 2018 | |
| | | | | | | | |
Performance preview (for the year ended October 31, 2018) | | | | | | | | |
Delaware Select Growth Fund (Institutional Cass shares) | | | 1-year return | | | | +7.10% | |
Delaware Select Growth Fund (Class A shares) | | | 1-year return | | | | +6.84% | |
Russell 3000® Growth Index (benchmark) | | | 1-year return | | | | +10.20% | |
Past performance does not guarantee future results.
For complete, annualized performance for Delaware Select Growth Fund, please see the table on page 4. Institutional Class shares are not subject to a sales charge and are offered for sale exclusively to certain eligible investors. In addition, Institutional Class shares pay no distribution and service fee.
The performance of Class A shares excludes the applicable sales charge. Both Institutional Class shares and Class A shares reflect the reinvestment of all distributions.
Please see page 6 for a description of the index. Index performance returns do not reflect any management fees, transaction costs, or expenses. Indices are unmanaged and one cannot invest directly in an index.
Jackson Square Partners, LLC (JSP), a US registered investment advisor, is the sub-advisor to the Fund. As sub-advisor, JSP is responsible for day-to-day management of the Fund’s assets. Delaware Management Company (DMC), a series of Macquarie Investment Management Business Trust, has ultimate responsibility for all investment advisory services.
Overall US stock performance was fair during the fiscal year ended Oct. 31, 2018, as the S&P 500® Index gained 7.35%, despite marked volatility. Gains spiked in January 2018, only to drop more than 10% during an early February selloff. Stocks slowly regained momentum throughout the summer and early fall but lost some ground once again as the United States geared up for the midterm election cycle. The result was net positive, particularly for the largest blue-chip stocks, as indicated by a 9.87% rise in the Dow Jones Industrial Average® during the fiscal period.
A robust labor market fueled US growth. The unemployment rate fell below 4% (its lowest level since 1969), consumer confidence was at an 18-year high, and the economy hit its fastest pace of growth since 2014. The fiscal year ended with retail sales in October ahead of expectations. (Source: US Bureau of Economic Analysis.)
The Federal Reserve raised rates four times throughout the fiscal year, in December 2017, then March, June, and September 2018. None of
| | |
Regardless of the economic outcome, we remain consistent in our long-term investment philosophy: We want to own what we view as strong secular-growth companies with solid business models and competitive positions that we believe can grow market share and have the potential to deliver shareholder value in a variety of market environments. | | |
1
Portfolio management review
Delaware Select Growth Fund
these moves came as a surprise to investors, despite a February transition from former Fed Chair Janet Yellen to Jerome Powell. In a September statement, the Federal Open Market Committee (FOMC) announced that the combination of strong labor-market conditions, sustained economic activity, and an inflation rate that was hovering around the target 2% objective all added up to “balanced” risks for the nation’s economic outlook.
The housing market, which had been on an upswing for nearly 10 years, began to wane during the fiscal period as rising house prices and mortgage rates combined with salary stagnation led potential homebuyers to hold off. Residential investment declined, as did existing- and new-home sales. Low inventory and a new tax law that reduces tax incentives for homeownership have the potential to solidify this slump.
An unprecedented surge in US crude oil and natural gas production during the fiscal year, made possible by shale development, led to record US exports. Oil prices had been creeping higher, but with expanding US crude inventories and a lowered estimate for global demand by the Organization of the Petroleum Exporting Countries (OPEC), prices tumbled in October 2018. (Sources: Bloomberg, U.S. Energy Information Administration.)
The US imposed taxes on imports, which included steel and aluminum, from China, Mexico, Canada, and the European Union; all four responded with retaliatory tariffs on US goods. The US, Canada, and Mexico, however, negotiated a new trade deal to replace the North American Free Trade Agreement (NAFTA), the United States-Mexico-Canada Agreement (USMCA).
The combination of a strong US dollar, rising US interest rates, and an escalating global trade war hurt overseas markets. International stocks were down 6.85% for the fiscal year, as measured by the MSCI EAFE Index (net). Emerging markets
fared worse, losing 12.52% for the same period, as measured by the MSCI Emerging Markets Index (net).
Within the Fund
For the fiscal year ended Oct. 31, 2018, Delaware Select Growth Fund Institutional Class shares returned +7.10%. The Fund’s Class A shares returned +6.84% at net asset value (NAV) and +0.69% at maximum offer price. These figures reflect all distributions reinvested. During the same period, the Fund’s benchmark, the Russell 3000 Growth Index, returned +10.20%. For complete, annualized performance of Delaware Select Growth Fund, please see the table on page 4.
Strong relative performance in the communication services and industrials sectors was unable to overcome weak relative performance in the information technology, consumer discretionary, and real estate sectors. On a stock-specific level, the following were the most significant contributors and detractors during the fiscal year:
TripAdvisor Inc., a website providing travel advice and planning features, contributed to the Fund’s performance during the fiscal year. The company’s earnings reports have been positive during the 12-month period, which management attributed to the stabilization of its click-based ad auction and lower online acquisition costs. TripAdvisor has seen accelerated growth in its nonhotel segment and has integrated third-party networks, such as delivery.com, into its website and mobile app. We believe that could drive synergies over the long term and consider TripAdvisor to be an undervalued asset due to its ability to attract 415 million interested travelers.
Bioverativ Inc., a biotech company specializing in the discovery, development, and delivery of therapies for the treatment of hemophilia, added to the Fund’s performance. Sanofi, a global pharmaceutical company based in France, agreed to buy Bioverativ for $11.6 billion, representing a 64% premium to the previous day’s closing. As a
2
leader in specialty care, Sanofi intends to leverage Bioverativ’s clinical expertise and portfolio in rare blood disorders. Overall, we were pleased with the premium offered.
LiveRamp Holdings Inc. (previously Acxiom Holdings Inc.), a global technology and enablement services company, was also a contributor to performance during the fiscal period. We recently entered into this position as we believe it is an underfollowed and undervalued name in the market. The company’s new CEO, Scott Howe, joined from Microsoft in 2011 and has brought new entrepreneurial vigor to a previously sleepy firm, in our view. Howe aggressively pursued and acquired LiveRamp, a rapidly growing, subscription-based, data onboarding and analytics company that has been nurtured as an autonomous division within Acxiom. Additionally, Acxiom recently announced the sale of its legacy AMS (or Acxiom Marketing Services) business to Interpublic Group for $2.3 billion, which will result in net $1.7 billion in cash upon closing. This was approximately half the company’s market cap at the time of the Fund’s investment. As a result, we believe new management, combined with a Software-as-a-Service (SaaS) data middleware provider embedded in a firm with large cash reserves, have the potential to position Acxiom to drive value over the long term.
DENTSPLY SIRONA Inc., a dental-equipment maker and dental-consumables producer, detracted from the Fund’s performance during the fiscal period. Investors have been concerned about declining revenues in the US amid continued headwinds related to foreign-exchange rates. Concern for the timing of a return to growth after recent investments and capital expenditures has weighed on the stock as well. Since we think these issues represent fundamental change to the thesis, we exited the position in the Fund.
Symantec Corp., a global leader in security and information management solutions, also detracted
from the Fund’s performance. Concerns raised by a former employee in conjunction with the U.S. Securities and Exchange Commission (SEC) triggered an internal investigation by the company’s Audit Committee. With little transparency provided to the public markets, we think this issue represents a fundamental change at the thesis level. As a result, we decided to exit the position and redeploy the capital elsewhere in the Fund’s portfolio.
Applied Materials Inc., the global leader in providing equipment, services, and software to enable the manufacture of advanced semiconductors and flat panel displays, also weighed on the Fund’s performance during the fiscal year. Despite earnings that were broadly in line with guidance, continued industry-wide memory and capital expenditure pushouts into 2019 seemed to provoke caution among investors, who have seen estimates come down across the sector. Nonetheless, we continue to believe we are witnessing a small cyclical downturn in an otherwise strong, secular growth story. We remain confident that Applied Materials is undervalued by the market, is competitively placed in a consolidated sector with high barriers to entry, and has growth drivers, namely increasing capital intensity at an industry level, that have the potential to position the company well for the long term.
Note that the Fund utilized foreign currency exchange contracts to facilitate the purchase and sale of equities traded on international exchanges. The effect of these contracts on performance was immaterial.
Regardless of the economic outcome, we remain consistent in our long-term investment philosophy: We want to own what we view as strong secular-growth companies with solid business models and competitive positions that we believe can grow market share and have the potential to deliver shareholder value in a variety of market environments.
3
| | | | |
| Performance summary | | | | |
| Delaware Select Growth Fund | | | October 31, 2018 | |
The performance quoted represents past performance and does not guarantee future results. Investment return and principal value of an investment will fluctuate so that shares, when redeemed, may be worth more or less than their original cost. Current performance may be lower or higher than the performance quoted. Performance data current to the most recent month end may be obtained by calling 800 523-1918 or visiting delawarefunds.com/performance.
| | | | | | | | | | | | | | | | |
Fund and benchmark performance1,2 | | | Average annual total returns through October 31, 2018 | |
| | | | 1 year | | | | 5 years | | | | 10 years | | | | Lifetime | |
Class A (Est. May 16, 1994) | | | | | | | | | | | | | | | | |
Excluding sales charge | | | +6.84% | | | | +7.42% | | | | +14.78% | | | | +10.07% | |
Including sales charge | | | +0.69% | | | | +6.15% | | | | +14.10% | | | | +9.80% | |
Class C (Est. May 20, 1994) | | | | | | | | | | | | | | | | |
Excluding sales charge | | | +6.02% | | | | +6.61% | | | | +13.92% | | | | +9.24% | |
Including sales charge | | | +5.04% | | | | +6.61% | | | | +13.92% | | | | +9.24% | |
Class R (Est. June 2, 2003) | | | | | | | | | | | | | | | | |
Excluding sales charge | | | +6.55% | | | | +7.14% | | | | +14.49% | | | | +8.82% | |
Including sales charge | | | +6.55% | | | | +7.14% | | | | +14.49% | | | | +8.82% | |
Institutional Class (Est. Aug. 28, 1997) | | | | | | | | | | | | | | | | |
Excluding sales charge | | | +7.10% | | | | +7.69% | | | | +15.07% | | | | +8.15% | |
Including sales charge | | | +7.10% | | | | +7.69% | | | | +15.07% | | | | +8.15% | |
Russell 3000 Growth Index | | | +10.20% | | | | +13.06% | | | | +15.33% | | | | +7.04%* | |
*The benchmark lifetime return is for Institutional Class share comparison only and is calculated using the last business day in the month of the Fund’s Institutional Class inception date.
1Returns reflect the reinvestment of all distributions and are presented both with and without the applicable sales charges described below. Returns do not reflect the deduction of taxes the shareholder would pay on Fund distributions or redemptions of Fund shares.
Expense limitations were in effect for certain classes during some or all of the periods shown in the “Fund and benchmark performance” table. Expenses for each class are listed on the “Fund expense ratios” table on page 5. Performance would have been lower had expense limitations not been in effect.
Institutional Class shares are not subject to a sales charge and are offered for sale exclusively to certain eligible investors. In addition, Institutional Class shares pay no distribution and service fee.
Class A shares are sold with a maximum front-end sales charge of 5.75%, and have an annual distribution and service fee of 0.25% of average daily net assets. Performance for Class A shares, excluding sales charges, assumes that no front-end sales charge applied.
Class C shares are sold with a contingent deferred sales charge of 1.00% if redeemed during the first 12 months. They are also subject to an annual distribution and service fee of 1.00% of average daily net assets. Performance for Class C shares, excluding sales charges, assumes either that contingent deferred sales charges did not apply or that the investment was not redeemed.
Class R shares are available only for certain retirement plan products. They are sold without a sales charge and have an annual distribution and service fee of 0.50% of average daily net assets.
4
Investments in small and/or medium-sized companies typically exhibit greater risk and higher volatility than larger, more established companies.
International investments entail risks not ordinarily associated with US investments including fluctuation in currency values, differences in
accounting principles, or economic or political instability in other nations.
Investing in emerging markets can be riskier than investing in established foreign markets due to increased volatility and lower trading volume.
2 The Fund’s expense ratios, as described in the most recent prospectus, are disclosed in the following “Fund expense ratios” table. Delaware Management Company has agreed to reimburse certain expenses and/or waive certain fees in order to prevent total annual fund operating expenses (excluding any 12b-1 fees, acquired fund fees and expenses, taxes, interest, short sale and dividend and interest expenses, brokerage fees, certain insurance costs, and nonroutine expenses or costs, including, but not limited to, those relating to reorganizations, litigation, conducting shareholder meetings, and liquidations) from exceeding 1.00% of the Fund’s average daily net assets during the period from Nov. 1, 2017 to Oct. 31, 2018.* Please see the most recent prospectus and any applicable supplement(s) for additional information on these fee waivers and/or reimbursements. Please see the “Financial highlights” section in this report for the most recent expense ratios.
| | | | | | | | |
| Fund expense ratios | | Class A | | Class C | | Class R | | Institutional Class |
Total annual operating expenses | | 1.28% | | 2.03% | | 1.53% | | 1.03% |
(without fee waivers) | | | | | | | | |
Net expenses | | 1.25% | | 2.00% | | 1.50% | | 1.00% |
(including fee waivers, if any) | | | | | | | | |
Type of waiver | | Contractual | | Contractual | | Contractual | | Contractual |
*The aggregate contractual waiver period covering this report is from Feb. 28, 2017 through Feb. 28, 2019.
5
Performance summary
Delaware Select Growth Fund
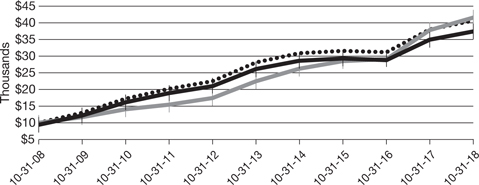
Performance of a $10,000 investment1
Average annual total returns from Oct. 31, 2008 through Oct. 31, 2018
| | | | | | | | | | | | |
| For the period beginning Oct. 31, 2008 through Oct. 31, 2018 | | | Starting value | | | | Ending value | |
 | | Russell 3000 Growth Index | | | $10,000 | | | | $41,644 | |
 | | Delaware Select Growth Fund — Institutional Class shares | | | $10,000 | | | | $40,701 | |
 | | Delaware Select Growth Fund — Class A shares | | | $9,425 | | | | $37,394 | |
1 The “Performance of a $10,000 investment” graph assumes $10,000 invested in Institutional Class and Class A shares of the Fund on Oct. 31, 2008, and includes the effect of a 5.75% front-end sales charge (for Class A shares) and the reinvestment of all distributions. The graph does not reflect the deduction of taxes the shareholders would pay on Fund distributions or redemptions of Fund shares. Expense limitations were in effect for some or all of the periods shown. Performance would have been lower had expense limitations not been in effect. Expenses are listed in the “Fund expense ratios” table on page 5. Please note additional details on pages 4 through 7.
The graph also assumes $10,000 invested in the Russell 3000 Growth Index as of Oct. 31, 2008. The Russell 3000 Growth Index measures the performance of the broad growth segment of the US equity universe. It includes those Russell 3000
companies with higher price-to-book ratios and higher forecasted growth values.
The S&P 500 Index, mentioned on page 1, measures the performance of 500 mostly large-cap stocks weighted by market value, and is often used to represent performance of the US stock market.
The Dow Jones Industrial Average, mentioned on page 1, is an often-quoted market indicator that comprises 30 widely held US blue-chip stocks.
The MSCI EAFE (Europe, Australasia, Far East) Index, mentioned on page 2, is a free float-adjusted market capitalization weighted index designed to measure equity market performance of developed markets, excluding the United States and Canada. Index “net” return approximates the minimum possible dividend reinvestment, after deduction of withholding tax at the highest possible rate.
6
The MSCI Emerging Markets Index, mentioned on page 2, is a free float-adjusted market capitalization index designed to measure equity market performance across emerging market countries worldwide. Index “net” return approximates the minimum possible dividend reinvestment, after deduction of withholding tax at the highest possible rate.
Frank Russell Company (“Russell”) is the source and owner of the trademarks, service marks, and
copyrights related to the Russell Indexes. Russell® is a trademark of the Frank Russell Company.
Index performance returns do not reflect any management fees, transaction costs, or expenses. Indices are unmanaged and one cannot invest directly in an index. Past performance is not a guarantee of future results.
Performance of other Fund classes will vary due to different charges and expenses.
| | | | | | |
| | | Nasdaq symbols | | CUSIPs | | |
Class A | | DVEAX | | 928931104 | | |
Class C | | DVECX | | 928931203 | | |
Class R | | DFSRX | | 928931740 | | |
Institutional Class | | VAGGX | | 928931757 | | |
7
| | | | |
| Disclosure of Fund expenses | | | | |
| For the six-month period from May 1, 2018 to October 31, 2018 (Unaudited) | | | | |
As a shareholder of the Fund, you incur two types of costs: (1) transaction costs, including sales charges (loads) on purchase payments, reinvested dividends, or other distributions; redemption fees; and exchange fees; and (2) ongoing costs, including management fees; distribution and service (12b-1) fees; and other Fund expenses. This example is intended to help you understand your ongoing costs (in dollars) of investing in the Fund and to compare these costs with the ongoing costs of investing in other mutual funds.
The example is based on an investment of $1,000 invested at the beginning of the period and held for the entire six-month period from May 1, 2018 to Oct. 31, 2018.
Actual expenses
The first section of the table shown, “Actual Fund return,” provides information about actual account values and actual expenses. You may use the information in this section of the table, together with the amount you invested, to estimate the expenses that you paid over the period. Simply divide your account value by $1,000 (for example, an $8,600 account value divided by $1,000 = 8.6), then multiply the result by the number in the first section under the heading entitled “Expenses Paid During Period” to estimate the expenses you paid on your account during this period.
Hypothetical example for comparison purposes
The second section of the table shown, “Hypothetical 5% return,” provides information about hypothetical account values and hypothetical expenses based on the Fund’s actual expense ratio and an assumed rate of return of 5% per year before expenses, which is not the Fund’s actual return. The hypothetical account values and expenses may not be used to estimate the actual ending account balance or expenses you paid for the period. You may use this information to compare the ongoing costs of investing in the Fund and other funds. To do so, compare this 5% hypothetical example with the 5% hypothetical examples that appear in the shareholder reports of the other funds.
Please note that the expenses shown in the table are meant to highlight your ongoing costs only and do not reflect any transactional costs, such as sales charges (loads), redemption fees, or exchange fees. Therefore, the second section of the table is useful in comparing ongoing costs only, and will not help you determine the relative total costs of owning different funds. In addition, if these transactional costs were included, your costs would have been higher. The Fund’s expenses shown in the table reflect fee waivers in effect. The Fund’s expenses shown in the table assume reinvestment of all dividends and distributions.
8
| | | | |
| Delaware Select Growth Fund | | | | |
| Expense analysis of an investment of $1,000 | | | | |
| | | | | | | | | | | | | | | | |
| | Beginning
Account Value
5/1/18 | | | Ending
Account Value
10/31/18 | | | Annualized
Expense Ratio | | | Expenses
Paid During Period
5/1/18 to 10/31/18* | |
Actual Fund return† | | | | | | | | | | | | | | | | |
Class A | | | $1,000.00 | | | | $1,041.90 | | | | 1.23% | | | | $6.33 | |
Class C | | | 1,000.00 | | | | 1,037.90 | | | | 1.98% | | | | 10.17 | |
Class R | | | 1,000.00 | | | | 1,040.50 | | | | 1.48% | | | | 7.61 | |
Institutional Class | | | 1,000.00 | | | | 1,043.30 | | | | 0.98% | | | | 5.05 | |
Hypothetical 5% return (5% return before expenses) | | | | | |
Class A | | | $1,000.00 | | | | $1,019.00 | | | | 1.23% | | | | $6.26 | |
Class C | | | 1,000.00 | | | | 1,015.22 | | | | 1.98% | | | | 10.06 | |
Class R | | | 1,000.00 | | | | 1,017.74 | | | | 1.48% | | | | 7.53 | |
Institutional Class | | | 1,000.00 | | | | 1,020.27 | | | | 0.98% | | | | 4.99 | |
*“Expenses Paid During Period” are equal to the Fund’s annualized expense ratio, multiplied by the average account value over the period, multiplied by 184/365 (to reflect the one-half year period).
†Because actual returns reflect only the most recent six-month period, the returns shown may differ significantly from fiscal year returns.
9
| | |
Security type / sector allocation and top 10 equity holdings | | |
| Delaware Select Growth Fund | | As of October 31, 2017 (Unaudited) |
Sector designations may be different than the sector designations presented in other Fund materials. The sector designations may represent the investment manager’s internal sector classifications.
| | |
| Security type / sector | | Percentage of net assets |
Common Stocks² | | 97.56% |
Consumer Discretionary | | 21.07% |
Energy | | 1.48% |
Financials | | 9.89% |
Healthcare | | 13.75% |
Industrials | | 8.22% |
Real Estate | | 3.14% |
Technology | | 40.01% |
Short-Term Investments | | 2.67% |
Total Value of Securities | | 100.23% |
Liabilities Net of Receivables and Other Assets | | (0.23%) |
Total Net Assets | | 100.00% |
| ² | Narrow industries are utilized for compliance purposes for diversification whereas broad sectors are used for financial reporting. |
To monitor compliance with the Fund’s concentration guidelines as described in the Fund’s prospectus and statement of additional information, the Technology sector (as disclosed herein for financial reporting purposes) is subdivided into a variety of “industries” (in accordance with the requirements of the Investment Company Act of 1940, as amended). The Technology sector consisted of commercial services, computers, diversified financial services, Internet, semiconductors, software, and telecommunications. As of Oct. 31, 2018 such amounts, as a percentage of total net assets, were 2.45%, 1.20%, 3.38%, 4.74%, 3.62%, 23.37%, and 1.25%, respectively. The percentage in any such single industry will comply with the Fund’s concentration policy even if the percentage in the Technology sector for financial reporting purposes may exceed 25%.
10
Holdings are for informational purposes only and are subject to change at any time. They are not a recommendation to buy, sell, or hold any security.
| | |
| Top 10 equity holdings | | Percentage of net assets |
LiveRamp Holdings | | 7.48% |
Microsoft | | 7.40% |
New York Times Class A | | 5.78% |
Biogen | | 4.21% |
FedEx | | 3.24% |
Liberty TripAdvisor Holdings Class A | | 3.11% |
IQVIA Holdings | | 3.09% |
TripAdvisor | | 3.07% |
KKR & Co. Class A | | 2.88% |
Take-Two Interactive Software | | 2.86% |
11
| | | | |
| Schedule of investments | | | | |
| Delaware Select Growth Fund | | | October 31, 2018 | |
| | | | | | | | |
| | Number of shares | | | Value (US $) | |
Common Stock – 97.56%² | | | | | | | | |
Consumer Discretionary – 21.07% | | | | | | | | |
Dollar General | | | 68,918 | | | $ | 7,676,087 | |
Dollar Tree † | | | 7,983 | | | | 672,967 | |
Dunkin’ Brands Group | | | 24,479 | | | | 1,776,196 | |
eBay † | | | 22,151 | | | | 643,044 | |
Hasbro | | | 92,968 | | | | 8,526,095 | |
Liberty Global Class A † | | | 93,659 | | | | 2,400,480 | |
Liberty Global Class C † | | | 174,209 | | | | 4,362,193 | |
Liberty Media-Liberty Formula One Class C † | | | 8,062 | | | | 266,691 | |
Liberty TripAdvisor Holdings Class A † | | | 667,228 | | | | 9,621,428 | |
Lowe’s | | | 8,839 | | | | 841,650 | |
New York Times Class A | | | 677,391 | | | | 17,883,122 | |
TripAdvisor † | | | 182,166 | | | | 9,498,135 | |
Wyndham Hotels & Resorts | | | 10,456 | | | | 515,376 | |
ZOZO | | | 19,342 | | | | 464,093 | |
| | | | | | | | |
| | | | | | | 65,147,557 | |
| | | | | | | | |
Energy – 1.48% | | | | | | | | |
Centennial Resource Development Class A † | | | 157,813 | | | | 3,023,697 | |
Kinder Morgan | | | 90,316 | | | | 1,537,178 | |
| | | | | | | | |
| | | | | | | 4,560,875 | |
| | | | | | | | |
Financials – 9.89% | | | | | | | | |
Affiliated Managers Group | | | 4,073 | | | | 462,937 | |
Charles Schwab | | | 175,890 | | | | 8,133,154 | |
CME Group | | | 37,652 | | | | 6,899,352 | |
Intercontinental Exchange | | | 55,740 | | | | 4,294,210 | |
KKR & Co. Class A | | | 376,192 | | | | 8,896,941 | |
LendingTree † | | | 9,399 | | | | 1,895,684 | |
| | | | | | | | |
| | | | | | | 30,582,278 | |
| | | | | | | | |
Healthcare – 13.75% | | | | | | | | |
ABIOMED † | | | 1,585 | | | | 540,802 | |
AMAG Pharmaceuticals † | | | 95,903 | | | | 2,061,915 | |
Biogen † | | | 42,815 | | | | 13,027,320 | |
Cambrex † | | | 6,652 | | | | 354,485 | |
Evolent Health Class A † | | | 40,035 | | | | 888,777 | |
Haemonetics † | | | 20,676 | | | | 2,160,022 | |
Illumina † | | | 14,897 | | | | 4,635,202 | |
IQVIA Holdings † | | | 77,714 | | | | 9,553,382 | |
Portola Pharmaceuticals † | | | 99,937 | | | | 1,967,760 | |
UnitedHealth Group | | | 27,938 | | | | 7,301,596 | |
| | | | | | | | |
| | | | | | | 42,491,261 | |
| | | | | | | | |
12
| | | | | | | | |
| | Number of shares | | | Value (US $) | |
Common Stock² (continued) | | | | | | | | |
Industrials – 8.22% | | | | | | | | |
Boeing | | | 21,475 | | | $ | 7,620,619 | |
Expeditors International of Washington | | | 40,010 | | | | 2,687,872 | |
Experian | | | 32,324 | | | | 743,426 | |
FedEx | | | 45,470 | | | | 10,018,860 | |
IHS Markit † | | | 44,499 | | | | 2,337,532 | |
Safran | | | 15,606 | | | | 2,016,729 | |
| | | | | | | | |
| | | | | | | 25,425,038 | |
| | | | | | | | |
Real Estate – 3.14% | | | | | | | | |
Crown Castle International | | | 23,817 | | | | 2,589,861 | |
Equinix | | | 1,665 | | | | 630,602 | |
Equity Commonwealth † | | | 79,988 | | | | 2,382,043 | |
Outfront Media | | | 43,398 | | | | 769,013 | |
Redfin † | | | 215,451 | | | | 3,328,718 | |
| | | | | | | | |
| | | | | | | 9,700,237 | |
| | | | | | | | |
Technology – 40.01% | | | | | | | | |
Alibaba Group Holding ADR † | | | 10,875 | | | | 1,547,295 | |
Alphabet Class A † | | | 2,171 | | | | 2,367,649 | |
Alphabet Class C † | | | 3,781 | | | | 4,071,267 | |
Amadeus IT Group | | | 4,781 | | | | 384,988 | |
Applied Materials | | | 219,259 | | | | 7,209,236 | |
Arista Networks † | | | 16,773 | | | | 3,863,661 | |
ASML Holding | | | 3,380 | | | | 582,185 | |
Autodesk † | | | 53,376 | | | | 6,898,848 | |
Baidu ADR † | | | 5,343 | | | | 1,015,491 | |
Cars.com† | | | 29,378 | | | | 767,060 | |
Coupa Software † | | | 11,256 | | | | 729,726 | |
Electronic Arts † | | | 55,715 | | | | 5,068,951 | |
IPG Photonics † | | | 7,730 | | | | 1,032,341 | |
j2 Global | | | 52,717 | | | | 3,839,906 | |
LiveRamp Holdings † | | | 506,107 | | | | 23,118,967 | |
Logitech International | | | 25,448 | | | | 942,194 | |
Mastercard Class A | | | 25,494 | | | | 5,039,399 | |
MercadoLibre | | | 1,417 | | | | 459,817 | |
Microsoft | | | 214,139 | | | | 22,872,187 | |
Paycom Software † | | | 2,210 | | | | 276,692 | |
PayPal Holdings † | | | 89,902 | | | | 7,568,849 | |
Samsung Electronics | | | 13,050 | | | | 488,537 | |
Samsung Electronics GDR | | | 2,027 | | | | 1,891,191 | |
Scout24 144A # | | | 31,498 | | | | 1,305,384 | |
ServiceNow † | | | 1,259 | | | | 227,929 | |
Take-Two Interactive Software † | | | 68,505 | | | | 8,828,239 | |
Tencent Holdings | | | 17,082 | | | | 585,217 | |
13
Schedule of investments
Delaware Select Growth Fund
| | | | | | | | |
| | Number of shares | | | Value (US $) | |
Common Stock² (continued) | | | | | | | | |
Technology (continued) | | | | | | | | |
Varonis Systems † | | | 45,458 | | | $ | 2,776,120 | |
Visa Class A | | | 39,280 | | | | 5,414,748 | |
Wix.com † | | | 11,505 | | | | 1,120,012 | |
Yelp † | | | 32,800 | | | | 1,404,496 | |
| | | | | | | | |
| | | | | | | 123,698,582 | |
| | | | | | | | |
Total Common Stock (cost $272,190,991) | | | | | | | 301,605,828 | |
| | | | | | | | |
| | |
| | Principal amount° | | | | |
Short-Term Investments – 2.67% | | | | | | | | |
Discount Note – 0.40%≠ | | | | | | | | |
Federal Home Loan Bank 2.00% 11/1/18 | | | 1,249,851 | | | | 1,249,851 | |
| | | | | | | | |
| | | | | | 1,249,851 | |
| | | | | | | | |
Repurchase Agreements – 2.27% | | | | | | | | |
Bank of America Merrill Lynch
2.12%, dated 10/31/18, to be repurchased on 11/1/18, repurchase price $961,481 (collateralized by US government obligations 0.00% 5/15/19 –8/15/31; market value $980,653) | | | 961,424 | | | | 961,424 | |
Bank of Montreal
2.10%, dated 10/31/18, to be repurchased on 11/1/18, repurchase price $2,644,071 (collateralized by US government obligations 0.00%–3.75% 11/1/18–2/15/47; market value $2,696,796) | | | 2,643,917 | | | | 2,643,917 | |
BNP Paribas
2.17%, dated 10/31/18, to be repurchased on 11/1/18, repurchase price $3,395,089 (collateralized by US government obligations 0.00%–8.00% 2/28/19–8/15/46; market value $3,462,783) | | | 3,394,885 | | | | 3,394,885 | |
| | | | | | | | |
| | | | | | 7,000,226 | |
| | | | | | | | |
Total Short-Term Investments (cost $8,250,077) | | | | | | | 8,250,077 | |
| | | | | | | | |
| | |
Total Value of Securities – 100.23%
(cost $280,441,068) | | | | | | $ | 309,855,905 | |
| | | | | | | | |
| # | Security exempt from registration under Rule 144A of the Securities Act of 1933, as amended. At Oct. 31, 2018, the aggregate value of Rule 144A securities was $1,305,384, which represents 0.42% of the Fund’s net assets. See Note 11 in “Notes to financial statements.” |
| ² | Narrow industries are utilized for compliance purposes for diversification whereas broad sectors are used for financial reporting. |
| ≠ | The rate shown is the effective yield at the time of purchase. |
| ° | Principal amount shown is stated in USD unless noted that the security is denominated in another currency. |
14
| † | Non-income producing security. |
| The | following foreign currency exchange contracts were outstanding at Oct. 31, 2018:1 |
Foreign Currency Exchange Contracts
| | | | | | | | | | | | |
Counterparty | | Contracts to Receive (Deliver) | | In Exchange For | | Settlement
Date | | | Unrealized
Depreciation | |
BNYM | | EUR 1,704,817 | | USD (1,935,168) | | | 11/1/18 | | | $ | (4,058 | ) |
The use of foreign currency exchange contracts involves elements of market risk and risks in excess of the amounts disclosed in the financial statements. The foreign currency exchange contracts presented above represent the Fund’s total exposure in such contracts, whereas only the net unrealized appreciation (depreciation) is reflected in the Fund’s net assets.
1See Note 8 in “Notes to financial statements.”
Summary of abbreviations:
ADR – American Depositary Receipt
BNYM – BNY Mellon
EUR – European Monetary Unit
GDR – Global Depositary Receipt
USD – US Dollar
See accompanying notes, which are an integral part of the financial statements.
15
| | | | |
| Statement of assets and liabilities | | | | |
| Delaware Select Growth Fund | | | October 31, 2018 | |
| | | | |
Assets: | | | | |
Investments, at value1 | | $ | 309,855,905 | |
Foreign currencies, at value2 | | | 506,050 | |
Cash | | | 1,237 | |
Receivable for securities sold | | | 1,791,186 | |
Foreign tax reclaims receivable | | | 159,731 | |
Dividends and interest receivable | | | 93,590 | |
Receivable for fund shares sold | | | 21,506 | |
| | | | |
Total assets | | | 312,429,205 | |
| | | | |
Liabilities: | | | | |
Payable for securities purchased | | | 2,305,712 | |
Payable for fund shares redeemed | | | 539,921 | |
Investment management fees payable to affiliates | | | 205,322 | |
Other accrued expenses | | | 147,526 | |
Distribution fees payable to affiliates | | | 66,546 | |
Unrealized depreciation on foreign currency exchange contracts | | | 4,058 | |
Dividend disbursing and transfer agent fees and expenses payable to affiliates | | | 2,653 | |
Accounting and administration expenses payable to affiliates | | | 1,353 | |
Trustees’ fees and expenses payable | | | 788 | |
Legal fees payable to affiliates | | | 498 | |
Reports and statements to shareholders expenses payable to affiliates | | | 245 | |
| | | | |
Total liabilities | | | 3,274,622 | |
| | | | |
Total Net Assets | | $ | 309,154,583 | |
| | | | |
| |
Net Assets Consist of: | | | | |
Paid-in capital | | $ | 207,479,783 | |
Total distributable earnings (loss) | | | 101,674,800 | |
| | | | |
Total Net Assets | | $ | 309,154,583 | |
| | | | |
16
| | | | |
Net Asset Value | | | | |
Class A: | | | | |
Net assets | | $ | 241,008,556 | |
Shares of beneficial interest outstanding, unlimited authorization, no par | | | 6,064,348 | |
Net asset value per share | | $ | 39.74 | |
Sales charge | | | 5.75 | % |
Offering price per share, equal to net asset value per share / (1 – sales charge) | | $ | 42.16 | |
| |
Class C: | | | | |
Net assets | | $ | 13,759,000 | |
Shares of beneficial interest outstanding, unlimited authorization, no par | | | 492,821 | |
Net asset value per share | | $ | 27.92 | |
| |
Class R: | | | | |
Net assets | | $ | 4,100,076 | |
Shares of beneficial interest outstanding, unlimited authorization, no par | | | 109,938 | |
Net asset value per share | | $ | 37.29 | |
| |
Institutional Class: | | | | |
Net assets | | $ | 50,286,951 | |
Shares of beneficial interest outstanding, unlimited authorization, no par | | | 1,160,322 | |
Net asset value per share | | $ | 43.34 | |
| |
| | | | |
1 Investments, at cost | | $ | 280,441,068 | |
2 Foreign currencies, at cost | | | 517,869 | |
See accompanying notes, which are an integral part of the financial statements.
17
| | | | |
| Statement of operations | | | | |
| Delaware Select Growth Fund | | | Year ended October 31, 2018 | |
| | | | |
Investment Income: | | | | |
Dividends | | $ | 2,973,131 | |
Interest | | | 64,633 | |
Foreign tax withheld | | | (36,379 | ) |
| | | | |
| | | 3,001,385 | |
| | | | |
Expenses: | | | | |
Management fees | | | 2,742,944 | |
Distribution expenses — Class A | | | 609,551 | |
Distribution expenses — Class C | | | 331,658 | |
Distribution expenses — Class R | | | 22,606 | |
Dividend disbursing and transfer agent fees and expenses | | | 505,523 | |
Accounting and administration expenses | | | 97,418 | |
Reports and statements to shareholders expenses | | | 69,316 | |
Registration fees | | | 65,779 | |
Audit and tax fees | | | 36,329 | |
Legal fees | | | 31,276 | |
Trustees’ fees and expenses | | | 17,272 | |
Custodian fees | | | 15,911 | |
Other | | | 25,189 | |
| | | | |
| | | 4,570,772 | |
Less expenses paid indirectly | | | (1,655 | ) |
| | | | |
Total operating expenses | | | 4,569,117 | |
| | | | |
Net Investment Loss | | | (1,567,732 | ) |
| | | | |
| |
Net Realized and Unrealized Gain (Loss): | | | | |
Net realized gain (loss) on: | | | | |
Investments | | | 77,905,806 | |
Foreign currencies | | | (4,524 | ) |
Foreign currency exchange contracts | | | (5,182 | ) |
| | | | |
Net realized gain | | | 77,896,100 | |
| | | | |
Net change in unrealized appreciation (depreciation) of: | | | | |
Investments | | | (47,700,050 | ) |
Foreign currencies | | | (9,279 | ) |
Foreign currency exchange contracts | | | (4,058 | ) |
| | | | |
Net change in unrealized appreciation (depreciation) | | | (47,713,387 | ) |
| | | | |
Net Realized and Unrealized Gain | | | 30,182,713 | |
| | | | |
Net Increase in Net Assets Resulting from Operations | | $ | 28,614,981 | |
| | | | |
See accompanying notes, which are an integral part of the financial statements.
18
This page intentionally left blank.
| | | | |
| Statements of changes in net assets | | | | |
| Delaware Select Growth Fund | | | | |
| | | | | | | | |
| | | Year ended | |
| | | 10/31/18 | | | 10/31/17 | |
Increase (Decrease) in Net Assets from Operations: | | | | | | | | |
Net investment loss | | $ | (1,567,732 | ) | | $ | (1,729,908 | ) |
Net realized gain | | | 77,896,100 | | | | 26,638,046 | |
Net change in unrealized appreciation (depreciation) | | | (47,713,387 | ) | | | 57,756,983 | |
| | | | | | | | |
Net increase in net assets resulting from operations | | | 28,614,981 | | | | 82,665,121 | |
| | | | | | | | |
| | |
Dividends and Distributions to Shareholders from: | | | | | | | | |
Distributable earnings*: | | | | | | | | |
Class A | | | (13,284,528 | ) | | | (33,563,358 | ) |
Class C | | | (3,396,155 | ) | | | (10,351,305 | ) |
Class R | | | (291,213 | ) | | | (1,391,001 | ) |
Institutional Class | | | (5,317,098 | ) | | | (20,784,384 | ) |
| | | | | | | | |
| | | (22,288,994 | ) | | | (66,090,048 | ) |
| | | | | | | | |
| | |
Capital Share Transactions: | | | | | | | | |
Proceeds from shares sold: | | | | | | | | |
Class A | | | 31,571,991 | | | | 10,376,973 | |
Class C | | | 478,378 | | | | 518,709 | |
Class R | | | 621,092 | | | | 1,299,257 | |
Institutional Class | | | 10,198,960 | | | | 25,672,077 | |
| | |
Net asset value of shares based upon reinvestment of dividends and distributions: | | | | | | | | |
Class A | | | 13,034,709 | | | | 32,864,589 | |
Class C | | | 3,354,158 | | | | 10,034,042 | |
Class R | | | 288,244 | | | | 1,390,989 | |
Institutional Class | | | 5,243,724 | | | | 20,470,366 | |
| | | | | | | | |
| | | 64,791,256 | | | | 102,627,002 | |
| | | | | | | | |
20
| | | | | | | | |
| | | Year ended | |
| | | 10/31/18 | | | 10/31/17 | |
Capital Share Transactions (continued): | | | | | | | | |
Cost of shares redeemed: | | | | | | | | |
Class A | | $ | (42,282,478 | ) | | $ | (70,786,700 | ) |
Class C | | | (35,721,542 | ) | | | (25,425,897 | ) |
Class R | | | (1,737,760 | ) | | | (9,284,945 | ) |
Institutional Class | | | (72,842,025 | ) | | | (118,440,922 | ) |
| | | | | | | | |
| | | (152,583,805 | ) | | | (223,938,464 | ) |
| | | | | | | | |
| | |
Decrease in net assets derived from capital share transactions | | | (87,792,549 | ) | | | (121,311,462 | ) |
| | | | | | | | |
Net Decrease in Net Assets | | | (81,466,562 | ) | | | (104,736,389 | ) |
Net Assets: | | | | | | | | |
Beginning of year | | $ | 390,621,145 | | | $ | 495,357,534 | |
| | | | | | | | |
End of year1 | | $ | 309,154,583 | | | $ | 390,621,145 | |
| | | | | | | | |
| 1 | Net Assets – There was no undistributed net investment income for the year ended 10/31/17. The Securities and Exchange Commission eliminated the requirement to disclose undistributed (distributions in excess of) net investment income in 2018. |
| * | For the year ended Oct. 31, 2018, the Fund has adopted amendments to Regulation S-X (see Note 13 in “Notes to financial statements”). For the year ended Oct. 31, 2017, the dividends and distributions to shareholders were as follows: |
| | | | | | | | |
| | | Class A | | Class C | | Class R | | Institutional
Class |
Distributions from net realized gains | | $(33,563,358) | | $(10,351,305) | | $(1,391,001) | | $(20,784,384) |
See accompanying notes, which are an integral part of the financial statements.
21
| | | | |
| Financial highlights | | | | |
| Delaware Select Growth Fund Class A | | | | |
Selected data for each share of the Fund outstanding throughout each period were as follows:
|
Net asset value, beginning of period |
|
Income (loss) from investment operations: |
Net investment income (loss)1 |
Net realized and unrealized gain (loss) |
|
Total from investment operations |
|
Less dividends and distributions from: |
Net investment income |
Net realized gain |
|
Total dividends and distributions |
|
Net asset value, end of period |
|
|
Total return2 |
|
Ratios and supplemental data: |
Net assets, end of period (000 omitted) |
Ratio of expenses to average net assets |
Ratio of expenses to average net assets prior to fees waived |
Ratio of net investment income (loss) to average net assets |
Ratio of net investment income (loss) to average net assets prior to fees waived |
Portfolio turnover |
| 1 | The average shares outstanding method has been applied for per share information. |
| 2 | Total investment return is based on the change in net asset value of a share during the period and assumes reinvestment of dividends and distributions at net asset value and does not reflect the impact of a sales charge. Total investment return during some of the periods shown reflects a waiver by the manager. Performance would have been lower had the waiver not been in effect. |
See accompanying notes, which are an integral part of the financial statements.
22
| | | | | | | | | | | | | | | | | | | | |
| | | Year ended | |
| | | 10/31/18 | | | 10/31/17 | | | 10/31/16 | | | 10/31/15 | | | 10/31/14 | |
| | $ | 39.46 | | | $ | 37.68 | | | $ | 47.82 | | | $ | 52.44 | | | $ | 49.60 | |
| | | | | | | | | | | | | | | | | | | | |
| | | | | |
| | | (0.17 | ) | | | (0.14 | ) | | | (0.11 | ) | | | 0.05 | | | | (0.06 | ) |
| | | 2.69 | | | | 7.13 | | | | (0.31 | ) | | | 1.20 | | | | 4.68 | |
| | | | | | | | | | | | | | | | | | | | |
| | | 2.52 | | | | 6.99 | | | | (0.42 | ) | | | 1.25 | | | | 4.62 | |
| | | | | | | | | | | | | | | | | | | | |
| | | | | | | | | | | | | | | | | | | | |
| | | | | |
| | | — | | | | — | | | | — | | | | (0.09 | ) | | | — | |
| | | (2.24 | ) | | | (5.21 | ) | | | (9.72 | ) | | | (5.78 | ) | | | (1.78 | ) |
| | | | | | | | | | | | | | | | | | | | |
| | | (2.24 | ) | | | (5.21 | ) | | | (9.72 | ) | | | (5.87 | ) | | | (1.78 | ) |
| | | | | | | | | | | | | | | | | | | | |
| | | | | |
| | $ | 39.74 | | | $ | 39.46 | | | $ | 37.68 | | | $ | 47.82 | | | $ | 52.44 | |
| | | | | | | | | | | | | | | | | | | | |
| | | | | |
| | | 6.84% | | | | 21.43% | | | | (1.63% | ) | | | 2.31% | | | | 9.53% | |
| | | | | |
| | | | | | | | | | | | | | | | | | | | |
| | $ | 241,009 | | | $ | 237,363 | | | $ | 253,027 | | | $ | 348,846 | | | $ | 402,000 | |
| | | 1.24% | | | | 1.25% | | | | 1.26% | | | | 1.25% | | | | 1.25% | |
| | | 1.24% | | | | 1.28% | | | | 1.28% | | | | 1.25% | | | | 1.25% | |
| | | (0.42% | ) | | | (0.39% | ) | | | (0.30% | ) | | | 0.09% | | | | (0.12% | ) |
| | | (0.42% | ) | | | (0.42% | ) | | | (0.32% | ) | | | 0.09% | | | | (0.12% | ) |
| | | | 51% | | | | 35% | | | | 33% | | | | 46% | | | | 41% | |
23
| | | | |
| Financial highlights | | | | |
| Delaware Select Growth Fund Class C | | | | |
Selected data for each share of the Fund outstanding throughout each period were as follows:
|
Net asset value, beginning of period |
|
Income (loss) from investment operations: |
Net investment loss1 |
Net realized and unrealized gain (loss) |
|
Total from investment operations |
|
Less dividends and distributions from: |
Net realized gain |
|
Total dividends and distributions |
|
|
Net asset value, end of period |
|
|
Total return2 |
|
Ratios and supplemental data: |
Net assets, end of period (000 omitted) |
Ratio of expenses to average net assets |
Ratio of expenses to average net assets prior to fees waived |
Ratio of net investment loss to average net assets |
Ratio of net investment loss to average net assets prior to fees waived |
Portfolio turnover |
| 1 | The average shares outstanding method has been applied for per share information. |
| 2 | Total investment return is based on the change in net asset value of a share during the period and assumes reinvestment of dividends and distributions at net asset value and does not reflect the impact of a sales charge. Total investment return during some of the periods shown reflects a waiver by the manager. Performance would have been lower had the waiver not been in effect. |
See accompanying notes, which are an integral part of the financial statements.
24
| | | | | | | | | | | | | | | | | | | | |
| | | Year ended | |
| | | 10/31/18 | | | 10/31/17 | | | 10/31/16 | | | 10/31/15 | | | 10/31/14 | |
| | $ | 28.60 | | | $ | 28.91 | | | $ | 39.13 | | | $ | 44.16 | | | $ | 42.34 | |
| | | | | |
| | | (0.33 | ) | | | (0.30 | ) | | | (0.31 | ) | | | (0.27 | ) | | | (0.37 | ) |
| | | 1.89 | | | | 5.20 | | | | (0.19 | ) | | | 1.02 | | | | 3.97 | |
| | | | | | | | | | | | | | | | | | | | |
| | | 1.56 | | | | 4.90 | | | | (0.50 | ) | | | 0.75 | | | | 3.60 | |
| | | | | | | | | | | | | | | | | | | | |
| | | | | |
| | | | | | | | | | | | | | | | | | | | |
| | | (2.24 | ) | | | (5.21 | ) | | | (9.72 | ) | | | (5.78 | ) | | | (1.78 | ) |
| | | | | | | | | | | | | | | | | | | | |
| | | (2.24 | ) | | | (5.21 | ) | | | (9.72 | ) | | | (5.78 | ) | | | (1.78 | ) |
| | | | | | | | | | | | | | | | | | | | |
| | | | | |
| | $ | 27.92 | | | $ | 28.60 | | | $ | 28.91 | | | $ | 39.13 | | | $ | 44.16 | |
| | | | | | | | | | | | | | | | | | | | |
| | | | | |
| | | 6.02% | | | | 20.57% | | | | (2.36% | ) | | | 1.52% | | | | 8.71% | |
| | | | | |
| | | | | | | | | | | | | | | | | | | | |
| | $ | 13,759 | | | $ | 44,775 | | | $ | 60,815 | | | $ | 87,833 | | | $ | 101,991 | |
| | | 1.99% | | | | 2.00% | | | | 2.01% | | | | 2.00% | | | | 2.00% | |
| | | 1.99% | | | | 2.03% | | | | 2.03% | | | | 2.00% | | | | 2.00% | |
| | | (1.17% | ) | | | (1.14% | ) | | | (1.05% | ) | | | (0.66% | ) | | | (0.87% | ) |
| | | (1.17% | ) | | | (1.17% | ) | | | (1.07% | ) | | | (0.66% | ) | | | (0.87% | ) |
| | | | 51% | | | | 35% | | | | 33% | | | | 46% | | | | 41% | |
25
| | | | |
| Financial highlights | | | | |
| Delaware Select Growth Fund Class R | | | | |
Selected data for each share of the Fund outstanding throughout each period were as follows:
|
Net asset value, beginning of period |
|
Income (loss) from investment operations: |
Net investment loss1 |
Net realized and unrealized gain (loss) |
|
Total from investment operations |
|
Less dividends and distributions from: |
Net realized gain |
|
Total dividends and distributions |
|
|
Net asset value, end of period |
|
|
Total return2 |
|
Ratios and supplemental data: |
Net assets, end of period (000 omitted) |
Ratio of expenses to average net assets |
Ratio of expenses to average net assets prior to fees waived |
Ratio of net investment loss to average net assets |
Ratio of net investment loss to average net assets prior to fees waived |
Portfolio turnover |
| 1 | The average shares outstanding method has been applied for per share information. |
| 2 | Total investment return is based on the change in net asset value of a share during the period and assumes reinvestment of dividends and distributions at net asset value. Total investment return during some of the periods shown reflects a waiver by the manager. Performance would have been lower had the waiver not been in effect. |
See accompanying notes, which are an integral part of the financial statements.
26
| | | | | | | | | | | | | | | | | | | | |
| | | Year ended | |
| | | 10/31/18 | | | 10/31/17 | | | 10/31/16 | | | 10/31/15 | | | 10/31/14 | |
| | $ | 37.26 | | | $ | 35.94 | | | $ | 46.15 | | | $ | 50.83 | | | $ | 48.25 | |
| | | | | |
| | | | | | | | | | | | | | | | | | | | |
| | | (0.25 | ) | | | (0.22 | ) | | | (0.20 | ) | | | (0.08 | ) | | | (0.18 | ) |
| | | 2.52 | | | | 6.75 | | | | (0.29 | ) | | | 1.18 | | | | 4.54 | |
| | | | | | | | | | | | | | | | | | | | |
| | | 2.27 | | | | 6.53 | | | | (0.49 | ) | | | 1.10 | | | | 4.36 | |
| | | | | | | | | | | | | | | | | | | | |
| | | | | |
| | | | | | | | | | | | | | | | | | | | |
| | | (2.24 | ) | | | (5.21 | ) | | | (9.72 | ) | | | (5.78 | ) | | | (1.78 | ) |
| | | | | | | | | | | | | | | | | | | | |
| | | (2.24 | ) | | | (5.21 | ) | | | (9.72 | ) | | | (5.78 | ) | | | (1.78 | ) |
| | | | | | | | | | | | | | | | | | | | |
| | | | | |
| | $ | 37.29 | | | $ | 37.26 | | | $ | 35.94 | | | $ | 46.15 | | | $ | 50.83 | |
| | | | | | | | | | | | | | | | | | | | |
| | | | | |
| | | 6.55% | | | | 21.16% | | | | (1.87% | ) | | | 2.02% | | | | 9.26% | |
| | | | | |
| | | | | | | | | | | | | | | | | | | | |
| | $ | 4,100 | | | $ | 4,913 | | | $ | 11,487 | | | $ | 18,766 | | | $ | 20,022 | |
| | | 1.49% | | | | 1.50% | | | | 1.51% | | | | 1.50% | | | | 1.50% | |
| | | 1.49% | | | | 1.53% | | | | 1.53% | | | | 1.50% | | | | 1.50% | |
| | | (0.67% | ) | | | (0.64% | ) | | | (0.55% | ) | | | (0.16% | ) | | | (0.37% | ) |
| | | (0.67% | ) | | | (0.67% | ) | | | (0.57% | ) | | | (0.16% | ) | | | (0.37% | ) |
| | | | 51% | | | | 35% | | | | 33% | | | | 46% | | | | 41% | |
27
| | | | |
| Financial highlights | | | | |
| Delaware Select Growth Fund Institutional Class | | | | |
Selected data for each share of the Fund outstanding throughout each period were as follows:
|
Net asset value, beginning of period |
|
Income (loss) from investment operations: |
Net investment income (loss)1 |
Net realized and unrealized gain (loss) |
|
Total from investment operations |
|
Less dividends and distributions from: |
Net investment income |
Net realized gain |
|
Total dividends and distributions |
|
|
Net asset value, end of period |
|
|
Total return2 |
|
Ratios and supplemental data: |
Net assets, end of period (000 omitted) |
Ratio of expenses to average net assets |
Ratio of expenses to average net assets prior to fees waived |
Ratio of net investment income (loss) to average net assets |
Ratio of net investment income (loss) to average net assets prior to fees waived |
Portfolio turnover |
| 1 | The average shares outstanding method has been applied for per share information. |
| 2 | Total investment return is based on the change in net asset value of a share during the period and assumes reinvestment of dividends and distributions at net asset value. Total investment return during some of the periods shown reflects a waiver by the manager. Performance would have been lower had the waiver not been in effect. |
See accompanying notes, which are an integral part of the financial statements.
28
| | | | | | | | | | | | | | | | | | | | |
| | | Year ended | |
| | | 10/31/18 | | | 10/31/17 | | | 10/31/16 | | | 10/31/15 | | | 10/31/14 | |
| | $ | 42.73 | | | $ | 40.27 | | | $ | 50.35 | | | $ | 54.92 | | | $ | 51.73 | |
| | | | | |
| | | | | | | | | | | | | | | | | | | | |
| | | (0.07 | ) | | | (0.05 | ) | | | (0.02 | ) | | | 0.18 | | | | 0.07 | |
| | | 2.92 | | | | 7.72 | | | | (0.34 | ) | | | 1.25 | | | | 4.90 | |
| | | | | | | | | | | | | | | | | | | | |
| | | 2.85 | | | | 7.67 | | | | (0.36 | ) | | | 1.43 | | | | 4.97 | |
| | | | | | | | | | | | | | | | | | | | |
| | | | | |
| | | | | | | | | | | | | | | | | | | | |
| | | — | | | | — | | | | — | | | | (0.22 | ) | | | — | |
| | | (2.24 | ) | | | (5.21 | ) | | | (9.72 | ) | | | (5.78 | ) | | | (1.78 | ) |
| | | | | | | | | | | | | | | | | | | | |
| | | (2.24 | ) | | | (5.21 | ) | | | (9.72 | ) | | | (6.00 | ) | | | (1.78 | ) |
| | | | | | | | | | | | | | | | | | | | |
| | | | | |
| | $ | 43.34 | | | $ | 42.73 | | | $ | 40.27 | | | $ | 50.35 | | | $ | 54.92 | |
| | | | | | | | | | | | | | | | | | | | |
| | | | | |
| | | 7.10% | | | | 21.76% | | | | (1.37% | ) | | | 2.54% | | | | 9.80% | |
| | | | | |
| | | | | | | | | | | | | | | | | | | | |
| | $ | 50,287 | | | $ | 103,570 | | | $ | 170,029 | | | $ | 422,581 | | | $ | 496,967 | |
| | | 0.99% | | | | 1.00% | | | | 1.01% | | | | 1.00% | | | | 1.00% | |
| | | 0.99% | | | | 1.03% | | | | 1.03% | | | | 1.00% | | | | 1.00% | |
| | | (0.17% | ) | | | (0.14% | ) | | | (0.05% | ) | | | 0.34% | | | | 0.13% | |
| | | (0.17% | ) | | | (0.17% | ) | | | (0.07% | ) | | | 0.34% | | | | 0.13% | |
| | | | 51% | | | | 35% | | | | 33% | | | | 46% | | | | 41% | |
29
| | | | |
| Notes to financial statements | | | | |
| Delaware Select Growth Fund | | | October 31, 2018 | |
Voyageur Mutual Funds III (Trust) is organized as a Delaware statutory trust and offers one series: Delaware Select Growth Fund (Fund). The Fund is an open-end investment company. The Fund is considered diversified under the Investment Company Act of 1940, as amended (1940 Act), and offers Class A, Class C, Class R, and Institutional Class shares. Class A shares are sold with a maximum front-end sales charge of 5.75%. Class A share purchases of $1,000,000 or more will incur a contingent deferred sales charge (CDSC) instead of a front-end sales charge of 1.00% if redeemed during the first year, and 0.50% during the second year, provided that Delaware Distributors, L.P. (DDLP) paid a financial advisor a commission on the purchase of those shares. Class C shares are sold with a CDSC of 1.00%, which will be incurred if redeemed during the first 12 months. Class R and Institutional Class shares are not subject to a sales charge and are offered for sale exclusively to certain eligible investors.
The investment objective of the Fund is to seek long-term capital appreciation.
1. Significant Accounting Policies
The Fund is an investment company and follows accounting and reporting guidance under Financial Accounting Standards Board (FASB) Accounting Standards Codification Topic 946, Financial Services –Investment Companies. The following accounting policies are in accordance with US generally accepted accounting principles (US GAAP) and are consistently followed by the Fund.
Security Valuation – Equity securities, except those traded on the Nasdaq Stock Market LLC (Nasdaq), are valued at the last quoted sales price as of the time of the regular close of the New York Stock Exchange on the valuation date. Equity securities traded on the Nasdaq are valued in accordance with the Nasdaq Official Closing Price, which may not be the last sales price. If, on a particular day, an equity security does not trade, the mean between the bid and ask prices will be used, which approximates fair value. Equity securities listed on a foreign exchange are normally valued at the last quoted sales price on the valuation date. US government and agency securities are valued at the mean between the bid and ask prices, which approximates fair value. Foreign currency exchange contracts and foreign cross currency exchange contracts are valued at the mean between the bid and ask prices, which approximates fair value. Interpolated values are derived when the settlement date of the contract is an interim date for which quotations are not available. Generally, other securities and assets for which market quotations are not readily available are valued at fair value as determined in good faith under the direction of the Trust’s Board of Trustees (Board). In determining whether market quotations are readily available or fair valuation will be used, various factors will be taken into consideration, such as market closures or suspension of trading in a security. The Fund may use fair value pricing more frequently for securities traded primarily in non-US markets because, among other things, most foreign markets close well before the Fund values its securities, generally as of 4:00pm Eastern time. The earlier close of these foreign markets gives rise to the possibility that significant events, including broad market moves, government actions or pronouncements, aftermarket trading, or news events may have occurred in the interim. Whenever such a significant event occurs, the Fund may value foreign securities using fair value prices based on third-party vendor modeling tools (international fair value pricing). Restricted securities are valued at fair value using methods approved by the Board.
Federal and Foreign Income Taxes – No provision for federal income taxes has been made as the Fund intends to continue to qualify for federal income tax purposes as a regulated investment company under Subchapter M of the Internal Revenue Code of 1986, as amended, and make the
30
requisite distributions to shareholders. The Fund evaluates tax positions taken or expected to be taken in the course of preparing the Fund’s tax returns to determine whether the tax positions are “more-likely-than-not” of being sustained by the applicable tax authority. Tax positions not deemed to meet the “more-likely-than-not” threshold are recorded as a tax benefit or expense in the current year. Management has analyzed the Fund’s tax positions taken or expected to be taken on the Fund’s federal income tax returns through the year ended Oct. 31, 2018 and for all open tax years (years ended Oct. 31, 2015–Oct. 31, 2017), and has concluded that no provision for federal income tax is required in the Fund’s financial statements. If applicable, the Fund recognizes interest accrued on unrecognized tax benefits in interest expense and penalties in other expenses on the “Statement of operations.” During the year ended Oct. 31, 2018, the Fund did not incur any interest or tax penalties. In regard to foreign taxes only, the Fund has open tax years in certain foreign countries in which it invests in that may date back to the inception of the Fund.
Class Accounting – Investment income, common expenses, and realized and unrealized gain (loss) on investments are allocated to the various classes of the Fund on the basis of daily net assets of each class. Distribution expenses relating to a specific class are charged directly to that class.
Repurchase Agreements – The Fund may purchase certain US government securities subject to the counterparty’s agreement to repurchase them at an agreed upon date and price. The counterparty will be required on a daily basis to maintain the value of the collateral subject to the agreement at not less than the repurchase price (including accrued interest). The agreements are conditioned upon the collateral being deposited under the Federal Reserve book-entry system with the Fund’s custodian or a third-party sub-custodian. In the event of default or bankruptcy by the other party to the agreement, retention of the collateral may be subject to legal proceedings. All open repurchase agreements as of the date of this report were entered into on Oct. 31, 2018, and matured on the next business day.
Foreign Currency Transactions – Transactions denominated in foreign currencies are recorded at the prevailing exchange rates on the valuation date in accordance with the Fund’s prospectus. The value of all assets and liabilities denominated in foreign currencies is translated daily into US dollars at the exchange rate of such currencies against the US dollar. Transaction gains or losses resulting from changes in exchange rates during the reporting period or upon settlement of the foreign currency transaction are reported in operations for the current period. The Fund generally does not bifurcate that portion of realized gains and losses on investments which is due to changes in foreign exchange rates from that which is due to changes in market prices. These gains and losses are included on the “Statement of operations” under “Net realized gain (loss) on investments.” The Fund reports certain foreign currency related transactions as components of realized gains (losses) for financial reporting purposes, whereas such components are treated as ordinary income (loss) for federal income tax purposes.
Use of Estimates – The preparation of financial statements in conformity with US GAAP requires management to make estimates and assumptions that affect the fair value of investments, the reported amounts of assets and liabilities and disclosure of contingent assets and liabilities at the date of the financial statements, and the reported amounts of revenues and expenses during the reporting period. Actual results could differ from those estimates and the differences could be material.
31
Notes to financial statements
Delaware Select Growth Fund
1. Significant Accounting Policies (continued)
Other – Expenses directly attributable to the Fund are charged directly to the Fund. Other expenses common to various funds within the Delaware Funds® by Macquarie (Delaware Funds) are generally allocated among such funds on the basis of average net assets. Management fees and certain other expenses are paid monthly. Security transactions are recorded on the date the securities are purchased or sold (trade date) for financial reporting purposes. Costs used in calculating realized gains and losses on the sale of investment securities are those of the specific securities sold. Dividend income is recorded on the ex-dividend date and interest income is recorded on the accrual basis. Discounts and premiums on debt securities are accreted or amortized to interest income, respectively, over the lives of the respective securities using the effective interest method. Taxable non-cash dividends are recorded as dividend income. Distributions received from investments in real estate investment trusts (REITs) are recorded as dividend income on the ex-dividend date, subject to reclassification upon notice of the character of such distributions by the issuer. Foreign dividends are also recorded on the ex-dividend date or as soon after the ex-dividend date that the Fund is aware of such dividends, net of all tax withholdings, a portion of which may be reclaimable. Withholding taxes and reclaims on foreign dividends have been recorded in accordance with the Fund’s understanding of the applicable country’s tax rules and rates. The Fund declares and pays dividends from net investment income and distributions from net realized gain on investments, if any, annually. The Fund may distribute more frequently, if necessary for tax purposes. Dividends and distributions, if any, are recorded on the ex-dividend date.
The Fund receives earnings credits from its custodian when positive cash balances are maintained, which may be used to offset custody fees. The expense paid under this arrangement is on the “Statement of operations” under “Custodian fees” with the corresponding expense offset included under “Less expenses paid indirectly.” For the year ended Oct. 31, 2018, the Fund earned $495 under this arrangement.
The Fund receives earnings credits from its transfer agent when positive cash balances are maintained, which may be used to offset transfer agent fees. If the amount earned is greater than $1, the expense paid under this arrangement is included on the “Statement of operations” under “Dividend disbursing and transfer agent fees and expenses” with the corresponding expense offset included under “Less expenses paid indirectly.” For the year ended Oct. 31, 2018, the Fund earned $1,160 under this arrangement.
2. Investment Management, Administration Agreements, and Other Transactions with Affiliates
In accordance with the terms of its investment management agreement, the Fund pays Delaware Management Company (DMC), a series of Macquarie Investment Management Business Trust and the investment manager, an annual fee which is calculated daily and paid monthly at the rate of 0.75% on the first $500 million of average daily net assets of the Fund, 0.70% on the next $500 million, 0.65% on the next $1.5 billion, and 0.60% on average daily net assets in excess of $2.5 billion.
DMC has contractually agreed to waive that portion if any, of its management fee and/or pay/reimburse the Fund to the extent necessary to ensure that total annual fund operating expenses (excluding any distribution and service (12b-1) fees, acquired funds fees and expenses, taxes, interest, short sale dividend and interest expenses, brokerage fees, certain insurance costs, and nonroutine expenses or
32
costs, including, but not limited to those relating to reorganizations, litigation, conducting shareholder meetings, and liquidations) do not exceed 1.00% of the Fund’s average daily net assets from Nov. 1, 2017 through Oct. 31, 2018.* For purposes of these waivers and reimbursements, nonroutine expenses may also include such additional costs and expenses as may be agreed upon from time to time by the Board and DMC. These expense waivers and reimbursements apply to expenses paid directly to the Fund and may only be terminated by agreement of DMC and the Fund. The waivers and reimbursements are accrued daily and received monthly.
Jackson Square Partners, LLC (JSP), a related party of DMC, furnishes investment sub-advisory services to the Fund. For these services, DMC, not the Fund, pays JSP fees based on the aggregate average daily net assets of the Fund at the following annual rate: 0.450% of the first $500 million; 0.420% of the next $500 million; 0.390% of the next $1.5 billion; and 0.360% of aggregate average daily net assets in excess of $2.5 billion.
Delaware Investments Fund Services Company (DIFSC), an affiliate of DMC, provides fund accounting and financial administration oversight services to the Fund. For these services, DIFSC’s fees are calculated daily and paid monthly based on the aggregate daily net assets of all funds within the Delaware Funds at the following annual rate: 0.00475% of the first $35 billion; 0.0040% of the next $10 billion; and 0.0025% of aggregate average daily net assets in excess of $45 billion (Total Fee). Each Fund in the Delaware Funds pays a minimum of $4,000, which, in aggregate, is subtracted from the Total Fee. Each fund then pays its portion of the remainder of the Total Fee on a relative net asset value (NAV) basis. For the year ended Oct. 31, 2018, the Fund was charged $17,799 for these services. This amount is included on the “Statement of operations” under “Accounting and administration expenses.”
DIFSC is also the transfer agent and dividend disbursing agent of the Fund. For these services, DIFSC’s fees were calculated daily and paid monthly based on the aggregate daily net assets of the retail funds within the Delaware Funds from Nov. 1, 2017 through June 30, 2018 at the following annual rate: 0.025% of the first $20 billion; 0.020% of the next $5 billion; 0.015% of the next $5 billion; and 0.013% of average daily net assets in excess of $30 billion. Effective July 1, 2018, the Fund as well as the other Delaware Funds entered into an amendment to the DIFSC agreement. Under the amendment to the DIFSC agreement, DIFSC’s fees are calculated daily and paid monthly based on the aggregate daily net assets of the retail funds within the Delaware Funds at the following annual rate: 0.014% of the first $20 billion; 0.011% of the next $5 billion; 0.007% of the next $5 billion; 0.005% of the next $20 billion; and 0.0025% of average daily net assets in excess of $50 billion. The fees payable to DIFSC under the transfer agent agreement described above are allocated among all retail funds in the Delaware Funds on a relative NAV basis. This amount is included on the “Statement of operations” under “Dividend disbursing and transfer agent fees and expenses.” For the year ended Oct. 31, 2018, the Fund was charged $60,302 for these services. Pursuant to a sub-transfer agency agreement between DIFSC and BNY Mellon Investment Servicing (US) Inc. (BNYMIS), BNYMIS provides certain sub-transfer agency services to the Fund. Sub-transfer agency fees are paid by the Fund and are also included on the “Statement of operations” under “Dividend disbursing and transfer agent fees and expenses.”
Pursuant to a distribution agreement and distribution plan, the Fund pays DDLP, the distributor and an affiliate of DMC, an annual 12b-1 fee of 0.25% of the average daily net assets of the Class A shares,
33
Notes to financial statements
Delaware Select Growth Fund
2. Investment Management, Administration Agreements, and Other Transactions with Affiliates (continued)
1.00% of the average daily net assets of the Class C shares, and 0.50% of the average daily net assets of the Class R shares. These fees are calculated daily and paid monthly. Institutional Class shares pay no 12b-1 fees.
As provided in the investment management agreement, the Fund bears a portion of the cost of certain resources shared with DMC, including the cost of internal personnel of DMC and/or its affiliates that provide legal, tax, and regulatory reporting services to the Fund. For the year ended Oct. 31, 2018, the Fund was charged $10,201 for internal legal, tax, and regulatory reporting services provided by DMC and/or its affiliates’ employees. This amount is included on the “Statement of operations” under “Legal fees.”
For the year ended Oct. 31, 2018, DDLP earned $6,351 for commissions on sales of the Fund’s Class A shares. For the year ended Oct. 31, 2018, DDLP received gross CDSC commissions of $21 and $695 on redemptions of the Fund’s Class A and Class C shares, respectively, and these commissions were entirely used to offset upfront commissions previously paid by DDLP to broker/dealers on sales of those shares.
Trustees’ fees include expenses accrued by the Fund for each Trustee’s retainer and meeting fees. Certain officers of DMC, DIFSC, and DDLP are officers and/or Trustees of the Trust. These officers and Trustees are paid no compensation by the Fund.
*The aggregate contractual waiver period covering this report is from Feb. 28, 2017 through Feb. 28, 2019.
3. Investments
For the year ended Oct. 31, 2018, the Fund made purchases and sales of investment securities other than short-term investments as follows:
| | | | |
Purchases | | $ | 182,186,011 | |
Sales | | | 296,900,393 | |
The tax cost of investments includes adjustments to net unrealized appreciation (depreciation) which may not necessarily be final tax cost basis adjustments, but approximate the tax basis unrealized gains and losses that may be realized and distributed to shareholders. At Oct. 31, 2018, the cost and unrealized appreciation (depreciation) of investments and derivatives for federal income tax purposes for the Fund were as follows:
| | | | |
Cost of investments and derivatives | | $ | 281,223,470 | |
| | | | |
Aggregate unrealized appreciation of investments and derivatives | | $ | 55,264,705 | |
Aggregate unrealized depreciation of investments and derivatives | | | (26,632,270 | ) |
| | | | |
Net unrealized appreciation of investments and derivatives | | $ | 28,632,435 | |
| | | | |
US GAAP defines fair value as the price that the Fund would receive to sell an asset or pay to transfer a liability in an orderly transaction between market participants at the measurement date under current market conditions. A three-level hierarchy for fair value measurements has been established based upon
34
the transparency of inputs to the valuation of an asset or liability. Inputs may be observable or unobservable and refer broadly to the assumptions that market participants would use in pricing the asset or liability. Observable inputs reflect the assumptions market participants would use in pricing the asset or liability based on market data obtained from sources independent of the reporting entity. Unobservable inputs reflect the reporting entity’s own assumptions about the assumptions that market participants would use in pricing the asset or liability based on the best information available under the circumstances. The Fund’s investment in its entirety is assigned a level based upon the observability of the inputs which are significant to the overall valuation. The three-level hierarchy of inputs is summarized below.
| | | | |
| Level 1 | | – | | Inputs are quoted prices in active markets for identical investments. (Examples: equity securities, open-end investment companies, futures contracts, exchange-traded options contracts) |
| | |
| Level 2 | | – | | Other observable inputs, including, but not limited to: quoted prices for similar assets or liabilities in markets that are active, quoted prices for identical or similar assets or liabilities in markets that are not active, inputs other than quoted prices that are observable for the assets or liabilities (such as interest rates, yield curves, volatilities, prepayment speeds, loss severities, credit risks, and default rates) or other market-corroborated inputs. (Examples: debt securities, government securities, swap contracts, foreign currency exchange contracts, foreign securities utilizing international fair value pricing, broker-quoted securities, fair valued securities) |
| | |
| Level 3 | | – | | Significant unobservable inputs, including the Fund’s own assumptions used to determine the fair value of investments. (Examples: broker-quoted securities, fair valued securities) |
Level 3 investments are valued using significant unobservable inputs. The Fund may also use an income-based valuation approach in which the anticipated future cash flows of the investment are discounted to calculate fair value. Discounts may also be applied due to the nature or duration of any restrictions on the disposition of the investments. Valuations may also be based upon current market prices of securities that are comparable in coupon, rating, maturity, and industry. The derived value of a Level 3 investment may not represent the value which is received upon disposition and this could impact the results of operations.
35
Notes to financial statements
Delaware Select Growth Fund
3. Investments (continued)
The following table summarizes the valuation of the Fund’s investments by fair value hierarchy levels as of Oct. 31, 2018:
| | | | | | | | | | | | | | | |
Securities | | Level 1 | | Level 2 | | Total |
Assets: | | | | | | |
Common Stock | | | | | | | | | | | | | | | |
Consumer Discretionary | | | $ | 64,683,464 | | | | $ | 464,093 | | | | $ | 65,147,557 | |
Energy | | | | 4,560,875 | | | | | — | | | | | 4,560,875 | |
Financials | | | | 30,582,278 | | | | | — | | | | | 30,582,278 | |
Healthcare | | | | 42,491,261 | | | | | — | | | | | 42,491,261 | |
Industrials | | | | 22,664,883 | | | | | 2,760,155 | | | | | 25,425,038 | |
Real Estate | | | | 9,700,237 | | | | | — | | | | | 9,700,237 | |
Technology | | | | 119,410,077 | | | | | 4,288,505 | | | | | 123,698,582 | |
Short-Term Investments | | | | — | | | | | 8,250,077 | | | | | 8,250,077 | |
| | | | | | | | | | | | | | | |
Total Value of Securities | | | $ | 294,093,075 | | | | $ | 15,762,830 | | | | $ | 309,855,905 | |
| | | | | | | | | | | | | | | |
Derivatives:* | | | | | | | | | | | | | | | |
Liabilities: | | | | | | | | | | | | | | | |
Foreign Currency Exchange Contracts | | | $ | — | | | | $ | (4,058 | ) | | | $ | (4,058 | ) |
*Foreign currency exchange contracts are valued at the unrealized appreciation (depreciation) of the instrument at the year end.
During the year ended Oct. 31, 2018, there were no transfers between Level 1 investments, Level 2 investments, or Level 3 investments that had a significant impact to the Fund. This does not include transfers between Level 1 investments and Level 2 investments due to the Fund utilizing international fair value pricing during the period. In accordance with the fair valuation procedures described in Note 1, international fair value pricing of securities in the Fund occurs when market volatility exceeds an established rolling threshold. If the threshold is exceeded on a given date, then prices of international securities (those that traded on exchanges that close at a different time than the time that the Fund’s NAV is determined) are established using a separate pricing feed from a third party vendor designed to establish a price for each such security as of the time that the Fund’s NAV is determined. Further, international fair value pricing uses other observable market-based inputs in place of the closing exchange price due to the events occurring after the close of the exchange or market on which the investment is principally traded, causing a change in classification between levels. The Fund’s policy is to recognize transfers between levels based on fair value at the beginning of the reporting period.
A reconciliation of Level 3 investments is presented when the Fund has a significant amount of Level 3 investments at the beginning, interim, or end of the period in relation to net assets. During the year ended Oct. 31, 2018, there were no Level 3 investments.
36
4. Dividend and Distribution Information
Income and long-term capital gain distributions are determined in accordance with federal income tax regulations, which may differ from US GAAP. Additionally, distributions from net gains on foreign currency transactions and net short-term gains on sales of investment securities are treated as ordinary income for federal income tax purposes. The tax character of dividends and distributions paid during the years ended Oct. 31, 2018 and 2017 were as follows:
| | | | | | | | |
| | | Year ended | |
| | | 10/31/18 | | | 10/31/17 | |
Ordinary income | | $ | 3,158,529 | | | $ | — | |
Long-term capital gain | | | 19,130,465 | | | | 66,090,048 | |
| | | | | | | | |
Total | | $ | 22,288,994 | | | $ | 66,090,048 | |
| | | | | | | | |
5. Components of Net Assets on a Tax Basis
As of Oct. 31, 2018, the components of net assets on a tax basis were as follow:
| | | | |
Shares of beneficial interest | | $ | 207,479,783 | |
Undistributed ordinary income | | | 8,993,397 | |
Undistributed long-term capital gain | | | 64,048,968 | |
Unrealized appreciation of investments and foreign currencies | | | 28,632,435 | |
| | | | |
Net assets | | $ | 309,154,583 | |
| | | | |
The difference between book basis and tax basis components of net assets is primarily attributable to tax deferral of losses on wash sales and mark-to-market of foreign currency exchange contracts.
37
Notes to financial statements
Delaware Select Growth Fund
6. Capital Shares
Transactions in capital shares were as follows:
| | | | | | | | |
| | | Year ended | |
| | | 10/31/18 | | | 10/31/17 | |
Shares sold: | | | | | | | | |
Class A | | | 752,887 | | | | 291,445 | |
Class C | | | 16,716 | | | | 19,923 | |
Class R | | | 16,324 | | | | 39,179 | |
Institutional Class | | | 234,379 | | | | 674,077 | |
| | |
Shares issued upon reinvestment of dividends and distributions: | | | | | | | | |
Class A | | | 354,414 | | | | 1,006,311 | |
Class C | | | 128,956 | | | | 421,244 | |
Class R | | | 8,333 | | | | 45,016 | |
Institutional Class | | | 131,060 | | | | 580,226 | |
| | | | | | | | |
| | | 1,643,069 | | | | 3,077,421 | |
| | | | | | | | |
Shares redeemed: | | | | | | | | |
Class A | | | (1,057,971 | ) | | | (1,998,457 | ) |
Class C | | | (1,218,654 | ) | | | (978,840 | ) |
Class R | | | (46,589 | ) | | | (271,932 | ) |
Institutional Class | | | (1,629,156 | ) | | | (3,051,974 | ) |
| | | | | | | | |
| | | (3,952,370 | ) | | | (6,301,203 | ) |
| | | | | | | | |
Net decrease | | | (2,309,301 | ) | | | (3,223,782 | ) |
| | | | | | | | |
Certain shareholders may exchange shares of one class for shares of another class in the same Fund. These exchange transactions are included as subscriptions and redemptions in the table above and on the “Statements of changes in net assets.” For the years ended Oct. 31, 2018 and 2017, the Fund had the following exchange transactions:
| | | | | | | | | | | | | | | | | | | | |
| | | Exchange Redemptions | | | Exchange Subscriptions | | | | |
| Year ended | | Class A
Shares | | | Class C
Shares | | | Class A
Shares | | | Institutional
Class
Shares | | | Value | |
10/31/18 | | | 5,022 | | | | 261,889 | | | | 181,915 | | | | 6,950 | | | $ | 7,977,617 | |
10/31/17 | | | 104,977 | | | | 5,012 | | | | 1,904 | | | | 98,748 | | | | 3,753,347 | |
7. Line of Credit
The Fund, along with certain other funds in the Delaware Funds (Participants), was a participant in a $155,000,000 revolving line of credit intended to be used for temporary or emergency purposes as an additional source of liquidity to fund redemptions of investor shares. Under the agreement, the Participants were charged an annual commitment fee of 0.15%, which was allocated across the Participants based on a weighted average of the respective net assets of each Participant. The Participants were permitted to borrow up to a maximum of one-third of their net assets under the
38
agreement. Each Participant was individually, and not jointly, liable for its particular advances, if any, under the line of credit. The line of credit available under the agreement expired on Nov. 6, 2017.
On Nov. 6, 2017, the Fund, along with the other Participants, entered into an amendment to the agreement for a $155,000,000 revolving line of credit. The revolving line of credit available was reduced from $155,000,000 to $130,000,000 on Sept. 6, 2018. The revolving line of credit was to be used as described above and operated in substantially the same manner as the original agreement. The line of credit available under the agreement expired on Nov. 5, 2018.
The Fund had no amounts outstanding as of Oct. 31, 2018, or at any time during the year then ended.
8. Derivatives
US GAAP requires disclosures that enable investors to understand: (1) how and why an entity uses derivatives; (2) how they are accounted for; and (3) how they affect an entity’s results of operations and financial position.
Foreign Currency Exchange Contracts – The Fund may enter into foreign currency exchange contracts and foreign cross currency exchange contracts as a way of managing foreign exchange rate risk. The Fund may enter into these contracts to fix the US dollar value of a security that it has agreed to buy or sell for the period between the date the trade was entered into and the date the security is delivered and paid for. The Fund may also use these contracts to hedge the US dollar value of securities it already owns that are denominated in foreign currencies. In addition, the Fund may enter into these contracts to facilitate or expedite the settlement of portfolio transactions. The change in value is recorded as an unrealized gain or loss. When the contract is closed, a realized gain or loss is recorded equal to the difference between the value of the contract at the time it was opened and the value at the time it was closed.
The use of foreign currency exchange contracts and foreign cross currency exchange contracts does not eliminate fluctuations in the underlying prices of the securities, but does establish a rate of exchange that can be achieved in the future. Although foreign currency exchange contracts and foreign cross currency exchange contracts limit the risk of loss due to an unfavorable change in the value of the hedged currency, they also limit any potential gain that might result should the value of the currency change favorably. In addition, the Fund could be exposed to risks if the counterparties to the contracts are unable to meet the terms of their contracts. The Fund’s maximum risk of loss from counterparty credit risk is the value of its currency exchanged with the counterparty. The risk is generally mitigated by having a netting arrangement between the Fund and the counterparty and by the posting of collateral by the counterparty to the Fund to cover the Fund’s exposure to the counterparty.
During the year ended Oct. 31, 2018, the Fund entered into foreign currency exchange contracts to fix the US dollar value of a security between trade date and settle date.
39
Notes to financial statements
Delaware Select Growth Fund
8. Derivatives (continued)
Derivatives Generally. The table below summarizes the average balance of derivative holdings by the Fund during the year ended Oct. 31, 2018.
| | | | | | | | | | | | | | | | |
| | | Long Derivative
Volume | | | Short Derivative
Volume | |
Foreign currency exchange contracts (average cost) | | | USD | | | | 10,493 | | | | USD | | | | 35,941 | |
9. Offsetting
The Fund entered into an International Swaps and Derivatives Association, Inc. Master Agreement (ISDA Master Agreement) or similar agreement with certain of its derivative contract counterparties in order to better define its contractual rights and to secure rights that will help the Fund mitigate its counterparty risk. An ISDA Master Agreement is a bilateral agreement between the Fund and a counterparty that governs over-the-counter (OTC) derivatives and foreign exchange contracts and typically contains, among other things, collateral posting items and netting provisions in the event of a default and/or termination event. Under an ISDA Master Agreement, the Fund may, under certain circumstances, offset with the counterparty certain derivative financial instruments’ payables and/or receivables with collateral held and/or posted and create one single net payment. The provisions of the ISDA Master Agreement typically permit a single net payment in the event of default (close-out), including the bankruptcy or insolvency of the counterparty. However, bankruptcy or insolvency laws of a particular jurisdiction may impose restrictions on or prohibitions against the right of offset in bankruptcy, insolvency, or other events.
For financial reporting purposes, the Fund does not offset derivative assets and derivative liabilities that are subject to netting arrangements on the “Statement of assets and liabilities.”
At Oct. 31, 2018, the Fund had the following assets and liabilities subject to offsetting provisions:
Offsetting of Financial Assets and Liabilities and Derivative Assets and Liabilities
| | | | | | | | | | |
Counterparty | | Gross Value of
Derivative Asset | | | | Gross Value of
Derivative Liability | | | | Net Position |
| | | | | |
BNY Mellon | | $- | | | | $(4,058) | | | | $(4,058) |
| | | | | | | | | | | | |
Counterparty | | Net Position | | Fair Value of
Non-Cash
Collateral Received | | Cash Collateral
Received | | Fair Value of
Non-Cash
Collateral Pledged | | Cash
Collateral
Pledged | | Net Exposure(a) |
| | | | | | |
BNY Mellon | | $(4,058) | | $— | | $— | | $— | | $— | | $(4,058) |
Master Repurchase Agreements
Repurchase agreements are entered into by the Fund under Master Repurchase Agreements (each, an MRA). The MRA permits the Fund, under certain circumstances including an event of default (such as bankruptcy or insolvency), to offset payables and/or receivables with collateral held by and/or posted to the counterparty. As a result, one single net payment is created. Bankruptcy or insolvency laws of a particular jurisdiction may impose restrictions on or prohibitions against such a right of offset in the event of the MRA counterparty’s bankruptcy or insolvency. Based on the terms of the MRA, the Fund receives securities as collateral with a market value in excess of the repurchase price at maturity. Upon a bankruptcy or insolvency of the MRA counterparty, the Fund would recognize a liability with respect to
40
such excess collateral. The liability reflects the Fund’s obligation under bankruptcy law to return the excess to the counterparty. As of Oct. 31, 2018, the following table is a summary of the Fund’s repurchase agreements by counterparty which are subject to offset under an MRA:
| | | | | | | | | | | | | | | | | | | | | | | | | |
Counterparty | | Repurchase
Agreements | | Fair Value of
Non-Cash
Collateral Received(b) | | Cash
Collateral
Received | | Net Collateral
Received | | Net Exposure(a) |
Bank of America Merrill Lynch | | | $ | 961,424 | | | | $ | (961,424 | ) | | | $ | — | | | | $ | (961,424 | ) | | | $ | — | |
Bank of Montreal | | | | 2,643,917 | | | | | (2,643,917 | ) | | | | — | | | | | (2,643,917 | ) | | | | — | |
BNP Paribas | | | | 3,394,885 | | | | | (3,394,885 | ) | | | | — | | | | | (3,394,885 | ) | | | | — | |
| | | | | | | | | | | | | | | | | | | | | | | | | |
Total | | | $ | 7,000,226 | | | | $ | (7,000,226 | ) | | | $ | — | | | | $ | (7,000,226 | ) | | | $ | — | |
| | | | | | | | | | | | | | | | | | | | | | | | | |
(a)Net exposure represents the net receivable (payable) that would be due from (to) the counterparty in the event of default.
(b)The value of the related collateral received exceeded the value of the repurchase agreements as of Oct. 31, 2018.
10. Securities Lending
The Fund, along with other funds in the Delaware Funds, may lend its securities pursuant to a security lending agreement (Lending Agreement) with The Bank of New York Mellon (BNY Mellon). At the time a security is loaned, the borrower must post collateral equal to the required percentage of the market value of the loaned security, including any accrued interest. The required percentage is: (1) 102% with respect to US securities and foreign securities that are denominated and payable in US dollars; and (2) 105% with respect to foreign securities. With respect to each loan, if on any business day the aggregate market value of securities collateral plus cash collateral held is less than the aggregate market value of the securities which are the subject of such loan, the borrower will be notified to provide additional collateral by the end of the following business day which, together with the collateral already held, will be not less than the applicable initial collateral requirements for such security loan. If the aggregate market value of securities collateral and cash collateral held with respect to a security loan exceeds the applicable initial collateral requirement, upon the request of the borrower, BNY Mellon must return enough collateral to the borrower by the end of the following business day to reduce the value of the remaining collateral to the applicable initial collateral requirement for such security loan. As a result of the foregoing, the value of the collateral held with respect to a loaned security on any particular day may be more or less than the value of the security on loan. The collateral percentage with respect to the market value of the loaned security is determined by the security lending agent.
Cash collateral received by each fund of the Trust is generally invested in a series of individual separate accounts, each corresponding to a fund. The investment guidelines permit each separate account to hold certain securities that would be considered eligible securities for a money market fund. Cash collateral received is generally invested in government securities; certain obligations issued by government sponsored enterprises; repurchase agreements collateralized by US Treasury securities; obligations issued by the central government of any Organization for Economic Cooperation and Development (OECD) country or its agencies, instrumentalities or establishments; obligations of supranational organizations, commercial paper, notes, bonds and other debt obligations; certificates of
41
Notes to financial statements
Delaware Select Growth Fund
10. Securities Lending (continued)
deposit, time deposits, and other bank obligations; and asset-backed securities. A fund can also accept US government securities and letters of credit (non-cash collateral) in connection with securities loans.
In the event of default or bankruptcy by the lending agent, realization and/or retention of the collateral may be subject to legal proceedings. In the event the borrower fails to return loaned securities and the collateral received is insufficient to cover the value of the loaned securities and provided such collateral shortfall is not the result of investment losses, the lending agent has agreed to pay the amount of the shortfall to the Fund or, at the discretion of the lending agent, replace the loaned securities. The Fund continues to record dividends or interest, as applicable, on the securities loaned and is subject to changes in value of the securities loaned that may occur during the term of the loan. The Fund has the right under the Lending Agreement to recover the securities from the borrower on demand. With respect to security loans collateralized by non-cash collateral, the Fund receives loan premiums paid by the borrower. With respect to security loans collateralized by cash collateral, the earnings from the collateral investments are shared among the Fund, the security lending agent, and the borrower. The Fund records security lending income net of allocations to the security lending agent and the borrower.
The Fund may incur investment losses as a result of investing securities lending collateral. This could occur if an investment in the collateral investment account defaulted or became impaired. Under those circumstances, the value of a Fund’s cash collateral account may be less than the amount the Fund would be required to return to the borrowers of the securities and the Fund would be required to make up for this shortfall.
During the year ended Oct. 31, 2018, the Fund had no securities out on loan.
11. Credit and Market Risk
The Fund invested in growth stocks (such as those in the technology sector), which reflect projections of future earnings and revenue. These prices may rise or fall dramatically depending on whether those projections are met. These companies’ stock prices may be more volatile, particularly over the short term.
The Fund invests a significant portion of its assets in small- and mid-sized companies and may be subject to certain risks associated with ownership of securities of such companies. Investments in small- or mid-sized companies may be more volatile than investments in larger companies for a number of reasons, which include more limited financial resources or a dependence on narrow product lines.
Some countries in which the Fund may invest require governmental approval for the repatriation of investment income, capital, or the proceeds of sales of securities by foreign investors. In addition, if there is deterioration in a country’s balance of payments or for other reasons, a country may impose temporary restrictions on foreign capital remittances abroad.
The securities exchanges of certain foreign markets are substantially smaller, less liquid, and more volatile than the major securities markets in the United States. Consequently, acquisition and disposition of securities by the Fund may be inhibited. In addition, a significant portion of the aggregate market value
42
of equity securities listed on the major securities exchanges in emerging markets is held by a smaller number of investors. This may limit the number of shares available for acquisition or disposition by the Fund.
The Fund may invest up to 15% of its net assets in illiquid securities, which may include securities with contractual restrictions on resale, securities exempt from registration under Rule 144A promulgated under the Securities Act of 1933, as amended, and other securities which may not be readily marketable. The relative illiquidity of these securities may impair the Fund from disposing of them in a timely manner and at a fair price when it is necessary or desirable to do so. While maintaining oversight, the Board has delegated to DMC the day-to-day functions of determining whether individual securities are liquid for purposes of the Fund’s limitation on investments in illiquid securities. Securities eligible for resale pursuant to Rule 144A, which are determined to be liquid, are not subject to the Fund’s 15% limit on investments in illiquid securities. Rule 144A securities have been identified on the “Schedule of investments.” Restricted securities are valued pursuant to the security valuation procedures described in Note 1.
12. Contractual Obligations
The Fund enters into contracts in the normal course of business that contain a variety of indemnifications. The Fund’s maximum exposure under these arrangements is unknown. However, the Fund has not had prior claims or losses pursuant to these contracts. Management has reviewed the Fund’s existing contracts and expects the risk of loss to be remote.
13. Recent Accounting Pronouncements
In August 2018, the FASB issued an Accounting Standards Update, ASU 2018-13, which changes certain fair value measurement disclosure requirements. The ASU 2018-13, in addition to other modifications and additions, removes the requirement to disclose the amount and reasons for transfers between Level 1 and Level 2 of the fair value hierarchy, the policy for the timing of transfers between levels and the valuation process for Level 3 fair value measurements. The ASU 2018-13 is effective for fiscal years, and interim periods within those fiscal years, beginning after Dec. 15, 2019. At this time, management is evaluating the implications of these changes on the financial statements.
In August 2018, the Securities and Exchange Commission (SEC) adopted amendments to Regulation S-X to update and simplify the disclosure requirements for registered investment companies by eliminating requirements that are redundant or duplicative of US GAAP requirements or other SEC disclosure requirements. The new amendments require the presentation of the total, rather than the components, of distributable earnings on the “Statement of assets and liabilities” and the total, rather than the components, of dividends from net investment income and distributions from net realized gains on the “Statements of changes in net assets.” The amendments also removed the requirement for the parenthetical disclosure of undistributed net investment income on the “Statements of changes in net assets” and certain tax adjustments that were reflected in the “Notes to financial statements.” All of these have been reflected in the Fund’s financial statements.
43
Notes to financial statements
Delaware Select Growth Fund
14. Subsequent Events
On Nov. 5, 2018, the Fund, along with the other Participants, entered into an amendment to the agreement for a $190,000,000 revolving line of credit to be used as described in Note 7 and to be operated in substantially the same manner as the agreement described in Note 7. The revolving line of credit available was increased from $190,000,000 to $220,000,000 on Nov. 29, 2018. Under the amendment to the agreement, the Participants are charged an annual commitment fee of 0.15%, which is allocated across the Participants based on a weighted average of the respective net assets of each Participant. The line of credit available under the agreement expires on Nov. 4, 2019.
Management has determined that no other material events or transactions occurred subsequent to Oct. 31, 2018, that would require recognition or disclosure in the Fund’s financial statements.
44
|
| Report of independent |
| registered public accounting firm |
To the Board of Trustees of Voyageur Mutual Funds III
and Shareholders of Delaware Select Growth Fund
Opinion on the Financial Statements
We have audited the accompanying statement of assets and liabilities, including the schedule of investments, of Delaware Select Growth Fund (constituting Voyageur Mutual Funds III, referred to hereafter as the “Fund”) as of October 31, 2018, the related statement of operations for the year ended October 31, 2018, the statements of changes in net assets for each of the two years in the period ended October 31, 2018, including the related notes, and the financial highlights for each of the five years in the period ended October 31, 2018 (collectively referred to as the “financial statements”). In our opinion, the financial statements present fairly, in all material respects, the financial position of the Fund as of October 31, 2018, the results of its operations for the year then ended, the changes in its net assets for each of the two years in the period ended October 31, 2018 and the financial highlights for each of the five years in the period ended October 31, 2018 in conformity with accounting principles generally accepted in the United States of America.
Basis for Opinion
These financial statements are the responsibility of the Fund’s management. Our responsibility is to express an opinion on the Fund’s financial statements based on our audits. We are a public accounting firm registered with the Public Company Accounting Oversight Board (United States) (“PCAOB”) and are required to be independent with respect to the Fund in accordance with the U.S. federal securities laws and the applicable rules and regulations of the Securities and Exchange Commission and the PCAOB.
We conducted our audits of these financial statements in accordance with the standards of the PCAOB. Those standards require that we plan and perform the audit to obtain reasonable assurance about whether the financial statements are free of material misstatement, whether due to error or fraud.
Our audits included performing procedures to assess the risks of material misstatement of the financial statements, whether due to error or fraud, and performing procedures that respond to those risks. Such procedures included examining, on a test basis, evidence regarding the amounts and disclosures in the financial statements. Our audits also included evaluating the accounting principles used and significant estimates made by management, as well as evaluating the overall presentation of the financial statements. Our procedures included confirmation of securities owned as of October 31, 2018 by correspondence with the custodian and brokers; when replies were not received from brokers, we performed other auditing procedures. We believe that our audits provide a reasonable basis for our opinion.
/s/PricewaterhouseCoopers LLP
Philadelphia, Pennsylvania
December 20, 2018
We have served as the auditor of one or more investment companies in Delaware Funds® by Macquarie since 2010.
45
|
| Other Fund information (Unaudited) |
| Delaware Select Growth Fund |
Tax Information
The information set forth below is for the Fund’s fiscal year as required by federal income tax laws. Shareholders, however, must report distributions on a calendar year basis for income tax purposes, which may include distributions for portions of two fiscal years of the Fund. Accordingly, the information needed by shareholders for income tax purposes will be sent to them in January of each year. Please consult your tax advisor for proper treatment of this information.
All disclosures are based on financial information available as of the date of this annual report and, accordingly are subject to change. For any and all items requiring reporting, it is the intention of the Fund to report the maximum amount permitted under the Internal Revenue Code and the regulations thereunder.
For the fiscal year ended Oct. 31, 2018, the Fund reports distributions paid during the year as follows:
| | | | |
(A) Long-Term Capital Gain Distributions (Tax Basis) | | | 85.83% | |
(B) Ordinary Income Distributions (Tax Basis)1 | | | 14.17% | |
Total Distributions (Tax Basis) | | | 100.00% | |
(C) Qualifying Dividends2 | | | 46.07% | |
(A) and (B) are based on a percentage of the Fund’s total distributions.
(C) is based on a percentage of the Fund’s ordinary income distributions.
1For the fiscal year ended Oct. 31, 2018, certain dividends paid by the Fund may be subject to a maximum tax rate of 20%. The percentage of dividends paid by the Fund from ordinary income reported as qualified income is 47.77%. Complete information will be compiled and reported in conjunction with your 2018 Form 1099-DIV.
2Qualifying dividends represent dividends which qualify for the corporate dividends received deduction.
For the fiscal year ended Oct. 31, 2018, certain interest income paid by the Fund, determined to be Qualified Interest Income and Qualified Short-Term Capital Gains may be subject to relief from US withholding for foreign shareholders, as provided by the American Jobs Creation Act of 2004; the Tax Relief Unemployment Insurance Reauthorization, and Job Creations Act of 2010; and as extended by the American Taxpayer Relief Act of 2012. For the fiscal year ended Oct. 31, 2018, the Fund reported maximum distributions of Qualified Interest Income of $45,997 and Qualified Short-Term Capital Gains of $11,227,207.
Board consideration of sub-advisory agreements for Delaware Select Growth Fund at a meeting held May 16-17, 2018
At a meeting held on May 16-17, 2018, the Board of Trustees of Voyageur Mutual Funds III, including a majority of non-interested or independent Trustees (the “Independent Trustees”), approved a new Sub-Advisory Agreement between Delaware Select Growth Fund (“DMC” or “Management”) and each of Macquarie Investment Management Global Limited (“MIMGL”) and Macquarie Funds Management Hong Kong Limited (“MFMHK”) for Delaware Select Growth Fund (the “Fund”). MIMGL and MFMHK may also be referenced as “sub-advisor(s)” below.
In reaching the decision to approve the Sub-Advisory Agreements, the Board considered and reviewed information about each of MIMGL and MFMHK, including its personnel, operations, and financial condition, which had been provided by MIMGL and MFMHK, respectively. The Board also reviewed material furnished by DMC, including: a memorandum from DMC reviewing the Sub-Advisory
46
Agreements and the various services proposed to be rendered by MIMGL and MFMHK; information concerning MIMGL’s and MFMHK’s organizational structure and the experience of their key investment management personnel; copies of MIMGL’s and MFMHK’s Form ADV, financial statements, compliance policies and procedures, and Codes of Ethics; relevant performance information provided with respect to MIMGL and MFMHK; and a copy of the Sub-Advisory Agreements.
In considering such information and materials, the Independent Trustees received assistance and advice from and met separately with independent counsel. The materials prepared by Management in connection with the approval of the Sub-Advisory Agreements were sent to the Independent Trustees in advance of the meeting. While attention was given to all information furnished, the following discusses some primary factors relevant to the Board’s decision. This discussion of the information and factors considered by the Board (as well as the discussion above) is not intended to be exhaustive, but rather summarizes certain factors considered by the Board. In view of the wide variety of factors considered, the Board did not, unless otherwise noted, find it practicable to quantify or otherwise assign relative weights to the following factors. In addition, individual Trustees may have assigned different weights to various factors.
Nature, extent, and quality of services. The Board considered the nature, extent, and quality of services that MIMGL and MFMHK each would provide as a sub-advisor to the Fund. The Trustees considered the investment process to be employed by MIMGL and MFMHK in connection with DMC’s collaboration with MIMGL and MFMHK in managing the Fund, and the qualifications and experience of MIMGL and MFMHK’s equity teams with regard to implementing the Fund’s investment mandates. The Board considered MIMGL and MFMHK’s organization, personnel, and operations. The Trustees also considered Management’s review and recommendation process with respect to MIMGL and MFMHK, and Management’s favorable assessment as to the nature, extent, and quality of the sub-advisory services expected to be provided by MIMGL and MFMHK to the Fund. Based on their consideration and review of the foregoing factors, the Board concluded that the nature, extent, and quality of the sub-advisory services to be provided by MIMGL and MFMHK, as well as MIMGL and MFMHK’s ability to render such services based on its experience, organization and resources, were appropriate for the Fund, in light of the Fund’s investment objective, strategies, and policies. In discussing the nature of the services proposed to be provided by the sub-advisors, several Board members observed that, unlike traditional sub-advisors, who make the investment-related decisions with respect to the sub-advised portfolio, the relationship contemplated in this case is limited to access to the additional quantitative investment resources and related technology support of MIMGL and MFMHK.
Sub-advisory fees. The Board considered that DMC would not pay MIMGL and MFMHK fees in conjunction with the services that would be rendered to the sub-advised Fund. The Board concluded that, in light of the quality and extent of the services to be provided and the business relationships between the advisor and sub-advisors, the proposed fee arrangement was understandable and reasonable.
Investment performance. In evaluating performance, the Board considered that MIMGL and MFMHK would provide trade execution support, but that DMC’s portfolio managers for the Fund would retain portfolio management discretion over the Fund.
47
Other Fund information (Unaudited)
Delaware Select Growth Fund
Board consideration of sub-advisory agreements for Delaware Select Growth Fund at a meeting held May 16-17, 2018 (continued)
Economies of scale and fall-out benefits. The Board considered whether the proposed fee arrangement would reflect economies of scale for the benefit of Fund investors as assets in the Fund increased, as applicable. The Board also considered that DMC and its affiliates may benefit by leveraging the global resources of its affiliates.
Board consideration of advisory and sub-advisory agreements for Delaware Select Growth Fund at a meeting held August 15-16, 2018
At a meeting held on Aug. 15-16, 2018 (the “Annual Meeting”), the Board of Trustees (the “Board”), including a majority of disinterested or independent Trustees, approved the renewal of the Investment Advisory Agreement and Investment Sub-Advisory Agreement for Delaware Select Growth Fund (the “Fund”). In making its decision, the Board considered information furnished at regular quarterly Board meetings, including reports detailing Fund performance, investment strategies, and expenses, as well as information prepared specifically in connection with the renewal of the investment advisory and sub-advisory contracts. Information furnished specifically in connection with the renewal of the Investment Management Agreement with Delaware Management Company (“DMC”), a series of Macquarie Investment Management Business Trust (“MIMBT”), and Sub-Advisory Agreement with Jackson Square Partners, LLC (“JSP”), included materials provided by DMC and its affiliates (collectively, “Macquarie Investment Management”) and JSP, as applicable, concerning, among other things, the nature, extent, and quality of services provided to the Fund; the costs of such services to the Fund; economies of scale; and the investment manager’s financial condition and profitability. In addition, in connection with the Annual Meeting, materials were provided to the Trustees in May 2018, including reports provided by Broadridge Financial Solutions (“Broadridge”). The Broadridge reports compared the Fund’s investment performance and expenses with those of other comparable mutual funds. The Independent Trustees reviewed and discussed the Broadridge reports with independent legal counsel to the Independent Trustees. In addition to the information noted above, the Board also requested and received information regarding DMC’s or JSP’s, as applicable, policy with respect to advisory fee levels and its breakpoint philosophy; the structure of portfolio manager compensation; comparative client fee information; and any constraints or limitations on the availability of securities for certain investment styles, which had in the past year inhibited, or which were likely in the future to inhibit, the investment manager’s ability to invest fully in accordance with Fund policies.
In considering information relating to the approval of the Fund’s advisory and sub-advisory agreements, the Independent Trustees received assistance and advice from and met separately with independent legal counsel to the Independent Trustees and also from an experienced and knowledgeable independent fund consultant, JDL Consultants, LLC (“JDL”). Although the Board gave attention to all information furnished, the following discussion identifies, under separate headings, the primary factors taken into account by the Board during its contract renewal considerations.
Nature, extent, and quality of services. The Board considered the services provided by DMC to the Fund and its shareholders. In reviewing the nature, extent, and quality of services, the Board considered reports furnished to it throughout the year, which covered matters such as the relative performance of the Fund; compliance of portfolio managers with the investment policies, strategies, and restrictions for
48
the Fund; compliance by DMC and Delaware Distributors, L.P. (together, “Management”) personnel with the Code of Ethics adopted throughout the Delaware Funds® by Macquarie (“Delaware Funds”); and adherence to fair value pricing procedures as established by the Board. The Board was pleased with the current staffing of DMC and the emphasis placed on research in the investment process. The Board recognized DMC’s receipt of certain favorable industry distinctions during the past several years. The Board gave favorable consideration to DMC’s efforts to control expenses while maintaining service levels committed to Fund matters. The Board also noted the benefits provided to Fund shareholders (a) through each shareholder’s ability to: (i) exchange an investment in one Delaware Fund for the same class of shares in another Delaware Fund without a sales charge, or (ii) to reinvest Fund dividends into additional shares of the Fund or into additional shares of other Delaware Funds, and (b) the privilege to combine holdings in other Delaware Funds to obtain a reduced sales charge. The Board was satisfied with the nature, extent, and quality of the overall services provided by DMC.
Nature, extent, and quality of services. The Board considered the services provided by JSP to the Fund and its shareholders. In reviewing the nature, extent, and quality of services, the Board considered reports furnished to it throughout the year at regular Board Meetings covering matters such as relative performance of the Fund, compliance of portfolio managers with the investment policies, strategies, and restrictions for the Fund; the compliance of JSP personnel with its Code of Ethics; and adherence to fair value pricing procedures as established by the Board. The Board was pleased with the current staffing of JSP and the emphasis placed on research in the investment process. The Board was satisfied with the nature, extent, and quality of the overall services provided by JSP.
Investment performance. The Board placed significant emphasis on the investment performance of the Fund in view of the importance of investment performance to shareholders. Although the Board considered performance reports and discussions with portfolio managers at Investment Committee meetings throughout the year, the Board gave particular weight to the Broadridge reports furnished for the Annual Meeting. The Broadridge reports prepared for the Fund showed the investment performance of its Class A shares in comparison to a group of similar funds as selected by Broadridge (the “Performance Universe”). A fund with the best performance ranked first, and a fund with the poorest performance ranked last. The highest/best performing 25% of funds in the Performance Universe make up the first quartile; the next 25%, the second quartile; the next 25%, the third quartile; and the poorest/worst performing 25% of funds in the Performance Universe make up the fourth quartile. Comparative annualized performance for the Fund was shown for the past 1-, 3-, 5-, and 10-year periods, to the extent applicable, ended Jan. 31, 2018. The Board’s objective is that the Fund’s performance for the 1-, 3-, and 5-year periods be at or above the median of its Performance Universe.
The Performance Universe for the Fund consisted of the Fund and all retail and institutional multi-cap growth funds as selected by Broadridge. The Broadridge report comparison showed that the Fund’s total return for the 1-year period was in the third quartile of its Performance Universe. The report further showed that the Fund’s total return for the 3- and 5-year periods was in the fourth quartile of its Performance Universe and the Fund’s total return for the 10-year period was in the second quartile of its Performance Universe. The Board noted that the Fund’s performance was not in line with the Board’s objective. In evaluating the Fund’s performance, the Board considered the performance attribution included in the Meeting materials, as well as the numerous investment and performance reports
49
Other Fund information (Unaudited)
Delaware Select Growth Fund
Board consideration of advisory and sub-advisory agreements for Delaware Select Growth Fund at a meeting held August 15-16, 2018 (continued)
delivered by Management personnel to the Board’s Investments Committee. The Board was satisfied that Management was taking action to improve Fund performance and meet the Board’s performance objective.
Comparative expenses. The Board considered expense data for the Delaware Funds. Management provided the Board with information on pricing levels and fee structures for the Fund as of its most recently completed fiscal year. The Board also focused on the comparative analysis of effective management fees and total expense ratios of the Fund versus effective management fees and total expense ratios of a group of similar funds as selected by Broadridge (the “Expense Group”). In reviewing comparative costs, the Fund’s contractual management fee and the actual management fee incurred by the Fund were compared with the contractual management fees (assuming all funds in the Expense Group were similar in size to the Fund) and actual management fees (as reported by each fund) within the Expense Group, taking into account any applicable breakpoints and fee waivers. The Fund’s total expenses were also compared with those of its Expense Group. The Broadridge total expenses, for comparative consistency, were shown by Broadridge for Class A shares and comparative total expenses including 12b-1 and non-12b-1 service fees. The Board’s objective is for each Fund’s total expense ratio to be competitive with those of the peer funds within its Expense Group.
The expense comparisons for the Fund showed that its actual management fee was in the quartile with the second lowest expenses of its Expense Group and its total expenses were in the quartile with the second highest expenses of its Expense Group. The Board gave favorable consideration to the Fund’s management fee, but noted that the Fund’s total expenses were not in line with the Board’s objective. In evaluating the total expenses, the Board considered fee waivers in place through February 2019 and various initiatives implemented by Management, such as the negotiation of lower fees for fund accounting, fund accounting oversight and custody services, which had created an opportunity for a further reduction in expenses. The Board was satisfied with Management’s efforts to improve the Fund’s total expense ratio and to bring it in line with the Board’s objective.
Management profitability. The Board considered the level of profits realized by DMC in connection with the operation of the Fund. In this respect, the Board reviewed the Investment Management Profitability Analysis that addressed the overall profitability of DMC’s business in providing management and other services to each of the individual funds and the Delaware Funds as a whole. Specific attention was given to the methodology used by DMC in allocating costs for the purpose of determining profitability. Management stated that the level of profits of DMC, to a certain extent, reflects recent operational cost savings and efficiencies initiated by DMC. The Board considered DMC’s efforts to improve services provided to Fund shareholders and to meet additional regulatory and compliance requirements resulting from recent industry-wide Securities and Exchange Commission initiatives. The Board also considered the extent to which DMC might derive ancillary benefits from fund operations, including the potential for procuring additional business as a result of the prestige and visibility associated with its role as service provider to the Delaware Funds and the benefits from allocation of fund brokerage to improve trading efficiencies. As part of its work, the Board also reviewed a report prepared by JDL regarding MIMBT profitability as compared to certain peer fund complexes and the Independent Trustees met with JDL
50
personnel to discuss DMC’s profitability in such context. The Board found that the management fees were reasonable in light of the services rendered and the level of profitability of DMC.
Management profitability. Trustees were also given available information on profits being realized by JSP in relation to the services being provided to the Fund and in relation to JSP’s overall investment advisory business, but believed such information to be of limited relevance because the sub-advisory fees are paid by DMC out of its management fee, and changes in the level of sub-advisory fees have no impact on Fund expenses. The Board was also provided information on potential fall-out benefits derived or to be derived by JSP in connection with its relationship to the Fund, such as reputational enhancement, soft dollar arrangements or commissions paid to affiliated broker/dealers, as applicable.
Economies of scale. The Trustees considered whether economies of scale are realized by DMC as the Fund’s assets increase and the extent to which any economies of scale are reflected in the level of management fees charged. The Trustees reviewed the Fund’s advisory fee pricing and structure, approved by the Board and shareholders, which includes breakpoints, and which applies to most funds in the Delaware Funds complex. Breakpoints in the advisory fee occur when the advisory fee rate is reduced on assets in excess of specified levels. Breakpoints result in a lower advisory fee than would otherwise be the case in the absence of breakpoints, when the asset levels specified in the breakpoints are exceeded. Although, as of March 31, 2018, the Fund had not reached a size at which it could take advantage of any breakpoints in the applicable fee schedule, the Board recognized that the fee was structured so that, if the Fund increases sufficiently in size, then economies of scale may be shared.
51
| | | | |
| Board of trustees / directors and officers addendum | | | | |
| Delaware Funds® by Macquarie | | | | |
A mutual fund is governed by a Board of Trustees/Directors (“Trustees”), which has oversight responsibility for the management of a fund’s business affairs. Trustees establish procedures and oversee and review the performance of the investment manager, the distributor, and others who perform services for the fund. The independent fund trustees, in particular, are advocates
| | | | |
Name, Address, and Birth Date | | Position(s) Held with Fund(s) | | Length of Time Served |
Interested Trustee | | | | |
Shawn K. Lytle1, 2 2005 Market Street Philadelphia, PA 19103 February 1970 | | President, Chief Executive Officer, and Trustee | | Trustee since September 2015 |
| | | | President and Chief Executive Officer since August 2015 |
| | |
| | | | |
Independent Trustees | | | | |
Thomas L. Bennett 2005 Market Street Philadelphia, PA 19103 October 1947 | | Chair and Trustee | | Trustee since March 2005 |
|
| | | | Chair since March 2015 |
|
Ann D. Borowiec 2005 Market Street Philadelphia, PA 19103 November 1958 | | Trustee | | Since March 2015 |
Joseph W. Chow 2005 Market Street Philadelphia, PA 19103 January 1953 | | Trustee | | Since January 2013 |
| | | | |
| | | | |
| | | | |
| 1 | Shawn K. Lytle is considered to be an “Interested Trustee” because he is an executive officer of the Fund’s(s’) investment advisor. |
| 2 | Shawn K. Lytle, David F. Connor, Daniel V. Geatens, and Richard Salus serve in similar capacities for the six portfolios of the Optimum Fund Trust, which have the same investment advisor, principal underwriter, and transfer agent as the registrant. Mr. Geatens also serves as the Chief Financial Officer and Treasurer for Macquarie Global Infrastructure Total Return Fund Inc., which has an affiliated investment manager. |
52
for shareholder interests. Each trustee has served in that capacity since he or she was elected to or appointed to the Board of Trustees, and will continue to serve until his or her retirement or the election of a new trustee in his or her place. The following is a list of the Trustees and Officers with certain background and related information.
| | | | |
Principal Occupation(s) During the Past Five Years | | Number of Portfolios in Fund Complex Overseen by Trustee or Officer | | Other Directorships Held by Trustee or Officer |
| | | | |
President — Macquarie Investment Management3 (June 2015–Present) Regional Head of Americas— UBS Global Asset Management (April 2010–May 2015) | | 59 | | Trustee — UBS Relationship Funds, SMA Relationship Trust, and UBS Funds (May 2010–April 2015) |
| | | | |
Private Investor (March 2004–Present) | | 59 | | None |
Chief Executive Officer, Private Wealth Management (2011–2013) and Market Manager, New Jersey Private Bank (2005–2011) — J.P. Morgan Chase & Co. | | 59 | | Director — Banco Santander International (October 2016–Present) Director — Santander Bank, N.A. (December 2016–Present) |
Private Investor (April 2011–Present) | | 59 | | Director and Audit Committee Member — Hercules Technology Growth Capital, Inc. (July 2004–July 2014) |
| 3 | Macquarie Investment Management is the marketing name for Macquarie Management Holdings, Inc. and its subsidiaries, including the Fund’s(s’) investment advisor, principal underwriter, and its transfer agent. |
53
Board of trustees / directors and officers addendum
Delaware Funds® by Macquarie
| | | | |
| Name, Address, | | Position(s) | | Length of |
| and Birth Date | | Held with Fund(s) | | Time Served |
Independent Trustees (continued) | | | | |
| John A. Fry | | Trustee | | Since January 2001 |
| 2005 Market Street | | | | |
Philadelphia, PA 19103 May 1960 | | | | |
| Lucinda S. Landreth | | Trustee | | Since March 2005 |
| 2005 Market Street | | | | |
| Philadelphia, PA 19103 | | | | |
| June 1947 | | | | |
| Frances A. Sevilla-Sacasa | | Trustee | | Since September 2011 |
| 2005 Market Street | | | | |
| Philadelphia, PA 19103 | | | | |
January 1956 | | | | |
54
| | | | |
| | | Number of Portfolios in | | |
| Principal Occupation(s) | | Fund Complex Overseen | | Other Directorships |
| During the Past Five Years | | by Trustee or Officer | | Held by Trustee or Officer |
| | |
| | | | |
| President — | | 59 | | Director, Compensation |
| Drexel University | | | | Committee and |
| (August 2010–Present) | | | | Governance Committee |
| | | | Member — Community |
| President — | | | | Health Systems |
| Franklin & Marshall College | | | | |
| (July 2002–July 2010) | | | | Director — Drexel |
| | | | Morgan & Co. |
| | |
| | | | Director; Audit Committee |
| | | | Member — vTv |
| | | | Therapeutics LLC |
| | |
| | | | Director; Audit Committee Member — FS Credit Real |
| | | | | Estate Income Trust, Inc. |
| Private Investor | | 59 | | None |
(2004–Present) | | | | |
| Private Investor | | 59 | | Trust Manager and |
| (January 2017–Present) | | | | Audit Committee |
Chief Executive Officer — | | | | Chair — Camden |
| Banco Itaú | | | | Property Trust |
| International | | | | (August 2011–Present) |
| (April 2012–December 2016) | | | | |
| | |
| Executive Advisor to Dean | | | | Director — |
| (August 2011–March 2012) | | | | Carrizo Oil & Gas, Inc. |
| and Interim Dean | | | | (March 2018–Present) |
| (January 2011–July 2011) — | | | | |
| University of Miami School of | | | | |
| Business Administration | | | | |
| | |
| President — U.S. Trust, | | | | |
| Bank of America Private | | | | |
| Wealth Management | | | | |
| (Private Banking) | | | | |
(July 2007–December 2008) | | | | |
55
Board of trustees / directors and officers addendum
Delaware Funds® by Macquarie
| | | | |
Name, Address, and Birth Date | | Position(s) Held with Fund(s) | | Length of Time Served |
Independent Trustees (continued) | | |
Thomas K. Whitford 2005 Market Street Philadelphia, PA 19103 March 1956 | | Trustee | | Since January 2013 |
Janet L. Yeomans 2005 Market Street Philadelphia, PA 19103 July 1948 | | Trustee | | Since April 1999 |
Officers | | | | |
David F. Connor 2005 Market Street Philadelphia, PA 19103 December 1963 | | Senior Vice President, General Counsel, and Secretary | | Senior Vice President since May 2013; General Counsel since May 2015; Secretary since October 2005 |
Daniel V. Geatens 2005 Market Street Philadelphia, PA 19103 October 1972 | | Vice President and Treasurer | | Vice President and Treasurer since October 2007 |
Richard Salus 2005 Market Street Philadelphia, PA 19103 October 1963 | | Senior Vice President and Chief Financial Officer | | Senior Vice President and Chief Financial Officer since November 2006 |
The Statement of Additional Information for the Fund(s) includes additional information about the Trustees and Officers and is available, without charge, upon request by calling 800 523-1918.
56
| | | | |
Principal Occupation(s) During the Past Five Years | | Number of Portfolios in Fund Complex Overseen by Trustee or Officer | | Other Directorships Held by Trustee or Officer |
| | |
| | | | |
Vice Chairman (2010–April 2013) — PNC Financial Services Group | | 59 | | Director — HSBC Finance Corporation and HSBC North America Holdings Inc. (December 2013–Present) |
| | |
| | | | Director — |
| | | | | HSBC Bank USA, Inc. (July 2014-March 2017) |
| Vice President and Treasurer | | 59 | | Director (2009–2017); |
| (January 2006–July 2012), | | | | Personnel and Compensation |
| Vice President — | | | | Committee Chair; Member of |
| Mergers & Acquisitions | | | | Nominating, Investments, and |
| (January 2003–January 2006), | | | | Audit Committees for various |
| and Vice President | | | | periods throughout |
| and Treasurer | | | | directorship — |
| (July 1995–January 2003) — | | | | Okabena Company |
3M Company | | | | |
| | |
| | | | |
| David F. Connor has served | | 59 | | None2 |
in various capacities at different times at | | | | |
| Macquarie Investment | | | | |
Management. | | | | |
| Daniel V. Geatens has served | | 59 | | None2 |
in various capacities at different times at | | | | |
| Macquarie Investment | | | | |
Management. | | | | |
| Richard Salus has served | | 59 | | None2 |
in various executive capacities at different times at | | | | |
| Macquarie Investment | | | | |
Management. | | | | |
57
| | | | | | |
| Board of trustees | | | | | | |
Shawn K. Lytle President and Chief Executive Officer Delaware Funds® by Macquarie Philadelphia, PA Thomas L. Bennett Chairman of the Board Delaware Funds by Macquarie Private Investor Rosemont, PA | | Ann D. Borowiec Former Chief Executive Officer Private Wealth Management J.P. Morgan Chase & Co. New York, NY Joseph W. Chow Former Executive Vice President State Street Corporation Boston, MA | | John A. Fry President Drexel University Philadelphia, PA Lucinda S. Landreth Former Chief Investment Officer Assurant, Inc. New York, NY | | Frances A. Sevilla-Sacasa Former Chief Executive Officer Banco Itaú International Miami, FL Thomas K.Whitford Former Vice Chairman PNC Financial Services Group Pittsburgh, PA Janet L. Yeomans Former Vice President and Treasurer 3M Company St. Paul, MN |
| Affiliated officers | | | | | | |
| | | |
| David F. Connor | | Daniel V. Geatens | | Richard Salus | | |
| Senior Vice President, | | Vice President and | | Senior Vice President and | | |
| General Counsel, | | Treasurer | | Chief Financial Officer | | |
| and Secretary | | Delaware Funds | | Delaware Funds | | |
| Delaware Funds | | by Macquarie | | by Macquarie | | |
| by Macquarie | | Philadelphia, PA | | Philadelphia, PA | | |
| Philadelphia, PA | | | | | | |
This annual report is for the information of Delaware Select Growth Fund shareholders, but it may be used with prospective investors when preceded or accompanied by the Delaware Fund fact sheet for the most recently completed calendar quarter. These documents are available at delawarefunds.com/literature.
The Fund files its complete schedule of portfolio holdings with the Securities and Exchange Commission (SEC) for the first and third quarters of each fiscal year on Form N-Q. The Fund’s Forms N-Q, as well as a description of the policies and procedures that the Fund uses to determine how to vote proxies (if any) relating to portfolio securities are available without charge (i) upon request, by calling 800 523-1918; and (ii) on the SEC’s website at sec.gov. In addition, a description of the policies and procedures that the Fund uses to determine how to vote proxies (if any) relating to portfolio securities and the Schedule of Investments included in the Fund’s most recent Form N-Q are available without charge on the Fund’s website at delawarefunds.com/literature. The Fund’s Forms N-Q may be reviewed and copied at the SEC’s Public Reference Room in Washington, D.C.; information on the operation of the Public Reference Room may be obtained by calling 800 SEC-0330.
Information (if any) regarding how the Fund voted proxies relating to portfolio securities during the most recently disclosed 12-month period ended June 30 is available without charge (i) through the Fund’s website at delawarefunds.com/proxy; and (ii) on the SEC’s website at sec.gov.
58
Item 2. Code of Ethics
Item 3. Audit Committee Financial Expert
The registrant’s Board of Trustees has determined that certain members of the registrant’s Audit Committee are audit committee financial experts, as defined below. For purposes of this item, an “audit committee financial expert” is a person who has the following attributes:
a. An understanding of generally accepted accounting principles and financial statements;
b. The ability to assess the general application of such principles in connection with the accounting for estimates, accruals, and reserves;
c. Experience preparing, auditing, analyzing, or evaluating financial statements that present a breadth and level of complexity of accounting issues that are generally comparable to the breadth and complexity of issues that can reasonably be expected to be raised by the registrant’s financial statements, or experience actively supervising one or more persons engaged in such activities;
d. An understanding of internal controls and procedures for financial reporting; and
e. An understanding of audit committee functions.
An “audit committee financial expert” shall have acquired such attributes through:
a. Education and experience as a principal financial officer, principal accounting officer, controller, public accountant, or auditor or experience in one or more positions that involve the performance of similar functions;
b. Experience actively supervising a principal financial officer, principal accounting officer, controller, public accountant, auditor, or person performing similar functions;
c. Experience overseeing or assessing the performance of companies or public accountants with respect to the preparation, auditing, or evaluation of financial statements; or
d. Other relevant experience.
The registrant’s Board of Trustees has also determined that each member of the registrant’s Audit Committee is independent. In order to be “independent” for purposes of this item, the Audit Committee member may not: (i) other than in his or her capacity as a member of the Board of Trustees or any committee thereof, accept directly or indirectly any consulting, advisory or other compensatory fee from the issuer; or (ii) be an “interested person” of the registrant as defined in Section 2(a)(19) of the Investment Company Act of 1940.
The names of the audit committee financial experts on the registrant’s Audit Committee are set forth below:
Joseph W. Chow
John A. Fry
Lucinda S. Landreth
Thomas K. Whitford
Janet L. Yeomans
Item 4. Principal Accountant Fees and Services
The aggregate fees billed for services provided to the registrant by its independent auditors for the audit of the registrant’s annual financial statements and for services normally provided by the independent auditors in connection with statutory and regulatory filings or engagements were $31,010 for the fiscal year ended October 31, 2018.
The aggregate fees billed for services provided to the registrant by its independent auditors for the audit of the registrant’s annual financial statements and for services normally provided by the independent auditors in connection with statutory and regulatory filings or engagements were $30,140 for the fiscal year ended October 31, 2017.
The aggregate fees billed by the registrant’s independent auditors for services relating to the performance of the audit of the registrant’s financial statements and not reported under paragraph (a) of this Item were $0 for the fiscal year ended October 31, 2018.
The aggregate fees billed by the registrant’s independent auditors for services relating to the performance of the audit of the registrant’s financial statements and not reported under paragraph (a) of this Item were $0 for the fiscal year ended October 31, 2017.
The aggregate fees billed by the registrant’s independent auditors for tax-related services provided to the registrant’s investment adviser and other service providers under common control with the adviser and that relate directly to the operations or financial reporting of the registrant were $0 for the registrant’s fiscal year ended October 31, 2018.
The aggregate fees billed by the registrant’s independent auditors for tax-related services provided to the registrant’s investment adviser and other service providers under common control with the adviser and that relate directly to the operations or financial reporting of the registrant were $0 for the registrant’s fiscal year ended October 31, 2017.
The aggregate fees billed for all services provided by the independent auditors to the registrant other than those set forth in paragraphs (a), (b) and (c) of this Item were $0 for the fiscal year ended October 31, 2018.
The aggregate fees billed for all services provided by the independent auditors to the registrant other than those set forth in paragraphs (a), (b) and (c) of this Item were $0 for the fiscal year ended October 31, 2017.
Under the Pre-Approval Policy, the Audit Committee has also pre-approved the services set forth in the table below with respect to the registrant’s investment adviser and other entities controlling, controlled by or under common control with the investment adviser that provide ongoing services to the registrant (the “Control Affiliates”) up to the specified fee limit. This fee limit is based on aggregate fees to the investment adviser and its Control Affiliates.
The Pre-Approval Policy requires the registrant’s independent auditors to report to the Audit Committee at each of its regular meetings regarding all services initiated since the last such report was rendered, including those services authorized by the Pre-Approval Policy.
(f) Not applicable.
(g) The aggregate non-audit fees billed by the registrant’s independent auditors for services rendered to the registrant and to its investment adviser and other service providers under common control with the adviser were $11,748,000 and $11,180,000 for the registrant’s fiscal years ended October 31, 2018 and October 31, 2017, respectively.
(h) In connection with its selection of the independent auditors, the registrant’s Audit Committee has considered the independent auditors’ provision of non-audit services to the registrant’s investment adviser and other service providers under common control with the adviser that were not required to be pre-approved pursuant to Rule 2-01(c)(7)(ii) of Regulation S-X. The Audit Committee has determined that the independent auditors’ provision of these services is compatible with maintaining the auditors’ independence.
Item 5. Audit Committee of Listed Registrants
Not applicable.
Item 6. Investments
(a) Included as part of report to shareholders filed under Item 1 of this Form N-CSR.
(b) Divestment of securities in accordance with Section 13(c) of the Investment Company Act of 1940.
Not applicable.
Item 7. Disclosure of Proxy Voting Policies and Procedures for Closed-End Management Investment Companies
Not applicable.
Item 8. Portfolio Managers of Closed-End Management Investment Companies
Not applicable.
Item 9. Purchases of Equity Securities by Closed-End Management Investment Company and Affiliated Purchasers
Not applicable.
Item 10. Submission of Matters to a Vote of Security Holders
Not applicable.
Item 11. Controls and Procedures
The registrant’s principal executive officer and principal financial officer have evaluated the registrant’s disclosure controls and procedures within 90 days of the filing of this report and have concluded that they are effective in providing reasonable assurance that the information required to be disclosed by the registrant in its reports or statements filed under the Securities Exchange Act of 1934 is recorded, processed, summarized and reported within the time periods specified in the rules and forms of the Securities and Exchange Commission.
There were no significant changes in the registrant’s internal control over financial reporting that occurred during the second fiscal quarter of the period covered by the report to stockholders included herein (i.e., the registrant’s fourth fiscal quarter) that have materially affected, or are reasonably likely to materially affect, the registrant’s internal control over financial reporting.
Item 12. Disclosure of Securities Lending Activities for Closed-End Management Investment Companies
Not applicable.
Item 13. Exhibits
Not applicable.
(2) Certifications of Principal Executive Officer and Principal Financial Officer pursuant to Rule 30a-2 under the Investment Company Act of 1940 are attached hereto as Exhibit 99.CERT.
(3) Written solicitations to purchase securities pursuant to Rule 23c-1 under the Securities Exchange Act of 1934.
Not applicable.
(b) Certifications pursuant to Section 906 of the Sarbanes-Oxley Act of 2002 are furnished herewith as Exhibit 99.906CERT.
Pursuant to the requirements of the Securities Exchange Act of 1934 and the Investment Company Act of 1940, the registrant has duly caused this report to be signed on its behalf, by the undersigned, thereunto duly authorized.
Pursuant to the requirements of the Securities Exchange Act of 1934 and the Investment Company Act of 1940, this report has been signed below by the following persons on behalf of the registrant and in the capacities and on the dates indicated.