Item 1. Reports to Stockholders
Annual report
US equity mutual fund
Delaware Select Growth Fund
October 31, 2019
Beginning on or about June 1, 2021, as permitted by regulations adopted by the Securities and Exchange Commission, paper copies of your Fund’s shareholder reports will no longer be sent to you by mail, unless you specifically request them from the Fund or from your financial intermediary, such as a broker/dealer, bank, or insurance company. Instead, you will be notified by mail each time a report is posted on the website and provided with a link to access the report.
If you already elected to receive shareholder reports electronically, you will not be affected by this change and you do not need to take any action. You may elect to receive shareholder reports and other communications from the Fund electronically by signing up at delawarefunds.com/edelivery. If you own these shares through a financial intermediary, you may contact your financial intermediary.
You may elect to receive paper copies of all future shareholder reports free of charge. You can inform the Fund that you wish to continue receiving paper copies of your shareholder reports by contacting us at 800523-1918. If you own these shares through a financial intermediary, you may contact your financial intermediary to elect to continue to receive paper copies of your shareholder reports. Your election to receive reports in paper will apply to all funds held with the Delaware Funds® by Macquarie or your financial intermediary.
Carefully consider the Fund’s investment objectives, risk factors, charges, and expenses before investing. This and other information can be found in the Fund’s prospectus and its summary prospectus, which may be obtained by visiting delawarefunds.com/literature or calling 800523-1918. Investors should read the prospectus and the summary prospectus carefully before investing.
You can obtain shareholder reports and prospectuses online instead of in the mail.
Visit delawarefunds.com/edelivery.

Experience Delaware Funds®by Macquarie
Macquarie Investment Management (MIM) is a global asset manager with offices throughout the United States, Europe, Asia, and Australia. As active managers we prioritize autonomy and accountability at the investment team level in pursuit of opportunities that matter for clients. Delaware Funds is one of the longest-standing mutual fund families, with more than 80 years in existence.
If you are interested in learning more about creating an investment plan, contact your financial advisor.
You can learn more about Delaware Funds or obtain a prospectus for Delaware Select Growth Fund at delawarefunds.com/literature.
Manage your account online
| · | | Check your account balance and transactions |
| · | | View statements and tax forms |
| · | | Make purchases and redemptions |
Visit delawarefunds.com/account-access.
Macquarie Asset Management (MAM) offers a diverse range of products including securities investment management, infrastructure and real asset management, and fund and equity-based structured products. MIM is the marketing name for certain companies comprising the asset management division of Macquarie Group. This includes the following investment advisers: Macquarie Investment Management Business Trust (MIMBT), Macquarie Funds Management Hong Kong Limited, Macquarie Investment Management Austria Kapitalanlage AG, Macquarie Investment Management Global Limited, Macquarie Investment Management Europe Limited, Macquarie Capital Investment Management LLC, and Macquarie Investment Management Europe S.A.
The Fund is distributed byDelaware Distributors, L.P. (DDLP), an affiliate of MIMBT and Macquarie Group Limited.
Other than Macquarie Bank Limited (MBL), none of the entities noted are authorized deposit-taking institutions for the purposes of the Banking Act 1959 (Commonwealth of Australia). The obligations of these entities do not represent deposits or other liabilities of MBL. MBL does not guarantee or otherwise provide assurance in respect of the obligations of these entities, unless noted otherwise. The Fund is governed by US laws and regulations.
Unless otherwise noted, views expressed herein are current as of Oct. 31, 2019, and subject to change for events occurring after such date.
The Fund is not FDIC insured and is not guaranteed. It is possible to lose the principal amount invested.
Advisory services provided by Delaware Management Company, a series of MIMBT, a US registered investment advisor.
All third-party marks cited are the property of their respective owners.
© 2019 Macquarie Management Holdings, Inc.
| | |
Portfolio management review |
Delaware Select Growth Fund | | November 12, 2019 (Unaudited) |
| | | | |
| Performance preview (for the year ended October 31, 2019) | | |
Delaware Select Growth Fund (Institutional Class shares) | | 1-year return | | +11.71% |
Delaware Select Growth Fund (Class A shares) | | 1-year return | | +11.42% |
Russell 3000® Growth Index (benchmark) | | 1-year return | | +16.34% |
Past performance does not guarantee future results.
For complete, annualized performance for Delaware Select Growth Fund, please see the table on page 5.
Institutional Class shares are not subject to a sales charge and are offered for sale exclusively to certain eligible investors. In addition, Institutional Class shares pay no distribution and service fee.
The performance of Class A shares excludes the applicable sales charge. Both Institutional Class shares and Class A shares reflect the reinvestment of all distributions.
Please see page 7 for a description of the index. Index performance returns do not reflect any management fees, transaction costs, or expenses. Indices are unmanaged and one cannot invest directly in an index.
Jackson Square Partners, LLC (JSP), a US registered investment advisor, is thesub-advisor to the Fund. Assub-advisor, JSP is responsible forday-to-day management of the Fund’s assets. Delaware Management Company (DMC), a series of Macquarie Investment Management Business Trust (MIMBT), has ultimate responsibility for all investment advisory services.
Market review
Equity markets generally made strong gains during the fiscal year ended Oct. 31, 2019. Markets in the United States rose 14.33%, as measured by the S&P 500® Index. International markets gained 11.04% (net) and emerging markets gained 11.86% (net), as measured by the MSCI EAFE (Europe, Australasia, Far East) Index and the MSCI Emerging Markets Index, respectively.
In December 2018, the US economy began to wane, the result, in part, of a disagreement between President Trump and members of Congress about the $5.7 billion federal operations budget. Approximately 800,000 federal employees were furloughed or worked without pay during the35-day federal shutdown, the longest in US history.
The domestic economy started to bounce back in early 2019, when it appeared thatUS-China trade negotiations might forestall further tariff increases. Diplomacy between the two countries broke down, however, and in May, the US increased
|
The markets’ generally positive bias, albeit with bouts of caution, enhances our desire as “intrinsic value” investors to be somewhat contrarian by leaning into lower-duration growth stocks and reallocating to newer ideas and holdings that we believe have more idiosyncratic fundamental drivers and/or trade at a bigger discount to intrinsic business value. |
1
Portfolio management review
Delaware Select Growth Fund
the tax import rate from 10% to 25% on $200 billion worth of Chinese imports. China responded with its own tariff hikes, and during the next several months, each nation continued to increase its tax bill in response to the other. At the same time, positive economic events at home – including solid employment numbers, an increase in manufacturing, and the first hints of a dovish tilt from the Federal Reserve – helped buoy investor sentiment.
In May 2019, the US economy started to slow. A combination of low inflation, weaker economic data, and continued trade concerns forged a path for the Fed to reduce interest rates in July for the first time in 11 years. The Fed cut rates again in September, and then once more in October. Just one year earlier, the Fed had been on a steady march to raise rates; the cuts signaled a reversal of strategy.
Euro-zone countries faced similar concerns. The European Central Bank (ECB) hinted at quantitative easing, which it later initiated in September. Germany, struggling with political uncertainties, teetered on the brink of a recession. In the United Kingdom, new Prime Minister Boris Johnson had yet to negotiate an agreeable strategy for withdrawing from the European Union.
Toward the end of the Fund’s fiscal year, news that the US and China had hammered out the first phase of a trade agreement seemed to pacify US investors. Still, manufacturing gains tapered, consumer confidence fell, and the pace of job growth began to slow. On the brighter side, corporate earnings per share (EPS) continued to grow and the S&P 500 Index posted positive gains.
Within the Fund
For the fiscal year ended Oct. 31, 2019, Delaware Select Growth Fund Institutional Class shares gained 11.71%. The Fund’s Class A shares advanced 11.42% at net asset value (NAV) and 5.03% at maximum offer price. These figures
reflect all distributions reinvested. During the same period, the Fund’s benchmark, the Russell 3000 Growth Index, rose 16.34%. For complete, annualized performance of Delaware Select Growth Fund, please see the table on page 5.
Strong relative performance in the information technology sector was unable to overcome weak relative performance in communication services. On a stock-specific level, the following were the most significant detractors and contributors during the12-month period.
Liberty TripAdvisor Holdings Inc., a travel website providing travel advice and planning features, detracted from the Fund’s performance during the fiscal year. The company’s hotel segment has struggled against competitive headwinds, including increased challenges from Google’s search business. That said, we believe Liberty TripAdvisor Holdings’ commitment to an increased focus on its experiences and dining products – a growing business line that enhances the company’s overall profitability – is the right strategic move. We continue to monitor the fundamentals closely.
Farfetch Ltd., aUK-based online retail business selling multi-brand digital luxury goods in 122 countries, detracted from the Fund’s performance during the fiscal year. The company announced an unexpected acquisition of New Guards Group, owner ofOff-White, which seemed to surprise investors. This acquisition gives Farfetch exclusive rights to sellOff-White goods, attracting a younger demographic and adding exposure to this demographic for its other customers. Additionally, Farfetch announced it faced greater headwinds from increased promotions by both offline and online retailers. This pressure is expected to be temporary, lasting two to four quarters, as brands withdraw inventory from the wholesale channel and continue to accelerate supply growth at Farfetch. Lastly, the company announced the departure of its chief operating officer. While each of these events can be reasonably explained, we
2
believe the combination of these negative events in a single quarter has impaired management’s credibility in its first year as a public company. We remain optimistic about Farfetch’s long-term opportunity to be the primary destination for online, multi-brand shopping in the luxury segment, but are carefully evaluating recent events.
LiveRamp Holdings Inc., a global technology and enablement-services company, also detracted from the Fund’s performance during the fiscal year. Despite slightly disappointing earnings, we believe recent stock weakness can be partly attributed to concerns about upcoming changes to Google Chrome’s security policy. That said, the absence of third-party cookie data as a result of changes in security policy should increase the relative value of first-party data for marketers. Further, the company announced that it had agreed to acquire Data Plus Math Corp., raising questions among investors about execution risk. Although we remain untroubled on its merits, we will monitor the acquisition. We continue to believe that LiveRamp Holdings is well positioned to drive value over the long term given the combination of new management, an attractivesoftware-as-a-service (SaaS) data platform, and a strong balance sheet with excess cash.
Chewy Inc., an online retailer of pet food and otherpet-related products, was purchased during the fiscal year and contributed to the Fund’s performance. The stock went public to significant investor interest due to its strong brand recognition, subscription-heavy model, and brand and industry barriers to new entrants into the space. We like the high reoccurring revenue frompet-product sales and what we view as Chewy’s competitive position in thepet-supply area. While profit margins are low today as Chewy invests in fulfillment and brand recognition, we see the upside potential over time to financial metrics and
to the stock as customer lifetime value grows with each new customer.
Applied Materials Inc., the global leader in providing equipment for advanced semiconductors and flat-panel displays, added to the Fund’s performance during the12-month period. The sector drifted higher on stronger foundry investment from Taiwanese semiconductor manufacturer TSMC, signs of a bottom in the NAND flash memory market (flash memory is a type of nonvolatile storage technology that does not require power to retain data). Additionally, management provided positive commentary on market-share gains in 2020. We remain confident that Applied Materials is undervalued by the market and is attractively positioned in a consolidating sector with high barriers to entry.
Charter Communications Inc., a cable telecommunications company, also contributed to the Fund’s performance. The company continues to report strong earnings driven by broadband-subscriber additions that are well above consensus. Charter Communications generated margin expansion of earnings before interest, taxes, depreciation, and amortization (EBITDA), driven by the economically accretive mix shift towards broadband and declines in capital intensity. We believe these trends support our thesis and should continue to do so for the foreseeable future. The stock remains undervalued versus our intrinsic business value estimate even with strongyear-to-date stock performance. Overall, we like the company’s cable business given the structurally high barriers to entry, limited competition in broadband, inherent long-term pricing power, and the fact that it directly benefits from the durable and inexorable secular trends underlying consumer high-speed data consumption.
The Fund used foreign currency exchange contracts to facilitate the purchase and sale of
3
Portfolio management review
Delaware Select Growth Fund
equities traded on international exchanges. The effect of these contracts on performance was immaterial.
The markets’ generally positive bias, albeit with bouts of caution, enhances our desire as “intrinsic value” investors to be somewhat contrarian by leaning into lower-duration growth stocks and reallocating to newer ideas and holdings that we believe have more idiosyncratic fundamental drivers and/or trade at a bigger discount to intrinsic business value.
Regardless of the economic outcome, we remain consistent in our long-term investment philosophy: We want to own what we view as strong secular-growth companies with solid business models and competitive positions that we believe can grow market share and have the potential to deliver shareholder value in a variety of market environments.
4
| | |
| Performance summary | | |
Delaware Select Growth Fund | | October 31, 2019 (Unaudited) |
The performance quoted represents past performance and does not guarantee future results. Investment return and principal value of an investment will fluctuate so that shares, when redeemed, may be worth more or less than their original cost. Current performance may be lower or higher than the performance quoted. Performance data current to the most recent month end may be obtained by calling 800523-1918 or visiting delawarefunds.com/performance.
| | | | | | | | | | |
| Fund and benchmark performance1,2 | | Average annual total returns through October 31, 2019 | |
| | | 1 year | | 5 year | | 10 year | | Lifetime | |
Class A (Est. May 16, 1994) | | | | | | | | | | |
Excluding sales charge | | +11.42% | | +7.78% | | +13.02% | | | +10.12 | % |
Including sales charge | | +5.03% | | +6.52% | | +12.35% | | | +9.86 | % |
Class C (Est. May 20, 1994) | | | | | | | | | | |
Excluding sales charge | | +10.61% | | +6.98% | | +12.18% | | | +9.30 | % |
Including sales charge | | +9.88% | | +6.98% | | +12.18% | | | +9.30 | % |
Class R (Est. June 2, 2003) | | | | | | | | | | |
Excluding sales charge | | +11.17% | | +7.52% | | +12.74% | | | +8.96 | % |
Including sales charge | | +11.17% | | +7.52% | | +12.74% | | | +8.96 | % |
Institutional Class (Est. Aug. 28, 1997) | | | | | | | | | | |
Excluding sales charge | | +11.71% | | +8.06% | | +13.31% | | | +8.31 | % |
Including sales charge | | +11.71% | | +8.06% | | +13.31% | | | +8.31 | % |
Russell 3000 Growth Index | | +16.34% | | +13.05% | | +15.26% | | | +7.44 | %* |
*The benchmark lifetime return is for Institutional Class share comparison only and is calculated using the last business day in the month of the Fund’s Institutional Class inception date.
1Returns reflect the reinvestment of all distributions and are presented both with and without the applicable sales charges described below. Returns do not reflect the deduction of taxes the shareholder would pay on Fund distributions or redemptions of Fund shares.
Expense limitations were in effect for certain classes during some or all of the periods shown in the “Fund and benchmark performance” table. Expenses for each class are listed on the “Fund expense ratios” table on page 6. Performance would have been lower had expense limitations not been in effect.
Institutional Class shares are not subject to a sales charge and are offered for sale exclusively to certain eligible investors. In addition, Institutional Class shares pay no distribution and service(12b-1) fee.
Class A shares are sold with a maximumfront-end sales charge of 5.75%, and have an annual12b-1 fee of 0.25% of average daily net assets. Performance for Class A shares, excluding sales charges, assumes that nofront-end sales charge applied.
Class C shares are sold with a contingent deferred sales charge of 1.00% if redeemed during the first 12 months. They are also subject to an annual12b-1 fee of 1.00% of average daily net assets. Performance for Class C shares, excluding sales charges, assumes either that contingent deferred sales charges did not apply or that the investment was not redeemed.
Class R shares are available only for certain retirement plan products. They are sold without a sales charge and have an annual12b-1 fee of 0.50% of average daily net assets.
5
Performance summary
Delaware Select Growth Fund
Investments in small and/ormedium-sized companies typically exhibit greater risk and higher volatility than larger, more established companies.
International investments entail risks not ordinarily associated with US investments including fluctuation in currency values, differences in
accounting principles, or economic or political instability in other nations.
Investing in emerging markets can be riskier than investing in established foreign markets due to increased volatility and lower trading volume.
2 The Fund’s expense ratios, as described in the most recent prospectus, are disclosed in the following “Fund expense ratios” table. Delaware Management Company has agreed to reimburse certain expenses and/or waive certain fees in order to prevent total annual fund operating expenses (excluding any12b-1 fees, acquired fund fees and expenses, taxes, interest, short sale and dividend and interest expenses, brokerage fees, certain insurance costs, and nonroutine expenses or costs, including, but not limited to, those relating to reorganizations, litigation, conducting shareholder meetings, and liquidations) from exceeding 1.00% of the Fund’s average daily net assets during the period from Nov. 1, 2018 to Oct. 31, 2019.** Please see the most recent prospectus and any applicable supplement(s) for additional information on these fee waivers and/or reimbursements. Please see the “Financial highlights” section in this report for the most recent expense ratios.
| | | | | | | | |
| Fund expense ratios | | Class A | | Class C | | Class R | | Institutional Class |
Total annual operating expenses | | 1.24% | | 1.99% | | 1.49% | | 0.99% |
(without fee waivers) | | | | | | | | |
Net expenses | | 1.24% | | 1.99% | | 1.49% | | 0.99% |
(including fee waivers, if any) | | | | | | | | |
Type of waiver | | n/a | | n/a | | n/a | | n/a |
**The aggregate contractual waiver period covering this report is from Feb. 28, 2018 through Feb. 28, 2020.
6
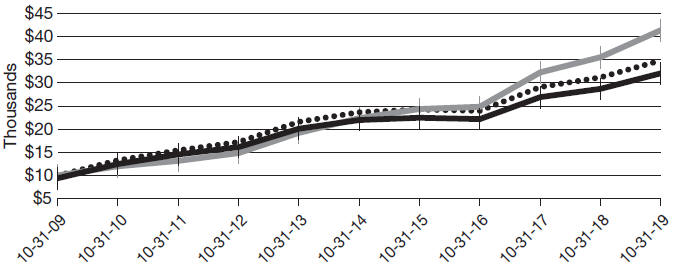
Performance of a $10,000 investment1
Average annual total returns from Oct. 31, 2009 through Oct. 31, 2019
| | | | | | | | | | |
For the period beginning Oct. 31, 2009 through Oct. 31, 2019 | | Starting value | | | Ending value | |
 | | Russell 3000 Growth Index | | | $10,000 | | | | $41,393 | |
| | | |

| | Delaware Select Growth Fund — Institutional Class shares | | | $10,000 | | | | $34,876 | |
| | | |

| | Delaware Select Growth Fund — Class A shares | | | $9,425 | | | | $32,051 | |
1 The “Performance of a $10,000 investment” graph assumes $10,000 invested in Institutional Class and Class A shares of the Fund on Oct. 31, 2009, and includes the effect of a 5.75%front-end sales charge (for Class A shares) and the reinvestment of all distributions. The graph does not reflect the deduction of taxes the shareholders would pay on Fund distributions or redemptions of Fund shares. Expense limitations were in effect for some or all of the periods shown. Performance would have been lower had expense limitations not been in effect. Expenses are listed in the “Fund expense ratios” table on page 6. Please note additional details on pages 5 through 8.
The graph also assumes $10,000 invested in the Russell 3000 Growth Index as of Oct. 31, 2009. The Russell 3000 Growth Index measures the performance of the broad growth segment of the US equity universe. It includes those Russell 3000
companies with higherprice-to-book ratios and higher forecasted growth values.
The S&P 500 Index, mentioned on page 1, measures the performance of 500 mostlylarge-cap stocks weighted by market value, and is often used to represent performance of the US stock market.
The MSCI EAFE (Europe, Australasia, Far East) Index, mentioned on page 1, represents large- andmid-cap stocks across 21 developed markets, excluding the United States and Canada. The index covers approximately 85% of the free float-adjusted market capitalization in each country. Index “net” return approximates the minimum possible dividend reinvestment, after deduction of withholding tax at the highest possible rate.
The MSCI Emerging Markets Index, mentioned on page 1, represents large- andmid-cap stocks across emerging market countries worldwide. The
7
Performance summary
Delaware Select Growth Fund
index covers approximately 85% of the free float-adjusted market capitalization in each country. Index “net” return approximates the minimum possible dividend reinvestment, after deduction of withholding tax at the highest possible rate.
Frank Russell Company is the source and owner of the trademarks, service marks and copyrights related to the Russell Indexes. Russell® is a trademark of Frank Russell Company.
Index performance returns do not reflect any management fees, transaction costs, or expenses. Indices are unmanaged and one cannot invest directly in an index.Past performance is not a guarantee of future results.
Performance of other Fund classes will vary due to different charges and expenses.
| | | | | | |
| | | | |
| | | Nasdaq symbols | | CUSIPs | | |
Class A | | DVEAX | | 928931104 | | |
Class C | | DVECX | | 928931203 | | |
Class R | | DFSRX | | 928931740 | | |
Institutional Class | | VAGGX | | 928931757 | | |
8
Disclosure of Fund expenses
For thesix-month period from May 1, 2019 to October 31, 2019 (Unaudited)
As a shareholder of the Fund, you incur two types of costs: (1) transaction costs, including sales charges (loads) on purchase payments, reinvested dividends, or other distributions; redemption fees; and exchange fees; and (2) ongoing costs, including management fees; distribution and service(12b-1) fees; and other Fund expenses. This example is intended to help you understand your ongoing costs (in dollars) of investing in the Fund and to compare these costs with the ongoing costs of investing in other mutual funds.
The example is based on an investment of $1,000 invested at the beginning of the period and held for the entiresix-month period from May 1, 2019 to Oct. 31, 2019.
Actual expenses
The first section of the table shown, “Actual Fund return,” provides information about actual account values and actual expenses. You may use the information in this section of the table, together with the amount you invested, to estimate the expenses that you paid over the period. Simply divide your account value by $1,000 (for example, an $8,600 account value divided by $1,000 = 8.6), then multiply the result by the number in the first section under the heading entitled “Expenses Paid During Period” to estimate the expenses you paid on your account during this period.
Hypothetical example for comparison purposes
The second section of the table shown, “Hypothetical 5% return,” provides information about hypothetical account values and hypothetical expenses based on the Fund’s actual expense ratio and an assumed rate of return of 5% per year before expenses, which is not the Fund’s actual return. The hypothetical account values and expenses may not be used to estimate the actual ending account balance or expenses you paid for the period. You may use this information to compare the ongoing costs of investing in the Fund and other funds. To do so, compare this 5% hypothetical example with the 5% hypothetical examples that appear in the shareholder reports of the other funds.
Please note that the expenses shown in the table are meant to highlight your ongoing costs only and do not reflect any transactional costs, such as sales charges (loads), redemption fees, or exchange fees. Therefore, the second section of the table is useful in comparing ongoing costs only, and will not help you determine the relative total costs of owning different funds. In addition, if these transactional costs were included, your costs would have been higher. The Fund’s expenses shown in the table reflect fee waivers in effect and assume reinvestment of all dividends and distributions.
9
Disclosure of Fund expenses
For the six-month period from May 1, 2019 to October 31, 2019 (Unaudited)
Delaware Select Growth Fund
Expense analysis of an investment of $1,000
| | | | | | | | | | | | | | | | | | | | |
| | | Beginning Account Value 5/1/19 | | Ending Account Value 10/31/19 | | Annualized Expense Ratio | | Expenses Paid During Period 5/1/19 to 10/31/19* |
| | | | |
Actual Fund return† | | | | | | | | | | | | | | | | | | | | |
Class A | | | | $1,000.00 | | | | | $985.10 | | | | | 1.25 | % | | | | $6.25 | |
Class C | | | | 1,000.00 | | | | | 981.70 | | | | | 2.00 | % | | | | 9.99 | |
Class R | | | | 1,000.00 | | | | | 984.10 | | | | | 1.50 | % | | | | 7.50 | |
Institutional Class | | | | 1,000.00 | | | | | 986.40 | | | | | 1.00 | % | | | | 5.01 | |
| | |
Hypothetical 5% return(5% return before expenses) | | | | | | | | | | | |
Class A | | | | $1,000.00 | | | | | $1,018.90 | | | | | 1.25 | % | | | | $6.36 | |
Class C | | | | 1,000.00 | | | | | 1,015.12 | | | | | 2.00 | % | | | | 10.16 | |
Class R | | | | 1,000.00 | | | | | 1,017.64 | | | | | 1.50 | % | | | | 7.63 | |
Institutional Class | | | | 1,000.00 | | | | | 1,020.16 | | | | | 1.00 | % | | | | 5.09 | |
*“Expenses Paid During Period” are equal to the Fund’s annualized expense ratio, multiplied by the average account value over the period, multiplied by 184/365 (to reflect theone-half year period).
†Because actual returns reflect only the most recentsix-month period, the returns shown may differ significantly from fiscal year returns.
In addition to the Fund’s expenses reflected above, the Fund also indirectly bears its portion of the fees and expenses of the investment companies (Underlying Funds) in which it invests. The table above does not reflect the expenses of the Underlying Funds.
10
Security type / sector allocation and top 10 equity holdings
Delaware Select Growth Fund | As of October 31, 2019 (Unaudited) |
Sector designations may be different than the sector designations presented in other Fund materials. The sector designations may represent the investment manager’s internal sector classifications.
| | | | |
| Security type / sector | | Percentage of net assets |
Common Stocks² | | | 98.76 | % |
Communication Services | | | 19.04 | % |
Consumer Discretionary | | | 13.92 | % |
Consumer Staples | | | 2.53 | % |
Energy | | | 0.28 | % |
Financials | | | 8.32 | % |
Healthcare | | | 11.78 | % |
Industrials | | | 4.69 | % |
Materials | | | 3.59 | % |
Real Estate | | | 1.38 | % |
Technology | | | 33.23 | % |
Short-Term Investments | | | 1.41 | % |
Total Value of Securities | | | 100.17 | % |
Liabilities Net of Receivables and Other Assets | | | (0.17 | %) |
Total Net Assets | | | 100.00 | % |
| ² | Narrow industries are utilized for compliance purposes for diversification whereas broad sectors are used for financial reporting. |
To monitor compliance with the Fund’s concentration guidelines as described in the Fund’s prospectus and statement of additional information, the Technology sector (as disclosed herein for financial reporting purposes) is subdivided into a variety of “industries” (in accordance with the requirements of the Investment Company Act of 1940, as amended). The Technology sector consisted of commercial services, computers, diversified financial services, Internet, semiconductors, software, and telecommunications. As of Oct. 31, 2019 such amounts, as a percentage of total net assets, were 6.76%, 3.60%, 4.85%, 1.24%, 1.64%, 13.62%, and 1.52%, respectively. The percentage in any such single industry will comply with the Fund’s concentration policy even if the percentage in the Technology sector for financial reporting purposes may exceed 25%.
11
Security type / sector allocation and top 10 equity holdings
Delaware Select Growth Fund
Holdings are for informational purposes only and are subject to change at any time. They are not a recommendation to buy, sell, or hold any security.
| | |
| Top 10 equity holdings | | Percentage of net assets |
Microsoft | | 8.37% |
New York Times Class A | | 7.56% |
LiveRamp Holdings | | 5.00% |
Ball | | 3.59% |
KKR & Co. Class A | | 3.58% |
Charter Communications Class A | | 3.34% |
Dollar Tree | | 3.23% |
IQVIA Holdings | | 2.97% |
Varonis Systems | | 2.92% |
Autodesk | | 2.73% |
12
Schedule of investments
Delaware Select Growth Fund | October 31, 2019 |
| | | | | | | | |
| | | Number of shares | | | Value (US $) | |
| |
Common Stock – 98.76%² | | | | | | | | |
| |
Communication Services – 19.04% | | | | | | | | |
Alphabet Class A † | | | 824 | | | $ | 1,037,251 | |
Alphabet Class C † | | | 824 | | | | 1,038,331 | |
Charter Communications Class A † | | | 20,646 | | | | 9,659,438 | |
GCI Liberty Class A † | | | 22,675 | | | | 1,586,797 | |
Liberty Global Class C † | | | 167,979 | | | | 4,009,659 | |
Liberty TripAdvisor Holdings Class A † | | | 328,942 | | | | 3,174,290 | |
Netflix † | | | 12,114 | | | | 3,481,685 | |
New York Times Class A | | | 708,903 | | | | 21,905,103 | |
Take-Two Interactive Software † | | | 55,022 | | | | 6,621,898 | |
TripAdvisor † | | | 54,101 | | | | 2,185,680 | |
Ubisoft Entertainment † | | | 7,568 | | | | 446,845 | |
| | | | | | | | |
| | | | | | | 55,146,977 | |
| | | | | | | | |
Consumer Discretionary – 13.92% | | | | | | | | |
Afya Class A † | | | 8,592 | | | | 231,984 | |
Arco Platform Class A † | | | 13,141 | | | | 545,351 | |
Chewy Class A † | | | 91,467 | | | | 2,256,491 | |
Dollar Tree † | | | 84,675 | | | | 9,348,120 | |
Domino’s Pizza | | | 3,412 | | | | 926,767 | |
Dunkin’ Brands Group | | | 23,808 | | | | 1,871,785 | |
Farfetch Class A † | | | 151,475 | | �� | | 1,352,672 | |
Hasbro | | | 74,696 | | | | 7,268,668 | |
Papa John’s International | | | 99,254 | | | | 5,811,322 | |
Stitch Fix Class A † | | | 236,636 | | | | 5,409,499 | |
Wyndham Hotels & Resorts | | | 97,933 | | | | 5,285,444 | |
| | | | | | | | |
| | | | | | | 40,308,103 | |
| | | | | | | | |
Consumer Staples – 2.53% | | | | | | | | |
Constellation Brands Class A | | | 38,555 | | | | 7,338,173 | |
| | | | | | | | |
| | | | | | | 7,338,173 | |
| | | | | | | | |
Energy – 0.28% | | | | | | | | |
Kinder Morgan | | | 41,181 | | | | 822,796 | |
| | | | | | | | |
| | | | | | | 822,796 | |
| | | | | | | | |
Financials – 8.32% | | | | | | | | |
Charles Schwab | | | 175,874 | | | | 7,159,830 | |
CME Group | | | 29,879 | | | | 6,147,604 | |
KKR & Co. Class A | | | 359,512 | | | | 10,364,731 | |
LendingTree † | | | 1,137 | | | | 409,149 | |
| | | | | | | | |
| | | | | | | 24,081,314 | |
| | | | | | | | |
Healthcare – 11.78% | | | | | | | | |
ABIOMED † | | | 6,781 | | | | 1,407,600 | |
Biogen † | | | 10,108 | | | | 3,019,361 | |
Haemonetics † | | | 18,070 | | | | 2,181,591 | |
13
Schedule of investments
Delaware Select Growth Fund
| | | | | | | | |
| | | Number of shares | | | Value (US $) | |
| |
Common Stock²(continued) | | | | | | | | |
| |
Healthcare(continued) | | | | | | | | |
HealthEquity † | | | 70,412 | | | $ | 3,998,697 | |
Illumina † | | | 18,367 | | | | 5,427,816 | |
IQVIA Holdings † | | | 59,541 | | | | 8,598,911 | |
Nevro † | | | 5,036 | | | | 434,103 | |
Portola Pharmaceuticals † | | | 71,871 | | | | 2,077,791 | |
UnitedHealth Group | | | 27,550 | | | | 6,961,885 | |
| | | | | | | | |
| | | | | | | 34,107,755 | |
| | | | | | | | |
Industrials – 4.69% | | | | | | | | |
Airbus | | | 15,795 | | | | 2,262,268 | |
Expeditors International of Washington | | | 27,820 | | | | 2,029,191 | |
Experian | | | 37,764 | | | | 1,187,719 | |
IHS Markit † | | | 28,370 | | | | 1,986,467 | |
Safran | | | 22,104 | | | | 3,496,970 | |
Waste Management | | | 23,291 | | | | 2,613,483 | |
| | | | | | | | |
| | | | | | | 13,576,098 | |
| | | | | | | | |
Materials – 3.59% | | | | | | | | |
Ball | | | 148,645 | | | | 10,400,691 | |
| | | | | | | | |
| | | | | | | 10,400,691 | |
| | | | | | | | |
Real Estate – 1.38% | | | | | | | | |
Crown Castle International | | | 7,541 | | | | 1,046,615 | |
Equity Commonwealth | | | 19,968 | | | | 642,570 | |
Redfin † | | | 133,392 | | | | 2,319,687 | |
| | | | | | | | |
| | | | | | | 4,008,872 | |
| | | | | | | | |
Technology – 33.23% | | | | | | | | |
Alibaba Group Holding ADR † | | | 6,663 | | | | 1,177,152 | |
Amadeus IT Group | | | 5,628 | | | | 416,410 | |
Applied Materials | | | 41,243 | | | | 2,237,845 | |
Arista Networks † | | | 18,015 | | | | 4,405,929 | |
ASML Holding | | | 4,126 | | | | 1,081,406 | |
Autodesk † | | | 53,707 | | | | 7,914,263 | |
Coupa Software † | | | 4,114 | | | | 565,634 | |
Guidewire Software † | | | 10,294 | | | | 1,160,546 | |
IPG Photonics † | | | 4,499 | | | | 604,126 | |
j2 Global | | | 31,593 | | | | 3,000,071 | |
LiveRamp Holdings † | | | 370,489 | | | | 14,482,415 | |
Logitech International | | | 48,332 | | | | 1,977,374 | |
Mastercard Class A | | | 23,721 | | | | 6,566,210 | |
Microsoft | | | 169,130 | | | | 24,248,168 | |
Paycom Software † | | | 2,205 | | | | 466,424 | |
PayPal Holdings † | | | 44,736 | | | | 4,657,018 | |
SailPoint Technologies Holding † | | | 29,165 | | | | 564,634 | |
14
| | | | | | | | |
| | | Number of shares | | | Value (US $) | |
| |
Common Stock²(continued) | | | | | | | | |
| |
Technology(continued) | | | | | | | | |
Samsung Electronics | | | 19,162 | | | $ | 830,087 | |
ServiceNow † | | | 6,126 | | | | 1,514,715 | |
Varonis Systems † | | | 118,171 | | | | 8,455,135 | |
Visa Class A | | | 41,807 | | | | 7,477,600 | |
Wix.com † | | | 19,772 | | | | 2,413,568 | |
| | | | | | | | |
| | | | | | | 96,216,730 | |
| | | | | | | | |
Total Common Stock(cost $245,930,678) | | | | | | | 286,007,509 | |
| | | | | | | | |
| | |
| | | | | | | | |
| |
Short-Term Investments – 1.41% | | | | | | | | |
| |
Money Market Mutual Funds – 1.41% | | | | | | | | |
BlackRock FedFund - Institutional Shares(seven-day effective yield 1.72%) | | | 814,457 | | | | 814,457 | |
Fidelity Investments Money Market Government Portfolio - Class I(seven-day effective yield 1.72%) | | | 814,458 | | | | 814,458 | |
GS Financial Square Government Fund - Institutional Shares(seven-day effective yield 1.71%) | | | 814,458 | | | | 814,458 | |
Morgan Stanley Government Portfolio - Institutional Share Class(seven-day effective yield 1.72%) | | | 814,458 | | | | 814,458 | |
State Street Institutional US Government Money Market Fund - Investor Class(seven-day effective yield 1.67%) | | | 814,458 | | | | 814,458 | |
| | | | | | | | |
Total Short-Term Investments(cost $4,072,289) | | | | | | | 4,072,289 | |
| | | | | | | | |
| | |
Total Value of Securities – 100.17%
(cost $250,002,967) | | | | | | $ | 290,079,798 | |
| | | | | | | | |
| ² | Narrow industries are utilized for compliance purposes for diversification whereas broad sectors are used for financial reporting. |
| † | Non-income producing security. |
Summary of abbreviations:
ADR – American Depositary Receipt
GS – Goldman Sachs
See accompanying notes, which are an integral part of the financial statements.
15
| | |
| Statement of assets and liabilities |
Delaware Select Growth Fund | | October 31, 2019 |
| | | | |
Assets: | | | | |
Investments, at value1 | | $ | 290,079,798 | |
Receivable for securities sold | | | 144,760 | |
Foreign tax reclaims receivable | | | 92,011 | |
Dividends and interest receivable | | | 81,739 | |
Receivable for fund shares sold | | | 57,768 | |
| | | | |
Total assets | | | 290,456,076 | |
| | | | |
Liabilities: | | | | |
Payable for securities purchased | | | 391,731 | |
Investment management fees payable to affiliates | | | 178,051 | |
Payable for fund shares redeemed | | | 107,018 | |
Dividend disbursing and transfer agent fees and expenses payable tonon-affiliates | | | 61,548 | |
Distribution fees payable to affiliates | | | 57,696 | |
Other accrued expenses | | | 35,214 | |
Reports and statements to shareholders expenses payable tonon-affiliates | | | 32,070 | |
Dividend disbursing and transfer agent fees and expenses payable to affiliates | | | 2,160 | |
Accounting and administration expenses payable to affiliates | | | 1,154 | |
Trustees’ fees and expenses payable to affiliates | | | 891 | |
Legal fees payable to affiliates | | | 427 | |
Reports and statements to shareholders expenses payable to affiliates | | | 294 | |
| | | | |
Total liabilities | | | 868,254 | |
| | | | |
Total Net Assets | | $ | 289,587,822 | |
| | | | |
| |
Net Assets Consist of: | | | | |
Paid-in capital | | $ | 229,656,700 | |
Total distributable earnings (loss) | | | 59,931,122 | |
| | | | |
Total Net Assets | | $ | 289,587,822 | |
| | | | |
16
| | | | |
Net Asset Value | | | | |
Class A: | | | | |
Net assets | | $ | 231,410,339 | |
Shares of beneficial interest outstanding, unlimited authorization, no par | | | 6,865,892 | |
Net asset value per share | | $ | 33.70 | |
Sales charge | | | 5.75 | % |
Offering price per share, equal to net asset value per share / (1 – sales charge) | | $ | 35.76 | |
| |
Class C: | | | | |
Net assets | | $ | 9,578,240 | |
Shares of beneficial interest outstanding, unlimited authorization, no par | | | 470,244 | |
Net asset value per share | | $ | 20.37 | |
| |
Class R: | | | | |
Net assets | | $ | 2,881,357 | |
Shares of beneficial interest outstanding, unlimited authorization, no par | | | 93,257 | |
Net asset value per share | | $ | 30.90 | |
| |
Institutional Class: | | | | |
Net assets | | $ | 45,717,886 | |
Shares of beneficial interest outstanding, unlimited authorization, no par | | | 1,209,177 | |
Net asset value per share | | $ | 37.81 | |
| |
1Investments, at cost | | $ | 250,002,967 | |
See accompanying notes, which are an integral part of the financial statements.
17
Statement of operations
Delaware Select Growth Fund | Year ended October 31, 2019 |
| | | | |
Investment Income: | | | | |
Dividends | | $ | 2,301,012 | |
Interest | | | 55,763 | |
Foreign tax withheld | | | (33,469 | ) |
| | | | |
| | | 2,323,306 | |
| | | | |
Expenses: | | | | |
Management fees | | | 2,255,378 | |
Distribution expenses — Class A | | | 594,748 | |
Distribution expenses — Class C | | | 119,934 | |
Distribution expenses — Class R | | | 17,949 | |
Dividend disbursing and transfer agent fees and expenses | | | 384,771 | |
Accounting and administration expenses | | | 93,106 | |
Registration fees | | | 80,197 | |
Reports and statements to shareholders expenses | | | 64,181 | |
Legal fees | | | 39,702 | |
Audit and tax fees | | | 36,926 | |
Custodian fees | | | 21,450 | |
Trustees’ fees and expenses | | | 18,212 | |
Other | | | 22,528 | |
| | | | |
| | | 3,749,082 | |
Less expenses waived | | | (7,569 | ) |
Less expenses paid indirectly | | | (2,418 | ) |
| | | | |
Total operating expenses | | | 3,739,095 | |
| | | | |
Net Investment Loss | | | (1,415,789 | ) |
| | | | |
| |
Net Realized and Unrealized Gain (Loss): | | | | |
Net realized gain (loss) on: | | | | |
Investments | | | 23,365,063 | |
Foreign currencies | | | (29,609 | ) |
Foreign currency exchange contracts | | | (4,696 | ) |
| | | | |
Net realized gain | | | 23,330,758 | |
| | | | |
Net change in unrealized appreciation (depreciation) of: | | | | |
Investments | | | 10,661,994 | |
Foreign currencies | | | 13,558 | |
Foreign currency exchange contracts | | | 4,058 | |
| | | | |
Net change in unrealized appreciation (depreciation) | | | 10,679,610 | |
| | | | |
Net Realized and Unrealized Gain | | | 34,010,368 | |
| | | | |
Net Increase in Net Assets Resulting from Operations | | $ | 32,594,579 | |
| | | | |
See accompanying notes, which are an integral part of the financial statements.
18
This page intentionally left blank.
Statements of changes in net assets
Delaware Select Growth Fund
| | | | | | | | |
| | | Year ended | |
| | | 10/31/19 | | | 10/31/18 | |
Increase (Decrease) in Net Assets from Operations: | | | | | | | | |
Net investment loss | | $ | (1,415,789 | ) | | $ | (1,567,732 | ) |
Net realized gain | | | 23,330,758 | | | | 77,896,100 | |
Net change in unrealized appreciation (depreciation) | | | 10,679,610 | | | | (47,713,387 | ) |
| | | | | | | | |
Net increase in net assets resulting from operations | | | 32,594,579 | | | | 28,614,981 | |
| | | | | | | | |
| | |
Dividends and Distributions to Shareholders from: | | | | | | | | |
Distributable earnings: | | | | | | | | |
Class A | | | (57,743,174 | ) | | | (13,284,528 | ) |
Class C | | | (4,583,459 | ) | | | (3,396,155 | ) |
Class R | | | (1,037,563 | ) | | | (291,213 | ) |
Institutional Class | | | (10,974,061 | ) | | | (5,317,098 | ) |
| | | | | | | | |
| | | (74,338,257 | ) | | | (22,288,994 | ) |
| | | | | | | | |
| | |
Capital Share Transactions: | | | | | | | | |
Proceeds from shares sold: | | | | | | | | |
Class A | | | 5,585,208 | | | | 31,571,991 | |
Class C | | | 192,623 | | | | 478,378 | |
Class R | | | 472,527 | | | | 621,092 | |
Institutional Class | | | 7,040,232 | | | | 10,198,960 | |
| | |
Net asset value of shares based upon reinvestment of dividends and distributions: | | | | | | | | |
Class A | | | 56,868,379 | | | | 13,034,709 | |
Class C | | | 4,468,307 | | | | 3,354,158 | |
Class R | | | 1,031,887 | | | | 288,244 | |
Institutional Class | | | 10,841,155 | | | | 5,243,724 | |
| | | | | | | | |
| | | 86,500,318 | | | | 64,791,256 | |
| | | | | | | | |
20
| | | | | | | | |
| | | Year ended | |
| | | 10/31/19 | | | 10/31/18 | |
Capital Share Transactions (continued): | | | | | | | | |
Cost of shares redeemed: | | | | | | | | |
Class A | | $ | (40,320,309 | ) | | $ | (42,282,478 | ) |
Class C | | | (5,531,390 | ) | | | (35,721,542 | ) |
Class R | | | (2,066,114 | ) | | | (1,737,760 | ) |
Institutional Class | | | (16,405,588 | ) | | | (72,842,025 | ) |
| | | | | | | | |
| | | (64,323,401 | ) | | | (152,583,805 | ) |
| | | | | | | | |
Increase (Decrease) in net assets derived from capital share transactions | | | 22,176,917 | | | | (87,792,549 | ) |
| | | | | | | | |
Net Decrease in Net Assets | | | (19,566,761 | ) | | | (81,466,562 | ) |
Net Assets: | | | | | | | | |
Beginning of year | | $ | 309,154,583 | | | $ | 390,621,145 | |
| | | | | | | | |
End of year | | $ | 289,587,822 | | | $ | 309,154,583 | |
| | | | | | | | |
See accompanying notes, which are an integral part of the financial statements.
21
Financial highlights
Delaware Select Growth Fund Class A
Selected data for each share of the Fund outstanding throughout each period were as follows:
|
Net asset value, beginning of period |
|
Income (loss) from investment operations: |
Net investment income (loss)1 |
Net realized and unrealized gain (loss) |
Total from investment operations |
|
Less dividends and distributions from: |
Net investment income |
Net realized gain |
Total dividends and distributions |
|
Net asset value, end of period |
|
Total return2 |
|
Ratios and supplemental data: |
Net assets, end of period (000 omitted) |
Ratio of expenses to average net assets |
Ratio of expenses to average net assets prior to fees waived |
Ratio of net investment income (loss) to average net assets |
Ratio of net investment income (loss) to average net assets prior to fees waived |
Portfolio turnover |
| 1 | The average shares outstanding method has been applied for per share information. | |
| 2 | Total return is based on the change in net asset value of a share during the period and assumes reinvestment of dividends and distributions at net asset value and does not reflect the impact of a sales charge. Total return during some of the periods shown reflects a waiver by the manager. Performance would have been lower had the waiver not been in effect. | |
See accompanying notes, which are an integral part of the financial statements.
22
| | | | | | | | | | | | | | | | | | | | | | | | | | | | | | | | | | | | | | |
| | | | Year ended | |
| | | | | | |
| | | | 10/31/19 | | | | | | 10/31/18 | | | | | | 10/31/17 | | | | | | 10/31/16 | | | | | | 10/31/15 | |
| | |
| | | | $ | 39.74 | | | | | | | $ | 39.46 | | | | | | | $ | 37.68 | | | | | | | $ | 47.82 | | | | | | | $ | 52.44 | |
| | | | | | | | | |
| | | | | (0.16 | ) | | | | | | | (0.17 | ) | | | | | | | (0.14 | ) | | | | | | | (0.11 | ) | | | | | | | 0.05 | |
| | | | | 3.75 | | | | | | | | 2.69 | | | | | | | | 7.13 | | | | | | | | (0.31 | ) | | | | | | | 1.20 | |
| | | | | | | | | | | | | | | | | | | | | | | | | | | | | | | | | | | | | | |
| | | | | 3.59 | | | | | | | | 2.52 | | | | | | | | 6.99 | | | | | | | | (0.42 | ) | | | | | | | 1.25 | |
| | | | | | | | | | | | | | | | | | | | | | | | | | | | | | | | | | | | | | |
| | | | | | | | | |
| | | | | — | | | | | | | | — | | | | | | | | — | | | | | | | | — | | | | | | | | (0.09 | ) |
| | | | | (9.63 | ) | | | | | | | (2.24 | ) | | | | | | | (5.21 | ) | | | | | | | (9.72 | ) | | | | | | | (5.78 | ) |
| | | | | | | | | | | | | | | | | | | | | | | | | | | | | | | | | | | | | | |
| | | | | | (9.63 | ) | | | | | | | (2.24 | ) | | | | | | | (5.21 | ) | | | | | | | (9.72 | ) | | | | | | | (5.87 | ) |
| | | | | | | | | | | | | | | | | | | | | | | | | | | | | | | | | | | | | | |
| | | | | | | | | |
| | | | $ | 33.70 | | | | | | | $ | 39.74 | | | | | | | $ | 39.46 | | | | | | | $ | 37.68 | | | | | | | $ | 47.82 | |
| | | | | | | | | | | | | | | | | | | | | | | | | | | | | | | | | | | | | | |
| | | | | | | | | |
| | | | | 11.42% | | | | | | | | 6.84% | | | | | | | | 21.43% | | | | | | | | (1.63% | ) | | | | | | | 2.31% | |
| | | | | | | | | |
| | | | $ | 231,410 | | | | | | | $ | 241,009 | | | | | | | $ | 237,363 | | | | | | | $ | 253,027 | | | | | | | $ | 348,846 | |
| | | | | 1.25% | | | | | | | | 1.24% | | | | | | | | 1.25% | | | | | | | | 1.26% | | | | | | | | 1.25% | |
| | | | | | | | | |
| | | | | 1.25% | | | | | | | | 1.24% | | | | | | | | 1.28% | | | | | | | | 1.28% | | | | | | | | 1.25% | |
| | | | | (0.48% | ) | | | | | | | (0.42% | ) | | | | | | | (0.39% | ) | | | | | | | (0.30% | ) | | | | | | | 0.09% | |
| | | | | | | | | |
| | | | | (0.48% | ) | | | | | | | (0.42% | ) | | | | | | | (0.42% | ) | | | | | | | (0.32% | ) | | | | | | | 0.09% | |
| | | | | 48% | | | | | | | | 51% | | | | | | | | 35% | | | | | | | | 33% | | | | | | | | 46% | |
| | |
23
Financial highlights
Delaware Select Growth Fund Class C
Selected data for each share of the Fund outstanding throughout each period were as follows:
|
| |
Net asset value, beginning of period |
|
Income (loss) from investment operations: |
Net investment loss1 |
Net realized and unrealized gain (loss) |
Total from investment operations |
|
Less dividends and distributions from: |
Net realized gain |
Total dividends and distributions |
|
Net asset value, end of period |
|
Total return2 |
|
Ratios and supplemental data: |
Net assets, end of period (000 omitted) |
Ratio of expenses to average net assets |
Ratio of expenses to average net assets prior to fees waived |
Ratio of net investment loss to average net assets |
Ratio of net investment loss to average net assets prior to fees waived |
Portfolio turnover |
| 1 | The average shares outstanding method has been applied for per share information. |
| 2 | Total return is based on the change in net asset value of a share during the period and assumes reinvestment of dividends and distributions at net asset value and does not reflect the impact of a sales charge. Total return during some of the periods shown reflects a waiver by the manager. Performance would have been lower had the waiver not been in effect. |
See accompanying notes, which are an integral part of the financial statements.
24
| | | | | | | | | | | | | | | | | | | | | | | | | | | | |
| | | Year ended | |
| | | 10/31/19 | | | | | 10/31/18 | | | | | 10/31/17 | | | | | 10/31/16 | | | | | 10/31/15 | |
| |
| | $ | 27.92 | | | | | $ | 28.60 | | | | | $ | 28.91 | | | | | $ | 39.13 | | | | | $ | 44.16 | |
| | | | | | | | | |
| | | (0.25 | ) | | | | | (0.33 | ) | | | | | (0.30 | ) | | | | | (0.31 | ) | | | | | (0.27 | ) |
| | | 2.33 | | | | | | 1.89 | | | | | | 5.20 | | | | | | (0.19 | ) | | | | | 1.02 | |
| | | | | | | | | | | | | | | | | | | | | | | | | | | | |
| | | 2.08 | | | | | | 1.56 | | | | | | 4.90 | | | | | | (0.50 | ) | | | | | 0.75 | |
| | | | | | | | | | | | | | | | | | | | | | | | | | | | |
| | | | | | | | | |
| | | (9.63 | ) | | | | | (2.24 | ) | | | | | (5.21 | ) | | | | | (9.72 | ) | | | | | (5.78 | ) |
| | | | | | | | | | | | | | | | | | | | | | | | | | | | |
| | | (9.63 | ) | | | | | (2.24 | ) | | | | | (5.21 | ) | | | | | (9.72 | ) | | | | | (5.78 | ) |
| | | | | | | | | | | | | | | | | | | | | | | | | | | | |
| | | | | | | | | |
| | $ | 20.37 | | | | | $ | 27.92 | | | | | $ | 28.60 | | | | | $ | 28.91 | | | | | $ | 39.13 | |
| | | | | | | | | | | | | | | | | | | | | | | | | | | | |
| | | | | | | | | |
| | | 10.61% | | | | | | 6.02% | | | | | | 20.57% | | | | | | (2.36% | ) | | | | | 1.52% | |
| | | | | | | | | |
| | $ | 9,578 | | | | | $ | 13,759 | | | | | $ | 44,775 | | | | | $ | 60,815 | | | | | $ | 87,833 | |
| | | 2.00% | | | | | | 1.99% | | | | | | 2.00% | | | | | | 2.01% | | | | | | 2.00% | |
| | | | | | | | | |
| | | 2.00% | | | | | | 1.99% | | | | | | 2.03% | | | | | | 2.03% | | | | | | 2.00% | |
| | | (1.23% | ) | | | | | (1.17% | ) | | | | | (1.14% | ) | | | | | (1.05% | ) | | | | | (0.66% | ) |
| | | | | | | | | |
| | | (1.23% | ) | | | | | (1.17% | ) | | | | | (1.17% | ) | | | | | (1.07% | ) | | | | | (0.66% | ) |
| | | 48% | | | | | | 51% | | | | | | 35% | | | | | | 33% | | | | | | 46% | |
|
| |
25
Financial highlights
Delaware Select Growth Fund Class R
Selected data for each share of the Fund outstanding throughout each period were as follows:
|
Net asset value, beginning of period |
|
Income (loss) from investment operations: |
Net investment loss1 |
Net realized and unrealized gain (loss) |
Total from investment operations |
|
Less dividends and distributions from: |
Net realized gain |
Total dividends and distributions |
|
Net asset value, end of period |
|
Total return2 |
|
Ratios and supplemental data: |
Net assets, end of period (000 omitted) |
Ratio of expenses to average net assets |
Ratio of expenses to average net assets prior to fees waived |
Ratio of net investment loss to average net assets |
Ratio of net investment loss to average net assets prior to fees waived |
Portfolio turnover |
| 1 | The average shares outstanding method has been applied for per share information. | |
| 2 | Total return is based on the change in net asset value of a share during the period and assumes reinvestment of dividends and distributions at net asset value. Total return during some of the periods shown reflects a waiver by the manager. Performance would have been lower had the waiver not been in effect. | |
See accompanying notes, which are an integral part of the financial statements.
26
| | | | | | | | | | | | | | | | | | | | | | | | | | | | |
| | | Year ended | |
| | | 10/31/19 | | | | | 10/31/18 | | | | | 10/31/17 | | | | | 10/31/16 | | | | | 10/31/15 | |
| |
| | $ | 37.29 | | | | | $ | 37.26 | | | | | $ | 35.94 | | | | | $ | 46.15 | | | | | $ | 50.83 | |
| | | | | | | | | |
| | | (0.22 | ) | | | | | (0.25 | ) | | | | | (0.22 | ) | | | | | (0.20 | ) | | | | | (0.08 | ) |
| | | 3.46 | | | | | | 2.52 | | | | | | 6.75 | | | | | | (0.29 | ) | | | | | 1.18 | |
| | | | | | | | | | | | | | | | | | | | | | | | | | | | |
| | | 3.24 | | | | | | 2.27 | | | | | | 6.53 | | | | | | (0.49 | ) | | | | | 1.10 | |
| | | | | | | | | | | | | | | | | | | | | | | | | | | | |
| | | | | | | | | |
| | | (9.63 | ) | | | | | (2.24 | ) | | | | | (5.21 | ) | | | | | (9.72 | ) | | | | | (5.78 | ) |
| | | | | | | | | | | | | | | | | | | | | | | | | | | | |
| | | (9.63 | ) | | | | | (2.24 | ) | | | | | (5.21 | ) | | | | | (9.72 | ) | | | | | (5.78 | ) |
| | | | | | | | | | | | | | | | | | | | | | | | | | | | |
| | | | | | | | | |
| | $ | 30.90 | | | | | $ | 37.29 | | | | | $ | 37.26 | | | | | $ | 35.94 | | | | | $ | 46.15 | |
| | | | | | | | | | | | | | | | | | | | | | | | | | | | |
| | | | | | | | | |
| | | 11.17% | | | | | | 6.55% | | | | | | 21.16% | | | | | | (1.87% | ) | | | | | 2.02% | |
| | | | | | | | | |
| | $ | 2,882 | | | | | $ | 4,100 | | | | | $ | 4,913 | | | | | $ | 11,487 | | | | | $ | 18,766 | |
| | | 1.50% | | | | | | 1.49% | | | | | | 1.50% | | | | | | 1.51% | | | | | | 1.50% | |
| | | | | | | | | |
| | | 1.50% | | | | | | 1.49% | | | | | | 1.53% | | | | | | 1.53% | | | | | | 1.50% | |
| | | (0.73% | ) | | | | | (0.67% | ) | | | | | (0.64% | ) | | | | | (0.55% | ) | | | | | (0.16% | ) |
| | | | | | | | | |
| | | (0.73% | ) | | | | | (0.67% | ) | | | | | (0.67% | ) | | | | | (0.57% | ) | | | | | (0.16% | ) |
| | | 48% | | | | | | 51% | | | | | | 35% | | | | | | 33% | | | | | | 46% | |
|
| |
27
Financial highlights
Delaware Select Growth Fund Institutional Class
Selected data for each share of the Fund outstanding throughout each period were as follows:
|
Net asset value, beginning of period |
|
Income (loss) from investment operations: |
Net investment income (loss)1 |
Net realized and unrealized gain (loss) |
Total from investment operations |
|
Less dividends and distributions from: |
Net investment income |
Net realized gain |
Total dividends and distributions |
|
Net asset value, end of period |
|
Total return2 |
|
Ratios and supplemental data: |
Net assets, end of period (000 omitted) |
Ratio of expenses to average net assets |
Ratio of expenses to average net assets prior to fees waived |
Ratio of net investment income (loss) to average net assets |
Ratio of net investment income (loss) to average net assets prior to fees waived |
Portfolio turnover |
| 1 | The average shares outstanding method has been applied for per share information. | |
| 2 | Total return is based on the change in net asset value of a share during the period and assumes reinvestment of dividends and distributions at net asset value. Total return during some of the periods shown reflects a waiver by the manager. Performance would have been lower had the waiver not been in effect. | |
See accompanying notes, which are an integral part of the financial statements.
28
| | | | | | | | | | | | | | | | | | | | | | | | | | | | |
| | | Year ended | |
| | | 10/31/19 | | | | | 10/31/18 | | | | | 10/31/17 | | | | | 10/31/16 | | | | | 10/31/15 | |
| |
| | $ | 43.34 | | | | | $ | 42.73 | | | | | $ | 40.27 | | | | | $ | 50.35 | | | | | $ | 54.92 | |
| | | | | | | | | |
| | | (0.08 | ) | | | | | (0.07 | ) | | | | | (0.05 | ) | | | | | (0.02 | ) | | | | | 0.18 | |
| | | 4.18 | | | | | | 2.92 | | | | | | 7.72 | | | | | | (0.34 | ) | | | | | 1.25 | |
| | | | | | | | | | | | | | | | | | | | | | | | | | | | |
| | | 4.10 | | | | | | 2.85 | | | | | | 7.67 | | | | | | (0.36 | ) | | | | | 1.43 | |
| | | | | | | | | | | | | | | | | | | | | | | | | | | | |
| | | | | | | | | |
| | | — | | | | | | — | | | | | | — | | | | | | — | | | | | | (0.22 | ) |
| | | (9.63 | ) | | | | | (2.24 | ) | | | | | (5.21 | ) | | | | | (9.72 | ) | | | | | (5.78 | ) |
| | | | | | | | | | | | | | | | | | | | | | | | | | | | |
| | | (9.63 | ) | | | | | (2.24 | ) | | | | | (5.21 | ) | | | | | (9.72 | ) | | | | | (6.00 | ) |
| | | | | | | | | | | | | | | | | | | | | | | | | | | | |
| | | | | | | | | |
| | $ | 37.81 | | | | | $ | 43.34 | | | | | $ | 42.73 | | | | | $ | 40.27 | | | | | $ | 50.35 | |
| | | | | | | | | | | | | | | | | | | | | | | | | | | | |
| | | | | | | | | |
| | | 11.71% | | | | | | 7.10% | | | | | | 21.76% | | | | | | (1.37% | ) | | | | | 2.54% | |
| | | | | | | | | |
| | $ | 45,718 | | | | | $ | 50,287 | | | | | $ | 103,570 | | | | | $ | 170,029 | | | | | $ | 422,581 | |
| | | 1.00% | | | | | | 0.99% | | | | | | 1.00% | | | | | | 1.01% | | | | | | 1.00% | |
| | | | | | | | | |
| | | 1.00% | | | | | | 0.99% | | | | | | 1.03% | | | | | | 1.03% | | | | | | 1.00% | |
| | | (0.23% | ) | | | | | (0.17% | ) | | | | | (0.14% | ) | | | | | (0.05% | ) | | | | | 0.34% | |
| | | | | | | | | |
| | | (0.23% | ) | | | | | (0.17% | ) | | | | | (0.17% | ) | | | | | (0.07% | ) | | | | | 0.34% | |
| | | 48% | | | | | | 51% | | | | | | 35% | | | | | | 33% | | | | | | 46% | |
|
| |
29
| | |
| Notes to financial statements | | |
| Delaware Select Growth Fund | | October 31, 2019 |
Voyageur Mutual Funds III (Trust) is organized as a Delaware statutory trust and offers one series: Delaware Select Growth Fund (Fund). The Fund is anopen-end investment company. The Fund is considered diversified under the Investment Company Act of 1940, as amended, and offers Class A, Class C, Class R, and Institutional Class shares. Class A shares are sold with a maximumfront-end sales charge of 5.75%. Class A share purchases of $1,000,000 or more will incur a contingent deferred sales charge (CDSC) instead of afront-end sales charge of 1.00%, if redeemed during the first year, and 0.50% during the second year, provided that Delaware Distributors, L.P. (DDLP) paid a financial advisor a commission on the purchase of those shares. Class C shares are sold with a CDSC of 1.00%, which will be incurred if redeemed during the first 12 months. Class R and Institutional Class shares are not subject to a sales charge and are offered for sale exclusively to certain eligible investors.
The investment objective of the Fund is to seek long-term capital appreciation.
1. Significant Accounting Policies
The Fund follows accounting and reporting guidance under Financial Accounting Standards Board (FASB) Accounting Standards Codification Topic 946, Financial Services – Investment Companies. The following accounting policies are in accordance with US generally accepted accounting principles (US GAAP) and are consistently followed by the Fund.
Security Valuation— Equity securities, except those traded on the Nasdaq Stock Market LLC (Nasdaq), are valued at the last quoted sales price as of the time of the regular close of the New York Stock Exchange on the valuation date. Equity securities traded on the Nasdaq are valued in accordance with the Nasdaq Official Closing Price, which may not be the last sales price. If, on a particular day, an equity security does not trade, the mean between the bid and ask prices will be used, which approximates fair value. Equity securities listed on a foreign exchange are normally valued at the last quoted sales price on the valuation date. US government and agency securities are valued at the mean between the bid and ask prices, which approximates fair value. Investments in repurchase agreements are generally valued at par, which approximates fair value, each business day.Open-end investment companies are valued at their published net asset value (NAV). Foreign currency exchange contracts and foreign cross currency exchange contracts are valued at the mean between the bid and ask prices, which approximates fair value. Interpolated values are derived when the settlement date of the contract is an interim date for which quotations are not available. Generally, other securities and assets for which market quotations are not readily available are valued at fair value as determined in good faith under the direction of the Trust’s Board of Trustees (Board). In determining whether market quotations are readily available or fair valuation will be used, various factors will be taken into consideration, such as market closures or suspension of trading in a security. The Fund may use fair value pricing more frequently for securities traded primarily innon-US markets because, among other things, most foreign markets close well before the Fund values its securities, generally as of 4:00pm Eastern time. The earlier close of these foreign markets gives rise to the possibility that significant events, including broad market moves, government actions or pronouncements, aftermarket trading, or news events may have occurred in the interim. Whenever such a significant event occurs, the Fund may value foreign securities using fair value prices based on third-party vendor modeling tools (international fair value pricing). Restricted securities are valued at fair value using methods approved by the Board.
30
Federal and Foreign Income Taxes— No provision for federal income taxes has been made as the Fund intends to continue to qualify for federal income tax purposes as a regulated investment company under Subchapter M of the Internal Revenue Code of 1986, as amended, and make the requisite distributions to shareholders. The Fund evaluates tax positions taken or expected to be taken in the course of preparing the Fund’s tax returns to determine whether the tax positions are“more-likely-than-not” of being sustained by the applicable tax authority. Tax positions not deemed to meet the“more-likely-than-not” threshold are recorded as a tax benefit or expense in the current year. Management has analyzed the Fund’s tax positions taken or expected to be taken on the Fund’s federal income tax returns through the year ended Oct. 31, 2019 and for all open tax years (years ended Oct. 31, 2016–Oct. 31, 2018), and has concluded that no provision for federal income tax is required in the Fund’s financial statements. If applicable, the Fund recognizes interest accrued on unrecognized tax benefits in interest expense and penalties in “Other expenses” on the “Statement of operations.” During the year ended Oct. 31, 2019, the Fund did not incur any interest or tax penalties. In regard to foreign taxes only, the Fund has open tax years in certain foreign countries in which it invests in that may date back to the inception of the Fund.
Class Accounting— Investment income, common expenses, and realized and unrealized gain (loss) on investments are allocated to the various classes of the Fund on the basis of daily net assets of each class. Distribution expenses relating to a specific class are charged directly to that class.
Repurchase Agreements— The Fund may purchase certain US government securities subject to the counterparty’s agreement to repurchase them at an agreed upon date and price. The counterparty will be required on a daily basis to maintain the value of the collateral subject to the agreement at not less than the repurchase price (including accrued interest). The agreements are conditioned upon the collateral being deposited under the Federal Reserve book-entry system with the Fund’s custodian or a third-partysub-custodian. In the event of default or bankruptcy by the other party to the agreement, retention of the collateral may be subject to legal proceedings. At Oct. 31, 2019, the Fund held no investments in repurchase agreements.
Foreign Currency Transactions— Transactions denominated in foreign currencies are recorded at the prevailing exchange rates on the valuation date in accordance with the Fund’s prospectus. The value of all assets and liabilities denominated in foreign currencies is translated daily into US dollars at the exchange rate of such currencies against the US dollar. Transaction gains or losses resulting from changes in exchange rates during the reporting period or upon settlement of the foreign currency transaction are reported in operations for the current period. The Fund generally does not bifurcate that portion of realized gains and losses on investments which is due to changes in foreign exchange rates from that which is due to changes in market prices. These gains and losses are included on the “Statement of operations” under “Net realized gain (loss) on investments.” The Fund reports certain foreign currency related transactions as components of realized gains (losses) for financial reporting purposes, whereas such components are treated as ordinary income (loss) for federal income tax purposes.
31
Notes to financial statements
Delaware Select Growth Fund
1. Significant Accounting Policies (continued)
Use of Estimates— The preparation of financial statements in conformity with US GAAP requires management to make estimates and assumptions that affect the fair value of investments, the reported amounts of assets and liabilities and disclosure of contingent assets and liabilities at the date of the financial statements, and the reported amounts of revenues and expenses during the reporting period. Actual results could differ from those estimates and the differences could be material.
Other— Expenses directly attributable to the Fund are charged directly to the Fund. Other expenses common to various funds within the Delaware Funds® by Macquarie (Delaware Funds) are generally allocated among such funds on the basis of average net assets. Management fees and certain other expenses are paid monthly. Security transactions are recorded on the date the securities are purchased or sold (trade date) for financial reporting purposes. Costs used in calculating realized gains and losses on the sale of investment securities are those of the specific securities sold. Dividend income is recorded on theex-dividend date and interest income is recorded on the accrual basis. Discounts and premiums on debt securities are accreted or amortized to interest income, respectively, over the lives of the respective securities using the effective interest method. Taxablenon-cash dividends are recorded as dividend income. Distributions received from investments in real estate investment trusts (REITs) are recorded as dividend income on theex-dividend date, subject to reclassification upon notice of the character of such distributions by the issuer. Foreign dividends are also recorded on theex-dividend date or as soon after theex-dividend date that the Fund is aware of such dividends, net of all tax withholdings, a portion of which may be reclaimable. Withholding taxes and reclaims on foreign dividends have been recorded in accordance with the Fund’s understanding of the applicable country’s tax rules and rates. The Fund declares and pays dividends from net investment income and distributions from net realized gain on investments, if any, annually. The Fund may distribute more frequently, if necessary for tax purposes. Dividends and distributions, if any, are recorded on theex-dividend date.
The Fund receives earnings credits from its custodian when positive cash balances are maintained, which may be used to offset custody fees. The expenses paid under this arrangement are included on the “Statement of operations” under “Custodian fees” with the corresponding expenses offset included under “Less expenses paid indirectly.” For the year ended Oct. 31, 2019, the Fund earned $1,504 under this arrangement.
The Fund receives earnings credits from its transfer agent when positive cash balances are maintained, which may be used to offset transfer agent fees. If the amount earned is greater than $1, the expenses paid under this arrangement are included on the “Statement of operations” under “Dividend disbursing and transfer agent fees and expenses” with the corresponding expenses offset included under “Less expenses paid indirectly.” For the year ended Oct. 31, 2019, the Fund earned $914 under this arrangement.
2. Investment Management, Administration Agreements, and Other Transactions with Affiliates
In accordance with the terms of its investment management agreement, the Fund pays Delaware Management Company (DMC), a series of Macquarie Investment Management Business Trust and the investment manager, an annual fee which is calculated daily and paid monthly at the rates of 0.75% on
32
the first $500 million of average daily net assets of the Fund, 0.70% on the next $500 million, 0.65% on the next $1.5 billion, and 0.60% on average daily net assets in excess of $2.5 billion.
DMC has contractually agreed to waive that portion if any, of its management fee and/or pay/reimburse the Fund to the extent necessary to ensure that total annual fund operating expenses (excluding any distribution and service(12b-1) fees, acquired funds fees and expenses, taxes, interest, short sale, dividend and interest expenses, brokerage fees, certain insurance costs, and nonroutine expenses or costs, including, but not limited to those relating to reorganizations, litigation, conducting shareholder meetings, and liquidations) do not exceed 1.00% of the Fund’s average daily net assets from Nov. 1, 2018 through Oct. 31, 2019.* For purposes of these waivers and reimbursements, nonroutine expenses may also include such additional costs and expenses as may be agreed upon from time to time by the Board and DMC. These expense waivers and reimbursements apply to expenses paid directly to the Fund and may only be terminated by agreement of DMC and the Fund. The waivers and reimbursements are accrued daily and received monthly.
Jackson Square Partners, LLC (JSP), a related party of DMC, furnishes investmentsub-advisory services to the Fund. For these services, DMC, not the Fund, pays JSP fees based on the aggregate average daily net assets of the Fund at the following annual rates: 0.450% of the first $500 million; 0.420% of the next $500 million; 0.390% of the next $1.5 billion; and 0.360% of aggregate average daily net assets in excess of $2.5 billion.
Effective May 30, 2019, DMC may permit its affiliates, Macquarie Investment Management Global Limited (MIMGL) and Macquarie Funds Management Hong Kong Limited (together, the “AffiliatedSub-Advisors”), to execute Fund equity security trades on behalf of the Manager. The Manager may also seek quantitative support from MIMGL. Although the AffiliatedSub-Advisors serve assub-advisors, DMC has ultimate responsibility for all investment advisory services. For these services, DMC, not the Fund, may pay each AffiliatedSub-Advisor a portion of its investment management fee.
Delaware Investments Fund Services Company (DIFSC), an affiliate of DMC, provides fund accounting and financial administrative oversight services to the Fund. For these services, DIFSC’s fees are calculated daily and paid monthly based on the aggregate daily net assets of all funds within the Delaware Funds at the following annual rates: 0.00475% of the first $35 billion; 0.0040% of the next $10 billion; and 0.0025% of aggregate average daily net assets in excess of $45 billion (Total Fee). Each fund in the Delaware Funds pays a minimum of $4,000, which, in aggregate, is subtracted from the Total Fee. Each fund then pays its portion of the remainder of the Total Fee on a relative NAV basis. This amount is included on the “Statement of operations” under “Accounting and administration expenses.” For the year ended Oct. 31, 2019, the Fund was charged $15,284 for these services.
DIFSC is also the transfer agent and dividend disbursing agent of the Fund. For these services, DIFSC’s fees are calculated daily and paid monthly based on the aggregate daily net assets of the retail funds within the Delaware Funds at the following annual rates: 0.014% of the first $20 billion; 0.011% of the next $5 billion; 0.007% of the next $5 billion; 0.005% of the next $20 billion; and 0.0025% of average daily net assets in excess of $50 billion. The fees payable to DIFSC under the shareholder services agreement described above are allocated among all retail funds in the Delaware Funds on a relative NAV basis. This amount is included on the “Statement of operations” under “Dividend disbursing and transfer agent fees and expenses.” For the year ended Oct. 31, 2019, the Fund was charged $29,565 for these
33
Notes to financial statements
Delaware Select Growth Fund
2. Investment Management, Administration Agreements, and Other Transactions with Affiliates (continued)
services. Pursuant to asub-transfer agency agreement between DIFSC and BNY Mellon Investment Servicing (US) Inc. (BNYMIS), BNYMIS provides certainsub-transfer agency services to the Fund.Sub-transfer agency fees are paid by the Fund and are also included on the “Statement of operations” under “Dividend disbursing and transfer agent fees and expenses.” The fees that are calculated daily and paid as invoices are received on a monthly or quarterly basis.
Pursuant to a distribution agreement and distribution plan, the Fund pays DDLP, the distributor and an affiliate of DMC, an annual12b-1 fees of 0.25% of the average daily net assets of the Class A shares, 1.00% of the average daily net assets of the Class C shares, and 0.50% of the average daily net assets of the Class R shares. The fees are calculated daily and paid monthly. Institutional Class shares do not pay12b-1 fees.
As provided in the investment management agreement, the Fund bears a portion of the cost of certain resources shared with DMC, including the cost of internal personnel of DMC and/or its affiliates that provide legal, tax, and regulatory reporting services to the Fund. For the year ended Oct. 31, 2019, the Fund was charged $8,254 for internal legal, tax, and regulatory reporting services provided by DMC and/or its affiliates’ employees. This amount is included on the “Statement of operations” under “Legal fees.”
For the year ended Oct. 31, 2019, DDLP earned $6,718 for commissions on sales of the Fund’s Class A shares. For the year ended Oct. 31, 2019, DDLP received gross CDSC commissions of $144 and $59 on redemptions of the Fund’s Class A and Class C shares, respectively, and these commissions were entirely used to offset upfront commissions previously paid by DDLP to broker/dealers on sales of those shares.
Trustees’ fees include expenses accrued by the Fund for each Trustee’s retainer and meeting fees. Certain officers of DMC, DIFSC, and DDLP are officers and/or Trustees of the Trust. These officers and Trustees are paid no compensation by the Fund.
In addition to the management fees and other expenses of the Fund, the Fund indirectly bears the investment management fees and other expenses of the investment companies (Underlying Funds) in which it invests. The amount of these fees and expenses incurred indirectly by the Fund will vary based upon the expense and fee levels of the Underlying Funds and the number of shares that are owned of the Underlying Funds at different times.
*The aggregate contractual waiver period covering this report is from Feb. 28, 2018 through Feb. 28, 2020.
3. Investments
For the year ended Oct. 31, 2019, the Fund made purchases and sales of investment securities other than short-term investments as follows:
| | | | |
Purchases | | $ | 143,183,338 | |
Sales | | | 191,743,560 | |
34
The tax cost of investments includes adjustments to net unrealized appreciation (depreciation) which may not necessarily be final tax cost basis adjustments, but approximate the tax basis unrealized gains and losses that may be realized and distributed to shareholders. At Oct. 31, 2019, the cost and unrealized appreciation (depreciation) of investments for federal income tax purposes for the Fund were as follows:
| | | | |
Cost of investments | | $ | 250,182,657 | |
| | | | |
Aggregate unrealized appreciation of investments | | $ | 60,559,810 | |
Aggregate unrealized depreciation of investments | | | (20,662,669 | ) |
| | | | |
Net unrealized appreciation of investments | | $ | 39,897,141 | |
| | | | |
US GAAP defines fair value as the price that the Fund would receive to sell an asset or pay to transfer a liability in an orderly transaction between market participants at the measurement date under current market conditions. A three-level hierarchy for fair value measurements has been established based upon the transparency of inputs to the valuation of an asset or liability. Inputs may be observable or unobservable and refer broadly to the assumptions that market participants would use in pricing the asset or liability. Observable inputs reflect the assumptions market participants would use in pricing the asset or liability based on market data obtained from sources independent of the reporting entity. Unobservable inputs reflect the reporting entity’s own assumptions about the assumptions that market participants would use in pricing the asset or liability based on the best information available under the circumstances. The Fund’s investment in its entirety is assigned a level based upon the observability of the inputs which are significant to the overall valuation. The three-level hierarchy of inputs is summarized below.
| | |
| Level 1 – | | Inputs are quoted prices in active markets for identical investments. (Examples: equity securities,open-end investment companies, futures contracts, and exchange-traded options contracts) |
| |
| Level 2 – | | Other observable inputs, including, but not limited to: quoted prices for similar assets or liabilities in markets that are active, quoted prices for identical or similar assets or liabilities in markets that are not active, inputs other than quoted prices that are observable for the assets or liabilities (such as interest rates, yield curves, volatilities, prepayment speeds, loss severities, credit risks, and default rates) or other market-corroborated inputs. (Examples: debt securities, government securities, swap contracts, foreign currency exchange contracts, foreign securities utilizing international fair value pricing, broker-quoted securities, and fair valued securities) |
| |
| Level 3 – | | Significant unobservable inputs, including the Fund’s own assumptions used to determine the fair value of investments. (Examples: broker-quoted securities and fair valued securities) |
Level 3 investments are valued using significant unobservable inputs. The Fund may also use an income-based valuation approach in which the anticipated future cash flows of the investment are discounted to calculate fair value. Discounts may also be applied due to the nature or duration of any restrictions on the disposition of the investments. Valuations may also be based upon current market prices of securities that are comparable in coupon, rating, maturity, and industry. The derived value of a Level 3 investment may not represent the value which is received upon disposition and this could impact the results of operations.
35
Notes to financial statements
Delaware Select Growth Fund
3. Investments (continued)
The following table summarizes the valuation of the Fund’s investments by fair value hierarchy levels as of Oct. 31, 2019:
| | | | |
| | | Level 1 | |
| |
Securities | | | | |
Assets: | | | | |
Common Stock | | | | |
Communication Services | | $ | 55,146,977 | |
Consumer Discretionary | | | 40,308,103 | |
Consumer Staples | | | 7,338,173 | |
Energy | | | 822,796 | |
Financials | | | 24,081,314 | |
Healthcare | | | 34,107,755 | |
Industrials | | | 13,576,098 | |
Materials | | | 10,400,691 | |
Real Estate | | | 4,008,872 | |
Technology | | | 96,216,730 | |
Short-Term Investments | | | 4,072,289 | |
| | | | |
Total Value of Securities | | $ | 290,079,798 | |
| | | | |
During the year ended Oct. 31, 2019, there were no transfers between Level 1 investments, Level 2 investments, or Level 3 investments that had a significant impact to the Fund. This does not include transfers between Level 1 investments and Level 2 investments due to the Fund utilizing international fair value pricing during the period. In accordance with the fair valuation procedures described in Note 1, international fair value pricing of securities in the Fund occurs when market volatility exceeds an established rolling threshold. If the threshold is exceeded on a given date, then prices of international securities (those that traded on exchanges that close at a different time than the time that the Fund’s NAV is determined) are established using a separate pricing feed from a third-party vendor designed to establish a price for each such security as of the time that the Fund’s NAV is determined. Further, international fair value pricing uses other observable market-based inputs in place of the closing exchange price due to the events occurring after the close of the exchange or market on which the investment is principally traded, causing a change in classification between levels. International fair value pricing was not utilized at Oct. 31, 2019. The Fund’s policy is to recognize transfers between levels based on fair value at the beginning of the reporting period.
A reconciliation of Level 3 investments is presented when the Fund has a significant amount of Level 3 investments at the beginning, interim, or end of the period in relation to net assets. During the year ended Oct. 31, 2019, there were no Level 3 investments.
4. Dividend and Distribution Information
Income and long-term capital gain distributions are determined in accordance with federal income tax regulations, which may differ from US GAAP. Additionally, distributions from net gains on foreign currency transactions and net short-term gains on sales of investment securities are treated as ordinary
36
income for federal income tax purposes. The tax character of dividends and distributions paid during the years ended Oct. 31, 2019 and 2018 were as follows:
| | | | | | | | | | | | |
| | | Year ended | |
| | | 10/31/19 | | | | | | 10/31/18 | |
Ordinary income | | $ | 10,289,289 | | | | | | | $ | 3,158,529 | |
Long-term capital gain | | | 64,048,968 | | | | | | | | 19,130,465 | |
| | | | | | | | | | | | |
Total | | $ | 74,338,257 | | | | | | | $ | 22,288,994 | |
| | | | | | | | | | | | |
5. Components of Net Assets on a Tax Basis
As of Oct. 31, 2019, the components of net assets on a tax basis were as follow:
| | | | |
Shares of beneficial interest | | $ | 229,656,700 | |
Undistributed ordinary income | | | 2,097,330 | |
Undistributed long-term capital gain | | | 17,936,651 | |
Unrealized appreciation of investments and foreign currencies | | | 39,897,141 | |
| | | | |
Net assets | | $ | 289,587,822 | |
| | | | |
The difference between book basis and tax basis components of net assets is primarily attributable to tax deferral of losses on wash sales.
37
Notes to financial statements
Delaware Select Growth Fund
| | | | | | | | | | | | |
| 6. Capital Shares | | | | | | | | | | | | |
| | | |
Transactions in capital shares were as follows: | | | | | | | | | | | | |
| |
| | | Year ended | |
| | | 10/31/19 | | | | | | 10/31/18 | |
Shares sold: | | | | | | | | | | | | |
Class A | | | 168,743 | | | | | | | | 752,887 | |
Class C | | | 9,702 | | | | | | | | 16,716 | |
Class R | | | 14,527 | | | | | | | | 16,324 | |
Institutional Class | | | 184,373 | | | | | | | | 234,379 | |
| | | |
Shares issued upon reinvestment of dividends and distributions: | | | | | | | | | | | | |
Class A | | | 1,852,994 | | | | | | | | 354,414 | |
Class C | | | 239,316 | | | | | | | | 128,956 | |
Class R | | | 36,592 | | | | | | | | 8,333 | |
Institutional Class | | | 315,609 | | | | | | | | 131,060 | |
| | | | | | | | | | | | |
| | | 2,821,856 | | | | | | | | 1,643,069 | |
| | | | | | | | | | | | |
| | | |
Shares redeemed: | | | | | | | | | | | | |
Class A | | | (1,220,193 | ) | | | | | | | (1,057,971 | ) |
Class C | | | (271,595 | ) | | | | | | | (1,218,654 | ) |
Class R | | | (67,800 | ) | | | | | | | (46,589 | ) |
Institutional Class | | | (451,127 | ) | | | | | | | (1,629,156 | ) |
| | | | | | | | | | | | |
| | | (2,010,715 | ) | | | | | | | (3,952,370 | ) |
| | | | | | | | | | | | |
Net increase (decrease) | | | 811,141 | | | | | | | | (2,309,301 | ) |
| | | | | | | | | | | | |
Certain shareholders may exchange shares of one class for shares of another class in the same Fund. These exchange transactions are included as subscriptions and redemptions in the table above and on the “Statements of changes in net assets.” For the years ended Oct. 31, 2019 and 2018, the Fund had the following exchange transactions:
| | | | | | | | | | | | | | | | | | | | | | | | | | | | | | | | | | | | |
| | | Exchange Redemptions | | | | | | Exchange Subscriptions | | | | | | | |
| | | | | | | | | | | | | | | | | | | | | Institutional | | | | | | | |
| | | Class A | | | | | | Class C | | | | | | Class A | | | | | | Class | | | | | | | |
| Year ended | | Shares | | | | | | Shares | | | | | | Shares | | | | | | Shares | | | | | | Value | |
10/31/19 | | | 7,958 | | | | | | | | 27,796 | | | | | | | | 17,085 | | | | | | | | 7,112 | | | | | | | $ | 833,525 | |
10/31/18 | | | 5,022 | | | | | | | | 261,889 | | | | | | | | 181,915 | | | | | | | | 6,950 | | | | | | | | 7,977,617 | |
7. Line of Credit
The Fund, along with certain other funds in the Delaware Funds (Participants), was a participant in a revolving line of credit intended to be used for temporary or emergency purposes as an additional source of liquidity to fund redemptions of investor shares. The revolving line of credit available was reduced from $155,000,000 to $130,000,0000 on Sept. 6, 2018. Under the agreement, the Participants were charged an annual commitment fee of 0.15%, which was allocated across the Participants based on a weighted average of the respective net assets of each Participant. The Participants were permitted to borrow up to a maximum ofone-third of their net assets under the agreement. Each Participant was
38
individually, and not jointly, liable for its particular advances, if any, under the line of credit. The line of credit available under the agreement expired on Nov. 5, 2018.
On Nov. 5, 2018, the Participants entered into an amendment to the agreement for a $190,000,000 revolving line of credit. The revolving line of credit available was increased to $220,000,000 on Nov. 29, 2018. The revolving line of credit is to be used as described above and operates in substantially the same manner as the original agreement. The line of credit available under the agreement expires on Nov. 4, 2019.
The Fund had no amounts outstanding as of Oct. 31, 2019, or at any time during the year then ended.
8. Derivatives
US GAAP requires disclosures that enable investors to understand: (1) how and why an entity uses derivatives; (2) how they are accounted for; and (3) how they affect an entity’s results of operations and financial position.
Foreign Currency Exchange Contracts— The Fund may enter into foreign currency exchange contracts and foreign cross currency exchange contracts as a way of managing foreign exchange rate risk. The Fund may enter into these contracts to fix the US dollar value of a security that it has agreed to buy or sell for the period between the date the trade was entered into and the date the security is delivered and paid for. The Fund may also use these contracts to hedge the US dollar value of securities it already owns that are denominated in foreign currencies. In addition, the Fund may enter into these contracts to facilitate or expedite the settlement of portfolio transactions. The change in value is recorded as an unrealized gain or loss. When the contract is closed, a realized gain or loss is recorded equal to the difference between the value of the contract at the time it was opened and the value at the time it was closed.
The use of foreign currency exchange contracts and foreign cross currency exchange contracts does not eliminate fluctuations in the underlying prices of the securities, but does establish a rate of exchange that can be achieved in the future. Although foreign currency exchange contracts and foreign cross currency exchange contracts limit the risk of loss due to an unfavorable change in the value of the hedged currency, they also limit any potential gain that might result should the value of the currency change favorably. In addition, the Fund could be exposed to risks if the counterparties to the contracts are unable to meet the terms of their contracts. The Fund’s maximum risk of loss from counterparty credit risk is the value of its currency exchanged with the counterparty. The risk is generally mitigated by having a netting arrangement between the Fund and the counterparty and by the posting of collateral by the counterparty to the Fund to cover the Fund’s exposure to the counterparty.
During the year ended Oct. 31, 2019, the Fund entered into foreign currency exchange contracts to fix the US dollar value of a security between trade date and settle date.
During the year ended Oct. 31, 2019, the Fund experienced net realized gains or losses attributable to foreign currency holdings, which is disclosed on the “Statement of operations.”
39
Notes to financial statements
Delaware Select Growth Fund
8. Derivatives (continued)
Derivatives Generally.The table below summarizes the average balance of derivative holdings by the Fund during the year ended Oct. 31, 2019.
| | | | | | | | | | | | | | | | |
| | | Long Derivative | | | Short Derivative | |
| | | Volume | | | Volume | |
Foreign currency exchange contracts (average cost) | | | USD | | | | 16,460 | | | | USD | | | | 10,384 | |
9. Securities Lending
The Fund, along with other funds in the Delaware Funds, may lend its securities pursuant to a security lending agreement (Lending Agreement) with The Bank of New York Mellon (BNY Mellon). At the time a security is loaned, the borrower must post collateral equal to the required percentage of the market value of the loaned security, including any accrued interest. The required percentage is: (1) 102% with respect to US securities and foreign securities that are denominated and payable in US dollars; and (2) 105% with respect to foreign securities. With respect to each loan, if on any business day, the aggregate market value of securities collateral plus cash collateral held is less than the aggregate market value of the securities which are the subject of such loan, the borrower will be notified to provide additional collateral by the end of the following business day, which, together with the collateral already held, will be not less than the applicable initial collateral requirements for such security loan. If the aggregate market value of securities collateral and cash collateral held with respect to a security loan exceeds the applicable initial collateral requirement, upon the request of the borrower, BNY Mellon must return enough collateral to the borrower by the end of the following business day to reduce the value of the remaining collateral to the applicable initial collateral requirement for such security loan. As a result of the foregoing, the value of the collateral held with respect to a loaned security on any particular day, may be more or less than the value of the security on loan. The collateral percentage with respect to the market value of the loaned security is determined by the security lending agent.
Cash collateral received by each fund of the Trust is generally invested in a series of individual separate accounts, each corresponding to a fund. The investment guidelines permit each separate account to hold certain securities that would be considered eligible securities for a money market fund. Cash collateral received is generally invested in government securities; certain obligations issued by government sponsored enterprises; repurchase agreements collateralized by US Treasury securities; obligations issued by the central government of any Organization for Economic Cooperation and Development (OECD) country or its agencies, instrumentalities or establishments; obligations of supranational organizations; commercial paper, notes, bonds, and other debt obligations; certificates of deposit, time deposits, and other bank obligations; and asset-backed securities. The Fund can also accept US government securities and letters of credit(non-cash collateral) in connection with securities loans.
In the event of default or bankruptcy by the lending agent, realization and/or retention of the collateral may be subject to legal proceedings. In the event the borrower fails to return loaned securities and the collateral received is insufficient to cover the value of the loaned securities and provided such collateral shortfall is not the result of investment losses, the lending agent has agreed to pay the amount of the shortfall to the Fund or, at the discretion of the lending agent, replace the loaned securities. The Fund continues to record dividends or interest, as applicable, on the securities loaned and is subject to
40
changes in value of the securities loaned that may occur during the term of the loan. The Fund has the right under the Lending Agreement to recover the securities from the borrower on demand. With respect to security loans collateralized bynon-cash collateral, the Fund receives loan premiums paid by the borrower. With respect to security loans collateralized by cash collateral, the earnings from the collateral investments are shared among the Fund, the security lending agent, and the borrower. The Fund records security lending income net of allocations to the security lending agent and the borrower.
The Fund may incur investment losses as a result of investing securities lending collateral. This could occur if an investment in the collateral investment account defaulted or became impaired. Under those circumstances, the value of the Fund’s cash collateral account may be less than the amount the Fund would be required to return to the borrowers of the securities and the Fund would be required to make up for this shortfall.
During the year ended Oct. 31, 2019, the Fund had no securities out on loan.
10. Credit and Market Risk
The Fund invested in growth stocks (such as those in the technology sector), which reflect projections of future earnings and revenue. These prices may rise or fall dramatically depending on whether those projections are met. These companies’ stock prices may be more volatile, particularly over the short term.
The Fund invests a significant portion of its assets in small- andmid-sized companies and may be subject to certain risks associated with ownership of securities of such companies. Investments in small- ormid-sized companies may be more volatile than investments in larger companies for a number of reasons, which include more limited financial resources or a dependence on narrow product lines.
Some countries in which the Fund may invest require governmental approval for the repatriation of investment income, capital, or the proceeds of sales of securities by foreign investors. In addition, if there is deterioration in a country’s balance of payments or for other reasons, a country may impose temporary restrictions on foreign capital remittances abroad.
The securities exchanges of certain foreign markets are substantially smaller, less liquid, and more volatile than the major securities markets in the United States. Consequently, acquisition and disposition of securities by the Fund may be inhibited. In addition, a significant portion of the aggregate market value of equity securities listed on the major securities exchanges in emerging markets is held by a smaller number of investors. This may limit the number of shares available for acquisition or disposition by the Fund.
The Fund may invest up to 15% of its net assets in illiquid securities, which may include securities with contractual restrictions on resale, securities exempt from registration under Rule 144A promulgated under the Securities Act of 1933, as amended, and other securities which may not be readily marketable. The relative illiquidity of these securities may impair the Fund from disposing of them in a timely manner and at a fair price when it is necessary or desirable to do so. While maintaining oversight, the Board has delegated to DMC theday-to-day functions of determining whether individual securities are liquid for purposes of the Fund’s limitation on investments in illiquid securities. Securities eligible for resale pursuant to Rule 144A, which are determined to be liquid, are not subject to the Fund’s 15% limit on
41
Notes to financial statements
Delaware Select Growth Fund
10. Credit and Market Risk (continued)
investments in illiquid securities. Rule 144A securities have been identified on the “Schedule of investments.” Restricted securities are valued pursuant to the security valuation procedures described in Note 1.
11. Contractual Obligations
The Fund enters into contracts in the normal course of business that contain a variety of indemnifications. The Fund’s maximum exposure under these arrangements is unknown. However, the Fund has not had prior claims or losses pursuant to these contracts. Management has reviewed the Fund’s existing contracts and expects the risk of loss to be remote.
12. Recent Accounting Pronouncements
In August 2018, the FASB issued an Accounting Standards Update (ASU), ASU2018-13, which changes certain fair value measurement disclosure requirements. The ASU2018-13, in addition to other modifications and additions, removes the requirement to disclose the amount and reasons for transfers between Level 1 and Level 2 of the fair value hierarchy, the policy for the timing of transfers between levels and the valuation process for Level 3 fair value measurements. The ASU2018-13 is effective for fiscal years, and interim periods within those fiscal years, beginning after Dec. 15, 2019. At this time, management is evaluating the implications of these changes on the financial statements.
13. Subsequent Events
On Nov. 4, 2019, the Fund, along with the other Participants, entered into an amendment to the agreement for a $250,000,000 revolving line of credit to be used as described in Note 7 and to be operated in substantially the same manner as the agreement described in Note 7. Under the amendment to the agreement, the Participants are charged an annual commitment fee of 0.15%, which is allocated across the Participants based on a weighted average of the respective net assets of each Participant. The line of credit available under the agreement expires on Nov. 2, 2020.
Management has determined that no other material events or transactions occurred subsequent to Oct. 31, 2019, that would require recognition or disclosure in the Fund’s financial statements.
42
Report of independent
registered public accounting firm
To the Board of Trustees of Voyageur Mutual Funds III
and Shareholders of Delaware Select Growth Fund
Opinion on the Financial Statements
We have audited the accompanying statement of assets and liabilities, including the schedule of investments, of Delaware Select Growth Fund (constituting Voyageur Mutual Funds III, referred to hereafter as the “Fund”) as of October 31, 2019, the related statement of operations for the year ended October 31, 2019, the statements of changes in net assets for each of the two years in the period ended October 31, 2019, including the related notes, and the financial highlights for each of the five years in the period ended October 31, 2019 (collectively referred to as the “financial statements”). In our opinion, the financial statements present fairly, in all material respects, the financial position of the Fund as of October 31, 2019, the results of its operations for the year then ended, the changes in its net assets for each of the two years in the period ended October 31, 2019 and the financial highlights for each of the five years in the period ended October 31, 2019 in conformity with accounting principles generally accepted in the United States of America.
Basis for Opinion
These financial statements are the responsibility of the Fund’s management. Our responsibility is to express an opinion on the Fund’s financial statements based on our audits. We are a public accounting firm registered with the Public Company Accounting Oversight Board (United States) (PCAOB) and are required to be independent with respect to the Fund in accordance with the U.S. federal securities laws and the applicable rules and regulations of the Securities and Exchange Commission and the PCAOB.
We conducted our audits of these financial statements in accordance with the standards of the PCAOB. Those standards require that we plan and perform the audit to obtain reasonable assurance about whether the financial statements are free of material misstatement, whether due to error or fraud.
Our audits included performing procedures to assess the risks of material misstatement of the financial statements, whether due to error or fraud, and performing procedures that respond to those risks. Such procedures included examining, on a test basis, evidence regarding the amounts and disclosures in the financial statements. Our audits also included evaluating the accounting principles used and significant estimates made by management, as well as evaluating the overall presentation of the financial statements. Our procedures included confirmation of securities owned as of October 31, 2019 by correspondence with the custodian, transfer agents and brokers; when replies were not received from brokers, we performed other auditing procedures. We believe that our audits provide a reasonable basis for our opinion.
/s/ PricewaterhouseCoopers LLP
Philadelphia, Pennsylvania
December 20, 2019
We have served as the auditor of one or more investment companies in Delaware Funds® by Macquarie since 2010.
43
Other Fund information (Unaudited)
Delaware Select Growth Fund
Tax Information
The information set forth below is for the Fund’s fiscal year as required by federal income tax laws. Shareholders, however, must report distributions on a calendar year basis for income tax purposes, which may include distributions for portions of two fiscal years of the Fund. Accordingly, the information needed by shareholders for income tax purposes will be sent to them in January of each year. Please consult your tax advisor for proper treatment of this information.
All disclosures are based on financial information available as of the date of this annual report and, accordingly are subject to change. For any and all items requiring reporting, it is the intention of the Fund to report the maximum amount permitted under the Internal Revenue Code and the regulations thereunder.
For the fiscal year ended Oct. 31, 2019, the Fund reports distributions paid during the year as follows:
| | | | |
(A) Long-Term Capital Gain Distributions (Tax Basis) | | | 86.16 | % |
(B) Ordinary Income Distributions (Tax Basis)1 | | | 13.84 | % |
Total Distributions (Tax Basis) | | | 100.00 | % |
(C) Qualifying Dividends2 | | | 20.19 | % |
(A) and (B) are based on a percentage of the Fund’s total distributions.
(C) is based on a percentage of the Fund’s ordinary income distributions.
1For the fiscal year ended Oct. 31, 2019, certain dividends paid by the Fund may be subject to a maximum tax rate of 20%. The percentage of dividends paid by the Fund from ordinary income reported as qualified income is 22.22%. Complete information will be compiled and reported in conjunction with your 2018 Form1099-DIV.
2Qualifying dividends represent dividends which qualify for the corporate dividends received deduction.
For the fiscal year ended Oct. 31, 2019, certain interest income paid by the Fund, determined to be Qualified Short-Term Capital Gains may be subject to relief from US withholding for foreign shareholders, as provided by the American Jobs Creation Act of 2004; the Tax Relief Unemployment Insurance Reauthorization, and Job Creations Act of 2010; and as extended by the American Taxpayer Relief Act of 2012. For the fiscal year ended Oct. 31, 2019, the Fund reported maximum distributions of Qualified Short-Term Capital Gains of $3,393,222.
Board consideration of Investment Advisory andSub-Advisory Agreements for Delaware Select Growth Fund
At a meeting held on Aug.21-22, 2019 (the “Annual Meeting”), the Board of Trustees (the “Board”), including a majority of disinterested or independent Trustees, approved the renewal of the Investment Advisory andSub-Advisory Agreements for Delaware Select Growth Fund (the “Fund”). In making its decision, the Board considered information furnished at regular quarterly Board meetings, including reports detailing Fund performance, investment strategies, and expenses, as well as information prepared specifically in connection with the renewal of the investment advisory andsub-advisory contracts. Information furnished specifically in connection with the renewal of the Investment Management Agreement with Delaware Management Company (“DMC”), a series of Macquarie Investment Management Business Trust (“MIMBT”) and theSub-Advisory Agreements with Jackson Square Partners, LLC (“JSP”), Macquarie Funds Management Hong Kong Limited (“MFMHK”), and Macquarie Investment Management Global Limited (“MIMGL”), included materials provided by DMC and its affiliates (collectively, “Macquarie Investment Management”), JSP, MFMHK, and MIMGL, concerning,
44
among other things, the nature, extent, and quality of services provided to the Fund; the costs of such services to the Fund; economies of scale; and the investment manager’s financial condition and profitability. In addition, in connection with the Annual Meeting, materials were provided to the Trustees in May 2019, including reports provided by Broadridge Financial Solutions (“Broadridge”). The Broadridge reports compared the Fund’s investment performance and expenses with those of other comparable mutual funds. The Independent Trustees reviewed and discussed the Broadridge reports with independent legal counsel to the Independent Trustees. In addition to the information noted above, the Board also requested and received information regarding DMC’s policy with respect to advisory fee levels and its breakpoint philosophy; the structure of portfolio manager compensation; comparative client fee information; and any constraints or limitations on the availability of securities for certain investment styles, which had in the past year inhibited, or which were likely in the future to inhibit, the investment manager’s ability to invest fully in accordance with Fund policies.
In considering information relating to the approval of the Fund’s investment advisory andsub-advisory agreements, the Independent Trustees received assistance and advice from and met separately with independent legal counsel to the Independent Trustees and also received assistance and advice from an experienced and knowledgeable independent fund consultant, JDL Consultants, LLC (“JDL”). Although the Board gave attention to all information furnished, the following discussion identifies, under separate headings, the primary factors taken into account by the Board during its contract renewal considerations.
Nature, extent, and quality of services.The Board considered the services provided by DMC to the Fund and its shareholders. In reviewing the nature, extent, and quality of services, the Board considered reports furnished to it throughout the year, which covered matters such as the relative performance of the Fund; compliance of portfolio managers with the investment policies, strategies, and restrictions for the Fund; compliance by DMC and Delaware Distributors, L.P. (together, “Management”) personnel with the Code of Ethics adopted throughout the Delaware Funds® by Macquarie (“Delaware Funds”); and adherence to fair value pricing procedures as established by the Board. The Board was pleased with the current staffing of DMC and the emphasis placed on research in the investment process. The Board recognized DMC’s receipt of certain favorable industry distinctions during the past several years. The Board gave favorable consideration to DMC’s efforts to control expenses while maintaining service levels committed to Fund matters. The Board also noted the benefits provided to Fund shareholders through (a) each shareholder’s ability to: (i) exchange an investment in one Delaware Fund for the same class of shares in another Delaware Fund without a sales charge, or (ii) reinvest Fund dividends into additional shares of the Fund or into additional shares of other Delaware Funds, and (b) the privilege to combine holdings in other Delaware Funds to obtain a reduced sales charge. The Board was satisfied with the nature, extent, and quality of the overall services provided by DMC.
Nature, extent, and quality of services.The Board considered the services provided by JSP to the Fund and its shareholders. In reviewing the nature, extent, and quality of services, the Board considered reports furnished to it throughout the year at regular Board Meetings covering matters such as relative performance of the Fund; compliance of portfolio managers with the investment policies, strategies, and restrictions for the Fund; the compliance of JSP personnel with its Code of Ethics; and adherence to fair value pricing procedures as established by the Board. The Board was pleased with the current staffing of
45
Other Fund information (Unaudited)
Delaware Select Growth Fund
Board consideration of Investment Advisory andSub-Advisory Agreements for Delaware Select Growth Fund (continued)
JSP and the emphasis placed on research in the investment process. The Board was satisfied with the nature, extent, and quality of the overall services provided by JSP.
Nature, extent, and quality of services.The Board considered the services provided by MIMGL to the Fund and its shareholders. In reviewing the nature, extent, and quality of services, the Board considered reports furnished to it throughout the year at regular Board Meetings covering matters such as relative performance of the Fund; compliance of portfolio managers with the investment policies, strategies, and restrictions for the Fund; the compliance of MIMGL personnel with its Code of Ethics; and adherence to fair value pricing procedures as established by the Board. The Board was pleased with the current staffing of MIMGL and the emphasis placed on research in the investment process. The Board was satisfied with the nature, extent, and quality of the overall services provided by MIMGL.
Nature, extent, and quality of services.The Board considered the services provided by MFMHK to the Fund and its shareholders. In reviewing the nature, extent, and quality of services, the Board considered reports furnished to it throughout the year at regular Board Meetings covering matters such as relative performance of the Fund; compliance of portfolio managers with the investment policies, strategies, and restrictions for the Fund; the compliance of MFMHK personnel with its Code of Ethics; and adherence to fair value pricing procedures as established by the Board. The Board was pleased with the current staffing of MFMHK and the emphasis placed on research in the investment process. The Board was satisfied with the nature, extent, and quality of the overall services provided by MFMHK.
Investment performance.The Board placed significant emphasis on the investment performance of the Fund in view of the importance of investment performance to shareholders. Although the Board considered performance reports and discussions with portfolio managers at Investment Committee meetings throughout the year, the Board gave particular weight to the Broadridge reports furnished for the Annual Meeting. The Broadridge reports prepared for the Fund showed the investment performance of its Class A shares in comparison to a group of similar funds as selected by Broadridge (the “Performance Universe”). A fund with the best performance ranked first, and a fund with the poorest performance ranked last. The highest/best performing 25% of funds in the Performance Universe make up the first quartile; the next 25%, the second quartile; the next 25%, the third quartile; and the poorest/worst performing 25% of funds in the Performance Universe make up the fourth quartile. Comparative annualized performance for the Fund was shown for the past1-,3-,5-, and10-year periods, to the extent applicable, ended Jan. 31, 2019. The Board’s objective is that the Fund’s performance for the1-,3-, and5-year periods be at or above the median of its Performance Universe.
The Performance Universe for the Fund consisted of the Fund and all retail and institutionalmulti-cap growth funds as selected by Broadridge. The Broadridge report comparison showed that the Fund’s total return for the1-year period was in the second quartile of its Performance Universe. The report further showed that the Fund’s total return for the3- and5-year periods was in the fourth quartile of its Performance Universe and the Fund’s total return for the10-year period was in the first quartile of its Performance Universe. The Board observed that the Fund’s performance results were mixed but tended toward median, which was acceptable.
46
Comparative expenses.The Board considered expense data for the Delaware Funds. Management provided the Board with information on pricing levels and fee structures for the Fund as of its most recently completed fiscal year. The Board also focused on the comparative analysis of effective management fees and total expense ratios of the Fund versus effective management fees and total expense ratios of a group of similar funds as selected by Broadridge (the “Expense Group”). In reviewing comparative costs, the Fund’s contractual management fee and the actual management fee incurred by the Fund were compared with the contractual management fees (assuming all funds in the Expense Group were similar in size to the Fund) and actual management fees (as reported by each fund) within the Expense Group, taking into account any applicable breakpoints and fee waivers. The Fund’s total expenses were also compared with those of its Expense Group. The Broadridge total expenses, for comparative consistency, were shown by Broadridge for Class A shares and comparative total expenses including12b-1 andnon-12b-1 service fees. The Board’s objective is for the Fund’s total expense ratio to be competitive with those of the peer funds within its Expense Group.
The expense comparisons for the Fund showed that its actual management fee was in the quartile with the second lowest expenses of its Expense Group and its total expenses were in the quartile with the second highest expenses of its Expense Group. The Board gave favorable consideration to the Fund’s management fee but noted that the Fund’s total expenses were not in line with the Board’s objective. In evaluating the total expenses, the Board considered fee waivers in place through February 2020 and various initiatives implemented by Management, such as the negotiation of lower fees for fund accounting, fund accounting oversight, and custody services, which had created an opportunity for a further reduction in expenses. The Board was satisfied with Management’s efforts to improve the Fund’s total expense ratio and to bring it in line with the Board’s objective.
Management profitability.The Board considered the level of profits realized by DMC in connection with the operation of the Fund. In this respect, the Board reviewed the Investment Management Profitability Analysis that addressed the overall profitability of DMC’s business in providing management and other services to each of the individual funds and the Delaware Funds as a whole. Specific attention was given to the methodology used by DMC in allocating costs for the purpose of determining profitability. Management stated that the level of profits of DMC, to a certain extent, reflects recent operational cost savings and efficiencies initiated by DMC. The Board considered DMC’s efforts to improve services provided to Fund shareholders and to meet additional regulatory and compliance requirements resulting from recent industry-wide Securities and Exchange Commission initiatives. The Board also considered the extent to which DMC might derive ancillary benefits from fund operations, including the potential for procuring additional business as a result of the prestige and visibility associated with its role as service provider to the Delaware Funds and the benefits from allocation of fund brokerage to improve trading efficiencies. As part of its work, the Board also reviewed a report prepared by JDL regarding MIMBT profitability as compared to certain peer fund complexes and the Independent Trustees discussed with JDL personnel regarding DMC’s profitability in such context. The Board found that the management fees were reasonable in light of the services rendered and the level of profitability of DMC.
Management profitability.Trustees were also given available information on profits being realized by JSP in relation to the services being provided to the Fund and in relation to JSP’s overall investment advisory business, but believed such information to be of limited relevance because thesub-advisory fees are paid by DMC out of its management fee, and changes in the level ofsub-advisory fees have no
47
Other Fund information (Unaudited)
Delaware Select Growth Fund
Board consideration of Investment Advisory andSub-Advisory Agreements for Delaware Select Growth Fund (continued)
impact on Fund expenses. The Board was also provided information on potentialfall-out benefits derived or to be derived by JSP in connection with its relationship to the Fund, such as reputational enhancement, soft dollar arrangements, or commissions paid to affiliated broker/dealers, as applicable.
Management profitability.Trustees were also given available information on profits being realized by MIMGL in relation to the services being provided to the Fund and in relation to MIMGL’s overall investment advisory business, but believed such information to be of limited relevance because thesub-advisory fees are paid by DMC out of its management fee, and changes in the level ofsub-advisory fees have no impact on Fund expenses. The Board was also provided information on potentialfall-out benefits derived or to be derived by MIMGL in connection with its relationship to the Fund, such as reputational enhancement, soft dollar arrangements, or commissions paid to affiliated broker/dealers, as applicable.
Management profitability.Trustees were also given available information on profits being realized by MFMHK in relation to the services being provided to the Fund and in relation to MFMHK’s overall investment advisory business, but believed such information to be of limited relevance because thesub-advisory fees are paid by DMC out of its management fee, and changes in the level ofsub-advisory fees have no impact on Fund expenses. The Board was also provided information on potentialfall-out benefits derived or to be derived by MFMHK in connection with its relationship to the Fund, such as reputational enhancement, soft dollar arrangements, or commissions paid to affiliated broker/dealers, as applicable.
Economies of scale.The Trustees considered whether economies of scale are realized by DMC as the Fund’s assets increase and the extent to which any economies of scale are reflected in the level of management fees charged. The Trustees reviewed the Fund’s advisory fee pricing and structure, approved by the Board and shareholders, which includes breakpoints, and which applies to most funds in the Delaware Funds complex. Breakpoints in the advisory fee occur when the advisory fee rate is reduced on assets in excess of specified levels. Breakpoints result in a lower advisory fee than would otherwise be the case in the absence of breakpoints, when the asset levels specified in the breakpoints are exceeded. Although, as of March 31, 2019, the Fund had not reached a size at which it could take advantage of any breakpoints in the applicable fee schedule, the Board recognized that the fee was structured so that, if the Fund increases sufficiently in size, then economies of scale may be shared.
48
This page intentionally left blank.
Board of trustees / directors and officers addendum
Delaware Funds®by Macquarie
A mutual fund is governed by a Board of Trustees/Directors (“Trustees”), which has oversight responsibility for the management of a fund’s business affairs. Trustees establish procedures and oversee and review the performance of the investment manager, the distributor, and others who perform services for the fund. The independent fund trustees, in particular, are advocates
| | | | |
| Name, Address, | | Position(s) | | Length of |
| and Birth Date | | Held with Fund(s) | | Time Served |
Interested Trustee | | | | |
Shawn K. Lytle1 2005 Market Street Philadelphia, PA 19103 February 1970 | | President, Chief Executive Officer, and Trustee | | President and Chief Executive Officer since August 2015 |
| | |
| | | | Trustee since September 2015 |
| | |
| | | | |
Independent Trustees | | | | |
Thomas L. Bennett 2005 Market Street Philadelphia, PA 19103 | | Chair and Trustee | | Trustee since March 2005 |
| October 1947 | | | | Chair since March 2015 |
|
Jerome D. Abernathy 2005 Market Street Philadelphia, PA 19103 July 1959 | | Trustee | | Since January 2019 |
|
Ann D. Borowiec 2005 Market Street Philadelphia, PA 19103 November 1958 | | Trustee | | Since March 2015 |
|
| 1 | Shawn K. Lytle is considered to be an “Interested Trustee” because he is an executive officer of the Fund’s(s’) investment advisor. |
50
for shareholder interests. Each trustee has served in that capacity since he or she was elected to or appointed to the Board of Trustees, and will continue to serve until his or her retirement or the election of a new trustee in his or her place. The following is a list of the Trustees and Officers with certain background and related information.
| | | | |
Principal Occupation(s) During the Past Five Years | | Number of Portfolios in Fund Complex Overseen by Trustee or Officer | | Other Directorships Held by Trustee or Officer |
| | | | |
| | |
| President — Macquarie | | 95 | | Trustee — UBS |
| Investment Management2 | | | | Relationship Funds, |
| (June 2015–Present) | | | | SMA Relationship |
| | | | Trust, and UBS Funds |
| Regional Head of | | | | (May 2010–April 2015) |
| Americas — UBS Global | | | | |
| Asset Management | | | | |
(April 2010–May 2015) | | | | |
| | | | |
| | |
Private Investor (March 2004–Present) | | 95 | | None |
|
Managing Member, Stonebrook Capital Management, LLC (financial technology: macro factors and databases) (January 1993–Present) | | 95 | | None |
|
Chief Executive Officer, Private Wealth Management (2011–2013) and Market Manager, New Jersey Private Bank (2005–2011) — J.P. Morgan Chase & Co. | | 95 | | Director — Banco Santander International (October 2016–Present) Director — Santander Bank, N.A. (December 2016–Present) |
|
| 2 | Macquarie Investment Management is the marketing name for Macquarie Management Holdings, Inc. and its subsidiaries, including the Fund’s(s’) investment advisor, principal underwriter, and its transfer agent. |
51
Board of trustees / directors and officers addendum
Delaware Funds®by Macquarie
| | | | |
| Name, Address, | | Position(s) | | Length of |
| and Birth Date | | Held with Fund(s) | | Time Served |
Independent Trustees (continued) | | | | |
Joseph W. Chow 2005 Market Street Philadelphia, PA 19103 January 1953 | | Trustee | | Since January 2013 |
|
| | |
John A. Fry 2005 Market Street Philadelphia, PA 19103 May 1960 | | Trustee | | Since January 2001 |
|
Lucinda S. Landreth 2005 Market Street Philadelphia, PA 19103 June 1947 | | Trustee | | Since March 2005 |
|
52
| | | | |
| | | Number of Portfolios in | | |
| Principal Occupation(s) | | Fund Complex Overseen | | Other Directorships |
| During the Past Five Years | | by Trustee or Officer | | Held by Trustee or Officer |
| | | | |
Private Investor (April 2011–Present) | | 95 | | Director and Audit Committee Member — Hercules Technology Growth Capital, Inc. (July 2004–July 2014) |
|
President — Drexel University (August 2010–Present) President — Franklin & Marshall College (July 2002–June 2010) | | 95 | | Director; Compensation Committee and Governance Committee Member — Community Health Systems (May 2004–present) Director — Drexel Morgan & Co. (2015–present) Director and Audit Committee Member — vTv Therapeutics Inc. (2017–present) |
| | |
| | | | Director and Audit Committee Member — FS Credit Real Estate Income Trust, Inc. (2018–present) |
|
Private Investor (2004–Present) | | 95 | | None |
|
53
Board of trustees / directors and officers addendum
Delaware Funds®by Macquarie
| | | | |
| Name, Address, | | Position(s) | | Length of |
| and Birth Date | | Held with Fund(s) | | Time Served |
Independent Trustees (continued) | | | | |
Frances A. Sevilla-Sacasa 2005 Market Street Philadelphia, PA 19103 January 1956 | | Trustee | | Since September 2011 |
|
Thomas K. Whitford 2005 Market Street Philadelphia, PA 19103 March 1956 | | Trustee | | Since January 2013 |
|
54
| | | | |
| | | Number of Portfolios in | | |
| Principal Occupation(s) | | Fund Complex Overseen | | Other Directorships |
| During the Past Five Years | | by Trustee or Officer | | Held by Trustee or Officer |
| | | | |
Private Investor (January 2017–Present) Chief Executive Officer — Banco Itaú International (April 2012–December 2016) Executive Advisor to Dean (August 2011–March 2012) and Interim Dean (January 2011–July 2011) — University of Miami School of Business Administration President — U.S. Trust, Bank of America Private Wealth Management (Private Banking) (July 2007–December 2008) | | 95 | | Trust Manager and Audit Committee Chair — Camden Property Trust (August 2011–Present) Director; Audit Committee Member — Carrizo Oil & Gas, Inc. (March 2018–Present) |
|
Vice Chairman (2010–April 2013) — PNC Financial Services Group | | 95 | | Director — HSBC North America Holdings Inc. (December 2013–Present) Director — HSBC USA Inc. (July 2014–Present) Director — HSBC Bank USA, National Association (July 2014–March 2017) Director — HSBC Finance Corporation (December 2013–April 2018) |
|
55
Board of trustees / directors and officers addendum
Delaware Funds®by Macquarie
| | | | |
| Name, Address, | | Position(s) | | Length of |
| and Birth Date | | Held with Fund(s) | | Time Served |
Independent Trustees (continued) | | | | |
| | |
Christianna Wood 2005 Market Street Philadelphia, PA 19103 August 1959 | | Trustee | | Since January 2019 |
|
56
| | | | |
| | Number of Portfolios in | | |
| Principal Occupation(s) | | Fund Complex Overseen | | Other Directorships |
| During the Past Five Years | | by Trustee or Officer | | Held by Trustee or Officer |
| | | | |
Chief Executive Officer and President — Gore Creek Capital, Ltd. (August 2009–Present) | | 95 | | Director; Finance Committee and Audit Committee Member — H&R Block Corporation (July 2008–Present) Director; Chair of Investments Committee and Audit Committee Member — Grange Insurance (2013–Present) Trustee; Chair of Nominating and Governance Committee and Audit Committee Member — The Merger Fund (2013–Present), The Merger Fund VL (2013-Present), WCM Alternatives: Event-Driven Fund (2013–Present), and WCM Alternatives: Credit Event Fund (December 2017–Present) Director; Chair of Governance Committee and Audit Committee Member — International Securities Exchange (2010–2016) |
57
Board of trustees / directors and officers addendum
Delaware Funds®by Macquarie
| | | | |
| Name, Address, | | Position(s) | | Length of |
| and Birth Date | | Held with Fund(s) | | Time Served |
Independent Trustees (continued) | | |
Janet L. Yeomans 2005 Market Street Philadelphia, PA 19103 July 1948 | | Trustee | | Since April 1999 |
Officers | | | | |
David F. Connor 2005 Market Street Philadelphia, PA 19103 December 1963 | | Senior Vice President, General Counsel, and Secretary | | Senior Vice President since May 2013; General Counsel since May 2015; Secretary since October 2005 |
Daniel V. Geatens 2005 Market Street Philadelphia, PA 19103 October 1972 | | Vice President and Treasurer | | Vice President and Treasurer since October 2007 |
Richard Salus 2005 Market Street Philadelphia, PA 19103 October 1963 | | Senior Vice President and Chief Financial Officer | | Senior Vice President and Chief Financial Officer since November 2006 |
The Statement of Additional Information for the Fund(s) includes additional information about the Trustees and Officers and is available, without charge, upon request by calling 800523-1918.
58
| | | | |
| | | Number of Portfolios in | | |
| Principal Occupation(s) | | Fund Complex Overseen | | Other Directorships |
| During the Past Five Years | | by Trustee or Officer | | Held by Trustee or Officer |
| | | | |
Vice President and Treasurer (January 2006–July 2012), Vice President — Mergers & Acquisitions (January 2003–January 2006), and Vice President and Treasurer (July 1995–January 2003) — 3M Company | | 95 | | Director; Personnel and Compensation Committee Chair; Member of Nominating, Investments, and Audit Committees for various periods throughout directorship — Okabena Company (2009–2017) |
| | | | |
David F. Connor has served in various capacities at different times at Macquarie Investment Management. | | 95 | | None3 |
Daniel V. Geatens has served in various capacities at different times at Macquarie Investment Management. | | 95 | | None3 |
Richard Salus has served in various capacities at different times at Macquarie Investment Management. | | 95 | | None3 |
| 3 | David F. Connor, Daniel V. Geatens, and Richard Salus serve in similar capacities for the six portfolios of the Optimum Fund Trust, which have the same investment advisor, principal underwriter, and transfer agent as the registrant. Mr. Geatens also serves as the Chief Financial Officer and Treasurer for Macquarie Global Infrastructure Total Return Fund Inc., which has an affiliated investment manager. |
59
About the organization
| | | | | | |
| Board of trustees | | | | | | |
| | | |
Shawn K. Lytle President and Chief Executive Officer Delaware Funds® by Macquarie Philadelphia, PA Thomas L. Bennett Chairman of the Board Delaware Funds by Macquarie Private Investor Rosemont, PA Jerome D. Abernathy Managing Member Stonebrook Capital Management, LLC Jersey City, NJ Affiliated officers David F. Connor Senior Vice President, General Counsel, and Secretary Delaware Funds by Macquarie Philadelphia, PA | | Ann D. Borowiec Former Chief Executive Officer Private Wealth Management J.P. Morgan Chase & Co. New York, NY Joseph W. Chow Former Executive Vice President State Street Corporation Boston, MA John A. Fry President Drexel University Philadelphia, PA Daniel V. Geatens Vice President and Treasurer Delaware Funds by Macquarie Philadelphia, PA | | Lucinda S. Landreth Former Chief Investment Officer Assurant, Inc. New York, NY Frances A. Sevilla-Sacasa Former Chief Executive Officer Banco Itaú International Miami, FL Richard Salus Senior Vice President and Chief Financial Officer Delaware Funds by Macquarie Philadelphia, PA | | Thomas K. Whitford Former Vice Chairman PNC Financial Services Group Pittsburgh, PA Christianna Wood Chief Executive Officer and President Gore Creek Capital, Ltd. Golden, CO Janet L. Yeomans Former Vice President and Treasurer 3M Company St. Paul, MN |
This annual report is for the information of Delaware Select Growth Fund shareholders, but it may be used with prospective investors when preceded or accompanied by the Delaware Fund fact sheet for the most recently completed calendar quarter. These documents are available at delawarefunds.com/literature.
The Fund files its complete schedule of portfolio holdings with the Securities and Exchange Commission (SEC) for the first and third quarters of each fiscal year on FormN-Q or FormN-PORT (available for filings after March 31, 2019). The Fund’s FormsN-Q or FormsN-PORT, as well as a description of the policies and procedures that the Fund uses to determine how to vote proxies (if any) relating to portfolio securities, are available without charge (i) upon request, by calling 800523-1918; and (ii) on the SEC’s website at sec.gov. In addition, a description of the policies and procedures that the Fund uses to determine how to vote proxies (if any) relating to portfolio securities and the Schedule of Investments included in the Fund’s most recent FormN-Q or FormN-PORT are available without charge on the Fund’s website at delawarefunds.com/literature. The Fund’s FormsN-Q and FormsN-PORT may be reviewed and copied at the SEC’s Public Reference Room in Washington, D.C.; information on the operation of the Public Reference Room may be obtained by calling 800SEC-0330.
Information (if any) regarding how the Fund voted proxies relating to portfolio securities during the most recently disclosed12-month period ended June 30 is available without charge (i) through the Fund’s website at delawarefunds.com/proxy; and (ii) on the SEC’s website at sec.gov.
60
Item 2. Code of Ethics
Item 3. Audit Committee Financial Expert
The registrant’s Board of Trustees has determined that certain members of the registrant’s Audit Committee are audit committee financial experts, as defined below. For purposes of this item, an “audit committee financial expert” is a person who has the following attributes:
a. An understanding of generally accepted accounting principles and financial statements;
b. The ability to assess the general application of such principles in connection with the accounting for estimates, accruals, and reserves;
c. Experience preparing, auditing, analyzing, or evaluating financial statements that present a breadth and level of complexity of accounting issues that are generally comparable to the breadth and complexity of issues that can reasonably be expected to be raised by the registrant’s financial statements, or experience actively supervising one or more persons engaged in such activities;
d. An understanding of internal controls and procedures for financial reporting; and
e. An understanding of audit committee functions.
An “audit committee financial expert” shall have acquired such attributes through:
a. Education and experience as a principal financial officer, principal accounting officer, controller, public accountant, or auditor or experience in one or more positions that involve the performance of similar functions;
b. Experience actively supervising a principal financial officer, principal accounting officer, controller, public accountant, auditor, or person performing similar functions;
c. Experience overseeing or assessing the performance of companies or public accountants with respect to the preparation, auditing, or evaluation of financial statements; or
d. Other relevant experience.
The registrant’s Board of Trustees has also determined that each member of the registrant’s Audit Committee is independent. In order to be “independent” for purposes of this item, the Audit Committee member may not: (i) other than in his or her capacity as a member of the Board of Trustees or any committee thereof, accept directly or indirectly any consulting, advisory or other compensatory fee from the issuer; or (ii) be an “interested person” of the registrant as defined in Section 2(a)(19) of the Investment Company Act of 1940.
The names of the audit committee financial experts on the registrant’s Audit Committee are set forth below:
John A. Fry
Lucinda S. Landreth
Thomas K. Whitford
Christianna Wood
Item 4. Principal Accountant Fees and Services
The aggregate fees billed for services provided to the registrant by its independent auditors for the audit of the registrant’s annual financial statements and for services normally provided by the independent auditors in connection with statutory and regulatory filings or engagements were $31,630 for the fiscal year ended October 31, 2019.
The aggregate fees billed for services provided to the registrant by its independent auditors for the audit of the registrant’s annual financial statements and for services normally provided by the independent auditors in connection with statutory and regulatory filings or engagements were $31,010 for the fiscal year ended October 31, 2018.
The aggregate fees billed by the registrant’s independent auditors for services relating to the performance of the audit of the registrant’s financial statements and not reported under paragraph (a) of this Item were $0 for the fiscal year ended October 31, 2019.
The aggregate fees billed by the registrant’s independent auditors for services relating to the performance of the audit of the registrant’s financial statements and not reported under paragraph (a) of this Item were $0 for the fiscal year ended October 31, 2018.
The aggregate fees billed by the registrant’s independent auditors for tax-related services provided to the registrant’s investment adviser and other service providers under common control with the adviser and that relate directly to the operations or financial reporting of the registrant were $0 for the registrant’s fiscal year ended October 31, 2019.
The aggregate fees billed by the registrant’s independent auditors for tax-related services provided to the registrant’s investment adviser and other service providers under common control with the adviser and that relate directly to the operations or financial reporting of the registrant were $0 for the registrant’s fiscal year ended October 31, 2018.
The aggregate fees billed for all services provided by the independent auditors to the registrant other than those set forth in paragraphs (a), (b) and (c) of this Item were $0 for the fiscal year ended October 31, 2019.
The aggregate fees billed for all services provided by the independent auditors to the registrant other than those set forth in paragraphs (a), (b) and (c) of this Item were $0 for the fiscal year ended October 31, 2018.
Under the Pre-Approval Policy, the Audit Committee has also pre-approved the services set forth in the table below with respect to the registrant’s investment adviser and other entities controlling, controlled by or under common control with the investment adviser that provide ongoing services to the registrant (the “Control Affiliates”) up to the specified fee limit. This fee limit is based on aggregate fees to the investment adviser and its Control Affiliates.
The Pre-Approval Policy requires the registrant’s independent auditors to report to the Audit Committee at each of its regular meetings regarding all services initiated since the last such report was rendered, including those services authorized by the Pre-Approval Policy.
(f) Not applicable.
(g) The aggregate non-audit fees billed by the registrant’s independent auditors for services rendered to the registrant and to its investment adviser and other service providers under common control with the adviser were $9,955,000 and $11,748,000 for the registrant’s fiscal years ended October 31, 2019 and October 31, 2018, respectively.
(h) In connection with its selection of the independent auditors, the registrant’s Audit Committee has considered the independent auditors’ provision of non-audit services to the registrant’s investment adviser and other service providers under common control with the adviser that were not required to be pre-approved pursuant to Rule 2-01(c)(7)(ii) of Regulation S-X. The Audit Committee has determined that the independent auditors’ provision of these services is compatible with maintaining the auditors’ independence.
Item 5. Audit Committee of Listed Registrants
Not applicable.
Item 6. Investments
(a) Included as part of report to shareholders filed under Item 1 of this Form N-CSR.
(b) Divestment of securities in accordance with Section 13(c) of the Investment Company Act of 1940.
Not applicable.
Item 7. Disclosure of Proxy Voting Policies and Procedures for Closed-End Management Investment Companies
Not applicable.
Item 8. Portfolio Managers of Closed-End Management Investment Companies
Not applicable.
Item 9. Purchases of Equity Securities by Closed-End Management Investment Companies and Affiliated Purchasers
Not applicable.
Item 10. Submission of Matters to a Vote of Security Holders
Not applicable.
Item 11. Controls and Procedures
The registrant’s principal executive officer and principal financial officer have evaluated the registrant’s disclosure controls and procedures within 90 days of the filing of this report and have concluded that they are effective in providing reasonable assurance that the information required to be disclosed by the registrant in its reports or statements filed under the Securities Exchange Act of 1934 is recorded, processed, summarized and reported within the time periods specified in the rules and forms of the Securities and Exchange Commission.
There were no significant changes in the registrant’s internal control over financial reporting that occurred during the period covered by the report to stockholders included herein that have materially affected, or are reasonably likely to materially affect, the registrant’s internal control over financial reporting.
Item 12. Disclosure of Securities Lending Activities for Closed-End Management Investment Companies
Not applicable.
Item 13. Exhibits
Not applicable.
(2) Certifications of Principal Executive Officer and Principal Financial Officer pursuant to Rule 30a-2 under the Investment Company Act of 1940 are attached hereto as Exhibit 99.CERT.
(3) Written solicitations to purchase securities pursuant to Rule 23c-1 under the Securities Exchange Act of 1934.
Not applicable.
(b) Certifications pursuant to Section 906 of the Sarbanes-Oxley Act of 2002 are furnished herewith as Exhibit 99.906CERT.
Pursuant to the requirements of the Securities Exchange Act of 1934 and the Investment Company Act of 1940, the registrant has duly caused this report to be signed on its behalf, by the undersigned, thereunto duly authorized.
Pursuant to the requirements of the Securities Exchange Act of 1934 and the Investment Company Act of 1940, this report has been signed below by the following persons on behalf of the registrant and in the capacities and on the dates indicated.