UNITED STATES
SECURITIES AND EXCHANGE COMMISSION
Washington, D.C. 20549
FORM N-CSR
CERTIFIED SHAREHOLDER REPORT OF REGISTERED
MANAGEMENT INVESTMENT COMPANIES
Investment Company Act file number: 811-04236
JPMorgan Trust II
(Exact name of registrant as specified in charter)
270 Park Avenue
New York, NY 10017
(Address of principal executive offices) (Zip code)
Frank J. Nasta
270 Park Avenue
New York, NY 10017
(Name and Address of Agent for Service)
Registrant’s telephone number, including area code: (800) 480-4111
Date of fiscal year end: Last day of February
Date of reporting period: March 1, 2016 through August 31, 2016
Form N-CSR is to be used by management investment companies to file reports with the Commission not later than 10 days after the transmission to stockholders of any report that is required to be transmitted to stockholders under Rule 30e-1 under the Investment Company Act of 1940 (17 CFR 270.30e-1). The Commission may use the information provided on Form N-CSR in its regulatory, disclosure review, inspection, and policymaking roles.
A registrant is required to disclose the information specified by Form N-CSR, and the Commission will make this information public. A registrant is not required to respond to the collection of information contained in Form N-CSR unless the Form displays a currently valid Office of Management and Budget (“OMB”) control number. Please direct comments concerning the accuracy of the information collection burden estimate and any suggestions for reducing the burden to Secretary, Securities and Exchange Commission, 450 Fifth Street, NW, Washington, DC 20549-0609. The OMB has reviewed this collection of information under the clearance requirements of 44 U.S.C. Section 3507.
��
ITEM 1. REPORTS TO STOCKHOLDERS.
The following is a copy of the report transmitted to shareholders pursuant to Rule 30e-1 under the Investment Company Act of 1940 (17 CFR 270.30e-1).
Semi-Annual Report
J.P. Morgan Municipal Bond Funds
August 31, 2016 (Unaudited)
JPMorgan Municipal Income Fund
JPMorgan Ohio Municipal Bond Fund
JPMorgan Short-Intermediate Municipal Bond Fund
JPMorgan Tax Free Bond Fund

CONTENTS
Investments in a Fund are not deposits or obligations of, or guaranteed or endorsed by, any bank and are not insured or guaranteed by the FDIC, the Federal Reserve Board or any other government agency. You could lose money if you sell when a Fund’s share price is lower than when you invested.
Past performance is no guarantee of future performance. The general market views expressed in this report are opinions based on market and other conditions through the end of the reporting period and are subject to change without notice. These views are not intended to predict the future performance of a Fund or the securities markets. References to specific securities and their issuers are for illustrative purposes only and are not intended to be, and should not be interpreted as, recommendations to purchase or sell such securities. Such views are not meant as investment advice and may not be relied on as an indication of trading intent on behalf of any Fund.
Prospective investors should refer to the Funds’ prospectus for a discussion of the Funds’ investment objectives, strategies and risks. Call J.P. Morgan Funds Service Center at 1-800-480-4111 for a prospectus containing more complete information about a Fund, including management fees and other expenses. Please read it carefully before investing.
CEO’S LETTER
September 22, 2016 (Unaudited)
Dear Shareholder;
The U.S. continued to lead a slow global economic expansion through August 2016, further raising pressure on the U.S. Federal Reserve (the “Fed”) to begin raising interest rates even as leading central banks elsewhere extended their extraordinary stimulus efforts.
| | |
 | | “It is especially notable that in the wake of a sell-off in June, financial markets fully recovered in the following two months.” |
Amid uncertainty about China’s economic outlook in early 2016, a sharp sell-off in financial markets following Britain’s June 23rd vote to exit the European Union and low U.S. inflation, the Fed declined to raise rates at its May and July meetings. However, financial markets rebounded quickly from the so-called Brexit sell-off and investor concerns about China’s economy receded. By August 2016, investors’ appetite for risk had returned, driving up prices for both stocks and bonds and pushing market volatility to record lows.
Meanwhile, U.S. gross domestic product remained low but positive through the first and second quarters of 2016. Unemployment remained at 5.0% or lower from February through August and sales of new homes in the U.S. returned to levels last seen before the 2008 financial crisis.
Overseas, the European Central Bank (ECB) surprised financial markets in early March with a further cut in interest rates and an expansion of its own quantitative easing program, along with other specific stimulus policies. In July, the ECB maintained its key interest rate at zero. Partly in response to the Brexit vote, Britain’s central bank cut interest rates in August to their lowest level in the bank’s 322-year history and reintroduced a quantitative easing program and began buying corporate bonds. After introducing negative interest rates in early 2016 to combat sputtering growth, the Bank of Japan changed direction in early September 2016 and unveiled a “yield curve control” to improve commercial bank earnings and investment returns for pension funds and insurers.
The ultimate effect of these central bank actions was to produce negative yields on government bonds in Europe and Japan, which led to a bond market rally in the U.S. as investors sought returns in U.S. Treasury bonds. Bond yields generally move in the opposite direction of bond prices and the bond market rally pushed Treasury bond yields to record lows in July.
In this environment, the financial market’s implied probability of an interest rate increase at the Fed’s September 2016 meeting rose to 36% at the end of August. However, the U.S. central bank declined to raise rates, citing below-target inflation data and concerns about continued job growth.
While Fed Chairwoman Janet Yellen indicated there is a greater likelihood of an interest rate increase in December 2016, both the International Monetary Fund and the World Bank have issued warnings about slowing economic growth in the U.S. and the rest of the world.
During the six months ended August 31, 2016, U.S. investors generally enjoyed solid returns in both bond and stock markets. It is especially notable that in the wake of a sell-off in June, financial markets fully recovered in the following two months. We believe this outcome clearly illustrates the wisdom of an investment perspective that is diversified, persistent and is guided by a long-term vision.
We look forward to managing your investment needs for years to come. Should you have any questions, please visit www.jpmorganfunds.com or contact the J.P. Morgan Funds Service Center at 1-800-480-4111.
Sincerely yours,

George C.W. Gatch
CEO, Investment Funds Management,
J.P. Morgan Asset Management
| | | | | | | | |
| | | |
| AUGUST 31, 2016 | | J.P. MORGAN MUNICIPAL BOND FUNDS | | | | | 1 | |
J.P. Morgan Municipal Bond Funds
MARKET OVERVIEW
SIX MONTHS ENDED AUGUST 31, 2016 (Unaudited)
Overall, U.S. financial markets provided positive returns for the six month reporting period and rebounded from a startling but short sell-off in late June that was sparked by the British vote to exit the European Union. Continued low interest rates in the U.S. and negative rates elsewhere, along with generally strong U.S. corporate earnings, supported increased investment in U.S. equities during the six month period. Meanwhile, a global bond market rally drove government bond yields, which generally move inversely to bond prices, into negative territory in Japan and Europe. Overseas buying of U.S. debt helped push yields on 10-year Treasury bonds to a record low of 1.32% in July.
During the six month reporting period, U.S. interest rates fell and the yield curve, which shows the relationship between yields and maturity dates for a set of similar bonds, flattened out. Short term interest rates hovered near historic lows and long term interest rates moved lower. Overseas investors, responding to negative bond yields in Japan and Europe, bought U.S. debt and helped push bond yields lower. Municipal bonds in the U.S. generally continued to provide positive returns as investors sought to benefit from higher quality, income producing and tax advantages of the asset class.
| | | | | | |
| | | |
| 2 | | | | J.P. MORGAN MUNICIPAL BOND FUNDS | | AUGUST 31, 2016 |
JPMorgan Municipal Income Fund
FUND COMMENTARY
SIX MONTHS ENDED AUGUST 31, 2016 (Unaudited)
| | | | |
| REPORTING PERIOD RETURN: | |
| Fund (Select Class Shares)* | | | 2.37% | |
| Barclays U.S. 1-15 Year Blend (1-17) Municipal Bond Index | | | 2.16% | |
| |
| Net Assets as of 8/31/2016 (In Thousands) | | | $312,703 | |
| Duration as of 8/31/2016 | | | 4.9 years | |
INVESTMENT OBJECTIVE**
The JPMorgan Municipal Income Fund (the “Fund”) seeks current income exempt from federal income taxes.
WHAT WERE THE MAIN DRIVERS OF THE FUND’S PERFORMANCE?
For the six months ended August 31, 2016, the Fund outperformed the Barclays U.S. 1-15 Year Blend (1-17) Municipal Bond Index (the “Benchmark”).
Relative to the Benchmark, the Fund’s longer duration profile amid declining interest rates was a leading contributor to performance. Duration measures the price sensitivity of a bond or a portfolio of bonds to relative changes in interest rates. Generally, bonds with longer duration will experience a larger increase or decrease in price as interest rates fall or rise, respectively, versus bonds with shorter duration. The Fund’s allocation to the higher-yielding housing revenue bond and industrial development revenue/pollution control revenue bond sectors and its overweight allocation to the leasing and water & sewer sectors also contributed to relative performance. The Fund’s underweight position in the pre-refunded debt sector also helped relative performance.
The Fund’s underweight positions in bonds issued by New Jersey and Illinois was a leading detractor from performance relative to the Benchmark. The Fund’s underweight position in bonds rated BBB and its underweight position in the transportation revenue bond sector also detracted from relative performance.
HOW WAS THE FUND POSITIONED?
The Fund’s portfolio managers continued to emphasize higher yielding sectors, particularly the housing sector. Over the six month period, the Fund’s average duration was longer than that of the Benchmark.
| | | | |
CREDIT QUALITY ALLOCATIONS*** | |
| AAA | | | 24.1 | % |
| AA | | | 49.7 | |
| A | | | 17.5 | |
| BBB | | | 4.1 | |
| BB | | | 0.5 | |
| NR | | | 4.1 | |
J.P. Morgan Investment Management receives credit ratings on underlying securities of the portfolio from three major rating agencies — Standard & Poor’s (“S&P”), Moody’s and Fitch. When calculating credit quality breakdown, S&P is used as the primary independent rating agency source. Where an S&P rating is not available for a particular security, the Moody’s rating will be used, if available, and Fitch, if available, is used for securities not rated by Moody’s or S&P. Securities not rated by any of the three agencies are reflected as not rated (NR).
Although the Credit Quality Allocations table reflects the ratings of the bonds detailed in the Schedule of Investments, 4.8% of the investments in the table is held in prerefunded municipal bonds or escrowed to maturity securities. Prerefunded municipal bonds and escrowed to maturity securities are bonds the principal and interest of which are to be paid by Treasuries, Agencies and other government securities that have been placed in escrow accounts. For both prerefunded and escrowed to maturity securities, the credit status is considered the same, the only difference is prerefundeds are paid off at a call date while escrowed to maturity are retired at maturity.
| * | | The return shown is based on net asset values calculated for shareholder transactions and may differ from the return shown in the financial highlights, which reflects adjustments made to the net asset values in accordance with accounting principles generally accepted in the United States of America. |
| ** | | The adviser seeks to achieve the Fund’s objective. There can be no guarantee it will be achieved. |
| *** | | Percentages indicated are based on total investments as of August 31, 2016. The Fund’s portfolio composition is subject to change. |
| | | | | | | | |
| | | |
| AUGUST 31, 2016 | | J.P. MORGAN MUNICIPAL BOND FUNDS | | | | | 3 | |
JPMorgan Municipal Income Fund
FUND COMMENTARY
SIX MONTHS ENDED AUGUST 31, 2016 (Unaudited) (continued)
| | | | | | | | | | | | | | | | | | |
AVERAGE ANNUAL TOTAL RETURNS AS OF AUGUST 31, 2016 | |
| | | | | |
| | | INCEPTION DATE OF
CLASS | | 6 MONTH* | | | 1 YEAR | | | 5 YEAR | | | 10 YEAR | |
CLASS A SHARES | | February 23, 1993 | | | | | | | | | | | | | | | | |
With Sales Charge** | | | | | (1.67 | )% | | | 1.45 | % | | | 2.63 | % | | | 3.36 | % |
Without Sales Charge | | | | | 2.13 | | | | 5.41 | | | | 3.41 | | | | 3.75 | |
CLASS C SHARES | | November 4, 1997 | | | | | | | | | | | | | | | | |
With CDSC*** | | | | | 0.95 | | | | 3.85 | | | | 2.84 | | | | 3.16 | |
Without CDSC | | | | | 1.95 | | | | 4.85 | | | | 2.84 | | | | 3.16 | |
SELECT CLASS SHARES | | February 9, 1993 | | | 2.37 | | | | 5.81 | | | | 3.69 | | | | 4.02 | |
| ** | | Sales Charge for Class A Shares is 3.75%. |
| *** | | Assumes a 1% CDSC (contingent deferred sales charge) for the 6 month and one year periods and 0% CDSC thereafter. |
TEN YEAR PERFORMANCE (8/31/06 TO 8/31/16)
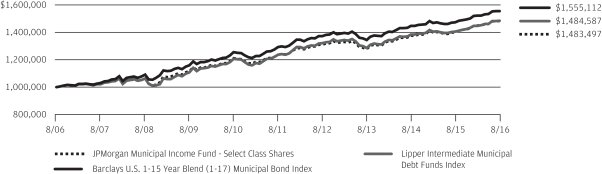
The performance quoted is past performance and is not a guarantee of future results. Mutual funds are subject to certain market risks. Investment returns and principal value of an investment will fluctuate so that an investor’s shares, when redeemed, may be worth more or less than their original cost. Current performance may be higher or lower than the performance data shown. For up-to-date, month-end performance information please call 1-800-480-4111.
The graph illustrates comparative performance for $1,000,000 invested in Select Class Shares of the JPMorgan Municipal Income Fund, the Barclays U.S. 1-15 Year Blend (1-17) Municipal Bond Index and the Lipper Intermediate Municipal Debt Funds Index from August 31, 2006 to August 31, 2016. The performance of the Fund assumes reinvestment of all dividends and capital gain distributions, if any, and does not include a sales charge. The performance of the Barclays U.S. 1-15 Year Blend (1-17) Municipal Bond Index does not reflect the deduction of expenses or a sales charge associated with a mutual fund and has been adjusted to reflect reinvestment of all dividends and capital gain distributions of the securities included in the benchmark, if applicable. The performance of the Lipper Intermediate Municipal Debt Funds Index includes expenses associated with a mutual fund, such as investment management fees. These expenses are not identical to the expenses incurred by the Fund. The
Barclays U.S. 1-15 Year Blend (1-17) Municipal Bond Index represents the performance of municipal bonds with maturities from 1 to 17 years. The Lipper Intermediate Municipal Debt Funds Index is an index based on the total returns of certain mutual funds within the Fund’s designated category as determined by Lipper, Inc. Investors cannot invest directly in an index.
Capital gain distributions are subject to federal income tax; a portion of the Fund’s income distributions may be subject to the alternative minimum tax and some investors may be subject to certain state and local taxes.
Select Class Shares have a $1,000,000 minimum initial investment.
Fund performance may reflect the waiver of the Fund’s fees and reimbursement of expenses for certain periods since the inception date. Without these waivers and reimbursements, performance would have been lower. Also, performance shown in this section does not reflect the deduction of taxes that a shareholder would pay on Fund distributions or redemptions of Fund shares.
The returns shown are based on net asset values calculated for shareholder transactions and may differ from the returns shown in the financial highlights, which reflect adjustments made to the net asset values in accordance with accounting principles generally accepted in the United States of America.
| | | | | | |
| | | |
| 4 | | | | J.P. MORGAN MUNICIPAL BOND FUNDS | | AUGUST 31, 2016 |
JPMorgan Ohio Municipal Bond Fund
FUND COMMENTARY
SIX MONTHS ENDED AUGUST 31, 2016 (Unaudited)
| | | | |
| REPORTING PERIOD RETURN: | |
| Fund (Select Class Shares)* | | | 1.84% | |
| Barclays U.S. 1-15 Year Blend (1-17) Municipal Bond Index | | | 2.16% | |
| |
| Net Assets as of 8/31/2016 (In Thousands) | | $ | 133,295 | |
| Duration as of 8/31/2016 | | | 4.5 years | |
INVESTMENT OBJECTIVE**
The JPMorgan Ohio Municipal Bond Fund (the “Fund”) seeks current income exempt from federal income tax and Ohio personal income tax, consistent with the preservation of principal.
WHAT WERE THE MAIN DRIVERS OF THE FUND’S PERFORMANCE?
For the six months ended August 31, 2016, the Fund underperformed the Barclays U.S. 1-15 Year Blend (1-17) Municipal Bond Index (the “Benchmark”).
Relative to the Benchmark, the Fund’s underweight and shorter duration in the transportation sector and bonds rated single A detracted from performance. The Fund’s underweight position in state general obligation and special tax bonds also hindered relative performance. Duration measures the price sensitivity of a bond or a portfolio of bonds to relative changes in interest rates. Generally, bonds with longer duration will experience a larger increase or decrease in price as interest rates fall or rise, respectively, versus bonds with shorter duration.
The Fund’s overweight position and longer duration in local obligation bonds was a leading contributor to performance relative to the Benchmark. The Fund’s overweight position and longer duration in the education and water & sewer sectors and in bonds rated AA also helped relative performance.
HOW WAS THE FUND POSITIONED?
During the reporting period, the Fund’s average duration contracted relative to the Benchmark as interest rates trended lower during the reporting period. The Fund’s portfolio managers preferred to invest in issuances from large, highly rated state and local municipalities. Among revenue bond sectors, the Fund managers preferred essential service sectors. However, Fund positioning is generally a result of security structure, duration, credit quality and the unique characteristics of the Ohio municipal bond market.
| | | | |
CREDIT QUALITY ALLOCATIONS*** | |
| AAA | | | 16.2 | % |
| AA | | | 69.2 | |
| A | | | 12.5 | |
| NR | | | 2.1 | |
J.P. Morgan Investment Management receives credit ratings on underlying securities of the portfolio from three major rating agencies — Standard & Poor’s (“S&P”), Moody’s and Fitch. When calculating credit quality breakdown, S&P is used as the primary independent rating agency source. Where an S&P rating is not available for a particular security, the Moody’s rating will be used, if available, and Fitch, if available, is used for securities not rated by Moody’s or S&P. Securities not rated by any of the three agencies are reflected as not rated (NR).
Although the Credit Quality Allocations table reflects the ratings of the bonds detailed in the Schedule of Investments, 18.7% of the investments in the table is held in prerefunded municipal bonds or escrowed to maturity securities. Prerefunded municipal bonds and escrowed to maturity securities are bonds the principal and interest of which are to be paid by Treasuries, Agencies and other government securities that have been placed in escrow accounts. For both prerefunded and escrowed to maturity securities, the credit status is considered the same, the only difference is prerefundeds are paid off at a call date while escrowed to maturity are retired at maturity.
| * | | The return shown is based on net asset values calculated for shareholder transactions and may differ from the return shown in the financial highlights, which reflects adjustments made to the net asset values in accordance with accounting principles generally accepted in the United States of America. |
| ** | | The adviser seeks to achieve the Fund’s objective. There can be no guarantee it will be achieved. |
| *** | | Percentages indicated are based on total investments as of August 31, 2016. The Fund’s portfolio composition is subject to change. |
| | | | | | | | |
| | | |
| AUGUST 31, 2016 | | J.P. MORGAN MUNICIPAL BOND FUNDS | | | | | 5 | |
JPMorgan Ohio Municipal Bond Fund
FUND COMMENTARY
SIX MONTHS ENDED AUGUST 31, 2016 (Unaudited) (continued)
| | | | | | | | | | | | | | | | | | |
AVERAGE ANNUAL TOTAL RETURNS AS OF AUGUST 31, 2016 | |
| | | | | |
| | | INCEPTION DATE OF
CLASS | | 6 MONTH* | | | 1 YEAR | | | 5 YEAR | | | 10 YEAR | |
CLASS A SHARES | | February 18, 1992 | | | | | | | | | | | | | | | | |
With Sales Charge** | | | | | (2.12 | )% | | | 0.40 | % | | | 2.08 | % | | | 3.20 | % |
Without Sales Charge | | | | | 1.71 | | | | 4.33 | | | | 2.87 | | | | 3.60 | |
CLASS C SHARES | | February 19, 2005 | | | | | | | | | | | | | | | | |
With CDSC*** | | | | | 0.38 | | | | 2.64 | | | | 2.25 | | | | 2.97 | |
Without CDSC | | | | | 1.38 | | | | 3.64 | | | | 2.25 | | | | 2.97 | |
SELECT CLASS SHARES | | July 2, 1991 | | | 1.84 | | | | 4.61 | | | | 3.12 | | | | 3.86 | |
| ** | | Sales Charge for Class A Shares is 3.75%. |
| *** | | Assumes a 1% CDSC (contingent deferred sales charge) for the 6 month and one year periods and 0% CDSC thereafter. |
TEN YEAR PERFORMANCE (8/31/06 TO 8/31/16)
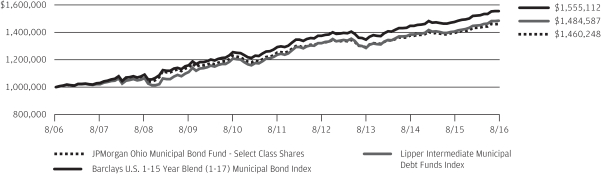
The performance quoted is past performance and is not a guarantee of future results. Mutual funds are subject to certain market risks. Investment returns and principal value of an investment will fluctuate so that an investor’s shares, when redeemed, may be worth more or less than their original cost. Current performance may be higher or lower than the performance data shown. For up-to-date month-end performance information please call 1-800-480-4111.
The graph illustrates comparative performance for $1,000,000 invested in Select Class Shares of the JPMorgan Ohio Municipal Bond Fund, the Barclays U.S. 1-15 Year Blend (1-17) Municipal Bond Index and the Lipper Intermediate Municipal Debt Funds Index from August 31, 2006 to August 31, 2016. The performance of the Fund assumes reinvestment of all dividends and capital gain distributions, if any, and does not include a sales charge. The performance of the Barclays U.S. 1-15 Year Blend (1-17) Municipal Bond Index does not reflect the deduction of expenses or a sales charge associated with a mutual fund and has been adjusted to reflect reinvestment of all dividends and capital gain distributions of the securities included in the benchmark, if applicable. The performance of the Lipper Intermediate Municipal Debt Funds Index includes expenses associated with a mutual fund, such as investment management fees. These expenses are not identical to the expenses incurred by the Fund. The
Barclays U.S. 1-15 Year Blend (1-17) Municipal Bond Index represents the performance of municipal bonds with maturities from 1 to 17 years. The Lipper Intermediate Municipal Debt Funds Index is an index based on the total returns of certain mutual funds within the Fund’s designated category as determined by Lipper, Inc. Investors cannot invest directly in an index.
Capital gain distributions are subject to federal income tax; a portion of the Fund’s income distributions may be subject to the alternative minimum tax and some investors may be subject to certain state and local taxes.
Select Class Shares have a $1,000,000 minimum initial investment.
Fund performance may reflect the waiver of the Fund’s fees and reimbursement of expenses for certain periods since the inception date. Without these waivers and reimbursements, performance would have been lower. Also, performance shown in this section does not reflect the deduction of taxes that a shareholder would pay on Fund distributions or redemptions of Fund shares.
The returns shown are based on net asset values calculated for shareholder transactions and may differ from the returns shown in the financial highlights, which reflect adjustments made to the net asset values in accordance with accounting principles generally accepted in the United States of America.
| | | | | | |
| | | |
| 6 | | | | J.P. MORGAN MUNICIPAL BOND FUNDS | | AUGUST 31, 2016 |
JPMorgan Short-Intermediate Municipal Bond Fund
FUND COMMENTARY
SIX MONTHS ENDED AUGUST 31, 2016 (Unaudited)
| | | | |
| REPORTING PERIOD RETURN: | |
| Fund (Select Class Shares)* | | | 1.16% | |
| Barclays U.S. 1-5 Year Blend (1-6) Municipal Bond Index | | | 0.69% | |
| |
| Net Assets as of 8/31/2016 (In Thousands) | | | $2,357,008 | |
| Duration as of 8/31/2016 | | | 3.6 years | |
INVESTMENT OBJECTIVE**
The JPMorgan Short-Intermediate Municipal Bond Fund (the “Fund”) seeks as high a level of current income exempt from federal income tax as is consistent with relative stability of principal.
WHAT WERE THE MAIN DRIVERS OF THE FUND’S PERFORMANCE?
For the six months ended August 31, 2016, the Fund outperformed the Barclays U.S. 1-5 Year Blend (1-6) Municipal Bond Index (the “Benchmark”).
Relative to the Benchmark, the Fund’s longer duration profile was a leading contributor to performance amid falling interest rates. Duration measures the price sensitivity of a bond or a portfolio of bonds to relative changes in interest rates. Generally, bonds with longer duration will experience a larger increase or decrease in price as interest rates fall or rise, respectively, versus bonds with shorter duration. The Fund’s positioning at the short and long ends of the yield curve was also a significant contributor to relative performance. The yield curve shows the relationship between yields and maturity dates for a set of similar bonds.
The Fund’s underweight position in pre-refunded debt and its overweight positions in the leasing, education and transportation sectors and its overweight position in New York State bonds also contributed to relative performance.
The Fund’s underweight positions both in bonds rated A and BBB and in the housing and resource recovery bond sectors were leading detractors from performance relative to the Benchmark. The Fund’s underweight position in bonds from New Jersey also detracted from relative performance.
HOW WAS THE FUND POSITIONED?
During the reporting period, the Fund employed a bottom-up, security selection-based investment approach. The Fund’s portfolio managers sought to take advantage of opportunities stemming from increased volatility, supply pressures and headline credit risk, while maintaining the Fund’s bias toward higher quality issuances.
| | | | |
CREDIT QUALITY ALLOCATIONS*** | |
| AAA | | | 27.6 | % |
| AA | | | 50.9 | |
| A | | | 18.6 | |
| BBB | | | 1.6 | |
| NR | | | 1.3 | |
J.P. Morgan Investment Management receives credit ratings on underlying securities of the portfolio from three major rating agencies — Standard & Poor’s (“S&P”), Moody’s and Fitch. When calculating credit quality breakdown, S&P is used as the primary independent rating agency source. Where an S&P rating is not available for a particular security, the Moody’s rating will be used, if available, and Fitch, if available, is used for securities not rated by Moody’s or S&P. Securities not rated by any of the three agencies are reflected as not rated (NR).
Although the Credit Quality Allocations table reflects the ratings of the bonds detailed in the Schedule of Investments, 4.5% of the investments in the table is held in prerefunded municipal bonds or escrowed to maturity securities. Prerefunded municipal bonds and escrowed to maturity securities are bonds the principal and interest of which are to be paid by Treasuries, Agencies and other government securities that have been placed in escrow accounts. For both prerefunded and escrowed to maturity securities, the credit status is considered the same, the only difference is prerefundeds are paid off at a call date while escrowed to maturity are retired at maturity.
| * | | The return shown is based on net asset values calculated for shareholder transactions and may differ from the return shown in the financial highlights, which reflects adjustments made to the net asset values in accordance with accounting principles generally accepted in the United States of America. |
| ** | | The adviser seeks to achieve the Fund’s objective. There can be no guarantee it will be achieved. |
| *** | | Percentages indicated are based on total investments as of August 31, 2016. The Fund’s portfolio composition is subject to change. |
| | | | | | | | |
| | | |
| AUGUST 31, 2016 | | J.P. MORGAN MUNICIPAL BOND FUNDS | | | | | 7 | |
JPMorgan Short-Intermediate Municipal Bond Fund
FUND COMMENTARY
SIX MONTHS ENDED AUGUST 31, 2016 (Unaudited) (continued)
| | | | | | | | | | | | | | | | | | |
AVERAGE ANNUAL TOTAL RETURNS AS OF AUGUST 31, 2016 | |
| | | | | |
| | | INCEPTION DATE OF
CLASS | | 6 MONTH* | | | 1 YEAR | | | 5 YEAR | | | 10 YEAR | |
CLASS A SHARES | | May 4, 1998 | | | | | | | | | | | | | | | | |
With Sales Charge** | | | | | (1.28 | )% | | | 0.48 | % | | | 0.54 | % | | | 1.80 | % |
Without Sales Charge | | | | | 1.02 | | | | 2.76 | | | | 0.99 | | | | 2.03 | |
CLASS C SHARES | | November 1, 2001 | | | | | | | | | | | | | | | | |
With CDSC*** | | | | | (0.32 | ) | | | 1.23 | | | | 0.47 | | | | 1.51 | |
Without CDSC | | | | | 0.68 | | | | 2.23 | | | | 0.47 | | | | 1.51 | |
INSTITUTIONAL CLASS SHARES | | June 19, 2009 | | | 1.27 | | | | 3.27 | | | | 1.47 | | | | 2.46 | |
SELECT CLASS SHARES | | May 4, 1998 | | | 1.16 | | | | 3.02 | | | | 1.24 | | | | 2.28 | |
| ** | | Sales Charge for Class A Shares is 3.75%. |
| *** | | Assumes a 1% CDSC (contingent deferred sales charge) for the 6 month and one year periods and 0% CDSC thereafter. |
TEN YEAR PERFORMANCE (8/31/06 TO 8/31/16)
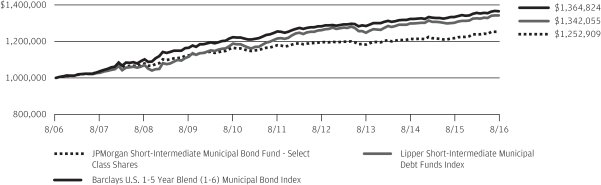
The performance quoted is past performance and is not a guarantee of future results. Mutual funds are subject to certain market risks. Investment returns and principal value of an investment will fluctuate so that an investor’s shares, when redeemed, may be worth more or less than their original cost. Current performance may be higher or lower than the performance data shown. For up-to-date, month-end performance information please call 1-800-480-4111.
Returns for Institutional Class Shares prior to its inception are based on the performance of Select Class Shares. The actual returns of Institutional Class Shares would have been different than those shown because Institutional Class Shares had different expenses than Select Class Shares.
The graph illustrates comparative performance for $1,000,000 invested in Select Class Shares of the JPMorgan Short-Intermediate Municipal Bond Fund, the Barclays U.S. 1-5 Year Blend (1-6) Municipal Bond Index and the Lipper Short-Intermediate Municipal Debt Funds Index from August 31, 2006 to August 31, 2016. The performance of the Fund assumes reinvestment of all dividends and capital gain distributions, if any, and does not include a sales charge. The performance of the Barclays U.S. 1-5 Year Blend (1-6) Municipal Bond Index does not reflect the deduction of expenses or a sales charge associated with a mutual fund and has been adjusted to reflect reinvestment of all dividends and capital gain distributions of the securities included in the benchmark, if applicable. The performance of the Lipper Short-Intermediate Municipal Debt Funds Index includes expenses associated with a mutual fund,
such as investment management fees. These expenses are not identical to the expenses incurred by the Fund. The Barclays U.S. 1-5 Year Blend (1-6) Municipal Bond Index is an unmanaged index of investment grade tax-exempt municipal bonds with maturities of 1–5.999 years. The Lipper Short-Intermediate Municipal Debt Funds Index represents the total returns of certain mutual funds within the Fund’s designated category as determined by Lipper, Inc. Investors cannot invest directly in an index.
Capital gain distributions are subject to federal income tax; a portion of the Fund’s income distributions may be subject to the alternative minimum tax and some investors may be subject to certain state and local taxes.
Select Class Shares have a $1,000,000 minimum initial investment.
Fund performance may reflect the waiver of the Fund’s fees and reimbursement of expenses for certain periods since the inception date. Without these waivers and reimbursements, performance would have been lower. Also, performance shown in this section does not reflect the deduction of taxes that a shareholder would pay on Fund distributions or redemptions of Fund shares.
The returns shown are based on net asset values calculated for shareholder transactions and may differ from the returns shown in the financial highlights, which reflect adjustments made to the net asset values in accordance with accounting principles generally accepted in the United States of America.
| | | | | | |
| | | |
| 8 | | | | J.P. MORGAN MUNICIPAL BOND FUNDS | | AUGUST 31, 2016 |
JPMorgan Tax Free Bond Fund
FUND COMMENTARY
SIX MONTHS ENDED AUGUST 31, 2016 (Unaudited)
| | | | |
| REPORTING PERIOD RETURN: | |
| Fund (Class A Shares, without a sales charge)* | | | 3.95% | |
| Barclays Municipal Bond Index | | | 3.14% | |
| |
| Net Assets as of 8/31/2016 (In Thousands) | | | $365,729 | |
| Duration as of 8/31/2016 | | | 6.1 years | |
INVESTMENT OBJECTIVE**
The JPMorgan Tax Free Bond Fund (the “Fund”) seeks as high a level of current income exempt from federal income tax as is consistent with relative stability of principal.
WHAT WERE THE MAIN DRIVERS OF THE FUND’S PERFORMANCE?
For the six months ended August 31, 2016, the Fund outperformed the Barclays Municipal Bond Index (the “Benchmark”). Relative to the Benchmark, the Fund’s longer duration profile and its overweight positions in the short and long ends of the yield curve were leading contributors to performance. Duration measures the price sensitivity of a bond or a portfolio of bonds to relative changes in interest rates. Generally, bonds with longer duration will experience a larger increase or decrease in price as interest rates fall or rise, respectively, versus bonds with shorter duration. The yield curve shows the relationship between yields and maturity dates for a set of similar bonds at a given point in time.
The Fund’s overweight position in water & sewer bonds and its underweight position in state general obligation bonds also contributed to relative performance, as did the Fund’s overweight position in California bonds and its underweight position in Florida bonds.
The Fund’s overweight position in pre-refunded bonds and its underweight positions in industrial development revenue/pollution control revenue bonds and housing bonds were leading detractors from performance relative to the Benchmark.
HOW WAS THE FUND POSITIONED?
The Fund continued to employ a bottom-up, security selection-based investment approach and sought to take advantage of opportunities stemming from increased volatility, supply pressures and headline credit risk. For liquidity, and to enhance the Fund’s overall credit quality, the Fund maintained its overweight position versus the Benchmark in pre-refunded bonds.
| | | | |
CREDIT QUALITY ALLOCATIONS*** | |
| AAA | | | 26.4 | % |
| AA | | | 57.3 | |
| A | | | 10.2 | |
| BBB | | | 3.6 | |
| NR | | | 2.5 | |
J.P. Morgan Investment Management receives credit ratings on underlying securities of the portfolio from three major rating agencies — S&P, Moody’s and Fitch. When calculating credit quality breakdown, Standard & Poor’s (“S&P”), is used as the primary independent rating agency source. Where an S&P rating is not available for a particular security, the Moody’s rating will be used, if available, and Fitch, if available, is used for securities not rated by Moody’s or S&P. Securities not rated by any of the three agencies are reflected as not rated (NR).
Although the Credit Quality Allocations table reflects the ratings of the bonds detailed in the Schedule of Investments, 20.0% of the investments in the table is held in prerefunded municipal bonds or escrowed to maturity securities. Prerefunded municipal bonds and escrowed to maturity securities are bonds the principal and interest of which are to be paid by Treasuries, Agencies and other government securities that have been placed in escrow accounts. For both prerefunded and escrowed to maturity securities, the credit status is considered the same, the only difference is prerefundeds are paid off at a call date while escrowed to maturity are retired at maturity.
| * | | The return shown is based on net asset values calculated for shareholder transactions and may differ from the return shown in the financial highlights, which reflects adjustments made to the net asset values in accordance with accounting principles generally accepted in the United States of America. |
| ** | | The adviser seeks to achieve the Fund’s objective. There can be no guarantee it will be achieved. |
| *** | | Percentages indicated are based on total investments as of August 31, 2016. The Fund’s portfolio composition is subject to change. |
| | | | | | | | |
| | | |
| AUGUST 31, 2016 | | J.P. MORGAN MUNICIPAL BOND FUNDS | | | | | 9 | |
JPMorgan Tax Free Bond Fund
FUND COMMENTARY
SIX MONTHS ENDED AUGUST 31, 2016 (Unaudited) (continued)
| | | | | | | | | | | | | | | | | | |
AVERAGE ANNUAL TOTAL RETURNS AS OF AUGUST 31, 2016 | |
| | | | | |
| | | INCEPTION DATE OF
CLASS | | 6 MONTH* | | | 1 YEAR | | | 5 YEAR | | | 10 YEAR | |
CLASS A SHARES | | March 1, 1988 | | | | | | | | | | | | | | | | |
With Sales Charge** | | | | | 0.05 | % | | | 3.56 | % | | | 4.04 | % | | | 3.92 | % |
Without Sales Charge | | | | | 3.95 | | | | 7.63 | | | | 4.83 | | | | 4.32 | |
CLASS C SHARES | | July 1, 2008 | | | | | | | | | | | | | | | | |
With CDSC*** | | | | | 2.55 | | | | 5.87 | | | | 4.12 | | | | 3.61 | |
Without CDSC | | | | | 3.55 | | | | 6.87 | | | | 4.12 | | | | 3.61 | |
SELECT CLASS SHARES | | February 1, 1995 | | | 3.97 | | | | 7.77 | | | | 5.01 | | | | 4.49 | |
| ** | | Sales Charge for Class A Shares is 3.75%. |
| *** | | Assumes a 1% CDSC (contingent deferred sales charge) for the 6 month and one year periods and 0% CDSC thereafter. |
TEN YEAR PERFORMANCE (8/31/06 TO 8/31/16)
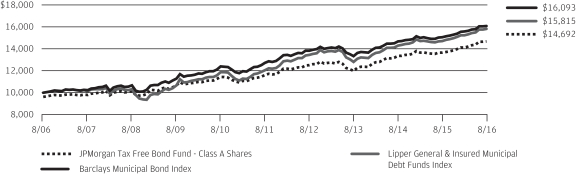
The performance quoted is past performance and is not a guarantee of future results. Mutual funds are subject to certain market risks. Investment returns and principal value of an investment will fluctuate so that an investor’s shares, when redeemed, may be worth more or less than their original cost. Current performance may be higher or lower than the performance data shown. For up-to-date, month-end performance information please call 1-800-480-4111.
Returns for Class C Shares prior to its inception are based on the performance of Class B Shares, all of which converted to Class A Shares on June 19, 2015. The actual returns of Class C Shares would have been similar to those shown because Class C Shares had similar expenses to Class B Shares.
The graph illustrates comparative performance for $10,000 invested in Class A Shares of the JPMorgan Tax Free Bond Fund, the Barclays Municipal Bond Index and the Lipper General & Insured Municipal Debt Funds Index from August 31, 2006 to August 31, 2016. The performance of the Fund assumes reinvestment of all dividends and capital gain distributions, if any, and includes a sales charge. The performance of the Barclays Municipal Bond Index does not reflect the deduction of expenses or a sales charge associated with a mutual fund and has been adjusted to reflect reinvestment of all dividends and capital gain distributions of the securities included in the benchmark, if applicable. The performance of the Lipper General & Insured Municipal Debt Funds Index includes expenses associated with a mutual fund, such as investment
management fees. These expenses are not identical to the expenses incurred by the Fund. The Barclays Municipal Bond Index is a total return performance benchmark for the long-term, investment-grade tax-exempt bond market. The Lipper General & Insured Municipal Debt Funds Index represents the total returns of certain mutual funds within the Fund’s designated category as defined by Lipper, Inc. Investors cannot invest directly in an index.
Capital gain distributions are subject to federal income tax; a portion of the Fund’s income distributions may be subject to the alternative minimum tax and some investors may be subject to certain state and local taxes.
Class A Shares have a $1,000 minimum initial investment and carry a 3.75% sales charge.
Fund performance may reflect the waiver of the Fund’s fees and reimbursement of expenses for certain periods since the inception date. Without these waivers and reimbursements, performance would have been lower. Also, performance shown in this section does not reflect the deduction of taxes that a shareholder would pay on Fund distributions or redemptions of Fund shares.
The returns shown are based on net asset values calculated for shareholder transactions and may differ from the returns shown in the financial highlights, which reflect adjustments made to the net asset values in accordance with accounting principles generally accepted in the United States of America.
| | | | | | |
| | | |
| 10 | | | | J.P. MORGAN MUNICIPAL BOND FUNDS | | AUGUST 31, 2016 |
JPMorgan Municipal Income Fund
SCHEDULE OF PORTFOLIO INVESTMENTS
AS OF AUGUST 31, 2016 (Unaudited)
(Amounts in thousands)
| | | | | | | | |
PRINCIPAL
AMOUNT($) | | | SECURITY DESCRIPTION | | VALUE($) | |
| Municipal Bonds — 94.5% (t) | |
| | | | Alabama — 0.8% | |
| | | | Utility — 0.8% | |
| | 2,000 | | | The Lower Alabama Gas District, Gas Project, Series A, Rev., 5.000%, 09/01/31 | | | 2,536 | |
| | | | | | | | |
| | | | Alaska — 0.7% | |
| | | | Housing — 0.3% | |
| | 1,000 | | | Alaska Housing Finance Corp., General Mortgage, Series A, Rev., 3.500%, 06/01/46 | | | 1,083 | |
| | | | | | | | |
| | | | Other Revenue — 0.4% | | | | |
| | 1,195 | | | Northern Tobacco Securitization Corp., Series A, Rev., 4.625%, 06/01/23 | | | 1,214 | |
| | | | | | | | |
| | | | Total Alaska | | | 2,297 | |
| | | | | | | | |
| | | | Arizona — 1.9% | |
| | | | Water & Sewer — 1.9% | |
| | 2,645 | | | City of Scottsdale, Water & Sewer System, Rev., 5.250%, 07/01/22 | | | 3,273 | |
| | 2,150 | | | City of Tucson, Water System, Rev., 5.000%, 07/01/24 | | | 2,723 | |
| | | | | | | | |
| | | | Total Arizona | | | 5,996 | |
| | | | | | | | |
| | | | Arkansas — 0.0% (g) | |
| | | | Housing — 0.0% (g) | |
| | 15 | | | Arkansas Development Finance Authority, Single Family Mortgage, Series D, Rev., AMT, GNMA/FNMA/FHLMC, 5.500%, 01/01/37 | | | 15 | |
| | | | | | | | |
| | | | California — 2.4% | |
| | | | General Obligation — 0.3% | |
| | 1,000 | | | Salinas Union High School District, GO, Zero Coupon, 08/01/20 | | | 941 | |
| | | | | | | | |
| | | | Housing — 0.1% | |
| | 205 | | | California Rural Home Mortgage Finance Authority, Single Family Mortgage, Mortgage-Backed Security Program, Series A, Rev., GNMA/FNMA/FHLMC, 5.400%, 12/01/36 | | | 211 | |
| | | | | | | | |
| | | | Industrial Development Revenue/Pollution Control Revenue — 0.6% | |
| | 1,750 | | | California Pollution Control Financing Authority, Solid Waste Disposal, Waste Management, Inc. Project, Series B-2, Rev., VAR, AMT, 3.125%, 11/03/25 | | | 1,861 | |
| | | | | | | | |
| | | | Prerefunded — 1.1% | |
| | 1,000 | | | Alum Rock Union Elementary School District, Election of 2008, Series A, GO, AGC, 5.250%, 08/01/18 (p) | | | 1,089 | |
| | 2,000 | | | San Diego Public Facilities Financing Authority, Series A, Rev., 5.250%, 08/01/20 (p) | | | 2,343 | |
| | | | | | | | |
| | | | | | | 3,432 | |
| | | | | | | | |
| | | | | | | | |
PRINCIPAL
AMOUNT($) | | | SECURITY DESCRIPTION | | VALUE($) | |
| | | | | | | | |
| | | | Transportation — 0.3% | |
| | 1,000 | | | Bay Area Toll Authority, Toll Bridge, San Francisco Bay Area, Series C, Rev., VAR, 1.875%, 04/01/19 | | | 1,021 | |
| | | | | | | | |
| | | | Total California | | | 7,466 | |
| | | | | | | | |
| | | | Colorado — 1.5% | |
| | | | Certificate of Participation/Lease — 0.2% | | | | |
| | 625 | | | Pueblo County Judicial Complex Project, COP, AGM, 5.000%, 09/15/21 | | | 730 | |
| | | | | | | | |
| | | | General Obligation — 0.4% | | | | |
| | 1,000 | | | Douglas County School District No. Re-1, Douglas & Elbert Counties, GO, 5.250%, 12/15/20 | | | 1,185 | |
| | | | | | | | |
| | | | Hospital — 0.8% | |
| | 2,415 | | | Colorado Health Facilities Authority, Parkview Medical Center, Inc., Project, Series B, Rev., 5.000%, 09/01/22 | | | 2,511 | |
| | | | | | | | |
| | | | Housing — 0.1% | |
| | | | Denver City & County, Single Family Home Mortgage, Metropolitan Mayors Caucus Program, | | | | |
| | 75 | | | Rev., GNMA COLL, 6.150%, 11/01/34 | | | 77 | |
| | 25 | | | Series A, Rev., GNMA/FNMA/FHLMC, 7.300%, 11/01/31 | | | 25 | |
| | 140 | | | El Paso County, Single Family Mortgage, Southern Front Range Region Program, Series E, Rev., AMT, GNMA/FNMA/FHLMC, 5.850%, 04/01/41 | | | 143 | |
| | | | | | | | |
| | | | | | | 245 | |
| | | | | | | | |
| | | | Total Colorado | | | 4,671 | |
| | | | | | | | |
| | | | Connecticut — 1.9% | |
| | | | Education — 1.4% | |
| | | | Connecticut State Higher Education Supplemental Loan Authority, CHESLA Loan Program, | | | | |
| | 760 | | | Series A, Rev., 4.000%, 11/15/19 | | | 807 | |
| | 1,560 | | | Series A, Rev., 5.250%, 11/15/23 | | | 1,800 | |
| | 1,500 | | | Series A, Rev., 5.250%, 11/15/24 | | | 1,731 | |
| | | | | | | | |
| | | | | | | 4,338 | |
| | | | | | | | |
| | | | Housing — 0.5% | |
| | | | Connecticut Housing Finance Authority, Housing Mortgage Finance Program, | | | | |
| | 625 | | | Subseries A-1, Rev., 4.000%, 11/15/45 | | | 681 | |
| | 1,000 | | | Subseries E-1, Rev., 3.500%, 11/15/46 | | | 1,080 | |
| | | | | | | | |
| | | | | | | 1,761 | |
| | | | | | | | |
| | | | Total Connecticut | | | 6,099 | |
| | | | | | | | |
SEE NOTES TO FINANCIAL STATEMENTS.
| | | | | | | | |
| | | |
| AUGUST 31, 2016 | | J.P. MORGAN MUNICIPAL BOND FUNDS | | | | | 11 | |
JPMorgan Municipal Income Fund
SCHEDULE OF PORTFOLIO INVESTMENTS
AS OF AUGUST 31, 2016 (Unaudited) (continued)
(Amounts in thousands)
| | | | | | | | |
PRINCIPAL
AMOUNT($) | | | SECURITY DESCRIPTION | | VALUE($) | |
| Municipal Bonds — continued | |
| | | | Delaware — 0.2% | |
| | | | Housing — 0.2% | |
| | | | Delaware State Housing Authority, Senior Single Family Mortgage, | | | | |
| | 415 | | | Series A-1, Rev., AMT, 4.900%, 07/01/29 | | | 450 | |
| | 240 | | | Series D-1, Rev., AMT, GNMA/FNMA/FHLMC, 4.625%, 01/01/23 | | | 242 | |
| | | | | | | | |
| | | | Total Delaware | | | 692 | |
| | | | | | | | |
| | | | District of Columbia — 1.2% | |
| | | | Water & Sewer — 1.2% | |
| | 3,000 | | | District of Columbia Water & Sewer Authority Public Utility, Subordinate Lien, Green Bonds, Series A, Rev., 5.000%, 10/01/45 | | | 3,650 | |
| | | | | | | | |
| | | | Florida — 12.1% | |
| | | | Certificate of Participation/Lease — 3.6% | |
| | 4,000 | | | Collier County School Board, Master Lease Program, Series A, COP, AGM, 5.250%, 02/15/21 | | | 4,721 | |
| | 2,250 | | | South Florida Water Management District, COP, 5.000%, 10/01/32 | | | 2,791 | |
| | 3,000 | | | The School Board of Miami-Dade County, Series D, COP, 5.000%, 02/01/27 | | | 3,761 | |
| | | | | | | | |
| | | | | | | 11,273 | |
| | | | | | | | |
| | | | Hospital — 0.4% | |
| | 1,100 | | | Palm Beach County Health Facilities Authority, Hospital, BRRH Corp. Obligated Group, Rev., 5.000%, 12/01/21 | | | 1,282 | |
| | | | | | | | |
| | | | Housing — 1.2% | |
| | 420 | | | Broward County Housing Finance Authority, Series B, Rev., AMT, GNMA/FNMA/FHLMC, 4.500%, 04/01/27 | | | 422 | |
| | | | Florida Housing Finance Corp., Homeowner Mortgage Special Program, | | | | |
| | 635 | | | Series A, Rev., GNMA/FNMA/FHLMC, 5.000%, 07/01/28 | | | 666 | |
| | 615 | | | Series B, Rev., GNMA/FNMA/FHLMC, 4.500%, 01/01/29 | | | 652 | |
| | 705 | | | Series B, Rev., GNMA COLL, 4.500%, 01/01/29 | | | 752 | |
| | 440 | | | Hillsborough County Housing Finance Authority, Single Family Mortgage, Series 2, Rev., AMT, GNMA/FNMA/FHLMC, 4.400%, 10/01/27 | | | 439 | |
| | 470 | | | Orange County Housing Finance Authority, Multi-County Program, Series A, Rev., AMT, GNMA/FNMA/FHLMC, 5.125%, 09/01/38 | | | 483 | |
| | 435 | | | Pinellas County Housing Finance Authority, Multi-County Program, Series A-2, Rev., AMT, GNMA/FNMA/FHLMC, 4.900%, 09/01/27 | | | 443 | |
| | | | | | | | |
| | | | | | | 3,857 | |
| | | | | | | | |
| | | | | | | | |
PRINCIPAL
AMOUNT($) | | | SECURITY DESCRIPTION | | VALUE($) | |
| | | | | | | | |
| | | | Industrial Development Revenue/Pollution Control Revenue — 0.5% | |
| | 835 | | | Broward County Fuel System, Fort Lauderdale Fuel Facilities LLC Project, Series A, Rev., AMT, AGM, 5.000%, 04/01/24 | | | 989 | |
| | 500 | | | County of Escambia, Pollution Control, Gulf Power Company Project, Rev., VAR, 2.100%, 04/11/19 | | | 513 | |
| | | | | | | | |
| | | | | | | 1,502 | |
| | | | | | | | |
| | | | Other Revenue — 1.4% | |
| | 1,600 | | | County of Lee, Florida Solid Waste System, Rev., AMT, NATL-RE, 5.000%, 10/01/22 (w) | | | 1,891 | |
| | 2,000 | | | Miami Beach Redevelopment Agency, Historic Convention Village, Series A, Rev., 5.000%, 02/01/27 | | | 2,445 | |
| | | | | | | | |
| | | | | | | 4,336 | |
| | | | | | | | |
| | | | Transportation — 1.6% | |
| | 2,635 | | | City of Orlando, Greater Orlando Aviation Authority, Airport Facilities, Series B, Rev., AMT, 5.000%, 10/01/26 | | | 3,028 | |
| | 1,500 | | | Tampa-Hillsborough County Expressway Authority, Series A, Rev., 5.000%, 07/01/27 | | | 1,789 | |
| | | | | | | | |
| | | | | | | 4,817 | |
| | | | | | | | |
| | | | Utility — 3.4% | |
| | 5,000 | | | City of Port St. Lucie, Utility Systems, Rev., NATL-RE, 5.250%, 09/01/24 | | | 6,260 | |
| | 800 | | | Florida Municipal Power Agency, All Requirements Power Supply Project, Series A, Rev., 5.000%, 10/01/30 | | | 1,006 | |
| | 2,000 | | | Palm Beach County Solid Waste Authority, Rev., BHAC, 5.500%, 10/01/22 | | | 2,287 | |
| | 1,000 | | | Pasco County, Solid Waste Disposal & Resource Recovery System, Rev., AMT, 5.000%, 10/01/20 | | | 1,152 | |
| | | | | | | | |
| | | | | | | 10,705 | |
| | | | | | | | |
| | | | Total Florida | | | 37,772 | |
| | | | | | | | |
| | | | Georgia — 1.2% | |
| | | | Housing — 0.2% | |
| | 590 | | | Atlanta Urban Residential Finance Authority, Single Family Mortgage, Mortgage-Backed Securities Program, Series B, Rev., GNMA/FNMA/FHLMC, 5.500%, 03/01/41 | | | 620 | |
| | | | | | | | |
SEE NOTES TO FINANCIAL STATEMENTS.
| | | | | | |
| | | |
| 12 | | | | J.P. MORGAN MUNICIPAL BOND FUNDS | | AUGUST 31, 2016 |
| | | | | | | | |
PRINCIPAL
AMOUNT($) | | | SECURITY DESCRIPTION | | VALUE($) | |
| Municipal Bonds — continued | |
| | | | Industrial Development Revenue/Pollution Control Revenue — 1.0% | |
| | 3,000 | | | Monroe County Development Authority, Pollution Control, Oglethorpe Power Corp. Scherer Project, Series A, Rev., VAR, 2.400%, 04/01/20 | | | 3,109 | |
| | | | | | | | |
| | | | Total Georgia | | | 3,729 | |
| | | | | | | | |
| | | | Hawaii — 0.5% | |
| | | | General Obligation — 0.5% | |
| | 1,470 | | | City & County of Honolulu, Series D, GO, 5.250%, 09/01/26 | | | 1,664 | |
| | | | | | | | |
| | | | Illinois — 1.0% | |
| | | | General Obligation — 0.7% | |
| | 2,000 | | | Chicago Board of Education, Series C, GO, AGC-ICC, 5.250%, 12/01/26 | | | 2,130 | |
| | | | | | | | |
| | | | Housing — 0.1% | |
| | | | City of Aurora, Single Family Mortgage, | | | | |
| | 206 | | | Series A, Rev., AMT, GNMA/FNMA/FHLMC, 5.500%, 12/01/39 | | | 213 | |
| | 209 | | | Series B, Rev., GNMA/FNMA/FHLMC, 5.450%, 12/01/39 | | | 215 | |
| | 25 | | | City of Peoria, City of Moline & City of Freeport, Collateralized Single Family Mortgage, Series A, Rev., GNMA COLL, 7.600%, 04/01/27 | | | 25 | |
| | | | | | | | |
| | | | | | | 453 | |
| | | | | | | | |
| | | | Prerefunded — 0.2% | |
| | 555 | | | City of Chicago, Single Family Mortgage, Series K, Rev., FHLMC COLL, 5.350%, 12/01/16 (p) | | | 589 | |
| | | | | | | | |
| | | | Total Illinois | | | 3,172 | |
| | | | | | | | |
| | | | Indiana — 2.5% | |
| | | | Hospital — 0.7% | |
| | 1,670 | | | Indiana Health Facility Financing Authority, Ascension Health Credit Group, Series A-1, Rev., 5.000%, 11/15/34 | | | 2,048 | |
| | | | | | | | |
| | | | Housing — 0.2% | |
| | 735 | | | Indiana Housing & Community Development Authority, Home First Mortgage, Series A, Rev., GNMA/FNMA/FHLMC, 4.500%, 06/01/28 | | | 782 | |
| | | | | | | | |
| | | | Other Revenue — 0.8% | |
| | 2,000 | | | City of Whiting, Environmental Facilities, BP Products North America, Inc. Project, Rev., VAR, AMT, 5.000%, 11/01/22 | | | 2,370 | |
| | | | | | | | |
| | | | | | | | |
PRINCIPAL
AMOUNT($) | | | SECURITY DESCRIPTION | | VALUE($) | |
| | | | | | | | |
| | | | Water & Sewer — 0.8% | |
| | 1,250 | | | Indiana State Finance Authority, First Lien Wastewater Utility, CWA Authority Project, Series A, Rev., 5.000%, 10/01/30 | | | 1,489 | |
| | 1,050 | | | Indianapolis Local Public Improvement Bond Bank, Waterworks Project, Series F, Rev., NATL-RE, 5.000%, 07/01/19 | | | 1,054 | |
| | | | | | | | |
| | | | | | | 2,543 | |
| | | | | | | | |
| | | | Total Indiana | | | 7,743 | |
| | | | | | | | |
| | | | Iowa — 0.9% | |
| | | | Education — 0.6% | |
| | | | Iowa Student Loan Liquidity Corp., Student Loan, | | | | |
| | 500 | | | Series A, Rev., AMT, 5.000%, 12/01/18 | | | 543 | |
| | 1,000 | | | Series A, Rev., AMT, 5.000%, 12/01/25 | | | 1,211 | |
| | | | | | | | |
| | | | | | | 1,754 | |
| | | | | | | | |
| | | | Housing — 0.3% | |
| | | | Iowa Finance Authority, Single Family Mortgage, Mortgage-Backed Securities Program, | | | | |
| | 185 | | | Series 1, Rev., GNMA/FNMA/FHLMC, 5.000%, 07/01/28 | | | 194 | |
| | 720 | | | Series A, Rev., GNMA/FNMA/FHLMC, 4.000%, 07/01/46 | | | 796 | |
| | | | | | | | |
| | | | | | | 990 | |
| | | | | | | | |
| | | | Total Iowa | | | 2,744 | |
| | | | | | | | |
| | | | Kentucky — 0.2% | |
| | | | Industrial Development Revenue/Pollution Control Revenue — 0.2% | |
| | 500 | | | County of Carroll, Kentucky Pollution Control, Kentucky Utilities Company Project, Series A, Rev.,VAR, 1.050%, 09/01/19 | | | 500 | |
| | | | | | | | |
| | | | Louisiana — 0.5% | |
| | | | Housing — 0.5% | |
| | 615 | | | Calcasieu Parish Public Trust Authority, Single Family Mortgage, Mortgage-Backed Securities Program, Series B, Rev., AMT, GNMA/FNMA/FHLMC, 5.350%, 09/01/38 | | | 640 | |
| | 193 | | | East Baton Rouge Mortgage Finance Authority, Single Family Mortgage, Mortgage-Backed Securities Program, Series A-2, Rev., GNMA/FNMA/FHLMC, 5.250%, 10/01/39 | | | 199 | |
| | 390 | | | Louisiana Housing Finance Agency, Single Family Mortgage, Home Ownership Program, Series A, Rev., GNMA/FNMA/FHLMC, 5.500%, 06/01/40 | | | 402 | |
SEE NOTES TO FINANCIAL STATEMENTS.
| | | | | | | | |
| | | |
| AUGUST 31, 2016 | | J.P. MORGAN MUNICIPAL BOND FUNDS | | | | | 13 | |
JPMorgan Municipal Income Fund
SCHEDULE OF PORTFOLIO INVESTMENTS
AS OF AUGUST 31, 2016 (Unaudited) (continued)
(Amounts in thousands)
| | | | | | | | |
PRINCIPAL
AMOUNT($) | | | SECURITY DESCRIPTION | | VALUE($) | |
| Municipal Bonds — continued | |
| | | | Housing — continued | |
| | 185 | | | Louisiana Housing Finance Agency, Single Family Mortgage, Mortgage-Backed Securities Program, Series A, Rev., GNMA/FNMA/FHLMC, 4.600%, 12/01/28 | | | 191 | |
| | | | | | | | |
| | | | Total Louisiana | | | 1,432 | |
| | | | | | | | |
| | | | Maine — 0.6% | |
| | | | Housing — 0.6% | |
| | | | Maine State Housing Authority, | | | | |
| | 1,020 | | | Series A, Rev., 4.000%, 11/15/45 | | | 1,119 | |
| | 365 | | | Series A-1, Rev., AMT, 4.500%, 11/15/28 | | | 389 | |
| | 295 | | | Series B, Rev., 4.000%, 11/15/43 | | | 313 | |
| | | | | | | | |
| | | | Total Maine | | | 1,821 | |
| | | | | | | | |
| | | | Massachusetts — 8.8% | |
| | | | Education — 1.1% | |
| | 1,000 | | | Massachusetts Educational Financing Authority, Education Loan, Rev., AMT, 5.000%, 07/01/21 | | | 1,140 | |
| | 820 | | | Massachusetts Health & Educational Facilities Authority, Massachusetts Institute of Technology, Series L, Rev., 5.250%, 07/01/33 | | | 1,189 | |
| | 1,060 | | | Massachusetts Health & Educational Facilities Authority, Springfield College, Rev., 5.000%, 10/15/17 (p) | | | 1,112 | |
| | | | | | | | |
| | | | | | | 3,441 | |
| | | | | | | | |
| | | | General Obligation — 1.0% | |
| | 2,500 | | | Commonwealth of Massachusetts, Series B, GO, AGM, 5.250%, 09/01/21 | | | 3,024 | |
| | | | | | | | |
| | | | Housing — 0.3% | |
| | | | Massachusetts Housing Finance Agency, Single Family Housing, | | | | |
| | 445 | | | Series 169, Rev., 4.000%, 12/01/44 | | | 473 | |
| | 500 | | | Series 183, Rev., 3.500%, 12/01/46 | | | 537 | |
| | | | | | | | |
| | | | | | | 1,010 | |
| | | | | | | | |
| | | | Water & Sewer — 6.4% | |
| | 5,000 | | | Massachusetts Water Pollution Abatement Trust, Pool Program, Rev., 5.250%, 08/01/24 | | | 6,513 | |
| | | | Massachusetts Water Resources Authority, | | | | |
| | 7,925 | | | Series B, Rev., AGM, 5.250%, 08/01/28 | | | 10,799 | |
| | 2,000 | | | Series B, Rev., AGM, 5.250%, 08/01/29 | | | 2,761 | |
| | | | | | | | |
| | | | | | | 20,073 | |
| | | | | | | | |
| | | | Total Massachusetts | | | 27,548 | |
| | | | | | | | |
| | | | | | | | |
PRINCIPAL
AMOUNT($) | | | SECURITY DESCRIPTION | | VALUE($) | |
| | | | | | | | |
| | | | Michigan — 1.4% | |
| | | | Housing — 0.6% | |
| | 2,030 | | | Michigan State Housing Development Authority, Rental Housing, Series D, Rev., AMT, AGM, 4.950%, 04/01/21 | | | 2,035 | |
| | | | | | | | |
| | | | Industrial Development Revenue/Pollution Control Revenue — 0.8% | |
| | 570 | | | Michigan Strategic Fund, The Detroit Edison Company Pollution Control Bonds Project, Series CC, Rev.,VAR, 1.450%, 09/01/21 | | | 570 | |
| | 1,705 | | | Saginaw County Economic Development Corp., BGI South LLC-Recovery Zone, Rev., 5.000%, 12/01/20 | | | 1,917 | |
| | | | | | | | |
| | | | | | | 2,487 | |
| | | | | | | | |
| | | | Total Michigan | | | 4,522 | |
| | | | | | | | |
| | | | Minnesota — 2.3% | |
| | | | General Obligation — 0.0% (g) | |
| | 35 | | | State of Minnesota, Series A, GO, 5.000%, 10/01/21 (p) | | | 42 | |
| | | | | | | | |
| | | | Housing — 2.3% | |
| | | | Dakota County Community Development Agency, Single Family Mortgage, Mortgage-Backed Securities Program, | | | | |
| | 465 | | | Series A, Rev., GNMA/FNMA/FHLMC, 4.500%, 06/01/35 | | | 493 | |
| | 489 | | | Series A, Rev., GNMA/FNMA/FHLMC, 5.125%, 12/01/40 | | | 493 | |
| | 30 | | | Series B, Rev., GNMA/FNMA/FHLMC, 5.150%, 12/01/38 | | | 31 | |
| | 590 | | | Minneapolis Community Development Agency, Multi-Family Housing, Riverside Homes Project, Rev., 6.100%, 09/01/19 | | | 592 | |
| | | | Minneapolis/St. Paul Housing Finance Board, Single Family Mortgage, Mortgage-Backed Securities Program, City Living Home Programs, | | | | |
| | 197 | | | Series A-1, Rev., GNMA/FNMA/FHLMC, 5.250%, 12/01/40 | | | 198 | |
| | 545 | | | Series A-2, Rev., GNMA/FNMA/FHLMC, 5.520%, 03/01/41 | | | 580 | |
| | | | Minnesota Housing Finance Agency, Homeownership Finance, Mortgage-Backed Securities Program, | | | | |
| | 630 | | | Series A, Rev., GNMA/FNMA/FHLMC, 4.250%, 07/01/28 | | | 657 | |
| | 320 | | | Series D, Rev., GNMA/FNMA/FHLMC, 4.500%, 07/01/34 | | | 337 | |
SEE NOTES TO FINANCIAL STATEMENTS.
| | | | | | |
| | | |
| 14 | | | | J.P. MORGAN MUNICIPAL BOND FUNDS | | AUGUST 31, 2016 |
| | | | | | | | |
PRINCIPAL
AMOUNT($) | | | SECURITY DESCRIPTION | | VALUE($) | |
| Municipal Bonds — continued | |
| | | | Housing — continued | |
| | | | Minnesota Housing Finance Agency, Non Profit Housing, State Appropriation, | | | | |
| | 1,015 | | | Rev., 5.250%, 08/01/24 | | | 1,192 | |
| | 1,070 | | | Rev., 5.250%, 08/01/25 | | | 1,253 | |
| | 825 | | | Rev., 5.250%, 08/01/26 | | | 964 | |
| | 455 | | | Minnesota Housing Finance Agency, Residential Housing Finance, Series D, Rev., GNMA/FNMA/FHLMC, 4.000%, 07/01/40 | | | 474 | |
| | | | | | | | |
| | | | | | | 7,264 | |
| | | | | | | | |
| | | | Total Minnesota | | | 7,306 | |
| | | | | | | | |
| | | | Mississippi — 0.7% | |
| | | | Housing — 0.7% | |
| | 695 | | | Mississippi Home Corp., Home Ownership Mortgage, Series A, Rev., GNMA COLL, 4.500%, 12/01/31 | | | 732 | |
| | 1,450 | | | Mississippi Home Corp., Single Family Mortgage, Series B-1, Rev., GNMA/FNMA/FHLMC, 5.375%, 12/01/38 | | | 1,506 | |
| | | | | | | | |
| | | | Total Mississippi | | | 2,238 | |
| | | | | | | | |
| | | | Missouri — 1.5% | |
| | | | Housing — 0.8% | |
| | 1,880 | | | Missouri Housing Development Commission, Single Family Mortgage, First Place Homeownership Loan Program, Series B, Rev., GNMA/FNMA/FHLMC COLL, 3.500%, 05/01/41 | | | 2,038 | |
| | 105 | | | Missouri Housing Development Commission, Single Family Mortgage, Homeownership Loan Program, Series B-1, Rev., AMT, GNMA/FNMA/FHLMC, 5.050%, 03/01/38 | | | 108 | |
| | 340 | | | Missouri Housing Development Commission, Single Family Mortgage, Special Homeownership Loan Program, Series E-1, Rev., GNMA/FNMA/FHLMC, 5.000%, 11/01/27 | | | 363 | |
| | | | | | | | |
| | | | | | | 2,509 | |
| | | | | | | | |
| | | | Transportation — 0.7% | |
| | 2,105 | | | City of St. Louis, Lambert-St. Louis International Airport, Series B, Rev., AMT, AGM, 5.000%, 07/01/19 | | | 2,178 | |
| | | | | | | | |
| | | | Total Missouri | | | 4,687 | |
| | | | | | | | |
| | | | Nevada — 0.5% | |
| | | | Housing — 0.0% (g) | |
| | 74 | | | Nevada Rural Housing Authority, Single Family Mortgage, Series A, Rev., AMT, GNMA/FNMA/FHLMC, 5.200%, 11/01/40 | | | 74 | |
| | | | | | | | |
| | | | | | | | |
PRINCIPAL
AMOUNT($) | | | SECURITY DESCRIPTION | | VALUE($) | |
| | | | | | | | |
| | | | Prerefunded — 0.5% | |
| | 1,360 | | | Las Vegas Convention & Visitors Authority, Rev., AMBAC, 5.000%, 01/01/18 (p) | | | 1,439 | |
| | | | | | | | |
| | | | Total Nevada | | | 1,513 | |
| | | | | | | | |
| | | | New Hampshire — 2.0% | |
| | | | Education — 1.9% | |
| | | | City of Manchester, School Facilities, | | | | |
| | 3,545 | | | Rev., NATL-RE, 5.500%, 06/01/24 | | | 4,550 | |
| | 900 | | | Rev., NATL-RE, 5.500%, 06/01/27 | | | 1,217 | |
| | | | | | | | |
| | | | | | | 5,767 | |
| | | | | | | | |
| | | | Housing — 0.1% | |
| | 370 | | | New Hampshire Housing Finance Authority, Single Family Mortgage, Series E, Rev., 6.625%, 07/01/38 | | | 393 | |
| | | | | | | | |
| | | | Total New Hampshire | | | 6,160 | |
| | | | | | | | |
| | | | New Jersey — 3.0% | |
| | | | Education — 0.9% | |
| | 250 | | | New Jersey Educational Facilities Authority, College of New Jersey Issue, Series A, Rev., 5.000%, 07/01/18 | | | 269 | |
| | | | New Jersey Higher Education Student Assistance Authority, Senior Student Loan, | | | | |
| | 500 | | | Series 1A, Rev., AMT, 5.000%, 12/01/19 | | | 551 | |
| | 1,750 | | | Series 1A, Rev., AMT, 5.000%, 12/01/24 | | | 2,070 | |
| | | | | | | | |
| | | | | | | 2,890 | |
| | | | | | | | |
| | | | General Obligation — 0.5% | |
| | 1,215 | | | Egg Harbor Township Board of Education, GO, AGM, 5.750%, 07/15/24 | | | 1,567 | |
| | | | | | | | |
| | | | Industrial Development Revenue/Pollution Control Revenue — 0.2% | |
| | 500 | | | Gloucester County Improvement Authority, Solid Waste Resource Recovery, Waste Management, Inc., Project, Series A, Rev., VAR, 2.125%, 12/01/17 | | | 508 | |
| | | | | | | | |
| | | | Other Revenue — 0.7% | |
| | | | New Jersey Health Care Facilities Financing Authority, University Hospital Issue, | | | | |
| | 1,000 | | | Series A, Rev., AGM, 5.000%, 07/01/22 | | | 1,188 | |
| | 820 | | | Series A, Rev., AGM, 5.000%, 07/01/23 | | | 989 | |
| | | | | | | | |
| | | | | | | 2,177 | |
| | | | | | | | |
| | | | Transportation — 0.7% | |
| | 2,000 | | | New Jersey Transportation Trust Fund Authority, Transportation System, Series A, Rev., 5.500%, 12/15/21 | | | 2,333 | |
| | | | | | | | |
| | | | Total New Jersey | | | 9,475 | |
| | | | | | | | |
SEE NOTES TO FINANCIAL STATEMENTS.
| | | | | | | | |
| | | |
| AUGUST 31, 2016 | | J.P. MORGAN MUNICIPAL BOND FUNDS | | | | | 15 | |
JPMorgan Municipal Income Fund
SCHEDULE OF PORTFOLIO INVESTMENTS
AS OF AUGUST 31, 2016 (Unaudited) (continued)
(Amounts in thousands)
| | | | | | | | |
PRINCIPAL
AMOUNT($) | | | SECURITY DESCRIPTION | | VALUE($) | |
| Municipal Bonds — continued | |
| | | | New Mexico — 0.2% | |
| | | | Housing — 0.2% | |
| | 625 | | | New Mexico Mortgage Finance Authority, Single Family Mortgage Program, Series B-3, Class I, Rev., AMT, GNMA/FNMA/FHLMC, 4.200%, 07/01/28 | | | 627 | |
| | | | | | | | |
| | | | New York — 11.6% | |
| | | | Housing — 1.3% | |
| | | | New York Mortgage Agency, Homeowner Mortgage, | | | | |
| | 1,745 | | | Series 195, Rev., 4.000%, 10/01/46 | | | 1,919 | |
| | 1,665 | | | Series 197, Rev., 3.500%, 10/01/44 | | | 1,805 | |
| | 450 | | | New York State Mortgage Agency, 39th Series, Rev., 5.000%, 04/01/28 | | | 478 | |
| | | | | | | | |
| | | | | | | 4,202 | |
| | | | | | | | |
| | | | Other Revenue — 2.4% | |
| | 4,000 | | | New York State Dormitory Authority, Sales Tax, Series B, Rev., 5.000%, 03/15/30 | | | 5,082 | |
| | | | Niagara Tobacco Asset Securitization Corp., Tobacco Settlement Asset-Backed Bonds, | | | | |
| | 400 | | | Rev., 5.000%, 05/15/22 | | | 471 | |
| | 1,660 | | | Rev., 5.000%, 05/15/23 | | | 1,990 | |
| | | | | | | | |
| | | | | | | 7,543 | |
| | | | | | | | |
| | | | Prerefunded — 0.0% (g) | |
| | 5 | | | New York State Dormitory Authority, Series A, Rev., 5.250%, 02/15/19 (p) | | | 5 | |
| | | | | | | | |
| | | | Special Tax — 2.7% | |
| | 1,995 | | | New York State Dormitory Authority, Series A, Rev., 5.250%, 02/15/24 | | | 2,207 | |
| | 1,000 | | | New York State Dormitory Authority, Personal Education, Series C, Rev., 5.000%, 03/15/26 | | | 1,064 | |
| | 4,000 | | | New York State Urban Development Corp., State Personal Income Tax, Series A, Rev., 5.000%, 03/15/32 | | | 5,003 | |
| | | | | | | | |
| | | | | | | 8,274 | |
| | | | | | | | |
| | | | Transportation — 2.8% | |
| | 3,000 | | | Metropolitan Transportation Authority, Dedicated Tax Fund, Series A, Rev., 5.000%, 11/15/29 | | | 3,657 | |
| | 3,000 | | | Port Authority of New York & New Jersey, Consolidated, 194th Series, Rev., 5.000%, 10/15/30 | | | 3,801 | |
| | 1,000 | | | Triborough Bridge & Tunnel Authority, MTA Bridges & Tunnels, Series B, Rev., 5.000%, 11/15/29 | | | 1,215 | |
| | | | | | | | |
| | | | | | | 8,673 | |
| | | | | | | | |
| | | | | | | | |
PRINCIPAL
AMOUNT($) | | | SECURITY DESCRIPTION | | VALUE($) | |
| | | | | | | | |
| | | | Water & Sewer — 2.4% | |
| | 1,000 | | | New York City Municipal Water Finance Authority, Water & Sewer System, Second General Resolution, Fiscal Year 2015, Series FF, Rev., 5.000%, 06/15/31 | | | 1,253 | |
| | | | New York State Environmental Facilities Corp., State Clean Water & Drinking Water Revolving Funds, New York City Municipal Water Finance Authority Projects — Second Resolution, | | | | |
| | 2,500 | | | Series A, Rev., 5.250%, 06/15/27 | | | 2,807 | |
| | 3,000 | | | Series B, Rev., 5.000%, 06/15/28 | | | 3,550 | |
| | | | | | | | |
| | | | | | | 7,610 | |
| | | | | | | | |
| | | | Total New York | | | 36,307 | |
| | | | | | | | |
| | | | North Carolina — 2.1% | |
| | | | Other Revenue — 0.4% | |
| | 1,000 | | | County of Randolph, Limited Obligation, Series B, Rev., 5.000%, 10/01/26 | | | 1,286 | |
| | | | | | | | |
| | | | Prerefunded — 0.5% | |
| | 1,355 | | | University of North Carolina, Series A, Rev., 5.250%, 10/01/19 (p) | | | 1,542 | |
| | | | | | | | |
| | | | Water & Sewer — 1.2% | |
| | 3,330 | | | City of Charlotte, Water & Sewer System, Rev., 5.250%, 07/01/22 | | | 3,741 | |
| | | | | | | | |
| | | | Total North Carolina | | | 6,569 | |
| | | | | | | | |
| | | | North Dakota — 2.3% | |
| | | | Housing — 1.6% | |
| | | | North Dakota Housing Finance Agency, Home Mortgage Finance Program, | | | | |
| | 585 | | | Series B, Rev., 5.000%, 07/01/28 | | | 622 | |
| | 625 | | | Series D, Rev., 3.500%, 07/01/46 | | | 675 | |
| | 1,995 | | | Series D, Rev., 4.000%, 07/01/46 | | | 2,182 | |
| | 730 | | | Series D, Rev., 4.500%, 01/01/29 | | | 772 | |
| | 590 | | | Series F, Rev., AMT, 4.500%, 01/01/35 | | | 620 | |
| | | | | | | | |
| | | | | | | 4,871 | |
| | | | | | | | |
| | | | Utility — 0.7% | |
| | 2,000 | | | McLean County, Solid Waste Facilities, Great River Energy Project, Series A, Rev., 4.875%, 07/01/26 | | | 2,197 | |
| | | | | | | | |
| | | | Total North Dakota | | | 7,068 | |
| | | | | | | | |
| | | | Ohio — 1.9% | |
| | | | General Obligation — 0.6% | | | | |
| | 1,500 | | | Lakota Local School District, Series A, GO, NATL-RE, 5.250%, 12/01/25 | | | 1,963 | |
| | | | | | | | |
SEE NOTES TO FINANCIAL STATEMENTS.
| | | | | | |
| | | |
| 16 | | | | J.P. MORGAN MUNICIPAL BOND FUNDS | | AUGUST 31, 2016 |
| | | | | | | | |
PRINCIPAL
AMOUNT($) | | | SECURITY DESCRIPTION | | VALUE($) | |
| Municipal Bonds — continued | |
| | | | Housing — 0.6% | |
| | 1,665 | | | Ohio Housing Finance Agency Residential Mortgage, Mortgage-Backed Securities Program, Series D, Rev., 4.000%, 03/01/47 | | | 1,826 | |
| | 35 | | | Ohio Housing Finance Agency, Single Family Mortgage, Series 1, Rev., GNMA/FNMA/FHLMC, 5.000%, 11/01/28 | | | 37 | |
| | | | | | | | |
| | | | | | | 1,863 | |
| | | | | | | | |
| | | | Industrial Development Revenue/Pollution Control Revenue — 0.7% | |
| | 1,615 | | | Ohio State Water Development Authority, Water Pollution Control Loan Fund, Series B, Rev., 5.000%, 12/01/29 | | | 2,063 | |
| | | | | | | | |
| | | | Utility — 0.0% (g) | |
| | 75 | | | American Municipal Power, Inc., Unrefunded Balance, Prairie State Energy Campus Project, Series A, Rev., 5.250%, 02/15/21 | | | 80 | |
| | | | | | | | |
| | | | Total Ohio | | | 5,969 | |
| | | | | | | | |
| | | | Oklahoma — 0.4% | |
| | | | Housing — 0.4% | |
| | 56 | | | IDK Partners III Trust, Mortgage Pass-Through Certificates, Class A, Rev., 5.100%, 08/01/23 | | | 56 | |
| | 600 | | | Oklahoma County Home Finance Authority, Single Family Mortgage-Backed Securities Program, Series A, Rev., AMT, GNMA/FNMA/FHLMC, 5.400%, 10/01/38 | | | 619 | |
| | 565 | | | Oklahoma Housing Finance Agency, Single Family Mortgage, Homeownership Loan Program, Series A, Rev., GNMA COLL, 4.375%, 09/01/27 | | | 587 | |
| | | | | | | | |
| | | | Total Oklahoma | | | 1,262 | |
| | | | | | | | |
| | | | Oregon — 0.5% | |
| | | | Housing — 0.5% | |
| | 1,405 | | | Oregon State Housing & Community Services Department, Single Family Mortgage Program, Series B, Rev., AMT, 5.000%, 07/01/30 | | | 1,508 | |
| | | | | | | | |
| | | | Pennsylvania — 3.0% | |
| | | | Education — 0.7% | |
| | 2,000 | | | University of Pittsburgh of the Commonwealth System of Higher Education, University Capital Project, Series B, Rev., 5.250%, 09/15/26 | | | 2,262 | |
| | | | | | | | |
| | | | Housing — 0.7% | |
| | 1,900 | | | Pennsylvania Housing Finance Agency, Single Family Mortgage, Series 118A, Rev., AMT, 3.500%, 04/01/40 | | | 2,005 | |
| | | | | | | | |
| | | | | | | | |
PRINCIPAL
AMOUNT($) | | | SECURITY DESCRIPTION | | VALUE($) | |
| | | | | | | | |
| | | | Industrial Development Revenue/Pollution Control Revenue — 0.7% | |
| | 1,250 | | | Bucks County Industrial Development Authority, Waste Management, Inc., Project, Rev., VAR, AMT, 1.375%, 02/01/17 | | | 1,253 | |
| | 1,000 | | | Pennsylvania Economic Development Financing Authority, Solid Waste Disposal, Waste Management, Inc. Project, Series A, Rev., 2.625%, 11/01/21 | | | 1,057 | |
| | | | | | | | |
| | | | | | | 2,310 | |
| | | | | | | | |
| | | | Other Revenue — 0.7% | |
| | 2,000 | | | Philadelphia Redevelopment Authority, Neighborhood Transformation Initiative, Rev., 5.000%, 04/15/19 | | | 2,200 | |
| | | | | | | | |
| | | | Transportation — 0.2% | |
| | 600 | | | Allegheny County Airport Authority, Pittsburgh International Airport, Series A-1, Rev., AMT, 5.000%, 01/01/26 | | | 685 | |
| | | | | | | | |
| | | | Total Pennsylvania | | | 9,462 | |
| | | | | | | | |
| | | | Rhode Island — 1.5% | |
| | | | Education — 0.6% | |
| | | | Rhode Island Student Loan Authority, Student Loan Program, | | | | |
| | 650 | | | Series A, Rev., AMT, 5.000%, 12/01/18 | | | 701 | |
| | 1,000 | | | Series A, Rev., AMT, 5.000%, 12/01/19 | | | 1,103 | |
| | | | | | | | |
| | | | | | | 1,804 | |
| | | | | | | | |
| | | | Transportation — 0.9% | |
| | 2,600 | | | Rhode Island Economic Development Corp., Series B, Rev., 5.000%, 07/01/22 | | | 3,015 | |
| | | | | | | | |
| | | | Total Rhode Island | | | 4,819 | |
| | | | | | | | |
| | | | South Carolina — 1.0% | |
| | | | Housing — 0.3% | |
| | | | South Carolina State Housing Finance & Development Authority, | | | | |
| | 385 | | | Series 1, Rev., GNMA COLL, 5.000%, 01/01/28 | | | 408 | |
| | 570 | | | Series B-2, Rev., AMT, 4.000%, 07/01/43 | | | 621 | |
| | | | | | | | |
| | | | | | | 1,029 | |
| | | | | | | | |
| | | | Prerefunded — 0.7% | |
| | 1,855 | | | York County School District No. 1, Series A, GO, SCSDE, 5.250%, 03/01/19 (p) | | | 2,067 | |
| | | | | | | | |
| | | | Total South Carolina | | | 3,096 | |
| | | | | | | | |
SEE NOTES TO FINANCIAL STATEMENTS.
| | | | | | | | |
| | | |
| AUGUST 31, 2016 | | J.P. MORGAN MUNICIPAL BOND FUNDS | | | | | 17 | |
JPMorgan Municipal Income Fund
SCHEDULE OF PORTFOLIO INVESTMENTS
AS OF AUGUST 31, 2016 (Unaudited) (continued)
(Amounts in thousands)
| | | | | | | | |
PRINCIPAL
AMOUNT($) | | | SECURITY DESCRIPTION | | VALUE($) | |
| Municipal Bonds — continued | |
| | | | South Dakota — 0.9% | |
| | | | Housing — 0.9% | |
| | | | South Dakota Housing Development Authority, Homeownership Mortgage, | | | | |
| | 2,435 | | | Series D, Rev., 4.000%, 11/01/45 | | | 2,686 | |
| | 135 | | | Series E, Rev., 6.000%, 11/01/38 | | | 136 | |
| | | | | | | | |
| | | | Total South Dakota | | | 2,822 | |
| | | | | | | | |
| | | | Tennessee — 2.3% | |
| | | | Housing — 0.5% | |
| | | | Tennessee Housing Development Agency, Homeownership Program, | | | | |
| | 190 | | | Series 1C, Rev., AMT, 3.750%, 01/01/25 | | | 192 | |
| | 20 | | | Series 2007-1, Rev., AMT, 5.500%, 01/01/38 | | | 20 | |
| | | | Tennessee Housing Development Agency, Housing Finance Program, | | | | |
| | 670 | | | Series A-1, Rev., 5.000%, 01/01/27 | | | 698 | |
| | 185 | | | Series A-2, Rev., 4.200%, 07/01/25 | | | 191 | |
| | 360 | | | Tennessee Housing Development Agency, Residential Finance Program, Series 2B, Rev., 4.000%, 07/01/43 | | | 385 | |
| | | | | | | | |
| | | | | | | 1,486 | |
| | | | | | | | |
| | | | Transportation — 0.4% | |
| | 1,000 | | | Memphis-Shelby County Airport Authority, Series B, Rev., AMT, 5.750%, 07/01/25 | | | 1,143 | |
| | | | | | | | |
| | | | Utility — 0.7% | |
| | 2,000 | | | Tennessee Energy Acquisition Corp., Gas Project, Series A, Rev., 5.250%, 09/01/21 | | | 2,344 | |
| | | | | | | | |
| | | | Water & Sewer — 0.7% | | | | |
| | 2,000 | | | Nashville & Davidson County Metropolitan Government, Water & Sewer, Series A, Rev., AGM, 5.250%, 01/01/21 | | | 2,370 | |
| | | | | | | | |
| | | | Total Tennessee | | | 7,343 | |
| | | | | | | | |
| | | | Texas — 5.6% | |
| | | | General Obligation — 1.8% | |
| | 2,000 | | | Socorro Independent School District, Series A, GO, PSF-GTD, 5.000%, 08/15/24 | | | 2,542 | |
| | 450 | | | State of Texas, Water Financial Assistance, Series D, GO, 5.000%, 05/15/33 | | | 558 | |
| | 2,000 | | | Texas Transportation Commission, Mobility Fund, GO, 5.000%, 10/01/24 | | | 2,521 | |
| | | | | | | | |
| | | | | | | 5,621 | |
| | | | | | | | |
| | | | Housing — 0.9% | |
| | 1,085 | | | Multi-Family Housing, Bond Pass-Through Certificates, Grand Reserve Apartments, Series 8, Rev., VAR, 5.950%, 11/01/23 | | | 1,086 | |
| | | | | | | | |
PRINCIPAL
AMOUNT($) | | | SECURITY DESCRIPTION | | VALUE($) | |
| | | | | | | | |
| | | | Housing — continued | |
| | 775 | | | Texas Department of Housing & Community Affairs, Residential Mortgage, Series A, Rev., GNMA/FNMA/FHLMC, 5.000%, 07/01/29 | | | 829 | |
| | 418 | | | Texas State Affordable Housing Corp., Single Family Mortgage, Series C, Rev., GNMA/FNMA/FHLMC, 5.300%, 10/01/39 | | | 430 | |
| | 218 | | | West Central Regional Housing Finance Corp., Mortgage-Backed Securities Program, Single Family Mortgage, Series A, Rev., AMT, GNMA/FNMA/FHLMC, 5.350%, 12/01/39 | | | 221 | |
| | | | | | | | |
| | | | | | | 2,566 | |
| | | | | | | | |
| | | | Industrial Development Revenue/Pollution Control Revenue — 1.0% | |
| | | | Harris County Industrial Development Corp., Solid Waste Disposal, Deer Park Refining Limited Partnership Project, | | | | |
| | 900 | | | Rev., 4.700%, 05/01/18 | | | 944 | |
| | 2,000 | | | Rev., 5.000%, 02/01/23 | | | 2,224 | |
| | | | | | | | |
| | | | | | | 3,168 | |
| | | | | | | | |
| | | | Prerefunded — 0.8% | |
| | 2,500 | | | Wichita Falls Independent School District, School Building, GO, PSF-GTD, 5.000%, 02/01/17 (p) | | | 2,547 | |
| | | | | | | | |
| | | | Transportation — 1.1% | |
| | 2,800 | | | Dallas Area Rapid Transit, Senior Lien, Series A, Rev., 5.000%, 12/01/32 | | | 3,503 | |
| | | | | | | | |
| | | | Total Texas | | | 17,405 | |
| | | | | | | | |
| | | | Utah — 2.4% | |
| | | | Housing — 2.0% | |
| | 1,945 | | | Utah Housing Corp., Single Family Mortgage, Series D, Rev., FHA, 4.000%, 01/01/45 | | | 2,128 | |
| | 3,245 | | | Utah State Board of Regents, Student Fee & Housing System, Rev., NATL-RE, 5.250%, 04/01/23 | | | 4,031 | |
| | | | | | | | |
| | | | | | | 6,159 | |
| | | | | | | | |
| | | | Other Revenue — 0.4% | |
| | 970 | | | Utah Transit Authority, Sales Tax, Series C, Rev., AGM, 5.250%, 06/15/29 | | | 1,329 | |
| | | | | | | | |
| | | | Total Utah | | | 7,488 | |
| | | | | | | | |
| | | | Vermont — 3.8% | |
| | | | Education — 1.7% | |
| | | | Vermont Student Assistance Corp., Education Loan, | | | | |
| | 1,000 | | | Series A, Rev., AMT, 5.000%, 06/15/23 | | | 1,150 | |
| | 1,400 | | | Series A, Rev., AMT, 5.000%, 06/15/24 | | | 1,625 | |
SEE NOTES TO FINANCIAL STATEMENTS.
| | | | | | |
| | | |
| 18 | | | | J.P. MORGAN MUNICIPAL BOND FUNDS | | AUGUST 31, 2016 |
| | | | | | | | |
PRINCIPAL
AMOUNT($) | | | SECURITY DESCRIPTION | | VALUE($) | |
| Municipal Bonds — continued | |
| | | | Education — continued | |
| | 2,150 | | | Series A, Rev., AMT, 5.000%, 06/15/25 | | | 2,516 | |
| | | | | | | | |
| | | | | | | 5,291 | |
| | | | | | | | |
| | | | Housing — 2.1% | |
| | | | Vermont Housing Finance Agency, Multiple Purpose, | | | | |
| | 1,800 | | | Series A, Rev., AMT, 4.000%, 11/01/46 | | | 1,923 | |
| | 2,230 | | | Series B, Rev., AMT, 3.750%, 11/01/45 | | | 2,354 | |
| | 435 | | | Series B, Rev., AMT, 4.125%, 11/01/42 | | | 453 | |
| | 1,650 | | | Series C, Rev., AMT, GNMA/FNMA/FHLMC COLL, 4.000%, 11/01/46 | | | 1,807 | |
| | | | | | | | |
| | | | | | | 6,537 | |
| | | | | | | | |
| | | | Total Vermont | | | 11,828 | |
| | | | | | | | |
| | | | Virginia — 1.5% | |
| | | | Education — 0.8% | |
| | 2,000 | | | Virginia Public School Authority, School Financing, Series B, Rev., 5.000%, 08/01/24 | | | 2,540 | |
| | | | | | | | |
| | | | Prerefunded — 0.7% | |
| | 2,050 | | | Virginia Public Building Authority, Public Facilities, Series B, Rev., 5.250%, 08/01/18 (p) | | | 2,226 | |
| | | | | | | | |
| | | | Total Virginia | | | 4,766 | |
| | | | | | | | |
| | | | Washington — 1.5% | |
| | | | General Obligation — 0.8% | | | | |
| | 2,000 | | | State of Washington, Motor Vehicle Fuel Tax, Series B, GO, 5.000%, 07/01/22 | | | 2,432 | |
| | | | | | | | |
| | | | Transportation — 0.5% | |
| | 1,300 | | | Port of Seattle, Series B, Rev., AMT, 5.000%, 09/01/25 | | | 1,520 | |
| | | | | | | | |
| | | | | | | | |
PRINCIPAL
AMOUNT($) | | | SECURITY DESCRIPTION | | VALUE($) | |
| | | | | | | | |
| | | | Utility — 0.2% | |
| | 500 | | | Chelan County Public Utility District No.1, Series A, Rev., AMT, 5.500%, 07/01/26 | | | 590 | |
| | | | | | | | |
| | | | Total Washington | | | 4,542 | |
| | | | | | | | |
| | | | West Virginia — 1.0% | |
| | | | Other Revenue — 1.0% | |
| | 2,690 | | | West Virginia Economic Development Authority, Lease, Correctional Juvenile & Public Safety Facilities, Series A, Rev., 5.000%, 06/01/29 | | | 3,156 | |
| | | | | | | | |
| | | | Wisconsin — 0.7% | | | | |
| | | | Other Revenue — 0.7% | | | | |
| | 2,000 | | | State of Wisconsin, General Fund Annual Appropriation, Series A, Rev., 5.750%, 05/01/29 | | | 2,256 | |
| | | | | | | | |
| | | | Total Municipal Bonds
(Cost $277,355) | | | 295,741 | |
| | | | | | | | |
| | |
| SHARES | | | | | | |
| Investment Company — 1.9% | |
| | 389 | | | Nuveen Premium Income Municipal Fund, Inc. (Cost $5,430) | | | 5,938 | |
| | | | | | | | |
| Short-Term Investment — 3.3% | |
| | | | Investment Company — 3.3% | | | | |
| | 10,171 | | | JPMorgan U.S. Government Money Market Fund, Institutional Class Shares, 0.310% (b) (l) (Cost $10,171) | | | 10,171 | |
| | | | | | | | |
| | | | Total Investments — 99.7%
(Cost $292,956) | | | 311,850 | |
| | | | Other Assets in Excess of Liabilities — 0.3% | | | 853 | |
| | | | | | | | |
| | | | NET ASSETS — 100.0% | | $ | 312,703 | |
| | | | | | | | |
Percentages indicated are based on net assets.
SEE NOTES TO FINANCIAL STATEMENTS.
| | | | | | | | |
| | | |
| AUGUST 31, 2016 | | J.P. MORGAN MUNICIPAL BOND FUNDS | | | | | 19 | |
JPMorgan Ohio Municipal Bond Fund
SCHEDULE OF PORTFOLIO INVESTMENTS
AS OF AUGUST 31, 2016 (Unaudited)
(Amounts in thousands)
| | | | | | | | |
PRINCIPAL
AMOUNT($) | | | SECURITY DESCRIPTION | | VALUE($) | |
| Municipal Bonds — 97.3% (t) | |
| | | | California — 1.0% | |
| | | | General Obligation — 1.0% | |
| | 1,500 | | | Napa & Sonoma Counties Valley Community College District, Election of 2002, Series C, GO, NATL-RE, Zero Coupon, 08/01/20 (p) | | | 1,287 | |
| | | | | | | | |
| | | | Illinois — 1.1% | |
| | | | Water & Sewer — 1.1% | |
| | 1,500 | | | City of Chicago, Water, Second Lien, Series A, Rev., AMBAC, 5.000%, 11/01/20 | | | 1,511 | |
| | | | | | | | |
| | | | Louisiana — 1.2% | |
| | | | Housing — 1.2% | |
| | 1,685 | | | Jefferson Parish Finance Authority, Single Family Mortgage, Rev., FGIC, Zero Coupon, 05/01/17 (p) | | | 1,677 | |
| | | | | | | | |
| | | | Ohio — 92.1% | |
| | | | Certificate of Participation/Lease — 1.5% | |
| | 1,800 | | | Ohio State Department of Administrative Services, State Taxation Accounting & Revenue System Project, COP, 5.000%, 09/01/18 | | | 1,951 | |
| | | | | | | | |
| | | | Education — 11.4% | |
| | 1,285 | | | Cuyahoga Community College District, General Receipts, Series D, Rev., 5.000%, 08/01/27 | | | 1,536 | |
| | | | Ohio State University, General Receipts, | | | | |
| | 85 | | | Series D, Rev., 5.000%, 12/01/26 (p) | | | 114 | |
| | 85 | | | Series D, Rev., 5.000%, 12/01/27 (p) | | | 115 | |
| | 500 | | | Ohio State University, General Receipts, Special Purpose, Series A, Rev., 5.000%, 06/01/28 | | | 612 | |
| | | | Ohio State University, General Receipts, Unrefunded Balance, | | | | |
| | 1,915 | | | Series D, Rev., 5.000%, 12/01/26 | | | 2,517 | |
| | 1,915 | | | Series D, Rev., 5.000%, 12/01/27 | | | 2,550 | |
| | 1,650 | | | State of Ohio, Higher Educational Facility, Case Western Reserve University 2006 Project, Rev., NATL-RE, 5.250%, 12/01/19 | | | 1,885 | |
| | 2,185 | | | State of Ohio, Higher Educational Facility, Otterbein College 2008 Project, Series A, Rev., 5.500%, 12/01/23 | | | 2,381 | |
| | 2,000 | | | State of Ohio, Higher Educational Facility, University of Dayton 2013 Project, Rev., 5.000%, 12/01/28 | | | 2,385 | |
| | 1,000 | | | Wright State University, General Receipts, Series A, Rev., 5.000%, 05/01/26 | | | 1,151 | |
| | | | | | | | |
| | | | | | | 15,246 | |
| | | | | | | | |
| | | | General Obligation — 24.6% | |
| | | | Central Ohio Solid Waste Authority, Solid Waste Facilities Improvement, Limited Tax, | | | | |
| | 1,170 | | | GO, 5.000%, 12/01/26 | | | 1,414 | |
| | | | | | | | |
PRINCIPAL
AMOUNT($) | | | SECURITY DESCRIPTION | | VALUE($) | |
| | | | | | | | |
| | | | General Obligation — continued | |
| | 1,610 | | | GO, 5.000%, 12/01/29 | | | 1,934 | |
| | 1,500 | | | City of Cincinnati, Various Purpose, Series C, GO, 5.000%, 12/01/18 | | | 1,549 | |
| | 1,240 | | | City of Cleveland, Various Purpose, GO, 5.000%, 12/01/26 | | | 1,521 | |
| | 1,500 | | | City of Columbus, Limited Tax, Various Purpose, Series B, GO, 5.000%, 08/15/28 | | | 1,871 | |
| | 2,470 | | | City of Columbus, Unlimited Tax, Various Purpose, Series B, GO, 5.000%, 12/01/32 | | | 3,108 | |
| | 2,500 | | | County of Butler, Lakota Local School District, Series A, GO, NATL-RE, FGIC, 5.250%, 12/01/24 | | | 3,213 | |
| | | | County of Hamilton, Cincinnati City School District, Board of Education, Classroom Facilities Construction & Improvement, | | | | |
| | 1,000 | | | GO, NATL-RE, FGIC, 5.250%, 12/01/20 | | | 1,177 | |
| | 3,000 | | | GO, NATL-RE, FGIC, 5.250%, 12/01/24 | | | 3,864 | |
| | 1,800 | | | GO, NATL-RE, 5.250%, 12/01/25 | | | 2,339 | |
| | 1,000 | | | Franklin & Licking Counties, New Albany Plain Local School District, Various Purpose, GO, 5.000%, 12/01/25 | | | 1,163 | |
| | 2,450 | | | Lakewood City School District, Capital Appreciation, GO, AGM, Zero Coupon, 12/01/17 | | | 2,423 | |
| | 1,500 | | | State of Ohio, Common Schools, Series B, GO, 5.000%, 09/15/26 | | | 1,763 | |
| | | | State of Ohio, Higher Educational, | | | | |
| | 1,500 | | | Series C, GO, 5.000%, 11/01/31 | | | 1,866 | |
| | 1,000 | | | Series C, GO, 5.000%, 11/01/33 | | | 1,234 | |
| | 1,000 | | | State of Ohio, Infrastructure Improvement, Series C, GO, 5.000%, 03/01/29 | | | 1,219 | |
| | 1,000 | | | Toledo City School District, School Facilities Improvement, GO, 5.000%, 12/01/23 | | | 1,177 | |
| | | | | | | | |
| | | | | | | 32,835 | |
| | | | | | | | |
| | | | Hospital — 9.4% | |
| | | | County of Franklin, Hospital Facilities, OhioHealth Corp., | | | | |
| | 1,000 | | | Rev., 5.000%, 05/15/27 | | | 1,214 | |
| | 500 | | | Rev., 5.000%, 05/15/31 | | | 611 | |
| | | | State of Ohio, Hospital, Cleveland Clinic Health System Obligated Group, | | | | |
| | 2,000 | | | Series A, Rev., 5.000%, 01/01/26 | | | 2,114 | |
| | 1,500 | | | Series B, Rev., 5.000%, 01/01/25 | | | 1,645 | |
| | | | State of Ohio, University Hospital Health System, Inc., | | | | |
| | 1,500 | | | Series A, Rev., 5.000%, 01/15/20 | | | 1,689 | |
| | 550 | | | Series A, Rev., 5.000%, 01/15/24 | | | 613 | |
SEE NOTES TO FINANCIAL STATEMENTS.
| | | | | | |
| | | |
| 20 | | | | J.P. MORGAN MUNICIPAL BOND FUNDS | | AUGUST 31, 2016 |
| | | | | | | | |
PRINCIPAL
AMOUNT($) | | | SECURITY DESCRIPTION | | VALUE($) | |
| Municipal Bonds — continued | |
| | | | Hospital — continued | |
| | 1,000 | | | Series A, Rev., 5.000%, 01/15/28 | | | 1,177 | |
| | 1,885 | | | Series A, Rev., 5.000%, 01/15/32 | | | 2,299 | |
| | 1,000 | | | Series A, Rev., 5.250%, 01/15/23 | | | 1,127 | |
| | | | | | | | |
| | | | | | | 12,489 | |
| | | | | | | | |
| | | | Housing — 3.2% | |
| | 550 | | | County of Cuyahoga, Multi-Family Housing, Allerton Apartments Project, Series A, Rev., FHA, GNMA COLL, 4.900%, 08/20/22 | | | 575 | |
| | 85 | | | County of Trumbull, Multi-Family Housing, Royal Mall Apartments Project, Series A, Rev., FHA, GNMA COLL, 4.800%, 05/20/17 | | | 86 | |
| | | | Ohio Housing Finance Agency, | | | | |
| | 1,000 | | | Series A, Rev., AGM, 5.000%, 04/01/22 | | | 1,025 | |
| | 500 | | | Series A, Rev., AGM, 5.000%, 04/01/27 | | | 513 | |
| | 1,390 | | | Ohio Housing Finance Agency, Multi-Family Housing, Hillwood II Project, Rev., AMT, GNMA COLL, 4.850%, 05/20/21 | | | 1,421 | |
| | 70 | | | Ohio Housing Finance Agency, Multi-Family Housing, Warren Heights, Series C, Rev., AMT, FHA, GNMA COLL, 4.500%, 11/20/17 | | | 70 | |
| | 425 | | | Ohio Housing Finance Agency, Residential Mortgage-Backed Securities Program, Series J, Rev., GNMA/FNMA/FHLMC, 5.900%, 09/01/23 | | | 438 | |
| | 70 | | | Summit County Port Authority, Multi-Family Housing, Callis Tower Apartments Project, Rev., FHA, GNMA COLL, 4.500%, 09/20/17 (w) | | | 71 | |
| | | | | | | | |
| | | | | | | 4,199 | |
| | | | | | | | |
| | | | Other Revenue — 8.5% | |
| | | | City of Cleveland, Parking Facilities, | | | | |
| | 930 | | | Rev., AGM, 5.250%, 09/15/21 | | | 1,086 | |
| | 440 | | | Rev., AGM, 5.250%, 09/15/21 (p) | | | 534 | |
| | 1,310 | | | County of Cuyahoga, Economic Development, Shaker Square Project, Series D, Rev., 5.000%, 12/01/25 | | | 1,478 | |
| | 1,250 | | | County of Cuyahoga, Various Purpose, Rev., 5.000%, 12/01/29 | | | 1,557 | |
| | 115 | | | Franklin County Convention Facilities Authority, Rev., 5.000%, 12/01/22 | | | 121 | |
| | | | Ohio State Building Authority, State Facilities, Administrative Building Fund Projects, | | | | |
| | 1,000 | | | Series B, Rev., 5.000%, 10/01/23 | | | 1,127 | |
| | 1,220 | | | Series B, Rev., 5.000%, 10/01/24 | | | 1,374 | |
| | 1,235 | | | RiverSouth Authority, RiverSouth Area Redevelopment, Series A, Rev., 5.000%, 12/01/21 | | | 1,471 | |
| | | | | | | | |
PRINCIPAL
AMOUNT($) | | | SECURITY DESCRIPTION | | VALUE($) | |
| | | | | | | | |
| | | | Other Revenue — continued | |
| | 1,000 | | | State of Ohio, Cultural & Sports Capital Appreciation Facilities, Series A, Rev., 5.250%, 10/01/20 | | | 1,166 | |
| | 1,235 | | | State of Ohio, Parks & Recreation Capital Facilities, Series II-A, Rev., 5.000%, 12/01/20 | | | 1,439 | |
| | | | | | | | |
| | | | | | | 11,353 | |
| | | | | | | | |
| | | | Prerefunded — 14.0% | |
| | 1,000 | | | American Municipal Power-Ohio, Inc., Prairie State Energy Campus Project, Series A, Rev., AGC, 5.000%, 02/15/19 (p) | | | 1,103 | |
| | 1,530 | | | Beavercreek City School District, Counties of Greene & Montgomery, School Improvement, GO, 5.000%, 06/01/19 (p) | | | 1,709 | |
| | 115 | | | Central Ohio Solid Waste Authority, Solid Waste Facilities Improvement, Limited Tax, GO, 5.000%, 06/01/22 (p) | | | 140 | |
| | 2,000 | | | City of Avon, Series B, GO, 5.000%, 12/01/18 (p) | | | 2,194 | |
| | 1,500 | | | City of Columbus, Unlimited Tax, Various Purpose, Series A, GO, 5.000%, 07/01/21 (p) | | | 1,790 | |
| | 1,000 | | | City of Strongsville, Limited Tax, Various Purpose, GO, 5.000%, 12/01/18 (p) | | | 1,098 | |
| | 1,000 | | | County of Franklin, City of Columbus, School District, School Facilities Construction & Improvement, GO, 5.000%, 06/01/19 (p) | | | 1,116 | |
| | 1,405 | | | Delaware & Franklin Counties, Olentangy Local School District, School Facilities Construction & Improvement, GO, 5.000%, 06/01/18 (p) | | | 1,512 | |
| | 1,000 | | | Franklin, Delaware & Union Counties, Dublin City School District, School Facilities Construction & Improvement, GO, 5.000%, 12/01/18 (p) | | | 1,098 | |
| | 1,835 | | | Ohio State Building Authority, State Facilities, Administrative Building Fund Projects, Series A, Rev., 5.000%, 04/01/19 (p) | | | 2,036 | |
| | 1,745 | | | Ohio State Building Authority, State Facilities, Adult Correctional Building Fund Projects, Series A, Rev., 5.000%, 04/01/19 (p) | | | 1,937 | |
| | 1,750 | | | State of Ohio, Infrastructure Improvement, Series A, GO, 5.375%, 03/01/18 (p) | | | 1,875 | |
| | 1,000 | | | State of Ohio, Revitalization Project, Series A, Rev., 5.000%, 04/01/18 (p) | | | 1,069 | |
| | | | | | | | |
| | | | | | | 18,677 | |
| | | | | | | | |
| | | | Transportation — 8.7% | |
| | 2,000 | | | City of Cleveland, Airport System, Series A, Rev., AGM-CR, AMBAC, 5.250%, 01/01/20 | | | 2,264 | |
| | 2,000 | | | Columbus Regional Airport Authority, Rev., NATL-RE, 5.000%, 01/01/19 | | | 2,029 | |
SEE NOTES TO FINANCIAL STATEMENTS.
| | | | | | | | |
| | | |
| AUGUST 31, 2016 | | J.P. MORGAN MUNICIPAL BOND FUNDS | | | | | 21 | |
JPMorgan Ohio Municipal Bond Fund
SCHEDULE OF PORTFOLIO INVESTMENTS
AS OF AUGUST 31, 2016 (Unaudited) (continued)
(Amounts in thousands)
| | | | | | | | |
PRINCIPAL
AMOUNT($) | | | SECURITY DESCRIPTION | | VALUE($) | |
| Municipal Bonds — continued | |
| | | | Transportation — continued | |
| | | | Ohio State Turnpike Commission, | | | | |
| | 2,000 | | | Series A, Rev., 5.000%, 02/15/22 | | | 2,177 | |
| | 1,185 | | | Series A, Rev., 5.000%, 02/15/23 | | | 1,290 | |
| | 2,000 | | | Series A, Rev., 5.250%, 02/15/27 | | | 2,646 | |
| | 1,000 | | | State of Ohio, Capital Facilities Lease Appropriation, Series A, Rev., 5.000%, 04/01/30 | | | 1,237 | |
| | | | | | | | |
| | | | | | | 11,643 | |
| | | | | | | | |
| | | | Utility — 2.0% | |
| | | | City of Hamilton, Electric System, | | | | |
| | 950 | | | Series A, Rev., AGC, 5.000%, 10/01/20 | | | 1,062 | |
| | 1,000 | | | Series A, Rev., AGC, 5.000%, 10/01/21 | | | 1,115 | |
| | 480 | | | Cleveland Department of Public Utilities, Division of Public Power System, Unrefunded Balance, Series A-1, Rev., NATL-RE, 5.000%, 11/15/20 | | | 484 | |
| | | | | | | | |
| | | | | | | 2,661 | |
| | | | | | | | |
| | | | Water & Sewer — 8.8% | |
| | | | City of Columbus, Sewerage System, | | | | |
| | 1,000 | | | Rev., 5.000%, 06/01/28 | | | 1,269 | |
| | 1,950 | | | Rev., 5.000%, 06/01/29 | | | 2,506 | |
| | 1,880 | | | Rev., 5.000%, 06/01/30 | | | 2,400 | |
| | 1,000 | | | City of Toledo, Water System, Series A, Rev., 5.000%, 11/15/25 | | | 1,180 | |
| | | | | | | | |
PRINCIPAL
AMOUNT($) | | | SECURITY DESCRIPTION | | VALUE($) | |
| | | | | | | | |
| | | | Water & Sewer — continued | |
| | | | Ohio State Water Development Authority, Fresh Water, | | | | |
| | 2,000 | | | Rev., 5.500%, 12/01/21 | | | 2,469 | |
| | 1,500 | | | Series A, Rev., 5.000%, 12/01/30 | | | 1,921 | |
| | | | | | | | |
| | | | | | | 11,745 | |
| | | | | | | | |
| | | | Total Ohio | | | 122,799 | |
| | | | | | | | |
| | | | Texas — 1.9% | |
| | | | Housing — 1.9% | |
| | 2,500 | | | Southeast Texas Housing Finance Corp., Single Family Mortgage, Series A, Rev., NATL-RE, Zero Coupon, 09/01/17 (p) | | | 2,481 | |
| | | | | | | | |
| | | | Total Municipal Bonds
(Cost $119,429) | | | 129,755 | |
| | | | | | | | |
| | |
| SHARES | | | | | | |
| Short-Term Investment — 2.0% | |
| | | | Investment Company — 2.0% | |
| | 2,626 | | | JPMorgan U.S. Government Money Market Fund, Institutional Class Shares, 0.310% (b) (l) (Cost $2,626) | | | 2,626 | |
| | | | | | | | |
| | | | Total Investments — 99.3%
(Cost $122,055) | | | 132,381 | |
| | | | Other Assets in Excess of
Liabilities — 0.7% | | | 914 | |
| | | | | | | | |
| | | | NET ASSETS — 100.0% | | $ | 133,295 | |
| | | | | | | | |
Percentages indicated are based on net assets.
SEE NOTES TO FINANCIAL STATEMENTS.
| | | | | | |
| | | |
| 22 | | | | J.P. MORGAN MUNICIPAL BOND FUNDS | | AUGUST 31, 2016 |
JPMorgan Short-Intermediate Municipal Bond Fund
SCHEDULE OF PORTFOLIO INVESTMENTS
AS OF AUGUST 31, 2016 (Unaudited)
(Amounts in thousands)
| | | | | | | | |
PRINCIPAL
AMOUNT($) | | | SECURITY DESCRIPTION | | VALUE($) | |
| Collateralized Mortgage Obligation — 0.0% (g) | |
| | | | Agency CMO — 0.0% (g) | |
| | 347 | | | Federal National Mortgage Association REMIC, Series 2002-36, Class FS, VAR, 1.024%, 06/25/32
(Cost $347) | | | 351 | |
| | | | | | | | |
| Daily Demand Notes — 1.1% | |
| | | | Indiana — 0.2% | |
| | | | Utility — 0.2% | |
| | 5,300 | | | Indiana Municipal Power Agency, Power Supply System, Series B, Rev., VRDO, 0.580%, 09/01/16 | | | 5,300 | |
| | | | | | | | |
| | | | Michigan — 0.3% | |
| | | | Education — 0.3% | |
| | 6,160 | | | Regents of the University of Michigan, Series B, Rev., VRDO, 0.560%, 09/01/16 | | | 6,160 | |
| | | | | | | | |
| | | | New York — 0.3% | |
| | | | General Obligation — 0.3% | |
| | 8,000 | | | City of New York, Fiscal Year 2012, Series G, Subseries G-6, GO, VRDO, 0.570%, 09/01/16 | | | 8,000 | |
| | | | | | | | |
| | | | Ohio — 0.3% | |
| | | | Hospital — 0.3% | |
| | | | State of Ohio, University Hospitals Health System, Inc., | | | | |
| | 5,000 | | | Series A, Rev., VRDO, 0.950%, 09/01/16 | | | 5,000 | |
| | 2,500 | | | Series B, Rev., VRDO, 0.950%, 09/01/16 | | �� | 2,500 | |
| | | | | | | | |
| | | | Total Ohio | | | 7,500 | |
| | | | | | | | |
| | | | Total Daily Demand Notes
(Cost $26,960) | | | 26,960 | |
| | | | | | | | |
| Monthly Demand Notes — 3.2% | |
| | | | Connecticut — 1.4% | |
| | | | Education — 1.4% | |
| | 15,000 | | | State of Connecticut, Health & Educational Facilities Authority, Hartford Healthcare Issue, Series G, Rev., VAR, 1.306%, 10/03/16 | | | 14,974 | |
| | 18,775 | | | State of Connecticut, Health & Educational Facility Authority, Series B, Rev., VAR, 0.901%, 10/03/16 | | | 18,743 | |
| | | | | | | | |
| | | | Total Connecticut | | | 33,717 | |
| | | | | | | | |
| | | | Kansas — 0.1% | |
| | | | Transportation — 0.1% | |
| | 2,000 | | | State of Kansas, Department of Transportation, Highway, Series B-3, Rev., VAR, 0.591%, 10/03/16 | | | 1,993 | |
| | | | | | | | |
| | | | | | | | |
PRINCIPAL
AMOUNT($) | | | SECURITY DESCRIPTION | | VALUE($) | |
| | | | | | | | |
| | | | Louisiana — 0.6% | |
| | | | Other Revenue — 0.4% | |
| | 9,500 | | | State of Louisiana, Gasoline & Fuels Tax, Second Lien Revenue, Libor Index, Series A, Rev., VAR, 0.836%, 10/03/16 | | | 9,474 | |
| | | | | | | | |
| | | | Water & Sewer — 0.2% | |
| | 4,795 | | | East Baton Rouge Sewerage Commission, Series A, Rev., VAR, 0.866%, 10/03/16 | | | 4,752 | |
| | | | | | | | |
| | | | Total Louisiana | | | 14,226 | |
| | | | | | | | |
| | | | New Jersey — 0.2% | |
| | | | Transportation — 0.2% | |
| | 4,000 | | | New Jersey Turnpike Authority, Series B-3, Rev., VAR, 0.921%, 10/03/16 | | | 3,992 | |
| | | | | | | | |
| | | | New York — 0.9% | |
| | | | Transportation — 0.7% | |
| | 15,000 | | | Triborough Bridge & Tunnel Authority, Subseries B-C, Rev., VAR, 0.751%, 10/03/16 | | | 14,860 | |
| | | | | | | | |
| | | | Utility — 0.2% | |
| | 5,000 | | | Long Island Power Authority, Electric System, Series C, Rev., VAR, 1.016%, 10/03/16 | | | 5,006 | |
| | | | | | | | |
| | | | Total New York | | | 19,866 | |
| | | | | | | | |
| | | | Total Monthly Demand Notes
(Cost $74,067) | | | 73,794 | |
| | | | | | | | |
| Municipal Bonds — 86.7% (t) | |
| | | | Alabama — 0.5% | |
| | | | Industrial Development Revenue/Pollution Control Revenue — 0.1% | |
| | 3,480 | | | City of Mobile, Industrial Development Board, Pollution Control, Alabama Power Co., Barry Plant Project, Series A, Rev., VAR, 1.650%, 03/20/17 | | | 3,498 | |
| | | | | | | | |
| | | | Other Revenue — 0.0% (g) | |
| | 500 | | | Montgomery County Public Building Authority, Revenue Refunding Warrants, Facilities Project, Rev., 5.000%, 03/01/23 | | | 610 | |
| | | | | | | | |
| | | | Utility — 0.4% | |
| | 7,675 | | | The Black Belt Energy Gas District Gas Supply, Series A, Rev., VAR, 4.000%, 06/01/21 | | | 8,594 | |
| | | | | | | | |
| | | | Total Alabama | | | 12,702 | |
| | | | | | | | |
| | | | Alaska — 0.5% | |
| | | | General Obligation — 0.5% | |
| | | | State of Alaska, | | | | |
| | 8,230 | | | Series A, GO, 5.000%, 08/01/17 | | | 8,560 | |
| | 2,000 | | | Series B, GO, 5.000%, 08/01/18 | | | 2,161 | |
| | | | | | | | |
| | | | | | | 10,721 | |
| | | | | | | | |
SEE NOTES TO FINANCIAL STATEMENTS.
| | | | | | | | |
| | | |
| AUGUST 31, 2016 | | J.P. MORGAN MUNICIPAL BOND FUNDS | | | | | 23 | |
JPMorgan Short-Intermediate Municipal Bond Fund
SCHEDULE OF PORTFOLIO INVESTMENTS
AS OF AUGUST 31, 2016 (Unaudited) (continued)
(Amounts in thousands)
| | | | | | | | |
PRINCIPAL
AMOUNT($) | | | SECURITY DESCRIPTION | | VALUE($) | |
| Municipal Bonds — continued | |
| | | | Industrial Development Revenue/Pollution Control Revenue — 0.0% (g) | |
| | 765 | | | Alaska Industrial Development & Export Authority Power, Snettisham Hydroelectric Project, Rev., AMT, 5.000%, 01/01/17 | | | 775 | |
| | | | | | | | |
| | | | Utility — 0.0% (g) | |
| | 500 | | | City of Anchorage, Electric Utilities, Senior Lien, Series A, Rev., 5.000%, 12/01/23 | | | 619 | |
| | | | | | | | |
| | | | Total Alaska | | | 12,115 | |
| | | | | | | | |
| | | | Arizona — 0.9% | |
| | | | Certificate of Participation/Lease — 0.0% (g) | |
| | 500 | | | Arizona School Facilities Board, Series A-1, COP, 5.000%, 09/01/19 | | | 560 | |
| | | | | | | | |
| | | | General Obligation — 0.2% | |
| | 2,550 | | | City of Scottsdale, GO, 5.000%, 07/01/22 | | | 3,119 | |
| | 1,550 | | | Maricopa County, Saddle Mountain Unified School District No. 90, Arizona School Improvement, Series A, GO, 3.000%, 07/01/17 | | | 1,577 | |
| | | | | | | | |
| | | | | | | 4,696 | |
| | | | | | | | |
| | | | Hospital — 0.4% | |
| | | | Arizona Health Facilities Authority, Scottsdale Lincoln Hospitals, | | | | |
| | 250 | | | Series A, Rev., 5.000%, 12/01/21 | | | 298 | |
| | 1,500 | | | Series A, Rev., 5.000%, 12/01/24 | | | 1,893 | |
| | 3,540 | | | Series A, Rev., 5.000%, 12/01/25 | | | 4,441 | |
| | 3,000 | | | Series A, Rev., 5.000%, 12/01/26 | | | 3,740 | |
| | | | | | | | |
| | | | | | | 10,372 | |
| | | | | | | | |
| | | | Transportation — 0.2% | |
| | | | Maricopa County, Regional Public Transportation Authority, Excise Tax Revenue, Public Transportation Fund, | | | | |
| | 1,000 | | | Rev., 5.250%, 07/01/18 | | | 1,084 | |
| | 3,100 | | | Rev., 5.250%, 07/01/19 | | | 3,492 | |
| | | | | | | | |
| | | | | | | 4,576 | |
| | | | | | | | |
| | | | Water & Sewer — 0.1% | |
| | 1,000 | | | Pima County, Sewer System, Rev., 5.000%, 07/01/18 | | | 1,079 | |
| | | | | | | | |
| | | | Total Arizona | | | 21,283 | |
| | | | | | | | |
| | | | Arkansas — 0.4% | |
| | | | Education — 0.2% | |
| | 300 | | | Board of Trustees of the University of Arkansas, Student Fee, Ualr Campus, Rev., 3.000%, 10/01/26 | | | 333 | |
| | | | | | | | |
PRINCIPAL
AMOUNT($) | | | SECURITY DESCRIPTION | | VALUE($) | |
| | | | | | | | |
| | | | Education — continued | |
| | | | University of Arkansas, Uams Campus, | | | | |
| | 535 | | | Rev., 5.000%, 03/01/20 | | | 611 | |
| | 500 | | | Rev., 5.000%, 03/01/25 | | | 638 | |
| | 1,000 | | | Rev., 5.000%, 03/01/26 | | | 1,270 | |
| | 1,000 | | | Rev., 5.000%, 03/01/27 | | | 1,262 | |
| | | | | | | | |
| | | | | | | 4,114 | |
| | | | | | | | |
| | | | Hospital — 0.1% | |
| | 1,410 | | | County of Pulaski, Arkansas Children’s Hospital, Rev., 5.000%, 03/01/28 | | | 1,775 | |
| | | | | | | | |
| | | | Special Tax — 0.0% (g) | |
| | 580 | | | City of Little Rock, Hotel & Restaurant, Rev., 5.000%, 07/01/20 | | | 668 | |
| | | | | | | | |
| | | | Water & Sewer — 0.1% | |
| | 1,095 | | | City of Fort Smith, Water & Sewer Refunding & Construction, Rev., 5.000%, 10/01/28 | | | 1,361 | |
| | 555 | | | City of Little Rock, Sewer, Rev., 5.000%, 10/01/25 | | | 698 | |
| | | | | | | | |
| | | | | | | 2,059 | |
| | | | | | | | |
| | | | Total Arkansas | | | 8,616 | |
| | | | | | | | |
| | | | California — 19.4% | |
| | | | Certificate of Participation/Lease — 0.1% | |
| | | | City of Chula Vista, Police Facility Project, | | | | |
| | 360 | | | COP, 5.000%, 10/01/21 | | | 428 | |
| | 465 | | | COP, 5.000%, 10/01/22 | | | 563 | |
| | 1,000 | | | COP, 5.000%, 10/01/23 | | | 1,237 | |
| | | | Goleta Water District, | | | | |
| | 175 | | | Series A, COP, AGM, 4.000%, 12/01/16 | | | 177 | |
| | 140 | | | Series A, COP, AGM, 5.000%, 12/01/20 | | | 164 | |
| | | | | | | | |
| | | | | | | 2,569 | |
| | | | | | | | |
| | | | Education — 1.0% | |
| | 325 | | | California Education Facilities Authority, Santa Clara University, Rev., 5.000%, 04/01/27 | | | 417 | |
| | | | California Educational Facilities Authority, Claremont Mckenna College, | | | | |
| | 1,575 | | | Series A, Rev., 4.000%, 01/01/23 | | | 1,864 | |
| | 1,675 | | | Series A, Rev., 4.000%, 01/01/24 | | | 2,015 | |
| | 750 | | | Series A, Rev., 5.000%, 01/01/26 | | | 991 | |
| | 11,505 | | | Regents of the University of California, Series AK, Rev., VAR, 5.000%, 05/15/23 | | | 14,360 | |
| | 4,750 | | | Regents of the University of California, Limited Project, Series I, Rev., 5.000%, 05/15/17 | | | 4,901 | |
| | | | | | | | |
| | | | | | | 24,548 | |
| | | | | | | | |
SEE NOTES TO FINANCIAL STATEMENTS.
| | | | | | |
| | | |
| 24 | | | | J.P. MORGAN MUNICIPAL BOND FUNDS | | AUGUST 31, 2016 |
| | | | | | | | |
PRINCIPAL
AMOUNT($) | | | SECURITY DESCRIPTION | | VALUE($) | |
| Municipal Bonds — continued | |
| | | | General Obligation — 7.7% | |
| | | | Albany Unified School District, | | | | |
| | 230 | | | GO, 5.000%, 08/01/25 | | | 298 | |
| | 760 | | | GO, 5.000%, 08/01/27 | | | 988 | |
| | 1,050 | | | Allan Hancock Joint Community College District, GO, 5.000%, 08/01/22 | | | 1,287 | |
| | | | California State, Various Purpose, | | | | |
| | 1,855 | | | GO, 5.000%, 03/01/17 | | | 1,897 | |
| | 3,560 | | | GO, 5.000%, 11/01/23 | | | 4,464 | |
| | 13,210 | | | GO, 5.000%, 03/01/26 | | | 16,932 | |
| | 2,000 | | | GO, 5.000%, 09/01/27 | | | 2,392 | |
| | 2,500 | | | GO, 5.000%, 09/01/28 | | | 2,985 | |
| | 2,810 | | | Series B, GO, 5.000%, 09/01/23 | | | 3,511 | |
| | | | City & County of San Francisco, | | | | |
| | 5,310 | | | Series A, GO, 5.000%, 06/15/25 | | | 6,443 | |
| | 10,000 | | | Series R-1, GO, 5.000%, 06/15/24 | | | 12,533 | |
| | 5,845 | | | City of Los Angeles, Series B, GO, 5.000%, 09/01/18 | | | 6,355 | |
| | 415 | | | Contra Costa Community College District, Election of 2014, Series A, GO, 4.000%, 08/01/25 | | | 497 | |
| | | | County of Los Angeles, Community College District, | | | | |
| | 5,000 | | | Series A, GO, 5.000%, 08/01/29 | | | 6,302 | |
| | 5,000 | | | Series C, GO, 5.000%, 06/01/26 | | | 6,648 | |
| | | | County of Sacramento, Center Joint Unified School District, | | | | |
| | 2,500 | | | GO, Zero Coupon, 08/01/28 | | | 1,840 | |
| | 1,000 | | | GO, Zero Coupon, 08/01/30 | | | 678 | |
| | 1,000 | | | GO, Zero Coupon, 08/01/31 | | | 647 | |
| | | | County of Sacramento, San Juan Unified School District, Election of 2002, | | | | |
| | 525 | | | GO, 5.000%, 08/01/17 | | | 546 | |
| | 395 | | | GO, 5.000%, 08/01/18 | | | 428 | |
| | 860 | | | GO, 5.000%, 08/01/19 | | | 968 | |
| | 775 | | | GO, 5.000%, 08/01/20 | | | 903 | |
| | 1,000 | | | County of Santa Clara, Moreland School District, GO, 5.000%, 08/01/21 | | | 1,199 | |
| | 6,055 | | | County of Santa Clara, San Jose Evergreen Community College District, Series B, GO, 5.000%, 09/01/18 | | | 6,585 | |
| | | | Folsom Cordova Unified School District, School Facilities Improvement District No. 2, | | | | |
| | 1,000 | | | GO, 2.000%, 10/01/16 | | | 1,001 | |
| | 845 | | | GO, 5.000%, 10/01/17 | | | 886 | |
| | 1,500 | | | Foothill-De Anza Community College District, GO, 5.000%, 08/01/28 | | | 1,925 | |
| | | | | | | | |
PRINCIPAL
AMOUNT($) | | | SECURITY DESCRIPTION | | VALUE($) | |
| | |
| | | | General Obligation — continued | |
| | | | Grossmont Healthcare District, | | | | |
| | 1,225 | | | Series D, GO, 5.000%, 07/15/26 | | | 1,573 | |
| | 1,285 | | | Series D, GO, 5.000%, 07/15/27 | | | 1,638 | |
| | 1,000 | | | Grossmont Healthcare District, Election of 2006, Series C, GO, 5.000%, 07/15/26 | | | 1,284 | |
| | 1,170 | | | Hanford Joint Union High School District, GO, AGM, 5.000%, 08/01/27 | | | 1,487 | |
| | 11,535 | | | Los Angeles Unified School District, Series C, GO, 5.000%, 07/01/21 | | | 13,827 | |
| | | | Moulton-Niguel Water District Consolidated, | | | | |
| | 2,260 | | | GO, 4.000%, 09/01/16 | | | 2,260 | |
| | 335 | | | GO, 4.000%, 09/01/17 | | | 347 | |
| | 1,100 | | | GO, 5.000%, 09/01/16 | | | 1,100 | |
| | 300 | | | GO, 5.000%, 09/01/18 | | | 326 | |
| | | | Novato Unified School District, | | | | |
| | 535 | | | GO, 4.000%, 02/01/22 | | | 620 | |
| | 685 | | | GO, 5.000%, 02/01/23 | | | 850 | |
| | 870 | | | GO, 5.000%, 02/01/24 | | | 1,104 | |
| | 1,500 | | | GO, 5.000%, 08/01/25 | | | 1,911 | |
| | 1,800 | | | GO, 5.000%, 08/01/26 | | | 2,294 | |
| | 1,200 | | | Oak Grove School District, GO, 5.000%, 08/01/23 | | | 1,512 | |
| | 1,770 | | | Placentia-Yorba Linda Unified School District, GO, 5.000%, 08/01/25 | | | 2,304 | |
| | 2,000 | | | Salinas Union High School District, GO, Zero Coupon, 08/01/20 | | | 1,881 | |
| | 1,400 | | | San Diego Community College District, GO, 5.000%, 08/01/18 | | | 1,520 | |
| | | | San Diego Unified School District, Dedicated Unlimited Ad Valorem Property Tax, | | | | |
| | 3,825 | | | Series R-3, GO, 5.000%, 07/01/17 | | | 3,968 | |
| | 6,310 | | | Series R-3, GO, 5.000%, 07/01/19 | | | 7,081 | |
| | | | San Diego Unified School District, Election of 2012, | | | | |
| | 700 | | | Series F, GO, 5.000%, 07/01/28 | | | 896 | |
| | 550 | | | Series F, GO, 5.000%, 07/01/29 | | | 698 | |
| | 500 | | | Series F, GO, 5.000%, 07/01/30 | | | 631 | |
| | 575 | | | Series F, GO, 5.000%, 07/01/31 | | | 722 | |
| | | | San Francisco Bay Area Rapid Transit District, Election of 2004, | | | | |
| | 2,735 | | | Series D, GO, 3.000%, 08/01/22 | | | 3,053 | |
| | 1,500 | | | Series D, GO, 5.000%, 08/01/27 | | | 1,938 | |
| | 1,685 | | | Series D, GO, 5.000%, 08/01/28 | | | 2,163 | |
| | 8,580 | | | San Francisco Unified School District, GO, 5.000%, 06/15/18 | | | 9,251 | |
SEE NOTES TO FINANCIAL STATEMENTS.
| | | | | | | | |
| | | |
| AUGUST 31, 2016 | | J.P. MORGAN MUNICIPAL BOND FUNDS | | | | | 25 | |
JPMorgan Short-Intermediate Municipal Bond Fund
SCHEDULE OF PORTFOLIO INVESTMENTS
AS OF AUGUST 31, 2016 (Unaudited) (continued)
(Amounts in thousands)
| | | | | | | | |
PRINCIPAL
AMOUNT($) | | | SECURITY DESCRIPTION | | VALUE($) | |
| Municipal Bonds — continued | |
| | | | General Obligation — continued | |
| | 5,190 | | | San Francisco Unified School District, Proposition A, Election of 2011, Series B, GO, 5.000%, 06/15/24 | | | 6,350 | |
| | | | San Mateo County Community College District, | | | | |
| | 700 | | | GO, 5.000%, 09/01/25 | | | 897 | |
| | 1,095 | | | GO, 5.000%, 09/01/26 | | | 1,401 | |
| | | | Walnut Valley, Unified School District, | | | | |
| | 100 | | | GO, 5.000%, 08/01/24 | | | 128 | |
| | 150 | | | GO, 5.000%, 08/01/25 | | | 195 | |
| | 135 | | | GO, 5.000%, 08/01/26 | | | 178 | |
| | 245 | | | GO, 5.000%, 08/01/27 | | | 321 | |
| | 10,495 | | | Whittier Union School District, GO, 5.000%, 08/01/23 | | | 13,221 | |
| | | | | | | | |
| | | | | | | 182,068 | |
| | | | | | | | |
| | | | Hospital — 2.4% | |
| | | | California Health Facilities Financing Authority, Adventist Health System/West, | | | | |
| | 2,750 | | | Series A, Rev., 4.000%, 03/01/29 | | | 3,167 | |
| | 2,500 | | | Series A, Rev., 4.000%, 03/01/30 | | | 2,851 | |
| | 2,000 | | | Series A, Rev., 4.000%, 03/01/32 | | | 2,257 | |
| | | | California Health Facilities Financing Authority, Cedars-Sinal Medical Center, | | | | |
| | 1,850 | | | Rev., 5.000%, 11/15/25 | | | 2,392 | |
| | 6,000 | | | Rev., 5.000%, 11/15/26 | | | 7,734 | |
| | 1,160 | | | California Health Facilities Financing Authority, Memorial Health Services, Series A, Rev., 5.000%, 10/01/16 | | | 1,164 | |
| | | | California Health Facilities Financing Authority, Providence Health & Services, | | | | |
| | 750 | | | Series A, Rev., 5.000%, 10/01/21 | | | 905 | |
| | 1,500 | | | Series A, Rev., 5.000%, 10/01/22 | | | 1,851 | |
| | 10,000 | | | California Health Facilities Financing Authority, St. Joseph Health System, Series C, Rev., VAR, 5.000%, 10/18/22 | | | 12,176 | |
| | | | California Health Facilities Financing Authority, St. Joseph Health System Obligated Group, | | | | |
| | 5,000 | | | Series C, Rev., VAR, 5.000%, 10/15/19 | | | 5,608 | |
| | 12,870 | | | Series D, Rev., VAR, 5.000%, 10/15/20 | | | 14,874 | |
| | 100 | | | California Municipal Finance Authority, NorthBay Healthcare Group, Rev., 5.000%, 11/01/16 | | | 101 | |
| | 350 | | | California Statewide Communities Development Authority, Series B, Rev., 5.000%, 08/15/26 | | | 456 | |
| | | | | | | | |
| | | | | | | 55,536 | |
| | | | | | | | |
| | | | Other Revenue — 2.5% | |
| | | | Alameda County Transport Authority, Sales Tax, | | | | |
| | 5,000 | | | Rev., 3.000%, 03/01/17 | | | 5,065 | |
| | | | | | | | |
PRINCIPAL
AMOUNT($) | | | SECURITY DESCRIPTION | | VALUE($) | |
| | | | | | | | |
| | | | Other Revenue — continued | |
| | 3,095 | | | Rev., 3.000%, 03/01/18 | | | 3,210 | |
| | 5,000 | | | Rev., 4.000%, 03/01/19 | | | 5,425 | |
| | 5,000 | | | Rev., 4.000%, 03/01/22 | | | 5,818 | |
| | 1,240 | | | Rev., 5.000%, 03/01/20 | | | 1,425 | |
| | 1,000 | | | Anaheim Public Financing Authority, Anaheim Convention Center Expansion Project, Series A, Rev., 5.000%, 05/01/17 | | | 1,029 | |
| | 700 | | | California Municipal Finance Authority, NorthBay Healthcare Group, Series A, Rev., 2.000%, 11/01/17 | | | 708 | |
| | 4,500 | | | California State Public Works Board, Department of General Services, Series F, Rev., 5.000%, 05/01/21 | | | 5,343 | |
| | | | Contra Costa County Transportation Authority, Sales Tax, | | | | |
| | 3,420 | | | Series A, Rev., 4.000%, 03/01/23 | | | 4,050 | |
| | 3,830 | | | Series A, Rev., 4.000%, 03/01/25 | | | 4,660 | |
| | 2,420 | | | Series A, Rev., 5.000%, 03/01/23 | | | 3,018 | |
| | 2,000 | | | Series A, Rev., 5.000%, 03/01/24 | | | 2,549 | |
| | 1,250 | | | Series A, Rev., 5.000%, 03/01/25 | | | 1,621 | |
| | 1,000 | | | Series B, Rev., 4.000%, 03/01/18 | | | 1,052 | |
| | 1,600 | | | Series B, Rev., 5.000%, 03/01/18 | | | 1,707 | |
| | 1,750 | | | Series B, Rev., 5.000%, 03/01/19 | | | 1,942 | |
| | 500 | | | Glendale Redevelopment Agency, Successor Agency, Rev., AGM, 4.000%, 12/01/16 | | | 504 | |
| | 1,000 | | | Golden State Tobacco Securitization Corp., Tobacco Settlement, Series A, Rev., 5.000%, 06/01/21 | | | 1,186 | |
| | | | Riverside Community Properties Development, Inc., Riverside County Law Building Project, | | | | |
| | 640 | | | Rev., 5.000%, 10/15/18 | | | 696 | |
| | 780 | | | Rev., 5.000%, 10/15/19 | | | 878 | |
| | | | San Diego County Regional Transportation Commission, Sales Tax, | | | | |
| | 250 | | | Series A, Rev., 5.000%, 04/01/21 | | | 298 | |
| | 100 | | | Series A, Rev., 5.000%, 04/01/22 | | | 123 | |
| | 1,700 | | | San Francisco State Building Authority & Oakland State Building Authority, Elihu M. Harris State Office Building, Series A, Rev., 5.000%, 12/01/22 | | | 2,074 | |
| | 1,225 | | | Santa Clara County Financing Authority, Capital Projects, Series A, Rev., 5.000%, 02/01/19 | | | 1,354 | |
| | 1,000 | | | Santa Clara Valley Transportation Authority, Sales Tax, Series A, Rev., 5.000%, 04/01/26 | | | 1,291 | |
| | 1,000 | | | Sonoma County Transportation Authority, Sales Tax, Rev., 5.000%, 12/01/24 | | | 1,289 | |
| | | | | | | | |
| | | | | | | 58,315 | |
| | | | | | | | |
SEE NOTES TO FINANCIAL STATEMENTS.
| | | | | | |
| | | |
| 26 | | | | J.P. MORGAN MUNICIPAL BOND FUNDS | | AUGUST 31, 2016 |
| | | | | | | | |
PRINCIPAL
AMOUNT($) | | | SECURITY DESCRIPTION | | VALUE($) | |
| Municipal Bonds — continued | |
| | | | Prerefunded — 0.0% (g) | |
| | 1,160 | | | California State Public Works Board, California State University, Series E, Rev., 5.000%, 04/01/19 (p) | | | 1,289 | |
| | | | | | | | |
| | | | Transportation — 2.2% | |
| | 7,550 | | | Bay Area Toll Authority, Toll Bridge, San Francisco Bay Area, Series C, Rev., VAR, 1.875%, 04/01/19 | | | 7,712 | |
| | 10,000 | | | City of Long Beach Harbor, Series C, Rev., 5.000%, 11/15/18 | | | 10,954 | |
| | | | City of Los Angeles Department of Airports, | | | | |
| | 1,590 | | | Series A, Rev., AMT, 5.000%, 05/15/21 | | | 1,868 | |
| | 315 | | | Series B, Rev., 4.000%, 05/15/23 | | | 375 | |
| | 365 | | | Series B, Rev., 4.000%, 05/15/24 | | | 441 | |
| | 1,015 | | | Series C, Rev., 4.000%, 05/15/18 | | | 1,075 | |
| | 1,000 | | | Series C, Rev., 5.000%, 05/15/19 | | | 1,119 | |
| | 750 | | | Series C, Rev., 5.000%, 05/15/22 | | | 912 | |
| | 700 | | | Series C, Rev., 5.000%, 05/15/24 | | | 885 | |
| | 3,380 | | | Series D, Rev., AMT, 5.000%, 05/15/22 | | | 4,053 | |
| | 2,700 | | | Series D, Rev., AMT, 5.000%, 05/15/27 | | | 3,365 | |
| | 1,950 | | | Series D, Rev., AMT, 5.000%, 05/15/28 | | | 2,409 | |
| | 2,550 | | | Series D, Rev., AMT, 5.000%, 05/15/29 | | | 3,127 | |
| | 9,665 | | | Los Angeles County Metropolitan Transportation Authority, Series A, Rev., 5.000%, 07/01/19 | | | 10,849 | |
| | 1,000 | | | Los Angeles County Metropolitan Transportation Authority, Union Station Gateway Project, Rev., 5.000%, 07/01/27 | | | 1,285 | |
| | 255 | | | San Bernardino County Transportation Authority, Series A, Rev., 3.000%, 03/01/17 | | | 258 | |
| | | | San Francisco Bay Area Rapid Transit District, Sales Tax, | | | | |
| | 525 | | | Series A, Rev., 5.000%, 07/01/24 | | | 675 | |
| | 905 | | | Series A, Rev., 5.000%, 07/01/25 | | | 1,184 | |
| | | | | | | | |
| | | | | | | 52,546 | |
| | | | | | | | |
| | | | Utility — 1.5% | |
| | 15,000 | | | California State Department of Water Resources, Power Supply, Series L, Rev., 5.000%, 05/01/19 | | | 16,728 | |
| | | | City of Los Angeles Department of Water & Power, Power System, | | | | |
| | 5,000 | | | Series A, Rev., 4.000%, 07/01/17 | | | 5,146 | |
| | 10,000 | | | Series B, Rev., 5.000%, 12/01/18 | | | 10,938 | |
| | 1,000 | | | Southern California, Public Power Authority Canyon Power Project, Series A, Rev., 5.000%, 07/01/26 | | | 1,186 | |
| | 400 | | | Walnut Energy Center Authority, Series A, Rev., 5.000%, 01/01/23 | | | 493 | |
| | | | | | | | |
| | | | | | | 34,491 | |
| | | | | | | | |
| | | | | | | | |
PRINCIPAL
AMOUNT($) | | | SECURITY DESCRIPTION | | VALUE($) | |
| | | | | | | | |
| | | | Water & Sewer — 2.0% | | | | |
| | | | Burlingame Financing Authority Water & Wastewater, | | | | |
| | 250 | | | Rev., 4.000%, 04/01/20 | | | 279 | |
| | 200 | | | Rev., 4.000%, 04/01/21 | | | 229 | |
| | 480 | | | Rev., 5.000%, 04/01/24 | | | 614 | |
| | 545 | | | Rev., 5.000%, 04/01/25 | | | 712 | |
| | | | California State Department of Water Resources, Central Valley Project Water System, | | | | |
| | 4,870 | | | Series AI, Rev., 5.000%, 12/01/17 | | | 5,147 | |
| | 130 | | | Series AI, Rev., 5.000%, 12/01/17 (p) | | | 137 | |
| | | | City of Los Angeles Wastewater System Subordinate, | | | | |
| | 1,500 | | | Series A, Rev., 5.000%, 06/01/18 | | | 1,615 | |
| | 1,250 | | | Series A, Rev., 5.000%, 06/01/19 | | | 1,399 | |
| | 2,750 | | | Series A, Rev., 5.000%, 06/01/22 | | | 3,368 | |
| | | | County of San Mateo, Silicon Valley Clean Water, | | | | |
| | 400 | | | Rev., 4.000%, 02/01/19 | | | 433 | |
| | 300 | | | Rev., 5.000%, 02/01/17 | | | 306 | |
| | 320 | | | Rev., 5.000%, 02/01/18 | | | 340 | |
| | 400 | | | Rev., 5.000%, 08/01/28 | | | 515 | |
| | 390 | | | Rev., 5.000%, 08/01/29 | | | 499 | |
| | | | East Bay Municipal Utility District, Wastewater System, | | | | |
| | 3,000 | | | Series A, Rev., 5.000%, 06/01/20 | | | 3,478 | |
| | 2,330 | | | Series B, Rev., 5.000%, 06/01/19 | | | 2,608 | |
| | | | Metropolitan Water District of Southern California, | | | | |
| | 4,000 | | | Series A, Rev., 5.000%, 07/01/18 | | | 4,324 | |
| | 8,000 | | | Series A, Rev., 5.000%, 07/01/19 | | | 8,983 | |
| | 5,000 | | | Series C, Rev., 5.000%, 07/01/18 | | | 5,405 | |
| | 6,105 | | | Series C-1, Rev., VAR, 3.000%, 10/01/19 | | | 6,493 | |
| | | | | | | | |
| | | | | | | 46,884 | |
| | | | | | | | |
| | | | Total California | | | 458,246 | |
| | | | | | | | |
| | | | Colorado — 1.1% | |
| | | | Certificate of Participation/Lease — 0.3% | |
| | | | City of Longmont, | | | | |
| | 100 | | | Series A, COP, 5.000%, 12/01/21 | | | 119 | |
| | 100 | | | Series A, COP, 5.000%, 12/01/22 | | | 121 | |
| | 100 | | | Series A, COP, 5.000%, 12/01/24 | | | 123 | |
| | | | County of Boulder, Flood Reconstruction Projects, | | | | |
| | 720 | | | COP, 5.000%, 12/01/22 | | | 837 | |
| | 500 | | | COP, 5.000%, 12/01/23 | | | 581 | |
| | 500 | | | COP, 5.000%, 12/01/25 | | | 579 | |
SEE NOTES TO FINANCIAL STATEMENTS.
| | | | | | | | |
| | | |
| AUGUST 31, 2016 | | J.P. MORGAN MUNICIPAL BOND FUNDS | | | | | 27 | |
JPMorgan Short-Intermediate Municipal Bond Fund
SCHEDULE OF PORTFOLIO INVESTMENTS
AS OF AUGUST 31, 2016 (Unaudited) (continued)
(Amounts in thousands)
| | | | | | | | |
PRINCIPAL
AMOUNT($) | | | SECURITY DESCRIPTION | | VALUE($) | |
| Municipal Bonds — continued | |
| | | | Certificate of Participation/Lease — continued | |
| | | | County of Eagle, | | | | |
| | 500 | | | COP, 3.000%, 12/01/18 | | | 523 | |
| | 200 | | | COP, 5.000%, 12/01/22 | | | 242 | |
| | | | Regional Transportation District, | | | | |
| | 2,000 | | | Series A, COP, 5.000%, 06/01/23 | | | 2,289 | |
| | 1,700 | | | Series A, COP, 5.000%, 06/01/25 | | | 1,928 | |
| | | | | | | | |
| | | | | | | 7,342 | |
| | | | | | | | |
| | | | Education — 0.3% | |
| | | | University of Colorado, University Enterprise, | | | | |
| | 3,150 | | | Series A, Rev., 5.000%, 06/01/22 | | | 3,844 | |
| | 2,300 | | | Series B-1, Rev., 5.000%, 06/01/23 | | | 2,873 | |
| | | | | | | | |
| | | | | | | 6,717 | |
| | | | | | | | |
| | | | General Obligation — 0.1% | |
| | | | Counties of Gunnison, Watershed School District No. 1, | | | | |
| | 300 | | | GO, 4.000%, 12/01/22 | | | 349 | |
| | 500 | | | GO, 5.000%, 12/01/26 | | | 632 | |
| | 1,000 | | | Routt County, Colorado School District Re-2 Steamboat Springs Refunding, Series A, GO, 4.000%, 12/01/18 | | | 1,074 | |
| | | | | | | | |
| | | | | | | 2,055 | |
| | | | | | | | |
| | | | Other Revenue — 0.4% | |
| | 1,800 | | | City and County of Denver, Tax Revenue Refunding & Improvement, Series A, Rev., 5.000%, 08/01/23 | | | 2,231 | |
| | 1,000 | | | County of Boulder, Rev., 5.000%, 12/15/16 | | | 1,013 | |
| | | | Denver Urban Renewal Authority, | | | | |
| | 1,850 | | | Series A-1, Rev., 5.000%, 12/01/16 | | | 1,870 | |
| | 2,210 | | | Series B-1, Rev., 5.000%, 12/01/19 | | | 2,498 | |
| | 840 | | | Series B-1, Rev., 5.000%, 12/01/25 | | | 1,073 | |
| | | | | | | | |
| | | | | | | 8,685 | |
| | | | | | | | |
| | | | Water & Sewer — 0.0% (g) | |
| | 1,000 | | | Board of Water Works of Pueblo, Water, Rev., 2.000%, 11/01/18 | | | 1,026 | |
| | | | | | | | |
| | | | Total Colorado | | | 25,825 | |
| | | | | | | | |
| | | | Connecticut — 1.7% | |
| | | | General Obligation — 0.7% | |
| | 1,125 | | | City of Shelton, GO, 4.000%, 08/01/17 | | | 1,160 | |
| | | | State of Connecticut, | | | | |
| | 6,500 | | | Series B, GO, 5.000%, 05/15/21 | | | 7,609 | |
| | 8,000 | | | Series C, GO, 5.000%, 06/15/20 | | | 9,150 | |
| | | | | | | | |
| | | | | | | 17,919 | |
| | | | | | | | |
| | | | | | | | |
PRINCIPAL
AMOUNT($) | | | SECURITY DESCRIPTION | | VALUE($) | |
| | | | | | | | |
| | | | Transportation — 1.0% | |
| | | | State of Connecticut, Transportation Infrastructure, Special Tax, | | | | |
| | 4,265 | | | Series A, Rev., 5.000%, 12/01/17 | | | 4,498 | |
| | 10,000 | | | Series A, Rev., 5.000%, 09/01/28 | | | 12,422 | |
| | 5,750 | | | Series B, Rev., 5.000%, 12/01/17 | | | 6,065 | |
| | | | | | | | |
| | | | | | | 22,985 | |
| | | | | | | | |
| | | | Total Connecticut | | | 40,904 | |
| | | | | | | | |
| | | | Delaware — 0.0% (g) | |
| | | | General Obligation — 0.0% (g) | |
| | 120 | | | State of Delaware, GO, 5.000%, 07/01/19 | | | 134 | |
| | | | | | | | |
| | | | District of Columbia — 0.7% | |
| | | | Hospital — 0.5% | |
| | | | District of Columbia Children’s Hospital, | | | | |
| | 1,100 | | | Rev., 5.000%, 07/15/20 | | | 1,268 | |
| | 500 | | | Rev., 5.000%, 07/15/21 | | | 593 | |
| | 850 | | | Rev., 5.000%, 07/15/22 | | | 1,030 | |
| | 2,725 | | | Rev., 5.000%, 07/15/23 | | | 3,371 | |
| | 1,100 | | | Rev., 5.000%, 07/15/25 | | | 1,409 | |
| | 1,000 | | | Rev., 5.000%, 07/15/26 | | | 1,280 | |
| | 2,500 | | | Rev., 5.000%, 07/15/29 | | | 3,131 | |
| | | | | | | | |
| | | | | | | 12,082 | |
| | | | | | | | |
| | | | Transportation — 0.1% | |
| | 1,475 | | | Metropolitan Washington Airports Authority, Airport System, Series C, Rev., 5.000%, 10/01/21 | | | 1,759 | |
| | | | | | | | |
| | | | Water & Sewer — 0.1% | |
| | 1,475 | | | District of Columbia, Water & Sewer Authority, Public Utility, Subordinated Lien, Series A, Rev., 5.000%, 10/01/29 | | | 1,875 | |
| | | | | | | | |
| | | | Total District of Columbia | | | 15,716 | |
| | | | | | | | |
| | | | Florida — 2.6% | |
| | | | Certificate of Participation/Lease — 1.4% | |
| | 5,600 | | | Miami-Dade County School Board, Series A, COP, 5.000%, 05/01/26 | | | 6,946 | |
| | | | School Board of Duval County, | | | | |
| | 1,035 | | | Series B, COP, 5.000%, 07/01/19 | | | 1,154 | |
| | 750 | | | Series B, COP, 5.000%, 07/01/21 | | | 886 | |
| | 4,000 | | | Series B, COP, 5.000%, 07/01/26 | | | 5,004 | |
| | | | Seminole County School Board, | | | | |
| | 295 | | | Series A, COP, 4.000%, 07/01/18 | | | 311 | |
| | 200 | | | Series A, COP, 5.000%, 07/01/19 | | | 222 | |
| | 210 | | | Series A, COP, 5.000%, 07/01/20 | | | 241 | |
SEE NOTES TO FINANCIAL STATEMENTS.
| | | | | | |
| | | |
| 28 | | | | J.P. MORGAN MUNICIPAL BOND FUNDS | | AUGUST 31, 2016 |
| | | | | | | | |
PRINCIPAL
AMOUNT($) | | | SECURITY DESCRIPTION | | VALUE($) | |
| Municipal Bonds — continued | |
| | | | Certificate of Participation/Lease — continued | |
| | | | St. Johns County School Board, Master Lease Program, | | | | |
| | 7,645 | | | COP, 5.000%, 07/01/17 | | | 7,922 | |
| | 3,000 | | | COP, 5.000%, 07/01/18 | | | 3,233 | |
| | 1,500 | | | COP, 5.000%, 07/01/19 | | | 1,671 | |
| | 2,000 | | | COP, 5.000%, 07/01/20 | | | 2,296 | |
| | 1,750 | | | COP, 5.000%, 07/01/21 | | | 2,064 | |
| | 750 | | | St. Lucie County School Board, Master Lease Program, Series A, COP, 5.000%, 07/01/19 | | | 834 | |
| | | | | | | | |
| | | | | | | 32,784 | |
| | | | | | | | |
| | | | Education — 0.2% | |
| | 1,660 | | | Board of Governors of the University of Florida, Student Activity, Rev., 5.000%, 07/01/20 | | | 1,912 | |
| | | | Florida Higher Educational Facilities Authority, | | | | |
| | 1,250 | | | Rev., 5.000%, 04/01/28 | | | 1,552 | |
| | 1,250 | | | Rev., 5.000%, 04/01/29 | | | 1,545 | |
| | | | | | | | |
| | | | | | | 5,009 | |
| | | | | | | | |
| | | | General Obligation — 0.1% | |
| | 450 | | | City of Port St. Lucie, GO, 4.000%, 07/01/17 | | | 462 | |
| | 1,000 | | | Reedy Creek Improvement District, Series B, GO, 4.000%, 06/01/19 | | | 1,088 | |
| | | | | | | | |
| | | | | | | 1,550 | |
| | | | | | | | |
| | | | Hospital — 0.1% | |
| | | | Miami Beach Health Facilities Authority, Mt Sinai Medical Centre, | | | | |
| | 200 | | | Rev., 4.000%, 11/15/16 | | | 201 | |
| | 150 | | | Rev., 4.000%, 11/15/17 | | | 156 | |
| | 1,000 | | | Palm Beach County Health Facilities Authority, Hospital, BRRH Corp., Obligated Group, Rev., 3.000%, 12/01/16 | | | 1,005 | |
| | | | | | | | |
| | | | | | | 1,362 | |
| | | | | | | | |
| | | | Other Revenue — 0.3% | |
| | 550 | | | City of Jacksonville, Series B, Rev., 5.000%, 10/01/17 | | | 576 | |
| | 1,000 | | | Lee County, Rev., 5.000%, 10/01/17 | | | 1,047 | |
| | | | Orlando, Citry of Florida, Capital Improvement Refunding, | | | | |
| | 1,000 | | | Series B, Rev., 5.000%, 10/01/25 | | | 1,283 | |
| | 1,200 | | | Series B, Rev., 5.000%, 10/01/26 | | | 1,560 | |
| | | | St. Johns County School Sales Tax, | | | | |
| | 1,000 | | | Rev., 5.000%, 10/01/19 | | | 1,128 | |
| | 1,000 | | | Rev., 5.000%, 10/01/25 | | | 1,285 | |
| | | | | | | | |
PRINCIPAL
AMOUNT($) | | | SECURITY DESCRIPTION | | VALUE($) | |
| | | | | | | | |
| | | | Other Revenue — continued | |
| | | | The School Board of Escambia County, Sales Tax, | | | | |
| | 685 | | | Rev., 5.000%, 09/01/23 | | | 847 | |
| | 275 | | | Rev., 5.000%, 09/01/24 | | | 346 | |
| | 120 | | | Rev., 5.000%, 09/01/25 | | | 153 | |
| | | | | | | | |
| | | | | | | 8,225 | |
| | | | | | | | |
| | | | Prerefunded — 0.2% | |
| | 230 | | | Florida State Municipal Power Agency, Series A, Rev., 5.000%, 10/01/18 (p) | | | 251 | |
| | 4,500 | | | Hillsborough County Industrial Development Authority, Health Facilities Projects, University Community Hospital, Series A, Rev., 5.625%, 08/15/18 (p) | | | 4,934 | |
| | | | | | | | |
| | | | | | | 5,185 | |
| | | | | | | | |
| | | | Transportation — 0.3% | |
| | | | Miami-Dade County Expressway Authority, Toll System, | | | | |
| | 1,550 | | | Series A, Rev., 5.000%, 07/01/20 | | | 1,784 | |
| | 625 | | | Series A, Rev., 5.000%, 07/01/22 | | | 752 | |
| | 815 | | | Series A, Rev., 5.000%, 07/01/28 (w) | | | 1,031 | |
| | 1,090 | | | Series A, Rev., 5.000%, 07/01/29 (w) | | | 1,370 | |
| | 850 | | | Series B, Rev., 5.000%, 07/01/25 | | | 1,054 | |
| | | | | | | | |
| | | | | | | 5,991 | |
| | | | | | | | |
| | | | Total Florida | | | 60,106 | |
| | | | | | | | |
| | | | Georgia — 2.2% | |
| | | | General Obligation — 1.5% | |
| | 1,065 | | | Bryan County, School District, Sales Tax, GO, 4.000%, 08/01/17 | | | 1,098 | |
| | 1,000 | | | City of Atlanta, Series A, GO, 4.000%, 12/01/19 | | | 1,103 | |
| | 1,400 | | | County of Sumter, Sales Tax, GO, 4.000%, 12/01/18 | | | 1,501 | |
| | | | State of Georgia, | | | | |
| | 14,800 | | | Series I, GO, 5.000%, 07/01/18 | | | 15,983 | |
| | 1,250 | | | Series I, GO, 5.000%, 07/01/19 | | | 1,401 | |
| | 8,165 | | | Series I, GO, 5.000%, 07/01/21 | | | 9,762 | |
| | 4,270 | | | Series J-2, GO, 4.000%, 11/01/17 | | | 4,441 | |
| | | | | | | | |
| | | | | | | 35,289 | |
| | | | | | | | |
| | | | Housing — 0.1% | |
| | | | Georgia Housing & Finance Authority, Single Family, | | | | |
| | 750 | | | Series A-4, Rev., 0.800%, 06/01/17 | | | 751 | |
| | 700 | | | Series A-4, Rev., 0.900%, 12/01/17 | | | 702 | |
| | | | | | | | |
| | | | | | | 1,453 | |
| | | | | | | | |
SEE NOTES TO FINANCIAL STATEMENTS.
| | | | | | | | |
| | | |
| AUGUST 31, 2016 | | J.P. MORGAN MUNICIPAL BOND FUNDS | | | | | 29 | |
JPMorgan Short-Intermediate Municipal Bond Fund
SCHEDULE OF PORTFOLIO INVESTMENTS
AS OF AUGUST 31, 2016 (Unaudited) (continued)
(Amounts in thousands)
| | | | | | | | |
PRINCIPAL
AMOUNT($) | | | SECURITY DESCRIPTION | | VALUE($) | |
| Municipal Bonds — continued | |
| | | | Industrial Development Revenue/Pollution Control Revenue — 0.2% | |
| | 4,000 | | | Monroe County Development Authority, Pollution Control, Gulf Power Company Plant, Scherer Project, Rev., VAR, 2.000%, 06/21/18 | | | 4,071 | |
| | | | | | | | |
| | | | Other Revenue — 0.2% | |
| | 5,000 | | | Fulton County Development Authority, Technology Athletic Association Project, Series A, Rev., 5.000%, 10/01/22 | | | 6,022 | |
| | | | | | | | |
| | | | Special Tax — 0.1% | |
| | | | Atlanta Development Authority, New Downtown Atlanta Stadium Project, Senior Lien, | | | | |
| | 1,000 | | | Series A-1, Rev., 5.000%, 07/01/27 | | | 1,256 | |
| | 1,000 | | | Series A-1, Rev., 5.000%, 07/01/28 | | | 1,246 | |
| | 750 | | | Series A-1, Rev., 5.000%, 07/01/29 | | | 928 | |
| | | | | | | | |
| | | | | | | 3,430 | |
| | | | | | | | |
| | | | Utility — 0.1% | |
| | 1,685 | | | Camden County Public Service Authority, St. Mary’s Project, Rev., 5.000%, 12/01/16 | | | 1,704 | |
| | | | | | | | |
| | | | Total Georgia | | | 51,969 | |
| | | | | | | | |
| | | | Guam — 0.4% | |
| | | | Other Revenue — 0.4% | |
| | | | Government of Guam, Limited Obligation Section 30, | | | | |
| | 750 | | | Series A, Rev., 5.000%, 12/01/18 | | | 810 | |
| | 2,725 | | | Series A, Rev., 5.000%, 12/01/22 | | | 3,217 | |
| | 2,000 | | | Series A, Rev., 5.000%, 12/01/23 | | | 2,398 | |
| | 2,280 | | | Series A, Rev., 5.000%, 12/01/24 | | | 2,774 | |
| | | | | | | | |
| | | | Total Guam | | | 9,199 | |
| | | | | | | | |
| | | | Hawaii — 1.1% | |
| | | | General Obligation — 1.1% | |
| | | | City & County of Honolulu, | | | | |
| | 1,500 | | | Series A, GO, 5.000%, 10/01/18 | | | 1,633 | |
| | 3,700 | | | Series B, GO, 5.000%, 10/01/18 | | | 4,029 | |
| | | | State of Hawaii, | | | | |
| | 10,160 | | | Series DY, GO, 5.000%, 02/01/20 | | | 11,589 | |
| | 7,640 | | | Series EF, GO, 5.000%, 11/01/21 | | | 9,179 | |
| | | | | | | | |
| | | | Total Hawaii | | | 26,430 | |
| | | | | | | | |
| | | | Idaho — 0.0% (g) | |
| | | | Education — 0.0% (g) | |
| | 565 | | | University of Idaho, Series A, Rev., 5.000%, 04/01/22 | | | 681 | |
| | | | | | | | |
| | | | | | | | |
PRINCIPAL
AMOUNT($) | | | SECURITY DESCRIPTION | | VALUE($) | |
| | | | | | | | |
| | | | Illinois — 3.6% | |
| | | | Education — 0.2% | |
| | 5,000 | | | Illinois Educational Facilities Authority, University of Chicago, Series B-2, Rev., VAR, 1.550%, 02/13/20 | | | 5,099 | |
| | | | | | | | |
| | | | General Obligation — 1.4% | |
| | 5,000 | | | City of Chicago, Series C, GO, 5.000%, 01/01/22 | | | 5,362 | |
| | 4,740 | | | City of Peoria, Tazewell County, Community College District No. 514, Series A, GO, 5.000%, 12/01/19 | | | 5,385 | |
| | | | County of Dupage, Courthouse Project, | | | | |
| | 335 | | | GO, 5.000%, 01/01/24 | | | 417 | |
| | 525 | | | GO, 5.000%, 01/01/27 | | | 666 | |
| | 250 | | | GO, 5.000%, 01/01/28 | | | 315 | |
| | 730 | | | GO, 5.000%, 01/01/29 | | | 912 | |
| | 3,460 | | | County of Winnebago, Series A, GO, 4.000%, 12/30/19 | | | 3,817 | |
| | 3,000 | | | DuPage County Community Unit School District No. 200, Wheaton Warrenville, GO, 4.000%, 11/01/21 | | | 3,412 | |
| | 2,800 | | | DuPage County Forest Preserve District, GO, 5.000%, 01/01/21 | | | 3,275 | |
| | 355 | | | Forest Preserve District of Will County, Limited tax, Series A, GO, 5.000%, 12/15/24 | | | 444 | |
| | | | Kendall Kane & Will Counties Community Unit School District, | | | | |
| | 1,000 | | | GO, 5.000%, 02/01/25 | | | 1,233 | |
| | 1,135 | | | GO, 5.000%, 02/01/26 | | | 1,411 | |
| | | | McHenry County, Woodstock Community Unit School District No. 200, | | | | |
| | 1,000 | | | GO, 2.000%, 01/15/17 | | | 1,005 | |
| | 300 | | | GO, 5.000%, 01/15/21 | | | 350 | |
| | 2,500 | | | State of Illinois, GO, 4.000%, 02/01/18 | | | 2,584 | |
| | 2,250 | | | Village of Wilmette, GO, 4.125%, 12/01/16 | | | 2,270 | |
| | | | | | | | |
| | | | | | | 32,858 | |
| | | | | | | | |
| | | | Other Revenue — 0.7% | |
| | 6,000 | | | Illinois Finance Authority, Advocate Health Care, Series A-1, Rev., VAR, 5.000%, 01/15/20 | | | 6,780 | |
| | | | Illinois Finance Authority, Depaul University, | | | | |
| | 200 | | | Rev., 5.000%, 10/01/23 | | | 246 | |
| | 340 | | | Rev., 5.000%, 10/01/24 | | | 425 | |
| | 300 | | | Rev., 5.000%, 10/01/25 | | | 380 | |
| | 500 | | | Rev., 5.000%, 10/01/26 | | | 640 | |
| | 500 | | | Rev., 5.000%, 10/01/27 | | | 635 | |
| | 250 | | | Rev., 5.000%, 10/01/28 | | | 314 | |
SEE NOTES TO FINANCIAL STATEMENTS.
| | | | | | |
| | | |
| 30 | | | | J.P. MORGAN MUNICIPAL BOND FUNDS | | AUGUST 31, 2016 |
| | | | | | | | |
PRINCIPAL
AMOUNT($) | | | SECURITY DESCRIPTION | | VALUE($) | |
| Municipal Bonds — continued | |
| | | | Other Revenue — continued | |
| | 2,000 | | | Illinois Finance Authority, Northwest Community Hospital, Series A, Rev., 5.000%, 07/01/31 | | | 2,443 | |
| | 2,715 | | | Illinois Finance Authority, Rush University Medical Center Obligated Group, Series A, Rev., 5.000%, 11/15/25 | | | 3,417 | |
| | | | Illinois Finance Authority, Silver Cross Hospital & Medical Centers, | | | | |
| | 150 | | | Series C, Rev., 5.000%, 08/15/21 | | | 173 | |
| | 500 | | | Series C, Rev., 5.000%, 08/15/22 | | | 584 | |
| | | | | | | | |
| | | | | | | 16,037 | |
| | | | | | | | |
| | | | Transportation — 0.4% | |
| | | | City of Chicago, Chicago Midway Airport Second Lien Revenue Refunding, | | | | |
| | 1,460 | | | Series A, Rev., AMT, 5.000%, 01/01/20 | | | 1,641 | |
| | 2,580 | | | Series A, Rev., AMT, 5.000%, 01/01/21 | | | 2,972 | |
| | 500 | | | Series B, Rev., 5.000%, 01/01/20 | | | 567 | |
| | 5,000 | | | Illinois State Toll Highway Authority, Senior Priority, Series B, Rev., 5.000%, 12/01/17 | | | 5,267 | |
| | | | | | | | |
| | | | | | | 10,447 | |
| | | | | | | | |
| | | | Utility — 0.9% | |
| | | | Citiy of Springfield, Senior Lien Electric, | | | | |
| | 3,500 | | | Rev., 5.000%, 03/01/24 | | | 4,298 | |
| | 4,000 | | | Rev., 5.000%, 03/01/26 | | | 4,955 | |
| | 4,500 | | | Municipal Electric Agency Power Supply System, Series A, Rev., 5.000%, 02/01/19 | | | 4,932 | |
| | | | Northern Illinois Municipal Power Agency, Prairie Project, | | | | |
| | 2,200 | | | Series A, Rev., 4.000%, 12/01/32 (w) | | | 2,439 | |
| | 3,415 | | | Series A, Rev., 5.000%, 12/01/29 (w) | | | 4,237 | |
| | | | | | | | |
| | | | | | | 20,861 | |
| | | | | | | | |
| | | | Total Illinois | | | 85,302 | |
| | | | | | | | |
| | | | Indiana — 1.0% | |
| | | | Education — 0.1% | |
| | | | County of Elkhart, GCS School Building Corp. One, First Mortgage Refunding & Improvement, | | | | |
| | 300 | | | Rev., 4.000%, 07/15/17 | | | 309 | |
| | 265 | | | Rev., 5.000%, 07/15/18 | | | 285 | |
| | | | New Albany Floyd County School Building Corp., | | | | |
| | 700 | | | Rev., 5.000%, 07/15/21 | | | 828 | |
| | 835 | | | Rev., 5.000%, 07/15/22 | | | 1,006 | |
| | | | | | | | |
| | | | | | | 2,428 | |
| | | | | | | | |
| | | | | | | | |
PRINCIPAL
AMOUNT($) | | | SECURITY DESCRIPTION | | VALUE($) | |
| | | | | | | | |
| | | | Other Revenue — 0.6% | |
| | 1,000 | | | Fort Wayne Redevelopment Authority Lease Rent, Harrison Square Project, Rev., 5.000%, 08/01/23 | | | 1,230 | |
| | 1,170 | | | Indiana Finance Authority, Educational Facilities, Indianapolis Museum of Art, Inc. Project, Series B, Rev., 5.000%, 02/01/19 | | | 1,278 | |
| | 1,000 | | | Indiana Finance Authority, Stadium Project, Lease Appropriation, Series A, Rev., 5.250%, 02/01/28 | | | 1,274 | |
| | | | Indiana State Finance Authority State Revolving Fund Program Refunding, | | | | |
| | 3,080 | | | Series B, Rev., 5.000%, 02/01/18 | | | 3,270 | |
| | 5,500 | | | Series B, Rev., 5.000%, 02/01/19 | | | 6,065 | |
| | 750 | | | Indiana State Office Building Commission, Indiana State Museum Facility, Series C, Rev., NATL-RE, 5.250%, 07/01/19 (p) | | | 845 | |
| | | | | | | | |
| | | | | | | 13,962 | |
| | | | | | | | |
| | | | Transportation — 0.1% | |
| | 1,700 | | | The Indianapolis Local Public Improvement Bond Bank, Airport Authority project, Series A, Rev., 5.000%, 01/01/19 | | | 1,857 | |
| | | | | | | | |
| | | | Utility — 0.2% | |
| | | | Indiana Municipal Power Agency, Power Supply System, | | | | |
| | 1,085 | | | Series A, Rev., 5.000%, 01/01/17 | | | 1,101 | |
| | 1,000 | | | Series A, Rev., 5.000%, 01/01/18 | | | 1,059 | |
| | 1,250 | | | Series A, Rev., 5.000%, 01/01/19 | | | 1,375 | |
| | | | | | | | |
| | | | | | | 3,535 | |
| | | | | | | | |
| | | | Water & Sewer — 0.0% (g) | |
| | 620 | | | Evansville Local Public Improvement Bond Bank, Sewage Works Project, Series A, Rev., 5.000%, 07/01/19 | | | 690 | |
| | | | | | | | |
| | | | Total Indiana | | | 22,472 | |
| | | | | | | | |
| | | | Kansas — 0.5% | |
| | | | Certificate of Participation/Lease — 0.0% (g) | | | | |
| | 915 | | | Johnson County Park & Recreation District, Series A, COP, 4.000%, 09/01/16 | | | 915 | |
| | | | | | | | |
| | | | General Obligation — 0.1% | | | | |
| | 200 | | | Butler County, Unified School District No. 375, GO, 4.000%, 09/01/24 | | | 228 | |
| | 1,500 | | | Johnson County Unified School District No. 233, Series B, GO, 5.000%, 09/01/24 (w) | | | 1,891 | |
| | | | | | | | |
| | | | | | | 2,119 | |
| | | | | | | | |
SEE NOTES TO FINANCIAL STATEMENTS.
| | | | | | | | |
| | | |
| AUGUST 31, 2016 | | J.P. MORGAN MUNICIPAL BOND FUNDS | | | | | 31 | |
JPMorgan Short-Intermediate Municipal Bond Fund
SCHEDULE OF PORTFOLIO INVESTMENTS
AS OF AUGUST 31, 2016 (Unaudited) (continued)
(Amounts in thousands)
| | | | | | | | |
PRINCIPAL
AMOUNT($) | | | SECURITY DESCRIPTION | | VALUE($) | |
| Municipal Bonds — continued | |
| | | | Other Revenue — 0.0% (g) | |
| | 1,000 | | | Wyandotte County-Kansas City Unified Government, Sales Tax, Redevelopment Project Area B, Sub Lien, Rev., 5.000%, 12/01/16 | | | 1,011 | |
| | | | | | | | |
| | | | Prerefunded — 0.1% | |
| | 1,795 | | | Kansas Development Finance Authority, Public Water Supply, Series DW-1, Rev., 3.250%, 04/01/17 (p) | | | 1,823 | |
| | | | | | | | |
| | | | Transportation — 0.2% | |
| | 3,400 | | | Kansas State Department Transportation Highway, Series C, Rev., 5.000%, 09/01/17 | | | 3,551 | |
| | | | | | | | |
| | | | Water & Sewer — 0.1% | |
| | 2,200 | | | City of Wichita, Water & Sewer Utility, Series A, Rev., 5.000%, 10/01/22 | | | 2,678 | |
| | | | | | | | |
| | | | Total Kansas | | | 12,097 | |
| | | | | | | | |
| | | | Kentucky — 1.2% | |
| | | | Education — 0.4% | |
| | 6,980 | | | University of Kentucky, Series D, Rev., 5.000%, 10/01/21 | | | 8,358 | |
| | | | | | | | |
| | | | Industrial Development Revenue/Pollution Control Revenue — 0.4% | |
| | 3,000 | | | County of Carroll, Kentucky Pollution Control, Kentucky Utilities Company Project, Series A, Rev.,VAR, 1.050%, 09/01/19 | | | 2,997 | |
| | 7,000 | | | Louisville/Jefferson County Metro Government, Pollution Control, Louisville Gas & Electric Co. Project, Series A, Rev., VAR, 1.650%, 04/03/17 | | | 7,028 | |
| | | | | | | | |
| | | | | | | 10,025 | |
| | | | | | | | |
| | | | Prerefunded — 0.1% | |
| | 2,500 | | | Louisville/Jefferson County Metro Government, Health Facilities, Jewish Hospital & St. Mary’s HealthCare, Inc. Project, Rev., 6.125%, 02/01/18 (p) | | | 2,694 | |
| | | | | | | | |
| | | | Transportation — 0.2% | |
| | | | Kentucky Asset/Liability Commission, Project Notes, Federal Highway Trust Fund, | | | | |
| | 750 | | | Series A, Rev., 5.000%, 09/01/23 | | | 912 | |
| | 1,750 | | | Series A, Rev., 5.000%, 09/01/25 | | | 2,222 | |
| | | | Louisville Regional Airport Authority, Airport System, | | | | |
| | 1,500 | | | Series A, Rev., AMT, 3.000%, 07/01/17 | | | 1,528 | |
| | 345 | | | Series B, Rev., 4.000%, 07/01/18 | | | 366 | |
| | | | | | | | |
| | | | | | | 5,028 | |
| | | | | | | | |
| | | | | | | | |
PRINCIPAL
AMOUNT($) | | | SECURITY DESCRIPTION | | VALUE($) | |
| | | | | | | | |
| | | | Water & Sewer — 0.1% | |
| | 1,000 | | | Kentucky Infrastructure Authority, Wastewater & Drinking Water Revolving Fund, Series A, Rev., 4.000%, 02/01/17 | | | 1,014 | |
| | | | | | | | |
| | | | Total Kentucky | | | 27,119 | |
| | | | | | | | |
| | | | Louisiana — 0.5% | |
| | | | General Obligation — 0.3% | |
| | | | State of Louisiana, | | | | |
| | 360 | | | Series A, GO, 5.000%, 08/01/19 (p) | | | 405 | |
| | 7,000 | | | Series B, GO, 5.000%, 11/15/18 | | | 7,635 | |
| | | | | | | | |
| | | | | | | 8,040 | |
| | | | | | | | |
| | | | Other Revenue — 0.1% | |
| | | | Louisiana Public Facilities Authority, Ochsner Clinic Foundation Project, | | | | |
| | 160 | | | Rev., 3.000%, 05/15/17 | | | 162 | |
| | 300 | | | Rev., 3.000%, 05/15/18 | | | 311 | |
| | 2,250 | | | Tobacco Settlement Financing Corp., Asset-Backed, Series A, Rev., 5.000%, 05/15/17 | | | 2,318 | |
| | | | | | | | |
| | | | | | | 2,791 | |
| | | | | | | | |
| | | | Water & Sewer — 0.1% | |
| | 1,100 | | | City of New Orleans, Rev., 5.000%, 12/01/18 | | | 1,197 | |
| | | | | | | | |
| | | | Total Louisiana | | | 12,028 | |
| | | | | | | | |
| | | | Maine — 0.5% | |
| | | | General Obligation — 0.5% | |
| | 750 | | | City of Westbrook, GO, 5.000%, 10/15/24 | | | 947 | |
| | | | State of Maine, | | | | |
| | 4,740 | | | Series B, GO, 4.000%, 06/01/17 | | | 4,865 | |
| | 6,000 | | | Series B, GO, 5.000%, 06/01/18 | | | 6,458 | |
| | | | | | | | |
| | | | Total Maine | | | 12,270 | |
| | | | | | | | |
| | | | Maryland — 2.5% | |
| | | | Education — 0.3% | |
| | | | University of Maryland, Auxiliary Facilities & Tuition System, | | | | |
| | 1,000 | | | Series A, Rev., 5.000%, 04/01/17 | | | 1,027 | |
| | 5,540 | | | Series A, Rev., 5.000%, 04/01/20 | | | 6,361 | |
| | | | | | | | |
| | | | | | | 7,388 | |
| | | | | | | | |
| | | | General Obligation — 1.9% | |
| | 2,000 | | | County of Montgomery, Public Improvement, Series A, GO, 5.000%, 08/01/19 | | | 2,249 | |
| | | | State of Maryland, State & Local Facilities Loan, | | | | |
| | 12,795 | | | Series A, GO, 5.000%, 08/01/20 | | | 14,881 | |
| | 17,780 | | | Series B, GO, 5.000%, 03/15/18 | | | 18,978 | |
| | 6,900 | | | Series C, GO, 5.000%, 08/01/20 | | | 8,025 | |
| | | | | | | | |
| | | | | | | 44,133 | |
| | | | | | | | |
SEE NOTES TO FINANCIAL STATEMENTS.
| | | | | | |
| | | |
| 32 | | | | J.P. MORGAN MUNICIPAL BOND FUNDS | | AUGUST 31, 2016 |
| | | | | | | | |
PRINCIPAL
AMOUNT($) | | | SECURITY DESCRIPTION | | VALUE($) | |
| Municipal Bonds — continued | |
| | | | Other Revenue — 0.0% (g) | |
| | 750 | | | State of Maryland, Health & Higher Educational Facilities Authority, Peninsula Regional Medical Center, Rev., 5.000%, 07/01/22 | | | 910 | |
| | | | | | | | |
| | | | Prerefunded — 0.2% | |
| | 4,335 | | | State of Maryland, State & Local Facilities Loan, Series C, GO, 5.000%, 03/01/19 (p) | | | 4,800 | |
| | | | | | | | |
| | | | Transportation — 0.1% | |
| | 2,070 | | | Maryland State Transportation Authority, Rev., GRAN, 5.000%, 03/01/17 | | | 2,116 | |
| | | | | | | | |
| | | | Total Maryland | | | 59,347 | |
| | | | | | | | |
| | | | Massachusetts — 2.0% | |
| | | | Education — 0.4% | |
| | 1,000 | | | Massachusetts Development Finance Agency, Boston College, Series S, Rev., 5.000%, 07/01/17 | | | 1,037 | |
| | 4,535 | | | Massachusetts Health & Educational Facilities Authority, Various Amherst College, Series K-2, Rev., VAR, 1.700%, 11/01/16 | | | 4,543 | |
| | 3,295 | | | Massachusetts School Building Authority, Series A, Rev., 5.000%, 11/15/24 | | | 4,228 | |
| | | | | | | | |
| | | | | | | 9,808 | |
| | | | | | | | |
| | | | General Obligation — 0.9% | |
| | | | City of Boston, | | | | |
| | 6,820 | | | Series A, GO, 5.000%, 03/01/22 | | | 8,292 | |
| | 7,360 | | | Series A, GO, 5.000%, 03/01/23 | | | 9,148 | |
| | 4,310 | | | Massachusetts State Consolidate Loan of 2014, Series 2, GO, 4.000%, 04/01/18 | | | 4,540 | |
| | | | | | | | |
| | | | | | | 21,980 | |
| | | | | | | | |
| | | | Hospital — 0.1% | |
| | | | Massachusetts Development Finance Agency, Umass Memorial Health Care Obligated Group, | | | | |
| | 450 | | | Series I, Rev., 5.000%, 07/01/18 | | | 481 | |
| | 1,150 | | | Series I, Rev., 5.000%, 07/01/27 | | | 1,436 | |
| | 500 | | | Massachusetts State Development Finance Agency, Lahey Health System, Series F, Rev., 5.000%, 08/15/26 | | | 574 | |
| | | | | | | | |
| | | | | | | 2,491 | |
| | | | | | | | |
| | | | Other Revenue — 0.2% | |
| | 700 | | | Massachusetts Development Finance Agency, Berklee College of Music, Rev., 5.000%, 10/01/27 | | | 898 | |
| | 3,250 | | | Massachusetts Development Finance Agency, Caregroup, Series H-1, Rev., 5.000%, 07/01/19 | | | 3,617 | |
| | | | | | | | |
| | | | | | | 4,515 | |
| | | | | | | | |
| | | | | | | | |
PRINCIPAL
AMOUNT($) | | | SECURITY DESCRIPTION | | VALUE($) | |
| | | | | | | | |
| | | | Prerefunded — 0.4% | |
| | 7,515 | | | Massachusetts Health & Educational Facilities Authority, Institute of Technology, Series O, Rev., 6.000%, 07/01/18 (p) | | | 8,249 | |
| | | | | | | | |
| | | | Transportation — 0.0% (g) | |
| | 100 | | | Commonwealth of Massachusetts, Rail Enhancement Program, Series A, Rev., 5.000%, 06/01/20 | | | 116 | |
| | 750 | | | Massachusetts Port Authority, Series C, Rev., 5.000%, 07/01/23 | | | 933 | |
| | | | | | | | |
| | | | | | | 1,049 | |
| | | | | | | | |
| | | | Total Massachusetts | | | 48,092 | |
| | | | | | | | |
| | | | Michigan — 1.1% | |
| | | | General Obligation — 0.3% | |
| | 1,000 | | | Kalamazoo Public Schools, GO, 5.000%, 05/01/22 | | | 1,204 | |
| | | | Troy School District, School Building & Site, | | | | |
| | 1,425 | | | GO, Q-SBLF, 3.000%, 05/01/17 | | | 1,448 | |
| | 875 | | | GO, Q-SBLF, 4.000%, 05/01/18 | | | 922 | |
| | 650 | | | GO, Q-SBLF, 5.000%, 05/01/19 | | | 719 | |
| | 500 | | | GO, Q-SBLF, 5.000%, 05/01/20 | | | 571 | |
| | 550 | | | GO, Q-SBLF, 5.000%, 05/01/21 | | | 646 | |
| | 500 | | | GO, Q-SBLF, 5.000%, 05/01/22 | | | 599 | |
| | | | | | | | |
| | | | | | | 6,109 | |
| | | | | | | | |
| | | | Hospital — 0.1% | |
| | 2,250 | | | Michigan State Hospital Finance Authority, Ascension Health Credit Group, Series B-4, Rev., 5.000%, 11/15/27 | | | 2,828 | |
| | | | | | | | |
| | | | Industrial Development Revenue/Pollution Control Revenue — 0.1% | |
| | 2,600 | | | Michigan Strategic Fund, The Detroit Edison Company Pollution Control Bonds Project, Series CC, Rev.,VAR, 1.450%, 09/01/21 | | | 2,598 | |
| | | | | | | | |
| | | | Other Revenue — 0.3% | |
| | | | Michigan Finance Authority, Clean Water Revolving Fund, | | | | |
| | 2,110 | | | Rev., 5.000%, 10/01/16 | | | 2,118 | |
| | 2,250 | | | Rev., 5.000%, 10/01/21 | | | 2,698 | |
| | | | Michigan Finance Authority, Local Government Loan Program, | | | | |
| | 1,290 | | | Series B, Rev., 4.000%, 11/01/18 | | | 1,377 | |
| | 675 | | | Series B, Rev., 4.000%, 11/01/19 | | | 739 | |
| | 455 | | | Series B, Rev., 4.000%, 11/01/20 | | | 507 | |
| | | | | | | | |
| | | | | | | 7,439 | |
| | | | | | | | |
SEE NOTES TO FINANCIAL STATEMENTS.
| | | | | | | | |
| | | |
| AUGUST 31, 2016 | | J.P. MORGAN MUNICIPAL BOND FUNDS | | | | | 33 | |
JPMorgan Short-Intermediate Municipal Bond Fund
SCHEDULE OF PORTFOLIO INVESTMENTS
AS OF AUGUST 31, 2016 (Unaudited) (continued)
(Amounts in thousands)
| | | | | | | | |
PRINCIPAL
AMOUNT($) | | | SECURITY DESCRIPTION | | VALUE($) | |
| Municipal Bonds — continued | |
| | | | Prerefunded — 0.2% | |
| | 5,055 | | | Michigan Municipal Bond Authority, Clean Water Revolving Fund, Rev., 5.000%, 10/01/17 (p) | | | 5,297 | |
| | | | | | | | |
| | | | Water & Sewer — 0.1% | |
| | | | City of Grand Rapids, Sanitary Sewer System Improvement, | | | | |
| | 350 | | | Rev., 5.000%, 01/01/22 | | | 420 | |
| | 450 | | | Rev., 5.000%, 01/01/23 | | | 551 | |
| | | | City of Wyoming, Water Supply System, | | | | |
| | 175 | | | Rev., 5.000%, 06/01/24 | | | 217 | |
| | 610 | | | Rev., 5.000%, 06/01/27 | | | 769 | |
| | | | | | | | |
| | | | | | | 1,957 | |
| | | | | | | | |
| | | | Total Michigan | | | 26,228 | |
| | | | | | | | |
| | | | Minnesota — 1.2% | |
| | | | Education — 0.1% | |
| | | | Minnesota Higher Education Facilities Authority, | | | | |
| | 350 | | | Series L, Rev., 4.000%, 04/01/20 | | | 388 | |
| | 400 | | | Series L, Rev., 5.000%, 04/01/23 | | | 489 | |
| | 750 | | | Series L, Rev., 5.000%, 04/01/26 | | | 958 | |
| | | | | | | | |
| | | | | | | 1,835 | |
| | | | | | | | |
| | | | General Obligation — 0.7% | |
| | 11,885 | | | State of Minnesota, Series A, GO, 5.000%, 08/01/18 | | | 12,872 | |
| | 3,500 | | | State of Minnesota, Various Purpose, Series A, GO, 5.000%, 06/01/17 | | | 3,616 | |
| | | | | | | | |
| | | | | | | 16,488 | |
| | | | | | | | |
| | | | Hospital — 0.1% | |
| | 1,300 | | | City of St. Cloud Minnesota, Centracare Health System, Series A, Rev., 5.000%, 05/01/28 | | | 1,641 | |
| | | | | | | | |
| | | | Transportation — 0.1% | |
| | | | Minneapolis-St Paul Metropolitan Airports Commission, Subordinate Airport, | | | | |
| | 750 | | | Series A, Rev., 5.000%, 01/01/18 | | | 793 | |
| | 220 | | | Series A, Rev., 5.000%, 01/01/20 | | | 250 | |
| | 1,000 | | | Series A, Rev., 5.000%, 01/01/22 | | | 1,197 | |
| | | | | | | | |
| | | | | | | 2,240 | |
| | | | | | | | |
| | | | Utility — 0.2% | |
| | | | Western Minnesota Municipal Power Agency, Power Supply, | | | | |
| | 2,400 | | | Series A, Rev., 3.000%, 01/01/18 | | | 2,475 | |
| | 1,500 | | | Series A, Rev., 5.000%, 01/01/23 | | | 1,836 | |
| | 1,000 | | | Series A, Rev., 5.000%, 01/01/24 | | | 1,249 | |
| | | | | | | | |
| | | | | | | 5,560 | |
| | | | | | | | |
| | | | Total Minnesota | | | 27,764 | |
| | | | | | | | |
| | | | | | | | |
PRINCIPAL
AMOUNT($) | | | SECURITY DESCRIPTION | | VALUE($) | |
| | | | | | | | |
| | | | Mississippi — 0.9% | |
| | | | Education — 0.1% | |
| | 1,745 | | | Mississippi State University Educational Building Corp., New Facilities & Refinancing Project, Series A, Rev., 4.000%, 08/01/18 | | | 1,855 | |
| | 780 | | | University of Mississippi Educational Building Corp., Series A, Rev., 3.000%, 10/01/32 | | | 815 | |
| | | | | | | | |
| | | | | | | 2,670 | |
| | | | | | | | |
| | | | General Obligation — 0.5% | |
| | | | State of Mississippi, | | | | |
| | 6,735 | | | Series C, GO, 5.000%, 10/01/25 | | | 8,698 | |
| | 2,500 | | | Series F, GO, 5.250%, 10/01/23 | | | 3,168 | |
| | | | | | | | |
| | | | | | | 11,866 | |
| | | | | | | | |
| | | | Other Revenue — 0.3% | |
| | 6,080 | | | Mississippi Development Bank, Mississippi Department of Corrections East Mississippi Correctional Facility Project, Series C, Rev., 5.000%, 08/01/26 | | | 7,685 | |
| | | | | | | | |
| | | | Total Mississippi | | | 22,221 | |
| | | | | | | | |
| | | | Missouri — 1.5% | |
| | | | Certificate of Participation/Lease — 0.1% | | | | |
| | 1,000 | | | City of Chesterfield, COP, 5.000%, 12/01/21 | | | 1,197 | |
| | 750 | | | Cole County Missouri Refunding, Jail Project, COP, 4.000%, 12/01/16 | | | 756 | |
| | 1,000 | | | St. Charles County Public Water Supply District No. 2, Series B, COP, 5.000%, 12/01/23 | | | 1,211 | |
| | | | | | | | |
| | | | | | | 3,164 | |
| | | | | | | | |
| | | | Education — 0.2% | |
| | | | Health & Educational Facilities Authority, | | | | |
| | 450 | | | Rev., 4.000%, 10/01/18 | | | 481 | |
| | 625 | | | Rev., 4.000%, 10/01/19 | | | 686 | |
| | 300 | | | Rev., 4.000%, 10/01/20 | | | 338 | |
| | 300 | | | Rev., 4.000%, 10/01/21 | | | 344 | |
| | | | Missouri State Health & Educational Facilities Authority, Health Facilities, BJC Health System, | | | | |
| | 1,000 | | | Rev., 5.000%, 01/01/17 | | | 1,015 | |
| | 950 | | | Rev., 5.000%, 01/01/18 | | | 1,006 | |
| | 855 | | | Rev., 5.000%, 01/01/19 | | | 939 | |
| | 225 | | | Rev., 5.000%, 01/01/21 | | | 264 | |
| | | | | | | | |
| | | | | | | 5,073 | |
| | | | | | | | |
| | | | General Obligation — 0.1% | |
| | 350 | | | County of Clay, North Kansas City School District 74, Refunding & Improvement, Missouri Direct Deposit Program, GO, 5.000%, 03/01/22 | | | 424 | |
SEE NOTES TO FINANCIAL STATEMENTS.
| | | | | | |
| | | |
| 34 | | | | J.P. MORGAN MUNICIPAL BOND FUNDS | | AUGUST 31, 2016 |
| | | | | | | | |
PRINCIPAL
AMOUNT($) | | | SECURITY DESCRIPTION | | VALUE($) | |
| Municipal Bonds — continued | |
| | | | General Obligation — continued | |
| | 1,900 | | | Francis Howell School Missouri Direct Deposit Program, GO, 4.000%, 03/01/24 | | | 2,249 | |
| | 325 | | | School District of the City of Ladue, GO, 4.000%, 03/01/21 | | | 370 | |
| | | | | | | | |
| | | | | | | 3,043 | |
| | | | | | | | |
| | | | Industrial Development Revenue/Pollution Control Revenue — 0.3% | |
| | 2,895 | | | Kansas City Industrial Development Authority, Series A, Rev., AMBAC, 5.000%, 12/01/20 | | | 3,045 | |
| | 550 | | | Missouri Environmental Improvement & Energy Resources Authority, Water Pollution Control & Drinking Water, Series B, Rev., 5.000%, 07/01/23 | | | 643 | |
| | 2,045 | | | State of Missouri, Environmental Improvement & Energy Residual Authority, Water Pollution Control & Drinking Water, Series A, Rev., 5.000%, 01/01/24 | | | 2,449 | |
| | | | | | | | |
| | | | | | | 6,137 | |
| | | | | | | | |
| | | | Other Revenue — 0.3% | |
| | 2,100 | | | Bi-State Development Agency, Metropolitan District, Sales Tax Appropriation, Combined Lien, Series A, Rev., 5.000%, 10/01/17 | | | 2,201 | |
| | 350 | | | City of Springfield, Series A, Rev., 4.000%, 09/01/18 | | | 372 | |
| | 2,000 | | | County of Jackson, Harry S. Truman Sports Complex Project, Rev., 5.000%, 12/01/22 | | | 2,430 | |
| | 2,010 | | | County of St. Louis, Regional Convention & Sports Complex Authority, Convention & Sports Facility, Series B, Rev., 5.000%, 08/15/19 | | | 2,246 | |
| | | | | | | | |
| | | | | | | 7,249 | |
| | | | | | | | |
| | | | Prerefunded — 0.1% | |
| | 2,205 | | | Missouri Environmental Improvement & Energy Resources Authority, Water Pollution Control & Drinking Water, Series B, Rev., 5.000%, 01/01/21 (p) | | | 2,595 | |
| | | | | | | | |
| | | | Transportation — 0.4% | |
| | | | Kansas City, Missouri Airport Refunding, General Improvement, | | | | |
| | 2,500 | | | Series B, Rev., 5.000%, 09/01/17 | | | 2,606 | |
| | 1,250 | | | Series B, Rev., 5.000%, 09/01/18 | | | 1,352 | |
| | | | Missouri Airport Refunding, Lambert St. Louis International Airport, | | | | |
| | 1,575 | | | Rev., 5.000%, 07/01/21 | | | 1,841 | |
| | 1,000 | | | Rev., 5.000%, 07/01/22 | | | 1,189 | |
| | | | | | | | |
PRINCIPAL
AMOUNT($) | | | SECURITY DESCRIPTION | | VALUE($) | |
| | | | | | | | |
| | | | Transportation — continued | |
| | 1,080 | | | Rev., 5.000%, 07/01/23 | | | 1,305 | |
| | | | | | | | |
| | | | | | | 8,293 | |
| | | | | | | | |
| | | | Total Missouri | | | 35,554 | |
| | | | | | | | |
| | | | Montana — 0.1% | |
| | | | General Obligation — 0.1% | |
| | | | State of Montana, Long-Range Building Program, | | | | |
| | 690 | | | GO, 5.000%, 08/01/21 | | | 827 | |
| | 1,000 | | | GO, 5.000%, 08/01/22 | | | 1,227 | |
| | 650 | | | Yellowstone County, School District No. 2 Billings, School Building, GO, 5.000%, 06/15/20 | | | 751 | |
| | | | | | | | |
| | | | Total Montana | | | 2,805 | |
| | | | | | | | |
| | | | Nebraska — 0.5% | |
| | | | General Obligation — 0.1% | |
| | 1,680 | | | City of Omaha, Various Purpose, Series A, GO, 4.000%, 11/15/16 | | | 1,692 | |
| | | | | | | | |
| | | | Hospital — 0.1% | |
| | 2,350 | | | Douglas County Hospital Authority No. 2, Nebraska Health Facilities & Medicine, Rev., 4.000%, 05/15/32 | | | 2,644 | |
| | | | | | | | |
| | | | Utility — 0.3% | |
| | 2,000 | | | Central Plains Energy Project, Gas Project No. 3, Rev., 5.000%, 09/01/17 | | | 2,073 | |
| | 1,750 | | | Municipal Energy Agency of Nebraska, Series A, Rev., 5.000%, 04/01/17 | | | 1,795 | |
| | 2,610 | | | Nebraska Public Power District, Series B, Rev., 5.000%, 01/01/32 | | | 3,238 | |
| | | | | | | | |
| | | | | | | 7,106 | |
| | | | | | | | |
| | | | Total Nebraska | | | 11,442 | |
| | | | | | | | |
| | | | Nevada — 0.2% | |
| | | | Other Revenue — 0.1% | |
| | 1,250 | | | County of Clark, Series A, Rev., 4.000%, 07/01/18 | | | 1,325 | |
| | | | | | | | |
| | | | | | | | |
| | | | Water & Sewer — 0.1% | |
| | 2,215 | | | Truckee Meadows Water Authority, Rev., 5.000%, 07/01/32 | | | 2,794 | |
| | | | | | | | |
| | | | Total Nevada | | | 4,119 | |
| | | | | | | | |
| | | | New Hampshire — 0.2% | |
| | | | General Obligation — 0.2% | |
| | 2,880 | | | State of New Hampshire, Series A, GO, 5.000%, 03/01/26 | | | 3,707 | |
| | | | | | | | |
SEE NOTES TO FINANCIAL STATEMENTS.
| | | | | | | | |
| | | |
| AUGUST 31, 2016 | | J.P. MORGAN MUNICIPAL BOND FUNDS | | | | | 35 | |
JPMorgan Short-Intermediate Municipal Bond Fund
SCHEDULE OF PORTFOLIO INVESTMENTS
AS OF AUGUST 31, 2016 (Unaudited) (continued)
(Amounts in thousands)
| | | | | | | | |
PRINCIPAL
AMOUNT($) | | | SECURITY DESCRIPTION | | VALUE($) | |
| Municipal Bonds — continued | |
| | | | New Jersey — 1.6% | |
| | | | Education — 0.2% | |
| | | | New Jersey Economic Development Authority, School Facilities Construction, | | | | |
| | 1,040 | | | Series A, Rev., 5.250%, 12/15/20 | | | 1,132 | |
| | 1,570 | | | Series I, Rev., 5.500%, 09/01/16 (p) | | | 1,570 | |
| | 2,500 | | | New Jersey Educational Facilities Authority, Princeton University, Series B, Rev., 5.000%, 07/01/27 | | | 3,304 | |
| | | | | | | | |
| | | | | | | 6,006 | |
| | | | | | | | |
| | | | General Obligation — 0.9% | |
| | | | City of Bayonne, State of New Jersey Qualified General Improvement, | | | | |
| | 245 | | | GO, 5.000%, 07/01/23 | | | 295 | |
| | 680 | | | GO, 5.000%, 07/01/25 | | | 846 | |
| | 1,425 | | | GO, 5.000%, 07/01/26 | | | 1,792 | |
| | 780 | | | GO, 5.000%, 07/01/28 | | | 965 | |
| | | | County of Passaic, | | | | |
| | 2,355 | | | GO, 5.000%, 02/01/19 | | | 2,593 | |
| | 1,685 | | | GO, 5.000%, 02/01/20 | | | 1,918 | |
| | 90 | | | GO, 5.000%, 02/01/21 | | | 106 | |
| | | | State of New Jersey, | | | | |
| | 525 | | | GO, AGM, 4.000%, 02/15/20 | | | 578 | |
| | 10,075 | | | Series Q, GO, 5.000%, 08/15/20 | | | 11,469 | |
| | 425 | | | Township of South Brunswick, GO, 5.000%, 09/01/22 | | | 515 | |
| | | | | | | | |
| | | | | | | 21,077 | |
| | | | | | | | |
| | | | Other Revenue — 0.3% | |
| | 2,225 | | | New Jersey Environmental Infrastructure Trust, Series A, Rev., 5.000%, 09/01/18 | | | 2,417 | |
| | 4,000 | | | Tobacco Settlement Financing Corp., Asset-Backed, Series 1A, Rev., 5.000%, 06/01/18 | | | 4,130 | |
| | | | | | | | |
| | | | | | | 6,547 | |
| | | | | | | | |
| | | | Prerefunded — 0.1% | |
| | 1,680 | | | New Jersey Transportation Trust Fund Authority, Transportation System, Series A, Rev., 6.000%, 12/15/18 (p) | | | 1,885 | |
| | | | | | | | |
| | | | Transportation — 0.1% | |
| | 1,500 | | | New Jersey Transportation Trust Fund Authority, Transportation System, Series B, Rev., NATL-RE, 5.500%, 12/15/16 | | | 1,521 | |
| | | | | | | | |
| | | | Total New Jersey | | | 37,036 | |
| | | | | | | | |
| | | | | | | | |
PRINCIPAL
AMOUNT($) | | | SECURITY DESCRIPTION | | VALUE($) | |
| | | | | | | | |
| | | | New Mexico — 0.0% (g) | |
| | | | Other Revenue — 0.0% (g) | |
| | 800 | | | New Mexico Finance Authority, Senior Lien Public Project, Series B, Rev., 5.000%, 06/01/21 | | | 950 | |
| | | | | | | | |
| | | | New York — 13.4% | |
| | | | Education — 0.6% | |
| | | | New York State Dormitory Authority, Columbia University, | | | | |
| | 585 | | | Series B, Rev., 5.000%, 10/01/21 | | | 705 | |
| | 2,500 | | | Series B, Rev., 5.000%, 10/01/23 | | | 3,153 | |
| | 5,000 | | | New York State Dormitory Authority, New York University, Series A, Rev., 5.000%, 07/01/24 | | | 6,361 | |
| | 2,350 | | | New York State Dormitory Authority, School Districts Financing Program, Series F, Rev., AGM, 5.000%, 10/01/16 | | | 2,359 | |
| | 1,100 | | | New York State Dormitory Authority, The New School, Series A, Rev., 5.000%, 07/01/24 | | | 1,375 | |
| | | | | | | | |
| | | | | | | 13,953 | |
| | | | | | | | |
| | | | General Obligation — 1.8% | |
| | 2,410 | | | Bedford Central School District, GO, 5.000%, 11/15/22 | | | 2,978 | |
| | 4,230 | | | City of New York, Fiscal Year 2003, Series C, Subseries C-A, GO, 5.000%, 08/01/17 | | | 4,401 | |
| | 3,860 | | | City of New York, Fiscal Year 2012, Subseries G-1, GO, 5.000%, 04/01/20 | | | 4,427 | |
| | 3,695 | | | City of New York, Fiscal Year 2013, Series B, GO, 4.000%, 08/01/19 | | | 4,037 | |
| | 6,250 | | | City of New York, Fiscal Year 2014, Series K, GO, 5.000%, 08/01/19 | | | 7,008 | |
| | | | Counties of Rockland & Orange, Ramapo Central School District, | | | | |
| | 1,800 | | | GO, 4.000%, 10/15/17 | | | 1,869 | |
| | 2,030 | | | GO, 4.000%, 10/15/19 | | | 2,231 | |
| | 285 | | | County of Allegany, Public Improvement, GO, 4.000%, 09/15/19 | | | 313 | |
| | 6,750 | | | County of Westchester, Series B, GO, 5.000%, 11/15/25 | | | 8,855 | |
| | 2,025 | | | Hampton Bays Union Free School District, GO, 5.000%, 09/15/22 | | | 2,481 | |
| | 1,300 | | | South Orangetown New York Central School District, GO, 5.000%, 12/01/23 | | | 1,651 | |
| | | | Town of East Hampton, | | | | |
| | 1,000 | | | GO, 5.000%, 05/15/21 | | | 1,191 | |
| | 1,000 | | | GO, 5.000%, 05/15/23 | | | 1,253 | |
| | | | | | | | |
| | | | | | | 42,695 | |
| | | | | | | | |
SEE NOTES TO FINANCIAL STATEMENTS.
| | | | | | |
| | | |
| 36 | | | | J.P. MORGAN MUNICIPAL BOND FUNDS | | AUGUST 31, 2016 |
| | | | | | | | |
PRINCIPAL
AMOUNT($) | | | SECURITY DESCRIPTION | | VALUE($) | |
| Municipal Bonds — continued | |
| | | | Hospital — 0.1% | |
| | | | Build Resource Corp., The New York Methodist Hospital Project, | | | | |
| | 1,000 | | | Rev., 5.000%, 07/01/18 | | | 1,072 | |
| | 550 | | | Rev., 5.000%, 07/01/21 | | | 643 | |
| | 800 | | | Nassau County Local Economic Assistance Corp., Catholic Health Services, Long Island Obligated Group Project, Series B, Rev., 5.000%, 07/01/23 | | | 970 | |
| | | | | | | | |
| | | | | | | 2,685 | |
| | | | | | | | |
| | | | Industrial Development Revenue/Pollution Control Revenue — 0.1% | |
| | 3,000 | | | New York State Energy Research & Development Authority, Pollution Control, Electric & Gas Corp., Project, Series C, Rev., VAR, 2.000%, 05/01/20 | | | 3,080 | |
| | | | | | | | |
| | | | Other Revenue — 5.3% | |
| | | | Battery Park City Authority, | | | | |
| | 3,450 | | | Series A, Rev., 3.000%, 11/01/18 | | | 3,636 | |
| | 2,500 | | | Series A, Rev., 4.000%, 11/01/19 | | | 2,770 | |
| | | | Brooklyn Arena Local Development Corp., | | | | |
| | 500 | | | Series A, Rev., 5.000%, 07/15/20 (w) | | | 568 | |
| | 1,250 | | | Series A, Rev., 5.000%, 07/15/26 (w) | | | 1,571 | |
| | 1,125 | | | Series A, Rev., 5.000%, 07/15/28 (w) | | | 1,410 | |
| | 7,555 | | | City of New York, Transitional Finance Authority, Future Tax, Subseries C-1, Rev., 5.000%, 11/01/16 (p) | | | 7,612 | |
| | 2,445 | | | City of New York, Transitional Finance Authority, Unrefunded Balance, Future Tax, Subseries C-1, Rev., 5.000%, 11/01/16 | | | 2,464 | |
| | 500 | | | City of Troy Capital Resources Corp., Rensselaer Polytechnic Institute Project, Rev., 5.000%, 08/01/20 | | | 573 | |
| | | | New York City Transitional Finance Authority, Future Tax Secured, Fiscal Year 2003, | | | | |
| | 2,750 | | | Series B, Rev., 5.000%, 02/01/20 | | | 3,144 | |
| | 2,120 | | | Subseries A-1, Rev., 5.000%, 11/01/17 | | | 2,229 | |
| | | | New York City Transitional Finance Authority, Future Tax Secured, Fiscal Year 2014, | | | | |
| | 1,490 | | | Series A, Subseries A-1, Rev., 5.000%, 11/01/17 (p) | | | 1,567 | |
| | 3,700 | | | Series A, Subseries A-1, Rev., 5.000%, 11/01/20 | | | 4,334 | |
| | | | New York City, The Trust for Cultural Resources Museum Modern Art, | | | | |
| | 6,510 | | | Series 1-E, Rev., 4.000%, 02/01/23 | | | 7,673 | |
| | 3,500 | | | Series 1-E, Rev., 4.000%, 04/01/28 | | | 4,202 | |
| | 3,000 | | | Series 1-E, Rev., 4.000%, 04/01/29 | | | 3,572 | |
| | | | | | | | |
PRINCIPAL
AMOUNT($) | | | SECURITY DESCRIPTION | | VALUE($) | |
| | | | | | | | |
| | | | Other Revenue — continued | |
| | 1,750 | | | Series 1-E, Rev., 4.000%, 04/01/30 | | | 2,071 | |
| | 1,750 | | | Series 1-E, Rev., 4.000%, 04/01/31 | | | 2,059 | |
| | 5,000 | | | New York Convention Center Development Corp. Hotel Unit Fee Secured, Rev., 5.000%, 11/15/26 | | | 6,415 | |
| | 1,210 | | | New York Local Government Assistance Corp., Senior Lien, Series A, Rev., 5.000%, 04/01/17 | | | 1,242 | |
| | | | New York Local Government Assistance Corp., Subordinated Lien, | | | | |
| | 2,845 | | | Series A-5/6, Rev., 5.000%, 04/01/18 | | | 3,042 | |
| | 1,500 | | | Series A-5/6, Rev., 5.500%, 04/01/19 | | | 1,685 | |
| | | | New York State Dormitory Authority, Fordham University, | | | | |
| | 400 | | | Series A, Rev., 5.000%, 07/01/28 | | | 513 | |
| | 500 | | | Series B, Rev., 5.000%, 10/01/24 | | | 644 | |
| | | | New York State Dormitory Authority, State Sales Tax, | | | | |
| | 2,000 | | | Series A, Rev., 5.000%, 03/15/17 | | | 2,049 | |
| | 3,000 | | | Series A, Rev., 5.000%, 03/15/18 | | | 3,205 | |
| | 2,000 | | | Series A, Rev., 5.000%, 03/15/21 | | | 2,375 | |
| | 10,180 | | | New York State Environmental Facilities Corp., Green Bonds, Series D, Rev., 5.000%, 09/15/21 | | | 12,282 | |
| | | | Sales Tax Asset Receivable Corp., Fiscal Year 2015, | | | | |
| | 8,525 | | | Series A, Rev., 5.000%, 10/15/19 | | | 9,654 | |
| | 15,405 | | | Series A, Rev., 5.000%, 10/15/20 | | | 18,035 | |
| | 4,800 | | | Series A, Rev., 5.000%, 10/15/22 | | | 5,921 | |
| | 4,500 | | | Series A, Rev., 5.000%, 10/15/25 | | | 5,770 | |
| | | | | | | | |
| | | | | | | 124,287 | |
| | | | | | | | |
| | | | Prerefunded — 0.6% | |
| | 12,055 | | | Westchester Tobacco Asset Securitization Corp., Capital Appreciation, Rev., 6.950%, 07/15/17 (p) | | | 12,848 | |
| | | | | | | | |
| | | | Special Tax — 0.9% | |
| | 1,110 | | | New York State Dormitory Authority, Personal Income Tax, Series G, Rev., 5.000%, 08/15/21 | | | 1,330 | |
| | 1,000 | | | New York State Urban Development Corp., Economic Development & Housing, Series A-1, Rev., 5.000%, 12/15/16 | | | 1,013 | |
| | 17,140 | | | New York State Urban Development Corp., General Purpose, Series C, Rev., 5.000%, 03/15/18 | | | 18,295 | |
| | | | | | | | |
| | | | | | | 20,638 | |
| | | | | | | | |
SEE NOTES TO FINANCIAL STATEMENTS.
| | | | | | | | |
| | | |
| AUGUST 31, 2016 | | J.P. MORGAN MUNICIPAL BOND FUNDS | | | | | 37 | |
JPMorgan Short-Intermediate Municipal Bond Fund
SCHEDULE OF PORTFOLIO INVESTMENTS
AS OF AUGUST 31, 2016 (Unaudited) (continued)
(Amounts in thousands)
| | | | | | | | |
PRINCIPAL
AMOUNT($) | | | SECURITY DESCRIPTION | | VALUE($) | |
| Municipal Bonds — continued | |
| | | | Transportation — 3.2% | |
| | | | Buffalo & Fort Erie Public Bridge Authority, Toll Bridge System, | | | | |
| | 465 | | | Rev., 5.000%, 01/01/20 | | | 527 | |
| | 815 | | | Rev., 5.000%, 01/01/21 | | | 952 | |
| | | | Metropolitan Transportation Authority, | | | | |
| | 11,000 | | | Series C, Rev., VAR, 4.000%, 11/15/20 | | | 12,290 | |
| | 2,770 | | | Series D, Rev., 5.000%, 11/15/18 | | | 3,029 | |
| | 1,435 | | | Subseries A-1, Rev., 5.000%, 11/15/20 | | | 1,673 | |
| | 2,000 | | | Subseries C-1, Rev., 5.000%, 11/15/19 | | | 2,263 | |
| | 3,000 | | | Subseries C-1, Rev., 5.000%, 11/15/24 | | | 3,797 | |
| | 3,000 | | | Metropolitan Transportation Authority, Dedicated Tax Fund, Subseries B-2, Rev., 5.000%, 11/01/16 | | | 3,023 | |
| | | | New York State Thruway Authority, | | | | |
| | 32,125 | | | Series A, Rev., 5.000%, 05/01/19 | | | 35,699 | |
| | 4,200 | | | Series J, Rev., 5.000%, 01/01/18 | | | 4,440 | |
| | 2,500 | | | Port Authority of New York & New Jersey, Consolidated 185, Rev., AMT, 5.000%, 09/01/17 | | | 2,605 | |
| | 5,000 | | | Triborough Bridge & Tunnel Authority, Series B, Rev., 5.000%, 11/15/17 | | | 5,271 | |
| | | | | | | | |
| | | | | | | 75,569 | |
| | | | | | | | |
| | | | Water & Sewer — 0.8% | |
| | | | New York City Municipal Water Finance Authority, Water & Sewer System, Second General Resolution, | | | | |
| | 4,000 | | | Series CC-2, Rev., 5.000%, 06/15/18 | | | 4,053 | |
| | 5,000 | | | Series EE, Rev., 5.000%, 06/15/19 | | | 5,596 | |
| | 9,385 | | | New York State Environmental Facilities Corp., State Clean Water & Drinking Water Revolving Funds, New York City Municipal Water Finance Authority Projects, Second Resolution, Series A, Rev., 5.000%, 06/15/17 | | | 9,718 | |
| | | | | | | | |
| | | | | | | 19,367 | |
| | | | | | | | |
| | | | Total New York | | | 315,122 | |
| | | | | | | | |
| | | | North Carolina — 0.6% | |
| | | | General Obligation — 0.5% | |
| | 2,230 | | | City of Durham, Series C, GO, 5.000%, 07/01/18 | | | 2,408 | |
| | 9,670 | | | State of North Carolina, Series D, GO, 4.000%, 06/01/20 | | | 10,829 | |
| | | | | | | | |
| | | | | | | 13,237 | |
| | | | | | | | |
| | | | Prerefunded — 0.1% | |
| | 1,510 | | | County of Union, North Carolina, Series D, GO, NATL-RE, 5.000%, 03/01/17 (p) | | | 1,543 | |
| | | | | | | | |
| | | | Total North Carolina | | | 14,780 | |
| | | | | | | | |
| | | | | | | | |
PRINCIPAL
AMOUNT($) | | | SECURITY DESCRIPTION | | VALUE($) | |
| | | | | | | | |
| | | | Ohio — 1.4% | |
| | | | Education — 0.3% | |
| | 535 | | | Ohio Higher Educational Facility Commission, Case Western Reserve University Project, Series A, Rev., 4.000%, 12/01/19 | | | 589 | |
| | | | Ohio Higher Educational Facility Commission, Denison University Project, | | | | |
| | 2,920 | | | Rev., 5.000%, 11/01/24 | | | 3,673 | |
| | 1,000 | | | Rev., 5.000%, 11/01/26 | | | 1,263 | |
| | | | Ohio State Higher Educational Facility Commission, Oberlin College, | | | | |
| | 600 | | | Rev., 4.000%, 10/01/18 | | | 642 | |
| | 675 | | | Rev., 4.000%, 10/01/19 | | | 741 | |
| | 1,000 | | | Rev., 5.000%, 10/01/20 | | | 1,160 | |
| | | | | | | | |
| | | | | | | 8,068 | |
| | | | | | | | |
| | | | General Obligation — 0.1% | |
| | 1,200 | | | City of Columbus, Series A, GO, 2.000%, 07/01/17 | | | 1,214 | |
| | | | City of Dublin, Various Purpose, | | | | |
| | 500 | | | GO, 4.000%, 12/01/27 | | | 605 | |
| | 300 | | | GO, 4.000%, 12/01/28 | | | 361 | |
| | | | | | | | |
| | | | | | | 2,180 | |
| | | | | | | | |
| | | | Hospital — 0.2% | |
| | | | County Of Lake, Hospital Facilities, Lake Hospital System, Inc., | | | | |
| | 1,445 | | | Rev., 5.000%, 08/15/23 | | | 1,740 | |
| | 1,655 | | | Rev., 5.000%, 08/15/24 | | | 2,027 | |
| | | | | | | | |
| | | | | | | 3,767 | |
| | | | | | | | |
| | | | Other Revenue — 0.7% | |
| | | | City of Toledo, Water System, | | | | |
| | 2,165 | | | Rev., 5.000%, 11/15/27 | | | 2,793 | |
| | 1,045 | | | Rev., 5.000%, 11/15/28 | | | 1,339 | |
| | 1,155 | | | Rev., 5.000%, 11/15/29 | | | 1,472 | |
| | 1,165 | | | County of Cuyahoga, Rev., 5.000%, 12/01/22 | | | 1,432 | |
| | 1,250 | | | Ohio State, Capital Facilities, Lease Appropriation, Adult Correctional Building Funding Projects, Series A, Rev., 5.000%, 10/01/16 | | | 1,255 | |
| | 200 | | | RiverSouth Authority, Riversouth Area Redevelopment Refunding, Series A, Rev., 5.000%, 06/01/22 | | | 240 | |
| | 3,595 | | | State of Ohio, Capital Facilities Lease Appropriation, Cultural & Sports Facilities Building Fund Projects, Series B, Rev., 5.000%, 04/01/24 | | | 4,500 | |
SEE NOTES TO FINANCIAL STATEMENTS.
| | | | | | |
| | | |
| 38 | | | | J.P. MORGAN MUNICIPAL BOND FUNDS | | AUGUST 31, 2016 |
| | | | | | | | |
PRINCIPAL
AMOUNT($) | | | SECURITY DESCRIPTION | | VALUE($) | |
| Municipal Bonds — continued | |
| | | | Other Revenue — continued | |
| | 1,000 | | | State of Ohio, Capital Facilities Lease-Appropriation, Series A, Rev., 5.000%, 10/01/18 | | | 1,089 | |
| | 1,500 | | | State of Ohio, Capital Facilities Lease-Appropriation, Mental Health Facilities Improvement, Funds Project, Series A, Rev., 4.000%, 02/01/17 | | | 1,522 | |
| | | | | | | | |
| | | | | | | 15,642 | |
| | | | | | | | |
| | | | Water & Sewer — 0.1% | |
| | | | Hamilton County, Sewer System, Metropolitan Sewer District of Greater Cincinnati, | | | | |
| | 500 | | | Series A, Rev., 5.000%, 12/01/18 | | | 548 | |
| | 640 | | | Series A, Rev., 5.000%, 12/01/19 | | | 726 | |
| | 1,375 | | | Series A, Rev., 5.000%, 12/01/21 | | | 1,654 | |
| | | | | | | | |
| | | | | | | 2,928 | |
| | | | | | | | |
| | | | Total Ohio | | | 32,585 | |
| | | | | | | | |
| | | | Oklahoma — 0.9% | | | | |
| | | | Education — 0.6% | | | | |
| | | | Blaine County Educational Facilities Authority, Educational Facilities, Watonga Public Schools Project, | | | | |
| | 555 | | | Rev., 5.000%, 12/01/18 | | | 603 | |
| | 850 | | | Rev., 5.000%, 12/01/19 | | | 953 | |
| | 1,000 | | | Cleveland County Educational Facilities Authority, Educational Facilities Lease, Moore Public Schools Project, Rev., 5.000%, 06/01/17 | | | 1,031 | |
| | 6,195 | | | Cleveland County Educational Facilities Authority, Educational Facilities Lease, Norman Public Schools Project, Rev., 5.000%, 07/01/19 | | | 6,882 | |
| | 450 | | | Oklahoma County Finance Authority, Educational Facilities, Lease Western Harrah Public Schools Project, Rev., 2.000%, 09/01/18 | | | 458 | |
| | | | Oklahoma County Finance Authority, Educational Facilities, Lease Western Heights Public School Project, | | | | |
| | 250 | | | Rev., 4.000%, 09/01/18 | | | 265 | |
| | 325 | | | Rev., 5.000%, 09/01/19 | | | 362 | |
| | 2,000 | | | Tulsa County Industrial Authority Educational Facilities Lease, Jenks Public Schools Project, Rev., 5.000%, 09/01/21 | | | 2,352 | |
| | | | | | | | |
| | | | | | | 12,906 | |
| | | | | | | | |
| | | | | | | | |
PRINCIPAL
AMOUNT($) | | | SECURITY DESCRIPTION | | VALUE($) | |
| | | | | | | | |
| | | | Other Revenue — 0.3% | |
| | | | Cleveland County Justice Authority, Sales Tax, Detention Facility Project, | | | | |
| | 1,205 | | | Rev., 3.000%, 03/01/17 | | | 1,218 | |
| | 1,000 | | | Rev., 3.000%, 03/01/18 | | | 1,030 | |
| | 500 | | | Rev., 4.000%, 03/01/20 | | | 536 | |
| | 700 | | | Oklahoma Capitol Improvement Authority, Agency Facilities, Series C, Rev., 5.000%, 07/01/19 | | | 781 | |
| | 3,225 | | | Oklahoma Capitol Improvement Authority, State Facilities, Series A, Rev., 5.000%, 01/01/24 | | | 4,047 | |
| | | | | | | | |
| | | | | | | 7,612 | |
| | | | | | | | |
| | | | Utility — 0.0% (g) | |
| | 600 | | | The Edmond Public Works Authority, Sales Tax And Utility System, Rev., 5.000%, 07/01/29 | | | 757 | |
| | | | | | | | |
| | | | Total Oklahoma | | | 21,275 | |
| | | | | | | | |
| | | | Oregon — 1.2% | |
| | | | General Obligation — 0.7% | |
| | 5,530 | | | State Of Oregon, Series A, GO, 2.000%, 09/15/16 | | | 5,533 | |
| | 2,000 | | | State of Oregon, Article XI-Q State Projects, Series H, GO, 5.000%, 05/01/21 | | | 2,377 | |
| | 7,005 | | | State of Oregon, Tax-Exempt Refunding, Series L, GO, 5.000%, 11/01/19 | | | 7,945 | |
| | | | | | | | |
| | | | | | | 15,855 | |
| | | | | | | | |
| | | | Hospital — 0.1% | |
| | 500 | | | Deschutes County Facilities Authority, Oregon Hospital, St. Charles Health System, Inc., Series A, Rev., 4.000%, 01/01/33 (w) | | | 554 | |
| | 1,000 | | | Oregon State Facilities Authority, Providence Health & Services, Series A, Rev., 4.000%, 10/01/16 | | | 1,003 | |
| | | | | | | | |
| | | | | | | 1,557 | |
| | | | | | | | |
| | | | Prerefunded — 0.3% | |
| | 6,210 | | | Oregon State Department of Administrative Services, Lottery, Series A, Rev., 5.250%, 04/01/19 (p) | | | 6,924 | |
| | | | | | | | |
| | | | Transportation — 0.1% | |
| | | | Port of Portland, International Airport, | | | | |
| | 1,000 | | | Series 23, Rev., 5.000%, 07/01/23 | | | 1,239 | |
| | 1,595 | | | Series 23, Rev., 5.000%, 07/01/24 | | | 2,014 | |
| | | | | | | | |
| | | | | | | 3,253 | |
| | | | | | | | |
| | | | Utility — 0.0% (g) | |
| | 325 | | | City of Eugene, Oregon Electric Utility System, Series A, Rev., 4.000%, 08/01/31 | | | 377 | |
| | | | | | | | |
SEE NOTES TO FINANCIAL STATEMENTS.
| | | | | | | | |
| | | |
| AUGUST 31, 2016 | | J.P. MORGAN MUNICIPAL BOND FUNDS | | | | | 39 | |
JPMorgan Short-Intermediate Municipal Bond Fund
SCHEDULE OF PORTFOLIO INVESTMENTS
AS OF AUGUST 31, 2016 (Unaudited) (continued)
(Amounts in thousands)
| | | | | | | | |
PRINCIPAL
AMOUNT($) | | | SECURITY DESCRIPTION | | VALUE($) | |
| Municipal Bonds — continued | |
| | | | Water & Sewer — 0.0% (g) | | | | |
| | 40 | | | City of Portland, Sewer System, First Lien, Series A, Rev., 5.000%, 10/01/23 | | | 50 | |
| | | | | | | | |
| | | | Total Oregon | | | 28,016 | |
| | | | | | | | |
| | | | Pennsylvania — 3.9% | |
| | | | Education — 0.7% | |
| | 5,055 | | | Pennsylvania State Higher Educational Facilities Authority, Trustees of the University, Series B, Rev., 5.000%, 10/01/22 | | | 6,185 | |
| | | | State Public School Building Authority, Community College of Philadelphia Project, | | | | |
| | 2,760 | | | Rev., 5.000%, 06/15/21 | | | 3,190 | |
| | 2,625 | | | Rev., 5.000%, 06/15/24 | | | 3,162 | |
| | 2,860 | | | State Public School Building Authority, Montgomery County Community College, Rev., 5.000%, 05/01/19 | | | 3,146 | |
| | | | | | | | |
| | | | | | | 15,683 | |
| | | | | | | | |
| | | | General Obligation — 0.2% | |
| | 2,200 | | | Commonwealth of Pennsylvania, First Series, GO, 5.000%, 07/01/18 | | | 2,365 | |
| | 310 | | | County of Bucks, GO, 5.000%, 05/01/26 | | | 407 | |
| | 350 | | | Schuylkill Valley School District, GO, 5.000%, 04/01/22 | | | 421 | |
| | 1,045 | | | Souderton Area School District, Series A, GO, 4.000%, 11/15/18 | | | 1,116 | |
| | | | | | | | |
| | | | | | | 4,309 | |
| | | | | | | | |
| | | | Hospital — 0.2% | |
| | 1,225 | | | Lancaster County Hospital Authority, Health System, General Hospital Project, Series B, Rev., 4.000%, 07/01/17 (p) | | | 1,260 | |
| | 1,400 | | | Southcentral General Authority, Hanover Hospital, Inc., Rev., 5.000%, 12/01/26 | | | 1,699 | |
| | | | Southcentral General Authority, Wellspan Health Obligation Group, | | | | |
| | 380 | | | Series A, Rev., 5.000%, 06/01/24 | | | 470 | |
| | 1,000 | | | Series A, Rev., 5.000%, 06/01/27 | | | 1,216 | |
| | | | | | | | |
| | | | | | | 4,645 | |
| | | | | | | | |
| | | | Other Revenue — 0.9% | |
| | 14,950 | | | Pennsylvania Economic Development Financing Authority, Unemployment Compensation, Series B, Rev., 5.000%, 07/01/21 | | | 15,802 | |
| | 5,000 | | | Philadelphia City Municipal Authority, Series A, Rev., 5.000%, 11/15/17 | | | 5,249 | |
| | | | | | | | |
| | | | | | | 21,051 | |
| | | | | | | | |
| | | | | | | | |
PRINCIPAL
AMOUNT($) | | | SECURITY DESCRIPTION | | VALUE($) | |
| | | | | | | | |
| | | | Prerefunded — 0.2% | |
| | 5,675 | | | Commonwealth of Pennsylvania, Second Series, GO, 5.000%, 03/01/17 (p) | | | 5,802 | |
| | | | | | | | |
| | | | Transportation — 0.4% | |
| | | | Pennsylvania Turnpike Commission, Oil Franchise Tax Senior, | | | | |
| | 1,000 | | | Series A, Rev., 5.000%, 12/01/22 | | | 1,219 | |
| | 2,000 | | | Series A, Rev., 5.000%, 12/01/23 | | | 2,486 | |
| | 4,000 | | | Series A, Rev., 5.000%, 12/01/32 | | | 5,029 | |
| | | | | | | | |
| | | | | | | 8,734 | |
| | | | | | | | |
| | | | Water & Sewer — 1.3% | |
| | | | Allegheny County Sanitary Authority, Sewer, | | | | |
| | 1,335 | | | Rev., AGM, 4.000%, 12/01/31 | | | 1,523 | |
| | 4,000 | | | Rev., 5.000%, 12/01/21 | | | 4,758 | |
| | 3,000 | | | Rev., 5.000%, 12/01/22 | | | 3,636 | |
| | 4,000 | | | Rev., 5.000%, 12/01/23 | | | 4,942 | |
| | | | City of Philadelphia, Water & Wastewater, | | | | |
| | 8,530 | | | Series A, Rev., 5.000%, 01/01/20 | | | 9,682 | |
| | 1,510 | | | Series A, Rev., 5.000%, 07/01/22 | | | 1,823 | |
| | 2,595 | | | Series A, Rev., 5.000%, 07/01/24 | | | 3,260 | |
| | 750 | | | Pittsburgh Water & Sewer Authority, First Lien, Series B, Rev., AGM, 4.000%, 09/01/17 | | | 775 | |
| | | | | | | | |
| | | | | | | 30,399 | |
| | | | | | | | |
| | | | Total Pennsylvania | | | 90,623 | |
| | | | | | | | |
| | | | Rhode Island — 0.2% | |
| | | | General Obligation — 0.2% | |
| | | | State of Rhode Island & Providence Plantations, Consolidated Capital Development Loan, | | | | |
| | 1,000 | | | Series A, GO, 5.000%, 10/15/18 | | | 1,091 | |
| | 1,475 | | | Series A, GO, 5.000%, 10/15/19 (p) | | | 1,669 | |
| | 1,000 | | | State of Rhode Island & Providence Plantations, Consolidated Capital Development Loan of 2014, Series A, GO, 5.000%, 11/01/19 | | | 1,132 | |
| | | | | | | | |
| | | | | | | 3,892 | |
| | | | | | | | |
| | | | Industrial Development Revenue/Pollution Control Revenue — 0.0% (g) | |
| | 590 | | | Rhode Island Clean Water Finance Agency, Water Pollution Control Revolving Fund, Green Bonds, Series A, Rev., 5.000%, 10/01/26 | | | 755 | |
| | | | | | | | |
| | | | Total Rhode Island | | | 4,647 | |
| | | | | | | | |
| | | | South Carolina — 0.4% | |
| | | | Education — 0.2% | |
| | 3,840 | | | SCAGO Educational Facilities Corp., School District of Pickens County Project, Rev., 5.000%, 12/01/20 | | | 4,446 | |
| | | | | | | | |
SEE NOTES TO FINANCIAL STATEMENTS.
| | | | | | |
| | | |
| 40 | | | | J.P. MORGAN MUNICIPAL BOND FUNDS | | AUGUST 31, 2016 |
| | | | | | | | |
PRINCIPAL
AMOUNT($) | | | SECURITY DESCRIPTION | | VALUE($) | |
| Municipal Bonds — continued | |
| | | �� | General Obligation — 0.1% | |
| | | | State of South Carolina, | | | | |
| | 1,310 | | | Series B, GO, 5.000%, 04/01/18 | | | 1,401 | |
| | 1,110 | | | Series D, GO, 5.000%, 04/01/18 | | | 1,187 | |
| | | | | | | | |
| | | | | | | 2,588 | |
| | | | | | | | |
| | | | Special Tax — 0.1% | |
| | | | County of Charleston, | | | | |
| | 645 | | | Rev., 5.000%, 12/01/18 | | | 706 | |
| | 1,000 | | | Rev., 5.000%, 12/01/19 | | | 1,133 | |
| | | | | | | | |
| | | | | | | 1,839 | |
| | | | | | | | |
| | | | Total South Carolina | | | 8,873 | |
| | | | | | | | |
| | | | South Dakota — 0.1% | |
| | | | Education — 0.1% | |
| | | | South Dakota Health & Educational Facilities Authority, | | | | |
| | 625 | | | Series B, Rev., 4.000%, 11/01/20 | | | 699 | |
| | 500 | | | Series B, Rev., 4.000%, 11/01/21 | | | 566 | |
| | 375 | | | Series B, Rev., 5.000%, 11/01/22 | | | 454 | |
| | | | | | | | |
| | | | | | | 1,719 | |
| | | | | | | | |
| | | | Other Revenue — 0.0% (g) | |
| | | | South Dakota State Building Authority, | | | | |
| | 500 | | | Series B, Rev., 5.000%, 06/01/19 | | | 557 | |
| | 485 | | | Series B, Rev., 5.000%, 06/01/21 | | | 574 | |
| | | | | | | | |
| | | | | | | 1,131 | |
| | | | | | | | |
| | | | Total South Dakota | | | 2,850 | |
| | | | | | | | |
| | | | Tennessee — 0.4% | |
| | | | Education — 0.1% | |
| | 1,250 | | | Tennessee State School Authority, Higher Educational Facilities, Series B, Rev., 3.000%, 11/01/16 | | | 1,255 | |
| | | | | | | | |
| | | | General Obligation — 0.3% | |
| | 2,330 | | | County of Maury, GO, 4.000%, 04/01/17 | | | 2,377 | |
| | 2,500 | | | The Metropolitan Government of Nashville & Davidson County, GO, 4.000%, 01/01/30 | | | 2,939 | |
| | 1,000 | | | Williamson County District School, Series A, GO, 5.000%, 04/01/18 | | | 1,070 | |
| | | | | | | | |
| | | | | | | 6,386 | |
| | | | | | | | |
| | | | Other Revenue — 0.0% (g) | |
| | 5 | | | Metropolitan Government of Nashville & Davidson, County Sports Authority, Public Improvement, Rev., 5.000%, 07/01/20 | | | 6 | |
| | | | | | | | |
| | | | | | | | |
PRINCIPAL
AMOUNT($) | | | SECURITY DESCRIPTION | | VALUE($) | |
| | | | | | | | |
| | | | Utility — 0.0% (g) | |
| | 800 | | | City of Chattanooga, Electric System, Series A, Rev., 5.000%, 09/01/22 | | | 979 | |
| | | | | | | | |
| | | | Water & Sewer — 0.0% (g) | |
| | 835 | | | Clarksville Tennessee Water Sewer & Gas Refunding-Sub Lien, Rev., 4.000%, 02/01/17 | | | 846 | |
| | | | | | | | |
| | | | Total Tennessee | | | 9,472 | |
| | | | | | | | |
| | | | Texas — 7.3% | |
| | | | Education — 0.1% | |
| | 790 | | | Austin Community College District, Combined Fee, Series A, Rev., 5.000%, 02/01/21 | | | 922 | |
| | 790 | | | Stephen F. Austin State University, Board of Regents, Revenue Financing System, Rev., 4.000%, 10/15/18 | | | 840 | |
| | | | | | | | |
| | | | | | | 1,762 | |
| | | | | | | | |
| | | | General Obligation — 3.8% | |
| | | | Allen Independent School District, School Building, | | | | |
| | 400 | | | GO, PSF-GTD, 5.000%, 02/15/26 | | | 520 | |
| | 705 | | | GO, PSF-GTD, 5.000%, 02/15/27 | | | 910 | |
| | 840 | | | Argyle Independent School District, School Building, GO, PSF-GTD, 3.000%, 08/15/19 | | | 894 | |
| | | | City of Abilene, Taylor & Jones Counties, | | | | |
| | 500 | | | GO, 4.000%, 02/15/27 (w) | | | 582 | |
| | 475 | | | GO, 5.000%, 02/15/21 | | | 557 | |
| | | | City of Beaumont, | | | | |
| | 1,855 | | | GO, 4.000%, 03/01/29 | | | 2,153 | |
| | 1,000 | | | GO, 4.000%, 03/01/30 | | | 1,152 | |
| | | | City of Colony, | | | | |
| | 620 | | | GO, 5.000%, 08/15/19 | | | 696 | |
| | 610 | | | GO, 5.000%, 08/15/20 | | | 705 | |
| | 1,045 | | | City of Denton, GO, 5.000%, 02/15/23 | | | 1,283 | |
| | 8,030 | | | City of El Paso, GO, 4.000%, 08/15/29 | | | 9,244 | |
| | | | City of El Paso, Refunding & Improvement, | | | | |
| | 530 | | | GO, 5.000%, 08/15/21 | | | 629 | |
| | 4,035 | | | GO, 5.000%, 08/15/25 | | | 5,144 | |
| | | | City of Fort Worth, Certificates of Obligation, | | | | |
| | 445 | | | Series A, GO, 3.000%, 03/01/17 | | | 451 | |
| | 500 | | | Series A, GO, 4.000%, 03/01/18 | | | 525 | |
| | 785 | | | Series A, GO, 4.000%, 03/01/19 | | | 848 | |
| | | | City of Fort Worth, Refunding & Improvement, General Purpose, | | | | |
| | 870 | | | GO, 3.000%, 03/01/17 | | | 881 | |
| | 1,000 | | | GO, 4.000%, 03/01/18 | | | 1,050 | |
| | 1,060 | | | GO, 4.000%, 03/01/19 | | | 1,145 | |
SEE NOTES TO FINANCIAL STATEMENTS.
| | | | | | | | |
| | | |
| AUGUST 31, 2016 | | J.P. MORGAN MUNICIPAL BOND FUNDS | | | | | 41 | |
JPMorgan Short-Intermediate Municipal Bond Fund
SCHEDULE OF PORTFOLIO INVESTMENTS
AS OF AUGUST 31, 2016 (Unaudited) (continued)
(Amounts in thousands)
| | | | | | | | |
PRINCIPAL
AMOUNT($) | | | SECURITY DESCRIPTION | | VALUE($) | |
| Municipal Bonds — continued | |
| | | | General Obligation — continued | |
| | 1,640 | | | City of Grand Prairie, GO, 5.000%, 02/15/25 | | | 2,096 | |
| | 185 | | | City of Mesquite, County of Dallas, GO, 4.000%, 02/15/18 | | | 193 | |
| | 355 | | | City of Mesquite, County of Dallas, Certificates of Obligation, GO, 3.000%, 02/15/18 | | | 366 | |
| | 1,000 | | | City of Pasadena, Series A, GO, 4.000%, 02/15/28 | | | 1,150 | |
| | 2,000 | | | City of San Antonio, General Improvement, GO, 5.000%, 02/01/23 | | | 2,443 | |
| | | | City of Waxahachie, | | | | |
| | 2,075 | | | Series A, GO, 4.000%, 08/01/27 | | | 2,468 | |
| | 775 | | | Series A, GO, 4.000%, 08/01/29 | | | 907 | |
| | 1,715 | | | Series B, GO, 4.000%, 08/01/27 | | | 2,040 | |
| | 1,785 | | | Series B, GO, 4.000%, 08/01/28 | | | 2,106 | |
| | 1,100 | | | Series B, GO, 4.000%, 08/01/29 | | | 1,287 | |
| | 1,350 | | | City of Wylie, GO, 5.000%, 02/15/27 | | | 1,719 | |
| | 5,150 | | | County of Travis, Austin Independent School District, Unlimited Tax Refunding, GO, NATL-RE, 5.000%, 08/01/17 | | | 5,361 | |
| | 9,275 | | | Fort Worth Independent School District & School Building, GO, PSF-GTD, 3.000%, 02/15/29 (w) | | | 9,844 | |
| | 4,305 | | | Irving Independent School District, Series A, GO, PSF-GTD, 5.000%, 02/15/25 | | | 5,507 | |
| | | | Judson Independent School District, | | | | |
| | 3,240 | | | GO, PSF-GTD, 3.000%, 02/01/30 (w) | | | 3,405 | |
| | 6,000 | | | GO, PSF-GTD, 3.000%, 02/01/31 (w) | | | 6,259 | |
| | 420 | | | GO, PSF-GTD, 4.000%, 02/01/18 | | | 439 | |
| | 595 | | | Series A, GO, 5.000%, 02/01/19 | | | 655 | |
| | 750 | | | Mabank Independent School District, School Building, GO, PSF-GTD, 5.000%, 08/15/25 | | | 964 | |
| | | | Mesquite Independent School District, | | | | |
| | 1,295 | | | Series A, GO, PSF-GTD, 4.000%, 08/15/29 | | | 1,521 | |
| | 1,375 | | | Series A, GO, PSF-GTD, 4.000%, 08/15/30 | | | 1,605 | |
| | 1,000 | | | Series B, GO, PSF-GTD, 4.000%, 08/15/28 | | | 1,184 | |
| | 1,880 | | | Northside Independent School District, School Building, GO, PSF-GTD, 5.000%, 08/15/25 | | | 2,429 | |
| | 3,000 | | | State of Texas, Transportation Commission Mobility, GO, 5.000%, 10/01/19 | | | 3,391 | |
| | | | | | | | |
| | | | | | | 88,708 | |
| | | | | | | | |
| | | | Other Revenue — 0.8% | |
| | 10,755 | | | Harris County, Houston Sports Authority Senior Lien, Series A, Rev., AGM, 5.000%, 11/15/26 | | | 13,276 | |
| | 4,700 | | | Lower Colorado River Authority, Series B, Rev., 5.000%, 05/15/23 | | | 5,694 | |
| | | | | | | | |
PRINCIPAL
AMOUNT($) | | | SECURITY DESCRIPTION | | VALUE($) | |
| | | | | | | | |
| | | | Other Revenue — continued | |
| | 505 | | | Midtown Redevelopment Authority, Tax Allocation, Rev., 4.000%, 01/01/17 | | | 510 | |
| | | | | | | | |
| | | | | | | 19,480 | |
| | | | | | | | |
| | | | Prerefunded — 0.6% | |
| | 5,605 | | | Harris County Health Facilities Development Corp., Memorial Hermann Healthcare System, Series B, Rev., 7.250%, 12/01/18 (p) | | | 6,423 | |
| | 60 | | | Lower Colorado River Authority, Series B, Rev., 5.000%, 05/15/22 (p) | | | 73 | |
| | 7,000 | | | North East Independent School District, School Building, Series A, GO, PSF-GTD, 5.000%, 08/01/17 (p) | | | 7,282 | |
| | | | | | | | |
| | | | | | | 13,778 | |
| | | | | | | | |
| | | | Transportation — 1.2% | |
| | 500 | | | Harris County Metropolitan Transit Authority, Series A, Rev., 5.000%, 11/01/16 | | | 504 | |
| | | | Harris County, Toll Road, Senior Lien, | | | | |
| | 4,000 | | | Series A, Rev., 5.000%, 08/15/26 | | | 5,213 | |
| | 4,500 | | | Series A, Rev., 5.000%, 08/15/28 | | | 5,759 | |
| | 500 | | | Love Field Airport Modernization Corp., Rev., AMT, 5.000%, 11/01/18 | | | 542 | |
| | 3,140 | | | North Texas Tollway Authority System, First Tier, Series A, Rev., 5.000%, 01/01/27 | | | 3,837 | |
| | 1,155 | | | North Texas Tollway Authority, Special Projects System, Series A, Rev., 5.000%, 09/01/16 | | | 1,155 | |
| | 10,125 | | | Texas Transportation Commission Central, Turnpike System, Second Tier, Series A, Rev., VAR, 5.000%, 04/01/20 | | | 11,505 | |
| | | | | | | | |
| | | | | | | 28,515 | |
| | | | | | | | |
| | | | Utility — 0.3% | |
| | | | City of Cedar Park, Utility System, | | | | |
| | 820 | | | Rev., 5.000%, 08/15/21 | | | 975 | |
| | 560 | | | Rev., 5.000%, 08/15/22 | | | 679 | |
| | 5,000 | | | City of Houston, Utility System Revenue Refunding, Series C, Rev., 5.000%, 05/15/20 | | | 5,750 | |
| | | | City of Victoria, Utility System, | | | | |
| | 160 | | | Rev., 2.000%, 12/01/18 | | | 164 | |
| | 150 | | | Rev., 2.500%, 12/01/19 | | | 158 | |
| | | | | | | | |
| | | | | | | 7,726 | |
| | | | | | | | |
| | | | Water & Sewer — 0.5% | |
| | 3,520 | | | City of Dallas, Waterworks & Sewer System, Series A, Rev., 5.000%, 10/01/19 | | | 3,975 | |
| | | | City of Galveston, Waterworks & Sewer System, | | | | |
| | 180 | | | Rev., 4.000%, 05/01/18 | | | 190 | |
SEE NOTES TO FINANCIAL STATEMENTS.
| | | | | | |
| | | |
| 42 | | | | J.P. MORGAN MUNICIPAL BOND FUNDS | | AUGUST 31, 2016 |
| | | | | | | | |
PRINCIPAL
AMOUNT($) | | | SECURITY DESCRIPTION | | VALUE($) | |
| Municipal Bonds — continued | |
| | | | Water & Sewer — continued | |
| | 205 | | | Rev., 5.000%, 05/01/19 | | | 227 | |
| | 245 | | | Rev., 5.000%, 05/01/20 | | | 281 | |
| | 265 | | | Rev., 5.000%, 05/01/21 | | | 312 | |
| | 380 | | | Rev., 5.000%, 05/01/24 | | | 476 | |
| | 850 | | | Rev., 5.000%, 05/01/26 | | | 1,051 | |
| | 1,000 | | | City of San Antonio, Water System, Junior Lien, Series E, Rev., 5.000%, 05/15/19 | | | 1,114 | |
| | 1,035 | | | North Harris County, Regional Water Authority, Senior Lien, Rev., 5.000%, 12/15/19 | | | 1,172 | |
| | | | Trinity River Authority Central Regional Wastewater System, | | | | |
| | 1,500 | | | Rev., 5.000%, 08/01/18 | | | 1,624 | |
| | 1,250 | | | Rev., 5.000%, 08/01/19 | | | 1,403 | |
| | | | | | | | |
| | | | | | | 11,825 | |
| | | | | | | | |
| | | | Total Texas | | | 171,794 | |
| | | | | | | | |
| | | | Utah — 1.2% | |
| | | | General Obligation — 0.5% | |
| | | | State of Utah, | | | | |
| | 4,925 | | | GO, 5.000%, 07/01/21 | | | 5,891 | |
| | 4,855 | | | Series C, GO, 5.000%, 07/01/18 | | | 5,244 | |
| | | | | | | | |
| | | | | | | 11,135 | |
| | | | | | | | |
| | | | Other Revenue — 0.0% (g) | |
| | 500 | | | West Valley City Municipal Building Authority, Rev., AGM, 4.000%, 02/01/33 | | | 555 | |
| | | | | | | | |
| | | | Transportation — 0.7% | |
| | | | Utah Transit Authority Subordinated Sales Tax, | | | | |
| | 10,000 | | | Rev., 3.000%, 12/15/27 | | | 10,676 | |
| | 5,680 | | | Rev., 3.000%, 12/15/28 | | | 5,967 | |
| | | | | | | | |
| | | | | | | 16,643 | |
| | | | | | | | |
| | | | Total Utah | | | 28,333 | |
| | | | | | | | |
| | | | Vermont — 0.2% | |
| | | | Education — 0.1% | |
| | | | University of Vermont & State Agricultural College, | | | | |
| | 750 | | | Rev., 5.000%, 10/01/21 | | | 897 | |
| | 855 | | | Rev., 5.000%, 10/01/22 | | | 1,045 | |
| | | | | | | | |
| | | | | | | 1,942 | |
| | | | | | | | |
| | | | General Obligation — 0.1% | |
| | 1,025 | | | City of Burlington, Vermont, Series A, GO, 3.000%, 11/01/18 | | | 1,071 | |
| | | | | | | | |
| | | | Other Revenue — 0.0% (g) | |
| | | | Vermont Municipal Bond Bank, | | | | |
| | 545 | | | Series 2, Rev., 5.000%, 12/01/17 | | | 575 | |
| | | | | | | | |
PRINCIPAL
AMOUNT($) | | | SECURITY DESCRIPTION | | VALUE($) | |
| | | | | | | | |
| | | | Other Revenue — continued | |
| | 400 | | | Series 3, Rev., 5.000%, 12/01/21 | | | 481 | |
| | | | | | | | |
| | | | | | | 1,056 | |
| | | | | | | | |
| | | | Total Vermont | | | 4,069 | |
| | | | | | | | |
| | | | Virginia — 2.4% | |
| | | | Education — 0.2% | |
| | 2,900 | | | Virginia Public School Authority, Special Obligation, Rev., 5.000%, 07/15/19 | | | 3,255 | |
| | | | | | | | |
| | | | General Obligation — 0.7% | |
| | 3,940 | | | City of Alexandria, Series A, GO, 4.250%, 06/15/18 | | | 4,195 | |
| | | | County of Arlington, | | | | |
| | 5,390 | | | Series B, GO, 5.000%, 08/15/22 | | | 6,619 | |
| | 5,000 | | | Series B, GO, 5.000%, 08/15/25 | | | 6,545 | |
| | | | | | | | |
| | | | | | | 17,359 | |
| | | | | | | | |
| | | | Industrial Development Revenue/Pollution Control Revenue — 0.2% | |
| | 5,090 | | | Virginia Beach Development Authority, Public Refunded, Series C, Rev., 5.000%, 08/01/18 | | | 5,500 | |
| | | | | | | | |
| | | | Other Revenue — 0.3% | |
| | 2,150 | | | Fairfax County Economic Development Authority, County Facilities Projects, Series A, Rev., 4.000%, 10/01/18 | | | 2,296 | |
| | 1,300 | | | Virginia Resources Authority, Infrastructure & State Moral Obligation, Series B, Rev., 5.000%, 11/01/18 | | | 1,421 | |
| | 2,250 | | | Virginia Resources Authority, Infrastructure Pooled Financing Program, Series C, Rev., 5.000%, 11/01/20 | | | 2,635 | |
| | | | | | | | |
| | | | | | | 6,352 | |
| | | | | | | | |
| | | | Prerefunded — 0.3% | |
| | 1,450 | | | City of Norfolk, Capital Improvement, Series C, GO, 5.000%, 04/01/17 (p) | | | 1,487 | |
| | | | Virginia Resources Authority, Clean Water State Revolving Fund, | | | | |
| | 4,725 | | | Rev., 4.750%, 10/01/17 (p) | | | 4,939 | |
| | | | | | | | |
| | | | | | | 6,426 | |
| | | | | | | | |
| | | | Water & Sewer — 0.7% | |
| | | | City of Norfolk, Water Revenue, | | | | |
| | 4,435 | | | Rev., 5.000%, 11/01/17 | | | 4,662 | |
| | 1,340 | | | Rev., 5.000%, 11/01/18 | | | 1,464 | |
| | 3,190 | | | County of Fairfax, Sewer Revenue, Rev., 5.000%, 07/15/19 | | | 3,581 | |
SEE NOTES TO FINANCIAL STATEMENTS.
| | | | | | | | |
| | | |
| AUGUST 31, 2016 | | J.P. MORGAN MUNICIPAL BOND FUNDS | | | | | 43 | |
JPMorgan Short-Intermediate Municipal Bond Fund
SCHEDULE OF PORTFOLIO INVESTMENTS
AS OF AUGUST 31, 2016 (Unaudited) (continued)
(Amounts in thousands)
| | | | | | | | |
PRINCIPAL
AMOUNT($) | | | SECURITY DESCRIPTION | | VALUE($) | |
| Municipal Bonds — continued | |
| | | | Water & Sewer — continued | |
| | 5,615 | | | Fairfax County Water Authority, Series B, Rev., 5.250%, 04/01/24 | | | 7,268 | |
| | | | | | | | |
| | | | | | | 16,975 | |
| | | | | | | | |
| | | | Total Virginia | | | 55,867 | |
| | | | | | | | |
| | | | Washington — 1.2% | |
| | | | Certificate of Participation/Lease — 0.2% | |
| | | | State of Washington, State & Local Agency Real & Personal Property, | | | | |
| | 2,555 | | | Series D, COP, 5.000%, 07/01/18 | | | 2,752 | |
| | 3,125 | | | Series D, COP, 5.000%, 07/01/19 | | | 3,487 | |
| | | | | | | | |
| | | | | | | 6,239 | |
| | | | | | | | |
| | | | Education — 0.0% (g) | |
| | 125 | | | University of Washington, Rev., 1.750%, 04/01/19 | | | 128 | |
| | | | | | | | |
| | | | General Obligation — 0.6% | |
| | 2,000 | | | County of King, Shoreline School District No. 412, GO, 4.000%, 12/01/16 | | | 2,017 | |
| | | | King County Public Hospital District No. 2, Evergreenhealth, | | | | |
| | 1,370 | | | GO, 5.000%, 12/01/18 | | | 1,500 | |
| | 870 | | | GO, 5.000%, 12/01/19 | | | 986 | |
| | 1,400 | | | Snohomish County School District No. 002, Everett Refunding, GO, 4.000%, 12/01/17 | | | 1,457 | |
| | 7,300 | | | State of Washington, Various Purpose, Series R-2011B, GO, 5.000%, 07/01/17 | | | 7,571 | |
| | | | | | | | |
| | | | | | | 13,531 | |
| | | | | | | | |
| | | | Other Revenue — 0.2% | |
| | 3,205 | | | Central Puget Sound Regional Transit Authority, Sales Tax, Green Bonds, Series S-1, Rev., 5.000%, 11/01/29 | | | 4,069 | |
| | | | | | | | |
| | | | Transportation — 0.2% | |
| | 4,000 | | | Port of Seattle, Intermediate Lien, Series B, Rev., 5.000%, 03/01/19 | | | 4,421 | |
| | | | | | | | |
| | | | Utility — 0.0% (g) | |
| | 500 | | | County of Snohomish, Public Utility District No. 1, Electric System, Rev., 5.000%, 12/01/25 | | | 648 | |
| | | | | | | | |
| | | | Total Washington | | | 29,036 | |
| | | | | | | | |
| | | | West Virginia — 0.2% | |
| | | | Hospital — 0.1% | |
| | | | Monongalia County Building Commission, Health System, | | | | |
| | 1,545 | | | Rev., 5.000%, 07/01/18 | | | 1,655 | |
| | 1,565 | | | Rev., 5.000%, 07/01/22 | | | 1,865 | |
| | | | | | | | |
| | | | | | | 3,520 | |
| | | | | | | | |
| | | | | | | | |
PRINCIPAL
AMOUNT($) | | | SECURITY DESCRIPTION | | VALUE($) | |
| | | | | | | | |
| | | | Water & Sewer — 0.1% | |
| | 595 | | | West Virginia Water Development Authority, Infrastructure Jobs Dev Council, Series A, Rev., 3.000%, 10/01/16 | | | 596 | |
| | | | West Virginia Water Development Authority, Loan Program II, | | | | |
| | 540 | | | Series A-II, Rev., 3.000%, 11/01/16 | | | 542 | |
| | 555 | | | Series B-II, Rev., 3.000%, 11/01/16 | | | 558 | |
| | | | | | | | |
| | | | | | | 1,696 | |
| | | | | | | | |
| | | | Total West Virginia | | | 5,216 | |
| | | | | | | | |
| | | | Wisconsin — 1.1% | |
| | | | Certificate of Participation/Lease — 0.1% | |
| | | | State of Wisconsin, Master Lease, | | | | |
| | 800 | | | Series A, COP, 5.000%, 09/01/17 | | | 834 | |
| | 1,125 | | | Series A, COP, 5.000%, 09/01/18 | | | 1,217 | |
| | | | | | | | |
| | | | | | | 2,051 | |
| | | | | | | | |
| | | | Education — 0.4% | |
| | 5,815 | | | Wisconsin Health & Educational Facilities Authority, Ascension Health Alliance Senior Credit Group, Series B-2, Rev., VAR, 4.000%, 05/30/19 | | | 6,290 | |
| | 450 | | | Wisconsin Health & Educational Facilities Authority, Monroe Clinic, Inc., Rev., 4.000%, 02/15/31 | | | 495 | |
| | 1,250 | | | Wisconsin Health & Educational Facilities Authority, Thedacare, Inc., Rev., 5.000%, 12/15/20 | | | 1,451 | |
| | | | | | | | |
| | | | | | | 8,236 | |
| | | | | | | | |
| | | | General Obligation — 0.2% | |
| | 2,275 | | | City of Oak Creek, Milwaukee County, GO, 2.000%, 11/01/16 | | | 2,277 | |
| | | | Pierce County, Ellsworth Community School District, | | | | |
| | 335 | | | GO, 4.000%, 04/01/27 | | | 384 | |
| | 280 | | | GO, 4.000%, 04/01/28 | | | 318 | |
| | 1,990 | | | State of Wisconsin, Series A, GO, 5.000%, 05/01/18 | | | 2,135 | |
| | | | | | | | |
| | | | | | | 5,114 | |
| | | | | | | | |
| | | | Prerefunded — 0.4% | |
| | 8,440 | | | State of Wisconsin, Series A, GO, 5.000%, 05/01/21 (p) | | | 10,012 | |
| | | | | | | | |
| | | | Total Wisconsin | | | 25,413 | |
| | | | | | | | |
| | | | Total Municipal Bonds
(Cost $1,985,227) | | | 2,042,450 | |
| | | | | | | | |
SEE NOTES TO FINANCIAL STATEMENTS.
| | | | | | |
| | | |
| 44 | | | | J.P. MORGAN MUNICIPAL BOND FUNDS | | AUGUST 31, 2016 |
| | | | | | | | |
PRINCIPAL
AMOUNT($) | | | SECURITY DESCRIPTION | | VALUE($) | |
| Weekly Demand Notes — 7.2% | |
| | | | California — 1.3% | |
| | | | Other Revenue — 0.9% | |
| | | | California Infrastructure & Economic Development Bank, The J. Paul Getty Trust, | | | | |
| | 10,800 | | | Series A-1, Rev., VAR, 0.910%, 09/01/16 | | | 10,801 | |
| | 5,000 | | | Series A-3, Rev., VAR, 0.910%, 09/01/16 | | | 4,993 | |
| | 5,000 | | | Series A-4, Rev., VAR, 0.910%, 09/01/16 | | | 4,993 | |
| | 1,500 | | | California Statewide Communities Development Authority, Kaiser Permanente, Series B, Rev., VAR, 1.580%, 09/01/16 | | | 1,503 | |
| | | | | | | | |
| | | | | | | 22,290 | |
| | | | | | | | |
| | | | Transportation — 0.4% | |
| | 9,000 | | | Bay Area Toll Authority, Toll Bridge, San Francisco Bay Area, Series G, Rev., VAR, 1.230%, 09/01/16 | | | 8,965 | |
| | | | | | | | |
| | | | Total California | | | 31,255 | |
| | | | | | | | |
| | | | Connecticut — 0.1% | |
| | | | General Obligation — 0.1% | |
| | 1,500 | | | State of Connecticut, SIFMA Index, Series B, GO, VAR, 1.120%, 09/01/16 | | | 1,498 | |
| | | | | | | | |
| | | | Georgia — 0.3% | |
| | | | Other Revenue — 0.2% | |
| | 5,000 | | | Metropolitan Atlanta Rapid Transit Authority, Sales Tax, Rev., VAR, 0.910%, 09/01/16 | | | 4,996 | |
| | | | | | | | |
| | | | Water & Sewer — 0.1% | |
| | 3,000 | | | City of Atlanta, Water & Wastewater, Revenue Refunding, Series A-1, Rev., VAR, 1.852%, 09/01/16 | | | 3,042 | |
| | | | | | | | |
| | | | Total Georgia | | | 8,038 | |
| | | | | | | | |
| | | | Massachusetts — 0.4% | |
| | | | General Obligation — 0.4% | |
| | 10,000 | | | Commonwealth of Massachusetts, Subseries D-2, GO, VAR, 0.930%, 09/01/16 | | | 9,995 | |
| | | | | | | | |
| | | | Michigan — 0.2% | |
| | | | Education — 0.2% | |
| | 5,000 | | | Regents of the University of Michigan, Series E, Rev., VAR, 1.060%, 09/01/16 | | | 4,975 | |
| | | | | | | | |
| | | | New York — 0.5% | |
| | | | General Obligation — 0.4% | |
| | 10,000 | | | City of New York, Subseries J-9, GO, VAR, 1.030%, 09/01/16 | | | 9,994 | |
| | | | | | | | |
| | | | Transportation — 0.1% | |
| | 2,500 | | | Metropolitan Transportation Authority, Series D-2, Rev., VAR, 0.990%, 09/01/16 | | | 2,497 | |
| | | | | | | | |
| | | | Total New York | | | 12,491 | |
| | | | | | | | |
| | | | | | | | |
PRINCIPAL
AMOUNT($) | | | SECURITY DESCRIPTION | | VALUE($) | |
| | | | | | | | |
| | | | Ohio — 0.5% | |
| | | | Hospital — 0.5% | |
| | 10,800 | | | County of Allen, Mercy Health, Series B, Rev., VAR, 1.380%, 09/01/16 | | | 10,709 | |
| | | | | | | | |
| | | | Oklahoma — 0.1% | |
| | | | Utility — 0.1% | |
| | 2,030 | | | Oklahoma Municipal Power Authority, SIFMA Index, Series A, Rev., VAR, 1.430%, 09/01/16 | | | 2,027 | |
| | | | | | | | |
| | | | Oregon — 0.3% | |
| | | | Hospital — 0.3% | |
| | | | Oregon State Facilities Authority, Providence Health & Services, | | | | |
| | 3,350 | | | Series C, Rev., VAR, 0.860%, 09/01/16 | | | 3,350 | |
| | 5,000 | | | Series C, Rev., VAR, 1.510%, 09/01/16 | | | 5,000 | |
| | | | | | | | |
| | | | Total Oregon | | | 8,350 | |
| | | | | | | | |
| | | | Pennsylvania — 0.4% | |
| | | | Transportation — 0.4% | |
| | | | Pennsylvania Turnpike Commission, | | | | |
| | 5,000 | | | Series A, Rev., VAR, 1.310%, 09/01/16 | | | 4,994 | |
| | 1,525 | | | Series A-2, Rev., VAR, 1.130%, 09/01/16 | | | 1,522 | |
| | 2,500 | | | Subseries A-2, Rev., VAR, 1.430%, 09/01/16 | | | 2,500 | |
| | | | | | | | |
| | | | Total Pennsylvania | | | 9,016 | |
| | | | | | | | |
| | | | Texas — 2.5% | |
| | | | Education — 0.3% | |
| | 7,500 | | | County of Harris, Cultural Education Facilities Finance Corp., Children’s Hospital, Series 3, Rev., VAR, 1.206%, 09/01/16 | | | 7,497 | |
| | | | | | | | |
| | | | General Obligation — 0.8% | |
| | 17,500 | | | State of Texas, Transportation Commission Mobility, Series B, GO, VAR, 1.010%, 09/01/16 | | | 17,398 | |
| | | | | | | | |
| | | | Transportation — 0.9% | |
| | | | Harris County, Toll Road, Senior Lien, | | | | |
| | 3,200 | | | Series A, Rev., VAR, 1.260%, 09/01/16 | | | 3,201 | |
| | 2,500 | | | Series A, Rev., VAR, 1.410%, 09/01/16 | | | 2,502 | |
| | 6,000 | | | North Texas Tollway Authority System, First Tier, Series C, Rev., VAR, 1.300%, 09/01/16 | | | 6,018 | |
| | 10,000 | | | Texas Transportation Commission State Highway Fund, First Tier, SIFMA Index, Series B, Rev., VAR, 0.980%, 09/01/16 | | | 9,994 | |
| | | | | | | | |
| | | | | | | 21,715 | |
| | | | | | | | |
SEE NOTES TO FINANCIAL STATEMENTS.
| | | | | | | | |
| | | |
| AUGUST 31, 2016 | | J.P. MORGAN MUNICIPAL BOND FUNDS | | | | | 45 | |
JPMorgan Short-Intermediate Municipal Bond Fund
SCHEDULE OF PORTFOLIO INVESTMENTS
AS OF AUGUST 31, 2016 (Unaudited) (continued)
(Amounts in thousands)
| | | | | | | | |
PRINCIPAL
AMOUNT($) | | | SECURITY DESCRIPTION | | VALUE($) | |
| Weekly Demand Notes — continued | |
| | | | Utility — 0.3% | |
| | 7,500 | | | City of San Antonio, Electric & Gas Systems, Junior Lien, Series B, Rev., VAR, 1.010%, 09/01/16 | | | 7,476 | |
| | | | | | | | |
| | | | Water & Sewer — 0.2% | |
| | 4,000 | | | City of San Antonio, Water System, Junior Lien, Series F, Rev., VAR, 1.310%, 09/01/16 | | | 4,000 | |
| | | | | | | | |
| | | | Total Texas | | | 58,086 | |
| | | | | | | | |
| | | | Washington — 0.6% | |
| | | | Other Revenue — 0.2% | |
| | 5,000 | | | Central Puget Sound Regional Transit Authority, Sales Tax, Series S-2A, Rev., VAR, 1.330%, 09/01/16 | | | 5,005 | |
| | | | | | | | |
| | | | Utility — 0.4% | |
| | 7,500 | | | City of Seattle, Municipal Light & Power, Series B-1, Rev., VAR, 1.310%, 09/01/16 | | | 7,500 | |
| | 1,000 | | | Grant County Public Utility District No. 2, Electric System, Series K, Rev., VAR, 0.950%, 09/01/16 | | | 996 | |
| | | | | | | | |
| | | | | | | 8,496 | |
| | | | | | | | |
| | | | Total Washington | | | 13,501 | |
| | | | | | | | |
| | | | Total Weekly Demand Notes
(Cost $170,103) | | | 169,941 | |
| | | | | | | | |
| | | | | | | | |
SHARES | | | SECURITY DESCRIPTION | | VALUE($) | |
| Short-Term Investment — 3.6% | |
| | | | Investment Company — 3.6% | |
| | 85,536 | | | JPMorgan U.S. Government Money Market Fund, Institutional Class Shares, 0.310% (b) (l)
(Cost $85,536) | | | 85,536 | |
| | | | | | | | |
| | | | Total Investments — 101.8%
(Cost $2,342,240) | | | 2,399,032 | |
| | | | | | | | |
| | | | Liabilities in Excess of
Other Assets — (1.8)% | | | (42,024 | ) |
| | | | | | | | |
| | | | NET ASSETS — 100.0% | | $ | 2,357,008 | |
| | | | | | | | |
Percentages indicated are based on net assets.
SEE NOTES TO FINANCIAL STATEMENTS.
| | | | | | |
| | | |
| 46 | | | | J.P. MORGAN MUNICIPAL BOND FUNDS | | AUGUST 31, 2016 |
JPMorgan Tax Free Bond Fund
SCHEDULE OF PORTFOLIO INVESTMENTS
AS OF AUGUST 31, 2016 (Unaudited)
(Amounts in thousands)
| | | | | | | | |
PRINCIPAL
AMOUNT($) | | | SECURITY DESCRIPTION | | VALUE($) | |
| Municipal Bonds — 88.6% (t) | | | | |
| | | | Alabama — 0.6% | |
| | | | Industrial Development Revenue/Pollution Control Revenue — 0.3% | |
| | 1,000 | | | Alabama Capital Region Solid Waste Disposal Authority, Tax-Exempt Solid Waste Disposal, IREP-Montgomery MRF, LLC Project, Series A, Rev., AMT, 4.500%, 06/15/34 | | | 1,064 | |
| | | | | | | | |
| | | | Other Revenue — 0.3% | | | | |
| | 1,000 | | | Montgomery County Public Building Authority, Facilities Project, Rev., 5.000%, 03/01/29 | | | 1,223 | |
| | | | | | | | |
| | | | Total Alabama | | | 2,287 | |
| | | | | | | | |
| | | | Alaska — 3.8% | | | | |
| | | | Other Revenue — 0.0% (g) | | | | |
| | 70 | | | Alaska Municipal Bond Bank Authority, Rev., 5.750%, 09/01/33 | | | 77 | |
| | | | | | | | |
| | | | Prerefunded — 1.6% | | | | |
| | 2,430 | | | Alaska Municipal Bond Bank Authority, Rev., 5.750%, 09/01/18 (p) | | | 2,677 | |
| | 1,745 | | | Matanuska-Susitna Borough, Goose Creek Correctional Center Project, Rev., AGC, 6.000%, 09/01/19 (p) | | | 2,014 | |
| | 1,005 | | | Matanuska-Susitna Borough, Goose Creek Correctional Center Project, Unrefunded Balance, Rev., AGC, 6.000%, 09/01/28 (p) | | | 1,160 | |
| | | | | | | | |
| | | | | | | 5,851 | |
| | | | | | | | |
| | | | Utility — 2.2% | | | | |
| | | | Alaska Energy Authority, Power, Bradley Lake Hydroelectric Project, Fourth Series, | | | | |
| | 3,485 | | | Rev., AGM, 6.000%, 07/01/17 | | | 3,637 | |
| | 3,915 | | | Rev., AGM, 6.000%, 07/01/19 | | | 4,469 | |
| | | | | | | | |
| | | | | | | 8,106 | |
| | | | | | | | |
| | | | Total Alaska | | | 14,034 | |
| | | | | | | | |
| | | | Arizona — 0.5% | | | | |
| | | | General Obligation — 0.5% | | | | |
| | 1,475 | | | City Of Casa Grande, Arizona, Series B, GO, 4.000%, 08/01/32 | | | 1,689 | |
| | | | | | | | |
| | | | Arkansas — 0.4% | | | | |
| | | | Education — 0.1% | | | | |
| | 185 | | | Board of Trustees of the University of Arkansas, Various Facility, Fayetteville Campus, Series A, Rev., 5.000%, 11/01/37 | | | 232 | |
| | | | | | | | |
| | | | Hospital — 0.3% | | | | |
| | | | City of Springdale, Public Facilities Board Hospital, | | | | |
| | 890 | | | Rev., 4.000%, 03/01/33 | | | 997 | |
| | | | | | | | |
PRINCIPAL
AMOUNT($) | | | SECURITY DESCRIPTION | | VALUE($) | |
| | | | | | | | |
| | | | Hospital — continued | | | | |
| | 100 | | | Rev., 4.000%, 03/01/36 | | | 111 | |
| | | | | | | | |
| | | | | | | 1,108 | |
| | | | | | | | |
| | | | Total Arkansas | | | 1,340 | |
| | | | | | | | |
| | | | California — 20.5% | | | | |
| | | | Certificate of Participation/Lease — 0.5% | | | | |
| | 1,500 | | | Riverside Public Financing Authority, Riverside Pavement Rehabilitation Project, COP, AGM, 5.000%, 06/01/33 | | | 1,764 | |
| | | | | | | | |
| | | | Education — 1.4% | | | | |
| | 500 | | | California Educational Facilities Authority, Claremont McKenna College, Series A, Rev., 4.000%, 01/01/39 | | | 563 | |
| | 1,000 | | | California Educational Facilities Authority, Stanford University, Series U-3, Rev., 5.000%, 06/01/43 | | | 1,485 | |
| | | | California State University, Systemwide, | | | | |
| | 2,450 | | | Series A, Rev., 3.125%, 11/01/36 | | | 2,503 | |
| | 500 | | | Series A, Rev., 4.000%, 11/01/45 | | | 564 | |
| | | | | | | | |
| | | | | | | 5,115 | |
| | | | | | | | |
| | | | General Obligation — 6.7% | | | | |
| | 355 | | | County of Santa Clara, Campbell Union High School District, GO, 3.000%, 08/01/31 | | | 386 | |
| | 250 | | | County of Santa Clara, Palo Alto Unified School District, GO, 3.000%, 08/01/35 | | | 263 | |
| | | | Los Angeles Unified School District, | | | | |
| | 1,500 | | | Series A, GO, 5.000%, 07/01/30 | | | 1,783 | |
| | 5,000 | | | Series D, GO, 5.000%, 01/01/34 | | | 5,603 | |
| | 7,150 | | | Mount San Antonio Community College District, Election of 2008, Series A, GO, Zero Coupon, 08/01/43 | | | 6,352 | |
| | | | Pittsburg Unified School District, | | | | |
| | 1,025 | | | GO, 4.000%, 08/01/32 | | | 1,188 | |
| | 1,640 | | | GO, 4.000%, 08/01/36 | | | 1,866 | |
| | 50 | | | Pomona Unified School District, Series A, GO, NATL-RE, 6.100%, 02/01/20 | | | 59 | |
| | 3,000 | | | Santa Maria Joint Union High School District, Santa Barbara & San Luis Obispo, GO, Zero Coupon, 08/01/37 | | | 1,179 | |
| | 100 | | | Santa Monica-Malibu Unified School District, GO, 4.000%, 08/01/21 | | | 115 | |
| | 5,000 | | | State of California, Various Purpose, GO, 6.500%, 04/01/33 | | | 5,735 | |
| | | | | | | | |
| | | | | | | 24,529 | |
| | | | | | | | |
SEE NOTES TO FINANCIAL STATEMENTS.
| | | | | | | | |
| | | |
| AUGUST 31, 2016 | | J.P. MORGAN MUNICIPAL BOND FUNDS | | | | | 47 | |
JPMorgan Tax Free Bond Fund
SCHEDULE OF PORTFOLIO INVESTMENTS
AS OF AUGUST 31, 2016 (Unaudited) (continued)
(Amounts in thousands)
| | | | | | | | |
PRINCIPAL
AMOUNT($) | | | SECURITY DESCRIPTION | | VALUE($) | |
| Municipal Bonds — continued | |
| | | | Hospital — 3.0% | | | | |
| | 2,215 | | | California Health Facilities Financing Authority, Cedars-Sinai Medical Center, Rev., 5.000%, 11/15/28 | | | 2,816 | |
| | 5,000 | | | California Health Facilities Financing Authority, Providence St. Joseph Health, Series A, Rev., 4.000%, 10/01/47 (w) | | | 5,576 | |
| | 2,250 | | | California Health Facilities Financing Authority, Sutter Health, Series A, Rev., 5.000%, 11/15/41 | | | 2,768 | |
| | | | | | | | |
| | | | | | | 11,160 | |
| | | | | | | | |
| | | | Prerefunded — 2.9% | | | | |
| | 40 | | | California Health Facilities Financing Authority, Providence Health & Services, Series C, Rev., 6.500%, 10/01/18 (p) | | | 45 | |
| | 1,960 | | | California Health Facilities Financing Authority, Unrefunded Balance, Providence Health & Services, Series C, Rev., 6.500%, 10/01/18 (p) | | | 2,198 | |
| | 7,500 | | | San Diego Public Facilities Financing Authority, Senior Sewer, Series A, Rev., 5.250%, 05/15/19 (p) | | | 8,429 | |
| | | | | | | | |
| | | | | | | 10,672 | |
| | | | | | | | |
| | | | Transportation — 1.9% | | | | |
| | 1,250 | | | City of Los Angeles, Department of Airports, Series A, Rev., AMT, 5.000%, 05/15/38 | | | 1,470 | |
| | 1,000 | | | Los Angeles County Metropolitan Transportation Authority, Union Station Gateway Project, Rev., 5.000%, 07/01/27 | | | 1,285 | |
| | | | Los Angeles Harbor Department, | | | | |
| | 1,165 | | | Rev., 7.600%, 10/01/18 (p) | | | 1,249 | |
| | 350 | | | Series A, Rev., 5.000%, 08/01/26 | | | 454 | |
| | 2,000 | | | San Francisco Bay Area Rapid Transit District, Sales Tax, Series A, Rev., 4.000%, 07/01/33 | | | 2,324 | |
| | | | | | | | |
| | | | | | | 6,782 | |
| | | | | | | | |
| | | | Utility — 2.2% | | | | |
| | 375 | | | City of Los Angeles Department of Water & Power, Power System, Series B, Rev., 5.000%, 07/01/36 | | | 467 | |
| | 610 | | | City of Los Angeles, Department of Water & Power, Power System, Series D, Rev., 5.000%, 07/01/33 | | | 759 | |
| | 2,000 | | | Long Beach Bond Finance Authority, Natural Gas Purchase, Series A, Rev., 5.250%, 11/15/21 | | | 2,327 | |
| | 2,500 | | | Los Angeles Department of Water & Power, Power System, Sub Series A-1, Rev., 5.250%, 07/01/38 | | | 2,702 | |
| | | | | | | | |
PRINCIPAL
AMOUNT($) | | | SECURITY DESCRIPTION | | VALUE($) | |
| | | | | | | | |
| | | | Utility — continued | | | | |
| | 595 | | | Northern California Transmission Agency, Transmission Project, Series A, Rev., 5.000%, 05/01/31 | | | 754 | |
| | 1,000 | | | Southern California, Public Power Authority Canyon Power Project, Series A, Rev., 5.000%, 07/01/27 | | | 1,184 | |
| | | | | | | | |
| | | | | | | 8,193 | |
| | | | | | | | |
| | | | Water & Sewer — 1.9% | | | | |
| | | | East Bay Municipal Utility District Water System, Green Bonds, | | | | |
| | 2,450 | | | Series B, Rev., 5.000%, 06/01/32 | | | 3,077 | |
| | 515 | | | Series B, Rev., 5.000%, 06/01/33 | | | 645 | |
| | 3,000 | | | Metropolitan Water District of Southern California, Series A, Rev., 5.000%, 07/01/32 | | | 3,113 | |
| | | | | | | | |
| | | | | | | 6,835 | |
| | | | | | | | |
| | | | Total California | | | 75,050 | |
| | | | | | | | |
| | | | Colorado — 4.5% | | | | |
| | | | Certificate of Participation/Lease — 2.1% | | | | |
| | 4,655 | | | Adams County, Colorado Refunding & Improvement, COP, 4.000%, 12/01/40 | | | 5,212 | |
| | 2,000 | | | State of Colorado, Building Excellent Schools Today, Series G, COP, 5.000%, 03/15/32 | | | 2,313 | |
| | | | | | | | |
| | | | | | | 7,525 | |
| | | | | | | | |
| | | | Education — 0.0% (g) | | | | |
| | 150 | | | Board of Governors of the University of Colorado, Enterprise System, Series E-1, Rev., 5.000%, 03/01/35 | | | 182 | |
| | | | | | | | |
| | | | Hospital — 0.9% | | | | |
| | 2,130 | | | Colorado Health Facilities Authority, Vail Valley Medical Centre Project, Rev., 4.000%, 01/15/45 | | | 2,312 | |
| | 1,000 | | | Denver Health & Hospital Authority, Series A, Rev., 5.250%, 12/01/45 | | | 1,165 | |
| | | | | | | | |
| | | | | | | 3,477 | |
| | | | | | | | |
| | | | Other Revenue — 0.4% | | | | |
| | 1,000 | | | City Of Aurora, Rev., 5.000%, 08/01/28 | | | 1,290 | |
| | | | | | | | |
| | | | Prerefunded — 1.1% | | | | |
| | | | Colorado Water Resources & Power Development Authority, Water & Wastewater Utility Enterprise Project, | | | | |
| | 1,000 | | | Series A, Rev., AGC, 5.125%, 12/01/30 (p) | | | 1,100 | |
| | 1,000 | | | Series A, Rev., AGC, 5.250%, 12/01/38 (p) | | | 1,102 | |
SEE NOTES TO FINANCIAL STATEMENTS.
| | | | | | |
| | | |
| 48 | | | | J.P. MORGAN MUNICIPAL BOND FUNDS | | AUGUST 31, 2016 |
| | | | | | | | |
PRINCIPAL
AMOUNT($) | | | SECURITY DESCRIPTION | | VALUE($) | |
| Municipal Bonds — continued | |
| | | | Prerefunded — continued | | | | |
| | 1,500 | | | University of Colorado, University Enterprise, Series A, Rev., 5.375%, 06/01/19 (p) | | | 1,689 | |
| | | | | | | | |
| | | | | | | 3,891 | |
| | | | | | | | |
| | | | Total Colorado | | | 16,365 | |
| | | | | | | | |
| | | | Delaware — 0.6% | | | | |
| | | | Education — 0.3% | | | | |
| | | | The Delaware Economic Development Authority, Newark Charter School Inc. Project, | | | | |
| | 500 | | | Series A, Rev., 5.000%, 09/01/36 | | | 582 | |
| | 500 | | | Series A, Rev., 5.000%, 09/01/46 | | | 577 | |
| | | | | | | | |
| | | | | | | 1,159 | |
| | | | | | | | |
| | | | Hospital — 0.3% | | | | |
| | 1,160 | | | Delaware State Economic Development Authority, Osteopathic Hospital Association, Series A, Rev., 6.900%, 01/01/18 (p) | | | 1,213 | |
| | | | | | | | |
| | | | Total Delaware | | | 2,372 | |
| | | | | | | | |
| | | | District of Columbia — 1.6% | | | | |
| | | | Education — 0.3% | | | | |
| | | | District of Columbia, | | | | |
| | 500 | | | Series A, Rev., 6.000%, 07/01/43 | | | 602 | |
| | 500 | | | Series A, Rev., 6.000%, 07/01/48 | | | 598 | |
| | | | | | | | |
| | | | | | | 1,200 | |
| | | | | | | | |
| | | | General Obligation — 1.3% | | | | |
| | 3,965 | | | District of Columbia, Series B, GO, NATL-RE, 6.000%, 06/01/19 | | | 4,524 | |
| | | | | | | | |
| | | | Total District of Columbia | | | 5,724 | |
| | | | | | | | |
| | | | Florida — 3.9% | | | | |
| | | | General Obligation — 0.9% | | | | |
| | 2,415 | | | Hillsborough County, Parks & Recreation Program, GO, NATL-RE, 5.250%, 07/01/25 | | | 3,180 | |
| | | | | | | | |
| | | | Hospital — 0.0% (g) | | | | |
| | 215 | | | Orange County Health Facilities Authority, Orlando Health Inc., Series B, Rev., 4.000%, 10/01/45 | | | 233 | |
| | | | | | | | |
| | | | Other Revenue — 1.2% | | | | |
| | 2,240 | | | County of Palm Beach, Rev., 5.000%, 05/01/38 | | | 2,777 | |
| | | | Palm Beach County, Public Improvement, | | | | |
| | 1,115 | | | Rev., 5.000%, 05/01/24 | | | 1,413 | |
| | 135 | | | Rev., 5.000%, 05/01/27 | | | 175 | |
| | | | | | | | |
| | | | | | | 4,365 | |
| | | | | | | | |
| | | | | | | | |
PRINCIPAL
AMOUNT($) | | | SECURITY DESCRIPTION | | VALUE($) | |
| | | | | | | | |
| | | | Transportation — 0.9% | | | | |
| | 3,205 | | | Hillsborough County Aviation Authority, Tampa International Airport, Series B, Rev., NATL-RE, 6.000%, 10/01/18 | | | 3,522 | |
| | | | | | | | |
| | | | Utility — 0.9% | | | | |
| | 2,820 | | | Tohopekaliga Water Authority, Utility System Revenue, Series A, Rev., 4.000%, 10/01/41 | | | 3,181 | |
| | | | | | | | |
| | | | Total Florida | | | 14,481 | |
| | | | | | | | |
| | | | Georgia — 1.3% | | | | |
| | | | Hospital — 1.3% | | | | |
| | 3,845 | | | Dalton Development Authority, Hamilton Health Care System, Rev., NATL-RE, 5.500%, 08/15/26 | | | 4,611 | |
| | | | | | | | |
| | | | Illinois — 3.2% | | | | |
| | | | Education — 0.6% | | | | |
| | 1,750 | | | Chicago Public Building Commission, Board of Education, Series A, Rev., NATL-RE, 7.000%, 01/01/20 (p) | | | 2,033 | |
| | | | | | | | |
| | | | General Obligation — 1.0% | | | | |
| | 355 | | | Cook County Forest Preserve District, Limited Tax Project, Series B, GO, 5.000%, 12/15/37 | | | 398 | |
| | 3,000 | | | State of Illinois, GO, 5.500%, 07/01/38 | | | 3,381 | |
| | | | | | | | |
| | | | | | | 3,779 | |
| | | | | | | | |
| | | | Other Revenue — 0.3% | | | | |
| | 1,000 | | | Illinois Finance Authority, Series A, Rev., 4.000%, 10/01/31 | | | 1,123 | |
| | | | | | | | |
| | | | Transportation — 1.3% | | | | |
| | 1,500 | | | Chicago O’Hare International Airport, General Airport, Third Lien, Series A, Rev., NATL-RE, 5.750%, 01/01/39 | | | 1,754 | |
| | 2,580 | | | Regional Transportation Authority, Series D, Rev., NATL-RE, 7.750%, 06/01/19 | | | 2,870 | |
| | | | | | | | |
| | | | | | | 4,624 | |
| | | | | | | | |
| | | | Total Illinois | | | 11,559 | |
| | | | | | | | |
| | | | Indiana — 1.3% | | | | |
| | | | Other Revenue — 1.3% | | | | |
| | 4,000 | | | Indiana Finance Authority, State Revolving Fund Program, Series A, Rev., 5.000%, 02/01/30 | | | 4,761 | |
| | | | | | | | |
| | | | Kentucky — 1.3% | | | | |
| | | | Education — 1.3% | | | | |
| | | | Oldham County, Kentucky School District Finance Corp., School Building, | | | | |
| | 1,760 | | | Rev., 5.000%, 06/01/26 | | | 2,241 | |
| | 2,000 | | | Rev., 5.000%, 06/01/27 | | | 2,579 | |
| | | | | | | | |
| | | | Total Kentucky | | | 4,820 | |
| | | | | | | | |
SEE NOTES TO FINANCIAL STATEMENTS.
| | | | | | | | |
| | | |
| AUGUST 31, 2016 | | J.P. MORGAN MUNICIPAL BOND FUNDS | | | | | 49 | |
JPMorgan Tax Free Bond Fund
SCHEDULE OF PORTFOLIO INVESTMENTS
AS OF AUGUST 31, 2016 (Unaudited) (continued)
(Amounts in thousands)
| | | | | | | | |
PRINCIPAL
AMOUNT($) | | | SECURITY DESCRIPTION | | VALUE($) | |
| Municipal Bonds — continued | |
| | | | Louisiana — 0.7% | | | | |
| | | | Other Revenue — 0.7% | | | | |
| | 1,150 | | | Louisiana Public Facilities Authority, Ochsner Clinic Foundation Project, Rev., 5.000%, 05/15/47 | | | 1,350 | |
| | 1,000 | | | Tobacco Settlement Financing Corp., Asset-Backed, Series A, Rev., 5.250%, 05/15/35 | | | 1,141 | |
| | | | | | | | |
| | | | Total Louisiana | | | 2,491 | |
| | | | | | | | |
| | | | Maine — 1.8% | | | | |
| | | | Prerefunded — 1.8% | | | | |
| | | | Maine Turnpike Authority, | | | | |
| | 5,675 | | | Rev., 6.000%, 07/01/19 (p) | | | 6,514 | |
| | | | | | | | |
| | | | Total Maine | | | 6,514 | |
| | | | | | | | |
| | | | Maryland — 0.5% | | | | |
| | | | General Obligation — 0.5% | | | | |
| | 1,420 | | | Baltimore County, Consolidated Public Improvement, GO, 5.000%, 08/01/26 | | | 1,841 | |
| | | | | | | | |
| | | | Massachusetts — 0.6% | | | | |
| | | | General Obligation — 0.5% | | | | |
| | 1,500 | | | Commonwealth of Massachusetts, Series A, GO, 5.000%, 03/01/32 | | | 1,844 | |
| | | | | | | | |
| | | | Water & Sewer — 0.1% | | | | |
| | 285 | | | Massachusetts Water Pollution Abatement Trust, Pool Program, Rev., 5.250%, 08/01/28 | | | 392 | |
| | | | | | | | |
| | | | Total Massachusetts | | | 2,236 | |
| | | | | | | | |
| | | | Michigan — 0.5% | | | | |
| | | | Other Revenue — 0.5% | | | | |
| | 1,500 | | | Michigan State Trunk Line, Rev., 5.000%, 11/15/36 | | | 1,757 | |
| | | | | | | | |
| | | | Minnesota — 0.3% | | | | |
| | | | General Obligation — 0.3% | | | | |
| | 765 | | | Independent School District No. 720, Shakopee Public Schools, Series A, GO, 5.000%, 02/01/25 | | | 972 | |
| | | | | | | | |
| | | | Mississippi — 0.4% | | | | |
| | | | Water & Sewer — 0.4% | | | | |
| | 1,000 | | | Mississippi Development Bank, Water & Sewer System Project, Special Obligation, Rev., AGM, 6.875%, 12/01/40 | | | 1,356 | |
| | | | | | | | |
| | | | Montana — 0.1% | | | | |
| | | | Prerefunded — 0.1% | | | | |
| | 400 | | | City of Helena, COP, 5.000%, 01/01/29 (p) | | | 440 | |
| | | | | | | | |
| | | | | | | | |
PRINCIPAL
AMOUNT($) | | | SECURITY DESCRIPTION | | VALUE($) | |
| | | | | | | | |
| | | | Nebraska — 0.1% | | | | |
| | | | Utility — 0.1% | | | | |
| | 280 | | | Public Power Generation Agency, Whelan Energy Center Unit 2, Series A, Rev., 5.000%, 01/01/41 | | | 339 | |
| | | | | | | | |
| | | | New Jersey — 1.3% | | | | |
| | | | Housing — 0.1% | | | | |
| | 505 | | | New Jersey Housing & Mortgage Finance Agency, Single Family Housing, Series AA, Rev., 6.375%, 10/01/28 (w) | | | 523 | |
| | | | | | | | |
| | | | Transportation — 1.2% | | | | |
| | 10,435 | | | New Jersey Transportation Trust Fund Authority, Capital Appreciation, Transportation Systems, Series A, Rev., Zero Coupon, 12/15/36 | | | 4,445 | |
| | | | | | | | |
| | | | Total New Jersey | | | 4,968 | |
| | | | | | | | |
| | | | New York — 12.1% | | | | |
| | | | Education — 1.6% | | | | |
| | 3,000 | | | New York State Dormitory Authority, Columbia University, Sub Series A-2, Rev., 5.000%, 10/01/46 | | | 4,588 | |
| | 1,025 | | | State Dormitory Authority, New York University, Series A, Rev., 5.000%, 07/01/28 | | | 1,330 | |
| | | | | | | | |
| | | | | | | 5,918 | |
| | | | | | | | |
| | | | General Obligation — 0.5% | | | | |
| | | | Gorham-Middlesex Central School District, | | | | |
| | 795 | | | GO, 3.000%, 12/15/20 | | | 856 | |
| | 820 | | | GO, 3.000%, 12/15/21 | | | 897 | |
| | | | | | | | |
| | | | | | | 1,753 | |
| | | | | | | | |
| | | | Other Revenue — 2.5% | | | | |
| | | | Brooklyn Arena Local Development Corp., | | | | |
| | 625 | | | Series A, Rev., 5.000%, 07/15/26 (w) | | | 786 | |
| | 565 | | | Series A, Rev., 5.000%, 07/15/28 (w) | | | 708 | |
| | 1,475 | | | New York City Municipal Water Finance Authority, Building Aid, Series S-1, Rev., 5.000%, 07/15/33 | | | 1,839 | |
| | 4,450 | | | New York State Dormitory Authority, State Sales Tax, Series A, Rev., 5.000%, 03/15/26 | | | 5,757 | |
| | | | | | | | |
| | | | | | | 9,090 | |
| | | | | | | | |
| | | | Prerefunded — 0.3% | | | | |
| | 1,150 | | | New York City Municipal Water Finance Authority, Water & Sewer System, Series A, Rev., 5.750%, 06/15/18 (p) | | | 1,254 | |
| | | | | | | | |
| | | | Transportation — 4.3% | | | | |
| | 12,000 | | | Port Authority of New York & New Jersey, Consolidated, 93rd Series, Rev., 6.125%, 06/01/94 | | | 15,587 | |
| | | | | | | | |
SEE NOTES TO FINANCIAL STATEMENTS.
| | | | | | |
| | | |
| 50 | | | | J.P. MORGAN MUNICIPAL BOND FUNDS | | AUGUST 31, 2016 |
| | | | | | | | |
PRINCIPAL
AMOUNT($) | | | SECURITY DESCRIPTION | | VALUE($) | |
| Municipal Bonds — continued | |
| | | | Utility — 1.4% | | | | |
| | 4,250 | | | Utility Debt Securitization Authority, Series TE, Rev., 5.000%, 12/15/41 | | | 5,178 | |
| | | | | | | | |
| | | | Water & Sewer — 1.5% | | | | |
| | | | New York City Municipal Water Finance Authority, Water & Sewer System, | | | | |
| | 360 | | | Series A, Rev., 4.500%, 06/15/32 | | | 438 | |
| | 3,850 | | | Series A, Rev., 5.750%, 06/15/40 | | | 4,202 | |
| | | | Water Authority of Great Neck North, New York water system, | | | | |
| | 200 | | | Series A, Rev., 4.000%, 01/01/29 | | | 240 | |
| | 35 | | | Series A, Rev., 4.000%, 01/01/30 | | | 42 | |
| | 425 | | | Series A, Rev., 4.000%, 01/01/33 | | | 501 | |
| | | | | | | | |
| | | | | | | 5,423 | |
| | | | | | | | |
| | | | Total New York | | | 44,203 | |
| | | | | | | | |
| | | | North Carolina — 0.5% | | | | |
| | | | Other Revenue — 0.5% | | | | |
| | | | City of Wilmington, | | | | |
| | 490 | | | Rev., 4.000%, 06/01/33 | | | 567 | |
| | 1,250 | | | Rev., 4.000%, 06/01/34 | | | 1,439 | |
| | | | | | | | |
| | | | Total North Carolina | | | 2,006 | |
| | | | | | | | |
| | | | North Dakota — 0.0% (g) | | | | |
| | | | General Obligation — 0.0% (g) | | | | |
| | 105 | | | West Fargo Public School District No. 6, Series A, GO, 3.000%, 05/01/25 | | | 117 | |
| | | | | | | | |
| | | | Ohio — 1.4% | | | | |
| | | | General Obligation — 0.6% | | | | |
| | | | Greenville City School District, School Improvement, | | | | |
| | 1,000 | | | GO, 5.250%, 01/01/38 | | | 1,162 | |
| | 1,000 | | | GO, 5.250%, 01/01/41 | | | 1,160 | |
| | | | | | | | |
| | | | | | | 2,322 | |
| | | | | | | | |
| | | | Hospital — 0.3% | | | | |
| | 1,000 | | | County of Warren, Otterbein Homes Obligated Group, Healthcare Facilities, Series A, Rev., 5.500%, 07/01/39 | | | 1,177 | |
| | | | | | | | |
| | | | Prerefunded — 0.5% | | | | |
| | | | County of Richland, Correctional Facilities Improvement, | | | | |
| | 500 | | | GO, AGC, 5.875%, 12/01/18 (p) | | | 558 | |
| | 400 | | | GO, AGC, 6.000%, 12/01/18 (p) | | | 448 | |
| | 650 | | | GO, AGC, 6.125%, 12/01/18 (p) | | | 730 | |
| | | | | | | | |
| | | | | | | 1,736 | |
| | | | | | | | |
| | | | Total Ohio | | | 5,235 | |
| | | | | | | | |
| | | | | | | | |
PRINCIPAL
AMOUNT($) | | | SECURITY DESCRIPTION | | VALUE($) | |
| | | | | | | | |
| | | | Oklahoma — 1.4% | | | | |
| | | | Utility — 0.8% | | | | |
| | 2,500 | | | The Edmond Public Works Authority, Sales Tax and Utility System, Rev., 4.000%, 07/01/41 | | | 2,781 | |
| | | | | | | | |
| | | | Water & Sewer — 0.6% | | | | |
| | 2,000 | | | Oklahoma City Water Utilities Trust, Water & Sewer System, Series A, Rev., 5.000%, 07/01/34 | | | 2,225 | |
| | | | | | | | |
| | | | Total Oklahoma | | | 5,006 | |
| | | | | | | | |
| | | | Oregon — 1.0% | | | | |
| | | | Utility — 0.7% | | | | |
| | | | City Of Eugene, Oregon Electric Utility System, | | | | |
| | 1,000 | | | Series A, Rev., 4.000%, 08/01/32 | | | 1,154 | |
| | 1,035 | | | Series A, Rev., 5.000%, 08/01/30 | | | 1,321 | |
| | | | | | | | |
| | | | | | | 2,475 | |
| | | | | | | | |
| | | | Water & Sewer — 0.3% | | | | |
| | 825 | | | City of Portland, Sewer System, First Lien, Series A, Rev., 5.000%, 06/01/26 | | | 1,063 | |
| | | | | | | | |
| | | | Total Oregon | | | 3,538 | |
| | | | | | | | |
| | | | Pennsylvania — 0.1% | | | | |
| | | | General Obligation — 0.1% | | | | |
| | 250 | | | County Of Allegheny Pennsylvania, Series C, GO, 5.000%, 11/01/23 | | | 310 | |
| | | | | | | | |
| | | | South Carolina — 6.7% | | | | |
| | | | General Obligation — 0.3% | | | | |
| | | | Anderson County South Carolina School District No. 5, | | | | |
| | 630 | | | GO, SCSDE, 5.000%, 03/01/27 | | | 812 | |
| | 140 | | | Series B, GO, SCSDE, 5.000%, 03/01/28 | | | 179 | |
| | | | | | | | |
| | | | | | | 991 | |
| | | | | | | | |
| | | | Prerefunded — 2.9% | | | | |
| | 9,515 | | | Laurens County School District No. 056, GO, AGC, SCSDE, 6.125%, 03/01/19 (p) | | | 10,807 | |
| | | | | | | | |
| | | | Utility — 2.8% | | | | |
| | 3,900 | | | Piedmont Municipal Power Agency, Electric, Rev., FGIC, 6.750%, 01/01/20 (p) | | | 4,659 | |
| | 4,615 | | | Piedmont Municipal Power Agency, Electric, Unrefunded Balance, Rev., NATL-RE, 6.750%, 01/01/20 | | | 5,453 | |
| | | | | | | | |
| | | | | | | 10,112 | |
| | | | | | | | |
| | | | Water & Sewer — 0.7% | | | | |
| | | | City of Anderson, South Carolina Water & Sewer System, | | | | |
| | 320 | | | Rev., 5.000%, 07/01/29 | | | 406 | |
SEE NOTES TO FINANCIAL STATEMENTS.
| | | | | | | | |
| | | |
| AUGUST 31, 2016 | | J.P. MORGAN MUNICIPAL BOND FUNDS | | | | | 51 | |
JPMorgan Tax Free Bond Fund
SCHEDULE OF PORTFOLIO INVESTMENTS
AS OF AUGUST 31, 2016 (Unaudited) (continued)
(Amounts in thousands)
| | | | | | | | |
PRINCIPAL
AMOUNT($) | | | SECURITY DESCRIPTION | | VALUE($) | |
| Municipal Bonds — continued | |
| | | | Water & Sewer — continued | | | | |
| | 680 | | | Rev., 5.000%, 07/01/30 | | | 860 | |
| | 535 | | | Rev., 5.000%, 07/01/31 | | | 673 | |
| | 500 | | | Rev., 5.000%, 07/01/32 | | | 628 | |
| | | | | | | | |
| | | | | | | 2,567 | |
| | | | | | | | |
| | | | Total South Carolina | | | 24,477 | |
| | | | | | | | |
| | | | South Dakota — 0.2% | | | | |
| | | | Other Revenue — 0.1% | | | | |
| | 300 | | | South Dakota State Building Authority, Series A, Rev., 5.000%, 06/01/22 | | | 362 | |
| | | | | | | | |
| | | | Utility — 0.1% | | | | |
| | 555 | | | Heartland Consumers Power District, Unrefunded Balance, Rev., AGM, 6.000%, 01/01/17 (p) | | | 565 | |
| | | | | | | | |
| | | | Total South Dakota | | | 927 | |
| | | | | | | | |
| | | | Tennessee — 1.1% | | | | |
| | | | General Obligation — 0.2% | | | | |
| | 175 | | | Franklin Special School District, Limited Tax School Refunding & Improvement, GO, 5.000%, 06/01/31 | | | 220 | |
| | 400 | | | The Metropolitan Government of Nashville & Davidson County, GO, 4.000%, 01/01/31 | | | 467 | |
| | | | | | | | |
| | | | | | | 687 | |
| | | | | | | | |
| | | | Utility — 0.9% | | | | |
| | 1,955 | | | City Of Memphis, Tennessee Electric System, Rev., 5.000%, 12/01/28 | | | 2,534 | |
| | 535 | | | The City Of Clarksville, Tennessee Water, Sewer and Gas, Rev., 5.000%, 02/01/35 | | | 667 | |
| | | | | | | | |
| | | | | | | 3,201 | |
| | | | | | | | |
| | | | Total Tennessee | | | 3,888 | |
| | | | | | | | |
| | | | Texas — 8.1% | | | | |
| | | | Education — 1.5% | | | | |
| | 1,250 | | | Clifton Higher Education Finance Corp., Idea Public Schools, Rev., 6.000%, 08/15/33 | | | 1,524 | |
| | | | Tarrant County Cultural Education Facilities Finance Corp., Hendrick Medical Center, Hospital, | | | | |
| | 1,000 | | | Rev., 5.125%, 09/01/33 | | | 1,169 | |
| | 2,300 | | | Rev., 5.500%, 09/01/43 | | | 2,715 | |
| | | | | | | | |
| | | | | | | 5,408 | |
| | | | | | | | |
| | | | General Obligation — 0.7% | | | | |
| | 535 | | | City of Carrollton, GO, 5.000%, 08/15/26 | | | 597 | |
| | 1,645 | | | Wink Loving Independent School District, GO, 4.000%, 02/15/21 | | | 1,859 | |
| | | | | | | | |
| | | | | | | 2,456 | |
| | | | | | | | |
| | | | | | | | |
PRINCIPAL
AMOUNT($) | | | SECURITY DESCRIPTION | | VALUE($) | |
| | | | | | | | |
| | | | Hospital — 0.4% | | | | |
| | 1,375 | | | Harris County Health Facilities Development Corp., Texas Children’s Hospital Project, Rev., 5.500%, 10/01/19 (p)(w) | | | 1,492 | |
| | | | | | | | |
| | | | Prerefunded — 3.0% | | | | |
| | 4,435 | | | Canyon Regional Water Authority, Wells Ranch Project, Rev., AMBAC, 5.125%, 08/01/25 (p) | | | 4,621 | |
| | 2,200 | | | City of Forney, Independent School District, Series A, GO, PSF-GTD, 5.750%, 08/15/18 (p) | | | 2,419 | |
| | 3,500 | | | Harris County Health Facilities Development Corp., Memorial Hermann Healthcare System, Series B, Rev., 7.250%, 12/01/18 (p) | | | 4,011 | |
| | | | | | | | |
| | | | | | | 11,051 | |
| | | | | | | | |
| | | | Transportation — 1.3% | | | | |
| | 1,965 | | | Dallas-Fort Worth International Airport, Joint Improvement, Series A, Rev., 5.000%, 11/01/42 | | | 2,241 | |
| | 2,000 | | | North Texas Tollway Authority, Special Projects System, Series A, Rev., 6.000%, 09/01/41 | | | 2,448 | |
| | | | | | | | |
| | | | | | | 4,689 | |
| | | | | | | | |
| | | | Utility — 0.2% | | | | |
| | | | City of San Antonio, Electric & Gas Systems, | | | | |
| | 480 | | | Rev., 5.000%, 02/01/17 (p) | | | 489 | |
| | 85 | | | Rev., 5.000%, 02/01/32 | | | 107 | |
| | | | | | | | |
| | | | | | | 596 | |
| | | | | | | | |
| | | | Water & Sewer — 1.0% | | | | |
| | 2,500 | | | City of Houston, Water & Sewer System, Junior Lien, Series A, Rev., AGM, 5.750%, 12/01/32 (p) | | | 3,822 | |
| | | | | | | | |
| | | | Total Texas | | | 29,514 | |
| | | | | | | | |
| | | | Utah — 1.1% | | | | |
| | | | Other Revenue — 0.4% | | | | |
| | 1,270 | | | Municipal Building Authority Of West Valley City, Rev., 5.000%, 02/01/27 | | | 1,591 | |
| | 110 | | | Utah Infrastructure Agency Telecommunications and Franchise Tax, Rev., 4.000%, 10/15/40 | | | 122 | |
| | | | | | | | |
| | | | | | | 1,713 | |
| | | | | | | | |
| | | | Water & Sewer — 0.7% | | | | |
| | 2,000 | | | Jordan Valley Water Conservancy District, Series A, Rev., 5.000%, 10/01/46 | | | 2,476 | |
| | | | | | | | |
| | | | Total Utah | | | 4,189 | |
| | | | | | | | |
SEE NOTES TO FINANCIAL STATEMENTS.
| | | | | | |
| | | |
| 52 | | | | J.P. MORGAN MUNICIPAL BOND FUNDS | | AUGUST 31, 2016 |
| | | | | | | | |
PRINCIPAL
AMOUNT($) | | | SECURITY DESCRIPTION | | VALUE($) | |
| Municipal Bonds — continued | |
| | | | Virginia — 0.5% | | | | |
| | | | Transportation — 0.5% | | | | |
| | | | Capital Region Airport Commission (Richmond International Airport), | | | | |
| | 500 | | | Series A, Rev., 4.000%, 07/01/35 | | | 568 | |
| | 350 | | | Series A, Rev., 4.000%, 07/01/36 | | | 396 | |
| | 750 | | | Series A, Rev., 4.000%, 07/01/38 | | | 850 | |
| | | | | | | | |
| | | | Total Virginia | | | 1,814 | |
| | | | | | | | |
| | | | Washington — 4.6% | | | | |
| | | | Education — 1.9% | | | | |
| | 500 | | | Washington State University, Rev., 5.000%, 10/01/40 | | | 612 | |
| | 5,430 | | | Western Washington University, Housing & Dining System, Junior Lien, Series A, Rev., AMBAC, 5.500%, 10/01/22 | | | 6,360 | |
| | | | | | | | |
| | | | | | | 6,972 | |
| | | | | | | | |
| | | | General Obligation — 1.2% | | | | |
| | 2,500 | | | State Of Washington, Series 2017A, GO, 5.000%, 08/01/38 | | | 3,100 | |
| | 1,000 | | | State of Washington, Various Purpose, Series C, GO, 5.000%, 02/01/34 | | | 1,241 | |
| | | | | | | | |
| | | | | | | 4,341 | |
| | | | | | | | |
| | | | | | | | |
PRINCIPAL
AMOUNT($) | | | SECURITY DESCRIPTION | | VALUE($) | |
| | | | | | | | |
| | | | Prerefunded — 1.5% | | | | |
| | 5,000 | | | Washington Health Care Facilities Authority, Multicare Health System, Series A, Rev., AGM, 5.000%, 08/15/18 (p) | | | 5,423 | |
| | | | | | | | |
| | | | Total Washington | | | 16,736 | |
| | | | | | | | |
| | | | Total Municipal Bonds
(Cost $290,535) | | | 323,967 | |
| | | | | | | | |
| | |
| SHARES | | | | | | |
| Short-Term Investment — 14.2% | | | | |
| | | | Investment Company — 14.2% | | | | |
| | 51,970 | | | JPMorgan U.S. Government Money Market Fund, Institutional Class Shares, 0.310% (b) (l) (Cost $51,970) | | | 51,970 | |
| | | | | | | | |
| | | | Total Investments — 102.8%
(Cost $342,505) | | | 375,937 | |
| | | | Liabilities in Excess of
Other Assets — (2.8)% | | | (10,208 | ) |
| | | | | | | | |
| | | | NET ASSETS — 100.0% | | $ | 365,729 | |
| | | | | | | | |
Percentages indicated are based on net assets.
SEE NOTES TO FINANCIAL STATEMENTS.
| | | | | | | | |
| | | |
| AUGUST 31, 2016 | | J.P. MORGAN MUNICIPAL BOND FUNDS | | | | | 53 | |
J.P. Morgan Municipal Bond Funds
NOTES TO SCHEDULE OF PORTFOLIO INVESTMENTS
AS OF AUGUST 31, 2016 (Unaudited)
| | |
| AGC | | — Insured by Assured Guaranty Corp. |
| AGM | | — Insured by Assured Guaranty Municipal Corp. |
| AMBAC | | — Insured by American Municipal Bond Assurance Corp. |
| AMT | | — Alternative Minimum Tax |
| BHAC | | — Insured by Berkshire Hathaway Assurance Corp. |
| BRRH | | — Boca Raton Regional Hospital |
CHESLA | | — Connecticut Higher Education Supplemental Loan Authority |
| CMO | | — Collateralized Mortgage Obligation |
| COLL | | — Collateral |
| COP | | — Certificate of Participation |
| CR | | — Custodial Receipts |
| FGIC | | — Insured by Financial Guaranty Insurance Co. |
| FHA | | — Federal Housing Administration |
| FHLMC | | — Federal Home Loan Mortgage Corp. |
| FNMA | | — Federal National Mortgage Association |
| GNMA | | — Government National Mortgage Association |
| GO | | — General Obligation |
| GRAN | | — Grant Revenue Anticipation Note |
| GTD | | — Guaranteed |
| ICC | | — Insured Custody Certificates |
| MTA | | — Metropolitan Transportation Authority |
| NATL | | — Insured by National Public Finance Guarantee Corp. |
| | |
| PSF | | — Permanent School Fund |
| Q-SBLF | | — Qualified School Bond Loan Fund |
| RE | | — Reinsured |
| REMIC | | — Real Estate Mortgage Investment Conduit |
| Rev. | | — Revenue |
| SCSDE | | — South Carolina School District Enhancement |
| SIFMA | | — Securities Industry and Financial Markets Association |
| VAR | | — Variable Rate Security. The interest rate shown is the rate in effect as of August 31, 2016. |
| VRDO | | — Variable Rate Demand Obligation. The interest rate shown is the rate in effect as of August 31, 2016. |
| |
| (b) | | — Investment in affiliate. Money market fund is registered under the Investment Company Act of 1940, as amended, and advised by J.P. Morgan Investment Management Inc. |
| (g) | | — Amount rounds to less than 0.05%. |
| (l) | | — The rate shown is the current yield as of August 31, 2016. |
| (p) | | — Security is prerefunded or escrowed to maturity. |
| (t) | | — The date shown represents the earliest of the prerefunded date, next put date, or final maturity date. |
| (w) | | — All or a portion of the security is a when-issued security, delayed delivery security, or forward commitment. |
Detailed information about investment portfolios of the underlying funds can be found in shareholder reports filed with the Securities and Exchange Commission (SEC) by each such underlying fund semi-annually on Form N-CSR and in certified portfolio holdings filed quarterly on Form N-Q, and are available for download from both the SEC’s as well as each respective underlying fund’s website. Detailed information about underlying J.P. Morgan Funds can also be found at www.jpmorganfunds.com or by calling 1-800-480-4111.
SEE NOTES TO FINANCIAL STATEMENTS.
| | | | | | |
| | | |
| 54 | | | | J.P. MORGAN MUNICIPAL BOND FUNDS | | AUGUST 31, 2016 |
THIS PAGE IS INTENTIONALLY LEFT BLANK
| | | | | | | | |
| | | |
| AUGUST 31, 2016 | | J.P. MORGAN MUNICIPAL BOND FUNDS | | | | | 55 | |
STATEMENTS OF ASSETS AND LIABILITIES
AS OF AUGUST 31, 2016 (Unaudited)
(Amounts in thousands, except per share amounts)
| | | | | | | | | | | | | | | | |
| | | Municipal
Income Fund | | | Ohio
Municipal
Bond Fund | | | Short-
Intermediate
Municipal
Bond Fund | | | Tax Free
Bond Fund | |
ASSETS: | | | | | | | | | | | | | | | | |
Investments in non-affiliates, at value | | $ | 301,679 | | | $ | 129,755 | | | $ | 2,313,496 | | | $ | 323,967 | |
Investments in affiliates, at value | | | 10,171 | | | | 2,626 | | | | 85,536 | | | | 51,970 | |
| | | | | | | | | | | | | | | | |
Total investment securities, at value | | | 311,850 | | | | 132,381 | | | | 2,399,032 | | | | 375,937 | |
Cash | | | — | | | | — | | | | — | (a) | | | — | |
Receivables: | | | | | | | | | | | | | | | | |
Investment securities sold | | | 743 | | | | 25 | | | | 1,915 | | | | 108 | |
Investment securities sold — delayed delivery securities | | | 125 | | | | 30 | | | | 2,075 | | | | 3,082 | |
Fund shares sold | | | 305 | | | | 61 | | | | 2,316 | | | | 1,420 | |
Interest and dividends from non-affiliates | | | 3,217 | | | | 1,380 | | | | 21,577 | | | | 3,458 | |
Dividends from affiliates | | | 3 | | | | 1 | | | | 22 | | | | 9 | |
| | | | | | | | | | | | | | | | |
Total Assets | | | 316,243 | | | | 133,878 | | | | 2,426,937 | | | | 384,014 | |
| | | | | | | | | | | | | | | | |
| | | | |
LIABILITIES: | | | | | | | | | | | | | | | | |
Payables: | | | | | | | | | | | | | | | | |
Investment securities purchased | | | 1,247 | | | | — | | | | 25,596 | | | | 7,990 | |
Investment securities purchased — delayed delivery securities | | | 1,891 | | | | — | | | | 40,521 | | | | 9,617 | |
Fund shares redeemed | | | 192 | | | | 441 | | | | 3,149 | | | | 428 | |
Accrued liabilities: | | | | | | | | | | | | | | | | |
Investment advisory fees | | | 58 | | | | 31 | | | | 321 | | | | 63 | |
Administration fees | | | 9 | | | | 7 | | | | 70 | | | | 9 | |
Distribution fees | | | 29 | | | | 29 | | | | 18 | | | | 60 | |
Shareholder servicing fees | | | 54 | | | | 15 | | | | 44 | | | | 35 | |
Custodian and accounting fees | | | 7 | | | | 8 | | | | 54 | | | | 11 | |
Trustees’ and Chief Compliance Officer’s fees | | | — | (a) | | | 1 | | | | 2 | | | | — | |
Audit fees | | | 32 | | | | 33 | | | | 29 | | | | 40 | |
Other | | | 21 | | | | 18 | | | | 125 | | | | 32 | |
| | | | | | | | | | | | | | | | |
Total Liabilities | | | 3,540 | | | | 583 | | | | 69,929 | | | | 18,285 | |
| | | | | | | | | | | | | | | | |
Net Assets | | $ | 312,703 | | | $ | 133,295 | | | $ | 2,357,008 | | | $ | 365,729 | |
| | | | | | | | | | | | | | | | |
| (a) | Amount rounds to less than 500. |
SEE NOTES TO FINANCIAL STATEMENTS.
| | | | | | |
| | | |
| 56 | | | | J.P. MORGAN MUNICIPAL BOND FUNDS | | AUGUST 31, 2016 |
| | | | | | | | | | | | | | | | |
| | | Municipal
Income Fund | | | Ohio
Municipal
Bond Fund | | | Short-
Intermediate
Municipal
Bond Fund | | | Tax Free
Bond Fund | |
NET ASSETS: | | | | | | | | | | | | | | | | |
Paid-in-Capital | | $ | 290,329 | | | $ | 122,320 | | | $ | 2,290,131 | | | $ | 325,555 | |
Accumulated undistributed (distributions in excess of) net investment income | | | (34 | ) | | | (6 | ) | | | (143 | ) | | | (50 | ) |
Accumulated net realized gains (losses) | | | 3,514 | | | | 655 | | | | 10,228 | | | | 6,792 | |
Net unrealized appreciation (depreciation) | | | 18,894 | | | | 10,326 | | | | 56,792 | | | | 33,432 | |
| | | | | | | | | | | | | | | | |
Total Net Assets | | $ | 312,703 | | | $ | 133,295 | | | $ | 2,357,008 | | | $ | 365,729 | |
| | | | | | | | | | | | | | | | |
| | | | |
Net Assets: | | | | | | | | | | | | | | | | |
Class A | | $ | 82,515 | | | $ | 50,951 | | | $ | 37,863 | | | $ | 174,844 | |
Class C | | | 19,203 | | | | 29,069 | | | | 16,228 | | | | 36,466 | |
Institutional Class | | | — | | | | — | | | | 2,143,937 | | | | — | |
Select Class | | | 210,985 | | | | 53,275 | | | | 158,980 | | | | 154,419 | |
| | | | | | | | | | | | | | | | |
Total | | $ | 312,703 | | | $ | 133,295 | | | $ | 2,357,008 | | | $ | 365,729 | |
| | | | | | | | | | | | | | | | |
| | | | |
Outstanding units of beneficial interest (shares) ($0.0001 par value; unlimited number of shares authorized): | | | | | | | | | | | | | | | | |
Class A | | | 8,094 | | | | 4,610 | | | | 3,516 | | | | 13,598 | |
Class C | | | 1,901 | | | | 2,616 | | | | 1,495 | | | | 2,858 | |
Institutional Class | | | — | | | | — | | | | 198,105 | | | | — | |
Select Class | | | 20,834 | | | | 4,852 | | | | 14,723 | | | | 12,056 | |
| | | | |
Net Asset Value (a): | | | | | | | | | | | | | | | | |
Class A — Redemption price per share | | $ | 10.19 | | | $ | 11.05 | | | $ | 10.77 | | | $ | 12.86 | |
Class C — Offering price per share (b) | | | 10.10 | | | | 11.11 | | | | 10.85 | | | | 12.76 | |
Institutional Class — Offering and redemption price per share | | | — | | | | — | | | | 10.82 | | | | — | |
Select Class — Offering and redemption price per share | | | 10.13 | | | | 10.98 | | | | 10.80 | | | | 12.81 | |
Class A maximum sales charge | | | 3.75 | % | | | 3.75 | % | | | 2.25 | % | | | 3.75 | % |
Class A maximum public offering price per share
[net asset value per share/(100% — maximum sales charge)] | | $ | 10.59 | | | $ | 11.48 | | | $ | 11.02 | | | $ | 13.36 | |
| | | | | | | | | | | | | | | | |
| | | | |
Cost of investments in non-affiliates | | $ | 282,785 | | | $ | 119,429 | | | $ | 2,256,704 | | | $ | 290,535 | |
Cost of investments in affiliates | | | 10,171 | | | | 2,626 | | | | 85,536 | | | | 51,970 | |
| (a) | Per share amounts may not recalculate due to rounding of net assets and/or shares outstanding. |
| (b) | Redemption price for Class C Shares varies based upon length of time the shares are held. |
SEE NOTES TO FINANCIAL STATEMENTS.
| | | | | | | | |
| | | |
| AUGUST 31, 2016 | | J.P. MORGAN MUNICIPAL BOND FUNDS | | | | | 57 | |
STATEMENTS OF OPERATIONS
FOR THE SIX MONTHS ENDED AUGUST 31, 2016 (Unaudited)
(Amounts in thousands)
| | | | | | | | | | | | | | | | |
| | | Municipal
Income Fund | | | Ohio
Municipal
Bond Fund | | | Short-
Intermediate
Municipal
Bond Fund | | | Tax Free
Bond Fund | |
INVESTMENT INCOME: | |
Interest income from non-affiliates | | $ | 4,830 | | | $ | 2,323 | | | $ | 19,467 | | | $ | 6,376 | |
Dividend income from non-affiliates | | | 158 | | | | — | | | | — | | | | — | |
Dividend income from affiliates | | | 10 | | | | 2 | | | | 62 | | | | 24 | |
| | | | | | | | | | | | | | | | |
Total investment income | | | 4,998 | | | | 2,325 | | | | 19,529 | | | | 6,400 | |
| | | | | | | | | | | | | | | | |
|
EXPENSES: | |
Investment advisory fees | | | 475 | | | | 201 | | | | 3,063 | | | | 501 | |
Administration fees | | | 130 | | | | 55 | | | | 1,005 | | | | 137 | |
Distribution fees: | | | | | | | | | | | | | | | | |
Class A | | | 100 | | | | 64 | | | | 50 | | | | 206 | |
Class C | | | 66 | | | | 105 | | | | 63 | | | | 119 | |
Shareholder servicing fees: | | | | | | | | | | | | | | | | |
Class A | | | 100 | | | | 64 | | | | 50 | | | | 206 | |
Class C | | | 22 | | | | 35 | | | | 21 | | | | 40 | |
Institutional Class | | | — | | | | — | | | | 1,119 | | | | — | |
Select Class | | | 275 | | | | 68 | | | | 194 | | | | 171 | |
Custodian and accounting fees | | | 42 | | | | 40 | | | | 135 | | | | 45 | |
Interest expense to affiliates | | | — | (a) | | | — | | | | — | | | | — | |
Professional fees | | | 29 | | | | 27 | | | | 33 | | | | 36 | |
Trustees’ and Chief Compliance Officer’s fees | | | 11 | | | | 12 | | | | 14 | | | | 11 | |
Printing and mailing costs | | | 5 | | | | 6 | | | | 42 | | | | 7 | |
Registration and filing fees | | | 22 | | | | 7 | | | | 61 | | | | 31 | |
Transfer agency fees (See Note 2.D.) | | | 4 | | | | 4 | | | | 13 | | | | 13 | |
Sub-transfer agency fees (See Note 2.D.) | | | 18 | | | | 10 | | | | 178 | | | | 27 | |
Other | | | 3 | | | | 4 | | | | 19 | | | | 6 | |
| | | | | | | | | | | | | | | | |
Total expenses | | | 1,302 | | | | 702 | | | | 6,060 | | | | 1,556 | |
| | | | | | | | | | | | | | | | |
Less fees waived | | | (236 | ) | | | (93 | ) | | | (2,533 | ) | | | (462 | ) |
Less earnings credits | | | — | | | | — | | | | — | (a) | | | — | |
Less expense reimbursements | | | — | | | | — | | | | (130 | ) | | | — | |
| | | | | | | | | | | | | | | | |
Net expenses | | | 1,066 | | | | 609 | | | | 3,397 | | | | 1,094 | |
| | | | | | | | | | | | | | | | |
Net investment income (loss) | | | 3,932 | | | | 1,716 | | | | 16,132 | | | | 5,306 | |
| | | | | | | | | | | | | | | | |
| | | | |
REALIZED/UNREALIZED GAINS (LOSSES): | | | | | | | | | | | | | | | | |
Net realized gain (loss) on transactions from investments in non-affiliates | | | 3,523 | | | | 263 | | | | 9,024 | | | | 4,727 | |
Change in net unrealized appreciation/depreciation on investments in non-affiliates | | | (358 | ) | | | 318 | | | | 4,399 | | | | 2,414 | |
| | | | | | | | | | | | | | | | |
Net realized/unrealized gains (losses) | | | 3,165 | | | | 581 | | | | 13,423 | | | | 7,141 | |
| | | | | | | | | | | | | | | | |
Change in net assets resulting from operations | | $ | 7,097 | | | $ | 2,297 | | | $ | 29,555 | | | $ | 12,447 | |
| | | | | | | | | | | | | | | | |
| (a) | Amount rounds to less than 500. |
SEE NOTES TO FINANCIAL STATEMENTS.
| | | | | | |
| | | |
| 58 | | | | J.P. MORGAN MUNICIPAL BOND FUNDS | | AUGUST 31, 2016 |
STATEMENTS OF CHANGES IN NET ASSETS
FOR THE PERIODS INDICATED
(Amounts in thousands)
| | | | | | | | | | | | | | | | |
| | | Municipal Income Fund | | | Ohio Municipal Bond Fund | |
| | | Six Months Ended
August 31, 2016
(Unaudited) | | | Year Ended
February 29, 2016 | | | Six Months Ended
August 31, 2016
(Unaudited) | | | Year Ended
February 29, 2016 | |
CHANGE IN NET ASSETS RESULTING FROM OPERATIONS: | | | | | | | | | | | | | | | | |
Net investment income (loss) | | $ | 3,932 | | | $ | 8,523 | | | $ | 1,716 | | | $ | 3,902 | |
Net realized gain (loss) | | | 3,523 | | | | 2,323 | | | | 263 | | | | 881 | |
Distributions of capital gains received from investment company affiliates | | | — | | | | 2 | | | | — | | | | — | (a) |
Change in net unrealized appreciation/depreciation | | | (358 | ) | | | (284 | ) | | | 318 | | | | (1,269 | ) |
| | | | | | | | | | | | | | | | |
Change in net assets resulting from operations | | | 7,097 | | | | 10,564 | | | | 2,297 | | | | 3,514 | |
| | | | | | | | | | | | | | | | |
| | | |
DISTRIBUTIONS TO SHAREHOLDERS: | | | | | | | | | | | | | |
Class A | | | | | | | | | | | | | | | | |
From net investment income | | | (970 | ) | | | (1,746 | ) | | | (680 | ) | | | (1,480 | ) |
From net realized gains | | | — | | | | (513 | ) | | | — | | | | (470 | ) |
Class B (b) | | | | | | | | | | | | | | | | |
From net investment income | | | — | | | | — | (a) | | | — | | | | (3 | ) |
Class C | | | | | | | | | | | | | | | | |
From net investment income | | | (165 | ) | | | (289 | ) | | | (281 | ) | | | (604 | ) |
From net realized gains | | | — | | | | (105 | ) | | | — | | | | (240 | ) |
Select Class | | | | | | | | | | | | | | | | |
From net investment income | | | (2,899 | ) | | | (6,683 | ) | | | (789 | ) | | | (1,922 | ) |
From net realized gains | | | — | | | | (1,813 | ) | | | — | | | | (526 | ) |
| | | | | | | | | | | | | | | | |
Total distributions to shareholders | | | (4,034 | ) | | | (11,149 | ) | | | (1,750 | ) | | | (5,245 | ) |
| | | | | | | | | | | | | | | | |
| | | | |
CAPITAL TRANSACTIONS: | | | | | | | | | | | | | | | | |
Change in net assets resulting from capital transactions | | | (25,294 | ) | | | (2,140 | ) | | | 465 | | | | (15,915 | ) |
| | | | | | | | | | | | | | | | |
| | | | |
NET ASSETS: | | | | | | | | | | | | | | | | |
Change in net assets | | | (22,231 | ) | | | (2,725 | ) | | | 1,012 | | | | (17,646 | ) |
Beginning of period | | | 334,934 | | | | 337,659 | | | | 132,283 | | | | 149,929 | |
| | | | | | | | | | | | | | | | |
End of period | | $ | 312,703 | | | $ | 334,934 | | | $ | 133,295 | | | $ | 132,283 | |
| | | | | | | | | | | | | | | | |
Accumulated undistributed (distributions in excess of) net investment income | | $ | (34 | ) | | $ | 68 | | | $ | (6 | ) | | $ | 28 | |
| | | | | | | | | | | | | | | | |
| (a) | Amount rounds to less than 500. |
| (b) | All remaining Class B Shares converted to Class A Shares on June 19, 2015. |
SEE NOTES TO FINANCIAL STATEMENTS.
| | | | | | | | |
| | | |
| AUGUST 31, 2016 | | J.P. MORGAN MUNICIPAL BOND FUNDS | | | | | 59 | |
STATEMENTS OF CHANGES IN NET ASSETS
FOR THE PERIODS INDICATED (continued)
(Amounts in thousands)
| | | | | | | | | | | | | | | | |
| | | Short-Intermediate Municipal Bond Fund | | | Tax Free Bond Fund | |
| | | Six Months Ended
August 31, 2016
(Unaudited) | | | Year Ended
February 29, 2016 | | | Six Months Ended
August 31, 2016
(Unaudited) | | | Year Ended
February 29, 2016 | |
CHANGE IN NET ASSETS RESULTING FROM OPERATIONS: | | | | | | | | | | | | | | | | |
Net investment income (loss) | | $ | 16,132 | | | $ | 36,155 | | | $ | 5,306 | | | $ | 11,022 | |
Net realized gain (loss) | | | 9,024 | | | | 4,455 | | | | 4,727 | | | | 3,539 | |
Distributions of capital gains received from investment company affiliates | | | — | | | | 3 | | | | — | | | | 2 | |
Change in net unrealized appreciation/depreciation | | | 4,399 | | | | 22,057 | | | | 2,414 | | | | (4,498 | ) |
| | | | | | | | | | | | | | | | |
Change in net assets resulting from operations | | | 29,555 | | | | 62,670 | | | | 12,447 | | | | 10,065 | |
| | | | | | | | | | | | | | | | |
| | | | |
DISTRIBUTIONS TO SHAREHOLDERS: | | | | | | | | | | | | | | | | |
Class A | | | | | | | | | | | | | | | | |
From net investment income | | | (180 | ) | | | (279 | ) | | | (2,613 | ) | | | (5,422 | ) |
From net realized gains | | | — | | | | — | | | | — | | | | (1,137 | ) |
Class B (a) | | | | | | | | | | | | | | | | |
From net investment income | | | — | | | | — | (b) | | | — | | | | (3 | ) |
Class C | | | | | | | | | | | | | | | | |
From net investment income | | | (35 | ) | | | (34 | ) | | | (406 | ) | | | (774 | ) |
From net realized gains | | | — | | | | — | | | | — | | | | (190 | ) |
Institutional Class | | | | | | | | | | | | | | | | |
From net investment income | | | (15,603 | ) | | | (34,727 | ) | | | — | | | | — | |
Select Class | | | | | | | | | | | | | | | | |
From net investment income | | | (919 | ) | | | (1,502 | ) | | | (2,311 | ) | | | (5,128 | ) |
From net realized gains | | | — | | | | — | | | | — | | | | (966 | ) |
| | | | | | | | | | | | | | | | |
Total distributions to shareholders | | | (16,737 | ) | | | (36,542 | ) | | | (5,330 | ) | | | (13,620 | ) |
| | | | | | | | | | | | | | | | |
| | | | |
CAPITAL TRANSACTIONS: | | | | | | | | | | | | | | | | |
Change in net assets resulting from capital transactions | | | (316,222 | ) | | | (450,440 | ) | | | 53,599 | | | | (35,086 | ) |
| | | | | | | | | | | | | | | | |
| | | | |
NET ASSETS: | | | | | | | | | | | | | | | | |
Change in net assets | | | (303,404 | ) | | | (424,312 | ) | | | 60,716 | | | | (38,641 | ) |
Beginning of period | | | 2,660,412 | | | | 3,084,724 | | | | 305,013 | | | | 343,654 | |
| | | | | | | | | | | | | | | | |
End of period | | $ | 2,357,008 | | | $ | 2,660,412 | | | $ | 365,729 | | | $ | 305,013 | |
| | | | | | | | | | | | | | | | |
Accumulated undistributed (distributions in excess of) net investment income | | $ | (143 | ) | | $ | 462 | | | $ | (50 | ) | | $ | (26 | ) |
| | | | | | | | | | | | | | | | |
| (a) | All remaining Class B Shares converted to Class A Shares on June 19, 2015. |
| (b) | Amount rounds to less than 500. |
SEE NOTES TO FINANCIAL STATEMENTS.
| | | | | | |
| | | |
| 60 | | | | J.P. MORGAN MUNICIPAL BOND FUNDS | | AUGUST 31, 2016 |
| | | | | | | | | | | | | | | | |
| | | Municipal Income Fund | | | Ohio Municipal Bond Fund | |
| | | Six Months Ended
August 31, 2016
(Unaudited) | | | Year Ended
February 29, 2016 | | | Six Months Ended
August 31, 2016
(Unaudited) | | | Year Ended
February 29, 2016 | |
CAPITAL TRANSACTIONS: | | | | | | | | | | | | | | | | |
Class A | | | | | | | | | | | | | | | | |
Proceeds from shares issued | | $ | 13,996 | | | $ | 16,000 | | | $ | 1,865 | | | $ | 3,024 | |
Distributions reinvested | | | 950 | | | | 2,210 | | | | 636 | | | | 1,825 | |
Cost of shares redeemed | | | (6,299 | ) | | | (13,070 | ) | | | (2,673 | ) | | | (5,644 | ) |
Conversion from Class B Shares | | | — | | | | 31 | | | | — | | | | 459 | |
| | | | | | | | | | | | | | | | |
Change in net assets resulting from Class A capital transactions | | $ | 8,647 | | | $ | 5,171 | | | $ | (172 | ) | | $ | (336 | ) |
| | | | | | | | | | | | | | | | |
Class B (a) | | | | | | | | | | | | | | | | |
Proceeds from shares issued | | $ | — | | | $ | — | (b) | | $ | — | | | $ | 1 | |
Distributions reinvested | | | — | | | | — | (b) | | | — | | | | 2 | |
Cost of shares redeemed | | | — | | | | (10 | ) | | | — | | | | (72 | ) |
Conversion to Class A Shares | | | — | | | | (31 | ) | | | — | | | | (459 | ) |
| | | | | | | | | | | | | | | | |
Change in net assets resulting from Class B capital transactions | | $ | — | | | $ | (41 | ) | | $ | — | | | $ | (528 | ) |
| | | | | | | | | | | | | | | | |
Class C | | | | | | | | | | | | | | | | |
Proceeds from shares issued | | $ | 4,322 | | | $ | 4,893 | | | $ | 3,429 | | | $ | 2,398 | |
Distributions reinvested | | | 149 | | | | 346 | | | | 270 | | | | 815 | |
Cost of shares redeemed | | | (1,383 | ) | | | (3,716 | ) | | | (1,293 | ) | | | (3,608 | ) |
| | | | | | | | | | | | | | | | |
Change in net assets resulting from Class C capital transactions | | $ | 3,088 | | | $ | 1,523 | | | $ | 2,406 | | | $ | (395 | ) |
| | | | | | | | | | | | | | | | |
Select Class | | | | | | | | | | | | | | | | |
Proceeds from shares issued | | $ | 27,867 | | | $ | 87,128 | | | $ | 3,412 | | | $ | 5,370 | |
Distributions reinvested | | | 420 | | | | 1,019 | | | | 593 | | | | 1,753 | |
Cost of shares redeemed | | | (65,316 | ) | | | (96,940 | ) | | | (5,774 | ) | | | (21,779 | ) |
| | | | | | | | | | | | | | | | |
Change in net assets resulting from Select Class capital transactions | | $ | (37,029 | ) | | $ | (8,793 | ) | | $ | (1,769 | ) | | $ | (14,656 | ) |
| | | | | | | | | | | | | | | | |
Total change in net assets resulting from capital transactions | | $ | (25,294 | ) | | $ | (2,140 | ) | | $ | 465 | | | $ | (15,915 | ) |
| | | | | | | | | | | | | | | | |
| (a) | All remaining Class B Shares converted to Class A Shares on June 19, 2015. |
| (b) | Amount rounds to less than 500. |
SEE NOTES TO FINANCIAL STATEMENTS.
| | | | | | | | |
| | | |
| AUGUST 31, 2016 | | J.P. MORGAN MUNICIPAL BOND FUNDS | | | | | 61 | |
STATEMENTS OF CHANGES IN NET ASSETS
FOR THE PERIODS INDICATED (continued)
(Amounts in thousands)
| | | | | | | | | | | | | | | | |
| | | Municipal Income Fund | | | Ohio Municipal Bond Fund | |
| | | Six Months Ended
August 31, 2016
(Unaudited) | | | Year Ended
February 29, 2016 | | | Six Months Ended
August 31, 2016
(Unaudited) | | | Year Ended
February 29, 2016 | |
SHARE TRANSACTIONS: | | | | | | | | | | | | | | | | |
Class A | | | | | | | | | | | | | | | | |
Issued | | | 1,378 | | | | 1,592 | | | | 169 | | | | 274 | |
Reinvested | | | 93 | | | | 221 | | | | 58 | | | | 166 | |
Redeemed | | | (619 | ) | | | (1,302 | ) | | | (242 | ) | | | (512 | ) |
Conversion from Class B Shares | | | — | | | | 3 | | | | — | | | | 42 | |
| | | | | | | | | | | | | | | | |
Change in Class A Shares | | | 852 | | | | 514 | | | | (15 | ) | | | (30 | ) |
| | | | | | | | | | | | | | | | |
Class B (a) | | | | | | | | | | | | | | | | |
Issued | | | — | | | | — | (b) | | | — | | | | 1 | |
Reinvested | | | — | | | | — | (b) | | | — | | | | — | (b) |
Redeemed | | | — | | | | (1 | ) | | | — | | | | (7 | ) |
Conversion to Class A Shares | | | — | | | | (3 | ) | | | — | | | | (41 | ) |
| | | | | | | | | | | | | | | | |
Change in Class B Shares | | | — | | | | (4 | ) | | | — | | | | (47 | ) |
| | | | | | | | | | | | | | | | |
Class C | | | | | | | | | | | | | | | | |
Issued | | | 429 | | | | 489 | | | | 308 | | | | 216 | |
Reinvested | | | 15 | | | | 35 | | | | 24 | | | | 74 | |
Redeemed | | | (137 | ) | | | (374 | ) | | | (116 | ) | | | (326 | ) |
| | | | | | | | | | | | | | | | |
Change in Class C Shares | | | 307 | | | | 150 | | | | 216 | | | | (36 | ) |
| | | | | | | | | | | | | | | | |
Select Class | | | | | | | | | | | | | | | | |
Issued | | | 2,759 | | | | 8,731 | | | | 311 | | | | 490 | |
Reinvested | | | 42 | | | | 102 | | | | 54 | | | | 160 | |
Redeemed | | | (6,479 | ) | | | (9,723 | ) | | | (525 | ) | | | (1,986 | ) |
| | | | | | | | | | | | | | | | |
Change in Select Class Shares | | | (3,678 | ) | | | (890 | ) | | | (160 | ) | | | (1,336 | ) |
| | | | | | | | | | | | | | | | |
| (a) | All remaining Class B Shares converted to Class A Shares on June 19, 2015. |
| (b) | Amount rounds to less than 500. |
SEE NOTES TO FINANCIAL STATEMENTS.
| | | | | | |
| | | |
| 62 | | | | J.P. MORGAN MUNICIPAL BOND FUNDS | | AUGUST 31, 2016 |
| | | | | | | | | | | | | | | | |
| | | Short-Intermediate Municipal Bond Fund | | | Tax Free Bond Fund | |
| | | Six Months Ended
August 31, 2016
(Unaudited) | | | Year Ended
February 29, 2016 | | | Six Months Ended
August 31, 2016
(Unaudited) | | | Year Ended
February 29, 2016 | |
CAPITAL TRANSACTIONS: | | | | | | | | | | | | | | | | |
Class A | | | | | | | | | | | | | | | | |
Proceeds from shares issued | | $ | 6,602 | | | $ | 9,633 | | | $ | 34,317 | | | $ | 37,119 | |
Distributions reinvested | | | 176 | | | | 269 | | | | 2,515 | | | | 6,297 | |
Cost of shares redeemed | | | (7,478 | ) | | | (12,393 | ) | | | (17,780 | ) | | | (56,410 | ) |
Conversion from Class B Shares | | | — | | | | 40 | | | | — | | | | 381 | |
| | | | | | | | | | | | | | | | |
Change in net assets resulting from Class A capital transactions | | $ | (700 | ) | | $ | (2,451 | ) | | $ | 19,052 | | | $ | (12,613 | ) |
| | | | | | | | | | | | | | | | |
Class B (a) | | | | | | | | | | | | | | | | |
Proceeds from shares issued | | $ | — | | | $ | — | (b) | | $ | — | | | $ | — | (b) |
Distributions reinvested | | | — | | | | — | (b) | | | — | | | | 3 | |
Cost of shares redeemed | | | — | | | | — | | | | — | | | | (228 | ) |
Conversion to Class A Shares | | | — | | | | (40 | ) | | | — | | | | (381 | ) |
| | | | | | | | | | | | | | | | |
Change in net assets resulting from Class B capital transactions | | $ | — | | | $ | (40 | ) | | $ | — | | | $ | (606 | ) |
| | | | | | | | | | | | | | | | |
Class C | | | | | | | | | | | | | | | | |
Proceeds from shares issued | | $ | 1,030 | | | $ | 6,849 | | | $ | 12,394 | | | $ | 5,451 | |
Distributions reinvested | | | 31 | | | | 30 | | | | 397 | | | | 947 | |
Cost of shares redeemed | | | (2,629 | ) | | | (7,401 | ) | | | (3,699 | ) | | | (6,982 | ) |
| | | | | | | | | | | | | | | | |
Change in net assets resulting from Class C capital transactions | | $ | (1,568 | ) | | $ | (522 | ) | | $ | 9,092 | | | $ | (584 | ) |
| | | | | | | | | | | | | | | | |
Institutional Class | | | | | | | | | | | | | | | | |
Proceeds from shares issued | | $ | 261,206 | | | $ | 1,058,123 | | | $ | — | | | $ | — | |
Distributions reinvested | | | 3,670 | | | | 5,951 | | | | — | | | | — | |
Cost of shares redeemed | | | (586,037 | ) | | | (1,492,628 | ) | | | — | | | | — | |
| | | | | | | | | | | | | | | | |
Change in net assets resulting from Institutional Class capital transactions | | $ | (321,161 | ) | | $ | (428,554 | ) | | $ | — | | | $ | — | |
| | | | | | | | | | | | | | | | |
Select Class | | | | | | | | | | | | | | | | |
Proceeds from shares issued | | $ | 22,294 | | | $ | 47,246 | | | $ | 38,354 | | | $ | 27,990 | |
Distributions reinvested | | | 144 | | | | 286 | | | | 1,082 | | | | 2,391 | |
Cost of shares redeemed | | | (15,231 | ) | | | (66,405 | ) | | | (13,981 | ) | | | (51,664 | ) |
| | | | | | | | | | | | | | | | |
Change in net assets resulting from Select Class capital transactions | | $ | 7,207 | | | $ | (18,873 | ) | | $ | 25,455 | | | $ | (21,283 | ) |
| | | | | | | | | | | | | | | | |
Total change in net assets resulting from capital transactions | | $ | (316,222 | ) | | $ | (450,440 | ) | | $ | 53,599 | | | $ | (35,086 | ) |
| | | | | | | | | | | | | | | | |
| (a) | All remaining Class B Shares converted to Class A Shares on June 19, 2015. |
| (b) | Amount rounds to less than 500. |
SEE NOTES TO FINANCIAL STATEMENTS.
| | | | | | | | |
| | | |
| AUGUST 31, 2016 | | J.P. MORGAN MUNICIPAL BOND FUNDS | | | | | 63 | |
STATEMENTS OF CHANGES IN NET ASSETS
FOR THE PERIODS INDICATED (continued)
(Amounts in thousands)
| | | | | | | | | | | | | | | | |
| | | Short-Intermediate Municipal Bond Fund | | | Tax Free Bond Fund | |
| | | Six Months Ended
August 31, 2016
(Unaudited) | | | Year Ended
February 29, 2016 | | | Six Months Ended
August 31, 2016
(Unaudited) | | | Year Ended
February 29, 2016 | |
SHARE TRANSACTIONS: | | | | | | | | | | | | | | | | |
Class A | | | | | | | | | | | | | | | | |
Issued | | | 616 | | | | 910 | | | | 2,686 | | | | 2,962 | |
Reinvested | | | 16 | | | | 25 | | | | 197 | | | | 503 | |
Redeemed | | | (696 | ) | | | (1,170 | ) | | | (1,389 | ) | | | (4,496 | ) |
Conversion from Class B Shares | | | — | | | | 4 | | | | — | | | | 31 | |
| | | | | | | | | | | | | | | | |
Change in Class A Shares | | | (64 | ) | | | (231 | ) | | | 1,494 | | | | (1,000 | ) |
| | | | | | | | | | | | | | | | |
Class B (a) | | | | | | | | | | | | | | | | |
Issued | | | — | | | | — | (b) | | | — | | | | — | (b) |
Reinvested | | | — | | | | — | (b) | | | — | | | | — | (b) |
Redeemed | | | — | | | | — | | | | — | | | | (18 | ) |
Conversion to Class A Shares | | | — | | | | (4 | ) | | | — | | | | (31 | ) |
| | | | | | | | | | | | | | | | |
Change in Class B Shares | | | — | | | | (4 | ) | | | — | | | | (49 | ) |
| | | | | | | | | | | | | | | | |
Class C | | | | | | | | | | | | | | | | |
Issued | | | 94 | | | | 640 | | | | 978 | | | | 437 | |
Reinvested | | | 3 | | | | 3 | | | | 32 | | | | 76 | |
Redeemed | | | (243 | ) | | | (692 | ) | | | (292 | ) | | | (561 | ) |
| | | | | | | | | | | | | | | | |
Change in Class C Shares | | | (146 | ) | | | (49 | ) | | | 718 | | | | (48 | ) |
| | | | | | | | | | | | | | | | |
Institutional Class | | | | | | | | | | | | | | | | |
Issued | | | 24,211 | | | | 99,256 | | | | — | | | | — | |
Reinvested | | | 340 | | | | 558 | | | | — | | | | — | |
Redeemed | | | (54,397 | ) | | | (139,661 | ) | | | — | | | | — | |
| | | | | | | | | | | | | | | | |
Change in Institutional Class Shares | | | (29,846 | ) | | | (39,847 | ) | | | — | | | | — | |
| | | | | | | | | | | | | | | | |
Select Class | | | | | | | | | | | | | | | | |
Issued | | | 2,071 | | | | 4,432 | | | | 3,010 | | | | 2,236 | |
Reinvested | | | 14 | | | | 27 | | | | 85 | | | | 192 | |
Redeemed | | | (1,415 | ) | | | (6,244 | ) | | | (1,104 | ) | | | (4,147 | ) |
| | | | | | | | | | | | | | | | |
Change in Select Class Shares | | | 670 | | | | (1,785 | ) | | | 1,991 | | | | (1,719 | ) |
| | | | | | | | | | | | | | | | |
| (a) | All remaining Class B Shares converted to Class A Shares on June 19, 2015. |
| (b) | Amount rounds to less than 500. |
SEE NOTES TO FINANCIAL STATEMENTS.
| | | | | | |
| | | |
| 64 | | | | J.P. MORGAN MUNICIPAL BOND FUNDS | | AUGUST 31, 2016 |
THIS PAGE IS INTENTIONALLY LEFT BLANK
| | | | | | | | |
| | | |
| AUGUST 31, 2016 | | J.P. MORGAN MUNICIPAL BOND FUNDS | | | | | 65 | |
FINANCIAL HIGHLIGHTS
FOR THE PERIODS INDICATED
| | | | | | | | | | | | | | | | | | | | | | | | | | | | |
| | | Per share operating performance | |
| | | | | | Investment operations | | | Distributions | |
| | | Net asset
value,
beginning
of period | | | Net
investment
income
(loss)(b) | | |
Net realized
and unrealized
gains
(losses) on
investments | | | Total from
investment
operations | | | Net
investment
income | | | Net
realized
gain | | | Total
distributions | |
Municipal Income Fund | | | | | | | | | | | | | | | | | | | | | | | | | | | | |
Class A | | | | | | | | | |
Six Months Ended August 31, 2016 (Unaudited) | | $ | 10.10 | | | $ | 0.12 | | | $ | 0.09 | | | $ | 0.21 | | | $ | (0.12 | ) | | $ | — | | | $ | (0.12 | ) |
Year Ended February 29, 2016 | | | 10.11 | | | | 0.25 | | | | 0.08 | | | | 0.33 | | | | (0.26 | ) | | | (0.08 | ) | | | (0.34 | ) |
Year Ended February 28, 2015 | | | 9.98 | | | | 0.27 | | | | 0.18 | | | | 0.45 | | | | (0.27 | ) | | | (0.05 | ) | | | (0.32 | ) |
Year Ended February 28, 2014 | | | 10.41 | | | | 0.28 | | | | (0.28 | ) | | | — | (g) | | | (0.29 | ) | | | (0.14 | ) | | | (0.43 | ) |
Year Ended February 28, 2013 | | | 10.35 | | | | 0.29 | | | | 0.05 | | | | 0.34 | | | | (0.28 | ) | | | — | | | | (0.28 | ) |
Year Ended February 29, 2012 | | | 9.86 | | | | 0.30 | | | | 0.50 | | | | 0.80 | | | | (0.31 | ) | | | — | | | | (0.31 | ) |
| | |
Class C | | | | | | | | | |
Six Months Ended August 31, 2016 (Unaudited) | | | 10.00 | | | | 0.09 | | | | 0.10 | | | | 0.19 | | | | (0.09 | ) | | | — | | | | (0.09 | ) |
Year Ended February 29, 2016 | | | 10.02 | | | | 0.19 | | | | 0.07 | | | | 0.26 | | | | (0.20 | ) | | | (0.08 | ) | | | (0.28 | ) |
Year Ended February 28, 2015 | | | 9.90 | | | | 0.21 | | | | 0.17 | | | | 0.38 | | | | (0.21 | ) | | | (0.05 | ) | | | (0.26 | ) |
Year Ended February 28, 2014 | | | 10.33 | | | | 0.22 | | | | (0.28 | ) | | | (0.06 | ) | | | (0.23 | ) | | | (0.14 | ) | | | (0.37 | ) |
Year Ended February 28, 2013 | | | 10.27 | | | | 0.23 | | | | 0.06 | | | | 0.29 | | | | (0.23 | ) | | | — | | | | (0.23 | ) |
Year Ended February 29, 2012 | | | 9.78 | | | | 0.24 | | | | 0.50 | | | | 0.74 | | | | (0.25 | ) | | | — | | | | (0.25 | ) |
|
Select Class | |
Six Months Ended August 31, 2016 (Unaudited) | | | 10.03 | | | | 0.13 | | | | 0.11 | | | | 0.24 | | | | (0.14 | ) | | | — | | | | (0.14 | ) |
Year Ended February 29, 2016 | | | 10.04 | | | | 0.28 | | | | 0.07 | | | | 0.35 | | | | (0.28 | ) | | | (0.08 | ) | | | (0.36 | ) |
Year Ended February 28, 2015 | | | 9.92 | | | | 0.29 | | | | 0.17 | | | | 0.46 | | | | (0.29 | ) | | | (0.05 | ) | | | (0.34 | ) |
Year Ended February 28, 2014 | | | 10.35 | | | | 0.30 | | | | (0.27 | ) | | | 0.03 | | | | (0.32 | ) | | | (0.14 | ) | | | (0.46 | ) |
Year Ended February 28, 2013 | | | 10.29 | | | | 0.31 | | | | 0.06 | | | | 0.37 | | | | (0.31 | ) | | | — | | | | (0.31 | ) |
Year Ended February 29, 2012 | | | 9.80 | | | | 0.32 | | | | 0.50 | | | | 0.82 | | | | (0.33 | ) | | | — | | | | (0.33 | ) |
| (a) | Annualized for periods less than one year, unless otherwise noted. |
| (b) | Calculated based upon average shares outstanding. |
| (c) | Not annualized for periods less than one year. |
| (d) | Includes adjustments in accordance with accounting principles generally accepted in the United States of America and as such, the net asset values for financial reporting purposes and the returns based upon those net asset values may differ from the net asset values and returns for shareholder transactions. |
| (e) | Includes earnings credits and interest expense, if applicable, each of which is less than 0.005% unless otherwise noted. |
| (f) | Portfolio turnover is calculated by dividing the lesser of total purchases or sales of portfolio securities for the reporting period by the monthly average value of portfolio securities owned during the reporting period. Excluded from both the numerator and denominator are amounts relating to derivatives and securities whose maturities or expiration dates at the time of acquisition were one year or less. |
| (g) | Amount rounds to less than $0.005. |
SEE NOTES TO FINANCIAL STATEMENTS.
| | | | | | |
| | | |
| 66 | | | | J.P. MORGAN MUNICIPAL BOND FUNDS | | AUGUST 31, 2016 |
| | | | | | | | | | | | | | | | | | | | | | | | | | |
| | | Ratios/Supplemental data | |
| | | | | | | | | | Ratios to average net assets (a) | | | | |
Net asset
value,
end of
period | | | Total return
(excludes
sales charge) (c)(d) | | | Net assets,
end of
period
(000’s) | | | Net expenses
(including
imputed
interest) (e) | | | Net
investment
income
(loss) | | | Expenses
without waivers,
reimbursements and
earnings credits
(including imputed
interest) | | | Portfolio
turnover
rate (c)(f) | |
| | | | | | | | | | | | | | | | | | | | | | | | | | |
| | | | | | | | | | | | | | | | | | | | | | | | | | |
| $ | 10.19 | | | | 2.13 | % | | $ | 82,515 | | | | 0.81 | % | | | 2.33 | % | | | 0.98 | % | | | 8 | % |
| | 10.10 | | | | 3.26 | | | | 73,120 | | | | 0.82 | | | | 2.52 | | | | 0.97 | | | | 22 | |
| | 10.11 | | | | 4.47 | | | | 68,003 | | | | 0.86 | | | | 2.65 | | | | 0.97 | | | | 9 | |
| | 9.98 | | | | 0.13 | | | | 64,327 | | | | 0.87 | | | | 2.78 | | | | 0.94 | | | | 3 | |
| | 10.41 | | | | 3.35 | | | | 86,839 | | | | 0.86 | | | | 2.76 | | | | 0.92 | | | | 13 | |
| | 10.35 | | | | 8.19 | | | | 90,497 | | | | 0.86 | | | | 2.95 | | | | 0.93 | | | | 6 | |
| | | | | | |
| | | | | | | | | | | | | | | | | | | | | | | | | | |
| | 10.10 | | | | 1.95 | | | | 19,203 | | | | 1.38 | | | | 1.76 | | | | 1.48 | | | | 8 | |
| | 10.00 | | | | 2.61 | | | | 15,950 | | | | 1.39 | | | | 1.95 | | | | 1.48 | | | | 22 | |
| | 10.02 | | | | 3.81 | | | | 14,462 | | | | 1.44 | | | | 2.07 | | | | 1.47 | | | | 9 | |
| | 9.90 | | | | (0.45 | ) | | | 15,425 | | | | 1.44 | | | | 2.20 | | | | 1.44 | | | | 3 | |
| | 10.33 | | | | 2.80 | | | | 26,248 | | | | 1.42 | | | | 2.21 | | | | 1.42 | | | | 13 | |
| | 10.27 | | | | 7.66 | | | | 26,863 | | | | 1.42 | | | | 2.39 | | | | 1.43 | | | | 6 | |
| | | | | | |
| | | | | | | | | | | | | | | | | | | | | | | | | | |
| | 10.13 | | | | 2.37 | | | | 210,985 | | | | 0.56 | | | | 2.59 | | | | 0.71 | | | | 8 | |
| | 10.03 | | | | 3.56 | | | | 245,864 | | | | 0.57 | | | | 2.77 | | | | 0.70 | | | | 22 | |
| | 10.04 | | | | 4.66 | | | | 255,153 | | | | 0.61 | | | | 2.91 | | | | 0.71 | | | | 9 | |
| | 9.92 | | | | 0.38 | | | | 279,537 | | | | 0.62 | | | | 3.02 | | | | 0.69 | | | | 3 | |
| | 10.35 | | | | 3.61 | | | | 483,257 | | | | 0.62 | | | | 3.01 | | | | 0.67 | | | | 13 | |
| | 10.29 | | | | 8.49 | | | | 616,596 | | | | 0.61 | | | | 3.20 | | | | 0.68 | | | | 6 | |
SEE NOTES TO FINANCIAL STATEMENTS.
| | | | | | | | |
| | | |
| AUGUST 31, 2016 | | J.P. MORGAN MUNICIPAL BOND FUNDS | | | | | 67 | |
FINANCIAL HIGHLIGHTS
FOR THE PERIODS INDICATED (continued)
| | | | | | | | | | | | | | | | | | | | | | | | | | | | |
| | | Per share operating performance | |
| | | | | | Investment operations | | | Distributions | |
| | | Net asset
value,
beginning
of period | | | Net
investment
income
(loss) (b) | | | Net realized
and unrealized
gains
(losses) on
investments | | | Total from
investment
operations | | | Net
investment
income | | | Net
realized
gain | | | Total
distributions | |
Ohio Municipal Bond Fund | | | | | | | | | |
Class A | | | | | | | | | |
Six Months Ended August 31, 2016 (Unaudited) | | $ | 11.01 | | | $ | 0.14 | | | $ | 0.05 | | | $ | 0.19 | | | $ | (0.15 | ) | | $ | — | | | $ | (0.15 | ) |
Year Ended February 29, 2016 | | | 11.14 | | | | 0.31 | | | | (0.02 | ) | | | 0.29 | | | | (0.32 | ) | | | (0.10 | ) | | | (0.42 | ) |
Year Ended February 28, 2015 | | | 11.17 | | | | 0.32 | | | | 0.06 | | | | 0.38 | | | | (0.33 | ) | | | (0.08 | ) | | | (0.41 | ) |
Year Ended February 28, 2014 | | | 11.51 | | | | 0.32 | | | | (0.34 | ) | | | (0.02 | ) | | | (0.32 | ) | | | — | (g) | | | (0.32 | ) |
Year Ended February 28, 2013 | | | 11.50 | | | | 0.32 | | | | 0.01 | | | | 0.33 | | | | (0.31 | ) | | | (0.01 | ) | | | (0.32 | ) |
Year Ended February 29, 2012 | | | 10.95 | | | | 0.35 | | | | 0.56 | | | | 0.91 | | | | (0.35 | ) | | | (0.01 | ) | | | (0.36 | ) |
| | |
Class C | | | | | | | | | |
Six Months Ended August 31, 2016 (Unaudited) | | | 11.07 | | | | 0.11 | | | | 0.04 | | | | 0.15 | | | | (0.11 | ) | | | — | | | | (0.11 | ) |
Year Ended February 29, 2016 | | | 11.19 | | | | 0.25 | | | | (0.02 | ) | | | 0.23 | | | | (0.25 | ) | | | (0.10 | ) | | | (0.35 | ) |
Year Ended February 28, 2015 | | | 11.22 | | | | 0.26 | | | | 0.05 | | | | 0.31 | | | | (0.26 | ) | | | (0.08 | ) | | | (0.34 | ) |
Year Ended February 28, 2014 | | | 11.56 | | | | 0.25 | | | | (0.33 | ) | | | (0.08 | ) | | | (0.26 | ) | | | — | (g) | | | (0.26 | ) |
Year Ended February 28, 2013 | | | 11.55 | | | | 0.25 | | | | 0.01 | | | | 0.26 | | | | (0.24 | ) | | | (0.01 | ) | | | (0.25 | ) |
Year Ended February 29, 2012 | | | 10.99 | | | | 0.28 | | | | 0.57 | | | | 0.85 | | | | (0.28 | ) | | | (0.01 | ) | | | (0.29 | ) |
|
Select Class | |
Six Months Ended August 31, 2016 (Unaudited) | | | 10.94 | | | | 0.16 | | | | 0.04 | | | | 0.20 | | | | (0.16 | ) | | | — | | | | (0.16 | ) |
Year Ended February 29, 2016 | | | 11.07 | | | | 0.34 | | | | (0.02 | ) | | | 0.32 | | | | (0.35 | ) | | | (0.10 | ) | | | (0.45 | ) |
Year Ended February 28, 2015 | | | 11.10 | | | | 0.35 | | | | 0.06 | | | | 0.41 | | | | (0.36 | ) | | | (0.08 | ) | | | (0.44 | ) |
Year Ended February 28, 2014 | | | 11.44 | | | | 0.35 | | | | (0.34 | ) | | | 0.01 | | | | (0.35 | ) | | | — | (g) | | | (0.35 | ) |
Year Ended February 28, 2013 | | | 11.43 | | | | 0.35 | | | | 0.01 | | | | 0.36 | | | | (0.34 | ) | | | (0.01 | ) | | | (0.35 | ) |
Year Ended February 29, 2012 | | | 10.88 | | | | 0.37 | | | | 0.57 | | | | 0.94 | | | | (0.38 | ) | | | (0.01 | ) | | | (0.39 | ) |
| (a) | Annualized for periods less than one year, unless otherwise noted. |
| (b) | Calculated based upon average shares outstanding. |
| (c) | Not annualized for periods less than one year. |
| (d) | Includes adjustments in accordance with accounting principles generally accepted in the United States of America and as such, the net asset values for financial reporting purposes and the returns based upon those net asset values may differ from the net asset values and returns for shareholder transactions. |
| (e) | Includes earnings credits and interest expense, if applicable, each of which is less than 0.005% unless otherwise noted. |
| (f) | Portfolio turnover is calculated by dividing the lesser of total purchases or sales of portfolio securities for the reporting period by the monthly average value of portfolio securities owned during the reporting period. Excluded from both the numerator and denominator are amounts relating to derivatives and securities whose maturities or expiration dates at the time of acquisition were one year or less. |
| (g) | Amount rounds to less than $0.005. |
SEE NOTES TO FINANCIAL STATEMENTS.
| | | | | | |
| | | |
| 68 | | | | J.P. MORGAN MUNICIPAL BOND FUNDS | | AUGUST 31, 2016 |
| | | | | | | | | | | | | | | | | | | | | | | | | | |
| | | Ratios/Supplemental data | |
| | | | | | | | | | Ratios to average net assets (a) | | | | |
Net asset
value,
end of
period | | | Total return
(excludes
sales charge) (c)(d) | | | Net assets,
end of
period
(000’s) | | | Net
expenses (e) | | | Net
investment
income
(loss) | | | Expenses
without waivers,
reimbursements and
earnings credits | | | Portfolio
turnover
rate (c)(f) | |
| | | | | | | | | | | | | | | | | | | | | | | | | | |
| | | | | | | | | | | | | | | | | | | | | | | | | | |
| $ | 11.05 | | | | 1.71 | % | | $ | 50,951 | | | | 0.88 | % | | | 2.59 | % | | | 1.04 | % | | | 4 | % |
| | 11.01 | | | | 2.72 | | | | 50,915 | | | | 0.88 | | | | 2.83 | | | | 0.98 | | | | 8 | |
| | 11.14 | | | | 3.47 | | | | 51,856 | | | | 0.88 | | | | 2.89 | | | | 1.07 | | | | 3 | |
| | 11.17 | | | | (0.08 | ) | | | 61,153 | | | | 0.88 | | | | 2.85 | | | | 0.99 | | | | 3 | |
| | 11.51 | | | | 2.86 | | | | 90,786 | | | | 0.87 | | | | 2.77 | | | | 0.97 | | | | 6 | |
| | 11.50 | | | | 8.44 | | | | 86,982 | | | | 0.88 | | | | 3.09 | | | | 0.98 | | | | 6 | |
| | | | | | |
| | | | | | | | | | | | | | | | | | | | | | | | | | |
| | 11.11 | | | | 1.38 | | | | 29,069 | | | | 1.52 | | | | 1.95 | | | | 1.55 | | | | 4 | |
| | 11.07 | | | | 2.14 | | | | 26,556 | | | | 1.49 | | | | 2.22 | | | | 1.49 | | | | 8 | |
| | 11.19 | | | | 2.81 | | | | 27,267 | | | | 1.50 | | | | 2.27 | | | | 1.57 | | | | 3 | |
| | 11.22 | | | | (0.70 | ) | | | 29,872 | | | | 1.48 | | | | 2.24 | | | | 1.48 | | | | 3 | |
| | 11.56 | | | | 2.27 | | | | 55,414 | | | | 1.46 | | | | 2.18 | | | | 1.47 | | | | 6 | |
| | 11.55 | | | | 7.87 | | | | 51,690 | | | | 1.48 | | | | 2.49 | | | | 1.48 | | | | 6 | |
| | | | | | |
| | | | | | | | | | | | | | | | | | | | | | | | | | |
| | 10.98 | | | | 1.84 | | | | 53,275 | | | | 0.63 | | | | 2.84 | | | | 0.79 | | | | 4 | |
| | 10.94 | | | | 2.99 | | | | 54,812 | | | | 0.63 | | | | 3.08 | | | | 0.74 | | | | 8 | |
| | 11.07 | | | | 3.75 | | | | 70,270 | | | | 0.63 | | | | 3.15 | | | | 0.82 | | | | 3 | |
| | 11.10 | | | | 0.17 | | | | 90,114 | | | | 0.63 | | | | 3.11 | | | | 0.74 | | | | 3 | |
| | 11.44 | | | | 3.12 | | | | 103,644 | | | | 0.62 | | | | 3.02 | | | | 0.72 | | | | 6 | |
| | 11.43 | | | | 8.77 | | | | 100,013 | | | | 0.63 | | | | 3.34 | | | | 0.73 | | | | 6 | |
SEE NOTES TO FINANCIAL STATEMENTS.
| | | | | | | | |
| | | |
| AUGUST 31, 2016 | | J.P. MORGAN MUNICIPAL BOND FUNDS | | | | | 69 | |
FINANCIAL HIGHLIGHTS
FOR THE PERIODS INDICATED (continued)
| | | | | | | | | | | | | | | | | | | | |
| | | Per share operating performance | |
| | | | | | Investment operations | | | Distributions | |
| | | Net asset
value,
beginning
of period | | | Net
investment
income
(loss) (b) | | | Net realized
and unrealized
gains
(losses) on
investments | | | Total from
investment
operations | | | Net
investment
income | |
Short-Intermediate Municipal Bond Fund | |
Class A | |
Six Months Ended August 31, 2016 (Unaudited) | | $ | 10.71 | | | $ | 0.05 | | | $ | 0.06 | | | $ | 0.11 | | | $ | (0.05 | ) |
Year Ended February 29, 2016 | | | 10.62 | | | | 0.08 | | | | 0.09 | | | | 0.17 | | | | (0.08 | ) |
Year Ended February 28, 2015 | | | 10.61 | | | | 0.06 | | | | 0.01 | | | | 0.07 | | | | (0.06 | ) |
Year Ended February 28, 2014 | | | 10.63 | | | | 0.07 | | | | (0.03 | ) | | | 0.04 | | | | (0.06 | ) |
Year Ended February 28, 2013 | | | 10.65 | | | | 0.08 | | | | (0.02 | ) | | | 0.06 | | | | (0.08 | ) |
Year Ended February 29, 2012 | | | 10.44 | | | | 0.11 | | | | 0.21 | | | | 0.32 | | | | (0.11 | ) |
|
Class C | |
Six Months Ended August 31, 2016 (Unaudited) | | | 10.80 | | | | 0.02 | | | | 0.05 | | | | 0.07 | | | | (0.02 | ) |
Year Ended February 29, 2016 | | | 10.70 | | | | 0.02 | | | | 0.10 | | | | 0.12 | | | | (0.02 | ) |
Year Ended February 28, 2015 | | | 10.69 | | | | 0.01 | | | | — | (g) | | | 0.01 | | | | — | (g) |
Year Ended February 28, 2014 | | | 10.71 | | | | 0.01 | | | | (0.02 | ) | | | (0.01 | ) | | | (0.01 | ) |
Year Ended February 28, 2013 | | | 10.74 | | | | 0.03 | | | | (0.03 | ) | | | — | (g) | | | (0.03 | ) |
Year Ended February 29, 2012 | | | 10.53 | | | | 0.06 | | | | 0.21 | | | | 0.27 | | | | (0.06 | ) |
|
Institutional Class | |
Six Months Ended August 31, 2016 (Unaudited) | | | 10.76 | | | | 0.07 | | | | 0.07 | | | | 0.14 | | | | (0.08 | ) |
Year Ended February 29, 2016 | | | 10.67 | | | | 0.13 | | | | 0.09 | | | | 0.22 | | | | (0.13 | ) |
Year Ended February 28, 2015 | | | 10.66 | | | | 0.11 | | | | 0.01 | | | | 0.12 | | | | (0.11 | ) |
Year Ended February 28, 2014 | | | 10.68 | | | | 0.12 | | | | (0.03 | ) | | | 0.09 | | | | (0.11 | ) |
Year Ended February 28, 2013 | | | 10.71 | | | | 0.14 | | | | (0.04 | ) | | | 0.10 | | | | (0.13 | ) |
Year Ended February 29, 2012 | | | 10.49 | | | | 0.16 | | | | 0.22 | | | | 0.38 | | | | (0.16 | ) |
|
Select Class | |
Six Months Ended August 31, 2016 (Unaudited) | | | 10.74 | | | | 0.06 | | | | 0.06 | | | | 0.12 | | | | (0.06 | ) |
Year Ended February 29, 2016 | | | 10.65 | | | | 0.10 | | | | 0.10 | | | | 0.20 | | | | (0.11 | ) |
Year Ended February 28, 2015 | | | 10.65 | | | | 0.09 | | | | — | (g) | | | 0.09 | | | | (0.09 | ) |
Year Ended February 28, 2014 | | | 10.66 | | | | 0.09 | | | | (0.02 | ) | | | 0.07 | | | | (0.08 | ) |
Year Ended February 28, 2013 | | | 10.68 | | | | 0.11 | | | | (0.02 | ) | | | 0.09 | | | | (0.11 | ) |
Year Ended February 29, 2012 | | | 10.47 | | | | 0.14 | | | | 0.21 | | | | 0.35 | | | | (0.14 | ) |
| (a) | Annualized for periods less than one year, unless otherwise noted. |
| (b) | Calculated based upon average shares outstanding. |
| (c) | Not annualized for periods less than one year. |
| (d) | Includes adjustments in accordance with accounting principles generally accepted in the United States of America and as such, the net asset values for financial reporting purposes and the returns based upon those net asset values may differ from the net asset values and returns for shareholder transactions. |
| (e) | Includes earnings credits and interest expense, if applicable, each of which is less than 0.005% unless otherwise noted. |
| (f) | Portfolio turnover is calculated by dividing the lesser of total purchases or sales of portfolio securities for the reporting period by the monthly average value of portfolio securities owned during the reporting period. Excluded from both the numerator and denominator are amounts relating to derivatives and securities whose maturities or expiration dates at the time of acquisition were one year or less. |
| (g) | Amount rounds to less than $0.005. |
SEE NOTES TO FINANCIAL STATEMENTS.
| | | | | | |
| | | |
| 70 | | | | J.P. MORGAN MUNICIPAL BOND FUNDS | | AUGUST 31, 2016 |
| | | | | | | | | | | | | | | | | | | | | | | | | | |
| | | Ratios/Supplemental data | |
| | | | | | | | | | Ratios to average net assets (a) | | | | |
Net asset
value,
end of
period | | | Total return
(excludes
sales charge) (c)(d) | | | Net assets,
end of
period
(000’s) | | | Net
expenses (e) | | | Net
investment
income
(loss) | | | Expenses
without waivers,
reimbursements and
earnings credits | | | Portfolio
turnover
rate (c)(f) | |
| | | | | | | | | | | | | | | | | | | | | | | | | | |
| | | | | | | | | | | | | | | | | | | | | | | | | | |
| $ | 10.77 | | | | 1.02 | % | | $ | 37,863 | | | | 0.74 | % | | | 0.85 | % | | | 0.87 | % | | | 17 | % |
| | 10.71 | | | | 1.58 | | | | 38,345 | | | | 0.75 | | | | 0.71 | | | | 0.87 | | | | 39 | |
| | 10.62 | | | | 0.64 | | | | 40,468 | | | | 0.74 | | | | 0.55 | | | | 0.87 | | | | 53 | |
| | 10.61 | | | | 0.38 | | | | 41,685 | | | | 0.74 | | | | 0.63 | | | | 0.87 | | | | 39 | |
| | 10.63 | | | | 0.56 | | | | 73,578 | | | | 0.74 | | | | 0.77 | | | | 0.86 | | | | 33 | |
| | 10.65 | | | | 3.05 | | | | 80,858 | | | | 0.75 | | | | 1.04 | | | | 0.87 | | | | 43 | |
| | | | | | |
| | | | | | | | | | | | | | | | | | | | | | | | | | |
| | 10.85 | | | | 0.68 | | | | 16,228 | | | | 1.24 | | | | 0.35 | | | | 1.39 | | | | 17 | |
| | 10.80 | | | | 1.14 | | | | 17,709 | | | | 1.25 | | | | 0.21 | | | | 1.40 | | | | 39 | |
| | 10.70 | | | | 0.13 | | | | 18,082 | | | | 1.24 | | | | 0.05 | | | | 1.38 | | | | 53 | |
| | 10.69 | | | | (0.10 | ) | | | 21,918 | | | | 1.24 | | | | 0.13 | | | | 1.37 | | | | 39 | |
| | 10.71 | | | | (0.05 | ) | | | 35,324 | | | | 1.24 | | | | 0.28 | | | | 1.36 | | | | 33 | |
| | 10.74 | | | | 2.54 | | | | 43,532 | | | | 1.25 | | | | 0.53 | | | | 1.37 | | | | 43 | |
| | | | | | |
| | | | | | | | | | | | | | | | | | | | | | | | | | |
| | 10.82 | | | | 1.27 | | | | 2,143,937 | | | | 0.25 | | | | 1.34 | | | | 0.47 | | | | 17 | |
| | 10.76 | | | | 2.09 | | | | 2,453,419 | | | | 0.25 | | | | 1.21 | | | | 0.47 | | | | 39 | |
| | 10.67 | | | | 1.13 | | | | 2,857,462 | | | | 0.24 | | | | 1.05 | | | | 0.47 | | | | 53 | |
| | 10.66 | | | | 0.88 | | | | 2,175,023 | | | | 0.23 | | | | 1.10 | | | | 0.49 | | | | 39 | |
| | 10.68 | | | | 0.95 | | | | 272,548 | | | | 0.24 | | | | 1.27 | | | | 0.46 | | | | 33 | |
| | 10.71 | | | | 3.67 | | | | 250,344 | | | | 0.24 | | | | 1.53 | | | | 0.46 | | | | 43 | |
| | | | | | |
| | | | | | | | | | | | | | | | | | | | | | | | | | |
| | 10.80 | | | | 1.16 | | | | 158,980 | | | | 0.49 | | | | 1.09 | | | | 0.61 | | | | 17 | |
| | 10.74 | | | | 1.85 | | | | 150,939 | | | | 0.50 | | | | 0.96 | | | | 0.62 | | | | 39 | |
| | 10.65 | | | | 0.80 | | | | 168,672 | | | | 0.49 | | | | 0.80 | | | | 0.61 | | | | 53 | |
| | 10.65 | | | | 0.67 | | | | 178,381 | | | | 0.49 | | | | 0.88 | | | | 0.61 | | | | 39 | |
| | 10.66 | | | | 0.80 | | | | 924,024 | | | | 0.49 | | | | 1.01 | | | | 0.61 | | | | 33 | |
| | 10.68 | | | | 3.32 | | | | 751,495 | | | | 0.50 | | | | 1.28 | | | | 0.62 | | | | 43 | |
SEE NOTES TO FINANCIAL STATEMENTS.
| | | | | | | | |
| | | |
| AUGUST 31, 2016 | | J.P. MORGAN MUNICIPAL BOND FUNDS | | | | | 71 | |
FINANCIAL HIGHLIGHTS
FOR THE PERIODS INDICATED (continued)
| | | | | | | | | | | | | | | | | | | | | | | | | | | | |
| | | Per share operating performance | |
| | | | | | Investment operations | | | Distributions | |
| | | Net asset
value,
beginning
of period | | | Net
investment
income
(loss) (b) | | | Net realized
and unrealized
gains
(losses) on
investments | | | Total from
investment
operations | | | Net
investment
income | | | Net
realized
gain | | | Total
distributions | |
Tax Free Bond Fund | |
Class A | |
Six Months Ended August 31, 2016 (Unaudited) | | $ | 12.57 | | | $ | 0.20 | | | $ | 0.29 | | | $ | 0.49 | | | $ | (0.20 | ) | | $ | — | | | $ | (0.20 | ) |
Year Ended February 29, 2016 | | | 12.70 | | | | 0.45 | | | | (0.01 | ) | | | 0.44 | | | | (0.47 | ) | | | (0.10 | ) | | | (0.57 | ) |
Year Ended February 28, 2015 | | | 12.41 | | | | 0.44 | | | | 0.39 | | | | 0.83 | | | | (0.44 | ) | | | (0.10 | ) | | | (0.54 | ) |
Year Ended February 28, 2014 | | | 12.88 | | | | 0.46 | | | | (0.44 | ) | | | 0.02 | | | | (0.48 | ) | | | (0.01 | ) | | | (0.49 | ) |
Year Ended February 28, 2013 | | | 12.77 | | | | 0.47 | | | | 0.09 | | | | 0.56 | | | | (0.45 | ) | | | — | | | | (0.45 | ) |
Year Ended February 29, 2012 | | | 12.08 | | | | 0.50 | | | | 0.70 | | | | 1.20 | | | | (0.51 | ) | | | — | | | | (0.51 | ) |
|
Class C | |
Six Months Ended August 31, 2016 (Unaudited) | | | 12.48 | | | | 0.16 | | | | 0.28 | | | | 0.44 | | | | (0.16 | ) | | | — | | | | (0.16 | ) |
Year Ended February 29, 2016 | | | 12.60 | | | | 0.37 | | | | (0.01 | ) | | | 0.36 | | | | (0.38 | ) | | | (0.10 | ) | | | (0.48 | ) |
Year Ended February 28, 2015 | | | 12.33 | | | | 0.35 | | | | 0.38 | | | | 0.73 | | | | (0.36 | ) | | | (0.10 | ) | | | (0.46 | ) |
Year Ended February 28, 2014 | | | 12.80 | | | | 0.37 | | | | (0.44 | ) | | | (0.07 | ) | | | (0.39 | ) | | | (0.01 | ) | | | (0.40 | ) |
Year Ended February 28, 2013 | | | 12.69 | | | | 0.38 | | | | 0.10 | | | | 0.48 | | | | (0.37 | ) | | | — | | | | (0.37 | ) |
Year Ended February 29, 2012 | | | 12.01 | | | | 0.41 | | | | 0.69 | | | | 1.10 | | | | (0.42 | ) | | | — | | | | (0.42 | ) |
|
Select Class | |
Six Months Ended August 31, 2016 (Unaudited) | | | 12.53 | | | | 0.21 | | | | 0.28 | | | | 0.49 | | | | (0.21 | ) | | | — | | | | (0.21 | ) |
Year Ended February 29, 2016 | | | 12.65 | | | | 0.47 | | | | — | (g) | | | 0.47 | | | | (0.49 | ) | | | (0.10 | ) | | | (0.59 | ) |
Year Ended February 28, 2015 | | | 12.37 | | | | 0.46 | | | | 0.38 | | | | 0.84 | | | | (0.46 | ) | | | (0.10 | ) | | | (0.56 | ) |
Year Ended February 28, 2014 | | | 12.84 | | | | 0.48 | | | | (0.44 | ) | | | 0.04 | | | | (0.50 | ) | | | (0.01 | ) | | | (0.51 | ) |
Year Ended February 28, 2013 | | | 12.73 | | | | 0.49 | | | | 0.09 | | | | 0.58 | | | | (0.47 | ) | | | — | | | | (0.47 | ) |
Year Ended February 29, 2012 | | | 12.05 | | | | 0.52 | | | | 0.69 | | | | 1.21 | | | | (0.53 | ) | | | — | | | | (0.53 | ) |
| (a) | Annualized for periods less than one year, unless otherwise noted. |
| (b) | Calculated based upon average shares outstanding. |
| (c) | Not annualized for periods less than one year. |
| (d) | Includes adjustments in accordance with accounting principles generally accepted in the United States of America and as such, the net asset values for financial reporting purposes and the returns based upon those net asset values may differ from the net asset values and returns for shareholder transactions. |
| (e) | Includes earnings credits and interest expense, if applicable, each of which is less than 0.005% unless otherwise noted. |
| (f) | Portfolio turnover is calculated by dividing the lesser of total purchases or sales of portfolio securities for the reporting period by the monthly average value of portfolio securities owned during the reporting period. Excluded from both the numerator and denominator are amounts relating to derivatives and securities whose maturities or expiration dates at the time of acquisition were one year or less. |
| (g) | Amount rounds to less than $0.005. |
SEE NOTES TO FINANCIAL STATEMENTS.
| | | | | | |
| | | |
| 72 | | | | J.P. MORGAN MUNICIPAL BOND FUNDS | | AUGUST 31, 2016 |
| | | | | | | | | | | | | | | | | | | | | | | | | | |
| | | Ratios/Supplemental data | |
| | | | | | | | | | Ratios to average net assets (a) | | | | |
Net asset
value,
end of
period | | | Total return
(excludes
sales charge) (c)(d) | | | Net assets,
end of
period
(000’s) | | | Net
expenses (e) | | | Net
investment
income
(loss) | | | Expenses
without waivers,
reimbursements and
earnings credits | | | Portfolio
turnover
rate (c)(f) | |
| | | | | | | | | | | | | | | | | | | | | | | | | | |
| | | | | | | | | | | | | | | | | | | | | | | | | | |
| $ | 12.86 | | | | 3.95 | % | | $ | 174,844 | | | | 0.66 | % | | | 3.17 | % | | | 0.99 | % | | | 51 | % |
| | 12.57 | | | | 3.53 | | | | 152,207 | | | | 0.67 | | | | 3.62 | | | | 0.97 | | | | 94 | |
| | 12.70 | | | | 6.83 | | | | 166,359 | | | | 0.74 | | | | 3.49 | | | | 0.98 | | | | 90 | |
| | 12.41 | | | | 0.31 | | | | 129,124 | | | | 0.74 | | | | 3.72 | | | | 0.99 | | | | 62 | |
| | 12.88 | | | | 4.45 | | | | 198,873 | | | | 0.74 | | | | 3.67 | | | | 0.94 | | | | 43 | |
| | 12.77 | | | | 10.12 | | | | 183,329 | | | | 0.75 | | | | 4.06 | | | | 0.96 | | | | 24 | |
| | | | | | |
| | | | | | | | | | | | | | | | | | | | | | | | | | |
| | 12.76 | | | | 3.55 | | | | 36,466 | | | | 1.35 | | | | 2.47 | | | | 1.49 | | | | 51 | |
| | 12.48 | | | | 2.92 | | | | 26,715 | | | | 1.36 | | | | 2.93 | | | | 1.47 | | | | 94 | |
| | 12.60 | | | | 5.99 | | | | 27,579 | | | | 1.43 | | | | 2.81 | | | | 1.48 | | | | 90 | |
| | 12.33 | | | | (0.40 | ) | | | 25,057 | | | | 1.43 | | | | 3.00 | | | | 1.48 | | | | 62 | |
| | 12.80 | | | | 3.80 | | | | 57,237 | | | | 1.43 | | | | 2.98 | | | | 1.44 | | | | 43 | |
| | 12.69 | | | | 9.34 | | | | 40,523 | | | | 1.44 | | | | 3.37 | | | | 1.46 | | | | 24 | |
| | | | | | |
| | | | | | | | | | | | | | | | | | | | | | | | | | |
| | 12.81 | | | | 3.97 | | | | 154,419 | | | | 0.49 | | | | 3.33 | | | | 0.73 | | | | 51 | |
| | 12.53 | | | | 3.82 | | | | 126,091 | | | | 0.50 | | | | 3.79 | | | | 0.71 | | | | 94 | |
| | 12.65 | | | | 6.95 | | | | 149,102 | | | | 0.57 | | | | 3.67 | | | | 0.72 | | | | 90 | |
| | 12.37 | | | | 0.49 | | | | 129,602 | | | | 0.57 | | | | 3.89 | | | | 0.74 | | | | 62 | |
| | 12.84 | | | | 4.63 | | | | 200,023 | | | | 0.57 | | | | 3.85 | | | | 0.69 | | | | 43 | |
| | 12.73 | | | | 10.25 | | | | 210,217 | | | | 0.58 | | | | 4.25 | | | | 0.71 | | | | 24 | |
SEE NOTES TO FINANCIAL STATEMENTS.
| | | | | | | | |
| | | |
| AUGUST 31, 2016 | | J.P. MORGAN MUNICIPAL BOND FUNDS | | | | | 73 | |
NOTES TO FINANCIAL STATEMENTS
AS OF AUGUST 31, 2016 (Unaudited)
1. Organization
JPMorgan Trust II (“JPM II” or the “Trust”) was formed on November 12, 2004, as a Delaware statutory trust, pursuant to a Declaration of Trust dated November 5, 2004 and is registered under the Investment Company Act of 1940, as amended (the “1940 Act”), as an open-end management investment company.
The following are 4 separate funds of the Trust (collectively, the “Funds”) covered by this report:
| | | | |
| | | Classes Offered | | Diversified/Non-Diversified |
| Municipal Income Fund | | Class A, Class C and Select Class | | Diversified |
| Ohio Municipal Bond Fund | | Class A, Class C and Select Class | | Diversified |
| Short-Intermediate Municipal Bond Fund | | Class A, Class C, Institutional Class and Select Class | | Diversified |
| Tax Free Bond Fund | | Class A, Class C and Select Class | | Diversified |
The investment objective of Municipal Income Fund is to seek current income exempt from federal income taxes.
The investment objective of Ohio Municipal Bond Fund is to seek current income exempt from federal income tax and Ohio personal income tax, consistent with the preservation of principal.
The investment objective of Short-Intermediate Municipal Bond Fund and Tax Free Bond Fund is to seek as high a level of current income exempt from federal income tax as is consistent with relative stability of principal.
Class A Shares generally provide for a front-end sales charge while Class C Shares provide for a contingent deferred sales charge (“CDSC”) (except for Class C Shares of Short-Intermediate Municipal Bond Fund purchased before September 3, 2013). Effective September 3, 2013, purchases of Class C Shares of the Short-Intermediate Municipal Bond Fund were subject to a CDSC on the original cost of shares. No sales charges are assessed with respect to Institutional Class and Select Class Shares. All classes of shares have equal rights as to earnings, assets and voting privileges, except that each class may bear different transfer agency, sub-transfer agency, distribution and shareholder servicing fees and each class has exclusive voting rights with respect to its distribution plan and shareholder servicing agreements. Certain Class A Shares, for which front-end sales charges have been waived, may be subject to a CDSC as described in the Funds’ prospectus.
On June 19, 2015, all remaining Class B Shares converted to Class A Shares of the same Fund. Prior to June 19, 2015, Class B Shares automatically converted to Class A Shares after eight years (except for Short-Intermediate Municipal Bond Fund whose Class B Shares converted to Class A Shares after six years) and provided for a CDSC.
J.P. Morgan Investment Management Inc. (“JPMIM”) an indirect, wholly-owned subsidiary of JPMorgan Chase & Co. (“JPMorgan”) acts as Adviser (the “Adviser”) and Administrator (the “Administrator”) to the Funds. Prior to April 1, 2016, JPMorgan Funds Management, Inc. (“JPMFM”) served as the Funds’ administrator. Effective April 1, 2016, JPMFM merged into JPMIM and JPMIM became the Funds’ Administrator under the Administration Agreement.
2. Significant Accounting Policies
The following is a summary of significant accounting policies followed by the Funds in the preparation of their financial statements. The Funds are investment companies and, accordingly, follow the investment company accounting and reporting guidance of the Financial Accounting Standards Board Accounting Standards Codification Topic 946 — Investment Companies, which is part of U.S. generally accepted accounting principles (“GAAP”). The preparation of financial statements in conformity with GAAP requires management to make estimates and assumptions that affect the reported amounts of assets and liabilities and disclosure of contingent assets and liabilities at the date of the financial statements and the reported amounts of increases and decreases in net assets from operations during the reporting period. Actual results could differ from those estimates.
A. Valuation of Investments — The valuation of investments is in accordance with GAAP and the Funds’ valuation policies set forth by and under the supervision and responsibility of the Board of Trustees (the “Board”), which established the following approach to valuation, as described more fully below: (i) investments for which market quotations are readily available shall be valued at such unadjusted quoted prices and (ii) all other investments for which market quotations are not readily available shall be valued at their fair value as determined in good faith by the Board.
The Administrator has established the J.P. Morgan Asset Management Americas Valuation Committee (“AVC”) to assist the Board with the oversight and monitoring of the valuation of the Funds’ investments. The Administrator implements the valuation policies of the Funds’ investments, as directed by the Board. The AVC oversees and carries out the policies for the valuation of investments held in the Funds. This includes monitoring the appropriateness of fair values based on results of ongoing valuation oversight, including but not limited to consideration of macro or security specific events, market events and pricing vendor and broker due diligence. The Administrator is responsible for discussing and assessing the potential impacts to the fair values on an ongoing basis, and at least on a quarterly basis with the AVC and the Board.
A market-based approach is primarily used to value the Funds’ investments. Investments for which market quotations are not readily available are fair valued by approved affiliated and unaffiliated pricing vendors or third party broker-dealers (collectively referred to as “Pricing Services”) or may be internally fair valued using methods set forth by the valuation policies approved by the Board. This may include related or comparable assets or liabilities, recent transactions, market multiples, book values, and other relevant information for the investment to determine the fair value of the investment. An income-based valuation approach may be used in which the anticipated future cash flows of the investment are discounted to calculate the fair value. Discounts may also be applied due to the nature or duration of any restrictions on the disposition of the investments. Valuations
| | | | | | |
| | | |
| 74 | | | | J.P. MORGAN MUNICIPAL BOND FUNDS | | AUGUST 31, 2016 |
may be based upon current market prices of securities that are comparable in coupon, rating, maturity and industry. It is possible that the estimated values may differ significantly from the values that would have been used, had a ready market for the investments existed, and such differences could be material.
Fixed income instruments are valued based on prices received from Pricing Services. The Pricing Services use multiple valuation techniques to determine the valuation of fixed income instruments. In instances where sufficient market activity exists, the Pricing Services may utilize a market-based approach through which trades or quotes from market makers are used to determine the valuation of these instruments. In instances where sufficient market activity may not exist, the Pricing Services also utilize proprietary valuation models which may consider market transactions in comparable securities and the various relationships between securities in determining fair value and/or market characteristics in order to estimate the relevant cash flows, which are then discounted to calculate the fair values.
Investments in open-end investment companies (the “Underlying Funds”) are valued at each Underlying Fund’s net asset value per share (‘NAV’) as of the report date.
Valuations reflected in this report are as of the report date. As a result, changes in valuation due to market events and/or issuer related events after the report date and prior to issuance of the report are not reflected herein.
The various inputs that are used in determining the valuation of the Funds’ investments are summarized into the three broad levels listed below.
| • | | Level 1 — Unadjusted inputs using quoted prices in active markets for identical investments. |
| • | | Level 2 — Other significant observable inputs including, but not limited to, quoted prices for similar investments, inputs other than quoted prices that are observable for investments (such as interest rates, prepayment speeds, credit risk, etc.) or other market corroborated inputs. |
| • | | Level 3 — Significant inputs based on the best information available in the circumstances, to the extent observable inputs are not available (including the Funds’ assumptions in determining the fair value of investments). |
A financial instrument’s level within the fair value hierarchy is based on the lowest level of any input, both individually and in the aggregate, that is significant to the fair value measurement. The inputs or methodology used for valuing instruments are not necessarily an indication of the risk associated with investing in those instruments.
The following tables represent each valuation input by municipal sector as presented on the Schedules of Portfolio Investments (“SOIs”) (amounts in thousands):
Municipal Income Fund
| | | | | | | | | | | | | | | | |
| | | Level 1
Quoted prices | | | Level 2
Other significant
observable inputs | | | Level 3
Significant
unobservable inputs | | | Total | |
Investments in Securities | | | | | | | | | | | | | | | | |
Debt Securities | | | | | | | | | | | | | | | | |
Municipal Bonds | | | | | | | | | | | | | | | | |
Alabama | | | | | | | | | | | | | | | | |
Utility | | $ | — | | | $ | 2,536 | | | $ | — | | | $ | 2,536 | |
Alaska | | | | | | | | | | | | | | | | |
Housing | | | — | | | | 1,083 | | | | — | | | | 1,083 | |
Other Revenue | | | — | | | | 1,214 | | | | — | | | | 1,214 | |
| | | | | | | | | | | | | | | | |
Total Alaska | | | — | | | | 2,297 | | | | — | | | | 2,297 | |
| | | | | | | | | | | | | | | | |
Arizona | | | | | | | | | | | | | | | | |
Water & Sewer | | | — | | | | 5,996 | | | | — | | | | 5,996 | |
Arkansas | | | | | | | | | | | | | | | | |
Housing | | | — | | | | 15 | | | | — | | | | 15 | |
California | | | | | | | | | | | | | | | | |
General Obligation | | | — | | | | 941 | | | | — | | | | 941 | |
Housing | | | — | | | | 211 | | | | — | | | | 211 | |
Industrial Development Revenue/Pollution Control Revenue | | | — | | | | 1,861 | | | | — | | | | 1,861 | |
Prerefunded | | | — | | | | 3,432 | | | | — | | | | 3,432 | |
Transportation | | | — | | | | 1,021 | | | | — | | | | 1,021 | |
| | | | | | | | | | | | | | | | |
Total California | | | — | | | | 7,466 | | | | — | | | | 7,466 | |
| | | | | | | | | | | | | | | | |
| | | | | | | | |
| | | |
| AUGUST 31, 2016 | | J.P. MORGAN MUNICIPAL BOND FUNDS | | | | | 75 | |
NOTES TO FINANCIAL STATEMENTS
AS OF AUGUST 31, 2016 (Unaudited) (continued)
| | | | | | | | | | | | | | | | |
| Municipal Income Fund (continued) | | | | | | | | | | | | | | | | |
| | | Level 1
Quoted prices | | | Level 2
Other significant
observable inputs | | | Level 3
Significant
unobservable inputs | | | Total | |
Colorado | | | | | | | | | | | | | | | | |
Certificate of Participation/Lease | | $ | — | | | $ | 730 | | | $ | — | | | $ | 730 | |
General Obligation | | | — | | | | 1,185 | | | | — | | | | 1,185 | |
Hospital | | | — | | | | 2,511 | | | | — | | | | 2,511 | |
Housing | | | — | | | | 245 | | | | — | | | | 245 | |
| | | | | | | | | | | | | | | | |
Total Colorado | | | — | | | | 4,671 | | | | — | | | | 4,671 | |
| | | | | | | | | | | | | | | | |
Connecticut | | | | | | | | | | | | | | | | |
Education | | | — | | | | 4,338 | | | | — | | | | 4,338 | |
Housing | | | — | | | | 1,761 | | | | — | | | | 1,761 | |
| | | | | | | | | | | | | | | | |
Total Connecticut | | | — | | | | 6,099 | | | | — | | | | 6,099 | |
| | | | | | | | | | | | | | | | |
Delaware | | | | | | | | | | | | | | | | |
Housing | | | — | | | | 692 | | | | — | | | | 692 | |
District of Columbia | | | | | | | | | | | | | | | | |
Water & Sewer | | | — | | | | 3,650 | | | | — | | | | 3,650 | |
Florida | | | | | | | | | | | | | | | | |
Certificate of Participation/Lease | | | — | | | | 11,273 | | | | — | | | | 11,273 | |
Hospital | | | — | | | | 1,282 | | | | — | | | | 1,282 | |
Housing | | | — | | | | 3,857 | | | | — | | | | 3,857 | |
Industrial Development Revenue/Pollution Control Revenue | | | — | | | | 1,502 | | | | — | | | | 1,502 | |
Other Revenue | | | — | | | | 4,336 | | | | — | | | | 4,336 | |
Transportation | | | — | | | | 4,817 | | | | — | | | | 4,817 | |
Utility | | | — | | | | 10,705 | | | | — | | | | 10,705 | |
| | | | | | | | | | | | | | | | |
Total Florida | | | — | | | | 37,772 | | | | — | | | | 37,772 | |
| | | | | | | | | | | | | | | | |
Georgia | | | | | | | | | | | | | | | | |
Housing | | | — | | | | 620 | | | | — | | | | 620 | |
Industrial Development Revenue/Pollution Control Revenue | | | — | | | | 3,109 | | | | — | | | | 3,109 | |
| | | | | | | | | | | | | | | | |
Total Georgia | | | — | | | | 3,729 | | | | — | | | | 3,729 | |
| | | | | | | | | | | | | | | | |
Hawaii | | | | | | | | | | | | | | | | |
General Obligation | | | — | | | | 1,664 | | | | — | | | | 1,664 | |
Illinois | | | | | | | | | | | | | | | | |
General Obligation | | | — | | | | 2,130 | | | | — | | | | 2,130 | |
Housing | | | — | | | | 453 | | | | — | | | | 453 | |
Prerefunded | | | — | | | | 589 | | | | — | | | | 589 | |
| | | | | | | | | | | | | | | | |
Total Illinois | | | — | | | | 3,172 | | | | — | | | | 3,172 | |
| | | | | | | | | | | | | | | | |
Indiana | | | | | | | | | | | | | | | | |
Hospital | | | — | | | | 2,048 | | | | — | | | | 2,048 | |
Housing | | | — | | | | 782 | | | | — | | | | 782 | |
Other Revenue | | | — | | | | 2,370 | | | | — | | | | 2,370 | |
Water & Sewer | | | — | | | | 2,543 | | | | — | | | | 2,543 | |
| | | | | | | | | | | | | | | | |
Total Indiana | | | — | | | | 7,743 | | | | — | | | | 7,743 | |
| | | | | | | | | | | | | | | | |
Iowa | | | | | | | | | | | | | | | | |
Education | | | — | | | | 1,754 | | | | — | | | | 1,754 | |
Housing | | | — | | | | 990 | | | | — | | | | 990 | |
| | | | | | | | | | | | | | | | |
Total Iowa | | | — | | | | 2,744 | | | | — | | | | 2,744 | |
| | | | | | | | | | | | | | | | |
Kentucky | | | | | | | | | | | | | | | | |
Industrial Development Revenue/Pollution Control Revenue | | | — | | | | 500 | | | | — | | | | 500 | |
Louisiana | | | | | | | | | | | | | | | | |
Housing | | | — | | | | 1,432 | | | | — | | | | 1,432 | |
| | | | | | |
| | | |
| 76 | | | | J.P. MORGAN MUNICIPAL BOND FUNDS | | AUGUST 31, 2016 |
| | | | | | | | | | | | | | | | |
| Municipal Income Fund (continued) | | | | | | | | | | | | | | | | |
| | | Level 1
Quoted prices | | | Level 2
Other significant
observable inputs | | | Level 3
Significant
unobservable inputs | | | Total | |
Maine | | | | | | | | | | | | | | | | |
Housing | | $ | — | | | $ | 1,821 | | | $ | — | | | $ | 1,821 | |
Massachusetts | | | | | | | | | | | | | | | | |
Education | | | — | | | | 3,441 | | | | — | | | | 3,441 | |
General Obligation | | | — | | | | 3,024 | | | | — | | | | 3,024 | |
Housing | | | — | | | | 1,010 | | | | — | | | | 1,010 | |
Water & Sewer | | | — | | | | 20,073 | | | | — | | | | 20,073 | |
| | | | | | | | | | | | | | | | |
Total Massachusetts | | | — | | | | 27,548 | | | | — | | | | 27,548 | |
| | | | | | | | | | | | | | | | |
Michigan | | | | | | | | | | | | | | | | |
Housing | | | — | | | | 2,035 | | | | — | | | | 2,035 | |
Industrial Development Revenue/Pollution Control Revenue | | | — | | | | 2,487 | | | | — | | | | 2,487 | |
| | | | | | | | | | | | | | | | |
Total Michigan | | | — | | | | 4,522 | | | | — | | | | 4,522 | |
| | | | | | | | | | | | | | | | |
Minnesota | | | | | | | | | | | | | | | | |
General Obligation | | | — | | | | 42 | | | | — | | | | 42 | |
Housing | | | — | | | | 7,264 | | | | — | | | | 7,264 | |
| | | | | | | | | | | | | | | | |
Total Minnesota | | | — | | | | 7,306 | | | | — | | | | 7,306 | |
| | | | | | | | | | | | | | | | |
Mississippi | | | | | | | | | | | | | | | | |
Housing | | | — | | | | 2,238 | | | | — | | | | 2,238 | |
Missouri | | | | | | | | | | | | | | | | |
Housing | | | — | | | | 2,509 | | | | — | | | | 2,509 | |
Transportation | | | — | | | | 2,178 | | | | — | | | | 2,178 | |
| | | | | | | | | | | | | | | | |
Total Missouri | | | — | | | | 4,687 | | | | — | | | | 4,687 | |
| | | | | | | | | | | | | | | | |
Nevada | | | | | | | | | | | | | | | | |
Housing | | | — | | | | 74 | | | | — | | | | 74 | |
Prerefunded | | | — | | | | 1,439 | | | | — | | | | 1,439 | |
| | | | | | | | | | | | | | | | |
Total Nevada | | | — | | | | 1,513 | | | | — | | | | 1,513 | |
| | | | | | | | | | | | | | | | |
New Hampshire | | | | | | | | | | | | | | | | |
Education | | | — | | | | 5,767 | | | | — | | | | 5,767 | |
Housing | | | — | | | | 393 | | | | — | | | | 393 | |
| | | | | | | | | | | | | | | | |
Total New Hampshire | | | — | | | | 6,160 | | | | — | | | | 6,160 | |
| | | | | | | | | | | | | | | | |
New Jersey | | | | | | | | | | | | | | | | |
Education | | | — | | | | 2,890 | | | | — | | | | 2,890 | |
General Obligation | | | — | | | | 1,567 | | | | — | | | | 1,567 | |
Industrial Development Revenue/Pollution Control Revenue | | | — | | | | 508 | | | | — | | | | 508 | |
Other Revenue | | | — | | | | 2,177 | | | | — | | | | 2,177 | |
Transportation | | | — | | | | 2,333 | | | | — | | | | 2,333 | |
| | | | | | | | | | | | | | | | |
Total New Jersey | | | — | | | | 9,475 | | | | — | | | | 9,475 | |
| | | | | | | | | | | | | | | | |
New Mexico | | | | | | | | | | | | | | | | |
Housing | | | — | | | | 627 | | | | — | | | | 627 | |
New York | | | | | | | | | | | | | | | | |
Housing | | | — | | | | 4,202 | | | | — | | | | 4,202 | |
Other Revenue | | | — | | | | 7,543 | | | | — | | | | 7,543 | |
Prerefunded | | | — | | | | 5 | | | | — | | | | 5 | |
Special Tax | | | — | | | | 8,274 | | | | — | | | | 8,274 | |
Transportation | | | — | | | | 8,673 | | | | — | | | | 8,673 | |
Water & Sewer | | | — | | | | 7,610 | | | | — | | | | 7,610 | |
| | | | | | | | | | | | | | | | |
Total New York | | | — | | | | 36,307 | | | | — | | | | 36,307 | |
| | | | | | | | | | | | | | | | |
| | | | | | | | |
| | | |
| AUGUST 31, 2016 | | J.P. MORGAN MUNICIPAL BOND FUNDS | | | | | 77 | |
NOTES TO FINANCIAL STATEMENTS
AS OF AUGUST 31, 2016 (Unaudited) (continued)
| | | | | | | | | | | | | | | | |
| Municipal Income Fund (continued) | | | | | | | | | | | | | | | | |
| | | Level 1
Quoted prices | | | Level 2
Other significant
observable inputs | | | Level 3
Significant
unobservable inputs | | | Total | |
North Carolina | | | | | | | | | | | | | | | | |
Other Revenue | | $ | — | | | $ | 1,286 | | | $ | — | | | $ | 1,286 | |
Prerefunded | | | — | | | | 1,542 | | | | — | | | | 1,542 | |
Water & Sewer | | | — | | | | 3,741 | | | | — | | | | 3,741 | |
| | | | | | | | | | | | | | | | |
Total North Carolina | | | — | | | | 6,569 | | | | — | | | | 6,569 | |
| | | | | | | | | | | | | | | | |
North Dakota | | | | | | | | | | | | | | | | |
Housing | | | — | | | | 4,871 | | | | — | | | | 4,871 | |
Utility | | | — | | | | 2,197 | | | | — | | | | 2,197 | |
| | | | | | | | | | | | | | | | |
Total North Dakota | | | — | | | | 7,068 | | | | — | | | | 7,068 | |
| | | | | | | | | | | | | | | | |
Ohio | | | | | | | | | | | | | | | | |
General Obligation | | | — | | | | 1,963 | | | | — | | | | 1,963 | |
Housing | | | — | | | | 1,863 | | | | — | | | | 1,863 | |
Industrial Development Revenue/Pollution Control Revenue | | | — | | | | 2,063 | | | | — | | | | 2,063 | |
Utility | | | — | | | | 80 | | | | — | | | | 80 | |
| | | | | | | | | | | | | | | | |
Total Ohio | | | — | | | | 5,969 | | | | — | | | | 5,969 | |
| | | | | | | | | | | | | | | | |
Oklahoma | | | | | | | | | | | | | | | | |
Housing | | | — | | | | 1,206 | | | | 56 | | | | 1,262 | |
Oregon | | | | | | | | | | | | | | | | |
Housing | | | — | | | | 1,508 | | | | — | | | | 1,508 | |
Pennsylvania | | | | | | | | | | | | | | | | |
Education | | | — | | | | 2,262 | | | | — | | | | 2,262 | |
Housing | | | — | | | | 2,005 | | | | — | | | | 2,005 | |
Industrial Development Revenue/Pollution Control Revenue | | | — | | | | 2,310 | | | | — | | | | 2,310 | |
Other Revenue | | | — | | | | 2,200 | | | | — | | | | 2,200 | |
Transportation | | | — | | | | 685 | | | | — | | | | 685 | |
| | | | | | | | | | | | | | | | |
Total Pennsylvania | | | — | | | | 9,462 | | | | — | | | | 9,462 | |
| | | | | | | | | | | | | | | | |
Rhode Island | | | | | | | | | | | | | | | | |
Education | | | — | | | | 1,804 | | | | — | | | | 1,804 | |
Transportation | | | — | | | | 3,015 | | | | — | | | | 3,015 | |
| | | | | | | | | | | | | | | | |
Total Rhode Island | | | — | | | | 4,819 | | | | — | | | | 4,819 | |
| | | | | | | | | | | | | | | | |
South Carolina | | | | | | | | | | | | | | | | |
Housing | | | — | | | | 1,029 | | | | — | | | | 1,029 | |
Prerefunded | | | — | | | | 2,067 | | | | — | | | | 2,067 | |
| | | | | | | | | | | | | | | | |
Total South Carolina | | | — | | | | 3,096 | | | | — | | | | 3,096 | |
| | | | | | | | | | | | | | | | |
South Dakota | | | | | | | | | | | | | | | | |
Housing | | | — | | | | 2,822 | | | | — | | | | 2,822 | |
Tennessee | | | | | | | | | | | | | | | | |
Housing | | | — | | | | 1,486 | | | | — | | | | 1,486 | |
Transportation | | | — | | | | 1,143 | | | | — | | | | 1,143 | |
Utility | | | — | | | | 2,344 | | | | — | | | | 2,344 | |
Water & Sewer | | | — | | | | 2,370 | | | | — | | | | 2,370 | |
| | | | | | | | | | | | | | | | |
Total Tennessee | | | — | | | | 7,343 | | | | — | | | | 7,343 | |
| | | �� | | | | | | | | | | | | | |
Texas | | | | | | | | | | | | | | | | |
General Obligation | | | — | | | | 5,621 | | | | — | | | | 5,621 | |
Housing | | | — | | | | 2,566 | | | | — | | | | 2,566 | |
Industrial Development Revenue/Pollution Control Revenue | | | — | | | | 3,168 | | | | — | | | | 3,168 | |
Prerefunded | | | — | | | | 2,547 | | | | — | | | | 2,547 | |
Transportation | | | — | | | | 3,503 | | | | — | | | | 3,503 | |
| | | | | | | | | | | | | | | | |
Total Texas | | | — | | | | 17,405 | | | | — | | | | 17,405 | |
| | | | | | | | | | | | | | | | |
| | | | | | |
| | | |
| 78 | | | | J.P. MORGAN MUNICIPAL BOND FUNDS | | AUGUST 31, 2016 |
| | | | | | | | | | | | | | | | |
| Municipal Income Fund (continued) | | | | | | | | | | | | | | | | |
| | | Level 1
Quoted prices | | | Level 2
Other significant
observable inputs | | | Level 3
Significant
unobservable inputs | | | Total | |
Utah | | | | | | | | | | | | | | | | |
Housing | | $ | — | | | $ | 6,159 | | | $ | — | | | $ | 6,159 | |
Other Revenue | | | — | | | | 1,329 | | | | — | | | | 1,329 | |
| | | | | | | | | | | | | | | | |
Total Utah | | | — | | | | 7,488 | | | | — | | | | 7,488 | |
| | | | | | | | | | | | | | | | |
Vermont | | | | | | | | | | | | | | | | |
Education | | | — | | | | 5,291 | | | | — | | | | 5,291 | |
Housing | | | — | | | | 6,537 | | | | — | | | | 6,537 | |
| | | | | | | | | | | | | | | | |
Total Vermont | | | — | | | | 11,828 | | | | — | | | | 11,828 | |
| | | | | | | | | | | | | | | | |
Virginia | | | | | | | | | | | | | | | | |
Education | | | — | | | | 2,540 | | | | — | | | | 2,540 | |
Prerefunded | | | — | | | | 2,226 | | | | — | | | | 2,226 | |
| | | | | | | | | | | | | | | | |
Total Virginia | | | — | | | | 4,766 | | | | — | | | | 4,766 | |
| | | | | | | | | | | | | | | | |
Washington | | | | | | | | | | | | | | | | |
General Obligation | | | — | | | | 2,432 | | | | — | | | | 2,432 | |
Transportation | | | — | | | | 1,520 | | | | — | | | | 1,520 | |
Utility | | | — | | | | 590 | | | | — | | | | 590 | |
| | | | | | | | | | | | | | | | |
Total Washington | | | — | | | | 4,542 | | | | — | | | | 4,542 | |
| | | | | | | | | | | | | | | | |
West Virginia | | | | | | | | | | | | | | | | |
Other Revenue | | | — | | | | 3,156 | | | | — | | | | 3,156 | |
Wisconsin | | | | | | | | | | | | | | | | |
Other Revenue | | | — | | | | 2,256 | | | | — | | | | 2,256 | |
| | | | | | | | | | | | | | | | |
Total Municipal Bonds | | | — | | | | 295,685 | | | | 56 | | | | 295,741 | |
| | | | | | | | | | | | | | | | |
Investment Company | | | 5,938 | | | | — | | | | — | | | | 5,938 | |
Short-Term Investment | | | | | | | | | | | | | | | | |
Investment Company | | | 10,171 | | | | — | | | | — | | | | 10,171 | |
| | | | | | | | | | | | | | | | |
Total Investments in Securities | | $ | 16,109 | | | $ | 295,685 | | | $ | 56 | | | $ | 311,850 | |
| | | | | | | | | | | | | | | | |
| | | | | | | | | | | | | | | | |
| | | | |
| Ohio Municipal Bond Fund | | | | | | | | | | | | | | | | |
| | | | |
| | | Level 1
Quoted prices | | | Level 2
Other significant
observable inputs | | | Level 3
Significant
unobservable inputs | | | Total | |
Total Investments in Securities (a) | | $ | 2,626 | | | $ | 129,755 | | | $ | — | | | $ | 132,381 | |
| | | | | | | | | | | | | | | | |
| | | | | | | | | | | | | | | | |
| | | | |
| Short-Intermediate Municipal Bond Fund | | | | | | | | | | | | | | | | |
| | | | |
| | | Level 1
Quoted prices | | | Level 2
Other significant
observable inputs | | | Level 3
Significant
unobservable inputs | | | Total | |
Total Investments in Securities (a) | | $ | 85,536 | | | $ | 2,313,496 | | | $ | — | | | $ | 2,399,032 | |
| | | | | | | | | | | | | | | | |
| | | | | | | | | | | | | | | | |
| | | | |
| Tax Free Bond Fund | | | | | | | | | | | | | | | | |
| | | | |
| | | Level 1
Quoted prices | | | Level 2
Other significant
observable inputs | | | Level 3
Significant
unobservable inputs | | | Total | |
Total Investments in Securities (a) | | $ | 51,970 | | | $ | 323,967 | | | $ | — | | | $ | 375,937 | |
| | | | | | | | | | | | | | | | |
| (a) | All portfolio holdings designated as level 1 and level 2 are disclosed individually on the SOIs. Level 1 consists of a money market mutual fund that is held for daily investments of cash. Please refer to the SOIs for industry specifics of portfolio holdings. |
There were no transfers among any levels during the six months ended August 31, 2016.
| | | | | | | | |
| | | |
| AUGUST 31, 2016 | | J.P. MORGAN MUNICIPAL BOND FUNDS | | | | | 79 | |
NOTES TO FINANCIAL STATEMENTS
AS OF AUGUST 31, 2016 (Unaudited) (continued)
B. When Issued, Delayed Delivery Securities and Forward Commitments — The Funds purchased when issued securities, including To Be Announced (“TBA”) securities, and entered into contracts to purchase or sell securities for a fixed price that may be settled a month or more after the trade date, or purchased delayed delivery securities which generally settle seven days after the trade date. When issued securities are securities that have been authorized, but not issued in the market. A forward commitment involves entering into a contract to purchase or sell securities for a fixed price at a future date that may be settled a month or more after the trade date. A delayed delivery security is agreed upon in advance between the buyer and the seller of the security and is generally delivered beyond seven days of the agreed upon date. The purchase of securities on a when issued, delayed delivery, or forward commitment basis involves the risk that the value of the security to be purchased declines before settlement date. The sale of securities on a forward commitment basis involves the risk that the value of the securities sold may increase before the settlement date. The Funds may be exposed to credit risk if the counterparty fails to perform under the terms of the transaction. Interest income for securities purchased on a when issued, delayed delivery, or forward commitment basis is not accrued until settlement date.
The Funds had when issued securities, forward commitments or delayed delivery securities outstanding as of August 31, 2016, which are shown as a Receivable for Investment securities sold — delayed delivery securities and Payable for Investment securities purchased — delayed delivery securities, respectively, on the Statement of Assets and Liabilities. The values of these securities held at August 31, 2016 are detailed on the SOIs.
The Funds did not have TBA purchase commitments outstanding as of August 31, 2016.
C. Security Transactions and Investment Income — Investment transactions are accounted for on the trade date (the date the order to buy or sell is executed). Securities gains and losses are calculated on a specifically identified cost basis. Interest income is determined on the basis of coupon interest accrued using the effective interest method which adjusts for amortization of premiums and accretion of discounts. Dividend income net of foreign taxes withheld, if any, is recorded on the ex-dividend date or when a fund first learns of the dividend.
D. Allocation of Income and Expenses — Expenses directly attributable to a fund are charged directly to that fund, while the expenses attributable to more than one fund of the Trust are allocated among the respective funds. In calculating the NAV of each class, investment income, realized and unrealized gains and losses and expenses, other than class specific expenses, are allocated daily to each class of shares based upon the proportion of net assets of each class at the beginning of each day.
Transfer agency fees and sub-transfer agency fees are class-specific expenses. The amount of transfer agency fees and sub-transfer agency fees charged to each class of the Funds for the six months ended August 31, 2016 are as follows (amounts in thousands):
| | | | | | | | | | | | | | | | | | | | |
| | | Class A | | | Class C | | | Institutional Class | | | Select Class | | | Total | |
Municipal Income Fund | | | | | | | | | | | | | | | | | | | | |
Transfer agency fees | | $ | 1 | | | $ | 1 | | | | n/a | | | $ | 2 | | | $ | 4 | |
Sub-transfer agency fees | | | 8 | | | | 2 | | | | n/a | | | | 8 | | | | 18 | |
| | | | | |
Ohio Municipal Bond Fund | | | | | | | | | | | | | | | | | | | | |
Transfer agency fees | | | 1 | | | | 1 | | | | n/a | | | | 2 | | | | 4 | |
Sub-transfer agency fees | | | 4 | | | | 3 | | | | n/a | | | | 3 | | | | 10 | |
| | | | | |
Short-Intermediate Municipal Bond Fund | | | | | | | | | | | | | | | | | | | | |
Transfer agency fees | | | 1 | | | | 1 | | | $ | 10 | | | | 1 | | | | 13 | |
Sub-transfer agency fees | | | 3 | | | | 3 | | | | 170 | | | | 2 | | | | 178 | |
| | | | | |
Tax Free Bond Fund | | | | | | | | | | | | | | | | | | | | |
Transfer agency fees | | | 10 | | | | 1 | | | | n/a | | | | 2 | | | | 13 | |
Sub-transfer agency fees | | | 14 | | | | 4 | | | | n/a | | | | 9 | | | | 27 | |
E. Federal Income Taxes — Each Fund is treated as a separate taxable entity for Federal income tax purposes. Each Fund’s policy is to comply with the provisions of the Internal Revenue Code of 1986, as amended (the “Code”), applicable to regulated investment companies and to distribute to shareholders all of its distributable net investment income and net realized capital gains on investments. Accordingly, no provision for Federal income tax is necessary. Management has reviewed the Funds’ tax positions for all open tax years and has determined that as of August 31, 2016, no liability for income tax is required in the Funds’ financial statements for net unrecognized tax benefits. However, management’s conclusions may be subject to future review based on changes in, or the interpretation of, the accounting standards or tax laws and regulations. Each of the Funds’ Federal tax returns for the prior three fiscal years remains subject to examination by the Internal Revenue Service.
F. Distributions to Shareholders — Distributions from net investment income are generally declared and paid monthly and are declared separately for each class. No class has preferential dividend rights; differences in per share rates are due to differences in separate class expenses. Net realized capital gains, if any, are distributed by each Fund at least annually. The amount of distributions from net investment income and net realized capital gains is determined in accordance with Federal income tax regulations, which may differ from GAAP. To the extent these “book/tax” differences are permanent in nature (i.e., that they result from other than timing of recognition — “temporary differences”), such amounts are reclassified within the capital accounts based on their Federal tax-basis treatment.
| | | | | | |
| | | |
| 80 | | | | J.P. MORGAN MUNICIPAL BOND FUNDS | | AUGUST 31, 2016 |
3. Fees and Other Transactions with Affiliates
A. Investment Advisory Fee — Pursuant to an Investment Advisory Agreement, the Adviser supervises the investments of each Fund and for such services is paid a fee. The fee is accrued daily and paid monthly based on each Fund’s respective average daily net assets. The annual rate for each Fund is as follows:
| | | | |
Municipal Income Fund | | | 0.30 | % |
Ohio Municipal Bond Fund | | | 0.30 | |
Short-Intermediate Municipal Bond Fund | | | 0.25 | |
Tax Free Bond Fund | | | 0.30 | |
The Adviser waived Investment Advisory fees and/or reimbursed expenses as outlined in Note 3.F.
B. Administration Fee — Pursuant to an Administration Agreement, the Administrator provides certain administration services to the Funds. In consideration of these services, the Administrator receives a fee accrued daily and paid monthly at an annual rate of 0.15% of the first $25 billion of the average daily net assets of all funds in the J.P. Morgan Funds Complex covered by the Administration Agreement (excluding certain funds of funds and money market funds) and 0.075% of the average daily net assets in excess of $25 billion of all such funds. For the six months ended August 31, 2016, the effective annualized rate was 0.08% of each Fund’s average daily net assets, notwithstanding any fee waivers and/or expense reimbursements.
The Administrator waived Administration fees as outlined in Note 3.F.
JPMorgan Chase Bank, N.A. (“JPMCB”), a wholly-owned subsidiary of JPMorgan, serves as the Funds’ sub-administrator (the “Sub-administrator”). For its services as Sub-administrator, JPMCB receives a portion of the fees payable to the Administrator.
C. Distribution Fees — Pursuant to a Distribution Agreement, JPMorgan Distribution Services, Inc. (the “Distributor”), a wholly-owned subsidiary of JPMorgan, serves as the Trust’s exclusive underwriter and promotes and arranges for the sale of each Fund’s shares.
The Board has adopted a Distribution Plan (the “Distribution Plan”) for Class A and Class C Shares of the Funds in accordance with Rule 12b-1 under the 1940 Act. The Distribution Plan provides that each Fund shall pay distribution fees, including payments to the Distributor, at annual rates of the average daily net assets as shown in the table below:
| | | | | | |
| | | Class A | | Class C | |
| | 0.25% | | | 0.75 | % |
In addition, the Distributor is entitled to receive the front-end sales charges from purchases of Class A Shares and the CDSC from redemptions of Class C Shares and certain Class A Shares for which front-end sales charges have been waived. For the six months ended August 31, 2016, the Distributor retained the following (amounts in thousands):
| | | | | | | | |
| | | Front-End Sales Charge | | | CDSC | |
Municipal Income Fund | | $ | 9 | | | $ | — | |
Ohio Municipal Bond Fund | | | 4 | | | | — | |
Short-Intermediate Municipal Bond Fund | | | 3 | | | | — | |
Tax Free Bond Fund | | | 27 | | | | — | |
D. Shareholder Servicing Fees — The Trust, on behalf of the Funds, has entered into a Shareholder Servicing Agreement with the Distributor under which the Distributor provides certain support services to the shareholders. For performing these services, the Distributor receives a fee that is accrued daily and paid monthly equal to a percentage of the average daily net assets as shown in the table below:
| | | | | | | | | | | | | | | | |
| | | Class A | | | Class C | | | Institutional Class | | | Select Class | |
Municipal Income Fund | | | 0.25 | % | | | 0.25 | % | | | n/a | | | | 0.25 | % |
Ohio Municipal Bond Fund | | | 0.25 | | | | 0.25 | | | | n/a | | | | 0.25 | |
Short-Intermediate Municipal Bond Fund | | | 0.25 | | | | 0.25 | | | | 0.10 | % | | | 0.25 | |
Tax Free Bond Fund | | | 0.25 | | | | 0.25 | | | | n/a | | | | 0.25 | |
The Distributor has entered into shareholder services contracts with affiliated and unaffiliated financial intermediaries who provide shareholder services and other related services to their clients or customers who invest in the Funds under which the Distributor will pay all or a portion of such fees earned to financial intermediaries for performing such services.
The Distributor waived shareholder servicing fees as outlined in Note 3.F.
E. Custodian and Accounting Fees — JPMCB provides portfolio custody and accounting services to the Funds. For performing these services, the Funds pay JPMCB transaction and asset-based fees that vary according to the number of transactions and positions, plus out-of-pocket expenses. The amounts paid directly to JPMCB by the Funds for custody and accounting services are included in Custodian and accounting fees on the Statements of Operations. Payments to the custodian may be reduced by credits earned by each Fund, based on uninvested cash balances held by the custodian. Such earnings credits, if any, are presented separately on the Statements of Operations.
| | | | | | | | |
| | | |
| AUGUST 31, 2016 | | J.P. MORGAN MUNICIPAL BOND FUNDS | | | | | 81 | |
NOTES TO FINANCIAL STATEMENTS
AS OF AUGUST 31, 2016 (Unaudited) (continued)
Interest expense paid to the custodian related to cash overdrafts, if any, is included in Interest expense to affiliates on the Statements of Operations.
F. Waivers and Reimbursements — The Adviser, Administrator and/or Distributor have contractually agreed to waive fees and/or reimburse the Funds to the extent that total annual operating expenses (excluding acquired fund fees and expenses other than certain money market fund fees as described below, dividend and interest expenses related to short sales, interest, taxes, expenses related to litigation and potential litigation and extraordinary expenses) exceed the percentages of the Funds’ respective average daily net assets as shown in the table below:
| | | | | | | | | | | | | | | | |
| | | Class A | | | Class C | | | Institutional Class | | | Select Class | |
Municipal Income Fund | | | 0.82 | % | | | 1.39 | % | | | n/a | | | | 0.57 | % |
Ohio Municipal Bond Fund | | | 0.88 | | | | 1.53 | | | | n/a | | | | 0.63 | |
Short-Intermediate Municipal Bond Fund | | | 0.75 | | | | 1.25 | | | | 0.25 | % | | | 0.50 | |
Tax Free Bond Fund | | | 0.67 | | | | 1.36 | | | | n/a | | | | 0.50 | |
The expense limitation agreements were in effect for the six months ended August 31, 2016. The contractual limitations percentages in the table above are in place until October 31, 2016.
Effective November 1, 2016, the contractual expense limitations for the Funds will be reduced until at least October 31, 2018, as shown in the table below:
| | | | | | | | | | | | | | | | |
| | | Class A | | | Class C | | | Institutional Class | | | Select Class | |
Municipal Income Fund | | | 0.70 | % | | | 1.25 | % | | | n/a | | | | 0.45 | % |
Ohio Municipal Bond Fund | | | 0.75 | | | | 1.25 | | | | n/a | | | | 0.50 | |
Short-Intermediate Municipal Bond Fund | | | 0.70 | | | | 1.20 | | | | 0.25 | % | | | 0.25 | |
Tax Free Bond Fund | | | 0.67 | | | | 1.25 | | | | n/a | | | | 0.45 | |
For the six months ended August 31, 2016, the Funds’ service providers waived fees and/or reimbursed expenses for each of the Funds as follows (amounts in thousands). None of these parties expect the Funds to repay any such waived fees and/or reimbursed expenses in future years.
| | | | | | | | | | | | | | | | | | | | |
| | | Contractual Waivers | | | | |
| | | Investment
Advisory | | | Administration | | | Shareholder
Servicing | | | Total | | | Contractual
Reimbursement | |
Municipal Income Fund | | $ | 91 | | | $ | 61 | | | $ | 75 | | | $ | 227 | | | $ | — | |
Ohio Municipal Bond Fund | | | 12 | | | | 8 | | | | 72 | | | | 92 | | | | — | |
Short-Intermediate Municipal Bond Fund | | | 819 | | | | 545 | | | | 1,125 | | | | 2,489 | | | | 130 | |
Tax Free Bond Fund | | | 130 | | | | 87 | | | | 227 | | | | 444 | | | | — | |
Additionally, the Funds may invest in one or more money market funds advised by the Adviser or its affiliates (affiliated money market funds). Effective July 1, 2016, the Adviser, Administrator and/or Distributor, as shareholder servicing agent, have contractually agreed to waive fees and/or reimburse expenses in an amount sufficient to offset the respective net fees each collects from the affiliated money market fund on the applicable Funds’ investment in such affiliated money market fund. Prior to July 1, 2016, a portion of the waiver was voluntary.
The amounts of these waivers resulting from investments in these money market funds for the six months ended August 31, 2016 were as follows (amounts in thousands):
| | | | |
Municipal Income Fund | | $ | 9 | |
Ohio Municipal Bond Fund | | | 1 | |
Short-Intermediate Municipal Bond Fund | | | 44 | |
Tax Free Bond Fund | | | 18 | |
G. Other — Certain officers of the Trust are affiliated with the Adviser, the Administrator and the Distributor. Such officers, with the exception of the Chief Compliance Officer, receive no compensation from the Funds for serving in their respective roles.
The Board appointed a Chief Compliance Officer to the Funds in accordance with Federal securities regulations. Each Fund, along with other affiliated funds, makes reimbursement payments, on a pro-rata basis, to the Administrator for a portion of the fees associated with the Office of the Chief Compliance Officer. Such fees are included in Trustees’ and Chief Compliance Officer’s fees on the Statements of Operations.
The Trust adopted a Trustee Deferred Compensation Plan (the “Plan”) which allows the Independent Trustees to defer the receipt of all or a portion of compensation related to performance of their duties as Trustees. The deferred fees are invested in various J.P. Morgan Funds until distribution in accordance with the Plan.
During the six months ended August 31, 2016, Municipal Income Fund, Short-Intermediate Municipal Bond Fund and Tax Free Bond Fund purchased securities from an underwriting syndicate in which the principal underwriter or members of the syndicate are affiliated with the Adviser.
The Funds may use related party broker-dealers. For the six months ended August 31, 2016, the Funds did not incur any brokerage commissions with broker-dealers affiliated with the Adviser.
| | | | | | |
| | | |
| 82 | | | | J.P. MORGAN MUNICIPAL BOND FUNDS | | AUGUST 31, 2016 |
The Securities and Exchange Commission (“SEC”) has granted an exemptive order permitting the Funds to engage in principal transactions with J.P. Morgan Securities, Inc., an affiliated broker, involving taxable money market instruments, subject to certain conditions.
4. Investment Transactions
During the six months ended August 31, 2016, purchases and sales of investments (excluding short-term investments) were as follows (amounts in thousands):
| | | | | | | | |
| | | Purchases
(excluding U.S.
Government) | | | Sales
(excluding U.S.
Government) | |
Municipal Income Fund | | $ | 23,403 | | | $ | 49,422 | |
Ohio Municipal Bond Fund | | | 4,893 | | | | 7,570 | |
Short-Intermediate Municipal Bond Fund | | | 416,562 | | | | 749,210 | |
Tax Free Bond Fund | | | 192,048 | | | | 157,977 | |
During the six months ended August 31, 2016, there were no purchases or sales of U.S. Government securities.
5. Federal Income Tax Matters
For Federal income tax purposes, the cost and unrealized appreciation (depreciation) in value of investment securities held at August 31, 2016 were as follows (amounts in thousands):
| | | | | | | | | | | | | | | | |
| | | Aggregate
Cost | | | Gross
Unrealized
Appreciation | | | Gross
Unrealized
Depreciation | | | Net Unrealized
Appreciation
(Depreciation) | |
Municipal Income Fund | | $ | 292,956 | | | $ | 18,915 | | | $ | 21 | | | $ | 18,894 | |
Ohio Municipal Bond Fund | | | 122,055 | | | | 10,326 | | | | — | | | | 10,326 | |
Short-Intermediate Municipal Bond Fund | | | 2,342,240 | | | | 58,020 | | | | 1,228 | | | | 56,792 | |
Tax Free Bond Fund | | | 342,505 | | | | 33,437 | | | | 5 | | | | 33,432 | |
Under the Regulated Investment Company Modernization Act of 2010 (the “Act”), net capital losses recognized by the Funds after February 28, 2011 are carried forward indefinitely, and retain their character as short-term and/or long-term losses. Prior to the Act, net capital losses incurred by the Funds were carried forward for eight years and treated as short-term losses. The Act requires that post-enactment net capital losses be used before pre-enactment net capital losses.
At February 29, 2016, the Funds did not have net capital loss carryforwards.
At February 29, 2016, the following Fund utilized pre-enactment capital loss carryforwards as follows (amounts in thousands):
| | | | |
Short-Intermediate Municipal Bond Fund | | $ | 3,252 | |
6. Borrowings
The Funds rely upon an exemptive order granted by the SEC (the “Order”) permitting the establishment and operation of an Interfund Lending Facility (the “Facility”). The Facility allows the Funds to directly lend and borrow money to or from any other fund relying upon the Order at rates beneficial to both the borrowing and lending funds. Advances under the Facility are taken primarily for temporary or emergency purposes, including the meeting of redemption requests that otherwise might require the untimely disposition of securities, and are subject to each Fund’s borrowing restrictions. The Interfund loan rate is determined, as specified in the Order, by averaging the current repurchase agreement rate and the current bank loan rate. The Order was granted to JPM II and may be relied upon by the Funds because the Funds and the series of JPMorgan Trust II are all investment companies in the same “group of investment companies” (as defined in Section 12(d)(1)(G) of the 1940 Act).
The Trust and JPMCB have entered into a financing arrangement. Under this arrangement, JPMCB provides an unsecured, uncommitted credit facility in the aggregate amount of $100 million to certain of the J.P. Morgan Funds, including the Funds. Advances under the arrangement are taken primarily for temporary or emergency purposes, including the meeting of redemption requests that otherwise might require the untimely disposition of securities, and are subject to each Fund’s borrowing restrictions. Interest on borrowings is payable at a rate determined by JPMCB at the time of borrowing. This agreement has been extended until November 7, 2016.
The Funds had no borrowings outstanding from another fund or from the unsecured, uncommitted credit facility at August 31, 2016. Average borrowings from the Facility for, or at any time during the six months ended August 31, 2016, were as follows (amounts in thousands):
| | | | | | | | | | | | | | | | |
| | | Average
Borrowings | | | Average Interest
Rate Paid | | | Number of
Days Outstanding | | | Interest
Paid | |
Municipal Income Fund | | $ | 20,758 | | | | 0.44 | % | | | 1 | | | $ | — | (a) |
| (a) | Amount rounds to less than 500. |
| | | | | | | | |
| | | |
| AUGUST 31, 2016 | | J.P. MORGAN MUNICIPAL BOND FUNDS | | | | | 83 | |
NOTES TO FINANCIAL STATEMENTS
AS OF AUGUST 31, 2016 (Unaudited) (continued)
Interest expense paid as a result of borrowing from another fund or from the unsecured, uncommited credit facility is included in Interest expense to affiliates on the Statements of Operations.
In addition, effective August 16, 2016, the Trust along with certain other trusts (“Borrowers”) entered into a joint syndicated senior unsecured revolving credit facility totaling $1.5 billion (“Credit Facility”) with various lenders and The Bank of New York Mellon, as administrative agent for the lenders. This Credit Facility provides a source of funds to the Borrowers for temporary and emergency purposes, including the meeting of redemption requests that otherwise might require the untimely disposition of securities. Under the terms of the Credit Facility, a borrowing fund must have a minimum of $25,000,000 in adjusted net asset value and not exceed certain adjusted net asset coverage ratios prior to and during the time in which and any borrowings are outstanding. If a fund does not comply with the aforementioned requirements, the Fund must remediate within three business days with respect to the $25,000,000 minimum adjusted net asset value or within one business day with respect to certain asset coverage ratios or the administrative agent at the request of, or with the consent of, the lenders may terminate the Credit Facility and declare any outstanding borrowings to be due and payable immediately.
Interest associated with any borrowing under the Credit Facility is charged to the borrowing fund at a rate of interest equal to 1.00% plus the greater of the federal funds effective rate or one month LIBOR. The annual commitment fee to maintain the Credit Facility is 0.15% and is incurred on the unused portion of the Credit Facility and is allocated to all participating funds pro rata based on their respective net assets. The initial term of the Credit Facility is 364 days, unless extended.
The Funds did not utilize the Credit Facility during the six months ended August 31, 2016.
7. Risks, Concentrations and Indemnifications
In the normal course of business, the Funds enter into contracts that contain a variety of representations which provide general indemnifications. Each Fund’s maximum exposure under these arrangements is unknown. The amount of exposure would depend on future claims that may be made against each Fund that have not yet occurred. However, based on experience, the Funds expect the risk of loss to be remote.
As of August 31, 2016, the Funds had affiliated omnibus accounts which collectively represented the following percentage of each Fund’s net assets as follows:
| | | | | | | | |
| | | Number of
Affiliated
Omnibus
Accounts | | | % of the
Fund | |
Municipal Income Fund | | | 2 | | | | 71.9 | % |
Ohio Municipal Bond Fund | | | 1 | | | | 63.2 | |
Short-Intermediate Municipal Bond Fund | | | 2 | | | | 93.0 | |
Tax Free Bond Fund | | | 2 | | | | 55.1 | |
Significant shareholder transactions by these shareholders may impact the Funds’ performance.
Due to Municipal Income Fund investments in Underlying Funds, the Fund indirectly pays a portion of the expenses incurred by the underlying funds. As a result, the cost of investing in the Fund may be higher than the cost of investing in a mutual fund that invests directly in individual securities and financial instruments. The Fund is also subject to certain risks related to the Underlying Funds’ investments in securities and financial instruments such as fixed income securities, including high yield, asset-backed and mortgage-related securities, including collateralized mortgage obligations and stripped mortgage-backed securities, equity securities, foreign and emerging markets securities, and convertible securities. These securities are subject to risks specific to their structure, sector or market.
The Funds are subject to interest rate and credit risk. The value of debt securities may decline as interest rates increase. The Funds could lose money if the issuer of a fixed income security is unable to pay interest or repay principal when it is due. The Funds invest in floating rate loans and other floating rate debt securities. Although these investments are generally less sensitive to interest rate changes than other fixed rate instruments, the value of floating rate loans and other floating rate investments may decline if their interest rates do not rise as quickly, or as much, as general interest rates. Many factors can cause interest rates to rise. Some examples include central bank monetary policy, rising inflation rates and general economic conditions. Given the historically low interest rate environment, risks associated with rising rates are heightened. The ability of the issuers of debt to meet their obligations may be affected by the economic and political developments in a specific industry or region.
Specific risks and concentrations present in the underlying funds are disclosed within their individual financial statements and registration statements, as appropriate.
The Funds invest primarily in a portfolio of debt obligations issued by states, territories and possessions of the United States and by the District of Columbia, and by their political subdivisions and duly constituted authorities. The Ohio Municipal Bond Fund primarily invests in issuers in the State of Ohio. These debt obligations may be insured by private insurers who guarantee the payment of principal and interest in the event of issuer default. The value of these investments may be impacted by changes to bond insurers’ ratings and the Fund’s ability to collect principal and interest in the event of an issuer’s default may be limited if the private insurer does not have the wherewithal to satisfy its obligation.
| | | | | | |
| | | |
| 84 | | | | J.P. MORGAN MUNICIPAL BOND FUNDS | | AUGUST 31, 2016 |
SCHEDULE OF SHAREHOLDER EXPENSES
(Unaudited)
Hypothetical $1,000 Investment
As a shareholder of the Funds, you incur two types of costs: (1) transaction costs, including sales charges (loads) on purchase payments and (2) ongoing costs, including investment advisory, fees, administration fees, distribution fees and other Fund expenses. The examples below are intended to help you understand your ongoing costs (in dollars) of investing in the Funds and to compare these ongoing costs with the ongoing costs of investing in other mutual funds. The examples assume that you had a $1,000 investment in each Class at the beginning of the reporting period, March 1, 2016, and continued to hold your shares at the end of the reporting period, August 31, 2016.
Actual Expenses
For each Class of each Fund in the table below, the first line provides information about actual account values and actual expenses. You may use the information in this line, together with the amount you invested, to estimate the expenses that you paid over the period. Simply divide your account value by $1,000 (for example, an $8,600 account value divided by $1,000 = 8.6), then multiply the result by the number in the first line of each Class under the heading entitled “Expenses Paid During the Period” to estimate the expenses you paid on your account during this period.
Hypothetical Example for Comparison Purposes
The second line of each Class in the table below provides information about hypothetical account values and hypothetical expenses based on the Class’ actual expense ratio and an assumed rate of return of 5% per year before expenses, which is not the Class’ actual return. The hypothetical account values and expenses may not be used to estimate the actual ending account balance or expenses you paid for the period. You may use this information to compare the ongoing costs of investing in the Class of the Fund and other funds. To do so, compare this 5% hypothetical example with the 5% hypothetical examples that appear in the shareholder reports of the other funds. Please note that the expenses shown in the table are meant to highlight your ongoing costs only and do not reflect any transaction costs, such as sales charges (loads) or redemption fees. Therefore, the second line for each Class in the table is useful in comparing ongoing costs only, and will not help you determine the relative total costs of owning different funds. In addition, if these transaction costs were included, your costs would have been higher. The examples also assume all dividends and distributions have been reinvested.
| | | | | | | | | | | | | | | | |
| | | Beginning
Account Value
March 1, 2016 | | | Ending
Account Value
August 31, 2016 | | | Expenses
Paid During
the Period* | | | Annualized
Expense
Ratio | |
Municipal Income Fund | | | | | | | | | | | | | | | | |
Class A | | | | | | | | | | | | | | | | |
Actual | | $ | 1,000.00 | | | $ | 1,021.30 | | | $ | 4.13 | | | | 0.81 | % |
Hypothetical | | | 1,000.00 | | | | 1,021.12 | | | | 4.13 | | | | 0.81 | |
Class C | | | | | | | | | | | | | | | | |
Actual | | | 1,000.00 | | | | 1,019.50 | | | | 7.02 | | | | 1.38 | |
Hypothetical | | | 1,000.00 | | | | 1,018.25 | | | | 7.02 | | | | 1.38 | |
Select Class | | | | | | | | | | | | | | | | |
Actual | | | 1,000.00 | | | | 1,023.70 | | | | 2.86 | | | | 0.56 | |
Hypothetical | | | 1,000.00 | | | | 1,022.38 | | | | 2.85 | | | | 0.56 | |
| | | | |
Ohio Municipal Bond Fund | | | | | | | | | | | | | | | | |
Class A | | | | | | | | | | | | | | | | |
Actual | | | 1,000.00 | | | | 1,017.10 | | | | 4.47 | | | | 0.88 | |
Hypothetical | | | 1,000.00 | | | | 1,020.77 | | | | 4.48 | | | | 0.88 | |
Class C | | | | | | | | | | | | | | | | |
Actual | | | 1,000.00 | | | | 1,013.80 | | | | 7.72 | | | | 1.52 | |
Hypothetical | | | 1,000.00 | | | | 1,017.54 | | | | 7.73 | | | | 1.52 | |
Select Class | | | | | | | | | | | | | | | | |
Actual | | | 1,000.00 | | | | 1,018.40 | | | | 3.21 | | | | 0.63 | |
Hypothetical | | | 1,000.00 | | | | 1,022.03 | | | | 3.21 | | | | 0.63 | |
| | | | |
Short-Intermediate Municipal Bond Fund | | | | | | | | | | | | | | | | |
Class A | | | | | | | | | | | | | | | | |
Actual | | | 1,000.00 | | | | 1,010.20 | | | | 3.75 | | | | 0.74 | |
Hypothetical | | | 1,000.00 | | | | 1,021.48 | | | | 3.77 | | | | 0.74 | |
Class C | | | | | | | | | | | | | | | | |
Actual | | | 1,000.00 | | | | 1,006.80 | | | | 6.27 | | | | 1.24 | |
Hypothetical | | | 1,000.00 | | | | 1,018.95 | | | | 6.31 | | | | 1.24 | |
| | | | | | | | |
| | | |
| AUGUST 31, 2016 | | J.P. MORGAN MUNICIPAL BOND FUNDS | | | | | 85 | |
SCHEDULE OF SHAREHOLDER EXPENSES
(Unaudited) (continued)
Hypothetical $1,000 Investment
| | | | | | | | | | | | | | | | |
| | | Beginning
Account Value
March 1, 2016 | | | Ending
Account Value
August 31, 2016 | | | Expenses
Paid During
the Period* | | | Annualized
Expense
Ratio | |
Short-Intermediate Municipal Bond Fund (continued) | | | | | | | | | | | | | | | | |
Institutional Class | | | | | | | | | | | | | | | | |
Actual | | $ | 1,000.00 | | | $ | 1,012.70 | | | $ | 1.27 | | | | 0.25 | % |
Hypothetical | | | 1,000.00 | | | | 1,023.95 | | | | 1.28 | | | | 0.25 | |
Select Class | | | | | | | | | | | | | | | | |
Actual | | | 1,000.00 | | | | 1,011.60 | | | | 2.48 | | | | 0.49 | |
Hypothetical | | | 1,000.00 | | | | 1,022.74 | | | | 2.50 | | | | 0.49 | |
| | | | |
Tax Free Bond Fund | | | | | | | | | | | | | | | | |
Class A | | | | | | | | | | | | | | | | |
Actual | | | 1,000.00 | | | | 1,039.50 | | | | 3.39 | | | | 0.66 | |
Hypothetical | | | 1,000.00 | | | | 1,021.88 | | | | 3.36 | | | | 0.66 | |
Class C | | | | | | | | | | | | | | | | |
Actual | | | 1,000.00 | | | | 1,035.50 | | | | 6.93 | | | | 1.35 | |
Hypothetical | | | 1,000.00 | | | | 1,018.40 | | | | 6.87 | | | | 1.35 | |
Select Class | | | | | | | | | | | | | | | | |
Actual | | | 1,000.00 | | | | 1,039.70 | | | | 2.52 | | | | 0.49 | |
Hypothetical | | | 1,000.00 | | | | 1,022.74 | | | | 2.50 | | | | 0.49 | |
| * | Expenses are equal to each Class’ respective annualized expense ratio, multiplied by the average account value over the period, multiplied by 184/365 (to reflect the one-half year period). |
| | | | | | |
| | | |
| 86 | | | | J.P. MORGAN MUNICIPAL BOND FUNDS | | AUGUST 31, 2016 |
BOARD APPROVAL OF INVESTMENT ADVISORY AGREEMENTS
(Unaudited)
The Board of Trustees has established various standing committees composed of Trustees with diverse backgrounds, to which the Board of Trustees has assigned specific subject matter responsibilities to further enhance the effectiveness of the Board’s oversight and decision making. The Board of Trustees and its investment committees (money market and alternative products, equity, and fixed income) meet regularly throughout the year and consider factors that are relevant to their annual consideration of investment advisory agreements at each meeting. They also meet for the specific purpose of considering investment advisory agreement annual renewals. The Board of Trustees held meetings in person in June and August 2016, at which the Trustees considered the continuation of the investment advisory agreements for each of the Funds whose semi-annual report is contained herein (each an “Advisory Agreement” and collectively, the “Advisory Agreements”). At the June meeting, the Board’s investment committees met to review and consider performance, expense and related information for the J.P. Morgan Funds. Each investment committee reported to the full Board, which then considered the investment committee’s preliminary findings. At the August meeting, the Trustees continued their review and consideration. The Trustees, including a majority of the Trustees who are not “interested persons” (as defined in the 1940 Act) of any party to the Advisory Agreements or any of their affiliates, approved the continuation of each Advisory Agreement on August 17, 2016.
As part of their review of the Advisory Agreements, the Trustees considered and reviewed performance and other information about the Funds received from the Adviser. This information includes the Funds’ performance as compared to the performance of their peers and benchmarks and analyses by the Adviser of the Funds’ performance. In addition, the Trustees have engaged an independent management consulting firm (“independent consultant”) to report on the performance of certain J.P. Morgan Funds at each of the Trustees’ regular meetings. The Adviser also periodically provides comparative information regarding the Funds’ expense ratios and those of their peer groups. In addition, in preparation for the June and August meetings, the Trustees requested, received and evaluated extensive materials from the Adviser, including performance and expense information compiled by Broadridge, using data from Lipper Inc., independent providers of investment company data (together, “Broadridge/Lipper”). The Trustees’ independent consultant also provided additional analyses of the Funds’ performance, as well as a risk/return assessment of certain Funds as compared to the Funds’ objectives and peers in connection with the Trustees’ review of the Advisory Agreements. Before voting on the proposed Advisory Agreements, the Trustees reviewed the proposed Advisory Agreements with representatives of the Adviser, counsel to the Trust and independent legal counsel and received a memorandum from independent legal counsel to the Trustees discus-
sing the legal standards for their consideration of the proposed Advisory Agreements. The Trustees also discussed the proposed Advisory Agreements in executive sessions with independent legal counsel at which no representatives of the Adviser were present. Set forth below is a summary of the material factors evaluated by the Trustees in determining whether to approve each Advisory Agreement.
The Trustees considered information provided with respect to the Funds over the course of the year. Each Trustee attributed different weights to the various factors and no factor alone was considered determinative. From year to year, the Trustees consider and place emphasis on relevant information in light of changing circumstances in market and economic conditions. The Trustees determined that the compensation to be received by the Adviser from each Fund under the applicable Advisory Agreement was fair and reasonable and that the continuance of each Advisory Agreement was in the best interests of each Fund and its shareholders.
The factors summarized below were considered and discussed by the Trustees in reaching their conclusions:
Nature, Extent and Quality of Services Provided by the Adviser
The Trustees received and considered information regarding the nature, extent and quality of the services provided to each Fund under the Advisory Agreement. The Trustees took into account information furnished throughout the year at Trustee meetings, as well as the materials furnished specifically in connection with this annual review process. The Trustees considered the background and experience of the Adviser’s senior management and the expertise of, and the amount of attention given to each Fund by, investment personnel of the Adviser. In addition, the Trustees reviewed the qualifications, backgrounds and responsibilities of the portfolio management team primarily responsible for the day-to-day management of each Fund and the infrastructure supporting the team. The Trustees also considered information provided by the Adviser and JPMorgan Distribution Services, Inc. (“JPMDS”) about the structure and distribution strategy of each Fund. The Trustees reviewed information relating to the Adviser’s risk governance model and reports showing the Adviser’s compliance structure and ongoing compliance processes. The Trustees also considered the quality of administrative services provided by J.P. Morgan Investment Management Inc. in its role as administrator (“JPMIM”).
The Trustees also considered their knowledge of the nature and quality of the services provided by the Adviser and its affiliates to the Funds gained from their experience as Trustees of the J.P. Morgan Funds. In addition, they considered the overall reputation and capabilities of the Adviser and its affiliates, the commitment of the Adviser to provide high quality service to the Funds, their overall confidence in the Adviser’s integrity and the Adviser’s responsiveness to questions or concerns
| | | | | | | | |
| | | |
| AUGUST 31, 2016 | | J.P. MORGAN MUNICIPAL BOND FUNDS | | | | | 87 | |
BOARD APPROVAL OF INVESTMENT ADVISORY AGREEMENTS
(Unaudited) (continued)
raised by them, including the Adviser’s willingness to consider and implement organizational and operational changes designed to improve investment results and the services provided to each Fund.
Based upon these considerations and other factors, the Trustees concluded that they were satisfied with the nature, extent and quality of the investment advisory services provided to the Funds by the Adviser.
Costs of Services Provided and Profitability to the Adviser and its Affiliates
The Trustees received and considered information regarding the profitability to the Adviser and its affiliates in providing services to each of the Funds. The Trustees reviewed and discussed this data. The Trustees recognized that this data is not audited and represents the Adviser’s determination of its and its affiliates’ revenues from the contractual services provided to the Funds, less expenses of providing such services. Expenses include direct and indirect costs and are calculated using an allocation methodology developed by the Adviser. The Trustees also recognized that it is difficult to make comparisons of profitability from fund investment advisory contracts because comparative information is not generally publicly available and is affected by numerous factors, including the structure of the particular adviser, the types of funds it manages, its business mix, numerous assumptions regarding allocations and the fact that publicly-traded fund managers’ operating profits and net income are net of distribution and marketing expenses. Based upon their review, the Trustees concluded that the profitability to the Adviser under each of the Advisory Agreements was not unreasonable in light of the services and benefits provided to each Fund.
Fall-Out Benefits
The Trustees reviewed information regarding potential “fallout” or ancillary benefits received by the Adviser and its affiliates as a result of their relationship with the Funds. The Trustees also reviewed the Adviser’s allocation of fund brokerage for the J.P. Morgan Funds complex, including allocations to brokers who provide research to the Adviser.
The Trustees also considered that JPMDS, an affiliate of the Adviser, and JPMIM earn fees from the Funds for providing shareholder and administrative services, respectively. These fees were shown separately in the profitability analysis presented to the Trustees. The Trustees also considered the payments of Rule 12b-1 fees to JPMDS, which also acts as the Funds’ distributor and that these fees are in turn generally paid to financial intermediaries that sell the Funds, including financial intermediaries that are affiliates of the Adviser. The Trustees also considered the fees paid to JPMorgan Chase Bank, N.A. (“JPMCB”) for custody and fund accounting, and other related services.
Economies of Scale
The Trustees considered the extent to which the Funds may benefit from economies of scale. The Trustees considered that there may not be a direct relationship between economies of scale realized by the Funds and those realized by the Adviser as assets increase. The Trustees noted that the proposed investment advisory fee schedule for each Fund does not contain breakpoints, but that the fees remain competitive with peer funds. The Trustees also considered that the Adviser has implemented fee waivers and expense limitations (“Fee Caps”) which allow each Fund’s shareholders to share potential economies of scale from a Fund’s inception. The Trustees also considered that the Adviser has shared economies of scale by adding or enhancing services to the Funds over time, noting the Adviser’s substantial investments in its business in support of the Funds, including investments in trading systems and technology (including cybersecurity improvements), retention of key talent, additions to analyst and portfolio management teams, and regulatory support enhancements. The Trustees also considered whether it would be appropriate to add advisory fee breakpoints and the Trustees concluded that the current fee structure was reasonable in light of the Fee Caps that the Adviser has in place that serve to limit the overall net expense ratios of each Fund at competitive levels. The Trustees concluded that the Funds’ shareholders received the benefits of potential economies of scale through the Fee Caps and the Adviser’s reinvestment in its operations to serve the Funds and their shareholders.
Independent Written Evaluation of the Funds’ Senior Officer
The Trustees noted that, upon their direction, the Senior Officer for the Funds had prepared an independent written evaluation in order to assist the Trustees in determining the reasonableness of the proposed management fees. In determining whether to continue the Advisory Agreements, the Trustees considered the Senior Officer’s report.
Fees Relative to Adviser’s Other Clients
The Trustees received and considered information about the nature and extent of investment advisory services and fee rates offered to other clients of the Adviser, including institutional separate accounts and/or funds sub-advised by the Adviser, and for investment management styles substantially similar to that of each Fund. The Trustees considered the complexity of investment management for registered mutual funds relative to the Adviser’s other clients and noted differences in the regulatory, legal and other risks and responsibilities of providing services to the different clients. The Trustees considered that serving as an adviser to a registered mutual fund involves greater responsibilities and risks than acting as a sub-adviser and observed that sub-advisory fees may be lower than those charged by the Adviser to each Fund. The Trustees also noted that the adviser, not the mutual fund, pays the sub-advisory fee
| | | | | | |
| | | |
| 88 | | | | J.P. MORGAN MUNICIPAL BOND FUNDS | | AUGUST 31, 2016 |
and that many responsibilities related to the advisory function are retained by the primary adviser. The Trustees concluded that the fee rates charged to each Fund in comparison to those charged to the Adviser’s other clients were reasonable.
Investment Performance
The Trustees received and considered absolute and/or relative performance for the Funds in a report prepared by Broadridge/Lipper. The Trustees considered the total return performance information, which included the ranking of the Funds within a performance universe made up of funds with the same Broadridge/Lipper investment classification and objective (the “Universe”), as well as a subset of funds within the Universe (the “Peer Group”), by total return for applicable one-, three- and five-year periods. The Trustees reviewed a description of Broadridge/Lipper’s methodology for selecting mutual funds in each Fund’s Peer Group and Universe. The Trustees also considered the Funds’ performance in light of their investment strategies and high-quality focus as compared to those of the Peer Group and/or Universe which included competitor funds that did not have a similar focus. The Broadridge/Lipper materials provided to the Trustees highlighted information with respect to certain representative classes to assist the Trustees in their review. As part of this review, the Trustees also reviewed each Fund’s performance against its benchmark and considered the performance information provided for the Funds at regular Board meetings by the Adviser and the Trustees’ independent consultant and also considered an analysis prepared by the Trustees’ independent consultant. For certain Funds, the Trustees and Adviser determined that the Peer Group and/or Universe were less meaningful and the independent consultant prepared an analysis of those Funds across various risk and return metrics including standard deviation, Sharpe ratio, credit quality, and duration compared to customized peer groups of funds with similar portfolio objectives (as selected by the independent consultant). The Broadridge/Lipper performance data noted by the Trustees as part of their review and the determinations made by the Trustees with respect to each Fund’s performance for certain representative classes are summarized below:
The Trustees noted that the Municipal Income Fund’s performance for Class A shares was in the third, fourth, and fifth quintiles based upon the Peer Group, and in the second, third and fourth quintiles based upon the Universe, for the one-, three-, and five-year periods ended December 31, 2015, respectively. The Trustees noted that the performance for Select Class shares was in the first, first, and third quintiles based upon the Peer Group, and in the first, second and third quintiles based upon the Universe, for the one-, three-, and five-year periods ended December 31, 2015, respectively. The Trustees discussed the performance and investment strategy of the Fund with the Adviser and reviewed the performance analysis and evaluation prepared by the independent consultant. Based upon these
discussions and various other factors, the Trustees concluded that the Fund’s performance was reasonable.
The Trustees noted that the Ohio Municipal Bond Fund’s performance for Class A shares was in the fifth quintile based upon the Peer Group for each of the one-, three-, and five-year periods ended December 31, 2015, and in the fourth, third and fourth quintiles based upon the Universe for the one-, three-, and five-year periods ended December 31, 2015, respectively. The Trustees noted that performance for Select Class shares was in the third, second and third quintiles based upon the Universe for the one-, three-, and five-year periods ended December 31, 2015, respectively. The Trustees discussed the performance and investment strategy of the Fund with the Adviser and reviewed the performance analysis and evaluation prepared by the independent consultant. Based upon these discussions and various other factors, the Trustees concluded that the Fund’s performance was reasonable. The Trustees requested, however, that the Adviser provide additional Fund performance information to be reviewed with the members of the fixed income committee at each of their regular meetings over the course of next year.
The Trustees noted that the Short-Intermediate Municipal Bond Fund’s performance for Class A shares was in the fourth, fifth and fifth quintiles based upon the Peer Group and in the fourth, fourth and fifth quintiles based upon the Universe, for the one-, three-, and five-year periods ended December 31, 2015, respectively. The Trustees noted that the performance for Select Class shares was in the third, fourth, and fifth quintiles based upon the Universe for the one-, three-, and five-year periods ended December 31, 2015, respectively. The Trustees discussed the performance and investment strategy of the Fund with the Adviser and reviewed the performance analysis and evaluation prepared by the independent consultant. Based upon these discussions and various other factors, the Trustees concluded that the Fund’s performance was reasonable.
The Trustees noted that the Tax Free Bond Fund’s performance for Class A shares was in the third, first, and fifth quintiles based upon the Peer Group, and in the third, second, and fourth quintiles based upon the Universe, for the one-, three-, and five-year periods ended December 31, 2015, respectively. The Trustees noted that the performance for Select Class shares was in the second, second and fourth quintiles based upon the Peer Group, and in the second, first and fourth quintiles based upon the Universe, for the one-, three- and five-year periods ended December 31, 2015, respectively. The Trustees discussed the performance and investment strategy of the Fund with the Adviser and reviewed the performance analysis and evaluation prepared by the independent consultant. Based upon these discussions and various other factors, the Trustees concluded that the Fund’s performance was reasonable.
| | | | | | | | |
| | | |
| AUGUST 31, 2016 | | J.P. MORGAN MUNICIPAL BOND FUNDS | | | | | 89 | |
BOARD APPROVAL OF INVESTMENT ADVISORY AGREEMENTS
(Unaudited) (continued)
Advisory Fees and Expense Ratios
The Trustees considered the contractual advisory fee rate paid by each Fund to the Adviser and compared that rate to the information prepared by Broadridge/Lipper concerning management fee rates paid by other funds in the same Broadridge/Lipper category as each Fund. The Trustees recognized that Broadridge/Lipper reported each Fund’s management fee rate as the combined contractual advisory fee and administration fee rates. The Trustees also reviewed information about other expenses and the expense ratios for each Fund. The Trustees considered the fee waiver and/or expense reimbursement arrangements currently in place for each Fund and considered the net advisory fee rate after taking into account any waivers and/or reimbursements. The Trustees recognized that it is difficult to make comparisons of advisory fees because there are variations in the services that are included in the fees paid by other funds. The Trustees’ determinations as a result of the review of each Fund’s advisory fees and expense ratios for certain representative classes are summarized below:
The Trustees noted that the Municipal Income Fund’s net advisory fee and actual total expenses for Class A shares were in the first and fourth quintiles, respectively, based upon both the Peer Group and Universe. The Trustees noted that the net advisory fee for Select Class shares was in the first quintile based upon both the Peer Group and Universe, and that the actual total expenses for Select Class shares were in the second and third quintiles based upon the Peer Group and Universe, respectively. After considering the factors identified above, in light of this information, the Trustees concluded that the advisory fee was reasonable.
The Trustees noted that the Ohio Municipal Bond Fund’s net advisory fee for Class A shares was in the second and third quintiles, based upon the Peer Group and Universe, respectively, and that the actual total expenses for Class A shares was in the fifth quintile based upon both the Peer Group and Universe. The Trustees noted that the net advisory fee and actual total expenses for Select Class shares were in the second and fourth quintiles, respectively, based upon the Universe. After considering the factors identified above, in light of this information, the Trustees concluded that the advisory fees were reasonable.
The Trustees noted that the Short-Intermediate Municipal Bond Fund’s net advisory fee for Class A shares was in the first quintile based upon both the Peer Group and Universe, and that the actual total expenses for Class A shares were in the fourth and third quintiles based upon the Peer Group and Universe, respectively. The Trustees noted that the net advisory fee for Select Class shares was in the first quintile based upon both the Peer Group and Universe, and that the actual total expenses for Select Class shares were in the first and third quintiles based upon the Peer Group and Universe, respectively. After considering the factors identified above, in light of this information, the Trustees concluded that the advisory fee was reasonable.
The Trustees noted that the Tax Free Bond Fund’s net advisory fee and actual total expenses for both Class A and Select Class shares were in the first quintile based upon both the Peer Group and Universe. After considering the factors identified above, in light of this information, the Trustees concluded that the advisory fee was reasonable.
| | | | | | |
| | | |
| 90 | | | | J.P. MORGAN MUNICIPAL BOND FUNDS | | AUGUST 31, 2016 |
J.P. Morgan Funds are distributed by JPMorgan Distribution Services, Inc., which is an affiliate of JPMorgan Chase & Co. Affiliates of JPMorgan Chase & Co. receive fees for providing various services to the funds.
Contact JPMorgan Distribution Services, Inc. at 1-800-480-4111 for a fund prospectus. You can also visit us at www.jpmorganfunds.com. Investors should carefully consider the investment objectives and risk as well as charges and expenses of the mutual fund before investing. The prospectus contains this and other information about the mutual fund. Read the prospectus carefully before investing.
Investors may obtain information about the Securities Investor Protection Corporation (SIPC), including the SIPC brochure by visiting www.sipc.org or by calling SIPC at 202-371-8300.
Each Fund files a complete schedule of its fund holdings for the first and third quarters of its fiscal year with the SEC on Form N-Q. The Funds’ Forms N-Q are available on the SEC’s website at http://www.sec.gov and may be reviewed and copied at the SEC’s Public Reference Room in Washington, DC. Information on the operation of the SEC’s Public Reference Room may be obtained by calling 1-800-SEC-0330. Shareholders may request the Form N-Q without charge by calling 1-800-480-4111 or by visiting the J.P. Morgan Funds’ website at www.jpmorganfunds.com.
A description of each Fund’s policies and procedures with respect to the disclosure of each Fund’s holdings is available in the prospectus and Statement of Additional Information.
A copy of proxy policies and procedures is available without charge upon request by calling 1-800-480-4111 and on the Funds’ website at www.jpmorganfunds.com. A description of such policies and procedures is on the SEC’s website at www.sec.gov. The Trustees have delegated the authority to vote proxies for securities owned by the Funds to the Adviser. A copy of the Funds’ voting record for the most recent 12-month period ended June 30 is available on the SEC’s website at www.sec.gov or at the Funds’ website at www.jpmorganfunds.com no later than August 31 of each year. The Funds’ proxy voting record will include, among other things, a brief description of the matter voted on for each fund security, and will state how each vote was cast, for example, for or against the proposal.


J.P. Morgan Asset Management is the marketing name for the asset management businesses of JPMorgan Chase & Co. Those businesses include, but are not limited to, J.P. Morgan Investment Management Inc., Security Capital Research & Management Incorporated and J.P. Morgan Alternative Asset Management, Inc.
| | | | |
| | © JPMorgan Chase & Co., 2016. All rights reserved. August 2016. | | SAN-MUNIBOND-816 |
Semi-Annual Report
J.P. Morgan Money Market Funds
August 31, 2016 (Unaudited)
JPMorgan Prime Money Market Fund
JPMorgan Liquid Assets Money Market Fund
JPMorgan U.S. Government Money Market Fund
JPMorgan U.S. Treasury Plus Money Market Fund
JPMorgan Federal Money Market Fund
JPMorgan 100% U.S. Treasury Securities Money Market Fund
JPMorgan Tax Free Money Market Fund
JPMorgan Municipal Money Market Fund

CONTENTS
The following disclosure applies to the JPMorgan Liquid Assets Money Market Fund, JPMorgan Tax Free Money Market Fund and the JPMorgan Municipal Money Market Fund.
You could lose money by investing in the Funds. Although the Funds seek to preserve the value of your investment at $1.00 per share, it cannot guarantee it will do so. The Funds may impose a fee upon the sale of your shares or may temporarily suspend your ability to sell shares if the Funds’ liquidity falls below required minimums because of market conditions or other factors. An investment in the Funds is not insured or guaranteed by the Federal Deposit Insurance Corporation or any other government agency. The Funds’ sponsor has no legal obligation to provide financial support to the Funds, and you should not expect that the sponsor will provide financial support to the Funds at any time.
The following disclosure applies to the JPMorgan Prime Money Market Fund.
You could lose money by investing in the Fund. Because the share price of the Fund will fluctuate, when you sell your shares they may be worth more or less than what you originally paid for them. The Fund may impose a fee upon the sale of your shares or may temporarily suspend your ability to sell shares if the Fund’s liquidity falls below required minimums because of market conditions or other factors. An investment in the Fund is not insured or guaranteed by the Federal Deposit Insurance Corporation or any other government agency. The Fund’s sponsor has no legal obligation to provide financial support to the Fund, and you should not expect that the sponsor will provide financial support to the Fund at any time.
Any gain resulting from the sale or exchange of Fund shares will be taxable as long-term or short-term gain, depending upon how long you have held your shares.
The following disclosure applies to the JPMorgan U.S. Government Money Market Fund, JPMorgan U.S. Treasury Plus Money Market Fund, JPMorgan Federal Money Market Fund and the JPMorgan 100% U.S. Treasury Securities Money Market Fund.
You could lose money by investing in the Funds. Although the Funds seek to preserve the value of your investment at $1.00 per share, it cannot guarantee it will do so. An investment in the Funds is not insured or guaranteed by the Federal Deposit Insurance Corporation or any other government agency. The Funds’ sponsor has no legal obligation to provide financial support to the Funds, and you should not expect that the sponsor will provide financial support to the Funds at any time.
Past performance is no guarantee of future performance. The general market views expressed in this report are opinions based on market and other conditions through the end of the reporting period and are subject to change without notice. These views are not intended to predict the future performance of a Fund or the securities markets. References to specific securities and their issuers are for illustrative purposes only and are not intended to be, and should not be interpreted as, recommendations to purchase or sell such securities. Such views are not meant as investment advice and may not be relied on as an indication of trading intent on behalf of any Fund.
Prospective investors should refer to the Funds’ prospectus for a discussion of the Funds’ investment objectives, strategies and risks. Call J.P. Morgan Funds Service Center at 1-800-480-4111 (retail investors) or 1-800-766-7722 (institutional investors) for a prospectus containing more complete information about a Fund, including management fees and other expenses. Please read it carefully before investing.
CEO’S LETTER
September 22, 2016 (Unaudited)
Dear Shareholder,
The U.S. continued to lead a slow global economic expansion through August 2016, further raising pressure on the U.S. Federal Reserve (the “Fed”) to begin raising interest rates even as leading central banks elsewhere extended their extraordinary stimulus efforts.
| | |
 | | “It is especially notable that in the wake of a sell-off in June, financial markets fully recovered in the following two months.” |
Amid uncertainty about China’s economic outlook in early 2016, a sharp sell-off in financial markets following Britain’s June 23rd vote to exit the European Union and low U.S. inflation, the Fed declined to raise rates at its May and July meetings. However, financial markets rebounded quickly from the so-called Brexit sell-off and investor concerns about China’s economy receded. By August 2016, investors’ appetite for risk had returned, driving up prices for both stocks and bonds and pushing market volatility to record lows.
Meanwhile, U.S. gross domestic product remained low but positive through the first and second quarters of 2016. Unemployment remained at 5.0% or lower from February through August and sales of new homes in the U.S. returned to levels last seen before the 2008 financial crisis.
Overseas, the European Central Bank (ECB) surprised financial markets in early March with a further cut in interest rates and an expansion of its own quantitative easing program, along with other specific stimulus policies. In July, the ECB maintained its key interest rate at zero. Partly in response to the Brexit vote, Britain’s central bank cut interest rates in August to their lowest level in the bank’s 322-year history and reintroduced a quantitative easing program and began buying corporate bonds. After introducing negative interest rates in early 2016 to combat sputtering growth, the Bank of Japan changed direction in early September 2016 and unveiled a “yield curve control” to improve commercial bank earnings and investment returns for pension funds and insurers.
The ultimate effect of these central bank actions was to produce negative yields on government bonds in Europe and Japan, which led to a bond market rally in the U.S. as investors sought returns in U.S. Treasury bonds. Bond yields generally move in the opposite direction of bond prices and the bond market rally pushed Treasury bond yields to record lows in July.
In this environment, the financial market’s implied probability of an interest rate increase at the Fed’s September 2016 meeting rose to 36% at the end of August. However, the U.S. central bank declined to raise rates, citing below-target inflation data and concerns about continued job growth.
While Fed Chairwoman Janet Yellen indicated there is a greater likelihood of an interest rate increase in December 2016, both the International Monetary Fund and the World Bank have issued warnings about slowing economic growth in the U.S. and the rest of the world.
During the six months ended August 31, 2016, U.S. investors generally enjoyed solid returns in both bond and stock markets. It is especially notable that in the wake of a sell-off in June, financial markets fully recovered in the following two months. We believe this outcome clearly illustrates the wisdom of an investment perspective that is diversified, persistent and is guided by a long-term vision.
We look forward to managing your investment needs for years to come. Should you have any questions, please visit www.jpmorganfunds.com or contact the J.P. Morgan Funds Service Center at 1-800-480-4111.
Sincerely yours,

George C.W. Gatch
CEO, Investment Funds Management,
J.P. Morgan Asset Management
| | | | | | | | |
| | | |
| AUGUST 31, 2016 | | J.P. MORGAN MONEY MARKET FUNDS | | | | | 1 | |
JPMorgan Prime Money Market Fund
FUND FACTS
SIX MONTHS ENDED AUGUST 31, 2016 (Unaudited)
| | |
| Objective* | | Aims to provide the highest possible level of current income while still maintaining liquidity and preserving capital |
| Primary Investments | | High quality, short-term, U.S. dollar-denominated money market instruments |
| Suggested investment time frame | | Short-term |
| Share classes offered | | Class C, Agency, Capital, Cash Management, Direct^^^, Eagle Class, IM, Institutional Class, Investor, Morgan, Premier, Reserve and Service Shares |
| Net Assets as of August 31, 2016 | | $74.6 Billion |
| Weighted Average Maturity^ | | 8 days |
| Weighted Average Life^^ | | 9 days |
| | | | |
MATURITY SCHEDULE**^ | |
| 1 day | | | 53.5 | % |
| 2–7 days | | | 23.3 | |
| 8–30 days | | | 18.2 | |
| 31–60 days | | | 1.9 | |
| 61–90 days | | | 2.0 | |
| 91–180 days | | | 1.1 | |
| | | | |
7-DAY SEC YIELD AS OF AUGUST 31, 2016 (1) | |
| Class C Shares | | | 0.01 | % |
| Agency Shares | | | 0.26 | |
| Capital Shares | | | 0.39 | |
| Cash Management Shares | | | 0.01 | |
| Eagle Class Shares | | | 0.01 | |
| IM Shares | | | 0.36 | |
| Institutional Class Shares | | | 0.36 | |
| Investor Shares | | | 0.02 | |
| Morgan Shares | | | 0.01 | |
| Premier Shares | | | 0.07 | |
| Reserve Shares | | | 0.01 | |
| Service Shares | | | 0.01 | |
The performance quoted is past performance and is not a guarantee of future results. Mutual funds are subject to certain market risks. Investment returns and principal value of an investment will fluctuate so that an investor’s shares, when redeemed, may be worth more or less than their original cost. Current performance may be higher or lower than the performance data shown. For up-to-date month-end performance information please call 1-800-480-4111 (retail investors) or 1-800-766-7722 (institutional investors).
| ^ | The calculation takes into account the period remaining until the date on which, in accordance with the terms of the security, the principal amount must unconditionally be paid, or in the case of a security called for redemption, the date on which the redemption payment must be made and may utilize the interest rate reset date for variable or floating rate securities. |
| ^^ | The calculation takes into account the period remaining until the date on which, in accordance with the terms of the security, the principal amount must unconditionally be paid, or in the case of a security called for redemption, the date on which the redemption payment must be made. |
| ^^^ | Direct Shares of the Prime Money Market Fund had no assets as of August 16, 2016. |
| * | During the period, the objective changed to seeking current income while seeking to maintain liquidity and a low volatility of principal. |
| ** | Percentages indicated are based upon total investments as of August 31, 2016. |
| (1) | The yields for Class C Shares, Agency Shares, Capital Shares, Cash Management Shares, Eagle Class Shares, IM Shares, Institutional Class Shares, Investor Shares, Morgan Shares, Premier Shares, Reserve Shares and Service Shares reflect the reimbursements and/or waivers of certain expenses. Without these reimbursements and/or waivers, the yields would have been (0.65)%, 0.21%, 0.31%, (0.43)%, (0.19)%, 0.36%, 0.26%, 0.02%, (0.01)%, 0.06%, (0.19)% and (0.54)% for Class C Shares, Agency Shares, Capital Shares, Cash Management Shares, Eagle Class Shares, IM Shares, Institutional Class Shares, Investor Shares, Morgan Shares, Premier Shares, Reserve Shares and Service Shares, respectively. |
| | An unaudited, uncertified list of prior-day portfolio holdings of the JPMorgan Prime Money Market Fund is available upon request. Please contact your J.P. Morgan representative to obtain further information regarding this facility and information on holdings. |
| | | | | | |
| | | |
| 2 | | | | J.P. MORGAN MONEY MARKET FUNDS | | AUGUST 31, 2016 |
JPMorgan Liquid Assets Money Market Fund
FUND FACTS
SIX MONTHS ENDED AUGUST 31, 2016 (Unaudited)
| | |
| Objective | | Seeks current income with liquidity and stability of principal |
| Primary Investments | | High quality, short-term instruments including corporate notes, U.S. government securities, asset-backed securities, repurchase agreements, commercial paper, funding agreements, certificates of deposit, municipal obligations and bank obligations |
| Suggested investment time frame | | Short-term |
| Share classes offered | | Class C, Agency, Capital, E*Trade, Institutional Class, Investor, Morgan, Premier, Reserve and Service Shares |
| Net Assets as of August 31, 2016 | | $4.1 Billion |
| Weighted Average Maturity^ | | 3 days |
| Weighted Average Life^^ | | 3 days |
| | | | |
MATURITY SCHEDULE*^ | |
| 1 day | | | 70.1 | % |
| 2–7 days | | | 22.0 | |
| 8–30 days | | | 7.9 | |
| | | | |
7-DAY SEC YIELD AS OF AUGUST 31, 2016 (1) | |
| Class C Shares | | | 0.01 | % |
| Agency Shares | | | 0.20 | |
| Capital Shares | | | 0.28 | |
| E*Trade Shares | | | 0.01 | |
| Institutional Class Shares | | | 0.25 | |
| Investor Shares | | | 0.01 | |
| Morgan Shares | | | 0.01 | |
| Premier Shares | | | 0.02 | |
| Reserve Shares | | | 0.01 | |
| Service Shares | | | 0.01 | |
The performance quoted is past performance and is not a guarantee of future results. Mutual funds are subject to certain market risks. Investment returns and principal value of an investment will fluctuate so that an investor’s shares, when redeemed, may be worth more or less than their original cost. Current performance may be higher or lower than the performance data shown. For up-to-date month-end performance information please call 1-800-480-4111 (retail investors) or 1-800-766-7722 (institutional investors).
An investment in a money market fund is not insured by the FDIC or any other government agency. Although money market funds strive to preserve the value of the investment at $1.00 per share, it is possible to lose money by investing in a money market fund.
| ^ | The calculation takes into account the period remaining until the date on which, in accordance with the terms of the security, the principal amount must unconditionally be paid, or in the case of a security called for redemption, the date on which the redemption payment must be made and may utilize the interest rate reset date for variable or floating rate securities. |
| ^^ | The calculation takes into account the period remaining until the date on which, in accordance with the terms of the security, the principal amount must unconditionally be paid, or in the case of a security called for redemption, the date on which the redemption payment must be made. |
| * | Percentages indicated are based upon total investments as of August 31, 2016. |
| (1) | The yields for Class C Shares, Agency Shares, Capital Shares, E*Trade Shares, Institutional Class Shares, Investor Shares, Morgan Shares, Premier Shares, Reserve Shares and Service Shares reflect the reimbursements and/or waivers of certain expenses. Without these reimbursements and/or waivers, the yields would have been (0.70)%, 0.14%, 0.24%, (0.61)%, 0.19%, (0.06)%, (0.16)%, 0.00%, (0.36)% and (3.62)% for Class C Shares, Agency Shares, Capital Shares, E*Trade Shares, Institutional Class Shares, Investor Shares, Morgan Shares, Premier Shares, Reserve Shares and Service Shares, respectively. |
| | An unaudited, uncertified list of prior-day portfolio holdings of the JPMorgan Liquid Assets Money Market Fund is available upon request. Please contact your J.P. Morgan representative to obtain further information regarding this facility and information on holdings. |
| | | | | | | | |
| | | |
| AUGUST 31, 2016 | | J.P. MORGAN MONEY MARKET FUNDS | | | | | 3 | |
JPMorgan U.S. Government Money Market Fund
FUND FACTS
SIX MONTHS ENDED AUGUST 31, 2016 (Unaudited)
| | |
| Objective | | Seeks high current income with liquidity and stability of principal |
| Primary Investments | | High quality, short-term securities issued or guaranteed by the U.S. government or by U.S. government agencies or instrumentalities and repurchase agreements collateralized by such obligations |
| Suggested investment time frame | | Short-term |
| Share classes offered | | Agency, Capital, Direct, Eagle Class, E*Trade, IM, Institutional Class, Investor, Morgan, Premier, Reserve and Service Shares |
| Net Assets as of August 31, 2016 | | $109.5 Billion |
| Weighted Average Maturity^ | | 31 days |
| Weighted Average Life^^ | | 116 days |
| | | | |
MATURITY SCHEDULE*^ | |
| 1 day | | | 35.4 | % |
| 2–7 days | | | 23.1 | |
| 8–30 days | | | 14.0 | |
| 31–60 days | | | 4.5 | |
| 61–90 days | | | 11.3 | |
| 91–180 days | | | 10.4 | |
| 181+ days | | | 1.3 | |
| | | | |
7-DAY SEC YIELD AS OF AUGUST 31, 2016 (1) | |
| Agency Shares | | | 0.19 | % |
| Capital Shares | | | 0.34 | |
| Direct Shares | | | 0.18 | |
| Eagle Class Shares | | | 0.01 | |
| E*Trade Shares | | | 0.02 | |
| IM Shares | | | 0.34 | |
| Institutional Class Shares | | | 0.31 | |
| Investor Shares | | | 0.01 | |
| Morgan Shares | | | 0.01 | |
| Premier Shares | | | 0.04 | |
| Reserve Shares | | | 0.01 | |
| Service Shares | | | 0.01 | |
The performance quoted is past performance and is not a guarantee of future results. Mutual funds are subject to certain market risks. Investment returns and principal value of an investment will fluctuate so that an investor’s shares, when redeemed, may be worth more or less than their original cost. Current performance may be higher or lower than the performance data shown. For up-to-date month-end performance information please call 1-800-480-4111 (retail investors) or 1-800-766-7722 (institutional investors).
An investment in a money market fund is not insured by the FDIC or any other government agency. Although money market funds strive to preserve the value of the investment at $1.00 per share, it is possible to lose money by investing in a money market fund.
| ^ | The calculation takes into account the period remaining until the date on which, in accordance with the terms of the security, the principal amount must unconditionally be paid, or in the case of a security called for redemption, the date on which the redemption payment must be made and may utilize the interest rate reset date for variable or floating rate securities. |
| ^^ | The calculation takes into account the period remaining until the date on which, in accordance with the terms of the security, the principal amount must unconditionally be paid, or in the case of a security called for redemption, the date on which the redemption payment must be made. |
| * | Percentages indicated are based upon total investments as of August 31, 2016. |
| (1) | The yields for Agency Shares, Capital Shares, Direct Shares, Eagle Class Shares, E*Trade Shares, IM Shares, Institutional Class Shares, Investor Shares, Morgan Shares, Premier Shares, Reserve Shares and Service Shares reflect the reimbursements and/or waivers of certain expenses. Without these reimbursements and/or waivers, the yields would have been 0.12%, 0.22%, 0.11%, (0.28)%, (0.76)%, 0.27%, 0.17%, (0.09)%, (0.19)%, (0.03)%, (0.28)% and (0.63)% for Agency Shares, Capital Shares, Direct Shares, Eagle Class Shares, E*Trade Shares, IM Shares, Institutional Class Shares, Investor Shares, Morgan Shares, Premier Shares, Reserve Shares and Service Shares, respectively. |
| | An unaudited, uncertified list of prior-day portfolio holdings of the JPMorgan U.S. Government Money Market Fund is available upon request. Please contact your J.P. Morgan representative to obtain further information regarding this facility and information on holdings. |
| | | | | | |
| | | |
| 4 | | | | J.P. MORGAN MONEY MARKET FUNDS | | AUGUST 31, 2016 |
JPMorgan U.S. Treasury Plus Money Market Fund
FUND FACTS
SIX MONTHS ENDED AUGUST 31, 2016 (Unaudited)
| | |
| Objective | | Seeks current income with liquidity and stability of principal |
| Primary Investments | | Direct obligations of the U.S. Treasury including Treasury bills, bonds and notes and other obligations issued or guaranteed by the U.S. Treasury and repurchase agreements collateralized by U.S. Treasury securities |
| Suggested investment time frame | | Short-term |
| Share classes offered | | Class C, Agency, Direct, Eagle Class, IM, Institutional Class, Investor, Morgan, Premier, Reserve and Service Shares |
| Net Assets as of August 31, 2016 | | $19.7 Billion |
| Weighted Average Maturity^ | | 39 days |
| Weighted Average Life^^ | | 99 days |
| | | | |
MATURITY SCHEDULE*^ | |
| 1 day | | | 54.9 | % |
| 2–7 days | | | 7.9 | |
| 8–30 days | | | 9.7 | |
| 61–90 days | | | 4.4 | |
| 91–180 days | | | 19.0 | |
| 181+ days | | | 4.1 | |
| | | | |
7-DAY SEC YIELD AS OF AUGUST 31, 2016 (1) | |
| Class C Shares | | | 0.00 | % |
| Agency Shares | | | 0.14 | |
| Direct Shares | | | 0.10 | |
| Eagle Class Shares | | | 0.00 | |
| IM Shares | | | 0.24 | |
| Institutional Class Shares | | | 0.19 | |
| Investor Shares | | | 0.00 | |
| Morgan Shares | | | 0.00 | |
| Premier Shares | | | 0.00 | |
| Reserve Shares | | | 0.00 | |
| Service Shares | | | 0.00 | |
The performance quoted is past performance and is not a guarantee of future results. Mutual funds are subject to certain market risks. Investment returns and principal value of an investment will fluctuate so that an investor’s shares, when redeemed, may be worth more or less than their original cost. Current performance may be higher or lower than the performance data shown. For up-to-date month-end performance information please call 1-800-480-4111 (retail investors) or 1-800-766-7722 (institutional investors).
An investment in a money market fund is not insured by the FDIC or any other government agency. Although money market funds strive to preserve the value of the investment at $1.00 per share, it is possible to lose money by investing in a money market fund.
| ^ | The calculation takes into account the period remaining until the date on which, in accordance with the terms of the security, the principal amount must unconditionally be paid, or in the case of a security called for redemption, the date on which the redemption payment must be made and may utilize the interest rate reset date for variable or floating rate securities. |
| ^^ | The calculation takes into account the period remaining until the date on which, in accordance with the terms of the security, the principal amount must unconditionally be paid, or in the case of a security called for redemption, the date on which the redemption payment must be made. |
| * | Percentages indicated are based upon total investments as of August 31, 2016. |
| (1) | The yields for Class C Shares, Agency Shares, Direct Shares, Eagle Class Shares, IM Shares, Institutional Class Shares, Investor Shares, Morgan Shares, Premier Shares, Reserve Shares and Service Shares reflect the reimbursements and/or waivers of certain expenses. Without these reimbursements and/or waivers, the yields would have been (0.76)%, 0.10%, 0.09%, (3.83)%, 0.24%, 0.15%, (0.11)%, (0.21)%, (0.07)%, (0.30)% and (4.26)% for Class C Shares, Agency Shares, Direct Shares, Eagle Class Shares, IM Shares, Institutional Class Shares, Investor Shares, Morgan Shares, Premier Shares, Reserve Shares and Service Shares, respectively. |
| | An unaudited, uncertified list of prior-day portfolio holdings of the JPMorgan U.S. Treasury Plus Money Market Fund is available upon request. Please contact your J.P. Morgan representative to obtain further information regarding this facility and information on holdings. |
| | | | | | | | |
| | | |
| AUGUST 31, 2016 | | J.P. MORGAN MONEY MARKET FUNDS | | | | | 5 | |
JPMorgan Federal Money Market Fund
FUND FACTS
SIX MONTHS ENDED AUGUST 31, 2016 (Unaudited)
| | |
| Objective | | Aims to provide current income while still preserving capital and maintaining liquidity |
| Primary Investments | | Direct obligations of the U.S. Treasury including Treasury bills, bonds and notes as well as debt obligations issued or guaranteed by U.S. government agencies or instrumentalities |
| Suggested investment time frame | | Short-term |
| Share classes offered | | Agency, Institutional Class, Morgan, Premier and Reserve Shares |
| Net Assets as of August 31, 2016 | | $2.9 Billion |
| Weighted Average Maturity^ | | 36 days |
| Weighted Average Life^^ | | 111 days |
| | | | |
MATURITY SCHEDULE*^ | |
| 1 day | | | 3.1 | % |
| 2–7 days | | | 16.9 | |
| 8–30 days | | | 36.2 | |
| 31–60 days | | | 23.4 | |
| 61–90 days | | | 14.5 | |
| 91–180 days | | | 5.9 | |
| | | | |
7-DAY SEC YIELD AS OF AUGUST 31, 2016 (1) | |
| Agency Shares | | | 0.17 | % |
| Institutional Class Shares | | | 0.22 | |
| Morgan Shares | | | 0.01 | |
| Premier Shares | | | 0.01 | |
| Reserve Shares | | | 0.01 | |
The performance quoted is past performance and is not a guarantee of future results. Mutual funds are subject to certain market risks. Investment returns and principal value of an investment will fluctuate so that an investor’s shares, when redeemed, may be worth more or less than their original cost. Current performance may be higher or lower than the performance data shown. For up-to-date month-end performance information please call 1-800-480-4111 (retail investors) or 1-800-766-7722 (institutional investors).
An investment in a money market fund is not insured by the FDIC or any other government agency. Although money market funds strive to preserve the value of the investment at $1.00 per share, it is possible to lose money by investing in a money market fund.
| ^ | The calculation takes into account the period remaining until the date on which, in accordance with the terms of the security, the principal amount must unconditionally be paid, or in the case of a security called for redemption, the date on which the redemption payment must be made and may utilize the interest rate reset date for variable or floating rate securities. |
| ^^ | The calculation takes into account the period remaining until the date on which, in accordance with the terms of the security, the principal amount must unconditionally be paid, or in the case of a security called for redemption, the date on which the redemption payment must be made. |
| * | Percentages indicated are based upon total investments as of August 31, 2016. |
| (1) | The yields for Agency Shares, Institutional Class Shares, Morgan Shares, Premier Shares and Reserve Shares reflect the reimbursements and/or waivers of certain expenses. Without these reimbursements and/or waivers, the yields would have been 0.07%, 0.12%, (0.25)%, (0.09)% and (0.36)% for Agency Shares, Institutional Class Shares, Morgan Shares, Premier Shares and Reserve Shares, respectively. |
| | An unaudited, uncertified list of prior-day portfolio holdings of the JPMorgan Federal Money Market Fund is available upon request. Please contact your J.P. Morgan representative to obtain further information regarding this facility and information on holdings. |
| | | | | | |
| | | |
| 6 | | | | J.P. MORGAN MONEY MARKET FUNDS | | AUGUST 31, 2016 |
JPMorgan 100% U.S. Treasury Securities Money Market Fund
FUND FACTS
SIX MONTHS ENDED AUGUST 31, 2016 (Unaudited)
| | |
| Objective | | Aims to provide the highest possible level of current income while still maintaining liquidity and providing maximum safety of principal |
| Primary Investments | | Direct obligations of the U.S. Treasury including Treasury bills, bonds and notes |
| Suggested investment time frame | | Short-term |
| Share classes offered | | Agency, Capital, Institutional Class, Morgan, Premier, Reserve and Service Shares |
| Net Assets as of August 31, 2016 | | $22.8 Billion |
| Weighted Average Maturity^ | | 46 days |
| Weighted Average Life^^ | | 111 days |
| | | | |
MATURITY SCHEDULE*^ | |
| 1 day | | | 24.1 | % |
| 2–7 days | | | 4.2 | |
| 8–30 days | | | 30.1 | |
| 31–60 days | | | 2.1 | |
| 61–90 days | | | 18.1 | |
| 91–180 days | | | 19.4 | |
| 181+ days | | | 2.0 | |
| | | | |
7-DAY SEC YIELD AS OF AUGUST 31, 2016 (1) | |
| Agency Shares | | | 0.11 | % |
| Capital Shares | | | 0.19 | |
| Institutional Class Shares | | | 0.16 | |
| Morgan Shares | | | 0.00 | |
| Premier Shares | | | 0.00 | |
| Reserve Shares | | | 0.00 | |
| Service Shares | | | 0.00 | |
The performance quoted is past performance and is not a guarantee of future results. Mutual funds are subject to certain market risks. Investment returns and principal value of an investment will fluctuate so that an investor’s shares, when redeemed, may be worth more or less than their original cost. Current performance may be higher or lower than the performance data shown. For up-to-date month-end performance information please call 1-800-480-4111 (retail investors) or 1-800-766-7722 (institutional investors).
An investment in a money market fund is not insured by the FDIC or any other government agency. Although money market funds strive to preserve the value of the investment at $1.00 per share, it is possible to lose money by investing in a money market fund.
| ^ | The calculation takes into account the period remaining until the date on which, in accordance with the terms of the security, the principal amount must unconditionally be paid, or in the case of a security called for redemption, the date on which the redemption payment must be made and may utilize the interest rate reset date for variable or floating rate securities. |
| ^^ | The calculation takes into account the period remaining until the date on which, in accordance with the terms of the security, the principal amount must unconditionally be paid, or in the case of a security called for redemption, the date on which the redemption payment must be made. |
| * | Percentages indicated are based upon total investments as of August 31, 2016. |
| (1) | The yields for Agency Shares, Capital Shares, Institutional Class Shares, Morgan Shares, Premier Shares, Reserve Shares and Service Shares reflect the reimbursements and/or waivers of certain expenses. Without these reimbursements and/or waivers, the yields would have been 0.06%, 0.16%,0.11%, (0.24)%, (0.09)%, (0.34)% and (3.94)% for Agency Shares, Capital Shares, Institutional Class Shares, Morgan Shares, Premier Shares, Reserve Shares and Service Shares, respectively. |
| | An unaudited, uncertified list of prior-day portfolio holdings of the JPMorgan 100% U.S. Treasury Securities Money Market Fund is available upon request. Please contact your J.P. Morgan representative to obtain further information regarding this facility and information on holdings. |
| | | | | | | | |
| | | |
| AUGUST 31, 2016 | | J.P. MORGAN MONEY MARKET FUNDS | | | | | 7 | |
JPMorgan Tax Free Money Market Fund
FUND FACTS
SIX MONTHS ENDED AUGUST 31, 2016 (Unaudited)
| | |
| Objective | | Aims to provide the highest possible level of current income which is excluded from gross income, while still preserving capital and maintaining liquidity* |
| Primary Investments | | High quality short-term municipal securities, the interest on which is excluded from federal income taxes |
| Suggested investment time frame | | Short-term |
| Share classes offered | | Agency, Direct, Eagle Class, Institutional Class, Morgan, Premier and Reserve Shares |
| Net Assets as of August 31, 2016 | | $14.1 Billion |
| Weighted Average Maturity^ | | 18 days |
| Weighted Average Life^^ | | 18 days |
| | | | |
MATURITY SCHEDULE**^ | |
| 1 day | | | 14.0 | % |
| 2–7 days | | | 66.2 | |
| 8–30 days | | | 2.6 | |
| 31–60 days | | | 6.5 | |
| 61-90 days | | | 5.7 | |
| 91–180 days | | | 3.6 | |
| 181+ days | | | 1.4 | |
| | | | |
7-DAY SEC YIELD AS OF AUGUST 31, 2016 (1) | |
| Agency Shares | | | 0.30 | % |
| Direct Shares | | | 0.27 | |
| Eagle Class Shares | | | 0.01 | |
| Institutional Class Shares | | | 0.35 | |
| Morgan Shares | | | 0.01 | |
| Premier Shares | | | 0.11 | |
| Reserve Shares | | | 0.01 | |
The performance quoted is past performance and is not a guarantee of future results. Mutual funds are subject to certain market risks. Investment returns and principal value of an investment will fluctuate so that an investor’s shares, when redeemed, may be worth more or less than their original cost. Current performance may be higher or lower than the performance data shown. For up-to-date month-end performance information please call 1-800-480-4111 (retail investors) or 1-800-766-7722 (institutional investors).
An investment in a money market fund is not insured by the FDIC or any other government agency. Although money market funds strive to preserve the value of the investment at $1.00 per share, it is possible to lose money by investing in a money market fund.
| ^ | The calculation takes into account the period remaining until the date on which, in accordance with the terms of the security, the principal amount must unconditionally be paid, or in the case of a security called for redemption, the date on which the redemption payment must be made and may utilize the interest rate reset date for variable or floating rate securities. |
| ^^ | The calculation takes into account the period remaining until the date on which, in accordance with the terms of the security, the principal amount must unconditionally be paid, or in the case of a security called for redemption, the date on which the redemption payment must be made. |
| * | A portion of the Fund’s income distributions may be subject to the Alternative Minimum Tax (AMT), and some investors may be subject to certain state and local taxes. |
| ** | Percentages indicated are based upon total investments as of August 31, 2016. |
| (1) | The yields for Agency Shares, Direct Shares, Eagle Class Shares, Institutional Class Shares, Morgan Shares, Premier Shares and Reserve Shares reflect the reimbursements and/or waivers of certain expenses. Without these reimbursements and/or waivers, the yields would have been 0.25%, (2.99)%, (0.15)%, 0.30%, (0.05)%, 0.10% and (0.14)% for Agency Shares, Direct Shares, Eagle Class Shares, Institutional Class Shares, Morgan Shares, Premier Shares and Reserve Shares, respectively. |
| | An unaudited, uncertified list of prior-day portfolio holdings of the JPMorgan Tax Free Money Market Fund is available upon request. Please contact your J.P. Morgan representative to obtain further information regarding this facility and information on holdings. |
| | | | | | |
| | | |
| 8 | | | | J.P. MORGAN MONEY MARKET FUNDS | | AUGUST 31, 2016 |
JPMorgan Municipal Money Market Fund
FUND FACTS
SIX MONTHS ENDED AUGUST 31, 2016 (Unaudited)
| | |
| Objective | | Seeks as high a level of current interest income exempt from federal income tax as is consistent with liquidity and stability of principal* |
| Primary Investments | | High quality short-term municipal securities, the interest on which is excluded from federal income taxes |
| Suggested investment time frame | | Short-term |
| Share classes offered | | Agency, Eagle Class, E*Trade, Institutional Class, Morgan, Premier, Reserve and Service Shares |
| Net Assets as of August 31, 2016 | | $3.6 Billion |
| Weighted Average Maturity^ | | 6 days |
| Weighted Average Life^^ | | 6 days |
| | | | |
MATURITY SCHEDULE**^ | |
| 1 day | | | 13.7 | % |
| 2–7 days | | | 86.3 | |
| | | | |
7-DAY SEC YIELD AS OF AUGUST 31, 2016 (1) | |
| Agency Shares | | | 0.34 | % |
| Eagle Class Shares | | | 0.01 | |
| E*Trade Shares | | | 0.01 | |
| Institutional Class Shares | | | 0.39 | |
| Morgan Shares | | | 0.01 | |
| Premier Shares | | | 0.15 | |
| Reserve Shares | | | 0.01 | |
| Service Shares | | | 0.01 | |
The performance quoted is past performance and is not a guarantee of future results. Mutual funds are subject to certain market risks. Investment returns and principal value of an investment will fluctuate so that an investor’s shares, when redeemed, may be worth more or less than their original cost. Current performance may be higher or lower than the performance data shown. For up-to-date month-end performance information please call 1-800-480-4111 (retail investors) or 1-800-766-7722 (institutional investors).
An investment in a money market fund is not insured by the FDIC or any other government agency. Although money market funds strive to preserve the value of the investment at $1.00 per share, it is possible to lose money by investing in a money market fund.
| ^ | The calculation takes into account the period remaining until the date on which, in accordance with the terms of the security, the principal amount must unconditionally be paid, or in the case of a security called for redemption, the date on which the redemption payment must be made and may utilize the interest rate reset date for variable or floating rate securities. |
| ^^ | The calculation takes into account the period remaining until the date on which, in accordance with the terms of the security, the principal amount must unconditionally be paid, or in the case of a security called for redemption, the date on which the redemption payment must be made. |
| * | A portion of the Fund’s income distributions may be subject to the Alternative Minimum Tax (AMT), and some investors may be subject to certain state and local taxes. |
| ** | Percentages indicated are based upon total investments as of August 31, 2016. |
| (1) | The yields for Agency Shares, Eagle Class Shares, E*Trade Shares, Institutional Class Shares, Morgan Shares, Premier Shares, Reserve Shares and Service Shares reflect the reimbursements and/or waivers of certain expenses. Without these reimbursements and/or waivers, the yields would have been 0.27%, (0.12)%, (0.47)%, 0.33%, (0.03)%, 0.12%, (0.14)% and (0.48)% for Agency Shares, Eagle Class Shares, E*Trade Shares, Institutional Class Shares, Morgan Shares, Premier Shares, Reserve Shares and Service Shares, respectively. |
| | An unaudited, uncertified list of prior-day portfolio holdings of the JPMorgan Municipal Money Market Fund is available upon request. Please contact your J.P. Morgan representative to obtain further information regarding this facility and information on holdings. |
| | | | | | | | |
| | | |
| AUGUST 31, 2016 | | J.P. MORGAN MONEY MARKET FUNDS | | | | | 9 | |
JPMorgan Prime Money Market Fund
SCHEDULE OF PORTFOLIO INVESTMENTS
AS OF AUGUST 31, 2016 (Unaudited)
(Amounts in thousands)
| | | | | | | | |
PRINCIPAL
AMOUNT($) | | | SECURITY DESCRIPTION (t) | | VALUE($) | |
| | | | | | | | |
| Certificates of Deposit — 24.5% | |
| | | | Agricultural Bank of China Ltd., | | | | |
| | 175,000 | | | 0.850%, 09/14/16 | | | 175,000 | |
| | 100,000 | | | 0.850%, 09/26/16 | | | 100,000 | |
| | 305,000 | | | Australia & New Zealand Banking Group Ltd., 0.700%, 09/01/16 | | | 305,000 | |
| | | | Banco Del Estado De Chile, | | | | |
| | 100,000 | | | 0.410%, 09/02/16 | | | 100,000 | |
| | 100,000 | | | 0.410%, 09/07/16 | | | 100,000 | |
| | 100,000 | | | 0.420%, 09/02/16 | | | 100,000 | |
| | 60,000 | | | VAR, 0.844%, 09/01/16 | | | 60,000 | |
| | | | Bank of China Ltd., | | | | |
| | 648,000 | | | 0.850%, 09/16/16 | | | 648,000 | |
| | 300,000 | | | 0.850%, 09/26/16 | | | 300,000 | |
| | | | Bank of Montreal, | | | | |
| | 203,390 | | | 0.400%, 09/01/16 | | | 203,390 | |
| | 300,000 | | | 0.400%, 09/02/16 | | | 300,000 | |
| | 500,000 | | | 0.470%, 09/12/16 | | | 500,000 | |
| | 160,000 | | | 0.470%, 09/14/16 | | | 160,000 | |
| | 255,000 | | | VAR, 0.848%, 09/08/16 | | | 255,000 | |
| | 110,000 | | | VAR, 0.903%, 09/12/16 | | | 110,000 | |
| | | | Bank of Tokyo-Mitsubishi UFJ Ltd., | | | | |
| | 350,000 | | | 0.420%, 09/01/16 | | | 350,000 | |
| | 499,530 | | | 0.420%, 09/06/16 | | | 499,530 | |
| | 50,000 | | | 0.890%, 10/07/16 | | | 50,000 | |
| | 250,000 | | | Banque Federative du Credit Mutuel S.A., 0.740%, 09/06/16 | | | 249,974 | |
| | 100,000 | | | BNP Paribas, 0.880%, 10/12/16 | | | 100,000 | |
| | | | BNP Paribas S.A., | | | | |
| | 500,000 | | | 0.490%, 09/06/16 | | | 499,966 | |
| | 500,000 | | | 0.500%, 09/09/16 | | | 499,944 | |
| | 250,000 | | | 0.770%, 09/01/16 | | | 250,000 | |
| | | | China Construction Bank Corp., | | | | |
| | 175,000 | | | 0.800%, 09/01/16 | | | 175,000 | |
| | 300,000 | | | 0.850%, 09/01/16 | | | 300,000 | |
| | 247,700 | | | 0.850%, 09/09/16 | | | 247,700 | |
| | 200,000 | | | 0.850%, 09/15/16 | | | 200,000 | |
| | 325,000 | | | 0.850%, 09/26/16 | | | 325,000 | |
| | 300,000 | | | 0.850%, 09/29/16 | | | 300,000 | |
| | 250,000 | | | Cooperatieve Rabobank U.A., 0.900%, 09/19/16 | | | 249,888 | |
| | | | Credit Agricole Corporate and Investment Bank, | | | | |
| | 420,000 | | | 0.490%, 09/08/16 | | | 420,000 | |
| | 100,000 | | | 0.900%, 10/05/16 | | | 100,000 | |
| | 115,000 | | | Credit Industriel et Commercial, 0.900%, 11/10/16 | | | 115,000 | |
| | | | | | | | |
PRINCIPAL
AMOUNT($) | | | SECURITY DESCRIPTION | | VALUE($) | |
| | | | | | | | |
| | | | | | | | |
| | | | Credit Suisse AG, | | | | |
| | 150,000 | | | VAR, 0.944%, 09/01/16 | | | 150,000 | |
| | 150,000 | | | VAR, 0.948%, 09/06/16 | | | 150,000 | |
| | | | DNB Bank ASA, | | | | |
| | 999,530 | | | 0.400%, 09/01/16 | | | 999,530 | |
| | 500,000 | | | 0.420%, 09/01/16 | | | 500,000 | |
| | 450,000 | | | 0.480%, 09/09/16 | | | 449,952 | |
| | | | DZ Bank AG, | | | | |
| | 400,000 | | | 0.490%, 09/12/16 | | | 399,940 | |
| | 99,000 | | | 0.750%, 09/07/16 | | | 99,000 | |
| | | | Industrial & Commercial Bank of China Ltd., | | | | |
| | 50,000 | | | 0.850%, 09/02/16 | | | 49,999 | |
| | 207,000 | | | 0.850%, 09/08/16 | | | 207,000 | |
| | 590,000 | | | 0.850%, 09/26/16 | | | 590,000 | |
| | 398,600 | | | 0.920%, 09/16/16 | | | 398,600 | |
| | 20,000 | | | ING Bank N.V., 0.960%, 11/25/16 | | | 20,000 | |
| | | | KBC Bank N.V., | | | | |
| | 59,530 | | | 0.420%, 09/06/16 | | | 59,530 | |
| | 450,000 | | | 0.703%, 09/12/16 | | | 449,904 | |
| | 50,000 | | | 0.750%, 09/19/16 | | | 49,981 | |
| | | | Landesbank Hessen-Thuringen Girozentrale, | | | | |
| | 225,000 | | | 0.560%, 09/09/16 | | | 224,972 | |
| | 580,000 | | | 0.580%, 09/06/16 | | | 579,953 | |
| | | | Mitsubishi UFJ Trust & Banking Corp., | | | | |
| | 35,000 | | | 0.720%, 09/13/16 | | | 34,992 | |
| | 25,000 | | | 0.990%, 12/13/16 | | | 24,929 | |
| | | | Mizuho Bank Ltd., | | | | |
| | 190,000 | | | 0.600%, 09/12/16 | | | 189,965 | |
| | 456,000 | | | 0.610%, 09/12/16 | | | 455,915 | |
| | 250,000 | | | 0.613%, 09/02/16 | | | 249,996 | |
| | 171,968 | | | Natixis, 0.930%, 10/31/16 | | | 171,968 | |
| | 200,000 | | | Oversea-Chinese Banking Corp. Ltd., 0.540%, 09/14/16 | | | 200,000 | |
| | 200,000 | | | State Street Bank & Trust Co., VAR, 0.878%, 09/14/16 | | | 200,000 | |
| | | | Sumitomo Mitsui Banking Corp., | | | | |
| | 250,000 | | | 0.550%, 09/02/16 | | | 250,000 | |
| | 260,000 | | | 0.560%, 09/09/16 | | | 259,968 | |
| | | | Sumitomo Mitsui Trust Bank Ltd., | | | | |
| | 970,000 | | | 0.420%, 09/01/16 | | | 970,000 | |
| | 300,000 | | | 0.470%, 09/08/16 | | | 300,000 | |
| | 250,000 | | | 0.500%, 09/07/16 | | | 250,000 | |
| | 25,000 | | | 0.750%, 10/14/16 | | | 25,000 | |
| | 100,000 | | | 0.900%, 10/14/16 | | | 100,000 | |
| | 150,000 | | | 0.920%, 11/16/16 | | | 149,710 | |
| | 500,000 | | | Toronto-Dominion Bank, 0.490%, 09/09/16 | | | 499,946 | |
SEE NOTES TO FINANCIAL STATEMENTS.
| | | | | | |
| | | |
| 10 | | | | J.P. MORGAN MONEY MARKET FUNDS | | AUGUST 31, 2016 |
| | | | | | | | |
PRINCIPAL
AMOUNT($) | | | SECURITY DESCRIPTION | | VALUE($) | |
| | | | | | | | |
| Certificates of Deposit — continued | |
| | | | UBS AG, | | | | |
| | 50,000 | | | 0.910%, 11/07/16 | | | 50,000 | |
| | 10,000 | | | VAR, 0.897%, 09/06/16 | | | 10,000 | |
| | 128,700 | | | Wells Fargo Bank N.A., VAR, 1.028%, 09/12/16 | | | 128,700 | |
| | | | | | | | |
| | | | Total Certificates of Deposit
(Cost $18,247,842) | | | 18,247,842 | |
| | | | | | | | |
| Commercial Paper — 11.0% (n) | |
| | | | Agricultural Bank of China Ltd., | | | | |
| | 285,000 | | | 0.851%, 09/08/16 (e) | | | 284,953 | |
| | 690,000 | | | 0.851%, 09/26/16 (e) | | | 689,593 | |
| | 98,000 | | | Antalis S.A., 0.550%, 09/12/16 (e) | | | 97,984 | |
| | 105,000 | | | Barton Capital S.A., 0.550%, 09/02/16 (e) | | | 104,998 | |
| | 100,000 | | | Bedford Row Funding Corp., VAR, 0.864%, 09/19/16 (e) | | | 100,000 | |
| | | | BNP Paribas, | | | | |
| | 182,812 | | | 0.300%, 09/01/16 | | | 182,812 | |
| | 250,000 | | | 0.420%, 09/01/16 (e) | | | 250,000 | |
| | 850,000 | | | 0.420%, 09/06/16 (e) | | | 849,950 | |
| | | | BPCE S.A., | | | | |
| | 500,000 | | | 0.450%, 09/12/16 (e) | | | 499,931 | |
| | 440,000 | | | 0.757%, 09/01/16 (e) | | | 440,000 | |
| | 45,000 | | | 0.894%, 10/03/16 (e) | | | 44,965 | |
| | | | Caisse Centrale Desjardins, | | | | |
| | 168,000 | | | 0.420%, 09/01/16 (e) | | | 168,000 | |
| | 150,000 | | | 0.420%, 09/07/16 (e) | | | 149,989 | |
| | 249,600 | | | 0.440%, 09/02/16 (e) | | | 249,597 | |
| | 147,000 | | | Cancara Asset Securitisation LLC, 0.550%, 09/06/16 (e) | | | 146,989 | |
| | 25,043 | | | Cedar Spring Capital Co. LLC, 0.681%, 09/08/16 (e) | | | 25,040 | |
| | 190,240 | | | China Construction Bank Corp., 0.450%, 09/01/16 (e) | | | 190,240 | |
| | 125,000 | | | Concord Minutemen Capital Co. LLC, Series A,0.540%, 09/06/16 (e) | | | 124,991 | |
| | | | Credit Agricole Corporate and Investment Bank, | | | | |
| | 138,467 | | | 0.320%, 09/01/16 | | | 138,467 | |
| | 600,000 | | | 0.500%, 09/06/16 | | | 599,958 | |
| | 200,000 | | | Crown Point Capital Co. LLC, Series A,VAR, 1.024%, 09/29/16 (e) | | | 200,000 | |
| | 66,000 | | | DBS Bank Ltd., 0.541%, 09/15/16 (e) | | | 65,986 | |
| | 111,000 | | | Dexia Credit Local S.A., 0.904%, 09/13/16 | | | 110,967 | |
| | | | Gotham Funding Corp., | | | | |
| | 175,000 | | | 0.550%, 09/06/16 (e) | | | 174,986 | |
| | 75,000 | | | 0.570%, 09/07/16 (e) | | | 74,993 | |
| | 147,013 | | | 0.570%, 09/08/16 (e) | | | 146,997 | |
| | | | | | | | |
PRINCIPAL
AMOUNT($) | | | SECURITY DESCRIPTION | | VALUE($) | |
| | | | | | | | |
| | | | | | | | |
| | 75,000 | | | ING U.S. Funding LLC, 0.899%, 10/03/16 | | | 74,940 | |
| | 60,000 | | | Kells Funding LLC, 0.530%, 09/27/16 (e) | | | 59,977 | |
| | 250,000 | | | KFW, 0.420%, 09/12/16 (e) | | | 249,968 | |
| | 137,000 | | | Liberty Street Funding LLC, 0.600%, 09/28/16 (e) | | | 136,938 | |
| | | | Natixis, | | | | |
| | 178,558 | | | 0.300%, 09/01/16 | | | 178,558 | |
| | 128,000 | | | 0.935%, 10/31/16 | | | 127,802 | |
| | | | Regency Markets No. 1 LLC, | | | | |
| | 91,784 | | | 0.550%, 09/28/16 (e) | | | 91,746 | |
| | 99,494 | | | 0.550%, 09/14/16 (e) | | | 99,474 | |
| | 75,000 | | | Ridgefield Funding Co. LLC, Series B1,0.550%, 09/08/16 (e) | | | 74,992 | |
| | | | Skandinaviska Enskilda Banken AB, | | | | |
| | 378,000 | | | 0.834%, 09/22/16 (e) | | | 377,817 | |
| | 50,000 | | | 0.854%, 10/24/16 | | | 49,937 | |
| | 145,000 | | | Toronto-Dominion Holdings USA, Inc., 0.661%, 10/11/16 (e) | | | 144,894 | |
| | | | Victory Receivables Corp., | | | | |
| | 50,000 | | | 0.560%, 09/02/16 (e) | | | 49,999 | |
| | 34,581 | | | 0.570%, 09/06/16 (e) | | | 34,579 | |
| | 200,000 | | | 0.580%, 09/14/16 (e) | | | 199,958 | |
| | 100,000 | | | Westpac Banking Corp., VAR, 0.878%, 09/16/16 (e) | | | 100,000 | |
| | 67,000 | | | Working Capital Management Co. LP, 0.540%, 09/07/16 (e) | | | 66,994 | |
| | | | | | | | |
| | | | Total Commercial Paper
(Cost $8,230,959) | | | 8,230,959 | |
| | | | | | | | |
| Repurchase Agreements — 7.6% | |
| | 50,000 | | | BNP Paribas, 1.050%, dated 08/31/16, due 10/05/16, repurchase price $50,051, collateralized by Asset-Backed Securities, 0.000% - 1.633%, due 01/30/26 - 03/25/36, Collateralized Mortgage Obligations, 0.000% - 0.754%, due 11/25/25 - 03/19/36, Corporate Bonds, 3.250% - 12.000%, due 11/05/18 - 12/15/55, Corporate Notes, 4.250% - 4.250%, due 05/13/19 - 05/13/19, Federal National Mortgage Association Connecticut Avenue Securities, 1.724% - 7.274%, due 05/28/24 - 01/25/29 and Municipal Debt Securities, 1.110% - 1.110%, due 09/15/27 - 09/15/27, with a value of $54,066. | | | 50,000 | |
| | 175,000 | | | Citigroup Global Markets, Inc., 1.175%, dated 08/31/16, due 09/01/16, repurchase price $175,006, collateralized by Asset-Backed Securities, 0.000% - 14.725%, due 12/25/31 - 11/25/51, with a value of $189,000. | | | 175,000 | |
SEE NOTES TO FINANCIAL STATEMENTS.
| | | | | | | | |
| | | |
| AUGUST 31, 2016 | | J.P. MORGAN MONEY MARKET FUNDS | | | | | 11 | |
JPMorgan Prime Money Market Fund
SCHEDULE OF PORTFOLIO INVESTMENTS
AS OF AUGUST 31, 2016 (Unaudited) (continued)
(Amounts in thousands)
| | | | | | | | |
PRINCIPAL
AMOUNT($) | | | SECURITY DESCRIPTION | | VALUE($) | |
| | | | | | | | |
| Repurchase Agreements — continued | |
| | 175,000 | | | Citigroup Global Markets, Inc., 1.175%, dated 08/31/16, due 09/01/16, repurchase price $175,006, collateralized by Corporate Bonds, 0.000% - 15.000%, due 09/05/16 - 12/01/37, Corporate Notes, 0.000% - 8.875%, due 04/04/17 - 01/01/49 and Sovereign Government Securities, 0.000% - 11.750%, due 04/14/19 - 01/27/45, with a value of $189,000. | | | 175,000 | |
| | 400,000 | | | Credit Suisse, 0.550%, dated 08/31/16, due 09/07/16, repurchase price $400,043, collateralized by Asset-Backed Securities, 4.824% - 4.824%, due 07/25/25 - 07/25/25 and Collateralized Mortgage Obligations, 0.000% - 13.329%, due 12/27/18 - 05/10/63, with a value of $432,000. | | | 400,000 | |
| | 300,000 | | | Credit Suisse, 1.007%, dated 08/31/16, due 10/05/16, repurchase price $300,294, collateralized by Collateralized Mortgage Obligations, 0.000% - 0.000%, due 02/27/56 - 02/27/56, with a value of $324,004. | | | 300,000 | |
| | 100,000 | | | HSBC Securities USA, Inc., 0.400%, dated 08/31/16, due 09/01/16, repurchase price $100,001, collateralized by Corporate Bonds, 0.900% - 7.250%, due 03/22/17 - 08/04/46 and Corporate Notes, 1.500% - 2.500%, due 10/07/17 - 01/19/21, with a value of $105,004. | | | 100,000 | |
| | 230,000 | | | HSBC Securities USA, Inc., 0.400%, dated 08/31/16, due 09/01/16, repurchase price $230,003, collateralized by Corporate Bonds, 0.010% - 7.625%, due 10/01/16 - 05/19/46 and Corporate Notes, 1.250% - 4.400%, due 05/08/17 - 06/14/46, with a value of $241,503. | | | 230,000 | |
| | 120,000 | | | HSBC Securities USA, Inc., 0.550%, dated 08/31/16, due 09/01/16, repurchase price $120,002, collateralized by Corporate Bonds, 4.500% - 12.500%, due 12/01/16 - 06/26/42, with a value of $129,601. | | | 120,000 | |
| | | | | | | | |
PRINCIPAL
AMOUNT($) | | | SECURITY DESCRIPTION | | VALUE($) | |
| | | | | | | | |
| | | | | | | | |
| | 625,000 | | | Merrill Lynch PFS, Inc., 1.100%, dated 08/31/16, due 10/05/16, repurchase price $625,668, collateralized by Asset-Backed Securities, 0.000% - 9.798%, due 03/15/17 - 01/01/99, Collateralized Mortgage Obligations, 0.000% - 31.772%, due 08/25/18 - 05/11/63, Corporate Bonds, 0.000% - 9.875%, due 11/16/16 - 06/05/15, Corporate Notes, 2.375% - 8.875%, due 11/06/17 - 07/28/25, Sovereign Government Securities, 0.000% - 13.625%, due 01/17/17 - 04/22/46, Municipal Debt Securities, 4.150% - 7.781%, due 08/01/17 - 06/01/47 and U.S. Treasury Securities, 0.000% - 0.625%, due 10/15/16 - 11/10/16, with a value of $673,961. | | | 625,000 | |
| | 375,000 | | | Merrill Lynch PFS, Inc., 1.100%, dated 08/31/16, due 10/05/16, repurchase price $375,401, collateralized by Asset-Backed Securities, 0.000% - 7.220%, due 01/13/18 - 12/06/50 and Collateralized Mortgage Obligations, 0.000% - 35.854%, due 01/15/28 - 08/25/55, with a value of $405,000. | | | 375,000 | |
| | 475,000 | | | Merrill Lynch PFS, Inc., 1.100%, dated 08/31/16, due 10/05/16, repurchase price $475,508, collateralized by Asset-Backed Securities, 0.000% - 12.443%, due 08/01/17 - 02/25/55 and Collateralized Mortgage Obligations, 0.000% - 46.164%, due 03/25/21 - 08/25/55, with a value of $512,882. | | | 475,000 | |
| | 500,000 | | | Societe Generale S.A., 0.400%, dated 08/31/16, due 09/01/16, repurchase price $500,006, collateralized by Corporate Bonds, 1.423% - 5.838%, due 03/15/17 - 10/01/46 and Corporate Notes, 0.000% - 6.875%, due 04/25/18 - 05/15/44, with a value of $525,006. | | | 500,000 | |
| | 250,000 | | | Societe Generale S.A., 0.500%, dated 08/31/16, due 09/01/16, repurchase price $250,003, collateralized by Corporate Bonds, 2.600% - 8.375%, due 04/15/18 - 12/18/73, Corporate Notes, 2.800% - 8.000%, due 01/16/20 - 12/01/37 and Sovereign Government Securities, 0.000% - 10.125%, due 01/17/17 - 01/27/45, with a value of $267,196. | | | 250,000 | |
SEE NOTES TO FINANCIAL STATEMENTS.
| | | | | | |
| | | |
| 12 | | | | J.P. MORGAN MONEY MARKET FUNDS | | AUGUST 31, 2016 |
| | | | | | | | |
PRINCIPAL
AMOUNT($) | | | SECURITY DESCRIPTION | | VALUE($) | |
| | | | | | | | |
| Repurchase Agreements —continued | |
| | 800,000 | | | Societe Generale S.A., 0.540%, dated 08/31/16, due 09/07/16, repurchase price $800,084, collateralized by Corporate Bonds, 0.000% - 7.750%, due 01/11/17 - 02/26/55, Corporate Notes, 0.000% - 7.300%, due 11/03/16 - 01/15/38 and Sovereign Government Securities, 0.000% - 11.875%, due 04/03/18 - 03/01/41, with a value of $840,089. | | | 800,000 | |
| | 100,000 | | | Wells Fargo Securities, LLC, 0.400%, dated 08/31/16, due 09/01/16, repurchase price $100,001, collateralized by Asset-Backed Securities, 0.000% - 8.890%, due 06/01/17 - 10/18/52, Federal National Mortgage Association Connecticut Avenue Securities, 4.988% - 6.524%, due 02/26/24 - 10/25/28 and Municipal Debt Securities, 3.500% - 6.319%, due 08/01/20 - 01/01/42, with a value of $107,923. | | | 100,000 | |
| | 375,000 | | | Wells Fargo Securities, LLC, 0.400%, dated 08/31/16, due 09/01/16, repurchase price $375,004, collateralized by Collateralized Mortgage Obligations, 0.000% - 6.134%, due 11/06/17 - 03/17/59, with a value of $405,005. | | | 375,000 | |
| | 100,000 | | | Wells Fargo Securities, LLC, 0.450%, dated 08/31/16, due 09/01/16, repurchase price $100,001, collateralized by Asset-Backed Securities, 0.000% - 6.900%, due 10/15/21 - 10/18/52 and Collateralized Mortgage Obligations, 0.000% - 2.556%, due 02/25/31 - 01/17/59, with a value of $108,002. | | | 100,000 | |
| | 175,000 | | | Wells Fargo Securities, LLC, 0.600%, dated 08/31/16, due 09/06/16, repurchase price $175,018, collateralized by Corporate Bonds, 4.000% - 12.125%, due 03/01/17 - 04/01/45, with a value of $189,022. | | | 175,000 | |
| | 200,000 | | | Wells Fargo Securities, LLC, 0.600%, dated 08/31/16, due 09/06/16, repurchase price $200,020, collateralized by Asset-Backed Securities, 0.000% - 9.130%, due 07/20/18 - 04/18/52, with a value of $216,025. | | | 200,000 | |
| | 175,000 | | | Wells Fargo Securities, LLC, 0.600%, dated 08/31/16, due 09/07/16, repurchase price $175,020, collateralized by Collateralized Mortgage Obligations, 0.000% - 6.000%, due 10/25/34 - 02/18/48, with a value of $189,022. | | | 175,000 | |
| | | | | | | | |
| | | | Total Repurchase Agreements
(Cost $5,700,000) | | | 5,700,000 | |
| | | | | | | | |
| | | | | | | | |
PRINCIPAL
AMOUNT($) | | | SECURITY DESCRIPTION | | VALUE($) | |
| | | | | | | | |
| Time Deposits — 53.4% | | | | |
| | | | ABN AMRO Bank N.V., | | | | |
| | 320,000 | | | 0.350%, 09/01/16 | | | 320,000 | |
| | 1,500,000 | | | 0.440%, 09/01/16 | | | 1,500,000 | |
| | | | Australia & New Zealand Banking Group Ltd., | | | | |
| | 600,000 | | | 0.310%, 09/01/16 | | | 600,000 | |
| | 1,000,000 | | | 0.430%, 09/01/16 | | | 1,000,000 | |
| | | | Bank of Tokyo-Mitsubishi UFJ Ltd., | | | | |
| | 1,000,000 | | | 0.300%, 09/01/16 | | | 1,000,000 | |
| | 1,000,000 | | | 0.300%, 09/01/16 | | | 1,000,000 | |
| | | | Canadian Imperial Bank of Commerce, | | | | |
| | 50,000 | | | 0.220%, 09/01/16 | | | 50,000 | |
| | 118,854 | | | 0.300%, 09/01/16 | | | 118,854 | |
| | 494,910 | | | 0.300%, 09/01/16 | | | 494,910 | |
| | 200,000 | | | Chiba Bank Ltd., 0.430%, 09/01/16 | | | 200,000 | |
| | 450,000 | | | China Construction Bank Corp., 0.450%, 09/01/16 | | | 450,000 | |
| | 200,000 | | | Citibank N.A., 0.410%, 09/07/16 | | | 200,000 | |
| | 1,419,530 | | | Cooperatieve Rabobank U.A., 0.430%, 09/06/16 | | | 1,419,530 | |
| | | | Credit Agricole Corporate and Investment Bank, | | | | |
| | 389,436 | | | 0.320%, 09/01/16 | | | 389,436 | |
| | 897,928 | | | 0.320%, 09/01/16 | | | 897,928 | |
| | 1,145,000 | | | 0.320%, 09/01/16 | | | 1,145,000 | |
| | | | Credit Industriel et Commercial, | | | | |
| | 1,000,000 | | | 0.310%, 09/01/16 | | | 1,000,000 | |
| | 1,095,000 | | | 0.310%, 09/01/16 | | | 1,095,000 | |
| | 1,184,000 | | | 0.310%, 09/01/16 | | | 1,184,000 | |
| | | | DNB Bank ASA, | | | | |
| | 100,000 | | | 0.300%, 09/01/16 | | | 100,000 | |
| | 1,600,000 | | | 0.300%, 09/01/16 | | | 1,600,000 | |
| | 599,530 | | | Industrial & Commercial Bank of China Ltd., 0.480%, 09/06/16 | | | 599,530 | |
| | 2,155,000 | | | KBC Bank N.V., 0.320%, 09/01/16 | | | 2,155,000 | |
| | 270,604 | | | National Australia Bank Ltd., 0.300%, 09/01/16 | | | 270,604 | |
| | | | Natixis S.A., | | | | |
| | 275,000 | | | 0.300%, 09/01/16 | | | 275,000 | |
| | 1,959,978 | | | 0.310%, 09/01/16 | | | 1,959,978 | |
| | | | Nordea Bank Finland plc, | | | | |
| | 100,000 | | | 0.300%, 09/01/16 | | | 100,000 | |
| | 100,000 | | | 0.300%, 09/01/16 | | | 100,000 | |
| | 500,000 | | | 0.300%, 09/01/16 | | | 500,000 | |
| | 1,000,000 | | | 0.300%, 09/01/16 | | | 1,000,000 | |
| | 1,999,530 | | | 0.400%, 09/06/16 | | | 1,999,530 | |
SEE NOTES TO FINANCIAL STATEMENTS.
| | | | | | | | |
| | | |
| AUGUST 31, 2016 | | J.P. MORGAN MONEY MARKET FUNDS | | | | | 13 | |
JPMorgan Prime Money Market Fund
SCHEDULE OF PORTFOLIO INVESTMENTS
AS OF AUGUST 31, 2016 (Unaudited) (continued)
(Amounts in thousands)
| | | | | | | | |
PRINCIPAL
AMOUNT($) | | | SECURITY DESCRIPTION | | VALUE($) | |
| | | | | | | | |
| Time Deposits — continued | | | | |
| | | | Royal Bank of Canada, | | | | |
| | 1,000,000 | | | 0.300%, 09/01/16 | | | 1,000,000 | |
| | 1,634,530 | | | 0.300%, 09/01/16 | | | 1,634,530 | |
| | 830,296 | | | 0.350%, 09/01/16 | | | 830,296 | |
| | | | Skandinaviska Enskilda Banken AB, | | | | |
| | 996,766 | | | 0.300%, 09/01/16 | | | 996,766 | |
| | 1,000,000 | | | 0.300%, 09/01/16 | | | 1,000,000 | |
| | 1,271,836 | | | 0.300%, 09/01/16 | | | 1,271,836 | |
| | | | Standard Chartered Bank, | | | | |
| | 799,530 | | | 0.420%, 09/01/16 | | | 799,530 | |
| | 300,000 | | | 0.420%, 09/06/16 | | | 300,000 | |
| | | | Svenska Handelsbanken AB, | | | | |
| | 1,000,000 | | | 0.300%, 09/01/16 | | | 1,000,000 | |
| | 2,619,530 | | | 0.400%, 09/06/16 | | | 2,619,530 | |
| | | | Swedbank AB, | | | | |
| | 1,660,000 | | | 0.300%, 09/01/16 | | | 1,660,000 | |
| | 1,999,530 | | | 0.410%, 09/06/16 | | | 1,999,530 | |
| | | | | | | | |
| | | | Total Time Deposits
(Cost $39,836,318) | | | 39,836,318 | |
| | | | | | | | |
| U.S. Government Agency Security — 0.0% (g) | | | | |
| | 10,000 | | | Federal Home Loan Mortgage Corp., 0.875%, 10/14/16
(Cost $10,006) | | | 10,006 | |
| | | | | | | | |
| | | | | | | | |
PRINCIPAL
AMOUNT($) | | | SECURITY DESCRIPTION | | VALUE($) | |
| | | | | | | | |
| U.S. Treasury Obligations — 2.2% | |
| | | | U.S. Treasury Notes — 2.2% | | | | |
| | 350,000 | | | 0.625%, 11/15/16 | | | 350,003 | |
| | 700,000 | | | 0.875%, 11/30/16 | | | 700,423 | |
| | 102,000 | | | 2.750%, 11/30/16 | | | 102,544 | |
| | 517,733 | | | 4.625%, 11/15/16 | | | 521,953 | |
| | | | | | | | |
| | | | Total U.S. Treasury Obligations
(Cost $1,674,923) | | | 1,674,923 | |
| | | | | | | | |
| Weekly Demand Notes — 0.2% | |
| | | | New Jersey — 0.2% | | | | |
| | 67,745 | | | Jets Stadium Development LLC, Series A-4A, VRDO, 0.590%, 09/07/16 (e) | | | 67,745 | |
| | 49,515 | | | Jets Stadium Finance Issuer 2015 LLC, VRDO, 0.590%, 09/07/16 (e) | | | 49,515 | |
| | | | | | | | |
| | | | Total Weekly Demand Notes
(Cost $117,260) | | | 117,260 | |
| | | | | | | | |
| | | | Total Investments — 98.9%
(Cost $73,817,308)* | | | 73,817,308 | |
| | | | Other Assets in Excess of
Liabilities — 1.1% | | | 798,777 | |
| | | | | | | | |
| | | | NET ASSETS — 100.0% | | $ | 74,616,085 | |
| | | | | | | | |
Percentages indicated are based on net assets.
SEE NOTES TO FINANCIAL STATEMENTS.
| | | | | | |
| | | |
| 14 | | | | J.P. MORGAN MONEY MARKET FUNDS | | AUGUST 31, 2016 |
JPMorgan Liquid Assets Money Market Fund
SCHEDULE OF PORTFOLIO INVESTMENTS
AS OF AUGUST 31, 2016 (Unaudited)
(Amounts in thousands)
| | | | | | | | |
PRINCIPAL
AMOUNT($) | | | SECURITY DESCRIPTION (t) | | VALUE($) | |
| | | | | | | | |
| Certificates of Deposit — 13.0% | |
| | 15,000 | | | Agricultural Bank of China Ltd., 0.850%, 09/14/16 | | | 15,000 | |
| | | | Bank of Montreal, | | | | |
| | 143,000 | | | 0.400%, 09/01/16 | | | 143,000 | |
| | 15,000 | | | 0.470%, 09/14/16 | | | 15,000 | |
| | 50,000 | | | Bank of Tokyo-Mitsubishi UFJ Ltd., 0.420%, 09/01/16 | | | 50,000 | |
| | | | China Construction Bank Corp., | | | | |
| | 25,000 | | | 0.850%, 09/01/16 | | | 25,000 | |
| | 25,000 | | | 0.850%, 09/09/16 | | | 25,000 | |
| | 25,000 | | | 0.850%, 09/15/16 | | | 25,000 | |
| | 50,000 | | | Credit Agricole Corporate and Investment Bank, 0.490%, 09/08/16 | | | 50,000 | |
| | 10,000 | | | DZ Bank AG, 0.750%, 09/06/16 | | | 10,000 | |
| | 23,000 | | | Industrial & Commercial Bank of China Ltd., 0.850%, 09/08/16 | | | 23,000 | |
| | 25,000 | | | Mizuho Bank Ltd., 0.612%, 09/02/16 | | | 24,999 | |
| | | | Sumitomo Mitsui Trust Bank Ltd., | | | | |
| | 80,000 | | | 0.420%, 09/01/16 | | | 80,000 | |
| | 50,000 | | | 0.500%, 09/07/16 | | | 50,000 | |
| | | | | | | | |
| | | | Total Certificates of Deposit
(Cost $535,999) | | | 535,999 | |
| | | | | | | | |
| Commercial Paper — 7.4% (n) | |
| | 32,000 | | | Agricultural Bank of China Ltd., 0.851%, 09/08/16 (e) | | | 31,995 | |
| | 10,000 | | | BPCE S.A., 0.757%, 09/01/16 (e) | | | 10,000 | |
| | 20,000 | | | Cancara Asset Securitisation LLC, 0.550%, 09/06/16 (e) | | | 19,998 | |
| | 25,000 | | | Concord Minutemen Capital Co. LLC, Series A, 0.540%, 09/06/16 (e) | | | 24,998 | |
| | 100,000 | | | Credit Agricole Corporate and Investment Bank, 0.500%, 09/06/16 | | | 99,993 | |
| | 29,674 | | | Industrial & Commercial Bank of China Ltd., 0.450%, 09/01/16 (e) | | | 29,674 | |
| | 55,000 | | | KFW, 0.420%, 09/09/16 (e) | | | 54,995 | |
| | 30,000 | | | Victory Receivables Corp., 0.570%, 09/06/16 (e) | | | 29,998 | |
| | | | | | | | |
| | | | Total Commercial Paper
(Cost $301,651) | | | 301,651 | |
| | | | | | | | |
| Corporate Note — 2.1% | |
| | | | Financials — 2.1% | | | | |
| | | | Banks — 2.1% | | | | |
| | 85,000 | | | Royal Bank of Canada, VAR, 0.825%, 09/09/16
(Cost $85,000) | | | 85,000 | |
| | | | | | | | |
| | | | | | | | |
PRINCIPAL
AMOUNT($) | | | SECURITY DESCRIPTION | | VALUE($) | |
| | | | | | | | |
| Repurchase Agreement — 2.4% | |
| | 100,000 | | | HSBC Securities USA, Inc., 0.550%, dated 08/31/16, due 09/01/16, repurchase price $100,002, collateralized by Corporate Bonds, 3.875% - 9.125%, due 03/01/17 - 06/15/24 with a value of $108,005.
(Cost $100,000) | | | 100,000 | |
| | | | | | | | |
| Time Deposits — 74.7% | |
| | 180,000 | | | ABN AMRO Bank N.V., 0.350%, 09/01/16 | | | 180,000 | |
| | 150,000 | | | Australia & New Zealand Banking Group Ltd., 0.310%, 09/01/16 | | | 150,000 | |
| | 100,000 | | | Bank of Tokyo-Mitsubishi UFJ Ltd., 0.300%, 09/01/16 | | | 100,000 | |
| | 180,000 | | | BNP Paribas, 0.300%, 09/01/16 | | | 180,000 | |
| | | | Canadian Imperial Bank of Commerce, | | | | |
| | 67,717 | | | 0.300%, 09/01/16 | | | 67,717 | |
| | 100,000 | | | 0.300%, 09/01/16 | | | 100,000 | |
| | 200,000 | | | Chiba Bank Ltd., 0.430%, 09/01/16 | | | 200,000 | |
| | 100,000 | | | China Construction Bank Corp., 0.450%, 09/01/16 | | | 100,000 | |
| | 200,000 | | | Citibank N.A., 0.410%, 09/07/16 | | | 200,000 | |
| | 200,000 | | | Cooperatieve Rabobank U.A., 0.430%, 09/06/16 | | | 200,000 | |
| | 55,000 | | | Credit Agricole Corporate and Investment Bank, 0.320%, 09/01/16 | | | 55,000 | |
| | 180,000 | | | Credit Industriel et Commercial, 0.310%, 09/01/16 | | | 180,000 | |
| | 185,000 | | | KBC Bank N.V., 0.320%, 09/01/16 | | | 185,000 | |
| | 185,000 | | | National Australia Bank Ltd., 0.300%, 09/01/16 | | | 185,000 | |
| | 175,000 | | | Natixis S.A., 0.310%, 09/01/16 | | | 175,000 | |
| | 100,000 | | | Royal Bank of Canada, 0.300%, 09/01/16 | | | 100,000 | |
| | 200,233 | | | Skandinaviska Enskilda Banken AB, 0.300%, 09/01/16 | | | 200,233 | |
| | 200,000 | | | Standard Chartered Bank, 0.420%, 09/01/16 | | | 200,000 | |
| | 125,000 | | | Svenska Handelsbanken AB, 0.400%, 09/06/16 | | | 125,000 | |
| | | | Swedbank AB, | | | | |
| | 90,000 | | | 0.300%, 09/01/16 | | | 90,000 | |
| | 100,000 | | | 0.410%, 09/06/16 | | | 100,000 | |
| | | | | | | | |
| | | | Total Time Deposits
(Cost $3,072,950) | | | 3,072,950 | |
| | | | | | | | |
SEE NOTES TO FINANCIAL STATEMENTS.
| | | | | | | | |
| | | |
| AUGUST 31, 2016 | | J.P. MORGAN MONEY MARKET FUNDS | | | | | 15 | |
JPMorgan Liquid Assets Money Market Fund
SCHEDULE OF PORTFOLIO INVESTMENTS
AS OF AUGUST 31, 2016 (Unaudited) (continued)
(Amounts in thousands)
| | | | | | | | |
PRINCIPAL
AMOUNT($) | | | SECURITY DESCRIPTION | | VALUE($) | |
| | | | | | | | |
| Weekly Demand Notes — 0.5% | |
| | | | New Jersey — 0.5% | | | | |
| | 16,855 | | | Jets Stadium Development LLC, Series A-4A, VRDO, 0.590%, 09/07/16 (e) | | | 16,855 | |
| | 4,985 | | | Jets Stadium Finance Issuer 2015 LLC, VRDO, 0.590%, 09/07/16 (e) | | | 4,985 | |
| | | | | | | | |
| | | | Total Weekly Demand Notes
(Cost $21,840) | | | 21,840 | |
| | | | | | | | |
| | | | Total Investments — 100.1%
(Cost $4,117,440)* | | | 4,117,440 | |
| | | | Liabilities in Excess of
Other Assets — (0.1)% | | | (3,441 | ) |
| | | | | | | | |
| | | | NET ASSETS — 100.0% | | $ | 4,113,999 | |
| | | | | | | | |
Percentages indicated are based on net assets.
SEE NOTES TO FINANCIAL STATEMENTS.
| | | | | | |
| | | |
| 16 | | | | J.P. MORGAN MONEY MARKET FUNDS | | AUGUST 31, 2016 |
JPMorgan U.S. Government Money Market Fund
SCHEDULE OF PORTFOLIO INVESTMENTS
AS OF AUGUST 31, 2016 (Unaudited)
(Amounts in thousands)
| | | | | | | | |
PRINCIPAL
AMOUNT($) | | | SECURITY DESCRIPTION (t) | | VALUE($) | |
| | | | | | | | |
| U.S. Government Agency Securities — 40.1% | |
| | | | Federal Farm Credit Bank — 2.4% | |
| | 15,000 | | | DN, 0.411%, 12/09/16 (n) | | | 14,983 | |
| | 150,000 | | | DN, 0.417%, 09/26/16 (n) | | | 149,957 | |
| | 10,000 | | | DN, 0.451%, 10/19/16 (n) | | | 9,994 | |
| | 15,000 | | | DN, 0.461%, 09/28/16 (n) | | | 14,995 | |
| | 69,000 | | | DN, 0.481%, 09/30/16 (n) | | | 68,973 | |
| | 25,000 | | | DN, 0.481%, 10/06/16 (n) | | | 24,988 | |
| | 25,000 | | | DN, 0.502%, 01/17/17 (n) | | | 24,952 | |
| | 100,000 | | | DN, 0.502%, 01/25/17 (n) | | | 99,797 | |
| | 25,000 | | | DN, 0.511%, 10/18/16 (n) | | | 24,983 | |
| | 75,000 | | | DN, 0.532%, 04/03/17 (n) | | | 74,764 | |
| | 80,000 | | | VAR, 0.484%, 09/01/16 | | | 79,993 | |
| | 203,000 | | | VAR, 0.497%, 09/21/16 | | | 202,958 | |
| | 120,000 | | | VAR, 0.514%, 09/19/16 | | | 119,989 | |
| | 64,836 | | | VAR, 0.518%, 09/14/16 | | | 64,837 | |
| | 153,000 | | | VAR, 0.524%, 09/26/16 | | | 152,968 | |
| | 130,000 | | | VAR, 0.524%, 09/29/16 | | | 129,995 | |
| | 175,000 | | | VAR, 0.529%, 09/26/16 | | | 174,990 | |
| | 50,000 | | | VAR, 0.548%, 09/13/16 | | | 50,006 | |
| | 119,100 | | | VAR, 0.558%, 09/13/16 | | | 119,138 | |
| | 250,000 | | | VAR, 0.577%, 09/16/16 | | | 249,930 | |
| | 500,000 | | | VAR, 0.586%, 09/02/16 | | | 499,930 | |
| | 275,000 | | | VAR, 0.607%, 09/06/16 | | | 274,988 | |
| | | | | | | | |
| | | | | | | 2,628,108 | |
| | | | | | | | |
| | | | Federal Home Loan Bank — 32.7% | | | | |
| | 70,000 | | | 2.000%, 09/09/16 | | | 70,022 | |
| | 1,250,000 | | | DN, 0.343%, 11/23/16 (n) | | | 1,249,011 | |
| | 913,500 | | | DN, 0.378%, 10/19/16 (n) | | | 913,040 | |
| | 82,000 | | | DN, 0.400%, 10/05/16 (n) | | | 81,969 | |
| | 125,000 | | | DN, 0.401%, 11/21/16 (n) | | | 124,887 | |
| | 225,998 | | | DN, 0.401%, 12/02/16 (n) | | | 225,767 | |
| | 750,000 | | | DN, 0.401%, 12/05/16 (n) | | | 749,208 | |
| | 150,000 | | | DN, 0.401%, 12/21/16 (n) | | | 149,815 | |
| | 100,000 | | | DN, 0.416%, 12/19/16 (n) | | | 99,874 | |
| | 25,000 | | | DN, 0.421%, 09/22/16 (n) | | | 24,994 | |
| | 250,000 | | | DN, 0.431%, 10/14/16 (n) | | | 249,872 | |
| | 25,750 | | | DN, 0.446%, 11/09/16 (n) | | | 25,728 | |
| | 500,000 | | | DN, 0.451%, 09/15/16 (n) | | | 499,912 | |
| | 150,750 | | | DN, 0.451%, 10/21/16 (n) | | | 150,656 | |
| | 250,000 | | | DN, 0.451%, 11/15/16 (n) | | | 249,766 | |
| | 150,000 | | | DN, 0.451%, 02/03/17 (n) | | | 149,709 | |
| | 277,000 | | | DN, 0.452%, 12/14/16 (n) | | | 276,639 | |
| | 550,000 | | | DN, 0.456%, 10/25/16 (n) | | | 549,625 | |
| | 296,000 | | | DN, 0.456%, 11/16/16 (n) | | | 295,716 | |
| | 1,000,000 | | | DN, 0.461%, 09/02/16 (n) | | | 999,987 | |
| | | | | | | | |
PRINCIPAL
AMOUNT($) | | | SECURITY DESCRIPTION | | VALUE($) | |
| | | | | | | | |
| | | | | | | | |
| | | | Federal Home Loan Bank — continued | | | | |
| | 100,000 | | | DN, 0.461%, 09/23/16 (n) | | | 99,972 | |
| | 80,000 | | | DN, 0.461%, 10/18/16 (n) | | | 79,952 | |
| | 100,000 | | | DN, 0.461%, 10/26/16 (n) | | | 99,930 | |
| | 493,850 | | | DN, 0.467%, 01/18/17 (n) | | | 492,961 | |
| | 80,400 | | | DN, 0.470%, 09/16/16 (n) | | | 80,384 | |
| | 521,000 | | | DN, 0.471%, 09/21/16 (n) | | | 520,864 | |
| | 59,800 | | | DN, 0.471%, 10/12/16 (n) | | | 59,768 | |
| | 739,500 | | | DN, 0.471%, 12/12/16 (n) | | | 738,516 | |
| | 250,000 | | | DN, 0.477%, 01/20/17 (n) | | | 249,534 | |
| | 836,000 | | | DN, 0.479%, 02/15/17 (n) | | | 834,146 | |
| | 1,269,000 | | | DN, 0.481%, 01/27/17 (n) | | | 1,266,496 | |
| | 207,000 | | | DN, 0.484%, 02/24/17 (n) | | | 206,511 | |
| | 557,800 | | | DN, 0.486%, 01/25/17 (n) | | | 556,703 | |
| | 500,000 | | | DN, 0.501%, 09/01/16 (n) | | | 500,000 | |
| | 250,000 | | | DN, 0.501%, 09/19/16 (n) | | | 249,937 | |
| | 480,000 | | | DN, 0.501%, 09/20/16 (n) | | | 479,873 | |
| | 70,000 | | | DN, 0.501%, 12/09/16 (n) | | | 69,904 | |
| | 250,000 | | | DN, 0.501%, 12/16/16 (n) | | | 249,632 | |
| | 200,000 | | | DN, 0.501%, 02/28/17 (n) | | | 199,500 | |
| | 21,000 | | | DN, 0.501%, 03/15/17 (n) | | | 20,943 | |
| | 35,000 | | | DN, 0.502%, 01/10/17 (n) | | | 34,936 | |
| | 500,000 | | | DN, 0.522%, 01/17/17 (n) | | | 499,003 | |
| | 625,000 | | | VAR, 0.666%, 12/06/16 | | | 624,946 | |
| | 500,000 | | | VAR, 0.497%, 09/06/16 | | | 500,000 | |
| | 175,000 | | | VAR, 0.507%, 09/21/16 | | | 174,992 | |
| | 75,000 | | | VAR, 0.514%, 09/06/16 | | | 75,000 | |
| | 500,000 | | | VAR, 0.514%, 09/06/16 | | | 500,000 | |
| | 250,000 | | | VAR, 0.518%, 09/06/16 | | | 250,000 | |
| | 609,000 | | | VAR, 0.524%, 09/06/16 | | | 608,970 | |
| | 100,000 | | | VAR, 0.524%, 09/26/16 | | | 99,980 | |
| | 528,000 | | | VAR, 0.525%, 11/25/16 | | | 528,000 | |
| | 500,000 | | | VAR, 0.528%, 09/14/16 | | | 500,000 | |
| | 425,000 | | | VAR, 0.529%, 09/06/16 | | | 425,000 | |
| | 500,000 | | | VAR, 0.529%, 11/26/16 | | | 500,000 | |
| | 750,000 | | | VAR, 0.542%, 09/19/16 | | | 750,000 | |
| | 525,000 | | | VAR, 0.544%, 09/28/16 | | | 525,000 | |
| | 150,000 | | | VAR, 0.546%, 09/14/16 | | | 150,000 | |
| | 1,000,000 | | | VAR, 0.546%, 09/19/16 | | | 1,000,000 | |
| | 325,000 | | | VAR, 0.547%, 09/09/16 | | | 325,000 | |
| | 500,000 | | | VAR, 0.566%, 10/04/16 | | | 499,935 | |
| | 60,580 | | | VAR, 0.567%, 09/06/16 | | | 60,580 | |
| | 250,000 | | | VAR, 0.578%, 09/15/16 | | | 250,002 | |
| | 250,000 | | | VAR, 0.583%, 09/13/16 | | | 249,997 | |
| | 140,000 | | | VAR, 0.599%, 09/21/16 | | | 140,000 | |
| | 500,000 | | | VAR, 0.601%, 09/17/16 | | | 500,000 | |
SEE NOTES TO FINANCIAL STATEMENTS.
| | | | | | | | |
| | | |
| AUGUST 31, 2016 | | J.P. MORGAN MONEY MARKET FUNDS | | | | | 17 | |
JPMorgan U.S. Government Money Market Fund
SCHEDULE OF PORTFOLIO INVESTMENTS
AS OF AUGUST 31, 2016 (Unaudited) (continued)
(Amounts in thousands)
| | | | | | | | |
PRINCIPAL
AMOUNT($) | | | SECURITY DESCRIPTION | | VALUE($) | |
| | | | | | | | |
| U.S. Government Agency Securities — continued | |
| | | | Federal Home Loan Bank — continued | | | | |
| | 500,000 | | | VAR, 0.607%, 09/19/16 | | | 500,000 | |
| | 448,000 | | | VAR, 0.607%, 09/29/16 | | | 448,279 | |
| | 230,000 | | | VAR, 0.610%, 09/26/16 | | | 230,000 | |
| | 300,000 | | | VAR, 0.621%, 10/26/16 | | | 300,010 | |
| | 250,000 | | | VAR, 0.625%, 11/26/16 | | | 250,000 | |
| | 150,000 | | | VAR, 0.628%, 10/19/16 | | | 150,000 | |
| | 700,000 | | | VAR, 0.631%, 09/12/16 | | | 699,964 | |
| | 250,000 | | | VAR, 0.632%, 09/07/16 | | | 250,000 | |
| | 210,000 | | | VAR, 0.636%, 09/12/16 | | | 210,015 | |
| | 235,000 | | | VAR, 0.636%, 10/26/16 | | | 235,039 | |
| | 150,000 | | | VAR, 0.642%, 09/07/16 | | | 150,000 | |
| | 250,000 | | | VAR, 0.642%, 09/07/16 | | | 250,000 | |
| | 300,000 | | | VAR, 0.645%, 10/25/16 | | | 300,000 | |
| | 225,000 | | | VAR, 0.651%, 11/16/16 | | | 224,998 | |
| | 975,000 | | | VAR, 0.651%, 11/16/16 | | | 975,000 | |
| | 175,000 | | | VAR, 0.659%, 11/02/16 | | | 175,000 | |
| | 250,000 | | | VAR, 0.660%, 09/06/16 | | | 250,220 | |
| | 500,000 | | | VAR, 0.665%, 11/25/16 | | | 500,000 | |
| | 227,900 | | | VAR, 0.665%, 11/26/16 | | | 227,900 | |
| | 950,000 | | | VAR, 0.665%, 11/26/16 | | | 950,000 | |
| | 525,000 | | | VAR, 0.667%, 11/15/16 | | | 525,000 | |
| | 250,000 | | | VAR, 0.667%, 11/23/16 | | | 250,000 | |
| | 450,000 | | | VAR, 0.668%, 11/12/16 | | | 450,000 | |
| | 250,000 | | | VAR, 0.669%, 11/02/16 | | | 249,971 | |
| | 177,000 | | | VAR, 0.700%, 11/07/16 | | | 177,036 | |
| | 250,000 | | | VAR, 0.702%, 11/09/16 | | | 250,000 | |
| | 100,000 | | | VAR, 0.717%, 11/10/16 | | | 100,000 | |
| | 400,000 | | | VAR, 0.726%, 11/21/16 | | | 400,000 | |
| | 500,000 | | | VAR, 0.726%, 11/21/16 | | | 500,000 | |
| | 150,000 | | | VAR, 0.728%, 11/14/16 | | | 150,000 | |
| | 175,000 | | | VAR, 0.758%, 11/14/16 | | | 174,996 | |
| | 250,000 | | | VAR, 0.763%, 11/16/16 | | | 250,000 | |
| | 500,000 | | | VAR, 0.792%, 11/23/16 | | | 499,970 | |
| | 76,220 | | | VAR, 0.805%, 11/25/16 | | | 76,249 | |
| | 500,000 | | | VAR, 0.69%, 12/01/16 | | | 499,982 | |
| | | | | | | | |
| | | | | | | 35,792,693 | |
| | | | | | | | |
| | | | Federal Home Loan Mortgage Corp. — 3.2% | |
| | 600,000 | | | DN, 0.401%, 12/21/16 (n) | | | 599,260 | |
| | 250,000 | | | DN, 0.431%, 09/12/16 (n) | | | 249,967 | |
| | 70,700 | | | DN, 0.436%, 09/23/16 (n) | | | 70,681 | |
| | 83,334 | | | DN, 0.459%, 02/07/17 (n) | | | 83,165 | |
| | 1,175,000 | | | VAR, 0.631%, 10/08/16 | | | 1,175,000 | |
| | 83,500 | | | VAR, 0.637%, 10/12/16 | | | 83,500 | |
| | 575,000 | | | VAR, 0.642%, 09/21/16 | | | 574,948 | |
| | | | | | | | |
PRINCIPAL
AMOUNT($) | | | SECURITY DESCRIPTION | | VALUE($) | |
| | | | | | | | |
| | | | | | | | |
| | | | Federal Home Loan Mortgage Corp. — continued | |
| | 675,000 | | | VAR, 0.681%, 09/08/16 | | | 675,000 | |
| | | | | | | | |
| | | | | | | 3,511,521 | |
| | | | | | | | |
| | | | Federal National Mortgage Association — 1.8% | |
| | 5,118 | | | 4.875%, 12/15/16 | | | 5,182 | |
| | 200,000 | | | DN, 0.401%, 01/09/17 (n) | | | 199,711 | |
| | 250,000 | | | VAR, 0.507%, 09/06/16 | | | 249,959 | |
| | 400,000 | | | VAR, 0.508%, 09/08/16 | | | 399,959 | |
| | 280,000 | | | VAR, 0.517%, 09/16/16 | | | 279,973 | |
| | 275,000 | | | VAR, 0.535%, 09/26/16 | | | 274,989 | |
| | 500,000 | | | VAR, 0.594%, 09/21/16 | | | 500,240 | |
| | | | | | | | |
| | | | | | | 1,910,013 | |
| | | | | | | | |
| | | | Total U.S. Government Agency Securities
(Cost $43,842,335) | | | 43,842,335 | |
| | | | | | | | |
| U.S. Treasury Obligations — 4.3% | |
| | | | U.S. Treasury Bill — 1.1% (n) | |
| | 1,250,000 | | | 0.627%, 02/23/17 | | | 1,247,281 | |
| | | | | | | | |
| | | | U.S. Treasury Notes — 3.2% | | | | |
| | 480,000 | | | 0.500%, 01/31/17 | | | 480,097 | |
| | 535,000 | | | 0.500%, 02/28/17 | | | 535,048 | |
| | 425,000 | | | 0.625%, 12/31/16 | | | 425,294 | |
| | 600,000 | | | 0.750%, 03/15/17 | | | 600,794 | |
| | 200,000 | | | 0.875%, 11/30/16 | | | 200,230 | |
| | 235,000 | | | 0.875%, 12/31/16 | | | 235,352 | |
| | 1,000,000 | | | 2.750%, 11/30/16 | | | 1,005,588 | |
| | | | | | | | |
| | | | | | | 3,482,403 | |
| | | | | | | | |
| | | | Total U.S. Treasury Obligations
(Cost $4,729,684) | | | 4,729,684 | |
| | | | | | | | |
| Repurchase Agreements — 56.0% | |
| | 6,400,000 | | | Agency Joint Trading Account I, J.P.Morgan Investment Management Inc., as agent, 0.338%, dated 08/31/16, due 09/01/16, repurchase price $6,400,060. [1] | | | 6,400,000 | |
| | 385,285 | | | Agency Joint Trading Account II, J.P.Morgan Investment Management Inc., as agent, 0.340%, dated 08/31/16, due 09/01/16, repurchase price $385,289. [2] | | | 385,285 | |
| | 250,000 | | | Bank of America N.A., 0.340%, dated 08/31/16, due 09/01/16, repurchase price $250,002, collateralized by Federal Home Loan Mortgage Corporation, 3.000% - 3.500%, due 04/01/45 - 07/01/45, with a value of $255,000. | | | 250,000 | |
SEE NOTES TO FINANCIAL STATEMENTS.
| | | | | | |
| | | |
| 18 | | | | J.P. MORGAN MONEY MARKET FUNDS | | AUGUST 31, 2016 |
| | | | | | | | |
PRINCIPAL
AMOUNT($) | | | SECURITY DESCRIPTION | | VALUE($) | |
| | | | | | | | |
| Repurchase Agreements — continued | |
| | 500,000 | | | Bank of Nova Scotia, 0.330%, dated 08/31/16, due 09/07/16, repurchase price $500,032, collateralized by Federal Home Loan Mortgage Corporation, 3.136% - 4.000%, due 12/01/41 - 03/01/46, Federal National Mortgage Association, 2.500% - 5.000%, due 01/01/26 - 06/01/46, and Government National Mortgage Association, 3.000% - 4.500%, due 05/15/41 - 07/20/46, U.S. Treasury Securities, 2.375% - 2.375%, due 01/15/17 - 01/15/17, with a value of $510,000. | | | 500,000 | |
| | 100,000 | | | Bank of Nova Scotia, 0.340%, dated 08/31/16, due 09/01/16, repurchase price $100,001, collateralized by Federal Home Loan Mortgage Corporation, 2.165% - 2.886%, due 06/01/42 - 06/01/44, Federal National Mortgage Association, 2.276% - 4.500%, due 01/01/26 - 08/01/46 and Government National Mortgage Association, 3.000% - 3.000%, due 03/20/42 - 03/20/42, with a value of $102,000. | | | 100,000 | |
| | 1,000,000 | | | Barclays Capital, Inc., 0.310%, dated 08/31/16, due 09/02/16, repurchase price $1,000,017, collateralized by U.S. Treasury Securities, 0.000% - 6.125%, due 11/15/16 - 05/15/46, with a value of $1,020,000. | | | 1,000,000 | |
| | 1,500,000 | | | Barclays Capital, Inc., 0.320%, dated 08/31/16, due 09/02/16, repurchase price $1,500,027, collateralized by U.S. Treasury Securities, 0.000% - 2.375%, due 11/15/16 - 08/15/46, with a value of $1,530,000. | | | 1,500,000 | |
| | 1,000,000 | | | Barclays Capital, Inc., 0.320%, dated 08/31/16, due 09/01/16, repurchase price $1,000,009, collateralized by U.S. Treasury Securities, 0.000% - 9.125%, due 09/30/16 - 08/15/46, with a value of $1,020,000. | | | 1,000,000 | |
| | 500,000 | | | Barclays Capital, Inc., 0.320%, dated 08/31/16, due 09/01/16, repurchase price $500,004, collateralized by U.S. Treasury Securities, 0.000% - 2.875%, due 02/28/17 - 08/15/46, with a value of $510,000. | | | 500,000 | |
| | 1,000,000 | | | Barclays Capital, Inc., 0.320%, dated 08/31/16, due 09/07/16, repurchase price $1,000,062, collateralized by U.S. Treasury Securities, 0.000% - 2.625%, due 10/31/16 - 08/15/46, with a value of $1,020,000. | | | 1,000,000 | |
| | | | | | | | |
PRINCIPAL
AMOUNT($) | | | SECURITY DESCRIPTION | | VALUE($) | |
| | | | | | | | |
| | | | | |
| | 250,000 | | | Barclays Capital, Inc., 0.340%, dated 08/31/16, due 09/02/16, repurchase price $250,005, collateralized by Federal Home Loan Mortgage Corporation, 3.500% - 5.969%, due 11/15/35 - 08/01/46, Federal National Mortgage Association, 4.012% - 6.712%, due 03/18/27 - 08/25/46 and Government National Mortgage Association, 5.168% - 7.668%, due 12/20/28 - 04/20/46, U.S. Treasury Securities, 0.750% - 0.750%, due 08/31/18 - 08/31/18, with a value of $257,168. | | | 250,000 | |
| | 1,000,000 | | | BNP Paribas, 0.320%, dated 08/31/16, due 09/01/16, repurchase price $1,000,009, collateralized by U.S. Treasury Securities, 0.000% - 6.875%, due 01/15/17 - 02/15/43, with a value of $1,020,009. | | | 1,000,000 | |
| | 1,000,000 | | | BNP Paribas, 0.330%, dated 08/31/16, due 09/01/16, repurchase price $1,000,009, collateralized by Federal Home Loan Mortgage Corporation, 0.981% - 9.000%, due 11/01/17 - 09/01/46, Federal National Mortgage Association, 0.893% - 8.000%, due 12/01/17 - 09/25/46, Government National Mortgage Association, 1.167% - 7.000%, due 08/20/24 - 07/20/46 and U.S. Treasury Securities, 0.000% - 4.500%, due 07/20/17 - 02/15/46, with a value of $1,021,157. | | | 1,000,000 | |
| | 1,000,000 | | | BNP Paribas, 0.350%, dated 08/31/16, due 10/27/16, repurchase price $1,000,554, collateralized by U.S. Treasury Securities, 0.000% - 4.500%, due 03/15/17 - 02/15/45, with a value of $1,020,860. | | | 1,000,000 | |
| | 1,000,000 | | | Credit Agricole Corporate and Investment Bank, 0.310%, dated 08/31/16, due 09/02/16, repurchase price $1,000,017, collateralized by U.S. Treasury Securities, 0.000% - 2.000%, due 02/16/17 - 02/15/45, with a value of $1,020,000. | | | 1,000,000 | |
| | 250,000 | | | Credit Agricole Corporate and Investment Bank, 0.320%, dated 08/31/16, due 09/07/16, repurchase price $250,016, collateralized by U.S. Treasury Securities, 0.125% - 0.125%, due 01/15/22 - 01/15/23, with a value of $255,000. | | | 250,000 | |
| | 500,000 | | | Credit Agricole Corporate and Investment Bank, 0.320%, dated 08/31/16, due 09/01/16, repurchase price $500,004, collateralized by U.S. Treasury Securities, 1.500% - 2.375%, due 01/15/17 - 05/31/20, with a value of $510,000. | | | 500,000 | |
SEE NOTES TO FINANCIAL STATEMENTS.
| | | | | | | | |
| | | |
| AUGUST 31, 2016 | | J.P. MORGAN MONEY MARKET FUNDS | | | | | 19 | |
JPMorgan U.S. Government Money Market Fund
SCHEDULE OF PORTFOLIO INVESTMENTS
AS OF AUGUST 31, 2016 (Unaudited) (continued)
(Amounts in thousands)
| | | | | | | | |
PRINCIPAL
AMOUNT($) | | | SECURITY DESCRIPTION | | VALUE($) | |
| | | | | | | | |
| Repurchase Agreements — continued | |
| | 250,000 | | | Credit Agricole Corporate and Investment Bank, 0.330%, dated 08/31/16, due 09/02/16, repurchase price $250,005, collateralized by U.S. Treasury Securities, 0.750% - 0.750%, due 02/28/18 - 02/28/18, with a value of $255,000. | | | 250,000 | |
| | 500,000 | | | Credit Agricole Corporate and Investment Bank, 0.330%, dated 08/31/16, due 09/06/16, repurchase price $500,028, collateralized by Federal Home Loan Mortgage Corporation, 4.500% - 4.500%, due 01/01/46 - 01/01/46, Federal National Mortgage Association, 3.000% - 3.000%, due 08/01/46 - 08/01/46 and Government National Mortgage Association, 3.000% - 4.500%, due 10/15/42 - 02/20/45, with a value of $510,000. | | | 500,000 | |
| | 250,000 | | | Credit Suisse, 0.380%, dated 08/31/16, due 09/21/16, repurchase price $250,055, collateralized by Federal National Mortgage Association, 2.154% - 3.540%, due 03/01/22 - 11/01/45, with a value of $255,000. | | | 250,000 | |
| | 500,000 | | | Deutsche Bank Securities, Inc., 0.340%, dated 08/31/16, due 09/01/16, repurchase price $500,005, collateralized by U.S. Treasury Securities, 1.625% - 4.750%, due 06/30/20 - 02/15/41, with a value of $510,000. | | | 500,000 | |
| | 500,000 | | | Deutsche Bank Securities, Inc., 0.340%, dated 08/31/16, due 09/01/16, repurchase price $500,005, collateralized by U.S. Treasury Securities, 0.625% - 2.500%, due 12/15/16 - 05/15/24, with a value of $510,000. | | | 500,000 | |
| | 500,000 | | | Deutsche Bank Securities, Inc., 0.350%, dated 08/31/16, due 09/06/16, repurchase price $500,029, collateralized by U.S. Treasury Securities, 0.875% - 3.000%, due 12/31/16 - 11/15/44, with a value of $510,000. | | | 500,000 | |
| | 500,000 | | | Deutsche Bank Securities, Inc., 0.350%, dated 08/31/16, due 09/01/16, repurchase price $500,005, collateralized by Federal Home Loan Mortgage Corporation, 2.000% - 9.000%, due 11/01/16 - 09/01/46, Federal National Mortgage Association, 2.000% - 9.500%, due 10/01/16 - 01/01/49 and Government National Mortgage Association, 3.500% - 3.500%, due 12/20/45 - 12/20/45, with a value of $510,000. | | | 500,000 | |
| | | | | | | | |
PRINCIPAL
AMOUNT($) | | | SECURITY DESCRIPTION | | VALUE($) | |
| | | | | | | | |
| | | | | |
| | 1,000,000 | | | Deutsche Bank Securities, Inc., 0.350%, dated 08/31/16, due 09/01/16, repurchase price $1,000,010, collateralized by Federal Home Loan Mortgage Corporation, 3.000% - 5.000%, due 06/15/27 - 08/15/45, Federal National Mortgage Association, 3.000% - 117.500%, due 04/25/22 - 12/25/45 and Government National Mortgage Association, 2.500% - 7.118%, due 08/20/32 - 01/16/54, with a value of $1,030,000. | | | 1,000,000 | |
| | 250,000 | | | Deutsche Bank Securities, Inc., 0.350%, dated 08/31/16, due 09/07/16, repurchase price $250,017, collateralized by U.S. Treasury Securities, 1.000% - 3.875%, due 12/31/17 - 08/15/40, with a value of $255,000. | | | 250,000 | |
| | 500,000 | | | Deutsche Bank Securities, Inc., 0.360%, dated 08/31/16, due 09/02/16, repurchase price $500,010, collateralized by Federal Home Loan Mortgage Corporation, 0.000% - 10.022%, due 06/15/25 - 10/15/45, Federal National Mortgage Association, 2.500% - 7.000%, due 03/01/24 - 07/01/46 and Government National Mortgage Association, 5.750% - 5.750%, due 11/15/32 - 11/15/32, with a value of $511,287. | | | 500,000 | |
| | 750,000 | | | Deutsche Bank Securities, Inc., 0.360%, dated 08/31/16, due 09/07/16, repurchase price $750,053, collateralized by Federal Home Loan Mortgage Corporation, 0.831% - 3.750%, due 10/15/33 - 11/15/38, Government National Mortgage Association, 1.650% - 2.550%, due 07/16/33 - 10/16/50 and U.S. Treasury Securities, 1.375% - 2.250%, due 11/30/17 - 03/31/20, with a value of $766,097. | | | 750,000 | |
| | 1,500,000 | | | Deutsche Bank Securities, Inc., 0.360%, dated 08/31/16, due 09/06/16, repurchase price $1,500,090, collateralized by Government National Mortgage Association, 3.500% - 3.500%, due 07/20/46 - 07/20/46 and U.S. Treasury Securities, 1.125% - 2.125%, due 01/31/21 - 08/31/21, with a value of $1,530,000. | | | 1,500,000 | |
SEE NOTES TO FINANCIAL STATEMENTS.
| | | | | | |
| | | |
| 20 | | | | J.P. MORGAN MONEY MARKET FUNDS | | AUGUST 31, 2016 |
| | | | | | | | |
PRINCIPAL
AMOUNT($) | | | SECURITY DESCRIPTION | | VALUE($) | |
| | | | | | | | |
| Repurchase Agreements — continued | |
| | 750,000 | | | Deutsche Bank Securities, Inc., 0.360%, dated 08/31/16, due 09/02/16, repurchase price $750,015, collateralized by Federal Home Loan Mortgage Corporation, 0.950% - 0.950%, due 01/30/19 - 01/30/19, Government National Mortgage Association, 4.000% - 4.750%, due 08/20/40 - 11/16/40, U.S. Treasury Securities, 1.375% - 2.125%, due 03/31/20 - 01/31/21 and Tennessee Valley Authority, 4.250% - 5.375%, due 09/15/39 - 09/15/65, with a value of $766,483. | | | 750,000 | |
| | 9,000,000 | | | Federal Reserve Bank, 0.250%, dated 08/31/16, due 09/01/16, repurchase price $9,000,063, collateralized by U.S. Treasury Securities, 1.500% - 6.125%, due 11/15/19 - 08/15/43, with a value of $9,000,063. | | | 9,000,000 | |
| | 4,700,000 | | | Federal Reserve Bank, 0.250%, dated 08/31/16, due 09/01/16, repurchase price $4,700,033, collateralized by U.S. Treasury Securities, 1.500% - 6.125%, due 11/15/19 - 08/15/43, with a value of $4,700,033. | | | 4,700,000 | |
| | 500,000 | | | Goldman Sachs International, 0.310%, dated 08/31/16, due 09/02/16, repurchase price $500,009, collateralized by Government National Mortgage Association, 2.500% - 5.000%, due 07/20/41 - 08/20/46, with a value of $510,000. | | | 500,000 | |
| | 1,000,000 | | | Goldman Sachs International, 0.320%, dated 08/31/16, due 09/07/16, repurchase price $1,000,062, collateralized by Government National Mortgage Association, 0.757% - 7.500%, due 10/16/22 - 08/20/46, with a value of $1,023,258. | | | 1,000,000 | |
| | 1,000,000 | | | Goldman Sachs International, 0.320%, dated 08/31/16, due 09/06/16, repurchase price $1,000,053, collateralized by Government National Mortgage Association, 1.875% - 11.500%, due 09/15/16 - 08/20/46, with a value of $1,020,976. | | | 1,000,000 | |
| | | | | | | | |
PRINCIPAL
AMOUNT($) | | | SECURITY DESCRIPTION | | VALUE($) | |
| | | | | | | | |
| | | | | | | | |
| | 8,000,000 | | | Nomura Securities International, Inc., 0.380%, dated 08/31/16, due 09/01/16, repurchase price $8,000,084, collateralized by Federal Home Loan Mortgage Corporation, 2.000% - 7.500%, due 12/01/17 - 09/01/46, Federal National Mortgage Association, 0.000% - 8.500%, due 12/01/16 - 07/01/48, Government National Mortgage Association, 1.572% - 9.000%, due 12/15/17 - 07/20/66, U.S. Treasury Securities, 0.000% - 3.750%, due 09/15/16 - 02/15/45 and Tennessee Valley Authority, 5.375% - 5.980%, due 04/01/36 - 04/01/56, with a value of $8,160,086. | | | 8,000,000 | |
| | 500,000 | | | RBC Capital Markets LLC, 0.350%, dated 08/31/16, due 09/07/16, repurchase price $500,034, collateralized by Federal Home Loan Mortgage Corporation, 2.500% - 3.500%, due 01/15/33 - 12/15/44, Federal National Mortgage Association, 3.000% - 4.000%, due 04/01/27 - 06/01/46, Government National Mortgage Association, 1.875% - 4.000%, due 08/20/40 - 07/20/46 and U.S. Treasury Securities, 1.125% - 2.000%, due 11/30/19 - 02/15/22, with a value of $510,238. | | | 500,000 | |
| | 500,000 | | | RBC Capital Markets LLC, 0.350%, dated 08/31/16, due 09/07/16, repurchase price $500,034, collateralized by Federal Home Loan Mortgage Corporation, 1.500% - 8.500%, due 08/01/17 - 09/01/46, Federal National Mortgage Association, 1.650% - 7.100%, due 10/01/17 - 08/01/46, Government National Mortgage Association, 0.762% - 5.500%, due 02/20/27 - 07/20/46 and U.S. Treasury Securities, 0.125% - 1.875%, due 02/28/21 - 10/31/22, with a value of $510,100. | | | 500,000 | |
| | 500,000 | | | RBC Capital Markets LLC, 0.350%, dated 08/31/16, due 09/07/16, repurchase price $500,034, collateralized by Federal Home Loan Mortgage Corporation, 2.359% - 6.049%, due 12/01/20 - 07/01/46, Federal National Mortgage Association, 2.000% - 6.000%, due 05/01/19 - 09/25/46, and Government National Mortgage Association, 1.875% - 7.500%, due 04/20/24 - 07/20/46, with a value of $510,063. | | | 500,000 | |
SEE NOTES TO FINANCIAL STATEMENTS.
| | | | | | | | |
| | | |
| AUGUST 31, 2016 | | J.P. MORGAN MONEY MARKET FUNDS | | | | | 21 | |
JPMorgan U.S. Government Money Market Fund
SCHEDULE OF PORTFOLIO INVESTMENTS
AS OF AUGUST 31, 2016 (Unaudited) (continued)
(Amounts in thousands)
| | | | | | | | |
PRINCIPAL
AMOUNT($) | | | SECURITY DESCRIPTION | | VALUE($) | |
| | | | | | | | |
| Repurchase Agreements — continued | |
| | 1,000,000 | | | RBC Capital Markets LLC, 0.390%, dated 08/31/16, due 09/07/16, repurchase price $1,000,076, collateralized by Federal Home Loan Mortgage Corporation, 2.000% - 8.000%, due 01/01/17 - 09/01/46, Federal National Mortgage Association, 1.500% - 7.000%, due 06/01/17 - 07/01/46, Government National Mortgage Association, 1.875% - 8.000%, due 12/25/22 - 07/20/46 and U.S. Treasury Securities, 0.625% - 3.750%, due 02/15/17 - 02/15/44, with a value of $1,020,228. | | | 1,000,000 | |
| | 500,000 | | | Societe Generale S.A., 0.320%, dated 08/31/16, due 09/02/16, repurchase price $500,009, collateralized by U.S. Treasury Securities, 0.000% - 4.625%, due 12/08/16 - 11/15/45, with a value of $510,000. | | | 500,000 | |
| | 1,250,000 | | | Societe Generale S.A., 0.330%, dated 08/31/16, due 09/02/16, repurchase price $1,250,023, collateralized by U.S. Treasury Securities, 0.000% - 8.875%, due 09/22/16 - 02/15/45, with a value of $1,275,000. | | | 1,250,000 | |
| | 250,000 | | | Societe Generale S.A., 0.330%, dated 08/31/16, due 09/06/16, repurchase price $250,014, collateralized by Government National Mortgage Association, 1.690% - 7.000%, due 02/15/17 - 08/20/66, with a value of $255,000. | | | 250,000 | |
| | 1,000,000 | | | Societe Generale S.A., 0.330%, dated 08/31/16, due 09/07/16, repurchase price $1,000,064, collateralized by U.S. Treasury Securities, 0.000% - 6.500%, due 01/05/17 - 08/15/44, with a value of $1,020,000. | | | 1,000,000 | |
| | 800,000 | | | Societe Generale S.A., 0.330%, dated 08/31/16, due 09/02/16, repurchase price $800,015, collateralized by Government National Mortgage Association, 1.875% - 5.492%, due 04/20/26 - 04/20/66, with a value of $816,000. | | | 800,000 | |
| | 1,000,000 | | | Societe Generale S.A., 0.330%, dated 08/31/16, due 09/01/16, repurchase price $1,000,009, collateralized by U.S. Treasury Securities, 0.000% - 8.750%, due 09/15/16 - 08/15/44, with a value of $1,020,000. | | | 1,000,000 | |
| | | | | | | | |
PRINCIPAL
AMOUNT($) | | | SECURITY DESCRIPTION | | VALUE($) | |
| | | | | | | | |
| | | | | | | | |
| | 1,500,000 | | | Societe Generale S.A., 0.340%, dated 08/31/16, due 09/07/16, repurchase price $1,500,099, collateralized by Government National Mortgage Association, 1.875% - 6.000%, due 09/20/27 - 05/20/66, with a value of $1,530,000. | | | 1,500,000 | |
| | 300,000 | | | Societe Generale S.A., 0.350%, dated 08/31/16, due 09/02/16, repurchase price $300,006, collateralized by Federal Home Loan Mortgage Corporation, 2.628% - 6.030%, due 04/01/37 - 06/01/46, Federal National Mortgage Association, 1.188% - 4.000%, due 05/25/23 - 07/01/44, Government National Mortgage Association, 3.000% - 7.000%, due 07/15/27 - 03/20/46 and U.S. Treasury Securities, 0.000% - 8.125%, due 12/08/16 - 05/15/46, with a value of $306,112. | | | 300,000 | |
| | 500,000 | | | Societe Generale S.A., 0.370%, dated 08/31/16, due 09/01/16, repurchase price $500,005, collateralized by U.S. Treasury Securities, 0.000% - 9.125%, due 11/03/16 - 08/15/44, with a value of $510,000. | | | 500,000 | |
| | 1,000,000 | | | Societe Generale S.A., 0.420%, dated 08/31/16, due 09/14/16, repurchase price $1,000,163, collateralized by U.S. Treasury Securities, 0.000% - 5.500%, due 09/15/16 - 02/15/45, with a value of $1,020,000. | | | 1,000,000 | |
| | 500,000 | | | Wells Fargo Bank N.A., 0.420%, dated 08/31/16, due 11/10/16, repurchase price $500,414, collateralized by Federal Home Loan Mortgage Corporation, 2.500% - 3.500%, due 04/01/30 - 10/01/45, with a value of $510,536. | | | 500,000 | |
| | 250,000 | | | Wells Fargo Securities, LLC, 0.420%, dated 08/31/16, due 09/06/16, repurchase price $250,018, collateralized by U.S. Treasury Securities, 1.500% - 2.500%, due 06/30/17 - 11/30/19, with a value of $255,268. | | | 250,000 | |
SEE NOTES TO FINANCIAL STATEMENTS.
| | | | | | |
| | | |
| 22 | | | | J.P. MORGAN MONEY MARKET FUNDS | | AUGUST 31, 2016 |
| | | | | | | | |
PRINCIPAL
AMOUNT($) | | | SECURITY DESCRIPTION | | VALUE($) | |
| | | | | | | | |
| Repurchase Agreements — continued | |
| | 400,000 | | | Wells Fargo Securities, LLC, 0.450%, dated 08/31/16, due 09/06/16, repurchase price $400,030, collateralized by Federal Home Loan Mortgage Corporation, 3.000% - 3.500%, due 07/01/31 - 07/01/46 and Federal National Mortgage Association, 3.000% - 3.500%, due 08/01/26 - 06/01/46, with a value of $408,459. | | | 400,000 | |
| | | | | | | | |
| | | | Total Repurchase Agreements
(Cost $61,335,285) | | | 61,335,285 | |
| | | | | | | | |
| | | | Total Investments — 100.4%
(Cost $109,907,304)* | | | 109,907,304 | |
| | | | Liabilities in Excess of
Other Assets — (0.4)% | | | (432,269 | ) |
| | | | | | | | |
| | | | NET ASSETS — 100.0% | | $ | 109,475,035 | |
| | | | | | | | |
Percentages indicated are based on net assets.
SEE NOTES TO FINANCIAL STATEMENTS.
| | | | | | | | |
| | | |
| AUGUST 31, 2016 | | J.P. MORGAN MONEY MARKET FUNDS | | | | | 23 | |
JPMorgan U.S. Treasury Plus Money Market Fund
SCHEDULE OF PORTFOLIO INVESTMENTS
AS OF AUGUST 31, 2016 (Unaudited)
(Amounts in thousands)
| | | | | | | | |
PRINCIPAL
AMOUNT($) | | | SECURITY DESCRIPTION (t) | | VALUE($) | |
| | | | | | | | |
| U.S. Treasury Obligations — 48.1% | |
| | | | U.S. Treasury Bills — 13.3% (n) | |
| | 250,000 | | | 0.386%, 11/17/16 | | | 249,794 | |
| | 600,000 | | | 0.400%, 01/12/17 | | | 599,114 | |
| | 250,000 | | | 0.401%, 12/22/16 | | | 249,688 | |
| | 280,000 | | | 0.417%, 02/02/17 | | | 279,502 | |
| | 150,000 | | | 0.423%, 01/19/17 | | | 149,754 | |
| | 250,000 | | | 0.432%, 12/08/16 | | | 249,707 | |
| | 100,000 | | | 0.446%, 09/22/16 | | | 99,974 | |
| | 252,613 | | | 0.479%, 09/01/16 | | | 252,613 | |
| | 250,000 | | | 0.508%, 09/15/16 | | | 249,951 | |
| | 250,000 | | | 0.451%, 02/23/17 | | | 249,453 | |
| | | | | | | | |
| | | | | | | 2,629,550 | |
| | | | | | | | |
| | | | U.S. Treasury Notes — 34.8% | |
| | 75,000 | | | 0.375%, 10/31/16 | | | 74,993 | |
| | 75,000 | | | 0.500%, 09/30/16 | | | 74,999 | |
| | 250,000 | | | 0.625%, 11/15/16 | | | 249,998 | |
| | 325,515 | | | 0.625%, 12/15/16 | | | 325,659 | |
| | 350,000 | | | 0.625%, 12/31/16 | | | 350,138 | |
| | 297,000 | | | 0.625%, 05/31/17 | | | 297,094 | |
| | 150,000 | | | 0.750%, 03/15/17 | | | 150,195 | |
| | 567,000 | | | 0.875%, 11/30/16 | | | 567,651 | |
| | 200,000 | | | 0.875%, 12/31/16 | | | 200,280 | |
| | 300,000 | | | 0.875%, 04/30/17 | | | 300,710 | |
| | 250,000 | | | 1.000%, 09/30/16 | | | 250,101 | |
| | 200,000 | | | 1.000%, 10/31/16 | | | 200,191 | |
| | 75,000 | | | 2.500%, 06/30/17 | | | 76,180 | |
| | 200,000 | | | 2.750%, 11/30/16 | | | 201,163 | |
| | 350,000 | | | 3.125%, 01/31/17 | | | 353,888 | |
| | 100,000 | | | 4.625%, 11/15/16 | | | 100,860 | |
| | 225,000 | | | VAR 0.388%, 09/01/16 | | | 224,979 | |
| | 650,000 | | | VAR 0.409%, 09/01/16 | | | 649,767 | |
| | 563,000 | | | VAR 0.412%, 09/01/16 | | | 562,860 | |
| | 54,000 | | | VAR 0.419%, 09/01/16 | | | 54,003 | |
| | 550,000 | | | VAR 0.503%, 09/01/16 | | | 550,042 | |
| | 650,000 | | | VAR 0.525%, 09/01/16 | | | 649,986 | |
| | 387,000 | | | VAR 0.607%, 09/01/16 | | | 387,239 | |
| | | | | | | | |
| | | | | | | 6,852,976 | |
| | | | | | | | |
| | | | Total U.S. Treasury Obligations
(Cost $9,482,526) | | | 9,482,526 | |
| | | | | | | | |
| Repurchase Agreements — 52.7% | |
| | 500,000 | | | Deutsche Bank Securities, Inc., 0.350%, dated 08/31/16, due 09/02/16, repurchase price $500,010, collateralized by U.S. Treasury Securities, 1.250% - 2.000%, due 11/30/19 - 08/31/21, with a value of $510,000. | | | 500,000 | |
| | | | | | | | |
PRINCIPAL
AMOUNT($) | | | SECURITY DESCRIPTION | | VALUE($) | |
| | | | | | | | |
| | | | | | | | |
| | 4,250,000 | | | Federal Reserve Bank of New York, 0.250%, dated 08/31/16, due 09/01/16, repurchase price $4,250,030, collateralized by U.S. Treasury Securities, 1.500% - 3.375%, due 11/15/19 - 02/15/43, with a value of $4,250,030. | | | 4,250,000 | |
| | 100,000 | | | HSBC Securities USA, Inc., 0.290%, dated 08/31/16, due 09/01/16, repurchase price $100,001, collateralized by U.S. Treasury Securities, 1.125%, due 02/28/21, with a value of $102,000. | | | 100,000 | |
| | 250,000 | | | JPMorgan Securities LLC, 0.330%, dated 08/31/16, due 09/01/16, repurchase price $250,002, collateralized by U.S. Treasury Securities, 1.625% - 5.250%, due 12/31/22 - 11/15/28, with a value of $255,005. | | | 250,000 | |
| | 1,800,000 | | | Nomura Securities International, Inc., 0.350%, dated 08/31/16, due 09/01/16, repurchase price $1,800,018, collateralized by U.S. Treasury Securities, 0.000% - 8.875%, due 09/15/16 - 05/15/46, with a value of $1,836,018. | | | 1,800,000 | |
| | 500,000 | | | RBC Capital Markets LLC, 0.320%, dated 08/31/16, due 09/07/16, repurchase price $500,031, collateralized by U.S. Treasury Securities, 0.000% - 8.875%, due 09/15/16 - 02/15/46, with a value of $510,000. | | | 500,000 | |
| | 1,000,000 | | | Royal Bank of Scotland Group plc, 0.320%, dated 08/31/16, due 09/01/16, repurchase price $1,000,009, collateralized by U.S. Treasury Securities, 1.000% - 3.375%, due 03/15/18 - 07/31/22, with a value of $1,020,002. | | | 1,000,000 | |
| | 500,000 | | | Societe Generale S.A., 0.320%, dated 08/31/16, due 09/06/16, repurchase price $500,027, collateralized by U.S. Treasury Securities, 0.000% - 2.875%, due 09/15/16 - 08/15/45, with a value of $510,000. | | | 500,000 | |
| | 350,000 | | | Societe Generale S.A., 0.400%, dated 08/31/16, due 09/12/16, repurchase price $350,047, collateralized by U.S. Treasury Securities, 0.000% - 9.125%, due 11/30/16 - 08/15/454, with a value of $357,000. | | | 350,000 | |
| | 738,355 | | | Treasury Joint Trading Account I, J.P. Morgan Investment Management Inc., as agent, 0.320%, dated 08/31/16, due 09/01/16, repurchase price $738,362. [3] | | | 738,355 | |
SEE NOTES TO FINANCIAL STATEMENTS.
| | | | | | |
| | | |
| 24 | | | | J.P. MORGAN MONEY MARKET FUNDS | | AUGUST 31, 2016 |
| | | | | | | | |
PRINCIPAL
AMOUNT($) | | | SECURITY DESCRIPTION | | VALUE($) | |
| | | | | | | | |
| Repurchase Agreements — continued | |
| | 400,000 | | | Wells Fargo Securities, LLC, 0.400%, dated 08/31/16, due 09/12/16, repurchase price $400,053, collateralized by U.S. Treasury Securities, 1.500% - 4.625%, due 11/15/16 - 11/15/22, with a value of $408,286. | | | 400,000 | |
| | | | | | | | |
| | | | Total Repurchase Agreements
(Cost $10,388,355) | | | 10,388,355 | |
| | | | | | | | |
| | | | Total Investments — 100.8%
(Cost $19,870,881)* | | | 19,870,881 | |
| | | | Liabilities in Excess of
Other Assets — (0.8)% | | | (164,937 | ) |
| | | | | | | | |
| | | | NET ASSETS — 100.0% | | $ | 19,705,944 | |
| | | | | | | | |
Percentages indicated are based on net assets.
SEE NOTES TO FINANCIAL STATEMENTS.
| | | | | | | | |
| | | |
| AUGUST 31, 2016 | | J.P. MORGAN MONEY MARKET FUNDS | | | | | 25 | |
JPMorgan Federal Money Market Fund
SCHEDULE OF PORTFOLIO INVESTMENTS
AS OF AUGUST 31, 2016 (Unaudited)
(Amounts in thousands)
| | | | | | | | |
PRINCIPAL
AMOUNT($) | | | SECURITY DESCRIPTION (t) | | VALUE($) | |
| | | | | | | | |
| U.S. Government Agency Securities — 78.9% | |
| | | | Federal Farm Credit Bank — 9.7% | |
| | 25,000 | | | DN, 0.481%, 12/02/16 (n) | | | 24,969 | |
| | 74,500 | | | VAR, 0.469%, 09/06/16 | | | 74,507 | |
| | 12,500 | | | VAR, 0.510%, 09/01/16 | | | 12,485 | |
| | 50,000 | | | VAR, 0.525%, 09/01/16 | | | 49,926 | |
| | 25,000 | | | VAR, 0.607%, 09/06/16 | | | 24,999 | |
| | 25,000 | | | VAR, 0.624%, 09/26/16 | | | 25,000 | |
| | 25,000 | | | VAR, 0.668%, 09/08/16 | | | 25,004 | |
| | 40,000 | | | VAR, 0.668%, 09/12/16 | | | 39,994 | |
| | | | | | | | |
| | | | | | | 276,884 | |
| | | | | | | | |
| | | | Federal Home Loan Bank — 69.2% | |
| | 20,000 | | | 0.700%, 02/24/17 | | | 20,018 | |
| | 26,392 | | | DN, 0.050%, 09/01/16 (n) | | | 26,392 | |
| | 32,775 | | | DN, 0.276%, 09/23/16 (n) | | | 32,769 | |
| | 16,900 | | | DN, 0.292%, 10/19/16 (n) | | | 16,893 | |
| | 15,000 | | | DN, 0.300%, 09/29/16 (n) | | | 14,996 | |
| | 18,700 | | | DN, 0.300%, 10/05/16 (n) | | | 18,695 | |
| | 5,100 | | | DN, 0.300%, 10/06/16 (n) | | | 5,098 | |
| | 129,555 | | | DN, 0.300%, 10/07/16 (n) | | | 129,516 | |
| | 12,100 | | | DN, 0.300%, 10/11/16 (n) | | | 12,096 | |
| | 20,250 | | | DN, 0.300%, 10/14/16 (n) | | | 20,243 | |
| | 100,000 | | | DN, 0.300%, 10/20/16 (n) | | | 99,959 | |
| | 100,000 | | | DN, 0.300%, 10/21/16 (n) | | | 99,958 | |
| | 17,590 | | | DN, 0.300%, 10/24/16 (n) | | | 17,582 | |
| | 100,000 | | | DN, 0.302%, 10/12/16 (n) | | | 99,966 | |
| | 100,000 | | | DN, 0.310%, 10/26/16 (n) | | | 99,953 | |
| | 48,760 | | | DN, 0.320%, 10/28/16 (n) | | | 48,735 | |
| | 73,000 | | | DN, 0.330%, 09/06/16 (n) | | | 72,997 | |
| | 50,000 | | | DN, 0.345%, 11/28/16 (n) | | | 49,958 | |
| | 100,000 | | | DN, 0.375%, 09/30/16 (n) | | | 99,970 | |
| | 116,000 | | | DN, 0.386%, 09/02/16 (n) | | | 115,999 | |
| | 13,000 | | | DN, 0.461%, 02/03/17 (n) | | | 12,974 | |
| | 120,000 | | | DN, 0.466%, 09/07/16 (n) | | | 119,991 | |
| | 120,000 | | | DN, 0.472%, 09/09/16 (n) | | | 119,987 | |
| | 30,000 | | | DN, 0.486%, 01/25/17 (n) | | | 29,941 | |
| | 30,000 | | | DN, 0.511%, 12/07/16 (n) | | | 29,959 | |
| | 113,000 | | | DN, 0.582%, 09/14/16 (n) | | | 112,976 | |
| | 35,000 | | | VAR, 0.527%, 09/21/16 | | | 34,979 | |
| | | | | | | | |
PRINCIPAL
AMOUNT($) | | | SECURITY DESCRIPTION | | VALUE($) | |
| | | | | | | | |
| | | | | | | | |
| | | | Federal Home Loan Bank — continued | |
| | 50,000 | | | VAR, 0.544%, 09/28/16 | | | 50,000 | |
| | 25,000 | | | VAR, 0.546%, 09/14/16 | | | 25,000 | |
| | 50,000 | | | VAR, 0.580%, 09/27/16 | | | 50,000 | |
| | 15,000 | | | VAR, 0.597%, 10/21/16 | | | 15,000 | |
| | 50,000 | | | VAR, 0.607%, 09/19/16 | | | 50,000 | |
| | 40,000 | | | VAR, 0.610%, 09/26/16 | | | 40,000 | |
| | 25,000 | | | VAR, 0.631%, 09/11/16 | | | 24,999 | |
| | 25,000 | | | VAR, 0.659%, 11/02/16 | | | 25,000 | |
| | 50,000 | | | VAR, 0.661%, 09/08/16 | | | 49,994 | |
| | 25,000 | | | VAR, 0.662%, 09/07/16 | | | 25,021 | |
| | 25,000 | | | VAR, 0.668%, 11/12/16 | | | 25,000 | |
| | 35,000 | | | VAR, 0.811%, 11/22/16 | | | 35,000 | |
| | | | | | | | |
| | | | | | | 1,977,614 | |
| | | | | | | | |
| | | | Total U.S. Government Agency Securities
(Cost $2,254,498) | | | 2,254,498 | |
| | | | | | | | |
| U.S. Treasury Obligations — 21.0% | |
| | | | U.S. Treasury Bills — 14.1% (n) | |
| | 311,285 | | | 0.279%, 09/08/16 | | | 311,268 | |
| | 92,159 | | | 0.298%, 11/25/16 | | | 92,094 | |
| | | | | | | | |
| | | | | | | 403,362 | |
| | | | | | | | |
| | | | U.S. Treasury Notes — 6.9% | |
| | 25,000 | | | 0.875%, 12/31/16 | | | 25,033 | |
| | 95,000 | | | 1.000%, 10/31/16 | | | 95,101 | |
| | 25,000 | | | 3.125%, 01/31/17 | | | 25,275 | |
| | 50,000 | | | 4.625%, 11/15/16 | | | 50,437 | |
| | | | | | | | |
| | | �� | | | | 195,846 | |
| | | | | | | | |
| | | | Total U.S. Treasury Obligations
(Cost $599,208) | | | 599,208 | |
| | | | | | | | |
| | | | Total Investments — 99.9%
(Cost $2,853,706)* | | | 2,853,706 | |
| | | | Other Assets in Excess of
Liabilities — 0.1% | | | 2,187 | |
| | | | | | | | |
| | | | NET ASSETS — 100.0% | | $ | 2,855,893 | |
| | | | | | | | |
Percentages indicated are based on net assets.
SEE NOTES TO FINANCIAL STATEMENTS.
| | | | | | |
| | | |
| 26 | | | | J.P. MORGAN MONEY MARKET FUNDS | | AUGUST 31, 2016 |
JPMorgan 100% U.S. Treasury Securities Money Market Fund
SCHEDULE OF PORTFOLIO INVESTMENTS
AS OF AUGUST 31, 2016 (Unaudited)
(Amounts in thousands)
| | | | | | | | |
PRINCIPAL
AMOUNT($) | | | SECURITY DESCRIPTION (t) | | VALUE($) | |
| | | | | | | | |
| U.S. Treasury Obligations — 106.3% | |
| | | | U.S. Treasury Bills — 41.7% (n) | | | | |
| | 1,623,162 | | | 0.204%, 09/01/16 | | | 1,623,162 | |
| | 1,250,000 | | | 0.253%, 09/29/16 | | | 1,249,753 | |
| | 1,365,066 | | | 0.272%, 09/22/16 | | | 1,364,849 | |
| | 1,020,692 | | | 0.279%, 09/08/16 | | | 1,020,637 | |
| | 2,500,000 | | | 0.280%, 09/15/16 | | | 2,499,728 | |
| | 56,703 | | | 0.316%, 11/25/16 | | | 56,661 | |
| | 500,000 | | | 0.323%, 10/20/16 | | | 499,781 | |
| | 730,000 | | | 0.336%, 12/01/16 | | | 729,394 | |
| | 450,000 | | | 0.401%, 02/02/17 | | | 449,229 | |
| | | | | | | | |
| | | | | | | 9,493,194 | |
| | | | | | | | |
| | | | U.S. Treasury Notes — 64.6% | | | | |
| | 200,000 | | | 0.375%, 10/31/16 | | | 199,949 | |
| | 360,000 | | | 0.500%, 09/30/16 | | | 360,041 | |
| | 285,000 | | | 0.500%, 11/30/16 | | | 285,119 | |
| | 269,000 | | | 0.500%, 02/28/17 | | | 269,035 | |
| | 121,000 | | | 0.625%, 11/15/16 | | | 121,078 | |
| | 750,000 | | | 0.625%, 12/15/16 | | | 750,353 | |
| | 330,000 | | | 0.625%, 02/15/17 | | | 330,238 | |
| | 124,000 | | | 0.875%, 09/15/16 | | | 124,022 | |
| | 731,445 | | | 0.875%, 11/30/16 | | | 732,383 | |
| | 625,000 | | | 0.875%, 12/31/16 | | | 625,723 | |
| | 100,000 | | | 0.875%, 04/30/17 | | | 100,235 | |
| | 413,715 | | | 1.000%, 09/30/16 | | | 413,924 | |
| | 1,175,000 | | | 1.000%, 10/31/16 | | | 1,176,246 | |
| | | | | | | | |
PRINCIPAL
AMOUNT($) | | | SECURITY DESCRIPTION | | VALUE($) | |
| | | | | | | | |
| | | | | | | | |
| | | | U.S. Treasury Notes — continued | | | | |
| | 500,000 | | | 2.750%, 11/30/16 | | | 502,840 | |
| | 250,000 | | | 3.000%, 09/30/16 | | | 250,517 | |
| | 1,507,000 | | | 3.125%, 10/31/16 | | | 1,513,692 | |
| | 100,000 | | | 3.125%, 01/31/17 | | | 101,098 | |
| | 120,000 | | | 3.125%, 04/30/17 | | | 122,027 | |
| | 1,305,000 | | | 4.625%, 11/15/16 | | | 1,316,368 | |
| | 200,000 | | | 4.625%, 02/15/17 | | | 203,753 | |
| | 500,000 | | | VAR 0.388%, 09/01/16 | | | 499,953 | |
| | 925,000 | | | VAR 0.409%, 09/01/16 | | | 924,883 | |
| | 1,011,469 | | | VAR 0.412%, 09/01/16 | | | 1,011,356 | |
| | 1,070,000 | | | VAR 0.419%, 09/01/16 | | | 1,070,001 | |
| | 875,000 | | | VAR 0.503%, 09/01/16 | | | 875,063 | |
| | 300,000 | | | VAR 0.525%, 09/01/16 | | | 300,213 | |
| | 539,000 | | | VAR 0.607%, 09/01/16 | | | 540,045 | |
| | | | | | | | |
| | | | | | | 14,720,155 | |
| | | | | | | | |
| | | | Total U.S. Treasury Obligations
(Cost $24,213,349) | | | 24,213,349 | |
| | | | | | | | |
| | | | Total Investments — 106.3%
(Cost $24,213,349)* | | | 24,213,349 | |
| | | | | | | | |
| | | | Liabilities in Excess of
Other Assets — (6.3)% | | | (1,428,941 | ) |
| | | | | | | | |
| | | | NET ASSETS — 100.0% | | $ | 22,784,408 | |
| | | | | | | | |
Percentages indicated are based on net assets.
SEE NOTES TO FINANCIAL STATEMENTS.
| | | | | | | | |
| | | |
| AUGUST 31, 2016 | | J.P. MORGAN MONEY MARKET FUNDS | | | | | 27 | |
JPMorgan Tax Free Money Market Fund
SCHEDULE OF PORTFOLIO INVESTMENTS
AS OF AUGUST 31, 2016 (Unaudited)
(Amounts in thousands)
| | | | | | | | |
PRINCIPAL
AMOUNT($) | | | SECURITY DESCRIPTION (t) | | VALUE($) | |
| | | | | | | | |
| Commercial Paper — 23.4% (n) | |
| | | | California — 5.1% | |
| | | | California Statewide Communities Development Authority, | | | | |
| | 11,000 | | | Series 2008 B, 0.480%, 11/02/16 | | | 11,000 | |
| | 47,000 | | | Series 2008 B , 0.480%, 11/03/16 | | | 47,000 | |
| | 35,000 | | | Series 2008 B, 0.500%, 12/01/16 | | | 35,000 | |
| | 47,000 | | | Series 2008 B, 0.500%, 12/01/16 | | | 47,000 | |
| | 45,865 | | | Series 2008 C, 0.640%, 12/08/16 | | | 45,865 | |
| | 17,000 | | | Series 2009 B-1, 0.500%, 10/03/16 | | | 17,000 | |
| | 13,000 | | | Series 2009 B-1, 0.550%, 11/02/16 | | | 13,000 | |
| | 45,000 | | | Series 2009 B-1, 0.550%, 11/03/16 | | | 45,000 | |
| | 15,000 | | | Series 2009 B-2, 0.530%, 12/05/16 | | | 15,000 | |
| | 22,000 | | | Series 2009 B-2, 0.550%, 12/01/16 | | | 22,000 | |
| | 11,000 | | | Series 2009 B-3, 0.550%, 11/02/16 | | | 11,000 | |
| | 19,000 | | | Series 2009 B-3, 0.600%, 11/07/16 | | | 19,000 | |
| | 45,000 | | | Series 2009 B-4, 0.550%, 11/02/16 | | | 45,000 | |
| | 10,000 | | | Series 2009 B-4, 0.600%, 11/07/16 | | | 10,000 | |
| | 30,000 | | | Series 2009 D, 0.500%, 10/03/16 | | | 30,000 | |
| | 20,000 | | | Series 2009 D, 0.500%, 12/06/16 | | | 20,000 | |
| | 27,500 | | | Series B-5, 0.510%, 12/06/16 | | | 27,500 | |
| | 10,000 | | | Series B-5, 520%, 09/15/16 | | | 10,000 | |
| | 58,750 | | | Series B-5, 0.520%, 12/05/16 | | | 58,750 | |
| | 10,000 | | | Series D, 0.500%, 12/01/16 | | | 10,000 | |
| | 20,000 | | | Series D, 0.550%, 12/01/16 | | | 20,000 | |
| | 20,500 | | | Series D, 0.500%, 12/06/16 | | | 20,500 | |
| | | | State of California, | | | | |
| | 20,000 | | | Series A-2, LOC: Wells Fargo Bank N.A., 0.470%, 10/03/16 | | | 20,000 | |
| | 61,490 | | | Series A-2, LOC: Royal Bank of Canada, 0.490%, 11/02/16 | | | 61,490 | |
| | 43,000 | | | Series A-2, LOC: Royal Bank of Canada, 0.500%, 10/18/16 | | | 43,000 | |
| | 13,300 | | | Series 11A5, LOC: U.S. Bank N.A., 0.520%, 11/02/16 | | | 13,300 | |
| | | | | | | | |
| | | | | | | 717,405 | |
| | | | | | | | |
| | | | Florida — 0.4% | |
| | 31,240 | | | Alachua County Health Facilities Authority, Series 2008 A, LOC: Bank of America N.A., 0.430%, 09/01/16 | | | 31,240 | |
| | 18,945 | | | County of Hillsborough, Series A, LOC: Bank of Tokyo-Mitsubishi UFJ Ltd., 0.470%, 09/08/16 | | | 18,945 | |
| | | | | | | | |
| | | | | | | 50,185 | |
| | | | | | | | |
| | | | Maryland — 0.9% | |
| | 49,900 | | | Baltimore County, Consolidated Public Improvement Bonds, Series 2011, 0.430%, 09/01/16 | | | 49,900 | |
| | | | | | | | |
PRINCIPAL
AMOUNT($) | | | SECURITY DESCRIPTION | | VALUE($) | |
| | | | | | | | |
| | | | | | | | |
| | | | Maryland — continued | |
| | 52,000 | | | County of Montgomery, Series 2010 A, LIQ: PNC Bank N.A., 0.510%, 11/01/16 | | | 52,000 | |
| | 31,735 | | | Maryland Health & Higher Educational Facilities Authority, Series B, 0.480%, 10/03/16 | | | 31,735 | |
| | | | | | | | |
| | | | | | | 133,635 | |
| | | | | | | | |
| | | | Massachusetts — 1.4% | |
| | 26,000 | | | Massachusetts Port Authority, Series 2012 B, LOC: TD Bank N.A., 0.480%, 10/11/16 | | | 26,000 | |
| | | | Massachusetts School Building Authority, | | | | |
| | 78,750 | | | Series A, LOC: Bank of America N.A., 0.460%, 10/05/16 | | | 78,750 | |
| | 26,000 | | | Series A, 0.480%, 11/01/16 | | | 26,000 | |
| | 18,000 | | | Massachusetts State Health & Educational Facilities Authority, Series H-2, 0.470%, 09/01/16 | | | 18,000 | |
| | 49,000 | | | Massachusetts Water Resources Authority, Series 99, LOC: State Street Bank & Trust, 0.530%, 12/07/16 | | | 49,000 | |
| | | | | | | | |
| | | | | | | 197,750 | |
| | | | | | | | |
| | | | Michigan — 1.9% | |
| | 38,000 | | | Michigan State Building Authority, Series 7, LOC: State Street Bank & Trust, 0.600%, 09/29/16 | | | 38,000 | |
| | | | Michigan State Hospital Finance Authority, | | | | |
| | 39,875 | | | Series 2008 C, 0.460%, 10/03/16 | | | 39,875 | |
| | 117,735 | | | Series 2008 C, 0.480%, 10/04/16 | | | 117,735 | |
| | 23,220 | | | Michigan State University, Series E, 0.700%, 12/16/16 | | | 23,220 | |
| | 45,700 | | | University of Michigan, Series B, 0.460%, 09/01/16 | | | 45,700 | |
| | | | | | | | |
| | | | | | | 264,530 | |
| | | | | | | | |
| | | | Minnesota — 3.7% | |
| | | | City of Jacksonville, Health Care Facilities, | | | | |
| | 35,000 | | | Series 2015, 0.500%, 11/01/16 | | | 35,000 | |
| | 50,000 | | | Series 2015, 0.500%, 11/02/16 | | | 50,000 | |
| | 119,400 | | | City of Rochester, Series 2000 B, LIQ: U.S. Bank N.A., 0.500%, 10/13/16 | | | 119,400 | |
| | | | City of Rochester, Health Care Facilities, Mayo Clinic, | | | | |
| | 30,600 | | | Series 2000 A, LIQ: U.S. Bank N.A., 0.470%, 09/15/16 | | | 30,600 | |
| | 90,000 | | | Series 2000 A, 0.480%, 09/14/16 | | | 90,000 | |
| | 33,000 | | | Series 2008 C, 0.500%, 11/01/16 | | | 33,000 | |
| | 17,000 | | | Series 2008 C, 0.520%, 11/15/16 | | | 17,000 | |
| | 75,000 | | | Series 2014, 0.420%, 09/01/16 | | | 75,000 | |
SEE NOTES TO FINANCIAL STATEMENTS.
| | | | | | |
| | | |
| 28 | | | | J.P. MORGAN MONEY MARKET FUNDS | | AUGUST 31, 2016 |
| | | | | | | | |
PRINCIPAL
AMOUNT($) | | | SECURITY DESCRIPTION | | VALUE($) | |
| | | | | | | | |
| Commercial Paper — continued | |
| | | | Minnesota — continued | |
| | 45,000 | | | Series 2014, 0.580%, 11/08/16 | | | 45,000 | |
| | 26,590 | | | University of Minnesota, Series 2005 A, 0.490%, 10/04/16 | | | 26,590 | |
| | | | | | | | |
| | | | | | | 521,590 | |
| | | | | | | | |
| | | | Missouri — 1.2% | | | | |
| | 30,000 | | | Curators of University of Missouri, Series A, 0.500%, 12/07/16 | | | 30,000 | |
| | | | Missouri State Health & Educational Facilities Authority, | | | | |
| | 50,000 | | | Series 2014 B, 0.450%, 09/07/16 | | | 50,000 | |
| | 20,000 | | | Series 2014 C, 0.540%, 10/06/16 | | | 20,000 | |
| | 25,000 | | | Series 2014 D, 0.540%, 10/06/16 | | | 25,000 | |
| | 50,000 | | | Series 2014 E, 0.460%, 09/07/16 | | | 50,000 | |
| | | | | | | | |
| | | | | | | 175,000 | |
| | | | | | | | |
| | | | Nevada — 1.1% | | | | |
| | 150,000 | | | Las Vegas Valley Water District, Series 2004 B, 0.470%, 09/01/16 | | | 150,000 | |
| | | | | | | | |
| | | | North Carolina — 0.1% | | | | |
| | 15,000 | | | City of Charlotte, Series 2014, LIQ: Bank of America N.A., 0.580%, 10/04/16 | | | 15,000 | |
| | | | | | | | |
| | | | Pennsylvania — 0.1% | | | | |
| | 18,000 | | | University of Pittsburgh-of the Commonwealth System of Higher Education, Series B-2, 0.520%, 11/15/16 | | | 18,000 | |
| | | | | | | | |
| | | | Tennessee — 1.8% | | | | |
| | | | Metropolitan Government of Nashville & Davidson County, | | | | |
| | 42,640 | | | Series A-1, LOC: Mizuho Bank Ltd., 0.500%, 11/02/16 | | | 42,640 | |
| | 45,110 | | | Series A-1, LOC: Mizuho Bank Ltd., 0.500%, 11/03/16 | | | 45,110 | |
| | 55,685 | | | Series A-1, LOC: Mizuho Bank Ltd., 0.510%, 10/17/16 | | | 55,685 | |
| | | | Metropolitan Government of Nashville & Davidson County, Water & Sewer, | | | | |
| | 25,000 | | | Series A, LOC: Bank of Tokyo-Mitsubishi UFJ Ltd., 0.510%, 09/06/16 | | | 25,000 | |
| | 25,000 | | | Series A, LOC: Bank of Tokyo-Mitsubishi UFJ Ltd., 0.510%, 09/20/16 | | | 25,000 | |
| | 57,500 | | | Series A, LOC: Bank of Tokyo-Mitsubishi UFJ Ltd., 0.530%, 10/17/16 | | | 57,500 | |
| | | | | | | | |
| | | | | | | 250,935 | |
| | | | | | | | |
| | | | Texas — 4.4% | | | | |
| | 55,000 | | | City of Garland, Series 2014, LOC: Wells Fargo Bank N.A., 0.500%, 10/06/16 | | | 55,000 | |
| | | | | | | | |
PRINCIPAL
AMOUNT($) | | | SECURITY DESCRIPTION | | VALUE($) | |
| | | | | | | | |
| | | | | | | | |
| | | | Texas — continued | | | | |
| | 88,255 | | | City of San Antonio, Water System, Series B, LOC: Wells Fargo Bank N.A., 0.480%, 09/01/16 | | | 88,255 | |
| | 21,960 | | | Texas Public Finance Authority, Series 2003, 0.670%, 09/15/16 | | | 21,960 | |
| | | | University of Texas System, | | | | |
| | 24,774 | | | Series A, 0.430%, 09/01/16 | | | 24,774 | |
| | 25,000 | | | Series A, 0.440%, 09/01/16 | | | 25,000 | |
| | 21,000 | | | Series A, 0.440%, 09/07/16 | | | 21,000 | |
| | 49,000 | | | Series A, 0.450%, 09/08/16 | | | 49,000 | |
| | 21,000 | | | Series A, 0.450%, 09/16/16 | | | 21,000 | |
| | 25,000 | | | Series A, 0.450%, 10/05/16 | | | 25,000 | |
| | 25,000 | | | Series A, 0.460%, 09/02/16 | | | 25,000 | |
| | 25,000 | | | Series A, 0.460%, 09/07/16 | | | 25,000 | |
| | 25,000 | | | Series A, 0.460%, 09/08/16 | | | 25,000 | |
| | 21,292 | | | Series A, 0.470%, 09/20/16 | | | 21,292 | |
| | 25,000 | | | Series A, 0.490%, 10/03/16 | | | 25,000 | |
| | 25,000 | | | Series A, 0.500%, 11/01/16 | | | 25,000 | |
| | 25,000 | | | Series A, 0.500%, 11/02/16 | | | 25,000 | |
| | 50,000 | | | Series A, 0.500%, 11/08/16 | | | 50,000 | |
| | 25,000 | | | Series A, 0.520%, 12/01/16 | | | 25,000 | |
| | 25,000 | | | Series A, 0.590%, 01/04/17 | | | 25,000 | |
| | 25,000 | | | Series A, 0.600%, 01/12/17 | | | 25,000 | |
| | | | | | | | |
| | | | | | | 627,281 | |
| | | | | | | | |
| | | | Washington — 0.2% | | | | |
| | 35,000 | | | University of Washington, Series A, 0.460%, 10/12/16 | | | 35,000 | |
| | | | | | | | |
| | | | Wisconsin — 1.1% | | | | |
| | | | State of Wisconsin, | | | | |
| | 29,415 | | | Series 2005 A, 0.440%, 09/01/16 | | | 29,415 | |
| | 16,714 | | | Series 2013 A, 0.500%, 09/16/16 | | | 16,714 | |
| | | | Wisconsin Health & Educational Facilities Authority, Aurora Health Care, Inc., | | | | |
| | 52,850 | | | LOC: Bank of America N.A., 0.440%, 09/01/16 | | | 52,850 | |
| | 49,840 | | | LOC: Bank of America N.A., 0.530%, 11/02/16 | | | 49,840 | |
| | | | | | | | |
| | | | | | | 148,819 | |
| | | | | | | | |
| | | | Total Commercial Paper
(Cost $3,305,130) | | | 3,305,130 | |
| | | | | | | | |
| Municipal Bonds — 70.1% | |
| | | | Alabama — 0.2% | | | | |
| | 15,000 | | | East Alabama Health Care Authority, Series B, Rev., VRDO, 0.640%, 09/07/16 | | | 15,000 | |
| | 775 | | | Mobile County IDA, PCR, ExxonMobil Project, Rev., VRDO, 0.580%, 09/01/16 | | | 775 | |
SEE NOTES TO FINANCIAL STATEMENTS.
| | | | | | | | |
| | | |
| AUGUST 31, 2016 | | J.P. MORGAN MONEY MARKET FUNDS | | | | | 29 | |
JPMorgan Tax Free Money Market Fund
SCHEDULE OF PORTFOLIO INVESTMENTS
AS OF AUGUST 31, 2016 (Unaudited) (continued)
(Amounts in thousands)
| | | | | | | | |
PRINCIPAL
AMOUNT($) | | | SECURITY DESCRIPTION | | VALUE($) | |
| | | | | | | | |
| Municipal Bonds — continued | |
| | | | Alabama — continued | | | | |
| | | | The Mobile Downtown Redevelopment Authority, Gulf Opportunity Zone, Austal USA LLC Project, | | | | |
| | 8,335 | | | Series A, Rev., VRDO, LOC: Bank of America N.A., 0.630%, 09/07/16 (e) | | | 8,335 | |
| | 10,450 | | | Series B, Rev., VRDO, LOC: Wells Fargo Bank N.A., 0.630%, 09/07/16 (e) | | | 10,450 | |
| | | | | | | | |
| | | | | | | 34,560 | |
| | | | | | | | |
| | | | Alaska — 0.9% | | | | |
| | 12,300 | | | Alaska Housing Finance Corp., Governmental Purpose, University of Alaska, Series A, Rev., VRDO, 0.620%, 09/07/16 | | | 12,300 | |
| | 50,880 | | | Alaska Housing Finance Corp., Home Mortgage, Series A, Rev., VRDO, 0.580%, 09/07/16 | | | 50,880 | |
| | | | City of Valdez, Marine Terminal, Exxon Pipeline Co. Project, | | | | |
| | 37,120 | | | Series B, Rev., VRDO, 0.580%, 09/01/16 | | | 37,120 | |
| | 11,030 | | | Series C, Rev., VRDO, 0.580%, 09/01/16 | | | 11,030 | |
| | 23,500 | | | State of Alaska, International Airports Revenue, Series A, Rev., VRDO, LOC: State Street Bank & Trust, 0.630%, 09/07/16 | | | 23,500 | |
| | | | | | | | |
| | | | | | | 134,830 | |
| | | | | | | | |
| | | | Arizona — 0.8% | |
| | | | Arizona Health Facilities Authority, Banner Health, | | | | |
| | 18,195 | | | Series 2008G, Rev., VRDO, LOC: Wells Fargo Bank N.A., 0.640%, 09/07/16 | | | 18,195 | |
| | 15,000 | | | Series B, Rev., VRDO, LOC: Bank of Tokyo-Mitsubishi UFJ Ltd., 0.640%, 09/07/16 | | | 15,000 | |
| | 15,600 | | | City of Mesa, Utility System, Series ROCS-RR-II-R-11032, Rev., VRDO, AGM, LIQ: Citibank N.A., 0.580%, 09/07/16 (e) | | | 15,600 | |
| | 2,000 | | | Phoenix City IDA, Multi-Family Housing, Del Mar Terrace Apartments Project, Series A, Rev., VRDO, FHLMC COLL, LIQ: FHLMC, 0.650%, 09/07/16 | | | 2,000 | |
| | 37,440 | | | Salt River Pima-Maricopa Indian Community, Rev., VRDO, LOC: Bank of America N.A., 0.620%, 09/07/16 | | | 37,440 | |
| | 21,835 | | | The Industrial Development Authority of The City of Phoenix, Health Care Facilities, Mayo Clinic, Series 2014-B, Rev., VRDO, 0.550%, 09/01/16 | | | 21,835 | |
| | | | | | | | |
| | | | | | | 110,070 | |
| | | | | | | | |
| | | | | | | | |
PRINCIPAL
AMOUNT($) | | | SECURITY DESCRIPTION | | VALUE($) | |
| | | | | | | | |
| | |
| | | | California — 3.6% | |
| | 28,780 | | | ABAG Finance Authority for Nonprofit Corps., Sharp HealthCare, Series D, Rev., VRDO, LOC: Citibank N.A., 0.600%, 09/07/16 | | | 28,780 | |
| | 1,664 | | | California Educational Facilities Authority, Series 3144, Rev., VRDO, LIQ: Morgan Stanley Bank, 0.590%, 09/07/16 (e) | | | 1,665 | |
| | | | California Health Facilities Financing Authority, Adventist Health System, | | | | |
| | 2,400 | | | Series A, Rev., VRDO, LOC: U.S. Bank N.A., 0.560%, 09/07/16 | | | 2,400 | |
| | 3,500 | | | Series B, Rev., VRDO, LOC: U.S. Bank N.A., 0.560%, 09/07/16 | | | 3,500 | |
| | 25,560 | | | California Health Facilities Financing Authority, Catholic Healthcare West Loan Program, Series H, Rev., VRDO, LOC: Sumitomo Mitsui Banking, 0.610%, 09/07/16 | | | 25,560 | |
| | 30,000 | | | California Health Facilities Financing Authority, Stanford Hospital & Clinics, Series B-1, Rev., VRDO, 0.620%, 09/07/16 | | | 30,000 | |
| | 1,220 | | | California Infrastructure & Economic Development Bank, IDR, Pleasant Mattress, Inc. Project, Series A, Rev., VRDO, LOC: Wells Fargo Bank N.A., 0.630%, 09/07/16 | | | 1,220 | |
| | 2,870 | | | California Municipal Finance Authority, La Sierra University, Series A, Rev., VRDO, LOC: Wells Fargo Bank N.A., 0.610%, 09/07/16 | | | 2,870 | |
| | 3,650 | | | California Statewide Communities Development Authority, Multi-Family Housing, Golden Age Garden Apartments, Series H, Rev., VRDO, FHLMC, LIQ: FHLMC, 0.610%, 09/07/16 | | | 3,650 | |
| | 8,700 | | | California Statewide Communities Development Authority, Multi-Family Housing, Kelvin Court, Series B, Rev., VRDO, FNMA, LIQ: FNMA, 0.640%, 09/07/16 | | | 8,700 | |
| | 1,400 | | | City of Modesto, Multi-Family Housing, Valley Oak Project, Series A, Rev., VRDO, FHLMC, LOC: FHLMC, 0.610%, 09/07/16 | | | 1,400 | |
| | 900 | | | City of Vacaville, Multi-Family Housing, Sycamores Apartments, Series A, Rev., VRDO, FNMA, LIQ: FNMA, 0.620%, 09/07/16 | | | 900 | |
| | 8,800 | | | City of Whittier, Health Facilities, Presbyterian Intercommunity, Series A, Rev., VRDO, LOC: U.S. Bank N.A., 0.600%, 09/07/16 | | | 8,800 | |
| | 26,860 | | | El Dorado Irrigation District, COP, VRDO, LOC: Citibank N.A., 0.600%, 09/07/16 | | | 26,860 | |
| | 1,500 | | | Irvine Ranch Water District, Nos. 105, 140, 240 & 250, CONS, VRDO, LOC: Sumitomo Mitsui Banking Corp., 0.610%, 09/07/16 | | | 1,500 | |
SEE NOTES TO FINANCIAL STATEMENTS.
| | | | | | |
| | | |
| 30 | | | | J.P. MORGAN MONEY MARKET FUNDS | | AUGUST 31, 2016 |
| | | | | | | | |
PRINCIPAL
AMOUNT($) | | | SECURITY DESCRIPTION | | VALUE($) | |
| | | | | | | | |
| Municipal Bonds — continued | |
| | | | California — continued | |
| | 31,745 | | | Irvine Unified School District, Community Facilities District No. 09-1, Special Tax, Series 2014 B, VRDO, LOC: Sumitomo Mitsui Banking, 0.610%, 09/07/16 | | | 31,745 | |
| | | | Los Angeles Community College District, | | | | |
| | 10,800 | | | Series ROCS-RR-II-R-11768, GO, VRDO, AGM-CR, FGIC, LIQ: Citibank N.A., 0.580%, 09/07/16 (e) | | | 10,800 | |
| | 11,820 | | | Series ROCS-RR-II-R-11773, GO, VRDO, LIQ: Citibank N.A., 0.580%, 09/07/16 (e) | | | 11,820 | |
| | 25,000 | | | Los Angeles Department of Water & Power, Power System, Series B, Subseries B-2, Rev., VRDO, 0.600%, 09/07/16 | | | 25,000 | |
| | 9,200 | | | Los Angeles Department of Water & Power, Waterworks, Series B, Subseries B-3, Rev., VRDO, 0.550%, 09/07/16 | | | 9,200 | |
| | | | Metropolitan Water District of Southern California, | | | | |
| | 11,500 | | | Series A-1, Rev., VRDO, 0.550%, 09/07/16 | | | 11,500 | |
| | 26,050 | | | Series A-2, Rev., VRDO, 0.550%, 09/07/16 | | | 26,050 | |
| 34,850 | | | Regents of the University of California, Series AL-4, Rev., VRDO, 0.550%, 09/07/16 | | | 34,850 | |
| | 5,000 | | | Sacramento County Sanitation Districts Financing Authority, Municipal Securities Trust Receipts, Series SGC-47, Class A, Rev., VRDO, FGIC, LIQ: Societe Generale, 0.580%, 09/07/16 (e) | | | 5,000 | |
| | 18,000 | | | San Diego Community College District, Series ROCS-RR-II-R-11775, GO, VRDO, LIQ: Citibank N.A., 0.580%, 09/07/16 (e) | | | 18,000 | |
| | 4,775 | | | San Francisco City & County Airports Commission, San Francisco International Airport, Second Series, Series 36C, Rev., VRDO, LOC: Bank of Tokyo-Mitsubishi UFJ Ltd., 0.620%, 09/07/16 | | | 4,775 | |
| | 6,140 | | | San Francisco City & County Redevelopment Agency, Multi-Family Housing, Notre Dame Apartments, Series G, Rev., VRDO, LOC: Citibank N.A., 0.610%, 09/07/16 | | | 6,140 | |
| | 38,970 | | | Southern California Public Power Authority, Magnolia Power Project A, Series 2009-1, Rev., VRDO, LOC: U.S. Bank N.A., 0.600%, 09/07/16 | | | 38,970 | |
| | 24,100 | | | State of California, Series A, Subseries A-3, GO, VRDO, LOC: Mizuho Bank Ltd., 0.640%, 09/07/16 | | | 24,100 | |
| | 33,000 | | | State of California, Municipal Securities Trust Receipts, Series SGC-6, Class A, GO, VRDO, LIQ: Societe Generale, 0.580%, 09/07/16 | | | 33,000 | |
| | | | | | | | |
PRINCIPAL
AMOUNT($) | | | SECURITY DESCRIPTION | | VALUE($) | |
| | | | | | | | |
| | | | | | | | |
| | | | California — continued | |
| | | | Tender Option Bond Trust Receipts /CTFS Various State, | | | | |
| | 8,230 | | | Series 2015-XM0075, Rev., VRDO, LIQ: Bank of America N.A., 0.590%, 09/07/16 (e) | | | 8,230 | |
| | 12,665 | | | Series 2016-XM0230, Rev., VRDO, LIQ: Bank of America N.A., 0.560%, 09/07/16 (e) | | | 12,665 | |
| | 55,260 | | | Series 2016-XF0431, GO, VRDO, LIQ: Bank of America N.A., 0.560%, 09/07/16 (e) | | | 55,260 | |
| | | | | | | | |
| | | | | | | 514,910 | |
| | | | | | | | |
| | | | Colorado — 2.5% | | | | |
| | 45,570 | | | City of Colorado Springs, Systems Improvement, Series A, Rev., VRDO, 0.550%, 09/07/16 | | | 45,570 | |
| | 22,210 | | | City of Colorado Springs, Utilities Revenue System, Sub Lien, Series A, Rev., VRDO, LOC: Bank of America N.A., 0.610%, 09/07/16 | | | 22,210 | |
| | | | City of Colorado Springs, Utilities System Improvement, | | | | |
| | 43,765 | | | Series A, Rev., VRDO, 0.550%, 09/07/16 | | | 43,765 | |
| | 10,800 | | | Series A, Rev., VRDO, 0.600%, 09/07/16 | | | 10,800 | |
| | 20,000 | | | City of Colorado Springs, Utilities System, Sub Lien, Series A, Rev., VRDO, 0.610%, 09/07/16 | | | 20,000 | |
| | 57,410 | | | Colorado Educational & Cultural Facilities Authority, Nature Conservancy Project, Series 2012, Rev., VRDO, 0.620%, 09/07/16 | | | 57,410 | |
| | 11,100 | | | Colorado Health Facilities Authority, The Evangelical Lutheran Good Samaritan Society Project, Rev., VRDO, LOC: U.S. Bank N.A., 0.560%, 09/07/16 | | | 11,100 | |
| | 745 | | | Colorado Housing & Finance Authority, Multi-Family Housing Project, Series A-4, Rev., VRDO, FHLB, 0.620%, 09/07/16 | | | 745 | |
| | | | Colorado Housing & Finance Authority, Single Family Mortgage, | | | | |
| | 49,825 | | | Series B-2, Rev., VRDO, AMT, 0.620%, 09/07/16 | | | 49,825 | |
| | 40,645 | | | Series B-3, Rev., VRDO, AMT, FHLB, 0.620%, 09/07/16 | | | 40,645 | |
| | 15,010 | | | County of Arapahoe, Multi-Family Rental Housing, Hunter’s Run Project, Rev., VRDO, FHLMC, LIQ: FHLMC, 0.600%, 09/07/16 | | | 15,010 | |
| | 35,075 | | | Moffat County, PCR, Tri-State Generation and Transmission Association, Inc. Project, Rev., VRDO, LOC: Bank of America N.A., 0.580%, 09/07/16 | | | 35,075 | |
| | | | | | | | |
| | | | | | | 352,155 | |
| | | | | | | | |
SEE NOTES TO FINANCIAL STATEMENTS.
| | | | | | | | |
| | | |
| AUGUST 31, 2016 | | J.P. MORGAN MONEY MARKET FUNDS | | | | | 31 | |
JPMorgan Tax Free Money Market Fund
SCHEDULE OF PORTFOLIO INVESTMENTS
AS OF AUGUST 31, 2016 (Unaudited) (continued)
(Amounts in thousands)
| | | | | | | | |
PRINCIPAL
AMOUNT($) | | | SECURITY DESCRIPTION | | VALUE($) | |
| | | | | | | | |
| Municipal Bonds — continued | |
| | | | Connecticut — 0.3% | | | | |
| | 10,000 | | | Connecticut State Health & Educational Facility Authority, Rev., VRDO, 0.570%, 09/07/16 | | | 10,000 | |
| | 35,000 | | | State of Connecticut, GO, VRDO, 0.610%, 09/07/16 | | | 35,000 | |
| | | | | | | | |
| | | | | | | 45,000 | |
| | | | | | | | |
| | | | Delaware — 0.1% | | | | |
| | 8,525 | | | Delaware State Health Facilities Authority, Christiana Care Health Services, Series B, Rev., VRDO, 0.580%, 09/07/16 | | | 8,525 | |
| | 200 | | | University of Delaware, Series B, Rev., VRDO, 0.640%, 09/01/16 | | | 200 | |
| | | | | | | | |
| | | | | | | 8,725 | |
| | | | | | | | |
| | | | District of Columbia — 0.5% | | | | |
| | 1,660 | | | District of Columbia, American Psychology Association, Rev., VRDO, LOC: Bank of America N.A., 0.650%, 09/07/16 | | | 1,660 | |
| | 28,725 | | | District of Columbia, Georgetown University, Series 2007 C-2, Rev., VRDO, LOC: Sumitomo Mitsui Banking Corp., 0.580%, 09/07/16 | | | 28,725 | |
| | 1,848 | | | District of Columbia, Pooled Loan Program, Series A, Rev., VRDO, LOC: Bank of America N.A., 0.810%, 09/07/16 | | | 1,848 | |
| | 18,315 | | | Metropolitan Washington Airports Authority, Subseries D-2, Rev., VRDO, LOC: TD Bank N.A., 0.600%, 09/07/16 | | | 18,315 | |
| | 22,675 | | | Metropolitan Washington Airports Authority, Airport System, Series D, Subseries D2, Rev., VRDO, LOC: TD Bank N.A., 0.600%, 09/01/16 | | | 22,675 | |
| | | | | | | | |
| | | | | | | 73,223 | |
| | | | | | | | |
| | | | Florida — 2.2% | | | | |
| | 20,495 | | | Eclipse Funding Trust, Solar Eclipse, Various States, Series 2007-0051, Rev., VRDO, LIQ: U.S. Bank N.A., 0.560%, 09/07/16 (e) | | | 20,495 | |
| | 18,765 | | | Florida Gulf Coast University Financing Corp., Housing Project, Series A, Rev., VRDO, LOC: BMO Harris Bank N.A., 0.570%, 09/07/16 | | | 18,765 | |
| | 1,300 | | | Florida Housing Finance Corp., Multi-Family Mortgage, Tuscany Lake Apartments, Rev., VRDO, FNMA, LIQ: FNMA, 0.640%, 09/07/16 | | | 1,300 | |
| | 300 | | | Gainesville Utility Systems, Series A, Rev., VRDO, 0.610%, 09/01/16 | | | 300 | |
| | | | Highlands County Health Facilities Authority, Hospital, Adventist Health System/Sunbelt Obligated Group, | | | | |
| | 48,000 | | | Series I-2, Rev., VRDO, 0.560%, 09/07/16 | | | 48,000 | |
| | | | | | | | |
PRINCIPAL
AMOUNT($) | | | SECURITY DESCRIPTION | | VALUE($) | |
| | | | | | | | |
| | | | | | | | |
| | | | Florida — continued | | | | |
| | 15,100 | | | Series I-3, Rev., VRDO, 0.550%, 09/07/16 | | | 15,100 | |
| | 18,300 | | | Series I-4, Rev., VRDO, 0.560%, 09/07/16 | | | 18,300 | |
| | 7,140 | | | Highlands County Health Facilities Authority, Hospital, Adventist Health Systems, Series A, Rev., VRDO, 0.560%, 09/07/16 | | | 7,140 | |
| | | | JEA, Electric System, | | | | |
| | 21,500 | | | Series B-2, Rev., VRDO, 0.610%, 09/07/16 | | | 21,500 | |
| | 27,600 | | | Series B-3, Rev., VRDO, 0.610%, 09/07/16 | | | 27,600 | |
| | 200 | | | JEA, Water and Sewer Systems, Series A-2, Rev., VRDO, LOC: Sumitomo Mitsui Banking Corp., 0.600%, 09/07/16 | | | 200 | |
| | | | Orange County Health Facilities Authority, The Nemours Foundation Project, | | | | |
| | 3,575 | | | Series 2009C-1, Rev., VRDO, LOC: Wells Fargo Bank N.A., 0.580%, 09/07/16 | | | 3,575 | |
| | 18,185 | | | Series 2009C-2, Rev., VRDO, LOC: Wells Fargo Bank N.A., 0.580%, 09/07/16 | | | 18,185 | |
| | 28,820 | | | Series B, Rev., VRDO, LOC: Northern Trust Co., 0.590%, 09/07/16 | | | 28,820 | |
| | 21,420 | | | Orange County School Board, Certificates of Participation, Series 2008C, COP, VRDO, LOC: Bank of America N.A., 0.620%, 09/07/16 | | | 21,420 | |
| | 22,285 | | | Orange County Tourist Development Tax, Series 2352, Rev., VRDO, FGIC, LIQ: Wells Fargo & Co., 0.580%, 09/07/16 (e) | | | 22,285 | |
| | | | Tender Option Bond Trust Receipts/CTFS Various State, | | | | |
| | 14,900 | | | Series 2015-XF0251, Rev., VRDO, LIQ: Bank of America N.A., 0.580%, 09/07/16 (e) | | | 14,900 | |
| | 16,575 | | | Series 2016-XG0002, Rev., VRDO, LIQ: Bank of America N.A., 0.580%, 09/07/16 (e) | | | 16,575 | |
| | | | | | | | |
| | | | | | | 304,460 | |
| | | | | | | | |
| | | | Georgia — 2.1% | |
| | 47,400 | | | Burke County Development Authorities, Pollution Control, Oglethorpe Power Corp. Vogtle Project, Series 2010A, Rev., VRDO, LOC: Bank of America N.A., 0.640%, 09/07/16 | | | 47,400 | |
| | 10,735 | | | DeKalb County Housing Authority, Multi-Family Housing, Timber Trace Apartments Project, Rev., VRDO, FHLMC, LIQ: FHLMC, 0.660%, 09/07/16 | | | 10,735 | |
| | 110,790 | | | DeKalb Private Hospital Authority, Children’s Healthcare of Atlanta, Inc. Project, Rev., VRDO, 0.670%, 09/07/16 | | | 110,790 | |
SEE NOTES TO FINANCIAL STATEMENTS.
| | | | | | |
| | | |
| 32 | | | | J.P. MORGAN MONEY MARKET FUNDS | | AUGUST 31, 2016 |
| | | | | | | | |
PRINCIPAL
AMOUNT($) | | | SECURITY DESCRIPTION | | VALUE($) | |
| | | | | | | | |
| Municipal Bonds — continued | |
| | | | Georgia — continued | |
| | 47,550 | | | Georgia Municipal Electric Authority, Project One, Series B, Rev., VRDO, LOC: Bank of Tokyo-Mitsubishi UFJ Ltd., 0.570%, 09/07/16 | | | 47,550 | |
| | 2,770 | | | Griffin-Spaulding County Development Authority, Industrial Development, Norcom, Inc. Project, Rev., VRDO, LOC: Bank of America N.A., 0.770%, 09/07/16 | | | 2,770 | |
| | 5,940 | | | Henry County Water & Sewer Authority, EAGLE, Series 2005-0008, Class A, Rev., VRDO, BHAC, AGM-CR, NATL-RE, LIQ: Citibank N.A., 0.580%, 09/07/16 | | | 5,940 | |
| | | | Private Colleges & Universities Authority, Emory University, | | | | |
| | 500 | | | Series B-1, Rev., VRDO, 0.570%, 09/07/16 | | | 500 | |
| | 43,295 | | | Series C-1, Rev., VRDO, 0.610%, 09/07/16 | | | 43,295 | |
| | 22,000 | | | Series C-5, Rev., VRDO, 0.610%, 09/07/16 | | | 22,000 | |
| | | | | | | | |
| | | | | | | 290,980 | |
| | | | | | | | |
| | | | Idaho — 0.1% | |
| | 8,700 | | | Coeur d’Alene Tribe, Rev., VRDO, LOC: Bank of America N.A., 0.630%, 09/07/16 | | | 8,700 | |
| | 6,875 | | | Idaho State Building Authority, Prison Facilities Project, Series A, Rev., VRDO, 0.550%, 09/07/16 | | | 6,875 | |
| | | | | | | | |
| | | | | | | 15,575 | |
| | | | | | | | |
| | | | Illinois — 4.6% | |
| | 4,300 | | | City of Galesburg, Knox College Project, Rev., VRDO, LOC: PNC Bank N.A., 0.590%, 09/07/16 | | | 4,300 | |
| | 24,715 | | | County of Cook, Illinois, Catholic Theological Union Project, Series 2005, Rev., VRDO, LOC: U.S. Bank N.A., 0.610%, 09/07/16 | | | 24,715 | |
| | 10,200 | | | County of Cook, Village of Justice, Multi-Family Housing, Candlewood Apartments Project, Rev., VRDO, FNMA, LIQ: FNMA, 0.660%, 09/07/16 | | | 10,200 | |
| | 1,140 | | | County of Lake, A.L. Hansen Manufacturing Co. Project, Rev., VRDO, LOC: Harris Trust & Savings Bank, 0.650%, 09/07/16 | | | 1,140 | |
| | 15,555 | | | County of Will, Village of Romeoville, Lewis University, Rev., VRDO, LOC: Wells Fargo Bank N.A., 0.600%, 09/01/16 | | | 15,555 | |
| | 10,000 | | | Illinois Development Finance Authority, Residential Rental, F.C. Harris Pavilion Project, Rev., VRDO, FNMA, LIQ: FHLMC, 0.650%, 09/07/16 | | | 10,000 | |
| | 13,000 | | | Illinois Development Finance Authority, Village of Oak Park Residence Corporation Project, Series 2001, Rev., VRDO, LOC: PNC Bank N.A., 0.590%, 09/07/16 | | | 13,000 | |
| | | | | | | | |
PRINCIPAL
AMOUNT($) | | | SECURITY DESCRIPTION | | VALUE($) | |
| | | | | | | | |
| | | | | | | | |
| | | | Illinois — continued | |
| | 6,200 | | | Illinois Educational Facilities Authority, Adler Planetarium, Series 1997, Rev., VRDO, LOC: PNC Bank N.A., 0.600%, 09/07/16 | | | 6,200 | |
| | 49,230 | | | Illinois Finance Authority, Advocate Healthcare Network, Series C-2A, Rev., VRDO, 0.570%, 09/07/16 | | | 49,230 | |
| | 12,790 | | | Illinois Finance Authority, Bradley University, Series B, Rev., VRDO, LOC: PNC Bank N.A., 0.580%, 09/07/16 | | | 12,790 | |
| | 65,865 | | | Illinois Finance Authority, Chicago Symphony Orchestra, Rev., VRDO, LOC: PNC Bank N.A., 0.580%, 09/07/16 | | | 65,865 | |
| | 21,250 | | | Illinois Finance Authority, Edward Hospital Obligated Group, Series A, Rev., VRDO, LOC: BMO Harris Bank N.A., 0.650%, 09/07/16 | | | 21,250 | |
| | | | Illinois Finance Authority, Healthcare System, | | | | |
| | 22,970 | | | Rev., VRDO, LOC: Wells Fargo Bank N.A., 0.520%, 09/07/16 | | | 22,970 | |
| | 20,750 | | | Series B, Rev., VRDO, LOC: PNC Bank N.A., 0.640%, 09/07/16 | | | 20,750 | |
| | 31,535 | | | Illinois Finance Authority, Northwestern Memorial Hospital, Series A-4, Rev., VRDO, 0.560%, 09/07/16 | | | 31,535 | |
| | | | Illinois Finance Authority, University of Chicago, | | | | |
| | 75,620 | | | Series 2008, Rev., VRDO, 0.590%, 09/07/16 | | | 75,620 | |
| | 22,134 | | | Series B, Rev., VRDO, 0.580%, 09/07/16 | | | 22,134 | |
| | 39,495 | | | Series C, Rev., VRDO, 0.580%, 09/07/16 | | | 39,495 | |
| | 2,600 | | | Illinois Finance Authority, University of Chicago Medical Center, Series E-1, Rev., VRDO, LOC: Wells Fargo Bank N.A., 0.600%, 09/01/16 | | | 2,600 | |
| | 6,700 | | | Illinois Housing Development Authority, Homeowner Mortgage, Series C-3, Rev., VRDO, AMT, 0.680%, 09/07/16 | | | 6,700 | |
| | | | Illinois State Toll Highway Authority, Toll Highway, | | | | |
| | 50,000 | | | Series A-1B, Rev., VRDO, 0.630%, 09/07/16 | | | 50,000 | |
| | 30,000 | | | Series A-1B, Rev., VRDO, LOC: Mizuho Bank Ltd., 0.640%, 09/07/16 | | | 30,000 | |
| | 51,900 | | | Series A-2A, Rev., VRDO, LOC: Bank of Tokyo-Mitsubishi UFJ Ltd., 0.610%, 09/07/16 | | | 51,900 | |
| | 21,300 | | | Jackson-Union Counties Regional Port District, Port Facility, Enron Transportation Services, LP Project, Rev., VRDO, LOC: Wells Fargo Bank N.A., 0.660%, 09/07/16 | | | 21,300 | |
SEE NOTES TO FINANCIAL STATEMENTS.
| | | | | | | | |
| | | |
| AUGUST 31, 2016 | | J.P. MORGAN MONEY MARKET FUNDS | | | | | 33 | |
JPMorgan Tax Free Money Market Fund
SCHEDULE OF PORTFOLIO INVESTMENTS
AS OF AUGUST 31, 2016 (Unaudited) (continued)
(Amounts in thousands)
| | | | | | | | |
PRINCIPAL
AMOUNT($) | | | SECURITY DESCRIPTION | | VALUE($) | |
| | | | | | | | |
| Municipal Bonds — continued | |
| | | | Illinois — continued | |
| | 17,705 | | | Puttable Floating Option Tax-Exempt Receipts, Series PT-4702, Rev., VRDO, LIQ: Bank of America N.A., 0.730%, 09/07/16 (e) | | | 17,705 | |
| | 6,530 | | | Regional Transportation Authority, Series SGC-55, Class A, Rev., VRDO, FGIC, LOC: Societe Generale, 0.580%, 09/07/16 (e) | | | 6,530 | |
| | 13,635 | | | Tender Option Bond Trust Receipts/CTFS Various State, Series 2016-XF0435, Rev., VRDO, LIQ: Bank of America N.A., 0.560%, 09/07/16 (e) | | | 13,635 | |
| | | | | | | | |
| | | | | | | 647,119 | |
| | | | | | | | |
| | | | Indiana — 2.5% | |
| | 9,600 | | | City of Madison, Economic Development, Arvin Sango, Inc. Project, Series 1987, Rev., VRDO, LOC: Bank of Tokyo-Mitsubishi UFJ Ltd., 0.630%, 09/07/16 | | | 9,600 | |
| | 9,100 | | | City of Rockport, PCR, AEP Generating Co. Project, Series A, Rev., VRDO, LOC: Bank of Tokyo-Mitsubishi UFJ Ltd., 0.630%, 09/07/16 | | | 9,100 | |
| | 25,425 | | | Eclipse Funding Trust, Solar Eclipse, Various States, Series 2006-0162, Rev., VRDO, AGM, LIQ: U.S. Bank N.A., 0.560%, 09/07/16 (e) | | | 25,425 | |
| | 19,610 | | | Indiana Health & Educational Facility Financing Authority, Community Hospital of Lagrange County, Inc. Project, Series A, Rev., VRDO, LOC: PNC Bank N.A., 0.580%, 09/07/16 | | | 19,610 | |
| | | | Indiana Health Facility Financing Authority, Ascension Health, | | | | |
| | 29,400 | | | Series A-2, Rev., VRDO, 0.620%, 09/07/16 | | | 29,400 | |
| | 57,810 | | | Series E-6, Rev., VRDO, 0.640%, 09/07/16 | | | 57,810 | |
| | 7,900 | | | Indiana Health Facility Financing Authority, Community Hospital Project, Series A, Rev., VRDO, LOC: Wells Fargo Bank N.A., 0.620%, 09/07/16 | | | 7,900 | |
| | 35,275 | | | Indiana State Finance Authority, Ascension Health Senior Credit Group, Series E-8, Rev., VRDO, 0.620%, 09/07/16 | | | 35,275 | |
| | 33,425 | | | Indiana State Finance Authority, Lease Appropriation, Stadium Project, Series A-2, Rev., VRDO, 0.580%, 09/07/16 | | | 33,425 | |
| | 36,000 | | | Indiana State Finance Authority, Midwestern Disaster Relief, Ohio Electric Corp. Project, Series B, Rev., VRDO, LOC: Sumitomo Mitsui Banking Corp., 0.580%, 09/07/16 | | | 36,000 | |
| | 74,585 | | | Indiana State Finance Authority, Parkview Health System, Series C, Rev., VRDO, LOC: Sumitomo Mitsui Banking, 0.600%, 09/07/16 | | | 74,585 | |
| | | | | | | | |
PRINCIPAL
AMOUNT($) | | | SECURITY DESCRIPTION | | VALUE($) | |
| | | | | | | | |
| | | | | | | | |
| | | | Indiana — continued | |
| | 18,600 | | | Indiana State Finance Authority, University Health, Series E, Rev., VRDO, LOC: Bank of America N.A., 0.570%, 09/07/16 | | | 18,600 | |
| | | | | | | | |
| | | | | | | 356,730 | |
| | | | | | | | |
| | | | Iowa — 0.6% | | | | |
| | 7,570 | | | Iowa Finance Authority, Midwest Disaster Area, Chrisbro III, Inc. Project, Rev., VRDO, LOC: U.S. Bank N.A., 0.600%, 09/07/16 | | | 7,570 | |
| | 80,800 | | | Iowa Finance Authority, Midwestern Disaster Area, Archer-Daniels-Midland Company Project, Rev., VRDO, 0.620%, 09/07/16 | | | 80,800 | |
| | | | | | | | |
| | | | | | | 88,370 | |
| | | | | | | | |
| | | | Kansas — 0.3% | | | | |
| | 28,915 | | | Kansas State Department of Transportation, Highway, Series C-2, Rev., VRDO, 0.600%, 09/07/16 | | | 28,915 | |
| | 19,720 | | | Olathe Health Facilities, Olathe Medical Center, Series C, Rev., VRDO, LOC: Bank of America N.A., 0.580%, 09/01/16 | | | 19,720 | |
| | | | | | | | |
| | | | | | | 48,635 | |
| | | | | | | | |
| | | | Kentucky — 0.5% | | | | |
| | 33,200 | | | County of Carroll, Environmental Facilities, Kentucky Utilities Co. Project, Series A, Rev., VRDO, AMT, LOC: Bank of Tokyo-Mitsubishi UFJ Ltd., 0.650%, 09/07/16 | | | 33,200 | |
| | 10,100 | | | County of Carroll, Solid Waste Disposal, Colotex Corp. Project, Rev., VRDO, LOC: Bank of America N.A., 0.620%, 09/07/16 | | | 10,100 | |
| | 32,000 | | | County of Louisville & Jefferson, Metropolitan Government Norton Healthcare, Inc., Rev., VRDO, LOC: PNC Bank N.A., 0.600%, 09/07/16 | | | 32,000 | |
| | | | | | | | |
| | | | | | | 75,300 | |
| | | | | | | | |
| | | | Louisiana — 0.7% | | | | |
| | 31,600 | | | East Baton Rouge Parish Industrial Development Board, Inc., ExxonMobil Project, Series A, Rev., VRDO, 0.570%, 09/01/16 | | | 31,600 | |
| | 17,335 | | | Eclipse Funding Trust, Solar Eclipse, Various States, Series 2007-0112, Rev., VRDO, LIQ: U.S. Bank N.A., 0.570%, 09/07/16 | | | 17,335 | |
| | 39,300 | | | Louisiana Public Facilities Authority, Dynamic Fuels LLC Project, Rev., VRDO, LOC: Bank of America N.A., 0.600%, 09/01/16 (p) | | | 39,300 | |
| | 7,240 | | | State of Louisiana, Gas & Fuels Tax, Series ROCS-RR-II-R-11899, Rev., VRDO, LIQ: Citibank N.A., 0.580%, 09/07/16 (e) | | | 7,240 | |
| | | | | | | | |
| | | | | | | 95,475 | |
| | | | | | | | |
SEE NOTES TO FINANCIAL STATEMENTS.
| | | | | | |
| | | |
| 34 | | | | J.P. MORGAN MONEY MARKET FUNDS | | AUGUST 31, 2016 |
| | | | | | | | |
PRINCIPAL
AMOUNT($) | | | SECURITY DESCRIPTION | | VALUE($) | |
| | | | | | | | |
| Municipal Bonds — continued | |
| | | | Maryland — 1.0% | | | | |
| | 15,200 | | | Maryland Community Development Administration, Department of Housing & Community Development, Multi-Family Housing, MonteVerde Apartments, Series E, Rev., VRDO, AMT, FHLMC, LOC: FHLMC, 0.630%, 09/07/16 | | | 15,200 | |
| | 6,400 | | | Maryland Community Development Administration, Department of Housing & Community Development, Multi-Family Housing, Parklane Apartments, Series C, Rev., VRDO, FNMA, LIQ: FNMA, 0.650%, 09/07/16 | | | 6,400 | |
| | 11,700 | | | Maryland Community Development Administration, Department of Housing & Community Development, Multi-Family Housing, Walker Mews Apartments, Series A, Rev., VRDO, FHLMC, LIQ: FHLMC, 0.660%, 09/07/16 | | | 11,700 | |
| | 22,360 | | | Maryland Economic Development Corp., Multi-Modal, Howard Hughes Medical Institute Project, Series B, Rev., VRDO, 0.620%, 09/07/16 | | | 22,360 | |
| | 26,100 | | | Maryland Health & Higher Education Facilities Authority, Pooled Loan Program, Series A, Rev., VRDO, LOC: TD Bank N.A., 0.650%, 09/07/16 | | | 26,100 | |
| | 6,300 | | | Maryland Health & Higher Educational Facilities Authority, Series B, Rev., VRDO, LOC: TD Bank N.A., 0.590%, 09/07/16 | | | 6,300 | |
| | 16,100 | | | Maryland Health & Higher Educational Facilities Authority, John Hopkins University, Series A, Rev., VRDO, 0.580%, 09/07/16 | | | 16,100 | |
| | 4,279 | | | Maryland Health & Higher Educational Facilities Authority, Pooled Loan Program, Series D, Rev., VRDO, LOC: Bank of America N.A., 0.650%, 09/07/16 | | | 4,279 | |
| | 1,100 | | | Maryland Health & Higher Educational Facilities Authority, University of Maryland Medical System, Series D, Rev., VRDO, LOC: TD Bank N.A., 0.580%, 09/01/16 | | | 1,100 | |
| | 30,415 | | | Maryland Stadium Authority, Sports Facilities, Football Stadium Issue, Rev., VRDO, 0.580%, 09/07/16 | | | 30,415 | |
| | 2,000 | | | Montgomery County Housing Opportunities Commission, Oakfield Apartments, Rev., VRDO, AMT, FNMA, LIQ: FNMA, 0.660%, 09/07/16 | | | 2,000 | |
| | | | | | | | |
| | | | | | | 141,954 | |
| | | | | | | | |
| | | | | | | | |
PRINCIPAL
AMOUNT($) | | | SECURITY DESCRIPTION | | VALUE($) | |
| | | | | | | | |
| | | | | | | | |
| | | | Massachusetts — 1.9% | | | | |
| | 40,000 | | | Commonwealth of Massachusetts, Central Artery/Ted Williams Tunnel Infrastructure Loan Act of 2000, Series A, GO, VRDO, 0.600%, 09/07/16 | | | 40,000 | |
| | 500 | | | Massachusetts Development Finance Agency, Partners HealthCare System, Series K-1, Rev., VRDO, 0.620%, 09/07/16 | | | 500 | |
| | | | Massachusetts Health & Educational Facilities Authority, Partners Healthcare System, | | | | |
| | 32,000 | | | Series F3, Rev., VRDO, LOC: TD Bank N.A., 0.560%, 09/07/16 | | | 32,000 | |
| | 29,700 | | | Series I-2, Rev., VRDO, 0.560%, 09/07/16 | | | 29,700 | |
| | 43,625 | | | Massachusetts State Department of Transportation, Commonwealth Contract Assistance Secured, Series A-1, Rev., VRDO, 0.590%, 09/07/16 | | | 43,625 | |
| | 2,300 | | | Massachusetts State Development Finance Agency, First Mortgage Brookhaven, Series B, Rev., VRDO, LOC: Bank of America N.A., 0.760%, 09/07/16 | | | 2,300 | |
| | 24,200 | | | Massachusetts State Health & Educational Facilities Authority, Amherst College, Series J-1, Rev., VRDO, 0.610%, 09/07/16 | | | 24,200 | |
| | 5,930 | | | Massachusetts State Health & Educational Facilities Authority, Baystate Medical Center, Series G, Rev., VRDO, LOC: Wells Fargo Bank N.A., 0.560%, 09/01/16 | | | 5,930 | |
| | | | Massachusetts State Health & Educational Facilities Authority, Capital Asset Program, | | | | |
| | 22,975 | | | Series M-2, Rev., VRDO, LOC: Bank of America N.A., 0.660%, 09/07/16 | | | 22,975 | |
| | 2,300 | | | Series M-4A, Rev., VRDO, LOC: Bank of America N.A., 0.660%, 09/07/16 | | | 2,300 | |
| | 22,000 | | | Massachusetts Water Resources Authority, Series A-3, Rev., VRDO, 0.610%, 09/07/16 | | | 22,000 | |
| | 41,170 | | | University of Massachusetts, Building Authority, Series 1, Rev., VRDO, 0.570%, 09/07/16 | | | 41,170 | |
| | | | | | | | |
| | | | | | | 266,700 | |
| | | | | | | | |
| | | | Michigan — 0.6% | | | | |
| | 34,140 | | | Kent Hospital Finance Authority, Spectrum Health System, Series B-3, Rev., VRDO, 0.620%, 09/07/16 | | | 34,140 | |
| | 20,000 | | | Michigan Finance Authority, Hospital Project & Refunding, Ascension Senior Credit Group, Series 2016 E-2, Rev., VRDO, 0.620%, 09/07/16 | | | 20,000 | |
| | 15,380 | | | Regents of the University of Michigan, Series 2012 A, Rev., VRDO, 0.600%, 09/07/16 | | | 15,380 | |
SEE NOTES TO FINANCIAL STATEMENTS.
| | | | | | | | |
| | | |
| AUGUST 31, 2016 | | J.P. MORGAN MONEY MARKET FUNDS | | | | | 35 | |
JPMorgan Tax Free Money Market Fund
SCHEDULE OF PORTFOLIO INVESTMENTS
AS OF AUGUST 31, 2016 (Unaudited) (continued)
(Amounts in thousands)
| | | | | | | | |
PRINCIPAL
AMOUNT($) | | | SECURITY DESCRIPTION | | VALUE($) | |
| | | | | | | | |
| Municipal Bonds — continued | |
| | | | Michigan — continued | | | | |
| | 11,580 | | | Tender Option Bond Trust Receipts/CTFS Various State, Series 2016-XF0394, Rev., VRDO, LIQ: Bank of America N.A., 0.600%, 09/07/16 (e) | | | 11,580 | |
| | | | | | | | |
| | | | | | | 81,100 | |
| | | | | | | | |
| | | | Minnesota — 2.0% | | | | |
| | | | City of Rochester, Health Care Facilities, Mayo Clinic, | | | | |
| | 62,950 | | | Series A, Rev., VRDO, 0.560%, 09/07/16 | | | 62,950 | |
| | 22,000 | | | Series B, Rev., VRDO, 0.560%, 09/07/16 | | | 22,000 | |
| | 7,000 | | | County of Hennepin, Ballpark Project, Third Lien, Series C, Rev., VRDO, 0.570%, 09/07/16 | | | 7,000 | |
| | 29,960 | | | Eclipse Funding Trust, LOC: U.S. Bank NA, 0.560%, 09/07/16 | | | 29,960 | |
| | | | Eclipse Funding Trust, Solar Eclipse, Various States, | | | | |
| | 30,515 | | | Series 2007-0032, Rev., VRDO, LIQ: U.S. Bank N.A., 0.570%, 09/07/16 (e) | | | 30,515 | |
| | 17,785 | | | Series 2007-0059, Rev., VRDO, LIQ: U.S. Bank N.A., 0.580%, 09/01/16 (e) | | | 17,785 | |
| | 8,200 | | | Midwest Consortium of Municipal Utilities, Draw Down Association Financing Project, Series B, Rev., VRDO, LOC: U.S. Bank N.A., 0.620%, 09/07/16 | | | 8,200 | |
| | 37,570 | | | Minneapolis & St Paul Housing & Redevelopment Authority, Health Care System, Allina Health System, Series C-2, Rev., VRDO, LOC: Wells Fargo Bank N.A., 0.570%, 09/07/16 | | | 37,570 | |
| | 43,700 | | | Minneapolis & St Paul Housing & Redevelopment Authority, Health Care System, Allina Health System,, Rev., VRDO, LOC: Wells Fargo Bank N.A., 0.580%, 09/07/16 | | | 43,700 | |
| | 24,990 | | | RBC Municipal Products, Inc. Trust, Floater Certificates, Series E-19, Rev., VRDO, LOC: Royal Bank of Canada, 0.600%, 09/01/16 (e) | | | 24,990 | |
| | | | | | | | |
| | | | | | | 284,670 | |
| | | | | | | | |
| | | | Mississippi — 1.3% | | | | |
| | | | Mississippi Business Finance Corp., Gulf Opportunity Zone Industrial Development, Chevron U.S.A., Inc. Project, | | | | |
| | 17,090 | | | Series A, Rev., VRDO, 0.580%, 09/01/16 | | | 17,090 | |
| | 8,370 | | | Series A, Rev., VRDO, 0.600%, 09/01/16 | | | 8,370 | |
| | 10,700 | | | Series B, Rev., VRDO, 0.620%, 09/01/16 | | | 10,700 | |
| | 12,835 | | | Series C, Rev., VRDO, 0.600%, 09/01/16 | | | 12,835 | |
| | | | | | | | |
PRINCIPAL
AMOUNT($) | | | SECURITY DESCRIPTION | | VALUE($) | |
| | | | | | | | |
| | | | | | | | |
| | | | Mississippi — continued | | | | |
| | 20,000 | | | Series E, Rev., VRDO, 0.570%, 09/01/16 | | | 20,000 | |
| | 325 | | | Series F, Rev., VRDO, 0.620%, 09/01/16 | | | 325 | |
| | 10,125 | | | Series F, Rev., VRDO, 0.610%, 09/07/16 | | | 10,125 | |
| | 25,800 | | | Series G, Rev., VRDO, 0.600%, 09/01/16 | | | 25,800 | |
| | 17,500 | | | Series G, Rev., VRDO, 0.620%, 09/01/16 | | | 17,500 | |
| | 36,205 | | | Series I, Rev., VRDO, 0.600%, 09/01/16 | | | 36,205 | |
| | 11,200 | | | Mississippi Development Bank, Jackson Industrial Water System Project, Rev., VRDO, 0.600%, 09/01/16 | | | 11,200 | |
| | 10,430 | | | Mississippi Hospital Equipment & Facilities Authority, Rev., VRDO, 0.640%, 09/07/16 | | | 10,430 | |
| | | | | | | | |
| | | | | | | 180,580 | |
| | | | | | | | |
| | | | Missouri — 2.1% | | | | |
| | 59,075 | | | City of Kansas, Series E, Rev., VRDO, LOC: Sumitomo Mitsui Banking Corp., 0.620%, 09/07/16 | | | 59,075 | |
| | 725 | | | Kansas City IDA, Livers Bronze Co. Project, Rev., VRDO, LOC: Bank of America N.A., 0.820%, 09/07/16 | | | 725 | |
| | 32,700 | | | Missouri Development Finance Board, Cultural Facilities, Kauffman Center for the Performing Arts Project, Series A, Rev., VRDO, 0.610%, 09/01/16 | | | 32,700 | |
| | | | Missouri State Health & Educational Facilities Authority, | | | | |
| | 36,445 | | | Series 2000, Rev., VRDO, LOC: Bank of America N.A., 0.640%, 09/07/16 | | | 36,445 | |
| | 3,800 | | | Series C, Rev., VRDO, 0.560%, 09/01/16 | | | 3,800 | |
| | 400 | | | Series D, Rev., VRDO, 0.600%, 09/01/16 | | | 400 | |
| | 59,000 | | | Missouri State Health & Educational Facilities Authority, BJC Health System, Series D, Rev., VRDO, 0.570%, 09/07/16 | | | 59,000 | |
| | 2,500 | | | Missouri State Health & Educational Facilities Authority, Educational Facilities, Washington University, Series C, Rev., VRDO, 0.600%, 09/01/16 | | | 2,500 | |
| | 48,725 | | | Missouri State Health & Educational Facilities Authority, Health Facilities, SSM Health Care, Series G, Rev., VRDO, 0.570%, 09/07/16 | | | 48,725 | |
| | 1,670 | | | Missouri State Health & Educational Facilities Authority, Saint Louis University, Series A-2, Rev., VRDO, LOC: Wells Fargo Bank N.A., 0.600%, 09/01/16 | | | 1,670 | |
| | 50,000 | | | Missouri State Health & Educational Facilities Authority, SSM Health Care, Series F, Rev., VRDO, 0.570%, 09/07/16 | | | 50,000 | |
| | | | | | | | |
| | | | | | | 295,040 | |
| | | | | | | | |
SEE NOTES TO FINANCIAL STATEMENTS.
| | | | | | |
| | | |
| 36 | | | | J.P. MORGAN MONEY MARKET FUNDS | | AUGUST 31, 2016 |
| | | | | | | | |
PRINCIPAL
AMOUNT($) | | | SECURITY DESCRIPTION | | VALUE($) | |
| | | | | | | | |
| Municipal Bonds — continued | |
| | | | Nebraska — 0.2% | | | | |
| | 29,295 | | | County of Lancaster, Hospital Authority No. 1, BryanLGH Medical Center, Series B-2, Rev., VRDO, LOC: U.S. Bank N.A., 0.590%, 09/07/16 | | | 29,295 | |
| | | | | | | | |
| | | | Nevada — 1.4% | |
| | 29,335 | | | City of Reno, Renown Regional Medical Center, Series A, Rev., VRDO, LOC: Union Bank N.A., 0.630%, 09/07/16 | | | 29,335 | |
| | | | Clark County, Nevada Airport System, Sub Lien, | | | | |
| | 50,055 | | | Series 2011 B-1, Rev., VRDO, AMT, LOC: Citibank N.A., 0.610%, 09/07/16 | | | 50,055 | |
| | 6,965 | | | Series 2011 B-2, Rev., VRDO, AMT, LOC: Royal Bank of Canada, 0.630%, 09/07/16 | | | 6,965 | |
| | 39,060 | | | Series D-3, Rev., VRDO, LOC: Bank of America N.A., 0.600%, 09/07/16 | | | 39,060 | |
| | 28,735 | | | County of Clark, Airport, Series A, GO, VRDO, AMT, 0.610%, 09/07/16 | | | 28,735 | |
| | | | Nevada Housing Division, Multi-Unit Housing, | | | | |
| | 8,550 | | | Series A, Rev., VRDO, FNMA, LIQ: FNMA, 0.630%, 09/07/16 | | | 8,550 | |
| | 13,900 | | | Series A, Rev., VRDO, LOC: Wells Fargo Bank N.A., 0.710%, 09/07/16 | | | 13,900 | |
| | 2,815 | | | Series M, Rev., VRDO, LOC: U.S. Bank N.A., 0.630%, 09/07/16 | | | 2,815 | |
| | 3,360 | | | Nevada Housing Division, Multi-Unit Housing, Horizon, Series A, Rev., VRDO, FNMA, LIQ: FNMA, 0.630%, 09/07/16 | | | 3,360 | |
| | 12,710 | | | Nevada Housing Division, Multi-Unit Housing, Silverado, Series A, Rev., VRDO, FNMA, LIQ: FNMA, 0.630%, 09/07/16 | | | 12,710 | |
| | | | | | | | |
| | | | | | | 195,485 | |
| | | | | | | | |
| | | | New Jersey — 0.1% | | | | |
| | 11,460 | | | New Jersey Housing & Mortgage Finance Agency, Single Family Housing, Series I, Rev., VRDO, AMT, 0.630%, 09/07/16 | | | 11,460 | |
| | | | | | | | |
| | | | New Mexico — 0.5% | | | | |
| | 22,275 | | | New Mexico Hospital Equipment Loan Council, Hospital System, Presbyterian Healthcare Services, Series C, Rev., VRDO, 0.590%, 09/07/16 | | | 22,275 | |
| | | | University of New Mexico, Subordinate Lien System, | | | | |
| | 27,755 | | | Series 2001, Rev., VRDO, 0.610%, 09/07/16 | | | 27,755 | |
| | 16,650 | | | Series B, Rev., VRDO, 0.610%, 09/07/16 | | | 16,650 | |
| | | | | | | | |
| | | | | | | 66,680 | |
| | | | | | | | |
| | | | | | | | |
PRINCIPAL
AMOUNT($) | | | SECURITY DESCRIPTION | | VALUE($) | |
| | | | | | | | |
| | | | | | | | |
| | | | New York — 19.1% | | | | |
| | 1,500 | | | City of New York, Fiscal Year 1994, Subseries H-3, GO, VRDO, AGM, 0.590%, 09/01/16 | | | 1,500 | |
| | | | City of New York, Fiscal Year 2004, | | | | |
| | 17,850 | | | Series A, Subseries A-3, GO, VRDO, LOC: Morgan Stanley Bank, 0.650%, 09/07/16 | | | 17,850 | |
| | 8,330 | | | Subseries H-1, GO, VRDO, LOC: Bank of New York Mellon, 0.590%, 09/01/16 | | | 8,330 | |
| | 1,325 | | | Subseries H-4, GO, VRDO, LOC: Bank of New York Mellon, 0.590%, 09/01/16 | | | 1,325 | |
| | | | City of New York, Fiscal Year 2006, | | | | |
| | 22,770 | | | Series E, Subseries E-3, GO, VRDO, LOC: Bank of America N.A., 0.600%, 09/07/16 | | | 22,770 | |
| | 34,100 | | | Series E, Subseries E-4, GO, VRDO, LOC: Bank of America N.A., 0.600%, 09/07/16 | | | 34,100 | |
| | 36,400 | | | Series F, Subseries F-3, GO, VRDO, LOC: Sumitomo Mitsui Banking, 0.570%, 09/07/16 | | | 36,400 | |
| | 34,200 | | | Series F, Subseries F-4B, GO, VRDO, LOC: Bank of Tokyo-Mitsubishi UFJ Ltd., 0.600%, 09/07/16 | | | 34,200 | |
| | 25,800 | | | Series I, Subseries I-5, GO, VRDO, LOC: Bank of New York Mellon, 0.590%, 09/01/16 | | | 25,800 | |
| | | | City of New York, Fiscal Year 2008, | | | | |
| | 37,700 | | | Series D, Subseries D-4, GO, VRDO, 0.580%, 09/07/16 | | | 37,700 | |
| | 61,735 | | | Series J, Subseries J-10, GO, VRDO, LOC: Bank of Tokyo-Mitsubishi UFJ Ltd., 0.590%, 09/07/16 | | | 61,735 | |
| | 4,000 | | | Series L, Subseries L-4, GO, VRDO, LOC: U.S. Bank N.A., 0.580%, 09/01/16 | | | 4,000 | |
| | | | City of New York, Fiscal Year 2012, | | | | |
| | 3,830 | | | Series A, Subseries A-5, GO, VRDO, LOC: Royal Bank of Canada, 0.580%, 09/01/16 | | | 3,830 | |
| | 2,800 | | | Series D, Subseries D-3B, GO, VRDO, LOC: Royal Bank of Canada, 0.580%, 09/01/16 | | | 2,800 | |
| | 12,750 | | | City of New York, Fiscal Year 2013, Series A, Subseries A-4, GO, VRDO, LOC: Sumitomo Mitsui Banking Corp., 0.570%, 09/07/16 | | | 12,750 | |
| | | | City of New York, Fiscal Year 2014, | | | | |
| | 16,050 | | | Series D, Subseries D-5, GO, VRDO, LOC: PNC Bank N.A., 0.600%, 09/01/16 | | | 16,050 | |
| | 10,550 | | | Subseries D-4, GO, VRDO, LOC: TD Bank N.A., 0.580%, 09/01/16 | | | 10,550 | |
SEE NOTES TO FINANCIAL STATEMENTS.
| | | | | | | | |
| | | |
| AUGUST 31, 2016 | | J.P. MORGAN MONEY MARKET FUNDS | | | | | 37 | |
JPMorgan Tax Free Money Market Fund
SCHEDULE OF PORTFOLIO INVESTMENTS
AS OF AUGUST 31, 2016 (Unaudited) (continued)
(Amounts in thousands)
| | | | | | | | |
PRINCIPAL
AMOUNT($) | | | SECURITY DESCRIPTION | | VALUE($) | |
| | | | | | | | |
| Municipal Bonds — continued | |
| | | | New York — continued | | | | |
| | 3,450 | | | City of New York, Fiscal Year 2015, Series F, Subseries F-7, GO, VRDO, LOC: Royal Bank of Canada, 0.580%, 09/01/16 | | | 3,450 | |
| | | | Metropolitan Transportation Authority, | | | | |
| | 15,900 | | | Series E-5, Rev., VRDO, LOC: U.S. Bank N.A., 0.580%, 09/01/16 | | | 15,900 | |
| | 18,000 | | | Subseries E-3, Rev., VRDO, LOC: Citibank N.A., 0.610%, 09/07/16 | | | 18,000 | |
| | 10,000 | | | Subseries G-2, Rev., VRDO, LOC: TD Bank N.A., 0.570%, 09/07/16 | | | 10,000 | |
| | | | Metropolitan Transportation Authority, Dedicated Tax Fund, | | | | |
| | 48,185 | | | Series A1A, Rev., 5.000%, 03/01/17 | | | 49,243 | |
| | 41,310 | | | Series A1B, Rev., 2.000%, 03/01/17 | | | 41,604 | |
| | 10,000 | | | Series A1C, Rev., 2.000%, 03/01/17 | | | 10,071 | |
| | 98,250 | | | Series A1D, Rev., 2.000%, 03/01/17 | | | 98,948 | |
| | 500 | | | Series A, Subseries A-1, Rev., VRDO, LOC: Royal Bank of Canada, 0.580%, 09/01/16 | | | 500 | |
| | 20,000 | | | Subseries B-1, Rev., VRDO, LOC: Bank of Tokyo-Mitsubishi UFJ Ltd., 0.570%, 09/07/16 | | | 20,000 | |
| | 20,000 | | | Metropolitan Transportation Authority, Transportation, Series 2012E, Subseries 2005E-3, Rev., VRDO, LOC: Bank of Montreal, 0.580%, 09/07/16 | | | 20,000 | |
| | 19,350 | | | Nassau County Interim Finance Authority, A Public Benefit Corp., of the State of New York, Sales Tax Secured, Series B, Rev., VRDO, LOC: Sumitomo Mitsui Banking, 0.610%, 09/07/16 | | | 19,350 | |
| | | | Nassau Health Care Corp., | | | | |
| | 10,480 | | | Subseries B-1, Rev., VRDO, LOC: TD Bank N.A., 0.590%, 09/07/16 | | | 10,480 | |
| | 14,750 | | | Subseries B-2, Rev., VRDO, LOC: TD Bank N.A., 0.600%, 09/07/16 | | | 14,750 | |
| | 124,300 | | | Nassau Interim Finance Authority, Sales Tax Secured, Series A, Rev., VRDO, 0.620%, 09/07/16 | | | 124,300 | |
| | 8,750 | | | New York City Health & Hospital Corp., Health System, Series B, Rev., VRDO, LOC:TD BANK NA, 0.640%, 09/07/16 | | | 8,750 | |
| | 4,760 | | | New York City Housing Development Corp., Multi-Family Housing, Ogden Ave. Apartments, Series A, Rev., VRDO, FNMA, LIQ: FNMA, 0.660%, 09/07/16 | | | 4,760 | |
| | 25,000 | | | New York City Housing Development Corp., Multi-Family Mortgage, Series A, Rev., VRDO, LOC: Bank of America N.A., 0.590%, 09/07/16 | | | 25,000 | |
| | | | | | | | |
PRINCIPAL
AMOUNT($) | | | SECURITY DESCRIPTION | | VALUE($) | |
| | | | | | | | |
| | | | | | | | |
| | | | New York — continued | | | | |
| | 2,800 | | | New York City Housing Development Corp., Multi-Family Mortgage, 245 East 124th Street, Series A, Rev., VRDO, AMT, FHLMC, LIQ: FHLMC, 0.640%, 09/07/16 | | | 2,800 | |
| | 7,255 | | | New York City Housing Development Corp., Multi-Family Mortgage, 500 East 165th Street Apartments, Series A, Rev., VRDO, LOC: Bank of America N.A., 0.670%, 09/07/16 | | | 7,255 | |
| | 13,600 | | | New York City Housing Development Corp., Multi-Family Mortgage, Highbridge Apartments, Series A, Rev., VRDO, FNMA, LIQ: FNMA, 0.660%, 09/07/16 | | | 13,600 | |
| | 44,900 | | | New York City Housing Development Corp., Multi-Family Rental Housing, 90 Washington Street, Series A, Rev., VRDO, FNMA, LIQ: FNMA, 0.640%, 09/07/16 | | | 44,900 | |
| | 47,800 | | | New York City Housing Development Corp., Multi-Family Rental Housing, Royal Properties, Series A, Rev., VRDO, FNMA, LOC: FNMA, 0.640%, 09/07/16 | | | 47,800 | |
| | 10,630 | | | New York City Housing Development Corp., Multi-Family Rental Housing, West 89th Street Development, Series A, Rev., VRDO, FNMA, LIQ: FNMA, 0.680%, 09/07/16 | | | 10,630 | |
| | 45,000 | | | New York City Industrial Development Agency, 123 Washington LLC Project, Series 2007, Rev., VRDO, LOC: Bank of China, 0.640%, 09/01/16 | | | 45,000 | |
| | | | New York City Municipal Water Finance Authority, Water & Sewer System, | | | | |
| | 44,100 | | | Series B, Subseries B-3, Rev., VRDO, 0.580%, 09/01/16 | | | 44,100 | |
| | 45,100 | | | Subseries F1A, Rev., VRDO, 0.560%, 09/07/16 | | | 45,100 | |
| | | | New York City Municipal Water Finance Authority, Water & Sewer System, Fiscal Year 2008, | | | | |
| | 64,400 | | | Rev., VRDO, 0.600%, 09/07/16 | | | 64,400 | |
| | 23,805 | | | Series B, Subseries B-4, Rev., VRDO, 0.600%, 09/07/16 | | | 23,805 | |
| | 120 | | | New York City Municipal Water Finance Authority, Water & Sewer System, Second General Resolution, Fiscal Year 2007, Series CC, Subseries CC-1, Rev., VRDO, 0.580%, 09/01/16 | | | 120 | |
| | | | New York City Municipal Water Finance Authority, Water & Sewer System, Second General Resolution, Fiscal Year 2008, | | | | |
| | 29,350 | | | Series BB, Subseries BB-1, Rev., VRDO, 0.550%, 09/07/16 | | | 29,350 | |
SEE NOTES TO FINANCIAL STATEMENTS.
| | | | | | |
| | | |
| 38 | | | | J.P. MORGAN MONEY MARKET FUNDS | | AUGUST 31, 2016 |
| | | | | | | | |
PRINCIPAL
AMOUNT($) | | | SECURITY DESCRIPTION | | VALUE($) | |
| | | | | | | | |
| Municipal Bonds — continued | |
| | | | New York — continued | | | | |
| | 13,000 | | | Subseries BB-4, Rev., VRDO, 0.600%, 09/07/16 | | | 13,000 | |
| | 37,420 | | | New York City Municipal Water Finance Authority, Water & Sewer System, Second General Resolution, Fiscal Year 2009, Series BB, Subseries BB-1, Rev., VRDO, 0.620%, 09/01/16 | | | 37,420 | |
| | | | New York City Municipal Water Finance Authority, Water & Sewer System, Second General Resolution, Fiscal Year 2011, | | | | |
| | 66,125 | | | Series DD, Subseries DD-1, Rev., VRDO, 0.580%, 09/01/16 | | | 66,125 | |
| | 4,070 | | | Series DD, Subseries DD-3A, Rev., VRDO, 0.580%, 09/01/16 | | | 4,070 | |
| | 4,885 | | | Subseries DD-3B, Rev., VRDO, 0.580%, 09/01/16 | | | 4,885 | |
| | | | New York City Municipal Water Finance Authority, Water & Sewer System, Second General Resolution, Fiscal Year 2013, | | | | |
| | 15,400 | | | Series AA, Subseries AA-1, Rev., VRDO, 0.600%, 09/01/16 | | | 15,400 | |
| | 37,700 | | | Series AA, Subseries AA-2, Rev., VRDO, 0.550%, 09/07/16 | | | 37,700 | |
| | 46,900 | | | New York City Municipal Water Finance Authority, Water & Sewer System, Second General Resolution, Fiscal Year 2014, Series AA, Subseries AA-3, Rev., VRDO, 0.580%, 09/01/16 | | | 46,900 | |
| | | | New York City Municipal Water Finance Authority, Water & Sewer System, Second General Resolution, Fiscal Year 2015, | | | | |
| | 25,600 | | | Subseries BB-1, Rev., VRDO, 0.580%, 09/01/16 | | | 25,600 | |
| | 19,485 | | | Subseries BB-4, Rev., VRDO, 0.580%, 09/01/16 | | | 19,485 | |
| | | | New York City Municipal Water Finance Authority, Water & Sewer System, Second General Resolution, Fiscal Year 2016, | | | | |
| | 25,000 | | | Series AA-2, Rev., VRDO, 0.580%, 09/01/16 | | | 25,000 | |
| | 48,800 | | | Series AA-2, Rev., VRDO, 0.600%, 09/01/16 | | | 48,800 | |
| | 11,055 | | | New York City Transitional Finance Authority, Series 1, Subseries 1D, Rev., VRDO, 0.620%, 09/01/16 | | | 11,055 | |
| | | | New York City Transitional Finance Authority, EAGLE, | | | | |
| | 48,260 | | | Series 2007-0004, Class A, Rev., VRDO, AGM-CR, FGIC, LIQ: Citibank N.A., 0.590%, 09/07/16 | | | 48,260 | |
| | | | | | | | |
PRINCIPAL
AMOUNT($) | | | SECURITY DESCRIPTION | | VALUE($) | |
| | | | | | | | |
| | | | | | | | |
| | | | New York — continued | | | | |
| | 36,060 | | | Series 2007-0014, Class A, Rev., VRDO, AGM-CR, FGIC, LIQ: Landesbank Hessen-Thuringen, 0.590%, 09/07/16 | | | 36,060 | |
| | 66,200 | | | New York City Transitional Finance Authority, Future Tax Secured, Fiscal Year 1999, Series A, Subseries A-1, Rev., VRDO, 0.650%, 09/07/16 | | | 66,200 | |
| | 52,770 | | | New York City Transitional Finance Authority, Future Tax Secured, Fiscal Year 2001, Series C, Rev., VRDO, 0.600%, 09/01/16 | | | 52,770 | |
| | 9,175 | | | New York City Transitional Finance Authority, Future Tax Secured, Fiscal Year 2003, Subseries A-4, Rev., VRDO, 0.580%, 09/01/16 | | | 9,175 | |
| | 17,000 | | | New York City Transitional Finance Authority, Future Tax Secured, Fiscal Year 2013, Series A, Subseries A-5, Rev., VRDO, 0.580%, 09/01/16 | | | 17,000 | |
| | | | New York City Transitional Finance Authority, New York City Recovery, | | | | |
| | 2,360 | | | Series 1, Subseries 1A, Rev., VRDO, LIQ: Landesbank Hessen-Thuringen, 0.660%, 09/07/16 | | | 2,360 | |
| | 14,865 | | | Series 2, Subseries 2F, Rev., VRDO, LIQ: Sumitomo Mitsui Banking, 0.650%, 09/01/16 | | | 14,865 | |
| | 19,925 | | | Series 3, Subseries 3-G, Rev., VRDO, 0.630%, 09/07/16 | | | 19,925 | |
| | 24,700 | | | New York City, Fiscal Year 2008, Subseries D-3, GO, VRDO, LIQ: Credit Agricole Corporate and Investment Bank, 0.580%, 09/07/16 | | | 24,700 | |
| | 3,160 | | | New York Liberty Development Corp., Series ROCS-RR-II-R-11868, Rev., VRDO, LIQ: Citibank N.A., 0.600%, 09/07/16 (e) | | | 3,160 | |
| | 7,400 | | | New York State Dormitory Authority, Series ROCS-RR II R-14018, Rev., VRDO, LIQ: Citibank N.A., 0.580%, 09/07/16 (e) | | | 7,400 | |
| | 45,600 | | | New York State Dormitory Authority, City University System, CONS Fifth General Resolution, Series D, Rev., VRDO, LOC: TD Bank N.A., 0.570%, 09/07/16 | | | 45,600 | |
| | 69,525 | | | New York State Dormitory Authority, Court Facilities Lease, Series B, Rev., VRDO, LOC: Mizuho Bank Ltd., 0.650%, 09/07/16 | | | 69,525 | |
| | 500 | | | New York State Dormitory Authority, EAGLE, Series 2006-0138, Class A, Rev., VRDO, LIQ: Citibank N.A., 0.590%, 09/07/16 (e) | | | 500 | |
| | 23,585 | | | New York State Dormitory Authority, St. John’s University, Series B-1, Rev., VRDO, LOC: Bank of America N.A., 0.600%, 09/07/16 | | | 23,585 | |
SEE NOTES TO FINANCIAL STATEMENTS.
| | | | | | | | |
| | | |
| AUGUST 31, 2016 | | J.P. MORGAN MONEY MARKET FUNDS | | | | | 39 | |
JPMorgan Tax Free Money Market Fund
SCHEDULE OF PORTFOLIO INVESTMENTS
AS OF AUGUST 31, 2016 (Unaudited) (continued)
(Amounts in thousands)
| | | | | | | | |
PRINCIPAL
AMOUNT($) | | | SECURITY DESCRIPTION | | VALUE($) | |
| | | | | | | | |
| Municipal Bonds — continued | |
| | | | New York — continued | | | | |
| | | | New York State Energy Research & Development Authority, Consolidated Edison Co., Inc. Project, | | | | |
| | 12,700 | | | Series 2004C, Subseries C-1, Rev., VRDO, LOC: Mizuho Bank Ltd., 0.620%, 09/07/16 | | | 12,700 | |
| | 19,920 | | | Series A, Subseries A-3, Rev., VRDO, LOC: Mizuho Bank Ltd., 0.620%, 09/07/16 | | | 19,920 | |
| | 1,800 | | | New York State Housing Finance Agency, Series A, Rev., VRDO, FNMA, LIQ: FNMA, 0.680%, 09/07/16 | | | 1,800 | |
| | 2,755 | | | New York State Housing Finance Agency, 10 Barclay Street, Series A, Rev., VRDO, FNMA, LIQ: FNMA, 0.650%, 09/07/16 | | | 2,755 | |
| | 8,000 | | | New York State Housing Finance Agency, 101 West End Avenue, Series A, Rev., VRDO, FNMA, LIQ: FNMA, 0.600%, 09/07/16 | | | 8,000 | |
| | 33,095 | | | New York State Housing Finance Agency, 160 Madison Avenue Housing, Rev., VRDO, LOC: PNC Bank N.A., 0.580%, 09/01/16 | | | 33,095 | |
| | 51,100 | | | New York State Housing Finance Agency, 188 Ludlow Street, Series A, Rev., VRDO, LOC: Landesbank Hessen-Thuringen, 0.650%, 09/07/16 | | | 51,100 | |
| | 10,000 | | | New York State Housing Finance Agency, 205 East 92nd Street, Series A, Rev., VRDO, LOC: Wells Fargo Bank N.A., 0.630%, 09/07/16 | | | 10,000 | |
| | 11,550 | | | New York State Housing Finance Agency, 222 East 44th Street Housing, Series A, Rev., VRDO, LOC: Bank of China, 0.710%, 09/07/16 | | | 11,550 | |
| | 4,200 | | | New York State Housing Finance Agency, 240 East 39th Street, Series A, Rev., VRDO, FNMA, LOC: FNMA, 0.670%, 09/07/16 | | | 4,200 | |
| | 7,200 | | | New York State Housing Finance Agency, 345 East 94th Street, Series A, Rev., VRDO, FHLMC, LIQ: FHLMC, 0.600%, 09/07/16 | | | 7,200 | |
| | 3,200 | | | New York State Housing Finance Agency, 360 West 43rd Street, Series A, Rev., VRDO, FNMA, LIQ: FNMA, 0.680%, 09/07/16 | | | 3,200 | |
| | 21,500 | | | New York State Housing Finance Agency, 555 Tenth Avenue Housing, Series A, Rev., VRDO, LOC: Landesbank Hessen-Thuringen, 0.660%, 09/07/16 | | | 21,500 | |
| | | | New York State Housing Finance Agency, 605 West 42 Street, | | | | |
| | 47,280 | | | Series A, Rev., VRDO, LOC: Bank of China, 0.640%, 09/01/16 | | | 47,280 | |
| | 80,000 | | | Series A, Rev., VRDO, LOC: Bank of China, 0.640%, 09/01/16 | | | 80,000 | |
| | | | | | | | |
PRINCIPAL
AMOUNT($) | | | SECURITY DESCRIPTION | | VALUE($) | |
| | | | | | | | |
| | | | | | | | |
| | | | New York — continued | | | | |
| | 5,500 | | | New York State Housing Finance Agency, 625 West 57th Street, Series A-1, Rev., VRDO, LOC: Bank of New York Mellon, 0.570%, 09/07/16 | | | 5,500 | |
| | 17,760 | | | New York State Housing Finance Agency, 80 Dekalb Avenue, Series B, Rev., VRDO, LOC: Landesbank Hessen-Thuringen, 0.650%, 09/07/16 | | | 17,760 | |
| | 50,000 | | | New York State Housing Finance Agency, 88 Leonard Street, Series A, Rev., VRDO, LOC: Landesbank Hessen-Thuringen, 0.660%, 09/07/16 | | | 50,000 | |
| | 9,550 | | | New York State Housing Finance Agency, Chelsea Arms, Series A, Rev., VRDO, FNMA, LIQ: FNMA, 0.680%, 09/07/16 | | | 9,550 | |
| | 3,900 | | | New York State Housing Finance Agency, Clinton Park Phase II, Series A-1, Rev., VRDO, LOC: Wells Fargo Bank N.A., 0.660%, 09/07/16 | | | 3,900 | |
| | 7,400 | | | New York State Housing Finance Agency, East 84th Street, Series A, Rev., VRDO, FNMA, LOC: FNMA, 0.670%, 09/07/16 | | | 7,400 | |
| | 28,550 | | | New York State Housing Finance Agency, Historic Front Street, Series A, Rev., VRDO, LOC: Landesbank Hessen-Thuringen, 0.620%, 09/07/16 | | | 28,550 | |
| | 7,050 | | | New York State Housing Finance Agency, North End, Series A, Rev., VRDO, FNMA, LIQ: FNMA, 0.650%, 09/07/16 | | | 7,050 | |
| | 27,000 | | | New York State Housing Finance Agency, Related 205 East 92nd Street Housing, Series A, Rev., VRDO, LOC: Wells Fargo Bank N.A., 0.630%, 09/07/16 | | | 27,000 | |
| | 6,680 | | | New York State Housing Finance Agency, Talleyrand Crescent, Rev., VRDO, FNMA, LOC: FNMA, 0.630%, 09/07/16 | | | 6,680 | |
| | 11,300 | | | New York State Housing Finance Agency, Theater Row, Series A, Rev., VRDO, FHLMC, LOC: FHLMC, 0.680%, 09/07/16 | | | 11,300 | |
| | 50,065 | | | New York State Housing Finance Agency, Tribeca Green, Series A, Rev., VRDO, LOC: Landesbank Hessen-Thuringen, 0.660%, 09/07/16 | | | 50,065 | |
| | 10,000 | | | New York State Housing Finance Agency, Victory, Series A, Rev., VRDO, FHLMC, LIQ: FHLMC, 0.680%, 09/07/16 | | | 10,000 | |
| | 2,100 | | | New York State Housing Finance Agency, West 23rd Street, Series A, Rev., VRDO, FNMA, LIQ: FNMA, 0.680%, 09/07/16 | | | 2,100 | |
| | 100 | | | New York State Housing Finance Agency, Weyant Green Apartments, Series A, Rev., VRDO, FNMA, LIQ: FNMA, 0.680%, 09/07/16 | | | 100 | |
SEE NOTES TO FINANCIAL STATEMENTS.
| | | | | | |
| | | |
| 40 | | | | J.P. MORGAN MONEY MARKET FUNDS | | AUGUST 31, 2016 |
| | | | | | | | |
PRINCIPAL
AMOUNT($) | | | SECURITY DESCRIPTION | | VALUE($) | |
| | | | | | | | |
| Municipal Bonds — continued | |
| | | | New York — continued | | | | |
| | 3,400 | | | New York State Housing Finance Agency, Worth Street, Series A, Rev., VRDO, FNMA, LIQ: FNMA, 0.680%, 09/07/16 | | | 3,400 | |
| | 11,250 | | | Tender Option Bond Trust Receipts/CTFS Various State, Series 2016-XG0018, Rev., VRDO, LIQ: Bank of America N.A., 0.630%, 09/07/16 (e) | | | 11,250 | |
| | 40,790 | | | Triborough Bridge & Tunnel Authority, Series A, Rev., VRDO, LOC: TD Bank N.A., 0.590%, 09/07/16 | | | 40,790 | |
| | | | Triborough Bridge & Tunnel Authority, MTA Bridges & Tunnels, | | | | |
| | 28,890 | | | Rev., VRDO, LOC: Bank of Tokyo-Mitsubishi UFJ Ltd., 0.640%, 09/07/16 | | | 28,890 | |
| | 57,290 | | | Series B-1, Rev., VRDO, LOC: PNC Bank N.A., 0.600%, 09/07/16 | | | 57,290 | |
| | | | | | | | |
| | | | | | | 2,695,056 | |
| | | | | | | | |
| | | | North Carolina — 3.5% | | | | |
| | 25,515 | | | Buncombe County Metropolitan Sewerage District, Series A, Rev., VRDO, 0.610%, 09/07/16 | | | 25,515 | |
| | 2,560 | | | Charlotte-Mecklenburg Hospital Authority, Carolinas Healthcare System, Series H, Rev., VRDO, LOC: Wells Fargo Bank N.A., 0.600%, 09/01/16 | | | 2,560 | |
| | 26,200 | | | City of Charlotte, 2003 Governmental Facilities Projects, Series G, COP, VRDO, LIQ: Wells Fargo Bank N.A., 0.610%, 09/07/16 | | | 26,200 | |
| | | | City of Charlotte, Charlotte Douglas International Airport, | | | | |
| | 13,205 | | | Series B, Rev., VRDO, LOC: Bank of America N.A., 0.630%, 09/07/16 | | | 13,205 | |
| | 6,925 | | | Series C, Rev., VRDO, LOC: Bank of America N.A., 0.630%, 09/07/16 | | | 6,925 | |
| | 7,675 | | | City of Charlotte, Governmental Facilities, Series F, COP, VRDO, 0.630%, 09/07/16 | | | 7,675 | |
| | 17,365 | | | City of Charlotte, Water & Sewer System, Series B, Rev., VRDO, 0.600%, 09/07/16 | | | 17,365 | |
| | 19,580 | | | City of Greensboro, Combined Enterprise System, Series A, Rev., VRDO, 0.630%, 09/07/16 | | | 19,580 | |
| | 5,415 | | | City of Raleigh, Combined Enterprise System, Series B, Rev., VRDO, 0.630%, 09/07/16 | | | 5,415 | |
| | | | City of Raleigh, Downtown Improvement Projects, | | | | |
| | 40,900 | | | Series A, COP, VRDO, 0.570%, 09/07/16 | | | 40,900 | |
| | 42,325 | | | Series B-2, COP, VRDO, 0.600%, 09/07/16 | | | 42,325 | |
| | 8,330 | | | City of Raleigh, Enterprise System, Series A, Rev., VRDO, 0.630%, 09/07/16 | | | 8,330 | |
| | | | | | | | |
PRINCIPAL
AMOUNT($) | | | SECURITY DESCRIPTION | | VALUE($) | |
| | | | | | | | |
| | | | | | | | |
| | | | North Carolina — continued | | | | |
| | 18,380 | | | Durham County Industrial Facilities & Pollution Control Financing Authority, Research Triangle Institute, Rev., VRDO, LOC: Wells Fargo Bank N.A., 0.610%, 09/07/16 | | | 18,380 | |
| | | | Forsyth County, | | | | |
| | 6,535 | | | Series A, GO, VRDO, 0.570%, 09/07/16 | | | 6,535 | |
| | 6,300 | | | Series B, GO, VRDO, 0.570%, 09/07/16 | | | 6,300 | |
| | 14,600 | | | Series B, GO, VRDO, 0.570%, 09/07/16 | | | 14,600 | |
| | 16,000 | | | North Carolina Capital Facilities Finance Agency, NCCU Real Estate, Series A, Rev., VRDO, LOC: Wells Fargo Bank N.A., 0.570%, 09/07/16 | | | 16,000 | |
| | 14,960 | | | North Carolina Medical Care Commission, Health Care Facilities, WakeMed, Series C, Rev., VRDO, LOC: Wells Fargo Bank N.A., 0.610%, 09/07/16 | | | 14,960 | |
| | 21,775 | | | North Carolina Medical Care Commission, Health System, Rev., VRDO, 0.620%, 09/07/16 | | | 21,775 | |
| | 25,000 | | | North Carolina Medical Care Commission, Moses Cone Health System, Series A, Rev., VRDO, 0.660%, 09/07/16 | | | 25,000 | |
| | 40,505 | | | North Carolina State University at Raleigh, Board of Governors, Series B, Rev., VRDO, 0.570%, 09/07/16 | | | 40,505 | |
| | 14,900 | | | Orange Water & Sewer Authority, Series B, Rev., VRDO, 0.570%, 09/07/16 | | | 14,900 | |
| | 17,130 | | | Piedmont Triad Airport Authority, Series A, Rev., VRDO, LOC: Branch Banking & Trust, 0.660%, 09/07/16 | | | 17,130 | |
| | | | University of North Carolina, University Hospital at Chapel Hill, | | | | |
| | 17,540 | | | Series A, Rev., VRDO, 0.550%, 09/01/16 | | | 17,540 | |
| | 14,000 | | | Series A, Rev., VRDO, 0.570%, 09/07/16 | | | 14,000 | |
| | 100 | | | Series B, Rev., VRDO, 0.550%, 09/01/16 | | | 100 | |
| | 20,435 | | | Series B, Rev., VRDO, 0.560%, 09/07/16 | | | 20,435 | |
| | 30,000 | | | Wake County, Public Improvement, Series B, GO, VRDO, 0.560%, 09/07/16 | | | 30,000 | |
| | | | | | | | |
| | | | | | | 494,155 | |
| | | | | | | | |
| | | | Ohio — 1.0% | | | | |
| | 400 | | | City of Blue Ash, Economic Development, Ursuline Academy of Cincinnati Project, Series 2008, Rev., VRDO, LOC: PNC Bank N.A., 0.600%, 09/07/16 | | | 400 | |
| | 9,715 | | | County of Cuyahoga, Civic Facilities, Rev., VRDO, LOC: PNC Bank N.A., 0.590%, 09/07/16 | | | 9,715 | |
| | 24,700 | | | County of Cuyahoga, Ohio, Hospital Facilities, Sisters of Charity Health System, Series 2000, Rev., VRDO, LOC: PNC Bank N.A., 0.580%, 09/07/16 | | | 24,700 | |
SEE NOTES TO FINANCIAL STATEMENTS.
| | | | | | | | |
| | | |
| AUGUST 31, 2016 | | J.P. MORGAN MONEY MARKET FUNDS | | | | | 41 | |
JPMorgan Tax Free Money Market Fund
SCHEDULE OF PORTFOLIO INVESTMENTS
AS OF AUGUST 31, 2016 (Unaudited) (continued)
(Amounts in thousands)
| | | | | | | | |
PRINCIPAL
AMOUNT($) | | | SECURITY DESCRIPTION | | VALUE($) | |
| | | | | | | | |
| Municipal Bonds — continued | |
| | | | Ohio — continued | | | | |
| | 10,020 | | | Franklin County, Ohio Health Care Facilities, Ohio Presbyterian Retirement Services, Series B, Rev., VRDO, LOC: PNC Bank N.A., 0.590%, 09/07/16 | | | 10,020 | |
| | | | Ohio State University, General Receipts, | | | | |
| | 500 | | | Rev., VRDO, 0.530%, 09/07/16 | | | 500 | |
| | 25,000 | | | Rev., VRDO, 0.600%, 09/07/16 | | | 25,000 | |
| | 45,000 | | | Ohio State Water Development Authority, Water Pollution Control Loan Fund, Series 2016 A, Rev., VRDO, LIQ: BMO Harris Bank N.A., 0.650%, 09/07/16 | | | 45,000 | |
| | | | State of Ohio, Infrastructure Improvement, | | | | |
| | 20,715 | | | Series A, GO, VRDO, 0.620%, 09/07/16 | | | 20,715 | |
| | 10,495 | | | Series B, GO, VRDO, 0.620%, 09/07/16 | | | 10,495 | |
| | | | | | | | |
| | | | | | | 146,545 | |
| | | | | | | | |
| | | | Oklahoma — 0.1% | |
| | 10,490 | | | Tulsa County Home Finance Authority, Multi-Family Housing, Waterford Apartments, Rev., VRDO, FNMA, LIQ: FNMA, 0.620%, 09/07/16 | | | 10,490 | |
| | | | | | | | |
| | | | Oregon — 0.1% | |
| | 15,450 | | | Clackamas County Hospital Facility Authority, Legacy Health System, Series B, Rev., VRDO, LOC: U.S. Bank N.A., 0.610%, 09/07/16 | | | 15,450 | |
| | | | | | | | |
| | | | Pennsylvania — 2.7% | | | | |
| | | | Bucks County IDA, Grand View Hospital, | | | | |
| | 10,835 | | | Series A, Rev., VRDO, LOC: TD Bank N.A., 0.570%, 09/07/16 | | | 10,835 | |
| | 7,000 | | | Series B, Rev., VRDO, LOC: PNC Bank N.A., 0.580%, 09/07/16 | | | 7,000 | |
| | 20,130 | | | Butler County General Authority, Series SGC-58, Class A, Rev., VRDO, LIQ: Societe Generale, 0.580%, 09/07/16 (e) | | | 20,130 | |
| | 8,570 | | | Butler County General Authority, North Allegheny School District Project, Rev., VRDO, 0.590%, 09/07/16 | | | 8,570 | |
| | 33,250 | | | City of Philadelphia PA Gas Works, Series B, Rev., VRDO, LOC: Wells Fargo Bank N.A., 0.570%, 09/07/16 | | | 33,250 | |
| | 23,700 | | | City of Philadelphia, Gas Works, Series D, Rev., VRDO, LOC: Royal Bank of Canada, 0.600%, 09/07/16 | | | 23,700 | |
| | 33,775 | | | County of Allegheny, Series C-50, GO, VRDO, LOC: PNC Bank N.A., 0.580%, 09/07/16 | | | 33,775 | |
| | 17,300 | | | County of Montour, Geisinger Authority Health System, Series B, Rev., VRDO, 0.560%, 09/01/16 | | | 17,300 | |
| | | | | | | | |
PRINCIPAL
AMOUNT($) | | | SECURITY DESCRIPTION | | VALUE($) | |
| | | | | | | | |
| | | | | | | | |
| | | | Pennsylvania — continued | | | | |
| | 10,000 | | | Delaware County IDA, Airport Facilities, United Parcel Service Project, Series 2015, Rev., VRDO, 0.710%, 09/01/16 | | | 10,000 | |
| | 17,155 | | | Delaware Valley Regional Finance Authority, Local Government, Class A, Rev., VRDO, LIQ: Societe Generale, 0.580%, 09/07/16 (e) | | | 17,155 | |
| | 27,350 | | | Fayette County Hospital Authority, Regional Health System, Series A, Rev., VRDO, LOC: PNC Bank N.A., 0.580%, 09/07/16 | | | 27,350 | |
| | | | Montgomery County Redevelopment Authority, Multi-Family Housing, Brookside Manors Apartments Project, | | | | |
| | 4,810 | | | Series A, Rev., VRDO, FNMA, LIQ: FNMA, 0.600%, 09/07/16 | | | 4,810 | |
| | 2,405 | | | Series A-T2, Rev., VRDO, FNMA, LIQ: FNMA, 0.600%, 09/07/16 | | | 2,405 | |
| | 17,080 | | | Montgomery County Redevelopment Authority, Multi-Family Housing, Kingswood Apartments Project, Series A, Rev., VRDO, FNMA, LIQ: FNMA, 0.600%, 09/07/16 | | | 17,080 | |
| | 24,665 | | | Northeastern Pennsylvania Hospital and Education Authority, The Commonwealth Medical College Project, Rev., VRDO, LOC: PNC Bank N.A., 0.580%, 09/07/16 | | | 24,665 | |
| | 44,500 | | | Pennsylvania Economic Development Financing Authority, PSEG Power LLC Project, Rev., VRDO, LOC: TD Bank N.A., 0.590%, 09/07/16 | | | 44,500 | |
| | 12,975 | | | Pennsylvania Housing Finance Agency, Building Development, Rev., VRDO, 0.600%, 09/07/16 | | | 12,975 | |
| | | | Pennsylvania Housing Finance Agency, Single Family Mortgage, | | | | |
| | 28,710 | | | Series 2005-89, Rev., VRDO, AMT, 0.650%, 09/07/16 | | | 28,710 | |
| | 6,600 | | | Series 99C, Rev., VRDO, AMT, 0.660%, 09/07/16 | | | 6,600 | |
| | 10,000 | | | Philadelphia Authority, Industrial Development Multi-Modal Lease, Series B-3, Rev., VRDO, LOC: PNC Bank N.A., 0.580%, 09/07/16 | | | 10,000 | |
| | 20,000 | | | Pittsburgh Water & Sewer Authority, Series B-2, Rev., VRDO, LOC: Royal Bank of Canada, 0.600%, 09/07/16 | | | 20,000 | |
| | | | | | | | |
| | | | | | | 380,810 | |
| | | | | | | | |
| | | | Rhode Island — 1.1% | | | | |
| | 1,640 | | | Rhode Island Health & Educational Building Corp., Educational Institution, International Institute of Rhode Island, Rev., VRDO, LOC: Bank of America N.A., 0.780%, 09/07/16 | | | 1,640 | |
SEE NOTES TO FINANCIAL STATEMENTS.
| | | | | | |
| | | |
| 42 | | | | J.P. MORGAN MONEY MARKET FUNDS | | AUGUST 31, 2016 |
| | | | | | | | |
PRINCIPAL
AMOUNT($) | | | SECURITY DESCRIPTION | | VALUE($) | |
| | | | | | | | |
| Municipal Bonds — continued | |
| | | | Rhode Island — continued | | | | |
| | 31,650 | | | Rhode Island Health & Educational Building Corp., Higher Education Facilities, Brown University Issue, Series A, Rev., VRDO, 0.570%, 09/07/16 | | | 31,650 | |
| | 34,030 | | | Rhode Island Health & Educational Building Corp., Higher Education Facilities, Roger Williams University Issue, Series 2008 B, Rev., VRDO, LOC: U.S. Bank N.A., 0.570%, 09/07/16 | | | 34,030 | |
| | | | Rhode Island Health & Educational Building Corp., Higher Education Facility, Rhode Island School of Design Issue, | | | | |
| | 47,110 | | | Series 2008A, Rev., VRDO, LOC: U.S. Bank N.A., 0.600%, 09/07/16 | | | 47,110 | |
| | 7,045 | | | Series B, Rev., VRDO, LOC: TD Bank N.A., 0.590%, 09/07/16 | | | 7,045 | |
| | 7,000 | | | Rhode Island Housing & Mortgage Finance Corp., Multi-Family Housing, Sutterfield Project, Rev., VRDO, AMT, FHLMC, LIQ: FHLMC, 0.630%, 09/07/16 | | | 7,000 | |
| | 24,600 | | | Rhode Island Housing & Mortgage Finance Corp., Multi-Family Housing, University Heights Project, Rev., VRDO, AMT, FHLMC, LIQ: FHLMC, 0.630%, 09/07/16 | | | 24,600 | |
| | 750 | | | Rhode Island Industrial Facilities Corp., Marine Terminal, ExxonMobil Project, Rev., VRDO, 0.580%, 09/01/16 | | | 750 | |
| | | | | | | | |
| | | | | | | 153,825 | |
| | | | | | | | |
| | | | South Carolina — 0.5% | | | | |
| | 10,000 | | | City of Columbia, Waterworks & Sewer System, Rev., VRDO, LOC: Sumitomo Mitsui Banking Corp., 0.590%, 09/01/16 | | | 10,000 | |
| | 5,325 | | | City of North Charleston, Public Facilities Convention, COP, VRDO, LOC: Bank of America N.A., 0.570%, 09/07/16 | | | 5,325 | |
| | 50,000 | | | County of Richland, Series 2015, GO, 2.000%, 10/28/16 | | | 50,118 | |
| | 200 | | | South Carolina Educational Facilities Authority, Morris College Project, Rev., VRDO, LOC: Bank of America N.A., 0.790%, 09/01/16 | | | 200 | |
| | | | | | | | |
| | | | | | | 65,643 | |
| | | | | | | | |
| | | | Tennessee — 0.4% | | | | |
| | 8,075 | | | City of Johnson, Health and Educational Facilities Board, Series 2013, Rev., VRDO, LOC: U.S. Bank N.A., 0.620%, 09/07/16 | | | 8,075 | |
| | 14,675 | | | Memphis City Health, Educational & Housing Facility Board, Multi-Family Housing, Watergrove Apartments Project, Rev., VRDO, FHLMC, LIQ: FHLMC, 0.600%, 09/07/16 | | | 14,675 | |
| | | | | | | | |
PRINCIPAL
AMOUNT($) | | | SECURITY DESCRIPTION | | VALUE($) | |
| | | | | | | | |
| | | | | | | | |
| | | | Tennessee — continued | | | | |
| | 30,935 | | | Montgomery County Public Building Authority, Tennessee County Loan Pool, Rev., VRDO, LOC: Bank of America N.A., 0.630%, 09/01/16 | | | 30,935 | |
| | | | | | | | |
| | | | | | | 53,685 | |
| | | | | | | | |
| | | | Texas — 3.3% | | | | |
| | 9,100 | | | Bexar County Housing Finance Authority, Multi-Family Housing, Altamonte Apartment Projects, Rev., VRDO, FNMA, LIQ: FNMA, 0.610%, 09/07/16 | | | 9,100 | |
| | 45,475 | | | City of Austin, Airport System, Subseries 2005-4, Rev., VRDO, AMT, AGM, LOC: Sumitomo Mitsui Banking Corp., 0.590%, 09/07/16 | | | 45,475 | |
| | | | City of Houston, Combined Utility System, First Lien, | | | | |
| | 21,000 | | | Series 2004B-2, Rev., VRDO, LOC: Citibank N.A., 0.580%, 09/07/16 | | | 21,000 | |
| | 10,600 | | | Series 2004B-3, Rev., VRDO, LOC: Sumitomo Mitsui Banking Corp., 0.580%, 09/07/16 | | | 10,600 | |
| | 41,700 | | | Series 2004B-4, Rev., VRDO, LOC: Bank of Tokyo-Mitsubishi UFJ Ltd., 0.580%, 09/07/16 | | | 41,700 | |
| | 24,225 | | | County of Harris, Series SGC-31, Class A, Rev., VRDO, LIQ: Societe Generale, 0.580%, 09/07/16 | | | 24,225 | |
| | 600 | | | County of Jefferson, Port of Port Arthur Navigation District, Fina Oil & Chemical Co. Project, Rev., VRDO, 0.700%, 09/01/16 | | | 600 | |
| | 45,755 | | | Crawford Education Facilities Corp., Education, Houston Baptist University Project, Rev., VRDO, LOC: Bank of America N.A., 0.660%, 09/07/16 | | | 45,755 | |
| | 15,000 | | | Gulf Coast Waste Disposal Authority, Environmental Facilities, American Acryl L.P. Project, Series 2003, Rev., VRDO, AMT, LOC: Bank of Tokyo-Mitsubishi UFJ Ltd., 0.590%, 09/07/16 | | | 15,000 | |
| | | | Lower Neches Valley Authority Industrial Development Corp., ExxonMobil Project, | | | | |
| | 34,795 | | | Series 2010, Rev., VRDO, 0.580%, 09/01/16 | | | 34,795 | |
| | 25,450 | | | Series 2011, Rev., VRDO, 0.580%, 09/01/16 | | | 25,450 | |
| | 1,250 | | | Series A, Rev., VRDO, 0.580%, 09/01/16 | | | 1,250 | |
| | 2,865 | | | Subseries A-3, Rev., VRDO, 0.580%, 09/01/16 | | | 2,865 | |
SEE NOTES TO FINANCIAL STATEMENTS.
| | | | | | | | |
| | | |
| AUGUST 31, 2016 | | J.P. MORGAN MONEY MARKET FUNDS | | | | | 43 | |
JPMorgan Tax Free Money Market Fund
SCHEDULE OF PORTFOLIO INVESTMENTS
AS OF AUGUST 31, 2016 (Unaudited) (continued)
(Amounts in thousands)
| | | | | | | | |
PRINCIPAL
AMOUNT($) | | | SECURITY DESCRIPTION | | VALUE($) | |
| | | | | | | | |
| Municipal Bonds — continued | |
| | | | Texas — continued | | | | |
| | 25,900 | | | Midlothian Industrial Development Corp., Environmental Facilities, Holcim Project, Rev., VRDO, LOC: UBS AG, 0.650%, 09/07/16 | | | 25,900 | |
| | 6,750 | | | North Texas Tollway Authority, Rev., VRDO, LIQ: Citibank N.A., 0.590%, 09/07/16 (e) | | | 6,750 | |
| | 8,300 | | | Southeast Texas Housing Finance Corp., Wyndham Park Apartments, Rev., VRDO, FNMA, LIQ: FNMA, 0.610%, 09/07/16 | | | 8,300 | |
| | 5,385 | | | SunAmerica Taxable Trust, Series 2002-1, Class A, Rev., VRDO, FHLMC, LOC: FHLMC, 0.620%, 09/07/16 | | | 5,385 | |
| | | | Tarrant County Cultural Education Facilities Finance Corp., Texas Health Resources System, | | | | |
| | 18,500 | | | Series 2012-B, Rev., VRDO, 0.630%, 09/07/16 | | | 18,500 | |
| | 55,250 | | | Series A, Rev., VRDO, 0.630%, 09/07/16 | | | 55,250 | |
| | | | Tender Option Bond Trust Receipts/CTFS Various State, | | | | |
| | 9,335 | | | Series 2015-XM0071, Rev., VRDO, LIQ: Bank of America N.A., 0.610%, 09/07/16 (e) | | | 9,335 | |
| | 9,495 | | | Series 2016-XF2321, Rev., VRDO, LIQ: Wells Fargo Bank N.A., 0.590%, 09/07/16 (e) | | | 9,495 | |
| | 740 | | | Texas Department of Housing & Community Affairs, Multi-Family Housing, Timber Point Apartments Project, Series A-1, Rev., VRDO, FHLMC, LIQ: FHLMC, 0.680%, 09/07/16 | | | 740 | |
| | 34,345 | | | University of Texas System, Board of Regents, Financing System, Series B, Rev., VRDO, 0.560%, 09/07/16 | | | 34,345 | |
| | 11,765 | | | University of Texas System, Board of Regents, Permanent University Fund, Series A, Rev., VRDO, LIQ: University of Texas Permanent University Fund, 0.560%, 09/07/16 | | | 11,765 | |
| | | | | | | | |
| | | | | | | 463,580 | |
| | | | | | | | |
| | | | Utah — 0.9% | | | | |
| | 23,700 | | | Central Utah Water Conservancy District, Series A, Rev., VRDO, 0.630%, 09/07/16 | | | 23,700 | |
| | | | County of Utah Hospital, IHC Health Services, | | | | |
| | 22,150 | | | Series 2014B, Rev., VRDO, 0.600%, 09/07/16 | | | 22,150 | |
| | 40,000 | | | Series 2014C, Rev., VRDO, 0.600%, 09/07/16 | | | 40,000 | |
| | 7,925 | | | Series B, Rev., VRDO, 0.560%, 09/07/16 | | | 7,925 | |
| | 8,200 | | | Series C, Rev., VRDO, 0.560%, 09/07/16 | | | 8,200 | |
| | | | | | | | |
PRINCIPAL
AMOUNT($) | | | SECURITY DESCRIPTION | | VALUE($) | |
| | | | | | | | |
| | | | | | | | |
| | | | Utah — continued | | | | |
| | 20,095 | | | Murray City, Utah, IHC Health Services, Inc., Series D, Rev., VRDO, 0.580%, 09/01/16 | | | 20,095 | |
| | | | Utah Housing Finance Agency, Single Family Mortgage, | | | | |
| | 4,365 | | | Series D-1, Rev., VRDO, AMT, LOC: Bayerische Landesbank, 0.700%, 09/07/16 | | | 4,365 | |
| | 4,460 | | | Series E-1, Rev., VRDO, AMT, LIQ: Bayerische Landesbank, 0.700%, 09/07/16 | | | 4,460 | |
| | 3,970 | | | Series F-2, Rev., VRDO, 0.600%, 09/07/16 | | | 3,970 | |
| | | | | | | | |
| | | | | | | 134,865 | |
| | | | | | | | |
| | | | Vermont — 0.3% | | | | |
| | 36,300 | | | Vermont Educational & Health Buildings Financing Agency, Norwich University Project, Rev., VRDO, LOC: TD Bank N.A., 0.590%, 09/07/16 | | | 36,300 | |
| | | | | | | | |
| | | | Virginia — 1.9% | | | | |
| | 20,300 | | | County of Loudon, IDA, Multi-Modal, Howard Huges Medical Institute, Series B, Rev., VRDO, 0.620%, 09/07/16 | | | 20,300 | |
| | 22,930 | | | Fairfax County EDA, Smithsonian Institution Issue, Series A, Rev., VRDO, 0.570%, 09/07/16 | | | 22,930 | |
| | | | Federal Home Loan Mortgage Corp., Multi-Family Housing, | | | | |
| | 14,847 | | | Series M019, Rev., VRDO, FHLMC, LIQ: FHLMC, 0.630%, 09/07/16 | | | 14,847 | |
| | 18,835 | | | Series M020, Rev., VRDO, FHLMC, LIQ: FHLMC, 0.630%, 09/07/16 | | | 18,835 | |
| | 12,205 | | | Series M024, Rev., VRDO, FHLMC, LIQ: FHLMC, 1.130%, 09/07/16 | | | 12,205 | |
| | 21,230 | | | Series M025, Class A, Rev., VRDO, FHLMC, LIQ: FHLMC, 0.650%, 09/07/16 | | | 21,230 | |
| | 11,565 | | | Series M026, Class A, Rev., VRDO, FHLMC, LIQ: FHLMC, 0.650%, 09/07/16 | | | 11,565 | |
| | | | Loudoun County IDA, Howard Hughes Medical, | | | | |
| | 37,600 | | | Series C, Rev., VRDO, 0.620%, 09/07/16 | | | 37,600 | |
| | 15,000 | | | Series D, Rev., VRDO, 0.620%, 09/07/16 | | | 15,000 | |
| | 27,850 | | | Series E, Rev., VRDO, 0.600%, 09/07/16 | | | 27,850 | |
| | 25,655 | | | Series F, Rev., VRDO, 0.600%, 09/07/16 | | | 25,655 | |
| | 7,170 | | | Loudoun County Sanitation Authority, Water & Sewer System, Rev., VRDO, 0.570%, 09/07/16 | | | 7,170 | |
| | 17,675 | | | Montgomery County IDA, Virginia Tech Foundation, Series A, Rev., VRDO, 0.610%, 09/07/16 | | | 17,675 | |
SEE NOTES TO FINANCIAL STATEMENTS.
| | | | | | |
| | | |
| 44 | | | | J.P. MORGAN MONEY MARKET FUNDS | | AUGUST 31, 2016 |
| | | | | | | | |
PRINCIPAL
AMOUNT($) | | | SECURITY DESCRIPTION | | VALUE($) | |
| | | | | | | | |
| Municipal Bonds — continued | |
| | | | Virginia — continued | | | | |
| | 2,435 | | | Virginia College Building Authority, Educatioal Facilities, 21st Century College & Equipment Programs, Series C, Rev., VRDO, 0.600%, 09/01/16 | | | 2,435 | |
| | 9,400 | | | Virginia College Building Authority, Educatioal Facilities, Washington and Lee University, Series B, Rev., VRDO, 0.570%, 09/07/16 | | | 9,400 | |
| | | | | | | | |
| | | | | | | 264,697 | |
| | | | | | | | |
| | | | Washington — 0.9% | | | | |
| | 17,000 | | | Chelan County Public Utility District No.1, Series B, Rev., VRDO, 0.650%, 09/07/16 | | | 17,000 | |
| | 22,000 | | | County of King, Sewer, Series B, Rev., VRDO, LOC: Landesbank Hessen-Thuringen, 0.650%, 09/07/16 | | | 22,000 | |
| | 31,050 | | | King County Housing Authority, Series A, Rev., VRDO, FHLMC, LIQ: FHLMC, 0.630%, 09/07/16 | | | 31,050 | |
| | 9,750 | | | University of Washington, Series 2015-XF2183, Rev., VRDO, LIQ: Morgan Stanley Bank, 0.590%, 09/01/16 (e) | | | 9,750 | |
| | 2,935 | | | Washington State Housing Finance Commission, Franke Tobey Jones Project, Rev., VRDO, LOC: Wells Fargo Bank N.A., 0.620%, 09/07/16 | | | 2,935 | |
| | 1,945 | | | Washington State Housing Finance Commission, Local 82 - JATC Educational Development Trust Project, Rev., VRDO, LOC: U.S. Bank N.A., 0.640%, 09/01/16 | | | 1,945 | |
| | 14,660 | | | Washington State Housing Finance Commission, Multi-Family Housing, Rev., VRDO, AMT, FNMA, LIQ: FNMA, 0.650%, 09/07/16 | | | 14,660 | |
| | 25,015 | | | Washington State Housing Finance Commission, Urban Center Apartments Project, Series 2012, Rev., VRDO, FHLMC, LIQ: FHLMC, 0.620%, 09/07/16 | | | 25,015 | |
| | | | | | | | |
| | | | | | | 124,355 | |
| | | | | | | | |
| | | | West Virginia — 0.3% | |
| | 44,000 | | | West Virginia EDA, Solid Waste Disposal Facilities, Kentucky Power Co., Mitchell Project, Series A, Rev., VRDO, LOC: Sumitomo Mitsui Banking, 0.580%, 09/07/16 | | | 44,000 | |
| | | | | | | | |
| | | | Wisconsin — 0.2% | |
| | 21,200 | | | Wisconsin Health & Educational Facilities Authority, Aurora Health Care, Inc., Series 09-A, Rev., VRDO, LOC: Bank of Montreal, 0.580%, 09/01/16 | | | 21,200 | |
| | | | | | | | |
PRINCIPAL
AMOUNT($) | | | SECURITY DESCRIPTION | | VALUE($) | |
| | | | | | | | |
| | | | | | | | |
| | | | Wisconsin — continued | |
| | 11,205 | | | Wisconsin Housing & EDA, Home Ownership, Series C, Rev., VRDO, AMT, 0.600%, 09/07/16 | | | 11,205 | |
| | | | | | | | |
| | | | | | | 32,405 | |
| | | | | | | | |
| | | | Wyoming — 0.2% | | | | |
| | | | Uinta County, Pollution Control, Chevron USA, Inc. Project | | | | |
| | 23,850 | | | Rev., VRDO, 0.560%, 09/01/16 | | | 23,850 | |
| | 400 | | | Rev., VRDO, 0.580%, 09/01/16 | | | 400 | |
| | | | | | | | |
| | | | | | | 24,250 | |
| | | | | | | | |
| | | | Total Municipal Bonds
(Cost $9,889,192) | | | 9,889,192 | |
| | | | | | | | |
|
| SHARES | |
| Variable Rate Demand Preferred Shares — 5.6% | |
| | | | Nuveen AMT-Free Municipal Income Fund | | | | |
| | 27,500 | | | Series 2, LIQ: Citibank N.A., 0.640%, 09/07/16 # (e) | | | 27,500 | |
| | 11,000 | | | Series 4, LIQ: Royal Bank of Canada, 0.670%, 09/07/16 # (e) | | | 11,000 | |
| | | | Nuveen California AMT-Free Municipal Income Fund | | | | |
| | 40,000 | | | 0.640%, 09/07/16 # (e) | | | 40,000 | |
| | 14,100 | | | Series 5, LIQ: TD Bank N.A., 0.640%, 09/07/16 # (e) | | | 14,100 | |
| | | | Nuveen California Dividend Advantage Municipal Fund | | | | |
| | 59,200 | | | Series 1, LIQ: Societe Generale, 0.700%, 09/07/16 # (e) | | | 59,200 | |
| | 8,500 | | | Series 2, LIQ: Citibank N.A., 0.670%, 09/07/16 # (e) | | | 8,500 | |
| | 21,000 | | | Series 5, LIQ: Citibank N.A., 0.670%, 09/07/16 # (e) | | | 21,000 | |
| | 20,000 | | | Series 6, LIQ: Citibank N.A., 0.670%, 09/07/16 # (e) | | | 20,000 | |
| | 30,000 | | | Nuveen Enhanced AMT- Free Municipal Credit, 0.650%, 09/07/16 # (e) | | | 30,000 | |
| | 249,300 | | | Nuveen Enhanced AMT-Free Municipal Credit Opportunities Fund, Series 4, LIQ: Citibank N.A., 0.640%, 09/07/16 # (e) | | | 249,300 | |
| | 153,500 | | | Nuveen Municipal Market Opportunity Fund, Inc., LIQ: TD Bank N.A., 0.680%, 09/07/16 # (e) | | | 153,500 | |
| | 25,000 | | | Nuveen New Jersey Dividend Advantage Municipal Fund, Series 2, LIQ: Royal Bank of Canada, 0.670%, 09/07/16 # (e) | | | 25,000 | |
SEE NOTES TO FINANCIAL STATEMENTS.
| | | | | | | | |
| | | |
| AUGUST 31, 2016 | | J.P. MORGAN MONEY MARKET FUNDS | | | | | 45 | |
JPMorgan Tax Free Money Market Fund
SCHEDULE OF PORTFOLIO INVESTMENTS
AS OF AUGUST 31, 2016 (Unaudited) (continued)
(Amounts in thousands)
| | | | | | | | |
| SHARES | | | SECURITY DESCRIPTION | | VALUE($) | |
| | | | | | | | |
| Variable Rate Demand Preferred Shares — continued | |
| | | | Nuveen New York AMT-Free Municipal Income Fund, Inc. | | | | |
| | 47,400 | | | Series 2, LIQ: Citibank N.A., 0.620%,
09/07/16 # (e) | | | 47,400 | |
| | 8,500 | | | Series 3, LIQ: Citibank N.A., 0.620%,
09/07/16 # (e) | | | 8,500 | |
| | 16,000 | | | Nuveen Ohio Quality Income Municipal Fund, LIQ: Royal Bank of Canada, 0.680%, 09/07/16 # (e) | | | 16,000 | |
| | 17,500 | | | Nuveen Pennsylvania Investment Quality Municipal Fund, Series 2, LIQ: Royal Bank of Canada, 0.680%, 09/07/16 # (e) | | | 17,500 | |
| | 38,000 | | | Nuveen Virginia Premium Income Municipal Fund, LIQ: TD Bank N.A., 0.680%, 09/07/16 # (e) | | | 38,000 | |
| | | | | | | | |
| | | | Total Variable Rate Demand Preferred Shares
(Cost $786,500) | | | 786,500 | |
| | | | | | | | |
| | | | Total Investments — 99.1%
(Cost $13,980,822)* | | | 13,980,822 | |
| | | | Other Assets in Excess
of Liabilities — 0.9% | | | 119,935 | |
| | | | | | | | |
| | | | NET ASSETS — 100.0% | | $ | 14,100,757 | |
| | | | | | | | |
Percentages indicated are based on net assets.
SEE NOTES TO FINANCIAL STATEMENTS.
| | | | | | |
| | | |
| 46 | | | | J.P. MORGAN MONEY MARKET FUNDS | | AUGUST 31, 2016 |
JPMorgan Municipal Money Market Fund
SCHEDULE OF PORTFOLIO INVESTMENTS
AS OF AUGUST 31, 2016 (Unaudited)
(Amounts in thousands)
| | | | | | | | |
PRINCIPAL
AMOUNT($) | | | SECURITY DESCRIPTION (t) | | VALUE($) | |
| | | | | | | | |
| Commercial Paper — 4.4% (n) | |
| | | | Alabama — 1.6% | | | | |
| | | | Huntsville Health Care Authority, | | | | |
| | 30,000 | | | 0.510%, 09/02/16 | | | 30,000 | |
| | 29,000 | | | 0.550%, 09/06/16 | | | 29,000 | |
| | | | | | | | |
| | | | | | | 59,000 | |
| | | | | | | | |
| | | | California — 0.8% | | | | |
| | 28,000 | | | San Francisco City & County Airports Commission, International Airport, Series A-3, LOC: Royal Bank of Canada, 0.360%, 09/01/16 | | | 28,000 | |
| | | | | | | | |
| | | | Nebraska — 2.0% | | | | |
| | | | Lincoln Nebraska Electric System, | | | | |
| | 40,000 | | | 0.480%, 09/06/16 | | | 40,000 | |
| | 32,750 | | | 0.480%, 09/07/16 | | | 32,750 | |
| | | | | | | | |
| | | | | | | 72,750 | |
| | | | | | | | |
| | | | Total Commercial Paper
(Cost $159,750) | | | 159,750 | |
| | | | | | | | |
| Daily Demand Notes — 12.9% | |
| | | | Arizona — 0.3% | | | | |
| | 9,735 | | | The Industrial Development Authority of The City of Phoenix, Health Care Facilities, Mayo Clinic, Series 2014B, Rev., VRDO, 0.550%, 09/01/16 | | | 9,735 | |
| | | | | | | | |
| | | | California — 1.5% | | | | |
| | | | California Pollution Control Financing Authority, Pacific Gas & Electric Co., | | | | |
| | 40,500 | | | Rev., VRDO, LOC: Mizuho Bank Ltd., 0.620%, 09/01/16 | | | 40,500 | |
| | 15,000 | | | Series B, Rev., VRDO, LOC: Canadian Imperial Bank of Commerce, 0.610%, 09/01/16 | | | 15,000 | |
| | 123 | | | City of Irvine, Improvement Bond Act of 1915, Reassessment District No. 85-7A, Series A, VRDO, LOC: Bank of Tokyo-Mitsubishi UFJ Ltd., 0.580%, 09/01/16 | | | 123 | |
| | | | | | | | |
| | | | | | | 55,623 | |
| | | | | | | | |
| | | | Kentucky — 0.2% | | | | |
| | 8,000 | | | Louisville & Jefferson County, Regional Airport Authority, Special Facilities, UPS Worldwide Forwarding, Inc. Project, Series A, Rev., VRDO, 0.590%, 09/01/16 | | | 8,000 | |
| | | | | | | | |
| | | | Michigan — 1.5% | | | | |
| | 10,835 | | | Michigan State Housing Development Authority, Multi-Family Housing, Jackson Project, Rev., VRDO, FHLB, LOC: FHLB, 0.610%, 09/01/16 | | | 10,835 | |
| | 45,265 | | | Michigan State Housing Development Authority, Rental Housing, Series C, Rev., VRDO, AMT, LIQ: Bank of America N.A., 0.680%, 09/01/16 | | | 45,265 | |
| | | | | | | | |
| | | | | | | 56,100 | |
| | | | | | | | |
| | | | | | | | |
PRINCIPAL
AMOUNT($) | | | SECURITY DESCRIPTION | | VALUE($) | |
| | | | | | | | |
| | | | | | | | |
| | | | Nevada — 1.5% | | | | |
| | 53,200 | | | City of Reno, Sales Tax Revenue, Senior Lien, ReTrac-Reno Transportation Rail Access Corridor Project, Series 2008A, Rev., VRDO, LOC: Bank of New York Mellon, 0.640%, 09/01/16 | | | 53,200 | |
| | | | | | | | |
| | | | New York — 5.8% | | | | |
| | 10,000 | | | City of New York, Fiscal Year 2017, Series A, Subseries A-6, GO, VRDO, 0.590%, 09/01/16 | | | 10,000 | |
| | 15,610 | | | New York City Municipal Water Finance Authority, Water & Sewer System, Second General Resolution, Fiscal Year 2009, Series BB, Subseries BB-1, Rev., VRDO, 0.620%, 09/01/16 | | | 15,610 | |
| | 45,000 | | | New York City Transitional Finance Authority, Future Tax Secured, Series C, Rev., VRDO, LOC: Morgan Stanley Bank, 0.680%, 09/01/16 | | | 45,000 | |
| | 32,335 | | | New York State Housing Finance Agency, 350 West 43rd Street Housing, Series A, Rev., VRDO, LOC: Landesbank Hessen-Thuringen, 0.610%, 09/01/16 | | | 32,335 | |
| | 42,390 | | | New York State Housing Finance Agency, 455 West 37th Street Housing, Series A, Rev., VRDO, AMT, LOC: Landesbank Hessen-Thuringen, 0.610%, 09/01/16 | | | 42,390 | |
| | 9,000 | | | New York State Housing Finance Agency, Manhattan West Residential Housing, Series A, Rev., VRDO, LOC: Bank of China, 0.630%, 09/01/16 | | | 9,000 | |
| | | | New York State Mortgage Agency, Homeowner Mortgage, | | | | |
| | 27,105 | | | Series 135, Rev., VRDO, AMT, 0.590%, 09/01/16 | | | 27,105 | |
| | 27,635 | | | Series 142, Rev., VRDO, AMT, 0.620%, 09/01/16 | | | 27,635 | |
| | | | | | | | |
| | | | | | | 209,075 | |
| | | | | | | | |
| | | | Tennessee — 0.8% | | | | |
| | 10,000 | | | Clarksville Public Building Authority, Rev., VRDO, LOC: Bank of America N.A., 0.620%, 09/01/16 | | | 10,000 | |
| | 20,000 | | | Clarksville Public Building Authority, Pooled Financing, Series 2008, Rev., VRDO, LOC: Bank of America N.A., 0.620%, 09/01/16 | | | 20,000 | |
| | | | | | | | |
| | | | | | | 30,000 | |
| | | | | | | | |
| | | | Texas — 0.8% | | | | |
| | 18,700 | | | Lower Neches Valley Authority Industrial Development Corp., Subseries B-2, Rev., VRDO, 0.610%, 09/01/16 | | | 18,700 | |
SEE NOTES TO FINANCIAL STATEMENTS.
| | | | | | | | |
| | | |
| AUGUST 31, 2016 | | J.P. MORGAN MONEY MARKET FUNDS | | | | | 47 | |
JPMorgan Municipal Money Market Fund
SCHEDULE OF PORTFOLIO INVESTMENTS
AS OF AUGUST 31, 2016 (Unaudited) (continued)
(Amounts in thousands)
| | | | | | | | |
PRINCIPAL
AMOUNT($) | | | SECURITY DESCRIPTION | | VALUE($) | |
| | | | | | | | |
| Daily Demand Notes — continued | |
| | | | Texas — continued | | | | |
| | 10,330 | | | Lower Neches Valley Authority Industrial Development Corp., ExxonMobil Project, Subseries B-4, Rev., VRDO, 0.610%, 09/01/16 | | | 10,330 | |
| | | | | | | | |
| | | | | | | 29,030 | |
| | | | | | | | |
| | | | Virginia — 0.5% | |
| | 7,900 | | | County of King George, IDA, Birchwood Power Partners, Series A, Rev., VRDO, LOC: Mizuho Bank Ltd., 0.620%, 09/01/16 | | | 7,900 | |
| | | | County of King George, IDA, Birchwood Power Partners, L.P. Project, | | | | |
| | 2,700 | | | Series 1995, Rev., VRDO, LOC: Mizuho Bank Ltd., 0.610%, 09/01/16 | | | 2,700 | |
| | 9,300 | | | Series 1997, Rev., VRDO, LOC: Mizuho Bank Ltd., 0.610%, 09/01/16 | | | 9,300 | |
| | | | | | | | |
| | | | | | | 19,900 | |
| | | | | | | | |
| | | | Total Daily Demand Notes
(Cost $470,663) | | | 470,663 | |
| | | | | | | | |
| Weekly Demand Notes — 75.2% | |
| | | | Alabama — 1.1% | |
| | 40,000 | | | Board of Trustees of the University of Alabama at Birmingham, Series 2012-C, Rev., VRDO, LOC: PNC Bank N.A., 0.610%, 09/07/16 | | | 40,000 | |
| | | | | | | | |
| | | | Arkansas — 0.4% | |
| | 15,000 | | | Arkansas Development Finance Authority, Solid Waste Disposal, Waste Management of Arkansas, Inc. Project, Rev., VRDO, LOC: Bank of America N.A., 0.650%, 09/07/16 | | | 15,000 | |
| | | | | | | | |
| | | | California — 3.4% | |
| | 5,800 | | | California Health Facilities Financing Authority, Adventist Health System, Series B, Rev., VRDO, LOC: U.S. Bank N.A., 0.560%, 09/07/16 | | | 5,800 | |
| | 9,470 | | | California Housing Finance Agency, Series 2016-XF2308, Rev., VRDO, LIQ: Morgan Stanley Bank, 0.790%, 09/07/16 (e) | | | 9,470 | |
| | 5,775 | | | California Housing Finance Agency, Home Mortgage, Series K, Rev., VRDO, AMT, LOC: Bank of Tokyo-Mitsubishi UFJ Ltd., 0.630%, 09/07/16 | | | 5,775 | |
| | 29,320 | | | California Statewide Communities Development Authority, Multi-Family Housing, Bay Vista at Meadow Park Apartments, Series NN-1, Rev., VRDO, FNMA, LIQ: FNMA, 0.620%, 09/07/16 | | | 29,320 | |
| | 10,050 | | | City of Whittier, Health Facilities, Presbyterian Intercommunity, Series A, Rev., VRDO, LOC: U.S. Bank N.A., 0.600%, 09/07/16 | | | 10,050 | |
| | | | | | | | |
PRINCIPAL
AMOUNT($) | | | SECURITY DESCRIPTION | | VALUE($) | |
| | | | | | | | |
| | | | | | | | |
| | | | California — continued | |
| | 13,430 | | | Irvine Unified School District, Community Facilities District No. 09-1, Special Tax, Series 2014B, VRDO, LOC: Sumitomo Mitsui Banking, 0.610%, 09/07/16 | | | 13,430 | |
| | 35,550 | | | Los Angeles City Department of Water & Power, Power System, Series B, Subseries B-1, Rev., VRDO, 0.600%, 09/07/16 | | | 35,550 | |
| | 13,750 | | | Tender Option Bond Trust Receipts/CTFS Various State, Series 2016-XF0452, Rev., VRDO, LIQ: TD Bank N.A., 0.620%, 09/07/16 (e) | | | 13,750 | |
| | | | | | | | |
| | | | | | | 123,145 | |
| | | | | | | | |
| | | | Colorado — 2.5% | | | | |
| | 50,000 | | | City of Colorado Springs, Utilities System Improvement, Series 2007-B, Rev., VRDO, 0.600%, 09/07/16 | | | 50,000 | |
| | 20,000 | | | City of Colorado Springs, Utilities System, Sub Lien, Series A, Rev., VRDO, 0.610%, 09/07/16 | | | 20,000 | |
| | 390 | | | Colorado Educational & Cultural Facilities Authority, Nature Conservancy Project, Series 2012, Rev., VRDO, 0.620%, 09/07/16 | | | 390 | |
| | 20,000 | | | Tender Option Bond Trust Receipts/CTFS Various State, Series 2016-ZF0467, Rev., VRDO, LOC: Royal Bank of Canada, 0.630%, 09/07/16 (e) | | | 20,000 | |
| | | | | | | | |
| | | | | | | 90,390 | |
| | | | | | | | |
| | | | Connecticut — 0.8% | | | | |
| | 30,000 | | | Connecticut Housing Finance Authority, Housing Mortgage Finance Program, Series D, Subseries D-3, Rev., VRDO, AMT, 0.610%, 09/07/16 | | | 30,000 | |
| | | | | | | | |
| | | | Delaware — 0.9% | | | | |
| | 32,080 | | | County of New Castle, FlightSafety International, Inc. Project, Rev., VRDO, 0.600%, 09/07/16 | | | 32,080 | |
| | 1,255 | | | Delaware State Housing Authority, MERLOTS, Series C66, Rev., VRDO, LIQ: Wells Fargo Bank N.A., 0.890%, 09/07/16 (e) | | | 1,255 | |
| | | | | | | | |
| | | | | | | 33,335 | |
| | | | | | | | |
| | | | District of Columbia — 0.9% | | | | |
| | 32,460 | | | Metropolitan Washington Airports Authority, Subseries C-2, Rev., VRDO, LOC: Sumitomo Mitsui Banking, 0.550%, 09/07/16 | | | 32,460 | |
| | | | | | | | |
| | | | Florida — 4.7% | | | | |
| | 55,470 | | | Capital Trust Agency, Atlantic Housing Foundation, Series A, Rev., VRDO, FNMA, LIQ: FNMA, 0.600%, 09/07/16 | | | 55,470 | |
SEE NOTES TO FINANCIAL STATEMENTS.
| | | | | | |
| | | |
| 48 | | | | J.P. MORGAN MONEY MARKET FUNDS | | AUGUST 31, 2016 |
| | | | | | | | |
PRINCIPAL
AMOUNT($) | | | SECURITY DESCRIPTION | | VALUE($) | |
| | | | | | | | |
| Weekly Demand Notes — continued | |
| | | | Florida — continued | | | | |
| | 17,800 | | | Collier County IDA, Allete, Inc. Project, Series 2006, Rev., VRDO, LOC: Wells Fargo Bank N.A., 0.620%, 09/07/16 | | | 17,800 | |
| | 18,000 | | | County of Palm Beach, Special Purpose Facilities, FlightSafety Project, Rev., VRDO, 0.600%, 09/07/16 | | | 18,000 | |
| | 14,825 | | | Florida Housing Finance Corp., Multi-Family Mortgage, Boynton Bay Apartments, Series I, Rev., VRDO, LOC: Citibank N.A., 0.620%, 09/07/16 | | | 14,825 | |
| | 24,965 | | | Florida State Department of Environmental Protection, Everglades Restoration, Series A, Rev., VRDO, AGC, 0.620%, 09/07/16 | | | 24,965 | |
| | 10,785 | | | Highlands County Health Facilities Authority, Hospital, Adventist Health System/Sunbelt Obligated Group, Series 2012I, Rev., VRDO, 0.550%, 09/07/16 | | | 10,785 | |
| | 18,990 | | | Highlands County Health Facilities Authority, Hospital, Adventist Health Systems, Series A, Rev., VRDO, 0.560%, 09/07/16 | | | 18,990 | |
| | 11,270 | | | Sumter County IDA, Solid Waste Disposal, American Cement Co., LLC Project, Rev., VRDO, LOC: Bank of America N.A., 0.740%, 09/07/16 | | | 11,270 | |
| | | | | | | | |
| | | | | | | 172,105 | |
| | | | | | | | |
| | | | Georgia — 0.8% | |
| | 28,485 | | | Fulton County Development Authority, Airport Facility, FlightSafety International, Inc. Project, Series B, Rev., VRDO, 0.600%, 09/07/16 | | | 28,485 | |
| | | | | | | | |
| | | | Idaho — 0.8% | |
| | 30,355 | | | Idaho Housing & Finance Association, Single Family Mortgage, Series A-3, Class I, Rev., VRDO, AMT, LIQ: Barclays Bank plc, 0.700%, 09/07/16 | | | 30,355 | |
| | | | | | | | |
| | | | Illinois — 5.5% | |
| | 14,000 | | | Chicago Midway Airport, Second Lien, Series C-2, Rev., VRDO, AMT, LOC: Wells Fargo Bank N.A., 0.620%, 09/07/16 | | | 14,000 | |
| | 15,280 | | | Illinois Finance Authority, Museum of Science & Industry, Series 2009-D, Rev., VRDO, LOC: Northern Trust Co., 0.590%, 09/07/16 | | | 15,280 | |
| | 6,300 | | | Illinois Finance Authority, OSF Healthcare System, Series B, Rev., VRDO, LOC: PNC Bank N.A., 0.640%, 09/07/16 | | | 6,300 | |
| | | | Illinois Finance Authority, University of Chicago, | | | | |
| | 4,889 | | | Series 2008, Rev., VRDO, 0.590%, 09/07/16 | | | 4,889 | |
| | 20,935 | | | Series C, Rev., VRDO, 0.580%, 09/07/16 | | | 20,935 | |
| | | | | | | | |
PRINCIPAL
AMOUNT($) | | | SECURITY DESCRIPTION | | VALUE($) | |
| | | | | | | | |
| | | | | | | | |
| | | | Illinois — continued | |
| | 11,420 | | | Illinois Finance Authority, University of Chicago Medical Center, Series 2011B, Rev., VRDO, LOC: Wells Fargo Bank N.A., 0.620%, 09/07/16 | | | 11,420 | |
| | 105,350 | | | Illinois State Toll Highway Authority, Toll Highway, Series A-1B, Rev., VRDO, AGM, 0.630%, 09/07/16 | | | 105,350 | |
| | 4,100 | | | Indiana Finance Authority, Solid Waste Disposal, Four-Leaf Clover Dairy LLC Project, Rev., VRDO, LOC: Bank of America N.A., 0.770%, 09/07/16 | | | 4,100 | |
| | 17,995 | | | Puttable Floating Option Tax-Exempt Receipts, Series PT-4702, Rev., VRDO, LIQ: Bank of America N.A., 0.730%, 09/07/16 (e) | | | 17,995 | |
| | | | | | | | |
| | | | | | | 200,269 | |
| | | | | | | | |
| | | | Indiana — 0.1% | |
| | 2,500 | | | Tender Option Bond Trust Receipts/CTFS Various State, Series 2016-ZF0280, Rev., VRDO, LIQ: TD Bank N.A., 0.600%, 09/07/16 (e) | | | 2,500 | |
| | | | | | | | |
| | | | Iowa — 0.9% | |
| | | | Iowa Finance Authority, Multi-Family Housing, | | | | |
| | 10,730 | | | Series A, Rev., VRDO, AMT, 0.600%, 09/07/16 | | | 10,730 | |
| | 8,285 | | | Series B, Rev., VRDO, AMT, 0.600%, 09/07/16 | | | 8,285 | |
| | 15,000 | | | Iowa Finance Authority, UnityPoint Health Project, Series 2013B-2, Rev., VRDO, LOC: Union Bank N.A., 0.630%, 09/07/16 | | | 15,000 | |
| | | | | | | | |
| | | | | | | 34,015 | |
| | | | | | | | |
| | | | Kansas — 1.1% | |
| | 20,780 | | | City of Wichita, Airport Facility, FlightSafety International, Inc., Series VIII, Rev., VRDO, 0.600%, 09/07/16 | | | 20,780 | |
| | 19,900 | | | Kansas State, Department of Transportation, Highway, Series C-3, Rev., VRDO, 0.570%, 09/07/16 | | | 19,900 | |
| | | | | | | | |
| | | | | | | 40,680 | |
| | | | | | | | |
| | | | Kentucky — 1.1% | |
| | 16,800 | | | County of Carroll, Environmental Facilities, Kentucky Utilities Co. Project, Series A, Rev., VRDO, AMT, LOC: Bank of Tokyo-Mitsubishi UFJ Ltd., 0.650%, 09/07/16 | | | 16,800 | |
| | 17,900 | | | Kenton County Airport Board, Special Facilities, FlightSafety International, Inc. Project, Series A, Rev., VRDO, 0.600%, 09/07/16 | | | 17,900 | |
SEE NOTES TO FINANCIAL STATEMENTS.
| | | | | | | | |
| | | |
| AUGUST 31, 2016 | | J.P. MORGAN MONEY MARKET FUNDS | | | | | 49 | |
JPMorgan Municipal Money Market Fund
SCHEDULE OF PORTFOLIO INVESTMENTS
AS OF AUGUST 31, 2016 (Unaudited) (continued)
(Amounts in thousands)
| | | | | | | | |
PRINCIPAL
AMOUNT($) | | | SECURITY DESCRIPTION | | VALUE($) | |
| | | | | | | | |
| Weekly Demand Notes — continued | |
| | | | Kentucky — continued | |
| | 5,740 | | | Maysville Industrial Bldg., Green Tokai Co., Rev., VRDO, LOC: Bank of Tokyo-Mitsubishi UFJ Ltd., 0.590%, 09/07/16 | | | 5,740 | |
| | | | | | | | |
| | | | | | | 40,440 | |
| | | | | | | | |
| | | | Maine — 0.5% | | | | |
| | 17,360 | | | Maine State Housing Mortgage Authority, Series G, Rev., VRDO, AMT, 0.640%, 09/07/16 | | | 17,360 | |
| | | | | | | | |
| | | | Maryland — 2.8% | | | | |
| | | | Maryland Community Development Administration, Department of Housing & Community Development, Residential, | | | | |
| | 24,700 | | | Series G, Rev., VRDO, AMT, 0.640%, 09/07/16 | | | 24,700 | |
| | 53,800 | | | Series J, Rev., VRDO, AMT, 0.610%, 09/07/16 | | | 53,800 | |
| | 13,900 | | | Prince Georges County Housing Authority, Multi-Family, Allentowne Apartments Project, Rev., VRDO, FHLMC, LIQ: FHLMC, 0.610%, 09/07/16 | | | 13,900 | |
| | 7,925 | | | Tender Option Bond Trust Receipts, Series 2016-XG0006, Rev., VRDO, LIQ: Bank of America N.A., 0.660%, 09/07/16 (e) | | | 7,925 | |
| | | | | | | | |
| | | | | | | 100,325 | |
| | | | | | | | |
| | | | Massachusetts — 0.3% | | | | |
| | 12,450 | | | Massachusetts Bay Transportation Authority, General Transportation System, Series A-2, Rev., VRDO, 0.620%, 09/07/16 | | | 12,450 | |
| | | | | | | | |
| | | | Minnesota — 0.2% | | | | |
| | 7,000 | | | Oakdale Multifamily, Housing Cottage Homesteads, Rev., VRDO, FHLMC, LOC: FHLMC, 0.650%, 09/07/16 | | | 7,000 | |
| | | | | | | | |
| | | | Mississippi — 1.1% | | | | |
| | 40,000 | | | Mississippi Hospital Equipment & Facilities Authority, North Mississippi Health Services, Series 1, Rev., VRDO, 0.580%, 09/07/16 | | | 40,000 | |
| | | | | | | | |
| | | | Nevada — 4.6% | | | | |
| | | | Clark County, Airport System Subordinate Lien, | | | | |
| | 50,000 | | | Series 2008D-2A, Rev., VRDO, LOC: Wells Fargo Bank N.A., 0.600%, 09/07/16 | | | 50,000 | |
| | 50,000 | | | Series D-1, Rev., VRDO, LOC: Sumitomo Mitsui Banking, 0.600%, 09/07/16 | | | 50,000 | |
| | 50,000 | | | Clark County, Nevada Las Vegas-Mccarran International Airport, Passenger Facility Charge, Series F-2, Rev., VRDO, LOC: Union Bank N.A., 0.600%, 09/07/16 | | | 50,000 | |
| | | | | | | | |
PRINCIPAL
AMOUNT($) | | | SECURITY DESCRIPTION | | VALUE($) | |
| | | | | | | | |
| | | | | | | | |
| | | | Nevada — continued | | | | |
| | 17,850 | | | Nevada Housing Division, Multi-Unit Housing, Reno Apartments, Series A, Rev., VRDO, FNMA, LIQ: FNMA, 0.630%, 09/07/16 | | | 17,850 | |
| | | | | | | | |
| | | | | | | 167,850 | |
| | | | | | | | |
| | | | New Jersey — 1.6% | | | | |
| | | | New Jersey Housing & Mortgage Finance Agency, Single Family Housing, | | | | |
| | 17,200 | | | Series R, Rev., VRDO, 0.660%, 09/07/16 | | | 17,200 | |
| | 33,500 | | | Series V, Rev., VRDO, AMT, LOC: Bank of America N.A., 0.600%, 09/07/16 | | | 33,500 | |
| | 7,900 | | | Series Y, Rev., VRDO, AMT, 0.630%, 09/07/16 | | | 7,900 | |
| | | | | | | | |
| | | | | | | 58,600 | |
| | | | | | | | |
| | | | New Mexico — 0.5% | | | | |
| | 16,260 | | | University of New Mexico, Subordinate Lien System, Series 2002C, Rev., VRDO, 0.610%, 09/07/16 | | | 16,260 | |
| | | | | | | | |
| | | | New York — 10.3% | | | | |
| | 14,800 | | | City of New York, Fiscal Year 2008, Series J, Subseries J-8, GO, VRDO, LOC: Sumitomo Mitsui Banking, 0.650%, 09/07/16 | | | 14,800 | |
| | 47,035 | | | EAGLE Tax-Exempt Trust, Series 2008-0055F, Class A, Rev., VRDO, FHLMC COLL, LIQ: FHLB, 0.590%, 09/07/16 (e) | | | 47,035 | |
| | 20,000 | | | New York City Housing Development Corp., Multi-Family Mortgage, Related-Upper East, Series A, Rev., VRDO, AMT, LOC: Landesbank Baden-Wuerttemberg, 0.680%, 09/07/16 | | | 20,000 | |
| | 19,000 | | | New York City Industrial Development Agency, Special Facility, Air Express International Corp. Project, Rev., VRDO, LOC: Citibank N.A., 0.670%, 09/07/16 | | | 19,000 | |
| | 40,000 | | | New York Housing Development Corp., Multi-Family Rent Housing, Westport Development, Series A, Rev., VRDO, FNMA, LIQ: FNMA, 0.670%, 09/07/16 | | | 40,000 | |
| | 17,800 | | | New York State Energy Research & Development Authority, Consolidated Edison Co. of New York, Inc. Project, Series 2004C, Subseries C-1, Rev., VRDO, LOC: Mizuho Bank Ltd., 0.620%, 09/07/16 | | | 17,800 | |
| | 31,900 | | | New York State Housing Finance Agency, 188 Ludlow Street, Series A, Rev., VRDO, LOC: Landesbank Hessen-Thuringen, 0.650%, 09/07/16 | | | 31,900 | |
| | 11,650 | | | New York State Housing Finance Agency, 222 East 44th Street Housing, Series A, Rev., VRDO, LOC: Bank of China, 0.580%, 09/07/16 | | | 11,650 | |
SEE NOTES TO FINANCIAL STATEMENTS.
| | | | | | |
| | | |
| 50 | | | | J.P. MORGAN MONEY MARKET FUNDS | | AUGUST 31, 2016 |
| | | | | | | | |
PRINCIPAL
AMOUNT($) | | | SECURITY DESCRIPTION | | VALUE($) | |
| | | | | | | | |
| Weekly Demand Notes — continued | |
| | | | New York — continued | | | | |
| | 44,215 | | | New York State Housing Finance Agency, 29 Flatbush Avenue Housing, Series A, Rev., VRDO, LOC: Landesbank Hessen-Thuringen, 0.650%, 09/07/16 | | | 44,215 | |
| | 40,000 | | | New York State Housing Finance Agency, 55 West 25th Street Housing, Series A, Rev., VRDO, FNMA, LIQ: FNMA, 0.670%, 09/07/16 | | | 40,000 | |
| | 16,700 | | | New York State Housing Finance Agency, 80 Dekalb Avenue Housing, Series A, Rev., VRDO, LOC: Landesbank Hessen-Thuringen, 0.650%, 09/07/16 | | | 16,700 | |
| | 18,250 | | | New York State Housing Finance Agency, Helena Housing, Series A, Rev., VRDO, FNMA, LOC: FNMA, 0.650%, 09/07/16 | | | 18,250 | |
| | 18,075 | | | New York State Housing Finance Agency, Parkledge Apartments, Series A, Rev., VRDO, FHLMC, LOC: FHLMC, 0.640%, 09/07/16 | | | 18,075 | |
| | 11,815 | | | New York State Housing Finance Agency, Remeeder Houses Apartments, Series A, Rev., VRDO, LOC: Citibank N.A., 0.650%, 09/07/16 | | | 11,815 | |
| | 6,700 | | | New York State Housing Finance Agency, Warren Knolls Apartments, Series A, Rev., VRDO, FNMA, LIQ: FNMA, 0.630%, 09/07/16 | | | 6,700 | |
| | 6,700 | | | New York State Housing Finance Agency, West Haverstraw Senior Citizens Apartments, Series A, Rev., VRDO, FNMA, LIQ: FNMA, 0.630%, 09/07/16 | | | 6,700 | |
| | 9,505 | | | Port Authority of New York & New Jersey, Series ROCS-RR-II-R-11770, Rev., VRDO, LIQ: Citibank N.A., 0.600%, 09/07/16 (e) | | | 9,505 | |
| | | | | | | | |
| | | | | | | 374,145 | |
| | | | | | | | |
| | | | North Carolina — 2.3% | | | | |
| | 49,360 | | | City of Raleigh, Downtown Improvement Projects, Series B-1, COP, VRDO, 0.600%, 09/07/16 | | | 49,360 | |
| | 5,840 | | | Mecklenburg County Industrial Facilities & Pollution Control Financing Authority, Industrial Development, Ferguson Supply & Box Mfg. Co. & Fergie-Burgess, LLC Project, Rev., VRDO, LOC: Bank of America N.A., 0.780%, 09/07/16 | | | 5,840 | |
| | 5,000 | | | North Carolina Capital Facilities Finance Agency, Educational Facilities, Series 2016-ZM0153, Rev., VRDO, LIQ: Morgan Stanley Bank, 0.590%, 09/07/16 (e) | | | 5,000 | |
| | 6,890 | | | North Carolina Capital Facilities Finance Agency, Educational Facilities, Wake Forest University, Series B, Rev., VRDO, 0.670%, 09/07/16 | | | 6,890 | |
| | | | | | | | |
PRINCIPAL
AMOUNT($) | | | SECURITY DESCRIPTION | | VALUE($) | |
| | | | | | | | |
| | | | | | | | |
| | | | North Carolina — continued | | | | |
| | 5,800 | | | North Carolina Medical Care Commission, Moses Cone Health System, Series 2001-A, Rev., VRDO, 0.570%, 09/07/16 | | | 5,800 | |
| | 9,800 | | | Person County Industrial Facilities & Pollution Control Financing Authority, Recovery Zone Facility, CertainTeed Gypsum NC, Inc., Series 2010, Rev., VRDO, LOC: Credit Industrial E.T., 0.630%, 09/07/16 | | | 9,800 | |
| | | | | | | | |
| | | | | | | 82,690 | |
| | | | | | | | |
| | | | North Dakota — 1.1% | | | | |
| | | | North Dakota Housing Finance Agency, Housing Finance Program, Home Mortgage, | | | | |
| | 13,155 | | | Series A, Rev., VRDO, AMT, 0.630%, 09/07/16 | | | 13,155 | |
| | 27,055 | | | Series B, Rev., VRDO, AMT, 0.620%, 09/07/16 | | | 27,055 | |
| | | | | | | | |
| | | | | | | 40,210 | |
| | | | | | | | |
| | | | Ohio — 0.5% | | | | |
| | 5,350 | | | County of Franklin, Multi-Family Housing, Ashton Square Apartments Project, Rev., VRDO, FNMA, LIQ: FNMA, 0.640%, 09/07/16 | | | 5,350 | |
| | 11,455 | | | Ohio Housing Finance Agency, Residential Mortgage, Mortgage-Backed Securities Program, Series I, Rev., VRDO, AMT, GNMA/FNMA/FHLMC, LOC: FHLMC, 0.600%, 09/07/16 | | | 11,455 | |
| | | | | | | | |
| | | | | | | 16,805 | |
| | | | | | | | |
| | | | Oregon — 1.1% | | | | |
| | 41,265 | | | Port of Portland, Oregon Portland International Airport, Series 18B, Rev., VRDO, AMT, LOC: Industrial & Commercial Bank of China, 0.800%, 09/07/16 | | | 41,265 | |
| | | | | | | | |
| | | | Pennsylvania — 3.9% | | | | |
| | 11,465 | | | Adams County IDA, Gettysburg Foundation Facility, Series A, Rev., VRDO, LOC: Manufacturers & Traders Trust Co., 0.610%, 09/07/16 | | | 11,465 | |
| | 3,900 | | | County of Allegheny, Residential Finance Authority, Single Family Mortgage, Series PP, Rev., VRDO, AMT, GNMA COLL, 0.820%, 09/07/16 | | | 3,900 | |
| | 14,165 | | | Delaware Valley Regional Financial Authority, Series SGC-63, Class A, Rev., VRDO, LIQ: Societe Generale, 0.580%, 09/07/16 (e) | | | 14,165 | |
| | | | Pennsylvania Housing Finance Agency, Single Family Mortgage, | | | | |
| | 29,270 | | | Series 2003-79B, Rev., VRDO, AMT, 0.630%, 09/07/16 | | | 29,270 | |
SEE NOTES TO FINANCIAL STATEMENTS.
| | | | | | | | |
| | | |
| AUGUST 31, 2016 | | J.P. MORGAN MONEY MARKET FUNDS | | | | | 51 | |
JPMorgan Municipal Money Market Fund
SCHEDULE OF PORTFOLIO INVESTMENTS
AS OF AUGUST 31, 2016 (Unaudited) (continued)
(Amounts in thousands)
| | | | | | | | |
PRINCIPAL
AMOUNT($) | | | SECURITY DESCRIPTION | | VALUE($) | |
| | | | | | | | |
| Weekly Demand Notes — continued | |
| | | | Pennsylvania — continued | | | | |
| | 13,430 | | | Series 2004-82B, Rev., VRDO, AMT, 0.630%, 09/07/16 | | | 13,430 | |
| | 12,080 | | | Series 2004-83C, Rev., VRDO, AMT, 0.650%, 09/07/16 | | | 12,080 | |
| | 800 | | | Series 2005-88C, Rev., VRDO, AMT, 0.630%, 09/07/16 | | | 800 | |
| | 12,430 | | | Series 2005-91B, Rev., VRDO, AMT, LOC: Bank of Tokyo Ltd., 0.650%, 09/07/16 | | | 12,430 | |
| | 19,725 | | | Series 2006-93B, Rev., VRDO, AMT, 0.660%, 09/07/16 | | | 19,725 | |
| | 17,905 | | | Series 2007-98C, Rev., VRDO, AMT, 0.660%, 09/07/16 | | | 17,905 | |
| | 5,545 | | | Series 2007-99C, Rev., VRDO, AMT, 0.660%, 09/07/16 | | | 5,545 | |
| | | | | | | | |
| | | | | | | 140,715 | |
| | | | | | | | |
| | | | Rhode Island — 0.8% | | | | |
| | 25,750 | | | Rhode Island Housing & Mortgage Finance Corp., Multi-Family Housing, The Groves at Johanston Project, Series 2006, Rev., VRDO, FHLMC, LIQ: FHLMC, 0.590%, 09/07/16 | | | 25,750 | |
| | 2,100 | | | Rhode Island Housing & Mortgage Finance Corp., Multi-Family Housing, University Heights Project, Rev., VRDO, AMT, FHLMC, LIQ: FHLMC, 0.630%, 09/07/16 | | | 2,100 | |
| | | | | | | | |
| | | | | | | 27,850 | |
| | | | | | | | |
| | | | South Carolina — 0.1% | | | | |
| | 5,000 | | | Tender Option Bond Trust Receipts/CTFS Various State, Series 2015-XF2204, Rev., VRDO, LIQ: Citibank N.A., 0.580%, 09/07/16 (e) | | | 5,000 | |
| | | | | | | | |
| | | | South Dakota — 0.9% | | | | |
| | 34,000 | | | South Dakota Housing Development Authority, Home Ownership Mortgage, Series F, Rev., VRDO, AMT, 0.610%, 09/07/16 | | | 34,000 | |
| | | | | | | | |
| | | | Tennessee — 0.9% | | | | |
| | 9,000 | | | Jackson Industrial Development Board, Industrial Development, General Cable Corp. Project, Rev., VRDO, LOC: PNC Bank N.A., 0.640%, 09/07/16 | | | 9,000 | |
| | 10,970 | | | Metropolitan Government of Nashville & Davidson County, Health & Educational Facilities Board, Multi-Family Housing, The Retreat at Dry Creek Farms Apartments Project, Rev., VRDO, LOC: Citibank N.A., 0.630%, 09/07/16 | | | 10,970 | |
| | 14,000 | | | Wilson County, Tennessee Sports Authority, Rev., VRDO, LOC: PNC Bank N.A., 0.600%, 09/07/16 | | | 14,000 | |
| | | | | | | | |
| | | | | | | 33,970 | |
| | | | | | | | |
| | | | | | | | |
PRINCIPAL
AMOUNT($) | | | SECURITY DESCRIPTION | | VALUE($) | |
| | | | | | | | |
| | | | | | | | |
| | | | Texas — 5.5% | | | | |
| | 13,695 | | | County of Harris, Series SGC-31, Class A, Rev., VRDO, LIQ: Societe Generale, 0.580%, 09/07/16 | | | 13,695 | |
| | 22,300 | | | Dallas-Fort Worth International Airport Facilities Improvement Corp., Airport Facility, FlightSafety Texas, Inc. Project, Series 1999, Rev., VRDO, 0.600%, 09/07/16 | | | 22,300 | |
| | 12,945 | | | Montgomery Country Housing Finance Corp., Multi-Family Housing, Park at Woodline Townhomes, Rev., VRDO, LOC: Citibank N.A., 0.620%, 09/07/16 | | | 12,945 | |
| | 10,950 | | | North Texas Tollway Authority, Series 2016-XF2220, Rev., VRDO, LIQ: Citibank N.A., 0.590%, 09/07/16 (e) | | | 10,950 | |
| | 4,500 | | | San Jacinto Community College District, Series 2015-XF2010, GO, VRDO, LIQ: Morgan Stanley Bank, 0.590%, 09/07/16 (e) | | | 4,500 | |
| | | | State of Texas, | | | | |
| | 50,000 | | | Series 2016, GO, VRDO, 0.640%, 09/07/16 | | | 50,000 | |
| | 9,800 | | | Series C, GO, VRDO, 0.620%, 09/07/16 | | | 9,800 | |
| | 10,190 | | | SunAmerica Taxable Trust, Series 2002-1, Class A, Rev., VRDO, FHLMC, LOC: FHLMC, 0.620%, 09/07/16 | | | 10,190 | |
| | 15,000 | | | Tarrant County Cultural Education Facilities Finance Corp., Texas Health Resources System, Series 2012-B, Rev., VRDO, 0.630%, 09/07/16 | | | 15,000 | |
| | 36,455 | | | Tender Option Bond Trust Receipts/CTFS Various State, Series 2016-ZF0465, Rev., VRDO, LOC: Royal Bank of Canada, 0.630%, 09/07/16 (e) | | | 36,455 | |
| | 14,630 | | | Texas Department of Housing & Community Affairs, Single Family Mortgage, Series D, Rev., VRDO, AMT, GNMA/FNMA/FHLMC, LIQ: Texas Comptroller of Public Accounts, 0.630%, 09/07/16 | | | 14,630 | |
| | | | | | | | |
| | | | | | | 200,465 | |
| | | | | | | | |
| | | | Utah — 3.1% | | | | |
| | 6,375 | | | County of Utah Hospital, IHC Health Services, Series B, Rev., VRDO, 0.560%, 09/07/16 | | | 6,375 | |
| | 35,000 | | | Utah County, Health Services, Inc., Series 2016C, Rev., VRDO, 0.530%, 09/07/16 | | | 35,000 | |
| | | | Utah Housing Corp., Single Family Mortgage, | | | | |
| | 3,515 | | | Series A-1, Class I, Rev., VRDO, 0.700%, 09/07/16 | | | 3,515 | |
| | 2,915 | | | Series A-2, Rev., VRDO, LOC: FHLMC, 0.700%, 09/07/16 | | | 2,915 | |
| | 4,900 | | | Series B, Class I, Rev., VRDO, 0.700%, 09/07/16 | | | 4,900 | |
SEE NOTES TO FINANCIAL STATEMENTS.
| | | | | | |
| | | |
| 52 | | | | J.P. MORGAN MONEY MARKET FUNDS | | AUGUST 31, 2016 |
| | | | | | | | |
PRINCIPAL
AMOUNT($) | | | SECURITY DESCRIPTION | | VALUE($) | |
| | | | | | | | |
| Weekly Demand Notes — continued | |
| | | | Utah — continued | | | | |
| | 5,990 | | | Series C-2, Class I, Rev., VRDO, FHA, 0.700%, 09/07/16 | | | 5,990 | |
| | 5,330 | | | Series D-2, Class I, Rev., VRDO, 0.700%, 09/07/16 | | | 5,330 | |
| | 48,265 | | | Wells Fargo Stage Trust, Various States, Series 33C, Rev., VRDO, LIQ: Wells Fargo Bank N.A., 0.610%, 09/07/16 (e) | | | 48,265 | |
| | | | | | | | |
| | | | | | | 112,290 | |
| | | | | | | | |
| | | | Virginia — 4.3% | | | | |
| | 11,000 | | | City of Norfolk, Economic Development Authority, Hospital Facilities Revenue, Sentara Healthcare, Series A, Rev., VRDO, 0.590%, 09/07/16 | | | 11,000 | |
| | | | Federal Home Loan Mortgage Corp., Multi-Family Housing, | | | | |
| | 8,375 | | | Series M015, Class A, Rev., VRDO, FHLMC, LIQ: FHLMC, 0.630%, 09/07/16 | | | 8,375 | |
| | 94,507 | | | Series M017, Class A, Rev., VRDO, FHLMC, LIQ: FHLMC, 0.590%, 09/07/16 (e) | | | 94,507 | |
| | 21,250 | | | Series M025, Class A, Rev., VRDO, FHLMC, LIQ: FHLMC, 0.650%, 09/07/16 | | | 21,250 | |
| | 22,105 | | | Series M026, Class A, Rev., VRDO, FHLMC, LIQ: FHLMC, 0.650%, 09/07/16 | | | 22,105 | |
| | | | | | | | |
| | | | | | | 157,237 | |
| | | | | | | | |
| | | | Washington — 2.5% | | | | |
| | 10,000 | | | Port Grays Harbor Industrial Development Corp., Murphy Co. Project, Rev., VRDO, LOC: U.S. Bank N.A., 0.650%, 09/07/16 | | | 10,000 | |
| | 32,880 | | | Port of Seattle, Sub Lien, Series 2008, Rev., VRDO, AMT, LOC: Bank of Tokyo-Mitsubishi UFJ Ltd., 0.620%, 09/07/16 | | | 32,880 | |
| | 9,000 | | | Washington State Health Care Facilities Authority, Series 2016-XF2349, Rev., VRDO, NATL, LIQ: Credit Suisse, 0.590%, 09/07/16 (e) | | | 9,000 | |
| | 9,985 | | | Washington State Housing Finance Commission, Multi-Family Housing, Barkley Ridge Apartments Project, Series A, Rev., VRDO, FHLMC, LIQ: FHLMC, 0.620%, 09/07/16 | | | 9,985 | |
| | 27,180 | | | Washington State Housing Finance Commission, Multi-Family Housing, Queen Anne Project, Series A, Rev., VRDO, FNMA, LIQ: FNMA, 0.620%, 09/07/16 | | | 27,180 | |
| | | | | | | | |
| | | | | | | 89,045 | |
| | | | | | | | |
| | | | West Virginia — 0.6% | | | | |
| | 21,000 | | | West Virginia EDA, Solid Waste Disposal Facilities, Kentucky Power Co., Mitchell Project, Series 2014A, Rev., VRDO, LOC: Sumitomo Mitsui Banking, 0.580%, 09/07/16 | | | 21,000 | |
| | | | | | | | |
| | | | | | | | |
PRINCIPAL
AMOUNT($) | | | SECURITY DESCRIPTION | | VALUE($) | |
| | | | | | | | |
| | | | | | | | |
| | | | Wisconsin — 0.7% | | | | |
| | | | Wisconsin Housing & EDA, Home Ownership, | | | | |
| | 9,500 | | | Series C, Rev., VRDO, FNMA COLL, 0.600%, 09/07/16 | | | 9,500 | |
| | 13,100 | | | Series E, Rev., VRDO, AMT, 0.630%, 09/07/16 | | | 13,100 | |
| | 1,945 | | | Series ROCS-RR-II-R-11522, Rev., VRDO, LIQ: Citibank N.A., 0.600%, 09/07/16 (e) | | | 1,945 | |
| | | | | | | | |
| | | | | | | 24,545 | |
| | | | | | | | |
| | | | Total Weekly Demand Notes
(Cost $2,734,256) | | | 2,734,256 | |
| | | | | | | | |
|
| SHARES | |
| Variable Rate Demand Preferred Shares — 7.3% | |
| | 22,000 | | | Nuveen AMT-Free Municipal Income Fund, Series 2, LIQ: Citibank N.A., 0.640%, 09/07/16 # (e) | | | 22,000 | |
| | | | Nuveen California Dividend Advantage Municipal Fund | | | | |
| | 10,000 | | | Series 4, VRDO, LIQ: Royal Bank of Canada, 0.670%, 09/07/16 # (e) | | | 10,000 | |
| | 5,000 | | | Series 6, VRDO, LIQ: Citibank N.A., 0.670%, 09/07/16 # (e) | | | 5,000 | |
| | 15,500 | | | Nuveen Enhanced AMT-Free Municipal Credit Opportunities Fund, Series 4, LIQ: Citibank N.A., 0.640%, 09/07/16 # (e) | | | 15,500 | |
| | 40,000 | | | Nuveen Investment Quality Municipal Fund, Inc., VRDO, LIQ: Barclays Bank plc, 0.720%,
09/07/16 # (e) | | | 40,000 | |
| | 25,000 | | | Nuveen Municipal Market Opportunity Fund, Inc., LIQ: TD Bank N.A., 0.680%, 09/07/16 # (e) | | | 25,000 | |
| | 30,600 | | | Nuveen New Jersey Dividend Advantage Municipal Fund, Series 3, VRDO, LIQ: Royal Bank of Canada, 0.670%, 09/07/16 # (e) | | | 30,600 | |
| | 8,600 | | | Nuveen New York AMT-Free Municipal Income Fund, Series 1, VRDO, LIQ: Citibank N.A., 0.620%, 09/07/16 # (e) | | | 8,600 | |
| | 7,000 | | | Nuveen Ohio Quality Income Municipal Fund, LIQ: Royal Bank of Canada, 0.680%, 09/07/16 # (e) | | | 7,000 | |
| | 19,000 | | | Nuveen Pennsylvania Investment Quality Municipal Fund, Series 3, LIQ: Royal Bank of Canada, 0.680%, 09/07/16 # (e) | | | 19,000 | |
| | 9,700 | | | Nuveen Premier Municipal Income Fund, Inc., VRDO, LIQ: Barclays Bank plc, 0.720%, 09/07/16 # (e) | | | 9,700 | |
SEE NOTES TO FINANCIAL STATEMENTS.
| | | | | | | | |
| | | |
| AUGUST 31, 2016 | | J.P. MORGAN MONEY MARKET FUNDS | | | | | 53 | |
JPMorgan Municipal Money Market Fund
SCHEDULE OF PORTFOLIO INVESTMENTS
AS OF AUGUST 31, 2016 (Unaudited) (continued)
(Amounts in thousands)
| | | | | | | | |
| SHARES | | | SECURITY DESCRIPTION | | VALUE($) | |
| | | | | | | | |
| Variable Rate Demand Preferred Shares — continued | |
| | 73,200 | | | Nuveen Premium Income Municipal Fund 2, Inc., VRDO, LIQ: Barclays Bank plc, 0.720%,
09/07/16 # (e) | | | 73,200 | |
| | | | | | | | |
| | | | Total Variable Rate Demand Preferred Shares
(Cost $265,600) | | | 265,600 | |
| | | | | | | | |
| | | | Total Investments — 99.8%
(Cost $3,630,269)* | | | 3,630,269 | |
| | | | Other Assets in Excess of
Liabilities — 0.2% | | | 6,910 | |
| | | | | | | | |
| | | | NET ASSETS — 100.0% | | $ | 3,637,179 | |
| | | | | | | | |
Percentages indicated are based on net assets.
SEE NOTES TO FINANCIAL STATEMENTS.
| | | | | | |
| | | |
| 54 | | | | J.P. MORGAN MONEY MARKET FUNDS | | AUGUST 31, 2016 |
J.P. Morgan Money Market Funds
NOTES TO SCHEDULE OF PORTFOLIO INVESTMENTS
AS OF AUGUST 31, 2016 (Unaudited)
| | |
| AGC | | — Insured by Assured Guaranty Corp. |
| AGM | | — Insured by Assured Guaranty Municipal Corp. |
| AMT | | — Alternative Minimum Tax |
| BHAC | | — Insured by Berkshire Hathaway Assurance Corp. |
| COLL | | — Collateral |
| CONS | | — Consolidated Bonds |
| COP | | — Certificate of Participation |
| CR | | — Custodial Receipts |
| DN | | — Discount Notes |
| EAGLE | | — Earnings of accrual generated on local tax-exempt securities |
| EDA | | — Economic Development Authority |
| FGIC | | — Insured by Financial Guaranty Insurance Co. |
| FHA | | — Federal Housing Administration |
| FHLB | | — Federal Home Loan Bank |
| FHLMC | | — Federal Home Loan Mortgage Corp. |
| FNMA | | — Federal National Mortgage Association |
| GNMA | | — Government National Mortgage Association |
| GO | | — General Obligation |
| IDA | | — Industrial Development Authority |
| IDR | | — Industrial Development Revenue |
| LIQ | | — Liquidity Agreement |
| LOC | | — Letter of Credit |
| MERLOTS | | — Municipal Exempt Receipts Liquidity Optional Tender |
| MTA | | — Metropolitan Transportation Authority |
| NATL | | — Insured by National Public Finance Guarantee Corp. |
| PA | | — Port Authority |
| PCR | | — Pollution Control Revenue |
| RE | | — Reinsured |
| Rev. | | — Revenue |
| ROCS | | — Reset Option Certificates |
| VAR | | — Variable Rate Security. The interest rate shown is the rate in effect as of August 31, 2016. |
| VRDO | | — Variable Rate Demand Obligation. The interest rate shown is the rate in effect as of August 31, 2016. |
| |
| (e) | | — Security is exempt from registration under Rule 144A of the Securities Act of 1933, as amended. Unless otherwise indicated, this security has been determined to be liquid under procedures established by the Board of Trustees and may be resold in transactions exempt from registration, normally to qualified institutional buyers. |
| (g) | | — Amount rounds to less than 0.05% |
| (n) | | — The rate shown is the effective yield at the date of purchase. |
| (p) | | — Security is prerefunded or escrowed to maturity. |
| (t) | | — The date shown represents the earliest of the next put date, next demand date or final maturity date. |
| * | | — The cost of securities is substantially the same for federal income tax purposes. |
| # | | — Variable Rate Demand Preferred Shares of a closed-end investment company which have a weekly demand feature. The interest rate shown is the rate in effect as of August 31, 2016. |
Additional Investment Information:
1] Agency Joint Trading Account I — At August 31, 2016, certain Funds had undivided interests in the Agency Joint Trading Account I with a maturity value of September 01, 2016, as follows (amounts in thousands):
| | | | | | | | | | | | |
| Fund | | Principal Amount | | | Repurchase
Price | | | Collateral Value
Allocation | |
| U.S. Government Money Market Fund | | $ | 6,400,000 | | | $ | 6,400,060 | | | $ | 6,529,120 | |
Repurchase Agreements — At August 31, 2016, the Principal Amounts of certain Funds’ interests in the Agency Joint Trading Account I were as follows (amounts in thousands):
| | | | | | | | |
| Counterparty | | Interest Rate | | | U.S. Government
Money Market Fund | |
| BNP Paribas | | | 0.330 | % | | $ | 750,000 | |
| Credit Agricole Corporate and Investment Bank | | | 0.340 | % | | | 500,000 | |
| Mitsubishi UFJ Trust & Banking Corp. | | | 0.330 | % | | | 500,000 | |
| Societe Generale S.A. | | | 0.340 | % | | | 300,000 | |
| TD Securities USA LLC | | | 0.340 | % | | | 500,000 | |
| Wells Fargo Bank N.A. | | | 0.340 | % | | | 700,000 | |
| Wells Fargo Securities, LLC | | | 0.340 | % | | | 3,150,000 | |
| Total | | | | | | $ | 6,400,000 | |
At August 31, 2016, the Agency Joint Trading Account I was fully collateralized by:
| | | | | | |
| Issuer | | Interest Rates | | Maturity Dates | |
| Federal Home Loan Mortgage Corporation | | 0.625% to 7.500% | | | 07/28/17 to 09/01/46 | |
| Federal National Mortgage Association | | 0.875% to 7.250% | | | 10/26/17 to 07/25/54 | |
| Government National Mortgage Association | | 1.002% to 8.500% | | | 02/15/17 to 06/20/66 | |
| U.S. Treasury Securities | | 0.000% to 8.750% | | | 09/08/16 to 02/15/46 | |
[2] Agency Joint Trading Account II — At August 31, 2016, certain Funds had undivided interests in the Agency Joint Trading Account I with a maturity value of September 01, 2016, as follows (amounts in thousands):
| | | | | | | | | | | | |
| Fund | | Principal Amount | | | Repurchase Price | | | Collateral Value
Allocation | |
| U.S. Government Money Market Fund | | $ | 385,285 | | | $ | 385,289 | | | $ | 392,991 | |
Repurchase Agreements — At August 31, 2016, the Principal Amounts of certain Funds’ interests in the Agency Joint Trading Account II were as follows (amounts in thousands):
| | | | | | | | |
| Counterparty | | Interest Rate | | | U.S. Government
Money Market Fund | |
| Citibank N.A. | | | 0.340 | % | | $ | 91,735 | |
| Citigroup Global Markets, Inc. | | | 0.340 | % | | | 91,735 | |
| Merrill Lynch PFS, Inc. | | | 0.340 | % | | | 201,815 | |
| Total | | | | | | $ | 385,285 | |
SEE NOTES TO FINANCIAL STATEMENTS.
| | | | | | | | |
| | | |
| AUGUST 31, 2016 | | J.P. MORGAN MONEY MARKET FUNDS | | | | | 55 | |
J.P. Morgan Money Market Funds
NOTES TO SCHEDULE OF PORTFOLIO INVESTMENTS
AS OF AUGUST 31, 2016 (Unaudited) (continued)
At August 31, 2016, the Agency Joint Trading Account II was fully collateralized by:
| | | | | | |
| Issuer | | Interest Rates | | Maturity Dates | |
| Federal Home Loan Mortgage Corporation | | 2.154% to 7.000% | | | 01/01/19 to 12/01/47 | |
| Federal National Mortgage Association | | 0.987% to 7.962% | | | 07/01/18 to 09/01/46 | |
| Government National Mortgage Association | | 1.371% to 7.000% | | | 10/15/23 to 07/20/66 | |
| U.S. Treasury Securities | | 0.000% to 8.750% | | | 11/15/16 to 05/15/45 | |
[3] Treasury Joint Trading Account I — At August 31, 2016, certain Funds had undivided interests in the Treasury Joint Trading Account I with a maturity value of September 01, 2016, as follows (amounts in thousands):
| | | | | | | | | | | | |
| Fund | | Principal Amount | | | Repurchase
Price | | | Collateral Value
Allocation | |
| U.S. Treasury Plus Money Market Fund | | $ | 738,355 | | | $ | 738,362 | | | $ | 753,126 | |
Repurchase Agreements — At August 31, 2016, the Principal Amounts of certain Funds’ interests in the Treasury Joint Account I were as follows (amounts in thousands):
| | | | | | | | |
| Counterparty | | Interest Rate | | | U.S. Treasury Plus
Money Market Fund | |
| Bank of Nova Scotia | | | 0.320 | % | | $ | 99,108 | |
| Citibank N.A. | | | 0.320 | % | | | 99,108 | |
| Societe Generale S.A. | | | 0.320 | % | | | 99,108 | |
| Wells Fargo Bank N.A. | | | 0.320 | % | | | 242,815 | |
| Wells Fargo Securities, LLC | | | 0.320 | % | | | 198,216 | |
| Total | | | | | | $ | 738,355 | |
At August 31, 2016, the Treasury Joint Account I was fully collateralized by:
| | | | | | |
| Issuer | | Interest Rates | | Maturity Dates | |
| U.S. Treasury Securities | | 0.000% to 9.125% | | | 09/15/16 to 02/15/45 | |
SEE NOTES TO FINANCIAL STATEMENTS.
| | | | | | |
| | | |
| 56 | | | | J.P. MORGAN MONEY MARKET FUNDS | | AUGUST 31, 2016 |
THIS PAGE IS INTENTIONALLY LEFT BLANK
| | | | | | | | |
| | | |
| AUGUST 31, 2016 | | J.P. MORGAN MONEY MARKET FUNDS | | | | | 57 | |
STATEMENTS OF ASSETS AND LIABILITIES
AS OF AUGUST 31, 2016 (Unaudited)
(Amounts in thousands, except per share amounts)
| | | | | | | | | | | | | | | | |
| | | Prime Money
Market Fund | | | Liquid
Assets Money
Market Fund | | | U.S.
Government
Money
Market Fund | | | U.S.
Treasury
Plus Money
Market Fund | |
ASSETS: | |
Investments in non-affiliates, at value | | $ | 68,117,308 | | | $ | 4,017,440 | | | $ | 48,572,019 | | | $ | 9,482,526 | |
Repurchase agreements, at value | | | 5,700,000 | | | | 100,000 | | | | 61,335,285 | | | | 10,388,355 | |
| | | | | | | | | | | | | | | | |
Total investment securities, at value | | | 73,817,308 | | | | 4,117,440 | | | | 109,907,304 | | | | 19,870,881 | |
Cash | | | 807,948 | | | | — | | | | 185,667 | | | | — | |
Receivables: | | | | | | | | | | | | | | | | |
Investment securities sold | | | — | | | | — | | | | 498,882 | | | | — | |
Fund shares sold | | | — | (a) | | | — | | | | 6,132 | | | | — | (a) |
Interest from non-affiliates | | | 19,322 | | | | 315 | | | | 31,339 | | | | 12,501 | |
Prepaid expenses and other assets | | | 4 | | | | — | | | | 4 | | | | — | (a) |
| | | | | | | | | | | | | | | | |
Total Assets | | | 74,644,582 | | | | 4,117,755 | | | | 110,629,328 | | | | 19,883,382 | |
| | | | | | | | | | | | | | | | |
|
LIABILITIES: | |
Payables: | | | | | | | | | | | | | | | | |
Due to custodian | | | — | | | | — | (a) | | | — | | | | 11 | |
Distributions | | | 13,331 | | | | 586 | | | | 14,163 | | | | 1,543 | |
Investment securities purchased | | | — | | | | — | | | | 1,124,927 | | | | 172,313 | |
Fund shares redeemed | | | — | | | | — | | | | 2,867 | | | | — | |
Accrued liabilities: | | | | | | | | | | | | | | | | |
Investment advisory fees | | | 5,349 | | | | 397 | | | | 3,031 | | | | 1,278 | |
Administration fees | | | 4,634 | | | | 347 | | | | 3,298 | | | | 1,091 | |
Distribution fees | | | 193 | | | | 124 | | | | 35 | | | | 22 | |
Shareholder servicing fees | | | 2,309 | | | | 774 | | | | 4,681 | | | | 881 | |
Custodian and accounting fees | | | 576 | | | | 190 | | | | 270 | | | | 63 | |
Trustees’ and Chief Compliance Officer’s fees | | | 149 | | | | 12 | | | | 176 | | | | 28 | |
Printing and mailing cost | | | 802 | | | | 1,107 | | | | 486 | | | | 58 | |
Other | | | 1,154 | | | | 219 | | | | 359 | | | | 150 | |
| | | | | | | | | | | | | | | | |
Total Liabilities | | | 28,497 | | | | 3,756 | | | | 1,154,293 | | | | 177,438 | |
| | | | | | | | | | | | | | | | |
Net Assets | | $ | 74,616,085 | | | $ | 4,113,999 | | | $ | 109,475,035 | | | $ | 19,705,944 | |
| | | | | | | | | | | | | | | | |
| (a) | Amount rounds to less than 500. |
SEE NOTES TO FINANCIAL STATEMENTS.
| | | | | | |
| | | |
| 58 | | | | J.P. MORGAN MONEY MARKET FUNDS | | AUGUST 31, 2016 |
| | | | | | | | | | | | | | | | |
| | | Prime Money
Market Fund | | | Liquid
Assets Money
Market Fund | | | U.S.
Government
Money
Market Fund | | | U.S.
Treasury
Plus Money
Market Fund | |
NET ASSETS: | |
Paid-in-Capital | | $ | 74,616,734 | | | $ | 4,114,121 | | | $ | 109,476,054 | | | $ | 19,706,437 | |
Accumulated undistributed (distributions in excess of) net investment income | | | (800 | ) | | | (222 | ) | | | (1,365 | ) | | | (535 | ) |
Accumulated net realized gains (losses) | | | 151 | | | | 100 | | | | 346 | | | | 42 | |
| | | | | | | | | | | | | | | | |
Total Net Assets | | $ | 74,616,085 | | | $ | 4,113,999 | | | $ | 109,475,035 | | | $ | 19,705,944 | |
| | | | | | | | | | | | | | | | |
|
Net Assets: | |
Class C | | $ | 30,200 | | | $ | 420,505 | | | $ | — | | | $ | 144,145 | |
Agency | | | 5,202,903 | | | | 68,629 | | | | 11,801,713 | | | | 1,483,259 | |
Capital | | | 45,447,290 | | | | 251,375 | | | | 63,438,539 | | | | — | |
Cash Management | | | 43,772 | | | | — | | | | — | | | | — | |
Direct | | | — | | | | — | | | | 238,664 | | | | 59,080 | |
Eagle Class | | | 374,627 | | | | — | | | | 392,486 | | | | 20 | |
E*Trade | | | — | | | | 426,481 | | | | 20 | | | | — | |
IM | | | 2,244,380 | | | | — | | | | 269,471 | | | | 5,574,193 | |
Institutional Class | | | 16,215,266 | | | | 1,288,613 | | | | 21,423,039 | | | | 11,345,550 | |
Investor | | | 226,303 | | | | 25,920 | | | | 600,602 | | | | 77,854 | |
Morgan | | | 1,108,068 | | | | 1,582,173 | | | | 2,231,555 | | | | 637,889 | |
Premier | | | 1,616,316 | | | | 38,094 | | | | 8,228,594 | | | | 289,177 | |
Reserve | | | 685,741 | | | | 12,209 | | | | 80,255 | | | | 94,757 | |
Service | | | 1,421,219 | | | | — | (a) | | | 770,097 | | | | 20 | |
| | | | | | | | | | | | | | | | |
Total | | $ | 74,616,085 | | | $ | 4,113,999 | | | $ | 109,475,035 | | | $ | 19,705,944 | |
| | | | | | | | | | | | | | | | |
|
Outstanding units of beneficial interest (shares) | |
($0.0001 par value; unlimited number of shares authorized): | | | | | | | | | | | | | | | | |
Class C | | | 30,199 | | | | 420,500 | | | | — | | | | 144,146 | |
Agency | | | 5,202,884 | | | | 68,628 | | | | 11,801,807 | | | | 1,483,304 | |
Capital | | | 45,447,808 | | | | 251,371 | | | | 63,439,205 | | | | — | |
Cash Management | | | 43,769 | | | | — | | | | — | | | | — | |
Direct | | | — | | | | — | | | | 238,666 | | | | 59,081 | |
Eagle Class | | | 374,621 | | | | — | | | | 392,485 | | | | 20 | |
E*Trade | | | — | | | | 426,476 | | | | 20 | | | | — | |
IM | | | 2,244,375 | | | | — | | | | 269,475 | | | | 5,574,378 | |
Institutional Class | | | 16,215,233 | | | | 1,288,598 | | | | 21,423,230 | | | | 11,345,895 | |
Investor | | | 226,300 | | | | 25,920 | | | | 600,605 | | | | 77,856 | |
Morgan | | | 1,108,055 | | | | 1,582,154 | | | | 2,231,557 | | | | 637,902 | |
Premier | | | 1,616,300 | | | | 38,094 | | | | 8,228,630 | | | | 289,183 | |
Reserve | | | 685,729 | | | | 12,209 | | | | 80,255 | | | | 94,760 | |
Service | | | 1,421,181 | | | | — | (a) | | | 770,090 | | | | 20 | |
Net Asset Value, offering and redemption price per share (all classes) | | | 1.00 | | | | 1.00 | | | | 1.00 | | | | 1.00 | |
| | | | | | | | | | | | | | | | |
| | | | |
Cost of investments in non-affiliates | | $ | 68,117,308 | | | $ | 4,017,440 | | | $ | 48,572,019 | | | $ | 9,482,526 | |
Cost of repurchase agreements | | | 5,700,000 | | | | 100,000 | | | | 61,335,285 | | | | 10,388,355 | |
| (a) | Amount rounds to less than 500. |
SEE NOTES TO FINANCIAL STATEMENTS.
| | | | | | | | |
| | | |
| AUGUST 31, 2016 | | J.P. MORGAN MONEY MARKET FUNDS | | | | | 59 | |
STATEMENTS OF ASSETS AND LIABILITIES
AS OF AUGUST 31, 2016 (Unaudited) (continued)
(Amounts in thousands, except per share amounts)
| | | | | | | | | | | | | | | | |
| | | Federal Money
Market Fund | | | 100% U.S.
Treasury
Securities
Money
Market Fund | | | Tax Free
Money
Market Fund | | | Municipal
Money
Market Fund | |
ASSETS: | |
Investments in non-affiliates, at value | | $ | 2,853,706 | | | $ | 24,213,349 | | | $ | 13,980,822 | | | $ | 3,630,269 | |
Cash | | | 1 | | | | 3 | | | | 1 | | | | 5 | |
Receivables: | | | | | | | | | | | | | | | | |
Investment securities sold | | | — | | | | 499,703 | | | | 118,311 | | | | 7,686 | |
Fund shares sold | | | 7,291 | | | | — | | | | — | | | | — | |
Interest from non-affiliates | | | 1,520 | | | | 56,065 | | | | 8,395 | | | | 2,663 | |
| | | | | | | | | | | | | | | | |
Total Assets | | | 2,862,518 | | | | 24,769,120 | | | | 14,107,529 | | | | 3,640,623 | |
| | | | | | | | | | | | | | | | |
|
LIABILITIES: | |
Payables: | | | | | | | | | | | | | | | | |
Distributions | | | 327 | | | | 1,334 | | | | 2,181 | | | | 11 | |
Investment securities purchased | | | — | | | | 1,979,148 | | | | — | | | | 2,001 | |
Fund shares redeemed | | | 5,480 | | | | — | | | | — | | | | — | |
Accrued liabilities: | | | | | | | | | | | | | | | | |
Investment advisory fees | | | 103 | | | | 1,394 | | | | 1,037 | | | | 187 | |
Administration fees | | | 105 | | | | 1,212 | | | | 896 | | | | 166 | |
Distribution fees | | | — | | | | — | | | | 111 | | | | 235 | |
Shareholder servicing fees | | | 206 | | | | 1,272 | | | | 2,125 | | | | 711 | |
Custodian and accounting fees | | | 34 | | | | 150 | | | | 112 | | | | 24 | |
Trustees’ and Chief Compliance Officer’s fees | | | 3 | | | | 78 | | | | 27 | | | | 6 | |
Other | | | 367 | | | | 124 | | | | 283 | | | | 103 | |
| | | | | | | | | | | | | | | | |
Total Liabilities | | | 6,625 | | | | 1,984,712 | | | | 6,772 | | | | 3,444 | |
| | | | | | | | | | | | | | | | |
Net Assets | | $ | 2,855,893 | | | $ | 22,784,408 | | | $ | 14,100,757 | | | $ | 3,637,179 | |
| | | | | | | | | | | | | | | | |
SEE NOTES TO FINANCIAL STATEMENTS.
| | | | | | |
| | | |
| 60 | | | | J.P. MORGAN MONEY MARKET FUNDS | | AUGUST 31, 2016 |
| | | | | | | | | | | | | | | | |
| | | Federal Money
Market Fund | | | 100% U.S.
Treasury
Securities
Money
Market Fund | | | Tax Free
Money
Market Fund | | | Municipal
Money
Market Fund | |
NET ASSETS: | |
Paid-in-Capital | | $ | 2,855,938 | | | $ | 22,784,739 | | | $ | 14,100,470 | | | $ | 3,636,980 | |
Accumulated undistributed (distributions in excess of) net investment income | | | (200 | ) | | | (602 | ) | | | (9 | ) | | | 6 | |
Accumulated net realized gains (losses) | | | 155 | | | | 271 | | | | 296 | | | | 193 | |
| | | | | | | | | | | | | | | | |
Total Net Assets | | $ | 2,855,893 | | | $ | 22,784,408 | | | $ | 14,100,757 | | | $ | 3,637,179 | |
| | | | | | | | | | | | | | | | |
|
Net Assets: | |
Agency | | $ | 201,448 | | | $ | 1,037,195 | | | $ | 152,218 | | | $ | 19,297 | |
Capital | | | — | | | | 10,327,334 | | | | — | | | | — | |
Direct | | | — | | | | — | | | | 20 | | | | — | |
Eagle Class | | | — | | | | — | | | | 172 | | | | 528,653 | |
E*Trade | | | — | | | | — | | | | — | | | | 2,060,253 | |
Institutional Class | | | 2,376,386 | | | | 8,810,515 | | | | 8,721,340 | | | | 177,347 | |
Morgan | | | 140,866 | | | | 1,456,333 | | | | 59,735 | | | | 375,595 | |
Premier | | | 136,350 | | | | 1,056,980 | | | | 1,900,573 | | | | 23,140 | |
Reserve | | | 843 | | | | 96,031 | | | | 3,266,699 | | | | 88 | |
Service | | | — | | | | 20 | | | | — | | | | 452,806 | |
| | | | | | | | | | | | | | | | |
Total | | $ | 2,855,893 | | | $ | 22,784,408 | | | $ | 14,100,757 | | | $ | 3,637,179 | |
| | | | | | | | | | | | | | | | |
|
Outstanding units of beneficial interest (shares) | |
($0.0001 par value; unlimited number of shares authorized): | | | | | | | | | | | | | | | | |
Agency | | | 201,473 | | | | 1,037,210 | | | | 152,208 | | | | 19,297 | |
Capital | | | — | | | | 10,327,446 | | | | — | | | | — | |
Direct | | | — | | | | — | | | | 20 | | | | — | |
Eagle Class | | | — | | | | — | | | | 171 | | | | 528,625 | |
E*Trade | | | — | | | | — | | | | — | | | | 2,060,127 | |
Institutional Class | | | 2,376,770 | | | | 8,810,601 | | | | 8,720,914 | | | | 177,340 | |
Morgan | | | 140,888 | | | | 1,456,348 | | | | 59,731 | | | | 375,576 | |
Premier | | | 136,370 | | | | 1,056,991 | | | | 1,900,471 | | | | 23,139 | |
Reserve | | | 843 | | | | 96,032 | | | | 3,266,501 | | | | 88 | |
Service | | | — | | | | 20 | | | | — | | | | 452,778 | |
Net Asset Value, offering and redemption price per share (all classes) | | | 1.00 | | | | 1.00 | | | | 1.00 | | | | 1.00 | |
| | | | | | | | | | | | | | | | |
| | | | |
Cost of investments in non-affiliates | | $ | 2,853,706 | | | $ | 24,213,349 | | | $ | 13,980,822 | | | $ | 3,630,269 | |
SEE NOTES TO FINANCIAL STATEMENTS.
| | | | | | | | |
| | | |
| AUGUST 31, 2016 | | J.P. MORGAN MONEY MARKET FUNDS | | | | | 61 | |
STATEMENTS OF OPERATIONS
FOR THE SIX MONTHS ENDED AUGUST 31, 2016 (Unaudited)
(Amounts in thousands)
| | | | | | | | | | | | | | | | |
| | | Prime Money
Market Fund | | | Liquid
Assets Money
Market Fund | | | U.S.
Government
Money
Market Fund | | | U.S.
Treasury
Plus Money
Market Fund | |
INVESTMENT INCOME: | |
Interest income from non-affiliates | | $ | 298,969 | | | $ | 28,016 | | | $ | 148,526 | | | $ | 35,604 | |
Income from interfund lending (net) | | | — | | | | 7 | | | | — | | | | — | |
| | | | | | | | | | | | | | | | |
Total investment income | | | 298,969 | | | | 28,023 | | | | 148,526 | | | | 35,604 | |
| | | | | | | | | | | | | | | | |
|
EXPENSES: | |
Investment advisory fees | | | 40,744 | | | | 3,984 | | | | 27,976 | | | | 7,292 | |
Administration fees | | | 35,821 | | | | 3,507 | | | | 24,526 | | | | 6,403 | |
Distribution fees (See Note 4) | | | 7,603 | | | | 4,260 | | | | 2,714 | | | | 1,643 | |
Shareholder servicing fees (See Note 4) | | | 45,835 | | | | 7,912 | | | | 42,389 | | | | 8,583 | |
Custodian and accounting fees | | | 1,670 | | | | 215 | | | | 638 | | | | 158 | |
Professional fees | | | 597 | | | | 70 | | | | 333 | | | | 107 | |
Trustees’ and Chief Compliance Officer’s fees | | | 366 | | | | 42 | | | | 302 | | | | 43 | |
Printing and mailing costs | | | 146 | | | | 876 | | | | 267 | | | | 45 | |
Registration and filing fees | | | 356 | | | | 85 | | | | 205 | | | | 91 | |
Transfer agency fees (See Note 2.E.) | | | 1,333 | | | | 194 | | | | 653 | | | | 177 | |
Other | | | 464 | | | | 75 | | | | 84 | | | | 86 | |
| | | | | | | | | | | | | | | | |
Total expenses | | | 134,935 | | | | 21,220 | | | | 100,087 | | | | 24,628 | |
| | | | | | | | | | | | | | | | |
Less fees waived | | | (24,227 | ) | | | (6,034 | ) | | | (26,403 | ) | | | (4,897 | ) |
Less earnings credits | | | (6 | ) | | | — | | | | (12 | ) | | | (3 | ) |
Less expense reimbursements | | | — | | | | — | (a) | | | (103 | ) | | | — | (a) |
| | | | | | | | | | | | | | | | |
Net expenses | | | 110,702 | | | | 15,186 | | | | 73,569 | | | | 19,728 | |
| | | | | | | | | | | | | | | | |
Net investment income (loss) | | | 188,267 | | | | 12,837 | | | | 74,957 | | | | 15,876 | |
| | | | | | | | | | | | | | | | |
| | | | |
REALIZED/UNREALIZED GAINS (LOSSES): | | | | | | | | | | | | | | | | |
Net realized gain (loss) on transactions from investments in non-affiliates | | | 151 | | | | 87 | | | | 345 | | | | 40 | |
| | | | | | | | | | | | | | | | |
Change in net assets resulting from operations | | $ | 188,418 | | | $ | 12,924 | | | $ | 75,302 | | | $ | 15,916 | |
| | | | | | | | | | | | | | | | |
| (a) | Amount rounds to less than 500. |
SEE NOTES TO FINANCIAL STATEMENTS.
| | | | | | |
| | | |
| 62 | | | | J.P. MORGAN MONEY MARKET FUNDS | | AUGUST 31, 2016 |
| | | | | | | | | | | | | | | | |
| | | Federal Money
Market Fund | | | 100% U.S.
Treasury
Securities
Money
Market Fund | | | Tax Free
Money
Market Fund | | | Municipal
Money
Market Fund | |
INVESTMENT INCOME: | |
Interest income from non-affiliates | | $ | 6,720 | | | $ | 39,413 | | | $ | 32,202 | | | $ | 6,404 | |
| | | | | | | | | | | | | | | | |
|
EXPENSES: | |
Investment advisory fees | | | 1,327 | | | | 8,879 | | | | 7,120 | | | | 1,253 | |
Administration fees | | | 1,166 | | | | 7,799 | | | | 6,260 | | | | 1,101 | |
Distribution fees (See Note 4) | | | 69 | | | | 855 | | | | 6,716 | | | | 7,615 | |
Shareholder servicing fees | | | 2,026 | | | | 12,111 | | | | 17,044 | | | | 4,579 | |
Custodian and accounting fees | | | 61 | | | | 255 | | | | 234 | | | | 58 | |
Interest expense to affiliates | | | — | | | | — | | | | — | (a) | | | — | (a) |
Professional fees | | | 37 | | | | 145 | | | | 116 | | | | 39 | |
Trustees’ and Chief Compliance Officer’s fees | | | 19 | | | | 105 | | | | 41 | | | | 21 | |
Printing and mailing costs | | | 541 | | | | 33 | | | | 69 | | | | 133 | |
Registration and filing fees | | | 127 | | | | 93 | | | | 19 | | | | 55 | |
Transfer agency fees (See Note 2.E.) | | | 68 | | | | 282 | | | | 203 | | | | 37 | |
Other | | | 20 | | | | 31 | | | | 77 | | | | 10 | |
| | | | | | | | | | | | | | | | |
Total expenses | | | 5,461 | | | | 30,588 | | | | 37,899 | | | | 14,901 | |
| | | | | | | | | | | | | | | | |
Less fees waived | | | (1,663 | ) | | | (6,410 | ) | | | (14,426 | ) | | | (8,859 | ) |
Less earnings credits | | | — | | | | — | (a) | | | — | | | | — | |
Less expense reimbursements | | | — | | | | — | (a) | | | — | (a) | | | — | |
| | | | | | | | | | | | | | | | |
Net expenses | | | 3,798 | | | | 24,178 | | | | 23,473 | | | | 6,042 | |
| | | | | | | | | | | | | | | | |
Net investment income (loss) | | | 2,922 | | | | 15,235 | | | | 8,729 | | | | 362 | |
| | | | | | | | | | | | | | | | |
| | | | |
REALIZED/UNREALIZED GAINS (LOSSES): | | | | | | | | | | | | | | | | |
Net realized gain (loss) on transactions from investments in non-affiliates | | | 140 | | | | 201 | | | | 142 | | | | 197 | |
| | | | | | | | | | | | | | | | |
Change in net assets resulting from operations | | $ | 3,062 | | | $ | 15,436 | | | $ | 8,871 | | | $ | 559 | |
| | | | | | | | | | | | | | | | |
| (a) | Amount rounds to less than 500. |
SEE NOTES TO FINANCIAL STATEMENTS.
| | | | | | | | |
| | | |
| AUGUST 31, 2016 | | J.P. MORGAN MONEY MARKET FUNDS | | | | | 63 | |
STATEMENTS OF CHANGES IN NET ASSETS
FOR THE PERIODS INDICATED
(Amounts in thousands)
| | | | | | | | | | | | | | | | |
| | | Prime Money Market Fund | | | Liquid Assets Money Market Fund | |
| | | Six Months Ended
August 31, 2016
(Unaudited) | | | Year Ended
February 29, 2016 | | | Six Months Ended
August 31, 2016
(Unaudited) | | | Year Ended
February 29, 2016 | |
CHANGE IN NET ASSETS RESULTING FROM
OPERATIONS: | | | | | | | | | | | | | | | | |
Net investment income (loss) | | $ | 188,267 | | | $ | 134,486 | | | $ | 12,837 | | | $ | 12,860 | |
Net realized gain (loss) | | | 151 | | | | 371 | | | | 87 | | | | 79 | |
| | | | | | | | | | | | | | | | |
Change in net assets resulting from operations | | | 188,418 | | | | 134,857 | | | | 12,924 | | | | 12,939 | |
| | | | | | | | | | | | | | | | |
| | | | |
DISTRIBUTIONS TO SHAREHOLDERS: | | | | | | | | | | | | | | | | |
Class B (a) | | | | | | | | | | | | | | | | |
From net investment income | | | — | | | | — | (b) | | | — | | | | — | (b) |
Class C | | | | | | | | | | | | | | | | |
From net investment income | | | (2 | ) | | | (2 | ) | | | (23 | ) | | | (53 | ) |
From net realized gains | | | — | | | | — | (b) | | | — | | | | (5 | ) |
Agency | | | | | | | | | | | | | | | | |
From net investment income | | | (11,881 | ) | | | (4,977 | ) | | | (132 | ) | | | (58 | ) |
From net realized gains | | | — | | | | (17 | ) | | | — | | | | (1 | ) |
Capital | | | | | | | | | | | | | | | | |
From net investment income | | | (127,705 | ) | | | (96,527 | ) | | | (3,147 | ) | | | (4,571 | ) |
From net realized gains | | | — | | | | (168 | ) | | | — | | | | (29 | ) |
Cash Management | | | | | | | | | | | | | | | | |
From net investment income | | | (15 | ) | | | (85 | ) | | | — | | | | — | |
From net realized gains | | | — | | | | (2 | ) | | | — | | | | — | |
Direct (c) | | | | | | | | | | | | | | | | |
From net investment income | | | (1,651 | ) | | | (1,289 | ) | | | — | | | | — | |
From net realized gains | | | — | | | | (4 | ) | | | — | | | | — | |
Eagle Class | | | | | | | | | | | | | | | | |
From net investment income | | | (19 | ) | | | (35 | ) | | | — | | | | — | |
From net realized gains | | | — | | | | (1 | ) | | | — | | | | — | |
E*Trade | | | | | | | | | | | | | | | | |
From net investment income | | | — | | | | — | | | | (23 | ) | | | (604 | ) |
From net realized gains | | | — | | | | — | | | | — | | | | (58 | ) |
IM | | | | | | | | | | | | | | | | |
From net investment income | | | (4,916 | ) | | | (4,235 | ) | | | — | | | | — | |
From net realized gains | | | — | | | | (5 | ) | | | — | | | | — | |
Institutional Class | | | | | | | | | | | | | | | | |
From net investment income | | | (39,200 | ) | | | (26,145 | ) | | | (9,155 | ) | | | (7,335 | ) |
From net realized gains | | | — | | | | (56 | ) | | | — | | | | (51 | ) |
Investor | | | | | | | | | | | | | | | | |
From net investment income | | | (630 | ) | | | (204 | ) | | | (31 | ) | | | (18 | ) |
From net realized gains | | | — | | | | (3 | ) | | | — | | | | (1 | ) |
Morgan | | | | | | | | | | | | | | | | |
From net investment income | | | (563 | ) | | | (254 | ) | | | (84 | ) | | | (167 | ) |
From net realized gains | | | — | | | | (5 | ) | | | — | | | | (17 | ) |
Premier | | | | | | | | | | | | | | | | |
From net investment income | | | (1,555 | ) | | | (447 | ) | | | (86 | ) | | | (29 | ) |
From net realized gains | | | — | | | | (6 | ) | | | — | | | | (1 | ) |
Reserve | | | | | | | | | | | | | | | | |
From net investment income | | | (44 | ) | | | (105 | ) | | | (7 | ) | | | (17 | ) |
From net realized gains | | | — | | | | (2 | ) | | | — | | | | (2 | ) |
Service | | | | | | | | | | | | | | | | |
From net investment income | | | (86 | ) | | | (181 | ) | | | (3 | ) | | | (9 | ) |
From net realized gains | | | — | | | | (4 | ) | | | — | | | | (1 | ) |
| | | | | | | | | | | | | | | | |
Total distributions to shareholders | | | (188,267 | ) | | | (134,759 | ) | | | (12,691 | ) | | | (13,027 | ) |
| | | | | | | | | | | | | | | | |
SEE NOTES TO FINANCIAL STATEMENTS.
| | | | | | |
| | | |
| 64 | | | | J.P. MORGAN MONEY MARKET FUNDS | | AUGUST 31, 2016 |
| | | | | | | | | | | | | | | | |
| | | Prime Money Market Fund | | | Liquid Assets Money Market Fund | |
| | | Six Months Ended
August 31, 2016
(Unaudited) | | | Year Ended
February 29, 2016 | | | Six Months Ended
August 31, 2016
(Unaudited) | | | Year Ended
February 29, 2016 | |
CAPITAL TRANSACTIONS: | | | | | | | | | | | | | | | | |
Change in net assets resulting from capital transactions | | $ | (31,838,913 | ) | | $ | (9,582,493 | ) | | $ | (9,042,783 | ) | | $ | (6,935,158 | ) |
| | | | | | | | | | | | | | | | |
|
NET ASSETS: | |
Change in net assets | | | (31,838,762 | ) | | | (9,582,395 | ) | | | (9,042,550 | ) | | | (6,935,246 | ) |
Beginning of period | | | 106,454,847 | | | | 116,037,242 | | | | 13,156,549 | | | | 20,091,795 | |
| | | | | | | | | | | | | | | | |
End of period | | $ | 74,616,085 | | | $ | 106,454,847 | | | $ | 4,113,999 | | | $ | 13,156,549 | |
| | | | | | | | | | | | | | | | |
Accumulated undistributed (distributions in excess of) net investment income | | $ | (800 | ) | | $ | (800 | ) | | $ | (222 | ) | | $ | (368 | ) |
| | | | | | | | | | | | | | | | |
| (a) | All remaining Class B Shares converted to Morgan Shares on June 19, 2015. |
| (b) | Amount rounds to less than 500. |
| (c) | Direct Shares of the Prime Money Market Fund had no assets as of August 16, 2016. |
SEE NOTES TO FINANCIAL STATEMENTS.
| | | | | | | | |
| | | |
| AUGUST 31, 2016 | | J.P. MORGAN MONEY MARKET FUNDS | | | | | 65 | |
STATEMENTS OF CHANGES IN NET ASSETS
FOR THE PERIODS INDICATED (continued)
(Amounts in thousands)
| | | | | | | | | | | | | | | | |
| | | U.S. Government Money Market Fund | | | U.S. Treasury Plus Money Market Fund | |
| | | Six Months Ended
August 31, 2016
(Unaudited) | | | Year Ended
February 29, 2016 | | | Six Months Ended
August 31, 2016
(Unaudited) | | | Year Ended
February 29, 2016 | |
CHANGE IN NET ASSETS RESULTING FROM
OPERATIONS: | | | | | | | | | | | | | | | | |
Net investment income (loss) | | $ | 74,957 | | | $ | 16,928 | | | $ | 15,876 | | | $ | 3,591 | |
Net realized gain (loss) | | | 345 | | | | 549 | | | | 40 | | | | 119 | |
| | | | | | | | | | | | | | | | |
Change in net assets resulting from operations | | | 75,302 | | | | 17,477 | | | | 15,916 | | | | 3,710 | |
| | | | | | | | | | | | | | | | |
| | | | |
DISTRIBUTIONS TO SHAREHOLDERS: | | | | | | | | | | | | | | | | |
Class B (a) | | | | | | | | | | | | | | | | |
From net investment income | | | — | | | | — | | | | — | | | | — | (b) |
From net realized gains | | | — | | | | — | | | | — | | | | — | (b) |
Class C | | | | | | | | | | | | | | | | |
From net investment income | | | — | | | | — | | | | — | | | | — | (b) |
From net realized gains | | | — | | | | — | | | | — | | | | (1 | ) |
Agency | | | | | | | | | | | | | | | | |
From net investment income | | | (7,998 | ) | | | (2,033 | ) | | | (829 | ) | | | (123 | ) |
From net realized gains | | | — | | | | (92 | ) | | | — | | | | (7 | ) |
Capital | | | | | | | | | | | | | | | | |
From net investment income | | | (52,185 | ) | | | (10,376 | ) | | | — | | | | — | |
From net realized gains | | | — | | | | (246 | ) | | | — | | | | — | |
Direct | | | | | | | | | | | | | | | | |
From net investment income | | | (354 | ) | | | (144 | ) | | | (229 | ) | | | (50 | ) |
From net realized gains | | | — | | | | (9 | ) | | | — | | | | (6 | ) |
Eagle Class | | | | | | | | | | | | | | | | |
From net investment income | | | (20 | ) | | | (36 | ) | | | — | | | | — | |
From net realized gains | | | — | | | | (4 | ) | | | — | | | | — | |
E*Trade (c) | | | | | | | | | | | | | | | | |
From net investment income | | | — | (b) | | | — | | | | — | | | | — | |
IM | | | | | | | | | | | | | | | | |
From net investment income | | | (458 | ) | | | (313 | ) | | | (6,629 | ) | | | (1,463 | ) |
From net realized gains | | | — | | | | (5 | ) | | | — | | | | (27 | ) |
Institutional Class | | | | | | | | | | | | | | | | |
From net investment income | | | (12,974 | ) | | | (2,982 | ) | | | (8,189 | ) | | | (1,983 | ) |
From net realized gains | | | — | | | | (84 | ) | | | — | | | | (64 | ) |
Investor | | | | | | | | | | | | | | | | |
From net investment income | | | (149 | ) | | | (310 | ) | | | — | | | | — | (b) |
From net realized gains | | | — | | | | (31 | ) | | | — | | | | (1 | ) |
Morgan | | | | | | | | | | | | | | | | |
From net investment income | | | (101 | ) | | | (216 | ) | | | — | | | | (1 | ) |
From net realized gains | | | — | | | | (23 | ) | | | — | | | | (5 | ) |
Premier | | | | | | | | | | | | | | | | |
From net investment income | | | (696 | ) | | | (569 | ) | | | — | (b) | | | (1 | ) |
From net realized gains | | | — | | | | (72 | ) | | | — | | | | (2 | ) |
Reserve | | | | | | | | | | | | | | | | |
From net investment income | | | (2 | ) | | | (7 | ) | | | — | | | | (2 | ) |
From net realized gains | | | — | | | | — | (b) | | | — | | | | (5 | ) |
Service | | | | | | | | | | | | | | | | |
From net investment income | | | (20 | ) | | | (67 | ) | | | — | | | | — | |
From net realized gains | | | — | | | | (4 | ) | | | — | | | | — | |
| | | | | | | | | | | | | | | | |
Total distributions to shareholders | | | (74,957 | ) | | | (17,623 | ) | | | (15,876 | ) | | | (3,741 | ) |
| | | | | | | | | | | | | | | | |
SEE NOTES TO FINANCIAL STATEMENTS.
| | | | | | |
| | | |
| 66 | | | | J.P. MORGAN MONEY MARKET FUNDS | | AUGUST 31, 2016 |
| | | | | | | | | | | | | | | | |
| | | U.S. Government Money Market Fund | | | U.S. Treasury Plus Money Market Fund | |
| | | Six Months Ended
August 31, 2016
(Unaudited) | | | Year Ended
February 29, 2016 | | | Six Months Ended
August 31, 2016
(Unaudited) | | | Year Ended
February 29, 2016 | |
CAPITAL TRANSACTIONS: | | | | | | | | | | | | | | | | |
Change in net assets resulting from capital transactions | | $ | 49,105,129 | | | $ | 288,249 | | | $ | 2,677,387 | | | $ | 3,069,769 | |
| | | | | | | | | | | | | | | | |
| | | | |
NET ASSETS: | | | | | | | | | | | | | | | | |
Change in net assets | | | 49,105,474 | | | | 288,103 | | | | 2,677,427 | | | | 3,069,738 | |
Beginning of period | | | 60,369,561 | | | | 60,081,458 | | | | 17,028,517 | | | | 13,958,779 | |
| | | | | | | | | | | | | | | | |
End of period | | $ | 109,475,035 | | | $ | 60,369,561 | | | $ | 19,705,944 | | | $ | 17,028,517 | |
| | | | | | | | | | | | | | | | |
Accumulated undistributed (distributions in excess of) net investment income | | $ | (1,365 | ) | | $ | (1,365 | ) | | $ | (535 | ) | | $ | (535 | ) |
| | | | | | | | | | | | | | | | |
| (a) | All remaining Class B Shares converted to Morgan Shares on June 19, 2015. |
| (b) | Amount rounds to less than 500. |
| (c) | Commencement of offering of class of shares effective March 9, 2016 for U.S. Government Money Market Fund. |
SEE NOTES TO FINANCIAL STATEMENTS.
| | | | | | | | |
| | | |
| AUGUST 31, 2016 | | J.P. MORGAN MONEY MARKET FUNDS | | | | | 67 | |
STATEMENTS OF CHANGES IN NET ASSETS
FOR THE PERIODS INDICATED (continued)
(Amounts in thousands)
| | | | | | | | | | | | | | | | |
| | | Federal Money Market Fund | | | 100% U.S. Treasury Securities Money Market Fund | |
| | | Six Months Ended
August 31, 2016
(Unaudited) | | | Year Ended
February 29, 2016 | | | Six Months Ended
August 31, 2016
(Unaudited) | | | Year Ended
February 29, 2016 | |
CHANGE IN NET ASSETS RESULTING FROM OPERATIONS: | | | | | | | | | | | | | | | | |
Net investment income (loss) | | $ | 2,922 | | | $ | 1,126 | | | $ | 15,235 | | | $ | 2,186 | |
Net realized gain (loss) | | | 140 | | | | 72 | | | | 201 | | | | 130 | |
| | | | | | | | | | | | | | | | |
Change in net assets resulting from operations | | | 3,062 | | | | 1,198 | | | | 15,436 | | | | 2,316 | |
| | | | | | | | | | | | | | | | |
|
DISTRIBUTIONS TO SHAREHOLDERS: | |
Agency | | | | | | | | | | | | | | | | |
From net investment income | | | (167 | ) | | | (36 | ) | | | (685 | ) | | | (92 | ) |
From net realized gains | | | — | | | | (4 | ) | | | — | | | | (7 | ) |
Capital | | | | | | | | | | | | | | | | |
From net investment income | | | — | | | | — | | | | (8,772 | ) | | | (1,354 | ) |
From net realized gains | | | — | | | | — | | | | — | | | | (44 | ) |
Institutional Class | | | | | | | | | | | | | | | | |
From net investment income | | | (2,742 | ) | | | (1,066 | ) | | | (5,778 | ) | | | (785 | ) |
From net realized gains | | | — | | | | (64 | ) | | | — | | | | (36 | ) |
Morgan | | | | | | | | | | | | | | | | |
From net investment income | | | (6 | ) | | | (11 | ) | | | — | | | | (4 | ) |
From net realized gains | | | — | | | | (2 | ) | | | — | | | | (9 | ) |
Premier | | | | | | | | | | | | | | | | |
From net investment income | | | (7 | ) | | | (20 | ) | | | — | | | | (3 | ) |
From net realized gains | | | — | | | | (3 | ) | | | — | | | | (5 | ) |
Reserve | | | | | | | | | | | | | | | | |
From net investment income | | | — | (a) | | | (2 | ) | | | — | | | | — | (a) |
From net realized gains | | | — | | | | — | (a) | | | — | | | | — | (a) |
Service | | | | | | | | | | | | | | | | |
From net realized gains | | | — | | | | — | | | | — | | | | — | (a) |
| | | | | | | | | | | | | | | | |
Total distributions to shareholders | | | (2,922 | ) | | | (1,208 | ) | | | (15,235 | ) | | | (2,339 | ) |
| | | | | | | | | | | | | | | | |
|
CAPITAL TRANSACTIONS: | |
Change in net assets resulting from capital transactions | | | (1,315,577 | ) | | | (242,718 | ) | | | 513,265 | | | | (1,232,721 | ) |
| | | | | | | | | | | | | | | | |
|
NET ASSETS: | |
Change in net assets | | | (1,315,437 | ) | | | (242,728 | ) | | | 513,466 | | | | (1,232,744 | ) |
Beginning of period | | | 4,171,330 | | | | 4,414,058 | | | | 22,270,942 | | | | 23,503,686 | |
| | | | | | | | | | | | | | | | |
End of period | | $ | 2,855,893 | | | $ | 4,171,330 | | | $ | 22,784,408 | | | $ | 22,270,942 | |
| | | | | | | | | | | | | | | | |
Accumulated undistributed (distributions in excess of) net investment income | | $ | (200 | ) | | $ | (200 | ) | | $ | (602 | ) | | $ | (602 | ) |
| | | | | | | | | | | | | | | | |
| (a) | Amount rounds to less than 500. |
SEE NOTES TO FINANCIAL STATEMENTS.
| | | | | | |
| | | |
| 68 | | | | J.P. MORGAN MONEY MARKET FUNDS | | AUGUST 31, 2016 |
| | | | | | | | | | | | | | | | |
| | | Tax Free Money Market Fund | | | Municipal Money Market Fund | |
| | | Six Months Ended
August 31, 2016
(Unaudited) | | | Year Ended
February 29, 2016 | | | Six Months Ended
August 31, 2016
(Unaudited) | | | Year Ended
February 29, 2016 | |
CHANGE IN NET ASSETS RESULTING FROM OPERATIONS: | | | | | | | | | | | | | | | | |
Net investment income (loss) | | $ | 8,729 | | | $ | 1,933 | | | $ | 362 | | | $ | 301 | |
Net realized gain (loss) | | | 142 | | | | 1,715 | | | | 197 | | | | 140 | |
| | | | | | | | | | | | | | | | |
Change in net assets resulting from operations | | | 8,871 | | | | 3,648 | | | | 559 | | | | 441 | |
| | | | | | | | | | | | | | | | |
|
DISTRIBUTIONS TO SHAREHOLDERS: | |
Agency | | | | | | | | | | | | | | | | |
From net investment income | | | (210 | ) | | | (32 | ) | | | (47 | ) | | | (8 | ) |
From net realized gains | | | — | | | | (46 | ) | | | — | | | | (4 | ) |
Direct | | | | | | | | | | | | | | | | |
From net investment income | | | — | (a) | | | — | (a) | | | — | | | | — | |
From net realized gains | | | — | | | | — | (a) | | | — | | | | — | |
Eagle Class (b) | | | | | | | | | | | | | | | | |
From net investment income | | | (60 | ) | | | (126 | ) | | | (1 | ) | | | — | |
From net realized gains | | | — | | | | (200 | ) | | | — | | | | — | |
E*Trade | | | | | | | | | | | | | | | | |
From net investment income | | | — | | | | — | | | | (101 | ) | | | (195 | ) |
From net realized gains | | | — | | | | — | | | | — | | | | (95 | ) |
Institutional Class | | | | | | | | | | | | | | | | |
From net investment income | | | (8,060 | ) | | | (1,046 | ) | | | (169 | ) | | | (15 | ) |
From net realized gains | | | — | | | | (1,559 | ) | | | — | | | | (7 | ) |
Morgan | | | | | | | | | | | | | | | | |
From net investment income | | | (5 | ) | | | (11 | ) | | | (19 | ) | | | (37 | ) |
From net realized gains | | | — | | | | (24 | ) | | | — | | | | (20 | ) |
Premier | | | | | | | | | | | | | | | | |
From net investment income | | | (187 | ) | | | (262 | ) | | | (3 | ) | | | (3 | ) |
From net realized gains | | | — | | | | (388 | ) | | | — | | | | (1 | ) |
Reserve | | | | | | | | | | | | | | | | |
From net investment income | | | (207 | ) | | | (456 | ) | | | — | (a) | | | (1 | ) |
From net realized gains | | | — | | | | (704 | ) | | | — | | | | (1 | ) |
Service | | | | | | | | | | | | | | | | |
From net investment income | | | — | | | | — | | | | (22 | ) | | | (42 | ) |
From net realized gains | | | — | | | | — | | | | — | | | | (21 | ) |
| | | | | | | | | | | | | | | | |
Total distributions to shareholders | | | (8,729 | ) | | | (4,854 | ) | | | (362 | ) | | | (450 | ) |
| | | | | | | | | | | | | | | | |
|
CAPITAL TRANSACTIONS: | |
Change in net assets resulting from capital transactions | | | (4,868,680 | ) | | | (1,226,248 | ) | | | 434,508 | | | | 139,977 | |
| | | | | | | | | | | | | | | | |
|
NET ASSETS: | |
Change in net assets | | | (4,868,538 | ) | | | (1,227,454 | ) | | | 434,705 | | | | 139,968 | |
Beginning of period | | | 18,969,295 | | | | 20,196,749 | | | | 3,202,474 | | | | 3,062,506 | |
| | | | | | | | | | | | | | | | |
End of period | | $ | 14,100,757 | | | $ | 18,969,295 | | | $ | 3,637,179 | | | $ | 3,202,474 | |
| | | | | | | | | | | | | | | | |
Accumulated undistributed (distributions in excess of) net investment income | | $ | (9 | ) | | $ | (9 | ) | | $ | 6 | | | $ | 6 | |
| | | | | | | | | | | | | | | | |
| (a) | Amount rounds to less than 500. |
| (b) | Commencement of offering of class of shares effective July 1 2016 for Municipal Money Market Fund. |
SEE NOTES TO FINANCIAL STATEMENTS.
| | | | | | | | |
| | | |
| AUGUST 31, 2016 | | J.P. MORGAN MONEY MARKET FUNDS | | | | | 69 | |
STATEMENTS OF CHANGES IN NET ASSETS
FOR THE PERIODS INDICATED (continued)
(Amounts in thousands)
| | | | | | | | | | | | | | | | |
| | | Prime Money Market Fund | | | Liquid Assets Money Market Fund | |
| | | Six Months Ended
August 31, 2016
(Unaudited) | | | Year Ended
February 29, 2016 | | | Six Months Ended
August 31, 2016
(Unaudited) | | | Year Ended
February 29, 2016 | |
CAPITAL TRANSACTIONS: | | | | | | | | | | | | | | | | |
Class B (a) | | | | | | | | | | | | | | | | |
Proceeds from shares issued | | $ | — | | | $ | — | | | $ | — | | | $ | 69 | |
Distributions reinvested | | | — | | | | — | (b) | | | — | | | | — | (b) |
Cost of shares redeemed | | | — | | | | (105 | ) | | | — | | | | (409 | ) |
Conversion to Morgan Shares | | | — | | | | (514 | ) | | | — | | | | (1,054 | ) |
| | | | | | | | | | | | | | | | |
Change in net assets resulting from Class C capital transactions | | $ | — | | | $ | (619 | ) | | $ | — | | | $ | (1,394 | ) |
| | | | | | | | | | | | | | | | |
Class C | | | | | | | | | | | | | | | | |
Proceeds from shares issued | | $ | 11,996 | | | $ | 47,970 | | | $ | 94,057 | | | $ | 219,626 | |
Distributions reinvested | | | 2 | | | | 2 | | | | 23 | | | | 58 | |
Cost of shares redeemed | | | (21,356 | ) | | | (25,312 | ) | | | (179,189 | ) | | | (418,347 | ) |
| | | | | | | | | | | | | | | | |
Change in net assets resulting from Class C capital transactions | | $ | (9,358 | ) | | $ | 22,660 | | | $ | (85,109 | ) | | $ | (198,663 | ) |
| | | | | | | | | | | | | | | | |
Agency | | | | | | | | | | | | | | | | |
Proceeds from shares issued | | $ | 271,543,292 | | | $ | 402,268,621 | | | $ | 220,158 | | | $ | 315,483 | |
Distributions reinvested | | | 1,345 | | | | 562 | | | | 66 | | | | 34 | |
Cost of shares redeemed | | | (274,483,225 | ) | | | (400,731,257 | ) | | | (223,338 | ) | | | (339,426 | ) |
| | | | | | | | | | | | | | | | |
Change in net assets resulting from Agency capital transactions | | $ | (2,938,588 | ) | | $ | 1,537,926 | | | $ | (3,114 | ) | | $ | (23,909 | ) |
| | | | | | | | | | | | | | | | |
Capital | | | | | | | | | | | | | | | | |
Proceeds from shares issued | | $ | 430,153,761 | | | $ | 898,641,705 | | | $ | 3,189,140 | | | $ | 13,791,594 | |
Distributions reinvested | | | 59,786 | | | | 41,937 | | | | 2,236 | | | | 3,255 | |
Cost of shares redeemed | | | (449,456,972 | ) | | | (900,133,191 | ) | | | (5,011,532 | ) | | | (14,612,885 | ) |
| | | | | | | | | | | | | | | | |
Change in net assets resulting from Capital capital transactions | | $ | (19,243,425 | ) | | $ | (1,449,549 | ) | | $ | (1,820,156 | ) | | $ | (818,036 | ) |
| | | | | | | | | | | | | | | | |
Cash Management | | | | | | | | | | | | | | | | |
Proceeds from shares issued | | $ | 115,462 | | | $ | 2,286,522 | | | $ | — | | | $ | — | |
Distributions reinvested | | | 10 | | | | 80 | | | | — | | | | — | |
Cost of shares redeemed | | | (560,100 | ) | | | (3,034,255 | ) | | | — | | | | — | |
| | | | | | | | | | | | | | | | |
Change in net assets resulting from Cash Management capital transactions | | $ | (444,628 | ) | | $ | (747,653 | ) | | $ | — | | | $ | — | |
| | | | | | | | | | | | | | | | |
Direct (c) | | | | | | | | | | | | | | | | |
Proceeds from shares issued | | $ | 738,453 | | | $ | 2,720,187 | | | $ | — | | | $ | — | |
Cost of shares redeemed | | | (2,069,406 | ) | | | (3,808,687 | ) | | | — | | | | — | |
| | | | | | | | | | | | | | | | |
Change in net assets resulting from Direct capital transactions | | $ | (1,330,953 | ) | | $ | (1,088,500 | ) | | $ | — | | | $ | — | |
| | | | | | | | | | | | | | | | |
Eagle Class | | | | | | | | | | | | | | | | |
Proceeds from shares issued | | $ | 186,456 | | | $ | 512,243 | | | $ | — | | | $ | — | |
Distributions reinvested | | | 19 | | | | 36 | | | | — | | | | — | |
Cost of shares redeemed | | | (208,270 | ) | | | (440,029 | ) | | | — | | | | — | |
| | | | | | | | | | | | | | | | |
Change in net assets resulting from Eagle Class capital transactions | | $ | (21,795 | ) | | $ | 72,250 | | | $ | — | | | $ | — | |
| | | | | | | | | | | | | | | | |
E*Trade | | | | | | | | | | | | | | | | |
Proceeds from shares issued | | $ | — | | | $ | — | | | $ | 533,811 | | | $ | 2,338,735 | |
Distributions reinvested | | | — | | | | — | | | | 23 | | | | 662 | |
Cost of shares redeemed | | | — | | | | — | | | | (1,865,837 | ) | | | (8,078,883 | ) |
| | | | | | | | | | | | | | | | |
Change in net assets resulting from E*Trade capital transactions | | $ | — | | | $ | — | | | $ | (1,332,003 | ) | | $ | (5,739,486 | ) |
| | | | | | | | | | | | | | | | |
SEE NOTES TO FINANCIAL STATEMENTS.
| | | | | | |
| | | |
| 70 | | | | J.P. MORGAN MONEY MARKET FUNDS | | AUGUST 31, 2016 |
| | | | | | | | | | | | | | | | |
| | | Prime Money Market Fund | | | Liquid Assets Money Market Fund | |
| | | Six Months Ended
August 31, 2016
(Unaudited) | | | Year Ended
February 29, 2016 | | | Six Months Ended
August 31, 2016
(Unaudited) | | | Year Ended
February 29, 2016 | |
CAPITAL TRANSACTIONS: (continued) | | | | | | | | | | | | | |
IM | | | | | | | | | | | | | | | | |
Proceeds from shares issued | | $ | 13,427,678 | | | $ | 37,443,428 | | | $ | — | | | $ | — | |
Distributions reinvested | | | — | | | | 75 | | | | — | | | | — | |
Cost of shares redeemed | | | (13,811,828 | ) | | | (38,564,457 | ) | | | — | | | | — | |
| | | | | | | | | | | | | | | | |
Change in net assets resulting from IM capital transactions | | $ | (384,150 | ) | | $ | (1,120,954 | ) | | $ | — | | | $ | — | |
| | | | | | | | | | | | | | | | |
Institutional Class | | | | | | | | | | | | | | | | |
Proceeds from shares issued | | $ | 83,526,420 | | | $ | 164,150,461 | | | $ | 18,064,087 | | | $ | 45,216,773 | |
Distributions reinvested | | | 10,611 | | | | 6,984 | | | | 1,976 | | | | 1,748 | |
Cost of shares redeemed | | | (87,333,171 | ) | | | (171,864,961 | ) | | | (23,408,216 | ) | | | (45,280,508 | ) |
| | | | | | | | | | | | | | | | |
Change in net assets resulting from Institutional Class capital transactions | | $ | (3,796,140 | ) | | $ | (7,707,516 | ) | | $ | (5,342,153 | ) | | $ | (61,987 | ) |
| | | | | | | | | | | | | | | | |
Investor | | | | | | | | | | | | | | | | |
Proceeds from shares issued | | $ | 302,724 | | | $ | 1,377,808 | | | $ | 183,299 | | | $ | 437,316 | |
Distributions reinvested | | | 630 | | | | 207 | | | | 6 | | | | 3 | |
Cost of shares redeemed | | | (1,918,468 | ) | | | (618,251 | ) | | | (275,203 | ) | | | (435,697 | ) |
| | | | | | | | | | | | | | | | |
Change in net assets resulting from Investor capital transactions | | $ | (1,615,114 | ) | | $ | 759,764 | | | $ | (91,898 | ) | | $ | 1,622 | |
| | | | | | | | | | | | | | | | |
Morgan | | | | | | | | | | | | | | | | |
Proceeds from shares issued | | $ | 35,673,980 | | | $ | 87,350,729 | | | $ | 1,197,180 | | | $ | 2,541,275 | |
Distributions reinvested | | | 322 | | | | 146 | | | | 80 | | | | 173 | |
Cost of shares redeemed | | | (36,443,344 | ) | | | (87,753,254 | ) | | | (1,224,549 | ) | | | (2,617,604 | ) |
Conversion from Class B Shares | | | — | | | | 514 | | | | — | | | | 1,054 | |
| | | | | | | | | | | | | | | | |
Change in net assets resulting from Morgan capital transactions | | $ | (769,042 | ) | | $ | (401,865 | ) | | $ | (27,289 | ) | | $ | (75,102 | ) |
| | | | | | | | | | | | | | | | |
Premier | | | | | | | | | | | | | | | | |
Proceeds from shares issued | | $ | 41,380,293 | | | $ | 51,258,738 | | | $ | 195,832 | | | $ | 580,727 | |
Distributions reinvested | | | 461 | | | | 128 | | | | 8 | | | | 3 | |
Cost of shares redeemed | | | (41,795,439 | ) | | | (50,817,662 | ) | | | (290,089 | ) | | | (566,543 | ) |
| | | | | | | | | | | | | | | | |
Change in net assets resulting from Premier capital transactions | | $ | (414,685 | ) | | $ | 441,204 | | | $ | (94,249 | ) | | $ | 14,187 | |
| | | | | | | | | | | | | | | | |
Reserve | | | | | | | | | | | | | | | | |
Proceeds from shares issued | | $ | 11,767,824 | | | $ | 26,828,510 | | | $ | 15,253,244 | | | $ | 36,717,078 | |
Distributions reinvested | | | 39 | | | | 95 | | | | 1 | | | | 3 | |
Cost of shares redeemed | | | (12,012,316 | ) | | | (27,052,886 | ) | | | (15,430,442 | ) | | | (36,700,330 | ) |
| | | | | | | | | | | | | | | | |
Change in net assets resulting from Reserve capital transactions | | $ | (244,453 | ) | | $ | (224,281 | ) | | $ | (177,197 | ) | | $ | 16,751 | |
| | | | | | | | | | | | | | | | |
Service | | | | | | | | | | | | | | | | |
Proceeds from shares issued | | $ | 617,812 | | | $ | 2,294,901 | | | $ | 7,122,042 | | | $ | 16,481,056 | |
Distributions reinvested | | | 86 | | | | 185 | | | | — | (b) | | | 3 | |
Cost of shares redeemed | | | (1,244,480 | ) | | | (1,970,446 | ) | | | (7,191,657 | ) | | | (16,530,200 | ) |
| | | | | | | | | | | | | | | | |
Change in net assets resulting from Service capital transactions | | $ | (626,582 | ) | | $ | 324,640 | | | $ | (69,615 | ) | | $ | (49,141 | ) |
| | | | | | | | | | | | | | | | |
Total change in net assets resulting from capital transactions | | $ | (31,838,913 | ) | | $ | (9,582,493 | ) | | $ | (9,042,783 | ) | | $ | (6,935,158 | ) |
| | | | | | | | | | | | | | | | |
| (a) | All remaining Class B Shares converted to Morgan Shares on June 19, 2015. |
| (b) | Amount rounds to less than 500. |
| (c) | Direct Shares of the Prime Money Market Fund had no assets as of August 16, 2016. |
SEE NOTES TO FINANCIAL STATEMENTS.
| | | | | | | | |
| | | |
| AUGUST 31, 2016 | | J.P. MORGAN MONEY MARKET FUNDS | | | | | 71 | |
STATEMENTS OF CHANGES IN NET ASSETS
FOR THE PERIODS INDICATED (continued)
(Amounts in thousands)
| | | | | | | | | | | | | | | | |
| | | Prime Money Market Fund | | | Liquid Assets Money Market Fund | |
| | | Six Months Ended
August 31, 2016
(Unaudited) | | | Year Ended
February 29, 2016 | | | Six Months Ended
August 31, 2016
(Unaudited) | | | Year Ended
February 29, 2016 | |
SHARE TRANSACTIONS: | |
Class B (a) | |
Issued | | | — | | | | — | | | | — | | | | 69 | |
Reinvested | | | — | | | | — | (b) | | | — | | | | — | (b) |
Redeemed | | | — | | | | (105 | ) | | | — | | | | (409 | ) |
Conversion to Morgan Shares | | | — | | | | (514 | ) | | | — | | | | (1,054 | ) |
| | | | | | | | | | | | | | | | |
Change in Class C Shares | | | — | | | | (619 | ) | | | — | | | | (1,394 | ) |
| | | | | | | | | | | | | | | | |
Class C | |
Issued | | | 11,996 | | | | 47,970 | | | | 94,046 | | | | 219,626 | |
Reinvested | | | 2 | | | | 2 | | | | 23 | | | | 58 | |
Redeemed | | | (21,356 | ) | | | (25,312 | ) | | | (179,184 | ) | | | (418,347 | ) |
| | | | | | | | | | | | | | | | |
Change in Class C Shares | | | (9,358 | ) | | | 22,660 | | | | (85,115 | ) | | | (198,663 | ) |
| | | | | | | | | | | | | | | | |
Agency | |
Issued | | | 271,543,299 | | | | 402,268,621 | | | | 220,184 | | | | 315,483 | |
Reinvested | | | 1,345 | | | | 562 | | | | 66 | | | | 34 | |
Redeemed | | | (274,483,220 | ) | | | (400,731,257 | ) | | | (223,338 | ) | | | (339,426 | ) |
| | | | | | | | | | | | | | | | |
Change in Agency Shares | | | (2,938,576 | ) | | | 1,537,926 | | | | (3,088 | ) | | | (23,909 | ) |
| | | | | | | | | | | | | | | | |
Capital | |
Issued | | | 430,153,702 | | | | 898,641,705 | | | | 3,189,113 | | | | 13,791,594 | |
Reinvested | | | 59,786 | | | | 41,937 | | | | 2,236 | | | | 3,255 | |
Redeemed | | | (449,456,909 | ) | | | (900,133,191 | ) | | | (5,011,503 | ) | | | (14,612,885 | ) |
| | | | | | | | | | | | | | | | |
Change in Capital Shares | | | (19,243,421 | ) | | | (1,449,549 | ) | | | (1,820,154 | ) | | | (818,036 | ) |
| | | | | | | | | | | | | | | | |
Cash Management | |
Issued | | | 115,466 | | | | 2,286,522 | | | | — | | | | — | |
Reinvested | | | 10 | | | | 80 | | | | — | | | | — | |
Redeemed | | | (560,100 | ) | | | (3,034,255 | ) | | | — | | | | — | |
| | | | | | | | | | | | | | | | |
Change in Cash Management Shares | | | (444,624 | ) | | | (747,653 | ) | | | — | | | | — | |
| | | | | | | | | | | | | | | | |
Direct (c) | |
Issued | | | 738,445 | | | | 2,720,187 | | | | — | | | | — | |
Redeemed | | | (2,069,406 | ) | | | (3,808,687 | ) | | | — | | | | — | |
| | | | | | | | | | | | | | | | |
Change in Direct Shares | | | (1,330,961 | ) | | | (1,088,500 | ) | | | — | | | | — | |
| | | | | | | | | | | | | | | | |
Eagle Class | |
Issued | | | 186,450 | | | | 512,243 | | | | — | | | | — | |
Reinvested | | | 19 | | | | 36 | | | | — | | | | — | |
Redeemed | | | (208,270 | ) | | | (440,029 | ) | | | — | | | | — | |
| | | | | | | | | | | | | | | | |
Change in Eagle Class Shares | | | (21,801 | ) | | | 72,250 | | | | — | | | | — | |
| | | | | | | | | | | | | | | | |
E*Trade | |
Issued | | | — | | | | — | | | | 533,699 | | | | 2,338,735 | |
Reinvested | | | — | | | | — | | | | 23 | | | | 662 | |
Redeemed | | | — | | | | — | | | | (1,865,778 | ) | | | (8,078,883 | ) |
| | | | | | | | | | | | | | | | |
Change in E*Trade Shares | | | — | | | | — | | | | (1,332,056 | ) | | | (5,739,486 | ) |
| | | | | | | | | | | | | | | | |
IM | |
Issued | | | 13,427,669 | | | | 37,443,428 | | | | — | | | | — | |
Reinvested | | | — | | | | 75 | | | | — | | | | — | |
Redeemed | | | (13,811,822 | ) | | | (38,564,457 | ) | | | — | | | | — | |
| | | | | | | | | | | | | | | | |
Change in IM Shares | | | (384,153 | ) | | | (1,120,954 | ) | | | — | | | | — | |
| | | | | | | | | | | | | | | | |
SEE NOTES TO FINANCIAL STATEMENTS.
| | | | | | |
| | | |
| 72 | | | | J.P. MORGAN MONEY MARKET FUNDS | | AUGUST 31, 2016 |
| | | | | | | | | | | | | | | | |
| | | Prime Money Market Fund | | | Liquid Assets Money Market Fund | |
| | | Six Months Ended
August 31, 2016
(Unaudited) | | | Year Ended
February 29, 2016 | | | Six Months Ended
August 31, 2016
(Unaudited) | | | Year Ended
February 29, 2016 | |
SHARE TRANSACTIONS: (continued) | |
Institutional Class | |
Issued | | | 83,526,353 | | | | 164,150,461 | | | | 18,064,128 | | | | 45,216,773 | |
Reinvested | | | 10,611 | | | | 6,984 | | | | 1,976 | | | | 1,748 | |
Redeemed | | | (87,333,142 | ) | | | (171,864,961 | ) | | | (23,408,167 | ) | | | (45,280,508 | ) |
| | | | | | | | | | | | | | | | |
Change in Institutional Class Shares | | | (3,796,178 | ) | | | (7,707,516 | ) | | | (5,342,063 | ) | | | (61,987 | ) |
| | | | | | | | | | | | | | | | |
Investor | |
Issued | | | 302,724 | | | | 1,377,808 | | | | 183,265 | | | | 437,316 | |
Reinvested | | | 630 | | | | 207 | | | | 6 | | | | 3 | |
Redeemed | | | (1,918,468 | ) | | | (618,251 | ) | | | (275,198 | ) | | | (435,697 | ) |
| | | | | | | | | | | | | | | | |
Change in Investor Shares | | | (1,615,114 | ) | | | 759,764 | | | | (91,927 | ) | | | 1,622 | |
| | | | | | | | | | | | | | | | |
Morgan | |
Issued | | | 35,673,987 | | | | 87,350,729 | | | | 1,197,147 | | | | 2,541,275 | |
Reinvested | | | 322 | | | | 146 | | | | 80 | | | | 173 | |
Redeemed | | | (36,443,342 | ) | | | (87,753,254 | ) | | | (1,224,546 | ) | | | (2,617,604 | ) |
Conversion from Class B Shares | | | — | | | | 514 | | | | — | | | | 1,054 | |
| | | | | | | | | | | | | | | | |
Change in Morgan Shares | | | (769,033 | ) | | | (401,865 | ) | | | (27,319 | ) | | | (75,102 | ) |
| | | | | | | | | | | | | | | | |
Premier | |
Issued | | | 41,380,308 | | | | 51,258,738 | | | | 195,834 | | | | 580,727 | |
Reinvested | | | 461 | | | | 128 | | | | 8 | | | | 3 | |
Redeemed | | | (41,795,438 | ) | | | (50,817,662 | ) | | | (290,087 | ) | | | (566,543 | ) |
| | | | | | | | | | | | | | | | |
Change in Premier Shares | | | (414,669 | ) | | | 441,204 | | | | (94,245 | ) | | | 14,187 | |
| | | | | | | | | | | | | | | | |
Reserve | |
Issued | | | 11,767,833 | | | | 26,828,510 | | | | 15,253,242 | | | | 36,717,078 | |
Reinvested | | | 39 | | | | 95 | | | | 1 | | | | 3 | |
Redeemed | | | (12,012,316 | ) | | | (27,052,886 | ) | | | (15,430,440 | ) | | | (36,700,330 | ) |
| | | | | | | | | | | | | | | | |
Change in Reserve Shares | | | (244,444 | ) | | | (224,281 | ) | | | (177,197 | ) | | | 16,751 | |
| | | | | | | | | | | | | | | | |
Service | |
Issued | | | 617,814 | | | | 2,294,901 | | | | 7,122,037 | | | | 16,481,056 | |
Reinvested | | | 86 | | | | 185 | | | | — | (a) | | | 3 | |
Redeemed | | | (1,244,479 | ) | | | (1,970,446 | ) | | | (7,191,655 | ) | | | (16,530,200 | ) |
| | | | | | | | | | | | | | | | |
Change in Service Shares | | | (626,579 | ) | | | 324,640 | | | | (69,618 | ) | | | (49,141 | ) |
| | | | | | | | | | | | | | | | |
| (a) | All remaining Class B Shares converted to Morgan Shares on June 19, 2015. |
| (b) | Amount rounds to less than 500. |
| (c) | Direct Shares of the Prime Money Market Fund had no assets as of August 16, 2016. |
SEE NOTES TO FINANCIAL STATEMENTS.
| | | | | | | | |
| | | |
| AUGUST 31, 2016 | | J.P. MORGAN MONEY MARKET FUNDS | | | | | 73 | |
STATEMENTS OF CHANGES IN NET ASSETS
FOR THE PERIODS INDICATED (continued)
(Amounts in thousands)
| | | | | | | | | | | | | | | | |
| | | U.S. Government Money Market Fund | | | U.S. Treasury Plus Money Market Fund | |
| | | Six Months Ended
August 31, 2016
(Unaudited) | | | Year Ended
February 29, 2016 | | | Six Months Ended
August 31, 2016
(Unaudited) | | | Year Ended
February 29, 2016 | |
CAPITAL TRANSACTIONS: | | | | | | | | | | | | | | | | |
Class B (a) | | | | | | | | | | | | | | | | |
Proceeds from shares issued | | $ | — | | | $ | — | | | $ | — | | | $ | 2 | |
Distributions reinvested | | | — | | | | — | | | | — | | | | — | |
Cost of shares redeemed | | | — | | | | — | | | | — | | | | (9 | ) |
Conversion to Morgan Shares | | | — | | | | — | | | | — | | | | (138 | ) |
| | | | | | | | | | | | | | | | |
Change in net assets resulting from Class C capital transactions | | $ | — | | | $ | — | | | $ | — | | | $ | (145 | ) |
| | | | | | | | | | | | | | | | |
Class C | | | | | | | | | | | | | | | | |
Proceeds from shares issued | | $ | — | | | $ | — | | | $ | 40,048 | | | $ | 105,451 | |
Distributions reinvested | | | — | | | | — | | | | — | | | | 1 | |
Cost of shares redeemed | | | — | | | | — | | | | (50,891 | ) | | | (119,329 | ) |
| | | | | | | | | | | | | | | | |
Change in net assets resulting from Class C capital transactions | | $ | — | | | $ | — | | | $ | (10,843 | ) | | $ | (13,877 | ) |
| | | | | | | | | | | | | | | | |
Agency | | | | | | | | | | | | | | | | |
Proceeds from shares issued | | $ | 405,046,574 | | | $ | 458,807,419 | | | $ | 49,077,020 | | | $ | 70,874,808 | |
Distributions reinvested | | | 198 | | | | 71 | | | | 150 | | | | 43 | |
Cost of shares redeemed | | | (400,839,261 | ) | | | (458,642,107 | ) | | | (48,550,835 | ) | | | (70,776,186 | ) |
| | | | | | | | | | | | | | | | |
Change in net assets resulting from Agency capital transactions | | $ | 4,207,511 | | | $ | 165,383 | | | $ | 526,335 | | | $ | 98,665 | |
| | | | | | | | | | | | | | | | |
Capital | | | | | | | | | | | | | | | | |
Proceeds from shares issued | | $ | 253,798,183 | | | $ | 415,543,073 | | | $ | — | | | $ | — | |
Distributions reinvested | | | 24,188 | | | | 5,314 | | | | — | | | | — | |
Cost of shares redeemed | | | (218,430,997 | ) | | | (420,473,412 | ) | | | — | | | | — | |
| | | | | | | | | | | | | | | | |
Change in net assets resulting from Capital capital transactions | | $ | 35,391,374 | | | $ | (4,925,025 | ) | | $ | — | | | $ | — | |
| | | | | | | | | | | | | | | | |
Direct | | | | | | | | | | | | | | | | |
Proceeds from shares issued | | $ | 340,578 | | | $ | 1,908,801 | | | $ | 1,036,087 | | | $ | 3,264,083 | |
Cost of shares redeemed | | | (972,036 | ) | | | (1,333,724 | ) | | | (1,649,633 | ) | | | (3,813,462 | ) |
| | | | | | | | | | | | | | | | |
Change in net assets resulting from Direct capital transactions | | $ | (631,458 | ) | | $ | 575,077 | | | $ | (613,546 | ) | | $ | (549,379 | ) |
| | | | | | | | | | | | | | | | |
Eagle Class | | | | | | | | | | | | | | | | |
Proceeds from shares issued | | $ | 618,535 | | | $ | 1,119,514 | | | $ | — | | | $ | — | |
Distributions reinvested | | | 20 | | | | 40 | | | | — | | | | — | |
Cost of shares redeemed | | | (663,442 | ) | | | (1,033,247 | ) | | | — | | | | (80 | ) |
| | | | | | | | | | | | | | | | |
Change in net assets resulting from Eagle Class capital transactions | | $ | (44,887 | ) | | $ | 86,307 | | | $ | — | | | $ | (80 | ) |
| | | | | | | | | | | | | | | | |
E*Trade (b) | | | | | | | | | | | | | | | | |
Proceeds from shares issued | | $ | 20 | | | $ | — | | | $ | — | | | $ | — | |
Distributions reinvested | | | — | (b) | | | — | | | | — | | | | — | |
| | | | | | | | | | | | | | | | |
Change in net assets resulting from E*Trade capital transactions | | $ | 20 | | | $ | — | | | $ | — | | | $ | — | |
| | | | | | | | | | | | | | | | |
IM | | | | | | | | | | | | | | | | |
Proceeds from shares issued | | $ | 1,992,845 | | | $ | 1,759,427 | | | $ | 15,461,750 | | | $ | 26,161,561 | |
Distributions reinvested | | | — | (b) | | | — | (b) | | | 3,228 | | | | 608 | |
Cost of shares redeemed | | | (2,371,665 | ) | | | (2,253,893 | ) | | | (14,679,048 | ) | | | (24,419,657 | ) |
| | | | | | | | | | | | | | | | |
Change in net assets resulting from IM capital transactions | | $ | (378,820 | ) | | $ | (494,466 | ) | | $ | 785,930 | | | $ | 1,742,512 | |
| | | | | | | | | | | | | | | | |
SEE NOTES TO FINANCIAL STATEMENTS.
| | | | | | |
| | | |
| 74 | | | | J.P. MORGAN MONEY MARKET FUNDS | | AUGUST 31, 2016 |
| | | | | | | | | | | | | | | | |
| | | U.S. Government Money Market Fund | | | U.S. Treasury Plus Money Market Fund | |
| | | Six Months Ended
August 31, 2016
(Unaudited) | | | Year Ended
February 29, 2016 | | | Six Months Ended
August 31, 2016
(Unaudited) | | | Year Ended
February 29, 2016 | |
CAPITAL TRANSACTIONS: (continued) | | | | | | | | | | | | | | | | |
Institutional Class | | | | | | | | | | | | | | | | |
Proceeds from shares issued | | $ | 77,492,314 | | | $ | 148,109,991 | | | $ | 35,707,196 | | | $ | 92,331,037 | |
Distributions reinvested | | | 3,216 | | | | 626 | | | | 4,486 | | | | 1,031 | |
Cost of shares redeemed | | | (64,776,688 | ) | | | (147,686,296 | ) | | | (33,102,776 | ) | | | (90,112,215 | ) |
| | | | | | | | | | | | | | | | |
Change in net assets resulting from Institutional Class capital transactions | | $ | 12,718,842 | | | $ | 424,321 | | | $ | 2,608,906 | | | $ | 2,219,853 | |
| | | | | | | | | | | | | | | | |
Investor | | | | | | | | | | | | | | | | |
Proceeds from shares issued | | $ | 820,050 | | | $ | 2,858,618 | | | $ | 79,781 | | | $ | 213,845 | |
Distributions reinvested | | | 149 | | | | 341 | | | | — | | | | — | (b) |
Cost of shares redeemed | | | (4,076,160 | ) | | | (2,069,037 | ) | | | (90,944 | ) | | | (306,734 | ) |
| | | | | | | | | | | | | | | | |
Change in net assets resulting from Investor capital transactions | | $ | (3,255,961 | ) | | $ | 789,922 | | | $ | (11,163 | ) | | $ | (92,889 | ) |
| | | | | | | | | | | | | | | | |
Morgan | | | | | | | | | | | | | | | | |
Proceeds from shares issued | | $ | 108,980,925 | | | $ | 176,475,885 | | | $ | 15,096,272 | | | $ | 31,568,183 | |
Distributions reinvested | | | 22 | | | | 41 | | | | — | | | | 1 | |
Cost of shares redeemed | | | (108,978,564 | ) | | | (176,286,032 | ) | | | (15,164,594 | ) | | | (31,596,879 | ) |
Conversion from Class B Shares | | | — | | | | — | | | | — | | | | 138 | |
| | | | | | | | | | | | | | | | |
Change in net assets resulting from Morgan capital transactions | | $ | 2,383 | | | $ | 189,894 | | | $ | (68,322 | ) | | $ | (28,557 | ) |
| | | | | | | | | | | | | | | | |
Premier | | | | | | | | | | | | | | | | |
Proceeds from shares issued | | $ | 111,569,706 | | | $ | 172,471,600 | | | $ | 3,991,248 | | | $ | 18,135,751 | |
Distributions reinvested | | | 24 | | | | 30 | | | | — | (b) | | | — | (b) |
Cost of shares redeemed | | | (110,912,002 | ) | | | (168,342,824 | ) | | | (3,946,329 | ) | | | (18,274,505 | ) |
| | | | | | | | | | | | | | | | |
Change in net assets resulting from Premier capital transactions | | $ | 657,728 | | | $ | 4,128,806 | | | $ | 44,919 | | | $ | (138,754 | ) |
| | | | | | | | | | | | | | | | |
Reserve | | | | | | | | | | | | | | | | |
Proceeds from shares issued | | $ | 1,601,552 | | | $ | 4,891,894 | | | $ | 9,168,462 | | | $ | 21,347,634 | |
Distributions reinvested | | | 2 | | | | 5 | | | | — | | | | 7 | |
Cost of shares redeemed | | | (1,537,597 | ) | | | (5,025,881 | ) | | | (9,753,291 | ) | | | (21,515,141 | ) |
| | | | | | | | | | | | | | | | |
Change in net assets resulting from Reserve capital transactions | | $ | 63,957 | | | $ | (133,982 | ) | | $ | (584,829 | ) | | $ | (167,500 | ) |
| | | | | | | | | | | | | | | | |
Service | | | | | | | | | | | | | | | | |
Proceeds from shares issued | | $ | 1,882,756 | | | $ | 4,033,487 | | | $ | — | | | $ | — | |
Distributions reinvested | | | 20 | | | | 67 | | | | — | | | | — | |
Cost of shares redeemed | | | (1,508,336 | ) | | | (4,551,542 | ) | | | — | | | | (80 | ) |
| | | | | | | | | | | | | | | | |
Change in net assets resulting from Service capital transactions | | $ | 374,440 | | | $ | (517,988 | ) | | $ | — | | | $ | (80 | ) |
| | | | | | | | | | | | | | | | |
Total change in net assets resulting from capital transactions | | $ | 49,105,129 | | | $ | 288,249 | | | $ | 2,677,387 | | | $ | 3,069,769 | |
| | | | | | | | | | | | | | | | |
| (a) | All remaining Class B Shares converted to Morgan Shares on June 19, 2015. |
| (b) | Amount rounds to less than 500. |
| (c) | Commencement of offering of class of shares effective March 9, 2016 for U.S. Government Money Market Fund. |
SEE NOTES TO FINANCIAL STATEMENTS.
| | | | | | | | |
| | | |
| AUGUST 31, 2016 | | J.P. MORGAN MONEY MARKET FUNDS | | | | | 75 | |
STATEMENTS OF CHANGES IN NET ASSETS
FOR THE PERIODS INDICATED (continued)
(Amounts in thousands)
| | | | | | | | | | | | | | | | |
| | | U.S. Government Money Market Fund | | | U.S. Treasury Plus Money Market Fund | |
| | | Six Months Ended
August 31, 2016
(Unaudited) | | | Year Ended
February 29, 2016 | | | Six Months Ended
August 31, 2016
(Unaudited) | | | Year Ended
February 29, 2016 | |
SHARE TRANSACTIONS: | |
Class B (a) | |
Issued | | | — | | | | — | | | | — | | | | 2 | |
Reinvested | | | — | | | | — | | | | — | | | | — | |
Redeemed | | | — | | | | — | | | | — | | | | (9 | ) |
Conversion to Morgan Shares | | | — | | | | — | | | | — | | | | (138 | ) |
| | | | | | | | | | | | | | | | |
Change in Class C Shares | | | — | | | | — | | | | — | | | | (145 | ) |
| | | | | | | | | | | | | | | | |
Class C | |
Issued | | | — | | | | — | | | | 40,044 | | | | 105,447 | |
Reinvested | | | — | | | | — | | | | — | | | | 1 | |
Redeemed | | | — | | | | — | | | | (50,891 | ) | | | (119,329 | ) |
| | | | | | | | | | | | | | | | |
Change in Class C Shares | | | — | | | | — | | | | (10,847 | ) | | | (13,881 | ) |
| | | | | | | | | | | | | | | | |
Agency | |
Issued | | | 405,046,543 | | | | 458,807,414 | | | | 49,077,020 | | | | 70,874,851 | |
Reinvested | | | 198 | | | | 71 | | | | 150 | | | | 43 | |
Redeemed | | | (400,839,260 | ) | | | (458,642,107 | ) | | | (48,550,824 | ) | | | (70,776,184 | ) |
| | | | | | | | | | | | | | | | |
Change in Agency Shares | | | 4,207,481 | | | | 165,378 | | | | 526,346 | | | | 98,710 | |
| | | | | | | | | | | | | | | | |
Capital | |
Issued | | | 253,798,242 | | | | 415,543,073 | | | | — | | | | — | |
Reinvested | | | 24,188 | | | | 5,314 | | | | — | | | | — | |
Redeemed | | | (218,430,852 | ) | | | (420,473,354 | ) | | | — | | | | — | |
| | | | | | | | | | | | | | | | |
Change in Capital Shares | | | 35,391,578 | | | | (4,924,967 | ) | | | — | | | | — | |
| | | | | | | | | | | | | | | | |
Direct | |
Issued | | | 340,565 | | | | 1,908,801 | | | | 1,036,063 | | | | 3,263,950 | |
Redeemed | | | (972,036 | ) | | | (1,333,724 | ) | | | (1,649,633 | ) | | | (3,813,462 | ) |
| | | | | | | | | | | | | | | | |
Change in Direct Shares | | | (631,471 | ) | | | 575,077 | | | | (613,570 | ) | | | (549,512 | ) |
| | | | | | | | | | | | | | | | |
Eagle Class | |
Issued | | | 618,525 | | | | 1,119,514 | | | | — | | | | — | |
Reinvested | | | 20 | | | | 40 | | | | — | | | | — | |
Redeemed | | | (663,442 | ) | | | (1,033,247 | ) | | | — | | | | (80 | ) |
| | | | | | | | | | | | | | | | |
Change in Eagle Class Shares | | | (44,897 | ) | | | 86,307 | | | | — | | | | (80 | ) |
| | | | | | | | | | | | | | | | |
E*Trade (b) | |
Issued | | | 20 | | | | — | | | | — | | | | — | |
Reinvested | | | — | (c) | | | — | | | | — | | | | — | |
| | | | | | | | | | | | | | | | |
Change in E*Trade Shares | | | 20 | | | | — | | | | — | | | | — | |
| | | | | | | | | | | | | | | | |
IM | |
Issued | | | 1,992,836 | | | | 1,759,427 | | | | 15,461,742 | | | | 26,161,793 | |
Reinvested | | | — | (c) | | | — | (c) | | | 3,228 | | | | 608 | |
Redeemed | | | (2,371,665 | ) | | | (2,253,893 | ) | | | (14,679,023 | ) | | | (24,419,626 | ) |
| | | | | | | | | | | | | | | | |
Change in IM Shares | | | (378,829 | ) | | | (494,466 | ) | | | 785,947 | | | | 1,742,775 | |
| | | | | | | | | | | | | | | | |
Institutional Class | |
Issued | | | 77,492,308 | | | | 148,109,983 | | | | 35,707,187 | | | | 92,331,104 | |
Reinvested | | | 3,216 | | | | 626 | | | | 4,486 | | | | 1,031 | |
Redeemed | | | (64,776,631 | ) | | | (147,686,296 | ) | | | (33,102,731 | ) | | | (90,112,215 | ) |
| | | | | | | | | | | | | | | | |
Change in Institutional Class Shares | | | 12,718,893 | | | | 424,313 | | | | 2,608,942 | | | | 2,219,920 | |
| | | | | | | | | | | | | | | | |
SEE NOTES TO FINANCIAL STATEMENTS.
| | | | | | |
| | | |
| 76 | | | | J.P. MORGAN MONEY MARKET FUNDS | | AUGUST 31, 2016 |
| | | | | | | | | | | | | | | | |
| | | U.S. Government Money Market Fund | | | U.S. Treasury Plus Money Market Fund | |
| | | Six Months Ended
August 31, 2016
(Unaudited) | | | Year Ended
February 29, 2016 | | | Six Months Ended
August 31, 2016
(Unaudited) | | | Year Ended
February 29, 2016 | |
SHARE TRANSACTIONS: (continued) | |
Investor | |
Issued | | | 819,985 | | | | 2,858,618 | | | | 79,779 | | | | 213,816 | |
Reinvested | | | 149 | | | | 341 | | | | — | | | | — | (c) |
Redeemed | | | (4,076,160 | ) | | | (2,069,037 | ) | | | (90,943 | ) | | | (306,734 | ) |
| | | | | | | | | | | | | | | | |
Change in Investor Shares | | | (3,256,026 | ) | | | 789,922 | | | | (11,164 | ) | | | (92,918 | ) |
| | | | | | | | | | | | | | | | |
Morgan | |
Issued | | | 108,980,887 | | | | 176,475,820 | | | | 15,096,260 | | | | 31,568,121 | |
Reinvested | | | 22 | | | | 41 | | | | — | | | | 1 | |
Redeemed | | | (108,978,563 | ) | | | (176,286,032 | ) | | | (15,164,590 | ) | | | (31,596,878 | ) |
Conversion from Class B Shares | | | — | | | | — | | | | — | | | | 138 | |
| | | | | | | | | | | | | | | | |
Change in Morgan Shares | | | 2,346 | | | | 189,829 | | | | (68,330 | ) | | | (28,618 | ) |
| | | | | | | | | | | | | | | | |
Premier | |
Issued | | | 111,569,629 | | | | 172,471,600 | | | | 3,991,243 | | | | 18,135,678 | |
Reinvested | | | 24 | | | | 30 | | | | — | (c) | | | — | (c) |
Redeemed | | | (110,912,002 | ) | | | (168,342,804 | ) | | | (3,946,328 | ) | | | (18,274,505 | ) |
| | | | | | | | | | | | | | | | |
Change in Premier Shares | | | 657,651 | | | | 4,128,826 | | | | 44,915 | | | | (138,827 | ) |
| | | | | | | | | | | | | | | | |
Reserve | |
Issued | | | 1,601,552 | | | | 4,891,894 | | | | 9,168,438 | | | | 21,347,559 | |
Reinvested | | | 2 | | | | 5 | | | | — | | | | 7 | |
Redeemed | | | (1,537,597 | ) | | | (5,025,881 | ) | | | (9,753,290 | ) | | | (21,515,141 | ) |
| | | | | | | | | | | | | | | | |
Change in Reserve Shares | | | 63,957 | | | | (133,982 | ) | | | (584,852 | ) | | | (167,575 | ) |
| | | | | | | | | | | | | | | | |
Service | |
Issued | | | 1,882,742 | | | | 4,033,487 | | | | — | | | | — | |
Reinvested | | | 20 | | | | 67 | | | | — | | | | — | |
Redeemed | | | (1,508,336 | ) | | | (4,551,542 | ) | | | — | | | | (80 | ) |
| | | | | | | | | | | | | | | | |
Change in Service Shares | | | 374,426 | | | | (517,988 | ) | | | — | | | | (80 | ) |
| | | | | | | | | | | | | | | | |
| (a) | All remaining Class B Shares converted to Morgan Shares on June 19, 2015. |
| (b) | Commencement of offering of class of shares effective March 9, 2016 for U.S. Government Money Market Fund. |
| (c) | Amount rounds to less than 500. |
SEE NOTES TO FINANCIAL STATEMENTS.
| | | | | | | | |
| | | |
| AUGUST 31, 2016 | | J.P. MORGAN MONEY MARKET FUNDS | | | | | 77 | |
STATEMENTS OF CHANGES IN NET ASSETS
FOR THE PERIODS INDICATED (continued)
(Amounts in thousands)
| | | | | | | | | | | | | | | | |
| | | Federal Money Market Fund | | | 100% U.S. Treasury Securities Money
Market Fund | |
| | | Six Months Ended
August 31, 2016
(Unaudited) | | | Year Ended
February 29, 2016 | | | Six Months Ended
August 31, 2016
(Unaudited) | | | Year Ended
February 29, 2016 | |
CAPITAL TRANSACTIONS: | | | | | | | | | | | | | | | | |
Agency | | | | | | | | | | | | | | | | |
Proceeds from shares issued | | $ | 870,469 | | | $ | 826,639 | | | $ | 38,151,588 | | | $ | 79,326,288 | |
Distributions reinvested | | | 29 | | | | 7 | | | | 280 | | | | 49 | |
Cost of shares redeemed | | | (903,015 | ) | | | (677,466 | ) | | | (39,010,433 | ) | | | (79,130,787 | ) |
| | | | | | | | | | | | | | | | |
Change in net assets resulting from Agency capital transactions | | $ | (32,517 | ) | | $ | 149,180 | | | $ | (858,565 | ) | | $ | 195,550 | |
| | | | | | | | | | | | | | | | |
Capital | | | | | | | | | | | | | | | | |
Proceeds from shares issued | | $ | — | | | $ | — | | | $ | 21,844,273 | | | $ | 41,633,858 | |
Distributions reinvested | | | — | | | | — | | | | 5,468 | | | | 850 | |
Cost of shares redeemed | | | — | | | | — | | | | (21,200,806 | ) | | | (40,673,839 | ) |
| | | | | | | | | | | | | | | | |
Change in net assets resulting from Capital capital transactions | | $ | — | | | $ | — | | | $ | 648,935 | | | $ | 960,869 | |
| | | | | | | | | | | | | | | | |
Institutional Class | | | | | | | | | | | | | | | | |
Proceeds from shares issued | | $ | 5,829,438 | | | $ | 8,640,303 | | | $ | 11,324,771 | | | $ | 32,337,241 | |
Distributions reinvested | | | 1,036 | | | | 516 | | | | 1,893 | | | | 211 | |
Cost of shares redeemed | | | (7,070,198 | ) | | | (9,020,779 | ) | | | (9,894,991 | ) | | | (35,260,715 | ) |
| | | | | | | | | | | | | | | | |
Change in net assets resulting from Institutional Class capital transactions | | $ | (1,239,724 | ) | | $ | (379,960 | ) | | $ | 1,431,673 | | | $ | (2,923,263 | ) |
| | | | | | | | | | | | | | | | |
Morgan | | | | | | | | | | | | | | | | |
Proceeds from shares issued | | $ | 559,050 | | | $ | 740,934 | | | $ | 122,606,153 | | | $ | 281,077,841 | |
Distributions reinvested | | | 4 | | | | 9 | | | | — | | | | 2 | |
Cost of shares redeemed | | | (549,917 | ) | | | (720,496 | ) | | | (123,140,510 | ) | | | (280,564,759 | ) |
| | | | | | | | | | | | | | | | |
Change in net assets resulting from Morgan capital transactions | | $ | 9,137 | | | $ | 20,447 | | | $ | (534,357 | ) | | $ | 513,084 | |
| | | | | | | | | | | | | | | | |
Premier | | | | | | | | | | | | | | | | |
Proceeds from shares issued | | $ | 186,899 | | | $ | 397,701 | | | $ | 13,706,327 | | | $ | 36,693,783 | |
Distributions reinvested | | | 3 | | | | 10 | | | | — | | | | — | (a) |
Cost of shares redeemed | | | (222,366 | ) | | | (445,687 | ) | | | (13,868,669 | ) | | | (36,734,086 | ) |
| | | | | | | | | | | | | | | | |
Change in net assets resulting from Premier capital transactions | | $ | (35,464 | ) | | $ | (47,976 | ) | | $ | (162,342 | ) | | $ | (40,303 | ) |
| | | | | | | | | | | | | | | | |
Reserve | | | | | | | | | | | | | | | | |
Proceeds from shares issued | | $ | 9,110 | | | $ | 44,122 | | | $ | 79,346 | | | $ | 1,075,542 | |
Distributions reinvested | | | — | (a) | | | 2 | | | | — | | | | — | (a) |
Cost of shares redeemed | | | (26,119 | ) | | | (28,533 | ) | | | (91,425 | ) | | | (1,014,120 | ) |
| | | | | | | | | | | | | | | | |
Change in net assets resulting from Reserve capital transactions | | $ | (17,009 | ) | | $ | 15,591 | | | $ | (12,079 | ) | | $ | 61,422 | |
| | | | | | | | | | | | | | | | |
Service | | | | | | | | | | | | | | | | |
Proceeds from shares issued | | $ | — | | | $ | — | | | $ | — | | | $ | — | |
Distributions reinvested | | | — | | | | — | | | | — | | | | — | (a) |
Cost of shares redeemed | | | — | | | | — | | | | — | | | | (80 | ) |
| | | | | | | | | | | | | | | | |
Change in net assets resulting from Service capital transactions | | $ | — | | | $ | — | | | $ | — | | | $ | (80 | ) |
| | | | | | | | | | | | | | | | |
Total change in net assets resulting from capital transactions | | $ | (1,315,577 | ) | | $ | (242,718 | ) | | $ | 513,265 | | | $ | (1,232,721 | ) |
| | | | | | | | | | | | | | | | |
| (a) | Amount rounds to less than 500. |
SEE NOTES TO FINANCIAL STATEMENTS.
| | | | | | |
| | | |
| 78 | | | | J.P. MORGAN MONEY MARKET FUNDS | | AUGUST 31, 2016 |
| | | | | | | | | | | | | | | | |
| | | Federal Money Market Fund | | | 100% U.S. Treasury Securities Money
Market Fund | |
| | | Six Months Ended
August 31, 2016
(Unaudited) | | | Year Ended
February 29, 2016 | | | Six Months Ended
August 31, 2016
(Unaudited) | | | Year Ended
February 29, 2016 | |
SHARE TRANSACTIONS: | |
Agency | |
Issued | | | 870,456 | | | | 826,639 | | | | 38,151,584 | | | | 79,326,288 | |
Reinvested | | | 29 | | | | 7 | | | | 280 | | | | 49 | |
Redeemed | | | (902,982 | ) | | | (677,466 | ) | | | (39,010,434 | ) | | | (79,130,783 | ) |
| | | | | | | | | | | | | | | | |
Change in Agency Shares | | | (32,497 | ) | | | 149,180 | | | | (858,570 | ) | | | 195,554 | |
| | | | | | | | | | | | | | | | |
Capital | |
Issued | | | — | | | | — | | | | 21,844,315 | | | | 41,633,847 | |
Reinvested | | | — | | | | — | | | | 5,468 | | | | 850 | |
Redeemed | | | — | | | | — | | | | (21,200,806 | ) | | | (40,673,839 | ) |
| | | | | | | | | | | | | | | | |
Change in Capital Shares | | | — | | | | — | | | | 648,977 | | | | 960,858 | |
| | | | | | | | | | | | | | | | |
Institutional Class | |
Issued | | | 5,829,406 | | | | 8,640,303 | | | | 11,324,715 | | | | 32,337,240 | |
Reinvested | | | 1,036 | | | | 516 | | | | 1,893 | | | | 211 | |
Redeemed | | | (7,070,170 | ) | | | (9,020,779 | ) | | | (9,894,986 | ) | | | (35,260,715 | ) |
| | | | | | | | | | | | | | | | |
Change in Institutional Class Shares | | | (1,239,728 | ) | | | (379,960 | ) | | | 1,431,622 | | | | (2,923,264 | ) |
| | | | | | | | | | | | | | | | |
Morgan | |
Issued | | | 559,029 | | | | 740,934 | | | | 122,606,168 | | | | 281,077,841 | |
Reinvested | | | 4 | | | | 9 | | | | — | | | | 2 | |
Redeemed | | | (549,897 | ) | | | (720,496 | ) | | | (123,140,511 | ) | | | (280,564,757 | ) |
| | | | | | | | | | | | | | | | |
Change in Morgan Shares | | | 9,136 | | | | 20,447 | | | | (534,343 | ) | | | 513,086 | |
| | | | | | | | | | | | | | | | |
Premier | |
Issued | | | 186,882 | | | | 397,701 | | | | 13,706,306 | | | | 36,693,783 | |
Reinvested | | | 3 | | | | 10 | | | | — | | | | — | (a) |
Redeemed | | | (222,363 | ) | | | (445,687 | ) | | | (13,868,668 | ) | | | (36,734,082 | ) |
| | | | | | | | | | | | | | | | |
Change in Premier Shares | | | (35,478 | ) | | | (47,976 | ) | | | (162,362 | ) | | | (40,299 | ) |
| | | | | | | | | | | | | | | | |
Reserve | |
Issued | | | 9,108 | | | | 44,122 | | | | 79,365 | | | | 1,075,542 | |
Reinvested | | | — | (a) | | | 2 | | | | — | | | | — | (a) |
Redeemed | | | (26,119 | ) | | | (28,533 | ) | | | (91,424 | ) | | | (1,014,118 | ) |
| | | | | | | | | | | | | | | | |
Change in Reserve Shares | | | (17,011 | ) | | | 15,591 | | | | (12,059 | ) | | | 61,424 | |
| | | | | | | | | | | | | | | | |
Service | |
Reinvested | | | — | | | | — | | | | — | | | | — | (a) |
Redeemed | | | — | | | | — | | | | — | | | | (80 | ) |
| | | | | | | | | | | | | | | | |
Change in Service Shares | | | — | | | | — | | | | — | | | | (80 | ) |
| | | | | | | | | | | | | | | | |
| (a) | Amount rounds to less than 500. |
SEE NOTES TO FINANCIAL STATEMENTS.
| | | | | | | | |
| | | |
| AUGUST 31, 2016 | | J.P. MORGAN MONEY MARKET FUNDS | | | | | 79 | |
STATEMENTS OF CHANGES IN NET ASSETS
FOR THE PERIODS INDICATED (continued)
(Amounts in thousands)
| | | | | | | | | | | | | | | | |
| | | Tax Free Money Market Fund | | | Municipal Money Market Fund | |
| | | Six Months Ended
August 31, 2016
(Unaudited) | | | Year Ended
February 29, 2016 | | | Six Months Ended
August 31, 2016
(Unaudited) | | | Year Ended
February 29, 2016 | |
CAPITAL TRANSACTIONS: | | | | | | | | | | | | | | | | |
Agency | | | | | | | | | | | | | | | | |
Proceeds from shares issued | | $ | 669,086 | | | $ | 1,357,982 | | | $ | 333,043 | | | $ | 884,994 | |
Distributions reinvested | | | 49 | | | | 17 | | | | 1 | | | | — | (a) |
Cost of shares redeemed | | | (861,497 | ) | | | (1,335,799 | ) | | | (507,004 | ) | | | (772,935 | ) |
| | | | | | | | | | | | | | | | |
Change in net assets resulting from Agency capital transactions | | $ | (192,362 | ) | | $ | 22,200 | | | $ | (173,960 | ) | | $ | 112,059 | |
| | | | | | | | | | | | | | | | |
Direct | | | | | | | | | | | | | | | | |
Distributions reinvested | | $ | — | (a) | | $ | — | (a) | | $ | — | | | $ | — | |
Cost of shares redeemed | | | — | | | | (80 | ) | | | — | | | | — | |
| | | | | | | | | | | | | | | | |
Change in net assets resulting from Direct capital transactions | | $ | — | (a) | | $ | (80 | ) | | $ | — | | | $ | — | |
| | | | | | | | | | | | | | | | |
Eagle Class (b) | | | | | | | | | | | | | | | | |
Proceeds from shares issued | | $ | 526,223 | | | $ | 964,565 | | | $ | 535,827 | | | $ | — | |
Distributions reinvested | | | 52 | | | | 326 | | | | 1 | | | | — | |
Cost of shares redeemed | | | (1,827,313 | ) | | | (963,540 | ) | | | (7,176 | ) | | | — | |
| | | | | | | | | | | | | | | | |
Change in net assets resulting from Eagle Class capital transactions | | $ | (1,301,038 | ) | | $ | 1,351 | | | $ | 528,652 | | | $ | — | |
| | | | | | | | | | | | | | | | |
E*Trade | | | | | | | | | | | | | | | | |
Proceeds from shares issued | | $ | — | | | $ | — | | | $ | 373,070 | | | $ | 542,546 | |
Distributions reinvested | | | — | | | | — | | | | 101 | | | | 290 | |
Cost of shares redeemed | | | — | | | | — | | | | (248,368 | ) | | | (608,414 | ) |
| | | | | | | | | | | | | | | | |
Change in net assets resulting from E*Trade capital transactions | | $ | — | | | $ | — | | | $ | 124,803 | | | $ | (65,578 | ) |
| | | | | | | | | | | | | | | | |
Institutional Class | | | | | | | | | | | | | | | | |
Proceeds from shares issued | | $ | 37,633,200 | | | $ | 76,627,965 | | | $ | 397,023 | | | $ | 752,041 | |
Distributions reinvested | | | 413 | | | | 226 | | | | 152 | | | | 20 | |
Cost of shares redeemed | | | (38,919,375 | ) | | | (78,283,310 | ) | | | (352,444 | ) | | | (807,933 | ) |
| | | | | | | | | | | | | | | | |
Change in net assets resulting from Institutional Class capital transactions | | $ | (1,285,762 | ) | | $ | (1,655,119 | ) | | $ | 44,731 | | | $ | (55,872 | ) |
| | | | | | | | | | | | | | | | |
Morgan | | | | | | | | | | | | | | | | |
Proceeds from shares issued | | $ | 4,185,534 | | | $ | 9,507,184 | | | $ | 365,811 | | | $ | 798,706 | |
Distributions reinvested | | | 1 | | | | 4 | | | | 18 | | | | 55 | |
Cost of shares redeemed | | | (4,237,182 | ) | | | (9,505,238 | ) | | | (377,780 | ) | | | (764,717 | ) |
| | | | | | | | | | | | | | | | |
Change in net assets resulting from Morgan capital transactions | | $ | (51,647 | ) | | $ | 1,950 | | | $ | (11,951 | ) | | $ | 34,044 | |
| | | | | | | | | | | | | | | | |
Premier | | | | | | | | | | | | | | | | |
Proceeds from shares issued | | $ | 4,457,725 | | | $ | 10,163,022 | | | $ | 16,377 | | | $ | 38,321 | |
Distributions reinvested | | | 3 | | | | 9 | | | | 2 | | | | 4 | |
Cost of shares redeemed | | | (5,541,314 | ) | | | (9,771,894 | ) | | | (21,692 | ) | | | (39,248 | ) |
| | | | | | | | | | | | | | | | |
Change in net assets resulting from Premier capital transactions | | $ | (1,083,586 | ) | | $ | 391,137 | | | $ | (5,313 | ) | | $ | (923 | ) |
| | | | | | | | | | | | | | | | |
Reserve | | | | | | | | | | | | | | | | |
Proceeds from shares issued | | $ | 5,881,425 | | | $ | 13,523,582 | | | $ | 1,104,423 | | | $ | 2,530,262 | |
Distributions reinvested | | | 20 | | | | 98 | | | | — | (a) | | | — | (a) |
Cost of shares redeemed | | | (6,835,730 | ) | | | (13,511,367 | ) | | | (1,114,131 | ) | | | (2,532,070 | ) |
| | | | | | | | | | | | | | | | |
Change in net assets resulting from Reserve capital transactions | | $ | (954,285 | ) | | $ | 12,313 | | | $ | (9,708 | ) | | $ | (1,808 | ) |
| | | | | | | | | | | | | | | | |
SEE NOTES TO FINANCIAL STATEMENTS.
| | | | | | |
| | | |
| 80 | | | | J.P. MORGAN MONEY MARKET FUNDS | | AUGUST 31, 2016 |
| | | | | | | | | | | | | | | | |
| | | Tax Free Money Market Fund | | | Municipal Money Market Fund | |
| | | Six Months Ended
August 31, 2016
(Unaudited) | | | Year Ended
February 29, 2016 | | | Six Months Ended
August 31, 2016
(Unaudited) | | | Year Ended
February 29, 2016 | |
CAPITAL TRANSACTIONS: (continued) | | | | | | | | | | | | | | | | |
Service | | | | | | | | | | | | | | | | |
Proceeds from shares issued | | $ | — | | | $ | — | | | $ | 1,701,114 | | | $ | 3,569,690 | |
Distributions reinvested | | | — | | | | — | | | | 21 | | | | 61 | |
Cost of shares redeemed | | | — | | | | — | | | | (1,763,881 | ) | | | (3,451,696 | ) |
| | | | | | | | | | | | | | | | |
Change in net assets resulting from Service capital transactions | | $ | — | | | $ | — | | | $ | (62,746 | ) | | $ | 118,055 | |
| | | | | | | | | | | | | | | | |
Total change in net assets resulting from capital transactions | | $ | (4,868,680 | ) | | $ | (1,226,248 | ) | | $ | 434,508 | | | $ | 139,977 | |
| | | | | | | | | | | | | | | | |
| (a) | Amount rounds to less than 500. |
| (b) | Commencement of offering of class of shares effective July 1, 2016, for Municipal Money Market Fund. |
SEE NOTES TO FINANCIAL STATEMENTS.
| | | | | | | | |
| | | |
| AUGUST 31, 2016 | | J.P. MORGAN MONEY MARKET FUNDS | | | | | 81 | |
STATEMENTS OF CHANGES IN NET ASSETS
FOR THE PERIODS INDICATED (continued)
(Amounts in thousands)
| | | | | | | | | | | | | | | | |
| | | Tax Free Money Market Fund | | | Municipal Money Market Fund | |
| | | Six Months Ended
August 31, 2016
(Unaudited) | | | Year Ended
February 29, 2016 | | | Six Months Ended
August 31, 2016
(Unaudited) | | | Year Ended
February 29, 2016 | |
SHARE TRANSACTIONS: | |
Agency | |
Issued | | | 669,085 | | | | 1,357,982 | | | | 333,042 | | | | 884,994 | |
Reinvested | | | 49 | | | | 17 | | | | 1 | | | | — | (a) |
Redeemed | | | (861,492 | ) | | | (1,335,799 | ) | | | (507,001 | ) | | | (772,935 | ) |
| | | | | | | | | | | | | | | | |
Change in Agency Shares | | | (192,358 | ) | | | 22,200 | | | | (173,958 | ) | | | 112,059 | |
| | | | | | | | | | | | | | | | |
Direct | |
Reinvested | | | — | (a) | | | — | (a) | | | — | | | | — | |
Redeemed | | | — | | | | (80 | ) | | | — | | | | — | |
| | | | | | | | | | | | | | | | |
Change in Direct Shares | | | — | (a) | | | (80 | ) | | | — | | | | — | |
| | | | | | | | | | | | | | | | |
Eagle Class (b) | |
Issued | | | 526,206 | | | | 964,565 | | | | 535,800 | | | | — | |
Reinvested | | | 52 | | | | 326 | | | | 1 | | | | — | |
Redeemed | | | (1,827,245 | ) | | | (963,540 | ) | | | (7,176 | ) | | | — | |
| | | | | | | | | | | | | | | | |
Change in Eagle Class Shares | | | (1,300,987 | ) | | | 1,351 | | | | 528,625 | | | | — | |
| | | | | | | | | | | | | | | | |
E*Trade | |
Issued | | | — | | | | — | | | | 373,074 | | | | 542,546 | |
Reinvested | | | — | | | | — | | | | 101 | | | | 290 | |
Redeemed | | | — | | | | — | | | | (248,350 | ) | | | (608,414 | ) |
| | | | | | | | | | | | | | | | |
Change in E*Trade Shares | | | — | | | | — | | | | 124,825 | | | | (65,578 | ) |
| | | | | | | | | | | | | | | | |
Institutional Class | |
Issued | | | 37,633,110 | | | | 76,627,923 | | | | 397,024 | | | | 752,041 | |
Reinvested | | | 413 | | | | 226 | | | | 152 | | | | 20 | |
Redeemed | | | (38,919,320 | ) | | | (78,283,310 | ) | | | (352,439 | ) | | | (807,933 | ) |
| | | | | | | | | | | | | | | | |
Change in Institutional Class Shares | | | (1,285,797 | ) | | | (1,655,161 | ) | | | 44,737 | | | | (55,872 | ) |
| | | | | | | | | | | | | | | | |
Morgan | |
Issued | | | 4,185,534 | | | | 9,507,184 | | | | 365,803 | | | | 798,706 | |
Reinvested | | | 1 | | | | 4 | | | | 18 | | | | 55 | |
Redeemed | | | (4,237,181 | ) | | | (9,505,235 | ) | | | (377,774 | ) | | | (764,717 | ) |
| | | | | | | | | | | | | | | | |
Change in Morgan Shares | | | (51,646 | ) | | | 1,953 | | | | (11,953 | ) | | | 34,044 | |
| | | | | | | | | | | | | | | | |
Premier | |
Issued | | | 4,457,710 | | | | 10,163,022 | | | | 16,375 | | | | 38,321 | |
Reinvested | | | 3 | | | | 9 | | | �� | 2 | | | | 4 | |
Redeemed | | | (5,541,290 | ) | | | (9,771,863 | ) | | | (21,691 | ) | | | (39,248 | ) |
| | | | | | | | | | | | | | | | |
Change in Premier Shares | | | (1,083,577 | ) | | | 391,168 | | | | (5,314 | ) | | | (923 | ) |
| | | | | | | | | | | | | | | | |
Reserve | |
Issued | | | 5,881,364 | | | | 13,523,582 | | | | 1,104,423 | | | | 2,530,262 | |
Reinvested | | | 20 | | | | 98 | | | | — | (a) | | | — | (a) |
Redeemed | | | (6,835,699 | ) | | | (13,511,360 | ) | | | (1,114,131 | ) | | | (2,532,070 | ) |
| | | | | | | | | | | | | | | | |
Change in Reserve Shares | | | (954,315 | ) | | | 12,320 | | | | (9,708 | ) | | | (1,808 | ) |
| | | | | | | | | | | | | | | | |
Service | |
Issued | | | — | | | | — | | | | 1,701,107 | | | | 3,569,690 | |
Reinvested | | | — | | | | — | | | | 21 | | | | 61 | |
Redeemed | | | — | | | | — | | | | (1,763,875 | ) | | | (3,451,696 | ) |
| | | | | | | | | | | | | | | | |
Change in Service Shares | | | — | | | | — | | | | (62,747 | ) | | | 118,055 | |
| | | | | | | | | | | | | | | | |
| (a) | Amount rounds to less than 500. |
| (b) | Commencement of offering of class of shares effective July 1, 2016, for Municipal Money Market Fund. |
SEE NOTES TO FINANCIAL STATEMENTS.
| | | | | | |
| | | |
| 82 | | | | J.P. MORGAN MONEY MARKET FUNDS | | AUGUST 31, 2016 |
THIS PAGE IS INTENTIONALLY LEFT BLANK
| | | | | | | | |
| | | |
| AUGUST 31, 2016 | | J.P. MORGAN MONEY MARKET FUNDS | | | | | 83 | |
FINANCIAL HIGHLIGHTS
FOR THE PERIODS INDICATED
| | | | | | | | | | | | | | | | | | | | | | | | | | | | |
| | | | | | Per share operating performance | |
| | | | | | Investment operations | | | Distributions | |
| | | Net asset
value,
beginning
of period | | | Net
investment
income
(loss) | | | Net realized
and unrealized
gains
(losses) on
investments | | | Total from
investment
operations | | | Net
investment
income | | | Net
realized
gain | | | Total
distributions | |
Prime Money Market Fund | | | | | | | | | | | | | | | | | | | | | | | | | | | | |
Class C | | | | | | | | | | | | | | | | | | | | | | | | | | | | |
Six Months Ended August 31, 2016 (Unaudited) | | $ | 1.00 | | | $ | — | (d)(e) | | $ | — | (e) | | $ | — | (e) | | $ | — | (e) | | $ | — | (e) | | $ | — | (e) |
Year Ended February 29, 2016 | | | 1.00 | | | | — | (d)(e) | | | — | (e) | | | — | (e) | | | — | (e) | | | — | (e) | | | — | (e) |
Year Ended February 28, 2015 | | | 1.00 | | | | — | (e) | | | — | (e) | | | — | (e) | | | — | (e) | | | — | (e) | | | — | (e) |
Year Ended February 28, 2014 | | | 1.00 | | | | — | (e) | | | — | (e) | | | — | (e) | | | — | (e) | | | — | (e) | | | — | (e) |
Year Ended February 28, 2013 | | | 1.00 | | | | — | (e) | | | — | (e) | | | — | (e) | | | — | (e) | | | — | (e) | | | — | (e) |
Year Ended February 29, 2012 | | | 1.00 | | | | — | (e) | | | — | (e) | | | — | (e) | | | — | (e) | | | — | (e) | | | — | (e) |
| | | | | | | |
Agency | | | | | | | | | | | | | | | | | | | | | | | | | | | | |
Six Months Ended August 31, 2016 (Unaudited) | | | 1.00 | | | | — | (d)(e) | | | — | (e) | | | — | (e) | | | — | (e) | | | — | (e) | | | — | (e) |
Year Ended February 29, 2016 | | | 1.00 | | | | — | (d)(e) | | | — | (e) | | | — | (e) | | | — | (e) | | | — | (e) | | | — | (e) |
Year Ended February 28, 2015 | | | 1.00 | | | | — | (e) | | | — | (e) | | | — | (e) | | | — | (e) | | | — | (e) | | | — | (e) |
Year Ended February 28, 2014 | | | 1.00 | | | | — | (e) | | | — | (e) | | | — | (e) | | | — | (e) | | | — | (e) | | | — | (e) |
Year Ended February 28, 2013 | | | 1.00 | | | | — | (e) | | | — | (e) | | | — | (e) | | | — | (e) | | | — | (e) | | | — | (e) |
Year Ended February 29, 2012 | | | 1.00 | | | | — | (e) | | | — | (e) | | | — | (e) | | | — | (e) | | | — | (e) | | | — | (e) |
| | | | | | | |
Capital | | | | | | | | | | | | | | | | | | | | | | | | | | | | |
Six Months Ended August 31, 2016 (Unaudited) | | | 1.00 | | | | — | (d)(e) | | | — | (e) | | | — | (e) | | | — | (e) | | | — | (e) | | | — | (e) |
Year Ended February 29, 2016 | | | 1.00 | | | | — | (d)(e) | | | — | (e) | | | — | (e) | | | — | (e) | | | — | (e) | | | — | (e) |
Year Ended February 28, 2015 | | | 1.00 | | | | — | (e) | | | — | (e) | | | — | (e) | | | — | (e) | | | — | (e) | | | — | (e) |
Year Ended February 28, 2014 | | | 1.00 | | | | — | (e) | | | — | (e) | | | — | (e) | | | — | (e) | | | — | (e) | | | — | (e) |
Year Ended February 28, 2013 | | | 1.00 | | | | — | (e) | | | — | (e) | | | — | (e) | | | — | (e) | | | — | (e) | | | — | (e) |
Year Ended February 29, 2012 | | | 1.00 | | | | — | (e) | | | — | (e) | | | — | (e) | | | — | (e) | | | — | (e) | | | — | (e) |
| | | | | | | |
Cash Management | | | | | | | | | | | | | | | | | | | | | | | | | | | | |
Six Months Ended August 31, 2016 (Unaudited) | | | 1.00 | | | | — | (d)(e) | | | — | (e) | | | — | (e) | | | — | (e) | | | — | (e) | | | — | (e) |
Year Ended February 29, 2016 | | | 1.00 | | | | — | (d)(e) | | | — | (e) | | | — | (e) | | | — | (e) | | | — | (e) | | | — | (e) |
Year Ended February 28, 2015 | | | 1.00 | | | | — | (e) | | | — | (e) | | | — | (e) | | | — | (e) | | | — | (e) | | | — | (e) |
Year Ended February 28, 2014 | | | 1.00 | | | | — | (e) | | | — | (e) | | | — | (e) | | | — | (e) | | | — | (e) | | | — | (e) |
Year Ended February 28, 2013 | | | 1.00 | | | | — | (e) | | | — | (e) | | | — | (e) | | | — | (e) | | | — | (e) | | | — | (e) |
Year Ended February 29, 2012 | | | 1.00 | | | | — | (e) | | | — | (e) | | | — | (e) | | | — | (e) | | | — | (e) | | | — | (e) |
| | | | | | | |
Direct (f) | | | | | | | | | | | | | | | | | | | | | | | | | | | | |
For the Period Ended August 16, 2016 (Unaudited) (f) | | | 1.00 | | | | — | (d)(e) | | | — | (e) | | | — | (e) | | | — | (e) | | | — | (e) | | | — | (e) |
Year Ended February 29, 2016 | | | 1.00 | | | | — | (d)(e) | | | — | (e) | | | — | (e) | | | — | (e) | | | — | (e) | | | — | (e) |
Year Ended February 28, 2015 | | | 1.00 | | | | — | (e) | | | — | (e) | | | — | (e) | | | — | (e) | | | — | (e) | | | — | (e) |
Year Ended February 28, 2014 | | | 1.00 | | | | — | (e) | | | — | (e) | | | — | (e) | | | — | (e) | | | — | (e) | | | — | (e) |
Year Ended February 28, 2013 | | | 1.00 | | | | — | (e) | | | — | (e) | | | — | (e) | | | — | (e) | | | — | (e) | | | — | (e) |
Year Ended February 29, 2012 | | | 1.00 | | | | — | (e) | | | — | (e) | | | — | (e) | | | — | (e) | | | — | (e) | | | — | (e) |
| | | | | | | |
Eagle Class | | | | | | | | | | | | | | | | | | | | | | | | | | | | |
Six Months Ended August 31, 2016 (Unaudited) | | | 1.00 | | | | — | (d)(e) | | | — | (e) | | | — | (e) | | | — | (e) | | | — | (e) | | | — | (e) |
Year Ended February 29, 2016 | | | 1.00 | | | | — | (d)(e) | | | — | (e) | | | — | (e) | | | — | (e) | | | — | (e) | | | — | (e) |
Year Ended February 28, 2015 | | | 1.00 | | | | — | (e) | | | — | (e) | | | — | (e) | | | — | (e) | | | — | (e) | | | — | (e) |
Year Ended February 28, 2014 | | | 1.00 | | | | — | (e) | | | — | (e) | | | — | (e) | | | — | (e) | | | — | (e) | | | — | (e) |
Year Ended February 28, 2013 | | | 1.00 | | | | — | (e) | | | — | (e) | | | — | (e) | | | — | (e) | | | — | (e) | | | — | (e) |
Year Ended February 29, 2012 | | | 1.00 | | | | — | (e) | | | — | (e) | | | — | (e) | | | — | (e) | | | — | (e) | | | — | (e) |
| | | | | | | |
IM | | | | | | | | | | | | | | | | | | | | | | | | | | | | |
Six Months Ended August 31, 2016 (Unaudited) | | | 1.00 | | | | — | (d)(e) | | | — | (e) | | | — | (e) | | | — | (e) | | | — | (e) | | | — | (e) |
Year Ended February 29, 2016 | | | 1.00 | | | | — | (d)(e) | | | — | (e) | | | — | (e) | | | — | (e) | | | — | (e) | | | — | (e) |
Year Ended February 28, 2015 | | | 1.00 | | | | — | (e) | | | — | (e) | | | — | (e) | | | — | (e) | | | — | (e) | | | — | (e) |
Year Ended February 28, 2014 | | | 1.00 | | | | — | (e) | | | — | (e) | | | — | (e) | | | — | (e) | | | — | (e) | | | — | (e) |
May 31, 2012 (g) through February 28, 2013 | | | 1.00 | | | | — | (e) | | | — | (e) | | | — | (e) | | | — | (e) | | | — | (e) | | | — | (e) |
| (a) | Annualized for periods less than one year, unless otherwise noted. |
| (b) | Not annualized for periods less than one year. |
| (c) | Includes earnings credits and interest expense, if applicable, each of which is less than 0.005% unless otherwise noted. |
| (d) | Calculated based upon average shares outstanding. |
| (e) | Amount rounds to less than $0.005. |
| (f) | Direct Shares of the Prime Money Market Fund had no assets as of August 16, 2016. |
| (g) | Commencement of offering of class of shares. |
SEE NOTES TO FINANCIAL STATEMENTS.
| | | | | | |
| | | |
| 84 | | | | J.P. MORGAN MONEY MARKET FUNDS | | AUGUST 31, 2016 |
| | | | | | | | | | | | | | | | | | | | | | |
| | | Ratios/Supplemental data | |
| | | | | | | | | | Ratios to average net assets (a) | |
Net asset
value,
end of
period | | | Total return (b) | | | Net assets,
end of period (000’s) | | | Net
expenses (c) | | | Net
investment
income
(loss) | | | Expenses
without waivers,
reimbursements and
earnings credits | |
| | | | | | | | | | | | | | | | | | | | | | |
| | | | | | | | | | | | | | | | | | | | | | |
| $ | 1.00 | | | | 0.01 | % | | $ | 30,200 | | | | 0.57 | % | | | 0.01 | % | | | 1.17 | % |
| | 1.00 | | | | 0.01 | | | | 39,558 | | | | 0.34 | | | | 0.01 | | | | 1.18 | |
| | 1.00 | | | | 0.01 | | | | 16,897 | | | | 0.22 | | | | 0.01 | | | | 1.16 | |
| | 1.00 | | | | 0.01 | | | | 17,658 | | | | 0.23 | | | | 0.01 | | | | 1.16 | |
| | 1.00 | | | | 0.01 | | | | 9,087 | | | | 0.32 | | | | 0.01 | | | | 1.16 | |
| | 1.00 | | | | 0.01 | | | | 9,993 | | | | 0.29 | | | | 0.01 | | | | 1.16 | |
| | | | | |
| | | | | | | | | | | | | | | | | | | | | | |
| | 1.00 | | | | 0.16 | | | | 5,202,903 | | | | 0.26 | | | | 0.33 | | | | 0.31 | |
| | 1.00 | | | | 0.07 | | | | 8,141,439 | | | | 0.26 | | | | 0.07 | | | | 0.31 | |
| | 1.00 | | | | 0.01 | | | | 6,603,508 | | | | 0.22 | | | | 0.01 | | | | 0.31 | |
| | 1.00 | | | | 0.01 | | | | 7,565,361 | | | | 0.23 | | | | 0.01 | | | | 0.31 | |
| | 1.00 | | | | 0.08 | | | | 7,532,479 | | | | 0.26 | | | | 0.08 | | | | 0.31 | |
| | 1.00 | | | | 0.04 | | | | 8,019,311 | | | | 0.26 | | | | 0.04 | | | | 0.31 | |
| | | | | |
| | | | | | | | | | | | | | | | | | | | | | |
| | 1.00 | | | | 0.21 | | | | 45,447,290 | | | | 0.17 | | | | 0.41 | | | | 0.21 | |
| | 1.00 | | | | 0.14 | | | | 64,690,852 | | | | 0.18 | | | | 0.14 | | | | 0.21 | |
| | 1.00 | | | | 0.05 | | | | 66,140,350 | | | | 0.18 | | | | 0.05 | | | | 0.21 | |
| | 1.00 | | | | 0.06 | | | | 68,193,741 | | | | 0.18 | | | | 0.06 | | | | 0.21 | |
| | 1.00 | | | | 0.16 | | | | 68,141,597 | | | | 0.18 | | | | 0.16 | | | | 0.21 | |
| | 1.00 | | | | 0.12 | | | | 75,485,880 | | | | 0.18 | | | | 0.12 | | | | 0.21 | |
| | | | | |
| | | | | | | | | | | | | | | | | | | | | | |
| | 1.00 | | | | 0.01 | | | | 43,772 | | | | 0.58 | | | | 0.01 | | | | 0.96 | |
| | 1.00 | | | | 0.01 | | | | 488,399 | | | | 0.29 | | | | 0.01 | | | | 0.96 | |
| | 1.00 | | | | 0.01 | | | | 1,236,050 | | | | 0.22 | | | | 0.01 | | | | 0.96 | |
| | 1.00 | | | | 0.01 | | | | 753,657 | | | | 0.23 | | | | 0.01 | | | | 0.96 | |
| | 1.00 | | | | 0.01 | | | | 702,440 | | | | 0.32 | | | | 0.01 | | | | 0.96 | |
| | 1.00 | | | | 0.01 | | | | 527,614 | | | | 0.29 | | | | 0.01 | | | | 0.96 | |
| | | | | |
| | | | | | | | | | | | | | | | | | | | | | |
| | 1.00 | | | | 0.12 | | | | — | | | | 0.30 | | | | 0.29 | | | | 0.31 | |
| | 1.00 | | | | 0.07 | | | | 1,330,952 | | | | 0.25 | | | | 0.06 | | | | 0.31 | |
| | 1.00 | | | | 0.04 | | | | 2,419,449 | | | | 0.19 | | | | 0.04 | | | | 0.31 | |
| | 1.00 | | | | 0.02 | | | | 1,596,040 | | | | 0.21 | | | | 0.02 | | | | 0.31 | |
| | 1.00 | | | | 0.04 | | | | 754,195 | | | | 0.30 | | | | 0.04 | | | | 0.31 | |
| | 1.00 | | | | 0.02 | | | | 1,558,831 | | | | 0.28 | | | | 0.02 | | | | 0.31 | |
| | | | | |
| | | | | | | | | | | | | | | | | | | | | | |
| | 1.00 | | | | 0.01 | | | | 374,627 | | | | 0.57 | | | | 0.01 | | | | 0.71 | |
| | 1.00 | | | | 0.01 | | | | 396,419 | | | | 0.32 | | | | 0.01 | | | | 0.71 | |
| | 1.00 | | | | 0.01 | | | | 324,169 | | | | 0.22 | | | | 0.01 | | | | 0.71 | |
| | 1.00 | | | | 0.01 | | | | 373,324 | | | | 0.23 | | | | 0.01 | | | | 0.71 | |
| | 1.00 | | | | 0.01 | | | | 431,169 | | | | 0.35 | | | | 0.01 | | | | 0.71 | |
| | 1.00 | | | | 0.01 | | | | 838,513 | | | | 0.29 | | | | 0.01 | | | | 0.71 | |
| | | | | |
| | | | | | | | | | | | | | | | | | | | | | |
| | 1.00 | | | | 0.21 | | | | 2,244,380 | | | | 0.16 | | | | 0.43 | | | | 0.16 | |
| | 1.00 | | | | 0.17 | | | | 2,628,508 | | | | 0.16 | | | | 0.16 | | | | 0.16 | |
| | 1.00 | | | | 0.07 | | | | 3,749,460 | | | | 0.16 | | | | 0.08 | | | | 0.16 | |
| | 1.00 | | | | 0.08 | | | | 100 | | | | 0.16 | | | | 0.08 | | | | 0.16 | |
| | 1.00 | | | | 0.12 | | | | 100 | | | | 0.16 | | | | 0.16 | | | | 0.16 | |
SEE NOTES TO FINANCIAL STATEMENTS.
| | | | | | | | |
| | | |
| AUGUST 31, 2016 | | J.P. MORGAN MONEY MARKET FUNDS | | | | | 85 | |
FINANCIAL HIGHLIGHTS
FOR THE PERIODS INDICATED (continued)
| | | | | | | | | | | | | | | | | | | | | | | | | | | | |
| | | | | | Per share operating performance | |
| | | | | | Investment operations | | | Distributions | |
| | | Net asset
value,
beginning
of period | | | Net
investment
income
(loss) | | | Net realized
and unrealized
gains
(losses) on
investments | | | Total from
investment
operations | | | Net
investment
income | | | Net
realized
gain | | | Total
distributions | |
Prime Money Market Fund (continued) | | | | | | | | | | | | | | | | | | | | | | | | | | | | |
Institutional Class | | | | | | | | | | | | | | | | | | | | | | | | | | | | |
Six Months Ended August 31, 2016 (Unaudited) | | $ | 1.00 | | | $ | — | (d)(e) | | $ | — | (e) | | $ | — | (e) | | $ | — | (e) | | $ | — | (e) | | $ | — | (e) |
Year Ended February 29, 2016 | | | 1.00 | | | | — | (d)(e) | | | — | (e) | | | — | (e) | | | — | (e) | | | — | (e) | | | — | (e) |
Year Ended February 28, 2015 | | | 1.00 | | | | — | (e) | | | — | (e) | | | — | (e) | | | — | (e) | | | — | (e) | | | — | (e) |
Year Ended February 28, 2014 | | | 1.00 | | | | — | (e) | | | — | (e) | | | — | (e) | | | — | (e) | | | — | (e) | | | — | (e) |
Year Ended February 28, 2013 | | | 1.00 | | | | — | (e) | | | — | (e) | | | — | (e) | | | — | (e) | | | — | (e) | | | — | (e) |
Year Ended February 29, 2012 | | | 1.00 | | | | — | (e) | | | — | (e) | | | — | (e) | | | — | (e) | | | — | (e) | | | — | (e) |
| | | | | | | |
Investor | | | | | | | | | | | | | | | | | | | | | | | | | | | | |
Six Months Ended August 31, 2016 (Unaudited) | | | 1.00 | | | | — | (d)(e) | | | — | (e) | | | — | (e) | | | — | (e) | | | — | (e) | | | — | (e) |
Year Ended February 29, 2016 | | | 1.00 | | | | — | (d)(e) | | | — | (e) | | | — | (e) | | | — | (e) | | | — | (e) | | | — | (e) |
Year Ended February 28, 2015 | | | 1.00 | | | | — | (e) | | | — | (e) | | | — | (e) | | | — | (e) | | | — | (e) | | | — | (e) |
Year Ended February 28, 2014 | | | 1.00 | | | | — | (e) | | | — | (e) | | | — | (e) | | | — | (e) | | | — | (e) | | | — | (e) |
Year Ended February 28, 2013 | | | 1.00 | | | | — | (e) | | | — | (e) | | | — | (e) | | | — | (e) | | | — | (e) | | | — | (e) |
Year Ended February 29, 2012 | | | 1.00 | | | | — | (e) | | | — | (e) | | | — | (e) | | | — | (e) | | | — | (e) | | | — | (e) |
| | | | | | | |
Morgan | | | | | | | | | | | | | | | | | | | | | | | | | | | | |
Six Months Ended August 31, 2016 (Unaudited) | | | 1.00 | | | | — | (d)(e) | | | — | (e) | | | — | (e) | | | — | (e) | | | — | (e) | | | — | (e) |
Year Ended February 29, 2016 | | | 1.00 | | | | — | (d)(e) | | | — | (e) | | | — | (e) | | | — | (e) | | | — | (e) | | | — | (e) |
Year Ended February 28, 2015 | | | 1.00 | | | | — | (e) | | | — | (e) | | | — | (e) | | | — | (e) | | | — | (e) | | | — | (e) |
Year Ended February 28, 2014 | | | 1.00 | | | | — | (e) | | | — | (e) | | | — | (e) | | | — | (e) | | | — | (e) | | | — | (e) |
Year Ended February 28, 2013 | | | 1.00 | | | | — | (e) | | | — | (e) | | | — | (e) | | | — | (e) | | | — | (e) | | | — | (e) |
Year Ended February 29, 2012 | | | 1.00 | | | | — | (e) | | | — | (e) | | | — | (e) | | | — | (e) | | | — | (e) | | | — | (e) |
| | | | | | | |
Premier | | | | | | | | | | | | | | | | | | | | | | | | | | | | |
Six Months Ended August 31, 2016 (Unaudited) | | | 1.00 | | | | — | (d)(e) | | | — | (e) | | | — | (e) | | | — | (e) | | | — | (e) | | | — | (e) |
Year Ended February 29, 2016 | | | 1.00 | | | | — | (d)(e) | | | — | (e) | | | — | (e) | | | — | (e) | | | — | (e) | | | — | (e) |
Year Ended February 28, 2015 | | | 1.00 | | | | — | (e) | | | — | (e) | | | — | (e) | | | — | (e) | | | — | (e) | | | — | (e) |
Year Ended February 28, 2014 | | | 1.00 | | | | — | (e) | | | — | (e) | | | — | (e) | | | — | (e) | | | — | (e) | | | — | (e) |
Year Ended February 28, 2013 | | | 1.00 | | | | — | (e) | | | — | (e) | | | — | (e) | | | — | (e) | | | — | (e) | | | — | (e) |
Year Ended February 29, 2012 | | | 1.00 | | | | — | (e) | | | — | (e) | | | — | (e) | | | — | (e) | | | — | (e) | | | — | (e) |
| | | | | | | |
Reserve | | | | | | | | | | | | | | | | | | | | | | | | | | | | |
Six Months Ended August 31, 2016 (Unaudited) | | | 1.00 | | | | — | (d)(e) | | | — | (e) | | | — | (e) | | | — | (e) | | | — | (e) | | | — | (e) |
Year Ended February 29, 2016 | | | 1.00 | | | | — | (d)(e) | | | — | (e) | | | — | (e) | | | — | (e) | | | — | (e) | | | — | (e) |
Year Ended February 28, 2015 | | | 1.00 | | | | — | (e) | | | — | (e) | | | — | (e) | | | — | (e) | | | — | (e) | | | — | (e) |
Year Ended February 28, 2014 | | | 1.00 | | | | — | (e) | | | — | (e) | | | — | (e) | | | — | (e) | | | — | (e) | | | — | (e) |
Year Ended February 28, 2013 | | | 1.00 | | | | — | (e) | | | — | (e) | | | — | (e) | | | — | (e) | | | — | (e) | | | — | (e) |
Year Ended February 29, 2012 | | | 1.00 | | | | — | (e) | | | — | (e) | | | — | (e) | | | — | (e) | | | — | (e) | | | — | (e) |
| | | | | | | |
Service | | | | | | | | | | | | | | | | | | | | | | | | | | | | |
Six Months Ended August 31, 2016 (Unaudited) | | | 1.00 | | | | — | (d)(e) | | | — | (e) | | | — | (e) | | | — | (e) | | | — | (e) | | | — | (e) |
Year Ended February 29, 2016 | | | 1.00 | | | | — | (d)(e) | | | — | (e) | | | — | (e) | | | — | (e) | | | — | (e) | | | — | (e) |
Year Ended February 28, 2015 | | | 1.00 | | | | — | (e) | | | — | (e) | | | — | (e) | | | — | (e) | | | — | (e) | | | — | (e) |
Year Ended February 28, 2014 | | | 1.00 | | | | — | (e) | | | — | (e) | | | — | (e) | | | — | (e) | | | — | (e) | | | — | (e) |
Year Ended February 28, 2013 | | | 1.00 | | | | — | (e) | | | — | (e) | | | — | (e) | | | — | (e) | | | — | (e) | | | — | (e) |
Year Ended February 29, 2012 | | | 1.00 | | | | — | (e) | | | — | (e) | | | — | (e) | | | — | (e) | | | — | (e) | | | — | (e) |
| (a) | Annualized for periods less than one year, unless otherwise noted. |
| (b) | Not annualized for periods less than one year. |
| (c) | Includes earnings credits and interest expense, if applicable, each of which is less than 0.005% unless otherwise noted. |
| (d) | Calculated based upon average shares outstanding. |
| (e) | Amount rounds to less than $0.005. |
| (f) | Commencement of offering of class of shares. |
SEE NOTES TO FINANCIAL STATEMENTS.
| | | | | | |
| | | |
| 86 | | | | J.P. MORGAN MONEY MARKET FUNDS | | AUGUST 31, 2016 |
| | | | | | | | | | | | | | | | | | | | | | |
| | | Ratios/Supplemental data | |
| | | | | | | | | | Ratios to average net assets (a) | |
Net asset
value,
end of
period | | | Total return (b) | | | Net assets,
end of period (000’s) | | | Net
expenses (c) | | | Net
investment
income
(loss) | | | Expenses
without waivers,
reimbursements and
earnings credits | |
| | | | | | | | | | | | | | | | | | | | | | |
| | | | | | | | | | | | | | | | | | | | | | |
| $ | 1.00 | | | | 0.19 | % | | $ | 16,215,266 | | | | 0.20 | % | | | 0.38 | % | | | 0.26 | % |
| | 1.00 | | | | 0.11 | | | | 20,011,248 | | | | 0.21 | | | | 0.10 | | | | 0.26 | |
| | 1.00 | | | | 0.02 | | | | 27,718,738 | | | | 0.21 | | | | 0.02 | | | | 0.26 | |
| | 1.00 | | | | 0.03 | | | | 29,139,007 | | | | 0.21 | | | | 0.03 | | | | 0.26 | |
| | 1.00 | | | | 0.13 | | | | 23,495,745 | | | | 0.21 | | | | 0.13 | | | | 0.26 | |
| | 1.00 | | | | 0.09 | | | | 26,769,490 | | | | 0.21 | | | | 0.09 | | | | 0.26 | |
| | | | | |
| | | | | | | | | | | | | | | | | | | | | | |
| | 1.00 | | | | 0.04 | | | | 226,303 | | | | 0.51 | | | | 0.09 | | | | 0.51 | |
| | 1.00 | | | | 0.01 | | | | 1,841,412 | | | | 0.32 | | | | 0.01 | | | | 0.51 | |
| | 1.00 | | | | 0.01 | | | | 1,081,648 | | | | 0.22 | | | | 0.01 | | | | 0.51 | |
| | 1.00 | | | | 0.01 | | | | 692,922 | | | | 0.23 | | | | 0.01 | | | | 0.51 | |
| | 1.00 | | | | 0.01 | | | | 403,330 | | | | 0.33 | | | | 0.01 | | | | 0.51 | |
| | 1.00 | | | | 0.01 | | | | 520,797 | | | | 0.29 | | | | 0.01 | | | | 0.51 | |
| | | | | |
| | | | | | | | | | | | | | | | | | | | | | |
| | 1.00 | | | | 0.03 | | | | 1,108,068 | | | | 0.52 | | | | 0.07 | | | | 0.53 | |
| | 1.00 | | | | 0.01 | | | | 1,877,099 | | | | 0.31 | | | | 0.01 | | | | 0.52 | |
| | 1.00 | | | | 0.01 | | | | 2,278,962 | | | | 0.22 | | | | 0.01 | | | | 0.51 | |
| | 1.00 | | | | 0.01 | | | | 2,332,919 | | | | 0.23 | | | | 0.01 | | | | 0.51 | |
| | 1.00 | | | | 0.01 | | | | 2,549,889 | | | | 0.33 | | | | 0.01 | | | | 0.51 | |
| | 1.00 | | | | 0.01 | | | | 2,667,326 | | | | 0.29 | | | | 0.01 | | | | 0.51 | |
| | | | | |
| | | | | | | | | | | | | | | | | | | | | | |
| | 1.00 | | | | 0.07 | | | | 1,616,316 | | | | 0.45 | | | | 0.14 | | | | 0.46 | |
| | 1.00 | | | | 0.02 | | | | 2,030,985 | | | | 0.30 | | | | 0.02 | | | | 0.46 | |
| | 1.00 | | | | 0.01 | | | | 1,589,780 | | | | 0.22 | | | | 0.01 | | | | 0.46 | |
| | 1.00 | | | | 0.01 | | | | 2,021,372 | | | | 0.23 | | | | 0.01 | | | | 0.46 | |
| | 1.00 | | | | 0.01 | | | | 2,540,125 | | | | 0.33 | | | | 0.01 | | | | 0.46 | |
| | 1.00 | | | | 0.01 | | | | 3,338,000 | | | | 0.29 | | | | 0.01 | | | | 0.46 | |
| | | | | |
| | | | | | | | | | | | | | | | | | | | | | |
| | 1.00 | | | | 0.01 | | | | 685,741 | | | | 0.58 | | | | 0.01 | | | | 0.71 | |
| | 1.00 | | | | 0.01 | | | | 930,188 | | | | 0.31 | | | | 0.01 | | | | 0.71 | |
| | 1.00 | | | | 0.01 | | | | 1,154,468 | | | | 0.22 | | | | 0.01 | | | | 0.71 | |
| | 1.00 | | | | 0.01 | | | | 1,426,646 | | | | 0.23 | | | | 0.01 | | | | 0.71 | |
| | 1.00 | | | | 0.01 | | | | 1,449,080 | | | | 0.32 | | | | 0.01 | | | | 0.71 | |
| | 1.00 | | | | 0.01 | | | | 1,526,992 | | | | 0.29 | | | | 0.01 | | | | 0.71 | |
| | | | | |
| | | | | | | | | | | | | | | | | | | | | | |
| | 1.00 | | | | 0.01 | | | | 1,421,219 | | | | 0.58 | | | | 0.01 | | | | 1.06 | |
| | 1.00 | | | | 0.01 | | | | 2,047,788 | | | | 0.32 | | | | 0.01 | | | | 1.06 | |
| | 1.00 | | | | 0.01 | | | | 1,723,144 | | | | 0.22 | | | | 0.01 | | | | 1.06 | |
| | 1.00 | | | | 0.01 | | | | 1,814,501 | | | | 0.23 | | | | 0.01 | | | | 1.06 | |
| | 1.00 | | | | 0.01 | | | | 1,563,743 | | | | 0.32 | | | | 0.01 | | | | 1.06 | |
| | 1.00 | | | | 0.01 | | | | 1,419,924 | | | | 0.29 | | | | 0.01 | | | | 1.06 | |
SEE NOTES TO FINANCIAL STATEMENTS.
| | | | | | | | |
| | | |
| AUGUST 31, 2016 | | J.P. MORGAN MONEY MARKET FUNDS | | | | | 87 | |
FINANCIAL HIGHLIGHTS
FOR THE PERIODS INDICATED (continued)
| | | | | | | | | | | | | | | | | | | | | | | | | | | | |
| | | | | | Per share operating performance | |
| | | | | | Investment operations | | | Distributions | |
| | | Net asset
value,
beginning
of period | | | Net
investment
income
(loss) | | | Net realized
and unrealized
gains
(losses) on
investments | | | Total from
investment
operations | | | Net
investment
income | | | Net
realized
gain | | | Total
distributions | |
Liquid Assets Money Market Fund | | | | | | | | | | | | | | | | | | | | | | | | | | | | |
Class C | | | | | | | | | | | | | | | | | | | | | | | | | | | | |
Six Months Ended August 31, 2016 (Unaudited) | | $ | 1.00 | | | $ | — | (d)(e) | | $ | — | (e) | | $ | — | (e) | | $ | — | (e) | | $ | — | | | $ | — | (e) |
Year Ended February 29, 2016 | | | 1.00 | | | | — | (d)(e) | | | — | (e) | | | — | (e) | | | — | (e) | | | — | (e) | | | — | (e) |
Year Ended February 28, 2015 | | | 1.00 | | | | — | (e) | | | — | (e) | | | — | (e) | | | — | (e) | | | — | (e) | | | — | (e) |
Year Ended February 28, 2014 | | | 1.00 | | | | — | (e) | | | — | (e) | | | — | (e) | | | — | (e) | | | — | (e) | | | — | (e) |
Year Ended February 28, 2013 | | | 1.00 | | | | — | (e) | | | — | (e) | | | — | (e) | | | — | (e) | | | — | (e) | | | — | (e) |
Year Ended February 29, 2012 | | | 1.00 | | | | — | (e) | | | — | (e) | | | — | (e) | | | — | (e) | | | — | (e) | | | — | (e) |
| | | | | | | |
Agency | | | | | | | | | | | | | | | | | | | | | | | | | | | | |
Six Months Ended August 31, 2016 (Unaudited) | | | 1.00 | | | | — | (d)(e) | | | — | (e) | | | — | (e) | | | — | (e) | | | — | | | | — | (e) |
Year Ended February 29, 2016 | | | 1.00 | | | | — | (d)(e) | | | — | (e) | | | — | (e) | | | — | (e) | | | — | (e) | | | — | (e) |
Year Ended February 28, 2015 | | | 1.00 | | | | — | (e) | | | — | (e) | | | — | (e) | | | — | (e) | | | — | (e) | | | — | (e) |
Year Ended February 28, 2014 | | | 1.00 | | | | — | (e) | | | — | (e) | | | — | (e) | | | — | (e) | | | — | (e) | | | — | (e) |
Year Ended February 28, 2013 | | | 1.00 | | | | — | (e) | | | — | (e) | | | — | (e) | | | — | (e) | | | — | (e) | | | — | (e) |
Year Ended February 29, 2012 | | | 1.00 | | | | — | (e) | | | — | (e) | | | — | (e) | | | — | (e) | | | — | (e) | | | — | (e) |
| | | | | | | |
Capital | | | | | | | | | | | | | | | | | | | | | | | | | | | | |
Six Months Ended August 31, 2016 (Unaudited) | | | 1.00 | | | | — | (d)(e) | | | — | (e) | | | — | (e) | | | — | (e) | | | — | | | | — | (e) |
Year Ended February 29, 2016 | | | 1.00 | | | | — | (d)(e) | | | — | (e) | | | — | (e) | | | — | (e) | | | — | (e) | | | — | (e) |
Year Ended February 28, 2015 | | | 1.00 | | | | — | (e) | | | — | (e) | | | — | (e) | | | — | (e) | | | — | (e) | | | — | (e) |
Year Ended February 28, 2014 | | | 1.00 | | | | — | (e) | | | — | (e) | | | — | (e) | | | — | (e) | | | — | (e) | | | — | (e) |
Year Ended February 28, 2013 | | | 1.00 | | | | — | (e) | | | — | (e) | | | — | (e) | | | — | (e) | | | — | (e) | | | — | (e) |
Year Ended February 29, 2012 | | | 1.00 | | | | — | (e) | | | — | (e) | | | — | (e) | | | — | (e) | | | — | (e) | | | — | (e) |
| | | | | | | |
E*Trade | | | | | | | | | | | | | | | | | | | | | | | | | | | | |
Six Months Ended August 31, 2016 (Unaudited) | | | 1.00 | | | | — | (d)(e) | | | — | (e) | | | — | (e) | | | — | (e) | | | — | | | | — | (e) |
Year Ended February 29, 2016 | | | 1.00 | | | | — | (d)(e) | | | — | (e) | | | — | (e) | | | — | (e) | | | — | (e) | | | — | (e) |
Year Ended February 28, 2015 | | | 1.00 | | | | — | (e) | | | — | (e) | | | — | (e) | | | — | (e) | | | — | (e) | | | — | (e) |
Year Ended February 28, 2014 | | | 1.00 | | | | — | (e) | | | — | (e) | | | — | (e) | | | — | (e) | | | — | (e) | | | — | (e) |
Year Ended February 28, 2013 | | | 1.00 | | | | — | (e) | | | — | (e) | | | — | (e) | | | — | (e) | | | — | (e) | | | — | (e) |
Year Ended February 29, 2012 | | | 1.00 | | | | — | (e) | | | — | (e) | | | — | (e) | | | — | (e) | | | — | (e) | | | — | (e) |
| | | | | | | |
Institutional Class | | | | | | | | | | | | | | | | | | | | | | | | | | | | |
Six Months Ended August 31, 2016 (Unaudited) | | | 1.00 | | | | — | (d)(e) | | | — | (e) | | | — | (e) | | | — | (e) | | | — | | | | — | (e) |
Year Ended February 29, 2016 | | | 1.00 | | | | — | (d)(e) | | | — | (e) | | | — | (e) | | | — | (e) | | | — | (e) | | | — | (e) |
Year Ended February 28, 2015 | | | 1.00 | | | | — | (e) | | | — | (e) | | | — | (e) | | | — | (e) | | | — | (e) | | | — | (e) |
Year Ended February 28, 2014 | | | 1.00 | | | | — | (e) | | | — | (e) | | | — | (e) | | | — | (e) | | | — | (e) | | | — | (e) |
Year Ended February 28, 2013 | | | 1.00 | | | | — | (e) | | | — | (e) | | | — | (e) | | | — | (e) | | | — | (e) | | | — | (e) |
Year Ended February 29, 2012 | | | 1.00 | | | | — | (e) | | | — | (e) | | | — | (e) | | | — | (e) | | | — | (e) | | | — | (e) |
| | | | | | | |
Investor | | | | | | | | | | | | | | | | | | | | | | | | | | | | |
Six Months Ended August 31, 2016 (Unaudited) | | | 1.00 | | | | — | (d)(e) | | | — | (e) | | | — | (e) | | | — | (e) | | | — | | | | — | (e) |
Year Ended February 29, 2016 | | | 1.00 | | | | — | (d)(e) | | | — | (e) | | | — | (e) | | | — | (e) | | | — | (e) | | | — | (e) |
Year Ended February 28, 2015 | | | 1.00 | | | | — | (e) | | | — | (e) | | | — | (e) | | | — | (e) | | | — | (e) | | | — | (e) |
Year Ended February 28, 2014 | | | 1.00 | | | | — | (e) | | | — | (e) | | | — | (e) | | | — | (e) | | | — | (e) | | | — | (e) |
Year Ended February 28, 2013 | | | 1.00 | | | | — | (e) | | | — | (e) | | | — | (e) | | | — | (e) | | | — | (e) | | | — | (e) |
Year Ended February 29, 2012 | | | 1.00 | | | | — | (e) | | | — | (e) | | | — | (e) | | | — | (e) | | | — | (e) | | | — | (e) |
| (a) | Annualized for periods less than one year, unless otherwise noted. |
| (b) | Not annualized for periods less than one year. |
| (c) | Includes earnings credits and interest expense, if applicable, each of which is less than 0.005% unless otherwise noted. |
| (d) | Calculated based upon average shares outstanding. |
| (e) | Amount rounds to less than $0.005. |
| (f) | Amount rounds to less than 0.005% |
SEE NOTES TO FINANCIAL STATEMENTS.
| | | | | | |
| | | |
| 88 | | | | J.P. MORGAN MONEY MARKET FUNDS | | AUGUST 31, 2016 |
| | | | | | | | | | | | | | | | | | | | | | |
| | | Ratios/Supplemental data | |
| | | | | | | | | | Ratios to average net assets (a) | |
Net asset
value,
end of
period | | | Total return (b) | | |
Net assets,
end of
period
(000’s) | | | Net
expenses (c) | | | Net
investment
income
(loss) | | | Expenses
without waivers,
reimbursements and
earnings credits | |
| | | | | | | | | | | | | | | | | | | �� | | | |
| | | | | | | | | | | | | | | | | | | | | | |
| $ | 1.00 | | | | 0.01 | % | | $ | 420,505 | | | | 0.55 | % | | | 0.01 | % | | | 1.18 | % |
| | 1.00 | | | | 0.01 | | | | 505,609 | | | | 0.33 | | | | 0.01 | | | | 1.18 | |
| | 1.00 | | | | 0.01 | | | | 704,276 | | | | 0.24 | | | | 0.01 | | | | 1.17 | |
| | 1.00 | | | | 0.01 | | | | 670,626 | | | | 0.24 | | | | 0.01 | | | | 1.18 | |
| | 1.00 | | | | 0.01 | | | | 364,445 | | | | 0.34 | | | | 0.01 | | | | 1.17 | |
| | 1.00 | | | | 0.01 | | | | 398,734 | | | | 0.30 | | | | 0.01 | | | | 1.17 | |
| | | | | |
| | | | | | | | | | | | | | | | | | | | | | |
| | 1.00 | | | | 0.15 | | | | 68,629 | | | | 0.26 | | | | 0.29 | | | | 0.33 | |
| | 1.00 | | | | 0.08 | | | | 71,741 | | | | 0.26 | | | | 0.07 | | | | 0.33 | |
| | 1.00 | | | | 0.01 | | | | 95,650 | | | | 0.24 | | | | 0.01 | | | | 0.32 | |
| | 1.00 | | | | 0.01 | | | | 71,955 | | | | 0.24 | | | | 0.01 | | | | 0.33 | |
| | 1.00 | | | | 0.09 | | | | 122,386 | | | | 0.26 | | | | 0.09 | | | | 0.32 | |
| | 1.00 | | | | 0.05 | | | | 134,975 | | | | 0.26 | | | | 0.05 | | | | 0.32 | |
| | | | | |
| | | | | | | | | | | | | | | | | | | | | | |
| | 1.00 | | | | 0.19 | | | | 251,375 | | | | 0.18 | | | | 0.38 | | | | 0.23 | |
| | 1.00 | | | | 0.16 | | | | 2,071,483 | | | | 0.18 | | | | 0.15 | | | | 0.22 | |
| | 1.00 | | | | 0.07 | | | | 2,889,536 | | | | 0.18 | | | | 0.06 | | | | 0.22 | |
| | 1.00 | | | | 0.07 | | | | 3,795,256 | | | | 0.18 | | | | 0.07 | | | | 0.23 | |
| | 1.00 | | | | 0.17 | | | | 2,806,226 | | | | 0.18 | | | | 0.17 | | | | 0.22 | |
| | 1.00 | | | | 0.13 | | | | 2,985,462 | | | | 0.18 | | | | 0.13 | | | | 0.22 | |
| | | | | |
| | | | | | | | | | | | | | | | | | | | | | |
| | 1.00 | | | | 0.01 | | | | 426,481 | | | | 0.54 | | | | 0.01 | | | | 1.09 | |
| | 1.00 | | | | 0.01 | | | | 1,758,478 | | | | 0.30 | | | | 0.01 | | | | 1.07 | |
| | 1.00 | | | | 0.03 | | | | 7,497,985 | | | | 0.22 | | | | 0.03 | | | | 1.07 | |
| | 1.00 | | | | 0.05 | | | | 5,922,072 | | | | 0.20 | | | | 0.05 | | | | 1.08 | |
| | 1.00 | | | | 0.05 | | | | 2,446,643 | | | | 0.27 | | | | 0.05 | | | | 1.07 | |
| | 1.00 | | | | 0.05 | | | | 199,806 | | | | 0.26 | | | | 0.05 | | | | 1.07 | |
| | | | | |
| | | | | | | | | | | | | | | | | | | | | | |
| | 1.00 | | | | 0.17 | | | | 1,288,613 | | | | 0.21 | | | | 0.35 | | | | 0.28 | |
| | 1.00 | | | | 0.13 | | | | 6,630,618 | | | | 0.21 | | | | 0.13 | | | | 0.28 | |
| | 1.00 | | | | 0.04 | | | | 6,692,633 | | | | 0.21 | | | | 0.04 | | | | 0.27 | |
| | 1.00 | | | | 0.04 | | | | 2,901,004 | | | | 0.21 | | | | 0.04 | | | | 0.28 | |
| | 1.00 | | | | 0.14 | | | | 2,534,423 | | | | 0.21 | | | | 0.14 | | | | 0.27 | |
| | 1.00 | | | | 0.10 | | | | 4,243,305 | | | | 0.21 | | | | 0.10 | | | | 0.27 | |
| | | | | |
| | | | | | | | | | | | | | | | | | | | | | |
| | 1.00 | | | | 0.03 | | | | 25,920 | | | | 0.51 | | | | 0.06 | | | | 0.53 | |
| | 1.00 | | | | 0.02 | | | | 117,816 | | | | 0.32 | | | | 0.01 | | | | 0.53 | |
| | 1.00 | | | | 0.01 | | | | 116,196 | | | | 0.23 | | | | 0.01 | | | | 0.52 | |
| | 1.00 | | | | 0.01 | | | | 753,825 | | | | 0.24 | | | | 0.01 | | | | 0.53 | |
| | 1.00 | | | | 0.01 | | | | 567,682 | | | | 0.34 | | | | 0.01 | | | | 0.52 | |
| | 1.00 | | | | 0.01 | | | | 562,453 | | | | 0.30 | | | | 0.01 | | | | 0.52 | |
SEE NOTES TO FINANCIAL STATEMENTS.
| | | | | | | | |
| | | |
| AUGUST 31, 2016 | | J.P. MORGAN MONEY MARKET FUNDS | | | | | 89 | |
FINANCIAL HIGHLIGHTS
FOR THE PERIODS INDICATED (continued)
| | | | | | | | | | | | | | | | | | | | | | | | | | | | |
| | | | | | Per share operating performance | |
| | | | | | Investment operations | | | Distributions | |
| | | Net asset
value,
beginning
of period | | | Net
investment
income
(loss) | | | Net realized
and unrealized
gains
(losses) on
investments | | | Total from
investment
operations | | | Net
investment
income | | | Net
realized
gain | | | Total
distributions | |
Liquid Assets Money Market Fund (continued) | | | | | | | | | | | | | | | | | | | | | | | | | | | | |
Morgan | | | | | | | | | | | | | | | | | | | | | | | | | | | | |
Six Months Ended August 31, 2016 (Unaudited) | | $ | 1.00 | | | $ | — | (d)(e) | | $ | — | (e) | | $ | — | (e) | | $ | — | (e) | | $ | — | | | $ | — | (e) |
Year Ended February 29, 2016 | | | 1.00 | | | | — | (d)(e) | | | — | (e) | | | — | (e) | | | — | (e) | | | — | (e) | | | — | (e) |
Year Ended February 28, 2015 | | | 1.00 | | | | — | (e) | | | — | (e) | | | — | (e) | | | — | (e) | | | — | (e) | | | — | (e) |
Year Ended February 28, 2014 | | | 1.00 | | | | — | (e) | | | — | (e) | | | — | (e) | | | — | (e) | | | — | (e) | | | — | (e) |
Year Ended February 28, 2013 | | | 1.00 | | | | — | (e) | | | — | (e) | | | — | (e) | | | — | (e) | | | — | (e) | | | — | (e) |
Year Ended February 29, 2012 | | | 1.00 | | | | — | (e) | | | — | (e) | | | — | (e) | | | — | (e) | | | — | (e) | | | — | (e) |
| | | | | | | |
Premier | | | | | | | | | | | | | | | | | | | | | | | | | | | | |
Six Months Ended August 31, 2016 (Unaudited) | | | 1.00 | | | | — | (d)(e) | | | — | (e) | | | — | (e) | | | — | (e) | | | — | | | | — | (e) |
Year Ended February 29, 2016 | | | 1.00 | | | | — | (d)(e) | | | — | (e) | | | — | (e) | | | — | (e) | | | — | (e) | | | — | (e) |
Year Ended February 28, 2015 | | | 1.00 | | | | — | (e) | | | — | (e) | | | — | (e) | | | — | (e) | | | — | (e) | | | — | (e) |
Year Ended February 28, 2014 | | | 1.00 | | | | — | (e) | | | — | (e) | | | — | (e) | | | — | (e) | | | — | (e) | | | — | (e) |
Year Ended February 28, 2013 | | | 1.00 | | | | — | (e) | | | — | (e) | | | — | (e) | | | — | (e) | | | — | (e) | | | — | (e) |
Year Ended February 29, 2012 | | | 1.00 | | | | — | (e) | | | — | (e) | | | — | (e) | | | — | (e) | | | — | (e) | | | — | (e) |
| | | | | | | |
Reserve | | | | | | | | | | | | | | | | | | | | | | | | | | | | |
Six Months Ended August 31, 2016 (Unaudited) | | | 1.00 | | | | — | (d)(e) | | | — | (e) | | | — | (e) | | | — | (e) | | | — | | | | — | (e) |
Year Ended February 29, 2016 | | | 1.00 | | | | — | (d)(e) | | | — | (e) | | | — | (e) | | | — | (e) | | | — | (e) | | | — | (e) |
Year Ended February 28, 2015 | | | 1.00 | | | | — | (e) | | | — | (e) | | | — | (e) | | | — | (e) | | | — | (e) | | | — | (e) |
Year Ended February 28, 2014 | | | 1.00 | | | | — | (e) | | | — | (e) | | | — | (e) | | | — | (e) | | | — | (e) | | | — | (e) |
Year Ended February 28, 2013 | | | 1.00 | | | | — | (e) | | | — | (e) | | | — | (e) | | | — | (e) | | | — | (e) | | | — | (e) |
Year Ended February 29, 2012 | | | 1.00 | | | | — | (e) | | | — | (e) | | | — | (e) | | | — | (e) | | | — | (e) | | | — | (e) |
| | | | | | | |
Service | | | | | | | | | | | | | | | | | | | | | | | | | | | | |
Six Months Ended August 31, 2016 (Unaudited) | | | 1.00 | | | | — | (d)(e) | | | — | (e) | | | — | (e) | | | — | (e) | | | — | | | | — | (e) |
Year Ended February 29, 2016 | | | 1.00 | | | | — | (d)(e) | | | — | (e) | | | — | (e) | | | — | (e) | | | — | (e) | | | — | (e) |
Year Ended February 28, 2015 | | | 1.00 | | | | — | (e) | | | — | (e) | | | — | (e) | | | — | (e) | | | — | (e) | | | — | (e) |
Year Ended February 28, 2014 | | | 1.00 | | | | — | (e) | | | — | (e) | | | — | (e) | | | — | (e) | | | — | (e) | | | — | (e) |
Year Ended February 28, 2013 | | | 1.00 | | | | — | (e) | | | — | (e) | | | — | (e) | | | — | (e) | | | — | (e) | | | — | (e) |
Year Ended February 29, 2012 | | | 1.00 | | | | — | (e) | | | — | (e) | | | — | (e) | | | — | (e) | | | — | (e) | | | — | (e) |
| (a) | Annualized for periods less than one year, unless otherwise noted. |
| (b) | Not annualized for periods less than one year. |
| (c) | Includes earnings credits and interest expense, if applicable, each of which is less than 0.005% unless otherwise noted. |
| (d) | Calculated based upon average shares outstanding. |
| (e) | Amount rounds to less than $0.005. |
| (f) | Amount rounds to less than 0.005% |
| (g) | Amount rounds to less than 500. |
SEE NOTES TO FINANCIAL STATEMENTS.
| | | | | | |
| | | |
| 90 | | | | J.P. MORGAN MONEY MARKET FUNDS | | AUGUST 31, 2016 |
| | | | | | | | | | | | | | | | | | | | | | |
| | | Ratios/Supplemental data | |
| | | | | | | | | | Ratios to average net assets (a) | |
Net asset
value,
end of
period | | | Total return (b) | | |
Net assets,
end of
period
(000’s) | | | Net
expenses (c) | | | Net
investment
income
(loss) | | | Expenses
without waivers,
reimbursements and
earnings credits | |
| | | | | | | | | | | | | | | | | | | | | | |
| | | | | | | | | | | | | | | | | | | | | | |
| $ | 1.00 | | | | 0.01 | % | | $ | 1,582,173 | | | | 0.54 | % | | | 0.01 | % | | | 0.63 | % |
| | 1.00 | | | | 0.01 | | | | 1,609,448 | | | | 0.33 | | | | 0.01 | | | | 0.63 | |
| | 1.00 | | | | 0.01 | | | | 1,684,561 | | | | 0.24 | | | | 0.01 | | | | 0.62 | |
| | 1.00 | | | | 0.01 | | | | 2,367,494 | | | | 0.24 | | | | 0.01 | | | | 0.63 | |
| | 1.00 | | | | 0.01 | | | | 2,472,266 | | | | 0.34 | | | | 0.01 | | | | 0.62 | |
| | 1.00 | | | | 0.01 | | | | 2,975,898 | | | | 0.30 | | | | 0.01 | | | | 0.62 | |
| | | | | |
| | | | | | | | | | | | | | | | | | | | | | |
| | 1.00 | | | | 0.05 | | | | 38,094 | | | | 0.45 | | | | 0.10 | | | | 0.48 | |
| | 1.00 | | | | 0.02 | | | | 132,337 | | | | 0.32 | | | | 0.02 | | | | 0.48 | |
| | 1.00 | | | | 0.01 | | | | 118,152 | | | | 0.24 | | | | 0.01 | | | | 0.47 | |
| | 1.00 | | | | 0.01 | | | | 130,733 | | | | 0.24 | | | | 0.01 | | | | 0.48 | |
| | 1.00 | | | | 0.01 | | | | 154,775 | | | | 0.34 | | | | 0.01 | | | | 0.47 | |
| | 1.00 | | | | 0.01 | | | | 166,487 | | | | 0.30 | | | | 0.01 | | | | 0.47 | |
| | | | | |
| | | | | | | | | | | | | | | | | | | | | | |
| | 1.00 | | | | 0.01 | | | | 12,209 | | | | 0.55 | | | | 0.01 | | | | 0.73 | |
| | 1.00 | | | | 0.01 | | | | 189,404 | | | | 0.33 | | | | 0.01 | | | | 0.73 | |
| | 1.00 | | | | 0.01 | | | | 172,653 | | | | 0.24 | | | | 0.01 | | | | 0.72 | |
| | 1.00 | | | | 0.01 | | | | 184,873 | | | | 0.24 | | | | 0.01 | | | | 0.73 | |
| | 1.00 | | | | 0.01 | | | | 178,029 | | | | 0.34 | | | | 0.01 | | | | 0.72 | |
| | 1.00 | | | | 0.01 | | | | 249,909 | | | | 0.30 | | | | 0.01 | | | | 0.72 | |
| | | | | |
| | | | | | | | | | | | | | | | | | | | | | |
| | 1.00 | | | | — | (f) | | | — | (g) | | | 0.55 | | | | 0.01 | | | | 1.08 | |
| | 1.00 | | | | 0.01 | | | | 69,615 | | | | 0.32 | | | | 0.01 | | | | 1.08 | |
| | 1.00 | | | | 0.01 | | | | 118,759 | | | | 0.24 | | | | 0.01 | | | | 1.07 | |
| | 1.00 | | | | 0.01 | | | | 118,455 | | | | 0.24 | | | | 0.01 | | | | 1.08 | |
| | 1.00 | | | | 0.01 | | | | 118,015 | | | | 0.34 | | | | 0.01 | | | | 1.07 | |
| | 1.00 | | | | 0.01 | | | | 156,429 | | | | 0.30 | | | | 0.01 | | | | 1.07 | |
SEE NOTES TO FINANCIAL STATEMENTS.
| | | | | | | | |
| | | |
| AUGUST 31, 2016 | | J.P. MORGAN MONEY MARKET FUNDS | | | | | 91 | |
FINANCIAL HIGHLIGHTS
FOR THE PERIODS INDICATED (continued)
| | | | | | | | | | | | | | | | | | | | | | | | | | | | |
| | | | | | Per share operating performance | |
| | | | | | Investment operations | | | Distributions | |
| | | Net asset
value,
beginning
of period | | | Net
investment
income
(loss) | | | Net realized
and unrealized
gains
(losses) on
investments | | | Total from
investment
operations | | | Net
investment
income | | | Net
realized
gain | | | Total
distributions | |
U.S. Government Money Market Fund | | | | | | | | | | | | | | | | | | | | | | | | | | | | |
Agency | | | | | | | | | | | | | | | | | | | | | | | | | | | | |
Six Months Ended August 31, 2016 (Unaudited) | | $ | 1.00 | | | $ | — | (d)(e) | | $ | — | | | $ | — | (e) | | $ | — | (e) | | $ | — | | | $ | — | (e) |
Year Ended February 29, 2016 | | | 1.00 | | | | — | (d)(e) | | | — | (e) | | | — | (e) | | | — | (e) | | | — | (e) | | | — | (e) |
Year Ended February 28, 2015 | | | 1.00 | | | | — | (e) | | | — | (e) | | | — | (e) | | | — | (e) | | | — | (e) | | | — | (e) |
Year Ended February 28, 2014 | | | 1.00 | | | | — | (e) | | | — | (e) | | | — | (e) | | | — | (e) | | | — | (e) | | | — | (e) |
Year Ended February 28, 2013 | | | 1.00 | | | | — | (e) | | | — | (e) | | | — | (e) | | | — | (e) | | | — | (e) | | | — | (e) |
Year Ended February 29, 2012 | | | 1.00 | | | | — | (e) | | | — | (e) | | | — | (e) | | | — | (e) | | | — | (e) | | | — | (e) |
| | | | | | | |
Capital | | | | | | | | | | | | | | | | | | | | | | | | | | | | |
Six Months Ended August 31, 2016 (Unaudited) | | | 1.00 | | | | — | (d)(e) | | | — | | | | — | (e) | | | — | (e) | | | — | | | | — | (e) |
Year Ended February 29, 2016 | | | 1.00 | | | | — | (d)(e) | | | — | (e) | | | — | (e) | | | — | (e) | | | — | (e) | | | — | (e) |
Year Ended February 28, 2015 | | | 1.00 | | | | — | (e) | | | — | (e) | | | — | (e) | | | — | (e) | | | — | (e) | | | — | (e) |
Year Ended February 28, 2014 | | | 1.00 | | | | — | (e) | | | — | (e) | | | — | (e) | | | — | (e) | | | — | (e) | | | — | (e) |
Year Ended February 28, 2013 | | | 1.00 | | | | — | (e) | | | — | (e) | | | — | (e) | | | — | (e) | | | — | (e) | | | — | (e) |
Year Ended February 29, 2012 | | | 1.00 | | | | — | (e) | | | — | (e) | | | — | (e) | | | — | (e) | | | — | (e) | | | — | (e) |
| | | | | | | |
Direct | | | | | | | | | | | | | | | | | | | | | | | | | | | | |
Six Months Ended August 31, 2016 (Unaudited) | | | 1.00 | | | | — | (d)(e) | | | — | | | | — | (e) | | | — | (e) | | | — | | | | — | (e) |
Year Ended February 29, 2016 | | | 1.00 | | | | — | (d)(e) | | | — | (e) | | | — | (e) | | | — | (e) | | | — | (e) | | | — | (e) |
Year Ended February 28, 2015 | | | 1.00 | | | | — | (e) | | | — | (e) | | | — | (e) | | | — | (e) | | | — | (e) | | | — | (e) |
Year Ended February 28, 2014 | | | 1.00 | | | | — | (e) | | | — | (e) | | | — | (e) | | | — | (e) | | | — | (e) | | | — | (e) |
Year Ended February 28, 2013 | | | 1.00 | | | | — | (e) | | | — | (e) | | | — | (e) | | | — | (e) | | | — | (e) | | | — | (e) |
Year Ended February 29, 2012 | | | 1.00 | | | | — | (e) | | | — | (e) | | | — | (e) | | | — | (e) | | | — | (e) | | | — | (e) |
| | | | | | | |
Eagle Class | | | | | | | | | | | | | | | | | | | | | | | | | | | | |
Six Months Ended August 31, 2016 (Unaudited) | | | 1.00 | | | | — | (d)(e) | | | — | | | | — | (e) | | | — | (e) | | | — | | | | — | (e) |
Year Ended February 29, 2016 | | | 1.00 | | | | — | (d)(e) | | | — | (e) | | | — | (e) | | | — | (e) | | | — | (e) | | | — | (e) |
Year Ended February 28, 2015 | | | 1.00 | | | | — | (e) | | | — | (e) | | | — | (e) | | | — | (e) | | | — | (e) | | | — | (e) |
Year Ended February 28, 2014 | | | 1.00 | | | | — | (e) | | | — | (e) | | | — | (e) | | | — | (e) | | | — | (e) | | | — | (e) |
March 1, 2012 through February 28, 2013 | | | 1.00 | | | | — | (e) | | | — | (e) | | | — | (e) | | | — | (e) | | | — | (e) | | | — | (e) |
| | | | | | | |
E*Trade | | | | | | | | | | | | | | | | | | | | | | | | | | | | |
March 9, 2016 (g) through August 31, 2016 (Unaudited) | | | 1.00 | | | | — | (d)(e) | | | — | | | | — | (e) | | | — | (e) | | | — | | | | — | (e) |
| | | | | | | |
IM | | | | | | | | | | | | | | | | | | | | | | | | | | | | |
Six Months Ended August 31, 2016 (Unaudited) | | | 1.00 | | | | — | (d)(e) | | | — | | | | — | (e) | | | — | (e) | | | — | | | | — | (e) |
Year Ended February 29, 2016 | | | 1.00 | | | | — | (d)(e) | | | — | (e) | | | — | (e) | | | — | (e) | | | — | (e) | | | — | (e) |
Year Ended February 28, 2015 | | | 1.00 | | | | — | (e) | | | — | (e) | | | — | (e) | | | — | (e) | | | — | (e) | | | — | (e) |
Year Ended February 28, 2014 | | | 1.00 | | | | — | (e) | | | — | (e) | | | — | (e) | | | — | (e) | | | — | (e) | | | — | (e) |
May 31, 2012 (g) through February 28, 2013 | | | 1.00 | | | | — | (e) | | | — | (e) | | | — | (e) | | | — | (e) | | | — | (e) | | | — | (e) |
| | | | | | | |
Institutional Class | | | | | | | | | | | | | | | | | | | | | | | | | | | | |
Six Months Ended August 31, 2016 (Unaudited) | | | 1.00 | | | | — | (d)(e) | | | — | | | | — | (e) | | | — | (e) | | | — | | | | — | (e) |
Year Ended February 29, 2016 | | | 1.00 | | | | — | (d)(e) | | | — | (e) | | | — | (e) | | | — | (e) | | | — | (e) | | | — | (e) |
Year Ended February 28, 2015 | | | 1.00 | | | | — | (e) | | | — | (e) | | | — | (e) | | | — | (e) | | | — | (e) | | | — | (e) |
Year Ended February 28, 2014 | | | 1.00 | | | | — | (e) | | | — | (e) | | | — | (e) | | | — | (e) | | | — | (e) | | | — | (e) |
Year Ended February 28, 2013 | | | 1.00 | | | | — | (e) | | | — | (e) | | | — | (e) | | | — | (e) | | | — | (e) | | | — | (e) |
Year Ended February 29, 2012 | | | 1.00 | | | | — | (e) | | | — | (e) | | | — | (e) | | | — | (e) | | | — | (e) | | | — | (e) |
| (a) | Annualized for periods less than one year, unless otherwise noted. |
| (b) | Not annualized for periods less than one year. |
| (c) | Includes earnings credits and interest expense, if applicable, each of which is less than 0.005% unless otherwise noted. |
| (d) | Calculated based upon average shares outstanding. |
| (e) | Amount rounds to less than $0.005. |
| (f) | Amount rounds to less than 0.005%. |
| (g) | Commencement of offering of class of shares. |
SEE NOTES TO FINANCIAL STATEMENTS.
| | | | | | |
| | | |
| 92 | | | | J.P. MORGAN MONEY MARKET FUNDS | | AUGUST 31, 2016 |
| | | | | | | | | | | | | | | | | | | | | | |
| | | Ratios/Supplemental data | |
| | | | | | | | | | Ratios to average net assets (a) | |
Net asset
value,
end of
period | | | Total return (b) | | | Net assets,
end of period
(000’s) | | | Net
expenses (c) | | | Net
investment
income
(loss) | | | Expenses
without waivers,
reimbursements and
earnings credits | |
| | | | | | | | | | | | | | | | | | | | | | |
| | | | | | | | | | | | | | | | | | | | | | |
| $ | 1.00 | | | | 0.09 | % | | $ | 11,801,713 | | | | 0.25 | % | | | 0.17 | % | | | 0.31 | % |
| | 1.00 | | | | 0.02 | | | | 7,594,151 | | | | 0.15 | | | | 0.02 | | | | 0.31 | |
| | 1.00 | | | | 0.01 | | | | 7,428,617 | | | | 0.08 | | | | 0.01 | | | | 0.31 | |
| | 1.00 | | | | 0.01 | | | | 7,098,492 | | | | 0.09 | | | | 0.01 | | | | 0.31 | |
| | 1.00 | | | | 0.00 | (f) | | | 9,712,330 | | | | 0.17 | | | | 0.00 | (f) | | | 0.31 | |
| | 1.00 | | | | 0.01 | | | | 8,520,118 | | | | 0.12 | | | | 0.01 | | | | 0.31 | |
| | | | | |
| | | | | | | | | | | | | | | | | | | | | | |
| | 1.00 | | | | 0.14 | | | | 63,438,539 | | | | 0.14 | | | | 0.28 | | | | 0.21 | |
| | 1.00 | | | | 0.04 | | | | 28,046,995 | | | | 0.14 | | | | 0.04 | | | | 0.21 | |
| | 1.00 | | | | 0.01 | | | | 32,973,407 | | | | 0.07 | | | | 0.01 | | | | 0.21 | |
| | 1.00 | | | | 0.01 | | | | 25,817,838 | | | | 0.09 | | | | 0.01 | | | | 0.21 | |
| | 1.00 | | | | 0.01 | | | | 28,211,844 | | | | 0.16 | | | | 0.01 | | | | 0.21 | |
| | 1.00 | | | | 0.01 | | | | 33,517,276 | | | | 0.12 | | | | 0.01 | | | | 0.21 | |
| | | | | |
| | | | | | | | | | | | | | | | | | | | | | |
| | 1.00 | | | | 0.07 | | | | 238,664 | | | | 0.29 | | | | 0.13 | | | | 0.31 | |
| | 1.00 | | | | 0.02 | | | | 870,118 | | | | 0.18 | | | | 0.02 | | | | 0.31 | |
| | 1.00 | | | | 0.01 | | | | 294,989 | | | | 0.07 | | | | 0.01 | | | | 0.31 | |
| | 1.00 | | | | 0.01 | | | | 281,437 | | | | 0.09 | | | | 0.01 | | | | 0.31 | |
| | 1.00 | | | | 0.00 | (f) | | | 392,336 | | | | 0.17 | | | | 0.00 | (f) | | | 0.31 | |
| | 1.00 | | | | 0.01 | | | | 645,927 | | | | 0.12 | | | | 0.01 | | | | 0.31 | |
| | | | | |
| | | | | | | | | | | | | | | | | | | | | | |
| | 1.00 | | | | 0.01 | | | | 392,486 | | | | 0.41 | | | | 0.01 | | | | 0.70 | |
| | 1.00 | | | | 0.01 | | | | 437,372 | | | | 0.18 | | | | 0.01 | | | | 0.71 | |
| | 1.00 | | | | 0.01 | | | | 351,014 | | | | 0.07 | | | | 0.01 | | | | 0.71 | |
| | 1.00 | | | | 0.01 | | | | 1,838,360 | | | | 0.09 | | | | 0.01 | | | | 0.71 | |
| | 1.00 | | | | 0.01 | | | | 2,219,405 | | | | 0.16 | | | | 0.01 | | | | 0.71 | |
| | | | | |
| | | | | | | | | | | | | | | | | | | | | | |
| | 1.00 | | | | 0.01 | | | | 20 | | | | 0.41 | | | | 0.02 | | | | 1.07 | |
| | | | | |
| | | | | | | | | | | | | | | | | | | | | | |
| | 1.00 | | | | 0.14 | | | | 269,471 | | | | 0.14 | | | | 0.28 | | | | 0.16 | |
| | 1.00 | | | | 0.05 | | | | 648,289 | | | | 0.13 | | | | 0.05 | | | | 0.16 | |
| | 1.00 | | | | 0.01 | | | | 1,142,811 | | | | 0.07 | | | | 0.01 | | | | 0.16 | |
| | 1.00 | | | | 0.01 | | | | 563,436 | | | | 0.08 | | | | 0.02 | | | | 0.16 | |
| | 1.00 | | | | 0.02 | | | | 100 | | | | 0.15 | | | | 0.03 | | | | 0.16 | |
| | | | | |
| | | | | | | | | | | | | | | | | | | | | | |
| | 1.00 | | | | 0.12 | | | | 21,423,039 | | | | 0.17 | | | | 0.25 | | | | 0.26 | |
| | 1.00 | | | | 0.04 | | | | 8,704,148 | | | | 0.15 | | | | 0.03 | | | | 0.26 | |
| | 1.00 | | | | 0.01 | | | | 8,279,641 | | | | 0.07 | | | | 0.01 | | | | 0.26 | |
| | 1.00 | | | | 0.01 | | | | 7,099,746 | | | | 0.09 | | | | 0.01 | | | | 0.26 | |
| | 1.00 | | | | 0.00 | (f) | | | 8,263,941 | | | | 0.17 | | | | 0.00 | (f) | | | 0.26 | |
| | 1.00 | | | | 0.01 | | | | 10,402,935 | | | | 0.12 | | | | 0.01 | | | | 0.26 | |
SEE NOTES TO FINANCIAL STATEMENTS.
| | | | | | | | |
| | | |
| AUGUST 31, 2016 | | J.P. MORGAN MONEY MARKET FUNDS | | | | | 93 | |
FINANCIAL HIGHLIGHTS
FOR THE PERIODS INDICATED (continued)
| | | | | | | | | | | | | | | | | | | | | | | | | | | | |
| | | | | | Per share operating performance | |
| | | | | | Investment operations | | | Distributions | |
| | | Net asset
value,
beginning
of period | | | Net
investment
income
(loss) | | | Net realized
and unrealized
gains
(losses) on
investments | | | Total from
investment
operations | | | Net
investment
income | | | Net
realized
gain | | | Total
distributions | |
U.S. Government Money Market Fund (continued) | | | | | | | | | | | | | | | | | | | | | | | | | | | | |
Investor | | | | | | | | | | | | | | | | | | | | | | | | | | | | |
Six Months Ended August 31, 2016 (Unaudited) | | $ | 1.00 | | | $ | — | (d)(e) | | $ | — | | | $ | — | (e) | | $ | — | (e) | | $ | — | | | $ | — | (e) |
Year Ended February 29, 2016 | �� | | 1.00 | | | | — | (d)(e) | | | — | (e) | | | — | (e) | | | — | (e) | | | — | (e) | | | — | (e) |
Year Ended February 28, 2015 | | | 1.00 | | | | — | (e) | | | — | (e) | | | — | (e) | | | — | (e) | | | — | (e) | | | — | (e) |
Year Ended February 28, 2014 | | | 1.00 | | | | — | (e) | | | — | (e) | | | — | (e) | | | — | (e) | | | — | (e) | | | — | (e) |
Year Ended February 28, 2013 | | | 1.00 | | | | — | (e) | | | — | (e) | | | — | (e) | | | — | (e) | | | — | (e) | | | — | (e) |
Year Ended February 29, 2012 | | | 1.00 | | | | — | (e) | | | — | (e) | | | — | (e) | | | — | (e) | | | — | (e) | | | — | (e) |
| | | | | | | |
Morgan | | | | | | | | | | | | | | | | | | | | | | | | | | | | |
Six Months Ended August 31, 2016 (Unaudited) | | | 1.00 | | | | — | (d)(e) | | | — | | | | — | (e) | | | — | (e) | | | — | | | | — | (e) |
Year Ended February 29, 2016 | | | 1.00 | | | | — | (d)(e) | | | — | (e) | | | — | (e) | | | — | (e) | | | — | (e) | | | — | (e) |
Year Ended February 28, 2015 | | | 1.00 | | | | — | (e) | | | — | (e) | | | — | (e) | | | — | (e) | | | — | (e) | | | — | (e) |
Year Ended February 28, 2014 | | | 1.00 | | | | — | (e) | | | — | (e) | | | — | (e) | | | — | (e) | | | — | (e) | | | — | (e) |
Year Ended February 28, 2013 | | | 1.00 | | | | — | (e) | | | — | (e) | | | — | (e) | | | — | (e) | | | — | (e) | | | — | (e) |
Year Ended February 29, 2012 | | | 1.00 | | | | — | (e) | | | — | (e) | | | — | (e) | | | — | (e) | | | — | (e) | | | — | (e) |
| | | | | | | |
Premier | | | | | | | | | | | | | | | | | | | | | | | | | | | | |
Six Months Ended August 31, 2016 (Unaudited) | | | 1.00 | | | | — | (d)(e) | | | — | | | | — | (e) | | | — | (e) | | | — | | | | — | (e) |
Year Ended February 29, 2016 | | | 1.00 | | | | — | (d)(e) | | | — | (e) | | | — | (e) | | | — | (e) | | | — | (e) | | | — | (e) |
Year Ended February 28, 2015 | | | 1.00 | | | | — | (e) | | | — | (e) | | | — | (e) | | | — | (e) | | | — | (e) | | | — | (e) |
Year Ended February 28, 2014 | | | 1.00 | | | | — | (e) | | | — | (e) | | | — | (e) | | | — | (e) | | | — | (e) | | | — | (e) |
Year Ended February 28, 2013 | | | 1.00 | | | | — | (e) | | | — | (e) | | | — | (e) | | | — | (e) | | | — | (e) | | | — | (e) |
Year Ended February 29, 2012 | | | 1.00 | | | | — | (e) | | | — | (e) | | | — | (e) | | | — | (e) | | | — | (e) | | | — | (e) |
| | | | | | | |
Reserve | | | | | | | | | | | | | | | | | | | | | | | | | | | | |
Six Months Ended August 31, 2016 (Unaudited) | | | 1.00 | | | | — | (d)(e) | | | — | | | | — | (e) | | | — | (e) | | | — | | | | — | (e) |
Year Ended February 29, 2016 | | | 1.00 | | | | — | (d)(e) | | | — | (e) | | | — | (e) | | | — | (e) | | | — | (e) | | | — | (e) |
Year Ended February 28, 2015 | | | 1.00 | | | | — | (e) | | | — | (e) | | | — | (e) | | | — | (e) | | | — | (e) | | | — | (e) |
Year Ended February 28, 2014 | | | 1.00 | | | | — | (e) | | | — | (e) | | | — | (e) | | | — | (e) | | | — | (e) | | | — | (e) |
Year Ended February 28, 2013 | | | 1.00 | | | | — | (e) | | | — | (e) | | | — | (e) | | | — | (e) | | | — | (e) | | | — | (e) |
Year Ended February 29, 2012 | | | 1.00 | | | | — | (e) | | | — | (e) | | | — | (e) | | | — | (e) | | | — | (e) | | | — | (e) |
| | | | | | | |
Service | | | | | | | | | | | | | | | | | | | | | | | | | | | | |
Six Months Ended August 31, 2016 (Unaudited) | | | 1.00 | | | | — | (d)(e) | | | — | | | | — | (e) | | | — | (e) | | | — | | | | — | (e) |
Year Ended February 29, 2016 | | | 1.00 | | | | — | (d)(e) | | | — | (e) | | | — | (e) | | | — | (e) | | | — | (e) | | | — | (e) |
Year Ended February 28, 2015 | | | 1.00 | | | | — | (e) | | | — | (e) | | | — | (e) | | | — | (e) | | | — | (e) | | | — | (e) |
Year Ended February 28, 2014 | | | 1.00 | | | | — | (e) | | | — | (e) | | | — | (e) | | | — | (e) | | | — | (e) | | | — | (e) |
Year Ended February 28, 2013 | | | 1.00 | | | | — | (e) | | | — | (e) | | | — | (e) | | | — | (e) | | | — | (e) | | | — | (e) |
Year Ended February 29, 2012 | | | 1.00 | | | | — | (e) | | | — | (e) | | | — | (e) | | | — | (e) | | | — | (e) | | | — | (e) |
| (a) | Annualized for periods less than one year, unless otherwise noted. |
| (b) | Not annualized for periods less than one year. |
| (c) | Includes earnings credits and interest expense, if applicable, each of which is less than 0.005% unless otherwise noted. |
| (d) | Calculated based upon average shares outstanding. |
| (e) | Amount rounds to less than $0.005. |
| (f) | Amount rounds to less than 0.005%. |
SEE NOTES TO FINANCIAL STATEMENTS.
| | | | | | |
| | | |
| 94 | | | | J.P. MORGAN MONEY MARKET FUNDS | | AUGUST 31, 2016 |
| | | | | | | | | | | | | | | | | | | | | | |
| | | Ratios/Supplemental data | |
| | | | | | | | | | Ratios to average net assets (a) | |
Net asset
value,
end of
period | | | Total return (b) | | | Net assets,
end of period
(000’s) | | | Net
expenses (c) | | | Net
investment
income
(loss) | | | Expenses
without waivers,
reimbursements and
earnings credits | |
| | | | | | | | | | | | | | | | | | | | | | |
| | | | | | | | | | | | | | | | | | | | | | |
| $ | 1.00 | | | | 0.01 | % | | $ | 600,602 | | | | 0.41 | % | | | 0.01 | % | | | 0.51 | % |
| | 1.00 | | | | 0.01 | | | | 3,856,545 | | | | 0.18 | | | | 0.01 | | | | 0.51 | |
| | 1.00 | | | | 0.01 | | | | 3,066,013 | | | | 0.07 | | | | 0.01 | | | | 0.51 | |
| | 1.00 | | | | 0.01 | | | | 3,664,674 | | | | 0.09 | | | | 0.01 | | | | 0.51 | |
| | 1.00 | | | | 0.00 | (f) | | | 4,437,341 | | | | 0.17 | | | | 0.00 | (f) | | | 0.51 | |
| | 1.00 | | | | 0.01 | | | | 4,401,603 | | | | 0.12 | | | | 0.01 | | | | 0.51 | |
| | | | | |
| | | | | | | | | | | | | | | | | | | | | | |
| | 1.00 | | | | 0.01 | | | | 2,231,555 | | | | 0.41 | | | | 0.01 | | | | 0.61 | |
| | 1.00 | | | | 0.01 | | | | 2,229,161 | | | | 0.17 | | | | 0.01 | | | | 0.61 | |
| | 1.00 | | | | 0.01 | | | | 2,039,361 | | | | 0.08 | | | | 0.01 | | | | 0.61 | |
| | 1.00 | | | | 0.01 | | | | 2,435,725 | | | | 0.09 | | | | 0.01 | | | | 0.61 | |
| | 1.00 | | | | 0.00 | (f) | | | 2,795,260 | | | | 0.17 | | | | 0.00 | (f) | | | 0.61 | |
| | 1.00 | | | | 0.01 | | | | 1,931,164 | | | | 0.13 | | | | 0.01 | | | | 0.61 | |
| | | | | |
| | | | | | | | | | | | | | | | | | | | | | |
| | 1.00 | | | | 0.01 | | | | 8,228,594 | | | | 0.40 | | | | 0.02 | | | | 0.46 | |
| | 1.00 | | | | 0.01 | | | | 7,570,828 | | | | 0.18 | | | | 0.01 | | | | 0.46 | |
| | 1.00 | | | | 0.01 | | | | 3,441,795 | | | | 0.07 | | | | 0.01 | | | | 0.46 | |
| | 1.00 | | | | 0.01 | | | | 3,646,033 | | | | 0.09 | | | | 0.01 | | | | 0.46 | |
| | 1.00 | | | | 0.00 | (f) | | | 4,184,299 | | | | 0.17 | | | | 0.00 | (f) | | | 0.46 | |
| | 1.00 | | | | 0.01 | | | | 4,841,573 | | | | 0.12 | | | | 0.01 | | | | 0.46 | |
| | | | | |
| | | | | | | | | | | | | | | | | | | | | | |
| | 1.00 | | | | 0.01 | | | | 80,255 | | | | 0.41 | | | | 0.01 | | | | 0.71 | |
| | 1.00 | | | | 0.01 | | | | 16,298 | | | | 0.12 | | | | 0.01 | | | | 0.71 | |
| | 1.00 | | | | 0.01 | | | | 150,289 | | | | 0.08 | | | | 0.01 | | | | 0.71 | |
| | 1.00 | | | | 0.01 | | | | 48,890 | | | | 0.09 | | | | 0.01 | | | | 0.71 | |
| | 1.00 | | | | 0.00 | (f) | | | 34,522 | | | | 0.17 | | | | 0.00 | (f) | | | 0.71 | |
| | 1.00 | | | | 0.01 | | | | 23,828 | | | | 0.14 | | | | 0.00 | (f) | | | 0.71 | |
| | | | | |
| | | | | | | | | | | | | | | | | | | | | | |
| | 1.00 | | | | 0.01 | | | | 770,097 | | | | 0.41 | | | | 0.01 | | | | 1.06 | |
| | 1.00 | | | | 0.01 | | | | 395,656 | | | | 0.15 | | | | 0.01 | | | | 1.06 | |
| | 1.00 | | | | 0.01 | | | | 913,521 | | | | 0.07 | | | | 0.01 | | | | 1.06 | |
| | 1.00 | | | | 0.01 | | | | 898,352 | | | | 0.09 | | | | 0.01 | | | | 1.06 | |
| | 1.00 | | | | 0.00 | (f) | | | 910,554 | | | | 0.17 | | | | 0.00 | (f) | | | 1.06 | |
| | 1.00 | | | | 0.01 | | | | 867,708 | | | | 0.13 | | | | 0.00 | (f) | | | 1.06 | |
SEE NOTES TO FINANCIAL STATEMENTS.
| | | | | | | | |
| | | |
| AUGUST 31, 2016 | | J.P. MORGAN MONEY MARKET FUNDS | | | | | 95 | |
FINANCIAL HIGHLIGHTS
FOR THE PERIODS INDICATED (continued)
| | | | | | | | | | | | | | | | | | | | | | | | | | | | |
| | | | | | Per share operating performance | |
| | | | | | Investment operations | | | Distributions | |
| | | Net asset
value,
beginning
of period | | | Net
investment
income
(loss) | | | Net realized
and unrealized
gains
(losses) on
investments | | | Total from
investment
operations | | | Net
investment
income | | | Net
realized
gain | | | Total
distributions | |
U.S. Treasury Plus Money Market Fund | | | | | | | | | | | | | | | | | | | | | | | | | | | | |
Class C | | | | | | | | | | | | | | | | | | | | | | | | | | | | |
Six Months Ended August 31, 2016 (Unaudited) | | $ | 1.00 | | | $ | — | (d) | | $ | — | (e) | | $ | — | (e) | | $ | — | | | $ | — | | | $ | — | |
Year Ended February 29, 2016 | | | 1.00 | | | | — | (d)(e) | | | — | (e) | | | — | (e) | | | — | (e) | | | — | (e) | | | — | (e) |
Year Ended February 28, 2015 | | | 1.00 | | | | — | | | | — | (e) | | | — | (e) | | | — | (e) | | | — | (e) | | | — | (e) |
Year Ended February 28, 2014 | | | 1.00 | | | | — | (e) | | | — | (e) | | | — | (e) | | | — | (e) | | | — | (e) | | | — | (e) |
Year Ended February 28, 2013 | | | 1.00 | | | | — | (e) | | | — | (e) | | | — | (e) | | | — | (e) | | | — | (e) | | | — | (e) |
Year Ended February 29, 2012 | | | 1.00 | | | | — | (e) | | | — | (e) | | | — | (e) | | | — | (e) | | | — | (e) | | | — | (e) |
| | | | | | | |
Agency | | | | | | | | | | | | | | | | | | | | | | | | | | | | |
Six Months Ended August 31, 2016 (Unaudited) | | | 1.00 | | | | — | (d)(e) | | | — | (e) | | | — | (e) | | | — | (e) | | | — | | | | — | (e) |
Year Ended February 29, 2016 | | | 1.00 | | | | — | (d)(e) | | | — | (e) | | | — | (e) | | | — | (e) | | | — | (e) | | | — | (e) |
Year Ended February 28, 2015 | | | 1.00 | | | | — | | | | — | (e) | | | — | (e) | | | — | (e) | | | — | (e) | | | — | (e) |
Year Ended February 28, 2014 | | | 1.00 | | | | — | (e) | | | — | (e) | | | — | (e) | | | — | (e) | | | — | (e) | | | — | (e) |
Year Ended February 28, 2013 | | | 1.00 | | | | — | | | | — | (e) | | | — | (e) | | | — | (e) | | | — | (e) | | | — | (e) |
Year Ended February 29, 2012 | | | 1.00 | | | | — | (e) | | | — | (e) | | | — | (e) | | | — | (e) | | | — | (e) | | | — | (e) |
| | | | | | | |
Direct | | | | | | | | | | | | | | | | | | | | | | | | | | | | |
Six Months Ended August 31, 2016 (Unaudited) | | | 1.00 | | | | — | (d)(e) | | | — | (e) | | | — | (e) | | | — | (e) | | | — | | | | — | (e) |
Year Ended February 29, 2016 | | | 1.00 | | | | — | (d)(e) | | | — | (e) | | | — | (e) | | | — | (e) | | | — | (e) | | | — | (e) |
Year Ended February 28, 2015 | | | 1.00 | | | | — | | | | — | (e) | | | — | (e) | | | — | (e) | | | — | (e) | | | — | (e) |
Year Ended February 28, 2014 | | | 1.00 | | | | — | (e) | | | — | (e) | | | — | (e) | | | — | (e) | | | — | (e) | | | — | (e) |
Year Ended February 28, 2013 | | | 1.00 | | | | — | | | | — | (e) | | | — | (e) | | | — | (e) | | | — | (e) | | | — | (e) |
Year Ended February 29, 2012 | | | 1.00 | | | | — | (e) | | | — | (e) | | | — | (e) | | | — | (e) | | | — | (e) | | | — | (e) |
| | | | | | | |
Eagle Class | | | | | | | | | | | | | | | | | | | | | | | | | | | | |
Six Months Ended August 31, 2016 (Unaudited) | | | 1.00 | | | | — | (d) | | | — | (e) | | | — | (e) | | | — | | | | — | | | | — | |
Year Ended February 29, 2016 | | | 1.00 | | | | — | (d)(e) | | | — | (e) | | | — | (e) | | | — | | | | — | | | | — | |
Year Ended February 28, 2015 | | | 1.00 | | | | — | | | | — | (e) | | | — | (e) | | | — | (e) | | | — | (e) | | | — | (e) |
Year Ended February 28, 2014 | | | 1.00 | | | | — | (e) | | | — | (e) | | | — | (e) | | | — | (e) | | | — | (e) | | | — | (e) |
March 1, 2012 (g) through February 28, 2013 | | | 1.00 | | | | — | | | | — | (e) | | | — | (e) | | | — | (e) | | | — | (e) | | | — | (e) |
| | | | | | | |
IM | | | | | | | | | | | | | | | | | | | | | | | | | | | | |
Six Months Ended August 31, 2016 (Unaudited) | | | 1.00 | | | | — | (d)(e) | | | — | (e) | | | — | (e) | | | — | (e) | | | — | | | | — | (e) |
Year Ended February 29, 2016 | | | 1.00 | | | | — | (d)(e) | | | — | (e) | | | — | (e) | | | — | (e) | | | — | (e) | | | — | (e) |
Year Ended February 28, 2015 | | | 1.00 | | | | — | | | | — | (e) | | | — | (e) | | | — | (e) | | | — | (e) | | | — | (e) |
Year Ended February 28, 2014 | | | 1.00 | | | | — | (e) | | | — | (e) | | | — | (e) | | | — | (e) | | | — | (e) | | | — | (e) |
May 31, 2012 (g) through February 28, 2013 | | | 1.00 | | | | — | (e) | | | — | (e) | | | — | (e) | | | — | (e) | | | — | (e) | | | — | (e) |
| | | | | | | |
Institutional Class | | | | | | | | | | | | | | | | | | | | | | | | | | | | |
Six Months Ended August 31, 2016 (Unaudited) | | | 1.00 | | | | — | (d)(e) | | | — | (e) | | | — | (e) | | | — | (e) | | | — | | | | — | (e) |
Year Ended February 29, 2016 | | | 1.00 | | | | — | (d)(e) | | | — | (e) | | | — | (e) | | | — | (e) | | | — | (e) | | | — | (e) |
Year Ended February 28, 2015 | | | 1.00 | | | | — | | | | — | (e) | | | — | (e) | | | — | (e) | | | — | (e) | | | — | (e) |
Year Ended February 28, 2014 | | | 1.00 | | | | — | (e) | | | — | (e) | | | — | (e) | | | — | (e) | | | — | (e) | | | — | (e) |
Year Ended February 28, 2013 | | | 1.00 | | | | — | (e) | | | — | (e) | | | — | (e) | | | — | (e) | | | — | (e) | | | — | (e) |
Year Ended February 29, 2012 | | | 1.00 | | | | — | (e) | | | — | (e) | | | — | (e) | | | — | (e) | | | — | (e) | | | — | (e) |
| (a) | Annualized for periods less than one year, unless otherwise noted. |
| (b) | Not annualized for periods less than one year. |
| (c) | Includes earnings credits and interest expense, if applicable, each of which is less than 0.005% unless otherwise noted. |
| (d) | Calculated based upon average shares outstanding. |
| (e) | Amount rounds to less than $0.005. |
| (f) | Amount rounds to less than 0.005% |
| (g) | Commencement of offering of class of shares. |
SEE NOTES TO FINANCIAL STATEMENTS.
| | | | | | |
| | | |
| 96 | | | | J.P. MORGAN MONEY MARKET FUNDS | | AUGUST 31, 2016 |
| | | | | | | | | | | | | | | | | | | | | | |
| | | Ratios/Supplemental data (a) | |
| | | | | | | | | | Ratios to average net assets | |
Net asset
value,
end of
period | | | Total return (b) | | | Net assets,
end of
period
(000’s) | | | Net
expenses (c) | | | Net
investment
income
(loss) | | | Expenses
without waivers,
reimbursements and
earnings credits | |
| | | | | | | | | | | | | | | | | | | | | | |
| | | | | | | | | | | | | | | | | | | | | | |
| $ | 1.00 | | | | 0.00 | % | | $ | 144,145 | | | | 0.39 | % | | | 0.00 | % | | | 1.16 | % |
| | 1.00 | | | | 0.00 | (f) | | | 154,988 | | | | 0.15 | | | | 0.00 | (f) | | | 1.16 | |
| | 1.00 | | | | 0.00 | (f) | | | 168,863 | | | | 0.07 | | | | 0.00 | (f) | | | 1.16 | |
| | 1.00 | | | | 0.00 | (f) | | | 142,412 | | | | 0.08 | | | | 0.00 | (f) | | | 1.16 | |
| | 1.00 | | | | 0.00 | (f) | | | 185,554 | | | | 0.15 | | | | 0.00 | (f) | | | 1.16 | |
| | 1.00 | | | | 0.00 | (f) | | | 189,206 | | | | 0.09 | | | | 0.00 | (f) | | | 1.16 | |
| | | | | |
| | | | | | | | | | | | | | | | | | | | | | |
| | 1.00 | | | | 0.07 | | | | 1,483,259 | | | | 0.26 | | | | 0.13 | | | | 0.31 | |
| | 1.00 | | | | 0.01 | | | | 956,921 | | | | 0.15 | | | | 0.01 | | | | 0.31 | |
| | 1.00 | | | | 0.00 | (f) | | | 858,260 | | | | 0.07 | | | | 0.00 | (f) | | | 0.31 | |
| | 1.00 | | | | 0.00 | (f) | | | 2,590,914 | | | | 0.08 | | | | 0.00 | (f) | | | 0.31 | |
| | 1.00 | | | | 0.00 | (f) | | | 2,869,561 | | | | 0.15 | | | | 0.00 | (f) | | | 0.31 | |
| | 1.00 | | | | 0.00 | (f) | | | 998,134 | | | | 0.09 | | | | 0.00 | (f) | | | 0.31 | |
| | | | | |
| | | | | | | | | | | | | | | | | | | | | | |
| | 1.00 | | | | 0.05 | | | | 59,080 | | | | 0.30 | | | | 0.09 | | | | 0.31 | |
| | 1.00 | | | | 0.01 | | | | 672,625 | | | | 0.13 | | | | 0.00 | (f) | | | 0.31 | |
| | 1.00 | | | | 0.00 | (f) | | | 1,222,018 | | | | 0.07 | | | | 0.00 | (f) | | | 0.31 | |
| | 1.00 | | | | 0.00 | (f) | | | 1,655,840 | | | | 0.08 | | | | 0.00 | (f) | | | 0.31 | |
| | 1.00 | | | | 0.00 | (f) | | | 1,634,584 | | | | 0.15 | | | | 0.00 | | | | 0.31 | |
| | 1.00 | | | | 0.00 | (f) | | | 2,070,205 | | | | 0.08 | | | | 0.00 | (f) | | | 0.31 | |
| | | | | |
| | | | | | | | | | | | | | | | | | | | | | |
| | 1.00 | | | | 0.00 | | | | 20 | | | | 0.39 | | | | 0.00 | | | | 2.25 | |
| | 1.00 | | | | 0.00 | (f) | | | 20 | | | | 0.12 | | | | 0.00 | (f) | | | 1.63 | |
| | 1.00 | | | | 0.00 | (f) | | | 100 | | | | 0.07 | | | | 0.00 | (f) | | | 0.71 | |
| | 1.00 | | | | 0.00 | (f) | | | 100 | | | | 0.08 | | | | 0.00 | (f) | | | 0.71 | |
| | 1.00 | | | | 0.00 | (f) | | | 100 | | | | 0.15 | | | | 0.00 | | | | 0.71 | |
| | | | | |
| | | | | | | | | | | | | | | | | | | | | | |
| | 1.00 | | | | 0.12 | | | | 5,574,193 | | | | 0.16 | | | | 0.23 | | | | 0.16 | |
| | 1.00 | | | | 0.04 | | | | 4,788,250 | | | | 0.12 | | | | 0.04 | | | | 0.16 | |
| | 1.00 | | | | 0.00 | (f) | | | 3,045,746 | | | | 0.07 | | | | 0.00 | (f) | | | 0.16 | |
| | 1.00 | | | | 0.00 | (f) | | | 1,931,586 | | | | 0.07 | | | | 0.00 | (f) | | | 0.16 | |
| | 1.00 | | | | 0.01 | | | | 100 | | | | 0.14 | | | | 0.02 | | | | 0.16 | |
| | | | | |
| | | | | | | | | | | | | | | | | | | | | | |
| | 1.00 | | | | 0.09 | | | | 11,345,550 | | | | 0.21 | | | | 0.18 | | | | 0.26 | |
| | 1.00 | | | | 0.02 | | | | 8,736,623 | | | | 0.13 | | | | 0.02 | | | | 0.26 | |
| | 1.00 | | | | 0.00 | (f) | | | 6,516,731 | | | | 0.07 | | | | 0.00 | (f) | | | 0.26 | |
| | 1.00 | | | | 0.00 | (f) | | | 7,296,339 | | | | 0.08 | | | | 0.00 | (f) | | | 0.26 | |
| | 1.00 | | | | 0.00 | (f) | | | 7,555,937 | | | | 0.15 | | | | 0.00 | (f) | | | 0.26 | |
| | 1.00 | | | | 0.00 | (f) | | | 6,946,570 | | | | 0.08 | | | | 0.00 | (f) | | | 0.26 | |
SEE NOTES TO FINANCIAL STATEMENTS.
| | | | | | | | |
| | | |
| AUGUST 31, 2016 | | J.P. MORGAN MONEY MARKET FUNDS | | | | | 97 | |
FINANCIAL HIGHLIGHTS
FOR THE PERIODS INDICATED (continued)
| | | | | | | | | | | | | | | | | | | | | | | | | | | | |
| | | | | | Per share operating performance | |
| | | | | | Investment operations | | | Distributions | |
| | | Net asset
value,
beginning
of period | | | Net
investment
income
(loss) | | | Net realized
and unrealized
gains
(losses) on
investments | | | Total from
investment
operations | | | Net
investment
income | | | Net
realized
gain | | | Total
distributions | |
U.S. Treasury Plus Money Market Fund (continued) | | | | | | | | | | | | | | | | | | | | | | | | | | | | |
Investor | | | | | | | | | | | | | | | | | | | | | | | | | | | | |
Six Months Ended August 31, 2016 (Unaudited) | | $ | 1.00 | | | $ | — | (d) | | $ | — | (e) | | $ | — | (e) | | $ | — | | | $ | — | | | $ | — | |
Year Ended February 29, 2016 | | | 1.00 | | | | — | (d)(e) | | | — | (e) | | | — | (e) | | | — | (e) | | | — | (e) | | | — | (e) |
Year Ended February 28, 2015 | | | 1.00 | | | | — | | | | — | (e) | | | — | (e) | | | — | (e) | | | — | (e) | | | — | (e) |
Year Ended February 28, 2014 | | | 1.00 | | | | — | (e) | | | — | (e) | | | — | (e) | | | — | (e) | | | — | (e) | | | — | (e) |
Year Ended February 28, 2013 | | | 1.00 | | | | — | | | | — | (e) | | | — | (e) | | | — | (e) | | | — | (e) | | | — | (e) |
Year Ended February 29, 2012 | | | 1.00 | | | | — | (e) | | | — | (e) | | | — | (e) | | | — | (e) | | | — | (e) | | | — | (e) |
| | | | | | | |
Morgan | | | | | | | | | | | | | | | | | | | | | | | | | | | | |
Six Months Ended August 31, 2016 (Unaudited) | | | 1.00 | | | | — | (d) | | | — | (e) | | | — | (e) | | | — | | | | — | | | | — | |
Year Ended February 29, 2016 | | | 1.00 | | | | — | (d)(e) | | | — | (e) | | | — | (e) | | | — | (e) | | | — | (e) | | | — | (e) |
Year Ended February 28, 2015 | | | 1.00 | | | | — | | | | — | (e) | | | — | (e) | | | — | (e) | | | — | (e) | | | — | (e) |
Year Ended February 28, 2014 | | | 1.00 | | | | — | (e) | | | — | (e) | | | — | (e) | | | — | (e) | | | — | (e) | | | — | (e) |
Year Ended February 28, 2013 | | | 1.00 | | | | — | (e) | | | — | (e) | | | — | (e) | | | — | (e) | | | — | (e) | | | — | (e) |
Year Ended February 29, 2012 | | | 1.00 | | | | — | (e) | | | — | (e) | | | — | (e) | | | — | (e) | | | — | (e) | | | — | (e) |
| | | | | | | |
Premier | | | | | | | | | | | | | | | | | | | | | | | | | | | | |
Six Months Ended August 31, 2016 (Unaudited) | | | 1.00 | | | | — | (d)(e) | | | — | (e) | | | — | (e) | | | — | (e) | | | — | | | | — | (e) |
Year Ended February 29, 2016 | | | 1.00 | | | | — | (d)(e) | | | — | (e) | | | — | (e) | | | — | (e) | | | — | (e) | | | — | (e) |
Year Ended February 28, 2015 | | | 1.00 | | | | — | | | | — | (e) | | | — | (e) | | | — | (e) | | | — | (e) | | | — | (e) |
Year Ended February 28, 2014 | | | 1.00 | | | | — | (e) | | | — | (e) | | | — | (e) | | | — | (e) | | | — | (e) | | | — | (e) |
Year Ended February 28, 2013 | | | 1.00 | | | | — | (e) | | | — | (e) | | | — | (e) | | | — | (e) | | | — | (e) | | | — | (e) |
Year Ended February 29, 2012 | | | 1.00 | | | | — | (e) | | | — | (e) | | | — | (e) | | | — | (e) | | | — | (e) | | | — | (e) |
| | | | | | | |
Reserve | | | | | | | | | | | | | | | | | | | | | | | | | | | | |
Six Months Ended August 31, 2016 (Unaudited) | | | 1.00 | | | | — | (d) | | | — | (e) | | | — | (e) | | | — | | | | — | | | | — | |
Year Ended February 29, 2016 | | | 1.00 | | | | — | (d)(e) | | | — | (e) | | | — | (e) | | | — | (e) | | | — | (e) | | | — | (e) |
Year Ended February 28, 2015 | | | 1.00 | | | | — | | | | — | (e) | | | — | (e) | | | — | (e) | | | — | (e) | | | — | (e) |
Year Ended February 28, 2014 | | | 1.00 | | | | — | (e) | | | — | (e) | | | — | (e) | | | — | (e) | | | — | (e) | | | — | (e) |
Year Ended February 28, 2013 | | | 1.00 | | | | — | (e) | | | — | (e) | | | — | (e) | | | — | (e) | | | — | (e) | | | — | (e) |
Year Ended February 29, 2012 | | | 1.00 | | | | — | (e) | | | — | (e) | | | — | (e) | | | — | (e) | | | — | (e) | | | — | (e) |
| | | | | | | |
Service | | | | | | | | | | | | | | | | | | | | | | | | | | | | |
Six Months Ended August 31, 2016 (Unaudited) | | | 1.00 | | | | — | (d) | | | — | (e) | | | — | (e) | | | — | | | | — | | | | — | |
Year Ended February 29, 2016 | | | 1.00 | | | | — | (d)(e) | | | — | (e) | | | — | (e) | | | — | | | | — | | | | — | |
Year Ended February 28, 2015 | | | 1.00 | | | | — | | | | — | (e) | | | — | (e) | | | — | (e) | | | — | (e) | | | — | (e) |
Year Ended February 28, 2014 | | | 1.00 | | | | — | (e) | | | — | (e) | | | — | (e) | | | — | (e) | | | — | (e) | | | — | (e) |
Year Ended February 28, 2013 | | | 1.00 | | | | — | (e) | | | — | (e) | | | — | (e) | | | — | (e) | | | — | (e) | | | — | (e) |
Year Ended February 29, 2012 | | | 1.00 | | | | — | (e) | | | — | (e) | | | — | (e) | | | — | (e) | | | — | (e) | | | — | (e) |
| (a) | Annualized for periods less than one year, unless otherwise noted. |
| (b) | Not annualized for periods less than one year. |
| (c) | Includes earnings credits and interest expense, if applicable, each of which is less than 0.005% unless otherwise noted. |
| (d) | Calculated based upon average shares outstanding. |
| (e) | Amount rounds to less than $0.005. |
| (f) | Amount rounds to less than 0.005% |
| (g) | Commencement of offering of class of shares. |
SEE NOTES TO FINANCIAL STATEMENTS.
| | | | | | |
| | | |
| 98 | | | | J.P. MORGAN MONEY MARKET FUNDS | | AUGUST 31, 2016 |
| | | | | | | | | | | | | | | | | | | | | | |
| | | Ratios/Supplemental data (a) | |
| | | | | | | | | | Ratios to average net assets | |
Net asset
value,
end of
period | | | Total return (b) | | | Net assets,
end of
period
(000’s) | | | Net
expenses (c) | | | Net
investment
income
(loss) | | | Expenses
without waivers,
reimbursements and
earnings credits | |
| | | | | | | | | | | | | | | | | | | | | | |
| | | | | | | | | | | | | | | | | | | | | | |
| $ | 1.00 | | | | 0.00 | % | | $ | 77,854 | | | | 0.39 | % | | | 0.00 | % | | | 0.51 | % |
| | 1.00 | | | | 0.00 | (f) | | | 89,016 | | | | 0.14 | | | | 0.00 | (f) | | | 0.51 | |
| | 1.00 | | | | 0.00 | (f) | | | 181,909 | | | | 0.07 | | | | 0.00 | (f) | | | 0.51 | |
| | 1.00 | | | | 0.00 | (f) | | | 237,466 | | | | 0.08 | | | | 0.00 | (f) | | | 0.51 | |
| | 1.00 | | | | 0.00 | (f) | | | 300,429 | | | | 0.15 | | | | 0.00 | | | | 0.51 | |
| | 1.00 | | | | 0.00 | (f) | | | 381,781 | | | | 0.08 | | | | 0.00 | (f) | | | 0.51 | |
| | | | | |
| | | | | | | | | | | | | | | | | | | | | | |
| | 1.00 | | | | 0.00 | | | | 637,889 | | | | 0.39 | | | | 0.00 | | | | 0.61 | |
| | 1.00 | | | | 0.00 | (f) | | | 706,209 | | | | 0.15 | | | | 0.00 | (f) | | | 0.61 | |
| | 1.00 | | | | 0.00 | (f) | | | 734,788 | | | | 0.07 | | | | 0.00 | (f) | | | 0.61 | |
| | 1.00 | | | | 0.00 | (f) | | | 612,152 | | | | 0.08 | | | | 0.00 | (f) | | | 0.61 | |
| | 1.00 | | | | 0.00 | (f) | | | 597,117 | | | | 0.15 | | | | 0.00 | (f) | | | 0.61 | |
| | 1.00 | | | | 0.00 | (f) | | | 554,548 | | | | 0.10 | | | | 0.00 | (f) | | | 0.61 | |
| | | | | |
| | | | | | | | | | | | | | | | | | | | | | |
| | 1.00 | | | | 0.00 | (f) | | | 289,177 | | | | 0.39 | | | | 0.00 | (f) | | | 0.46 | |
| | 1.00 | | | | 0.00 | (f) | | | 244,258 | | | | 0.14 | | | | 0.00 | (f) | | | 0.46 | |
| | 1.00 | | | | 0.00 | (f) | | | 383,019 | | | | 0.07 | | | | 0.00 | (f) | | | 0.46 | |
| | 1.00 | | | | 0.00 | (f) | | | 493,950 | | | | 0.08 | | | | 0.00 | (f) | | | 0.46 | |
| | 1.00 | | | | 0.00 | (f) | | | 611,667 | | | | 0.15 | | | | 0.00 | (f) | | | 0.46 | |
| | 1.00 | | | | 0.00 | (f) | | | 618,249 | | | | 0.09 | | | | 0.00 | (f) | | | 0.46 | |
| | | | | |
| | | | | | | | | | | | | | | | | | | | | | |
| | 1.00 | | | | 0.00 | | | | 94,757 | | | | 0.39 | | | | 0.00 | | | | 0.71 | |
| | 1.00 | | | | 0.00 | (f) | | | 679,587 | | | | 0.15 | | | | 0.00 | (f) | | | 0.71 | |
| | 1.00 | | | | 0.00 | (f) | | | 847,101 | | | | 0.07 | | | | 0.00 | (f) | | | 0.71 | |
| | 1.00 | | | | 0.00 | (f) | | | 943,099 | | | | 0.08 | | | | 0.00 | (f) | | | 0.71 | |
| | 1.00 | | | | 0.00 | (f) | | | 915,908 | | | | 0.15 | | | | 0.00 | (f) | | | 0.71 | |
| | 1.00 | | | | 0.00 | (f) | | | 998,994 | | | | 0.09 | | | | 0.00 | (f) | | | 0.71 | |
| | | | | |
| | | | | | | | | | | | | | | | | | | | | | |
| | 1.00 | | | | 0.00 | | | | 20 | | | | 0.39 | | | | 0.00 | | | | 2.51 | |
| | 1.00 | | | | 0.00 | (f) | | | 20 | | | | 0.12 | | | | 0.00 | (f) | | | 2.08 | |
| | 1.00 | | | | 0.00 | (f) | | | 100 | | | | 0.07 | | | | 0.00 | (f) | | | 1.06 | |
| | 1.00 | | | | 0.00 | (f) | | | 100 | | | | 0.08 | | | | 0.00 | (f) | | | 1.06 | |
| | 1.00 | | | | 0.00 | (f) | | | 100 | | | | 0.15 | | | | 0.00 | (f) | | | 1.06 | |
| | 1.00 | | | | 0.00 | (f) | | | 100 | | | | 0.09 | | | | 0.00 | (f) | | | 1.06 | |
SEE NOTES TO FINANCIAL STATEMENTS.
| | | | | | | | |
| | | |
| AUGUST 31, 2016 | | J.P. MORGAN MONEY MARKET FUNDS | | | | | 99 | |
FINANCIAL HIGHLIGHTS
FOR THE PERIODS INDICATED (continued)
| | | | | | | | | | | | | | | | | | | | | | | | | | | | |
| | | | | | Per share operating performance | |
| | | | | | Investment operations | | | Distributions | |
| | | Net asset
value,
beginning
of period | | | Net
investment
income
(loss) | | | Net realized
and unrealized
gains
(losses) on
investments | | | Total from
investment
operations | | | Net
investment
income | | | Net
realized
gain | | | Total
distributions | |
Federal Money Market Fund | | | | | | | | | | | | | | | | | | | | | | | | | | | | |
Agency | | | | | | | | | | | | | | | | | | | | | | | | | | | | |
Six Months Ended August 31, 2016 (Unaudited) | | $ | 1.00 | | | $ | — | (d)(e) | | $ | — | | | $ | — | (e) | | $ | — | (e) | | $ | — | | | $ | — | (e) |
Year Ended February 29, 2016 | | | 1.00 | | | | — | (d)(e) | | | — | (e) | | | — | (e) | | | — | (e) | | | — | (e) | | | — | (e) |
Year Ended February 28, 2015 | | | 1.00 | | | | — | (e) | | | — | (e) | | | — | (e) | | | — | (e) | | | — | (e) | | | — | (e) |
Year Ended February 28, 2014 | | | 1.00 | | | | — | (e) | | | — | (e) | | | — | (e) | | | — | (e) | | | — | (e) | | | — | (e) |
Year Ended February 28, 2013 | | | 1.00 | | | | — | (e) | | | — | (e) | | | — | (e) | | | — | (e) | | | — | (e) | | | — | (e) |
Year Ended February 29, 2012 | | | 1.00 | | | | — | (e) | | | — | | | | — | (e) | | | — | (e) | | | — | | | | — | (e) |
| | | | | | | |
Institutional Class | | | | | | | | | | | | | | | | | | | | | | | | | | | | |
Six Months Ended August 31, 2016 (Unaudited) | | | 1.00 | | | | — | (d)(e) | | | — | | | | — | (e) | | | — | (e) | | | — | | | | — | (e) |
Year Ended February 29, 2016 | | | 1.00 | | | | — | (d)(e) | | | — | (e) | | | — | (e) | | | — | (e) | | | — | (e) | | | — | (e) |
Year Ended February 28, 2015 | | | 1.00 | | | | — | (e) | | | — | (e) | | | — | (e) | | | — | (e) | | | — | (e) | | | — | (e) |
Year Ended February 28, 2014 | | | 1.00 | | | | — | (e) | | | — | (e) | | | — | (e) | | | — | (e) | | | — | (e) | | | — | (e) |
Year Ended February 28, 2013 | | | 1.00 | | | | — | (e) | | | — | (e) | | | — | (e) | | | — | (e) | | | — | (e) | | | — | (e) |
Year Ended February 29, 2012 | | | 1.00 | | | | — | (e) | | | — | | | | — | (e) | | | — | (e) | | | — | | | | — | (e) |
| | | | | | | |
Morgan | | | | | | | | | | | | | | | | | | | | | | | | | | | | |
Six Months Ended August 31, 2016 (Unaudited) | | | 1.00 | | | | — | (d)(e) | | | — | | | | — | (e) | | | — | (e) | | | — | | | | — | (e) |
Year Ended February 29, 2016 | | | 1.00 | | | | — | (d)(e) | | | — | (e) | | | — | (e) | | | — | (e) | | | — | (e) | | | — | (e) |
Year Ended February 28, 2015 | | | 1.00 | | | | — | (e) | | | — | (e) | | | — | (e) | | | — | (e) | | | — | (e) | | | — | (e) |
Year Ended February 28, 2014 | | | 1.00 | | | | — | (e) | | | — | (e) | | | — | (e) | | | — | (e) | | | — | (e) | | | — | (e) |
Year Ended February 28, 2013 | | | 1.00 | | | | — | (e) | | | — | (e) | | | — | (e) | | | — | (e) | | | — | (e) | | | — | (e) |
Year Ended February 29, 2012 | | | 1.00 | | | | — | (e) | | | — | | | | — | (e) | | | — | (e) | | | — | | | | — | (e) |
| | | | | | | |
Premier | | | | | | | | | | | | | | | | | | | | | | | | | | | | |
Six Months Ended August 31, 2016 (Unaudited) | | | 1.00 | | | | — | (d)(e) | | | — | | | | — | (e) | | | — | (e) | | | — | | | | — | (e) |
Year Ended February 29, 2016 | | | 1.00 | | | | — | (d)(e) | | | — | (e) | | | — | (e) | | | — | (e) | | | — | (e) | | | — | (e) |
Year Ended February 28, 2015 | | | 1.00 | | | | — | (e) | | | — | (e) | | | — | (e) | | | — | (e) | | | — | (e) | | | — | (e) |
Year Ended February 28, 2014 | | | 1.00 | | | | — | (e) | | | — | (e) | | | — | (e) | | | — | (e) | | | — | (e) | | | — | (e) |
Year Ended February 28, 2013 | | | 1.00 | | | | — | (e) | | | — | (e) | | | — | (e) | | | — | (e) | | | — | (e) | | | — | (e) |
Year Ended February 29, 2012 | | | 1.00 | | | | — | (e) | | | — | | | | — | (e) | | | — | (e) | | | — | | | | — | (e) |
| | | | | | | |
Reserve | | | | | | | | | | | | | | | | | | | | | | | | | | | | |
Six Months Ended August 31, 2016 (Unaudited) | | | 1.00 | | | | — | (d)(e) | | | — | | | | — | (e) | | | — | (e) | | | — | | | | — | (e) |
Year Ended February 29, 2016 | | | 1.00 | | | | — | (d)(e) | | | — | (e) | | | — | (e) | | | — | (e) | | | — | (e) | | | — | (e) |
Year Ended February 28, 2015 | | | 1.00 | | | | — | (e) | | | — | (e) | | | — | (e) | | | — | (e) | | | — | (e) | | | — | (e) |
Year Ended February 28, 2014 | | | 1.00 | | | | — | (e) | | | — | (e) | | | — | (e) | | | — | (e) | | | — | (e) | | | — | (e) |
Year Ended February 28, 2013 | | | 1.00 | | | | — | (e) | | | — | (e) | | | — | (e) | | | — | (e) | | | — | (e) | | | — | (e) |
Year Ended February 29, 2012 | | | 1.00 | | | | — | (e) | | | — | | | | — | (e) | | | — | (e) | | | — | | | | — | (e) |
| (a) | Annualized for periods less than one year, unless otherwise noted. |
| (b) | Not annualized for periods less than one year. |
| (c) | Includes earnings credits and interest expense, if applicable, each of which is less than 0.005% unless otherwise noted. |
| (d) | Calculated based upon average shares outstanding. |
| (e) | Amount rounds to less than $0.005. |
| (f) | Amount rounds to less than 0.005%. |
SEE NOTES TO FINANCIAL STATEMENTS.
| | | | | | |
| | | |
| 100 | | | | J.P. MORGAN MONEY MARKET FUNDS | | AUGUST 31, 2016 |
| | | | | | | | | | | | | | | | | | | | | | |
| | | Ratios/Supplemental data | |
| | | | | | | | | | Ratios to average net assets (a) | |
Net asset
value,
end of
period | | | Total return (b) | | | Net assets,
end of
period
(000’s) | | | Net
expenses (c) | | | Net
investment
income
(loss) | | | Expenses
without waivers,
reimbursements and
earnings credits | |
| | | | | | | | | | | | | | | | | | | | | | |
| | | | | | | | | | | | | | | | | | | | | | |
| $ | 1.00 | | | | 0.07 | % | | $ | 201,448 | | | | 0.26 | % | | | 0.14 | % | | | 0.35 | % |
| | 1.00 | | | | 0.02 | | | | 233,955 | | | | 0.16 | | | | 0.02 | | | | 0.33 | |
| | 1.00 | | | | 0.01 | | | | 84,778 | | | | 0.07 | | | | 0.00 | (f) | | | 0.35 | |
| | 1.00 | | | | 0.01 | | | | 233,285 | | | | 0.08 | | | | 0.01 | | | | 0.34 | |
| | 1.00 | | | | 0.01 | | | | 258,642 | | | | 0.11 | | | | 0.01 | | | | 0.33 | |
| | 1.00 | | | | 0.00 | (f) | | | 786,165 | | | | 0.11 | | | | 0.00 | (f) | | | 0.33 | |
| | | | | |
| | | | | | | | | | | | | | | | | | | | | | |
| | 1.00 | | | | 0.10 | | | | 2,376,386 | | | | 0.21 | | | | 0.19 | | | | 0.30 | |
| | 1.00 | | | | 0.03 | | | | 3,615,992 | | | | 0.13 | | | | 0.03 | | | | 0.28 | |
| | 1.00 | | | | 0.01 | | | | 3,995,934 | | | | 0.06 | | | | 0.01 | | | | 0.30 | |
| | — | | | | 0.01 | | | | 3,835,871 | | | | 0.07 | | | | 0.01 | | | | 0.29 | |
| | 1.00 | | | | 0.01 | | | | 3,259,389 | | | | 0.12 | | | | 0.01 | | | | 0.28 | |
| | 1.00 | | | | 0.00 | (f) | | | 4,325,820 | | | | 0.10 | | | | 0.00 | (f) | | | 0.28 | |
| | | | | |
| | | | | | | | | | | | | | | | | | | | | | |
| | 1.00 | | | | 0.01 | | | | 140,866 | | | | 0.39 | | | | 0.01 | | | | 0.67 | |
| | 1.00 | | | | 0.01 | | | | 131,723 | | | | 0.16 | | | | 0.01 | | | | 0.65 | |
| | 1.00 | | | | 0.01 | | | | 111,292 | | | | 0.07 | | | | 0.01 | | | | 0.65 | |
| | 1.00 | | | | 0.01 | | | | 96,652 | | | | 0.07 | | | | 0.01 | | | | 0.64 | |
| | 1.00 | | | | 0.01 | | | | 127,920 | | | | 0.12 | | | | 0.01 | | | | 0.63 | |
| | 1.00 | | | | 0.00 | (f) | | | 140,119 | | | | 0.11 | | | | 0.00 | (f) | | | 0.63 | |
| | | | | |
| | | | | | | | | | | | | | | | | | | | | | |
| | 1.00 | | | | 0.01 | | | | 136,350 | | | | 0.39 | | | | 0.01 | | | | 0.51 | |
| | 1.00 | | | | 0.01 | | | | 171,808 | | | | 0.14 | | | | 0.01 | | | | 0.49 | |
| | 1.00 | | | | 0.01 | | | | 219,792 | | | | 0.06 | | | | 0.01 | | | | 0.50 | |
| | 1.00 | | | | 0.01 | | | | 277,420 | | | | 0.07 | | | | 0.01 | | | | 0.49 | |
| | 1.00 | | | | 0.01 | | | | 292,491 | | | | 0.12 | | | | 0.01 | | | | 0.48 | |
| | 1.00 | | | | 0.00 | (f) | | | 435,501 | | | | 0.11 | | | | 0.00 | (f) | | | 0.48 | |
| | | | | |
| | | | | | | | | | | | | | | | | | | | | | |
| | 1.00 | | | | 0.01 | | | | 843 | | | | 0.39 | | | | 0.01 | | | | 0.75 | |
| | 1.00 | | | | 0.01 | | | | 17,852 | | | | 0.15 | | | | 0.01 | | | | 0.74 | |
| | 1.00 | | | | 0.01 | | | | 2,262 | | | | 0.06 | | | | 0.01 | | | | 0.75 | |
| | 1.00 | | | | 0.01 | | | | 2,429 | | | | 0.09 | | | | 0.00 | (f) | | | 0.74 | |
| | 1.00 | | | | 0.01 | | | | 18,231 | | | | 0.12 | | | | 0.01 | | | | 0.73 | |
| | 1.00 | | | | 0.00 | (f) | | | 11,368 | | | | 0.09 | | | | 0.01 | | | | 0.73 | |
SEE NOTES TO FINANCIAL STATEMENTS.
| | | | | | | | |
| | | |
| AUGUST 31, 2016 | | J.P. MORGAN MONEY MARKET FUNDS | | | | | 101 | |
FINANCIAL HIGHLIGHTS
FOR THE PERIODS INDICATED (continued)
| | | | | | | | | | | | | | | | | | | | | | | | | | | | |
| | | | | | Per share operating performance | |
| | | | | | Investment operations | | | Distributions | |
| | | Net asset
value,
beginning
of period | | | Net
investment
income
(loss) | | | Net realized
and unrealized
gains
(losses) on
investments | | | Total from
investment
operations | | | Net
investment
income | | | Net
realized
gain | | | Total
distributions | |
100% U.S. Treasury Securities Money Market Fund | | | | | | | | | | | | | | | | | | | | | | | | | |
Agency | | | | | | | | | | | | | | | | | | | | | | | | | | | | |
Six Months Ended August 31, 2016 (Unaudited) | | $ | 1.00 | | | $ | — | (d)(e) | | $ | — | (e) | | $ | — | (e) | | $ | — | (e) | | $ | — | | | $ | — | (e) |
Year Ended February 29, 2016 | | | 1.00 | | | | — | (d)(e) | | | — | (e) | | | — | (e) | | | — | (e) | | | — | (e) | | | — | (e) |
Year Ended February 28, 2015 | | | 1.00 | | | | — | | | | — | (e) | | | — | (e) | | | — | (e) | | | — | (e) | | | — | (e) |
Year Ended February 28, 2014 | | | 1.00 | | | | — | | | | — | (e) | | | — | (e) | | | — | (e) | | | — | (e) | | | — | (e) |
Year Ended February 28, 2013 | | | 1.00 | | | | — | | | | — | (e) | | | — | (e) | | | — | (e) | | | — | (e) | | | — | (e) |
Year Ended February 29, 2012 | | | 1.00 | | | | — | (e) | | | — | (e) | | | — | (e) | | | — | (e) | | | — | (e) | | | — | (e) |
| | | | | | | |
Capital | | | | | | | | | | | | | | | | | | | | | | | | | | | | |
Six Months Ended August 31, 2016 (Unaudited) | | | 1.00 | | | | — | (d)(e) | | | — | (e) | | | — | (e) | | | — | (e) | | | — | | | | — | (e) |
Year Ended February 29, 2016 | | | 1.00 | | | | — | (d)(e) | | | — | (e) | | | — | (e) | | | — | (e) | | | — | (e) | | | — | (e) |
Year Ended February 28, 2015 | | | 1.00 | | | | — | | | | — | (e) | | | — | (e) | | | — | (e) | | | — | (e) | | | — | (e) |
Year Ended February 28, 2014 | | | 1.00 | | | | — | | | | — | (e) | | | — | (e) | | | — | (e) | | | — | (e) | | | — | (e) |
Year Ended February 28, 2013 | | | 1.00 | | | | — | | | | — | (e) | | | — | (e) | | | — | (e) | | | — | (e) | | | — | (e) |
Year Ended February 29, 2012 | | | 1.00 | | | | — | (e) | | | — | (e) | | | — | (e) | | | — | (e) | | | — | (e) | | | — | (e) |
| | | | | | | |
Institutional Class | | | | | | | | | | | | | | | | | | | | | | | | | | | | |
Six Months Ended August 31, 2016 (Unaudited) | | | 1.00 | | | | — | (d)(e) | | | — | (e) | | | — | (e) | | | — | (e) | | | — | | | | — | (e) |
Year Ended February 29, 2016 | | | 1.00 | | | | — | (d)(e) | | | — | (e) | | | — | (e) | | | — | (e) | | | — | (e) | | | — | (e) |
Year Ended February 28, 2015 | | | 1.00 | | | | — | | | | — | (e) | | | — | (e) | | | — | (e) | | | — | (e) | | | — | (e) |
Year Ended February 28, 2014 | | | 1.00 | | | | — | | | | — | (e) | | | — | (e) | | | — | (e) | | | — | (e) | | | — | (e) |
Year Ended February 28, 2013 | | | 1.00 | | | | — | (e) | | | — | (e) | | | — | (e) | | | — | (e) | | | — | (e) | | | — | (e) |
Year Ended February 29, 2012 | | | 1.00 | | | | — | (e) | | | — | (e) | | | — | (e) | | | — | (e) | | | — | (e) | | | — | (e) |
| | | | | | | |
Morgan | | | | | | | | | | | | | | | | | | | | | | | | | | | | |
Six Months Ended August 31, 2016 (Unaudited) | | | 1.00 | | | | — | (d) | | | — | (e) | | | — | (e) | | | — | | | | — | | | | — | |
Year Ended February 29, 2016 | | | 1.00 | | | | — | (d)(e) | | | — | (e) | | | — | (e) | | | — | (e) | | | — | (e) | | | — | (e) |
Year Ended February 28, 2015 | | | 1.00 | | | | — | | | | — | (e) | | | — | (e) | | | — | (e) | | | — | (e) | | | — | (e) |
Year Ended February 28, 2014 | | | 1.00 | | | | — | | | | — | (e) | | | — | (e) | | | — | (e) | | | — | (e) | | | — | (e) |
Year Ended February 28, 2013 | | | 1.00 | | | | — | (e) | | | — | (e) | | | — | (e) | | | — | (e) | | | — | (e) | | | — | (e) |
Year Ended February 29, 2012 | | | 1.00 | | | | — | (e) | | | — | (e) | | | — | (e) | | | — | (e) | | | — | (e) | | | — | (e) |
| | | | | | | |
Premier | | | | | | | | | | | | | | | | | | | | | | | | | | | | |
Six Months Ended August 31, 2016 (Unaudited) | | | 1.00 | | | | — | (d) | | | — | (e) | | | — | (e) | | | — | | | | — | | | | — | |
Year Ended February 29, 2016 | | | 1.00 | | | | — | (d)(e) | | | — | (e) | | | — | (e) | | | — | (e) | | | — | (e) | | | — | (e) |
Year Ended February 28, 2015 | | | 1.00 | | | | — | | | | — | (e) | | | — | (e) | | | — | (e) | | | — | (e) | | | — | (e) |
Year Ended February 28, 2014 | | | 1.00 | | | | — | | | | — | (e) | | | — | (e) | | | — | (e) | | | — | (e) | | | — | (e) |
Year Ended February 28, 2013 | | | 1.00 | | | | — | (e) | | | — | (e) | | | — | (e) | | | — | (e) | | | — | (e) | | | — | (e) |
Year Ended February 29, 2012 | | | 1.00 | | | | — | (e) | | | — | (e) | | | — | (e) | | | — | (e) | | | — | (e) | | | — | (e) |
| | | | | | | |
Reserve | | | | | | | | | | | | | | | | | | | | | | | | | | | | |
Six Months Ended August 31, 2016 (Unaudited) | | | 1.00 | | | | — | (d) | | | — | (e) | | | — | (e) | | | — | | | | — | | | | — | |
Year Ended February 29, 2016 | | | 1.00 | | | | — | (d)(e) | | | — | (e) | | | — | (e) | | | — | (e) | | | — | (e) | | | — | (e) |
Year Ended February 28, 2015 | | | 1.00 | | | | — | | | | — | (e) | | | — | (e) | | | — | (e) | | | — | (e) | | | — | (e) |
Year Ended February 28, 2014 | | | 1.00 | | | | — | | | | — | (e) | | | — | (e) | | | — | (e) | | | — | (e) | | | — | (e) |
Year Ended February 28, 2013 | | | 1.00 | | | | — | (e) | | | — | (e) | | | — | (e) | | | — | (e) | | | — | (e) | | | — | (e) |
Year Ended February 29, 2012 | | | 1.00 | | | | — | (e) | | | — | (e) | | | — | (e) | | | — | (e) | | | — | (e) | | | — | (e) |
| | | | | | | |
Service | | | | | | | | | | | | | | | | | | | | | | | | | | | | |
Six Months Ended August 31, 2016 (Unaudited) | | | 1.00 | | | | — | (d) | | | — | (e) | | | — | (e) | | | — | | | | — | | | | — | |
Year Ended February 29, 2016 | | | 1.00 | | | | — | (d)(e) | | | — | (e) | | | — | (e) | | | — | | | | — | (e) | | | — | (e) |
Year Ended February 28, 2015 | | | 1.00 | | | | — | | | | — | (e) | | | — | (e) | | | — | (e) | | | — | (e) | | | — | (e) |
Year Ended February 28, 2014 | | | 1.00 | | | | — | | | | — | (e) | | | — | (e) | | | — | (e) | | | — | (e) | | | — | (e) |
Year Ended February 28, 2013 | | | 1.00 | | | | — | | | | — | (e) | | | — | (e) | | | — | (e) | | | — | (e) | | | — | (e) |
Year Ended February 29, 2012 | | | 1.00 | | | | — | (e) | | | — | (e) | | | — | (e) | | | — | (e) | | | — | (e) | | | — | (e) |
| (a) | Annualized for periods less than one year, unless otherwise noted. |
| (b) | Not annualized for periods less than one year. |
| (c) | Includes earnings credits and interest expense, if applicable, each of which is less than 0.005% unless otherwise noted. |
| (d) | Calculated based upon average shares outstanding. |
| (e) | Amount rounds to less than $0.005. |
| (f) | Amount rounds to less than 0.005%. |
SEE NOTES TO FINANCIAL STATEMENTS.
| | | | | | |
| | | |
| 102 | | | | J.P. MORGAN MONEY MARKET FUNDS | | AUGUST 31, 2016 |
| | | | | | | | | | | | | | | | | | | | | | |
| | | Ratios/Supplemental data | |
| | | | | | | | | | Ratios to average net assets (a) | |
Net asset
value,
end of
period | | | Total return (b) | | | Net assets,
end of
period
(000’s) | | | Net
expenses (c) | | | Net
investment
income
(loss) | | | Expenses
without waivers,
reimbursements and
earnings credits | |
| | | | | | | | | | | | | | | | | | | | | | |
| | | | | | | | | | | | | | | | | | | | | | |
| $ | 1.00 | | | | 0.05 | % | | $ | 1,037,195 | | | | 0.26 | % | | | 0.09 | % | | | 0.31 | % |
| | 1.00 | | | | 0.01 | | | | 1,895,744 | | | | 0.10 | | | | 0.01 | | | | 0.31 | |
| | 1.00 | | | | 0.00 | (f) | | | 1,700,093 | | | | 0.05 | | | | 0.00 | | | | 0.31 | |
| | 1.00 | | | | 0.00 | (f) | | | 1,991,907 | | | | 0.07 | | | | 0.00 | | | | 0.31 | |
| | 1.00 | | | | 0.00 | (f) | | | 2,685,908 | | | | 0.10 | | | | 0.00 | | | | 0.31 | |
| | 1.00 | | | | 0.00 | (f) | | | 1,914,902 | | | | 0.06 | | | | 0.00 | (f) | | | 0.31 | |
| | | | | |
| | | | | | | | | | | | | | | | | | | | | | |
| | 1.00 | | | | 0.09 | | | | 10,327,334 | | | | 0.18 | | | | 0.17 | | | | 0.21 | |
| | 1.00 | | | | 0.02 | | | | 9,678,309 | | | | 0.08 | | | | 0.01 | | | | 0.21 | |
| | 1.00 | | | | 0.00 | (f) | | | 8,717,551 | | | | 0.04 | | | | 0.00 | | | | 0.21 | |
| | 1.00 | | | | 0.00 | (f) | | | 9,468,647 | | | | 0.06 | | | | 0.00 | | | | 0.21 | |
| | 1.00 | | | | 0.00 | (f) | | | 9,726,191 | | | | 0.10 | | | | 0.00 | | | | 0.21 | |
| | 1.00 | | | | 0.00 | (f) | | | 8,254,673 | | | | 0.05 | | | | 0.00 | (f) | | | 0.21 | |
| | | | | |
| | | | | | | | | | | | | | | | | | | | | | |
| | 1.00 | | | | 0.07 | | | | 8,810,515 | | | | 0.21 | | | | 0.14 | | | | 0.26 | |
| | 1.00 | | | | 0.01 | | | | 7,378,773 | | | | 0.08 | | | | 0.01 | | | | 0.26 | |
| | 1.00 | | | | 0.00 | (f) | | | 10,302,127 | | | | 0.04 | | | | 0.00 | | | | 0.26 | |
| | 1.00 | | | | 0.00 | (f) | | | 9,143,359 | | | | 0.06 | | | | 0.00 | | | | 0.26 | |
| | 1.00 | | | | 0.00 | (f) | | | 8,763,499 | | | | 0.10 | | | | 0.00 | (f) | | | 0.26 | |
| | 1.00 | | | | 0.00 | (f) | | | 7,246,605 | | | | 0.06 | | | | 0.00 | (f) | | | 0.26 | |
| | | | | |
| | | | | | | | | | | | | | | | | | | | | | |
| | 1.00 | | | | 0.00 | | | | 1,456,333 | | | | 0.35 | | | | 0.00 | | | | 0.61 | |
| | 1.00 | | | | 0.00 | (f) | | | 1,990,677 | | | | 0.10 | | | | 0.00 | (f) | | | 0.61 | |
| | 1.00 | | | | 0.00 | (f) | | | 1,477,551 | | | | 0.05 | | | | 0.00 | | | | 0.61 | |
| | 1.00 | | | | 0.00 | (f) | | | 1,625,797 | | | | 0.07 | | | | 0.00 | | | | 0.61 | |
| | 1.00 | | | | 0.00 | (f) | | | 1,969,401 | | | | 0.10 | | | | 0.00 | (f) | | | 0.61 | |
| | 1.00 | | | | 0.00 | (f) | | | 1,512,492 | | | | 0.05 | | | | 0.00 | (f) | | | 0.61 | |
| | | | | |
| | | | | | | | | | | | | | | | | | | | | | |
| | 1.00 | | | | 0.00 | | | | 1,056,980 | | | | 0.35 | | | | 0.00 | | | | 0.46 | |
| | 1.00 | | | | 0.00 | (f) | | | 1,219,310 | | | | 0.10 | | | | 0.00 | (f) | | | 0.46 | |
| | 1.00 | | | | 0.00 | (f) | | | 1,259,597 | | | | 0.04 | | | | 0.00 | | | | 0.46 | |
| | 1.00 | | | | 0.00 | (f) | | | 1,130,636 | | | | 0.07 | | | | 0.00 | | | | 0.46 | |
| | 1.00 | | | | 0.00 | (f) | | | 1,361,053 | | | | 0.10 | | | | 0.00 | (f) | | | 0.46 | |
| | 1.00 | | | | 0.00 | (f) | | | 1,482,938 | | | | 0.06 | | | | 0.00 | (f) | | | 0.46 | |
| | | | | |
| | | | | | | | | | | | | | | | | | | | | | |
| | 1.00 | | | | 0.00 | | | | 96,031 | | | | 0.35 | | | | 0.00 | | | | 0.71 | |
| | 1.00 | | | | 0.00 | (f) | | | 108,109 | | | | 0.14 | | | | 0.00 | (f) | | | 0.71 | |
| | 1.00 | | | | 0.00 | (f) | | | 46,667 | | | | 0.04 | | | | 0.00 | | | | 0.71 | |
| | 1.00 | | | | 0.00 | (f) | | | 44,246 | | | | 0.07 | | | | 0.00 | | | | 0.71 | |
| | 1.00 | | | | 0.00 | (f) | | | 56,977 | | | | 0.10 | | | | 0.00 | (f) | | | 0.71 | |
| | 1.00 | | | | 0.00 | (f) | | | 69,684 | | | | 0.05 | | | | 0.01 | | | | 0.71 | |
| | | | | |
| | | | | | | | | | | | | | | | | | | | | | |
| | 1.00 | | | | 0.00 | | | | 20 | | | | 0.35 | | | | 0.00 | | | | 2.84 | |
| | 1.00 | | | | 0.00 | (f) | | | 20 | | | | 0.07 | | | | 0.00 | (f) | | | 2.08 | |
| | 1.00 | | | | 0.00 | (f) | | | 100 | | | | 0.04 | | | | 0.00 | | | | 1.06 | |
| | 1.00 | | | | 0.00 | (f) | | | 100 | | | | 0.06 | | | | 0.00 | | | | 1.06 | |
| | 1.00 | | | | 0.00 | (f) | | | 100 | | | | 0.10 | | | | 0.00 | | | | 1.06 | |
| | 1.00 | | | | 0.00 | (f) | | | 100 | | | | 0.06 | | | | 0.00 | (f) | | | 1.06 | |
SEE NOTES TO FINANCIAL STATEMENTS.
| | | | | | | | |
| | | |
| AUGUST 31, 2016 | | J.P. MORGAN MONEY MARKET FUNDS | | | | | 103 | |
FINANCIAL HIGHLIGHTS
FOR THE PERIODS INDICATED (continued)
| | | | | | | | | | | | | | | | | | | | | | | | | | | | |
| | | | | | Per share operating performance | |
| | | | | | Investment operations | | | Distributions | |
| | | Net asset
value,
beginning
of period | | | Net
investment
income
(loss) | | | Net realized
and unrealized
gains
(losses) on
investments | | | Total from
investment
operations | | | Net
investment
income | | | Net
realized
gain | | | Total
distributions | |
Tax Free Money Market Fund | | | | | | | | | | | | | | | | | | | | | |
Agency | | | | | | | | | | | | | | | | | | | | | | | | | | | | |
Six Months Ended August 31, 2016 (Unaudited) | | $ | 1.00 | | | $ | — | (d)(e) | | $ | — | | | $ | — | (e) | | $ | — | (e) | | $ | — | | | $ | — | (e) |
Year Ended February 29, 2016 | | | 1.00 | | | | — | (d)(e) | | | — | (e) | | | — | (e) | | | — | (e) | | | — | (e) | | | — | (e) |
Year Ended February 28, 2015 | | | 1.00 | | | | — | (e) | | | — | (e) | | | — | (e) | | | — | (e) | | | — | (e) | | | — | (e) |
Year Ended February 28, 2014 | | | 1.00 | | | | — | (e) | | | — | (e) | | | — | (e) | | | — | (e) | | | — | (e) | | | — | (e) |
Year Ended February 28, 2013 | | | 1.00 | | | | — | (e) | | | — | (e) | | | — | (e) | | | — | (e) | | | — | (e) | | | — | (e) |
Year Ended February 29, 2012 | | | 1.00 | | | | — | (e) | | | — | (e) | | | — | (e) | | | — | (e) | | | — | | | | — | (e) |
| | | | | | | |
Direct | | | | | | | | | | | | | | | | | | | | | | | | | | | | |
Six Months Ended August 31, 2016 (Unaudited) | | | 1.00 | | | | — | (d)(e) | | | — | | | | — | (e) | | | — | (e) | | | — | | | | — | (e) |
Year Ended February 29, 2016 | | | 1.00 | | | | — | (d)(e) | | | — | (e) | | | — | (e) | | | — | (e) | | | — | (e) | | | — | (e) |
Year Ended February 28, 2015 | | | 1.00 | | | | — | (e) | | | — | (e) | | | — | (e) | | | — | (e) | | | — | (e) | | | — | (e) |
Year Ended February 28, 2014 | | | 1.00 | | | | — | (e) | | | — | (e) | | | — | (e) | | | — | (e) | | | — | (e) | | | — | (e) |
Year Ended February 28, 2013 | | | 1.00 | | | | — | (e) | | | — | (e) | | | — | (e) | | | — | (e) | | | — | (e) | | | — | (e) |
Year Ended February 29, 2012 | | | 1.00 | | | | — | (e) | | | — | (e) | | | — | (e) | | | — | (e) | | | — | | | | — | (e) |
| | | | | | | |
Eagle Class | | | | | | | | | | | | | | | | | | | | | | | | | | | | |
Six Months Ended August 31, 2016 (Unaudited) | | | 1.00 | | | | — | (d)(e) | | | — | | | | — | (e) | | | — | (e) | | | — | | | | — | (e) |
Year Ended February 29, 2016 | | | 1.00 | | | | — | (d)(e) | | | — | (e) | | | — | (e) | | | — | (e) | | | — | (e) | | | — | (e) |
Year Ended February 28, 2015 | | | 1.00 | | | | — | (e) | | | — | (e) | | | — | (e) | | | — | (e) | | | — | (e) | | | — | (e) |
Year Ended February 28, 2014 | | | 1.00 | | | | — | (e) | | | — | (e) | | | — | (e) | | | — | (e) | | | — | (e) | | | — | (e) |
Year Ended February 28, 2013 | | | 1.00 | | | | — | (e) | | | — | (e) | | | — | (e) | | | — | (e) | | | — | (e) | | | — | (e) |
Year Ended February 29, 2012 | | | 1.00 | | | | — | (e) | | | — | (e) | | | — | (e) | | | — | (e) | | | — | | | | — | (e) |
| | | | | | | |
Institutional Class | | | | | | | | | | | | | | | | | | | | | | | | | | | | |
Six Months Ended August 31, 2016 (Unaudited) | | | 1.00 | | | | — | (d)(e) | | | — | | | | — | (e) | | | — | (e) | | | — | | | | — | (e) |
Year Ended February 29, 2016 | | | 1.00 | | | | — | (d)(e) | | | — | (e) | | | — | (e) | | | — | (e) | | | — | (e) | | | — | (e) |
Year Ended February 28, 2015 | | | 1.00 | | | | — | (e) | | | — | (e) | | | — | (e) | | | — | (e) | | | — | (e) | | | — | (e) |
Year Ended February 28, 2014 | | | 1.00 | | | | — | (e) | | | — | (e) | | | — | (e) | | | — | (e) | | | — | (e) | | | — | (e) |
Year Ended February 28, 2013 | | | 1.00 | | | | — | (e) | | | — | (e) | | | — | (e) | | | — | (e) | | | — | (e) | | | — | (e) |
Year Ended February 29, 2012 | | | 1.00 | | | | — | (e) | | | — | (e) | | | — | (e) | | | — | (e) | | | — | | | | — | (e) |
| | | | | | | |
Morgan | | | | | | | | | | | | | | | | | | | | | | | | | | | | |
Six Months Ended August 31, 2016 (Unaudited) | | | 1.00 | | | | — | (d)(e) | | | — | | | | — | (e) | | | — | (e) | | | — | | | | — | (e) |
Year Ended February 29, 2016 | | | 1.00 | | | | — | (d)(e) | | | — | (e) | | | — | (e) | | | — | (e) | | | — | (e) | | | — | (e) |
Year Ended February 28, 2015 | | | 1.00 | | | | — | (e) | | | — | (e) | | | — | (e) | | | — | (e) | | | — | (e) | | | — | (e) |
Year Ended February 28, 2014 | | | 1.00 | | | | — | (e) | | | — | (e) | | | — | (e) | | | — | (e) | | | — | (e) | | | — | (e) |
Year Ended February 28, 2013 | | | 1.00 | | | | — | (e) | | | — | (e) | | | — | (e) | | | — | (e) | | | — | (e) | | | — | (e) |
Year Ended February 29, 2012 | | | 1.00 | | | | — | (e) | | | — | (e) | | | — | (e) | | | — | (e) | | | — | | | | — | (e) |
| | | | | | | |
Premier | | | | | | | | | | | | | | | | | | | | | | | | | | | | |
Six Months Ended August 31, 2016 (Unaudited) | | | 1.00 | | | | — | (d)(e) | | | — | | | | — | (e) | | | — | (e) | | | — | | | | — | (e) |
Year Ended February 29, 2016 | | | 1.00 | | | | — | (d)(e) | | | — | (e) | | | — | (e) | | | — | (e) | | | — | (e) | | | — | (e) |
Year Ended February 28, 2015 | | | 1.00 | | | | — | (e) | | | — | (e) | | | — | (e) | | | — | (e) | | | — | (e) | | | — | (e) |
Year Ended February 28, 2014 | | | 1.00 | | | | — | (e) | | | — | (e) | | | — | (e) | | | — | (e) | | | — | (e) | | | — | (e) |
Year Ended February 28, 2013 | | | 1.00 | | | | — | (e) | | | — | (e) | | | — | (e) | | | — | (e) | | | — | (e) | | | — | (e) |
Year Ended February 29, 2012 | | | 1.00 | | | | — | (e) | | | — | (e) | | | — | (e) | | | — | (e) | | | — | | | | — | (e) |
| | | | | | | |
Reserve | | | | | | | | | | | | | | | | | | | | | | | | | | | | |
Six Months Ended August 31, 2016 (Unaudited) | | | 1.00 | | | | — | (d)(e) | | | — | | | | — | (e) | | | — | (e) | | | — | | | | — | (e) |
Year Ended February 29, 2016 | | | 1.00 | | | | — | (d)(e) | | | — | (e) | | | — | (e) | | | — | (e) | | | — | (e) | | | — | (e) |
Year Ended February 28, 2015 | | | 1.00 | | | | — | (e) | | | — | (e) | | | — | (e) | | | — | (e) | | | — | (e) | | | — | (e) |
Year Ended February 28, 2014 | | | 1.00 | | | | — | (e) | | | — | (e) | | | — | (e) | | | — | (e) | | | — | (e) | | | — | (e) |
Year Ended February 28, 2013 | | | 1.00 | | | | — | (e) | | | — | (e) | | | — | (e) | | | — | (e) | | | — | (e) | | | — | (e) |
Year Ended February 29, 2012 | | | 1.00 | | | | — | (e) | | | — | (e) | | | — | (e) | | | — | (e) | | | — | | | | — | (e) |
| (a) | Annualized for periods less than one year, unless otherwise noted. |
| (b) | Not annualized for periods less than one year. |
| (c) | Includes earnings credits and interest expense, if applicable, each of which is less than 0.005% unless otherwise noted. |
| (d) | Calculated based upon average shares outstanding. |
| (e) | Amount rounds to less than $0.005. |
| (f) | Amount rounds to less than 0.005% |
SEE NOTES TO FINANCIAL STATEMENTS.
| | | | | | |
| | | |
| 104 | | | | J.P. MORGAN MONEY MARKET FUNDS | | AUGUST 31, 2016 |
| | | | | | | | | | | | | | | | | | | | | | |
| | | Ratios/Supplemental data | |
| | | | | | | | | | Ratios to average net assets (a) | |
Net asset
value,
end of
period | | | Total return (b) | | |
Net assets,
end of
period
(000’s) | | | Net
expenses (c) | | | Net
investment
income
(loss) | | | Expenses
without waivers,
reimbursements and
earnings credits | |
| | | | | | | | | | | | | | | | | | | | | | |
| | | | | | | | | | | | | | | | | | | | | | |
| | $1.00 | | | | 0.06 | % | | $ | 152,218 | | | | 0.24 | % | | | 0.12 | % | | | 0.31 | % |
| | 1.00 | | | | 0.03 | | | | 344,578 | | | | 0.05 | | | | 0.01 | | | | 0.31 | |
| | 1.00 | | | | 0.02 | | | | 322,389 | | | | 0.07 | | | | 0.01 | | | | 0.31 | |
| | 1.00 | | | | 0.02 | | | | 307,751 | | | | 0.12 | | | | 0.01 | | | | 0.31 | |
| | 1.00 | | | | 0.01 | | | | 410,555 | | | | 0.21 | | | | 0.00 | (f) | | | 0.31 | |
| | 1.00 | | | | 0.01 | | | | 693,197 | | | | 0.21 | | | | 0.01 | | | | 0.31 | |
| | | | | |
| | | | | | | | | | | | | | | | | | | | | | |
| | 1.00 | | | | 0.05 | | | | 20 | | | | 0.27 | | | | 0.10 | | | | 2.10 | |
| | 1.00 | | | | 0.03 | | | | 20 | | | | 0.05 | | | | 0.01 | | | | 1.32 | |
| | 1.00 | | | | 0.02 | | | | 100 | | | | 0.07 | | | | 0.01 | | | | 0.31 | |
| | 1.00 | | | | 0.02 | | | | 100 | | | | 0.11 | | | | 0.01 | | | | 0.31 | |
| | 1.00 | | | | 0.01 | | | | 100 | | | | 0.21 | | | | 0.00 | (f) | | | 0.31 | |
| | 1.00 | | | | 0.01 | | | | 100 | | | | 0.22 | | | | 0.00 | (f) | | | 0.31 | |
| | | | | |
| | | | | | | | | | | | | | | | | | | | | | |
| | 1.00 | | | | 0.01 | | | | 172 | | | | 0.34 | | | | 0.01 | | | | 0.71 | |
| | 1.00 | | | | 0.03 | | | | 1,301,201 | | | | 0.04 | | | | 0.01 | | | | 0.71 | |
| | 1.00 | | | | 0.02 | | | | 1,299,916 | | | | 0.07 | | | | 0.01 | | | | 0.71 | |
| | 1.00 | | | | 0.02 | | | | 1,329,718 | | | | 0.11 | | | | 0.01 | | | | 0.71 | |
| | 1.00 | | | | 0.02 | | | | 1,363,619 | | | | 0.20 | | | | 0.01 | | | | 0.71 | |
| | 1.00 | | | | 0.02 | | | | 1,028,433 | | | | 0.21 | | | | 0.01 | | | | 0.71 | |
| | | | | |
| | | | | | | | | | | | | | | | | | | | | | |
| | 1.00 | | | | 0.09 | | | | 8,721,340 | | | | 0.19 | | | | 0.17 | | | | 0.26 | |
| | 1.00 | | | | 0.03 | | | | 10,007,028 | | | | 0.04 | | | | 0.01 | | | | 0.26 | |
| | 1.00 | | | | 0.02 | | | | 11,663,024 | | | | 0.07 | | | | 0.01 | | | | 0.26 | |
| | 1.00 | | | | 0.02 | | | | 10,650,809 | | | | 0.10 | | | | 0.01 | | | | 0.26 | |
| | 1.00 | | | | 0.03 | | | | 5,288,309 | | | | 0.20 | | | | 0.02 | | | | 0.26 | |
| | 1.00 | | | | 0.03 | | | | 6,362,480 | | | | 0.19 | | | | 0.03 | | | | 0.26 | |
| | | | | |
| | | | | | | | | | | | | | | | | | | | | | |
| | 1.00 | | | | 0.01 | | | | 59,735 | | | | 0.35 | | | | 0.01 | | | | 0.62 | |
| | 1.00 | | | | 0.03 | | | | 111,381 | | | | 0.04 | | | | 0.01 | | | | 0.62 | |
| | 1.00 | | | | 0.02 | | | | 109,439 | | | | 0.08 | | | | 0.01 | | | | 0.61 | |
| | 1.00 | | | | 0.02 | | | | 280,117 | | | | 0.12 | | | | 0.01 | | | | 0.61 | |
| | 1.00 | | | | 0.01 | | | | 448,515 | | | | 0.21 | | | | 0.00 | (f) | | | 0.61 | |
| | 1.00 | | | | 0.01 | | | | 422,534 | | | | 0.22 | | | | 0.00 | (f) | | | 0.61 | |
| | | | | |
| | | | | | | | | | | | | | | | | | | | | | |
| | 1.00 | | | | 0.01 | | | | 1,900,573 | | | | 0.34 | | | | 0.01 | | | | 0.46 | |
| | 1.00 | | | | 0.03 | | | | 2,984,160 | | | | 0.04 | | | | 0.01 | | | | 0.46 | |
| | 1.00 | | | | 0.02 | | | | 2,593,113 | | | | 0.07 | | | | 0.01 | | | | 0.46 | |
| | 1.00 | | | | 0.02 | | | | 2,390,160 | | | | 0.12 | | | | 0.01 | | | | 0.46 | |
| | 1.00 | | | | 0.01 | | | | 4,891,040 | | | | 0.21 | | | | 0.00 | (f) | | | 0.46 | |
| | 1.00 | | | | 0.01 | | | | 2,865,171 | | | | 0.22 | | | | 0.00 | (f) | | | 0.46 | |
| | | | | |
| | | | | | | | | | | | | | | | | | | | | | |
| | 1.00 | | | | 0.01 | | | | 3,266,699 | | | | 0.35 | | | | 0.01 | | | | 0.71 | |
| | 1.00 | | | | 0.03 | | | | 4,220,927 | | | | 0.04 | | | | 0.01 | | | | 0.71 | |
| | 1.00 | | | | 0.02 | | | | 4,208,768 | | | | 0.07 | | | | 0.01 | | | | 0.71 | |
| | 1.00 | | | | 0.02 | | | | 4,484,279 | | | | 0.12 | | | | 0.01 | | | | 0.71 | |
| | 1.00 | | | | 0.01 | | | | 6,804,823 | | | | 0.21 | | | | 0.00 | (f) | | | 0.71 | |
| | 1.00 | | | | 0.01 | | | | 7,340,658 | | | | 0.22 | | | | 0.00 | (f) | | | 0.71 | |
SEE NOTES TO FINANCIAL STATEMENTS.
| | | | | | | | |
| | | |
| AUGUST 31, 2016 | | J.P. MORGAN MONEY MARKET FUNDS | | | | | 105 | |
FINANCIAL HIGHLIGHTS
FOR THE PERIODS INDICATED (continued)
| | | | | | | | | | | | | | | | | | | | | | | | | | | | |
| | | | | | Per share operating performance | |
| | | | | | Investment operations | | | Distributions | |
| | | Net asset
value,
beginning
of period | | | Net
investment
income
(loss) | | | Net realized
and unrealized
gains
(losses) on
investments | | | Total from
investment
operations | | | Net
investment
income | | | Net
realized
gain | | | Total
distributions | |
Municipal Money Market Fund | | | | | | | | | | | | | | | | | | | | | | | | | | | | |
Agency | | | | | | | | | | | | | | | | | | | | | | | | | | | | |
Six Months Ended August 31, 2016 (Unaudited) | | $ | 1.00 | | | $ | — | (d)(e) | | $ | — | (e) | | $ | — | (e) | | $ | — | (e) | | $ | — | | | $ | — | (e) |
Year Ended February 29, 2016 | | | 1.00 | | | | — | (d)(e) | | | — | (e) | | | — | (e) | | | — | (e) | | | — | (e) | | | — | (e) |
Year Ended February 28, 2015 | | | 1.00 | | | | — | (e) | | | — | (e) | | | — | (e) | | | — | (e) | | | — | (e) | | | — | (e) |
Year Ended February 28, 2014 | | | 1.00 | | | | — | (e) | | | — | (e) | | | — | (e) | | | — | (e) | | | — | | | | — | (e) |
Year Ended February 28, 2013 | | | 1.00 | | | | — | (e) | | | — | (e) | | | — | (e) | | | — | (e) | | | — | | | | — | (e) |
Year Ended February 29, 2012 | | | 1.00 | | | | — | (e) | | | — | (e) | | | — | (e) | | | — | (e) | | | — | | | | — | (e) |
| | | | | | | |
Eagle Class | | | | | | | | | | | | | | | | | | | | | | | | | | | | |
July 1, 2016 (f) through August 31, 2016 (Unaudited) | | | 1.00 | | | | — | (d)(e) | | | — | (e) | | | — | (e) | | | — | (e) | | | — | | | | — | (e) |
| | | | | | | |
E*Trade | | | | | | | | | | | | | | | | | | | | | | | | | | | | |
Six Months Ended August 31, 2016 (Unaudited) | | | 1.00 | | | | — | (d)(e) | | | — | (e) | | | — | (e) | | | — | (e) | | | — | | | | — | (e) |
Year Ended February 29, 2016 | | | 1.00 | | | | — | (d)(e) | | | — | (e) | | | — | (e) | | | — | (e) | | | — | (e) | | | — | (e) |
Year Ended February 28, 2015 | | | 1.00 | | | | — | (e) | | | — | (e) | | | — | (e) | | | — | (e) | | | — | (e) | | | — | (e) |
Year Ended February 28, 2014 | | | 1.00 | | | | — | (e) | | | — | (e) | | | — | (e) | | | — | (e) | | | — | | | | — | (e) |
Year Ended February 28, 2013 | | | 1.00 | | | | — | (e) | | | — | (e) | | | — | (e) | | | — | (e) | | | — | | | | — | (e) |
Year Ended February 29, 2012 | | | 1.00 | | | | — | (e) | | | — | (e) | | | — | (e) | | | — | (e) | | | — | | | | — | (e) |
| | | | | | | |
Institutional Class | | | | | | | | | | | | | | | | | | | | | | | | | | | | |
Six Months Ended August 31, 2016 (Unaudited) | | | 1.00 | | | | — | (d)(e) | | | — | (e) | | | — | (e) | | | — | (e) | | | — | | | | — | (e) |
Year Ended February 29, 2016 | | | 1.00 | | | | — | (d)(e) | | | — | (e) | | | — | (e) | | | — | (e) | | | — | (e) | | | — | (e) |
Year Ended February 28, 2015 | | | 1.00 | | | | — | (e) | | | — | (e) | | | — | (e) | | | — | (e) | | | — | (e) | | | — | (e) |
Year Ended February 28, 2014 | | | 1.00 | | | | — | (e) | | | — | (e) | | | — | (e) | | | — | (e) | | | — | | | | — | (e) |
Year Ended February 28, 2013 | | | 1.00 | | | | — | (e) | | | — | (e) | | | — | (e) | | | — | (e) | | | — | | | | — | (e) |
Year Ended February 29, 2012 | | | 1.00 | | | | — | (e) | | | — | (e) | | | — | (e) | | | — | (e) | | | — | | | | — | (e) |
| | | | | | | |
Morgan | | | | | | | | | | | | | | | | | | | | | | | | | | | | |
Six Months Ended August 31, 2016 (Unaudited) | | | 1.00 | | | | — | (d)(e) | | | — | (e) | | | — | (e) | | | — | (e) | | | — | | | | — | (e) |
Year Ended February 29, 2016 | | | 1.00 | | | | — | (d)(e) | | | — | (e) | | | — | (e) | | | — | (e) | | | — | (e) | | | — | (e) |
Year Ended February 28, 2015 | | | 1.00 | | | | — | (e) | | | — | (e) | | | — | (e) | | | — | (e) | | | — | (e) | | | — | (e) |
Year Ended February 28, 2014 | | | 1.00 | | | | — | (e) | | | — | (e) | | | — | (e) | | | — | (e) | | | — | | | | — | (e) |
Year Ended February 28, 2013 | | | 1.00 | | | | — | (e) | | | — | (e) | | | — | (e) | | | — | | | | — | | | | — | |
Year Ended February 29, 2012 | | | 1.00 | | | | — | (e) | | | — | (e) | | | — | (e) | | | — | (e) | | | — | | | | — | (e) |
| | | | | | | |
Premier | | | | | | | | | | | | | | | | | | | | | | | | | | | | |
Six Months Ended August 31, 2016 (Unaudited) | | | 1.00 | | | | — | (d)(e) | | | — | (e) | | | — | (e) | | | — | (e) | | | — | | | | — | (e) |
Year Ended February 29, 2016 | | | 1.00 | | | | — | (d)(e) | | | — | (e) | | | — | (e) | | | — | (e) | | | — | (e) | | | — | (e) |
Year Ended February 28, 2015 | | | 1.00 | | | | — | (e) | | | — | (e) | | | — | (e) | | | — | (e) | | | — | (e) | | | — | (e) |
Year Ended February 28, 2014 | | | 1.00 | | | | — | (e) | | | — | (e) | | | — | (e) | | | — | (e) | | | — | | | | — | (e) |
Year Ended February 28, 2013 | | | 1.00 | | | | — | (e) | | | — | (e) | | | — | (e) | | | — | | | | — | | | | — | |
Year Ended February 29, 2012 | | | 1.00 | | | | — | (e) | | | — | (e) | | | — | (e) | | | — | (e) | | | — | | | | — | (e) |
| | | | | | | |
Reserve | | | | | | | | | | | | | | | | | | | | | | | | | | | | |
Six Months Ended August 31, 2016 (Unaudited) | | | 1.00 | | | | — | (d)(e) | | | — | (e) | | | — | (e) | | | — | (e) | | | — | | | | — | (e) |
Year Ended February 29, 2016 | | | 1.00 | | | | — | (d)(e) | | | — | (e) | | | — | (e) | | | — | (e) | | | — | (e) | | | — | (e) |
Year Ended February 28, 2015 | | | 1.00 | | | | — | (e) | | | — | (e) | | | — | (e) | | | — | (e) | | | — | (e) | | | — | (e) |
Year Ended February 28, 2014 | | | 1.00 | | | | — | (e) | | | — | (e) | | | — | (e) | | | — | (e) | | | — | | | | — | (e) |
Year Ended February 28, 2013 | | | 1.00 | | | | — | | | | — | (e) | | | — | (e) | | | — | | | | — | | | | — | |
Year Ended February 29, 2012 | | | 1.00 | | | | — | (e) | | | — | (e) | | | — | (e) | | | — | (e) | | | — | | | | — | (e) |
| (a) | Annualized for periods less than one year, unless otherwise noted. |
| (b) | Not annualized for periods less than one year. |
| (c) | Includes earnings credits and interest expense, if applicable, each of which is less than 0.005% unless otherwise noted. |
| (d) | Calculated based upon average shares outstanding. |
| (e) | Amount rounds to less than 0.005. |
| (f) | Commencement of offering of class of shares. |
| (g) | Amount rounds to less than 0.005% |
SEE NOTES TO FINANCIAL STATEMENTS.
| | | | | | |
| | | |
| 106 | | | | J.P. MORGAN MONEY MARKET FUNDS | | AUGUST 31, 2016 |
| | | | | | | | | | | | | | | | | | | | | | |
| | | Ratios/Supplemental data | |
| | | | | | | | | | Ratios to average net assets (a) | |
Net asset
value,
end of
period | | | Total return (b) | | | Net assets,
end of
period
(000’s) | | | Net
expenses (c) | | | Net
investment
income
(loss) | | | Expenses
without waivers,
reimbursements and
earnings credits | |
| | | | | | | | | | | | | | | | | | | | | | |
| | | | | | | | | | | | | | | | | | | | | | |
| $ | 1.00 | | | | 0.08 | % | | $ | 19,297 | | | | 0.22 | % | | | 0.12 | % | | | 0.32 | % |
| | 1.00 | | | | 0.01 | | | | 193,260 | | | | 0.08 | | | | 0.01 | | | | 0.32 | |
| | 1.00 | | | | 0.01 | | | | 81,196 | | | | 0.12 | | | | 0.01 | | | | 0.32 | |
| | 1.00 | | | | 0.01 | | | | 39,280 | | | | 0.19 | | | | 0.01 | | | | 0.32 | |
| | 1.00 | | | | 0.04 | | | | 64,782 | | | | 0.26 | | | | 0.04 | | | | 0.32 | |
| | 1.00 | | | | 0.07 | | | | 121,010 | | | | 0.26 | | | | 0.06 | | | | 0.32 | |
| | | | | |
| | | | | | | | | | | | | | | | | | | | | | |
| | 1.00 | | | | 0.00 | (g) | | | 528,653 | | | | 0.58 | | | | 0.01 | | | | 0.72 | |
| | | | | |
| | | | | | | | | | | | | | | | | | | | | | |
| | 1.00 | | | | 0.01 | | | | 2,060,253 | | | | 0.40 | | | | 0.01 | | | | 1.07 | |
| | 1.00 | | | | 0.01 | | | | 1,935,318 | | | | 0.08 | | | | 0.01 | | | | 1.07 | |
| | 1.00 | | | | 0.01 | | | | 2,000,898 | | | | 0.13 | | | | 0.01 | | | | 1.07 | |
| | 1.00 | | | | 0.01 | | | | 1,992,153 | | | | 0.18 | | | | 0.01 | | | | 1.07 | |
| | 1.00 | | | | 0.01 | | | | 1,874,152 | | | | 0.28 | | | | 0.01 | | | | 1.07 | |
| | 1.00 | | | | 0.01 | | | | 1,736,816 | | | | 0.31 | | | | 0.01 | | | | 1.07 | |
| | | | | |
| | | | | | | | | | | | | | | | | | | | | | |
| | 1.00 | | | | 0.11 | | | | 177,347 | | | | 0.20 | | | | 0.21 | | | | 0.27 | |
| | 1.00 | | | | 0.01 | | | | 132,605 | | | | 0.08 | | | | 0.01 | | | | 0.27 | |
| | 1.00 | | | | 0.01 | | | | 188,480 | | | | 0.13 | | | | 0.01 | | | | 0.27 | |
| | 1.00 | | | | 0.02 | | | | 224,592 | | | | 0.18 | | | | 0.02 | | | | 0.27 | |
| | 1.00 | | | | 0.08 | | | | 202,999 | | | | 0.21 | | | | 0.09 | | | | 0.27 | |
| | 1.00 | | | | 0.11 | | | | 548,856 | | | | 0.21 | | | | 0.12 | | | | 0.27 | |
| | | | | |
| | | | | | | | | | | | | | | | | | | | | | |
| | 1.00 | | | | 0.00 | (g) | | | 375,595 | | | | 0.40 | | | | 0.01 | | | | 0.62 | |
| | 1.00 | | | | 0.01 | | | | 387,521 | | | | 0.08 | | | | 0.01 | | | | 0.62 | |
| | 1.00 | | | | 0.01 | | | | 353,483 | | | | 0.13 | | | | 0.01 | | | | 0.62 | |
| | 1.00 | | | | 0.00 | (g) | | | 330,333 | | | | 0.19 | | | | 0.00 | (g) | | | 0.62 | |
| | 1.00 | | | | 0.00 | | | | 356,149 | | | | 0.29 | | | | 0.00 | (g) | | | 0.62 | |
| | 1.00 | | | | 0.00 | (g) | | | 334,195 | | | | 0.32 | | | | 0.00 | (g) | | | 0.62 | |
| | | | | |
| | | | | | | | | | | | | | | | | | | | | | |
| | 1.00 | | | | 0.01 | | | | 23,140 | | | | 0.38 | | | | 0.02 | | | | 0.48 | |
| | 1.00 | | | | 0.01 | | | | 28,451 | | | | 0.08 | | | | 0.01 | | | | 0.47 | |
| | 1.00 | | | | 0.01 | | | | 29,376 | | | | 0.13 | | | | 0.01 | | | | 0.47 | |
| | 1.00 | | | | 0.00 | (g) | | | 40,357 | | | | 0.19 | | | | 0.00 | (g) | | | 0.47 | |
| | 1.00 | | | | 0.00 | | | | 52,034 | | | | 0.29 | | | | 0.00 | (g) | | | 0.47 | |
| | 1.00 | | | | 0.00 | (g) | | | 78,792 | | | | 0.32 | | | | 0.00 | (g) | | | 0.47 | |
| | | | | |
| | | | | | | | | | | | | | | | | | | | | | |
| | 1.00 | | | | 0.00 | (g) | | | 88 | | | | 0.38 | | | | 0.01 | | | | 0.73 | |
| | 1.00 | | | | 0.01 | | | | 9,796 | | | | 0.08 | | | | 0.01 | | | | 0.73 | |
| | 1.00 | | | | 0.01 | | | | 11,604 | | | | 0.14 | | | | 0.01 | | | | 0.72 | |
| | 1.00 | | | | 0.00 | (g) | | | 32,909 | | | | 0.19 | | | | 0.00 | (g) | | | 0.72 | |
| | 1.00 | | | | 0.00 | | | | 45,250 | | | | 0.30 | | | | 0.00 | | | | 0.72 | |
| | 1.00 | | | | 0.00 | (g) | | | 54,714 | | | | 0.32 | | | | 0.00 | (g) | | | 0.72 | |
SEE NOTES TO FINANCIAL STATEMENTS.
| | | | | | | | |
| | | |
| AUGUST 31, 2016 | | J.P. MORGAN MONEY MARKET FUNDS | | | | | 107 | |
FINANCIAL HIGHLIGHTS
FOR THE PERIODS INDICATED (continued)
| | | | | | | | | | | | | | | | | | | | | | | | | | | | |
| | | | | | Per share operating performance | |
| | | | | | Investment operations | | | Distributions | |
| | | Net asset
value,
beginning
of period | | | Net
investment
income
(loss) | | | Net realized
and unrealized
gains
(losses) on
investments | | | Total from
investment
operations | | | Net
investment
income | | | Net
realized
gain | | | Total
distributions | |
Municipal Money Market Fund (continued) | | | | | | | | | | | | | | | | | | | | | | | | | | | | |
Service | | | | | | | | | | | | | | | | | | | | | | | | | | | | |
Six Months Ended August 31, 2016 (Unaudited) | | $ | 1.00 | | | $ | — | (d)(e) | | $ | — | (e) | | $ | — | (e) | | $ | — | (e) | | $ | — | | | $ | — | (e) |
Year Ended February 29, 2016 | | | 1.00 | | | | — | (d)(e) | | | — | (e) | | | — | (e) | | | — | (e) | | | — | (e) | | | — | (e) |
Year Ended February 28, 2015 | | | 1.00 | | | | — | (e) | | | — | (e) | | | — | (e) | | | — | (e) | | | — | (e) | | | — | (e) |
Year Ended February 28, 2014 | | | 1.00 | | | | — | (e) | | | — | (e) | | | — | (e) | | | — | (e) | | | — | | | | — | (e) |
Year Ended February 28, 2013 | | | 1.00 | | | | — | | | | — | (e) | | | — | (e) | | | — | | | | — | | | | — | |
Year Ended February 29, 2012 | | | 1.00 | | | | — | (e) | | | — | (e) | | | — | (e) | | | — | (e) | | | — | | | | — | (e) |
| (a) | Annualized for periods less than one year, unless otherwise noted. |
| (b) | Not annualized for periods less than one year. |
| (c) | Includes earnings credits and interest expense, if applicable, each of which is less than 0.005% unless otherwise noted. |
| (d) | Calculated based upon average shares outstanding. |
| (e) | Amount rounds to less than 0.005. |
| (f) | Amount rounds to less than 0.005% |
SEE NOTES TO FINANCIAL STATEMENTS.
| | | | | | |
| | | |
| 108 | | | | J.P. MORGAN MONEY MARKET FUNDS | | AUGUST 31, 2016 |
| | | | | | | | | | | | | | | | | | | | | | |
| | | Ratios/Supplemental data | |
| | | | | | | | | | Ratios to average net assets (a) | |
Net asset
value,
end of
period | | | Total return (b) | | | Net assets,
end of
period
(000’s) | | | Net
expenses (c) | | | Net
investment
income
(loss) | | | Expenses
without waivers,
reimbursements and
earnings credits | |
| | | | | | | | | | | | | | | | | | | | | | |
| | | | | | | | | | | | | | | | | | | | | | |
| $ | 1.00 | | | | 0.00 | %(f) | | $ | 452,806 | | | | 0.40 | % | | | 0.01 | % | | | 1.07 | % |
| | 1.00 | | | | 0.01 | | | | 515,523 | | | | 0.08 | | | | 0.01 | | | | 1.07 | |
| | 1.00 | | | | 0.01 | | | | 397,469 | | | | 0.12 | | | | 0.01 | | | | 1.07 | |
| | 1.00 | | | | 0.00 | (f) | | | 238,328 | | | | 0.19 | | | | 0.00 | (f) | | | 1.07 | |
| | 1.00 | | | | 0.00 | | | | 243,374 | | | | 0.29 | | | | 0.00 | | | | 1.07 | |
| | 1.00 | | | | 0.00 | (f) | | | 273,172 | | | | 0.32 | | | | 0.00 | (f) | | | 1.07 | |
SEE NOTES TO FINANCIAL STATEMENTS.
| | | | | | | | |
| | | |
| AUGUST 31, 2016 | | J.P. MORGAN MONEY MARKET FUNDS | | | | | 109 | |
NOTES TO FINANCIAL STATEMENTS
AS OF AUGUST 31, 2016 (Unaudited)
1. Organization
JPMorgan Trust I (“JPM I”) and JPMorgan Trust II (“JPM II”) collectively, (the “Trusts”) were formed on November 12, 2004, as Delaware statutory trusts, pursuant to Declarations of Trust dated November 5, 2004 and are registered under the Investment Company Act of 1940, as amended (the “1940 Act”), as open-end management investment companies.
The following are 8 separate funds of the Trusts (collectively, the “Funds”) covered by this report:
| | | | | | |
| | | Classes Offered | | Trust | | Diversified/Non-Diversified |
| Prime Money Market Fund | | Class C, Agency, Capital, Cash Management, Direct^, Eagle Class, IM, Institutional Class, Investor, Morgan, Premier, Reserve and Service | | JPM I | | Diversified |
| Liquid Assets Money Market Fund | | Class C, Agency, Capital, E*Trade, Institutional Class, Investor, Morgan, Premier, Reserve and Service | | JPM II | | Diversified |
| U.S. Government Money Market Fund | | Agency, Capital, Direct, E*Trade^^, Eagle Class, IM, Institutional Class, Investor, Morgan, Premier, Reserve and Service | | JPM II | | Diversified |
| U.S. Treasury Plus Money Market Fund | | Class C, Agency, Direct, Eagle Class, IM, Institutional Class, Investor, Morgan, Premier, Reserve and Service | | JPM II | | Diversified |
| Federal Money Market Fund | | Agency, Institutional Class, Morgan, Premier and Reserve | | JPM I | | Diversified |
| 100% U.S. Treasury Securities Money Market Fund | | Agency, Capital, Institutional Class, Morgan, Premier, Reserve and Service | | JPM I | | Diversified |
| Tax Free Money Market Fund | | Agency, Direct, Eagle Class, Institutional Class, Morgan, Premier and Reserve | | JPM I | | Diversified |
| Municipal Money Market Fund | | Agency, E*Trade, Eagle Class^^^, Institutional Class, Morgan, Premier, Reserve and Service | | JPM II | | Diversified |
| ^ | Direct Shares of the Prime Money Market Fund had no assets as of August 16, 2016. |
| ^^ | E*Trade Shares commenced operations on March 9, 2016 for the U.S. Government Money Market Fund. |
| ^^^ | Eagle Class Shares commenced operations on July 1, 2016 for the Municipal Money Market Fund. |
The investment objective of Prime Money Market Fund is to provide the highest possible level of current income while still maintaining liquidity and preserving capital. During the period, the investment objective changed to seeking current income while seeking to maintain liquidity and a low volatility of principal.
The investment objective of Liquid Assets Money Market Fund and U.S. Treasury Plus Money Market Fund is to seek current income with liquidity and stability of principal.
The investment objective of U.S. Government Money Market Fund is to seek high current income with liquidity and stability of principal.
The investment objective of Federal Money Market Fund is to provide current income while still preserving capital and maintaining liquidity.
The investment objective of 100% U.S. Treasury Securities Money Market Fund is to provide the highest possible level of current income while still maintaining liquidity and providing maximum safety of principal.
The investment objective of Tax Free Money Market Fund is to provide the highest possible level of current income which is excluded from gross income, while still preserving capital and maintaining liquidity.
The investment objective of Municipal Money Market Fund is to seek as high a level of current interest income exempt from federal income tax as is consistent with liquidity and stability of principal.
Class C Shares provide for a contingent deferred sales charge (“CDSC”). No sales charges are assessed with respect to the Agency, Capital, Cash Management, Direct, Eagle Class, E*Trade, IM, Institutional Class, Investor, Morgan, Premier, Reserve and Service Shares. All classes of shares have equal rights as to earnings, assets and voting privileges, except that each class may bear different distribution and shareholder servicing fees and each class has exclusive voting rights with respect to its distribution plan and shareholder servicing agreements.
On June 19, 2015, all remaining Class B Shares converted to Morgan Shares of the same Fund. Prior to June 19, 2015, Class B Shares automatically converted to Morgan Shares after eight years and provided for a CDSC.
J.P. Morgan Investment Management Inc. (“JPMIM”) an indirect, wholly-owned subsidiary of JPMorgan Chase & Co. (“JPMorgan”) acts as Adviser (the “Adviser”) and Administrator (the “Administrator”) to the Funds. Prior to April 1, 2016, JPMorgan Funds Management, Inc. (“JPMFM”) served as the Funds’ administrator. Effective April 1, 2016, JPMFM merged into JPMIM and JPMIM became the Funds’ Administrator under the Administration Agreement.
2. Significant Accounting Policies
The following is a summary of significant accounting policies followed by the Funds in the preparation of their financial statements. The Funds are investment companies and, accordingly, follow the investment company accounting and reporting guidance of the Financial Accounting Standards
Board Accounting Standards Codification Topic 946 — Investment Companies, which is part of U.S. generally accepted accounting principles
| | | | | | |
| | | |
| 110 | | | | J.P. MORGAN MONEY MARKET FUNDS | | AUGUST 31, 2016 |
(“GAAP”). The preparation of financial statements in conformity with GAAP requires management to make estimates and assumptions that affect the reported amounts of assets and liabilities and disclosure of contingent assets and liabilities at the date of the financial statements and the reported amounts of increases and decreases in net assets from operations during the reporting period. Actual results could differ from those estimates.
A. Valuation of Investments — The valuation of investments is in accordance with GAAP and the Funds’ valuation policies set forth by and under the supervision and responsibility of the Board of Trustees (the “Board”), which established the following approach to valuation, as described more fully below: securities and other debt instruments held by money market funds pursuant to Rule 2a-7 under the 1940 Act shall be valued using the amortized cost method provided that certain conditions are met.
The amortized cost method of valuation involves valuing a security at its cost initially and thereafter assuming a constant amortization to maturity of any discount or premium, regardless of the impact of fluctuating interest rates on the market value of the security. This method may result in periods during which value, as determined by amortized cost, is higher or lower than the price each Fund would receive if it sold the security. The market value of securities in the Funds can be expected to vary inversely with changes in prevailing interest rates.
JPMIM has established the J.P. Morgan Asset Management Americas Valuation Committee (“AVC”) to assist the Board with the oversight and monitoring of the Funds’ investments. The Administrator implements the valuation policies of the Funds’ investments, as directed by the Board. The AVC oversees and carries out the policies for the valuation of investments held in the Funds. This includes monitoring on a daily basis that the amortized cost valuation method fairly reflects the market-based net asset value (“NAV”) of the Funds.
Valuations reflected in this report are as of the report date. As a result, changes in valuation due to market events and/or issuer related events after the report date and prior to issuance of the report are not reflected herein.
The various inputs that are used in determining the fair value of the Funds’ investments are summarized into the three broad levels listed below.
| • | | Level 1 — Quoted prices in active markets for identical securities. |
| • | | Level 2 — Other significant observable inputs (including quoted prices for similar securities, interest rates, prepayment speeds, credit risk, etc.). |
| • | | Level 3 — Significant unobservable inputs (including the Funds’ own assumptions in determining the fair value of investments). |
A financial instrument’s level within the fair value hierarchy is based on the lowest level of any input, both individually and in the aggregate, that is significant to the fair value measurement. The inputs or methodology used for valuing securities are not necessarily an indication of the risk associated with investing in those securities. For example, money market securities are valued using amortized cost, in accordance with rules under the 1940 Act. Generally, amortized cost approximates the current fair value of a security, but since the value is not obtained from a quoted price in an active market, such securities are reflected as level 2.
The following is a summary of the inputs used as of August 31, 2016, in valuing the Funds’ assets and liabilities carried at amortized cost which approximates fair value (amounts in thousands):
| | | | | | | | | | | | | | | | |
| | | Level 1 Quoted prices | | | Level 2 Other significant observable inputs | | | Level 3 Significant
unobservable inputs | | | Total | |
Prime Money Market Fund | | | | | | | | | | | | | | | | |
Total Investments in Securities (a) | | $ | — | | | $ | 73,817,308 | | | $ | — | | | $ | 73,817,308 | |
| | | | | | | | | | | | | | | | |
Liquid Assets Money Market Fund | | | | | | | | | | | | | | | | |
Total Investments in Securities (a) | | $ | — | | | $ | 4,117,440 | | | $ | — | | | $ | 4,117,440 | |
| | | | | | | | | | | | | | | | |
U.S. Government Money Market Fund | | | | | | | | | | | | | | | | |
Total Investments in Securities (a) | | $ | — | | | $ | 109,907,304 | | | $ | — | | | $ | 109,907,304 | |
| | | | | | | | | | | | | | | | |
U.S. Treasury Plus Money Market Fund | | | | | | | | | | | | | | | | |
Total Investments in Securities (a) | | $ | — | | | $ | 19,870,881 | | | $ | — | | | $ | 19,870,881 | |
| | | | | | | | | | | | | | | | |
Federal Money Market Fund | | | | | | | | | | | | | | | | |
Total Investments in Securities (a) | | $ | — | | | $ | 2,853,706 | | | $ | — | | | $ | 2,853,706 | |
| | | | | | | | | | | | | | | | |
100% U.S. Treasury Securities Money Market Fund | | | | | | | | | | | | | | | | |
Total Investments in Securities (a) | | $ | — | | | $ | 24,213,349 | | | $ | — | | | $ | 24,213,349 | |
| | | | | | | | | | | | | | | | |
Tax Free Money Market Fund | | | | | | | | | | | | | | | | |
Total Investments in Securities (a) | | $ | — | | | $ | 13,980,822 | | | $ | — | | | $ | 13,980,822 | |
| | | | | | | | | | | | | | | | |
Municipal Money Market Fund | | | | | | | | | | | | | | | | |
Total Investments in Securities (a) | | $ | — | | | $ | 3,630,269 | | | $ | — | | | $ | 3,630,269 | |
| | | | | | | | | | | | | | | | |
| (a) | All portfolio holdings designated as level 2 are disclosed individually on the Schedules of Portfolio Investments (“SOIs”). Please refer to the SOIs for specifics of the major categories of portfolio holdings. |
| | | | | | | | |
| | | |
| AUGUST 31, 2016 | | J.P. MORGAN MONEY MARKET FUNDS | | | | | 111 | |
NOTES TO FINANCIAL STATEMENTS
AS OF AUGUST 31, 2016 (Unaudited) (continued)
There were no transfers among any levels during the six months ended August 31, 2016.
B. Restricted Securities — Certain securities held by the Funds may be subject to legal or contractual restrictions on resale. Restricted securities generally are resold in transactions exempt from registration under the Securities Act of 1933 (the “Securities Act”). Disposal of these securities may involve time-consuming negotiations and expense. Prompt sale at the current valuation may be difficult and could adversely affect the net assets of the Funds.
As of August 31, 2016, the Funds had no investments in restricted securities other than securities sold to the Funds under Rule 144A under the Securities Act.
C. Repurchase Agreements — The Funds may enter into repurchase agreement transactions that meet the credit guidelines of J.P. Morgan Investment Management Inc. (the “Adviser” or “JPMIM”), an indirect, wholly-owned subsidiary of JPMorgan Chase & Co. (“JPMorgan”). Repurchase agreements involve the purchase of securities subject to the seller’s agreement to repurchase the securities at a mutually agreed upon date and price. The Funds require that the collateral received in a repurchase agreement transaction be transferred to a custodian in a manner sufficient to enable the Funds to obtain collateral in the event of a counterparty default. If the counterparty defaults and the fair value of the collateral declines, realization of the collateral by the Funds may be delayed or limited. Repurchase agreement collateral may be held in segregated accounts maintained by JPMorgan Chase Bank, N.A. (“JPMCB”), a wholly-owned subsidiary of JPMorgan. The Prime Money Market Fund, Liquid Assets Money Market Fund, U.S. Government Money Market Fund and U.S. Treasury Plus Money Market Fund or their affiliates may transfer uninvested cash into joint accounts, which are utilized by multiple accounts or funds managed by the Adviser or its affiliates, the daily aggregate balance of which is invested in one or more repurchase agreements. Under these joint accounts, the Funds maintain pro-rata credit exposure to the underlying repurchase agreements’ counterparties and collateral.
The Funds’ repurchase agreements are not subject to master netting arrangements.
D. Security Transactions and Investment Income — Investment transactions are accounted for on the trade date (the date the order to buy or sell is executed). Securities gains and losses are calculated on a specifically identified cost basis. Interest income is determined on the basis of coupon interest accrued using the effective interest method which adjusts for amortization of premiums and accretion of discounts.
E. Allocation of Income and Expenses — Expenses directly attributable to a fund are charged directly to that fund, while the expenses attributable to more than one fund of the Trusts are allocated among the respective funds. In calculating the NAV of each class, investment income, realized and unrealized gains and losses and expenses, other than class specific expenses, are allocated daily to each class of shares based upon the proportion of net assets of each class at the beginning of each day.
Transfer agency fees are class-specific expenses. The amount of the transfer agency fees charged to each class of the Funds for the six months ended August 31, 2016 are as follows (amounts in thousands):
| | | | | | | | | | | | | | | | | | | | | | | | | | | | | | | | |
| | | Prime Money
Market Fund | | | Liquid
Assets
Money
Market Fund | | | U.S.
Government
Money Market
Fund | | | U.S.
Treasury
Plus Money
Market Fund | | | Federal
Money
Market
Fund | | | 100% U.S.
Treasury
Securities
Money Market
Fund | | | Tax Free
Money Market
Fund | | | Municipal
Money Market
Fund | |
Class C | | $ | 3 | | | $ | 7 | | | | n/a | | | $ | 3 | | | | n/a | | | | n/a | | | | n/a | | | | n/a | |
Agency | | | 82 | | | | 2 | | | $ | 89 | | | | 8 | | | $ | 3 | | | $ | 18 | | | $ | 4 | | | $ | 1 | |
Capital | | | 693 | | | | 24 | | | | 306 | | | | n/a | | | | n/a | | | | 108 | | | | n/a | | | | n/a | |
Cash Management | | | 6 | | | | n/a | | | | n/a | | | | n/a | | | | n/a | | | | n/a | | | | n/a | | | | n/a | |
Direct | | | 11 | | | | n/a | | | | 8 | | | | 9 | | | | n/a | | | | n/a | | | | — | (a) | | | n/a | |
Eagle Class | | | 4 | | | | n/a | | | | — | (a) | | | — | (a) | | | n/a | | | | n/a | | | | 13 | | | | — | |
E*Trade | | | n/a | | | | 33 | | | | — | (a) | | | n/a | | | | n/a | | | | n/a | | | | n/a | | | | 20 | |
IM | | | 25 | | | | n/a | | | | 8 | | | | 37 | | | | n/a | | | | n/a | | | | n/a | | | | n/a | |
Institutional Class | | | 262 | | | | 54 | | | | 100 | | | | 88 | | | | 47 | | | | 96 | | | | 107 | | | | 3 | |
Investor | | | 12 | | | | 2 | | | | 29 | | | | 2 | | | | n/a | | | | n/a | | | | n/a | | | | n/a | |
Morgan | | | 165 | | | | 66 | | | | 37 | | | | 18 | | | | 12 | | | | 39 | | | | 5 | | | | 7 | |
Premier | | | 41 | | | | 2 | | | | 69 | | | | 5 | | | | 6 | | | | 18 | | | | 30 | | | | 1 | |
Reserve | | | 11 | | | | 3 | | | | 1 | | | | 7 | | | | — | (a) | | | 3 | | | | 44 | | | | — | (a) |
Service | | | 18 | | | | 1 | | | | 6 | | | | — | (a) | | | n/a | | | | — | (a) | | | n/a | | | | 5 | |
| | | | | | | | | | | | | | | | | | | | | | | | | | | | | | | | |
Total | | $ | 1,333 | | | $ | 194 | | | $ | 653 | | | $ | 177 | | | $ | 68 | | | $ | 282 | | | $ | 203 | | | $ | 37 | |
| | | | | | | | | | | | | | | | | | | | | | | | | | | | | | | | |
| (a) | Amount rounds to less than 500. |
F. Federal Income Taxes — Each Fund is treated as a separate taxable entity for Federal income tax purposes. Each Fund’s policy is to comply with the provisions of the Internal Revenue Code of 1986, as amended (the “Code”), applicable to regulated investment companies and to distribute to shareholders all of its distributable net investment income and net realized capital gains on investments. Accordingly, no provision for Federal income tax is necessary. Management has reviewed the Funds’ tax positions for all open tax years and has determined that as of August 31, 2016, no liability for income tax is required in the Funds’ financial statements for net unrecognized tax benefits. However, management’s conclusions may be
| | | | | | |
| | | |
| 112 | | | | J.P. MORGAN MONEY MARKET FUNDS | | AUGUST 31, 2016 |
subject to future review based on changes in, or the interpretation of, the accounting standards or tax laws and regulations. Each of the Funds’ Federal tax returns for the prior three fiscal years remains subject to examination by the Internal Revenue Service.
G. Distributions to Shareholders — Distributions from net investment income are generally declared daily and paid monthly and are declared separately for each class. No class has preferential dividend rights; differences in per share rates are due to differences in separate class expenses. Net realized capital gains, if any, are distributed by each Fund at least annually. The amount of distributions from net investment income and net realized capital gains is determined in accordance with Federal income tax regulations, which may differ from GAAP. To the extent these “book/tax” differences are permanent in nature (i.e., that they result from other than timing of recognition — “temporary differences”), such amounts are reclassified within the capital accounts based on their Federal tax-basis treatment.
3. Fees and Other Transactions with Affiliates
A. Investment Advisory Fee — Pursuant to Investment Advisory Agreements, the Adviser supervises the investments of each Fund and for such services is paid a fee. The fee is accrued daily and generally paid monthly at an annual rate of 0.08% of each Fund’s average daily net assets.
The Adviser waived Investment Advisory fees and/or reimbursed expenses as outlined in Note 3.F.
B. Administration Fee — Pursuant to Administration Agreements, the Administrator provides certain administration services to the Funds. In consideration of these services, the Administrator receives a fee accrued daily and paid monthly at an annual rate of 0.10% of the first $100 billion of the average daily net assets of all money market funds in the J.P. Morgan Funds Complex covered by the Administration Agreement and 0.05% of the average daily net assets in excess of $100 billion of all such funds. For the six months ended August 31, 2016, the effective annualized rate was 0.07% of each Fund’s average daily net assets, notwithstanding any fee waivers and/or expense reimbursements.
The Administrator waived Administration fees as outlined in Note 3.F.
JPMCB serves as the Funds’ sub-administrator (the “Sub-administrator”). For its services as Sub-administrator, JPMCB receives a portion of the fees payable to the Administrator.
C. Distribution Fees — Pursuant to a Distribution Agreement, JPMorgan Distribution Services, Inc. (the “Distributor”), a wholly-owned subsidiary of JPMorgan, serves as the Trusts’ exclusive underwriter and promotes and arranges for the sale of each Fund’s shares.
The Board has adopted a Distribution Plan (the “Distribution Plan”) for Class C, Cash Management, Eagle Class, E*Trade, Morgan, Reserve, and Service Shares of the Funds, as applicable, in accordance with Rule 12b-1 under the 1940 Act. The Agency, Capital, Direct, IM, Institutional Class, Investor and Premier Shares do not participate in the Distribution Plan. The Distribution Plan provides that each Fund shall pay distribution fees, including payments to the Distributor, at annual rates of the average daily net assets as shown in the table below:
| | | | | | | | | | | | | | | | | | | | | | | | | | | | |
| | | Class C | | | Cash
Management | | | Eagle
Class | | | E*Trade | | | Morgan | | | Reserve | | | Service | |
Prime Money Market Fund | | | 0.75 | % | | | 0.50 | % | | | 0.25 | % | | | n/a | | | | n/a | | | | 0.25 | % | | | 0.60 | % |
Liquid Assets Money Market Fund | | | 0.75 | | | | n/a | | | | n/a | | | | 0.60 | % | | | 0.10 | % | | | 0.25 | | | | 0.60 | |
U.S. Government Money Market Fund | | | n/a | | | | n/a | | | | 0.25 | | | | 0.60 | | | | 0.10 | | | | 0.25 | | | | 0.60 | |
U.S. Treasury Plus Money Market Fund | | | 0.75 | | | | n/a | | | | 0.25 | | | | n/a | | | | 0.10 | | | | 0.25 | | | | 0.60 | |
Federal Money Market Fund | | | n/a | | | | n/a | | | | n/a | | | | n/a | | | | 0.10 | | | | 0.25 | | | | n/a | |
100% U.S. Treasury Securities Money Market Fund | | | n/a | | | | n/a | | | | n/a | | | | n/a | | | | 0.10 | | | | 0.25 | | | | 0.60 | |
Tax Free Money Market Fund | | | n/a | | | | n/a | | | | 0.25 | | | | n/a | | | | 0.10 | | | | 0.25 | | | | n/a | |
Municipal Money Market Fund | | | n/a | | | | n/a | | | | 0.25 | | | | 0.60 | | | | 0.10 | | | | 0.25 | | | | 0.60 | |
The Distributor waived Distribution fees as outlined in Note 3.F.
In addition, the Distributor is entitled to receive the CDSC from redemptions of Class C Shares. For the six months ended August 31, 2016, the Distributor retained the following amounts (in thousands):
| | | | |
| | | CDSC | |
Prime Money Market Fund | | $ | 1 | |
Liquid Assets Money Market Fund | | | — | (a) |
| (a) | Amount rounds to less than 500. |
D. Shareholder Servicing Fees — The Trusts, on behalf of the Funds, have entered into a Shareholder Servicing Agreement with the Distributor under which the Distributor provides certain support services to the shareholders. For performing these services, the Distributor receives a fee that is accrued daily and paid monthly equal to a percentage of the average daily net assets as shown in the table below:
| | | | | | | | | | | | | | | | | | | | | | | | |
| | | Class C | | | Agency | | | Capital | | | Cash
Management | | | Direct | | | Eagle Class | |
Prime Money Market Fund | | | 0.25 | % | | | 0.15 | % | | | 0.05 | % | | | 0.30 | % | | | 0.15 | % | | | 0.30 | % |
Liquid Assets Money Market Fund | | | 0.25 | | | | 0.15 | | | | 0.05 | | | | n/a | | | | n/a | | | | n/a | |
U.S. Government Money Market Fund | | | n/a | | | | 0.15 | | | | 0.05 | | | | n/a | | | | 0.15 | | | | 0.30 | |
| | | | | | | | |
| | | |
| AUGUST 31, 2016 | | J.P. MORGAN MONEY MARKET FUNDS | | | | | 113 | |
NOTES TO FINANCIAL STATEMENTS
AS OF AUGUST 31, 2016 (Unaudited) (continued)
| | | | | | | | | | | | | | | | | | | | | | | | |
| | | Class C | | | Agency | | | Capital | | | Cash
Management | | | Direct | | | Eagle Class | |
U.S. Treasury Plus Money Market Fund | | | 0.25 | % | | | 0.15 | % | | | n/a | | | | n/a | | | | 0.15 | % | | | 0.30 | % |
Federal Money Market Fund | | | n/a | | | | 0.15 | | | | n/a | | | | n/a | | | | n/a | | | | n/a | |
100% U.S. Treasury Securities Money Market Fund | | | n/a | | | | 0.15 | | | | 0.05 | % | | | n/a | | | | n/a | | | | n/a | |
Tax Free Money Market Fund | | | n/a | | | | 0.15 | | | | n/a | | | | n/a | | | | 0.15 | | | | 0.30 | |
Municipal Money Market Fund | | | n/a | | | | 0.15 | | | | n/a | | | | n/a | | | | n/a | | | | 0.30 | |
| | | | | | | | | | | | | | | | | | | | | | | | | | | | |
| | | E*Trade | | | Institutional
Class | | | Investor | | | Morgan | | | Premier | | | Reserve | | | Service | |
Prime Money Market Fund | | | n/a | | | | 0.10 | % | | | 0.35 | % | | | 0.35 | % | | | 0.30 | % | | | 0.30 | % | | | 0.30 | % |
Liquid Assets Money Market Fund | | | 0.30 | % | | | 0.10 | | | | 0.35 | | | | 0.35 | | | | 0.30 | | | | 0.30 | | | | 0.30 | |
U.S. Government Money Market Fund | | | 0.30 | | | | 0.10 | | | | 0.35 | | | | 0.35 | | | | 0.30 | | | | 0.30 | | | | 0.30 | |
U.S. Treasury Plus Money Market Fund | | | n/a | | | | 0.10 | | | | 0.35 | | | | 0.35 | | | | 0.30 | | | | 0.30 | | | | 0.30 | |
Federal Money Market Fund | | | n/a | | | | 0.10 | | | | n/a | | | | 0.35 | | | | 0.30 | | | | 0.30 | | | | n/a | |
100% U.S. Treasury Securities Money Market Fund | | | n/a | | | | 0.10 | | | | n/a | | | | 0.35 | | | | 0.30 | | | | 0.30 | | | | 0.30 | |
Tax Free Money Market Fund | | | n/a | | | | 0.10 | | | | n/a | | | | 0.35 | | | | 0.30 | | | | 0.30 | | | | n/a | |
Municipal Money Market Fund | | | 0.30 | | | | 0.10 | | | | n/a | | | | 0.35 | | | | 0.30 | | | | 0.30 | | | | 0.30 | |
The IM Shares do not pay a fee under the Shareholder Servicing Agreement.
The Distributor has entered into shareholder services contracts with affiliated and unaffiliated financial intermediaries who provide shareholder services and other related services to their clients or customers who invest in the Funds under which the Distributor will pay all or a portion of such fees earned to financial intermediaries for performing such services.
The Distributor waived shareholder servicing fees as outlined in Note 3.F.
E. Custodian and Accounting Fees — JPMCB provides portfolio custody and accounting services to the Funds. For performing these services, the Funds pay JPMCB transaction and asset-based fees that vary according to the number of transactions and positions, plus out-of-pocket expenses. The amounts paid directly to JPMCB by the Funds for custody and accounting services are included in Custodian and accounting fees on the Statements of Operations. Payments to the custodian may be reduced by credits earned by each Fund, based on uninvested cash balances held by the custodian. Such earnings credits, if any, are presented separately on the Statements of Operations.
Interest expense paid to the custodian related to cash overdrafts, if any, is included in Interest expense to affiliates on the Statements of Operations.
F. Waivers and Reimbursements — The Adviser, Administrator and Distributor have contractually agreed to waive fees and/or reimburse the Funds, except IM Shares, to the extent that total annual operating expenses (excluding acquired fund fees and expenses, dividend and interest expenses related to short sales, interest, taxes, expenses related to litigation and potential litigation, and extraordinary expenses) exceed the percentages of the Funds’ respective average daily net assets as shown in the table below:
| | | | | | | | | | | | | | | | | | | | | | | | |
| | | Class C | | | Agency | | | Capital | | | Cash
Management | | | Direct | | | Eagle Class | |
Prime Money Market Fund | | | 0.97 | % | | | 0.26 | % | | | 0.18 | % | | | 0.96 | % | | | 0.30 | % | | | 0.70 | % |
Liquid Assets Money Market Fund | | | 0.97 | | | | 0.26 | | | | 0.18 | | | | n/a | | | | n/a | | | | n/a | |
U.S. Government Money Market Fund | | | n/a | | | | 0.26 | | | | 0.18 | | | | n/a | | | | 0.30 | | | | 0.70 | |
U.S. Treasury Plus Money Market Fund | | | 0.97 | | | | 0.26 | | | | n/a | | | | n/a | | | | 0.30 | | | | 0.70 | |
Federal Money Market Fund | | | n/a | | | | 0.26 | | | | n/a | | | | n/a | | | | n/a | | | | n/a | |
100% U.S. Treasury Securities Money Market Fund | | | n/a | | | | 0.26 | | | | 0.18 | | | | n/a | | | | n/a | | | | n/a | |
Tax Free Money Market Fund | | | n/a | | | | 0.26 | | | | n/a | | | | n/a | | | | 0.30 | | | | 0.70 | |
Municipal Money Market Fund | | | n/a | | | | 0.26 | | | | n/a | | | | n/a | | | | n/a | | | | 0.70 | |
| | | | | | | | | | | | | | | | | | | | | | | | | | | | |
| | | E*Trade | | | Institutional
Class | | | Investor | | | Morgan | | | Premier | | | Reserve | | | Service | |
Prime Money Market Fund | | | n/a | | | | 0.21 | % | | | 0.51 | % | | | 0.52 | % | | | 0.45 | % | | | 0.70 | % | | | 1.05 | % |
Liquid Assets Money Market Fund | | | 1.00 | % | | | 0.21 | | | | 0.51 | | | | 0.59 | | | | 0.45 | | | | 0.70 | | | | 1.05 | |
U.S. Government Money Market Fund | | | 1.00 | | | | 0.21 | | | | 0.51 | | | | 0.59 | | | | 0.45 | | | | 0.70 | | | | 1.05 | |
U.S. Treasury Plus Money Market Fund | | | n/a | | | | 0.21 | | | | 0.51 | | | | 0.59 | | | | 0.45 | | | | 0.70 | | | | 1.05 | |
Federal Money Market Fund | | | n/a | | | | 0.21 | | | | n/a | | | | 0.59 | �� | | | 0.45 | | | | 0.70 | | | | n/a | |
100% U.S. Treasury Securities Money Market Fund | | | n/a | | | | 0.21 | | | | n/a | | | | 0.59 | | | | 0.45 | | | | 0.70 | | | | 1.05 | |
Tax Free Money Market Fund | | | n/a | | | | 0.21 | | | | n/a | | | | 0.59 | | | | 0.45 | | | | 0.70 | | | | n/a | |
Municipal Money Market Fund | | | 1.00 | | | | 0.21 | | | | n/a | | | | 0.59 | | | | 0.45 | | | | 0.70 | | | | 1.05 | |
The expense limitation agreements were in effect for the six months ended August 31, 2016, and are in place until at least June 30, 2017.
| | | | | | |
| | | |
| 114 | | | | J.P. MORGAN MONEY MARKET FUNDS | | AUGUST 31, 2016 |
In addition, the Funds’ service providers have voluntarily waived fees during the six months ended August 31, 2016. However, the Funds’ service providers are under no obligation to do so and may discontinue such voluntary waivers at any time.
For the six months ended August 31, 2016, the Funds’ service providers waived fees and/or reimbursed expenses for each of the Funds as follows (amounts in thousands). None of these parties expect the Funds to repay any such waived fees and/or reimbursed expenses in future years.
| | | | | | | | | | | | | | | | | | | | | | | | |
| | | Contractual Waivers | | | | | | | |
| | | Investment
Advisory | | | Administration | | | Shareholder
Servicing | | | Distribution | | | Total | | | Contractual
Reimbursements | |
Prime Money Market Fund | | $ | 31 | | | $ | — | | | $ | 16,606 | | | $ | — | | | $ | 16,637 | | | $ | — | |
Liquid Assets Money Market Fund | | | 660 | | | | 434 | | | | 2,322 | | | | — | | | | 3,416 | | | | — | (a) |
U.S. Government Money Market Fund | | | 5,316 | | | | 3,535 | | | | 11,890 | | | | — | (a) | | | 20,741 | | | | 103 | |
U.S. Treasury Plus Money Market Fund | | | 5 | | | | — | | | | 2,735 | | | | — | (a) | | | 2,740 | | | | — | (a) |
Federal Money Market Fund | | | 529 | | | | 353 | | | | 610 | | | | — | | | | 1,492 | | | | — | |
100% U.S. Treasury Securities Money Market Fund | | | 622 | | | | 412 | | | | 2,900 | | | | — | | | | 3,934 | | | | — | (a) |
Tax Free Money Market Fund | | | 464 | | | | 307 | | | | 1,975 | | | | — | | | | 2,746 | | | | — | (a) |
Municipal Money Market Fund | | | 207 | | | | 138 | | | | 581 | | | | — | | | | 926 | | | | — | |
| | | | | | | | | | | | | | | | | | | | |
| | | Voluntary Waivers | |
| | | Investment
Advisory | | | Administration | | | Shareholder
Servicing | | | Distribution | | | Total | |
Prime Money Market Fund | | $ | 356 | | | $ | 237 | | | $ | 1,517 | | | $ | 5,480 | | | $ | 7,590 | |
Liquid Assets Money Market Fund | | | — | (a) | | | — | (a) | | | 31 | | | | 2,587 | | | | 2,618 | |
U.S. Government Money Market Fund | | | — | | | | — | (a) | | | 3,002 | | | | 2,660 | | | | 5,662 | |
U.S. Treasury Plus Money Market Fund | | | — | (a) | | | 1 | | | | 640 | | | | 1,516 | | | | 2,157 | |
Federal Money Market Fund | | | — | | | | — | | | | 102 | | | | 69 | | | | 171 | |
100% U.S. Treasury Securities Money Market Fund | | | — | | | | — | | | | 1,621 | | | | 855 | | | | 2,476 | |
Tax Free Money Market Fund | | | 494 | | | | 329 | | | | 4,251 | | | | 6,606 | | | | 11,680 | |
Municipal Money Market Fund | | | 55 | | | | 37 | | | | 652 | | | | 7,189 | | | | 7,933 | |
| (a) | Amount rounds to less than 500. |
G. Other — Certain officers of the Trusts are affiliated with the Adviser, the Administrator and the Distributor. Such officers, with the exception of the Chief Compliance Officer, receive no compensation from the Funds for serving in their respective roles.
The Board appointed a Chief Compliance Officer to the Funds in accordance with Federal securities regulations. Each Fund, along with other affiliated funds, makes reimbursement payments, on a pro-rata basis, to the Administrator for a portion of the fees associated with the Office of the Chief Compliance Officer. Such fees are included in Trustees’ and Chief Compliance Officer’s fees on the Statements of Operations.
The Trusts adopted a Trustee Deferred Compensation Plan (the “Plan”) which allows the Independent Trustees to defer the receipt of all or a portion of compensation related to performance of their duties as Trustees. The deferred fees are invested in various J.P. Morgan Funds until distribution in accordance with the Plan.
The Funds may use related party broker-dealers. For the six months ended August 31, 2016, the Funds did not incur any brokerage commissions with broker-dealers affiliated with the Adviser.
The Securities and Exchange Commission (“SEC”) has granted an exemptive order permitting the Funds to engage in principal transactions with J.P. Morgan Securities, Inc., an affiliated broker, involving taxable money market instruments, subject to certain conditions.
The Funds are permitted to effect purchase and sale transactions with affiliated Funds under procedures adopted by the Board. The procedures have been designed to seek to ensure that any such security transaction complies with certain conditions of Rule 17a-7 of the 1940 Act. Further, as defined under the procedures, each transaction is effected at the current market price. Pursuant to these procedures, for the six months ended August 31, 2016, the Funds below engaged in such transactions in the following amounts (amounts in thousands):
| | | | | | | | | | | | |
| | | Purchases | | | Sales | | | Realized
Gain (Loss) | |
Tax Free Money Market Fund | | $ | 121,503 | | | $ | 135,223 | | | $ | — | |
Municipal Money Market Fund | | | 111,500 | | | | 84,349 | | | | — | |
| | | | | | | | |
| | | |
| AUGUST 31, 2016 | | J.P. MORGAN MONEY MARKET FUNDS | | | | | 115 | |
NOTES TO FINANCIAL STATEMENTS
AS OF AUGUST 31, 2016 (Unaudited) (continued)
4. Class Specific Expenses
The Funds’ class specific gross expenses for the six months ended August 31, 2016 were as follows (amounts in thousands):
| | | | | | | | |
| | | Distribution | | | Shareholder
Servicing | |
Prime Money Market Fund | | | | | | | | |
Class C | | $ | 131 | | | $ | 44 | |
Agency | | | — | | | | 5,460 | |
Capital | | | — | | | | 15,485 | |
Cash Management | | | 747 | | | | 448 | |
Direct | | | — | | | | 840 | |
Eagle Class | | | 466 | | | | 560 | |
Institutional Class | | | — | | | | 10,269 | |
Investor | | | — | | | | 2,576 | |
Morgan | | | — | | | | 2,869 | |
Premier | | | — | | | | 3,388 | |
Reserve | | | 1,096 | | | | 1,315 | |
Service | | | 5,163 | | | | 2,581 | |
| | | | | | | | |
| | $ | 7,603 | | | $ | 45,835 | |
| | | | | | | | |
| | |
Liquid Assets Money Market Fund | | | | | | | | |
Class C | | $ | 1,740 | | | $ | 580 | |
Agency | | | — | | | | 68 | |
Capital | | | — | | | | 408 | |
E*Trade | | | 1,371 | | | | 686 | |
Institutional Class | | | — | | | | 2,618 | |
Investor | | | — | | | | 181 | |
Morgan | | | 811 | | | | 2,838 | |
Premier | | | — | | | | 246 | |
Reserve | | | 169 | | | | 202 | |
Service | | | 169 | | | | 85 | |
| | | | | | | | |
| | $ | 4,260 | | | $ | 7,912 | |
| | | | | | | | |
| | |
U.S. Government Money Market Fund | | | | | | | | |
Agency | | $ | — | | | $ | 6,973 | |
Capital | | | — | | | | 9,134 | |
Direct | | | — | | | | 410 | |
Eagle Class | | | 498 | | | | 598 | |
E*Trade | | | — | (a) | | | — | (a) |
Institutional Class | | | — | | | | 5,109 | |
Investor | | | — | | | | 5,214 | |
Morgan | | | 1,002 | | | | 3,507 | |
Premier | | | — | | | | 10,810 | |
Reserve | | | 39 | | | | 46 | |
Service | | | 1,175 | | | | 588 | |
| | | | | | | | |
| | $ | 2,714 | | | $ | 42,389 | |
| | | | | | | | |
| | |
U.S. Treasury Plus Money Market Fund | | | | | | | | |
Class C | | $ | 552 | | | $ | 184 | |
Agency | | | — | | | | 941 | |
Direct | | | — | | | | 396 | |
Eagle Class | | | — | (a) | | | — | (a) |
Institutional Class | | | — | | | | 4,534 | |
Investor | | | — | | | | 147 | |
Morgan | | | 334 | | | | 1,171 | |
Premier | | | — | | | | 302 | |
Reserve | | | 757 | | | | 908 | |
Service | | | — | (a) | | | — | (a) |
| | | | | | | | |
| | $ | 1,643 | | | $ | 8,583 | |
| | | | | | | | |
| | | | | | |
| | | |
| 116 | | | | J.P. MORGAN MONEY MARKET FUNDS | | AUGUST 31, 2016 |
| | | | | | | | |
| | | Distribution | | | Shareholder
Servicing | |
Federal Money Market Fund | | | | | | | | |
Agency | | $ | — | | | $ | 172 | |
Institutional Class | | | — | | | | 1,405 | |
Morgan | | | 65 | | | | 228 | |
Premier | | | — | | | | 216 | |
Reserve | | | 4 | | | | 5 | |
| | | | | | | | |
| | $ | 69 | | | $ | 2,026 | |
| | | | | | | | |
| | |
100% U.S. Treasury Securities Money Market Fund | | | | | | | | |
Agency | | $ | — | | | $ | 1,089 | |
Capital | | | — | | | | 2,505 | |
Institutional | | | — | | | | 3,978 | |
Morgan | | | 766 | | | | 2,682 | |
Premier | | | — | | | | 1,751 | |
Reserve | | | 89 | | | | 106 | |
Service | | | — | (a) | | | — | (a) |
| | | | | | | | |
| | $ | 855 | | | $ | 12,111 | |
| | | | | | | | |
| | |
Tax Free Money Market Fund | | | | | | | | |
Agency | | $ | — | | | $ | 252 | |
Direct | | | — | | | | — | (a) |
Eagle Class | | | 1,494 | | | | 1,794 | |
Institutional Class | | | — | | | | 4,715 | |
Morgan | | | 50 | | | | 174 | |
Premier | | | — | | | | 3,903 | |
Reserve | | | 5,172 | | | | 6,206 | |
| | | | | | | | |
| | $ | 6,716 | | | $ | 17,044 | |
| | | | | | | | |
| | |
Municipal Money Market Fund | | | | | | | | |
Agency | | $ | — | | | $ | 57 | |
Eagle Class | | | 29 | | | | 35 | |
E*Trade | | | 6,051 | | | | 3,025 | |
Institutional Class | | | — | | | | 79 | |
Morgan | | | 189 | | | | 661 | |
Premier | | | — | | | | 41 | |
Reserve | | | 11 | | | | 13 | |
Service | | | 1,335 | | | | 668 | |
| | | | | | | | |
| | $ | 7,615 | | | $ | 4,579 | |
| | | | | | | | |
| (a) | Amount rounds to less than 500. |
5. Federal Income Tax Matters
At February 29, 2016, the Funds did not have any net capital loss carryforwards.
6. Borrowings
The Funds rely upon an exemptive order granted by the SEC (the “Order”) permitting the establishment and operation of an Interfund Lending Facility (the “Facility”). The Facility allows the Funds to directly lend and borrow money to or from any other fund relying upon the Order at rates beneficial to both the borrowing and lending funds. Advances under the Facility are taken primarily for temporary or emergency purposes, including the meeting of redemption requests that otherwise might require the untimely disposition of securities, and are subject to each Fund’s borrowing restrictions. The Interfund loan rate is determined, as specified in the Order, by averaging the current repurchase agreement rate and the current bank loan rate. The Order was granted to JPM II and may be relied upon by the Funds because the Funds and the series of JPM II are all investment companies in the same “group of investment companies” (as defined in Section 12(d)(1)(G) of the 1940 Act).
In addition, the Trusts and JPMCB have entered into a financing arrangement. Under this arrangement, JPMCB provides an unsecured, uncommitted credit facility in the aggregate amount of $100 million to certain of the J.P. Morgan Funds, including the Funds. Advances under the arrangement
| | | | | | | | |
| | | |
| AUGUST 31, 2016 | | J.P. MORGAN MONEY MARKET FUNDS | | | | | 117 | |
NOTES TO FINANCIAL STATEMENTS
AS OF AUGUST 31, 2016 (Unaudited) (continued)
are taken primarily for temporary or emergency purposes, including the meeting of redemption requests that otherwise might require the untimely disposition of securities, and are subject to each Fund’s borrowing restrictions. Interest on borrowings is payable at a rate determined by JPMCB at the time of borrowing. This agreement has been extended until November 7, 2016.
As of August 31, 2016, the Funds had no outstanding loans to another fund. Average loans made to another fund under the Facility for the six months ended August 31, 2016, were as follows (amounts in thousands):
| | | | | | | | | | | | |
| | | Average
Loans | | | Number of
Days Outstanding | | | Interest
Earned | |
Liquid Assets Money Market Fund | | $ | 16,458 | | | | 34 | | | $ | 7 | |
Interest earned as a result of lending money to another fund as of August 31, 2016, if any, is included in Income from interfund lending (net) on the Statements of Operations.
The Funds had no borrowings outstanding from another fund or from the unsecured, uncommitted credit facility during the six months ended August 31, 2016.
7. Risks, Concentrations and Indemnifications
In the normal course of business, the Funds enter into contracts that contain a variety of representations which provide general indemnifications. Each Fund’s maximum exposure under these arrangements is unknown. The amount of exposure would depend on future claims that may be made against each Fund that have not yet occurred. However, based on experience, the Funds expect the risk of loss to be remote.
As of August 31, 2016, an affiliate of the Adviser had investment discretion with respect to its clients’ holdings in the Funds, which collectively represents the following percentage of each Fund’s net assets:
| | | | | | | | | | | | | | | | |
| | | Number of
Affiliates Omnibus
Accounts | | | % of the Fund | | | Number of
Non—Affiliates Omnibus
Accounts | | | % of the Fund | |
Liquid Assets Money Market Fund | | | 1 | | | | 54.6 | % | | | 1 | | | | 12.0 | % |
U.S. Treasury Plus Money Market Fund | | | 1 | | | | 15.8 | | | | — | | | | — | |
Federal Money Market Fund | | | 1 | | | | 55.1 | | | | 1 | | | | 19.0 | |
100% U.S. Treasury Securities Money Market Fund | | | 1 | | | | 21.2 | | | | — | | | | — | |
Tax Free Money Market Fund | | | — | | | | — | | | | 2 | | | | 87.6 | |
Municipal Money Market Fund | | | 1 | | | | 12.0 | | | | 3 | | | | 83.8 | |
Significant shareholder transactions by these shareholders may impact the Funds’ performance.
The Municipal Money Market Fund and Tax Free Money Market Fund invest primarily in a portfolio of debt obligations issued by states, territories and possessions of the United States and by the District of Columbia, and by their political subdivisions and duly constituted authorities. An issuer’s ability to meet its payment obligations may be affected by economic or political developments in a specific state or region. These debt obligations may be insured by private insurers who guarantee the payment of principal and interest in the event of issuer default. These securities generally have features that preserve their eligibility for investment under Rule 2a-7 under the 1940 Act without relying on the ratings or solvency of such bond insurers. The value of these investments may be impacted by changes to bond insurers’ ratings and the Municipal Money Market Fund’s and Tax Free Money Market Fund’s ability to collect principal and interest, in the event of an issuer’s default, may be limited if the private insurer does not have the wherewithal to satisfy its obligation.
The profitability of banks depends largely on the availability and cost of funds, which can change depending upon economic conditions. Banks are also exposed to losses if borrowers cannot repay their loans.
8. Money Market Reform
On July 23, 2014, the SEC amended certain regulations under the 1940 Act that govern money market funds, requiring such funds be treated as Institutional, Retail or Government, in accordance with the criteria established by the SEC. Under these amendments, Retail and Government money market funds will be permitted to continue to utilize amortized cost to value their portfolio securities and to transact at their existing $1.00 share price. Institutional money market funds will be required to move to a floating NAV. Further, non-Government money market funds must adopt policies and procedures to allow for the Board to impose certain liquidity fees and redemption gates. Money market funds that are required to comply with the floating NAV and liquidity fees and redemption gate requirements must do so by no later than October 14, 2016. At a February 2016 meeting, the Funds’ Board of Trustees approved management’s recommendation that the JPMorgan Liquid Assets Money Market Fund, JPMorgan Tax Free Money Market Fund and JPMorgan Municipal Money Market Fund should seek to qualify as Retail money market funds, that the JPMorgan Prime Money Market Fund will not seek to qualify as a Retail or a Government money market fund and will be required to comply with the floating NAV on or before October 14, 2016 and liquidity fees and redemption gate requirements on October 14, 2016, and that the JPMorgan 100% U.S. Treasury Securities Money Market Fund, JPMorgan Federal Money Market Fund, JPMorgan U.S. Government Money Market Fund and JPMorgan U.S. Treasury Plus Money Market Fund should seek to qualify as Government money market funds on or before October 14, 2016.
Effective October 1, 2016, the JPMorgan Prime Money Market Fund floated its NAV as described above.
| | | | | | |
| | | |
| 118 | | | | J.P. MORGAN MONEY MARKET FUNDS | | AUGUST 31, 2016 |
Effective October 14, 2016, each of the JPMorgan Prime Money Market Fund, JPMorgan Liquid Assets Money Market Fund, JPMorgan Tax Free Money Market Fund and JPMorgan Municipal Money Market Fund reserve the ability to impose a liquidity fee and/or redemption gate in the event that its weekly liquid assets fall below a designated threshold.
During the period September 1, 2016 through October 27, 2016, JPMorgan Prime Money Market Fund had net redemptions of $49,657,028,178. This amount represented 67.7% of the Fund’s net assets as of August 31, 2016.
During the period September 1, 2016 through October 27, 2016, JPMorgan Liquid Assets Money Market Fund had net redemptions of $3,572,933,258. This amount represented 85.8% of the Fund’s net assets as of August 31, 2016.
During the period September 1, 2016 through October 27, 2016, JPMorgan Municipal Money Market Fund had net redemptions of $2,003,411,859. This amount represented 55.1% of the Fund’s net assets as of August 31, 2016.
| | | | | | | | |
| | | |
| AUGUST 31, 2016 | | J.P. MORGAN MONEY MARKET FUNDS | | | | | 119 | |
SCHEDULE OF SHAREHOLDER EXPENSES
(Unaudited)
Hypothetical $1,000 Investment
As a shareholder of the Funds, you incur two types of costs: (1) transaction costs, including sales charges (loads) on purchase payments and (2) ongoing costs, including investment advisory fees, administration fees, distribution fees and other Fund expenses. The examples below are intended to help you understand your ongoing costs (in dollars) of investing in the Funds and to compare these ongoing costs with the ongoing costs of investing in other mutual funds. The examples assume that you had a $1,000 investment in each Class at the beginning of the reporting period, March 1, 2016, and continued to hold your shares at the end of the reporting period, August 31, 2016.
Actual Expenses
For each Class of each Fund in the table below, the first line provides information about actual account values and actual expenses. You may use the information in this line, together with the amount you invested, to estimate the expenses that you paid over the period. Simply divide your account value by $1,000 (for example, an $8,600 account value divided by $1,000 = 8.6), then multiply the result by the number in the first line of each Class under the heading entitled “Expenses Paid During the Period” to estimate the expenses you paid on your account during this period.
Hypothetical Example for Comparison Purposes
The second line of each Class in the table below provides information about hypothetical account values and hypothetical expenses based on the Class’ actual expense ratio and an assumed rate of return of 5% per year before expenses, which is not the Class’ actual return. The hypothetical account values and expenses may not be used to estimate the actual ending account balance or expenses you paid for the period. You may use this information to compare the ongoing costs of investing in the Class of the Fund and other funds. To do so, compare this 5% hypothetical example with the 5% hypothetical examples that appear in the shareholder reports of the other funds. Please note that the expenses shown in the table are meant to highlight your ongoing costs only and do not reflect any transaction costs, such as sales charges (loads). Therefore, the second line for each Class in the table is useful in comparing ongoing costs only, and will not help you determine the relative total costs of owning different funds. In addition, if these transaction costs were included, your costs would have been higher. The examples also assume all dividends and distributions have been reinvested.
| | | | | | | | | | | | | | | | |
| | | Beginning
Account Value
March 1, 2016 | | | Ending
Account Value
August 31, 2016 | | | Expenses
Paid During
the Period | | | Annualized
Expense
Ratio | |
Prime Money Market Fund | | | | | | | | | | | | | | | | |
Class C | | | | | | | | | | | | | | | | |
Actual* | | $ | 1,000.00 | | | $ | 1,000.10 | | | $ | 2.87 | | | | 0.57 | % |
Hypothetical* | | | 1,000.00 | | | | 1,022.33 | | | | 2.91 | | | | 0.57 | |
Agency | | | | | | | | | | | | | | | | |
Actual* | | | 1,000.00 | | | | 1,001.60 | | | | 1.31 | | | | 0.26 | |
Hypothetical* | | | 1,000.00 | | | | 1,023.89 | | | | 1.33 | | | | 0.26 | |
Capital | | | | | | | | | | | | | | | | |
Actual* | | | 1,000.00 | | | | 1,002.10 | | | | 0.86 | | | | 0.17 | |
Hypothetical* | | | 1,000.00 | | | | 1,024.35 | | | | 0.87 | | | | 0.17 | |
Cash Management | | | | | | | | | | | | | | | | |
Actual* | | | 1,000.00 | | | | 1,000.10 | | | | 2.92 | | | | 0.58 | |
Hypothetical* | | | 1,000.00 | | | | 1,022.28 | | | | 2.96 | | | | 0.58 | |
Direct | | | | | | | | | | | | | | | | |
Actual* | | | 1,000.00 | | | | 1,000.00 | | | | 1.51 | | | | 0.30 | |
Hypothetical* | | | 1,000.00 | | | | 1,023.69 | | | | 1.53 | | | | 0.30 | |
Eagle Class | | | | | | | | | | | | | | | | |
Actual* | | | 1,000.00 | | | | 1,000.10 | | | | 2.87 | | | | 0.57 | |
Hypothetical* | | | 1,000.00 | | | | 1,022.33 | | | | 2.91 | | | | 0.57 | |
IM | | | | | | | | | | | | | | | | |
Actual* | | | 1,000.00 | | | | 1,002.10 | | | | 0.81 | | | | 0.16 | |
Hypothetical* | | | 1,000.00 | | | | 1,024.40 | | | | 0.82 | | | | 0.16 | |
Institutional Class | | | | | | | | | | | | | | | | |
Actual* | | | 1,000.00 | | | | 1,001.90 | | | | 1.01 | | | | 0.20 | |
Hypothetical* | | | 1,000.00 | | | | 1,024.20 | | | | 1.02 | | | | 0.20 | |
Investor | | | | | | | | | | | | | | | | |
Actual* | | | 1,000.00 | | | | 1,000.40 | | | | 2.57 | | | | 0.51 | |
Hypothetical* | | | 1,000.00 | | | | 1,022.63 | | | | 2.60 | | | | 0.51 | |
| | | | | | |
| | | |
| 120 | | | | J.P. MORGAN MONEY MARKET FUNDS | | AUGUST 31, 2016 |
| | | | | | | | | | | | | | | | |
| | | Beginning
Account Value
March 1, 2016 | | | Ending
Account Value
August 31, 2016 | | | Expenses
Paid During
the Period | | | Annualized
Expense
Ratio | |
Prime Money Market Fund (continued) | | | | | | | | | | | | | | | | |
Morgan | | | | | | | | | | | | | | | | |
Actual* | | $ | 1,000.00 | | | $ | 1,000.30 | | | | 2.62 | % | | | 0.52 | % |
Hypothetical* | | | 1,000.00 | | | | 1,022.58 | | | | 2.65 | | | | 0.52 | |
Premier | | | | | | | | | | | | | | | | |
Actual* | | | 1,000.00 | | | | 1,000.70 | | | | 2.27 | | | | 0.45 | |
Hypothetical* | | | 1,000.00 | | | | 1,022.94 | | | | 2.29 | | | | 0.45 | |
Reserve | | | | | | | | | | | | | | | | |
Actual* | | | 1,000.00 | | | | 1,000.10 | | | | 2.92 | | | | 0.58 | |
Hypothetical* | | | 1,000.00 | | | | 1,022.28 | | | | 2.96 | | | | 0.58 | |
Service | | | | | | | | | | | | | | | | |
Actual* | | | 1,000.00 | | | | 1,000.10 | | | | 2.92 | | | | 0.58 | |
Hypothetical* | | | 1,000.00 | | | | 1,022.28 | | | | 2.96 | | | | 0.58 | |
| | | | |
Liquid Assets Money Market Fund | | | | | | | | | | | | | | | | |
Class C | | | | | | | | | | | | | | | | |
Actual* | | | 1,000.00 | | | | 1,000.10 | | | | 2.77 | | | | 0.55 | |
Hypothetical* | | | 1,000.00 | | | | 1,022.43 | | | | 2.80 | | | | 0.55 | |
Agency | | | | | | | | | | | | | | | | |
Actual* | | | 1,000.00 | | | | 1,001.50 | | | | 1.31 | | | | 0.26 | |
Hypothetical* | | | 1,000.00 | | | | 1,023.89 | | | | 1.33 | | | | 0.26 | |
Capital | | | | | | | | | | | | | | | | |
Actual* | | | 1,000.00 | | | | 1,001.90 | | | | 0.91 | | | | 0.18 | |
Hypothetical* | | | 1,000.00 | | | | 1,024.30 | | | | 0.92 | | | | 0.18 | |
E*Trade | | | | | | | | | | | | | | | | |
Actual* | | | 1,000.00 | | | | 1,000.10 | | | | 2.72 | | | | 0.54 | |
Hypothetical* | | | 1,000.00 | | | | 1,022.48 | | | | 2.75 | | | | 0.54 | |
Institutional Class | | | | | | | | | | | | | | | | |
Actual* | | | 1,000.00 | | | | 1,001.70 | | | | 1.06 | | | | 0.21 | |
Hypothetical* | | | 1,000.00 | | | | 1,024.15 | | | | 1.07 | | | | 0.21 | |
Investor | | | | | | | | | | | | | | | | |
Actual* | | | 1,000.00 | | | | 1,000.30 | | | | 2.57 | | | | 0.51 | |
Hypothetical* | | | 1,000.00 | | | | 1,022.63 | | | | 2.60 | | | | 0.51 | |
Morgan | | | | | | | | | | | | | | | | |
Actual* | | | 1,000.00 | | | | 1,000.10 | | | | 2.72 | | | | 0.54 | |
Hypothetical* | | | 1,000.00 | | | | 1,022.48 | | | | 2.75 | | | | 0.54 | |
Premier | | | | | | | | | | | | | | | | |
Actual* | | | 1,000.00 | | | | 1,000.50 | | | | 2.27 | | | | 0.45 | |
Hypothetical* | | | 1,000.00 | | | | 1,022.94 | | | | 2.29 | | | | 0.45 | |
Reserve | | | | | | | | | | | | | | | | |
Actual* | | | 1,000.00 | | | | 1,000.10 | | | | 2.77 | | | | 0.55 | |
Hypothetical* | | | 1,000.00 | | | | 1,022.43 | | | | 2.80 | | | | 0.55 | |
Service | | | | | | | | | | | | | | | | |
Actual* | | | 1,000.00 | | | | 1,000.00 | | | | 2.77 | | | | 0.55 | |
Hypothetical* | | | 1,000.00 | | | | 1,022.43 | | | | 2.80 | | | | 0.55 | |
| | | | |
U.S. Government Money Market Fund | | | | | | | | | | | | | | | | |
Agency | | | | | | | | | | | | | | | | |
Actual* | | | 1,000.00 | | | | 1,000.90 | | | | 1.26 | | | | 0.25 | |
Hypothetical* | | | 1,000.00 | | | | 1,023.95 | | | | 1.28 | | | | 0.25 | |
Capital | | | | | | | | | | | | | | | | |
Actual* | | | 1,000.00 | | | | 1,001.40 | | | | 0.71 | | | | 0.14 | |
Hypothetical* | | | 1,000.00 | | | | 1,024.50 | | | | 0.71 | | | | 0.14 | |
Direct | | | | | | | | | | | | | | | | |
Actual* | | | 1,000.00 | | | | 1,000.70 | | | | 1.46 | | | | 0.29 | |
Hypothetical* | | | 1,000.00 | | | | 1,023.74 | | | | 1.48 | | | | 0.29 | |
| | | | | | | | |
| | | |
| AUGUST 31, 2016 | | J.P. MORGAN MONEY MARKET FUNDS | | | | | 121 | |
SCHEDULE OF SHAREHOLDER EXPENSES
(Unaudited) (continued)
Hypothetical $1,000 Investment
| | | | | | | | | | | | | | | | |
| | | Beginning
Account Value
March 1, 2016 | | | Ending
Account Value
August 31, 2016 | | | Expenses
Paid During
the Period | | | Annualized
Expense
Ratio | |
U.S. Government Money Market Fund (continued) | | | | | | | | | | | | | | | | |
Eagle Class | | | | | | | | | | | | | | | | |
Actual* | | $ | 1,000.00 | | | $ | 1,000.10 | | | $ | 2.07 | | | | 0.41 | % |
Hypothetical* | | | 1,000.00 | | | | 1,023.14 | | | | 2.09 | | | | 0.41 | |
E*Trade | | | | | | | | | | | | | | | | |
Actual** | | | 1,000.00 | | | | 1,000.10 | | | | 1.98 | | | | 0.41 | |
Hypothetical* | | | 1,000.00 | | | | 1,023.14 | | | | 2.09 | | | | 0.41 | |
IM | | | | | | | | | | | | | | | | |
Actual* | | | 1,000.00 | | | | 1,001.40 | | | | 0.71 | | | | 0.14 | |
Hypothetical* | | | 1,000.00 | | | | 1,024.50 | | | | 0.71 | | | | 0.14 | |
Institutional Class | | | | | | | | | | | | | | | | |
Actual* | | | 1,000.00 | | | | 1,001.20 | | | | 0.86 | | | | 0.17 | |
Hypothetical* | | | 1,000.00 | | | | 1,024.35 | | | | 0.87 | | | | 0.17 | |
Investor | | | | | | | | | | | | | | | | |
Actual* | | | 1,000.00 | | | | 1,000.10 | | | | 2.07 | | | | 0.41 | |
Hypothetical* | | | 1,000.00 | | | | 1,023.14 | | | | 2.09 | | | | 0.41 | |
Morgan | | | | | | | | | | | | | | | | |
Actual* | | | 1,000.00 | | | | 1,000.10 | | | | 2.07 | | | | 0.41 | |
Hypothetical* | | | 1,000.00 | | | | 1,023.14 | | | | 2.09 | | | | 0.41 | |
Premier | | | | | | | | | | | | | | | | |
Actual* | | | 1,000.00 | | | | 1,000.10 | | | | 2.02 | | | | 0.40 | |
Hypothetical* | | | 1,000.00 | | | | 1,023.19 | | | | 2.04 | | | | 0.40 | |
Reserve | | | | | | | | | | | | | | | | |
Actual* | | | 1,000.00 | | | | 1,000.10 | | | | 2.07 | | | | 0.41 | |
Hypothetical* | | | 1,000.00 | | | | 1,023.14 | | | | 2.09 | | | | 0.41 | |
Service | | | | | | | | | | | | | | | | |
Actual* | | | 1,000.00 | | | | 1,000.10 | | | | 2.07 | | | | 0.41 | |
Hypothetical* | | | 1,000.00 | | | | 1,023.14 | | | | 2.09 | | | | 0.41 | |
| | | | |
U.S. Treasury Plus Money Market Fund | | | | | | | | | | | | | | | | |
Class C | | | | | | | | | | | | | | | | |
Actual* | | | 1,000.00 | | | | 1,000.00 | | | | 1.97 | | | | 0.39 | |
Hypothetical* | | | 1,000.00 | | | | 1,023.24 | | | | 1.99 | | | | 0.39 | |
Agency | | | | | | | | | | | | | | | | |
Actual* | | | 1,000.00 | | | | 1,000.70 | | | | 1.31 | | | | 0.26 | |
Hypothetical* | | | 1,000.00 | | | | 1,023.89 | | | | 1.33 | | | | 0.26 | |
Direct | | | | | | | | | | | | | | | | |
Actual* | | | 1,000.00 | | | | 1,000.50 | | | | 1.51 | | | | 0.30 | |
Hypothetical* | | | 1,000.00 | | | | 1,023.69 | | | | 1.53 | | | | 0.30 | |
Eagle Class | | | | | | | | | | | | | | | | |
Actual* | | | 1,000.00 | | | | 1,000.00 | | | | 1.97 | | | | 0.39 | |
Hypothetical* | | | 1,000.00 | | | | 1,023.24 | | | | 1.99 | | | | 0.39 | |
IM | | | | | | | | | | | | | | | | |
Actual* | | | 1,000.00 | | | | 1,001.20 | | | | 0.81 | | | | 0.16 | |
Hypothetical* | | | 1,000.00 | | | | 1,024.40 | | | | 0.82 | | | | 0.16 | |
Institutional Class | | | | | | | | | | | | | | | | |
Actual* | | | 1,000.00 | | | | 1,000.90 | | | | 1.06 | | | | 0.21 | |
Hypothetical* | | | 1,000.00 | | | | 1,024.15 | | | | 1.07 | | | | 0.21 | |
Investor | | | | | | | | | | | | | | | | |
Actual* | | | 1,000.00 | | | | 1,000.00 | | | | 1.97 | | | | 0.39 | |
Hypothetical* | | | 1,000.00 | | | | 1,023.24 | | | | 1.99 | | | | 0.39 | |
Morgan | | | | | | | | | | | | | | | | |
Actual* | | | 1,000.00 | | | | 1,000.00 | | | | 1.97 | | | | 0.39 | |
Hypothetical* | | | 1,000.00 | | | | 1,023.24 | | | | 1.99 | | | | 0.39 | |
Premier | | | | | | | | | | | | | | | | |
Actual* | | | 1,000.00 | | | | 1,000.00 | | | | 1.97 | | | | 0.39 | |
Hypothetical* | | | 1,000.00 | | | | 1,023.24 | | | | 1.99 | | | | 0.39 | |
| | | | | | |
| | | |
| 122 | | | | J.P. MORGAN MONEY MARKET FUNDS | | AUGUST 31, 2016 |
| | | | | | | | | | | | | | | | |
| | | Beginning
Account Value
March 1, 2016 | | | Ending
Account Value
August 31, 2016 | | | Expenses
Paid During
the Period | | | Annualized
Expense
Ratio | |
U.S. Treasury Plus Money Market Fund (continued) | | | | | | | | | | | | | | | | |
Reserve | | | | | | | | | | | | | | | | |
Actual* | | $ | 1,000.00 | | | $ | 1,000.00 | | | $ | 1.97 | | | | 0.39 | % |
Hypothetical* | | | 1,000.00 | | | | 1,023.24 | | | | 1.99 | | | | 0.39 | |
Service | | | | | | | | | | | | | | | | |
Actual* | | | 1,000.00 | | | | 1,000.00 | | | | 1.97 | | | | 0.39 | |
Hypothetical* | | | 1,000.00 | | | | 1,023.24 | | | | 1.99 | | | | 0.39 | |
| | | | |
Federal Money Market Fund | | | | | | | | | | | | | | | | |
Agency | | | | | | | | | | | | | | | | |
Actual* | | | 1,000.00 | | | | 1,000.70 | | | | 1.31 | | | | 0.26 | |
Hypothetical* | | | 1,000.00 | | | | 1,023.89 | | | | 1.33 | | | | 0.26 | |
Institutional Class | | | | | | | | | | | | | | | | |
Actual* | | | 1,000.00 | | | | 1,001.00 | | | | 1.06 | | | | 0.21 | |
Hypothetical* | | | 1,000.00 | | | | 1,024.15 | | | | 1.07 | | | | 0.21 | |
Morgan | | | | | | | | | | | | | | | | |
Actual* | | | 1,000.00 | | | | 1,000.10 | | | | 1.97 | | | | 0.39 | |
Hypothetical* | | | 1,000.00 | | | | 1,023.24 | | | | 1.99 | | | | 0.39 | |
Premier | | | | | | | | | | | | | | | | |
Actual* | | | 1,000.00 | | | | 1,000.10 | | | | 1.97 | | | | 0.39 | |
Hypothetical* | | | 1,000.00 | | | | 1,023.24 | | | | 1.99 | | | | 0.39 | |
Reserve | | | | | | | | | | | | | | | | |
Actual* | | | 1,000.00 | | | | 1,000.10 | | | | 1.97 | | | | 0.39 | |
Hypothetical* | | | 1,000.00 | | | | 1,023.24 | | | | 1.99 | | | | 0.39 | |
| | | | |
100% U.S. Treasury Securities Money Market Fund | | | | | | | | | | | | | | | | |
Agency | | | | | | | | | | | | | | | | |
Actual* | | | 1,000.00 | | | | 1,000.50 | | | | 1.31 | | | | 0.26 | |
Hypothetical* | | | 1,000.00 | | | | 1,023.89 | | | | 1.33 | | | | 0.26 | |
Capital | | | | | | | | | | | | | | | | |
Actual* | | | 1,000.00 | | | | 1,000.90 | | | | 0.91 | | | | 0.18 | |
Hypothetical* | | | 1,000.00 | | | | 1,024.30 | | | | 0.92 | | | | 0.18 | |
Institutional Class | | | | | | | | | | | | | | | | |
Actual* | | | 1,000.00 | | | | 1,000.70 | | | | 1.06 | | | | 0.21 | |
Hypothetical* | | | 1,000.00 | | | | 1,024.15 | | | | 1.07 | | | | 0.21 | |
Morgan | | | | | | | | | | | | | | | | |
Actual* | | | 1,000.00 | | | | 1,000.00 | | | | 1.76 | | | | 0.35 | |
Hypothetical* | | | 1,000.00 | | | | 1,023.44 | | | | 1.79 | | | | 0.35 | |
Premier | | | | | | | | | | | | | | | | |
Actual* | | | 1,000.00 | | | | 1,000.00 | | | | 1.76 | | | | 0.35 | |
Hypothetical* | | | 1,000.00 | | | | 1,023.44 | | | | 1.79 | | | | 0.35 | |
Reserve | | | | | | | | | | | | | | | | |
Actual* | | | 1,000.00 | | | | 1,000.00 | | | | 1.76 | | | | 0.35 | |
Hypothetical* | | | 1,000.00 | | | | 1,023.44 | | | | 1.79 | | | | 0.35 | |
Service | | | | | | | | | | | | | | | | |
Actual* | | | 1,000.00 | | | | 1,000.00 | | | | 1.76 | | | | 0.35 | |
Hypothetical* | | | 1,000.00 | | | | 1,023.44 | | | | 1.79 | | | | 0.35 | |
| | | | |
Tax Free Money Market Fund | | | | | | | | | | | | | | | | |
Agency | | | | | | | | | | | | | | | | |
Actual* | | | 1,000.00 | | | | 1,000.60 | | | | 1.21 | | | | 0.24 | |
Hypothetical* | | | 1,000.00 | | | | 1,024.00 | | | | 1.22 | | | | 0.24 | |
Direct | | | | | | | | | | | | | | | | |
Actual* | | | 1,000.00 | | | | 1,000.50 | | | | 1.36 | | | | 0.27 | |
Hypothetical* | | | 1,000.00 | | | | 1,023.84 | | | | 1.38 | | | | 0.27 | |
Eagle Class | | | | | | | | | | | | | | | | |
Actual* | | | 1,000.00 | | | | 1,000.10 | | | | 1.71 | | | | 0.34 | |
Hypothetical* | | | 1,000.00 | | | | 1,023.49 | | | | 1.73 | | | | 0.34 | |
| | | | | | | | |
| | | |
| AUGUST 31, 2016 | | J.P. MORGAN MONEY MARKET FUNDS | | | | | 123 | |
SCHEDULE OF SHAREHOLDER EXPENSES
(Unaudited) (continued)
Hypothetical $1,000 Investment
| | | | | | | | | | | | | | | | |
| | | Beginning
Account Value
March 1, 2016 | | | Ending
Account Value
August 31, 2016 | | | Expenses
Paid During
the Period | | | Annualized
Expense
Ratio | |
Tax Free Money Market Fund (continued) | | | | | | | | | | | | | | | | |
Institutional Class | | | | | | | | | | | | | | | | |
Actual* | | $ | 1,000.00 | | | $ | 1,000.90 | | | $ | 0.96 | | | | 0.19 | % |
Hypothetical* | | | 1,000.00 | | | | 1,024.25 | | | | 0.97 | | | | 0.19 | |
Morgan | | | | | | | | | | | | | | | | |
Actual* | | | 1,000.00 | | | | 1,000.10 | | | | 1.76 | | | | 0.35 | |
Hypothetical* | | | 1,000.00 | | | | 1,023.44 | | | | 1.79 | | | | 0.35 | |
Premier | | | | | | | | | | | | | | | | |
Actual* | | | 1,000.00 | | | | 1,000.10 | | | | 1.71 | | | | 0.34 | |
Hypothetical* | | | 1,000.00 | | | | 1,023.49 | | | | 1.73 | | | | 0.34 | |
Reserve | | | | | | | | | | | | | | | | |
Actual* | | | 1,000.00 | | | | 1,000.10 | | | | 1.76 | | | | 0.35 | |
Hypothetical* | | | 1,000.00 | | | | 1,023.44 | | | | 1.79 | | | | 0.35 | |
| | | | |
Municipal Money Market Fund | | | | | | | | | | | | | | | | |
Agency | | | | | | | | | | | | | | | | |
Actual* | | | 1,000.00 | | | | 1,000.80 | | | | 1.11 | | | | 0.22 | |
Hypothetical* | | | 1,000.00 | | | | 1,024.10 | | | | 1.12 | | | | 0.22 | |
Eagle | | | | | | | | | | | | | | | | |
Actual*** | | | 1,000.00 | | | | 1,000.00 | | | | 0.97 | | | | 0.58 | |
Hypothetical* | | | 1,000.00 | | | | 1,022.28 | | | | 2.96 | | | | 0.58 | |
E*Trade | | | | | | | | | | | | | | | | |
Actual* | | | 1,000.00 | | | | 1,000.10 | | | | 2.02 | | | | 0.40 | |
Hypothetical* | | | 1,000.00 | | | | 1,023.19 | | | | 2.04 | | | | 0.40 | |
Institutional Class | | | | | | | | | | | | | | | | |
Actual* | | | 1,000.00 | | | | 1,001.10 | | | | 1.01 | | | | 0.20 | |
Hypothetical* | | | 1,000.00 | | | | 1,024.20 | | | | 1.02 | | | | 0.20 | |
Morgan | | | | | | | | | | | | | | | | |
Actual* | | | 1,000.00 | | | | 1,000.00 | | | | 2.02 | | | | 0.40 | |
Hypothetical* | | | 1,000.00 | | | | 1,023.19 | | | | 2.04 | | | | 0.40 | |
Premier | | | | | | | | | | | | | | | | |
Actual* | | | 1,000.00 | | | | 1,000.10 | | | | 1.92 | | | | 0.38 | |
Hypothetical* | | | 1,000.00 | | | | 1,023.29 | | | | 1.94 | | | | 0.38 | |
Reserve | | | | | | | | | | | | | | | | |
Actual* | | | 1,000.00 | | | | 1,000.00 | | | | 1.92 | | | | 0.38 | |
Hypothetical* | | | 1,000.00 | | | | 1,023.29 | | | | 1.94 | | | | 0.38 | |
Service | | | | | | | | | | | | | | | | |
Actual* | | | 1,000.00 | | | | 1,000.00 | | | | 2.02 | | | | 0.40 | |
Hypothetical* | | | 1,000.00 | | | | 1,023.19 | | | | 2.04 | | | | 0.40 | |
| * | Expenses are equal to each Class’ respective annualized expense ratio, multiplied by the average account value over the period, multiplied by 184/365 (to reflect the one-half year period). |
| ** | Expenses are equal to each Class’ respective annualized expense ratio, multiplied by the average account value over the period, multiplied by 175/365 (to reflect the one-half year period). Commencement of operations was March 9, 2016. |
| *** | Expenses are equal to each Class’ respective annualized expense ratio, multiplied by the average account value over the period, multiplied by 61/365 (to reflect the one-half year period). Commencement of operations was July 1, 2016. |
| | | | | | |
| | | |
| 124 | | | | J.P. MORGAN MONEY MARKET FUNDS | | AUGUST 31, 2016 |
BOARD APPROVAL OF INVESTMENT ADVISORY AGREEMENTS
(Unaudited)
The Board of Trustees has established various standing committees composed of Trustees with diverse backgrounds, to which the Board of Trustees has assigned specific subject matter responsibilities to further enhance the effectiveness of the Board’s oversight and decision making. The Board of Trustees and its investment committees (money market and alternative products, equity, and fixed income) meet regularly throughout the year and consider factors that are relevant to their annual consideration of investment advisory agreements at each meeting. They also meet for the specific purpose of considering investment advisory agreement annual renewals. The Board of Trustees held meetings in person in June and August 2016, at which the Trustees considered the continuation of the investment advisory agreements for each of the Funds whose semi-annual report is contained herein (each an “Advisory Agreement” and collectively, the “Advisory Agreements”). At the June meeting, the Board’s investment committees met to review and consider performance, expense and related information for the J.P. Morgan Funds. Each investment committee reported to the full Board, which then considered the investment committee’s preliminary findings. At the August meeting, the Trustees continued their review and consideration. The Trustees, including a majority of the Trustees who are not “interested persons” (as defined in the 1940 Act) of any party to the Advisory Agreements or any of their affiliates, approved the continuation of each Advisory Agreement on August 17, 2016.
As part of their review of the Advisory Agreements, the Trustees considered and reviewed performance and other information about the Funds received from the Adviser. This information includes the Funds’ performance as compared to the performance of their peers and analyses by the Adviser of the Funds’ performance. In addition, the Trustees have engaged an independent management consulting firm (“independent consultant”) to report on the performance of certain J.P. Morgan Funds at each of the Trustees’ regular meetings. The Adviser also periodically provides comparative information regarding the Funds’ expense ratios and those of their peer groups. In addition, in preparation for the June and August meetings, the Trustees requested, received and evaluated extensive materials from the Adviser, including, with respect to certain J.P. Morgan Funds, performance and expense information compiled by Broadridge, using data from Lipper Inc., independent providers of investment company data (together, “Broadridge/Lipper”). The Trustees’ independent consultant also provided additional analyses of the performance of certain J.P. Morgan Funds with greater than two years of performance history in connection with the Trustees’ review of the Advisory Agreements. Before voting on the proposed Advisory Agreements, the Trustees reviewed the proposed Advisory Agreements with representatives of the Adviser, counsel to the Trusts and independent legal counsel, and received a memorandum from independent legal counsel
to the Trustees discussing the legal standards for their consideration of the proposed Advisory Agreements. The Trustees also discussed the proposed Advisory Agreements in executive sessions with independent legal counsel at which no representatives of the Adviser were present. Set forth below is a summary of the material factors evaluated by the Trustees in determining whether to approve each Advisory Agreement.
The Trustees considered information provided with respect to the Funds over the course of the year. Each Trustee attributed different weights to the various factors and no factor alone was considered determinative. From year to year, the Trustees consider and place emphasis on relevant information in light of changing circumstances in market and economic conditions. The Trustees determined that the compensation to be received by the Adviser from each Fund under the applicable Advisory Agreement was fair and reasonable and that the continuance of each Advisory Agreement was in the best interests of the applicable Funds and their shareholders.
The factors summarized below were considered and discussed by the Trustees in reaching their conclusions:
Nature, Extent and Quality of Services Provided by the Adviser
The Trustees received and considered information regarding the nature, extent and quality of the services provided to each Fund under the Advisory Agreement. The Trustees took into account information furnished throughout the year at Trustee meetings, as well as the materials furnished specifically in connection with this annual review process. The Trustees considered the background and experience of the Adviser’s senior management and the expertise of, and the amount of attention given to each Fund by, investment personnel of the Adviser. In addition, the Trustees reviewed the qualifications, backgrounds and responsibilities of the portfolio management team primarily responsible for the day-to-day management of each Fund and the infrastructure supporting the team. The Trustees also considered information provided by the Adviser and JPMorgan Distribution Services, Inc. (“JPMDS”) about the structure and distribution strategy of each Fund. The Trustees reviewed information relating to the Adviser’s risk governance model and reports showing the Adviser’s compliance structure and ongoing compliance processes. The Trustees also considered the quality of administrative services provided by J.P. Morgan Investment Management Inc. in its role as administrator (“JPMIM”).
The Trustees also considered their knowledge of the nature and quality of the services provided by the Adviser and its affiliates to the Funds gained from their experience as Trustees of the J.P. Morgan Funds. In addition, they considered the overall reputation and capabilities of the Adviser and its affiliates, the commitment of the Adviser to provide high quality service to the Funds, their overall confidence in the Adviser’s integrity and the Adviser’s responsiveness to questions or concerns
| | | | | | | | |
| | | |
| AUGUST 31, 2016 | | J.P. MORGAN MONEY MARKET FUNDS | | | | | 125 | |
BOARD APPROVAL OF INVESTMENT ADVISORY AGREEMENTS
(Unaudited) (continued)
raised by them, including the Adviser’s willingness to consider and implement organizational and operational changes designed to improve investment results and the services provided to each Fund.
Based upon these considerations and other factors, the Trustees concluded that they were satisfied with the nature, extent and quality of the investment advisory services provided to the Funds by the Adviser.
Costs of Services Provided and Profitability to the Adviser and its Affiliates
The Trustees received and considered information regarding the profitability to the Adviser and its affiliates in providing services to each of the Funds. The Trustees reviewed and discussed this data. The Trustees recognized that this data is not audited and represents the Adviser’s determination of its and its affiliates’ revenues from the contractual services provided to the Funds, less expenses of providing such services. Expenses include direct and indirect costs and are calculated using an allocation methodology developed by the Adviser. The Trustees also recognized that it is difficult to make comparisons of profitability from fund investment advisory contracts because comparative information is not generally publicly available and is affected by numerous factors, including the structure of the particular adviser, the types of funds it manages, its business mix, numerous assumptions regarding allocations and the fact that publicly-traded fund managers’ operating profits and net income are net of distribution and marketing expenses. Based upon their review, the Trustees concluded that the profitability to the Adviser under each of the Advisory Agreements was not unreasonable in light of the services and benefits provided to each Fund.
Fall-Out Benefits
The Trustees reviewed information regarding potential “fallout” or ancillary benefits received by the Adviser and its affiliates as a result of their relationship with the Funds. The Trustees also reviewed the Adviser’s allocation of fund brokerage for the J.P. Morgan Funds complex, including allocations to brokers who provide research to the Adviser.
The Trustees also considered that JPMDS, an affiliate of the Adviser, and JPMIM earn fees from the Funds for providing shareholder and administration services, respectively. These fees were shown separately in the profitability analysis presented to the Trustees. The Trustees also considered the payments of Rule 12b-1 fees to JPMDS, which also acts as the Funds’ distributor and that these fees are in turn generally paid to financial intermediaries that sell the Funds, including financial intermediaries that are affiliates of the Adviser. The Trustees also considered the fees paid to JPMorgan Chase Bank, N.A. (“JPMCB”) for custody and fund accounting, and other related services.
Economies of Scale
The Trustees considered the extent to which the Funds may benefit from economies of scale. The Trustees considered that there may not be a direct relationship between economies of scale realized by the Funds and those realized by the Adviser as assets increase. The Trustees noted that the proposed investment advisory fee schedule for each Fund does not contain breakpoints, but that the fees remain competitive with peer funds. The Trustees also considered that the Adviser has implemented fee waivers and expense limitations (“Fee Caps”) for certain share classes which allow each Fund’s shareholders to share potential economies of scale from a Fund’s inception. The Trustees also considered that the Adviser has shared economies of scale by adding or enhancing services to the Funds over time, noting the Adviser’s substantial investments in its business in support of the Funds, including investments in trading systems and technology (including cybersecurity improvements), retention of key talent, additions to analyst and portfolio management teams, and regulatory support enhancements. The Trustees also considered whether it would be appropriate to add advisory fee breakpoints and the Trustees concluded that the current fee structure was reasonable in light of the Fee Caps that the Adviser has in place that serve to limit the overall net expense ratios of each Fund at competitive levels. The Trustees concluded that the Funds’ shareholders received the benefits of potential economies of scale through the Fee Caps and the Adviser’s reinvestment in its operations to serve the Funds and their shareholders.
Independent Written Evaluation of the Funds’ Senior Officer/Chief Compliance Officer
The Trustees noted that, upon their direction, the Senior Officer for the Prime Money Market Fund, Liquid Assets Money Market Fund, U.S. Government Money Market Fund, U.S. Treasury Plus Money Market Fund, 100% U.S. Treasury Securities Money Market Fund and Municipal Money Market Fund had prepared an independent written evaluation in order to assist the Trustees in determining the reasonableness of the proposed management fees. In determining whether to continue the Advisory Agreements, the Trustees considered the Senior Officer’s report.
The Trustees noted that, upon their direction, the Chief Compliance Officer for the Federal Money Market Fund and Tax Free Money Market Fund had prepared an independent written evaluation in order to assist the Trustees in determining the reasonableness of the proposed management fees. The Trustees considered the written evaluation in determining whether to continue the Advisory Agreements.
Fees Relative to Adviser’s Other Clients
The Trustees received and considered information about the nature and extent of investment advisory services and fee rates offered to other clients of the Adviser, including institutional
| | | | | | |
| | | |
| 126 | | | | J.P. MORGAN MONEY MARKET FUNDS | | AUGUST 31, 2016 |
separate accounts and/or funds sub-advised by the Adviser, and for investment management styles substantially similar to that of each Fund. The Trustees considered the complexity of investment management for registered mutual funds relative to the Adviser’s other clients and noted differences in the regulatory, legal and other risks and responsibilities of providing services to the different clients. The Trustees considered that serving as an adviser to a registered mutual fund involves greater responsibilities and risks than acting as a sub-adviser and observed that sub-advisory fees may be lower than those charged by the Adviser to each Fund. The Trustees also noted that the adviser, not the mutual fund, pays the sub-advisory fee and that many responsibilities related to the advisory function are retained by the primary adviser. The Trustees concluded that the fee rates charged to each Fund in comparison to those charged to the Adviser’s other clients were reasonable.
Investment Performance
The Trustees received and considered absolute and/or relative performance for the Funds in a report prepared by Broadridge/Lipper. The Trustees considered the total return performance information, which included the ranking of the Funds within a performance universe made up of funds with the same Broadridge/Lipper investment classification and objective (the “Universe”), as well as a subset of funds within the Universe (the “Peer Group”), by total return for applicable one-, three- and five-year periods. The Trustees reviewed a description of Broadridge/Lipper��s methodology for selecting mutual funds in each Fund’s Peer Group and Universe. The Broadridge/Lipper materials provided to the Trustees highlighted information with respect to certain representative classes to assist the Trustees in their review. As part of this review, the Trustees also considered the performance information provided for the Funds at regular Board meetings by the Adviser. The Broadridge/Lipper performance data noted by the Trustees as part of their review and the determinations made by the Trustees with respect to each Fund’s performance for certain representative classes are summarized below:
The Trustees noted that the Prime Money Market Fund’s performance for the Institutional shares was in the first quintile based upon the Peer Group, and in the second quintile based upon the Universe, for the one-, three-, and five-year periods ended December 31, 2015, respectively. The Trustees noted that the performance for the Morgan shares was in the first quintile based upon the Peer Group, and in the second quintile based upon the Universe, for the one-, three-, and five-year periods ended December 31, 2015, respectively. The Trustees noted that performance for the Service shares was in the third, first and second quintiles based upon the Peer Group, and in the fourth, third, and third quintiles, based upon the Universe, for the one-, three-, and five-year periods ended December 31, 2015, respectively. The Trustees discussed the performance and investment strategy of the Fund with the Adviser. Based upon
this discussion and various other factors, the Trustees concluded that the Fund’s performance was reasonable.
The Trustees noted that the Liquid Assets Money Market Fund’s performance for the Institutional shares was in the first quintile based upon the Peer Group and in the first, second and first quintile, based upon the Universe for the one-, three-, and five-year periods ended December 31, 2015, respectively. The Trustees noted that the performance for the Morgan shares was in the first quintile based on the Peer Group, and in the second Quintile based upon the Universe, for the one-, three-, and five-year periods ended December 31, 2015, respectively. The Trustees noted that the performance for the Service shares was in the second quintiles based upon the Peer Group, and in the fourth, third, and third quintiles, based upon the Universe, for the one-, three-, and five-year periods ended December 31, 2015, respectively. The Trustees discussed the performance and investment strategy of the Fund with the Adviser. Based upon this discussion and various other factors, the Trustees concluded that the Fund’s performance was reasonable.
The Trustees noted that the U.S. Government Money Market Fund’s performance for the Institutional shares was in the second quintile based upon both the Peer Group and the Universe, for the one-, three-, and five-year periods ended December 31, 2015, respectively. The Trustees noted that the performance for Morgan shares was in first quintile based upon both the Peer Group and the Universe, for the one-, three-, and five-year periods ended December 31, 2015, respectively. The Trustees noted that the performance for Service shares was in the second, first and first quintiles, based upon the Peer Group, and in the second quintile based upon the Universe, for the one-, three-, and five-year periods ended December 31, 2015, respectively The Trustees discussed the performance and investment strategy of the Fund with the Adviser. Based upon this discussion and various other factors, the Trustees concluded that the Fund’s performance was reasonable.
The Trustees noted that the U.S. Treasury Plus Money Market Fund’s performance for the Institutional shares was in the fifth quintile, based upon the Peer Group, and in the third quintile based upon the Universe, for the one-, three-, and five-year periods ended December 31, 2015, respectively. The Trustees noted that the performance for the Morgan shares was in third, third, and fourth quintiles, based upon the Peer Group, and in the third quintiles based upon the Universe, for one-, three-, and five-year periods ended December 31, 2015, respectively. The Trustees noted that the performance for the Service shares was in the fourth quintile based upon the Peer Group, and in the third quintile based upon the Universe, for the one-, three-, and five-year periods ended December 31, 2015, respectively. The Trustees discussed the performance and investment strategy of the Fund with the Adviser and, based upon this discussion and various other factors, the Trustees concluded that the Fund’s performance was reasonable.
| | | | | | | | |
| | | |
| AUGUST 31, 2016 | | J.P. MORGAN MONEY MARKET FUNDS | | | | | 127 | |
BOARD APPROVAL OF INVESTMENT ADVISORY AGREEMENTS
(Unaudited) (continued)
The Trustees noted that the Federal Money Market Fund’s performance for the Institutional shares was in the fourth, third and third quintiles based upon the Peer Group and in the second quintile based upon the Universe, for the one-, three-, and five-year periods ended December 31, 2015, respectively. The Trustees noted that the performance for the Morgan shares was in the first quintile based upon both the Peer Group and Universe, for the one-, three-, and five-year periods ended December 31, 2015, respectively. The Trustees discussed the performance and investment strategy of the Fund with the Adviser. Based upon this discussion and various other factors, the Trustees concluded that the Fund’s performance was reasonable.
The Trustees noted that the 100% U.S. Treasury Securities Money Market Fund’s performance for the Institutional shares was in the fifth quintile based upon the Peer Group, and in the third quintiles based upon the Universe, for the one-, three- and five-year period ended December 31, 2015, respectively. The Trustees noted that the performance for the Morgan shares was in the second, first and second quintiles based upon the Peer Group, and in the third quintile based upon the Universe, for the one-, three- and five-year period ended December 31, 2015, respectively. The Trustees noted that the performance for the Service shares was in the fifth quintile based upon the Peer Group, and in the third quintile for the one-, three- and five-year period ended December 31, 2015, respectively. The Trustees discussed the performance and investment strategy of the Fund with the Adviser and, based upon this discussion and various other factors, the Trustees concluded that the Fund’s performance was reasonable.
The Trustees noted that the Tax Free Money Market Fund’s performance for the Institutional shares was in the first, first and second quintiles based upon the Peer Group, and in the first, second, and second quintiles based upon the Universe, for the one-, three-, and five-year periods ended December 31, 2015, respectively. The Trustees noted that the performance for the Morgan shares was in the first, first, and third quintiles based upon the Peer Group, and in the first, second, and third quintiles based upon the Universe, for the one-, three-, and five-year periods ended December 31, 2015, respectively. The Trustees discussed the performance and investment strategy of the Fund with the Adviser and, based upon this discussion and various other factors, the Trustees concluded that the Fund’s performance was reasonable.
The Trustees noted that the Municipal Money Market Fund’s performance for the Institutional shares was in the third, second and first quintiles based upon the Universe, for the one-, three-, and five-year periods ended December 31, 2015. The Trustees noted that the performance for the Morgan shares was in the third quintiles based upon both the Peer Group and Universe, for the one-, three-, and five-year periods ended December 31, 2015. The Trustees noted that the performance for the Service shares was in the third quintile, based upon the Universe, for the one-,
three-, and five-year periods ended December 31, 2015. The Trustees discussed the performance and investment strategy of the Fund with the Adviser and, based upon this discussion and various other factors, the Trustees concluded that the Fund’s performance was reasonable.
Advisory Fees and Expense Ratios
The Trustees considered the contractual advisory fee rate paid by each Fund to the Adviser and compared that rate to the information prepared by Broadridge/Lipper concerning management fee rates paid by other funds in the same Broadridge/Lipper category as each Fund. The Trustees recognized that Broadridge/Lipper reported each Fund’s management fee rate as the combined contractual advisory fee and administration fee rates. The Trustees also reviewed information about other expenses and the expense ratios for each Fund. The Trustees considered the fee waiver and/or expense reimbursement arrangements currently in place for each Fund and considered the net advisory fee rate after taking into account any waivers and/or reimbursements. The Trustees recognized that it is difficult to make comparisons of advisory fees because there are variations in the services that are included in the fees paid by other funds. The Trustees’ determinations as a result of the review of each Fund’s advisory fees and expense ratios for certain representative classes are summarized below:
The Trustees noted that the Prime Money Market Fund’s net advisory fee for the Institutional shares was in the fourth quintile based upon the Peer Group, and in the third quintile based upon the Universe, and that actual total expenses were in the first quintile based upon the Peer Group, and in the third quintile, based upon the Universe. The Trustees noted that the net advisory fee for the Morgan shares was in the fifth quintile based upon the Peer Group, and in the fourth quintile based upon the Universe, and the actual total expenses were in the fifth quintile based upon both the Peer Group and the Universe. The Trustees noted that the net advisory fee for the Service shares was in the fourth quintile based upon the Peer Group, and in the third quintile based upon the Universe, and that the actual total expenses were in the fifth quintile based upon both the Peer Group and the Universe. After considering the factors identified above and the additional voluntary fee waivers as a result of the ongoing low interest rate environment, the Trustees concluded that the advisory fee was reasonable.
The Trustees noted that the Liquid Assets Money Market Fund’s net advisory fee for the Institutional shares was in the second quintile based upon the Peer Group and in the third quintile based upon the Universe, and that the actual total expenses were in the second quintile based upon the Peer Group and in the fourth quintile based upon the Universe. The Trustees noted that the net advisory fee for the Morgan shares was in the fifth quintile based upon the Peer Group, and in the fourth quintile, based upon the Universe, and that actual total
| | | | | | |
| | | |
| 128 | | | | J.P. MORGAN MONEY MARKET FUNDS | | AUGUST 31, 2016 |
expenses were in the fifth quintile based upon both the Peer Group and Universe. The Trustees noted that the for the Service shares, the net advisory fee was in the second quintile based upon the Peer Group, and in the third quintile based upon the Universe, and that the actual total expenses were in the fifth quintile based upon both the Peer Group and the Universe. After considering the factors identified above and the additional voluntary fee waivers as a result of the ongoing low interest rate environment, the Trustees concluded that the advisory fee was reasonable.
The Trustees noted that the U.S. Government Money Market Fund’s net advisory fee and actual total expenses for both Institutional and Service shares were in the fifth quintile based upon both the Peer Group and the Universe. The Trustees noted that the net advisory fee for the Morgan shares was in the fifth quintile based upon the Peer Group and in the fourth quintile based upon the Universe, and that the actual total expenses were in the fifth quintile based upon the Peer Group and in the fourth quintile based upon the Universe. After considering the factors identified above and the additional voluntary fee waivers as a result of the ongoing low interest rate environment, the Trustees concluded that the advisory fees were reasonable.
The Trustees noted that the U.S. Treasury Plus Money Market Fund’s net advisory fee and actual total expenses for each of the Institutional, Morgan and Service shares were in the fifth quintile, based upon both the Peer Group and the Universe. After considering the factors identified above and the additional voluntary fee waivers as a result of the ongoing low interest rate environment, the Trustees concluded that the advisory fees were reasonable.
The Trustees noted that the Federal Money Market Fund’s net advisory fee for the Institutional shares was in the third quintile, based upon both the Peer Group and the Universe, and that the actual total expenses were in the third quintile based upon the Peer Group and in the second quintile based upon the Universe. The Trustees noted that for the Morgan shares, the net advisory fee was in the fourth quintile based upon the Peer Group, and in the third quintile based upon the Universe, and that the actual total expenses were in the fifth quintile based upon the Peer Group, and in the fourth quintile based upon the Universe. After considering the factors identified above and the additional voluntary fee waivers as a result of the ongoing low interest rate environment, the Trustees concluded that the advisory fee was reasonable.
The Trustees noted that the 100% U.S. Treasury Securities Money Market Fund’s net advisory fee for Institutional shares was in the second quintile based upon the Peer Group, and in the third quintile based upon the Universe, and the actual total expenses were in the first quintile based upon the Peer Group, and in the second quintile based upon the Universe. The Trustees noted that the net advisory fee for the Morgan shares was in the fourth quintile based upon the Peer Group, and in the second quintile based upon the Universe, and that the actual total expenses were in the first quintile based upon both the Peer Group and the Universe. The Trustees noted that the net advisory fee for the Service shares was in the fifth quintile based upon the Peer Group, and in the third quintile based upon the Universe, and that the actual total expenses were in the fifth quintile based upon both the Peer Group and the Universe. After considering the factors identified above and the additional voluntary fee waivers as a result of the ongoing low interest rate environment, the Trustees concluded that the advisory fees were reasonable.
The Trustees noted that the Tax Free Money Market Fund’s net advisory fee for Institutional shares was in the second quintile, based upon both the Peer Group and the Universe, and that the actual total expenses were in the first quintile, based upon both the Peer Group and the Universe. The Trustees noted that the net advisory fee for the Morgan shares was in the fourth quintile based upon the Peer Group, and in the second quintile, based upon the Universe, and that the actual total expenses were in the first quintile based upon both the Peer Group and the Universe. After considering the factors identified above and the additional voluntary fee waivers as a result of the ongoing low interest rate environment, the Trustees concluded that the advisory fees were reasonable.
The Trustees noted that the Municipal Money Market Fund’s net advisory fee for the Institutional shares was in the fifth quintile based upon the Universe and that the actual total expenses were in the fourth quintile, based upon the Universe. The Trustees noted the net advisory fee for the Morgan shares was in the fifth quintile based upon both the Peer Group and the Universe, and that the actual total expenses were in the fourth quintile based upon the Peer Group, and in the third quintile based upon the Universe. The Trustees noted that the net advisory fee for the Service shares was in the fifth quintile based upon the Universe, and that the actual total expenses were in the fourth quintile based upon the Universe. After considering the factors identified above and the additional voluntary fee waivers as a result of the ongoing low interest rate environment, the Trustees concluded that the advisory fee was reasonable.
| | | | | | | | |
| | | |
| AUGUST 31, 2016 | | J.P. MORGAN MONEY MARKET FUNDS | | | | | 129 | |
TAX LETTER
(Unaudited)
Certain tax information for the J.P. Morgan Funds is required to be provided to shareholders based upon the Funds’ income and distributions for the taxable year ended February 29, 2016. The information and distributions reported in this letter may differ from the information and taxable distributions reported to the shareholders for the calendar year ending December 31, 2016. The information necessary to complete your income tax returns for the calendar year ending December 31, 2016 will be provided under separate cover.
Long Term Capital Gain
Each fund listed below distributed the following amount, or maximum allowable amount, of long-term capital gain dividends for the fiscal year ended February 29, 2016 (amounts in thousands):
| | | | |
| | | Long-Term
Capital Gain Distribution | |
Tax Free Money Market Fund | | $ | 1,518 | |
| | | | | | |
| | | |
| 130 | | | | J.P. MORGAN MONEY MARKET FUNDS | | AUGUST 31, 2016 |
J.P. Morgan Funds are distributed by JPMorgan Distribution Services, Inc., which is an affiliate of JPMorgan Chase & Co. Affiliates of JPMorgan Chase & Co. receive fees for providing various services to the funds.
Contact JPMorgan Distribution Services, Inc. at 1-800-480-4111 (retail investors) or 1-800-766-7722 (institutional investors) for a fund prospectus. You can also visit us at www.jpmorganfunds.com. Investors should carefully consider the investment objectives and risk as well as charges and expenses of the mutual fund before investing. The prospectus contains this and other information about the mutual fund. Read the prospectus carefully before investing.
Investors may obtain information about the Securities Investor Protection Corporation (SIPC), including the SIPC brochure by visiting www.sipc.org or by calling SIPC at 202-371-8300.
Each Fund files a complete schedule of its fund holdings for the first and third quarters of its fiscal year with the SEC on Form N-Q. The Funds’ Forms N-Q are available on the SEC’s website at http://www.sec.gov and may be reviewed and copied at the SEC’s Public Reference Room in Washington, DC. Information on the operation of the SEC’s Public Reference Room may be obtained by calling 1-800-SEC-0330. Shareholders may request the Form N-Q without charge by calling 1-800-480-4111 (retail investors) or 1-800-766-7722 (institutional investors) or by visiting the J.P. Morgan Funds’ website at www.jpmorganfunds.com.
A description of each Fund’s policies and procedures with respect to the disclosure of each Fund’s holdings is available in the prospectus and Statement of Additional Information.
A copy of proxy policies and procedures is available without charge upon request by calling 1-800-480-4111 (retail investors) or 1-800-766-7722 (institutional investors) and on the Funds’ website at www.jpmorganfunds.com. A description of such policies and procedures is on the SEC’s website at www.sec.gov. The Trustees have delegated the authority to vote proxies for securities owned by the Funds to the Adviser. A copy of the Funds’ voting record for the most recent 12-month period ended June 30 is available on the SEC’s website at www.sec.gov or at the Funds’ website at www.jpmorganfunds.com no later than August 31 of each year. The Funds’ proxy voting record will include, among other things, a brief description of the matter voted on for each fund security, and will state how each vote was cast, for example, for or against the proposal.

J.P. Morgan Asset Management is the marketing name for the asset management businesses of JPMorgan Chase & Co. Those businesses include, but are not limited to, J.P. Morgan Investment Management Inc., Security Capital Research & Management Incorporated and J.P. Morgan Alternative Asset Management, Inc.
| | | | |
| | © JPMorgan Chase & Co., 2016. All rights reserved. August 2016. | | SAN-MMKT-816 |
Semi-Annual Report
J.P. Morgan Income Funds
August 31, 2016 (Unaudited)
JPMorgan Core Bond Fund
JPMorgan Core Plus Bond Fund
JPMorgan Government Bond Fund
JPMorgan High Yield Fund
JPMorgan Inflation Managed Bond Fund
JPMorgan Limited Duration Bond Fund
JPMorgan Mortgage-Backed Securities Fund
JPMorgan Short Duration Bond Fund
JPMorgan Short Duration High Yield Fund
JPMorgan Treasury & Agency Fund
CONTENTS
Investments in a Fund are not deposits or obligations of, or guaranteed or endorsed by, any bank and are not insured or guaranteed by the FDIC, the Federal Reserve Board or any other government agency. You could lose money if you sell when a Fund’s share price is lower than when you invested.
Past performance is no guarantee of future performance. The general market views expressed in this report are opinions based on market and other conditions through the end of the reporting period and are subject to change without notice. These views are not intended to predict the future performance of a Fund or the securities markets. References to specific securities and their issuers are for illustrative purposes only and are not intended to be, and should not be interpreted as, recommendations to purchase or sell such securities. Such views are not meant as investment advice and may not be relied on as an indication of trading intent on behalf of any Fund.
Prospective investors should refer to the Funds’ prospectus for a discussion of the Funds’ investment objectives, strategies and risks. Call J.P. Morgan Funds Service Center at 1-800-480-4111 for a prospectus containing more complete information about a Fund, including management fees and other expenses. Please read it carefully before investing.
CEO’S LETTER
September 22, 2016 (Unaudited)
Dear Shareholder,
The U.S. continued to lead a slow global economic expansion through August 2016, further raising pressure on the U.S. Federal Reserve (the “Fed”) to begin raising interest rates even as leading central banks elsewhere extended their extraordinary stimulus efforts.
| | |
 | | “It is especially notable that in the wake of a sell-off in June, financial markets fully recovered in the following two months.” |
Amid uncertainty about China’s economic outlook in early 2016, a sharp sell-off in financial markets following Britain’s June 23rd vote to exit the European Union and low U.S. inflation, the Fed declined to raise rates at its May and July meetings. However, financial markets rebounded quickly from the so-called Brexit sell-off and investor concerns about China’s economy receded. By August 2016, investors’ appetite for risk had returned, driving up prices for both stocks and bonds and pushing market volatility to record lows.
Meanwhile, U.S. gross domestic product remained low but positive through the first and second quarters of 2016. Unemployment remained at 5.0% or lower from February through August and sales of new homes in the U.S. returned to levels last seen before the 2008 financial crisis.
Overseas, the European Central Bank (ECB) surprised financial markets in early March with a further cut in interest rates and an expansion of its own quantitative easing program, along with other specific stimulus policies. In July, the ECB maintained its key interest rate at zero. Partly in response to the Brexit vote, Britain’s central bank cut interest rates in August to their lowest level in the bank’s 322-year history and reintroduced a quantitative easing program and began buying corporate bonds. After introducing negative interest rates in early 2016 to combat sputtering growth, the Bank of Japan changed direction in early September 2016 and unveiled a “yield curve control” to improve commercial bank earnings and investment returns for pension funds and insurers.
The ultimate effect of these central bank actions was to produce negative yields on government bonds in Europe and Japan, which led to a bond market rally in the U.S. as investors sought returns in U.S. Treasury bonds. Bond yields generally move in the opposite direction of bond prices and the bond market rally pushed Treasury bond yields to record lows in July.
In this environment, the financial market’s implied probability of an interest rate increase at the Fed’s September 2016 meeting rose to 36% at the end of August. However, the U.S. central bank declined to raise rates, citing below-target inflation data and concerns about continued job growth.
While Fed Chairwoman Janet Yellen indicated there is a greater likelihood of an interest rate increase in December 2016, both the International Monetary Fund and the World Bank have issued warnings about slowing economic growth in the U.S. and the rest of the world.
During the six months ended August 31, 2016, U.S. investors generally enjoyed solid returns in both bond and stock markets. It is especially notable that in the wake of a sell-off in June, financial markets fully recovered in the following two months. We believe this outcome clearly illustrates the wisdom of an investment perspective that is diversified, persistent and is guided by a long-term vision.
We look forward to managing your investment needs for years to come. Should you have any questions, please visit www.jpmorganfunds.com or contact the J.P. Morgan Funds Service Center at 1-800-480-4111.
Sincerely yours,

George C.W. Gatch
CEO, Investment Funds Management,
J.P. Morgan Asset Management
| | | | | | | | |
| | | |
| AUGUST 31, 2016 | | J.P. MORGAN INCOME FUNDS | | | | | 1 | |
J.P. Morgan Income Funds
MARKET OVERVIEW
SIX MONTHS ENDED AUGUST 31, 2016 (Unaudited)
Overall, U.S. financial markets provided positive returns for the six month reporting period and rebounded from a startling but short sell-off in late June that was sparked by the British vote to exit the European Union. Continued low interest rates in the U.S. and negative rates elsewhere, along with generally strong U.S. corporate earnings, supported increased investment in U.S. stocks and bonds during the six month period.
A global bond market rally and central bank policies drove government bond yields, which generally move inversely to bond prices, into negative territory in Japan and Europe. Overseas buying of U.S. debt helped push yields on 10-year Treasury bonds to a record low of 1.32% in July. The relative health of the U.S. economy and demand from investors seeking higher yields bolstered prices for corporate bonds, particularly high yield bonds (also known as “junk bonds”). The Barclays U.S. Aggregate Index returned 3.68% and the Barclays High Yield Corporate Index returned 15.56% for the six months ended August 31, 2016.
| | | | | | |
| | | |
| 2 | | | | J.P. MORGAN INCOME FUNDS | | AUGUST 31, 2016 |
JPMorgan Core Bond Fund
FUND COMMENTARY
SIX MONTHS ENDED AUGUST 31, 2016 (Unaudited)
| | | | |
| REPORTING PERIOD RETURN: | |
| Fund (Select Class Shares)* | | | 3.27% | |
| Barclays U.S. Aggregate Index | | | 3.68% | |
| |
| Net Assets as of 8/31/2016 (In Thousands) | | | $29,525,120 | |
| Duration as of 8/31/2016 | | | 5.4 years | |
INVESTMENT OBJECTIVE**
The JPMorgan Core Bond Fund (the “Fund”) seeks to maximize total return by investing primarily in a diversified portfolio of intermediate- and long-term debt securities.
WHAT WERE THE MAIN DRIVERS OF THE FUND’S PERFORMANCE?
For the six months ended August 31, 2016, the Fund’s Select Class Shares underperformed the Barclays U.S. Aggregate Index (the “Benchmark”). Relative to the Benchmark, the Fund’s underweight position in the corporate credit sector, particularly its underweight position in industrial bonds, was a leading detractor from performance. Overall, the mortgages sector underperformed the broader fixed-income market during the reporting period and the Fund’s overweight position in the mortgages sector detracted from relative performance.
The Fund’s security selection in asset-backed securities, and agency and non-agency collateralized mortgage obligations were leading contributors to relative performance.
HOW WAS THE FUND POSITIONED?
The Fund’s portfolio managers continued to focus on security selection and relative value, which seeks to exploit pricing discrepancies between individual securities or market sectors. The portfolio managers used bottom-up fundamental research to construct, in their view, a portfolio of undervalued fixed income
securities. At August 31, 2016, the Fund had underweight positions in U.S. Treasury bonds and corporate bonds and had an overweight position in mortgage-backed securities relative to the Benchmark.
| | | | |
PORTFOLIO COMPOSITION*** | |
| U.S. Treasury Obligations | | | 25.1 | % |
| Corporate Bonds | | | 22.7 | |
| Mortgage Pass-Through Securities | | | 16.4 | |
| Collateralized Mortgage Obligations | | | 15.1 | |
| Asset-Backed Securities | | | 10.8 | |
| Commercial Mortgage-Backed Securities | | | 2.9 | |
| U.S. Government Agency Securities | | | 2.5 | |
| Foreign Government Securities | | | 1.0 | |
| Others (each less than 1.0%) | | | 0.6 | |
| Short-Term Investment | | | 2.9 | |
| * | | The return shown is based on the net asset values calculated for shareholder transactions and may differ from the return shown in the financial highlights, which reflects adjustments made to the net asset values in accordance with accounting principles generally accepted in the United States of America. |
| ** | | The adviser seeks to achieve the Fund’s objective. There can be no guarantee it will be achieved. |
| *** | | Percentages indicated are based on total investments as of August 31, 2016. The Fund’s portfolio composition is subject to change. |
| | | | | | | | |
| | | |
| AUGUST 31, 2016 | | J.P. MORGAN INCOME FUNDS | | | | | 3 | |
JPMorgan Core Bond Fund
FUND COMMENTARY
SIX MONTHS ENDED AUGUST 31, 2016 (Unaudited) (continued)
| | | | | | | | | | | | | | | | | | |
AVERAGE ANNUAL TOTAL RETURNS AS OF AUGUST 31, 2016 | |
| | | | | |
| | | INCEPTION DATE OF
CLASS | | 6 MONTH* | | | 1 YEAR | | | 5 YEAR | | | 10 YEAR | |
CLASS A SHARES | | May 1, 1992 | | | | | | | | | | | | | | | | |
With Sales Charge** | | | | | (0.70 | )% | | | 1.32 | % | | | 2.25 | % | | | 4.55 | % |
Without Sales Charge | | | | | 3.19 | | | | 5.23 | | | | 3.03 | | | | 4.95 | |
CLASS C SHARES | | March 22, 1999 | | | | | | | | | | | | | | | | |
With CDSC*** | | | | | 1.90 | | | | 3.49 | | | | 2.36 | | | | 4.27 | |
Without CDSC | | | | | 2.90 | | | | 4.49 | | | | 2.36 | | | | 4.27 | |
CLASS R2 SHARES | | November 3, 2008 | | | 3.15 | | | | 4.98 | | | | 2.78 | | | | 4.69 | |
CLASS R5 SHARES | | May 15, 2006 | | | 3.44 | | | | 5.57 | | | | 3.35 | | | | 5.27 | |
CLASS R6 SHARES | | February 22, 2005 | | | 3.48 | | | | 5.66 | | | | 3.43 | | | | 5.34 | |
SELECT CLASS SHARES | | June 1, 1991 | | | 3.27 | | | | 5.34 | | | | 3.21 | | | | 5.12 | |
| ** | | Sales Charge for Class A Shares is 3.75%. |
| *** | | Assumes a 1% CDSC (contingent deferred sales charge) for the 6 month and one year periods and 0% CDSC thereafter. |
TEN YEAR PERFORMANCE (8/31/06 TO 8/31/16)
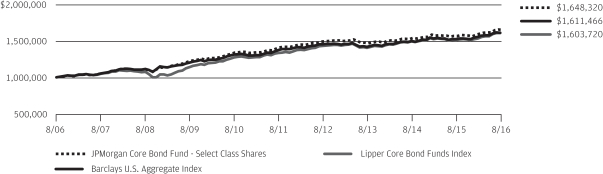
The performance quoted is past performance and is not a guarantee of future results. Mutual funds are subject to certain market risks. Investment returns and principal value of an investment will fluctuate so that an investor’s shares, when redeemed, may be worth more or less than their original cost. Current performance may be higher or lower than the performance data shown. For up-to-date month-end performance information please call 1-800-480-4111.
Returns shown for Class R2 Shares prior to its inception are based on the performance of Select Class Shares, the original class offered. With respect to Class R2 Shares, prior Class performance has been adjusted to reflect the differences in expenses between classes.
The graph illustrates comparative performance for $1,000,000 invested in Select Class Shares of the JPMorgan Core Bond Fund, the Barclays U.S. Aggregate Index and the Lipper Core Bond Funds Index from August 31, 2006 to August 31, 2016. The performance of the Fund assumes reinvestment of all dividends and capital gain distributions, if any, and does not include a sales charge. The performance of the Barclays U.S. Aggregate Index does not reflect the deduction of expenses or a sales charge associated with a mutual fund and has been adjusted to reflect reinvestment of all dividends and capital gain distributions of the securities included in the benchmark, if applicable. The performance of the Lipper Core Bond Funds Index includes expenses associated
with a mutual fund, such as investment management fees. These expenses are not identical to expenses incurred by the Fund. The Barclays U.S. Aggregate Index is an unmanaged index that represents securities that are SEC-registered, taxable, and dollar denominated. The index covers the U.S. investment grade fixed rate bond market, with index components for government and corporate securities, mortgage pass-through securities, and asset-backed securities. The Lipper Core Bond Funds Index is an index based on total returns of certain mutual funds within the Fund’s designated category as determined by Lipper, Inc. Investors cannot invest directly in an index.
Select Class Shares have a $1,000,000 minimum initial investment.
Fund performance may reflect the waiver of the Fund’s fees and reimbursement of expenses for certain periods since the inception date. Without these waivers and reimbursements, performance would have been lower. Also, performance shown in this section does not reflect the deduction of taxes that a shareholder would pay on Fund distributions or redemptions of Fund shares.
The returns shown are based on net asset values calculated for shareholder transactions and may differ from the returns shown in the financial highlights, which reflect adjustments made to the net asset values in accordance with accounting principles generally accepted in the United States of America.
| | | | | | |
| | | |
| 4 | | | | J.P. MORGAN INCOME FUNDS | | AUGUST 31, 2016 |
JPMorgan Core Plus Bond Fund
FUND COMMENTARY
SIX MONTHS ENDED AUGUST 31, 2016 (Unaudited)
| | | | |
| REPORTING PERIOD RETURN: | |
| Fund (Select Class Shares)* | | | 4.88% | |
| Barclays U.S. Aggregate Index | | | 3.68% | |
| |
| Net Assets as of 8/31/2016 (In Thousands) | | $ | 6,843,602 | |
| Duration as of 8/31/2016 | | | 5.7 years | |
INVESTMENT OBJECTIVE**
The JPMorgan Core Plus Bond Fund (the “Fund”) seeks a high level of current income by investing primarily in a diversified portfolio of high-, medium- and low-grade debt securities.
WHAT WERE THE MAIN DRIVERS OF THE FUND’S PERFORMANCE?
For the six months ended August 31, 2016, the Fund’s Select Class Shares outperformed the Barclays U.S. Aggregate Index (the “Benchmark”). Relative to the Benchmark, the Fund’s allocation to high yield bonds (also known as “junk bonds”), which outperformed investment grade debt securities during the six month reporting period, was a leading contributor to relative performance. The Fund’s overweight positions in corporate credit and commercial mortgage-backed securities, and its security selection in asset-backed securities, also contributed to relative performance.
The Fund’s overweight position in the broader mortgages sector was a leading detractor from performance relative to the Benchmark.
HOW WAS THE FUND POSITIONED?
The Fund continued to focus on security selection and relative value, which seeks to exploit pricing discrepancies between individual securities or market sectors. The Fund’s portfolio managers used bottom-up fundamental research to construct,
in their view, a portfolio of undervalued fixed income securities. The managers employ a macro-economic analysis to determine asset allocation and positioning on the yield curve. The yield curve shows the relationship between yields and maturity dates for a set of similar bonds at a given point in time.
| | | | |
PORTFOLIO COMPOSITION*** | |
| Corporate Bonds | | | 25.2 | % |
| U.S. Treasury Obligations | | | 24.9 | |
| Mortgage Pass-Through Securities | | | 16.4 | |
| Asset-Backed Securities | | | 11.3 | |
| Collateralized Mortgage Obligations | | | 8.7 | |
| Commercial Mortgage-Backed Securities | | | 5.5 | |
| Foreign Government Securities | | | 1.0 | |
| Others (each less than 1.0%) | | | 1.9 | |
| Short-Term Investment | | | 5.1 | |
| * | | The return shown is based on the net asset values calculated for shareholder transactions and may differ from the return shown in the financial highlights, which reflects adjustments made to the net asset values in accordance with accounting principles generally accepted in the United States of America. |
| ** | | The adviser seeks to achieve the Fund’s objective. There can be no guarantee it will be achieved. |
| *** | | Percentages indicated are based on total investments as of August 31, 2016. The Fund’s portfolio composition is subject to change. |
| | | | | | | | |
| | | |
| AUGUST 31, 2016 | | J.P. MORGAN INCOME FUNDS | | | | | 5 | |
JPMorgan Core Plus Bond Fund
FUND COMMENTARY
SIX MONTHS ENDED AUGUST 31, 2016 (Unaudited) (continued)
| | | | | | | | | | | | | | | | | | |
AVERAGE ANNUAL TOTAL RETURNS AS OF AUGUST 31, 2016 | |
| | | | | |
| | | INCEPTION DATE OF
CLASS | | 6 MONTH* | | | 1 YEAR | | | 5 YEAR | | | 10 YEAR | |
CLASS A SHARES | | March 5, 1993 | | | | | | | | | | | | | | | | |
With Sales Charge** | | | | | 0.79 | % | | | 1.88 | % | | | 3.46 | % | | | 5.04 | % |
Without Sales Charge | | | | | 4.75 | | | | 5.86 | | | | 4.25 | | | | 5.44 | |
CLASS C SHARES | | May 30, 2000 | | | | | | | | | | | | | | | | |
With CDSC*** | | | | | 3.36 | | | | 4.10 | | | | 3.57 | | | | 4.78 | |
Without CDSC | | | | | 4.36 | | | | 5.10 | | | | 3.57 | | | | 4.78 | |
CLASS R2 SHARES | | November 3, 2008 | | | 4.52 | | | | 5.26 | | | | 3.81 | | | | 5.05 | |
CLASS R6 SHARES | | February 22, 2005 | | | 4.90 | | | | 6.19 | | | | 4.60 | | | | 5.84 | |
INSTITUTIONAL CLASS SHARES | | June 19, 2009 | | | 4.73 | | | | 5.99 | | | | 4.52 | | | | 5.70 | |
SELECT CLASS SHARES | | March 5, 1993 | | | 4.88 | | | | 5.92 | | | | 4.35 | | | | 5.59 | |
| ** | | Sales Charge for Class A Shares is 3.75%. |
| *** | | Assumes a 1% CDSC (contingent deferred sales charge) for the 6 month and one year periods and 0% CDSC thereafter. |
TEN YEAR PERFORMANCE (8/31/06 TO 8/31/16)
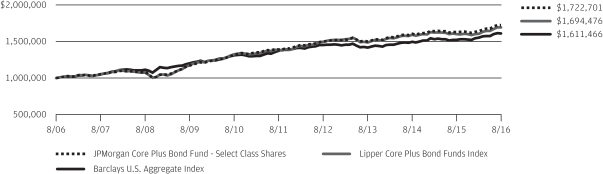
The performance quoted is past performance and is not a guarantee of future results. Mutual funds are subject to certain market risks. Investment returns and principal value of an investment will fluctuate so that an investor’s shares, when redeemed, may be worth more or less than their original cost. Current performance may be higher or lower than the performance data shown. For up-to-date month-end performance information please call 1-800-480-4111. Effective September 15, 2007, some of the Fund’s investment strategies changed. The Fund’s past performance would have been different if the Fund was managed using the current strategies.
Returns shown for Class R2 and Institutional Class Shares prior to their inception are based on the performance of Select Class Shares, the original class offered. With respect to Class R2 Shares, prior Class performance has been adjusted to reflect the differences in expenses between classes. Institutional Class and Select Class Shares would have substantially similar performance because the shares are invested in the same portfolio of securities, and the performance would differ only to the extent that the classes have different expenses.
The graph illustrates comparative performance for $1,000,000 invested in Select Class Shares of the JPMorgan Core Plus Bond Fund, the Barclays U.S. Aggregate Index and the Lipper Core Plus Bond Funds Index from August 31, 2006 to August 31, 2016. The performance of the Fund assumes reinvestment of all dividends and capital gain distributions, if any, and does not include a sales charge. The performance of the Barclays U.S. Aggregate Index does not reflect the deduction of expenses or a sales charge associated with a mutual
fund and has been adjusted to reflect reinvestment of all dividends and capital gain distributions of the securities included in the benchmark, if applicable. The performance of the Lipper Core Plus Bond Funds Index includes expenses associated with a mutual fund, such as investment management fees. These expenses are not identical to expenses incurred by the Fund. The Barclays U.S. Aggregate Index is an unmanaged index that represents securities that are SEC-registered, taxable, and dollar denominated. The index covers the U.S. investment grade fixed rate bond market, with index components for government and corporate securities, mortgage pass-through securities, and asset-backed securities. The Lipper Core Plus Bond Funds Index is an index based on total returns of certain mutual funds within the Fund’s designated category as determined by Lipper, Inc. Investors cannot invest directly in an index.
Select Class Shares have a $1,000,000 minimum initial investment.
Fund performance may reflect the waiver of the Fund’s fees and reimbursement of expenses for certain periods since the inception date. Without these waivers and reimbursements, performance would have been lower. Also, performance shown in this section does not reflect the deduction of taxes that a shareholder would pay on Fund distributions or redemptions of Fund shares.
The returns shown are based on net asset values calculated for shareholder transactions and may differ from the returns shown in the financial highlights, which reflect adjustments made to the net asset values in accordance with accounting principles generally accepted in the United States of America.
| | | | | | |
| | | |
| 6 | | | | J.P. MORGAN INCOME FUNDS | | AUGUST 31, 2016 |
JPMorgan Government Bond Fund
FUND COMMENTARY
SIX MONTHS ENDED AUGUST 31, 2016 (Unaudited)
| | | | |
| REPORTING PERIOD RETURN: | |
| Fund (Select Class Shares)* | | | 1.93% | |
| Barclays U.S. Government Bond Index | | | 2.07% | |
| |
| Net Assets as of 8/31/2016 (In Thousands) | | $ | 1,387,772 | |
| Duration as of 8/31/2016 | | | 5.3 years | |
INVESTMENT OBJECTIVE**
The JPMorgan Government Bond Fund (the “Fund”) seeks a high level of current income with liquidity and safety of principal.
WHAT WERE THE MAIN DRIVERS OF THE FUND’S PERFORMANCE?
For the six months ended August 31, 2016, the Fund’s Select Class Shares underperformed the Barclays U.S. Government Bond Index (the “Benchmark”). Amid a decline in long-term interest rates, the Fund’s allocation to U.S. Treasury Inflation Protected Securities, which are not held in the Benchmark, was a leading detractor from performance relative to the Benchmark. The Fund’s overweight allocation to agency debt made a positive contribution to relative performance.
HOW WAS THE FUND POSITIONED?
During the period, the Fund’s portfolio managers aimed to keep the duration of the Fund in a range of 5.00 to 5.50 years. Duration measures the price sensitivity of a bond or a portfolio of bonds relative to changes in interest rates. Generally, bonds with longer duration will experience a larger increase or decrease in price as interest rates fall or rise, respectively,
versus bonds with shorter duration. The Fund’s portfolio managers focused on security selection, using bottom-up fundamental research to construct, in their view, a portfolio of undervalued fixed income securities.
| | | | |
PORTFOLIO COMPOSITION*** | |
| Collateralized Mortgage Obligations | | | 37.3 | % |
| U.S. Treasury Obligations | | | 26.8 | |
| U.S. Government Agency Securities | | | 19.3 | |
| Mortgage Pass-Through Securities | | | 8.9 | |
| Commercial Mortgage-Backed Securities | | | 1.8 | |
| Foreign Government Security | | | 0.5 | |
| Short-Term Investment | | | 5.4 | |
| * | | The return shown is based on the net asset values calculated for shareholder transactions and may differ from the return shown in the financial highlights, which reflects adjustments made to the net asset values in accordance with accounting principles generally accepted in the United States of America. |
| ** | | The adviser seeks to achieve the Fund’s objective. There can be no guarantee it will be achieved. |
| *** | | Percentages indicated are based on total investments as of August 31, 2016. The Fund’s portfolio composition is subject to change. |
| | | | | | | | |
| | | |
| AUGUST 31, 2016 | | J.P. MORGAN INCOME FUNDS | | | | | 7 | |
JPMorgan Government Bond Fund
FUND COMMENTARY
SIX MONTHS ENDED AUGUST 31, 2016 (Unaudited) (continued)
| | | | | | | | | | | | | | | | | | |
AVERAGE ANNUAL TOTAL RETURNS AS OF AUGUST 31, 2016 | |
| | | | | |
| | | INCEPTION DATE OF
CLASS | | 6 MONTH* | | | 1 YEAR | | | 5 YEAR | | | 10 YEAR | |
CLASS A SHARES | | March 5, 1993 | | | | | | | | | | | | | | | | |
With Sales Charge** | | | | | (2.00 | )% | | | 0.18 | % | | | 1.52 | % | | | 4.21 | % |
Without Sales Charge | | | | | 1.79 | | | | 4.04 | | | | 2.31 | | | | 4.61 | |
CLASS C SHARES | | March 22, 1999 | | | | | | | | | | | | | | | | |
With CDSC*** | | | | | 0.42 | | | | 2.37 | | | | 1.57 | | | | 3.86 | |
Without CDSC | | | | | 1.42 | | | | 3.37 | | | | 1.57 | | | | 3.86 | |
CLASS R2 SHARES | | November 3, 2008 | | | 1.66 | | | | 3.78 | | | | 2.04 | | | | 4.35 | |
CLASS R6 SHARES | | August 1, 2016 | | | 1.84 | | | | 4.34 | | | | 2.56 | | | | 4.89 | |
SELECT CLASS SHARES | | February 8, 1993 | | | 1.93 | | | | 4.43 | | | | 2.58 | | | | 4.90 | |
| ** | | Sales Charge for Class A Shares is 3.75%. |
| *** | | Assumes a 1% CDSC (contingent deferred sales charge) for the 6 month and one year periods and 0% CDSC thereafter. |
TEN YEAR PERFORMANCE (8/31/06 TO 8/31/16)
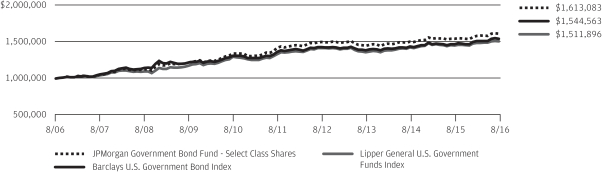
The performance quoted is past performance and is not a guarantee of future results. Mutual funds are subject to certain market risks. Investment returns and principal value of an investment will fluctuate so that an investor’s shares, when redeemed, may be worth more or less than their original cost. Current performance may be higher or lower than the performance data shown. For up-to-date month-end performance information please call 1-800-480-4111.
Returns shown for Class R2 and Class R6 Shares prior to their inception are based on the performance of Select Class Shares, the original class offered. Prior performance of Class R2 and Class R6 Shares have been adjusted to reflect the differences in expenses between classes.
The graph illustrates comparative performance for $1,000,000 invested in Select Class Shares of the JPMorgan Government Bond Fund, the Barclays U.S. Government Bond Index and the Lipper General U.S. Government Funds Index from August 31, 2006 to August 31, 2016. The performance of the Fund assumes reinvestment of all dividends and capital gain distributions, if any, and does not include a sales charge. The performance of the Barclays U.S. Government Bond Index does not include expenses or a sales charge associated with a mutual fund and has been adjusted to reflect reinvestment of all dividends and capital gain distributions of the securities included in the
benchmark, if applicable. The performance of the Lipper General U.S. Government Funds Index includes expenses associated with a mutual fund, such as investment management fees. These expenses are not identical to expenses incurred by the Fund. The Barclays U.S. Government Bond Index is an unmanaged index composed of securities issued by the U.S. Government. The Lipper General U.S. Government Funds Index is an index based on the total returns of certain mutual funds within the Fund’s designated category as determined by Lipper, Inc. Investors cannot invest directly in an index.
Select Class Shares have a $1,000,000 minimum initial investment.
Fund performance may reflect the waiver of the Fund’s fees and reimbursement of expenses for certain periods since the inception date. Without these waivers and reimbursements, performance would have been lower. Also, performance shown in this section does not reflect the deduction of taxes that a shareholder would pay on Fund distributions or redemptions of Fund shares.
The returns shown are based on net asset values calculated for shareholder transactions and may differ from the returns shown in the financial highlights, which reflect adjustments made to the net asset values in accordance with accounting principles generally accepted in the United States of America.
| | | | | | |
| | | |
| 8 | | | | J.P. MORGAN INCOME FUNDS | | AUGUST 31, 2016 |
JPMorgan High Yield Fund
FUND COMMENTARY
SIX MONTHS ENDED AUGUST 31, 2016 (Unaudited)
| | | | |
| REPORTING PERIOD RETURN: | |
| Fund (Select Class Shares)* | | | 13.21% | |
| Barclays U.S. Corporate High Yield — 2% Issuer Capped Index | | | 15.56% | |
| |
| Net Assets as of 8/31/2016 (In Thousands) | | $ | 12,097,748 | |
| Duration as of 8/31/2016 | | | 5.7 years | |
INVESTMENT OBJECTIVE**
The JPMorgan High Yield Fund (the “Fund”) seeks a high level of current income by investing primarily in a diversified portfolio of debt securities which are rated below investment grade or unrated. Capital appreciation is a secondary objective.
WHAT WERE THE MAIN DRIVERS OF THE FUND’S PERFORMANCE?
For the six months ended August 31, 2016, the Fund’s Select Class Shares underperformed the Barclays U.S. Corporate High Yield – 2% Issuer Capped Index (the “Benchmark”). During the reporting period, high yield bonds (also known as “junk bonds”) generally outperformed other sectors of the bond market amid investor demand for higher bond yields.
Relative to the Benchmark, the Fund’s security selection in the energy and basic materials sectors was a leading detractor from performance. The Fund’s underweight position in bonds rated BB through C detracted from relative performance as securities of lower credit quality outperformed the market during the six month period.
Relative to the Benchmark, the Fund’s security selection in the utilities sector and its underweight position in the consumer cyclicals sector made a positive contribution to performance. The Fund’s overweight positions in bonds rated BBB and unrated bonds also contributed to relative performance.
HOW WAS THE FUND POSITIONED?
The Fund’s portfolio managers sought to take specific, targeted credit risk based on the portfolio managers’ analysis of favorable risk/reward opportunities, while continuing to build a core of improving below investment grade investments. The portfolio managers moved the portfolio into higher quality debt securities amid persistent market volatility. In the energy sector, the managers continued to seek value in higher quality debt securities of companies with strong balance sheets.
| | | | |
PORTFOLIO COMPOSITION*** | |
| Corporate Bonds | | | 86.8 | % |
| Loan Assignments | | | 6.5 | |
| Others (each less than 1.0%) | | | 1.5 | |
| Short-Term Investments | | | 5.2 | |
| * | | The return shown is based on the net asset values calculated for shareholder transactions and may differ from the return shown in the financial highlights, which reflects adjustments made to the net asset values in accordance with accounting principles generally accepted in the United States of America. |
| ** | | The adviser seeks to achieve the Fund’s objective. There can be no guarantee it will be achieved. |
| *** | | Percentages indicated are based on total investments as of August 31, 2016. The Fund’s portfolio composition is subject to change. |
| | | | | | | | |
| | | |
| AUGUST 31, 2016 | | J.P. MORGAN INCOME FUNDS | | | | | 9 | |
JPMorgan High Yield Fund
FUND COMMENTARY
SIX MONTHS ENDED AUGUST 31, 2016 (Unaudited) (continued)
| | | | | | | | | | | | | | | | | | |
AVERAGE ANNUAL TOTAL RETURNS AS OF AUGUST 31, 2016 | |
| | | | | |
| | | INCEPTION DATE OF
CLASS | | 6 MONTH* | | | 1 YEAR | | | 5 YEAR | | | 10 YEAR | |
CLASS A SHARES | | November 13, 1998 | | | | | | | | | | | | | | | | |
With Sales Charge** | | | | | 8.75 | % | | | 2.43 | % | | | 5.59 | % | | | 6.35 | % |
Without Sales Charge | | | | | 13.01 | | | | 6.37 | | | | 6.40 | | | | 6.76 | |
CLASS C SHARES | | March 22, 1999 | | | | | | | | | | | | | | | | |
With CDSC*** | | | | | 11.66 | | | | 4.75 | | | | 5.78 | | | | 6.10 | |
Without CDSC | | | | | 12.66 | | | | 5.75 | | | | 5.78 | | | | 6.10 | |
CLASS R2 SHARES | | November 3, 2008 | | | 12.85 | | | | 6.03 | | | | 6.05 | | | | 6.44 | |
CLASS R5 SHARES | | May 15, 2006 | | | 13.21 | | | | 6.59 | | | | 6.67 | | | | 7.05 | |
CLASS R6 SHARES | | February 22, 2005 | | | 13.24 | | | | 6.63 | | | | 6.71 | | | | 7.10 | |
SELECT CLASS SHARES | | November 13, 1998 | | | 13.21 | | | | 6.57 | | | | 6.62 | | | | 7.00 | |
| ** | | Sales Charge for Class A Shares is 3.75%. |
| *** | | Assumes a 1% CDSC (contingent deferred sales charge) for the 6 month and one year periods and 0% CDSC thereafter. |
TEN YEAR PERFORMANCE (8/31/06 TO 8/31/16)
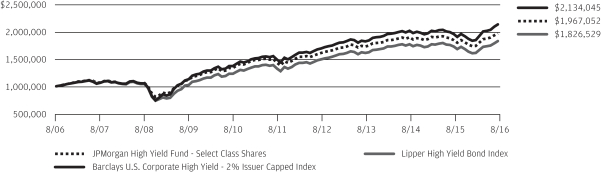
The performance quoted is past performance and is not a guarantee of future results. Mutual funds are subject to certain market risks. Investment returns and principal value of an investment will fluctuate so that an investor’s shares, when redeemed, may be worth more or less than their original cost. Current performance may be higher or lower than the performance data shown. For up-to-date month-end performance information please call 1-800-480-4111. Effective September 14, 2009, some of the Fund’s investment strategies changed. The Fund’s past performance would have been different if the Fund was managed using the current strategies.
Returns shown for Class R2 Shares prior to its inception are based on the performance of Select Class Shares, the original class offered. With respect to Class R2 Shares, prior Class performance has been adjusted to reflect the differences in expenses between classes.
The graph illustrates comparative performance for $1,000,000 invested in Select Class Shares of the JPMorgan High Yield Fund, the Barclays U.S. Corporate High Yield — 2% Issuer Capped Index and the Lipper High Yield Bond Index from August 31, 2006 to August 31, 2016. The performance of the Fund assumes reinvestment of all dividends and capital gain distributions, if any, and does not include a sales charge. The performance of the Barclays U.S. Corporate High Yield — 2% Issuer Capped Index does not reflect the deduction of expenses or a sales charge associated with a mutual fund and has been adjusted to reflect reinvestment of all dividends and capital gain distributions of
the securities included in the benchmark, if applicable. The performance of the Lipper High Yield Bond Index includes expenses associated with a mutual fund, such as investment management fees. These expenses are not identical to expenses incurred by the Fund. The Barclays U.S. Corporate High Yield — 2% Issuer Capped Index is an unmanaged index comprised of fixed rate, non-investment grade debt securities that are dollar denominated and non-convertible. The index limits the maximum exposure to any one issuer to 2%. The Lipper High Yield Bond Index is an index based on total returns of certain mutual funds within the Fund’s designated category as determined by Lipper, Inc. Investors cannot invest directly in an index.
Select Class Shares have a $1,000,000 minimum initial investment.
Fund performance may reflect the waiver of the Fund’s fees and reimbursement of expenses for certain periods since the inception date. Without these waivers and reimbursements, performance would have been lower. Also, performance shown in this section does not reflect the deduction of taxes that a shareholder would pay on Fund distributions or redemptions of Fund shares.
The returns shown are based on net asset values calculated for shareholder transactions and may differ from the returns shown in the financial highlights, which reflect adjustments made to the net asset values in accordance with accounting principles generally accepted in the United States of America.
| | | | | | |
| | | |
| 10 | | | | J.P. MORGAN INCOME FUNDS | | AUGUST 31, 2016 |
JPMorgan Inflation Managed Bond Fund
FUND COMMENTARY
SIX MONTHS ENDED AUGUST 31, 2016 (Unaudited)
| | | | |
| REPORTING PERIOD RETURN: | | | |
| Fund (Select Class Shares)* | | | 2.88% | |
| Barclays 1-10 Year U.S. TIPS Index | | | 2.58% | |
| Barclays U.S. Intermediate Aggregate Index | | | 2.17% | |
| Inflation Managed Bond Composite Benchmark (1) | | | 2.81% | |
| |
| Net Assets as of 8/31/2016 (In Thousands) | | $ | 1,418,331 | |
| Duration as of 8/31/2016 | | | 3.1 years | |
INVESTMENT OBJECTIVE**
The JPMorgan Inflation Managed Bond Fund (the “Fund”) seeks to maximize inflation protected total return.
WHAT WERE THE MAIN DRIVERS OF THE FUND’S PERFORMANCE?
For the six months ended August 31, 2016, the Fund’s Select Class Shares outperformed the Barclays 1-10 Year U.S. TIPS (Treasury Inflation Protected Securities) Index (the “Index”), the Barclays U.S. Intermediate Aggregate Index and the Inflation Managed Bond Composite Benchmark.
The Fund’s inflation hedge contributed to both absolute performance and performance relative to the Index. The recovery in prices for commodities and other assets, and a subsequent rise in inflation expectations, drove inflation-linked fixed income securities to outperform other fixed-income sectors.
Relative to the Index, the Fund’s overall shorter duration detracted from performance amid a decline in interest rates during the reporting period. Duration measures the price sensitivity of a bond or a portfolio of bonds to relative changes in interest rates. Generally, bonds with longer duration will experience a larger increase or decrease in price as interest rates fall or rise, respectively, versus bonds with shorter duration.
HOW WAS THE FUND POSITIONED?
Among the Fund’s fixed income holdings, the Fund’s portfolio managers continued to focus on security selection and relative value, which seeks to exploit pricing discrepancies between individual securities or market sectors. The Fund’s portfolio managers used bottom-up fundamental research to construct, in their view, a portfolio of undervalued fixed income securities.
The Fund’s portfolio managers sought to protect the portfolio from inflation risk across maturities. Therefore, the yield curve positioning of the underlying core bonds is used as the general basis for the Fund’s inflation swap positioning. The yield curve shows the relationship between yields and maturity dates for a set of similar bonds at a given point in time.
The Fund’s portfolio managers manage the duration of the inflation protection vs. the duration of the underlying bonds to protect the portfolio from both actual realized inflation as well as the loss of value that results from an increase in inflation expectations. The inflation protection is actively managed, and the Fund’s portfolio managers may elect to deviate from the yield curve positioning of the underlying bonds as a result of opportunities that result from macroeconomic or technical factors. During the reporting period, the managers reduced the Fund’s overall inflation exposure ahead of a typically poor seasonal environment for inflation-linked securities.
| | | | |
PORTFOLIO COMPOSITION*** | |
| Corporate Bonds | | | 31.9 | % |
| Collateralized Mortgage Obligations | | | 16.9 | |
| U.S. Government Agency Securities | | | 15.3 | |
| U.S. Treasury Obligations | | | 12.1 | |
| Mortgage Pass-Through Securities | | | 8.8 | |
| Asset-Backed Securities | | | 6.2 | |
| Commercial Mortgage-Backed Securities | | | 3.0 | |
| Foreign Government Securities | | | 0.4 | |
| Short-Term Investments | | | 5.4 | |
| * | | The return shown is based on the net asset values calculated for shareholder transactions and may differ from the return shown in the financial highlights, which reflects adjustments made to the net asset values in accordance with accounting principles generally accepted in the United States of America. |
| ** | | The adviser seeks to achieve the Fund’s objective. There can be no guarantee it will be achieved. |
| *** | | Percentages indicated are based on total investments as of August 31, 2016. The Fund’s portfolio composition is subject to change. |
| (1) | | The Fund’s composite benchmark is determined by adding the performance return of the Barclays Intermediate Government/Credit Index and 80% of the Barclays Inflation Swap 5 Year Zero Coupon Index. |
| | | | | | | | |
| | | |
| AUGUST 31, 2016 | | J.P. MORGAN INCOME FUNDS | | | | | 11 | |
JPMorgan Inflation Managed Bond Fund
FUND COMMENTARY
SIX MONTHS ENDED AUGUST 31, 2016 (Unaudited) (continued)
| | | | | | | | | | | | | | | | | | |
AVERAGE ANNUAL TOTAL RETURNS AS OF AUGUST 31, 2016 | |
| | | | | |
| | | INCEPTION DATE OF
CLASS | | 6 MONTH* | | | 1 YEAR | | | 5 YEAR | | | SINCE
INCEPTION | |
CLASS A SHARES | | March 31, 2010 | | | | | | | | | | | | | | | | |
With Sales Charge** | | | | | (1.13 | )% | | | (0.67 | )% | | | 0.35 | % | | | 1.64 | % |
Without Sales Charge | | | | | 2.77 | | | | 3.25 | | | | 1.12 | | | | 2.25 | |
CLASS C SHARES | | March 31, 2010 | | | | | | | | | | | | | | | | |
With CDSC*** | | | | | 1.47 | | | | 1.54 | | | | 0.46 | | | | 1.58 | |
Without CDSC | | | | | 2.47 | | | | 2.54 | | | | 0.46 | | | | 1.58 | |
CLASS R2 SHARES | | March 31, 2010 | | | 2.76 | | | | 3.00 | | | | 0.87 | | | | 2.00 | |
CLASS R5 SHARES | | March 31, 2010 | | | 2.88 | | | | 3.36 | | | | 1.31 | | | | 2.46 | |
CLASS R6 SHARES | | November 30, 2010 | | | 3.03 | | | | 3.57 | | | | 1.39 | | | | 2.52 | |
SELECT CLASS SHARES | | March 31, 2010 | | | 2.88 | | | | 3.34 | | | | 1.27 | | | | 2.39 | |
| ** | | Sales Charge for Class A Shares is 3.75%. |
| *** | | Assumes a 1% CDSC (contingent deferred sales charge) for the 6 month and one year periods and 0% CDSC thereafter. |
LIFE OF FUND PERFORMANCE (3/31/10 TO 8/31/16)
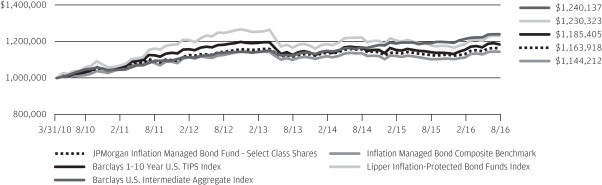
The performance quoted is past performance and is not a guarantee of future results. Mutual funds are subject to certain market risks. Investment returns and principal value of an investment will fluctuate so that an investor’s shares, when redeemed, may be worth more or less than their original cost. Current performance may be higher or lower than the performance data shown. For up-to-date, month-end performance information please call 1-800-480-4111.
The Fund commenced operations on March 31, 2010.
Returns for Class R6 Shares prior to its inception date are based on the performance of Class R5 Shares. The actual returns of Class R6 Shares would have been different than those shown because Class R6 Shares have different expenses than Class R5 Shares.
The graph illustrates comparative performance for $1,000,000 invested in Select Class Shares of the JPMorgan Inflation Managed Bond Fund, the Barclays 1–10 Year U.S. TIPS Index, the Barclays U.S. Intermediate Aggregate Index, the Inflation Managed Bond Composite Benchmark and the Lipper Inflation-Protected Bond Funds Index from March 31, 2010 to August 31, 2016. The performance of the Fund assumes reinvestment of all dividends and capital gain distributions, if any, and does not include a sales charge. The performance of the Barclays 1–10 Year U.S. TIPS Index and the Barclays U.S. Intermediate Aggregate Index does not reflect the deduction of expenses or a sales charge associated with a mutual fund and has been adjusted to reflect reinvestment of all dividends and capital gain distributions of securities included in the benchmarks, if applicable. The performance of the Lipper Inflation-Protected Bond
Funds Index includes expenses associated with a mutual fund, such as investment management fees. These expenses are not identical to the expenses incurred by the Fund. The Barclays 1–10 Year U.S. TIPS Index represents the performance of intermediate (1–10 year) U.S. Treasury Inflation Protection Securities. The Barclays U.S. Intermediate Aggregate Index is an unmanaged index comprised of U.S. government, mortgage, corporate and asset-backed securities with maturities of one to 10 years. The Inflation Managed Bond Composite Benchmark is determined by adding the Barclays Intermediate Government/Credit Index and 80% of the Barclays Inflation Swap 5 Year Zero Coupon Index. The Lipper Inflation-Protected Bond Funds Index is an index based on total returns of certain mutual funds within the Fund’s designated category as determined by Lipper, Inc. Investors cannot invest directly in an index.
Select Class Shares have a $1,000,000 minimum initial investment.
Fund performance may reflect the waiver of the Fund’s fees and reimbursement of expenses for certain periods since the inception date. Without these waivers and reimbursements, performance would have been lower. Also, performance shown in this section does not reflect the deduction of taxes that a shareholder would pay on Fund distributions or redemptions of Fund shares.
The returns shown are based on net asset values calculated for shareholder transactions and may differ from the returns shown in the financial highlights, which reflect adjustments made to the net asset values in accordance with accounting principles generally accepted in the United States of America.
| | | | | | |
| | | |
| 12 | | | | J.P. MORGAN INCOME FUNDS | | AUGUST 31, 2016 |
JPMorgan Limited Duration Bond Fund
FUND COMMENTARY
SIX MONTHS ENDED AUGUST 31, 2016 (Unaudited)
| | | | |
| REPORTING PERIOD RETURN: | |
| Fund (Select Class Shares)* | | | 1.08% | |
| Barclays 1–3 Year U.S. Government/Credit Bond Index | | | 0.94% | |
| |
| Net Assets as of 8/31/2016 (In Thousands) | | $ | 1,262,518 | |
| Duration as of 8/31/2016 | | | 1.2 years | |
INVESTMENT OBJECTIVE**
The JPMorgan Limited Duration Bond Fund (the “Fund”) seeks a high level of current income consistent with low volatility of principal.
WHAT WERE THE MAIN DRIVERS OF THE FUND’S PERFORMANCE?
For the six months ended August 31, 2016, the Fund’s Select Class Shares outperformed the Barclays 1–3 Year U.S. Government/Credit Bond Index (the “Benchmark”).
The Fund’s overweight position in the 5-10 year maturity portion of the yield curve made positive contributions to relative performance. The yield curve shows the relationship between yields and maturity dates for a set of similar bonds at a given point in time. The Fund’s allocation to mortgage securities, which are not held in the Benchmark, also contributed to relative performance.
During the reporting period, corporate bonds performed strongly and the Fund’s underweight position in corporate bonds detracted from relative performance.
HOW WAS THE FUND POSITIONED?
During the six month period, the Fund’s portfolio managers continued to focus on security selection, using bottom-up fundamental research to construct, in their view, a portfolio of undervalued fixed income securities. During the reporting period, the Fund’s portfolio managers used a money market
fund to maintain a degree of liquidity for the Fund. During the reporting period, the Fund’s overall duration increased to 1.15 years at August 31, 2016, from 0.98 years at February 29, 2016. Duration measures the price sensitivity of a bond or a portfolio of bonds to relative changes in interest rates. Generally, bonds with longer duration will experience a larger increase or decrease in price as interest rates fall or rise, respectively, versus bonds with shorter duration.
| | | | |
PORTFOLIO COMPOSITION*** | |
| Collateralized Mortgage Obligations | | | 55.5 | % |
| Asset-Backed Securities | | | 19.8 | |
| Corporate Bonds | | | 9.0 | |
| Mortgage Pass-Through Securities | | | 4.0 | |
| Commercial Mortgage-Backed Securities | | | 3.2 | |
| Municipal Bond | | | 0.1 | |
| Short-Term Investment | | | 8.4 | |
| * | | The return shown is based on the net asset values calculated for shareholder transactions and may differ from the return shown in the financial highlights, which reflects adjustments made to the net asset values in accordance with accounting principles generally accepted in the United States of America. |
| ** | | The adviser seeks to achieve the Fund’s objective. There can be no guarantee it will be achieved. |
| *** | | Percentages indicated are based on total investments as of August 31, 2016. The Fund’s portfolio composition is subject to change. |
| | | | | | | | |
| | | |
| AUGUST 31, 2016 | | J.P. MORGAN INCOME FUNDS | | | | | 13 | |
JPMorgan Limited Duration Bond Fund
FUND COMMENTARY
SIX MONTHS ENDED AUGUST 31, 2016 (Unaudited) (continued)
| | | | | | | | | | | | | | | | | | |
AVERAGE ANNUAL TOTAL RETURNS AS OF AUGUST 31, 2016 | |
| | | | | |
| | | INCEPTION DATE OF
CLASS | | 6 MONTH* | | | 1 YEAR | | | 5 YEAR | | | 10 YEAR | |
CLASS A SHARES | | March 10, 1993 | | | | | | | | | | | | | | | | |
With Sales Charge** | | | | | (1.32 | )% | | | (1.26 | )% | | | 1.75 | % | | | 2.33 | % |
Without Sales Charge | | | | | 0.95 | | | | 1.02 | | | | 2.22 | | | | 2.56 | |
CLASS C SHARES | | November 1, 2001 | | | | | | | | | | | | | | | | |
With CDSC*** | | | | | (0.29 | ) | | | (0.57 | ) | | | 1.70 | | | | 2.05 | |
Without CDSC | | | | | 0.71 | | | | 0.43 | | | | 1.70 | | | | 2.05 | |
CLASS R6 SHARES | | February 22, 2005 | | | 1.19 | | | | 1.39 | | | | 2.67 | | | | 3.02 | |
SELECT CLASS SHARES | | February 2, 1993 | | | 1.08 | | | | 1.17 | | | | 2.46 | | | | 2.81 | |
| ** | | Sales Charge for Class A Shares is 2.25%. |
| *** | | Assumes a 1% CDSC (contingent deferred sales charge) for the 6 month and one year periods and 0% CDSC thereafter. |
TEN YEAR PERFORMANCE (8/31/06 TO 8/31/16)
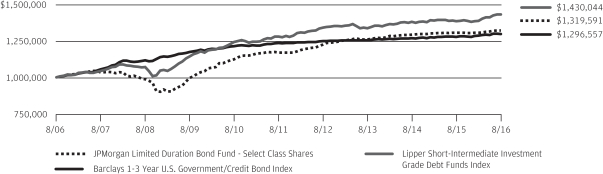
The performance quoted is past performance and is not a guarantee of future results. Mutual funds are subject to certain market risks. Investment returns and principal value of an investment will fluctuate so that an investor’s shares, when redeemed, may be worth more or less than their original cost. Current performance may be higher or lower than the performance data shown. For up-to-date month-end performance information please call 1-800-480-4111.
The graph illustrates comparative performance for $1,000,000 invested in Select Class Shares of the JPMorgan Limited Duration Bond Fund, the Barclays 1–3 Year U.S. Government/Credit Bond Index and the Lipper Short-Intermediate Investment Grade Debt Funds Index from August 31, 2006 to August 31, 2016. The performance of the Fund assumes reinvestment of all dividends and capital gain distributions, if any, and does not include a sales charge. The performance of the Barclays 1–3 Year U.S. Government/Credit Bond Index does not reflect the deduction of expenses or sales charges associated with a mutual fund and has been adjusted to reflect reinvestment of all dividends and capital gain distributions of the securities included in the benchmark, if applicable. The performance of the Lipper Short-Intermediate Investment Grade Debt Funds Index includes expenses associated with a mutual fund, such as investment
management fees. These expenses are not identical to expenses incurred by the Fund. The Barclays 1–3 Year U.S. Government/Credit Bond Index is an unmanaged index of investment grade government and corporate bonds with maturities of one to three years. The Lipper Short-Intermediate Investment Grade Debt Funds Index is an index based on total returns of certain mutual funds within the Fund’s designated category as determined by Lipper, Inc. Investors cannot invest directly in an index.
Select Class Shares have a $1,000,000 minimum initial investment.
Fund performance may reflect the waiver of the Fund’s fees and reimbursement of expenses for certain periods since the inception date. Without these waivers and reimbursements, performance would have been lower. Also, performance shown in this section does not reflect the deduction of taxes that a shareholder would pay on Fund distributions or redemptions of Fund shares.
The returns shown are based on net asset values calculated for shareholder transactions and may differ from the returns shown in the financial highlights, which reflect adjustments made to the net asset values in accordance with accounting principles generally accepted in the United States of America.
| | | | | | |
| | | |
| 14 | | | | J.P. MORGAN INCOME FUNDS | | AUGUST 31, 2016 |
JPMorgan Mortgage-Backed Securities Fund
FUND COMMENTARY
SIX MONTHS ENDED AUGUST 31, 2016 (Unaudited)
| | | | |
| REPORTING PERIOD RETURN: | | | |
| Fund (Select Class Shares)* | | | 1.77% | |
| Barclays U.S. MBS Index | | | 1.73% | |
| |
| Net Assets as of 8/31/2016 (In Thousands) | | $ | 2,782,498 | |
| Duration as of 8/31/2016 | | | 3.4 years | |
INVESTMENT OBJECTIVE**
The JPMorgan Mortgage-Backed Securities Fund (the “Fund”) seeks to maximize total return by investing primarily in a diversified portfolio of debt securities backed by pools of residential and/or commercial mortgages.
WHAT WERE THE MAIN DRIVERS OF THE FUND’S PERFORMANCE?
For the six months ended August 31, 2016, the Fund’s Select Class Shares outperformed the Barclays U.S. MBS Index (the “Benchmark”).
Relative to the Benchmark, the Fund’s allocations to agency pass-through bonds and non-agency mortgage bonds were leading contributors to performance. The Fund’s allocation to commercial mortgage backed securities also contributed to relative performance.
The Fund’s allocation to agency collateralized mortgage obligations detracted from relative performance. The Fund’s allocation to short-term debt securities, which were used to manage liquidity within the Fund, also detracted from relative performance.
HOW WAS THE FUND POSITIONED?
The Fund continued to focus on security selection and relative value, which seeks to exploit pricing discrepancies between individual securities or market sectors. The Fund’s portfolio managers used bottom-up fundamental research to construct, in their view, a portfolio of undervalued fixed income securities.
| | | | |
PORTFOLIO COMPOSITION*** | |
| Mortgage Pass-Through Securities | | | 39.3 | % |
| Collateralized Mortgage Obligations | | | 38.3 | |
| Asset-Backed Securities | | | 9.3 | |
| Commercial Mortgage-Backed Securities | | | 5.2 | |
| U.S. Treasury Obligations | | | 1.0 | |
| Loan Assignment | | | 0.2 | |
| Short-Term Investment | | | 6.7 | |
| * | | The return shown is based on the net asset values calculated for shareholder transactions and may differ from the return shown in the financial highlights, which reflects adjustments made to the net asset values in accordance with accounting principles generally accepted in the United States of America. |
| ** | | The adviser seeks to achieve the Fund’s objective. There can be no guarantee it will be achieved. |
| *** | | Percentages indicated are based on total investments as of August 31, 2016. The Fund’s portfolio composition is subject to change. |
| | | | | | | | |
| | | |
| AUGUST 31, 2016 | | J.P. MORGAN INCOME FUNDS | | | | | 15 | |
JPMorgan Mortgage-Backed Securities Fund
FUND COMMENTARY
SIX MONTHS ENDED AUGUST 31, 2016 (Unaudited) (continued)
| | | | | | | | | | | | | | | | | | |
AVERAGE ANNUAL TOTAL RETURNS AS OF AUGUST 31, 2016 | |
| | | | | |
| | | INCEPTION DATE OF
CLASS | | 6 MONTH* | | | 1 YEAR | | | 5 YEAR | | | 10 YEAR | |
CLASS A SHARES | | August 18, 2000 | | | | | | | | | | | | | | | | |
With Sales Charge** | | | | | (2.18 | )% | | | (0.51 | )% | | | 2.17 | % | | | 4.83 | % |
Without Sales Charge | | | | | 1.60 | | | | 3.35 | | | | 2.95 | | | | 5.23 | |
CLASS C SHARES | | July 2, 2012 | | | | | | | | | | | | | | | | |
With CDSC*** | | | | | 0.31 | | | | 1.87 | | | | 2.46 | | | | 4.72 | |
Without CDSC | | | | | 1.31 | | | | 2.87 | | | | 2.46 | | | | 4.72 | |
CLASS R6 SHARES | | February 22, 2005 | | | 1.76 | | | | 3.78 | | | | 3.37 | | | | 5.65 | |
SELECT CLASS SHARES | | August 18, 2000 | | | 1.77 | | | | 3.70 | | | | 3.23 | | | | 5.51 | |
| ** | | Sales Charge for Class A Shares is 3.75%. |
| *** | | Assumes a 1% CDSC (contingent deferred sales charge) for the 6 month and one year periods and 0% CDSC thereafter. |
TEN YEAR PERFORMANCE (8/31/06 TO 8/31/16)
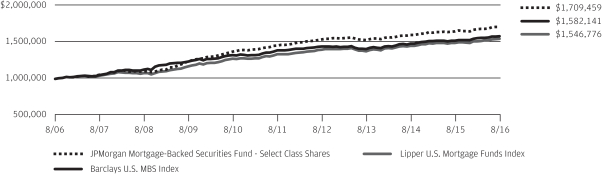
The performance quoted is past performance and is not a guarantee of future results. Mutual funds are subject to certain market risks. Investment returns and principal value of an investment will fluctuate so that an investor’s shares, when redeemed, may be worth more or less than their original cost. Current performance may be higher or lower than the performance data shown. For up-to-date month-end performance information please call 1-800-480-4111.
Returns shown for Class C Shares prior to its inception are based on the performance of Select Class Shares, the original class offered. Prior Class performance has been adjusted to reflect the differences in expenses between classes.
The graph illustrates comparative performance for $1,000,000 invested in Select Class Shares of the JPMorgan Mortgage-Backed Securities Fund, the Barclays U.S. MBS Index and the Lipper U.S. Mortgage Funds Index from August 31, 2006 to August 31, 2016. The performance of the Fund assumes reinvestment of all dividends and capital gain distributions, if any, and does not include a sales charge. The performance of the Barclays U.S. MBS Index does not reflect the deduction of expenses or a sales charge associated with a mutual fund and has been adjusted to reflect reinvestment of all dividends and capital gain distributions of the securities included in the benchmark, if applicable. The performance of the Lipper U.S. Mortgage Funds Index includes
expenses associated with a mutual fund, such as investment management fees. These expenses are not identical to expenses incurred by the Fund. The Barclays U.S. MBS Index covers the mortgage-backed pass-through securities of Ginnie Mae (GNMA), Fannie Mae (FNMA), and Freddie Mac (FHLMC). The index includes fixed-rate and hybrid adjustable rate mortgage (ARM) pass-through securities. The Lipper U.S. Mortgage Funds Index is an index based on total returns of certain mutual funds within the Fund’s designated category as determined by Lipper, Inc. Investors cannot invest directly in an index.
Select Class Shares have a $1,000,000 minimum initial investment.
Fund performance may reflect the waiver of the Fund’s fees and reimbursement of expenses for certain periods since the inception date. Without these waivers and reimbursements, performance would have been lower. Also, performance shown in this section does not reflect the deduction of taxes that a shareholder would pay on Fund distributions or redemptions of Fund shares.
The returns shown are based on net asset values calculated for shareholder transactions and may differ from the returns shown in the financial highlights, which reflect adjustments made to the net asset values in accordance with accounting principles generally accepted in the United States of America.
| | | | | | |
| | | |
| 16 | | | | J.P. MORGAN INCOME FUNDS | | AUGUST 31, 2016 |
JPMorgan Short Duration Bond Fund
FUND COMMENTARY
SIX MONTHS ENDED AUGUST 31, 2016 (Unaudited)
| | | | |
| REPORTING PERIOD RETURN: | |
| Fund (Select Class Shares)* | | | 0.99% | |
| Barclays 1–3 Year U.S. Government/Credit Bond Index | | | 0.94% | |
| |
| Net Assets as of 8/31/2016 (In Thousands) | | $ | 11,065,173 | |
| Duration as of 8/31/2016 | | | 1.8 years | |
INVESTMENT OBJECTIVE**
The JPMorgan Short Duration Bond Fund (the “Fund”) seeks current income consistent with preservation of capital through investment in high- and medium-grade fixed income securities.
WHAT WERE THE MAIN DRIVERS OF THE FUND’S PERFORMANCE?
For the six months ended August 31, 2016, the Fund’s Select Class Shares outperformed the Barclays 1–3 Year U.S. Government/Credit Bond Index (the “Benchmark”). The Fund’s allocation to asset-backed securities, which are not held in the Benchmark, made a positive contribution to performance relative to the Benchmark. The Fund’s allocation to commercial mortgage-backed securities also contributed to relative performance.
Relative to the Benchmark, the Fund’s security selection in the non-corporate credit sector and its allocation to agency debt were leading detractors from performance.
HOW WAS THE FUND POSITIONED?
The Fund’s portfolio managers continued to focus on security selection, using bottom-up fundamental research to construct what they believed to be a portfolio of undervalued fixed income securities. The Fund was positioned with an
underweight position in corporate bonds and agency bonds and an overweight in mortgage-backed and asset-backed securities, which were not held in the Benchmark.
| | | | |
PORTFOLIO COMPOSITION*** | |
| U.S. Treasury Obligations | | | 56.3 | % |
| Corporate Bonds | | | 22.5 | |
| Asset-Backed Securities | | | 8.9 | |
| Collateralized Mortgage Obligations | | | 4.2 | |
| U.S. Government Agency Securities | | | 3.9 | |
| Mortgage Pass-Through Securities | | | 2.6 | |
| Commercial Mortgage-Backed Securities | | | 1.2 | |
| Short-Term Investment | | | 0.4 | |
| * | | The return shown is based on the net asset values calculated for shareholder transactions and may differ from the return shown in the financial highlights, which reflects adjustments made to the net asset values in accordance with accounting principles generally accepted in the United States of America. |
| ** | | The adviser seeks to achieve the Fund’s objective. There can be no guarantee it will be achieved. |
| *** | | Percentages indicated are based on total investments as of August 31, 2016. The Fund’s portfolio composition is subject to change. |
| | | | | | | | |
| | | |
| AUGUST 31, 2016 | | J.P. MORGAN INCOME FUNDS | | | | | 17 | |
JPMorgan Short Duration Bond Fund
FUND COMMENTARY
SIX MONTHS ENDED AUGUST 31, 2016 (Unaudited) (continued)
| | | | | | | | | | | | | | | | | | |
AVERAGE ANNUAL TOTAL RETURNS AS OF AUGUST 31, 2016 | |
| | | | | |
| | | INCEPTION DATE OF
CLASS | | 6 MONTH* | | | 1 YEAR | | | 5 YEAR | | | 10 YEAR | |
CLASS A SHARES | | February 18, 1992 | | | | | | | | | | | | | | | | |
With Sales Charge** | | | | | (1.52 | )% | | | (1.32 | )% | | | 0.16 | % | | | 2.02 | % |
Without Sales Charge | | | | | 0.76 | | | | 0.95 | | | | 0.61 | | | | 2.25 | |
CLASS C SHARES | | November 1, 2001 | | | | | | | | | | | | | | | | |
With CDSC*** | | | | | (0.50 | ) | | | (0.56 | ) | | | 0.12 | | | | 1.74 | |
Without CDSC | | | | | 0.50 | | | | 0.44 | | | | 0.12 | | | | 1.74 | |
CLASS R6 SHARES | | February 22, 2005 | | | 1.02 | | | | 1.38 | | | | 1.12 | | | | 2.76 | |
SELECT CLASS SHARES | | September 4, 1990 | | | 0.99 | | | | 1.22 | | | | 0.88 | | | | 2.51 | |
| ** | | Sales Charge for Class A Shares is 2.25%. |
| *** | | Assumes a 1% CDSC (contingent deferred sales charge) for the 6 month and one year periods and 0% CDSC thereafter. |
TEN YEAR PERFORMANCE (8/31/06 TO 8/31/16)
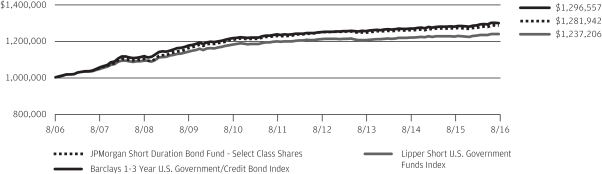
The performance quoted is past performance and is not a guarantee of future results. Mutual funds are subject to certain market risks. Investment returns and principal value of an investment will fluctuate so that an investor’s shares, when redeemed, may be worth more or less than their original cost. Current performance may be higher or lower than the performance data shown. For up-to-date month-end performance information please call 1-800-480-4111.
The graph illustrates comparative performance for $1,000,000 invested in Select Class Shares of the JPMorgan Short Duration Bond Fund, the Barclays 1–3 Year U.S. Government/Credit Bond Index and the Lipper Short U.S. Government Funds Index from August 31, 2006 to August 31, 2016. The performance of the Fund assumes reinvestment of all dividends and capital gain distributions, if any, and does not include a sales charge. The performance of the Barclays 1–3 Year U.S. Government/Credit Bond Index does not reflect the deduction of expenses or a sales charge associated with a mutual fund and has been adjusted to reflect reinvestment of all dividends and capital gain distributions of the securities included in the benchmark, if applicable. The performance of the Lipper Short U.S. Government Funds Index includes expenses associated with a
mutual fund, such as investment management fees. These expenses are not identical to expenses incurred by the Fund. The Barclays 1–3 Year U.S. Government/Credit Bond Index is an unmanaged index of investment grade government and corporate bonds with maturities of one to three years. The Lipper Short U.S. Government Funds Index is an index based on total returns of certain mutual funds within the Fund’s designated category as determined by Lipper, Inc. Investors cannot invest directly in an index.
Select Class Shares have a $1,000,000 minimum initial investment.
Fund performance may reflect the waiver of the Fund’s fees and reimbursement of expenses for certain periods since the inception date. Without these waivers and reimbursements, performance would have been lower. Also, performance shown in this section does not reflect the deduction of taxes that a shareholder would pay on Fund distributions or redemptions of Fund shares.
The returns shown are based on net asset values calculated for shareholder transactions and may differ from the returns shown in the financial highlights, which reflect adjustments made to the net asset values in accordance with accounting principles generally accepted in the United States of America.
| | | | | | |
| | | |
| 18 | | | | J.P. MORGAN INCOME FUNDS | | AUGUST 31, 2016 |
JPMorgan Short Duration High Yield Fund
FUND COMMENTARY
SIX MONTHS ENDED AUGUST 31, 2016 (Unaudited)
| | | | |
| REPORTING PERIOD RETURN: | |
| Fund (Select Class Shares)* | | | 8.86% | |
| Barclays U.S. Aggregate Index | | | 3.68% | |
| BofA Merrill Lynch 1-5 Year U.S. Cash Pay High Yield Constrained Index | | | 15.01% | |
| |
| Net Assets as of 8/31/2016 (In Thousands) | | $ | 166,442 | |
| Duration as of 8/31/2016 | | | 2.7 years | |
INVESTMENT OBJECTIVE**
The JPMorgan Short Duration High Yield Fund (the “Fund”) seeks current income with a secondary objective of capital appreciation.
WHAT WERE THE MAIN DRIVERS OF THE FUND’S PERFORMANCE?
For the six months ended August 31, 2016, the Fund’s Select Class Shares outperformed the Barclays U.S. Aggregate Index and underperformed the BofA Merrill Lynch 1-5 Year U.S. Cash Pay High Yield Constrained Index (the “Benchmark”). During the reporting period, high yield bonds (also known as “junk bonds”) generally outperformed other sectors of the bond market amid relative strength in the U.S. economy and investor demand for higher yielding bonds. The Fund’s allocation to high yield bonds made a positive contribution to performance relative to the Barclays U.S. Aggregate Index.
The Fund’s underweight allocation to corporate bonds and its allocation to bank debt, which was not held in the Benchmark, were leading detractors from performance relative to the Benchmark. The Fund’s underweight position and security selection in the energy sector, its security selection in the basic industries sector and its underweight position in bonds rated CCC and lower also detracted from relative performance.
The Fund’s underweight position in the capital goods and banking sectors made a positive contribution to relative performance for the six month reporting period. The Fund’s allocation
to unrated bonds, which were not held in the Benchmark, also contributed to relative performance.
HOW WAS THE FUND POSITIONED?
Relative to the Benchmark, the Fund was overweight in securities rated AAA, A and B and was underweight in securities rated BB, CCC and lower. The portfolio managers remained cautious about companies that they believed had elevated credit risk.
| | | | |
PORTFOLIO COMPOSITION*** | |
| Corporate Bonds | | | 73.9 | % |
| Loan Assignments | | | 21.1 | |
| Other (each less than 1.0%) | | | 1.7 | |
| Short-Term Investment | | | 3.3 | |
| * | | The return shown is based on the net asset values calculated for shareholder transactions and may differ from the return shown in the financial highlights, which reflects adjustments made to the net asset values in accordance with accounting principles generally accepted in the United States of America. |
| ** | | The adviser seeks to achieve the Fund’s objective. There can be no guarantee it will be achieved. |
| *** | | Percentages indicated are based on total investments as of August 31, 2016. The Fund’s portfolio composition is subject to change. |
| | | | | | | | |
| | | |
| AUGUST 31, 2016 | | J.P. MORGAN INCOME FUNDS | | | | | 19 | |
JPMorgan Short Duration High Yield Fund
FUND COMMENTARY
SIX MONTHS ENDED AUGUST 31, 2016 (Unaudited) (continued)
| | | | | | | | | | | | | | | | | | |
AVERAGE ANNUAL TOTAL RETURNS AS OF AUGUST 31, 2016 | |
| | | | | |
| | | INCEPTION DATE OF
CLASS | | 6 MONTH* | | | 1 YEAR | | | 3 YEAR | | | SINCE
INCEPTION | |
CLASS A SHARES | | March 1, 2013 | | | | | | | | | | | | | | | | |
With Sales Charge** | | | | | 6.20 | % | | | 1.70 | % | | | 1.79 | % | | | 1.74 | % |
Without Sales Charge | | | | | 8.59 | | | | 4.06 | | | | 2.57 | | | | 2.40 | |
CLASS C SHARES | | March 1, 2013 | | | | | | | | | | | | | | | | |
With CDSC*** | | | | | 7.45 | | | | 2.55 | | | | 2.05 | | | | 1.89 | |
Without CDSC | | | | | 8.45 | | | | 3.55 | | | | 2.05 | | | | 1.89 | |
CLASS R6 SHARES | | March 1, 2013 | | | 8.93 | | | | 4.48 | | | | 2.99 | | | | 2.81 | |
SELECT CLASS SHARES | | March 1, 2013 | | | 8.86 | | | | 4.35 | | | | 2.84 | | | | 2.66 | |
| ** | | Sales Charge for Class A Shares is 2.25%. |
| *** | | Assumes a 1% CDSC (contingent deferred sales charge) for the 6 month and one year periods and 0% CDSC thereafter. |
LIFE OF FUND PERFORMANCE (3/1/13 TO 8/31/16)
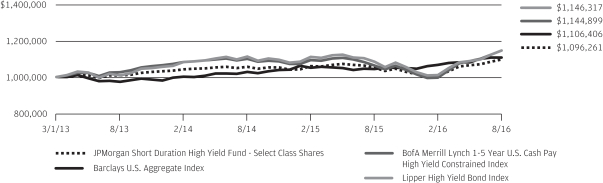
The performance quoted is past performance and is not a guarantee of future results. Mutual funds are subject to certain market risks. Investment returns and principal value of an investment will fluctuate so that an investor’s shares, when redeemed, may be worth more or less than their original cost. Current performance may be higher or lower than the performance data shown. For up-to-date month-end performance information please call 1-800-480-4111.
The Fund commenced operations on March 1, 2013.
The graph illustrates comparative performance for $1,000,000 invested in Select Class Shares of the JPMorgan Short Duration High Yield Fund, the Barclays U.S. Aggregate Index, the BofA Merrill Lynch 1-5 Year U.S. Cash Pay High Yield Constrained Index and the Lipper High Yield Bond Index from March 1, 2013 to August 31, 2016. The performance of the Fund assumes reinvestment of all dividends and capital gain distributions, if any, and does not include a sales charge. The performance of the Barclays U.S. Aggregate Index does not reflect the deduction of expenses or a sales charge associated with a mutual fund and has been adjusted to reflect reinvestment of all dividends and capital gain distributions of the securities included in the benchmark, if applicable. The performance of the BofA Merrill Lynch 1-5 Year U.S. Cash Pay High Yield Constrained Index does not reflect the deduction of expenses or a sales charge associated with a mutual fund and has been adjusted to reflect reinvestment of all dividends and capital gain distributions of the securities included in the benchmark, if applicable. The performance of the Lipper High Yield Bond Index
includes expenses associated with a mutual fund, such as investment management fees. These expenses are not identical to expenses incurred by the Fund. The Barclays U.S. Aggregate Index is an unmanaged index that represents securities that are SEC-registered, taxable, and dollar denominated. The index covers the U.S. investment grade fixed rate bond market, with index components for government and corporate securities, mortgage pass-through securities, and asset-backed securities. The BofA Merrill Lynch 1-5 Year U.S. Cash Pay High Yield Constrained Index contains all securities in the BofA Merrill Lynch U.S. Cash Pay High Yield Index with a remaining term to final maturity less than 5 years but caps issuer exposure at 2%. The Lipper High Yield Bond Index is an index based on total returns of certain mutual funds within the Fund’s designated category as determined by Lipper, Inc. Investors cannot invest directly in an index.
Select Class Shares have a $1,000,000 minimum initial investment.
Fund performance may reflect the waiver of the Fund’s fees and reimbursement of expenses for certain periods since the inception date. Without these waivers and reimbursements, performance would have been lower. Also, performance shown in this section does not reflect the deduction of taxes that a shareholder would pay on Fund distributions or redemptions of Fund shares.
The returns shown are based on net asset values calculated for shareholder transactions and may differ from the returns shown in the financial highlights, which reflect adjustments made to the net asset values in accordance with accounting principles generally accepted in the United States of America.
| | | | | | |
| | | |
| 20 | | | | J.P. MORGAN INCOME FUNDS | | AUGUST 31, 2016 |
JPMorgan Treasury & Agency Fund
FUND COMMENTARY
SIX MONTHS ENDED AUGUST 31, 2016 (Unaudited)
| | | | |
| REPORTING PERIOD RETURN: | | | |
| Fund (Select Class Shares)* | | | 0.49% | |
| Barclays 1–5 Year U.S. Treasury Index | | | 0.69% | |
| |
| Net Assets as of 8/31/2016 (In Thousands) | | $ | 103,078 | |
| Duration as of 8/31/2016 | | | 2.1 years | |
INVESTMENT OBJECTIVE**
The JPMorgan Treasury & Agency Fund (the “Fund”) seeks a high level of current income by investing in U.S. Treasury and other U.S. agency obligations with a primary, but not exclusive, focus on issues that produce income exempt from state income taxes.
WHAT WERE THE MAIN DRIVERS OF THE FUND’S PERFORMANCE?
For the six months ended August 31, 2016, the Fund’s Select Class Shares underperformed the Barclays 1-5 Year U.S. Treasury Index (the “Benchmark”). Relative to the Benchmark, the Fund’s shorter overall duration was a detractor from performance. Duration measures the price sensitivity of a bond or a portfolio of bonds to relative changes in interest rates. Generally, bonds with longer duration will experience a larger increase or decrease in price as interest rates fall or rise, respectively, versus bonds with shorter duration.
The Fund’s allocation and security selection in agency bonds, which are not held in the Benchmark, was a leading contributor to performance relative to the Benchmark.
HOW WAS THE FUND POSITIONED?
The Fund’s portfolio managers continued to focus on security selection, using bottom-up fundamental research to construct, in their view, a portfolio of undervalued fixed income securities.
| | | | |
PORTFOLIO COMPOSITION*** | |
| U.S. Treasury Obligations | | | 86.7 | % |
| U.S. Government Agency Securities | | | 12.3 | |
| Short-Term Investment | | | 1.0 | |
| * | | The return shown is based on the net asset values calculated for shareholder transactions and may differ from the return shown in the financial highlights, which reflects adjustments made to the net asset values in accordance with accounting principles generally accepted in the United States of America. |
| ** | | The adviser seeks to achieve the Fund’s objective. There can be no guarantee it will be achieved. |
| *** | | Percentages indicated are based on total investments as of August 31, 2016. The Fund’s portfolio composition is subject to change. |
| | | | | | | | |
| | | |
| AUGUST 31, 2016 | | J.P. MORGAN INCOME FUNDS | | | | | 21 | |
JPMorgan Treasury & Agency Fund
FUND COMMENTARY
SIX MONTHS ENDED AUGUST 31, 2016 (Unaudited) (continued)
| | | | | | | | | | | | | | | | | | |
AVERAGE ANNUAL TOTAL RETURNS AS OF AUGUST 31, 2016 | |
| | | | | |
| | | INCEPTION DATE OF
CLASS | | 6 MONTH* | | | 1 YEAR | | | 5 YEAR | | | 10 YEAR | |
CLASS A SHARES | | January 20, 1997 | | | | | | | | | | | | | | | | |
With Sales Charge** | | | | | (1.90 | )% | | | (1.44 | )% | | | (0.24 | )% | | | 1.83 | % |
Without Sales Charge | | | | | 0.39 | | | | 0.86 | | | | 0.22 | | | | 2.06 | |
SELECT CLASS SHARES | | January 20, 1997 | | | 0.49 | | | | 1.19 | | | | 0.48 | | | | 2.32 | |
| ** | | Sales Charge for Class A Shares is 2.25%. |
TEN YEAR PERFORMANCE (8/31/06 TO 8/31/16)
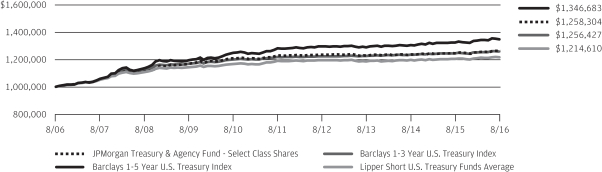
The performance quoted is past performance and is not a guarantee of future results. Mutual funds are subject to certain market risks. Investment returns and principal value of an investment will fluctuate so that an investor’s shares, when redeemed, may be worth more or less than their original cost. Current performance may be higher or lower than the performance data shown. For up-to-date month-end performance information please call 1-800-480-4111.
The graph illustrates comparative performance for $1,000,000 invested in Select Class Shares of the JPMorgan Treasury & Agency Fund, the Barclays 1–5 Year U.S. Treasury Index, the Barclays 1–3 Year U.S. Treasury Index and the Lipper Short U.S. Treasury Funds Average from August 31, 2006 to August 31, 2016. The performance of the Fund assumes reinvestment of all dividends and capital gain distributions, if any, and does not include a sales charge. The performance of the Barclays 1–5 Year U.S. Treasury Index and the Barclays 1–3 Year U.S. Treasury Index does not reflect the deduction of expenses or a sales charge associated with a mutual fund and has been adjusted to reflect reinvestment of all dividends and capital gain distributions of the securities included in the benchmarks, if applicable. The performance of the Lipper Short U.S. Treasury Funds Average includes expenses associated with a mutual fund, such as investment management fees. These expenses are not identical to
expenses incurred by the Fund. The Barclays 1–5 Year U.S. Treasury Index is an unmanaged index comprised of U.S. Treasury issued securities with maturities of one to five years. The Barclays 1–3 Year U.S. Treasury Index is an unmanaged index comprised of U.S. Treasury issued securities with maturities of one to three years. Investors cannot invest directly in an index. The Lipper Short U.S. Treasury Funds Average is an average based on the total returns of all mutual funds within the Fund’s designated category as determined by Lipper, Inc.
Select Class Shares have a $1,000,000 minimum initial investment.
Fund performance may reflect the waiver of the Fund’s fees and reimbursement of expenses for certain periods since the inception date. Without these waivers and reimbursements, performance would have been lower. Also, performance shown in this section does not reflect the deduction of taxes that a shareholder would pay on Fund distributions or redemptions of Fund shares.
The returns shown are based on net asset values calculated for shareholder transactions and may differ from the returns shown in the financial highlights, which reflect adjustments made to the net asset values in accordance with accounting principles generally accepted in the United States of America.
| | | | | | |
| | | |
| 22 | | | | J.P. MORGAN INCOME FUNDS | | AUGUST 31, 2016 |
JPMorgan Core Bond Fund
SCHEDULE OF PORTFOLIO INVESTMENTS
AS OF AUGUST 31, 2016 (Unaudited)
(Amounts in thousands)
| | | | | | | | |
PRINCIPAL
AMOUNT($) | | | SECURITY DESCRIPTION | | VALUE($) | |
| Asset-Backed Securities — 10.7% | |
| | 5,650 | | | ABFC Trust, Series 2005-AQ1, Class A4, SUB, 4.861%, 06/25/35 | | | 5,775 | |
| | | | Academic Loan Funding Trust, | | | | |
| | 5,280 | | | Series 2012-1A, Class A1, VAR, 1.288%, 12/27/22 (e) | | | 5,281 | |
| | 3,984 | | | Series 2013-1A, Class A, VAR, 1.324%, 12/26/44 (e) | | | 3,918 | |
| | | | Ally Auto Receivables Trust, | | | | |
| | 562 | | | Series 2013-2, Class A3, 0.790%, 01/15/18 | | | 562 | |
| | 1,200 | | | Series 2013-2, Class A4, 1.240%, 11/15/18 | | | 1,201 | |
| | 5,737 | | | Series 2014-SN2, Class A3, 1.030%, 09/20/17 | | | 5,736 | |
| | 1,476 | | | Series 2015-SN1, Class A2A, 0.930%, 06/20/17 | | | 1,476 | |
| | 7,021 | | | Series 2015-SN1, Class A3, 1.210%, 12/20/17 | | | 7,020 | |
| | 6,678 | | | Series 2016-1, Class A2A, 1.200%, 08/15/18 | | | 6,684 | |
| | 26,835 | | | Series 2016-2, Class A2, 1.170%, 10/15/18 | | | 26,850 | |
| | | | American Credit Acceptance Receivables Trust, | | | | |
| | 1,769 | | | Series 2014-2, Class B, 2.260%, 03/10/20 (e) | | | 1,770 | |
| | 2,374 | | | Series 2014-3, Class B, 2.430%, 06/10/20 (e) | | | 2,373 | |
| | 2,798 | | | Series 2015-1, Class A, 1.430%, 08/12/19 (e) | | | 2,796 | |
| | 6,377 | | | Series 2015-2, Class A, 1.570%, 06/12/19 (e) | | | 6,374 | |
| | 8,997 | | | Series 2015-2, Class C, 4.320%, 05/12/21 (e) | | | 8,999 | |
| | 5,000 | | | Series 2016-2, Class C, 6.090%, 05/12/22 (e) | | | 5,249 | |
| | 9,219 | | | Series 2016-3, Class A, 1.700%, 11/12/20 (e) | | | 9,212 | |
| | 17,165 | | | Series 2016-1A, Class B, 4.240%, 06/13/22 (e) | | | 17,602 | |
| | | | American Homes 4 Rent Trust, | | | | |
| | 4,000 | | | Series 2014-SFR1, Class C, VAR, 2.257%, 06/17/31 (e) | | | 3,967 | |
| | 12,111 | | | Series 2014-SFR2, Class A, 3.786%, 10/17/36 (e) | | | 13,128 | |
| | 2,400 | | | Series 2014-SFR2, Class B, 4.290%, 10/17/36 (e) | | | 2,618 | |
| | 4,000 | | | Series 2014-SFR2, Class D, 5.149%, 10/17/36 (e) | | | 4,384 | |
| | 7,300 | | | Series 2014-SFR2, Class E, 6.231%, 10/17/36 (e) | | | 7,993 | |
| | | | | | | | |
PRINCIPAL
AMOUNT($) | | | SECURITY DESCRIPTION | | VALUE($) | |
| | | | | | | | |
| | 9,709 | | | Series 2014-SFR3, Class A, 3.678%, 12/17/36 (e) | | | 10,459 | |
| | 3,750 | | | Series 2014-SFR3, Class C, 4.596%, 12/17/36 (e) | | | 4,050 | |
| | 16,970 | | | Series 2014-SFR3, Class E, 6.418%, 12/17/36 (e) | | | 18,817 | |
| | 17,806 | | | Series 2015-SFR1, Class A, 3.467%, 04/17/52 (e) | | | 19,007 | |
| | 7,420 | | | Series 2015-SFR1, Class E, 5.639%, 04/17/52 (e) | | | 7,816 | |
| | 1,415 | | | Series 2015-SFR2, Class E, 6.070%, 10/17/45 (e) | | | 1,537 | |
| | | | AmeriCredit Automobile Receivables Trust, | | | | |
| | 396 | | | Series 2013-5, Class A3, 0.900%, 09/10/18 | | | 395 | |
| | 3,653 | | | Series 2015-2, Class A2A, 0.830%, 09/10/18 | | | 3,651 | |
| | 6,357 | | | Series 2016-1, Class A3, 1.810%, 10/08/20 | | | 6,387 | |
| | 19,794 | | | Series 2016-2, Class A2A, 1.420%, 10/08/19 | | | 19,802 | |
| | 3,582 | | | Series 2016-2, Class A3, 1.600%, 11/09/20 | | | 3,586 | |
| | 5,937 | | | Series 2016-3, Class A3, 1.460%, 05/08/21 | | | 5,920 | |
| | 38 | | | Ameriquest Mortgage Securities, Inc. Asset-Backed Pass-Through Certificates, Series 2003-13, Class AF6, SUB, 4.972%, 01/25/34 | | | 39 | |
| | 49,800 | | | Anchor Assets IX LLC, Series 2016-1, Class A, 5.125%, 02/15/20 (e) | | | 49,800 | |
| | 25,074 | | | ARLP Securitization Trust, Series 2015-1, Class A1, SUB, 3.967%, 05/25/55 (e) | | | 24,490 | |
| | | | AXIS Equipment Finance Receivables III LLC, | | | | |
| | 9,507 | | | Series 2015-1A, Class A2, 1.900%, 03/20/20 (e) | | | 9,488 | |
| | 1,200 | | | Series 2015-1A, Class C, 3.410%, 04/20/20 (e) | | | 1,181 | |
| | 1,200 | | | Series 2015-1A, Class D, 4.050%, 05/20/20 (e) | | | 1,154 | |
| | | | B2R Mortgage Trust, | | | | |
| | 9,507 | | | Series 2015-1, Class A1, 2.524%, 05/15/48 (e) | | | 9,482 | |
| | 19,526 | | | Series 2015-2, Class A, 3.336%, 11/15/48 (e) | | | 20,042 | |
| | 9,300 | | | BA Credit Card Trust, Series 2015-A2, Class A, 1.360%, 09/15/20 | | | 9,323 | |
| | 12,698 | | | Banc of America Funding Corp., Series 2012-R6, Class 1A1, 3.000%, 10/26/39 (e) | | | 12,504 | |
SEE NOTES TO FINANCIAL STATEMENTS.
| | | | | | | | |
| | | |
| AUGUST 31, 2016 | | J.P. MORGAN INCOME FUNDS | | | | | 23 | |
JPMorgan Core Bond Fund
SCHEDULE OF PORTFOLIO INVESTMENTS
AS OF AUGUST 31, 2016 (Unaudited) (continued)
(Amounts in thousands)
| | | | | | | | |
PRINCIPAL
AMOUNT($) | | | SECURITY DESCRIPTION | | VALUE($) | |
| Asset-Backed Securities — continued | |
| | | | BCC Funding Corp. X, | | | | |
| | 16,731 | | | Series 2015-1, Class A2, 2.224%, 10/20/20 (e) | | | 16,671 | |
| | 2,717 | | | Series 2015-1, Class D, 4.544%, 12/21/20 (e) | | | 2,739 | |
| | 444 | | | Bear Stearns Asset-Backed Securities Trust, Series 2006-SD1, Class A, VAR, 0.894%, 04/25/36 (e) | | | 430 | |
| | 1,850 | | | Blue Elephant Loan Trust, Series 2015-1, Class B, 5.560%, 12/15/22 (e) | | | 1,843 | |
| | | | BMW Vehicle Owner Trust, | | | | |
| | 175 | | | Series 2013-A, Class A3, 0.670%, 11/27/17 | | | 175 | |
| | 4,702 | | | Series 2014-A, Class A3, 0.970%, 11/26/18 | | | 4,700 | |
| | 3,570 | | | BXG Receivables Note Trust, Series 2012-A, Class A, 2.660%, 12/02/27 (e) | | | 3,555 | |
| | | | Cabela’s Credit Card Master Note Trust, | | | | |
| | 6,816 | | | Series 2012-1A, Class A1, 1.630%, 02/18/20 (e) | | | 6,825 | |
| | 5,757 | | | Series 2015-2, Class A1, 2.250%, 07/17/23 | | | 5,809 | |
| | 6,254 | | | CAM Mortgage LLC, Series 2015-1, Class A, SUB, 3.500%, 07/15/64 (e) | | | 6,252 | |
| | | | Capital Auto Receivables Asset Trust, | | | | |
| | 18,072 | | | Series 2016-1, Class A3, 1.730%, 04/20/20 | | | 18,100 | |
| | 4,276 | | | Series 2016-2, Class A2A, 1.320%, 01/22/19 | | | 4,269 | |
| | | | CarFinance Capital Auto Trust, | | | | |
| | 411 | | | Series 2013-1A, Class B, 2.750%, 11/15/18 (e) | | | 413 | |
| | 726 | | | Series 2014-1A, Class A, 1.460%, 12/17/18 (e) | | | 725 | |
| | 2,250 | | | Series 2014-1A, Class B, 2.720%, 04/15/20 (e) | | | 2,251 | |
| | 7,963 | | | Series 2014-2A, Class A, 1.440%, 11/16/20 (e) | | | 7,923 | |
| | 5,960 | | | Series 2015-1A, Class A, 1.750%, 06/15/21 (e) | | | 5,926 | |
| | 10,928 | | | Carlyle Global Market Strategies Commodities Funding Ltd., (Cayman Islands), Series 2014-1A, Class A, VAR, 2.528%, 10/15/21 (e) | | | 8,961 | |
| | | | CarMax Auto Owner Trust, | | | | |
| | 9,689 | | | Series 2013-2, Class A4, 0.840%, 11/15/18 | | | 9,674 | |
| | 1,176 | | | Series 2013-4, Class A3, 0.800%, 07/16/18 | | | 1,176 | |
| | | | | | | | |
PRINCIPAL
AMOUNT($) | | | SECURITY DESCRIPTION | | VALUE($) | |
| | | | | | | | |
| | 2,612 | | | Series 2013-4, Class A4, 1.280%, 05/15/19 | | | 2,615 | |
| | 5,354 | | | Series 2014-2, Class A3, 0.980%, 01/15/19 | | | 5,349 | |
| | 4,716 | | | Series 2015-2, Class A2A, 0.820%, 06/15/18 | | | 4,713 | |
| | 3,897 | | | Carnow Auto Receivables Trust, Series 2015-1A, Class A, 1.690%, 01/15/20 (e) | | | 3,893 | |
| | | | Chase Funding Trust, | | | | |
| | 1,773 | | | Series 2003-4, Class 1A5, SUB, 5.315%, 05/25/33 | | | 1,820 | |
| | 2,737 | | | Series 2003-6, Class 1A5, SUB, 5.164%, 11/25/34 | | | 2,840 | |
| | 4,664 | | | Series 2003-6, Class 1A7, SUB, 4.277%, 11/25/34 | | | 4,756 | |
| | 28,332 | | | Chrysler Capital Auto Receivables Trust, Series 2016-AA, Class A3, 1.770%, 10/15/20 (e) | | | 28,387 | |
| | | | Citi Held For Asset Issuance, | | | | |
| | 3,138 | | | Series 2015-PM1, Class A, 1.850%, 12/15/21 (e) | | | 3,134 | |
| | 12,837 | | | Series 2015-PM1, Class B, 2.930%, 12/15/21 (e) | | | 12,696 | |
| | 21,078 | | | Series 2016-MF1, Class A, 4.480%, 08/15/22 (e) | | | 21,260 | |
| | 25,040 | | | Series 2016-PM1, Class A, 4.650%, 04/15/25 (e) | | | 25,403 | |
| | 950 | | | Citibank Credit Card Issuance Trust, Series 2007-A3, Class A3, 6.150%, 06/15/39 | | | 1,399 | |
| | 264 | | | Citigroup Global Markets Mortgage Securities VII, Inc., Series 2003-UP1, Class A, SUB, 3.950%, 04/25/32 (e) | | | 262 | |
| | 443 | | | Citigroup Mortgage Loan Trust, Inc., Series 2003-HE3, Class A, VAR, 0.904%, 12/25/33 | | | 435 | |
| | 20,177 | | | Colony American Finance Ltd., (Cayman Islands), Series 2016-1, Class A, 2.544%, 06/15/48 (e) | | | 20,181 | |
| | 23,510 | | | Colony American Homes, Series 2014-2A, Class A, VAR, 1.472%, 07/17/31 (e) | | | 23,332 | |
| | 26,904 | | | Concord Funding Co. LLC, Series 2012-2, Class A, 3.145%, 01/15/17 (e) | | | 26,916 | |
| | 8,628 | | | Conix Mortgage Asset Trust, Series 2013-1, Class A, VAR, 4.704%, 12/25/47 | | | 1,432 | |
| | 2,231 | | | Consumer Credit Origination Loan Trust, Series 2015-1, Class A, 2.820%, 03/15/21 (e) | | | 2,232 | |
| | 19,583 | | | COOF Securitization Trust Ltd., Series 2014-1, Class A, IO, VAR, 2.893%, 06/25/40 (e) | | | 2,514 | |
SEE NOTES TO FINANCIAL STATEMENTS.
| | | | | | |
| | | |
| 24 | | | | J.P. MORGAN INCOME FUNDS | | AUGUST 31, 2016 |
| | | | | | | | |
PRINCIPAL
AMOUNT($) | | | SECURITY DESCRIPTION | | VALUE($) | |
| Asset-Backed Securities — continued | |
| | | | CPS Auto Receivables Trust, | | | | |
| | 2,723 | | | Series 2012-B, Class A, 2.520%, 09/16/19 (e) | | | 2,725 | |
| | 2,321 | | | Series 2013-A, Class A, 1.310%, 06/15/20 (e) | | | 2,299 | |
| | 351 | | | Series 2013-C, Class A, 1.640%, 04/16/18 (e) | | | 351 | |
| | 1,290 | | | Series 2013-D, Class A, 1.540%, 07/16/18 (e) | | | 1,290 | |
| | 1,489 | | | Series 2014-A, Class A, 1.210%, 08/15/18 (e) | | | 1,488 | |
| | 2,910 | | | Series 2014-B, Class A, 1.110%, 11/15/18 (e) | | | 2,903 | |
| | 6,350 | | | Series 2014-B, Class C, 3.230%, 05/15/20 (e) | | | 6,253 | |
| | 4,101 | | | Series 2014-C, Class A, 1.310%, 02/15/19 (e) | | | 4,094 | |
| | 4,347 | | | Series 2014-C, Class C, 3.770%, 08/17/20 (e) | | | 4,270 | |
| | 8,489 | | | Series 2014-D, Class A, 1.490%, 04/15/19 (e) | | | 8,480 | |
| | 4,000 | | | Series 2014-D, Class C, 4.350%, 11/16/20 (e) | | | 3,933 | |
| | 8,040 | | | Series 2015-A, Class A, 1.530%, 07/15/19 (e) | | | 8,029 | |
| | 2,900 | | | Series 2015-A, Class C, 4.000%, 02/16/21 (e) | | | 2,823 | |
| | 25,798 | | | Series 2015-B, Class A, 1.650%, 11/15/19 (e) | | | 25,746 | |
| | 16,500 | | | Series 2015-B, Class C, 4.200%, 05/17/21 (e) | | | 15,883 | |
| | 5,849 | | | Series 2015-C, Class D, 4.630%, 08/16/21 (e) | | | 5,776 | |
| | 14,569 | | | Series 2016-A, Class A, 2.250%, 10/15/19 (e) | | | 14,619 | |
| | 8,013 | | | Series 2016-B, Class A, 2.070%, 11/15/19 (e) | | | 8,031 | |
| | 2,456 | | | Series 2016-B, Class B, 3.180%, 09/15/20 (e) | | | 2,465 | |
| | 7,840 | | | Series 2016-C, Class C, 3.270%, 06/15/22 (e) | | | 7,810 | |
| | | | CPS Auto Trust, | | | | |
| | 2,083 | | | Series 2012-C, Class A, 1.820%, 12/16/19 (e) | | | 2,079 | |
| | 1,219 | | | Series 2012-D, Class A, 1.480%, 03/16/20 (e) | | | 1,217 | |
| | | | Credit Acceptance Auto Loan Trust, | | | | |
| | 11,847 | | | Series 2014-1A, Class A, 1.550%, 10/15/21 (e) | | | 11,843 | |
| | | | | | | | |
PRINCIPAL
AMOUNT($) | | | SECURITY DESCRIPTION | | VALUE($) | |
| | | | | | | | |
| | 17,727 | | | Series 2015-2A, Class A, 2.400%, 02/15/23 (e) | | | 17,771 | |
| | 2,605 | | | Series 2015-2A, Class C, 3.760%, 02/15/24 (e) | | | 2,602 | |
| | | | CWABS, Inc. Asset-Backed Certificates, | | | | |
| | 280 | | | Series 2003-5, Class MF1, VAR, 5.403%, 01/25/34 | | | 279 | |
| | 10 | | | Series 2004-1, Class 3A, VAR, 1.084%, 04/25/34 | | | 8 | |
| | 635 | | | Series 2004-1, Class M1, VAR, 1.274%, 03/25/34 | | | 611 | |
| | 243 | | | CWABS, Inc. Asset-Backed Certificates Trust, Series 2004-6, Class M1, VAR, 1.424%, 10/25/34 | | | 228 | |
| | 91 | | | CWABS, Inc., Asset-Backed Certificates, Series 2004-1, Class M2, VAR, 1.349%, 03/25/34 | | | 84 | |
| | | | Drive Auto Receivables Trust, | | | | |
| | 12,065 | | | Series 2015-AA, Class D, 4.120%, 07/15/22 (e) | | | 12,346 | |
| | 15,484 | | | Series 2015-BA, Class B, 2.120%, 06/17/19 (e) | | | 15,504 | |
| | 14,251 | | | Series 2015-BA, Class D, 3.840%, 07/15/21 (e) | | | 14,372 | |
| | 6,588 | | | Series 2015-CA, Class D, 4.200%, 09/15/21 (e) | | | 6,574 | |
| | 2,640 | | | Series 2015-DA, Class D, 4.590%, 01/17/23 (e) | | | 2,731 | |
| | 13,085 | | | Series 2016-AA, Class B, 3.170%, 05/15/20 (e) | | | 13,227 | |
| | 16,810 | | | Series 2016-AA, Class C, 3.910%, 05/17/21 (e) | | | 17,201 | |
| | 3,182 | | | Series 2016-BA, Class B, 2.560%, 06/15/20 (e) | | | 3,198 | |
| | | | DT Auto Owner Trust, | | | | |
| | 3,498 | | | Series 2015-2A, Class A, 1.240%, 09/17/18 (e) | | | 3,498 | |
| | 12,166 | | | Series 2015-2A, Class D, 4.250%, 02/15/22 (e) | | | 12,145 | |
| | 14,959 | | | Series 2016-1A, Class A, 2.000%, 09/16/19 (e) | | | 14,985 | |
| | 11,818 | | | Series 2016-2A, Class A, 1.730%, 08/15/19 (e) | | | 11,807 | |
| | 5,808 | | | Series 2016-2A, Class C, 3.670%, 01/18/22 (e) | | | 5,930 | |
| | | | Exeter Automobile Receivables Trust, | | | | |
| | 235 | | | Series 2014-2A, Class A, 1.060%, 08/15/18 (e) | | | 235 | |
| | 2,595 | | | Series 2014-2A, Class C, 3.260%, 12/16/19 (e) | | | 2,608 | |
SEE NOTES TO FINANCIAL STATEMENTS.
| | | | | | | | |
| | | |
| AUGUST 31, 2016 | | J.P. MORGAN INCOME FUNDS | | | | | 25 | |
JPMorgan Core Bond Fund
SCHEDULE OF PORTFOLIO INVESTMENTS
AS OF AUGUST 31, 2016 (Unaudited) (continued)
(Amounts in thousands)
| | | | | | | | |
PRINCIPAL
AMOUNT($) | | | SECURITY DESCRIPTION | | VALUE($) | |
| Asset-Backed Securities — continued | |
| | 3,920 | | | Series 2014-3A, Class A, 1.320%, 01/15/19 (e) | | | 3,915 | |
| | 5,389 | | | Series 2014-3A, Class B, 2.770%, 11/15/19 (e) | | | 5,431 | |
| | 5,550 | | | Series 2015-1A, Class A, 1.600%, 06/17/19 (e) | | | 5,556 | |
| | 9,000 | | | Series 2015-1A, Class B, 2.840%, 03/16/20 (e) | | | 8,980 | |
| | 9,311 | | | Series 2015-2A, Class A, 1.540%, 11/15/19 (e) | | | 9,290 | |
| | 12,582 | | | Series 2015-3A, Class A, 2.000%, 03/16/20 (e) | | | 12,573 | |
| | 15,414 | | | Series 2016-2A, Class A, 2.210%, 07/15/20 (e) | | | 15,385 | |
| | 7,800 | | | Series 2016-2A, Class B, 3.640%, 02/15/22 (e) | | | 7,772 | |
| | 1,726 | | | Fifth Third Auto Trust, Series 2014-3, Class A3, 0.960%, 03/15/19 | | | 1,725 | |
| | | | First Investors Auto Owner Trust, | | | | |
| | 543 | | | Series 2014-3A, Class A2, 1.060%, 11/15/18 (e) | | | 543 | |
| | 4,892 | | | Series 2014-3A, Class A3, 1.670%, 11/16/20 (e) | | | 4,894 | |
| | 3,711 | | | Series 2015-1A, Class A2, 1.210%, 04/15/19 (e) | | | 3,706 | |
| | 5,530 | | | Series 2015-2A, Class A1, 1.590%, 12/16/19 (e) | | | 5,519 | |
| | 2,933 | | | Series 2015-2A, Class D, 4.220%, 12/15/21 (e) | | | 2,869 | |
| | 17,817 | | | Series 2016-1A, Class A1, 1.920%, 05/15/20 (e) | | | 17,845 | |
| | | | FirstKey Lending Trust, | | | | |
| | 29,615 | | | Series 2015-SFR1, Class A, 2.553%, 03/09/47 (e) | | | 29,521 | |
| | 11,055 | | | Series 2015-SFR1, Class B, 3.417%, 03/09/47 (e) | | | 11,098 | |
| | | | Flagship Credit Auto Trust, | | | | |
| | 2,215 | | | Series 2013-2, Class A, 1.940%, 01/15/19 (e) | | | 2,216 | |
| | 1,895 | | | Series 2014-1, Class A, 1.210%, 04/15/19 (e) | | | 1,892 | |
| | 2,220 | | | Series 2014-1, Class B, 2.550%, 02/18/20 (e) | | | 2,223 | |
| | 6,757 | | | Series 2014-2, Class A, 1.430%, 12/16/19 (e) | | | 6,737 | |
| | 7,359 | | | Series 2014-2, Class B, 2.840%, 11/16/20 (e) | | | 7,390 | |
| | 3,958 | | | Series 2014-2, Class C, 3.950%, 12/15/20 (e) | | | 3,973 | |
| | | | | | | | |
PRINCIPAL
AMOUNT($) | | | SECURITY DESCRIPTION | | VALUE($) | |
| | | | | | | | |
| | 11,714 | | | Series 2015-1, Class A, 1.630%, 06/15/20 (e) | | | 11,669 | |
| | 17,379 | | | Series 2015-3, Class A, 2.380%, 10/15/20 (e) | | | 17,447 | |
| | 5,299 | | | Series 2015-3, Class B, 3.680%, 03/15/22 (e) | | | 5,422 | |
| | 5,163 | | | Series 2015-3, Class C, 4.650%, 03/15/22 (e) | | | 5,275 | |
| | 26,014 | | | Series 2016-1, Class A, 2.770%, 12/15/20 (e) | | | 26,141 | |
| | 3,150 | | | Series 2016-2, Class B, 3.840%, 09/15/22 (e) | | | 3,244 | |
| | 21,080 | | | Series 2016-2, Class C, 6.220%, 09/15/22 (e) | | | 22,683 | |
| | | | Ford Credit Auto Lease Trust, | | | | |
| | 920 | | | Series 2014-B, Class A3, 0.890%, 09/15/17 | | | 919 | |
| | 2,970 | | | Series 2014-B, Class A4, 1.100%, 11/15/17 | | | 2,970 | |
| | | | Ford Credit Auto Owner Trust, | | | | |
| | 3,675 | | | Series 2014-B, Class A3, 0.900%, 10/15/18 | | | 3,673 | |
| | 5,168 | | | Series 2014-C, Class A3, 1.060%, 05/15/19 | | | 5,168 | |
| | 9,816 | | | Series 2015-A, Class A3, 1.280%, 09/15/19 | | | 9,833 | |
| | 7,756 | | | Series 2016-B, Class A3, 1.330%, 10/15/20 | | | 7,774 | |
| | 1,393 | | | Freedom Trust, Series 2012-2, Class A24, VAR, 5.979%, 10/26/42 (e) | | | 1,402 | |
| | 494 | | | FRT Trust, Series 2013-1A, Class A2N, SUB, 5.000%, 10/25/33 (e) | | | 487 | |
| | 18,471 | | | GCAT, Series 2015-2, Class A1, SUB, 3.750%, 07/25/20 (e) | | | 18,374 | |
| | 413 | | | GE Capital Mortgage Services, Inc. Trust, Series 1999-HE1, Class M, VAR, 6.705%, 04/25/29 | | | 349 | |
| | | | GLC II Trust, | | | | |
| | 6,637 | | | Series 2014-A, Class A, 4.000%, 12/18/20 (e) | | | 6,554 | |
| | 1,261 | | | Series 2014-A, Class B, 6.000%, 12/18/20 (e) | | | 1,233 | |
| | | | GLC Trust, | | | | |
| | 7,219 | | | Series 2014-A, Class A, 3.000%, 07/15/21 (e) | | | 7,169 | |
| | 602 | | | Series 2014-A, Class B, 4.000%, 07/15/21 (e) | | | 588 | |
| | | | GLS Auto Receivables Trust, | | | | |
| | 20,626 | | | Series 2015-1A, Class A, 2.250%, 12/15/20 (e) | | | 20,584 | |
SEE NOTES TO FINANCIAL STATEMENTS.
| | | | | | |
| | | |
| 26 | | | | J.P. MORGAN INCOME FUNDS | | AUGUST 31, 2016 |
| | | | | | | | |
PRINCIPAL
AMOUNT($) | | | SECURITY DESCRIPTION | | VALUE($) | |
| Asset-Backed Securities — continued | |
| | 9,473 | | | Series 2015-1A, Class B, 4.430%, 12/15/20 (e) | | | 9,538 | |
| | 31,140 | | | Series 2016-1A, Class A, 2.730%, 10/15/20 (e) | | | 31,297 | |
| | 8,500 | | | Series 2016-1A, Class C, 6.900%, 10/15/21 (e) | | | 8,961 | |
| | | | GM Financial Automobile Leasing Trust, | | | | |
| | 8,903 | | | Series 2015-1, Class A2, 1.100%, 12/20/17 | | | 8,901 | |
| | 10,058 | | | Series 2015-1, Class A3, 1.530%, 09/20/18 | | | 10,092 | |
| | 4,191 | | | Series 2015-1, Class A4, 1.730%, 06/20/19 | | | 4,206 | |
| | 3,461 | | | GMAT Trust, Series 2013-1A, Class A, SUB, 3.967%, 11/25/43 (e) | | | 3,460 | |
| | | | GO Financial Auto Securitization Trust, | | | | |
| | 3,828 | | | Series 2015-1, Class A, 1.810%, 03/15/18 (e) | | | 3,822 | |
| | 8,462 | | | Series 2015-1, Class B, 3.590%, 10/15/20 (e) | | | 8,431 | |
| | 11,580 | | | Series 2015-2, Class A, 3.270%, 11/15/18 (e) | | | 11,636 | |
| | 8,222 | | | Gold Key Resorts LLC, Series 2014-A, Class A, 3.220%, 03/17/31 (e) | | | 8,238 | |
| | 8,855 | | | Green Tree Agency Advance Funding Trust I, Series 2015-T1, Class CT1, 3.438%, 10/15/46 (e) | | | 8,848 | |
| | 612 | | | Home Equity Mortgage Loan Asset-Backed Trust, Series 2006-A, Class A3, VAR, 0.724%, 03/25/36 | | | 555 | |
| | | | Honda Auto Receivables Owner Trust, | | | | |
| | 700 | | | Series 2013-4, Class A3, 0.690%, 09/18/17 | | | 699 | |
| | 700 | | | Series 2013-4, Class A4, 1.040%, 02/18/20 | | | 700 | |
| | 3,509 | | | Series 2014-2, Class A3, 0.770%, 03/19/18 | | | 3,506 | |
| | 298 | | | Series 2015-1, Class A2, 0.700%, 06/15/17 | | | 298 | |
| | 12,800 | | | Series 2016-1, Class A2, 1.010%, 06/18/18 | | | 12,791 | |
| | | | HSBC Home Equity Loan Trust USA, | | | | |
| | 162 | | | Series 2007-1, Class AS, VAR, 0.712%, 03/20/36 | | | 161 | |
| | 2,522 | | | Series 2007-3, Class APT, VAR, 1.712%, 11/20/36 | | | 2,516 | |
| | | | Hyundai Auto Receivables Trust, | | | | |
| | 4,759 | | | Series 2014-B, Class A3, 0.900%, 12/17/18 | | | 4,755 | |
| | | | | | | | |
PRINCIPAL
AMOUNT($) | | | SECURITY DESCRIPTION | | VALUE($) | |
| | | | | | | | |
| | 2,546 | | | Series 2015-B, Class A2A, 0.690%, 04/16/18 | | | 2,545 | |
| | 9,311 | | | Series 2015-B, Class A3, 1.120%, 11/15/19 | | | 9,303 | |
| | 6,560 | | | Series 2016-A, Class A3, 1.560%, 09/15/20 | | | 6,608 | |
| | 21,877 | | | Invitation Homes Trust, Series 2014-SFR1, Class A, VAR, 1.507%, 06/17/31 (e) | | | 21,756 | |
| | | | KGS-Alpha SBA COOF Trust, | | | | |
| | 79,494 | | | Series 2012-2, Class A, IO, VAR, 0.878%, 08/25/38 (e) | | | 2,149 | |
| | 21,839 | | | Series 2012-3, Class A, IO, VAR, 1.432%, 09/25/26 (e) | | | 399 | |
| | 112,496 | | | Series 2012-4, Class A, IO, VAR, 09/25/37 (e) | | | 4,130 | |
| | 47,401 | | | Series 2012-6, Class A, IO, VAR, 0.620%, 05/25/39 (e) | | | 889 | |
| | 54,390 | | | Series 2013-2, Class A, IO, VAR, 1.596%, 03/25/39 (e) | | | 2,541 | |
| | 47,715 | | | Series 2014-1, Class A, IO, VAR, 1.347%, 10/25/32 (e) | | | 1,864 | |
| | 16,312 | | | Series 2014-2, Class A, IO, VAR, 3.168%, 04/25/40 (e) | | | 1,927 | |
| | 19,434 | | | Series 2015-2, Class A, IO, VAR, 2.899%, 07/25/41 (e) | | | 2,578 | |
| | 9,329 | | | LendingClub Issuance Trust, Series 2016-NP1, Class A, 3.750%, 06/15/22 (e) | | | 9,341 | |
| | 20,739 | | | Lendmark Funding Trust, Series 2016-A, Class A, 4.820%, 08/21/23 (e) | | | 20,563 | |
| | | | Long Beach Mortgage Loan Trust, | | | | |
| | 3,645 | | | Series 2004-1, Class M1, VAR, 1.274%, 02/25/34 (e) | | | 3,458 | |
| | 546 | | | Series 2004-3, Class M1, VAR, 1.379%, 07/25/34 | | | 524 | |
| | 471 | | | Series 2006-WL2, Class 2A3, VAR, 0.724%, 01/25/36 (e) | | | 457 | |
| | | | LV Tower 52 Issuer LLC, | | | | |
| | 24,339 | | | Series 2013-1, Class A, 5.500%, 07/15/19 (e) | | | 23,723 | |
| | 9,028 | | | Series 2013-1, Class M, 7.500%, 07/15/19 (e) | | | 8,498 | |
| | | | MarketPlace Loan Trust, | | | | |
| | 1,504 | | | Series 2015-OD3, Class A, 3.250%, 09/17/17 (e) | | | 1,496 | |
| | 5,507 | | | Series 2015-OD3, Class B, 5.250%, 09/17/17 (e) | | | 5,469 | |
| | 4,736 | | | Series 2015-OD4, Class A, 3.250%, 12/18/17 (e) | | | 4,738 | |
| | 7,249 | | | Series 2015-OD4, Class B, 5.250%, 12/18/17 (e) | | | 7,204 | |
SEE NOTES TO FINANCIAL STATEMENTS.
| | | | | | | | |
| | | |
| AUGUST 31, 2016 | | J.P. MORGAN INCOME FUNDS | | | | | 27 | |
JPMorgan Core Bond Fund
SCHEDULE OF PORTFOLIO INVESTMENTS
AS OF AUGUST 31, 2016 (Unaudited) (continued)
(Amounts in thousands)
| | | | | | | | |
PRINCIPAL
AMOUNT($) | | | SECURITY DESCRIPTION | | VALUE($) | |
| Asset-Backed Securities — continued | |
| | 30,371 | | | Marlette Funding Trust, Series 2016-1A, Class A, 3.060%, 01/17/23 (e) | | | 30,396 | |
| | 12,654 | | | Mercedes-Benz Auto Receivables Trust, Series 2015-1, Class A2A, 0.820%, 06/15/18 | | | 12,647 | |
| | 8,222 | | | Mid-State Capital Corp. Trust, Series 2006-1, Class M1, 6.083%, 10/15/40 (e) | | | 8,581 | |
| | | | Mid-State Capital Trust, | | | | |
| | 3,944 | | | Series 2010-1, Class A, 3.500%, 12/15/45 (e) | | | 4,038 | |
| | 7,098 | | | Series 2010-1, Class M, 5.250%, 12/15/45 (e) | | | 7,526 | |
| | | | Nationstar HECM Loan Trust, | | | | |
| | 1,160 | | | Series 2015-2A, Class A, 2.883%, 11/25/25 (e) | | | 1,160 | |
| | 7,858 | | | Series 2016-1A, Class A, 2.981%, 02/25/26 (e) | | | 7,853 | |
| | 8,828 | | | Series 2016-1A, Class M1, 4.360%, 02/25/26 (e) | | | 8,829 | |
| | 7,404 | | | Series 2016-2A, Class A, 2.239%, 06/25/26 (e) | | | 7,404 | |
| | 8,914 | | | Series 2016-3A, Class A, 2.013%, 08/25/26 (e) | | | 8,914 | |
| | 2,578 | | | New Century Home Equity Loan Trust, Series 2003-5, Class AI6, SUB, 5.171%, 11/25/33 | | | 2,647 | |
| | 11,891 | | | Nissan Auto Lease Trust, Series 2015-A, Class A2A, 0.990%, 11/15/17 | | | 11,890 | |
| | | | Nissan Auto Receivables Owner Trust, | | | | |
| | 3,418 | | | Series 2014-B, Class A3, 1.110%, 05/15/19 | | | 3,419 | |
| | 6,326 | | | Series 2016-B, Class A3, 1.320%, 01/15/21 | | | 6,341 | |
| | | | NRPL Trust, | | | | |
| | 15,126 | | | Series 2015-1A, Class A1, SUB, 3.875%, 11/01/54 (e) | | | 15,021 | |
| | 12,500 | | | Series 2015-1A, Class A2, SUB, 3.875%, 11/01/54 (e) | | | 12,407 | |
| | 34,055 | | | Series 2015-2A, Class A1, SUB, 3.750%, 10/25/57 (e) | | | 33,307 | |
| | 7,000 | | | Series 2015-2A, Class A2, SUB, 3.750%, 10/25/57 (e) | | | 6,621 | |
| | | | NRZ Advance Receivables Trust Advance Receivables Backed Notes, | | | | |
| | 14,811 | | | Series 2015-T2, Class DT2, 4.679%, 08/17/48 (e) | | | 14,752 | |
| | 9,747 | | | Series 2016-T1, Class AT1, 2.751%, 06/15/49 (e) | | | 9,715 | |
| | | | | | | | |
PRINCIPAL
AMOUNT($) | | | SECURITY DESCRIPTION | | VALUE($) | |
| | | | | | | | |
| | | | Oak Hill Advisors Residential Loan Trust, | | | | |
| | 14,332 | | | Series 2015-NPL2, Class A1, SUB, 3.721%, 07/25/55 (e) | | | 14,205 | |
| | 5,128 | | | Series 2015-NPL2, Class A2, SUB, 4.000%, 07/25/55 (e) | | | 5,027 | |
| | | | Ocwen Master Advance Receivables Trust, | | | | |
| | 20,536 | | | Series 2015-T3, Class AT3, 3.211%, 11/15/47 (e) | | | 20,547 | |
| | 3,921 | | | Series 2015-T3, Class BT3, 3.704%, 11/15/47 (e) | | | 3,921 | |
| | 3,894 | | | Series 2015-T3, Class CT3, 4.196%, 11/15/47 (e) | | | 3,903 | |
| | 14,999 | | | Series 2015-T3, Class DT3, 4.687%, 11/15/47 (e) | | | 15,004 | |
| | 9,662 | | | Series 2016-T1, Class AT1, 2.521%, 08/17/48 (e) | | | 9,656 | |
| | 4,384 | | | Series 2016-T1, Class DT1, 4.246%, 08/17/48 (e) | | | 4,381 | |
| | | | OnDeck Asset Securitization Trust II LLC, | | | | |
| | 14,247 | | | Series 2016-1A, Class A, 4.210%, 05/17/20 (e) | | | 14,318 | |
| | 7,826 | | | Series 2016-1A, Class B, 7.630%, 05/17/20 (e) | | | 7,944 | |
| | | | OneMain Direct Auto Receivables Trust, | | | | |
| | 25,355 | | | Series 2016-1A, Class A, 2.040%, 01/15/21 (e) | | | 25,316 | |
| | 5,057 | | | Series 2016-1A, Class C, 4.580%, 09/15/21 (e) | | | 5,040 | |
| | | | OneMain Financial Issuance Trust, | | | | |
| | 18,916 | | | Series 2014-1A, Class A, 2.430%, 06/18/24 (e) | | | 18,935 | |
| | 3,571 | | | Series 2014-1A, Class B, 3.240%, 06/18/24 (e) | | | 3,579 | |
| | 38,001 | | | Series 2014-2A, Class A, 2.470%, 09/18/24 (e) | | | 38,058 | |
| | 11,466 | | | Series 2014-2A, Class B, 3.020%, 09/18/24 (e) | | | 11,439 | |
| | 28,767 | | | Series 2015-1A, Class A, 3.190%, 03/18/26 (e) | | | 29,079 | |
| | 10,800 | | | Series 2015-1A, Class B, 3.850%, 03/18/26 (e) | | | 10,732 | |
| | 56,051 | | | Series 2015-2A, Class A, 2.570%, 07/18/25 (e) | | | 56,110 | |
| | 11,620 | | | Series 2015-2A, Class B, 3.100%, 07/18/25 (e) | | | 11,371 | |
| | 12,500 | | | Series 2016-1A, Class C, 6.000%, 02/20/29 (e) | | | 12,587 | |
| | 30,435 | | | Series 2016-2A, Class C, SUB, 7.200%, 03/20/28 (e) | | | 30,408 | |
SEE NOTES TO FINANCIAL STATEMENTS.
| | | | | | |
| | | |
| 28 | | | | J.P. MORGAN INCOME FUNDS | | AUGUST 31, 2016 |
| | | | | | | | |
PRINCIPAL
AMOUNT($) | | | SECURITY DESCRIPTION | | VALUE($) | |
| Asset-Backed Securities — continued | |
| | 5,675 | | | OneMain Financial Issuance Trust 2016-2, Series 2016-2A, Class B, 5.940%, 03/20/28 (e) | | | 5,903 | |
| | | | Oportun Funding II LLC, | | | | |
| | 29,486 | | | Series 2016-A, Class A, 4.700%, 03/08/21 (e) | | | 29,486 | |
| | 11,354 | | | Series 2016-A, Class B, 6.410%, 03/08/21 (e) | | | 11,347 | |
| | | | Oportun Funding III LLC, | | | | |
| | 24,511 | | | Series 2016-B, Class A, 3.690%, 07/08/21 (e) | | | 24,438 | |
| | 2,677 | | | Series 2016-B, Class B, 5.160%, 07/08/21 (e) | | | 2,669 | |
| | 134 | | | Option One Mortgage Loan Trust, Series 2003-1, Class A2, VAR, 1.364%, 02/25/33 | | | 126 | |
| | 2,161 | | | PFS Tax Lien Trust, Series 2014-1, 1.440%, 05/15/29 (e) | | | 2,148 | |
| | | | Pretium Mortgage Credit Partners I LLC, | | | | |
| | 12,767 | | | Series 2015-NPL2, Class A1, SUB, 3.750%, 07/27/30 (e) | | | 12,771 | |
| | 12,483 | | | Series 2015-NPL2, Class A2, SUB, 4.250%, 07/27/30 (e) | | | 12,298 | |
| | | | Progreso Receivables Funding III LLC, | | | | |
| | 24,831 | | | Series 2015-A, Class A, 3.625%, 02/08/20 (e) | | | 24,839 | |
| | 7,935 | | | Series 2015-A, Class B, 5.500%, 02/08/20 (e) | | | 7,945 | |
| | | | Progreso Receivables Funding IV LLC, | | | | |
| | 13,022 | | | Series 2015-B, Class A, 3.000%, 07/28/20 (e) | | | 12,964 | |
| | 6,046 | | | Series 2015-B, Class B, 5.000%, 07/28/20 (e) | | | 6,040 | |
| | | | Progress Residential Trust, | | | | |
| | 26,662 | | | Series 2015-SFR2, Class A, 2.740%, 06/12/32 (e) | | | 27,012 | |
| | 7,295 | | | Series 2015-SFR2, Class B, 3.138%, 06/12/32 (e) | | | 7,377 | |
| | 16,110 | | | Series 2015-SFR2, Class C, 3.436%, 06/12/32 (e) | | | 16,203 | |
| | 8,917 | | | Series 2015-SFR2, Class E, 4.427%, 06/12/32 (e) | | | 8,830 | |
| | 32,590 | | | Series 2015-SFR3, Class A, 3.067%, 11/12/32 (e) | | | 33,461 | |
| | 1,791 | | | Series 2015-SFR3, Class D, 4.673%, 11/12/32 (e) | | | 1,866 | |
| | 4,000 | | | Series 2015-SFR3, Class E, 5.660%, 11/12/32 (e) | | | 4,140 | |
| | | | | | | | |
PRINCIPAL
AMOUNT($) | | | SECURITY DESCRIPTION | | VALUE($) | |
| | | | | | | | |
| | | | Purchasing Power Funding LLC, | | | | |
| | 28,000 | | | Series 2015-A, Class A2, 4.750%, 12/15/19 (e) | | | 28,052 | |
| | 7,446 | | | Series 2015-A, Class B, 6.000%, 12/15/19 (e) | | | 7,409 | |
| | | | RAMP Trust, | | | | |
| | 994 | | | Series 2004-RS11, Class M1, VAR, 1.454%, 11/25/34 (e) | | | 988 | |
| | 5,591 | | | Series 2006-RZ1, Class A3, VAR, 0.824%, 03/25/36 (e) | | | 5,547 | |
| | | | RASC Trust, | | | | |
| | 41 | | | Series 2002-KS4, Class AIIB, VAR, 1.024%, 07/25/32 | | | 37 | |
| | 46 | | | Series 2003-KS5, Class AIIB, VAR, 1.104%, 07/25/33 | | | 41 | |
| | 57 | | | Series 2003-KS9, Class A2B, VAR, 1.164%, 11/25/33 | | | 48 | |
| | 3,506 | | | RBSHD Trust, Series 2013-1A, Class A, SUB, 7.685%, 10/25/47 (e) | | | 3,506 | |
| | 97 | | | Renaissance Home Equity Loan Trust, Series 2007-2, Class AF2, SUB, 5.675%, 06/25/37 | | | 45 | |
| | 12,762 | | | RMAT LLC, Series 2015-NPL1, Class A1, SUB, 3.750%, 05/25/55 (e) | | | 12,659 | |
| | | | Santander Drive Auto Receivables Trust, | | | | |
| | 2,400 | | | Series 2015-3, Class A3, 1.490%, 06/17/19 | | | 2,403 | |
| | 2,000 | | | Series 2015-4, Class A3, 1.580%, 09/16/19 | | | 2,004 | |
| | 5,906 | | | Series 2015-S1, Class R1, 1.930%, 09/17/19 (e) | | | 5,862 | |
| | 468 | | | Series 2015-S2, Class R1, 1.840%, 11/18/19 (e) | | | 468 | |
| | 4,289 | | | Series 2015-S7, Class R1, 1.970%, 03/16/21 (e) | | | 4,257 | |
| | 5,319 | | | Series 2016-1, Class A2A, 1.410%, 07/15/19 | | | 5,322 | |
| | 8,849 | | | Series 2016-1, Class A3, 1.620%, 03/16/20 | | | 8,850 | |
| | 1,030 | | | Saxon Asset Securities Trust, Series 2003-1, Class AF6, SUB, 4.795%, 06/25/33 (e) | | | 1,039 | |
| | 669 | | | Securitized Asset-Backed Receivables LLC Trust, Series 2006-CB1, Class AF2, SUB, 3.392%, 01/25/36 | | | 498 | |
| | 3,188 | | | Selene Non-Performing Loans LLC, Series 2014-1A, Class A, SUB, 2.981%, 05/25/54 (e) | | | 3,167 | |
| | 4,467 | | | Sierra Auto Receivables Securitization Trust, Series 2016-1A, Class A, 2.850%, 01/18/22 (e) | | | 4,460 | |
SEE NOTES TO FINANCIAL STATEMENTS.
| | | | | | | | |
| | | |
| AUGUST 31, 2016 | | J.P. MORGAN INCOME FUNDS | | | | | 29 | |
JPMorgan Core Bond Fund
SCHEDULE OF PORTFOLIO INVESTMENTS
AS OF AUGUST 31, 2016 (Unaudited) (continued)
(Amounts in thousands)
| | | | | | | | |
PRINCIPAL
AMOUNT($) | | | SECURITY DESCRIPTION | | VALUE($) | |
| Asset-Backed Securities — continued | |
| | 4,088 | | | Skopos Auto Receivables Trust, Series 2015-2A, Class A, 3.550%, 02/15/20 (e) | | | 4,080 | |
| | 19,032 | | | SoFi Consumer Loan Program LLC, Series 2016-2A, Class A, 3.090%, 10/27/25 (e) | | | 19,185 | |
| | | | SpringCastle America Funding LLC, | | | | |
| | 28,521 | | | Series 2014-AA, Class A, 2.700%, 05/25/23 (e) | | | 28,543 | |
| | 13,500 | | | Series 2014-AA, Class B, 4.610%, 10/25/27 (e) | | | 13,480 | |
| | | | Springleaf Funding Trust, | | | | |
| | 32,623 | | | Series 2014-AA, Class A, 2.410%, 12/15/22 (e) | | | 32,643 | |
| | 3,616 | | | Series 2014-AA, Class B, 3.450%, 12/15/22 (e) | | | 3,618 | |
| | 38,406 | | | Series 2015-AA, Class A, 3.160%, 11/15/24 (e) | | | 38,731 | |
| | 8,805 | | | Series 2015-AA, Class B, 3.620%, 11/15/24 (e) | | | 8,627 | |
| | 15,206 | | | Spruce ABS Trust, Series 2016-E1, Class A, 4.320%, 06/15/28 (e) | | | 15,190 | |
| | | | SPS Servicer Advance Receivables Trust Advance Receivables Backed Notes, | | | | |
| | 10,295 | | | Series 2015-T2, Class CT2, 3.740%, 01/15/47 (e) | | | 10,296 | |
| | 9,453 | | | Series 2015-T2, Class DT2, 4.230%, 01/15/47 (e) | | | 9,453 | |
| | 1,619 | | | Series 2015-T3, Class CT3, 3.910%, 07/15/47 (e) | | | 1,621 | |
| | | | Structured Asset Securities Corp. Mortgage Pass-Through Certificates, | | | | |
| | 538 | | | Series 2002-AL1, Class A2, 3.450%, 02/25/32 | | | 536 | |
| | 1,183 | | | Series 2002-AL1, Class A3, 3.450%, 02/25/32 | | | 1,173 | |
| | 1,861 | | | Series 2004-6XS, Class A5A, SUB, 6.030%, 03/25/34 | | | 1,863 | |
| | 1,489 | | | Series 2004-6XS, Class A5B, SUB, 6.050%, 03/25/34 | | | 1,505 | |
| | 10,521 | | | Sunset Mortgage Loan Co. LLC, Series 2014-NPL2, Class A, SUB, 3.721%, 11/16/44 (e) | | | 10,465 | |
| | 3,776 | | | Tidewater Auto Receivables Trust, Series 2014-AA, Class C, 2.560%, 08/15/19 (e) | | | 3,777 | |
| | | | Toyota Auto Receivables Owner Trust, | | | | |
| | 4,028 | | | Series 2014-C, Class A3, 0.930%, 07/16/18 | | | 4,026 | |
| | 5,871 | | | Series 2016-B, Class A3, 1.300%, 04/15/20 | | | 5,874 | |
| | | | | | | | |
PRINCIPAL
AMOUNT($) | | | SECURITY DESCRIPTION | | VALUE($) | |
| | | | | | | | |
| | 23,536 | | | Trafigura Securitisation Finance plc, (Ireland), Series 2014-1A, Class A, VAR, 1.458%, 10/15/18 (e) | | | 23,183 | |
| | 6,034 | | | Tricon American Homes Trust, Series 2015-SFR1, Class A, VAR, 1.757%, 05/17/32 (e) | | | 5,990 | |
| | | | U.S. Residential Opportunity Fund III Trust, | | | | |
| | 16,652 | | | Series 2016-1III, Class A, SUB, 3.475%, 07/27/36 (e) | | | 16,658 | |
| | 22,030 | | | Series 2016-2III, Class A, SUB, 3.475%, 08/27/36 (e) | | | 22,010 | |
| | | | United Auto Credit Securitization Trust, | | | | |
| | 5,000 | | | Series 2016-1, Class B, 2.730%, 05/15/18 (e) | | | 5,004 | |
| | 6,000 | | | Series 2016-1, Class C, 3.550%, 08/15/19 (e) | | | 5,996 | |
| | 16,784 | | | Vericrest Opportunity Loan Trust, Series 2015-NPL3, Class A1, SUB, 3.375%, 10/25/58 (e) | | | 16,744 | |
| | 2,394 | | | Verizon Owner Trust, Series 2016-1A, Class A, 1.420%, 01/20/21 (e) | | | 2,394 | |
| | 3,988 | | | VML LLC, Series 2014-NPL1, Class A1, VAR, 3.875%, 04/27/54 (e) | | | 3,975 | |
| | 3,415 | | | Volkswagen Auto Lease Trust, Series 2015-A, Class A2A, 0.870%, 06/20/17 | | | 3,413 | |
| | 4,249 | | | VOLT NPL X LLC, Series 2014-NPL8, Class A1, SUB, 3.375%, 10/26/54 (e) | | | 4,243 | |
| | | | VOLT XIX LLC, | | | | |
| | 10,950 | | | Series 2014-NP11, Class A1, SUB, 3.875%, 04/25/55 (e) | | | 10,974 | |
| | 2,600 | | | Series 2014-NP11, Class A2, SUB, 5.000%, 04/25/55 (e) | | | 2,531 | |
| | 13,680 | | | VOLT XL LLC, Series 2015-NP14, Class A1, SUB, 4.375%, 11/27/45 (e) | | | 13,820 | |
| | 7,399 | | | VOLT XLV LLC, Series 2016-NPL5, Class A1, SUB, 4.000%, 05/25/46 (e) | | | 7,454 | |
| | 18,368 | | | VOLT XLVI LLC, Series 2016-NPL6, Class A1, SUB, 3.844%, 06/25/46 (e) | | | 18,457 | |
| | 12,158 | | | VOLT XLVII LLC, Series 2016-NPL7, Class A1, SUB, 3.750%, 06/25/46 (e) | | | 12,184 | |
| | | | VOLT XXII LLC, | | | | |
| | 12,923 | | | Series 2015-NPL4, Class A1, SUB, 3.500%, 02/25/55 (e) | | | 12,933 | |
| | 6,168 | | | Series 2015-NPL4, Class A2, SUB, 4.250%, 02/25/55 (e) | | | 5,913 | |
| | 18,633 | | | VOLT XXIV LLC, Series 2015-NPL6, Class A1, SUB, 3.500%, 02/25/55 (e) | | | 18,627 | |
| | 45,249 | | | VOLT XXV LLC, Series 2015-NPL8, Class A1, SUB, 3.500%, 06/26/45 (e) | | | 45,226 | |
SEE NOTES TO FINANCIAL STATEMENTS.
| | | | | | |
| | | |
| 30 | | | | J.P. MORGAN INCOME FUNDS | | AUGUST 31, 2016 |
| | | | | | | | |
PRINCIPAL
AMOUNT($) | | | SECURITY DESCRIPTION | | VALUE($) | |
| Asset-Backed Securities — continued | |
| | | | VOLT XXVI LLC, | | | | |
| | 11,686 | | | Series 2014-NPL6, Class A1, SUB, 3.125%, 09/25/43 (e) | | | 11,652 | |
| | 9,201 | | | Series 2014-NPL6, Class A2, SUB, 4.250%, 09/25/43 (e) | | | 8,901 | |
| | 20,816 | | | VOLT XXVII LLC, Series 2014-NPL7, Class A1, SUB, 3.375%, 08/27/57 (e) | | | 20,786 | |
| | 14,294 | | | VOLT XXX LLC, Series 2015-NPL1, Class A1, SUB, 3.625%, 10/25/57 (e) | | | 14,303 | |
| | 14,242 | | | VOLT XXXI LLC, Series 2015-NPL2, Class A1, SUB, 3.375%, 02/25/55 (e) | | | 14,235 | |
| | 13,094 | | | VOLT XXXIII LLC, Series 2015-NPL5, Class A1, SUB, 3.500%, 03/25/55 (e) | | | 13,093 | |
| | 26,261 | | | VOLT XXXIV LLC, Series 2015-NPL7, Class A1, SUB, 3.250%, 02/25/55 (e) | | | 26,190 | |
| | 13,793 | | | VOLT XXXV LLC, Series 2015-NPL9, Class A1, SUB, 3.500%, 06/26/45 (e) | | | 13,787 | |
| | | | Westgate Resorts LLC, | | | | |
| | 2,805 | | | Series 2013-1A, Class A, 2.250%, 08/20/25 (e) | | | 2,803 | |
| | 3,251 | | | Series 2015-1A, Class A, 2.750%, 05/20/27 (e) | | | 3,229 | |
| | 15,571 | | | Westlake Automobile Receivables Trust, Series 2016-2A, Class A2, 1.570%, 06/17/19 (e) | | | 15,550 | |
| | | | World Omni Auto Receivables Trust, | | | | |
| | 702 | | | Series 2013-B, Class A3, 0.830%, 08/15/18 | | | 702 | |
| | 1,398 | | | Series 2013-B, Class A4, 1.320%, 01/15/20 | | | 1,400 | |
| | 1,393 | | | Series 2015-A, Class A2A, 0.790%, 07/16/18 | | | 1,392 | |
| | 4,378 | | | Series 2015-A, Class A3, 1.340%, 05/15/20 | | | 4,387 | |
| | | | | | | | |
| | | | Total Asset-Backed Securities
(Cost $3,168,087) | | | 3,170,195 | |
| | | | | | | | |
| Collateralized Mortgage Obligations — 15.1% | |
| | | | Agency CMO — 12.7% | | | | |
| | 10,000 | | | Federal Home Loan Mortgage Corp., 09/25/31 (w) | | | 10,004 | |
| | | | Federal Home Loan Mortgage Corp. - Government National Mortgage Association, | | | | |
| | 163 | | | Series 8, Class ZA, 7.000%, 03/25/23 | | | 178 | |
| | 105 | | | Series 24, Class ZE, 6.250%, 11/25/23 | | | 117 | |
| | 756 | | | Series 29, Class L, 7.500%, 04/25/24 | | | 847 | |
| | | | Federal Home Loan Mortgage Corp. Reference REMIC, | | | | |
| | 5,216 | | | Series R006, Class ZA, 6.000%, 04/15/36 | | | 6,011 | |
| | 7,164 | | | Series R007, Class ZA, 6.000%, 05/15/36 | | | 8,118 | |
| | | | | | | | |
PRINCIPAL
AMOUNT($) | | | SECURITY DESCRIPTION | | VALUE($) | |
| | | | | | | | |
| | | | Agency CMO — continued | | | | |
| | | | Federal Home Loan Mortgage Corp. REMIC, | | | | |
| | 3 | | | Series 22, Class C, 9.500%, 04/15/20 | | | 3 | |
| | 6 | | | Series 23, Class F, 9.600%, 04/15/20 | | | 7 | |
| | 1 | | | Series 46, Class B, 7.800%, 09/15/20 | | | 1 | |
| | 1 | | | Series 47, Class F, 10.000%, 06/15/20 | | | 1 | |
| | — | (h) | | Series 85, Class C, 8.600%, 01/15/21 | | | — | (h) |
| | 5 | | | Series 99, Class Z, 9.500%, 01/15/21 | | | 5 | |
| | 18 | | | Series 114, Class H, 6.950%, 01/15/21 | | | 19 | |
| | — | (h) | | Series 204, Class E, HB, IF, 1,787.516%, 05/15/23 | | | 2 | |
| | — | (h) | | Series 1045, Class G, HB, 1,066.208%, 02/15/21 | | | — | (h) |
| | 4 | | | Series 1065, Class J, 9.000%, 04/15/21 | | | 4 | |
| | 1 | | | Series 1079, Class S, HB, IF, 32.274%, 05/15/21 | | | 2 | |
| | 3 | | | Series 1084, Class F, VAR, 1.458%, 05/15/21 | | | 3 | |
| | 2 | | | Series 1084, Class S, HB, IF, 42.941%, 05/15/21 | | | 3 | |
| | 5 | | | Series 1116, Class I, 5.500%, 08/15/21 | | | 5 | |
| | 25 | | | Series 1144, Class KB, 8.500%, 09/15/21 | | | 27 | |
| | — | (h) | | Series 1172, Class L, HB, VAR, 1,181.250%, 11/15/21 | | | — | (h) |
| | — | (h) | | Series 1196, Class B, HB, IF, 1,137.063%, 01/15/22 | | | 3 | |
| | 10 | | | Series 1206, Class IA, 7.000%, 03/15/22 | | | 11 | |
| | 16 | | | Series 1250, Class J, 7.000%, 05/15/22 | | | 17 | |
| | 46 | | | Series 1343, Class LA, 8.000%, 08/15/22 | | | 52 | |
| | 19 | | | Series 1343, Class LB, 7.500%, 08/15/22 | | | 21 | |
| | 32 | | | Series 1370, Class JA, VAR, 1.658%, 09/15/22 | | | 33 | |
| | 31 | | | Series 1455, Class WB, IF, 4.421%, 12/15/22 | | | 33 | |
| | 287 | | | Series 1466, Class PZ, 7.500%, 02/15/23 | | | 317 | |
| | 4 | | | Series 1470, Class F, VAR, 1.690%, 02/15/23 | | | 4 | |
| | 51 | | | Series 1491, Class I, 7.500%, 04/15/23 | | | 56 | |
| | 166 | | | Series 1498, Class I, VAR, 1.658%, 04/15/23 | | | 170 | |
| | 241 | | | Series 1502, Class PX, 7.000%, 04/15/23 | | | 262 | |
| | 27 | | | Series 1505, Class Q, 7.000%, 05/15/23 | | | 30 | |
| | 113 | | | Series 1518, Class G, IF, 8.591%, 05/15/23 | | | 133 | |
| | 21 | | | Series 1541, Class M, HB, IF, 24.763%, 07/15/23 | | | 32 | |
| | 100 | | | Series 1541, Class O, VAR, 0.840%, 07/15/23 | | | 100 | |
SEE NOTES TO FINANCIAL STATEMENTS.
| | | | | | | | |
| | | |
| AUGUST 31, 2016 | | J.P. MORGAN INCOME FUNDS | | | | | 31 | |
JPMorgan Core Bond Fund
SCHEDULE OF PORTFOLIO INVESTMENTS
AS OF AUGUST 31, 2016 (Unaudited) (continued)
(Amounts in thousands)
| | | | | | | | |
PRINCIPAL
AMOUNT($) | | | SECURITY DESCRIPTION | | VALUE($) | |
| Collateralized Mortgage Obligations — continued | |
| | | | Agency CMO — continued | | | | |
| | 6 | | | Series 1570, Class F, VAR, 2.190%, 08/15/23 | | | 6 | |
| | 215 | | | Series 1573, Class PZ, 7.000%, 09/15/23 | | | 237 | |
| | 117 | | | Series 1591, Class PV, 6.250%, 10/15/23 | | | 129 | |
| | 46 | | | Series 1602, Class SA, HB, IF, 21.100%, 10/15/23 | | | 69 | |
| | 702 | | | Series 1608, Class L, 6.500%, 09/15/23 | | | 804 | |
| | 273 | | | Series 1642, Class PJ, 6.000%, 11/15/23 | | | 299 | |
| | 108 | | | Series 1658, Class GZ, 7.000%, 01/15/24 | | | 120 | |
| | 14 | | | Series 1671, Class L, 7.000%, 02/15/24 | | | 16 | |
| | 19 | | | Series 1671, Class QC, IF, 10.000%, 02/15/24 | | | 27 | |
| | 12 | | | Series 1686, Class SH, IF, 18.095%, 02/15/24 | | | 17 | |
| | 93 | | | Series 1695, Class EB, 7.000%, 03/15/24 | | | 103 | |
| | 18 | | | Series 1699, Class FC, VAR, 1.108%, 03/15/24 | | | 19 | |
| | 120 | | | Series 1700, Class GA, PO, 02/15/24 | | | 115 | |
| | 482 | | | Series 1706, Class K, 7.000%, 03/15/24 | | | 537 | |
| | 9 | | | Series 1709, Class FA, VAR, 0.730%, 03/15/24 | | | 9 | |
| | 348 | | | Series 1720, Class PL, 7.500%, 04/15/24 | | | 390 | |
| | 328 | | | Series 1737, Class L, 6.000%, 06/15/24 | | | 373 | |
| | 63 | | | Series 1745, Class D, 7.500%, 08/15/24 | | | 71 | |
| | 256 | | | Series 1798, Class F, 5.000%, 05/15/23 | | | 274 | |
| | 5 | | | Series 1807, Class G, 9.000%, 10/15/20 | | | 5 | |
| | 48 | | | Series 1829, Class ZB, 6.500%, 03/15/26 | | | 53 | |
| | 318 | | | Series 1863, Class Z, 6.500%, 07/15/26 | | | 364 | |
| | 52 | | | Series 1865, Class D, PO, 02/15/24 | | | 48 | |
| | 48 | | | Series 1890, Class H, 7.500%, 09/15/26 | | | 55 | |
| | 132 | | | Series 1899, Class ZE, 8.000%, 09/15/26 | | | 152 | |
| | 295 | | | Series 1927, Class PH, 7.500%, 01/15/27 | | | 336 | |
| | 236 | | | Series 1927, Class ZA, 6.500%, 01/15/27 | | | 271 | |
| | 8 | | | Series 1935, Class FL, VAR, 1.208%, 02/15/27 | | | 8 | |
| | 105 | | | Series 1963, Class Z, 7.500%, 01/15/27 | | | 120 | |
| | 15 | | | Series 1970, Class PG, 7.250%, 07/15/27 | | | 17 | |
| | 261 | | | Series 1981, Class Z, 6.000%, 05/15/27 | | | 289 | |
| | 172 | | | Series 1983, Class Z, 6.500%, 12/15/23 | | | 189 | |
| | 106 | | | Series 1987, Class PE, 7.500%, 09/15/27 | | | 118 | |
| | 162 | | | Series 2019, Class Z, 6.500%, 12/15/27 | | | 180 | |
| | 540 | | | Series 2033, Class J, 5.600%, 06/15/23 | | | 572 | |
| | 61 | | | Series 2033, Class SN, HB, IF, 28.332%, 03/15/24 | | | 29 | |
| | 170 | | | Series 2038, Class PN, IO, 7.000%, 03/15/28 | | | 32 | |
| | | | | | | | |
PRINCIPAL
AMOUNT($) | | | SECURITY DESCRIPTION | | VALUE($) | |
| | | | | | | | |
| | | | Agency CMO — continued | | | | |
| | 540 | | | Series 2040, Class PE, 7.500%, 03/15/28 | | | 618 | |
| | 179 | | | Series 2054, Class PV, 7.500%, 05/15/28 | | | 205 | |
| | 16 | | | Series 2056, Class TD, 6.500%, 05/15/18 | | | 17 | |
| | 273 | | | Series 2063, Class PG, 6.500%, 06/15/28 | | | 315 | |
| | 34 | | | Series 2064, Class TE, 7.000%, 06/15/28 | | | 38 | |
| | 112 | | | Series 2070, Class C, 6.000%, 07/15/28 | | | 123 | |
| | 569 | | | Series 2075, Class PH, 6.500%, 08/15/28 | | | 632 | |
| | 609 | | | Series 2075, Class PM, 6.250%, 08/15/28 | | | 680 | |
| | 108 | | | Series 2086, Class GB, 6.000%, 09/15/28 | | | 123 | |
| | 220 | | | Series 2089, Class PJ, IO, 7.000%, 10/15/28 | | | 25 | |
| | 487 | | | Series 2095, Class PE, 6.000%, 11/15/28 | | | 558 | |
| | 948 | | | Series 2106, Class ZD, 6.000%, 12/15/28 | | | 1,056 | |
| | 1,287 | | | Series 2110, Class PG, 6.000%, 01/15/29 | | | 1,479 | |
| | 275 | | | Series 2125, Class JZ, 6.000%, 02/15/29 | | | 306 | |
| | 1,433 | | | Series 2126, Class CB, 6.250%, 02/15/29 | | | 1,615 | |
| | 38 | | | Series 2132, Class SB, HB, IF, 28.410%, 03/15/29 | | | 67 | |
| | 13 | | | Series 2134, Class PI, IO, 6.500%, 03/15/19 | | | 1 | |
| | 21 | | | Series 2141, Class IO, IO, 7.000%, 04/15/29 | | | 2 | |
| | 89 | | | Series 2163, Class PC, IO, 7.500%, 06/15/29 | | | 11 | |
| | 1,164 | | | Series 2169, Class TB, 7.000%, 06/15/29 | | | 1,331 | |
| | 534 | | | Series 2172, Class QC, 7.000%, 07/15/29 | | | 603 | |
| | 296 | | | Series 2176, Class OJ, 7.000%, 08/15/29 | | | 344 | |
| | 2 | | | Series 2196, Class TL, 7.500%, 11/15/29 | | | 2 | |
| | 257 | | | Series 2201, Class C, 8.000%, 11/15/29 | | | 295 | |
| | 12 | | | Series 2204, Class GB, VAR, 8.000%, 12/20/29 | | | 12 | |
| | 563 | | | Series 2208, Class PG, 7.000%, 01/15/30 | | | 648 | |
| | 158 | | | Series 2209, Class TC, 8.000%, 01/15/30 | | | 190 | |
| | 525 | | | Series 2210, Class Z, 8.000%, 01/15/30 | | | 607 | |
| | 96 | | | Series 2224, Class CB, 8.000%, 03/15/30 | | | 114 | |
| | 147 | | | Series 2230, Class Z, 8.000%, 04/15/30 | | | 171 | |
| | 112 | | | Series 2234, Class PZ, 7.500%, 05/15/30 | | | 130 | |
| | 107 | | | Series 2247, Class Z, 7.500%, 08/15/30 | | | 124 | |
| | 280 | | | Series 2256, Class MC, 7.250%, 09/15/30 | | | 323 | |
| | 366 | | | Series 2259, Class ZM, 7.000%, 10/15/30 | | | 420 | |
| | 7 | | | Series 2261, Class ZY, 7.500%, 10/15/30 | | | 9 | |
| | 35 | | | Series 2262, Class Z, 7.500%, 10/15/30 | | | 41 | |
| | 433 | | | Series 2271, Class PC, 7.250%, 12/15/30 | | | 498 | |
| | 343 | | | Series 2283, Class K, 6.500%, 12/15/23 | | | 378 | |
| | 198 | | | Series 2296, Class PD, 7.000%, 03/15/31 | | | 231 | |
| | 70 | | | Series 2306, Class K, PO, 05/15/24 | | | 68 | |
SEE NOTES TO FINANCIAL STATEMENTS.
| | | | | | |
| | | |
| 32 | | | | J.P. MORGAN INCOME FUNDS | | AUGUST 31, 2016 |
| | | | | | | | |
PRINCIPAL
AMOUNT($) | | | SECURITY DESCRIPTION | | VALUE($) | |
| Collateralized Mortgage Obligations — continued | |
| | | | Agency CMO — continued | | | | |
| | 169 | | | Series 2306, Class SE, IF, IO, 9.020%, 05/15/24 | | | 33 | |
| | 116 | | | Series 2313, Class LA, 6.500%, 05/15/31 | | | 136 | |
| | 221 | | | Series 2325, Class PM, 7.000%, 06/15/31 | | | 258 | |
| | 455 | | | Series 2332, Class ZH, 7.000%, 07/15/31 | | | 521 | |
| | 98 | | | Series 2333, Class HC, 6.000%, 07/15/31 | | | 97 | |
| | 2,633 | | | Series 2344, Class ZD, 6.500%, 08/15/31 | | | 3,117 | |
| | 262 | | | Series 2344, Class ZJ, 6.500%, 08/15/31 | | | 303 | |
| | 235 | | | Series 2345, Class NE, 6.500%, 08/15/31 | | | 274 | |
| | 45 | | | Series 2347, Class VP, 6.500%, 03/15/20 | | | 47 | |
| | 236 | | | Series 2351, Class PZ, 6.500%, 08/15/31 | | | 273 | |
| | 3 | | | Series 2353, Class TD, 6.000%, 09/15/16 | | | 3 | |
| | — | (h) | | Series 2355, Class BP, 6.000%, 09/15/16 | | | — | (h) |
| | — | (h) | | Series 2359, Class PM, 6.000%, 09/15/16 | | | — | (h) |
| | 461 | | | Series 2359, Class ZB, 8.500%, 06/15/31 | | | 545 | |
| | 1 | | | Series 2360, Class PG, 6.000%, 09/15/16 | | | 1 | |
| | 1 | | | Series 2366, Class MD, 6.000%, 10/15/16 | | | 1 | |
| | 238 | | | Series 2367, Class ME, 6.500%, 10/15/31 | | | 272 | |
| | 222 | | | Series 2388, Class FB, VAR, 1.108%, 01/15/29 | | | 225 | |
| | 6 | | | Series 2391, Class QR, 5.500%, 12/15/16 | | | 6 | |
| | 4 | | | Series 2394, Class MC, 6.000%, 12/15/16 | | | 4 | |
| | 261 | | | Series 2399, Class OH, 6.500%, 01/15/32 | | | 294 | |
| | 424 | | | Series 2399, Class TH, 6.500%, 01/15/32 | | | 475 | |
| | 503 | | | Series 2410, Class NG, 6.500%, 02/15/32 | | | 571 | |
| | 307 | | | Series 2410, Class OE, 6.375%, 02/15/32 | | | 336 | |
| | 558 | | | Series 2410, Class QS, IF, 18.180%, 02/15/32 | | | 877 | |
| | 219 | | | Series 2410, Class QX, IF, IO, 8.142%, 02/15/32 | | | 66 | |
| | 572 | | | Series 2412, Class SP, IF, 15.085%, 02/15/32 | | | 767 | |
| | 1,385 | | | Series 2418, Class FO, VAR, 1.408%, 02/15/32 | | | 1,415 | |
| | 473 | | | Series 2420, Class XK, 6.500%, 02/15/32 | | | 532 | |
| | 407 | | | Series 2423, Class MC, 7.000%, 03/15/32 | | | 470 | |
| | 532 | | | Series 2423, Class MT, 7.000%, 03/15/32 | | | 614 | |
| | 622 | | | Series 2423, Class TB, 6.500%, 03/15/32 | | | 716 | |
| | 13 | | | Series 2425, Class OB, 6.000%, 03/15/17 | | | 13 | |
| | 683 | | | Series 2430, Class WF, 6.500%, 03/15/32 | | | 797 | |
| | 980 | | | Series 2434, Class TC, 7.000%, 04/15/32 | | | 1,146 | |
| | 1,545 | | | Series 2434, Class ZA, 6.500%, 04/15/32 | | | 1,780 | |
| | 1,033 | | | Series 2435, Class CJ, 6.500%, 04/15/32 | | | 1,194 | |
| | 340 | | | Series 2436, Class MC, 7.000%, 04/15/32 | | | 382 | |
| | 164 | | | Series 2441, Class GF, 6.500%, 04/15/32 | | | 193 | |
| | | | | | | | |
PRINCIPAL
AMOUNT($) | | | SECURITY DESCRIPTION | | VALUE($) | |
| | | | | | | | |
| | | | Agency CMO — continued | | | | |
| | 437 | | | Series 2444, Class ES, IF, IO, 7.442%, 03/15/32 | | | 120 | |
| | 397 | | | Series 2450, Class GZ, 7.000%, 05/15/32 | | | 456 | |
| | 285 | | | Series 2450, Class SW, IF, IO, 7.492%, 03/15/32 | | | 70 | |
| | 562 | | | Series 2455, Class GK, 6.500%, 05/15/32 | | | 652 | |
| | — | (h) | | Series 2458, Class QE, 5.500%, 06/15/17 | | | — | (h) |
| | 459 | | | Series 2458, Class ZM, 6.500%, 06/15/32 | | | 533 | |
| | 7 | | | Series 2463, Class CE, 6.000%, 06/15/17 | | | 7 | |
| | 337 | | | Series 2466, Class DH, 6.500%, 06/15/32 | | | 387 | |
| | 630 | | | Series 2466, Class PH, 6.500%, 06/15/32 | | | 725 | |
| | 569 | | | Series 2474, Class NR, 6.500%, 07/15/32 | | | 656 | |
| | 1,063 | | | Series 2475, Class S, IF, IO, 7.492%, 02/15/32 | | | 253 | |
| | 744 | | | Series 2484, Class LZ, 6.500%, 07/15/32 | | | 869 | |
| | 9 | | | Series 2488, Class WS, IF, 15.603%, 08/15/17 | | | 9 | |
| | 791 | | | Series 2500, Class MC, 6.000%, 09/15/32 | | | 901 | |
| | 37 | | | Series 2508, Class AQ, 5.500%, 10/15/17 | | | 37 | |
| | 904 | | | Series 2512, Class PG, 5.500%, 10/15/22 | | | 988 | |
| | 291 | | | Series 2535, Class BK, 5.500%, 12/15/22 | | | 314 | |
| | 166 | | | Series 2537, Class TE, 5.500%, 12/15/17 | | | 170 | |
| | 81 | | | Series 2543, Class LX, 5.000%, 12/15/17 | | | 82 | |
| | 1,251 | | | Series 2543, Class YX, 6.000%, 12/15/32 | | | 1,409 | |
| | 713 | | | Series 2544, Class HC, 6.000%, 12/15/32 | | | 818 | |
| | 62 | | | Series 2549, Class ZG, 5.000%, 01/15/18 | | | 63 | |
| | 841 | | | Series 2552, Class ME, 6.000%, 01/15/33 | | | 970 | |
| | 756 | | | Series 2567, Class QD, 6.000%, 02/15/33 | | | 868 | |
| | 723 | | | Series 2571, Class FY, VAR, 1.258%, 12/15/32 | | | 736 | |
| | 90 | | | Series 2571, Class SK, HB, IF, 32.311%, 09/15/23 | | | 154 | |
| | 427 | | | Series 2571, Class SY, IF, 17.382%, 12/15/32 | | | 607 | |
| | 3,077 | | | Series 2575, Class ME, 6.000%, 02/15/33 | | | 3,389 | |
| | 1,270 | | | Series 2586, Class HD, 5.500%, 03/15/23 | | | 1,444 | |
| | 354 | | | Series 2586, Class WI, IO, 6.500%, 03/15/33 | | | 60 | |
| | 1,273 | | | Series 2595, Class HC, 5.500%, 04/15/23 | | | 1,458 | |
| | 547 | | | Series 2596, Class QG, 6.000%, 03/15/33 | | | 601 | |
| | 99 | | | Series 2611, Class UH, 4.500%, 05/15/18 | | | 101 | |
| | 143 | | | Series 2626, Class NS, IF, IO, 6.042%, 06/15/23 | | | 6 | |
| | 1,159 | | | Series 2631, Class SA, IF, 13.919%, 06/15/33 | | | 1,599 | |
| | 841 | | | Series 2636, Class Z, 4.500%, 06/15/18 | | | 862 | |
SEE NOTES TO FINANCIAL STATEMENTS.
| | | | | | | | |
| | | |
| AUGUST 31, 2016 | | J.P. MORGAN INCOME FUNDS | | | | | 33 | |
JPMorgan Core Bond Fund
SCHEDULE OF PORTFOLIO INVESTMENTS
AS OF AUGUST 31, 2016 (Unaudited) (continued)
(Amounts in thousands)
| | | | | | | | |
PRINCIPAL
AMOUNT($) | | | SECURITY DESCRIPTION | | VALUE($) | |
| Collateralized Mortgage Obligations — continued | |
| | | | Agency CMO — continued | | | | |
| | 141 | | | Series 2637, Class SA, IF, IO, 5.592%, 06/15/18 | | | 5 | |
| | 116 | | | Series 2638, Class DS, IF, 8.092%, 07/15/23 | | | 125 | |
| | 4 | | | Series 2642, Class SL, IF, 6.553%, 07/15/33 | | | 5 | |
| | 61 | | | Series 2650, Class PO, PO, 12/15/32 | | | 60 | |
| | 470 | | | Series 2650, Class SO, PO, 12/15/32 | | | 459 | |
| | 800 | | | Series 2651, Class VZ, 4.500%, 07/15/18 | | | 821 | |
| | 8,786 | | | Series 2653, Class PZ, 5.000%, 07/15/33 | | | 10,066 | |
| | 369 | | | Series 2671, Class S, IF, 13.828%, 09/15/33 | | | 485 | |
| | 324 | | | Series 2692, Class SC, IF, 12.271%, 07/15/33 | | | 369 | |
| | 3,320 | | | Series 2709, Class PG, 5.000%, 11/15/23 | | | 3,603 | |
| | 797 | | | Series 2710, Class HB, 5.500%, 11/15/23 | | | 873 | |
| | 338 | | | Series 2720, Class PC, 5.000%, 12/15/23 | | | 366 | |
| | 2,766 | | | Series 2722, Class PF, VAR, 1.108%, 12/15/33 | | | 2,780 | |
| | 9,421 | | | Series 2733, Class SB, IF, 7.553%, 10/15/33 | | | 10,392 | |
| | 197 | | | Series 2744, Class PE, 5.500%, 02/15/34 | | | 208 | |
| | 329 | | | Series 2744, Class TU, 5.500%, 05/15/32 | | | 333 | |
| | 329 | | | Series 2748, Class KO, PO, 10/15/23 | | | 322 | |
| | 405 | | | Series 2758, Class AO, PO, 03/15/19 | | | 396 | |
| | 6 | | | Series 2780, Class JG, 4.500%, 04/15/19 | | | 7 | |
| | 191 | | | Series 2780, Class SY, IF, 15.383%, 11/15/33 | | | 260 | |
| | 2,680 | | | Series 2802, Class OH, 6.000%, 05/15/34 | | | 2,922 | |
| | 93 | | | Series 2835, Class QO, PO, 12/15/32 | | | 85 | |
| | 16 | | | Series 2840, Class JO, PO, 06/15/23 | | | 15 | |
| | 958 | | | Series 2903, Class Z, 5.000%, 12/15/24 | | | 1,042 | |
| | 658 | | | Series 2929, Class MS, HB, IF, 25.926%, 02/15/35 | | | 1,044 | |
| | 1,999 | | | Series 2934, Class EC, PO, 02/15/20 | | | 1,954 | |
| | 595 | | | Series 2934, Class HI, IO, 5.000%, 02/15/20 | | | 36 | |
| | 364 | | | Series 2934, Class KI, IO, 5.000%, 02/15/20 | | | 19 | |
| | 142 | | | Series 2945, Class SA, IF, 11.380%, 03/15/20 | | | 152 | |
| | 270 | | | Series 2967, Class S, HB, IF, 31.033%, 04/15/25 | | | 411 | |
| | 9,187 | | | Series 2968, Class EH, 6.000%, 04/15/35 | | | 10,972 | |
| | 512 | | | Series 2968, Class MD, 5.500%, 12/15/33 | | | 520 | |
| | 943 | | | Series 2981, Class FA, VAR, 0.908%, 05/15/35 | | | 942 | |
| | | | | | | | |
PRINCIPAL
AMOUNT($) | | | SECURITY DESCRIPTION | | VALUE($) | |
| | | | | | | | |
| | | | Agency CMO — continued | | | | |
| | 1,027 | | | Series 2988, Class AF, VAR, 0.808%, 06/15/35 | | | 1,021 | |
| | 21 | | | Series 2989, Class PO, PO, 06/15/23 | | | 21 | |
| | 534 | | | Series 2990, Class GO, PO, 02/15/35 | | | 506 | |
| | 1,093 | | | Series 2990, Class SL, HB, IF, 22.632%, 06/15/34 | | | 1,506 | |
| | 102 | | | Series 2990, Class WP, IF, 15.718%, 06/15/35 | | | 122 | |
| | 84 | | | Series 3014, Class OD, PO, 08/15/35 | | | 81 | |
| | 167 | | | Series 3022, Class SX, IF, 15.606%, 08/15/25 | | | 214 | |
| | 506 | | | Series 3029, Class SO, PO, 09/15/35 | | | 485 | |
| | 320 | | | Series 3051, Class DP, HB, IF, 25.794%, 10/15/25 | | | 477 | |
| | 591 | | | Series 3064, Class SG, IF, 18.308%, 11/15/35 | | | 860 | |
| | 15 | | | Series 3068, Class AO, PO, 01/15/35 | | | 14 | |
| | 946 | | | Series 3077, Class TO, PO, 04/15/35 | | | 867 | |
| | 981 | | | Series 3085, Class WF, VAR, 1.308%, 08/15/35 | | | 1,000 | |
| | 2,255 | | | Series 3101, Class UZ, 6.000%, 01/15/36 | | | 2,606 | |
| | 173 | | | Series 3102, Class HS, HB, IF, 22.705%, 01/15/36 | | | 275 | |
| | 1,874 | | | Series 3117, Class AO, PO, 02/15/36 | | | 1,763 | |
| | 431 | | | Series 3117, Class EO, PO, 02/15/36 | | | 396 | |
| | 613 | | | Series 3117, Class OG, PO, 02/15/36 | | | 576 | |
| | 372 | | | Series 3117, Class OK, PO, 02/15/36 | | | 328 | |
| | 1,155 | | | Series 3122, Class OH, PO, 03/15/36 | | | 1,086 | |
| | 1,061 | | | Series 3122, Class OP, PO, 03/15/36 | | | 997 | |
| | 18 | | | Series 3122, Class ZB, 6.000%, 03/15/36 | | | 24 | |
| | 120 | | | Series 3134, Class PO, PO, 03/15/36 | | | 111 | |
| | 1,393 | | | Series 3137, Class XP, 6.000%, 04/15/36 | | | 1,613 | |
| | 643 | | | Series 3138, Class PO, PO, 04/15/36 | | | 588 | |
| | 2,152 | | | Series 3147, Class PO, PO, 04/15/36 | | | 2,020 | |
| | 126 | | | Series 3149, Class SO, PO, 05/15/36 | | | 115 | |
| | 519 | | | Series 3151, Class PO, PO, 05/15/36 | | | 501 | |
| | 860 | | | Series 3153, Class EO, PO, 05/15/36 | | | 765 | |
| | 283 | | | Series 3164, Class MG, 6.000%, 06/15/36 | | | 319 | |
| | 2,015 | | | Series 3171, Class MO, PO, 06/15/36 | | | 1,912 | |
| | 402 | | | Series 3179, Class OA, PO, 07/15/36 | | | 377 | |
| | 1,804 | | | Series 3181, Class AZ, 6.500%, 07/15/36 | | | 2,096 | |
| | 174 | | | Series 3194, Class SA, IF, IO, 6.592%, 07/15/36 | | | 20 | |
| | 1,335 | | | Series 3195, Class PD, 6.500%, 07/15/36 | | | 1,514 | |
| | 2,791 | | | Series 3200, Class AY, 5.500%, 08/15/36 | | | 3,137 | |
| | 576 | | | Series 3200, Class PO, PO, 08/15/36 | | | 528 | |
SEE NOTES TO FINANCIAL STATEMENTS.
| | | | | | |
| | | |
| 34 | | | | J.P. MORGAN INCOME FUNDS | | AUGUST 31, 2016 |
| | | | | | | | |
PRINCIPAL
AMOUNT($) | | | SECURITY DESCRIPTION | | VALUE($) | |
| Collateralized Mortgage Obligations — continued | |
| | | | Agency CMO — continued | | | | |
| | 8,513 | | | Series 3202, Class HI, IF, IO, 6.142%, 08/15/36 | | | 1,649 | |
| | 356 | | | Series 3213, Class OA, PO, 09/15/36 | | | 341 | |
| | 245 | | | Series 3218, Class AO, PO, 09/15/36 | | | 211 | |
| | 551 | | | Series 3218, Class BE, 6.000%, 09/15/35 | | | 556 | |
| | 1,200 | | | Series 3219, Class DI, IO, 6.000%, 04/15/36 | | | 213 | |
| | 671 | | | Series 3225, Class EO, PO, 10/15/36 | | | 616 | |
| | 734 | | | Series 3232, Class ST, IF, IO, 6.192%, 10/15/36 | | | 132 | |
| | 177 | | | Series 3233, Class OP, PO, 05/15/36 | | | 169 | |
| | 1,307 | | | Series 3253, Class PO, PO, 12/15/21 | | | 1,282 | |
| | 318 | | | Series 3256, Class PO, PO, 12/15/36 | | | 291 | |
| | 584 | | | Series 3260, Class CS, IF, IO, 5.632%, 01/15/37 | | | 82 | |
| | 316 | | | Series 3261, Class OA, PO, 01/15/37 | | | 302 | |
| | 1,197 | | | Series 3274, Class B, 6.000%, 02/15/37 | | | 1,325 | |
| | 164 | | | Series 3274, Class JO, PO, 02/15/37 | | | 153 | |
| | 716 | | | Series 3275, Class FL, VAR, 0.948%, 02/15/37 | | | 716 | |
| | 4,897 | | | Series 3284, Class CB, 5.000%, 03/15/22 | | | 5,122 | |
| | 299 | | | Series 3286, Class PO, PO, 03/15/37 | | | 275 | |
| | 930 | | | Series 3290, Class SB, IF, IO, 5.942%, 03/15/37 | | | 149 | |
| | 959 | | | Series 3302, Class UT, 6.000%, 04/15/37 | | | 1,098 | |
| | 708 | | | Series 3305, Class MG, IF, 2.728%, 07/15/34 | | | 752 | |
| | 2,330 | | | Series 3315, Class HZ, 6.000%, 05/15/37 | | | 2,484 | |
| | 709 | | | Series 3316, Class PO, PO, 05/15/37 | | | 679 | |
| | 38 | | | Series 3318, Class AO, PO, 05/15/37 | | | 35 | |
| | 174 | | | Series 3326, Class JO, PO, 06/15/37 | | | 166 | |
| | 1,062 | | | Series 3329, Class JD, 6.000%, 06/15/36 | | | 1,093 | |
| | 364 | | | Series 3331, Class PO, PO, 06/15/37 | | | 345 | |
| | 853 | | | Series 3344, Class SL, IF, IO, 6.092%, 07/15/37 | | | 140 | |
| | 475 | | | Series 3365, Class PO, PO, 09/15/37 | | | 452 | |
| | 267 | | | Series 3371, Class FA, VAR, 1.108%, 09/15/37 | | | 268 | |
| | 416 | | | Series 3373, Class TO, PO, 04/15/37 | | | 397 | |
| | 2,644 | | | Series 3383, Class SA, IF, IO, 5.942%, 11/15/37 | | | 363 | |
| | 3,998 | | | Series 3387, Class SA, IF, IO, 5.912%, 11/15/37 | | | 661 | |
| | 1,580 | | | Series 3393, Class JO, PO, 09/15/32 | | | 1,475 | |
| | 142 | | | Series 3398, Class PO, PO, 01/15/36 | | | 142 | |
| | 4,756 | | | Series 3404, Class SC, IF, IO, 5.492%, 01/15/38 | | | 707 | |
| | | | | | | | |
PRINCIPAL
AMOUNT($) | | | SECURITY DESCRIPTION | | VALUE($) | |
| | | | | | | | |
| | | | Agency CMO — continued | | | | |
| | 203 | | | Series 3422, Class SE, IF, 16.181%, 02/15/38 | | | 273 | |
| | 4,714 | | | Series 3423, Class PB, 5.500%, 03/15/38 | | | 5,380 | |
| | 1,882 | | | Series 3424, Class PI, IF, IO, 6.292%, 04/15/38 | | | 297 | |
| | 262 | | | Series 3443, Class SY, IF, 9.000%, 03/15/37 | | | 321 | |
| | 1,272 | | | Series 3453, Class B, 5.500%, 05/15/38 | | | 1,392 | |
| | 2,064 | | | Series 3455, Class SE, IF, IO, 5.692%, 06/15/38 | | | 334 | |
| | 290 | | | Series 3461, Class LZ, 6.000%, 06/15/38 | | | 330 | |
| | 5,845 | | | Series 3461, Class Z, 6.000%, 06/15/38 | | | 6,608 | |
| | 3,721 | | | Series 3481, Class SJ, IF, IO, 5.342%, 08/15/38 | | | 446 | |
| | 2,961 | | | Series 3501, Class CB, 5.500%, 01/15/39 | | | 3,355 | |
| | 856 | | | Series 3510, Class OD, PO, 02/15/37 | | | 773 | |
| | 1,572 | | | Series 3511, Class SA, IF, IO, 5.492%, 02/15/39 | | | 281 | |
| | 397 | | | Series 3523, Class SD, IF, 18.266%, 06/15/36 | | | 542 | |
| | 1,930 | | | Series 3531, Class SA, IF, IO, 5.792%, 05/15/39 | | | 235 | |
| | 1,119 | | | Series 3531, Class SM, IF, IO, 5.592%, 05/15/39 | | | 114 | |
| | 1,450 | | | Series 3546, Class A, VAR, 2.261%, 02/15/39 | | | 1,482 | |
| | 1,047 | | | Series 3549, Class FA, VAR, 1.708%, 07/15/39 | | | 1,063 | |
| | 1,210 | | | Series 3607, Class AO, PO, 04/15/36 | | | 1,154 | |
| | 2,218 | | | Series 3607, Class BO, PO, 04/15/36 | | | 2,114 | |
| | 2,812 | | | Series 3607, Class OP, PO, 07/15/37 | | | 2,573 | |
| | 3,597 | | | Series 3607, Class PO, PO, 05/15/37 | | | 3,220 | |
| | 1,692 | | | Series 3607, Class TO, PO, 10/15/39 | | | 1,496 | |
| | 2,061 | | | Series 3608, Class SC, IF, IO, 5.742%, 12/15/39 | | | 307 | |
| | 1,896 | | | Series 3611, Class PO, PO, 07/15/34 | | | 1,812 | |
| | 1,794 | | | Series 3614, Class QB, 4.000%, 12/15/24 | | | 1,989 | |
| | 1,714 | | | Series 3621, Class BO, PO, 01/15/40 | | | 1,577 | |
| | 4,125 | | | Series 3632, Class BS, IF, 15.808%, 02/15/40 | | | 6,105 | |
| | 996 | | | Series 3645, Class KZ, 5.500%, 08/15/36 | | | 1,086 | |
| | 6,098 | | | Series 3654, Class DC, 5.000%, 04/15/30 | | | 7,227 | |
| | 2,540 | | | Series 3659, Class VE, 5.000%, 03/15/26 | | | 2,725 | |
| | 10,432 | | | Series 3680, Class MA, 4.500%, 07/15/39 | | | 11,276 | |
| | 6,278 | | | Series 3684, Class CY, 4.500%, 06/15/25 | | | 7,029 | |
| | 1,293 | | | Series 3688, Class CU, VAR, 6.729%, 11/15/21 | | | 1,355 | |
SEE NOTES TO FINANCIAL STATEMENTS.
| | | | | | | | |
| | | |
| AUGUST 31, 2016 | | J.P. MORGAN INCOME FUNDS | | | | | 35 | |
JPMorgan Core Bond Fund
SCHEDULE OF PORTFOLIO INVESTMENTS
AS OF AUGUST 31, 2016 (Unaudited) (continued)
(Amounts in thousands)
| | | | | | | | |
PRINCIPAL
AMOUNT($) | | | SECURITY DESCRIPTION | | VALUE($) | |
| Collateralized Mortgage Obligations — continued | |
| | | | Agency CMO — continued | | | | |
| | 12,071 | | | Series 3688, Class GT, VAR, 7.277%, 11/15/46 | | | 14,053 | |
| | 26,029 | | | Series 3704, Class CT, 7.000%, 12/15/36 | | | 30,890 | |
| | 10,518 | | | Series 3704, Class DT, 7.500%, 11/15/36 | | | 12,558 | |
| | 9,254 | | | Series 3704, Class ET, 7.500%, 12/15/36 | | | 11,349 | |
| | 5,070 | | | Series 3710, Class FL, VAR, 1.008%, 05/15/36 | | | 5,097 | |
| | 9,281 | | | Series 3740, Class SB, IF, IO, 5.492%, 10/15/40 | | | 1,508 | |
| | 7,376 | | | Series 3740, Class SC, IF, IO, 5.492%, 10/15/40 | | | 1,256 | |
| | 9,393 | | | Series 3747, Class HI, IO, 4.500%, 07/15/37 | | | 349 | |
| | 8,302 | | | Series 3759, Class HI, IO, 4.000%, 08/15/37 | | | 338 | |
| | 5,132 | | | Series 3760, Class GI, IO, 4.000%, 10/15/37 | | | 162 | |
| | 3,374 | | | Series 3760, Class NI, IO, 4.000%, 10/15/37 | | | 75 | |
| | 4,415 | | | Series 3779, Class IH, IO, 4.000%, 11/15/34 | | | 109 | |
| | 6,000 | | | Series 3793, Class AB, 3.500%, 01/15/26 | | | 6,481 | |
| | 5,401 | | | Series 3795, Class EI, IO, 5.000%, 10/15/39 | | | 849 | |
| | 207 | | | Series 3798, Class BF, VAR, 0.808%, 06/15/24 | | | 207 | |
| | 2,755 | | | Series 3800, Class AI, IO, 4.000%, 11/15/29 | | | 178 | |
| | 2,257 | | | Series 3801, Class GB, 4.500%, 11/15/40 | | | 2,269 | |
| | 22,639 | | | Series 3802, Class LS, IF, IO, 1.952%, 01/15/40 | | | 1,451 | |
| | 11,319 | | | Series 3819, Class ZQ, 6.000%, 04/15/36 | | | 12,909 | |
| | 4,452 | | | Series 3852, Class QN, IF, 5.500%, 05/15/41 | | | 4,912 | |
| | 11,896 | | | Series 3852, Class TP, IF, 5.500%, 05/15/41 | | | 12,822 | |
| | 9,581 | | | Series 3860, Class PZ, 5.000%, 05/15/41 | | | 12,112 | |
| | 1,649 | | | Series 3895, Class WA, VAR, 5.703%, 10/15/38 | | | 1,865 | |
| | 4,443 | | | Series 3920, Class LP, 5.000%, 01/15/34 | | | 4,937 | |
| | 10,835 | | | Series 3957, Class B, 4.000%, 11/15/41 | | | 11,602 | |
| | 2,882 | | | Series 3966, Class BF, VAR, 1.008%, 10/15/40 | | | 2,898 | |
| | 5,170 | | | Series 3966, Class NA, 4.000%, 12/15/41 | | | 5,596 | |
| | 8,680 | | | Series 3998, Class GF, VAR, 0.958%, 05/15/36 | | | 8,713 | |
| | 11,044 | | | Series 4012, Class FN, VAR, 1.008%, 03/15/42 | | | 11,078 | |
| | | | | | | | |
PRINCIPAL
AMOUNT($) | | | SECURITY DESCRIPTION | | VALUE($) | |
| | | | | | | | |
| | | | Agency CMO — continued | | | | |
| | 5,123 | | | Series 4032, Class TO, PO, 07/15/37 | | | 4,841 | |
| | 11,761 | | | Series 4048, Class FB, VAR, 0.908%, 10/15/41 | | | 11,755 | |
| | 19,432 | | | Series 4048, Class FJ, VAR, 0.867%, 07/15/37 | | | 19,164 | |
| | 2,511 | | | Series 4073, Class MF, VAR, 0.958%, 08/15/39 | | | 2,518 | |
| | 5,506 | | | Series 4077, Class FB, VAR, 1.008%, 07/15/42 | | | 5,512 | |
| | 8,609 | | | Series 4087, Class FA, VAR, 0.958%, 05/15/39 | | | 8,586 | |
| | 6,966 | | | Series 4095, Class FB, VAR, 0.908%, 04/15/39 | | | 7,009 | |
| | 1,794 | | | Series 4217, Class KY, 3.000%, 06/15/43 | | | 1,866 | |
| | 7,929 | | | Series 4219, Class JA, 3.500%, 08/15/39 | | | 8,345 | |
| | 4,297 | | | Series 4238, Class WY, 3.000%, 08/15/33 | | | 4,452 | |
| | 5,256 | | | Series 4257, Class DZ, 2.500%, 10/15/43 | | | 4,938 | |
| | 23,843 | | | Series 4374, Class NC, SUB, 2.750%, 02/15/46 | | | 24,694 | |
| | | | Federal Home Loan Mortgage Corp. STRIPS, | | | | |
| | 1 | | | Series 134, Class B, IO, 9.000%, 04/01/22 | | | — | (h) |
| | 979 | | | Series 197, Class PO, PO, 04/01/28 | | | 865 | |
| | 2,101 | | | Series 233, Class 11, IO, 5.000%, 09/15/35 | | | 306 | |
| | 1,765 | | | Series 233, Class 12, IO, 5.000%, 09/15/35 | | | 268 | |
| | 3,318 | | | Series 233, Class 13, IO, 5.000%, 09/15/35 | | | 496 | |
| | 6,287 | | | Series 239, Class S30, IF, IO, 7.192%, 08/15/36 | | | 1,137 | |
| | 682 | | | Series 243, Class 16, IO, 4.500%, 11/15/20 | | | 29 | |
| | 464 | | | Series 243, Class 17, IO, 4.500%, 12/15/20 | | | 23 | |
| | 77,638 | | | Series 262, Class 35, 3.500%, 07/15/42 | | | 82,618 | |
| | 29,599 | | | Series 264, Class F1, VAR, 1.058%, 07/15/42 | | | 29,584 | |
| | 12,167 | | | Series 270, Class F1, VAR, 1.008%, 08/15/42 | | | 12,135 | |
| | 6,417 | | | Series 299, Class 300, 3.000%, 01/15/43 | | | 6,677 | |
| | 11,761 | | | Series 310, Class PO, PO, 09/15/43 | | | 10,258 | |
| | | | Federal Home Loan Mortgage Corp. Structured Pass-Through Securities, | | | | |
| | 687 | | | Series T-41, Class 3A, VAR, 5.853%, 07/25/32 | | | 734 | |
| | 2,849 | | | Series T-42, Class A5, 7.500%, 02/25/42 | | | 3,414 | |
| | 2,058 | | | Series T-48, Class 1A, VAR, 5.316%, 07/25/33 | | | 2,461 | |
SEE NOTES TO FINANCIAL STATEMENTS.
| | | | | | |
| | | |
| 36 | | | | J.P. MORGAN INCOME FUNDS | | AUGUST 31, 2016 |
| | | | | | | | |
PRINCIPAL
AMOUNT($) | | | SECURITY DESCRIPTION | | VALUE($) | |
| Collateralized Mortgage Obligations — continued | |
| | | | Agency CMO — continued | | | | |
| | 444 | | | Series T-51, Class 2A, VAR, 7.500%, 08/25/42 | | | 546 | |
| | 2,768 | | | Series T-54, Class 2A, 6.500%, 02/25/43 | | | 3,334 | |
| | 938 | | | Series T-54, Class 3A, 7.000%, 02/25/43 | | | 1,127 | |
| | 6,571 | | | Series T-56, Class A5, 5.231%, 05/25/43 | | | 7,352 | |
| | 680 | | | Series T-57, Class 1A3, 7.500%, 07/25/43 | | | 842 | |
| | 265 | | | Series T-57, Class 1AP, PO, 07/25/43 | | | 231 | |
| | 3,734 | | | Series T-58, Class 4A, 7.500%, 09/25/43 | | | 4,514 | |
| | 311 | | | Series T-58, Class APO, PO, 09/25/43 | | | 272 | |
| | 3,744 | | | Series T-59, Class 1A2, 7.000%, 10/25/43 | | | 4,500 | |
| | 346 | | | Series T-59, Class 1AP, PO, 10/25/43 | | | 292 | |
| | 6,626 | | | Series T-62, Class 1A1, VAR, 1.689%, 10/25/44 | | | 6,756 | |
| | 17,458 | | | Series T-76, Class 2A, VAR, 1.665%, 10/25/37 | | | 18,372 | |
| | | | Federal National Mortgage Association - ACES, | | | | |
| | 16,423 | | | Series 2010-M1, Class A2, 4.450%, 09/25/19 | | | 17,739 | |
| | 6,569 | | | Series 2010-M3, Class A3, VAR, 4.332%, 03/25/20 | | | 7,078 | |
| | 5,317 | | | Series 2010-M7, Class A2, 3.655%, 11/25/20 | | | 5,656 | |
| | 8,968 | | | Series 2011-M1, Class A3, 3.763%, 06/25/21 | | | 9,767 | |
| | 7,770 | | | Series 2011-M2, Class A2, 3.645%, 04/25/21 | | | 8,344 | |
| | 52,463 | | | Series 2011-M2, Class A3, 3.764%, 04/25/21 | | | 56,998 | |
| | 28,877 | | | Series 2011-M4, Class A2, 3.726%, 06/25/21 | | | 31,392 | |
| | 6,139 | | | Series 2011-M8, Class A2, 2.922%, 08/25/21 | | | 6,462 | |
| | 6,457 | | | Series 2012-M8, Class ASQ3, 1.801%, 12/25/19 | | | 6,519 | |
| | 4,610 | | | Series 2012-M11, Class FA, VAR, 0.980%, 08/25/19 | | | 4,591 | |
| | 11,791 | | | Series 2013-M7, Class A2, 2.280%, 12/27/22 | | | 12,087 | |
| | 11,658 | | | Series 2013-M9, Class A2, VAR, 2.389%, 01/25/23 | | | 12,048 | |
| | 4,118 | | | Series 2013-M13, Class A2, VAR, 2.624%, 04/25/23 | | | 4,295 | |
| | 16,876 | | | Series 2014-M2, Class A2, VAR, 3.513%, 12/25/23 | | | 18,539 | |
| | 24,000 | | | Series 2014-M3, Class A2, VAR, 3.501%, 01/25/24 | | | 26,086 | |
| | 359 | | | Series 2014-M5, Class FA, VAR, 0.825%, 01/25/17 | | | 358 | |
| | | | | | | | |
PRINCIPAL
AMOUNT($) | | | SECURITY DESCRIPTION | | VALUE($) | |
| | | | | | | | |
| | | | Agency CMO — continued | | | | |
| | 3,280 | | | Series 2014-M9, Class A2, VAR, 3.103%, 07/25/24 | | | 3,493 | |
| | 25,000 | | | Series 2014-M12, Class ASV2, VAR, 2.614%, 10/25/21 | | | 26,098 | |
| | 11,740 | | | Series 2014-M13, Class A2, VAR, 3.021%, 08/25/24 | | | 12,552 | |
| | 12,039 | | | Series 2015-M1, Class A2, 2.532%, 09/25/24 | | | 12,429 | |
| | 12,578 | | | Series 2015-M2, Class A3, VAR, 3.150%, 12/25/24 | | | 13,344 | |
| | 30,000 | | | Series 2015-M3, Class A2, 2.723%, 10/25/24 | | | 31,377 | |
| | 7,298 | | | Series 2015-M7, Class A2, 2.590%, 12/25/24 | | | 7,562 | |
| | 10,000 | | | Series 2015-M8, Class A2, VAR, 2.900%, 01/25/25 | | | 10,605 | |
| | 57,555 | | | Series 2015-M10, Class A2, VAR, 3.092%, 04/25/27 | | | 61,590 | |
| | 64,822 | | | Series 2016-M1, Class A2, VAR, 2.939%, 01/25/26 | | | 68,719 | |
| | | | Federal National Mortgage Association Grantor Trust, | | | | |
| | 1,063 | | | Series 1999-T2, Class A1, VAR, 7.500%, 01/19/39 | | | 1,214 | |
| | 1,489 | | | Series 2001-T3, Class A1, 7.500%, 11/25/40 | | | 1,791 | |
| | 1,557 | | | Series 2002-T16, Class A2, 7.000%, 07/25/42 | | | 1,859 | |
| | 432 | | | Series 2004-T1, Class 1A2, 6.500%, 01/25/44 | | | 519 | |
| | 3,223 | | | Series 2004-T2, Class 1A4, 7.500%, 11/25/43 | | | 3,849 | |
| | 1,922 | | | Series 2004-T2, Class 2A, VAR, 3.663%, 07/25/43 | | | 1,992 | |
| | 4,578 | | | Series 2004-T3, Class 1A2, 6.500%, 02/25/44 | | | 5,189 | |
| | 1,886 | | | Series 2004-T3, Class 1A3, 7.000%, 02/25/44 | | | 2,249 | |
| | 426 | | | Series 2004-T3, Class PT1, VAR, 9.140%, 01/25/44 | | | 385 | |
| | | | Federal National Mortgage Association REMIC, | | | | |
| | 3 | | | Series 1988-7, Class Z, 9.250%, 04/25/18 | | | 3 | |
| | 14 | | | Series 1989-70, Class G, 8.000%, 10/25/19 | | | 15 | |
| | 8 | | | Series 1989-78, Class H, 9.400%, 11/25/19 | | | 8 | |
| | 9 | | | Series 1989-83, Class H, 8.500%, 11/25/19 | | | 10 | |
SEE NOTES TO FINANCIAL STATEMENTS.
| | | | | | | | |
| | | |
| AUGUST 31, 2016 | | J.P. MORGAN INCOME FUNDS | | | | | 37 | |
JPMorgan Core Bond Fund
SCHEDULE OF PORTFOLIO INVESTMENTS
AS OF AUGUST 31, 2016 (Unaudited) (continued)
(Amounts in thousands)
| | | | | | | | |
PRINCIPAL
AMOUNT($) | | | SECURITY DESCRIPTION | | VALUE($) | |
| Collateralized Mortgage Obligations — continued | |
| | | | Agency CMO — continued | | | | |
| | 5 | | | Series 1989-89, Class H, 9.000%, 11/25/19 | | | 5 | |
| | 5 | | | Series 1990-1, Class D, 8.800%, 01/25/20 | | | 6 | |
| | 2 | | | Series 1990-7, Class B, 8.500%, 01/25/20 | | | 2 | |
| | 2 | | | Series 1990-60, Class K, 5.500%, 06/25/20 | | | 2 | |
| | 3 | | | Series 1990-63, Class H, 9.500%, 06/25/20 | | | 4 | |
| | 3 | | | Series 1990-93, Class G, 5.500%, 08/25/20 | | | 3 | |
| | — | (h) | | Series 1990-94, Class H, HB, 505.000%, 08/25/20 | | | — | (h) |
| | — | (h) | | Series 1990-95, Class J, HB, 1,118.040%, 08/25/20 | | | — | (h) |
| | 26 | | | Series 1990-102, Class J, 6.500%, 08/25/20 | | | 28 | |
| | 15 | | | Series 1990-120, Class H, 9.000%, 10/25/20 | | | 16 | |
| | 2 | | | Series 1990-134, Class SC, HB, IF, 20.813%, 11/25/20 | | | 3 | |
| | — | (h) | | Series 1990-140, Class K, HB, 652.145%, 12/25/20 | | | 1 | |
| | 5 | | | Series 1991-24, Class Z, 5.000%, 03/25/21 | | | 5 | |
| | 3 | | | Series 1991-42, Class S, IF, 16.757%, 05/25/21 | | | 4 | |
| | 1 | | | Series 1992-101, Class J, 7.500%, 06/25/22 | | | 1 | |
| | 182 | | | Series 1992-117, Class MA, 8.000%, 07/25/22 | | | 201 | |
| | 29 | | | Series 1992-136, Class PK, 6.000%, 08/25/22 | | | 31 | |
| | 20 | | | Series 1992-143, Class MA, 5.500%, 09/25/22 | | | 22 | |
| | 220 | | | Series 1992-150, Class M, 8.000%, 09/25/22 | | | 243 | |
| | 74 | | | Series 1992-163, Class M, 7.750%, 09/25/22 | | | 82 | |
| | 105 | | | Series 1992-188, Class PZ, 7.500%, 10/25/22 | | | 118 | |
| | 47 | | | Series 1993-21, Class KA, 7.700%, 03/25/23 | | | 53 | |
| | 107 | | | Series 1993-25, Class J, 7.500%, 03/25/23 | | | 118 | |
| | 19 | | | Series 1993-27, Class SA, IF, 15.500%, 02/25/23 | | | 26 | |
| | 282 | | | Series 1993-37, Class PX, 7.000%, 03/25/23 | | | 310 | |
| | | | | | | | |
PRINCIPAL
AMOUNT($) | | | SECURITY DESCRIPTION | | VALUE($) | |
| | | | | | | | |
| | | | Agency CMO — continued | | | | |
| | 101 | | | Series 1993-54, Class Z, 7.000%, 04/25/23 | | | 111 | |
| | 1,093 | | | Series 1993-56, Class PZ, 7.000%, 05/25/23 | | | 1,212 | |
| | 49 | | | Series 1993-62, Class SA, IF, 18.923%, 04/25/23 | | | 68 | |
| | 537 | | | Series 1993-99, Class Z, 7.000%, 07/25/23 | | | 585 | |
| | 27 | | | Series 1993-122, Class M, 6.500%, 07/25/23 | | | 29 | |
| | 583 | | | Series 1993-136, Class ZB, VAR, 6.792%, 07/25/23 | | | 638 | |
| | 888 | | | Series 1993-141, Class Z, 7.000%, 08/25/23 | | | 975 | |
| | 25 | | | Series 1993-165, Class SD, IF, 13.393%, 09/25/23 | | | 33 | |
| | 32 | | | Series 1993-165, Class SK, IF, 12.500%, 09/25/23 | | | 36 | |
| | 46 | | | Series 1993-178, Class PK, 6.500%, 09/25/23 | | | 51 | |
| | 23 | | | Series 1993-179, Class SB, HB, IF, 26.731%, 10/25/23 | | | 36 | |
| | 15 | | | Series 1993-179, Class SC, IF, 10.500%, 10/25/23 | | | 19 | |
| | 705 | | | Series 1993-183, Class KA, 6.500%, 10/25/23 | | | 811 | |
| | 310 | | | Series 1993-189, Class PL, 6.500%, 10/25/23 | | | 343 | |
| | 7 | | | Series 1993-199, Class FA, VAR, 1.074%, 10/25/23 | | | 7 | |
| | 41 | | | Series 1993-205, Class H, PO, 09/25/23 | | | 40 | |
| | 68 | | | Series 1993-225, Class UB, 6.500%, 12/25/23 | | | 76 | |
| | 20 | | | Series 1993-230, Class FA, VAR, 1.124%, 12/25/23 | | | 20 | |
| | 57 | | | Series 1993-247, Class FE, VAR, 1.524%, 12/25/23 | | | 57 | |
| | 69 | | | Series 1993-247, Class SA, HB, IF, 27.956%, 12/25/23 | | | 112 | |
| | 26 | | | Series 1993-247, Class SU, IF, 12.260%, 12/25/23 | | | 34 | |
| | 5 | | | Series 1994-9, Class E, PO, 11/25/23 | | | 5 | |
| | 230 | | | Series 1994-37, Class L, 6.500%, 03/25/24 | | | 254 | |
| | 1,241 | | | Series 1994-40, Class Z, 6.500%, 03/25/24 | | | 1,354 | |
| | 1,788 | | | Series 1994-62, Class PK, 7.000%, 04/25/24 | | | 1,981 | |
SEE NOTES TO FINANCIAL STATEMENTS.
| | | | | | |
| | | |
| 38 | | | | J.P. MORGAN INCOME FUNDS | | AUGUST 31, 2016 |
| | | | | | | | |
PRINCIPAL
AMOUNT($) | | | SECURITY DESCRIPTION | | VALUE($) | |
| Collateralized Mortgage Obligations — continued | |
| | | | Agency CMO — continued | | | | |
| | 811 | | | Series 1994-63, Class PK, 7.000%, 04/25/24 | | | 909 | |
| | 44 | | | Series 1995-2, Class Z, 8.500%, 01/25/25 | | | 51 | |
| | 260 | | | Series 1995-19, Class Z, 6.500%, 11/25/23 | | | 299 | |
| | 436 | | | Series 1996-14, Class SE, IF, IO, 9.170%, 08/25/23 | | | 95 | |
| | — | (h) | | Series 1996-27, Class FC, VAR, 1.024%, 03/25/17 | | | — | (h) |
| | 448 | | | Series 1996-48, Class Z, 7.000%, 11/25/26 | | | 496 | |
| | 37 | | | Series 1996-59, Class J, 6.500%, 08/25/22 | | | 40 | |
| | 85 | | | Series 1997-20, Class IB, IO, VAR, 1.840%, 03/25/27 | | | 3 | |
| | 279 | | | Series 1997-20, Class IO, IO, VAR, 1.840%, 03/25/27 | | | 9 | |
| | 72 | | | Series 1997-27, Class J, 7.500%, 04/18/27 | | | 80 | |
| | 109 | | | Series 1997-29, Class J, 7.500%, 04/20/27 | | | 127 | |
| | 268 | | | Series 1997-32, Class PG, 6.500%, 04/25/27 | | | 308 | |
| | 444 | | | Series 1997-39, Class PD, 7.500%, 05/20/27 | | | 518 | |
| | 23 | | | Series 1997-42, Class ZC, 6.500%, 07/18/27 | | | 27 | |
| | 462 | | | Series 1997-61, Class ZC, 7.000%, 02/25/23 | | | 512 | |
| | 115 | | | Series 1997-81, Class PI, IO, 7.000%, 12/18/27 | | | 13 | |
| | 16 | | | Series 1998-4, Class C, PO, 04/25/23 | | | 15 | |
| | 162 | | | Series 1998-36, Class ZB, 6.000%, 07/18/28 | | | 185 | |
| | 83 | | | Series 1998-43, Class SA, IF, IO, 19.057%, 04/25/23 | | | 32 | |
| | 149 | | | Series 1998-66, Class SB, IF, IO, 7.626%, 12/25/28 | | | 25 | |
| | 90 | | | Series 1999-17, Class C, 6.350%, 04/25/29 | | | 99 | |
| | 341 | | | Series 1999-18, Class Z, 5.500%, 04/18/29 | | | 379 | |
| | 36 | | | Series 1999-38, Class SK, IF, IO, 7.526%, 08/25/23 | | | 3 | |
| | 42 | | | Series 1999-52, Class NS, HB, IF, 21.912%, 10/25/23 | | | 63 | |
| | 127 | | | Series 1999-62, Class PB, 7.500%, 12/18/29 | | | 148 | |
| | | | | | | | |
PRINCIPAL
AMOUNT($) | | | SECURITY DESCRIPTION | | VALUE($) | |
| | | | | | | | |
| | | | Agency CMO — continued | | | | |
| | 697 | | | Series 2000-2, Class ZE, 7.500%, 02/25/30 | | | 799 | |
| | 249 | | | Series 2000-20, Class SA, IF, IO, 8.576%, 07/25/30 | | | 65 | |
| | 32 | | | Series 2000-52, Class IO, IO, 8.500%, 01/25/31 | | | 6 | |
| | 172 | | | Series 2001-4, Class PC, 7.000%, 03/25/21 | | | 185 | |
| | 92 | | | Series 2001-7, Class PF, 7.000%, 03/25/31 | | | 106 | |
| | 258 | | | Series 2001-30, Class PM, 7.000%, 07/25/31 | | | 295 | |
| | 461 | | | Series 2001-33, Class ID, IO, 6.000%, 07/25/31 | | | 89 | |
| | 485 | | | Series 2001-36, Class DE, 7.000%, 08/25/31 | | | 565 | |
| | 628 | | | Series 2001-44, Class MY, 7.000%, 09/25/31 | | | 723 | |
| | 127 | | | Series 2001-44, Class PD, 7.000%, 09/25/31 | | | 144 | |
| | 106 | | | Series 2001-44, Class PU, 7.000%, 09/25/31 | | | 123 | |
| | 1,014 | | | Series 2001-48, Class Z, 6.500%, 09/25/21 | | | 1,128 | |
| | 105 | | | Series 2001-49, Class Z, 6.500%, 09/25/31 | | | 121 | |
| | 80 | | | Series 2001-52, Class KB, 6.500%, 10/25/31 | | | 90 | |
| | 846 | | | Series 2001-60, Class PX, 6.000%, 11/25/31 | | | 970 | |
| | 348 | | | Series 2001-60, Class QS, HB, IF, 22.665%, 09/25/31 | | | 622 | |
| | 824 | | | Series 2001-61, Class Z, 7.000%, 11/25/31 | | | 935 | |
| | 4 | | | Series 2001-71, Class MB, 6.000%, 12/25/16 | | | 4 | |
| | 1 | | | Series 2001-71, Class QE, 6.000%, 12/25/16 | | | 1 | |
| | 28 | | | Series 2001-72, Class SX, IF, 16.245%, 12/25/31 | | | 40 | |
| | 22 | | | Series 2001-74, Class MB, 6.000%, 12/25/16 | | | 22 | |
| | 35 | | | Series 2001-81, Class LO, PO, 01/25/32 | | | 33 | |
| | 372 | | | Series 2002-1, Class G, 7.000%, 07/25/23 | | | 412 | |
| | 164 | | | Series 2002-1, Class HC, 6.500%, 02/25/22 | | | 183 | |
| | 117 | | | Series 2002-1, Class SA, HB, IF, 23.483%, 02/25/32 | | | 202 | |
SEE NOTES TO FINANCIAL STATEMENTS.
| | | | | | | | |
| | | |
| AUGUST 31, 2016 | | J.P. MORGAN INCOME FUNDS | | | | | 39 | |
JPMorgan Core Bond Fund
SCHEDULE OF PORTFOLIO INVESTMENTS
AS OF AUGUST 31, 2016 (Unaudited) (continued)
(Amounts in thousands)
| | | | | | | | |
PRINCIPAL
AMOUNT($) | | | SECURITY DESCRIPTION | | VALUE($) | |
| Collateralized Mortgage Obligations — continued | |
| | | | Agency CMO — continued | | | | |
| | 57 | | | Series 2002-1, Class UD, HB, IF, 22.665%, 12/25/23 | | | 86 | |
| | 17 | | | Series 2002-2, Class UC, 6.000%, 02/25/17 | | | 17 | |
| | 8 | | | Series 2002-3, Class OG, 6.000%, 02/25/17 | | | 8 | |
| | 1,022 | | | Series 2002-5, Class PK, 6.000%, 02/25/22 | | | 1,127 | |
| | — | (h) | | Series 2002-7, Class OG, 6.000%, 03/25/17 | | | — | (h) |
| | 904 | | | Series 2002-13, Class SJ, IF, IO, 1.600%, 03/25/32 | | | 46 | |
| | 13 | | | Series 2002-13, Class ST, IF, 10.000%, 03/25/32 | | | 17 | |
| | 2,118 | | | Series 2002-15, Class ZA, 6.000%, 04/25/32 | | | 2,430 | |
| | 19 | | | Series 2002-16, Class PG, 6.000%, 04/25/17 | | | 19 | |
| | 2 | | | Series 2002-19, Class PE, 6.000%, 04/25/17 | | | 2 | |
| | 27 | | | Series 2002-21, Class LO, PO, 04/25/32 | | | 25 | |
| | 397 | | | Series 2002-21, Class PE, 6.500%, 04/25/32 | | | 451 | |
| | 55 | | | Series 2002-24, Class AJ, 6.000%, 04/25/17 | | | 56 | |
| | 807 | | | Series 2002-28, Class PK, 6.500%, 05/25/32 | | | 903 | |
| | 31 | | | Series 2002-31, Class S, IF, 18.061%, 05/25/17 | | | 33 | |
| | 314 | | | Series 2002-37, Class Z, 6.500%, 06/25/32 | | | 365 | |
| | 6 | | | Series 2002-38, Class QE, 6.000%, 06/25/17 | | | 6 | |
| | 902 | | | Series 2002-48, Class GH, 6.500%, 08/25/32 | | | 1,048 | |
| | 1,253 | | | Series 2002-54, Class PG, 6.000%, 09/25/22 | | | 1,389 | |
| | 38 | | | Series 2002-57, Class AE, 5.500%, 09/25/17 | | | 38 | |
| | 29 | | | Series 2002-63, Class KC, 5.000%, 10/25/17 | | | 29 | |
| | 208 | | | Series 2002-71, Class AP, 5.000%, 11/25/32 | | | 226 | |
| | 142 | | | Series 2002-77, Class S, IF, 13.522%, 12/25/32 | | | 175 | |
| | 2,131 | | | Series 2002-78, Class Z, 5.500%, 12/25/32 | | | 2,307 | |
| | 480 | | | Series 2002-83, Class CS, 6.881%, 08/25/23 | | | 528 | |
| | | | | | | | |
PRINCIPAL
AMOUNT($) | | | SECURITY DESCRIPTION | | VALUE($) | |
| | | | | | | | |
| | | | Agency CMO — continued | | | | |
| | 732 | | | Series 2002-90, Class A1, 6.500%, 06/25/42 | | | 868 | |
| | 313 | | | Series 2003-9, Class NZ, 6.500%, 02/25/33 | | | 352 | |
| | 415 | | | Series 2003-14, Class TI, IO, 5.000%, 03/25/33 | | | 60 | |
| | 2,191 | | | Series 2003-17, Class EQ, 5.500%, 03/25/23 | | | 2,398 | |
| | 3,314 | | | Series 2003-22, Class UD, 4.000%, 04/25/33 | | | 3,559 | |
| | 4,078 | | | Series 2003-23, Class EQ, 5.500%, 04/25/23 | | | 4,477 | |
| | 117 | | | Series 2003-32, Class KC, 5.000%, 05/25/18 | | | 120 | |
| | 1,377 | | | Series 2003-33, Class IA, IO, 6.500%, 05/25/33 | | | 251 | |
| | 606 | | | Series 2003-34, Class AX, 6.000%, 05/25/33 | | | 698 | |
| | 2,023 | | | Series 2003-34, Class ED, 6.000%, 05/25/33 | | | 2,274 | |
| | 574 | | | Series 2003-34, Class GB, 6.000%, 03/25/33 | | | 605 | |
| | 1,075 | | | Series 2003-34, Class GE, 6.000%, 05/25/33 | | | 1,265 | |
| | 112 | | | Series 2003-35, Class EA, PO, 05/25/33 | | | 102 | |
| | 143 | | | Series 2003-39, Class IO, IO, VAR, 6.000%, 05/25/33 | | | 31 | |
| | 946 | | | Series 2003-39, Class LW, 5.500%, 05/25/23 | | | 1,021 | |
| | 178 | | | Series 2003-42, Class GB, 4.000%, 05/25/33 | | | 191 | |
| | 928 | | | Series 2003-47, Class PE, 5.750%, 06/25/33 | | | 1,057 | |
| | 212 | | | Series 2003-52, Class SX, HB, IF, 21.377%, 10/25/31 | | | 316 | |
| | 377 | | | Series 2003-64, Class SX, IF, 12.515%, 07/25/33 | | | 477 | |
| | 973 | | | Series 2003-71, Class DS, IF, 6.808%, 08/25/33 | | | 1,103 | |
| | 3,596 | | | Series 2003-72, Class IE, IO, 5.500%, 08/25/33 | | | 598 | |
| | 1,660 | | | Series 2003-73, Class HC, 5.500%, 08/25/33 | | | 1,877 | |
| | 81 | | | Series 2003-74, Class SH, IF, 9.226%, 08/25/33 | | | 94 | |
| | 272 | | | Series 2003-80, Class SY, IF, IO, 7.126%, 06/25/23 | | | 7 | |
| | 592 | | | Series 2003-81, Class HC, 4.750%, 09/25/18 | | | 606 | |
SEE NOTES TO FINANCIAL STATEMENTS.
| | | | | | |
| | | |
| 40 | | | | J.P. MORGAN INCOME FUNDS | | AUGUST 31, 2016 |
| | | | | | | | |
PRINCIPAL
AMOUNT($) | | | SECURITY DESCRIPTION | | VALUE($) | |
| Collateralized Mortgage Obligations — continued | |
| | | | Agency CMO — continued | | | | |
| | 436 | | | Series 2003-82, Class VB, 5.500%, 08/25/33 | | | 440 | |
| | 848 | | | Series 2003-83, Class PG, 5.000%, 06/25/23 | | | 881 | |
| | 263 | | | Series 2003-91, Class SD, IF, 11.626%, 09/25/33 | | | 321 | |
| | 11,668 | | | Series 2003-105, Class AZ, 5.500%, 10/25/33 | | | 13,283 | |
| | 1,817 | | | Series 2003-116, Class SB, IF, IO, 7.076%, 11/25/33 | | | 407 | |
| | 9,182 | | | Series 2003-122, Class ZJ, 6.000%, 12/25/33 | | | 10,763 | |
| | 428 | | | Series 2003-130, Class CS, IF, 13.051%, 12/25/33 | | | 482 | |
| | 107 | | | Series 2003-130, Class SX, IF, 10.733%, 01/25/34 | | | 131 | |
| | 223 | | | Series 2003-131, Class SK, IF, 15.151%, 01/25/34 | | | 280 | |
| | 101 | | | Series 2003-132, Class OA, PO, 08/25/33 | | | 97 | |
| | 1,228 | | | Series 2004-4, Class QI, IF, IO, 6.576%, 06/25/33 | | | 124 | |
| | 913 | | | Series 2004-4, Class QM, IF, 13.151%, 06/25/33 | | | 1,126 | |
| | 615 | | | Series 2004-10, Class SC, HB, IF, 26.502%, 02/25/34 | | | 746 | |
| | 2,957 | | | Series 2004-17, Class H, 5.500%, 04/25/34 | | | 3,317 | |
| | 150 | | | Series 2004-21, Class AE, 4.000%, 04/25/19 | | | 153 | |
| | 1,016 | | | Series 2004-25, Class SA, IF, 18.083%, 04/25/34 | | | 1,510 | |
| | 1,661 | | | Series 2004-28, Class PF, VAR, 0.924%, 03/25/34 | | | 1,662 | |
| | 3,706 | | | Series 2004-36, Class FA, VAR, 0.924%, 05/25/34 | | | 3,704 | |
| | 424 | | | Series 2004-36, Class PC, 5.500%, 02/25/34 | | | 443 | |
| | 1,584 | | | Series 2004-36, Class SA, IF, 18.083%, 05/25/34 | | | 2,443 | |
| | 304 | | | Series 2004-36, Class SN, IF, 13.151%, 07/25/33 | | | 342 | |
| | 1,810 | | | Series 2004-46, Class EP, PO, 03/25/34 | | | 1,704 | |
| | 334 | | | Series 2004-46, Class QB, HB, IF, 21.902%, 05/25/34 | | | 505 | |
| | 265 | | | Series 2004-46, Class SK, IF, 15.058%, 05/25/34 | | | 349 | |
| | 6,577 | | | Series 2004-50, Class VZ, 5.500%, 07/25/34 | | | 7,332 | |
| | | | | | | | |
PRINCIPAL
AMOUNT($) | | | SECURITY DESCRIPTION | | VALUE($) | |
| | | | | | | | |
| | | | Agency CMO — continued | | | | |
| | 239 | | | Series 2004-51, Class SY, IF, 13.191%, 07/25/34 | | | 319 | |
| | 236 | | | Series 2004-53, Class NC, 5.500%, 07/25/24 | | | 256 | |
| | 173 | | | Series 2004-59, Class BG, PO, 12/25/32 | | | 164 | |
| | 4,161 | | | Series 2004-61, Class FH, VAR, 1.324%, 11/25/32 | | | 4,254 | |
| | 101 | | | Series 2004-61, Class SH, HB, IF, 21.891%, 11/25/32 | | | 150 | |
| | 272 | | | Series 2004-61, Class SK, IF, 8.500%, 11/25/32 | | | 328 | |
| | 2,110 | | | Series 2004-65, Class EY, 5.500%, 08/25/24 | | | 2,321 | |
| | 242 | | | Series 2004-74, Class SW, IF, 14.485%, 11/25/31 | | | 342 | |
| | 744 | | | Series 2004-79, Class S, IF, 18.358%, 08/25/32 | | | 866 | |
| | 306 | | | Series 2004-79, Class SP, IF, 18.358%, 11/25/34 | | | 384 | |
| | 167 | | | Series 2004-81, Class AC, 4.000%, 11/25/19 | | | 171 | |
| | 3,420 | | | Series 2004-81, Class JG, 5.000%, 11/25/24 | | | 3,718 | |
| | 2,083 | | | Series 2004-87, Class F, VAR, 1.274%, 01/25/34 | | | 2,122 | |
| | 1,687 | | | Series 2005-25, Class PF, VAR, 0.874%, 04/25/35 | | | 1,683 | |
| | 160 | | | Series 2005-42, Class PS, IF, 15.689%, 05/25/35 | | | 205 | |
| | 21 | | | Series 2005-52, Class PA, 6.500%, 06/25/35 | | | 22 | |
| | 1,204 | | | Series 2005-56, Class S, IF, IO, 6.186%, 07/25/35 | | | 234 | |
| | 575 | | | Series 2005-56, Class TP, IF, 16.577%, 08/25/33 | | | 775 | |
| | 182 | | | Series 2005-57, Class CD, HB, IF, 23.159%, 01/25/35 | | | 229 | |
| | 17 | | | Series 2005-57, Class DC, HB, IF, 20.071%, 12/25/34 | | | 18 | |
| | 551 | | | Series 2005-59, Class SU, HB, IF, 22.878%, 06/25/35 | | | 821 | |
| | 431 | | | Series 2005-66, Class SG, IF, 16.064%, 07/25/35 | | | 638 | |
| | 1,984 | | | Series 2005-67, Class EY, 5.500%, 08/25/25 | | | 2,205 | |
| | 1,799 | | | Series 2005-68, Class PG, 5.500%, 08/25/35 | | | 2,037 | |
| | 549 | | | Series 2005-68, Class UC, 5.000%, 06/25/35 | | | 576 | |
SEE NOTES TO FINANCIAL STATEMENTS.
| | | | | | | | |
| | | |
| AUGUST 31, 2016 | | J.P. MORGAN INCOME FUNDS | | | | | 41 | |
JPMorgan Core Bond Fund
SCHEDULE OF PORTFOLIO INVESTMENTS
AS OF AUGUST 31, 2016 (Unaudited) (continued)
(Amounts in thousands)
| | | | | | | | |
PRINCIPAL
AMOUNT($) | | | SECURITY DESCRIPTION | | VALUE($) | |
| Collateralized Mortgage Obligations — continued | |
| | | | Agency CMO — continued | | | | |
| | 864 | | | Series 2005-72, Class SB, IF, 15.564%, 08/25/35 | | | 1,189 | |
| | 627 | | | Series 2005-73, Class PS, IF, 15.389%, 08/25/35 | | | 882 | |
| | 9,627 | | | Series 2005-73, Class ZB, 5.500%, 08/25/35 | | | 10,359 | |
| | 472 | | | Series 2005-74, Class CP, HB, IF, 22.827%, 05/25/35 | | | 687 | |
| | 2,059 | | | Series 2005-74, Class CS, IF, 18.578%, 05/25/35 | | | 2,911 | |
| | 1,415 | | | Series 2005-74, Class SK, IF, 18.688%, 05/25/35 | | | 2,006 | |
| | 216 | | | Series 2005-75, Class SV, HB, IF, 22.102%, 09/25/35 | | | 338 | |
| | 1,801 | | | Series 2005-84, Class XM, 5.750%, 10/25/35 | | | 1,963 | |
| | 738 | | | Series 2005-90, Class ES, IF, 15.564%, 10/25/35 | | | 996 | |
| | 287 | | | Series 2005-90, Class PO, PO, 09/25/35 | | | 275 | |
| | 1,238 | | | Series 2005-93, Class MF, VAR, 0.774%, 08/25/34 | | | 1,238 | |
| | 3,627 | | | Series 2005-106, Class US, HB, IF, 22.644%, 11/25/35 | | | 5,598 | |
| | 368 | | | Series 2005-109, Class PC, 6.000%, 12/25/35 | | | 410 | |
| | 5,075 | | | Series 2005-110, Class GL, 5.500%, 12/25/35 | | | 5,964 | |
| | 1,386 | | | Series 2005-121, Class DX, 5.500%, 01/25/26 | | | 1,513 | |
| | 4,094 | | | Series 2006-8, Class JZ, 5.500%, 03/25/36 | | | 4,646 | |
| | 9,898 | | | Series 2006-8, Class WN, IF, IO, 6.176%, 03/25/36 | | | 2,097 | |
| | 2,700 | | | Series 2006-8, Class WQ, PO, 03/25/36 | | | 2,366 | |
| | 240 | | | Series 2006-11, Class PS, HB, IF, 22.644%, 03/25/36 | | | 371 | |
| | 3,860 | | | Series 2006-12, Class BZ, 5.500%, 03/25/36 | | | 4,377 | |
| | 191 | | | Series 2006-15, Class OT, PO, 01/25/36 | | | 186 | |
| | 1,584 | | | Series 2006-16, Class HZ, 5.500%, 03/25/36 | | | 1,702 | |
| | 298 | | | Series 2006-16, Class OA, PO, 03/25/36 | | | 274 | |
| | 930 | | | Series 2006-22, Class AO, PO, 04/25/36 | | | 850 | |
| | 1,668 | | | Series 2006-23, Class FK, VAR, 0.774%, 04/25/36 | | | 1,656 | |
| | 465 | | | Series 2006-23, Class KO, PO, 04/25/36 | | | 422 | |
| | 1,073 | | | Series 2006-27, Class OH, PO, 04/25/36 | | | 1,009 | |
| | 305 | | | Series 2006-33, Class LS, HB, IF, 27.790%, 05/25/36 | | | 550 | |
| | | | | | | | |
PRINCIPAL
AMOUNT($) | | | SECURITY DESCRIPTION | | VALUE($) | |
| | | | | | | | |
| | | | Agency CMO — continued | | | | |
| | 693 | | | Series 2006-39, Class WC, 5.500%, 01/25/36 | | | 759 | |
| | 769 | | | Series 2006-43, Class DO, PO, 06/25/36 | | | 737 | |
| | 260 | | | Series 2006-43, Class PO, PO, 06/25/36 | | | 249 | |
| | 527 | | | Series 2006-44, Class GO, PO, 06/25/36 | | | 499 | |
| | 1,368 | | | Series 2006-44, Class P, PO, 12/25/33 | | | 1,304 | |
| | 600 | | | Series 2006-46, Class FW, VAR, 0.924%, 06/25/36 | | | 599 | |
| | 96 | | | Series 2006-46, Class SW, HB, IF, 22.277%, 06/25/36 | | | 142 | |
| | 914 | | | Series 2006-46, Class UC, 5.500%, 12/25/35 | | | 993 | |
| | 1,764 | | | Series 2006-50, Class JO, PO, 06/25/36 | | | 1,690 | |
| | 2,216 | | | Series 2006-50, Class PS, PO, 06/25/36 | | | 2,112 | |
| | 2,255 | | | Series 2006-53, Class US, IF, IO, 6.056%, 06/25/36 | | | 324 | |
| | 4,910 | | | Series 2006-56, Class FC, VAR, 0.814%, 07/25/36 | | | 4,893 | |
| | 171 | | | Series 2006-58, Class AP, PO, 07/25/36 | | | 163 | |
| | 529 | | | Series 2006-58, Class FL, VAR, 0.984%, 07/25/36 | | | 530 | |
| | 891 | | | Series 2006-58, Class IG, IF, IO, 5.996%, 07/25/36 | | | 170 | |
| | 327 | | | Series 2006-58, Class PO, PO, 07/25/36 | | | 312 | |
| | 304 | | | Series 2006-59, Class QO, PO, 01/25/33 | | | 299 | |
| | 286 | | | Series 2006-60, Class AK, HB, IF, 26.702%, 07/25/36 | | | 530 | |
| | 1,135 | | | Series 2006-60, Class DO, PO, 04/25/35 | | | 1,086 | |
| | 230 | | | Series 2006-62, Class PS, HB, IF, 36.754%, 07/25/36 | | | 450 | |
| | 3,482 | | | Series 2006-63, Class ZH, 6.500%, 07/25/36 | | | 4,100 | |
| | 606 | | | Series 2006-65, Class QO, PO, 07/25/36 | | | 559 | |
| | 7,338 | | | Series 2006-71, Class ZL, 6.000%, 07/25/36 | | | 8,429 | |
| | 1,087 | | | Series 2006-72, Class GO, PO, 08/25/36 | | | 1,031 | |
| | 216 | | | Series 2006-72, Class TO, PO, 08/25/36 | | | 207 | |
| | 2,633 | | | Series 2006-77, Class PC, 6.500%, 08/25/36 | | | 3,042 | |
| | 607 | | | Series 2006-78, Class BZ, 6.500%, 08/25/36 | | | 687 | |
| | 1,911 | | | Series 2006-79, Class DF, VAR, 0.874%, 08/25/36 | | | 1,908 | |
| | 453 | | | Series 2006-79, Class DO, PO, 08/25/36 | | | 427 | |
| | 576 | | | Series 2006-79, Class OP, PO, 08/25/36 | | | 556 | |
| | 428 | | | Series 2006-85, Class MZ, 6.500%, 09/25/36 | | | 485 | |
SEE NOTES TO FINANCIAL STATEMENTS.
| | | | | | |
| | | |
| 42 | | | | J.P. MORGAN INCOME FUNDS | | AUGUST 31, 2016 |
| | | | | | | | |
PRINCIPAL
AMOUNT($) | | | SECURITY DESCRIPTION | | VALUE($) | |
| Collateralized Mortgage Obligations — continued | |
| | | | Agency CMO — continued | | | | |
| | 584 | | | Series 2006-86, Class OB, PO, 09/25/36 | | | 561 | |
| | 597 | | | Series 2006-90, Class AO, PO, 09/25/36 | | | 562 | |
| | 267 | | | Series 2006-94, Class GK, HB, IF, 30.628%, 10/25/26 | | | 453 | |
| | 358 | | | Series 2006-95, Class SG, HB, IF, 24.102%, 10/25/36 | | | 578 | |
| | 154 | | | Series 2006-109, Class PO, PO, 11/25/36 | | | 147 | |
| | 990 | | | Series 2006-110, Class PO, PO, 11/25/36 | | | 947 | |
| | 408 | | | Series 2006-111, Class EO, PO, 11/25/36 | | | 390 | |
| | 505 | | | Series 2006-113, Class PO, PO, 07/25/36 | | | 493 | |
| | 116 | | | Series 2006-115, Class ES, HB, IF, 24.462%, 12/25/36 | | | 180 | |
| | 492 | | | Series 2006-115, Class OK, PO, 12/25/36 | | | 450 | |
| | 2,370 | | | Series 2006-117, Class GS, IF, IO, 6.126%, 12/25/36 | | | 263 | |
| | 1,443 | | | Series 2006-118, Class A1, VAR, 0.584%, 12/25/36 | | | 1,411 | |
| | 5,501 | | | Series 2006-118, Class A2, VAR, 0.584%, 12/25/36 | | | 5,484 | |
| | 207 | | | Series 2006-119, Class PO, PO, 12/25/36 | | | 196 | |
| | 827 | | | Series 2006-128, Class BP, 5.500%, 01/25/37 | | | 886 | |
| | 478 | | | Series 2006-128, Class PO, PO, 01/25/37 | | | 446 | |
| | 1,549 | | | Series 2006-130, Class GI, IO, 6.500%, 07/25/32 | | | 259 | |
| | 73 | | | Series 2007-1, Class SD, HB, IF, 35.854%, 02/25/37 | | | 187 | |
| | 810 | | | Series 2007-7, Class SG, IF, IO, 5.976%, 08/25/36 | | | 226 | |
| | 1,874 | | | Series 2007-10, Class FD, VAR, 0.774%, 02/25/37 | | | 1,866 | |
| | 4,119 | | | Series 2007-14, Class ES, IF, IO, 5.916%, 03/25/37 | | | 728 | |
| | 435 | | | Series 2007-14, Class OP, PO, 03/25/37 | | | 401 | |
| | 413 | | | Series 2007-15, Class NO, PO, 03/25/22 | | | 399 | |
| | 1,517 | | | Series 2007-16, Class FC, VAR, 1.274%, 03/25/37 | | | 1,537 | |
| | 1,708 | | | Series 2007-18, Class MZ, 6.000%, 03/25/37 | | | 1,870 | |
| | 167 | | | Series 2007-22, Class SC, IF, IO, 5.556%, 03/25/37 | | | 28 | |
| | 1,435 | | | Series 2007-28, Class EO, PO, 04/25/37 | | | 1,383 | |
| | 878 | | | Series 2007-29, Class SG, HB, IF, 20.918%, 04/25/37 | | | 1,312 | |
| | 1,570 | | | Series 2007-35, Class SI, IF, IO, 5.576%, 04/25/37 | | | 249 | |
| | 301 | | | Series 2007-42, Class AO, PO, 05/25/37 | | | 290 | |
| | | | | | | | |
PRINCIPAL
AMOUNT($) | | | SECURITY DESCRIPTION | | VALUE($) | |
| | | | | | | | |
| | | | Agency CMO — continued | | | | |
| | 4,592 | | | Series 2007-42, Class B, 6.000%, 05/25/37 | | | 5,202 | |
| | 761 | | | Series 2007-43, Class FL, VAR, 0.824%, 05/25/37 | | | 758 | |
| | 3,100 | | | Series 2007-53, Class SH, IF, IO, 5.576%, 06/25/37 | | | 437 | |
| | 4,865 | | | Series 2007-54, Class FA, VAR, 0.924%, 06/25/37 | | | 4,862 | |
| | 1,060 | | | Series 2007-54, Class WI, IF, IO, 5.576%, 06/25/37 | | | 198 | |
| | 10,157 | | | Series 2007-60, Class AX, IF, IO, 6.626%, 07/25/37 | | | 2,379 | |
| | 601 | | | Series 2007-62, Class SE, IF, 15.189%, 07/25/37 | | | 794 | |
| | 885 | | | Series 2007-64, Class FB, VAR, 0.894%, 07/25/37 | | | 886 | |
| | 3,473 | | | Series 2007-65, Class KI, IF, IO, 6.096%, 07/25/37 | | | 451 | |
| | 1,026 | | | Series 2007-67, Class PO, PO, 07/25/37 | | | 930 | |
| | 2,519 | | | Series 2007-70, Class Z, 5.500%, 07/25/37 | | | 2,844 | |
| | 6,300 | | | Series 2007-72, Class EK, IF, IO, 5.876%, 07/25/37 | | | 1,091 | |
| | 1,465 | | | Series 2007-76, Class AZ, 5.500%, 08/25/37 | | | 1,602 | |
| | 1,847 | | | Series 2007-76, Class ZG, 6.000%, 08/25/37 | | | 2,069 | |
| | 1,149 | | | Series 2007-77, Class FG, VAR, 1.024%, 03/25/37 | | | 1,152 | |
| | 403 | | | Series 2007-78, Class CB, 6.000%, 08/25/37 | | | 455 | |
| | 2,148 | | | Series 2007-78, Class PE, 6.000%, 08/25/37 | | | 2,416 | |
| | 891 | | | Series 2007-79, Class SB, HB, IF, 22.094%, 08/25/37 | | | 1,351 | |
| | 2,531 | | | Series 2007-81, Class GE, 6.000%, 08/25/37 | | | 2,773 | |
| | 230 | | | Series 2007-85, Class SL, IF, 14.839%, 09/25/37 | | | 323 | |
| | 3,153 | | | Series 2007-88, Class VI, IF, IO, 6.016%, 09/25/37 | | | 655 | |
| | 3,399 | | | Series 2007-91, Class ES, IF, IO, 5.936%, 10/25/37 | | | 508 | |
| | 492 | | | Series 2007-92, Class YA, 6.500%, 06/25/37 | | | 554 | |
| | 820 | | | Series 2007-92, Class YS, IF, IO, 5.256%, 06/25/37 | | | 121 | |
| | 566 | | | Series 2007-97, Class FC, VAR, 1.024%, 07/25/37 | | | 568 | |
SEE NOTES TO FINANCIAL STATEMENTS.
| | | | | | | | |
| | | |
| AUGUST 31, 2016 | | J.P. MORGAN INCOME FUNDS | | | | | 43 | |
JPMorgan Core Bond Fund
SCHEDULE OF PORTFOLIO INVESTMENTS
AS OF AUGUST 31, 2016 (Unaudited) (continued)
(Amounts in thousands)
| | | | | | | | |
PRINCIPAL
AMOUNT($) | | | SECURITY DESCRIPTION | | VALUE($) | |
| Collateralized Mortgage Obligations — continued | |
| | | | Agency CMO — continued | | | | |
| | 2,285 | | | Series 2007-97, Class KI, IO, 7.000%, 05/25/33 | | | 279 | |
| | 371 | | | Series 2007-98, Class FB, VAR, 0.974%, 06/25/37 | | | 387 | |
| | 3,115 | | | Series 2007-100, Class SM, IF, IO, 5.926%, 10/25/37 | | | 557 | |
| | 11,213 | | | Series 2007-101, Class A2, VAR, 0.774%, 06/27/36 | | | 10,952 | |
| | 1,274 | | | Series 2007-106, Class A7, VAR, 6.150%, 10/25/37 | | | 1,423 | |
| | 235 | | | Series 2007-108, Class SA, IF, IO, 5.836%, 12/25/37 | | | 38 | |
| | 3,935 | | | Series 2007-109, Class AI, IF, IO, 5.876%, 12/25/37 | | | 528 | |
| | 2,777 | | | Series 2007-112, Class MJ, 6.500%, 12/25/37 | | | 3,288 | |
| | 3,263 | | | Series 2007-112, Class SA, IF, IO, 5.926%, 12/25/37 | | | 658 | |
| | 9,360 | | | Series 2007-114, Class A6, VAR, 0.724%, 10/27/37 | | | 9,341 | |
| | 8,690 | | | Series 2007-116, Class HI, IO, VAR, 1.641%, 01/25/38 | | | 621 | |
| | 3,715 | | | Series 2008-1, Class BI, IF, IO, 5.386%, 02/25/38 | | | 612 | |
| | 6,119 | | | Series 2008-4, Class SD, IF, IO, 5.476%, 02/25/38 | | | 1,044 | |
| | 913 | | | Series 2008-10, Class XI, IF, IO, 5.706%, 03/25/38 | | | 134 | |
| | 1,032 | | | Series 2008-16, Class IS, IF, IO, 5.676%, 03/25/38 | | | 167 | |
| | 812 | | | Series 2008-18, Class FA, VAR, 1.424%, 03/25/38 | | | 824 | |
| | 396 | | | Series 2008-18, Class SP, IF, 12.951%, 03/25/38 | | | 502 | |
| | 1,518 | | | Series 2008-20, Class SA, IF, IO, 6.466%, 03/25/38 | | | 291 | |
| | 1,373 | | | Series 2008-27, Class SN, IF, IO, 6.376%, 04/25/38 | | | 225 | |
| | 476 | | | Series 2008-28, Class QS, IF, 19.127%, 04/25/38 | | | 690 | |
| | 1,028 | | | Series 2008-32, Class SA, IF, IO, 6.326%, 04/25/38 | | | 167 | |
| | 3,861 | | | Series 2008-35, Class IM, IO, VAR, 0.642%, 10/25/16 | | | 2 | |
| | 389 | | | Series 2008-42, Class AO, PO, 09/25/36 | | | 374 | |
| | 45 | | | Series 2008-44, Class PO, PO, 05/25/38 | | | 43 | |
| | 3,529 | | | Series 2008-46, Class HI, IO, VAR, 1.891%, 06/25/38 | | | 231 | |
| | | | | | | | |
PRINCIPAL
AMOUNT($) | | | SECURITY DESCRIPTION | | VALUE($) | |
| | | | | | | | |
| | | | Agency CMO — continued | | | | |
| | 682 | | | Series 2008-47, Class SI, IF, IO, 5.976%, 06/25/23 | | | 58 | |
| | 931 | | | Series 2008-53, Class CI, IF, IO, 6.676%, 07/25/38 | | | 174 | |
| | 4,206 | | | Series 2008-55, Class S, IF, IO, 7.076%, 07/25/28 | | | 703 | |
| | 722 | | | Series 2008-56, Class AC, 5.000%, 07/25/38 | | | 790 | |
| | 831 | | | Series 2008-60, Class JC, 5.000%, 07/25/38 | | | 920 | |
| | 1,606 | | | Series 2008-61, Class BH, 4.500%, 07/25/23 | | | 1,694 | |
| | 541 | | | Series 2008-76, Class GF, VAR, 1.174%, 09/25/23 | | | 542 | |
| | 3,324 | | | Series 2008-80, Class SA, IF, IO, 5.326%, 09/25/38 | | | 476 | |
| | 1,838 | | | Series 2008-81, Class SB, IF, IO, 5.326%, 09/25/38 | | | 276 | |
| | 202 | | | Series 2009-4, Class BD, 4.500%, 02/25/39 | | | 215 | |
| | 2,169 | | | Series 2009-6, Class GS, IF, IO, 6.026%, 02/25/39 | | | 451 | |
| | 1,029 | | | Series 2009-9, Class IO, IO, 5.000%, 02/25/24 | | | 66 | |
| | 3,806 | | | Series 2009-11, Class NB, 5.000%, 03/25/29 | | | 4,155 | |
| | 721 | | | Series 2009-15, Class MI, IO, 5.000%, 03/25/24 | | | 28 | |
| | 1,711 | | | Series 2009-17, Class QS, IF, IO, 6.126%, 03/25/39 | | | 251 | |
| | 409 | | | Series 2009-18, Class IO, IO, 5.000%, 03/25/24 | | | 21 | |
| | 2,843 | | | Series 2009-19, Class PW, 4.500%, 10/25/36 | | | 3,102 | |
| | 107 | | | Series 2009-47, Class MT, 7.000%, 07/25/39 | | | 119 | |
| | 1,472 | | | Series 2009-52, Class PI, IO, 5.000%, 07/25/39 | | | 189 | |
| | 5,333 | | | Series 2009-59, Class HB, 5.000%, 08/25/39 | | | 5,975 | |
| | 6,247 | | | Series 2009-60, Class HT, 6.000%, 08/25/39 | | | 7,149 | |
| | 125 | | | Series 2009-63, Class P, 5.000%, 03/25/37 | | | 137 | |
| | 4,432 | | | Series 2009-65, Class MT, 5.000%, 09/25/39 | | | 4,727 | |
| | 2,697 | | | Series 2009-69, Class WA, VAR, 6.021%, 09/25/39 | | | 3,108 | |
| | 1,481 | | | Series 2009-70, Class CO, PO, 01/25/37 | | | 1,362 | |
SEE NOTES TO FINANCIAL STATEMENTS.
| | | | | | |
| | | |
| 44 | | | | J.P. MORGAN INCOME FUNDS | | AUGUST 31, 2016 |
| | | | | | | | |
PRINCIPAL
AMOUNT($) | | | SECURITY DESCRIPTION | | VALUE($) | |
| Collateralized Mortgage Obligations — continued | |
| | | | Agency CMO — continued | | | | |
| | 1,395 | | | Series 2009-84, Class WS, IF, IO, 5.376%, 10/25/39 | | | 170 | |
| | 3,447 | | | Series 2009-86, Class IP, IO, 5.500%, 10/25/39 | | | 500 | |
| | 8,719 | | | Series 2009-86, Class OT, PO, 10/25/37 | | | 7,944 | |
| | 1,691 | | | Series 2009-99, Class SC, IF, IO, 5.656%, 12/25/39 | | | 250 | |
| | 4,030 | | | Series 2009-99, Class WA, VAR, 6.295%, 12/25/39 | | | 4,630 | |
| | 6,171 | | | Series 2009-103, Class MB, VAR, 2.800%, 12/25/39 | | | 6,506 | |
| | 2,608 | | | Series 2009-112, Class ST, IF, IO, 5.726%, 01/25/40 | | | 447 | |
| | 797 | | | Series 2009-113, Class AO, PO, 01/25/40 | | | 752 | |
| | 1,070 | | | Series 2010-1, Class WA, VAR, 6.218%, 02/25/40 | | | 1,235 | |
| | 1,769 | | | Series 2010-14, Class FJ, VAR, 1.124%, 03/25/40 | | | 1,791 | |
| | 3,264 | | | Series 2010-16, Class WA, VAR, 6.443%, 03/25/40 | | | 3,826 | |
| | 3,006 | | | Series 2010-16, Class WB, VAR, 6.239%, 03/25/40 | | | 3,472 | |
| | 2,200 | | | Series 2010-35, Class SB, IF, IO, 5.896%, 04/25/40 | | | 296 | |
| | 2,392 | | | Series 2010-35, Class SJ, IF, 15.919%, 04/25/40 | | | 3,316 | |
| | 389 | | | Series 2010-39, Class OT, PO, 10/25/35 | | | 368 | |
| | 1,535 | | | Series 2010-40, Class FJ, VAR, 1.124%, 04/25/40 | | | 1,546 | |
| | 1,325 | | | Series 2010-42, Class S, IF, IO, 5.876%, 05/25/40 | | | 230 | |
| | 1,466 | | | Series 2010-43, Class FD, VAR, 1.124%, 05/25/40 | | | 1,479 | |
| | 445 | | | Series 2010-45, Class BD, 4.500%, 11/25/38 | | | 456 | |
| | 5,239 | | | Series 2010-49, Class SC, IF, 11.611%, 03/25/40 | | | 6,723 | |
| | 8,753 | | | Series 2010-58, Class MB, 5.500%, 06/25/40 | | | 9,693 | |
| | 1,305 | | | Series 2010-63, Class AP, PO, 06/25/40 | | | 1,180 | |
| | 12,755 | | | Series 2010-64, Class DM, 5.000%, 06/25/40 | | | 14,145 | |
| | 6,103 | | | Series 2010-71, Class HJ, 5.500%, 07/25/40 | | | 6,837 | |
| | 1,794 | | | Series 2010-102, Class PN, 5.000%, 09/25/40 | | | 2,159 | |
| | 1,581 | | | Series 2010-103, Class SB, IF, IO, 5.576%, 11/25/49 | | | 214 | |
| | | | | | | | |
PRINCIPAL
AMOUNT($) | | | SECURITY DESCRIPTION | | VALUE($) | |
| | | | | | | | |
| | | | Agency CMO — continued | | | | |
| | 7,918 | | | Series 2010-111, Class AE, 5.500%, 04/25/38 | | | 8,146 | |
| | 17,488 | | | Series 2010-111, Class AM, 5.500%, 10/25/40 | | | 20,610 | |
| | 12,866 | | | Series 2010-125, Class SA, IF, IO, 3.916%, 11/25/40 | | | 1,231 | |
| | 10,126 | | | Series 2010-147, Class SA, IF, IO, 6.006%, 01/25/41 | | | 2,385 | |
| | 2,702 | | | Series 2010-148, Class MA, 4.000%, 02/25/39 | | | 2,783 | |
| | 1,930 | | | Series 2011-2, Class WA, VAR, 5.822%, 02/25/51 | | | 2,134 | |
| | 507 | | | Series 2011-17, Class EF, VAR, 0.824%, 07/25/25 | | | 508 | |
| | 4,613 | | | Series 2011-19, Class ZY, 6.500%, 07/25/36 | | | 5,304 | |
| | 969 | | | Series 2011-22, Class MA, 6.500%, 04/25/38 | | | 1,063 | |
| | 22,185 | | | Series 2011-30, Class LS, IO, VAR, 1.880%, 04/25/41 | | | 1,576 | |
| | 9,416 | | | Series 2011-31, Class DB, 3.500%, 04/25/31 | | | 10,117 | |
| | 5,965 | | | Series 2011-39, Class ZA, 6.000%, 11/25/32 | | | 6,834 | |
| | 5,018 | | | Series 2011-47, Class ZA, 5.500%, 07/25/38 | | | 5,498 | |
| | 633 | | | Series 2011-58, Class WA, VAR, 5.450%, 07/25/51 | | | 710 | |
| | 3,529 | | | Series 2011-75, Class FA, VAR, 1.038%, 08/25/41 | | | 3,571 | |
| | 3,363 | | | Series 2011-101, Class FM, VAR, 1.074%, 01/25/41 | | | 3,379 | |
| | 1,890 | | | Series 2011-111, Class DF, VAR, 0.924%, 12/25/38 | | | 1,893 | |
| | 19,860 | | | Series 2011-118, Class LB, 7.000%, 11/25/41 | | | 23,587 | |
| | 26,236 | | | Series 2011-118, Class MT, 7.000%, 11/25/41 | | | 31,175 | |
| | 22,806 | | | Series 2011-118, Class NT, 7.000%, 11/25/41 | | | 26,955 | |
| | 1,149 | | | Series 2011-149, Class EF, VAR, 1.024%, 07/25/41 | | | 1,152 | |
| | 4,083 | | | Series 2011-149, Class MF, VAR, 1.024%, 11/25/41 | | | 4,086 | |
| | 4,144 | | | Series 2012-14, Class FB, VAR, 0.974%, 08/25/37 | | | 4,158 | |
| | 39,256 | | | Series 2012-47, Class HF, VAR, 0.924%, 05/25/27 | | | 39,264 | |
SEE NOTES TO FINANCIAL STATEMENTS.
| | | | | | | | |
| | | |
| AUGUST 31, 2016 | | J.P. MORGAN INCOME FUNDS | | | | | 45 | |
JPMorgan Core Bond Fund
SCHEDULE OF PORTFOLIO INVESTMENTS
AS OF AUGUST 31, 2016 (Unaudited) (continued)
(Amounts in thousands)
| | | | | | | | |
PRINCIPAL
AMOUNT($) | | | SECURITY DESCRIPTION | | VALUE($) | |
| Collateralized Mortgage Obligations — continued | |
| | | | Agency CMO — continued | | | | |
| | 6,227 | | | Series 2012-87, Class KF, VAR, 0.974%, 09/25/37 | | | 6,258 | |
| | 4,623 | | | Series 2012-89, Class FD, VAR, 0.974%, 04/25/39 | | | 4,649 | |
| | 10,862 | | | Series 2012-97, Class FB, VAR, 1.024%, 09/25/42 | | | 10,779 | |
| | 4,891 | | | Series 2012-99, Class FA, VAR, 0.974%, 09/25/42 | | | 4,928 | |
| | 3,023 | | | Series 2012-101, Class FC, VAR, 1.024%, 09/25/42 | | | 3,023 | |
| | 9,816 | | | Series 2012-108, Class F, VAR, 1.024%, 10/25/42 | | | 9,827 | |
| | 5,884 | | | Series 2013-4, Class AJ, 3.500%, 02/25/43 | | | 6,176 | |
| | 6,000 | | | Series 2013-81, Class TA, 3.000%, 02/25/43 | | | 5,989 | |
| | 16,432 | | | Series 2013-92, Class PO, PO, 09/25/43 | | | 14,098 | |
| | 7,887 | | | Series 2013-100, Class WB, 3.000%, 10/25/33 | | | 8,077 | |
| | 12,773 | | | Series 2013-101, Class DO, PO, 10/25/43 | | | 11,012 | |
| | 27,824 | | | Series 2013-128, Class PO, PO, 12/25/43 | | | 23,859 | |
| | 11,901 | | | Series 2013-135, Class PO, PO, 01/25/44 | | | 10,319 | |
| | 25,947 | | | Series 2016-38, Class NA, 3.000%, 01/25/46 | | | 27,264 | |
| | 4 | | | Series G-14, Class L, 8.500%, 06/25/21 | | | 5 | |
| | — | (h) | | Series G-17, Class S, HB, VAR, 1,026.982%, 06/25/21 | | | 1 | |
| | 18 | | | Series G-18, Class Z, 8.750%, 06/25/21 | | | 20 | |
| | — | (h) | | Series G-22, Class G, 6.000%, 12/25/16 | | | — | (h) |
| | 11 | | | Series G-28, Class S, IF, 14.576%, 09/25/21 | | | 13 | |
| | 34 | | | Series G-35, Class M, 8.750%, 10/25/21 | | | 37 | |
| | 5 | | | Series G-51, Class SA, HB, IF, 26.181%, 12/25/21 | | | 7 | |
| | — | (h) | | Series G92-27, Class SQ, HB, IF, 11,389.778%, 05/25/22 | | | 5 | |
| | 167 | | | Series G92-35, Class E, 7.500%, 07/25/22 | | | 184 | |
| | — | (h) | | Series G92-35, Class G, HB, 1,184.775%, 07/25/22 | | | 1 | |
| | 15 | | | Series G92-42, Class Z, 7.000%, 07/25/22 | | | 17 | |
| | 57 | | | Series G92-44, Class ZQ, 8.000%, 07/25/22 | | | 58 | |
| | 24 | | | Series G92-45, Class Z, 6.000%, 08/25/22 | | | 24 | |
| | 16 | | | Series G92-52, Class FD, VAR, 0.545%, 09/25/22 | | | 16 | |
| | 159 | | | Series G92-54, Class ZQ, 7.500%, 09/25/22 | | | 173 | |
| | | | | | | | |
PRINCIPAL
AMOUNT($) | | | SECURITY DESCRIPTION | | VALUE($) | |
| | | | | | | | |
| | | | Agency CMO — continued | | | | |
| | 14 | | | Series G92-59, Class F, VAR, 1.390%, 10/25/22 | | | 14 | |
| | 31 | | | Series G92-61, Class Z, 7.000%, 10/25/22 | | | 35 | |
| | 23 | | | Series G92-62, Class B, PO, 10/25/22 | | | 22 | |
| | 110 | | | Series G93-1, Class KA, 7.900%, 01/25/23 | | | 123 | |
| | 44 | | | Series G93-5, Class Z, 6.500%, 02/25/23 | | | 49 | |
| | 33 | | | Series G93-14, Class J, 6.500%, 03/25/23 | | | 37 | |
| | 74 | | | Series G93-17, Class SI, IF, 6.000%, 04/25/23 | | | 84 | |
| | 66 | | | Series G93-27, Class FD, VAR, 1.404%, 08/25/23 | | | 67 | |
| | 15 | | | Series G93-37, Class H, PO, 09/25/23 | | | 14 | |
| | 71 | | | Series G95-1, Class C, 8.800%, 01/25/25 | | | 80 | |
| | | | Federal National Mortgage Association REMIC Trust, | | | | |
| | 1,340 | | | Series 2003-W1, Class 1A1, VAR, 5.632%, 12/25/42 | | | 1,520 | |
| | 350 | | | Series 2003-W1, Class 2A, VAR, 6.307%, 12/25/42 | | | 411 | |
| | 203 | | | Series 2003-W4, Class 2A, VAR, 6.264%, 10/25/42 | | | 231 | |
| | 6,098 | | | Series 2004-W10, Class A6, 5.750%, 08/25/34 | | | 7,134 | |
| | 1,119 | | | Series 2004-W11, Class 1A1, 6.000%, 05/25/44 | | | 1,328 | |
| | 1,946 | | | Series 2005-W1, Class 1A2, 6.500%, 10/25/44 | | | 2,295 | |
| | 1,875 | | | Series 2006-W3, Class 2A, 6.000%, 09/25/46 | | | 2,101 | |
| | 574 | | | Series 2007-W3, Class 1A3, 6.750%, 04/25/37 | | | 643 | |
| | 574 | | | Series 2007-W5, Class PO, PO, 06/25/37 | | | 530 | |
| | 424 | | | Series 2007-W7, Class 1A4, HB, IF, 36.034%, 07/25/37 | | | 653 | |
| | 265 | | | Series 2007-W10, Class 2A, VAR, 6.348%, 08/25/47 | | | 302 | |
| | 9,641 | | | Series 2009-W1, Class A, 6.000%, 12/25/49 | | | 11,050 | |
| | | | Federal National Mortgage Association STRIPS, | | | | |
| | — | (h) | | Series 23, Class 2, IO, 10.000%, 09/25/17 | | | — | (h) |
| | 1 | | | Series 50, Class 2, IO, 10.500%, 03/25/19 | | | — | (h) |
| | 14 | | | Series 218, Class 2, IO, 7.500%, 04/25/23 | | | 3 | |
| | 11 | | | Series 265, Class 2, 9.000%, 03/25/24 | | | 13 | |
| | 1,078 | | | Series 300, Class 1, PO, 09/25/24 | | | 957 | |
| | 150 | | | Series 329, Class 1, PO, 01/25/33 | | | 137 | |
| | 201 | | | Series 339, Class 18, IO, 4.500%, 07/25/18 | | | 6 | |
SEE NOTES TO FINANCIAL STATEMENTS.
| | | | | | |
| | | |
| 46 | | | | J.P. MORGAN INCOME FUNDS | | AUGUST 31, 2016 |
| | | | | | | | |
PRINCIPAL
AMOUNT($) | | | SECURITY DESCRIPTION | | VALUE($) | |
| Collateralized Mortgage Obligations — continued | |
| | | | Agency CMO — continued | | | | |
| | 283 | | | Series 339, Class 21, IO, 4.500%, 08/25/18 | | | 6 | |
| | 141 | | | Series 339, Class 28, IO, 5.500%, 08/25/18 | | | 4 | |
| | 195 | | | Series 345, Class 6, IO, VAR, 5.000%, 12/25/33 | | | 35 | |
| | 809 | | | Series 365, Class 8, IO, 5.500%, 05/25/36 | | | 149 | |
| | 53 | | | Series 368, Class 3, IO, 4.500%, 11/25/20 | | | 2 | |
| | 530 | | | Series 374, Class 5, IO, 5.500%, 08/25/36 | | | 99 | |
| | 544 | | | Series 383, Class 33, IO, 6.000%, 01/25/38 | | | 92 | |
| | 221 | | | Series 393, Class 6, IO, 5.500%, 04/25/37 | | | 36 | |
| | 27,453 | | | Series 411, Class F1, VAR, 1.074%, 08/25/42 | | | 27,410 | |
| | 9,720 | | | Series 412, Class F2, VAR, 1.024%, 08/25/42 | | | 9,676 | |
| | | | Federal National Mortgage Association Trust, | | | | |
| | 1,253 | | | Series 2003-W2, Class 1A1, 6.500%, 07/25/42 | | | 1,474 | |
| | 722 | | | Series 2003-W2, Class 2A9, 5.900%, 07/25/42 | | | 829 | |
| | 4,790 | | | Series 2003-W6, Class 2A4, 5.204%, 09/25/42 | | | 5,517 | |
| | 2,062 | | | Series 2003-W6, Class 3A, 6.500%, 09/25/42 | | | 2,429 | |
| | 2,517 | | | Series 2003-W8, Class 2A, 7.000%, 10/25/42 | | | 2,983 | |
| | 457 | | | Series 2003-W8, Class 3F1, VAR, 0.924%, 05/25/42 | | | 453 | |
| | 449 | | | Series 2004-W1, Class 1A6, 5.040%, 11/25/43 | | | 449 | |
| | 3,323 | | | Series 2004-W1, Class 2A2, 7.000%, 12/25/33 | | | 3,965 | |
| | 772 | | | Series 2004-W2, Class 2A2, 7.000%, 02/25/44 | | | 902 | |
| | 791 | | | Series 2004-W8, Class 3A, 7.500%, 06/25/44 | | | 902 | |
| | 2,187 | | | Series 2004-W15, Class 2AF, VAR, 0.774%, 08/25/44 | | | 2,176 | |
| | 17,659 | | | Series 2005-W3, Class 2AF, VAR, 0.744%, 03/25/45 | | | 17,185 | |
| | 962 | | | Series 2005-W4, Class 1A1, 6.000%, 08/25/45 | | | 1,105 | |
| | 8,184 | | | Series 2006-W2, Class 1AF1, VAR, 0.744%, 02/25/46 | | | 8,176 | |
| | 2,404 | | | Series 2006-W2, Class 2A, VAR, 2.518%, 11/25/45 | | | 2,554 | |
| | | | | | | | |
PRINCIPAL
AMOUNT($) | | | SECURITY DESCRIPTION | | VALUE($) | |
| | | | | | | | |
| | | | Agency CMO — continued | | | | |
| | 15,834 | | | Federal National Mortgage Association Whole Loan, Series 2007-W1, Class 1AF1, VAR, 0.784%, 11/25/46 | | | 15,864 | |
| | | | Government National Mortgage Association, | | | | |
| | 1,626 | | | Series 1994-7, Class PQ, 6.500%, 10/16/24 | | | 1,837 | |
| | 1,502 | | | Series 1999-4, Class ZB, 6.000%, 02/20/29 | | | 1,690 | |
| | 146 | | | Series 1999-30, Class S, IF, IO, 8.093%, 08/16/29 | | | 35 | |
| | 205 | | | Series 1999-40, Class ZW, 7.500%, 11/20/29 | | | 238 | |
| | 168 | | | Series 2000-9, Class Z, 8.000%, 06/20/30 | | | 201 | |
| | 1,798 | | | Series 2000-9, Class ZJ, 8.500%, 02/16/30 | | | 2,120 | |
| | 1,610 | | | Series 2000-21, Class Z, 9.000%, 03/16/30 | | | 1,953 | |
| | 260 | | | Series 2000-31, Class Z, 9.000%, 10/20/30 | | | 300 | |
| | 153 | | | Series 2000-35, Class ZA, 9.000%, 11/20/30 | | | 164 | |
| | 14 | | | Series 2000-36, Class IK, IO, 9.000%, 11/16/30 | | | 2 | |
| | 71 | | | Series 2001-6, Class SD, IF, IO, 8.043%, 03/16/31 | | | 24 | |
| | 776 | | | Series 2001-22, Class PS, IF, 19.689%, 03/17/31 | | | 1,277 | |
| | 189 | | | Series 2001-35, Class SA, IF, IO, 7.743%, 08/16/31 | | | 64 | |
| | 176 | | | Series 2001-36, Class S, IF, IO, 7.543%, 08/16/31 | | | 59 | |
| | 741 | | | Series 2002-24, Class AG, IF, IO, 7.443%, 04/16/32 | | | 158 | |
| | 68 | | | Series 2002-24, Class SB, IF, 11.165%, 04/16/32 | | | 86 | |
| | 83 | | | Series 2002-31, Class S, IF, IO, 8.193%, 01/16/31 | | | 22 | |
| | 1,489 | | | Series 2002-31, Class SE, IF, IO, 6.993%, 04/16/30 | | | 271 | |
| | 724 | | | Series 2002-40, Class UK, 6.500%, 06/20/32 | | | 856 | |
| | 24 | | | Series 2002-41, Class SV, IF, 9.000%, 06/16/32 | | | 31 | |
| | 2,800 | | | Series 2002-45, Class QE, 6.500%, 06/20/32 | | | 3,327 | |
| | 837 | | | Series 2002-47, Class PG, 6.500%, 07/16/32 | | | 985 | |
| | 294 | | | Series 2002-47, Class PY, 6.000%, 07/20/32 | | | 332 | |
SEE NOTES TO FINANCIAL STATEMENTS.
| | | | | | | | |
| | | |
| AUGUST 31, 2016 | | J.P. MORGAN INCOME FUNDS | | | | | 47 | |
JPMorgan Core Bond Fund
SCHEDULE OF PORTFOLIO INVESTMENTS
AS OF AUGUST 31, 2016 (Unaudited) (continued)
(Amounts in thousands)
| | | | | | | | |
PRINCIPAL
AMOUNT($) | | | SECURITY DESCRIPTION | | VALUE($) | |
| Collateralized Mortgage Obligations — continued | |
| | | | Agency CMO — continued | | | | |
| | 1,410 | | | Series 2002-47, Class ZA, 6.500%, 07/20/32 | | | 1,671 | |
| | 946 | | | Series 2002-52, Class GH, 6.500%, 07/20/32 | | | 1,133 | |
| | 149 | | | Series 2002-70, Class PS, IF, IO, 7.188%, 08/20/32 | | | 4 | |
| | 1,265 | | | Series 2002-75, Class PB, 6.000%, 11/20/32 | | | 1,487 | |
| | 738 | | | Series 2003-11, Class SK, IF, IO, 7.193%, 02/16/33 | | | 134 | |
| | 325 | | | Series 2003-12, Class SP, IF, IO, 7.188%, 02/20/33 | | | 86 | |
| | 117 | | | Series 2003-24, Class PO, PO, 03/16/33 | | | 109 | |
| | 3,270 | | | Series 2003-25, Class PZ, 5.500%, 04/20/33 | | | 3,717 | |
| | 2,830 | | | Series 2003-40, Class TJ, 6.500%, 03/20/33 | | | 3,252 | |
| | 1,004 | | | Series 2003-46, Class MG, 6.500%, 05/20/33 | | | 1,183 | |
| | 842 | | | Series 2003-46, Class TC, 6.500%, 03/20/33 | | | 960 | |
| | 563 | | | Series 2003-52, Class AP, PO, 06/16/33 | | | 492 | |
| | 1,528 | | | Series 2003-58, Class BE, 6.500%, 01/20/33 | | | 1,745 | |
| | 1,909 | | | Series 2003-75, Class ZX, 6.000%, 09/16/33 | | | 2,164 | |
| | 90 | | | Series 2003-90, Class PO, PO, 10/20/33 | | | 84 | |
| | 1,293 | | | Series 2003-97, Class SA, IF, IO, 6.043%, 11/16/33 | | | 209 | |
| | 1,113 | | | Series 2003-112, Class SA, IF, IO, 6.043%, 12/16/33 | | | 238 | |
| | 432 | | | Series 2003-112, Class TS, IF, IO, 6.438%, 10/20/32 | | | 4 | |
| | 209 | | | Series 2003-114, Class SH, IF, 13.774%, 11/17/32 | | | 257 | |
| | 517 | | | Series 2004-28, Class S, IF, 18.269%, 04/16/34 | | | 780 | |
| | 1,029 | | | Series 2004-46, Class PO, PO, 06/20/34 | | | 985 | |
| | 3,680 | | | Series 2004-49, Class Z, 6.000%, 06/20/34 | | | 4,200 | |
| | 476 | | | Series 2004-71, Class SB, HB, IF, 26.948%, 09/20/34 | | | 804 | |
| | 476 | | | Series 2004-71, Class ST, IF, 7.000%, 09/20/34 | | | 533 | |
| | 556 | | | Series 2004-73, Class AE, IF, 13.810%, 08/17/34 | | | 680 | |
| | 3,705 | | | Series 2004-73, Class JL, IF, IO, 6.043%, 09/16/34 | | | 718 | |
| | | | | | | | |
PRINCIPAL
AMOUNT($) | | | SECURITY DESCRIPTION | | VALUE($) | |
| | | | | | | | |
| | | | Agency CMO — continued | | | | |
| | 121 | | | Series 2004-83, Class AP, IF, 13.162%, 10/16/34 | | | 146 | |
| | 175 | | | Series 2004-87, Class SB, IF, 7.088%, 03/17/33 | | | 187 | |
| | 381 | | | Series 2004-89, Class LS, HB, IF, 22.526%, 10/16/34 | | | 601 | |
| | 5,833 | | | Series 2004-90, Class SI, IF, IO, 5.588%, 10/20/34 | | | 895 | |
| | 3,017 | | | Series 2004-96, Class SC, IF, IO, 5.568%, 11/20/34 | | | 480 | |
| | 4,125 | | | Series 2005-3, Class SK, IF, IO, 6.238%, 01/20/35 | | | 665 | |
| | 131 | | | Series 2005-7, Class JM, IF, 15.605%, 05/18/34 | | | 165 | |
| | 792 | | | Series 2005-35, Class FL, VAR, 0.862%, 03/20/32 | | | 792 | |
| | 184 | | | Series 2005-44, Class SP, IF, 11.175%, 10/20/34 | | | 209 | |
| | 433 | | | Series 2005-56, Class IC, IO, 5.500%, 07/20/35 | | | 83 | |
| | 27 | | | Series 2005-65, Class SA, HB, IF, 20.791%, 08/20/35 | | | 39 | |
| | 209 | | | Series 2005-66, Class SP, IF, 19.145%, 08/16/35 | | | 314 | |
| | 1,870 | | | Series 2005-68, Class DP, IF, 15.213%, 06/17/35 | | | 2,654 | |
| | 8,631 | | | Series 2005-68, Class KI, IF, IO, 5.788%, 09/20/35 | | | 1,494 | |
| | 2,811 | | | Series 2005-72, Class AZ, 5.500%, 09/20/35 | | | 3,156 | |
| | 485 | | | Series 2005-82, Class PO, PO, 10/20/35 | | | 443 | |
| | 798 | | | Series 2005-91, Class PI, IO, 6.000%, 12/20/35 | | | 140 | |
| | 710 | | | Series 2006-16, Class OP, PO, 03/20/36 | | | 681 | |
| | 657 | | | Series 2006-20, Class QA, 5.750%, 02/20/36 | | | 710 | |
| | 975 | | | Series 2006-22, Class AO, PO, 05/20/36 | | | 931 | |
| | 3,995 | | | Series 2006-33, Class Z, 6.500%, 07/20/36 | | | 4,776 | |
| | 142 | | | Series 2006-34, Class PO, PO, 07/20/36 | | | 135 | |
| | 156 | | | Series 2006-38, Class SW, IF, IO, 5.988%, 06/20/36 | | | 18 | |
| | 5,303 | | | Series 2006-38, Class ZK, 6.500%, 08/20/36 | | | 6,234 | |
| | 2,322 | | | Series 2006-57, Class PZ, 5.565%, 10/20/36 | | | 2,596 | |
| | 1,315 | | | Series 2006-59, Class SD, IF, IO, 6.188%, 10/20/36 | | | 221 | |
SEE NOTES TO FINANCIAL STATEMENTS.
| | | | | | |
| | | |
| 48 | | | | J.P. MORGAN INCOME FUNDS | | AUGUST 31, 2016 |
| | | | | | | | |
PRINCIPAL
AMOUNT($) | | | SECURITY DESCRIPTION | | VALUE($) | |
| Collateralized Mortgage Obligations — continued | |
| | | | Agency CMO — continued | | | | |
| | 2,142 | | | Series 2006-65, Class SA, IF, IO, 6.288%, 11/20/36 | | | 420 | |
| | 2,064 | | | Series 2007-9, Class CI, IF, IO, 5.688%, 03/20/37 | | | 346 | |
| | 3,322 | | | Series 2007-17, Class JI, IF, IO, 6.303%, 04/16/37 | | | 669 | |
| | 1,289 | | | Series 2007-17, Class JO, PO, 04/16/37 | | | 1,167 | |
| | 1,301 | | | Series 2007-19, Class SD, IF, IO, 5.688%, 04/20/37 | | | 202 | |
| | 788 | | | Series 2007-25, Class FN, VAR, 0.807%, 05/16/37 | | | 787 | |
| | 2,618 | | | Series 2007-26, Class SC, IF, IO, 5.688%, 05/20/37 | | | 488 | |
| | 2,324 | | | Series 2007-27, Class SD, IF, IO, 5.688%, 05/20/37 | | | 465 | |
| | 211 | | | Series 2007-28, Class BO, PO, 05/20/37 | | | 194 | |
| | 3,382 | | | Series 2007-35, Class PO, PO, 06/16/37 | | | 3,268 | |
| | 460 | | | Series 2007-36, Class HO, PO, 06/16/37 | | | 439 | |
| | 1,970 | | | Series 2007-36, Class SE, IF, IO, 5.963%, 06/16/37 | | | 362 | |
| | 2,063 | | | Series 2007-36, Class SJ, IF, IO, 5.738%, 06/20/37 | | | 285 | |
| | 1,997 | | | Series 2007-40, Class SD, IF, IO, 6.238%, 07/20/37 | | | 357 | |
| | 3,006 | | | Series 2007-40, Class SN, IF, IO, 6.168%, 07/20/37 | | | 523 | |
| | 2,870 | | | Series 2007-45, Class QA, IF, IO, 6.128%, 07/20/37 | | | 587 | |
| | 744 | | | Series 2007-50, Class AI, IF, IO, 6.263%, 08/20/37 | | | 108 | |
| | 1,862 | | | Series 2007-53, Class ES, IF, IO, 6.038%, 09/20/37 | | | 344 | |
| | 524 | | | Series 2007-53, Class SW, IF, 18.668%, 09/20/37 | | | 737 | |
| | 2,841 | | | Series 2007-57, Class PO, PO, 03/20/37 | | | 2,696 | |
| | 2,460 | | | Series 2007-67, Class SI, IF, IO, 5.998%, 11/20/37 | | | 407 | |
| | 765 | | | Series 2007-71, Class SB, IF, IO, 6.188%, 07/20/36 | | | 33 | |
| | 1,996 | | | Series 2007-72, Class US, IF, IO, 6.038%, 11/20/37 | | | 350 | |
| | 2,247 | | | Series 2007-73, Class MI, IF, IO, 5.488%, 11/20/37 | | | 343 | |
| | 1,962 | | | Series 2007-74, Class SL, IF, IO, 6.033%, 11/16/37 | | | 332 | |
| | 4,347 | | | Series 2007-76, Class SB, IF, IO, 5.988%, 11/20/37 | | | 754 | |
| | 3,159 | | | Series 2007-79, Class SY, IF, IO, 6.038%, 12/20/37 | | | 567 | |
| | | | | | | | |
PRINCIPAL
AMOUNT($) | | | SECURITY DESCRIPTION | | VALUE($) | |
| | | | | | | | |
| | | | Agency CMO — continued | | | | |
| | 151 | | | Series 2008-1, Class PO, PO, 01/20/38 | | | 139 | |
| | 245 | | | Series 2008-7, Class SK, IF, 18.413%, 11/20/37 | | | 369 | |
| | 343 | | | Series 2008-7, Class SP, IF, 12.375%, 10/20/37 | | | 455 | |
| | 503 | | | Series 2008-17, Class IO, IO, 5.500%, 02/20/38 | | | 74 | |
| | 504 | | | Series 2008-20, Class PO, PO, 09/20/37 | | | 481 | |
| | 532 | | | Series 2008-29, Class PO, PO, 02/17/33 | | | 515 | |
| | 3,530 | | | Series 2008-32, Class PI, IO, 5.500%, 10/16/37 | | | 389 | |
| | 1,142 | | | Series 2008-33, Class XS, IF, IO, 7.193%, 04/16/38 | | | 262 | |
| | 5,381 | | | Series 2008-36, Class AY, 5.000%, 04/16/23 | | | 5,605 | |
| | 3,076 | | | Series 2008-36, Class SH, IF, IO, 5.788%, 04/20/38 | | | 492 | |
| | 9,417 | | | Series 2008-40, Class SA, IF, IO, 5.893%, 05/16/38 | | | 1,841 | |
| | 99 | | | Series 2008-43, Class NA, 5.500%, 11/20/37 | | | 101 | |
| | 1,577 | | | Series 2008-50, Class KB, 6.000%, 06/20/38 | | | 1,805 | |
| | 775 | | | Series 2008-55, Class SA, IF, IO, 5.688%, 06/20/38 | | | 140 | |
| | 2,794 | | | Series 2008-60, Class CS, IF, IO, 5.638%, 07/20/38 | | | 385 | |
| | 252 | | | Series 2008-60, Class PO, PO, 01/20/38 | | | 249 | |
| | 3,214 | | | Series 2008-69, Class QD, 5.750%, 07/20/38 | | | 3,450 | |
| | 1,031 | | | Series 2008-71, Class SC, IF, IO, 5.488%, 08/20/38 | | | 134 | |
| | 3,305 | | | Series 2008-76, Class US, IF, IO, 5.388%, 09/20/38 | | | 465 | |
| | 2,170 | | | Series 2008-79, Class CS, IF, 6.288%, 06/20/35 | | | 2,494 | |
| | 6,894 | | | Series 2008-81, Class S, IF, IO, 5.688%, 09/20/38 | | | 1,028 | |
| | 3,392 | | | Series 2008-93, Class AS, IF, IO, 5.188%, 12/20/38 | | | 498 | |
| | 6,169 | | | Series 2008-95, Class DS, IF, IO, 6.788%, 12/20/38 | | | 1,246 | |
| | 1,939 | | | Series 2008-96, Class SL, IF, IO, 5.488%, 12/20/38 | | | 284 | |
| | 1,488 | | | Series 2009-6, Class SA, IF, IO, 5.593%, 02/16/39 | | | 239 | |
| | 1,697 | | | Series 2009-6, Class SH, IF, IO, 5.528%, 02/20/39 | | | 271 | |
SEE NOTES TO FINANCIAL STATEMENTS.
| | | | | | | | |
| | | |
| AUGUST 31, 2016 | | J.P. MORGAN INCOME FUNDS | | | | | 49 | |
JPMorgan Core Bond Fund
SCHEDULE OF PORTFOLIO INVESTMENTS
AS OF AUGUST 31, 2016 (Unaudited) (continued)
(Amounts in thousands)
| | | | | | | | |
PRINCIPAL
AMOUNT($) | | | SECURITY DESCRIPTION | | VALUE($) | |
| Collateralized Mortgage Obligations — continued | |
| | | | Agency CMO — continued | | | | |
| | 2,882 | | | Series 2009-10, Class SA, IF, IO, 5.438%, 02/20/39 | | | 390 | |
| | 763 | | | Series 2009-10, Class SL, IF, IO, 5.993%, 03/16/34 | | | 29 | |
| | 2,322 | | | Series 2009-11, Class SC, IF, IO, 5.643%, 02/16/39 | | | 296 | |
| | 888 | | | Series 2009-14, Class KI, IO, 6.500%, 03/20/39 | | | 196 | |
| | 1,933 | | | Series 2009-14, Class NI, IO, 6.500%, 03/20/39 | | | 417 | |
| | 5,243 | | | Series 2009-22, Class SA, IF, IO, 5.758%, 04/20/39 | | | 818 | |
| | 1,379 | | | Series 2009-24, Class DS, IF, IO, 5.788%, 03/20/39 | | | 94 | |
| | 1,441 | | | Series 2009-25, Class SE, IF, IO, 7.088%, 09/20/38 | | | 278 | |
| | 3,034 | | | Series 2009-31, Class TS, IF, IO, 5.788%, 03/20/39 | | | 338 | |
| | 642 | | | Series 2009-33, Class CI, IO, 5.500%, 05/20/39 | | | 97 | |
| | 850 | | | Series 2009-33, Class TI, IO, 6.000%, 05/20/39 | | | 149 | |
| | 1,073 | | | Series 2009-35, Class SN, IF, IO, 5.893%, 12/16/38 | | | 61 | |
| | 11,836 | | | Series 2009-35, Class ZB, 5.500%, 05/16/39 | | | 14,236 | |
| | 3,958 | | | Series 2009-42, Class SC, IF, IO, 5.568%, 06/20/39 | | | 664 | |
| | 2,727 | | | Series 2009-43, Class SA, IF, IO, 5.438%, 06/20/39 | | | 432 | |
| | 4,681 | | | Series 2009-64, Class SN, IF, IO, 5.593%, 07/16/39 | | | 493 | |
| | 959 | | | Series 2009-65, Class IQ, IO, 6.000%, 12/20/38 | | | 128 | |
| | 4,174 | | | Series 2009-72, Class SM, IF, IO, 5.743%, 08/16/39 | | | 668 | |
| | 2,753 | | | Series 2009-75, Class MN, 5.500%, 09/20/39 | | | 3,362 | |
| | 4,047 | | | Series 2009-79, Class OK, PO, 11/16/37 | | | 3,850 | |
| | 6,567 | | | Series 2009-81, Class SB, IF, IO, 5.578%, 09/20/39 | | | 991 | |
| | 5,694 | | | Series 2009-102, Class SM, IF, IO, 5.893%, 06/16/39 | | | 457 | |
| | 2,170 | | | Series 2009-104, Class AB, 7.000%, 08/16/39 | | | 2,425 | |
| | 5,587 | | | Series 2009-106, Class AS, IF, IO, 5.893%, 11/16/39 | | | 936 | |
| | 19,137 | | | Series 2009-106, Class ST, IF, IO, 5.488%, 02/20/38 | | | 3,375 | |
| | | | | | | | |
PRINCIPAL
AMOUNT($) | | | SECURITY DESCRIPTION | | VALUE($) | |
| | | | | | | | |
| | | | Agency CMO — continued | | | | |
| | 2,881 | | | Series 2009-121, Class VA, 5.500%, 11/20/20 | | | 3,000 | |
| | 1,371 | | | Series 2010-14, Class AO, PO, 12/20/32 | | | 1,330 | |
| | 763 | | | Series 2010-14, Class BO, PO, 11/20/35 | | | 700 | |
| | 2,549 | | | Series 2010-14, Class CO, PO, 08/20/35 | | | 2,415 | |
| | 3,041 | | | Series 2010-14, Class QP, 6.000%, 12/20/39 | | | 3,173 | |
| | 2,122 | | | Series 2010-41, Class WA, VAR, 5.822%, 10/20/33 | | | 2,418 | |
| | 1,079 | | | Series 2010-103, Class WA, VAR, 5.725%, 08/20/34 | | | 1,217 | |
| | 1,492 | | | Series 2010-129, Class AW, VAR, 6.109%, 04/20/37 | | | 1,681 | |
| | 7,169 | | | Series 2010-130, Class CP, 7.000%, 10/16/40 | | | 8,442 | |
| | 10,029 | | | Series 2010-157, Class OP, PO, 12/20/40 | | | 9,090 | |
| | 26,505 | | | Series 2010-H17, Class XQ, VAR, 5.238%, 07/20/60 | | | 28,141 | |
| | 713 | | | Series 2011-22, Class WA, VAR, 5.937%, 02/20/37 | | | 800 | |
| | 5,742 | | | Series 2011-43, Class ZQ, 5.500%, 01/16/33 | | | 6,490 | |
| | 4,948 | | | Series 2011-75, Class SM, IF, IO, 6.088%, 05/20/41 | | | 1,065 | |
| | 2,536 | | | Series 2011-97, Class WA, VAR, 6.117%, 11/20/38 | | | 2,878 | |
| | 3,560 | | | Series 2011-137, Class WA, VAR, 5.537%, 07/20/40 | | | 4,033 | |
| | 1,500 | | | Series 2011-157, Class UY, 3.000%, 12/20/41 | | | 1,569 | |
| | 8,401 | | | Series 2011-163, Class WA, VAR, 5.861%, 12/20/38 | | | 9,609 | |
| | 2,645 | | | Series 2011-H05, Class FB, VAR, 0.968%, 12/20/60 | | | 2,635 | |
| | 3,379 | | | Series 2011-H06, Class FA, VAR, 0.918%, 02/20/61 | | | 3,360 | |
| | 3,566 | | | Series 2011-H19, Class FA, VAR, 0.938%, 08/20/61 | | | 3,549 | |
| | 4,111 | | | Series 2012-59, Class WA, VAR, 5.583%, 08/20/38 | | | 4,721 | |
| | 5,259 | | | Series 2012-141, Class WA, VAR, 4.529%, 11/16/41 | | | 5,818 | |
| | 3,718 | | | Series 2012-141, Class WB, VAR, 3.970%, 09/16/42 | | | 3,926 | |
| | 5,569 | | | Series 2012-141, Class WC, VAR, 3.714%, 01/20/42 | | | 5,907 | |
| | 11,194 | | | Series 2012-H08, Class FB, VAR, 1.068%, 03/20/62 | | | 11,192 | |
SEE NOTES TO FINANCIAL STATEMENTS.
| | | | | | |
| | | |
| 50 | | | | J.P. MORGAN INCOME FUNDS | | AUGUST 31, 2016 |
| | | | | | | | |
PRINCIPAL
AMOUNT($) | | | SECURITY DESCRIPTION | | VALUE($) | |
| Collateralized Mortgage Obligations — continued | |
| | | | Agency CMO — continued | | | | |
| | 8,231 | | | Series 2012-H08, Class FS, VAR, 1.168%, 04/20/62 | | | 8,267 | |
| | 66,592 | | | Series 2012-H10, Class FA, VAR, 1.018%, 12/20/61 | | | 66,463 | |
| | 6,110 | | | Series 2012-H15, Class FA, VAR, 0.918%, 05/20/62 | | | 6,110 | |
| | 2,556 | | | Series 2012-H18, Class NA, VAR, 0.988%, 08/20/62 | | | 2,549 | |
| | 26,015 | | | Series 2012-H21, Class CF, VAR, 1.168%, 05/20/61 | | | 26,050 | |
| | 26,529 | | | Series 2012-H21, Class DF, VAR, 1.118%, 05/20/61 | | | 26,550 | |
| | 28,063 | | | Series 2012-H22, Class FD, VAR, 0.938%, 01/20/61 | | | 28,020 | |
| | 5,984 | | | Series 2012-H24, Class FA, VAR, 0.918%, 03/20/60 | | | 5,984 | |
| | 8,605 | | | Series 2012-H24, Class FD, VAR, 1.058%, 09/20/62 | | | 8,608 | |
| | 4,376 | | | Series 2012-H24, Class FE, VAR, 1.068%, 10/20/62 | | | 4,359 | |
| | 14,865 | | | Series 2012-H24, Class FG, VAR, 0.898%, 04/20/60 | | | 14,836 | |
| | 13,806 | | | Series 2012-H26, Class JA, VAR, 1.018%, 10/20/61 | | | 13,803 | |
| | 19,360 | | | Series 2012-H26, Class MA, VAR, 1.018%, 07/20/62 | | | 19,304 | |
| | 8,395 | | | Series 2012-H27, Class FB, VAR, 0.968%, 10/20/62 | | | 8,375 | |
| | 31,457 | | | Series 2012-H28, Class FA, VAR, 1.048%, 09/20/62 | | | 31,450 | |
| | 28,213 | | | Series 2012-H29, Class FA, VAR, 0.983%, 10/20/62 | | | 28,120 | |
| | 4,242 | | | Series 2012-H30, Class JA, VAR, 0.948%, 01/20/60 | | | 4,243 | |
| | 7,027 | | | Series 2012-H30, Class PA, VAR, 0.918%, 11/20/59 | | | 7,027 | |
| | 25,850 | | | Series 2012-H31, Class FD, VAR, 0.808%, 12/20/62 | | | 25,598 | |
| | 5,262 | | | Series 2013-26, Class AK, VAR, 4.662%, 09/20/41 | | | 5,736 | |
| | 2,763 | | | Series 2013-54, Class WA, VAR, 4.699%, 11/20/42 | | | 3,037 | |
| | 1,972 | | | Series 2013-75, Class WA, VAR, 5.220%, 06/20/40 | | | 2,173 | |
| | 2,981 | | | Series 2013-91, Class WA, VAR, 4.498%, 04/20/43 | | | 3,203 | |
| | 3,874 | | | Series 2013-147, Class BE, 4.000%, 12/20/39 | | | 4,400 | |
| | | | | | | | |
PRINCIPAL
AMOUNT($) | | | SECURITY DESCRIPTION | | VALUE($) | |
| | | | | | | | |
| | | | Agency CMO — continued | | | | |
| | 27,483 | | | Series 2013-H01, Class FA, 1.650%, 01/20/63 | | | 27,403 | |
| | 12,026 | | | Series 2013-H01, Class JA, VAR, 0.788%, 01/20/63 | | | 11,885 | |
| | 9,757 | | | Series 2013-H01, Class TA, VAR, 0.968%, 01/20/63 | | | 9,751 | |
| | 1,189 | | | Series 2013-H02, Class HF, VAR, 0.768%, 11/20/62 | | | 1,188 | |
| | 2,844 | | | Series 2013-H03, Class FA, VAR, 0.768%, 08/20/60 | | | 2,843 | |
| | 37,102 | | | Series 2013-H04, Class BA, 1.650%, 02/20/63 | | | 36,994 | |
| | 2,645 | | | Series 2013-H04, Class SA, VAR, 0.888%, 02/20/63 | | | 2,622 | |
| | 3,460 | | | Series 2013-H07, Class GA, VAR, 0.938%, 03/20/63 | | | 3,442 | |
| | 10,911 | | | Series 2013-H07, Class HA, VAR, 0.878%, 03/20/63 | | | 10,826 | |
| | 9,119 | | | Series 2013-H07, Class JA, 1.750%, 03/20/63 | | | 9,163 | |
| | 5,012 | | | Series 2013-H07, Class MA, VAR, 1.018%, 04/20/62 | | | 5,010 | |
| | 14,683 | | | Series 2013-H08, Class FC, VAR, 0.918%, 02/20/63 | | | 14,594 | |
| | 11,563 | | | Series 2013-H09, Class HA, 1.650%, 04/20/63 | | | 11,526 | |
| | 3,278 | | | Series 2013-H14, Class FC, VAR, 0.938%, 06/20/63 | | | 3,261 | |
| | 3,056 | | | Series 2013-H14, Class FG, VAR, 0.938%, 05/20/63 | | | 3,041 | |
| | 8,097 | | | Series 2014-6, Class W, VAR, 5.463%, 01/20/39 | | | 8,998 | |
| | 6,487 | | | Series 2014-41, Class W, VAR, 4.655%, 10/20/42 | | | 7,045 | |
| | 5,627 | | | Series 2014-188, Class W, VAR, 4.674%, 10/20/41 | | | 6,182 | |
| | 21,460 | | | Series 2014-H01, Class FD, VAR, 1.118%, 01/20/64 | | | 21,503 | |
| | 15,169 | | | Series 2014-H05, Class FA, VAR, 1.158%, 02/20/64 | | | 15,238 | |
| | 5,254 | | | Series 2014-H06, Class HB, VAR, 1.118%, 03/20/64 | | | 5,263 | |
| | 15,247 | | | Series 2014-H09, Class TA, VAR, 1.068%, 04/20/64 | | | 15,244 | |
| | 23,615 | | | Series 2014-H10, Class TA, VAR, 1.068%, 04/20/64 | | | 23,613 | |
| | 25,736 | | | Series 2014-H11, Class VA, VAR, 0.968%, 06/20/64 | | | 25,597 | |
SEE NOTES TO FINANCIAL STATEMENTS.
| | | | | | | | |
| | | |
| AUGUST 31, 2016 | | J.P. MORGAN INCOME FUNDS | | | | | 51 | |
JPMorgan Core Bond Fund
SCHEDULE OF PORTFOLIO INVESTMENTS
AS OF AUGUST 31, 2016 (Unaudited) (continued)
(Amounts in thousands)
| | | | | | | | |
PRINCIPAL
AMOUNT($) | | | SECURITY DESCRIPTION | | VALUE($) | |
| Collateralized Mortgage Obligations — continued | |
| | | | Agency CMO — continued | | | | |
| | 25,202 | | | Series 2014-H15, Class FA, VAR, 0.968%, 07/20/64 | | | 25,067 | |
| | 18,959 | | | Series 2014-H17, Class FC, VAR, 0.968%, 07/20/64 | | | 18,857 | |
| | 22,579 | | | Series 2014-H19, Class FE, VAR, 0.938%, 09/20/64 | | | 22,427 | |
| | 10,791 | | | Series 2014-H20, Class LF, VAR, 1.068%, 10/20/64 | | | 10,684 | |
| | 6,111 | | | Series 2015-91, Class W, VAR, 5.240%, 05/20/40 | | | 6,829 | |
| | 7,973 | | | Series 2015-137, Class WA, VAR, 5.488%, 01/20/38 | | | 9,012 | |
| | 12,831 | | | Series 2015-H02, Class FB, VAR, 1.012%, 12/20/64 | | | 12,773 | |
| | 12,135 | | | Series 2015-H03, Class FA, VAR, 0.968%, 12/20/64 | | | 12,087 | |
| | 41,209 | | | Series 2015-H05, Class FC, VAR, 0.948%, 02/20/65 | | | 40,937 | |
| | 25,789 | | | Series 2015-H06, Class FA, VAR, 0.948%, 02/20/65 | | | 25,651 | |
| | 18,643 | | | Series 2015-H07, Class ES, VAR, 0.000%, 02/20/65 | | | 18,541 | |
| | 58,860 | | | Series 2015-H08, Class FC, VAR, 0.950%, 03/20/65 | | | 58,473 | |
| | 46,753 | | | Series 2015-H10, Class FC, VAR, 0.948%, 04/20/65 | | | 46,438 | |
| | 28,330 | | | Series 2015-H12, Class FA, VAR, 0.948%, 05/20/65 | | | 28,144 | |
| | 12,520 | | | Series 2015-H15, Class FD, VAR, 0.908%, 06/20/65 | | | 12,406 | |
| | 19,620 | | | Series 2015-H15, Class FJ, VAR, 0.908%, 06/20/65 | | | 19,443 | |
| | 26,343 | | | Series 2015-H16, Class FG, VAR, 0.908%, 07/20/65 | | | 26,127 | |
| | 29,897 | | | Series 2015-H16, Class FL, VAR, 0.908%, 07/20/65 | | | 29,622 | |
| | 21,747 | | | Series 2015-H18, Class FA, VAR, 0.918%, 06/20/65 | | | 21,596 | |
| | 21,913 | | | Series 2015-H20, Class FA, VAR, 0.938%, 08/20/65 | | | 21,752 | |
| | 19,265 | | | Series 2015-H23, Class FB, VAR, 0.988%, 09/20/65 | | | 19,179 | |
| | 6,139 | | | Series 2015-H26, Class FG, VAR, 0.988%, 10/20/65 | | | 6,110 | |
| | 13,355 | | | Series 2015-H32, Class FH, VAR, 1.128%, 12/20/65 | | | 13,400 | |
| | 61,600 | | | Series 2016-H07, Class FA, VAR, 1.218%, 03/20/66 | | | 62,091 | |
| | | | | | | | |
PRINCIPAL
AMOUNT($) | | | SECURITY DESCRIPTION | | VALUE($) | |
| | | | | | | | |
| | | | Agency CMO — continued | | | | |
| | 15,543 | | | Series 2016-H07, Class FB, VAR, 1.218%, 03/20/66 | | | 15,666 | |
| | 27,925 | | | Series 2016-H11, Class FD, VAR, 0.868%, 05/20/66 | | | 27,949 | |
| | | | NCUA Guaranteed Notes Trust, | | | | |
| | 16,295 | | | Series 2010-R3, Class 1A, VAR, 1.054%, 12/08/20 | | | 16,324 | |
| | 2,731 | | | Series 2010-R3, Class 3A, 2.400%, 12/08/20 | | | 2,747 | |
| | | | Vendee Mortgage Trust, | | | | |
| | 4,202 | | | Series 1993-1, Class ZB, 7.250%, 02/15/23 | | | 4,708 | |
| | 1,040 | | | Series 1994-1, Class 1, VAR, 5.512%, 02/15/24 | | | 1,135 | |
| | 3,208 | | | Series 1994-1, Class 2ZB, 6.500%, 02/15/24 | | | 3,610 | |
| | 1,547 | | | Series 1996-1, Class 1Z, 6.750%, 02/15/26 (e) | | | 1,789 | |
| | 696 | | | Series 1996-2, Class 1Z, 6.750%, 06/15/26 | | | 799 | |
| | 2,117 | | | Series 1997-1, Class 2Z, 7.500%, 02/15/27 | | | 2,487 | |
| | 1,432 | | | Series 1998-1, Class 2E, 7.000%, 03/15/28 (e) | | | 1,716 | |
| | | | | | | | |
| | | | | | | 3,740,099 | |
| | | | | | | | |
| | | | Non-Agency CMO — 2.4% | |
| | 27,651 | | | Access PT Funding Trust, Series 2016-1, 6.250%, 02/16/21 (e) | | | 27,646 | |
| | | | Ajax Mortgage Loan Trust, | | | | |
| | 13,257 | | | Series 2013-A, Class A, VAR, 3.500%, 02/25/51 (e) | | | 13,165 | |
| | 3,414 | | | Series 2013-B, Class A, VAR, 3.500%, 02/25/51 (e) | | | 3,396 | |
| | 6,496 | | | Series 2013-C, Class A, SUB, 4.500%, 03/25/53 (e) | | | 6,696 | |
| | 8,911 | | | Series 2014-A, Class A, SUB, 4.000%, 10/25/57 (e) | | | 8,865 | |
| | 9,998 | | | Series 2015-B, Class A, SUB, 3.875%, 07/25/60 (e) | | | 9,849 | |
| | | | Alternative Loan Trust, | | | | |
| | 121 | | | Series 2002-12, Class PO, PO, 11/25/32 | | | 92 | |
| | 8,969 | | | Series 2004-2CB, Class 1A9, 5.750%, 03/25/34 | | | 8,913 | |
| | 2,595 | | | Series 2005-1CB, Class 1A6, IF, IO, 6.576%, 03/25/35 | | | 586 | |
| | 8,222 | | | Series 2005-20CB, Class 3A8, IF, IO, 4.226%, 07/25/35 | | | 1,173 | |
SEE NOTES TO FINANCIAL STATEMENTS.
| | | | | | |
| | | |
| 52 | | | | J.P. MORGAN INCOME FUNDS | | AUGUST 31, 2016 |
| | | | | | | | |
PRINCIPAL
AMOUNT($) | | | SECURITY DESCRIPTION | | VALUE($) | |
| Collateralized Mortgage Obligations — continued | |
| | | | Non-Agency CMO — continued | | | | |
| | 7,944 | | | Series 2005-22T1, Class A2, IF, IO, 4.546%, 06/25/35 | | | 1,450 | |
| | 3,559 | | | Series 2005-28CB, Class 1A4, 5.500%, 08/25/35 | | | 3,464 | |
| | 109 | | | Series 2005-28CB, Class 3A5, 6.000%, 08/25/35 | | | 80 | |
| | 28,392 | | | Series 2005-37T1, Class A2, IF, IO, 4.526%, 09/25/35 | | | 5,412 | |
| | 3,694 | | | Series 2005-54CB, Class 1A11, 5.500%, 11/25/35 | | | 3,447 | |
| | 14,653 | | | Series 2005-54CB, Class 1A2, IF, IO, 4.326%, 11/25/35 | | | 2,272 | |
| | 47 | | | Series 2005-54CB, Class 1A7, 5.500%, 11/25/35 | | | 44 | |
| | 1,493 | | | Series 2005-64CB, Class 1A9, 5.500%, 12/25/35 | | | 1,379 | |
| | 2,871 | | | Series 2005-J1, Class 1A4, IF, IO, 4.576%, 02/25/35 | | | 160 | |
| | | | American General Mortgage Loan Trust, | | | | |
| | 374 | | | Series 2006-1, Class A5, VAR, 5.750%, 12/25/35 (e) | | | 385 | |
| | 2,313 | | | Series 2010-1A, Class A4, VAR, 5.650%, 03/25/58 (e) | | | 2,327 | |
| | | | Angel Oak Mortgage Trust LLC, | | | | |
| | 9,959 | | | Series 2015-1, Class A, SUB, 4.500%, 11/25/45 (e) | | | 9,984 | |
| | 4,533 | | | Series 2015-1, Class M, SUB, 5.500%, 11/25/45 (e) | | | 4,521 | |
| | | | ASG Resecuritization Trust, | | | | |
| | 741 | | | Series 2009-1, Class A60, VAR, 2.535%, 06/26/37 (e) | | | 736 | |
| | 7,986 | | | Series 2009-3, Class A65, VAR, 2.379%, 03/26/37 (e) | | | 7,942 | |
| | 305 | | | Series 2009-5, Class A50, VAR, 3.553%, 02/28/37 (e) | | | 304 | |
| | 2,390 | | | Series 2010-2, Class A60, VAR, 2.014%, 01/28/37 (e) | | | 2,364 | |
| | 4,333 | | | Series 2011-1, Class 2A35, 6.000%, 09/28/36 (e) | | | 3,683 | |
| | 3,380 | | | Series 2011-1, Class 3A50, VAR, 3.101%, 11/28/35 (e) | | | 3,333 | |
| | | | Banc of America Alternative Loan Trust, | | | | |
| | 3,208 | | | Series 2003-11, Class 1A1, 6.000%, 01/25/34 | | | 3,284 | |
| | 2,511 | | | Series 2003-11, Class 2A1, 6.000%, 01/25/34 | | | 2,575 | |
| | 368 | | | Series 2003-11, Class PO, PO, 01/25/34 | | | 290 | |
| | 800 | | | Series 2004-1, Class 1A1, 6.000%, 02/25/34 | | | 849 | |
| | | | | | | | |
PRINCIPAL
AMOUNT($) | | | SECURITY DESCRIPTION | | VALUE($) | |
| | | | | | | | |
| | | | Non-Agency CMO — continued | | | | |
| | 295 | | | Series 2004-1, Class 5A1, 5.500%, 02/25/19 | | | 297 | |
| | 91 | | | Series 2004-6, Class 15PO, PO, 07/25/19 | | | 90 | |
| | 623 | | | Series 2004-8, Class 3A1, 5.500%, 09/25/19 | | | 610 | |
| | 591 | | | Series 2005-5, Class 1CB1, 5.500%, 06/25/35 | | | 550 | |
| | 1,793 | | | Series 2005-9, Class CBIO, IO, 5.500%, 10/25/35 | | | 442 | |
| | | | Banc of America Funding Trust, | | | | |
| | 407 | | | Series 2004-1, Class PO, PO, 03/25/34 | | | 321 | |
| | 577 | | | Series 2004-2, Class 1CB1, 5.750%, 09/20/34 | | | 597 | |
| | 872 | | | Series 2004-C, Class 1A1, VAR, 3.082%, 12/20/34 | | | 855 | |
| | 521 | | | Series 2005-6, Class 2A7, 5.500%, 10/25/35 | | | 498 | |
| | 398 | | | Series 2005-7, Class 30PO, PO, 11/25/35 | | | 305 | |
| | 154 | | | Series 2005-8, Class 30PO, PO, 01/25/36 | | | 112 | |
| | 942 | | | Series 2005-E, Class 4A1, VAR, 2.938%, 03/20/35 (e) | | | 946 | |
| | 244 | | | Series 2006-1, Class XPO, PO, 01/25/36 | | | 193 | |
| | 2,266 | | | Series 2010-R11A, Class 1A6, VAR, 5.079%, 08/26/35 (e) | | | 2,272 | |
| | | | Banc of America Mortgage Trust, | | | | |
| | 210 | | | Series 2003-C, Class 3A1, VAR, 3.181%, 04/25/33 (e) | | | 212 | |
| | 1,479 | | | Series 2003-E, Class 2A2, VAR, 3.275%, 06/25/33 (a) | | | 1,474 | |
| | 11 | | | Series 2004-1, Class APO, PO, 02/25/34 | | | 10 | |
| | 355 | | | Series 2004-3, Class 15IO, IO, VAR, 0.229%, 04/25/19 | | | 1 | |
| | 474 | | | Series 2004-3, Class 1A26, 5.500%, 04/25/34 | | | 475 | |
| | 44 | | | Series 2004-4, Class APO, PO, 05/25/34 | | | 37 | |
| | 557 | | | Series 2004-5, Class 2A2, 5.500%, 06/25/34 | | | 563 | |
| | 108 | | | Series 2004-5, Class 4A1, 4.750%, 06/25/19 | | | 108 | |
| | 292 | | | Series 2004-9, Class 3A1, 6.500%, 09/25/32 (e) | | | 303 | |
| | 3 | | | Series 2004-9, Class 3PO, PO, 09/25/32 | | | 3 | |
| | 804 | | | Series 2004-J, Class 3A1, VAR, 3.150%, 11/25/34 | | | 788 | |
| | 498 | | | Series 2005-1, Class 2A1, 5.000%, 02/25/20 | | | 505 | |
| | | | BCAP LLC Trust, | | | | |
| | 1,923 | | | Series 2009-RR5, Class 8A1, 5.500%, 11/26/34 (e) | | | 1,994 | |
SEE NOTES TO FINANCIAL STATEMENTS.
| | | | | | | | |
| | | |
| AUGUST 31, 2016 | | J.P. MORGAN INCOME FUNDS | | | | | 53 | |
JPMorgan Core Bond Fund
SCHEDULE OF PORTFOLIO INVESTMENTS
AS OF AUGUST 31, 2016 (Unaudited) (continued)
(Amounts in thousands)
| | | | | | | | |
PRINCIPAL
AMOUNT($) | | | SECURITY DESCRIPTION | | VALUE($) | |
| Collateralized Mortgage Obligations — continued | |
| | | | Non-Agency CMO — continued | | | | |
| | 1,117 | | | Series 2009-RR13, Class 17A2, VAR, 5.500%, 04/26/37 (e) | | | 1,117 | |
| | 2,787 | | | Series 2009-RR14, Class 3A2, VAR, 2.893%, 08/26/35 (e) | | | 2,792 | |
| | 1,028 | | | Series 2010-RR5, Class 2A5, VAR, 5.402%, 04/26/37 (e) | | | 1,034 | |
| | 325 | | | Series 2010-RR6, Class 22A3, VAR, 2.919%, 06/26/36 (e) | | | 324 | |
| | 584 | | | Series 2010-RR7, Class 1A5, VAR, 3.021%, 04/26/35 (e) | | | 579 | |
| | 11,006 | | | Series 2010-RR7, Class 2A1, VAR, 2.623%, 07/26/45 (e) | | | 10,920 | |
| | 5,046 | | | Series 2010-RR8, Class 3A4, VAR, 3.087%, 05/26/35 (e) | | | 4,964 | |
| | 476 | | | Series 2010-RR12, Class 2A5, VAR, 2.977%, 01/26/36 (e) | | | 471 | |
| | 1,151 | | | Series 2010-RR12, Class 4A5, VAR, 3.010%, 10/26/36 (e) | | | 1,141 | |
| | 60 | | | Series 2011-R11, Class 24A5, VAR, 3.000%, 08/26/22 (e) | | | 60 | |
| | 717 | | | Series 2011-R11, Class 25A5, VAR, 4.000%, 08/26/21 (e) | | | 719 | |
| | 6,121 | | | Series 2011-RR4, Class 6A3, VAR, 5.000%, 08/26/37 (e) | | | 6,175 | |
| | 1,561 | | | Series 2011-RR5, Class 11A3, VAR, 0.638%, 05/28/36 (e) | | | 1,555 | |
| | 8,444 | | | Series 2011-RR10, Class 2A1, VAR, 1.352%, 09/26/37 (e) | | | 8,164 | |
| | 1,602 | | | Series 2012-RR1, Class 5A1, VAR, 9.858%, 07/26/37 (e) | | | 1,653 | |
| | 5,398 | | | Series 2012-RR3, Class 2A5, VAR, 2.404%, 05/26/37 (e) | | | 5,382 | |
| | 2,435 | | | Series 2012-RR4, Class 8A3, VAR, 0.717%, 06/26/47 (e) | | | 2,376 | |
| | 3,093 | | | Series 2012-RR10, Class 1A1, VAR, 0.718%, 02/26/37 (e) | | | 3,000 | |
| | 2,034 | | | Bear Stearns ALT-A Trust, Series 2005-2, Class 1A1, VAR, 1.024%, 03/25/35 | | | 1,985 | |
| | | | Bear Stearns ARM Trust, | | | | |
| | 1,521 | | | Series 2003-2, Class A5, VAR, 2.756%, 01/25/33 (e) | | | 1,525 | |
| | 205 | | | Series 2003-7, Class 3A, VAR, 2.835%, 10/25/33 | | | 201 | |
| | 910 | | | Series 2004-2, Class 14A, VAR, 3.344%, 05/25/34 | | | 904 | |
| | 4,962 | | | Series 2005-5, Class A1, VAR, 2.580%, 08/25/35 | | | 4,985 | |
| | 4,302 | | | Series 2006-1, Class A1, VAR, 2.580%, 02/25/36 | | | 4,198 | |
| | | | | | | | |
PRINCIPAL
AMOUNT($) | | | SECURITY DESCRIPTION | | VALUE($) | |
| | | | | | | | |
| | | | Non-Agency CMO — continued | | | | |
| | 238 | | | Cendant Mortgage Capital CDMC Mortgage Pass-Through Certificates, Series 2003-8, Class 1P, PO, 10/25/33 | | | 217 | |
| | 79 | | | Cendant Mortgage Capital LLC CDMC Mortgage Pass-Through Certificates, Series 2004-1, Class P, PO, 02/25/34 | | | 68 | |
| | | | Chase Mortgage Finance Trust, | | | | |
| | 867 | | | Series 2007-A1, Class 1A3, VAR, 2.970%, 02/25/37 | | | 856 | |
| | 1,769 | | | Series 2007-A1, Class 2A1, VAR, 3.097%, 02/25/37 | | | 1,766 | |
| | 242 | | | Series 2007-A1, Class 7A1, VAR, 3.053%, 02/25/37 | | | 242 | |
| | 1,033 | | | Series 2007-A1, Class 9A1, VAR, 3.000%, 02/25/37 | | | 1,022 | |
| | 710 | | | Series 2007-A2, Class 1A1, VAR, 3.144%, 07/25/37 | | | 704 | |
| | 1,062 | | | Series 2007-A2, Class 2A1, VAR, 2.883%, 07/25/37 | | | 1,054 | |
| | | | CHL Mortgage Pass-Through Trust, | | | | |
| | 156 | | | Series 2002-18, Class PO, PO, 11/25/32 | | | 135 | |
| | 475 | | | Series 2004-3, Class A26, 5.500%, 04/25/34 | | | 476 | |
| | 323 | | | Series 2004-3, Class A4, 5.750%, 04/25/34 | | | 321 | |
| | 2,107 | | | Series 2004-5, Class 1A4, 5.500%, 06/25/34 | | | 2,175 | |
| | 147 | | | Series 2004-7, Class 2A1, VAR, 2.940%, 06/25/34 | | | 143 | |
| | 641 | | | Series 2004-8, Class 2A1, 4.500%, 06/25/19 | | | 653 | |
| | 246 | | | Series 2004-HYB1, Class 2A, VAR, 2.806%, 05/20/34 | | | 234 | |
| | 1,137 | | | Series 2004-HYB3, Class 2A, VAR, 2.761%, 06/20/34 | | | 1,080 | |
| | 741 | | | Series 2004-HYB6, Class A3, VAR, 2.792%, 11/20/34 | | | 706 | |
| | 76 | | | Series 2004-J8, Class 1A2, 4.750%, 11/25/19 | | | 77 | |
| | 358 | | | Series 2005-14, Class A2, 5.500%, 07/25/35 | | | 345 | |
| | 185 | | | Series 2005-16, Class A23, 5.500%, 09/25/35 | | | 175 | |
| | 2,712 | | | Series 2005-22, Class 2A1, VAR, 2.755%, 11/25/35 (e) | | | 2,221 | |
| | | | Citicorp Mortgage Securities Trust, | | | | |
| | 133 | | | Series 2006-1, Class 2A1, 5.000%, 02/25/21 | | | 137 | |
SEE NOTES TO FINANCIAL STATEMENTS.
| | | | | | |
| | | |
| 54 | | | | J.P. MORGAN INCOME FUNDS | | AUGUST 31, 2016 |
| | | | | | | | |
PRINCIPAL
AMOUNT($) | | | SECURITY DESCRIPTION | | VALUE($) | |
| Collateralized Mortgage Obligations — continued | |
| | | | Non-Agency CMO — continued | | | | |
| | 883 | | | Series 2006-4, Class 1A2, 6.000%, 08/25/36 | | | 887 | |
| | | | Citigroup Global Markets Mortgage Securities VII, Inc., | | | | |
| | 1,869 | | | Series 2003-HYB1, Class A, VAR, 2.740%, 09/25/33 (e) | | | 1,854 | |
| | 12 | | | Series 2003-UP2, Class PO1, PO, 12/25/18 (e) | | | 10 | |
| | | | Citigroup Mortgage Loan Trust, | | | | |
| | 5,758 | | | Series 2008-AR4, Class 1A1A, VAR, 2.993%, 11/25/38 (e) | | | 5,727 | |
| | 1,249 | | | Series 2009-5, Class 8A1, 6.000%, 06/25/36 (e) | | | 1,261 | |
| | 900 | | | Series 2009-8, Class 4A1, 6.000%, 11/25/36 (e) | | | 925 | |
| | 4,624 | | | Series 2009-10, Class 1A1, VAR, 2.631%, 09/25/33 (e) | | | 4,651 | |
| | 2,664 | | | Series 2009-10, Class 2A1A, 7.000%, 12/25/35 (e) | | | 2,737 | |
| | 2,160 | | | Series 2009-11, Class 3A1, VAR, 5.750%, 05/25/37 (e) | | | 2,180 | |
| | 508 | | | Series 2010-3, Class 4A1, VAR, 2.580%, 02/25/36 (e) | | | 504 | |
| | 492 | | | Series 2010-7, Class 10A1, VAR, 2.762%, 02/25/35 (e) | | | 488 | |
| | 3,740 | | | Series 2010-8, Class 5A6, 4.000%, 11/25/36 (e) | | | 3,751 | |
| | 5,359 | | | Series 2010-8, Class 6A6, 4.500%, 12/25/36 (e) | | | 5,381 | |
| | 1,818 | | | Series 2010-10, Class 2A1, VAR, 2.729%, 02/25/36 (e) | | | 1,830 | |
| | 4,081 | | | Series 2015-A, Class B2, VAR, 4.500%, 06/25/58 (e) | | | 4,163 | |
| | | | Citigroup Mortgage Loan Trust, Inc., | | | | |
| | 596 | | | Series 2003-1, Class 2A5, 5.250%, 10/25/33 | | | 603 | |
| | 104 | | | Series 2003-1, Class 2A6, PO, 10/25/33 | | | 94 | |
| | 80 | | | Series 2003-1, Class PO2, PO, 10/25/33 | | | 65 | |
| | 81 | | | Series 2003-1, Class PO3, PO, 09/25/33 | | | 73 | |
| | 73 | | | Series 2003-UP3, Class A3, 7.000%, 09/25/33 | | | 74 | |
| | 160 | | | Series 2003-UST1, Class A1, 5.500%, 12/25/18 | | | 160 | |
| | 35 | | | Series 2003-UST1, Class PO1, PO, 12/25/18 | | | 33 | |
| | 18 | | | Series 2003-UST1, Class PO3, PO, 12/25/18 | | | 17 | |
| | 496 | | | Series 2004-UST1, Class A6, VAR, 2.645%, 08/25/34 | | | 476 | |
| | | | | | | | |
PRINCIPAL
AMOUNT($) | | | SECURITY DESCRIPTION | | VALUE($) | |
| | | | | | | | |
| | | | Non-Agency CMO — continued | | | | |
| | 331 | | | Series 2005-1, Class 2A1A, VAR, 2.801%, 04/25/35 | | | 262 | |
| | 1,655 | | | Series 2005-2, Class 2A11, 5.500%, 05/25/35 | | | 1,691 | |
| | 984 | | | Series 2005-5, Class 1A2, VAR, 3.406%, 08/25/35 (e) | | | 714 | |
| | | | Credit Suisse First Boston Mortgage Securities Corp., | | | | |
| | 11 | | | Series 1997-2, Class A, 7.500%, 06/25/20 (e) | | | 11 | |
| | 1,090 | | | Series 2003-1, Class DB1, VAR, 6.738%, 02/25/33 | | | 1,103 | |
| | 1,077 | | | Series 2003-21, Class 1A4, 5.250%, 09/25/33 | | | 1,104 | |
| | 810 | | | Series 2003-23, Class 1P, PO, 10/25/33 | | | 702 | |
| | 160 | | | Series 2003-23, Class 2A5, 5.000%, 10/25/18 | | | 160 | |
| | 32 | | | Series 2003-25, Class 2A1, 4.500%, 10/25/18 | | | 32 | |
| | 1,589 | | | Series 2003-27, Class 5A3, 5.250%, 11/25/33 | | | 1,607 | |
| | 630 | | | Series 2003-27, Class 5A4, 5.250%, 11/25/33 | | | 638 | |
| | 589 | | | Series 2003-AR15, Class 3A1, VAR, 3.187%, 06/25/33 | | | 583 | |
| | 984 | | | Series 2004-4, Class 2A4, 5.500%, 09/25/34 | | | 1,028 | |
| | 623 | | | Series 2004-5, Class 3A1, 5.250%, 08/25/19 | | | 632 | |
| | 10 | | | Series 2004-5, Class 5P, PO, 08/25/19 | | | 10 | |
| | 1,564 | | | Series 2004-8, Class 1A4, 5.500%, 12/25/34 | | | 1,635 | |
| | 231 | | | Series 2005-9, Class AP, PO, 10/25/35 | | | 167 | |
| | 3,350 | | | Series 2005-9, Class DX, IO, 5.500%, 10/25/35 (e) | | | 193 | |
| | 177 | | | Series 2005-10, Class AP, PO, 11/25/35 | | | 112 | |
| | 1,050 | | | Credit Suisse Mortgage Capital Certificates, Series 2009-3R, Class 19A3, 6.000%, 01/27/38 (e) | | | 1,061 | |
| | | | CSMC, | | | | |
| | 27,524 | | | Series 2010-11R, Class A6, VAR, 1.493%, 06/28/47 (e) | | | 26,490 | |
| | 2,109 | | | Series 2010-17R, Class 1A1, VAR, 2.792%, 06/26/36 (e) | | | 2,124 | |
| | 3,312 | | | Series 2011-16R, Class 7A3, VAR, 3.500%, 12/27/36 (e) | | | 3,317 | |
| | 1,060 | | | Series 2011-6R, Class 3A1, VAR, 3.210%, 07/28/36 (e) | | | 1,064 | |
SEE NOTES TO FINANCIAL STATEMENTS.
| | | | | | | | |
| | | |
| AUGUST 31, 2016 | | J.P. MORGAN INCOME FUNDS | | | | | 55 | |
JPMorgan Core Bond Fund
SCHEDULE OF PORTFOLIO INVESTMENTS
AS OF AUGUST 31, 2016 (Unaudited) (continued)
(Amounts in thousands)
| | | | | | | | |
PRINCIPAL
AMOUNT($) | | | SECURITY DESCRIPTION | | VALUE($) | |
| Collateralized Mortgage Obligations — continued | |
| | | | Non-Agency CMO — continued | | | | |
| | 1,624 | | | Series 2012-2R, Class 2A1, VAR, 2.631%, 03/27/47 (e) | | | 1,607 | |
| | 2,404 | | | Series 2012-3R, Class 1A1, VAR, 2.715%, 07/27/37 (e) | | | 2,415 | |
| | | | Deutsche Alt-A Securities, Inc., Mortgage Loan Trust, | | | | |
| | 573 | | | Series 2005-1, Class 2A1, VAR, 5.804%, 02/25/20 | | | 579 | |
| | 796 | | | Series 2005-3, Class 1A1, VAR, 4.979%, 06/25/20 | | | 796 | |
| | 14 | | | Deutsche Mortgage Securities, Inc., Mortgage Loan Trust, Series 2004-1, Class 2APO, PO, 10/25/18 | | | 14 | |
| | | | First Horizon Alternative Mortgage Securities Trust, | | | | |
| | 1,363 | | | Series 2005-FA8, Class 1A19, 5.500%, 11/25/35 | | | 1,174 | |
| | 11,419 | | | Series 2007-FA4, Class 1A2, IF, IO, 5.126%, 08/25/37 | | | 2,834 | |
| | | | First Horizon Mortgage Pass-Through Trust, | | | | |
| | 636 | | | Series 2004-AR2, Class 2A1, VAR, 3.065%, 05/25/34 | | | 628 | |
| | 314 | | | Series 2004-AR7, Class 2A2, VAR, 2.709%, 02/25/35 (e) | | | 312 | |
| | 1,943 | | | Series 2005-AR1, Class 2A2, VAR, 2.935%, 04/25/35 (e) | | | 1,945 | |
| | | | GMACM Mortgage Loan Trust, | | | | |
| | 4,071 | | | Series 2003-AR1, Class A4, VAR, 3.328%, 10/19/33 | | | 4,023 | |
| | 3,108 | | | Series 2003-AR2, Class 2A4, VAR, 3.205%, 12/19/33 | | | 3,058 | |
| | 116 | | | Series 2003-J8, Class A, 5.250%, 12/25/33 | | | 120 | |
| | 1,584 | | | Series 2004-J5, Class A7, 6.500%, 01/25/35 | | | 1,635 | |
| | 479 | | | Series 2004-J6, Class 1A1, 5.000%, 01/25/20 | | | 489 | |
| | 2,561 | | | Series 2005-AR3, Class 3A4, VAR, 3.304%, 06/19/35 | | | 2,504 | |
| | | | GSMPS Mortgage Loan Trust, | | | | |
| | 672 | | | Series 2004-4, Class 1AF, VAR, 0.924%, 06/25/34 (e) | | | 599 | |
| | 1,244 | | | Series 2005-RP2, Class 1AF, VAR, 0.874%, 03/25/35 (e) | | | 1,071 | |
| | 7,532 | | | Series 2005-RP3, Class 1AF, VAR, 0.874%, 09/25/35 (e) | | | 6,484 | |
| | 5,552 | | | Series 2005-RP3, Class 1AS, IO, VAR, 4.240%, 09/25/35 (e) | | | 776 | |
| | | | | | | | |
PRINCIPAL
AMOUNT($) | | | SECURITY DESCRIPTION | | VALUE($) | |
| | | | | | | | |
| | | | Non-Agency CMO — continued | | | | |
| | | | GSR Mortgage Loan Trust, | | | | |
| | 441 | | | Series 2003-3F, Class 4A3, 5.750%, 04/25/33 | | | 459 | |
| | 157 | | | Series 2003-6F, Class A2, VAR, 0.924%, 09/25/32 | | | 148 | |
| | 1,214 | | | Series 2004-13F, Class 3A3, 6.000%, 11/25/34 (e) | | | 1,244 | |
| | 1,379 | | | Series 2004-6F, Class 2A4, 5.500%, 05/25/34 | | | 1,415 | |
| | 761 | | | Series 2004-6F, Class 3A4, 6.500%, 05/25/34 | | | 809 | |
| | 440 | | | Series 2005-5F, Class 8A3, VAR, 1.024%, 06/25/35 | | | 417 | |
| | 2,320 | | | Series 2005-7F, Class 3A9, 6.000%, 09/25/35 | | | 2,465 | |
| | 158 | | | Series 2005-AR6, Class 3A1, VAR, 3.058%, 09/25/35 | | | 157 | |
| | 1,220 | | | Series 2006-1F, Class 1A3, 5.500%, 02/25/36 | | | 1,153 | |
| | 4,788 | | | Series 2006-1F, Class 2A4, 6.000%, 02/25/36 | | | 4,205 | |
| | 3,832 | | | Series 2007-1F, Class 2A4, 5.500%, 01/25/37 | | | 3,688 | |
| | 7,873 | | | Homeowner Assistance Program Reverse Mortgage Loan Trust, Series 2013-RM1, Class A, 4.000%, 05/26/53 (e) | | | 7,814 | |
| | 1,495 | | | Impac CMB Trust, Series 2005-4, Class 2A1, VAR, 1.124%, 05/25/35 | | | 1,434 | |
| | | | Impac Secured Assets CMN Owner Trust, | | | | |
| | 909 | | | Series 2003-2, Class A1, 5.500%, 08/25/33 | | | 918 | |
| | 38 | | | Series 2004-3, Class 1A4, VAR, 1.324%, 11/25/34 | | | 37 | |
| | | | Impac Secured Assets Trust, | | | | |
| | 4,684 | | | Series 2006-1, Class 2A1, VAR, 0.874%, 05/25/36 | | | 4,206 | |
| | 4,581 | | | Series 2006-2, Class 2A1, VAR, 0.874%, 08/25/36 | | | 4,498 | |
| | | | JP Morgan Mortgage Trust, | | | | |
| | 678 | | | Series 2004-A3, Class 4A1, VAR, 3.212%, 07/25/34 | | | 696 | |
| | 772 | | | Series 2004-A4, Class 1A1, VAR, 3.307%, 09/25/34 | | | 788 | |
| | 282 | | | Series 2004-S1, Class 1A7, 5.000%, 09/25/34 | | | 288 | |
| | 1,855 | | | Series 2005-A1, Class 3A4, VAR, 3.008%, 02/25/35 | | | 1,888 | |
| | 11,329 | | | Series 2006-A2, Class 4A1, VAR, 3.185%, 08/25/34 | | | 11,357 | |
SEE NOTES TO FINANCIAL STATEMENTS.
| | | | | | |
| | | |
| 56 | | | | J.P. MORGAN INCOME FUNDS | | AUGUST 31, 2016 |
| | | | | | | | |
PRINCIPAL
AMOUNT($) | | | SECURITY DESCRIPTION | | VALUE($) | |
| Collateralized Mortgage Obligations — continued | |
| | | | Non-Agency CMO — continued | | | | |
| | 6,641 | | | Series 2006-A2, Class 5A3, VAR, 2.783%, 11/25/33 | | | 6,731 | |
| | 1,557 | | | Series 2006-A3, Class 6A1, VAR, 3.145%, 08/25/34 (e) | | | 1,558 | |
| | 1,292 | | | Series 2007-A1, Class 5A1, VAR, 2.911%, 07/25/35 | | | 1,291 | |
| | 517 | | | Series 2007-A1, Class 5A2, VAR, 2.911%, 07/25/35 | | | 523 | |
| | 560 | | | JP Morgan Resecuritization Trust, Series 2009-6, Class 4A1, VAR, 2.978%, 09/26/36 (e) | | | 560 | |
| | | | Lehman Mortgage Trust, | | | | |
| | 825 | | | Series 2006-2, Class 1A1, VAR, 5.928%, 04/25/36 | | | 736 | |
| | 620 | | | Series 2007-6, Class 1A8, 6.000%, 07/25/37 | | | 554 | |
| | 4,095 | | | Series 2008-2, Class 1A6, 6.000%, 03/25/38 | | | 3,080 | |
| | | | MASTR Adjustable Rate Mortgages Trust, | | | | |
| | 823 | | | Series 2004-3, Class 4A2, VAR, 2.690%, 04/25/34 | | | 763 | |
| | 3,033 | | | Series 2004-13, Class 2A1, VAR, 2.882%, 04/21/34 | | | 3,097 | |
| | 541 | | | Series 2004-15, Class 3A1, VAR, 3.406%, 12/25/34 | | | 533 | |
| | | | MASTR Alternative Loan Trust, | | | | |
| | 880 | | | Series 2003-9, Class 2A1, 6.000%, 12/25/33 | | | 874 | |
| | 252 | | | Series 2003-9, Class 8A1, 6.000%, 01/25/34 | | | 252 | |
| | 710 | | | Series 2004-3, Class 2A1, 6.250%, 04/25/34 | | | 739 | |
| | 2,425 | | | Series 2004-3, Class 3A1, 6.000%, 04/25/34 | | | 2,541 | |
| | 451 | | | Series 2004-6, Class 30PO, PO, 07/25/34 | | | 328 | |
| | 276 | | | Series 2004-6, Class 7A1, 6.000%, 07/25/34 | | | 269 | |
| | 374 | | | Series 2004-7, Class 30PO, PO, 08/25/34 | | | 293 | |
| | 457 | | | Series 2004-8, Class 6A1, 5.500%, 09/25/19 | | | 465 | |
| | 152 | | | Series 2004-10, Class 1A1, 4.500%, 09/25/19 | | | 153 | |
| | 615 | | | Series 2005-6, Class 3A1, 5.500%, 11/25/20 | | | 599 | |
| | | | MASTR Asset Securitization Trust, | | | | |
| | 37 | | | Series 2003-2, Class 1A1, 5.000%, 03/25/18 | | | 37 | |
| | 20 | | | Series 2003-2, Class 2A1, 4.500%, 03/25/18 | | | 20 | |
| | | | | | | | |
PRINCIPAL
AMOUNT($) | | | SECURITY DESCRIPTION | | VALUE($) | |
| | | | | | | | |
| | | | Non-Agency CMO — continued | | | | |
| | 65 | | | Series 2003-2, Class 2A10, 4.500%, 03/25/18 | | | 65 | |
| | 55 | | | Series 2003-8, Class 1A1, 5.500%, 09/25/33 | | | 54 | |
| | 68 | | | Series 2003-9, Class 15PO, PO, 10/25/18 | | | 66 | |
| | 119 | | | Series 2003-9, Class 2A7, 5.500%, 10/25/33 | | | 118 | |
| | 42 | | | Series 2003-11, Class 3A1, 4.500%, 12/25/18 | | | 42 | |
| | 67 | | | Series 2003-12, Class 30PO, PO, 12/25/33 | | | 60 | |
| | 242 | | | Series 2003-12, Class 6A1, 5.000%, 12/25/33 | | | 244 | |
| | 52 | | | Series 2004-1, Class 30PO, PO, 02/25/34 | | | 41 | |
| | 1,621 | | | Series 2004-4, Class 1A6, 5.250%, 12/26/33 | | | 1,677 | |
| | 9 | | | Series 2004-4, Class 3A1, 4.500%, 04/25/19 | | | 9 | |
| | 40 | | | Series 2004-6, Class 15PO, PO, 07/25/19 | | | 39 | |
| | 130 | | | Series 2004-8, Class 1A1, 4.750%, 08/25/19 | | | 133 | |
| | 27 | | | Series 2004-8, Class PO, PO, 08/25/19 (e) | | | 25 | |
| | 232 | | | Series 2004-9, Class 5A1, 5.250%, 09/25/19 (e) | | | 235 | |
| | 774 | | | Series 2004-P7, Class A6, 5.500%, 12/27/33 (e) | | | 829 | |
| | | | MASTR Reperforming Loan Trust, | | | | |
| | 10,203 | | | Series 2005-2, Class 1A1F, VAR, 0.874%, 05/25/35 (e) | | | 7,980 | |
| | 1,250 | | | Series 2006-2, Class 1A1, VAR, 4.553%, 05/25/36 (e) | | | 1,125 | |
| | 620 | | | MASTR Resecuritization Trust, Series 2005-PO, Class 3PO, PO, 05/28/35 (e) | | | 491 | |
| | | | Merrill Lynch Mortgage Investors Trust, | | | | |
| | 787 | | | Series 2003-A5, Class 2A6, VAR, 2.900%, 08/25/33 | | | 791 | |
| | 1,544 | | | Series 2003-E, Class A1, VAR, 1.144%, 10/25/28 | | | 1,470 | |
| | 3,203 | | | Series 2003-F, Class A1, VAR, 1.164%, 10/25/28 | | | 3,128 | |
| | 1,629 | | | Series 2004-1, Class 2A1, VAR, 2.682%, 12/25/34 (e) | | | 1,630 | |
| | 656 | | | Series 2004-A, Class A1, VAR, 0.984%, 04/25/29 | | | 614 | |
| | 1,350 | | | Series 2004-A4, Class A2, VAR, 2.855%, 08/25/34 | | | 1,372 | |
| | 1,367 | | | Series 2004-C, Class A2, VAR, 1.529%, 07/25/29 | | | 1,299 | |
| | 2,508 | | | Series 2005-A2, Class A1, VAR, 2.650%, 02/25/35 | | | 2,447 | |
SEE NOTES TO FINANCIAL STATEMENTS.
| | | | | | | | |
| | | |
| AUGUST 31, 2016 | | J.P. MORGAN INCOME FUNDS | | | | | 57 | |
JPMorgan Core Bond Fund
SCHEDULE OF PORTFOLIO INVESTMENTS
AS OF AUGUST 31, 2016 (Unaudited) (continued)
(Amounts in thousands)
| | | | | | | | |
PRINCIPAL
AMOUNT($) | | | SECURITY DESCRIPTION | | VALUE($) | |
| Collateralized Mortgage Obligations — continued | |
| | | | Non-Agency CMO — continued | | | | |
| | 2,944 | | | Merrill Lynch Mortgage-Backed Securities Trust, Series 2007-3, Class 1A3, VAR, 1.581%, 06/25/37 | | | 2,854 | |
| | 6 | | | ML Trust XLVII, Series 47, Class Z, 8.985%, 10/20/20 | | | 6 | |
| | | | Morgan Stanley Mortgage Loan Trust, | | | | |
| | 2,970 | | | Series 2004-3, Class 4A, VAR, 5.676%, 04/25/34 (e) | | | 3,107 | |
| | 706 | | | Series 2004-9, Class 4A, VAR, 4.936%, 10/25/19 | | | 695 | |
| | — | (h) | | Morgan Stanley Mortgage Trust, Series 35, Class 2, HB, IF, 14,804.840%, 04/20/21 (e) | | | — | (h) |
| | 1,081 | | | MortgageIT Trust, Series 2005-1, Class 1A1, VAR, 1.164%, 02/25/35 (e) | | | 1,040 | |
| | | | MRFC Mortgage Pass-Through Trust, | | | | |
| | 3,388 | | | Series 2000-TBC2, Class A1, VAR, 0.988%, 06/15/30 | | | 3,210 | |
| | 724 | | | Series 2000-TBC3, Class A1, VAR, 0.948%, 12/15/30 | | | 688 | |
| | 704 | | | NACC Reperforming Loan REMIC Trust, Series 2004-R2, Class A1, VAR, 6.500%, 10/25/34 (e) | | | 706 | |
| | | | Nomura Asset Acceptance Corp. Alternative Loan Trust, | | | | |
| | 311 | | | Series 2003-A1, Class A1, 5.500%, 05/25/33 | | | 316 | |
| | 198 | | | Series 2003-A1, Class A2, 6.000%, 05/25/33 | | | 202 | |
| | 69 | | | Series 2003-A1, Class A5, 7.000%, 04/25/33 (e) | | | 71 | |
| | 3 | | | Series 2003-A1, Class A7, 5.000%, 04/25/18 (e) | | | 3 | |
| | 293 | | | Nomura Resecuritization Trust, Series 2010-6RA, Class 1A5, VAR, 3.006%, 03/26/36 (e) | | | 290 | |
| | 5 | | | PaineWebber CMO Trust, Series P, Class 4, 8.500%, 08/01/19 | | | 5 | |
| | 1,218 | | | Prime Mortgage Trust, Series 2004-CL1, Class 1A1, 6.000%, 02/25/34 | | | 1,271 | |
| | 551 | | | Provident Funding Mortgage Loan Trust, Series 2005-1, Class 2A1, VAR, 2.842%, 05/25/35 (e) | | | 530 | |
| | | | RALI Trust, | | | | |
| | 13 | | | Series 2001-QS19, Class A2, 6.000%, 12/25/16 | | | 12 | |
| | 127 | | | Series 2002-QS8, Class A5, 6.250%, 06/25/17 | | | 127 | |
| | | | | | | | |
PRINCIPAL
AMOUNT($) | | | SECURITY DESCRIPTION | | VALUE($) | |
| | | | | | | | |
| | | | Non-Agency CMO — continued | | | | |
| | 47 | | | Series 2002-QS16, Class A3, IF, 15.526%, 10/25/17 | | | 49 | |
| | 122 | | | Series 2003-QS3, Class A2, IF, 15.346%, 02/25/18 | | | 128 | |
| | 360 | | | Series 2003-QS9, Class A3, IF, IO, 7.026%, 05/25/18 | | | 11 | |
| | 246 | | | Series 2003-QS12, Class A2A, IF, IO, 7.076%, 06/25/18 | | | 9 | |
| | 75 | | | Series 2003-QS12, Class A5, IO, 5.000%, 06/25/18 | | | 2 | |
| | 9,073 | | | Series 2003-QS13, Class A2, 4.000%, 07/25/33 | | | 8,650 | |
| | 577 | | | Series 2003-QS14, Class A1, 5.000%, 07/25/18 | | | 579 | |
| | 174 | | | Series 2003-QS18, Class A1, 5.000%, 09/25/18 | | | 176 | |
| | 7,336 | | | Series 2004-QS7, Class A4, 5.500%, 05/25/34 | | | 7,448 | |
| | 2,076 | | | Series 2005-QA6, Class A32, VAR, 3.936%, 05/25/35 | | | 1,737 | |
| | 242 | | | Series 2007-QS1, Class 1A1, 6.000%, 01/25/37 | | | 201 | |
| | | | RBSSP Resecuritization Trust, | | | | |
| | 3,728 | | | Series 2009-1, Class 1A1, 6.500%, 02/26/36 (e) | | | 3,959 | |
| | 957 | | | Series 2009-2, Class 1A1, 7.000%, 08/26/37 (e) | | | 998 | |
| | 473 | | | Series 2009-9, Class 7A4, VAR, 6.000%, 07/26/37 (e) | | | 474 | |
| | 4,010 | | | Series 2009-12, Class 1A1, VAR, 5.851%, 11/25/33 (e) | | | 4,154 | |
| | 980 | | | Series 2010-9, Class 3A1, VAR, 5.000%, 10/26/34 (e) | | | 993 | |
| | 1,993 | | | Series 2010-9, Class 7A5, VAR, 4.000%, 05/26/37 (e) | | | 1,974 | |
| | 107 | | | Reperforming Loan REMIC Trust, Series 2005-R1, Class 2APO, PO, 03/25/35 (e) | | | 88 | |
| | | | Residential Asset Securitization Trust, | | | | |
| | 206 | | | Series 2003-A8, Class A5, 4.250%, 10/25/18 | | | 206 | |
| | 305 | | | Series 2003-A13, Class A3, 5.500%, 01/25/34 | | | 312 | |
| | 15 | | | Series 2003-A14, Class A1, 4.750%, 02/25/19 | | | 15 | |
| | 9,502 | | | Series 2005-A2, Class A4, IF, IO, 4.526%, 03/25/35 | | | 1,376 | |
| | 958 | | | Series 2006-A4, Class 2A5, 6.000%, 05/25/36 (e) | | | 884 | |
SEE NOTES TO FINANCIAL STATEMENTS.
| | | | | | |
| | | |
| 58 | | | | J.P. MORGAN INCOME FUNDS | | AUGUST 31, 2016 |
| | | | | | | | |
PRINCIPAL
AMOUNT($) | | | SECURITY DESCRIPTION | | VALUE($) | |
| Collateralized Mortgage Obligations — continued | |
| | | | Non-Agency CMO — continued | | | | |
| | | | RFMSI Trust, | | | | |
| | 39 | | | Series 2003-S14, Class A4, PO, 07/25/18 | | | 38 | |
| | 114 | | | Series 2003-S16, Class A3, 5.000%, 09/25/18 | | | 114 | |
| | 210 | | | Series 2003-S20, Class 2A1, 4.750%, 12/25/18 | | | 211 | |
| | 148 | | | Series 2004-S6, Class 2A6, PO, 06/25/34 | | | 115 | |
| | 857 | | | Series 2005-SA4, Class 1A1, VAR, 3.223%, 09/25/35 (e) | | | 710 | |
| | | | Sequoia Mortgage Trust, | | | | |
| | 1,622 | | | Series 2004-8, Class A1, VAR, 1.212%, 09/20/34 | | | 1,538 | |
| | 2,329 | | | Series 2004-8, Class A2, VAR, 1.950%, 09/20/34 | | | 2,236 | |
| | 722 | | | Series 2004-10, Class A1A, VAR, 1.132%, 11/20/34 (e) | | | 676 | |
| | 2,237 | | | Series 2004-11, Class A1, VAR, 1.112%, 12/20/34 | | | 2,185 | |
| | 1,721 | | | Series 2004-12, Class A3, VAR, 1.245%, 01/20/35 | | | 1,580 | |
| | | | Springleaf Mortgage Loan Trust, | | | | |
| | 4,732 | | | Series 2013-1A, Class A, VAR, 1.270%, 06/25/58 (e) | | | 4,716 | |
| | 9,745 | | | Series 2013-1A, Class M1, VAR, 2.310%, 06/25/58 (e) | | | 9,709 | |
| | 7,103 | | | Series 2013-1A, Class M2, VAR, 3.140%, 06/25/58 (e) | | | 7,083 | |
| | 5,974 | | | Series 2013-1A, Class M3, VAR, 3.790%, 06/25/58 (e) | | | 5,989 | |
| | 8,455 | | | Series 2013-2A, Class A, VAR, 1.780%, 12/25/65 (e) | | | 8,411 | |
| | 7,808 | | | Series 2013-2A, Class M1, VAR, 3.520%, 12/25/65 (e) | | | 7,847 | |
| | 370 | | | Series 2013-3A, Class A, VAR, 1.870%, 09/25/57 (e) | | | 371 | |
| | 10,968 | | | Series 2013-3A, Class M1, VAR, 3.790%, 09/25/57 (e) | | | 10,972 | |
| | 258 | | | Structured Adjustable Rate Mortgage Loan Trust, Series 2004-6, Class 5A4, VAR, 2.813%, 06/25/34 | | | 258 | |
| | | | Structured Asset Mortgage Investments II Trust, | | | | |
| | 1,953 | | | Series 2004-AR5, Class 1A1, VAR, 1.174%, 10/19/34 | | | 1,862 | |
| | 6,924 | | | Series 2005-AR5, Class A3, VAR, 0.764%, 07/19/35 | | | 6,682 | |
| | | | Structured Asset Securities Corp., | | | | |
| | 2,393 | | | Series 2003-37A, Class 2A, VAR, 2.697%, 12/25/33 | | | 2,376 | |
| | | | | | | | |
PRINCIPAL
AMOUNT($) | | | SECURITY DESCRIPTION | | VALUE($) | |
| | | | | | | | |
| | | | Non-Agency CMO — continued | | | | |
| | 2,504 | | | Series 2004-4XS, Class 1A5, SUB, 5.610%, 02/25/34 | | | 2,574 | |
| | 935 | | | Series 2005-RF3, Class 1A, VAR, 0.874%, 06/25/35 (e) | | | 748 | |
| | | | Structured Asset Securities Corp. Mortgage Pass-Through Certificates, | | | | |
| | 305 | | | Series 2003-29, Class 1A1, 4.750%, 09/25/18 | | | 307 | |
| | 288 | | | Series 2003-30, Class 1A1, 5.500%, 10/25/33 | | | 301 | |
| | 210 | | | Series 2003-32, Class 1A1, VAR, 5.221%, 11/25/33 | | | 210 | |
| | 2,745 | | | Series 2003-33H, Class 1A1, 5.500%, 10/25/33 | | | 2,799 | |
| | 809 | | | Series 2003-34A, Class 3A3, VAR, 2.931%, 11/25/33 | | | 794 | |
| | 5,258 | | | Series 2004-5H, Class A4, 5.540%, 12/25/33 (e) | | | 5,400 | |
| | 439 | | | Structured Asset Securities Corp. Trust, Series 2005-6, Class 4A1, 5.000%, 05/25/35 | | | 444 | |
| | | | Thornburg Mortgage Securities Trust, | | | | |
| | 5,173 | | | Series 2003-4, Class A1, VAR, 1.164%, 09/25/43 (e) | | | 4,976 | |
| | 3,618 | | | Series 2004-4, Class 3A, VAR, 2.183%, 12/25/44 | | | 3,574 | |
| | | | WaMu Mortgage Pass-Through Certificates Trust, | | | | |
| | 1,296 | | | Series 2003-AR7, Class A7, VAR, 2.677%, 08/25/33 | | | 1,296 | |
| | 7,246 | | | Series 2003-AR9, Class 1A6, VAR, 2.631%, 09/25/33 | | | 7,329 | |
| | 1,325 | | | Series 2003-AR9, Class 2A, VAR, 2.755%, 09/25/33 | | | 1,296 | |
| | 3,914 | | | Series 2003-AR11, Class A6, VAR, 2.549%, 10/25/33 | | | 3,943 | |
| | 1,203 | | | Series 2003-S1, Class A5, 5.500%, 04/25/33 | | | 1,237 | |
| | 299 | | | Series 2003-S4, Class 2A10, IF, 16.020%, 06/25/33 | | | 369 | |
| | 256 | | | Series 2003-S8, Class A5, 4.500%, 09/25/18 | | | 256 | |
| | 92 | | | Series 2003-S8, Class A6, 4.500%, 09/25/18 | | | 92 | |
| | 4,937 | | | Series 2003-S9, Class A8, 5.250%, 10/25/33 | | | 5,134 | |
| | 101 | | | Series 2003-S9, Class P, PO, 10/25/33 | | | 86 | |
| | 54 | | | Series 2003-S10, Class A2, 5.000%, 10/25/18 | | | 55 | |
SEE NOTES TO FINANCIAL STATEMENTS.
| | | | | | | | |
| | | |
| AUGUST 31, 2016 | | J.P. MORGAN INCOME FUNDS | | | | | 59 | |
JPMorgan Core Bond Fund
SCHEDULE OF PORTFOLIO INVESTMENTS
AS OF AUGUST 31, 2016 (Unaudited) (continued)
(Amounts in thousands)
| | | | | | | | |
PRINCIPAL
AMOUNT($) | | | SECURITY DESCRIPTION | | VALUE($) | |
| Collateralized Mortgage Obligations — continued | |
| | | | Non-Agency CMO — continued | | | | |
| | 153 | | | Series 2003-S13, Class 23A1, VAR, 1.074%, 12/25/18 | | | 150 | |
| | 1,779 | | | Series 2004-AR3, Class A1, VAR, 2.783%, 06/25/34 | | | 1,792 | |
| | 2,286 | | | Series 2004-AR3, Class A2, VAR, 2.783%, 06/25/34 | | | 2,303 | |
| | 436 | | | Series 2004-CB2, Class 5A, 5.000%, 07/25/19 | | | 440 | |
| | 512 | | | Series 2004-CB2, Class 7A, 5.500%, 08/25/19 | | | 519 | |
| | 761 | | | Series 2004-RS2, Class A4, 5.000%, 11/25/33 | | | 773 | |
| | 4,302 | | | Series 2004-S2, Class 2A4, 5.500%, 06/25/34 | | | 4,479 | |
| | 934 | | | Series 2004-S3, Class 1A5, 5.000%, 07/25/34 | | | 969 | |
| | 991 | | | Series 2006-AR8, Class 1A2, VAR, 2.790%, 08/25/46 | | | 862 | |
| | 191 | | | Series 2006-AR10, Class 2P, VAR, 2.684%, 09/25/36 | | | 165 | |
| | | | Washington Mutual Mortgage Pass-Through Certificates WMALT Trust, | | | | |
| | 1,723 | | | Series 2005-1, Class 1A1, 5.500%, 03/25/35 | | | 1,704 | |
| | 155 | | | Series 2005-1, Class CP, PO, 03/25/35 | | | 114 | |
| | 10,414 | | | Series 2005-2, Class 1A4, IF, IO, 4.526%, 04/25/35 | | | 1,586 | |
| | 2,869 | | | Series 2005-2, Class 2A3, IF, IO, 4.476%, 04/25/35 | | | 497 | |
| | 3,675 | | | Series 2005-4, Class CB7, 5.500%, 06/25/35 | | | 3,397 | |
| | 3,422 | | | Series 2005-4, Class CX, IO, 5.500%, 06/25/35 | | | 708 | |
| | 721 | | | Series 2005-6, Class 2A4, 5.500%, 08/25/35 | | | 661 | |
| | 286 | | | Series 2006-1, Class 3A2, 5.750%, 02/25/36 | | | 263 | |
| | | | Washington Mutual MSC Mortgage Pass-Through Certificates Trust, | | | | |
| | 44 | | | Series 2003-MS5, Class 1A4, VAR, 1.024%, 03/25/18 | | | 44 | |
| | 16 | | | Series 2003-MS7, Class P, PO, 03/25/33 | | | 13 | |
| | | | Wells Fargo Alternative Loan Trust, | | | | |
| | 112 | | | Series 2003-1, Class APO, PO, 09/25/33 | | | 100 | |
| | 384 | | | Series 2007-PA3, Class 1A2, 5.750%, 07/25/37 | | | 340 | |
| | | | Wells Fargo Mortgage-Backed Securities Trust, | | | | |
| | 2,567 | | | Series 2003-K, Class 1A1, VAR, 2.638%, 11/25/33 | | | 2,569 | |
| | | | | | | | |
PRINCIPAL
AMOUNT($) | | | SECURITY DESCRIPTION | | VALUE($) | |
| | | | | | | | |
| | | | Non-Agency CMO — continued | | | | |
| | 98 | | | Series 2003-K, Class 1A2, VAR, 2.638%, 11/25/33 | | | 99 | |
| | 390 | | | Series 2003-L, Class 2A1, VAR, 2.719%, 11/25/33 | | | 381 | |
| | 572 | | | Series 2004-4, Class A9, 5.500%, 05/25/34 | | | 584 | |
| | 898 | | | Series 2004-B, Class A1, VAR, 2.732%, 02/25/34 | | | 892 | |
| | 2,019 | | | Series 2004-EE, Class 2A1, VAR, 2.967%, 12/25/34 | | | 2,033 | |
| | 1,374 | | | Series 2004-EE, Class 2A2, VAR, 2.967%, 12/25/34 | | | 1,398 | |
| | 2,472 | | | Series 2004-EE, Class 3A1, VAR, 3.028%, 12/25/34 | | | 2,549 | |
| | 807 | | | Series 2004-EE, Class 3A2, VAR, 3.028%, 12/25/34 | | | 832 | |
| | 3,466 | | | Series 2004-I, Class 1A1, VAR, 2.893%, 07/25/34 | | | 3,506 | |
| | 9,591 | | | Series 2004-P, Class 2A1, VAR, 2.988%, 09/25/34 | | | 9,874 | |
| | 4,186 | | | Series 2004-S, Class A1, VAR, 2.989%, 09/25/34 | | | 4,255 | |
| | 1,314 | | | Series 2004-V, Class 1A1, VAR, 3.008%, 10/25/34 | | | 1,321 | |
| | 1,686 | | | Series 2004-V, Class 1A2, VAR, 3.008%, 10/25/34 | | | 1,726 | |
| | 994 | | | Series 2005-14, Class 1A1, 5.500%, 12/25/35 | | | 1,030 | |
| | 218 | | | Series 2005-14, Class 2APO, PO, 12/25/35 | | | 195 | |
| | 17,232 | | | Series 2005-AR3, Class 1A1, VAR, 3.041%, 03/25/35 | | | 17,609 | |
| | 2,010 | | | Series 2005-AR8, Class 2A1, VAR, 2.977%, 06/25/35 | | | 2,045 | |
| | 437 | | | Series 2007-7, Class A7, 6.000%, 06/25/37 (e) | | | 429 | |
| | 2,546 | | | Series 2007-11, Class A14, 6.000%, 08/25/37 (e) | | | 2,529 | |
| | | | | | | | |
| | | | | | | 701,959 | |
| | | | | | | | |
| | | | Total Collateralized Mortgage Obligations
(Cost $4,292,186) | | | 4,442,058 | |
| | | | | | | | |
| Commercial Mortgage-Backed Securities — 2.9% | |
| | | | A10 Securitization LLC, | | | | |
| | 125 | | | Series 2013-1, Class A, 2.400%, 11/15/25 (e) | | | 125 | |
| | 13,679 | | | Series 2015-1, Class A1, 2.100%, 04/15/34 (e) | | | 13,610 | |
| | 4,310 | | | Series 2015-1, Class A2, 3.130%, 04/15/34 (e) | | | 4,323 | |
SEE NOTES TO FINANCIAL STATEMENTS.
| | | | | | |
| | | |
| 60 | | | | J.P. MORGAN INCOME FUNDS | | AUGUST 31, 2016 |
| | | | | | | | |
PRINCIPAL
AMOUNT($) | | | SECURITY DESCRIPTION | | VALUE($) | |
| Commercial Mortgage-Backed Securities — continued | |
| | 2,625 | | | Series 2015-1, Class B, 4.120%, 04/15/34 (e) | | | 2,651 | |
| | | | A10 Term Asset Financing LLC, | | | | |
| | 7,514 | | | Series 2013-2, Class A, 2.620%, 11/15/27 (e) | | | 7,493 | |
| | 2,000 | | | Series 2013-2, Class B, 4.380%, 11/15/27 (e) | | | 1,968 | |
| | 2,442 | | | Series 2013-2, Class C, 5.120%, 11/15/27 (e) | | | 2,419 | |
| | 5,880 | | | Series 2014-1, Class A1, 1.720%, 04/15/33 (e) | | | 5,849 | |
| | 2,113 | | | Series 2014-1, Class B, 3.870%, 04/15/33 (e) | | | 2,108 | |
| | | | ACRE Commercial Mortgage Trust, (Cayman Islands), | | | | |
| | 3,932 | | | Series 2014-FL2, Class B, VAR, 2.557%, 08/15/31 (e) | | | 3,923 | |
| | 3,982 | | | Series 2014-FL2, Class C, VAR, 3.007%, 08/15/31 (e) | | | 3,958 | |
| | 2,750 | | | Series 2014-FL2, Class D, VAR, 3.907%, 08/15/31 (e) | | | 2,677 | |
| | | | BAMLL Commercial Mortgage Securities Trust, | | | | |
| | 7,026 | | | Series 2012-PARK, Class A, 2.959%, 12/10/30 (e) | | | 7,359 | |
| | 7,700 | | | Series 2014-520M, Class C, VAR, 4.354%, 08/15/46 (e) | | | 7,761 | |
| | | | Banc of America Commercial Mortgage Trust, | | | | |
| | 239 | | | Series 2006-3, Class A4, VAR, 5.889%, 07/10/44 | | | 239 | |
| | 717 | | | Series 2006-5, Class A4, 5.414%, 09/10/47 | | | 717 | |
| | 65,636 | | | Series 2006-5, Class XC, IO, VAR, 0.841%, 09/10/47 (e) | | | 41 | |
| | 7,309 | | | Series 2007-5, Class A4, 5.492%, 02/10/51 | | | 7,492 | |
| | | | Banc of America Merrill Lynch Commercial Mortgage, Inc., | | | | |
| | 804 | | | Series 2005-1, Class AJ, VAR, 5.527%, 11/10/42 | | | 803 | |
| | 1,396 | | | Series 2005-3, Class AM, 4.727%, 07/10/43 | | | 1,390 | |
| | 42,829 | | | Series 2005-5, Class XC, IO, VAR, 0.054%, 10/10/45 (e) | | | 14 | |
| | 3,984 | | | Banc of America Re-REMIC Trust, Series 2009-UB1, Class A4A, VAR, 5.703%, 06/24/50 (e) | | | 4,024 | |
| | | | BB-UBS Trust, | | | | |
| | 23,898 | | | Series 2012-SHOW, Class A, 3.430%, 11/05/36 (e) | | | 25,635 | |
| | | | | | | | |
PRINCIPAL
AMOUNT($) | | | SECURITY DESCRIPTION | | VALUE($) | |
| | | | | | | | |
| | 4,949 | | | Series 2012-TFT, Class A, 2.892%, 06/05/30 (e) | | | 5,030 | |
| | | | Bear Stearns Commercial Mortgage Securities Trust, | | | | |
| | 144,537 | | | Series 2006-PW14, Class X1, IO, VAR, 0.817%, 12/11/38 (e) | | | 90 | |
| | 59 | | | Series 2006-T24, Class A4, 5.537%, 10/12/41 | | | 59 | |
| | 520,463 | | | Series 2007-T26, Class X1, IO, VAR, 0.294%, 01/12/45 (e) | | | 366 | |
| | 130,636 | | | CD Commercial Mortgage Trust, Series 2007-CD4, Class XC, IO, VAR, 0.573%, 12/11/49 (e) | | | 104 | |
| | 44,374 | | | CD Mortgage Trust, Series 2006-CD3, Class XS, IO, VAR, 0.624%, 10/15/48 (e) | | | 445 | |
| | 4,653 | | | CGBAM Commercial Mortgage Trust, Series 2014-HD, Class A, VAR, 1.308%, 02/15/31 (e) | | | 4,623 | |
| | 3,520 | | | Citigroup Commercial Mortgage Trust, Series 2013-SMP, Class A, 2.110%, 01/12/30 (e) | | | 3,535 | |
| | | | COBALT CMBS Commercial Mortgage Trust, | | | | |
| | 1,547 | | | Series 2006-C1, Class A4, 5.223%, 08/15/48 | | | 1,546 | |
| | 5,022 | | | Series 2006-C1, Class AM, 5.254%, 08/15/48 | | | 5,039 | |
| | 79,740 | | | Series 2006-C1, Class IO, IO, VAR, 0.930%, 08/15/48 | | | 162 | |
| | | | COMM Mortgage Trust, | | | | |
| | 8,968 | | | Series 2012-9W57, Class A, 2.365%, 02/10/29 (e) | | | 8,990 | |
| | 26,354 | | | Series 2012-CR2, Class XA, IO, VAR, 1.897%, 08/15/45 (e) | | | 2,071 | |
| | 4,484 | | | Series 2013-300P, Class A1, 4.353%, 08/10/30 (e) | | | 5,073 | |
| | 6,150 | | | Series 2013-SFS, Class A2, VAR, 3.086%, 04/12/35 (e) | | | 6,422 | |
| | 13,800 | | | Series 2014-CR19, Class A5, 3.796%, 08/10/47 | | | 15,222 | |
| | 7,748 | | | Series 2014-PAT, Class A, VAR, 1.308%, 08/13/27 (e) | | | 7,719 | |
| | 10,196 | | | Series 2014-TWC, Class A, VAR, 1.358%, 02/13/32 (e) | | | 10,196 | |
| | 2,850 | | | Series 2014-TWC, Class B, VAR, 2.120%, 02/13/32 (e) | | | 2,845 | |
| | 9,250 | | | Series 2015-CR24, Class A5, 3.696%, 08/10/48 | | | 10,173 | |
| | 17,593 | | | Series 2015-CR25, Class A4, 3.759%, 08/10/48 (e) | | | 19,395 | |
SEE NOTES TO FINANCIAL STATEMENTS.
| | | | | | | | |
| | | |
| AUGUST 31, 2016 | | J.P. MORGAN INCOME FUNDS | | | | | 61 | |
JPMorgan Core Bond Fund
SCHEDULE OF PORTFOLIO INVESTMENTS
AS OF AUGUST 31, 2016 (Unaudited) (continued)
(Amounts in thousands)
| | | | | | | | |
PRINCIPAL
AMOUNT($) | | | SECURITY DESCRIPTION | | VALUE($) | |
| Commercial Mortgage-Backed Securities — continued | |
| | 1,196 | | | Commercial Mortgage Trust, Series 2006-GG7, Class AM, VAR, 5.964%, 07/10/38 | | | 1,195 | |
| | 189,730 | | | Credit Suisse Commercial Mortgage Trust, Series 2007-C2, Class AX, IO, VAR, 0.212%, 01/15/49 (e) | | | 47 | |
| | 9,500 | | | CSMC Trust, Series 2014-USA, Class D, 4.373%, 09/15/37 (e) | | | 9,145 | |
| | 23,978 | | | DBUBS Mortgage Trust, Series 2011-LC2A, Class XA, IO, VAR, 1.333%, 07/10/44 (e) | | | 956 | |
| | 4,000 | | | DBWF Mortgage Trust, Series 2015-LCM, Class A2, VAR, 3.535%, 06/10/34 (e) | | | 4,183 | |
| | 6,784 | | | FDIC Guaranteed Notes Trust, Series 2010-C1, Class A, 2.980%, 12/06/20 (e) | | | 6,864 | |
| | | | Federal Home Loan Mortgage Corp., Multifamily Structured Pass-Through Certificates, | | | | |
| | 70,000 | | | Series K037, Class A2, 3.490%, 01/25/24 | | | 77,458 | |
| | 20,914 | | | Series K038, Class A2, 3.389%, 03/25/24 | | | 23,031 | |
| | 23,597 | | | Series K052, Class A2, 3.151%, 11/25/25 | | | 25,670 | |
| | 6,102 | | | Series KJ02, Class A2, 2.597%, 09/25/20 | | | 6,297 | |
| | 36,100 | | | Series KPLB, Class A, 2.770%, 05/25/25 | | | 37,826 | |
| | 14,000 | | | Series KS01, Class A2, 2.522%, 01/25/23 | | | 14,517 | |
| | 41,500 | | | Series KSMC, Class A2, 2.615%, 01/25/23 | | | 43,378 | |
| | | | FORT CRE LLC, | | | | |
| | 9,370 | | | Series 2016-1A, Class B, VAR, 3.250%, 05/31/36 (e) | | | 9,370 | |
| | 14,100 | | | Series 2016-1A, Class C, VAR, 3.750%, 05/31/36 (e) | | | 14,100 | |
| | | | FREMF Mortgage Trust, | | | | |
| | 8,451 | | | Series 2016-K56, Class B, VAR, 4.070%, 06/25/49 (e) | | | 8,421 | |
| | 11,070 | | | Series 2016-K722, Class B, VAR, 3.966%, 07/25/49 (e) | | | 10,903 | |
| | | | Government National Mortgage Association, | | | | |
| | 13,641 | | | Series 2014-168, Class VA, VAR, 3.400%, 01/16/37 | | | 14,704 | |
| | 14,215 | | | Series 2014-168, Class VB, VAR, 3.491%, 06/16/47 | | | 15,405 | |
| | 11,071 | | | GS Mortgage Securities Corp. II, Series 2013-KING, Class A, 2.706%, 12/10/27 (e) | | | 11,255 | |
| | | | GS Mortgage Securities Corp. Trust, | | | | |
| | 67,725 | | | Series 2012-SHOP, Class XA, IO, VAR, 1.438%, 06/05/31 (e) | | | 2,206 | |
| | 4,384 | | | Series 2013-NYC5, Class A, 2.318%, 01/10/30 (e) | | | 4,405 | |
| | | | GS Mortgage Securities Trust, | | | | |
| | 40,167 | | | Series 2006-GG8, Class X, IO, VAR, 0.747%, 11/10/39 (e) | | | — | (h) |
| | | | | | | | |
PRINCIPAL
AMOUNT($) | | | SECURITY DESCRIPTION | | VALUE($) | |
| | | | | | | | |
| | 1,600 | | | Series 2011-GC5, Class D, VAR, 5.558%, 08/10/44 (e) | | | 1,662 | |
| | | | JP Morgan Chase Commercial Mortgage Securities Trust, | | | | |
| | 188 | | | Series 2005-CB11, Class AJ, VAR, 5.584%, 08/12/37 | | | 187 | |
| | 79,867 | | | Series 2005-CB11, Class X1, IO, VAR, 0.056%, 08/12/37 (e) | | | 53 | |
| | 74,622 | | | Series 2005-LDP5, Class X1, IO, VAR, 0.131%, 12/15/44 (e) | | | 70 | |
| | 58,946 | | | Series 2006-CB15, Class X1, IO, VAR, 0.482%, 06/12/43 | | | 59 | |
| | 1,744 | | | Series 2006-LDP9, Class A3SF, VAR, 0.663%, 05/15/47 | | | 1,733 | |
| | 3,587 | | | Series 2006-LDP9, Class AMS, 5.337%, 05/15/47 | | | 3,558 | |
| | 1,177 | | | Series 2007-C1, Class A4, 5.716%, 02/15/51 | | | 1,210 | |
| | 244,974 | | | Series 2007-LD12, Class X, IO, VAR, 0.186%, 02/15/51 | | | 131 | |
| | 8,924 | | | Ladder Capital Commercial Mortgage Trust, Series 2013-GCP, Class A2, 3.985%, 02/15/36 (e) | | | 9,780 | |
| | | | LB-UBS Commercial Mortgage Trust, | | | | |
| | 4,260 | | | Series 2007-C1, Class AM, 5.455%, 02/15/40 (e) | | | 4,289 | |
| | 3,282 | | | Series 2007-C2, Class A3, 5.430%, 02/15/40 | | | 3,315 | |
| | 89,611 | | | Series 2007-C2, Class XW, IO, VAR, 0.737%, 02/15/40 | | | 200 | |
| | | | ML-CFC Commercial Mortgage Trust, | | | | |
| | 107,656 | | | Series 2006-4, Class XC, IO, VAR, 0.768%, 12/12/49 (e) | | | 103 | |
| | 5,029 | | | Series 2007-9, Class A4, 5.700%, 09/12/49 | | | 5,192 | |
| | 18,000 | | | Morgan Stanley Bank of America Merrill Lynch Trust, Series 2014-C14, Class A3, 3.669%, 02/15/47 | | | 19,090 | |
| | | | Morgan Stanley Capital I Trust, | | | | |
| | 89,990 | | | Series 2006-IQ12, Class X1, IO, VAR, 0.717%, 12/15/43 (e) | | | 50 | |
| | 247,860 | | | Series 2007-HQ11, Class X, IO, VAR, 0.379%, 02/12/44 (e) | | | 100 | |
| | 71,135 | | | Series 2007-HQ13, Class X1, IO, VAR, 0.627%, 12/15/44 (e) | | | 245 | |
| | 225,664 | | | Series 2007-IQ13, Class X, IO, VAR, 0.567%, 03/15/44 (e) | | | 333 | |
| | 5,477 | | | Series 2011-C3, Class A3, 4.054%, 07/15/49 | | | 5,725 | |
SEE NOTES TO FINANCIAL STATEMENTS.
| | | | | | |
| | | |
| 62 | | | | J.P. MORGAN INCOME FUNDS | | AUGUST 31, 2016 |
| | | | | | | | |
PRINCIPAL
AMOUNT($) | | | SECURITY DESCRIPTION | | VALUE($) | |
| Commercial Mortgage-Backed Securities — continued | |
| | 7,174 | | | Series 2012-C4, Class A3, 2.991%, 03/15/45 | | | 7,392 | |
| | | | Morgan Stanley Re-REMIC Trust, | | | | |
| | 7,200 | | | Series 2012-IO, Class AXA, 1.000%, 03/27/51 (e) | | | 7,164 | |
| | 8,962 | | | Series 2012-XA, Class A, 2.000%, 07/27/49 (e) | | | 8,886 | |
| | 10,268 | | | Series 2012-XA, Class B, 0.250%, 07/27/49 (e) | | | 9,193 | |
| | 4,100 | | | NorthStar, (Cayman Islands), Series 2013-1A, Class B, VAR, 5.524%, 08/25/29 (e) | | | 4,141 | |
| | | | PFP Ltd., (Cayman Islands), | | | | |
| | 11,006 | | | Series 2015-2, Class A, VAR, 1.958%, 07/14/34 (e) | | | 10,931 | |
| | 7,564 | | | Series 2015-2, Class C, VAR, 3.758%, 07/14/34 (e) | | | 7,370 | |
| | 4,646 | | | Series 2015-2, Class D, VAR, 4.508%, 07/14/34 (e) | | | 4,489 | |
| | | | RAIT Trust, | | | | |
| | 2,775 | | | Series 2014-FL3, Class A, VAR, 1.758%, 12/15/31 (e) | | | 2,740 | |
| | 8,939 | | | Series 2014-FL3, Class AS, VAR, 2.308%, 12/15/31 (e) | | | 8,829 | |
| | 4,676 | | | Series 2014-FL3, Class B, VAR, 3.158%, 12/15/31 (e) | | | 4,649 | |
| | 7,145 | | | Series 2015-FL4, Class A, VAR, 1.857%, 12/15/31 (e) | | | 7,144 | |
| | 9,668 | | | Series 2015-FL4, Class AS, VAR, 2.257%, 12/15/31 (e) | | | 9,732 | |
| | 12,154 | | | Series 2015-FL5, Class B, VAR, 4.408%, 01/15/31 (e) | | | 12,154 | |
| | 4,450 | | | RBS Commercial Funding, Inc. Trust, Series 2013-SMV, Class A, 3.260%, 03/11/31 (e) | | | 4,617 | |
| | | | Resource Capital Corp., Ltd., (Cayman Islands), | | | | |
| | 3,747 | | | Series 2015-CRE4, Class A, VAR, 1.907%, 08/15/32 (e) | | | 3,698 | |
| | 6,908 | | | Series 2015-CRE4, Class B, VAR, 3.507%, 08/15/32 (e) | | | 6,494 | |
| | 2,994 | | | RREF LLC, Series 2015-LT7, Class A, 3.000%, 12/25/32 (e) | | | 2,994 | |
| | 14,841 | | | UBS Commercial Mortgage Trust, Series 2012-C1, Class XA, IO, VAR, 2.274%, 05/10/45 (e) | | | 1,432 | |
| | 15,527 | | | UBS-BAMLL Trust, Series 2012-WRM, Class A, 3.663%, 06/10/30 (e) | | | 16,447 | |
| | | | UBS-Barclays Commercial Mortgage Trust, | | | | |
| | 9,327 | | | Series 2012-C2, Class A4, 3.525%, 05/10/63 | | | 10,104 | |
| | | | | | | | |
PRINCIPAL
AMOUNT($) | | | SECURITY DESCRIPTION | | VALUE($) | |
| | | | | | | | |
| | 62,695 | | | Series 2012-C2, Class XA, IO, VAR, 1.797%, 05/10/63 (e) | | | 3,407 | |
| | 2,357 | | | Series 2013-C6, Class A4, 3.244%, 04/10/46 | | | 2,516 | |
| | | | VNDO Mortgage Trust, | | | | |
| | 11,148 | | | Series 2012-6AVE, Class A, 2.996%, 11/15/30 (e) | | | 11,705 | |
| | 30,750 | | | Series 2013-PENN, Class A, 3.808%, 12/13/29 (e) | | | 33,056 | |
| | 49,070 | | | Wachovia Bank Commercial Mortgage Trust, Series 2006-C24, Class XC, IO, VAR, 0.165%, 03/15/45 (e) | | | 1 | |
| | | | Wells Fargo Commercial Mortgage Trust, | | | | |
| | 13,452 | | | Series 2013-120B, Class A, VAR, 2.800%, 03/18/28 (e) | | | 13,780 | |
| | 8,751 | | | Series 2015-C30, Class A4, 3.664%, 09/15/58 | | | 9,591 | |
| | 76 | | | Wells Fargo Resecuritization Trust, Series 2012-IO, Class A, 1.750%, 08/20/21 (e) | | | 76 | |
| | | | WFRBS Commercial Mortgage Trust, | | | | |
| | 9,206 | | | Series 2011-C3, Class A4, 4.375%, 03/15/44 (e) | | | 10,156 | |
| | 9,327 | | | Series 2012-C6, Class A4, 3.440%, 04/15/45 | | | 10,010 | |
| | 2,500 | | | Series 2013-C11, Class D, VAR, 4.317%, 03/15/45 (e) | | | 2,344 | |
| | | | | | | | |
| | | | Total Commercial Mortgage-Backed Securities
(Cost $832,973) | | | 861,347 | |
| | | | | | | | |
| Corporate Bonds — 22.7% | |
| | | | Consumer Discretionary — 1.5% | | | | |
| | | | Auto Components — 0.1% | | | | |
| | | | Johnson Controls, Inc., | | | | |
| | 4,124 | | | 3.750%, 12/01/21 | | | 4,384 | |
| | 2,991 | | | 4.250%, 03/01/21 | | | 3,210 | |
| | 3,676 | | | 4.950%, 07/02/64 | | | 3,915 | |
| | 6,278 | | | 5.250%, 12/01/41 | | | 7,307 | |
| | | | | | | | |
| | | | | | | 18,816 | |
| | | | | | | | |
| | | | Automobiles — 0.2% | | | | |
| | | | Daimler Finance North America LLC, | | | | |
| | 3,758 | | | 1.875%, 01/11/18 (e) | | | 3,783 | |
| | 1,250 | | | 2.000%, 07/06/21 (e) | | | 1,255 | |
| | 2,089 | | | 2.250%, 03/02/20 (e) | | | 2,128 | |
| | 1,692 | | | 2.375%, 08/01/18 (e) | | | 1,720 | |
| | 4,706 | | | 2.625%, 09/15/16 (e) | | | 4,708 | |
| | 8,789 | | | 2.950%, 01/11/17 (e) | | | 8,848 | |
| | 1,345 | | | 8.500%, 01/18/31 | | | 2,243 | |
| | 11,046 | | | Ford Motor Co., 7.450%, 07/16/31 | | | 14,996 | |
SEE NOTES TO FINANCIAL STATEMENTS.
| | | | | | | | |
| | | |
| AUGUST 31, 2016 | | J.P. MORGAN INCOME FUNDS | | | | | 63 | |
JPMorgan Core Bond Fund
SCHEDULE OF PORTFOLIO INVESTMENTS
AS OF AUGUST 31, 2016 (Unaudited) (continued)
(Amounts in thousands)
| | | | | | | | |
PRINCIPAL
AMOUNT($) | | | SECURITY DESCRIPTION | | VALUE($) | |
| Corporate Bonds — continued | |
| | | | Automobiles — continued | | | | |
| | | | General Motors Co., | | | | |
| | 4,400 | | | 4.875%, 10/02/23 | | | 4,791 | |
| | 7,452 | | | 6.600%, 04/01/36 | | | 9,188 | |
| | | | Hyundai Capital America, | | | | |
| | 2,560 | | | 2.000%, 07/01/19 (e) | | | 2,574 | |
| | 3,299 | | | 2.400%, 10/30/18 (e) | | | 3,345 | |
| | 7,600 | | | 3.000%, 03/18/21 (e) | | | 7,883 | |
| | 904 | | | Kia Motors Corp., (South Korea), 2.625%, 04/21/21 (e) | | | 932 | |
| | | | | | | | |
| | | | | | | 68,394 | |
| | | | | | | | |
| | | | Hotels, Restaurants & Leisure — 0.0% (g) | | | | |
| | 6,540 | | | McDonald’s Corp., 4.700%, 12/09/35 | | | 7,503 | |
| | 4,590 | | | Starbucks Corp., 2.700%, 06/15/22 | | | 4,816 | |
| | | | | | | | |
| | | | | | | 12,319 | |
| | | | | | | | |
| | | | Internet & Direct Marketing Retail — 0.1% | | | | |
| | | | Amazon.com, Inc., | | | | |
| | 8,688 | | | 3.800%, 12/05/24 | | | 9,694 | |
| | 8,677 | | | 4.800%, 12/05/34 | | | 10,420 | |
| | | | | | | | |
| | | | | | | 20,114 | |
| | | | | | | | |
| | | | Media — 0.9% | | | | |
| | | | 21st Century Fox America, Inc., | | | | |
| | 2,242 | | | 6.200%, 12/15/34 | | | 2,854 | |
| | 2,690 | | | 6.650%, 11/15/37 | | | 3,604 | |
| | 1,345 | | | 6.900%, 08/15/39 | | | 1,845 | |
| | 1,762 | | | 7.250%, 05/18/18 | | | 1,930 | |
| | 3,946 | | | 7.300%, 04/30/28 | | | 5,348 | |
| | 2,690 | | | 7.625%, 11/30/28 | | | 3,748 | |
| | 986 | | | 8.000%, 10/17/16 | | | 993 | |
| | 942 | | | 8.875%, 04/26/23 | | | 1,272 | |
| | 1,525 | | | 9.500%, 07/15/24 | | | 2,205 | |
| | | | CBS Corp., | | | | |
| | 5,275 | | | 3.700%, 08/15/24 | | | 5,563 | |
| | 4,293 | | | 4.000%, 01/15/26 | | | 4,612 | |
| | 2,679 | | | 4.600%, 01/15/45 | | | 2,826 | |
| | 673 | | | 4.850%, 07/01/42 | | | 715 | |
| | 2,004 | | | 4.900%, 08/15/44 | | | 2,174 | |
| | 583 | | | 5.900%, 10/15/40 | | | 711 | |
| | | | Charter Communications Operating LLC/Charter Communications Operating Capital, | | | | |
| | 11,182 | | | 4.464%, 07/23/22 (e) | | | 12,123 | |
| | 4,374 | | | 6.384%, 10/23/35 (e) | | | 5,231 | |
| | 4,708 | | | Comcast Cable Communications Holdings, Inc., 9.455%, 11/15/22 | | | 6,615 | |
| | | | | | | | |
PRINCIPAL
AMOUNT($) | | | SECURITY DESCRIPTION | | VALUE($) | |
| | | | | | | | |
| | | | Media — continued | | | | |
| | 897 | | | Comcast Cable Communications LLC, 8.875%, 05/01/17 | | | 943 | |
| | 1,614 | | | Comcast Cable Holdings LLC, 10.125%, 04/15/22 | | | 2,110 | |
| | | | Comcast Corp., | | | | |
| | 2,773 | | | 3.375%, 08/15/25 | | | 2,989 | |
| | 3,361 | | | 4.200%, 08/15/34 | | | 3,755 | |
| | 10,484 | | | 4.250%, 01/15/33 | | | 11,778 | |
| | 2,690 | | | 6.450%, 03/15/37 | | | 3,776 | |
| | 897 | | | 6.500%, 01/15/17 | | | 915 | |
| | 17,907 | | | 6.500%, 11/15/35 | | | 25,238 | |
| | | | Cox Communications, Inc., | | | | |
| | 3,027 | | | 3.250%, 12/15/22 (e) | | | 3,045 | |
| | 5,600 | | | 4.800%, 02/01/35 (e) | | | 5,449 | |
| | 1,166 | | | 8.375%, 03/01/39 (e) | | | 1,496 | |
| | 2,627 | | | Cox Enterprises, Inc., 7.375%, 07/15/27 (e) | | | 3,219 | |
| | | | Discovery Communications LLC, | | | | |
| | 6,532 | | | 4.375%, 06/15/21 | | | 7,069 | |
| | 5,069 | | | 4.950%, 05/15/42 | | | 4,753 | |
| | | | Grupo Televisa SAB, (Mexico), | | | | |
| | 1,494 | | | 4.625%, 01/30/26 | | | 1,652 | |
| | 1,332 | | | 6.125%, 01/31/46 | | | 1,585 | |
| | 3,018 | | | Historic TW, Inc., 9.150%, 02/01/23 | | | 4,091 | |
| | | | NBCUniversal Media LLC, | | | | |
| | 6,080 | | | 4.375%, 04/01/21 | | | 6,798 | |
| | 4,575 | | | 5.950%, 04/01/41 | | | 6,255 | |
| | 3,233 | | | 6.400%, 04/30/40 | | | 4,610 | |
| | 1,654 | | | Sky plc, (United Kingdom), 3.750%, 09/16/24 (e) | | | 1,756 | |
| | | | Time Warner Cable, Inc., | | | | |
| | 3,350 | | | 5.500%, 09/01/41 | | | 3,636 | |
| | 873 | | | 5.850%, 05/01/17 | | | 898 | |
| | 4,125 | | | 5.875%, 11/15/40 | | | 4,601 | |
| | 2,327 | | | 6.550%, 05/01/37 | | | 2,808 | |
| | 4,080 | | | 6.750%, 07/01/18 | | | 4,446 | |
| | 1,794 | | | 6.750%, 06/15/39 | | | 2,211 | |
| | 2,197 | | | 7.300%, 07/01/38 | | | 2,853 | |
| | 1,928 | | | 8.250%, 04/01/19 | | | 2,228 | |
| | 1,601 | | | 8.750%, 02/14/19 | | | 1,860 | |
| | 2,030 | | | Time Warner Cos., Inc., 7.570%, 02/01/24 | | | 2,637 | |
| | 7,641 | | | Time Warner Entertainment Co. LP, 8.375%, 07/15/33 | | | 10,445 | |
| | | | Time Warner, Inc., | | | | |
| | 10,400 | | | 3.600%, 07/15/25 | | | 11,138 | |
| | 5,085 | | | 4.750%, 03/29/21 | | | 5,700 | |
SEE NOTES TO FINANCIAL STATEMENTS.
| | | | | | |
| | | |
| 64 | | | | J.P. MORGAN INCOME FUNDS | | AUGUST 31, 2016 |
| | | | | | | | |
PRINCIPAL
AMOUNT($) | | | SECURITY DESCRIPTION | | VALUE($) | |
| Corporate Bonds — continued | |
| | | | Media — continued | | | | |
| | 1,573 | | | 5.375%, 10/15/41 | | | 1,903 | |
| | 2,802 | | | 6.200%, 03/15/40 | | | 3,618 | |
| | 1,474 | | | 6.250%, 03/29/41 | | | 1,940 | |
| | 2,238 | | | 6.500%, 11/15/36 | | | 2,908 | |
| | 3,430 | | | 7.625%, 04/15/31 | | | 4,836 | |
| | 3,225 | | | 7.700%, 05/01/32 | | | 4,610 | |
| | | | Viacom, Inc., | | | | |
| | 1,440 | | | 2.750%, 12/15/19 | | | 1,472 | |
| | 2,489 | | | 3.125%, 06/15/22 | | | 2,484 | |
| | 599 | | | 3.250%, 03/15/23 | | | 597 | |
| | 5,046 | | | 4.250%, 09/01/23 | | | 5,346 | |
| | 6,243 | | | 4.375%, 03/15/43 | | | 5,654 | |
| | 1,813 | | | 4.500%, 02/27/42 | | | 1,665 | |
| | 1,559 | | | 4.850%, 12/15/34 | | | 1,574 | |
| | 3,978 | | | 6.875%, 04/30/36 | | | 4,651 | |
| | | | Walt Disney Co. (The), | | | | |
| | 3,829 | | | 1.850%, 07/30/26 | | | 3,684 | |
| | 1,190 | | | 3.000%, 07/30/46 | | | 1,146 | |
| | | | | | | | |
| | | | | | | 271,200 | |
| | | | | | | | |
| | | | Multiline Retail — 0.1% | | | | |
| | | | Macy’s Retail Holdings, Inc., | | | | |
| | 3,662 | | | 2.875%, 02/15/23 | | | 3,598 | |
| | 5,011 | | | 4.375%, 09/01/23 | | | 5,294 | |
| | 3,368 | | | 4.500%, 12/15/34 | | | 3,187 | |
| | 877 | | | 5.125%, 01/15/42 | | | 847 | |
| | 4,602 | | | 6.375%, 03/15/37 | | | 5,047 | |
| | 925 | | | 6.900%, 04/01/29 | | | 1,054 | |
| | 1,166 | | | 7.450%, 07/15/17 | | | 1,224 | |
| | 3,458 | | | Nordstrom, Inc., 4.000%, 10/15/21 | | | 3,704 | |
| | 2,565 | | | Target Corp., 2.500%, 04/15/26 | | | 2,631 | |
| | | | | | | | |
| | | | | | | 26,586 | |
| | | | | | | | |
| | | | Specialty Retail — 0.1% | | | | |
| | 3,013 | | | Bed Bath & Beyond, Inc., 4.915%, 08/01/34 | | | 3,073 | |
| | 3,199 | | | Gap, Inc. (The), 5.950%, 04/12/21 | | | 3,465 | |
| | | | Home Depot, Inc. (The), | | | | |
| | 7,447 | | | 2.625%, 06/01/22 | | | 7,745 | |
| | 2,897 | | | 3.000%, 04/01/26 | | | 3,089 | |
| | 5,037 | | | 4.250%, 04/01/46 | | | 5,855 | |
| | | | Lowe’s Cos., Inc., | | | | |
| | 1,820 | | | 3.375%, 09/15/25 | | | 1,970 | |
| | 3,901 | | | 4.650%, 04/15/42 | | | 4,614 | |
| | 2,067 | | | 5.125%, 11/15/41 | | | 2,599 | |
| | 2,150 | | | 6.875%, 02/15/28 | | | 2,964 | |
| | | | | | | | |
PRINCIPAL
AMOUNT($) | | | SECURITY DESCRIPTION | | VALUE($) | |
| | | | | | | | |
| | | | Specialty Retail — continued | | | | |
| | 3,139 | | | Series B, 7.110%, 05/15/37 | | | 4,509 | |
| | | | | | | | |
| | | | | | | 39,883 | |
| | | | | | | | |
| | | | Total Consumer Discretionary | | | 457,312 | |
| | | | | | | | |
| | | | Consumer Staples — 1.2% | | | | |
| | | | Beverages — 0.5% | | | | |
| | | | Anheuser-Busch Cos. LLC, | | | | |
| | 897 | | | 5.500%, 01/15/18 | | | 948 | |
| | 986 | | | 5.750%, 04/01/36 | | | 1,275 | |
| | | | Anheuser-Busch InBev Finance, Inc., | | | | |
| | 1,151 | | | 1.900%, 02/01/19 | | | 1,163 | |
| | 26,883 | | | 3.300%, 02/01/23 | | | 28,209 | |
| | 12,594 | | | 3.650%, 02/01/26 | | | 13,445 | |
| | 7,000 | | | 3.700%, 02/01/24 | | | 7,596 | |
| | 10,350 | | | 4.700%, 02/01/36 | | | 11,997 | |
| | 8,194 | | | 4.900%, 02/01/46 | | | 9,909 | |
| | 4,687 | | | Brown-Forman Corp., 4.500%, 07/15/45 | | | 5,493 | |
| | 1,000 | | | Coca-Cola Femsa SAB de CV, (Mexico), 3.875%, 11/26/23 | | | 1,080 | |
| | | | Diageo Capital plc, (United Kingdom), | | | | |
| | 3,524 | | | 1.500%, 05/11/17 | | | 3,537 | |
| | 2,493 | | | 4.828%, 07/15/20 | | | 2,790 | |
| | 4,484 | | | Diageo Investment Corp., 8.000%, 09/15/22 | | | 5,880 | |
| | 2,601 | | | Heineken N.V., (Netherlands), 1.400%, 10/01/17 (e) | | | 2,606 | |
| | 4,417 | | | Molson Coors Brewing Co., 3.000%, 07/15/26 | | | 4,470 | |
| | | | PepsiCo, Inc., | | | | |
| | 10,210 | | | 1.250%, 08/13/17 | | | 10,248 | |
| | 5,025 | | | 3.100%, 07/17/22 | | | 5,340 | |
| | 3,615 | | | 4.450%, 04/14/46 | | | 4,367 | |
| | 207 | | | 7.900%, 11/01/18 | | | 237 | |
| | 7,179 | | | SABMiller Holdings, Inc., 3.750%, 01/15/22 (e) | | | 7,807 | |
| | | | | | | | |
| | | | | | | 128,397 | |
| | | | | | | | |
| | | | Food & Staples Retailing — 0.4% | | | | |
| | 7,510 | | | Costco Wholesale Corp., 2.250%, 02/15/22 | | | 7,710 | |
| | | | CVS Health Corp., | | | | |
| | 15,135 | | | 2.125%, 06/01/21 | | | 15,300 | |
| | 7,492 | | | 2.875%, 06/01/26 | | | 7,675 | |
| | 5,196 | | | 4.000%, 12/05/23 | | | 5,749 | |
| | 2,155 | | | 5.300%, 12/05/43 | | | 2,695 | |
| | 5,723 | | | CVS Pass-Through Trust, 5.926%, 01/10/34 (e) | | | 6,780 | |
SEE NOTES TO FINANCIAL STATEMENTS.
| | | | | | | | |
| | | |
| AUGUST 31, 2016 | | J.P. MORGAN INCOME FUNDS | | | | | 65 | |
JPMorgan Core Bond Fund
SCHEDULE OF PORTFOLIO INVESTMENTS
AS OF AUGUST 31, 2016 (Unaudited) (continued)
(Amounts in thousands)
| | | | | | | | |
PRINCIPAL
AMOUNT($) | | | SECURITY DESCRIPTION | | VALUE($) | |
| Corporate Bonds — continued | |
| | | | Food & Staples Retailing — continued | | | | |
| | | | Kroger Co. (The), | | | | |
| | 3,468 | | | 2.200%, 01/15/17 | | | 3,484 | |
| | 2,093 | | | 4.000%, 02/01/24 | | | 2,309 | |
| | 829 | | | 5.400%, 07/15/40 | | | 1,026 | |
| | 1,794 | | | 6.150%, 01/15/20 | | | 2,047 | |
| | 538 | | | 6.400%, 08/15/17 | | | 564 | |
| | 12,466 | | | 6.900%, 04/15/38 | | | 17,729 | |
| | 11,049 | | | 7.500%, 04/01/31 | | | 15,731 | |
| | 1,861 | | | Sysco Corp., 3.750%, 10/01/25 | | | 2,015 | |
| | 3,435 | | | Walgreen Co., 4.400%, 09/15/42 | | | 3,668 | |
| | | | Walgreens Boots Alliance, Inc., | | | | |
| | 15,024 | | | 3.100%, 06/01/23 | | | 15,492 | |
| | 4,311 | | | 3.800%, 11/18/24 | | | 4,623 | |
| | 2,517 | | | 4.500%, 11/18/34 | | | 2,734 | |
| | 2,700 | | | 4.800%, 11/18/44 | | | 3,031 | |
| | | | Wal-Mart Stores, Inc., | | | | |
| | 1,076 | | | 5.000%, 10/25/40 | | | 1,374 | |
| | 942 | | | 6.200%, 04/15/38 | | | 1,359 | |
| | 628 | | | 7.550%, 02/15/30 | | | 960 | |
| | | | | | | | |
| | | | | | | 124,055 | |
| | | | | | | | |
| | | | Food Products — 0.3% | | | | |
| | | | Bunge Ltd. Finance Corp., | | | | |
| | 2,551 | | | 3.250%, 08/15/26 | | | 2,563 | |
| | 1,281 | | | 3.500%, 11/24/20 | | | 1,333 | |
| | 6,959 | | | 8.500%, 06/15/19 | | | 8,138 | |
| | 543 | | | Bunge N.A. Finance LP, 5.900%, 04/01/17 | | | 556 | |
| | | | Cargill, Inc., | | | | |
| | 6,950 | | | 3.300%, 03/01/22 (e) | | | 7,268 | |
| | 2,443 | | | 4.307%, 05/14/21 (e) | | | 2,692 | |
| | 1,390 | | | 6.000%, 11/27/17 (e) | | | 1,471 | |
| | 2,556 | | | 7.350%, 03/06/19 (e) | | | 2,925 | |
| | 1,638 | | | ConAgra Foods, Inc., 2.100%, 03/15/18 | | | 1,648 | |
| | | | Kellogg Co., | | | | |
| | 2,278 | | | 1.750%, 05/17/17 | | | 2,289 | |
| | 2,036 | | | 3.250%, 05/21/18 | | | 2,100 | |
| | | | Kraft Heinz Foods Co., | | | | |
| | 6,663 | | | 3.500%, 06/06/22 | | | 7,115 | |
| | 4,392 | | | 5.000%, 06/04/42 | | | 5,119 | |
| | 1,215 | | | 5.375%, 02/10/20 | | | 1,360 | |
| | 4,612 | | | 6.125%, 08/23/18 | | | 5,026 | |
| | 2,690 | | | 6.500%, 02/09/40 | | | 3,700 | |
| | 13,399 | | | 6.875%, 01/26/39 | | | 18,822 | |
| | | | Mead Johnson Nutrition Co., | | | | |
| | 2,074 | | | 3.000%, 11/15/20 | | | 2,164 | |
| | | | | | | | |
PRINCIPAL
AMOUNT($) | | | SECURITY DESCRIPTION | | VALUE($) | |
| | | | | | | | |
| | | | Food Products — continued | | | | |
| | 993 | | | Class C, 4.125%, 11/15/25 | | | 1,087 | |
| | 6,100 | | | Mondelez International, Inc., 4.000%, 02/01/24 | | | 6,731 | |
| | | | Tyson Foods, Inc., | | | | |
| | 4,951 | | | 3.950%, 08/15/24 | | | 5,360 | |
| | 7,255 | | | 4.875%, 08/15/34 | | | 8,238 | |
| | | | | | | | |
| | | | | | | 97,705 | |
| | | | | | | | |
| | | | Household Products — 0.0% (g) | | | | |
| | | | Kimberly-Clark Corp., | | | | |
| | 1,220 | | | 2.400%, 03/01/22 | | | 1,262 | |
| | 2,842 | | | 3.050%, 08/15/25 | | | 3,049 | |
| | 448 | | | 7.500%, 11/01/18 | | | 508 | |
| | 1,146 | | | Procter & Gamble - ESOP, Series A, 9.360%, 01/01/21 | | | 1,352 | |
| | 897 | | | Procter & Gamble Co. (The), 5.500%, 02/01/34 | | | 1,240 | |
| | | | | | | | |
| | | | | | | 7,411 | |
| | | | | | | | |
| | | | Total Consumer Staples | | | 357,568 | |
| | | | | | | | |
| | | | Energy — 2.1% | | | | |
| | | | Energy Equipment & Services — 0.1% | | | | |
| | 3,802 | | | Diamond Offshore Drilling, Inc., 4.875%, 11/01/43 | | | 2,798 | |
| | | | Halliburton Co., | | | | |
| | 2,882 | | | 3.500%, 08/01/23 | | | 2,979 | |
| | 2,098 | | | 4.850%, 11/15/35 | | | 2,241 | |
| | 673 | | | 6.150%, 09/15/19 | | | 754 | |
| | 4,529 | | | 7.450%, 09/15/39 | | | 6,338 | |
| | 2,242 | | | 7.600%, 08/15/96 (e) | | | 2,868 | |
| | | | Nabors Industries, Inc., | | | | |
| | 1,065 | | | 4.625%, 09/15/21 | | | 1,015 | |
| | 1,205 | | | 5.000%, 09/15/20 | | | 1,192 | |
| | 1,411 | | | National Oilwell Varco, Inc., 1.350%, 12/01/17 | | | 1,401 | |
| | | | Noble Holding International Ltd., (Cayman Islands), | | | | |
| | 420 | | | 5.250%, 03/15/42 | | | 248 | |
| | 2,200 | | | 6.050%, 03/01/41 | | | 1,331 | |
| | 2,543 | | | 7.950%, 04/01/45 | | | 1,856 | |
| | 740 | | | Schlumberger Holdings Corp., 4.000%, 12/21/25 (e) | | | 808 | |
| | 2,931 | | | Schlumberger Investment S.A., (Luxembourg), 3.300%, 09/14/21 (e) | | | 3,111 | |
| | | | | | | | |
| | | | | | | 28,940 | |
| | | | | | | | |
SEE NOTES TO FINANCIAL STATEMENTS.
| | | | | | |
| | | |
| 66 | | | | J.P. MORGAN INCOME FUNDS | | AUGUST 31, 2016 |
| | | | | | | | |
PRINCIPAL
AMOUNT($) | | | SECURITY DESCRIPTION | | VALUE($) | |
| Corporate Bonds — continued | |
| | | | Oil, Gas & Consumable Fuels — 2.0% | | | | |
| | 2,381 | | | Alberta Energy Co., Ltd., (Canada), 7.375%, 11/01/31 | | | 2,488 | |
| | 1,794 | | | Anadarko Finance Co., (Canada), Series B, 7.500%, 05/01/31 | | | 2,174 | |
| | 1,480 | | | Anadarko Holding Co., 7.150%, 05/15/28 | | | 1,725 | |
| | 3,226 | | | Anadarko Petroleum Corp., 8.700%, 03/15/19 | | | 3,683 | |
| | 2,933 | | | ANR Pipeline Co., 9.625%, 11/01/21 | | | 3,926 | |
| | | | Apache Corp., | | | | |
| | 853 | | | 3.250%, 04/15/22 | | | 872 | |
| | 3,611 | | | 4.750%, 04/15/43 | | | 3,727 | |
| | 2,242 | | | 6.900%, 09/15/18 | | | 2,450 | |
| | 1,552 | | | BG Energy Capital plc, (United Kingdom), 5.125%, 10/15/41 (e) | | | 1,823 | |
| | | | Boardwalk Pipelines LP, | | | | |
| | 1,866 | | | 4.950%, 12/15/24 | | | 1,925 | |
| | 2,057 | | | 5.950%, 06/01/26 | | | 2,245 | |
| | | | BP Capital Markets plc, (United Kingdom), | | | | |
| | 1,987 | | | 1.375%, 11/06/17 | | | 1,990 | |
| | 5,991 | | | 1.846%, 05/05/17 | | | 6,017 | |
| | 5,200 | | | 2.237%, 05/10/19 | | | 5,318 | |
| | 3,779 | | | 2.750%, 05/10/23 | | | 3,850 | |
| | 3,479 | | | 3.119%, 05/04/26 | | | 3,592 | |
| | 2,273 | | | 3.245%, 05/06/22 | | | 2,401 | |
| | 4,509 | | | 3.506%, 03/17/25 | | | 4,802 | |
| | 7,135 | | | 3.814%, 02/10/24 | | | 7,766 | |
| | | | Buckeye Partners LP, | | | | |
| | 2,100 | | | 2.650%, 11/15/18 | | | 2,121 | |
| | 2,000 | | | 4.350%, 10/15/24 | | | 2,025 | |
| | 2,500 | | | 4.875%, 02/01/21 | | | 2,669 | |
| | 5,130 | | | 5.850%, 11/15/43 | | | 5,337 | |
| | 462 | | | Burlington Resources Finance Co., (Canada), 7.400%, 12/01/31 | | | 610 | |
| | 1,794 | | | Burlington Resources, Inc., 8.200%, 03/15/25 | | | 2,335 | |
| | | | Canadian Natural Resources Ltd., (Canada), | | | | |
| | 3,463 | | | 3.900%, 02/01/25 | | | 3,489 | |
| | 359 | | | 5.900%, 02/01/18 | | | 377 | |
| | 4,152 | | | 6.250%, 03/15/38 | | | 4,563 | |
| | 1,300 | | | 6.450%, 06/30/33 | | | 1,429 | |
| | 1,794 | | | 6.750%, 02/01/39 | | | 2,038 | |
| | 359 | | | 7.200%, 01/15/32 | | | 421 | |
| | | | Cenovus Energy, Inc., (Canada), | | | | |
| | 1,599 | | | 3.000%, 08/15/22 | | | 1,525 | |
| | 2,695 | | | 4.450%, 09/15/42 | | | 2,193 | |
| | 5,616 | | | 6.750%, 11/15/39 | | | 5,996 | |
| | | | | | | | |
PRINCIPAL
AMOUNT($) | | | SECURITY DESCRIPTION | | VALUE($) | |
| | | | | | | | |
| | | | Oil, Gas & Consumable Fuels — continued | | | | |
| | | | Chevron Corp., | | | | |
| | 2,725 | | | 2.355%, 12/05/22 | | | 2,790 | |
| | 11,130 | | | 2.566%, 05/16/23 | | | 11,371 | |
| | 4,574 | | | 4.950%, 03/03/19 | | | 4,991 | |
| | 11,698 | | | CNOOC Finance 2015 Australia Pty Ltd., (Australia), 2.625%, 05/05/20 | | | 11,962 | |
| | 11,233 | | | CNOOC Nexen Finance 2014 ULC, (Canada), 4.250%, 04/30/24 | | | 12,257 | |
| | 471 | | | Conoco Funding Co., (Canada), 7.250%, 10/15/31 | | | 622 | |
| | | | ConocoPhillips, | | | | |
| | 3,139 | | | 5.750%, 02/01/19 | | | 3,432 | |
| | 1,300 | | | 6.500%, 02/01/39 | | | 1,708 | |
| | 1,099 | | | ConocoPhillips Canada Funding Co. I, (Canada), 5.625%, 10/15/16 | | | 1,105 | |
| | | | ConocoPhillips Co., | | | | |
| | 1,889 | | | 2.200%, 05/15/20 | | | 1,904 | |
| | 9,861 | | | 3.350%, 11/15/24 | | | 10,151 | |
| | 1,300 | | | 4.200%, 03/15/21 | | | 1,402 | |
| | | | Devon Energy Corp., | | | | |
| | 5,180 | | | 3.250%, 05/15/22 | | | 5,139 | |
| | 2,807 | | | 4.750%, 05/15/42 | | | 2,611 | |
| | 4,475 | | | 7.950%, 04/15/32 | | | 5,480 | |
| | | | Ecopetrol S.A., (Colombia), | | | | |
| | 3,333 | | | 4.125%, 01/16/25 | | | 3,225 | |
| | 5,409 | | | 5.375%, 06/26/26 | | | 5,519 | |
| | 2,575 | | | 5.875%, 09/18/23 | | | 2,787 | |
| | | | Encana Corp., (Canada), | | | | |
| | 2,090 | | | 6.500%, 05/15/19 | | | 2,238 | |
| | 1,027 | | | 6.500%, 08/15/34 | | | 1,037 | |
| | | | Energy Transfer Partners LP, | | | | |
| | 3,584 | | | 3.600%, 02/01/23 | | | 3,528 | |
| | 6,594 | | | 4.050%, 03/15/25 | | | 6,584 | |
| | 2,519 | | | 5.150%, 03/15/45 | | | 2,417 | |
| | 4,843 | | | Eni S.p.A., (Italy), Series EX2, 5.700%, 10/01/40 (e) | | | 5,152 | |
| | | | EnLink Midstream Partners LP, | | | | |
| | 1,145 | | | 2.700%, 04/01/19 | | | 1,128 | |
| | 5,421 | | | 4.150%, 06/01/25 | | | 5,133 | |
| | 3,250 | | | 5.050%, 04/01/45 | | | 2,818 | |
| | | | Enterprise Products Operating LLC, | | | | |
| | 3,040 | | | 3.700%, 02/15/26 | | | 3,168 | |
| | 2,600 | | | 3.750%, 02/15/25 | | | 2,717 | |
| | 2,687 | | | 3.900%, 02/15/24 | | | 2,844 | |
| | 2,705 | | | 3.950%, 02/15/27 | | | 2,845 | |
| | 1,251 | | | 4.900%, 05/15/46 | | | 1,338 | |
SEE NOTES TO FINANCIAL STATEMENTS.
| | | | | | | | |
| | | |
| AUGUST 31, 2016 | | J.P. MORGAN INCOME FUNDS | | | | | 67 | |
JPMorgan Core Bond Fund
SCHEDULE OF PORTFOLIO INVESTMENTS
AS OF AUGUST 31, 2016 (Unaudited) (continued)
(Amounts in thousands)
| | | | | | | | |
PRINCIPAL
AMOUNT($) | | | SECURITY DESCRIPTION | | VALUE($) | |
| Corporate Bonds — continued | |
| | | | Oil, Gas & Consumable Fuels — continued | | | | |
| | 1,189 | | | 4.950%, 10/15/54 | | | 1,250 | |
| | 1,758 | | | 5.100%, 02/15/45 | | | 1,943 | |
| | 1,259 | | | 5.950%, 02/01/41 | | | 1,498 | |
| | 515 | | | Series H, 6.650%, 10/15/34 | | | 639 | |
| | 1,100 | | | Series J, 5.750%, 03/01/35 | | | 1,243 | |
| | | | EOG Resources, Inc., | | | | |
| | 2,164 | | | 2.625%, 03/15/23 | | | 2,159 | |
| | 4,753 | | | 4.100%, 02/01/21 | | | 5,138 | |
| | 4,120 | | | 5.100%, 01/15/36 | | | 4,727 | |
| | 1,614 | | | 6.875%, 10/01/18 | | | 1,777 | |
| | | | Exxon Mobil Corp., | | | | |
| | 7,000 | | | 2.397%, 03/06/22 | | | 7,199 | |
| | 7,398 | | | 3.043%, 03/01/26 | | | 7,849 | |
| | 2,726 | | | 4.114%, 03/01/46 | | | 3,138 | |
| | | | Gulf South Pipeline Co. LP, | | | | |
| | 4,598 | | | 4.000%, 06/15/22 | | | 4,442 | |
| | 920 | | | 6.300%, 08/15/17 (e) | | | 954 | |
| | 1,507 | | | Hess Corp., 7.875%, 10/01/29 | | | 1,831 | |
| | 1,036 | | | Husky Energy, Inc., (Canada), 6.150%, 06/15/19 | | | 1,129 | |
| | | | Kerr-McGee Corp., | | | | |
| | 1,103 | | | 6.950%, 07/01/24 | | | 1,290 | |
| | 11,707 | | | 7.875%, 09/15/31 | | | 14,166 | |
| | | | Magellan Midstream Partners LP, | | | | |
| | 2,338 | | | 3.200%, 03/15/25 | | | 2,355 | |
| | 7,133 | | | 5.150%, 10/15/43 | | | 7,819 | |
| | 1,794 | | | 6.550%, 07/15/19 | | | 2,020 | |
| | | | Marathon Oil Corp., | | | | |
| | 6,517 | | | 2.800%, 11/01/22 | | | 5,957 | |
| | 2,528 | | | 5.900%, 03/15/18 | | | 2,631 | |
| | 2,511 | | | 6.000%, 10/01/17 | | | 2,596 | |
| | 3,980 | | | Marathon Petroleum Corp., 3.625%, 09/15/24 | | | 4,032 | |
| | | | Noble Energy, Inc., | | | | |
| | 2,200 | | | 5.050%, 11/15/44 | | | 2,196 | |
| | 5,216 | | | 5.625%, 05/01/21 | | | 5,437 | |
| | | | Occidental Petroleum Corp., | | | | |
| | 3,457 | | | 3.400%, 04/15/26 | | | 3,654 | |
| | 6,636 | | | 3.500%, 06/15/25 | | | 7,050 | |
| | | | ONEOK Partners LP, | | | | |
| | 3,960 | | | 3.200%, 09/15/18 | | | 4,027 | |
| | 1,164 | | | 3.375%, 10/01/22 | | | 1,172 | |
| | 13,625 | | | 4.900%, 03/15/25 | | | 14,754 | |
| | 2,576 | | | 5.000%, 09/15/23 | | | 2,795 | |
| | 1,825 | | | 6.650%, 10/01/36 | | | 1,992 | |
| | 3,000 | | | 8.625%, 03/01/19 | | | 3,385 | |
| | | | | | | | |
PRINCIPAL
AMOUNT($) | | | SECURITY DESCRIPTION | | VALUE($) | |
| | | | | | | | |
| | | | Oil, Gas & Consumable Fuels — continued | | | | |
| | | | Petro-Canada, (Canada), | | | | |
| | 2,286 | | | 6.050%, 05/15/18 | | | 2,448 | |
| | 2,870 | | | 6.800%, 05/15/38 | | | 3,841 | |
| | | | Petroleos Mexicanos, (Mexico), | | | | |
| | 4,433 | | | 4.250%, 01/15/25 | | | 4,437 | |
| | 6,403 | | | 4.500%, 01/23/26 | | | 6,419 | |
| | 2,165 | | | 4.875%, 01/18/24 | | | 2,257 | |
| | 4,898 | | | 5.500%, 06/27/44 | | | 4,629 | |
| | 4,042 | | | 5.625%, 01/23/46 | | | 3,898 | |
| | 4,385 | | | 6.375%, 02/04/21 (e) | | | 4,849 | |
| | 4,650 | | | 6.375%, 01/23/45 | | | 4,897 | |
| | 4,700 | | | 6.625%, 06/15/35 | | | 5,076 | |
| | 3,644 | | | 6.875%, 08/04/26 (e) | | | 4,236 | |
| | | | Phillips 66, | | | | |
| | 2,099 | | | 2.950%, 05/01/17 | | | 2,123 | |
| | 1,181 | | | 4.300%, 04/01/22 | | | 1,301 | |
| | | | Plains All American Pipeline LP/PAA Finance Corp., | | | | |
| | 1,938 | | | 2.600%, 12/15/19 | | | 1,951 | |
| | 7,000 | | | 3.600%, 11/01/24 | | | 6,791 | |
| | 16,535 | | | 4.650%, 10/15/25 | | | 17,155 | |
| | 9,221 | | | 4.900%, 02/15/45 | | | 8,487 | |
| | 6,120 | | | Schlumberger Holdings Corp., 3.625%, 12/21/22 (e) | | | 6,528 | |
| | 4,132 | | | Sinopec Group Overseas Development 2013 Ltd., (United Kingdom), 4.375%, 10/17/23 (e) | | | 4,607 | |
| | | | Spectra Energy Capital LLC, | | | | |
| | 6,334 | | | 3.300%, 03/15/23 | | | 6,253 | |
| | 2,197 | | | 5.650%, 03/01/20 | | | 2,373 | |
| | 2,233 | | | 7.500%, 09/15/38 | | | 2,724 | |
| | 4,475 | | | 8.000%, 10/01/19 | | | 5,164 | |
| | | | Spectra Energy Partners LP, | | | | |
| | 2,658 | | | 2.950%, 09/25/18 | | | 2,707 | |
| | 4,750 | | | 3.500%, 03/15/25 | | | 4,865 | |
| | 1,866 | | | 4.500%, 03/15/45 | | | 1,909 | |
| | 1,801 | | | 5.950%, 09/25/43 | | | 2,179 | |
| | | | Statoil ASA, (Norway), | | | | |
| | 2,646 | | | 1.150%, 05/15/18 | | | 2,639 | |
| | 1,917 | | | 1.200%, 01/17/18 | | | 1,914 | |
| | 2,430 | | | 2.450%, 01/17/23 | | | 2,474 | |
| | 5,765 | | | 2.650%, 01/15/24 | | | 5,903 | |
| | 3,320 | | | 3.150%, 01/23/22 | | | 3,517 | |
| | 3,461 | | | 3.250%, 11/10/24 | | | 3,659 | |
| | 1,673 | | | 4.250%, 11/23/41 | | | 1,845 | |
| | 3,318 | | | 5.250%, 04/15/19 | | | 3,632 | |
SEE NOTES TO FINANCIAL STATEMENTS.
| | | | | | |
| | | |
| 68 | | | | J.P. MORGAN INCOME FUNDS | | AUGUST 31, 2016 |
| | | | | | | | |
PRINCIPAL
AMOUNT($) | | | SECURITY DESCRIPTION | | VALUE($) | |
| Corporate Bonds — continued | |
| | | | Oil, Gas & Consumable Fuels — continued | | | | |
| | | | Suncor Energy, Inc., (Canada), | | | | |
| | 2,152 | | | 5.950%, 12/01/34 | | | 2,587 | |
| | 1,704 | | | 6.100%, 06/01/18 | | | 1,830 | |
| | 807 | | | 6.850%, 06/01/39 | | | 1,113 | |
| | | | Sunoco Logistics Partners Operations LP, | | | | |
| | 4,366 | | | 3.900%, 07/15/26 | | | 4,409 | |
| | 1,814 | | | 4.250%, 04/01/24 | | | 1,884 | |
| | 5,160 | | | 4.400%, 04/01/21 | | | 5,503 | |
| | 600 | | | 4.650%, 02/15/22 | | | 646 | |
| | 1,840 | | | 5.300%, 04/01/44 | | | 1,866 | |
| | 6,969 | | | 5.350%, 05/15/45 | | | 7,203 | |
| | 6,209 | | | Texas Eastern Transmission LP, 2.800%, 10/15/22 (e) | | | 6,194 | |
| | | | Tosco Corp., | | | | |
| | 3,408 | | | 7.800%, 01/01/27 | | | 4,481 | |
| | 3,139 | | | 8.125%, 02/15/30 | | | 4,350 | |
| | 5,675 | | | Total Capital Canada Ltd., (Canada), 2.750%, 07/15/23 | | | 5,854 | |
| | | | Total Capital International S.A., (France), | | | | |
| | 1,894 | | | 1.500%, 02/17/17 | | | 1,899 | |
| | 5,044 | | | 1.550%, 06/28/17 | | | 5,063 | |
| | 1,256 | | | 2.700%, 01/25/23 | | | 1,303 | |
| | 5,000 | | | 2.750%, 06/19/21 | | | 5,237 | |
| | 1,989 | | | 3.750%, 04/10/24 | | | 2,186 | |
| | | | TransCanada PipeLines Ltd., (Canada), | | | | |
| | 4,155 | | | 4.875%, 01/15/26 | | | 4,805 | |
| | 6,345 | | | 6.200%, 10/15/37 | | | 8,072 | |
| | 1,704 | | | 6.500%, 08/15/18 | | | 1,859 | |
| | 2,377 | | | 7.125%, 01/15/19 | | | 2,649 | |
| | 1,883 | | | 7.250%, 08/15/38 | | | 2,648 | |
| | | | Western Gas Partners LP, | | | | |
| | 3,421 | | | 4.650%, 07/01/26 | | | 3,547 | |
| | 607 | | | 5.375%, 06/01/21 | | | 660 | |
| | | | | | | | |
| | | | | | | 605,084 | |
| | | | | | | | |
| | | | Total Energy | | | 634,024 | |
| | | | | | | | |
| | | | Financials — 9.0% | | | | |
| | | | Banks — 4.1% | |
| | | | ABN AMRO Bank N.V., (Netherlands), | | | | |
| | 9,759 | | | 1.800%, 06/04/18 (e) | | | 9,795 | |
| | 3,394 | | | 2.500%, 10/30/18 (e) | | | 3,460 | |
| | 3,079 | | | 4.750%, 07/28/25 (e) | | | 3,257 | |
| | 3,800 | | | 4.800%, 04/18/26 (e) | | | 4,051 | |
| | | | ANZ New Zealand International Ltd., (New Zealand), | | | | |
| | 5,200 | | | 2.600%, 09/23/19 (e) | | | 5,319 | |
| | 3,016 | | | 2.850%, 08/06/20 (e) | | | 3,112 | |
| | | | | | | | |
PRINCIPAL
AMOUNT($) | | | SECURITY DESCRIPTION | | VALUE($) | |
| | | | | | | | |
| | | | Banks — continued | |
| | | | Australia & New Zealand Banking Group Ltd., (Australia), | | | | |
| | 5,560 | | | 1.450%, 05/15/18 | | | 5,559 | |
| | 8,932 | | | 2.400%, 11/23/16 (e) | | | 8,960 | |
| | 1,834 | | | 4.400%, 05/19/26 (e) | | | 1,944 | |
| | 2,571 | | | 4.875%, 01/12/21 (e) | | | 2,870 | |
| | | | Bank of America Corp., | | | | |
| | 14,852 | | | 2.000%, 01/11/18 | | | 14,942 | |
| | 12,693 | | | 3.300%, 01/11/23 | | | 13,185 | |
| | 7,598 | | | 3.500%, 04/19/26 | | | 7,930 | |
| | 24,248 | | | 3.875%, 08/01/25 | | | 25,973 | |
| | 3,403 | | | 4.000%, 04/01/24 | | | 3,679 | |
| | 11,538 | | | 4.000%, 01/22/25 | | | 12,015 | |
| | 530 | | | 4.100%, 07/24/23 | | | 575 | |
| | 1,890 | | | 4.125%, 01/22/24 | | | 2,058 | |
| | 5,998 | | | 4.200%, 08/26/24 | | | 6,362 | |
| | 6,055 | | | 4.250%, 10/22/26 | | | 6,422 | |
| | 5,041 | | | 4.450%, 03/03/26 | | | 5,424 | |
| | 11,565 | | | 5.000%, 05/13/21 | | | 12,974 | |
| | 15,875 | | | 5.625%, 07/01/20 | | | 17,921 | |
| | 7,155 | | | 5.650%, 05/01/18 | | | 7,615 | |
| | 4,155 | | | 5.750%, 12/01/17 | | | 4,369 | |
| | 2,960 | | | 5.875%, 01/05/21 | | | 3,410 | |
| | 19,000 | | | 6.400%, 08/28/17 | | | 19,908 | |
| | 11,523 | | | 6.875%, 04/25/18 | | | 12,489 | |
| | 3,140 | | | 7.625%, 06/01/19 | | | 3,607 | |
| | 10,870 | | | Series L, 2.250%, 04/21/20 | | | 10,954 | |
| | 2,530 | | | Series L, 2.650%, 04/01/19 | | | 2,589 | |
| | 8,782 | | | Series L, 3.950%, 04/21/25 | | | 9,140 | |
| | | | Bank of Montreal, (Canada), | | | | |
| | 5,996 | | | 1.400%, 09/11/17 | | | 6,007 | |
| | 6,305 | | | 2.375%, 01/25/19 | | | 6,433 | |
| | 7,632 | | | 2.550%, 11/06/22 | | | 7,842 | |
| | | | Bank of Nova Scotia (The), (Canada), | | | | |
| | 7,533 | | | 1.450%, 04/25/18 | | | 7,551 | |
| | 13,000 | | | 1.700%, 06/11/18 | | | 13,073 | |
| | 8,518 | | | Bank of Tokyo-Mitsubishi UFJ Ltd. (The), (Japan), 2.350%, 02/23/17 (e) | | | 8,566 | |
| | | | Banque Federative du Credit Mutuel S.A., (France), | | | | |
| | 8,000 | | | 1.700%, 01/20/17 (e) | | | 8,013 | |
| | 1,977 | | | 2.000%, 04/12/19 (e) | | | 1,990 | |
| | | | Barclays Bank plc, (United Kingdom), | | | | |
| | 2,392 | | | 2.250%, 05/10/17 (e) | | | 2,408 | |
| | 3,318 | | | 6.050%, 12/04/17 (e) | | | 3,483 | |
| | 986 | | | Series 1, 5.000%, 09/22/16 | | | 988 | |
SEE NOTES TO FINANCIAL STATEMENTS.
| | | | | | | | |
| | | |
| AUGUST 31, 2016 | | J.P. MORGAN INCOME FUNDS | | | | | 69 | |
JPMorgan Core Bond Fund
SCHEDULE OF PORTFOLIO INVESTMENTS
AS OF AUGUST 31, 2016 (Unaudited) (continued)
(Amounts in thousands)
| | | | | | | | |
PRINCIPAL
AMOUNT($) | | | SECURITY DESCRIPTION | | VALUE($) | |
| Corporate Bonds — continued | |
| | | | Banks — continued | |
| | | | Barclays plc, (United Kingdom), | | | | |
| | 8,888 | | | 3.200%, 08/10/21 | | | 8,945 | |
| | 15,214 | | | 3.650%, 03/16/25 | | | 15,124 | |
| | 2,993 | | | 4.375%, 01/12/26 | | | 3,125 | |
| | 2,605 | | | 5.250%, 08/17/45 | | | 2,996 | |
| | | | BB&T Corp., | | | | |
| | 3,334 | | | 1.600%, 08/15/17 | | | 3,349 | |
| | 2,200 | | | 2.050%, 05/10/21 | | | 2,217 | |
| | 6,000 | | | 2.625%, 06/29/20 | | | 6,187 | |
| | 2,466 | | | 5.250%, 11/01/19 | | | 2,717 | |
| | 1,480 | | | 6.850%, 04/30/19 | | | 1,680 | |
| | 4,000 | | | BNP Paribas S.A., (France), 4.375%, 05/12/26 (e) | | | 4,137 | |
| | 3,000 | | | BNP Paribas SA, (France), 4.375%, 09/28/25 (e) | | | 3,100 | |
| | 3,708 | | | BNZ International Funding Ltd., (New Zealand), 2.350%, 03/04/19 (e) | | | 3,758 | |
| | 4,170 | | | Branch Banking & Trust Co., 5.625%, 09/15/16 | | | 4,175 | |
| | | | Canadian Imperial Bank of Commerce, (Canada), | | | | |
| | 2,740 | | | 1.600%, 09/06/19 | | | 2,737 | |
| | 12,882 | | | 2.250%, 07/21/20 (e) | | | 13,130 | |
| | 18,804 | | | Capital One Bank USA N.A., 3.375%, 02/15/23 | | | 19,320 | |
| | 5,909 | | | Capital One N.A., 2.350%, 08/17/18 | | | 5,988 | |
| | 4,190 | | | Capital One N.A./Mclean V.A., 2.400%, 09/05/19 | | | 4,265 | |
| | | | Citigroup, Inc., | | | | |
| | 7,450 | | | 1.700%, 04/27/18 | | | 7,458 | |
| | 5,000 | | | 1.750%, 05/01/18 | | | 5,007 | |
| | 5,915 | | | 1.800%, 02/05/18 | | | 5,937 | |
| | 7,940 | | | 2.050%, 12/07/18 | | | 7,999 | |
| | 7,289 | | | 2.150%, 07/30/18 | | | 7,358 | |
| | 2,309 | | | 2.350%, 08/02/21 | | | 2,314 | |
| | 5,000 | | | 2.400%, 02/18/20 | | | 5,065 | |
| | 8,395 | | | 2.700%, 03/30/21 | | | 8,560 | |
| | 6,100 | | | 3.400%, 05/01/26 | | | 6,276 | |
| | 12,625 | | | 3.700%, 01/12/26 | | | 13,326 | |
| | 3,077 | | | 3.875%, 03/26/25 | | | 3,174 | |
| | 6,441 | | | 4.125%, 07/25/28 | | | 6,549 | |
| | 6,200 | | | 4.300%, 11/20/26 | | | 6,511 | |
| | 2,450 | | | 4.400%, 06/10/25 | | | 2,597 | |
| | 3,750 | | | 4.650%, 07/30/45 | | | 4,276 | |
| | 6,570 | | | 4.750%, 05/18/46 | | | 6,973 | |
| | 905 | | | 5.300%, 05/06/44 | | | 1,048 | |
| | 4,296 | | | 5.500%, 09/13/25 | | | 4,867 | |
| | | | | | | | |
PRINCIPAL
AMOUNT($) | | | SECURITY DESCRIPTION | | VALUE($) | |
| | | | | | | | |
| | | | Banks — continued | |
| | 1,842 | | | 5.875%, 01/30/42 | | | 2,386 | |
| | 3,363 | | | 6.625%, 01/15/28 | | | 4,250 | |
| | 1,424 | | | 8.125%, 07/15/39 | | | 2,260 | |
| | 1,590 | | | Citizens Financial Group, Inc., 2.375%, 07/28/21 | | | 1,598 | |
| | 1,250 | | | Comerica Bank, 5.200%, 08/22/17 | | | 1,295 | |
| | | | Comerica, Inc., | | | | |
| | 2,140 | | | 2.125%, 05/23/19 | | | 2,158 | |
| | 1,148 | | | 3.800%, 07/22/26 | | | 1,188 | |
| | | | Commonwealth Bank of Australia, (Australia), | | | | |
| | 4,035 | | | 2.000%, 09/06/21 (e) | | | 4,030 | |
| | 7,264 | | | 2.250%, 03/16/17 (e) | | | 7,310 | |
| | 4,920 | | | 4.500%, 12/09/25 (e) | | | 5,266 | |
| | | | Cooperatieve Rabobank UA, (Netherlands), | | | | |
| | 5,500 | | | 2.500%, 01/19/21 | | | 5,651 | |
| | 2,243 | | | 3.375%, 01/19/17 | | | 2,263 | |
| | 11,498 | | | 3.875%, 02/08/22 | | | 12,557 | |
| | 7,438 | | | 4.375%, 08/04/25 | | | 7,870 | |
| | 3,139 | | | 5.800%, 09/30/101 (e) | | | 4,115 | |
| | 9,100 | | | Credit Agricole S.A., (France), 4.375%, 03/17/25 (e) | | | 9,368 | |
| | | | Credit Suisse Group Funding Guernsey Ltd., (United Kingdom), | | | | |
| | 1,764 | | | 2.750%, 03/26/20 | | | 1,769 | |
| | 3,278 | | | 3.125%, 12/10/20 | | | 3,317 | |
| | 2,109 | | | 3.450%, 04/16/21 (e) | | | 2,154 | |
| | 2,429 | | | 3.750%, 03/26/25 | | | 2,433 | |
| | 2,746 | | | 3.800%, 09/15/22 | | | 2,802 | |
| | 8,035 | | | 3.800%, 06/09/23 (e) | | | 8,151 | |
| | 5,016 | | | 4.550%, 04/17/26 (e) | | | 5,297 | |
| | 3,089 | | | 4.875%, 05/15/45 | | | 3,349 | |
| | 4,287 | | | Danske Bank A/S, (Denmark), 2.000%, 09/08/21 (e) | | | 4,270 | |
| | | | Discover Bank, | | | | |
| | 2,185 | | | 3.100%, 06/04/20 | | | 2,248 | |
| | 6,500 | | | 3.200%, 08/09/21 | | | 6,677 | |
| | 7,685 | | | 4.200%, 08/08/23 | | | 8,233 | |
| | | | Fifth Third Bancorp, | | | | |
| | 7,022 | | | 2.875%, 07/27/20 | | | 7,272 | |
| | 1,300 | | | 5.450%, 01/15/17 | | | 1,319 | |
| | | | Fifth Third Bank, | | | | |
| | 6,100 | | | 2.375%, 04/25/19 | | | 6,223 | |
| | 2,846 | | | 2.875%, 10/01/21 | | | 2,972 | |
| | | | HSBC Bank plc, (United Kingdom), | | | | |
| | 8,206 | | | 1.500%, 05/15/18 (e) | | | 8,184 | |
| | 5,346 | | | 4.125%, 08/12/20 (e) | | | 5,746 | |
| | 8,968 | | | 4.750%, 01/19/21 (e) | | | 9,921 | |
SEE NOTES TO FINANCIAL STATEMENTS.
| | | | | | |
| | | |
| 70 | | | | J.P. MORGAN INCOME FUNDS | | AUGUST 31, 2016 |
| | | | | | | | |
PRINCIPAL
AMOUNT($) | | | SECURITY DESCRIPTION | | VALUE($) | |
| Corporate Bonds — continued | |
| | | | Banks — continued | |
| | | | HSBC Holdings plc, (United Kingdom), | | | | |
| | 16,403 | | | 3.600%, 05/25/23 | | | 16,967 | |
| | 12,977 | | | 4.000%, 03/30/22 | | | 13,880 | |
| | 2,932 | | | 4.250%, 08/18/25 | | | 3,043 | |
| | 6,457 | | | 6.100%, 01/14/42 | | | 8,771 | |
| | | | Huntington Bancshares, Inc., | | | | |
| | 10,169 | | | 2.300%, 01/14/22 | | | 10,126 | |
| | 2,357 | | | 3.150%, 03/14/21 | | | 2,450 | |
| | | | Huntington National Bank (The), | | | | |
| | 709 | | | 2.000%, 06/30/18 | | | 714 | |
| | 6,583 | | | 2.875%, 08/20/20 | | | 6,773 | |
| | 4,225 | | | Industrial & Commercial Bank of China Ltd., (China), 2.351%, 11/13/17 | | | 4,252 | |
| | 4,225 | | | KeyBank N.A., 3.180%, 05/22/22 | | | 4,376 | |
| | | | KeyCorp, | | | | |
| | 2,136 | | | 2.900%, 09/15/20 | | | 2,217 | |
| | 2,200 | | | 5.100%, 03/24/21 | | | 2,483 | |
| | | | Lloyds Bank plc, (United Kingdom), | | | | |
| | 4,356 | | | 1.750%, 03/16/18 | | | 4,356 | |
| | 4,659 | | | 2.050%, 01/22/19 | | | 4,673 | |
| | 2,688 | | | Lloyds Banking Group plc, (United Kingdom), 3.100%, 07/06/21 | | | 2,731 | |
| | 4,036 | | | Manufacturers & Traders Trust Co., 6.625%, 12/04/17 | | | 4,295 | |
| | 2,881 | | | Mitsubishi UFJ Financial Group, Inc., (Japan), 2.950%, 03/01/21 | | | 2,969 | |
| | | | Mizuho Bank Ltd., (Japan), | | | | |
| | 3,021 | | | 1.800%, 03/26/18 (e) | | | 3,029 | |
| | 3,167 | | | 2.650%, 09/25/19 (e) | | | 3,233 | |
| | 4,462 | | | Mizuho Financial Group, Inc., (Japan), 2.632%, 04/12/21 (e) | | | 4,527 | |
| | 3,242 | | | MUFG Americas Holdings Corp., 2.250%, 02/10/20 | | | 3,266 | |
| | 17,936 | | | National Australia Bank Ltd., (Australia), 2.000%, 06/20/17 (e) | | | 18,067 | |
| | 3,587 | | | National City Bank, 5.800%, 06/07/17 | | | 3,701 | |
| | | | Nordea Bank AB, (Sweden), | | | | |
| | 2,242 | | | 1.625%, 05/15/18 (e) | | | 2,250 | |
| | 13,766 | | | 3.125%, 03/20/17 (e) | | | 13,918 | |
| | 6,408 | | | 4.250%, 09/21/22 (e) | | | 6,889 | |
| | | | PNC Bank N.A., | | | | |
| | 2,855 | | | 1.950%, 03/04/19 | | | 2,888 | |
| | 2,000 | | | 6.875%, 04/01/18 | | | 2,164 | |
| | | | PNC Financial Services Group, Inc. (The), | | | | |
| | 1,500 | | | 3.900%, 04/29/24 | | | 1,615 | |
| | 5,904 | | | 4.375%, 08/11/20 | | | 6,468 | |
| | | | | | | | |
PRINCIPAL
AMOUNT($) | | | SECURITY DESCRIPTION | | VALUE($) | |
| | | | | | | | |
| | | | Banks — continued | |
| | 5,112 | | | 5.125%, 02/08/20 | | | 5,680 | |
| | 1,103 | | | 5.625%, 02/01/17 | | | 1,123 | |
| | 1,839 | | | 6.700%, 06/10/19 | | | 2,098 | |
| | 5,000 | | | PNC Financial Services Group, Inc./(The), SUB, 2.854%, 11/09/22 | | | 5,133 | |
| | 6,594 | | | Regions Financial Corp., 3.200%, 02/08/21 | | | 6,836 | |
| | | | Royal Bank of Canada, (Canada), | | | | |
| | 6,315 | | | 1.200%, 09/19/17 | | | 6,316 | |
| | 8,000 | | | 1.875%, 02/05/20 | | | 8,073 | |
| | 10,700 | | | 2.000%, 10/01/18 | | | 10,826 | |
| | 3,885 | | | 2.000%, 12/10/18 | | | 3,928 | |
| | 1,345 | | | 2.200%, 07/27/18 | | | 1,365 | |
| | 6,150 | | | Royal Bank of Scotland Group plc, (United Kingdom), 4.800%, 04/05/26 | | | 6,435 | |
| | | | Santander UK Group Holdings plc, (United Kingdom), | | | | |
| | 1,200 | | | 2.875%, 10/16/20 | | | 1,208 | |
| | 5,000 | | | 2.875%, 08/05/21 | | | 4,987 | |
| | 3,011 | | | 3.125%, 01/08/21 | | | 3,057 | |
| | 6,414 | | | Santander UK plc, (United Kingdom), 2.500%, 03/14/19 | | | 6,507 | |
| | 2,594 | | | Skandinaviska Enskilda Banken AB, (Sweden), 1.750%, 03/19/18 (e) | | | 2,604 | |
| | 6,000 | | | Societe Generale S.A., (France), 2.500%, 04/08/21 (e) | | | 6,175 | |
| | 2,197 | | | SouthTrust Bank, 7.690%, 05/15/25 | | | 2,896 | |
| | 10,603 | | | SpareBank 1 Boligkreditt A.S., (Norway), 1.750%, 11/15/19 (e) | | | 10,616 | |
| | 5,938 | | | Stadshypotek AB, (Sweden), 1.875%, 10/02/19 (e) | | | 5,986 | |
| | | | Standard Chartered plc, (United Kingdom), | | | | |
| | 8,631 | | | 4.050%, 04/12/26 (e) | | | 8,939 | |
| | 5,291 | | | 5.200%, 01/26/24 (e) | | | 5,677 | |
| | | | Sumitomo Mitsui Financial Group, Inc., (Japan), | | | | |
| | 6,102 | | | 2.632%, 07/14/26 | | | 6,042 | |
| | 4,262 | | | Series 5FXD, 2.058%, 07/14/21 | | | 4,231 | |
| | | | SunTrust Banks, Inc., | | | | |
| | 2,637 | | | 2.900%, 03/03/21 | | | 2,733 | |
| | 897 | | | 6.000%, 09/11/17 | | | 937 | |
| | 505 | | | 7.250%, 03/15/18 | | | 546 | |
| | | | Toronto-Dominion Bank (The), (Canada), | | | | |
| | 12,555 | | | 1.500%, 03/13/17 (e) | | | 12,584 | |
| | 4,828 | | | 1.750%, 07/23/18 | | | 4,862 | |
| | 1,501 | | | 1.950%, 01/22/19 | | | 1,519 | |
| | 2,988 | | | 2.125%, 04/07/21 | | | 3,021 | |
| | 4,063 | | | 2.250%, 11/05/19 | | | 4,148 | |
SEE NOTES TO FINANCIAL STATEMENTS.
| | | | | | | | |
| | | |
| AUGUST 31, 2016 | | J.P. MORGAN INCOME FUNDS | | | | | 71 | |
JPMorgan Core Bond Fund
SCHEDULE OF PORTFOLIO INVESTMENTS
AS OF AUGUST 31, 2016 (Unaudited) (continued)
(Amounts in thousands)
| | | | | | | | |
PRINCIPAL
AMOUNT($) | | | SECURITY DESCRIPTION | | VALUE($) | |
| Corporate Bonds — continued | |
| | | | Banks — continued | |
| | | | U.S. Bancorp, | | | | |
| | 5,036 | | | 1.650%, 05/15/17 | | | 5,055 | |
| | 3,289 | | | 3.000%, 03/15/22 | | | 3,476 | |
| | 3,191 | | | 4.125%, 05/24/21 | | | 3,543 | |
| | 1,256 | | | 7.500%, 06/01/26 | | | 1,693 | |
| | 6,833 | | | U.S. Bank N.A., 2.800%, 01/27/25 | | | 7,064 | |
| | 9,800 | | | US Bancorp, Series V, 2.375%, 07/22/26 | | | 9,720 | |
| | | | Wachovia Corp., | | | | |
| | 2,735 | | | 5.750%, 06/15/17 | | | 2,831 | |
| | 29,966 | | | 5.750%, 02/01/18 | | | 31,821 | |
| | | | Wells Fargo & Co., | | | | |
| | 10,110 | | | 2.100%, 07/26/21 | | | 10,155 | |
| | 10,156 | | | 2.600%, 07/22/20 | | | 10,446 | |
| | 6,811 | | | 3.000%, 02/19/25 | | | 7,001 | |
| | 3,843 | | | 3.000%, 04/22/26 | | | 3,939 | |
| | 10,308 | | | 3.300%, 09/09/24 | | | 10,890 | |
| | 8,071 | | | 3.500%, 03/08/22 | | | 8,619 | |
| | 4,357 | | | 4.100%, 06/03/26 | | | 4,730 | |
| | 4,489 | | | 4.300%, 07/22/27 | | | 4,955 | |
| | 7,623 | | | 4.600%, 04/01/21 | | | 8,474 | |
| | 6,442 | | | 4.650%, 11/04/44 | | | 7,072 | |
| | 2,755 | | | 5.606%, 01/15/44 | | | 3,441 | |
| | 8,237 | | | 5.625%, 12/11/17 | | | 8,682 | |
| | 7,300 | | | Series N, 2.150%, 01/30/20 | | | 7,419 | |
| | 13,622 | | | Wells Fargo Bank N.A., 6.000%, 11/15/17 | | | 14,358 | |
| | | | Westpac Banking Corp., (Australia), | | | | |
| | 6,405 | | | 2.000%, 03/03/20 (e) | | | 6,475 | |
| | 5,874 | | | 2.450%, 11/28/16 (e) | | | 5,895 | |
| | 9,606 | | | 4.875%, 11/19/19 | | | 10,520 | |
| | | | | | | | |
| | | | | | | 1,218,822 | |
| | | | | | | | |
| | | | Capital Markets — 2.0% | | | | |
| | | | Ameriprise Financial, Inc., | | | | |
| | 8,146 | | | 2.875%, 09/15/26 | | | 8,184 | |
| | 5,650 | | | 4.000%, 10/15/23 | | | 6,187 | |
| | | | Bank of New York Mellon Corp. (The), | | | | |
| | 2,020 | | | 2.050%, 05/03/21 | | | 2,042 | |
| | 4,310 | | | 2.200%, 03/04/19 | | | 4,386 | |
| | 3,110 | | | 2.200%, 08/16/23 | | | 3,099 | |
| | 8,088 | | | 2.600%, 08/17/20 | | | 8,335 | |
| | 1,043 | | | 2.800%, 05/04/26 | | | 1,075 | |
| | 3,800 | | | 3.250%, 09/11/24 | | | 4,050 | |
| | 3,089 | | | 3.550%, 09/23/21 | | | 3,322 | |
| | 3,363 | | | 4.600%, 01/15/20 | | | 3,685 | |
| | 3,335 | | | Series 0012, 3.650%, 02/04/24 | | | 3,653 | |
| | 1,667 | | | Series G, 2.200%, 05/15/19 | | | 1,703 | |
| | | | | | | | |
PRINCIPAL
AMOUNT($) | | | SECURITY DESCRIPTION | | VALUE($) | |
| | | | | | | | |
| | | | Capital Markets — continued | |
| | | | BlackRock, Inc., | | | | |
| | 4,287 | | | 3.375%, 06/01/22 | | | 4,618 | |
| | 3,515 | | | 3.500%, 03/18/24 | | | 3,889 | |
| | 4,145 | | | 4.250%, 05/24/21 | | | 4,618 | |
| | 4,190 | | | Series 2, 5.000%, 12/10/19 | | | 4,664 | |
| | | | Blackstone Holdings Finance Co. LLC, | | | | |
| | 3,107 | | | 4.450%, 07/15/45 (e) | | | 3,235 | |
| | 12,555 | | | 5.875%, 03/15/21 (e) | | | 14,574 | |
| | 2,690 | | | CDP Financial, Inc., (Canada), 4.400%, 11/25/19 (e) | | | 2,936 | |
| | 1,435 | | | Charles Schwab Corp. (The), 3.225%, 09/01/22 | | | 1,525 | |
| | | | CME Group, Inc., | | | | |
| | 9,865 | | | 3.000%, 09/15/22 | | | 10,436 | |
| | 5,537 | | | 3.000%, 03/15/25 | | | 5,836 | |
| | 1,004 | | | 5.300%, 09/15/43 | | | 1,329 | |
| | | | Credit Suisse AG, (Switzerland), | | | | |
| | 2,955 | | | 1.750%, 01/29/18 | | | 2,960 | |
| | 3,733 | | | 2.300%, 05/28/19 | | | 3,785 | |
| | 1,626 | | | 3.000%, 10/29/21 | | | 1,677 | |
| | 2,700 | | | 3.625%, 09/09/24 | | | 2,833 | |
| | | | Deutsche Bank AG, (Germany), | | | | |
| | 4,299 | | | 1.875%, 02/13/18 | | | 4,277 | |
| | 3,849 | | | 2.950%, 08/20/20 | | | 3,840 | |
| | 6,151 | | | 3.375%, 05/12/21 | | | 6,145 | |
| | 7,819 | | | 6.000%, 09/01/17 | | | 8,123 | |
| | 2,242 | | | FMR LLC, 6.450%, 11/15/39 (e) | | | 3,012 | |
| | | | Goldman Sachs Group, Inc. (The), | | | | |
| | 6,428 | | | 2.600%, 04/23/20 | | | 6,557 | |
| | 4,682 | | | 2.625%, 01/31/19 | | | 4,802 | |
| | 2,045 | | | 2.625%, 04/25/21 | | | 2,081 | |
| | 2,975 | | | 2.750%, 09/15/20 | | | 3,056 | |
| | 5,930 | | | 2.875%, 02/25/21 | | | 6,100 | |
| | 4,008 | | | 3.500%, 01/23/25 | | | 4,161 | |
| | 2,287 | | | 3.625%, 01/22/23 | | | 2,424 | |
| | 2,971 | | | 3.750%, 05/22/25 | | | 3,142 | |
| | 2,665 | | | 3.750%, 02/25/26 | | | 2,821 | |
| | 4,341 | | | 3.850%, 07/08/24 | | | 4,627 | |
| | 12,326 | | | 4.000%, 03/03/24 | | | 13,275 | |
| | 10,573 | | | 4.250%, 10/21/25 | | | 11,215 | |
| | 6,033 | | | 5.250%, 07/27/21 | | | 6,848 | |
| | 14,150 | | | 5.375%, 03/15/20 | | | 15,741 | |
| | 6,753 | | | 5.750%, 01/24/22 | | | 7,831 | |
| | 8,939 | | | 5.950%, 01/18/18 | | | 9,473 | |
| | 1,435 | | | 6.750%, 10/01/37 | | | 1,841 | |
SEE NOTES TO FINANCIAL STATEMENTS.
| | | | | | |
| | | |
| 72 | | | | J.P. MORGAN INCOME FUNDS | | AUGUST 31, 2016 |
| | | | | | | | |
PRINCIPAL
AMOUNT($) | | | SECURITY DESCRIPTION | | VALUE($) | |
| Corporate Bonds — continued | |
| | | | Capital Markets — continued | |
| | 29,379 | | | 7.500%, 02/15/19 | | | 33,446 | |
| | 13,156 | | | Series D, 6.000%, 06/15/20 | | | 15,012 | |
| | | | ING Bank N.V., (Netherlands), | | | | |
| | 6,000 | | | 1.650%, 08/15/19 (e) | | | 5,989 | |
| | 9,890 | | | 3.750%, 03/07/17 (e) | | | 10,012 | |
| | | | Intercontinental Exchange, Inc., | | | | |
| | 2,108 | | | 2.500%, 10/15/18 | | | 2,158 | |
| | 5,021 | | | 4.000%, 10/15/23 | | | 5,537 | |
| | | | Invesco Finance plc, (United Kingdom), | | | | |
| | 2,510 | | | 3.750%, 01/15/26 | | | 2,697 | |
| | 3,914 | | | 4.000%, 01/30/24 | | | 4,286 | |
| | | | Jefferies Group LLC, | | | | |
| | 2,466 | | | 5.125%, 04/13/18 | | | 2,576 | |
| | 5,022 | | | 6.450%, 06/08/27 | | | 5,631 | |
| | 8,295 | | | 6.875%, 04/15/21 | | | 9,515 | |
| | 6,482 | | | Legg Mason, Inc., 4.750%, 03/15/26 | | | 7,080 | |
| | | | Macquarie Bank Ltd., (Australia), | | | | |
| | 19,160 | | | 1.600%, 10/27/17 (e) | | | 19,201 | |
| | 7,499 | | | 2.600%, 06/24/19 (e) | | | 7,637 | |
| | 6,300 | | | 2.850%, 07/29/20 (e) | | | 6,439 | |
| | 6,300 | | | 4.000%, 07/29/25 (e) | | | 6,742 | |
| | | | Macquarie Group Ltd., (Australia), | | | | |
| | 4,125 | | | 6.000%, 01/14/20 (e) | | | 4,571 | |
| | 9,649 | | | 6.250%, 01/14/21 (e) | | | 10,984 | |
| | | | Morgan Stanley, | | | | |
| | 7,500 | | | 2.500%, 04/21/21 | | | 7,578 | |
| | 4,100 | | | 2.650%, 01/27/20 | | | 4,205 | |
| | 13,243 | | | 2.800%, 06/16/20 | | | 13,616 | |
| | 2,254 | | | 3.125%, 07/27/26 | | | 2,267 | |
| | 7,335 | | | 3.700%, 10/23/24 | | | 7,772 | |
| | 6,405 | | | 3.875%, 01/27/26 | | | 6,840 | |
| | 19,814 | | | 4.000%, 07/23/25 | | | 21,398 | |
| | 9,880 | | | 4.100%, 05/22/23 | | | 10,476 | |
| | 1,640 | | | 4.350%, 09/08/26 | | | 1,755 | |
| | 9,322 | | | 5.000%, 11/24/25 | | | 10,391 | |
| | 3,130 | | | 5.500%, 07/24/20 | | | 3,530 | |
| | 4,701 | | | 5.500%, 07/28/21 | | | 5,386 | |
| | 12,752 | | | 5.625%, 09/23/19 | | | 14,174 | |
| | 6,509 | | | 5.750%, 01/25/21 | | | 7,461 | |
| | 960 | | | 5.950%, 12/28/17 | | | 1,016 | |
| | 8,631 | | | 6.625%, 04/01/18 | | | 9,299 | |
| | 7,533 | | | 7.300%, 05/13/19 | | | 8,599 | |
| | 2,610 | | | Nomura Holdings, Inc., (Japan), 6.700%, 03/04/20 | | | 3,003 | |
| | | | | | | | |
PRINCIPAL
AMOUNT($) | | | SECURITY DESCRIPTION | | VALUE($) | |
| | | | | | | | |
| | | | Capital Markets — continued | |
| | | | State Street Corp., | | | | |
| | 3,191 | | | 3.100%, 05/15/23 | | | 3,334 | |
| | 17,629 | | | 3.550%, 08/18/25 | | | 19,261 | |
| | 5,771 | | | 3.700%, 11/20/23 | | | 6,367 | |
| | 2,279 | | | TD Ameritrade Holding Corp., 2.950%, 04/01/22 | | | 2,373 | |
| | | | Thomson Reuters Corp., (Canada), | | | | |
| | 3,119 | | | 3.850%, 09/29/24 | | | 3,341 | |
| | 8,115 | | | 3.950%, 09/30/21 | | | 8,666 | |
| | 2,716 | | | 4.500%, 05/23/43 | | | 2,906 | |
| | 1,928 | | | 4.700%, 10/15/19 | | | 2,089 | |
| | | | | | | | |
| | | | | | | 596,644 | |
| | | | | | | | |
| | | | Consumer Finance — 1.0% | | | | |
| | 3,367 | | | AerCap Ireland Capital Ltd./AerCap Global Aviation Trust, (Ireland), 3.950%, 02/01/22 | | | 3,493 | |
| | 4,394 | | | American Express Centurion Bank, 6.000%, 09/13/17 | | | 4,610 | |
| | 2,466 | | | American Express Co., 7.000%, 03/19/18 | | | 2,673 | |
| | | | American Express Credit Corp., | | | | |
| | 7,553 | | | 1.800%, 07/31/18 | | | 7,616 | |
| | 7,225 | | | 1.875%, 11/05/18 | | | 7,295 | |
| | 10,951 | | | 2.250%, 05/05/21 | | | 11,135 | |
| | 7,590 | | | 2.375%, 05/26/20 | | | 7,769 | |
| | | | American Honda Finance Corp., | | | | |
| | 2,626 | | | 1.600%, 02/16/18 (e) | | | 2,644 | |
| | 3,696 | | | 2.125%, 02/28/17 (e) | | | 3,716 | |
| | 3,055 | | | 2.125%, 10/10/18 | | | 3,115 | |
| | 598 | | | 2.250%, 08/15/19 | | | 613 | |
| | 10,292 | | | 2.600%, 09/20/16 (e) | | | 10,300 | |
| | 1,335 | | | 7.625%, 10/01/18 (e) | | | 1,501 | |
| | | | Capital One Financial Corp., | | | | |
| | 3,175 | | | 3.200%, 02/05/25 | | | 3,230 | |
| | 10,432 | | | 3.500%, 06/15/23 | | | 10,899 | |
| | 1,939 | | | 3.750%, 04/24/24 | | | 2,051 | |
| | 7,424 | | | 3.750%, 07/28/26 | | | 7,453 | |
| | 7,925 | | | 4.200%, 10/29/25 | | | 8,278 | |
| | | | Caterpillar Financial Services Corp., | | | | |
| | 3,353 | | | 2.250%, 12/01/19 | | | 3,435 | |
| | 5,040 | | | 2.400%, 08/09/26 | | | 5,019 | |
| | 3,873 | | | 2.850%, 06/01/22 | | | 4,047 | |
| | 897 | | | 5.450%, 04/15/18 | | | 957 | |
| | 3,139 | | | 7.050%, 10/01/18 | | | 3,507 | |
| | 538 | | | 7.150%, 02/15/19 | | | 612 | |
SEE NOTES TO FINANCIAL STATEMENTS.
| | | | | | | | |
| | | |
| AUGUST 31, 2016 | | J.P. MORGAN INCOME FUNDS | | | | | 73 | |
JPMorgan Core Bond Fund
SCHEDULE OF PORTFOLIO INVESTMENTS
AS OF AUGUST 31, 2016 (Unaudited) (continued)
(Amounts in thousands)
| | | | | | | | |
PRINCIPAL
AMOUNT($) | | | SECURITY DESCRIPTION | | VALUE($) | |
| Corporate Bonds — continued | |
| | | | Consumer Finance — continued | |
| | | | Ford Motor Credit Co. LLC, | | | | |
| | 5,190 | | | 1.684%, 09/08/17 | | | 5,196 | |
| | 2,690 | | | 2.145%, 01/09/18 | | | 2,706 | |
| | 6,244 | | | 2.240%, 06/15/18 | | | 6,296 | |
| | 2,196 | | | 2.375%, 03/12/19 | | | 2,225 | |
| | 10,210 | | | 3.000%, 06/12/17 | | | 10,333 | |
| | 3,709 | | | 3.096%, 05/04/23 | | | 3,751 | |
| | 6,991 | | | 3.336%, 03/18/21 | | | 7,254 | |
| | 7,923 | | | 4.134%, 08/04/25 | | | 8,405 | |
| | 1,200 | | | 4.250%, 02/03/17 | | | 1,214 | |
| | 3,446 | | | 4.250%, 09/20/22 | | | 3,724 | |
| | | | General Motors Financial Co., Inc., | | | | |
| | 3,163 | | | 3.100%, 01/15/19 | | | 3,225 | |
| | 7,227 | | | 3.200%, 07/13/20 | | | 7,388 | |
| | 5,107 | | | 3.200%, 07/06/21 | | | 5,187 | |
| | 8,201 | | | 3.700%, 05/09/23 | | | 8,359 | |
| | 276 | | | HSBC Finance Corp., 7.350%, 11/27/32 | | | 353 | |
| | | | HSBC USA, Inc., | | | | |
| | 6,681 | | | 1.625%, 01/16/18 | | | 6,682 | |
| | 7,174 | | | 2.350%, 03/05/20 | | | 7,215 | |
| | 7,405 | | | 2.750%, 08/07/20 | | | 7,563 | |
| | | | John Deere Capital Corp., | | | | |
| | 4,869 | | | 1.200%, 10/10/17 | | | 4,877 | |
| | 1,073 | | | 1.700%, 01/15/20 | | | 1,084 | |
| | 2,915 | | | 2.450%, 09/11/20 | | | 3,000 | |
| | 3,237 | | | 2.800%, 01/27/23 | | | 3,374 | |
| | 6,356 | | | 2.800%, 03/06/23 | | | 6,656 | |
| | 2,234 | | | 3.150%, 10/15/21 | | | 2,377 | |
| | 6,316 | | | Nissan Motor Acceptance Corp., 1.800%, 03/15/18 (e) | | | 6,350 | |
| | | | PACCAR Financial Corp., | | | | |
| | 2,175 | | | 1.300%, 05/10/19 | | | 2,175 | |
| | 4,103 | | | 1.400%, 05/18/18 | | | 4,129 | |
| | 3,536 | | | 1.600%, 03/15/17 | | | 3,549 | |
| | 14,832 | | | Synchrony Financial, 3.700%, 08/04/26 | | | 14,690 | |
| | | | Toyota Motor Credit Corp., | | | | |
| | 3,498 | | | 1.375%, 01/10/18 | | | 3,511 | |
| | 5,109 | | | 1.450%, 01/12/18 | | | 5,128 | |
| | 4,484 | | | 1.750%, 05/22/17 | | | 4,505 | |
| | 2,179 | | | 1.900%, 04/08/21 | | | 2,210 | |
| | | | | | | | |
| | | | | | | 280,659 | |
| | | | | | | | |
| | | | Diversified Financial Services — 0.9% | | | | |
| | 6,654 | | | Bank of America N.A., 5.300%, 03/15/17 | | | 6,795 | |
| | | | Berkshire Hathaway, Inc., | | | | |
| | 2,326 | | | 3.000%, 02/11/23 | | | 2,471 | |
| | | | | | | | |
PRINCIPAL
AMOUNT($) | | | SECURITY DESCRIPTION | | VALUE($) | |
| | | | | | | | |
| | | | Diversified Financial Services — continued | | | | |
| | 18,815 | | | 3.400%, 01/31/22 | | | 20,280 | |
| | 5,254 | | | 3.750%, 08/15/21 | | | 5,761 | |
| | | | GE Capital International Funding Co., Unlimited Co., (Ireland), | | | | |
| | 44,099 | | | 2.342%, 11/15/20 | | | 45,379 | |
| | 17,059 | | | 3.373%, 11/15/25 | | | 18,628 | |
| | 10,575 | | | 4.418%, 11/15/35 | | | 12,105 | |
| | 2,242 | | | Murray Street Investment Trust I, SUB, 4.647%, 03/09/17 | | | 2,281 | |
| | 1,933 | | | National Rural Utilities Cooperative Finance Corp., 10.375%, 11/01/18 | | | 2,294 | |
| | 2,635 | | | Nationwide Building Society, (United Kingdom), 2.450%, 07/27/21 (e) | | | 2,658 | |
| | | | Private Export Funding Corp., | | | | |
| | 10,700 | | | Series EE, 2.800%, 05/15/22 | | | 11,340 | |
| | 12,505 | | | Series KK, 3.550%, 01/15/24 | | | 13,909 | |
| | 8,428 | | | Series Z, 4.375%, 03/15/19 | | | 9,097 | |
| | | | Shell International Finance B.V., (Netherlands), | | | | |
| | 4,381 | | | 1.125%, 08/21/17 | | | 4,383 | |
| | 8,042 | | | 2.125%, 05/11/20 | | | 8,206 | |
| | 19,688 | | | 2.875%, 05/10/26 | | | 20,246 | |
| | 19,323 | | | 4.000%, 05/10/46 | | | 20,246 | |
| | 7,389 | | | 4.125%, 05/11/35 | | | 8,099 | |
| | 2,690 | | | 4.300%, 09/22/19 | | | 2,918 | |
| | 7,695 | | | 4.375%, 03/25/20 | | | 8,431 | |
| | 5,381 | | | 6.375%, 12/15/38 | | | 7,402 | |
| | | | Siemens Financieringsmaatschappij N.V., (Netherlands), | | | | |
| | 4,371 | | | 2.900%, 05/27/22 (e) | | | 4,618 | |
| | 3,421 | | | 4.400%, 05/27/45 (e) | | | 4,160 | |
| | 1,211 | | | 5.750%, 10/17/16 (e) | | | 1,218 | |
| | | | UBS Group Funding Jersey Ltd., (Jersey), | | | | |
| | 7,735 | | | 2.650%, 02/01/22 (e) | | | 7,726 | |
| | 2,500 | | | 4.125%, 09/24/25 (e) | | | 2,632 | |
| | 6,471 | | | 4.125%, 04/15/26 (e) | | | 6,827 | |
| | 4,230 | | | Voya Financial, Inc., 3.650%, 06/15/26 | | | 4,264 | |
| | | | | | | | |
| | | | | | | 264,374 | |
| | | | | | | | |
| | | | Insurance — 1.0% | | | | |
| | 8,295 | | | AIG SunAmerica Global Financing X, 6.900%, 03/15/32 (e) | | | 11,025 | |
| | 3,650 | | | Allstate Corp. (The), 3.150%, 06/15/23 | | | 3,880 | |
| | | | American International Group, Inc., | | | | |
| | 2,671 | | | 3.750%, 07/10/25 | | | 2,817 | |
| | 3,407 | | | 3.875%, 01/15/35 | | | 3,382 | |
SEE NOTES TO FINANCIAL STATEMENTS.
| | | | | | |
| | | |
| 74 | | | | J.P. MORGAN INCOME FUNDS | | AUGUST 31, 2016 |
| | | | | | | | |
PRINCIPAL
AMOUNT($) | | | SECURITY DESCRIPTION | | VALUE($) | |
| Corporate Bonds — continued | |
| | | | Insurance — continued | | | | |
| | 4,478 | | | 4.125%, 02/15/24 | | | 4,817 | |
| | 6,665 | | | 4.700%, 07/10/35 | | | 7,193 | |
| | 1,280 | | | 4.875%, 06/01/22 | | | 1,433 | |
| | 1,496 | | | Aon Corp., 6.250%, 09/30/40 | | | 1,934 | |
| | 3,083 | | | Aon plc, (United Kingdom), 3.875%, 12/15/25 | | | 3,317 | |
| | | | Berkshire Hathaway Finance Corp., | | | | |
| | 870 | | | 1.300%, 05/15/18 | | | 872 | |
| | 2,795 | | | 4.300%, 05/15/43 | | | 3,209 | |
| | 13,241 | | | 4.400%, 05/15/42 | | | 15,363 | |
| | 10,493 | | | 5.400%, 05/15/18 | | | 11,236 | |
| | 1,166 | | | 5.750%, 01/15/40 | | | 1,586 | |
| | 1,013 | | | Chubb Corp. (The), 5.750%, 05/15/18 | | | 1,089 | |
| | | | Chubb INA Holdings, Inc., | | | | |
| | 2,420 | | | 2.300%, 11/03/20 | | | 2,489 | |
| | 3,418 | | | 2.875%, 11/03/22 | | | 3,597 | |
| | | | CNA Financial Corp., | | | | |
| | 2,633 | | | 3.950%, 05/15/24 | | | 2,777 | |
| | 1,921 | | | 4.500%, 03/01/26 | | | 2,078 | |
| | | | Jackson National Life Global Funding, | | | | |
| | 3,581 | | | 1.875%, 10/15/18 (e) | | | 3,617 | |
| | 4,054 | | | 3.050%, 04/29/26 (e) | | | 4,122 | |
| | 2,690 | | | 4.700%, 06/01/18 (e) | | | 2,832 | |
| | | | Liberty Mutual Group, Inc., | | | | |
| | 3,049 | | | 5.000%, 06/01/21 (e) | | | 3,376 | |
| | 6,000 | | | 6.500%, 03/15/35 (e) | | | 7,602 | |
| | | | Liberty Mutual Insurance Co., | | | | |
| | 620 | | | 7.875%, 10/15/26 (e) | | | 799 | |
| | 700 | | | 8.500%, 05/15/25 (e) | | | 894 | |
| | | | Lincoln National Corp., | | | | |
| | 1,925 | | | 4.000%, 09/01/23 | | | 2,046 | |
| | 3,761 | | | 4.200%, 03/15/22 | | | 4,064 | |
| | 1,670 | | | 6.150%, 04/07/36 | | | 1,994 | |
| | | | Marsh & McLennan Cos., Inc., | | | | |
| | 5,001 | | | 2.350%, 03/06/20 | | | 5,085 | |
| | 1,991 | | | 3.300%, 03/14/23 | | | 2,085 | |
| | | | Massachusetts Mutual Life Insurance Co., | | | | |
| | 1,767 | | | 5.375%, 12/01/41 (e) | | | 2,116 | |
| | 1,070 | | | 8.875%, 06/01/39 (e) | | | 1,704 | |
| | | | MassMutual Global Funding II, | | | | |
| | 14,348 | | | 2.100%, 08/02/18 (e) | | | 14,568 | |
| | 3,346 | | | 2.500%, 10/17/22 (e) | | | 3,377 | |
| | | | MetLife, Inc., | | | | |
| | 2,027 | | | 4.050%, 03/01/45 | | | 2,018 | |
| | 2,000 | | | 4.875%, 11/13/43 | | | 2,251 | |
| | 731 | | | Series A, 6.817%, 08/15/18 | | | 806 | |
| | | | | | | | |
PRINCIPAL
AMOUNT($) | | | SECURITY DESCRIPTION | | VALUE($) | |
| | | | | | | | |
| | | | Insurance — continued | | | | |
| | | | Metropolitan Life Global Funding I, | | | | |
| | 12,099 | | | 1.500%, 01/10/18 (e) | | | 12,159 | |
| | 6,421 | | | 2.300%, 04/10/19 (e) | | | 6,551 | |
| | 11,927 | | | 3.650%, 06/14/18 (e) | | | 12,414 | |
| | 12,858 | | | 3.875%, 04/11/22 (e) | | | 13,938 | |
| | 11,147 | | | Nationwide Mutual Insurance Co., 9.375%, 08/15/39 (e) | | | 17,813 | |
| | | | New York Life Global Funding, | | | | |
| | 1,806 | | | 1.950%, 02/11/20 (e) | | | 1,828 | |
| | 29,382 | | | 2.150%, 06/18/19 (e) | | | 29,964 | |
| | 3,587 | | | Pacific Life Global Funding, 5.000%, 05/15/17 (e) | | | 3,659 | |
| | 4,574 | | | Pacific Life Insurance Co., 9.250%, 06/15/39 (e) | | | 7,224 | |
| | 1,343 | | | Pricoa Global Funding I, 1.600%, 05/29/18 (e) | | | 1,349 | |
| | | | Principal Financial Group, Inc., | | | | |
| | 1,290 | | | 1.850%, 11/15/17 | | | 1,298 | |
| | 794 | | | 3.125%, 05/15/23 | | | 812 | |
| | 7,544 | | | Progressive Corp. (The), 2.450%, 01/15/27 | | | 7,504 | |
| | 7,284 | | | Prudential Financial, Inc., 5.750%, 07/15/33 | | | 8,702 | |
| | 10,349 | | | Prudential Insurance Co. of America (The), 8.300%, 07/01/25 (e) | | | 13,996 | |
| | 2,597 | | | Reliance Standard Life Global Funding II, 3.050%, 01/20/21 (e) | | | 2,662 | |
| | 960 | | | Travelers Cos., Inc. (The), 5.800%, 05/15/18 | | | 1,031 | |
| | | | | | | | |
| | | | | | | 292,354 | |
| | | | | | | | |
| | | | Thrifts & Mortgage Finance — 0.0% (g) | | | | |
| | | | BPCE S.A., (France), | | | | |
| | 5,650 | | | 1.625%, 01/26/18 | | | 5,663 | |
| | 6,100 | | | 4.875%, 04/01/26 (e) | | | 6,431 | |
| | | | | | | | |
| | | | | | | 12,094 | |
| | | | | | | | |
| | | | Total Financials | | | 2,664,947 | |
| | | | | | | | |
| | | | Health Care — 1.3% | | | | |
| | | | Biotechnology — 0.3% | | | | |
| | | | Amgen, Inc., | | | | |
| | 1,066 | | | 2.125%, 05/01/20 | | | 1,082 | |
| | 3,005 | | | 3.625%, 05/22/24 | | | 3,240 | |
| | 6,278 | | | 3.875%, 11/15/21 | | | 6,831 | |
| | 1,000 | | | 4.400%, 05/01/45 | | | 1,075 | |
| | 20,892 | | | 4.663%, 06/15/51 (e) | | | 22,492 | |
| | 4,336 | | | 4.950%, 10/01/41 | | | 4,944 | |
| | 1,771 | | | 5.700%, 02/01/19 | | | 1,947 | |
| | | | Baxalta, Inc., | | | | |
| | 3,356 | | | 3.600%, 06/23/22 | | | 3,454 | |
| | 1,096 | | | 5.250%, 06/23/45 | | | 1,288 | |
SEE NOTES TO FINANCIAL STATEMENTS.
| | | | | | | | |
| | | |
| AUGUST 31, 2016 | | J.P. MORGAN INCOME FUNDS | | | | | 75 | |
JPMorgan Core Bond Fund
SCHEDULE OF PORTFOLIO INVESTMENTS
AS OF AUGUST 31, 2016 (Unaudited) (continued)
(Amounts in thousands)
| | | | | | | | |
PRINCIPAL
AMOUNT($) | | | SECURITY DESCRIPTION | | VALUE($) | |
| Corporate Bonds — continued | |
| | | | Biotechnology — continued | | | | |
| | | | Biogen, Inc., | | | | |
| | 5,466 | | | 3.625%, 09/15/22 | | | 5,846 | |
| | 1,383 | | | 5.200%, 09/15/45 | | | 1,669 | |
| | | | Celgene Corp., | | | | |
| | 5,762 | | | 2.875%, 08/15/20 | | | 5,980 | |
| | 8,865 | | | 3.250%, 08/15/22 | | | 9,247 | |
| | 6,875 | | | 3.625%, 05/15/24 | | | 7,280 | |
| | 4,195 | | | 5.000%, 08/15/45 | | | 4,841 | |
| | | | Gilead Sciences, Inc., | | | | |
| | 3,532 | | | 3.250%, 09/01/22 | | | 3,760 | |
| | 3,850 | | | 3.650%, 03/01/26 | | | 4,174 | |
| | 1,150 | | | 3.700%, 04/01/24 | | | 1,245 | |
| | 4,758 | | | 4.600%, 09/01/35 | | | 5,362 | |
| | | | | | | | |
| | | | | | | 95,757 | |
| | | | | | | | |
| | | | Health Care Equipment & Supplies — 0.1% | | | | |
| | | | Becton, Dickinson & Co., | | | | |
| | 1,030 | | | 2.675%, 12/15/19 | | | 1,066 | |
| | 1,537 | | | 3.734%, 12/15/24 | | | 1,670 | |
| | 628 | | | 5.000%, 05/15/19 | | | 685 | |
| | 2,500 | | | Danaher Corp., 2.400%, 09/15/20 | | | 2,581 | |
| | | | Medtronic, Inc., | | | | |
| | 5,206 | | | 3.150%, 03/15/22 | | | 5,529 | |
| | 6,075 | | | 4.375%, 03/15/35 | | | 6,979 | |
| | 904 | | | Stryker Corp., 3.500%, 03/15/26 | | | 960 | |
| | | | | | | | |
| | | | | | | 19,470 | |
| | | | | | | | |
| | | | Health Care Providers & Services — 0.4% | | | | |
| | | | Aetna, Inc., | | | | |
| | 3,654 | | | 2.800%, 06/15/23 | | | 3,735 | |
| | 2,752 | | | 4.250%, 06/15/36 | | | 2,863 | |
| | 1,777 | | | 4.500%, 05/15/42 | | | 1,970 | |
| | 2,959 | | | 6.750%, 12/15/37 | | | 4,136 | |
| | | | Anthem, Inc., | | | | |
| | 2,511 | | | 2.300%, 07/15/18 | | | 2,548 | |
| | 4,210 | | | 3.125%, 05/15/22 | | | 4,372 | |
| | 2,354 | | | 3.300%, 01/15/23 | | | 2,464 | |
| | 3,477 | | | 4.625%, 05/15/42 | | | 3,846 | |
| | 3,394 | | | 4.650%, 01/15/43 | | | 3,792 | |
| | 4,149 | | | 4.650%, 08/15/44 | | | 4,602 | |
| | | | Cardinal Health, Inc., | | | | |
| | 3,693 | | | 2.400%, 11/15/19 | | | 3,771 | |
| | 4,500 | | | 3.750%, 09/15/25 | | | 4,878 | |
| | | | Express Scripts Holding Co., | | | | |
| | 3,693 | | | 3.000%, 07/15/23 | | | 3,751 | |
| | 6,120 | | | 3.500%, 06/15/24 | | | 6,355 | |
| | 1,904 | | | 4.800%, 07/15/46 | | | 2,020 | |
| | | | | | | | |
PRINCIPAL
AMOUNT($) | | | SECURITY DESCRIPTION | | VALUE($) | |
| | | | | | | | |
| | | | Health Care Providers & Services — continued | |
| | 3,409 | | | Laboratory Corp. of America Holdings, 3.200%, 02/01/22 | | | 3,540 | |
| | 2,975 | | | Mayo Clinic, Series 2016, 4.128%, 11/15/52 | | | 3,428 | |
| | 3,335 | | | Memorial Sloan-Kettering Cancer Center, 4.200%, 07/01/55 | | | 3,805 | |
| | 1,684 | | | Quest Diagnostics, Inc., 3.450%, 06/01/26 | | | 1,749 | |
| | 4,275 | | | Texas Health Resources, 4.330%, 11/15/55 | | | 4,876 | |
| | | | UnitedHealth Group, Inc., | | | | |
| | 3,636 | | | 1.700%, 02/15/19 | | | 3,670 | |
| | 1,615 | | | 2.750%, 02/15/23 | | | 1,673 | |
| | 2,690 | | | 2.875%, 03/15/23 | | | 2,811 | |
| | 4,726 | | | 3.100%, 03/15/26 | | | 4,983 | |
| | 4,532 | | | 3.350%, 07/15/22 | | | 4,877 | |
| | 5,955 | | | 3.375%, 11/15/21 | | | 6,401 | |
| | 6,229 | | | 4.625%, 07/15/35 | | | 7,390 | |
| | 4,888 | | | 6.625%, 11/15/37 | | | 7,082 | |
| | | | | | | | |
| | | | | | | 111,388 | |
| | | | | | | | |
| | | | Life Sciences Tools & Services — 0.0% (g) | | | | |
| | | | Thermo Fisher Scientific, Inc., | | | | |
| | 2,501 | | | 3.000%, 04/15/23 | | | 2,561 | |
| | 1,947 | | | 3.150%, 01/15/23 | | | 2,001 | |
| | 1,048 | | | 3.600%, 08/15/21 | | | 1,114 | |
| | 1,946 | | | 4.150%, 02/01/24 | | | 2,133 | |
| | | | | | | | |
| | | | | | | 7,809 | |
| | | | | | | | |
| | | | Pharmaceuticals — 0.5% | | | | |
| | | | AbbVie, Inc., | | | | |
| | 7,526 | | | 1.750%, 11/06/17 | | | 7,560 | |
| | 7,466 | | | 2.500%, 05/14/20 | | | 7,637 | |
| | 2,980 | | | 2.850%, 05/14/23 | | | 3,024 | |
| | 8,491 | | | 2.900%, 11/06/22 | | | 8,746 | |
| | 5,328 | | | 3.200%, 11/06/22 | | | 5,567 | |
| | 1,796 | | | 3.200%, 05/14/26 | | | 1,839 | |
| | 2,129 | | | 4.300%, 05/14/36 | | | 2,250 | |
| | 14,649 | | | 4.500%, 05/14/35 | | | 15,884 | |
| | | | Actavis Funding SCS, (Luxembourg), | | | | |
| | 3,041 | | | 3.450%, 03/15/22 | | | 3,183 | |
| | 9,655 | | | 4.550%, 03/15/35 | | | 10,397 | |
| | 2,354 | | | Actavis, Inc., 3.250%, 10/01/22 | | | 2,442 | |
| | | | Allergan, Inc., | | | | |
| | 1,600 | | | 2.800%, 03/15/23 | | | 1,596 | |
| | 3,111 | | | 3.375%, 09/15/20 | | | 3,263 | |
| | 2,991 | | | Bayer U.S. Finance LLC, 2.375%, 10/08/19 (e) | | | 3,042 | |
| | 5,743 | | | Forest Laboratories LLC, 5.000%, 12/15/21 (e) | | | 6,445 | |
SEE NOTES TO FINANCIAL STATEMENTS.
| | | | | | |
| | | |
| 76 | | | | J.P. MORGAN INCOME FUNDS | | AUGUST 31, 2016 |
| | | | | | | | |
PRINCIPAL
AMOUNT($) | | | SECURITY DESCRIPTION | | VALUE($) | |
| Corporate Bonds — continued | |
| | | | Pharmaceuticals — continued | | | | |
| | 2,780 | | | GlaxoSmithKline Capital plc, (United Kingdom), 2.850%, 05/08/22 | | | 2,929 | |
| | 1,883 | | | GlaxoSmithKline Capital, Inc., 6.375%, 05/15/38 | | | 2,745 | |
| | 3,771 | | | Johnson & Johnson, 3.550%, 03/01/36 | | | 4,246 | |
| | | | Merck & Co., Inc., | | | | |
| | 933 | | | 1.300%, 05/18/18 | | | 938 | |
| | 6,011 | | | 2.350%, 02/10/22 | | | 6,186 | |
| | 3,268 | | | 2.400%, 09/15/22 | | | 3,372 | |
| | 3,139 | | | 2.800%, 05/18/23 | | | 3,305 | |
| | 2,100 | | | 3.700%, 02/10/45 | | | 2,251 | |
| | | | Mylan N.V., (Netherlands), | | | | |
| | 4,153 | | | 3.950%, 06/15/26 (e) | | | 4,279 | |
| | 2,870 | | | 5.250%, 06/15/46 (e) | | | 3,154 | |
| | | | Mylan, Inc., | | | | |
| | 7,886 | | | 3.125%, 01/15/23 (e) | | | 7,873 | |
| | 2,300 | | | 5.400%, 11/29/43 | | | 2,581 | |
| | 3,294 | | | Novartis Capital Corp., 3.400%, 05/06/24 | | | 3,620 | |
| | 3,901 | | | Pfizer, Inc., 3.000%, 06/15/23 | | | 4,170 | |
| | 2,066 | | | Teva Pharmaceutical Finance Co. LLC, 6.150%, 02/01/36 | | | 2,629 | |
| | | | Teva Pharmaceutical Finance Netherlands III B.V., (Netherlands), | | | | |
| | 2,321 | | | 2.200%, 07/21/21 | | | 2,306 | |
| | 2,057 | | | 2.800%, 07/21/23 | | | 2,066 | |
| | 844 | | | 4.100%, 10/01/46 | | | 857 | |
| | 708 | | | Wyeth LLC, 6.450%, 02/01/24 | | | 898 | |
| | | | Zoetis, Inc., | | | | |
| | 1,869 | | | 1.875%, 02/01/18 | | | 1,873 | |
| | 1,115 | | | 4.700%, 02/01/43 | | | 1,190 | |
| | | | | | | | |
| | | | | | | 146,343 | |
| | | | | | | | |
| | | | Total Health Care | | | 380,767 | |
| | | | | | | | |
| | | | Industrials — 1.7% | | | | |
| | | | Aerospace & Defense — 0.3% | | | | |
| | 3,267 | | | Airbus Group Finance B.V., (Netherlands), 2.700%, 04/17/23 (e) | | | 3,379 | |
| | | | BAE Systems Holdings, Inc., | | | | |
| | 9,772 | | | 3.800%, 10/07/24 (e) | | | 10,329 | |
| | 2,107 | | | 6.375%, 06/01/19 (e) | | | 2,346 | �� |
| | 4,778 | | | BAE Systems plc, (United Kingdom), 5.800%, 10/11/41 (e) | | | 5,994 | |
| | | | Boeing Co. (The), | | | | |
| | 448 | | | 4.875%, 02/15/20 | | | 502 | |
| | 1,076 | | | 7.950%, 08/15/24 | | | 1,516 | |
| | | | | | | | |
PRINCIPAL
AMOUNT($) | | | SECURITY DESCRIPTION | | VALUE($) | |
| | | | | | | | |
| | | | Aerospace & Defense — continued | | | | |
| | | | Lockheed Martin Corp., | | | | |
| | 2,766 | | | 2.125%, 09/15/16 | | | 2,767 | |
| | 937 | | | 3.100%, 01/15/23 | | | 989 | |
| | 4,010 | | | 4.070%, 12/15/42 | | | 4,335 | |
| | 897 | | | 4.250%, 11/15/19 | | | 974 | |
| | 6,385 | | | 4.500%, 05/15/36 | | | 7,390 | |
| | 1,569 | | | 4.850%, 09/15/41 | | | 1,871 | |
| | 1,753 | | | Series B, 6.150%, 09/01/36 | | | 2,380 | |
| | 1,794 | | | Northrop Grumman Systems Corp., 7.750%, 02/15/31 | | | 2,677 | |
| | 8,650 | | | Precision Castparts Corp., 3.250%, 06/15/25 | | | 9,311 | |
| | 2,180 | | | Raytheon Co., 3.150%, 12/15/24 | | | 2,346 | |
| | | | United Technologies Corp., | | | | |
| | 1,777 | | | 1.800%, 06/01/17 | | | 1,788 | |
| | 4,552 | | | 3.100%, 06/01/22 | | | 4,879 | |
| | 4,246 | | | 4.150%, 05/15/45 | | | 4,822 | |
| | 6,022 | | | 4.500%, 06/01/42 | | | 7,138 | |
| | 701 | | | 6.700%, 08/01/28 | | | 954 | |
| | | | | | | | |
| | | | | | | 78,687 | |
| | | | | | | | |
| | | | Air Freight & Logistics — 0.0% (g) | | | | |
| | 1,670 | | | Federal Express Corp. 1998 Pass-Through Trust, 6.720%, 01/15/22 | | | 1,874 | |
| | | | FedEx Corp., | | | | |
| | 2,678 | | | 3.250%, 04/01/26 | | | 2,834 | |
| | 2,232 | | | 3.900%, 02/01/35 | | | 2,330 | |
| | | | United Parcel Service of America, Inc., | | | | |
| | 2,107 | | | 8.375%, 04/01/20 | | | 2,601 | |
| | 717 | | | SUB, 8.375%, 04/01/30 | | | 1,059 | |
| | 1,621 | | | United Parcel Service, Inc., 2.450%, 10/01/22 | | | 1,692 | |
| | | | | | | | |
| | | | | | | 12,390 | |
| | | | | | | | |
| | | | Airlines — 0.1% | | | | |
| | 3,047 | | | Air Canada 2013-1 Class A Pass-Through Trust, (Canada), 4.125%, 05/15/25 (e) | | | 3,242 | |
| | 894 | | | American Airlines 2011-1 Class A Pass-Through Trust, 5.250%, 01/31/21 | | | 972 | |
| | 3,082 | | | American Airlines 2013-2 Class A Pass-Through Trust, 4.950%, 01/15/23 | | | 3,371 | |
| | 1,887 | | | American Airlines 2016-2 Class A Pass- Through Trust, 3.650%, 06/15/28 | | | 1,988 | |
| | 268 | | | Continental Airlines 1999-2 Class A-1 Pass-Through Trust, 7.256%, 03/15/20 | | | 288 | |
| | 3,013 | | | Continental Airlines 2007-1 Class A Pass-Through Trust, 5.983%, 04/19/22 | | | 3,401 | |
| | 1,663 | | | Continental Airlines 2012-2 Class A Pass-Through Trust, 4.000%, 10/29/24 | | | 1,784 | |
SEE NOTES TO FINANCIAL STATEMENTS.
| | | | | | | | |
| | | |
| AUGUST 31, 2016 | | J.P. MORGAN INCOME FUNDS | | | | | 77 | |
JPMorgan Core Bond Fund
SCHEDULE OF PORTFOLIO INVESTMENTS
AS OF AUGUST 31, 2016 (Unaudited) (continued)
(Amounts in thousands)
| | | | | | | | |
PRINCIPAL
AMOUNT($) | | | SECURITY DESCRIPTION | | VALUE($) | |
| Corporate Bonds — continued | |
| | | | Airlines — continued | | | | |
| | 2,175 | | | Delta Air Lines 2010-2 Class A Pass-Through Trust, 4.950%, 05/23/19 | | | 2,295 | |
| | 761 | | | Delta Air Lines 2011-1 Class A Pass-Through Trust, 5.300%, 04/15/19 | | | 813 | |
| | 2,580 | | | Delta Air Lines 2012-1 Class A Pass-Through Trust, 4.750%, 05/07/20 | | | 2,754 | |
| | 6,874 | | | United Airlines 2016-1 Class A Pass-Through Trust, 3.450%, 07/07/28 | | | 7,169 | |
| | | | | | | | |
| | | | | | | 28,077 | |
| | | | | | | | |
| | | | Commercial Services & Supplies — 0.1% | | | | |
| | 1,525 | | | Pitney Bowes, Inc., 5.600%, 03/15/18 | | | 1,608 | |
| | | | Republic Services, Inc., | | | | |
| | 2,099 | | | 2.900%, 07/01/26 | | | 2,138 | |
| | 4,309 | | | 3.550%, 06/01/22 | | | 4,620 | |
| | | | Waste Management, Inc., | | | | |
| | 3,635 | | | 2.400%, 05/15/23 | | | 3,673 | |
| | 1,062 | | | 3.900%, 03/01/35 | | | 1,143 | |
| | 1,690 | | | 4.750%, 06/30/20 | | | 1,877 | |
| | | | | | | | |
| | | | | | | 15,059 | |
| | | | | | | | |
| | | | Construction & Engineering — 0.0% (g) | | | | |
| | | | ABB Finance USA, Inc., | | | | |
| | 1,504 | | | 1.625%, 05/08/17 | | | 1,510 | |
| | 2,092 | | | 2.875%, 05/08/22 | | | 2,196 | |
| | 928 | | | 4.375%, 05/08/42 | | | 1,076 | |
| | 4,910 | | | Fluor Corp., 3.375%, 09/15/21 | | | 5,254 | |
| | | | | | | | |
| | | | | | | 10,036 | |
| | | | | | | | |
| | | | Electrical Equipment — 0.0% (g) | | | | |
| | | | Eaton Corp., | | | | |
| | 1,418 | | | 1.500%, 11/02/17 | | | 1,423 | |
| | 1,247 | | | 4.000%, 11/02/32 | | | 1,346 | |
| | 2,377 | | | 5.600%, 05/15/18 | | | 2,539 | |
| | 1,794 | | | 7.625%, 04/01/24 | | | 2,263 | |
| | | | | | | | |
| | | | | | | 7,571 | |
| | | | | | | | |
| | | | Industrial Conglomerates — 0.4% | | | | |
| | | | General Electric Co., | | | | |
| | 2,854 | | | 1.600%, 11/20/17 | | | 2,871 | |
| | 1,318 | | | 2.100%, 12/11/19 | | | 1,355 | |
| | 6,863 | | | 2.300%, 04/27/17 | | | 6,921 | |
| | 3,043 | | | 2.700%, 10/09/22 | | | 3,178 | |
| | 1,718 | | | 3.100%, 01/09/23 | | | 1,833 | |
| | 4,815 | | | 3.150%, 09/07/22 | | | 5,140 | |
| | 4,366 | | | 3.375%, 03/11/24 | | | 4,778 | |
| | 3,698 | | | 4.375%, 09/16/20 | | | 4,104 | |
| | 4,892 | | | 4.650%, 10/17/21 | | | 5,585 | |
| | | | | | | | |
PRINCIPAL
AMOUNT($) | | | SECURITY DESCRIPTION | | VALUE($) | |
| | | | | | | | |
| | | | Industrial Conglomerates — continued | |
| | 459 | | | 5.300%, 02/11/21 | | | 528 | |
| | 1,345 | | | 5.400%, 02/15/17 | | | 1,367 | |
| | 5,046 | | | 5.500%, 01/08/20 | | | 5,713 | |
| | 6,636 | | | 5.625%, 09/15/17 | | | 6,949 | |
| | 20,649 | | | 5.625%, 05/01/18 | | | 22,193 | |
| | 488 | | | 5.875%, 01/14/38 | | | 668 | |
| | 1,361 | | | 6.000%, 08/07/19 | | | 1,547 | |
| | 232 | | | 6.875%, 01/10/39 | | | 355 | |
| | 3,139 | | | VAR, 0.987%, 02/15/17 | | | 3,142 | |
| | 2,373 | | | Series A, 6.750%, 03/15/32 | | | 3,394 | |
| | 1,345 | | | Honeywell International, Inc., 5.300%, 03/01/18 | | | 1,428 | |
| | 3,907 | | | Hutchison Whampoa International 12 II Ltd., (Cayman Islands), 3.250%, 11/08/22 (e) | | | 4,147 | |
| | 2,860 | | | Ingersoll-Rand Global Holding Co., Ltd., 4.250%, 06/15/23 | | | 3,146 | |
| | | | Koninklijke Philips N.V., (Netherlands), | | | | |
| | 7,508 | | | 3.750%, 03/15/22 | | | 8,079 | |
| | 1,494 | | | 5.750%, 03/11/18 | | | 1,593 | |
| | 493 | | | 7.200%, 06/01/26 | | | 618 | |
| | | | Pentair Finance S.A., (Luxembourg), | | | | |
| | 6,588 | | | 2.900%, 09/15/18 | | | 6,635 | |
| | 3,000 | | | 4.650%, 09/15/25 | | | 3,132 | |
| | 1,261 | | | Roper Technologies, Inc., 3.000%, 12/15/20 | | | 1,313 | |
| | 1,540 | | | Tyco International Finance S.A., (Luxembourg), 5.125%, 09/14/45 | | | 1,860 | |
| | | | | | | | |
| | | | | | | 113,572 | |
| | | | | | | | |
| | | | Machinery — 0.1% | | | | |
| | | | Caterpillar, Inc., | | | | |
| | 1,676 | | | 1.500%, 06/26/17 | | | 1,681 | |
| | 1,913 | | | 2.600%, 06/26/22 | | | 1,992 | |
| | | | Deere & Co., | | | | |
| | 5,382 | | | 2.600%, 06/08/22 | | | 5,574 | |
| | 2,386 | | | 3.900%, 06/09/42 | | | 2,651 | |
| | 15,246 | | | Illinois Tool Works, Inc., 3.900%, 09/01/42 | | | 17,094 | |
| | 695 | | | Ingersoll-Rand Co., 6.391%, 11/15/27 | | | 825 | |
| | | | Parker-Hannifin Corp., | | | | |
| | 3,759 | | | 4.450%, 11/21/44 | | | 4,521 | |
| | 695 | | | 5.500%, 05/15/18 | | | 746 | |
| | | | | | | | |
| | | | | | | 35,084 | |
| | | | | | | | |
| | | | Professional Services — 0.0% (g) | | | | |
| | 2,538 | | | Equifax, Inc., 2.300%, 06/01/21 | | | 2,552 | |
| | | | | | | | |
SEE NOTES TO FINANCIAL STATEMENTS.
| | | | | | |
| | | |
| 78 | | | | J.P. MORGAN INCOME FUNDS | | AUGUST 31, 2016 |
| | | | | | | | |
PRINCIPAL
AMOUNT($) | | | SECURITY DESCRIPTION | | VALUE($) | |
| Corporate Bonds — continued | |
| | | | Road & Rail — 0.6% | | | | |
| | | | Burlington Northern Santa Fe LLC, | | | | |
| | 1,794 | | | 3.000%, 03/15/23 | | | 1,896 | |
| | 3,821 | | | 3.050%, 03/15/22 | | | 4,046 | |
| | 1,865 | | | 3.450%, 09/15/21 | | | 2,010 | |
| | 1,272 | | | 3.600%, 09/01/20 | | | 1,370 | |
| | 2,365 | | | 3.750%, 04/01/24 | | | 2,615 | |
| | 3,010 | | | 3.900%, 08/01/46 | | | 3,267 | |
| | 4,018 | | | 4.375%, 09/01/42 | | | 4,610 | |
| | 3,150 | | | 4.700%, 09/01/45 | | | 3,803 | |
| | 3,380 | | | 5.150%, 09/01/43 | | | 4,271 | |
| | 9,266 | | | 5.400%, 06/01/41 | | | 11,863 | |
| | 3,282 | | | 5.650%, 05/01/17 | | | 3,381 | |
| | 1,502 | | | 5.750%, 03/15/18 | | | 1,606 | |
| | 3,244 | | | 5.750%, 05/01/40 | | | 4,351 | |
| | 538 | | | 6.700%, 08/01/28 | | | 736 | |
| | 1,166 | | | 7.290%, 06/01/36 | | | 1,721 | |
| | | | Canadian Pacific Railway Co., (Canada), | | | | |
| | 4,200 | | | 4.500%, 01/15/22 | | | 4,606 | |
| | 7,086 | | | 6.125%, 09/15/152 | | | 8,834 | |
| | 1,345 | | | 7.125%, 10/15/31 | | | 1,869 | |
| | | | CSX Corp., | | | | |
| | 3,200 | | | 3.400%, 08/01/24 | | | 3,425 | |
| | 2,659 | | | 3.950%, 05/01/50 | | | 2,744 | |
| | 1,781 | | | 4.250%, 06/01/21 | | | 1,961 | |
| | 1,516 | | | 4.750%, 05/30/42 | | | 1,750 | |
| | 3,498 | | | 5.500%, 04/15/41 | | | 4,413 | |
| | 628 | | | 7.375%, 02/01/19 | | | 714 | |
| | 3,587 | | | 7.900%, 05/01/17 | | | 3,742 | |
| | | | ERAC USA Finance LLC, | | | | |
| | 3,010 | | | 2.600%, 12/01/21 (e) | | | 3,060 | |
| | 3,474 | | | 4.500%, 08/16/21 (e) | | | 3,826 | |
| | 2,388 | | | 5.250%, 10/01/20 (e) | | | 2,678 | |
| | 3,104 | | | 5.625%, 03/15/42 (e) | | | 3,800 | |
| | 359 | | | 6.375%, 10/15/17 (e) | | | 378 | |
| | 4,417 | | | 6.700%, 06/01/34 (e) | | | 5,934 | |
| | | | Norfolk Southern Corp., | | | | |
| | 2,558 | | | 2.903%, 02/15/23 | | | 2,650 | |
| | 4,957 | | | 3.250%, 12/01/21 | | | 5,238 | |
| | 2,888 | | | 3.950%, 10/01/42 | | | 3,057 | |
| | 51 | | | 5.590%, 05/17/25 | | | 62 | |
| | 3,049 | | | 6.000%, 03/15/05 | | | 3,770 | |
| | 9,412 | | | 6.000%, 05/23/113 | | | 11,667 | |
| | 121 | | | 7.700%, 05/15/17 | | | 126 | |
| | | | | | | | |
PRINCIPAL
AMOUNT($) | | | SECURITY DESCRIPTION | | VALUE($) | |
| | | | | | | | |
| | | | Road & Rail — continued | | | | |
| | | | Penske Truck Leasing Co. LP/PTL Finance Corp., | | | | |
| | 3,744 | | | 2.875%, 07/17/18 (e) | | | 3,814 | |
| | 5,795 | | | 3.375%, 02/01/22 (e) | | | 5,991 | |
| | | | Ryder System, Inc., | | | | |
| | 1,432 | | | 2.500%, 03/01/17 | | | 1,437 | |
| | 1,435 | | | 2.500%, 03/01/18 | | | 1,454 | |
| | 4,930 | | | 2.500%, 05/11/20 | | | 4,965 | |
| | 3,451 | | | 2.875%, 09/01/20 | | | 3,516 | |
| | | | Union Pacific Corp., | | | | |
| | 1,297 | | | 2.950%, 01/15/23 | | | 1,361 | |
| | 1,230 | | | 3.646%, 02/15/24 | | | 1,347 | |
| | 3,935 | | | 4.163%, 07/15/22 | | | 4,430 | |
| | 1,435 | | | 4.300%, 06/15/42 | | | 1,640 | |
| | 919 | | | 4.821%, 02/01/44 | | | 1,126 | |
| | 186 | | | Union Pacific Railroad Co. 2003 Pass-Through Trust, Series 03-1, 4.698%, 01/02/24 | | | 201 | |
| | 3,380 | | | Union Pacific Railroad Co. 2015-1 Pass-Through Trust, 2.695%, 05/12/27 | | | 3,357 | |
| | | | | | | | |
| | | | | | | 166,489 | |
| | | | | | | | |
| | | | Trading Companies & Distributors — 0.1% | | | | |
| | | | Air Lease Corp., | | | | |
| | 6,266 | | | 3.000%, 09/15/23 | | | 6,201 | |
| | 4,000 | | | 3.875%, 04/01/21 | | | 4,215 | |
| | | | WW Grainger, Inc., | | | | |
| | 2,178 | | | 3.750%, 05/15/46 | | | 2,305 | |
| | 4,364 | | | 4.600%, 06/15/45 | | | 5,220 | |
| | | | | | | | |
| | | | | | | 17,941 | |
| | | | | | | | |
| | | | Total Industrials | | | 487,458 | |
| | | | | | | | |
| | | | Information Technology — 1.4% | | | | |
| | | | Communications Equipment — 0.1% | | | | |
| | | | Cisco Systems, Inc., | | | | |
| | 3,488 | | | 2.600%, 02/28/23 | | | 3,640 | |
| | 1,479 | | | 2.900%, 03/04/21 | | | 1,561 | |
| | 1,822 | | | 2.950%, 02/28/26 | | | 1,944 | |
| | 6,539 | | | 3.000%, 06/15/22 | | | 6,973 | |
| | 4,500 | | | 3.625%, 03/04/24 | | | 5,001 | |
| | 4,179 | | | 5.500%, 01/15/40 | | | 5,532 | |
| | 4,475 | | | 5.900%, 02/15/39 | | | 6,162 | |
| | 7,570 | | | Harris Corp., 3.832%, 04/27/25 | | | 8,018 | |
| | | | | | | | |
| | | | | | | 38,831 | |
| | | | | | | | |
| | | | Electronic Equipment, Instruments & Components — 0.1% | |
| | | | Arrow Electronics, Inc., | | | | |
| | 1,712 | | | 3.000%, 03/01/18 | | | 1,734 | |
SEE NOTES TO FINANCIAL STATEMENTS.
| | | | | | | | |
| | | |
| AUGUST 31, 2016 | | J.P. MORGAN INCOME FUNDS | | | | | 79 | |
JPMorgan Core Bond Fund
SCHEDULE OF PORTFOLIO INVESTMENTS
AS OF AUGUST 31, 2016 (Unaudited) (continued)
(Amounts in thousands)
| | | | | | | | |
PRINCIPAL
AMOUNT($) | | | SECURITY DESCRIPTION | | VALUE($) | |
| Corporate Bonds — continued | |
| | | | Electronic Equipment, Instruments & Components — continued | |
| | 1,595 | | | 4.500%, 03/01/23 | | | 1,695 | |
| | 4,157 | | | 6.000%, 04/01/20 | | | 4,584 | |
| | 2,421 | | | 6.875%, 06/01/18 | | | 2,587 | |
| | 11,025 | | | 7.500%, 01/15/27 | | | 13,676 | |
| | | | | | | | |
| | | | | | | 24,276 | |
| | | | | | | | |
| | | | Internet Software & Services — 0.1% | | | | |
| | | | eBay, Inc., | | | | |
| | 9,053 | | | 2.600%, 07/15/22 | | | 9,167 | |
| | 4,006 | | | 3.450%, 08/01/24 | | | 4,171 | |
| | 1,851 | | | 4.000%, 07/15/42 | | | 1,742 | |
| | | | | | | | |
| | | | | | | 15,080 | |
| | | | | | | | |
| | | | IT Services — 0.2% | | | | |
| | 2,170 | | | HP Enterprise Services LLC, 7.450%, 10/15/29 | | | 2,628 | |
| | | | International Business Machines Corp., | | | | |
| | 4,972 | | | 1.800%, 05/17/19 | | | 5,048 | |
| | 23,206 | | | 2.250%, 02/19/21 | | | 23,891 | |
| | 683 | | | 4.000%, 06/20/42 | | | 729 | |
| | 592 | | | 6.220%, 08/01/27 | | | 786 | |
| | 7,578 | | | 7.625%, 10/15/18 | | | 8,569 | |
| | 2,620 | | | Total System Services, Inc., 4.800%, 04/01/26 | | | 2,894 | |
| | | | Xerox Corp., | | | | |
| | 1,759 | | | 2.950%, 03/15/17 | | | 1,771 | |
| | 2,370 | | | 5.625%, 12/15/19 | | | 2,565 | |
| | 2,870 | | | 6.750%, 02/01/17 | | | 2,930 | |
| | | | | | | | |
| | | | | | | 51,811 | |
| | | | | | | | |
| | | | Semiconductors & Semiconductor Equipment — 0.1% | |
| | | | Intel Corp., | | | | |
| | 2,105 | | | 3.100%, 07/29/22 | | | 2,247 | |
| | 2,274 | | | 3.300%, 10/01/21 | | | 2,454 | |
| | 4,598 | | | 3.700%, 07/29/25 | | | 5,118 | |
| | 8,173 | | | 4.000%, 12/15/32 | | | 9,093 | |
| | 3,089 | | | 4.900%, 07/29/45 | | | 3,753 | |
| | 7,430 | | | National Semiconductor Corp., 6.600%, 06/15/17 | | | 7,753 | |
| | 3,769 | | | Texas Instruments, Inc., 1.650%, 08/03/19 | | | 3,815 | |
| | | | | | | | |
| | | | | | | 34,233 | |
| | | | | | | | |
| | | | Software — 0.4% | | | | |
| | 3,121 | | | Intuit, Inc., 5.750%, 03/15/17 | | | 3,197 | |
| | | | Microsoft Corp., | | | | |
| | 2,069 | | | 0.875%, 11/15/17 | | | 2,069 | |
| | | | | | | | |
PRINCIPAL
AMOUNT($) | | | SECURITY DESCRIPTION | | VALUE($) | |
| | | | | | | | |
| | | | Software — continued | | | | |
| | 3,037 | | | 2.125%, 11/15/22 | | | 3,075 | |
| | 4,650 | | | 2.375%, 02/12/22 | | | 4,796 | |
| | 10,221 | | | 2.375%, 05/01/23 | | | 10,486 | |
| | 3,459 | | | 3.500%, 02/12/35 | | | 3,580 | |
| | 7,202 | | | 3.625%, 12/15/23 | | | 7,945 | |
| | 3,620 | | | 4.000%, 02/12/55 | | | 3,813 | |
| | 3,974 | | | 4.200%, 11/03/35 | | | 4,504 | |
| | 1,089 | | | 4.500%, 10/01/40 | | | 1,266 | |
| | 4,348 | | | 4.750%, 11/03/55 | | | 5,183 | |
| | | | Oracle Corp., | | | | |
| | 2,187 | | | 1.900%, 09/15/21 | | | 2,191 | |
| | 5,728 | | | 2.400%, 09/15/23 | | | 5,772 | |
| | 1,928 | | | 2.800%, 07/08/21 | | | 2,018 | |
| | 14,625 | | | 2.950%, 05/15/25 | | | 15,150 | |
| | 1,295 | | | 3.625%, 07/15/23 | | | 1,411 | |
| | 11,695 | | | 3.850%, 07/15/36 | | | 12,331 | |
| | 1,880 | | | 3.900%, 05/15/35 | | | 1,983 | |
| | 3,085 | | | 4.300%, 07/08/34 | | | 3,422 | |
| | 14,500 | | | 4.375%, 05/15/55 | | | 15,777 | |
| | 4,753 | | | 5.000%, 07/08/19 | | | 5,237 | |
| | 3,049 | | | 5.750%, 04/15/18 | | | 3,275 | |
| | 2,300 | | | 6.125%, 07/08/39 | | | 3,152 | |
| | 1,749 | | | 6.500%, 04/15/38 | | | 2,468 | |
| | | | | | | | |
| | | | | | | 124,101 | |
| | | | | | | | |
| | | | Technology Hardware, Storage & Peripherals — 0.4% | |
| | | | Apple, Inc., | | | | |
| | 12,381 | | | 2.150%, 02/09/22 | | | 12,626 | |
| | 15,286 | | | 2.400%, 05/03/23 | | | 15,647 | |
| | 5,261 | | | 2.450%, 08/04/26 | | | 5,275 | |
| | 13,459 | | | 2.850%, 05/06/21 | | | 14,195 | |
| | 12,828 | | | 3.200%, 05/13/25 | | | 13,707 | |
| | 798 | | | 3.250%, 02/23/26 | | | 852 | |
| | 4,375 | | | 3.450%, 02/09/45 | | | 4,302 | |
| | 3,512 | | | 3.850%, 08/04/46 | | | 3,640 | |
| | 4,257 | | | 4.500%, 02/23/36 | | | 4,919 | |
| | 6,866 | | | VAR, 1.009%, 05/03/18 | | | 6,885 | |
| | 1,704 | | | Dell, Inc., 7.100%, 04/15/28 | | | 1,772 | |
| | | | Diamond 1 Finance Corp./Diamond 2 Finance Corp., | | | | |
| | 4,134 | | | 4.420%, 06/15/21 (e) | | | 4,325 | |
| | 6,612 | | | 5.450%, 06/15/23 (e) | | | 7,044 | |
| | 5,662 | | | 6.020%, 06/15/26 (e) | | | 6,070 | |
| | | | HP, Inc., | | | | |
| | 3,233 | | | 4.300%, 06/01/21 | | | 3,488 | |
SEE NOTES TO FINANCIAL STATEMENTS.
| | | | | | |
| | | |
| 80 | | | | J.P. MORGAN INCOME FUNDS | | AUGUST 31, 2016 |
| | | | | | | | |
PRINCIPAL
AMOUNT($) | | | SECURITY DESCRIPTION | | VALUE($) | |
| Corporate Bonds — continued | |
| | | | Technology Hardware, Storage & Peripherals — continued | |
| | 2,541 | | | 4.375%, 09/15/21 | | | 2,738 | |
| | 2,837 | | | 4.650%, 12/09/21 | | | 3,104 | |
| | 6,352 | | | 6.000%, 09/15/41 | | | 6,552 | |
| | | | | | | | |
| | | | | | | 117,141 | |
| | | | | | | | |
| | | | Total Information Technology | | | 405,473 | |
| | | | | | | | |
| | | | Materials — 0.6% | | | | |
| | | | Chemicals — 0.4% | | | | |
| | | | Agrium, Inc., (Canada), | | | | |
| | 3,196 | | | 3.375%, 03/15/25 | | | 3,286 | |
| | 3,557 | | | 4.125%, 03/15/35 | | | 3,509 | |
| | 4,962 | | | 5.250%, 01/15/45 | | | 5,523 | |
| | 9,510 | | | CF Industries, Inc., 7.125%, 05/01/20 | | | 10,935 | |
| | | | Dow Chemical Co. (The), | | | | |
| | 7,954 | | | 3.000%, 11/15/22 | | | 8,234 | |
| | 5,750 | | | 3.500%, 10/01/24 | | | 6,097 | |
| | 4,058 | | | 4.125%, 11/15/21 | | | 4,437 | |
| | 1,727 | | | 5.250%, 11/15/41 | | | 1,979 | |
| | 1,206 | | | 7.375%, 11/01/29 | | | 1,641 | |
| | 875 | | | 8.550%, 05/15/19 | | | 1,032 | |
| | | | E.I. du Pont de Nemours & Co., | | | | |
| | 1,396 | | | 4.900%, 01/15/41 | | | 1,605 | |
| | 1,345 | | | 5.600%, 12/15/36 | | | 1,666 | |
| | | | Ecolab, Inc., | | | | |
| | 3,672 | | | 1.450%, 12/08/17 | | | 3,682 | |
| | 3,636 | | | 3.250%, 01/14/23 | | | 3,798 | |
| | 897 | | | 5.500%, 12/08/41 | | | 1,128 | |
| | 2,459 | | | Monsanto Co., 4.700%, 07/15/64 | | | 2,364 | |
| | | | Mosaic Co. (The), | | | | |
| | 1,974 | | | 3.750%, 11/15/21 | | | 2,082 | |
| | 7,080 | | | 4.250%, 11/15/23 | | | 7,550 | |
| | 449 | | | 4.875%, 11/15/41 | | | 445 | |
| | 5,054 | | | 5.450%, 11/15/33 | | | 5,541 | |
| | 5,233 | | | 5.625%, 11/15/43 | | | 5,740 | |
| | | | Potash Corp. of Saskatchewan, Inc., (Canada), | | | | |
| | 2,326 | | | 3.000%, 04/01/25 | | | 2,360 | |
| | 269 | | | 3.250%, 12/01/17 | | | 275 | |
| | 3,408 | | | 6.500%, 05/15/19 | | | 3,825 | |
| | | | PPG Industries, Inc., | | | | |
| | 1,026 | | | 5.500%, 11/15/40 | | | 1,278 | |
| | 972 | | | 6.650%, 03/15/18 | | | 1,041 | |
| | 1,883 | | | 9.000%, 05/01/21 | | | 2,411 | |
| | 2,612 | | | Praxair, Inc., 2.650%, 02/05/25 | | | 2,690 | |
| | | | Union Carbide Corp., | | | | |
| | 5,426 | | | 7.500%, 06/01/25 | | | 6,830 | |
| | | | | | | | |
PRINCIPAL
AMOUNT($) | | | SECURITY DESCRIPTION | | VALUE($) | |
| | | | | | | | |
| | | | Chemicals — continued | | | | |
| | 5,919 | | | 7.750%, 10/01/96 | | | 7,485 | |
| | | | | | | | |
| | | | | | | 110,469 | |
| | | | | | | | |
| | | | Construction Materials — 0.0% (g) | | | | |
| | | | CRH America, Inc., | | | | |
| | 2,811 | | | 3.875%, 05/18/25 (e) | | | 3,013 | |
| | 6,052 | | | 5.125%, 05/18/45 (e) | | | 6,777 | |
| | | | | | | | |
| | | | | | | 9,790 | |
| | | | | | | | |
| | | | Containers & Packaging — 0.0% (g) | | | | |
| | | | International Paper Co., | | | | |
| | 6,472 | | | 3.000%, 02/15/27 | | | 6,435 | |
| | 1,670 | | | 5.000%, 09/15/35 | | | 1,865 | |
| | 3,945 | | | 7.300%, 11/15/39 | | | 5,334 | |
| | | | | | | | |
| | | | | | | 13,634 | |
| | | | | | | | |
| | | | Metals & Mining — 0.2% | | | | |
| | | | BHP Billiton Finance USA Ltd., (Australia), | | | | |
| | 6,613 | | | 3.850%, 09/30/23 | | | 7,219 | |
| | 1,600 | | | 5.000%, 09/30/43 | | | 1,910 | |
| | 1,435 | | | 5.400%, 03/29/17 | | | 1,468 | |
| | 2,466 | | | 6.500%, 04/01/19 | | | 2,771 | |
| | | | Freeport-McMoRan, Inc., | | | | |
| | 8,701 | | | 2.150%, 03/01/17 | | | 8,668 | |
| | 6,296 | | | 3.875%, 03/15/23 | | | 5,399 | |
| | 7,646 | | | 5.400%, 11/14/34 | | | 5,964 | |
| | 2,271 | | | 5.450%, 03/15/43 | | | 1,737 | |
| | | | Nucor Corp., | | | | |
| | 1,529 | | | 4.000%, 08/01/23 | | | 1,651 | |
| | 470 | | | 6.400%, 12/01/37 | | | 595 | |
| | 1,767 | | | Placer Dome, Inc., (Canada), 6.450%, 10/15/35 | | | 2,025 | |
| | 1,794 | | | Rio Tinto Finance USA Ltd., (Australia), 9.000%, 05/01/19 | | | 2,134 | |
| | 1,199 | | | TCI Communications, Inc., 7.125%, 02/15/28 | | | 1,702 | |
| | | | Teck Resources Ltd., (Canada), | | | | |
| | 2,865 | | | 3.750%, 02/01/23 | | | 2,456 | |
| | 4,904 | | | 4.750%, 01/15/22 | | | 4,587 | |
| | | | | | | | |
| | | | | | | 50,286 | |
| | | | | | | | |
| | | | Total Materials | | | 184,179 | |
| | | | | | | | |
| | | | Real Estate — 0.6% | | | | |
| | | | Equity Real Estate Investment Trusts (REITs) — 0.6% | |
| | | | American Tower Corp., | | | | |
| | 4,378 | | | 3.375%, 10/15/26 | | | 4,487 | |
| | 2,959 | | | 3.500%, 01/31/23 | | | 3,091 | |
| | 4,995 | | | 4.700%, 03/15/22 | | | 5,527 | |
SEE NOTES TO FINANCIAL STATEMENTS.
| | | | | | | | |
| | | |
| AUGUST 31, 2016 | | J.P. MORGAN INCOME FUNDS | | | | | 81 | |
JPMorgan Core Bond Fund
SCHEDULE OF PORTFOLIO INVESTMENTS
AS OF AUGUST 31, 2016 (Unaudited) (continued)
(Amounts in thousands)
| | | | | | | | |
PRINCIPAL
AMOUNT($) | | | SECURITY DESCRIPTION | | VALUE($) | |
| Corporate Bonds — continued | |
| | | | Equity Real Estate Investment Trusts (REITs) — continued | |
| | 2,270 | | | 5.000%, 02/15/24 | | | 2,594 | |
| | 260 | | | 5.900%, 11/01/21 | | | 303 | |
| | | | American Tower Trust I, | | | | |
| | 3,439 | | | 1.551%, 03/15/18 (e) | | | 3,431 | |
| | 6,220 | | | 3.070%, 03/15/23 (e) | | | 6,468 | |
| | 8,971 | | | AvalonBay Communities, Inc., 2.850%, 03/15/23 | | | 9,137 | |
| | | | Boston Properties LP, | | | | |
| | 3,702 | | | 2.750%, 10/01/26 | | | 3,663 | |
| | 3,155 | | | 3.125%, 09/01/23 | | | 3,267 | |
| | 3,157 | | | 3.650%, 02/01/26 | | | 3,368 | |
| | 4,550 | | | Brixmor Operating Partnership LP, 3.850%, 02/01/25 | | | 4,636 | |
| | | | Crown Castle International Corp., | | | | |
| | 3,703 | | | 2.250%, 09/01/21 | | | 3,697 | |
| | 7,500 | | | 4.875%, 04/15/22 | | | 8,368 | |
| | 2,900 | | | 5.250%, 01/15/23 | | | 3,312 | |
| | 1,814 | | | Duke Realty LP, 3.250%, 06/30/26 | | | 1,862 | |
| | | | Equity Commonwealth, | | | | |
| | 6,287 | | | 5.875%, 09/15/20 | | | 6,956 | |
| | 3,489 | | | 6.650%, 01/15/18 | | | 3,618 | |
| | | | ERP Operating LP, | | | | |
| | 7,000 | | | 3.000%, 04/15/23 | | | 7,199 | |
| | 2,255 | | | 4.625%, 12/15/21 | | | 2,527 | |
| | | | HCP, Inc., | | | | |
| | 2,651 | | | 3.400%, 02/01/25 | | | 2,613 | |
| | 8,366 | | | 3.875%, 08/15/24 | | | 8,560 | |
| | 1,349 | | | 4.200%, 03/01/24 | | | 1,411 | |
| | 6,353 | | | 4.250%, 11/15/23 | | | 6,694 | |
| | 5,043 | | | National Retail Properties, Inc., 4.000%, 11/15/25 | | | 5,407 | |
| | | | Prologis LP, | | | | |
| | 2,653 | | | 3.750%, 11/01/25 | | | 2,865 | |
| | 2,987 | | | 4.250%, 08/15/23 | | | 3,312 | |
| | 4,610 | | | Scentre Group Trust 1/Scentre Group Trust 2, (Australia), 3.500%, 02/12/25 (e) | | | 4,818 | |
| | | | Simon Property Group LP, | | | | |
| | 8,221 | | | 2.150%, 09/15/17 | | | 8,284 | |
| | 3,410 | | | 3.375%, 10/01/24 | | | 3,656 | |
| | 2,090 | | | 3.750%, 02/01/24 | | | 2,282 | |
| | 3,838 | | | 4.125%, 12/01/21 | | | 4,241 | |
| | 3,138 | | | 4.375%, 03/01/21 | | | 3,472 | |
| | 3,081 | | | UDR, Inc., 2.950%, 09/01/26 | | | 3,094 | |
| | | | Ventas Realty LP, | | | | |
| | 1,350 | | | 3.125%, 06/15/23 | | | 1,376 | |
| | 1,929 | | | 3.500%, 02/01/25 | | | 1,999 | |
| | | | | | | | |
PRINCIPAL
AMOUNT($) | | | SECURITY DESCRIPTION | | VALUE($) | |
| | | | | | | | |
| | | | Equity Real Estate Investment Trusts (REITs) — continued | |
| | 2,382 | | | 3.750%, 05/01/24 | | | 2,498 | |
| | 2,746 | | | 4.125%, 01/15/26 | | | 2,973 | |
| | | | Welltower, Inc., | | | | |
| | 1,639 | | | 4.000%, 06/01/25 | | | 1,754 | |
| | 4,002 | | | 4.500%, 01/15/24 | | | 4,386 | |
| | | | | | | | |
| | | | Total Real Estate | | | 163,206 | |
| | | | | | | | |
| | | | Telecommunication Services — 1.4% | | | | |
| | | | Diversified Telecommunication Services — 1.3% | |
| | | | AT&T, Inc., | | | | |
| | 29,467 | | | 3.000%, 06/30/22 | | | 30,358 | |
| | 7,297 | | | 3.400%, 05/15/25 | | | 7,513 | |
| | 13,847 | | | 3.600%, 02/17/23 | | | 14,617 | |
| | 9,257 | | | 3.800%, 03/15/22 | | | 9,929 | |
| | 2,086 | | | 3.875%, 08/15/21 | | | 2,261 | |
| | 2,245 | | | 3.950%, 01/15/25 | | | 2,406 | |
| | 9,748 | | | 4.300%, 12/15/42 | | | 9,792 | |
| | 4,439 | | | 4.350%, 06/15/45 | | | 4,474 | |
| | 5,022 | | | 4.600%, 02/15/21 | | | 5,521 | |
| | 3,777 | | | 4.750%, 05/15/46 | | | 4,039 | |
| | 12,806 | | | 5.350%, 09/01/40 | | | 14,631 | |
| | 4,722 | | | 5.500%, 02/01/18 | | | 4,989 | |
| | 11,179 | | | 6.000%, 08/15/40 | | | 13,542 | |
| | 6,457 | | | 6.300%, 01/15/38 | | | 8,164 | |
| | 2,861 | | | 6.375%, 03/01/41 | | | 3,638 | |
| | 1,091 | | | 6.500%, 09/01/37 | | | 1,419 | |
| | 1,600 | | | Bellsouth Capital Funding Corp., 7.875%, 02/15/30 | | | 2,203 | |
| | 15,000 | | | BellSouth LLC, 6.550%, 06/15/34 | | | 17,924 | |
| | | | British Telecommunications plc, (United Kingdom), | | | | |
| | 2,203 | | | 2.350%, 02/14/19 | | | 2,249 | |
| | 2,511 | | | 5.950%, 01/15/18 | | | 2,668 | |
| | 879 | | | 9.375%, 12/15/30 | | | 1,434 | |
| | 4,036 | | | Centel Capital Corp., 9.000%, 10/15/19 | | | 4,670 | |
| | | | Deutsche Telekom International Finance B.V., (Netherlands), | | | | |
| | 2,291 | | | 2.250%, 03/06/17 (e) | | | 2,305 | |
| | 2,087 | | | 4.875%, 03/06/42 (e) | | | 2,476 | |
| | 1,816 | | | 6.000%, 07/08/19 | | | 2,038 | |
| | 5,201 | | | 8.750%, 06/15/30 | | | 8,130 | |
| | | | GTP Acquisition Partners I LLC, | | | | |
| | 10,038 | | | 2.350%, 06/15/20 (e) | | | 9,977 | |
| | 11,667 | | | 3.482%, 06/16/25 (e) | | | 12,162 | |
| | 2,063 | | | Nippon Telegraph & Telephone Corp., (Japan), 1.400%, 07/18/17 | | | 2,068 | |
SEE NOTES TO FINANCIAL STATEMENTS.
| | | | | | |
| | | |
| 82 | | | | J.P. MORGAN INCOME FUNDS | | AUGUST 31, 2016 |
| | | | | | | | |
PRINCIPAL
AMOUNT($) | | | SECURITY DESCRIPTION | | VALUE($) | |
| Corporate Bonds — continued | |
| | | | Diversified Telecommunication Services — continued | |
| | | | Orange S.A., (France), | | | | |
| | 3,799 | | | 2.750%, 09/14/16 | | | 3,801 | |
| | 6,382 | | | 9.000%, 03/01/31 | | | 10,229 | |
| | 7,308 | | | Qwest Corp., 6.750%, 12/01/21 | | | 8,150 | |
| | | | Telefonica Emisiones S.A.U., (Spain), | | | | |
| | 1,916 | | | 3.192%, 04/27/18 | | | 1,965 | |
| | 150 | | | 4.570%, 04/27/23 | | | 169 | |
| | 4,358 | | | 5.134%, 04/27/20 | | | 4,833 | |
| | 2,025 | | | 5.462%, 02/16/21 | | | 2,311 | |
| | | | Verizon Communications, Inc., | | | | |
| | 1,790 | | | 2.625%, 02/21/20 | | | 1,846 | |
| | 10,870 | | | 2.625%, 08/15/26 | | | 10,755 | |
| | 6,192 | | | 3.500%, 11/01/21 | | | 6,655 | |
| | 15,346 | | | 3.500%, 11/01/24 | | | 16,456 | |
| | 11,683 | | | 4.150%, 03/15/24 | | | 12,975 | |
| | 3,373 | | | 4.272%, 01/15/36 | | | 3,542 | |
| | 13,420 | | | 4.400%, 11/01/34 | | | 14,269 | |
| | 9,294 | | | 4.500%, 09/15/20 | | | 10,257 | |
| | 3,993 | | | 4.522%, 09/15/48 | | | 4,234 | |
| | 5,210 | | | 4.672%, 03/15/55 | | | 5,418 | |
| | 28,901 | | | 4.862%, 08/21/46 | | | 32,132 | |
| | 3,895 | | | 5.012%, 08/21/54 | | | 4,271 | |
| | 16,811 | | | 5.150%, 09/15/23 | | | 19,649 | |
| | 4,094 | | | 5.850%, 09/15/35 | | | 5,115 | |
| | | | | | | | |
| | | | | | | 386,629 | |
| | | | | | | | |
| | | | Wireless Telecommunication Services — 0.1% | |
| | | | America Movil S.A.B. de C.V., (Mexico), | | | | |
| | 3,833 | | | 2.375%, 09/08/16 | | | 3,814 | |
| | 3,250 | | | 3.125%, 07/16/22 | | | 3,364 | |
| | 2,457 | | | 6.125%, 03/30/40 | | | 3,083 | |
| | | | Rogers Communications, Inc., (Canada), | | | | |
| | 8,302 | | | 4.100%, 10/01/23 | | | 9,232 | |
| | 2,242 | | | 8.750%, 05/01/32 | | | 3,318 | |
| | | | Vodafone Group plc, (United Kingdom), | | | | |
| | 10,583 | | | 1.500%, 02/19/18 | | | 10,582 | |
| | 3,676 | | | 1.625%, 03/20/17 | | | 3,684 | |
| | 675 | | | 2.950%, 02/19/23 | | | 699 | |
| | | | | | | | |
| | | | | | | 37,776 | |
| | | | | | | | |
| | | | Total Telecommunication Services | | | 424,405 | |
| | | | | | | | |
| | | | Utilities — 1.9% | | | | |
| | | | Electric Utilities — 1.3% | | | | |
| | | | Alabama Power Co., | | | | |
| | 1,644 | | | 3.750%, 03/01/45 | | | 1,741 | |
| | | | | | | | |
PRINCIPAL
AMOUNT($) | | | SECURITY DESCRIPTION | | VALUE($) | |
| | | | | | | | |
| | | | Electric Utilities — continued | | | | |
| | 769 | | | 6.000%, 03/01/39 | | | 1,028 | |
| | 1,904 | | | 6.125%, 05/15/38 | | | 2,581 | |
| | 2,134 | | | American Electric Power Co., Inc., 1.650%, 12/15/17 | | | 2,138 | |
| | 3,740 | | | Appalachian Power Co., Series P, 6.700%, 08/15/37 | | | 5,027 | |
| | | | Arizona Public Service Co., | | | | |
| | 748 | | | 2.200%, 01/15/20 | | | 759 | |
| | 1,923 | | | 4.500%, 04/01/42 | | | 2,281 | |
| | 3,036 | | | 5.050%, 09/01/41 | | | 3,800 | |
| | | | Baltimore Gas & Electric Co., | | | | |
| | 4,419 | | | 2.800%, 08/15/22 | | | 4,616 | |
| | 3,755 | | | 3.500%, 08/15/46 | | | 3,821 | |
| | | | Cleveland Electric Illuminating Co. (The), | | | | |
| | 840 | | | 5.950%, 12/15/36 | | | 974 | |
| | 3,094 | | | Series D, 7.880%, 11/01/17 | | | 3,305 | |
| | 4,791 | | | Comision Federal de Electricidad, (Mexico), 4.875%, 05/26/21 (e) | | | 5,146 | |
| | 3,615 | | | Commonwealth Edison Co., 3.650%, 06/15/46 | | | 3,818 | |
| | 830 | | | Connecticut Light & Power Co. (The), 5.650%, 05/01/18 | | | 890 | |
| | 1,687 | | | DTE Electric Co., 2.650%, 06/15/22 | | | 1,746 | |
| | | | Duke Energy Carolinas LLC, | | | | |
| | 1,228 | | | 4.250%, 12/15/41 | | | 1,400 | |
| | 1,786 | | | 4.300%, 06/15/20 | | | 1,973 | |
| | 1,256 | | | 5.100%, 04/15/18 | | | 1,335 | |
| | 1,397 | | | 6.000%, 01/15/38 | | | 1,913 | |
| | | | Duke Energy Corp., | | | | |
| | 3,812 | | | 2.150%, 11/15/16 | | | 3,821 | |
| | 1,382 | | | 2.650%, 09/01/26 | | | 1,375 | |
| | 2,660 | | | 3.550%, 09/15/21 | | | 2,852 | |
| | | | Duke Energy Florida LLC, | | | | |
| | 1,009 | | | 5.650%, 06/15/18 | | | 1,087 | |
| | 628 | | | 6.400%, 06/15/38 | | | 897 | |
| | | | Duke Energy Indiana LLC, | | | | |
| | 3,462 | | | 3.750%, 07/15/20 | | | 3,740 | |
| | 4,500 | | | 3.750%, 05/15/46 | | | 4,755 | |
| | 2,780 | | | 6.350%, 08/15/38 | | | 3,943 | |
| | 3,297 | | | Duke Energy Ohio, Inc., 3.700%, 06/15/46 | | | 3,472 | |
| | | | Duke Energy Progress LLC, | | | | |
| | 2,911 | | | 2.800%, 05/15/22 | | | 3,045 | |
| | 3,230 | | | 3.000%, 09/15/21 | | | 3,424 | |
| | 2,985 | | | 3.250%, 08/15/25 | | | 3,212 | |
| | 1,886 | | | 4.100%, 05/15/42 | | | 2,094 | |
| | 1,569 | | | 4.100%, 03/15/43 | | | 1,739 | |
SEE NOTES TO FINANCIAL STATEMENTS.
| | | | | | | | |
| | | |
| AUGUST 31, 2016 | | J.P. MORGAN INCOME FUNDS | | | | | 83 | |
JPMorgan Core Bond Fund
SCHEDULE OF PORTFOLIO INVESTMENTS
AS OF AUGUST 31, 2016 (Unaudited) (continued)
(Amounts in thousands)
| | | | | | | | |
PRINCIPAL
AMOUNT($) | | | SECURITY DESCRIPTION | | VALUE($) | |
| Corporate Bonds — continued | |
| | | | Electric Utilities — continued | | | | |
| | 2,258 | | | 4.150%, 12/01/44 | | | 2,551 | |
| | 1,794 | | | 5.300%, 01/15/19 | | | 1,956 | |
| | | | Electricite de France S.A., (France), | | | | |
| | 3,961 | | | 2.150%, 01/22/19 (e) | | | 4,011 | |
| | 6,600 | | | 6.000%, 01/22/144 (e) | | | 7,216 | |
| | | | Enel Finance International N.V., (Netherlands), | | | | |
| | 5,408 | | | 5.125%, 10/07/19 (e) | | | 5,938 | |
| | 897 | | | 6.000%, 10/07/39 (e) | | | 1,114 | |
| | 2,631 | | | Entergy Arkansas, Inc., 3.500%, 04/01/26 | | | 2,863 | |
| | 2,469 | | | Entergy Corp., 2.950%, 09/01/26 | | | 2,490 | |
| | | | Entergy Louisiana LLC, | | | | |
| | 4,606 | | | 3.050%, 06/01/31 | | | 4,698 | |
| | 1,551 | | | 3.250%, 04/01/28 | | | 1,650 | |
| | 3,688 | | | Entergy Mississippi, Inc., 2.850%, 06/01/28 | | | 3,771 | |
| | 2,674 | | | Exelon Corp., 3.400%, 04/15/26 | | | 2,815 | |
| | | | Florida Power & Light Co., | | | | |
| | 493 | | | 5.625%, 04/01/34 | | | 649 | |
| | 897 | | | 5.950%, 02/01/38 | | | 1,246 | |
| | 359 | | | Georgia Power Co., 5.950%, 02/01/39 | | | 476 | |
| | 4,351 | | | Great Plains Energy, Inc., 4.850%, 06/01/21 | | | 4,751 | |
| | | | Hydro-Quebec, (Canada), | | | | |
| | 1,614 | | | 9.400%, 02/01/21 | | | 2,096 | |
| | 7,174 | | | Series HY, 8.400%, 01/15/22 | | | 9,366 | |
| | 2,642 | | | Series IO, 8.050%, 07/07/24 | | | 3,653 | |
| | | | Indiana Michigan Power Co., | | | | |
| | 973 | | | 7.000%, 03/15/19 | | | 1,094 | |
| | 8,609 | | | Series J, 3.200%, 03/15/23 | | | 8,974 | |
| | 269 | | | Jersey Central Power & Light Co., 7.350%, 02/01/19 | | | 301 | |
| | 3,968 | | | John Sevier Combined Cycle Generation LLC, 4.626%, 01/15/42 | | | 4,654 | |
| | | | Kansas City Power & Light Co., | | | | |
| | 3,255 | | | 3.150%, 03/15/23 | | | 3,318 | |
| | 8,968 | | | 5.300%, 10/01/41 | | | 10,748 | |
| | 2,759 | | | Louisville Gas & Electric Co., Series 25, 3.300%, 10/01/25 | | | 2,957 | |
| | 4,957 | | | Massachusetts Electric Co., 4.004%, 08/15/46 (e) | | | 5,181 | |
| | 628 | | | MidAmerican Energy Co., 5.300%, 03/15/18 | | | 667 | |
| | | | Nevada Power Co., | | | | |
| | 329 | | | 5.375%, 09/15/40 | | | 410 | |
| | 3,354 | | | 5.450%, 05/15/41 | | | 4,331 | |
| | 2,018 | | | 6.500%, 08/01/18 | | | 2,210 | |
| | 1,637 | | | 7.125%, 03/15/19 | | | 1,868 | |
| | 700 | | | Series N, 6.650%, 04/01/36 | | | 965 | |
| | | | | | | | |
PRINCIPAL
AMOUNT($) | | | SECURITY DESCRIPTION | | VALUE($) | |
| | | | | | | | |
| | | | Electric Utilities — continued | | | | |
| | | | NextEra Energy Capital Holdings, Inc., | | | | |
| | 2,651 | | | 2.400%, 09/15/19 | | | 2,695 | |
| | 1,076 | | | 6.000%, 03/01/19 | | | 1,184 | |
| | | | Niagara Mohawk Power Corp., | | | | |
| | 3,051 | | | 3.508%, 10/01/24 (e) | | | 3,284 | |
| | 1,457 | | | 4.881%, 08/15/19 (e) | | | 1,591 | |
| | 2,242 | | | Northern States Power Co., 6.250%, 06/01/36 | | | 3,147 | |
| | 780 | | | Ohio Edison Co., 6.875%, 07/15/36 | | | 1,030 | |
| | | | Ohio Power Co., | | | | |
| | 1,390 | | | 6.050%, 05/01/18 | | | 1,488 | |
| | 560 | | | Series M, 5.375%, 10/01/21 | | | 637 | |
| | | | Oncor Electric Delivery Co. LLC, | | | | |
| | 5,515 | | | 6.800%, 09/01/18 | | | 6,076 | |
| | 1,076 | | | 7.000%, 09/01/22 | | | 1,365 | |
| | | | Pacific Gas & Electric Co., | | | | |
| | 5,047 | | | 2.450%, 08/15/22 | | | 5,169 | |
| | 3,349 | | | 2.950%, 03/01/26 | | | 3,493 | |
| | 1,265 | | | 3.250%, 09/15/21 | | | 1,340 | |
| | 1,794 | | | 3.250%, 06/15/23 | | | 1,907 | |
| | 5,781 | | | 3.500%, 06/15/25 | | | 6,290 | |
| | 1,681 | | | 4.450%, 04/15/42 | | | 1,934 | |
| | 6,511 | | | 4.500%, 12/15/41 | | | 7,535 | |
| | 650 | | | 4.600%, 06/15/43 | | | 767 | |
| | 1,776 | | | 5.625%, 11/30/17 | | | 1,870 | |
| | 399 | | | 6.050%, 03/01/34 | | | 540 | |
| | 673 | | | 8.250%, 10/15/18 | | | 765 | |
| | | | PacifiCorp, | | | | |
| | 2,765 | | | 3.600%, 04/01/24 | | | 3,022 | |
| | 897 | | | 3.850%, 06/15/21 | | | 979 | |
| | 224 | | | 5.500%, 01/15/19 | | | 245 | |
| | 2,556 | | | 5.650%, 07/15/18 | | | 2,762 | |
| | | | PECO Energy Co., | | | | |
| | 5,022 | | | 2.375%, 09/15/22 | | | 5,118 | |
| | 807 | | | 5.350%, 03/01/18 | | | 855 | |
| | 807 | | | Pennsylvania Electric Co., 6.050%, 09/01/17 | | | 839 | |
| | 1,184 | | | Potomac Electric Power Co., 6.500%, 11/15/37 | | | 1,699 | |
| | 1,543 | | | PPL Electric Utilities Corp., 2.500%, 09/01/22 | | | 1,576 | |
| | | | Progress Energy, Inc., | | | | |
| | 3,380 | | | 3.150%, 04/01/22 | | | 3,550 | |
| | 3,388 | | | 4.400%, 01/15/21 | | | 3,716 | |
| | 2,600 | | | 7.000%, 10/30/31 | | | 3,526 | |
| | 1,327 | | | 7.750%, 03/01/31 | | | 1,876 | |
SEE NOTES TO FINANCIAL STATEMENTS.
| | | | | | |
| | | |
| 84 | | | | J.P. MORGAN INCOME FUNDS | | AUGUST 31, 2016 |
| | | | | | | | |
PRINCIPAL
AMOUNT($) | | | SECURITY DESCRIPTION | | VALUE($) | |
| Corporate Bonds — continued | |
| | | | Electric Utilities — continued | | | | |
| | | | Public Service Co. of Colorado, | | | | |
| | 1,821 | | | 2.250%, 09/15/22 | | | 1,858 | |
| | 1,040 | | | 3.200%, 11/15/20 | | | 1,103 | |
| | 1,175 | | | 3.550%, 06/15/46 | | | 1,235 | |
| | 247 | | | 5.800%, 08/01/18 | | | 268 | |
| | | | Public Service Co. of Oklahoma, | | | | |
| | 1,761 | | | 4.400%, 02/01/21 | | | 1,916 | |
| | 1,242 | | | 5.150%, 12/01/19 | | | 1,368 | |
| | 3,901 | | | Series G, 6.625%, 11/15/37 | | | 5,143 | |
| | | | Public Service Electric & Gas Co., | | | | |
| | 6,334 | | | 3.000%, 05/15/25 | | | 6,709 | |
| | 1,021 | | | 5.375%, 11/01/39 | | | 1,331 | |
| | 740 | | | Series I, 1.800%, 06/01/19 | | | 748 | |
| | 387 | | | South Carolina Electric & Gas Co., 4.500%, 06/01/64 | | | 413 | |
| | | | Southern California Edison Co., | | | | |
| | 1,928 | | | 1.845%, 02/01/22 | | | 1,929 | |
| | 886 | | | 3.875%, 06/01/21 | | | 970 | |
| | 3,408 | | | 3.900%, 12/01/41 | | | 3,697 | |
| | 1,256 | | | 5.500%, 08/15/18 | | | 1,361 | |
| | 895 | | | 6.000%, 01/15/34 | | | 1,204 | |
| | 2,197 | | | 6.050%, 03/15/39 | | | 3,071 | |
| | 578 | | | Series 08-A, 5.950%, 02/01/38 | | | 798 | |
| | 2,854 | | | Series C, 3.500%, 10/01/23 | | | 3,110 | |
| | 2,666 | | | Southern Co. (The), 1.950%, 09/01/16 | | | 2,666 | |
| | | | Southwestern Public Service Co., | | | | |
| | 2,700 | | | 4.500%, 08/15/41 | | | 3,166 | |
| | 3,049 | | | Series G, 8.750%, 12/01/18 | | | 3,526 | |
| | 2,095 | | | State Grid Overseas Investment 2013 Ltd., (United Kingdom), 1.750%, 05/22/18 (e) | | | 2,098 | |
| | 2,482 | | | Three Gorges Finance I Cayman Islands Ltd., (Cayman Islands), 3.150%, 06/02/26 (e) | | | 2,552 | |
| | 5,800 | | | Toledo Edison Co. (The), 6.150%, 05/15/37 | | | 7,261 | |
| | | | Virginia Electric & Power Co., | | | | |
| | 696 | | | 2.950%, 01/15/22 | | | 731 | |
| | 1,280 | | | 3.450%, 02/15/24 | | | 1,393 | |
| | 4,842 | | | 5.400%, 04/30/18 | | | 5,161 | |
| | 2,100 | | | Series A, 6.000%, 05/15/37 | | | 2,840 | |
| | 234 | | | Wisconsin Electric Power Co., 2.950%, 09/15/21 | | | 247 | |
| | | | Xcel Energy, Inc., | | | | |
| | 3,656 | | | 3.300%, 06/01/25 | | | 3,867 | |
| | 539 | | | 4.700%, 05/15/20 | | | 589 | |
| | 829 | | | 4.800%, 09/15/41 | | | 997 | |
| | 6,254 | | | 6.500%, 07/01/36 | | | 8,660 | |
| | | | | | | | |
| | | | | | | 368,592 | |
| | | | | | | | |
| | | | | | | | |
PRINCIPAL
AMOUNT($) | | | SECURITY DESCRIPTION | | VALUE($) | |
| | | | | | | | |
| | | | Gas Utilities — 0.1% | | | | |
| | | | Atmos Energy Corp., | | | | |
| | 1,750 | | | 4.125%, 10/15/44 | | | 1,944 | |
| | 7,215 | | | 4.150%, 01/15/43 | | | 7,922 | |
| | 619 | | | 8.500%, 03/15/19 | | | 722 | |
| | 2,201 | | | Boston Gas Co., 4.487%, 02/15/42 (e) | | | 2,452 | |
| | 1,372 | | | CenterPoint Energy Resources Corp., 4.500%, 01/15/21 | | | 1,486 | |
| | 2,214 | | | Dominion Gas Holdings LLC, 2.800%, 11/15/20 | | | 2,286 | |
| | 4,242 | | | KeySpan Gas East Corp., 2.742%, 08/15/26 (e) | | | 4,308 | |
| | 4,862 | | | Korea Gas Corp., (South Korea), 1.875%, 07/18/21 (e) | | | 4,887 | |
| | | | | | | | |
| | | | | | | 26,007 | |
| | | | | | | | |
| | | | Independent Power & Renewable Electricity Producers — 0.1% | |
| | | | Exelon Generation Co. LLC, | | | | |
| | 2,100 | | | 2.950%, 01/15/20 | | | 2,159 | |
| | 5,381 | | | 4.000%, 10/01/20 | | | 5,736 | |
| | 1,665 | | | 5.750%, 10/01/41 | | | 1,815 | |
| | | | PSEG Power LLC, | | | | |
| | 2,879 | | | 4.150%, 09/15/21 | | | 3,077 | |
| | 2,456 | | | 4.300%, 11/15/23 | | | 2,654 | |
| | 1,125 | | | 8.625%, 04/15/31 | | | 1,479 | |
| | | | Southern Power Co., | | | | |
| | 3,108 | | | 4.150%, 12/01/25 | | | 3,360 | |
| | 3,879 | | | 5.150%, 09/15/41 | | | 4,279 | |
| | 3,222 | | | Tri-State Generation & Transmission Association, Inc., 4.250%, 06/01/46 | | | 3,459 | |
| | | | | | | | |
| | | | | | | 28,018 | |
| | | | | | | | |
| | | | Multi-Utilities — 0.4% | | | | |
| | 1,457 | | | Berkshire Hathaway Energy Co., 5.750%, 04/01/18 | | | 1,557 | |
| | 3,390 | | | CenterPoint Energy, Inc., 6.500%, 05/01/18 | | | 3,631 | |
| | | | CMS Energy Corp., | | | | |
| | 3,458 | | | 3.000%, 05/15/26 | | | 3,527 | |
| | 2,400 | | | 3.875%, 03/01/24 | | | 2,631 | |
| | 2,760 | | | Consolidated Edison Co. of New York, Inc., 5.700%, 06/15/40 | | | 3,647 | |
| | | | Consumers Energy Co., | | | | |
| | 1,343 | | | 2.850%, 05/15/22 | | | 1,405 | |
| | 2,150 | | | 3.250%, 08/15/46 | | | 2,162 | |
| | 1,256 | | | 5.650%, 04/15/20 | | | 1,426 | |
| | 1,478 | | | Delmarva Power & Light Co., 4.000%, 06/01/42 | | | 1,621 | |
SEE NOTES TO FINANCIAL STATEMENTS.
| | | | | | | | |
| | | |
| AUGUST 31, 2016 | | J.P. MORGAN INCOME FUNDS | | | | | 85 | |
JPMorgan Core Bond Fund
SCHEDULE OF PORTFOLIO INVESTMENTS
AS OF AUGUST 31, 2016 (Unaudited) (continued)
(Amounts in thousands)
| | | | | | | | |
PRINCIPAL
AMOUNT($) | | | SECURITY DESCRIPTION | | VALUE($) | |
| Corporate Bonds — continued | |
| | | | Multi-Utilities — continued | | | | |
| | | | Dominion Resources, Inc., | | | | |
| | 1,076 | | | 7.000%, 06/15/38 | | | 1,502 | |
| | 1,840 | | | Series C, 4.900%, 08/01/41 | | | 2,112 | |
| | 1,927 | | | Series D, 2.850%, 08/15/26 | | | 1,934 | |
| | 5,067 | | | Series F, 5.250%, 08/01/33 | | | 5,812 | |
| | | | DTE Energy Co., | | | | |
| | 6,150 | | | 3.300%, 06/15/22 | | | 6,539 | |
| | 2,000 | | | 6.375%, 04/15/33 | | | 2,638 | |
| | 1,400 | | | Series F, 3.850%, 12/01/23 | | | 1,536 | |
| | | | NiSource Finance Corp., | | | | |
| | 2,457 | | | 3.850%, 02/15/23 | | | 2,635 | |
| | 6,726 | | | 5.800%, 02/01/42 | | | 8,649 | |
| | | | San Diego Gas & Electric Co., | | | | |
| | 2,690 | | | 3.950%, 11/15/41 | | | 3,007 | |
| | 1,852 | | | 6.000%, 06/01/26 | | | 2,416 | |
| | 973 | | | Series FFF, 6.125%, 09/15/37 | | | 1,359 | |
| | | | Sempra Energy, | | | | |
| | 3,139 | | | 2.875%, 10/01/22 | | | 3,244 | |
| | 3,827 | | | 3.550%, 06/15/24 | | | 4,052 | |
| | 2,348 | | | 4.050%, 12/01/23 | | | 2,588 | |
| | 1,345 | | | 6.000%, 10/15/39 | | | 1,749 | |
| | 2,063 | | | 6.150%, 06/15/18 | | | 2,222 | |
| | 7,309 | | | 9.800%, 02/15/19 | | | 8,700 | |
| | | | Southern Co. Gas Capital Corp., | | | | |
| | 1,690 | | | 3.250%, 06/15/26 | | | 1,742 | |
| | 4,609 | | | 3.500%, 09/15/21 | | | 4,857 | |
| | 1,392 | | | 4.400%, 06/01/43 | | | 1,498 | |
| | 10,518 | | | 5.875%, 03/15/41 | | | 13,296 | |
| | 7,009 | | | WEC Energy Group, Inc., 3.550%, 06/15/25 | | | 7,554 | |
| | | | | | | | |
| | | | | | | 113,248 | |
| | | | | | | | |
| | | | Water Utilities — 0.0% (g) | | | | |
| | | | American Water Capital Corp., | | | | |
| | 5,248 | | | 3.400%, 03/01/25 | | | 5,666 | |
| | 3,354 | | | 6.593%, 10/15/37 | | | 4,906 | |
| | | | | | | | |
| | | | | | | 10,572 | |
| | | | | | | | |
| | | | Total Utilities | | | 546,437 | |
| | | | | | | | |
| | | | Total Corporate Bonds
(Cost $6,325,982) | | | 6,705,776 | |
| | | | | | | | |
| Foreign Government Securities — 1.0% | |
| | | | Israel Government AID Bond, (Israel), | | | | |
| | 3,000 | | | Zero Coupon, 11/01/19 | | | 2,863 | |
| | 3,587 | | | Zero Coupon, 11/01/23 | | | 3,096 | |
| | 21,968 | | | Zero Coupon, 11/01/24 | | | 18,375 | |
| | 7,240 | | | 5.500%, 12/04/23 | | | 9,061 | |
| | | | | | | | |
PRINCIPAL
AMOUNT($) | | | SECURITY DESCRIPTION | | VALUE($) | |
| | | | | | | | |
| | 7,330 | | | 5.500%, 04/26/24 | | | 9,255 | |
| | 6,771 | | | 5.500%, 09/18/33 | | | 9,598 | |
| | 5,000 | | | Series 1, Zero Coupon, 11/01/24 | | | 4,271 | |
| | 24,791 | | | Series 2, Zero Coupon, 11/01/24 | | | 21,175 | |
| | 3,155 | | | Series 4-Z, Zero Coupon, 08/15/22 | | | 2,821 | |
| | 10,000 | | | Series 6-Z, Zero Coupon, 08/15/22 | | | 8,933 | |
| | 10,000 | | | Series 8-Z, Zero Coupon, 02/15/24 | | | 8,559 | |
| | 3,305 | | | Series 8-Z, Zero Coupon, 08/15/24 | | | 2,787 | |
| | 23,876 | | | Series 8-Z, Zero Coupon, 08/15/25 | | | 19,493 | |
| | 25,875 | | | Series 9-Z, Zero Coupon, 05/15/24 | | | 21,983 | |
| | 2,517 | | | Series 9-Z, Zero Coupon, 11/15/24 | | | 2,106 | |
| | 24,763 | | | Series 9-Z, Zero Coupon, 05/15/25 | | | 20,389 | |
| | 14,275 | | | Series 9-Z, Zero Coupon, 11/15/25 | | | 11,566 | |
| | 6,000 | | | Series 11-Z, Zero Coupon, 11/15/25 | | | 4,859 | |
| | 2,242 | | | Series 11-Z, Zero Coupon, 11/15/26 | | | 1,754 | |
| | 11,427 | | | Province of Ontario, (Canada), 1.650%, 09/27/19 | | | 11,514 | |
| | 502 | | | Province of Quebec, (Canada), Series A, SUB, 7.365%, 03/06/26 | | | 708 | |
| | | | Republic of Colombia, (Colombia), | | | | |
| | 3,137 | | | 4.000%, 02/26/24 | | | 3,302 | |
| | 3,811 | | | 4.500%, 01/28/26 | | | 4,154 | |
| | 3,979 | | | 5.000%, 06/15/45 | | | 4,312 | |
| | 941 | | | 5.625%, 02/26/44 | | | 1,086 | |
| | | | Republic of Panama, (Panama), | | | | |
| | 2,796 | | | 3.750%, 03/16/25 | | | 3,027 | |
| | 2,371 | | | 4.000%, 09/22/24 | | | 2,602 | |
| | 737 | | | Republic of Peru, (Peru), 5.625%, 11/18/50 | | | 971 | |
| | | | Republic of Poland, (Poland), | | | | |
| | 1,797 | | | 3.250%, 04/06/26 | | | 1,907 | |
| | 6,568 | | | 4.000%, 01/22/24 | | | 7,291 | |
| | | | Republic of South Africa, (South Africa), | | | | |
| | 8,616 | | | 5.375%, 07/24/44 | | | 9,380 | |
| | 3,502 | | | 5.875%, 09/16/25 | | | 3,918 | |
| | | | United Mexican States, (Mexico), | | | | |
| | 11,021 | | | 3.500%, 01/21/21 | | | 11,779 | |
| | 7,166 | | | 3.600%, 01/30/25 | | | 7,578 | |
| | 7,316 | | | 4.000%, 10/02/23 | | | 7,947 | |
| | 7,300 | | | 4.125%, 01/21/26 | | | 8,003 | |
| | 4,228 | | | 4.350%, 01/15/47 | | | 4,360 | |
| | — | | | 4.350%, 01/15/47 | | | — | |
| | 2,862 | | | 4.600%, 01/23/46 | | | 3,095 | |
| | 3,906 | | | 4.750%, 03/08/44 | | | 4,301 | |
| | 12,227 | | | 5.550%, 01/21/45 | | | 15,070 | |
| | 5,118 | | | 5.750%, 10/12/101 | | | 5,834 | |
| | | | | | | | |
| | | | Total Foreign Government Securities
(Cost $283,836) | | | 305,083 | |
| | | | | | | | |
SEE NOTES TO FINANCIAL STATEMENTS.
| | | | | | |
| | | |
| 86 | | | | J.P. MORGAN INCOME FUNDS | | AUGUST 31, 2016 |
| | | | | | | | |
PRINCIPAL
AMOUNT($) | | | SECURITY DESCRIPTION | | VALUE($) | |
| Mortgage Pass-Through Securities — 16.4% | |
| | | | Federal Home Loan Mortgage Corp., | | | | |
| | 721 | | | ARM, 2.345%, 10/01/36 | | | 762 | |
| | 12 | | | ARM, 2.395%, 07/01/19 | | | 12 | |
| | 603 | | | ARM, 2.425%, 04/01/37 | | | 633 | |
| | 1,394 | | | ARM, 2.429%, 05/01/37 | | | 1,453 | |
| | 4,691 | | | ARM, 2.467%, 12/01/36 | | | 4,935 | |
| | 389 | | | ARM, 2.496%, 11/01/36 | | | 412 | |
| | 1,545 | | | ARM, 2.515%, 11/01/36 | | | 1,626 | |
| | 147 | | | ARM, 2.540%, 01/01/37 | | | 154 | |
| | 161 | | | ARM, 2.565%, 12/01/36 | | | 170 | |
| | 741 | | | ARM, 2.569%, 11/01/36 | | | 786 | |
| | 76 | | | ARM, 2.572%, 01/01/27 | | | 80 | |
| | 364 | | | ARM, 2.587%, 08/01/36 | | | 380 | |
| | 3,284 | | | ARM, 2.592%, 10/01/36 | | | 3,429 | |
| | 2,436 | | | ARM, 2.593%, 11/01/36 | | | 2,583 | |
| | 345 | | | ARM, 2.605%, 12/01/33 | | | 367 | |
| | 1,498 | | | ARM, 2.613%, 10/01/36 | | | 1,589 | |
| | 695 | | | ARM, 2.617%, 11/01/36 | | | 737 | |
| | 73 | | | ARM, 2.623%, 09/01/32 | | | 77 | |
| | 40 | | | ARM, 2.625%, 07/01/26 | | | 40 | |
| | 902 | | | ARM, 2.631%, 08/01/36 | | | 945 | |
| | 2,278 | | | ARM, 2.634%, 01/01/35 | | | 2,408 | |
| | 686 | | | ARM, 2.639%, 01/01/35 | | | 726 | |
| | 1,724 | | | ARM, 2.647%, 10/01/36 | | | 1,807 | |
| | 5,457 | | | ARM, 2.651%, 08/01/36 | | | 5,744 | |
| | 205 | | | ARM, 2.652%, 04/01/30 - 02/01/37 | | | 217 | |
| | 1,417 | | | ARM, 2.655%, 02/01/36 | | | 1,495 | |
| | 730 | | | ARM, 2.669%, 07/01/36 | | | 768 | |
| | 821 | | | ARM, 2.685%, 10/01/36 | | | 867 | |
| | 233 | | | ARM, 2.693%, 08/01/35 | | | 245 | |
| | 323 | | | ARM, 2.700%, 02/01/36 | | | 341 | |
| | 1,006 | | | ARM, 2.715%, 06/01/37 | | | 1,057 | |
| | 4,480 | | | ARM, 2.739%, 12/01/36 | | | 4,746 | |
| | 977 | | | ARM, 2.760%, 05/01/36 | | | 1,037 | |
| | 628 | | | ARM, 2.766%, 07/01/36 | | | 653 | |
| | 2,130 | | | ARM, 2.768%, 05/01/33 | | | 2,249 | |
| | 531 | | | ARM, 2.772%, 07/01/36 | | | 562 | |
| | 1,871 | | | ARM, 2.787%, 09/01/34 - 11/01/37 | | | 1,976 | |
| | 147 | | | ARM, 2.796%, 02/01/37 | | | 156 | |
| | 1,613 | | | ARM, 2.820%, 05/01/36 | | | 1,704 | |
| | 4,496 | | | ARM, 2.842%, 03/01/37 | | | 4,713 | |
| | 1,553 | | | ARM, 2.856%, 04/01/34 - 01/01/37 | | | 1,645 | |
| | 3,711 | | | ARM, 2.885%, 12/01/36 - 05/01/37 | | | 3,935 | |
| | 423 | | | ARM, 2.910%, 10/01/36 | | | 439 | |
| | 1,993 | | | ARM, 2.912%, 09/01/36 | | | 2,116 | |
| | 1,188 | | | ARM, 2.947%, 10/01/36 | | | 1,264 | |
| | | | | | | | |
PRINCIPAL
AMOUNT($) | | | SECURITY DESCRIPTION | | VALUE($) | |
| | | | | | | | |
| | 86 | | | ARM, 2.953%, 04/01/37 | | | 89 | |
| | 1,174 | | | ARM, 2.959%, 05/01/38 | | | 1,239 | |
| | 1,428 | | | ARM, 2.972%, 02/01/37 | | | 1,513 | |
| | 2,261 | | | ARM, 2.995%, 09/01/36 - 05/01/37 | | | 2,393 | |
| | 760 | | | ARM, 3.003%, 12/01/35 | | | 806 | |
| | 4,173 | | | ARM, 3.063%, 06/01/36 | | | 4,415 | |
| | 2,610 | | | ARM, 3.079%, 02/01/37 | | | 2,746 | |
| | 241 | | | ARM, 3.081%, 12/01/36 | | | 261 | |
| | 3,070 | | | ARM, 3.100%, 05/01/37 | | | 3,258 | |
| | 1,801 | | | ARM, 3.101%, 04/01/38 | | | 1,917 | |
| | 705 | | | ARM, 3.117%, 07/01/37 | | | 736 | |
| | 1,471 | | | ARM, 3.121%, 06/01/36 | | | 1,558 | |
| | 1,640 | | | ARM, 3.141%, 03/01/36 | | | 1,732 | |
| | 741 | | | ARM, 3.148%, 03/01/37 | | | 777 | |
| | 1,196 | | | ARM, 3.200%, 04/01/37 | | | 1,260 | |
| | 356 | | | ARM, 3.255%, 02/01/37 | | | 381 | |
| | 1,960 | | | ARM, 3.321%, 05/01/37 | | | 2,088 | |
| | 400 | | | ARM, 3.334%, 03/01/37 | | | 424 | |
| | 339 | | | ARM, 3.439%, 05/01/36 | | | 359 | |
| | 1,469 | | | ARM, 3.442%, 03/01/36 | | | 1,547 | |
| | 1,215 | | | ARM, 3.867%, 07/01/40 | | | 1,261 | |
| | 7,397 | | | 4.000%, 04/01/43 | | | 8,002 | |
| | 38,182 | | | Federal Home Loan Mortgage Corp. Gold Pools, 4.500%, 01/01/46 | | | 42,527 | |
| | | | Federal Home Loan Mortgage Corp. Gold Pools, 15 Year, Single Family, | | | | |
| | 16 | | | 4.000%, 06/01/18 | | | 17 | |
| | 258 | | | 4.500%, 08/01/18 - 10/01/18 | | | 265 | |
| | 854 | | | 5.000%, 10/01/17 - 12/01/18 | | | 878 | |
| | 1,129 | | | 5.500%, 06/01/17 - 02/01/24 | | | 1,170 | |
| | 1,271 | | | 6.000%, 04/01/17 - 03/01/22 | | | 1,301 | |
| | 162 | | | 6.500%, 11/01/17 - 03/01/22 | | | 167 | |
| | | | Federal Home Loan Mortgage Corp. Gold Pools, 20 Year, Single Family, | | | | |
| | 11,585 | | | 3.500%, 01/01/32 - 03/01/32 | | | 12,334 | |
| | 86 | | | 6.000%, 12/01/22 | | | 98 | |
| | 488 | | | 6.500%, 01/01/28 | | | 569 | |
| | | | Federal Home Loan Mortgage Corp. Gold Pools, 30 Year, Single Family, | | | | |
| | 34,834 | | | 3.000%, 08/01/43 | | | 36,574 | |
| | 30,301 | | | 4.500%, 05/01/41 | | | 33,331 | |
| | 31,352 | | | 5.000%, 01/01/34 - 08/01/40 | | | 34,723 | |
| | 5,608 | | | 5.500%, 01/01/33 - 03/01/40 | | | 6,345 | |
| | 882 | | | 6.000%, 10/01/29 - 12/01/36 | | | 1,022 | |
| | 5,476 | | | 6.500%, 08/01/29 - 03/01/38 | | | 6,470 | |
| | 1,517 | | | 7.000%, 04/01/26 - 02/01/37 | | | 1,787 | |
| | 1,870 | | | 7.500%, 08/01/25 - 09/01/38 | | | 2,254 | |
SEE NOTES TO FINANCIAL STATEMENTS.
| | | | | | | | |
| | | |
| AUGUST 31, 2016 | | J.P. MORGAN INCOME FUNDS | | | | | 87 | |
JPMorgan Core Bond Fund
SCHEDULE OF PORTFOLIO INVESTMENTS
AS OF AUGUST 31, 2016 (Unaudited) (continued)
(Amounts in thousands)
| | | | | | | | |
PRINCIPAL
AMOUNT($) | | | SECURITY DESCRIPTION | | VALUE($) | |
| Mortgage Pass-Through Securities — continued | |
| | 15 | | | 8.000%, 07/01/20 - 11/01/24 | | | 17 | |
| | 44 | | | 8.500%, 07/01/28 | | | 54 | |
| | | | Federal Home Loan Mortgage Corp. Gold Pools, FHA/VA, | | | | |
| | 6,030 | | | 7.500%, 01/01/32 - 12/01/36 | | | 7,127 | |
| | 1,724 | | | 10.000%, 10/01/30 | | | 1,885 | |
| | | | Federal Home Loan Mortgage Corp. Gold Pools, Other, | | | | |
| | 72,885 | | | 3.500%, 02/01/33 - 06/01/43 | | | 77,714 | |
| | 120,380 | | | 4.000%, 06/01/42 - 01/01/46 | | | 130,869 | |
| | 1,087 | | | 5.500%, 04/01/18 | | | 1,116 | |
| | 1,512 | | | 6.000%, 02/01/33 - 11/01/36 | | | 1,698 | |
| | 13,625 | | | 6.500%, 12/01/35 - 06/01/37 | | | 15,520 | |
| | 10 | | | 7.000%, 07/01/29 | | | 11 | |
| | 292 | | | 10.000%, 03/17/26 | | | 302 | |
| | | | Federal National Mortgage Association, | | | | |
| | 3 | | | ARM, 1.875%, 01/01/19 | | | 3 | |
| | 356 | | | ARM, 2.176%, 08/01/34 | | | 366 | |
| | 403 | | | ARM, 2.213%, 09/01/37 | | | 423 | |
| | 271 | | | ARM, 2.242%, 03/01/19 - 10/01/34 | | | 288 | |
| | 3,528 | | | ARM, 2.264%, 09/01/36 | | | 3,661 | |
| | 30 | | | ARM, 2.280%, 01/01/34 | | | 30 | |
| | 1,249 | | | ARM, 2.281%, 07/01/37 | | | 1,294 | |
| | 553 | | | ARM, 2.287%, 09/01/33 | | | 572 | |
| | 164 | | | ARM, 2.350%, 11/01/34 | | | 174 | |
| | 772 | | | ARM, 2.361%, 09/01/36 | | | 814 | |
| | 444 | | | ARM, 2.364%, 11/01/33 | | | 471 | |
| | 877 | | | ARM, 2.369%, 01/01/37 | | | 911 | |
| | 71 | | | ARM, 2.382%, 09/01/34 | | | 74 | |
| | 1,224 | | | ARM, 2.386%, 02/01/37 | | | 1,273 | |
| | 3,856 | | | ARM, 2.395%, 01/01/35 | | | 4,028 | |
| | 364 | | | ARM, 2.403%, 09/01/35 | | | 383 | |
| | 288 | | | ARM, 2.404%, 08/01/34 | | | 300 | |
| | 1,596 | | | ARM, 2.408%, 01/01/36 | | | 1,673 | |
| | 61 | | | ARM, 2.445%, 07/01/34 | | | 65 | |
| | 142 | | | ARM, 2.451%, 01/01/35 | | | 149 | |
| | 583 | | | ARM, 2.457%, 07/01/35 | | | 619 | |
| | 263 | | | ARM, 2.470%, 02/01/35 | | | 273 | |
| | 694 | | | ARM, 2.475%, 09/01/36 | | | 729 | |
| | 829 | | | ARM, 2.477%, 11/01/37 | | | 880 | |
| | 273 | | | ARM, 2.487%, 11/01/34 | | | 290 | |
| | 148 | | | ARM, 2.500%, 08/01/35 | | | 156 | |
| | 556 | | | ARM, 2.506%, 03/01/35 | | | 585 | |
| | 2,499 | | | ARM, 2.532%, 11/01/37 | | | 2,614 | |
| | 97 | | | ARM, 2.533%, 09/01/37 | | | 99 | |
| | 184 | | | ARM, 2.547%, 01/01/34 | | | 193 | |
| | | | | | | | |
PRINCIPAL
AMOUNT($) | | | SECURITY DESCRIPTION | | VALUE($) | |
| | | | | | | | |
| | 405 | | | ARM, 2.555%, 05/01/35 | | | 425 | |
| | 1,440 | | | ARM, 2.557%, 10/01/36 | | | 1,527 | |
| | 69 | | | ARM, 2.585%, 09/01/27 | | | 73 | |
| | 4,247 | | | ARM, 2.603%, 08/01/36 - 09/01/36 | | | 4,445 | |
| | 613 | | | ARM, 2.617%, 08/01/36 | | | 649 | |
| | 1 | | | ARM, 2.625%, 08/01/19 | | | 1 | |
| | 4,718 | | | ARM, 2.650%, 12/01/37 | | | 5,002 | |
| | 673 | | | ARM, 2.669%, 01/01/36 | | | 709 | |
| | 3,354 | | | ARM, 2.671%, 07/01/37 | | | 3,581 | |
| | 220 | | | ARM, 2.685%, 09/01/33 | | | 234 | |
| | 879 | | | ARM, 2.695%, 09/01/36 | | | 931 | |
| | 1,098 | | | ARM, 2.697%, 09/01/37 | | | 1,158 | |
| | 75 | | | ARM, 2.716%, 07/01/37 | | | 78 | |
| | 2,520 | | | ARM, 2.720%, 12/01/36 | | | 2,650 | |
| | 790 | | | ARM, 2.741%, 11/01/36 | | | 838 | |
| | 450 | | | ARM, 2.750%, 01/01/37 | | | 475 | |
| | 408 | | | ARM, 2.753%, 01/01/38 | | | 425 | |
| | 649 | | | ARM, 2.762%, 04/01/35 | | | 686 | |
| | 557 | | | ARM, 2.791%, 10/01/34 | | | 593 | |
| | 1,921 | | | ARM, 2.810%, 08/01/33 - 12/01/36 | | | 2,029 | |
| | 3,266 | | | ARM, 2.837%, 10/01/36 | | | 3,479 | |
| | 1,151 | | | ARM, 2.841%, 10/01/36 | | | 1,227 | |
| | 2,596 | | | ARM, 2.842%, 04/01/37 | | | 2,734 | |
| | 92 | | | ARM, 2.845%, 05/01/35 | | | 96 | |
| | 1,589 | | | ARM, 2.882%, 02/01/37 | | | 1,674 | |
| | 677 | | | ARM, 2.907%, 06/01/34 | | | 718 | |
| | 424 | | | ARM, 2.928%, 06/01/36 | | | 446 | |
| | 312 | | | ARM, 2.967%, 05/01/36 | | | 326 | |
| | 998 | | | ARM, 3.020%, 07/01/36 | | | 1,059 | |
| | 590 | | | ARM, 3.039%, 11/01/36 | | | 623 | |
| | 872 | | | ARM, 3.042%, 10/01/35 | | | 931 | |
| | 1,147 | | | ARM, 3.073%, 07/01/37 | | | 1,204 | |
| | 2,188 | | | ARM, 3.075%, 06/01/36 | | | 2,328 | |
| | 195 | | | ARM, 3.125%, 08/01/36 | | | 203 | |
| | 636 | | | ARM, 3.184%, 06/01/36 | | | 673 | |
| | 127 | | | ARM, 3.248%, 09/01/37 | | | 130 | |
| | 34 | | | ARM, 3.250%, 01/01/36 | | | 34 | |
| | 6,098 | | | ARM, 3.362%, 03/01/36 | | | 6,410 | |
| | 310 | | | ARM, 3.375%, 02/01/36 | | | 328 | |
| | 2,648 | | | ARM, 3.585%, 08/01/37 | | | 2,819 | |
| | 42 | | | ARM, 3.824%, 03/01/29 | | | 44 | |
| | 575 | | | ARM, 5.310%, 08/01/36 | | | 588 | |
| | 278 | | | ARM, 6.044%, 09/01/37 | | | 295 | |
| | 11,034 | | | 2.610%, 06/01/26 | | | 11,471 | |
| | 17,846 | | | 2.640%, 06/01/26 | | | 18,601 | |
| | 15,975 | | | 2.670%, 07/01/31 | | | 16,448 | |
SEE NOTES TO FINANCIAL STATEMENTS.
| | | | | | |
| | | |
| 88 | | | | J.P. MORGAN INCOME FUNDS | | AUGUST 31, 2016 |
| | | | | | | | |
PRINCIPAL
AMOUNT($) | | | SECURITY DESCRIPTION | | VALUE($) | |
| Mortgage Pass-Through Securities — continued | |
| | 10,000 | | | 2.730%, 07/01/28 | | | 10,421 | |
| | 4,935 | | | 2.810%, 08/01/31 | | | 5,157 | |
| | 8,178 | | | 2.900%, 06/01/31 | | | 8,598 | |
| | 20,082 | | | 4.000%, 06/01/42 | | | 22,071 | |
| | | | Federal National Mortgage Association, 15 Year, Single Family, | | | | |
| | 155 | | | 3.500%, 04/01/19 | | | 163 | |
| | 1,555 | | | 4.500%, 05/01/18 - 12/01/19 | | | 1,595 | |
| | 3,996 | | | 5.000%, 04/01/18 - 08/01/24 | | | 4,158 | |
| | 3,706 | | | 5.500%, 02/01/18 - 07/01/20 | | | 3,833 | |
| | 8,823 | | | 6.000%, 08/01/17 - 07/01/24 | | | 9,536 | |
| | 1,411 | | | 6.500%, 03/01/17 - 02/01/24 | | | 1,536 | |
| | 25 | | | 7.000%, 03/01/17 - 11/01/17 | | | 26 | |
| | — | (h) | | 7.500%, 03/01/17 | | | — | (h) |
| | | | Federal National Mortgage Association, 20 Year, Single Family, | | | | |
| | 13,847 | | | 3.500%, 07/01/32 - 08/01/32 | | | 14,742 | |
| | 27,737 | | | 4.000%, 01/01/35 | | | 30,424 | |
| | 962 | | | 5.500%, 07/01/25 | | | 1,080 | |
| | 6,026 | | | 6.000%, 07/01/26 - 09/01/29 | | | 6,886 | |
| | 1,910 | | | 6.500%, 05/01/22 - 08/01/26 | | | 2,203 | |
| | | | Federal National Mortgage Association, 30 Year, FHA/VA, | | | | |
| | 139 | | | 6.000%, 09/01/33 | | | 156 | |
| | 196 | | | 6.500%, 03/01/29 | | | 224 | |
| | 16 | | | 7.000%, 02/01/33 | | | 17 | |
| | 43 | | | 8.000%, 06/01/28 | | | 49 | |
| | 13 | | | 8.500%, 02/01/30 | | | 13 | |
| | 14 | | | 9.000%, 05/01/18 - 12/01/30 | | | 14 | |
| | 6 | | | 9.500%, 12/01/18 | | | 7 | |
| | | | Federal National Mortgage Association, 30 Year, Single Family, | | | | |
| | 31,334 | | | 3.000%, 06/01/43 | | | 32,828 | |
| | 161,021 | | | 3.500%, 06/01/43 - 01/01/46 | | | 172,531 | |
| | 782 | | | 4.000%, 12/01/33 | | | 839 | |
| | 20,183 | | | 4.500%, 11/01/33 - 09/01/43 | | | 22,105 | |
| | 25,063 | | | 5.000%, 06/01/33 - 08/01/40 | | | 27,950 | |
| | 16,161 | | | 5.500%, 11/01/32 - 12/01/39 | | | 18,381 | |
| | 13,195 | | | 6.000%, 12/01/28 - 11/01/38 | | | 15,251 | |
| | 25,615 | | | 6.500%, 11/01/29 - 10/01/38 | | | 29,796 | |
| | 13,098 | | | 7.000%, 01/01/24 - 01/01/39 | | | 15,688 | |
| | 9,061 | | | 7.500%, 11/01/22 - 04/01/39 | | | 11,307 | |
| | 699 | | | 8.000%, 03/01/21 - 01/01/38 | | | 840 | |
| | 15 | | | 8.500%, 07/01/24 - 05/01/25 | | | 17 | |
| | 11 | | | 9.500%, 07/01/28 | | | 12 | |
| | 5 | | | 10.000%, 02/01/24 | | | 6 | |
| | | | | | | | |
PRINCIPAL
AMOUNT($) | | | SECURITY DESCRIPTION | | VALUE($) | |
| | | | | | | | |
| | | | Federal National Mortgage Association, Other, | | | | |
| | 37,854 | | | ARM, 0.815%, 01/01/23 | | | 37,832 | |
| | 10,000 | | | ARM, 0.835%, 12/01/24 | | | 10,034 | |
| | 9,865 | | | ARM, 0.845%, 02/01/23 | | | 9,903 | |
| | 6,300 | | | ARM, 0.845%, 03/01/25 | | | 6,318 | |
| | 6,729 | | | ARM, 0.855%, 01/01/23 | | | 6,776 | |
| | 15,000 | | | ARM, 0.895%, 07/01/24 | | | 15,149 | |
| | 7,120 | | | ARM, 0.925%, 11/01/23 | | | 7,120 | |
| | 3,889 | | | ARM, 0.935%, 08/01/22 | | | 3,891 | |
| | 8,177 | | | ARM, 1.265%, 03/01/22 | | | 8,201 | |
| | 99 | | | ARM, 2.725%, 08/01/34 | | | 105 | |
| | 5,059 | | | ARM, 6.070%, 11/01/18 | | | 5,217 | |
| | 6,972 | | | 1.470%, 12/01/19 | | | 6,971 | |
| | 8,968 | | | 1.690%, 12/01/19 | | | 9,016 | |
| | 15,402 | | | 1.940%, 01/01/17 - 07/01/19 | | | 15,539 | |
| | 13,452 | | | 2.000%, 12/01/20 | | | 13,725 | |
| | 80,712 | | | 2.010%, 06/01/20 | | | 82,107 | |
| | 2,083 | | | 2.030%, 08/01/19 | | | 2,133 | |
| | 17,092 | | | 2.140%, 04/01/19 | | | 17,359 | |
| | 4,262 | | | 2.150%, 01/01/23 | | | 4,358 | |
| | 8,259 | | | 2.190%, 05/01/19 | | | 8,402 | |
| | 6,266 | | | 2.200%, 07/01/19 | | | 6,381 | |
| | 5,652 | | | 2.240%, 12/01/22 | | | 5,808 | |
| | 8,969 | | | 2.280%, 12/01/22 | | | 9,216 | |
| | 3,326 | | | 2.320%, 12/01/22 | | | 3,425 | |
| | 14,983 | | | 2.330%, 01/01/23 | | | 15,440 | |
| | 32,625 | | | 2.340%, 12/01/22 - 01/01/23 | | | 33,634 | |
| | 27,245 | | | 2.370%, 07/01/19 - 01/01/23 | | | 28,076 | |
| | 7,555 | | | 2.380%, 11/01/22 | | | 7,803 | |
| | 14,892 | | | 2.390%, 10/01/22 - 12/01/22 | | | 15,402 | |
| | 9,706 | | | 2.395%, 01/01/22 | | | 10,043 | |
| | 49,987 | | | 2.400%, 12/01/22 - 05/01/26 | | | 51,585 | |
| | 5,232 | | | 2.410%, 11/01/22 | | | 5,401 | |
| | 18,115 | | | 2.420%, 12/01/22 - 06/01/23 | | | 18,723 | |
| | 15,821 | | | 2.440%, 11/01/22 - 01/01/23 | | | 16,362 | |
| | 43,588 | | | 2.450%, 06/01/19 - 02/01/23 | | | 44,989 | |
| | 7,806 | | | 2.470%, 09/01/22 - 11/01/22 | | | 8,097 | |
| | 32,854 | | | 2.490%, 10/01/17 - 05/01/26 | | | 33,788 | |
| | 12,555 | | | 2.500%, 04/01/23 | | | 13,058 | |
| | 8,251 | | | 2.510%, 01/01/23 | | | 8,536 | |
| | 37,191 | | | 2.520%, 10/01/22 - 05/01/23 | | | 38,729 | |
| | 2,690 | | | 2.540%, 05/01/23 | | | 2,803 | |
| | 14,447 | | | 2.550%, 11/01/22 | | | 15,025 | |
| | 5,260 | | | 2.570%, 10/01/22 | | | 5,476 | |
| | 7,740 | | | 2.590%, 06/01/28 | | | 8,018 | |
| | 14,131 | | | 2.600%, 06/01/22 - 01/01/23 | | | 14,745 | |
SEE NOTES TO FINANCIAL STATEMENTS.
| | | | | | | | |
| | | |
| AUGUST 31, 2016 | | J.P. MORGAN INCOME FUNDS | | | | | 89 | |
JPMorgan Core Bond Fund
SCHEDULE OF PORTFOLIO INVESTMENTS
AS OF AUGUST 31, 2016 (Unaudited) (continued)
(Amounts in thousands)
| | | | | | | | |
PRINCIPAL
AMOUNT($) | | | SECURITY DESCRIPTION | | VALUE($) | |
| Mortgage Pass-Through Securities — continued | |
| | 7,710 | | | 2.610%, 07/01/22 | | | 8,055 | |
| | 5,201 | | | 2.620%, 10/01/17 | | | 5,248 | |
| | 22,410 | | | 2.630%, 09/01/21 - 06/01/25 | | | 23,416 | |
| | 5,854 | | | 2.635%, 10/01/22 | | | 6,115 | |
| | 6,679 | | | 2.640%, 04/01/23 - 07/01/23 | | | 6,996 | |
| | 8,968 | | | 2.650%, 08/01/22 | | | 9,385 | |
| | 17,738 | | | 2.660%, 12/01/22 | | | 18,832 | |
| | 15,761 | | | 2.670%, 07/01/22 | | | 16,489 | |
| | 15,034 | | | 2.680%, 05/01/25 - 06/01/27 | | | 15,682 | |
| | 12,054 | | | 2.690%, 10/01/17 - 07/01/22 | | | 12,508 | |
| | 23,991 | | | 2.700%, 04/01/22 - 04/01/25 | | | 25,111 | |
| | 5,296 | | | 2.705%, 04/01/23 | | | 5,579 | |
| | 8,271 | | | 2.750%, 03/01/22 | | | 8,680 | |
| | 13,945 | | | 2.760%, 06/01/22 | | | 14,698 | |
| | 17,806 | | | 2.766%, 06/01/23 | | | 18,740 | |
| | 22,420 | | | 2.770%, 05/01/22 - 06/01/23 | | | 23,614 | |
| | 4,281 | | | 2.780%, 06/01/27 | | | 4,499 | |
| | 8,000 | | | 2.790%, 05/01/27 | | | 8,376 | |
| | 10,000 | | | 2.810%, 05/01/27 | | | 10,537 | |
| | 9,481 | | | 2.820%, 07/01/22 | | | 10,000 | |
| | 39,974 | | | 2.830%, 05/01/27 - 06/01/27 | | | 42,015 | |
| | 44,432 | | | 2.840%, 01/01/25 - 04/01/26 | | | 46,989 | |
| | 19,475 | | | 2.860%, 05/01/22 - 01/01/25 | | | 20,570 | |
| | 8,500 | | | 2.890%, 05/01/27 | | | 8,991 | |
| | 16,512 | | | 2.900%, 05/01/22 - 12/01/24 | | | 17,487 | |
| | 6,000 | | | 2.910%, 03/01/27 | | | 6,360 | |
| | 56,820 | | | 2.920%, 12/01/24 - 05/01/30 | | | 60,103 | |
| | 34,283 | | | 2.940%, 05/01/22 - 05/01/30 | | | 36,336 | |
| | 23,684 | | | 2.960%, 01/01/25 - 06/01/30 | | | 25,095 | |
| | 44,306 | | | 2.970%, 01/01/22 - 06/01/30 | | | 47,100 | |
| | 19,730 | | | 2.980%, 07/01/22 | | | 20,999 | |
| | 17,473 | | | 2.990%, 02/01/22 - 01/01/25 | | | 18,608 | |
| | 52,467 | | | 3.000%, 06/01/27 - 02/01/43 | | | 55,104 | |
| | 9,753 | | | 3.020%, 05/01/22 - 06/01/25 | | | 10,397 | |
| | 56,789 | | | 3.030%, 12/01/21 - 04/01/30 | | | 60,593 | |
| | 10,762 | | | 3.040%, 12/01/18 | | | 11,151 | |
| | 13,229 | | | 3.050%, 04/01/22 - 01/01/25 | | | 14,070 | |
| | 7,497 | | | 3.060%, 02/01/22 | | | 8,001 | |
| | 28,068 | | | 3.080%, 03/01/22 - 04/01/30 | | | 29,999 | |
| | 20,979 | | | 3.090%, 01/01/22 - 02/01/22 | | | 22,337 | |
| | 37,990 | | | 3.100%, 05/01/22 - 05/01/30 | | | 40,756 | |
| | 25,303 | | | 3.110%, 12/01/24 | | | 27,228 | |
| | 49,482 | | | 3.120%, 01/01/22 - 06/01/35 | | | 52,927 | |
| | 47,234 | | | 3.130%, 04/01/30 - 06/01/30 | | | 50,102 | |
| | 45,724 | | | 3.140%, 02/01/22 - 12/01/26 | | | 49,074 | |
| | 9,507 | | | 3.150%, 07/01/30 | | | 10,215 | |
| | | | | | | | |
PRINCIPAL
AMOUNT($) | | | SECURITY DESCRIPTION | | VALUE($) | |
| | | | | | | | |
| | 13,200 | | | 3.170%, 08/01/25 - 02/01/30 | | | 14,292 | |
| | 18,803 | | | 3.180%, 01/01/26 - 06/01/30 | | | 20,295 | |
| | 17,000 | | | 3.190%, 12/01/26 | | | 18,446 | |
| | 7,174 | | | 3.200%, 01/01/22 | | | 7,678 | |
| | 23,090 | | | 3.210%, 03/01/22 - 03/01/31 | | | 24,993 | |
| | 14,091 | | | 3.220%, 12/01/26 - 04/01/30 | | | 15,246 | |
| | 5,037 | | | 3.230%, 11/01/20 | | | 5,350 | |
| | 20,000 | | | 3.240%, 12/01/26 | | | 21,719 | |
| | 18,140 | | | 3.250%, 09/01/26 - 07/01/27 | | | 19,741 | |
| | 8,000 | | | 3.260%, 12/01/26 | | | 8,712 | |
| | 6,751 | | | 3.270%, 11/01/20 | | | 7,196 | |
| | 61,337 | | | 3.290%, 10/01/20 - 11/01/26 | | | 66,752 | |
| | 15,564 | | | 3.300%, 12/01/26 - 07/01/30 | | | 17,058 | |
| | 3,327 | | | 3.310%, 12/01/21 | | | 3,571 | |
| | 8,500 | | | 3.320%, 05/01/24 | | | 9,276 | |
| | 10,000 | | | 3.330%, 09/01/27 | | | 10,959 | |
| | 16,000 | | | 3.340%, 02/01/27 | | | 17,491 | |
| | 17,355 | | | 3.350%, 11/01/20 - 09/01/30 | | | 18,843 | |
| | 7,082 | | | 3.360%, 10/01/20 | | | 7,558 | |
| | 7,893 | | | 3.370%, 09/01/30 | | | 8,665 | |
| | 12,018 | | | 3.380%, 01/01/18 - 12/01/23 | | | 12,476 | |
| | 2,381 | | | 3.390%, 08/01/17 | | | 2,411 | |
| | 3,011 | | | 3.400%, 10/01/21 | | | 3,239 | |
| | 16,676 | | | 3.430%, 09/01/20 - 11/01/21 | | | 17,896 | |
| | 12,775 | | | 3.440%, 12/01/21 - 10/01/26 | | | 14,024 | |
| | 32,305 | | | 3.450%, 01/01/24 - 04/01/35 | | | 35,298 | |
| | 7,550 | | | 3.480%, 12/01/20 | | | 8,098 | |
| | 213,444 | | | 3.500%, 10/01/20 - 01/01/44 | | | 227,599 | |
| | 9,000 | | | 3.510%, 08/01/23 | | | 9,910 | |
| | 5,420 | | | 3.520%, 01/01/18 | | | 5,531 | |
| | 8,609 | | | 3.540%, 10/01/20 | | | 9,249 | |
| | 7,395 | | | 3.543%, 12/01/20 | | | 7,928 | |
| | 13,000 | | | 3.550%, 02/01/30 | | | 14,436 | |
| | 3,647 | | | 3.563%, 01/01/21 | | | 3,925 | |
| | 19,231 | | | 3.570%, 11/01/34 | | | 20,800 | |
| | 22,840 | | | 3.590%, 10/01/20 - 08/01/23 | | | 24,885 | |
| | 1,636 | | | 3.600%, 09/01/20 | | | 1,760 | |
| | 9,239 | | | 3.610%, 11/01/34 | | | 10,077 | |
| | 9,498 | | | 3.630%, 01/01/18 - 10/01/35 | | | 10,255 | |
| | 10,900 | | | 3.640%, 06/01/18 - 01/01/25 | | | 11,613 | |
| | 42,150 | | | 3.670%, 07/01/23 | | | 46,781 | |
| | 3,237 | | | 3.700%, 12/01/20 | | | 3,491 | |
| | 15,541 | | | 3.739%, 06/01/18 | | | 15,997 | |
| | 9,793 | | | 3.740%, 07/01/20 - 07/01/23 | | | 10,691 | |
| | 3,866 | | | 3.760%, 12/01/35 | | | 4,299 | |
| | 27,400 | | | 3.765%, 12/01/25 | | | 30,779 | |
SEE NOTES TO FINANCIAL STATEMENTS.
| | | | | | |
| | | |
| 90 | | | | J.P. MORGAN INCOME FUNDS | | AUGUST 31, 2016 |
| | | | | | | | |
PRINCIPAL
AMOUNT($) | | | SECURITY DESCRIPTION | | VALUE($) | |
| Mortgage Pass-Through Securities — continued | |
| | 34,369 | | | 3.770%, 01/01/21 - 09/01/21 | | | 37,421 | |
| | 4,929 | | | 3.800%, 03/01/18 | | | 5,062 | |
| | 21,188 | | | 3.830%, 12/01/20 - 12/01/21 | | | 23,208 | |
| | 22,186 | | | 3.850%, 09/01/20 - 09/01/21 | | | 24,105 | |
| | 8,257 | | | 3.860%, 07/01/21 | | | 9,016 | |
| | 10,139 | | | 3.870%, 01/01/21 | | | 11,032 | |
| | 14,836 | | | 3.881%, 09/01/21 | | | 16,192 | |
| | 30,952 | | | 3.890%, 08/01/20 - 09/01/21 | | | 33,750 | |
| | 5,979 | | | 3.915%, 10/01/20 | | | 6,480 | |
| | 5,661 | | | 3.920%, 09/01/21 | | | 6,208 | |
| | 16,111 | | | 3.930%, 07/01/20 - 01/01/21 | | | 17,428 | |
| | 8,968 | | | 3.940%, 07/01/21 | | | 9,859 | |
| | 13,267 | | | 3.950%, 07/01/20 | | | 14,357 | |
| | 8,449 | | | 3.960%, 08/01/20 | | | 9,159 | |
| | 5,447 | | | 3.970%, 06/01/21 | | | 5,965 | |
| | 4,595 | | | 3.990%, 07/01/21 | | | 5,039 | |
| | 159,001 | | | 4.000%, 04/01/20 - 03/01/46 | | | 172,382 | |
| | 6,009 | | | 4.020%, 06/01/21 | | | 6,613 | |
| | 5,718 | | | 4.050%, 01/01/21 - 08/01/21 | | | 6,277 | |
| | 8,659 | | | 4.060%, 07/01/21 | | | 9,527 | |
| | 26,927 | | | 4.066%, 07/01/20 | | | 29,182 | |
| | 15,475 | | | 4.070%, 10/01/21 | | | 17,091 | |
| | 5,865 | | | 4.100%, 06/01/21 | | | 6,449 | |
| | 14,355 | | | 4.130%, 11/01/19 - 08/01/21 | | | 15,640 | |
| | 14,787 | | | 4.160%, 03/01/21 | | | 16,264 | |
| | 16,337 | | | 4.180%, 12/01/19 - 09/01/23 | | | 18,250 | |
| | 4,708 | | | 4.190%, 06/01/21 | | | 5,196 | |
| | 17,725 | | | 4.240%, 11/01/19 - 06/01/21 | | | 19,518 | |
| | 15,784 | | | 4.250%, 04/01/21 | | | 17,477 | |
| | 27,628 | | | 4.260%, 12/01/19 - 07/01/21 | | | 30,406 | |
| | 6,237 | | | 4.263%, 06/01/21 | | | 6,846 | |
| | 15,965 | | | 4.281%, 01/01/20 | | | 17,128 | |
| | 6,102 | | | 4.283%, 01/01/21 | | | 6,692 | |
| | 4,781 | | | 4.295%, 06/01/21 | | | 5,308 | |
| | 6,641 | | | 4.300%, 08/01/20 - 04/01/21 | | | 6,996 | |
| | 7,792 | | | 4.307%, 07/01/21 | | | 8,667 | |
| | 10,505 | | | 4.330%, 02/01/21 - 04/01/21 | | | 11,611 | |
| | 16,142 | | | 4.340%, 06/01/21 | | | 17,996 | |
| | 12,697 | | | 4.350%, 04/01/20 | | | 13,833 | |
| | 13,040 | | | 4.360%, 05/01/21 | | | 14,470 | |
| | 9,817 | | | 4.369%, 02/01/20 | | | 10,664 | |
| | 14,280 | | | 4.381%, 04/01/20 | | | 15,541 | |
| | 6,564 | | | 4.390%, 05/01/21 | | | 7,283 | |
| | 55,153 | | | 4.399%, 02/01/20 | | | 59,969 | |
| | 2,511 | | | 4.400%, 02/01/20 | | | 2,728 | |
| | 3,643 | | | 4.450%, 01/01/21 | | | 4,025 | |
| | | | | | | | |
PRINCIPAL
AMOUNT($) | | | SECURITY DESCRIPTION | | VALUE($) | |
| | | | | | | | |
| | 8,071 | | | 4.480%, 06/01/21 | | | 9,038 | |
| | 99,773 | | | 4.500%, 08/01/21 - 03/01/44 | | | 111,689 | |
| | 17,328 | | | 4.514%, 12/01/19 | | | 18,695 | |
| | 5,258 | | | 4.540%, 01/01/20 - 07/01/26 | | | 5,948 | |
| | 9,087 | | | 4.552%, 08/01/26 | | | 10,543 | |
| | 10,873 | | | 4.640%, 01/01/21 | | | 12,084 | |
| | 9,965 | | | 4.663%, 12/01/26 | | | 11,785 | |
| | 9,166 | | | 4.762%, 08/01/26 | | | 10,883 | |
| | 5,834 | | | 4.766%, 08/01/26 | | | 6,928 | |
| | 1,754 | | | 5.000%, 04/01/31 - 12/01/32 | | | 1,979 | |
| | 7,613 | | | 5.240%, 05/01/17 | | | 7,693 | |
| | 1,804 | | | 5.500%, 03/01/17 - 06/01/39 | | | 1,935 | |
| | 10,100 | | | 5.895%, 10/01/17 | | | 10,541 | |
| | 2,348 | | | 6.000%, 02/01/36 - 11/01/48 | | | 2,639 | |
| | 1,890 | | | 6.500%, 04/01/36 - 05/01/37 | | | 2,137 | |
| | 1,393 | | | 7.000%, 02/01/36 - 01/01/38 | | | 1,591 | |
| | 145 | | | 8.000%, 11/01/37 | | | 163 | |
| | 28 | | | 10.500%, 04/15/19 | | | 30 | |
| | | | Government National Mortgage Association II, 30 Year, Single Family, | | | | |
| | 3,316 | | | 3.750%, 07/20/45 | | | 3,536 | |
| | 8,774 | | | 4.250%, 12/20/44 | | | 9,596 | |
| | 2,246 | | | 5.500%, 09/20/39 | | | 2,571 | |
| | 11,999 | | | 6.000%, 03/20/28 - 08/20/39 | | | 13,770 | |
| | 1,033 | | | 6.500%, 07/20/29 | | | 1,219 | |
| | 460 | | | 7.000%, 08/20/38 | | | 537 | |
| | 85 | | | 7.500%, 02/20/28 - 09/20/28 | | | 104 | |
| | 161 | | | 8.000%, 12/20/25 - 09/20/28 | | | 189 | |
| | 80 | | | 8.500%, 03/20/25 - 05/20/25 | | | 91 | |
| | | | Government National Mortgage Association II, Other, | | | | |
| | 3,140 | | | 3.750%, 09/20/38 - 01/20/39 | | | 3,368 | |
| | 4,512 | | | 4.462%, 05/20/63 | | | 4,875 | |
| | 77 | | | 6.000%, 11/20/38 | | | 84 | |
| | | | Government National Mortgage Association, 15 Year, Single Family, | | | | |
| | 5 | | | 6.000%, 10/15/17 | | | 5 | |
| | 12 | | | 6.500%, 06/15/17 | | | 12 | |
| | | | Government National Mortgage Association, 30 Year, Single Family, | | | | |
| | 3,861 | | | 5.500%, 04/15/33 - 09/15/34 | | | 4,439 | |
| | 108 | | | 6.000%, 11/15/28 | | | 123 | |
| | 2,554 | | | 6.500%, 01/15/24 - 12/15/35 | | | 2,986 | |
| | 5,044 | | | 7.000%, 08/15/23 - 04/15/37 | | | 6,072 | |
| | 584 | | | 7.500%, 11/15/22 - 10/15/37 | | | 636 | |
| | 18 | | | 8.000%, 07/15/22 - 08/15/28 | | | 18 | |
| | 1 | | | 8.500%, 03/15/17 - 11/15/17 | | | 1 | |
SEE NOTES TO FINANCIAL STATEMENTS.
| | | | | | | | |
| | | |
| AUGUST 31, 2016 | | J.P. MORGAN INCOME FUNDS | | | | | 91 | |
JPMorgan Core Bond Fund
SCHEDULE OF PORTFOLIO INVESTMENTS
AS OF AUGUST 31, 2016 (Unaudited) (continued)
(Amounts in thousands)
| | | | | | | | |
PRINCIPAL
AMOUNT($) | | | SECURITY DESCRIPTION | | VALUE($) | |
| Mortgage Pass-Through Securities — continued | |
| | 13 | | | 9.000%, 12/15/16 - 11/15/24 | | | 14 | |
| | 509 | | | 9.500%, 09/15/18 - 12/15/25 | | | 550 | |
| | | | | | | | |
| | | | Total Mortgage Pass-Through Securities
(Cost $4,642,351) | | | 4,834,777 | |
| | | | | | | | |
| Municipal Bonds — 0.3% (t) | |
| | | | California — 0.0% (g) | | | | |
| | 3,060 | | | Los Angeles City Department of Airports, International Airport, Series C, Rev., 6.582%, 05/15/39 | | | 4,269 | |
| | 2,400 | | | State of California, Various Purpose, GO, 7.300%, 10/01/39 | | | 3,708 | |
| | | | | | | | |
| | | | | | | 7,977 | |
| | | | | | | | |
| | | | Illinois — 0.0% (g) | | | | |
| | 4,890 | | | State of Illinois, Taxable Pension, GO, 5.100%, 06/01/33 | | | 4,767 | |
| | | | | | | | |
| | | | New York — 0.2% | | | | |
| | 2,240 | | | New York State Dormitory Authority, State Personal Income Tax, General Purpose, Series D, Rev., 5.600%, 03/15/40 | | | 3,080 | |
| | | | Port Authority of New York & New Jersey, Consolidated, | | | | |
| | 10,965 | | | Series 164, Rev., 5.647%, 11/01/40 | | | 14,760 | |
| | 17,925 | | | Series 174, Rev., 4.458%, 10/01/62 | | | 21,184 | |
| | 3,780 | | | Port Authority of New York & New Jersey, Consolidated 165, Rev., 5.647%, 11/01/40 | | | 5,088 | |
| | | | | | | | |
| | | | | | | 44,112 | |
| | | | | | | | |
| | | | Ohio — 0.1% | | | | |
| | 11,725 | | | American Municipal Power, Inc., Meldahl Hydroelectric Project, Series B, Rev., 7.499%, 02/15/50 | | | 17,856 | |
| | 3,478 | | | Ohio St Univ Gen Rcpts Taxable-Multiyear Debt Issuance Prog-Ser A 09/Mar/2016 01/Dec/2056 4.048%, Series A, Rev., 4.048%, 12/01/56 | | | 3,973 | |
| | | | Ohio State University, General Receipts, | | | | |
| | 1,000 | | | Rev., 5.590%, 12/01/144 | | | 1,220 | |
| | 9,576 | | | Series A, Rev., 4.800%, 06/01/113 | | | 11,097 | |
| | | | | | | | |
| | | | | | | 34,146 | |
| | | | | | | | |
| | | | Total Municipal Bonds (Cost $73,122) | | | 91,002 | |
| | | | | | | | |
| Preferred Security — 0.0% (g) (x) | |
| | | | Financials — 0.0% (g) | | | | |
| | | | Insurance — 0.0% (g) | | | | |
| | 9,929 | | | Dai-ichi Life Insurance Co. Ltd. (The), (Japan), VAR, 4.000%, 07/24/26 (e)
(Cost $9,929) | | | 10,128 | |
| | | | | | | | |
| | | | | | | | |
PRINCIPAL
AMOUNT($) | | | SECURITY DESCRIPTION | | VALUE($) | |
| Supranational — 0.1% | |
| | 23,640 | | | African Development Bank, 8.800%, 09/01/19
(Cost $27,505) | | | 28,544 | |
| | | | | | | | |
| U.S. Government Agency Securities — 2.5% | |
| | 2,986 | | | Federal Farm Credit Bank, 5.125%, 11/15/18 | | | 3,256 | |
| | 9,865 | | | Federal Home Loan Bank, 5.500%, 07/15/36 | | | 14,542 | |
| | 23,765 | | | Federal National Mortgage Association, 4.068%, 06/01/17 | | | 23,650 | |
| | 8,071 | | | Federal National Mortgage Association STRIPS, 3.655%, 05/15/30 (n) | | | 5,704 | |
| | | | Financing Corp. STRIPS, | | | | |
| | 59,680 | | | 1.261%, 05/11/18 (n) | | | 58,791 | |
| | 3,506 | | | 1.572%, 11/30/17 (n) | | | 3,465 | |
| | 1,795 | | | 2.096%, 03/07/19 (n) | | | 1,746 | |
| | 1,688 | | | 2.182%, 04/06/18 (n) | | | 1,664 | |
| | 27,586 | | | 2.886%, 09/26/19 (n) | | | 26,649 | |
| | 11,944 | | | Government Trust Certificate, Series 1-Z, Zero Coupon, 04/01/19 | | | 11,531 | |
| | | | Residual Funding Corp. STRIPS, | | | | |
| | 43,764 | | | 1.438%, 01/15/21 (n) | | | 41,160 | |
| | 166,149 | | | 1.597%, 10/15/19 (n) | | | 160,280 | |
| | 225,211 | | | 1.844%, 07/15/20 (n) | | | 213,554 | |
| | 50,759 | | | 1.898%, 10/15/20 (n) | | | 48,073 | |
| | 30,700 | | | 2.734%, 01/15/30 (n) | | | 22,098 | |
| | 18,250 | | | 2.943%, 04/15/30 (n) | | | 13,086 | |
| | | | Tennessee Valley Authority, | | | | |
| | 4,129 | | | 4.250%, 09/15/65 | | | 5,015 | |
| | 2,632 | | | 4.625%, 09/15/60 | | | 3,375 | |
| | 14,269 | | | 5.250%, 09/15/39 | | | 20,114 | |
| | 493 | | | 5.500%, 06/15/38 | | | 704 | |
| | 7,668 | | | 5.880%, 04/01/36 | | | 11,341 | |
| | | | Tennessee Valley Authority STRIPS, | | | | |
| | 3,711 | | | 2.130%, 12/15/17 (n) | | | 3,664 | |
| | 3,500 | | | 3.239%, 12/15/28 (n) | | | 2,428 | |
| | 17,495 | | | 3.550%, 11/01/25 (n) | | | 14,083 | |
| | 2,242 | | | 4.251%, 06/15/35 (n) | | | 1,267 | |
| | 10,762 | | | 4.323%, 05/01/19 (n) | | | 10,384 | |
| | 3,119 | | | 4.608%, 07/15/28 (n) | | | 2,211 | |
| | | | | | | | |
| | | | Total U.S. Government Agency Securities
(Cost $703,629) | | | 723,835 | |
| | | | | | | | |
| U.S. Treasury Obligations — 25.1% | |
| | | | U.S. Treasury Bonds, | | | | |
| | 25,000 | | | 2.875%, 05/15/43 | | | 28,406 | |
| | 26,500 | | | 3.500%, 02/15/39 | | | 33,407 | |
| | 38,050 | | | 4.250%, 05/15/39 | | | 53,081 | |
| | 88,390 | | | 4.375%, 02/15/38 | | | 125,417 | |
| | 76,320 | | | 4.375%, 11/15/39 | | | 108,380 | |
SEE NOTES TO FINANCIAL STATEMENTS.
| | | | | | |
| | | |
| 92 | | | | J.P. MORGAN INCOME FUNDS | | AUGUST 31, 2016 |
| | | | | | | | |
PRINCIPAL
AMOUNT($) | | | SECURITY DESCRIPTION | | VALUE($) | |
| U.S. Treasury Obligations — continued | |
| | 134,780 | | | 4.375%, 05/15/40 | | | 191,724 | |
| | 8,900 | | | 4.500%, 02/15/36 | | | 12,717 | |
| | 12,861 | | | 4.500%, 05/15/38 | | | 18,572 | |
| | 71,284 | | | 4.500%, 08/15/39 | | | 102,855 | |
| | 31,370 | | | 4.750%, 02/15/37 | | | 46,290 | |
| | 583 | | | 5.250%, 11/15/28 | | | 812 | |
| | 50,572 | | | 7.500%, 11/15/16 | | | 51,310 | |
| | 4,000 | | | 7.875%, 02/15/21 | | | 5,167 | |
| | 29,475 | | | 8.000%, 11/15/21 | | | 39,521 | |
| | 14,932 | | | 8.125%, 05/15/21 | | | 19,674 | |
| | 41,000 | | | 8.500%, 02/15/20 | | | 51,444 | |
| | 17,000 | | | 8.750%, 05/15/20 | | | 21,743 | |
| | 54,785 | | | 8.750%, 08/15/20 | | | 71,071 | |
| | | | U.S. Treasury Coupon STRIPS, | | | | |
| | 4,100 | | | 1.774%, 11/15/18 (n) | | | 4,026 | |
| | 72,700 | | | 1.775%, 11/15/19 (n) | | | 70,295 | |
| | 123,537 | | | 1.869%, 05/15/21 (n) | | | 116,504 | |
| | 17,000 | | | 1.925%, 08/15/25 (n) | | | 14,701 | |
| | 212,665 | | | 2.077%, 02/15/21 (n) | | | 201,285 | |
| | 113,900 | | | 2.108%, 11/15/23 (n) | | | 101,953 | |
| | 63,421 | | | 2.187%, 05/15/25 (n) | | | 55,067 | |
| | 106,435 | | | 2.296%, 08/15/23 (n) | | | 95,798 | |
| | 59,076 | | | 2.342%, 02/15/24 (n) | | | 52,659 | |
| | 149,456 | | | 2.384%, 05/15/22 (n) | | | 138,191 | |
| | 25,842 | | | 2.398%, 02/15/20 (n) | | | 24,912 | |
| | 105,800 | | | 2.486%, 08/15/22 (n) | | | 97,369 | |
| | 204,956 | | | 2.568%, 02/15/22 (n) | | | 190,517 | |
| | 171,800 | | | 2.615%, 11/15/22 (n) | | | 157,177 | |
| | 108,421 | | | 2.680%, 08/15/21 (n) | | | 101,686 | |
| | 248,580 | | | 2.688%, 05/15/23 (n) | | | 224,766 | |
| | 51,591 | | | 2.743%, 08/15/24 (n) | | | 45,564 | |
| | 54,049 | | | 2.799%, 05/15/28 (n) | | | 43,551 | |
| | 121,891 | | | 2.833%, 02/15/34 (n) | | | 84,336 | |
| | 97,800 | | | 2.849%, 08/15/32 (n) | | | 70,678 | |
| | 71,937 | | | 2.879%, 08/15/18 (n) | | | 70,812 | |
| | 329,322 | | | 2.886%, 02/15/23 (n) | | | 299,578 | |
| | 172,788 | | | 2.958%, 11/15/32 (n) | | | 124,034 | |
| | 14,870 | | | 3.039%, 05/15/29 (n) | | | 11,693 | |
| | 103,866 | | | 3.076%, 02/15/32 (n) | | | 76,285 | |
| | 78,371 | | | 3.091%, 11/15/21 (n) | | | 73,190 | |
| | 17,278 | | | 3.113%, 05/15/24 (n) | | | 15,332 | |
| | 221,297 | | | 3.191%, 05/15/32 (n) | | | 161,205 | |
| | 72,532 | | | 3.193%, 08/15/28 (n) | | | 58,231 | |
| | 189,907 | | | 3.200%, 08/15/20 (n) | | | 181,750 | |
| | 7,608 | | | 3.243%, 08/15/26 (n) | | | 6,434 | |
| | 16,680 | | | 3.255%, 05/15/35 (n) | | | 11,142 | |
| | | | | | | | |
PRINCIPAL
AMOUNT($) | | | SECURITY DESCRIPTION | | VALUE($) | |
| | | | | | | | |
| | 93,350 | | | 3.275%, 05/15/31 (n) | | | 69,849 | |
| | 133,709 | | | 3.277%, 11/15/33 (n) | | | 93,419 | |
| | 59,956 | | | 3.304%, 11/15/29 (n) | | | 46,620 | |
| | 14,106 | | | 3.313%, 05/15/18 (n) | | | 13,917 | |
| | 79,788 | | | 3.329%, 08/15/31 (n) | | | 59,459 | |
| | 143,105 | | | 3.332%, 05/15/33 (n) | | | 101,483 | |
| | 21,613 | | | 3.357%, 11/15/34 (n) | | | 14,619 | |
| | 36,300 | | | 3.359%, 02/15/33 (n) | | | 25,902 | |
| | 347,451 | | | 3.364%, 05/15/20 (n) | | | 333,531 | |
| | 38,512 | | | 3.369%, 08/15/29 (n) | | | 30,143 | |
| | 87,828 | | | 3.400%, 11/15/26 (n) | | | 73,731 | |
| | 135,684 | | | 3.427%, 02/15/27 (n) | | | 113,190 | |
| | 81,052 | | | 3.452%, 02/15/29 (n) | | | 64,149 | |
| | 84,028 | | | 3.471%, 11/15/27 (n) | | | 68,650 | |
| | 98,421 | | | 3.508%, 11/15/31 (n) | | | 72,605 | |
| | 27,839 | | | 3.545%, 11/15/16 (n) | | | 27,821 | |
| | 180,863 | | | 3.566%, 08/15/19 (n) | | | 175,627 | |
| | 122,874 | | | 3.597%, 05/15/19 (n) | | | 119,751 | |
| | 25,155 | | | 3.630%, 08/15/34 (n) | | | 17,154 | |
| | 28,525 | | | 3.673%, 05/15/34 (n) | | | 19,578 | |
| | 25,906 | | | 3.699%, 02/15/35 (n) | | | 17,431 | |
| | 38,200 | | | 3.839%, 11/15/24 (n) | | | 33,595 | |
| | 89,733 | | | 3.854%, 08/15/30 (n) | | | 68,352 | |
| | 57,436 | | | 3.915%, 11/15/30 (n) | | | 43,478 | |
| | 72,252 | | | 3.967%, 02/15/31 (n) | | | 54,545 | |
| | 46,760 | | | 4.025%, 11/15/28 (n) | | | 37,315 | |
| | 31,792 | | | 4.201%, 02/15/18 (n) | | | 31,443 | |
| | 67,515 | | | 4.330%, 02/15/28 (n) | | | 54,751 | |
| | 75,636 | | | 4.381%, 05/15/30 (n) | | | 58,072 | |
| | 6,700 | | | 4.404%, 02/15/26 (n) | | | 5,714 | |
| | 24,999 | | | 4.449%, 05/15/26 (n) | | | 21,187 | |
| | 45,886 | | | 4.517%, 08/15/27 (n) | | | 37,791 | |
| | 24,963 | | | 4.692%, 08/15/33 (n) | | | 17,574 | |
| | 82,771 | | | 4.901%, 11/15/17 (n) | | | 82,038 | |
| | 43,147 | | | 4.981%, 02/15/17 (n) | | | 43,051 | |
| | 1,525 | | | 5.107%, 08/15/35 (n) | | | 1,011 | |
| | 111,213 | | | 5.142%, 02/15/30 (n) | | | 85,926 | |
| | 6,601 | | | 5.326%, 02/15/25 (n) | | | 5,762 | |
| | 17,309 | | | 5.982%, 05/15/27 (n) | | | 14,339 | |
| | 1,054 | | | 6.179%, 05/15/36 (n) | | | 687 | |
| | | | U.S. Treasury Inflation Indexed Bonds, | | | | |
| | 2,100 | | | 1.750%, 01/15/28 | | | 2,810 | |
| | 3,587 | | | 2.500%, 01/15/29 | | | 5,088 | |
| | 9,066 | | | 3.625%, 04/15/28 | | | 18,582 | |
| | | | U.S. Treasury Inflation Indexed Notes, | | | | |
| | 10,000 | | | 0.125%, 04/15/18 | | | 10,474 | |
SEE NOTES TO FINANCIAL STATEMENTS.
| | | | | | | | |
| | | |
| AUGUST 31, 2016 | | J.P. MORGAN INCOME FUNDS | | | | | 93 | |
JPMorgan Core Bond Fund
SCHEDULE OF PORTFOLIO INVESTMENTS
AS OF AUGUST 31, 2016 (Unaudited) (continued)
(Amounts in thousands)
| | | | | | | | |
PRINCIPAL
AMOUNT($) | | | SECURITY DESCRIPTION | | VALUE($) | |
| U.S. Treasury Obligations — continued | |
| | 22,231 | | | 0.125%, 01/15/22 | | | 23,871 | |
| | 2,584 | | | 1.375%, 01/15/20 | | | 3,033 | |
| | | | U.S. Treasury Notes, | | | | |
| | 27,600 | | | 0.750%, 02/15/19 | | | 27,514 | |
| | 69,175 | | | 0.875%, 10/15/17 | | | 69,289 | |
| | 2,128 | | | 0.875%, 01/31/18 | | | 2,131 | |
| | 4,905 | | | 0.875%, 07/31/19 | | | 4,898 | |
| | 20,788 | | | 1.000%, 11/30/19 | | | 20,796 | |
| | 16,770 | | | 1.250%, 10/31/18 | | | 16,911 | |
| | 99,091 | | | 1.250%, 11/30/18 | | | 99,954 | |
| | 38,500 | | | 1.250%, 02/29/20 | | | 38,780 | |
| | 16,278 | | | 1.375%, 12/31/18 | | | 16,467 | |
| | 13,000 | | | 1.375%, 02/28/19 | | | 13,158 | |
| | 10,000 | | | 1.375%, 05/31/20 | | | 10,107 | |
| | 11,860 | | | 1.500%, 05/31/19 | | | 12,049 | |
| | 8,000 | | | 1.625%, 07/31/19 | | | 8,159 | |
| | 5,000 | | | 1.750%, 10/31/20 | | | 5,121 | |
| | 6,000 | | | 1.875%, 08/31/22 | | | 6,177 | |
| | 2,500 | | | 2.000%, 11/30/20 | | | 2,586 | |
| | 15,000 | | | 2.000%, 02/28/21 | | | 15,534 | |
| | 10,000 | | | 2.125%, 08/31/20 | | | 10,389 | |
| | 45,000 | | | 2.125%, 09/30/21 | | | 46,939 | |
| | 1,794 | | | 2.250%, 11/30/17 | | | 1,827 | |
| | 23,317 | | | 2.625%, 01/31/18 | | | 23,922 | |
| | 90,991 | | | 2.625%, 08/15/20 | | | 96,251 | |
| | 34,504 | | | 2.625%, 11/15/20 | | | 36,572 | |
| | 2,242 | | | 2.750%, 11/30/16 | | | 2,255 | |
| | 12,681 | | | 2.750%, 12/31/17 | | | 13,011 | |
| | 52,451 | | | 2.875%, 03/31/18 | | | 54,145 | |
| | 29,550 | | | 3.125%, 10/31/16 | | | 29,687 | |
| | 1,794 | | | 3.125%, 01/31/17 | | | 1,814 | |
| | | | | | | | |
PRINCIPAL
AMOUNT($) | | | SECURITY DESCRIPTION | | VALUE($) | |
| | | | | | | | |
| | 52,041 | | | 3.125%, 04/30/17 | | | 52,919 | |
| | 180,518 | | | 3.125%, 05/15/19 | | | 191,201 | |
| | 25,000 | | | 3.125%, 05/15/21 | | | 27,181 | |
| | 86,535 | | | 3.250%, 12/31/16 | | | 87,350 | |
| | 47,007 | | | 3.500%, 02/15/18 | | | 48,851 | |
| | 17,039 | | | 3.625%, 02/15/21 | | | 18,837 | |
| | 11,647 | | | 4.250%, 11/15/17 | | | 12,134 | |
| | 8,520 | | | 4.625%, 02/15/17 | | | 8,678 | |
| | | | | | | | |
| | | | Total U.S. Treasury Obligations
(Cost $6,798,388) | | | 7,415,024 | |
| | | | | | | | |
| Loan Assignment — 0.2% | |
| | | | Consumer Discretionary — 0.2% | | | | |
| | | | Hotels, Restaurants & Leisure — 0.2% | | | | |
| | 46,289 | | | Lila Mexican Holdings LLC, Tranche B, VAR, 3.508%, 08/11/22
(Cost $44,869) | | | 45,199 | |
| | | | | | | | |
| | | | Total Loan Assignments
(Cost $44,869) | | | 45,199 | |
| | | | | | | | |
| | |
| SHARES | | | | | | |
| Short-Term Investment — 2.9% | |
| | | | Investment Company — 2.9% | | | | |
| | 856,578 | | | JPMorgan Prime Money Market Fund, Institutional Class Shares, 0.360% (b) (l)
(Cost $856,578) | | | 856,578 | |
| | | | | | | | |
| | | | Total Investments — 99.9%
(Cost $28,059,435) | | | 29,489,546 | |
| | | | Other Assets in Excess of
Liabilities — 0.1% | | | 35,574 | |
| | | | | | | | |
| | | | NET ASSETS — 100.0% | | $ | 29,525,120 | |
| | | | | | | | |
Percentages indicated are based on net assets.
SEE NOTES TO FINANCIAL STATEMENTS.
| | | | | | |
| | | |
| 94 | | | | J.P. MORGAN INCOME FUNDS | | AUGUST 31, 2016 |
JPMorgan Core Plus Bond Fund
SCHEDULE OF PORTFOLIO INVESTMENTS
AS OF AUGUST 31, 2016 (Unaudited)
(Amounts in U.S. Dollars, unless otherwise noted)
(Amounts in thousands)
| | | | | | | | |
PRINCIPAL
AMOUNT | | | SECURITY DESCRIPTION | | VALUE | |
| Asset-Backed Securities — 11.2% | |
| | 507 | | | Academic Loan Funding Trust, Series 2012-1A, Class A1, VAR, 1.288%, 12/27/22 (e) | | | 507 | |
| | | | Accredited Mortgage Loan Trust, | | | | |
| | 232 | | | Series 2006-1, Class A3, VAR, 0.704%, 04/25/36 | | | 231 | |
| | 277 | | | Series 2006-2, Class A3, VAR, 0.674%, 09/25/36 | | | 275 | |
| | 2,375 | | | Ally Auto Receivables Trust, Series 2015-SN1, Class A3, 1.210%, 12/20/17 | | | 2,375 | |
| | | | American Credit Acceptance Receivables Trust, | | | | |
| | 5,000 | | | Series 2013-2, Class D, 5.920%, 08/17/20 (e) | | | 5,010 | |
| | 10,000 | | | Series 2016-2, Class C, 6.090%, 05/12/22 (e) | | | 10,499 | |
| | 6,975 | | | Series 2016-3, Class C, 4.260%, 08/12/22 (e) | | | 6,955 | |
| | | | American Homes 4 Rent Trust, | | | | |
| | 5,000 | | | Series 2014-SFR3, Class D, 5.040%, 12/17/36 (e) | | | 5,447 | |
| | 1,445 | | | Series 2014-SFR3, Class E, 6.418%, 12/17/36 (e) | | | 1,602 | |
| | 1,250 | | | Series 2015-SFR1, Class E, 5.639%, 04/17/52 (e) | | | 1,317 | |
| | | | AmeriCredit Automobile Receivables Trust, | | | | |
| | 2,926 | | | Series 2015-1, Class A3, 1.260%, 11/08/19 | | | 2,924 | |
| | 4,580 | | | Series 2015-2, Class A3, 1.270%, 01/08/20 | | | 4,577 | |
| | 5,317 | | | Series 2016-3, Class B, 1.800%, 10/08/21 | | | 5,293 | |
| | | | Ameriquest Mortgage Securities, Inc. Asset-Backed Pass-Through Certificates, | | | | |
| | 260 | | | Series 2003-5, Class A6, SUB, 4.244%, 04/25/33 | | | 263 | |
| | 42 | | | Series 2003-13, Class AF6, SUB, 4.972%, 01/25/34 | | | 42 | |
| | | | Anchor Assets IX LLC, | | | | |
| | 10,000 | | | Series 2016-1, Class A, 5.125%, 02/15/20 (e) | | | 10,000 | |
| | 7,100 | | | Series 2016-1, Class B, 6.250%, 02/15/20 (e) | | | 7,100 | |
| | 700 | | | AXIS Equipment Finance Receivables II LLC, Series 2013-1A, Class D, 4.940%, 07/20/18 (e) | | | 704 | |
| | | | B2R Mortgage Trust, | | | | |
| | 3,734 | | | Series 2015-1, Class A1, 2.524%, 05/15/48 (e) | | | 3,724 | |
| | 4,491 | | | Series 2016-1, Class A, 2.567%, 07/15/49 (e) | | | 4,466 | |
| | 3 | | | BankBoston Home Equity Loan Trust, Series 1998-1, Class A6, 6.350%, 07/25/28 | | | 3 | |
| | | | | | | | |
PRINCIPAL
AMOUNT | | | SECURITY DESCRIPTION | | VALUE | |
| | | | | | | | |
| | | | Bear Stearns Asset-Backed Securities Trust, | | | | |
| | 333 | | | Series 2003-SD2, Class 2A, VAR, 3.261%, 06/25/43 | | | 314 | |
| | 433 | | | Series 2006-SD1, Class A, VAR, 0.894%, 04/25/36 | | | 420 | |
| | | | Blue Elephant Loan Trust, | | | | |
| | 901 | | | Series 2015-1, Class A, 3.120%, 12/15/22 (e) | | | 900 | |
| | 1,850 | | | Series 2015-1, Class B, 5.560%, 12/15/22 (e) | | | 1,843 | |
| | 599 | | | BXG Receivables Note Trust, Series 2012-A, Class A, 2.660%, 12/02/27 (e) | | | 596 | |
| | 1,895 | | | California Republic Auto Receivables Trust, Series 2016-2, Class A3, 1.560%, 07/15/20 | | | 1,892 | |
| | 10,000 | | | CAM Mortgage LLC, Series 2015-1, Class M, VAR, 4.750%, 07/15/64 (e) | | | 9,813 | |
| | 6,455 | | | Capital Auto Receivables Asset Trust, Series 2015-1, Class A2, 1.420%, 06/20/18 | | | 6,459 | |
| | | | CarFinance Capital Auto Trust, | | | | |
| | 458 | | | Series 2013-1A, Class B, 2.750%, 11/15/18 (e) | | | 460 | |
| | 2,500 | | | Series 2014-1A, Class C, 3.450%, 04/15/20 (e) | | | 2,496 | |
| | 3,193 | | | Series 2014-2A, Class B, 2.640%, 11/16/20 (e) | | | 3,191 | |
| | 2,750 | | | Series 2014-2A, Class C, 3.240%, 11/16/20 (e) | | | 2,684 | |
| | 4,000 | | | Series 2014-2A, Class D, 4.280%, 11/16/20 (e) | | | 3,909 | |
| | 5,400 | | | Series 2015-1A, Class C, 4.660%, 06/15/21 (e) | | | 5,301 | |
| | 3,900 | | | Series 2015-1A, Class D, 3.580%, 06/15/21 (e) | | | 3,818 | |
| | 1,070 | | | Series 2015-1A, Class E, 5.490%, 01/18/22 (e) | | | 1,029 | |
| | 2,215 | | | Carlyle Global Market Strategies Commodities Funding Ltd., (Cayman Islands), Series 2014-1A, Class A, VAR, 2.528%, 10/15/21 (e) | | | 1,816 | |
| | | | Centex Home Equity Loan Trust, | | | | |
| | 127 | | | Series 2001-B, Class A6, 6.360%, 07/25/32 | | | 128 | |
| | 211 | | | Series 2002-C, Class AF4, SUB, 4.980%, 06/25/31 | | | 213 | |
| | 133 | | | Series 2003-B, Class AF4, SUB, 3.735%, 02/25/32 | | | 134 | |
| | 93 | | | Series 2004-D, Class AF4, SUB, 5.180%, 06/25/32 | | | 94 | |
| | 3,000 | | | Citi Held For Asset Issuance 2016-PM1, Series 2016-PM1, Class B, 7.670%, 04/15/25 (e) | | | 3,174 | |
SEE NOTES TO FINANCIAL STATEMENTS.
| | | | | | | | |
| | | |
| AUGUST 31, 2016 | | J.P. MORGAN INCOME FUNDS | | | | | 95 | |
JPMorgan Core Plus Bond Fund
SCHEDULE OF PORTFOLIO INVESTMENTS
AS OF AUGUST 31, 2016 (Unaudited) (continued)
(Amounts in U.S. Dollars, unless otherwise noted)
(Amounts in thousands)
| | | | | | | | |
PRINCIPAL
AMOUNT | | | SECURITY DESCRIPTION | | VALUE | |
| Asset-Backed Securities — continued | |
| | 1,372 | | | Citibank Credit Card Issuance Trust, Series 2007-A3, Class A3, 6.150%, 06/15/39 | | | 2,021 | |
| | 206 | | | Citigroup Global Markets Mortgage Securities VII, Inc., Series 2003-UP1, Class A, SUB, 3.950%, 04/25/32 (e) | | | 205 | |
| | 3,308 | | | Colony American Finance Ltd., (Cayman Islands), Series 2016-1, Class A, 2.544%, 06/15/48 (e) | | | 3,308 | |
| | 5,000 | | | Conix Mortgage Asset Trust, Series 2013-1, Class M1, VAR, 5.069%, 12/25/47 (e) | | | 285 | |
| | 2,597 | | | Consumer Credit Origination Loan Trust, Series 2015-1, Class B, 5.210%, 03/15/21 (e) | | | 2,592 | |
| | 14,779 | | | COOF Securitization Trust Ltd., Series 2014-1, Class A, IO, VAR, 2.893%, 06/25/40 (e) | | | 1,897 | |
| | 134 | | | Countrywide Asset-Backed Certificates, Series 2004-13, Class MV8, VAR, 2.188%, 01/25/35 | | | 3 | |
| | | | CPS Auto Receivables Trust, | | | | |
| | 736 | | | Series 2012-B, Class A, 2.520%, 09/16/19 (e) | | | 737 | |
| | 230 | | | Series 2013-A, Class A, 1.310%, 06/15/20 (e) | | | 228 | |
| | 2,099 | | | Series 2016-B, Class B, 3.180%, 09/15/20 (e) | | | 2,107 | |
| | 12,600 | | | Series 2016-C, Class C, 3.270%, 06/15/22 (e) | | | 12,551 | |
| | | | CPS Auto Trust, | | | | |
| | 262 | | | Series 2012-C, Class B, 2.280%, 12/16/19 (e) | | | 261 | |
| | 164 | | | Series 2012-D, Class A, 1.480%, 03/16/20 (e) | | | 164 | |
| | 75 | | | Credit Suisse First Boston Mortgage Securities Corp., Series 2002-HE4, Class AF, SUB, 5.510%, 08/25/32 | | | 81 | |
| | | | CWABS, Inc. Asset-Backed Certificates Trust, | | | | |
| | 297 | | | Series 2004-1, Class 3A, VAR, 1.084%, 04/25/34 | | | 247 | |
| | 324 | | | Series 2004-1, Class M1, VAR, 1.274%, 03/25/34 | | | 311 | |
| | 46 | | | Series 2004-1, Class M2, VAR, 1.349%, 03/25/34 | | | 43 | |
| | 689 | | | Series 2004-6, Class M1, VAR, 1.424%, 10/25/34 | | | 645 | |
| | | | Drive Auto Receivables Trust, | | | | |
| | 2,943 | | | Series 2015-AA, Class D, 4.120%, 07/15/22 (e) | | | 3,011 | |
| | 5,900 | | | Series 2015-DA, Class D, 4.590%, 01/17/23 (e) | | | 6,103 | |
| | | | | | | | |
PRINCIPAL
AMOUNT | | | SECURITY DESCRIPTION | | VALUE | |
| | | | | | | | |
| | | | DT Auto Owner Trust, | | | | |
| | 5,727 | | | Series 2015-1A, Class D, 4.260%, 02/15/22 (e) | | | 5,730 | |
| | 5,000 | | | Series 2016-1A, Class D, 4.660%, 12/15/22 (e) | | | 5,010 | |
| | 974 | | | Series 2016-2A, Class C, 3.670%, 01/18/22 (e) | | | 994 | |
| | 10,965 | | | Series 2016-3A, Class B, 2.650%, 07/15/20 (e) | | | 10,945 | |
| | 6,000 | | | Series 2016-3A, Class C, 3.150%, 03/15/22 (e) | | | 5,986 | |
| | 373 | | | Equity One Mortgage Pass-Through Trust, Series 2003-2, Class M1, VAR, 5.050%, 09/25/33 | | | 375 | |
| | | | Exeter Automobile Receivables Trust, | | | | |
| | 1,125 | | | Series 2014-2A, Class C, 3.260%, 12/16/19 (e) | | | 1,131 | |
| | 5,555 | | | Series 2014-3A, Class B, 2.770%, 11/15/19 (e) | | | 5,598 | |
| | 2,150 | | | Series 2015-2A, Class D, 5.790%, 05/16/22 (e) | | | 2,122 | |
| | 6,884 | | | Series 2015-3A, Class C, 4.830%, 08/16/21 (e) | | | 6,814 | |
| | 445 | | | Series 2016-1A, Class C, 5.520%, 10/15/21 (e) | | | 448 | |
| | 3,000 | | | First Investors Auto Owner Trust, Series 2013-1A, Class C, 2.020%, 01/15/19 (e) | | | 3,003 | |
| | 7,834 | | | FirstKey Lending Trust, Series 2015-SFR1, Class A, 2.553%, 03/09/47 (e) | | | 7,809 | |
| | | | Flagship Credit Auto Trust, | | | | |
| | 3,875 | | | Series 2013-1, Class C, 3.590%, 03/15/19 (e) | | | 3,901 | |
| | 4,000 | | | Series 2014-1, Class C, 3.340%, 04/15/20 (e) | | | 3,980 | |
| | 4,460 | | | Series 2014-2, Class B, 2.840%, 11/16/20 (e) | | | 4,479 | |
| | 4,337 | | | Series 2014-2, Class C, 3.950%, 12/15/20 (e) | | | 4,354 | |
| | 6,000 | | | Series 2016-2, Class C, 6.220%, 09/15/22 (e) | | | 6,456 | |
| | 2,581 | | | Ford Credit Auto Owner Trust, Series 2015-A, Class A3, 1.280%, 09/15/19 | | | 2,585 | |
| | 9,457 | | | GCAT, Series 2015-2, Class A1, SUB, 3.750%, 07/25/20 (e) | | | 9,408 | |
| | 620 | | | GE Capital Mortgage Services, Inc. Trust, Series 1999-HE1, Class A6, VAR, 6.700%, 04/25/29 | | | 668 | |
| | | | GLC II Trust, | | | | |
| | 871 | | | Series 2014-A, Class A, 4.000%, 12/18/20 (e) | | | 860 | |
| | 3,064 | | | Series 2014-A, Class B, 6.000%, 12/18/20 (e) | | | 2,997 | |
SEE NOTES TO FINANCIAL STATEMENTS.
| | | | | | |
| | | |
| 96 | | | | J.P. MORGAN INCOME FUNDS | | AUGUST 31, 2016 |
| | | | | | | | |
PRINCIPAL
AMOUNT | | | SECURITY DESCRIPTION | | VALUE | |
| Asset-Backed Securities — continued | |
| | | | GLC Trust, | | | | |
| | 2,005 | | | Series 2014-A, Class A, 3.000%, 07/15/21 (e) | | | 1,991 | |
| | 1,003 | | | Series 2014-A, Class B, 4.000%, 07/15/21 (e) | | | 980 | |
| | 5,000 | | | GLS Auto Receivables Trust, Series 2016-1A, Class C, 6.900%, 10/15/21 (e) | | | 5,271 | |
| | | | GMAT Trust, | | | | |
| | 459 | | | Series 2013-1A, Class A, SUB, 3.967%, 11/25/43 (e) | | | 459 | |
| | 5,000 | | | Series 2013-1A, Class M, VAR, 5.000%, 11/25/43 (e) | | | 4,755 | |
| | | | GO Financial Auto Securitization Trust, | | | | |
| | 9,400 | | | Series 2015-1, Class C, 5.760%, 03/15/21 (e) | | | 9,364 | |
| | 6,398 | | | Series 2015-2, Class A, 3.270%, 11/15/18 (e) | | | 6,429 | |
| | 10,370 | | | Green Tree Agency Advance Funding Trust I, Series 2015-T1, Class DT1, 3.931%, 10/15/46 (e) | | | 10,361 | |
| | 120 | | | Home Loan Trust, Series 2003-HI2, Class A6, SUB, 5.260%, 07/25/28 | | | 120 | |
| | 5,672 | | | Honda Auto Receivables Owner Trust, Series 2015-1, Class A3, 1.050%, 10/15/18 | | | 5,673 | |
| | 230 | | | HSBC Home Equity Loan Trust USA, Series 2007-3, Class APT, VAR, 1.712%, 11/20/36 | | | 229 | |
| | 2,392 | | | Hyundai Auto Receivables Trust, Series 2015-A, Class A3, 1.050%, 04/15/19 | | | 2,392 | |
| | | | KGS-Alpha SBA COOF Trust, | | | | |
| | 19,644 | | | Series 2012-2, Class A, IO, VAR, 0.881%, 08/25/38 (e) | | | 531 | |
| | 23,842 | | | Series 2012-4, Class A, IO, VAR, 1.060%, 09/25/37 (e) | | | 876 | |
| | 16,077 | | | Series 2013-2, Class A, IO, VAR, 1.596%, 03/25/39 (e) | | | 751 | |
| | 2,003 | | | LendingClub Issuance Trust, Series 2016-NP1, Class A, 3.750%, 06/15/22 (e) | | | 2,006 | |
| | | | Long Beach Mortgage Loan Trust, | | | | |
| | 86 | | | Series 2004-1, Class M3, VAR, 1.574%, 02/25/34 | | | 82 | |
| | 2 | | | Series 2004-5, Class M6, VAR, 3.024%, 09/25/34 | | | 1 | |
| | | | LV Tower 52 Issuer LLC, | | | | |
| | 8,113 | | | Series 2013-1, Class A, 5.500%, 07/15/19 (e) | | | 7,908 | |
| | 9,651 | | | Series 2013-1, Class M, 7.500%, 07/15/19 (e) | | | 9,084 | |
| | | | | | | | |
PRINCIPAL
AMOUNT | | | SECURITY DESCRIPTION | | VALUE | |
| | | | | | | | |
| | | | MarketPlace Loan Trust, | | | | |
| | 2,661 | | | Series 2015-OD4, Class A, 3.250%, 12/18/17 (e) | | | 2,663 | |
| | 2,537 | | | Series 2015-OD4, Class B, 5.250%, 12/18/17 (e) | | | 2,521 | |
| | | | Marlette Funding Trust, | | | | |
| | 6,523 | | | Series 2016-1A, Class A, 3.060%, 01/17/23 (e) | | | 6,528 | |
| | 6,741 | | | Series 2016-1A, Class B, 4.780%, 10/15/21 (e) | | | 6,729 | |
| | | | Mid-State Capital Corp. Trust, | | | | |
| | 166 | | | Series 2005-1, Class A, 5.745%, 01/15/40 | | | 177 | |
| | 3,935 | | | Series 2005-1, Class M1, 6.106%, 01/15/40 | | | 4,234 | |
| | 1,891 | | | Series 2006-1, Class A, 5.787%, 10/15/40 (e) | | | 2,020 | |
| | 2,294 | | | Series 2006-1, Class M1, 6.083%, 10/15/40 (e) | | | 2,395 | |
| | 917 | | | Series 2006-1, Class M2, 6.742%, 10/15/40 (e) | | | 971 | |
| | 379 | | | Morgan Stanley ABS Capital I, Inc. Trust, Series 2003-SD1, Class M1, VAR, 2.774%, 03/25/33 | | | 353 | |
| | | | Nationstar HECM Loan Trust, | | | | |
| | 3,598 | | | Series 2016-2A, Class A, 2.239%, 06/25/26 (e) | | | 3,598 | |
| | 6,299 | | | Series 2016-2A, Class M1, 3.598%, 06/25/26 (e) | | | 6,299 | |
| | 9,502 | | | Series 2016-3A, Class M1, 3.147%, 08/25/26 (e) | | | 9,505 | |
| | | | New Century Home Equity Loan Trust, | | | | |
| | 719 | | | Series 2003-5, Class AI6, SUB, 5.171%, 11/25/33 | | | 738 | |
| | 610 | | | Series 2005-1, Class M1, VAR, 1.199%, 03/25/35 | | | 570 | |
| | | | NRPL Trust, | | | | |
| | 9,617 | | | Series 2015-2A, Class A1, SUB, 3.750%, 10/25/57 (e) | | | 9,406 | |
| | 3,278 | | | Series 2015-2A, Class A2, SUB, 3.750%, 10/25/57 (e) | | | 3,101 | |
| | 2,635 | | | NRZ Advance Receivables Trust Advance Receivables Backed, Series 2016-T1, Class CT1, 3.836%, 06/15/49 (e) | | | 2,609 | |
| | 10,150 | | | NRZ Advance Receivables Trust Advance Receivables Backed Notes, Series 2015-T4, Class DT4, 4.671%, 11/15/47 (e) | | | 10,159 | |
| | 5,257 | | | Oak Hill Advisors Residential Loan Trust, Series 2015-NPL2, Class A2, SUB, 4.000%, 07/25/55 (e) | | | 5,153 | |
SEE NOTES TO FINANCIAL STATEMENTS.
| | | | | | | | |
| | | |
| AUGUST 31, 2016 | | J.P. MORGAN INCOME FUNDS | | | | | 97 | |
JPMorgan Core Plus Bond Fund
SCHEDULE OF PORTFOLIO INVESTMENTS
AS OF AUGUST 31, 2016 (Unaudited) (continued)
(Amounts in U.S. Dollars, unless otherwise noted)
(Amounts in thousands)
| | | | | | | | |
PRINCIPAL
AMOUNT | | | SECURITY DESCRIPTION | | VALUE | |
| Asset-Backed Securities — continued | |
| | | | Ocwen Master Advance Receivables Trust, | | | | |
| | 1,338 | | | Series 2015-T3, Class CT3, 4.196%, 11/15/47 (e) | | | 1,341 | |
| | 9,984 | | | Series 2015-T3, Class DT3, 4.687%, 11/15/47 (e) | | | 9,987 | |
| | 6,725 | | | Series 2016-T2, Class DT2, 4.446%, 08/16/49 (e) | | | 6,719 | |
| | 1,823 | | | OnDeck Asset Securitization Trust II LLC, Series 2016-1A, Class B, 7.630%, 05/17/20 (e) | | | 1,850 | |
| | | | OneMain Direct Auto Receivables Trust, | | | | |
| | 8,949 | | | Series 2016-1A, Class A, 2.040%, 01/15/21 (e) | | | 8,935 | |
| | 10,000 | | | Series 2016-1A, Class C, 4.580%, 09/15/21 (e) | | | 9,968 | |
| | | | OneMain Financial Issuance Trust, | | | | |
| | 5,985 | | | Series 2014-1A, Class A, 2.430%, 06/18/24 (e) | | | 5,991 | |
| | 4,502 | | | Series 2014-1A, Class B, 3.240%, 06/18/24 (e) | | | 4,513 | |
| | 410 | | | Series 2014-2A, Class A, 2.470%, 09/18/24 (e) | | | 411 | |
| | 3,944 | | | Series 2014-2A, Class C, 4.330%, 09/18/24 (e) | | | 3,892 | |
| | 5,267 | | | Series 2014-2A, Class D, 5.310%, 09/18/24 (e) | | | 5,185 | |
| | 7,020 | | | Series 2015-1A, Class A, 3.190%, 03/18/26 (e) | | | 7,096 | |
| | 7,435 | | | Series 2015-1A, Class C, 5.120%, 03/18/26 (e) | | | 7,415 | |
| | 6,120 | | | Series 2015-2A, Class C, 4.320%, 07/18/25 (e) | | | 6,086 | |
| | 4,000 | | | Series 2016-1A, Class B, 4.570%, 02/20/29 (e) | | | 4,027 | |
| | 7,400 | | | Series 2016-1A, Class C, 6.000%, 02/20/29 (e) | | | 7,452 | |
| | 6,535 | | | Series 2016-2A, Class C, SUB, 7.200%, 03/20/28 (e) | | | 6,529 | |
| | | | Oportun Funding II LLC, | | | | |
| | 4,738 | | | Series 2016-A, Class A, 4.700%, 03/08/21 (e) | | | 4,738 | |
| | 1,622 | | | Series 2016-A, Class B, 6.410%, 03/08/21 (e) | | | 1,621 | |
| | 2,394 | | | Oportun Funding III LLC, Series 2016-B, Class B, 5.160%, 07/08/21 (e) | | | 2,387 | |
| | 137 | | | Park Place Securities, Inc., Asset-Backed Pass-Through Certificates, Series 2004-WCW1, Class M2, VAR, 1.544%, 09/25/34 | | | 138 | |
| | 255 | | | PFS Tax Lien Trust, Series 2014-1, 1.440%, 05/15/29 (e) | | | 254 | |
| | | | | | | | |
PRINCIPAL
AMOUNT | | | SECURITY DESCRIPTION | | VALUE | |
| | | | | | | | |
| | 11,167 | | | Pretium Mortgage Credit Partners I LLC, Series 2015-NPL2, Class A1, SUB, 3.750%, 07/27/30 (e) | | | 11,169 | |
| | | | Progreso Receivables Funding III LLC, | | | | |
| | 5,885 | | | Series 2015-A, Class A, 3.625%, 02/08/20 (e) | | | 5,887 | |
| | 4,531 | | | Series 2015-A, Class B, 5.500%, 02/08/20 (e) | | | 4,536 | |
| | | | Progress Residential Trust, | | | | |
| | 10,806 | | | Series 2015-SFR2, Class A, 2.740%, 06/12/32 (e) | | | 10,948 | |
| | 5,000 | | | Series 2015-SFR2, Class D, 3.684%, 06/12/32 (e) | | | 5,020 | |
| | 3,602 | | | Series 2015-SFR2, Class E, 4.427%, 06/12/32 (e) | | | 3,567 | |
| | 914 | | | Series 2015-SFR3, Class D, 4.673%, 11/12/32 (e) | | | 952 | |
| | 5,580 | | | Series 2015-SFR3, Class E, 5.660%, 11/12/32 (e) | | | 5,776 | |
| | 2,012 | | | Series 2016-SFR1, Class C, VAR, 2.982%, 09/17/33 (e) | | | 2,036 | |
| | 4,647 | | | Series 2016-SFR1, Class E, VAR, 4.332%, 09/17/33 (e) | | | 4,679 | |
| | | | Purchasing Power Funding LLC, | | | | |
| | 9,400 | | | Series 2015-A, Class A2, 4.750%, 12/15/19 (e) | | | 9,418 | |
| | 1,118 | | | Series 2015-A, Class B, 6.000%, 12/15/19 (e) | | | 1,112 | |
| | 243 | | | Securitized Asset-Backed Receivables LLC Trust, Series 2006-CB1, Class AF2, SUB, 3.392%, 01/25/36 | | | 180 | |
| | 253 | | | Selene Non-Performing Loans LLC, Series 2014-1A, Class A, SUB, 2.981%, 05/25/54 (e) | | | 252 | |
| | 3,231 | | | Sierra Auto Receivables Securitization Trust, Series 2016-1A, Class A, 2.850%, 01/18/22 (e) | | | 3,226 | |
| | 1,700 | | | SNAAC Auto Receivables Trust, Series 2014-1A, Class E, 4.580%, 04/15/21 (e) | | | 1,660 | |
| | 4,092 | | | SoFi Consumer Loan Program LLC, Series 2016-2A, Class A, 3.090%, 10/27/25 (e) | | | 4,125 | |
| | 1,397 | | | Soundview Home Loan Trust, Series 2007-OPT1, Class 2A1, VAR, 0.604%, 06/25/37 | | | 885 | |
| | | | Springleaf Funding Trust, | | | | |
| | 6,000 | | | Series 2014-AA, Class C, 4.450%, 12/15/22 (e) | | | 5,986 | |
| | 5,808 | | | Series 2015-AA, Class C, 5.040%, 11/15/24 (e) | | | 5,722 | |
SEE NOTES TO FINANCIAL STATEMENTS.
| | | | | | |
| | | |
| 98 | | | | J.P. MORGAN INCOME FUNDS | | AUGUST 31, 2016 |
| | | | | | | | |
PRINCIPAL
AMOUNT | | | SECURITY DESCRIPTION | | VALUE | |
| Asset-Backed Securities — continued | |
| | 5,800 | | | Series 2015-AA, Class D, 6.310%, 11/15/24 (e) | | | 5,842 | |
| | 9,290 | | | Spruce ABS Trust, Series 2016-E1, Class B, 6.900%, 06/15/28 (e) | | | 9,241 | |
| | 9 | | | Structured Asset Securities Corp. Mortgage Loan Trust, Series 2007-OSI, Class A2, VAR, 0.614%, 06/25/37 | | | 9 | |
| | 2,218 | | | Sunset Mortgage Loan Co. LLC, Series 2014-NPL2, Class A, SUB, 3.721%, 11/16/44 (e) | | | 2,206 | |
| | 4,678 | | | Tidewater Auto Receivables Trust, Series 2014-AA, Class D, 3.570%, 05/15/21 (e) | | | 4,674 | |
| | 4,195 | | | Trafigura Securitisation Finance plc, (Ireland), Series 2014-1A, Class B, VAR, 2.758%, 10/15/21 (e) | | | 4,111 | |
| | 3,989 | | | Truman Capital Mortgage Loan Trust, Series 2014-NPL3, Class A2, SUB, 4.000%, 04/25/53 (e) | | | 3,957 | |
| | | | U.S. Residential Opportunity Fund III Trust, | | | | |
| | 3,576 | | | Series 2016-1III, Class A, SUB, 3.475%, 07/27/36 (e) | | | 3,577 | |
| | 14,270 | | | Series 2016-2III, Class A, SUB, 3.475%, 08/27/36 (e) | | | 14,257 | |
| | 397 | | | Unipac IX LLC, 13.000%, 12/31/20 | | | 376 | |
| | | | United Auto Credit Securitization Trust, | | | | |
| | 2,310 | | | Series 2014-1, Class D, 2.380%, 10/15/18 (e) | | | 2,304 | |
| | 4,750 | | | Series 2014-1, Class E, 3.890%, 07/15/20 (e) | | | 4,737 | |
| | 6,000 | | | Series 2016-1, Class D, 4.680%, 07/15/20 (e) | | | 5,965 | |
| | 3,750 | | | Series 2016-1, Class E, 7.100%, 05/16/22 (e) | | | 3,714 | |
| | 6,291 | | | Vericrest Opportunity Loan Trust, Series 2015-NPL3, Class A1, SUB, 3.375%, 10/25/58 (e) | | | 6,277 | |
| | 2,688 | | | VOLT XIX LLC, Series 2014-NP11, Class A1, SUB, 3.875%, 04/25/55 (e) | | | 2,693 | |
| | 7,962 | | | VOLT XL LLC, Series 2015-NP14, Class A1, SUB, 4.375%, 11/27/45 (e) | | | 8,043 | |
| | 2,341 | | | VOLT XLV LLC, Series 2016-NPL5, Class A1, SUB, 4.000%, 05/25/46 (e) | | | 2,359 | |
| | 11,963 | | | VOLT XLVI LLC, Series 2016-NPL6, Class A1, SUB, 3.844%, 06/25/46 (e) | | | 12,022 | |
| | 6,635 | | | VOLT XLVII LLC, Series 2016-NPL7, Class A1, SUB, 3.750%, 06/25/46 (e) | | | 6,649 | |
| | 4,925 | | | VOLT XLVIII LLC, Series 2016-NPL8, Class A1, SUB, 3.500%, 07/25/46 (e) | | | 4,921 | |
| | 4,334 | | | VOLT XXII LLC, Series 2015-NPL4, Class A2, SUB, 4.250%, 02/25/55 (e) | | | 4,155 | |
| | | | | | | | |
PRINCIPAL
AMOUNT | | | SECURITY DESCRIPTION | | VALUE | |
| | | | | | | | |
| | 6,080 | | | VOLT XXIV LLC, Series 2015-NPL6, Class A1, SUB, 3.500%, 02/25/55 (e) | | | 6,078 | |
| | 5,934 | | | VOLT XXV LLC, Series 2015-NPL8, Class A1, SUB, 3.500%, 06/26/45 (e) | | | 5,931 | |
| | 10,302 | | | VOLT XXVII LLC, Series 2014-NPL7, Class A2, SUB, 4.750%, 08/27/57 (e) | | | 10,037 | |
| | 5,289 | | | VOLT XXX LLC, Series 2015-NPL1, Class A1, SUB, 3.625%, 10/25/57 (e) | | | 5,292 | |
| | 2,374 | | | VOLT XXXI LLC, Series 2015-NPL2, Class A1, SUB, 3.375%, 02/25/55 (e) | | | 2,373 | |
| | 8,118 | | | VOLT XXXIII LLC, Series 2015-NPL5, Class A1, SUB, 3.500%, 03/25/55 (e) | | | 8,118 | |
| | | | Westgate Resorts LLC, | | | | |
| | 1,516 | | | Series 2014-1A, Class C, 5.500%, 12/20/26 (e) | | | 1,510 | |
| | 4,310 | | | Series 2015-1A, Class B, 3.500%, 05/20/27 (e) | | | 4,253 | |
| | | | Westlake Automobile Receivables Trust, | | | | |
| | 2,321 | | | Series 2014-2A, Class D, 2.860%, 07/15/21 (e) | | | 2,308 | |
| | 3,260 | | | Series 2016-1A, Class E, 6.520%, 06/15/22 (e) | | | 3,293 | |
| | 3,937 | | | Series 2016-2A, Class C, 2.830%, 05/17/21 (e) | | | 3,957 | |
| | | | | | | | |
| | | | Total Asset-Backed Securities
(Cost $767,781) | | | 764,353 | |
| | | | | | | | |
| Collateralized Mortgage Obligations — 8.7% | |
| | | | Agency CMO — 7.4% | | | | |
| | 12,340 | | | Federal Home Loan Mortgage Corp., | | | | |
| | | | 09/25/31 (w) | | | 12,345 | |
| | | | Federal Home Loan Mortgage Corp. - Government National Mortgage Association, | | | | |
| | 73 | | | Series 23, Class KZ, PAC, 6.500%, 11/25/23 | | | 82 | |
| | 493 | | | Series 24, Class J, PAC, 6.250%, 11/25/23 | | | 549 | |
| | 83 | | | Series 31, Class Z, 8.000%, 04/25/24 | | | 95 | |
| | | | Federal Home Loan Mortgage Corp. REMIC, | | | | |
| | 4 | | | Series 38, Class D, 9.500%, 05/15/20 | | | 4 | |
| | 1 | | | Series 81, Class A, 8.125%, 11/15/20 | | | 1 | |
| | 3 | | | Series 84, Class F, 9.200%, 10/15/20 | | | 4 | |
| | 2 | | | Series 109, Class I, 9.100%, 01/15/21 | | | 2 | |
| | — | (h) | | Series 198, Class Z, 8.500%, 09/15/22 | | | — | (h) |
| | 48 | | | Series 1316, Class Z, 8.000%, 06/15/22 | | | 53 | |
| | 15 | | | Series 1343, Class LB, 7.500%, 08/15/22 | | | 17 | |
| | — | (h) | | Series 1351, Class TF, HB, 1,010.000%, 08/15/22 | | | 6 | |
| | 32 | | | Series 1456, Class Z, 7.500%, 01/15/23 | | | 35 | |
| | 215 | | | Series 1543, Class VN, 7.000%, 07/15/23 | | | 238 | |
| | 189 | | | Series 1577, Class PV, 6.500%, 09/15/23 | | | 208 | |
SEE NOTES TO FINANCIAL STATEMENTS.
| | | | | | | | |
| | | |
| AUGUST 31, 2016 | | J.P. MORGAN INCOME FUNDS | | | | | 99 | |
JPMorgan Core Plus Bond Fund
SCHEDULE OF PORTFOLIO INVESTMENTS
AS OF AUGUST 31, 2016 (Unaudited) (continued)
(Amounts in U.S. Dollars, unless otherwise noted)
(Amounts in thousands)
| | | | | | | | |
PRINCIPAL
AMOUNT | | | SECURITY DESCRIPTION | | VALUE | |
| Collateralized Mortgage Obligations — continued | |
| | | | Agency CMO — continued | | | | |
| | 363 | | | Series 1608, Class L, 6.500%, 09/15/23 | | | 416 | |
| | 358 | | | Series 1611, Class Z, 6.500%, 11/15/23 | | | 398 | |
| | 305 | | | Series 1628, Class LZ, 6.500%, 12/15/23 | | | 333 | |
| | 143 | | | Series 1630, Class PK, 6.000%, 11/15/23 | | | 156 | |
| | 406 | | | Series 1671, Class I, 7.000%, 02/15/24 | | | 440 | |
| | 16 | | | Series 1671, Class QC, IF, 10.000%, 02/15/24 | | | 23 | |
| | 30 | | | Series 1695, Class G, HB, IF, 28.332%, 03/15/24 | | | 49 | |
| | 19 | | | Series 1710, Class GB, HB, IF, 42.685%, 04/15/24 | | | 34 | |
| | 74 | | | Series 1911, Class SD, IF, IO, 10.169%, 07/15/23 | | | 17 | |
| | 39 | | | Series 2022, Class PE, 6.500%, 01/15/28 | | | 44 | |
| | 291 | | | Series 2033, Class K, 6.050%, 08/15/23 | | | 316 | |
| | 237 | | | Series 2036, Class PG, 6.500%, 01/15/28 | | | 267 | |
| | 41 | | | Series 2089, Class PJ, IO, 7.000%, 10/15/28 | | | 5 | |
| | 683 | | | Series 2091, Class PG, 6.000%, 11/15/28 | | | 750 | |
| | 157 | | | Series 2116, Class ZA, 6.000%, 01/15/29 | | | 177 | |
| | 44 | | | Series 2148, Class ZA, 6.000%, 04/15/29 | | | 51 | |
| | 130 | | | Series 2201, Class C, 8.000%, 11/15/29 | | | 150 | |
| | 27 | | | Series 2261, Class ZY, 7.500%, 10/15/30 | | | 31 | |
| | 262 | | | Series 2293, Class ZA, 6.000%, 03/15/31 | | | 302 | |
| | 37 | | | Series 2310, Class Z, 6.000%, 04/15/31 | | | 43 | |
| | 17 | | | Series 2313, Class LA, 6.500%, 05/15/31 | | | 20 | |
| | 128 | | | Series 2325, Class JO, PO, 06/15/31 | | | 117 | |
| | 391 | | | Series 2330, Class PE, 6.500%, 06/15/31 | | | 435 | |
| | 6 | | | Series 2394, Class MC, 6.000%, 12/15/16 | | | 6 | |
| | 4 | | | Series 2399, Class PG, 6.000%, 01/15/17 | | | 4 | |
| | 300 | | | Series 2410, Class QB, 6.250%, 02/15/32 | | | 336 | |
| | 1,191 | | | Series 2427, Class GE, 6.000%, 03/15/32 | | | 1,367 | |
| | 981 | | | Series 2430, Class WF, 6.500%, 03/15/32 | | | 1,145 | |
| | 188 | | | Series 2466, Class DH, 6.500%, 06/15/32 | | | 216 | |
| | 677 | | | Series 2530, Class SK, IF, IO, 7.592%, 06/15/29 | | | 149 | |
| | 69 | | | Series 2534, Class SI, IF, 19.740%, 02/15/32 | | | 109 | |
| | 511 | | | Series 2543, Class YX, 6.000%, 12/15/32 | | | 576 | |
| | 347 | | | Series 2557, Class HL, 5.300%, 01/15/33 | | | 385 | |
| | 568 | | | Series 2586, Class IO, IO, 6.500%, 03/15/33 | | | 62 | |
| | 164 | | | Series 2594, Class IV, IO, 7.000%, 03/15/32 | | | 20 | |
| | 397 | | | Series 2610, Class UI, IO, 6.500%, 05/15/33 | | | 65 | |
| | 283 | | | Series 2636, Class Z, 4.500%, 06/15/18 | | | 290 | |
| | | | | | | | |
PRINCIPAL
AMOUNT | | | SECURITY DESCRIPTION | | VALUE | |
| | | | | | | | |
| | | | Agency CMO — continued | | | | |
| | 36 | | | Series 2643, Class SA, HB, IF, 42.200%, 03/15/32 | | | 67 | |
| | 16 | | | Series 2650, Class PO, PO, 12/15/32 | | | 16 | |
| | 26 | | | Series 2650, Class SO, PO, 12/15/32 | | | 26 | |
| | 201 | | | Series 2656, Class AC, 6.000%, 08/15/33 | | | 228 | |
| | 235 | | | Series 2656, Class PE, 4.500%, 07/15/18 | | | 241 | |
| | 595 | | | Series 2699, Class W, 5.500%, 11/15/33 | | | 651 | |
| | 705 | | | Series 2733, Class SB, IF, 7.553%, 10/15/33 | | | 778 | |
| | 262 | | | Series 2756, Class NA, 5.000%, 02/15/24 | | | 284 | |
| | 74 | | | Series 2764, Class S, IF, 12.481%, 07/15/33 | | | 93 | |
| | 75 | | | Series 2801, Class JN, 5.000%, 06/15/33 | | | 76 | |
| | 525 | | | Series 2845, Class QH, 5.000%, 08/15/34 | | | 577 | |
| | 432 | | | Series 2864, Class NS, IF, IO, 6.592%, 09/15/34 | | | 36 | |
| | 1,502 | | | Series 2912, Class EH, 5.500%, 01/15/35 | | | 1,719 | |
| | 54 | | | Series 2980, Class QB, 6.500%, 05/15/35 | | | 63 | |
| | 459 | | | Series 2989, Class TG, 5.000%, 06/15/25 | | | 502 | |
| | 91 | | | Series 2990, Class SL, HB, IF, 22.632%, 06/15/34 | | | 126 | |
| | 783 | | | Series 2994, Class SC, IF, IO, 5.092%, 02/15/33 | | | 30 | |
| | 221 | | | Series 2995, Class FT, VAR, 0.758%, 05/15/29 | | | 219 | |
| | 810 | | | Series 3005, Class ED, 5.000%, 07/15/25 | | | 885 | |
| | 34 | | | Series 3005, Class PV, IF, 11.931%, 10/15/33 | | | 40 | |
| | 132 | | | Series 3028, Class ME, 5.000%, 02/15/34 | | | 132 | |
| | 403 | | | Series 3031, Class BN, HB, IF, 19.870%, 08/15/35 | | | 771 | |
| | 265 | | | Series 3059, Class B, 5.000%, 02/15/35 | | | 269 | |
| | 112 | | | Series 3064, Class OG, 5.500%, 06/15/34 | | | 114 | |
| | 3 | | | Series 3068, Class AO, PO, 01/15/35 | | | 3 | |
| | 240 | | | Series 3117, Class EO, PO, 02/15/36 | | | 221 | |
| | 82 | | | Series 3134, Class PO, PO, 03/15/36 | | | 76 | |
| | 94 | | | Series 3138, Class PO, PO, 04/15/36 | | | 86 | |
| | 445 | | | Series 3152, Class MO, PO, 03/15/36 | | | 423 | |
| | 503 | | | Series 3184, Class YO, PO, 03/15/36 | | | 486 | |
| | 2,360 | | | Series 3187, Class Z, 5.000%, 07/15/36 | | | 2,618 | |
| | 712 | | | Series 3201, Class IN, IF, IO, 5.742%, 08/15/36 | | | 102 | |
| | 1,780 | | | Series 3202, Class HI, IF, IO, 6.142%, 08/15/36 | | | 345 | |
| | 120 | | | Series 3219, Class PD, 6.000%, 11/15/35 | | | 121 | |
| | 326 | | | Series 3274, Class B, 6.000%, 02/15/37 | | | 360 | |
| | 166 | | | Series 3292, Class DO, PO, 03/15/37 | | | 157 | |
SEE NOTES TO FINANCIAL STATEMENTS.
| | | | | | |
| | | |
| 100 | | | | J.P. MORGAN INCOME FUNDS | | AUGUST 31, 2016 |
| | | | | | | | |
PRINCIPAL
AMOUNT | | | SECURITY DESCRIPTION | | VALUE | |
| Collateralized Mortgage Obligations — continued | |
| | | | Agency CMO — continued | | | | |
| | 754 | | | Series 3305, Class IW, IF, IO, 5.942%, 04/15/37 | | | 109 | |
| | 43 | | | Series 3306, Class TB, IF, 3.258%, 04/15/37 | | | 46 | |
| | 38 | | | Series 3306, Class TC, IF, 2.718%, 04/15/37 | | | 40 | |
| | 101 | | | Series 3331, Class PO, PO, 06/15/37 | | | 96 | |
| | 187 | | | Series 3383, Class OP, PO, 11/15/37 | | | 178 | |
| | 3,634 | | | Series 3409, Class DB, 6.000%, 01/15/38 | | | 4,067 | |
| | 249 | | | Series 3531, Class SM, IF, IO, 5.592%, 05/15/39 | | | 26 | |
| | 55 | | | Series 3542, Class TN, IF, 6.000%, 07/15/36 | | | 64 | |
| | 220 | | | Series 3546, Class A, VAR, 2.261%, 02/15/39 | | | 225 | |
| | 371 | | | Series 3572, Class JS, IF, IO, 6.292%, 09/15/39 | | | 55 | |
| | 1,086 | | | Series 3605, Class NC, 5.500%, 06/15/37 | | | 1,244 | |
| | 1,173 | | | Series 3609, Class SA, IF, IO, 5.832%, 12/15/39 | | | 271 | |
| | 397 | | | Series 3610, Class CA, 4.500%, 12/15/39 | | | 436 | |
| | 141 | | | Series 3611, Class PO, PO, 07/15/34 | | | 135 | |
| | 1,407 | | | Series 3648, Class CY, 4.500%, 03/15/30 | | | 1,527 | |
| | 315 | | | Series 3653, Class HJ, 5.000%, 04/15/40 | | | 352 | |
| | 5,223 | | | Series 3677, Class PB, 4.500%, 05/15/40 | | | 5,638 | |
| | 573 | | | Series 3737, Class DG, 5.000%, 10/15/30 | | | 627 | |
| | 559 | | | Series 3747, Class HI, IO, 4.500%, 07/15/37 | | | 21 | |
| | 609 | | | Series 3827, Class BD, 4.000%, 08/15/39 | | | 632 | |
| | 645 | | | Series 3852, Class TP, IF, 5.500%, 05/15/41 | | | 695 | |
| | 459 | | | Series 3855, Class AM, 6.500%, 11/15/36 | | | 510 | |
| | 366 | | | Series 3890, Class ET, 5.500%, 11/15/23 | | | 398 | |
| | 3,508 | | | Series 4030, Class IL, IO, 3.500%, 04/15/27 | | | 353 | |
| | 4,000 | | | Series 4060, Class TB, 2.500%, 06/15/27 | | | 4,062 | |
| | 8,129 | | | Series 4146, Class KI, IO, 3.000%, 12/15/32 | | | 1,098 | |
| | 8,338 | | | Series 4374, Class NC, SUB, 2.750%, 02/15/46 | | | 8,635 | |
| | | | Federal Home Loan Mortgage Corp. STRIPS, | | | | |
| | 258 | | | Series 186, Class PO, PO, 08/01/27 | | | 212 | |
| | 7,399 | | | Series 262, Class 35, 3.500%, 07/15/42 | | | 7,874 | |
| | 2,850 | | | Series 279, Class 35, 3.500%, 09/15/42 | | | 3,060 | |
| | 8,465 | | | Series 323, Class 300, 3.000%, 01/15/44 | | | 8,814 | |
| | 6,987 | | | Series 334, Class 300, 3.000%, 08/15/44 | | | 7,274 | |
| | 639 | | | Federal Home Loan Mortgage Corp. Structured Pass-Through Securities, Series T-76, Class 2A, VAR, 1.665%, 10/25/37 | | | 672 | |
| | | | | | | | |
PRINCIPAL
AMOUNT | | | SECURITY DESCRIPTION | | VALUE | |
| | | | | | | | |
| | | | Agency CMO — continued | | | | |
| | | | Federal National Mortgage Association - ACES, | | | | |
| | 2,270 | | | Series 2011-M2, Class A2, 3.645%, 04/25/21 | | | 2,438 | |
| | 1,680 | | | Series 2011-M4, Class A2, 3.726%, 06/25/21 | | | 1,826 | |
| | 631 | | | Series 2011-M8, Class A2, 2.922%, 08/25/21 | | | 664 | |
| | 3,259 | | | Series 2013-M7, Class A2, 2.280%, 12/27/22 | | | 3,341 | |
| | 14,450 | | | Series 2014-M12, Class ASV2, VAR, 2.614%, 10/25/21 | | | 15,085 | |
| | 8,909 | | | Series 2014-M13, Class A2, VAR, 3.021%, 08/25/24 | | | 9,525 | |
| | 8,935 | | | Series 2014-M3, Class A2, VAR, 3.501%, 01/25/24 | | | 9,712 | |
| | 12,965 | | | Series 2015-M1, Class A2, 2.532%, 09/25/24 | | | 13,385 | |
| | 8,528 | | | Series 2015-M10, Class A2, VAR, 3.092%, 04/25/27 | | | 9,126 | |
| | 1,808 | | | Series 2015-M13, Class A2, VAR, 2.801%, 06/25/25 | | | 1,894 | |
| | 20,802 | | | Series 2015-M2, Class A3, VAR, 3.049%, 12/25/24 | | | 22,069 | |
| | 10,000 | | | Series 2015-M3, Class A2, 2.723%, 10/25/24 | | | 10,459 | |
| | 21,276 | | | Series 2015-M5, Class A1, VAR, 2.869%, 03/25/25 | | | 22,385 | |
| | 12,398 | | | Series 2015-M7, Class A2, 2.590%, 12/25/24 | | | 12,846 | |
| | 11,700 | | | Series 2015-M8, Class A2, VAR, 2.900%, 01/25/25 | | | 12,407 | |
| | 9,100 | | | Series 2016-M6, Class A2, 2.488%, 05/25/26 | | | 9,350 | |
| | 10,328 | | | Series 2016-M7, Class A2, 2.499%, 09/25/26 | | | 10,469 | |
| | | | Federal National Mortgage Association Grantor Trust, | | | | |
| | 25,631 | | | Series 2001-T12, Class IO, IO, VAR, 0.521%, 08/25/41 | | | 477 | |
| | 849 | | | Series 2002-T16, Class A2, 7.000%, 07/25/42 | | | 1,014 | |
| | 688 | | | Series 2002-T19, Class A1, 6.500%, 07/25/42 | | | 799 | |
| | 575 | | | Series 2002-T4, Class A2, 7.000%, 12/25/41 | | | 668 | |
| | 1,013 | | | Series 2002-T4, Class A4, 9.500%, 12/25/41 | | | 1,193 | |
| | 50,990 | | | Series 2002-T4, Class IO, IO, VAR, 0.408%, 12/25/41 | | | 494 | |
SEE NOTES TO FINANCIAL STATEMENTS.
| | | | | | | | |
| | | |
| AUGUST 31, 2016 | | J.P. MORGAN INCOME FUNDS | | | | | 101 | |
JPMorgan Core Plus Bond Fund
SCHEDULE OF PORTFOLIO INVESTMENTS
AS OF AUGUST 31, 2016 (Unaudited) (continued)
(Amounts in U.S. Dollars, unless otherwise noted)
(Amounts in thousands)
| | | | | | | | |
PRINCIPAL
AMOUNT | | | SECURITY DESCRIPTION | | VALUE | |
| Collateralized Mortgage Obligations — continued | |
| | | | Agency CMO — continued | | | | |
| | 488 | | | Series 2004-T1, Class 1A1, 6.000%, 01/25/44 | | | 565 | |
| | 344 | | | Series 2004-T2, Class 1A3, 7.000%, 11/25/43 | | | 396 | |
| | 408 | | | Series 2004-T2, Class 1A4, 7.500%, 11/25/43 | | | 488 | |
| | 6,913 | | | Series 2004-T3, Class 1IO4, IO, VAR, 0.578%, 02/25/44 | | | 67 | |
| | | | Federal National Mortgage Association REMIC, | | | | |
| | 1 | | | Series 1988-13, Class C, 9.300%, 05/25/18 | | | 1 | |
| | 15 | | | Series 1989-72, Class E, 9.350%, 10/25/19 | | | 16 | |
| | 1 | | | Series 1989-98, Class H, 11.500%, 12/25/19 | | | 1 | |
| | 2 | | | Series 1990-1, Class D, 8.800%, 01/25/20 | | | 2 | |
| | 2 | | | Series 1990-110, Class H, 8.750%, 09/25/20 | | | 2 | |
| | 2 | | | Series 1990-117, Class E, 8.950%, 10/25/20 | | | 2 | |
| | 24 | | | Series 1991-141, Class PZ, 8.000%, 10/25/21 | | | 26 | |
| | 10 | | | Series 1992-31, Class M, 7.750%, 03/25/22 | | | 11 | |
| | 11 | | | Series 1992-79, Class Z, 9.000%, 06/25/22 | | | 13 | |
| | 10 | | | Series 1992-101, Class J, 7.500%, 06/25/22 | | | 11 | |
| | 134 | | | Series 1992-200, Class SK, HB, IF, 24.030%, 11/25/22 | | | 199 | |
| | 10 | | | Series 1993-23, Class PZ, 7.500%, 03/25/23 | | | 11 | |
| | 77 | | | Series 1993-56, Class PZ, 7.000%, 05/25/23 | | | 85 | |
| | 42 | | | Series 1993-60, Class Z, 7.000%, 05/25/23 | | | 46 | |
| | 81 | | | Series 1993-79, Class PL, 7.000%, 06/25/23 | | | 89 | |
| | 149 | | | Series 1993-141, Class Z, 7.000%, 08/25/23 | | | 163 | |
| | 69 | | | Series 1993-149, Class M, 7.000%, 08/25/23 | | | 77 | |
| | 170 | | | Series 1993-160, Class ZA, 6.500%, 09/25/23 | | | 185 | |
| | 26 | | | Series 1993-165, Class SA, IF, 18.527%, 09/25/23 | | | 36 | |
| | 3 | | | Series 1993-205, Class H, PO, 09/25/23 | | | 3 | |
| | 23 | | | Series 1993-247, Class SM, HB, IF, 27.780%, 12/25/23 | | | 34 | |
| | 28 | | | Series 1993-255, Class E, 7.100%, 12/25/23 | | | 30 | |
| | 250 | | | Series 1994-29, Class Z, 6.500%, 02/25/24 | | | 279 | |
| | | | | | | | |
PRINCIPAL
AMOUNT | | | SECURITY DESCRIPTION | | VALUE | |
| | | | | | | | |
| | | | Agency CMO — continued | | | | |
| | 37 | | | Series 1994-65, Class PK, PO, 04/25/24 | | | 35 | |
| | 164 | | | Series 1995-4, Class Z, 7.500%, 10/25/22 | | | 181 | |
| | 506 | | | Series 1995-19, Class Z, 6.500%, 11/25/23 | | | 581 | |
| | 44 | | | Series 1997-11, Class E, 7.000%, 03/18/27 | | | 50 | |
| | 186 | | | Series 1997-20, Class D, 7.000%, 03/17/27 | | | 215 | |
| | 19 | | | Series 1997-27, Class J, 7.500%, 04/18/27 | | | 21 | |
| | 442 | | | Series 1997-37, Class SM, IF, IO, 7.476%, 12/25/22 | | | 53 | |
| | 293 | | | Series 1997-42, Class EG, 8.000%, 07/18/27 | | | 335 | |
| | 226 | | | Series 1997-63, Class ZA, 6.500%, 09/18/27 | | | 260 | |
| | 237 | | | Series 1998-66, Class FB, VAR, 0.874%, 12/25/28 | | | 239 | |
| | 447 | | | Series 1999-47, Class JZ, 8.000%, 09/18/29 | | | 511 | |
| | 187 | | | Series 2000-8, Class Z, 7.500%, 02/20/30 | | | 223 | |
| | 143 | | | Series 2001-4, Class PC, 7.000%, 03/25/21 | | | 154 | |
| | 209 | | | Series 2001-14, Class Z, 6.000%, 05/25/31 | | | 232 | |
| | 269 | | | Series 2001-16, Class Z, 6.000%, 05/25/31 | | | 309 | |
| | 237 | | | Series 2001-36, Class ST, IF, IO, 7.976%, 11/25/30 | | | 59 | |
| | 609 | | | Series 2001-72, Class SB, IF, IO, 6.976%, 12/25/31 | | | 114 | |
| | 1,189 | | | Series 2001-81, Class HE, 6.500%, 01/25/32 | | | 1,373 | |
| | 93 | | | Series 2002-19, Class SC, IF, 13.287%, 03/17/32 | | | 129 | |
| | 9 | | | Series 2002-55, Class QE, 5.500%, 09/25/17 | | | 9 | |
| | 1,310 | | | Series 2002-56, Class PE, 6.000%, 09/25/32 | | | 1,508 | |
| | 27 | | | Series 2002-63, Class KC, 5.000%, 10/25/17 | | | 27 | |
| | 10 | | | Series 2002-73, Class AN, 5.000%, 11/25/17 | | | 11 | |
| | 901 | | | Series 2002-86, Class PG, 6.000%, 12/25/32 | | | 1,039 | |
| | 97 | | | Series 2003-14, Class EH, IF, IO, 7.076%, 03/25/18 | | | 4 | |
| | 538 | | | Series 2003-17, Class EQ, 5.500%, 03/25/23 | | | 588 | |
| | 92 | | | Series 2003-18, Class GT, 5.000%, 03/25/18 | | | 94 | |
| | 635 | | | Series 2003-22, Class Z, 6.000%, 04/25/33 | | | 704 | |
| | 2,893 | | | Series 2003-25, Class KP, 5.000%, 04/25/33 | | | 3,234 | |
| | 763 | | | Series 2003-47, Class PE, 5.750%, 06/25/33 | | | 868 | |
SEE NOTES TO FINANCIAL STATEMENTS.
| | | | | | |
| | | |
| 102 | | | | J.P. MORGAN INCOME FUNDS | | AUGUST 31, 2016 |
| | | | | | | | |
PRINCIPAL
AMOUNT | | | SECURITY DESCRIPTION | | VALUE | |
| Collateralized Mortgage Obligations — continued | |
| | | | Agency CMO — continued | | | | |
| | 96 | | | Series 2003-64, Class KS, IF, 9.008%, 07/25/18 | | | 101 | |
| | 56 | | | Series 2003-64, Class SX, IF, 12.515%, 07/25/33 | | | 71 | |
| | 14 | | | Series 2003-91, Class SD, IF, 11.626%, 09/25/33 | | | 17 | |
| | 248 | | | Series 2004-72, Class F, VAR, 1.024%, 09/25/34 | | | 248 | |
| | 3,000 | | | Series 2005-19, Class PB, 5.500%, 03/25/35 | | | 3,643 | |
| | 30 | | | Series 2005-42, Class PS, IF, 15.689%, 05/25/35 | | | 39 | |
| | 24 | | | Series 2005-51, Class MO, PO, 06/25/35 | | | 24 | |
| | 1,455 | | | Series 2005-53, Class CS, IF, IO, 6.176%, 06/25/35 | | | 317 | |
| | 165 | | | Series 2005-65, Class KO, PO, 08/25/35 | | | 146 | |
| | 842 | | | Series 2005-72, Class WS, IF, IO, 6.226%, 08/25/35 | | | 138 | |
| | 335 | | | Series 2005-84, Class XM, 5.750%, 10/25/35 | | | 365 | |
| | 134 | | | Series 2005-90, Class ES, IF, 15.564%, 10/25/35 | | | 181 | |
| | 691 | | | Series 2005-97, Class B, 5.500%, 11/25/35 | | | 711 | |
| | 135 | | | Series 2005-106, Class US, HB, IF, 22.644%, 11/25/35 | | | 209 | |
| | 580 | | | Series 2006-9, Class KZ, 6.000%, 03/25/36 | | | 662 | |
| | 543 | | | Series 2006-20, Class IB, IF, IO, 6.066%, 04/25/36 | | | 87 | |
| | 288 | | | Series 2006-22, Class AO, PO, 04/25/36 | | | 263 | |
| | 1,604 | | | Series 2006-27, Class OB, PO, 04/25/36 | | | 1,430 | |
| | 170 | | | Series 2006-27, Class OH, PO, 04/25/36 | | | 159 | |
| | 94 | | | Series 2006-59, Class QO, PO, 01/25/33 | | | 92 | |
| | 71 | | | Series 2006-61, Class AP, 6.000%, 08/25/35 | | | 72 | |
| | 699 | | | Series 2006-77, Class PC, 6.500%, 08/25/36 | | | 808 | |
| | 299 | | | Series 2006-110, Class PO, PO, 11/25/36 | | | 286 | |
| | 28 | | | Series 2006-114, Class HD, 5.500%, 10/25/35 | | | 28 | |
| | 242 | | | Series 2006-128, Class PO, PO, 01/25/37 | | | 226 | |
| | 215 | | | Series 2007-10, Class Z, 6.000%, 02/25/37 | | | 235 | |
| | 223 | | | Series 2007-22, Class SC, IF, IO, 5.556%, 03/25/37 | | | 38 | |
| | 8,531 | | | Series 2007-54, Class IB, IF, IO, 5.886%, 06/25/37 | | | 1,246 | |
| | 106 | | | Series 2007-68, Class IA, IO, 6.500%, 06/25/37 | | | 14 | |
| | 296 | | | Series 2007-71, Class GZ, 6.000%, 07/25/47 | | | 328 | |
| | | | | | | | |
PRINCIPAL
AMOUNT | | | SECURITY DESCRIPTION | | VALUE | |
| | | | | | | | |
| | | | Agency CMO — continued | | | | |
| | 4,167 | | | Series 2007-109, Class YI, IF, IO, 5.926%, 12/25/37 | | | 665 | |
| | 1,570 | | | Series 2008-62, Class SM, IF, IO, 5.676%, 07/25/38 | | | 256 | |
| | 1,818 | | | Series 2008-91, Class SI, IF, IO, 5.476%, 03/25/38 | | | 245 | |
| | 275 | | | Series 2008-93, Class AM, 5.500%, 06/25/37 | | | 291 | |
| | 74 | | | Series 2008-95, Class AI, IO, 5.000%, 12/25/23 | | | 1 | |
| | 157 | | | Series 2009-17, Class AI, IO, 5.000%, 03/25/24 | | | 8 | |
| | 412 | | | Series 2009-23, Class MI, IO, 4.500%, 04/25/24 | | | 19 | |
| | 745 | | | Series 2009-29, Class LA, VAR, 1.510%, 05/25/39 | | | 716 | |
| | 644 | | | Series 2009-52, Class PI, IO, 5.000%, 07/25/39 | | | 83 | |
| | 1,921 | | | Series 2009-89, Class A1, 5.410%, 05/25/35 | | | 2,026 | |
| | 1,121 | | | Series 2009-112, Class ST, IF, IO, 5.726%, 01/25/40 | | | 192 | |
| | 737 | | | Series 2009-112, Class SW, IF, IO, 5.726%, 01/25/40 | | | 114 | |
| | 1,381 | | | Series 2010-10, Class NT, 5.000%, 02/25/40 | | | 1,592 | |
| | 1,414 | | | Series 2010-35, Class SB, IF, IO, 5.896%, 04/25/40 | | | 190 | |
| | 221 | | | Series 2010-43, Class CI, IO, 4.500%, 02/25/25 | | | 8 | |
| | 513 | | | Series 2010-49, Class SC, IF, 11.611%, 03/25/40 | | | 659 | |
| | 1,690 | | | Series 2010-70, Class SA, IF, IO, 6.000%, 04/25/38 | | | 295 | |
| | 238 | | | Series 2010-111, Class AE, 5.500%, 04/25/38 | | | 245 | |
| | 543 | | | Series 2011-19, Class ZY, 6.500%, 07/25/36 | | | 624 | |
| | 713 | | | Series 2011-22, Class MA, 6.500%, 04/25/38 | | | 782 | |
| | 11,439 | | | Series 2011-126, Class KB, 4.000%, 12/25/41 | | | 12,947 | |
| | 4,846 | | | Series 2012-46, Class KI, IO, 3.500%, 05/25/27 | | | 548 | |
| | 9,632 | | | Series 2012-148, Class IE, IO, 3.000%, 01/25/33 | | | 1,272 | |
| | 15,305 | | | Series 2013-13, Class IK, IO, 2.500%, 03/25/28 | | | 1,280 | |
| | 26,891 | | | Series 2016-33, Class JA, 3.000%, 07/25/45 | | | 28,032 | |
SEE NOTES TO FINANCIAL STATEMENTS.
| | | | | | | | |
| | | |
| AUGUST 31, 2016 | | J.P. MORGAN INCOME FUNDS | | | | | 103 | |
JPMorgan Core Plus Bond Fund
SCHEDULE OF PORTFOLIO INVESTMENTS
AS OF AUGUST 31, 2016 (Unaudited) (continued)
(Amounts in U.S. Dollars, unless otherwise noted)
(Amounts in thousands)
| | | | | | | | |
PRINCIPAL
AMOUNT | | | SECURITY DESCRIPTION | | VALUE | |
| Collateralized Mortgage Obligations — continued | |
| | | | Agency CMO — continued | | | | |
| | 19,657 | | | Series 2016-38, Class NA, 3.000%, 01/25/46 | | | 20,655 | |
| | 11 | | | Series G-29, Class O, 8.500%, 09/25/21 | | | 12 | |
| | 4 | | | Series G92-30, Class Z, 7.000%, 06/25/22 | | | 4 | |
| | 14 | | | Series G92-62, Class B, PO, 10/25/22 | | | 13 | |
| | | | Federal National Mortgage Association REMIC Trust, | | | | |
| | 393 | | | Series 2001-W3, Class A, VAR, 6.636%, 09/25/41 | | | 443 | |
| | 5,298 | | | Series 2002-W10, Class IO, IO, VAR, 0.937%, 08/25/42 | | | 172 | |
| | 10,260 | | | Series 2002-W7, Class IO1, IO, VAR, 0.925%, 06/25/29 | | | 298 | |
| | 161 | | | Series 2003-W4, Class 2A, VAR, 6.264%, 10/25/42 | | | 183 | |
| | 21,367 | | | Series 2004-W11, Class 1IO1, IO, VAR, 0.360%, 05/25/44 | | | 302 | |
| | 336 | | | Series 2004-W6, Class 3A4, 6.500%, 07/25/34 | | | 345 | |
| | | | Federal National Mortgage Association STRIPS, | | | | |
| | 1,274 | | | Series 203, Class 2, IO, 8.000%, 02/25/23 | | | 274 | |
| | 205 | | | Series 266, Class 2, IO, 7.500%, 08/25/24 | | | 27 | |
| | 1,284 | | | Series 313, Class 1, PO, 06/25/31 | | | 1,126 | |
| | 154 | | | Series 348, Class 30, IO, 5.500%, 12/25/18 | | | 7 | |
| | 147 | | | Series 348, Class 31, IO, VAR, 5.500%, 12/25/18 | | | 7 | |
| | 169 | | | Series 356, Class 42, IO, 5.500%, 12/25/19 | | | 10 | |
| | 355 | | | Series 380, Class S36, IF, IO, 7.376%, 07/25/37 | | | 78 | |
| | 212 | | | Series 383, Class 68, IO, 6.500%, 09/25/37 | | | 42 | |
| | 313 | | | Series 383, Class 69, IO, VAR, 6.500%, 10/25/37 | | | 62 | |
| | 113 | | | Series 383, Class 86, IO, VAR, 7.000%, 09/25/37 | | | 26 | |
| | | | Federal National Mortgage Association Trust, | | | | |
| | 20 | | | Series 2003-W3, Class 2A5, 5.356%, 06/25/42 | | | 23 | |
| | 264 | | | Series 2003-W6, Class 1A41, 5.398%, 10/25/42 | | | 299 | |
| | 410 | | | Series 2004-W2, Class 1A, 6.000%, 02/25/44 | | | 449 | |
| | 116 | | | Series 2004-W2, Class 2A2, 7.000%, 02/25/44 | | | 135 | |
| | 297 | | | Series 2004-W8, Class 3A, 7.500%, 06/25/44 | | | 338 | |
| | 640 | | | Series 2004-W9, Class 1A3, 6.050%, 02/25/44 | | | 754 | |
| | 462 | | | Series 2005-W4, Class 1A1, 6.000%, 08/25/45 | | | 530 | |
| | | | | | | | |
PRINCIPAL
AMOUNT | | | SECURITY DESCRIPTION | | VALUE | |
| | | | | | | | |
| | | | Agency CMO — continued | | | | |
| | | | Government National Mortgage Association, | | | | |
| | 76 | | | Series 1997-7, Class ZA, 9.000%, 05/16/27 | | | 87 | |
| | 10 | | | Series 1999-43, Class TA, IF, 9.350%, 11/16/29 | | | 12 | |
| | 156 | | | Series 2000-9, Class Z, 8.000%, 06/20/30 | | | 186 | |
| | 1,263 | | | Series 2002-4, Class TD, 7.000%, 01/20/32 | | | 1,511 | |
| | 741 | | | Series 2002-13, Class QA, IF, IO, 7.543%, 02/16/32 | | | 168 | |
| | 22 | | | Series 2002-47, Class HM, 6.000%, 07/16/32 | | | 25 | |
| | 2,117 | | | Series 2002-68, Class SC, IF, IO, 5.193%, 10/16/32 | | | 343 | |
| | 1,059 | | | Series 2002-84, Class PH, PAC, 6.000%, 11/16/32 | | | 1,208 | |
| | 1,117 | | | Series 2003-18, Class PG, PAC, 5.500%, 03/20/33 | | | 1,250 | |
| | 122 | | | Series 2003-52, Class SB, IF, 10.663%, 06/16/33 | | | 157 | |
| | 161 | | | Series 2003-79, Class PV, PAC, 5.500%, 10/20/23 | | | 162 | |
| | 1,942 | | | Series 2003-101, Class SK, IF, IO, 6.053%, 10/17/33 | | | 396 | |
| | 239 | | | Series 2004-2, Class SA, IF, 18.722%, 01/16/34 | | | 430 | |
| | 3,765 | | | Series 2004-19, Class KE, PAC, 5.000%, 03/16/34 | | | 4,241 | |
| | 21 | | | Series 2004-73, Class AE, IF, 13.810%, 08/17/34 | | | 26 | |
| | 1,059 | | | Series 2004-86, Class SP, IF, IO, 5.588%, 09/20/34 | | | 150 | |
| | 780 | | | Series 2004-90, Class SI, IF, IO, 5.588%, 10/20/34 | | | 120 | |
| | 1,713 | | | Series 2004-105, Class SN, IF, IO, 5.588%, 12/20/34 | | | 246 | |
| | 130 | | | Series 2005-56, Class IC, IO, 5.500%, 07/20/35 | | | 25 | |
| | 1,269 | | | Series 2006-23, Class S, IF, IO, 5.988%, 01/20/36 | | | 83 | |
| | 1,390 | | | Series 2006-26, Class S, IF, IO, 5.988%, 06/20/36 | | | 280 | |
| | 374 | | | Series 2006-33, Class PK, 6.000%, 07/20/36 | | | 432 | |
| | 1,959 | | | Series 2007-7, Class EI, IF, IO, 5.688%, 02/20/37 | | | 313 | |
| | 986 | | | Series 2007-9, Class CI, IF, IO, 5.688%, 03/20/37 | | | 165 | |
| | 1,469 | | | Series 2007-16, Class KU, IF, IO, 6.138%, 04/20/37 | | | 266 | |
| | 134 | | | Series 2007-17, Class JO, PO, 04/16/37 | | | 121 | |
SEE NOTES TO FINANCIAL STATEMENTS.
| | | | | | |
| | | |
| 104 | | | | J.P. MORGAN INCOME FUNDS | | AUGUST 31, 2016 |
| | | | | | | | |
PRINCIPAL
AMOUNT | | | SECURITY DESCRIPTION | | VALUE | |
| Collateralized Mortgage Obligations — continued | |
| | | | Agency CMO — continued | | | | |
| | 1,082 | �� | | Series 2007-22, Class PK, PAC, 5.500%, 04/20/37 | | | 1,264 | |
| | 1,912 | | | Series 2007-24, Class SA, IF, IO, 5.998%, 05/20/37 | | | 360 | |
| | 457 | | | Series 2007-26, Class SC, IF, IO, 5.688%, 05/20/37 | | | 85 | |
| | 384 | | | Series 2007-67, Class SI, IF, IO, 5.998%, 11/20/37 | | | 64 | |
| | 83 | | | Series 2008-29, Class PO, PO, 02/17/33 | | | 80 | |
| | 226 | | | Series 2008-34, Class OC, PO, 06/20/37 | | | 196 | |
| | 714 | | | Series 2008-40, Class PS, IF, IO, 5.993%, 05/16/38 | | | 109 | |
| | 1,389 | | | Series 2008-40, Class SA, IF, IO, 5.893%, 05/16/38 | | | 272 | |
| | 40 | | | Series 2008-43, Class NA, PAC, 5.500%, 11/20/37 | | | 41 | |
| | 1,657 | | | Series 2008-49, Class PH, PAC, 5.250%, 06/20/38 | | | 1,877 | |
| | 2,960 | | | Series 2008-50, Class SA, IF, IO, 5.718%, 06/20/38 | | | 451 | |
| | 1,999 | | | Series 2008-55, Class PL, PAC, 5.500%, 06/20/38 | | | 2,239 | |
| | 912 | | | Series 2009-12, Class IE, IO, 5.500%, 03/20/39 | | | 162 | |
| | 1,823 | | | Series 2009-16, Class SJ, IF, IO, 6.288%, 05/20/37 | | | 313 | |
| | 813 | | | Series 2009-72, Class SM, IF, IO, 5.743%, 08/16/39 | | | 130 | |
| | 293 | | | Series 2009-75, Class IY, IO, 5.500%, 06/20/39 | | | 65 | |
| | 1,042 | | | Series 2009-77, Class CS, IF, IO, 6.493%, 06/16/38 | | | 99 | |
| | 329 | | | Series 2009-79, Class OK, PO, 11/16/37 | | | 313 | |
| | 274 | | | Series 2009-81, Class A, 5.750%, 09/20/36 | | | 305 | |
| | 836 | | | Series 2009-106, Class XL, IF, IO, 6.238%, 06/20/37 | | | 101 | |
| | 905 | | | Series 2010-4, Class SB, IF, IO, 5.993%, 08/16/39 | | | 73 | |
| | 92 | | | Series 2010-14, Class QP, 6.000%, 12/20/39 | | | 96 | |
| | 498 | | | Series 2010-31, Class SK, IF, IO, 5.588%, 11/20/34 | | | 75 | |
| | 1,623 | | | Series 2010-61, Class PC, PAC, 4.500%, 02/20/37 | | | 1,641 | |
| | 194 | | | Series 2010-107, Class AY, 5.000%, 10/20/36 | | | 194 | |
| | 818 | | | Series 2010-157, Class OP, PO, 12/20/40 | | | 741 | |
| | 9,562 | | | Series 2012-H11, Class FA, VAR, 1.168%, 02/20/62 | | | 9,595 | |
| | | | | | | | |
PRINCIPAL
AMOUNT | | | SECURITY DESCRIPTION | | VALUE | |
| | | | | | | | |
| | | | Agency CMO — continued | | | | |
| | 2,471 | | | Series 2012-H18, Class FA, VAR, 1.018%, 08/20/62 | | | 2,466 | |
| | 4,718 | | | Series 2013-H04, Class BA, 1.650%, 02/20/63 | | | 4,705 | |
| | 7,857 | | | Series 2013-H20, Class FB, VAR, 1.468%, 08/20/63 | | | 7,976 | |
| | 9,507 | | | Series 2013-H23, Class FA, VAR, 1.768%, 09/20/63 | | | 9,766 | |
| | 4,772 | | | Series 2014-60, Class W, VAR, 4.303%, 02/20/29 | | | 5,045 | |
| | 2,453 | | | Series 2015-157, Class GA, PAC, 3.000%, 01/20/45 | | | 2,514 | |
| | 9,351 | | | Series 2015-H02, Class HA, 2.500%, 01/20/65 | | | 9,342 | |
| | 11,563 | | | Series 2015-H04, Class FL, VAR, 0.938%, 02/20/65 | | | 11,490 | |
| | 9,055 | | | Series 2015-H23, Class FB, VAR, 0.988%, 09/20/65 | | | 9,014 | |
| | 7,950 | | | Series 2015-H32, Class FH, VAR, 1.128%, 12/20/65 | | | 7,977 | |
| | 13,008 | | | Series 2016-H16, Class FD, VAR, 1.615%, 06/20/66 | | | 12,970 | |
| | 8,000 | | | Series 2016-H17, Class FC, VAR, 1.326%, 08/20/66 | | | 8,009 | |
| | 142 | | | NCUA Guaranteed Notes Trust, Series 2010-R3, Class 3A, 2.400%, 12/08/20 | | | 143 | |
| | | | Vendee Mortgage Trust, | | | | |
| | 559 | | | Series 1996-2, Class 1Z, 6.750%, 06/15/26 | | | 643 | |
| | 1,482 | | | Series 1998-1, Class 2E, 7.000%, 03/15/28 | | | 1,776 | |
| | 208 | | | Series 1999-1, Class 2Z, 6.500%, 01/15/29 | | | 239 | |
| | | | | | | | |
| | | | | | | 502,261 | |
| | | | | | | | |
| | | | Non-Agency CMO — 1.3% | | | | |
| | 4,135 | | | Access PT Funding Trust, Series 2016-1, 6.250%, 02/16/21 | | | 4,134 | |
| | 128 | | | Adjustable Rate Mortgage Trust, Series 2005-5, Class 6A21, VAR, 0.754%, 09/25/35 | | | 123 | |
| | 1,001 | | | Ajax Mortgage Loan Trust, Series 2013-A, Class A, VAR, 3.500%, 02/25/51 (e) | | | 994 | |
| | | | Alternative Loan Trust, | | | | |
| | 89 | | | Series 2003-J3, Class 2A1, 6.250%, 12/25/33 | | | 91 | |
| | 980 | | | Series 2004-22CB, Class 1A1, 6.000%, 10/25/34 | | | 1,049 | |
| | 489 | | | Series 2005-23CB, Class A2, 5.500%, 07/25/35 | | | 461 | |
| | 2,436 | | | Series 2005-54CB, Class 1A11, 5.500%, 11/25/35 | | | 2,273 | |
| | 842 | | | Series 2005-86CB, Class A11, 5.500%, 02/25/36 | | | 716 | |
SEE NOTES TO FINANCIAL STATEMENTS.
| | | | | | | | |
| | | |
| AUGUST 31, 2016 | | J.P. MORGAN INCOME FUNDS | | | | | 105 | |
JPMorgan Core Plus Bond Fund
SCHEDULE OF PORTFOLIO INVESTMENTS
AS OF AUGUST 31, 2016 (Unaudited) (continued)
(Amounts in U.S. Dollars, unless otherwise noted)
(Amounts in thousands)
| | | | | | | | |
PRINCIPAL
AMOUNT | | | SECURITY DESCRIPTION | | VALUE | |
| Collateralized Mortgage Obligations — continued | |
| | | | Non-Agency CMO — continued | | | | |
| | 48 | | | Series 2005-J6, Class 2A1, 5.500%, 07/25/25 | | | 47 | |
| | 233 | | | Series 2006-26CB, Class A9, 6.500%, 09/25/36 | | | 184 | |
| | | | American General Mortgage Loan Trust, | | | | |
| | 167 | | | Series 2006-1, Class A5, VAR, 5.750%, 12/25/35 (e) | | | 172 | |
| | 172 | | | Series 2010-1A, Class A4, VAR, 5.650%, 03/25/58 (e) | | | 173 | |
| | | | Angel Oak Mortgage Trust LLC, | | | | |
| | 5,796 | | | Series 2015-1, Class A, SUB, 4.500%, 11/25/45 (e) | | | 5,811 | |
| | 800 | | | Series 2015-1, Class M, SUB, 5.500%, 11/25/45 (e) | | | 798 | |
| | | | Banc of America Alternative Loan Trust, | | | | |
| | 253 | | | Series 2003-11, Class 2A1, 6.000%, 01/25/34 | | | 259 | |
| | 482 | | | Series 2004-1, Class 1A1, 6.000%, 02/25/34 | | | 512 | |
| | 138 | | | Series 2004-6, Class 4A1, 5.000%, 07/25/19 | | | 140 | |
| | | | Banc of America Funding Trust, | | | | |
| | 1,500 | | | Series 2005-5, Class 3A5, PAC, 5.500%, 08/25/35 | | | 1,410 | |
| | 115 | | | Series 2005-7, Class 30PO, PO, 11/25/35 | | | 88 | |
| | 594 | | | Series 2005-E, Class 4A1, VAR, 2.938%, 03/20/35 | | | 597 | |
| | | | Banc of America Mortgage Trust, | | | | |
| | 66 | | | Series 2004-2, Class 2A4, 5.500%, 03/25/34 | | | 64 | |
| | 106 | | | Series 2004-5, Class 3A3, 5.000%, 06/25/19 | | | 106 | |
| | 31 | | | Series 2004-5, Class 4A1, 4.750%, 06/25/19 | | | 31 | |
| | — | (h) | | Series 2004-11, Class 15PO, PO, 01/25/20 | | | — | (h) |
| | 274 | | | Series 2004-F, Class 1A1, VAR, 3.164%, 07/25/34 | | | 278 | |
| | 21 | | | Series 2005-1, Class 15PO, PO, 02/25/20 | | | 20 | |
| | 263 | | | Series 2005-1, Class 1A17, 5.500%, 02/25/35 | | | 244 | |
| | 136 | | | Series 2005-1, Class 2A1, 5.000%, 02/25/20 | | | 138 | |
| | 23 | | | Series 2005-10, Class 15PO, PO, 11/25/20 | | | 21 | |
| | 23 | | | Series 2005-11, Class 15PO, PO, 12/25/20 | | | 22 | |
| | | | BCAP LLC Trust, | | | | |
| | 86 | | | Series 2009-RR5, Class 8A1, 5.500%, 11/26/34 (e) | | | 90 | |
| | 750 | | | Series 2011-RR4, Class 6A3, VAR, 5.000%, 08/26/37 (e) | | | 756 | |
| | | | | | | | |
PRINCIPAL
AMOUNT | | | SECURITY DESCRIPTION | | VALUE | |
| | | | | | | | |
| | | | Non-Agency CMO — continued | | | | |
| | 153 | | | Bear Stearns ARM Trust, Series 2003-7, Class 3A, VAR, 2.835%, 10/25/33 | | | 150 | |
| | 3 | | | Bear Stearns Mortgage Securities, Inc., Series 1997-6, Class 1A, VAR, 6.297%, 03/25/31 | | | 3 | |
| | 2,015 | | | Chase Mortgage Finance Trust, Series 2007-A2, Class 2A1, VAR, 2.883%, 07/25/37 | | | 2,000 | |
| | | | CHL Mortgage Pass-Through Trust, | | | | |
| | 291 | | | Series 2004-3, Class A25, 5.750%, 04/25/34 | | | 282 | |
| | 385 | | | Series 2004-5, Class 2A9, 5.250%, 05/25/34 | | | 386 | |
| | 191 | | | Series 2004-8, Class 2A1, 4.500%, 06/25/19 | | | 195 | |
| | 132 | | | Series 2004-J1, Class 2A1, 4.750%, 01/25/19 | | | 133 | |
| | 591 | | | Series 2004-J7, Class 2A2, 4.500%, 08/25/19 | | | 597 | |
| | 592 | | | Series 2005-22, Class 2A1, VAR, 2.755%, 11/25/35 | | | 485 | |
| | 66 | | | Citicorp Mortgage Securities Trust, Series 2006-1, Class 2A1, 5.000%, 02/25/21 | | | 68 | |
| | | | Citigroup Mortgage Loan Trust, | | | | |
| | 1,379 | | | Series 2009-3, Class 5A2, 6.000%, 02/25/37 (e) | | | 1,372 | |
| | 69 | | | Series 2010-8, Class 5A6, 4.000%, 11/25/36 (e) | | | 69 | |
| | 88 | | | Series 2010-8, Class 6A6, 4.500%, 12/25/36 (e) | | | 88 | |
| | | | Citigroup Mortgage Loan Trust, Inc., | | | | |
| | 6 | | | Series 2003-UST1, Class PO3, PO, 12/25/18 | | | 5 | |
| | 152 | | | Series 2004-HYB4, Class AA, VAR, 0.854%, 12/25/34 | | | 133 | |
| | 236 | | | Series 2004-UST1, Class A3, VAR, 2.635%, 08/25/34 | | | 237 | |
| | | | Credit Suisse First Boston Mortgage Securities Corp., | | | | |
| | 98 | | | Series 2003-29, Class 8A1, 6.000%, 11/25/18 | | | 101 | |
| | 728 | | | Series 2004-4, Class 5A4, IF, IO, 7.026%, 08/25/34 | | | 61 | |
| | 327 | | | Series 2005-1, Class 1A16, 5.500%, 02/25/35 | | | 332 | |
| | 52 | | | Series 2005-7, Class 5A1, 4.750%, 08/25/20 | | | 52 | |
| | 289 | | | Series 2005-10, Class 10A4, PAC, 6.000%, 11/25/35 | | | 182 | |
| | 511 | | | Series 2005-10, Class 6A13, 5.500%, 11/25/35 | | | 426 | |
SEE NOTES TO FINANCIAL STATEMENTS.
| | | | | | |
| | | |
| 106 | | | | J.P. MORGAN INCOME FUNDS | | AUGUST 31, 2016 |
| | | | | | | | |
PRINCIPAL
AMOUNT | | | SECURITY DESCRIPTION | | VALUE | |
| Collateralized Mortgage Obligations — continued | |
| | | | Non-Agency CMO — continued | | | | |
| | 81 | | | Credit Suisse Mortgage Capital Certificates, Series 2009-3R, Class 19A3, 6.000%, 01/27/38 (e) | | | 82 | |
| | 1,855 | | | CSMC Trust, Series 2010-11R, Class A6, VAR, 1.524%, 06/28/47 (e) | | | 1,785 | |
| | 59 | | | Deutsche Alt-A Securities, Inc., Mortgage Loan Trust, Series 2005-3, Class 4APO, PO, 06/25/35 | | | 43 | |
| | 285 | | | DLJ Mortgage Acceptance Corp., Series 1993-19, Class A7, 6.750%, 01/25/24 | | | 287 | |
| | 558 | | | First Horizon Alternative Mortgage Securities Trust, Series 2004-AA3, Class A1, VAR, 2.780%, 09/25/34 | | | 541 | |
| | | | First Horizon Mortgage Pass-Through Trust, | | | | |
| | 508 | | | Series 2004-AR6, Class 2A1, VAR, 2.811%, 12/25/34 | | | 507 | |
| | 175 | | | Series 2004-AR7, Class 2A2, VAR, 2.709%, 02/25/35 | | | 174 | |
| | | | GMACM Mortgage Loan Trust, | | | | |
| | 169 | | | Series 2003-J10, Class A1, 4.750%, 01/25/19 | | | 169 | |
| | 148 | | | Series 2004-J5, Class A7, 6.500%, 01/25/35 | | | 153 | |
| | 300 | | | Series 2005-AR3, Class 3A4, VAR, 3.304%, 06/19/35 | | | 293 | |
| | | | GSR Mortgage Loan Trust, | | | | |
| | 184 | | | Series 2003-7F, Class 1A4, 5.250%, 06/25/33 | | | 187 | |
| | 280 | | | Series 2004-6F, Class 2A4, 5.500%, 05/25/34 | | | 288 | |
| | 237 | | | Series 2004-6F, Class 3A4, 6.500%, 05/25/34 | | | 252 | |
| | 165 | | | Series 2004-8F, Class 2A3, 6.000%, 09/25/34 | | | 168 | |
| | 51 | | | Series 2005-5F, Class 8A1, VAR, 1.024%, 06/25/35 | | | 48 | |
| | 29 | | | Series 2005-5F, Class 8A3, VAR, 1.024%, 06/25/35 | | | 28 | |
| | 279 | | | Series 2007-2F, Class 2A7, 5.750%, 02/25/37 | | | 274 | |
| | 2,187 | | | Homeowner Assistance Program Reverse Mortgage Loan Trust, Series 2013-RM1, Class A, 4.000%, 05/26/53 (e) | | | 2,170 | |
| | | | Impac CMB Trust, | | | | |
| | 777 | | | Series 2004-10, Class 3A1, VAR, 1.224%, 03/25/35 | | | 699 | |
| | 481 | | | Series 2004-10, Class 3A2, VAR, 1.324%, 03/25/35 | | | 417 | |
| | | | | | | | |
PRINCIPAL
AMOUNT | | | SECURITY DESCRIPTION | | VALUE | |
| | | | | | | | |
| | | | Non-Agency CMO — continued | | | | |
| | 12 | | | Impac Secured Assets CMN Owner Trust, Series 2003-2, Class A1, 5.500%, 08/25/33 | | | 12 | |
| | | | JP Morgan Mortgage Trust, | | | | |
| | 587 | | | Series 2004-S1, Class 3A1, 5.500%, 09/25/34 | | | 587 | |
| | 717 | | | Series 2004-S2, Class 4A5, 6.000%, 11/25/34 | | | 721 | |
| | 322 | | | Series 2004-S2, Class 5A1, 5.500%, 12/25/19 | | | 322 | |
| | 522 | | | Series 2006-A2, Class 4A1, VAR, 3.185%, 08/25/34 | | | 524 | |
| | 403 | | | Series 2006-A2, Class 5A3, VAR, 2.783%, 11/25/33 | | | 408 | |
| | 144 | | | Series 2007-A1, Class 5A2, VAR, 2.911%, 07/25/35 | | | 146 | |
| | 126 | | | MASTR Adjustable Rate Mortgages Trust, Series 2004-13, Class 2A1, VAR, 2.882%, 04/21/34 | | | 129 | |
| | | | MASTR Alternative Loan Trust, | | | | |
| | 90 | | | Series 2003-7, Class 4A3, 8.000%, 11/25/18 | | | 92 | |
| | 100 | | | Series 2003-8, Class 3A1, 5.500%, 12/25/33 | | | 105 | |
| | 109 | | | Series 2003-9, Class 5A1, 4.500%, 12/25/18 | | | 109 | |
| | 693 | | | Series 2004-6, Class 6A1, 6.500%, 07/25/34 | | | 688 | |
| | 614 | | | Series 2004-6, Class 7A1, 6.000%, 07/25/34 | | | 599 | |
| | 80 | | | Series 2004-7, Class 30PO, PO, 08/25/34 | | | 63 | |
| | 52 | | | Series 2004-7, Class 3A1, 6.500%, 08/25/34 | | | 54 | |
| | 153 | | | Series 2004-8, Class 6A1, 5.500%, 09/25/19 | | | 156 | |
| | 238 | | | Series 2004-10, Class 1A1, 4.500%, 09/25/19 | | | 239 | |
| | 70 | | | Series 2004-11, Class 8A3, 5.500%, 10/25/19 | | | 71 | |
| | 14 | | | Series 2005-1, Class 5A1, 5.500%, 01/25/20 | | | 14 | |
| | | | MASTR Asset Securitization Trust, | | | | |
| | 25 | | | Series 2003-6, Class 8A1, 5.500%, 07/25/33 | | | 25 | |
| | 96 | | | Series 2003-10, Class 3A1, 5.500%, 11/25/33 | | | 98 | |
| | 13 | | | Series 2003-11, Class 10A1, 5.000%, 12/25/18 | | | 13 | |
| | 31 | | | Series 2003-11, Class 3A1, 4.500%, 12/25/18 | | | 32 | |
SEE NOTES TO FINANCIAL STATEMENTS.
| | | | | | | | |
| | | |
| AUGUST 31, 2016 | | J.P. MORGAN INCOME FUNDS | | | | | 107 | |
JPMorgan Core Plus Bond Fund
SCHEDULE OF PORTFOLIO INVESTMENTS
AS OF AUGUST 31, 2016 (Unaudited) (continued)
(Amounts in U.S. Dollars, unless otherwise noted)
(Amounts in thousands)
| | | | | | | | |
PRINCIPAL
AMOUNT | | | SECURITY DESCRIPTION | | VALUE | |
| Collateralized Mortgage Obligations — continued | |
| | | | Non-Agency CMO — continued | | | | |
| | 11 | | | Series 2004-6, Class 15PO, PO, 07/25/19 | | | 10 | |
| | 80 | | | Series 2004-6, Class 3A1, 5.250%, 07/25/19 | | | 81 | |
| | 42 | | | Series 2004-6, Class 4A1, 5.000%, 07/25/19 | | | 43 | |
| | 15 | | | Series 2004-8, Class PO, PO, 08/25/19 | | | 14 | |
| | 27 | | | Series 2004-10, Class 1A1, 4.500%, 10/25/19 | | | 27 | |
| | 322 | | | Series 2004-P7, Class A6, 5.500%, 12/27/33 (e) | | | 345 | |
| | 78 | | | MASTR Resecuritization Trust, Series 2005-PO, Class 3PO, PO, 05/28/35 (e) | | | 61 | |
| | | | Merrill Lynch Mortgage Investors Trust, | | | | |
| | 348 | | | Series 2004-C, Class A2, VAR, 1.529%, 07/25/29 | | | 330 | |
| | 471 | | | Series 2004-D, Class A3, VAR, 2.654%, 09/25/29 | | | 469 | |
| | | | Morgan Stanley Mortgage Loan Trust, | | | | |
| | 530 | | | Series 2004-3, Class 4A, VAR, 5.676%, 04/25/34 | | | 554 | |
| | 247 | | | Series 2004-7AR, Class 2A6, VAR, 2.946%, 09/25/34 | | | 251 | |
| | | | MortgageIT Trust, | | | | |
| | 3,073 | | | Series 2004-2, Class A1, VAR, 1.264%, 12/25/34 | | | 3,038 | |
| | 213 | | | Series 2005-1, Class 1A1, VAR, 1.164%, 02/25/35 | | | 205 | |
| | 194 | | | NACC Reperforming Loan REMIC Trust, Series 2004-R2, Class A1, VAR, 6.500%, 10/25/34 (e) | | | 194 | |
| | 35 | | | Nomura Asset Acceptance Corp. Alternative Loan Trust, Series 2005-AR1, Class 1A1, VAR, 2.830%, 02/25/35 | | | 35 | |
| | 3,966 | | | Opteum Mortgage Acceptance Corp. Asset Backed Pass-Through Certificates, Series 2005-2, Class AI3, VAR, 0.844%, 04/25/35 | | | 3,893 | |
| | 375 | | | PHH Mortgage Trust, Series 2008-CIM2, Class 5A1, 6.000%, 07/25/38 | | | 379 | |
| | 247 | | | Prime Mortgage Trust, Series 2004-CL1, Class 1A1, 6.000%, 02/25/34 | | | 258 | |
| | | | RALI Trust, | | | | |
| | 113 | | | Series 2003-QS14, Class A1, 5.000%, 07/25/18 | | | 113 | |
| | 240 | | | Series 2004-QS3, Class CB, 5.000%, 03/25/19 | | | 239 | |
| | 2,935 | | | Series 2005-QS5, Class A4, 5.750%, 04/25/35 | | | 2,751 | |
| | | | | | | | |
PRINCIPAL
AMOUNT | | | SECURITY DESCRIPTION | | VALUE | |
| | | | | | | | |
| | | | Non-Agency CMO — continued | | | | |
| | | | Residential Asset Securitization Trust, | | | | |
| | 135 | | | Series 2003-A8, Class A1, 3.750%, 10/25/18 | | | 134 | |
| | 178 | | | Series 2006-A6, Class 2A13, 6.000%, 07/25/36 | | | 153 | |
| | | | RFMSI Trust, | | | | |
| | 73 | | | Series 2004-S4, Class 2A7, 4.500%, 04/25/19 | | | 73 | |
| | 239 | | | Series 2005-SA4, Class 1A1, VAR, 3.223%, 09/25/35 | | | 198 | |
| | 1,802 | | | Series 2006-S1, Class 1A8, 5.750%, 01/25/36 | | | 1,667 | |
| | 49 | | | SACO I, Inc., Series 1997-2, Class 1A5, 7.000%, 08/25/36 (e) | | | 49 | |
| | 883 | | | Sequoia Mortgage Trust, Series 2004-8, Class A2, VAR, 1.950%, 09/20/34 | | | 848 | |
| | | | Springleaf Mortgage Loan Trust, | | | | |
| | 656 | | | Series 2013-1A, Class A, VAR, 1.270%, 06/25/58 (e) | | | 653 | |
| | 4,075 | | | Series 2013-1A, Class B1, VAR, 5.580%, 06/25/58 (e) | | | 4,106 | |
| | 2,084 | | | Series 2013-2A, Class M1, VAR, 3.520%, 12/25/65 (e) | | | 2,095 | |
| | 5,050 | | | Series 2013-2A, Class M2, VAR, 4.480%, 12/25/65 (e) | | | 5,073 | |
| | 399 | | | Structured Adjustable Rate Mortgage Loan Trust, Series 2004-14, Class 1A, VAR, 2.884%, 10/25/34 | | | 402 | |
| | | | Structured Asset Securities Corp., | | | | |
| | 1,575 | | | Series 2003-37A, Class 1A, VAR, 3.087%, 12/25/33 | | | 1,551 | |
| | 217 | | | Series 2003-37A, Class 2A, VAR, 2.697%, 12/25/33 | | | 215 | |
| | | | Structured Asset Securities Corp. Mortgage Pass-Through Certificates, | | | | |
| | 2,445 | | | Series 2003-26A, Class 3A5, VAR, 2.963%, 09/25/33 | | | 2,352 | |
| | 274 | | | Series 2003-33H, Class 1A1, 5.500%, 10/25/33 | | | 279 | |
| | 130 | | | Series 2004-7, Class 2A1, VAR, 5.491%, 05/25/24 | | | 133 | |
| | | | WaMu Mortgage Pass-Through Certificates Trust, | | | | |
| | 22 | | | Series 2002-S8, Class 2A7, 5.250%, 01/25/18 | | | 22 | |
| | 359 | | | Series 2003-AR8, Class A, VAR, 2.697%, 08/25/33 | | | 363 | |
| | 240 | | | Series 2003-AR9, Class 1A6, VAR, 2.631%, 09/25/33 | | | 243 | |
SEE NOTES TO FINANCIAL STATEMENTS.
| | | | | | |
| | | |
| 108 | | | | J.P. MORGAN INCOME FUNDS | | AUGUST 31, 2016 |
| | | | | | | | |
PRINCIPAL
AMOUNT | | | SECURITY DESCRIPTION | | VALUE | |
| Collateralized Mortgage Obligations — continued | |
| | | | Non-Agency CMO — continued | |
| | 1 | | | Series 2003-S4, Class 3A, 5.500%, 06/25/33 | | | 1 | |
| | 815 | | | Series 2004-AR11, Class A, VAR, 2.713%, 10/25/34 | | | 820 | |
| | 99 | | | Series 2004-AR3, Class A1, VAR, 2.783%, 06/25/34 | | | 100 | |
| | 916 | | | Series 2004-AR3, Class A2, VAR, 2.783%, 06/25/34 | | | 923 | |
| | 120 | | | Series 2004-CB2, Class 7A, 5.500%, 08/25/19 | | | 121 | |
| | 128 | | | Series 2004-CB3, Class 4A, 6.000%, 10/25/19 | | | 132 | |
| | 864 | | | Series 2004-S2, Class 2A4, 5.500%, 06/25/34 | | | 900 | |
| | 103 | | | Series 2005-AR2, Class 2A21, VAR, 0.854%, 01/25/45 | | | 95 | |
| | 973 | | | Washington Mutual Mortgage Pass-Through Certificates WMALT Trust, Series 2005-4, Class CB7, 5.500%, 06/25/35 | | | 900 | |
| | 517 | | | Washington Mutual MSC Mortgage Pass-Through Certificates Trust, Series 2004-RA1, Class 2A, 7.000%, 03/25/34 | | | 561 | |
| | | | Wells Fargo Mortgage-Backed Securities Trust, | | | | |
| | 378 | | | Series 2003-D, Class A1, VAR, 2.740%, 02/25/33 | | | 373 | |
| | 174 | | | Series 2003-M, Class A1, VAR, 2.787%, 12/25/33 | | | 174 | |
| | 120 | | | Series 2004-B, Class A1, VAR, 2.732%, 02/25/34 | | | 119 | |
| | 127 | | | Series 2004-DD, Class 2A8, VAR, 2.834%, 01/25/35 | | | 121 | |
| | 150 | | | Series 2004-EE, Class 3A1, VAR, 3.028%, 12/25/34 | | | 155 | |
| | 207 | | | Series 2004-EE, Class 3A2, VAR, 3.028%, 12/25/34 | | | 213 | |
| | 426 | | | Series 2004-K, Class 1A2, VAR, 3.107%, 07/25/34 | | | 425 | |
| | 48 | | | Series 2004-Q, Class 1A3, VAR, 2.949%, 09/25/34 | | | 48 | |
| | 131 | | | Series 2004-Q, Class 2A2, VAR, 2.952%, 09/25/34 | | | 128 | |
| | 699 | | | Series 2004-U, Class A1, VAR, 3.006%, 10/25/34 | | | 695 | |
| | 2,175 | | | Series 2005-9, Class 2A10, 5.250%, 10/25/35 | | | 2,181 | |
| | 618 | | | Series 2005-AR16, Class 2A1, VAR, 2.852%, 02/25/34 | | | 622 | |
| | | | | | | | |
PRINCIPAL
AMOUNT | | | SECURITY DESCRIPTION | | VALUE | |
| | |
| | | | Non-Agency CMO — continued | | | | |
| | 3,222 | | | Series 2005-AR3, Class 1A1, VAR, 3.041%, 03/25/35 | | | 3,292 | |
| | | | | | | | |
| | | | | | | 89,929 | |
| | | | | | | | |
| | | | Total Collateralized Mortgage Obligations
(Cost $577,008) | | | 592,190 | |
| | | | | | | | |
| Commercial Mortgage-Backed Securities — 5.4% | |
| | | | A10 Securitization LLC, | | | | |
| | 29 | | | Series 2013-1, Class A, 2.400%, 11/15/25 (e) | | | 29 | |
| | 3,000 | | | Series 2013-1, Class B, 4.120%, 11/15/25 (e) | | | 3,004 | |
| | 7,664 | | | Series 2015-1, Class A2, 3.130%, 04/15/34 (e) | | | 7,687 | |
| | 3,000 | | | Series 2015-1, Class B, 4.120%, 04/15/34 (e) | | | 3,029 | |
| | | | A10 Term Asset Financing LLC, | | | | |
| | 1,000 | | | Series 2013-2, Class D, 6.230%, 11/15/27 (e) | | | 995 | |
| | 6,021 | | | Series 2014-1, Class A2, 3.020%, 04/15/33 (e) | | | 5,921 | |
| | 1,171 | | | Series 2014-1, Class C, 4.570%, 04/15/33 (e) | | | 1,167 | |
| | 3,340 | | | ACRE Commercial Mortgage Trust, (Cayman Islands), Series 2014-FL2, Class D, VAR, 3.907%, 08/15/31 (e) | | | 3,251 | |
| | | | BAMLL Commercial Mortgage Securities Trust, | | | | |
| | 2,985 | | | Series 2012-PARK, Class A, 2.959%, 12/10/30 (e) | | | 3,127 | |
| | 8,400 | | | Series 2016-FR14, Class A, VAR, 3.147%, 02/27/48 (e) | | | 7,802 | |
| | | | Banc of America Commercial Mortgage Trust, | | | | |
| | 48 | | | Series 2006-3, Class A4, VAR, 5.889%, 07/10/44 | | | 48 | |
| | 303 | | | Series 2006-5, Class A4, 5.414%, 09/10/47 | | | 303 | |
| | 4,000 | | | Series 2007-2, Class AM, VAR, 5.801%, 04/10/49 | | | 4,086 | |
| | | | Banc of America Merrill Lynch Commercial Mortgage, Inc., | | | | |
| | 310 | | | Series 2005-1, Class AJ, VAR, 5.527%, 11/10/42 | | | 310 | |
| | 147 | | | Series 2005-3, Class AM, 4.727%, 07/10/43 | | | 146 | |
| | 234 | | | Banc of America Re-REMIC Trust, Series 2009-UB1, Class A4A, VAR, 5.703%, 06/24/50 (e) | | | 236 | |
| | 9,400 | | | BBCCRE Trust, Series 2015-GTP, Class A, 3.966%, 08/10/33 (e) | | | 10,231 | |
SEE NOTES TO FINANCIAL STATEMENTS.
| | | | | | | | |
| | | |
| AUGUST 31, 2016 | | J.P. MORGAN INCOME FUNDS | | | | | 109 | |
JPMorgan Core Plus Bond Fund
SCHEDULE OF PORTFOLIO INVESTMENTS
AS OF AUGUST 31, 2016 (Unaudited) (continued)
(Amounts in U.S. Dollars, unless otherwise noted)
(Amounts in thousands)
| | | | | | | | |
PRINCIPAL
AMOUNT | | | SECURITY DESCRIPTION | | VALUE | |
| Commercial Mortgage-Backed Securities — continued | |
| | | | BB-UBS Trust, | | | | |
| | 12,692 | | | Series 2012-SHOW, Class E, VAR, 4.160%, 11/05/36 (e) | | | 12,576 | |
| | 972 | | | Series 2012-TFT, Class A, 2.892%, 06/05/30 (e) | | | 988 | |
| | | | Bear Stearns Commercial Mortgage Securities Trust, | | | | |
| | 6 | | | Series 2006-T24, Class A4, 5.537%, 10/12/41 | | | 6 | |
| | 4,000 | | | Series 2007-PW16, Class AM, VAR, 5.910%, 06/11/40 | | | 4,106 | |
| | 5,700 | | | Series 2007-PW17, Class AMFL, VAR, 1.198%, 06/11/50 (e) | | | 5,601 | |
| | 5,000 | | | BWAY Mortgage Trust, Series 2013-1515, Class F, VAR, 4.058%, 03/10/33 (e) | | | 4,830 | |
| | 16,558 | | | Capmark Mortgage Securities, Inc., Series 1998-C2, Class X, IO, VAR, 1.236%, 05/15/35 | | | 240 | |
| | 47,999 | | | CD Commercial Mortgage Trust, Series 2007-CD4, Class XC, IO, VAR, 0.573%, 12/11/49 (e) | | | 38 | |
| | 5,000 | | | CFCRE Commercial Mortgage Trust, Series 2011-C2, Class D, VAR, 5.885%, 12/15/47 (e) | | | 5,392 | |
| | | | COBALT CMBS Commercial Mortgage Trust, | | | | |
| | 1,057 | | | Series 2006-C1, Class A4, 5.223%, 08/15/48 | | | 1,056 | |
| | 4,471 | | | Series 2006-C1, Class AM, 5.254%, 08/15/48 | | | 4,486 | |
| | | | COMM Mortgage Trust, | | | | |
| | 23,067 | | | Series 2012-CR2, Class XA, IO, VAR, 1.897%, 08/15/45 | | | 1,813 | |
| | 7,000 | | | Series 2013-CR9, Class D, VAR, 4.398%, 07/10/45 (e) | | | 6,188 | |
| | 6,100 | | | Series 2013-WWP, Class A2, 3.424%, 03/10/31 (e) | | | 6,530 | |
| | 8,032 | | | Series 2015-CR24, Class A5, 3.696%, 08/10/48 | | | 8,834 | |
| | 6,856 | | | Series 2015-CR25, Class A4, 3.759%, 08/10/48 | | | 7,558 | |
| | 3,292 | | | Commercial Mortgage Trust, Series 2006-GG7, Class AM, VAR, 5.964%, 07/10/38 | | | 3,288 | |
| | 112,521 | | | Credit Suisse Commercial Mortgage Trust, Series 2007-C2, Class AX, IO, VAR, 0.212%, 01/15/49 (e) | | | 28 | |
| | 270 | | | Credit Suisse First Boston Mortgage Securities Corp., Series 1998-C2, Class F, VAR, 6.750%, 11/15/30 (e) | | | 272 | |
| | 12,304 | | | CSAIL Commercial Mortgage Trust, Series 2015-C3, Class A4, 3.718%, 08/15/48 | | | 13,554 | |
| | | | | | | | |
PRINCIPAL
AMOUNT | | | SECURITY DESCRIPTION | | VALUE | |
| | | | | | | | |
| | 15,200 | | | CSMC Trust, Series 2014-USA, Class D, 4.373%, 09/15/37 (e) | | | 14,632 | |
| | 12,295 | | | DBUBS Mortgage Trust, Series 2011-LC2A, Class XA, IO, VAR, 1.333%, 07/10/44 (e) | | | 490 | |
| | | | Federal Home Loan Mortgage Corp., Multifamily Structured Pass-Through Certificates, | | | | |
| | 15,000 | | | Series K037, Class A2, 3.490%, 01/25/24 | | | 16,598 | |
| | 3,429 | | | Series K038, Class A2, 3.389%, 03/25/24 | | | 3,776 | |
| | 13,500 | | | Series K048, Class A2, VAR, 3.284%, 06/25/25 | | | 14,806 | |
| | 3,791 | | | Series K052, Class A2, 3.151%, 11/25/25 | | | 4,124 | |
| | 70,498 | | | Series K708, Class X1, IO, VAR, 1.593%, 01/25/19 | | | 2,103 | |
| | 8,843 | | | FHLMC Federal Home Loan Mortgage Corp., Multifamily Structured Pass-Through Certificates, Series K152, Class A2, 3.080%, 01/25/31 | | | 9,569 | |
| | 25,000 | | | FHLMC Multifamily Structured Pass-Through Certificates, Series KJ06, Class A, 2.272%, 01/25/23 | | | 25,322 | |
| | 17,000 | | | FORT CRE LLC, Series 2016-1A, Class D, VAR, 6.350%, 05/31/36 (e) | | | 17,000 | |
| | | | FREMF Mortgage Trust, | | | | |
| | 7,000 | | | Series 2014-K39, Class C, VAR, 4.282%, 08/25/47 (e) | | | 6,918 | |
| | 9,580 | | | Series 2015-K720, Class B, VAR, 3.506%, 07/25/22 (e) | | | 9,401 | |
| | 10,000 | | | Series 2016-K55, Class B, VAR, 4.294%, 04/25/49 (e) | | | 10,148 | |
| | 2,049 | | | Series 2016-K56, Class B, VAR, 4.070%, 06/25/49 (e) | | | 2,042 | |
| | 8,010 | | | Series 2016-K722, Class B, VAR, 3.966%, 07/25/49 (e) | | | 7,889 | |
| | 20,000 | | | GS Mortgage Securities Corp. Trust, Series 2012-SHOP, Class XA, IO, VAR, 1.438%, 06/05/31 (e) | | | 652 | |
| | 5,000 | | | GS Mortgage Securities Trust, Series 2011-GC5, Class D, VAR, 5.558%, 08/10/44 (e) | | | 5,193 | |
| | | | JP Morgan Chase Commercial Mortgage Securities Trust, | | | | |
| | 102 | | | Series 2005-CB11, Class AJ, VAR, 5.584%, 08/12/37 | | | 102 | |
| | 28,564 | | | Series 2005-CB11, Class X1, IO, VAR, 0.056%, 08/12/37 (e) | | | 19 | |
| | 35,904 | | | Series 2005-LDP5, Class X1, IO, VAR, 0.131%, 12/15/44 (e) | | | 34 | |
| | 13,146 | | | Series 2006-CB15, Class X1, IO, VAR, 0.482%, 06/12/43 | | | 13 | |
| | 58 | | | Series 2006-CB17, Class A4, 5.429%, 12/12/43 | | | 58 | |
SEE NOTES TO FINANCIAL STATEMENTS.
| | | | | | |
| | | |
| 110 | | | | J.P. MORGAN INCOME FUNDS | | AUGUST 31, 2016 |
| | | | | | | | |
PRINCIPAL
AMOUNT | | | SECURITY DESCRIPTION | | VALUE | |
| Commercial Mortgage-Backed Securities — continued | |
| | 4,718 | | | Series 2006-LDP8, Class X, IO, VAR, 0.727%, 05/15/45 | | | — | (h) |
| | 2,000 | | | Series 2006-LDP9, Class AMS, 5.337%, 05/15/47 | | | 1,984 | |
| | 7,745 | | | Series 2010-C2, Class XA, IO, VAR, 1.815%, 11/15/43 (e) | | | 344 | |
| | | | LB-UBS Commercial Mortgage Trust, | | | | |
| | 3,030 | | | Series 2007-C1, Class AM, 5.455%, 02/15/40 | | | 3,051 | |
| | 2,769 | | | Series 2007-C2, Class A3, 5.430%, 02/15/40 | | | 2,797 | |
| | 2,776 | | | Series 2007-C7, Class A3, VAR, 5.866%, 09/15/45 | | | 2,881 | |
| | | | ML-CFC Commercial Mortgage Trust, | | | | |
| | 32,475 | | | Series 2006-4, Class XC, IO, VAR, 0.768%, 12/12/49 (e) | | | 31 | |
| | 10,074 | | | Series 2007-9, Class A4, 5.700%, 09/12/49 | | | 10,400 | |
| | | | Morgan Stanley Capital I Trust, | | | | |
| | 3,581 | | | Series 2006-IQ12, Class AM, 5.370%, 12/15/43 | | | 3,596 | |
| | 2,925 | | | Series 2006-IQ12, Class AMFX, 5.370%, 12/15/43 | | | 2,937 | |
| | 58,333 | | | Series 2007-HQ11, Class X, IO, VAR, 0.379%, 02/12/44 (e) | | | 23 | |
| | 699 | | | Series 2011-C3, Class A3, 4.054%, 07/15/49 | | | 731 | |
| | | | Morgan Stanley Re-REMIC Trust, | | | | |
| | 1,386 | | | Series 2012-IO, Class AXA, 1.000%, 03/27/51 (e) | | | 1,379 | |
| | 250 | | | Series 2012-XA, Class A, 2.000%, 07/27/49 (e) | | | 248 | |
| | 1,500 | | | Series 2012-XA, Class B, 0.250%, 07/27/49 (e) | | | 1,343 | |
| | 1,804 | | | NorthStar, (Cayman Islands), Series 2013-1A, Class B, VAR, 5.524%, 08/25/29 (e) | | | 1,822 | |
| | 3,451 | | | PFP Ltd., (Cayman Islands), Series 2015-2, Class D, VAR, 4.508%, 07/14/34 (e) | | | 3,334 | |
| | | | RAIT Trust, | | | | |
| | 4,904 | | | Series 2014-FL3, Class B, VAR, 3.158%, 12/15/31 (e) | | | 4,877 | |
| | 1,885 | | | Series 2015-FL5, Class B, VAR, 4.408%, 01/15/31 (e) | | | 1,885 | |
| | | | UBS Commercial Mortgage Trust, | | | | |
| | 9,459 | | | Series 2012-C1, Class D, VAR, 5.731%, 05/10/45 (e) | | | 9,709 | |
| | 7,753 | | | Series 2012-C1, Class XA, IO, VAR, 2.274%, 05/10/45 (e) | | | 748 | |
| | 2,191 | | | UBS-BAMLL Trust, Series 2012-WRM, Class A, 3.663%, 06/10/30 (e) | | | 2,321 | |
| | | | | | | | |
PRINCIPAL
AMOUNT | | | SECURITY DESCRIPTION | | VALUE | |
| | | | | | | | |
| | | | UBS-Barclays Commercial Mortgage Trust, | | | | |
| | 1,560 | | | Series 2012-C2, Class A4, 3.525%, 05/10/63 | | | 1,690 | |
| | 16,407 | | | Series 2012-C2, Class XA, IO, VAR, 1.797%, 05/10/63 (e) | | | 891 | |
| | 5,291 | | | VNDO Mortgage Trust, Series 2012-6AVE, Class A, 2.996%, 11/15/30 (e) | | | 5,556 | |
| | 62,930 | | | Wachovia Bank Commercial Mortgage Trust, Series 2007-C30, Class XC, IO, VAR, 0.509%, 12/15/43 (e) | | | 87 | |
| | 7,598 | | | Wells Fargo Commercial Mortgage Trust, Series 2015-C30, Class A4, 3.664%, 09/15/58 | | | 8,328 | |
| | 4 | | | Wells Fargo Resecuritization Trust, Series 2012-IO, Class A, 1.750%, 08/20/21 (e) | | | 4 | |
| | | | WFRBS Commercial Mortgage Trust, | | | | |
| | 2,500 | | | Series 2011-C3, Class A4, 4.375%, 03/15/44 (e) | | | 2,758 | |
| | 6,640 | | | Series 2013-C11, Class D, VAR, 4.317%, 03/15/45 (e) | | | 6,225 | |
| | | | | | | | |
| | | | Total Commercial Mortgage-Backed Securities
(Cost $368,440) | | | 371,625 | |
| | | | | | | | |
| Convertible bond — 0.0% (g) | |
| | 120 | | | Motors Liquidation Co. 03/06/32
(Cost $—) | | | — | (h) |
| | | | | | | | |
| Corporate Bonds — 25.0% | |
| | | | Consumer Discretionary — 2.7% | |
| | | | Auto Components — 0.2% | |
| | | | American Axle & Manufacturing, Inc., | | | | |
| | 300 | | | 6.250%, 03/15/21 | | | 314 | |
| | 1,425 | | | 6.625%, 10/15/22 | | | 1,519 | |
| | | | Goodyear Tire & Rubber Co. (The), | | | | |
| | 900 | | | 5.000%, 05/31/26 | | | 942 | |
| | 570 | | | 5.125%, 11/15/23 | | | 596 | |
| | 1,175 | | | 7.000%, 05/15/22 | | | 1,251 | |
| | | | Icahn Enterprises LP/Icahn Enterprises Finance Corp., | | | | |
| | 2,025 | | | 4.875%, 03/15/19 | | | 2,006 | |
| | 767 | | | 5.875%, 02/01/22 | | | 716 | |
| | 1,293 | | | 6.000%, 08/01/20 | | | 1,243 | |
| | | | Johnson Controls, Inc., | | | | |
| | 323 | | | 3.625%, 07/02/24 | | | 344 | |
| | 1,180 | | | 4.950%, 07/02/64 | | | 1,257 | |
| | 890 | | | 5.700%, 03/01/41 | | | 1,080 | |
| | 250 | | | MPG Holdco I, Inc., 7.375%, 10/15/22 | | | 258 | |
| | 1,748 | | | Tenneco, Inc., 5.375%, 12/15/24 | | | 1,862 | |
| | | | ZF North America Capital, Inc., | | | | |
| | 1,000 | | | 4.000%, 04/29/20 (e) | | | 1,062 | |
SEE NOTES TO FINANCIAL STATEMENTS.
| | | | | | | | |
| | | |
| AUGUST 31, 2016 | | J.P. MORGAN INCOME FUNDS | | | | | 111 | |
JPMorgan Core Plus Bond Fund
SCHEDULE OF PORTFOLIO INVESTMENTS
AS OF AUGUST 31, 2016 (Unaudited) (continued)
(Amounts in U.S. Dollars, unless otherwise noted)
(Amounts in thousands)
| | | | | | | | |
PRINCIPAL
AMOUNT | | | SECURITY DESCRIPTION | | VALUE | |
| Corporate Bonds — continued | |
| | | | Auto Components — continued | |
| | 576 | | | 4.500%, 04/29/22 (e) | | | 609 | |
| | 841 | | | 4.750%, 04/29/25 (e) | | | 892 | |
| | | | | | | | |
| | | | | | | 15,951 | |
| | | | | | | | |
| | | | Automobiles — 0.2% | |
| | | | Daimler Finance North America LLC, | | | | |
| | 1,000 | | | 2.700%, 08/03/20 (e) | | | 1,033 | |
| | 1,500 | | | 2.875%, 03/10/21 (e) | | | 1,562 | |
| | 560 | | | 8.500%, 01/18/31 | | | 934 | |
| | | | Fiat Chrysler Automobiles N.V., (Netherlands), | | | | |
| | 1,470 | | | 4.500%, 04/15/20 | | | 1,507 | |
| | 708 | | | 5.250%, 04/15/23 | | | 730 | |
| | | | Ford Motor Co., | | | | |
| | 3,500 | | | 6.625%, 10/01/28 | | | 4,442 | |
| | 500 | | | 7.450%, 07/16/31 | | | 679 | |
| | | | General Motors Co., | | | | |
| | 1,425 | | | 5.000%, 04/01/35 | | | 1,500 | |
| | 1,425 | | | 5.200%, 04/01/45 | | | 1,517 | |
| | 595 | | | 6.600%, 04/01/36 | | | 733 | |
| | | | Jaguar Land Rover Automotive plc, (United Kingdom), | | | | |
| | 992 | | | 4.125%, 12/15/18 (e) | | | 1,022 | |
| | 657 | | | 4.250%, 11/15/19 (e) | | | 686 | |
| | 150 | | | 5.625%, 02/01/23 (e) | | | 158 | |
| | | | Motors Liquidation Co., | | | | |
| | 385 | | | 0.000%, 07/15/33 | | | — | (h) |
| | 21 | | | 0.000%, 04/15/41 | | | — | (h) |
| | 1 | | | 0.000%, 07/15/41 | | | — | |
| | 55 | | | 0.000%, 05/15/48 | | | — | (h) |
| | 1 | | | 0.000%, 10/01/51 | | | — | |
| | 42 | | | 0.000%, 02/15/52 | | | — | (h) |
| | 2,500 | | | 7.700%, 04/15/16 (d) | | | — | (h) |
| | | | | | | | |
| | | | | | | 16,503 | |
| | | | | | | | |
| | | | Diversified Consumer Services — 0.1% | | | | |
| | | | Service Corp. International, | | | | |
| | 725 | | | 5.375%, 05/15/24 | | | 778 | |
| | 963 | | | 7.625%, 10/01/18 | | | 1,077 | |
| | 2,300 | | | 8.000%, 11/15/21 | | | 2,720 | |
| | | | | | | | |
| | | | | | | 4,575 | |
| | | | | | | | |
| | | | Hotels, Restaurants & Leisure — 0.4% | | | | |
| | 250 | | | 1011778 B.C. ULC/New Red Finance, Inc., (Canada), 4.625%, 01/15/22 (e) | | | 259 | |
| | 270 | | | CCM Merger, Inc., 9.125%, 05/01/19 (e) | | | 283 | |
| | 850 | | | Choice Hotels International, Inc., 5.750%, 07/01/22 | | | 931 | |
| | | | | | | | |
PRINCIPAL
AMOUNT | | | SECURITY DESCRIPTION | | VALUE | |
| | | | | | | | |
| | | | Hotels, Restaurants & Leisure — continued | |
| | 548 | | | Chukchansi Economic Development Authority, 9.750%, 05/30/20 (e) (d) | | | 301 | |
| | | | GLP Capital LP/GLP Financing II, Inc., | | | | |
| | 50 | | | 4.375%, 04/15/21 | | | 53 | |
| | 1,505 | | | 5.375%, 11/01/23 | | | 1,650 | |
| | 220 | | | 5.375%, 04/15/26 | | | 240 | |
| | 1,560 | | | Hilton Escrow Issuer LLC/Hilton Escrow Issuer Corp., 4.250%, 09/01/24 (e) | | | 1,589 | |
| | 430 | | | Hilton Worldwide Finance LLC/Hilton Worldwide Finance Corp., 5.625%, 10/15/21 | | | 445 | |
| | 1,580 | | | International Game Technology plc, (United Kingdom), 6.500%, 02/15/25 (e) | | | 1,713 | |
| | 3,600 | | | McDonald’s Corp., 2.750%, 12/09/20 | | | 3,746 | |
| | | | MGM Resorts International, | | | | |
| | 754 | | | 4.625%, 09/01/26 | | | 746 | |
| | 1,805 | | | 6.000%, 03/15/23 | | | 1,960 | |
| | 2,215 | | | 6.625%, 12/15/21 | | | 2,486 | |
| | 565 | | | Royal Caribbean Cruises Ltd., (Liberia), 5.250%, 11/15/22 | | | 616 | |
| | | | Sabre GLBL, Inc., | | | | |
| | 190 | | | 5.250%, 11/15/23 (e) | | | 195 | |
| | 408 | | | 5.375%, 04/15/23 (e) | | | 422 | |
| | 1,465 | | | Scientific Games International, Inc., 7.000%, 01/01/22 (e) | | | 1,557 | |
| | 500 | | | Seminole Hard Rock Entertainment, Inc./Seminole Hard Rock International LLC, 5.875%, 05/15/21 (e) | | | 504 | |
| | | | Six Flags Entertainment Corp., | | | | |
| | 340 | | | 4.875%, 07/31/24 (e) | | | 347 | |
| | 875 | | | 5.250%, 01/15/21 (e) | | | 905 | |
| | 895 | | | Speedway Motorsports, Inc., 5.125%, 02/01/23 | | | 924 | |
| | 1,573 | | | Starbucks Corp., 2.700%, 06/15/22 | | | 1,651 | |
| | | | Wynn Las Vegas LLC/Wynn Las Vegas Capital Corp., | | | | |
| | 925 | | | 5.375%, 03/15/22 | | | 961 | |
| | 1,290 | | | 5.500%, 03/01/25 (e) | | | 1,303 | |
| | | | | | | | |
| | | | | | | 25,787 | |
| | | | | | | | |
| | | | Household Durables — 0.2% | | | | |
| | | | CalAtlantic Group, Inc., | | | | |
| | 207 | | | 5.875%, 11/15/24 | | | 224 | |
| | 790 | | | 8.375%, 01/15/21 | | | 942 | |
| | 166 | | | 10.750%, 09/15/16 | | | 166 | |
| | | | D.R. Horton, Inc., | | | | |
| | 1,000 | | | 4.375%, 09/15/22 | | | 1,055 | |
| | 600 | | | 4.750%, 02/15/23 | | | 643 | |
SEE NOTES TO FINANCIAL STATEMENTS.
| | | | | | |
| | | |
| 112 | | | | J.P. MORGAN INCOME FUNDS | | AUGUST 31, 2016 |
| | | | | | | | |
PRINCIPAL
AMOUNT | | | SECURITY DESCRIPTION | | VALUE | |
| Corporate Bonds — continued | |
| | | | Household Durables — continued | |
| | 60 | | | DR Horton, Inc., 5.750%, 08/15/23 | | | 68 | |
| | | | Lennar Corp., | | | | |
| | 1,618 | | | 4.500%, 06/15/19 | | | 1,699 | |
| | 286 | | | 4.500%, 11/15/19 | | | 302 | |
| | 500 | | | 4.750%, 11/15/22 | | | 526 | |
| | 1,250 | | | 4.750%, 05/30/25 | | | 1,297 | |
| | 270 | | | 6.950%, 06/01/18 | | | 291 | |
| | 1,015 | | | Series B, 12.250%, 06/01/17 | | | 1,092 | |
| | 595 | | | M/I Homes, Inc., 6.750%, 01/15/21 | | | 622 | |
| | 565 | | | Meritage Homes Corp., 7.000%, 04/01/22 | | | 630 | |
| | 1,597 | | | PulteGroup, Inc., 5.500%, 03/01/26 | | | 1,704 | |
| | | | Toll Brothers Finance Corp., | | | | |
| | 420 | | | 4.375%, 04/15/23 | | | 429 | |
| | 521 | | | 4.875%, 11/15/25 | | | 546 | |
| | 130 | | | 5.625%, 01/15/24 | | | 139 | |
| | 879 | | | 5.875%, 02/15/22 | | | 964 | |
| | | | | | | | |
| | | | | | | 13,339 | |
| | | | | | | | |
| | | | Internet & Direct Marketing Retail — 0.0% (g) | |
| | | | Amazon.com, Inc., | | | | |
| | 500 | | | 3.300%, 12/05/21 | | | 537 | |
| | 1,523 | | | 4.800%, 12/05/34 | | | 1,829 | |
| | 299 | | | Netflix, Inc., 5.750%, 03/01/24 | | | 323 | |
| | 1,000 | | | QVC, Inc., 4.450%, 02/15/25 | | | 996 | |
| | | | | | | | |
| | | | | | | 3,685 | |
| | | | | | | | |
| | | | Media — 1.2% | | | | |
| | | | 21st Century Fox America, Inc., | | | | |
| | 600 | | | 6.750%, 01/09/38 | | | 769 | |
| | 800 | | | 7.750%, 01/20/24 | | | 1,030 | |
| | 200 | | | 7.850%, 03/01/39 | | | 293 | |
| | 147 | | | 8.875%, 04/26/23 | | | 198 | |
| | | | Altice U.S. Finance I Corp., | | | | |
| | 935 | | | 5.375%, 07/15/23 (e) | | | 978 | |
| | 1,172 | | | 5.500%, 05/15/26 (e) | | | 1,233 | |
| | 1,710 | | | AMC Networks, Inc., 5.000%, 04/01/24 | | | 1,753 | |
| | 1,178 | | | CBS Corp., 3.700%, 08/15/24 | | | 1,242 | |
| | | | Charter Communications Operating LLC/Charter Communications Operating Capital, | | | | |
| | 1,992 | | | 4.464%, 07/23/22 (e) | | | 2,160 | |
| | 242 | | | 4.908%, 07/23/25 (e) | | | 267 | |
| | 240 | | | Comcast Cable Communications Holdings, Inc., 9.455%, 11/15/22 | | | 337 | |
| | | | Comcast Corp., | | | | |
| | 1,290 | | | 1.625%, 01/15/22 | | | 1,281 | |
| | 4,200 | | | 2.350%, 01/15/27 | | | 4,163 | |
| | | | | | | | |
PRINCIPAL
AMOUNT | | | SECURITY DESCRIPTION | | VALUE | |
| | | | | | | | |
| | | | Media — continued | |
| | 5,000 | | | 3.375%, 08/15/25 | | | 5,390 | |
| | 2,819 | | | 4.200%, 08/15/34 | | | 3,149 | |
| | 2,405 | | | 4.600%, 08/15/45 | | | 2,831 | |
| | 240 | | | 6.300%, 11/15/17 | | | 255 | |
| | 435 | | | 6.500%, 11/15/35 | | | 613 | |
| | 177 | | | 6.550%, 07/01/39 | | | 255 | |
| | 1,750 | | | CSC Holdings LLC, 6.750%, 11/15/21 | | | 1,868 | |
| | 946 | | | Discovery Communications LLC, 4.950%, 05/15/42 | | | 887 | |
| | | | DISH DBS Corp., | | | | |
| | 2,362 | | | 5.875%, 07/15/22 | | | 2,406 | |
| | 8,334 | | | 6.750%, 06/01/21 | | | 8,954 | |
| | 130 | | | 7.750%, 07/01/26 (e) | | | 139 | |
| | 2,131 | | | 7.875%, 09/01/19 | | | 2,376 | |
| | 1,000 | | | Historic TW, Inc., 9.150%, 02/01/23 | | | 1,356 | |
| | 1,587 | | | Hughes Satellite Systems Corp., 5.250%, 08/01/26 (e) | | | 1,577 | |
| | | | iHeartCommunications, Inc., | | | | |
| | 890 | | | 9.000%, 12/15/19 | | | 720 | |
| | 950 | | | 9.000%, 03/01/21 | | | 712 | |
| | | | Lamar Media Corp., | | | | |
| | 1,250 | | | 5.000%, 05/01/23 | | | 1,322 | |
| | 90 | | | 5.375%, 01/15/24 | | | 96 | |
| | 470 | | | Liberty Interactive LLC, 8.250%, 02/01/30 | | | 505 | |
| | 810 | | | NBCUniversal Media LLC, 5.950%, 04/01/41 | | | 1,107 | |
| | | | Nielsen Finance LLC/Nielsen Finance Co., | | | | |
| | 655 | | | 4.500%, 10/01/20 | | | 671 | |
| | 2,352 | | | 5.000%, 04/15/22 (e) | | | 2,417 | |
| | 785 | | | Outfront Media Capital LLC/Outfront Media Capital Corp., 5.625%, 02/15/24 | | | 835 | |
| | 265 | | | Quebecor, Inc., (Canada), 9.750%, 01/15/16 (d) | | | – | |
| | | | Sirius XM Radio, Inc., | | | | |
| | 2,505 | | | 4.625%, 05/15/23 (e) | | | 2,533 | |
| | 1,930 | | | 5.250%, 08/15/22 (e) | | | 2,036 | |
| | 900 | | | 5.375%, 04/15/25 (e) | | | 943 | |
| | 1,231 | | | 5.375%, 07/15/26 (e) | | | 1,267 | |
| | 1,015 | | | Starz LLC/Starz Finance Corp., 5.000%, 09/15/19 | | | 1,030 | |
| | | | TEGNA, Inc., | | | | |
| | 1,184 | | | 5.125%, 07/15/20 | | | 1,226 | |
| | 585 | | | 5.500%, 09/15/24 (e) | | | 617 | |
| | 2,100 | | | 6.375%, 10/15/23 | | | 2,273 | |
| | 335 | | | Time Warner Cable, Inc., 7.300%, 07/01/38 | | | 435 | |
| | 660 | | | Time Warner Cos., Inc., 7.570%, 02/01/24 | | | 857 | |
SEE NOTES TO FINANCIAL STATEMENTS.
| | | | | | | | |
| | | |
| AUGUST 31, 2016 | | J.P. MORGAN INCOME FUNDS | | | | | 113 | |
JPMorgan Core Plus Bond Fund
SCHEDULE OF PORTFOLIO INVESTMENTS
AS OF AUGUST 31, 2016 (Unaudited) (continued)
(Amounts in U.S. Dollars, unless otherwise noted)
(Amounts in thousands)
| | | | | | | | |
PRINCIPAL
AMOUNT | | | SECURITY DESCRIPTION | | VALUE | |
| Corporate Bonds — continued | |
| | | | Media — continued | |
| | 1,860 | | | Time Warner Entertainment Co. LP, 8.375%, 07/15/33 | | | 2,543 | |
| | 182 | | | Time Warner, Inc., 5.375%, 10/15/41 | | | 220 | |
| | | | Unitymedia Hessen GmbH & Co. KG/Unitymedia NRW GmbH, (Germany), | | | | |
| | 755 | | | 5.000%, 01/15/25 (e) | | | 787 | |
| | 900 | | | 5.500%, 01/15/23 (e) | | | 947 | |
| | | | Univision Communications, Inc., | | | | |
| | 1,350 | | | 5.125%, 05/15/23 (e) | | | 1,404 | |
| | 500 | | | 5.125%, 02/15/25 (e) | | | 523 | |
| | 350 | | | 6.750%, 09/15/22 (e) | | | 372 | |
| | 70 | | | Viacom, Inc., 4.375%, 03/15/43 | | | 63 | |
| | | | Videotron Ltd., (Canada), | | | | |
| | 2,622 | | | 5.375%, 06/15/24 (e) | | | 2,756 | |
| | | | Walt Disney Co. (The), | | | | |
| | 389 | | | 1.850%, 07/30/26 | | | 374 | |
| | 500 | | | Series B, 5.875%, 12/15/17 | | | 530 | |
| | 755 | | | Series B, 7.000%, 03/01/32 | | | 1,101 | |
| | | | | | | | |
| | | | | | | 80,982 | |
| | | | | | | | |
| | | | Multiline Retail — 0.1% | | | | |
| | 3,782 | | | Dollar Tree, Inc., 5.750%, 03/01/23 | | | 4,071 | |
| | 475 | | | Macy’s Retail Holdings, Inc., 6.900%, 04/01/29 | | | 541 | |
| | | | | | | | |
| | | | | | | 4,612 | |
| | | | | | | | |
| | | | Specialty Retail — 0.3% | | | | |
| | 220 | | | AutoNation, Inc., 5.500%, 02/01/20 | | | 241 | |
| | 2,000 | | | Caleres, Inc., 6.250%, 08/15/23 | | | 2,080 | |
| | 1,470 | | | Claire’s Stores, Inc., 9.000%, 03/15/19 (e) | | | 847 | |
| | 500 | | | CST Brands, Inc., 5.000%, 05/01/23 | | | 529 | |
| | 410 | | | Group 1 Automotive, Inc., 5.250%, 12/15/23 (e) | | | 415 | |
| | | | Home Depot, Inc. (The), | | | | |
| | 734 | | | 2.625%, 06/01/22 | | | 764 | |
| | 2,751 | | | 3.000%, 04/01/26 | | | 2,933 | |
| | | | L Brands, Inc., | | | | |
| | 400 | | | 5.625%, 02/15/22 | | | 444 | |
| | 3,500 | | | 5.625%, 10/15/23 | | | 3,915 | |
| | 650 | | | 6.750%, 07/01/36 | | | 698 | |
| | 625 | | | 6.875%, 11/01/35 | | | 683 | |
| | 500 | | | 8.500%, 06/15/19 | | | 586 | |
| | | | Lowe’s Cos., Inc., | | | | |
| | 665 | | | 3.125%, 09/15/24 | | | 708 | |
| | 1,262 | | | 3.375%, 09/15/25 | | | 1,366 | |
| | 116 | | | 5.125%, 11/15/41 | | | 146 | |
| | | | | | | | |
PRINCIPAL
AMOUNT | | | SECURITY DESCRIPTION | | VALUE | |
| | | | | | | | |
| | | | Specialty Retail — continued | |
| | 951 | | | Series B, 7.110%, 05/15/37 | | | 1,366 | |
| | 660 | | | Nebraska Book Holdings, Inc., 15.000%, 06/30/16 (e) (d) | | | 118 | |
| | 752 | | | Penske Automotive Group, Inc., 5.500%, 05/15/26 | | | 752 | |
| | 435 | | | Radio Systems Corp., 8.375%, 11/01/19 (e) | | | 455 | |
| | | | Sally Holdings LLC/Sally Capital, Inc., | | | | |
| | 500 | | | 5.500%, 11/01/23 | | | 532 | |
| | 817 | | | 5.625%, 12/01/25 | | | 885 | |
| | 1,000 | | | 5.750%, 06/01/22 | | | 1,044 | |
| | | | | | | | |
| | | | | | | 21,507 | |
| | | | | | | | |
| | | | Textiles, Apparel & Luxury Goods — 0.0% (g) | | | | |
| | | | Hanesbrands, Inc., | | | | |
| | 274 | | | 4.625%, 05/15/24 (e) | | | 287 | |
| | 274 | | | 4.875%, 05/15/26 (e) | | | 285 | |
| | 470 | | | Levi Strauss & Co., 5.000%, 05/01/25 | | | 488 | |
| | | | | | | | |
| | | | | | | 1,060 | |
| | | | | | | | |
| | | | Total Consumer Discretionary | | | 188,001 | |
| | | | | | | | |
| | | | Consumer Staples — 1.6% | | | | |
| | | | Beverages — 0.5% | | | | |
| | | | Anheuser-Busch Cos. LLC, | | | | |
| | 325 | | | 5.500%, 01/15/18 | | | 344 | |
| | 550 | | | 5.750%, 04/01/36 | | | 711 | |
| | 280 | | | 7.550%, 10/01/30 | | | 399 | |
| | | | Anheuser-Busch InBev Finance, Inc., | | | | |
| | 50 | | | 1.900%, 02/01/19 | | | 50 | |
| | 2,551 | | | 3.300%, 02/01/23 | | | 2,677 | |
| | 1,225 | | | 3.700%, 02/01/24 | | | 1,329 | |
| | 3,990 | | | 4.700%, 02/01/36 | | | 4,625 | |
| | 5,415 | | | 4.900%, 02/01/46 | | | 6,548 | |
| | 2,360 | | | Anheuser-Busch InBev Worldwide, Inc., 5.375%, 01/15/20 | | | 2,641 | |
| | 1,000 | | | Coca-Cola Co. (The), 2.250%, 09/01/26 | | | 999 | |
| | | | Constellation Brands, Inc., | | | | |
| | 608 | | | 3.750%, 05/01/21 | | | 643 | |
| | 216 | | | 4.250%, 05/01/23 | | | 231 | |
| | 396 | | | 4.750%, 11/15/24 | | | 432 | |
| | 932 | | | 4.750%, 12/01/25 | | | 1,014 | |
| | 1,165 | | | 6.000%, 05/01/22 | | | 1,351 | |
| | | | Diageo Investment Corp., | | | | |
| | 1,000 | | | 7.450%, 04/15/35 | | | 1,528 | |
| | 365 | | | 8.000%, 09/15/22 | | | 478 | |
| | 575 | | | DS Services of America, Inc., 10.000%, 09/01/21 (e) | | | 645 | |
SEE NOTES TO FINANCIAL STATEMENTS.
| | | | | | |
| | | |
| 114 | | | | J.P. MORGAN INCOME FUNDS | | AUGUST 31, 2016 |
| | | | | | | | |
PRINCIPAL
AMOUNT | | | SECURITY DESCRIPTION | | VALUE | |
| Corporate Bonds — continued | |
| | | | Beverages — continued | |
| | 677 | | | Heineken N.V., (Netherlands), 1.400%, 10/01/17 (e) | | | 678 | |
| | | | PepsiCo, Inc., | | | | |
| | 2,500 | | | 2.150%, 10/14/20 | | | 2,563 | |
| | 572 | | | 3.100%, 07/17/22 | | | 608 | |
| | 1,845 | | | 3.500%, 07/17/25 | | | 2,039 | |
| | 730 | | | 4.450%, 04/14/46 | | | 882 | |
| | 70 | | | 7.900%, 11/01/18 | | | 80 | |
| | | | | | | | |
| | | | | | | 33,495 | |
| | | | | | | | |
| | | | Food & Staples Retailing — 0.4% | | | | |
| | | | CVS Health Corp., | | | | |
| | 2,460 | | | 2.800%, 07/20/20 | | | 2,562 | |
| | 1,659 | | | 4.000%, 12/05/23 | | | 1,835 | |
| | 3,830 | | | 5.125%, 07/20/45 | | | 4,775 | |
| | 1,780 | | | Ingles Markets, Inc., 5.750%, 06/15/23 | | | 1,852 | |
| | | | Kroger Co. (The), | | | | |
| | 215 | | | 6.400%, 08/15/17 | | | 226 | |
| | 1,162 | | | 7.500%, 04/01/31 | | | 1,654 | |
| | 900 | | | Series B, 7.700%, 06/01/29 | | | 1,268 | |
| | 430 | | | New Albertsons, Inc., 8.700%, 05/01/30 | | | 439 | |
| | 1,125 | | | SUPERVALU, Inc., 7.750%, 11/15/22 | | | 1,063 | |
| | | | Sysco Corp., | | | | |
| | 1,575 | | | 2.500%, 07/15/21 | | | 1,613 | |
| | 1,517 | | | 2.600%, 06/12/22 | | | 1,539 | |
| | | | Walgreens Boots Alliance, Inc., | | | | |
| | 527 | | | 3.100%, 06/01/23 | | | 544 | |
| | 4,337 | | | 3.450%, 06/01/26 | | | 4,511 | |
| | | | Wal-Mart Stores, Inc., | | | | |
| | 300 | | | 2.550%, 04/11/23 | | | 313 | |
| | 160 | | | 5.000%, 10/25/40 | | | 204 | |
| | 1,000 | | | 6.200%, 04/15/38 | | | 1,443 | |
| | 260 | | | 7.550%, 02/15/30 | | | 397 | |
| | | | | | | | |
| | | | | | | 26,238 | |
| | | | | | | | |
| | | | Food Products — 0.5% | | | | |
| | 1,650 | | | Archer-Daniels-Midland Co., Class C, 2.500%, 08/11/26 | | | 1,660 | |
| | 326 | | | Bumble Bee Holdings, Inc., 9.000%, 12/15/17 (e) | | | 332 | |
| | | | Bunge Ltd. Finance Corp., | | | | |
| | 675 | | | 3.250%, 08/15/26 | | | 678 | |
| | 305 | | | 3.500%, 11/24/20 | | | 318 | |
| | 655 | | | 8.500%, 06/15/19 | | | 766 | |
| | 148 | | | Bunge N.A. Finance LP, 5.900%, 04/01/17 | | | 152 | |
| | | | | | | | |
PRINCIPAL
AMOUNT | | | SECURITY DESCRIPTION | | VALUE | |
| | | | | | | | |
| | | | Food Products — continued | |
| | | | Cargill, Inc., | | | | |
| | 350 | | | 1.900%, 03/01/17 (e) | | | 351 | |
| | 800 | | | 3.300%, 03/01/22 (e) | | | 837 | |
| | 470 | | | 4.760%, 11/23/45 (e) | | | 558 | |
| | 200 | | | 6.000%, 11/27/17 (e) | | | 212 | |
| | 1,000 | | | 7.350%, 03/06/19 (e) | | | 1,144 | |
| | | | ConAgra Foods, Inc., | | | | |
| | 135 | | | 3.250%, 09/15/22 | | | 140 | |
| | 180 | | | 6.625%, 08/15/39 | | | 206 | |
| | 2,560 | | | Darling Ingredients, Inc., 5.375%, 01/15/22 | | | 2,688 | |
| | 200 | | | FAGE International S.A./FAGE USA Dairy Industry, Inc., (Luxembourg), 5.625%, 08/15/26 (e) | | | 207 | |
| | | | JBS USA LUX S.A./JBS USA Finance, Inc., | | | | |
| | 793 | | | 5.750%, 06/15/25 (e) | | | 806 | |
| | 1,868 | | | 5.875%, 07/15/24 (e) | | | 1,930 | |
| | 3,447 | | | 7.250%, 06/01/21 (e) | | | 3,551 | |
| | 1,430 | | | 8.250%, 02/01/20 (e) | | | 1,478 | |
| | | | Kraft Heinz Foods Co., | | | | |
| | 429 | | | 3.500%, 06/06/22 | | | 458 | |
| | 2,310 | | | 4.375%, 06/01/46 | | | 2,498 | |
| | 488 | | | 5.000%, 06/04/42 | | | 569 | |
| | 946 | | | 5.200%, 07/15/45 | | | 1,134 | |
| | 599 | | | 6.125%, 08/23/18 | | | 653 | |
| | 153 | | | 6.375%, 07/15/28 | | | 186 | |
| | 200 | | | 6.500%, 02/09/40 | | | 275 | |
| | 277 | | | 6.750%, 03/15/32 | | | 365 | |
| | 575 | | | 6.875%, 01/26/39 | | | 808 | |
| | 497 | | | Mead Johnson Nutrition Co., Class C, 4.125%, 11/15/25 | | | 544 | |
| | 430 | | | Pilgrim’s Pride Corp., 5.750%, 03/15/25 (e) | | | 444 | |
| | 475 | | | Post Holdings, Inc., 6.750%, 12/01/21 (e) | | | 510 | |
| | | | Smithfield Foods, Inc., | | | | |
| | 591 | | | 5.250%, 08/01/18 (e) | | | 597 | |
| | 1,511 | | | 5.875%, 08/01/21 (e) | | | 1,579 | |
| | 102 | | | 7.750%, 07/01/17 | | | 106 | |
| | 435 | | | TreeHouse Foods, Inc., 6.000%, 02/15/24 (e) | | | 475 | |
| | | | Tyson Foods, Inc., | | | | |
| | 700 | | | 3.950%, 08/15/24 | | | 758 | |
| | 700 | | | 5.150%, 08/15/44 | | | 849 | |
| | | | | | | | |
| | | | | | | 30,822 | |
| | | | | | | | |
| | | | Household Products — 0.0% (g) | | | | |
| | 600 | | | Kimberly-Clark Corp., 2.400%, 06/01/23 | | | 620 | |
| | 458 | | | Procter & Gamble - ESOP, Series A, 9.360%, 01/01/21 | | | 541 | |
SEE NOTES TO FINANCIAL STATEMENTS.
| | | | | | | | |
| | | |
| AUGUST 31, 2016 | | J.P. MORGAN INCOME FUNDS | | | | | 115 | |
JPMorgan Core Plus Bond Fund
SCHEDULE OF PORTFOLIO INVESTMENTS
AS OF AUGUST 31, 2016 (Unaudited) (continued)
(Amounts in U.S. Dollars, unless otherwise noted)
(Amounts in thousands)
| | | | | | | | |
PRINCIPAL
AMOUNT | | | SECURITY DESCRIPTION | | VALUE | |
| Corporate Bonds — continued | |
| | | | Household Products — continued | |
| | | | Spectrum Brands, Inc., | | | | |
| | 525 | | | 6.125%, 12/15/24 | | | 566 | |
| | 1,219 | | | 6.625%, 11/15/22 | | | 1,304 | |
| | | | | | | | |
| | | | | | | 3,031 | |
| | | | | | | | |
| | | | Tobacco — 0.2% | | | | |
| | 7,500 | | | Altria Group, Inc., 2.625%, 01/14/20 | | | 7,788 | |
| | 3,575 | | | Reynolds American, Inc., 5.850%, 08/15/45 | | | 4,662 | |
| | | | | | | | |
| | | | | | | 12,450 | |
| | | | | | | | |
| | | | Total Consumer Staples | | | 106,036 | |
| | | | | | | | |
| | | | Energy — 2.9% | | | | |
| | | | Energy Equipment & Services — 0.2% | | | | |
| | 280 | | | Archrock Partners LP/Archrock Partners Finance Corp., 6.000%, 10/01/22 | | | 259 | |
| | 303 | | | Baker Hughes, Inc., 5.125%, 09/15/40 | | | 348 | |
| | 1,310 | | | Diamond Offshore Drilling, Inc., 4.875%, 11/01/43 | | | 964 | |
| | 825 | | | Ensco plc, (United Kingdom), 5.200%, 03/15/25 | | | 594 | |
| | | | Halliburton Co., | | | | |
| | 680 | | | 4.850%, 11/15/35 | | | 726 | |
| | 250 | | | 7.450%, 09/15/39 | | | 350 | |
| | 275 | | | 7.600%, 08/15/96 (e) | | | 352 | |
| | 700 | | | 8.750%, 02/15/21 | | | 867 | |
| | 1,418 | | | Noble Holding International Ltd., (Cayman Islands), 7.950%, 04/01/45 | | | 1,035 | |
| | 255 | | | Parker Drilling Co., 6.750%, 07/15/22 | | | 199 | |
| | | | Precision Drilling Corp., (Canada), | | | | |
| | 1,113 | | | 5.250%, 11/15/24 | | | 935 | |
| | 378 | | | 6.500%, 12/15/21 | | | 351 | |
| | | | Schlumberger Investment S.A., (Luxembourg), | | | | |
| | 640 | | | 2.400%, 08/01/22 (e) | | | 651 | |
| | 219 | | | 3.300%, 09/14/21 (e) | | | 232 | |
| | 1,210 | | | 3.650%, 12/01/23 | | | 1,317 | |
| | 1,557 | | | Sea Trucks Group Ltd., (United Kingdom), Reg. S, 9.000%, 03/26/18 (e) | | | 473 | |
| | 1,421 | | | Transocean, Inc., (Cayman Islands), 9.000%, 07/15/23 (e) | | | 1,374 | |
| | 630 | | | Trinidad Drilling Ltd., (Canada), 7.875%, 01/15/19 (e) | | | 580 | |
| | 1,032 | | | Unit Corp., 6.625%, 05/15/21 | | | 859 | |
| | | | Weatherford International Ltd., (Bermuda), | | | | |
| | 372 | | | 4.500%, 04/15/22 | | | 309 | |
| | 978 | | | 7.750%, 06/15/21 | | | 961 | |
| | 199 | | | 8.250%, 06/15/23 | | | 195 | |
| | | | | | | | |
| | | | | | | 13,931 | |
| | | | | | | | |
| | | | | | | | |
PRINCIPAL
AMOUNT | | | SECURITY DESCRIPTION | | VALUE | |
| | | | | | | | |
| | | | Oil, Gas & Consumable Fuels — 2.7% | | | | |
| | 175 | | | Alberta Energy Co., Ltd., (Canada), 7.375%, 11/01/31 | | | 183 | |
| | 278 | | | Anadarko Holding Co., 7.150%, 05/15/28 | | | 324 | |
| | | | Anadarko Petroleum Corp., | | | | |
| | 350 | | | 6.950%, 06/15/19 | | | 388 | |
| | 100 | | | 7.950%, 06/15/39 | | | 125 | |
| | 225 | | | 8.700%, 03/15/19 | | | 257 | |
| | 250 | | | ANR Pipeline Co., 9.625%, 11/01/21 | | | 335 | |
| | | | Antero Resources Corp., | | | | |
| | 235 | | | 5.125%, 12/01/22 | | | 232 | |
| | 2,837 | | | 5.375%, 11/01/21 | | | 2,840 | |
| | 450 | | | 6.000%, 12/01/20 | | | 461 | |
| | 775 | | | Apache Corp., 6.900%, 09/15/18 | | | 847 | |
| | | | Baytex Energy Corp., (Canada), | | | | |
| | 300 | | | 5.125%, 06/01/21 (e) | | | 250 | |
| | 300 | | | 5.625%, 06/01/24 (e) | | | 243 | |
| | 857 | | | Boardwalk Pipelines LP, 5.950%, 06/01/26 | | | 935 | |
| | | | BP Capital Markets plc, (United Kingdom), | | | | |
| | 206 | | | 1.375%, 11/06/17 | | | 206 | |
| | 589 | | | 1.375%, 05/10/18 | | | 590 | |
| | 1,545 | | | 2.750%, 05/10/23 | | | 1,574 | |
| | 385 | | | 3.245%, 05/06/22 | | | 407 | |
| | 1,800 | | | 3.535%, 11/04/24 | | | 1,921 | |
| | 612 | | | 3.814%, 02/10/24 | | | 666 | |
| | 515 | | | 4.750%, 03/10/19 | | | 557 | |
| | 600 | | | Buckeye Partners LP, 4.875%, 02/01/21 | | | 641 | |
| | 210 | | | Burlington Resources Finance Co., (Canada), 7.400%, 12/01/31 | | | 277 | |
| | 815 | | | Burlington Resources, Inc., 8.200%, 03/15/25 | | | 1,061 | |
| | | | California Resources Corp., | | | | |
| | 38 | | | 6.000%, 11/15/24 | | | 18 | |
| | 1,414 | | | 8.000%, 12/15/22 (e) | | | 955 | |
| | | | Canadian Natural Resources Ltd., (Canada), | | | | |
| | 1,035 | | | 3.900%, 02/01/25 | | | 1,042 | |
| | 330 | | | 6.250%, 03/15/38 | | | 363 | |
| | | | Cenovus Energy, Inc., (Canada), | | | | |
| | 123 | | | 3.000%, 08/15/22 | | | 117 | |
| | 294 | | | 4.450%, 09/15/42 | | | 239 | |
| | 2,438 | | | 5.700%, 10/15/19 | | | 2,619 | |
| | 4,871 | | | 6.750%, 11/15/39 | | | 5,201 | |
| | 715 | | | Cheniere Corpus Christi Holdings LLC, 7.000%, 06/30/24 (e) | | | 765 | |
| | 1,141 | | | Chesapeake Energy Corp., 8.000%, 12/15/22 (e) | | | 1,087 | |
SEE NOTES TO FINANCIAL STATEMENTS.
| | | | | | |
| | | |
| 116 | | | | J.P. MORGAN INCOME FUNDS | | AUGUST 31, 2016 |
| | | | | | | | |
PRINCIPAL
AMOUNT | | | SECURITY DESCRIPTION | | VALUE | |
| Corporate Bonds — continued | |
| | | | Oil, Gas & Consumable Fuels — continued | |
| | | | Chevron Corp., | | | | |
| | 540 | | | 2.355%, 12/05/22 | | | 553 | |
| | 7,000 | | | 2.411%, 03/03/22 | | | 7,189 | |
| | 2,500 | | | 2.566%, 05/16/23 | | | 2,554 | |
| | 1,550 | | | 2.954%, 05/16/26 | | | 1,612 | |
| | 402 | | | CITGO Petroleum Corp., 6.250%, 08/15/22 (e) | | | 393 | |
| | 1,243 | | | CNOOC Finance 2015 USA LLC, 3.500%, 05/05/25 | | | 1,298 | |
| | 1,026 | | | CNOOC Nexen Finance 2014 ULC, (Canada), 4.250%, 04/30/24 | | | 1,119 | |
| | | | Concho Resources, Inc., | | | | |
| | 450 | | | 5.500%, 10/01/22 | | | 466 | |
| | 945 | | | 6.500%, 01/15/22 | | | 983 | |
| | 215 | | | Conoco Funding Co., (Canada), 7.250%, 10/15/31 | | | 284 | |
| | | | ConocoPhillips, | | | | |
| | 275 | | | 5.750%, 02/01/19 | | | 301 | |
| | 750 | | | 6.500%, 02/01/39 | | | 985 | |
| | 410 | | | 7.000%, 03/30/29 | | | 523 | |
| | 1,500 | | | ConocoPhillips Co., 4.200%, 03/15/21 | | | 1,618 | |
| | 300 | | | ConocoPhillips Holding Co., 6.950%, 04/15/29 | | | 383 | |
| | | | Continental Resources, Inc., | | | | |
| | 1,086 | | | 5.000%, 09/15/22 | | | 1,051 | |
| | 614 | | | 7.125%, 04/01/21 | | | 635 | |
| | 236 | | | Devon Energy Corp., 3.250%, 05/15/22 | | | 234 | |
| | 270 | | | Devon Financing Corp. LLC, 7.875%, 09/30/31 | | | 331 | |
| | 800 | | | Ecopetrol S.A., (Colombia), 5.875%, 05/28/45 | | | 749 | |
| | | | Encana Corp., (Canada), | | | | |
| | 150 | | | 6.500%, 05/15/19 | | | 161 | |
| | 148 | | | 6.625%, 08/15/37 | | | 150 | |
| | | | Energy Transfer Equity LP, | | | | |
| | 2,250 | | | 5.875%, 01/15/24 | | | 2,306 | |
| | 495 | | | 7.500%, 10/15/20 | | | 542 | |
| | 1,080 | | | Energy Transfer Partners LP, 2.500%, 06/15/18 | | | 1,090 | |
| | 1,210 | | | Eni S.p.A., (Italy), Series EX2, 5.700%, 10/01/40 (e) | | | 1,287 | |
| | | | EnLink Midstream Partners LP, | | | | |
| | 841 | | | 2.700%, 04/01/19 | | | 828 | |
| | 922 | | | 4.150%, 06/01/25 | | | 873 | |
| | | | Enterprise Products Operating LLC, | | | | |
| | 1,252 | | | 3.350%, 03/15/23 | | | 1,296 | |
| | 1,026 | | | 3.700%, 02/15/26 | | | 1,070 | |
| | 582 | | | 3.750%, 02/15/25 | | | 608 | |
| | 330 | | | 4.950%, 10/15/54 | | | 347 | |
| | 333 | | | 5.950%, 02/01/41 | | | 396 | |
| | | | | | | | |
PRINCIPAL
AMOUNT | | | SECURITY DESCRIPTION | | VALUE | |
| | | | | | | | |
| | | | Oil, Gas & Consumable Fuels — continued | |
| | | | EOG Resources, Inc., | | | | |
| | 472 | | | 2.625%, 03/15/23 | | | 471 | |
| | 1,700 | | | 4.100%, 02/01/21 | | | 1,838 | |
| | 200 | | | 6.875%, 10/01/18 | | | 220 | |
| | | | EP Energy LLC/Everest Acquisition Finance, Inc., | | | | |
| | 2,000 | | | 7.750%, 09/01/22 | | | 1,095 | |
| | 2,354 | | | 9.375%, 05/01/20 | | | 1,518 | |
| | | | Exxon Mobil Corp., | | | | |
| | 3,140 | | | 2.397%, 03/06/22 | | | 3,229 | |
| | 1,736 | | | 3.043%, 03/01/26 | | | 1,842 | |
| | 1,045 | | | Gulf South Pipeline Co. LP, 4.000%, 06/15/22 | | | 1,009 | |
| | | | Hilcorp Energy I LP/Hilcorp Finance Co., | | | | |
| | 725 | | | 5.000%, 12/01/24 (e) | | | 703 | |
| | 1,500 | | | 5.750%, 10/01/25 (e) | | | 1,470 | |
| | 152 | | | 7.625%, 04/15/21 (e) | | | 156 | |
| | | | Holly Energy Partners LP/Holly Energy Finance Corp., | | | | |
| | 276 | | | 6.000%, 08/01/24 (e) | | | 282 | |
| | 337 | | | 6.500%, 03/01/20 | | | 347 | |
| | | | KazMunayGas National Co. JSC, (Kazakhstan), | | | | |
| | 200 | | | Reg. S, 4.400%, 04/30/23 | | | 200 | |
| | 300 | | | Reg. S, 6.375%, 04/09/21 | | | 328 | |
| | 205 | | | Reg. S, 7.000%, 05/05/20 | | | 228 | |
| | 200 | | | Reg. S, 9.125%, 07/02/18 | | | 220 | |
| | 800 | | | Kerr-McGee Corp., 7.875%, 09/15/31 | | | 968 | |
| | 150 | | | Kinder Morgan Energy Partners LP, 6.500%, 04/01/20 | | | 168 | |
| | | | Kinder Morgan, Inc., | | | | |
| | 1,565 | | | 5.000%, 02/15/21 (e) | | | 1,693 | |
| | 565 | | | 5.625%, 11/15/23 (e) | | | 617 | |
| | 150 | | | 7.000%, 06/15/17 | | | 156 | |
| | | | Marathon Oil Corp., | | | | |
| | 1,976 | | | 2.800%, 11/01/22 | | | 1,806 | |
| | 410 | | | 6.000%, 10/01/17 | | | 424 | |
| | | | MEG Energy Corp., (Canada), | | | | |
| | 186 | | | 6.375%, 01/30/23 (e) | | | 145 | |
| | 195 | | | 7.000%, 03/31/24 (e) | | | 157 | |
| | | | MPLX LP, | | | | |
| | 732 | | | 4.500%, 07/15/23 (e) | | | 738 | |
| | 986 | | | 4.875%, 12/01/24 (e) | | | 1,008 | |
| | 1,382 | | | 4.875%, 06/01/25 (e) | | | 1,410 | |
| | 3,000 | | | 5.500%, 02/15/23 (e) | | | 3,115 | |
| | 500 | | | Murphy Oil USA, Inc., 6.000%, 08/15/23 | | | 530 | |
| | | | Newfield Exploration Co., | | | | |
| | 475 | | | 5.375%, 01/01/26 | | | 477 | |
SEE NOTES TO FINANCIAL STATEMENTS.
| | | | | | | | |
| | | |
| AUGUST 31, 2016 | | J.P. MORGAN INCOME FUNDS | | | | | 117 | |
JPMorgan Core Plus Bond Fund
SCHEDULE OF PORTFOLIO INVESTMENTS
AS OF AUGUST 31, 2016 (Unaudited) (continued)
(Amounts in U.S. Dollars, unless otherwise noted)
(Amounts in thousands)
| | | | | | | | |
PRINCIPAL
AMOUNT | | | SECURITY DESCRIPTION | | VALUE | |
| Corporate Bonds — continued | |
| | | | Oil, Gas & Consumable Fuels — continued | |
| | 575 | | | 5.625%, 07/01/24 | | | 594 | |
| | 1,264 | | | 5.750%, 01/30/22 | | | 1,311 | |
| | | | Noble Energy, Inc., | | | | |
| | 583 | | | 3.900%, 11/15/24 | | | 595 | |
| | 286 | | | 5.050%, 11/15/44 | | | 286 | |
| | 1,500 | | | 5.250%, 11/15/43 | | | 1,513 | |
| | | | Occidental Petroleum Corp., | | | | |
| | 504 | | | 2.700%, 02/15/23 | | | 514 | |
| | 2,300 | | | 3.400%, 04/15/26 | | | 2,431 | |
| | | | ONEOK Partners LP, | | | | |
| | 2,350 | | | 4.900%, 03/15/25 | | | 2,545 | |
| | 875 | | | 6.650%, 10/01/36 | | | 955 | |
| | 8,004 | | | Pacific Exploration and Production Corp., (Canada), 12.000%, 12/22/16 | | | 8,124 | |
| | 533 | | | PBF Holding Co. LLC/PBF Finance Corp., 7.000%, 11/15/23 (e) | | | 507 | |
| | | | Penn Virginia Corp., | | | | |
| | 2,000 | | | 7.250%, 04/15/19 (d) | | | 800 | |
| | 1,000 | | | 8.500%, 05/01/20 (d) | | | 420 | |
| | | | Pertamina Persero PT, (Indonesia), | | | | |
| | 400 | | | 5.250%, 05/23/21 (e) | | | 435 | |
| | 200 | | | Reg. S, 5.625%, 05/20/43 | | | 210 | |
| | 200 | | | Reg. S, 6.000%, 05/03/42 | | | 220 | |
| | 200 | | | Reg. S, 6.500%, 05/27/41 | | | 234 | |
| | 230 | | | Petrobras Argentina S.A., (Argentina), 7.375%, 07/21/23 (e) | | | 235 | |
| | | | Petrobras Global Finance B.V., (Netherlands), | | | | |
| | 573 | | | 5.375%, 01/27/21 | | | 551 | |
| | 237 | | | 6.750%, 01/27/41 | | | 206 | |
| | 510 | | | 6.850%, 06/05/151 | | | 419 | |
| | 640 | | | 8.750%, 05/23/26 | | | 702 | |
| | 73 | | | Petrobras International Finance B.V., (Cayman Islands), 6.750%, 01/27/41 | | | 63 | |
| | 325 | | | Petrobras International Finance Co. - Pifco, (Cayman Islands), 6.875%, 01/20/40 | | | 288 | |
| | | | Petro-Canada, (Canada), | | | | |
| | 400 | | | 6.800%, 05/15/38 | | | 535 | |
| | 335 | | | 7.875%, 06/15/26 | | | 441 | |
| | | | Petroleos de Venezuela S.A., (Venezuela), | | | | |
| | 370 | | | Reg. S, 5.375%, 04/12/27 | | | 136 | |
| | 308 | | | Reg. S, 6.000%, 11/15/26 | | | 113 | |
| | 210 | | | Reg. S, 8.500%, 11/02/17 | | | 155 | |
| | 214 | | | Reg. S, 9.000%, 11/17/21 | | | 105 | |
| | 150 | | | Reg. S, 12.750%, 02/17/22 | | | 88 | |
| | | | Petroleos Mexicanos, (Mexico), | | | | |
| | 10 | | | 3.500%, 07/18/18 | | | 10 | |
| | | | | | | | |
PRINCIPAL
AMOUNT | | | SECURITY DESCRIPTION | | VALUE | |
| | | | | | | | |
| | | | Oil, Gas & Consumable Fuels — continued | |
| | 80 | | | 3.500%, 07/23/20 | | | 81 | |
| | 1,103 | | | 4.500%, 01/23/26 | | | 1,106 | |
| | 300 | | | 5.625%, 01/23/46 | | | 289 | |
| | 712 | | | 5.625%, 01/23/46 | | | 687 | |
| | 140 | | | 6.375%, 02/04/21 (e) | | | 155 | |
| | 400 | | | 6.375%, 01/23/45 | | | 421 | |
| | 315 | | | 6.625%, 06/15/35 | | | 340 | |
| | 290 | | | Reg. S, 6.875%, 08/04/26 | | | 337 | |
| | 30 | | | VAR, 2.699%, 07/18/18 | | | 31 | |
| | 150 | | | Petroleum Co. of Trinidad & Tobago Ltd., (Trinidad and Tobago), Reg. S, 9.750%, 08/14/19 | | | 166 | |
| | 100 | | | Petroliam Nasional Bhd, (Malaysia), Reg. S, 7.625%, 10/15/26 | | | 142 | |
| | 1,000 | | | Phillips 66, 4.650%, 11/15/34 | | | 1,093 | |
| | | | Plains All American Pipeline LP/PAA Finance Corp., | | | | |
| | 519 | | | 2.600%, 12/15/19 | | | 523 | |
| | 3,740 | | | 4.650%, 10/15/25 | | | 3,880 | |
| | | | QEP Resources, Inc., | | | | |
| | 286 | | | 5.250%, 05/01/23 | | | 280 | |
| | 475 | | | 5.375%, 10/01/22 | | | 470 | |
| | 1,219 | | | 6.875%, 03/01/21 | | | 1,275 | |
| | | | Range Resources Corp., | | | | |
| | 391 | | | 5.000%, 03/15/23 | | | 386 | |
| | 200 | | | 5.750%, 06/01/21 | | | 203 | |
| | | | Regency Energy Partners LP/Regency Energy Finance Corp., | | | | |
| | 167 | | | 4.500%, 11/01/23 | | | 169 | |
| | 1,420 | | | 5.000%, 10/01/22 | | | 1,508 | |
| | 2,635 | | | 5.500%, 04/15/23 | | | 2,725 | |
| | 348 | | | 5.875%, 03/01/22 | | | 382 | |
| | 770 | | | 6.500%, 07/15/21 | | | 795 | |
| | 2,750 | | | Rockies Express Pipeline LLC, 6.000%, 01/15/19 (e) | | | 2,894 | |
| | | | SM Energy Co., | | | | |
| | 589 | | | 5.000%, 01/15/24 | | | 539 | |
| | 752 | | | 5.625%, 06/01/25 | | | 703 | |
| | 427 | | | 6.500%, 11/15/21 | | | 423 | |
| | 15 | | | 6.500%, 01/01/23 | | | 15 | |
| | 340 | | | Southern Star Central Corp., 5.125%, 07/15/22 (e) | | | 341 | |
| | | | Spectra Energy Capital LLC, | | | | |
| | 145 | | | 7.500%, 09/15/38 | | | 177 | |
| | 1,500 | | | 8.000%, 10/01/19 | | | 1,731 | |
SEE NOTES TO FINANCIAL STATEMENTS.
| | | | | | |
| | | |
| 118 | | | | J.P. MORGAN INCOME FUNDS | | AUGUST 31, 2016 |
| | | | | | | | |
PRINCIPAL
AMOUNT | | | SECURITY DESCRIPTION | | VALUE | |
| Corporate Bonds — continued | |
| | | | Oil, Gas & Consumable Fuels — continued | |
| | 1,140 | | | Spectra Energy Partners LP, 4.500%, 03/15/45 | | | 1,166 | |
| | 200 | | | State Oil Co. of the Azerbaijan Republic, (Azerbaijan), 6.950%, 03/18/30 | | | 216 | |
| | | | Statoil ASA, (Norway), | | | | |
| | 263 | | | 2.450%, 01/17/23 | | | 268 | |
| | 2,179 | | | 2.650%, 01/15/24 | | �� | 2,231 | |
| | 790 | | | 3.150%, 01/23/22 | | | 837 | |
| | 435 | | | 7.150%, 11/15/25 | | | 593 | |
| | 45 | | | Stone Energy Corp., 7.500%, 11/15/22 | | | 25 | |
| | | | Suncor Energy, Inc., (Canada), | | | | |
| | 2,000 | | | 3.600%, 12/01/24 | | | 2,112 | |
| | 815 | | | 6.850%, 06/01/39 | | | 1,124 | |
| | | | Sunoco Logistics Partners Operations LP, | | | | |
| | 464 | | | 4.250%, 04/01/24 | | | 482 | |
| | 1,146 | | | 4.400%, 04/01/21 | | | 1,222 | |
| | 2,000 | | | 5.350%, 05/15/45 | | | 2,067 | |
| | | | Sunoco LP/Sunoco Finance Corp., | | | | |
| | 1,442 | | | 5.500%, 08/01/20 (e) | | | 1,464 | |
| | 959 | | | 6.250%, 04/15/21 (e) | | | 988 | |
| | 920 | | | 6.375%, 04/01/23 (e) | | | 947 | |
| | | | Targa Resources Partners LP/Targa Resources Partners Finance Corp., | | | | |
| | 500 | | | 4.250%, 11/15/23 | | | 481 | |
| | 1,840 | | | 5.250%, 05/01/23 | | | 1,868 | |
| | 300 | | | 6.375%, 08/01/22 | | | 310 | |
| | 400 | | | 6.875%, 02/01/21 | | | 414 | |
| | 164 | | | Tesoro Corp., 5.125%, 04/01/24 | | | 168 | |
| | | | Tesoro Logistics LP/Tesoro Logistics Finance Corp., | | | | |
| | 294 | | | 5.500%, 10/15/19 | | | 313 | |
| | 1,472 | | | 5.875%, 10/01/20 | | | 1,514 | |
| | 1,525 | | | 6.125%, 10/15/21 | | | 1,598 | |
| | 282 | | | 6.250%, 10/15/22 | | | 299 | |
| | 435 | | | 6.375%, 05/01/24 | | | 464 | |
| | 640 | | | Tosco Corp., 8.125%, 02/15/30 | | | 887 | |
| | 3,165 | | | Total Capital International S.A., (France), 2.750%, 06/19/21 | | | 3,315 | |
| | | | TransCanada PipeLines Ltd., (Canada), | | | | |
| | 256 | | | 1.875%, 01/12/18 | | | 257 | |
| | 285 | | | 2.500%, 08/01/22 | | | 286 | |
| | 340 | | | 3.750%, 10/16/23 | | | 364 | |
| | 1,000 | | | 6.200%, 10/15/37 | | | 1,272 | |
| | 606 | | | 7.250%, 08/15/38 | | | 852 | |
| | 410 | | | Transcontinental Gas Pipe Line Co. LLC, 7.850%, 02/01/26 (e) | | | 531 | |
| | | | | | | | |
PRINCIPAL
AMOUNT | | | SECURITY DESCRIPTION | | VALUE | |
| | | | | | | | |
| | | | Oil, Gas & Consumable Fuels — continued | |
| | 917 | | | Ultra Petroleum Corp., (Canada), 6.125%, 10/01/24 (d) | | | 747 | |
| | 446 | | | Western Gas Partners LP, 5.375%, 06/01/21 | | | 484 | |
| | 189 | | | Western Refining, Inc., 6.250%, 04/01/21 | | | 184 | |
| | 1,330 | | | Whiting Petroleum Corp., 5.000%, 03/15/19 | | | 1,230 | |
| | | | Williams Partners LP/ACMP Finance Corp., | | | | |
| | 1,579 | | | 4.875%, 05/15/23 | | | 1,595 | |
| | 750 | | | 4.875%, 03/15/24 | | | 768 | |
| | 3,000 | | | 6.125%, 07/15/22 | | | 3,119 | |
| | | | WPX Energy, Inc., | | | | |
| | 655 | | | 5.250%, 09/15/24 | | | 604 | |
| | 1,965 | | | 6.000%, 01/15/22 | | | 1,911 | |
| | | | YPF S.A., (Argentina), | | | | |
| | 240 | | | 8.500%, 03/23/21 (e) | | | 259 | |
| | 350 | | | Reg. S, 8.750%, 04/04/24 | | | 374 | |
| | | | | | | | |
| | | | | | | 182,727 | |
| | | | | | | | |
| | | | Total Energy | | | 196,658 | |
| | | | | | | | |
| | | | Financials — 6.6% | | | | |
| | | | Banks — 2.7% | | | | |
| | | | ABN AMRO Bank N.V., (Netherlands), | | | | |
| | 501 | | | 4.750%, 07/28/25 (e) | | | 530 | |
| | 400 | | | 4.800%, 04/18/26 (e) | | | 426 | |
| | 200 | | | Alfa Bank AO Via Alfa Bond Issuance plc, (Ireland), Reg. S, 7.750%, 04/28/21 | | | 228 | |
| | 544 | | | Australia & New Zealand Banking Group Ltd., (Australia), 2.400%, 11/23/16 (e) | | | 546 | |
| | | | Banco Nacional de Comercio Exterior SNC, (Mexico), | | | | |
| | 200 | | | 4.375%, 10/14/25 (e) | | | 213 | |
| | 200 | | | VAR, 3.800%, 08/11/26 (e) | | | 200 | |
| | | | Bank of America Corp., | | | | |
| | 1,825 | | | 2.000%, 01/11/18 | | | 1,836 | |
| | 143 | | | 3.300%, 01/11/23 | | | 148 | |
| | 3,150 | | | 3.500%, 04/19/26 | | | 3,288 | |
| | 960 | | | 4.000%, 04/01/24 | | | 1,038 | |
| | 5,277 | | | 4.000%, 01/22/25 | | | 5,495 | |
| | 2,400 | | | 4.200%, 08/26/24 | | | 2,546 | |
| | 473 | | | 4.250%, 10/22/26 | | | 502 | |
| | 1,294 | | | 4.450%, 03/03/26 | | | 1,392 | |
| | 1,540 | | | 5.000%, 05/13/21 | | | 1,728 | |
| | 1,275 | | | 5.625%, 07/01/20 | | | 1,439 | |
| | 695 | | | 5.650%, 05/01/18 | | | 740 | |
| | 500 | | | 6.400%, 08/28/17 | | | 524 | |
| | 1,710 | | | 6.875%, 04/25/18 | | | 1,853 | |
| | 500 | | | 7.800%, 09/15/16 | | | 501 | |
SEE NOTES TO FINANCIAL STATEMENTS.
| | | | | | | | |
| | | |
| AUGUST 31, 2016 | | J.P. MORGAN INCOME FUNDS | | | | | 119 | |
JPMorgan Core Plus Bond Fund
SCHEDULE OF PORTFOLIO INVESTMENTS
AS OF AUGUST 31, 2016 (Unaudited) (continued)
(Amounts in U.S. Dollars, unless otherwise noted)
(Amounts in thousands)
| | | | | | | | |
PRINCIPAL
AMOUNT | | | SECURITY DESCRIPTION | | VALUE | |
| Corporate Bonds — continued | |
| | | | Banks — continued | |
| | 1,500 | | | Series F, 6.975%, 03/07/37 | | | 1,912 | |
| | 2,515 | | | Series L, 2.250%, 04/21/20 | | | 2,534 | |
| | 1,326 | | | Series L, 3.950%, 04/21/25 | | | 1,380 | |
| | 200 | | | Bank of Ceylon, (Sri Lanka), 6.875%, 05/03/17 (e) | | | 204 | |
| | | | Bank of Montreal, (Canada), | | | | |
| | 623 | | | 1.400%, 09/11/17 | | | 624 | |
| | 653 | | | 1.500%, 07/18/19 | | | 652 | |
| | 2,000 | | | 1.750%, 06/15/22 (e) | | | 1,997 | |
| | 655 | | | 2.375%, 01/25/19 | | | 668 | |
| | | | Bank of Nova Scotia (The), (Canada), | | | | |
| | 880 | | | 1.450%, 04/25/18 | | | 882 | |
| | 1,000 | | | 1.650%, 06/14/19 | | | 1,001 | |
| | 1,725 | | | 1.850%, 04/14/20 | | | 1,740 | |
| | | | Barclays Bank plc, (United Kingdom), | | | | |
| | 200 | | | 2.250%, 05/10/17 (e) | | | 201 | |
| | 980 | | | 6.050%, 12/04/17 (e) | | | 1,029 | |
| | 2,508 | | | 7.625%, 11/21/22 | | | 2,817 | |
| | | | Barclays plc, (United Kingdom), | | | | |
| | 1,405 | | | 3.650%, 03/16/25 | | | 1,396 | |
| | 478 | | | 5.250%, 08/17/45 | | | 550 | |
| | | | BB&T Corp., | | | | |
| | 783 | | | 1.600%, 08/15/17 | | | 786 | |
| | 1,500 | | | 2.625%, 06/29/20 | | | 1,547 | |
| | 500 | | | 5.250%, 11/01/19 | | | 551 | |
| | 150 | | | 6.850%, 04/30/19 | | | 170 | |
| | 250 | | | BBVA Bancomer S.A., (Mexico), Reg. S, 6.750%, 09/30/22 | | | 283 | |
| | 650 | | | Caixa Economica Federal, (Brazil), Reg. S, 4.500%, 10/03/18 | | | 655 | |
| | 3,319 | | | Canadian Imperial Bank of Commerce, (Canada), 2.250%, 07/21/20 (e) | | | 3,383 | |
| | 2,500 | | | Capital One N.A., 1.500%, 03/22/18 | | | 2,493 | |
| | | | CIT Group, Inc., | | | | |
| | 1,574 | | | 3.875%, 02/19/19 | | | 1,609 | |
| | 1,004 | | | 5.000%, 05/15/17 | | | 1,024 | |
| | 2,410 | | | 5.000%, 08/15/22 | | | 2,555 | |
| | 125 | | | 5.250%, 03/15/18 | | | 130 | |
| | 5,458 | | | 5.375%, 05/15/20 | | | 5,833 | |
| | 1,295 | | | 5.500%, 02/15/19 (e) | | | 1,371 | |
| | 1,397 | | | 6.625%, 04/01/18 (e) | | | 1,489 | |
| | | | Citigroup, Inc., | | | | |
| | 1,394 | | | 1.800%, 02/05/18 | | | 1,399 | |
| | 2,500 | | | 4.300%, 11/20/26 | | | 2,625 | |
| | 5,000 | | | 4.600%, 03/09/26 | | | 5,373 | |
| | | | | | | | |
PRINCIPAL
AMOUNT | | | SECURITY DESCRIPTION | | VALUE | |
| | | | | | | | |
| | | | Banks — continued | |
| | 838 | | | 6.625%, 01/15/28 | | | 1,059 | |
| | 645 | | | 6.875%, 06/01/25 | | | 809 | |
| | 1,115 | | | 7.000%, 12/01/25 | | | 1,370 | |
| NOK | 16,500 | | | Cooperatieve Centrale Raiffeisen-Boerenleenbank B.A., (Netherlands), 3.500%, 04/18/17 | | | 2,006 | |
| | | | Cooperatieve Rabobank UA, (Netherlands), | | | | |
| | 2,000 | | | 2.500%, 01/19/21 | | | 2,055 | |
| | 1,045 | | | 3.875%, 02/08/22 | | | 1,141 | |
| | 6,500 | | | Credit Agricole S.A., (France), 2.375%, 07/01/21 (e) | | | 6,598 | |
| | 250 | | | Credit Suisse Group Funding Guernsey Ltd., (United Kingdom), 2.750%, 03/26/20 | | | 251 | |
| | 7,000 | | | Danske Bank A/S, (Denmark), 2.000%, 09/08/21 (e) | | | 6,972 | |
| | | | Fifth Third Bancorp, | | | | |
| | 625 | | | 2.875%, 07/27/20 | | | 647 | |
| | 500 | | | 5.450%, 01/15/17 | | | 508 | |
| | 234 | | | Fifth Third Bank, 3.850%, 03/15/26 | | | 249 | |
| | | | HSBC Bank plc, (United Kingdom), | | | | |
| | 474 | | | 1.500%, 05/15/18 (e) | | | 473 | |
| | 927 | | | 4.125%, 08/12/20 (e) | | | 996 | |
| | 650 | | | 4.750%, 01/19/21 (e) | | | 719 | |
| | 395 | | | HSBC Bank USA N.A., 6.000%, 08/09/17 | | | 411 | |
| | | | HSBC Holdings plc, (United Kingdom), | | | | |
| | 5,845 | | | 3.600%, 05/25/23 | | | 6,046 | |
| | 506 | | | 3.900%, 05/25/26 | | | 528 | |
| | 1,371 | | | 4.000%, 03/30/22 | | | 1,466 | |
| | 733 | | | 4.250%, 08/18/25 | | | 761 | |
| | 1,069 | | | 4.300%, 03/08/26 | | | 1,150 | |
| | | | Huntington Bancshares, Inc., | | | | |
| | 1,084 | | | 2.300%, 01/14/22 | | | 1,080 | |
| | 846 | | | 3.150%, 03/14/21 | | | 879 | |
| | 1,155 | | | Huntington National Bank (The), 2.875%, 08/20/20 | | | 1,188 | |
| | 200 | | | IDBI Bank Ltd., (India), 3.750%, 01/25/19 | | | 203 | |
| | 1,621 | | | KeyBank N.A., 3.180%, 05/22/22 | | | 1,679 | |
| | 605 | | | KeyCorp, 2.900%, 09/15/20 | | | 628 | |
| | 1,250 | | | Manufacturers & Traders Trust Co., 6.625%, 12/04/17 | | | 1,330 | |
| | 200 | | | MFB Magyar Fejlesztesi Bank Zrt, (Hungary), Reg. S, 6.250%, 10/21/20 | | | 224 | |
| | 1,750 | | | Mizuho Bank Ltd., (Japan), 1.700%, 09/25/17 (e) | | | 1,753 | |
| | | | National Australia Bank Ltd., (Australia), | | | | |
| | 875 | | | 2.000%, 06/20/17 (e) | | | 881 | |
| | 448 | | | 2.500%, 07/12/26 | | | 446 | |
SEE NOTES TO FINANCIAL STATEMENTS.
| | | | | | |
| | | |
| 120 | | | | J.P. MORGAN INCOME FUNDS | | AUGUST 31, 2016 |
| | | | | | | | |
PRINCIPAL
AMOUNT | | | SECURITY DESCRIPTION | | VALUE | |
| Corporate Bonds — continued | |
| | | | Banks — continued | |
| | 200 | | | National Savings Bank, (Sri Lanka), Reg. S, 8.875%, 09/18/18 | | | 216 | |
| | 886 | | | Nordea Bank AB, (Sweden), 4.250%, 09/21/22 (e) | | | 953 | |
| | 655 | | | PNC Bank N.A., 2.150%, 04/29/21 | | | 664 | |
| | | | PNC Financial Services Group, Inc. (The), | | | | |
| | 1,057 | | | 4.375%, 08/11/20 | | | 1,158 | |
| | 625 | | | 5.625%, 02/01/17 | | | 636 | |
| | | | Royal Bank of Canada, (Canada), | | | | |
| | 1,419 | | | 1.200%, 09/19/17 | | | 1,419 | |
| | 1,380 | | | 1.500%, 07/29/19 | | | 1,376 | |
| | 2,960 | | | 1.875%, 02/05/20 | | | 2,987 | |
| | 743 | | | 2.000%, 10/01/18 | | | 752 | |
| | 620 | | | 2.000%, 12/10/18 | | | 627 | |
| | | | Royal Bank of Scotland Group plc, (United Kingdom), | | | | |
| | 4,840 | | | 6.100%, 06/10/23 | | | 5,139 | |
| | 6,125 | | | 6.125%, 12/15/22 | | | 6,542 | |
| | 200 | | | Russian Agricultural Bank OJSC Via RSHB Capital S.A., (Luxembourg), Reg. S, 7.750%, 05/29/18 | | | 214 | |
| | 1,697 | | | Santander UK plc, (United Kingdom), 2.500%, 03/14/19 | | | 1,722 | |
| | 200 | | | Sberbank of Russia Via SB Capital S.A., (Luxembourg), Reg. S, 6.125%, 02/07/22 | | | 219 | |
| | 897 | | | Skandinaviska Enskilda Banken AB, (Sweden), 1.750%, 03/19/18 (e) | | | 901 | |
| | 1,545 | | | SpareBank 1 Boligkreditt A.S., (Norway), 1.750%, 11/15/19 (e) | | | 1,547 | |
| | 2,600 | | | Stadshypotek AB, (Sweden), 1.875%, 10/02/19 (e) | | | 2,621 | |
| | 2,500 | | | SunTrust Banks, Inc., 6.000%, 02/15/26 | | | 2,992 | |
| | | | Toronto-Dominion Bank (The), (Canada), | | | | |
| | 570 | | | 1.500%, 03/13/17 (e) | | | 571 | |
| | 2,852 | | | 1.750%, 07/23/18 | | | 2,872 | |
| | 712 | | | 1.950%, 01/22/19 | | | 721 | |
| | 453 | | | 2.250%, 11/05/19 | | | 462 | |
| | 2,000 | | | U.S. Bancorp, 7.500%, 06/01/26 | | | 2,695 | |
| | 2,225 | | | U.S. Bank N.A., 1.350%, 01/26/18 | | | 2,230 | |
| | 200 | | | Ukreximbank Via Biz Finance plc, (United Kingdom), Reg. S, 9.750%, 01/22/25 | | | 193 | |
| | 1,700 | | | US Bancorp, Series V, 2.375%, 07/22/26 | | | 1,686 | |
| | | | Vnesheconombank Via VEB Finance plc, (Ireland), | | | | |
| | 200 | | | Reg. S, 4.224%, 11/21/18 | | | 203 | |
| | 200 | | | Reg. S, 5.375%, 02/13/17 | | | 203 | |
| | 300 | | | Reg. S, 5.942%, 11/21/23 | | | 314 | |
| | | | | | | | |
PRINCIPAL
AMOUNT | | | SECURITY DESCRIPTION | | VALUE | |
| | | | | | | | |
| | | | Banks — continued | |
| | | | Wachovia Corp., | | | | |
| | 1,555 | | | 5.750%, 02/01/18 | | | 1,651 | |
| | 515 | | | SUB, 7.574%, 08/01/26 | | | 682 | |
| | | | Wells Fargo & Co., | | | | |
| | 1,200 | | | 2.100%, 07/26/21 | | | 1,205 | |
| | 1,607 | | | 2.550%, 12/07/20 | | | 1,652 | |
| | 613 | | | 2.600%, 07/22/20 | | | 631 | |
| | 3,475 | | | 3.000%, 04/22/26 | | | 3,562 | |
| | 7,565 | | | 3.300%, 09/09/24 | | | 7,992 | |
| | 576 | | | 4.300%, 07/22/27 | | | 636 | |
| | 853 | | | 5.606%, 01/15/44 | | | 1,065 | |
| | 1,665 | | | 5.625%, 12/11/17 | | | 1,755 | |
| | 750 | | | Wells Fargo Bank N.A., 6.000%, 11/15/17 | | | 791 | |
| | | | Westpac Banking Corp., (Australia), | | | | |
| | 356 | | | 1.600%, 08/19/19 | | | 355 | |
| | 1,281 | | | 2.000%, 03/03/20 (e) | | | 1,295 | |
| | 942 | | | 4.875%, 11/19/19 | | | 1,032 | |
| | | | | | | | |
| | | | | | | 193,681 | |
| | | | | | | | |
| | | | Capital Markets — 1.5% | | | | |
| | 508 | | | Ameriprise Financial, Inc., 2.875%, 09/15/26 | | | 510 | |
| | | | Bank of New York Mellon Corp. (The), | | | | |
| | 510 | | | 2.200%, 03/04/19 | | | 519 | |
| | 940 | | | 2.450%, 11/27/20 | | | 967 | |
| | 1,291 | | | 2.600%, 08/17/20 | | | 1,330 | |
| | 530 | | | 4.600%, 01/15/20 | | | 581 | |
| | | | BlackRock, Inc., | | | | |
| | 381 | | | 3.375%, 06/01/22 | | | 410 | |
| | 315 | | | 3.500%, 03/18/24 | | | 349 | |
| | 485 | | | 4.250%, 05/24/21 | | | 540 | |
| | 493 | | | Series 2, 5.000%, 12/10/19 | | | 549 | |
| | | | Blackstone Holdings Finance Co. LLC, | | | | |
| | 159 | | | 4.450%, 07/15/45 (e) | | | 165 | |
| | 1,000 | | | 5.875%, 03/15/21 (e) | | | 1,161 | |
| | 750 | | | Charles Schwab Corp. (The), 3.225%, 09/01/22 | | | 797 | |
| | 950 | | | CME Group, Inc., 3.000%, 09/15/22 | | | 1,005 | |
| | | | Credit Suisse AG, (Switzerland), | | | | |
| | 889 | | | 1.750%, 01/29/18 | | | 890 | |
| | 775 | | | 3.000%, 10/29/21 | | | 800 | |
| | 7,121 | | | 3.625%, 09/09/24 | | | 7,471 | |
| | | | Deutsche Bank AG, (Germany), | | | | |
| | 1,560 | | | 1.875%, 02/13/18 | | | 1,552 | |
| | 347 | | | 2.950%, 08/20/20 | | | 346 | |
| | 1,603 | | | 3.375%, 05/12/21 | | | 1,602 | |
SEE NOTES TO FINANCIAL STATEMENTS.
| | | | | | | | |
| | | |
| AUGUST 31, 2016 | | J.P. MORGAN INCOME FUNDS | | | | | 121 | |
JPMorgan Core Plus Bond Fund
SCHEDULE OF PORTFOLIO INVESTMENTS
AS OF AUGUST 31, 2016 (Unaudited) (continued)
(Amounts in U.S. Dollars, unless otherwise noted)
(Amounts in thousands)
| | | | | | | | |
PRINCIPAL
AMOUNT | | | SECURITY DESCRIPTION | | VALUE | |
| Corporate Bonds — continued | |
| | | | Capital Markets — continued | |
| | | | E*TRADE Financial Corp., | | | | |
| | 1,483 | | | 4.625%, 09/15/23 | | | 1,539 | |
| | 1,360 | | | 5.375%, 11/15/22 | | | 1,464 | |
| | | | Goldman Sachs Group, Inc. (The), | | | | |
| | 1,997 | | | 2.600%, 04/23/20 | | | 2,037 | |
| | 704 | | | 2.625%, 01/31/19 | | | 722 | |
| | 1,792 | | | 2.750%, 09/15/20 | | | 1,841 | |
| | 950 | | | 2.875%, 02/25/21 | | | 977 | |
| | 666 | | | 3.500%, 01/23/25 | | | 691 | |
| | 5,000 | | | 3.750%, 02/25/26 | | | 5,293 | |
| | 3,061 | | | 3.850%, 07/08/24 | | | 3,263 | |
| | 1,224 | | | 4.000%, 03/03/24 | | | 1,318 | |
| | 364 | | | 4.250%, 10/21/25 | | | 386 | |
| | 1,191 | | | 5.250%, 07/27/21 | | | 1,352 | |
| | 1,104 | | | 5.375%, 03/15/20 | | | 1,228 | |
| | 2,165 | | | 5.750%, 01/24/22 | | | 2,511 | |
| | 1,430 | | | 5.950%, 01/18/18 | | | 1,515 | |
| | 965 | | | 6.750%, 10/01/37 | | | 1,238 | |
| | 205 | | | 7.500%, 02/15/19 | | | 233 | |
| | 102 | | | Series D, 6.000%, 06/15/20 | | | 117 | |
| | 761 | | | ING Bank N.V., (Netherlands), 3.750%, 03/07/17 (e) | | | 770 | |
| | 565 | | | Intercontinental Exchange, Inc., 2.500%, 10/15/18 | | | 578 | |
| | | | Invesco Finance plc, (United Kingdom), | | | | |
| | 390 | | | 3.750%, 01/15/26 | | | 419 | |
| | 1,162 | | | 4.000%, 01/30/24 | | | 1,272 | |
| | | | Jefferies Group LLC, | | | | |
| | 950 | | | 6.250%, 01/15/36 | | | 1,003 | |
| | 140 | | | 6.450%, 06/08/27 | | | 157 | |
| | 880 | | | 6.875%, 04/15/21 | | | 1,010 | |
| | | | Legg Mason, Inc., | | | | |
| | 222 | | | 4.750%, 03/15/26 | | | 243 | |
| | 275 | | | 5.625%, 01/15/44 | | | 288 | |
| | | | Lehman Brothers Holdings, Inc., | | | | |
| | 1,000 | | | 0.000%, 05/17/49 (d) | | | 73 | |
| | 235 | | | 3.600%, 12/30/16 (d) | | | 17 | |
| | 295 | | | 8.500%, 02/01/16 | | | 21 | |
| | 995 | | | Macquarie Bank Ltd., (Australia), 1.600%, 10/27/17 (e) | | | 997 | |
| | 639 | | | Macquarie Group Ltd., (Australia), 6.250%, 01/14/21 (e) | | | 727 | |
| | | | Morgan Stanley, | | | | |
| | 1,932 | | | 2.650%, 01/27/20 | | | 1,982 | |
| | 5,285 | | | 3.125%, 07/27/26 | | | 5,316 | |
| | | | | | | | |
PRINCIPAL
AMOUNT | | | SECURITY DESCRIPTION | | VALUE | |
| | | | | | | | |
| | | | Capital Markets — continued | |
| | 3,467 | | | 3.700%, 10/23/24 | | | 3,674 | |
| | 1,368 | | | 3.875%, 01/27/26 | | | 1,461 | |
| | 660 | | | 4.000%, 07/23/25 | | | 713 | |
| | 5,117 | | | 4.300%, 01/27/45 | | | 5,531 | |
| | 867 | | | 5.000%, 11/24/25 | | | 966 | |
| | 113 | | | 5.500%, 07/24/20 | | | 127 | |
| | 2,779 | | | 5.500%, 07/28/21 | | | 3,184 | |
| | 310 | | | 5.625%, 09/23/19 | | | 345 | |
| | 1,050 | | | 5.750%, 01/25/21 | | | 1,203 | |
| | 320 | | | 5.950%, 12/28/17 | | | 339 | |
| | 1,250 | | | 6.625%, 04/01/18 | | | 1,347 | |
| | 965 | | | MSCI, Inc., 5.250%, 11/15/24 (e) | | | 1,025 | |
| | 295 | | | Neuberger Berman Group LLC/Neuberger Berman Finance Corp., 5.875%, 03/15/22 (e) | | | 308 | |
| | 193 | | | Nomura Holdings, Inc., (Japan), 6.700%, 03/04/20 | | | 222 | |
| | 740 | | | Northern Trust Co. (The), 6.500%, 08/15/18 | | | 811 | |
| | | | State Street Corp., | | | | |
| | 700 | | | 2.650%, 05/19/26 | | | 716 | |
| | 459 | | | 3.100%, 05/15/23 | | | 479 | |
| | 996 | | | 3.300%, 12/16/24 | | | 1,069 | |
| | 1,364 | | | 3.550%, 08/18/25 | | | 1,490 | |
| | 935 | | | 3.700%, 11/20/23 | | | 1,032 | |
| | 953 | | | TD Ameritrade Holding Corp., 2.950%, 04/01/22 | | | 992 | |
| | | | Thomson Reuters Corp., (Canada), | | | | |
| | 1,960 | | | 3.950%, 09/30/21 | | | 2,093 | |
| | 280 | | | 4.700%, 10/15/19 | | | 303 | |
| | 200 | | | 6.500%, 07/15/18 | | | 218 | |
| | 10,000 | | | UBS AG, (Switzerland), 2.375%, 08/14/19 | | | 10,204 | |
| | | | | | | | |
| | | | | | | 103,994 | |
| | | | | | | | |
| | | | Commercial Banks — 0.0% (g) | | | | |
| | 200 | | | Vnesheconombank Via VEB Finance plc, (Ireland), Reg. S, 6.025%, 07/05/22 | | | 211 | |
| | | | | | | | |
| | | | Consumer Finance — 0.8% | | | | |
| | | | Ally Financial, Inc., | | | | |
| | 839 | | | 3.600%, 05/21/18 | | | 853 | |
| | 5,895 | | | 4.125%, 03/30/20 | | | 6,087 | |
| | 2,656 | | | 4.625%, 05/19/22 | | | 2,789 | |
| | 580 | | | 4.750%, 09/10/18 | | | 602 | |
| | 1,500 | | | 6.250%, 12/01/17 | | | 1,573 | |
| | 1,820 | | | 8.000%, 11/01/31 | | | 2,279 | |
| | 276 | | | American Express Co., 3.625%, 12/05/24 | | | 288 | |
SEE NOTES TO FINANCIAL STATEMENTS.
| | | | | | |
| | | |
| 122 | | | | J.P. MORGAN INCOME FUNDS | | AUGUST 31, 2016 |
| | | | | | | | |
PRINCIPAL
AMOUNT | | | SECURITY DESCRIPTION | | VALUE | |
| Corporate Bonds — continued | |
| | | | Consumer Finance — continued | |
| | | | American Express Credit Corp., | | | | |
| | 1,448 | | | 2.125%, 03/18/19 | | | 1,476 | |
| | 2,000 | | | 2.250%, 08/15/19 | | | 2,042 | |
| | 405 | | | 2.250%, 05/05/21 | | | 412 | |
| | 1,452 | | | Series F, 2.600%, 09/14/20 | | | 1,496 | |
| | | | American Honda Finance Corp., | | | | |
| | 1,130 | | | 1.500%, 03/13/18 | | | 1,136 | |
| | 453 | | | 1.600%, 02/16/18 (e) | | | 456 | |
| | 200 | | | 2.125%, 02/28/17 (e) | | | 201 | |
| | 835 | | | 7.625%, 10/01/18 (e) | | | 939 | |
| | | | Capital One Financial Corp., | | | | |
| | 533 | | | 3.500%, 06/15/23 | | | 557 | |
| | 840 | | | 3.750%, 07/28/26 | | | 843 | |
| | 1,356 | | | 4.200%, 10/29/25 | | | 1,417 | |
| | | | Caterpillar Financial Services Corp., | | | | |
| | 2,000 | | | 1.700%, 08/09/21 | | | 1,987 | |
| | 1,242 | | | 2.100%, 06/09/19 | | | 1,267 | |
| | 581 | | | 2.850%, 06/01/22 | | | 607 | |
| | 850 | | | 5.450%, 04/15/18 | | | 907 | |
| | 866 | | | First Cash Financial Services, Inc., 6.750%, 04/01/21 | | | 896 | |
| | | | Ford Motor Credit Co. LLC, | | | | |
| | 1,592 | | | 2.145%, 01/09/18 | | | 1,601 | |
| | 476 | | | 2.551%, 10/05/18 | | | 484 | |
| | 687 | | | 3.219%, 01/09/22 | | | 707 | |
| | | | General Motors Financial Co., Inc., | | | | |
| | 171 | | | 3.700%, 05/09/23 | | | 174 | |
| | 640 | | | 4.250%, 05/15/23 | | | 670 | |
| | 400 | | | HSBC Finance Corp., 7.350%, 11/27/32 | | | 511 | |
| | | | HSBC USA, Inc., | | | | |
| | 2,340 | | | 1.625%, 01/16/18 | | | 2,341 | |
| | 2,913 | | | 2.750%, 08/07/20 | | | 2,975 | |
| | | | John Deere Capital Corp., | | | | |
| | 483 | | | 1.350%, 01/16/18 | | | 485 | |
| | 418 | | | 1.550%, 12/15/17 | | | 421 | |
| | 630 | | | 1.600%, 07/13/18 | | | 635 | |
| | 290 | | | 1.700%, 01/15/20 | | | 293 | |
| | 870 | | | 2.050%, 03/10/20 | | | 884 | |
| | 610 | | | 2.450%, 09/11/20 | | | 628 | |
| | 1,000 | | | 2.650%, 06/10/26 | | | 1,028 | |
| | 150 | | | 2.800%, 03/06/23 | | | 157 | |
| | 559 | | | 3.350%, 06/12/24 | | | 603 | |
| | 515 | | | 5.350%, 04/03/18 | | | 549 | |
| | 5,660 | | | Navient Corp., 8.450%, 06/15/18 | | | 6,169 | |
| | 555 | | | PACCAR Financial Corp., 1.600%, 03/15/17 | | | 557 | |
| | 834 | | | Synchrony Financial, 3.700%, 08/04/26 | | | 826 | |
| | | | | | | | |
PRINCIPAL
AMOUNT | | | SECURITY DESCRIPTION | | VALUE | |
| | | | | | | | |
| | | | Consumer Finance — continued | |
| | 2,580 | | | Toyota Motor Credit Corp., 1.450%, 01/12/18 | | | 2,590 | |
| | | | | | | | |
| | | | | | | 56,398 | |
| | | | | | | | |
| | | | Diversified Financial Services — 0.6% | | | | |
| | 4,529 | | | ACE Cash Express, Inc., 11.000%, 02/01/19 (e) | | | 2,129 | |
| | 200 | | | Banque Centrale de Tunisie International Bond, (Tunisia), Reg. S, 5.750%, 01/30/25 | | | 197 | |
| | | | Berkshire Hathaway, Inc., | | | | |
| | 1,221 | | | 2.750%, 03/15/23 | | | 1,269 | |
| | 475 | | | 3.000%, 02/11/23 | | | 505 | |
| | 1,500 | | | CNG Holdings, Inc., 9.375%, 05/15/20 (e) | | | 832 | |
| | 200 | | | Export-Import Bank of India, (India), Reg. S, 4.000%, 01/14/23 | | | 212 | |
| | 200 | | | Fondo MIVIVIENDA S.A., (Peru), Reg. S, 3.500%, 01/31/23 | | | 206 | |
| | | | GE Capital International Funding Co., Unlimited Co., (Ireland), | | | | |
| | 2,126 | | | 2.342%, 11/15/20 | | | 2,188 | |
| | 561 | | | 3.373%, 11/15/25 | | | 613 | |
| | 4,184 | | | 4.418%, 11/15/35 | | | 4,789 | |
| | | | National Rural Utilities Cooperative Finance Corp., | | | | |
| | 2,675 | | | 3.050%, 02/15/22 | | | 2,811 | |
| | 170 | | | 10.375%, 11/01/18 | | | 202 | |
| | 8,095 | | | Nationwide Building Society, (United Kingdom), 2.450%, 07/27/21 (e) | | | 8,167 | |
| | 790 | | | Nielsen Co. Luxembourg SARL (The), (Luxembourg), 5.500%, 10/01/21 (e) | | | 823 | |
| | 600 | | | Petronas Capital Ltd., (Malaysia), Reg. S, 3.500%, 03/18/25 | | | 643 | |
| | | | Shell International Finance B.V., (Netherlands), | | | | |
| | 425 | | | 1.125%, 08/21/17 | | | 425 | |
| | 2,545 | | | 2.125%, 05/11/20 | | | 2,597 | |
| | 246 | | | 2.875%, 05/10/26 | | | 253 | |
| | 4,355 | | | 4.000%, 05/10/46 | | | 4,563 | |
| | 2,500 | | | 4.300%, 09/22/19 | | | 2,712 | |
| | | | Siemens Financieringsmaatschappij N.V., (Netherlands), | | | | |
| | 756 | | | 2.900%, 05/27/22 (e) | | | 799 | |
| | 1,830 | | | 5.750%, 10/17/16 (e) | | | 1,841 | |
| | 300 | | | 6.125%, 08/17/26 (e) | | | 398 | |
| | 140 | | | Sinochem Overseas Capital Co., Ltd., (United Kingdom), Reg. S, 4.500%, 11/12/20 | | | 152 | |
| | 1,500 | | | Speedy Cash Intermediate Holdings Corp., 10.750%, 05/15/18 (e) | | | 1,054 | |
| | | | | | | | |
| | | | | | | 40,380 | |
| | | | | | | | |
SEE NOTES TO FINANCIAL STATEMENTS.
| | | | | | | | |
| | | |
| AUGUST 31, 2016 | | J.P. MORGAN INCOME FUNDS | | | | | 123 | |
JPMorgan Core Plus Bond Fund
SCHEDULE OF PORTFOLIO INVESTMENTS
AS OF AUGUST 31, 2016 (Unaudited) (continued)
(Amounts in U.S. Dollars, unless otherwise noted)
(Amounts in thousands)
| | | | | | | | |
PRINCIPAL
AMOUNT | | | SECURITY DESCRIPTION | | VALUE | |
| Corporate Bonds — continued | |
| | | | Insurance — 0.9% | | | | |
| | 651 | | | Allstate Corp. (The), 3.150%, 06/15/23 | | | 692 | |
| | | | American International Group, Inc., | | | | |
| | 1,500 | | | 2.300%, 07/16/19 | | | 1,528 | |
| | 1,241 | | | 3.875%, 01/15/35 | | | 1,232 | |
| | 3,750 | | | 4.800%, 07/10/45 | | | 4,031 | |
| | 240 | | | Aon Corp., 6.250%, 09/30/40 | | | 310 | |
| | | | Berkshire Hathaway Finance Corp., | | | | |
| | 1,000 | | | 5.400%, 05/15/18 | | | 1,071 | |
| | 500 | | | 5.750%, 01/15/40 | | | 680 | |
| | 315 | | | Chubb Corp. (The), 5.750%, 05/15/18 | | | 339 | |
| | 2,067 | | | Chubb INA Holdings, Inc., 2.875%, 11/03/22 | | | 2,175 | |
| | | | CNA Financial Corp., | | | | |
| | 373 | | | 3.950%, 05/15/24 | | | 394 | |
| | 271 | | | 4.500%, 03/01/26 | | | 293 | |
| | | | CNO Financial Group, Inc., | | | | |
| | 1,156 | | | 4.500%, 05/30/20 | | | 1,167 | |
| | 1,255 | | | 5.250%, 05/30/25 | | | 1,246 | |
| | 771 | | | Fidelity & Guaranty Life Holdings, Inc., 6.375%, 04/01/21 (e) | | | 769 | |
| | 996 | | | Hartford Financial Services Group, Inc. (The), VAR, 8.125%, 06/15/38 | | | 1,088 | |
| | 1,775 | | | Jackson National Life Global Funding, 1.875%, 10/15/18 (e) | | | 1,793 | |
| | | | Liberty Mutual Group, Inc., | | | | |
| | 375 | | | 6.500%, 05/01/42 (e) | | | 474 | |
| | 920 | | | 7.800%, 03/15/37 (e) | | | 1,067 | |
| | 1,100 | | | Lincoln National Corp., 3.350%, 03/09/25 | | | 1,119 | |
| | 2,684 | | | Manulife Financial Corp., (Canada), 4.150%, 03/04/26 | | | 2,923 | |
| | 1,271 | | | Marsh & McLennan Cos., Inc., 2.350%, 03/06/20 | | | 1,292 | |
| | 152 | | | Massachusetts Mutual Life Insurance Co., 5.375%, 12/01/41 (e) | | | 182 | |
| | 2,085 | | | MassMutual Global Funding II, 2.500%, 10/17/22 (e) | | | 2,104 | |
| | | | MetLife, Inc., | | | | |
| | 1,592 | | | 3.600%, 11/13/25 | | | 1,686 | |
| | 869 | | | 4.050%, 03/01/45 | | | 865 | |
| | | | Metropolitan Life Global Funding I, | | | | |
| | 924 | | | 1.500%, 01/10/18 (e) | | | 929 | |
| | 1,820 | | | 3.000%, 01/10/23 (e) | | | 1,879 | |
| | 400 | | | 3.650%, 06/14/18 (e) | | | 416 | |
| | 649 | | | 3.875%, 04/11/22 (e) | | | 703 | |
| | | | Nationwide Mutual Insurance Co., | | | | |
| | 1,465 | | | 7.875%, 04/01/33 (e) | | | 2,049 | |
| | 1,000 | | | 9.375%, 08/15/39 (e) | | | 1,598 | |
| | | | | | | | |
PRINCIPAL
AMOUNT | | | SECURITY DESCRIPTION | | VALUE | |
| | | | | | | | |
| | | | Insurance — continued | | | | |
| | | | New York Life Global Funding, | | | | |
| | 968 | | | 1.950%, 02/11/20 (e) | | | 980 | |
| | 2,039 | | | 2.150%, 06/18/19 (e) | | | 2,079 | |
| | 3,500 | | | 2.350%, 07/14/26 (e) | | | 3,478 | |
| | 303 | | | New York Life Insurance Co., 6.750%, 11/15/39 (e) | | | 425 | |
| | 400 | | | Pacific Life Global Funding, 5.000%, 05/15/17 (e) | | | 408 | |
| | 1,105 | | | Pacific Life Insurance Co., 9.250%, 06/15/39 (e) | | | 1,745 | |
| | 1,489 | | | Pricoa Global Funding I, 1.600%, 05/29/18 (e) | | | 1,495 | |
| | 175 | | | Principal Financial Group, Inc., 8.875%, 05/15/19 | | | 207 | |
| | | | Principal Life Global Funding II, | | | | |
| | 744 | | | 2.250%, 10/15/18 (e) | | | 757 | |
| | 586 | | | 3.000%, 04/18/26 (e) | | | 599 | |
| | 205 | | | Prudential Financial, Inc., 5.375%, 06/21/20 | | | 231 | |
| | 150 | | | Prudential Insurance Co. of America (The), 8.300%, 07/01/25 (e) | | | 203 | |
| | 500 | | | Teachers Insurance & Annuity Association of America, 4.900%, 09/15/44 (e) | | | 570 | |
| | 1,475 | | | Travelers Cos., Inc. (The), 5.800%, 05/15/18 | | | 1,585 | |
| | 700 | | | Travelers Property Casualty Corp., 7.750%, 04/15/26 | | | 953 | |
| | | | | | | | |
| | | | | | | 53,809 | |
| | | | | | | | |
| | | | Real Estate Management & Development — 0.0% (g) | |
| | 200 | | | Shimao Property Holdings Ltd., (Cayman Islands), 8.375%, 02/10/22 | | | 227 | |
| | | | | | | | |
| | | | Thrifts & Mortgage Finance — 0.1% | |
| | 2,145 | | | BPCE S.A., (France), 1.625%, 01/26/18 | | | 2,150 | |
| | 3,254 | | | Quicken Loans, Inc., 5.750%, 05/01/25 (e) | | | 3,247 | |
| | 689 | | | Radian Group, Inc., 7.000%, 03/15/21 | | | 775 | |
| | | | | | | | |
| | | | | | | 6,172 | |
| | | | | | | | |
| | | | Total Financials | | | 454,872 | |
| | | | | | | | |
| | | | Health Care — 2.0% | |
| | | | Biotechnology — 0.4% | |
| | | | Amgen, Inc., | | | | |
| | 600 | | | 2.600%, 08/19/26 | | | 597 | |
| | 1,700 | | | 3.625%, 05/22/24 | | | 1,833 | |
| | 640 | | | 3.875%, 11/15/21 | | | 696 | |
| | 558 | | | 4.563%, 06/15/48 (e) | | | 603 | |
| | 1,914 | | | 4.663%, 06/15/51 (e) | | | 2,061 | |
| | 150 | | | 5.700%, 02/01/19 | | | 165 | |
| | | | Baxalta, Inc., | | | | |
| | 1,333 | | | 3.600%, 06/23/22 | | | 1,372 | |
SEE NOTES TO FINANCIAL STATEMENTS.
| | | | | | |
| | | |
| 124 | | | | J.P. MORGAN INCOME FUNDS | | AUGUST 31, 2016 |
| | | | | | | | |
PRINCIPAL
AMOUNT | | | SECURITY DESCRIPTION | | VALUE | |
| Corporate Bonds — continued | |
| | | | Biotechnology — continued | | | | |
| | 840 | | | 5.250%, 06/23/45 | | | 987 | |
| | | | Biogen, Inc., | | | | |
| | 700 | | | 2.900%, 09/15/20 | | | 729 | |
| | 1,320 | | | 5.200%, 09/15/45 | | | 1,593 | |
| | | | Celgene Corp., | | | | |
| | 1,456 | | | 3.625%, 05/15/24 | | | 1,542 | |
| | 1,400 | | | 4.625%, 05/15/44 | | | 1,515 | |
| | | | Gilead Sciences, Inc., | | | | |
| | 981 | | | 3.250%, 09/01/22 | | | 1,044 | |
| | 1,546 | | | 3.650%, 03/01/26 | | | 1,676 | |
| | 500 | | | 3.700%, 04/01/24 | | | 541 | |
| | 1,700 | | | 4.400%, 12/01/21 | | | 1,909 | |
| | 3,925 | | | 4.750%, 03/01/46 | | | 4,567 | |
| | | | | | | | |
| | | | | | | 23,430 | |
| | | | | | | | |
| | | | Health Care Equipment & Supplies — 0.2% | | | | |
| | | | Becton, Dickinson & Co., | | | | |
| | 2,377 | | | 2.675%, 12/15/19 | | | 2,460 | |
| | 352 | | | 3.734%, 12/15/24 | | | 383 | |
| | 750 | | | 3.875%, 05/15/24 | | | 811 | |
| | 100 | | | 5.000%, 05/15/19 | | | 109 | |
| | 400 | | | 6.000%, 05/15/39 | | | 516 | |
| | 1,600 | | | Covidien International Finance S.A., (Luxembourg), 4.200%, 06/15/20 | | | 1,746 | |
| | 2,195 | | | Danaher Corp., 3.350%, 09/15/25 | | | 2,418 | |
| | 435 | | | Hill-Rom Holdings, Inc., 5.750%, 09/01/23 (e) | | | 457 | |
| | 835 | | | Hologic, Inc., 5.250%, 07/15/22 (e) | | | 888 | |
| | | | Mallinckrodt International Finance S.A., (Luxembourg), | | | | |
| | 240 | | | 3.500%, 04/15/18 | | | 240 | |
| | 228 | | | 4.750%, 04/15/23 | | | 212 | |
| | 1,039 | | | Mallinckrodt International Finance S.A./Mallinckrodt CB LLC, (Luxembourg), 5.625%, 10/15/23 (e) | | | 1,043 | |
| | | | Medtronic, Inc., | | | | |
| | 1,000 | | | 3.500%, 03/15/25 | | | 1,084 | |
| | 2,001 | | | 4.375%, 03/15/35 | | | 2,299 | |
| | 217 | | | 4.625%, 03/15/45 | | | 260 | |
| | | | Teleflex, Inc., | | | | |
| | 239 | | | 4.875%, 06/01/26 | | | 249 | |
| | 945 | | | 5.250%, 06/15/24 | | | 990 | |
| | | | | | | | |
| | | | | | | 16,165 | |
| | | | | | | | |
| | | | Health Care Providers & Services — 0.9% | |
| | | | Aetna, Inc., | | | | |
| | 546 | | | 2.800%, 06/15/23 | | | 558 | |
| | 245 | | | 4.250%, 06/15/36 | | | 255 | |
| | | | | | | | |
PRINCIPAL
AMOUNT | | | SECURITY DESCRIPTION | | VALUE | |
| | | | | | | | |
| | | | Health Care Providers & Services — continued | |
| | 224 | | | 4.500%, 05/15/42 | | | 248 | |
| | 180 | | | Amsurg Corp., 5.625%, 11/30/20 | | | 186 | |
| | | | Anthem, Inc., | | | | |
| | 577 | | | 3.125%, 05/15/22 | | | 600 | |
| | 1,505 | | | 3.300%, 01/15/23 | | | 1,575 | |
| | 687 | | | Ascension Health, 3.945%, 11/15/46 | | | 771 | |
| | 815 | | | Cardinal Health, Inc., 2.400%, 11/15/19 | | | 832 | |
| | | | Centene Corp., | | | | |
| | 1,159 | | | 4.750%, 05/15/22 | | | 1,204 | |
| | 1,420 | | | 5.625%, 02/15/21 | | | 1,510 | |
| | 1,310 | | | 6.125%, 02/15/24 | | | 1,428 | |
| | | | CHS/Community Health Systems, Inc., | | | | |
| | 342 | | | 5.125%, 08/15/18 | | | 346 | |
| | 1,775 | | | 5.125%, 08/01/21 | | | 1,751 | |
| | 970 | | | DaVita, Inc., 5.000%, 05/01/25 | | | 983 | |
| | | | Express Scripts Holding Co., | | | | |
| | 198 | | | 3.000%, 07/15/23 | | | 201 | |
| | 1,250 | | | 3.500%, 06/15/24 | | | 1,298 | |
| | | | Fresenius Medical Care U.S. Finance II, Inc., | | | | |
| | 660 | | | 4.125%, 10/15/20 (e) | | | 696 | |
| | 690 | | | 4.750%, 10/15/24 (e) | | | 738 | |
| | 346 | | | 5.625%, 07/31/19 (e) | | | 379 | |
| | 1,314 | | | 5.875%, 01/31/22 (e) | | | 1,495 | |
| | 1,250 | | | 6.500%, 09/15/18 (e) | | | 1,361 | |
| | 1,000 | | | 6.875%, 07/15/17 | | | 1,041 | |
| | 750 | | | Fresenius Medical Care U.S. Finance, Inc., 5.750%, 02/15/21 (e) | | | 851 | |
| | | | HCA, Inc., | | | | |
| | 947 | | | 3.750%, 03/15/19 | | | 976 | |
| | 1,050 | | | 4.250%, 10/15/19 | | | 1,101 | |
| | 1,420 | | | 4.500%, 02/15/27 | | | 1,434 | |
| | 1,176 | | | 4.750%, 05/01/23 | | | 1,230 | |
| | 2,050 | | | 5.000%, 03/15/24 | | | 2,168 | |
| | 950 | | | 5.250%, 04/15/25 | | | 1,018 | |
| | 725 | | | 5.250%, 06/15/26 | | | 775 | |
| | 857 | | | 5.375%, 02/01/25 | | | 885 | |
| | 2,557 | | | 5.875%, 03/15/22 | | | 2,813 | |
| | 2,810 | | | 6.500%, 02/15/20 | | | 3,102 | |
| | 2,065 | | | IASIS Healthcare LLC/IASIS Capital Corp., 8.375%, 05/15/19 | | | 1,872 | |
| | 1,265 | | | Laboratory Corp. of America Holdings, 3.200%, 02/01/22 | | | 1,314 | |
| | | | LifePoint Health, Inc., | | | | |
| | 680 | | | 5.375%, 05/01/24 (e) | | | 698 | |
| | 1,216 | | | 5.500%, 12/01/21 | | | 1,271 | |
SEE NOTES TO FINANCIAL STATEMENTS.
| | | | | | | | |
| | | |
| AUGUST 31, 2016 | | J.P. MORGAN INCOME FUNDS | | | | | 125 | |
JPMorgan Core Plus Bond Fund
SCHEDULE OF PORTFOLIO INVESTMENTS
AS OF AUGUST 31, 2016 (Unaudited) (continued)
(Amounts in U.S. Dollars, unless otherwise noted)
(Amounts in thousands)
| | | | | | | | |
PRINCIPAL
AMOUNT | | | SECURITY DESCRIPTION | | VALUE | |
| Corporate Bonds — continued | |
| | | | Health Care Providers & Services — continued | |
| | | | Memorial Sloan-Kettering Cancer Center, | | | | |
| | 225 | | | 4.125%, 07/01/52 | | | 253 | |
| | 785 | | | 4.200%, 07/01/55 | | | 896 | |
| | 174 | | | Quest Diagnostics, Inc., 3.450%, 06/01/26 | | | 181 | |
| | | | Tenet Healthcare Corp., | | | | |
| | 2,103 | | | 4.375%, 10/01/21 | | | 2,098 | |
| | 1,852 | | | 4.500%, 04/01/21 | | | 1,856 | |
| | 210 | | | 4.750%, 06/01/20 | | | 215 | |
| | 1,962 | | | 6.000%, 10/01/20 | | | 2,075 | |
| | 1,050 | | | 6.250%, 11/01/18 | | | 1,121 | |
| | 500 | | | VAR, 4.153%, 06/15/20 | | | 499 | |
| | 1,075 | | | Texas Health Resources, 4.330%, 11/15/55 | | | 1,226 | |
| | | | UnitedHealth Group, Inc., | | | | |
| | 2,500 | | | 2.875%, 12/15/21 | | | 2,631 | |
| | 125 | | | 3.350%, 07/15/22 | | | 135 | |
| | 806 | | | 3.375%, 11/15/21 | | | 866 | |
| | 98 | | | 4.625%, 07/15/35 | | | 116 | |
| | 1,390 | | | 6.000%, 02/15/18 | | | 1,485 | |
| | | | Universal Health Services, Inc., | | | | |
| | 172 | | | 3.750%, 08/01/19 (e) | | | 179 | |
| | 482 | | | 4.750%, 08/01/22 (e) | | | 500 | |
| | | | | | | | |
| | | | | | | 57,296 | |
| | | | | | | | |
| | | | Life Sciences Tools & Services — 0.0% (g) | | | | |
| | 980 | | | Quintiles Transnational Corp., 4.875%, 05/15/23 (e) | | | 1,019 | |
| | 628 | | | Thermo Fisher Scientific, Inc., 3.600%, 08/15/21 | | | 668 | |
| | | | | | | | |
| | | | | | | 1,687 | |
| | | | | | | | |
| | | | Pharmaceuticals — 0.5% | | | | |
| | | | AbbVie, Inc., | | | | |
| | 1,523 | | | 1.750%, 11/06/17 | | | 1,530 | |
| | 205 | | | 2.300%, 05/14/21 | | | 207 | |
| | 653 | | | 3.200%, 11/06/22 | | | 682 | |
| | 158 | | | 4.300%, 05/14/36 | | | 167 | |
| | 1,630 | | | 4.450%, 05/14/46 | | | 1,745 | |
| | 2,532 | | | 4.500%, 05/14/35 | | | 2,746 | |
| | | | Actavis Funding SCS, (Luxembourg), | | | | |
| | 542 | | | 3.450%, 03/15/22 | | | 567 | |
| | 552 | | | 4.550%, 03/15/35 | | | 595 | |
| | 300 | | | Actavis, Inc., 3.250%, 10/01/22 | | | 311 | |
| | 1,100 | | | Bayer U.S. Finance LLC, 2.375%, 10/08/19 (e) | | | 1,119 | |
| | 1,395 | | | Concordia International Corp., (Canada), 7.000%, 04/15/23 (e) | | | 1,081 | |
| | | | | | | | |
PRINCIPAL
AMOUNT | | | SECURITY DESCRIPTION | | VALUE | |
| | | | | | | | |
| | | | Pharmaceuticals — continued | |
| | | | GlaxoSmithKline Capital, Inc., | | | | |
| | 400 | | | 5.375%, 04/15/34 | | | 507 | |
| | 920 | | | 6.375%, 05/15/38 | | | 1,341 | |
| | 2,000 | | | Johnson & Johnson, 2.450%, 03/01/26 | | | 2,065 | |
| | | | Merck & Co., Inc., | | | | |
| | 1,953 | | | 2.350%, 02/10/22 | | | 2,010 | |
| | 562 | | | 2.800%, 05/18/23 | | | 591 | |
| | | | Mylan N.V., (Netherlands), | | | | |
| | 1,000 | | | 3.150%, 06/15/21 (e) | | | 1,022 | |
| | 1,000 | | | 5.250%, 06/15/46 (e) | | | 1,099 | |
| | 2,705 | | | Novartis Capital Corp., 3.400%, 05/06/24 | | | 2,973 | |
| | | | Pfizer, Inc., | | | | |
| | 1,500 | | | 2.750%, 06/03/26 | | | 1,556 | |
| | 800 | | | 3.000%, 06/15/23 | | | 855 | |
| | 250 | | | 6.200%, 03/15/19 | | | 280 | |
| | 745 | | | Pharmacia Corp., 6.600%, 12/01/28 | | | 1,027 | |
| | 450 | | | Roche Holdings, Inc., 2.250%, 09/30/19 (e) | | | 462 | |
| | | | Teva Pharmaceutical Finance Netherlands III B.V., (Netherlands), | | | | |
| | 8,145 | | | 2.800%, 07/21/23 | | | 8,182 | |
| | 708 | | | 3.150%, 10/01/26 | | | 713 | |
| | | | Valeant Pharmaceuticals International, Inc., (Canada), | | | | |
| | 400 | | | 5.375%, 03/15/20 (e) | | | 377 | |
| | 35 | | | 5.500%, 03/01/23 (e) | | | 30 | |
| | 833 | | | 5.875%, 05/15/23 (e) | | | 733 | |
| | 135 | | | 6.375%, 10/15/20 (e) | | | 129 | |
| | | | | | | | |
| | | | | | | 36,702 | |
| | | | | | | | |
| | | | Total Health Care | | | 135,280 | |
| | | | | | | | |
| | | | Health Care Providers & Services — 0.0% (g) | | | | |
| | | | Health Care — 0.0% (g) | | | | |
| | 400 | | | Kaiser Foundation Hospitals, 3.500%, 04/01/22 | | | 425 | |
| | | | | | | | |
| | | | Industrials — 2.0% | | | | |
| | | | Aerospace & Defense — 0.3% | | | | |
| | 589 | | | Airbus Group Finance B.V., (Netherlands), 2.700%, 04/17/23 (e) | | | 609 | |
| | | | BAE Systems Holdings, Inc., | | | | |
| | 1,350 | | | 3.800%, 10/07/24 (e) | | | 1,427 | |
| | 145 | | | 6.375%, 06/01/19 (e) | | | 162 | |
| | 400 | | | Boeing Co. (The), 6.125%, 02/15/33 | | | 549 | |
| | | | Bombardier, Inc., (Canada), | | | | |
| | 953 | | | 4.750%, 04/15/19 (e) | | | 956 | |
| | 217 | | | 5.500%, 09/15/18 (e) | | | 223 | |
SEE NOTES TO FINANCIAL STATEMENTS.
| | | | | | |
| | | |
| 126 | | | | J.P. MORGAN INCOME FUNDS | | AUGUST 31, 2016 |
| | | | | | | | |
PRINCIPAL
AMOUNT | | | SECURITY DESCRIPTION | | VALUE | |
| Corporate Bonds — continued | |
| | | | Aerospace & Defense — continued | |
| | 575 | | | 5.750%, 03/15/22 (e) | | | 543 | |
| | 500 | | | 7.750%, 03/15/20 (e) | | | 530 | |
| | 308 | | | General Dynamics Corp., 1.875%, 08/15/23 | | | 305 | |
| | 960 | | | Huntington Ingalls Industries, Inc., 5.000%, 12/15/21 (e) | | | 1,010 | |
| | | | Lockheed Martin Corp., | | | | |
| | 600 | | | 3.800%, 03/01/45 | | | 623 | |
| | 1,311 | | | 4.070%, 12/15/42 | | | 1,417 | |
| | 155 | | | Series B, 6.150%, 09/01/36 | | | 211 | |
| | 997 | | | Orbital ATK, Inc., 5.250%, 10/01/21 | | | 1,039 | |
| | 3,035 | | | Precision Castparts Corp., 3.250%, 06/15/25 | | | 3,267 | |
| | | | Raytheon Co., | | | | |
| | 280 | | | 3.150%, 12/15/24 | | | 302 | |
| | 730 | | | 4.875%, 10/15/40 | | | 911 | |
| | 700 | | | Triumph Group, Inc., 4.875%, 04/01/21 | | | 674 | |
| | 2,471 | | | United Technologies Corp., 4.500%, 06/01/42 | | | 2,929 | |
| | | | | | | | |
| | | | | | | 17,687 | |
| | | | | | | | |
| | | | Air Freight & Logistics — 0.0% (g) | | | | |
| | 669 | | | FedEx Corp., 3.900%, 02/01/35 | | | 699 | |
| | 235 | | | United Parcel Service of America, Inc., SUB, 8.375%, 04/01/30 | | | 347 | |
| | 534 | | | United Parcel Service, Inc., 2.450%, 10/01/22 | | | 557 | |
| | | | | | | | |
| | | | | | | 1,603 | |
| | | | | | | | |
| | | | Airlines — 0.1% | | | | |
| | 878 | | | Air Canada 2013-1 Class A Pass-Through Trust, (Canada), Series 2013-1A, 4.125%, 05/15/25 (e) | | | 934 | |
| | 1,055 | | | American Airlines 2016-2 Class A Pass-Through Trust, Series 16-2, Class A, 3.650%, 06/15/28 | | | 1,112 | |
| | 429 | | | Continental Airlines 2003-ERJ1 Pass-Through Trust, 7.875%, 07/02/18 | | | 447 | |
| | 301 | | | Continental Airlines 2004-ERJ1 Pass-Through Trust, 9.558%, 09/01/19 | | | 328 | |
| | 199 | | | Continental Airlines 2005-ERJ1 Pass-Through Trust, 9.798%, 04/01/21 | | | 221 | |
| | 542 | | | Continental Airlines 2006-ERJ1 Pass-Through Trust, 9.318%, 11/01/19 (e) | | | 582 | |
| | 222 | | | Delta Air Lines 2009-1 Series B Pass-Through Trust, Series 2009-1, Class B, 9.750%, 12/17/16 | | | 229 | |
| | 220 | | | Delta Air Lines 2012-1 Class A Pass-Through Trust, Series 2012-1A, 4.750%, 05/07/20 | | | 234 | |
| | 250 | | | Delta Air Lines 2012-1 Class B Pass-Through Trust, Series 2012-1B, 6.875%, 05/07/19 (e) | | | 270 | |
| | | | | | | | |
PRINCIPAL
AMOUNT | | | SECURITY DESCRIPTION | | VALUE | |
| | | | | | | | |
| | | | Airlines — continued | |
| | 89 | | | Northwest Airlines 2007-1 Class A Pass-Through Trust, Series 2007-1, Class A, 7.027%, 11/01/19 | | | 101 | |
| | 907 | | | U.S. Airways 2013-1 Class B Pass-Through Trust, Series 2013-1B, 5.375%, 11/15/21 | | | 938 | |
| | | | UAL 2007-1 Pass-Through Trust, | | | | |
| | 1,172 | | | 6.636%, 07/02/22 | | | 1,248 | |
| | 401 | | | Series B, 7.336%, 07/02/19 | | | 420 | |
| | 348 | | | United Airlines 2016-1 Class A Pass-Through Trust, 3.450%, 07/07/28 | | | 363 | |
| | 336 | | | United Airlines 2016-1 Class AA Pass-Through Trust, 3.100%, 07/07/28 | | | 348 | |
| | | | | | | | |
| | | | | | | 7,775 | |
| | | | | | | | |
| | | | Building Products — 0.2% | | | | |
| | | | Masco Corp., | | | | |
| | 839 | | | 4.450%, 04/01/25 | | | 899 | |
| | 2,982 | | | 5.950%, 03/15/22 | | | 3,462 | |
| | 95 | | | 7.125%, 03/15/20 | | | 110 | |
| | 240 | | | Masonite International Corp., (Canada), Class C, 5.625%, 03/15/23 (e) | | | 254 | |
| | | | Standard Industries, Inc., | | | | |
| | 382 | | | 5.125%, 02/15/21 (e) | | | 403 | |
| | 1,296 | | | 5.375%, 11/15/24 (e) | | | 1,377 | |
| | 639 | | | 5.500%, 02/15/23 (e) | | | 677 | |
| | 1,820 | | | 6.000%, 10/15/25 (e) | | | 1,993 | |
| | 643 | | | USG Corp., 5.500%, 03/01/25 (e) | | | 698 | |
| | | | | | | | |
| | | | | | | 9,873 | |
| | | | | | | | |
| | | | Commercial Services & Supplies — 0.3% | | | | |
| | | | ADT Corp. (The), | | | | |
| | 361 | | | 3.500%, 07/15/22 | | | 345 | |
| | 5,313 | | | 4.125%, 06/15/23 | | | 5,216 | |
| | 350 | | | 5.250%, 03/15/20 | | | 378 | |
| | 195 | | | Aramark Services, Inc., 5.125%, 01/15/24 | | | 202 | |
| | | | Covanta Holding Corp., | | | | |
| | 750 | | | 5.875%, 03/01/24 | | | 754 | |
| | 1,730 | | | 6.375%, 10/01/22 | | | 1,799 | |
| | 764 | | | Deluxe Corp., 6.000%, 11/15/20 | | | 792 | |
| | 5,494 | | | ILFC E-Capital Trust I, VAR, 3.980%, 12/21/65 (e) | | | 4,387 | |
| | 600 | | | ILFC E-Capital Trust II, VAR, 4.230%, 12/21/65 (e) | | | 486 | |
| | | | World Capital Corp., (Canada), | | | | |
| | 1,160 | | | 0.000%, 08/01/27 (d) | | | — | (h) |
| | 1,145 | | | 6.125%, 01/15/16 (d) | | | — | (h) |
| | 212 | | | R.R. Donnelley & Sons Co., 6.500%, 11/15/23 | | | 215 | |
SEE NOTES TO FINANCIAL STATEMENTS.
| | | | | | | | |
| | | |
| AUGUST 31, 2016 | | J.P. MORGAN INCOME FUNDS | | | | | 127 | |
JPMorgan Core Plus Bond Fund
SCHEDULE OF PORTFOLIO INVESTMENTS
AS OF AUGUST 31, 2016 (Unaudited) (continued)
(Amounts in U.S. Dollars, unless otherwise noted)
(Amounts in thousands)
| | | | | | | | |
PRINCIPAL
AMOUNT | | | SECURITY DESCRIPTION | | VALUE | |
| Corporate Bonds — continued | |
| | | | Commercial Services & Supplies — continued | |
| | | | Republic Services, Inc., | | | | |
| | 245 | | | 2.900%, 07/01/26 | | | 250 | |
| | 348 | | | 3.550%, 06/01/22 | | | 373 | |
| | 190 | | | 4.750%, 05/15/23 | | | 214 | |
| | | | Waste Management, Inc., | | | | |
| | 248 | | | 2.400%, 05/15/23 | | | 251 | |
| | 936 | | | 3.125%, 03/01/25 | | | 985 | |
| | 535 | | | 3.500%, 05/15/24 | | | 577 | |
| | 294 | | | 3.900%, 03/01/35 | | | 317 | |
| | 667 | | | West Corp., 4.750%, 07/15/21 (e) | | | 680 | |
| | | | | | | | |
| | | | | | | 18,221 | |
| | | | | | | | |
| | | | Construction & Engineering — 0.1% | | | | |
| | | | ABB Finance USA, Inc., | | | | |
| | 75 | | | 1.625%, 05/08/17 | | | 75 | |
| | 303 | | | 2.875%, 05/08/22 | | | 318 | |
| | 326 | | | 4.375%, 05/08/42 | | | 378 | |
| | | | AECOM, | | | | |
| | 1,200 | | | 5.750%, 10/15/22 | | | 1,272 | |
| | 1,550 | | | 5.875%, 10/15/24 | | | 1,696 | |
| | 360 | | | Fluor Corp., 3.375%, 09/15/21 | | | 385 | |
| | 2,600 | | | MasTec, Inc., 4.875%, 03/15/23 | | | 2,600 | |
| | 1,216 | | | Tutor Perini Corp., 7.625%, 11/01/18 | | | 1,228 | |
| | | | | | | | |
| | | | | | | 7,952 | |
| | | | | | | | |
| | | | Electrical Equipment — 0.1% | | | | |
| | | | Eaton Corp., | | | | |
| | 900 | | | 2.750%, 11/02/22 | | | 929 | |
| | 550 | | | 5.600%, 05/15/18 | | | 588 | |
| | 425 | | | Emerson Electric Co., 5.250%, 11/15/39 | | | 540 | |
| | 463 | | | EnerSys, 5.000%, 04/30/23 (e) | | | 462 | |
| | | | Power Sector Assets & Liabilities Management Corp., (Philippines), | | | | |
| | 100 | | | 7.390%, 12/02/24 (e) | | | 138 | |
| | 100 | | | Reg. S, 7.390%, 12/02/24 | �� | | 137 | |
| | | | Sensata Technologies B.V., (Netherlands), | | | | |
| | 1,000 | | | 4.875%, 10/15/23 (e) | | | 1,033 | |
| | 554 | | | 5.000%, 10/01/25 (e) | | | 573 | |
| | 170 | | | 5.625%, 11/01/24 (e) | | | 180 | |
| | | | | | | | |
| | | | | | | 4,580 | |
| | | | | | | | |
| | | | Industrial Conglomerates — 0.2% | | | | |
| | 200 | | | CITIC Ltd., (Hong Kong), Reg. S, 6.800%, 01/17/23 | | | 245 | |
| | | | General Electric Co., | | | | |
| | 436 | | | 1.600%, 11/20/17 | | | 439 | |
| | 629 | | | 2.200%, 01/09/20 | | | 646 | |
| | | | | | | | |
PRINCIPAL
AMOUNT | | | SECURITY DESCRIPTION | | VALUE | |
| | | | | | | | |
| | | | Industrial Conglomerates — continued | |
| | 4,671 | | | 2.300%, 04/27/17 | | | 4,710 | |
| | 501 | | | 2.700%, 10/09/22 | | | 523 | |
| | 215 | | | 3.150%, 09/07/22 | | | 230 | |
| | 85 | | | 5.300%, 02/11/21 | | | 98 | |
| | 94 | | | 5.500%, 01/08/20 | | | 106 | |
| | 965 | | | 5.875%, 01/14/38 | | | 1,320 | |
| | 145 | | | 6.875%, 01/10/39 | | | 222 | |
| | 100,000 | | | Series 15BR, 2.215%, 11/20/20 | | | 1,044 | |
| | 315 | | | Series A, 6.750%, 03/15/32 | | | 451 | |
| | | | Hutchison Whampoa International 12 II Ltd., (Cayman Islands), | | | | |
| | 437 | | | 2.000%, 11/08/17 (e) | | | 439 | |
| | 257 | | | 3.250%, 11/08/22 (e) | | | 273 | |
| | 215 | | | Koninklijke Philips N.V., (Netherlands), 7.200%, 06/01/26 | | | 270 | |
| | 2,037 | | | Pentair Finance S.A., (Luxembourg), 2.900%, 09/15/18 | | | 2,052 | |
| | 453 | | | Tyco International Finance S.A., (Luxembourg), 3.900%, 02/14/26 | | | 495 | |
| | | | | | | | |
| | | | | | | 13,563 | |
| | | | | | | | |
| | | | Machinery — 0.1% | | | | |
| | 565 | | | BlueLine Rental Finance Corp., 7.000%, 02/01/19 (e) | | | 489 | |
| | 1,000 | | | Bluewater Holding B.V., (Netherlands), Reg. S, 10.000%, 12/10/19 (e) | | | 440 | |
| | 1,910 | | | Briggs & Stratton Corp., 6.875%, 12/15/20 | | | 2,101 | |
| | | | Caterpillar, Inc., | | | | |
| | 198 | | | 2.600%, 06/26/22 | | | 206 | |
| | 680 | | | 3.803%, 08/15/42 | | | 714 | |
| | | | CNH Industrial Capital LLC, | | | | |
| | 850 | | | 3.375%, 07/15/19 | | | 862 | |
| | 655 | | | 3.625%, 04/15/18 | | | 668 | |
| | 2,104 | | | Illinois Tool Works, Inc., 3.900%, 09/01/42 | | | 2,359 | |
| | 135 | | | Ingersoll-Rand Co., 7.200%, 06/01/25 | | | 156 | |
| | 220 | | | Oshkosh Corp., 5.375%, 03/01/25 | | | 231 | |
| | | | Parker-Hannifin Corp., | | | | |
| | 438 | | | 3.300%, 11/21/24 | | | 470 | |
| | 440 | | | 6.250%, 05/15/38 | | | 632 | |
| | | | | | | | |
| | | | | | | 9,328 | |
| | | | | | | | |
| | | | Marine — 0.0% (g) | | | | |
| | 1,138 | | | Ultrapetrol Bahamas Ltd., (Bahamas), 8.875%, 06/15/21 (d) | | | 228 | |
| | | | | | | | |
| | | | Professional Services — 0.0% (g) | | | | |
| | 858 | | | CEB, Inc., 5.625%, 06/15/23 (e) | | | 852 | |
| | 244 | | | FTI Consulting, Inc., 6.000%, 11/15/22 | | | 257 | |
SEE NOTES TO FINANCIAL STATEMENTS.
| | | | | | |
| | | |
| 128 | | | | J.P. MORGAN INCOME FUNDS | | AUGUST 31, 2016 |
| | | | | | | | |
PRINCIPAL
AMOUNT | | | SECURITY DESCRIPTION | | VALUE | |
| Corporate Bonds — continued | |
| | | | Professional Services — continued | |
| | 1,110 | | | IHS Markit Ltd., (Bermuda), 5.000%, 11/01/22 (e) | | | 1,179 | |
| | | | | | | | |
| | | | | | | 2,288 | |
| | | | | | | | |
| | | | Road & Rail — 0.4% | | | | |
| | | | Ashtead Capital, Inc., | | | | |
| | 525 | | | 5.625%, 10/01/24 (e) | | | 552 | |
| | 1,058 | | | 6.500%, 07/15/22 (e) | | | 1,116 | |
| | 239 | | | Burlington Northern and Santa Fe Railway Co. 2000-2 Pass-Through Trust, Series 00-2, Class TR, 7.908%, 01/15/20 | | | 260 | |
| | | | Burlington Northern Santa Fe LLC, | | | | |
| | 162 | | | 3.000%, 03/15/23 | | | 171 | |
| | 2,500 | | | 3.050%, 09/01/22 | | | 2,644 | |
| | 510 | | | 4.375%, 09/01/42 | | | 585 | |
| | 1,630 | | | 4.700%, 09/01/45 | | | 1,968 | |
| | 220 | | | 5.650%, 05/01/17 | | | 227 | |
| | 1,150 | | | 6.700%, 08/01/28 | | | 1,573 | |
| | 927 | | | Canadian National Railway Co., (Canada), 6.375%, 11/15/37 | | | 1,324 | |
| | | | Canadian Pacific Railway Co., (Canada), | | | | |
| | 1,680 | | | 4.500%, 01/15/22 | | | 1,842 | |
| | 1,456 | | | 6.125%, 09/15/151 | | | 1,815 | |
| | 165 | | | 7.250%, 05/15/19 | | | 189 | |
| | 280 | | | 9.450%, 08/01/21 | | | 364 | |
| | | | CSX Corp., | | | | |
| | 284 | | | 3.950%, 05/01/50 | | | 293 | |
| | 1,075 | | | 7.375%, 02/01/19 | | | 1,222 | |
| | | | ERAC USA Finance LLC, | | | | |
| | 200 | | | 3.300%, 10/15/22 (e) | | | 209 | |
| | 250 | | | 6.375%, 10/15/17 (e) | | | 263 | |
| | 800 | | | 6.700%, 06/01/34 (e) | | | 1,075 | |
| | 200 | | | Georgian Railway JSC, (Georgia), Reg. S, 7.750%, 07/11/22 | | | 223 | |
| | 400 | | | Kazakhstan Temir Zholy Finance B.V., (Netherlands), Reg. S, 6.950%, 07/10/42 | | | 433 | |
| | | | Norfolk Southern Corp., | | | | |
| | 462 | | | 2.903%, 02/15/23 | | | 479 | |
| | 1,415 | | | 3.250%, 12/01/21 | | | 1,495 | |
| | 506 | | | 6.000%, 05/23/112 | | | 627 | |
| | 1,767 | | | Penske Truck Leasing Co. LP/PTL Finance Corp., 3.375%, 02/01/22 (e) | | | 1,827 | |
| | | | Ryder System, Inc., | | | | |
| | 500 | | | 2.450%, 11/15/18 | | | 507 | |
| | 325 | | | 2.450%, 09/03/19 | | | 330 | |
| | 840 | | | 2.650%, 03/02/20 | | | 858 | |
| | | | | | | | |
PRINCIPAL
AMOUNT | | | SECURITY DESCRIPTION | | VALUE | |
| | | | | | | | |
| | | | Road & Rail — continued | |
| | 200 | | | Transnet SOC Ltd., (South Africa), Reg. S, 4.000%, 07/26/22 | | | 193 | |
| | | | Union Pacific Corp., | | | | |
| | 225 | | | 2.250%, 02/15/19 | | | 230 | |
| | 341 | | | 4.163%, 07/15/22 | | | 384 | |
| | 283 | | | 4.300%, 06/15/42 | | | 323 | |
| | 3,220 | | | Union Pacific Railroad Co. 2015-1 Pass-Through Trust, 2.695%, 05/12/27 | | | 3,199 | |
| | | | | | | | |
| | | | | | | 28,800 | |
| | | | | | | | |
| | | | Trading Companies & Distributors — 0.2% | |
| | 560 | | | Ahern Rentals, Inc., 7.375%, 05/15/23 (e) | | | 384 | |
| | 242 | | | Air Lease Corp., 3.000%, 09/15/23 | | | 239 | |
| | | | Aircastle Ltd., (Bermuda), | | | | |
| | 1,196 | | | 5.000%, 04/01/23 | | | 1,268 | |
| | 647 | | | 5.125%, 03/15/21 | | | 702 | |
| | 475 | | | 5.500%, 02/15/22 | | | 516 | |
| | 213 | | | 6.250%, 12/01/19 | | | 236 | |
| | 1,885 | | | 7.625%, 04/15/20 | | | 2,177 | |
| | 200 | | | Fly Leasing Ltd., (Bermuda), 6.750%, 12/15/20 | | | 205 | |
| | | | United Rentals North America, Inc., | | | | |
| | 2,178 | | | 4.625%, 07/15/23 | | | 2,228 | |
| | 1,220 | | | 5.750%, 11/15/24 | | | 1,269 | |
| | 135 | | | 5.875%, 09/15/26 | | | 140 | |
| | 1,500 | | | 6.125%, 06/15/23 | | | 1,577 | |
| | 680 | | | WESCO Distribution, Inc., 5.375%, 06/15/24 (e) | | | 695 | |
| | | | WW Grainger, Inc., | | | | |
| | 436 | | | 3.750%, 05/15/46 | | | 462 | |
| | 791 | | | 4.600%, 06/15/45 | | | 946 | |
| | | | | | | | |
| | | | | | | 13,044 | |
| | | | | | | | |
| | | | Transportation Infrastructure — 0.0% (g) | | | | |
| | 150 | | | DP World Ltd., (United Arab Emirates), Reg. S, 6.850%, 07/02/37 | | | 175 | |
| | | | | | | | |
| | | | Total Industrials | | | 135,117 | |
| | | | | | | | |
| | | | Information Technology — 1.9% | | | | |
| | | | Communications Equipment — 0.3% | | | | |
| | | | Avaya, Inc., | | | | |
| | 4,960 | | | 7.000%, 04/01/19 (e) | | | 3,695 | |
| | 2,159 | | | 10.500%, 03/01/21 | | | 562 | |
| | | | Cisco Systems, Inc., | | | | |
| | 6,500 | | | 2.200%, 02/28/21 | | | 6,670 | |
| | 149 | | | 2.900%, 03/04/21 | | | 157 | |
| | 3,751 | | | 3.000%, 06/15/22 | | | 4,000 | |
SEE NOTES TO FINANCIAL STATEMENTS.
| | | | | | | | |
| | | |
| AUGUST 31, 2016 | | J.P. MORGAN INCOME FUNDS | | | | | 129 | |
JPMorgan Core Plus Bond Fund
SCHEDULE OF PORTFOLIO INVESTMENTS
AS OF AUGUST 31, 2016 (Unaudited) (continued)
(Amounts in U.S. Dollars, unless otherwise noted)
(Amounts in thousands)
| | | | | | | | |
PRINCIPAL
AMOUNT | | | SECURITY DESCRIPTION | | VALUE | |
| Corporate Bonds — continued | |
| | | | Communications Equipment — continued | |
| | 500 | | | 5.500%, 01/15/40 | | | 662 | |
| | 375 | | | 5.900%, 02/15/39 | | | 517 | |
| | | | CommScope, Inc., | | | | |
| | 602 | | | 4.375%, 06/15/20 (e) | | | 623 | |
| | 100 | | | 5.500%, 06/15/24 (e) | | | 105 | |
| | 2,046 | | | Goodman Networks, Inc., 12.125%, 07/01/18 | | | 1,013 | |
| | | | Nokia OYJ, (Finland), | | | | |
| | 783 | | | 5.375%, 05/15/19 | | | 846 | |
| | 587 | | | 6.625%, 05/15/39 | | | 640 | |
| | 930 | | | Plantronics, Inc., 5.500%, 05/31/23 (e) | | | 967 | |
| | | | | | | | |
| | | | | | | 20,457 | |
| | | | | | | | �� |
| | | | Electronic Equipment, Instruments & Components — 0.1% | |
| | 1,380 | | | Anixter, Inc., 5.500%, 03/01/23 | | | 1,452 | |
| | | | Arrow Electronics, Inc., | | | | |
| | 653 | | | 4.000%, 04/01/25 | | | 657 | |
| | 250 | | | 6.000%, 04/01/20 | | | 275 | |
| | 100 | | | 7.500%, 01/15/27 | | | 124 | |
| | 292 | | | CDW LLC/CDW Finance Corp., 6.000%, 08/15/22 | | | 314 | |
| | | | | | | | |
| | | | | | | 2,822 | |
| | | | | | | | |
| | | | Internet Software & Services — 0.1% | | | | |
| | | | eBay, Inc., | | | | |
| | 2,491 | | | 2.600%, 07/15/22 | | | 2,522 | |
| | 1,742 | | | 3.450%, 08/01/24 | | | 1,814 | |
| | | | Match Group, Inc., | | | | |
| | 280 | | | 6.375%, 06/01/24 | | | 305 | |
| | 500 | | | 6.750%, 12/15/22 | | | 532 | |
| | | | VeriSign, Inc., | | | | |
| | 716 | | | 4.625%, 05/01/23 | | | 732 | |
| | 166 | | | 5.250%, 04/01/25 | | | 173 | |
| | | | | | | | |
| | | | | | | 6,078 | |
| | | | | | | | |
| | | | IT Services — 0.1% | | | | |
| | 450 | | | Alliance Data Systems Corp., 5.375%, 08/01/22 (e) | | | 443 | |
| | | | First Data Corp., | | | | |
| | 1,491 | | | 5.000%, 01/15/24 (e) | | | 1,517 | |
| | 489 | | | 5.375%, 08/15/23 (e) | | | 507 | |
| | 2,134 | | | 6.750%, 11/01/20 (e) | | | 2,220 | |
| | | | International Business Machines Corp., | | | | |
| | 720 | | | 4.000%, 06/20/42 | | | 769 | |
| | 770 | | | 5.875%, 11/29/32 | | | 1,040 | |
| | 650 | | | 7.000%, 10/30/25 | | | 884 | |
| | 491 | | | Lender Processing Services, Inc./Black Knight Lending Solutions, Inc., 5.750%, 04/15/23 | | | 517 | |
| | | | | | | | |
PRINCIPAL
AMOUNT | | | SECURITY DESCRIPTION | | VALUE | |
| | |
| | | | IT Services — continued | |
| | 1,350 | | | Visa, Inc., Series 7YR, 2.800%, 12/14/22 | | | 1,416 | |
| | | | | | | | |
| | | | | | | 9,313 | |
| | | | | | | | |
| | | | Semiconductors & Semiconductor Equipment — 0.3% | |
| | | | Intel Corp., | | | | |
| | 825 | | | 2.600%, 05/19/26 | | | 846 | |
| | 565 | | | 2.700%, 12/15/22 | | | 591 | |
| | 605 | | | 3.100%, 07/29/22 | | | 646 | |
| | 634 | | | 3.300%, 10/01/21 | | | 684 | |
| | 326 | | | 3.700%, 07/29/25 | | | 363 | |
| | | | Micron Technology, Inc., | | | | |
| | 1,154 | | | 5.250%, 08/01/23 (e) | | | 1,117 | |
| | 626 | | | 5.250%, 01/15/24 (e) | | | 599 | |
| | 1,334 | | | 5.500%, 02/01/25 | | | 1,292 | |
| | 583 | | | 5.625%, 01/15/26 (e) | | | 557 | |
| | 332 | | | 5.875%, 02/15/22 | | | 334 | |
| | 784 | | | 7.500%, 09/15/23 (e) | | | 864 | |
| | | | NXP B.V./NXP Funding LLC, (Netherlands), | | | | |
| | 1,298 | | | 4.125%, 06/15/20 (e) | | | 1,344 | |
| | 2,086 | | | 4.125%, 06/01/21 (e) | | | 2,182 | |
| | 1,485 | | | 4.625%, 06/15/22 (e) | | | 1,564 | |
| | 500 | | | 5.750%, 02/15/21 (e) | | | 521 | |
| | 500 | | | 5.750%, 03/15/23 (e) | | | 532 | |
| | 1,307 | | | Qorvo, Inc., 6.750%, 12/01/23 (e) | | | 1,423 | |
| | 2,817 | | | QUALCOMM, Inc., 4.800%, 05/20/45 | | | 3,212 | |
| | 978 | | | Sensata Technologies UK Financing Co. plc, (United Kingdom), 6.250%, 02/15/26 (e) | | | 1,072 | |
| | 462 | | | Texas Instruments, Inc., 1.650%, 08/03/19 | | | 468 | |
| | | | | | | | |
| | | | | | | 20,211 | |
| | | | | | | | |
| | | | Software — 0.5% | | | | |
| | 2,080 | | | Activision Blizzard, Inc., 6.125%, 09/15/23 (e) | | | 2,275 | |
| | 655 | | | Intuit, Inc., 5.750%, 03/15/17 | | | 671 | |
| | | | Microsoft Corp., | | | | |
| | 519 | | | 2.125%, 11/15/22 | | | 526 | |
| | 25 | | | 2.375%, 02/12/22 | | | 26 | |
| | 30 | | | 2.375%, 05/01/23 | | | 31 | |
| | 5,265 | | | 2.650%, 11/03/22 | | | 5,506 | |
| | 2,000 | | | 3.450%, 08/08/36 | | | 2,059 | |
| | 545 | | | 3.625%, 12/15/23 | | | 601 | |
| | 2,575 | | | 4.450%, 11/03/45 | | | 2,995 | |
| | 595 | | | 4.500%, 10/01/40 | | | 691 | |
| | | | Open Text Corp., (Canada), | | | | |
| | 287 | | | 5.625%, 01/15/23 (e) | | | 296 | |
| | 399 | | | 5.875%, 06/01/26 (e) | | | 421 | |
SEE NOTES TO FINANCIAL STATEMENTS.
| | | | | | |
| | | |
| 130 | | | | J.P. MORGAN INCOME FUNDS | | AUGUST 31, 2016 |
| | | | | | | | |
PRINCIPAL
AMOUNT | | | SECURITY DESCRIPTION | | VALUE | |
| Corporate Bonds — continued | |
| | | | Software — continued | |
| | | | Oracle Corp., | | | | |
| | 418 | | | 1.900%, 09/15/21 | | | 419 | |
| | 495 | | | 2.400%, 09/15/23 | | | 499 | |
| | 1,821 | | | 2.500%, 10/15/22 | | | 1,870 | |
| | 369 | | | 2.800%, 07/08/21 | | | 386 | |
| | 1,500 | | | 3.900%, 05/15/35 | | | 1,582 | |
| | 7,000 | | | 4.000%, 07/15/46 | | | 7,371 | |
| | 780 | | | 4.300%, 07/08/34 | | | 865 | |
| | 5,215 | | | 4.375%, 05/15/55 | | | 5,674 | |
| | 241 | | | 5.375%, 07/15/40 | | | 302 | |
| | 1,030 | | | 6.500%, 04/15/38 | | | 1,454 | |
| | | | | | | | |
| | | | | | | 36,520 | |
| | | | | | | | |
| | | | Technology Hardware, Storage & Peripherals — 0.5% | |
| | | | Apple, Inc., | | | | |
| | 1,546 | | | 1.550%, 08/04/21 | | | 1,541 | |
| | 802 | | | 2.150%, 02/09/22 | | | 818 | |
| | 1,648 | | | 2.400%, 05/03/23 | | | 1,687 | |
| | 1,000 | | | 2.500%, 02/09/25 | | | 1,016 | |
| | 2,580 | | | 2.700%, 05/13/22 | | | 2,694 | |
| | 1,270 | | | 2.850%, 05/06/21 | | | 1,339 | |
| | 372 | | | 3.250%, 02/23/26 | | | 397 | |
| | 3,415 | | | 3.850%, 08/04/46 | | | 3,539 | |
| | 1,123 | | | 4.500%, 02/23/36 | | | 1,298 | |
| | | | Diamond 1 Finance Corp./Diamond 2 Finance Corp., | | | | |
| | 5 | | | 3.480%, 06/01/19 (e) | | | 5 | |
| | 411 | | | 4.420%, 06/15/21 (e) | | | 430 | |
| | 2,119 | | | 5.450%, 06/15/23 (e) | | | 2,258 | |
| | 660 | | | 5.875%, 06/15/21 (e) | | | 699 | |
| | 5,489 | | | 6.020%, 06/15/26 (e) | | | 5,884 | |
| | 680 | | | 7.125%, 06/15/24 (e) | | | 736 | |
| | 167 | | | 8.100%, 07/15/36 (e) | | | 194 | |
| | 238 | | | 8.350%, 07/15/46 (e) | | | 277 | |
| | 531 | | | Diebold, Inc., 8.500%, 04/15/24 (e) | | | 540 | |
| | | | HP, Inc., | | | | |
| | 524 | | | 4.300%, 06/01/21 | | | 565 | |
| | 290 | | | 4.375%, 09/15/21 | | | 313 | |
| | 141 | | | 6.000%, 09/15/41 | | | 145 | |
| | | | NCR Corp., | | | | |
| | 343 | | | 5.000%, 07/15/22 | | | 350 | |
| | 419 | | | 5.875%, 12/15/21 | | | 439 | |
| | 522 | | | 6.375%, 12/15/23 | | | 552 | |
| | | | Western Digital Corp., | | | | |
| | 1,008 | | | 7.375%, 04/01/23 (e) | | | 1,094 | |
| | | | | | | | |
PRINCIPAL
AMOUNT | | | SECURITY DESCRIPTION | | VALUE | |
| | | | | | | | |
| | | | Technology Hardware, Storage & Peripherals — continued | |
| | 2,168 | | | 10.500%, 04/01/24 (e) | | | 2,450 | |
| | | | | | | | |
| | | | | | | 31,260 | |
| | | | | | | | |
| | | | Total Information Technology | | | 126,661 | |
| | | | | | | | |
| | | | Materials — 1.6% | | | | |
| | | | Chemicals — 0.4% | | | | |
| | | | Agrium, Inc., (Canada), | | | | |
| | 511 | | | 4.125%, 03/15/35 | | | 504 | |
| | 1,875 | | | 5.250%, 01/15/45 | | | 2,087 | |
| | 1,675 | | | Ashland, Inc., 4.750%, 08/15/22 | | | 1,755 | |
| | 410 | | | Axalta Coating Systems LLC, 4.875%, 08/15/24 (e) | | | 427 | |
| | 1,500 | | | Axiall Corp., 4.875%, 05/15/23 | | | 1,573 | |
| | 370 | | | Basell Finance Co., B.V., (Netherlands), 8.100%, 03/15/27 (e) | | | 498 | |
| | | | Blue Cube Spinco, Inc., | | | | |
| | 1,713 | | | 9.750%, 10/15/23 (e) | | | 2,026 | |
| | 1,154 | | | 10.000%, 10/15/25 (e) | | | 1,373 | |
| | 1,520 | | | Celanese U.S. Holdings LLC, 4.625%, 11/15/22 | | | 1,662 | |
| | | | Dow Chemical Co. (The), | | | | |
| | 121 | | | 3.000%, 11/15/22 | | | 125 | |
| | 121 | | | 4.125%, 11/15/21 | | | 133 | |
| | | | E.I. du Pont de Nemours & Co., | | | | |
| | 851 | | | 4.900%, 01/15/41 | | | 978 | |
| | 625 | | | 6.500%, 01/15/28 | | | 801 | |
| | | | Ecolab, Inc., | | | | |
| | 363 | | | 1.450%, 12/08/17 | | | 364 | |
| | 892 | | | 2.250%, 01/12/20 | | | 910 | |
| | 1,027 | | | 3.250%, 01/14/23 | | | 1,073 | |
| | 179 | | | GCP Applied Technologies, Inc., 9.500%, 02/01/23 (e) | | | 205 | |
| | 3,372 | | | Hexion, Inc., 6.625%, 04/15/20 | | | 2,923 | |
| | 705 | | | Monsanto Co., 4.700%, 07/15/64 | | | 678 | |
| | | | Mosaic Co. (The), | | | | |
| | 429 | | | 3.750%, 11/15/21 | | | 452 | |
| | 354 | | | 4.250%, 11/15/23 | | | 377 | |
| | 429 | | | 4.875%, 11/15/41 | | | 426 | |
| | 364 | | | 5.450%, 11/15/33 | | | 399 | |
| | 100 | | | 5.625%, 11/15/43 | | | 110 | |
| | | | NOVA Chemicals Corp., (Canada), | | | | |
| | 372 | | | 5.000%, 05/01/25 (e) | | | 384 | |
| | 1,255 | | | 5.250%, 08/01/23 (e) | | | 1,302 | |
| | 240 | | | Nufarm Australia Ltd., (Australia), 6.375%, 10/15/19 (e) | | | 243 | |
| | 200 | | | OCP S.A., (Morocco), Reg. S, 6.875%, 04/25/44 | | | 234 | |
SEE NOTES TO FINANCIAL STATEMENTS.
| | | | | | | | |
| | | |
| AUGUST 31, 2016 | | J.P. MORGAN INCOME FUNDS | | | | | 131 | |
JPMorgan Core Plus Bond Fund
SCHEDULE OF PORTFOLIO INVESTMENTS
AS OF AUGUST 31, 2016 (Unaudited) (continued)
(Amounts in U.S. Dollars, unless otherwise noted)
(Amounts in thousands)
| | | | | | | | |
PRINCIPAL
AMOUNT | | | SECURITY DESCRIPTION | | VALUE | |
| Corporate Bonds — continued | |
| | | | Chemicals — continued | |
| | 1,123 | | | PolyOne Corp., 5.250%, 03/15/23 | | | 1,174 | |
| | 685 | | | Praxair, Inc., 2.650%, 02/05/25 | | | 705 | |
| | 1,305 | | | Union Carbide Corp., 7.750%, 10/01/96 | | | 1,650 | |
| | 140 | | | Valvoline, Inc., 5.500%, 07/15/24 (e) | | | 147 | |
| | | | W.R. Grace & Co.-Conn, | | | | |
| | 300 | | | 5.125%, 10/01/21 (e) | | | 319 | |
| | 100 | | | 5.625%, 10/01/24 (e) | | | 108 | |
| | | | | | | | |
| | | | | | | 28,125 | |
| | | | | | | | |
| | | | Construction Materials — 0.1% | | | | |
| | | | Cemex S.A.B. de C.V., (Mexico), | | | | |
| | 5,950 | | | 7.250%, 01/15/21 (e) | | | 6,380 | |
| | 200 | | | Reg. S, 6.125%, 05/05/25 | | | 210 | |
| | 1,249 | | | CRH America, Inc., 5.125%, 05/18/45 (e) | | | 1,399 | |
| | 400 | | | Lafarge S.A., (France), 7.125%, 07/15/36 | | | 500 | |
| | 517 | | | U.S. Concrete, Inc., 6.375%, 06/01/24 | | | 539 | |
| | | | | | | | |
| | | | | | | 9,028 | |
| | | | | | | | |
| | | | Containers & Packaging — 0.2% | |
| | | | Ball Corp., | | | | |
| | 550 | | | 4.000%, 11/15/23 | | | 560 | |
| | 900 | | | 4.375%, 12/15/20 | | | 969 | |
| | 1,150 | | | 5.000%, 03/15/22 | | | 1,242 | |
| | 940 | | | 5.250%, 07/01/25 | | | 1,017 | |
| | 360 | | | Cascades, Inc., (Canada), 5.500%, 07/15/22 (e) | | | 362 | |
| | 480 | | | Constar International, Inc., 11.000%, 12/31/17 (d) | | | 50 | |
| | 966 | | | Crown Americas LLC/Crown Americas Capital Corp. IV, 4.500%, 01/15/23 | | | 1,009 | |
| | | | Graphic Packaging International, Inc., | | | | |
| | 576 | | | 4.750%, 04/15/21 | | | 617 | |
| | 645 | | | 4.875%, 11/15/22 | | | 680 | |
| | 1,071 | | | International Paper Co., 3.000%, 02/15/27 | | | 1,065 | |
| | | | Sealed Air Corp., | | | | |
| | 515 | | | 4.875%, 12/01/22 (e) | | | 541 | |
| | 2,365 | | | 5.125%, 12/01/24 (e) | | | 2,530 | |
| | 500 | | | 5.250%, 04/01/23 (e) | | | 534 | |
| | 275 | | | 6.500%, 12/01/20 (e) | | | 314 | |
| | 826 | | | Silgan Holdings, Inc., 5.500%, 02/01/22 | | | 859 | |
| | | | | | | | |
| | | | | | | 12,349 | |
| | | | | | | | |
| | | | | | | | |
PRINCIPAL
AMOUNT | | | SECURITY DESCRIPTION | | VALUE | |
| | | | | | | | |
| | | | Metals & Mining — 0.9% | |
| | | | Alcoa, Inc., | | | | |
| | 2,820 | | | 5.125%, 10/01/24 | | | 2,975 | |
| | 1,581 | | | 5.400%, 04/15/21 | | | 1,677 | |
| | 940 | | | 5.720%, 02/23/19 | | | 1,009 | |
| | 2,714 | | | 5.870%, 02/23/22 | | | 2,938 | |
| | 544 | | | 6.150%, 08/15/20 | | | 594 | |
| | 1,072 | | | 6.750%, 01/15/28 | | | 1,193 | |
| | | | Anglo American Capital plc, (United Kingdom), | | | | |
| | 490 | | | 4.125%, 04/15/21 (e) | | | 485 | |
| | 2,600 | | | 4.450%, 09/27/20 (e) | | | 2,626 | |
| | 2,704 | | | 4.875%, 05/14/25 (e) | | | 2,711 | |
| | | | ArcelorMittal, (Luxembourg), | | | | |
| | 765 | | | 6.125%, 06/01/25 | | | 822 | |
| | 2,310 | | | 6.500%, 03/01/21 | | | 2,506 | |
| | 6,445 | | | 7.250%, 02/25/22 | | | 7,251 | |
| | 426 | | | 8.000%, 10/15/39 | | | 458 | |
| | | | BHP Billiton Finance USA Ltd., (Australia), | | | | |
| | 1,000 | | | 5.000%, 09/30/43 | | | 1,194 | |
| | 575 | | | 5.400%, 03/29/17 | | | 588 | |
| | 120 | | | 6.500%, 04/01/19 | | | 135 | |
| | 315 | | | BlueScope Steel Finance Ltd./BlueScope Steel Finance USA LLC, (Australia), 6.500%, 05/15/21 (e) | | | 335 | |
| | 200 | | | Cia Minera Milpo SAA, (Peru), Reg. S, 4.625%, 03/28/23 | | | 200 | |
| | 999 | | | Commercial Metals Co., 4.875%, 05/15/23 | | | 1,004 | |
| | | | Corp. Nacional del Cobre de Chile, (Chile), | | | | |
| | 200 | | | Reg. S, 3.875%, 11/03/21 | | | 212 | |
| | 200 | | | Reg. S, 4.500%, 08/13/23 | | | 214 | |
| | 750 | | | Reg. S, 4.500%, 09/16/25 | | | 794 | |
| | | | Freeport-McMoRan, Inc., | | | | |
| | 1,010 | | | 2.150%, 03/01/17 | | | 1,006 | |
| | 1,510 | | | 3.100%, 03/15/20 | | | 1,389 | |
| | 4,300 | | | 3.875%, 03/15/23 | | | 3,687 | |
| | 3,310 | | | 4.000%, 11/14/21 | | | 3,029 | |
| | 4,900 | | | 5.450%, 03/15/43 | | | 3,749 | |
| | 100 | | | Glencore Finance Canada Ltd., (Canada), 6.900%, 11/15/37 (e) | | | 108 | |
| | 931 | | | Kaiser Aluminum Corp., 5.875%, 05/15/24 (e) | | | 987 | |
| | 1,245 | | | Lundin Mining Corp., (Canada), 7.500%, 11/01/20 (e) | | | 1,313 | |
| | 1,510 | | | Nucor Corp., 6.400%, 12/01/37 | | | 1,911 | |
| | 660 | | | Placer Dome, Inc., (Canada), 6.450%, 10/15/35 | | | 756 | |
| | 500 | | | Rio Tinto Finance USA Ltd., (Australia), 9.000%, 05/01/19 | | | 595 | |
SEE NOTES TO FINANCIAL STATEMENTS.
| | | | | | |
| | | |
| 132 | | | | J.P. MORGAN INCOME FUNDS | | AUGUST 31, 2016 |
| | | | | | | | |
PRINCIPAL
AMOUNT | | | SECURITY DESCRIPTION | | VALUE | |
| Corporate Bonds — continued | |
| | | | Metals & Mining — continued | |
| | | | Southern Copper Corp., | | | | |
| | 510 | | | 5.875%, 04/23/45 | | | 514 | |
| | | | Steel Dynamics, Inc., | | | | |
| | 1,432 | | | 5.125%, 10/01/21 | | | 1,489 | |
| | 235 | | | 5.250%, 04/15/23 | | | 244 | |
| | 870 | | | 5.500%, 10/01/24 | | | 918 | |
| | 605 | | | 6.125%, 08/15/19 | | | 625 | |
| | 795 | | | 6.375%, 08/15/22 | | | 839 | |
| | | | Teck Resources Ltd., (Canada), | | | | |
| | 415 | | | 3.000%, 03/01/19 | | | 403 | |
| | 1,001 | | | 3.750%, 02/01/23 | | | 858 | |
| | 760 | | | 8.000%, 06/01/21 (e) | | | 823 | |
| | 434 | | | 8.500%, 06/01/24 (e) | | | 488 | |
| | | | | | | | |
| | | | | | | 57,652 | |
| | | | | | | | |
| | | | Paper & Forest Products — 0.0% (g) | |
| | | | Clearwater Paper Corp., | | | | |
| | 1,145 | | | 4.500%, 02/01/23 | | | 1,141 | |
| | 750 | | | 5.375%, 02/01/25 (e) | | | 757 | |
| | 335 | | | Hardwoods Acquisition, Inc., 7.500%, 08/01/21 (e) | | | 231 | |
| | 250 | | | Louisiana-Pacific Corp., 7.500%, 06/01/20 | | | 260 | |
| | | | | | | | |
| | | | | | | 2,389 | |
| | | | | | | | |
| | | | Total Materials | | | 109,543 | |
| | | | | | | | |
| | | | Oil, Gas & Consumable Fuels — 0.0% (g) | |
| | 200 | | | Sinopec Group Overseas Development 2015 Ltd., (United Kingdom), Reg. S, 4.100%, 04/28/45 | | | 220 | |
| | | | | | | | |
| | | | Real Estate — 0.4% | |
| | | | Equity Real Estate Investment Trusts (REITs) — 0.4% | |
| | 2,730 | | | American Tower Corp., 3.375%, 10/15/26 | | | 2,798 | |
| | | | American Tower Trust I, | | | | |
| | 723 | | | 1.551%, 03/15/18 (e) | | | 721 | |
| | 200 | | | 3.070%, 03/15/23 (e) | | | 208 | |
| | | | Boston Properties LP, | | | | |
| | 1,278 | | | 3.650%, 02/01/26 | | | 1,363 | |
| | 1,302 | | | 4.125%, 05/15/21 | | | 1,421 | |
| | 800 | | | 5.625%, 11/15/20 | | | 912 | |
| | 984 | | | Communications Sales & Leasing, Inc./CSL Capital LLC, 6.000%, 04/15/23 (e) | | | 1,030 | |
| | | | Duke Realty LP, | | | | |
| | 180 | | | 3.250%, 06/30/26 | | | 185 | |
| | 1,519 | | | 3.875%, 10/15/22 | | | 1,617 | |
| | 1,100 | | | DuPont Fabros Technology LP, 5.625%, 06/15/23 | | | 1,152 | |
| | | | | | | | |
PRINCIPAL
AMOUNT | | | SECURITY DESCRIPTION | | VALUE | |
| | | | | | | | |
| | | | Equity Real Estate Investment Trusts (REITs) — continued | |
| | | | Equinix, Inc., | | | | |
| | 1,000 | | | 4.875%, 04/01/20 | | | 1,040 | |
| | 208 | | | 5.375%, 01/01/22 | | | 222 | |
| | 2,645 | | | 5.750%, 01/01/25 | | | 2,830 | |
| | 266 | | | 5.875%, 01/15/26 | | | 290 | |
| | | | Equity Commonwealth, | | | | |
| | 1,865 | | | 5.875%, 09/15/20 | | | 2,064 | |
| | 300 | | | 6.650%, 01/15/18 | | | 311 | |
| | | | HCP, Inc., | | | | |
| | 500 | | | 3.875%, 08/15/24 | | | 512 | |
| | 564 | | | 4.250%, 11/15/23 | | | 594 | |
| | 1,236 | | | Prologis LP, 3.750%, 11/01/25 | | | 1,335 | |
| | 2,018 | | | Realty Income Corp., 3.875%, 07/15/24 | | | 2,139 | |
| | 345 | | | RHP Hotel Properties LP/RHP Finance Corp., 5.000%, 04/15/23 | | | 351 | |
| | | | Simon Property Group LP, | | | | |
| | 492 | | | 4.375%, 03/01/21 | | | 544 | |
| | 415 | | | 6.750%, 02/01/40 | | | 621 | |
| | 2,328 | | | Series 5YR, 2.500%, 07/15/21 | | | 2,396 | |
| | | | Ventas Realty LP, | | | | |
| | 448 | | | 3.500%, 02/01/25 | | | 464 | |
| | 588 | | | 3.750%, 05/01/24 | | | 617 | |
| | 304 | | | 4.125%, 01/15/26 | | | 329 | |
| | | | VEREIT Operating Partnership LP, | | | | |
| | 345 | | | 4.125%, 06/01/21 | | | 361 | |
| | 76 | | | 4.875%, 06/01/26 | | | 82 | |
| | | | | | | | |
| | | | | | | 28,509 | |
| | | | | | | | |
| | | | Real Estate Management & Development — 0.0% (g) | |
| | 200 | | | Franshion Development Ltd., (United Kingdom), Reg. S, 6.750%, 04/15/21 | | | 232 | |
| | 420 | | | Kennedy-Wilson, Inc., 5.875%, 04/01/24 | | | 424 | |
| | | | | | | | |
| | | | | | | 656 | |
| | | | | | | | |
| | | | Total Real Estate | | | 29,165 | |
| | | | | | | | |
| | | | Telecommunication Services — 1.8% | |
| | | | Diversified Telecommunication Services — 1.4% | |
| | 1,160 | | | Altice Financing S.A., (Luxembourg), 7.500%, 05/15/26 (e) | | | 1,221 | |
| | | | AT&T, Inc., | | | | |
| | 1,736 | | | 3.000%, 06/30/22 | | | 1,788 | |
| | 520 | | | 3.600%, 02/17/23 | | | 549 | |
| | 530 | | | 3.800%, 03/15/22 | | | 568 | |
| | 225 | | | 3.875%, 08/15/21 | | | 244 | |
| | 2,202 | | | 3.950%, 01/15/25 | | | 2,360 | |
| | 1,543 | | | 4.300%, 12/15/42 | | | 1,550 | |
SEE NOTES TO FINANCIAL STATEMENTS.
| | | | | | | | |
| | | |
| AUGUST 31, 2016 | | J.P. MORGAN INCOME FUNDS | | | | | 133 | |
JPMorgan Core Plus Bond Fund
SCHEDULE OF PORTFOLIO INVESTMENTS
AS OF AUGUST 31, 2016 (Unaudited) (continued)
(Amounts in U.S. Dollars, unless otherwise noted)
(Amounts in thousands)
| | | | | | | | |
PRINCIPAL
AMOUNT | | | SECURITY DESCRIPTION | | VALUE | |
| Corporate Bonds — continued | |
| | | | Diversified Telecommunication Services — continued | |
| | 466 | | | 4.350%, 06/15/45 | | | 470 | |
| | 407 | | | 4.750%, 05/15/46 | | | 435 | |
| | 4,200 | | | 4.800%, 06/15/44 | | | 4,464 | |
| | 1,030 | | | 5.350%, 09/01/40 | | | 1,177 | |
| | 610 | | | 5.500%, 02/01/18 | | | 644 | |
| | 580 | | | 6.000%, 08/15/40 | | | 703 | |
| | 1,500 | | | 6.300%, 01/15/38 | | | 1,897 | |
| | 600 | | | Bellsouth Capital Funding Corp., 7.875%, 02/15/30 | | | 826 | |
| | 2,025 | | | BellSouth LLC, 6.875%, 10/15/31 | | | 2,545 | |
| | | | CCO Holdings LLC/CCO Holdings Capital Corp., | | | | |
| | 576 | | | 5.250%, 03/15/21 | | | 601 | |
| | 1,000 | | | 5.250%, 09/30/22 | | | 1,050 | |
| | 696 | | | 5.375%, 05/01/25 (e) | | | 733 | |
| | 1,860 | | | 5.500%, 05/01/26 (e) | | | 1,969 | |
| | 167 | | | 5.750%, 09/01/23 | | | 176 | |
| | 2,877 | | | 5.750%, 02/15/26 (e) | | | 3,078 | |
| | 3,800 | | | 5.875%, 04/01/24 (e) | | | 4,095 | |
| | 592 | | | 5.875%, 05/01/27 (e) | | | 634 | |
| | 655 | | | 6.625%, 01/31/22 | | | 689 | |
| | 1,179 | | | Cincinnati Bell, Inc., 8.375%, 10/15/20 | | | 1,220 | |
| | | | Deutsche Telekom International Finance B.V., (Netherlands), | | | | |
| | 100 | | | 6.750%, 08/20/18 | | | 111 | |
| | 1,000 | | | 8.750%, 06/15/30 | | | 1,563 | |
| | 11,744 | | | Embarq Corp., 7.995%, 06/01/36 | | | 12,177 | |
| | | | Frontier Communications Corp., | | | | |
| | 245 | | | 6.250%, 09/15/21 | | | 239 | |
| | 685 | | | 7.125%, 03/15/19 | | | 738 | |
| | 205 | | | 8.125%, 10/01/18 | | | 226 | |
| | 2,150 | | | 8.500%, 04/15/20 | | | 2,319 | |
| | 1,090 | | | 9.000%, 08/15/31 | | | 1,060 | |
| | 3,934 | | | 9.250%, 07/01/21 | | | 4,259 | |
| | 1,139 | | | 10.500%, 09/15/22 | | | 1,239 | |
| | 2,562 | | | 11.000%, 09/15/25 | | | 2,767 | |
| | 1,000 | | | GTE Corp., 6.940%, 04/15/28 | | | 1,308 | |
| | 1,120 | | | Intelsat Jackson Holdings S.A., (Luxembourg), 8.000%, 02/15/24 (e) | | | 1,126 | |
| | 255 | | | Intelsat Luxembourg S.A., (Luxembourg), 7.750%, 06/01/21 | | | 75 | |
| | 272 | | | Level 3 Communications, Inc., 5.750%, 12/01/22 | | | 284 | |
| | | | Level 3 Financing, Inc., | | | | |
| | 3,327 | | | 5.250%, 03/15/26 (e) | | | 3,452 | |
| | 2,162 | | | 5.375%, 01/15/24 | | | 2,267 | |
| | | | | | | | |
PRINCIPAL
AMOUNT | | | SECURITY DESCRIPTION | | VALUE | |
| | | | | | | | |
| | | | Diversified Telecommunication Services — continued | |
| | 763 | | | Nippon Telegraph & Telephone Corp., (Japan), 1.400%, 07/18/17 | | | 765 | |
| | 1,190 | | | Qwest Capital Funding, Inc., 7.750%, 02/15/31 | | | 1,147 | |
| | 330 | | | Qwest Corp., 7.250%, 09/15/25 | | | 357 | |
| | 400 | | | Sprint Capital Corp., 8.750%, 03/15/32 | | | 396 | |
| | 190 | | | Telecom Italia Capital S.A., (Luxembourg), 7.721%, 06/04/38 | | | 209 | |
| | | | Telefonica Emisiones S.A.U., (Spain), | | | | |
| | 82 | | | 5.134%, 04/27/20 | | | 91 | |
| | 138 | | | 5.462%, 02/16/21 | | | 157 | |
| | 1,250 | | | UPCB Finance IV Ltd., (Cayman Islands), 5.375%, 01/15/25 (e) | | | 1,284 | |
| | | | Verizon Communications, Inc., | | | | |
| | 776 | | | 2.625%, 08/15/26 | | | 768 | |
| | 590 | | | 3.500%, 11/01/24 | | | 633 | |
| | 1,300 | | | 3.850%, 11/01/42 | | | 1,258 | |
| | 2,102 | | | 4.150%, 03/15/24 | | | 2,334 | |
| | 482 | | | 4.400%, 11/01/34 | | | 512 | |
| | 1,868 | | | 4.500%, 09/15/20 | | | 2,061 | |
| | 646 | | | 4.522%, 09/15/48 | | | 685 | |
| | 2,071 | | | 4.672%, 03/15/55 | | | 2,154 | |
| | 4,611 | | | 4.862%, 08/21/46 | | | 5,127 | |
| | 257 | | | 5.012%, 08/21/54 | | | 282 | |
| | 1,152 | | | 5.150%, 09/15/23 | | | 1,346 | |
| | 350 | | | Virgin Media Finance plc, (United Kingdom), 5.750%, 01/15/25 (e) | | | 356 | |
| | 395 | | | Virgin Media Secured Finance plc, (United Kingdom), 5.250%, 01/15/26 (e) | | | 404 | |
| | 1,287 | | | Wind Acquisition Finance S.A., (Luxembourg), 4.750%, 07/15/20 (e) | | | 1,303 | |
| | | | | | | | |
| | | | | | | 94,525 | |
| | | | | | | | |
| | | | Wireless Telecommunication Services — 0.4% | |
| | | | America Movil S.A.B. de C.V., (Mexico), | | | | |
| | 732 | | | 2.375%, 09/08/16 | | | 728 | |
| | 1,266 | | | 3.125%, 07/16/22 | | | 1,311 | |
| | 300 | | | 6.125%, 03/30/40 | | | 376 | |
| | 200 | | | Bharti Airtel International Netherlands B.V., (Netherlands), Reg. S, 5.125%, 03/11/23 | | | 220 | |
| | | | Crown Castle Towers LLC, | | | | |
| | 735 | | | 3.663%, 05/15/45 (e) | | | 774 | |
| | 1,220 | | | 6.113%, 01/15/20 (e) | | | 1,354 | |
| | 240 | | | Rogers Communications, Inc., (Canada), 6.800%, 08/15/18 | | | 264 | |
| | 3,029 | | | SoftBank Group Corp., (Japan), 4.500%, 04/15/20 (e) | | | 3,150 | |
SEE NOTES TO FINANCIAL STATEMENTS.
| | | | | | |
| | | |
| 134 | | | | J.P. MORGAN INCOME FUNDS | | AUGUST 31, 2016 |
| | | | | | | | |
PRINCIPAL
AMOUNT | | | SECURITY DESCRIPTION | | VALUE | |
| Corporate Bonds — continued | |
| | | | Wireless Telecommunication Services — continued | |
| | | | Sprint Communications, Inc., | | | | |
| | 2,050 | | | 7.000%, 03/01/20 (e) | | | 2,199 | |
| | 900 | | | 7.000%, 08/15/20 | | | 886 | |
| | 1,669 | | | 9.000%, 11/15/18 (e) | | | 1,838 | |
| | | | Sprint Corp., | | | | |
| | 110 | | | 7.125%, 06/15/24 | | | 103 | |
| | 88 | | | 7.250%, 09/15/21 | | | 87 | |
| | 189 | | | 7.875%, 09/15/23 | | | 183 | |
| | | | T-Mobile USA, Inc., | | | | |
| | 277 | | | 5.250%, 09/01/18 | | | 283 | |
| | 806 | | | 6.000%, 03/01/23 | | | 854 | |
| | 418 | | | 6.000%, 04/15/24 | | | 445 | |
| | 867 | | | 6.125%, 01/15/22 | | | 915 | |
| | 5,676 | | | 6.250%, 04/01/21 | | | 5,924 | |
| | 1,460 | | | 6.375%, 03/01/25 | | | 1,569 | |
| | 188 | | | 6.464%, 04/28/19 | | | 192 | |
| | 146 | | | 6.500%, 01/15/24 | | | 157 | |
| | 662 | | | 6.500%, 01/15/26 | | | 724 | |
| | 305 | | | 6.625%, 11/15/20 | | | 315 | |
| | 1,294 | | | 6.625%, 04/01/23 | | | 1,381 | |
| | 265 | | | 6.633%, 04/28/21 | | | 278 | |
| | 323 | | | 6.731%, 04/28/22 | | | 340 | |
| | 159 | | | 6.836%, 04/28/23 | | | 170 | |
| | | | Vodafone Group plc, (United Kingdom), | | | | |
| | 587 | | | 1.500%, 02/19/18 | | | 587 | |
| | 573 | | | 1.625%, 03/20/17 | | | 574 | |
| | | | | | | | |
| | | | | | | 28,181 | |
| | | | | | | | |
| | | | Total Telecommunication Services | | | 122,706 | |
| | | | | | | | |
| | | | Utilities — 1.5% | |
| | | | Electric Utilities — 0.7% | |
| | | | Alabama Power Co., | | | | |
| | 234 | | | 3.750%, 03/01/45 | | | 248 | |
| | 1,250 | | | 5.500%, 03/15/41 | | | 1,614 | |
| | 891 | | | 6.125%, 05/15/38 | | | 1,208 | |
| | 589 | | | Arizona Public Service Co., 2.200%, 01/15/20 | | | 598 | |
| | 1,016 | | | Baltimore Gas & Electric Co., 2.800%, 08/15/22 | | | 1,061 | |
| | 200 | | | Comision Federal de Electricidad, (Mexico), Reg. S, 5.750%, 02/14/42 | | | 220 | |
| | | | DTE Electric Co., | | | | |
| | 340 | | | 3.900%, 06/01/21 | | | 373 | |
| | 381 | | | 3.950%, 06/15/42 | | | 425 | |
| | | | Duke Energy Carolinas LLC, | | | | |
| | 3,005 | | | 4.300%, 06/15/20 | | | 3,319 | |
| | | | | | | | |
PRINCIPAL
AMOUNT | | | SECURITY DESCRIPTION | | VALUE | |
| | | | | | | | |
| | | | Electric Utilities — continued | |
| | 200 | | | 5.250%, 01/15/18 | | | 211 | |
| | 1,100 | | | 6.050%, 04/15/38 | | | 1,517 | |
| | 361 | | | Duke Energy Corp., 2.650%, 09/01/26 | | | 359 | |
| | 115 | | | Duke Energy Florida LLC, 5.650%, 06/15/18 | | | 124 | |
| | 280 | | | Duke Energy Indiana LLC, 3.750%, 07/15/20 | | | 302 | |
| | | | Duke Energy Progress LLC, | | | | |
| | 607 | | | 2.800%, 05/15/22 | | | 635 | |
| | 200 | | | 3.250%, 08/15/25 | | | 215 | |
| | 305 | | | 4.100%, 05/15/42 | | | 339 | |
| | 90 | | | 5.300%, 01/15/19 | | | 98 | |
| | 500 | | | 6.300%, 04/01/38 | | | 707 | |
| | 526 | | | Electricite de France S.A., (France), 2.150%, 01/22/19 (e) | | | 533 | |
| | 1,200 | | | Enel Finance International N.V., (Netherlands), 5.125%, 10/07/19 (e) | | | 1,318 | |
| | 782 | | | Entergy Corp., 2.950%, 09/01/26 | | | 789 | |
| | | | Eskom Holdings SOC Ltd., (South Africa), | | | | |
| | 200 | | | Reg. S, 6.750%, 08/06/23 | | | 198 | |
| | 300 | | | Reg. S, 7.125%, 02/11/25 | | | 297 | |
| | 1,355 | | | Exelon Corp., 4.450%, 04/15/46 | | | 1,506 | |
| | 140 | | | Georgia Power Co., 5.950%, 02/01/39 | | | 186 | |
| | 200 | | | Hrvatska Elektroprivreda, (Croatia), Reg. S, 5.875%, 10/23/22 | | | 217 | |
| | | | Hydro-Quebec, (Canada), | | | | |
| | 1,028 | | | 9.400%, 02/01/21 | | | 1,335 | |
| | 1,000 | | | Series HK, 9.375%, 04/15/30 | | | 1,685 | |
| | 842 | | | Series HY, 8.400%, 01/15/22 | | | 1,099 | |
| | 453 | | | John Sevier Combined Cycle Generation LLC, 4.626%, 01/15/42 | | | 531 | |
| | 988 | | | Massachusetts Electric Co., 5.900%, 11/15/39 (e) | | | 1,249 | |
| | | | MidAmerican Energy Co., | | | | |
| | 1,046 | | | 3.500%, 10/15/24 | | | 1,142 | |
| | 860 | | | 5.300%, 03/15/18 | | | 913 | |
| | | | Nevada Power Co., | | | | |
| | 446 | | | 5.375%, 09/15/40 | | | 555 | |
| | 600 | | | 7.125%, 03/15/19 | | | 685 | |
| | 398 | | | NextEra Energy Capital Holdings, Inc., 2.400%, 09/15/19 | | | 405 | |
| | 300 | | | Niagara Mohawk Power Corp., 4.881%, 08/15/19 (e) | | | 328 | |
| | | | Northern States Power Co., | | | | |
| | 173 | | | 5.350%, 11/01/39 | | | 227 | |
| | 765 | | | 6.250%, 06/01/36 | | | 1,074 | |
| | | | Pacific Gas & Electric Co., | | | | |
| | 1,000 | | | 3.250%, 06/15/23 | | | 1,063 | |
SEE NOTES TO FINANCIAL STATEMENTS.
| | | | | | | | |
| | | |
| AUGUST 31, 2016 | | J.P. MORGAN INCOME FUNDS | | | | | 135 | |
JPMorgan Core Plus Bond Fund
SCHEDULE OF PORTFOLIO INVESTMENTS
AS OF AUGUST 31, 2016 (Unaudited) (continued)
(Amounts in U.S. Dollars, unless otherwise noted)
(Amounts in thousands)
| | | | | | | | |
PRINCIPAL
AMOUNT | | | SECURITY DESCRIPTION | | VALUE | |
| Corporate Bonds — continued | |
| | | | Electric Utilities — continued | |
| | 898 | | | 3.500%, 06/15/25 | | | 977 | |
| | 214 | | | 3.750%, 08/15/42 | | | 223 | |
| | 267 | | | 4.500%, 12/15/41 | | | 309 | |
| | 1,010 | | | 5.625%, 11/30/17 | | | 1,064 | |
| | | | PacifiCorp, | | | | |
| | 700 | | | 3.850%, 06/15/21 | | | 764 | |
| | 880 | | | 5.750%, 04/01/37 | | | 1,168 | |
| | 250 | | | Series F, 7.240%, 08/16/23 | | | 316 | |
| | | | PECO Energy Co., | | | | |
| | 880 | | | 2.375%, 09/15/22 | | | 897 | |
| | 1,880 | | | 5.350%, 03/01/18 | | | 1,992 | |
| | 200 | | | Perusahaan Listrik Negara PT, (Indonesia), Reg. S, 5.500%, 11/22/21 | | | 223 | |
| | 360 | | | Potomac Electric Power Co., 6.500%, 11/15/37 | | | 516 | |
| | 929 | | | PPL Electric Utilities Corp., 2.500%, 09/01/22 | | | 949 | |
| | | | Public Service Co. of Colorado, | | | | |
| | 312 | | | 2.250%, 09/15/22 | | | 319 | |
| | 198 | | | 3.200%, 11/15/20 | | | 210 | |
| | 35 | | | 6.500%, 08/01/38 | | | 51 | |
| | 202 | | | Public Service Co. of New Hampshire, 3.500%, 11/01/23 | | | 216 | |
| | | | Public Service Co. of Oklahoma, | | | | |
| | 88 | | | 5.150%, 12/01/19 | | | 97 | |
| | 1,100 | | | Series G, 6.625%, 11/15/37 | | | 1,450 | |
| | | | Public Service Electric & Gas Co., | | | | |
| | 416 | | | 5.375%, 11/01/39 | | | 542 | |
| | 155 | | | Series I, 1.800%, 06/01/19 | | | 157 | |
| | 104 | | | South Carolina Electric & Gas Co., 4.500%, 06/01/64 | | | 111 | |
| | | | Southern California Edison Co., | | | | |
| | 674 | | | 1.845%, 02/01/22 | | | 675 | |
| | 450 | | | Series 06-E, 5.550%, 01/15/37 | | | 589 | |
| | 285 | | | Series 08-A, 5.950%, 02/01/38 | | | 393 | |
| | 292 | | | Southern Co. (The), 1.950%, 09/01/16 | | | 292 | |
| | 842 | | | Southwestern Electric Power Co., Series J, 3.900%, 04/01/45 | | | 855 | |
| | 120 | | | Union Electric Co., 8.450%, 03/15/39 | | | 204 | |
| | | | Virginia Electric & Power Co., | | | | |
| | 900 | | | 2.750%, 03/15/23 | | | 932 | |
| | 490 | | | 3.450%, 02/15/24 | | | 533 | |
| | 235 | | | 6.350%, 11/30/37 | | | 329 | |
| | 670 | | | 8.875%, 11/15/38 | | | 1,146 | |
| | 73 | | | Wisconsin Electric Power Co., 2.950%, 09/15/21 | | | 77 | |
| | | | | | | | |
PRINCIPAL
AMOUNT | | | SECURITY DESCRIPTION | | VALUE | |
| | | | | | | | |
| | | | Electric Utilities — continued | |
| | | | Xcel Energy, Inc., | | | | |
| | 985 | | | 3.300%, 06/01/25 | | | 1,042 | |
| | 36 | | | 4.800%, 09/15/41 | | | 43 | |
| | | | | | | | |
| | | | | | | 50,569 | |
| | | | | | | | |
| | | | Gas Utilities — 0.2% | |
| | 405 | | | AmeriGas Finance LLC/AmeriGas Finance Corp., 7.000%, 05/20/22 | | | 431 | |
| | | | AmeriGas Partners LP/AmeriGas Finance Corp., | | | | |
| | 740 | | | 5.625%, 05/20/24 | | | 792 | |
| | 740 | | | 5.875%, 08/20/26 | | | 794 | |
| | 582 | | | Atmos Energy Corp., 4.150%, 01/15/43 | | | 639 | |
| | 369 | | | Boston Gas Co., 4.487%, 02/15/42 (e) | | | 411 | |
| | 570 | | | CenterPoint Energy Resources Corp., 6.625%, 11/01/37 | | | 705 | |
| | 470 | | | Dominion Gas Holdings LLC, 2.800%, 11/15/20 | | | 485 | |
| | 793 | | | KeySpan Gas East Corp., 2.742%, 08/15/26 (e) | | | 805 | |
| | | | Sabine Pass Liquefaction LLC, | | | | |
| | 2,213 | | | 5.625%, 04/15/23 | | | 2,329 | |
| | 578 | | | 5.625%, 03/01/25 | | | 611 | |
| | 905 | | | 5.625%, 02/01/21 | | | 951 | |
| | 2,500 | | | 5.750%, 05/15/24 | | | 2,656 | |
| | 830 | | | 5.875%, 06/30/26 (e) | | | 888 | |
| | 1,071 | | | 6.250%, 03/15/22 | | | 1,146 | |
| | 1,100 | | | Southern California Gas Co., Series TT, 2.600%, 06/15/26 | | | 1,125 | |
| | 1,575 | | | Suburban Propane Partners LP/Suburban Energy Finance Corp., 5.500%, 06/01/24 | | | 1,591 | |
| | | | | | | | |
| | | | | | | 16,359 | |
| | | | | | | | |
| | | | Independent Power & Renewable Electricity
Producers — 0.4% | |
| | | | AES Corp., | | | | |
| | 240 | | | 4.875%, 05/15/23 | | | 243 | |
| | 275 | | | 5.500%, 03/15/24 | | | 285 | |
| | 615 | | | 5.500%, 04/15/25 | | | 631 | |
| | 500 | | | 6.000%, 05/15/26 | | | 531 | |
| | 3,500 | | | 7.375%, 07/01/21 | | | 4,016 | |
| | 486 | | | VAR, 3.842%, 06/01/19 | | | 486 | |
| | | | Calpine Corp., | | | | |
| | 950 | | | 5.250%, 06/01/26 (e) | | | 962 | |
| | 2,066 | | | 5.875%, 01/15/24 (e) | | | 2,185 | |
| | 1,000 | | | 6.000%, 01/15/22 (e) | | | 1,048 | |
| | 960 | | | Exelon Generation Co. LLC, 2.950%, 01/15/20 | | | 987 | |
| | 2,620 | | | GenOn Energy, Inc., 9.875%, 10/15/20 | | | 1,847 | |
SEE NOTES TO FINANCIAL STATEMENTS.
| | | | | | |
| | | |
| 136 | | | | J.P. MORGAN INCOME FUNDS | | AUGUST 31, 2016 |
| | | | | | | | |
PRINCIPAL
AMOUNT | | | SECURITY DESCRIPTION | | VALUE | |
| Corporate Bonds — continued | |
| | | | Independent Power & Renewable Electricity
Producers — continued | |
| | | | NRG Energy, Inc., | | | | |
| | 200 | | | 6.250%, 07/15/22 | | | 204 | |
| | 425 | | | 6.250%, 05/01/24 | | | 422 | |
| | 4,143 | | | 6.625%, 03/15/23 | | | 4,226 | |
| | 1,173 | | | 6.625%, 01/15/27 (e) | | | 1,175 | |
| | 530 | | | 7.250%, 05/15/26 (e) | | | 550 | |
| | 1,032 | | | NRG REMA LLC, Series B, 9.237%, 07/02/17 | | | 919 | |
| | 440 | | | NRG Yield Operating LLC, 5.000%, 09/15/26 (e) | | | 440 | |
| | 1,121 | | | PSEG Power LLC, 4.150%, 09/15/21 | | | 1,198 | |
| | 491 | | | Southern Power Co., 1.850%, 12/01/17 | | | 494 | |
| | | | Talen Energy Supply LLC, | | | | |
| | 1,763 | | | 4.625%, 07/15/19 (e) | | | 1,657 | |
| | 937 | | | 6.500%, 06/01/25 | | | 804 | |
| | | | TerraForm Power Operating LLC, | | | | |
| | 354 | | | 5.875%, 02/01/23 (e) | | | 356 | |
| | 188 | | | 6.125%, 06/15/25 (e) | | | 191 | |
| | | | | | | | |
| | | | | | | 25,857 | |
| | | | | | | | |
| | | | Multi-Utilities — 0.2% | |
| | 1,037 | | | Berkshire Hathaway Energy Co., 3.500%, 02/01/25 | | | 1,116 | |
| | | | Consolidated Edison Co. of New York, Inc., | | | | |
| | 400 | | | Series 06-E, 5.700%, 12/01/36 | | | 518 | |
| | 300 | | | Series 09-C, 5.500%, 12/01/39 | | | 388 | |
| | | | Consumers Energy Co., | | | | |
| | 491 | | | 4.350%, 08/31/64 | | | 572 | |
| | 925 | | | 6.700%, 09/15/19 | | | 1,068 | |
| | | | Dominion Resources, Inc., | | | | |
| | 400 | | | 7.000%, 06/15/38 | | | 559 | |
| | 803 | | | Series C, 2.000%, 08/15/21 | | | 805 | |
| | 46 | | | Series C, 4.900%, 08/01/41 | | | 53 | |
| | 785 | | | Series F, 5.250%, 08/01/33 | | | 900 | |
| | 434 | | | DTE Energy Co., 2.400%, 12/01/19 | | | 443 | |
| | 585 | | | NiSource Finance Corp., 6.400%, 03/15/18 | | | 626 | |
| | 555 | | | NRG Yield Operating LLC, 5.375%, 08/15/24 | | | 579 | |
| | | | San Diego Gas & Electric Co., | | | | |
| | 249 | | | 4.500%, 08/15/40 | | | 297 | |
| | 685 | | | 6.000%, 06/01/26 | | | 894 | |
| | 500 | | | 6.000%, 06/01/39 | | | 699 | |
| | | | Sempra Energy, | | | | |
| | 406 | | | 3.550%, 06/15/24 | | | 430 | |
| | 255 | | | 6.150%, 06/15/18 | | | 275 | |
| | 589 | | | 9.800%, 02/15/19 | | | 701 | |
| | | | | | | | |
PRINCIPAL
AMOUNT | | | SECURITY DESCRIPTION | | VALUE | |
| | | | | | | | |
| | | | Multi-Utilities — continued | |
| | 493 | | | Southern Co. Gas Capital Corp., 3.250%, 06/15/26 | | | 508 | |
| | | | | | | | |
| | | | | | | 11,431 | |
| | | | | | | | |
| | | | Water Utilities — 0.0% (g) | |
| | | | American Water Capital Corp., | | | | |
| | 622 | | | Class C, 3.400%, 03/01/25 | | | 671 | |
| | 680 | | | 3.850%, 03/01/24 | | | 752 | |
| | | | | | | | |
| | | | | | | 1,423 | |
| | | | | | | | |
| | | | Total Utilities | | | 105,639 | |
| | | | | | | | |
| | | | Total Corporate Bonds
(Cost $1,639,144) | | | 1,710,323 | |
| | | | | | | | |
| Foreign Government Securities — 1.0% | | | | |
| | 540 | | | Arab Republic of Egypt, (Egypt), Reg. S, 5.875%, 06/11/25 | | | 509 | |
| | 200 | | | Armenia International Bond, (Armenia), Reg. S, 7.150%, 03/26/25 | | | 214 | |
| | | | Brazil Notas do Tesouro Nacional, (Brazil), | | | | |
| BRL | 2,740 | | | Series F, 10.000%, 01/01/23 | | | 777 | |
| BRL | 2,800 | | | Series F, 10.000%, 01/01/25 | | | 782 | |
| | 200 | | | Export Credit Bank of Turkey, (Turkey), Reg. S, 5.375%, 11/04/16 | | | 201 | |
| | | | Federative Republic of Brazil, (Brazil), | | | | |
| | 200 | | | 4.875%, 01/22/21 | | | 213 | |
| | 200 | | | 5.000%, 01/27/45 | | | 186 | |
| BRL | 432 | | | 6.000%, 04/07/26 | | | 482 | |
| | — | (h) | | 6.000%, 04/07/26 | | | — | (h) |
| | 220 | | | 7.125%, 01/20/37 | | | 261 | |
| | 1,230 | | | 8.250%, 01/20/34 | | | 1,607 | |
| | | | Government of Dominican Republic, (Dominican Republic), | | | | |
| | 300 | | | Reg. S, 5.500%, 01/27/25 | | | 318 | |
| | 140 | | | Reg. S, 5.875%, 04/18/24 | | | 150 | |
| | 100 | | | Reg. S, 6.600%, 01/28/24 | | | 112 | |
| | 450 | | | Reg. S, 6.875%, 01/29/26 | | | 520 | |
| | 950 | | | Reg. S, 7.450%, 04/30/44 | | | 1,140 | |
| | | | Government of Jamaica, (Jamaica), | | | | |
| | 400 | | | 6.750%, 04/28/28 | | | 454 | |
| | 200 | | | 7.875%, 07/28/45 | | | 233 | |
| | 240 | | | 8.000%, 03/15/39 | | | 282 | |
| | 100 | | | 9.250%, 10/17/25 | | | 129 | |
| | | | Government of Mongolia, (Mongolia), | | | | |
| | 200 | | | Reg. S, 5.125%, 12/05/22 | | | 168 | |
| | 200 | | | Reg. S, 10.875%, 04/06/21 | | | 200 | |
| | 200 | | | Instituto Costarricense de Electricidad, (Costa Rica), Reg. S, 6.375%, 05/15/43 | | | 173 | |
SEE NOTES TO FINANCIAL STATEMENTS.
| | | | | | | | |
| | | |
| AUGUST 31, 2016 | | J.P. MORGAN INCOME FUNDS | | | | | 137 | |
JPMorgan Core Plus Bond Fund
SCHEDULE OF PORTFOLIO INVESTMENTS
AS OF AUGUST 31, 2016 (Unaudited) (continued)
(Amounts in U.S. Dollars, unless otherwise noted)
(Amounts in thousands)
| | | | | | | | |
PRINCIPAL
AMOUNT | | | SECURITY DESCRIPTION | | VALUE | |
| Foreign Government Securities — continued | |
| | 2,000 | | | Israel Government AID Bond, (Israel), 5.500%, 09/18/33 | | | 2,835 | |
| | 200 | | | Kingdom of Jordan, (Jordan), 6.125%, 01/29/26 (e) | | | 216 | |
| | 200 | | | Kingdom of Morocco, (Morocco), Reg. S, 4.250%, 12/11/22 | | | 214 | |
| | 1,250 | | | Province of Manitoba Canada, (Canada), 2.125%, 06/22/26 | | | 1,255 | |
| | 655 | | | Province of Nova Scotia, (Canada), 9.250%, 03/01/20 | | | 808 | |
| | | | Province of Quebec, (Canada), | | | | |
| | 300 | | | Series A, 6.350%, 01/30/26 | | | 397 | |
| | 2,220 | | | Series NN, 7.125%, 02/09/24 | | | 2,930 | |
| | | | Provincia de Buenos Aires, (Argentina), | | | | |
| | 200 | | | Reg. S, 9.375%, 09/14/18 | | | 219 | |
| | 350 | | | Reg. S, 9.950%, 06/09/21 | | | 396 | |
| | AUD 1,400 | | | Queensland Treasury Corp., (Australia), Reg. S, Series 18, 6.000%, 02/21/18 | | | 1,118 | |
| | 400 | | | Republic of Angola, (Angola), Reg. S, 9.500%, 11/12/25 | | | 398 | |
| | 188 | | | Republic of Angola Via Northern Lights III B.V., (Netherlands), Reg. S, 7.000%, 08/16/19 | | | 188 | |
| | | | Republic of Argentina, (Argentina), | | | | |
| | 210 | | | SUB, 2.500%, 12/31/38 | | | 145 | |
| | 350 | | | Reg. S, 6.250%, 04/22/19 (e) | | | 373 | |
| | 157 | | | 6.875%, 04/22/21 (e) | | | 170 | |
| | 550 | | | Reg. S, 6.875%, 04/22/21 | | | 597 | |
| | 400 | | | 7.125%, 07/06/36 (e) | | | 425 | |
| | 500 | | | 7.500%, 04/22/26 (e) | | | 556 | |
| | 150 | | | Reg. S, 7.625%, 04/22/46 | | | 169 | |
| | 294 | | | 8.280%, 12/31/33 | | | 337 | |
| | 170 | | | Series NY, SUB, 2.500%, 12/31/38 | | | 117 | |
| | 140 | | | Series NY, 8.280%, 12/31/33 | | | 161 | |
| | 440 | | | Republic of Azerbaijan, (Azerbaijan), Reg. S, 4.750%, 03/18/24 | | | 451 | |
| | 100 | | | Republic of Belarus, (Belarus), Reg. S, 8.950%, 01/26/18 | | | 105 | |
| | 81 | | | Republic of Belize, (Belize), Reg. S, SUB, 5.000%, 02/20/38 | | | 45 | |
| | | | Republic of Cameroon, (Cameroon), | | | | |
| | 200 | | | 9.500%, 11/19/25 (e) | | | 221 | |
| | 650 | | | Reg. S, 9.500%, 11/19/25 | | | 717 | |
| | | | Republic of Colombia, (Colombia), | | | | |
| | 200 | | | 2.625%, 03/15/23 | | | 196 | |
| | 599 | | | 5.000%, 06/15/45 | | | 649 | |
| | 200 | | | 5.625%, 02/26/44 | | | 231 | |
| | 150 | | | 6.125%, 01/18/41 | | | 181 | |
| | | | | | | | |
PRINCIPAL
AMOUNT | | | SECURITY DESCRIPTION | | VALUE | |
| | | | | | | | |
| | 140 | | | 7.375%, 09/18/37 | | | 188 | |
| | 240 | | | 8.125%, 05/21/24 | | | 316 | |
| | 370 | | | 10.375%, 01/28/33 | | | 586 | |
| | | | Republic of Costa Rica, (Costa Rica), | | | | |
| | 200 | | | Reg. S, 4.250%, 01/26/23 | | | 197 | |
| | 730 | | | Reg. S, 7.000%, 04/04/44 | | | 796 | |
| | 200 | | | Reg. S, 7.158%, 03/12/45 | | | 220 | |
| | | | Republic of Croatia, (Croatia), | | | | |
| | 700 | | | Reg. S, 5.500%, 04/04/23 | | | 765 | |
| | 200 | | | 6.375%, 03/24/21 (e) | | | 222 | |
| | 100 | | | Reg. S, 6.625%, 07/14/20 | | | 111 | |
| | 200 | | | Reg. S, 6.750%, 11/05/19 | | | 220 | |
| | | | Republic of Ecuador, (Ecuador), | | | | |
| | 950 | | | Reg. S, 7.950%, 06/20/24 | | | 832 | |
| | 400 | | | 10.500%, 03/24/20 (e) | | | 407 | |
| | 200 | | | 10.750%, 03/28/22 (e) | | | 205 | |
| | | | Republic of El Salvador, (El Salvador), | | | | |
| | 120 | | | Reg. S, 5.875%, 01/30/25 | | | 121 | |
| | 120 | | | Reg. S, 6.375%, 01/18/27 | | | 122 | |
| | 190 | | | Reg. S, 7.650%, 06/15/35 | | | 201 | |
| | 230 | | | Reg. S, 7.750%, 01/24/23 | | | 255 | |
| | 190 | | | Reg. S, 8.250%, 04/10/32 | | | 212 | |
| | 400 | | | Republic of Gabonese, (Gabon), Reg. S, 6.375%, 12/12/24 | | | 371 | |
| | | | Republic of Ghana, (Ghana), | | | | |
| | 200 | | | Reg. S, 8.125%, 01/18/26 | | | 184 | |
| | 200 | | | Reg. S, 10.750%, 10/14/30 | | | 226 | |
| | 400 | | | Republic of Honduras, (Honduras), Reg. S, 8.750%, 12/16/20 | | | 462 | |
| | | | Republic of Hungary, (Hungary), | | | | |
| | 600 | | | 5.375%, 02/21/23 | | | 679 | |
| | 370 | | | 5.375%, 03/25/24 | | | 424 | |
| | 340 | | | 5.750%, 11/22/23 | | | 396 | |
| | | | Republic of Indonesia, (Indonesia), | | | | |
| | 400 | | | Reg. S, 4.125%, 01/15/25 | | | 425 | |
| | 100 | | | Reg. S, 5.875%, 03/13/20 | | | 113 | |
| | 200 | | | Reg. S, 5.875%, 01/15/24 | | | 236 | |
| | 230 | | | Reg. S, 5.950%, 01/08/46 | | | 291 | |
| | 200 | | | Reg. S, 6.625%, 02/17/37 | | | 262 | |
| | 400 | | | Reg. S, 6.750%, 01/15/44 | | | 548 | |
| | 250 | | | Republic of Iraq, (Iraq), Reg. S, 5.800%, 01/15/28 | | | 202 | |
| | | | Republic of Ivory Coast, (Ivory Coast), | | | | |
| | 300 | | | Reg. S, 5.375%, 07/23/24 | | | 299 | |
| | 198 | | | Reg. S, SUB, 5.750%, 12/31/32 | | | 197 | |
| | 400 | | | Reg. S, 6.375%, 03/03/28 | | | 418 | |
SEE NOTES TO FINANCIAL STATEMENTS.
| | | | | | |
| | | |
| 138 | | | | J.P. MORGAN INCOME FUNDS | | AUGUST 31, 2016 |
| | | | | | | | |
PRINCIPAL
AMOUNT | | | SECURITY DESCRIPTION | | VALUE | |
| Foreign Government Securities — continued | |
| | | | Republic of Kazakhstan, (Kazakhstan), | | | | |
| | 200 | | | Reg. S, 3.875%, 10/14/24 | | | 207 | |
| | 200 | | | Reg. S, 5.125%, 07/21/25 | | | 225 | |
| | 240 | | | 5.125%, 07/21/25 (e) | | | 270 | |
| | 200 | | | Reg. S, 6.500%, 07/21/45 | | | 249 | |
| | 400 | | | Republic of Kenya, (Kenya), Reg. S, 6.875%, 06/24/24 | | | 392 | |
| | | | Republic of Lebanon, (Lebanon), | | | | |
| | 150 | | | 5.450%, 11/28/19 | | | 147 | |
| | 400 | | | Reg. S, 6.375%, 03/09/20 | | | 404 | |
| | 350 | | | Reg. S, 6.600%, 11/27/26 | | | 346 | |
| | 440 | | | Reg. S, 6.650%, 02/26/30 | | | 431 | |
| | 635 | | | Reg. S, 8.250%, 04/12/21 | | | 688 | |
| | 250 | | | 9.000%, 03/20/17 | | | 256 | |
| | | | Republic of Lithuania, (Lithuania), | | | | |
| | 300 | | | Reg. S, 6.125%, 03/09/21 | | | 353 | |
| | 200 | | | Reg. S, 6.625%, 02/01/22 | | | 246 | |
| | 200 | | | Republic of Namibia, (Namibia), Reg. S, 5.500%, 11/03/21 | | | 216 | |
| | 400 | | | Republic of Oman, (Oman), 4.750%, 06/15/26 (e) | | | 413 | |
| | | | Republic of Pakistan, (Pakistan), | | | | |
| | 200 | | | Reg. S, 7.250%, 04/15/19 | | | 213 | |
| | 200 | | | Reg. S, 8.250%, 04/15/24 | | | 225 | |
| | | | Republic of Panama, (Panama), | | | | |
| | 600 | | | 3.875%, 03/17/28 | | | 658 | |
| | 400 | | | 4.000%, 09/22/24 | | | 439 | |
| | 430 | | | 6.700%, 01/26/36 | | | 598 | |
| | 220 | | | 8.875%, 09/30/27 | | | 332 | |
| | 226 | | | 9.375%, 04/01/29 | | | 355 | |
| | | | Republic of Paraguay, (Paraguay), | | | | |
| | 400 | | | Reg. S, 4.625%, 01/25/23 | | | 425 | |
| | 400 | | | 5.000%, 04/15/26 (e) | | | 439 | |
| | | | Republic of Peru, (Peru), | | | | |
| | 160 | | | 4.125%, 08/25/27 | | | 182 | |
| | 620 | | | 5.625%, 11/18/50 | | | 817 | |
| | 373 | | | 8.750%, 11/21/33 | | | 606 | |
| | | | Republic of Philippines, (Philippines), | | | | |
| | 200 | | | 3.700%, 03/01/41 | | | 227 | |
| | 200 | | | 4.200%, 01/21/24 | | | 229 | |
| | 590 | | | 7.750%, 01/14/31 | | | 934 | |
| | 100 | | | 9.500%, 02/02/30 | | | 174 | |
| | 310 | | | 10.625%, 03/16/25 | | | 510 | |
| | | | Republic of Poland, (Poland), | | | | |
| | 100 | | | 3.250%, 04/06/26 | | | 106 | |
| | 420 | | | 4.000%, 01/22/24 | | | 466 | |
| | | | | | | | |
PRINCIPAL
AMOUNT | | | SECURITY DESCRIPTION | | VALUE | |
| | | | | | | | |
| | 200 | | | Republic of Qatar, (Qatar), Reg. S, 4.625%, 06/02/46 | | | 221 | |
| | | | Republic of Romania, (Romania), | | | | |
| | 430 | | | Reg. S, 4.375%, 08/22/23 | | | 474 | |
| | 142 | | | Reg. S, 4.875%, 01/22/24 | | | 162 | |
| | 162 | | | Reg. S, 6.750%, 02/07/22 | | | 196 | |
| | 200 | | | Republic of Senegal, (Senegal), Reg. S, 6.250%, 07/30/24 | | | 204 | |
| | | | Republic of Serbia, (Serbia), | | | | |
| | 300 | | | 5.250%, 11/21/17 (e) | | | 310 | |
| | 200 | | | Reg. S, 7.250%, 09/28/21 | | | 232 | |
| | | | Republic of South Africa, (South Africa), | | | | |
| | 200 | | | 4.665%, 01/17/24 | | | 207 | |
| | 200 | | | 5.375%, 07/24/44 | | | 218 | |
| | 500 | | | 5.500%, 03/09/20 | | | 539 | |
| | 500 | | | 5.875%, 09/16/25 | | | 559 | |
| | ZAR 13,700 | | | Series R207, 7.250%, 01/15/20 | | | 903 | |
| | | | Republic of Sri Lanka, (Sri Lanka), | | | | |
| | 400 | | | Reg. S, 5.875%, 07/25/22 | | | 412 | |
| | 400 | | | Reg. S, 6.250%, 10/04/20 | | | 420 | |
| | 200 | | | Reg. S, 6.250%, 07/27/21 | | | 211 | |
| | 300 | | | 6.825%, 07/18/26 (e) | | | 322 | |
| | 200 | | | 6.850%, 11/03/25 (e) | | | 214 | |
| | | | Republic of Turkey, (Turkey), | | | | |
| | 400 | | | 5.625%, 03/30/21 | | | 428 | |
| | 560 | | | 5.750%, 03/22/24 | | | 609 | |
| | 285 | | | 6.000%, 01/14/41 | | | 312 | |
| | 700 | | | 6.625%, 02/17/45 | | | 836 | |
| | 200 | | | 7.000%, 06/05/20 | | | 223 | |
| | 245 | | | 7.375%, 02/05/25 | | | 294 | |
| | | | Republic of Ukraine, (Ukraine), | | | | |
| | 100 | | | Reg. S, 7.750%, 09/01/19 | | | 100 | |
| | 400 | | | Reg. S, 7.750%, 09/01/20 (e) | | | 395 | |
| | 500 | | | 7.750%, 09/01/21 (e) | | | 490 | |
| | 480 | | | Reg. S, 7.750%, 09/01/22 (e) | | | 468 | |
| | 100 | | | Reg. S, 7.750%, 09/01/24 | | | 97 | |
| | 200 | | | Reg. S, 7.750%, 09/01/25 | | | 193 | |
| | | | Republic of Uruguay, (Uruguay), | | | | |
| | 330 | | | 5.100%, 06/18/50 | | | 348 | |
| | 379 | | | 7.625%, 03/21/36 | | | 541 | |
| | 65 | | | 7.875%, 01/15/33 | | | 93 | |
| | | | Republic of Venezuela, (Venezuela), | | | | |
| | 350 | | | Reg. S, 7.000%, 03/31/38 | | | 144 | |
| | 80 | | | Reg. S, 7.650%, 04/21/25 | | | 35 | |
| | 280 | | | Reg. S, 7.750%, 10/13/19 | | | 138 | |
| | 120 | | | Reg. S, 8.250%, 10/13/24 | | | 53 | |
SEE NOTES TO FINANCIAL STATEMENTS.
| | | | | | | | |
| | | |
| AUGUST 31, 2016 | | J.P. MORGAN INCOME FUNDS | | | | | 139 | |
JPMorgan Core Plus Bond Fund
SCHEDULE OF PORTFOLIO INVESTMENTS
AS OF AUGUST 31, 2016 (Unaudited) (continued)
(Amounts in U.S. Dollars, unless otherwise noted)
(Amounts in thousands)
| | | | | | | | |
PRINCIPAL
AMOUNT | | | SECURITY DESCRIPTION | | VALUE | |
| Foreign Government Securities — continued | |
| | 87 | | | Reg. S, 9.000%, 05/07/23 | | | 39 | |
| | 190 | | | 9.250%, 09/15/27 | | | 93 | |
| | 190 | | | Reg. S, 9.250%, 05/07/28 | | | 86 | |
| | 206 | | | 9.375%, 01/13/34 | | | 93 | |
| | 150 | | | Reg. S, 11.750%, 10/21/26 | | | 74 | |
| | 200 | | | Reg. S, 11.950%, 08/05/31 | | | 102 | |
| | 950 | | | Republic of Zambia, (Zambia), Reg. S, 8.970%, 07/30/27 | | | 930 | |
| | | | Russian Federation, (Russia), | | | | |
| | 400 | | | Reg. S, 4.875%, 09/16/23 | | | 438 | |
| | 600 | | | Reg. S, 5.000%, 04/29/20 | | | 646 | |
| | 400 | | | Reg. S, 5.875%, 09/16/43 | | | 475 | |
| AUD | 1,500 | | | South Australian Government Financing Authority, (Australia), Series 17, 5.750%, 09/20/17 | | | 1,175 | |
| | | | United Mexican States, (Mexico), | | | | |
| EUR | 140 | | | 3.375%, 02/23/31 | | | 184 | |
| | 1,585 | | | 3.600%, 01/30/25 | | | 1,676 | |
| | 240 | | | 4.350%, 01/15/47 | | | 248 | |
| | 800 | | | 5.550%, 01/21/45 | | | 986 | |
| | | | | | | | |
| | | | Total Foreign Government Securities
(Cost $66,784) | | | 69,264 | |
| | | | | | | | |
| Mortgage Pass-Through Securities — 16.2% | |
| | | | Federal Home Loan Mortgage Corp., | | | | |
| | 175 | | | ARM, 2.490%, 10/01/36 | | | 185 | |
| | 413 | | | ARM, 2.619%, 10/01/37 | | | 441 | |
| | 29 | | | ARM, 2.625%, 08/01/36 | | | 30 | |
| | 62 | | | ARM, 2.742%, 05/01/37 | | | 66 | |
| | 130 | | | ARM, 3.141%, 03/01/36 | | | 137 | |
| | 219 | | | ARM, 3.442%, 03/01/36 | | | 231 | |
| | | | Federal Home Loan Mortgage Corp. Gold Pools, 15 Year, Single Family, | | | | |
| | 1,948 | | | 4.000%, 02/01/26 | | | 2,072 | |
| | 91 | | | 4.500%, 10/01/18 | | | 93 | |
| | 8 | | | 5.000%, 05/01/18 | | | 8 | |
| | 1,182 | | | 5.500%, 01/01/21 - 12/01/24 | | | 1,268 | |
| | 68 | | | 6.000%, 11/01/21 | | | 72 | |
| | | | Federal Home Loan Mortgage Corp. Gold Pools, 20 Year, Single Family, | | | | |
| | 5,796 | | | 4.000%, 01/01/32 | | | 6,278 | |
| | 1,352 | | | 6.000%, 02/01/28 | | | 1,537 | |
| | 212 | | | 7.000%, 01/01/27 | | | 239 | |
| | | | Federal Home Loan Mortgage Corp. Gold Pools, 30 Year, Single Family, | | | | |
| | 14,742 | | | 3.000%, 12/01/42 - 02/01/43 | | | 15,423 | |
| | 41,676 | | | 3.500%, 12/01/45 - 08/01/46 | | | 43,974 | |
| | 10,947 | | | 4.000%, 09/01/33 - 08/01/46 (w) | | | 11,745 | |
| | | | | | | | |
PRINCIPAL
AMOUNT | | | SECURITY DESCRIPTION | | VALUE | |
| Mortgage Pass-Through Securities — continued | |
| | 4,090 | | | 4.500%, 05/01/41 - 02/01/42 | | | 4,515 | |
| | 20 | | | 6.000%, 02/01/29 | | | 23 | |
| | 341 | | | 6.500%, 01/01/24 - 11/01/36 | | | 402 | |
| | 360 | | | 7.000%, 09/01/24 - 10/01/36 | | | 411 | |
| | 20 | | | 7.500%, 10/01/19 - 02/01/27 | | | 21 | |
| | 58 | | | 8.000%, 08/01/27 | | | 72 | |
| | | | Federal Home Loan Mortgage Corp. Gold Pools, FHA/VA, | | | | |
| | 1,022 | | | 7.500%, 01/01/32 - 12/01/36 | | | 1,210 | |
| | 115 | | | 10.000%, 10/01/30 | | | 126 | |
| | | | Federal Home Loan Mortgage Corp. Gold Pools, Other, | | | | |
| | 19,281 | | | 3.500%, 09/01/32 - 07/01/46 | | | 20,555 | |
| | 10,761 | | | 4.000%, 06/01/42 - 01/01/46 | | | 11,701 | |
| | 21,069 | | | 4.500%, 09/01/42 - 02/01/44 | | | 23,414 | |
| | 4,929 | | | 5.000%, 09/01/43 | | | 5,569 | |
| | | | Federal National Mortgage Association, | | | | |
| | 107 | | | ARM, 2.281%, 07/01/37 | | | 111 | |
| | 184 | | | ARM, 2.541%, 07/01/37 | | | 194 | |
| | 67 | | | ARM, 2.542%, 04/01/37 | | | 70 | |
| | 136 | | | ARM, 2.547%, 01/01/34 | | | 144 | |
| | 313 | | | ARM, 2.816%, 04/01/37 | | | 330 | |
| | 153 | | | ARM, 2.845%, 05/01/35 | | | 161 | |
| | 265 | | | ARM, 2.847%, 03/01/37 | | | 278 | |
| | 21 | | | ARM, 3.125%, 10/01/33 | | | 21 | |
| | | | Federal National Mortgage Association, 15 Year, Single Family, | | | | |
| | 82 | | | 4.000%, 07/01/18 | | | 84 | |
| | 678 | | | 5.000%, 05/01/18 - 07/01/25 | | | 715 | |
| | 13 | | | 5.500%, 08/01/17 | | | 13 | |
| | 208 | | | 6.000%, 09/01/19 - 08/01/22 | | | 222 | |
| | | | Federal National Mortgage Association, 20 Year, Single Family, | | | | |
| | 511 | | | 3.500%, 12/01/30 | | | 541 | |
| | 107 | | | 6.500%, 11/01/18 | | | 123 | |
| | | | Federal National Mortgage Association, 30 Year, Single Family, | | | | |
| | 13,000 | | | TBA, 3.500%, 09/25/45 (w) | | | 13,695 | |
| | 14,847 | | | 3.000%, 01/01/43 - 02/01/43 | | | 15,463 | |
| | 29,796 | | | 3.500%, 05/01/46 - 08/01/46 | | | 31,455 | |
| | 73,829 | | | 4.000%, 06/01/42 - 06/01/46 (w) | | | 80,371 | |
| | 13,569 | | | 4.500%, 12/01/39 - 09/01/40 | | | 14,874 | |
| | 18,906 | | | 5.000%, 10/01/39 - 06/01/44 | | | 21,021 | |
| | 510 | | | 5.500%, 12/01/28 - 09/01/34 | | | 578 | |
| | 2,427 | | | 6.000%, 03/01/34 - 08/01/37 | | | 2,816 | |
| | 362 | | | 6.500%, 04/01/28 - 10/01/38 | | | 417 | |
| | 537 | | | 7.000%, 03/01/28 - 04/01/37 | | | 642 | |
SEE NOTES TO FINANCIAL STATEMENTS.
| | | | | | |
| | | |
| 140 | | | | J.P. MORGAN INCOME FUNDS | | AUGUST 31, 2016 |
| | | | | | | | |
PRINCIPAL
AMOUNT | | | SECURITY DESCRIPTION | | VALUE | |
| Mortgage Pass-Through Securities — continued | |
| | 142 | | | 7.500%, 10/01/26 - 11/01/38 | | | 172 | |
| | 2,542 | | | 8.000%, 08/01/22 - 12/01/36 | | | 3,074 | |
| | 21 | | | 8.500%, 10/01/25 - 12/01/25 | | | 23 | |
| | 2 | | | 9.000%, 01/01/19 - 04/01/25 | | | 2 | |
| | | | Federal National Mortgage Association, Other, | | | | |
| | 3,703 | | | ARM, 0.815%, 01/01/23 | | | 3,700 | |
| | 1,772 | | | 2.140%, 04/01/19 | | | 1,800 | |
| | 4,000 | | | 2.230%, 04/01/24 | | | 4,115 | |
| | 3,751 | | | 2.410%, 01/01/23 | | | 3,874 | |
| | 7,308 | | | 2.440%, 02/01/23 | | | 7,562 | |
| | 10,050 | | | 2.480%, 02/01/25 | | | 10,370 | |
| | 10,000 | | | 2.490%, 05/01/26 | | | 10,291 | |
| | 3,935 | | | 2.510%, 01/01/23 | | | 4,086 | |
| | 6,225 | | | 2.530%, 07/01/26 | | | 6,425 | |
| | 10,122 | | | 2.610%, 06/01/26 | | | 10,523 | |
| | 5,977 | | | 2.620%, 05/01/26 | | | 6,213 | |
| | 18,777 | | | 2.640%, 06/01/25 | | | 19,553 | |
| | 3,900 | | | 2.650%, 03/01/23 | | | 4,059 | |
| | 28,945 | | | 2.730%, 04/01/25 - 07/01/28 | | | 30,217 | |
| | 1,420 | | | 2.750%, 03/01/22 | | | 1,491 | |
| | 4,452 | | | 2.766%, 06/01/23 | | | 4,685 | |
| | 7,000 | | | 2.780%, 04/01/26 | | | 7,381 | |
| | 22,640 | | | 2.810%, 04/01/25 - 05/01/26 | | | 23,931 | |
| | 5,890 | | | 2.840%, 01/01/25 | | | 6,230 | |
| | 9,800 | | | 2.870%, 08/01/31 | | | 10,295 | |
| | 11,707 | | | 2.880%, 07/01/27 | | | 12,325 | |
| | 19,327 | | | 2.900%, 12/01/24 - 05/01/29 | | | 20,444 | |
| | 10,000 | | | 2.920%, 01/01/25 | | | 10,622 | |
| | 4,281 | | | 2.930%, 01/01/25 | | | 4,544 | |
| | 5,000 | | | 2.950%, 11/01/25 | | | 5,331 | |
| | 31,595 | | | 2.965%, 12/01/24 | | | 33,654 | |
| | 11,110 | | | 2.970%, 12/01/24 - 04/01/28 | | | 11,807 | |
| | 3,657 | | | 2.990%, 05/01/31 | | | 3,889 | |
| | 2,043 | | | 3.010%, 06/01/31 | | | 2,172 | |
| | 5,000 | | | 3.030%, 06/01/31 | | | 5,342 | |
| | 11,233 | | | 3.050%, 09/01/24 | | | 12,010 | |
| | 29,120 | | | 3.070%, 02/01/25 | | | 31,178 | |
| | 9,795 | | | 3.074%, 12/01/24 | | | 10,558 | |
| | 8,720 | | | 3.130%, 02/01/26 | | | 9,414 | |
| | 4,289 | | | 3.340%, 11/01/30 | | | 4,698 | |
| | 1,729 | | | 3.370%, 11/01/20 | | | 1,854 | |
| | 1,680 | | | 3.380%, 01/01/18 | | | 1,712 | |
| | 5,223 | | | 3.450%, 01/01/24 | | | 5,725 | |
| | 166,973 | | | 3.500%, 05/01/32 - 07/01/46 | | | 177,866 | |
| | 15,000 | | | 3.510%, 08/01/23 | | | 16,517 | |
| | 1,504 | | | 3.590%, 10/01/20 | | | 1,619 | |
| | | | | | | | |
PRINCIPAL
AMOUNT | | | SECURITY DESCRIPTION | | VALUE | |
| | | | | | | | |
| | 4,930 | | | 3.640%, 12/01/23 | | | 5,458 | |
| | 1,530 | | | 3.660%, 12/01/21 | | | 1,665 | |
| | 1,313 | | | 3.739%, 06/01/18 | | | 1,351 | |
| | 5,300 | | | 3.760%, 03/01/24 | | | 5,926 | |
| | 1,000 | | | 3.770%, 09/01/21 | | | 1,090 | |
| | 87,781 | | | 4.000%, 06/01/42 - 05/01/46 | | | 96,005 | |
| | 1,274 | | | 4.060%, 07/01/21 | | | 1,401 | |
| | 1,980 | | | 4.180%, 12/01/19 | | | 2,134 | |
| | 3,601 | | | 4.260%, 12/01/19 | | | 3,890 | |
| | 5,950 | | | 4.340%, 06/01/21 | | | 6,601 | |
| | 2,280 | | | 4.369%, 02/01/20 | | | 2,477 | |
| | 3,000 | | | 4.399%, 02/01/20 | | | 3,262 | |
| | 17,127 | | | 4.500%, 01/01/20 - 12/01/43 | | | 19,128 | |
| | 1,865 | | | 4.640%, 01/01/21 | | | 2,073 | |
| | 49 | | | 5.000%, 12/01/32 | | | 52 | |
| | 51 | | | 5.500%, 09/01/17 | | | 51 | |
| | 34 | | | 6.500%, 04/01/36 - 07/01/36 | | | 36 | |
| | | | Government National Mortgage Association II, 30 Year, Single Family, | | | | |
| | 5,822 | | | 3.500%, 06/20/46 - 07/20/46 | | | 6,189 | |
| | 6,413 | | | 3.750%, 06/20/46 - 07/20/46 | | | 6,871 | |
| | 1,738 | | | 4.000%, 06/20/46 | | | 1,871 | |
| | 3,243 | | | 6.000%, 11/20/32 - 09/20/38 | | | 3,772 | |
| | 770 | | | 6.500%, 02/20/29 - 10/20/39 | | | 926 | |
| | 2,306 | | | 7.000%, 06/20/32 - 01/20/39 | | | 2,727 | |
| | 239 | | | 7.500%, 08/20/25 - 05/20/32 | | | 278 | |
| | 539 | | | 8.000%, 08/20/26 - 09/20/31 | | | 646 | |
| | 182 | | | Government National Mortgage Association, 15 Year, Single Family, 6.500%, 10/15/23 | | | 197 | |
| | | | Government National Mortgage Association, 30 Year, Single Family, | | | | |
| | 21,901 | | | 4.000%, 07/15/46 - 08/15/46 | | | 23,756 | |
| | 3,140 | | | 4.500%, 05/15/46 | | | 3,519 | |
| | 6,586 | | | 6.000%, 08/15/36 | | | 7,696 | |
| | 172 | | | 6.500%, 02/15/28 - 10/15/29 | | | 198 | |
| | 59 | | | 7.000%, 02/15/24 - 11/15/27 | | | 64 | |
| | 52 | | | 7.250%, 09/15/21 - 01/15/28 | | | 52 | |
| | 32 | | | 7.500%, 10/15/22 - 02/15/27 | | | 33 | |
| | 2 | | | 7.750%, 02/15/27 | | | 2 | |
| | 1 | | | 8.500%, 11/15/25 | | | 2 | |
| | 23 | | | 9.000%, 12/15/16 - 01/15/25 | | | 25 | |
| | 1 | | | 10.000%, 11/15/20 | | | 1 | |
| | | | | | | | |
| | | | Total Mortgage Pass-Through Securities
(Cost $1,085,261) | | | 1,110,935 | |
| | | | | | | | |
SEE NOTES TO FINANCIAL STATEMENTS.
| | | | | | | | |
| | | |
| AUGUST 31, 2016 | | J.P. MORGAN INCOME FUNDS | | | | | 141 | |
JPMorgan Core Plus Bond Fund
SCHEDULE OF PORTFOLIO INVESTMENTS
AS OF AUGUST 31, 2016 (Unaudited) (continued)
(Amounts in U.S. Dollars, unless otherwise noted)
(Amounts in thousands)
| | | | | | | | |
PRINCIPAL
AMOUNT | | | SECURITY DESCRIPTION | | VALUE | |
| Municipal Bonds — 0.3% (t) | |
| | | | California — 0.1% | |
| | 200 | | | Alameda County Joint Powers Authority, Multiple Capital Projects, Series A, Rev., 7.046%, 12/01/44 | | | 299 | |
| | 1,000 | | | Los Angeles City Department of Airports, International Airport, Series C, Rev., 6.582%, 05/15/39 | | | 1,395 | |
| | 1,980 | | | State of California, Various Purpose, GO, 7.350%, 11/01/39 | | | 3,074 | |
| | 774 | | | University of California, Series AD, Rev., 4.858%, 05/15/123 | | | 891 | |
| | | | | | | | |
| | | | | | | 5,659 | |
| | | | | | | | |
| | | | District of Columbia — 0.0% | |
| | 345 | | | District of Columbia Water & Sewer Authority, Public Utility, Senior Lien, Series A, Rev., 4.814%, 10/01/144 | | | 417 | |
| | | | | | | | |
| | | | Illinois — 0.0% | |
| | 725 | | | Chicago Transit Authority, Sales & Transfer Tax Receipts-Retiree Health, Series B, Rev., 6.899%, 12/01/40 | | | 967 | |
| | 1,960 | | | State of Illinois, Taxable Pension, GO, 5.100%, 06/01/33 | | | 1,911 | |
| | | | | | | | |
| | | | | | | 2,878 | |
| | | | | | | | |
| | | | New York — 0.1% | |
| | | | New York State Dormitory Authority, State Personal Income Tax, General Purpose, | | | | |
| | 560 | | | Series H, Rev., 5.289%, 03/15/33 | | | 712 | |
| | 1,165 | | | Series H, Rev., 5.389%, 03/15/40 | | | 1,574 | |
| | 1,450 | | | Port Authority of New York & New Jersey, Consolidated, Series 164, Rev., 5.647%, 11/01/40 | | | 1,952 | |
| | 155 | | | Port Authority of New York & New Jersey, Consolidated 165, Rev., 5.647%, 11/01/40 | | | 209 | |
| | 740 | | | Port Authority of New York & New Jersey, Consolidated 174, Rev., 4.458%, 10/01/62 | | | 874 | |
| | | | | | | | |
| | | | | | | 5,321 | |
| | | | | | | | |
| | | | Ohio — 0.1% | |
| | 1,040 | | | American Municipal Power, Inc., Meldahl Hydroelectric Project, Series B, Rev., 7.499%, 02/15/50 | | | 1,584 | |
| | 1,563 | | | Ohio State University, General Receipts, Series A, Rev., 4.800%, 06/01/112 | | | 1,811 | |
| | | | | | | | |
| | | | | | | 3,395 | |
| | | | | | | | |
| | | | Total Municipal Bonds
(Cost $15,002) | | | 17,670 | |
| | | | | | | | |
| | | | | | | | |
PRINCIPAL
AMOUNT | | | SECURITY DESCRIPTION | | VALUE | |
| Preferred Securities — 0.3% (x) | |
| | | | Financials — 0.3% | |
| | | | Banks — 0.2% | |
| | | | Bank of America Corp., | | | | |
| | 1,022 | | | Series AA, VAR, 6.100%, 03/17/25 | | | 1,074 | |
| | 2,000 | | | Series K, VAR, 8.000%, 01/30/18 | | | 2,058 | |
| | | | Citigroup, Inc., | | | | |
| | 3,592 | | | Series O, VAR, 5.875%, 03/27/20 | | | 3,646 | |
| | 1,545 | | | Series Q, VAR, 5.950%, 08/15/20 | | | 1,573 | |
| | 581 | | | VAR, 5.950%, 01/30/23 | | | 604 | |
| | 430 | | | Series P, VAR, 5.950%, 05/15/25 | | | 444 | |
| | 813 | | | Series M, VAR, 6.300%, 05/15/24 | | | 842 | |
| | 626 | | | Credit Agricole S.A., (France), VAR, 8.125%, 12/23/25 (e) | | | 672 | |
| | 1,450 | | | Lloyds Banking Group plc, (United Kingdom), VAR, 6.375%, 06/27/20 | | | 1,629 | |
| | | | | | | | |
| | | | | | | 12,542 | |
| | | | | | | | |
| | | | Capital Markets — 0.1% | |
| | | | Goldman Sachs Group, Inc. (The), | | | | |
| | 215 | | | Series O, VAR, 5.300%, 11/10/26 | | | 220 | |
| | 2,253 | | | Series M, VAR, 5.375%, 05/10/20 | | | 2,278 | |
| | 1,500 | | | Series L, VAR, 5.700%, 05/10/19 | | | 1,532 | |
| | | | Morgan Stanley, | | | | |
| | 1,500 | | | Series H, VAR, 5.450%, 07/15/19 | | | 1,504 | |
| | 940 | | | Series J, VAR, 5.550%, 07/15/20 | | | 964 | |
| | | | | | | | |
| | | | | | | 6,498 | |
| | | | | | | | |
| | | | Total Preferred Securities
(Cost $18,899) | | | 19,040 | |
| | | | | | | | |
| Supranational — 0.0% (g) | |
| | 1,000 | | | African Development Bank, 8.800%, 09/01/19 | | | 1,208 | |
| | NZD 1,500 | | | International Finance Corp., 3.500%, 09/05/17 | | | 1,101 | |
| | | | | | | | |
| | | | Total Supranational
(Cost $2,377) | | | 2,309 | |
| | | | | | | | |
| U.S. Government Agency Securities — 0.6% | |
| | | | Federal National Mortgage Association, | | | | |
| | 7,360 | | | 06/01/17 | | | 7,324 | |
| | 1,500 | | | 5.625%, 07/15/37 | | | 2,250 | |
| | 385 | | | 6.250%, 05/15/29 | | | 559 | |
| | 1,275 | | | Federal National Mortgage Association STRIPS, 3.776%, 05/15/30 | | | 901 | |
| | | | Financing Corp. STRIPS, | | | | |
| | 3,100 | | | 1.383%, 11/30/17 | | | 3,063 | |
| | 1,000 | | | 1.531%, 05/11/18 | | | 985 | |
| | 1,500 | | | 2.743%, 09/26/19 | | | 1,449 | |
| | 212 | | | New Valley Generation II, 5.572%, 05/01/20 | | | 230 | |
SEE NOTES TO FINANCIAL STATEMENTS.
| | | | | | |
| | | |
| 142 | | | | J.P. MORGAN INCOME FUNDS | | AUGUST 31, 2016 |
| | | | | | | | |
PRINCIPAL
AMOUNT | | | SECURITY DESCRIPTION | | VALUE | |
| U.S. Government Agency Securities — continued | |
| | 421 | | | New Valley Generation V, 4.929%, 01/15/21 | | | 467 | |
| | | | Residual Funding Corp. STRIPS, | | | | |
| | 12,080 | | | 2.309%, 07/15/20 | | | 11,455 | |
| | 2,770 | | | 1.806%, 10/15/20 | | | 2,623 | |
| | 1,285 | | | 1.199%, 01/15/21 | | | 1,209 | |
| | | | Tennessee Valley Authority, | | | | |
| | 902 | | | 4.625%, 09/15/60 | | | 1,157 | |
| | 2,103 | | | 5.250%, 09/15/39 | | | 2,964 | |
| | 1,610 | | | 5.880%, 04/01/36 | | | 2,381 | |
| | 500 | | | Tennessee Valley Authority STRIPS, 6.471%, 11/01/25 | | | 403 | |
| | | | | | | | |
| | | | Total U.S. Government Agency Securities
(Cost $36,805) | | | 39,420 | |
| | | | | | | | |
| U.S. Treasury Obligations — 24.7% | |
| | | | U.S. Treasury Bonds, | | | | |
| | 39,408 | | | 2.500%, 02/15/45 | | | 41,620 | |
| | 20,000 | | | 2.500%, 02/15/46 | | | 21,127 | |
| | 9,677 | | | 2.500%, 05/15/46 | | | 10,240 | |
| | 50,000 | | | 2.875%, 08/15/45 | | | 56,856 | |
| | 19,000 | | | 3.000%, 05/15/42 | | | 22,092 | |
| | 64,035 | | | 3.000%, 11/15/44 | | | 74,530 | |
| | 42,260 | | | 3.000%, 05/15/45 | | | 49,188 | |
| | 42,852 | | | 3.000%, 11/15/45 | | | 49,924 | |
| | 85 | | | 3.500%, 02/15/39 | | | 107 | |
| | 9,250 | | | 3.625%, 08/15/43 | | | 12,015 | |
| | 16,709 | | | 3.750%, 11/15/43 | | | 22,188 | |
| | 8,674 | | | 4.375%, 05/15/40 | | | 12,339 | |
| | 37,318 | | | 4.375%, 05/15/41 | | | 53,405 | |
| | 8,400 | | | 4.500%, 02/15/36 | | | 12,003 | |
| | 3,890 | | | 4.500%, 05/15/38 | | | 5,617 | |
| | 2,500 | | | 5.250%, 02/15/29 | | | 3,498 | |
| | 21,000 | | | 5.500%, 08/15/28 | | | 29,710 | |
| | 2,625 | | | 7.875%, 02/15/21 | | | 3,391 | |
| | 7,920 | | | 8.000%, 11/15/21 | | | 10,619 | |
| | 13,600 | | | 8.125%, 05/15/21 | | | 17,919 | |
| | 10,000 | | | 8.125%, 08/15/21 | | | 13,319 | |
| | 5,000 | | | 8.500%, 02/15/20 | | | 6,274 | |
| | 6,000 | | | 8.750%, 08/15/20 | | | 7,784 | |
| | | | U.S. Treasury Coupon STRIPS, | | | | |
| | 48,829 | | | 0.464%, 08/15/28 (n) | | | 39,202 | |
| | 15 | | | 1.944%, 08/15/23 (n) | | | 13 | |
| | 6,495 | | | 2.204%, 02/15/21 (n) | | | 6,147 | |
| | 16,318 | | | 2.219%, 05/15/32 (n) | | | 11,887 | |
| | 7,390 | | | 2.223%, 05/15/22 (n) | | | 6,833 | |
| | 7,251 | | | 2.252%, 05/15/20 (n) | | | 6,960 | |
| | 15,000 | | | 2.305%, 05/15/21 (n) | | | 14,146 | |
| | | | | | | | |
PRINCIPAL
AMOUNT | | | SECURITY DESCRIPTION | | VALUE | |
| | | | | | | | |
| | 640 | | | 2.539%, 02/15/22 (n) | | | 595 | |
| | 225 | | | 2.713%, 02/15/23 (n) | | | 205 | |
| | 11,239 | | | Zero Coupon, 08/15/17 (n) | | | 11,169 | |
| | 185 | | | 3.202%, 08/15/19 (n) | | | 180 | |
| | 6,916 | | | 3.417%, 02/15/17 (n) | | | 6,901 | |
| | 14,565 | | | 3.513%, 11/15/17 (n) | | | 14,436 | |
| | 14,610 | | | 3.605%, 11/15/21 (n) | | | 13,644 | |
| | 5,000 | | | 3.712%, 08/15/22 (n) | | | 4,602 | |
| | 5,000 | | | 3.843%, 11/15/22 (n) | | | 4,574 | |
| | 42,000 | | | 4.374%, 11/15/33 (n) | | | 29,344 | |
| | 1,606 | | | 4.461%, 08/15/18 (n) | | | 1,581 | |
| | 4,000 | | | 4.473%, 02/15/18 (n) | | | 3,956 | |
| | 2,615 | | | 5.095%, 02/15/28 (n) | | | 2,121 | |
| | 1,000 | | | U.S. Treasury Inflation Indexed Bonds, 3.625%, 04/15/28 | | | 2,049 | |
| | | | U.S. Treasury Notes, | | | | |
| | 45 | | | 0.500%, 03/31/17 (k) | | | 45 | |
| | 7,740 | | | 0.625%, 08/31/17 | | | 7,735 | |
| | 10,300 | | | 0.875%, 07/31/19 (k) | | | 10,286 | |
| | 149,100 | | | 1.000%, 12/15/17 | | | 149,566 | |
| | 119,000 | | | 1.000%, 03/15/18 | | | 119,400 | |
| | 64,000 | | | 1.000%, 05/31/18 | | | 64,207 | |
| | 85,296 | | | 1.375%, 06/30/18 | | | 86,152 | |
| | 2,000 | | | 1.375%, 01/31/20 | | | 2,023 | |
| | 27,565 | | | 1.500%, 08/31/18 | | | 27,925 | |
| | 30,644 | | | 1.500%, 12/31/18 | | | 31,089 | |
| | 4,750 | | | 1.500%, 05/31/19 | | | 4,826 | |
| | 164,545 | | | 1.500%, 05/31/20 | | | 167,052 | |
| | 22,879 | | | 1.625%, 12/31/19 | | | 23,337 | |
| | 2,000 | | | 2.125%, 08/15/21 | | | 2,085 | |
| | 11,000 | | | 2.250%, 11/30/17 | | | 11,203 | |
| | 209,142 | | | 2.625%, 11/15/20 | | | 221,674 | |
| | 4,115 | | | 2.875%, 03/31/18 | | | 4,248 | |
| | 1,000 | | | 3.125%, 10/31/16 | | | 1,005 | |
| | 3,954 | | | 3.125%, 05/15/19 | | | 4,188 | |
| | 1,250 | | | 3.250%, 03/31/17 | | | 1,270 | |
| | 25,192 | | | 3.500%, 05/15/20 | | | 27,398 | |
| | 8,000 | | | 4.250%, 11/15/17 | | | 8,335 | |
| | | | | | | | |
| | | | Total U.S. Treasury Obligations
(Cost $1,617,678) | | | 1,691,359 | |
| | | | | | | | |
| | |
| SHARES | | | | | | |
| Common Stocks — 0.0% (g) | |
| | | | Consumer Discretionary — 0.0% (g) | |
| | | | Media — 0.0% (g) | |
| | — | (h) | | New Cotai LLC/New Cotai Capital Corp., Class B (a) (e) | | | 40 | |
| | | | | | | | |
SEE NOTES TO FINANCIAL STATEMENTS.
| | | | | | | | |
| | | |
| AUGUST 31, 2016 | | J.P. MORGAN INCOME FUNDS | | | | | 143 | |
JPMorgan Core Plus Bond Fund
SCHEDULE OF PORTFOLIO INVESTMENTS
AS OF AUGUST 31, 2016 (Unaudited) (continued)
(Amounts in U.S. Dollars, unless otherwise noted)
(Amounts in thousands)
| | | | | | | | |
SHARES | | | SECURITY DESCRIPTION | | VALUE | |
| Common Stocks — continued | |
| | | | Specialty Retail — 0.0% (g) | | | | |
| | 40 | | | Nebraska Book Holdings, Inc. (a) | | | 3 | |
| | | | | | | | |
| | | | Total Consumer Discretionary | | | 43 | |
| | | | | | | | |
| | | | Financials — 0.0% (g) | |
| | | | Insurance — 0.0% (g) | |
| | 1,551 | | | ACC Claims Holdings LLC (a) | | | 16 | |
| | | | | | | | |
| | | | Industrials — 0.0% (g) | |
| | | | Commercial Services & Supplies — 0.0% (g) | |
| | — | (h) | | Quad/Graphics, Inc. | | | 2 | |
| | | | | | | | |
| | | | Materials — 0.0% (g) | |
| | | | Containers & Packaging — 0.0% (g) | |
| | 9 | | | Constar International, Inc., Class A (a) | | | — | (h) |
| | | | | | | | |
| | | | Telecommunication Services — 0.0% (g) | |
| | | | Wireless Telecommunication Services — 0.0% (g) | |
| | 68 | | | NII Holdings, Inc. (a) | | | 226 | |
| | | | | | | | |
| | | | Utilities — 0.0% (g) | |
| | | | Independent Power & Renewable Electricity
Producers — 0.0% (g) | |
| | 4 | | | Dynegy, Inc. (a) | | | 50 | |
| | | | | | | | |
| | | | Total Common Stocks
(Cost $1,424) | | | 337 | |
| | | | | | | | |
| Preferred Stocks — 0.0% (g) | |
| | | | Financials — 0.0% (g) | |
| | | | Insurance — 0.0% (g) | |
| | 11 | | | Hartford Financial Services Group, Inc. (The), VAR, 7.875%, 04/15/42 ($25 par value) | | | 346 | |
| | 2 | | | XLIT Ltd., (Cayman Islands), Series D, VAR, 3.800%, 10/03/16 ($1,000 par value) @ | | | 1,886 | |
| | | | | | | | |
| | | | Total Financials | | | 2,232 | |
| | | | | | | | |
| | | | Industrials — 0.0% (g) | |
| | | | Commercial Services & Supplies — 0.0% (g) | |
| | 1 | | | Pitney Bowes International Holdings, Inc., Series F, 6.125%, 10/30/16 ($1,000 par value) @ | | | 1,028 | |
| | | | | | | | |
| | | | Materials — 0.0% (g) | |
| | | | Containers & Packaging — 0.0% (g) | |
| | 1 | | | Constar International, Inc., Class A ($— par value) | | | — | |
| | | | | | | | |
| | | | Total Preferred Stocks
(Cost $3,490) | | | 3,260 | |
| | | | | | | | |
| | | | | | | | |
PRINCIPAL
AMOUNT | | | SECURITY DESCRIPTION | | VALUE | |
| Loan Assignments — 0.7% | |
| | | | Consumer Discretionary — 0.3% | |
| | | | Automobiles — 0.0% (g) | |
| | 507 | | | Chrysler Group LLC, Term Loan B, VAR, 05/24/17 | | | 507 | |
| | | | | | | | |
| | | | Hotels, Restaurants & Leisure — 0.2% | |
| | 191 | | | Intrawest Operations Group LLC, Initial Term Loan, VAR, 12/09/20 | | | 192 | |
| | 16,643 | | | Lila Mexican Holdings LLC, Tranche B, VAR, 08/11/22 | | | 16,251 | |
| | | | | | | | |
| | | | | | | 16,443 | |
| | | | | | | | |
| | | | Media — 0.0% (g) | |
| | 200 | | | Gray Television, Inc., Initial Term Loan, VAR, 06/13/21 | | | 201 | |
| | 749 | | | iHeartCommunications, Inc., Term Loan D, VAR, 01/30/19 | | | 574 | |
| | 596 | | | iHeartCommunications, Inc., Tranche E Term Loan, VAR, 07/30/19 | | | 455 | |
| | 197 | | | Media General, Inc., Term B Loan, VAR, 07/31/20 | | | 197 | |
| | 192 | | | MTL Publishing LLC, Term B-3 Loan, VAR, 08/19/22 | | | 192 | |
| | 509 | | | Tribune Media Co., Term Loan B, VAR, 12/27/20 | | | 510 | |
| | 2,993 | | | Vertis, Inc., 1st Lien Term Loan, VAR, 12/20/15 (d) | | | — | (h) |
| | | | | | | | |
| | | | | | | 2,129 | |
| | | | | | | | |
| | | | Specialty Retail — 0.1% | |
| | 1,375 | | | Harbor Fre Tools USA, Inc., 1st Lien Term Loan, VAR, 4.000%, 08/11/23 | | | 1,378 | |
| | 1,301 | | | Petsmart, Inc., Term Loan B, VAR, 03/11/22 | | | 1,303 | |
| | 284 | | | Serta Simmons Holdings LLC, 1st Lien Senior Secured Term Loan, VAR, 10/01/19 | | | 285 | |
| | | | | | | | |
| | | | | | | 2,966 | |
| | | | | | | | |
| | | | Total Consumer Discretionary | | | 22,045 | |
| | | | | | | | |
| | | | Consumer Staples — 0.1% | |
| | | | Food & Staples Retailing — 0.1% | |
| | 1,541 | | | Albertson’s LLC, 2016-1 Term Loan B-4, VAR, 4.500%, 08/25/21 | | | 1,547 | |
| | 1,240 | | | Albertson’s LLC, 2016-1 Term Loan B-5, VAR, 4.750%, 12/21/22 | | | 1,247 | |
| | 1,181 | | | Rite Aid Corp., Tranche 2 Term Loan, VAR, 06/21/21 | | | 1,182 | |
| | 1,685 | | | SUPERVALU, Inc., Term Loan B, VAR, 03/21/19 | | | 1,686 | |
| | | | | | | | |
| | | | | | | 5,662 | |
| | | | | | | | |
SEE NOTES TO FINANCIAL STATEMENTS.
| | | | | | |
| | | |
| 144 | | | | J.P. MORGAN INCOME FUNDS | | AUGUST 31, 2016 |
| | | | | | | | |
PRINCIPAL
AMOUNT | | | SECURITY DESCRIPTION | | VALUE | |
| Loan Assignments — continued | |
| | | | Food Products — 0.0% (g) | |
| | 552 | | | Dole Food Co., Inc., Tranche B Term Loan, VAR, 11/01/18 | | | 553 | |
| | 398 | | | Pinnacle Foods Finance LLC, Fourth Amendment Tranche I Term Loan, VAR, 3.270%, 01/13/23 | | | 400 | |
| | | | | | | | |
| | | | | | | 953 | |
| | | | | | | | |
| | | | Total Consumer Staples | | | 6,615 | |
| | | | | | | | |
| | | | Energy — 0.1% | |
| | | | Oil, Gas & Consumable Fuels — 0.1% | |
| | 3,300 | | | Gulf Finance LLC, 1st Lien Term Loan B, VAR, 6.250%, 07/27/23 ^ | | | 3,195 | |
| | 548 | | | MEG Energy Corp., Incremental Term Loan, (Canada), VAR, 03/31/20 | | | 503 | |
| | | | | | | | |
| | | | Total Energy | | | 3,698 | |
| | | | | | | | |
| | | | Financials — 0.0% (g) | |
| | | | Consumer Finance — 0.0% (g) | |
| | 1,123 | | | Sears Roebuck Acceptance Corp., Term Loan, VAR, 06/30/18 | | | 1,088 | |
| | | | | | | | |
| | | | Health Care — 0.0% (g) | |
| | | | Health Care Equipment & Supplies — 0.0% (g) | |
| | 400 | | | Halyard Health, Inc., Term Loan, VAR, 11/01/21 | | | 399 | |
| | | | | | | | |
| | | | Health Care Providers & Services — 0.0% (g) | |
| | 219 | | | Acadia Healthcare Co., Inc., Tranche B-2 Term Loan, VAR, 02/16/23 | | | 219 | |
| | 722 | | | inVentiv Health, Inc., Term Loan B-4, VAR, 05/15/18 | | | 723 | |
| | | | | | | | |
| | | | | | | 942 | |
| | | | | | | | |
| | | | Pharmaceuticals — 0.0% (g) | |
| | 475 | | | Valeant Pharmaceuticals International, Inc., Series F-1 Tranche B Term Loan, (Canada), VAR, 04/01/22 | | | 476 | |
| | | | | | | | |
| | | | Total Health Care | | | 1,817 | |
| | | | | | | | |
| | | | Industrials — 0.0% (g) | |
| | | | Air Freight & Logistics — 0.0% (g) | |
| | 1,183 | | | XPO Logistics, Inc., Term loan, VAR, 4.250%, 10/31/21 ^ | | | 1,188 | |
| | | | | | | | |
| | | | Information Technology — 0.1% | |
| | | | IT Services — 0.0% (g) | |
| | 1,135 | | | First Data Corp., 2022 New Dollar Term Loan, VAR, 4.272%, 07/08/22 | | | 1,138 | |
| | | | | | | | |
| | | | Semiconductors & Semiconductor Equipment — 0.1% | |
| | 900 | | | Avago Technologies, Term A-2 Loan, (Singapore), VAR, 3.508%, 02/01/23 | | | 907 | |
| | | | | | | | |
PRINCIPAL
AMOUNT | | | SECURITY DESCRIPTION | | VALUE | |
| | | | | | | | |
| | | | Semiconductors & Semiconductor Equipment — continued | |
| | 445 | | | Microsemi Corp., Closing Date Term B Loan, VAR, 01/15/23 | | | 448 | |
| | 158 | | | NXP B.V./NXP Funding LLC, Term B Loan, (Netherlands), VAR, 12/07/20 | | | 159 | |
| | 393 | | | On Semiconductor Corp., Term Loan B, VAR, 03/31/23 | | | 398 | |
| | | | | | | | |
| | | | | | | 1,912 | |
| | | | | | | | |
| | | | Total Information Technology | | | 3,050 | |
| | | | | | | | |
| | | | Materials — 0.0% (g) | |
| | | | Chemicals — 0.0% (g) | |
| | 422 | | | Axalta Coating Systems U.S. Holdings, Inc., Term Loan, VAR, 02/01/20 | | | 423 | |
| | | | | | | | |
| | | | Containers & Packaging — 0.0% (g) | |
| | 200 | | | Berry Plastics Corp., Term Loan G, VAR, 3.500%, 01/06/21 | | | 200 | |
| | | | | | | | |
| | | | Total Materials | | | 623 | |
| | | | | | | | |
| | | | Telecommunication Services — 0.0% (g) | |
| | | | Diversified Telecommunication Services — 0.0% (g) | |
| | 805 | | | Cincinnati Bell, Inc., Term Loan, VAR, 09/10/20 | | | 805 | |
| | 1,187 | | | UPC Financing Partnership, Senior Secured Term Loan AN, VAR, 4.080%, 08/31/24 | | | 1,183 | |
| | | | | | | | |
| | | | Total Telecommunication Services | | | 1,988 | |
| | | | | | | | |
| | | | Utilities — 0.1% | |
| | | | Electric Utilities — 0.1% | |
| | 217 | | | Energy Future Intermediate Holding Co. LLC, Term Loan, VAR, 12/19/16 | | | 218 | |
| | 211 | | | Texas Competitive Electric Holdings Co. LLC, 1st Lien Term Loan C, VAR, 5.000%, 10/31/17 | | | 212 | |
| | 4,117 | | | Texas Competitive Electric Holdings Co. LLC, Extended Term Loan, VAR, 10/10/17 (d) | | | 1,317 | |
| | 2,117 | | | Texas Competitive Electric Holdings Co. LLC, Non-Extended Term Loan, VAR, 10/10/17 (d) | | | 666 | |
| | 927 | | | Texas Competitive Electric Holdings Co. LLC, Term Loan B, VAR, 5.000%, 10/31/17 | | | 929 | |
| | | | | | | | |
| | | | | | | 3,342 | |
| | | | | | | | |
| | | | Independent Power & Renewable Electricity
Producers — 0.0% (g) | |
| | 1,415 | | | Dynegy, Inc., 1st Lien Term Loan C, VAR, 5.000%, 06/27/23 | | | 1,415 | |
| | | | | | | | |
| | | | Total Utilities | | | 4,757 | |
| | | | | | | | |
| | | | Total Loan Assignments
(Cost $52,898) | | | 46,869 | |
| | | | | | | | |
SEE NOTES TO FINANCIAL STATEMENTS.
| | | | | | | | |
| | | |
| AUGUST 31, 2016 | | J.P. MORGAN INCOME FUNDS | | | | | 145 | |
JPMorgan Core Plus Bond Fund
SCHEDULE OF PORTFOLIO INVESTMENTS
AS OF AUGUST 31, 2016 (Unaudited) (continued)
(Amounts in U.S. Dollars, unless otherwise noted)
(Amounts in thousands, except number of Futures contracts)
| | | | | | | | |
NUMBER OF
WARRANTS | | | SECURITY DESCRIPTION | | VALUE | |
| Warrants — 0.0% (g) | |
| | | | Consumer Discretionary — 0.0% (g) | |
| | | | Specialty Retail — 0.0% (g) | |
| | 9 | | | Nebraska Book Co., Inc., expiring 06/29/19 (Strike Price $1.00) (a) | | | — | (h) |
| | 4 | | | Nebraska Book Holdings, Inc., expiring 06/29/19 (Strike Price $1.00) (a) | | | — | |
| | | | | | | | |
| | | | Total Consumer Discretionary | | | — | (h) |
| | | | | | | | |
| | | | Energy — 0.0% (g) | |
| | | | Oil, Gas & Consumable Fuels — 0.0% (g) | |
| | 1 | | | Gener8 Maritime, Inc., expiring 05/17/17 (Strike Price $1.00) (a) | | | — | |
| | 200 | | | Pacific Exploration and Production Corp., (Canada), expiring 10/24/16 (Strike Price $1.00) (a) | | | 576 | |
| | | | | | | | |
| | | | Total Energy | | | 576 | |
| | | | | | | | |
| | | | Total Warrants
(Cost $— (h)) | | | 576 | |
| | | | | | | | |
| | | | | | | | |
SHARES | | | SECURITY DESCRIPTION | | VALUE | |
| Short-Term Investment — 5.1% | |
| | | | Investment Company — 5.1% | |
| | 346,277 | | | JPMorgan Prime Money Market Fund, Institutional Class Shares, VAR, 0.360% (b) (l)
(Cost $346,277) | | | 346,277 | |
| | | | | | | | |
| | | | Total Investments — 99.2%
(Cost $6,599,268) | | | 6,785,807 | |
| | | | Other Assets in Excess of
Liabilities — 0.8% | | | 57,795 | |
| | | | | | | | |
| | | | NET ASSETS — 100.0% | | $ | 6,843,602 | |
| | | | | | | | |
Percentages indicated are based on net assets.
| | | | | | | | | | | | | | | | | | | | |
| Futures Contracts | | | | |
NUMBER OF
CONTRACTS | | | DESCRIPTION | | EXPIRATION
DATE | | | TRADING
CURRENCY | | | NOTIONAL VALUE AT
AUGUST 31, 2016 | | | NET
UNREALIZED
APPRECIATION
(DEPRECIATION) | |
| | | | Long Futures Outstanding | | | | | |
| | 470 | | | 10 Year U.S. Treasury Note | | | 12/20/16 | | | | USD | | | | 61,533 | | | | 58 | |
| | 652 | | | U.S. Treasury Long Bond | | | 12/20/16 | | | | USD | | | | 111,085 | | | | (31 | ) |
| | 406 | | | 2 Year U.S. Treasury Note | | | 12/30/16 | | | | USD | | | | 88,635 | | | | (38 | ) |
| | 209 | | | 5 Year U.S. Treasury Note | | | 12/30/16 | | | | USD | | | | 25,341 | | | | (28 | ) |
| | | | Short Futures Outstanding | | | | | |
| | (5 | ) | | 10 Year U.S. Treasury Note | | | 12/20/16 | | | | USD | | | | (654 | ) | | | 2 | |
| | (330 | ) | | 10 Year U.S. Ultra Bond | | | 12/20/16 | | | | USD | | | | (47,644 | ) | | | 56 | |
| | (264 | ) | | Ultra Long Term U.S. Treasury Bond | | | 12/20/16 | | | | USD | | | | (49,492 | ) | | | (112 | ) |
| | (41 | ) | | 5 Year U.S. Treasury Note | | | 12/30/16 | | | | USD | | | | (4,971 | ) | | | — | (h) |
| | | | | | | | | | | | | | | | | | | | |
| | | | | | | | | | | | | | | | | | | (93 | ) |
| | | | | | | | | | | | | | | | | | | | |
| | | | | | | | | | | | | | | | | | | | | | | | |
| Forward Foreign Currency Exchange Contracts | |
CONTRACTS
TO BUY | | | CURRENCY | | | COUNTERPARTY | | SETTLEMENT
DATE | | | SETTLEMENT
VALUE | | | VALUE AT
AUGUST 31, 2016 | | | NET
UNREALIZED
APPRECIATION
(DEPRECIATION) | |
| | 2,544 | | | | BRL | | | Barclays Bank plc†† | | | 09/30/16 | | | | 787 | | | | 781 | | | | (6 | ) |
| | 4,386 | | | | BRL | | | Deutsche Bank AG†† | | | 09/30/16 | | | | 1,321 | | | | 1,347 | | | | 26 | |
| | 108 | | | | EUR | | | Citibank, N.A. | | | 09/30/16 | | | | 123 | | | | 121 | | | | (2 | ) |
| | | | | | | | | | | | | | | 2,231 | | | | 2,249 | | | | 18 | |
| | |
SEE NOTES TO FINANCIAL STATEMENTS.
| | | | | | |
| | | |
| 146 | | | | J.P. MORGAN INCOME FUNDS | | AUGUST 31, 2016 |
| | | | | | | | | | | | | | | | | | | | | | | | |
CONTRACTS
TO SELL | | | CURRENCY | | | COUNTERPARTY | | SETTLEMENT
DATE | | | SETTLEMENT
VALUE | | | VALUE AT
AUGUST 31, 2016 | | | NET
UNREALIZED
APPRECIATION
(DEPRECIATION) | |
| | 3,100 | | | | AUD | | | Australia and New Zealand Banking Group Limited | | | 09/09/16 | | | | 2,241 | | | | 2,329 | | | | (88 | ) |
| | 6,611 | | | | BRL | | | Deutsche Bank AG† | | | 09/30/16 | | | | 2,000 | | | | 2,031 | | | | (31 | ) |
| | 2,863 | | | | BRL | | | HSBC Bank, N.A.† | | | 09/30/16 | | | | 820 | | | | 879 | | | | (59 | ) |
| | 1,378 | | | | EUR | | | Royal Bank of Canada | | | 09/09/16 | | | | 1,543 | | | | 1,538 | | | | 5 | |
| | 35 | | | | EUR | | | Goldman Sachs International | | | 09/30/16 | | | | 39 | | | | 38 | | | | 1 | |
| | 236 | | | | EUR | | | Royal Bank of Canada | | | 09/30/16 | | | | 267 | | | | 264 | | | | 3 | |
| | 104,000 | | | | JPY | | | Royal Bank of Canada | | | 09/09/16 | | | | 959 | | | | 1,006 | | | | (47 | ) |
| | 13,167 | | | | ZAR | | | Deutsche Bank AG | | | 09/09/16 | | | | 831 | | | | 894 | | | | (63 | ) |
| | | | | | | | | | | | | | | 8,700 | | | | 8,979 | | | | (279 | ) |
| | |
Centrally Cleared Credit Default Swaps — Buy Protection [1]
Credit Indices:
| | | | | | | | | | | | | | | | | | | | | | |
| REFERENCE OBLIGATION | | FUND PAYS
FIXED RATE (r) | | TERMINATION
DATE | | | IMPLIED CREDIT
SPREAD
AS OF
AUGUST 31, 2016 [3] | | | NOTIONAL
AMOUNT [4] | | | VALUE | | | UPFRONT
PREMIUMS (PAID)/
RECEIVED [5] | |
CDX.EM.25-V1 | | 1.000% quarterly | | | 06/20/21 | | | | 3.033 | % | | | 50,000 | | | | 3,115 | | | | (3,884 | ) |
| | | | | | | | | | | | | | | | | | | | | | |
| | | | | | | | | | | | | | | | | 3,115 | | | | (3,884 | ) |
| | | | | | | | | | | | | | | | | | | | | | |
Centrally Cleared Credit Default Swaps — Sell Protection [2]
Credit Indices:
| | | | | | | | | | | | | | | | | | | | | | |
| REFERENCE OBLIGATION | | FUND RECEIVES
FIXED RATE (r) | | TERMINATION
DATE | | | IMPLIED CREDIT
SPREAD
AS OF
AUGUST 31, 2016 [3] | | | NOTIONAL
AMOUNT [4] | | | VALUE | | | UPFRONT
PREMIUMS (PAID)/
RECEIVED [5] | |
CDX.NA.HY.26-V1 | | 5.000% quarterly | | | 06/20/21 | | | | 3.920 | % | | | 2,000 | | | | 88 | | | | (88 | ) |
CDX.NA.IG.26-V1 | | 1.000% quarterly | | | 06/20/21 | | | | 0.729 | | | | 41,000 | | | | 516 | | | | (515 | ) |
| | | | | | | | | | | | | | | | | | | | | | |
| | | | | | | | | | | | | | | | | 604 | | | | (603 | ) |
| | | | | | | | | | | | | | | | | | | | | | |
| [1] | The Fund, as a buyer of credit protection, is generally obligated to make periodic payments and may also pay or receive an upfront premium to or from the protection seller, in exchange for the right to receive a contingent payment, upon occurrence of a credit event with respect to an underlying reference obligation, as defined under the terms of individual swap contracts. |
| [2] | The Fund, as a seller of credit protection, receives periodic payments and may also receive or pay an upfront premium from or to the protection buyer, and is obligated to make a contingent payment, upon occurrence of a credit event with respect to an underlying reference obligation, as defined under the terms of individual swap contracts. |
| [3] | Implied credit spreads are an indication of the seller’s performance risk, related to the likelihood of a credit event occurring that would require a seller to make payment to a buyer. Implied credit spreads are used to determine the value of swap contracts and reflect the cost of buying/selling protection, which may include upfront payments made to enter into the contract. Therefore, higher spreads would indicate a greater likelihood that a seller will be obligated to perform (i.e., make payment) under the swap contract. Increasing values, in absolute terms and relative to notional amounts, are also indicative of greater performance risk. Implied credit spreads for credit default swaps on credit indices are linked to the weighted average spread across the underlying reference obligations included in a particular index. |
| [4] | The notional amount is the maximum amount that a seller of credit protection would be obligated to pay and a buyer of credit protection would receive, upon occurrence of a credit event. |
| [5] | Upfront premiums generally relate to payments made or received at the initiation of the agreement to compensate the differences between the stated terms of the swap agreement and current market conditions (credit spreads, interest rates and other relevant factors). |
SEE NOTES TO FINANCIAL STATEMENTS.
| | | | | | | | |
| | | |
| AUGUST 31, 2016 | | J.P. MORGAN INCOME FUNDS | | | | | 147 | |
JPMorgan Government Bond Fund
SCHEDULE OF PORTFOLIO INVESTMENTS
AS OF AUGUST 31, 2016 (Unaudited)
(Amounts in thousands)
| | | | | | | | |
PRINCIPAL
AMOUNT($) | | | SECURITY DESCRIPTION | | VALUE($) | |
| Collateralized Mortgage Obligations — 37.6% | |
| | | | Agency CMO — 37.6% | |
| | | | Federal Home Loan Mortgage Corp. REMIC, | | | | |
| | 30 | | | Series 1343, Class LA, 8.000%, 08/15/22 | | | 33 | |
| | 200 | | | Series 1367, Class K, 5.500%, 09/15/22 | | | 214 | |
| | 36 | | | Series 1591, Class E, 10.000%, 10/15/23 | | | 37 | |
| | 309 | | | Series 1633, Class Z, 6.500%, 12/15/23 | | | 337 | |
| | 254 | | | Series 1694, Class PK, 6.500%, 03/15/24 | | | 281 | |
| | 1,819 | | | Series 1785, Class A, 6.000%, 10/15/23 | | | 1,984 | |
| | 103 | | | Series 1999, Class PU, 7.000%, 10/15/27 | | | 117 | |
| | 202 | | | Series 2031, Class PG, 7.000%, 02/15/28 | | | 234 | |
| | 592 | | | Series 2035, Class PC, 6.950%, 03/15/28 | | | 676 | |
| | 411 | | | Series 2064, Class PD, 6.500%, 06/15/28 | | | 471 | |
| | 320 | | | Series 2095, Class PE, 6.000%, 11/15/28 | | | 367 | |
| | 161 | | | Series 2152, Class BD, 6.500%, 05/15/29 | | | 171 | |
| | 781 | | | Series 2162, Class TH, 6.000%, 06/15/29 | | | 904 | |
| | 451 | | | Series 2367, Class ME, 6.500%, 10/15/31 | | | 516 | |
| | 476 | | | Series 2480, Class EJ, 6.000%, 08/15/32 | | | 530 | |
| | 457 | | | Series 2562, Class PG, 5.000%, 01/15/18 | | | 467 | |
| | 3,874 | | | Series 2611, Class QZ, 5.000%, 05/15/33 | | | 4,432 | |
| | 204 | | | Series 2647, Class A, 3.250%, 04/15/32 | | | 215 | |
| | 264 | | | Series 2651, Class VZ, 4.500%, 07/15/18 | | | 271 | |
| | 940 | | | Series 2656, Class BG, 5.000%, 10/15/32 | | | 956 | |
| | 594 | | | Series 2688, Class DG, 4.500%, 10/15/23 | | | 641 | |
| | 1,225 | | | Series 2773, Class TB, 4.000%, 04/15/19 | | | 1,256 | |
| | 1,729 | | | Series 2841, Class AT, 4.000%, 08/15/19 | | | 1,772 | |
| | 829 | | | Series 2882, Class QD, 4.500%, 07/15/34 | | | 886 | |
| | 4,464 | | | Series 2915, Class MU, 5.000%, 01/15/35 | | | 4,899 | |
| | 906 | | | Series 2927, Class GA, 5.500%, 10/15/34 | | | 977 | |
| | 1,592 | | | Series 2931, Class QD, 4.500%, 02/15/20 | | | 1,649 | |
| | 599 | | | Series 3085, Class VS, HB, IF, 26.689%, 12/15/35 | | | 1,048 | |
| | 2,003 | | | Series 3181, Class OP, PO, 07/15/36 | | | 1,783 | |
| | 2,025 | | | Series 3188, Class GE, 6.000%, 07/15/26 | | | 2,302 | |
| | 6,414 | | | Series 3325, Class JL, 5.500%, 06/15/37 | | | 7,011 | |
| | 4,551 | | | Series 3341, Class PE, 6.000%, 07/15/37 | | | 5,109 | |
| | 1,215 | | | Series 3413, Class B, 5.500%, 04/15/37 | | | 1,350 | |
| | 4,000 | | | Series 3699, Class QH, 5.500%, 07/15/40 | | | 4,461 | |
| | 4,593 | | | Series 3737, Class DG, 5.000%, 10/15/30 | | | 5,023 | |
| | 7,000 | | | Series 3798, Class AY, 3.500%, 01/15/26 | | | 7,389 | |
| | 5,000 | | | Series 3809, Class BC, 3.500%, 02/15/26 | | | 5,238 | |
| | 6,351 | | | Series 3926, Class MW, 4.500%, 09/15/26 | | | 7,117 | |
| | 3,970 | | | Series 3927, Class PC, 4.500%, 09/15/41 | | | 4,801 | |
| | 18,796 | | | Series 3981, Class PA, 3.000%, 04/15/31 | | | 19,218 | |
| | 13,974 | | | Series 4002, Class MV, 4.000%, 01/15/30 | | | 14,754 | |
| | 14,484 | | | Series 4039, Class SA, IF, IO, 5.992%, 05/15/42 | | | 2,719 | |
| | | | | | | | |
PRINCIPAL
AMOUNT($) | | | SECURITY DESCRIPTION | | VALUE($) | |
| | | | | | | | |
| | | | Agency CMO — continued | |
| | 12,000 | | | Series 4047, Class PB, 3.500%, 01/15/41 | | | 12,922 | |
| | 5,000 | | | Series 4050, Class VE, 4.000%, 01/15/29 | | | 5,505 | |
| | 4,651 | | | Series 4066, Class VB, 3.500%, 01/15/29 | | | 5,050 | |
| | 3,104 | | | Series 4181, Class VA, 3.000%, 05/15/26 | | | 3,257 | |
| | 21,732 | | | Series 4186, Class JE, 2.000%, 03/15/33 | | | 21,907 | |
| | 13,772 | | | Series 4188, Class JG, 2.000%, 04/15/33 | | | 13,912 | |
| | 10,458 | | | Series 4206, Class DA, 2.000%, 05/15/33 | | | 10,664 | |
| | 1,450 | | | Series 4314, Class DY, 3.500%, 03/15/29 | | | 1,583 | |
| | 2,624 | | | Series 4336, Class YB, 3.000%, 05/15/29 | | | 2,791 | |
| | 5,873 | | | Series 4365, Class HZ, 3.000%, 01/15/40 | | | 5,814 | |
| | 10,000 | | | Series 4458, Class BW, 3.000%, 04/15/35 | | | 10,208 | |
| | 5,172 | | | Series 4594, Class GN, 2.500%, 02/15/45 | | | 5,328 | |
| | | | Federal Home Loan Mortgage Corp. STRIPS, | | | | |
| | 30 | | | Series 155, Class IO, IO, 7.000%, 11/01/23 | | | 5 | |
| | 17,556 | | | Series 264, Class 30, 3.000%, 07/15/42 | | | 17,951 | |
| | 10,393 | | | Series 267, Class 30, 3.000%, 08/15/42 | | | 10,776 | |
| | | | Federal Home Loan Mortgage Corp. Structured Pass-Through Securities, | | | | |
| | 1,544 | | | Series T-51, Class 1A, VAR, 6.500%, 09/25/43 | | | 1,836 | |
| | 1,782 | | | Series T-54, Class 2A, 6.500%, 02/25/43 | | | 2,146 | |
| | 798 | | | Series T-56, Class APO, PO, 05/25/43 | | | 720 | |
| | | | Federal National Mortgage Association - ACES, | | | | |
| | 4,464 | | | Series 2015-M13, Class A2, VAR, 2.801%, 06/25/25 | | | 4,677 | |
| | 11,927 | | | Series 2016-M1, Class A2, VAR, 2.939%, 01/25/26 | | | 12,644 | |
| | 593 | | | Federal National Mortgage Association Grantor Trust, Series 2004-T1, Class 1A2, 6.500%, 01/25/44 | | | 712 | |
| | | | Federal National Mortgage Association REMIC, | | | | |
| | 7 | | | Series 1988-16, Class B, 9.500%, 06/25/18 | | | 7 | |
| | 94 | | | Series 1993-110, Class H, 6.500%, 05/25/23 | | | 105 | |
| | 73 | | | Series 1993-146, Class E, PO, 05/25/23 | | | 69 | |
| | 1,208 | | | Series 1993-155, Class PJ, 7.000%, 09/25/23 | | | 1,355 | |
| | 14 | | | Series 1993-205, Class H, PO, 09/25/23 | | | 13 | |
| | 20 | | | Series 1993-217, Class H, PO, 08/25/23 | | | 19 | |
| | 16 | | | Series 1993-228, Class G, PO, 09/25/23 | | | 15 | |
| | 411 | | | Series 1994-37, Class L, 6.500%, 03/25/24 | | | 455 | |
| | 1,555 | | | Series 1994-51, Class PV, 6.000%, 03/25/24 | | | 1,700 | |
| | 736 | | | Series 1998-58, Class PC, 6.500%, 10/25/28 | | | 824 | |
| | 250 | | | Series 2000-8, Class Z, 7.500%, 02/20/30 | | | 298 | |
SEE NOTES TO FINANCIAL STATEMENTS.
| | | | | | |
| | | |
| 148 | | | | J.P. MORGAN INCOME FUNDS | | AUGUST 31, 2016 |
| | | | | | | | |
PRINCIPAL
AMOUNT($) | | | SECURITY DESCRIPTION | | VALUE($) | |
| Collateralized Mortgage Obligations — continued | |
| | | | Agency CMO — continued | |
| | 401 | | | Series 2001-33, Class ID, IO, 6.000%, 07/25/31 | | | 78 | |
| | 9 | | | Series 2002-2, Class UC, 6.000%, 02/25/17 | | | 9 | |
| | 6 | | | Series 2002-3, Class PG, 5.500%, 02/25/17 | | | 6 | |
| | 263 | | | Series 2002-73, Class OE, 5.000%, 11/25/17 | | | 268 | |
| | 543 | | | Series 2002-92, Class FB, VAR, 1.174%, 04/25/30 | | | 552 | |
| | 3,609 | | | Series 2003-21, Class PZ, 4.500%, 03/25/33 | | | 3,882 | |
| | 146 | | | Series 2003-67, Class SA, HB, IF, 42.091%, 10/25/31 | | | 238 | |
| | 823 | | | Series 2003-81, Class MC, 5.000%, 12/25/32 | | | 830 | |
| | 2,405 | | | Series 2003-128, Class DY, 4.500%, 01/25/24 | | | 2,584 | |
| | 982 | | | Series 2004-46, Class QD, HB, IF, 21.902%, 03/25/34 | | | 1,430 | |
| | 1,453 | | | Series 2004-54, Class FL, VAR, 0.924%, 07/25/34 | | | 1,454 | |
| | 1,459 | | | Series 2004-60, Class PA, 5.500%, 04/25/34 | | | 1,518 | |
| | 6,686 | | | Series 2005-22, Class EH, 5.000%, 04/25/35 | | | 7,285 | |
| | 1,156 | | | Series 2005-58, Class EP, 5.500%, 07/25/35 | | | 1,273 | |
| | 1,325 | | | Series 2005-62, Class DX, 5.000%, 05/25/34 | | | 1,357 | |
| | 1,429 | | | Series 2005-83, Class LA, 5.500%, 10/25/35 | | | 1,602 | |
| | 5,383 | | | Series 2005-116, Class PC, 6.000%, 01/25/36 | | | 6,089 | |
| | 4,262 | | | Series 2006-3, Class SB, IF, IO, 6.176%, 07/25/35 | | | 631 | |
| | 6,908 | | | Series 2006-51, Class FP, VAR, 0.874%, 03/25/36 | | | 6,903 | |
| | 87 | | | Series 2006-81, Class FA, VAR, 0.874%, 09/25/36 | | | 87 | |
| | 920 | | | Series 2006-110, Class PO, PO, 11/25/36 | | | 880 | |
| | 2,974 | | | Series 2007-76, Class PE, 6.000%, 08/25/37 | | | 3,321 | |
| | 768 | | | Series 2009-89, Class A1, 5.410%, 05/25/35 | | | 810 | |
| | 46 | | | Series 2010-4, Class SL, IF, 10.408%, 02/25/40 | | | 64 | |
| | 1,280 | | | Series 2010-11, Class CB, 4.500%, 02/25/40 | | | 1,377 | |
| | 6,000 | | | Series 2010-47, Class MB, 5.000%, 09/25/39 | | | 6,743 | |
| | | | | | | | |
PRINCIPAL
AMOUNT($) | | | SECURITY DESCRIPTION | | VALUE($) | |
| | | | | | | | |
| | | | Agency CMO — continued | |
| | 4,968 | | | Series 2010-68, Class EP, 4.500%, 12/25/39 | | | 5,333 | |
| | 5,000 | | | Series 2010-117, Class DY, 4.500%, 10/25/25 | | | 5,613 | |
| | 4,274 | | | Series 2010-155, Class B, 3.500%, 01/25/26 | | | 4,635 | |
| | 11,500 | | | Series 2011-145, Class PB, 3.500%, 01/25/32 | | | 12,467 | |
| | 12,523 | | | Series 2012-47, Class QE, 4.000%, 05/25/38 | | | 13,004 | |
| | 5,566 | | | Series 2012-50, Class HY, 4.000%, 05/25/42 | | | 6,261 | |
| | 7,640 | | | Series 2012-60, Class EP, 3.000%, 04/25/42 | | | 7,834 | |
| | 17,989 | | | Series 2012-63, Class VA, 4.000%, 08/25/23 | | | 19,176 | |
| | 1,400 | | | Series 2012-141, Class PB, 2.500%, 12/25/42 | | | 1,390 | |
| | 5,300 | | | Series 2013-106, Class PY, 3.000%, 10/25/33 | | | 5,506 | |
| | 3,699 | | | Series 2013-130, Class GY, 3.500%, 01/25/34 | | | 4,141 | |
| | 6,000 | | | Series 2015-11, Class AQ, 3.000%, 03/25/35 | | | 6,133 | |
| | 4,000 | | | Series 2015-28, Class GB, 3.500%, 05/25/35 | | | 4,397 | |
| | 4,653 | | | Series 2015-41, Class AY, 3.000%, 06/25/35 | | | 4,867 | |
| | 11,897 | | | Series 2015-48, Class DE, 3.000%, 10/25/44 | | | 12,311 | |
| | 4,491 | | | Series 2016-28, Class DW, 3.500%, 05/25/36 | | | 4,945 | |
| | 19,383 | | | Series 2016-38, Class NA, 3.000%, 01/25/46 | | | 20,367 | |
| | 9 | | | Series G92-35, Class EB, 7.500%, 07/25/22 | | | 10 | |
| | 11 | | | Series G92-44, Class ZQ, 8.000%, 07/25/22 | | | 11 | |
| | | | Federal National Mortgage Association REMIC Trust, | | | | |
| | 156 | | | Series 1999-W4, Class A9, 6.250%, 02/25/29 | | | 172 | |
| | 1,716 | | | Series 2002-W7, Class A4, 6.000%, 06/25/29 | | | 1,950 | |
| | 733 | | | Series 2003-W1, Class 1A1, VAR, 5.632%, 12/25/42 | | | 831 | |
| | 387 | | | Series 2003-W1, Class 2A, VAR, 6.307%, 12/25/42 | | | 455 | |
| | 2,449 | | | Series 2005-W1, Class 1A2, 6.500%, 10/25/44 | | | 2,888 | |
SEE NOTES TO FINANCIAL STATEMENTS.
| | | | | | | | |
| | | |
| AUGUST 31, 2016 | | J.P. MORGAN INCOME FUNDS | | | | | 149 | |
JPMorgan Government Bond Fund
SCHEDULE OF PORTFOLIO INVESTMENTS
AS OF AUGUST 31, 2016 (Unaudited) (continued)
(Amounts in thousands)
| | | | | | | | |
PRINCIPAL
AMOUNT($) | | | SECURITY DESCRIPTION | | VALUE($) | |
| Collateralized Mortgage Obligations — continued | |
| | | | Agency CMO — continued | |
| | 1,601 | | | Series 2009-W1, Class A, 6.000%, 12/25/49 | | | 1,835 | |
| | | | Federal National Mortgage Association STRIPS, | | | | |
| | 1,807 | | | Series 278, Class 1, VAR, 1.469%, 08/25/25 | | | 1,841 | |
| | 593 | | | Series 278, Class 3, VAR, 1.535%, 11/25/23 | | | 598 | |
| | 215 | | | Series 343, Class 23, IO, 4.000%, 10/25/18 | | | 6 | |
| | | | Government National Mortgage Association, | | | | |
| | 4,844 | | | Series 2001-64, Class PB, 6.500%, 12/20/31 | | | 5,532 | |
| | 3,285 | | | Series 2004-27, Class PD, 5.500%, 04/20/34 | | | 3,816 | |
| | 874 | | | Series 2008-15, Class NB, 4.500%, 02/20/38 | | | 942 | |
| | 4,606 | | | Series 2008-40, Class SA, IF, IO, 5.893%, 05/16/38 | | | 900 | |
| | 17,710 | | | Series 2009-42, Class TX, 4.500%, 06/20/39 | | | 19,156 | |
| | 51 | | | Series 2009-52, Class MA, 5.000%, 11/20/36 | | | 51 | |
| | 4,673 | | | Series 2009-69, Class WM, 5.500%, 08/20/39 | | | 5,030 | |
| | 13,158 | | | Series 2011-29, Class Z, 5.000%, 05/20/40 | | | 15,962 | |
| | | | | | | | |
| | | | Total Collateralized Mortgage Obligations
(Cost $502,218) | | | 521,521 | |
| | | | | | | | |
| Commercial Mortgage-Backed Securities — 1.8% | |
| | | | Federal Home Loan Mortgage Corp., Multifamily Structured Pass-Through Certificates, | | | | |
| | 6,026 | | | Series K046, Class A2, 3.205%, 03/25/25 | | | 6,575 | |
| | 6,500 | | | Series K048, Class A2, VAR, 3.284%, 06/25/25 | | | 7,129 | |
| | 3,519 | | | Series K049, Class A2, 3.010%, 07/25/25 | | | 3,786 | |
| | 6,716 | | | Series K052, Class A2, 3.151%, 11/25/25 | | | 7,306 | |
| | | | | | | | |
| | | | Total Commercial Mortgage-Backed Securities
(Cost $23,389) | | | 24,796 | |
| | | | | | | | |
| Foreign Government Security — 0.5% | |
| | 7,527 | | | Israel Government AID Bond, (Israel), Zero Coupon, 09/15/19
(Cost $6,996) | | | 7,213 | |
| | | | | | | | |
| Mortgage Pass-Through Securities — 8.9% | |
| | | | Federal Home Loan Mortgage Corp., | | | | |
| | 3 | | | ARM, 1.922%, 07/01/30 | | | 3 | |
| | 4 | | | ARM, 1.941%, 02/01/19 | | | 4 | |
| | 5 | | | ARM, 2.030%, 03/01/18 | | | 5 | |
| | 22 | | | ARM, 2.077%, 08/01/18 | | | 22 | |
| | 12 | | | ARM, 2.375%, 06/01/18 | | | 12 | |
| | | | | | | | |
PRINCIPAL
AMOUNT($) | | | SECURITY DESCRIPTION | | VALUE($) | |
| | | | | | | | |
| | 1,110 | | | ARM, 2.504%, 03/01/37 | | | 1,173 | |
| | 29 | | | ARM, 2.523%, 01/01/21 | | | 29 | |
| | 104 | | | ARM, 2.572%, 01/01/27 | | | 109 | |
| | 10 | | | ARM, 2.579%, 11/01/18 | | | 10 | |
| | 15 | | | ARM, 2.652%, 04/01/30 | | | 15 | |
| | 1 | | | ARM, 3.061%, 01/01/20 | | | 1 | |
| | 17 | | | Federal Home Loan Mortgage Corp. Gold Pools, 15 Year, Single Family, 5.000%, 12/01/16 | | | 18 | |
| | 233 | | | Federal Home Loan Mortgage Corp. Gold Pools, 20 Year, Single Family, 4.500%, 05/01/24 | | | 254 | |
| | | | Federal Home Loan Mortgage Corp. Gold Pools, 30 Year, Single Family, | | | | |
| | 1,070 | | | 4.500%, 10/01/40 | | | 1,175 | |
| | 285 | | | 5.500%, 11/01/33 | | | 318 | |
| | 80 | | | 6.000%, 02/01/32 | | | 92 | |
| | 350 | | | 6.500%, 01/01/24 - 06/01/29 | | | 406 | |
| | 743 | | | 7.000%, 08/01/25 - 09/01/29 | | | 854 | |
| | 39 | | | 7.500%, 09/01/24 - 08/01/25 | | | 44 | |
| | 22 | | | 8.000%, 11/01/24 | | | 25 | |
| | 87 | | | 8.500%, 05/01/24 - 07/01/28 | | | 101 | |
| | 1 | | | 9.000%, 10/01/17 - 11/01/21 | | | 1 | |
| | | | Federal National Mortgage Association, | | | | |
| | 13 | | | ARM, 1.875%, 06/01/17 - 06/01/20 | | | 14 | |
| | 24 | | | ARM, 1.919%, 06/01/29 | | | 25 | |
| | 72 | | | ARM, 1.941%, 11/01/27 - 11/01/40 | | | 76 | |
| | 12 | | | ARM, 2.524%, 07/01/17 | | | 12 | |
| | 13 | | | ARM, 2.577%, 08/01/19 | | | 13 | |
| | 13 | | | ARM, 2.875%, 01/01/29 | | | 13 | |
| | 11 | | | ARM, 3.892%, 09/01/27 | | | 12 | |
| | 3 | | | ARM, 6.000%, 12/01/18 | | | 3 | |
| | 6 | | | ARM, 6.002%, 04/01/19 | | | 6 | |
| | | | Federal National Mortgage Association, 15 Year, Single Family, | | | | |
| | 2,642 | | | 4.000%, 04/01/19 - 09/01/25 | | | 2,801 | |
| | 585 | | | 4.500%, 03/01/19 | | | 600 | |
| | 140 | | | 5.500%, 11/01/16 - 03/01/18 | | | 142 | |
| | 333 | | | Federal National Mortgage Association, 20 Year, Single Family, 5.000%, 11/01/23 | | | 369 | |
| | | | Federal National Mortgage Association, 30 Year, Single Family, | | | | |
| | 7,291 | | | 3.000%, 03/01/43 - 09/01/46 (w) | | | 7,604 | |
| | 13,970 | | | 3.500%, 05/01/42 - 12/01/45 | | | 14,915 | |
| | 3,615 | | | 3.500%, 09/01/46 (w) | | | 3,863 | |
| | 15,439 | | | 4.000%, 06/01/43 - 11/01/43 | | | 16,844 | |
| | 531 | | | 4.500%, 03/01/38 | | | 580 | |
| | 1,515 | | | 5.000%, 11/01/33 | | | 1,711 | |
| | 9,819 | | | 5.500%, 02/01/29 - 05/01/36 | | | 11,275 | |
SEE NOTES TO FINANCIAL STATEMENTS.
| | | | | | |
| | | |
| 150 | | | | J.P. MORGAN INCOME FUNDS | | AUGUST 31, 2016 |
| | | | | | | | |
PRINCIPAL
AMOUNT($) | | | SECURITY DESCRIPTION | | VALUE($) | |
| Mortgage Pass-Through Securities — continued | |
| | 1,418 | | | 6.000%, 07/01/36 | | | 1,668 | |
| | 344 | | | 6.500%, 06/01/26 - 04/01/32 | | | 411 | |
| | 3,234 | | | 7.000%, 02/01/24 - 03/01/35 | | | 3,977 | |
| | 92 | | | 7.500%, 03/01/30 - 04/01/30 | | | 96 | |
| | 4 | | | 10.000%, 09/01/17 - 07/01/20 | | | 4 | |
| | | | Federal National Mortgage Association, Other, | | | | |
| | 4,886 | | | VAR, 1.255%, 12/01/25 | | | 4,882 | |
| | 6,500 | | | 2.810%, 04/01/25 | | | 6,871 | |
| | 5,966 | | | 2.974%, 06/01/27 | | | 6,246 | |
| | 6,500 | | | 3.100%, 01/01/26 | | | 7,018 | |
| | 7,371 | | | 3.117%, 01/01/22 | | | 7,874 | |
| | 8,940 | | | 3.259%, 01/01/22 | | | 9,588 | |
| | 3,000 | | | 3.300%, 11/01/26 | | | 3,278 | |
| | 4,335 | | | 3.765%, 12/01/25 | | | 4,870 | |
| | 62 | | | 6.000%, 09/01/28 | | | 71 | |
| | | | Government National Mortgage Association II, 30 Year, Single Family, | | | | |
| | 164 | | | 8.000%, 11/20/26 - 11/20/27 | | | 194 | |
| | | | Government National Mortgage Association, 30 Year, Single Family, | | | | |
| | 1 | | | 6.000%, 10/15/23 | | | 2 | |
| | 387 | | | 6.500%, 06/15/23 - 02/15/24 | | | 445 | |
| | 164 | | | 7.000%, 12/15/22 - 06/15/28 | | | 172 | |
| | 256 | | | 7.500%, 02/15/22 - 02/15/28 | | | 279 | |
| | 100 | | | 8.000%, 07/15/22 - 08/15/26 | | | 109 | |
| | 199 | | | 9.000%, 02/15/17 - 11/15/24 | | | 219 | |
| | 1 | | | 9.500%, 08/15/17 - 09/15/20 | | | 1 | |
| | | | | | | | |
| | | | Total Mortgage Pass-Through Securities
(Cost $117,979) | | | 123,824 | |
| | | | | | | | |
| U.S. Government Agency Securities — 19.4% | |
| | | | Federal Farm Credit Banks, | | | | |
| | 10,000 | | | 5.750%, 05/11/26 | | | 13,206 | |
| | 12,824 | | | 5.750%, 12/07/28 | | | 17,617 | |
| | | | Federal National Mortgage Association, | | | | |
| | 10,000 | | | 6.250%, 05/15/29 | | | 14,509 | |
| | 30,000 | | | 9.323%, 10/09/19 (n) | | | 28,729 | |
| | | | Federal National Mortgage Association STRIPS, | | | | |
| | 8,000 | | | 2.348%, 10/08/27 (n) | | | 6,150 | |
| | 10,000 | | | 4.335%, 05/15/30 (n) | | | 7,068 | |
| | 9,200 | | | 13.356%, 05/29/26 (n) | | | 7,444 | |
| | | | Residual Funding Corp. STRIPS, | | | | |
| | 18,300 | | | 1.954%, 10/15/20 (n) | | | 17,332 | |
| | 57,000 | | | 2.124%, 07/15/20 (n) | | | 54,050 | |
| | 5,000 | | | 2.268%, 01/15/21 (n) | | | 4,702 | |
| | 60,673 | | | 3.402%, 10/15/19 (n) | | | 58,530 | |
| | 15,700 | | | 4.757%, 01/15/30 (n) | | | 11,301 | |
| | | | | | | | |
PRINCIPAL
AMOUNT($) | | | SECURITY DESCRIPTION | | VALUE($) | |
| | | | | | | | |
| | 5,000 | | | 14.663%, 04/15/30 (n) | | | 3,585 | |
| | 15,000 | | | Resolution Funding Corp. STRIPS, 15.173%, 04/15/28 (n) | | | 11,291 | |
| | 14,740 | | | Tennessee Valley Authority STRIPS, 5.177%, 12/15/17 (n) | | | 14,555 | |
| | | | | | | | |
| | | | Total U.S. Government Agency Securities
(Cost $239,827) | | | 270,069 | |
| | | | | | | | |
| U.S. Treasury Obligations — 26.9% | |
| | | | U.S. Treasury Bonds, | | | | |
| | 20,000 | | | 5.250%, 11/15/28 | | | 27,869 | |
| | 2,500 | | | 7.125%, 02/15/23 | | | 3,392 | |
| | 3,935 | | | 7.250%, 08/15/22 | | | 5,278 | |
| | 3,635 | | | 8.000%, 11/15/21 | | | 4,874 | |
| | 3,190 | | | 8.875%, 08/15/17 | | | 3,438 | |
| | 1,020 | | | 9.000%, 11/15/18 | | | 1,203 | |
| | 72,500 | | | U.S. Treasury Coupon STRIPS, 2.042%, 05/15/20 (n) | | | 69,596 | |
| | 55,000 | | | U.S. Treasury Inflation Indexed Bonds, 1.375%, 02/15/44 | | | 67,818 | |
| | | | U.S. Treasury Notes, | | | | |
| | 25,000 | | | 0.625%, 05/31/17 | | | 25,000 | |
| | 35,000 | | | 1.625%, 02/15/26 | | | 35,109 | |
| | 15,000 | | | 1.625%, 05/15/26 | | | 15,043 | |
| | 35,000 | | | 1.875%, 09/30/17 | | | 35,439 | |
| | 20,000 | | | 2.000%, 08/15/25 | | | 20,715 | |
| | 30,000 | | | 2.625%, 11/15/20 | | | 31,798 | |
| | 25,000 | | | 4.250%, 11/15/17 | | | 26,046 | |
| | 1,020 | | | 4.750%, 08/15/17 | | | 1,059 | |
| | | | | | | | |
| | | | Total U.S. Treasury Obligations
(Cost $354,679) | | | 373,677 | |
| | | | | | | | |
| | |
| SHARES | | | | | | |
| Short-Term Investment — 5.5% | |
| | | | Investment Company — 5.5% | |
| | 75,648 | | | JPMorgan U.S. Government Money Market Fund, Institutional Class Shares, 0.310% (b) (l)
(Cost $75,648) | | | 75,648 | |
| | | | | | | | |
| | | | Total Investments — 100.6%
(Cost $1,320,736) | | | 1,396,748 | |
| | | | Liabilities in Excess of
Other Assets — (0.6)% | | | (8,976 | ) |
| | | | | | | | |
| | | | NET ASSETS — 100.0% | | $ | 1,387,772 | |
| | | | | | | | |
Percentages indicated are based on net assets.
SEE NOTES TO FINANCIAL STATEMENTS.
| | | | | | | | |
| | | |
| AUGUST 31, 2016 | | J.P. MORGAN INCOME FUNDS | | | | | 151 | |
JPMorgan High Yield Fund
SCHEDULE OF PORTFOLIO INVESTMENTS
AS OF AUGUST 31, 2016 (Unaudited)
(Amounts in thousands)
| | | | | | | | |
PRINCIPAL
AMOUNT($) | | | SECURITY DESCRIPTION | | VALUE($) | |
| Asset-Backed Securities — 0.0% (g) | |
| | 269 | | | Countrywide Asset-Backed Certificates, Series 2004-13, Class MV8, VAR, 2.188%, 01/25/35 | | | 5 | |
| | 3 | | | Long Beach Mortgage Loan Trust, Series 2004-5, Class M6, VAR, 3.024%, 09/25/34 | | | 2 | |
| | 1,854 | | | Unipac IX LLC, 13.000%, 12/31/20 | | | 1,757 | |
| | | | | | | | |
| | | | Total Asset-Backed Securities
(Cost $1,826) | | | 1,764 | |
| | | | | | | | |
| Convertible Bonds — 0.1% | |
| | | | Consumer Discretionary — 0.0% (g) | |
| | | | Media — 0.0% (g) | |
| | 2,611 Units | | | Liberty Interactive LLC, 3.750%, 02/15/30 | | | 1,570 | |
| | | | | | | | |
| | | | Utilities — 0.1% | |
| | | | Independent Power & Renewable Electricity
Producers — 0.1% | |
| | 6,500 Units | | | NRG Yield, Inc., 3.250%, 06/01/20 (e) | | | 6,358 | |
| | | | | | | | |
| | | | Total Convertible Bonds
(Cost $7,379) | | | 7,928 | |
| | | | | | | | |
| Corporate Bonds — 86.6% | |
| | | | Consumer Discretionary — 17.6% | |
| | | | Auto Components — 1.6% | |
| | | | American Axle & Manufacturing, Inc., | | | | |
| | 4,300 | | | 6.250%, 03/15/21 | | | 4,493 | |
| | 6,350 | | | 6.625%, 10/15/22 | | | 6,771 | |
| | | | Goodyear Tire & Rubber Co. (The), | | | | |
| | 27,860 | | | 5.000%, 05/31/26 | | | 29,166 | |
| | 16,210 | | | 5.125%, 11/15/23 | | | 16,939 | |
| | | | Icahn Enterprises LP/Icahn Enterprises Finance Corp., | | | | |
| | 3,920 | | | 4.875%, 03/15/19 | | | 3,883 | |
| | 19,588 | | | 5.875%, 02/01/22 | | | 18,290 | |
| | 4,725 | | | 6.000%, 08/01/20 | | | 4,542 | |
| | 3,849 | | | JB Poindexter & Co., Inc., 9.000%, 04/01/22 (e) | | | 4,138 | |
| | 31,535 | | | MPG Holdco I, Inc., 7.375%, 10/15/22 | | | 32,501 | |
| | 8,029 | | | Tenneco, Inc., 5.375%, 12/15/24 | | | 8,551 | |
| | | | ZF North America Capital, Inc., | | | | |
| | 13,519 | | | 4.000%, 04/29/20 (e) | | | 14,356 | |
| | 19,699 | | | 4.500%, 04/29/22 (e) | | | 20,832 | |
| | 23,091 | | | 4.750%, 04/29/25 (e) | | | 24,505 | |
| | | | | | | | |
| | | | | | | 188,967 | |
| | | | | | | | |
| | | | Automobiles — 0.6% | |
| | | | Fiat Chrysler Automobiles N.V., (Netherlands), | | | | |
| | 14,652 | | | 4.500%, 04/15/20 | | | 15,018 | |
| | 14,546 | | | 5.250%, 04/15/23 | | | 15,004 | |
| | | | | | | | |
PRINCIPAL
AMOUNT($) | | | SECURITY DESCRIPTION | | VALUE($) | |
| | | | | | | | |
| | | | Automobiles — continued | |
| | | | Jaguar Land Rover Automotive plc, (United Kingdom), | | | | |
| | 15,269 | | | 4.125%, 12/15/18 (e) | | | 15,727 | |
| | 15,103 | | | 4.250%, 11/15/19 (e) | | | 15,764 | |
| | 12,400 | | | 5.625%, 02/01/23 (e) | | | 13,082 | |
| | | | Motors Liquidation Co., | | | | |
| | 50 | | | 0.684%, 06/01/49 | | | — | (h) |
| | 973 | | | 5.250%, 03/06/32 | | | — | (h) |
| | 47 | | | 5.250%, 10/01/51 | | | — | (h) |
| | 34,959 | | | 6.250%, 07/15/33 (d) | | | — | (h) |
| | 10,255 | | | 6.750%, 05/01/28 (d) | | | — | (h) |
| | 246 | | | 7.250%, 04/15/41 | | | — | (h) |
| | 284 | | | 7.250%, 07/15/41 | | | — | (h) |
| | 548 | | | 7.250%, 02/15/52 | | | — | (h) |
| | 404 | | | 7.375%, 05/15/48 | | | — | (h) |
| | 6,000 | | | 7.375%, 05/23/48 (d) | | | — | (h) |
| | 9,300 | | | 7.400%, 09/01/25 (d) | | | — | (h) |
| | 25,800 | | | 7.700%, 04/15/16 (d) | | | — | (h) |
| | 3,415 | | | 7.750%, 03/15/36 (d) | | | — | (h) |
| | 12,550 | | | 8.100%, 06/15/24 (d) | | | — | (h) |
| | 20,000 | | | 8.250%, 07/15/23 (d) | | | — | (h) |
| | | | | | | | |
| | | | | | | 74,595 | |
| | | | | | | | |
| | | | Distributors — 0.2% | |
| | | | Global Partners LP/GLP Finance Corp., | | | | |
| | 200 | | | 6.250%, 07/15/22 | | | 180 | |
| | 6,000 | | | 7.000%, 06/15/23 | | | 5,460 | |
| | 8,798 | | | LKQ Corp., 4.750%, 05/15/23 | | | 8,886 | |
| | 10,535 | | | Performance Food Group, Inc., 5.500%, 06/01/24 (e) | | | 10,943 | �� |
| | | | | | | | |
| | | | | | | 25,469 | |
| | | | | | | | |
| | | | Diversified Consumer Services — 0.2% | |
| | | | Service Corp. International, | | | | |
| | 6,995 | | | 5.375%, 05/15/24 | | | 7,502 | |
| | 10,170 | | | 8.000%, 11/15/21 | | | 12,026 | |
| | | | | | | | |
| | | | | | | 19,528 | |
| | | | | | | | |
| | | | Hotels, Restaurants & Leisure — 3.6% | |
| | | | 1011778 B.C. ULC/New Red Finance, Inc., (Canada), | | | | |
| | 2,852 | | | 4.625%, 01/15/22 (e) | | | 2,952 | |
| | 35,165 | | | 6.000%, 04/01/22 (e) | | | 36,791 | |
| | | | Boyd Gaming Corp., | | | | |
| | 6,035 | | | 6.375%, 04/01/26 (e) | | | 6,458 | |
| | 11,943 | | | 6.875%, 05/15/23 | | | 12,898 | |
SEE NOTES TO FINANCIAL STATEMENTS.
| | | | | | |
| | | |
| 152 | | | | J.P. MORGAN INCOME FUNDS | | AUGUST 31, 2016 |
| | | | | | | | |
PRINCIPAL
AMOUNT($) | | | SECURITY DESCRIPTION | | VALUE($) | |
| Corporate Bonds — continued | |
| | | | Hotels, Restaurants & Leisure — continued | |
| | 4,615 | | | CCM Merger, Inc., 9.125%, 05/01/19 (e) | | | 4,840 | |
| | 4,382 | | | Choice Hotels International, Inc., 5.750%, 07/01/22 | | | 4,798 | |
| | 20,268 | | | Chukchansi Economic Development Authority, 9.750%, 05/30/20 (e) (d) | | | 11,147 | |
| | 11,222 | | | Downstream Development Authority of the Quapaw Tribe of Oklahoma, 10.500%, 07/01/19 (e) | | | 11,531 | |
| | 5,505 | | | Eldorado Resorts, Inc., 7.000%, 08/01/23 | | | 5,808 | |
| | 14,025 | | | ESH Hospitality, Inc., 5.250%, 05/01/25 (e) | | | 14,021 | |
| | | | GLP Capital LP/GLP Financing II, Inc., | | | | |
| | 820 | | | 4.375%, 04/15/21 | | | 865 | |
| | 21,605 | | | 5.375%, 11/01/23 | | | 23,685 | |
| | 6,845 | | | 5.375%, 04/15/26 | | | 7,478 | |
| | 10,620 | | | Golden Nugget Escrow, Inc., 8.500%, 12/01/21 (e) | | | 11,098 | |
| | 13,680 | | | Hilton Escrow Issuer LLC/Hilton Escrow Issuer Corp., 4.250%, 09/01/24 (e) | | | 13,937 | |
| | 22,075 | | | International Game Technology plc, (United Kingdom), 6.500%, 02/15/25 (e) | | | 23,929 | |
| | | | KFC Holding Co./Pizza Hut Holdings LLC/Taco Bell of America LLC, | | | | |
| | 11,010 | | | 5.000%, 06/01/24 (e) | | | 11,547 | |
| | 11,010 | | | 5.250%, 06/01/26 (e) | | | 11,698 | |
| | 9,715 | | | Landry’s, Inc., 9.375%, 05/01/20 (e) | | | 10,225 | |
| | 4,230 | | | MGM Growth Properties Operating Partnership LP/MGP Finance Co.-Issuer, Inc., 5.625%, 05/01/24 (e) | | | 4,590 | |
| | | | MGM Resorts International, | | | | |
| | 13,083 | | | 4.625%, 09/01/26 | | | 12,952 | |
| | 24,665 | | | 6.000%, 03/15/23 | | | 26,776 | |
| | 15,080 | | | 6.625%, 12/15/21 | | | 16,927 | |
| | 13,635 | | | 6.750%, 10/01/20 | | | 15,237 | |
| | 9,615 | | | 7.750%, 03/15/22 | | | 11,178 | |
| | 4,741 | | | Rivers Pittsburgh Borrower LP/Rivers Pittsburgh Finance Corp., 6.125%, 08/15/21 (e) | | | 4,883 | |
| | 8,408 | | | Sabre GLBL, Inc., 5.375%, 04/15/23 (e) | | | 8,692 | |
| | | | Scientific Games International, Inc., | | | | |
| | 9,480 | | | 7.000%, 01/01/22 (e) | | | 10,072 | |
| | 22,095 | | | 10.000%, 12/01/22 | | | 20,438 | |
| | 20,675 | | | Seminole Hard Rock Entertainment, Inc./Seminole Hard Rock International LLC, 5.875%, 05/15/21 (e) | | | 20,830 | |
| | 13,594 | | | Shingle Springs Tribal Gaming Authority, 9.750%, 09/01/21 (e) | | | 14,885 | |
| | | | | | | | |
PRINCIPAL
AMOUNT($) | | | SECURITY DESCRIPTION | | VALUE($) | |
| | | | | | | | |
| | | | Hotels, Restaurants & Leisure — continued | |
| | 6,000 | | | Six Flags Entertainment Corp., 4.875%, 07/31/24 (e) | | | 6,120 | |
| | 6,000 | | | Speedway Motorsports, Inc., 5.125%, 02/01/23 | | | 6,195 | |
| | 9,231 | | | Station Casinos LLC, 7.500%, 03/01/21 | | | 9,816 | |
| | | | Wynn Las Vegas LLC/Wynn Las Vegas Capital Corp., | | | | |
| | 4,465 | | | 5.375%, 03/15/22 | | | 4,638 | |
| | 18,645 | | | 5.500%, 03/01/25 (e) | | | 18,831 | |
| | | | | | | | |
| | | | | | | 438,766 | |
| | | | | | | | |
| | | | Household Durables — 1.6% | |
| | | | CalAtlantic Group, Inc., | | | | |
| | 4,195 | | | 5.375%, 10/01/22 | | | 4,384 | |
| | 17,165 | | | 5.875%, 11/15/24 | | | 18,538 | |
| | 8,180 | | | 8.375%, 01/15/21 | | | 9,755 | |
| | | | D.R. Horton, Inc., | | | | |
| | 3,313 | | | 4.375%, 09/15/22 | | | 3,495 | |
| | 9,382 | | | 4.750%, 02/15/23 | | | 10,062 | |
| | | | Lennar Corp., | | | | |
| | 4,182 | | | 4.500%, 06/15/19 | | | 4,391 | |
| | 4,242 | | | 4.500%, 11/15/19 | | | 4,481 | |
| | 13,651 | | | 4.750%, 05/30/25 | | | 14,163 | |
| | 8,473 | | | 4.875%, 12/15/23 | | | 8,875 | |
| | 3,360 | | | 6.950%, 06/01/18 | | | 3,620 | |
| | 13,082 | | | M/I Homes, Inc., 6.750%, 01/15/21 | | | 13,671 | |
| | 11,635 | | | Mattamy Group Corp., (Canada), 6.500%, 11/15/20 (e) | | | 11,490 | |
| | | | Meritage Homes Corp., | | | | |
| | 9,263 | | | 7.000%, 04/01/22 | | | 10,328 | |
| | 990 | | | 7.150%, 04/15/20 | | | 1,094 | |
| | | | PulteGroup, Inc., | | | | |
| | 7,300 | | | 5.000%, 01/15/27 | | | 7,464 | |
| | 10,622 | | | 5.500%, 03/01/26 | | | 11,333 | |
| | 11,009 | | | Taylor Morrison Communities, Inc./Monarch Communities, Inc., 5.875%, 04/15/23 (e) | | | 11,504 | |
| | | | Tempur Sealy International, Inc., | | | | |
| | 1,798 | | | 5.500%, 06/15/26 (e) | | | 1,878 | |
| | 14,420 | | | 5.625%, 10/15/23 | | | 15,141 | |
| | | | Toll Brothers Finance Corp., | | | | |
| | 11,333 | | | 4.875%, 11/15/25 | | | 11,886 | |
| | 10,990 | | | 5.625%, 01/15/24 | | | 11,759 | |
| | | | | | | | |
| | | | | | | 189,312 | |
| | | | | | | | |
SEE NOTES TO FINANCIAL STATEMENTS.
| | | | | | | | |
| | | |
| AUGUST 31, 2016 | | J.P. MORGAN INCOME FUNDS | | | | | 153 | |
JPMorgan High Yield Fund
SCHEDULE OF PORTFOLIO INVESTMENTS
AS OF AUGUST 31, 2016 (Unaudited) (continued)
(Amounts in thousands)
| | | | | | | | |
PRINCIPAL
AMOUNT($) | | | SECURITY DESCRIPTION | | VALUE($) | |
| Corporate Bonds — continued | |
| | | | Internet & Direct Marketing Retail — 0.2% | | | | |
| | | | Netflix, Inc., | | | | |
| | 3,309 | | | 5.375%, 02/01/21 | | | 3,590 | |
| | 9,800 | | | 5.500%, 02/15/22 | | | 10,535 | |
| | 12,075 | | | 5.750%, 03/01/24 | | | 13,041 | |
| | | | | | | | |
| | | | | | | 27,166 | |
| | | | | | | | |
| | | | Media — 7.7% | |
| | | | Altice Luxembourg S.A., (Luxembourg), | | | | |
| | 5,572 | | | 7.625%, 02/15/25 (e) | | | 5,725 | |
| | 21,558 | | | 7.750%, 05/15/22 (e) | | | 22,946 | |
| | | | Altice U.S. Finance I Corp., | | | | |
| | 26,720 | | | 5.375%, 07/15/23 (e) | | | 27,956 | |
| | 21,433 | | | 5.500%, 05/15/26 (e) | | | 22,542 | |
| | 10,860 | | | AMC Entertainment, Inc., 5.875%, 02/15/22 | | | 11,186 | |
| | | | AMC Networks, Inc., | | | | |
| | 4,630 | | | 4.750%, 12/15/22 | | | 4,769 | |
| | 21,375 | | | 5.000%, 04/01/24 | | | 21,909 | |
| | | | Cablevision Systems Corp., | | | | |
| | 6,380 | | | 7.750%, 04/15/18 | | | 6,811 | |
| | 25,681 | | | 8.000%, 04/15/20 | | | 27,350 | |
| | 12,688 | | | 8.625%, 09/15/17 | | | 13,484 | |
| | 9,225 | | | Cenveo Corp., 8.500%, 09/15/22 (e) | | | 6,642 | |
| | | | Cinemark USA, Inc., | | | | |
| | 3,000 | | | 4.875%, 06/01/23 | | | 3,075 | |
| | 8,761 | | | 5.125%, 12/15/22 | | | 9,068 | |
| | | | Clear Channel Worldwide Holdings, Inc., | | | | |
| | 12,665 | | | Series A, 6.500%, 11/15/22 | | | 12,807 | |
| | 2,650 | | | Series A, 7.625%, 03/15/20 | | | 2,544 | |
| | 10,950 | | | Series B, 6.500%, 11/15/22 | | | 11,470 | |
| | 33,551 | | | Series B, 7.625%, 03/15/20 | | | 33,803 | |
| | | | DISH DBS Corp., | | | | |
| | 5,625 | | | 5.875%, 07/15/22 | | | 5,731 | |
| | 95,171 | | | 6.750%, 06/01/21 | | | 102,249 | |
| | 12,252 | | | 7.750%, 07/01/26 (e) | | | 13,073 | |
| | 7,327 | | | EMI Music Publishing Group North America Holdings, Inc., 7.625%, 06/15/24 (e) | | | 7,987 | |
| | | | Gray Television, Inc., | | | | |
| | 8,130 | | | 5.875%, 07/15/26 (e) | | | 8,476 | |
| | 18,785 | | | 7.500%, 10/01/20 | | | 19,536 | |
| | | | Hughes Satellite Systems Corp., | | | | |
| | 18,978 | | | 5.250%, 08/01/26 (e) | | | 18,859 | |
| | 7,496 | | | 6.625%, 08/01/26 (e) | | | 7,440 | |
| | | | iHeartCommunications, Inc., | | | | |
| | 10,817 | | | 9.000%, 12/15/19 | | | 8,748 | |
| | 1,365 | | | 9.000%, 03/01/21 | | | 1,024 | |
| | | | | | | | |
PRINCIPAL
AMOUNT($) | | | SECURITY DESCRIPTION | | VALUE($) | |
| | | | | | | | |
| | | | Media — continued | |
| | | | Lamar Media Corp., | | | | |
| | 6,325 | | | 5.000%, 05/01/23 | | | 6,689 | |
| | 1,425 | | | 5.375%, 01/15/24 | | | 1,517 | |
| | 9,255 | | | Liberty Interactive LLC, 8.250%, 02/01/30 | | | 9,949 | |
| | 13,725 | | | LIN Television Corp., 5.875%, 11/15/22 | | | 14,514 | |
| | 7,075 | | | Live Nation Entertainment, Inc., 5.375%, 06/15/22 (e) | | | 7,340 | |
| | 13,533 | | | Mediacom Broadband LLC/Mediacom Broadband Corp., 6.375%, 04/01/23 | | | 14,345 | |
| | 5,895 | | | Nexstar Broadcasting, Inc., 6.125%, 02/15/22 (e) | | | 6,101 | |
| | 10,845 | | | Nexstar Escrow Corp., 5.625%, 08/01/24 (e) | | | 11,062 | |
| | 31,200 | | | Nielsen Finance LLC/Nielsen Finance Co., 5.000%, 04/15/22 (e) | | | 32,054 | |
| | | | Outfront Media Capital LLC/Outfront Media Capital Corp., | | | | |
| | 10,028 | | | 5.625%, 02/15/24 | | | 10,667 | |
| | 15,319 | | | 5.875%, 03/15/25 | | | 16,392 | |
| | 4,740 | | | Quebecor Media, Inc., (Canada), 5.750%, 01/15/23 | | | 4,983 | |
| | 3,825 | | | Quebecor, Inc., (Canada), 9.750%, 01/15/16 (d) | | | — | (h) |
| | 6,917 | | | RCN Telecom Services LLC/RCN Capital Corp., 8.500%, 08/15/20 (e) | | | 7,375 | |
| | | | Regal Entertainment Group, | | | | |
| | 17,300 | | | 5.750%, 03/15/22 | | | 18,100 | |
| | 4,975 | | | 5.750%, 02/01/25 | | | 5,062 | |
| | | | Sinclair Television Group, Inc., | | | | |
| | 7,500 | | | 5.125%, 02/15/27 (e) | | | 7,556 | |
| | 13,600 | | | 5.375%, 04/01/21 | | | 14,144 | |
| | 18,790 | | | 5.625%, 08/01/24 (e) | | | 19,572 | |
| | | | Sirius XM Radio, Inc., | | | | |
| | 17,999 | | | 4.625%, 05/15/23 (e) | | | 18,201 | |
| | 17,023 | | | 5.375%, 04/15/25 (e) | | | 17,831 | |
| | 13,865 | | | 5.375%, 07/15/26 (e) | | | 14,264 | |
| | 4,103 | | | 5.750%, 08/01/21 (e) | | | 4,288 | |
| | | | TEGNA, Inc., | | | | |
| | 11,365 | | | 5.500%, 09/15/24 (e) | | | 11,990 | |
| | 16,865 | | | 6.375%, 10/15/23 | | | 18,257 | |
| | 15,803 | | | Unitymedia GmbH, (Germany), 6.125%, 01/15/25 (e) | | | 16,949 | |
| | 20,335 | | | Unitymedia Hessen GmbH & Co. KG/Unitymedia NRW GmbH, (Germany), 5.500%, 01/15/23 (e) | | | 21,403 | |
| | | | Univision Communications, Inc., | | | | |
| | 27,085 | | | 5.125%, 05/15/23 (e) | | | 28,168 | |
| | 22,190 | | | 5.125%, 02/15/25 (e) | | | 23,189 | |
SEE NOTES TO FINANCIAL STATEMENTS.
| | | | | | |
| | | |
| 154 | | | | J.P. MORGAN INCOME FUNDS | | AUGUST 31, 2016 |
| | | | | | | | |
PRINCIPAL
AMOUNT($) | | | SECURITY DESCRIPTION | | VALUE($) | |
| Corporate Bonds — continued | |
| | | | Media — continued | |
| | 31,362 | | | 6.750%, 09/15/22 (e) | | | 33,366 | |
| | 10,861 | | | 8.500%, 05/15/21 (e) | | | 11,295 | |
| | 20,789 | | | Videotron Ltd., (Canada), 5.375%, 06/15/24 (e) | | | 21,855 | |
| | | | WMG Acquisition Corp., | | | | |
| | 2,160 | | | 5.000%, 08/01/23 (e) | | | 2,219 | |
| | 10,483 | | | 5.625%, 04/15/22 (e) | | | 10,929 | |
| | 19,439 | | | 6.750%, 04/15/22 (e) | | | 20,678 | |
| | 7,625 | | | Ziggo Bond Finance B.V., (Netherlands), 5.875%, 01/15/25 (e) | | | 7,663 | |
| | | | | | | | |
| | | | | | | 927,177 | |
| | | | | | | | |
| | | | Multiline Retail — 0.5% | |
| | 29,900 | | | Dollar Tree, Inc., 5.750%, 03/01/23 | | | 32,180 | |
| | 12,840 | | | J.C. Penney Corp., Inc., 5.875%, 07/01/23 (e) | | | 13,397 | |
| | 15,300 | | | Neiman Marcus Group Ltd. LLC, 8.000%, 10/15/21 (e) | | | 13,092 | |
| | | | | | | | |
| | | | | | | 58,669 | |
| | | | | | | | |
| | | | Specialty Retail — 1.3% | |
| | 6,675 | | | Caleres, Inc., 6.250%, 08/15/23 | | | 6,942 | |
| | | | Claire’s Stores, Inc., | | | | |
| | 11,275 | | | 6.125%, 03/15/20 (e) | | | 5,976 | |
| | 32,700 | | | 9.000%, 03/15/19 (e) | | | 18,851 | |
| | 5,000 | | | CST Brands, Inc., 5.000%, 05/01/23 | | | 5,287 | |
| | 5,000 | | | Group 1 Automotive, Inc., 5.250%, 12/15/23 (e) | | | 5,063 | |
| | 9,830 | | | Guitar Center, Inc., 6.500%, 04/15/19 (e) | | | 8,749 | |
| | 10,550 | | | Jo-Ann Stores LLC, 8.125%, 03/15/19 (e) | | | 10,550 | |
| | | | L Brands, Inc., | | | | |
| | 13,900 | | | 5.625%, 10/15/23 | | | 15,550 | |
| | 10,900 | | | 6.750%, 07/01/36 | | | 11,712 | |
| | 8,030 | | | 6.875%, 11/01/35 | | | 8,773 | |
| | 2,149 | | | Nebraska Book Holdings, Inc., 15.000%, 06/30/16 (e) (d) | | | 384 | |
| | 11,600 | | | Party City Holdings, Inc., 6.125%, 08/15/23 (e) | | | 12,325 | |
| | 16,972 | | | Penske Automotive Group, Inc., 5.500%, 05/15/26 | | | 16,983 | |
| | 5,060 | | | Radio Systems Corp., 8.375%, 11/01/19 (e) | | | 5,288 | |
| | | | Sally Holdings LLC/Sally Capital, Inc., | | | | |
| | 5,200 | | | 5.500%, 11/01/23 | | | 5,538 | |
| | 11,150 | | | 5.625%, 12/01/25 | | | 12,076 | |
| | 1,700 | | | 5.750%, 06/01/22 | | | 1,774 | |
| | 8,058 | | | Serta Simmons Bedding LLC, 8.125%, 10/01/20 (e) | | | 8,400 | |
| | | | | | | | |
| | | | | | | 160,221 | |
| | | | | | | | |
| | | | | | | | |
PRINCIPAL
AMOUNT($) | | | SECURITY DESCRIPTION | | VALUE($) | |
| | | | | | | | |
| | | | Textiles, Apparel & Luxury Goods — 0.1% | |
| | | | Hanesbrands, Inc., | | | | |
| | 4,877 | | | 4.625%, 05/15/24 (e) | | | 5,103 | |
| | 4,877 | | | 4.875%, 05/15/26 (e) | | | 5,084 | |
| | 8,050 | | | Levi Strauss & Co., 5.000%, 05/01/25 | | | 8,352 | |
| | | | | | | | |
| | | | | | | 18,539 | |
| | | | | | | | |
| | | | Total Consumer Discretionary | | | 2,128,409 | |
| | | | | | | | |
| | | | Consumer Staples — 5.7% | |
| | | | Beverages — 0.6% | |
| | | | Constellation Brands, Inc., | | | | |
| | 3,239 | | | 3.750%, 05/01/21 | | | 3,425 | |
| | 5,180 | | | 4.250%, 05/01/23 | | | 5,526 | |
| | 5,855 | | | 4.750%, 11/15/24 | | | 6,382 | |
| | 3,330 | | | 4.750%, 12/01/25 | | | 3,624 | |
| | | | Cott Beverages, Inc., | | | | |
| | 22,655 | | | 5.375%, 07/01/22 | | | 23,391 | |
| | 14,981 | | | 6.750%, 01/01/20 | | | 15,693 | |
| | 12,898 | | | DS Services of America, Inc., 10.000%, 09/01/21 (e) | | | 14,478 | |
| | | | | | | | |
| | | | | | | 72,519 | |
| | | | | | | | |
| | | | Food & Staples Retailing — 1.6% | | | | |
| | | | Albertsons Cos. LLC/Safeway, Inc./New Albertson’s, Inc./Albertson’s LLC, | | | | |
| | 12,605 | | | 5.750%, 03/15/25 (e) | | | 13,046 | |
| | 31,999 | | | 6.625%, 06/15/24 (e) | | | 34,354 | |
| | 10,760 | | | Ingles Markets, Inc., 5.750%, 06/15/23 | | | 11,197 | |
| | | | New Albertsons, Inc., | | | | |
| | 3,978 | | | 6.625%, 06/01/28 | | | 3,669 | |
| | 11,882 | | | 7.450%, 08/01/29 | | | 11,704 | |
| | 1,500 | | | 7.750%, 06/15/26 | | | 1,515 | |
| | 6,116 | | | 8.000%, 05/01/31 | | | 6,208 | |
| | 7,899 | | | 8.700%, 05/01/30 | | | 8,057 | |
| | | | Rite Aid Corp., | | | | |
| | 32,566 | | | 6.125%, 04/01/23 (e) | | | 35,158 | |
| | 8,000 | | | 6.750%, 06/15/21 | | | 8,430 | |
| | 442 | | | Safeway, Inc., 5.000%, 08/15/19 | | | 449 | |
| | 46,460 | | | SUPERVALU, Inc., 7.750%, 11/15/22 | | | 43,905 | |
| | 5,675 | | | Tops Holding LLC/Tops Markets II Corp., 8.000%, 06/15/22 (e) | | | 5,093 | |
| | 8,315 | | | U.S. Foods, Inc., 5.875%, 06/15/24 (e) | | | 8,710 | |
| | | | | | | | |
| | | | | | | 191,495 | |
| | | | | | | | |
| | | | Food Products — 2.7% | |
| | 6,867 | | | B&G Foods, Inc., 4.625%, 06/01/21 | | | 7,081 | |
| | 16,703 | | | Bumble Bee Holdings, Inc., 9.000%, 12/15/17 (e) | | | 16,995 | |
SEE NOTES TO FINANCIAL STATEMENTS.
| | | | | | | | |
| | | |
| AUGUST 31, 2016 | | J.P. MORGAN INCOME FUNDS | | | | | 155 | |
JPMorgan High Yield Fund
SCHEDULE OF PORTFOLIO INVESTMENTS
AS OF AUGUST 31, 2016 (Unaudited) (continued)
(Amounts in thousands)
| | | | | | | | |
PRINCIPAL
AMOUNT($) | | | SECURITY DESCRIPTION | | VALUE($) | |
| Corporate Bonds — continued | |
| | | | Food Products — continued | |
| | 14,920 | | | Darling Ingredients, Inc., 5.375%, 01/15/22 | | | 15,666 | |
| | 23,679 | | | Dean Foods Co., 6.500%, 03/15/23 (e) | | | 25,159 | |
| | 3,075 | | | FAGE International S.A./FAGE USA Dairy Industry, Inc., (Luxembourg), 5.625%, 08/15/26 (e) | | | 3,179 | |
| | | | JBS USA LUX S.A./JBS USA Finance, Inc., | | | | |
| | 5,670 | | | 5.750%, 06/15/25 (e) | | | 5,761 | |
| | 29,785 | | | 5.875%, 07/15/24 (e) | | | 30,777 | |
| | 50,979 | | | 7.250%, 06/01/21 (e) | | | 52,508 | |
| | 17,849 | | | 8.250%, 02/01/20 (e) | | | 18,451 | |
| | 7,184 | | | Pilgrim’s Pride Corp., 5.750%, 03/15/25 (e) | | | 7,417 | |
| | 4,950 | | | Pinnacle Foods Finance LLC/Pinnacle Foods Finance Corp., 5.875%, 01/15/24 (e) | | | 5,334 | |
| | | | Post Holdings, Inc., | | | | |
| | 25,974 | | | 5.000%, 08/15/26 (e) | | | 25,909 | |
| | 29,039 | | | 6.750%, 12/01/21 (e) | | | 31,181 | |
| | 8,720 | | | 7.750%, 03/15/24 (e) | | | 9,690 | |
| | 2,000 | | | 8.000%, 07/15/25 (e) | | | 2,285 | |
| | | | Smithfield Foods, Inc., | | | | |
| | 15,714 | | | 5.250%, 08/01/18 (e) | | | 15,871 | |
| | 17,714 | | | 5.875%, 08/01/21 (e) | | | 18,511 | |
| | 18,959 | | | 6.625%, 08/15/22 | | | 20,097 | |
| | 12,700 | | | TreeHouse Foods, Inc., 6.000%, 02/15/24 (e) | | | 13,859 | |
| | | | | | | | |
| | | | | | | 325,731 | |
| | | | | | | | |
| | | | Household Products — 0.3% | |
| | 9,395 | | | Central Garden & Pet Co., 6.125%, 11/15/23 | | | 10,088 | |
| | | | Spectrum Brands, Inc., | | | | |
| | 17,866 | | | 5.750%, 07/15/25 | | | 19,362 | |
| | 9,304 | | | 6.125%, 12/15/24 | | | 10,037 | |
| | 5,137 | | | 6.625%, 11/15/22 | | | 5,496 | |
| | | | | | | | |
| | | | | | | 44,983 | |
| | | | | | | | |
| | | | Personal Products — 0.5% | |
| | 21,244 | | | NBTY, Inc., 7.625%, 05/15/21 (e) | | | 21,722 | |
| | | | Prestige Brands, Inc., | | | | |
| | 14,060 | | | 5.375%, 12/15/21 (e) | | | 14,552 | |
| | 5,825 | | | 6.375%, 03/01/24 (e) | | | 6,219 | |
| | 8,363 | | | Revlon Consumer Products Corp., 5.750%, 02/15/21 | | | 8,551 | |
| | 7,521 | | | Revlon Escrow Corp., 6.250%, 08/01/24 (e) | | | 7,803 | |
| | | | | | | | |
| | | | | | | 58,847 | |
| | | | | | | | |
| | | | Total Consumer Staples | | | 693,575 | |
| | | | | | | | |
| | | | | | | | |
PRINCIPAL
AMOUNT($) | | | SECURITY DESCRIPTION | | VALUE($) | |
| | | | | | | | |
| | | | Energy — 9.7% | | | | |
| | | | Energy Equipment & Services — 1.2% | |
| | 7,200 | | | Archrock Partners LP/Archrock Partners Finance Corp., 6.000%, 10/01/22 | | | 6,660 | |
| | 6,358 | | | Basic Energy Services, Inc., 7.750%, 10/15/22 | | | 2,448 | |
| | 8,400 | | | CSI Compressco LP/CSI Compressco Finance, Inc., 7.250%, 08/15/22 | | | 7,560 | |
| | | | Ensco plc, (United Kingdom), | | | | |
| | 2,298 | | | 4.500%, 10/01/24 | | | 1,636 | |
| | 4,589 | | | 4.700%, 03/15/21 | | | 3,960 | |
| | 8,030 | | | Hiland Partners Holdings LP/Hiland Partners Finance Corp., 5.500%, 05/15/22 (e) | | | 8,330 | |
| | 5,022 | | | Parker Drilling Co., 6.750%, 07/15/22 | | | 3,917 | |
| | | | Precision Drilling Corp., (Canada), | | | | |
| | 9,422 | | | 5.250%, 11/15/24 | | | 7,914 | |
| | 4,845 | | | 6.500%, 12/15/21 | | | 4,494 | |
| | 16,769 | | | Sea Trucks Group Ltd., (United Kingdom), Reg. S, 9.000%, 03/26/18 (e) | | | 5,094 | |
| | 3,000 | | | SESI LLC, 7.125%, 12/15/21 | | | 2,933 | |
| | | | Summit Midstream Holdings LLC/Summit Midstream Finance Corp., | | | | |
| | 6,265 | | | 5.500%, 08/15/22 | | | 5,913 | |
| | 3,804 | | | 7.500%, 07/01/21 | | | 3,861 | |
| | | | Transocean, Inc., (Cayman Islands), | | | | |
| | 9,986 | | | 6.800%, 03/15/38 | | | 6,466 | |
| | 23,564 | | | 9.000%, 07/15/23 (e) | | | 22,792 | |
| | 11,922 | | | Trinidad Drilling Ltd., (Canada), 7.875%, 01/15/19 (e) | | | 10,968 | |
| | 22,617 | | | Unit Corp., 6.625%, 05/15/21 | | | 18,829 | |
| | | | Weatherford International Ltd., (Bermuda), | | | | |
| | 5,131 | | | 4.500%, 04/15/22 | | | 4,259 | |
| | 8,332 | | | 7.000%, 03/15/38 | | | 6,270 | |
| | 3,002 | | | 7.750%, 06/15/21 | | | 2,949 | |
| | 2,952 | | | 8.250%, 06/15/23 | | | 2,901 | |
| | 7,725 | | | Western Refining Logistics LP/WNRL Finance Corp., 7.500%, 02/15/23 | | | 7,918 | |
| | | | | | | | |
| | | | | | | 148,072 | |
| | | | | | | | |
| | | | Oil, Gas & Consumable Fuels — 8.5% | |
| | | | Antero Resources Corp., | | | | |
| | 19,942 | | | 5.125%, 12/01/22 | | | 19,693 | |
| | 13,926 | | | 5.375%, 11/01/21 | | | 13,943 | |
| | 10,831 | | | 6.000%, 12/01/20 | | | 11,088 | |
| | | | Apache Corp., | | | | |
| | 2,187 | | | 3.250%, 04/15/22 | | | 2,236 | |
| | 4,345 | | | 4.750%, 04/15/43 | | | 4,484 | |
| | 3,136 | | | 6.000%, 01/15/37 | | | 3,604 | |
SEE NOTES TO FINANCIAL STATEMENTS.
| | | | | | |
| | | |
| 156 | | | | J.P. MORGAN INCOME FUNDS | | AUGUST 31, 2016 |
| | | | | | | | |
PRINCIPAL
AMOUNT($) | | | SECURITY DESCRIPTION | | VALUE($) | |
| Corporate Bonds — continued | |
| | | | Oil, Gas & Consumable Fuels — continued | |
| | | | Baytex Energy Corp., (Canada), | | | | |
| | 1,254 | | | 5.125%, 06/01/21 (e) | | | 1,044 | |
| | 4,544 | | | 5.625%, 06/01/24 (e) | | | 3,681 | |
| | 10,875 | | | Blue Racer Midstream LLC/Blue Racer Finance Corp., 6.125%, 11/15/22 (e) | | | 10,467 | |
| | | | Boardwalk Pipelines LP, | | | | |
| | 1,150 | | | 4.950%, 12/15/24 | | | 1,186 | |
| | 7,500 | | | 5.950%, 06/01/26 | | | 8,187 | |
| | 7,550 | | | Buckeye Partners LP, 5.600%, 10/15/44 | | | 7,629 | |
| | | | California Resources Corp., | | | | |
| | 223 | | | 5.500%, 09/15/21 | | | 115 | |
| | 116 | | | 6.000%, 11/15/24 | | | 56 | |
| | 13,890 | | | 8.000%, 12/15/22 (e) | | | 9,375 | |
| | | | Cenovus Energy, Inc., (Canada), | | | | |
| | 2,635 | | | 4.450%, 09/15/42 | | | 2,145 | |
| | 16,170 | | | 5.700%, 10/15/19 | | | 17,368 | |
| | 11,664 | | | 6.750%, 11/15/39 | | | 12,453 | |
| | 14,050 | | | Cheniere Corpus Christi Holdings LLC, 7.000%, 06/30/24 (e) | | | 15,033 | |
| | 19,195 | | | Chesapeake Energy Corp., 8.000%, 12/15/22 (e) | | | 18,283 | |
| | 10,160 | | | Citgo Holding, Inc., 10.750%, 02/15/20 (e) | | | 10,408 | |
| | 14,327 | | | CITGO Petroleum Corp., 6.250%, 08/15/22 (e) | | | 14,005 | |
| | | | Cloud Peak Energy Resources LLC/Cloud Peak Energy Finance Corp., | | | | |
| | 1,255 | | | 6.375%, 03/15/24 | | | 640 | |
| | 2,811 | | | 8.500%, 12/15/19 | | | 1,799 | |
| | 1,150 | | | Concho Resources, Inc., 5.500%, 10/01/22 | | | 1,190 | |
| | 8,470 | | | CONSOL Energy, Inc., 5.875%, 04/15/22 | | | 7,665 | |
| | | | Continental Resources, Inc., | | | | |
| | 39,730 | | | 5.000%, 09/15/22 | | | 38,439 | |
| | 3,117 | | | 7.125%, 04/01/21 | | | 3,226 | |
| | | | Crestwood Midstream Partners LP/Crestwood Midstream Finance Corp., | | | | |
| | 9,092 | | | 6.125%, 03/01/22 | | | 8,842 | |
| | 7,200 | | | 6.250%, 04/01/23 | | | 7,020 | |
| | | | Encana Corp., (Canada), | | | | |
| | 888 | | | 3.900%, 11/15/21 | | | 880 | |
| | 2,218 | | | 6.500%, 02/01/38 | | | 2,220 | |
| | | | Energy Transfer Equity LP, | | | | |
| | 20,596 | | | 5.875%, 01/15/24 | | | 21,111 | |
| | 1,000 | | | 7.500%, 10/15/20 | | | 1,095 | |
| | 4,032 | | | EnLink Midstream Partners LP, 4.850%, 07/15/26 | | | 4,005 | |
| | | | | | | | |
PRINCIPAL
AMOUNT($) | | | SECURITY DESCRIPTION | | VALUE($) | |
| | | | | | | | |
| | | | Oil, Gas & Consumable Fuels — continued | |
| | 8,048 | | | EnLink Midstream Partners LP/EnLink Midstream Finance Corp, 7.125%, 06/01/22 | | | 8,561 | |
| | | | EP Energy LLC/Everest Acquisition Finance, Inc., | | | | |
| | 6,982 | | | 6.375%, 06/15/23 | | | 3,823 | |
| | 10,802 | | | 7.750%, 09/01/22 | | | 5,914 | |
| | 32,606 | | | 9.375%, 05/01/20 | | | 21,031 | |
| | | | Genesis Energy LP/Genesis Energy Finance Corp., | | | | |
| | 8,325 | | | 5.625%, 06/15/24 | | | 8,013 | |
| | 5,790 | | | 6.000%, 05/15/23 | | | 5,761 | |
| | 4,770 | | | 6.750%, 08/01/22 | | | 4,865 | |
| | 12,043 | | | Halcon Resources Corp., 13.000%, 02/15/22 (e) | | | 6,684 | |
| | | | Hilcorp Energy I LP/Hilcorp Finance Co., | | | | |
| | 13,966 | | | 5.000%, 12/01/24 (e) | | | 13,547 | |
| | 15,000 | | | 5.750%, 10/01/25 (e) | | | 14,700 | |
| | 11,082 | | | 7.625%, 04/15/21 (e) | | | 11,387 | |
| | | | Holly Energy Partners LP/Holly Energy Finance Corp., | | | | |
| | 10,691 | | | 6.000%, 08/01/24 (e) | | | 10,905 | |
| | 6,047 | | | 6.500%, 03/01/20 | | | 6,228 | |
| | 14,391 | | | Jupiter Resources, Inc., (Canada), 8.500%, 10/01/22 (e) | | | 11,369 | |
| | 12,000 | | | Martin Midstream Partners LP/Martin Midstream Finance Corp., 7.250%, 02/15/21 | | | 11,385 | |
| | | | MEG Energy Corp., (Canada), | | | | |
| | 1,059 | | | 6.500%, 03/15/21 (e) | | | 868 | |
| | 14,010 | | | 7.000%, 03/31/24 (e) | | | 11,278 | |
| | | | MPLX LP, | | | | |
| | 8,414 | | | 4.500%, 07/15/23 (e) | | | 8,487 | |
| | 12,000 | | | 4.875%, 12/01/24 (e) | | | 12,267 | |
| | 24,982 | | | 4.875%, 06/01/25 (e) | | | 25,479 | |
| | 3,005 | | | Navios Maritime Acquisition Corp./Navios Acquisition Finance U.S., Inc., 8.125%, 11/15/21 (e) | | | 2,284 | |
| | | | Newfield Exploration Co., | | | | |
| | 10,351 | | | 5.375%, 01/01/26 | | | 10,403 | |
| | 10,657 | | | 5.750%, 01/30/22 | | | 11,056 | |
| | | | NGL Energy Partners LP/NGL Energy Finance Corp., | | | | |
| | 1,794 | | | 5.125%, 07/15/19 | | | 1,682 | |
| | 7,048 | | | 6.875%, 10/15/21 | | | 6,554 | |
| | | | NGPL PipeCo LLC, | | | | |
| | 15,600 | | | 7.119%, 12/15/17 (e) | | | 16,243 | |
| | 11,700 | | | 9.625%, 06/01/19 (e) | | | 12,227 | |
SEE NOTES TO FINANCIAL STATEMENTS.
| | | | | | | | |
| | | |
| AUGUST 31, 2016 | | J.P. MORGAN INCOME FUNDS | | | | | 157 | |
JPMorgan High Yield Fund
SCHEDULE OF PORTFOLIO INVESTMENTS
AS OF AUGUST 31, 2016 (Unaudited) (continued)
(Amounts in thousands)
| | | | | | | | |
PRINCIPAL
AMOUNT($) | | | SECURITY DESCRIPTION | | VALUE($) | |
| Corporate Bonds — continued | |
| | | | Oil, Gas & Consumable Fuels — continued | |
| | | | Oasis Petroleum, Inc., | | | | |
| | 9,657 | | | 6.875%, 03/15/22 | | | 8,981 | |
| | 1,025 | | | 6.875%, 01/15/23 | | | 946 | |
| | 7,176 | | | 7.250%, 02/01/19 | | | 7,068 | |
| | | | ONEOK Partners LP, | | | | |
| | 695 | | | 6.650%, 10/01/36 | | | 759 | |
| | 834 | | | 6.850%, 10/15/37 | | | 963 | |
| | 8,995 | | | PBF Holding Co. LLC/PBF Finance Corp., 7.000%, 11/15/23 (e) | | | 8,550 | |
| | | | Penn Virginia Corp., | | | | |
| | 1,500 | | | 7.250%, 04/15/19 (d) | | | 600 | |
| | 14,125 | | | 8.500%, 05/01/20 (d) | | | 5,932 | |
| | | | Plains All American Pipeline LP/PAA Finance Corp., | | | | |
| | 763 | | | 5.150%, 06/01/42 | | | 704 | |
| | 6,737 | | | 6.650%, 01/15/37 | | | 7,517 | |
| | | | QEP Resources, Inc., | | | | |
| | 9,170 | | | 5.250%, 05/01/23 | | | 8,987 | |
| | 19,600 | | | 5.375%, 10/01/22 | | | 19,404 | |
| | 11,942 | | | 6.875%, 03/01/21 | | | 12,485 | |
| | | | Range Resources Corp., | | | | |
| | 11,065 | | | 4.875%, 05/15/25 | | | 10,678 | |
| | 9,848 | | | 5.000%, 03/15/23 | | | 9,725 | |
| | | | Regency Energy Partners LP/Regency Energy Finance Corp., | | | | |
| | 4,168 | | | 4.500%, 11/01/23 | | | 4,213 | |
| | 8,792 | | | 5.000%, 10/01/22 | | | 9,339 | |
| | 14,035 | | | 5.500%, 04/15/23 | | | 14,516 | |
| | 9,457 | | | Rice Energy, Inc., 7.250%, 05/01/23 | | | 9,883 | |
| | | | Rockies Express Pipeline LLC, | | | | |
| | 22,875 | | | 6.000%, 01/15/19 (e) | | | 24,076 | |
| | 1,450 | | | 6.850%, 07/15/18 (e) | | | 1,535 | |
| | 17,176 | | | RSP Permian, Inc., 6.625%, 10/01/22 | | | 17,863 | |
| | | | SM Energy Co., | | | | |
| | 23,700 | | | 5.000%, 01/15/24 | | | 21,715 | |
| | 11,750 | | | 5.625%, 06/01/25 | | | 10,986 | |
| | 2,862 | | | 6.500%, 11/15/21 | | | 2,834 | |
| | 7,787 | | | 6.500%, 01/01/23 | | | 7,631 | |
| | 10,030 | | | Stone Energy Corp., 7.500%, 11/15/22 | | | 5,504 | |
| | | | Sunoco LP/Sunoco Finance Corp., | | | | |
| | 800 | | | 5.500%, 08/01/20 (e) | | | 812 | |
| | 15,678 | | | 6.250%, 04/15/21 (e) | | | 16,148 | |
| | 15,760 | | | 6.375%, 04/01/23 (e) | | | 16,233 | |
| | | | | | | | |
PRINCIPAL
AMOUNT($) | | | SECURITY DESCRIPTION | | VALUE($) | |
| | | | | | | | |
| | | | Oil, Gas & Consumable Fuels — continued | |
| | | | Targa Resources Partners LP/Targa Resources Partners Finance Corp., | | | | |
| | 10,000 | | | 5.250%, 05/01/23 | | | 10,150 | |
| | 7,175 | | | 6.875%, 02/01/21 | | | 7,426 | |
| | 4,288 | | | Tesoro Corp., 5.125%, 04/01/24 | | | 4,395 | |
| | | | Tesoro Logistics LP/Tesoro Logistics Finance Corp., | | | | |
| | 9,650 | | | 5.875%, 10/01/20 | | | 9,927 | |
| | 6,685 | | | 6.125%, 10/15/21 | | | 7,003 | |
| | 8,000 | | | 6.250%, 10/15/22 | | | 8,468 | |
| | 7,660 | | | 6.375%, 05/01/24 | | | 8,177 | |
| | 6,800 | | | Transcontinental Gas Pipe Line Co. LLC, 7.850%, 02/01/26 (e) | | | 8,803 | |
| | | | Ultra Petroleum Corp., (Canada), | | | | |
| | 4,262 | | | 5.750%, 12/15/18 (d) | | | 3,537 | |
| | 21,384 | | | 6.125%, 10/01/24 (d) | | | 17,428 | |
| | 7,920 | | | W&T Offshore, Inc., 8.500%, 06/15/19 | | | 2,396 | |
| | 4,704 | | | Western Refining, Inc., 6.250%, 04/01/21 | | | 4,575 | |
| | | | Whiting Petroleum Corp., | | | | |
| | 29,315 | | | 5.000%, 03/15/19 | | | 27,117 | |
| | 4,624 | | | 5.750%, 03/15/21 | | | 4,115 | |
| | | | Williams Partners LP/ACMP Finance Corp., | | | | |
| | 22,150 | | | 4.875%, 05/15/23 | | | 22,380 | |
| | 12,000 | | | 6.125%, 07/15/22 | | | 12,476 | |
| | | | WPX Energy, Inc., | | | | |
| | 9,865 | | | 5.250%, 09/15/24 | | | 9,100 | |
| | 41,983 | | | 6.000%, 01/15/22 | | | 40,829 | |
| | | | | | | | |
| | | | | | | 1,022,505 | |
| | | | | | | | |
| | | | Total Energy | | | 1,170,577 | |
| | | | | | | | |
| | | | Financials — 5.1% | |
| | | | Banks — 1.9% | |
| | | | CIT Group, Inc., | | | | |
| | 7,713 | | | 3.875%, 02/19/19 | | | 7,884 | |
| | 41,941 | | | 5.000%, 08/15/22 | | | 44,458 | |
| | 37,915 | | | 5.250%, 03/15/18 | | | 39,526 | |
| | 13,761 | | | 5.375%, 05/15/20 | | | 14,707 | |
| | 10,000 | | | 6.625%, 04/01/18 (e) | | | 10,655 | |
| | | | Royal Bank of Scotland Group plc, (United Kingdom), | | | | |
| | 4,518 | | | 6.000%, 12/19/23 | | | 4,779 | |
| | 51,480 | | | 6.100%, 06/10/23 | | | 54,663 | |
| | 46,019 | | | 6.125%, 12/15/22 | | | 49,149 | |
| | | | | | | | |
| | | | | | | 225,821 | |
| | | | | | | | |
SEE NOTES TO FINANCIAL STATEMENTS.
| | | | | | |
| | | |
| 158 | | | | J.P. MORGAN INCOME FUNDS | | AUGUST 31, 2016 |
| | | | | | | | |
PRINCIPAL
AMOUNT($) | | | SECURITY DESCRIPTION | | VALUE($) | |
| Corporate Bonds — continued | |
| | | | Capital Markets — 0.2% | |
| | | | E*TRADE Financial Corp., | | | | |
| | 9,260 | | | 4.625%, 09/15/23 | | | 9,611 | |
| | 5,850 | | | 5.375%, 11/15/22 | | | 6,296 | |
| | 10,028 | | | MSCI, Inc., 5.250%, 11/15/24 (e) | | | 10,655 | |
| | | | | | | | |
| | | | | | | 26,562 | |
| | | | | | | | |
| | | | Consumer Finance — 1.4% | |
| | | | Ally Financial, Inc., | | | | |
| | 8,901 | | | 3.250%, 02/13/18 | | | 8,990 | |
| | 18,355 | | | 3.250%, 11/05/18 | | | 18,527 | |
| | 7,206 | | | 3.600%, 05/21/18 | | | 7,323 | |
| | 8,000 | | | 4.125%, 03/30/20 | | | 8,260 | |
| | 32,604 | | | 4.125%, 02/13/22 | | | 33,501 | |
| | 32,112 | | | 4.625%, 05/19/22 | | | 33,718 | |
| | 11,345 | | | 4.625%, 03/30/25 | | | 11,770 | |
| | 23,264 | | | 8.000%, 11/01/31 | | | 29,138 | |
| | | | Springleaf Finance Corp., | | | | |
| | 1,822 | | | 7.750%, 10/01/21 | | | 1,913 | |
| | 10,793 | | | 8.250%, 12/15/20 | | | 11,792 | |
| | | | | | | | |
| | | | | | | 164,932 | |
| | | | | | | | |
| | | | Diversified Financial Services — 0.8% | |
| | 23,188 | | | ACE Cash Express, Inc., 11.000%, 02/01/19 (e) | | | 10,898 | |
| | 22,450 | | | Argos Merger Sub, Inc., 7.125%, 03/15/23 (e) | | | 23,600 | |
| | 19,738 | | | CNG Holdings, Inc., 9.375%, 05/15/20 (e) | | | 10,955 | |
| | 7,730 | | | Highland Ranch, 6.700%, 09/01/20 | | | 7,653 | |
| | | | Nationstar Mortgage LLC/Nationstar Capital Corp., | | | | |
| | 9,589 | | | 6.500%, 07/01/21 | | | 9,134 | |
| | 3,490 | | | 6.500%, 06/01/22 | | | 3,254 | |
| | 7,757 | | | 7.875%, 10/01/20 | | | 7,815 | |
| | 6,920 | | | 9.625%, 05/01/19 | | | 7,249 | |
| | 10,120 | | | Nielsen Co. Luxembourg SARL (The), (Luxembourg), 5.500%, 10/01/21 (e) | | | 10,550 | |
| | 13,435 | | | Speedy Cash Intermediate Holdings Corp., 10.750%, 05/15/18 (e) | | | 9,438 | |
| | | | | | | | |
| | | | | | | 100,546 | |
| | | | | | | | |
| | | | Insurance — 0.5% | |
| | 16,661 | | | CNO Financial Group, Inc., 5.250%, 05/30/25 | | | 16,536 | |
| | 4,762 | | | Fidelity & Guaranty Life Holdings, Inc., 6.375%, 04/01/21 (e) | | | 4,750 | |
| | 7,210 | | | Hartford Financial Services Group, Inc. (The), VAR, 8.125%, 06/15/38 | | | 7,877 | |
| | 14,342 | | | Liberty Mutual Group, Inc., 7.800%, 03/15/37 (e) | | | 16,637 | |
| | | | | | | | |
PRINCIPAL
AMOUNT($) | | | SECURITY DESCRIPTION | | VALUE($) | |
| | | | | | | | |
| | | | Insurance — continued | |
| | 11,400 | | | National Financial Partners Corp., 9.000%, 07/15/21 (e) | | | 11,770 | |
| | | | | | | | |
| | | | | | | 57,570 | |
| | | | | | | | |
| | | | Thrifts & Mortgage Finance — 0.3% | |
| | 26,329 | | | Quicken Loans, Inc., 5.750%, 05/01/25 (e) | | | 26,271 | |
| | 9,072 | | | Radian Group, Inc., 7.000%, 03/15/21 | | | 10,206 | |
| | | | | | | | |
| | | | | | | 36,477 | |
| | | | | | | | |
| | | | Total Financials | | | 611,908 | |
| | | | | | | | |
| | | | Health Care — 9.2% | |
| | | | Health Care Equipment & Supplies — 1.2% | |
| | | | Alere, Inc., | | | | |
| | 5,366 | | | 6.375%, 07/01/23 (e) | | | 5,487 | |
| | 12,213 | | | 6.500%, 06/15/20 | | | 11,984 | |
| | 250 | | | 7.250%, 07/01/18 | | | 256 | |
| | 20,797 | | | ConvaTec Healthcare E S.A., (Luxembourg), 10.500%, 12/15/18 (e) | | | 21,369 | |
| | 5,100 | | | Hill-Rom Holdings, Inc., 5.750%, 09/01/23 (e) | | | 5,355 | |
| | 17,430 | | | Hologic, Inc., 5.250%, 07/15/22 (e) | | | 18,541 | |
| | | | Mallinckrodt International Finance S.A., (Luxembourg), | | | | |
| | 1,067 | | | 3.500%, 04/15/18 | | | 1,068 | |
| | 2,784 | | | 4.750%, 04/15/23 | | | 2,584 | |
| | | | Mallinckrodt International Finance S.A./Mallinckrodt CB LLC, (Luxembourg), | | | | |
| | 10,040 | | | 4.875%, 04/15/20 (e) | | | 10,266 | |
| | 9,330 | | | 5.500%, 04/15/25 (e) | | | 9,190 | |
| | 24,111 | | | 5.625%, 10/15/23 (e) | | | 24,201 | |
| | 10,414 | | | 5.750%, 08/01/22 (e) | | | 10,518 | |
| | 7,714 | | | Sterigenics-Nordion Holdings LLC, 6.500%, 05/15/23 (e) | | | 8,062 | |
| | | | Teleflex, Inc., | | | | |
| | 5,000 | | | 4.875%, 06/01/26 | | | 5,212 | |
| | 9,785 | | | 5.250%, 06/15/24 | | | 10,250 | |
| | | | | | | | |
| | | | | | | 144,343 | |
| | | | | | | | |
| | | | Health Care Providers & Services — 5.9% | | | | |
| | | | Acadia Healthcare Co., Inc., | | | | |
| | 15,955 | | | 5.625%, 02/15/23 | | | 16,234 | |
| | 8,830 | | | 6.500%, 03/01/24 | | | 9,283 | |
| | | | Amsurg Corp., | | | | |
| | 6,200 | | | 5.625%, 11/30/20 | | | 6,417 | |
| | 8,365 | | | 5.625%, 07/15/22 | | | 8,637 | |
| | | | Centene Corp., | | | | |
| | 9,306 | | | 4.750%, 05/15/22 | | | 9,667 | |
SEE NOTES TO FINANCIAL STATEMENTS.
| | | | | | | | |
| | | |
| AUGUST 31, 2016 | | J.P. MORGAN INCOME FUNDS | | | | | 159 | |
JPMorgan High Yield Fund
SCHEDULE OF PORTFOLIO INVESTMENTS
AS OF AUGUST 31, 2016 (Unaudited) (continued)
(Amounts in thousands)
| | | | | | | | |
PRINCIPAL
AMOUNT($) | | | SECURITY DESCRIPTION | | VALUE($) | |
| Corporate Bonds — continued | |
| | | | Health Care Providers & Services — continued | |
| | 10,589 | | | 5.625%, 02/15/21 | | | 11,264 | |
| | 13,415 | | | 6.125%, 02/15/24 | | | 14,622 | |
| | | | CHS/Community Health Systems, Inc., | | | | |
| | 2,061 | | | 5.125%, 08/15/18 | | | 2,087 | |
| | 15,665 | | | 5.125%, 08/01/21 | | | 15,450 | |
| | 21,212 | | | 6.875%, 02/01/22 | | | 17,606 | |
| | 13,871 | | | 7.125%, 07/15/20 | | | 12,406 | |
| | 19,750 | | | 8.000%, 11/15/19 | | | 18,688 | |
| | | | DaVita, Inc., | | | | |
| | 18,915 | | | 5.000%, 05/01/25 | | | 19,170 | |
| | 19,420 | | | 5.125%, 07/15/24 | | | 20,051 | |
| | 8,500 | | | 5.750%, 08/15/22 | | | 8,915 | |
| | 9,550 | | | Envision Healthcare Corp., 5.125%, 07/01/22 (e) | | | 9,645 | |
| | | | Fresenius Medical Care U.S. Finance II, Inc., | | | | |
| | 4,205 | | | 4.125%, 10/15/20 (e) | | | 4,436 | |
| | 9,230 | | | 4.750%, 10/15/24 (e) | | | 9,876 | |
| | 4,281 | | | 5.625%, 07/31/19 (e) | | | 4,688 | |
| | 12,976 | | | 5.875%, 01/31/22 (e) | | | 14,760 | |
| | 2,075 | | | 6.500%, 09/15/18 (e) | | | 2,259 | |
| | 2,419 | | | 6.875%, 07/15/17 | | | 2,519 | |
| | 10,235 | | | Fresenius Medical Care U.S. Finance, Inc., 5.750%, 02/15/21 (e) | | | 11,617 | |
| | 11,585 | | | HCA Holdings, Inc., 6.250%, 02/15/21 | | | 12,541 | |
| | | | HCA, Inc., | | | | |
| | 11,028 | | | 3.750%, 03/15/19 | | | 11,373 | |
| | 9,680 | | | 4.250%, 10/15/19 | | | 10,152 | |
| | 12,385 | | | 4.500%, 02/15/27 | | | 12,509 | |
| | 11,871 | | | 5.000%, 03/15/24 | | | 12,553 | |
| | 16,185 | | | 5.250%, 04/15/25 | | | 17,338 | |
| | 12,340 | | | 5.250%, 06/15/26 | | | 13,188 | |
| | 36,840 | | | 5.375%, 02/01/25 | | | 38,051 | |
| | 10,440 | | | 5.875%, 03/15/22 | | | 11,484 | |
| | 19,145 | | | 5.875%, 02/15/26 | | | 20,253 | |
| | 11,356 | | | 6.500%, 02/15/20 | | | 12,535 | |
| | 21,198 | | | 7.500%, 02/15/22 | | | 24,200 | |
| | 20,955 | | | Series 1, 5.875%, 05/01/23 | | | 22,265 | |
| | 38,711 | | | IASIS Healthcare LLC/IASIS Capital Corp., 8.375%, 05/15/19 | | | 35,082 | |
| | 1,827 | | | inVentiv Health, Inc., 9.000%, 01/15/18 (e) | | | 1,891 | |
| | | | LifePoint Health, Inc., | | | | |
| | 7,970 | | | 5.375%, 05/01/24 (e) | | | 8,179 | |
| | 9,929 | | | 5.500%, 12/01/21 | | | 10,376 | |
| | 34,914 | | | MPH Acquisition Holdings LLC, 7.125%, 06/01/24 (e) | | | 37,532 | |
| | | | | | | | |
PRINCIPAL
AMOUNT($) | | | SECURITY DESCRIPTION | | VALUE($) | |
| | | | | | | | |
| | | | Health Care Providers & Services — continued | |
| | 17,645 | | | Team Health, Inc., 7.250%, 12/15/23 (e) | | | 19,233 | |
| | | | Tenet Healthcare Corp., | | | | |
| | 16,318 | | | 4.375%, 10/01/21 | | | 16,277 | |
| | 18,561 | | | 4.500%, 04/01/21 | | | 18,608 | |
| | 5,725 | | | 4.750%, 06/01/20 | | | 5,868 | |
| | 11,514 | | | 5.000%, 03/01/19 | | | 11,197 | |
| | 8,164 | | | 5.500%, 03/01/19 | | | 8,001 | |
| | 19,145 | | | 6.000%, 10/01/20 | | | 20,246 | |
| | 5,204 | | | 6.250%, 11/01/18 | | | 5,555 | |
| | 6,208 | | | 6.750%, 02/01/20 | | | 6,146 | |
| | 13,840 | | | 6.750%, 06/15/23 | | | 13,209 | |
| | 12,807 | | | 8.000%, 08/01/20 | | | 13,015 | |
| | 9,948 | | | 8.125%, 04/01/22 | | | 10,072 | |
| | | | | | | | |
| | | | | | | 709,226 | |
| | | | | | | | |
| | | | Health Care Technology — 0.3% | | | | |
| | | | Change Healthcare Holdings, Inc., | | | | |
| | 20,170 | | | 6.000%, 02/15/21 (e) | | | 21,380 | |
| | 11,853 | | | 11.000%, 12/31/19 | | | 12,535 | |
| | | | | | | | |
| | | | | | | 33,915 | |
| | | | | | | | |
| | | | Life Sciences Tools & Services — 0.1% | | | | |
| | 14,095 | | | Quintiles Transnational Corp., 4.875%, 05/15/23 (e) | | | 14,659 | |
| | | | | | | | |
| | | | Pharmaceuticals — 1.7% | |
| | 14,025 | | | Celtic Pharma Phinco B.V., (Bermuda), 17.000%, 06/15/12 (d) | | | 1 | |
| | | | Concordia International Corp., (Canada), | | | | |
| | 34,592 | | | 7.000%, 04/15/23 (e) | | | 26,809 | |
| | 9,500 | | | 9.500%, 10/21/22 (e) | | | 7,814 | |
| | 10,763 | | | Endo Finance LLC, 5.750%, 01/15/22 (e) | | | 10,030 | |
| | | | Endo Finance LLC/Endo Finco, Inc., | | | | |
| | 5,000 | | | 5.375%, 01/15/23 (e) | | | 4,525 | |
| | 7,185 | | | 7.250%, 01/15/22 (e) | | | 6,951 | |
| | | | Endo Ltd./Endo Finance LLC/Endo Finco, Inc., (Ireland), | | | | |
| | 17,105 | | | 6.000%, 07/15/23 (e) | | | 15,523 | |
| | 8,650 | | | 6.500%, 02/01/25 (e) | | | 7,677 | |
| | | | Valeant Pharmaceuticals International, Inc., (Canada), | | | | |
| | 24,825 | | | 5.375%, 03/15/20 (e) | | | 23,398 | |
| | 6,341 | | | 5.500%, 03/01/23 (e) | | | 5,517 | |
| | 6,075 | | | 5.625%, 12/01/21 (e) | | | 5,483 | |
| | 26,362 | | | 5.875%, 05/15/23 (e) | | | 23,198 | |
| | 28,520 | | | 6.125%, 04/15/25 (e) | | | 25,062 | |
| | 15,168 | | | 6.375%, 10/15/20 (e) | | | 14,485 | |
SEE NOTES TO FINANCIAL STATEMENTS.
| | | | | | |
| | | |
| 160 | | | | J.P. MORGAN INCOME FUNDS | | AUGUST 31, 2016 |
| | | | | | | | |
PRINCIPAL
AMOUNT($) | | | SECURITY DESCRIPTION | | VALUE($) | |
| Corporate Bonds — continued | |
| | | | Pharmaceuticals — continued | |
| | 3,870 | | | 6.750%, 08/15/21 (e) | | | 3,681 | |
| | 10,270 | | | 7.000%, 10/01/20 (e) | | | 10,013 | |
| | 10,420 | | | 7.250%, 07/15/22 (e) | | | 9,847 | |
| | 11,237 | | | 7.500%, 07/15/21 (e) | | | 11,044 | |
| | | | | | | | |
| | | | | | | 211,058 | |
| | | | | | | | |
| | | | Total Health Care | | | 1,113,201 | |
| | | | | | | | |
| | | | Industrials — 8.4% | |
| | | | Aerospace & Defense — 0.7% | |
| | | | Bombardier, Inc., (Canada), | | | | |
| | 6,425 | | | 4.750%, 04/15/19 (e) | | | 6,441 | |
| | 9,550 | | | 5.500%, 09/15/18 (e) | | | 9,813 | |
| | | | Orbital ATK, Inc., | | | | |
| | 3,485 | | | 5.250%, 10/01/21 | | | 3,633 | |
| | 7,230 | | | 5.500%, 10/01/23 | | | 7,610 | |
| | | | TransDigm, Inc., | | | | |
| | 6,940 | | | 5.500%, 10/15/20 | | | 7,122 | |
| | 15,793 | | | 6.000%, 07/15/22 | | | 16,425 | |
| | 8,435 | | | 6.375%, 06/15/26 (e) | | | 8,604 | |
| | 23,775 | | | 6.500%, 07/15/24 | | | 24,666 | |
| | | | | | | | |
| | | | | | | 84,314 | |
| | | | | | | | |
| | | | Air Freight & Logistics — 0.1% | |
| | | | XPO Logistics, Inc., | | | | |
| | 5,555 | | | 6.125%, 09/01/23 (e) | | | 5,708 | |
| | 11,450 | | | 6.500%, 06/15/22 (e) | | | 11,893 | |
| | | | | | | | |
| | | | | | | 17,601 | |
| | | | | | | | |
| | | | Airlines — 0.5% | |
| | 4,197 | | | Continental Airlines 2003-ERJ1 Pass-Through Trust, 7.875%, 07/02/18 | | | 4,375 | |
| | 5,956 | | | Continental Airlines 2005-ERJ1 Pass-Through Trust, 9.798%, 04/01/21 | | | 6,596 | |
| | 1,843 | | | Continental Airlines 2006-ERJ1 Pass-Through Trust, 9.318%, 11/01/19 (e) | | | 1,982 | |
| | 7,492 | | | Continental Airlines 2012-3 Class C Pass-Through Certificates, 6.125%, 04/29/18 | | | 7,866 | |
| | 3,460 | | | Delta Air Lines 2007-1 Class B Pass-Through Trust, 8.021%, 08/10/22 | | | 3,958 | |
| | 222 | | | Delta Air Lines 2009-1 Series B Pass-Through Trust, Series B, 9.750%, 12/17/16 | | | 229 | |
| | 9,656 | | | Delta Air Lines 2012-1 Class B Pass-Through Trust, 6.875%, 05/07/19 (e) | | | 10,428 | |
| | 11,093 | | | Northwest Airlines 2007-1 Class A Pass-Through Trust, 7.027%, 11/01/19 | | | 12,563 | |
| | 6,755 | | | U.S. Airways 2013-1 Class B Pass-Through Trust, 5.375%, 11/15/21 | | | 6,991 | |
| | | | | | | | |
PRINCIPAL
AMOUNT($) | | | SECURITY DESCRIPTION | | VALUE($) | |
| | | | | | | | |
| | | | Airlines — continued | |
| | 2,123 | | | UAL 2007-1 Pass-Through Trust, 6.636%, 07/02/22 | | | 2,261 | |
| | 697 | | | UAL 2009-2A Pass-Through Trust, 9.750%, 01/15/17 | | | 716 | |
| | | | | | | | |
| | | | | | | 57,965 | |
| | | | | | | | |
| | | | Building Products — 1.0% | |
| | 10,710 | | | Masonite International Corp., (Canada), 5.625%, 03/15/23 (e) | | | 11,353 | |
| | 10,564 | | | NCI Building Systems, Inc., 8.250%, 01/15/23 (e) | | | 11,568 | |
| | | | Standard Industries, Inc., | | | | |
| | 2,076 | | | 5.125%, 02/15/21 (e) | | | 2,190 | |
| | 14,175 | | | 5.375%, 11/15/24 (e) | | | 15,061 | |
| | 6,545 | | | 5.500%, 02/15/23 (e) | | | 6,938 | |
| | 21,700 | | | 6.000%, 10/15/25 (e) | | | 23,761 | |
| | 35,632 | | | Summit Materials LLC/Summit Materials Finance Corp., 6.125%, 07/15/23 | | | 36,166 | |
| | 11,705 | | | Unifrax I LLC/Unifrax Holding Co., 7.500%, 02/15/19 (e) | | | 10,535 | |
| | | | | | | | |
| | | | | | | 117,572 | |
| | | | | | | | |
| | | | Commercial Services & Supplies — 2.4% | |
| | 46,060 | | | ADT Corp. (The), 4.125%, 06/15/23 | | | 45,217 | |
| | 4,235 | | | Aramark Services, Inc., 5.125%, 01/15/24 | | | 4,391 | |
| | 28,097 | | | Casella Waste Systems, Inc., 7.750%, 02/15/19 | | | 28,729 | |
| | 7,630 | | | Covanta Holding Corp., 5.875%, 03/01/24 | | | 7,668 | |
| | 4,234 | | | Deluxe Corp., 6.000%, 11/15/20 | | | 4,388 | |
| | 21,185 | | | Garda World Security Corp., (Canada), 7.250%, 11/15/21 (e) | | | 19,331 | |
| | | | Harland Clarke Holdings Corp., | | | | |
| | 5,000 | | | 6.875%, 03/01/20 (e) | | | 4,812 | |
| | 391 | | | 9.750%, 08/01/18 (e) | | | 403 | |
| | 35,289 | | | ILFC E-Capital Trust I, VAR, 3.980%, 12/21/65 (e) | | | 28,178 | |
| | 32,786 | | | ILFC E-Capital Trust II, VAR, 4.230%, 12/21/65 (e) | | | 26,557 | |
| | 17,250 | | | Jaguar Holding Co. II/Pharmaceutical Product Development LLC, 6.375%, 08/01/23 (e) | | | 18,069 | |
| | 2,972 | | | Mustang Merger Corp., 8.500%, 08/15/21 (e) | | | 3,106 | |
| | 54,884 | | | Prime Security Services Borrower LLC/Prime Finance, Inc., 9.250%, 05/15/23 (e) | | | 59,824 | |
| | 8,000 | | | Quad/Graphics, Inc., 7.000%, 05/01/22 | | | 7,760 | |
| | | | Quebecor World Capital Corp., (Canada), | | | | |
| | 8,325 | | | 6.125%, 01/15/16 (d) | | | — | (h) |
| | 6,815 | | | 6.500%, 08/01/27 (d) | | | — | (h) |
SEE NOTES TO FINANCIAL STATEMENTS.
| | | | | | | | |
| | | |
| AUGUST 31, 2016 | | J.P. MORGAN INCOME FUNDS | | | | | 161 | |
JPMorgan High Yield Fund
SCHEDULE OF PORTFOLIO INVESTMENTS
AS OF AUGUST 31, 2016 (Unaudited) (continued)
(Amounts in thousands)
| | | | | | | | |
PRINCIPAL
AMOUNT($) | | | SECURITY DESCRIPTION | | VALUE($) | |
| Corporate Bonds — continued | |
| | | | Commercial Services & Supplies — continued | | | | |
| | 865 | | | Quebecor World Capital ULC, (Canada), 6.125%, 01/15/16 (d) | | | — | (h) |
| | 1,670 | | | R.R. Donnelley & Sons Co., 7.875%, 03/15/21 | | | 1,816 | |
| | | | West Corp., | | | | |
| | 11,172 | | | 4.750%, 07/15/21 (e) | | | 11,398 | |
| | 17,503 | | | 5.375%, 07/15/22 (e) | | | 17,065 | |
| | | | | | | | |
| | | | | | | 288,712 | |
| | | | | | | | |
| | | | Construction & Engineering — 0.8% | |
| | | | AECOM, | | | | |
| | 14,635 | | | 5.750%, 10/15/22 | | | 15,513 | |
| | 39,445 | | | 5.875%, 10/15/24 | | | 43,143 | |
| | 28,597 | | | MasTec, Inc., 4.875%, 03/15/23 | | | 28,597 | |
| | 11,857 | | | Tutor Perini Corp., 7.625%, 11/01/18 | | | 11,976 | |
| | | | | | | | |
| | | | | | | 99,229 | |
| | | | | | | | |
| | | | Electrical Equipment — 0.4% | |
| | 13,307 | | | EnerSys, 5.000%, 04/30/23 (e) | | | 13,274 | |
| | 10,175 | | | Novelis Corp., 6.250%, 08/15/24 (e) | | | 10,608 | |
| | | | Sensata Technologies B.V., (Netherlands), | | | | |
| | 11,128 | | | 4.875%, 10/15/23 (e) | | | 11,490 | |
| | 3,520 | | | 5.000%, 10/01/25 (e) | | | 3,643 | |
| | 2,101 | | | 5.625%, 11/01/24 (e) | | | 2,227 | |
| | 5,780 | | | Wise Metals Group LLC/Wise Alloys Finance Corp., 8.750%, 12/15/18 (e) | | | 5,953 | |
| | | | | | | | |
| | | | | | | 47,195 | |
| | | | | | | | |
| | | | Machinery — 0.6% | |
| | 12,887 | | | ATS Automation Tooling Systems, Inc., (Canada), 6.500%, 06/15/23 (e) | | | 13,145 | |
| | 18,586 | | | BlueLine Rental Finance Corp., 7.000%, 02/01/19 (e) | | | 16,077 | |
| | | | Bluewater Holding B.V., (Netherlands), | | | | |
| | 31,500 | | | Reg. S, 10.000%, 12/10/19 (e) | | | 13,860 | |
| | 8,875 | | | Briggs & Stratton Corp., 6.875%, 12/15/20 | | | 9,762 | |
| | 16,745 | | | Milacron LLC/Mcron Finance Corp., 7.750%, 02/15/21 (e) | | | 17,499 | |
| | | | Oshkosh Corp., | | | | |
| | 225 | | | 5.375%, 03/01/22 | | | 235 | |
| | 5,796 | | | 5.375%, 03/01/25 | | | 6,086 | |
| | | | | | | | |
| | | | | | | 76,664 | |
| | | | | | | | |
| | | | Marine — 0.1% | |
| | 6,552 | | | Shelf Drilling Holdings Ltd., (Cayman Islands), 8.625%, 11/01/18 (e) | | | 5,258 | |
| | 26,212 | | | Ultrapetrol Bahamas Ltd., (Bahamas), 8.875%, 06/15/21 (d) | | | 5,242 | |
| | | | | | | | |
| | | | | | | 10,500 | |
| | | | | | | | |
| | | | | | | | |
PRINCIPAL
AMOUNT($) | | | SECURITY DESCRIPTION | | VALUE($) | |
| | | | | | | | |
| | | | Professional Services — 0.1% | |
| | 5,795 | | | CEB, Inc., 5.625%, 06/15/23 (e) | | | 5,751 | |
| | 5,163 | | | IHS Markit Ltd., (Bermuda), 5.000%, 11/01/22 (e) | | | 5,486 | |
| | | | | | | | |
| | | | | | | 11,237 | |
| | | | | | | | |
| | | | Road & Rail — 0.2% | |
| | | | Ashtead Capital, Inc., | | | | |
| | 11,086 | | | 5.625%, 10/01/24 (e) | | | 11,654 | |
| | 14,610 | | | 6.500%, 07/15/22 (e) | | | 15,414 | |
| | | | | | | | |
| | | | | | | 27,068 | |
| | | | | | | | |
| | | | Trading Companies & Distributors — 1.5% | |
| | 17,210 | | | Ahern Rentals, Inc., 7.375%, 05/15/23 (e) | | | 11,789 | |
| | | | Aircastle Ltd., (Bermuda), | | | | |
| | 8,902 | | | 5.125%, 03/15/21 | | | 9,659 | |
| | 3,405 | | | 5.500%, 02/15/22 | | | 3,699 | |
| | 10,719 | | | 7.625%, 04/15/20 | | | 12,380 | |
| | 10,484 | | | H&E Equipment Services, Inc., 7.000%, 09/01/22 | | | 11,061 | |
| | | | HD Supply, Inc., | | | | |
| | 11,154 | | | 5.750%, 04/15/24 (e) | | | 11,879 | |
| | 28,700 | | | 7.500%, 07/15/20 | | | 29,884 | |
| | | | United Rentals North America, Inc., | | | | |
| | 7,850 | | | 4.625%, 07/15/23 | | | 8,031 | |
| | 7,595 | | | 5.500%, 07/15/25 | | | 7,823 | |
| | 24,125 | | | 5.750%, 11/15/24 | | | 25,090 | |
| | 15,440 | | | 5.875%, 09/15/26 | | | 16,057 | |
| | 8,488 | | | 6.125%, 06/15/23 | | | 8,923 | |
| | 10,500 | | | Univar USA, Inc., 6.750%, 07/15/23 (e) | | | 10,867 | |
| | 10,790 | | | WESCO Distribution, Inc., 5.375%, 06/15/24 (e) | | | 11,033 | |
| | | | | | | | |
| | | | | | | 178,175 | |
| | | | | | | | |
| | | | Total Industrials | | | 1,016,232 | |
| | | | | | | | |
| | | | Information Technology — 5.3% | |
| | | | Communications Equipment — 0.7% | |
| | 17,267 | | | Alcatel-Lucent USA, Inc., 6.450%, 03/15/29 | | | 18,778 | |
| | | | Avaya, Inc., | | | | |
| | 10,031 | | | 7.000%, 04/01/19 (e) | | | 7,473 | |
| | 6,818 | | | 10.500%, 03/01/21 | | | 1,773 | |
| | 6,807 | | | CommScope Technologies Finance LLC, 6.000%, 06/15/25 (e) | | | 7,224 | |
| | | | CommScope, Inc., | | | | |
| | 2,513 | | | 4.375%, 06/15/20 (e) | | | 2,601 | |
| | 10,830 | | | 5.000%, 06/15/21 (e) | | | 11,236 | |
| | 11,781 | | | 5.500%, 06/15/24 (e) | | | 12,370 | |
SEE NOTES TO FINANCIAL STATEMENTS.
| | | | | | |
| | | |
| 162 | | | | J.P. MORGAN INCOME FUNDS | | AUGUST 31, 2016 |
| | | | | | | | |
PRINCIPAL
AMOUNT($) | | | SECURITY DESCRIPTION | | VALUE($) | |
| Corporate Bonds — continued | |
| | | | Communications Equipment — continued | |
| | 15,912 | | | Goodman Networks, Inc., 12.125%, 07/01/18 | | | 7,876 | |
| | | | Nokia OYJ, (Finland), | | | | |
| | 6,517 | | | 5.375%, 05/15/19 | | | 7,047 | |
| | 5,650 | | | 6.625%, 05/15/39 | | | 6,158 | |
| | 6,550 | | | Plantronics, Inc., 5.500%, 05/31/23 (e) | | | 6,812 | |
| | | | | | | | |
| | | | | | | 89,348 | |
| | | | | | | | |
| | | | Electronic Equipment, Instruments & Components — 0.4% | |
| | 10,130 | | | Anixter, Inc., 5.500%, 03/01/23 | | | 10,662 | |
| | | | Belden, Inc., | | | | |
| | 5,649 | | | 5.250%, 07/15/24 (e) | | | 5,734 | |
| | 5,650 | | | 5.500%, 09/01/22 (e) | | | 5,890 | |
| | | | CDW LLC/CDW Finance Corp., | | | | |
| | 9,966 | | | 5.000%, 09/01/23 | | | 10,327 | |
| | 7,051 | | | 5.500%, 12/01/24 | | | 7,557 | |
| | 2,695 | | | 6.000%, 08/15/22 | | | 2,894 | |
| | 2,853 | | | Zebra Technologies Corp., 7.250%, 10/15/22 | | | 3,095 | |
| | | | | | | | |
| | | | | | | 46,159 | |
| | | | | | | | |
| | | | Internet Software & Services — 0.1% | |
| | 4,800 | | | Match Group, Inc., 6.375%, 06/01/24 | | | 5,220 | |
| | | | VeriSign, Inc., | | | | |
| | 6,008 | | | 4.625%, 05/01/23 | | | 6,143 | |
| | 2,933 | | | 5.250%, 04/01/25 | | | 3,058 | |
| | | | | | | | |
| | | | | | | 14,421 | |
| | | | | | | | |
| | | | IT Services — 0.9% | |
| | 9,550 | | | Alliance Data Systems Corp., 5.375%, 08/01/22 (e) | | | 9,407 | |
| | | | First Data Corp., | | | | |
| | 23,445 | | | 5.000%, 01/15/24 (e) | | | 23,855 | |
| | 8,260 | | | 5.375%, 08/15/23 (e) | | | 8,570 | |
| | 24,775 | | | 5.750%, 01/15/24 (e) | | | 25,363 | |
| | 5,370 | | | 6.750%, 11/01/20 (e) | | | 5,585 | |
| | 30,908 | | | 7.000%, 12/01/23 (e) | | | 32,415 | |
| | | | | | | | |
| | | | | | | 105,195 | |
| | | | | | | | |
| | | | Semiconductors & Semiconductor Equipment — 1.3% | |
| | | | Advanced Micro Devices, Inc., | | | | |
| | 6,052 | | | 6.750%, 03/01/19 | | | 6,082 | |
| | 18,232 | | | 7.000%, 07/01/24 | | | 16,773 | |
| | 770 | | | 7.500%, 08/15/22 | | | 747 | |
| | 3,440 | | | 7.750%, 08/01/20 | | | 3,406 | |
| | 2,499 | | | Entegris, Inc., 6.000%, 04/01/22 (e) | | | 2,599 | |
| | 2,315 | | | Freescale Semiconductor, Inc., 6.000%, 01/15/22 (e) | | | 2,440 | |
| | | | | | | | |
PRINCIPAL
AMOUNT($) | | | SECURITY DESCRIPTION | | VALUE($) | |
| | | | | | | | |
| | | | Semiconductors & Semiconductor Equipment — continued | |
| | | | Micron Technology, Inc., | | | | |
| | 15,555 | | | 5.250%, 08/01/23 (e) | | | 15,049 | |
| | 182 | | | 5.250%, 01/15/24 (e) | | | 174 | |
| | 4,936 | | | 5.500%, 02/01/25 | | | 4,782 | |
| | 5,558 | | | 5.625%, 01/15/26 (e) | | | 5,308 | |
| | 5,448 | | | 5.875%, 02/15/22 | | | 5,489 | |
| | 11,250 | | | 7.500%, 09/15/23 (e) | | | 12,403 | |
| | 5,700 | | | Microsemi Corp., 9.125%, 04/15/23 (e) | | | 6,527 | |
| | | | NXP B.V./NXP Funding LLC, (Netherlands), | | | | |
| | 10,909 | | | 4.125%, 06/15/20 (e) | | | 11,291 | |
| | 20,027 | | | 4.125%, 06/01/21 (e) | | | 20,948 | |
| | 13,426 | | | 4.625%, 06/15/22 (e) | | | 14,139 | |
| | 2,430 | | | 5.750%, 02/15/21 (e) | | | 2,533 | |
| | 3,963 | | | 5.750%, 03/15/23 (e) | | | 4,219 | |
| | 9,706 | | | Qorvo, Inc., 6.750%, 12/01/23 (e) | | | 10,567 | |
| | 5,867 | | | Sensata Technologies UK Financing Co. plc, (United Kingdom), 6.250%, 02/15/26 (e) | | | 6,432 | |
| | | | | | | | |
| | | | | | | 151,908 | |
| | | | | | | | |
| | | | Software — 0.7% | |
| | | | Infor U.S., Inc., | | | | |
| | 12,295 | | | 5.750%, 08/15/20 (e) | | | 12,977 | |
| | 16,502 | | | 6.500%, 05/15/22 | | | 16,729 | |
| | 10,842 | | | Informatica LLC, 7.125%, 07/15/23 (e) | | | 10,246 | |
| | 10,577 | | | Nuance Communications, Inc., 5.375%, 08/15/20 (e) | | | 10,828 | |
| | | | Open Text Corp., (Canada), | | | | |
| | 7,385 | | | 5.625%, 01/15/23 (e) | | | 7,625 | |
| | 7,211 | | | 5.875%, 06/01/26 (e) | | | 7,608 | |
| | 15,295 | | | Solera LLC/Solera Finance, Inc., 10.500%, 03/01/24 (e) | | | 16,939 | |
| | 4,630 | | | SS&C Technologies Holdings, Inc., 5.875%, 07/15/23 | | | 4,873 | |
| | | | | | | | |
| | | | | | | 87,825 | |
| | | | | | | | |
| | | | Technology Hardware, Storage & Peripherals — 1.2% | |
| | | | Diamond 1 Finance Corp./Diamond 2 Finance Corp., | | | | |
| | 135 | | | 3.480%, 06/01/19 (e) | | | 139 | |
| | 7,038 | | | 4.420%, 06/15/21 (e) | | | 7,363 | |
| | 20,333 | | | 5.450%, 06/15/23 (e) | | | 21,662 | |
| | 16,498 | | | 5.875%, 06/15/21 (e) | | | 17,464 | |
| | 20,333 | | | 6.020%, 06/15/26 (e) | | | 21,796 | |
| | 14,225 | | | 7.125%, 06/15/24 (e) | | | 15,403 | |
| | 1,844 | | | 8.100%, 07/15/36 (e) | | | 2,142 | |
| | 3,065 | | | 8.350%, 07/15/46 (e) | | | 3,570 | |
| | 21,198 | | | Diebold, Inc., 8.500%, 04/15/24 (e) | | | 21,569 | |
SEE NOTES TO FINANCIAL STATEMENTS.
| | | | | | | | |
| | | |
| AUGUST 31, 2016 | | J.P. MORGAN INCOME FUNDS | | | | | 163 | |
JPMorgan High Yield Fund
SCHEDULE OF PORTFOLIO INVESTMENTS
AS OF AUGUST 31, 2016 (Unaudited) (continued)
(Amounts in thousands)
| | | | | | | | |
PRINCIPAL
AMOUNT($) | | | SECURITY DESCRIPTION | | VALUE($) | |
| Corporate Bonds — continued | |
| | | | Technology Hardware, Storage & Peripherals — continued | |
| | | | NCR Corp., | | | | |
| | 3,142 | | | 5.000%, 07/15/22 | | | 3,205 | |
| | 1,176 | | | 5.875%, 12/15/21 | | | 1,232 | |
| | 2,730 | | | 6.375%, 12/15/23 | | | 2,887 | |
| | | | Western Digital Corp., | | | | |
| | 8,181 | | | 7.375%, 04/01/23 (e) | | | 8,876 | |
| | 15,432 | | | 10.500%, 04/01/24 (e) | | | 17,438 | |
| | | | | | | | |
| | | | | | | 144,746 | |
| | | | | | | | |
| | | | Total Information Technology | | | 639,602 | |
| | | | | | | | |
| | | | Materials — 10.1% | |
| | | | Chemicals — 2.5% | |
| | 10,870 | | | A Schulman, Inc., 6.875%, 06/01/23 (e) | | | 10,924 | |
| | 5,000 | | | Ashland, Inc., 6.875%, 05/15/43 | | | 5,450 | |
| | 7,900 | | | Axalta Coating Systems LLC, 4.875%, 08/15/24 (e) | | | 8,236 | |
| | 5,175 | | | Axiall Corp., 4.875%, 05/15/23 | | | 5,427 | |
| | 5,690 | | | Basell Finance Co., B.V., (Netherlands), 8.100%, 03/15/27 (e) | | | 7,655 | |
| | | | Blue Cube Spinco, Inc., | | | | |
| | 27,175 | | | 9.750%, 10/15/23 (e) | | | 32,134 | |
| | 40,868 | | | 10.000%, 10/15/25 (e) | | | 48,633 | |
| | 38,886 | | | CVR Partners LP/CVR Nitrogen Finance Corp., 9.250%, 06/15/23 (e) | | | 38,546 | |
| | 14,749 | | | GCP Applied Technologies, Inc., 9.500%, 02/01/23 (e) | | | 16,887 | |
| | 55,680 | | | Hexion, Inc., 6.625%, 04/15/20 | | | 48,268 | |
| | | | Momentive Performance Materials, Inc., | | | | |
| | 8,310 | | | 3.880%, 10/24/21 | | | 6,868 | |
| | 9,310 | | | 8.875%, 10/15/20 (d) | | | — | (h) |
| | | | NOVA Chemicals Corp., (Canada), | | | | |
| | 5,545 | | | 5.000%, 05/01/25 (e) | | | 5,725 | |
| | 10,435 | | | 5.250%, 08/01/23 (e) | | | 10,826 | |
| | 6,050 | | | Nufarm Australia Ltd., (Australia), 6.375%, 10/15/19 (e) | | | 6,126 | |
| | 26,138 | | | PolyOne Corp., 5.250%, 03/15/23 | | | 27,314 | |
| | 5,300 | | | Rain CII Carbon LLC/CII Carbon Corp., 8.000%, 12/01/18 (e) | | | 5,128 | |
| | 12,000 | | | Scotts Miracle-Gro Co. (The), 6.000%, 10/15/23 (e) | | | 12,825 | |
| | 5,690 | | | Valvoline, Inc., 5.500%, 07/15/24 (e) | | | 5,972 | |
| | | | | | | | |
| | | | | | | 302,944 | |
| | | | | | | | |
| | | | Construction Materials — 1.1% | |
| | 15,730 | | | Cemex Finance LLC, 9.375%, 10/12/22 (e) | | | 17,322 | |
| | | | Cemex S.A.B. de C.V., (Mexico), | | | | |
| | 24,380 | | | 5.700%, 01/11/25 (e) | | | 25,083 | |
| | | | | | | | |
PRINCIPAL
AMOUNT($) | | | SECURITY DESCRIPTION | | VALUE($) | |
| | | | | | | | |
| | | | Construction Materials — continued | |
| | 34,604 | | | 6.125%, 05/05/25 (e) | | | 36,379 | |
| | 37,003 | | | 7.750%, 04/16/26 (e) | | | 41,769 | |
| | 5,806 | | | Headwaters, Inc., 7.250%, 01/15/19 | | | 6,024 | |
| | 10,816 | | | U.S. Concrete, Inc., 6.375%, 06/01/24 | | | 11,276 | |
| | | | | | | | |
| | | | | | | 137,853 | |
| | | | | | | | |
| | | | Containers & Packaging — 1.5% | |
| | | | Ardagh Packaging Finance plc/Ardagh Holdings USA, Inc., (Ireland), | | | | |
| | 1,694 | | | 7.000%, 11/15/20 (e) | | | 1,692 | |
| | 3,320 | | | 7.250%, 05/15/24 (e) | | | 3,532 | |
| | | | Ball Corp., | | | | |
| | 4,991 | | | 4.000%, 11/15/23 | | | 5,078 | |
| | 5,000 | | | 5.000%, 03/15/22 | | | 5,400 | |
| | 11,740 | | | 5.250%, 07/01/25 | | | 12,709 | |
| | | | Berry Plastics Corp., | | | | |
| | 15,950 | | | 5.125%, 07/15/23 | | | 16,409 | |
| | 7,000 | | | 5.500%, 05/15/22 | | | 7,284 | |
| | | | Cascades, Inc., (Canada), | | | | |
| | 4,740 | | | 5.500%, 07/15/22 (e) | | | 4,764 | |
| | 7,655 | | | 5.750%, 07/15/23 (e) | | | 7,743 | |
| | 3,085 | | | Constar International, Inc., 11.000%, 12/31/17 (d) | | | 324 | |
| | | | Graphic Packaging International, Inc., | | | | |
| | 7,745 | | | 4.750%, 04/15/21 | | | 8,297 | |
| | 3,230 | | | 4.875%, 11/15/22 | | | 3,403 | |
| | | | Owens-Brockway Glass Container, Inc., | | | | |
| | 5,890 | | | 5.000%, 01/15/22 (e) | | | 6,199 | |
| | 12,403 | | | 5.375%, 01/15/25 (e) | | | 12,992 | |
| | 1,350 | | | 5.875%, 08/15/23 (e) | | | 1,476 | |
| | 1,802 | | | 6.375%, 08/15/25 (e) | | | 1,996 | |
| | | | Reynolds Group Issuer, Inc./Reynolds Group Issuer LLC, | | | | |
| | 10,695 | | | 5.125%, 07/15/23 (e) | | | 11,096 | |
| | 12,385 | | | 5.750%, 10/15/20 | | | 12,757 | |
| | 12,600 | | | 6.875%, 02/15/21 | | | 13,072 | |
| | 3,800 | | | 8.250%, 02/15/21 | | | 3,952 | |
| | 829 | | | 9.875%, 08/15/19 | | | 853 | |
| | | | Sealed Air Corp., | | | | |
| | 22,767 | | | 5.125%, 12/01/24 (e) | | | 24,361 | |
| | 10,344 | | | 5.250%, 04/01/23 (e) | | | 11,042 | |
| | | | | | | | |
| | | | | | | 176,431 | |
| | | | | | | | |
| | | | Metals & Mining — 4.8% | |
| | 16,255 | | | AK Steel Corp., 7.500%, 07/15/23 | | | 17,637 | |
SEE NOTES TO FINANCIAL STATEMENTS.
| | | | | | |
| | | |
| 164 | | | | J.P. MORGAN INCOME FUNDS | | AUGUST 31, 2016 |
| | | | | | | | |
PRINCIPAL
AMOUNT($) | | | SECURITY DESCRIPTION | | VALUE($) | |
| Corporate Bonds — continued | |
| | | | Metals & Mining — continued | |
| | | | Alcoa, Inc., | | | | |
| | 18,585 | | | 5.125%, 10/01/24 | | | 19,607 | |
| | 4,866 | | | 5.400%, 04/15/21 | | | 5,163 | |
| | 6,943 | | | 5.870%, 02/23/22 | | | 7,516 | |
| | 9,851 | | | 5.900%, 02/01/27 | | | 10,565 | |
| | 7,034 | | | 5.950%, 02/01/37 | | | 7,102 | |
| | 2,250 | | | 6.150%, 08/15/20 | | | 2,457 | |
| | 15,659 | | | 6.750%, 01/15/28 | | | 17,421 | |
| | | | Aleris International, Inc., | | | | |
| | 1,203 | | | 7.875%, 11/01/20 | | | 1,239 | |
| | 9,900 | | | 9.500%, 04/01/21 (e) | | | 10,865 | |
| | | | Anglo American Capital plc, (United Kingdom), | | | | |
| | 16,100 | | | 4.125%, 04/15/21 (e) | | | 15,939 | |
| | 8,517 | | | 4.125%, 09/27/22 (e) | | | 8,325 | |
| | 1,968 | | | 4.450%, 09/27/20 (e) | | | 1,988 | |
| | 25,315 | | | 4.875%, 05/14/25 (e) | | | 25,378 | |
| | | | ArcelorMittal, (Luxembourg), | | | | |
| | 5,170 | | | 6.125%, 06/01/25 | | | 5,558 | |
| | 3,245 | | | 6.250%, 08/05/20 | | | 3,505 | |
| | 14,005 | | | 6.500%, 03/01/21 | | | 15,195 | |
| | 58,000 | | | 7.250%, 02/25/22 | | | 65,250 | |
| | 2,900 | | | 7.750%, 03/01/41 | | | 3,016 | |
| | 5,270 | | | 8.000%, 10/15/39 | | | 5,665 | |
| | 5,300 | | | 10.850%, 06/01/19 | | | 6,320 | |
| | 18,487 | | | Coeur Mining, Inc., 7.875%, 02/01/21 | | | 18,256 | |
| | 17,188 | | | Commercial Metals Co., 4.875%, 05/15/23 | | | 17,274 | |
| | | | Freeport-McMoRan, Inc., | | | | |
| | 16,015 | | | 3.100%, 03/15/20 | | | 14,734 | |
| | 15,460 | | | 3.550%, 03/01/22 | | | 13,450 | |
| | 39,610 | | | 3.875%, 03/15/23 | | | 33,966 | |
| | 5,129 | | | 4.000%, 11/14/21 | | | 4,693 | |
| | 1,776 | | | 5.400%, 11/14/34 | | | 1,385 | |
| | 32,550 | | | 5.450%, 03/15/43 | | | 24,901 | |
| | 15,456 | | | Hecla Mining Co., 6.875%, 05/01/21 | | | 15,572 | |
| | 6,432 | | | HudBay Minerals, Inc., (Canada), 9.500%, 10/01/20 | | | 6,448 | |
| | 5,550 | | | Kaiser Aluminum Corp., 5.875%, 05/15/24 (e) | | | 5,883 | |
| | | | Lundin Mining Corp., (Canada), | | | | |
| | 10,080 | | | 7.500%, 11/01/20 (e) | | | 10,634 | |
| | 11,280 | | | 7.875%, 11/01/22 (e) | | | 12,070 | |
| | | | New Gold, Inc., (Canada), | | | | |
| | 12,111 | | | 6.250%, 11/15/22 (e) | | | 12,505 | |
| | 4,261 | | | 7.000%, 04/15/20 (e) | | | 4,389 | |
| | 21,539 | | | Novelis, Inc., (Canada), 8.750%, 12/15/20 | | | 22,562 | |
| | | | | | | | |
PRINCIPAL
AMOUNT($) | | | SECURITY DESCRIPTION | | VALUE($) | |
| | | | | | | | |
| | | | Metals & Mining — continued | |
| | 2,495 | | | Prince Mineral Holding Corp., 11.500%, 12/15/19 (e) | | | 2,264 | |
| | 8,160 | | | Signode Industrial Group Lux S.A./Signode Industrial Group U.S., Inc., 6.375%, 05/01/22 (e) | | | 8,323 | |
| | | | Steel Dynamics, Inc., | | | | |
| | 5,850 | | | 5.125%, 10/01/21 | | | 6,084 | |
| | 7,600 | | | 5.250%, 04/15/23 | | | 7,904 | |
| | 9,670 | | | 5.500%, 10/01/24 | | | 10,202 | |
| | 8,892 | | | 6.375%, 08/15/22 | | | 9,381 | |
| | 5,032 | | | Taseko Mines Ltd., (Canada), 7.750%, 04/15/19 | | | 3,214 | |
| | | | Teck Resources Ltd., (Canada), | | | | |
| | 8,250 | | | 3.000%, 03/01/19 | | | 8,002 | |
| | 9,070 | | | 4.750%, 01/15/22 | | | 8,483 | |
| | 8,060 | | | 5.400%, 02/01/43 | | | 6,005 | |
| | 7,270 | | | 6.000%, 08/15/40 | | | 5,889 | |
| | 7,310 | | | 6.125%, 10/01/35 | | | 6,104 | |
| | 1,920 | | | 8.000%, 06/01/21 (e) | | | 2,078 | |
| | 7,421 | | | 8.500%, 06/01/24 (e) | | | 8,349 | |
| | 10,885 | | | United States Steel Corp., 8.375%, 07/01/21 (e) | | | 11,838 | |
| | | | | | | | |
| | | | | | | 578,553 | |
| | | | | | | | |
| | | | Paper & Forest Products — 0.2% | |
| | | | Clearwater Paper Corp., | | | | |
| | 6,395 | | | 4.500%, 02/01/23 | | | 6,371 | |
| | 6,719 | | | 5.375%, 02/01/25 (e) | | | 6,786 | |
| | 15,735 | | | Hardwoods Acquisition, Inc., 7.500%, 08/01/21 (e) | | | 10,857 | |
| | 6,530 | | | NWH Escrow Corp., 7.500%, 08/01/21 (e) | | | 4,375 | |
| | | | | | | | |
| | | | | | | 28,389 | |
| | | | | | | | |
| | | | Total Materials | | | 1,224,170 | |
| | | | | | | | |
| | | | Real Estate — 0.8% | |
| | | | Equity Real Estate Investment Trusts (REITs) — 0.8% | |
| | 11,136 | | | Communications Sales & Leasing, Inc./CSL Capital LLC, 6.000%, 04/15/23 (e) | | | 11,660 | |
| | 10,830 | | | DuPont Fabros Technology LP, 5.875%, 09/15/21 | | | 11,331 | |
| | | | Equinix, Inc., | | | | |
| | 2,065 | | | 4.875%, 04/01/20 | | | 2,148 | |
| | 7,608 | | | 5.375%, 01/01/22 | | | 8,126 | |
| | 18,058 | | | 5.375%, 04/01/23 | | | 19,096 | |
| | 2,707 | | | 5.750%, 01/01/25 | | | 2,897 | |
| | 4,481 | | | 5.875%, 01/15/26 | | | 4,881 | |
SEE NOTES TO FINANCIAL STATEMENTS.
| | | | | | | | |
| | | |
| AUGUST 31, 2016 | | J.P. MORGAN INCOME FUNDS | | | | | 165 | |
JPMorgan High Yield Fund
SCHEDULE OF PORTFOLIO INVESTMENTS
AS OF AUGUST 31, 2016 (Unaudited) (continued)
(Amounts in thousands)
| | | | | | | | |
PRINCIPAL
AMOUNT($) | | | SECURITY DESCRIPTION | | VALUE($) | |
| Corporate Bonds — continued | |
| | | | Equity Real Estate Investment Trusts (REITs) — continued | |
| | | | Iron Mountain, Inc., | | | | |
| | 13,529 | | | 5.750%, 08/15/24 | | | 14,036 | |
| | 10,396 | | | 6.000%, 10/01/20 (e) | | | 11,046 | |
| | 5,387 | | | RHP Hotel Properties LP/RHP Finance Corp., 5.000%, 04/15/23 | | | 5,481 | |
| | | | VEREIT Operating Partnership LP, | | | | |
| | 3,025 | | | 4.125%, 06/01/21 | | | 3,161 | |
| | 1,289 | | | 4.875%, 06/01/26 | | | 1,389 | |
| | | | | | | | |
| | | | Total Real Estate | | | 95,252 | |
| | | | | | | | |
| | | | Telecommunication Services — 10.4% | |
| | | | Diversified Telecommunication Services — 7.1% | |
| | | | Altice Financing S.A., (Luxembourg), | | | | |
| | 10,515 | | | 6.500%, 01/15/22 (e) | | | 11,041 | |
| | 19,517 | | | 6.625%, 02/15/23 (e) | | | 20,322 | |
| | 16,485 | | | 7.500%, 05/15/26 (e) | | | 17,350 | |
| | | | CCO Holdings LLC/CCO Holdings Capital Corp., | | | | |
| | 1,000 | | | 5.125%, 05/01/23 (e) | | | 1,052 | |
| | 5,200 | | | 5.250%, 09/30/22 | | | 5,460 | |
| | 5,688 | | | 5.375%, 05/01/25 (e) | | | 5,994 | |
| | 10,128 | | | 5.500%, 05/01/26 (e) | | | 10,723 | |
| | 37,655 | | | 5.750%, 02/15/26 (e) | | | 40,291 | |
| | 53,808 | | | 5.875%, 04/01/24 (e) | | | 57,978 | |
| | 21,964 | | | Cincinnati Bell, Inc., 8.375%, 10/15/20 | | | 22,733 | |
| | 9,948 | | | Consolidated Communications, Inc., 6.500%, 10/01/22 | | | 9,650 | |
| | 128,912 | | | Embarq Corp., 7.995%, 06/01/36 | | | 133,667 | |
| | | | Frontier Communications Corp., | | | | |
| | 27,490 | | | 6.250%, 09/15/21 | | | 26,811 | |
| | 16,421 | | | 8.500%, 04/15/20 | | | 17,714 | |
| | 964 | | | 8.750%, 04/15/22 | | | 1,005 | |
| | 10,000 | | | 8.875%, 09/15/20 | | | 10,900 | |
| | 32,472 | | | 9.250%, 07/01/21 | | | 35,151 | |
| | 22,091 | | | 10.500%, 09/15/22 | | | 24,038 | |
| | 21,012 | | | 11.000%, 09/15/25 | | | 22,693 | |
| | | | Intelsat Jackson Holdings S.A., (Luxembourg), | | | | |
| | 14,521 | | | 5.500%, 08/01/23 | | | 9,910 | |
| | 7,910 | | | 7.250%, 04/01/19 | | | 6,338 | |
| | 15,080 | | | 7.250%, 10/15/20 | | | 11,725 | |
| | 19,125 | | | 8.000%, 02/15/24 (e) | | | 19,221 | |
| | 12,018 | | | Intelsat Luxembourg S.A., (Luxembourg), 7.750%, 06/01/21 | | | 3,545 | |
| | 22,112 | | | Level 3 Communications, Inc., 5.750%, 12/01/22 | | | 23,107 | |
| | | | Level 3 Financing, Inc., | | | | |
| | 7,358 | | | 5.125%, 05/01/23 | | | 7,643 | |
| | | | | | | | |
PRINCIPAL
AMOUNT($) | | | SECURITY DESCRIPTION | | VALUE($) | |
| | | | | | | | |
| | | | Diversified Telecommunication Services — continued | |
| | 14,544 | | | 5.250%, 03/15/26 (e) | | | 15,089 | |
| | 1,910 | | | 5.375%, 08/15/22 | | | 1,996 | |
| | 10,555 | | | 5.375%, 01/15/24 | | | 11,070 | |
| | 13,627 | | | 5.375%, 05/01/25 | | | 14,308 | |
| | 11,460 | | | 5.625%, 02/01/23 | | | 12,004 | |
| | 1,000 | | | 6.125%, 01/15/21 | | | 1,038 | |
| | | | Qwest Capital Funding, Inc., | | | | |
| | 7,892 | | | 6.875%, 07/15/28 | | | 7,132 | |
| | 20,558 | | | 7.750%, 02/15/31 | | | 19,813 | |
| | 5,575 | | | Qwest Corp., 7.250%, 09/15/25 | | | 6,028 | |
| | | | SBA Communications Corp., | | | | |
| | 13,205 | | | 4.875%, 07/15/22 | | | 13,535 | |
| | 2,380 | | | 4.875%, 09/01/24 (e) | | | 2,413 | |
| | | | SFR Group S.A., (France), | | | | |
| | 50,605 | | | 6.000%, 05/15/22 (e) | | | 51,718 | |
| | 11,702 | | | 6.250%, 05/15/24 (e) | | | 11,790 | |
| | 14,242 | | | 7.375%, 05/01/26 (e) | | | 14,705 | |
| | | | Sprint Capital Corp., | | | | |
| | 5,540 | | | 6.875%, 11/15/28 | | | 4,956 | |
| | 9,285 | | | 6.900%, 05/01/19 | | | 9,378 | |
| | 18,753 | | | 8.750%, 03/15/32 | | | 18,560 | |
| | 13,965 | | | UPCB Finance IV Ltd., (Cayman Islands), 5.375%, 01/15/25 (e) | | | 14,349 | |
| | | | Virgin Media Finance plc, (United Kingdom), | | | | |
| | 9,250 | | | 5.250%, 02/15/22 | | | 8,290 | |
| | 10,422 | | | 6.375%, 04/15/23 (e) | | | 11,100 | |
| | | | Virgin Media Secured Finance plc, (United Kingdom), | | | | |
| | 3,000 | | | 5.250%, 01/15/26 (e) | | | 3,067 | |
| | 7,867 | | | 5.375%, 04/15/21 (e) | | | 8,182 | |
| | | | Wind Acquisition Finance S.A., (Luxembourg), | | | | |
| | 4,696 | | | 4.750%, 07/15/20 (e) | | | 4,755 | |
| | 7,010 | | | 7.375%, 04/23/21 (e) | | | 7,220 | |
| | | | Windstream Services LLC, | | | | |
| | 4,903 | | | 7.500%, 06/01/22 | | | 4,719 | |
| | 6,606 | | | 7.500%, 04/01/23 | | | 6,266 | |
| | | | Zayo Group LLC/Zayo Capital, Inc., | | | | |
| | 16,700 | | | 6.000%, 04/01/23 | | | 17,368 | |
| | 5,525 | | | 6.375%, 05/15/25 | | | 5,830 | |
| | | | | | | | |
| | | | | | | 862,741 | |
| | | | | | | | |
| | | | Wireless Telecommunication Services — 3.3% | |
| | 21,169 | | | SoftBank Group Corp., (Japan), 4.500%, 04/15/20 (e) | | | 22,016 | |
| | | | Sprint Communications, Inc., | | | | |
| | 8,529 | | | 6.000%, 12/01/16 | | | 8,614 | |
SEE NOTES TO FINANCIAL STATEMENTS.
| | | | | | |
| | | |
| 166 | | | | J.P. MORGAN INCOME FUNDS | | AUGUST 31, 2016 |
| | | | | | | | |
PRINCIPAL
AMOUNT($) | | | SECURITY DESCRIPTION | | VALUE($) | |
| Corporate Bonds — continued | |
| | | | Wireless Telecommunication Services — continued | |
| | 23,125 | | | 7.000%, 03/01/20 (e) | | | 24,802 | |
| | 22,520 | | | 7.000%, 08/15/20 | | | 22,182 | |
| | 2,690 | | | 8.375%, 08/15/17 | | | 2,802 | |
| | 36,726 | | | 9.000%, 11/15/18 (e) | | | 40,444 | |
| | 3,596 | | | 9.125%, 03/01/17 | | | 3,699 | |
| | 2,455 | | | 9.250%, 04/15/22 | | | 2,578 | |
| | 5,758 | | | 11.500%, 11/15/21 | | | 6,478 | |
| | | | Sprint Corp., | | | | |
| | 25,764 | | | 7.125%, 06/15/24 | | | 24,025 | |
| | 17,249 | | | 7.250%, 09/15/21 | | | 17,055 | |
| | 27,634 | | | 7.625%, 02/15/25 | | | 26,174 | |
| | 23,004 | | | 7.875%, 09/15/23 | | | 22,314 | |
| | | | T-Mobile USA, Inc., | | | | |
| | 2,836 | | | 5.250%, 09/01/18 | | | 2,895 | |
| | 7,620 | | | 6.000%, 03/01/23 | | | 8,077 | |
| | 15,259 | | | 6.000%, 04/15/24 | | | 16,251 | |
| | 14,660 | | | 6.125%, 01/15/22 | | | 15,466 | |
| | 12,564 | | | 6.250%, 04/01/21 | | | 13,114 | |
| | 16,845 | | | 6.375%, 03/01/25 | | | 18,108 | |
| | 4,862 | | | 6.500%, 01/15/24 | | | 5,227 | |
| | 11,207 | | | 6.500%, 01/15/26 | | | 12,265 | |
| | 8,204 | | | 6.625%, 11/15/20 | | | 8,471 | |
| | 13,487 | | | 6.625%, 04/01/23 | | | 14,389 | |
| | 15,458 | | | 6.633%, 04/28/21 | | | 16,192 | |
| | 28,587 | | | 6.731%, 04/28/22 | | | 30,052 | |
| | 17,390 | | | 6.836%, 04/28/23 | | | 18,651 | |
| | | | | | | | |
| | | | | | | 402,341 | |
| | | | | | | | |
| | | | Total Telecommunication Services | | | 1,265,082 | |
| | | | | | | | |
| | | | Utilities — 4.3% | |
| | | | Electric Utilities — 0.2% | |
| | 23,018 | | | Terraform Global Operating LLC, 9.750%, 08/15/22 (e) | | | 23,363 | |
| | 15,375 | | | Texas Competitive Electric Holdings Co. LLC, VAR, 3.977%, 10/01/20 | | | 4,997 | |
| | | | | | | | |
| | | | | | | 28,360 | |
| | | | | | | | |
| | | | Gas Utilities — 1.3% | |
| | 12,275 | | | AmeriGas Finance LLC/AmeriGas Finance Corp., 7.000%, 05/20/22 | | | 13,073 | |
| | | | AmeriGas Partners LP/AmeriGas Finance Corp., | |
| | 5,357 | | | 5.625%, 05/20/24 | | | 5,732 | |
| | 5,356 | | | 5.875%, 08/20/26 | | | 5,744 | |
| | 16,574 | | | Ferrellgas LP/Ferrellgas Finance Corp., 6.750%, 06/15/23 | | | 14,958 | |
| | | | | | | | |
PRINCIPAL
AMOUNT($) | | | SECURITY DESCRIPTION | | VALUE($) | |
| | | | | | | | |
| | | | Gas Utilities — continued | |
| | 5,833 | | | PBF Logistics LP/PBF Logistics Finance Corp., 6.875%, 05/15/23 | | | 5,643 | |
| | | | Rose Rock Midstream LP/Rose Rock Finance Corp., | |
| | 5,385 | | | 5.625%, 07/15/22 | | | 4,954 | |
| | 6,417 | | | 5.625%, 11/15/23 | | | 5,840 | |
| | | | Sabine Pass Liquefaction LLC, | | | | |
| | 30,157 | | | 5.625%, 04/15/23 | | | 31,740 | |
| | 30,640 | | | 5.625%, 03/01/25 | | | 32,402 | |
| | 12,850 | | | 5.625%, 02/01/21 | | | 13,493 | |
| | 9,090 | | | 5.750%, 05/15/24 | | | 9,658 | |
| | 14,402 | | | 5.875%, 06/30/26 (e) | | | 15,410 | |
| | | | | | | | |
| | | | | | | 158,647 | |
| | | | | | | | |
| | | | Independent Power & Renewable Electricity
Producers — 2.5% | |
| | | | AES Corp., | | | | |
| | 3,000 | | | 4.875%, 05/15/23 | | | 3,037 | |
| | 20,000 | | | 5.500%, 03/15/24 | | | 20,750 | |
| | 10,165 | | | 5.500%, 04/15/25 | | | 10,424 | |
| | 8,453 | | | 6.000%, 05/15/26 | | | 8,971 | |
| | | | Calpine Corp., | | | | |
| | 16,308 | | | 5.250%, 06/01/26 (e) | | | 16,512 | |
| | 9,837 | | | 5.375%, 01/15/23 | | | 9,843 | |
| | 10,700 | | | 5.500%, 02/01/24 | | | 10,660 | |
| | 9,821 | | | 5.750%, 01/15/25 | | | 9,784 | |
| | 26,374 | | | 5.875%, 01/15/24 (e) | | | 27,890 | |
| | | | Dynegy, Inc., | | | | |
| | 29,544 | | | 5.875%, 06/01/23 | | | 26,811 | |
| | 6,000 | | | 7.375%, 11/01/22 | | | 5,910 | |
| | 11,750 | | | 7.625%, 11/01/24 | | | 11,486 | |
| | 32,044 | | | GenOn Energy, Inc., 9.875%, 10/15/20 | | | 22,591 | |
| | | | NRG Energy, Inc., | | | | |
| | 14,220 | | | 6.250%, 05/01/24 | | | 14,113 | |
| | 32,000 | | | 6.625%, 03/15/23 | | | 32,640 | |
| | 19,946 | | | 6.625%, 01/15/27 (e) | | | 19,983 | |
| | 3,000 | | | 7.250%, 05/15/26 (e) | | | 3,116 | |
| | | | Talen Energy Supply LLC, | | | | |
| | 7,603 | | | 4.625%, 07/15/19 (e) | | | 7,147 | |
| | 10,579 | | | 6.500%, 06/01/25 | | | 9,070 | |
| | | | TerraForm Power Operating LLC, | | | | |
| | 15,357 | | | 5.875%, 02/01/23 (e) | | | 15,415 | |
| | 12,640 | | | 6.125%, 06/15/25 (e) | | | 12,861 | |
| | | | | | | | |
| | | | | | | 299,014 | |
| | | | | | | | |
SEE NOTES TO FINANCIAL STATEMENTS.
| | | | | | | | |
| | | |
| AUGUST 31, 2016 | | J.P. MORGAN INCOME FUNDS | | | | | 167 | |
JPMorgan High Yield Fund
SCHEDULE OF PORTFOLIO INVESTMENTS
AS OF AUGUST 31, 2016 (Unaudited) (continued)
(Amounts in thousands)
| | | | | | | | |
PRINCIPAL
AMOUNT($) | | | SECURITY DESCRIPTION | | VALUE($) | |
| Corporate Bonds — continued | |
| | | | Multi-Utilities — 0.3% | |
| | | | NRG Yield Operating LLC, | | | | |
| | 6,850 | | | 5.000%, 09/15/26 (e) | | | 6,850 | |
| | 21,760 | | | 5.375%, 08/15/24 | | | 22,685 | |
| | | | | | | | |
| | | | | | | 29,535 | |
| | | | | | | | |
| | | | Total Utilities | | | 515,556 | |
| | | | | | | | |
| | | | Total Corporate Bonds
(Cost $10,350,329) | | | 10,473,564 | |
| | | | | | | | |
| Preferred Securities — 0.8% (x) | |
| | | | Financials — 0.8% | |
| | | | Banks — 0.8% | |
| | 20,448 | | | Bank of America Corp., Series AA, VAR, 6.100%, 03/17/25 | | | 21,496 | |
| | 22,680 | | | Barclays plc, (United Kingdom), VAR, 8.250%, 12/15/18 | | | 23,232 | |
| | | | Citigroup, Inc., | | | | |
| | 13,720 | | | Series R, VAR, 6.125%, 11/15/20 | | | 14,315 | |
| | 7,910 | | | Series T, VAR, 6.250%, 08/15/26 | | | 8,543 | |
| | 10,770 | | | Credit Agricole S.A., (France), VAR, 8.125%, 12/23/25 (e) | | | 11,558 | |
| | | | Royal Bank of Scotland Group plc, (United Kingdom), | | | | |
| | 10,292 | | | VAR, 7.500%, 08/10/20 | | | 9,752 | |
| | 6,561 | | | VAR, 8.000%, 08/10/25 | | | 6,378 | |
| | 4,790 | | | VAR, 8.625%, 08/15/21 | | | 4,880 | |
| | | | | | | | |
| | | | | | | 100,154 | |
| | | | | | | | |
| | | | Capital Markets — 0.0% (g) | |
| | 4,290 | | | Goldman Sachs Group, Inc. (The), Series O, VAR, 5.300%, 11/10/26 | | | 4,386 | |
| | | | | | | | |
| | | | Total Preferred Securities
(Cost $101,856) | | | 104,540 | |
| | | | | | | | |
| | |
| SHARES | | | | | | |
| Common Stocks — 0.0% (g) | |
| | | | Consumer Discretionary — 0.0% (g) | |
| | | | Media — 0.0% (g) | |
| | — | (h) | | New Cotai LLC/New Cotai Capital Corp., Class B, ADR (a) (e) | | | 1,463 | |
| | | | | | | | |
| | | | Specialty Retail — 0.0% (g) | |
| | 116 | | | Nebraska Book Holdings, Inc. (a) | | | 9 | |
| | | | | | | | |
| | | | Total Consumer Discretionary | | | 1,472 | |
| | | | | | | | |
| | | | Financials — 0.0% (g) | |
| | | | Diversified Financial Services — 0.0% (g) | |
| | 9,055 | | | Adelphia Recovery Trust (a) | | | — | (h) |
| | | | | | | | |
| | | | | | | | |
SHARES | | | SECURITY DESCRIPTION | | VALUE($) | |
| | | | | | | | |
| | | | Insurance — 0.0% (g) | |
| | 7,076 | | | ACC Claims Holdings LLC (a) | | | 71 | |
| | | | | | | | |
| | | | Total Financials | | | 71 | |
| | | | | | | | |
| | | | Industrials — 0.0% (g) | |
| | | | Commercial Services & Supplies — 0.0% (g) | |
| | 1 | | | Quad/Graphics, Inc. | | | 16 | |
| | | | | | | | |
| | | | Materials — 0.0% (g) | |
| | | | Containers & Packaging — 0.0% (g) | |
| | 58 | | | Constar International, Inc., Class A, ADR (a) | | | — | (h) |
| | | | | | | | |
| | | | Telecommunication Services — 0.0% (g) | |
| | | | Wireless Telecommunication Services — 0.0% (g) | |
| | 1,491 | | | NII Holdings, Inc. (a) | | | 4,964 | |
| | | | | | | | |
| | | | Utilities — 0.0% (g) | |
| | | | Independent Power & Renewable Electricity
Producers — 0.0% (g) | |
| | 100 | | | Dynegy, Inc. (a) | | | 1,267 | |
| | | | | | | | |
| | | | Total Common Stocks
(Cost $28,391) | | | 7,790 | |
| | | | | | | | |
| Preferred Stocks — 0.5% | |
| | | | Consumer Discretionary — 0.0% (g) | |
| | | | Media — 0.0% (g) | |
| | 1 | | | Spanish Broadcasting System, Inc., Series B, 10.750%, 10/03/16 ($1,000 par value) @ | | | 713 | |
| | | | | | | | |
| | | | Financials — 0.4% | |
| | | | Consumer Finance — 0.1% | |
| | 260 | | | GMAC Capital Trust I, Series 2, VAR, 6.602%, 02/15/40 ($25 par value) | | | 6,568 | |
| | | | | | | | |
| | | | Insurance — 0.3% | |
| | 312 | | | Hartford Financial Services Group, Inc. (The), VAR, 7.875%, 04/15/42 ($25 par value) | | | 9,818 | |
| | | | | | | | |
| | 34 | | | XLIT Ltd., (Cayman Islands), Series D, VAR, 3.800%, 10/03/16 ($1,000 par value) @ | | | 26,323 | |
| | | | | | | | |
| | | | | | | 36,141 | |
| | | | | | | | |
| | | | Total Financials | | | 42,709 | |
| | | | | | | | |
| | | | Industrials — 0.1% | |
| | | | Commercial Services & Supplies — 0.1% | |
| | 13 | | | Pitney Bowes International Holdings, Inc., Series F, 6.125%, 10/30/16 ($1,000 par value) @ | | | 13,047 | |
| | | | | | | | |
| | | | Materials — 0.0% (g) | |
| | | | Containers & Packaging — 0.0% (g) | |
| | 6 | | | Constar International, Inc., Class A | | | — | (h) |
| | | | | | | | |
| | | | Total Preferred Stocks
(Cost $55,897) | | | 56,469 | |
| | | | | | | | |
SEE NOTES TO FINANCIAL STATEMENTS.
| | | | | | |
| | | |
| 168 | | | | J.P. MORGAN INCOME FUNDS | | AUGUST 31, 2016 |
| | | | | | | | |
PRINCIPAL
AMOUNT($) | | | SECURITY DESCRIPTION | | VALUE($) | |
| Loan Assignments — 6.5% | |
| | | | Consumer Discretionary — 1.7% | |
| | | | Automobiles — 0.1% | |
| | 4,466 | | | Chrysler Group LLC, Term Loan B, VAR, 3.500%, 05/24/17 | | | 4,472 | |
| | 6,351 | | | Chrysler Group LLC, Tranche B Term Loan, VAR, 3.250%, 12/31/18 | | | 6,356 | |
| | | | | | | | |
| | | | | | | 10,828 | |
| | | | | | | | |
| | | | Hotels, Restaurants & Leisure — 0.2% | |
| | 13,752 | | | Graton Economic Development Authority, Incremental Term B Loan, VAR, 4.750%, 09/01/22 | | | 13,778 | |
| | 7,942 | | | Intrawest Operations Group LLC, Initial Term Loan, VAR, 5.000%, 12/09/20 | | | 7,969 | |
| | 5,911 | | | Scientific Games International, Inc., Initial Term Loan, VAR, 6.000%, 10/18/20 | | | 5,911 | |
| | | | | | | | |
| | | | | | | 27,658 | |
| | | | | | | | |
| | | | Leisure Products — 0.3% | |
| | 14,900 | | | Delta 2 Sarl, 2nd Lien Facility, (Luxembourg), VAR, 7.750%, 07/29/22 | | | 14,745 | |
| | 17,670 | | | Delta 2 Sarl, USD Facility B-3, VAR, 4.750%, 07/30/21 ^ | | | 17,568 | |
| | 8,342 | | | FGI Operating Co. LLC, Term B Loan, VAR, 5.500%, 04/19/19 | | | 7,591 | |
| | | | | | | | |
| | | | | | | 39,904 | |
| | | | | | | | |
| | | | Media — 0.9% | |
| | 16,975 | | | CSC Holdings LLC, Initial Term Loan, VAR, 5.000%, 10/09/22 | | | 17,106 | |
| | 2,797 | | | Entravision Communications Corp., Tranche B Term Loan, VAR, 3.500%, 05/31/20 | | | 2,788 | |
| | 8,285 | | | Gray Television, Inc., Initial Term Loan, VAR, 3.938%, 06/13/21 | | | 8,316 | |
| | 37,355 | | | iHeartCommunications, Inc., Term Loan D, VAR, 7.274%, 01/30/19 | | | 28,632 | |
| | 20,104 | | | iHeartCommunications, Inc., Tranche E Term Loan, VAR, 8.024%, 07/30/19 | | | 15,363 | |
| | 11,594 | | | Media General, Inc., Term B Loan, VAR, 4.000%, 07/31/20 | | | 11,594 | |
| | 3,149 | | | MTL Publishing LLC, Term B-3 Loan, VAR, 4.000%, 08/19/22 | | | 3,149 | |
| | 5,955 | | | Tribune Media Co., Term Loan B, VAR, 3.750%, 12/27/20 | | | 5,966 | |
| | 6,519 | | | Univision Communications, Inc., 2013 Incremental Term Loan, VAR, 4.000%, 03/01/20 | | | 6,513 | |
| | 11,059 | | | Univision Communications, Inc., Replacement 1st Lien Term Loan, VAR, 4.000%, 03/01/20 | | | 11,053 | |
| | | | | | | | |
| | | | | | | 110,480 | |
| | | | | | | | |
| | | | | | | | |
PRINCIPAL
AMOUNT($) | | | SECURITY DESCRIPTION | | VALUE($) | |
| | | | | | | | |
| | | | Specialty Retail — 0.2% | |
| | 10,683 | | | J. Crew Group, Inc., Initial Loan, VAR, 4.000%, 03/05/21 | | | 8,418 | |
| | 9,308 | | | Serta Simmons Holdings LLC, 1st Lien Senior Secured Term Loan, VAR, 4.250%, 10/01/19 | | | 9,336 | |
| | | | | | | | |
| | | | | | | 17,754 | |
| | | | | | | | |
| | | | Total Consumer Discretionary | | | 206,624 | |
| | | | | | | | |
| | | | Consumer Staples — 0.6% | |
| | | | Food & Staples Retailing — 0.4% | |
| | 32,995 | | | Albertson’s LLC, 2016-1 Term Loan B-5, VAR, 4.750%, 12/21/22 | | | 33,172 | |
| | 10,119 | | | SUPERVALU, Inc., Term Loan B, VAR, 5.500%, 03/21/19 | | | 10,122 | |
| | | | | | | | |
| | | | | | | 43,294 | |
| | | | | | | | |
| | | | Food Products — 0.1% | |
| | 3,815 | | | Dole Food Co., Inc., Tranche B Term Loan, VAR, 4.501%, 11/01/18 | | | 3,826 | |
| | 3,638 | | | Hearthside Group Holdings LLC, Term Loan, VAR, 4.500%, 06/02/21 | | | 3,638 | |
| | 2,782 | | | Pinnacle Foods Finance LLC, 1st Lien Term Loan G, VAR, 3.250%, 04/29/20 | | | 2,789 | |
| | 3,806 | | | Pinnacle Foods Finance LLC, Fourth Amendment Tranche I Term Loan, VAR, 3.270%, 01/13/23 | | | 3,826 | |
| | 2,918 | | | Pinnacle Foods Finance LLC, Tranche H Term Loan, VAR, 3.250%, 04/29/20 | | | 2,923 | |
| | | | | | | | |
| | | | | | | 17,002 | |
| | | | | | | | |
| | | | Personal Products — 0.1% | |
| | 8,238 | | | Revlon Consumer Products Corp., Term Loan B, VAR, 4.750%, 07/14/23 ^ | | | 8,226 | |
| | | | | | | | |
| | | | Total Consumer Staples | | | 68,522 | |
| | | | | | | | |
| | | | Energy — 1.0% | |
| | | | Energy Equipment & Services — 0.0% (g) | |
| | 3,300 | | | Floatel International Ltd., Initial Term Loan, (Bermuda), VAR, 6.000%, 06/27/20 | | | 2,062 | |
| | | | | | | | |
| | | | Oil, Gas & Consumable Fuels — 1.0% | |
| | 2,723 | | | Alon USA Partners LP, MLP Term Loans, VAR, 9.250%, 11/26/18 | | | 2,710 | |
| | 12,547 | | | California Resources, 1st Lien Second Out Term Loan, VAR, 11.500%, 08/05/21 ^ | | | 13,143 | |
| | 14,127 | | | Chesapeake Energy, First Lien Last Out Term Loan, VAR, 8.500%, 08/15/21 ^ | | | 14,568 | |
| | 5,865 | | | EP Energy LLC/Everest Acquisition LLC., 2nd Lien Term Loan, VAR, 9.750%, 06/30/21 ^ | | | 5,770 | |
SEE NOTES TO FINANCIAL STATEMENTS.
| | | | | | | | |
| | | |
| AUGUST 31, 2016 | | J.P. MORGAN INCOME FUNDS | | | | | 169 | |
JPMorgan High Yield Fund
SCHEDULE OF PORTFOLIO INVESTMENTS
AS OF AUGUST 31, 2016 (Unaudited) (continued)
(Amounts in thousands)
| | | | | | | | |
PRINCIPAL
AMOUNT($) | | | SECURITY DESCRIPTION | | VALUE($) | |
| Loan Assignments — continued | |
| | | | Oil, Gas & Consumable Fuels — continued | |
| | 9,160 | | | Fieldwood Energy LLC, 2nd Lien Closing Date Loan, VAR, 8.375%, 09/30/20 (d) | | | 3,298 | |
| | 56,740 | | | Gulf Finance LLC, 1st Lien Term Loan B, VAR, 6.250%, 07/27/23 ^ | | | 54,943 | |
| | 8,919 | | | MEG Energy Corp., Incremental Term Loan, (Canada), VAR, 3.750%, 03/31/20 | | | 8,185 | |
| | 6,365 | | | Peabody Energy Corp., Term Loan, VAR, 4.250%, 09/24/20 (d) | | | 4,378 | |
| | 5,657 | | | Sabine Oil & Gas Corp., Term Loan, VAR, 12.000%, 12/31/18 (d) ^ | | | 177 | |
| | 15,280 | | | Western Refining, Inc., 1st Lien Term Loan B, VAR, 5.500%, 06/23/23 | | | 14,860 | |
| | | | | | | | |
| | | | | | | 122,032 | |
| | | | | | | | |
| | | | Total Energy | | | 124,094 | |
| | | | | | | | |
| | | | Financials — 0.2% | |
| | | | Consumer Finance — 0.1% | |
| | 14,594 | | | Sears Roebuck Acceptance Corp., Term Loan, VAR, 5.500%, 06/30/18 | | | 14,138 | |
| | | | | | | | |
| | | | Diversified Financial Services — 0.1% | |
| | 10,979 | | | ROC Finance LLC, Funded Term B Loan, VAR, 5.000%, 06/20/19 | | | 10,712 | |
| | | | | | | | |
| | | | Total Financials | | | 24,850 | |
| | | | | | | | |
| | | | Health Care — 0.2% | |
| | | | Health Care Providers & Services — 0.1% | |
| | 5,777 | | | inVentiv Health, Inc., Term Loan B-4, VAR, 7.750%, 05/15/18 | | | 5,783 | |
| | | | | | | | |
| | | | Pharmaceuticals — 0.1% | |
| | 17,647 | | | Concordia Healthcare Corp., Initial Dollar Term Loan, (Canada), VAR, 5.250%, 10/21/21 | | | 16,684 | |
| | | | | | | | |
| | | | Total Health Care | | | 22,467 | |
| | | | | | | | |
| | | | Industrials — 0.4% | |
| | | | Air Freight & Logistics — 0.1% | |
| | 10,589 | | | XPO Logistics, Inc., Term loan, VAR, 4.250%, 10/31/21 ^ | | | 10,635 | |
| | | | | | | | |
| | | | Building Products — 0.1% | |
| | 11,529 | | | Stardust Finance, Senior Lien Term Loan, VAR, 6.500%, 03/14/22 ^ | | | 11,433 | |
| | | | | | | | |
| | | | Industrial Conglomerates — 0.0% (g) | |
| | 2,073 | | | Autoparts Holdings Ltd., Term Loan, VAR, 7.000%, 07/29/17 | | | 1,958 | |
| | | | | | | | |
| | | | Machinery — 0.1% | |
| | 14,099 | | | Onex Wizard Acquisition Co. II S.C.A., Initial Dollar Term Loan, (Luxembourg), VAR, 4.250%, 03/11/22 ^ | | | 14,113 | |
| | | | | | | | |
| | | | | | | | |
PRINCIPAL
AMOUNT($) | | | SECURITY DESCRIPTION | | VALUE($) | |
| | | | | | | | |
| | | | Marine — 0.1% | |
| | 2,590 | | | Drillships Ocean Ventures, Inc., Term Loan, VAR, 5.500%, 07/25/21 | | | 1,744 | |
| | 7,135 | | | Shelf Drilling Holdings Ltd., Term Loan, (Cayman Islands), VAR, 10.000%, 10/08/18 (d) | | | 3,995 | |
| | | | | | | | |
| | | | | | | 5,739 | |
| | | | | | | | |
| | | | Total Industrials | | | 43,878 | |
| | | | | | | | |
| | | | Information Technology — 0.7% | |
| | | | Communications Equipment — 0.1% | |
| | 18,496 | | | Avaya, Inc., Term Loan B-7, VAR, 6.250%, 05/29/20 | | | 13,803 | |
| | | | | | | | |
| | | | Internet Software & Services — 0.0% (g) | |
| | 3,020 | | | Solar Winds Holdings, Inc., 1st Lien Term loan, VAR, 5.500%, 02/03/23 | | | 3,030 | |
| | | | | | | | |
| | | | IT Services — 0.2% | |
| | 24,070 | | | First Data Corp., 2021 New Dollar Term Loan, VAR, 4.522%, 03/24/21 ^ | | | 24,181 | |
| | 4,436 | | | First Data Corp., 2022 New Dollar Term Loan, VAR, 4.272%, 07/08/22 | | | 4,448 | |
| | | | | | | | |
| | | | | | | 28,629 | |
| | | | | | | | |
| | | | Semiconductors & Semiconductor Equipment — 0.3% | |
| | 16,509 | | | Avago Technologies, Term A-2 Loan, (Singapore), VAR, 3.508%, 02/01/23 ^ | | | 16,651 | |
| | 14,286 | | | Microsemi Corp., Closing Date Term B Loan, VAR, 3.750%, 01/15/23 ^ | | | 14,374 | |
| | 2,701 | | | NXP B.V./NXP Funding LLC, Term B Loan, (Netherlands), VAR, 3.750%, 12/07/20 | | | 2,715 | |
| | 6,252 | | | On Semiconductor Corp., Term Loan B, VAR, 5.250%, 03/31/23 | | | 6,329 | |
| | | | | | | | |
| | | | | | | 40,069 | |
| | | | | | | | |
| | | | Software — 0.1% | |
| | 6,000 | | | Infor U.S., Inc., Tranche B-5 Term Loan, VAR, 3.750%, 06/03/20 | | | 5,931 | |
| | | | | | | | |
| | | | Total Information Technology | | | 91,462 | |
| | | | | | | | |
| | | | Materials — 0.4% | |
| | | | Containers & Packaging — 0.3% | |
| | 939 | | | Ardagh Holdings USA, Inc., New Term Loan, VAR, 4.000%, 12/17/19 | | | 943 | |
| | 4,962 | | | Berry Plastics Corp., Term Loan D, VAR, 3.500%, 02/08/20 | | | 4,951 | |
| | 6,285 | | | Berry Plastics Corp., Term Loan G, VAR, 3.500%, 01/06/21 | | | 6,270 | |
| | 7,962 | | | Berry Plastics Corp., Term Loan H, VAR, 3.750%, 10/01/22 | | | 7,957 | |
SEE NOTES TO FINANCIAL STATEMENTS.
| | | | | | |
| | | |
| 170 | | | | J.P. MORGAN INCOME FUNDS | | AUGUST 31, 2016 |
| | | | | | | | |
PRINCIPAL
AMOUNT($) | | | SECURITY DESCRIPTION | | VALUE($) | |
| Loan Assignments — continued | |
| | | | Containers & Packaging — continued | |
| | 2,543 | | | NVLX Acquisition LLC, 1st Lien Term Loan, VAR, 6.000%, 12/05/21 | | | 2,555 | |
| | 6,385 | | | Viskase Companies, Inc., Initial Term Loan, VAR, 4.250%, 01/30/21 ^ | | | 5,922 | |
| | | | | | | | |
| | | | | | | 28,598 | |
| | | | | | | | |
| | | | Metals & Mining — 0.1% | |
| | 1,124 | | | Atkore International, Inc., 1st Lien Initial Term Loan, VAR, 4.500%, 04/09/21 | | | 1,123 | |
| | 2,085 | | | Atkore International, Inc., 2nd Lien Initial Term Loan, VAR, 7.750%, 10/09/21 | | | 2,083 | |
| | 12,056 | | | FMG Resources Pty, Ltd., Term Loan B, VAR, 3.750%, 06/30/19 ^ | | | 11,984 | |
| | | | | | | | |
| | | | | | | 15,190 | |
| | | | | | | | |
| | | | Total Materials | | | 43,788 | |
| | | | | | | | |
| | | | Telecommunication Services — 0.4% | |
| | | | Diversified Telecommunication Services — 0.4% | |
| | 6,088 | | | Cincinnati Bell, Inc., Term Loan, VAR, 4.000%, 09/10/20 ^ | | | 6,088 | |
| | 20,233 | | | UPC Financing Partnership, Senior Secured Term Loan AN, VAR, 4.080%, 08/31/24 | | | 20,160 | |
| | 10,835 | | | Virgin Media Investments Holdings Ltd., F Facility, (United Kingdom), VAR, 3.649%, 06/30/23 ^ | | | 10,834 | |
| | 9,522 | | | Windstream, Term Loan B-6, VAR, 5.750%, 03/29/21 | | | 9,578 | |
| | | | | | | | |
| | | | | | | 46,660 | |
| | | | | | | | |
| | | | Wireless Telecommunication Services — 0.0% (g) | |
| | 3,993 | | | Syniverse Holdings, Inc., Initial Term Loan, VAR, 4.000%, 04/23/19 | | | 3,542 | |
| | 3,411 | | | Syniverse Holdings, Inc., Tranche B Term Loan, VAR, 4.000%, 04/23/19 | | | 3,030 | |
| | | | | | | | |
| | | | | | | 6,572 | |
| | | | | | | | |
| | | | Total Telecommunication Services | | | 53,232 | |
| | | | | | | | |
| | | | Utilities — 0.9% | |
| | | | Electric Utilities — 0.7% | |
| | 5,974 | | | Texas Competitive Electric Holdings Co. LLC, 1st Lien Term Loan C, VAR, 5.000%, 10/31/17 ^ | | | 5,987 | |
| | 83,215 | | | Texas Competitive Electric Holdings Co. LLC, Extended Term Loan, VAR, 4.970%, 10/10/17 (d) | | | 26,629 | |
| | 70,354 | | | Texas Competitive Electric Holdings Co. LLC, Non-Extended Term Loan, VAR, 4.970%, 10/10/17 (d) | | | 22,144 | |
| | | | | | | | |
PRINCIPAL
AMOUNT($) | | | SECURITY DESCRIPTION | | VALUE($) | |
| | | | | | | | |
| | | | Electric Utilities — continued | |
| | 27,971 | | | Texas Competitive Electric Holdings Co. LLC, Term Loan B, VAR, 5.000%, 10/31/17 ^ | | | 28,034 | |
| | | | | | | | |
| | | | | | | 82,794 | |
| | | | | | | | |
| | | | Independent Power & Renewable Electricity
Producers — 0.2% | |
| | 5,373 | | | Calpine Corp., Term Loan, VAR, 4.000%, 01/15/23 | | | 5,399 | |
| | 21,365 | | | Dynegy, Inc., 1st Lien Term Loan C, VAR, 5.000%, 06/27/23 | | | 21,368 | |
| | | | | | | | |
| | | | | | | 26,767 | |
| | | | | | | | |
| | | | Total Utilities | | | 109,561 | |
| | | | | | | | |
| | | | Total Loan Assignments
(Cost $899,130) | | | 788,478 | |
| | | | | | | | |
| | |
NUMBER OF
WARRANTS | | | | | | |
| Warrants — 0.0% (g) | |
| | | | Consumer Discretionary — 0.0% (g) | |
| | | | Specialty Retail — 0.0% (g) | |
| | 112 | | | Nebraska Book Co., Inc., expiring 06/29/19 (Strike Price $1.00) (a) | | | — | (h) |
| | 52 | | | Nebraska Book Holdings, Inc., expiring 06/29/19 (Strike Price $1.00) (a) | | | — | (h) |
| | | | | | | | |
| | | | Total Consumer Discretionary | | | — | (h) |
| | | | | | | | |
| | | | Energy — 0.0% (g) | |
| | | | Oil, Gas & Consumable Fuels — 0.0% (g) | |
| | 23 | | | Gener8 Maritime, Inc., expiring 05/17/17 (Strike Price $1.00) (a) | | | — | (h) |
| | | | | | | | |
| | | | Total Warrants
(Cost $2) | | | — | (h) |
| | | | | | | | |
| | |
PRINCIPAL
AMOUNT($) | | | | | | |
| Short-Term Investments — 5.2% | |
| | | | U.S. Treasury Obligations— 0.1% | |
| | | | U.S. Treasury Bills, | |
| | 7,560 | | | 0.322, 01/05/17 (k) (n) | | | 7,550 | |
| | 2,755 | | | 0.326, 10/06/16 (k) (n) | | | 2,754 | |
| | | | | | | | |
| | | | Total U.S. Treasury Obligations
(Cost $10,305) | | | 10,304 | |
| | | | | | | | |
SEE NOTES TO FINANCIAL STATEMENTS.
| | | | | | | | |
| | | |
| AUGUST 31, 2016 | | J.P. MORGAN INCOME FUNDS | | | | | 171 | |
JPMorgan High Yield Fund
SCHEDULE OF PORTFOLIO INVESTMENTS
AS OF AUGUST 31, 2016 (Unaudited) (continued)
(Amounts in thousands)
| | | | | | | | |
| SHARES | | | SECURITY DESCRIPTION | | VALUE($) | |
| | | | | | | | |
| | | | Investment Company — 5.1% | |
| | 616,479 | | | JPMorgan U.S. Government Money Market Fund, Institutional Class Shares, 0.310% (b) (l) | | | 616,479 | |
| | | | | | | | |
| | | | Total Short-Term Investments
(Cost $626,784) | | | 626,783 | |
| | | | | | | | |
| | | | Total Investments — 99.7%
(Cost $12,071,594) | | | 12,067,317 | |
| | | | Other Assets in Excess
of Liabilities — 0.3% | | | 30,431 | |
| | | | | | | | |
| | | | NET ASSETS — 100.0% | | $ | 12,097,748 | |
| | | | | | | | |
Percentages indicated are based on net assets.
Centrally Cleared Credit Default Swaps — Sell Protection [1]
Credit Indices:
| | | | | | | | | | | | | | | | | | | | | | |
| REFERENCE OBLIGATION | | FUND RECEIVES
FIXED RATE (r) | | TERMINATION
DATE | | | IMPLIED CREDIT
SPREAD
AS OF
AUGUST 31, 2016 [2] | | | NOTIONAL
AMOUNT [3] | | | VALUE | | | UPFRONT
PREMIUMS (PAID)/
RECEIVED [4] | |
CDX.NA.HY.26-V1 | | 5.000% quarterly | | | 06/20/21 | | | | 3.927 | % | | | 200,000 | | | | 10,927 | | | | (9,374 | ) |
| | | | | | | | | | | | | | | | | | | | | | |
| [1] | The Fund, as a seller of credit protection, receives periodic payments and may also receive or pay an upfront premium from or to the protection buyer, and is obligated to make a contingent payment, upon occurrence of a credit event with respect to an underlying reference obligation, as defined under the terms of individual swap contracts. |
| [2] | Implied credit spreads are an indication of the seller’s performance risk, related to the likelihood of a credit event occurring that would require a seller to make payment to a buyer. Implied credit spreads are used to determine the value of swap contracts and reflect the cost of buying/selling protection, which may include upfront payments made to enter into the contract. Therefore, higher spreads would indicate a greater likelihood that a seller will be obligated to perform (i.e., make payment) under the swap contract. Increasing values, in absolute terms and relative to notional amounts, are also indicative of greater performance risk. Implied credit spreads for credit default swaps on credit indices are linked to the weighted average spread across the underlying reference obligations included in a particular index. |
| [3] | The notional amount is the maximum amount that a seller of credit protection would be obligated to pay and a buyer of credit protection would receive, upon occurrence of a credit event. |
| [4] | Upfront premiums generally relate to payments made or received at the initiation of the agreement to compensate the differences between the stated terms of the swap agreement and current market conditions (credit spreads, interest rates and other relevant factors). |
SEE NOTES TO FINANCIAL STATEMENTS.
| | | | | | |
| | | |
| 172 | | | | J.P. MORGAN INCOME FUNDS | | AUGUST 31, 2016 |
JPMorgan Inflation Managed Bond Fund
SCHEDULE OF PORTFOLIO INVESTMENTS
AS OF AUGUST 31, 2016 (Unaudited)
(Amounts in thousands)
| | | | | | | | |
PRINCIPAL
AMOUNT($) | | | SECURITY DESCRIPTION | | VALUE($) | |
| Asset-Backed Securities — 6.4% | |
| | | | Ally Auto Receivables Trust, | | | | |
| | 87 | | | Series 2013-2, Class A3, 0.790%, 01/15/18 | | | 87 | |
| | 476 | | | Series 2015-1, Class A3, 1.390%, 09/16/19 | | | 477 | |
| | 305 | | | Series 2015-SN1, Class A3, 1.210%, 12/20/17 | | | 305 | |
| | 509 | | | Series 2016-1, Class A3, 1.470%, 04/15/20 | | | 511 | |
| | 800 | | | Series 2016-2, Class A3, 1.350%, 05/15/20 | | | 800 | |
| | | | American Express Credit Account Master Trust, | | | | |
| | 1,847 | | | Series 2014-2, Class A, 1.260%, 01/15/20 | | | 1,850 | |
| | 619 | | | Series 2014-3, Class A, 1.490%, 04/15/20 | | | 622 | |
| | | | AmeriCredit Automobile Receivables Trust, | | | | |
| | 71 | | | Series 2013-5, Class A3, 0.900%, 09/10/18 | | | 71 | |
| | 206 | | | Series 2015-4, Class A3, 1.700%, 07/08/20 | | | 207 | |
| | 428 | | | Series 2016-2, Class A3, 1.600%, 11/09/20 | | | 428 | |
| | 617 | | | B2R Mortgage Trust, Series 2015-1, Class A1, 2.524%, 05/15/48 (e) | | | 616 | |
| | 1,500 | | | BMW Vehicle Lease Trust, Series 2015-2, Class A3, 1.400%, 09/20/18 | | | 1,502 | |
| | | | BMW Vehicle Owner Trust, | | | | |
| | 80 | | | Series 2013-A, Class A3, 0.670%, 11/27/17 | | | 80 | |
| | 425 | | | Series 2014-A, Class A3, 0.970%, 11/26/18 | | | 425 | |
| | 463 | | | Cabela’s Credit Card Master Note Trust, Series 2015-2, Class A1, 2.250%, 07/17/23 | | | 467 | |
| | | | Capital Auto Receivables Asset Trust, | | | | |
| | 1,600 | | | Series 2015-1, Class A3, 1.610%, 06/20/19 | | | 1,605 | |
| | 617 | | | Series 2015-2, Class A3, 1.730%, 09/20/19 | | | 618 | |
| | 335 | | | CarFinance Capital Auto Trust, Series 2015-1A, Class A, 1.750%, 06/15/21 (e) | | | 333 | |
| | | | CarMax Auto Owner Trust, | | | | |
| | 214 | | | Series 2013-4, Class A3, 0.800%, 07/16/18 | | | 214 | |
| | 1,314 | | | Series 2014-2, Class A3, 0.980%, 01/15/19 | | | 1,313 | |
| | 527 | | | Series 2015-2, Class A3, 1.370%, 03/16/20 | | | 528 | |
| | 337 | | | Series 2016-1, Class A3, 1.610%, 11/16/20 | | | 339 | |
| | 711 | | | Series 2016-2, Class A3, 1.520%, 02/16/21 | | | 713 | |
| | 883 | | | Chrysler Capital Auto Receivables Trust, Series 2016-AA, Class A3, 1.770%, 10/15/20 (e) | | | 885 | |
| | 483 | | | Citi Held For Asset Issuance, Series 2015-PM1, Class A, 1.850%, 12/15/21 (e) | | | 482 | |
| | 3,200 | | | Citibank Credit Card Issuance Trust, Series 2014-A8, Class A8, 1.730%, 04/09/20 | | | 3,233 | |
| | | | CNH Equipment Trust, | | | | |
| | 81 | | | Series 2013-C, Class A3, 1.020%, 08/15/18 | | | 81 | |
| | 666 | | | Series 2013-D, Class A3, 0.770%, 10/15/18 | | | 666 | |
| | 756 | | | Series 2014-A, Class A3, 0.840%, 05/15/19 | | | 755 | |
| | 1,064 | | | Series 2014-B, Class A3, 0.910%, 05/15/19 | | | 1,063 | |
| | | | | | | | |
PRINCIPAL
AMOUNT($) | | | SECURITY DESCRIPTION | | VALUE($) | |
| | | | | | | | |
| | 136 | | | Consumer Credit Origination Loan Trust, Series 2015-1, Class A, 2.820%, 03/15/21 (e) | | | 136 | |
| | | | CPS Auto Receivables Trust, | | | | |
| | 74 | | | Series 2013-D, Class A, 1.540%, 07/16/18 (e) | | | 74 | |
| | 225 | | | Series 2014-B, Class A, 1.110%, 11/15/18 (e) | | | 224 | |
| | 468 | | | Series 2014-C, Class A, 1.310%, 02/15/19 (e) | | | 468 | |
| | 585 | | | Series 2014-D, Class A, 1.490%, 04/15/19 (e) | | | 585 | |
| | 1,098 | | | Series 2015-B, Class A, 1.650%, 11/15/19 (e) | | | 1,095 | |
| | 460 | | | Series 2016-B, Class A, 2.070%, 11/15/19 (e) | | | 461 | |
| | 1,857 | | | Credit Acceptance Auto Loan Trust, Series 2014-2A, Class A, 1.880%, 03/15/22 (e) | | | 1,857 | |
| | 26 | | | Credit Suisse First Boston Mortgage Securities Corp., Series 2004-CF2, Class 1A2, SUB, 5.150%, 01/25/43 (e) | | | 26 | |
| | 1,500 | | | Discover Card Execution Note Trust, Series 2015-A3, Class A, 1.450%, 03/15/21 | | | 1,506 | |
| | | | DT Auto Owner Trust, | | | | |
| | 333 | | | Series 2015-2A, Class A, 1.240%, 09/17/18 (e) | | | 333 | |
| | 826 | | | Series 2016-2A, Class A, 1.730%, 08/15/19 (e) | | | 825 | |
| | | | Exeter Automobile Receivables Trust, | | | | |
| | 4 | | | Series 2014-2A, Class A, 1.060%, 08/15/18 (e) | | | 3 | |
| | 247 | | | Series 2015-1A, Class A, 1.600%, 06/17/19 (e) | | | 247 | |
| | 834 | | | Series 2015-3A, Class A, 2.000%, 03/16/20 (e) | | | 834 | |
| | | | Fifth Third Auto Trust, | | | | |
| | 10 | | | Series 2013-A, Class A3, 0.610%, 09/15/17 | | | 10 | |
| | 318 | | | Series 2015-1, Class A3, 1.420%, 03/16/20 | | | 319 | |
| | 1,295 | | | FirstKey Lending Trust, Series 2015-SFR1, Class A, 2.553%, 03/09/47 (e) | | | 1,291 | |
| | | | Flagship Credit Auto Trust, | | | | |
| | 535 | | | Series 2014-2, Class A, 1.430%, 12/16/19 (e) | | | 533 | |
| | 501 | | | Series 2015-1, Class A, 1.630%, 06/15/20 (e) | | | 500 | |
| | 749 | | | Series 2016-2, Class A1, 2.280%, 05/15/20 (e) | | | 749 | |
SEE NOTES TO FINANCIAL STATEMENTS.
| | | | | | | | |
| | | |
| AUGUST 31, 2016 | | J.P. MORGAN INCOME FUNDS | | | | | 173 | |
JPMorgan Inflation Managed Bond Fund
SCHEDULE OF PORTFOLIO INVESTMENTS
AS OF AUGUST 31, 2016 (Unaudited) (continued)
(Amounts in thousands)
| | | | | | | | |
PRINCIPAL
AMOUNT($) | | | SECURITY DESCRIPTION | | VALUE($) | |
| Asset-Backed Securities — continued | |
| | 127 | | | Ford Credit Auto Lease Trust, Series 2014-B, Class A3, 0.890%, 09/15/17 | | | 127 | |
| | | | Ford Credit Auto Owner Trust, | | | | |
| | 22 | | | Series 2013-C, Class A3, 0.820%, 12/15/17 | | | 22 | |
| | 180 | | | Series 2013-D, Class A3, 0.670%, 04/15/18 | | | 180 | |
| | 735 | | | Series 2014-B, Class A3, 0.900%, 10/15/18 | | | 735 | |
| | 930 | | | Series 2014-C, Class A3, 1.060%, 05/15/19 | | | 930 | |
| | 668 | | | Series 2015-A, Class A3, 1.280%, 09/15/19 | | | 669 | |
| | 658 | | | Series 2015-B, Class A3, 1.160%, 11/15/19 | | | 658 | |
| | 585 | | | Series 2015-C, Class A3, 1.410%, 02/15/20 | | | 586 | |
| | 373 | | | Series 2016-B, Class A3, 1.330%, 10/15/20 | | | 374 | |
| | 1,478 | | | GCAT, Series 2015-2, Class A1, SUB, 3.750%, 07/25/20 (e) | | | 1,470 | |
| | 441 | | | GLC Trust, Series 2014-A, Class A, 3.000%, 07/15/21 (e) | | | 438 | |
| | | | GLS Auto Receivables Trust, | | | | |
| | 897 | | | Series 2015-1A, Class A, 2.250%, 12/15/20 (e) | | | 895 | |
| | 1,041 | | | Series 2016-1A, Class A, 2.730%, 10/15/20 (e) | | | 1,046 | |
| | | | GM Financial Automobile Leasing Trust, | | | | |
| | 963 | | | Series 2015-1, Class A3, 1.530%, 09/20/18 | | | 967 | |
| | 974 | | | Series 2015-3, Class A3, 1.690%, 03/20/19 | | | 979 | |
| | 248 | | | Series 2016-2, Class A3, 1.620%, 09/20/19 | | | 249 | |
| | 681 | | | GMAT Trust, Series 2013-1A, Class A, SUB, 3.967%, 11/25/43 (e) | | | 681 | |
| | | | Harley-Davidson Motorcycle Trust, | | | | |
| | 1,498 | | | Series 2015-1, Class A3, 1.410%, 06/15/20 | | | 1,501 | |
| | 716 | | | Series 2015-2, Class A3, 1.300%, 03/16/20 | | | 717 | |
| | | | Honda Auto Receivables Owner Trust, | | | | |
| | 163 | | | Series 2013-4, Class A3, 0.690%, 09/18/17 | | | 163 | |
| | 738 | | | Series 2014-1, Class A3, 0.670%, 11/21/17 | | | 737 | |
| | 806 | | �� | Series 2015-1, Class A3, 1.050%, 10/15/18 | | | 806 | |
| | 389 | | | Series 2016-1, Class A3, 1.220%, 12/18/19 | | | 389 | |
| | 392 | | | Series 2016-3, Class A3, 1.160%, 05/18/20 | | | 391 | |
| | | | Hyundai Auto Receivables Trust, | | | | |
| | 339 | | | Series 2014-A, Class A3, 0.790%, 07/16/18 | | | 338 | |
| | 988 | | | Series 2014-B, Class A3, 0.900%, 12/17/18 | | | 988 | |
| | 718 | | | Series 2015-A, Class A3, 1.050%, 04/15/19 | | | 718 | |
| | 343 | | | Series 2015-C, Class A3, 1.460%, 02/18/20 | | | 344 | |
| | | | John Deere Owner Trust, | | | | |
| | 1,129 | | | Series 2014-B, Class A3, 1.070%, 11/15/18 | | | 1,128 | |
| | 384 | | | Series 2015-B, Class A3, 1.440%, 10/15/19 | | | 385 | |
| | 1,199 | | | Lendmark Funding Trust, Series 2016-A, Class A, 4.820%, 08/21/23 (e) | | | 1,189 | |
| | 317 | | | Nationstar HECM Loan Trust, Series 2016-3A, Class A, 2.013%, 08/25/26 (e) | | | 317 | |
| | | | | | | | |
PRINCIPAL
AMOUNT($) | | | SECURITY DESCRIPTION | | VALUE($) | |
| | | | | | | | |
| | 1,000 | | | Nissan Auto Lease Trust, Series 2015-A, Class A3, 1.400%, 06/15/18 | | | 1,001 | |
| | | | Nissan Auto Receivables Owner Trust, | | | | |
| | 341 | | | Series 2013-C, Class A3, 0.670%, 08/15/18 | | | 340 | |
| | 506 | | | Series 2014-A, Class A3, 0.720%, 08/15/18 | | | 505 | |
| | 489 | | | Series 2014-B, Class A3, 1.110%, 05/15/19 | | | 489 | |
| | 823 | | | Series 2015-C, Class A3, 1.370%, 05/15/20 | | | 826 | |
| | 305 | | | Series 2016-B, Class A3, 1.320%, 01/15/21 | | | 306 | |
| | 956 | | | Oak Hill Advisors Residential Loan Trust, Series 2015-NPL2, Class A1, SUB, 3.721%, 07/25/55 (e) | | | 947 | |
| | | | OneMain Financial Issuance Trust, | | | | |
| | 773 | | | Series 2014-1A, Class A, 2.430%, 06/18/24 (e) | | | 774 | |
| | 1,490 | | | Series 2014-2A, Class A, 2.470%, 09/18/24 (e) | | | 1,492 | |
| | 1,295 | | | Series 2015-1A, Class A, 3.190%, 03/18/26 (e) | | | 1,309 | |
| | 1,750 | | | Series 2015-2A, Class A, 2.570%, 07/18/25 (e) | | | 1,752 | |
| | 102 | | | PFS Tax Lien Trust, Series 2014-1, 1.440%, 05/15/29 (e) | | | 102 | |
| | 1,642 | | | Pretium Mortgage Credit Partners I LLC, Series 2015-NPL2, Class A1, SUB, 3.750%, 07/27/30 (e) | | | 1,642 | |
| | 1,472 | | | Progreso Receivables Funding III LLC, Series 2015-A, Class A, 3.625%, 02/08/20 (e) | | | 1,472 | |
| | 1,100 | | | Purchasing Power Funding LLC, Series 2015-A, Class A2, 4.750%, 12/15/19 (e) | | | 1,102 | |
| | 213 | | | RAMP Trust, Series 2006-RZ1, Class A3, VAR, 0.824%, 03/25/36 | | | 211 | |
| | 191 | | | Saxon Asset Securities Trust, Series 2003-1, Class AF6, SUB, 4.795%, 06/25/33 | | | 193 | |
| | 612 | | | SoFi Consumer Loan Program, Series 2016-2A, Class A, 3.090%, 10/27/25 (e) | | | 617 | |
| | 1,444 | | | Springleaf Funding Trust, Series 2014-AA, Class A, 2.410%, 12/15/22 (e) | | | 1,445 | |
| | | | Toyota Auto Receivables Owner Trust, | | | | |
| | 679 | | | Series 2014-A, Class A3, 0.670%, 12/15/17 | | | 678 | |
| | 429 | | | Series 2014-C, Class A3, 0.930%, 07/16/18 | | | 429 | |
| | 600 | | | Series 2016-A, Class A3, 1.250%, 03/16/20 | | | 601 | |
| | 348 | | | Series 2016-B, Class A3, 1.300%, 04/15/20 | | | 348 | |
| | 877 | | | Trafigura Securitisation Finance plc, (Ireland), Series 2014-1A, Class A, VAR, 1.458%, 10/15/18 (e) | | | 864 | |
| | 73 | | | USAA Auto Owner Trust, Series 2014-1, Class A3, 0.580%, 12/15/17 | | | 73 | |
SEE NOTES TO FINANCIAL STATEMENTS.
| | | | | | |
| | | |
| 174 | | | | J.P. MORGAN INCOME FUNDS | | AUGUST 31, 2016 |
| | | | | | | | |
PRINCIPAL
AMOUNT($) | | | SECURITY DESCRIPTION | | VALUE($) | |
| Asset-Backed Securities — continued | |
| | 760 | | | Volkswagen Auto Lease Trust, Series 2015-A, Class A3, 1.250%, 12/20/17 | | | 759 | |
| | 541 | | | Volkswagen Auto Loan Enhanced Trust, Series 2013-2, Class A3, 0.700%, 04/20/18 | | | 540 | |
| | 207 | | | VOLT NPL X LLC, Series 2014-NPL8, Class A1, SUB, 3.375%, 10/26/54 (e) | | | 207 | |
| | 1,122 | | | VOLT XL LLC, Series 2015-NP14, Class A1, SUB, 4.375%, 11/27/45 (e) | | | 1,134 | |
| | 398 | | | VOLT XLVII LLC, Series 2016-NPL7, Class A1, SUB, 3.750%, 06/25/46 (e) | | | 399 | |
| | 449 | | | VOLT XXII LLC, Series 2015-NPL4, Class A1, SUB, 3.500%, 02/25/55 (e) | | | 450 | |
| | 858 | | | VOLT XXIV LLC, Series 2015-NPL6, Class A1, SUB, 3.500%, 02/25/55 (e) | | | 858 | |
| | 1,484 | | | VOLT XXV LLC, Series 2015-NPL8, Class A1, SUB, 3.500%, 06/26/45 (e) | | | 1,483 | |
| | 877 | | | VOLT XXVI LLC, Series 2014-NPL6, Class A1, SUB, 3.125%, 09/25/43 (e) | | | 874 | |
| | 911 | | | VOLT XXVII LLC, Series 2014-NPL7, Class A1, SUB, 3.375%, 08/27/57 (e) | | | 909 | |
| | 772 | | | VOLT XXX LLC, Series 2015-NPL1, Class A1, SUB, 3.625%, 10/25/57 (e) | | | 772 | |
| | 642 | | | VOLT XXXI LLC, Series 2015-NPL2, Class A1, SUB, 3.375%, 02/25/55 (e) | | | 641 | |
| | 1,309 | | | VOLT XXXIII LLC, Series 2015-NPL5, Class A1, SUB, 3.500%, 03/25/55 (e) | | | 1,309 | |
| | 1,061 | | | VOLT XXXV LLC, Series 2015-NPL9, Class A1, SUB, 3.500%, 06/26/45 (e) | | | 1,061 | |
| | 203 | | | Westgate Resorts LLC, Series 2015-1A, Class A, 2.750%, 05/20/27 (e) | | | 202 | |
| | 1,846 | | | Westlake Automobile Receivables Trust, Series 2016-1A, Class A2A, 1.820%, 01/15/19 (e) | | | 1,847 | |
| | | | World Omni Auto Receivables Trust, | | | | |
| | 437 | | | Series 2015-A, Class A3, 1.340%, 05/15/20 | | | 438 | |
| | 1,286 | | | Series 2015-B, Class A3, 1.490%, 12/15/20 | | | 1,291 | |
| | | | World Omni Automobile Lease Securitization Trust, | | | | |
| | 802 | | | Series 2014-A, Class A3, 1.160%, 09/15/17 | | | 802 | |
| | 1,093 | | | Series 2015-A, Class A3, 1.540%, 10/15/18 | | | 1,095 | |
| | | | | | | | |
| | | | Total Asset-Backed Securities
(Cost $90,952) | | | 91,058 | |
| | | | | | | | |
| Collateralized Mortgage Obligations — 17.4% | |
| | | | Agency CMO — 16.9% | | | | |
| | | | Federal Home Loan Mortgage Corp. REMIC, | | | | |
| | 29 | | | Series 1578, Class K, 6.900%, 09/15/23 | | | 32 | |
| | 239 | | | Series 2110, Class PG, 6.000%, 01/15/29 | | | 275 | |
| | — | (h) | | Series 2355, Class BP, 6.000%, 09/15/16 | | | — | (h) |
| | 1 | | | Series 2391, Class QR, 5.500%, 12/15/16 | | | 1 | |
| | | | | | | | |
PRINCIPAL
AMOUNT($) | | | SECURITY DESCRIPTION | | VALUE($) | |
| | | | | | | | |
| | | | Agency CMO — continued | | | | |
| | 2 | | | Series 2427, Class LW, 6.000%, 03/15/17 | | | 2 | |
| | 39 | | | Series 2436, Class MC, 7.000%, 04/15/32 | | | 44 | |
| | 46 | | | Series 2441, Class GF, 6.500%, 04/15/32 | | | 54 | |
| | 281 | | | Series 2505, Class D, 5.500%, 09/15/32 | | | 311 | |
| | 872 | | | Series 2525, Class AM, 4.500%, 04/15/32 | | | 968 | |
| | 139 | | | Series 2544, Class KE, 5.500%, 12/15/32 | | | 157 | |
| | 342 | | | Series 2557, Class HL, 5.300%, 01/15/33 | | | 381 | |
| | 8 | | | Series 2558, Class BD, 5.000%, 01/15/18 | | | 8 | |
| | 40 | | | Series 2564, Class NK, 5.000%, 02/15/18 | | | 41 | |
| | 107 | | | Series 2575, Class PE, 5.500%, 02/15/33 | | | 122 | |
| | 436 | | | Series 2586, Class WG, 4.000%, 03/15/33 | | | 470 | |
| | 5 | | | Series 2594, Class JB, 4.500%, 04/15/18 | | | 5 | |
| | 19 | | | Series 2595, Class HJ, 5.000%, 03/15/23 | | | 20 | |
| | 371 | | | Series 2596, Class QD, 4.000%, 03/15/33 | | | 399 | |
| | 141 | | | Series 2611, Class KH, 5.000%, 05/15/18 | | | 144 | |
| | 435 | | | Series 2621, Class QH, 5.000%, 05/15/33 | | | 481 | |
| | 561 | | | Series 2624, Class QH, 5.000%, 06/15/33 | | | 624 | |
| | 1,456 | | | Series 2626, Class JC, 5.000%, 06/15/23 | | | 1,562 | |
| | 739 | | | Series 2632, Class AB, 4.500%, 06/15/18 | | | 756 | |
| | 21 | | | Series 2648, Class BK, 5.000%, 07/15/33 | | | 22 | |
| | 42 | | | Series 2649, Class PJ, 3.500%, 06/15/33 | | | 44 | |
| | 17 | | | Series 2649, Class QH, 4.500%, 07/15/18 | | | 17 | |
| | 227 | | | Series 2649, Class WB, 3.500%, 07/15/23 | | | 238 | |
| | 893 | | | Series 2673, Class PE, 5.500%, 09/15/33 | | | 1,002 | |
| | 1,090 | | | Series 2685, Class DT, 5.000%, 10/15/23 | | | 1,192 | |
| | 251 | | | Series 2687, Class JH, 5.000%, 10/15/23 | | | 271 | |
| | 680 | | | Series 2696, Class DG, 5.500%, 10/15/33 | | | 765 | |
| | 101 | | | Series 2699, Class TC, 4.000%, 11/15/18 | | | 103 | |
| | 1,614 | | | Series 2701, Class AC, 5.000%, 11/15/23 | | | 1,747 | |
| | 284 | | | Series 2725, Class TA, 4.500%, 12/15/33 | | | 338 | |
| | 792 | | | Series 2733, Class ME, 5.000%, 01/15/34 | | | 883 | |
| | 29 | | | Series 2744, Class TU, 5.500%, 05/15/32 | | | 29 | |
| | 3 | | | Series 2750, Class JB, 4.500%, 02/15/19 | | | 3 | |
| | 237 | | | Series 2752, Class JB, 4.500%, 02/15/19 | | | 244 | |
| | 160 | | | Series 2760, Class KT, 4.500%, 09/15/32 | | | 165 | |
| | 318 | | | Series 2764, Class UE, 5.000%, 10/15/32 | | | 327 | |
| | 278 | | | Series 2768, Class PK, 5.000%, 03/15/34 | | | 304 | |
| | 118 | | | Series 2773, Class OC, 5.000%, 04/15/19 | | | 122 | |
| | 292 | | | Series 2804, Class AM, 5.000%, 03/15/34 | | | 294 | |
| | 99 | | | Series 2828, Class JE, 4.500%, 07/15/19 | | | 102 | |
| | 20 | | | Series 2843, Class BC, 5.000%, 08/15/19 | | | 21 | |
| | 197 | | | Series 2864, Class NB, 5.500%, 07/15/33 | | | 204 | |
| | 183 | | | Series 2875, Class HB, 4.000%, 10/15/19 | | | 187 | |
| | 505 | | | Series 2899, Class HB, 4.000%, 12/15/19 | | | 518 | |
| | 109 | | | Series 2910, Class BE, 4.500%, 12/15/19 | | | 112 | |
SEE NOTES TO FINANCIAL STATEMENTS.
| | | | | | | | |
| | | |
| AUGUST 31, 2016 | | J.P. MORGAN INCOME FUNDS | | | | | 175 | |
JPMorgan Inflation Managed Bond Fund
SCHEDULE OF PORTFOLIO INVESTMENTS
AS OF AUGUST 31, 2016 (Unaudited) (continued)
(Amounts in thousands)
| | | | | | | | |
PRINCIPAL
AMOUNT($) | | | SECURITY DESCRIPTION | | VALUE($) | |
| Collateralized Mortgage Obligations — continued | |
| | | | Agency CMO — continued | | | | |
| | 149 | | | Series 2920, Class KT, 4.500%, 01/15/20 | | | 153 | |
| | 140 | | | Series 2929, Class KG, 4.500%, 02/15/20 | | | 144 | |
| | 594 | | | Series 2934, Class KG, 5.000%, 02/15/35 | | | 665 | |
| | 28 | | | Series 2950, Class JA, 4.500%, 03/15/20 | | | 28 | |
| | 1,688 | | | Series 2960, Class JH, 5.500%, 04/15/35 | | | 1,892 | |
| | 59 | | | Series 2968, Class MD, 5.500%, 12/15/33 | | | 60 | |
| | 137 | | | Series 2981, Class BC, 4.500%, 05/15/20 | | | 140 | |
| | 56 | | | Series 2988, Class TY, 5.500%, 06/15/25 | | | 62 | |
| | 1,367 | | | Series 2989, Class TG, 5.000%, 06/15/25 | | | 1,493 | |
| | 17 | | | Series 2993, Class PM, 4.500%, 05/15/35 | | | 18 | |
| | 22 | | | Series 3017, Class MK, 5.000%, 12/15/34 | | | 22 | |
| | 55 | | | Series 3028, Class ME, 5.000%, 02/15/34 | | | 56 | |
| | 54 | | | Series 3036, Class TE, 5.500%, 12/15/34 | | | 55 | |
| | 25 | | | Series 3057, Class PE, 5.500%, 11/15/34 | | | 25 | |
| | 42 | | | Series 3077, Class TO, PO, 04/15/35 | | | 39 | |
| | 118 | | | Series 3082, Class PW, 5.500%, 12/15/35 | | | 135 | |
| | 2,726 | | | Series 3084, Class BH, 5.500%, 12/15/35 | | | 3,085 | |
| | 151 | | | Series 3087, Class KX, 5.500%, 12/15/25 | | | 166 | |
| | 2,564 | | | Series 3098, Class KG, 5.500%, 01/15/36 | | | 2,867 | |
| | 2,144 | | | Series 3102, Class CE, 5.500%, 01/15/26 | | | 2,377 | |
| | 59 | | | Series 3121, Class JD, 5.500%, 03/15/26 | | | 65 | |
| | 203 | | | Series 3123, Class HT, 5.000%, 03/15/26 | | | 222 | |
| | 112 | | | Series 3136, Class CO, PO, 04/15/36 | | | 101 | |
| | 85 | | | Series 3145, Class AJ, 5.500%, 04/15/36 | | | 96 | |
| | 803 | | | Series 3150, Class EQ, 5.000%, 05/15/26 | | | 875 | |
| | 151 | | | Series 3200, Class PO, PO, 08/15/36 | | | 138 | |
| | 114 | | | Series 3219, Class PD, 6.000%, 11/15/35 | | | 115 | |
| | 101 | | | Series 3270, Class AT, 5.500%, 01/15/37 | | | 115 | |
| | 17 | | | Series 3272, Class PA, 6.000%, 02/15/37 | | | 20 | |
| | 14 | | | Series 3289, Class ND, 5.500%, 06/15/35 | | | 14 | |
| | 2,155 | | | Series 3294, Class DB, 4.500%, 03/15/22 | | | 2,232 | |
| | 102 | | | Series 3337, Class MD, 5.500%, 06/15/27 | | | 115 | |
| | 136 | | | Series 3348, Class HT, 6.000%, 07/15/37 | | | 157 | |
| | 393 | | | Series 3349, Class HE, 5.500%, 07/15/36 | | | 403 | |
| | 42 | | | Series 3372, Class BD, 4.500%, 10/15/22 | | | 43 | |
| | 26 | | | Series 3508, Class PK, 4.000%, 02/15/39 | | | 27 | |
| | 44 | | | Series 3513, Class A, 4.500%, 02/15/39 | | | 47 | |
| | 652 | | | Series 3521, Class B, 4.000%, 04/15/24 | | | 706 | |
| | 125 | | | Series 3544, Class BC, 4.000%, 06/15/24 | | | 132 | |
| | 5,262 | | | Series 3546, Class NB, 4.000%, 06/15/24 | | | 5,605 | |
| | 2,537 | | | Series 3562, Class JC, 4.000%, 08/15/24 | | | 2,677 | |
| | 1,732 | | | Series 3563, Class BD, 4.000%, 08/15/24 | | | 1,805 | |
| | 64 | | | Series 3563, Class LB, 4.000%, 08/15/29 | | | 69 | |
| | 265 | | | Series 3571, Class MY, 4.000%, 09/15/24 | | | 289 | |
| | 1,828 | | | Series 3575, Class EB, 4.000%, 09/15/24 | | | 1,937 | |
| | | | | | | | |
PRINCIPAL
AMOUNT($) | | | SECURITY DESCRIPTION | | VALUE($) | |
| | | | | | | | |
| | | | Agency CMO — continued | | | | |
| | 2,811 | | | Series 3577, Class B, 4.000%, 09/15/24 | | | 2,968 | |
| | 442 | | | Series 3578, Class KB, 4.000%, 09/15/24 | | | 469 | |
| | 9 | | | Series 3593, Class PC, 5.000%, 05/15/38 | | | 9 | |
| | 318 | | | Series 3605, Class NB, 5.500%, 06/15/37 | | | 324 | |
| | 394 | | | Series 3647, Class GA, 5.000%, 11/15/28 | | | 405 | |
| | 10 | | | Series 3652, Class A, 4.500%, 11/15/24 | | | 10 | |
| | 314 | | | Series 3653, Class B, 4.500%, 04/15/30 | | | 345 | |
| | 2,116 | | | Series 3653, Class HJ, 5.000%, 04/15/40 | | | 2,365 | |
| | 135 | | | Series 3659, Class BD, 5.000%, 01/15/37 | | | 140 | |
| | 530 | | | Series 3659, Class VG, 5.000%, 09/15/34 | | | 593 | |
| | 2,435 | | | Series 3677, Class KB, 4.500%, 05/15/40 | | | 2,696 | |
| | 2,243 | | | Series 3677, Class PB, 4.500%, 05/15/40 | | | 2,421 | |
| | 97 | | | Series 3688, Class GT, VAR, 7.277%, 11/15/46 | | | 113 | |
| | 260 | | | Series 3715, Class PC, 4.500%, 08/15/40 | | | 288 | |
| | 883 | | | Series 3740, Class BP, 4.500%, 04/15/38 | | | 926 | |
| | 187 | | | Series 3747, Class HI, IO, 4.500%, 07/15/37 | | | 7 | |
| | 774 | | | Series 3747, Class PA, 4.000%, 04/15/38 | | | 809 | |
| | 120 | | | Series 3755, Class ML, 5.500%, 06/15/29 | | | 126 | |
| | 1,750 | | | Series 3787, Class AY, 3.500%, 01/15/26 | | | 1,853 | |
| | 1,275 | | | Series 3794, Class LB, 3.500%, 01/15/26 | | | 1,353 | |
| | 439 | | | Series 3797, Class PA, 4.500%, 08/15/39 | | | 454 | |
| | 1,661 | | | Series 3816, Class HA, 3.500%, 11/15/25 | | | 1,799 | |
| | 1,599 | | | Series 3819, Class ZQ, 6.000%, 04/15/36 | | | 1,823 | |
| | 500 | | | Series 3824, Class EY, 3.500%, 03/15/31 | | | 540 | |
| | 1,488 | | | Series 3827, Class BM, 5.500%, 08/15/39 | | | 1,608 | |
| | 264 | | | Series 3828, Class PU, 4.500%, 03/15/41 | | | 282 | |
| | 902 | | | Series 3852, Class TP, IF, 5.500%, 05/15/41 | | | 972 | |
| | 2,800 | | | Series 3874, Class DW, 3.500%, 06/15/21 | | | 2,962 | |
| | 1,600 | | | Series 3885, Class AC, 4.000%, 06/15/26 | | | 1,695 | |
| | 821 | | | Series 3898, Class KH, 3.500%, 06/15/26 | | | 884 | |
| | 1,146 | | | Series 3904, Class EC, 2.000%, 08/15/40 | | | 1,146 | |
| | 1,600 | | | Series 3911, Class B, 3.500%, 08/15/26 | | | 1,749 | |
| | 534 | | | Series 3955, Class HB, 3.000%, 12/15/40 | | | 549 | |
| | 2,500 | | | Series 3956, Class EB, 3.250%, 11/15/41 | | | 2,585 | |
| | 2,500 | | | Series 3959, Class PB, 3.000%, 11/15/26 | | | 2,630 | |
| | 1,650 | | | Series 3963, Class JB, 4.500%, 11/15/41 | | | 1,903 | |
| | 246 | | | Series 4026, Class MQ, 4.000%, 04/15/42 | | | 267 | |
| | 609 | | | Series 4085, Class FB, VAR, 0.908%, 01/15/39 | | | 611 | |
| | 3,316 | | | Series 4219, Class JA, 3.500%, 08/15/39 | | | 3,489 | |
| | 3,650 | | | Series 4238, Class UY, 3.000%, 08/15/33 | | | 3,800 | |
| | 2,574 | | | Series 4337, Class VJ, 3.500%, 06/15/27 | | | 2,784 | |
SEE NOTES TO FINANCIAL STATEMENTS.
| | | | | | |
| | | |
| 176 | | | | J.P. MORGAN INCOME FUNDS | | AUGUST 31, 2016 |
| | | | | | | | |
PRINCIPAL
AMOUNT($) | | | SECURITY DESCRIPTION | | VALUE($) | |
| Collateralized Mortgage Obligations — continued | |
| | | | Agency CMO — continued | | | | |
| | 1,850 | | | Federal Home Loan Mortgage Corp. STRIPS, Series 262, Class 35, 3.500%, 07/15/42 | | | 1,969 | |
| | | | Federal National Mortgage Association - ACES, | | | | |
| | 1,732 | | | Series 2011-M2, Class A2, 3.645%, 04/25/21 | | | 1,860 | |
| | 2,056 | | | Series 2011-M4, Class A1, 2.548%, 06/25/21 | | | 2,106 | |
| | 1,878 | | | Series 2013-M7, Class A2, 2.280%, 12/27/22 | | | 1,925 | |
| | 3,953 | | | Series 2013-M13, Class A2, VAR, 2.624%, 04/25/23 | | | 4,123 | |
| | 3,500 | | | Series 2014-M1, Class A2, VAR, 3.270%, 07/25/23 | | | 3,745 | |
| | 3,108 | | | Series 2014-M2, Class A2, VAR, 3.513%, 12/25/23 | | | 3,414 | |
| | 3,100 | | | Series 2014-M3, Class A2, VAR, 3.501%, 01/25/24 | | | 3,370 | |
| | 4,756 | | | Series 2014-M9, Class A2, VAR, 3.103%, 07/25/24 | | | 5,065 | |
| | 1,800 | | | Series 2014-M12, Class ASV2, VAR, 2.614%, 10/25/21 | | | 1,879 | |
| | 1,973 | | | Series 2014-M13, Class A2, VAR, 3.021%, 08/25/24 | | | 2,109 | |
| | 4,631 | | | Series 2015-M1, Class A2, 2.532%, 09/25/24 | | | 4,781 | |
| | 4,500 | | | Series 2015-M3, Class A2, 2.723%, 10/25/24 | | | 4,707 | |
| | 1,400 | | | Series 2015-M10, Class A2, VAR, 3.092%, 04/25/27 | | | 1,498 | |
| | | | Federal National Mortgage Association REMIC, | | | | |
| | 339 | | | Series 1997-57, Class PN, 5.000%, 09/18/27 | | | 371 | |
| | 136 | | | Series 2001-63, Class TC, 6.000%, 12/25/31 | | | 152 | |
| | 349 | | | Series 2001-81, Class HE, 6.500%, 01/25/32 | | | 403 | |
| | 2 | | | Series 2002-24, Class AJ, 6.000%, 04/25/17 | | | 2 | |
| | 342 | | | Series 2002-75, Class GB, 5.500%, 11/25/32 | | | 366 | |
| | 123 | | | Series 2002-85, Class PE, 5.500%, 12/25/32 | | | 137 | |
| | 127 | | | Series 2003-5, Class EQ, 5.500%, 02/25/23 | | | 139 | |
| | 77 | | | Series 2003-21, Class OU, 5.500%, 03/25/33 | | | 87 | |
| | 96 | | | Series 2003-23, Class CH, 5.000%, 04/25/33 | | | 106 | |
| | 800 | | | Series 2003-26, Class EB, 3.500%, 04/25/33 | | | 857 | |
| | | | | | | | |
PRINCIPAL
AMOUNT($) | | | SECURITY DESCRIPTION | | VALUE($) | |
| | | | | | | | |
| | | | Agency CMO — continued | | | | |
| | 181 | | | Series 2003-41, Class BK, 5.000%, 05/25/18 | | | 185 | |
| | 150 | | | Series 2003-48, Class TC, 5.000%, 06/25/23 | | | 161 | |
| | 130 | | | Series 2003-55, Class HY, 5.000%, 06/25/23 | | | 140 | |
| | 255 | | | Series 2003-63, Class YB, 5.000%, 07/25/33 | | | 280 | |
| | 458 | | | Series 2003-69, Class N, 5.000%, 07/25/33 | | | 501 | |
| | 432 | | | Series 2003-80, Class QG, 5.000%, 08/25/33 | | | 495 | |
| | 93 | | | Series 2003-84, Class GE, 4.500%, 09/25/18 | | | 95 | |
| | 323 | | | Series 2003-85, Class QD, 5.500%, 09/25/33 | | | 361 | |
| | 22 | | | Series 2003-87, Class TJ, 4.500%, 09/25/18 | | | 22 | |
| | 89 | | | Series 2003-94, Class CE, 5.000%, 10/25/33 | | | 96 | |
| | 587 | | | Series 2003-129, Class ME, 5.000%, 08/25/23 | | | 599 | |
| | 105 | | | Series 2003-134, Class MH, 5.000%, 06/25/33 | | | 108 | |
| | 567 | | | Series 2004-44, Class KT, 6.000%, 06/25/24 | | | 628 | |
| | 188 | | | Series 2004-53, Class NC, 5.500%, 07/25/24 | | | 204 | |
| | 394 | | | Series 2004-70, Class EB, 5.000%, 10/25/24 | | | 426 | |
| | 12 | | | Series 2004-81, Class HA, 4.250%, 10/25/24 | | | 12 | |
| | 527 | | | Series 2005-5, Class CK, 5.000%, 01/25/35 | | | 572 | |
| | 1,214 | | | Series 2005-29, Class WC, 4.750%, 04/25/35 | | | 1,339 | |
| | 164 | | | Series 2005-33, Class QD, 5.000%, 01/25/34 | | | 166 | |
| | 294 | | | Series 2005-48, Class TD, 5.500%, 06/25/35 | | | 342 | |
| | 828 | | | Series 2005-53, Class MJ, 5.500%, 06/25/35 | | | 931 | |
| | 105 | | | Series 2005-58, Class EP, 5.500%, 07/25/35 | | | 116 | |
| | 91 | | | Series 2005-62, Class CP, 4.750%, 07/25/35 | | | 98 | |
| | 250 | | | Series 2005-68, Class BE, 5.250%, 08/25/35 | | | 306 | |
| | 364 | | | Series 2005-68, Class PG, 5.500%, 08/25/35 | | | 412 | |
SEE NOTES TO FINANCIAL STATEMENTS.
| | | | | | | | |
| | | |
| AUGUST 31, 2016 | | J.P. MORGAN INCOME FUNDS | | | | | 177 | |
JPMorgan Inflation Managed Bond Fund
SCHEDULE OF PORTFOLIO INVESTMENTS
AS OF AUGUST 31, 2016 (Unaudited) (continued)
(Amounts in thousands)
| | | | | | | | |
PRINCIPAL
AMOUNT($) | | | SECURITY DESCRIPTION | | VALUE($) | |
| Collateralized Mortgage Obligations — continued | |
| | | | Agency CMO — continued | | | | |
| | 88 | | | Series 2005-86, Class AX, 5.500%, 10/25/35 | | | 89 | |
| | 8 | | | Series 2005-99, Class AE, 5.500%, 12/25/35 | | | 9 | |
| | 1,061 | | | Series 2005-102, Class PG, 5.000%, 11/25/35 | | | 1,178 | |
| | 764 | | | Series 2005-110, Class GL, 5.500%, 12/25/35 | | | 898 | |
| | 30 | | | Series 2005-110, Class MB, 5.500%, 09/25/35 | | | 32 | |
| | 435 | | | Series 2006-22, Class CE, 4.500%, 08/25/23 | | | 462 | |
| | 39 | | | Series 2006-41, Class MC, 5.500%, 07/25/35 | | | 40 | |
| | 133 | | | Series 2006-49, Class PA, 6.000%, 06/25/36 | | | 154 | |
| | 800 | | | Series 2006-114, Class HE, 5.500%, 12/25/36 | | | 890 | |
| | 69 | | | Series 2007-33, Class HE, 5.500%, 04/25/37 | | | 78 | |
| | 25 | | | Series 2007-65, Class KI, IF, IO, 6.096%, 07/25/37 | | | 3 | |
| | 555 | | | Series 2007-71, Class GB, 6.000%, 07/25/37 | | | 637 | |
| | 281 | | | Series 2007-71, Class KP, 5.500%, 07/25/37 | | | 310 | |
| | 153 | | | Series 2007-113, Class DB, 4.500%, 12/25/22 | | | 160 | |
| | 185 | | | Series 2008-65, Class CD, 4.500%, 08/25/23 | | | 191 | |
| | 1,189 | | | Series 2008-70, Class BY, 4.000%, 08/25/23 | | | 1,221 | |
| | 49 | | | Series 2008-72, Class BX, 5.500%, 08/25/38 | | | 55 | |
| | 20 | | | Series 2008-74, Class B, 5.500%, 09/25/38 | | | 23 | |
| | 792 | | | Series 2009-19, Class PW, 4.500%, 10/25/36 | | | 865 | |
| | 38 | | | Series 2009-37, Class KI, IF, IO, 5.476%, 06/25/39 | | | 5 | |
| | 228 | | | Series 2009-39, Class LB, 4.500%, 06/25/29 | | | 248 | |
| | 969 | | | Series 2009-62, Class HJ, 6.000%, 05/25/39 | | | 1,077 | |
| | 138 | | | Series 2009-71, Class MB, 4.500%, 09/25/24 | | | 148 | |
| | 240 | | | Series 2009-71, Class XB, 5.000%, 03/25/38 | | | 241 | |
| | 51 | | | Series 2009-78, Class J, 5.000%, 09/25/19 | | | 52 | |
| | | | | | | | |
PRINCIPAL
AMOUNT($) | | | SECURITY DESCRIPTION | | VALUE($) | |
| | | | | | | | |
| | | | Agency CMO — continued | | | | |
| | 34 | | | Series 2009-86, Class IP, IO, 5.500%, 10/25/39 | | | 5 | |
| | 94 | | | Series 2009-86, Class OT, PO, 10/25/37 | | | 86 | |
| | 2,151 | | | Series 2009-92, Class AD, 6.000%, 11/25/39 | | | 2,402 | |
| | 63 | | | Series 2009-96, Class CB, 4.000%, 11/25/49 | | | 66 | |
| | 344 | | | Series 2009-96, Class DB, 4.000%, 11/25/29 | | | 368 | |
| | 263 | | | Series 2009-112, Class ST, IF, IO, 5.726%, 01/25/40 | | | 45 | |
| | 120 | | | Series 2010-9, Class MD, 5.000%, 02/25/38 | | | 131 | |
| | 3,880 | | | Series 2010-22, Class PE, 5.000%, 03/25/40 | | | 4,340 | |
| | 500 | | | Series 2010-28, Class DE, 5.000%, 04/25/30 | | | 562 | |
| | 123 | | | Series 2010-35, Class SB, IF, IO, 5.896%, 04/25/40 | | | 17 | |
| | 3,125 | | | Series 2010-37, Class CY, 5.000%, 04/25/40 | | | 3,469 | |
| | 700 | | | Series 2010-41, Class DC, 4.500%, 05/25/25 | | | 749 | |
| | 2,135 | | | Series 2010-49, Class KB, 4.000%, 05/25/25 | | | 2,250 | |
| | 122 | | | Series 2010-54, Class EA, 4.500%, 06/25/40 | | | 132 | |
| | 54 | | | Series 2010-56, Class BD, 5.000%, 12/25/38 | | | 54 | |
| | 23 | | | Series 2010-64, Class DM, 5.000%, 06/25/40 | | | 26 | |
| | 408 | | | Series 2010-71, Class HJ, 5.500%, 07/25/40 | | | 457 | |
| | 4,000 | | | Series 2010-103, Class GB, 4.000%, 09/25/20 | | | 4,214 | |
| | 116 | | | Series 2010-111, Class AE, 5.500%, 04/25/38 | | | 119 | |
| | 4,850 | | | Series 2010-123, Class BP, 4.500%, 11/25/40 | | | 5,424 | |
| | 1,019 | | | Series 2010-135, Class HE, 3.000%, 01/25/21 | | | 1,037 | |
| | 498 | | | Series 2011-22, Class MA, 6.500%, 04/25/38 | | | 546 | |
| | 1,330 | | | Series 2011-39, Class ZA, 6.000%, 11/25/32 | | | 1,524 | |
| | 1,006 | | | Series 2011-41, Class KL, 4.000%, 05/25/41 | | | 1,113 | |
| | 500 | | | Series 2011-50, Class LP, 4.000%, 06/25/41 | | | 552 | |
SEE NOTES TO FINANCIAL STATEMENTS.
| | | | | | |
| | | |
| 178 | | | | J.P. MORGAN INCOME FUNDS | | AUGUST 31, 2016 |
| | | | | | | | |
PRINCIPAL
AMOUNT($) | | | SECURITY DESCRIPTION | | VALUE($) | |
| Collateralized Mortgage Obligations — continued | |
| | | | Agency CMO — continued | | | | |
| | 2,186 | | | Series 2011-61, Class V, 4.500%, 08/25/22 | | | 2,208 | |
| | 3,000 | | | Series 2011-75, Class BL, 3.500%, 08/25/21 | | | 3,173 | |
| | 1,000 | | | Series 2012-14, Class DE, 3.500%, 03/25/42 | | | 1,055 | |
| | 524 | | | Series 2012-103, Class DA, 3.500%, 10/25/41 | | | 541 | |
| | 1,312 | | | Series 2012-137, Class CF, VAR, 0.824%, 08/25/41 | | | 1,306 | |
| | 1,888 | | | Series 2013-83, Class CA, 3.500%, 10/25/37 | | | 1,969 | |
| | 2,250 | | | Series 2013-104, Class CY, 5.000%, 10/25/43 | | | 2,724 | |
| | | | Federal National Mortgage Association STRIPS, | | | | |
| | 51 | | | Series 293, Class 1, PO, 12/25/24 | | | 45 | |
| | 96 | | | Series 314, Class 1, PO, 07/25/31 | | | 88 | |
| | | | Government National Mortgage Association, | | | | |
| | 62 | | | Series 2002-44, Class JC, 6.000%, 07/20/32 | | | 71 | |
| | 573 | | | Series 2002-79, Class KL, 5.500%, 11/20/32 | | | 642 | |
| | 154 | | | Series 2003-10, Class KJ, 5.500%, 02/20/33 | | | 176 | |
| | 589 | | | Series 2003-29, Class PD, PAC, 5.500%, 04/16/33 | | | 661 | |
| | 357 | | | Series 2003-33, Class NE, PAC, 5.500%, 04/16/33 | | | 396 | |
| | 4 | | | Series 2003-40, Class TD, 5.000%, 03/20/33 | | | 4 | |
| | 204 | | | Series 2003-65, Class AP, 5.500%, 08/20/33 | | | 230 | |
| | 772 | | | Series 2003-77, Class TK, PAC, 5.000%, 09/16/33 | | | 859 | |
| | 1,665 | | | Series 2004-16, Class GC, 5.500%, 02/20/34 | | | 1,912 | |
| | 48 | | | Series 2004-54, Class BG, 5.500%, 07/20/34 | | | 54 | |
| | 899 | | | Series 2004-93, Class PD, 5.000%, 11/16/34 | | | 1,024 | |
| | 934 | | | Series 2004-101, Class BE, 5.000%, 11/20/34 | | | 1,042 | |
| | 450 | | | Series 2005-11, Class PL, PAC, 5.000%, 02/20/35 | | | 498 | |
| | 1,982 | | | Series 2005-26, Class XY, 5.500%, 03/20/35 | | | 2,237 | |
| | 516 | | | Series 2005-33, Class AY, 5.500%, 04/16/35 | | | 590 | |
| | 174 | | | Series 2005-49, Class B, 5.500%, 06/20/35 | | | 195 | |
| | | | | | | | |
PRINCIPAL
AMOUNT($) | | | SECURITY DESCRIPTION | | VALUE($) | |
| | | | | | | | |
| | | | Agency CMO — continued | | | | |
| | 431 | | | Series 2005-51, Class DC, 5.000%, 07/20/35 | | | 478 | |
| | 67 | | | Series 2005-56, Class BD, 5.000%, 07/20/35 | | | 74 | |
| | 40 | | | Series 2006-7, Class ND, 5.500%, 08/20/35 | | | 46 | |
| | 489 | | | Series 2007-37, Class LB, 5.500%, 06/16/37 | | | 559 | |
| | 376 | | | Series 2007-79, Class BL, 5.750%, 08/20/37 | | | 428 | |
| | 450 | | | Series 2008-7, Class PQ, 5.000%, 02/20/38 | | | 521 | |
| | 1,007 | | | Series 2008-9, Class PW, PAC, 5.250%, 02/20/38 | | | 1,130 | |
| | 277 | | | Series 2008-23, Class YA, PAC, 5.250%, 03/20/38 | | | 310 | |
| | 1,011 | | | Series 2008-33, Class PB, PAC, 5.500%, 04/20/38 | | | 1,149 | |
| | 293 | | | Series 2008-34, Class PG, PAC, 5.250%, 04/20/38 | | | 334 | |
| | 280 | | | Series 2008-35, Class NF, PAC, 5.000%, 04/20/38 | | | 312 | |
| | 274 | | | Series 2008-38, Class BE, 5.000%, 07/16/36 | | | 282 | |
| | 1,007 | | | Series 2008-38, Class BG, 5.000%, 05/16/38 | | | 1,148 | |
| | 324 | | | Series 2008-43, Class NB, PAC, 5.500%, 05/20/38 | | | 367 | |
| | 868 | | | Series 2008-56, Class PX, PAC, 5.500%, 06/20/38 | | | 978 | |
| | 973 | | | Series 2008-58, Class PD, PAC, 5.500%, 08/16/37 | | | 1,022 | |
| | 1,247 | | | Series 2008-58, Class PE, PAC, 5.500%, 07/16/38 | | | 1,470 | |
| | 7 | | | Series 2008-62, Class SA, IF, IO, 5.638%, 07/20/38 | | | 1 | |
| | 198 | | | Series 2008-76, Class US, IF, IO, 5.388%, 09/20/38 | | | 28 | |
| | 191 | | | Series 2008-95, Class DS, IF, IO, 6.788%, 12/20/38 | | | 39 | |
| | 308 | | | Series 2009-14, Class AG, 4.500%, 03/20/39 | | | 334 | |
| | 47 | | | Series 2009-15, Class NA, 5.000%, 12/20/38 | | | 49 | |
| | 47 | | | Series 2009-61, Class AP, PAC, 4.000%, 08/20/39 | | | 50 | |
| | 467 | | | Series 2009-72, Class SM, IF, IO, 5.743%, 08/16/39 | | | 75 | |
| | 331 | | | Series 2009-106, Class ST, IF, IO, 5.488%, 02/20/38 | | | 58 | |
SEE NOTES TO FINANCIAL STATEMENTS.
| | | | | | | | |
| | | |
| AUGUST 31, 2016 | | J.P. MORGAN INCOME FUNDS | | | | | 179 | |
JPMorgan Inflation Managed Bond Fund
SCHEDULE OF PORTFOLIO INVESTMENTS
AS OF AUGUST 31, 2016 (Unaudited) (continued)
(Amounts in thousands)
| | | | | | | | |
PRINCIPAL
AMOUNT($) | | | SECURITY DESCRIPTION | | VALUE($) | |
| Collateralized Mortgage Obligations — continued | |
| | | | Agency CMO — continued | | | | |
| | 175 | | | Series 2010-7, Class EA, PAC, 5.000%, 06/16/38 | | | 191 | |
| | 57 | | | Series 2010-14, Class QP, 6.000%, 12/20/39 | | | 59 | |
| | 397 | | | Series 2010-130, Class BD, 4.000%, 12/20/39 | | | 430 | |
| | 398 | | | Series 2010-157, Class OP, PO, 12/20/40 | | | 360 | |
| | 2,121 | | | Series 2011-97, Class WA, VAR, 6.117%, 11/20/38 | | | 2,407 | |
| | 2,011 | | | Series 2014-H11, Class VA, VAR, 0.968%, 06/20/64 | | | 2,000 | |
| | 3,001 | | | Series 2015-H20, Class FA, VAR, 0.938%, 08/20/65 | | | 2,979 | |
| | 2,022 | | | Series 2015-H26, Class FG, VAR, 0.988%, 10/20/65 | | | 2,012 | |
| | 1,138 | | | Vendee Mortgage Trust, Series 2003-2, Class Z, 5.000%, 05/15/33 | | | 1,307 | |
| | | | | | | | |
| | | | | | | 239,557 | |
| | | | | | | | |
| | | | Non-Agency CMO — 0.5% | | | | |
| | 606 | | | Bear Stearns ALT-A Trust, Series 2004-6, Class 1A, VAR, 1.164%, 07/25/34 | | | 577 | |
| | 21 | | | CHL Mortgage Pass-Through Trust, Series 2004-8, Class 2A1, 4.500%, 06/25/19 | | | 21 | |
| | 107 | | | Citigroup Mortgage Loan Trust, Series 2010-8, Class 5A6, 4.000%, 11/25/36 (e) | | | 108 | |
| | | | Citigroup Mortgage Loan Trust, Inc., | | | | |
| | 35 | | | Series 2003-1, Class 3A4, 5.250%, 09/25/33 | | | 35 | |
| | 77 | | | Series 2004-HYB4, Class WA, VAR, 2.879%, 12/25/34 | | | 76 | |
| | 48 | | | Credit Suisse First Boston Mortgage Securities Corp., Series 2003-27, Class 5A4, 5.250%, 11/25/33 | | | 48 | |
| | 252 | | | GMACM Mortgage Loan Trust, Series 2004-J5, Class A7, 6.500%, 01/25/35 | | | 260 | |
| | 270 | | | GSR Mortgage Loan Trust, Series 2004-6F, Class 2A4, 5.500%, 05/25/34 | | | 277 | |
| | | | JP Morgan Mortgage Trust, | | | | |
| | 880 | | | Series 2006-A2, Class 5A3, VAR, 2.783%, 11/25/33 | | | 892 | |
| | 158 | | | Series 2007-A1, Class 5A5, VAR, 2.911%, 07/25/35 | | | 158 | |
| | 225 | | | MASTR Adjustable Rate Mortgages Trust, Series 2004-13, Class 2A1, VAR, 2.882%, 04/21/34 | | | 230 | |
| | 13 | | | MASTR Alternative Loan Trust, Series 2004-5, Class 5A1, 4.750%, 06/25/19 | | | 13 | |
| | | | | | | | |
PRINCIPAL
AMOUNT($) | | | SECURITY DESCRIPTION | | VALUE($) | |
| | | | | | | | |
| | | | Non-Agency CMO — continued | | | | |
| | 186 | | | MASTR Asset Securitization Trust, Series 2003-11, Class 8A1, 5.500%, 12/25/33 | | | 189 | |
| | | | Merrill Lynch Mortgage Investors Trust, | | | | |
| | 298 | | | Series 2003-F, Class A1, VAR, 1.164%, 10/25/28 | | | 291 | |
| | 352 | | | Series 2004-B, Class A1, VAR, 1.024%, 05/25/29 | | | 343 | |
| | 79 | | | Morgan Stanley Mortgage Loan Trust, Series 2004-3, Class 4A, VAR, 5.676%, 04/25/34 | | | 83 | |
| | 68 | | | PHH Mortgage Trust, Series 2008-CIM2, Class 5A1, 6.000%, 07/25/38 | | | 69 | |
| | 9 | | | Prime Mortgage Trust, Series 2004-2, Class A2, 4.750%, 11/25/19 | | | 9 | |
| | 16 | | | RALI Trust, Series 2004-QS3, Class CB, 5.000%, 03/25/19 | | | 16 | |
| | 724 | | | Sequoia Mortgage Trust, Series 2004-11, Class A1, VAR, 1.112%, 12/20/34 | | | 708 | |
| | 444 | | | Springleaf Mortgage Loan Trust, Series 2013-3A, Class A, VAR, 1.870%, 09/25/57 (e) | | | 445 | |
| | 287 | | | Structured Asset Mortgage Investments II Trust, Series 2003-AR4, Class A1, VAR, 1.214%, 01/19/34 | | | 276 | |
| | 503 | | | Thornburg Mortgage Securities Trust, Series 2004-4, Class 3A, VAR, 2.183%, 12/25/44 | | | 497 | |
| | | | WaMu Mortgage Pass-Through Certificates Trust, | | | | |
| | 301 | | | Series 2003-AR11, Class A6, VAR, 2.549%, 10/25/33 | | | 303 | |
| | 4 | | | Series 2003-S6, Class 2A1, 5.000%, 07/25/18 | | | 4 | |
| | 945 | | | Wells Fargo Mortgage-Backed Securities Trust, Series 2004-P, Class 2A1, VAR, 2.988%, 09/25/34 | | | 973 | |
| | | | | | | | |
| | | | | | | 6,901 | |
| | | | | | | | |
| | | | Total Collateralized Mortgage Obligations
(Cost $239,849) | | | 246,458 | |
| | | | | | | | |
| Commercial Mortgage-Backed Securities — 3.2% | |
| | 1,325 | | | A10 Term Asset Financing LLC, Series 2014-1, Class A2, 3.020%, 04/15/33 (e) | | | 1,303 | |
| | | | Banc of America Commercial Mortgage Trust, | | | | |
| | 30 | | | Series 2006-3, Class A4, VAR, 5.889%, 07/10/44 | | | 30 | |
| | 97 | | | Series 2006-5, Class A4, 5.414%, 09/10/47 | | | 97 | |
SEE NOTES TO FINANCIAL STATEMENTS.
| | | | | | |
| | | |
| 180 | | | | J.P. MORGAN INCOME FUNDS | | AUGUST 31, 2016 |
| | | | | | | | |
PRINCIPAL
AMOUNT($) | | | SECURITY DESCRIPTION | | VALUE($) | |
| Commercial Mortgage-Backed Securities — continued | |
| | 29 | | | Banc of America Merrill Lynch Commercial Mortgage, Inc., Series 2005-3, Class AM, 4.727%, 07/10/43 | | | 29 | |
| | 1,400 | | | BB-UBS Trust, Series 2012-SHOW, Class A, 3.430%, 11/05/36 (e) | | | 1,502 | |
| | 14 | | | COBALT CMBS Commercial Mortgage Trust, Series 2006-C1, Class A4, 5.223%, 08/15/48 | | | 15 | |
| | 2,750 | | | COMM Mortgage Trust, Series 2012-9W57, Class A, 2.365%, 02/10/29 (e) | | | 2,757 | |
| | 109 | | | DBRR Trust, Series 2013-EZ3, Class A, VAR, 1.636%, 12/18/49 (e) | | | 108 | |
| | | | Federal Home Loan Mortgage Corp., Multifamily Structured Pass-Through Certificates, | | | | |
| | 2,045 | | | Series K029, Class A2, VAR, 3.320%, 02/25/23 | | | 2,232 | |
| | 4,000 | | | Series K037, Class A2, 3.490%, 01/25/24 | | | 4,426 | |
| | 1,000 | | | Series K038, Class A2, 3.389%, 03/25/24 | | | 1,101 | |
| | 2,503 | | | Series K046, Class A2, 3.205%, 03/25/25 | | | 2,731 | |
| | 2,000 | | | Series K048, Class A2, VAR, 3.284%, 06/25/25 | | | 2,194 | |
| | 469 | | | Series K049, Class A2, 3.010%, 07/25/25 | | | 505 | |
| | 1,354 | | | Series KF12, Class A, VAR, 1.224%, 09/25/22 | | | 1,359 | |
| | 327 | | | Series KJ02, Class A2, 2.597%, 09/25/20 | | | 337 | |
| | 1,750 | | | Series KPLB, Class A, 2.770%, 05/25/25 | | | 1,834 | |
| | 5,000 | | | Series KSMC, Class A2, 2.615%, 01/25/23 | | | 5,226 | |
| | 800 | | | Federal National Mortgage Association - ACES, Series 2016-M6, Class A2, 2.488%, 05/25/26 | | | 822 | |
| | 735 | | | FREMF Mortgage Trust, Series 2016-K722, Class B, VAR, 3.966%, 07/25/49 (e) | | | 724 | |
| | 1,344 | | | GS Mortgage Securities Corp. Trust, Series 2013-NYC5, Class A, 2.318%, 01/10/30 (e) | | | 1,350 | |
| | 57 | | | JP Morgan Chase Commercial Mortgage Securities Trust, Series 2005-CB11, Class AJ, VAR, 5.584%, 08/12/37 | | | 57 | |
| | 742 | | | LB-UBS Commercial Mortgage Trust, Series 2007-C2, Class A3, 5.430%, 02/15/40 | | | 749 | |
| | 9,827 | | | ML-CFC Commercial Mortgage Trust, Series 2006-4, Class XC, IO, VAR, 0.768%, 12/12/49 (e) | | | 10 | |
| | 2,200 | | | Morgan Stanley Bank of America Merrill Lynch Trust, Series 2014-C14, Class A3, 3.669%, 02/15/47 | | | 2,333 | |
| | | | Morgan Stanley Capital I Trust, | | | | |
| | 37,205 | | | Series 2007-HQ11, Class X, IO, VAR, 0.379%, 02/12/44 (e) | | | 15 | |
| | 577 | | | Series 2011-C3, Class A3, 4.054%, 07/15/49 | | | 603 | |
| | | | | | | | |
PRINCIPAL
AMOUNT($) | | | SECURITY DESCRIPTION | | VALUE($) | |
| | | | | | | | |
| | 190 | | | Morgan Stanley Re-REMIC Trust, Series 2012-XA, Class A, 2.000%, 07/27/49 (e) | | | 188 | |
| | 1,726 | | | PFP Ltd., (Cayman Islands), Series 2015-2, Class A, VAR, 1.958%, 07/14/34 (e) | | | 1,714 | |
| | 493 | | | RAIT Trust, Series 2015-FL4, Class A, VAR, 1.857%, 12/15/31 (e) | | | 493 | |
| | 866 | | | UBS-BAMLL Trust, Series 2012-WRM, Class A, 3.663%, 06/10/30 (e) | | | 917 | |
| | | | UBS-Barclays Commercial Mortgage Trust, | | | | |
| | 1,040 | | | Series 2012-C2, Class A4, 3.525%, 05/10/63 | | | 1,127 | |
| | 1,486 | | | Series 2013-C6, Class A4, 3.244%, 04/10/46 | | | 1,586 | |
| | 2,750 | | | VNDO Mortgage Trust, Series 2013-PENN, Class A, 3.808%, 12/13/29 (e) | | | 2,956 | |
| | 2 | | | Wells Fargo Resecuritization Trust, Series 2012-IO, Class A, 1.750%, 08/20/21 (e) | | | 2 | |
| | 1,800 | | | WFRBS Commercial Mortgage Trust, Series 2012-C6, Class A4, 3.440%, 04/15/45 | | | 1,932 | |
| | | | | | | | |
| | | | Total Commercial Mortgage-Backed Securities
(Cost $43,688) | | | 45,364 | |
| | | | | | | | |
| Corporate Bonds — 32.9% | |
| | | | Consumer Discretionary — 2.2% | | | | |
| | | | Auto Components — 0.1% | | | | |
| | | | Johnson Controls, Inc., | | | | |
| | 138 | | | 3.625%, 07/02/24 | | | 147 | |
| | 1,135 | | | 4.250%, 03/01/21 | | | 1,218 | |
| | 40 | | | 5.000%, 03/30/20 | | | 44 | |
| | | | | | | | |
| | | | | | | 1,409 | |
| | | | | | | | |
| | | | Automobiles — 0.2% | | | | |
| | | | Daimler Finance North America LLC, | | | | |
| | 2,100 | | | 2.250%, 07/31/19 (e) | | | 2,134 | |
| | 153 | | | 2.250%, 03/02/20 (e) | | | 156 | |
| | 584 | | | 2.625%, 09/15/16 (e) | | | 584 | |
| | | | | | | | |
| | | | | | | 2,874 | |
| | | | | | | | |
| | | | Hotels, Restaurants & Leisure — 0.1% | | | | |
| | 1,250 | | | McDonald’s Corp., 3.375%, 05/26/25 | | | 1,317 | |
| | 326 | | | Starbucks Corp., 2.700%, 06/15/22 | | | 342 | |
| | | | | | | | |
| | | | | | | 1,659 | |
| | | | | | | | |
| | | | Internet & Direct Marketing Retail — 0.1% | | | | |
| | 1,217 | | | Amazon.com, Inc., 3.800%, 12/05/24 | | | 1,358 | |
| | | | | | | | |
SEE NOTES TO FINANCIAL STATEMENTS.
| | | | | | | | |
| | | |
| AUGUST 31, 2016 | | J.P. MORGAN INCOME FUNDS | | | | | 181 | |
JPMorgan Inflation Managed Bond Fund
SCHEDULE OF PORTFOLIO INVESTMENTS
AS OF AUGUST 31, 2016 (Unaudited) (continued)
(Amounts in thousands)
| | | | | | | | |
PRINCIPAL
AMOUNT($) | | | SECURITY DESCRIPTION | | VALUE($) | |
| Corporate Bonds — continued | |
| | | | Media — 1.2% | | | | |
| | | | 21st Century Fox America, Inc., | | | | |
| | 30 | | | 7.250%, 05/18/18 | | | 33 | |
| | 600 | | | 7.430%, 10/01/26 | | | 802 | |
| | 200 | | | 7.700%, 10/30/25 | | | 275 | |
| | 1,019 | | | CBS Corp., 3.700%, 08/15/24 | | | 1,075 | |
| | 450 | | | Comcast Cable Communications LLC, 8.875%, 05/01/17 | | | 473 | |
| | 335 | | | Comcast Corp., 6.500%, 01/15/17 | | | 342 | |
| | 422 | | | Discovery Communications LLC, 4.375%, 06/15/21 | | | 457 | |
| | 285 | | | Grupo Televisa SAB, (Mexico), 4.625%, 01/30/26 | | | 315 | |
| | 1,715 | | | Historic TW, Inc., 9.150%, 02/01/23 | | | 2,325 | |
| | 400 | | | NBCUniversal Enterprise, Inc., 1.974%, 04/15/19 (e) | | | 407 | |
| | 2,000 | | | NBCUniversal Media LLC, 2.875%, 01/15/23 | | | 2,095 | |
| | | | Time Warner Cable, Inc., | | | | |
| | 50 | | | 8.250%, 04/01/19 | | | 58 | |
| | 3,425 | | | 8.750%, 02/14/19 | | | 3,978 | |
| | 500 | | | Time Warner Entertainment Co. LP, 8.375%, 07/15/33 | | | 683 | |
| | | | Time Warner, Inc., | | | | |
| | 400 | | | 3.400%, 06/15/22 | | | 424 | |
| | 200 | | | 3.550%, 06/01/24 | | | 213 | |
| | | | Viacom, Inc., | | | | |
| | 700 | | | 3.125%, 06/15/22 | | | 699 | |
| | 189 | | | 3.250%, 03/15/23 | | | 188 | |
| | 300 | | | 3.875%, 04/01/24 | | | 311 | |
| | 1,111 | | | 4.250%, 09/01/23 | | | 1,177 | |
| | 806 | | | Walt Disney Co. (The), 1.100%, 12/01/17 | | | 806 | |
| | | | | | | | |
| | | | | | | 17,136 | |
| | | | | | | | |
| | | | Multiline Retail — 0.2% | | | | |
| | | | Macy’s Retail Holdings, Inc., | | | | |
| | 160 | | | 3.625%, 06/01/24 | | | 162 | |
| | 40 | | | 4.500%, 12/15/34 | | | 38 | |
| | 1,240 | | | 7.450%, 07/15/17 | | | 1,302 | |
| | 175 | | | Nordstrom, Inc., 4.000%, 10/15/21 | | | 188 | |
| | 868 | | | Target Corp., 3.500%, 07/01/24 | | | 956 | |
| | | | | | | | |
| | | | | | | 2,646 | |
| | | | | | | | |
| | | | Specialty Retail — 0.3% | | | | |
| | 262 | | | Bed Bath & Beyond, Inc., 3.749%, 08/01/24 | | | 271 | |
| | | | Home Depot, Inc. (The), | | | | |
| | 531 | | | 2.000%, 06/15/19 | | | 542 | |
| | 450 | | | 2.700%, 04/01/23 | | | 470 | |
| | 986 | | | 3.750%, 02/15/24 | | | 1,098 | |
| | | | | | | | |
PRINCIPAL
AMOUNT($) | | | SECURITY DESCRIPTION | | VALUE($) | |
| | | | | | | | |
| | | | Specialty Retail — continued | | | | |
| | | | Lowe’s Cos., Inc., | | | | |
| | 1,004 | | | 3.125%, 09/15/24 | | | 1,069 | |
| | 238 | | | 3.375%, 09/15/25 | | | 258 | |
| | | | | | | | |
| | | | | | | 3,708 | |
| | | | | | | | |
| | | | Total Consumer Discretionary | | | 30,790 | |
| | | | | | | | |
| | | | Consumer Staples — 2.5% | | | | |
| | | | Beverages — 0.7% | | | | |
| | | | Anheuser-Busch InBev Finance, Inc., | | | | |
| | 1,384 | | | 3.300%, 02/01/23 | | | 1,452 | |
| | 2,000 | | | 3.700%, 02/01/24 | | | 2,171 | |
| | | | Coca-Cola Co. (The), | | | | |
| | 893 | | | 1.150%, 04/01/18 | | | 894 | |
| | 1,000 | | | 1.800%, 09/01/16 | | | 1,000 | |
| | 1,000 | | | Diageo Investment Corp., 2.875%, 05/11/22 | | | 1,046 | |
| | 1,257 | | | PepsiCo, Inc., 1.250%, 08/13/17 | | | 1,262 | |
| | 1,450 | | | SABMiller Holdings, Inc., 3.750%, 01/15/22 (e) | | | 1,577 | |
| | | | | | | | |
| | | | | | | 9,402 | |
| | | | | | | | |
| | | | Food & Staples Retailing — 0.8% | | | | |
| | 1,094 | | | Costco Wholesale Corp., 2.250%, 02/15/22 | | | 1,123 | |
| | | | CVS Health Corp., | | | | |
| | 1,100 | | | 2.750%, 12/01/22 | | | 1,136 | |
| | 1,357 | | | 4.000%, 12/05/23 | | | 1,502 | |
| | | | Kroger Co. (The), | | | | |
| | 92 | | | 5.400%, 07/15/40 | | | 114 | |
| | 700 | | | 6.150%, 01/15/20 | | | 799 | |
| | 1,000 | | | 6.400%, 08/15/17 | | | 1,048 | |
| | 208 | | | Sysco Corp., 3.750%, 10/01/25 | | | 225 | |
| | 1,692 | | | Walgreens Boots Alliance, Inc., 3.100%, 06/01/23 | | | 1,745 | |
| | | | Wal-Mart Stores, Inc., | | | | |
| | 1,650 | | | 2.550%, 04/11/23 | | | 1,720 | |
| | 200 | | | 3.300%, 04/22/24 | | | 219 | |
| | 930 | | | 3.625%, 07/08/20 | | | 1,008 | |
| | | | | | | | |
| | | | | | | 10,639 | |
| | | | | | | | |
| | | | Food Products — 0.9% | | | | |
| | | | Bunge Ltd. Finance Corp., | | | | |
| | 31 | | | 3.500%, 11/24/20 | | | 32 | |
| | 1,192 | | | 8.500%, 06/15/19 | | | 1,394 | |
| | | | Cargill, Inc., | | | | |
| | 900 | | | 3.300%, 03/01/22 (e) | | | 941 | |
| | 400 | | | 6.000%, 11/27/17 (e) | | | 423 | |
| | 1,000 | | | 7.350%, 03/06/19 (e) | | | 1,145 | |
SEE NOTES TO FINANCIAL STATEMENTS.
| | | | | | |
| | | |
| 182 | | | | J.P. MORGAN INCOME FUNDS | | AUGUST 31, 2016 |
| | | | | | | | |
PRINCIPAL
AMOUNT($) | | | SECURITY DESCRIPTION | | VALUE($) | |
| Corporate Bonds — continued | |
| | | | Food Products — continued | | | | |
| | | | General Mills, Inc., | | | | |
| | 2,075 | | | 3.150%, 12/15/21 | | | 2,203 | |
| | 100 | | | 5.650%, 02/15/19 | | | 110 | |
| | | | Kellogg Co., | | | | |
| | 513 | | | 3.250%, 05/21/18 | | | 529 | |
| | 1,606 | | | 4.000%, 12/15/20 | | | 1,760 | |
| | | | Kraft Heinz Foods Co., | | | | |
| | 1,419 | | | 3.500%, 06/06/22 | | | 1,515 | |
| | 310 | | | 5.375%, 02/10/20 | | | 347 | |
| | 425 | | | 6.875%, 01/26/39 | | | 597 | |
| | 89 | | | Mead Johnson Nutrition Co., Class C, 4.125%, 11/15/25 | | | 97 | |
| | 1,600 | | | Mondelez International, Inc., 4.000%, 02/01/24 | | | 1,766 | |
| | 171 | | | Tyson Foods, Inc., 2.650%, 08/15/19 | | | 175 | |
| | | | | | | | |
| | | | | | | 13,034 | |
| | | | | | | | |
| | | | Household Products — 0.1% | | | | |
| | | | Kimberly-Clark Corp., | | | | |
| | 200 | | | 2.400%, 03/01/22 | | | 207 | |
| | 1,800 | | | 2.400%, 06/01/23 | | | 1,859 | |
| | | | | | | | |
| | | | | | | 2,066 | |
| | | | | | | | |
| | | | Total Consumer Staples | | | 35,141 | |
| | | | | | | | |
| | | | Energy — 3.1% | | | | |
| | | | Energy Equipment & Services — 0.3% | | | | |
| | 150 | | | Diamond Offshore Drilling, Inc., 3.450%, 11/01/23 | | | 133 | |
| | | | Halliburton Co., | | | | |
| | 350 | | | 3.500%, 08/01/23 | | | 362 | |
| | 550 | | | 6.150%, 09/15/19 | | | 616 | |
| | 750 | | | 8.750%, 02/15/21 | | | 929 | |
| | 800 | | | Nabors Industries, Inc., 4.625%, 09/15/21 | | | 762 | |
| | | | Schlumberger Investment S.A., (Luxembourg), | | | | |
| | 233 | | | 3.300%, 09/14/21 (e) | | | 248 | |
| | 737 | | | 3.650%, 12/01/23 | | | 802 | |
| | | | | | | | |
| | | | | | | 3,852 | |
| | | | | | | | |
| | | | Oil, Gas & Consumable Fuels — 2.8% | |
| | 1,025 | | | Anadarko Petroleum Corp., 8.700%, 03/15/19 | | | 1,170 | |
| | 400 | | | Apache Corp., 6.900%, 09/15/18 | | | 437 | |
| | | | BP Capital Markets plc, (United Kingdom), | | | | |
| | 1,000 | | | 2.241%, 09/26/18 | | | 1,019 | |
| | 317 | | | 2.750%, 05/10/23 | | | 323 | |
| | 712 | | | 3.245%, 05/06/22 | | | 752 | |
| | 900 | | | Burlington Resources, Inc., 8.200%, 03/15/25 | | | 1,171 | |
| | | | | | | | |
PRINCIPAL
AMOUNT($) | | | SECURITY DESCRIPTION | | VALUE($) | |
| | | | | | | | |
| | | | Oil, Gas & Consumable Fuels — continued | |
| | | | Canadian Natural Resources Ltd., (Canada), | | | | |
| | 800 | | | 5.700%, 05/15/17 | | | 824 | |
| | 500 | | | 5.900%, 02/01/18 | | | 525 | |
| | 1,200 | | | Cenovus Energy, Inc., (Canada), 3.800%, 09/15/23 | | | 1,159 | |
| | | | Chevron Corp., | | | | |
| | 1,000 | | | 2.355%, 12/05/22 | | | 1,024 | |
| | 285 | | | 3.191%, 06/24/23 | | | 305 | |
| | 833 | | | CNOOC Nexen Finance 2014 ULC, (Canada), 4.250%, 04/30/24 | | | 909 | |
| | 375 | | | ConocoPhillips Holding Co., 6.950%, 04/15/29 | | | 479 | |
| | 725 | | | Devon Energy Corp., 3.250%, 05/15/22 | | | 719 | |
| | | | Ecopetrol S.A., (Colombia), | | | | |
| | 467 | | | 4.125%, 01/16/25 | | | 452 | |
| | 773 | | | 5.375%, 06/26/26 | | | 789 | |
| | | | Energy Transfer Partners LP, | | | | |
| | 537 | | | 3.600%, 02/01/23 | | | 528 | |
| | 182 | | | 4.050%, 03/15/25 | | | 182 | |
| | | | EnLink Midstream Partners LP, | | | | |
| | 281 | | | 2.700%, 04/01/19 | | | 277 | |
| | 633 | | | 4.150%, 06/01/25 | | | 599 | |
| | | | Enterprise Products Operating LLC, | | | | |
| | 225 | | | 3.350%, 03/15/23 | | | 233 | |
| | 651 | | | 3.700%, 02/15/26 | | | 679 | |
| | 150 | | | 3.750%, 02/15/25 | | | 157 | |
| | 263 | | | 3.900%, 02/15/24 | | | 278 | |
| | 333 | | | 3.950%, 02/15/27 | | | 350 | |
| | | | EOG Resources, Inc., | | | | |
| | 240 | | | 2.625%, 03/15/23 | | | 239 | |
| | 600 | | | 4.150%, 01/15/26 | | | 661 | |
| | 2,200 | | | Exxon Mobil Corp., 2.709%, 03/06/25 | | | 2,298 | |
| | 1,294 | | | Magellan Midstream Partners LP, 4.250%, 02/01/21 | | | 1,389 | |
| | 400 | | | Marathon Oil Corp., 2.800%, 11/01/22 | | | 366 | |
| | 964 | | | Marathon Petroleum Corp., 3.625%, 09/15/24 | | | 977 | |
| | 118 | | | Noble Energy, Inc., 5.625%, 05/01/21 | | | 123 | |
| | | | Occidental Petroleum Corp., | | | | |
| | 441 | | | 2.700%, 02/15/23 | | | 449 | |
| | 727 | | | 3.500%, 06/15/25 | | | 773 | |
| | 1,800 | | | ONEOK Partners LP, 4.900%, 03/15/25 | | | 1,949 | |
| | | | Petroleos Mexicanos, (Mexico), | | | | |
| | 731 | | | 4.500%, 01/23/26 | | | 733 | |
| | 270 | | | 4.875%, 01/18/24 | | | 282 | |
| | 466 | | | 6.375%, 02/04/21 (e) | | | 515 | |
| | 173 | | | Phillips 66, 4.300%, 04/01/22 | | | 191 | |
SEE NOTES TO FINANCIAL STATEMENTS.
| | | | | | | | |
| | | |
| AUGUST 31, 2016 | | J.P. MORGAN INCOME FUNDS | | | | | 183 | |
JPMorgan Inflation Managed Bond Fund
SCHEDULE OF PORTFOLIO INVESTMENTS
AS OF AUGUST 31, 2016 (Unaudited) (continued)
(Amounts in thousands)
| | | | | | | | |
PRINCIPAL
AMOUNT($) | | | SECURITY DESCRIPTION | | VALUE($) | |
| Corporate Bonds — continued | |
| | | | Oil, Gas & Consumable Fuels — continued | |
| | | | Plains All American Pipeline LP/PAA Finance Corp., | | | | |
| | 705 | | | 2.600%, 12/15/19 | | | 709 | |
| | 575 | | | 3.650%, 06/01/22 | | | 581 | |
| | 300 | | | 3.850%, 10/15/23 | | | 299 | |
| | | | Spectra Energy Capital LLC, | | | | |
| | 503 | | | 3.300%, 03/15/23 | | | 497 | |
| | 50 | | | 6.200%, 04/15/18 | | | 53 | |
| | 710 | | | 8.000%, 10/01/19 | | | 819 | |
| | | | Statoil ASA, (Norway), | | | | |
| | 1,200 | | | 1.150%, 05/15/18 | | | 1,197 | |
| | 1,179 | | | 2.650%, 01/15/24 | | | 1,207 | |
| | | | Suncor Energy, Inc., (Canada), | | | | |
| | 350 | | | 3.600%, 12/01/24 | | | 369 | |
| | 200 | | | 6.100%, 06/01/18 | | | 215 | |
| | | | Sunoco Logistics Partners Operations LP, | | | | |
| | 156 | | | 4.250%, 04/01/24 | | | 162 | |
| | 700 | | | 5.500%, 02/15/20 | | | 766 | |
| | 1,153 | | | Texas Eastern Transmission LP, 2.800%, 10/15/22 (e) | | | 1,150 | |
| | 821 | | | Total Capital Canada Ltd., (Canada), 2.750%, 07/15/23 | | | 847 | |
| | | | Total Capital International S.A., (France), | | | | |
| | 138 | | | 1.550%, 06/28/17 | | | 139 | |
| | 200 | | | 2.700%, 01/25/23 | | | 207 | |
| | 1,003 | | | 3.750%, 04/10/24 | | | 1,102 | |
| | | | TransCanada PipeLines Ltd., (Canada), | | | | |
| | 455 | | | 2.500%, 08/01/22 | | | 456 | |
| | 2,345 | | | 3.750%, 10/16/23 | | | 2,508 | |
| | 300 | | | 7.125%, 01/15/19 | | | 334 | |
| | | | | | | | |
| | | | | | | 39,902 | |
| | | | | | | | |
| | | | Total Energy | | | 43,754 | |
| | | | | | | | |
| | | | Financials — 10.8% | | | | |
| | | | Banks — 4.4% | |
| | 1,629 | | | ABN AMRO Bank N.V., (Netherlands), 2.500%, 10/30/18 (e) | | | 1,661 | |
| | | | Bank of America Corp., | | | | |
| | 427 | | | 2.000%, 01/11/18 | | | 429 | |
| | 53 | | | 3.300%, 01/11/23 | | | 55 | |
| | 1,154 | | | 4.000%, 01/22/25 | | | 1,202 | |
| | 737 | | | 4.125%, 01/22/24 | | | 803 | |
| | 556 | | | 4.450%, 03/03/26 | | | 598 | |
| | 780 | | | 5.000%, 05/13/21 | | | 875 | |
| | 865 | | | 5.625%, 07/01/20 | | | 976 | |
| | 585 | | | 5.650%, 05/01/18 | | | 622 | |
| | | | | | | | |
PRINCIPAL
AMOUNT($) | | | SECURITY DESCRIPTION | | VALUE($) | |
| | | | | | | | |
| | | | Banks — continued | |
| | 600 | | | 6.400%, 08/28/17 | | | 629 | |
| | 2,000 | | | 6.875%, 04/25/18 | | | 2,168 | |
| | 2,600 | | | 7.625%, 06/01/19 | | | 2,987 | |
| | | | Bank of Montreal, (Canada), | | | | |
| | 567 | | | 1.400%, 09/11/17 | | | 568 | |
| | 1,153 | | | 2.375%, 01/25/19 | | | 1,176 | |
| | 100 | | | 2.550%, 11/06/22 | | | 103 | |
| | | | Bank of Nova Scotia (The), (Canada), | | | | |
| | 2,000 | | | 1.450%, 04/25/18 | | | 2,005 | |
| | 630 | | | 2.800%, 07/21/21 | | | 656 | |
| | 952 | | | Barclays plc, (United Kingdom), 3.650%, 03/16/25 | | | 946 | |
| | | | BB&T Corp., | | | | |
| | 166 | | | 2.450%, 01/15/20 | | | 170 | |
| | 500 | | | 2.625%, 06/29/20 | | | 516 | |
| | 3,360 | | | Capital One Bank USA N.A., 3.375%, 02/15/23 | | | 3,452 | |
| | | | Citigroup, Inc., | | | | |
| | 1,000 | | | 1.550%, 08/14/17 | | | 1,001 | |
| | 845 | | | 1.800%, 02/05/18 | | | 848 | |
| | 2,000 | | | 2.050%, 12/07/18 | | | 2,015 | |
| | 650 | | | 3.400%, 05/01/26 | | | 669 | |
| | 778 | | | Commonwealth Bank of Australia, (Australia), 4.500%, 12/09/25 (e) | | | 833 | |
| | 903 | | | Cooperatieve Rabobank UA, (Netherlands), 3.875%, 02/08/22 | | | 986 | |
| | 447 | | | Discover Bank, 4.200%, 08/08/23 | | | 479 | |
| | 470 | | | Fifth Third Bancorp, 2.875%, 07/27/20 | | | 487 | |
| | | | Fifth Third Bank, | | | | |
| | 250 | | | 2.375%, 04/25/19 | | | 255 | |
| | 425 | | | 2.875%, 10/01/21 | | | 444 | |
| | | | HSBC Bank plc, (United Kingdom), | | | | |
| | 523 | | | 1.500%, 05/15/18 (e) | | | 521 | |
| | 1,100 | | | 4.750%, 01/19/21 (e) | | | 1,217 | |
| | | | HSBC Holdings plc, (United Kingdom), | | | | |
| | 1,100 | | | 4.000%, 03/30/22 | | | 1,176 | |
| | 800 | | | 4.250%, 03/14/24 | | | 833 | |
| | 251 | | | 4.300%, 03/08/26 | | | 270 | |
| | 352 | | | Huntington Bancshares, Inc., 3.150%, 03/14/21 | | | 366 | |
| | | | KeyCorp, | | | | |
| | 42 | | | 2.900%, 09/15/20 | | | 44 | |
| | 1,657 | | | 5.100%, 03/24/21 | | | 1,870 | |
| | 813 | | | Lloyds Bank plc, (United Kingdom), 1.750%, 03/16/18 | | | 813 | |
| | 1,000 | | | Manufacturers & Traders Trust Co., 6.625%, 12/04/17 | | | 1,064 | |
SEE NOTES TO FINANCIAL STATEMENTS.
| | | | | | |
| | | |
| 184 | | | | J.P. MORGAN INCOME FUNDS | | AUGUST 31, 2016 |
| | | | | | | | |
PRINCIPAL
AMOUNT($) | | | SECURITY DESCRIPTION | | VALUE($) | |
| Corporate Bonds — continued | |
| | | | Banks — continued | |
| | 909 | | | Mizuho Bank Ltd., (Japan), 2.650%, 09/25/19 (e) | | | 928 | |
| | 100 | | | National City Corp., 6.875%, 05/15/19 | | | 113 | |
| | 591 | | | Nordea Bank AB, (Sweden), 4.250%, 09/21/22 (e) | | | 635 | |
| | 356 | | | PNC Bank N.A., 1.950%, 03/04/19 | | | 360 | |
| | 50 | | | PNC Financial Services Group Inc. (The), 5.125%, 02/08/20 | | | 56 | |
| | | | PNC Financial Services Group, Inc. (The), | | | | |
| | 362 | | | 4.375%, 08/11/20 | | | 397 | |
| | 50 | | | 5.625%, 02/01/17 | | | 51 | |
| | 363 | | | 6.700%, 06/10/19 | | | 414 | |
| | 402 | | | Regions Financial Corp., 3.200%, 02/08/21 | | | 417 | |
| | | | Royal Bank of Canada, (Canada), | | | | |
| | 1,302 | | | 1.200%, 09/19/17 | | | 1,302 | |
| | 1,193 | | | 2.000%, 10/01/18 | | | 1,207 | |
| | 600 | | | 2.200%, 07/27/18 | | | 609 | |
| | 250 | | | Santander UK Group Holdings plc, (United Kingdom), 3.125%, 01/08/21 | | | 254 | |
| | 799 | | | Santander UK plc, (United Kingdom), 2.500%, 03/14/19 | | | 811 | |
| | 442 | | | Stadshypotek AB, (Sweden), 1.875%, 10/02/19 (e) | | | 446 | |
| | 1,800 | | | Standard Chartered plc, (United Kingdom), 5.200%, 01/26/24 (e) | | | 1,931 | |
| | | | SunTrust Banks, Inc., | | | | |
| | 1,500 | | | 2.750%, 05/01/23 | | | 1,518 | |
| | 800 | | | 3.500%, 01/20/17 | | | 806 | |
| | | | Toronto-Dominion Bank (The), (Canada), | | | | |
| | 400 | | | 1.500%, 03/13/17 (e) | | | 401 | |
| | 1,041 | | | 1.750%, 07/23/18 | | | 1,048 | |
| | | | U.S. Bancorp, | | | | |
| | 307 | | | 1.650%, 05/15/17 | | | 308 | |
| | 500 | | | 2.200%, 04/25/19 | | | 511 | |
| | 215 | | | 2.950%, 07/15/22 | | | 224 | |
| | 732 | | | 4.125%, 05/24/21 | | | 812 | |
| | | | Wachovia Corp., | | | | |
| | 1,000 | | | 5.750%, 06/15/17 | | | 1,035 | |
| | 3,895 | | | 5.750%, 02/01/18 | | | 4,136 | |
| | | | Wells Fargo & Co., | | | | |
| | 428 | | | 2.550%, 12/07/20 | | | 440 | |
| | 368 | | | 3.000%, 02/19/25 | | | 378 | |
| | 1,000 | | | 3.500%, 03/08/22 | | | 1,068 | |
| | 1,000 | | | Wells Fargo Bank N.A., 6.000%, 11/15/17 | | | 1,054 | |
| | 506 | | | Westpac Banking Corp., (Australia), 2.000%, 03/03/20 (e) | | | 512 | |
| | | | | | | | |
| | | | | | | 62,970 | |
| | | | | | | | |
| | | | | | | | |
PRINCIPAL
AMOUNT($) | | | SECURITY DESCRIPTION | | VALUE($) | |
| | | | | | | | |
| | | | Capital Markets — 2.9% | |
| | 2,150 | | | Ameriprise Financial, Inc., 4.000%, 10/15/23 | | | 2,354 | |
| | | | Bank of New York Mellon Corp. (The), | | | | |
| | 92 | | | 2.600%, 08/17/20 | | | 95 | |
| | 1,440 | | | 4.150%, 02/01/21 | | | 1,579 | |
| | 155 | | | 4.600%, 01/15/20 | | | 170 | |
| | 200 | | | BlackRock, Inc., 6.250%, 09/15/17 | | | 211 | |
| | 470 | | | Blackstone Holdings Finance Co. LLC, 4.750%, 02/15/23 (e) | | | 524 | |
| | 500 | | | CDP Financial, Inc., (Canada), 4.400%, 11/25/19 (e) | | | 546 | |
| | 40 | | | Charles Schwab Corp. (The), 3.225%, 09/01/22 | | | 42 | |
| | 1,666 | | | CME Group, Inc., 3.000%, 09/15/22 | | | 1,762 | |
| | | | Credit Suisse AG, (Switzerland), | | | | |
| | 833 | | | 1.750%, 01/29/18 | | | 834 | |
| | 520 | | | 3.625%, 09/09/24 | | | 546 | |
| | | | Deutsche Bank AG, (Germany), | | | | |
| | 610 | | | 1.875%, 02/13/18 | | | 607 | |
| | 350 | | | 6.000%, 09/01/17 | | | 363 | |
| | | | Goldman Sachs Group, Inc. (The), | | | | |
| | 500 | | | 3.625%, 01/22/23 | | | 530 | |
| | 92 | | | 4.250%, 10/21/25 | | | 98 | |
| | 196 | | | 5.250%, 07/27/21 | | | 222 | |
| | 900 | | | 5.375%, 03/15/20 | | | 1,001 | |
| | 5,150 | | | 7.500%, 02/15/19 | | | 5,863 | |
| | 1,195 | | | Series D, 6.000%, 06/15/20 | | | 1,364 | |
| | 1,502 | | | Intercontinental Exchange, Inc., 4.000%, 10/15/23 | | | 1,656 | |
| | 436 | | | Invesco Finance plc, (United Kingdom), 3.750%, 01/15/26 | | | 468 | |
| | 1,850 | | | Jefferies Group LLC, 6.875%, 04/15/21 | | | 2,122 | |
| | 334 | | | Legg Mason, Inc., 4.750%, 03/15/26 | | | 365 | |
| | | | Macquarie Bank Ltd., (Australia), | | | | |
| | 810 | | | 1.600%, 10/27/17 (e) | | | 812 | |
| | 481 | | | 2.600%, 06/24/19 (e) | | | 490 | |
| | 800 | | | Macquarie Group Ltd., (Australia), 6.250%, 01/14/21 (e) | | | 911 | |
| | | | Morgan Stanley, | | | | |
| | 600 | | | 2.650%, 01/27/20 | | | 615 | |
| | 1,081 | | | 3.875%, 01/27/26 | | | 1,155 | |
| | 880 | | | 4.350%, 09/08/26 | | | 942 | |
| | 622 | | | 5.000%, 11/24/25 | | | 693 | |
| | 154 | | | 5.500%, 07/24/20 | | | 174 | |
| | 2,500 | | | 5.625%, 09/23/19 | | | 2,779 | |
| | 687 | | | 5.750%, 01/25/21 | | | 787 | |
| | 1,000 | | | 6.625%, 04/01/18 | | | 1,077 | |
SEE NOTES TO FINANCIAL STATEMENTS.
| | | | | | | | |
| | | |
| AUGUST 31, 2016 | | J.P. MORGAN INCOME FUNDS | | | | | 185 | |
JPMorgan Inflation Managed Bond Fund
SCHEDULE OF PORTFOLIO INVESTMENTS
AS OF AUGUST 31, 2016 (Unaudited) (continued)
(Amounts in thousands)
| | | | | | | | |
PRINCIPAL
AMOUNT($) | | | SECURITY DESCRIPTION | | VALUE($) | |
| Corporate Bonds — continued | |
| | | | Capital Markets — continued | |
| | 1,700 | | | 7.300%, 05/13/19 | | | 1,941 | |
| | | | State Street Corp., | | | | |
| | 1,724 | | | 3.100%, 05/15/23 | | | 1,801 | |
| | 1,154 | | | 3.700%, 11/20/23 | | | 1,273 | |
| | | | Thomson Reuters Corp., (Canada), | | | | |
| | 1,700 | | | 3.950%, 09/30/21 | | | 1,815 | |
| | 800 | | | 4.300%, 11/23/23 | | | 879 | |
| | | | | | | | |
| | | | | | | 41,466 | |
| | | | | | | | |
| | | | Consumer Finance — 1.3% | | | | |
| | 400 | | | American Express Centurion Bank, 6.000%, 09/13/17 | | | 420 | |
| | | | American Express Co., | | | | |
| | 200 | | | 6.150%, 08/28/17 | | | 209 | |
| | 1,820 | | | 7.000%, 03/19/18 | | | 1,973 | |
| | | | American Honda Finance Corp., | | | | |
| | 250 | | | 2.250%, 08/15/19 | | | 256 | |
| | 1,450 | | | 7.625%, 10/01/18 (e) | | | 1,631 | |
| | | | Caterpillar Financial Services Corp., | | | | |
| | 176 | | | 2.250%, 12/01/19 | | | 180 | |
| | 510 | | | 2.750%, 08/20/21 | | | 534 | |
| | 900 | | | 2.850%, 06/01/22 | | | 941 | |
| | 675 | | | 7.150%, 02/15/19 | | | 768 | |
| | | | Ford Motor Credit Co. LLC, | | | | |
| | 484 | | | 1.724%, 12/06/17 | | | 485 | |
| | 792 | | | 2.375%, 03/12/19 | | | 802 | |
| | 627 | | | 3.000%, 06/12/17 | | | 635 | |
| | | | General Motors Financial Co., Inc., | | | | |
| | 522 | | | 3.100%, 01/15/19 | | | 532 | |
| | 615 | | | 3.700%, 05/09/23 | | | 627 | |
| | | | John Deere Capital Corp., | | | | |
| | 753 | | | 1.600%, 07/13/18 | | | 759 | |
| | 65 | | | 1.700%, 01/15/20 | | | 65 | |
| | 650 | | | 3.150%, 10/15/21 | | | 692 | |
| | 1,166 | | | Nissan Motor Acceptance Corp., 1.800%, 03/15/18 (e) | | | 1,172 | |
| | | | PACCAR Financial Corp., | | | | |
| | 591 | | | 1.600%, 03/15/17 | | | 594 | |
| | 1,400 | | | 2.200%, 09/15/19 | | | 1,431 | |
| | | | Toyota Motor Credit Corp., | | | | |
| | 429 | | | 1.375%, 01/10/18 | | | 430 | |
| | 1,700 | | | 2.125%, 07/18/19 | | | 1,737 | |
| | 800 | | | 2.625%, 01/10/23 | | | 828 | |
| | | | | | | | |
| | | | | | | 17,701 | |
| | | | | | | | |
| | | | | | | | |
PRINCIPAL
AMOUNT($) | | | SECURITY DESCRIPTION | | VALUE($) | |
| | | | | | | | |
| | | | Diversified Financial Services — 0.8% | |
| | 7,238 | | | GE Capital International Funding Co. Unlimited Co., (Ireland), 2.342%, 11/15/20 | | | 7,448 | |
| | 650 | | | National Rural Utilities Cooperative Finance Corp., 10.375%, 11/01/18 | | | 772 | |
| | | | Shell International Finance B.V., (Netherlands), | | | | |
| | 788 | | | 2.875%, 05/10/26 | | | 810 | |
| | 150 | | | 3.400%, 08/12/23 | | | 161 | |
| | 1,555 | | | 4.300%, 09/22/19 | | | 1,687 | |
| | 40 | | | 4.375%, 03/25/20 | | | 44 | |
| | | | | | | | |
| | | | | | | 10,922 | |
| | | | | | | | |
| | | | Insurance — 1.4% | |
| | 651 | | | Allstate Corp. (The), 3.150%, 06/15/23 | | | 692 | |
| | 818 | | | American International Group, Inc., 4.125%, 02/15/24 | | | 880 | |
| | | | Berkshire Hathaway Finance Corp., | | | | |
| | 323 | | | 1.300%, 05/15/18 | | | 324 | |
| | 2,160 | | | 5.400%, 05/15/18 | | | 2,313 | |
| | 61 | | | Chubb Corp. (The), 5.750%, 05/15/18 | | | 66 | |
| | 1,900 | | | Chubb INA Holdings, Inc., 2.700%, 03/13/23 | | | 1,967 | |
| | | | CNA Financial Corp., | | | | |
| | 499 | | | 3.950%, 05/15/24 | | | 526 | |
| | 364 | | | 4.500%, 03/01/26 | | | 394 | |
| | 675 | | | Jackson National Life Global Funding, 3.050%, 04/29/26 (e) | | | 686 | |
| | | | Liberty Mutual Group, Inc., | | | | |
| | 950 | | | 4.250%, 06/15/23 (e) | | | 1,028 | |
| | 900 | | | 5.000%, 06/01/21 (e) | | | 997 | |
| | 864 | | | Lincoln National Corp., 4.200%, 03/15/22 | | | 933 | |
| | 1,000 | | | Manulife Financial Corp., (Canada), 4.150%, 03/04/26 | | | 1,089 | |
| | 824 | | | Marsh & McLennan Cos., Inc., 2.350%, 03/06/20 | | | 838 | |
| | 1,216 | | | MassMutual Global Funding II, 2.100%, 08/02/18 (e) | | | 1,235 | |
| | | | Metropolitan Life Global Funding I, | | | | |
| | 710 | | | 1.500%, 01/10/18 (e) | | | 713 | |
| | 1,600 | | | 3.000%, 01/10/23 (e) | | | 1,652 | |
| | 426 | | | 3.875%, 04/11/22 (e) | | | 462 | |
| | | | New York Life Global Funding, | | | | |
| | 323 | | | 1.950%, 02/11/20 (e) | | | 327 | |
| | 1,024 | | | 2.150%, 06/18/19 (e) | | | 1,044 | |
| | 471 | | | Principal Financial Group, Inc., 3.125%, 05/15/23 | | | 482 | |
| | 650 | | | Prudential Insurance Co. of America (The), 8.300%, 07/01/25 (e) | | | 879 | |
SEE NOTES TO FINANCIAL STATEMENTS.
| | | | | | |
| | | |
| 186 | | | | J.P. MORGAN INCOME FUNDS | | AUGUST 31, 2016 |
| | | | | | | | |
PRINCIPAL
AMOUNT($) | | | SECURITY DESCRIPTION | | VALUE($) | |
| Corporate Bonds — continued | |
| | | | Insurance — continued | |
| | 373 | | | Reliance Standard Life Global Funding II, 3.050%, 01/20/21 (e) | | | 382 | |
| | | | | | | | |
| | | | | | | 19,909 | |
| | | | | | | | |
| | | | Total Financials | | | 152,968 | |
| | | | | | | | |
| | | | Health Care — 1.8% | | | | |
| | | | Biotechnology — 0.4% | |
| | | | Amgen, Inc., | | | | |
| | 1,100 | | | 3.875%, 11/15/21 | | | 1,197 | |
| | 1,350 | | | 4.100%, 06/15/21 | | | 1,479 | |
| | 117 | | | Baxalta, Inc., 3.600%, 06/23/22 | | | 120 | |
| | 612 | | | Biogen, Inc., 3.625%, 09/15/22 | | | 655 | |
| | | | Celgene Corp., | | | | |
| | 1,000 | | | 3.250%, 08/15/22 | | | 1,043 | |
| | 700 | | | 3.950%, 10/15/20 | | | 755 | |
| | 88 | | | Gilead Sciences, Inc., 3.250%, 09/01/22 | | | 94 | |
| | | | | | | | |
| | | | | | | 5,343 | |
| | | | | | | | |
| | | | Health Care Equipment & Supplies — 0.2% | | | | |
| | 246 | | | Becton, Dickinson & Co., 2.675%, 12/15/19 | | | 255 | |
| | 2,400 | | | Medtronic, Inc., 3.500%, 03/15/25 | | | 2,601 | |
| | | | | | | | |
| | | | | | | 2,856 | |
| | | | | | | | |
| | | | Health Care Providers & Services — 0.3% | |
| | 381 | | | Aetna, Inc., 1.750%, 05/15/17 | | | 382 | |
| | 700 | | | Anthem, Inc., 3.300%, 01/15/23 | | | 733 | |
| | 131 | | | Cardinal Health, Inc., 3.750%, 09/15/25 | | | 142 | |
| | 150 | | | McKesson Corp., 2.700%, 12/15/22 | | | 152 | |
| | | | UnitedHealth Group, Inc., | | | | |
| | 365 | | | 2.750%, 02/15/23 | | | 378 | |
| | 145 | | | 2.875%, 03/15/22 | | | 152 | |
| | 1,500 | | | 2.875%, 03/15/23 | | | 1,567 | |
| | 187 | | | 3.375%, 11/15/21 | | | 201 | |
| | 255 | | | 4.700%, 02/15/21 | | | 286 | |
| | 100 | | | WellPoint, Inc., 2.375%, 02/15/17 | | | 100 | |
| | | | | | | | |
| | | | | | | 4,093 | |
| | | | | | | | |
| | | | Life Sciences Tools & Services — 0.0% (g) | |
| | 441 | | | Thermo Fisher Scientific, Inc., 3.600%, 08/15/21 | | | 469 | |
| | | | | | | | |
| | | | Pharmaceuticals — 0.9% | |
| | | | AbbVie, Inc., | | | | |
| | 302 | | | 2.850%, 05/14/23 | | | 306 | |
| | 1,304 | | | 2.900%, 11/06/22 | | | 1,343 | |
| | 316 | | | Actavis Funding SCS, (Luxembourg), 3.450%, 03/15/22 | | | 331 | |
| | | | | | | | |
PRINCIPAL
AMOUNT($) | | | SECURITY DESCRIPTION | | VALUE($) | |
| | | | | | | | |
| | | | Pharmaceuticals — continued | |
| | 250 | | | Actavis, Inc., 3.250%, 10/01/22 | | | 259 | |
| | 1,210 | | | Bristol-Myers Squibb Co., 2.000%, 08/01/22 | | | 1,221 | |
| | 555 | | | Forest Laboratories LLC, 5.000%, 12/15/21 (e) | | | 623 | |
| | 1,875 | | | GlaxoSmithKline Capital, Inc., 2.800%, 03/18/23 | | | 1,969 | |
| | 1,657 | | | Johnson & Johnson, 2.050%, 03/01/23 | | | 1,692 | |
| | | | Merck & Co., Inc., | | | | |
| | 1,400 | | | 1.300%, 05/18/18 | | | 1,408 | |
| | 215 | | | 2.350%, 02/10/22 | | | 221 | |
| | 1,800 | | | Mylan N.V., (Netherlands), 2.500%, 06/07/19 (e) | | | 1,823 | |
| | 1,153 | | | Novartis Capital Corp., 3.400%, 05/06/24 | | | 1,267 | |
| | 498 | | | Teva Pharmaceutical Finance Co. B.V., (Netherlands), Series 2, 3.650%, 11/10/21 | | | 527 | |
| | 174 | | | Zoetis, Inc., 1.875%, 02/01/18 | | | 174 | |
| | | | | | | | |
| | | | | | | 13,164 | |
| | | | | | | | |
| | | | Total Health Care | | | 25,925 | |
| | | | | | | | |
| | | | Industrials — 3.6% | | | | |
| | | | Aerospace & Defense — 0.6% | |
| | 864 | | | BAE Systems Holdings, Inc., 3.800%, 10/07/24 (e) | | | 913 | |
| | | | Boeing Co. (The), | | | | |
| | 540 | | | 4.875%, 02/15/20 | | | 605 | |
| | 750 | | | 7.950%, 08/15/24 | | | 1,056 | |
| | 2,000 | | | General Dynamics Corp., 2.250%, 11/15/22 | | | 2,049 | |
| | | | Lockheed Martin Corp., | | | | |
| | 380 | | | 3.350%, 09/15/21 | | | 406 | |
| | 850 | | | 4.250%, 11/15/19 | | | 924 | |
| | 325 | | | Northrop Grumman Corp., 5.050%, 08/01/19 | | | 356 | |
| | | | Precision Castparts Corp., | | | | |
| | 1,500 | | | 2.500%, 01/15/23 | | | 1,555 | |
| | 800 | | | 3.250%, 06/15/25 | | | 861 | |
| | 476 | | | Raytheon Co., 3.150%, 12/15/24 | | | 512 | |
| | | | | | | | |
| | | | | | | 9,237 | |
| | | | | | | | |
| | | | Air Freight & Logistics — 0.3% | |
| | 796 | | | FedEx Corp., 3.200%, 02/01/25 | | | 835 | |
| | | | United Parcel Service, Inc., | | | | |
| | 1,457 | | | 2.450%, 10/01/22 | | | 1,521 | |
| | 1,600 | | | 3.125%, 01/15/21 | | | 1,708 | |
| | 425 | | | 5.125%, 04/01/19 | | | 467 | |
| | | | | | | | |
| | | | | | | 4,531 | |
| | | | | | | | |
SEE NOTES TO FINANCIAL STATEMENTS.
| | | | | | | | |
| | | |
| AUGUST 31, 2016 | | J.P. MORGAN INCOME FUNDS | | | | | 187 | |
JPMorgan Inflation Managed Bond Fund
SCHEDULE OF PORTFOLIO INVESTMENTS
AS OF AUGUST 31, 2016 (Unaudited) (continued)
(Amounts in thousands)
| | | | | | | | |
PRINCIPAL
AMOUNT($) | | | SECURITY DESCRIPTION | | VALUE($) | |
| Corporate Bonds — continued | |
| | | | Airlines — 0.2% | |
| | 388 | | | Air Canada 2013-1 Class A Pass-Through Trust, (Canada), 4.125%, 05/15/25 (e) | | | 413 | |
| | 65 | | | American Airlines 2011-1 Class A Pass-Through Trust, Series A, 5.250%, 01/31/21 | | | 70 | |
| | 825 | | | American Airlines 2013-2 Class A Pass-Through Trust, 4.950%, 01/15/23 | | | 902 | |
| | 126 | | | American Airlines 2016-2 Class A Pass-Through Trust, Series A, 3.650%, 06/15/28 | | | 133 | |
| | 309 | | | Continental Airlines 2007-1 Class A Pass-Through Trust, Series 071A, 5.983%, 04/19/22 | | | 349 | |
| | 259 | | | Continental Airlines 2012-2 Class A Pass-Through Trust, Series 2-A, 4.000%, 10/29/24 | | | 278 | |
| | 32 | | | Delta Air Lines 2010-2 Class A Pass-Through Trust, Series 2A, 4.950%, 05/23/19 | | | 34 | |
| | 58 | | | Delta Air Lines 2011-1 Class A Pass-Through Trust, Series A, 5.300%, 04/15/19 | | | 62 | |
| | 392 | | | Delta Air Lines 2012-1 Class A Pass-Through Trust, Series A, 4.750%, 05/07/20 | | | 418 | |
| | | | | | | | |
| | | | | | | 2,659 | |
| | | | | | | | |
| | | | Commercial Services & Supplies — 0.2% | |
| | | | Republic Services, Inc., | | | | |
| | 417 | | | 3.550%, 06/01/22 | | | 447 | |
| | 1,200 | | | 5.500%, 09/15/19 | | | 1,333 | |
| | | | Waste Management, Inc., | | | | |
| | 862 | | | 2.900%, 09/15/22 | | | 901 | |
| | 242 | | | 4.600%, 03/01/21 | | | 269 | |
| | 150 | | | 4.750%, 06/30/20 | | | 166 | |
| | | | | | | | |
| | | | | | | 3,116 | |
| | | | | | | | |
| | | | Construction & Engineering — 0.1% | |
| | 350 | | | ABB Finance USA, Inc., 2.875%, 05/08/22 | | | 367 | |
| | 526 | | | Fluor Corp., 3.375%, 09/15/21 | | | 563 | |
| | | | | | | | |
| | | | | | | 930 | |
| | | | | | | | |
| | | | Electrical Equipment — 0.0% (g) | |
| | 272 | | | Eaton Corp., 1.500%, 11/02/17 | | | 273 | |
| | | | | | | | |
| | | | Industrial Conglomerates — 0.6% | | | | |
| | | | General Electric Co., | | | | |
| | 636 | | | 1.600%, 11/20/17 | | | 640 | |
| | 200 | | | 2.100%, 12/11/19 | | | 205 | |
| | 125 | | | 4.375%, 09/16/20 | | | 139 | |
| | 1,919 | | | 4.650%, 10/17/21 | | | 2,191 | |
| | 95 | | | 5.300%, 02/11/21 | | | 109 | |
| | 529 | | | 5.500%, 01/08/20 | | | 599 | |
| | 80 | | | 5.625%, 09/15/17 | | | 84 | |
| | | | | | | | |
PRINCIPAL
AMOUNT($) | | | SECURITY DESCRIPTION | | VALUE($) | |
| | | | | | | | |
| | | | Industrial Conglomerates — continued | | | | |
| | 70 | | | 5.875%, 01/14/38 | | | 96 | |
| | 1,200 | | | Honeywell International, Inc., 4.250%, 03/01/21 | | | 1,340 | |
| | 490 | | | Hutchison Whampoa International 12 II Ltd., (Cayman Islands), 3.250%, 11/08/22 (e) | | | 520 | |
| | | | Koninklijke Philips N.V., (Netherlands), | | | | |
| | 1,200 | | | 3.750%, 03/15/22 | | | 1,291 | |
| | 480 | | | 5.750%, 03/11/18 | | | 512 | |
| | 208 | | | Roper Technologies, Inc., 3.000%, 12/15/20 | | | 216 | |
| | | | | | | | |
| | | | | | | 7,942 | |
| | | | | | | | |
| | | | Machinery — 0.2% | |
| | 30 | | | Caterpillar, Inc., 7.900%, 12/15/18 | | | 34 | |
| | | | Deere & Co., | | | | |
| | 298 | | | 2.600%, 06/08/22 | | | 309 | |
| | 700 | | | 4.375%, 10/16/19 | | | 765 | |
| | 1,400 | | | Illinois Tool Works, Inc., 3.500%, 03/01/24 | | | 1,532 | |
| | 228 | | | Parker-Hannifin Corp., 3.300%, 11/21/24 | | | 245 | |
| | | | | | | | |
| | | | | | | 2,885 | |
| | | | | | | | |
| | | | Professional Services — 0.0% (g) | | | | |
| | 264 | | | Equifax, Inc., 2.300%, 06/01/21 | | | 265 | |
| | | | | | | | |
| | | | Road & Rail — 1.4% | | | | |
| | | | Burlington Northern Santa Fe LLC, | | | | |
| | 125 | | | 3.600%, 09/01/20 | | | 135 | |
| | 2,000 | | | 4.100%, 06/01/21 | | | 2,213 | |
| | | | Canadian Pacific Railway Co., (Canada), | | | | |
| | 1,146 | | | 4.500%, 01/15/22 | | | 1,257 | |
| | 600 | | | 7.250%, 05/15/19 | | | 686 | |
| | | | CSX Corp., | | | | |
| | 3,000 | | | 6.250%, 03/15/18 | | | 3,217 | |
| | 230 | | | 7.375%, 02/01/19 | | | 261 | |
| | | | ERAC USA Finance LLC, | | | | |
| | 120 | | | 2.800%, 11/01/18 (e) | | | 123 | |
| | 1,500 | | | 3.300%, 10/15/22 (e) | | | 1,568 | |
| | 650 | | | 3.850%, 11/15/24 (e) | | | 701 | |
| | 315 | | | 4.500%, 08/16/21 (e) | | | 347 | |
| | | | Norfolk Southern Corp., | | | | |
| | 812 | | | 2.903%, 02/15/23 | | | 841 | |
| | 250 | | | 3.000%, 04/01/22 | | | 261 | |
| | 829 | | | 3.250%, 12/01/21 | | | 876 | |
| | 750 | | | 3.850%, 01/15/24 | | | 820 | |
| | 300 | | | 5.750%, 04/01/18 | | | 321 | |
| | 263 | | | Penske Truck Leasing Co. LP/PTL Finance Corp., 2.500%, 06/15/19 (e) | | | 265 | |
| | | | Ryder System, Inc., | | | | |
| | 555 | | | 2.450%, 09/03/19 | | | 563 | |
SEE NOTES TO FINANCIAL STATEMENTS.
| | | | | | |
| | | |
| 188 | | | | J.P. MORGAN INCOME FUNDS | | AUGUST 31, 2016 |
| | | | | | | | |
PRINCIPAL
AMOUNT($) | | | SECURITY DESCRIPTION | | VALUE($) | |
| Corporate Bonds — continued | |
| | | | Road & Rail — continued | | | | |
| | 145 | | | 2.500%, 03/01/17 | | | 145 | |
| | 145 | | | 2.500%, 03/01/18 | | | 147 | |
| | 535 | | | 3.500%, 06/01/17 | | | 544 | |
| | | | Union Pacific Corp., | | | | |
| | 850 | | | 3.250%, 01/15/25 | | | 911 | |
| | 1,200 | | | 3.750%, 03/15/24 | | | 1,323 | |
| | 1,931 | | | 4.163%, 07/15/22 | | | 2,174 | |
| | | | | | | | |
| | | | | | | 19,699 | |
| | | | | | | | |
| | | | Total Industrials | | | 51,537 | |
| | | | | | | | |
| | | | Information Technology — 1.5% | | | | |
| | | | Communications Equipment — 0.1% | | | | |
| | | | Cisco Systems, Inc., | | | | |
| | 90 | | | 2.450%, 06/15/20 | | | 93 | |
| | 181 | | | 2.900%, 03/04/21 | | | 191 | |
| | 90 | | | 4.450%, 01/15/20 | | | 99 | |
| | 975 | | | 4.950%, 02/15/19 | | | 1,062 | |
| | | | | | | | |
| | | | | | | 1,445 | |
| | | | | | | | |
| | | | Electronic Equipment, Instruments & Components — 0.1% | |
| | | | Arrow Electronics, Inc., | | | | |
| | 155 | | | 6.000%, 04/01/20 | | | 171 | |
| | 1,350 | | | 7.500%, 01/15/27 | | | 1,674 | |
| | | | | | | | |
| | | | | | | 1,845 | |
| | | | | | | | |
| | | | Internet Software & Services — 0.2% | | | | |
| | 2,673 | | | eBay, Inc., 2.600%, 07/15/22 | | | 2,707 | |
| | | | | | | | |
| | | | IT Services — 0.2% | | | | |
| | | | International Business Machines Corp., | | | | |
| | 252 | | | 1.800%, 05/17/19 | | | 256 | |
| | 1,150 | | | 2.250%, 02/19/21 | | | 1,184 | |
| | 40 | | | 8.375%, 11/01/19 | | | 49 | |
| | 329 | | | Total System Services, Inc., 4.800%, 04/01/26 | | | 363 | |
| | 864 | | | Xerox Corp., 5.625%, 12/15/19 | | | 935 | |
| | | | | | | | |
| | | | | | | 2,787 | |
| | | | | | | | |
| | | | Semiconductors & Semiconductor Equipment — 0.2% | |
| | | | Intel Corp., | | | | |
| | 987 | | | 2.700%, 12/15/22 | | | 1,032 | |
| | 728 | | | 3.100%, 07/29/22 | | | 777 | |
| | 773 | | | 3.300%, 10/01/21 | | | 834 | |
| | 790 | | | Texas Instruments, Inc., 2.750%, 03/12/21 | | | 832 | |
| | | | | | | | |
| | | | | | | 3,475 | |
| | | | | | | | |
| | | | Software — 0.4% | | | | |
| | 942 | | | Intuit, Inc., 5.750%, 03/15/17 | | | 965 | |
| | | | | | | | |
PRINCIPAL
AMOUNT($) | | | SECURITY DESCRIPTION | | VALUE($) | |
| | | | | | | | |
| | | | Software — continued | | | | |
| | | | Microsoft Corp., | | | | |
| | 486 | | | 2.375%, 05/01/23 | | | 499 | |
| | 1,500 | | | 4.200%, 06/01/19 | | | 1,621 | |
| | | | Oracle Corp., | | | | |
| | 287 | | | 1.900%, 09/15/21 | | | 288 | |
| | 1,285 | | | 2.500%, 10/15/22 | | | 1,320 | |
| | 253 | | | 2.800%, 07/08/21 | | | 265 | |
| | 720 | | | 5.750%, 04/15/18 | | | 773 | |
| | 50 | | | 6.500%, 04/15/38 | | | 70 | |
| | | | | | | | |
| | | | | | | 5,801 | |
| | | | | | | | |
| | | | Technology Hardware, Storage & Peripherals — 0.3% | |
| | | | Apple, Inc., | | | | |
| | 818 | | | 2.150%, 02/09/22 | | | 834 | |
| | 1,006 | | | 2.850%, 05/06/21 | | | 1,061 | |
| | 1,154 | | | 3.200%, 05/13/25 | | | 1,233 | |
| | 567 | | | HP, Inc., 4.375%, 09/15/21 | | | 611 | |
| | | | | | | | |
| | | | | | | 3,739 | |
| | | | | | | | |
| | | | Total Information Technology | | | 21,799 | |
| | | | | | | | |
| | | | Materials — 0.9% | | | | |
| | | | Chemicals — 0.6% | | | | |
| | 168 | | | Agrium, Inc., (Canada), 3.375%, 03/15/25 | | | 173 | |
| | | | Dow Chemical Co. (The), | | | | |
| | 594 | | | 3.000%, 11/15/22 | | | 615 | |
| | 800 | | | 3.500%, 10/01/24 | | | 848 | |
| | 52 | | | 4.125%, 11/15/21 | | | 57 | |
| | 17 | | | 8.550%, 05/15/19 | | | 20 | |
| | | | Ecolab, Inc., | | | | |
| | 279 | | | 1.450%, 12/08/17 | | | 280 | |
| | 167 | | | 2.250%, 01/12/20 | | | 170 | |
| | 330 | | | 3.250%, 01/14/23 | | | 345 | |
| | | | Mosaic Co. (The), | | | | |
| | 1,535 | | | 3.750%, 11/15/21 | | | 1,619 | |
| | 708 | | | 4.250%, 11/15/23 | | | 755 | |
| | | | Potash Corp. of Saskatchewan, Inc., (Canada), | | | | |
| | 100 | | | 3.625%, 03/15/24 | | | 105 | |
| | 1,050 | | | 6.500%, 05/15/19 | | | 1,178 | |
| | | | PPG Industries, Inc., | | | | |
| | 550 | | | 3.600%, 11/15/20 | | | 582 | |
| | 230 | | | 6.650%, 03/15/18 | | | 246 | |
| | 1,250 | | | Praxair, Inc., 2.200%, 08/15/22 | | | 1,269 | |
| | 315 | | | Rohm & Haas Co., 7.850%, 07/15/29 | | | 441 | |
| | 400 | | | Union Carbide Corp., 7.500%, 06/01/25 | | | 503 | |
| | | | | | | | |
| | | | | | | 9,206 | |
| | | | | | | | |
SEE NOTES TO FINANCIAL STATEMENTS.
| | | | | | | | |
| | | |
| AUGUST 31, 2016 | | J.P. MORGAN INCOME FUNDS | | | | | 189 | |
JPMorgan Inflation Managed Bond Fund
SCHEDULE OF PORTFOLIO INVESTMENTS
AS OF AUGUST 31, 2016 (Unaudited) (continued)
(Amounts in thousands)
| | | | | | | | |
PRINCIPAL
AMOUNT($) | | | SECURITY DESCRIPTION | | VALUE($) | |
| Corporate Bonds — continued | |
| | | | Construction Materials — 0.0% (g) | | | | |
| | 250 | | | CRH America, Inc., 3.875%, 05/18/25 (e) | | | 268 | |
| | | | | | | | |
| | | | Containers & Packaging — 0.0% (g) | | | | |
| | 350 | | | International Paper Co., 3.800%, 01/15/26 | | | 370 | |
| | | | | | | | |
| | | | Metals & Mining — 0.3% | | | | |
| | 382 | | | BHP Billiton Finance USA Ltd., (Australia), 2.050%, 09/30/18 | | | 387 | |
| | | | Freeport-McMoRan, Inc., | | | | |
| | 352 | | | 2.150%, 03/01/17 | | | 351 | |
| | 400 | | | 3.550%, 03/01/22 | | | 348 | |
| | 2,267 | | | 3.875%, 03/15/23 | | | 1,944 | |
| | | | Nucor Corp., | | | | |
| | 305 | | | 4.000%, 08/01/23 | | | 329 | |
| | 172 | | | 5.850%, 06/01/18 | | | 184 | |
| | | | | | | | |
| | | | | | | 3,543 | |
| | | | | | | | |
| | | | Total Materials | | | 13,387 | |
| | | | | | | | |
| | | | Real Estate — 0.9% | | | | |
| | | | Equity Real Estate Investment Trusts (REITs) — 0.9% | |
| | 360 | | | American Tower Corp., 3.500%, 01/31/23 | | | 376 | |
| | 909 | | | Boston Properties LP, 3.800%, 02/01/24 | | | 978 | |
| | 672 | | | Duke Realty LP, 4.375%, 06/15/22 | | | 732 | |
| | 600 | | | Equity Commonwealth, 6.650%, 01/15/18 | | | 622 | |
| | 1,047 | | | ERP Operating LP, 4.625%, 12/15/21 | | | 1,173 | |
| | | | HCP, Inc., | | | | |
| | 469 | | | 3.875%, 08/15/24 | | | 480 | |
| | 1,629 | | | 4.250%, 11/15/23 | | | 1,716 | |
| | | | Prologis LP, | | | | |
| | 127 | | | 3.750%, 11/01/25 | | | 137 | |
| | 457 | | | 4.250%, 08/15/23 | | | 507 | |
| | | | Realty Income Corp., | | | | |
| | 600 | | | 3.250%, 10/15/22 | | | 619 | |
| | 400 | | | 3.875%, 07/15/24 | | | 424 | |
| | 1,200 | | | Simon Property Group LP, 4.375%, 03/01/21 | | | 1,328 | |
| | 106 | | | UDR, Inc., 2.950%, 09/01/26 | | | 107 | |
| | | | Ventas Realty LP, | | | | |
| | 90 | | | 3.500%, 02/01/25 | | | 93 | |
| | 470 | | | 3.750%, 05/01/24 | | | 493 | |
| | 158 | | | 4.125%, 01/15/26 | | | 171 | |
| | | | Welltower, Inc., | | | | |
| | 600 | | | 3.750%, 03/15/23 | | | 631 | |
| | 2,007 | | | 4.500%, 01/15/24 | | | 2,200 | |
| | | | | | | | |
| | | | Total Real Estate | | | 12,787 | |
| | | | | | | | |
| | | | | | | | |
PRINCIPAL
AMOUNT($) | | | SECURITY DESCRIPTION | | VALUE($) | |
| | | | | | | | |
| | | | Telecommunication Services — 1.4% | | | | |
| | | | Diversified Telecommunication Services — 1.2% | |
| | | | AT&T, Inc., | | | | |
| | 825 | | | 3.000%, 06/30/22 | | | 850 | |
| | 750 | | | 3.600%, 02/17/23 | | | 792 | |
| | 1,232 | | | 3.800%, 03/15/22 | | | 1,321 | |
| | 775 | | | 3.875%, 08/15/21 | | | 840 | |
| | 360 | | | 4.450%, 04/01/24 | | | 397 | |
| | 2,800 | | | 5.500%, 02/01/18 | | | 2,958 | |
| | | | British Telecommunications plc, (United Kingdom), | | | | |
| | 1,500 | | | 1.250%, 02/14/17 | | | 1,501 | |
| | 350 | | | 2.350%, 02/14/19 | | | 357 | |
| | 900 | | | Deutsche Telekom International Finance B.V., (Netherlands), 6.750%, 08/20/18 | | | 994 | |
| | 267 | | | Nippon Telegraph & Telephone Corp., (Japan), 1.400%, 07/18/17 | | | 268 | |
| | | | Orange S.A., (France), | | | | |
| | 525 | | | 2.750%, 09/14/16 | | | 525 | |
| | 50 | | | 9.000%, 03/01/31 | | | 80 | |
| | | | Telefonica Emisiones S.A.U., (Spain), | | | | |
| | 420 | | | 3.192%, 04/27/18 | | | 431 | |
| | 409 | | | 5.134%, 04/27/20 | | | 454 | |
| | 114 | | | 5.462%, 02/16/21 | | | 130 | |
| | | | Verizon Communications, Inc., | | | | |
| | 822 | | | 2.625%, 02/21/20 | | | 848 | |
| | 886 | | | 4.150%, 03/15/24 | | | 984 | |
| | 1,057 | | | 4.500%, 09/15/20 | | | 1,166 | |
| | 1,000 | | | 5.150%, 09/15/23 | | | 1,169 | |
| | | | | | | | |
| | | | | | | 16,065 | |
| | | | | | | | |
| | | | Wireless Telecommunication Services — 0.2% | | | | |
| | 379 | | | America Movil S.A.B. de C.V., (Mexico), 3.125%, 07/16/22 | | | 392 | |
| | 608 | | | Rogers Communications, Inc., (Canada), 3.625%, 12/15/25 | | | 661 | |
| | | | Vodafone Group plc, (United Kingdom), | | | | |
| | 1,400 | | | 2.950%, 02/19/23 | | | 1,450 | |
| | 500 | | | 5.625%, 02/27/17 | | | 511 | |
| | | | | | | | |
| | | | | | | 3,014 | |
| | | | | | | | |
| | | | Total Telecommunication Services | | | 19,079 | |
| | | | | | | | |
| | | | Utilities — 4.2% | | | | |
| | | | Electric Utilities — 3.2% | | | | |
| | 800 | | | Appalachian Power Co., 4.600%, 03/30/21 | | | 879 | |
| | 372 | | | Arizona Public Service Co., 3.350%, 06/15/24 | | | 399 | |
SEE NOTES TO FINANCIAL STATEMENTS.
| | | | | | |
| | | |
| 190 | | | | J.P. MORGAN INCOME FUNDS | | AUGUST 31, 2016 |
| | | | | | | | |
PRINCIPAL
AMOUNT($) | | | SECURITY DESCRIPTION | | VALUE($) | |
| Corporate Bonds — continued | |
| | | | Electric Utilities — continued | | | | |
| | 1,595 | | | Baltimore Gas & Electric Co., 2.800%, 08/15/22 | | | 1,666 | |
| | 237 | | | Comision Federal de Electricidad, (Mexico), 4.875%, 05/26/21 (e) | | | 255 | |
| | | | DTE Electric Co., | | | | |
| | 197 | | | 2.650%, 06/15/22 | | | 204 | |
| | 1,000 | | | 3.375%, 03/01/25 | | | 1,081 | |
| | 1,500 | | | 3.650%, 03/15/24 | | | 1,648 | |
| | 200 | | | 3.900%, 06/01/21 | | | 219 | |
| | | | Duke Energy Carolinas LLC, | | | | |
| | 1,250 | | | 3.900%, 06/15/21 | | | 1,374 | |
| | 50 | | | 6.450%, 10/15/32 | | | 68 | |
| | 233 | | | Duke Energy Corp., 3.550%, 09/15/21 | | | 250 | |
| | 160 | | | Duke Energy Indiana LLC, 3.750%, 07/15/20 | | | 173 | |
| | 461 | | | Duke Energy Progress LLC, 2.800%, 05/15/22 | | | 482 | |
| | 720 | | | Electricite de France S.A., (France), 2.150%, 01/22/19 (e) | | | 729 | |
| | 400 | | | Enel Finance International N.V., (Netherlands), 5.125%, 10/07/19 (e) | | | 439 | |
| | 765 | | | Entergy Arkansas, Inc., 3.050%, 06/01/23 | | | 802 | |
| | 65 | | | Entergy Corp., 2.950%, 09/01/26 | | | 66 | |
| | 269 | | | Entergy Mississippi, Inc., 2.850%, 06/01/28 | | | 275 | |
| | 3,700 | | | Georgia Power Co., 4.250%, 12/01/19 | | | 4,005 | |
| | 1,663 | | | Great Plains Energy, Inc., 4.850%, 06/01/21 | | | 1,816 | |
| | 1,000 | | | Hydro-Quebec, (Canada), Series HY, 8.400%, 01/15/22 | | | 1,306 | |
| | | | Indiana Michigan Power Co., | | | | |
| | 25 | | | 7.000%, 03/15/19 | | | 28 | |
| | 100 | | | Series J, 3.200%, 03/15/23 | | | 104 | |
| | 200 | | | Kentucky Utilities Co., 3.300%, 10/01/25 | | | 217 | |
| | 94 | | | Louisville Gas & Electric Co., Series 25, 3.300%, 10/01/25 | | | 101 | |
| | | | Nevada Power Co., | | | | |
| | 1,000 | | | 6.500%, 08/01/18 | | | 1,095 | |
| | 1,000 | | | 7.125%, 03/15/19 | | | 1,141 | |
| | | | NextEra Energy Capital Holdings, Inc., | | | | |
| | 518 | | | 2.400%, 09/15/19 | | | 526 | |
| | 1,539 | | | 2.700%, 09/15/19 | | | 1,578 | |
| | 200 | | | 6.000%, 03/01/19 | | | 220 | |
| | 938 | | | Niagara Mohawk Power Corp., 3.508%, 10/01/24 (e) | | | 1,010 | |
| | 300 | | | NSTAR Electric Co., 2.375%, 10/15/22 | | | 304 | |
| | 1,200 | | | Ohio Power Co., Series M, 5.375%, 10/01/21 | | | 1,365 | |
| | 300 | | | Oncor Electric Delivery Co. LLC, 7.000%, 09/01/22 | | | 381 | |
| | | | | | | | |
PRINCIPAL
AMOUNT($) | | | SECURITY DESCRIPTION | | VALUE($) | |
| | | | | | | | |
| | | | Electric Utilities — continued | | | | |
| | | | Pacific Gas & Electric Co., | | | | |
| | 794 | | | 2.450%, 08/15/22 | | | 813 | |
| | 424 | | | 3.250%, 09/15/21 | | | 449 | |
| | 1,500 | | | 3.250%, 06/15/23 | | | 1,594 | |
| | 400 | | | 3.400%, 08/15/24 | | | 432 | |
| | 350 | | | 3.850%, 11/15/23 | | | 386 | |
| | 50 | | | 6.050%, 03/01/34 | | | 68 | |
| | 200 | | | PacifiCorp, 5.650%, 07/15/18 | | | 216 | |
| | 1,500 | | | Pennsylvania Electric Co., 6.050%, 09/01/17 | | | 1,560 | |
| | 752 | | | PPL Capital Funding, Inc., 4.200%, 06/15/22 | | | 820 | |
| | 224 | | | PPL Electric Utilities Corp., 2.500%, 09/01/22 | | | 229 | |
| | 560 | | | Progress Energy, Inc., 4.400%, 01/15/21 | | | 614 | |
| | 74 | | | Public Service Co. of Colorado, 3.200%, 11/15/20 | | | 78 | |
| | 283 | | | Public Service Co. of New Hampshire, 3.500%, 11/01/23 | | | 303 | |
| | 220 | | | Public Service Co. of Oklahoma, 4.400%, 02/01/21 | | | 239 | |
| | 1,100 | | | Public Service Electric & Gas Co., 2.000%, 08/15/19 | | | 1,120 | |
| | | | Southern California Edison Co., | | | | |
| | 958 | | | 3.875%, 06/01/21 | | | 1,049 | |
| | 650 | | | 5.500%, 08/15/18 | | | 705 | |
| | 1,860 | | | Southwestern Electric Power Co., 6.450%, 01/15/19 | | | 2,056 | |
| | 1,500 | | | Southwestern Public Service Co., Series G, 8.750%, 12/01/18 | | | 1,735 | |
| | | | Virginia Electric & Power Co., | | | | |
| | 1,600 | | | 2.750%, 03/15/23 | | | 1,657 | |
| | 1,099 | | | 2.950%, 01/15/22 | | | 1,155 | |
| | | | Wisconsin Electric Power Co., | | | | |
| | 1,000 | | | 1.700%, 06/15/18 | | | 1,009 | |
| | 545 | | | 2.950%, 09/15/21 | | | 574 | |
| | | | | | | | |
| | | | | | | 45,067 | |
| | | | | | | | |
| | | | Gas Utilities — 0.2% | | | | |
| | 1,365 | | | Atmos Energy Corp., 8.500%, 03/15/19 | | | 1,592 | |
| | 843 | | | CenterPoint Energy Resources Corp., 4.500%, 01/15/21 | | | 913 | |
| | | | | | | | |
| | | | | | | 2,505 | |
| | | | | | | | |
| | | | Independent Power & Renewable Electricity Producers — 0.1% | |
| | 180 | | | Exelon Generation Co. LLC, 4.000%, 10/01/20 | | | 192 | |
| | | | PSEG Power LLC, | | | | |
| | 1,290 | | | 4.150%, 09/15/21 | | | 1,378 | |
| | 221 | | | 4.300%, 11/15/23 | | | 239 | |
| | | | | | | | |
| | | | | | | 1,809 | |
| | | | | | | | |
SEE NOTES TO FINANCIAL STATEMENTS.
| | | | | | | | |
| | | |
| AUGUST 31, 2016 | | J.P. MORGAN INCOME FUNDS | | | | | 191 | |
JPMorgan Inflation Managed Bond Fund
SCHEDULE OF PORTFOLIO INVESTMENTS
AS OF AUGUST 31, 2016 (Unaudited) (continued)
(Amounts in thousands)
| | | | | | | | |
PRINCIPAL
AMOUNT($) | | | SECURITY DESCRIPTION | | VALUE($) | |
| Corporate Bonds — continued | |
| | | | Multi-Utilities — 0.6% | | | | |
| | 500 | | | CenterPoint Energy, Inc., 6.500%, 05/01/18 | | | 535 | |
| | | | Consumers Energy Co., | | | | |
| | 137 | | | 2.850%, 05/15/22 | | | 143 | |
| | 1,060 | | | 5.650%, 04/15/20 | | | 1,203 | |
| | 350 | | | Dominion Resources, Inc., Series B, 2.750%, 09/15/22 | | | 357 | |
| | 784 | | | DTE Energy Co., Series F, 3.850%, 12/01/23 | | | 860 | |
| | | | NiSource Finance Corp., | | | | |
| | 300 | | | 3.850%, 02/15/23 | | | 322 | |
| | 500 | | | 5.450%, 09/15/20 | | | 563 | |
| | 940 | | | 6.125%, 03/01/22 | | | 1,118 | |
| | 100 | | | 6.800%, 01/15/19 | | | 111 | |
| | 6 | | | San Diego Gas & Electric Co., 5.350%, 05/15/40 | | | 8 | |
| | | | Sempra Energy, | | | | |
| | 192 | | | 4.050%, 12/01/23 | | | 212 | |
| | 1,400 | | | 9.800%, 02/15/19 | | | 1,666 | |
| | | | Southern Co. Gas Capital Corp., | | | | |
| | 939 | | | 3.500%, 09/15/21 | | | 990 | |
| | 550 | | | 5.250%, 08/15/19 | | | 601 | |
| | | | | | | | |
| | | | | | | 8,689 | |
| | | | | | | | |
| | | | Water Utilities — 0.1% | | | | |
| | | | American Water Capital Corp., | | | | |
| | 364 | | | 3.400%, 03/01/25 | | | 393 | |
| | 1,400 | | | 3.850%, 03/01/24 | | | 1,548 | |
| | | | | | | | |
| | | | | | | 1,941 | |
| | | | | | | | |
| | | | Total Utilities | | | 60,011 | |
| | | | | | | | |
| | | | Total Corporate Bonds
(Cost $446,773) | | | 467,178 | |
| | | | | | | | |
| Foreign Government Securities — 0.4% | |
| | | | Republic of Panama, (Panama), | | | | |
| | 460 | | | 3.750%, 03/16/25 | | | 498 | |
| | 347 | | | 4.000%, 09/22/24 | | | 381 | |
| | | | Republic of Poland, (Poland), | | | | |
| | 800 | | | 3.250%, 04/06/26 | | | 849 | |
| | 467 | | | 4.000%, 01/22/24 | | | 518 | |
| | | | United Mexican States, (Mexico), | | | | |
| | 568 | | | 3.500%, 01/21/21 | | | 607 | |
| | 1,076 | | | 3.600%, 01/30/25 | | | 1,138 | |
| | 694 | | | 4.000%, 10/02/23 | | | 754 | |
| | 332 | | | 4.125%, 01/21/26 | | | 364 | |
| | | | | | | | |
| | | | Total Foreign Government Securities
(Cost $4,720) | | | 5,109 | |
| | | | | | | | |
| | | | | | | | |
PRINCIPAL
AMOUNT($) | | | SECURITY DESCRIPTION | | VALUE($) | |
| Mortgage Pass-Through Securities — 9.1% | |
| | 33 | | | Federal Home Loan Mortgage Corp. Gold Pools, 15 Year, Single Family, 5.500%, 02/01/24 | | | 36 | |
| | 158 | | | Federal Home Loan Mortgage Corp. Gold Pools, 20 Year, Single Family, 5.500%, 05/01/27 | | | 177 | |
| | | | Federal Home Loan Mortgage Corp. Gold Pools, 30 Year, Single Family, | | | | |
| | 1,889 | | | 4.500%, 05/01/41 | | | 2,078 | |
| | 287 | | | 5.000%, 10/01/33 | | | 324 | |
| | 3 | | | 6.000%, 12/01/36 | | | 3 | |
| | 1,842 | | | Federal Home Loan Mortgage Corp. Gold Pools, Other, 3.500%, 06/01/42 | | | 1,964 | |
| | | | Federal National Mortgage Association, | | | | |
| | 860 | | | 2.610%, 06/01/26 | | | 894 | |
| | 3,176 | | | 2.640%, 06/01/26 | | | 3,310 | |
| | 1,730 | | | 4.250%, 10/01/28 | | | 1,992 | |
| | | | Federal National Mortgage Association, 15 Year, Single Family, | | | | |
| | 33 | | | 6.000%, 10/01/19 - 01/01/24 | | | 34 | |
| | 1,542 | | | Federal National Mortgage Association, 20 Year, Single Family, 3.500%, 08/01/32 | | | 1,641 | |
| | | | Federal National Mortgage Association, 30 Year, Single Family, | | | | |
| | 1,256 | | | 5.000%, 08/01/40 | | | 1,406 | |
| | 763 | | | 6.000%, 12/01/32 - 04/01/35 | | | 883 | |
| | 1,061 | | | 6.500%, 10/01/36 - 10/01/38 | | | 1,220 | |
| | 670 | | | 7.000%, 04/01/37 - 11/01/38 | | | 788 | |
| | | | Federal National Mortgage Association, Other, | | | | |
| | 2,499 | | | ARM, 0.815%, 01/01/23 | | | 2,498 | |
| | 1,367 | | | ARM, 0.835%, 05/01/24 | | | 1,371 | |
| | 3,000 | | | 1.400%, 07/01/17 | | | 3,002 | |
| | 2,389 | | | 1.735%, 05/01/20 | | | 2,405 | |
| | 1,925 | | | 1.940%, 07/01/19 | | | 1,949 | |
| | 4,800 | | | 2.010%, 06/01/20 | | | 4,883 | |
| | 1,429 | | | 2.140%, 04/01/19 | | | 1,452 | |
| | 929 | | | 2.190%, 12/01/22 | | | 952 | |
| | 2,538 | | | 2.340%, 12/01/22 | | | 2,617 | |
| | 2,388 | | | 2.350%, 05/01/23 | | | 2,464 | |
| | 1,556 | | | 2.395%, 01/01/22 | | | 1,610 | |
| | 4,824 | | | 2.400%, 12/01/22 - 07/01/23 | | | 4,983 | |
| | 3,751 | | | 2.410%, 01/01/23 | | | 3,874 | |
| | 2,089 | | | 2.490%, 10/01/17 - 05/01/26 | | | 2,123 | |
| | 3,000 | | | 2.520%, 05/01/23 | | | 3,125 | |
| | 2,066 | | | 2.530%, 03/01/23 | | | 2,149 | |
| | 1,000 | | | 2.590%, 11/01/21 | | | 1,044 | |
| | 1,310 | | | 2.630%, 09/01/21 | | | 1,371 | |
| | 2,000 | | | 2.650%, 08/01/22 | | | 2,093 | |
| | 2,000 | | | 2.670%, 07/01/22 | | | 2,089 | |
SEE NOTES TO FINANCIAL STATEMENTS.
| | | | | | |
| | | |
| 192 | | | | J.P. MORGAN INCOME FUNDS | | AUGUST 31, 2016 |
| | | | | | | | |
PRINCIPAL
AMOUNT($) | | | SECURITY DESCRIPTION | | VALUE($) | |
| Mortgage Pass-Through Securities — continued | |
| | 2,057 | | | 2.680%, 05/01/25 | | | 2,150 | |
| | 2,499 | | | 2.705%, 04/01/23 | | | 2,632 | |
| | 2,200 | | | 2.810%, 04/01/25 | | | 2,325 | |
| | 1,107 | | | 2.900%, 06/01/22 | | | 1,171 | |
| | 1,473 | | | 3.020%, 06/01/25 | | | 1,575 | |
| | 3,683 | | | 3.030%, 12/01/21 - 04/01/27 | | | 3,933 | |
| | 1,919 | | | 3.050%, 10/01/20 | | | 2,023 | |
| | 2,500 | | | 3.100%, 09/01/25 | | | 2,695 | |
| | 1,345 | | | 3.110%, 10/01/21 | | | 1,431 | |
| | 1,482 | | | 3.370%, 11/01/20 | | | 1,589 | |
| | 5,000 | | | 3.380%, 01/01/18 - 12/01/23 | | | 5,208 | |
| | 1,267 | | | 3.450%, 11/01/23 | | | 1,387 | |
| | 990 | | | 3.480%, 12/01/20 | | | 1,062 | |
| | 5,942 | | | 3.500%, 05/01/43 - 06/01/43 | | | 6,336 | |
| | 1,671 | | | 3.590%, 10/01/20 | | | 1,799 | |
| | 1,150 | | | 3.690%, 11/01/23 | | | 1,280 | |
| | 4,332 | | | 3.739%, 06/01/18 | | | 4,460 | |
| | 3,400 | | | 3.770%, 09/01/21 | | | 3,706 | |
| | 2,275 | | | 3.804%, 05/01/22 | | | 2,472 | |
| | 1,197 | | | 3.860%, 07/01/21 | | | 1,307 | |
| | 3,394 | | | 4.000%, 07/01/42 | | | 3,674 | |
| | 1,000 | | | 4.040%, 10/01/20 | | | 1,091 | |
| | 999 | | | 4.260%, 07/01/21 | | | 1,108 | |
| | 3,251 | | | 4.295%, 06/01/21 | | | 3,609 | |
| | 1,854 | | | 4.330%, 04/01/21 | | | 2,047 | |
| | 730 | | | 4.369%, 02/01/20 | | | 793 | |
| | 933 | | | 4.640%, 01/01/21 | | | 1,037 | |
| | 313 | | | Government National Mortgage Association II, 30 Year, Single Family, 6.000%, 09/20/38 | | | 358 | |
| | | | | | | | |
| | | | Total Mortgage Pass-Through Securities
(Cost $124,856) | | | 129,062 | |
| | | | | | | | |
| U.S. Government Agency Securities — 15.8% | |
| | 16,450 | | | Federal Home Loan Banks, 1.125%, Zero Coupon, 06/21/19 | | | 16,501 | |
| | | | Federal Home Loan Mortgage Corp., | | | | |
| | 20,000 | | | 1.250%, 10/02/19 | | | 20,115 | |
| | 62,000 | | | 2.375%, 01/13/22 | | | 65,165 | |
| | | | | | | | |
PRINCIPAL
AMOUNT($) | | | SECURITY DESCRIPTION | | VALUE($) | |
| | | | | | | | |
| | | | Federal National Mortgage Association, | | | | |
| | 8,333 | | | 1.250%, 08/17/21 | | | 8,290 | |
| | 1,335 | | | 2.125%, 04/24/26 | | | 1,366 | |
| | 105,000 | | | 2.625%, 09/06/24 | | | 112,308 | |
| | 735 | | | Tennessee Valley Authority, 1.750%, 10/15/18 | | | 747 | |
| | | | | | | | |
| | | | Total U.S. Government Agency Securities
(Cost $217,418) | | | 224,492 | |
| | | | | | | | |
| U.S. Treasury Obligations — 12.6% | |
| | | | U.S. Treasury Inflation Indexed Bonds, | | | | |
| | 32,000 | | | 1.750%, 01/15/28 | | | 42,822 | |
| | 17,250 | | | 3.875%, 04/15/29 | | | 36,293 | |
| | | | U.S. Treasury Inflation Indexed Notes, | | | | |
| | 26,705 | | | 0.125%, 04/15/17 | | | 28,298 | |
| | 10,000 | | | 0.125%, 07/15/22 | | | 10,588 | |
| | 2,000 | | | 0.250%, 01/15/25 | | | 2,052 | |
| | 9,100 | | | 1.375%, 01/15/20 | | | 10,681 | |
| | 40,000 | | | 1.625%, 01/15/18 | | | 47,208 | |
| | | | | | | | |
| | | | Total U.S. Treasury Obligations
(Cost $176,510) | | | 177,942 | |
| | | | | | | | |
| | |
| SHARES | | | | | | |
| Short-Term Investments — 5.6% | |
| | | | Investment Companies — 5.6% | |
| | 73,311 | | | JPMorgan Prime Money Market Fund, Institutional Class Shares, 0.360% (b) (l) † | | | 73,311 | |
| | 6,500 | | | JPMorgan U.S. Government Money Market Fund, Institutional Class Shares, 0.200% (b) (l) † | | | 6,500 | |
| | | | | | | | |
| | | | Total Short-Term Investments
(Cost $79,811) | | | 79,811 | |
| | | | | | | | |
| | | | Total Investments — 103.4%
(Cost $1,424,577) | | | 1,466,474 | |
| | | | Liabilities in Excess of
Other Assets — (3.4)% | | | (48,143 | ) |
| | | | | | | | |
| | | | NET ASSETS — 100.0% | | $ | 1,418,331 | |
| | | | | | | | |
Percentages indicated are based on net assets.
SEE NOTES TO FINANCIAL STATEMENTS.
| | | | | | | | |
| | | |
| AUGUST 31, 2016 | | J.P. MORGAN INCOME FUNDS | | | | | 193 | |
JPMorgan Inflation Managed Bond Fund
SCHEDULE OF PORTFOLIO INVESTMENTS
AS OF AUGUST 31, 2016 (Unaudited) (continued)
(Amounts in thousands)
| | | | | | | | | | | | | | | | | | |
Inflation-Linked Swaps (Amounts in thousands) | | | | | | | | | | | | | | |
| | | RATE TYPE (r) | | | | | | | | | | |
| SWAP COUNTERPARTY | | PAYMENTS MADE
BY THE FUND | | PAYMENTS RECEIVED
BY THE FUND | | | TERMINATION
DATE | | | NOTIONAL
AMOUNT | | | VALUE | |
Barclays Bank plc | | 2.590% at termination | | | CPI-U at termination | | | | 12/31/19 | | | $ | 3,000 | | | $ | (305 | ) |
Barclays Bank plc | | 1.455% at termination | | | CPI-U at termination | | | | 01/15/22 | | | | 46,000 | | | | 225 | |
Barclays Bank plc | | 2.439% at termination | | | CPI-U at termination | | | | 05/15/24 | | | | 5,000 | | | | (548 | ) |
Barclays Bank plc | | 2.705% at termination | | | CPI-U at termination | | | | 09/02/44 | | | | 9,000 | | | | (3,307 | ) |
Barclays Bank plc | | 2.700% at termination | | | CPI-U at termination | | | | 09/03/44 | | | | 4,000 | | | | (1,461 | ) |
BNP Paribas | | 2.530% at termination | | | CPI-U at termination | | | | 02/22/18 | | | | 53,000 | | | | (3,599 | ) |
BNP Paribas | | 2.100% at termination | | | CPI-U at termination | | | | 08/26/18 | | | | 22,000 | | | | (993 | ) |
BNP Paribas | | 2.105% at termination | | | CPI-U at termination | | | | 08/26/18 | | | | 11,000 | | | | (499 | ) |
BNP Paribas | | 2.098% at termination | | | CPI-U at termination | | | | 09/09/18 | | | | 10,000 | | | | (453 | ) |
BNP Paribas | | 2.248% at termination | | | CPI-U at termination | | | | 01/15/19 | | | | 20,000 | | | | (1,212 | ) |
BNP Paribas | | 2.190% at termination | | | CPI-U at termination | | | | 09/03/19 | | | | 11,000 | | | | (611 | ) |
BNP Paribas | | 2.693% at termination | | | CPI-U at termination | | | | 09/03/44 | | | | 1,000 | | | | (362 | ) |
BNP Paribas | | 2.695% at termination | | | CPI-U at termination | | | | 09/03/44 | | | | 1,000 | | | | (363 | ) |
Citibank, N.A. | | 1.478% at termination | | | CPI-U at termination | | | | 04/02/17 | | | | 4,000 | | | | 10 | |
Citibank, N.A. | | 2.190% at termination | | | CPI-U at termination | | | | 09/02/19 | | | | 20,000 | | | | (1,111 | ) |
Citibank, N.A. | | 1.592% at termination | | | CPI-U at termination | | | | 06/24/21 | | | | 15,000 | | | | 12 | |
Citibank, N.A. | | 2.458% at termination | | | CPI-U at termination | | | | 05/21/24 | | | | 13,000 | | | | (1,459 | ) |
Citibank, N.A. | | 2.492% at termination | | | CPI-U at termination | | | | 08/27/24 | | | | 40,000 | | | | (4,727 | ) |
Citibank, N.A. | | 2.477% at termination | | | CPI-U at termination | | | | 09/02/24 | | | | 3,000 | | | | (349 | ) |
Citibank, N.A. | | 2.623% at termination | | | CPI-U at termination | | | | 10/07/24 | | | | 10,000 | | | | (453 | ) |
Credit Suisse International | | 2.085% at termination | | | CPI-U at termination | | | | 06/01/17 | | | | 25,000 | | | | (1,223 | ) |
Credit Suisse International | | 2.178% at termination | | | CPI-U at termination | | | | 05/28/18 | | | | 34,000 | | | | (1,789 | ) |
Credit Suisse International | | 2.315% at termination | | | CPI-U at termination | | | | 07/15/20 | | | | 50,000 | | | | (3,728 | ) |
Deutsche Bank AG, New York | | 2.500% at termination | | | CPI-U at termination | | | | 02/25/18 | | | | 23,000 | | | | (1,525 | ) |
Deutsche Bank AG, New York | | 2.500% at termination | | | CPI-U at termination | | | | 03/06/18 | | | | 49,000 | | | | (3,235 | ) |
Deutsche Bank AG, New York | | 2.140% at termination | | | CPI-U at termination | | | | 09/10/19 | | | | 41,000 | | | | (2,159 | ) |
Deutsche Bank AG, New York | | 1.565% at termination | | | CPI-U at termination | | | | 01/30/20 | | | | 35,000 | | | | (446 | ) |
Deutsche Bank AG, New York | | 1.748% at termination | | | CPI-U at termination | | | | 04/02/20 | | | | 32,000 | | | | (314 | ) |
Deutsche Bank AG, New York | | 1.525% at termination | | | CPI-U at termination | | | | 10/13/20 | | | | 18,000 | | | | (91 | ) |
Deutsche Bank AG, New York | | 2.477% at termination | | | CPI-U at termination | | | | 02/21/24 | | | | 10,000 | | | | (1,122 | ) |
Deutsche Bank AG, New York | | 2.415% at termination | | | CPI-U at termination | | | | 12/15/24 | | | | 42,000 | | | | (1,411 | ) |
Deutsche Bank AG, New York | | 1.978% at termination | | | CPI-U at termination | | | | 04/02/25 | | | | 37,000 | | | | (1,235 | ) |
Deutsche Bank AG, New York | | 2.000% at termination | | | CPI-U at termination | | | | 10/13/45 | | | | 3,000 | | | | (156 | ) |
Goldman Sachs International | | 2.211% at termination | | | CPI-U at termination | | | | 08/29/19 | | | | 27,000 | | | | (1,532 | ) |
Goldman Sachs International | | 2.185% at termination | | | CPI-U at termination | | | | 09/02/19 | | | | 26,000 | | | | (1,438 | ) |
Goldman Sachs International | | 2.194% at termination | | | CPI-U at termination | | | | 09/02/19 | | | | 29,000 | | | | (1,618 | ) |
Goldman Sachs International | | 2.100% at termination | | | CPI-U at termination | | | | 09/12/19 | | | | 41,000 | | | | (2,069 | ) |
Morgan Stanley Capital Services | | 2.195% at termination | | | CPI-U at termination | | | | 04/22/18 | | | | 28,000 | | | | (1,492 | ) |
Morgan Stanley Capital Services | | 2.145% at termination | | | CPI-U at termination | | | | 11/22/18 | | | | 24,000 | | | | (1,155 | ) |
Morgan Stanley Capital Services | | 1.442% at termination | | | CPI-U at termination | | | | 09/17/20 | | | | 93,000 | | | | (175 | ) |
Morgan Stanley Capital Services | | 2.500% at termination | | | CPI-U at termination | | | | 02/04/24 | | | | 15,000 | | | | (1,714 | ) |
Morgan Stanley Capital Services | | 2.673% at termination | | | CPI-U at termination | | | | 09/12/44 | | | | 2,000 | | | | (704 | ) |
Royal Bank of Scotland | | 2.475% at termination | | | CPI-U at termination | | | | 03/17/24 | | | | 2,000 | | | | (225 | ) |
Royal Bank of Scotland | | 2.733% at termination | | | CPI-U at termination | | | | 02/10/44 | | | | 5,000 | | | | (1,886 | ) |
| | | | | | | | | | | | | | | | | | |
| | | | | | | | | | | | | | | | $ | (54,007 | ) |
| | | | | | | | | | | | | | | | | | |
SEE NOTES TO FINANCIAL STATEMENTS.
| | | | | | |
| | | |
| 194 | | | | J.P. MORGAN INCOME FUNDS | | AUGUST 31, 2016 |
JPMorgan Limited Duration Bond Fund
SCHEDULE OF PORTFOLIO INVESTMENTS
AS OF AUGUST 31, 2016 (Unaudited)
(Amounts in thousands)
| | | | | | | | |
PRINCIPAL
AMOUNT($) | | | SECURITY DESCRIPTION | | VALUE($) | |
| Asset-Backed Securities — 19.6% | |
| | 1,446 | | | Accredited Mortgage Loan Trust, Series 2003-3, Class A1, SUB, 5.210%, 01/25/34 | | | 1,411 | |
| | 1,831 | | | Ally Auto Receivables Trust, Series 2015-SN1, Class A3, 1.210%, 12/20/17 | | | 1,831 | |
| | 2,564 | | | American Express Credit Account Master Trust, Series 2014-2, Class A, 1.260%, 01/15/20 | | | 2,568 | |
| | 280 | | | Ameriquest Mortgage Securities, Inc. Asset-Backed Pass-Through Certificates, Series 2003-7, Class M1, VAR, 1.763%, 08/25/33 | | | 267 | |
| | | | Amortizing Residential Collateral Trust, | | | | |
| | 91 | | | Series 2002-BC4, Class A, VAR, 1.104%, 07/25/32 | | | 86 | |
| | 571 | | | Series 2002-BC6, Class M1, VAR, 1.649%, 08/25/32 | | | 524 | |
| | 2,619 | | | Series 2002-BC9, Class M1, VAR, 2.174%, 12/25/32 | | | 2,401 | |
| | | | AMRESCO Residential Securities Corp. Mortgage Loan Trust, | | | | |
| | 3 | | | Series 1997-2, Class M1A, VAR, 1.079%, 06/25/27 | | | 3 | |
| | 445 | | | Series 1998-1, Class M1A, VAR, 1.133%, 01/25/28 | | | 430 | |
| | 609 | | | Series 1998-3, Class M1A, VAR, 1.154%, 09/25/28 | | | 577 | |
| | 3,459 | | | ARLP Securitization Trust, Series 2015-1, Class A1, SUB, 3.967%, 05/25/55 (e) | | | 3,378 | |
| | 333 | | | Asset-Backed Securities Corp. Home Equity Loan Trust, Series 2003-HE7, Class M2, VAR, 3.133%, 12/15/33 | | | 327 | |
| | 1,692 | | | AXIS Equipment Finance Receivables III LLC, Series 2015-1A, Class A2, 1.900%, 03/20/20 (e) | | | 1,688 | |
| | | | B2R Mortgage Trust, | | | | |
| | 1,080 | | | Series 2015-1, Class A1, 2.524%, 05/15/48 (e) | | | 1,077 | |
| | 2,478 | | | Series 2015-2, Class A, 3.336%, 11/15/48 (e) | | | 2,544 | |
| | 7,000 | | | BA Credit Card Trust, Series 2015-A2, Class A, 1.360%, 09/15/20 | | | 7,017 | |
| | 2,978 | | | BCC Funding Corp. X, Series 2015-1, Class A2, 2.224%, 10/20/20 (e) | | | 2,967 | |
| | 2,429 | | | Bear Stearns Asset-Backed Securities I Trust, Series 2005-HE1, Class M2, VAR, 1.733%, 01/25/35 | | | 2,256 | |
| | 887 | | | Bear Stearns Asset-Backed Securities Trust, Series 2003-SD1, Class A, VAR, 1.424%, 12/25/33 | | | 831 | |
| | 3,125 | | | BMW Vehicle Lease Trust, Series 2015-1, Class A3, 1.240%, 12/20/17 | | | 3,128 | |
| | 271 | | | BNC Mortgage Loan Trust, Series 2007-2, Class A2, VAR, 0.624%, 05/25/37 | | | 265 | |
| | | | | | | | |
PRINCIPAL
AMOUNT($) | | | SECURITY DESCRIPTION | | VALUE($) | |
| | | | | | | | |
| | 4,034 | | | Cabela’s Credit Card Master Note Trust, Series 2016-1, Class A1, 1.780%, 06/15/22 | | | 4,024 | |
| | | | California Republic Auto Receivables Trust, | | | | |
| | 448 | | | Series 2013-1, Class A2, 1.410%, 09/17/18 (e) | | | 449 | |
| | 6,685 | | | Series 2015-2, Class A3, 1.310%, 08/15/19 | | | 6,686 | |
| | 4,493 | | | Series 2015-3, Class A3, 1.620%, 11/15/19 | | | 4,498 | |
| | 948 | | | CAM Mortgage LLC, Series 2015-1, Class A, SUB, 3.500%, 07/15/64 (e) | | | 947 | |
| | 3,276 | | | Capital Auto Receivables Asset Trust, Series 2015-1, Class A2, 1.420%, 06/20/18 | | | 3,278 | |
| | 58 | | | CarFinance Capital Auto Trust, Series 2014-1A, Class A, 1.460%, 12/17/18 (e) | | | 58 | |
| | 1,688 | | | Carlyle Global Market Strategies Commodities Funding Ltd., (Cayman Islands), Series 2014-1A, Class A, VAR, 2.528%, 10/15/21 (e) | | | 1,384 | |
| | | | CarMax Auto Owner Trust, | | | | |
| | 3,512 | | | Series 2015-2, Class A3, 1.370%, 03/16/20 | | | 3,520 | |
| | 5,000 | | | Series 2015-4, Class A3, 1.560%, 11/16/20 | | | 5,027 | |
| | 354 | | | Centex Home Equity Loan Trust, Series 2002-A, Class MV1, VAR, 1.374%, 01/25/32 | | | 283 | |
| | 3,000 | | | Chrysler Capital Auto Receivables Trust, Series 2016-AA, Class A3, 1.770%, 10/15/20 (e) | | | 3,006 | |
| | 1,207 | | | Citi Held For Asset Issuance, Series 2015-PM1, Class A, 1.850%, 12/15/21 (e) | | | 1,205 | |
| | 3,849 | | | Colony American Finance Ltd., Series 2016-1, Class A, 2.544%, 06/15/48 (e) | | | 3,850 | |
| | 248 | | | Consumer Credit Origination Loan Trust, Series 2015-1, Class A, 2.820%, 03/15/21 (e) | | | 248 | |
| | | | Countrywide Asset-Backed Certificates, | | | | |
| | 82 | | | Series 2002-1, Class A, VAR, 1.084%, 08/25/32 | | | 71 | |
| | 129 | | | Series 2002-BC1, Class A, VAR, 1.184%, 04/25/32 | | | 83 | |
| | 113 | | | Series 2003-BC2, Class 2A1, VAR, 1.124%, 06/25/33 | | | 98 | |
| | 844 | | | Series 2003-BC5, Class M1, VAR, 1.574%, 09/25/33 | | | 765 | |
| | 263 | | | Series 2004-2, Class M4, VAR, 2.024%, 03/25/34 | | | 243 | |
| | 139 | | | Series 2004-S1, Class M2, SUB, 5.584%, 02/25/35 | | | 138 | |
| | 270 | | | Countrywide Home Equity Loan Trust, Series 2004-A, Class A, VAR, 0.728%, 04/15/30 | | | 261 | |
| | | | CPS Auto Receivables Trust, | | | | |
| | 105 | | | Series 2013-C, Class A, 1.640%, 04/16/18 (e) | | | 105 | |
SEE NOTES TO FINANCIAL STATEMENTS.
| | | | | | | | |
| | | |
| AUGUST 31, 2016 | | J.P. MORGAN INCOME FUNDS | | | | | 195 | |
JPMorgan Limited Duration Bond Fund
SCHEDULE OF PORTFOLIO INVESTMENTS
AS OF AUGUST 31, 2016 (Unaudited) (continued)
(Amounts in thousands)
| | | | | | | | |
PRINCIPAL
AMOUNT($) | | | SECURITY DESCRIPTION | | VALUE($) | |
| Asset-Backed Securities — continued | |
| | 179 | | | Series 2014-A, Class A, 1.210%, 08/15/18 (e) | | | 179 | |
| | 1,301 | | | Series 2014-D, Class A, 1.490%, 04/15/19 (e) | | | 1,300 | |
| | 1,419 | | | Series 2015-A, Class A, 1.530%, 07/15/19 (e) | | | 1,417 | |
| | 1,473 | | | Series 2016-B, Class B, 3.180%, 09/15/20 (e) | | | 1,478 | |
| | | | CWHEQ Revolving Home Equity Loan Trust, | | | | |
| | 356 | | | Series 2005-E, Class 2A, VAR, 0.728%, 11/15/35 | | | 313 | |
| | 1,612 | | | Series 2005-M, Class A1, VAR, 0.748%, 02/15/36 | | | 1,390 | |
| | 10,280 | | | Discover Card Execution Note Trust, Series 2014-A1, Class A1, VAR, 0.938%, 07/15/21 | | | 10,309 | |
| | 1,200 | | | DT Auto Owner Trust, Series 2016-2A, Class B, 2.920%, 05/15/20 (e) | | | 1,208 | |
| | | | Exeter Automobile Receivables Trust, | | | | |
| | 11 | | | Series 2014-2A, Class A, 1.060%, 08/15/18 (e) | | | 12 | |
| | 1,229 | | | Series 2015-2A, Class A, 1.540%, 11/15/19 (e) | | | 1,226 | |
| | 2,607 | | | Series 2015-3A, Class A, 2.000%, 03/16/20 (e) | | | 2,605 | |
| | 4,288 | | | Series 2016-2A, Class A, 2.210%, 07/15/20 (e) | | | 4,280 | |
| | | | First Franklin Mortgage Loan Trust, | | | | |
| | 98 | | | Series 2002-FF1, Class M1, VAR, 1.574%, 04/25/32 | | | 81 | |
| | 598 | | | Series 2002-FF4, Class M1, VAR, 2.099%, 02/25/33 | | | 336 | |
| | 325 | | | Series 2003-FFH1, Class M2, VAR, 3.149%, 09/25/33 | | | 263 | |
| | 547 | | | Series 2004-FF8, Class M4, VAR, 2.130%, 10/25/34 | | | 181 | |
| | | | First Investors Auto Owner Trust, | | | | |
| | 824 | | | Series 2015-1A, Class A2, 1.210%, 04/15/19 (e) | | | 823 | |
| | 1,646 | | | Series 2015-2A, Class A1, 1.590%, 12/16/19 (e) | | | 1,643 | |
| | 810 | | | First NLC Trust, Series 2005-2, Class M1, VAR, 1.004%, 09/25/35 | | | 796 | |
| | 2,266 | | | FirstKey Lending Trust, Series 2015-SFR1, Class A, 2.553%, 03/09/47 (e) | | | 2,259 | |
| | | | Flagship Credit Auto Trust, | | | | |
| | 251 | | | Series 2013-2, Class A, 1.940%, 01/15/19 (e) | | | 251 | |
| | 2,363 | | | Series 2016-2, Class A1, 2.280%, 05/15/20 (e) | | | 2,365 | |
| | | | | | | | |
PRINCIPAL
AMOUNT($) | | | SECURITY DESCRIPTION | | VALUE($) | |
| | | | | | | | |
| | | | Ford Credit Auto Owner Trust, | | | | |
| | 1,837 | | | Series 2014-B, Class A3, 0.900%, 10/15/18 | | | 1,837 | |
| | 2,632 | | | Series 2015-B, Class A3, 1.160%, 11/15/19 | | | 2,633 | |
| | 1,400 | | | Series 2016-B, Class A3, 1.330%, 10/15/20 | | | 1,403 | |
| | 3,580 | | | Fremont Home Loan Trust, Series 2005-C, Class M2, VAR, 1.014%, 07/25/35 | | | 3,198 | |
| | 802 | | | GLC Trust, Series 2014-A, Class A, 3.000%, 07/15/21 (e) | | | 797 | |
| | 6,244 | | | GM Financial Automobile Leasing Trust, Series 2015-2, Class A3, 1.680%, 12/20/18 | | | 6,272 | |
| | 137 | | | GreenPoint Mortgage Funding Trust, Series 2005-HE3, Class A, VAR, 0.688%, 09/15/30 | | | 120 | |
| | 3,582 | | | Harley-Davidson Motorcycle Trust, Series 2015-2, Class A3, 1.300%, 03/16/20 | | | 3,588 | |
| | 78 | | | Honda Auto Receivables Owner Trust, Series 2015-1, Class A2, 0.700%, 06/15/17 | | | 78 | |
| | 2,392 | | | Hyundai Auto Receivables Trust, Series 2015-A, Class A3, 1.050%, 04/15/19 | | | 2,393 | |
| | 4,883 | | | Invitation Homes Trust, Series 2014-SFR1, Class A, VAR, 1.507%, 06/17/31 (e) | | | 4,856 | |
| | 109 | | | Irwin Home Equity Loan Trust, Series 2004-1, Class 1A1, VAR, 1.164%, 12/25/24 | | | 100 | |
| | 5,500 | | | Leaf Receivables Funding 10 LLC, Series 2015-1, Class A3, 1.490%, 03/15/18 (e) | | | 5,493 | |
| | 10 | | | Lehman Home Equity Loan Trust, Series 1998-1, Class A1, 7.000%, 05/25/28 | | | 3 | |
| | 193 | | | Long Beach Mortgage Loan Trust, Series 2004-1, Class M3, VAR, 1.574%, 02/25/34 | | | 185 | |
| | 3,112 | | | Mercedes Benz Auto Lease Trust, Series 2015-A, Class A3, 1.100%, 08/15/17 | | | 3,112 | |
| | | | Morgan Stanley ABS Capital I, Inc. Trust, | | | | |
| | 1,236 | | | Series 2003-NC6, Class M1, VAR, 1.724%, 06/25/33 | | | 1,197 | |
| | 7,500 | | | Series 2005-WMC4, Class M5, VAR, 1.499%, 04/25/35 | | | 7,029 | |
| | 273 | | | New Century Home Equity Loan Trust, Series 2003-5, Class AII, VAR, 1.288%, 11/25/33 | | | 213 | |
| | 3,334 | | | Nissan Auto Lease Trust, Series 2015-B, Class A3, 1.540%, 04/16/18 | | | 3,345 | |
| | 3,628 | | | OneMain Direct Auto Receivables Trust, Series 2016-1A, Class A, 2.040%, 01/15/21 (e) | | | 3,622 | |
| | | | OneMain Financial Issuance Trust, | | | | |
| | 3,325 | | | Series 2014-1A, Class A, 2.430%, 06/18/24 (e) | | | 3,328 | |
| | 2,877 | | | Series 2015-1A, Class A, 3.190%, 03/18/26 (e) | | | 2,908 | |
SEE NOTES TO FINANCIAL STATEMENTS.
| | | | | | |
| | | |
| 196 | | | | J.P. MORGAN INCOME FUNDS | | AUGUST 31, 2016 |
| | | | | | | | |
PRINCIPAL
AMOUNT($) | | | SECURITY DESCRIPTION | | VALUE($) | |
| Asset-Backed Securities — continued | |
| | 3,500 | | | Series 2015-2A, Class A, 2.570%, 07/18/25 (e) | | | 3,504 | |
| | 632 | | | Option One Mortgage Acceptance Corp. Asset-Backed Certificates, Series 2002-4, Class M1, VAR, 1.424%, 07/25/32 | | | 592 | |
| | | | Park Place Securities, Inc., Asset-Backed Pass-Through Certificates, | | | | |
| | 764 | | | Series 2004-WHQ2, Class M2, VAR, 1.469%, 02/25/35 | | | 761 | |
| | 1,090 | | | Series 2005-WHQ3, Class M2, VAR, 1.199%, 06/25/35 | | | 1,088 | |
| | 255 | | | PFS Tax Lien Trust, Series 2014-1, Class NOTE, 1.440%, 05/15/29 (e) | | | 254 | |
| | 1,071 | | | Porsche Innovative Lease Owner Trust, Series 2014-1, Class A3, 1.030%, 11/20/17 (e) | | | 1,070 | |
| | | | Progress Residential Trust, | | | | |
| | 3,278 | | | Series 2015-SFR2, Class A, 2.740%, 06/12/32 (e) | | | 3,321 | |
| | 5,507 | | | Series 2015-SFR3, Class A, 3.067%, 11/12/32 (e) | | | 5,654 | |
| | 231 | | | RAMP Trust, Series 2003-RS2, Class AII, VAR, 1.204%, 03/25/33 | | | 207 | |
| | 523 | | | RASC Trust, Series 2003-KS4, Class MI2, SUB, 5.510%, 06/25/33 | | | 395 | |
| | | | Residential Funding Mortgage Securities II Home Loan Trust, | | | | |
| | 24 | | | Series 2001-HI2, Class AI7, SUB, 7.440%, 04/25/26 | | | 24 | |
| | 91 | | | Series 2001-HI4, Class A7, SUB, 7.240%, 10/25/26 | | | 90 | |
| | 28 | | | Series 2003-HS1, Class AII, VAR, 0.814%, 12/25/32 | | | 26 | |
| | 2,889 | | | Sofi Consumer Loan Program LLC, Series 2016-1, Class A, 3.260%, 08/25/25 (e) | | | 2,904 | |
| | | | SoFi Professional Loan Program LLC, | | | | |
| | 591 | | | Series 2014-B, Class A1, VAR, 1.774%, 08/25/32 (e) | | | 593 | |
| | 1,423 | | | Series 2015-A, Class A1, VAR, 1.724%, 03/25/33 (e) | | | 1,425 | |
| | 2,542 | | | Series 2015-B, Class A1, VAR, 1.574%, 04/25/35 (e) | | | 2,524 | |
| | 1,812 | | | Series 2015-C, Class A1, VAR, 1.574%, 08/27/35 (e) | | | 1,799 | |
| | 2,879 | | | Series 2016-B, Class A1, VAR, 1.724%, 06/25/33 (e) | | | 2,892 | |
| | 2,097 | | | SpringCastle America Funding LLC, Series 2014-AA, Class A, 2.700%, 05/25/23 (e) | | | 2,099 | |
| | 2,139 | | | Springleaf Funding Trust, Series 2014-AA, Class A, 2.410%, 12/15/22 (e) | | | 2,141 | |
| | | | | | | | |
PRINCIPAL
AMOUNT($) | | | SECURITY DESCRIPTION | | VALUE($) | |
| | | | | | | | |
| | 130 | | | Structured Asset Investment Loan Trust, Series 2003-BC2, Class A3, VAR, 1.224%, 04/25/33 | | | 126 | |
| | | | TCF Auto Receivables Owner Trust, | | | | |
| | 7,200 | | | Series 2015-1A, Class A3, 1.490%, 12/16/19 (e) | | | 7,199 | |
| | 2,249 | | | Series 2015-2A, Class A2, 1.640%, 01/15/19 (e) | | | 2,250 | |
| | 1,429 | | | Tricon American Homes Trust, Series 2015-SFR1, Class A, VAR, 1.757%, 05/17/32 (e) | | | 1,419 | |
| | 4,210 | | | U.S. Residential Opportunity Fund III Trust, Series 2016-2III, Class A, SUB, 3.475%, 08/27/36 (e) | | | 4,206 | |
| | 415 | | | VOLT NPL X LLC, Series 2014-NPL8, Class A1, SUB, 3.375%, 10/26/54 (e) | | | 414 | |
| | 973 | | | VOLT XIX LLC, Series 2014-NP11, Class A1, SUB, 3.875%, 04/25/55 (e) | | | 975 | |
| | 2,736 | | | VOLT XL LLC, Series 2015-NP14, Class A1, SUB, 4.375%, 11/27/45 (e) | | | 2,764 | |
| | 2,322 | | | VOLT XLVII LLC, Series 2016-NPL7, Class A1, SUB, 3.750%, 06/25/46 (e) | | | 2,327 | |
| | 1,686 | | | VOLT XXII LLC, Series 2015-NPL4, Class A1, SUB, 3.500%, 02/25/55 (e) | | | 1,687 | |
| | 1,961 | | | VOLT XXIV LLC, Series 2015-NPL6, Class A1, SUB, 3.500%, 02/25/55 (e) | | | 1,961 | |
| | 5,193 | | | VOLT XXV LLC, Series 2015-NPL8, Class A1, SUB, 3.500%, 06/26/45 (e) | | | 5,190 | |
| | 3,680 | | | VOLT XXVI LLC, Series 2014-NPL6, Class A2, SUB, 4.250%, 09/25/43 (e) | | | 3,560 | |
| | 2,082 | | | VOLT XXVII LLC, Series 2014-NPL7, Class A1, SUB, 3.375%, 08/27/57 (e) | | | 2,079 | |
| | 1,715 | | | VOLT XXX LLC, Series 2015-NPL1, Class A1, SUB, 3.625%, 10/25/57 (e) | | | 1,716 | |
| | 1,187 | | | VOLT XXXI LLC, Series 2015-NPL2, Class A1, SUB, 3.375%, 02/25/55 (e) | | | 1,187 | |
| | 3,273 | | | VOLT XXXIII LLC, Series 2015-NPL5, Class A1, SUB, 3.500%, 03/25/55 (e) | | | 3,273 | |
| | 4,140 | | | Westgate Resorts LLC, Series 2016-1A, Class A, 3.500%, 12/20/28 (e) | | | 4,140 | |
| | | | | | | | |
| | | | Total Asset-Backed Securities
(Cost $250,556) | | | 248,064 | |
| | | | | | | | |
| Collateralized Mortgage Obligations — 55.1% | |
| | | | Agency CMO — 49.4% | |
| | 169 | | | Federal Home Loan Mortgage Corp. - Government National Mortgage Association, Series 1, Class S, IF, IO, 8.437%, 10/25/22 | | | 20 | |
| | | | Federal Home Loan Mortgage Corp. REMIC, | | | | |
| | 3 | | | Series 1071, Class F, VAR, 1.458%, 04/15/21 | | | 3 | |
SEE NOTES TO FINANCIAL STATEMENTS.
| | | | | | | | |
| | | |
| AUGUST 31, 2016 | | J.P. MORGAN INCOME FUNDS | | | | | 197 | |
JPMorgan Limited Duration Bond Fund
SCHEDULE OF PORTFOLIO INVESTMENTS
AS OF AUGUST 31, 2016 (Unaudited) (continued)
(Amounts in thousands)
| | | | | | | | |
PRINCIPAL
AMOUNT($) | | | SECURITY DESCRIPTION | | VALUE($) | |
| Collateralized Mortgage Obligations — continued | |
| | | | Agency CMO — continued | |
| | 11 | | | Series 1343, Class LA, 8.000%, 08/15/22 | | | 12 | |
| | 9 | | | Series 1370, Class JA, VAR, 1.658%, 09/15/22 | | | 9 | |
| | 8 | | | Series 1379, Class W, VAR, 1.300%, 10/15/22 | | | 8 | |
| | 2 | | | Series 1508, Class KA, VAR, 1.290%, 05/15/23 | | | 2 | |
| | 142 | | | Series 1689, Class M, PO, 03/15/24 | | | 135 | |
| | 69 | | | Series 1771, Class PK, 8.000%, 02/15/25 | | | 78 | |
| | 120 | | | Series 1974, Class ZA, 7.000%, 07/15/27 | | | 134 | |
| | 21 | | | Series 1981, Class Z, 6.000%, 05/15/27 | | | 23 | |
| | 75 | | | Series 2033, Class PR, PO, 03/15/24 | | | 72 | |
| | 11 | | | Series 2261, Class ZY, 7.500%, 10/15/30 | | | 12 | |
| | 1 | | | Series 2289, Class NA, VAR, 10.067%, 05/15/20 | | | 1 | |
| | 39 | | | Series 2338, Class FN, VAR, 1.008%, 08/15/28 | | | 39 | |
| | 86 | | | Series 2416, Class SA, IF, 14.615%, 02/15/32 | | | 124 | |
| | 68 | | | Series 2416, Class SH, IF, 14.985%, 02/17/32 | | | 93 | |
| | 14 | | | Series 2477, Class FZ, VAR, 1.058%, 06/15/31 | | | 15 | |
| | 410 | | | Series 3085, Class VS, HB, IF, 26.689%, 12/15/35 | | | 718 | |
| | 533 | | | Series 3300, Class FA, VAR, 0.808%, 08/15/35 | | | 530 | |
| | 1,531 | | | Series 3737, Class DG, 5.000%, 10/15/30 | | | 1,674 | |
| | 2,428 | | | Series 3832, Class PL, 5.000%, 08/15/39 | | | 2,566 | |
| | 1,621 | | | Series 3841, Class JF, VAR, 0.908%, 10/15/38 | | | 1,627 | |
| | 6,407 | | | Series 3860, Class FP, VAR, 0.908%, 06/15/40 | | | 6,432 | |
| | 2,105 | | | Series 3952, Class MA, 3.000%, 11/15/21 | | | 2,162 | |
| | 8,840 | | | Series 4074, Class FE, VAR, 0.908%, 07/15/42 | | | 8,826 | |
| | 8,899 | | | Series 4111, Class FA, VAR, 0.858%, 08/15/39 | | | 8,912 | |
| | 4,897 | | | Series 4120, Class KI, IO, 3.000%, 10/15/32 | | | 474 | |
| | 14,648 | | | Series 4150, Class F, VAR, 0.878%, 01/15/43 | | | 14,628 | |
| | 17,083 | | | Series 4150, Class GE, 2.000%, 01/15/33 | | | 17,250 | |
| | 10,568 | | | Series 4161, Class YF, VAR, 0.878%, 02/15/43 | | | 10,550 | |
| | 5,578 | | | Series 4206, Class DA, 2.000%, 05/15/33 | | | 5,688 | |
| | 11,445 | | | Series 4281, Class FB, VAR, 1.058%, 12/15/43 | | | 11,458 | |
| | | | | | | | |
PRINCIPAL
AMOUNT($) | | | SECURITY DESCRIPTION | | VALUE($) | |
| | | | | | | | |
| | | | Agency CMO — continued | |
| | 18,707 | | | Series 4350, Class AF, VAR, 0.817%, 12/15/37 | | | 18,545 | |
| | 13,846 | | | Series 4350, Class FK, VAR, 0.817%, 06/15/38 | | | 13,797 | |
| | 2,172 | | | Series 4350, Class KF, VAR, 0.817%, 01/15/39 | | | 2,152 | |
| | 14,963 | | | Series 4363, Class FA, VAR, 0.525%, 09/15/41 | | | 14,870 | |
| | 7,059 | | | Series 4413, Class WF, VAR, 0.817%, 10/15/41 | | | 7,019 | |
| | 14,986 | | | Series 4448, Class TF, VAR, 0.787%, 05/15/40 | | | 14,927 | |
| | 42,005 | | | Series 4457, Class KF, VAR, 0.817%, 10/15/40 | | | 41,942 | |
| | 14,882 | | | Series 4480, Class FM, VAR, 0.817%, 06/15/40 | | | 14,898 | |
| | 11,109 | | | Series 4515, Class FA, VAR, 0.837%, 08/15/38 | | | 11,021 | |
| | 5,172 | | | Series 4594, Class GN, 2.500%, 02/15/45 | | | 5,328 | |
| | 23,305 | | | Federal Home Loan Mortgage Corp. STRIPS, Series 328, Class S4, IF, IO, 2.051%, 02/15/38 | | | 1,429 | |
| | | | Federal Home Loan Mortgage Corp. Structured Pass-Through Securities, | | | | |
| | 70 | | | Series T-51, Class 1APO, PO, 09/25/42 | | | 60 | |
| | 2,778 | | | Series T-54, Class 4A, VAR, 3.218%, 02/25/43 | | | 2,870 | |
| | 72 | | | Federal National Mortgage Association - ACES, Series 2014-M5, Class FA, VAR, 0.825%, 01/25/17 | | | 72 | |
| | | | Federal National Mortgage Association Grantor Trust, | | | | |
| | 404 | | | Series 2001-T8, Class A1, 7.500%, 07/25/41 | | | 471 | |
| | 1,277 | | | Series 2002-T6, Class A4, VAR, 3.535%, 03/25/41 | | | 1,330 | |
| | | | Federal National Mortgage Association REMIC, | | | | |
| | 4 | | | Series 1988-15, Class B, VAR, 1.074%, 06/25/18 | | | 4 | |
| | 1 | | | Series 1989-77, Class J, 8.750%, 11/25/19 | | | 1 | |
| | — | (h) | | Series 1989-89, Class H, 9.000%, 11/25/19 | | | — | (h) |
| | 21 | | | Series 1990-64, Class Z, 10.000%, 06/25/20 | | | 23 | |
| | 43 | | | Series 1990-145, Class A, VAR, 1.465%, 12/25/20 | | | 43 | |
| | 47 | | | Series 1991-142, Class PL, 8.000%, 10/25/21 | | | 51 | |
| | 48 | | | Series 1991-156, Class F, VAR, 1.824%, 11/25/21 | | | 50 | |
SEE NOTES TO FINANCIAL STATEMENTS.
| | | | | | |
| | | |
| 198 | | | | J.P. MORGAN INCOME FUNDS | | AUGUST 31, 2016 |
| | | | | | | | |
PRINCIPAL
AMOUNT($) | | | SECURITY DESCRIPTION | | VALUE($) | |
| Collateralized Mortgage Obligations — continued | |
| | | | Agency CMO — continued | |
| | — | (h) | | Series 1992-91, Class SQ, HB, IF, 8,985.610%, 05/25/22 | | | 9 | |
| | 85 | | | Series 1992-112, Class GB, 7.000%, 07/25/22 | | | 94 | |
| | 3 | | | Series 1992-154, Class SA, IF, IO, 5.400%, 08/25/22 | | | — | (h) |
| | 36 | | | Series 1992-200, Class FK, VAR, 1.990%, 11/25/22 | | | 37 | |
| | 42 | | | Series 1993-27, Class S, IF, 8.965%, 02/25/23 | | | 49 | |
| | 81 | | | Series 1993-110, Class H, 6.500%, 05/25/23 | | | 90 | |
| | 9 | | | Series 1993-119, Class H, 6.500%, 07/25/23 | | | 10 | |
| | 79 | | | Series 1993-146, Class E, PO, 05/25/23 | | | 75 | |
| | 36 | | | Series 1993-165, Class FH, VAR, 1.674%, 09/25/23 | | | 37 | |
| | 186 | | | Series 1993-179, Class FM, VAR, 1.940%, 10/25/23 | | | 191 | |
| | 34 | | | Series 1997-74, Class E, 7.500%, 10/20/27 | | | 40 | |
| | 353 | | | Series 2001-9, Class F, VAR, 0.757%, 02/17/31 | | | 354 | |
| | 86 | | | Series 2001-33, Class ID, IO, 6.000%, 07/25/31 | | | 17 | |
| | 85 | | | Series 2002-77, Class FY, VAR, 0.924%, 12/25/17 | | | 85 | |
| | 203 | | | Series 2003-17, Class FN, VAR, 0.824%, 03/25/18 | | | 203 | |
| | 30 | | | Series 2003-21, Class FK, VAR, 0.924%, 03/25/33 | | | 31 | |
| | 774 | | | Series 2004-17, Class BF, VAR, 0.874%, 01/25/34 | | | 772 | |
| | 1,218 | | | Series 2006-3, Class SB, IF, IO, 6.176%, 07/25/35 | | | 180 | |
| | 1,060 | | | Series 2006-16, Class HZ, 5.500%, 03/25/36 | | | 1,139 | |
| | 2,471 | | | Series 2006-124, Class FC, VAR, 0.874%, 01/25/37 | | | 2,464 | |
| | 543 | | | Series 2010-42, Class PD, 4.500%, 07/25/39 | | | 546 | |
| | 3,683 | | | Series 2012-38, Class PA, 2.000%, 09/25/41 | | | 3,730 | |
| | 6,244 | | | Series 2012-93, Class ME, 2.500%, 01/25/42 | | | 6,437 | |
| | 4,058 | | | Series 2012-114, Class VE, 3.500%, 10/25/25 | | | 4,295 | |
| | 14,267 | | | Series 2012-119, Class FB, VAR, 0.874%, 11/25/42 | | | 14,193 | |
| | 2,861 | | | Series 2013-6, Class FL, VAR, 0.924%, 02/25/43 | | | 2,854 | |
| | | | | | | | |
PRINCIPAL
AMOUNT($) | | | SECURITY DESCRIPTION | | VALUE($) | |
| | | | | | | | |
| | | | Agency CMO — continued | |
| | 5,302 | | | Series 2013-15, Class DC, 2.000%, 03/25/33 | | | 5,352 | |
| | 5,507 | | | Series 2013-23, Class KJ, 2.250%, 05/25/42 | | | 5,602 | |
| | 4,451 | | | Series 2013-26, Class AV, 3.500%, 04/25/26 | | | 4,725 | |
| | 3,392 | | | Series 2013-43, Class YH, 2.500%, 05/25/33 | | | 3,447 | |
| | 12,245 | | | Series 2013-54, Class HF, VAR, 0.724%, 10/25/41 | | | 12,203 | |
| | 740 | | | Series 2014-49, Class AF, VAR, 0.787%, 08/25/44 | | | 733 | |
| | 9,740 | | | Series 2014-66, Class WF, VAR, 0.817%, 10/25/54 | | | 9,720 | |
| | 18,945 | | | Series 2015-42, Class BF, VAR, 0.777%, 06/25/45 | | | 18,894 | |
| | 16,953 | | | Series 2015-91, Class AF, VAR, 0.837%, 12/25/45 | | | 16,855 | |
| | 22,134 | | | Series 2016-25, Class LA, 3.000%, 07/25/45 | | | 23,062 | |
| | 24,532 | | | Series 2016-30, Class PA, 3.000%, 04/25/45 | | | 25,612 | |
| | 7,970 | | | Series 2016-33, Class JA, 3.000%, 07/25/45 | | | 8,308 | |
| | 12,777 | | | Series 2016-38, Class NA, 3.000%, 01/25/46 | | | 13,426 | |
| | 3 | | | Series G92-44, Class ZQ, 8.000%, 07/25/22 | | | 3 | |
| | 507 | | | Series G94-9, Class PJ, 6.500%, 08/17/24 | | | 581 | |
| | | | Federal National Mortgage Association REMIC Trust, | | | | |
| | 277 | | | Series 2003-W1, Class 2A, VAR, 6.307%, 12/25/42 | | | 325 | |
| | 1,177 | | | Series 2003-W4, Class 5A, VAR, 3.230%, 10/25/42 | | | 1,187 | |
| | 1,742 | | | Series 2003-W15, Class 3A, VAR, 4.102%, 12/25/42 | | | 1,862 | |
| | 838 | | | Series 2009-W1, Class A, 6.000%, 12/25/49 | | | 961 | |
| | | | Federal National Mortgage Association STRIPS, | | | | |
| | 212 | | | Series 343, Class 23, IO, 4.000%, 10/25/18 | | | 6 | |
| | 308 | | | Series 343, Class 27, IO, 4.500%, 01/25/19 | | | 10 | |
| | 528 | | | Federal National Mortgage Association Trust, Series 2004-W2, Class 4A, VAR, 2.934%, 02/25/44 | | | 562 | |
| | | | Government National Mortgage Association, | | | | |
| | 11 | | | Series 2000-35, Class F, VAR, 1.057%, 12/16/25 | | | 11 | |
| | 214 | | | Series 2002-31, Class FC, VAR, 0.770%, 09/26/21 | | | 214 | |
SEE NOTES TO FINANCIAL STATEMENTS.
| | | | | | | | |
| | | |
| AUGUST 31, 2016 | | J.P. MORGAN INCOME FUNDS | | | | | 199 | |
JPMorgan Limited Duration Bond Fund
SCHEDULE OF PORTFOLIO INVESTMENTS
AS OF AUGUST 31, 2016 (Unaudited) (continued)
(Amounts in thousands)
| | | | | | | | |
PRINCIPAL
AMOUNT($) | | | SECURITY DESCRIPTION | | VALUE($) | |
| Collateralized Mortgage Obligations — continued | |
| | | | Agency CMO — continued | |
| | 4,383 | | | Series 2010-166, Class GP, 3.000%, 04/20/39 | | | 4,543 | |
| | 6,424 | | | Series 2012-61, Class FM, VAR, 0.907%, 05/16/42 | | | 6,435 | |
| | 3,327 | | | Series 2012-H21, Class FA, VAR, 0.968%, 07/20/62 | | | 3,301 | |
| | 17,659 | | | Series 2013-H16, Class FA, VAR, 1.008%, 07/20/63 | | | 17,616 | |
| | 18,691 | | | Series 2014-H07, Class FC, VAR, 1.068%, 05/20/64 | | | 18,690 | |
| | 6,003 | | | Series 2014-H11, Class JA, VAR, 0.968%, 06/20/64 | | | 5,974 | |
| | 15,791 | | | Series 2014-H17, Class FM, VAR, 0.948%, 08/20/64 | | | 15,693 | |
| | 8,980 | | | Series 2015-H03, Class FD, VAR, 1.108%, 01/20/65 | | | 8,910 | |
| | 17,501 | | | Series 2015-H04, Class FL, VAR, 0.938%, 02/20/65 | | | 17,391 | |
| | 9,443 | | | Series 2015-H12, Class FA, VAR, 0.948%, 05/20/65 | | | 9,381 | |
| | 20,076 | | | Series 2015-H12, Class FJ, VAR, 0.898%, 05/20/65 | | | 19,935 | |
| | 22,871 | | | Series 2015-H14, Class FB, VAR, 0.898%, 05/20/65 | | | 22,703 | |
| | 16,990 | | | Series 2015-H19, Class FN, VAR, 0.908%, 07/20/65 | | | 16,835 | |
| | 19,919 | | | Series 2015-H23, Class TA, VAR, 0.938%, 09/20/65 | | | 19,767 | |
| | | | | | | | |
| | | | | | | 623,945 | |
| | | | | | | | |
| | | | Non-Agency CMO — 5.7% | |
| | | | Alternative Loan Trust, | | | | |
| | 687 | | | Series 2004-33, Class 3A3, VAR, 2.663%, 12/25/34 | | | 622 | |
| | 23 | | | Series 2004-J4, Class 1A6, SUB, 5.400%, 06/25/34 | | | 23 | |
| | 383 | | | Banc of America Alternative Loan Trust, Series 2004-8, Class 3A1, 5.500%, 09/25/19 | | | 375 | |
| | | | Banc of America Funding Trust, | | | | |
| | 314 | | | Series 2005-E, Class 5A1, VAR, 3.173%, 05/20/35 | | | 310 | |
| | 582 | | | Series 2006-1, Class 2A1, 5.500%, 01/25/36 | | | 559 | |
| | | | Banc of America Mortgage Trust, | | | | |
| | 738 | | | Series 2004-D, Class 2A2, VAR, 3.258%, 05/25/34 | | | 730 | |
| | 535 | | | Series 2005-A, Class 3A1, VAR, 2.906%, 02/25/35 | | | 523 | |
| | | | | | | | |
PRINCIPAL
AMOUNT($) | | | SECURITY DESCRIPTION | | VALUE($) | |
| | | | | | | | |
| | | | Non-Agency CMO — continued | |
| | 478 | | | Bear Stearns Asset-Backed Securities I Trust, Series 2004-AC6, Class M1, VAR, 1.529%, 11/25/34 | | | 157 | |
| | | | CHL Mortgage Pass-Through Trust, | | | | |
| | 295 | | | Series 2003-21, Class A1, VAR, 3.244%, 05/25/33 | | | 297 | |
| | 139 | | | Series 2004-HYB8, Class 1A1, VAR, 1.212%, 01/20/35 | | | 125 | |
| | 339 | | | Series 2005-1, Class 1A2, VAR, 1.224%, 03/25/35 | | | 47 | |
| | 5 | | | Collateralized Mortgage Obligation Trust, Series 50, Class B, PO, 10/01/18 | | | 5 | |
| | | | Credit Suisse First Boston Mortgage Securities Corp., | | | | |
| | 1,045 | | | Series 2003-AR24, Class 2A4, VAR, 2.979%, 10/25/33 | | | 1,037 | |
| | 893 | | | Series 2004-5, Class 4A1, 6.000%, 09/25/34 | | | 909 | |
| | 133 | | | Series 2005-5, Class 1A1, 5.000%, 07/25/20 | | | 132 | |
| | 399 | | | Deutsche Alt-A Securities, Inc., Mortgage Loan Trust, Series 2005-1, Class 2A1, VAR, 5.804%, 02/25/20 | | | 403 | |
| | | | Federal Home Loan Mortgage Corp. Structured Agency Credit Risk Debt Notes, | | | | |
| | 4,500 | | | Series 2013-DN1, Class M1, VAR, 3.924%, 07/25/23 | | | 4,586 | |
| | 7,063 | | | Series 2015-DNA3, Class M2, VAR, 3.374%, 04/25/28 | | | 7,328 | |
| | | | Federal National Mortgage Association, Connecticut Avenue Securities, | | | | |
| | 2,161 | | | Series 2013-C01, Class M1, VAR, 2.524%, 10/25/23 | | | 2,183 | |
| | 2,088 | | | Series 2014-C01, Class M1, VAR, 2.124%, 01/25/24 | | | 2,103 | |
| | 6,099 | | | Series 2014-C02, Class 1M1, VAR, 1.474%, 05/25/24 | | | 6,102 | |
| | 2,064 | | | Series 2014-C03, Class 1M1, VAR, 1.724%, 07/25/24 | | | 2,069 | |
| | 369 | | | First Horizon Alternative Mortgage Securities Trust, Series 2005-FA10, Class 2A1, 5.250%, 12/25/20 | | | 374 | |
| | 849 | | | First Horizon Mortgage Pass-Through Trust, Series 2004-AR6, Class 2A1, VAR, 2.811%, 12/25/34 | | | 847 | |
| | 71 | | | First Republic Bank Mortgage Pass-Through Certificates Trust, Series 2000-FRB1, Class B1, VAR, 1.024%, 06/25/30 | | | 57 | |
| | 372 | | | First Republic Mortgage Loan Trust, Series 2000-FRB2, Class A1, VAR, 1.008%, 11/15/30 | | | 332 | |
SEE NOTES TO FINANCIAL STATEMENTS.
| | | | | | |
| | | |
| 200 | | | | J.P. MORGAN INCOME FUNDS | | AUGUST 31, 2016 |
| | | | | | | | |
PRINCIPAL
AMOUNT($) | | | SECURITY DESCRIPTION | | VALUE($) | |
| Collateralized Mortgage Obligations — continued | |
| | | | Non-Agency CMO — continued | |
| | 793 | | | GSAA Trust, Series 2004-CW1, Class 1A1, 5.500%, 04/01/34 | | | 815 | |
| | 467 | | | GSR Mortgage Loan Trust, Series 2004-10F, Class 7A1, 5.500%, 09/25/34 | | | 481 | |
| | | | Impac CMB Trust, | | | | |
| | 263 | | | Series 2004-3, Class 3A, VAR, 1.164%, 03/25/34 | | | 249 | |
| | 290 | | | Series 2004-6, Class 1A2, VAR, 1.304%, 10/25/34 | | | 267 | |
| | 1,366 | | | Series 2005-5, Class A1, VAR, 1.164%, 08/25/35 | | | 1,197 | |
| | 1,084 | | | Indymac INDA Mortgage Loan Trust, Series 2007-AR1, Class 1A1, VAR, 3.160%, 03/25/37 | | | 1,002 | |
| | 153 | | | JP Morgan Mortgage Trust, Series 2003-A1, Class 1A1, VAR, 2.583%, 10/25/33 | | | 150 | |
| | | | MASTR Adjustable Rate Mortgages Trust, | | | | |
| | 221 | | | Series 2003-5, Class 5A1, VAR, 2.375%, 10/25/33 | | | 220 | |
| | 404 | | | Series 2004-13, Class 2A1, VAR, 2.882%, 04/21/34 | | | 413 | |
| | 1,308 | | | Series 2004-13, Class 3A7B, VAR, 2.530%, 11/21/34 | | | 1,324 | |
| | 142 | | | MASTR Seasoned Securitization Trust, Series 2003-1, Class 3A2, VAR, 0.924%, 02/25/33 | | | 129 | |
| | | | Mellon Residential Funding Corp. Mortgage Pass-Through Certificates, | | | | |
| | 419 | | | Series 2001-TBC1, Class B1, VAR, 1.388%, 11/15/31 | | | 365 | |
| | 96 | | | Series 2002-TBC1, Class B1, VAR, 1.508%, 09/15/30 | | | 82 | |
| | 48 | | | Series 2002-TBC1, Class B2, VAR, 1.908%, 09/15/30 | | | 40 | |
| | 194 | | | Series 2002-TBC2, Class B1, VAR, 1.358%, 08/15/32 | | | 159 | |
| | | | Merrill Lynch Mortgage Investors Trust, | | | | |
| | 447 | | | Series 2004-1, Class 2A3, VAR, 2.682%, 12/25/34 | | | 414 | |
| | 617 | | | Series 2004-D, Class A1, VAR, 1.184%, 09/25/29 | | | 611 | |
| | 11 | | | ML Trust XLVII, Series 47, Class Z, 8.985%, 10/20/20 | | | 12 | |
| | | | Morgan Stanley Dean Witter Capital I, Inc. Trust, | | | | |
| | 289 | | | Series 2003-HYB1, Class A4, VAR, 2.197%, 03/25/33 | | | 262 | |
| | 270 | | | Series 2003-HYB1, Class B1, VAR, 2.197%, 03/25/33 | | | 198 | |
| | | | | | | | |
PRINCIPAL
AMOUNT($) | | | SECURITY DESCRIPTION | | VALUE($) | |
| | | | | | | | |
| | | | Non-Agency CMO — continued | |
| | | | Morgan Stanley Mortgage Loan Trust, | | | | |
| | 2,649 | | | Series 2004-3, Class 4A, VAR, 5.676%, 04/25/34 | | | 2,771 | |
| | 349 | | | Series 2004-5AR, Class 3A3, VAR, 2.857%, 07/25/34 | | | 321 | |
| | 1,968 | | | Series 2004-5AR, Class 3A5, VAR, 2.857%, 07/25/34 | | | 1,958 | |
| | 892 | | | Series 2004-11AR, Class 1A2A, VAR, 0.834%, 01/25/35 | | | 833 | |
| | 1,325 | | | NAAC Reperforming Loan REMIC Trust Certificates, Series 2004-R3, Class AF, VAR, 0.974%, 02/25/35 (e) | | | 1,088 | |
| | | | Nomura Asset Acceptance Corp. Alternative Loan Trust, | | | | |
| | 486 | | | Series 2003-A3, Class A1, SUB, 5.500%, 08/25/33 | | | 496 | |
| | 31 | | | Series 2004-AR1, Class 5A1, VAR, 1.284%, 08/25/34 | | | 29 | |
| | 776 | | | Prime Mortgage Trust, Series 2005-2, Class 2A1, VAR, 6.591%, 10/25/32 | | | 819 | |
| | 169 | | | RALI Trust, Series 2003-QS16, Class A1, 5.000%, 08/25/18 | | | 169 | |
| | | | RFMSI Trust, | | | | |
| | 3,242 | | | Series 2005-SA2, Class 2A2, VAR, 3.401%, 06/25/35 | | | 3,029 | |
| | 829 | | | Series 2006-SA4, Class 2A1, VAR, 4.034%, 11/25/36 | | | 727 | |
| | | | Sequoia Mortgage Trust, | | | | |
| | 65 | | | Series 11, Class A, VAR, 1.412%, 12/20/32 | | | 63 | |
| | 169 | | | Series 2003-3, Class A2, VAR, 1.625%, 07/20/33 | | | 159 | |
| | 1,642 | | | Series 2004-11, Class A2, VAR, 1.571%, 12/20/34 | | | 1,565 | |
| | 1,714 | | | Springleaf Mortgage Loan Trust, Series 2013-2A, Class A, VAR, 1.780%, 12/25/65 (e) | | | 1,705 | |
| | 134 | | | Structured Asset Mortgage Investments II Trust, Series 2004-AR1, Class 1A1, VAR, 1.214%, 03/19/34 | | | 129 | |
| | 1,049 | | | Structured Asset Mortgage Investments, Inc., Series 2002-AR2, Class A3, VAR, 1.264%, 07/19/32 | | | 787 | |
| | | | Structured Asset Securities Corp., Mortgage Pass-Through Certificates, | | | | |
| | 2,501 | | | Series 2003-24A, Class 2A, VAR, 3.089%, 07/25/33 | | | 2,375 | |
| | 1,678 | | | Series 2003-29, Class 3A1, VAR, 4.919%, 09/25/33 | | | 1,670 | |
| | 3,030 | | | Series 2003-32, Class 5A1, VAR, 5.804%, 11/25/33 | | | 3,110 | |
SEE NOTES TO FINANCIAL STATEMENTS.
| | | | | | | | |
| | | |
| AUGUST 31, 2016 | | J.P. MORGAN INCOME FUNDS | | | | | 201 | |
JPMorgan Limited Duration Bond Fund
SCHEDULE OF PORTFOLIO INVESTMENTS
AS OF AUGUST 31, 2016 (Unaudited) (continued)
(Amounts in thousands)
| | | | | | | | |
PRINCIPAL
AMOUNT($) | | | SECURITY DESCRIPTION | | VALUE($) | |
| Collateralized Mortgage Obligations — continued | |
| | | | Non-Agency CMO — continued | |
| | 831 | | | Series 2003-40A, Class 4A, VAR, 2.941%, 01/25/34 | | | 802 | |
| | 4,038 | | | Thornburg Mortgage Securities Trust, Series 2004-4, Class 5A, VAR, 2.540%, 12/25/44 | | | 3,825 | |
| | | | WaMu Mortgage Pass-Through Certificates Trust, | | | | |
| | 1,420 | | | Series 2004-AR3, Class A1, VAR, 2.783%, 06/25/34 | | | 1,431 | |
| | 752 | | | Series 2004-AR11, Class A, VAR, 2.713%, 10/25/34 | | | 756 | |
| | | | Wells Fargo Mortgage-Backed Securities Trust, | | | | |
| | 354 | | | Series 2003-K, Class 1A2, VAR, 2.638%, 11/25/33 | | | 356 | |
| | 482 | | | Series 2005-AR16, Class 3A2, VAR, 2.969%, 03/25/35 | | | 484 | |
| | 125 | | | Series 2006-17, Class A1, 5.500%, 11/25/21 | | | 127 | |
| | 137 | | | Series 2007-3, Class 3A1, 5.500%, 04/25/22 | | | 140 | |
| | | | | | | 72,349 | |
| | | | | | | | |
| | | | Total Collateralized Mortgage Obligations
(Cost $697,223) | | | 696,294 | |
| | | | | | | | |
| Commercial Mortgage-Backed Securities — 3.2% | |
| | | | A10 Securitization LLC, | | | | |
| | 1,935 | | | Series 2015-1, Class A1, 2.100%, 04/15/34 (e) | | | 1,925 | |
| | 2,371 | | | Series 2015-1, Class A2, 3.130%, 04/15/34 (e) | | | 2,378 | |
| | | | A10 Term Asset Financing LLC, | | | | |
| | 2,466 | | | Series 2014-1, Class A1, 1.720%, 04/15/33 (e) | | | 2,454 | |
| | 5,281 | | | Series 2016-1, Class A1, 2.420%, 03/15/35 (e) | | | 5,285 | |
| | 2,900 | | | BAMLL Commercial Mortgage Securities Trust, Series 2013-DSNY, Class A, VAR, 1.558%, 09/15/26 (e) | | | 2,898 | |
| | | | Bayview Commercial Asset Trust, | | | | |
| | 360 | | | Series 2004-3, Class A2, VAR, 0.944%, 01/25/35 (e) | | | 324 | |
| | 1,309 | | | Series 2005-2A, Class A2, VAR, 0.874%, 08/25/35 (e) | | | 1,141 | |
| | 261 | | | Series 2005-2A, Class M1, VAR, 0.954%, 08/25/35 (e) | | | 218 | |
| | 1,241 | | | Series 2007-3, Class A2, VAR, 0.814%, 07/25/37 (e) | | | 1,002 | |
| | 2,793 | | | BBCMS Trust, Series 2015-VFM, Class A1, 2.466%, 03/10/36 (e) | | | 2,798 | |
| | | | | | | | |
PRINCIPAL
AMOUNT($) | | | SECURITY DESCRIPTION | | VALUE($) | |
| | | | | | | | |
| | 6,000 | | | BHMS Mortgage Trust, Series 2014-ATLS, Class BFL, VAR, 2.447%, 07/05/33 (e) | | | 5,920 | |
| | | | COMM Mortgage Trust, | | | | |
| | 3,402 | | | Series 2012-9W57, Class A, 2.365%, 02/10/29 (e) | | | 3,410 | |
| | 2,667 | | | Series 2014-BBG, Class A, VAR, 1.308%, 03/15/29 (e) | | | 2,644 | |
| | 1,319 | | | Series 2014-PAT, Class A, VAR, 1.308%, 08/13/27 (e) | | | 1,314 | |
| | 3,774 | | | Series 2014-TWC, Class A, VAR, 1.358%, 02/13/32 (e) | | | 3,774 | |
| | 633 | | | GS Mortgage Securities Trust, Series 2013-GC16, Class A1, 1.264%, 11/10/46 | | | 633 | |
| | 396 | | | Morgan Stanley Capital I Trust, Series 2006-IQ12, Class A4, 5.332%, 12/15/43 | | | 396 | |
| | 726 | | | RAIT Trust, Series 2014-FL3, Class A, VAR, 1.758%, 12/15/31 (e) | | | 717 | |
| | 1,155 | | | UBS-BAMLL Trust, Series 2012-WRM, Class A, 3.663%, 06/10/30 (e) | | | 1,223 | |
| | | | | | | | |
| | | | Total Commercial Mortgage-Backed Securities
(Cost $41,108) | | | 40,454 | |
| | | | | | | | |
| Corporate Bonds — 9.0% | |
| | | | Consumer Discretionary — 0.3% | |
| | | | Media — 0.3% | |
| | 4,000 | | | Walt Disney Co. (The), VAR, 1.139%, 05/30/19 | | | 4,009 | |
| | | | | | | | |
| | | | Consumer Staples — 0.1% | |
| | | | Food & Staples Retailing — 0.1% | |
| | 607 | | | Walgreens Boots Alliance, Inc., 1.750%, 11/17/17 | | | 610 | |
| | | | | | | | |
| | | | Energy — 1.6% | |
| | | | Oil, Gas & Consumable Fuels — 1.6% | |
| | 3,000 | | | BP Capital Markets plc, (United Kingdom), VAR, 1.270%, 09/26/18 | | | 3,018 | |
| | 1,810 | | | Buckeye Partners LP, 4.875%, 02/01/21 | | | 1,933 | |
| | 2,882 | | | CNOOC Finance 2015 Australia Pty Ltd., (Australia), 2.625%, 05/05/20 | | | 2,947 | |
| | 4,963 | | | ConocoPhillips Co., 1.500%, 05/15/18 | | | 4,963 | |
| | 1,525 | | | ONEOK Partners LP, 3.200%, 09/15/18 | | | 1,551 | |
| | 1,628 | | | Plains All American Pipeline LP/PAA Finance Corp., 2.600%, 12/15/19 | | | 1,638 | |
| | 684 | | | Spectra Energy Partners LP, 2.950%, 09/25/18 | | | 697 | |
| | 3,000 | | | Statoil ASA, (Norway), VAR, 1.248%, 11/08/18 | | | 3,011 | |
| | 822 | | | TransCanada PipeLines Ltd., (Canada), 1.875%, 01/12/18 | | | 826 | |
| | | | | | | | |
| | | | Total Energy | | | 20,584 | |
| | | | | | | | |
SEE NOTES TO FINANCIAL STATEMENTS.
| | | | | | |
| | | |
| 202 | | | | J.P. MORGAN INCOME FUNDS | | AUGUST 31, 2016 |
| | | | | | | | |
PRINCIPAL
AMOUNT($) | | | SECURITY DESCRIPTION | | VALUE($) | |
| Corporate Bonds — continued | |
| | | | Financials — 5.1% | |
| | | | Banks — 1.9% | |
| | 3,000 | | | ABN AMRO Bank N.V., (Netherlands), VAR, 1.543%, 10/28/16 (e) | | | 3,003 | |
| | | | Bank of America Corp., | | | | |
| | 1,346 | | | 1.700%, 08/25/17 | | | 1,350 | |
| | 2,000 | | | Series L, 2.600%, 01/15/19 | | | 2,044 | |
| | 5,000 | | | Bank of Montreal, (Canada), 1.350%, 08/28/18 | | | 4,996 | |
| | 3,169 | | | Barclays plc, (United Kingdom), 2.875%, 06/08/20 | | | 3,194 | |
| | 3,000 | | | BB&T Corp., VAR, 1.417%, 02/01/19 | | | 3,016 | |
| | 923 | | | BNP Paribas S.A., (France), 2.700%, 08/20/18 | | | 944 | |
| | 2,750 | | | Citigroup, Inc., VAR, 1.497%, 11/15/16 | | | 2,753 | |
| | 964 | | | Discover Bank, 2.600%, 11/13/18 | | | 978 | |
| | 967 | | | SunTrust Banks, Inc., 2.350%, 11/01/18 | | | 983 | |
| | | | | | | | |
| | | | | | | 23,261 | |
| | | | | | | | |
| | | | Capital Markets — 0.7% | |
| | | | Goldman Sachs Group, Inc. (The), | | | | |
| | 1,000 | | | 2.625%, 04/25/21 | | | 1,018 | |
| | 3,000 | | | VAR, 1.917%, 11/15/18 | | | 3,033 | |
| | | | Morgan Stanley, | | | | |
| | 1,482 | | | 2.500%, 01/24/19 | | | 1,506 | |
| | 2,925 | | | 2.500%, 04/21/21 | | | 2,955 | |
| | | | | | | | |
| | | | | | | 8,512 | |
| | | | | | | | |
| | | | Consumer Finance — 1.7% | | | | |
| | 3,000 | | | American Express Credit Corp., VAR, 1.197%, 03/18/19 | | | 3,016 | |
| | 3,000 | | | American Honda Finance Corp., VAR, 1.157%, 10/07/16 | | | 3,002 | |
| | 4,000 | | | Ford Motor Credit Co. LLC, Series 1, VAR, 1.486%, 03/12/19 | | | 3,998 | |
| | 4,000 | | | HSBC USA, Inc., VAR, 1.520%, 09/24/18 | | | 3,991 | |
| | 2,824 | | | Nissan Motor Acceptance Corp., VAR, 1.386%, 03/03/17 (e) | | | 2,828 | |
| | 5,000 | | | Toyota Motor Credit Corp., VAR, 1.018%, 05/16/17 | | | 5,004 | |
| | | | | | | | |
| | | | | | | 21,839 | |
| | | | | | | | |
| | | | Diversified Financial Services — 0.3% | | | | |
| | 4,000 | | | Shell International Finance B.V., (Netherlands), VAR, 1.266%, 05/11/20 | | | 4,004 | |
| | | | | | | | |
| | | | Insurance — 0.5% | | | | |
| | 880 | | | Chubb INA Holdings, Inc., 2.300%, 11/03/20 | | | 905 | |
| | 1,982 | | | Jackson National Life Global Funding, 1.875%, 10/15/18 (e) | | | 2,002 | |
| | | | | | | | |
PRINCIPAL
AMOUNT($) | | | SECURITY DESCRIPTION | | VALUE($) | |
| | | | | | | | |
| | | | Insurance — continued | |
| | | | New York Life Global Funding, | | | | |
| | 2,485 | | | 1.125%, 03/01/17 (e) | | | 2,487 | |
| | 1,234 | | | 2.000%, 04/13/21 (e) | | | 1,245 | |
| | | | | | | | |
| | | | | | | 6,639 | |
| | | | | | | | |
| | | | Total Financials | | | 64,255 | |
| | | | | | | | |
| | | | Health Care — 0.4% | | | | |
| | | | Health Care Equipment & Supplies — 0.1% | | | | |
| | 857 | | | Medtronic, Inc., 1.500%, 03/15/18 | | | 862 | |
| | | | | | | | |
| | | | Life Sciences Tools & Services — 0.0% (g) | | | | |
| | 662 | | | Thermo Fisher Scientific, Inc., 1.300%, 02/01/17 | | | 662 | |
| | | | | | | | |
| | | | Pharmaceuticals — 0.3% | | | | |
| | 3,300 | | | Actavis Funding SCS, (Luxembourg), VAR, 1.548%, 09/01/16 | | | 3,300 | |
| | | | | | | | |
| | | | Total Health Care | | | 4,824 | |
| | | | | | | | |
| | | | Industrials — 0.2% | | | | |
| | | | Road & Rail — 0.2% | | | | |
| | 2,210 | | | Ryder System, Inc., 2.500%, 05/11/20 | | | 2,226 | |
| | | | | | | | |
| | | | Information Technology — 0.6% | |
| | | | Semiconductors & Semiconductor Equipment — 0.2% | |
| | 2,753 | | | Texas Instruments, Inc., 1.750%, 05/01/20 | | | 2,781 | |
| | | | | | | | |
| | | | Software — 0.2% | | | | |
| | 3,000 | | | Oracle Corp., VAR, 1.260%, 01/15/19 | | | 3,019 | |
| | | | | | | | |
| | | | Technology Hardware, Storage & Peripherals — 0.2% | |
| | 1,793 | | | Apple, Inc., VAR, 1.009%, 05/03/18 | | | 1,798 | |
| | | | | | | | |
| | | | Total Information Technology | | | 7,598 | |
| | | | | | | | |
| | | | Telecommunication Services — 0.3% | | | | |
| | | | Diversified Telecommunication Services — 0.1% | |
| | 1,314 | | | AT&T, Inc., 2.450%, 06/30/20 | | | 1,341 | |
| | | | | | | | |
| | | | Wireless Telecommunication Services — 0.2% | | | | |
| | 3,000 | | | America Movil S.A.B. de C.V., (Mexico), VAR, 1.656%, 09/12/16 | | | 2,996 | |
| | | | | | | | |
| | | | Total Telecommunication Services | | | 4,337 | |
| | | | | | | | |
| | | | Utilities — 0.4% | | | | |
| | | | Electric Utilities — 0.1% | | | | |
| | 1,081 | | | Duke Energy Corp., VAR, 1.034%, 04/03/17 | | | 1,082 | |
| | 828 | | | Southern California Edison Co., Series 14-B, 1.125%, 05/01/17 | | | 829 | |
| | | | | | | | |
| | | | | | | 1,911 | |
| | | | | | | | |
| | | | Gas Utilities — 0.2% | |
| | 2,100 | | | Korea Gas Corp., (South Korea), 2.250%, 07/25/17 (e) | | | 2,116 | |
| | | | | | | | |
SEE NOTES TO FINANCIAL STATEMENTS.
| | | | | | | | |
| | | |
| AUGUST 31, 2016 | | J.P. MORGAN INCOME FUNDS | | | | | 203 | |
JPMorgan Limited Duration Bond Fund
SCHEDULE OF PORTFOLIO INVESTMENTS
AS OF AUGUST 31, 2016 (Unaudited) (continued)
(Amounts in thousands)
| | | | | | | | |
PRINCIPAL
AMOUNT($) | | | SECURITY DESCRIPTION | | VALUE($) | |
| Corporate Bonds — continued | |
| | | | Independent Power & Renewable Electricity Producers — 0.1% | |
| | 870 | | | Exelon Generation Co. LLC, 2.950%, 01/15/20 | | | 895 | |
| | | | | | | | |
| | | | Total Utilities | | | 4,922 | |
| | | | | | | | |
| | | | Total Corporate Bonds
(Cost $112,595) | | | 113,365 | |
| | | | | | | | |
| Mortgage Pass-Through Securities — 4.0% | |
| | | | Federal Home Loan Mortgage Corp., | | | | |
| | 11 | | | ARM, 1.720%, 12/01/21 | | | 11 | |
| | 16 | | | ARM, 2.395%, 07/01/19 | | | 17 | |
| | 10 | | | ARM, 2.500%, 06/01/26 | | | 10 | |
| | 17 | | | ARM, 2.503%, 10/01/29 | | | 18 | |
| | 21 | | | ARM, 2.530%, 11/01/27 | | | 21 | |
| | 38 | | | ARM, 2.570%, 05/01/18 - 12/01/26 | | | 39 | |
| | 45 | | | ARM, 2.572%, 01/01/27 | | | 47 | |
| | 271 | | | ARM, 2.628%, 01/01/23 - 02/01/23 | | | 286 | |
| | 31 | | | ARM, 2.652%, 04/01/30 | | | 33 | |
| | 47 | | | ARM, 2.667%, 07/01/28 | | | 48 | |
| | 8 | | | ARM, 2.680%, 06/01/22 | | | 8 | |
| | 110 | | | ARM, 2.687%, 12/01/27 | | | 115 | |
| | 11 | | | ARM, 2.702%, 12/01/29 | | | 11 | |
| | 22 | | | ARM, 2.732%, 01/01/30 | | | 23 | |
| | 356 | | | ARM, 2.738%, 04/01/32 | | | 370 | |
| | 215 | | | ARM, 2.755%, 07/01/30 | | | 225 | |
| | 155 | | | ARM, 2.758%, 08/01/27 | | | 161 | |
| | 187 | | | ARM, 2.792%, 12/01/26 | | | 194 | |
| | 91 | | | ARM, 2.929%, 01/01/23 | | | 93 | |
| | 21 | | | ARM, 3.009%, 04/01/24 | | | 21 | |
| | 9 | | | ARM, 3.112%, 06/01/25 | | | 9 | |
| | 6,453 | | | Federal Home Loan Mortgage Corp. Gold Pools, 3.000%, 08/01/28 | | | 6,796 | |
| | 3 | | | Federal Home Loan Mortgage Corp. Gold Pools, 20 Year, Single Family, 8.000%, 06/01/17 | | | 3 | |
| | | | Federal Home Loan Mortgage Corp. Gold Pools, 30 Year, Single Family, | | | | |
| | 9 | | | 7.500%, 05/01/28 | | | 10 | |
| | 19 | | | 8.500%, 07/01/28 | | | 23 | |
| | 10 | | | 9.000%, 02/01/25 | | | 11 | |
| | | | Federal National Mortgage Association, | | | | |
| | 2 | | | ARM, 2.125%, 03/01/17 | | | 2 | |
| | 2 | | | ARM, 2.133%, 06/01/18 | | | 2 | |
| | 9 | | | ARM, 2.156%, 04/01/21 | | | 9 | |
| | 38 | | | ARM, 2.188%, 11/01/18 | | | 38 | |
| | 12 | | | ARM, 2.238%, 12/01/20 | | | 13 | |
| | 14 | | | ARM, 2.325%, 04/01/24 | | | 15 | |
| | 4 | | | ARM, 2.370%, 11/01/21 | | | 4 | |
| | | | | | | | |
PRINCIPAL
AMOUNT($) | | | SECURITY DESCRIPTION | | VALUE($) | |
| | | | | | | | |
| | 10 | | | ARM, 2.400%, 07/01/20 | | | 10 | |
| | 7 | | | ARM, 2.455%, 05/01/18 | | | 7 | |
| | 5 | | | ARM, 2.473%, 05/01/29 | | | 6 | |
| | 446 | | | ARM, 2.496%, 05/01/33 | | | 475 | |
| | 31 | | | ARM, 2.525%, 05/01/30 | | | 31 | |
| | 27 | | | ARM, 2.540%, 09/01/19 - 07/01/25 | | | 28 | |
| | 20 | | | ARM, 2.548%, 01/01/31 | | | 21 | |
| | 161 | | | ARM, 2.682%, 09/01/33 | | | 172 | |
| | 31 | | | ARM, 2.704%, 03/01/29 | | | 31 | |
| | 71 | | | ARM, 2.722%, 12/01/28 | | | 73 | |
| | 84 | | | ARM, 2.747%, 08/01/26 | | | 88 | |
| | 339 | | | ARM, 2.783%, 01/01/25 | | | 358 | |
| | 141 | | | ARM, 2.788%, 02/01/34 | | | 148 | |
| | 13 | | | ARM, 2.801%, 03/01/38 | | | 13 | |
| | 38 | | | ARM, 2.840%, 11/01/23 | | | 39 | |
| | 19 | | | ARM, 2.844%, 06/01/26 | | | 20 | |
| | 42 | | | ARM, 3.083%, 11/01/30 | | | 42 | |
| | 15 | | | ARM, 3.271%, 07/01/27 | | | 15 | |
| | 14 | | | ARM, 6.000%, 01/01/20 | | | 14 | |
| | 2,978 | | | Federal National Mortgage Association, 15 Year, Single Family, 4.000%, 02/01/25 | | | 3,166 | |
| | | | Federal National Mortgage Association, 20 Year, Single Family, | | | | |
| | 9,757 | | | 3.000%, 02/01/33 - 07/01/33 | | | 10,241 | |
| | 2,419 | | | 5.000%, 10/01/23 | | | 2,676 | |
| | | | Federal National Mortgage Association, 30 Year, FHA/VA, | | | | |
| | 17 | | | 7.000%, 03/01/27 | | | 18 | |
| | 13 | | | 8.000%, 11/01/27 | | | 13 | |
| | 16 | | | 8.500%, 10/01/24 | | | 16 | |
| | | | Federal National Mortgage Association, 30 Year, Single Family, | | | | |
| | 9,848 | | | 4.000%, 02/01/45 | | | 10,793 | |
| | 2,712 | | | 5.000%, 12/01/39 | | | 3,072 | |
| | 1,168 | | | 5.500%, 08/01/40 | | | 1,312 | |
| | 738 | | | 6.000%, 04/01/39 | | | 859 | |
| | 17 | | | 7.250%, 09/01/22 | | | 17 | |
| | 90 | | | 7.500%, 06/01/23 - 10/01/30 | | | 94 | |
| | | | Federal National Mortgage Association, Other, | | | | |
| | 5,596 | | | ARM, 1.255%, 12/01/25 | | | 5,591 | |
| | 56 | | | 12.000%, 11/01/30 | | | 61 | |
| | | | Government National Mortgage Association II, 30 Year, Single Family, | | | | |
| | 19 | | | 7.250%, 08/20/22 | | | 19 | |
| | 32 | | | 7.400%, 02/20/22 - 03/20/22 | | | 32 | |
| | 7 | | | 7.500%, 10/20/23 | | | 8 | |
| | 13 | | | 7.850%, 12/20/21 | | | 14 | |
| | 41 | | | 8.000%, 07/20/25 - 08/20/26 | | | 48 | |
SEE NOTES TO FINANCIAL STATEMENTS.
| | | | | | |
| | | |
| 204 | | | | J.P. MORGAN INCOME FUNDS | | AUGUST 31, 2016 |
| | | | | | | | |
PRINCIPAL
AMOUNT($) | | | SECURITY DESCRIPTION | | VALUE($) | |
| Mortgage Pass-Through Securities — continued | |
| | 1,853 | | | Government National Mortgage Association, 15 Year, Single Family, 4.500%, 10/15/24 | | | 1,992 | |
| | | | Government National Mortgage Association, 30 Year, Single Family, | | | | |
| | 16 | | | 7.000%, 06/15/24 | | | 16 | |
| | 16 | | | 8.000%, 10/15/27 | | | 18 | |
| | 8 | | | 9.000%, 11/15/24 | | | 8 | |
| | 49 | | | 9.500%, 07/15/25 | | | 55 | |
| | | | | | | | |
| | | | Total Mortgage Pass-Through Securities
(Cost $48,955) | | | 50,416 | |
| | | | | | | | |
| Municipal Bond — 0.1% (t) | |
| | | | California — 0.1% | | | | |
| | 870 | | | University of California, Series Y-1, Rev., VAR, 0.994%, 07/01/17
(Cost $870) | | | 870 | |
| | | | | | | | |
| | | | | | | | |
SHARES | | | SECURITY DESCRIPTION | | VALUE($) | |
| Short-Term Investment — 8.4% | |
| | | | Investment Company — 8.4% | | | | |
| | 106,063 | | | JPMorgan Prime Money Market Fund,
Institutional Class Shares, 0.360% (b) (l)
(Cost $106,063) | | | 106,063 | |
| | | | | | | | |
| | | | Total Investments — 99.4%
(Cost $1,257,370) | | | 1,255,526 | |
| | | | Other Assets in Excess of
Liabilities — 0.6% | | | 6,992 | |
| | | | | | | | |
| | | | NET ASSETS — 100.0% | | $ | 1,262,518 | |
| | | | | | | | |
Percentages indicated are based on net assets.
SEE NOTES TO FINANCIAL STATEMENTS.
| | | | | | | | |
| | | |
| AUGUST 31, 2016 | | J.P. MORGAN INCOME FUNDS | | | | | 205 | |
JPMorgan Mortgage-Backed Securities Fund
SCHEDULE OF PORTFOLIO INVESTMENTS
AS OF AUGUST 31, 2016 (Unaudited)
(Amounts in thousands)
| | | | | | | | |
PRINCIPAL
AMOUNT($) | | | SECURITY DESCRIPTION | | VALUE($) | |
| Asset-Backed Securities — 9.3% | |
| | | | ABFC Trust, | | | | |
| | 933 | | | Series 2005-AQ1, Class A4, SUB, 4.861%, 06/25/35 | | | 954 | |
| | 484 | | | Series 2005-WF1, Class A2C, VAR, 1.144%, 12/25/34 | | | 484 | |
| | 143 | | | Accredited Mortgage Loan Trust, Series 2006-1, Class A3, VAR, 0.668%, 04/25/36 | | | 142 | |
| | | | American Homes 4 Rent Trust, | | | | |
| | 2,200 | | | Series 2014-SFR1, Class D, VAR, 2.607%, 06/17/31 (e) | | | 2,185 | |
| | 3,328 | | | Series 2014-SFR2, Class A, 3.786%, 10/17/36 (e) | | | 3,608 | |
| | 1,500 | | | Series 2014-SFR2, Class E, 6.231%, 10/17/36 (e) | | | 1,642 | |
| | 3,437 | | | Series 2014-SFR3, Class A, 3.678%, 12/17/36 (e) | | | 3,703 | |
| | 5,850 | | | Series 2014-SFR3, Class B, 4.201%, 12/17/36 (e) | | | 6,349 | |
| | 1,570 | | | Series 2014-SFR3, Class C, 4.596%, 12/17/36 (e) | | | 1,696 | |
| | 2,650 | | | Series 2014-SFR3, Class D, 5.040%, 12/17/36 (e) | | | 2,887 | |
| | 3,172 | | | Series 2014-SFR3, Class E, 6.418%, 12/17/36 (e) | | | 3,517 | |
| | 1,951 | | | Series 2015-SFR1, Class A, 3.467%, 04/17/52 (e) | | | 2,083 | |
| | 3,030 | | | Series 2015-SFR1, Class E, 5.639%, 04/17/52 (e) | | | 3,192 | |
| | 1,971 | | | Series 2015-SFR2, Class A, 3.732%, 10/17/45 (e) | | | 2,140 | |
| | 3,600 | | | Series 2015-SFR2, Class E, 6.070%, 10/17/45 (e) | | | 3,909 | |
| | | | Anchor Assets IX LLC, | | | | |
| | 5,750 | | | Series 2016-1, Class A, 5.125%, 02/15/20 (e) | | | 5,750 | |
| | 4,000 | | | Series 2016-1, Class B, 6.250%, 02/15/20 (e) | | | 4,000 | |
| | 2,162 | | | ARLP Securitization Trust, Series 2015-1, Class A1, SUB, 3.967%, 05/25/55 (e) | | | 2,112 | |
| | | | B2R Mortgage Trust, | | | | |
| | 5,590 | | | Series 2015-1, Class A1, 2.524%, 05/15/48 (e) | | | 5,576 | |
| | 3,965 | | | Series 2015-2, Class A, 3.336%, 11/15/48 (e) | | | 4,070 | |
| | 2,994 | | | Series 2016-1, Class A, 2.567%, 07/15/49 (e) | | | 2,977 | |
| | 2,000 | | | Series 2016-1, Class B, 3.870%, 07/15/49 (e) | | | 2,045 | |
| | | | | | | | |
PRINCIPAL
AMOUNT($) | | | SECURITY DESCRIPTION | | VALUE($) | |
| | | | | | | | |
| | 3,131 | | | Banc of America Funding Corp., Series 2012-R6, Class 1A1, 3.000%, 10/26/39 (e) | | | 3,083 | |
| | 124 | | | Bear Stearns Asset-Backed Securities Trust, Series 2006-SD1, Class A, VAR, 0.894%, 04/25/36 | | | 120 | |
| | 958 | | | BXG Receivables Note Trust, Series 2012-A, Class A, 2.660%, 12/02/27 (e) | | | 954 | |
| | 474 | | | CAM Mortgage LLC, Series 2015-1, Class A, SUB, 3.500%, 07/15/64 (e) | | | 474 | |
| | | | Chase Funding Trust, | | | | |
| | 1,741 | | | Series 2002-3, Class 1A5, SUB, 5.907%, 06/25/32 | | | 1,700 | |
| | 753 | | | Series 2003-4, Class 1A5, SUB, 5.315%, 05/25/33 | | | 773 | |
| | 609 | | | Series 2003-6, Class 1A7, SUB, 4.277%, 11/25/34 | | | 621 | |
| | 59 | | | Citigroup Global Markets Mortgage Securities VII, Inc., Series 2003-UP1, Class A, SUB, 3.950%, 04/25/32 (e) | | | 58 | |
| | | | Citigroup Mortgage Loan Trust, Inc., | | | | |
| | 88 | | | Series 2003-HE3, Class A, VAR, 0.904%, 12/25/33 | | | 86 | |
| | 452 | | | Series 2004-HE1, Class A, VAR, 0.783%, 09/25/33 (e) | | | 443 | |
| | 1,818 | | | Colony American Finance Ltd., (Cayman Islands), Series 2016-1, Class A, 2.544%, 06/15/48 (e) | | | 1,818 | |
| | 1,618 | | | Conix Mortgage Asset Trust, Series 2013-1, Class A, VAR, 4.704%, 12/25/47 (d) | | | 269 | |
| | 150 | | | Federal National Mortgage Association REMIC Trust, Series 2001-W4, Class AF6, SUB, 5.610%, 01/25/32 | | | 165 | |
| | | | FirstKey Lending Trust, | | | | |
| | 5,661 | | | Series 2015-SFR1, Class A, 2.553%, 03/09/47 (e) | | | 5,643 | |
| | 1,442 | | | Series 2015-SFR1, Class B, 3.417%, 03/09/47 (e) | | | 1,448 | |
| | 1,478 | | | GCAT, Series 2015-2, Class A1, SUB, 3.750%, 07/25/20 (e) | | | 1,470 | |
| | 4,460 | | | Green Tree Agency Advance Funding Trust I, Series 2015-T1, Class CT1, 4.178%, 10/15/48 (e) | | | 4,460 | |
| | 4,025 | | | HERO Funding Trust, Series 2016-2A, Class A, 3.750%, 09/20/41 (e) | | | 4,035 | |
| | 159 | | | Home Equity Mortgage Loan Asset-Backed Trust, Series 2006-A, Class A3, VAR, 0.724%, 03/25/36 | | | 144 | |
SEE NOTES TO FINANCIAL STATEMENTS.
| | | | | | |
| | | |
| 206 | | | | J.P. MORGAN INCOME FUNDS | | AUGUST 31, 2016 |
| | | | | | | | |
PRINCIPAL
AMOUNT($) | | | SECURITY DESCRIPTION | | VALUE($) | |
| Asset-Backed Securities — continued | |
| | | | HSBC Home Equity Loan Trust USA, | | | | |
| | 120 | | | Series 2007-1, Class AS, VAR, 0.712%, 03/20/36 | | | 120 | |
| | 402 | | | Series 2007-3, Class APT, VAR, 1.712%, 11/20/36 | | | 401 | |
| | | | KGS-Alpha SBA COOF Trust, | | | | |
| | 5,066 | | | Series 2012-3, Class A, IO, VAR, 1.432%, 09/25/26 (e) | | | 93 | |
| | 23,842 | | | Series 2012-4, Class A, IO, VAR, 1.060%, 09/25/37 (e) | | | 875 | |
| | 15,314 | | | Series 2012-6, Class A, IO, VAR, 0.620%, 05/25/39 (e) | | | 287 | |
| | 3,887 | | | Series 2015-2, Class A, IO, VAR, 2.899%, 07/25/41 (e) | | | 516 | |
| | | | Long Beach Mortgage Loan Trust, | | | | |
| | 1,597 | | | Series 2004-1, Class M1, VAR, 1.274%, 02/25/34 | | | 1,515 | |
| | 188 | | | Series 2006-WL2, Class 2A3, VAR, 0.724%, 01/25/36 | | | 182 | |
| | | | LV Tower 52 Issuer LLC, | | | | |
| | 2,231 | | | Series 2013-1, Class A, 5.500%, 07/15/19 (e) | | | 2,175 | |
| | 778 | | | Series 2013-1, Class M, 7.500%, 07/15/19 (e) | | | 732 | |
| | 106,735 | | | Madison Avenue Manufactured Housing Contract, Series 2002-A, Class IO, IO, 0.300%, 03/25/32 | | | 1,283 | |
| | 2,292 | | | Mid-State Capital Corp. Trust, Series 2006-1, Class M1, 6.083%, 10/15/40 (e) | | | 2,392 | |
| | | | Mid-State Capital Trust, | | | | |
| | 1,099 | | | Series 2010-1, Class A, 3.500%, 12/15/45 (e) | | | 1,126 | |
| | 1,695 | | | Series 2010-1, Class M, 5.250%, 12/15/45 (e) | | | 1,797 | |
| | | | Nationstar HECM Loan Trust, | | | | |
| | 942 | | | Series 2015-2A, Class A, 2.883%, 11/25/25 (e) | | | 943 | |
| | 1,964 | | | Series 2015-2A, Class M1, 4.115%, 11/25/25 (e) | | | 1,963 | |
| | 841 | | | Series 2016-1A, Class M1, 4.360%, 02/25/26 (e) | | | 841 | |
| | 852 | | | Series 2016-2A, Class A, 2.239%, 06/25/26 (e) | | | 852 | |
| | 4,701 | | | Series 2016-2A, Class M1, 3.598%, 06/25/26 (e) | | | 4,701 | |
| | 2,154 | | | Series 2016-3A, Class A, 2.013%, 08/25/26 (e) | | | 2,154 | |
| | 498 | | | Series 2016-3A, Class M1, 3.147%, 08/25/26 (e) | | | 498 | |
| | | | | | | | |
PRINCIPAL
AMOUNT($) | | | SECURITY DESCRIPTION | | VALUE($) | |
| | | | | | | | |
| | 503 | | | New Century Home Equity Loan Trust, Series 2003-5, Class AI6, SUB, 5.171%, 11/25/33 | | | 517 | |
| | | | NRPL Trust, | | | | |
| | 1,568 | | | Series 2015-1A, Class A1, SUB, 3.875%, 11/01/54 (e) | | | 1,557 | |
| | 1,000 | | | Series 2015-1A, Class A2, SUB, 3.875%, 11/01/54 (e) | | | 992 | |
| | 3,730 | | | Series 2015-2A, Class A1, SUB, 3.750%, 10/25/57 (e) | | | 3,648 | |
| | 1,000 | | | Series 2015-2A, Class A2, SUB, 3.750%, 10/25/57 (e) | | | 946 | |
| | | | NRZ Advance Receivables Trust Advance Receivables Backed Notes, | | | | |
| | 5,000 | | | Series 2015-T4, Class AT4, 3.196%, 11/15/47 (e) | | | 4,986 | |
| | 2,600 | | | Series 2015-T4, Class DT4, 4.671%, 11/15/47 (e) | | | 2,602 | |
| | 2,095 | | | Series 2016-T1, Class BT1, 3.294%, 06/15/49 (e) | | | 2,072 | |
| | | | Oak Hill Advisors Residential Loan Trust, | | | | |
| | 956 | | | Series 2015-NPL2, Class A1, SUB, 3.721%, 07/25/55 (e) | | | 947 | |
| | 513 | | | Series 2015-NPL2, Class A2, SUB, 4.000%, 07/25/55 (e) | | | 503 | |
| | | | Ocwen Master Advance Receivables Trust, | | | | |
| | 3,668 | | | Series 2015-T3, Class AT3, 3.211%, 11/15/47 (e) | | | 3,670 | |
| | 609 | | | Series 2015-T3, Class CT3, 4.196%, 11/15/47 (e) | | | 610 | |
| | 1,250 | | | Series 2015-T3, Class DT3, 4.687%, 11/15/47 (e) | | | 1,250 | |
| | 3,600 | | | Series 2016-T1, Class AT1, 2.521%, 08/17/48 (e) | | | 3,598 | |
| | 1,522 | | | Series 2016-T2, Class BT2, 3.265%, 08/16/49 (e) | | | 1,521 | |
| | 3,025 | | | Series 2016-T2, Class DT2, 4.446%, 08/16/49 (e) | | | 3,022 | |
| | | | Pretium Mortgage Credit Partners I LLC, | | | | |
| | 1,232 | | | Series 2015-NPL2, Class A1, SUB, 3.750%, 07/27/30 (e) | | | 1,232 | |
| | 1,000 | | | Series 2015-NPL2, Class A2, SUB, 4.250%, 07/27/30 (e) | | | 985 | |
| | | | Progress Residential Trust, | | | | |
| | 7,269 | | | Series 2015-SFR2, Class A, 2.740%, 06/12/32 (e) | | | 7,364 | |
| | 1,761 | | | Series 2015-SFR2, Class B, 3.138%, 06/12/32 (e) | | | 1,781 | |
| | 2,566 | | | Series 2015-SFR2, Class C, 3.436%, 06/12/32 (e) | | | 2,581 | |
SEE NOTES TO FINANCIAL STATEMENTS.
| | | | | | | | |
| | | |
| AUGUST 31, 2016 | | J.P. MORGAN INCOME FUNDS | | | | | 207 | |
JPMorgan Mortgage-Backed Securities Fund
SCHEDULE OF PORTFOLIO INVESTMENTS
AS OF AUGUST 31, 2016 (Unaudited) (continued)
(Amounts in thousands)
| | | | | | | | |
PRINCIPAL
AMOUNT($) | | | SECURITY DESCRIPTION | | VALUE($) | |
| Asset-Backed Securities — continued | |
| | 6,000 | | | Series 2015-SFR2, Class D, 3.684%, 06/12/32 (e) | | | 6,024 | |
| | 2,070 | | | Series 2015-SFR2, Class E, 4.427%, 06/12/32 (e) | | | 2,050 | |
| | 5,867 | | | Series 2015-SFR3, Class A, 3.067%, 11/12/32 (e) | | | 6,024 | |
| | 2,000 | | | Series 2015-SFR3, Class C, 4.327%, 11/12/32 (e) | | | 2,081 | |
| | 1,593 | | | Series 2015-SFR3, Class D, 4.673%, 11/12/32 (e) | | | 1,660 | |
| | 1,350 | | | Series 2015-SFR3, Class E, 5.660%, 11/12/32 (e) | | | 1,397 | |
| | 1,488 | | | Series 2016-SFR1, Class C, VAR, 2.982%, 09/17/33 (e) | | | 1,505 | |
| | 3,098 | | | Series 2016-SFR1, Class E, VAR, 4.332%, 09/17/33 (e) | | | 3,119 | |
| | | | RAMP Trust, | | | | |
| | 13 | | | Series 2004-RS8, Class AI6, SUB, 4.980%, 08/25/34 | | | 13 | |
| | 482 | | | Series 2004-RS11, Class M1, VAR, 1.454%, 11/25/34 | | | 479 | |
| | 947 | | | Series 2006-RZ1, Class A3, VAR, 0.824%, 03/25/36 | | | 939 | |
| | 487 | | | Renaissance Home Equity Loan Trust, Series 2007-2, Class AF2, SUB, 5.675%, 06/25/37 | | | 228 | |
| | 1,013 | | | RMAT LLC, Series 2015-NPL1, Class A1, SUB, 3.750%, 05/25/55 (e) | | | 1,004 | |
| | 287 | | | Saxon Asset Securities Trust, Series 2003-1, Class AF6, SUB, 4.795%, 06/25/33 | | | 290 | |
| | 97 | | | Securitized Asset-Backed Receivables LLC Trust, Series 2006-CB1, Class AF2, SUB, 3.392%, 01/25/36 | | | 72 | |
| | 241 | | | Selene Non-Performing Loans LLC, Series 2014-1A, Class A, SUB, 2.981%, 05/25/54 (e) | | | 239 | |
| | | | SPS Servicer Advance Receivables Trust Advance Receivables Backed Notes, | | | | |
| | 2,200 | | | Series 2015-T2, Class DT2, 4.230%, 01/15/47 (e) | | | 2,200 | |
| | 2,138 | | | Series 2015-T3, Class DT3, 4.430%, 07/15/47 (e) | | | 2,140 | |
| | | | Structured Asset Securities Corp. Mortgage Pass-Through Certificates, | | | | |
| | 357 | | | Series 2002-AL1, Class A2, 3.450%, 02/25/32 | | | 356 | |
| | 880 | | | Series 2002-AL1, Class A3, 3.450%, 02/25/32 | | | 872 | |
| | | | | | | | |
PRINCIPAL
AMOUNT($) | | | SECURITY DESCRIPTION | | VALUE($) | |
| | | | | | | | |
| | 995 | | | Sunset Mortgage Loan Co. LLC, Series 2014-NPL2, Class A, SUB, 3.721%, 11/16/44 (e) | | | 990 | |
| | | | U.S. Residential Opportunity Fund III Trust, | | | | |
| | 1,536 | | | Series 2016-1III, Class A, SUB, 3.475%, 07/27/36 (e) | | | 1,536 | |
| | 8,905 | | | Series 2016-2III, Class A, SUB, 3.475%, 08/27/36 (e) | | | 8,897 | |
| | 1,399 | | | Vericrest Opportunity Loan Trust, Series 2015-NPL3, Class A1, SUB, 3.375%, 10/25/58 (e) | | | 1,395 | |
| | 260 | | | VML LLC, Series 2014-NPL1, Class A1, VAR, 3.875%, 04/27/54 (e) | | | 260 | |
| | 280 | | | VOLT NPL X LLC, Series 2014-NPL8, Class A1, SUB, 3.375%, 10/26/54 (e) | | | 279 | |
| | | | VOLT XIX LLC, | | | | |
| | 973 | | | Series 2014-NP11, Class A1, SUB, 3.875%, 04/25/55 (e) | | | 975 | |
| | 400 | | | Series 2014-NP11, Class A2, SUB, 5.000%, 04/25/55 (e) | | | 390 | |
| | 1,401 | | | VOLT XL LLC, Series 2015-NP14, Class A1, SUB, 4.375%, 11/27/45 (e) | | | 1,415 | |
| | 1,405 | | | VOLT XLV LLC, Series 2016-NPL5, Class A1, SUB, 4.000%, 05/25/46 (e) | | | 1,415 | |
| | 5,939 | | | VOLT XLVI LLC, Series 2016-NPL6, Class A1, SUB, 3.844%, 06/25/46 (e) | | | 5,968 | |
| | 1,436 | | | VOLT XLVII LLC, Series 2016-NPL7, Class A1, SUB, 3.750%, 06/25/46 (e) | | | 1,439 | |
| | 3,211 | | | VOLT XLVIII LLC, Series 2016-NPL8, Class A1, SUB, 3.500%, 07/25/46 (e) | | | 3,209 | |
| | | | VOLT XXII LLC, | | | | |
| | 843 | | | Series 2015-NPL4, Class A1, SUB, 3.500%, 02/25/55 (e) | | | 843 | |
| | 583 | | | Series 2015-NPL4, Class A2, SUB, 4.250%, 02/25/55 (e) | | | 559 | |
| | 1,471 | | | VOLT XXIV LLC, Series 2015-NPL6, Class A1, SUB, 3.500%, 02/25/55 (e) | | | 1,471 | |
| | 5,193 | | | VOLT XXV LLC, Series 2015-NPL8, Class A1, SUB, 3.500%, 06/26/45 (e) | | | 5,190 | |
| | 921 | | | VOLT XXVI LLC, Series 2014-NPL6, Class A2, SUB, 4.250%, 09/25/43 (e) | | | 891 | |
| | 1,561 | | | VOLT XXVII LLC, Series 2014-NPL7, Class A1, SUB, 3.375%, 08/27/57 (e) | | | 1,559 | |
| | 1,429 | | | VOLT XXX LLC, Series 2015-NPL1, Class A1, SUB, 3.625%, 10/25/57 (e) | | | 1,430 | |
| | 1,187 | | | VOLT XXXI LLC, Series 2015-NPL2, Class A1, SUB, 3.375%, 02/25/55 (e) | | | 1,187 | |
| | 1,768 | | | VOLT XXXIII LLC, Series 2015-NPL5, Class A1, SUB, 3.500%, 03/25/55 (e) | | | 1,768 | |
SEE NOTES TO FINANCIAL STATEMENTS.
| | | | | | |
| | | |
| 208 | | | | J.P. MORGAN INCOME FUNDS | | AUGUST 31, 2016 |
| | | | | | | | |
PRINCIPAL
AMOUNT($) | | | SECURITY DESCRIPTION | | VALUE($) | |
| Asset-Backed Securities — continued | |
| | 1,327 | | | VOLT XXXV LLC, Series 2015-NPL9, Class A1, SUB, 3.500%, 06/26/45 (e) | | | 1,326 | |
| | 2,497 | | | VOLT XXXIX LLC, Series 2015-NP13, Class A1, SUB, 4.125%, 10/25/45 (e) | | | 2,515 | |
| | | | Westgate Resorts LLC, | | | | |
| | 232 | | | Series 2015-1A, Class A, 2.750%, 05/20/27 (e) | | | 231 | |
| | 3,863 | | | Series 2015-2A, Class A, 3.200%, 07/20/28 (e) | | | 3,855 | |
| | 4,192 | | | Series 2015-2A, Class B, 4.000%, 07/20/28 (e) | | | 4,160 | |
| | 6,939 | | | Series 2016-1A, Class B, 4.500%, 12/20/28 (e) | | | 6,892 | |
| | | | | | | | |
| | | | Total Asset-Backed Securities
(Cost $257,265) | | | 259,352 | |
| | | | | | | | |
| Collateralized Mortgage Obligations — 38.6% | |
| | | | Agency CMO — 31.4% | |
| | | | Federal Home Loan Mortgage Corp. REMIC, | | | | |
| | 2 | | | Series 22, Class C, 9.500%, 04/15/20 | | | 2 | |
| | 4 | | | Series 23, Class F, 9.600%, 04/15/20 | | | 4 | |
| | 2 | | | Series 30, Class D, 9.500%, 02/15/20 | | | 2 | |
| | 1 | | | Series 47, Class F, 10.000%, 06/15/20 | | | 1 | |
| | 4 | | | Series 77, Class H, 8.500%, 09/15/20 | | | 5 | |
| | — | (h) | | Series 81, Class A, 8.125%, 11/15/20 | | | — | (h) |
| | 1 | | | Series 84, Class F, 9.200%, 10/15/20 | | | 1 | |
| | 1 | | | Series 99, Class Z, 9.500%, 01/15/21 | | | 1 | |
| | — | (h) | | Series 180, Class J, HB, 1,010.000%, 09/15/21 | | | — | (h) |
| | — | (h) | | Series 186, Class I, HB, 1,009.500%, 08/15/21 | | | — | (h) |
| | — | (h) | | Series 189, Class K, HB, 1,009.500%, 10/15/21 | | | — | (h) |
| | — | (h) | | Series 204, Class E, HB, IF, 1,787.516%, 05/15/23 | | | 1 | |
| | — | (h) | | Series 1045, Class G, HB, 1,066.208%, 02/15/21 | | | — | (h) |
| | 1 | | | Series 1065, Class J, 9.000%, 04/15/21 | | | 2 | |
| | 2 | | | Series 1079, Class S, HB, IF, 32.274%, 05/15/21 | | | 3 | |
| | — | (h) | | Series 1082, Class D, HB, 1,007.780%, 05/15/21 | | | — | (h) |
| | 1 | | | Series 1084, Class F, VAR, 1.458%, 05/15/21 | | | 1 | |
| | 1 | | | Series 1084, Class S, HB, IF, 42.941%, 05/15/21 | | | 1 | |
| | 2 | | | Series 1133, Class H, 7.000%, 09/15/21 | | | 2 | |
| | 7 | | | Series 1144, Class KB, 8.500%, 09/15/21 | | | 8 | |
| | | | | | | | |
PRINCIPAL
AMOUNT($) | | | SECURITY DESCRIPTION | | VALUE($) | |
| | | | | | | | |
| | | | Agency CMO — continued | |
| | — | (h) | | Series 1172, Class L, HB, VAR, 1,181.250%, 11/15/21 | | | — | (h) |
| | — | (h) | | Series 1196, Class B, HB, IF, 1,137.063%, 01/15/22 | | | 1 | |
| | 15 | | | Series 1343, Class LA, 8.000%, 08/15/22 | | | 17 | |
| | 8 | | | Series 1343, Class LB, 7.500%, 08/15/22 | | | 9 | |
| | 23 | | | Series 1374, Class Z, 7.000%, 10/15/22 | | | 25 | |
| | 7 | | | Series 1395, Class G, 6.000%, 10/15/22 | | | 8 | |
| | 58 | | | Series 1401, Class J, 7.000%, 10/15/22 | | | 63 | |
| | 92 | | | Series 1466, Class PZ, 7.500%, 02/15/23 | | | 102 | |
| | 3 | | | Series 1470, Class F, VAR, 1.690%, 02/15/23 | | | 3 | |
| | 3 | | | Series 1505, Class QB, IF, 19.582%, 05/15/23 | | | 4 | |
| | 26 | | | Series 1518, Class G, IF, 8.591%, 05/15/23 | | | 30 | |
| | 16 | | | Series 1526, Class L, 6.500%, 06/15/23 | | | 18 | |
| | 28 | | | Series 1541, Class O, VAR, 0.840%, 07/15/23 | | | 28 | |
| | 269 | | | Series 1552, Class IA, IF, 18.568%, 08/15/23 | | | 382 | |
| | 7 | | | Series 1570, Class F, VAR, 2.190%, 08/15/23 | | | 7 | |
| | 18 | | | Series 1570, Class SA, HB, IF, 23.980%, 08/15/23 | | | 27 | |
| | 75 | | | Series 1578, Class K, 6.900%, 09/15/23 | | | 82 | |
| | 8 | | | Series 1578, Class V, IO, 7.000%, 09/15/23 | | | 1 | |
| | 151 | | | Series 1591, Class PV, 6.250%, 10/15/23 | | | 166 | |
| | 15 | | | Series 1602, Class SA, HB, IF, 21.100%, 10/15/23 | | | 22 | |
| | 192 | | | Series 1628, Class LZ, 6.500%, 12/15/23 | | | 210 | |
| | 189 | | | Series 1638, Class H, 6.500%, 12/15/23 | | | 216 | |
| | 140 | | | Series 1644, Class K, 6.750%, 12/15/23 | | | 154 | |
| | 240 | | | Series 1658, Class GZ, 7.000%, 01/15/24 | | | 268 | |
| | 6 | | | Series 1671, Class QC, IF, 10.000%, 02/15/24 | | | 9 | |
| | 108 | | | Series 1677, Class Z, 7.500%, 07/15/23 | | | 120 | |
| | 5 | | | Series 1686, Class SH, IF, 18.095%, 02/15/24 | | | 8 | |
| | 96 | | | Series 1695, Class EB, 7.000%, 03/15/24 | | | 107 | |
| | 13 | | | Series 1699, Class FC, VAR, 1.108%, 03/15/24 | | | 13 | |
| | 22 | | | Series 1745, Class D, 7.500%, 08/15/24 | | | 25 | |
| | 345 | | | Series 1760, Class ZD, VAR, 1.080%, 02/15/24 | | | 344 | |
| | 39 | | | Series 1798, Class F, 5.000%, 05/15/23 | | | 42 | |
| | 2 | | | Series 1807, Class G, 9.000%, 10/15/20 | | | 2 | |
| | 310 | | | Series 1813, Class I, PO, 11/15/23 | | | 295 | |
SEE NOTES TO FINANCIAL STATEMENTS.
| | | | | | | | |
| | | |
| AUGUST 31, 2016 | | J.P. MORGAN INCOME FUNDS | | | | | 209 | |
JPMorgan Mortgage-Backed Securities Fund
SCHEDULE OF PORTFOLIO INVESTMENTS
AS OF AUGUST 31, 2016 (Unaudited) (continued)
(Amounts in thousands)
| | | | | | | | |
PRINCIPAL
AMOUNT($) | | | SECURITY DESCRIPTION | | VALUE($) | |
| Collateralized Mortgage Obligations — continued | |
| | | | Agency CMO — continued | |
| | 1,198 | | | Series 1813, Class J, IF, IO, 5.500%, 11/15/23 | | | 133 | |
| | 62 | | | Series 1829, Class ZB, 6.500%, 03/15/26 | | | 68 | |
| | 113 | | | Series 1863, Class Z, 6.500%, 07/15/26 | | | 130 | |
| | 6 | | | Series 1865, Class D, PO, 02/15/24 | | | 6 | |
| | 51 | | | Series 1899, Class ZE, 8.000%, 09/15/26 | | | 58 | |
| | 43 | | | Series 1963, Class Z, 7.500%, 01/15/27 | | | 49 | |
| | 15 | | | Series 1985, Class PR, IO, 8.000%, 07/15/27 | | | 2 | |
| | 19 | | | Series 1987, Class PE, 7.500%, 09/15/27 | | | 21 | |
| | 150 | | | Series 2033, Class J, 5.600%, 06/15/23 | | | 160 | |
| | 8 | | | Series 2033, Class SN, HB, IF, 28.332%, 03/15/24 | | | 4 | |
| | 11 | | | Series 2038, Class PN, IO, 7.000%, 03/15/28 | | | 2 | |
| | 105 | | | Series 2040, Class PE, 7.500%, 03/15/28 | | | 120 | |
| | 10 | | | Series 2042, Class T, 7.000%, 03/15/28 | | | 11 | |
| | 38 | | | Series 2060, Class Z, 6.500%, 05/15/28 | | | 44 | |
| | 84 | | | Series 2061, Class DC, IO, 6.500%, 06/15/28 | | | 9 | |
| | 8,230 | | | Series 2065, Class PX, IO, 0.750%, 08/17/27 | | | 177 | |
| | 236 | | | Series 2075, Class PH, 6.500%, 08/15/28 | | | 262 | |
| | 37 | | | Series 2086, Class GB, 6.000%, 09/15/28 | | | 42 | |
| | 18 | | | Series 2089, Class PJ, IO, 7.000%, 10/15/28 | | | 2 | |
| | 153 | | | Series 2110, Class PG, 6.000%, 01/15/29 | | | 176 | |
| | 210 | | | Series 2111, Class SB, IF, IO, 6.992%, 01/15/29 | | | 38 | |
| | 55 | | | Series 2125, Class JZ, 6.000%, 02/15/29 | | | 61 | |
| | 134 | | | Series 2130, Class QS, 6.000%, 03/15/29 | | | 153 | |
| | 25 | | | Series 2132, Class SB, HB, IF, 28.410%, 03/15/29 | | | 44 | |
| | 37 | | | Series 2132, Class ZL, 6.500%, 03/15/29 | | | 41 | |
| | 5 | | | Series 2141, Class IO, IO, 7.000%, 04/15/29 | | | 1 | |
| | 17 | | | Series 2163, Class PC, IO, 7.500%, 06/15/29 | | | 2 | |
| | 33 | | | Series 2178, Class PB, 7.000%, 08/15/29 | | | 38 | |
| | 54 | | | Series 2201, Class C, 8.000%, 11/15/29 | | | 62 | |
| | 5 | | | Series 2204, Class GB, VAR, 8.000%, 12/20/29 | | | 5 | |
| | 202 | | | Series 2209, Class TC, 8.000%, 01/15/30 | | | 243 | |
| | 107 | | | Series 2210, Class Z, 8.000%, 01/15/30 | | | 124 | |
| | 27 | | | Series 2224, Class CB, 8.000%, 03/15/30 | | | 32 | |
| | 22 | | | Series 2247, Class Z, 7.500%, 08/15/30 | | | 26 | |
| | 191 | | | Series 2254, Class Z, 9.000%, 09/15/30 | | | 228 | |
| | | | | | | | |
PRINCIPAL
AMOUNT($) | | | SECURITY DESCRIPTION | | VALUE($) | |
| | | | | | | | |
| | | | Agency CMO — continued | |
| | 106 | | | Series 2256, Class MC, 7.250%, 09/15/30 | | | 123 | |
| | 126 | | | Series 2259, Class ZM, 7.000%, 10/15/30 | | | 144 | |
| | 170 | | | Series 2271, Class PC, 7.250%, 12/15/30 | | | 196 | |
| | 66 | | | Series 2283, Class K, 6.500%, 12/15/23 | | | 73 | |
| | 43 | | | Series 2296, Class PD, 7.000%, 03/15/31 | | | 50 | |
| | 707 | | | Series 2303, Class ZD, 7.000%, 04/15/31 | | | 838 | |
| | 328 | | | Series 2303, Class ZN, 8.500%, 04/15/29 | | | 385 | |
| | 19 | | | Series 2306, Class K, PO, 05/15/24 | | | 18 | |
| | 47 | | | Series 2306, Class SE, IF, IO, 9.020%, 05/15/24 | | | 9 | |
| | 306 | | | Series 2344, Class ZD, 6.500%, 08/15/31 | | | 363 | |
| | 31 | | | Series 2344, Class ZJ, 6.500%, 08/15/31 | | | 36 | |
| | 24 | | | Series 2345, Class NE, 6.500%, 08/15/31 | | | 28 | |
| | 32 | | | Series 2347, Class VP, 6.500%, 03/15/20 | | | 34 | |
| | — | (h) | | Series 2353, Class TD, 6.000%, 09/15/16 | | | — | (h) |
| | — | (h) | | Series 2355, Class BP, 6.000%, 09/15/16 | | | — | (h) |
| | — | (h) | | Series 2358, Class PD, 6.000%, 09/15/16 | | | — | (h) |
| | — | (h) | | Series 2359, Class PM, 6.000%, 09/15/16 | | | — | (h) |
| | 114 | | | Series 2359, Class ZB, 8.500%, 06/15/31 | | | 134 | |
| | — | (h) | | Series 2360, Class PG, 6.000%, 09/15/16 | | | — | (h) |
| | — | (h) | | Series 2366, Class MD, 6.000%, 10/15/16 | | | — | (h) |
| | 501 | | | Series 2367, Class ZK, 6.000%, 10/15/31 | | | 574 | |
| | 10 | | | Series 2368, Class AS, IF, 19.610%, 10/15/31 | | | 14 | |
| | 24 | | | Series 2372, Class F, VAR, 1.008%, 10/15/31 | | | 24 | |
| | 25 | | | Series 2383, Class FD, VAR, 1.008%, 11/15/31 | | | 25 | |
| | 39 | | | Series 2388, Class UZ, 8.500%, 06/15/31 | | | 46 | |
| | 3 | | | Series 2391, Class QR, 5.500%, 12/15/16 | | | 3 | |
| | 1 | | | Series 2394, Class MC, 6.000%, 12/15/16 | | | 1 | |
| | 374 | | | Series 2399, Class TH, 6.500%, 01/15/32 | | | 418 | |
| | 80 | | | Series 2410, Class OE, 6.375%, 02/15/32 | | | 88 | |
| | 80 | | | Series 2410, Class QS, IF, 18.180%, 02/15/32 | | | 126 | |
| | 61 | | | Series 2410, Class QX, IF, IO, 8.142%, 02/15/32 | | | 18 | |
| | 91 | | | Series 2423, Class MC, 7.000%, 03/15/32 | | | 105 | |
| | 115 | | | Series 2423, Class MT, 7.000%, 03/15/32 | | | 133 | |
| | 7 | | | Series 2425, Class OB, 6.000%, 03/15/17 | | | 7 | |
| | 1,229 | | | Series 2431, Class F, VAR, 1.008%, 03/15/32 | | | 1,234 | |
| | 180 | | | Series 2433, Class SA, IF, 19.610%, 02/15/32 | | | 281 | |
| | 130 | | | Series 2434, Class TC, 7.000%, 04/15/32 | | | 152 | |
| | 204 | | | Series 2436, Class MC, 7.000%, 04/15/32 | | | 229 | |
SEE NOTES TO FINANCIAL STATEMENTS.
| | | | | | |
| | | |
| 210 | | | | J.P. MORGAN INCOME FUNDS | | AUGUST 31, 2016 |
| | | | | | | | |
PRINCIPAL
AMOUNT($) | | | SECURITY DESCRIPTION | | VALUE($) | |
| Collateralized Mortgage Obligations — continued | |
| | | | Agency CMO — continued | |
| | 70 | | | Series 2444, Class ES, IF, IO, 7.442%, 03/15/32 | | | 19 | |
| | 80 | | | Series 2450, Class GZ, 7.000%, 05/15/32 | | | 92 | |
| | 79 | | | Series 2450, Class SW, IF, IO, 7.492%, 03/15/32 | | | 20 | |
| | — | (h) | | Series 2458, Class QE, 5.500%, 06/15/17 | | | — | (h) |
| | 147 | | | Series 2462, Class NB, 6.500%, 06/15/22 | | | 161 | |
| | 278 | | | Series 2464, Class FE, VAR, 1.508%, 03/15/32 | | | 285 | |
| | 21 | | | Series 2470, Class SL, IF, 9.000%, 01/15/27 | | | 23 | |
| | 855 | | | Series 2494, Class SX, IF, IO, 6.492%, 02/15/32 | | | 152 | |
| | 267 | | | Series 2513, Class ZC, 5.500%, 10/15/32 | | | 302 | |
| | 152 | | | Series 2517, Class Z, 5.500%, 10/15/32 | | | 165 | |
| | 72 | | | Series 2535, Class BK, 5.500%, 12/15/22 | | | 78 | |
| | 28 | | | Series 2549, Class ZG, 5.000%, 01/15/18 | | | 28 | |
| | 1,519 | | | Series 2552, Class FP, VAR, 1.508%, 01/15/33 | | | 1,551 | |
| | 989 | | | Series 2557, Class HL, 5.300%, 01/15/33 | | | 1,099 | |
| | 46 | | | Series 2571, Class SK, HB, IF, 32.311%, 09/15/23 | | | 79 | |
| | 284 | | | Series 2586, Class WI, IO, 6.500%, 03/15/33 | | | 48 | |
| | 57 | | | Series 2611, Class SQ, IF, 11.985%, 05/15/33 | | | 72 | |
| | 68 | | | Series 2611, Class UH, 4.500%, 05/15/18 | | | 69 | |
| | 89 | | | Series 2626, Class NS, IF, IO, 6.042%, 06/15/23 | | | 4 | |
| | 47 | | | Series 2631, Class SA, IF, 13.919%, 06/15/33 | | | 65 | |
| | 95 | | | Series 2637, Class SA, IF, IO, 5.592%, 06/15/18 | | | 3 | |
| | 235 | | | Series 2641, Class WI, IO, 5.000%, 01/15/33 | | | 6 | |
| | 101 | | | Series 2650, Class PO, PO, 12/15/32 | | | 100 | |
| | 282 | | | Series 2650, Class SO, PO, 12/15/32 | | | 275 | |
| | 88 | | | Series 2671, Class S, IF, 13.828%, 09/15/33 | | | 116 | |
| | 135 | | | Series 2692, Class SC, IF, 12.271%, 07/15/33 | | | 154 | |
| | 53 | | | Series 2694, Class BA, 4.000%, 06/15/31 | | | 55 | |
| | 348 | | | Series 2720, Class PC, 5.000%, 12/15/23 | | | 377 | |
| | 1,987 | | | Series 2722, Class PF, VAR, 1.108%, 12/15/33 | | | 1,997 | |
| | 293 | | | Series 2725, Class SC, IF, 8.334%, 11/15/33 | | | 314 | |
| | | | | | | | |
PRINCIPAL
AMOUNT($) | | | SECURITY DESCRIPTION | | VALUE($) | |
| | | | | | | | |
| | | | Agency CMO — continued | |
| | 118 | | | Series 2744, Class TU, 5.500%, 05/15/32 | | | 120 | |
| | 102 | | | Series 2756, Class NA, 5.000%, 02/15/24 | | | 110 | |
| | 12 | | | Series 2780, Class JG, 4.500%, 04/15/19 | | | 12 | |
| | 247 | | | Series 2802, Class ZY, 6.000%, 05/15/34 | | | 274 | |
| | 104 | | | Series 2835, Class QO, PO, 12/15/32 | | | 95 | |
| | 34 | | | Series 2877, Class KO, PO, 03/15/19 | | | 33 | |
| | 474 | | | Series 2934, Class EC, PO, 02/15/20 | | | 464 | |
| | 493 | | | Series 2934, Class HI, IO, 5.000%, 02/15/20 | | | 30 | |
| | 284 | | | Series 2934, Class KI, IO, 5.000%, 02/15/20 | | | 15 | |
| | 79 | | | Series 2945, Class SA, IF, 11.380%, 03/15/20 | | | 85 | |
| | 9,979 | | | Series 2949, Class YZ, 5.500%, 03/15/35 | | | 11,049 | |
| | 137 | | | Series 2967, Class JI, IO, 5.000%, 04/15/20 | | | 9 | |
| | 71 | | | Series 2967, Class S, HB, IF, 31.033%, 04/15/25 | | | 108 | |
| | 13 | | | Series 2989, Class PO, PO, 06/15/23 | | | 13 | |
| | 152 | | | Series 2990, Class SL, HB, IF, 22.632%, 06/15/34 | | | 210 | |
| | 16 | | | Series 2990, Class WP, IF, 15.718%, 06/15/35 | | | 19 | |
| | 391 | | | Series 2994, Class FC, VAR, 0.908%, 02/15/33 | | | 391 | |
| | 131 | | | Series 3022, Class SX, IF, 15.606%, 08/15/25 | | | 168 | |
| | 1,470 | | | Series 3035, Class Z, 5.850%, 09/15/35 | | | 1,607 | |
| | 237 | | | Series 3068, Class QB, 4.500%, 06/15/20 | | | 242 | |
| | 352 | | | Series 3077, Class TO, PO, 04/15/35 | | | 322 | |
| | 247 | | | Series 3117, Class EO, PO, 02/15/36 | | | 227 | |
| | 396 | | | Series 3117, Class OG, PO, 02/15/36 | | | 373 | |
| | 248 | | | Series 3117, Class OK, PO, 02/15/36 | | | 219 | |
| | 69 | | | Series 3122, Class OH, PO, 03/15/36 | | | 65 | |
| | 20 | | | Series 3122, Class ZB, 6.000%, 03/15/36 | | | 27 | |
| | 41 | | | Series 3134, Class PO, PO, 03/15/36 | | | 38 | |
| | 1,553 | | | Series 3137, Class XP, 6.000%, 04/15/36 | | | 1,798 | |
| | 172 | | | Series 3138, Class PO, PO, 04/15/36 | | | 157 | |
| | 495 | | | Series 3143, Class BC, 5.500%, 02/15/36 | | | 555 | |
| | 61 | | | Series 3149, Class SO, PO, 05/15/36 | | | 56 | |
| | 362 | | | Series 3151, Class PO, PO, 05/15/36 | | | 349 | |
| | 445 | | | Series 3152, Class MO, PO, 03/15/36 | | | 423 | |
| | 233 | | | Series 3153, Class EO, PO, 05/15/36 | | | 207 | |
| | 287 | | | Series 3171, Class MO, PO, 06/15/36 | | | 272 | |
| | 181 | | | Series 3179, Class OA, PO, 07/15/36 | | | 170 | |
| | 108 | | | Series 3194, Class SA, IF, IO, 6.592%, 07/15/36 | | | 12 | |
SEE NOTES TO FINANCIAL STATEMENTS.
| | | | | | | | |
| | | |
| AUGUST 31, 2016 | | J.P. MORGAN INCOME FUNDS | | | | | 211 | |
JPMorgan Mortgage-Backed Securities Fund
SCHEDULE OF PORTFOLIO INVESTMENTS
AS OF AUGUST 31, 2016 (Unaudited) (continued)
(Amounts in thousands)
| | | | | | | | |
PRINCIPAL
AMOUNT($) | | | SECURITY DESCRIPTION | | VALUE($) | |
| Collateralized Mortgage Obligations — continued | |
| | | | Agency CMO — continued | |
| | 302 | | | Series 3200, Class PO, PO, 08/15/36 | | | 277 | |
| | 408 | | | Series 3210, Class PO, PO, 05/15/36 | | | 396 | |
| | 249 | | | Series 3219, Class DI, IO, 6.000%, 04/15/36 | | | 44 | |
| | 257 | | | Series 3232, Class ST, IF, IO, 6.192%, 10/15/36 | | | 46 | |
| | 507 | | | Series 3237, Class AO, PO, 11/15/36 | | | 462 | |
| | 130 | | | Series 3253, Class PO, PO, 12/15/21 | | | 127 | |
| | 222 | | | Series 3260, Class CS, IF, IO, 5.632%, 01/15/37 | | | 31 | |
| | 106 | | | Series 3262, Class SG, IF, IO, 5.892%, 01/15/37 | | | 14 | |
| | 114 | | | Series 3274, Class JO, PO, 02/15/37 | | | 107 | |
| | 153 | | | Series 3274, Class MO, PO, 02/15/37 | | | 146 | |
| | 80 | | | Series 3275, Class FL, VAR, 0.948%, 02/15/37 | | | 80 | |
| | 2,380 | | | Series 3282, Class YD, 5.500%, 02/15/22 | | | 2,559 | |
| | 57 | | | Series 3288, Class GS, IF, 0.560%, 03/15/37 | | | 56 | |
| | 558 | | | Series 3290, Class SB, IF, IO, 5.942%, 03/15/37 | | | 90 | |
| | 144 | | | Series 3305, Class MB, IF, 2.988%, 07/15/34 | | | 153 | |
| | 101 | | | Series 3316, Class JO, PO, 05/15/37 | | | 96 | |
| | 2,947 | | | Series 3318, Class BT, VAR, 7.000%, 05/15/34 | | | 3,445 | |
| | 1,978 | | | Series 3322, Class NS, VAR, 7.000%, 05/15/37 | | | 2,364 | |
| | 99 | | | Series 3371, Class FA, VAR, 1.108%, 09/15/37 | | | 100 | |
| | 303 | | | Series 3373, Class TO, PO, 04/15/37 | | | 289 | |
| | 411 | | | Series 3385, Class SN, IF, IO, 5.492%, 11/15/37 | | | 55 | |
| | 421 | | | Series 3387, Class SA, IF, IO, 5.912%, 11/15/37 | | | 70 | |
| | 294 | | | Series 3393, Class JO, PO, 09/15/32 | | | 274 | |
| | 583 | | | Series 3404, Class SC, IF, IO, 5.492%, 01/15/38 | | | 87 | |
| | 2,519 | | | Series 3422, Class AI, IO, SUB, 0.250%, 01/15/38 | | | 31 | |
| | 143 | | | Series 3422, Class LI, IO, 5.000%, 02/15/23 | | | 6 | |
| | 221 | | | Series 3451, Class SA, IF, IO, 5.542%, 05/15/38 | | | 30 | |
| | 284 | | | Series 3461, Class LZ, 6.000%, 06/15/38 | | | 323 | |
| | 864 | | | Series 3481, Class SJ, IF, IO, 5.342%, 08/15/38 | | | 104 | |
| | 186 | | | Series 3511, Class IO, IO, 5.000%, 12/15/21 | | | 11 | |
| | | | | | | | |
PRINCIPAL
AMOUNT($) | | | SECURITY DESCRIPTION | | VALUE($) | |
| | | | | | | | |
| | | | Agency CMO — continued | |
| | 214 | | | Series 3511, Class SA, IF, IO, 5.492%, 02/15/39 | | | 38 | |
| | 662 | | | Series 3531, Class SA, IF, IO, 5.792%, 05/15/39 | | | 81 | |
| | 1,091 | | | Series 3537, Class MI, IO, 5.000%, 06/15/38 | | | 137 | |
| | 147 | | | Series 3546, Class A, VAR, 2.261%, 02/15/39 | | | 150 | |
| | 216 | | | Series 3549, Class FA, VAR, 1.708%, 07/15/39 | | | 219 | |
| | 966 | | | Series 3572, Class JS, IF, IO, 6.292%, 09/15/39 | | | 144 | |
| | 356 | | | Series 3604, Class PO, PO, 05/15/36 | | | 339 | |
| | 376 | | | Series 3607, Class AO, PO, 04/15/36 | | | 358 | |
| | 376 | | | Series 3607, Class BO, PO, 04/15/36 | | | 358 | |
| | 827 | | | Series 3607, Class PO, PO, 05/15/37 | | | 741 | |
| | 435 | | | Series 3611, Class PO, PO, 07/15/34 | | | 415 | |
| | 1,700 | | | Series 3614, Class QB, 4.000%, 12/15/24 | | | 1,884 | |
| | 433 | | | Series 3621, Class BO, PO, 01/15/40 | | | 398 | |
| | 573 | | | Series 3621, Class PO, PO, 01/15/40 | | | 526 | |
| | 577 | | | Series 3623, Class LO, PO, 01/15/40 | | | 554 | |
| | 1,343 | | | Series 3632, Class BS, IF, 15.808%, 02/15/40 | | | 1,988 | |
| | 5,900 | | | Series 3659, Class VG, 5.000%, 09/15/34 | | | 6,602 | |
| | 346 | | | Series 3688, Class CU, VAR, 6.729%, 11/15/21 | | | 363 | |
| | 2,027 | | | Series 3688, Class NI, IO, 5.000%, 04/15/32 | | | 127 | |
| | 2,248 | | | Series 3704, Class DT, 7.500%, 11/15/36 | | | 2,684 | |
| | 1,709 | | | Series 3704, Class ET, 7.500%, 12/15/36 | | | 2,096 | |
| | 2,989 | | | Series 3714, Class IP, IO, 5.000%, 08/15/40 | | | 389 | |
| | 909 | | | Series 3739, Class LI, IO, 4.000%, 03/15/34 | | | 11 | |
| | 1,772 | | | Series 3740, Class SC, IF, IO, 5.492%, 10/15/40 | | | 302 | |
| | 2,373 | | | Series 3747, Class CY, 4.500%, 10/15/40 | | | 2,811 | |
| | 1,500 | | | Series 3747, Class PY, 4.000%, 10/15/40 | | | 1,683 | |
| | 1,719 | | | Series 3759, Class HI, IO, 4.000%, 08/15/37 | | | 70 | |
| | 981 | | | Series 3760, Class GI, IO, 4.000%, 10/15/37 | | | 31 | |
| | 1,500 | | | Series 3770, Class PY, 5.000%, 12/15/40 | | | 1,846 | |
| | 375 | | | Series 3789, Class EZ, 4.000%, 11/15/40 | | | 386 | |
| | 1,882 | | | Series 3795, Class EI, IO, 5.000%, 10/15/39 | | | 296 | |
| | 303 | | | Series 3852, Class QN, IF, 5.500%, 05/15/41 | | | 334 | |
SEE NOTES TO FINANCIAL STATEMENTS.
| | | | | | |
| | | |
| 212 | | | | J.P. MORGAN INCOME FUNDS | | AUGUST 31, 2016 |
| | | | | | | | |
PRINCIPAL
AMOUNT($) | | | SECURITY DESCRIPTION | | VALUE($) | |
| Collateralized Mortgage Obligations — continued | |
| | | | Agency CMO — continued | |
| | 531 | | | Series 3852, Class TP, IF, 5.500%, 05/15/41 | | | 572 | |
| | 2,599 | | | Series 3860, Class PZ, 5.000%, 05/15/41 | | | 3,285 | |
| | 519 | | | Series 3895, Class WA, VAR, 5.703%, 10/15/38 | | | 587 | |
| | 2,296 | | | Series 3966, Class BF, VAR, 1.008%, 10/15/40 | | | 2,308 | |
| | 3,669 | | | Series 3966, Class NA, 4.000%, 12/15/41 | | | 3,971 | |
| | 2,213 | | | Series 3998, Class GF, VAR, 0.958%, 05/15/36 | | | 2,222 | |
| | 1,000 | | | Series 4015, Class MY, 3.500%, 03/15/42 | | | 1,071 | |
| | 3,852 | | | Series 4048, Class FJ, VAR, 0.867%, 07/15/37 | | | 3,799 | |
| | 497 | | | Series 4126, Class JB, 2.500%, 11/15/42 | | | 496 | |
| | 1,000 | | | Series 4177, Class MQ, 2.500%, 03/15/43 | | | 992 | |
| | 2,989 | | | Series 4280, Class EO, PO, 12/15/43 | | | 2,710 | |
| | 3,052 | | | Series 4281, Class OB, PO, 12/15/43 | | | 2,604 | |
| | 4,600 | | | Series 4580, Class PT, VAR, 7.139%, 08/15/39 | | | 5,305 | |
| | | | Federal Home Loan Mortgage Corp. STRIPS, | | | | |
| | — | (h) | | Series 1, Class B, IO, 8.000%, 10/15/18 | | | — | (h) |
| | — | (h) | | Series 16, Class B, IO, 10.000%, 06/01/20 | | | — | (h) |
| | 3 | | | Series 134, Class B, IO, 9.000%, 04/01/22 | | | — | (h) |
| | 1,050 | | | Series 191, Class IO, IO, 8.000%, 01/01/28 | | | 246 | |
| | 437 | | | Series 197, Class PO, PO, 04/01/28 | | | 386 | |
| | 547 | | | Series 233, Class 11, IO, 5.000%, 09/15/35 | | | 80 | |
| | 315 | | | Series 233, Class 12, IO, 5.000%, 09/15/35 | | | 48 | |
| | 740 | | | Series 233, Class 13, IO, 5.000%, 09/15/35 | | | 111 | |
| | 1,056 | | | Series 239, Class S30, IF, IO, 7.192%, 08/15/36 | | | 191 | |
| | 178 | | | Series 243, Class 16, IO, 4.500%, 11/15/20 | | | 8 | |
| | 311 | | | Series 243, Class 17, IO, 4.500%, 12/15/20 | | | 15 | |
| | 25,528 | | | Series 262, Class 35, 3.500%, 07/15/42 | | | 27,165 | |
| | 1,431 | | | Series 299, Class 300, 3.000%, 01/15/43 | | | 1,489 | |
| | 3,009 | | | Series 310, Class PO, PO, 09/15/43 | | | 2,624 | |
| | | | Federal Home Loan Mortgage Corp. Structured Pass-Through Securities, | | | | |
| | 272 | | | Series T-41, Class 3A, VAR, 5.853%, 07/25/32 | | | 290 | |
| | 987 | | | Series T-42, Class A5, 7.500%, 02/25/42 | | | 1,182 | |
| | 60 | | | Series T-51, Class 1A, VAR, 6.500%, 09/25/43 | | | 72 | |
| | 71 | | | Series T-51, Class 2A, VAR, 7.500%, 08/25/42 | | | 88 | |
| | 1,644 | | | Series T-54, Class 2A, 6.500%, 02/25/43 | | | 1,980 | |
| | 799 | | | Series T-54, Class 3A, 7.000%, 02/25/43 | | | 960 | |
| | | | | | | | |
PRINCIPAL
AMOUNT($) | | | SECURITY DESCRIPTION | | VALUE($) | |
| | | | | | | | |
| | | | Agency CMO — continued | |
| | 1,466 | | | Series T-56, Class A5, 5.231%, 05/25/43 | | | 1,640 | |
| | 133 | | | Series T-58, Class APO, PO, 09/25/43 | | | 116 | |
| | 129 | | | Series T-59, Class 1AP, PO, 10/25/43 | | | 109 | |
| | 1,871 | | | Series T-62, Class 1A1, VAR, 1.689%, 10/25/44 | | | 1,908 | |
| | 3,893 | | | Series T-76, Class 2A, VAR, 1.665%, 10/25/37 | | | 4,097 | |
| | | | Federal National Mortgage Association - ACES, | | | | |
| | 3,407 | | | Series 2010-M1, Class A2, 4.450%, 09/25/19 | | | 3,680 | |
| | 4,578 | | | Series 2010-M3, Class A3, VAR, 4.332%, 03/25/20 | | | 4,933 | |
| | 9,480 | | | Series 2011-M2, Class A3, 3.764%, 04/25/21 | | | 10,299 | |
| | 5,000 | | | Series 2011-M4, Class A2, 3.726%, 06/25/21 | | | 5,435 | |
| | 4,000 | | | Series 2013-M9, Class A2, VAR, 2.389%, 01/25/23 | | | 4,134 | |
| | 2,500 | | | Series 2014-M3, Class A2, VAR, 3.501%, 01/25/24 | | | 2,717 | |
| | 1,640 | | | Series 2014-M9, Class A2, VAR, 3.103%, 07/25/24 | | | 1,747 | |
| | 2,000 | | | Series 2014-M12, Class ASV2, VAR, 2.614%, 10/25/21 | | | 2,088 | |
| | 2,419 | | | Series 2015-M2, Class A3, VAR, 3.150%, 12/25/24 | | | 2,566 | |
| | 3,000 | | | Series 2015-M3, Class A2, 2.723%, 10/25/24 | | | 3,138 | |
| | 1,230 | | | Series 2015-M7, Class A2, 2.590%, 12/25/24 | | | 1,274 | |
| | 7,777 | | | Series 2015-M10, Class A2, VAR, 3.092%, 04/25/27 | | | 8,322 | |
| | 3,091 | | | Series 2015-M13, Class A2, VAR, 2.801%, 06/25/25 | | | 3,239 | |
| | 5,000 | | | Series 2016-M2, Class AV2, 2.152%, 01/25/23 | | | 5,094 | |
| | 4,500 | | | Series 2016-M6, Class A2, 2.488%, 05/25/26 | | | 4,624 | |
| | | | Federal National Mortgage Association Grantor Trust, | | | | |
| | 615 | | | Series 2001-T7, Class A1, 7.500%, 02/25/41 | | | 741 | |
| | 25 | | | Series 2001-T10, Class PO, PO, 12/25/41 | | | 23 | |
| | 474 | | | Series 2001-T12, Class A2, 7.500%, 08/25/41 | | | 584 | |
| | 259 | | | Series 2002-T4, Class A2, 7.000%, 12/25/41 | | | 301 | |
SEE NOTES TO FINANCIAL STATEMENTS.
| | | | | | | | |
| | | |
| AUGUST 31, 2016 | | J.P. MORGAN INCOME FUNDS | | | | | 213 | |
JPMorgan Mortgage-Backed Securities Fund
SCHEDULE OF PORTFOLIO INVESTMENTS
AS OF AUGUST 31, 2016 (Unaudited) (continued)
(Amounts in thousands)
| | | | | | | | |
PRINCIPAL
AMOUNT($) | | | SECURITY DESCRIPTION | | VALUE($) | |
| Collateralized Mortgage Obligations — continued | |
| | | | Agency CMO — continued | |
| | 631 | | | Series 2002-T4, Class A3, 7.500%, 12/25/41 | | | 738 | |
| | 208 | | | Series 2002-T16, Class A2, 7.000%, 07/25/42 | | | 249 | |
| | 412 | | | Series 2002-T19, Class A2, 7.000%, 07/25/42 | | | 497 | |
| | 509 | | | Series 2004-T1, Class 1A1, 6.000%, 01/25/44 | | | 589 | |
| | 384 | | | Series 2004-T3, Class PT1, VAR, 9.140%, 01/25/44 | | | 347 | |
| | 3,229 | | | Federal National Mortgage Association Interest STRIPS, Series 373, Class 1, PO, 07/25/36 | | | 2,921 | |
| | | | Federal National Mortgage Association REMIC, | | | | |
| | 9 | | | Series 1988-7, Class Z, 9.250%, 04/25/18 | | | 9 | |
| | 1 | | | Series 1988-11, Class D, PO, 05/25/18 | | | 1 | |
| | 36 | | | Series 1988-21, Class G, 9.500%, 08/25/18 | | | 37 | |
| | — | (h) | | Series 1989-21, Class G, 10.450%, 04/25/19 | | | — | (h) |
| | 3 | | | Series 1989-27, Class Y, 6.900%, 06/25/19 | | | 3 | |
| | 3 | | | Series 1989-70, Class G, 8.000%, 10/25/19 | | | 3 | |
| | 2 | | | Series 1989-78, Class H, 9.400%, 11/25/19 | | | 2 | |
| | 1 | | | Series 1989-89, Class H, 9.000%, 11/25/19 | | | 1 | |
| | 1 | | | Series 1990-60, Class K, 5.500%, 06/25/20 | | | 1 | |
| | 1 | | | Series 1990-93, Class G, 5.500%, 08/25/20 | | | 1 | |
| | — | (h) | | Series 1990-95, Class J, HB, 1,118.040%, 08/25/20 | | | — | (h) |
| | 13 | | | Series 1990-102, Class J, 6.500%, 08/25/20 | | | 13 | |
| | 1 | | | Series 1990-134, Class SC, HB, IF, 20.813%, 11/25/20 | | | 2 | |
| | — | (h) | | Series 1990-140, Class K, HB, 652.145%, 12/25/20 | | | 1 | |
| | 46 | | | Series 1991-44, Class G, 8.500%, 05/25/21 | | | 50 | |
| | — | (h) | | Series 1991-60, Class PM, HB, 1,009.000%, 06/25/21 | | | — | (h) |
| | 3 | | | Series 1992-101, Class J, 7.500%, 06/25/22 | | | 4 | |
| | 77 | | | Series 1993-25, Class J, 7.500%, 03/25/23 | | | 85 | |
| | 39 | | | Series 1993-27, Class S, IF, 8.965%, 02/25/23 | | | 46 | |
| | 14 | | | Series 1993-31, Class K, 7.500%, 03/25/23 | | | 16 | |
| | 160 | | | Series 1993-54, Class Z, 7.000%, 04/25/23 | | | 176 | |
| | 9 | | | Series 1993-62, Class SA, IF, 18.923%, 04/25/23 | | | 12 | |
| | 8 | | | Series 1993-97, Class FA, VAR, 1.774%, 05/25/23 | | | 9 | |
| | 1 | | | Series 1993-108, Class D, PO, 02/25/23 | | | 1 | |
| | | | | | | | |
PRINCIPAL
AMOUNT($) | | | SECURITY DESCRIPTION | | VALUE($) | |
| | | | | | | | |
| | | | Agency CMO — continued | |
| | 21 | | | Series 1993-162, Class F, VAR, 1.474%, 08/25/23 | | | 21 | |
| | 3 | | | Series 1993-165, Class SD, IF, 13.393%, 09/25/23 | | | 4 | |
| | 34 | | | Series 1993-179, Class SB, HB, IF, 26.731%, 10/25/23 | | | 54 | |
| | 6 | | | Series 1993-228, Class G, PO, 09/25/23 | | | 6 | |
| | 6 | | | Series 1993-230, Class FA, VAR, 1.124%, 12/25/23 | | | 6 | |
| | 448 | | | Series 1994-26, Class J, PO, 01/25/24 | | | 423 | |
| | 47 | | | Series 1994-37, Class L, 6.500%, 03/25/24 | | | 52 | |
| | 16 | | | Series 1995-2, Class Z, 8.500%, 01/25/25 | | | 18 | |
| | 104 | | | Series 1996-14, Class SE, IF, IO, 9.170%, 08/25/23 | | | 23 | |
| | 4 | | | Series 1996-59, Class J, 6.500%, 08/25/22 | | | 4 | |
| | 29 | | | Series 1997-20, Class IO, IO, VAR, 1.840%, 03/25/27 | | | 1 | |
| | 11 | | | Series 1997-24, Class Z, 8.000%, 04/18/27 | | | 13 | |
| | 10 | | | Series 1997-27, Class J, 7.500%, 04/18/27 | | | 11 | |
| | 250 | | | Series 1997-46, Class Z, 7.500%, 06/17/27 | | | 285 | |
| | 9 | | | Series 1997-81, Class PI, IO, 7.000%, 12/18/27 | | | 1 | |
| | 582 | | | Series 1998-30, Class ZA, 6.500%, 05/20/28 | | | 653 | |
| | 92 | | | Series 1998-36, Class ZB, 6.000%, 07/18/28 | | | 105 | |
| | 64 | | | Series 1998-43, Class SA, IF, IO, 19.057%, 04/25/23 | | | 25 | |
| | 38 | | | Series 1999-57, Class Z, 7.500%, 12/25/19 | | | 40 | |
| | 65 | | | Series 1999-62, Class PB, 7.500%, 12/18/29 | | | 76 | |
| | 206 | | | Series 2000-18, Class EC, PO, 10/25/23 | | | 198 | |
| | 10 | | | Series 2000-52, Class IO, IO, 8.500%, 01/25/31 | | | 2 | |
| | 497 | | | Series 2001-4, Class ZA, 6.500%, 03/25/31 | | | 584 | |
| | 49 | | | Series 2001-7, Class PF, 7.000%, 03/25/31 | | | 56 | |
| | 62 | | | Series 2001-33, Class ID, IO, 6.000%, 07/25/31 | | | 12 | |
| | 94 | | | Series 2001-36, Class DE, 7.000%, 08/25/31 | | | 110 | |
| | 232 | | | Series 2001-38, Class FB, VAR, 1.024%, 08/25/31 | | | 232 | |
| | 42 | | | Series 2001-44, Class PD, 7.000%, 09/25/31 | | | 47 | |
| | 88 | | | Series 2001-44, Class PU, 7.000%, 09/25/31 | | | 101 | |
| | 122 | | | Series 2001-49, Class LZ, 8.500%, 07/25/31 | | | 143 | |
SEE NOTES TO FINANCIAL STATEMENTS.
| | | | | | |
| | | |
| 214 | | | | J.P. MORGAN INCOME FUNDS | | AUGUST 31, 2016 |
| | | | | | | | |
PRINCIPAL
AMOUNT($) | | | SECURITY DESCRIPTION | | VALUE($) | |
| Collateralized Mortgage Obligations — continued | |
| | | | Agency CMO — continued | |
| | 451 | | | Series 2001-53, Class FX, VAR, 0.874%, 10/25/31 | | | 451 | |
| | 243 | | | Series 2001-61, Class Z, 7.000%, 11/25/31 | | | 276 | |
| | 29 | | | Series 2001-72, Class SX, IF, 16.245%, 12/25/31 | | | 41 | |
| | 1 | | | Series 2001-74, Class MB, 6.000%, 12/25/16 | | | 1 | |
| | 25 | | | Series 2002-1, Class SA, HB, IF, 23.483%, 02/25/32 | | | 44 | |
| | 47 | | | Series 2002-1, Class UD, HB, IF, 22.665%, 12/25/23 | | | 71 | |
| | 171 | | | Series 2002-7, Class FD, VAR, 1.224%, 04/25/29 | | | 174 | |
| | 3 | | | Series 2002-9, Class ST, IF, 18.061%, 03/25/17 | | | 3 | |
| | 348 | | | Series 2002-13, Class SJ, IF, IO, 1.600%, 03/25/32 | | | 18 | |
| | 19 | | | Series 2002-13, Class ST, IF, 10.000%, 03/25/32 | | | 25 | |
| | 1 | | | Series 2002-19, Class PE, 6.000%, 04/25/17 | | | 1 | |
| | 457 | | | Series 2002-30, Class Z, 6.000%, 05/25/32 | | | 524 | |
| | 28 | | | Series 2002-37, Class Z, 6.500%, 06/25/32 | | | 32 | |
| | 938 | | | Series 2002-50, Class ZA, 6.000%, 05/25/31 | | | 1,024 | |
| | 584 | | | Series 2002-60, Class FA, VAR, 1.274%, 02/25/31 | | | 595 | |
| | 584 | | | Series 2002-60, Class FB, VAR, 1.274%, 02/25/31 | | | 595 | |
| | 43 | | | Series 2002-62, Class ZE, 5.500%, 11/25/17 | | | 44 | |
| | 21 | | | Series 2002-63, Class KC, 5.000%, 10/25/17 | | | 22 | |
| | 16 | | | Series 2002-63, Class LB, 5.500%, 10/25/17 | | | 17 | |
| | 69 | | | Series 2002-77, Class S, IF, 13.522%, 12/25/32 | | | 84 | |
| | 1,140 | | | Series 2003-2, Class F, VAR, 1.274%, 02/25/33 | | | 1,160 | |
| | 351 | | | Series 2003-7, Class A1, 6.500%, 12/25/42 | | | 406 | |
| | 709 | | | Series 2003-14, Class TI, IO, 5.000%, 03/25/33 | | | 103 | |
| | 842 | | | Series 2003-22, Class UD, 4.000%, 04/25/33 | | | 904 | |
| | 246 | | | Series 2003-26, Class XS, IF, IO, 6.526%, 03/25/23 | | | 13 | |
| | 977 | | | Series 2003-33, Class IA, IO, 6.500%, 05/25/33 | | | 178 | |
| | | | | | | | |
PRINCIPAL
AMOUNT($) | | | SECURITY DESCRIPTION | | VALUE($) | |
| | | | | | | | |
| | | | Agency CMO — continued | |
| | 44 | | | Series 2003-39, Class IO, IO, VAR, 6.000%, 05/25/33 | | | 10 | |
| | 1,219 | | | Series 2003-44, Class IU, IO, 7.000%, 06/25/33 | | | 293 | |
| | 26 | | | Series 2003-52, Class SX, HB, IF, 21.377%, 10/25/31 | | | 38 | |
| | 472 | | | Series 2003-72, Class IE, IO, 5.500%, 08/25/33 | | | 78 | |
| | 27 | | | Series 2003-74, Class SH, IF, 9.226%, 08/25/33 | | | 32 | |
| | 103 | | | Series 2003-80, Class SY, IF, IO, 7.126%, 06/25/23 | | | 3 | |
| | 451 | | | Series 2003-86, Class ZA, 5.500%, 09/25/33 | | | 504 | |
| | 73 | | | Series 2003-91, Class SD, IF, 11.626%, 09/25/33 | | | 89 | |
| | 2,710 | | | Series 2003-105, Class AZ, 5.500%, 10/25/33 | | | 3,086 | |
| | 8 | | | Series 2003-106, Class PO, PO, 08/25/17 | | | 8 | |
| | 525 | | | Series 2003-116, Class SB, IF, IO, 7.076%, 11/25/33 | | | 117 | |
| | 2,780 | | | Series 2003-122, Class ZJ, 6.000%, 12/25/33 | | | 3,259 | |
| | 53 | | | Series 2003-130, Class SX, IF, 10.733%, 01/25/34 | | | 66 | |
| | 75 | | | Series 2003-131, Class SK, IF, 15.151%, 01/25/34 | | | 94 | |
| | 65 | | | Series 2003-132, Class OA, PO, 08/25/33 | | | 62 | |
| | 145 | | | Series 2003-132, Class PI, IO, 5.500%, 08/25/33 | | | 14 | |
| | 460 | | | Series 2004-4, Class QI, IF, IO, 6.576%, 06/25/33 | | | 47 | |
| | 115 | | | Series 2004-4, Class QM, IF, 13.151%, 06/25/33 | | | 142 | |
| | 200 | | | Series 2004-10, Class SC, HB, IF, 26.502%, 02/25/34 | | | 242 | |
| | 660 | | | Series 2004-17, Class H, 5.500%, 04/25/34 | | | 740 | |
| | 267 | | | Series 2004-25, Class SA, IF, 18.083%, 04/25/34 | | | 398 | |
| | 917 | | | Series 2004-28, Class PF, VAR, 0.924%, 03/25/34 | | | 918 | |
| | 332 | | | Series 2004-36, Class SA, IF, 18.083%, 05/25/34 | | | 512 | |
| | 59 | | | Series 2004-36, Class SN, IF, 13.151%, 07/25/33 | | | 66 | |
| | 367 | | | Series 2004-46, Class EP, PO, 03/25/34 | | | 345 | |
| | 155 | | | Series 2004-46, Class QB, HB, IF, 21.902%, 05/25/34 | | | 235 | |
SEE NOTES TO FINANCIAL STATEMENTS.
| | | | | | | | |
| | | |
| AUGUST 31, 2016 | | J.P. MORGAN INCOME FUNDS | | | | | 215 | |
JPMorgan Mortgage-Backed Securities Fund
SCHEDULE OF PORTFOLIO INVESTMENTS
AS OF AUGUST 31, 2016 (Unaudited) (continued)
(Amounts in thousands)
| | | | | | | | |
PRINCIPAL
AMOUNT($) | | | SECURITY DESCRIPTION | | VALUE($) | |
| Collateralized Mortgage Obligations — continued | |
| | | | Agency CMO — continued | |
| | 114 | | | Series 2004-46, Class SK, IF, 15.058%, 05/25/34 | | | 150 | |
| | 3,667 | | | Series 2004-50, Class VZ, 5.500%, 07/25/34 | | | 4,088 | |
| | 45 | | | Series 2004-51, Class SY, IF, 13.191%, 07/25/34 | | | 60 | |
| | 292 | | | Series 2004-53, Class NC, 5.500%, 07/25/24 | | | 317 | |
| | 145 | | | Series 2004-59, Class BG, PO, 12/25/32 | | | 137 | |
| | 2,421 | | | Series 2004-61, Class FH, VAR, 1.324%, 11/25/32 | | | 2,475 | |
| | 97 | | | Series 2004-61, Class SK, IF, 8.500%, 11/25/32 | | | 116 | |
| | 398 | | | Series 2004-87, Class F, VAR, 1.274%, 01/25/34 | | | 406 | |
| | 1,021 | | | Series 2005-7, Class LO, PO, 02/25/35 | | | 936 | |
| | 194 | | | Series 2005-13, Class FL, VAR, 0.924%, 03/25/35 | | | 194 | |
| | 142 | | | Series 2005-15, Class MO, PO, 03/25/35 | | | 140 | |
| | 15,500 | | | Series 2005-19, Class PB, 5.500%, 03/25/35 | | | 18,820 | |
| | 26 | | | Series 2005-52, Class PA, 6.500%, 06/25/35 | | | 27 | |
| | 671 | | | Series 2005-56, Class S, IF, IO, 6.186%, 07/25/35 | | | 130 | |
| | 208 | | | Series 2005-66, Class SG, IF, 16.064%, 07/25/35 | | | 308 | |
| | 757 | | | Series 2005-66, Class SV, IF, IO, 6.226%, 07/25/35 | | | 139 | |
| | 365 | | | Series 2005-67, Class HG, 5.500%, 01/25/35 | | | 384 | |
| | 687 | | | Series 2005-68, Class PG, 5.500%, 08/25/35 | | | 778 | |
| | 175 | | | Series 2005-73, Class PS, IF, 15.389%, 08/25/35 | | | 246 | |
| | 592 | | | Series 2005-74, Class SK, IF, 18.688%, 05/25/35 | | | 839 | |
| | 458 | | | Series 2005-84, Class XM, 5.750%, 10/25/35 | | | 500 | |
| | 142 | | | Series 2005-90, Class AO, PO, 10/25/35 | | | 136 | |
| | 686 | | | Series 2005-90, Class ES, IF, 15.564%, 10/25/35 | | | 926 | |
| | 399 | | | Series 2005-90, Class PO, PO, 09/25/35 | | | 383 | |
| | 475 | | | Series 2005-103, Class SC, IF, 10.292%, 07/25/35 | | | 566 | |
| | 451 | | | Series 2005-106, Class US, HB, IF, 22.644%, 11/25/35 | | | 696 | |
| | | | | | | | |
PRINCIPAL
AMOUNT($) | | | SECURITY DESCRIPTION | | VALUE($) | |
| | | | | | | | |
| | | | Agency CMO — continued | |
| | 3,278 | | | Series 2006-8, Class WN, IF, IO, 6.176%, 03/25/36 | | | 694 | |
| | 894 | | | Series 2006-8, Class WQ, PO, 03/25/36 | | | 783 | |
| | 62 | | | Series 2006-15, Class OT, PO, 01/25/36 | | | 61 | |
| | 530 | | | Series 2006-16, Class HZ, 5.500%, 03/25/36 | | | 569 | |
| | 195 | | | Series 2006-23, Class KO, PO, 04/25/36 | | | 177 | |
| | 492 | | | Series 2006-27, Class OH, PO, 04/25/36 | | | 462 | |
| | 403 | | | Series 2006-44, Class GO, PO, 06/25/36 | | | 381 | |
| | 975 | | | Series 2006-44, Class P, PO, 12/25/33 | | | 930 | |
| | 225 | | | Series 2006-50, Class JO, PO, 06/25/36 | | | 215 | |
| | 333 | | | Series 2006-50, Class PS, PO, 06/25/36 | | | 318 | |
| | 636 | | | Series 2006-53, Class US, IF, IO, 6.056%, 06/25/36 | | | 91 | |
| | 1,064 | | | Series 2006-56, Class FT, VAR, 1.274%, 07/25/36 | | | 1,171 | |
| | 145 | | | Series 2006-58, Class AP, PO, 07/25/36 | | | 138 | |
| | 417 | | | Series 2006-58, Class PO, PO, 07/25/36 | | | 397 | |
| | 194 | | | Series 2006-59, Class QO, PO, 01/25/33 | | | 190 | |
| | 190 | | | Series 2006-60, Class DO, PO, 04/25/35 | | | 182 | |
| | 555 | | | Series 2006-63, Class ZH, 6.500%, 07/25/36 | | | 653 | |
| | 163 | | | Series 2006-65, Class QO, PO, 07/25/36 | | | 150 | |
| | 289 | | | Series 2006-72, Class GO, PO, 08/25/36 | | | 274 | |
| | 149 | | | Series 2006-72, Class HO, PO, 08/25/26 | | | 144 | |
| | 192 | | | Series 2006-72, Class TO, PO, 08/25/36 | | | 185 | |
| | 1,915 | | | Series 2006-77, Class PC, 6.500%, 08/25/36 | | | 2,213 | |
| | 449 | | | Series 2006-78, Class BZ, 6.500%, 08/25/36 | | | 509 | |
| | 268 | | | Series 2006-79, Class DO, PO, 08/25/36 | | | 253 | |
| | 325 | | | Series 2006-86, Class OB, PO, 09/25/36 | | | 313 | |
| | 333 | | | Series 2006-90, Class AO, PO, 09/25/36 | | | 314 | |
| | 1,715 | | | Series 2006-94, Class GI, IF, IO, 6.126%, 10/25/26 | | | 265 | |
| | 72 | | | Series 2006-94, Class GK, HB, IF, 30.628%, 10/25/26 | | | 122 | |
| | 2,015 | | | Series 2006-105, Class ME, 5.500%, 11/25/36 | | | 2,275 | |
| | 211 | | | Series 2006-110, Class PO, PO, 11/25/36 | | | 202 | |
| | 109 | | | Series 2006-111, Class EO, PO, 11/25/36 | | | 104 | |
| | 241 | | | Series 2006-113, Class PO, PO, 07/25/36 | | | 235 | |
| | 392 | | | Series 2006-115, Class OK, PO, 12/25/36 | | | 359 | |
| | 488 | | | Series 2006-117, Class GS, IF, IO, 6.126%, 12/25/36 | | | 54 | |
| | 283 | | | Series 2006-118, Class A2, VAR, 0.584%, 12/25/36 | | | 282 | |
SEE NOTES TO FINANCIAL STATEMENTS.
| | | | | | |
| | | |
| 216 | | | | J.P. MORGAN INCOME FUNDS | | AUGUST 31, 2016 |
| | | | | | | | |
PRINCIPAL
AMOUNT($) | | | SECURITY DESCRIPTION | | VALUE($) | |
| Collateralized Mortgage Obligations — continued | |
| | | | Agency CMO — continued | |
| | 115 | | | Series 2006-119, Class PO, PO, 12/25/36 | | | 109 | |
| | 693 | | | Series 2006-120, Class IO, IO, 6.500%, 12/25/36 | | | 146 | |
| | 481 | | | Series 2006-120, Class PF, VAR, 0.774%, 12/25/36 | | | 479 | |
| | 686 | | | Series 2006-126, Class AO, PO, 01/25/37 | | | 657 | |
| | 672 | | | Series 2006-130, Class GI, IO, 6.500%, 07/25/32 | | | 112 | |
| | 33 | | | Series 2007-1, Class SD, HB, IF, 35.854%, 02/25/37 | | | 83 | |
| | 254 | | | Series 2007-7, Class SG, IF, IO, 5.976%, 08/25/36 | | | 71 | |
| | 1,094 | | | Series 2007-14, Class ES, IF, IO, 5.916%, 03/25/37 | | | 193 | |
| | 243 | | | Series 2007-14, Class OP, PO, 03/25/37 | | | 223 | |
| | 110 | | | Series 2007-15, Class NO, PO, 03/25/22 | | | 107 | |
| | 220 | | | Series 2007-16, Class FC, VAR, 1.274%, 03/25/37 | | | 223 | |
| | 1,226 | | | Series 2007-18, Class MZ, 6.000%, 03/25/37 | | | 1,343 | |
| | 186 | | | Series 2007-22, Class SC, IF, IO, 5.556%, 03/25/37 | | | 32 | |
| | 86 | | | Series 2007-39, Class EF, VAR, 0.774%, 05/25/37 | | | 86 | |
| | 3,402 | | | Series 2007-46, Class ZK, 5.500%, 05/25/37 | | | 3,588 | |
| | 380 | | | Series 2007-54, Class FA, VAR, 0.924%, 06/25/37 | | | 380 | |
| | 1,182 | | | Series 2007-54, Class WI, IF, IO, 5.576%, 06/25/37 | | | 220 | |
| | 717 | | | Series 2007-60, Class AX, IF, IO, 6.626%, 07/25/37 | | | 168 | |
| | 395 | | | Series 2007-64, Class FB, VAR, 0.894%, 07/25/37 | | | 395 | |
| | 704 | | | Series 2007-65, Class KI, IF, IO, 6.096%, 07/25/37 | | | 91 | |
| | 2,087 | | | Series 2007-72, Class EK, IF, IO, 5.876%, 07/25/37 | | | 361 | |
| | 1,373 | | | Series 2007-76, Class ZG, 6.000%, 08/25/37 | | | 1,538 | |
| | 337 | | | Series 2007-78, Class CB, 6.000%, 08/25/37 | | | 380 | |
| | 74 | | | Series 2007-79, Class SB, HB, IF, 22.094%, 08/25/37 | | | 113 | |
| | 312 | | | Series 2007-88, Class VI, IF, IO, 6.016%, 09/25/37 | | | 65 | |
| | 1,034 | | | Series 2007-91, Class ES, IF, IO, 5.936%, 10/25/37 | | | 154 | |
| | | | | | | | |
PRINCIPAL
AMOUNT($) | | | SECURITY DESCRIPTION | | VALUE($) | |
| | | | | | | | |
| | | | Agency CMO — continued | |
| | 958 | | | Series 2007-100, Class SM, IF, IO, 5.926%, 10/25/37 | | | 171 | |
| | 992 | | | Series 2007-101, Class A2, VAR, 0.774%, 06/27/36 | | | 969 | |
| | 197 | | | Series 2007-106, Class A7, VAR, 6.150%, 10/25/37 | | | 220 | |
| | 1,898 | | | Series 2007-112, Class SA, IF, IO, 5.926%, 12/25/37 | | | 383 | |
| | 1,898 | | | Series 2007-114, Class A6, VAR, 0.724%, 10/27/37 | | | 1,894 | |
| | 2,495 | | | Series 2007-116, Class HI, IO, VAR, 1.641%, 01/25/38 | | | 178 | |
| | 812 | | | Series 2008-1, Class BI, IF, IO, 5.386%, 02/25/38 | | | 134 | |
| | 282 | | | Series 2008-10, Class XI, IF, IO, 5.706%, 03/25/38 | | | 41 | |
| | 1,319 | | | Series 2008-12, Class CO, PO, 03/25/38 | | | 1,212 | |
| | 438 | | | Series 2008-16, Class IS, IF, IO, 5.676%, 03/25/38 | | | 71 | |
| | 206 | | | Series 2008-19, Class IC, IO, 5.000%, 03/25/23 | | | 7 | |
| | 576 | | | Series 2008-20, Class SA, IF, IO, 6.466%, 03/25/38 | | | 110 | |
| | 213 | | | Series 2008-27, Class SN, IF, IO, 6.376%, 04/25/38 | | | 35 | |
| | 153 | | | Series 2008-32, Class SA, IF, IO, 6.326%, 04/25/38 | | | 25 | |
| | 573 | | | Series 2008-35, Class IM, IO, VAR, 0.642%, 10/25/16 | | | — | (h) |
| | 51 | | | Series 2008-44, Class PO, PO, 05/25/38 | | | 48 | |
| | 447 | | | Series 2008-47, Class SI, IF, IO, 5.976%, 06/25/23 | | | 38 | |
| | 316 | | | Series 2008-53, Class CI, IF, IO, 6.676%, 07/25/38 | | | 59 | |
| | 178 | | | Series 2008-76, Class GF, VAR, 1.174%, 09/25/23 | | | 178 | |
| | 81 | | | Series 2008-80, Class GP, 6.250%, 09/25/38 | | | 92 | |
| | 610 | | | Series 2008-80, Class SA, IF, IO, 5.326%, 09/25/38 | | | 87 | |
| | 303 | | | Series 2008-81, Class SB, IF, IO, 5.326%, 09/25/38 | | | 46 | |
| | 116 | | | Series 2009-4, Class BD, 4.500%, 02/25/39 | | | 123 | |
| | 284 | | | Series 2009-6, Class GS, IF, IO, 6.026%, 02/25/39 | | | 59 | |
| | 502 | | | Series 2009-9, Class IO, IO, 5.000%, 02/25/24 | | | 32 | |
SEE NOTES TO FINANCIAL STATEMENTS.
| | | | | | | | |
| | | |
| AUGUST 31, 2016 | | J.P. MORGAN INCOME FUNDS | | | | | 217 | |
JPMorgan Mortgage-Backed Securities Fund
SCHEDULE OF PORTFOLIO INVESTMENTS
AS OF AUGUST 31, 2016 (Unaudited) (continued)
(Amounts in thousands)
| | | | | | | | |
PRINCIPAL
AMOUNT($) | | | SECURITY DESCRIPTION | | VALUE($) | |
| Collateralized Mortgage Obligations — continued | |
| | | | Agency CMO — continued | |
| | 275 | | | Series 2009-12, Class IO, IO, 4.500%, 03/25/24 | | | 11 | |
| | 636 | | | Series 2009-17, Class QS, IF, IO, 6.126%, 03/25/39 | | | 93 | |
| | 1,981 | | | Series 2009-19, Class IP, IO, 5.500%, 10/25/36 | | | 297 | |
| | 120 | | | Series 2009-47, Class MT, 7.000%, 07/25/39 | | | 133 | |
| | 752 | | | Series 2009-52, Class PI, IO, 5.000%, 07/25/39 | | | 97 | |
| | 485 | | | Series 2009-62, Class HJ, 6.000%, 05/25/39 | | | 538 | |
| | 84 | | | Series 2009-63, Class P, 5.000%, 03/25/37 | | | 92 | |
| | 263 | | | Series 2009-69, Class PO, PO, 09/25/39 | | | 250 | |
| | 78 | | | Series 2009-79, Class UA, 7.000%, 03/25/38 | | | 88 | |
| | 394 | | | Series 2009-84, Class WS, IF, IO, 5.376%, 10/25/39 | | | 48 | |
| | 493 | | | Series 2009-86, Class IP, IO, 5.500%, 10/25/39 | | | 71 | |
| | 1,095 | | | Series 2009-86, Class OT, PO, 10/25/37 | | | 998 | |
| | 538 | | | Series 2009-92, Class AD, 6.000%, 11/25/39 | | | 601 | |
| | 291 | | | Series 2009-99, Class SC, IF, IO, 5.656%, 12/25/39 | | | 43 | |
| | 782 | | | Series 2009-99, Class WA, VAR, 6.295%, 12/25/39 | | | 898 | |
| | 2,919 | | | Series 2009-103, Class MB, VAR, 2.800%, 12/25/39 | | | 3,078 | |
| | 657 | | | Series 2009-112, Class ST, IF, IO, 5.726%, 01/25/40 | | | 113 | |
| | 502 | | | Series 2009-113, Class FB, VAR, 1.074%, 01/25/40 | | | 505 | |
| | 2,149 | | | Series 2010-1, Class WA, VAR, 6.218%, 02/25/40 | | | 2,479 | |
| | 1,482 | | | Series 2010-16, Class WA, VAR, 6.443%, 03/25/40 | | | 1,737 | |
| | 2,909 | | | Series 2010-16, Class WB, VAR, 6.239%, 03/25/40 | | | 3,360 | |
| | 553 | | | Series 2010-23, Class KS, IF, IO, 6.576%, 02/25/40 | | | 73 | |
| | 638 | | | Series 2010-35, Class SB, IF, IO, 5.896%, 04/25/40 | | | 86 | |
| | 334 | | | Series 2010-39, Class OT, PO, 10/25/35 | | | 316 | |
| | 642 | | | Series 2010-40, Class FJ, VAR, 1.124%, 04/25/40 | | | 647 | |
| | 274 | | | Series 2010-42, Class S, IF, IO, 5.876%, 05/25/40 | | | 47 | |
| | | | | | | | |
PRINCIPAL
AMOUNT($) | | | SECURITY DESCRIPTION | | VALUE($) | |
| | | | | | | | |
| | | | Agency CMO — continued | |
| | 981 | | | Series 2010-43, Class FD, VAR, 1.124%, 05/25/40 | | | 989 | |
| | 907 | | | Series 2010-49, Class SC, IF, 11.611%, 03/25/40 | | | 1,164 | |
| | 681 | | | Series 2010-61, Class WA, VAR, 5.949%, 06/25/40 | | | 780 | |
| | 2,864 | | | Series 2010-68, Class SA, IF, IO, 4.476%, 07/25/40 | | | 359 | |
| | 1,085 | | | Series 2010-103, Class ME, 4.000%, 09/25/40 | | | 1,171 | |
| | 1,676 | | | Series 2010-103, Class SB, IF, IO, 5.576%, 11/25/49 | | | 226 | |
| | 2,000 | | | Series 2010-111, Class AM, 5.500%, 10/25/40 | | | 2,357 | |
| | 245 | | | Series 2010-123, Class FL, VAR, 0.954%, 11/25/40 | | | 246 | |
| | 2,872 | | | Series 2010-125, Class SA, IF, IO, 3.916%, 11/25/40 | | | 275 | |
| | 2,721 | | | Series 2010-130, Class CY, 4.500%, 11/25/40 | | | 3,165 | |
| | 4,516 | | | Series 2010-147, Class SA, IF, IO, 6.006%, 01/25/41 | | | 1,064 | |
| | 540 | | | Series 2010-148, Class MA, 4.000%, 02/25/39 | | | 556 | |
| | 424 | | | Series 2011-2, Class WA, VAR, 5.822%, 02/25/51 | | | 469 | |
| | 1,674 | | | Series 2011-20, Class MW, 5.000%, 03/25/41 | | | 2,029 | |
| | 7,555 | | | Series 2011-21, Class CV, 4.500%, 09/25/26 | | | 7,577 | |
| | 2,680 | | | Series 2011-30, Class LS, IO, VAR, 1.880%, 04/25/41 | | | 190 | |
| | 2,660 | | | Series 2011-39, Class ZA, 6.000%, 11/25/32 | | | 3,048 | |
| | 583 | | | Series 2011-43, Class WA, VAR, 5.818%, 05/25/51 | | | 662 | |
| | 1,679 | | | Series 2011-47, Class ZA, 5.500%, 07/25/38 | | | 1,839 | |
| | 1,647 | | | Series 2011-56, Class VA, 5.000%, 09/25/40 | | | 1,665 | |
| | 1,365 | | | Series 2011-58, Class WA, VAR, 5.450%, 07/25/51 | | | 1,532 | |
| | 402 | | | Series 2011-75, Class FA, VAR, 1.038%, 08/25/41 | | | 407 | |
| | 2,313 | | | Series 2011-118, Class LB, 7.000%, 11/25/41 | | | 2,747 | |
| | 4,093 | | | Series 2011-118, Class MT, 7.000%, 11/25/41 | | | 4,863 | |
SEE NOTES TO FINANCIAL STATEMENTS.
| | | | | | |
| | | |
| 218 | | | | J.P. MORGAN INCOME FUNDS | | AUGUST 31, 2016 |
| | | | | | | | |
PRINCIPAL
AMOUNT($) | | | SECURITY DESCRIPTION | | VALUE($) | |
| Collateralized Mortgage Obligations — continued | |
| | | | Agency CMO — continued | |
| | 4,069 | | | Series 2011-118, Class NT, 7.000%, 11/25/41 | | | 4,809 | |
| | 1,676 | | | Series 2012-21, Class WA, VAR, 5.612%, 03/25/52 | | | 1,888 | |
| | 2,096 | | | Series 2012-58, Class FA, VAR, 1.024%, 03/25/39 | | | 2,103 | |
| | 2,563 | | | Series 2012-99, Class BY, 2.500%, 09/25/42 | | | 2,480 | |
| | 809 | | | Series 2013-2, Class LZ, 3.000%, 02/25/43 | | | 816 | |
| | 5,832 | | | Series 2013-4, Class AJ, 3.500%, 02/25/43 | | | 6,122 | |
| | 3,257 | | | Series 2013-92, Class PO, PO, 09/25/43 | | | 2,795 | |
| | 3,274 | | | Series 2013-101, Class DO, PO, 10/25/43 | | | 2,823 | |
| | 6,140 | | | Series 2013-135, Class PO, PO, 01/25/44 | | | 5,324 | |
| | 928 | | | Series 2014-44, Class B, 2.500%, 08/25/34 | | | 926 | |
| | 1,853 | | | Series 2015-85, Class HD, 3.000%, 11/25/45 | | | 1,896 | |
| | 4,753 | | | Series 2015-91, Class AC, VAR, 7.500%, 12/25/36 | | | 5,562 | |
| | 14,773 | | | Series 2016-33, Class JA, 3.000%, 07/25/45 | | | 15,400 | |
| | 7,273 | | | Series 2016-38, Class NA, 3.000%, 01/25/46 | | | 7,642 | |
| | 26 | | | Series G92-7, Class JQ, 8.500%, 01/25/22 | | | 29 | |
| | 3 | | | Series G92-12, Class B, 7.700%, 02/25/22 | | | 3 | |
| | 4 | | | Series G92-14, Class Z, 7.000%, 02/25/22 | | | 5 | |
| | — | (h) | | Series G92-27, Class SQ, HB, IF, 11,389.778%, 05/25/22 | | | 1 | |
| | 7 | | | Series G92-42, Class Z, 7.000%, 07/25/22 | | | 8 | |
| | 23 | | | Series G92-44, Class ZQ, 8.000%, 07/25/22 | | | 24 | |
| | 29 | | | Series G92-54, Class ZQ, 7.500%, 09/25/22 | | | 32 | |
| | 69 | | | Series G92-61, Class Z, 7.000%, 10/25/22 | | | 76 | |
| | 7 | | | Series G92-62, Class B, PO, 10/25/22 | | | 7 | |
| | 46 | | | Series G93-1, Class KA, 7.900%, 01/25/23 | | | 52 | |
| | 30 | | | Series G93-17, Class SI, IF, 6.000%, 04/25/23 | | | 35 | |
| | 262 | | | Series G94-7, Class PJ, 7.500%, 05/17/24 | | | 298 | |
| | 50 | | | Series G97-2, Class ZA, 8.500%, 02/17/27 | | | 61 | |
| | | | Federal National Mortgage Association REMIC Trust, | | | | |
| | 829 | | | Series 2001-W3, Class A, VAR, 6.636%, 09/25/41 | | | 935 | |
| | 3,733 | | | Series 2002-W10, Class IO, IO, VAR, 0.937%, 08/25/42 | | | 121 | |
| | 319 | | | Series 2003-W1, Class 1A1, VAR, 5.632%, 12/25/42 | | | 362 | |
| | 200 | | | Series 2003-W1, Class 2A, VAR, 6.307%, 12/25/42 | | | 235 | |
| | | | | | | | |
PRINCIPAL
AMOUNT($) | | | SECURITY DESCRIPTION | | VALUE($) | |
| | | | | | | | |
| | | | Agency CMO — continued | |
| | 47 | | | Series 2003-W4, Class 2A, VAR, 6.264%, 10/25/42 | | | 54 | |
| | 1,345 | | | Series 2004-W4, Class A7, 5.500%, 06/25/34 | | | 1,505 | |
| | 749 | | | Series 2004-W11, Class 1A1, 6.000%, 05/25/44 | | | 889 | |
| | 308 | | | Series 2006-W3, Class 1AF1, VAR, 0.764%, 10/25/46 | | | 308 | |
| | 360 | | | Series 2006-W3, Class 2A, 6.000%, 09/25/46 | | | 404 | |
| | 638 | | | Series 2007-W2, Class 1A1, VAR, 0.844%, 03/25/37 | | | 638 | |
| | 300 | | | Series 2007-W3, Class 1A3, 6.750%, 04/25/37 | | | 336 | |
| | 50 | | | Series 2007-W7, Class 1A4, HB, IF, 36.034%, 07/25/37 | | | 78 | |
| | 2,287 | | | Series 2009-W1, Class A, 6.000%, 12/25/49 | | | 2,622 | |
| | | | Federal National Mortgage Association STRIPS, | | | | |
| | 1 | | | Series 23, Class 2, IO, 10.000%, 09/25/17 | | | — | (h) |
| | — | (h) | | Series 59, Class 2, IO, 9.500%, 07/25/17 | | | — | (h) |
| | 172 | | | Series 213, Class 2, IO, 8.000%, 03/25/23 | | | 34 | |
| | 235 | | | Series 218, Class 2, IO, 7.500%, 04/25/23 | | | 42 | |
| | 6 | | | Series 265, Class 2, 9.000%, 03/25/24 | | | 7 | |
| | 12 | | | Series 285, Class 1, PO, 02/25/27 | | | 11 | |
| | 443 | | | Series 293, Class 1, PO, 12/25/24 | | | 396 | |
| | 232 | | | Series 300, Class 1, PO, 09/25/24 | | | 206 | |
| | 284 | | | Series 331, Class 13, IO, 7.000%, 11/25/32 | | | 63 | |
| | 164 | | | Series 339, Class 18, IO, 4.500%, 07/25/18 | | | 5 | |
| | 164 | | | Series 339, Class 21, IO, 4.500%, 08/25/18 | | | 4 | |
| | 136 | | | Series 339, Class 28, IO, 5.500%, 08/25/18 | | | 4 | |
| | 145 | | | Series 345, Class 6, IO, VAR, 5.000%, 12/25/33 | | | 26 | |
| | 348 | | | Series 345, Class 24, IO, VAR, 5.000%, 08/25/22 | | | 12 | |
| | 322 | | | Series 351, Class 7, IO, VAR, 5.000%, 04/25/34 | | | 59 | |
| | 410 | | | Series 356, Class 3, IO, 5.000%, 01/25/35 | | | 72 | |
| | 511 | | | Series 356, Class 39, IO, 5.000%, 01/25/20 | | | 28 | |
| | 555 | | | Series 365, Class 8, IO, 5.500%, 05/25/36 | | | 102 | |
| | 59 | | | Series 368, Class 3, IO, 4.500%, 11/25/20 | | | 2 | |
| | 197 | | | Series 374, Class 5, IO, 5.500%, 08/25/36 | | | 37 | |
| | 478 | | | Series 383, Class 32, IO, 6.000%, 01/25/38 | | | 89 | |
| | 90 | | | Series 393, Class 6, IO, 5.500%, 04/25/37 | | | 15 | |
| | 2,548 | | | Series 412, Class F2, VAR, 1.024%, 08/25/42 | | | 2,536 | |
SEE NOTES TO FINANCIAL STATEMENTS.
| | | | | | | | |
| | | |
| AUGUST 31, 2016 | | J.P. MORGAN INCOME FUNDS | | | | | 219 | |
JPMorgan Mortgage-Backed Securities Fund
SCHEDULE OF PORTFOLIO INVESTMENTS
AS OF AUGUST 31, 2016 (Unaudited) (continued)
(Amounts in thousands)
| | | | | | | | |
PRINCIPAL
AMOUNT($) | | | SECURITY DESCRIPTION | | VALUE($) | |
| Collateralized Mortgage Obligations — continued | |
| | | | Agency CMO — continued | |
| | | | Federal National Mortgage Association Trust, | | | | |
| | 345 | | | Series 2003-W2, Class 1A1, 6.500%, 07/25/42 | | | 406 | |
| | 312 | | | Series 2003-W8, Class 2A, 7.000%, 10/25/42 | | | 369 | |
| | 306 | | | Series 2003-W8, Class 3F1, VAR, 0.924%, 05/25/42 | | | 303 | |
| | 463 | | | Series 2004-W1, Class 2A2, 7.000%, 12/25/33 | | | 553 | |
| | 416 | | | Series 2004-W2, Class 2A2, 7.000%, 02/25/44 | | | 485 | |
| | 851 | | | Series 2005-W3, Class 2AF, VAR, 0.744%, 03/25/45 | | | 828 | |
| | 322 | | | Series 2005-W4, Class 1A1, 6.000%, 08/25/45 | | | 370 | |
| | 2,054 | | | Series 2005-W4, Class 3A, VAR, 2.592%, 06/25/45 | | | 2,138 | |
| | 456 | | | Series 2006-W2, Class 1AF1, VAR, 0.744%, 02/25/46 | | | 456 | |
| | | | Government National Mortgage Association, | | | | |
| | 489 | | | Series 1994-7, Class PQ, 6.500%, 10/16/24 | | | 553 | |
| | 170 | | | Series 1999-4, Class ZB, 6.000%, 02/20/29 | | | 192 | |
| | 4 | | | Series 1999-43, Class TA, IF, 9.350%, 11/16/29 | | | 5 | |
| | 86 | | | Series 2000-9, Class Z, 8.000%, 06/20/30 | | | 103 | |
| | 406 | | | Series 2000-9, Class ZJ, 8.500%, 02/16/30 | | | 479 | |
| | 363 | | | Series 2000-21, Class Z, 9.000%, 03/16/30 | | | 440 | |
| | 27 | | | Series 2000-36, Class HC, 7.330%, 11/20/30 | | | 32 | |
| | 9 | | | Series 2000-36, Class IK, IO, 9.000%, 11/16/30 | | | 1 | |
| | 583 | | | Series 2001-21, Class PE, 6.500%, 05/16/31 | | | 669 | |
| | 107 | | | Series 2001-31, Class SJ, HB, IF, 26.206%, 02/20/31 | | | 193 | |
| | 83 | | | Series 2001-35, Class SA, IF, IO, 7.743%, 08/16/31 | | | 28 | |
| | 91 | | | Series 2001-36, Class S, IF, IO, 7.543%, 08/16/31 | | | 30 | |
| | 25 | | | Series 2001-55, Class SF, HB, IF, 24.562%, 11/20/31 | | | 48 | |
| | 355 | | | Series 2002-4, Class TD, 7.000%, 01/20/32 | | | 425 | |
| | 313 | | | Series 2002-24, Class AG, IF, IO, 7.443%, 04/16/32 | | | 67 | |
| | 85 | | | Series 2002-24, Class SB, IF, 11.165%, 04/16/32 | | | 106 | |
| | 271 | | | Series 2002-24, Class Z, 8.500%, 04/16/32 | | | 311 | |
| | | | | | | | |
PRINCIPAL
AMOUNT($) | | | SECURITY DESCRIPTION | | VALUE($) | |
| | | | | | | | |
| | | | Agency CMO — continued | |
| | 533 | | | Series 2002-31, Class SE, IF, IO, 6.993%, 04/16/30 | | | 97 | |
| | 20 | | | Series 2002-33, Class SY, IF, 9.000%, 02/26/23 | | | 25 | |
| | 186 | | | Series 2002-40, Class UK, 6.500%, 06/20/32 | | | 219 | |
| | 59 | | | Series 2002-41, Class LS, IF, 9.000%, 06/16/32 | | | 78 | |
| | 107 | | | Series 2002-45, Class QE, 6.500%, 06/20/32 | | | 127 | |
| | 130 | | | Series 2002-47, Class PG, 6.500%, 07/16/32 | | | 153 | |
| | 31 | | | Series 2002-70, Class PS, IF, IO, 7.188%, 08/20/32 | | | 1 | |
| | 609 | | | Series 2003-11, Class SK, IF, IO, 7.193%, 02/16/33 | | | 110 | |
| | 15 | | | Series 2003-24, Class PO, PO, 03/16/33 | | | 14 | |
| | 518 | | | Series 2003-41, Class ID, IO, 5.500%, 05/20/33 | | | 94 | |
| | 129 | | | Series 2003-46, Class IH, IO, 5.500%, 12/20/32 | | | 2 | |
| | 40 | | | Series 2003-90, Class PO, PO, 10/20/33 | | | 37 | |
| | 574 | | | Series 2003-112, Class SA, IF, IO, 6.043%, 12/16/33 | | | 123 | |
| | 144 | | | Series 2003-112, Class TS, IF, IO, 6.438%, 10/20/32 | | | 1 | |
| | 137 | | | Series 2004-28, Class S, IF, 18.269%, 04/16/34 | | | 206 | |
| | 199 | | | Series 2004-46, Class AO, PO, 06/20/34 | | | 189 | |
| | 53 | | | Series 2004-71, Class ST, IF, 7.000%, 09/20/34 | | | 59 | |
| | 102 | | | Series 2004-73, Class AE, IF, 13.810%, 08/17/34 | | | 125 | |
| | 1,860 | | | Series 2004-73, Class JL, IF, IO, 6.043%, 09/16/34 | | | 360 | |
| | 637 | | | Series 2004-90, Class SI, IF, IO, 5.588%, 10/20/34 | | | 98 | |
| | 148 | | | Series 2005-24, Class ST, IF, 7.500%, 01/17/34 | | | 158 | |
| | 406 | | | Series 2005-26, Class VI, IO, 5.500%, 01/20/35 | | | 18 | |
| | 110 | | | Series 2005-35, Class FL, VAR, 0.862%, 03/20/32 | | | 110 | |
| | 2,077 | | | Series 2005-58, Class NI, IO, 5.500%, 08/20/35 | | | 339 | |
| | 253 | | | Series 2005-68, Class DP, IF, 15.213%, 06/17/35 | | | 359 | |
| | 1,264 | | | Series 2005-68, Class KI, IF, IO, 5.788%, 09/20/35 | | | 219 | |
SEE NOTES TO FINANCIAL STATEMENTS.
| | | | | | |
| | | |
| 220 | | | | J.P. MORGAN INCOME FUNDS | | AUGUST 31, 2016 |
| | | | | | | | |
PRINCIPAL
AMOUNT($) | | | SECURITY DESCRIPTION | | VALUE($) | |
| Collateralized Mortgage Obligations — continued | |
| | | | Agency CMO — continued | |
| | 1,567 | | | Series 2005-72, Class AZ, 5.500%, 09/20/35 | | | 1,759 | |
| | 518 | | | Series 2005-85, Class IO, IO, 5.500%, 11/16/35 | | | 111 | |
| | 226 | | | Series 2006-16, Class OP, PO, 03/20/36 | | | 217 | |
| | 151 | | | Series 2006-22, Class AO, PO, 05/20/36 | | | 145 | |
| | 135 | | | Series 2006-34, Class PO, PO, 07/20/36 | | | 128 | |
| | 464 | | | Series 2006-38, Class SW, IF, IO, 5.988%, 06/20/36 | | | 54 | |
| | 195 | | | Series 2006-59, Class SD, IF, IO, 6.188%, 10/20/36 | | | 33 | |
| | 1,218 | | | Series 2007-17, Class JI, IF, IO, 6.303%, 04/16/37 | | | 245 | |
| | 167 | | | Series 2007-17, Class JO, PO, 04/16/37 | | | 152 | |
| | 110 | | | Series 2007-25, Class FN, VAR, 0.807%, 05/16/37 | | | 110 | |
| | 642 | | | Series 2007-26, Class SC, IF, IO, 5.688%, 05/20/37 | | | 120 | |
| | 32 | | | Series 2007-27, Class MI, IO, 5.500%, 09/20/36 | | | — | (h) |
| | 31 | | | Series 2007-28, Class BO, PO, 05/20/37 | | | 29 | |
| | 595 | | | Series 2007-31, Class AO, PO, 05/16/37 | | | 576 | |
| | 37 | | | Series 2007-36, Class HO, PO, 06/16/37 | | | 35 | |
| | 732 | | | Series 2007-36, Class SE, IF, IO, 5.963%, 06/16/37 | | | 134 | |
| | 908 | | | Series 2007-36, Class SG, IF, IO, 5.958%, 06/20/37 | | | 171 | |
| | 636 | | | Series 2007-40, Class SD, IF, IO, 6.238%, 07/20/37 | | | 114 | |
| | 636 | | | Series 2007-42, Class SB, IF, IO, 6.238%, 07/20/37 | | | 116 | |
| | 256 | | | Series 2007-45, Class QA, IF, IO, 6.128%, 07/20/37 | | | 52 | |
| | 437 | | | Series 2007-50, Class AI, IF, IO, 6.263%, 08/20/37 | | | 63 | |
| | 88 | | | Series 2007-53, Class SW, IF, 18.668%, 09/20/37 | | | 123 | |
| | 684 | | | Series 2007-57, Class PO, PO, 03/20/37 | | | 650 | |
| | 299 | | | Series 2007-71, Class SB, IF, IO, 6.188%, 07/20/36 | | | 13 | |
| | 1,458 | | | Series 2007-74, Class SL, IF, IO, 6.033%, 11/16/37 | | | 247 | |
| | 497 | | | Series 2007-76, Class SA, IF, IO, 6.018%, 11/20/37 | | | 88 | |
| | 734 | | | Series 2007-79, Class SY, IF, IO, 6.038%, 12/20/37 | | | 132 | |
| | 96 | | | Series 2008-1, Class PO, PO, 01/20/38 | | | 88 | |
| | | | | | | | |
PRINCIPAL
AMOUNT($) | | | SECURITY DESCRIPTION | | VALUE($) | |
| | | | | | | | |
| | | | Agency CMO — continued | |
| | 398 | | | Series 2008-2, Class MS, IF, IO, 6.653%, 01/16/38 | | | 86 | |
| | 278 | | | Series 2008-10, Class S, IF, IO, 5.318%, 02/20/38 | | | 49 | |
| | 1,171 | | | Series 2008-13, Class PI, IO, 5.500%, 02/16/38 | | | 217 | |
| | 183 | | | Series 2008-20, Class PO, PO, 09/20/37 | | | 175 | |
| | 181 | | | Series 2008-29, Class PO, PO, 02/17/33 | | | 175 | |
| | 594 | | | Series 2008-32, Class PI, IO, 5.500%, 10/16/37 | | | 65 | |
| | 255 | | | Series 2008-33, Class XS, IF, IO, 7.193%, 04/16/38 | | | 58 | |
| | 1,500 | | | Series 2008-36, Class AY, 5.000%, 04/16/23 | | | 1,562 | |
| | 624 | | | Series 2008-36, Class SH, IF, IO, 5.788%, 04/20/38 | | | 100 | |
| | 2,211 | | | Series 2008-40, Class SA, IF, IO, 5.893%, 05/16/38 | | | 432 | |
| | 320 | | | Series 2008-55, Class SA, IF, IO, 5.688%, 06/20/38 | | | 58 | |
| | 121 | | | Series 2008-60, Class PO, PO, 01/20/38 | | | 119 | |
| | 1,873 | | | Series 2008-62, Class SA, IF, IO, 5.638%, 07/20/38 | | | 332 | |
| | 126 | | | Series 2008-71, Class SC, IF, IO, 5.488%, 08/20/38 | | | 16 | |
| | 481 | | | Series 2008-93, Class AS, IF, IO, 5.188%, 12/20/38 | | | 71 | |
| | 1,274 | | | Series 2008-95, Class DS, IF, IO, 6.788%, 12/20/38 | | | 257 | |
| | 360 | | | Series 2008-96, Class SL, IF, IO, 5.488%, 12/20/38 | | | 53 | |
| | 395 | | | Series 2009-6, Class SA, IF, IO, 5.593%, 02/16/39 | | | 64 | |
| | 739 | | | Series 2009-10, Class SA, IF, IO, 5.438%, 02/20/39 | | | 100 | |
| | 425 | | | Series 2009-10, Class SL, IF, IO, 5.993%, 03/16/34 | | | 16 | |
| | 2,302 | | | Series 2009-12, Class IE, IO, 5.500%, 03/20/39 | | | 410 | |
| | 446 | | | Series 2009-14, Class KI, IO, 6.500%, 03/20/39 | | | 98 | |
| | 513 | | | Series 2009-14, Class NI, IO, 6.500%, 03/20/39 | | | 111 | |
| | 294 | | | Series 2009-24, Class DS, IF, IO, 5.788%, 03/20/39 | | | 20 | |
| | 312 | | | Series 2009-25, Class SE, IF, IO, 7.088%, 09/20/38 | | | 60 | |
| | 179 | | | Series 2009-33, Class CI, IO, 5.500%, 05/20/39 | | | 27 | |
SEE NOTES TO FINANCIAL STATEMENTS.
| | | | | | | | |
| | | |
| AUGUST 31, 2016 | | J.P. MORGAN INCOME FUNDS | | | | | 221 | |
JPMorgan Mortgage-Backed Securities Fund
SCHEDULE OF PORTFOLIO INVESTMENTS
AS OF AUGUST 31, 2016 (Unaudited) (continued)
(Amounts in thousands)
| | | | | | | | |
PRINCIPAL
AMOUNT($) | | | SECURITY DESCRIPTION | | VALUE($) | |
| Collateralized Mortgage Obligations — continued | |
| | | | Agency CMO — continued | |
| | 400 | | | Series 2009-33, Class TI, IO, 6.000%, 05/20/39 | | | 70 | |
| | 929 | | | Series 2009-42, Class SC, IF, IO, 5.568%, 06/20/39 | | | 156 | |
| | 474 | | | Series 2009-43, Class SA, IF, IO, 5.438%, 06/20/39 | | | 75 | |
| | 2,843 | | | Series 2009-54, Class JZ, 5.500%, 07/20/39 | | | 3,182 | |
| | 856 | | | Series 2009-64, Class SN, IF, IO, 5.593%, 07/16/39 | | | 90 | |
| | 186 | | | Series 2009-65, Class IQ, IO, 6.000%, 12/20/38 | | | 25 | |
| | 700 | | | Series 2009-67, Class SA, IF, IO, 5.543%, 08/16/39 | | | 102 | |
| | 1,230 | | | Series 2009-72, Class SM, IF, IO, 5.743%, 08/16/39 | | | 197 | |
| | 439 | | | Series 2009-79, Class OK, PO, 11/16/37 | | | 417 | |
| | 1,270 | | | Series 2009-102, Class SM, IF, IO, 5.893%, 06/16/39 | | | 102 | |
| | 1,037 | | | Series 2009-104, Class AB, 7.000%, 08/16/39 | | | 1,159 | |
| | 1,416 | | | Series 2009-106, Class AS, IF, IO, 5.893%, 11/16/39 | | | 237 | |
| | 1,654 | | | Series 2009-106, Class ST, IF, IO, 5.488%, 02/20/38 | | | 292 | |
| | 1,432 | | | Series 2009-121, Class VA, 5.500%, 11/20/20 | | | 1,492 | |
| | 153 | | | Series 2010-14, Class AO, PO, 12/20/32 | | | 148 | |
| | 231 | | | Series 2010-14, Class BO, PO, 11/20/35 | | | 212 | |
| | 1,579 | | | Series 2010-14, Class CO, PO, 08/20/35 | | | 1,496 | |
| | 565 | | | Series 2010-14, Class QP, 6.000%, 12/20/39 | | | 590 | |
| | 1,820 | | | Series 2010-41, Class WA, VAR, 5.822%, 10/20/33 | | | 2,075 | |
| | 902 | | | Series 2010-103, Class WA, VAR, 5.725%, 08/20/34 | | | 1,018 | |
| | 999 | | | Series 2010-129, Class AW, VAR, 6.109%, 04/20/37 | | | 1,125 | |
| | 888 | | | Series 2010-130, Class CP, 7.000%, 10/16/40 | | | 1,046 | |
| | 2,734 | | | Series 2010-157, Class OP, PO, 12/20/40 | | | 2,478 | |
| | 32,839 | | | Series 2010-H17, Class XQ, VAR, 5.238%, 07/20/60 | | | 34,866 | |
| | 2,386 | | | Series 2011-22, Class WA, VAR, 5.937%, 02/20/37 | | | 2,676 | |
| | 2,970 | | | Series 2011-97, Class WA, VAR, 6.117%, 11/20/38 | | | 3,370 | |
| | | | | | | | |
PRINCIPAL
AMOUNT($) | | | SECURITY DESCRIPTION | | VALUE($) | |
| | | | | | | | |
| | | | Agency CMO — continued | |
| | 3,970 | | | Series 2011-137, Class WA, VAR, 5.537%, 07/20/40 | | | 4,497 | |
| | 2,842 | | | Series 2011-163, Class WA, VAR, 5.861%, 12/20/38 | | | 3,250 | |
| | 5,190 | | | Series 2012-24, Class WA, VAR, 5.593%, 07/20/41 | | | 5,939 | |
| | 5,912 | | | Series 2012-52, Class WA, VAR, 6.140%, 04/20/38 | | | 6,855 | |
| | 1,356 | | | Series 2012-59, Class WA, VAR, 5.583%, 08/20/38 | | | 1,557 | |
| | 7,785 | | | Series 2012-138, Class PT, VAR, 3.958%, 11/16/42 | | | 8,090 | |
| | 7,996 | | | Series 2012-141, Class WA, VAR, 4.529%, 11/16/41 | | | 8,846 | |
| | 7,699 | | | Series 2012-141, Class WB, VAR, 3.970%, 09/16/42 | | | 8,131 | |
| | 4,968 | | | Series 2012-141, Class WC, VAR, 3.714%, 01/20/42 | | | 5,269 | |
| | 19,283 | | | Series 2012-H10, Class FA, VAR, 1.018%, 12/20/61 | | | 19,246 | |
| | 3,407 | | | Series 2012-H15, Class FA, VAR, 0.918%, 05/20/62 | | | 3,407 | |
| | 14,090 | | | Series 2012-H21, Class CF, VAR, 1.168%, 05/20/61 | | | 14,109 | |
| | 14,791 | | | Series 2012-H21, Class DF, VAR, 1.118%, 05/20/61 | | | 14,803 | |
| | 6,954 | | | Series 2012-H22, Class FD, VAR, 0.938%, 01/20/61 | | | 6,943 | |
| | 5,339 | | | Series 2012-H24, Class FA, VAR, 0.918%, 03/20/60 | | | 5,338 | |
| | 7,381 | | | Series 2012-H24, Class FD, VAR, 1.058%, 09/20/62 | | | 7,383 | |
| | 3,414 | | | Series 2012-H24, Class FG, VAR, 0.898%, 04/20/60 | | | 3,407 | |
| | 6,348 | | | Series 2012-H26, Class JA, VAR, 1.018%, 10/20/61 | | | 6,347 | |
| | 11,166 | | | Series 2012-H26, Class MA, VAR, 1.018%, 07/20/62 | | | 11,134 | |
| | 5,617 | | | Series 2012-H27, Class FB, VAR, 0.968%, 10/20/62 | | | 5,603 | |
| | 8,418 | | | Series 2012-H28, Class FA, VAR, 1.048%, 09/20/62 | | | 8,416 | |
| | 1,631 | | | Series 2012-H30, Class JA, VAR, 0.948%, 01/20/60 | | | 1,632 | |
| | 1,567 | | | Series 2012-H30, Class PA, VAR, 0.918%, 11/20/59 | | | 1,567 | |
| | 8,236 | | | Series 2012-H31, Class FD, VAR, 0.808%, 12/20/62 | | | 8,155 | |
SEE NOTES TO FINANCIAL STATEMENTS.
| | | | | | |
| | | |
| 222 | | | | J.P. MORGAN INCOME FUNDS | | AUGUST 31, 2016 |
| | | | | | | | |
PRINCIPAL
AMOUNT($) | | | SECURITY DESCRIPTION | | VALUE($) | |
| Collateralized Mortgage Obligations — continued | |
| | | | Agency CMO — continued | |
| | 2,934 | | | Series 2013-26, Class AK, VAR, 4.662%, 09/20/41 | | | 3,198 | |
| | 3,697 | | | Series 2013-54, Class WA, VAR, 4.699%, 11/20/42 | | | 4,064 | |
| | 1,173 | | | Series 2013-75, Class WA, VAR, 5.220%, 06/20/40 | | | 1,292 | |
| | 10,680 | | | Series 2013-H01, Class FA, 1.650%, 01/20/63 | | | 10,649 | |
| | 4,733 | | | Series 2013-H01, Class JA, VAR, 0.788%, 01/20/63 | | | 4,678 | |
| | 4,882 | | | Series 2013-H01, Class TA, VAR, 0.968%, 01/20/63 | | | 4,879 | |
| | 442 | | | Series 2013-H02, Class HF, VAR, 0.768%, 11/20/62 | | | 441 | |
| | 2,114 | | | Series 2013-H03, Class FA, VAR, 0.768%, 08/20/60 | | | 2,113 | |
| | 14,410 | | | Series 2013-H04, Class BA, 1.650%, 02/20/63 | | | 14,368 | |
| | 3,245 | | | Series 2013-H04, Class SA, VAR, 0.888%, 02/20/63 | | | 3,216 | |
| | 1,449 | | | Series 2013-H05, Class FB, VAR, 0.868%, 02/20/62 | | | 1,446 | |
| | 2,315 | | | Series 2013-H07, Class GA, VAR, 0.938%, 03/20/63 | | | 2,302 | |
| | 6,084 | | | Series 2013-H07, Class HA, VAR, 0.878%, 03/20/63 | | | 6,037 | |
| | 12,478 | | | Series 2013-H07, Class JA, 1.750%, 03/20/63 | | | 12,539 | |
| | 3,867 | | | Series 2013-H07, Class MA, VAR, 1.018%, 04/20/62 | | | 3,865 | |
| | 2,098 | | | Series 2013-H08, Class BF, VAR, 0.868%, 03/20/63 | | | 2,080 | |
| | 4,465 | | | Series 2013-H08, Class FC, VAR, 0.918%, 02/20/63 | | | 4,437 | |
| | 5,525 | | | Series 2013-H09, Class HA, 1.650%, 04/20/63 | | | 5,507 | |
| | 3,001 | | | Series 2014-188, Class W, VAR, 4.674%, 10/20/41 | | | 3,297 | |
| | 1,134 | | | Series 2014-H17, Class FC, VAR, 0.968%, 07/20/64 | | | 1,128 | |
| | 2,037 | | | Series 2015-91, Class W, VAR, 5.240%, 05/20/40 | | | 2,277 | |
| | 805 | | | Series 2015-137, Class WA, VAR, 5.488%, 01/20/38 | | | 910 | |
| | 6,743 | | | Series 2015-H23, Class FB, VAR, 0.988%, 09/20/65 | | | 6,713 | |
| | 6,064 | | | Series 2015-H26, Class FG, VAR, 0.988%, 10/20/65 | | | 6,036 | |
| | | | | | | | |
PRINCIPAL
AMOUNT($) | | | SECURITY DESCRIPTION | | VALUE($) | |
| | | | | | | | |
| | | | Agency CMO — continued | |
| | 11,800 | | | Series 2015-H29, Class FL, VAR, 1.068%, 11/20/65 | | | 11,799 | |
| | 4,824 | | | Series 2015-H32, Class FH, VAR, 1.128%, 12/20/65 | | | 4,840 | |
| | 5,385 | | | Series 2016-H07, Class FA, VAR, 1.218%, 03/20/66 | | | 5,427 | |
| | 9,848 | | | Series 2016-H07, Class FQ, VAR, 1.168%, 03/20/66 | | | 9,900 | |
| | 2,518 | | | Series 2016-H11, Class FD, VAR, 0.868%, 05/20/66 | | | 2,520 | |
| | 9,471 | | | Series 2016-H13, Class FD, VAR, 0.962%, 05/20/66 | | | 9,457 | |
| | 6,811 | | | Series 2016-H13, Class FT, VAR, 1.067%, 05/20/66 | | | 6,807 | |
| | 8,968 | | | Series 2016-H16, Class FC, VAR, 1.615%, 07/20/66 | | | 8,943 | |
| | 6,000 | | | Series 2016-H17, Class FC, VAR, 1.326%, 08/20/66 | | | 6,007 | |
| | | | Vendee Mortgage Trust, | | | | |
| | 2,555 | | | Series 1994-1, Class 2ZB, 6.500%, 02/15/24 | | | 2,875 | |
| | 395 | | | Series 1996-1, Class 1Z, 6.750%, 02/15/26 | | | 456 | |
| | 212 | | | Series 1996-2, Class 1Z, 6.750%, 06/15/26 | | | 244 | |
| | 428 | | | Series 1997-1, Class 2Z, 7.500%, 02/15/27 | | | 503 | |
| | 320 | | | Series 1998-1, Class 2E, 7.000%, 03/15/28 | | | 384 | |
| | | | | | | | |
| | | | | | | 872,807 | |
| | | | | | | | |
| | | | Non-Agency CMO — 7.2% | | | | |
| | 2,722 | | | Access PT Funding Trust, Series 2016-1, 6.250%, 02/16/21 | | | 2,721 | |
| | | | Ajax Mortgage Loan Trust, | | | | |
| | 3,002 | | | Series 2013-A, Class A, VAR, 3.500%, 02/25/51 (e) | | | 2,981 | |
| | 1,195 | | | Series 2013-B, Class A, VAR, 3.500%, 02/25/51 (e) | | | 1,189 | |
| | 1,114 | | | Series 2014-A, Class A, SUB, 4.000%, 10/25/57 (e) | | | 1,108 | |
| | 962 | | | Series 2015-B, Class A, SUB, 3.875%, 07/25/60 (e) | | | 947 | |
| | | | Alternative Loan Trust, | | | | |
| | 415 | | | Series 2002-11, Class M, 6.500%, 10/25/32 | | | 406 | |
| | 1,447 | | | Series 2004-2CB, Class 1A9, 5.750%, 03/25/34 | | | 1,438 | |
| | 22 | | | Series 2004-J3, Class 4A1, 4.750%, 04/25/19 | | | 22 | |
| | 827 | | | Series 2005-1CB, Class 1A6, IF, IO, 6.576%, 03/25/35 | | | 187 | |
SEE NOTES TO FINANCIAL STATEMENTS.
| | | | | | | | |
| | | |
| AUGUST 31, 2016 | | J.P. MORGAN INCOME FUNDS | | | | | 223 | |
JPMorgan Mortgage-Backed Securities Fund
SCHEDULE OF PORTFOLIO INVESTMENTS
AS OF AUGUST 31, 2016 (Unaudited) (continued)
(Amounts in thousands)
| | | | | | | | |
PRINCIPAL
AMOUNT($) | | | SECURITY DESCRIPTION | | VALUE($) | |
| Collateralized Mortgage Obligations — continued | |
| | | | Non-Agency CMO — continued | | | | |
| | 4,167 | | | Series 2005-20CB, Class 3A8, IF, IO, 4.226%, 07/25/35 | | | 595 | |
| | 3,033 | | | Series 2005-22T1, Class A2, IF, IO, 4.546%, 06/25/35 | | | 553 | |
| | 132 | | | Series 2005-28CB, Class 3A5, 6.000%, 08/25/35 | | | 97 | |
| | 5,827 | | | Series 2005-37T1, Class A2, IF, IO, 4.526%, 09/25/35 | | | 1,111 | |
| | 5,447 | | | Series 2005-54CB, Class 1A2, IF, IO, 4.326%, 11/25/35 | | | 844 | |
| | 26 | | | Series 2005-54CB, Class 1A7, 5.500%, 11/25/35 | | | 25 | |
| | 910 | | | Series 2005-54CB, Class 1A11, 5.500%, 11/25/35 | | | 849 | |
| | 618 | | | Series 2005-57CB, Class 3A2, IF, IO, 4.576%, 12/25/35 | | | 103 | |
| | 447 | | | Series 2005-64CB, Class 1A9, 5.500%, 12/25/35 | | | 413 | |
| | 525 | | | Series 2005-86CB, Class A11, 5.500%, 02/25/36 | | | 446 | |
| | 1,077 | | | Series 2005-J1, Class 1A4, IF, IO, 4.576%, 02/25/35 | | | 60 | |
| | 15,681 | | | Series 2006-7CB, Class 1A2, IF, IO, 4.776%, 05/25/36 | | | 4,029 | |
| | 603 | | | Series 2006-26CB, Class A9, 6.500%, 09/25/36 | | | 478 | |
| | | | American General Mortgage Loan Trust, | | | | |
| | 167 | | | Series 2006-1, Class A5, VAR, 5.750%, 12/25/35 (e) | | | 172 | |
| | 516 | | | Series 2010-1A, Class A4, VAR, 5.650%, 03/25/58 (e) | | | 519 | |
| | | | Angel Oak Mortgage Trust LLC, | | | | |
| | 1,196 | | | Series 2015-1, Class A, SUB, 4.500%, 11/25/45 (e) | | | 1,199 | |
| | 1,333 | | | Series 2015-1, Class M, SUB, 5.500%, 11/25/45 (e) | | | 1,329 | |
| | | | ASG Resecuritization Trust, | | | | |
| | 150 | | | Series 2009-1, Class A60, VAR, 2.535%, 06/26/37 (e) | | | 149 | |
| | 970 | | | Series 2009-3, Class A65, VAR, 2.379%, 03/26/37 (e) | | | 965 | |
| | 1,333 | | | Series 2010-2, Class A60, VAR, 2.014%, 01/28/37 (e) | | | 1,318 | |
| | 532 | | | Series 2011-1, Class 2A35, 6.000%, 09/28/36 (e) | | | 452 | |
| | 1,001 | | | Series 2011-1, Class 3A50, VAR, 3.101%, 11/28/35 (e) | | | 987 | |
| | | | | | | | |
PRINCIPAL
AMOUNT($) | | | SECURITY DESCRIPTION | | VALUE($) | |
| | | | | | | | |
| | | | Non-Agency CMO — continued | | | | |
| | | | Banc of America Alternative Loan Trust, | | | | |
| | 313 | | | Series 2003-11, Class 2A1, 6.000%, 01/25/34 | | | 321 | |
| | 175 | | | Series 2003-11, Class PO, PO, 01/25/34 | | | 138 | |
| | 377 | | | Series 2004-1, Class 1A1, 6.000%, 02/25/34 | | | 400 | |
| | 46 | | | Series 2004-1, Class 5A1, 5.500%, 02/25/19 | | | 46 | |
| | 1,717 | | | Series 2005-1, Class CBIO, IO, 5.500%, 02/25/35 | | | 368 | |
| | 1,463 | | | Series 2005-12, Class CBIO, IO, 5.750%, 01/25/36 | | | 310 | |
| | | | Banc of America Funding Trust, | | | | |
| | 121 | | | Series 2004-1, Class PO, PO, 03/25/34 | | | 96 | |
| | 435 | | | Series 2004-3, Class 1A1, 5.500%, 10/25/34 | | | 446 | |
| | 393 | | | Series 2004-C, Class 1A1, VAR, 3.082%, 12/20/34 | | | 385 | |
| | 416 | | | Series 2005-1, Class 30IO, IO, 5.500%, 02/25/35 | | | 70 | |
| | 128 | | | Series 2005-4, Class 30PO, PO, 08/25/35 | | | 105 | |
| | 337 | | | Series 2005-6, Class 2A7, 5.500%, 10/25/35 | | | 322 | |
| | 38 | | | Series 2005-7, Class 30PO, PO, 11/25/35 | | | 29 | |
| | 167 | | | Series 2005-8, Class 30PO, PO, 01/25/36 | | | 122 | |
| | 938 | | | Series 2005-E, Class 4A1, VAR, 2.938%, 03/20/35 | | | 941 | |
| | 493 | | | Series 2010-R11A, Class 1A6, VAR, 5.079%, 08/26/35 (e) | | | 494 | |
| | | | Banc of America Mortgage Trust, | | | | |
| | 514 | | | Series 2003-A, Class 4A1, VAR, 2.899%, 02/25/33 | | | 508 | |
| | 158 | | | Series 2003-C, Class 3A1, VAR, 3.181%, 04/25/33 | | | 159 | |
| | 761 | | | Series 2003-E, Class 2A2, VAR, 3.275%, 06/25/33 | | | 759 | |
| | 591 | | | Series 2003-J, Class 3A2, VAR, 3.199%, 11/25/33 | | | 589 | |
| | 247 | | | Series 2004-3, Class 15IO, IO, VAR, 0.229%, 04/25/19 | | | 1 | |
| | 96 | | | Series 2004-3, Class 1A26, 5.500%, 04/25/34 | | | 96 | |
| | 59 | | | Series 2004-4, Class APO, PO, 05/25/34 | | | 50 | |
| | 2,889 | | | Series 2004-5, Class 15IO, IO, VAR, 0.226%, 06/25/19 | | | 3 | |
| | 25 | | | Series 2004-9, Class 3A1, 6.500%, 09/25/32 | | | 26 | |
SEE NOTES TO FINANCIAL STATEMENTS.
| | | | | | |
| | | |
| 224 | | | | J.P. MORGAN INCOME FUNDS | | AUGUST 31, 2016 |
| | | | | | | | |
PRINCIPAL
AMOUNT($) | | | SECURITY DESCRIPTION | | VALUE($) | |
| Collateralized Mortgage Obligations — continued | |
| | | | Non-Agency CMO — continued | | | | |
| | 442 | | | Series 2004-C, Class 2A2, VAR, 3.198%, 04/25/34 | | | 439 | |
| | 428 | | | Series 2004-J, Class 3A1, VAR, 3.150%, 11/25/34 | | | 420 | |
| | | | BCAP LLC Trust, | | | | |
| | 398 | | | Series 2009-RR5, Class 8A1, 5.500%, 11/26/34 (e) | | | 413 | |
| | 145 | | | Series 2009-RR13, Class 17A2, VAR, 5.500%, 04/26/37 (e) | | | 145 | |
| | 899 | | | Series 2009-RR14, Class 3A2, VAR, 2.893%, 08/26/35 (e) | | | 901 | |
| | 316 | | | Series 2010-RR5, Class 2A5, VAR, 5.402%, 04/26/37 (e) | | | 317 | |
| | 163 | | | Series 2010-RR7, Class 1A5, VAR, 3.021%, 04/26/35 (e) | | | 161 | |
| | 2,931 | | | Series 2010-RR7, Class 2A1, VAR, 2.623%, 07/26/45 (e) | | | 2,908 | |
| | 844 | | | Series 2010-RR8, Class 3A4, VAR, 3.087%, 05/26/35 (e) | | | 830 | |
| | 172 | | | Series 2010-RR12, Class 2A5, VAR, 2.977%, 01/26/36 (e) | | | 170 | |
| | 217 | | | Series 2010-RR12, Class 4A5, VAR, 3.010%, 10/26/36 (e) | | | 216 | |
| | 15 | | | Series 2011-R11, Class 24A5, VAR, 3.000%, 08/26/22 (e) | | | 15 | |
| | 199 | | | Series 2011-R11, Class 25A5, VAR, 4.000%, 08/26/21 (e) | | | 199 | |
| | 900 | | | Series 2011-RR4, Class 6A3, VAR, 5.000%, 08/26/37 (e) | | | 908 | |
| | 255 | | | Series 2011-RR5, Class 11A3, VAR, 0.638%, 05/28/36 (e) | | | 254 | |
| | 1,350 | | | Series 2011-RR10, Class 2A1, VAR, 1.352%, 09/26/37 (e) | | | 1,306 | |
| | 402 | | | Series 2012-RR1, Class 5A1, VAR, 9.858%, 07/26/37 (e) | | | 415 | |
| | 997 | | | Series 2012-RR3, Class 2A5, VAR, 2.404%, 05/26/37 (e) | | | 994 | |
| | 534 | | | Series 2012-RR4, Class 8A3, VAR, 0.717%, 06/26/47 (e) | | | 521 | |
| | 2,514 | | | Series 2012-RR10, Class 1A1, VAR, 0.718%, 02/26/37 (e) | | | 2,439 | |
| | 324 | | | Bear Stearns ALT-A Trust, Series 2005-2, Class 1A1, VAR, 1.024%, 03/25/35 | | | 316 | |
| | | | Bear Stearns ARM Trust, | | | | |
| | 309 | | | Series 2003-4, Class 3A1, VAR, 2.918%, 07/25/33 | | | 308 | |
| | 174 | | | Series 2003-7, Class 3A, VAR, 2.835%, 10/25/33 | | | 171 | |
| | | | | | | | |
PRINCIPAL
AMOUNT($) | | | SECURITY DESCRIPTION | | VALUE($) | |
| | | | | | | | |
| | | | Non-Agency CMO — continued | | | | |
| | 442 | | | Series 2004-1, Class 12A1, VAR, 3.080%, 04/25/34 | | | 436 | |
| | 203 | | | Series 2004-2, Class 14A, VAR, 3.344%, 05/25/34 | | | 202 | |
| | 858 | | | Series 2005-5, Class A1, VAR, 2.580%, 08/25/35 | | | 862 | |
| | 1,314 | | | Series 2006-1, Class A1, VAR, 2.580%, 02/25/36 | | | 1,282 | |
| | 575 | | | Bear Stearns Asset-Backed Securities Trust, Series 2003-AC5, Class A1, SUB, 5.750%, 10/25/33 | | | 590 | |
| | 67 | | | Cendant Mortgage Capital CDMC Mortgage Pass-Through Certificates, Series 2003-9, Class 1P, PO, 11/25/33 | | | 60 | |
| | | | Chase Mortgage Finance Trust, | | | | |
| | 2,611 | | | Series 2007-A1, Class 1A3, VAR, 2.970%, 02/25/37 | | | 2,577 | |
| | 231 | | | Series 2007-A1, Class 2A1, VAR, 3.097%, 02/25/37 | | | 230 | |
| | 262 | | | Series 2007-A1, Class 7A1, VAR, 3.053%, 02/25/37 | | | 262 | |
| | 670 | | | Series 2007-A1, Class 9A1, VAR, 3.000%, 02/25/37 | | | 663 | |
| | 592 | | | Series 2007-A2, Class 2A1, VAR, 2.883%, 07/25/37 | | | 588 | |
| | | | CHL Mortgage Pass-Through Trust, | | | | |
| | 276 | | | Series 2002-36, Class A22, 6.000%, 01/25/33 | | | 279 | |
| | 300 | | | Series 2004-3, Class A26, 5.500%, 04/25/34 | | | 300 | |
| | 54 | | | Series 2004-3, Class PO, PO, 04/25/34 | | | 48 | |
| | 822 | | | Series 2004-5, Class 1A4, 5.500%, 06/25/34 | | | 849 | |
| | 112 | | | Series 2004-7, Class 2A1, VAR, 2.940%, 06/25/34 | | | 109 | |
| | 485 | | | Series 2004-13, Class 1A4, 5.500%, 08/25/34 | | | 497 | |
| | 154 | | | Series 2004-HYB1, Class 2A, VAR, 2.806%, 05/20/34 | | | 146 | |
| | 664 | | | Series 2004-HYB3, Class 2A, VAR, 2.761%, 06/20/34 | | | 631 | |
| | 459 | | | Series 2004-HYB6, Class A3, VAR, 2.792%, 11/20/34 | | | 438 | |
| | 67 | | | Series 2004-J8, Class 1A2, 4.750%, 11/25/19 | | | 68 | |
| | 241 | | | Series 2005-16, Class A23, 5.500%, 09/25/35 | | | 227 | |
| | 1,183 | | | Series 2005-22, Class 2A1, VAR, 2.755%, 11/25/35 | | | 969 | |
SEE NOTES TO FINANCIAL STATEMENTS.
| | | | | | | | |
| | | |
| AUGUST 31, 2016 | | J.P. MORGAN INCOME FUNDS | | | | | 225 | |
JPMorgan Mortgage-Backed Securities Fund
SCHEDULE OF PORTFOLIO INVESTMENTS
AS OF AUGUST 31, 2016 (Unaudited) (continued)
(Amounts in thousands)
| | | | | | | | |
PRINCIPAL
AMOUNT($) | | | SECURITY DESCRIPTION | | VALUE($) | |
| Collateralized Mortgage Obligations — continued | |
| | | | Non-Agency CMO — continued | | | | |
| | 3,272 | | | Series 2007-4, Class 1A52, IF, IO, 4.876%, 05/25/37 | | | 706 | |
| | 63 | | | Citicorp Mortgage Securities REMIC Pass-Through Certificates Trust,
Series 2005-6, Class APO, PO, 09/25/35 | | | 54 | |
| | | | Citigroup Global Markets Mortgage Securities VII, Inc., | | | | |
| | 423 | | | Series 2003-HYB1, Class A, VAR, 2.740%, 09/25/33 | | | 420 | |
| | 5 | | | Series 2003-UP2, Class PO1, PO, 12/25/18 | | | 4 | |
| | | | Citigroup Mortgage Loan Trust, | | | | |
| | 1,031 | | | Series 2008-AR4, Class 1A1A, VAR, 2.993%, 11/25/38 (e) | | | 1,025 | |
| | 583 | | | Series 2009-8, Class 4A1, 6.000%, 11/25/36 (e) | | | 599 | |
| | 748 | | | Series 2009-10, Class 1A1, VAR, 2.631%, 09/25/33 (e) | | | 752 | |
| | 557 | | | Series 2009-10, Class 2A1A, 7.000%, 12/25/35 (e) | | | 572 | |
| | 528 | | | Series 2009-11, Class 3A1, VAR, 5.750%, 05/25/37 (e) | | | 533 | |
| | 99 | | | Series 2010-7, Class 10A1, VAR, 2.762%, 02/25/35 (e) | | | 99 | |
| | 736 | | | Series 2010-8, Class 5A6, 4.000%, 11/25/36 (e) | | | 738 | |
| | 1,011 | | | Series 2010-8, Class 6A6, 4.500%, 12/25/36 (e) | | | 1,015 | |
| | 728 | | | Series 2015-A, Class B2, VAR, 4.500%, 06/25/58 (e) | | | 742 | |
| | | | Citigroup Mortgage Loan Trust, Inc., | | | | |
| | 144 | | | Series 2003-1, Class 2A5, 5.250%, 10/25/33 | | | 145 | |
| | 71 | | | Series 2003-1, Class PO3, PO, 09/25/33 | | | 64 | |
| | 14 | | | Series 2003-1, Class WA2, 6.500%, 06/25/31 | | | 14 | |
| | 9 | | | Series 2003-1, Class WPO2, PO, 06/25/31 | | | 8 | |
| | 19 | | | Series 2003-UP3, Class A3, 7.000%, 09/25/33 | | | 19 | |
| | 46 | | | Series 2003-UST1, Class A1, 5.500%, 12/25/18 | | | 46 | |
| | 8 | | | Series 2003-UST1, Class PO1, PO, 12/25/18 | | | 7 | |
| | 3 | | | Series 2003-UST1, Class PO3, PO, 12/25/18 | | | 3 | |
| | 265 | | | Series 2004-UST1, Class A3, VAR, 2.635%, 08/25/34 | | | 265 | |
| | 192 | | | Series 2004-UST1, Class A6, VAR, 2.645%, 08/25/34 | | | 185 | |
| | 221 | | | Series 2005-1, Class 2A1A, VAR, 2.801%, 04/25/35 | | | 175 | |
| | | | | | | | |
PRINCIPAL
AMOUNT($) | | | SECURITY DESCRIPTION | | VALUE($) | |
| | | | | | | | |
| | | | Non-Agency CMO — continued | | | | |
| | 554 | | | Series 2005-2, Class 2A11, 5.500%, 05/25/35 | | | 566 | |
| | 665 | | | Series 2005-5, Class 1A2, VAR, 3.406%, 08/25/35 | | | 482 | |
| | | | Credit Suisse First Boston Mortgage Securities Corp., | | | | |
| | 790 | | | Series 2003-1, Class DB1, VAR, 6.738%, 02/25/33 | | | 799 | |
| | 276 | | | Series 2003-21, Class 1A4, 5.250%, 09/25/33 | | | 283 | |
| | 984 | | | Series 2003-27, Class 5A3, 5.250%, 11/25/33 | | | 995 | |
| | 476 | | | Series 2003-27, Class 5A4, 5.250%, 11/25/33 | | | 482 | |
| | 477 | | | Series 2003-29, Class 1A1, 6.500%, 12/25/33 | | | 504 | |
| | 316 | | | Series 2003-29, Class 5A1, 7.000%, 12/25/33 | | | 335 | |
| | 656 | | | Series 2003-AR15, Class 3A1, VAR, 3.187%, 06/25/33 | | | 650 | |
| | 439 | | | Series 2004-4, Class 2A4, 5.500%, 09/25/34 | | | 459 | |
| | 243 | | | Series 2004-5, Class 3A1, 5.250%, 08/25/19 | | | 247 | |
| | 498 | | | Series 2004-8, Class 1A4, 5.500%, 12/25/34 | | | 521 | |
| | 1,227 | | | Series 2004-AR2, Class 2A1, VAR, 2.879%, 03/25/34 | | | 1,240 | |
| | 1,432 | | | Series 2005-4, Class 2X, IO, VAR, 5.500%, 06/25/35 | | | 301 | |
| | 1,121 | | | Series 2005-9, Class DX, IO, 5.500%, 10/25/35 | | | 65 | |
| | 325 | | | Credit Suisse Mortgage Capital Certificates, Series 2009-3R, Class 19A3, 6.000%, 01/27/38 (e) | | | 329 | |
| | | | CSMC, | | | | |
| | 6,745 | | | Series 2010-11R, Class A6, VAR, 1.493%, 06/28/47 (e) | | | 6,492 | |
| | 251 | | | Series 2011-6R, Class 3A1, VAR, 3.210%, 07/28/36 (e) | | | 253 | |
| | 715 | | | Series 2011-16R, Class 7A3, VAR, 3.500%, 12/27/36 (e) | | | 716 | |
| | 670 | | | Series 2012-3R, Class 1A1, VAR, 2.715%, 07/27/37 (e) | | | 673 | |
| | 521 | | | CSMC Trust, Series 2012-2R, Class 2A1, VAR, 2.631%, 03/27/47 (e) | | | 516 | |
| | 239 | | | Deutsche Alt-A Securities, Inc., Mortgage Loan Trust, Series 2005-1, Class 2A1, VAR, 5.804%, 02/25/20 | | | 242 | |
SEE NOTES TO FINANCIAL STATEMENTS.
| | | | | | |
| | | |
| 226 | | | | J.P. MORGAN INCOME FUNDS | | AUGUST 31, 2016 |
| | | | | | | | |
PRINCIPAL
AMOUNT($) | | | SECURITY DESCRIPTION | | VALUE($) | |
| Collateralized Mortgage Obligations — continued | |
| | | | Non-Agency CMO — continued | | | | |
| | | | First Horizon Alternative Mortgage Securities Trust, | | | | |
| | 767 | | | Series 2004-AA4, Class A1, VAR, 2.716%, 10/25/34 | | | 750 | |
| | 416 | | | Series 2005-FA8, Class 1A19, 5.500%, 11/25/35 | | | 359 | |
| | 6,063 | | | Series 2007-FA4, Class 1A2, IF, IO, 5.126%, 08/25/37 | | | 1,505 | |
| | | | First Horizon Mortgage Pass-Through Trust, | | | | |
| | 193 | | | Series 2004-AR2, Class 2A1, VAR, 3.065%, 05/25/34 | | | 191 | |
| | 300 | | | Series 2004-AR7, Class 2A2, VAR, 2.709%, 02/25/35 | | | 299 | |
| | 507 | | | Series 2005-AR1, Class 2A2, VAR, 2.935%, 04/25/35 | | | 507 | |
| | | | GMACM Mortgage Loan Trust, | | | | |
| | 324 | | | Series 2003-AR1, Class A4, VAR, 3.328%, 10/19/33 | | | 320 | |
| | 1,111 | | | Series 2003-AR2, Class 2A4, VAR, 3.205%, 12/19/33 | | | 1,093 | |
| | 43 | | | Series 2003-J8, Class A, 5.250%, 12/25/33 | | | 45 | |
| | 449 | | | Series 2004-J1, Class A20, 5.500%, 04/25/34 | | | 454 | |
| | 883 | | | Series 2004-J5, Class A7, 6.500%, 01/25/35 | | | 912 | |
| | 190 | | | Series 2004-J6, Class 1A1, 5.000%, 01/25/20 | | | 193 | |
| | 1,955 | | | Series 2005-AR3, Class 3A4, VAR, 3.304%, 06/19/35 | | | 1,912 | |
| | | | GSMPS Mortgage Loan Trust, | | | | |
| | 418 | | | Series 2001-2, Class A, VAR, 7.500%, 06/19/32 (e) | | | 423 | |
| | 199 | | | Series 2004-4, Class 1AF, VAR, 0.924%, 06/25/34 (e) | | | 178 | |
| | 400 | | | Series 2005-RP2, Class 1AF, VAR, 0.874%, 03/25/35 (e) | | | 344 | |
| | 2,376 | | | Series 2005-RP3, Class 1AF, VAR, 0.874%, 09/25/35 (e) | | | 2,045 | |
| | 1,080 | | | Series 2005-RP3, Class 1AS, IO, VAR, 4.240%, 09/25/35 (e) | | | 151 | |
| | 2,327 | | | Series 2006-RP2, Class 1AS2, IF, IO, 5.600%, 04/25/36 (e) | | | 355 | |
| | | | GSR Mortgage Loan Trust, | | | | |
| | 117 | | | Series 2003-13, Class 1A1, VAR, 2.797%, 10/25/33 | | | 118 | |
| | 44 | | | Series 2003-6F, Class A2, VAR, 0.924%, 09/25/32 | | | 42 | |
| | | | | | | | |
PRINCIPAL
AMOUNT($) | | | SECURITY DESCRIPTION | | VALUE($) | |
| | | | | | | | |
| | | | Non-Agency CMO — continued | | | | |
| | 489 | | | Series 2003-7F, Class 1A4, 5.250%, 06/25/33 | | | 498 | |
| | 49 | | | Series 2004-3F, Class 3A8, 13.500%, 02/25/34 | | | 57 | |
| | 737 | | | Series 2004-6F, Class 2A4, 5.500%, 05/25/34 | | | 756 | |
| | 892 | | | Series 2004-8F, Class 2A3, 6.000%, 09/25/34 | | | 912 | |
| | 424 | | | Series 2004-13F, Class 3A3, 6.000%, 11/25/34 | | | 435 | |
| | 123 | | | Series 2005-5F, Class 8A3, VAR, 1.024%, 06/25/35 | | | 116 | |
| | 1,410 | | | Series 2005-7F, Class 3A9, 6.000%, 09/25/35 | | | 1,498 | |
| | 208 | | | Series 2006-1F, Class 1AP, PO, 02/25/36 | | | 159 | |
| | 3,738 | | | Series 2006-1F, Class 2A4, 6.000%, 02/25/36 | | | 3,282 | |
| | 1,019 | | | Series 2007-1F, Class 2A4, 5.500%, 01/25/37 | | | 981 | |
| | 2,624 | | | Homeowner Assistance Program Reverse Mortgage Loan Trust, Series 2013-RM1, Class A, 4.000%, 05/26/53 (e) | | | 2,605 | |
| | 150 | | | Impac CMB Trust, Series 2005-2, Class 2M1, VAR, 1.304%, 04/25/35 | | | 132 | |
| | 662 | | | Impac Secured Assets CMN Owner Trust, Series 2001-8, Class A6, 6.440%, 01/25/32 | | | 664 | |
| | 667 | | | Impac Secured Assets Trust, Series 2006-2, Class 2A1, VAR, 0.874%, 08/25/36 | | | 655 | |
| | 204 | | | IndyMac INDX Mortgage Loan Trust, Series 2006-AR3, Class 2A1A, VAR, 3.006%, 03/25/36 | | | 164 | |
| | | | JP Morgan Mortgage Trust, | | | | |
| | 325 | | | Series 2004-A3, Class 4A1, VAR, 3.212%, 07/25/34 | | | 334 | |
| | 187 | | | Series 2004-A4, Class 1A1, VAR, 3.307%, 09/25/34 | | | 191 | |
| | 60 | | | Series 2004-S1, Class 1A7, 5.000%, 09/25/34 | | | 62 | |
| | 548 | | | Series 2005-A1, Class 3A4, VAR, 3.008%, 02/25/35 | | | 558 | |
| | 884 | | | Series 2006-A2, Class 4A1, VAR, 3.185%, 08/25/34 | | | 886 | |
| | 740 | | | Series 2006-A2, Class 5A2, VAR, 2.783%, 11/25/33 | | | 750 | |
| | 1,339 | | | Series 2006-A2, Class 5A3, VAR, 2.783%, 11/25/33 | | | 1,357 | |
| | 304 | | | Series 2006-A3, Class 6A1, VAR, 3.145%, 08/25/34 | | | 304 | |
SEE NOTES TO FINANCIAL STATEMENTS.
| | | | | | | | |
| | | |
| AUGUST 31, 2016 | | J.P. MORGAN INCOME FUNDS | | | | | 227 | |
JPMorgan Mortgage-Backed Securities Fund
SCHEDULE OF PORTFOLIO INVESTMENTS
AS OF AUGUST 31, 2016 (Unaudited) (continued)
(Amounts in thousands)
| | | | | | | | |
PRINCIPAL
AMOUNT($) | | | SECURITY DESCRIPTION | | VALUE($) | |
| Collateralized Mortgage Obligations — continued | |
| | | | Non-Agency CMO — continued | | | | |
| | 360 | | | Series 2007-A1, Class 5A2, VAR, 2.911%, 07/25/35 | | | 364 | |
| | 490 | | | Series 2014-1, Class 1A11, VAR, 4.000%, 01/25/44 (e) | | | 515 | |
| | 3 | | | Kidder Peabody Mortgage Assets Trust, Series B, Class A1, PO, 04/22/18 | | | 3 | |
| | | | Lehman Mortgage Trust, | | | | |
| | 460 | | | Series 2006-2, Class 1A1, VAR, 5.928%, 04/25/36 | | | 411 | |
| | 276 | | | Series 2007-6, Class 1A8, 6.000%, 07/25/37 | | | 247 | |
| | 685 | | | Series 2008-2, Class 1A6, 6.000%, 03/25/38 | | | 515 | |
| | | | MASTR Adjustable Rate Mortgages Trust, | | | | |
| | 141 | | | Series 2004-3, Class 4A2, VAR, 2.690%, 04/25/34 | | | 131 | |
| | 31 | | | Series 2004-4, Class 2A1, VAR, 2.262%, 05/25/34 | | | 28 | |
| | 243 | | | Series 2004-13, Class 2A1, VAR, 2.882%, 04/21/34 | | | 248 | |
| | 1,219 | | | Series 2004-13, Class 3A7, VAR, 3.028%, 11/21/34 | | | 1,243 | |
| | 250 | | | Series 2004-15, Class 3A1, VAR, 3.406%, 12/25/34 | | | 246 | |
| | | | MASTR Alternative Loan Trust, | | | | |
| | 262 | | | Series 2003-4, Class 2A1, 6.250%, 06/25/33 | | | 272 | |
| | 156 | | | Series 2003-8, Class 3A1, 5.500%, 12/25/33 | | | 162 | |
| | 128 | | | Series 2003-8, Class 5A1, 5.000%, 11/25/18 | | | 131 | |
| | 91 | | | Series 2003-9, Class 8A1, 6.000%, 01/25/34 | | | 91 | |
| | 85 | | | Series 2004-1, Class 30PO, PO, 02/25/34 | | | 72 | |
| | 352 | | | Series 2004-3, Class 2A1, 6.250%, 04/25/34 | | | 366 | |
| | 175 | | | Series 2004-3, Class 30PO, PO, 04/25/34 | | | 138 | |
| | 157 | | | Series 2004-3, Class 30X1, IO, 6.000%, 04/25/34 | | | 35 | |
| | 238 | | | Series 2004-5, Class 30PO, PO, 06/25/34 | | | 207 | |
| | 99 | | | Series 2004-5, Class 30X1, IO, 6.000%, 06/25/34 | | | 18 | |
| | 1,052 | | | Series 2004-6, Class 7A1, 6.000%, 07/25/34 | | | 1,026 | |
| | 108 | | | Series 2004-6, Class 30X1, IO, 5.500%, 07/25/34 | | | 21 | |
| | 83 | | | Series 2004-7, Class 30PO, PO, 08/25/34 | | | 65 | |
| | | | | | | | |
PRINCIPAL
AMOUNT($) | | | SECURITY DESCRIPTION | | VALUE($) | |
| | | | | | | | |
| | | | Non-Agency CMO — continued | | | | |
| | 325 | | | Series 2004-7, Class AX1, IO, 5.500%, 08/25/34 | | | 69 | |
| | 110 | | | Series 2004-10, Class 1A1, 4.500%, 09/25/19 | | | 111 | |
| | 1,852 | | | Series 2005-3, Class AX2, IO, 6.000%, 04/25/35 | | | 467 | |
| | | | MASTR Asset Securitization Trust, | | | | |
| | 33 | | | Series 2003-2, Class 1A1, 5.000%, 03/25/18 | | | 33 | |
| | 11 | | | Series 2003-2, Class 2A1, 4.500%, 03/25/18 | | | 11 | |
| | 178 | | | Series 2003-3, Class 3A18, 5.500%, 04/25/33 | | | 178 | |
| | 11 | | | Series 2003-4, Class 3A2, 5.000%, 05/25/18 | | | 11 | |
| | 87 | | | Series 2003-4, Class 5A1, 5.500%, 05/25/33 | | | 89 | |
| | 49 | | | Series 2003-8, Class 1A1, 5.500%, 09/25/33 | | | 49 | |
| | 36 | | | Series 2003-9, Class 15PO, PO, 10/25/18 | | | 35 | |
| | 4 | | | Series 2003-10, Class 15PO, PO, 11/25/18 | | | 4 | |
| | 4 | | | Series 2003-11, Class 15PO, PO, 12/25/18 | | | 4 | |
| | 135 | | | Series 2003-12, Class 6A1, 5.000%, 12/25/33 | | | 136 | |
| | 27 | | | Series 2004-1, Class 30PO, PO, 02/25/34 | | | 21 | |
| | 27 | | | Series 2004-3, Class PO, PO, 03/25/34 | | | 24 | |
| | 25 | | | Series 2004-4, Class 3A1, 4.500%, 04/25/19 | | | 25 | |
| | 21 | | | Series 2004-8, Class 1A1, 4.750%, 08/25/19 | | | 21 | |
| | 23 | | | Series 2004-8, Class PO, PO, 08/25/19 | | | 22 | |
| | 26 | | | Series 2004-9, Class 5A1, 5.250%, 09/25/19 | | | 26 | |
| | 387 | | | Series 2004-P7, Class A6, 5.500%, 12/27/33 (e) | | | 414 | |
| | 2,133 | | | MASTR Reperforming Loan Trust, Series 2005-2, Class 1A1F, VAR, 0.874%, 05/25/35 (e) | | | 1,668 | |
| | 346 | | | MASTR Resecuritization Trust, Series 2005-PO, Class 3PO, PO, 05/28/35 (e) | | | 274 | |
| | | | Merrill Lynch Mortgage Investors Trust, | | | | |
| | 323 | | | Series 2003-A, Class 2A2, VAR, 2.049%, 03/25/28 | | | 301 | |
| | 127 | | | Series 2003-A4, Class 2A, VAR, 3.136%, 07/25/33 | | | 116 | |
| | 439 | | | Series 2003-A5, Class 2A6, VAR, 2.900%, 08/25/33 | | | 441 | |
SEE NOTES TO FINANCIAL STATEMENTS.
| | | | | | |
| | | |
| 228 | | | | J.P. MORGAN INCOME FUNDS | | AUGUST 31, 2016 |
| | | | | | | | |
PRINCIPAL
AMOUNT($) | | | SECURITY DESCRIPTION | | VALUE($) | |
| Collateralized Mortgage Obligations — continued | |
| | | | Non-Agency CMO — continued | | | | |
| | 1,033 | | | Series 2003-E, Class A1, VAR, 1.144%, 10/25/28 | | | 984 | |
| | 1,657 | | | Series 2003-F, Class A1, VAR, 1.164%, 10/25/28 | | | 1,618 | |
| | 568 | | | Series 2004-1, Class 2A1, VAR, 2.682%, 12/25/34 | | | 568 | |
| | 602 | | | Series 2004-A4, Class A2, VAR, 2.855%, 08/25/34 | | | 612 | |
| | 631 | | | Series 2004-D, Class A2, VAR, 1.949%, 09/25/29 | | | 604 | |
| | 338 | | | Series 2004-E, Class A2A, VAR, 1.613%, 11/25/29 | | | 325 | |
| | 54 | | | Series 2005-A1, Class 3A, VAR, 2.766%, 12/25/34 | | | 53 | |
| | 3 | | | ML Trust XLVII, Series 47, Class Z, 8.985%, 10/20/20 | | | 3 | |
| | 662 | | | Morgan Stanley Mortgage Loan Trust, Series 2004-3, Class 4A, VAR, 5.676%, 04/25/34 | | | 693 | |
| | — | (h) | | Morgan Stanley Mortgage Trust, Series 35, Class 2, HB, IF, 14,804.840%, 04/20/21 | | | — | (h) |
| | | | MortgageIT Trust, | | | | |
| | 397 | | | Series 2005-1, Class 1A1, VAR, 1.164%, 02/25/35 | | | 382 | |
| | 178 | | | Series 2005-5, Class A1, VAR, 0.784%, 12/25/35 | | | 160 | |
| | 435 | | | NACC Reperforming Loan REMIC Trust, Series 2004-R2, Class A1, VAR, 6.500%, 10/25/34 (e) | | | 436 | |
| | | | Nomura Asset Acceptance Corp. Alternative Loan Trust, | | | | |
| | 87 | | | Series 2003-A1, Class A1, 5.500%, 05/25/33 | | | 88 | |
| | 40 | | | Series 2003-A1, Class A2, 6.000%, 05/25/33 | | | 40 | |
| | 23 | | | Series 2003-A1, Class A5, 7.000%, 04/25/33 | | | 24 | |
| | 4 | | | Series 2003-A1, Class A7, 5.000%, 04/25/18 | | | 4 | |
| | 327 | | | Nomura Resecuritization Trust, Series 2010-6RA, Class 1A5, VAR, 3.006%, 03/26/36 (e) | | | 323 | |
| | | | Prime Mortgage Trust, | | | | |
| | 23 | | | Series 2004-1, Class 2A3, 5.250%, 08/25/34 | | | 23 | |
| | 543 | | | Series 2004-CL1, Class 1A1, 6.000%, 02/25/34 | | | 567 | |
| | 252 | | | Series 2005-4, Class 2PO, PO, 10/25/35 | | | 82 | |
| | | | | | | | |
PRINCIPAL
AMOUNT($) | | | SECURITY DESCRIPTION | | VALUE($) | |
| | | | | | | | |
| | | | Non-Agency CMO — continued | | | | |
| | 368 | | | Provident Funding Mortgage Loan Trust, Series 2005-1, Class 2A1, VAR, 2.842%, 05/25/35 | | | 355 | |
| | | | RALI Trust, | | | | |
| | 3 | | | Series 2001-QS19, Class A2, 6.000%, 12/25/16 | | | 3 | |
| | 6 | | | Series 2002-QS16, Class A3, IF, 15.526%, 10/25/17 | | | 6 | |
| | 26 | | | Series 2003-QS3, Class A2, IF, 15.346%, 02/25/18 | | | 28 | |
| | 70 | | | Series 2003-QS9, Class A3, IF, IO, 7.026%, 05/25/18 | | | 2 | |
| | 99 | | | Series 2003-QS12, Class A2A, IF, IO, 7.076%, 06/25/18 | | | 4 | |
| | 43 | | | Series 2003-QS12, Class A5, IO, 5.000%, 06/25/18 | | | 1 | |
| | 3,372 | | | Series 2003-QS13, Class A2, 4.000%, 07/25/33 | | | 3,215 | |
| | 501 | | | Series 2003-QS13, Class A5, VAR, 1.174%, 07/25/33 | | | 458 | |
| | 2,976 | | | Series 2003-QS13, Class A6, IF, IO, 0.600%, 07/25/33 | | | 61 | |
| | 169 | | | Series 2003-QS14, Class A1, 5.000%, 07/25/18 | | | 169 | |
| | 120 | | | Series 2003-QS18, Class A1, 5.000%, 09/25/18 | | | 121 | |
| | 690 | | | Series 2004-QA4, Class NB3, VAR, 4.085%, 09/25/34 | | | 684 | |
| | 195 | | | Series 2004-QA6, Class NB2, VAR, 3.344%, 12/26/34 | | | 164 | |
| | 1,073 | | | Series 2004-QS7, Class A4, 5.500%, 05/25/34 | | | 1,089 | |
| | 1,543 | | | Series 2005-QA6, Class A32, VAR, 3.936%, 05/25/35 | | | 1,291 | |
| | 184 | | | Series 2005-QA10, Class A31, VAR, 3.899%, 09/25/35 | | | 155 | |
| | 342 | | | Series 2007-QS1, Class 1A1, 6.000%, 01/25/37 | | | 284 | |
| | | | RBSSP Resecuritization Trust, | | | | |
| | 726 | | | Series 2009-1, Class 1A1, 6.500%, 02/26/36 (e) | | | 771 | |
| | 178 | | | Series 2009-2, Class 1A1, 7.000%, 08/26/37 (e) | | | 186 | |
| | 102 | | | Series 2009-9, Class 7A4, VAR, 6.000%, 07/26/37 (e) | | | 102 | |
| | 480 | | | Series 2009-12, Class 1A1, VAR, 5.851%, 11/25/33 (e) | | | 497 | |
| | 218 | | | Series 2010-9, Class 7A5, VAR, 4.000%, 05/26/37 (e) | | | 216 | |
SEE NOTES TO FINANCIAL STATEMENTS.
| | | | | | | | |
| | | |
| AUGUST 31, 2016 | | J.P. MORGAN INCOME FUNDS | | | | | 229 | |
JPMorgan Mortgage-Backed Securities Fund
SCHEDULE OF PORTFOLIO INVESTMENTS
AS OF AUGUST 31, 2016 (Unaudited) (continued)
(Amounts in thousands)
| | | | | | | | |
PRINCIPAL
AMOUNT($) | | | SECURITY DESCRIPTION | | VALUE($) | |
| Collateralized Mortgage Obligations — continued | |
| | | | Non-Agency CMO — continued | | | | |
| | 3,275 | | | Series 2012-6, Class 2A1, VAR, 0.648%, 10/26/36 (e) | | | 3,222 | |
| | | | Residential Asset Securitization Trust, | | | | |
| | 3 | | | Series 2002-A13, Class A4, 5.250%, 12/25/17 | | | 3 | |
| | 221 | | | Series 2003-A5, Class A1, 5.500%, 06/25/33 | | | 223 | |
| | 126 | | | Series 2003-A13, Class A3, 5.500%, 01/25/34 | | | 129 | |
| | 17 | | | Series 2003-A14, Class A1, 4.750%, 02/25/19 | | | 17 | |
| | 562 | | | Series 2004-IP2, Class 1A1, VAR, 2.904%, 12/25/34 | | | 564 | |
| | 3,532 | | | Series 2005-A2, Class A4, IF, IO, 4.526%, 03/25/35 | | | 511 | |
| | 1,663 | | | Series 2005-A16, Class AX, IO, 5.750%, 02/25/36 | | | 382 | |
| | 565 | | | Series 2006-A4, Class 2A5, 6.000%, 05/25/36 | | | 521 | |
| | 357 | | | Series 2006-A6, Class 2A13, 6.000%, 07/25/36 | | | 306 | |
| | | | RFMSI Trust, | | | | |
| | 23 | | | Series 2003-S14, Class A4, PO, 07/25/18 | | | 22 | |
| | 63 | | | Series 2003-S16, Class A3, 5.000%, 09/25/18 | | | 63 | |
| | 78 | | | Series 2003-S20, Class 2A1, 4.750%, 12/25/18 | | | 79 | |
| | 142 | | | Series 2004-S6, Class 2A6, PO, 06/25/34 | | | 110 | |
| | 409 | | | Series 2005-SA4, Class 1A1, VAR, 3.223%, 09/25/35 | | | 339 | |
| | 1 | | | RFSC Trust, Series 2002-RM1, Class API, PO, 12/25/17 | | | 1 | |
| | | | Sequoia Mortgage Trust, | | | | |
| | 732 | | | Series 2003-1, Class 1A, VAR, 1.272%, 04/20/33 | | | 687 | |
| | 1,085 | | | Series 2004-8, Class A1, VAR, 1.212%, 09/20/34 | | | 1,029 | |
| | 1,039 | | | Series 2004-8, Class A2, VAR, 1.950%, 09/20/34 | | | 997 | |
| | 2,632 | | | Series 2004-9, Class A1, VAR, 1.192%, 10/20/34 | | | 2,491 | |
| | 886 | | | Series 2004-10, Class A1A, VAR, 1.132%, 11/20/34 | | | 829 | |
| | | | Springleaf Mortgage Loan Trust, | | | | |
| | 1,715 | | | Series 2013-1A, Class A, VAR, 1.270%, 06/25/58 (e) | | | 1,709 | |
| | 2,644 | | | Series 2013-1A, Class M1, VAR, 2.310%, 06/25/58 (e) | | | 2,634 | |
| | | | | | | | |
PRINCIPAL
AMOUNT($) | | | SECURITY DESCRIPTION | | VALUE($) | |
| | | | | | | | |
| | | | Non-Agency CMO — continued | | | | |
| | 1,800 | | | Series 2013-1A, Class M2, VAR, 3.140%, 06/25/58 (e) | | | 1,795 | |
| | 1,268 | | | Series 2013-1A, Class M3, VAR, 3.790%, 06/25/58 (e) | | | 1,271 | |
| | 1,371 | | | Series 2013-2A, Class A, VAR, 1.780%, 12/25/65 (e) | | | 1,364 | |
| | 1,493 | | | Series 2013-2A, Class M1, VAR, 3.520%, 12/25/65 (e) | | | 1,501 | |
| | 201 | | | Structured Adjustable Rate Mortgage Loan Trust, Series 2004-6, Class 5A4, VAR, 2.813%, 06/25/34 | | | 201 | |
| | | | Structured Asset Mortgage Investments II Trust, | | | | |
| | 1,153 | | | Series 2004-AR5, Class 1A1, VAR, 1.174%, 10/19/34 | | | 1,099 | |
| | 1,894 | | | Series 2005-AR5, Class A3, VAR, 0.764%, 07/19/35 | | | 1,828 | |
| | 1,614 | | | Structured Asset Securities Corp., Series 2003-37A, Class 2A, VAR, 2.697%, 12/25/33 | | | 1,603 | |
| | | | Structured Asset Securities Corp. Mortgage Pass-Through Certificates, | | | | |
| | 153 | | | Series 2003-32, Class 1A1, VAR, 5.221%, 11/25/33 | | | 153 | |
| | 477 | | | Series 2003-33H, Class 1A1, 5.500%, 10/25/33 | | | 487 | |
| | 198 | | | Series 2003-33H, Class 1APO, PO, 10/25/33 | | | 185 | |
| | 505 | | | Series 2003-34A, Class 3A3, VAR, 2.931%, 11/25/33 | | | 496 | |
| | 1,106 | | | Series 2004-5H, Class A4, 5.540%, 12/25/33 | | | 1,135 | |
| | 133 | | | Structured Asset Securities Corp. Trust, Series 2005-6, Class 4A1, 5.000%, 05/25/35 | | | 135 | |
| | | | Thornburg Mortgage Securities Trust, | | | | |
| | 94 | | | Series 2003-4, Class A1, VAR, 1.164%, 09/25/43 | | | 90 | |
| | 93 | | | Series 2004-1, Class II2A, VAR, 1.811%, 03/25/44 | | | 90 | |
| | | | WaMu Mortgage Pass-Through Certificates Trust, | | | | |
| | 9 | | | Series 2002-S8, Class 2A7, 5.250%, 01/25/18 | | | 9 | |
| | 542 | | | Series 2003-AR7, Class A7, VAR, 2.677%, 08/25/33 | | | 542 | |
| | 454 | | | Series 2003-AR8, Class A, VAR, 2.697%, 08/25/33 | | | 458 | |
| | 1,608 | | | Series 2003-AR9, Class 1A6, VAR, 2.631%, 09/25/33 | | | 1,626 | |
SEE NOTES TO FINANCIAL STATEMENTS.
| | | | | | |
| | | |
| 230 | | | | J.P. MORGAN INCOME FUNDS | | AUGUST 31, 2016 |
| | | | | | | | |
PRINCIPAL
AMOUNT($) | | | SECURITY DESCRIPTION | | VALUE($) | |
| Collateralized Mortgage Obligations — continued | |
| | | | Non-Agency CMO — continued | | | | |
| | 377 | | | Series 2003-AR9, Class 2A, VAR, 2.755%, 09/25/33 | | | 369 | |
| | 1,104 | | | Series 2003-AR11, Class A6, VAR, 2.549%, 10/25/33 | | | 1,112 | |
| | 470 | | | Series 2003-S1, Class A5, 5.500%, 04/25/33 | | | 483 | |
| | 132 | | | Series 2003-S3, Class 1A4, 5.500%, 06/25/33 | | | 136 | |
| | 20 | | | Series 2003-S7, Class A1, 4.500%, 08/25/18 | | | 21 | |
| | 71 | | | Series 2003-S8, Class A6, 4.500%, 09/25/18 | | | 71 | |
| | 1,180 | | | Series 2003-S9, Class A8, 5.250%, 10/25/33 | | | 1,227 | |
| | 35 | | | Series 2003-S9, Class P, PO, 10/25/33 | | | 30 | |
| | 99 | | | Series 2004-AR3, Class A1, VAR, 2.783%, 06/25/34 | | | 100 | |
| | 672 | | | Series 2004-AR3, Class A2, VAR, 2.783%, 06/25/34 | | | 677 | |
| | 282 | | | Series 2004-CB2, Class 5A, 5.000%, 07/25/19 | | | 284 | |
| | 83 | | | Series 2004-CB2, Class 7A, 5.500%, 08/25/19 | | | 84 | |
| | 153 | | | Series 2004-CB3, Class 4A, 6.000%, 10/25/19 | | | 158 | |
| | 1,693 | | | Series 2004-S2, Class 2A4, 5.500%, 06/25/34 | | | 1,763 | |
| | 146 | | | Series 2006-AR10, Class 2P, VAR, 2.684%, 09/25/36 | | | 126 | |
| | | | Washington Mutual Mortgage Pass-Through Certificates WMALT Trust, | | | | |
| | 144 | | | Series 2005-1, Class 1A1, 5.500%, 03/25/35 | | | 142 | |
| | 5,907 | | | Series 2005-2, Class 1A4, IF, IO, 4.526%, 04/25/35 | | | 900 | |
| | 763 | | | Series 2005-4, Class CB7, 5.500%, 06/25/35 | | | 705 | |
| | 77 | | | Series 2005-4, Class DP, PO, 06/25/20 | | | 71 | |
| | 661 | | | Series 2005-6, Class 2A4, 5.500%, 08/25/35 | | | 606 | |
| | 7,607 | | | Series 2005-11, Class A4, IF, IO, 4.426%, 01/25/36 | | | 1,370 | |
| | | | Washington Mutual MSC Mortgage Pass-Through Certificates, | | | | |
| | 391 | | | Series 2004-RA2, Class 2A, 7.000%, 07/25/33 | | | 422 | |
| | 22 | | | Series 2004-RA4, Class 1P, PO, 04/25/19 | | | 21 | |
| | | | | | | | |
PRINCIPAL
AMOUNT($) | | | SECURITY DESCRIPTION | | VALUE($) | |
| | | | | | | | |
| | | | Non-Agency CMO — continued | | | | |
| | | | Wells Fargo Mortgage-Backed Securities Trust, | | | | |
| | 1,014 | | | Series 2003-G, Class A1, VAR, 2.898%, 06/25/33 | | | 1,016 | |
| | 183 | | | Series 2003-K, Class 1A1, VAR, 2.638%, 11/25/33 | | | 183 | |
| | 50 | | | Series 2003-K, Class 1A2, VAR, 2.638%, 11/25/33 | | | 50 | |
| | 107 | | | Series 2004-B, Class A1, VAR, 2.732%, 02/25/34 | | | 107 | |
| | 613 | | | Series 2004-EE, Class 2A1, VAR, 2.967%, 12/25/34 | | | 617 | |
| | 77 | | | Series 2004-EE, Class 2A2, VAR, 2.967%, 12/25/34 | | | 78 | |
| | 398 | | | Series 2004-EE, Class 3A1, VAR, 3.028%, 12/25/34 | | | 410 | |
| | 1,007 | | | Series 2004-I, Class 1A1, VAR, 2.893%, 07/25/34 | | | 1,018 | |
| | 2,011 | | | Series 2004-P, Class 2A1, VAR, 2.988%, 09/25/34 | | | 2,071 | |
| | 69 | | | Series 2004-Q, Class 1A3, VAR, 2.949%, 09/25/34 | | | 69 | |
| | 1,947 | | | Series 2004-S, Class A1, VAR, 2.989%, 09/25/34 | | | 1,979 | |
| | 1,622 | | | Series 2004-U, Class A1, VAR, 3.006%, 10/25/34 | | | 1,612 | |
| | 422 | | | Series 2004-V, Class 1A1, VAR, 3.008%, 10/25/34 | | | 424 | |
| | 97 | | | Series 2005-9, Class 1APO, PO, 10/25/35 | | | 87 | |
| | 461 | | | Series 2005-AR8, Class 2A1, VAR, 2.977%, 06/25/35 | | | 470 | |
| | 281 | | | Series 2005-AR16, Class 2A1, VAR, 2.852%, 02/25/34 | | | 282 | |
| | 692 | | | Series 2007-7, Class A7, 6.000%, 06/25/37 | | | 679 | |
| | 473 | | | Series 2007-11, Class A14, 6.000%, 08/25/37 | | | 470 | |
| | | | | | | | |
| | | | | | | 200,439 | |
| | | | | | | | |
| | | | Total Collateralized Mortgage Obligations
(Cost $1,037,905) | | | 1,073,246 | |
| | | | | | | | |
| Commercial Mortgage-Backed Securities — 5.2% | |
| | | | A10 Securitization LLC, | | | | |
| | 54 | | | Series 2013-1, Class A, 2.400%, 11/15/25 (e) | | | 54 | |
| | 1,005 | | | Series 2015-1, Class A1, 2.100%, 04/15/34 (e) | | | 1,000 | |
| | 431 | | | Series 2015-1, Class A2, 3.130%, 04/15/34 (e) | | | 432 | |
| | 375 | | | Series 2015-1, Class B, 4.120%, 04/15/34 (e) | | | 379 | |
SEE NOTES TO FINANCIAL STATEMENTS.
| | | | | | | | |
| | | |
| AUGUST 31, 2016 | | J.P. MORGAN INCOME FUNDS | | | | | 231 | |
JPMorgan Mortgage-Backed Securities Fund
SCHEDULE OF PORTFOLIO INVESTMENTS
AS OF AUGUST 31, 2016 (Unaudited) (continued)
(Amounts in thousands)
| | | | | | | | |
PRINCIPAL
AMOUNT($) | | | SECURITY DESCRIPTION | | VALUE($) | |
| Commercial Mortgage-Backed Securities — continued | |
| | 469 | | | A10 Term Asset Financing LLC, Series 2013-2, Class A, 2.620%, 11/15/27 (e) | | | 468 | |
| | | | ACRE Commercial Mortgage Trust, (Cayman Islands), | | | | |
| | 473 | | | Series 2014-FL2, Class B, VAR, 2.557%, 08/15/31 (e) | | | 472 | |
| | 673 | | | Series 2014-FL2, Class C, VAR, 3.007%, 08/15/31 (e) | | | 668 | |
| | 350 | | | Series 2014-FL2, Class D, VAR, 3.907%, 08/15/31 (e) | | | 341 | |
| | | | BAMLL Commercial Mortgage Securities Trust, | | | | |
| | 1,120 | | | Series 2012-PARK, Class A, 2.959%, 12/10/30 (e) | | | 1,173 | |
| | 1,000 | | | Series 2014-520M, Class A, VAR, 4.325%, 08/15/46 (e) | | | 1,171 | |
| | 2,500 | | | Series 2014-520M, Class C, VAR, 4.354%, 08/15/46 (e) | | | 2,520 | |
| | 5,185 | | | Series 2016-FR14, Class A, VAR, 3.147%, 02/27/48 (e) | | | 4,816 | |
| | 117 | | | Banc of America Merrill Lynch Commercial Mortgage, Inc., Series 2005-3, Class AM, 4.727%, 07/10/43 | | | 117 | |
| | | | BB-UBS Trust, | | | | |
| | 4,100 | | | Series 2012-SHOW, Class A, 3.430%, 11/05/36 (e) | | | 4,398 | |
| | 3,575 | | | Series 2012-SHOW, Class E, VAR, 4.160%, 11/05/36 (e) | | | 3,542 | |
| | 966 | | | Series 2012-TFT, Class A, 2.892%, 06/05/30 (e) | | | 982 | |
| | 2,110 | | | Bear Stearns Commercial Mortgage Securities Trust, Series 2007-PW17, Class AMFL, VAR, 1.198%, 06/11/50 (e) | | | 2,073 | |
| | 1,760 | | | Citigroup Commercial Mortgage Trust, Series 2013-SMP, Class A, 2.110%, 01/12/30 (e) | | | 1,768 | |
| | 3,000 | | | COBALT CMBS Commercial Mortgage Trust, Series 2006-C1, Class AM, 5.254%, 08/15/48 | | | 3,010 | |
| | | | COMM Mortgage Trust, | | | | |
| | 5,317 | | | Series 2012-CR2, Class XA, IO, VAR, 1.897%, 08/15/45 | | | 418 | |
| | 1,500 | | | Series 2013-300P, Class A1, 4.353%, 08/10/30 (e) | | | 1,697 | |
| | 140,365 | | | Series 2013-CR9, Class XB, IO, VAR, 0.250%, 07/10/45 (e) | | | 1,969 | |
| | 1,247 | | | Series 2013-SFS, Class A2, VAR, 3.086%, 04/12/35 (e) | | | 1,302 | |
| | 1,500 | | | Series 2014-CR19, Class A5, 3.796%, 08/10/47 | | | 1,655 | |
| | | | | | | | |
PRINCIPAL
AMOUNT($) | | | SECURITY DESCRIPTION | | VALUE($) | |
| | | | | | | | |
| | 2,500 | | | Series 2014-TWC, Class A, VAR, 1.358%, 02/13/32 (e) | | | 2,500 | |
| | 1,542 | | | Series 2015-CR24, Class A5, 3.696%, 08/10/48 | | | 1,696 | |
| | 1,562 | | | Series 2015-CR25, Class A4, 3.759%, 08/10/48 | | | 1,722 | |
| | 311 | | | Commercial Mortgage Trust, Series 2006-GG7, Class AM, VAR, 5.964%, 07/10/38 | | | 311 | |
| | 1,823 | | | DBWF Mortgage Trust, Series 2015-LCM, Class A1, 2.998%, 06/10/34 (e) | | | 1,895 | |
| | | | Federal Home Loan Mortgage Corp., Multifamily Structured Pass-Through Certificates, | | | | |
| | 2,557 | | | Series K029, Class A2, VAR, 3.320%, 02/25/23 | | | 2,791 | |
| | 4,000 | | | Series K037, Class A2, 3.490%, 01/25/24 | | | 4,426 | |
| | 857 | | | Series K038, Class A2, 3.389%, 03/25/24 | | | 944 | |
| | 4,924 | | | Series KF12, Class A, VAR, 1.224%, 09/25/22 | | | 4,942 | |
| | 545 | | | Series KJ02, Class A2, 2.597%, 09/25/20 | | | 563 | |
| | 5,000 | | | Series KPLB, Class A, 2.770%, 05/25/25 | | | 5,239 | |
| | 2,000 | | | Series KS01, Class A2, 2.522%, 01/25/23 | | | 2,074 | |
| | 7,200 | | | FORT CRE LLC, Series 2016-1A, Class D, VAR, 6.350%, 05/31/36 (e) | | | 7,200 | |
| | | | FREMF Mortgage Trust, | | | | |
| | 3,099 | | | Series 2014-K39, Class C, VAR, 4.282%, 08/25/47 (e) | | | 3,063 | |
| | 6,000 | | | Series 2015-K720, Class B, VAR, 3.506%, 07/25/22 (e) | | | 5,888 | |
| | 3,250 | | | Series 2016-K722, Class B, VAR, 3.966%, 07/25/49 (e) | | | 3,201 | |
| | | | Government National Mortgage Association, | | | | |
| | 1,873 | | | Series 2014-168, Class VA, VAR, 3.400%, 01/16/37 | | | 2,019 | |
| | 1,872 | | | Series 2014-168, Class VB, VAR, 3.491%, 06/16/47 | | | 2,029 | |
| | 2,684 | | | GS Mortgage Securities Corp. II, Series 2013-KING, Class A, 2.706%, 12/10/27 (e) | | | 2,728 | |
| | | | GS Mortgage Securities Corp. Trust, | | | | |
| | 20,000 | | | Series 2012-SHOP, Class XA, IO, VAR, 1.438%, 06/05/31 (e) | | | 652 | |
| | 2,444 | | | Series 2013-NYC5, Class A, 2.318%, 01/10/30 (e) | | | 2,455 | |
| | 7,390 | | | GS Mortgage Securities Trust, Series 2006-GG8, Class X, IO, VAR, 0.747%, 11/10/39 (e) | | | — | (h) |
| | | | JP Morgan Chase Commercial Mortgage Securities Trust, | | | | |
| | 15,118 | | | Series 2006-CB15, Class X1, IO, VAR, 0.482%, 06/12/43 | | | 15 | |
SEE NOTES TO FINANCIAL STATEMENTS.
| | | | | | |
| | | |
| 232 | | | | J.P. MORGAN INCOME FUNDS | | AUGUST 31, 2016 |
| | | | | | | | |
PRINCIPAL
AMOUNT($) | | | SECURITY DESCRIPTION | | VALUE($) | |
| Commercial Mortgage-Backed Securities — continued | |
| | 600 | | | Series 2006-LDP9, Class AMS, 5.337%, 05/15/47 | | | 595 | |
| | 875 | | | Series 2007-C1, Class A4, 5.716%, 02/15/51 | | | 900 | |
| | 2,686 | | | Ladder Capital Commercial Mortgage Trust, Series 2013-GCP, Class A2, 3.985%, 02/15/36 (e) | | | 2,944 | |
| | | | LB-UBS Commercial Mortgage Trust, | | | | |
| | 10,134 | | | Series 2006-C1, Class XCL, IO, VAR, 0.338%, 02/15/41 (e) | | | 1 | |
| | 1,925 | | | Series 2007-C1, Class AM, 5.455%, 02/15/40 | | | 1,938 | |
| | 495 | | | Series 2007-C2, Class A3, 5.430%, 02/15/40 | | | 500 | |
| | 838 | | | ML-CFC Commercial Mortgage Trust, Series 2007-9, Class A4, 5.700%, 09/12/49 | | | 865 | |
| | 1,000 | | | Morgan Stanley Bank of America Merrill Lynch Trust, Series 2014-C14, Class A3, 3.669%, 02/15/47 | | | 1,061 | |
| | | | Morgan Stanley Capital I Trust, | | | | |
| | 240 | | | Series 2007-T27, Class A4, VAR, 5.818%, 06/11/42 | | | 246 | |
| | 1,213 | | | Series 2011-C3, Class A3, 4.054%, 07/15/49 | | | 1,268 | |
| | 1,500 | | | Series 2012-C4, Class A3, 2.991%, 03/15/45 | | | 1,546 | |
| | | | Morgan Stanley Re-REMIC Trust, | | | | |
| | 2,676 | | | Series 2012-IO, Class AXA, 1.000%, 03/27/51 (e) | | | 2,663 | |
| | 2,085 | | | Series 2012-XA, Class A, 2.000%, 07/27/49 (e) | | | 2,067 | |
| | 3,410 | | | Series 2012-XA, Class B, 0.250%, 07/27/49 (e) | | | 3,053 | |
| | 486 | | | NorthStar, (Cayman Islands), Series 2013-1A, Class B, VAR, 5.524%, 08/25/29 (e) | | | 491 | |
| | | | PFP Ltd., (Cayman Islands), | | | | |
| | 759 | | | Series 2015-2, Class A, VAR, 1.958%, 07/14/34 (e) | | | 754 | |
| | 704 | | | Series 2015-2, Class C, VAR, 3.758%, 07/14/34 (e) | | | 686 | |
| | 487 | | | Series 2015-2, Class D, VAR, 4.508%, 07/14/34 (e) | | | 470 | |
| | | | RAIT Trust, | | | | |
| | 363 | | | Series 2014-FL3, Class A, VAR, 1.758%, 12/15/31 (e) | | | 358 | |
| | 2,475 | | | Series 2015-FL5, Class B, VAR, 4.408%, 01/15/31 (e) | | | 2,475 | |
| | 2,123 | | | RBS Commercial Funding, Inc. Trust, Series 2013-SMV, Class A, 3.260%, 03/11/31 (e) | | | 2,203 | |
| | | | | | | | |
PRINCIPAL
AMOUNT($) | | | SECURITY DESCRIPTION | | VALUE($) | |
| | | | | | | | |
| | 981 | | | Resource Capital Corp., Ltd., (Cayman Islands), Series 2015-CRE4, Class B, VAR, 3.507%, 08/15/32 (e) | | | 922 | |
| | 374 | | | RREF LLC, Series 2015-LT7, Class A, 3.000%, 12/25/32 (e) | | | 374 | |
| | 6,619 | | | UBS Commercial Mortgage Trust, Series 2012-C1, Class XA, IO, VAR, 2.274%, 05/10/45 (e) | | | 639 | |
| | 3,015 | | | UBS-BAMLL Trust, Series 2012-WRM, Class A, 3.663%, 06/10/30 (e) | | | 3,194 | |
| | | | UBS-Barclays Commercial Mortgage Trust, | | | | |
| | 1,300 | | | Series 2012-C2, Class A4, 3.525%, 05/10/63 | | | 1,408 | |
| | 14,264 | | | Series 2012-C2, Class XA, IO, VAR, 1.797%, 05/10/63 (e) | | | 775 | |
| | 857 | | | Series 2013-C6, Class A4, 3.244%, 04/10/46 | | | 915 | |
| | | | VNDO Mortgage Trust, | | | | |
| | 2,991 | | | Series 2012-6AVE, Class A, 2.996%, 11/15/30 (e) | | | 3,141 | |
| | 2,500 | | | Series 2013-PENN, Class A, 3.808%, 12/13/29 (e) | | | 2,687 | |
| | 7,576 | | | Wachovia Bank Commercial Mortgage Trust, Series 2006-C24, Class XC, IO, VAR, 0.165%, 03/15/45 (e) | | | — | (h) |
| | | | Wells Fargo Commercial Mortgage Trust, | | | | |
| | 3,000 | | | Series 2013-120B, Class A, VAR, 2.800%, 03/18/28 (e) | | | 3,073 | |
| | 1,458 | | | Series 2015-C30, Class A4, 3.664%, 09/15/58 | | | 1,598 | |
| | 17 | | | Wells Fargo Resecuritization Trust, Series 2012-IO, Class A, 1.750%, 08/20/21 (e) | | | 17 | |
| | | | WFRBS Commercial Mortgage Trust, | | | | |
| | 1,250 | | | Series 2011-C3, Class A4, 4.375%, 03/15/44 (e) | | | 1,379 | |
| | 1,200 | | | Series 2012-C6, Class A4, 3.440%, 04/15/45 | | | 1,288 | |
| | 750 | | | Series 2013-C11, Class D, VAR, 4.317%, 03/15/45 (e) | | | 703 | |
| | | | | | | | |
| | | | Total Commercial Mortgage-Backed Securities
(Cost $140,388) | | | 143,975 | |
| | | | | | | | |
| Mortgage Pass-Through Securities — 39.5% | |
| | | | Federal Home Loan Mortgage Corp., | | | | |
| | 155 | | | ARM, 2.429%, 05/01/37 | | | 162 | |
| | 191 | | | ARM, 2.496%, 11/01/36 | | | 202 | |
| | 258 | | | ARM, 2.515%, 11/01/36 | | | 272 | |
| | 170 | | | ARM, 2.592%, 10/01/36 | | | 178 | |
| | 388 | | | ARM, 2.593%, 11/01/36 | | | 411 | |
SEE NOTES TO FINANCIAL STATEMENTS.
| | | | | | | | |
| | | |
| AUGUST 31, 2016 | | J.P. MORGAN INCOME FUNDS | | | | | 233 | |
JPMorgan Mortgage-Backed Securities Fund
SCHEDULE OF PORTFOLIO INVESTMENTS
AS OF AUGUST 31, 2016 (Unaudited) (continued)
(Amounts in thousands)
| | | | | | | | |
PRINCIPAL
AMOUNT($) | | | SECURITY DESCRIPTION | | VALUE($) | |
| Mortgage Pass-Through Securities — continued | |
| | 122 | | | ARM, 2.605%, 12/01/33 | | | 129 | |
| | 155 | | | ARM, 2.617%, 11/01/36 | | | 164 | |
| | 68 | | | ARM, 2.628%, 10/01/37 | | | 73 | |
| | 168 | | | ARM, 2.631%, 08/01/36 | | | 176 | |
| | 181 | | | ARM, 2.634%, 01/01/35 | | | 192 | |
| | 320 | | | ARM, 2.647%, 10/01/36 | | | 336 | |
| | 47 | | | ARM, 2.652%, 02/01/37 | | | 50 | |
| | 90 | | | ARM, 2.664%, 03/01/35 | | | 95 | |
| | 165 | | | ARM, 2.677%, 03/01/36 | | | 175 | |
| | 14 | | | ARM, 2.732%, 01/01/30 | | | 15 | |
| | 164 | | | ARM, 2.796%, 02/01/37 | | | 174 | |
| | 98 | | | ARM, 2.811%, 09/01/37 | | | 103 | |
| | 161 | | | ARM, 2.820%, 05/01/36 | | | 170 | |
| | 617 | | | ARM, 2.842%, 03/01/37 | | | 647 | |
| | 151 | | | ARM, 2.856%, 04/01/34 | | | 160 | |
| | 107 | | | ARM, 2.885%, 12/01/36 | | | 114 | |
| | 193 | | | ARM, 2.912%, 09/01/36 | | | 205 | |
| | 638 | | | ARM, 2.947%, 10/01/36 | | | 678 | |
| | 155 | | | ARM, 2.959%, 05/01/38 | | | 163 | |
| | 159 | | | ARM, 3.003%, 12/01/35 | | | 168 | |
| | 90 | | | ARM, 3.031%, 02/01/37 | | | 95 | |
| | 358 | | | ARM, 3.063%, 06/01/36 | | | 379 | |
| | 237 | | | ARM, 3.101%, 04/01/38 | | | 252 | |
| | 91 | | | ARM, 3.157%, 07/01/37 | | | 95 | |
| | 85 | | | ARM, 3.255%, 02/01/37 | | | 91 | |
| | 196 | | | ARM, 3.442%, 03/01/36 | | | 206 | |
| | 27 | | | ARM, 6.335%, 10/01/36 | | | 28 | |
| | | | Federal Home Loan Mortgage Corp. Gold Pools, 15 Year, Single Family, | | | | |
| | 20 | | | 4.500%, 10/01/18 | | | 21 | |
| | 33 | | | 5.000%, 12/01/18 | | | 34 | |
| | 341 | | | 5.500%, 06/01/17 - 12/01/22 | | | 367 | |
| | 178 | | | 6.000%, 06/01/17 - 03/01/22 | | | 184 | |
| | 89 | | | 6.500%, 02/01/17 - 03/01/22 | | | 93 | |
| | 10 | | | 7.000%, 03/01/17 - 07/01/17 | | | 10 | |
| | | | Federal Home Loan Mortgage Corp. Gold Pools, 20 Year, Single Family, | | | | |
| | 1,550 | | | 4.000%, 02/01/32 | | | 1,673 | |
| | 969 | | | 5.500%, 05/01/27 - 03/01/28 | | | 1,096 | |
| | 273 | | | 6.000%, 12/01/22 - 02/01/24 | | | 311 | |
| | 374 | | | 6.500%, 01/01/28 | | | 436 | |
| | | | Federal Home Loan Mortgage Corp. Gold Pools, 30 Year, Single Family, | | | | |
| | 27,720 | | | 3.500%, 12/01/45 - 08/01/46 (w) | | | 29,248 | |
| | 152 | | | 4.000%, 10/01/33 | | | 163 | |
| | 11,879 | | | 4.500%, 05/01/41 - 10/01/41 | | | 13,056 | |
| | | | | | | | |
PRINCIPAL
AMOUNT($) | | | SECURITY DESCRIPTION | | VALUE($) | |
| | | | | | | | |
| | 11,044 | | | 5.000%, 11/01/35 - 06/01/44 | | | 12,248 | |
| | 2,168 | | | 5.500%, 01/01/33 - 03/01/40 | | | 2,463 | |
| | 383 | | | 6.000%, 11/01/28 - 12/01/33 | | | 441 | |
| | 2,035 | | | 6.500%, 05/01/24 - 03/01/38 | | | 2,427 | |
| | 749 | | | 7.000%, 07/01/29 - 10/01/36 | | | 889 | |
| | 48 | | | 7.500%, 09/01/38 | | | 59 | |
| | 18 | | | 8.500%, 08/01/30 | | | 18 | |
| | | | Federal Home Loan Mortgage Corp. Gold Pools, FHA/VA, | | | | |
| | 693 | | | 7.500%, 01/01/32 - 12/01/36 | | | 821 | |
| | 232 | | | 10.000%, 10/01/30 | | | 253 | |
| | | | Federal Home Loan Mortgage Corp. Gold Pools, Other, | | | | |
| | 24,712 | | | 3.500%, 10/01/32 - 06/01/43 | | | 26,359 | |
| | 19,450 | | | 4.000%, 09/01/32 - 01/01/46 | | | 21,038 | |
| | 3,443 | | | 4.500%, 01/01/46 | | | 3,835 | |
| | 383 | | | 5.500%, 02/01/18 - 12/01/35 | | | 401 | |
| | 1,589 | | | 6.000%, 02/01/33 - 04/01/36 | | | 1,790 | |
| | 2,609 | | | 6.500%, 11/01/36 - 10/17/38 | | | 2,989 | |
| | 18 | | | 10.500%, 07/20/21 | | | 18 | |
| | | | Federal Home Loan Mortgage Corp., 30 Year, Single Family, | | | | |
| | 1 | | | 7.500%, 03/01/17 - 05/01/17 | | | 1 | |
| | | | Federal National Mortgage Association, | | | | |
| | 148 | | | ARM, 2.075%, 10/01/34 | | | 156 | |
| | 374 | | | ARM, 2.176%, 08/01/34 | | | 385 | |
| | 2 | | | ARM, 2.242%, 03/01/19 | | | 2 | |
| | 168 | | | ARM, 2.297%, 01/01/33 | | | 174 | |
| | 182 | | | ARM, 2.310%, 07/01/33 | | | 188 | |
| | 248 | | | ARM, 2.364%, 11/01/33 | | | 263 | |
| | 238 | | | ARM, 2.370%, 02/01/35 | | | 246 | |
| | 212 | | | ARM, 2.380%, 10/01/34 | | | 224 | |
| | 157 | | | ARM, 2.382%, 09/01/34 | | | 166 | |
| | 1,657 | | | ARM, 2.395%, 01/01/35 | | | 1,731 | |
| | 125 | | | ARM, 2.403%, 09/01/35 | | | 131 | |
| | 125 | | | ARM, 2.408%, 01/01/36 | | | 131 | |
| | 260 | | | ARM, 2.452%, 10/01/34 | | | 273 | |
| | 146 | | | ARM, 2.470%, 02/01/35 | | | 152 | |
| | 387 | | | ARM, 2.475%, 09/01/36 | | | 406 | |
| | 118 | | | ARM, 2.488%, 06/01/35 | | | 124 | |
| | 65 | | | ARM, 2.527%, 11/01/33 | | | 69 | |
| | 223 | | | ARM, 2.532%, 11/01/37 | | | 233 | |
| | 139 | | | ARM, 2.539%, 02/01/34 | | | 148 | |
| | 93 | | | ARM, 2.547%, 01/01/34 | | | 98 | |
| | 127 | | | ARM, 2.552%, 04/01/34 | | | 132 | |
| | 352 | | | ARM, 2.555%, 05/01/35 | | | 370 | |
SEE NOTES TO FINANCIAL STATEMENTS.
| | | | | | |
| | | |
| 234 | | | | J.P. MORGAN INCOME FUNDS | | AUGUST 31, 2016 |
| | | | | | | | |
PRINCIPAL
AMOUNT($) | | | SECURITY DESCRIPTION | | VALUE($) | |
| Mortgage Pass-Through Securities — continued | |
| | 275 | | | ARM, 2.557%, 10/01/36 | | | 292 | |
| | 214 | | | ARM, 2.565%, 10/01/34 | | | 226 | |
| | 9 | | | ARM, 2.585%, 09/01/27 | | | 10 | |
| | 244 | | | ARM, 2.603%, 08/01/36 | | | 256 | |
| | 179 | | | ARM, 2.606%, 08/01/34 | | | 189 | |
| | 423 | | | ARM, 2.650%, 12/01/37 | | | 449 | |
| | 425 | | | ARM, 2.671%, 07/01/37 | | | 454 | |
| | 168 | | | ARM, 2.685%, 09/01/33 | | | 179 | |
| | 210 | | | ARM, 2.720%, 12/01/36 | | | 220 | |
| | 276 | | | ARM, 2.729%, 07/01/33 | | | 293 | |
| | 176 | | | ARM, 2.741%, 11/01/36 | | | 187 | |
| | 45 | | | ARM, 2.753%, 01/01/38 | | | 46 | |
| | 318 | | | ARM, 2.762%, 04/01/34 - 04/01/35 | | | 335 | |
| | 567 | | | ARM, 2.764%, 04/01/35 | | | 598 | |
| | 311 | | | ARM, 2.791%, 10/01/34 | | | 330 | |
| | 175 | | | ARM, 2.810%, 12/01/36 | | | 185 | |
| | 210 | | | ARM, 2.835%, 05/01/34 | | | 222 | |
| | 127 | | | ARM, 2.841%, 10/01/36 | | | 135 | |
| | 56 | | | ARM, 2.844%, 05/01/35 | | | 59 | |
| | 89 | | | ARM, 2.845%, 05/01/35 | | | 93 | |
| | 135 | | | ARM, 2.864%, 06/01/34 | | | 142 | |
| | 223 | | | ARM, 3.020%, 07/01/36 | | | 237 | |
| | 107 | | | ARM, 3.073%, 07/01/37 | | | 112 | |
| | 325 | | | ARM, 3.075%, 06/01/36 | | | 346 | |
| | 2,569 | | | ARM, 3.362%, 03/01/36 | | | 2,700 | |
| | 21 | | | ARM, 3.824%, 03/01/29 | | | 23 | |
| | | | Federal National Mortgage Association, 15 Year, Single Family, | | | | |
| | 76 | | | 4.500%, 03/01/19 | | | 78 | |
| | 536 | | | 5.000%, 06/01/18 - 08/01/24 | | | 564 | |
| | 625 | | | 5.500%, 11/01/18 - 11/01/23 | | | 654 | |
| | 308 | | | 6.000%, 08/01/17 - 08/01/21 | | | 318 | |
| | 413 | | | 6.500%, 03/01/17 - 02/01/24 | | | 449 | |
| | 72 | | | 7.000%, 05/01/17 - 08/01/21 | | | 75 | |
| | — | (h) | | 7.500%, 03/01/17 | | | — | (h) |
| | | | Federal National Mortgage Association, 20 Year, Single Family, | | | | |
| | 6,745 | | | 3.500%, 12/01/30 - 08/01/32 | | | 7,170 | |
| | 3,417 | | | 4.000%, 01/01/35 | | | 3,748 | |
| | 239 | | | 6.000%, 09/01/29 | | | 274 | |
| | 644 | | | 6.500%, 05/01/22 - 12/01/27 | | | 743 | |
| | 12 | | | 7.500%, 09/01/21 | | | 13 | |
| | | | Federal National Mortgage Association, 30 Year, FHA/VA, | | | | |
| | 46 | | | 6.000%, 09/01/33 | | | 52 | |
| | 2,518 | | | 6.500%, 02/01/29 - 08/01/39 | | | 2,919 | |
| | | | | | | | |
PRINCIPAL
AMOUNT($) | | | SECURITY DESCRIPTION | | VALUE($) | |
| | | | | | | | |
| | 98 | | | 7.000%, 10/01/28 - 02/01/33 | | | 112 | |
| | 34 | | | 8.000%, 06/01/28 | | | 39 | |
| | 8 | | | 8.500%, 03/01/30 - 06/01/30 | | | 9 | |
| | 76 | | | 9.000%, 05/01/18 - 06/01/31 | | | 84 | |
| | 4 | | | 10.000%, 07/01/19 | | | 4 | |
| | 3 | | | 10.500%, 11/01/18 | | | 3 | |
| | 5 | | | 11.000%, 04/01/19 | | | 5 | |
| | | | Federal National Mortgage Association, 30 Year, Single Family, | | | | |
| | 12,612 | | | 3.000%, 07/01/43 - 08/01/43 | | | 13,208 | |
| | 15,131 | | | 3.500%, 03/01/43 - 06/01/43 | | | 15,999 | |
| | 21,187 | | | 4.000%, 08/01/33 - 04/01/46 | | | 22,949 | |
| | 749 | | | 4.500%, 05/01/29 - 09/01/34 | | | 820 | |
| | 872 | | | 5.000%, 06/01/33 - 09/01/35 | | | 982 | |
| | 2,613 | | | 5.500%, 11/01/32 - 05/01/40 | | | 3,008 | |
| | 2,777 | | | 6.000%, 12/01/28 - 11/01/38 | | | 3,232 | |
| | 2,417 | | | 6.500%, 11/01/29 - 09/01/38 | | | 2,841 | |
| | 6,235 | | | 7.000%, 04/01/20 - 02/01/39 | | | 7,453 | |
| | 2,082 | | | 7.500%, 08/01/36 - 04/01/39 | | | 2,674 | |
| | 534 | | | 8.000%, 03/01/27 - 10/01/36 | | | 652 | |
| | 76 | | | 8.500%, 12/01/27 - 02/01/30 | | | 85 | |
| | 5 | | | 9.500%, 07/01/28 | | | 5 | |
| | 3 | | | 10.000%, 02/01/24 | | | 3 | |
| | | | Federal National Mortgage Association, Other, | | | | |
| | 1,938 | | | ARM, 0.845%, 03/01/25 | | | 1,944 | |
| | 1,944 | | | ARM, 0.935%, 08/01/22 | | | 1,946 | |
| | 7,329 | | | ARM, 1.255%, 12/01/25 | | | 7,322 | |
| | 3,647 | | | VAR, 1.265%, 03/01/22 | | | 3,658 | |
| | 92 | | | VAR, 2.725%, 08/01/34 | | | 97 | |
| | 2,347 | | | VAR, 6.070%, 11/01/18 | | | 2,420 | |
| | 463 | | | 1.660%, 11/01/17 | | | 462 | |
| | 2,000 | | | 1.690%, 12/01/19 | | | 2,011 | |
| | 1,884 | | | 1.750%, 06/01/20 | | | 1,898 | |
| | 2,830 | | | 2.000%, 12/01/20 | | | 2,887 | |
| | 20,000 | | | 2.010%, 06/01/20 | | | 20,346 | |
| | 4,051 | | | 2.150%, 01/01/23 | | | 4,142 | |
| | 1,638 | | | 2.240%, 12/01/22 | | | 1,683 | |
| | 7,979 | | | 2.340%, 12/01/22 - 01/01/23 | | | 8,226 | |
| | 11,955 | | | 2.370%, 11/01/22 - 12/01/22 | | | 12,346 | |
| | 1,872 | | | 2.380%, 11/01/22 | | | 1,934 | |
| | 703 | | | 2.395%, 01/01/22 | | | 727 | |
| | 6,000 | | | 2.400%, 12/01/22 - 02/01/23 | | | 6,196 | |
| | 5,601 | | | 2.410%, 11/01/22 | | | 5,782 | |
| | 3,262 | | | 2.420%, 12/01/22 | | | 3,370 | |
| | 5,800 | | | 2.460%, 02/01/23 | | | 5,973 | |
| | 2,889 | | | 2.470%, 09/01/22 - 11/01/22 | | | 2,997 | |
SEE NOTES TO FINANCIAL STATEMENTS.
| | | | | | | | |
| | | |
| AUGUST 31, 2016 | | J.P. MORGAN INCOME FUNDS | | | | | 235 | |
JPMorgan Mortgage-Backed Securities Fund
SCHEDULE OF PORTFOLIO INVESTMENTS
AS OF AUGUST 31, 2016 (Unaudited) (continued)
(Amounts in thousands)
| | | | | | | | |
PRINCIPAL
AMOUNT($) | | | SECURITY DESCRIPTION | | VALUE($) | |
| Mortgage Pass-Through Securities — continued | |
| | 4,862 | | | 2.510%, 10/01/22 - 06/01/23 | | | 5,057 | |
| | 7,576 | | | 2.520%, 10/01/22 | | | 7,885 | |
| | 11,288 | | | 2.530%, 10/01/22 - 12/01/22 | | | 11,753 | |
| | 2,500 | | | 2.590%, 11/01/21 | | | 2,611 | |
| | 5,029 | | | 2.600%, 06/01/22 | | | 5,248 | |
| | 2,600 | | | 2.630%, 09/01/21 - 11/01/21 | | | 2,718 | |
| | 1,902 | | | 2.640%, 04/01/23 | | | 1,991 | |
| | 10,320 | | | 2.650%, 08/01/22 - 03/01/23 | | | 10,788 | |
| | 2,000 | | | 2.660%, 12/01/22 | | | 2,129 | |
| | 8,532 | | | 2.670%, 07/01/22 | | | 8,926 | |
| | 5,686 | | | 2.690%, 07/01/22 | | | 5,962 | |
| | 5,000 | | | 2.700%, 04/01/25 | | | 5,235 | |
| | 6,425 | | | 2.750%, 03/01/22 - 07/01/22 | | | 6,744 | |
| | 7,000 | | | 2.760%, 06/01/22 | | | 7,378 | |
| | 11,504 | | | 2.790%, 06/01/22 - 06/01/27 | | | 12,114 | |
| | 1,730 | | | 2.810%, 05/01/27 | | | 1,823 | |
| | 9,250 | | | 2.830%, 07/01/22 - 05/01/27 | | | 9,752 | |
| | 1,670 | | | 2.840%, 01/01/25 | | | 1,766 | |
| | 7,895 | | | 2.860%, 05/01/22 - 08/01/22 | | | 8,344 | |
| | 1,300 | | | 2.870%, 09/01/27 | | | 1,358 | |
| | 1,510 | | | 2.890%, 01/01/25 | | | 1,601 | |
| | 9,534 | | | 2.900%, 05/01/22 - 12/01/24 | | | 10,093 | |
| | 3,000 | | | 2.920%, 05/01/30 | | | 3,130 | |
| | 3,704 | | | 2.940%, 05/01/22 | | | 3,924 | |
| | 6,500 | | | 2.950%, 12/01/24 - 11/01/25 | | | 6,924 | |
| | 2,026 | | | 2.960%, 06/01/30 | | | 2,141 | |
| | 4,165 | | | 2.970%, 12/01/24 - 06/01/30 | | | 4,425 | |
| | 4,937 | | | 2.980%, 03/01/22 - 06/01/22 | | | 5,245 | |
| | 8,658 | | | 2.990%, 02/01/22 - 05/01/31 | | | 9,202 | |
| | 8,511 | | | 3.000%, 05/01/22 - 08/01/43 | | | 8,919 | |
| | 6,138 | | | 3.020%, 05/01/22 - 06/01/25 | | | 6,538 | |
| | 21,250 | | | 3.030%, 12/01/21 - 06/01/31 | | | 22,611 | |
| | 2,000 | | | 3.040%, 12/01/24 | | | 2,142 | |
| | 4,811 | | | 3.080%, 05/01/22 - 06/01/27 | | | 5,155 | |
| | 7,282 | | | 3.090%, 01/01/22 | | | 7,740 | |
| | 4,342 | | | 3.100%, 05/01/22 - 09/01/25 | | | 4,662 | |
| | 4,000 | | | 3.110%, 12/01/24 | | | 4,304 | |
| | 11,528 | | | 3.120%, 01/01/22 - 06/01/35 | | | 12,305 | |
| | 8,839 | | | 3.130%, 01/01/22 - 06/01/30 | | | 9,384 | |
| | 11,206 | | | 3.140%, 02/01/22 - 12/01/26 | | | 11,998 | |
| | 5,225 | | | 3.200%, 02/01/22 - 06/01/30 | | | 5,614 | |
| | 2,481 | | | 3.230%, 11/01/20 | | | 2,635 | |
| | 2,134 | | | 3.235%, 10/01/26 | | | 2,315 | |
| | 4,857 | | | 3.240%, 01/01/22 | | | 5,201 | |
| | 1,911 | | | 3.270%, 11/01/20 | | | 2,036 | |
| | 10,007 | | | 3.280%, 10/01/20 - 11/01/30 | | | 10,832 | |
| | | | | | | | |
PRINCIPAL
AMOUNT($) | | | SECURITY DESCRIPTION | | VALUE($) | |
| | | | | | | | |
| | 6,906 | | | 3.290%, 10/01/20 - 08/01/26 | | | 7,486 | |
| | 1,005 | | | 3.300%, 07/01/30 | | | 1,104 | |
| | 2,473 | | | 3.320%, 08/01/30 | | | 2,702 | |
| | 3,890 | | | 3.350%, 11/01/20 | | | 4,146 | |
| | 3,644 | | | 3.360%, 10/01/20 | | | 3,890 | |
| | 5,036 | | | 3.370%, 11/01/20 - 09/01/30 | | | 5,438 | |
| | 862 | | | 3.377%, 10/01/20 | | | 918 | |
| | 1,500 | | | 3.380%, 12/01/23 | | | 1,642 | |
| | 4,161 | | | 3.390%, 12/01/29 - 09/01/30 | | | 4,559 | |
| | 7,846 | | | 3.430%, 09/01/20 - 11/01/21 | | | 8,410 | |
| | 2,310 | | | 3.460%, 04/01/27 | | | 2,533 | |
| | 2,476 | | | 3.480%, 12/01/20 | | | 2,656 | |
| | 6,418 | | | 3.490%, 09/01/23 | | | 7,035 | |
| | 50,424 | | | 3.500%, 02/01/33 - 06/01/46 | | | 53,748 | |
| | 2,500 | | | 3.540%, 10/01/20 | | | 2,686 | |
| | 4,123 | | | 3.543%, 12/01/20 | | | 4,420 | |
| | 2,000 | | | 3.550%, 02/01/30 | | | 2,221 | |
| | 1,538 | | | 3.570%, 11/01/34 | | | 1,664 | |
| | 3,723 | | | 3.590%, 12/01/20 - 08/01/23 | | | 4,097 | |
| | 2,736 | | | 3.600%, 09/01/20 | | | 2,943 | |
| | 2,431 | | | 3.610%, 11/01/34 | | | 2,652 | |
| | 12,479 | | | 3.620%, 09/01/20 | | | 13,428 | |
| | 1,955 | | | 3.630%, 10/01/29 | | | 2,173 | |
| | 6,100 | | | 3.670%, 07/01/23 | | | 6,770 | |
| | 2,356 | | | 3.740%, 07/01/20 - 07/01/23 | | | 2,565 | |
| | 5,000 | | | 3.765%, 12/01/25 | | | 5,617 | |
| | 26,661 | | | 3.770%, 01/01/21 - 09/01/21 | | | 29,050 | |
| | 6,200 | | | 3.830%, 12/01/21 | | | 6,832 | |
| | 1,803 | | | 3.840%, 09/01/20 | | | 1,947 | |
| | 2,302 | | | 3.860%, 07/01/21 | | | 2,513 | |
| | 2,975 | | | 3.870%, 01/01/21 | | | 3,237 | |
| | 5,000 | | | 3.890%, 09/01/21 | | | 5,481 | |
| | 3,433 | | | 3.930%, 07/01/20 - 01/01/21 | | | 3,724 | |
| | 4,000 | | | 3.940%, 07/01/21 | | | 4,397 | |
| | 20,043 | | | 3.950%, 07/01/20 - 07/01/21 | | | 21,870 | |
| | 2,827 | | | 3.960%, 08/01/20 | | | 3,064 | |
| | 5,586 | | | 3.970%, 06/01/21 - 07/01/21 | | | 6,121 | |
| | 2,196 | | | 3.990%, 07/01/21 | | | 2,408 | |
| | 29,190 | | | 4.000%, 11/01/33 - 09/01/42 | | | 31,560 | |
| | 3,000 | | | 4.020%, 06/01/21 | | | 3,302 | |
| | 1,600 | | | 4.040%, 10/01/20 | | | 1,746 | |
| | 3,178 | | | 4.050%, 08/01/21 | | | 3,497 | |
| | 7,991 | | | 4.060%, 07/01/21 | | | 8,792 | |
| | 7,506 | | | 4.066%, 07/01/20 | | | 8,135 | |
| | 2,205 | | | 4.070%, 10/01/21 | | | 2,435 | |
| | 10,608 | | | 4.080%, 11/01/26 | | | 12,037 | |
SEE NOTES TO FINANCIAL STATEMENTS.
| | | | | | |
| | | |
| 236 | | | | J.P. MORGAN INCOME FUNDS | | AUGUST 31, 2016 |
| | | | | | | | |
PRINCIPAL
AMOUNT($) | | | SECURITY DESCRIPTION | | VALUE($) | |
| Mortgage Pass-Through Securities — continued | |
| | 1,829 | | | 4.120%, 04/01/20 | | | 1,977 | |
| | 8,164 | | | 4.160%, 03/01/21 - 07/01/21 | | | 8,999 | |
| | 4,307 | | | 4.240%, 06/01/21 | | | 4,763 | |
| | 2,000 | | | 4.250%, 04/01/21 | | | 2,215 | |
| | 22,253 | | | 4.281%, 01/01/20 | | | 23,874 | |
| | 756 | | | 4.283%, 01/01/21 | | | 829 | |
| | 3,940 | | | 4.290%, 06/01/20 | | | 4,301 | |
| | 1,434 | | | 4.295%, 06/01/21 | | | 1,592 | |
| | 1,431 | | | 4.300%, 04/01/21 | | | 1,587 | |
| | 7,393 | | | 4.310%, 06/01/21 | | | 8,193 | |
| | 2,331 | | | 4.320%, 06/01/21 | | | 2,585 | |
| | 2,632 | | | 4.330%, 02/01/21 - 07/01/21 | | | 2,920 | |
| | 9,000 | | | 4.340%, 06/01/21 | | | 10,034 | |
| | 5,698 | | | 4.350%, 04/01/20 - 02/01/21 | | | 6,241 | |
| | 2,676 | | | 4.381%, 04/01/20 | | | 2,912 | |
| | 6,624 | | | 4.399%, 02/01/20 | | | 7,202 | |
| | 5,800 | | | 4.400%, 02/01/20 | | | 6,302 | |
| | 5,854 | | | 4.480%, 02/01/21 - 06/01/21 | | | 6,533 | |
| | 138 | | | 4.500%, 08/01/33 | | | 145 | |
| | 3,237 | | | 4.552%, 08/01/26 | | | 3,755 | |
| | 4,663 | | | 4.640%, 01/01/21 | | | 5,183 | |
| | 2,788 | | | 4.762%, 08/01/26 | | | 3,310 | |
| | 3,655 | | | 4.970%, 02/01/31 | | | 4,361 | |
| | 1,209 | | | 5.000%, 04/01/22 - 01/01/36 | | | 1,355 | |
| | 985 | | | 5.500%, 03/01/17 - 04/01/38 | | | 1,078 | |
| | 1,184 | | | 6.000%, 02/01/36 - 11/01/39 | | | 1,319 | |
| | 217 | | | 6.500%, 10/01/35 - 06/01/36 | | | 235 | |
| | 1,317 | | | 7.000%, 12/01/36 - 10/01/46 | | | 1,477 | |
| | 1 | | | 10.165%, 06/15/21 | | | 1 | |
| | 1 | | | 11.000%, 08/20/20 | | | 1 | |
| | 6 | | | Government National Mortgage Association II, 15 Year, Single Family, 6.000%, 04/20/17 | | | 6 | |
| | | | Government National Mortgage Association II, 30 Year, Single Family, | | | | |
| | 3,530 | | | 3.750%, 08/20/46 (w) | | | 3,770 | |
| | 1,922 | | | 4.000%, 03/20/46 | | | 2,081 | |
| | 2,720 | | | 4.250%, 12/20/44 | | | 2,975 | |
| | 455 | | | 5.500%, 09/20/39 | | | 521 | |
| | 2,163 | | | 6.000%, 08/20/39 | | | 2,507 | |
| | 1,610 | | | 6.500%, 10/20/33 - 01/20/39 | | | 1,790 | |
| | 12 | | | 7.500%, 02/20/28 - 09/20/28 | | | 15 | |
| | 19 | | | 8.000%, 06/20/26 - 10/20/27 | | | 23 | |
| | 12 | | | 8.500%, 03/20/25 - 05/20/25 | | | 14 | |
| | | | Government National Mortgage Association II, Other, | | | | |
| | 1,777 | | | 3.750%, 12/20/32 | | | 1,892 | |
| | | | | | | | |
PRINCIPAL
AMOUNT($) | | | SECURITY DESCRIPTION | | VALUE($) | |
| | | | | | | | |
| | 2,863 | | | 4.433%, 05/20/63 | | | 3,095 | |
| | 2,013 | | | 4.462%, 05/20/63 | | | 2,175 | |
| | 3,059 | | | 4.479%, 04/20/63 | | | 3,305 | |
| | 107 | | | 6.000%, 11/20/38 | | | 117 | |
| | | | Government National Mortgage Association, 15 Year, Single Family, | | | | |
| | 47 | | | 6.000%, 06/15/18 | | | 48 | |
| | — | (h) | | 7.000%, 10/15/16 | | | 1 | |
| | 3 | | | 7.500%, 11/15/17 | | | 3 | |
| | | | Government National Mortgage Association, 30 Year, Single Family, | | | | |
| | 4,000 | | | 4.000%, 08/15/46 | | | 4,321 | |
| | 54 | | | 6.375%, 08/15/26 | | | 61 | |
| | 1,389 | | | 6.500%, 10/15/27 - 04/15/33 | | | 1,598 | |
| | 1,389 | | | 7.000%, 09/15/31 - 03/15/37 | | | 1,647 | |
| | 52 | | | 7.500%, 11/15/22 - 01/15/33 | | | 54 | |
| | 1 | | | 8.000%, 09/15/22 | | | 1 | |
| | 6 | | | 9.000%, 01/15/31 | | | 6 | |
| | 154 | | | 9.500%, 10/15/24 | | | 166 | |
| | — | (h) | | 11.000%, 01/15/21 | | | — | (h) |
| | | | Government National Mortgage Association, Other, 20 Year, Single Family, | | | | |
| | 313 | | | 6.500%, 08/15/22 - 11/15/23 | | | 339 | |
| | 34 | | | 7.000%, 08/15/23 | | | 37 | |
| | | | | | | | |
| | | | Total Mortgage Pass-Through Securities
(Cost $1,055,332) | | | 1,100,967 | |
| | | | | | | | |
| U.S. Treasury Obligations — 1.0% | |
| | | | U.S. Treasury Bonds, | | | | |
| | 200 | | | 4.375%, 02/15/38 | | | 284 | |
| | 200 | | | 4.500%, 05/15/38 | | | 289 | |
| | | | U.S. Treasury Coupon STRIPS, | | | | |
| | 2,300 | | | 1.841%, 05/15/20 (n) | | | 2,208 | |
| | 140 | | | 1.960%, 08/15/23 (n) | | | 126 | |
| | 2,350 | | | 2.266%, 02/15/24 (n) | | | 2,095 | |
| | 6,000 | | | 2.332%, 05/15/21 (n) | | | 5,658 | |
| | 1,500 | | | 2.340%, 05/15/22 (n) | | | 1,387 | |
| | 500 | | | 2.582%, 05/15/23 (n) | | | 452 | |
| | 1,000 | | | 2.586%, 11/15/22 (n) | | | 915 | |
| | 2,360 | | | 2.657%, 02/15/23 (n) | | | 2,147 | |
| | 750 | | | 3.040%, 02/15/33 (n) | | | 535 | |
| | 500 | | | 3.305%, 08/15/30 (n) | | | 381 | |
| | 800 | | | 3.330%, 02/15/30 (n) | | | 618 | |
| | 800 | | | 3.393%, 08/15/31 (n) | | | 596 | |
| | 650 | | | 5.880%, 11/15/30 (n) | | | 492 | |
| | 500 | | | 6.099%, 02/15/29 (n) | | | 396 | |
| | 200 | | | 6.294%, 08/15/28 (n) | | | 160 | |
SEE NOTES TO FINANCIAL STATEMENTS.
| | | | | | | | |
| | | |
| AUGUST 31, 2016 | | J.P. MORGAN INCOME FUNDS | | | | | 237 | |
JPMorgan Mortgage-Backed Securities Fund
SCHEDULE OF PORTFOLIO INVESTMENTS
AS OF AUGUST 31, 2016 (Unaudited) (continued)
(Amounts in thousands)
| | | | | | | | |
PRINCIPAL
AMOUNT($) | | | SECURITY DESCRIPTION | | VALUE($) | |
| U.S. Treasury Obligations — continued | |
| | | | U.S. Treasury Notes, | | | | |
| | 700 | | | 1.750%, 10/31/20 | | | 717 | |
| | 4,300 | | | 1.750%, 05/15/23 | | | 4,389 | |
| | 2,500 | | | 2.000%, 10/31/21 | | | 2,592 | |
| | 1,000 | | | 2.125%, 12/31/21 | | | 1,044 | |
| | | | | | | | |
| | | | Total U.S. Treasury Obligations
(Cost $25,634) | | | 27,481 | |
| | | | | | | | |
| Loan Assignment — 0.2% | |
| | | | Consumer Discretionary — 0.2% | | | | |
| | | | Hotels, Restaurants & Leisure — 0.2% | | | | |
| | 5,462 | | | Lila Mexican Holdings LLC, Tranche B Term Loan, VAR, 3.508%, 08/11/22
(Cost $5,295) | | | 5,333 | |
| | | | | | | | |
| | | | | | | | |
SHARES | | | SECURITY DESCRIPTION | | VALUE($) | |
| Short-Term Investment — 6.8% | |
| | | | Investment Company — 6.8% | | | | |
| | 188,596 | | | JPMorgan Prime Money Market Fund, Institutional Class Shares, 0.360% (b) (l)
(Cost $188,596) | | | 188,596 | |
| | | | | | | | |
| | | | Total Investments — 100.6%
(Cost $2,710,415) | | | 2,798,950 | |
| | | | Liabilities in Excess of
Other Assets ��� (0.6)% | | | (16,452 | ) |
| | | | | | | | |
| | | | NET ASSETS — 100.0% | | $ | 2,782,498 | |
| | | | | | | | |
Percentages indicated are based on net assets.
SEE NOTES TO FINANCIAL STATEMENTS.
| | | | | | |
| | | |
| 238 | | | | J.P. MORGAN INCOME FUNDS | | AUGUST 31, 2016 |
JPMorgan Short Duration Bond Fund
SCHEDULE OF PORTFOLIO INVESTMENTS
AS OF AUGUST 31, 2016 (Unaudited)
(Amounts in thousands)
| | | | | | | | |
PRINCIPAL
AMOUNT($) | | | SECURITY DESCRIPTION | | VALUE($) | |
| Asset-Backed Securities — 8.9% | |
| | 3,546 | | | Academic Loan Funding Trust, Series 2012-1A, Class A1, VAR, 1.288%, 12/27/22 (e) | | | 3,547 | |
| | 1,170 | | | Accredited Mortgage Loan Trust, Series 2006-1, Class A3, VAR, 0.668%, 04/25/36 | | | 1,166 | |
| | 2,390 | | | Ally Auto Receivables Trust, Series 2016-1, Class A2A, 1.200%, 08/15/18 | | | 2,392 | |
| | 3,025 | | | Ally Master Owner Trust, Series 2014-3, Class A, 1.330%, 03/15/19 | | | 3,026 | |
| | | | American Credit Acceptance Receivables Trust, | | | | |
| | 1,003 | | | Series 2015-1, Class A, 1.430%, 08/12/19 (e) | | | 1,002 | |
| | 1,127 | | | Series 2015-2, Class A, 1.570%, 06/12/19 (e) | | | 1,126 | |
| | 3,022 | | | Series 2015-3, Class A, 1.950%, 09/12/19 (e) | | | 3,025 | |
| | 3,576 | | | Series 2016-3, Class A, 1.700%, 11/12/20 (e) | | | 3,573 | |
| | 4,875 | | | Series 2016-1A, Class A, 2.370%, 05/12/20 (e) | | | 4,896 | |
| | | | American Express Credit Account Master Trust, | | | | |
| | 4,565 | | | Series 2014-2, Class A, 1.260%, 01/15/20 | | | 4,572 | |
| | 3,602 | | | Series 2014-3, Class A, 1.490%, 04/15/20 | | | 3,618 | |
| | | | AmeriCredit Automobile Receivables Trust, | | | | |
| | 198 | | | Series 2013-5, Class A3, 0.900%, 09/10/18 | | | 198 | |
| | 200 | | | Series 2014-1, Class A3, 0.900%, 02/08/19 | | | 200 | |
| | 2,545 | | | Series 2014-2, Class A3, 0.940%, 02/08/19 | | | 2,543 | |
| | 7,869 | | | Series 2015-1, Class A3, 1.260%, 11/08/19 | | | 7,865 | |
| | 6,936 | | | Series 2015-2, Class A3, 1.270%, 01/08/20 | | | 6,931 | |
| | 3,446 | | | Series 2015-4, Class A3, 1.700%, 07/08/20 | | | 3,456 | |
| | 1,917 | | | Series 2016-1, Class A3, 1.810%, 10/08/20 | | | 1,926 | |
| | 40 | | | Amortizing Residential Collateral Trust, Series 2002-BC6, Class M1, VAR, 1.649%, 08/25/32 | | | 37 | |
| | 6,428 | | | Axis Equipment Finance Receivables III LLC, Series 2015-1A, Class A2, 1.900%, 03/20/20 (e) | | | 6,415 | |
| | | | Bear Stearns Asset-Backed Securities Trust, | | | | |
| | 319 | | | Series 2003-SD2, Class 2A, VAR, 3.261%, 06/25/43 | | | 300 | |
| | 303 | | | Series 2006-SD1, Class A, VAR, 0.894%, 04/25/36 | | | 294 | |
| | 7,535 | | | BMW Vehicle Lease Trust, Series 2016-1, Class A3, 1.340%, 01/22/19 | | | 7,516 | |
| | | | | | | | |
PRINCIPAL
AMOUNT($) | | | SECURITY DESCRIPTION | | VALUE($) | |
| | | | | | | | |
| | 1,545 | | | BMW Vehicle Owner Trust, Series 2013-A, Class A4, 1.120%, 04/27/20 | | | 1,545 | |
| | 1,197 | | | BXG Receivables Note Trust, Series 2012-A, Class A, 2.660%, 12/02/27 (e) | | | 1,192 | |
| | | | Cabela’s Credit Card Master Note Trust, | | | | |
| | 7,000 | | | Series 2012-1A, Class A1, 1.630%, 02/18/20 (e) | | | 7,009 | |
| | 7,605 | | | Series 2016-1, Class A1, 1.780%, 06/15/22 | | | 7,586 | |
| | | | Capital Auto Receivables Asset Trust, | | | | |
| | 1,306 | | | Series 2013-4, Class A3, 1.090%, 03/20/18 | | | 1,306 | |
| | 4,073 | | | Series 2014-1, Class A3, 1.320%, 06/20/18 | | | 4,075 | |
| | 548 | | | Series 2014-2, Class A3, 1.260%, 05/21/18 | | | 547 | |
| | 2,099 | | | Series 2014-3, Class A3, 1.480%, 11/20/18 | | | 2,099 | |
| | 4,500 | | | Series 2015-3, Class A2, 1.720%, 01/22/19 | | | 4,518 | |
| | 13,930 | | | Series 2015-3, Class A3, 1.940%, 01/21/20 | | | 13,997 | |
| | 5,128 | | | Series 2015-4, Class A2, 1.620%, 03/20/19 | | | 5,132 | |
| | 3,483 | | | Series 2016-1, Class A3, 1.730%, 04/20/20 | | | 3,488 | |
| | | | Capital One Multi-Asset Execution Trust, | | | | |
| | 3,540 | | | Series 2013-A3, Class A3, 0.960%, 09/16/19 | | | 3,540 | |
| | 2,000 | | | Series 2015-A7, Class A7, 1.450%, 08/16/21 | | | 2,009 | |
| | | | CarFinance Capital Auto Trust, | | | | |
| | 569 | | | Series 2014-1A, Class A, 1.460%, 12/17/18 (e) | | | 569 | |
| | 1,550 | | | Series 2014-1A, Class B, 2.720%, 04/15/20 (e) | | | 1,551 | |
| | 5,999 | | | Series 2014-2A, Class A, 1.440%, 11/16/20 (e) | | | 5,969 | |
| | 3,203 | | | Series 2015-1A, Class A, 1.750%, 06/15/21 (e) | | | 3,185 | |
| | | | CarMax Auto Owner Trust, | | | | |
| | 482 | | | Series 2013-4, Class A3, 0.800%, 07/16/18 | | | 482 | |
| | 842 | | | Series 2014-3, Class A3, 1.160%, 06/17/19 | | | 842 | |
| | 2,898 | | | Series 2014-4, Class A3, 1.250%, 11/15/19 | | | 2,901 | |
| | 7,075 | | | Series 2015-1, Class A3, 1.380%, 11/15/19 | | | 7,091 | |
SEE NOTES TO FINANCIAL STATEMENTS.
| | | | | | | | |
| | | |
| AUGUST 31, 2016 | | J.P. MORGAN INCOME FUNDS | | | | | 239 | |
JPMorgan Short Duration Bond Fund
SCHEDULE OF PORTFOLIO INVESTMENTS
AS OF AUGUST 31, 2016 (Unaudited) (continued)
(Amounts in thousands)
| | | | | | | | |
PRINCIPAL
AMOUNT($) | | | SECURITY DESCRIPTION | | VALUE($) | |
| Asset-Backed Securities — continued | |
| | 2,609 | | | Series 2015-2, Class A3, 1.370%, 03/16/20 | | | 2,615 | |
| | 13,250 | | | Series 2015-4, Class A3, 1.560%, 11/16/20 | | | 13,321 | |
| | 3,543 | | | Series 2016-1, Class A3, 1.610%, 11/16/20 | | | 3,560 | |
| | 9,560 | | | Series 2016-2, Class A3, 1.520%, 02/16/21 | | | 9,592 | |
| | 2,758 | | | Carnow Auto Receivables Trust, Series 2015-1A, Class A, 1.690%, 01/15/20 (e) | | | 2,755 | |
| | 2,281 | | | Centex Home Equity Loan Trust, Series 2002-C, Class AF4, SUB, 4.980%, 06/25/31 | | | 2,302 | |
| | | | Chrysler Capital Auto Receivables Trust, | | | | |
| | 4,889 | | | Series 2015-BA, Class A3, 1.910%, 03/16/20 (e) | | | 4,898 | |
| | 17,654 | | | Series 2016-AA, Class A3, 1.770%, 10/15/20 (e) | | | 17,688 | |
| | 3,500 | | | Series 2016-AA, Class A4, 1.960%, 01/18/22 (e) | | | 3,508 | |
| | 1,487 | | | CIT Equipment Collateral, Series 2014-VT1, Class A3, 1.500%, 10/21/19 (e) | | | 1,486 | |
| | 1,931 | | | Citi Held For Asset Issuance, Series 2015-PM1, Class A, 1.850%, 12/15/21 (e) | | | 1,929 | |
| | | | Citibank Credit Card Issuance Trust, | | | | |
| | 2,625 | | | Series 2007-A8, Class A8, 5.650%, 09/20/19 | | | 2,749 | |
| | 4,750 | | | Series 2014-A8, Class A8, 1.730%, 04/09/20 | | | 4,799 | |
| | | | CNH Equipment Trust, | | | | |
| | 433 | | | Series 2013-C, Class A3, 1.020%, 08/15/18 | | | 433 | |
| | 1,997 | | | Series 2014-A, Class A3, 0.840%, 05/15/19 | | | 1,995 | |
| | 5,330 | | | Series 2014-A, Class A4, 1.500%, 05/15/20 | | | 5,333 | |
| | 1,010 | | | Series 2016-B, Class A3, 1.630%, 08/15/21 | | | 1,011 | |
| | 7,047 | | | Colony American Finance Ltd., (Cayman Islands), Series 2016-1, Class A, 2.544%, 06/15/48 (e) | | | 7,048 | |
| | 1,029 | | | Consumer Credit Origination Loan Trust, Series 2015-1, Class A, 2.820%, 03/15/21 (e) | | | 1,029 | |
| | | | CPS Auto Receivables Trust, | | | | |
| | 1,886 | | | Series 2012-B, Class A, 2.520%, 09/16/19 (e) | | | 1,888 | |
| | 472 | | | Series 2013-A, Class A, 1.310%, 06/15/20 (e) | | | 467 | |
| | | | | | | | |
PRINCIPAL
AMOUNT($) | | | SECURITY DESCRIPTION | | VALUE($) | |
| | | | | | | | |
| | 96 | | | Series 2013-C, Class A, 1.640%, 04/16/18 (e) | | | 96 | |
| | 362 | | | Series 2013-D, Class A, 1.540%, 07/16/18 (e) | | | 362 | |
| | 366 | | | Series 2014-A, Class A, 1.210%, 08/15/18 (e) | | | 366 | |
| | 1,202 | | | Series 2014-B, Class A, 1.110%, 11/15/18 (e) | | | 1,200 | |
| | 3,357 | | | Series 2014-C, Class A, 1.310%, 02/15/19 (e) | | | 3,351 | |
| | 2,693 | | | Series 2015-A, Class A, 1.530%, 07/15/19 (e) | | | 2,690 | |
| | 2,880 | | | Series 2015-C, Class A, 1.770%, 06/17/19 (e) | | | 2,887 | |
| | 10,083 | | | Series 2016-A, Class A, 2.250%, 10/15/19 (e) | | | 10,117 | |
| | 5,740 | | | Series 2016-B, Class A, 2.070%, 11/15/19 (e) | | | 5,753 | |
| | | | CPS Auto Trust, | | | | |
| | 686 | | | Series 2012-C, Class A, 1.820%, 12/16/19 (e) | | | 685 | |
| | 1,026 | | | Series 2012-D, Class A, 1.480%, 03/16/20 (e) | | | 1,023 | |
| | | | Credit Acceptance Auto Loan Trust, | | | | |
| | 11,969 | | | Series 2014-2A, Class A, 1.880%, 03/15/22 (e) | | | 11,967 | |
| | 20,249 | | | Series 2015-1A, Class A, 2.000%, 07/15/22 (e) | | | 20,268 | |
| | 6,890 | | | Series 2015-2A, Class A, 2.400%, 02/15/23 (e) | | | 6,907 | |
| | 82 | | | Credit Suisse First Boston Mortgage Securities Corp., Series 2002-HE4, Class AF, SUB, 5.510%, 08/25/32 | | | 89 | |
| | 402 | | | CWABS, Inc. Asset-Backed Certificates Trust, Series 2004-6, Class M1, VAR, 1.424%, 10/25/34 | | | 377 | |
| | 9,435 | | | Discover Card Execution Note Trust, Series 2014-A4, Class A4, 2.120%, 12/15/21 | | | 9,620 | |
| | | | Drive Auto Receivables Trust, | | | | |
| | 15,000 | | | Series 2015-DA, Class B, 2.590%, 12/16/19 (e) | | | 15,075 | |
| | 3,459 | | | Series 2016-BA, Class A3, 1.670%, 07/15/19 (e) | | | 3,457 | |
| | | | DT Auto Owner Trust, | | | | |
| | 1,879 | | | Series 2015-2A, Class A, 1.240%, 09/17/18 (e) | | | 1,879 | |
| | 1,830 | | | Series 2015-3A, Class A, 1.660%, 03/15/19 (e) | | | 1,831 | |
SEE NOTES TO FINANCIAL STATEMENTS.
| | | | | | |
| | | |
| 240 | | | | J.P. MORGAN INCOME FUNDS | | AUGUST 31, 2016 |
| | | | | | | | |
PRINCIPAL
AMOUNT($) | | | SECURITY DESCRIPTION | | VALUE($) | |
| Asset-Backed Securities — continued | |
| | 9,616 | | | Series 2016-1A, Class A, 2.000%, 09/16/19 (e) | | | 9,633 | |
| | 5,814 | | | Series 2016-2A, Class A, 1.730%, 08/15/19 (e) | | | 5,808 | |
| | 6,913 | | | Series 2016-3A, Class A, 1.750%, 11/15/19 (e) | | | 6,905 | |
| | | | Exeter Automobile Receivables Trust, | | | | |
| | 23 | | | Series 2014-2A, Class A, 1.060%, 08/15/18 (e) | | | 23 | |
| | 741 | | | Series 2014-3A, Class A, 1.320%, 01/15/19 (e) | | | 740 | |
| | 10,379 | | | Series 2015-1A, Class A, 1.600%, 06/17/19 (e) | | | 10,389 | |
| | 4,031 | | | Series 2015-2A, Class A, 1.540%, 11/15/19 (e) | | | 4,021 | |
| | 15,746 | | | Series 2015-3A, Class A, 2.000%, 03/16/20 (e) | | | 15,736 | |
| | 5,752 | | | Series 2016-1A, Class A, 2.350%, 07/15/20 (e) | | | 5,755 | |
| | 6 | | | Federal Home Loan Mortgage Corp. Structured Pass-Through Securities, Series T-20, Class A6, SUB, 7.134%, 09/25/29 | | | 7 | |
| | | | Fifth Third Auto Trust, | | | | |
| | 2,210 | | | Series 2014-2, Class A4, 1.380%, 12/15/20 | | | 2,214 | |
| | 5,113 | | | Series 2015-1, Class A3, 1.420%, 03/16/20 | | | 5,123 | |
| | | | First Investors Auto Owner Trust, | | | | |
| | 239 | | | Series 2014-3A, Class A2, 1.060%, 11/15/18 (e) | | | 239 | |
| | 3,222 | | | Series 2015-1A, Class A2, 1.210%, 04/15/19 (e) | | | 3,218 | |
| | 3,292 | | | Series 2015-2A, Class A1, 1.590%, 12/16/19 (e) | | | 3,286 | |
| | 11,474 | | | Series 2016-1A, Class A1, 1.920%, 05/15/20 (e) | | | 11,492 | |
| | 5,827 | | | FirstKey Lending Trust, Series 2015-SFR1, Class A, 2.553%, 03/09/47 (e) | | | 5,809 | |
| | | | Flagship Credit Auto Trust, | | | | |
| | 704 | | | Series 2013-2, Class A, 1.940%, 01/15/19 (e) | | | 704 | |
| | 676 | | | Series 2014-1, Class A, 1.210%, 04/15/19 (e) | | | 675 | |
| | 3,325 | | | Series 2014-2, Class A, 1.430%, 12/16/19 (e) | | | 3,315 | |
| | 5,205 | | | Series 2015-1, Class A, 1.630%, 06/15/20 (e) | | | 5,185 | |
| | 6,684 | | | Series 2015-3, Class A, 2.380%, 10/15/20 (e) | | | 6,710 | |
| | | | | | | | |
PRINCIPAL
AMOUNT($) | | | SECURITY DESCRIPTION | | VALUE($) | |
| | | | | | | | |
| | 6,683 | | | Series 2016-2, Class A1, 2.280%, 05/15/20 (e) | | | 6,689 | |
| | | | Ford Credit Auto Lease Trust, | | | | |
| | 2,039 | | | Series 2014-B, Class A3, 0.890%, 09/15/17 | | | 2,039 | |
| | 14,125 | | | Series 2015-A, Class A3, 1.130%, 06/15/18 | | | 14,120 | |
| | | | Ford Credit Auto Owner Trust, | | | | |
| | 225 | | | Series 2013-C, Class A3, 0.820%, 12/15/17 | | | 225 | |
| | 1,669 | | | Series 2015-A, Class A3, 1.280%, 09/15/19 | | | 1,672 | |
| | 6,799 | | | Series 2015-B, Class A3, 1.160%, 11/15/19 | | | 6,802 | |
| | 2,596 | | | Series 2015-C, Class A3, 1.410%, 02/15/20 | | | 2,602 | |
| | 2,004 | | | Series 2016-B, Class A3, 1.330%, 10/15/20 | | | 2,009 | |
| | 6,797 | | | GCAT, Series 2015-2, Class A1, SUB, 3.750%, 07/25/20 (e) | | | 6,762 | |
| | 659 | | | GE Equipment Small Ticket LLC, Series 2014-1A, Class A3, 0.950%, 09/25/17 (e) | | | 658 | |
| | | | GLS Auto Receivables Trust, | | | | |
| | 4,484 | | | Series 2015-1A, Class A, 2.250%, 12/15/20 (e) | | | 4,475 | |
| | 19,083 | | | Series 2016-1A, Class A, 2.730%, 10/15/20 (e) | | | 19,179 | |
| | 4,405 | | | GM Financial Automobile Leasing Trust, Series 2015-1, Class A3, 1.530%, 09/20/18 | | | 4,420 | |
| | 1,562 | | | GMAT Trust, Series 2013-1A, Class A, SUB, 3.967%, 11/25/43 (e) | | | 1,562 | |
| | | | GO Financial Auto Securitization Trust, | | | | |
| | 1,106 | | | Series 2015-1, Class A, 1.810%, 03/15/18 (e) | | | 1,104 | |
| | 4,195 | | | Series 2015-2, Class A, 3.270%, 11/15/18 (e) | | | 4,216 | |
| | 14,689 | | | Green Tree Agency Advance Funding Trust I, Series 2015-T1, Class AT1, 2.302%, 10/15/46 (e) | | | 14,684 | |
| | | | Honda Auto Receivables Owner Trust, | | | | |
| | 462 | | | Series 2013-4, Class A3, 0.690%, 09/18/17 | | | 462 | |
| | 5,397 | | | Series 2016-1, Class A3, 1.220%, 12/18/19 | | | 5,394 | |
| | 1,911 | | | HSBC Home Equity Loan Trust USA, Series 2007-3, Class APT, VAR, 1.712%, 11/20/36 | | | 1,906 | |
SEE NOTES TO FINANCIAL STATEMENTS.
| | | | | | | | |
| | | |
| AUGUST 31, 2016 | | J.P. MORGAN INCOME FUNDS | | | | | 241 | |
JPMorgan Short Duration Bond Fund
SCHEDULE OF PORTFOLIO INVESTMENTS
AS OF AUGUST 31, 2016 (Unaudited) (continued)
(Amounts in thousands)
| | | | | | | | |
PRINCIPAL
AMOUNT($) | | | SECURITY DESCRIPTION | | VALUE($) | |
| Asset-Backed Securities — continued | |
| | | | Hyundai Auto Lease Securitization Trust, | | | | |
| | 4,102 | | | Series 2015-B, Class A3, 1.400%, 11/15/18 (e) | | | 4,113 | |
| | 4,000 | | | Series 2016-A, Class A3, 1.600%, 07/15/19 (e) | | | 4,010 | |
| | | | Hyundai Auto Receivables Trust, | | | | |
| | 298 | | | Series 2014-A, Class A3, 0.790%, 07/16/18 | | | 298 | |
| | 3,046 | | | Series 2014-A, Class A4, 1.320%, 08/15/19 | | | 3,050 | |
| | 1,559 | | | Series 2015-B, Class A3, 1.120%, 11/15/19 | | | 1,557 | |
| | 3,416 | | | Series 2015-B, Class A4, 1.480%, 06/15/21 | | | 3,408 | |
| | 5,577 | | | Series 2015-C, Class A3, 1.460%, 02/18/20 | | | 5,593 | |
| | 1,600 | | | Series 2016-A, Class A3, 1.560%, 09/15/20 | | | 1,612 | |
| | | | John Deere Owner Trust, | | | | |
| | 1,928 | | | Series 2014-B, Class A3, 1.070%, 11/15/18 | | | 1,927 | |
| | 1,961 | | | Series 2015-B, Class A3, 1.440%, 10/15/19 | | | 1,964 | |
| | 20,283 | | | LV Tower 52 Issuer LLC, Series 2013-1, Class A, 5.500%, 07/15/19 (e) | | | 19,770 | |
| | | | Mercedes-Benz Auto Lease Trust, | | | | |
| | 3,138 | | | Series 2015-A, Class A4, 1.210%, 10/15/20 | | | 3,139 | |
| | 7,836 | | | Series 2015-B, Class A3, 1.340%, 07/16/18 | | | 7,853 | |
| | 5,105 | | | Mercedes-Benz Auto Receivables Trust, Series 2015-1, Class A4, 1.750%, 12/15/21 | | | 5,155 | |
| | 628 | | | Mid-State Trust VI, Series 6, Class A1, 7.340%, 07/01/35 | | | 666 | |
| | 373 | | | Morgan Stanley ABS Capital I, Inc. Trust, Series 2003-SD1, Class M1, VAR, 2.774%, 03/25/33 | | | 348 | |
| | 253 | | | MSCC Heloc Trust, Series 2007-1, Class A, VAR, 0.624%, 12/25/31 | | | 251 | |
| | 1,657 | | | Nationstar HECM Loan Trust, Series 2015-2A, Class A, 2.883%, 11/25/25 (e) | | | 1,657 | |
| | 4,521 | | | NCUA Guaranteed Notes Trust, Series 2010-A1, Class A, VAR, 1.015%, 12/07/20 | | | 4,508 | |
| | 8,715 | | | Nissan Auto Lease Trust, Series 2015-B, Class A3, 1.540%, 04/16/18 | | | 8,745 | |
| | | | Nissan Auto Receivables Owner Trust, | | | | |
| | 1,870 | | | Series 2015-B, Class A3, 1.340%, 03/16/20 | | | 1,872 | |
| | | | | | | | |
PRINCIPAL
AMOUNT($) | | | SECURITY DESCRIPTION | | VALUE($) | |
| | | | | | | | |
| | 4,582 | | | Series 2016-A, Class A3, 1.340%, 10/15/20 | | | 4,595 | |
| | 3,130 | | | Series 2016-B, Class A3, 1.320%, 01/15/21 | | | 3,137 | |
| | 5,628 | | | NRZ Advance Receivables Trust Advance Receivables Backed, Series 2016-T1, Class AT1, 2.751%, 06/15/49 (e) | | | 5,609 | |
| | 4,299 | | | Oak Hill Advisors Residential Loan Trust, Series 2015-NPL2, Class A1, SUB, 3.721%, 07/25/55 (e) | | | 4,261 | |
| | 5,501 | | | Ocwen Master Advance Receivables Trust, Series 2015-T3, Class AT3, 3.211%, 11/15/47 (e) | | | 5,504 | |
| | 5,139 | | | OneMain Direct Auto Receivables Trust, Series 2016-1A, Class A, 2.040%, 01/15/21 (e) | | | 5,131 | |
| | | | OneMain Financial Issuance Trust, | | | | |
| | 3,499 | | | Series 2014-1A, Class A, 2.430%, 06/18/24 (e) | | | 3,503 | |
| | 10,263 | | | Series 2014-2A, Class A, 2.470%, 09/18/24 (e) | | | 10,278 | |
| | 11,832 | | | Series 2015-1A, Class A, 3.190%, 03/18/26 (e) | | | 11,960 | |
| | 16,951 | | | Series 2015-2A, Class A, 2.570%, 07/18/25 (e) | | | 16,969 | |
| | 19,336 | | | Oportun Funding II LLC, Series 2016-A, Class A, 4.700%, 03/08/21 (e) | | | 19,336 | |
| | 1,022 | | | PFS Tax Lien Trust, Series 2014-1, 1.440%, 05/15/29 (e) | | | 1,016 | |
| | 7,636 | | | Pretium Mortgage Credit Partners I LLC, Series 2015-NPL2, Class A1, SUB, 3.750%, 07/27/30 (e) | | | 7,638 | |
| | 11,173 | | | Progreso Receivables Funding III LLC, Series 2015-A, Class A, 3.625%, 02/08/20 (e) | | | 11,176 | |
| | 10,622 | | | Progress Residential Trust, Series 2015-SFR2, Class A, 2.740%, 06/12/32 (e) | | | 10,762 | |
| | 8,000 | | | Purchasing Power Funding LLC, Series 2015-A, Class A2, 4.750%, 12/15/19 (e) | | | 8,015 | |
| | 10 | | | RASC Trust, Series 2001-KS1, Class AI6, 6.349%, 03/25/32 | | | 10 | |
| | 2,610 | | | RBSHD Trust, Series 2013-1A, Class A, SUB, 7.685%, 10/25/47 (e) | | | 2,610 | |
| | | | Santander Drive Auto Receivables Trust, | | | | |
| | 418 | | | Series 2014-4, Class A3, 1.080%, 09/17/18 | | | 417 | |
| | 5,029 | | | Series 2016-1, Class A2A, 1.410%, 07/15/19 | | | 5,032 | |
| | 2,362 | | | Series 2016-2, Class A3, 1.560%, 05/15/20 | | | 2,364 | |
SEE NOTES TO FINANCIAL STATEMENTS.
| | | | | | |
| | | |
| 242 | | | | J.P. MORGAN INCOME FUNDS | | AUGUST 31, 2016 |
| | | | | | | | |
PRINCIPAL
AMOUNT($) | | | SECURITY DESCRIPTION | | VALUE($) | |
| Asset-Backed Securities — continued | |
| | 2,680 | | | Sierra Auto Receivables Securitization Trust, Series 2016-1A, Class A, 2.850%, 01/18/22 (e) | | | 2,675 | |
| | 2,628 | | | Skopos Auto Receivables Trust, Series 2015-2A, Class A, 3.550%, 02/15/20 (e) | | | 2,622 | |
| | 10,633 | | | SpringCastle America Funding LLC, Series 2014-AA, Class A, 2.700%, 05/25/23 (e) | | | 10,641 | |
| | | | Springleaf Funding Trust, | | | | |
| | 9,407 | | | Series 2014-AA, Class A, 2.410%, 12/15/22 (e) | | | 9,413 | |
| | 15,120 | | | Series 2015-AA, Class A, 3.160%, 11/15/24 (e) | | | 15,248 | |
| | 2,986 | | | Sunset Mortgage Loan Co. LLC, Series 2014-NPL2, Class A, SUB, 3.721%, 11/16/44 (e) | | | 2,970 | |
| | | | Synchrony Credit Card Master Note Trust, | | | | |
| | 7,500 | | | Series 2012-6, Class A, 1.360%, 08/17/20 | | | 7,540 | |
| | 4,800 | | | Series 2015-2, Class A, 1.600%, 04/15/21 | | | 4,821 | |
| | 9,388 | | | Series 2016-1, Class A, 2.040%, 03/15/22 | | | 9,511 | |
| | 871 | | | Toyota Auto Receivables Owner Trust, Series 2016-B, Class A3, 1.300%, 04/15/20 | | | 871 | |
| | 5,462 | | | Trafigura Securitisation Finance plc, (Ireland), Series 2014-1A, Class A, VAR, 1.458%, 10/15/18 (e) | | | 5,380 | |
| | 3,519 | | | United Auto Credit Securitization Trust, Series 2016-1, Class A, 2.000%, 10/15/17 (e) | | | 3,518 | |
| | 10,518 | | | Vericrest Opportunity Loan Trust, Series 2015-NPL3, Class A1, SUB, 3.375%, 10/25/58 (e) | | | 10,493 | |
| | 1,236 | | | Verizon Owner Trust, Series 2016-1A, Class A, 1.420%, 01/20/21 (e) | | | 1,236 | |
| | 6,953 | | | Volkswagen Auto Lease Trust, Series 2015-A, Class A3, 1.250%, 12/20/17 | | | 6,948 | |
| | 1,036 | | | VOLT NPL X LLC, Series 2014-NPL8, Class A1, SUB, 3.375%, 10/26/54 (e) | | | 1,035 | |
| | 5,199 | | | VOLT XL LLC, Series 2015-NP14, Class A1, SUB, 4.375%, 11/27/45 (e) | | | 5,252 | |
| | 2,576 | | | VOLT XLV LLC, Series 2016-NPL5, Class A1, SUB, 4.000%, 05/25/46 (e) | | | 2,595 | |
| | 7,163 | | | VOLT XLVI LLC, Series 2016-NPL6, Class A1, SUB, 3.844%, 06/25/46 (e) | | | 7,198 | |
| | 5,254 | | | VOLT XXII LLC, Series 2015-NPL4, Class A1, SUB, 3.500%, 02/25/55 (e) | | | 5,258 | |
| | 9,807 | | | VOLT XXIV LLC, Series 2015-NPL6, Class A1, SUB, 3.500%, 02/25/55 (e) | | | 9,804 | |
| | | | | | | | |
PRINCIPAL
AMOUNT($) | | | SECURITY DESCRIPTION | | VALUE($) | |
| | | | | | | | |
| | 10,385 | | | VOLT XXV LLC, Series 2015-NPL8, Class A1, SUB, 3.500%, 06/26/45 (e) | | | 10,380 | |
| | 9,367 | | | VOLT XXVII LLC, Series 2014-NPL7, Class A1, SUB, 3.375%, 08/27/57 (e) | | | 9,354 | |
| | 5,145 | | | VOLT XXX LLC, Series 2015-NPL1, Class A1, SUB, 3.625%, 10/25/57 (e) | | | 5,148 | |
| | 4,392 | | | VOLT XXXI LLC, Series 2015-NPL2, Class A1, SUB, 3.375%, 02/25/55 (e) | | | 4,390 | |
| | 11,223 | | | VOLT XXXIV LLC, Series 2015-NPL7, Class A1, SUB, 3.250%, 02/25/55 (e) | | | 11,193 | |
| | 4,994 | | | VOLT XXXIX LLC, Series 2015-NP13, Class A1, SUB, 4.125%, 10/25/45 (e) | | | 5,031 | |
| | 5,305 | | | VOLT XXXV LLC, Series 2015-NPL9, Class A1, SUB, 3.500%, 06/26/45 (e) | | | 5,303 | |
| | | | Westlake Automobile Receivables Trust, | | | | |
| | 8,391 | | | Series 2016-1A, Class A2A, 1.820%, 01/15/19 (e) | | | 8,397 | |
| | 2,610 | | | Series 2016-2A, Class A2, 1.570%, 06/17/19 (e) | | | 2,606 | |
| | | | World Financial Network Credit Card Master Trust, | | | | |
| | 13,905 | | | Series 2015-B, Class A, 2.550%, 06/17/24 | | | 14,279 | |
| | 3,600 | | | Series 2016-A, Class A, 2.030%, 04/15/25 | | | 3,625 | |
| | 3,168 | | | World Omni Auto Receivables Trust, Series 2014-B, Class A3, 1.140%, 01/15/20 | | | 3,167 | |
| | 3,527 | | | World Omni Automobile Lease Securitization Trust, Series 2016-A, Class A3, 1.450%, 08/15/19 | | | 3,538 | |
| | | | | | | | |
| | | | Total Asset-Backed Securities
(Cost $979,218) | | | 980,889 | |
| | | | | | | | |
| Collateralized Mortgage Obligations — 4.2% | |
| | | | Agency CMO — 3.7% | |
| | | | Federal Home Loan Mortgage Corp. - Government National Mortgage Association, | | | | |
| | 453 | | | Series 31, Class Z, 8.000%, 04/25/24 | | | 517 | |
| | 87 | | | Series 56, Class Z, 7.500%, 09/20/26 | | | 101 | |
| | | | Federal Home Loan Mortgage Corp. REMIC, | | | | |
| | — | (h) | | Series 2, Class Z, 9.300%, 03/15/19 | | | — | (h) |
| | 1 | | | Series 12, Class A, 9.250%, 11/15/19 | | | 1 | |
| | 1 | | | Series 16, Class D, 10.000%, 10/15/19 | | | 1 | |
| | 5 | | | Series 17, Class I, 9.900%, 10/15/19 | | | 5 | |
| | 9 | | | Series 23, Class F, 9.600%, 04/15/20 | | | 10 | |
| | 5 | | | Series 26, Class F, 9.500%, 02/15/20 | | | 5 | |
| | 1 | | | Series 81, Class A, 8.125%, 11/15/20 | | | 1 | |
| | 6 | | | Series 85, Class C, 8.600%, 01/15/21 | | | 6 | |
| | 4 | | | Series 99, Class Z, 9.500%, 01/15/21 | | | 4 | |
SEE NOTES TO FINANCIAL STATEMENTS.
| | | | | | | | |
| | | |
| AUGUST 31, 2016 | | J.P. MORGAN INCOME FUNDS | | | | | 243 | |
JPMorgan Short Duration Bond Fund
SCHEDULE OF PORTFOLIO INVESTMENTS
AS OF AUGUST 31, 2016 (Unaudited) (continued)
(Amounts in thousands)
| | | | | | | | |
PRINCIPAL
AMOUNT($) | | | SECURITY DESCRIPTION | | VALUE($) | |
| Collateralized Mortgage Obligations — continued | |
| | | | Agency CMO — continued | |
| | 1 | | | Series 159, Class H, 4.500%, 09/15/21 | | | 1 | |
| | 2 | | | Series 189, Class D, 6.500%, 10/15/21 | | | 2 | |
| | — | (h) | | Series 1045, Class G, HB, 1,066.208%, 02/15/21 | | | — | (h) |
| | 1 | | | Series 1053, Class G, 7.000%, 03/15/21 | | | 1 | |
| | 4 | | | Series 1056, Class KZ, 6.500%, 03/15/21 | | | 4 | |
| | 1 | | | Series 1074, Class H, 8.500%, 05/15/21 | | | 1 | |
| | 5 | | | Series 1082, Class C, 9.000%, 05/15/21 | | | 5 | |
| | 3 | | | Series 1087, Class I, 8.500%, 06/15/21 | | | 3 | |
| | 10 | | | Series 1125, Class Z, 8.250%, 08/15/21 | | | 11 | |
| | 9 | | | Series 1142, Class IA, 7.000%, 10/15/21 | | | 9 | |
| | 1 | | | Series 1169, Class G, 7.000%, 11/15/21 | | | 1 | |
| | 15 | | | Series 1343, Class LA, 8.000%, 08/15/22 | | | 17 | |
| | 3 | | | Series 1424, Class F, VAR, 1.240%, 11/15/22 | | | 3 | |
| | 75 | | | Series 1480, Class LZ, 7.500%, 03/15/23 | | | 82 | |
| | 183 | | | Series 1560, Class Z, 7.000%, 08/15/23 | | | 199 | |
| | 62 | | | Series 1754, Class Z, 8.500%, 09/15/24 | | | 71 | |
| | 151 | | | Series 1779, Class Z, 8.500%, 04/15/25 | | | 174 | |
| | 2 | | | Series 1807, Class G, 9.000%, 10/15/20 | | | 2 | |
| | 281 | | | Series 1888, Class Z, 7.000%, 08/15/26 | | | 310 | |
| | 1 | | | Series 2358, Class PD, 6.000%, 09/15/16 | | | 1 | |
| | 2 | | | Series 2390, Class CH, 5.500%, 12/15/16 | | | 2 | |
| | 342 | | | Series 2418, Class MF, 6.000%, 02/15/22 | | | 379 | |
| | 8 | | | Series 2425, Class JH, 6.000%, 03/15/17 | | | 8 | |
| | 48 | | | Series 2453, Class BD, 6.000%, 05/15/17 | | | 49 | |
| | 21 | | | Series 2458, Class OE, 6.000%, 06/15/17 | | | 21 | |
| | 21 | | | Series 2496, Class BK, 5.500%, 09/15/17 | | | 22 | |
| | 23 | | | Series 2503, Class TG, 5.500%, 09/15/17 | | | 24 | |
| | 31 | | | Series 2508, Class AQ, 5.500%, 10/15/17 | | | 31 | |
| | 109 | | | Series 2513, Class DB, 5.000%, 10/15/17 | | | 111 | |
| | 355 | | | Series 2542, Class ES, 5.000%, 12/15/17 | | | 362 | |
| | 373 | | | Series 2546, Class C, 5.000%, 12/15/17 | | | 380 | |
| | 1,211 | | | Series 2638, Class JG, 5.000%, 02/15/33 | | | 1,267 | |
| | 3,713 | | | Series 2682, Class JG, 4.500%, 10/15/23 | | | 4,004 | |
| | 1,238 | | | Series 2707, Class PE, 5.000%, 11/15/18 | | | 1,267 | |
| | 5,980 | | | Series 2750, Class DE, 4.500%, 02/15/19 | | | 6,131 | |
| | 710 | | | Series 2761, Class CB, 4.000%, 03/15/19 | | | 727 | |
| | 3,370 | | | Series 2843, Class BC, 5.000%, 08/15/19 | | | 3,475 | |
| | 1,254 | | | Series 2864, Class NB, 5.500%, 07/15/33 | | | 1,299 | |
| | 1,038 | | | Series 2976, Class HZ, 4.500%, 05/15/35 | | | 1,120 | |
| | 2,688 | | | Series 2988, Class TY, 5.500%, 06/15/25 | | | 2,985 | |
| | 4,230 | | | Series 2989, Class MU, IF, IO, 6.492%, 07/15/34 | | | 894 | |
| | 5,468 | | | Series 2989, Class TG, 5.000%, 06/15/25 | | | 5,971 | |
| | | | | | | | |
PRINCIPAL
AMOUNT($) | | | SECURITY DESCRIPTION | | VALUE($) | |
| | | | | | | | |
| | | | Agency CMO — continued | |
| | 453 | | | Series 2995, Class FT, VAR, 0.758%, 05/15/29 | | | 451 | |
| | 883 | | | Series 3002, Class BN, 5.000%, 07/15/35 | | | 974 | |
| | 2,988 | | | Series 3005, Class ED, 5.000%, 07/15/25 | | | 3,265 | |
| | 65 | | | Series 3005, Class PV, IF, 11.931%, 10/15/33 | | | 78 | |
| | 1,257 | | | Series 3305, Class IW, IF, IO, 5.942%, 04/15/37 | | | 182 | |
| | 22,003 | | | Series 3420, Class EI, IO, SUB, 1.120%, 08/15/37 | | | 1,153 | |
| | 1,850 | | | Series 3429, Class S, IF, IO, 6.312%, 03/15/38 | | | 299 | |
| | 2,099 | | | Series 3546, Class A, VAR, 2.261%, 02/15/39 | | | 2,145 | |
| | 329 | | | Series 3564, Class JA, 4.000%, 01/15/18 | | | 335 | |
| | 2,221 | | | Series 3572, Class JS, IF, IO, 6.292%, 09/15/39 | | | 330 | |
| | 6,748 | | | Series 3609, Class SA, IF, IO, 5.832%, 12/15/39 | | | 1,559 | |
| | 10,668 | | | Series 3747, Class HI, IO, 4.500%, 07/15/37 | | | 396 | |
| | 3,085 | | | Series 3784, Class S, IF, IO, 6.092%, 07/15/23 | | | 298 | |
| | 7,722 | | | Series 3855, Class AM, 6.500%, 11/15/36 | | | 8,577 | |
| | 5,468 | | | Series 3977, Class AB, 3.000%, 09/15/29 | | | 5,600 | |
| | 4,613 | | | Series 4088, Class LE, 4.000%, 10/15/40 | | | 4,789 | |
| | 15,415 | | | Series 4141, Class BI, IO, 2.500%, 12/15/27 | | | 1,305 | |
| | 23,238 | | | Series 4229, Class MA, 3.500%, 05/15/41 | | | 24,750 | |
| | 14,498 | | | Series 4305, Class A, 3.500%, 06/15/48 | | | 15,122 | |
| | 10,908 | | | Series 4305, Class KA, 3.000%, 03/15/38 | | | 11,144 | |
| | 22,167 | | | Series 4374, Class NC, SUB, 2.750%, 02/15/46 | | | 22,958 | |
| | | | Federal National Mortgage Association - ACES, | | | | |
| | 3,534 | | | Series 2011-M2, Class A1, 2.019%, 04/25/21 | | | 3,555 | |
| | 212 | | | Series 2014-M5, Class FA, VAR, 0.825%, 01/25/17 | | | 212 | |
| | | | Federal National Mortgage Association REMIC, | | | | |
| | 2 | | | Series 1988-7, Class Z, 9.250%, 04/25/18 | | | 2 | |
| | 1 | | | Series 1988-13, Class C, 9.300%, 05/25/18 | | | 1 | |
| | 2 | | | Series 1988-15, Class A, 9.000%, 06/25/18 | | | 2 | |
| | 1 | | | Series 1988-16, Class B, 9.500%, 06/25/18 | | | 1 | |
| | 2 | | | Series 1989-2, Class D, 8.800%, 01/25/19 | | | 2 | |
SEE NOTES TO FINANCIAL STATEMENTS.
| | | | | | |
| | | |
| 244 | | | | J.P. MORGAN INCOME FUNDS | | AUGUST 31, 2016 |
| | | | | | | | |
PRINCIPAL
AMOUNT($) | | | SECURITY DESCRIPTION | | VALUE($) | |
| Collateralized Mortgage Obligations — continued | |
| | | | Agency CMO — continued | |
| | 6 | | | Series 1989-27, Class Y, 6.900%, 06/25/19 | | | 7 | |
| | 1 | | | Series 1989-54, Class E, 8.400%, 08/25/19 | | | 2 | |
| | 2 | | | Series 1989-66, Class J, 7.000%, 09/25/19 | | | 2 | |
| | 1 | | | Series 1989-70, Class G, 8.000%, 10/25/19 | | | 1 | |
| | 15 | | | Series 1989-72, Class E, 9.350%, 10/25/19 | | | 16 | |
| | 2 | | | Series 1989-89, Class H, 9.000%, 11/25/19 | | | 2 | |
| | 1 | | | Series 1989-96, Class H, 9.000%, 12/25/19 | | | 1 | |
| | 3 | | | Series 1990-7, Class B, 8.500%, 01/25/20 | | | 3 | |
| | 2 | | | Series 1990-12, Class G, 4.500%, 02/25/20 | | | 2 | |
| | 6 | | | Series 1990-19, Class G, 9.750%, 02/25/20 | | | 7 | |
| | 8 | | | Series 1990-58, Class J, 7.000%, 05/25/20 | | | 8 | |
| | 10 | | | Series 1990-61, Class H, 7.000%, 06/25/20 | | | 10 | |
| | 5 | | | Series 1990-106, Class J, 8.500%, 09/25/20 | | | 5 | |
| | 3 | | | Series 1990-109, Class J, 7.000%, 09/25/20 | | | 3 | |
| | 3 | | | Series 1990-111, Class Z, 8.750%, 09/25/20 | | | 4 | |
| | 2 | | | Series 1990-117, Class E, 8.950%, 10/25/20 | | | 2 | |
| | 3 | | | Series 1990-123, Class G, 7.000%, 10/25/20 | | | 3 | |
| | 4 | | | Series 1990-132, Class Z, 7.000%, 11/25/20 | | | 4 | |
| | 66 | | | Series 1990-137, Class X, 9.000%, 12/25/20 | | | 72 | |
| | 1 | | | Series 1991-53, Class J, 7.000%, 05/25/21 | | | 1 | |
| | 3 | | | Series 1991-130, Class C, 9.000%, 09/25/21 | | | 3 | |
| | — | (h) | | Series 1992-96, Class B, PO, 05/25/22 | | | — | (h) |
| | 631 | | | Series 1992-131, Class KB, 8.000%, 08/25/22 | | | 702 | |
| | 546 | | | Series 1992-185, Class L, 8.000%, 10/25/22 | | | 614 | |
| | 2 | | | Series 1993-165, Class SN, IF, 11.471%, 09/25/23 | | | 3 | |
| | 16 | | | Series 1993-235, Class G, PO, 09/25/23 | | | 15 | |
| | | | | | | | |
PRINCIPAL
AMOUNT($) | | | SECURITY DESCRIPTION | | VALUE($) | |
| | |
| | | | Agency CMO — continued | |
| | 1,178 | | | Series 1994-15, Class ZK, 5.500%, 02/25/24 | | | 1,257 | |
| | 1,400 | | | Series 1994-43, Class PK, 6.350%, 02/25/24 | | | 1,482 | |
| | — | (h) | | Series 1995-W3, Class A, 9.000%, 04/25/25 | | | 1 | |
| | 926 | | | Series 1999-6, Class PB, 6.000%, 03/25/19 | | | 993 | |
| | 7,079 | | | Series 2001-81, Class HE, 6.500%, 01/25/32 | | | 8,171 | |
| | 22 | | | Series 2002-2, Class MG, 6.000%, 02/25/17 | | | 23 | |
| | 2 | | | Series 2002-3, Class OG, 6.000%, 02/25/17 | | | 2 | |
| | 6 | | | Series 2002-28, Class LD, 6.000%, 05/25/17 | | | 6 | |
| | 14 | | | Series 2002-58, Class HC, 5.500%, 09/25/17 | | | 14 | |
| | 48 | | | Series 2002-59, Class UC, 5.500%, 09/25/17 | | | 48 | |
| | 27 | | | Series 2002-63, Class KC, 5.000%, 10/25/17 | | | 27 | |
| | 6,235 | | | Series 2002-64, Class PG, 5.500%, 10/25/32 | | | 7,023 | |
| | 161 | | | Series 2003-16, Class LJ, 5.000%, 03/25/18 | | | 164 | |
| | 1,532 | | | Series 2003-24, Class PD, 5.000%, 04/25/18 | | | 1,562 | |
| | 566 | | | Series 2003-42, Class CI, IO, 6.500%, 05/25/33 | | | 58 | |
| | 804 | | | Series 2003-49, Class IO, IO, 6.500%, 06/25/33 | | | 138 | |
| | 440 | | | Series 2003-57, Class IB, IO, 5.000%, 06/25/18 | | | 15 | |
| | 49 | | | Series 2003-89, Class DC, 5.000%, 12/25/32 | | | 49 | |
| | 396 | | | Series 2003-92, Class HP, 4.500%, 09/25/18 | | | 406 | |
| | 378 | | | Series 2003-129, Class ME, 5.000%, 08/25/23 | | | 386 | |
| | 1,250 | | | Series 2004-60, Class PA, 5.500%, 04/25/34 | | | 1,300 | |
| | 496 | | | Series 2004-72, Class F, VAR, 1.024%, 09/25/34 | | | 495 | |
| | 72 | | | Series 2004-101, Class AR, 5.500%, 01/25/35 | | | 80 | |
| | 3,212 | | | Series 2005-19, Class PA, 5.500%, 07/25/34 | | | 3,419 | |
SEE NOTES TO FINANCIAL STATEMENTS.
| | | | | | | | |
| | | |
| AUGUST 31, 2016 | | J.P. MORGAN INCOME FUNDS | | | | | 245 | |
JPMorgan Short Duration Bond Fund
SCHEDULE OF PORTFOLIO INVESTMENTS
AS OF AUGUST 31, 2016 (Unaudited) (continued)
(Amounts in thousands)
| | | | | | | | |
PRINCIPAL
AMOUNT($) | | | SECURITY DESCRIPTION | | VALUE($) | |
| Collateralized Mortgage Obligations — continued | |
| | | | Agency CMO — continued | |
| | 1,441 | | | Series 2005-38, Class FK, VAR, 0.824%, 05/25/35 | | | 1,436 | |
| | 97 | | | Series 2005-84, Class MB, 5.750%, 10/25/35 | | | 108 | |
| | 4,099 | | | Series 2006-4, Class PB, 6.000%, 09/25/35 | | | 4,501 | |
| | 355 | | | Series 2006-58, Class ST, IF, IO, 6.626%, 07/25/36 | | | 64 | |
| | 135 | | | Series 2007-16, Class FC, VAR, 1.274%, 03/25/37 | | | 137 | |
| | 241 | | | Series 2007-22, Class SC, IF, IO, 5.556%, 03/25/37 | | | 41 | |
| | 4,405 | | | Series 2007-33, Class MS, IF, IO, 6.066%, 04/25/37 | | | 609 | |
| | 634 | | | Series 2007-54, Class FA, VAR, 0.924%, 06/25/37 | | | 633 | |
| | 2,903 | | | Series 2007-85, Class SH, IF, IO, 5.976%, 09/25/37 | | | 421 | |
| | 827 | | | Series 2007-106, Class A7, VAR, 6.150%, 10/25/37 | | | 923 | |
| | 444 | | | Series 2008-18, Class SE, IF, IO, 5.746%, 03/25/38 | | | 72 | |
| | 294 | | | Series 2008-72, Class IO, IO, 5.000%, 08/25/28 | | | 28 | |
| | 1,220 | | | Series 2008-93, Class AM, 5.500%, 06/25/37 | | | 1,291 | |
| | 1,437 | | | Series 2008-95, Class AI, IO, 5.000%, 12/25/23 | | | 29 | |
| | 3,150 | | | Series 2009-15, Class AC, 5.500%, 03/25/29 | | | 3,537 | |
| | 3,284 | | | Series 2009-29, Class LA, VAR, 1.510%, 05/25/39 | | | 3,156 | |
| | 1,730 | | | Series 2009-62, Class HJ, 6.000%, 05/25/39 | | | 1,922 | |
| | 4,119 | | | Series 2009-70, Class IN, IO, 4.500%, 08/25/19 | | | 129 | |
| | 10,038 | | | Series 2009-112, Class SW, IF, IO, 5.726%, 01/25/40 | | | 1,554 | |
| | 1,108 | | | Series 2010-58, Class MA, 5.500%, 12/25/38 | | | 1,157 | |
| | 2,177 | | | Series 2010-60, Class IO, IO, 4.000%, 06/25/20 | | | 108 | |
| | 4,675 | | | Series 2010-64, Class DM, 5.000%, 06/25/40 | | | 5,184 | |
| | 3,377 | | | Series 2010-111, Class AE, 5.500%, 04/25/38 | | | 3,474 | |
| | 11,517 | | | Series 2010-126, Class LI, IO, 4.000%, 11/25/40 | | | 817 | |
| | | | | | | | |
PRINCIPAL
AMOUNT($) | | | SECURITY DESCRIPTION | | VALUE($) | |
| | |
| | | | Agency CMO — continued | |
| | 1,326 | | | Series 2011-36, Class PA, 4.000%, 02/25/39 | | | 1,350 | |
| | 5,430 | | | Series 2011-42, Class DE, 3.250%, 11/25/28 | | | 5,486 | |
| | 31,013 | | | Series 2012-46, Class KI, IO, 3.500%, 05/25/27 | | | 3,510 | |
| | 6,610 | | | Series 2013-1, Class BA, 3.000%, 02/25/40 | | | 6,829 | |
| | 11,001 | | | Series 2013-9, Class CB, 5.500%, 04/25/42 | | | 12,428 | |
| | 4,007 | | | Series 2013-55, Class BA, 3.000%, 06/25/37 | | | 4,127 | |
| | 17,494 | | | Series 2013-83, Class CA, 3.500%, 10/25/37 | | | 18,244 | |
| | 11,618 | | | Series 2013-90, Class DK, 3.500%, 12/25/31 | | | 12,219 | |
| | 13,260 | | | Series 2013-92, Class A, 3.500%, 12/25/38 | | | 13,841 | |
| | 3,897 | | | Series 2013-96, Class CA, 4.000%, 04/25/41 | | | 4,115 | |
| | 11,584 | | | Series 2013-96, Class YA, 3.500%, 09/25/38 | | | 12,215 | |
| | 17,808 | | | Series 2014-23, Class PA, 3.500%, 08/25/36 | | | 18,530 | |
| | 8,060 | | | Series 2016-2, Class GA, 3.000%, 02/25/46 | | | 8,390 | |
| | 3 | | | Series G-11, Class Z, 8.500%, 05/25/21 | | | 4 | |
| | — | (h) | | Series G-22, Class ZT, 8.000%, 12/25/16 | | | — | (h) |
| | 159 | | | Series G92-19, Class M, 8.500%, 04/25/22 | | | 178 | |
| | 10 | | | Series G92-35, Class E, 7.500%, 07/25/22 | | | 11 | |
| | 304 | | | Series G92-35, Class EA, 8.000%, 07/25/22 | | | 329 | |
| | 4 | | | Series G92-40, Class ZC, 7.000%, 07/25/22 | | | 4 | |
| | 5 | | | Series G92-44, Class ZQ, 8.000%, 07/25/22 | | | 5 | |
| | 8 | | | Series G92-54, Class ZQ, 7.500%, 09/25/22 | | | 9 | |
| | 1,604 | | | Series G92-64, Class J, 8.000%, 11/25/22 | | | 1,801 | |
| | 723 | | | Series G92-66, Class K, 8.000%, 12/25/22 | | | 800 | |
| | 593 | | | Series G94-6, Class PJ, 8.000%, 05/17/24 | | | 675 | |
| | | | Federal National Mortgage Association STRIPS, | | | | |
| | — | (h) | | Series 268, Class 2, IO, 9.000%, 02/25/23 | | | — | (h) |
| | 1,069 | | | Series 334, Class 9, IO, 6.000%, 03/25/33 | | | 234 | |
| | 447 | | | Series 334, Class 13, IO, VAR, 6.000%, 03/25/33 | | | 84 | |
SEE NOTES TO FINANCIAL STATEMENTS.
| | | | | | |
| | | |
| 246 | | | | J.P. MORGAN INCOME FUNDS | | AUGUST 31, 2016 |
| | | | | | | | |
PRINCIPAL
AMOUNT($) | | | SECURITY DESCRIPTION | | VALUE($) | |
| Collateralized Mortgage Obligations — continued | |
| | | | Agency CMO — continued | |
| | 484 | | | Series 334, Class 17, IO, VAR, 6.500%, 02/25/33 | | | 98 | |
| | 136 | | | Series 334, Class 24, IO, VAR, 5.000%, 02/25/18 | | | 3 | |
| | 1,028 | | | Series 343, Class 21, IO, 4.000%, 09/25/18 | | | 31 | |
| | 359 | | | Series 345, Class 22, IO, VAR, 4.500%, 05/25/20 | | | 12 | |
| | 292 | | | Series 351, Class 28, IO, VAR, 5.000%, 04/25/19 | | | 13 | |
| | 360 | | | Series 356, Class 16, IO, VAR, 5.500%, 06/25/35 | | | 66 | |
| | 333 | | | Series 359, Class 16, IO, VAR, 5.500%, 10/25/35 | | | 55 | |
| | 483 | | | Series 369, Class 19, IO, VAR, 6.000%, 10/25/36 | | | 73 | |
| | 280 | | | Series 369, Class 26, IO, VAR, 6.500%, 10/25/36 | | | 58 | |
| | 664 | | | Series 386, Class 20, IO, VAR, 6.500%, 08/25/38 | | | 129 | |
| | 1,181 | | | Series 394, Class C3, IO, 6.500%, 09/25/38 | | | 221 | |
| | 4,708 | | | Federal National Mortgage Association Whole Loan, Series 2007-W1, Class 1AF1, VAR, 0.784%, 11/25/46 | | | 4,717 | |
| | | | Government National Mortgage Association, | | | | |
| | 635 | | | Series 2004-39, Class IN, IO, 5.500%, 06/20/33 | | | 86 | |
| | 5,297 | | | Series 2006-23, Class S, IF, IO, 5.988%, 01/20/36 | | | 346 | |
| | 13,210 | | | Series 2006-26, Class S, IF, IO, 5.988%, 06/20/36 | | | 2,657 | |
| | 8,182 | | | Series 2007-16, Class KU, IF, IO, 6.138%, 04/20/37 | | | 1,484 | |
| | 2,522 | | | Series 2008-75, Class SP, IF, IO, 6.958%, 08/20/38 | | | 483 | |
| | 3,338 | | | Series 2009-14, Class KS, IF, IO, 5.788%, 03/20/39 | | | 518 | |
| | 975 | | | Series 2009-14, Class NI, IO, 6.500%, 03/20/39 | | | 211 | |
| | 8,052 | | | Series 2009-14, Class SA, IF, IO, 5.568%, 03/20/39 | | | 1,194 | |
| | 1,841 | | | Series 2009-61, Class PD, 5.000%, 03/16/38 | | | 1,866 | |
| | 8,696 | | | Series 2009-106, Class XL, IF, IO, 6.238%, 06/20/37 | | | 1,048 | |
| | 415 | | | Series 2010-14, Class QP, 6.000%, 12/20/39 | | | 433 | |
| | | | | | | | |
PRINCIPAL
AMOUNT($) | | | SECURITY DESCRIPTION | | VALUE($) | |
| | |
| | | | Agency CMO — continued | |
| | 4,137 | | | Series 2011-48, Class QA, 5.000%, 08/16/39 | | | 4,379 | |
| | 6,520 | | | Series 2012-84, Class AB, 5.000%, 07/16/33 | | | 6,755 | |
| | 10,256 | | | Series 2012-96, Class WP, 6.500%, 08/16/42 | | | 11,911 | |
| | 2,741 | | | Series 2013-88, Class WA, VAR, 4.998%, 06/20/30 | | | 2,968 | |
| | 21,734 | | | Series 2013-H05, Class FB, VAR, 0.868%, 02/20/62 | | | 21,685 | |
| | | | NCUA Guaranteed Notes Trust, | | | | |
| | 10,673 | | | Series 2010-R3, Class 1A, VAR, 1.054%, 12/08/20 | | | 10,691 | |
| | 3,492 | | | Series 2010-R3, Class 3A, 2.400%, 12/08/20 | | | 3,513 | |
| | 3 | | | Vendee Mortgage Trust, Series 1994-3C, Class 3, 9.784%, 03/15/21 | | | 3 | |
| | | | | | | | |
| | | | | | | 404,629 | |
| | | | | | | | |
| | | | Non-Agency CMO — 0.5% | | | | |
| | 15,223 | | | Ajax Mortgage Loan Trust, Series 2014-A, Class A, SUB, 4.000%, 10/25/57 (e) | | | 15,145 | |
| | 51 | | | Alternative Loan Trust, Series 2003-J3, Class 2A1, 6.250%, 12/25/33 | | | 53 | |
| | | | Banc of America Mortgage Trust, | | | | |
| | 273 | | | Series 2004-4, Class 4A1, 4.750%, 05/25/19 | | | 277 | |
| | 583 | | | Series 2004-5, Class 4A1, 4.750%, 06/25/19 | | | 583 | |
| | 1,225 | | | Series 2005-1, Class 2A1, 5.000%, 02/25/20 | | | 1,243 | |
| | | | BCAP LLC Trust, | | | | |
| | 442 | | | Series 2009-RR13, Class 5A1, VAR, 5.750%, 01/26/36 (e) | | | 442 | |
| | 5,343 | | | Series 2013-RR4, Class A4A2, 2.000%, 02/13/51 (e) | | | 5,313 | |
| | 153 | | | Bear Stearns ARM Trust, Series 2003-7, Class 3A, VAR, 2.835%, 10/25/33 | | | 150 | |
| | | | CHL Mortgage Pass-Through Trust, | | | | |
| | 122 | | | Series 2003-J15, Class 3A1, 5.000%, 01/25/19 | | | 123 | |
| | 116 | | | Series 2004-8, Class 2A1, 4.500%, 06/25/19 | | | 118 | |
| | 258 | | | Citicorp Mortgage Securities Trust, Series 2006-1, Class 2A1, 5.000%, 02/25/21 | | | 265 | |
| | | | Citigroup Mortgage Loan Trust, | | | | |
| | 2,356 | | | Series 2008-AR4, Class 1A1A, VAR, 2.993%, 11/25/38 (e) | | | 2,344 | |
SEE NOTES TO FINANCIAL STATEMENTS.
| | | | | | | | |
| | | |
| AUGUST 31, 2016 | | J.P. MORGAN INCOME FUNDS | | | | | 247 | |
JPMorgan Short Duration Bond Fund
SCHEDULE OF PORTFOLIO INVESTMENTS
AS OF AUGUST 31, 2016 (Unaudited) (continued)
(Amounts in thousands)
| | | | | | | | |
PRINCIPAL
AMOUNT($) | | | SECURITY DESCRIPTION | | VALUE($) | |
| Collateralized Mortgage Obligations — continued | |
| | | | Non-Agency CMO — continued | |
| | 1,323 | | | Series 2010-8, Class 6A6, 4.500%, 12/25/36 (e) | | | 1,328 | |
| | | | Citigroup Mortgage Loan Trust, Inc., | | | | |
| | 107 | | | Series 2003-UP3, Class A1, 7.000%, 09/25/33 | | | 107 | |
| | 1,325 | | | Series 2004-UST1, Class A6, VAR, 2.645%, 08/25/34 | | | 1,272 | |
| | | | Credit Suisse First Boston Mortgage Securities Corp., | | | | |
| | 65 | | | Series 2003-17, Class 2A6, 3.500%, 07/25/18 | | | 65 | |
| | 300 | | | Series 2003-23, Class 8A1, 5.000%, 09/25/18 | | | 302 | |
| | 512 | | | Series 2004-8, Class 6A1, 4.500%, 12/25/19 | | | 516 | |
| | 637 | | | CSMC Mortgage-Backed Trust, Series 2007-5, Class 5A5, VAR, 5.407%, 12/25/14 | | | 514 | |
| | 591 | | | First Horizon Mortgage Pass-Through Trust, Series 2004-7, Class 2A1, 4.750%, 12/25/19 | | | 591 | |
| | 2,270 | | | GMACM Mortgage Loan Trust, Series 2003-AR1, Class A4, VAR, 3.328%, 10/19/33 | | | 2,243 | |
| | 4,374 | | | Homeowner Assistance Program Reverse Mortgage Loan Trust, Series 2013-RM1, Class A, 4.000%, 05/26/53 (e) | | | 4,341 | |
| | 716 | | | Impac Secured Assets CMN Owner Trust, Series 2004-4, Class 2A2, VAR, 1.244%, 02/25/35 | | | 710 | |
| | | | JP Morgan Mortgage Trust, | | | | |
| | 1,898 | | | Series 2004-S2, Class 5A1, 5.500%, 12/25/19 | | | 1,899 | |
| | 2,686 | | | Series 2006-A2, Class 4A1, VAR, 3.185%, 08/25/34 | | | 2,693 | |
| | — | (h) | | Kidder Peabody Mortgage Assets Trust, Series A, Class A1, 6.500%, 02/22/17 | | | — | (h) |
| | | | MASTR Alternative Loan Trust, | | | | |
| | 51 | | | Series 2004-8, Class 6A1, 5.500%, 09/25/19 | | | 52 | |
| | 809 | | | Series 2004-8, Class 7A1, 5.000%, 09/25/19 | | | 819 | |
| | | | MASTR Asset Securitization Trust, | | | | |
| | 77 | | | Series 2002-7, Class 1A1, 5.500%, 11/25/17 | | | 77 | |
| | 197 | | | Series 2003-2, Class 1A1, 5.000%, 03/25/18 | | | 197 | |
| | 135 | | | Series 2003-11, Class 10A1, 5.000%, 12/25/18 | | | 135 | |
| | | | | | | | |
PRINCIPAL
AMOUNT($) | | | SECURITY DESCRIPTION | | VALUE($) | |
| | |
| | | | Non-Agency CMO — continued | |
| | 490 | | | Series 2004-6, Class 6A1, 4.500%, 07/25/19 | | | 490 | |
| | — | (h) | | ML Trust XLIV, Series 44, Class G, 9.000%, 08/20/20 | | | — | (h) |
| | 39 | | | Morgan Stanley Mortgage Loan Trust, Series 2004-1, Class 1A3, 5.000%, 11/25/18 | | | 39 | |
| | | | Nomura Asset Acceptance Corp. Alternative Loan Trust, | | | | |
| | 46 | | | Series 2005-AR1, Class 1A1, VAR, 2.830%, 02/25/35 | | | 47 | |
| | 1,845 | | | Series 2005-AR6, Class 4A1, VAR, 0.784%, 12/25/35 | | | 742 | |
| | 787 | | | Prime Mortgage Trust, Series 2005-2, Class 1A1, 4.750%, 07/25/20 | | | 786 | |
| | | | Springleaf Mortgage Loan Trust, | | | | |
| | 809 | | | Series 2013-1A, Class A, VAR, 1.270%, 06/25/58 (e) | | | 806 | |
| | 2,169 | | | Series 2013-3A, Class A, VAR, 1.870%, 09/25/57 (e) | | | 2,172 | |
| | 819 | | | WaMu Mortgage Pass-Through Certificates Trust, Series 2003-S10, Class A4, 4.500%, 10/25/18 | | | 820 | |
| | | | Wells Fargo Mortgage-Backed Securities Trust, | | | | |
| | 863 | | | Series 2003-K, Class 1A1, VAR, 2.638%, 11/25/33 | | | 864 | |
| | 14 | | | Series 2003-K, Class 1A2, VAR, 2.638%, 11/25/33 | | | 14 | |
| | 2,292 | | | Series 2003-M, Class A1, VAR, 2.787%, 12/25/33 | | | 2,294 | |
| | 747 | | | Series 2004-EE, Class 2A2, VAR, 2.967%, 12/25/34 | | | 760 | |
| | 1,214 | | | Series 2004-EE, Class 3A2, VAR, 3.028%, 12/25/34 | | | 1,251 | |
| | 989 | | | Series 2004-O, Class A1, VAR, 2.992%, 08/25/34 | | | 1,002 | |
| | | | | | | | |
| | | | | | | 56,004 | |
| | | | | | | | |
| | | | Total Collateralized Mortgage Obligations
(Cost $454,387) | | | 460,633 | |
| | | | | | | | |
| Commercial Mortgage-Backed Securities — 1.2% | |
| | | | A10 Securitization LLC, | | | | |
| | 60 | | | Series 2013-1, Class A, 2.400%, 11/15/25 (e) | | | 60 | |
| | 12,562 | | | Series 2015-1, Class A1, 2.100%, 04/15/34 (e) | | | 12,498 | |
| | | | A10 Term Asset Financing LLC, | | | | |
| | 3,630 | | | Series 2013-2, Class A, 2.620%, 11/15/27 (e) | | | 3,620 | |
SEE NOTES TO FINANCIAL STATEMENTS.
| | | | | | |
| | | |
| 248 | | | | J.P. MORGAN INCOME FUNDS | | AUGUST 31, 2016 |
| | | | | | | | |
PRINCIPAL
AMOUNT($) | | | SECURITY DESCRIPTION | | VALUE($) | |
| Commercial Mortgage-Backed Securities — continued | |
| | 1,476 | | | Series 2014-1, Class A1, 1.720%, 04/15/33 (e) | | | 1,468 | |
| | | | Banc of America Commercial Mortgage Trust, | | | | |
| | 240 | | | Series 2006-3, Class A4, VAR, 5.889%, 07/10/44 | | | 240 | |
| | 1,077 | | | Series 2006-5, Class A4, 5.414%, 09/10/47 | | | 1,077 | |
| | 3,621 | | | COBALT CMBS Commercial Mortgage Trust, Series 2006-C1, Class A4, 5.223%, 08/15/48 | | | 3,618 | |
| | | | COMM Mortgage Trust, | | | | |
| | 4,225 | | | Series 2012-9W57, Class A, 2.365%, 02/10/29 (e) | | | 4,235 | |
| | 12,345 | | | Series 2014-TWC, Class A, VAR, 1.358%, 02/13/32 (e) | | | 12,345 | |
| | 846 | | | DBRR Trust, Series 2013-EZ3, Class A, VAR, 1.636%, 12/18/49 (e) | | | 840 | |
| | 14,770 | | | GS Mortgage Securities Trust, Series 2006-GG8, Class AM, 5.591%, 11/10/39 | | | 14,767 | |
| | | | JP Morgan Chase Commercial Mortgage Securities Trust, | | | | |
| | 338 | | | Series 2006-CB17, Class A4, 5.429%, 12/12/43 | | | 338 | |
| | 6,890 | | | Series 2006-LDP9, Class AM, 5.372%, 05/15/47 | | | 6,913 | |
| | 3,000 | | | Series 2006-LDP9, Class AMS, 5.337%, 05/15/47 | | | 2,976 | |
| | | | LB-UBS Commercial Mortgage Trust, | | | | |
| | 6,973 | | | Series 2007-C2, Class A3, 5.430%, 02/15/40 | | | 7,043 | |
| | 3,607 | | | Series 2007-C7, Class A3, VAR, 5.866%, 09/15/45 | | | 3,743 | |
| | 14,135 | | | ML-CFC Commercial Mortgage Trust, Series 2007-9, Class AMA, VAR, 5.853%, 09/12/49 | | | 14,470 | |
| | | | Morgan Stanley Capital I Trust, | | | | |
| | 10,000 | | | Series 2006-IQ12, Class AM, 5.370%, 12/15/43 | | | 10,041 | |
| | 8,887 | | | Series 2006-IQ12, Class AMFX, 5.370%, 12/15/43 | | | 8,924 | |
| | | | Morgan Stanley Re-REMIC Trust, | | | | |
| | 6,590 | | | Series 2012-IO, Class AXA, 1.000%, 03/27/51 (e) | | | 6,557 | |
| | 2,687 | | | Series 2012-XA, Class A, 2.000%, 07/27/49 (e) | | | 2,664 | |
| | 10,778 | | | PFP Ltd., (Cayman Islands), Series 2015-2, Class A, VAR, 1.958%, 07/14/34 (e) | | | 10,705 | |
| | 5,942 | | | TIAA Seasoned Commercial Mortgage Trust, Series 2007-C4, Class AJ, VAR, 5.482%, 08/15/39 | | | 6,001 | |
| | | | | | | | |
PRINCIPAL
AMOUNT($) | | | SECURITY DESCRIPTION | | VALUE($) | |
| | | | | | | | |
| | 34 | | | Wells Fargo Resecuritization Trust, Series 2012-IO, Class A, 1.750%, 08/20/21 (e) | | | 34 | |
| | | | | | | | |
| | | | Total Commercial Mortgage-Backed Securities
(Cost $142,780) | | | 135,177 | |
| | | | | | | | |
| Corporate Bonds — 22.4% | |
| | | | Consumer Discretionary — 0.9% | | | | |
| | | | Auto Components — 0.1% | |
| | | | Johnson Controls, Inc., | | | | |
| | 1,010 | | | 1.400%, 11/02/17 | | | 1,010 | |
| | 4,050 | | | 2.600%, 12/01/16 | | | 4,068 | |
| | 1,015 | | | 5.000%, 03/30/20 | | | 1,111 | |
| | | | | | | | |
| | | | | | | 6,189 | |
| | | | | | | | |
| | | | Automobiles — 0.3% | | | | |
| | 2,199 | | | BMW U.S. Capital LLC, 1.500%, 04/11/19 (e) | | | 2,209 | |
| | | | Daimler Finance North America LLC, | | | | |
| | 2,210 | | | 1.375%, 08/01/17 (e) | | | 2,214 | |
| | 2,050 | | | 1.650%, 03/02/18 (e) | | | 2,058 | |
| | 4,597 | | | 1.875%, 01/11/18 (e) | | | 4,628 | |
| | 2,175 | | | 2.000%, 08/03/18 (e) | | | 2,197 | |
| | 1,750 | | | 2.250%, 09/03/19 (e) | | | 1,780 | |
| | 5,000 | | | 2.250%, 03/02/20 (e) | | | 5,092 | |
| | 4,250 | | | 2.400%, 04/10/17 (e) | | | 4,283 | |
| | | | Hyundai Capital America, | | | | |
| | 859 | | �� | 2.000%, 07/01/19 (e) | | | 864 | |
| | 2,335 | | | 2.400%, 10/30/18 (e) | | | 2,367 | |
| | 3,011 | | | Kia Motors Corp., (South Korea), 2.625%, 04/21/21 (e) | | | 3,105 | |
| | 2,050 | | | Volkswagen Group of America Finance LLC, 1.250%, 05/23/17 (e) | | | 2,046 | |
| | | | | | | | |
| | | | | | | 32,843 | |
| | | | | | | | |
| | | | Hotels, Restaurants & Leisure — 0.0% (g) | | | | |
| | 830 | | | McDonald’s Corp., 3.500%, 07/15/20 | | | 886 | |
| | | | | | | | |
| | | | Internet & Direct Marketing Retail — 0.0% (g) | |
| | 5,009 | | | Amazon.com, Inc., 2.600%, 12/05/19 | | | 5,211 | |
| | | | | | | | |
| | | | Media — 0.3% | | | | |
| | | | 21st Century Fox America, Inc., | | | | |
| | 3,080 | | | 7.250%, 05/18/18 | | | 3,374 | |
| | 315 | | | 8.000%, 10/17/16 | | | 318 | |
| | | | CBS Corp., | | | | |
| | 3,500 | | | 2.300%, 08/15/19 | | | 3,543 | |
| | 1,865 | | | 5.750%, 04/15/20 | | | 2,109 | |
| | | | Comcast Corp., | | | | |
| | 1,950 | | | 5.875%, 02/15/18 | | | 2,083 | |
| | 416 | | | 6.500%, 01/15/17 | | | 424 | |
SEE NOTES TO FINANCIAL STATEMENTS.
| | | | | | | | |
| | | |
| AUGUST 31, 2016 | | J.P. MORGAN INCOME FUNDS | | | | | 249 | |
JPMorgan Short Duration Bond Fund
SCHEDULE OF PORTFOLIO INVESTMENTS
AS OF AUGUST 31, 2016 (Unaudited) (continued)
(Amounts in thousands)
| | | | | | | | |
PRINCIPAL
AMOUNT($) | | | SECURITY DESCRIPTION | | VALUE($) | |
| Corporate Bonds — continued | |
| | | | Media — continued | | | | |
| | | | Cox Communications, Inc., | | | | |
| | 1,190 | | | 5.875%, 12/01/16 (e) | | | 1,203 | |
| | 690 | | | 6.250%, 06/01/18 (e) | | | 735 | |
| | 5,157 | | | Grupo Televisa S.A.B., (Mexico), 6.000%, 05/15/18 | | | 5,508 | |
| | 800 | | | Historic TW, Inc., 6.875%, 06/15/18 | | | 876 | |
| | 556 | | | Sky plc, (United Kingdom), 2.625%, 09/16/19 (e) | | | 564 | |
| | | | Time Warner Cable, Inc., | | | | |
| | 3,886 | | | 5.850%, 05/01/17 | | | 3,999 | |
| | 675 | | | 6.750%, 07/01/18 | | | 735 | |
| | 2,540 | | | Time Warner, Inc., 4.875%, 03/15/20 | | | 2,809 | |
| | | | Viacom, Inc., | | | | |
| | 1,133 | | | 2.200%, 04/01/19 | | | 1,136 | |
| | 4,700 | | | 2.500%, 12/15/16 | | | 4,718 | |
| | 2,163 | | | 2.750%, 12/15/19 | | | 2,210 | |
| | 329 | | | Walt Disney Co. (The), 1.100%, 12/01/17 | | | 329 | |
| | | | | | | | |
| | | | | | | 36,673 | |
| | | | | | | | |
| | | | Multiline Retail — 0.1% | | | | |
| | | | Macy’s Retail Holdings, Inc., | | | | |
| | 1,576 | | | 3.450%, 01/15/21 | | | 1,643 | |
| | 6,930 | | | 7.450%, 07/15/17 | | | 7,276 | |
| | 645 | | | Target Corp., 2.300%, 06/26/19 | | | 665 | |
| | | | | | | | |
| | | | | | | 9,584 | |
| | | | | | | | |
| | | | Specialty Retail — 0.1% | | | | |
| | | | AutoZone, Inc., | | | | |
| | 3,985 | | | 1.625%, 04/21/19 | | | 3,994 | |
| | 1,639 | | | 7.125%, 08/01/18 | | | 1,809 | |
| | 2,155 | | | Home Depot, Inc. (The), 2.000%, 06/15/19 | | | 2,202 | |
| | 1,415 | | | Lowe’s Cos., Inc., 6.100%, 09/15/17 | | | 1,489 | |
| | | | | | | | |
| | | | | | | 9,494 | |
| | | | | | | | |
| | | | Textiles, Apparel & Luxury Goods — 0.0% (g) | | | | |
| | 955 | | | VF Corp., 5.950%, 11/01/17 | | | 1,006 | |
| | | | | | | | |
| | | | Total Consumer Discretionary | | | 101,886 | |
| | | | | | | | |
| | | | Consumer Staples — 1.0% | | | | |
| | | | Beverages — 0.3% | | | | |
| | 4,816 | | | Anheuser-Busch Cos. LLC, 5.000%, 03/01/19 | | | 5,210 | |
| | 8,049 | | | Anheuser-Busch InBev Finance, Inc., 1.900%, 02/01/19 | | | 8,133 | |
| | 6,042 | | | Anheuser-Busch InBev Worldwide, Inc., 5.375%, 01/15/20 | | | 6,760 | |
| | 3,400 | | | Beam Suntory, Inc., 1.875%, 05/15/17 | | | 3,410 | |
| | | | | | | | |
PRINCIPAL
AMOUNT($) | | | SECURITY DESCRIPTION | | VALUE($) | |
| | | | | | | | |
| | | | Beverages — continued | | | | |
| | | | Diageo Capital plc, (United Kingdom), | | | | |
| | 461 | | | 1.500%, 05/11/17 | | | 463 | |
| | 400 | | | 5.750%, 10/23/17 | | | 420 | |
| | 3,745 | | | Heineken N.V., (Netherlands), 1.400%, 10/01/17 (e) | | | 3,753 | |
| | 943 | | | PepsiCo, Inc., 1.500%, 02/22/19 | | | 952 | |
| | 4,630 | | | SABMiller Holdings, Inc., 2.200%, 08/01/18 (e) | | | 4,688 | |
| | 2,080 | | | SABMiller plc, (United Kingdom), 6.500%, 07/15/18 (e) | | | 2,269 | |
| | | | | | | | |
| | | | | | | 36,058 | |
| | | | | | | | |
| | | | Food & Staples Retailing — 0.4% | | | | |
| | 3,675 | | | Costco Wholesale Corp., 1.750%, 02/15/20 | | | 3,721 | |
| | | | CVS Health Corp., | | | | |
| | 1,500 | | | 1.900%, 07/20/18 | | | 1,518 | |
| | 4,819 | | | 2.125%, 06/01/21 | | | 4,872 | |
| | 9,410 | | | 2.250%, 12/05/18 | | | 9,611 | |
| | 4,207 | | | 2.250%, 08/12/19 | | | 4,310 | |
| | | | Kroger Co. (The), | | | | |
| | 2,835 | | | 2.200%, 01/15/17 | | | 2,848 | |
| | 4,765 | | | 2.300%, 01/15/19 | | | 4,856 | |
| | 800 | | | 6.400%, 08/15/17 | | | 839 | |
| | | | Sysco Corp., | | | | |
| | 1,383 | | | 2.600%, 10/01/20 | | | 1,427 | |
| | 2,350 | | | 5.250%, 02/12/18 | | | 2,473 | |
| | 2,974 | | | Walgreen Co., 5.250%, 01/15/19 | | | 3,217 | |
| | 6,877 | | | Walgreens Boots Alliance, Inc., 2.600%, 06/01/21 | | | 7,030 | |
| | | | | | | | |
| | | | | | | 46,722 | |
| | | | | | | | |
| | | | Food Products — 0.3% | | | | |
| | | | Bunge Ltd. Finance Corp., | | | | |
| | 1,180 | | | 3.200%, 06/15/17 | | | 1,196 | |
| | 774 | | | 3.500%, 11/24/20 | | | 806 | |
| | 685 | | | 8.500%, 06/15/19 | | | 801 | |
| | | | Cargill, Inc., | | | | |
| | 3,345 | | | 1.900%, 03/01/17 (e) | | | 3,360 | |
| | 275 | | | 6.000%, 11/27/17 (e) | | | 291 | |
| | 2,000 | | | 7.350%, 03/06/19 (e) | | | 2,289 | |
| | 1,800 | | | Ingredion, Inc., 1.800%, 09/25/17 | | | 1,808 | |
| | | | Kellogg Co., | | | | |
| | 729 | | | 1.750%, 05/17/17 | | | 733 | |
| | 1,200 | | | 3.250%, 05/21/18 | | | 1,237 | |
| | | | Kraft Heinz Foods Co., | | | | |
| | 1,793 | | | 2.250%, 06/05/17 | | | 1,807 | |
| | 1,340 | | | 6.125%, 08/23/18 | | | 1,460 | |
SEE NOTES TO FINANCIAL STATEMENTS.
| | | | | | |
| | | |
| 250 | | | | J.P. MORGAN INCOME FUNDS | | AUGUST 31, 2016 |
| | | | | | | | |
PRINCIPAL
AMOUNT($) | | | SECURITY DESCRIPTION | | VALUE($) | |
| Corporate Bonds — continued | |
| | | | Food Products — continued | | | | |
| | | | Mead Johnson Nutrition Co., | | | | |
| | 847 | | | 3.000%, 11/15/20 | | | 884 | |
| | 2,665 | | | 4.900%, 11/01/19 | | | 2,925 | |
| | 7,265 | | | Mondelez International, Inc., 2.250%, 02/01/19 | | | 7,395 | |
| | 4,089 | | | Tyson Foods, Inc., 2.650%, 08/15/19 | | | 4,194 | |
| | | | | | | | |
| | | | | | | 31,186 | |
| | | | | | | | |
| | | | Total Consumer Staples | | | 113,966 | |
| | | | | | | | |
| | | | Energy — 2.1% | | | | |
| | | | Energy Equipment & Services — 0.3% | | | | |
| | 1,954 | | | Halliburton Co., 2.000%, 08/01/18 | | | 1,966 | |
| | 6,445 | | | Nabors Industries, Inc., 6.150%, 02/15/18 | | | 6,679 | |
| | 3,667 | | | National Oilwell Varco, Inc., 1.350%, 12/01/17 | | | 3,640 | |
| | 8,008 | | | Noble Holding International Ltd., (Cayman Islands), 2.500%, 03/15/17 | | | 7,938 | |
| | 3,380 | | | Schlumberger Holdings Corp., 2.350%, 12/21/18 (e) | | | 3,438 | |
| | 1,901 | | | Schlumberger Investment S.A., (Luxembourg), 1.250%, 08/01/17 (e) | | | 1,901 | |
| | 4,980 | | | Transocean, Inc., (Cayman Islands), 3.750%, 10/15/17 | | | 4,968 | |
| | | | | | | | |
| | | | | | | 30,530 | |
| | | | | | | | |
| | | | Oil, Gas & Consumable Fuels — 1.8% | | | | |
| | | | Anadarko Petroleum Corp., | | | | |
| | 438 | | | 6.375%, 09/15/17 | | | 458 | |
| | 1,195 | | | 6.950%, 06/15/19 | | | 1,324 | |
| | 1,600 | | | 8.700%, 03/15/19 | | | 1,826 | |
| | 1,795 | | | BG Energy Capital plc, (United Kingdom), 2.875%, 10/15/16 (e) | | | 1,798 | |
| | | | Boardwalk Pipelines LP, | | | | |
| | 9,050 | | | 5.200%, 06/01/18 | | | 9,205 | |
| | 2,160 | | | 5.500%, 02/01/17 | | | 2,186 | |
| | 1,000 | | | BP Capital Markets America, Inc., 4.200%, 06/15/18 | | | 1,048 | |
| | | | BP Capital Markets plc, (United Kingdom), | | | | |
| | 8,002 | | | 1.375%, 11/06/17 | | | 8,013 | |
| | 470 | | | 4.500%, 10/01/20 | | | 519 | |
| | 1,820 | | | 4.742%, 03/11/21 | | | 2,058 | |
| | | | Buckeye Partners LP, | | | | |
| | 4,350 | | | 2.650%, 11/15/18 | | | 4,394 | |
| | 3,420 | | | 6.050%, 01/15/18 | | | 3,596 | |
| | | | Canadian Natural Resources Ltd., (Canada), | | | | |
| | 768 | | | 1.750%, 01/15/18 | | | 765 | |
| | 3,510 | | | 5.700%, 05/15/17 | | | 3,614 | |
| | | | | | | | |
PRINCIPAL
AMOUNT($) | | | SECURITY DESCRIPTION | | VALUE($) | |
| | | | | | | | |
| | | | Oil, Gas & Consumable Fuels — continued | | | | |
| | 1,620 | | | 5.900%, 02/01/18 | | | 1,703 | |
| | 4,790 | | | Cenovus Energy, Inc., (Canada), 5.700%, 10/15/19 | | | 5,145 | |
| | | | Chevron Corp., | | | | |
| | 1,917 | | | 1.365%, 03/02/18 | | | 1,922 | |
| | 2,580 | | | 1.561%, 05/16/19 | | | 2,597 | |
| | 815 | | | 1.718%, 06/24/18 | | | 824 | |
| | 1,376 | | | CNOOC Finance 2015 Australia Pty Ltd., (Australia), 2.625%, 05/05/20 | | | 1,407 | |
| | 6,264 | | | CNOOC Nexen Finance 2014 ULC, (Canada), 1.625%, 04/30/17 | | | 6,269 | |
| | | | ConocoPhillips, | | | | |
| | 1,400 | | | 5.750%, 02/01/19 | | | 1,531 | |
| | 1,065 | | | 6.650%, 07/15/18 | | | 1,161 | |
| | | | ConocoPhillips Co., | | | | |
| | 800 | | | 1.050%, 12/15/17 | | | 796 | |
| | 1,067 | | | 2.200%, 05/15/20 | | | 1,075 | |
| | 3,304 | | | 4.200%, 03/15/21 | | | 3,563 | |
| | 4,830 | | | Energy Transfer Partners LP, 6.700%, 07/01/18 | | | 5,176 | |
| | 7,375 | | | EnLink Midstream Partners LP, 2.700%, 04/01/19 | | | 7,264 | |
| | | | Enterprise Products Operating LLC, | | | | |
| | 2,135 | | | 5.250%, 01/31/20 | | | 2,357 | |
| | 698 | | | Series L, 6.300%, 09/15/17 | | | 732 | |
| | 9,632 | | | Series N, 6.500%, 01/31/19 | | | 10,715 | |
| | | | EOG Resources, Inc., | | | | |
| | 930 | | | 4.400%, 06/01/20 | | | 1,001 | |
| | 3,450 | | | 5.625%, 06/01/19 | | | 3,769 | |
| | 2,660 | | | Husky Energy, Inc., (Canada), 7.250%, 12/15/19 | | | 3,040 | |
| | 1,000 | | | Korea National Oil Corp., (South Korea), 3.125%, 04/03/17 (e) | | | 1,010 | |
| | 1,775 | | | Magellan Midstream Partners LP, 6.550%, 07/15/19 | | | 1,999 | |
| | 7,358 | | | Marathon Oil Corp., 2.700%, 06/01/20 | | | 7,142 | |
| | 6,610 | | | Noble Energy, Inc., 8.250%, 03/01/19 | | | 7,525 | |
| | 1,855 | | | Occidental Petroleum Corp., 1.500%, 02/15/18 | | | 1,862 | |
| | | | ONEOK Partners LP, | | | | |
| | 8,666 | | | 3.200%, 09/15/18 | | | 8,814 | |
| | 446 | | | 8.625%, 03/01/19 | | | 503 | |
| | 4,300 | | | Petrobras Global Finance B.V., (Netherlands), 6.125%, 10/06/16 | | | 4,311 | |
| | 2,560 | | | Petroleos Mexicanos, (Mexico), 3.125%, 01/23/19 | | | 2,589 | |
| | 3,026 | | | Phillips 66, 2.950%, 05/01/17 | | | 3,061 | |
SEE NOTES TO FINANCIAL STATEMENTS.
| | | | | | | | |
| | | |
| AUGUST 31, 2016 | | J.P. MORGAN INCOME FUNDS | | | | | 251 | |
JPMorgan Short Duration Bond Fund
SCHEDULE OF PORTFOLIO INVESTMENTS
AS OF AUGUST 31, 2016 (Unaudited) (continued)
(Amounts in thousands)
| | | | | | | | |
PRINCIPAL
AMOUNT($) | | | SECURITY DESCRIPTION | | VALUE($) | |
| Corporate Bonds — continued | |
| | | | Oil, Gas & Consumable Fuels — continued | | | | |
| | 1,480 | | | Pioneer Natural Resources Co., 6.875%, 05/01/18 | | | 1,593 | |
| | | | Plains All American Pipeline LP/PAA Finance Corp., | | | | |
| | 1,896 | | | 2.600%, 12/15/19 | | | 1,908 | |
| | 6,917 | | | 6.125%, 01/15/17 | | | 7,030 | |
| | 5,605 | | | 6.500%, 05/01/18 | | | 5,982 | |
| | 2,180 | | | 8.750%, 05/01/19 | | | 2,505 | |
| | 2,617 | | | Spectra Energy Capital LLC, 6.200%, 04/15/18 | | | 2,781 | |
| | 2,819 | | | Spectra Energy Partners LP, 2.950%, 09/25/18 | | | 2,870 | |
| | | | Statoil ASA, (Norway), | | | | |
| | 2,600 | | | 1.150%, 05/15/18 | | | 2,593 | |
| | 235 | | | 1.800%, 11/23/16 | | | 235 | |
| | 1,423 | | | 1.950%, 11/08/18 | | | 1,440 | |
| | 2,480 | | | 2.250%, 11/08/19 | | | 2,533 | |
| | 460 | | | 5.250%, 04/15/19 | | | 503 | |
| | 1,165 | | | Suncor Energy, Inc., (Canada), 6.100%, 06/01/18 | | | 1,251 | |
| | 3,350 | | | Sunoco Logistics Partners Operations LP, 5.500%, 02/15/20 | | | 3,668 | |
| | 3,990 | | | Texas Eastern Transmission LP, 6.000%, 09/15/17 (e) | | | 4,157 | |
| | | | Total Capital International S.A., (France), | | | | |
| | 1,774 | | | 1.500%, 02/17/17 | | | 1,778 | |
| | 727 | | | 1.550%, 06/28/17 | | | 730 | |
| | | | TransCanada PipeLines Ltd., (Canada), | | | | |
| | 351 | | | 1.875%, 01/12/18 | | | 353 | |
| | 4,454 | | | 3.125%, 01/15/19 | | | 4,571 | |
| | 715 | | | 3.800%, 10/01/20 | | | 765 | |
| | 1,040 | | | 6.500%, 08/15/18 | | | 1,134 | |
| | 2,695 | | | Valero Energy Corp., 9.375%, 03/15/19 | | | 3,187 | |
| | 4,850 | | | Western Gas Partners LP, 2.600%, 08/15/18 | | | 4,851 | |
| | | | | | | | |
| | | | | | | 200,085 | |
| | | | | | | | |
| | | | Total Energy | | | 230,615 | |
| | | | | | | | |
| | | | Financials — 12.1% | | | | |
| | | | Banks — 5.8% | | | | |
| | | | ABN AMRO Bank N.V., (Netherlands), | | | | |
| | 2,060 | | | 2.450%, 06/04/20 (e) | | | 2,111 | |
| | 6,346 | | | 2.500%, 10/30/18 (e) | | | 6,469 | |
| | 1,200 | | | American Express Bank FSB, 6.000%, 09/13/17 | | | 1,259 | |
| | 3,515 | | | ANZ New Zealand International Ltd., (New Zealand), 1.750%, 03/29/18 (e) | | | 3,525 | |
| | | | | | | | |
PRINCIPAL
AMOUNT($) | | | SECURITY DESCRIPTION | | VALUE($) | |
| | | | | | | | |
| | | | Banks — continued | | | | |
| | | | Australia & New Zealand Banking Group Ltd., (Australia), | | | | |
| | 3,078 | | | 1.450%, 05/15/18 | | | 3,077 | |
| | 550 | | | 1.500%, 01/16/18 | | | 552 | |
| | | | Bank of America Corp., | | | | |
| | 24,025 | | | 2.000%, 01/11/18 | | | 24,170 | |
| | 10,370 | | | 2.625%, 10/19/20 | | | 10,612 | |
| | 7,533 | | | 2.625%, 04/19/21 | | | 7,681 | |
| | 3,000 | | | 5.625%, 07/01/20 | | | 3,386 | |
| | 2,875 | | | 5.650%, 05/01/18 | | | 3,060 | |
| | 4,203 | | | 5.750%, 12/01/17 | | | 4,419 | |
| | 12,990 | | | 6.000%, 09/01/17 | | | 13,561 | |
| | 6,870 | | | 6.400%, 08/28/17 | | | 7,198 | |
| | 17,606 | | | 6.875%, 04/25/18 | | | 19,081 | |
| | 10,590 | | | 7.625%, 06/01/19 | | | 12,166 | |
| | 1,792 | | | Series L, 1.950%, 05/12/18 | | | 1,805 | |
| | 13,740 | | | Series L, 2.250%, 04/21/20 | | | 13,846 | |
| | 13,295 | | | Series L, 2.600%, 01/15/19 | | | 13,589 | |
| | 6,845 | | | Series L, 2.650%, 04/01/19 | | | 7,005 | |
| | | | Bank of Montreal, (Canada), | | | | |
| | 3,455 | | | 1.350%, 08/28/18 | | | 3,452 | |
| | 3,375 | | | 1.400%, 04/10/18 | | | 3,378 | |
| | 100 | | | 1.450%, 04/09/18 | | | 100 | |
| | 705 | | | 2.375%, 01/25/19 | | | 719 | |
| | | | Bank of Nova Scotia (The), (Canada), | | | | |
| | 6,293 | | | 2.050%, 06/05/19 | | | 6,368 | |
| | 3,814 | | | 2.450%, 03/22/21 | | | 3,907 | |
| | | | Bank of Tokyo-Mitsubishi UFJ Ltd. (The), (Japan), | | | | |
| | 1,589 | | | 1.450%, 09/08/17 (e) | | | 1,588 | |
| | 5,840 | | | 1.700%, 03/05/18 (e) | | | 5,848 | |
| | 400 | | | 2.150%, 09/14/18 (e) | | | 404 | |
| | 1,800 | | | 2.300%, 03/10/19 (e) | | | 1,822 | |
| | 1,000 | | | 2.700%, 09/09/18 (e) | | | 1,020 | |
| | | | Banque Federative du Credit Mutuel S.A., (France), | | | | |
| | 2,935 | | | 1.700%, 01/20/17 (e) | | | 2,939 | |
| | 2,031 | | | 2.500%, 10/29/18 (e) | | | 2,068 | |
| | 1,250 | | | Barclays Bank plc, (United Kingdom), Series 1, 5.000%, 09/22/16 | | | 1,252 | |
| | | | Barclays plc, (United Kingdom), | | | | |
| | 5,670 | | | 2.750%, 11/08/19 | | | 5,716 | |
| | 3,400 | | | 3.200%, 08/10/21 | | | 3,422 | |
| | | | BB&T Corp., | | | | |
| | 9,163 | | | 1.450%, 01/12/18 | | | 9,179 | |
| | 4,065 | | | 1.600%, 08/15/17 | | | 4,084 | |
SEE NOTES TO FINANCIAL STATEMENTS.
| | | | | | |
| | | |
| 252 | | | | J.P. MORGAN INCOME FUNDS | | AUGUST 31, 2016 |
| | | | | | | | |
PRINCIPAL
AMOUNT($) | | | SECURITY DESCRIPTION | | VALUE($) | |
| Corporate Bonds — continued | |
| | | | Banks — continued | | | | |
| | 950 | | | 2.050%, 06/19/18 | | | 962 | |
| | 3,993 | | | 2.250%, 02/01/19 | | | 4,070 | |
| | 1,890 | | | 2.450%, 01/15/20 | | | 1,937 | |
| | 2,500 | | | 2.625%, 06/29/20 | | | 2,578 | |
| | 1,878 | | | 5.250%, 11/01/19 | | | 2,069 | |
| | 2,360 | | | BNP Paribas S.A., (France), 2.375%, 09/14/17 | | | 2,383 | |
| | 1,684 | | | BNZ International Funding Ltd., (New Zealand), 2.350%, 03/04/19 (e) | | | 1,707 | |
| | | | Branch Banking & Trust Co., | | | | |
| | 675 | | | 1.050%, 12/01/16 | | | 675 | |
| | 3,000 | | | 1.450%, 05/10/19 | | | 3,001 | |
| | 300 | | | 2.850%, 04/01/21 | | | 313 | |
| | | | Capital One Bank USA N.A., | | | | |
| | 3,000 | | | 2.150%, 11/21/18 | | | 3,023 | |
| | 2,000 | | | 2.250%, 02/13/19 | | | 2,024 | |
| | | | Capital One N.A., | | | | |
| | 3,750 | | | 1.500%, 09/05/17 | | | 3,754 | |
| | 4,135 | | | 1.500%, 03/22/18 | | | 4,124 | |
| | 7,462 | | | 1.650%, 02/05/18 | | | 7,472 | |
| | 4,472 | | | 2.350%, 08/17/18 | | | 4,532 | |
| | 2,500 | | | 2.400%, 09/05/19 | | | 2,545 | |
| | | | Citigroup, Inc., | | | | |
| | 15,745 | | | 1.700%, 04/27/18 | | | 15,763 | |
| | 11,873 | | | 1.750%, 05/01/18 | | | 11,889 | |
| | 7,862 | | | 1.800%, 02/05/18 | | | 7,890 | |
| | 4,170 | | | 2.050%, 12/07/18 | | | 4,201 | |
| | 16,290 | | | 2.400%, 02/18/20 | | | 16,503 | |
| | 7,545 | | | 2.500%, 09/26/18 | | | 7,677 | |
| | 2,500 | | | 2.700%, 03/30/21 | | | 2,549 | |
| | 2,279 | | | Comerica Bank, 2.500%, 06/02/20 | | | 2,331 | |
| | 3,982 | | | Comerica, Inc., 2.125%, 05/23/19 | | | 4,014 | |
| | | | Commonwealth Bank of Australia, (Australia), | | | | |
| | 4,050 | | | 1.375%, 09/06/18 (e) | | | 4,041 | |
| | 1,450 | | | 2.250%, 03/13/19 | | | 1,474 | |
| | 2,050 | | | 2.300%, 03/12/20 | | | 2,089 | |
| | 5,073 | | | Cooperatieve Rabobank UA, (Netherlands), 2.250%, 01/14/19 | | | 5,152 | |
| | | | Credit Suisse Group Funding Guernsey Ltd., (United Kingdom), | | | | |
| | 774 | | | 2.750%, 03/26/20 | | | 776 | |
| | 5,211 | | | 3.450%, 04/16/21 (e) | | | 5,322 | |
| | 4,400 | | | Danske Bank A/S, (Denmark), 1.650%, 09/06/19 (e) | | | 4,394 | |
| | 3,800 | | | Discover Bank, 3.100%, 06/04/20 | | | 3,909 | |
| | 7,788 | | | Fifth Third Bancorp, 2.875%, 07/27/20 | | | 8,065 | |
| | | | | | | | |
PRINCIPAL
AMOUNT($) | | | SECURITY DESCRIPTION | | VALUE($) | |
| | | | | | | | |
| | | | Banks — continued | | | | |
| | | | Fifth Third Bank, | | | | |
| | 3,236 | | | 2.300%, 03/15/19 | | | 3,294 | |
| | 5,890 | | | 2.375%, 04/25/19 | | | 6,009 | |
| | | | HSBC Bank plc, (United Kingdom), | | | | |
| | 5,524 | | | 1.500%, 05/15/18 (e) | | | 5,509 | |
| | 4,200 | | | 4.750%, 01/19/21 (e) | | | 4,647 | |
| | 4,520 | | | HSBC Bank USA N.A., 6.000%, 08/09/17 | | | 4,702 | |
| | | | HSBC Holdings plc, (United Kingdom), | | | | |
| | 7,370 | | | 2.950%, 05/25/21 | | | 7,557 | |
| | 1,600 | | | 3.400%, 03/08/21 | | | 1,671 | |
| | | | Huntington Bancshares, Inc., | | | | |
| | 3,390 | | | 2.600%, 08/02/18 | | | 3,448 | |
| | 803 | | | 3.150%, 03/14/21 | | | 835 | |
| | 1,815 | | | 7.000%, 12/15/20 | | | 2,114 | |
| | | | Huntington National Bank (The), | | | | |
| | 3,006 | | | 2.000%, 06/30/18 | | | 3,026 | |
| | 2,899 | | | 2.200%, 11/06/18 | | | 2,930 | |
| | 2,175 | | | 2.200%, 04/01/19 | | | 2,197 | |
| | 3,218 | | | Industrial & Commercial Bank of China Ltd., (China), 2.351%, 11/13/17 | | | 3,238 | |
| | 1,560 | | | KeyBank N.A., 2.350%, 03/08/19 | | | 1,589 | |
| | | | KeyCorp, | | | | |
| | 1,570 | | | 2.300%, 12/13/18 | | | 1,595 | |
| | 11,369 | | | 2.900%, 09/15/20 | | | 11,798 | |
| | | | Lloyds Bank plc, (United Kingdom), | | | | |
| | 2,568 | | | 1.750%, 03/16/18 | | | 2,568 | |
| | 2,063 | | | 2.050%, 01/22/19 | | | 2,069 | |
| | | | Manufacturers & Traders Trust Co., | | | | |
| | 345 | | | 1.400%, 07/25/17 | | | 346 | |
| | 2,850 | | | 1.450%, 03/07/18 | | | 2,854 | |
| | 1,000 | | | 2.250%, 07/25/19 | | | 1,017 | |
| | 1,648 | | | 2.300%, 01/30/19 | | | 1,678 | |
| | 2,066 | | | 6.625%, 12/04/17 | | | 2,199 | |
| | | | Mizuho Bank Ltd., (Japan), | | | | |
| | 1,631 | | | 1.800%, 03/26/18 (e) | | | 1,635 | |
| | 1,000 | | | 2.450%, 04/16/19 (e) | | | 1,015 | |
| | 1,189 | | | 2.650%, 09/25/19 (e) | | | 1,214 | |
| | 2,069 | | | Mizuho Financial Group, Inc., (Japan), 2.632%, 04/12/21 (e) | | | 2,099 | |
| | 687 | | | MUFG Americas Holdings Corp., 1.625%, 02/09/18 | | | 687 | |
| | | | National Australia Bank Ltd., (Australia), | | | | |
| | 400 | | | 1.375%, 07/12/19 | | | 398 | |
| | 2,862 | | | 2.000%, 01/14/19 | | | 2,889 | |
| | 1,900 | | | 2.250%, 07/01/19 (e) | | | 1,932 | |
SEE NOTES TO FINANCIAL STATEMENTS.
| | | | | | | | |
| | | |
| AUGUST 31, 2016 | | J.P. MORGAN INCOME FUNDS | | | | | 253 | |
JPMorgan Short Duration Bond Fund
SCHEDULE OF PORTFOLIO INVESTMENTS
AS OF AUGUST 31, 2016 (Unaudited) (continued)
(Amounts in thousands)
| | | | | | | | |
PRINCIPAL
AMOUNT($) | | | SECURITY DESCRIPTION | | VALUE($) | |
| Corporate Bonds — continued | |
| | | | Banks — continued | | | | |
| | 1,850 | | | National City Bank, 5.800%, 06/07/17 | | | 1,909 | |
| | 4,425 | | | National City Corp., 6.875%, 05/15/19 | | | 4,994 | |
| | | | PNC Bank N.A., | | | | |
| | 1,000 | | | 1.500%, 10/18/17 | | | 1,003 | |
| | 1,975 | | | 1.500%, 02/23/18 | | | 1,982 | |
| | 1,014 | | | 1.950%, 03/04/19 | | | 1,026 | |
| | 2,000 | | | 2.300%, 06/01/20 | | | 2,042 | |
| | 4,300 | | | 2.400%, 10/18/19 | | | 4,408 | |
| | 1,000 | | | 2.600%, 07/21/20 | | | 1,032 | |
| | 250 | | | 6.000%, 12/07/17 | | | 264 | |
| | | | PNC Financial Services Group, Inc. (The), | | | | |
| | 7,278 | | | 5.125%, 02/08/20 | | | 8,086 | |
| | 647 | | | 5.625%, 02/01/17 | | | 659 | |
| | | | Royal Bank of Canada, (Canada), | | | | |
| | 1,585 | | | 1.500%, 01/16/18 | | | 1,588 | |
| | 5,960 | | | 1.625%, 04/15/19 | | | 5,976 | |
| | 3,250 | | | 1.875%, 02/05/20 | | | 3,280 | |
| | 1,635 | | | 2.000%, 12/10/18 | | | 1,653 | |
| | 15,915 | | | 2.200%, 07/27/18 | | | 16,155 | |
| | 1,469 | | | Santander UK Group Holdings plc, (United Kingdom), 3.125%, 01/08/21 | | | 1,492 | |
| | 5,718 | | | Santander UK plc, (United Kingdom), 2.500%, 03/14/19 | | | 5,801 | |
| | 884 | | | Skandinaviska Enskilda Banken AB, (Sweden), 1.750%, 03/19/18 (e) | | | 888 | |
| | | | Sumitomo Mitsui Banking Corp., (Japan), | | | | |
| | 3,250 | | | 1.500%, 01/18/18 | | | 3,245 | |
| | 775 | | | 2.500%, 07/19/18 | | | 787 | |
| | | | SunTrust Banks, Inc., | | | | |
| | 8,531 | | | 2.350%, 11/01/18 | | | 8,671 | |
| | 900 | | | 2.500%, 05/01/19 | | | 919 | |
| | 2,425 | | | 2.900%, 03/03/21 | | | 2,513 | |
| | 1,000 | | | 7.250%, 03/15/18 | | | 1,082 | |
| | 500 | | | Svenska Handelsbanken AB, (Sweden), 1.625%, 03/21/18 | | | 502 | |
| | | | Toronto-Dominion Bank (The), (Canada), | | | | |
| | 2,183 | | | 2.125%, 04/07/21 | | | 2,207 | |
| | 550 | | | 2.250%, 11/05/19 | | | 562 | |
| | 2,998 | | | U.S. Bancorp, 1.950%, 11/15/18 | | | 3,044 | |
| | | | U.S. Bank N.A., | | | | |
| | 3,630 | | | 1.350%, 01/26/18 | | | 3,638 | |
| | 4,000 | | | 1.400%, 04/26/19 | | | 4,003 | |
| | 2,000 | | | 2.125%, 10/28/19 | | | 2,042 | |
| | | | Wachovia Corp., | | | | |
| | 5,165 | | | 5.750%, 06/15/17 | | | 5,346 | |
| | 10,367 | | | 5.750%, 02/01/18 | | | 11,009 | |
| | | | | | | | |
PRINCIPAL
AMOUNT($) | | | SECURITY DESCRIPTION | | VALUE($) | |
| | |
| | | | Banks — continued | | | | |
| | | | Wells Fargo & Co., | | | | |
| | 25,648 | | | 2.150%, 01/30/20 | | | 26,066 | |
| | 12,550 | | | 2.550%, 12/07/20 | | | 12,900 | |
| | 12,332 | | | 2.600%, 07/22/20 | | | 12,684 | |
| | | | Wells Fargo Bank N.A., | | | | |
| | 3,100 | | | 1.750%, 05/24/19 | | | 3,124 | |
| | 1,750 | | | 6.000%, 11/15/17 | | | 1,844 | |
| | | | Westpac Banking Corp., (Australia), | | | | |
| | 1,047 | | | 1.550%, 05/25/18 | | | 1,052 | |
| | 1,632 | | | 2.000%, 08/14/17 | | | 1,643 | |
| | 1,202 | | | 2.250%, 01/17/19 | | | 1,221 | |
| | 4,000 | | | 2.600%, 11/23/20 | | | 4,115 | |
| | 3,106 | | | 4.875%, 11/19/19 | | | 3,402 | |
| | | | | | | | |
| | | | | | | 643,664 | |
| | | | | | | | |
| | | | Capital Markets — 2.8% | | | | |
| | 1,200 | | | Ameritech Capital Funding Corp., 6.450%, 01/15/18 | | | 1,275 | |
| | | | Bank of New York Mellon Corp. (The), | | | | |
| | 3,450 | | | 2.050%, 05/03/21 | | | 3,488 | |
| | 6,452 | | | 2.200%, 03/04/19 | | | 6,565 | |
| | 5,040 | | | 2.500%, 04/15/21 | | | 5,187 | |
| | 1,100 | | | 4.600%, 01/15/20 | | | 1,205 | |
| | 4,254 | | | Series G, 2.150%, 02/24/20 | | | 4,330 | |
| | 4,914 | | | BlackRock, Inc., Series 2, 5.000%, 12/10/19 | | | 5,470 | |
| | | | Credit Suisse AG, (Switzerland), | | | | |
| | 7,500 | | | 1.700%, 04/27/18 | | | 7,504 | |
| | 2,383 | | | 1.750%, 01/29/18 | | | 2,387 | |
| | 1,250 | | | 2.300%, 05/28/19 | | | 1,267 | |
| | | | Deutsche Bank AG, (Germany), | | | | |
| | 1,232 | | | 1.350%, 05/30/17 | | | 1,229 | |
| | 20,339 | | | 1.875%, 02/13/18 | | | 20,235 | |
| | | | Goldman Sachs Group, Inc. (The), | | | | |
| | 7,740 | | | 2.600%, 04/23/20 | | | 7,895 | |
| | 6,812 | | | 2.625%, 01/31/19 | | | 6,987 | |
| | 5,810 | | | 2.625%, 04/25/21 | | | 5,912 | |
| | 2,025 | | | 2.750%, 09/15/20 | | | 2,080 | |
| | 4,295 | | | 2.875%, 02/25/21 | | | 4,418 | |
| | 27,314 | | | 5.375%, 03/15/20 | | | 30,385 | |
| | 6,198 | | | 5.950%, 01/18/18 | | | 6,568 | |
| | 18,799 | | | 7.500%, 02/15/19 | | | 21,402 | |
| | 2,375 | | | Series D, 6.000%, 06/15/20 | | | 2,710 | |
| | | | ING Bank N.V., (Netherlands), | | | | |
| | 1,500 | | | 1.800%, 03/16/18 (e) | | | 1,507 | |
| | 1,676 | | | 2.300%, 03/22/19 (e) | | | 1,701 | |
| | 3,772 | | | 2.450%, 03/16/20 (e) | | | 3,849 | |
SEE NOTES TO FINANCIAL STATEMENTS.
| | | | | | |
| | | |
| 254 | | | | J.P. MORGAN INCOME FUNDS | | AUGUST 31, 2016 |
| | | | | | | | |
PRINCIPAL
AMOUNT($) | | | SECURITY DESCRIPTION | | VALUE($) | |
| Corporate Bonds — continued | |
| | | | Capital Markets — continued | | | | |
| | 4,640 | | | 3.750%, 03/07/17 (e) | | | 4,697 | |
| | 2,486 | | | Intercontinental Exchange, Inc., 2.500%, 10/15/18 | | | 2,545 | |
| | 2,210 | | | Jefferies Group LLC, 5.125%, 04/13/18 | | | 2,308 | |
| | | | Macquarie Bank Ltd., (Australia), | | | | |
| | 6,545 | | | 1.600%, 10/27/17 (e) | | | 6,559 | |
| | 7,574 | | | 2.600%, 06/24/19 (e) | | | 7,713 | |
| | | | Macquarie Group Ltd., (Australia), | | | | |
| | 3,080 | | | 3.000%, 12/03/18 (e) | | | 3,154 | |
| | 3,817 | | | 4.875%, 08/10/17 (e) | | | 3,931 | |
| | 446 | | | 7.625%, 08/13/19 (e) | | | 511 | |
| | | | Morgan Stanley, | | | | |
| | 2,528 | | | 1.875%, 01/05/18 | | | 2,541 | |
| | 7,165 | | | 2.450%, 02/01/19 | | | 7,303 | |
| | 28,644 | | | 2.650%, 01/27/20 | | | 29,380 | |
| | 10,706 | | | 2.800%, 06/16/20 | | | 11,007 | |
| | 5,400 | | | 5.500%, 01/26/20 | | | 6,005 | |
| | 4,115 | | | 5.500%, 07/24/20 | | | 4,641 | |
| | 2,836 | | | 5.750%, 01/25/21 | | | 3,251 | |
| | 10,310 | | | 5.950%, 12/28/17 | | | 10,909 | |
| | 1,090 | | | 6.250%, 08/28/17 | | | 1,141 | |
| | 5,026 | | | 6.625%, 04/01/18 | | | 5,415 | |
| | 4,861 | | | 7.300%, 05/13/19 | | | 5,549 | |
| | 2,070 | | | Northern Trust Co. (The), 6.500%, 08/15/18 | | | 2,269 | |
| | | | State Street Corp., | | | | |
| | 1,005 | | | 1.350%, 05/15/18 | | | 1,008 | |
| | 1,991 | | | 2.550%, 08/18/20 | | | 2,062 | |
| | 500 | | | TD Ameritrade Holding Corp., 5.600%, 12/01/19 | | | 558 | |
| | | | Thomson Reuters Corp., (Canada), | | | | |
| | 1,550 | | | 1.300%, 02/23/17 | | | 1,552 | |
| | 885 | | | 1.650%, 09/29/17 | | | 889 | |
| | 1,320 | | | 6.500%, 07/15/18 | | | 1,437 | |
| | | | UBS AG, (Switzerland), | | | | |
| | 2,000 | | | 1.375%, 06/01/17 | | | 2,001 | |
| | 1,400 | | | 1.375%, 08/14/17 | | | 1,400 | |
| | 8,864 | | | 1.800%, 03/26/18 | | | 8,913 | |
| | 1,500 | | | 2.350%, 03/26/20 | | | 1,534 | |
| | 12,664 | | | 2.375%, 08/14/19 | | | 12,922 | |
| | 600 | | | 5.875%, 12/20/17 | | | 634 | |
| | | | | | | | |
| | | | | | | 311,295 | |
| | | | | | | | |
| | | | Consumer Finance — 2.1% | | | | |
| | | | American Express Centurion Bank, | | | | |
| | 1,633 | | | 5.950%, 06/12/17 | | | 1,692 | |
| | 1,945 | | | 6.000%, 09/13/17 | | | 2,040 | |
| | | | | | | | |
PRINCIPAL
AMOUNT($) | | | SECURITY DESCRIPTION | | VALUE($) | |
| | | | | | | | |
| | | | Consumer Finance — continued | | | | |
| | | | American Express Co., | | | | |
| | 9,610 | | | 6.150%, 08/28/17 | | | 10,064 | |
| | 5,015 | | | 7.000%, 03/19/18 | | | 5,436 | |
| | 1,395 | | | 8.125%, 05/20/19 | | | 1,627 | |
| | | | American Express Credit Corp., | | | | |
| | 3,635 | | | 1.550%, 09/22/17 | | | 3,647 | |
| | 1,296 | | | 1.800%, 07/31/18 | | | 1,307 | |
| | 2,753 | | | 1.875%, 11/05/18 | | | 2,779 | |
| | 1,994 | | | 2.125%, 03/18/19 | | | 2,033 | |
| | 8,570 | | | 2.250%, 08/15/19 | | | 8,749 | |
| | 5,279 | | | 2.250%, 05/05/21 | | | 5,368 | |
| | 2,001 | | | Series F, 2.600%, 09/14/20 | | | 2,062 | |
| | | | American Honda Finance Corp., | | | | |
| | 1,475 | | | 1.550%, 12/11/17 | | | 1,485 | |
| | 4,150 | | | 1.600%, 02/16/18 (e) | | | 4,179 | |
| | 2,950 | | | 1.600%, 07/13/18 | | | 2,972 | |
| | 1,419 | | | 2.450%, 09/24/20 | | | 1,467 | |
| | 2,250 | | | 7.625%, 10/01/18 (e) | | | 2,530 | |
| | 4,100 | | | Series A, 2.150%, 03/13/20 | | | 4,179 | |
| | | | Capital One Financial Corp., | | | | |
| | 613 | | | 2.450%, 04/24/19 | | | 625 | |
| | 4,340 | | | 4.750%, 07/15/21 | | | 4,845 | |
| | 392 | | | 6.750%, 09/15/17 | | | 413 | |
| | | | Caterpillar Financial Services Corp., | | | | |
| | 1,840 | | | 1.700%, 06/16/18 | | | 1,857 | |
| | 2,165 | | | 2.100%, 06/09/19 | | | 2,208 | |
| | 2,130 | | | 2.250%, 12/01/19 | | | 2,182 | |
| | 2,055 | | | 7.050%, 10/01/18 | | | 2,296 | |
| | 760 | | | 7.150%, 02/15/19 | | | 865 | |
| | | | Ford Motor Credit Co. LLC, | | | | |
| | 1,573 | | | 1.684%, 09/08/17 | | | 1,575 | |
| | 3,515 | | | 1.724%, 12/06/17 | | | 3,520 | |
| | 10,211 | | | 2.375%, 01/16/18 | | | 10,314 | |
| | 6,146 | | | 2.375%, 03/12/19 | | | 6,228 | |
| | 2,338 | | | 2.459%, 03/27/20 | | | 2,357 | |
| | 1,322 | | | 2.551%, 10/05/18 | | | 1,343 | |
| | 2,575 | | | 2.875%, 10/01/18 | | | 2,638 | |
| | 6,233 | | | 3.000%, 06/12/17 | | | 6,308 | |
| | 1,818 | | | 3.336%, 03/18/21 | | | 1,886 | |
| | 10,200 | | | 4.250%, 02/03/17 | | | 10,321 | |
| | 500 | | | 5.000%, 05/15/18 | | | 527 | |
| | 650 | | | 8.000%, 12/15/16 | | | 663 | |
| | 2,170 | | | 8.125%, 01/15/20 | | | 2,570 | |
| | | | General Motors Financial Co., Inc., | | | | |
| | 7,066 | | | 2.400%, 05/09/19 | | | 7,098 | |
SEE NOTES TO FINANCIAL STATEMENTS.
| | | | | | | | |
| | | |
| AUGUST 31, 2016 | | J.P. MORGAN INCOME FUNDS | | | | | 255 | |
JPMorgan Short Duration Bond Fund
SCHEDULE OF PORTFOLIO INVESTMENTS
AS OF AUGUST 31, 2016 (Unaudited) (continued)
(Amounts in thousands)
| | | | | | | | |
PRINCIPAL
AMOUNT($) | | | SECURITY DESCRIPTION | | VALUE($) | |
| Corporate Bonds — continued | |
| | | | Consumer Finance — continued | | | | |
| | 2,294 | | | 3.100%, 01/15/19 | | | 2,339 | |
| | 3,504 | | | 3.200%, 07/13/20 | | | 3,582 | |
| | 2,804 | | | 3.200%, 07/06/21 | | | 2,848 | |
| | 600 | | | 3.250%, 05/15/18 | | | 612 | |
| | 11,821 | | | 4.200%, 03/01/21 | | | 12,473 | |
| | 3,515 | | | 6.750%, 06/01/18 | | | 3,804 | |
| | | | HSBC USA, Inc., | | | | |
| | 5,590 | | | 1.625%, 01/16/18 | | | 5,591 | |
| | 2,845 | | | 1.700%, 03/05/18 | | | 2,848 | |
| | 4,525 | | | 2.350%, 03/05/20 | | | 4,551 | |
| | 5,990 | | | 2.750%, 08/07/20 | | | 6,118 | |
| | | | John Deere Capital Corp., | | | | |
| | 1,107 | | | 1.350%, 01/16/18 | | | 1,112 | |
| | 1,351 | | | 1.550%, 12/15/17 | | | 1,360 | |
| | 1,260 | | | 1.700%, 01/15/20 | | | 1,273 | |
| | 2,600 | | | 1.950%, 03/04/19 | | | 2,643 | |
| | | | Nissan Motor Acceptance Corp., | | | | |
| | 3,883 | | | 1.800%, 03/15/18 (e) | | | 3,904 | |
| | 5,280 | | | 2.350%, 03/04/19 (e) | | | 5,366 | |
| | | | Toyota Motor Credit Corp., | | | | |
| | 10,991 | | | 1.375%, 01/10/18 | | | 11,032 | |
| | 3,394 | | | 1.900%, 04/08/21 | | | 3,442 | |
| | 8,753 | | | 2.100%, 01/17/19 | | | 8,917 | |
| | 6,700 | | | 2.125%, 07/18/19 | | | 6,846 | |
| | 2,363 | | | Volkswagen International Finance N.V., (Netherlands), 2.375%, 03/22/17 (e) | | | 2,374 | |
| | | | | | | | |
| | | | | | | 229,290 | |
| | | | | | | | |
| | | | Diversified Financial Services — 0.4% | | | | |
| | | | Bank of America N.A., | | | | |
| | 5,250 | | | 2.050%, 12/07/18 | | | 5,321 | |
| | 400 | | | 5.300%, 03/15/17 | | | 409 | |
| | 1,000 | | | 6.100%, 06/15/17 | | | 1,037 | |
| | 6,012 | | | Berkshire Hathaway, Inc., 1.550%, 02/09/18 | | | 6,056 | |
| | 629 | | | Boeing Capital Corp., 4.700%, 10/27/19 | | | 695 | |
| | 13,419 | | | GE Capital International Funding Co. Unlimited Co., (Ireland), 2.342%, 11/15/20 | | | 13,809 | |
| | 1,115 | | | National Rural Utilities Cooperative Finance Corp., 2.350%, 06/15/20 | | | 1,141 | |
| | 1,269 | | | Nationwide Building Society, (United Kingdom), 2.450%, 07/27/21 (e) | | | 1,281 | |
| | | | Shell International Finance B.V., (Netherlands), | | | | |
| | 533 | | | 1.125%, 08/21/17 | | | 533 | |
| | 4,470 | | | 1.375%, 05/10/19 | | | 4,467 | |
| | 3,315 | | | 1.625%, 11/10/18 | | | 3,334 | |
| | 1,682 | | | 2.125%, 05/11/20 | | | 1,716 | |
| | | | | | | | |
PRINCIPAL
AMOUNT($) | | | SECURITY DESCRIPTION | | VALUE($) | |
| | | | | | | | |
| | | | Diversified Financial Services — continued | | | | |
| | 1,200 | | | Siemens Financieringsmaatschappij N.V., (Netherlands), 5.750%, 10/17/16 (e) | | | 1,207 | |
| | 1,562 | | | Total Capital Canada Ltd., (Canada), 1.450%, 01/15/18 | | | 1,569 | |
| | | | UBS Group Funding Jersey Ltd., (Jersey), | | | | |
| | 2,530 | | | 2.950%, 09/24/20 (e) | | | 2,595 | |
| | 1,371 | | | 3.000%, 04/15/21 (e) | | | 1,413 | |
| | | | | | | | |
| | | | | | | 46,583 | |
| | | | | | | | |
| | | | Insurance — 0.9% | | | | |
| | 1,390 | | | ACE INA Holdings, Inc., 5.800%, 03/15/18 | | | 1,485 | |
| | 5,078 | | | American International Group, Inc., 3.300%, 03/01/21 | | | 5,327 | |
| | 2,045 | | | Aon Corp., 5.000%, 09/30/20 | | | 2,262 | |
| | | | Berkshire Hathaway Finance Corp., | | | | |
| | 2,294 | | | 1.300%, 05/15/18 | | | 2,300 | |
| | 1,654 | | | 1.700%, 03/15/19 | | | 1,675 | |
| | 4,670 | | | Chubb Corp. (The), 5.750%, 05/15/18 | | | 5,020 | |
| | 783 | | | Chubb INA Holdings, Inc., 2.300%, 11/03/20 | | | 805 | |
| | | | CNA Financial Corp., | | | | |
| | 2,000 | | | 5.875%, 08/15/20 | | | 2,264 | |
| | 1,255 | | | 6.950%, 01/15/18 | | | 1,338 | |
| | 1,790 | | | 7.350%, 11/15/19 | | | 2,054 | |
| | | | Jackson National Life Global Funding, | | | | |
| | 1,695 | | | 1.875%, 10/15/18 (e) | | | 1,712 | |
| | 2,910 | | | 2.250%, 04/29/21 (e) | | | 2,934 | |
| | 4,500 | | | 2.300%, 04/16/19 (e) | | | 4,572 | |
| | | | Lincoln National Corp., | | | | |
| | 470 | | | 6.250%, 02/15/20 | | | 530 | |
| | 7,862 | | | 8.750%, 07/01/19 | | | 9,191 | |
| | 6,571 | | | Marsh & McLennan Cos., Inc., 2.350%, 09/10/19 | | | 6,678 | |
| | | | MassMutual Global Funding II, | | | | |
| | 2,272 | | | 2.000%, 04/15/21 (e) | | | 2,283 | |
| | 2,085 | | | 2.100%, 08/02/18 (e) | | | 2,117 | |
| | | | Metropolitan Life Global Funding I, | | | | |
| | 5,250 | | | 1.500%, 01/10/18 (e) | | | 5,276 | |
| | 6,781 | | | 2.300%, 04/10/19 (e) | | | 6,918 | |
| | | | New York Life Global Funding, | | | | |
| | 4,600 | | | 1.550%, 11/02/18 (e) | | | 4,623 | |
| | 920 | | | 2.100%, 01/02/19 (e) | | | 936 | |
| | 7,291 | | | 2.150%, 06/18/19 (e) | | | 7,435 | |
| | | | Pricoa Global Funding I, | | | | |
| | 2,200 | | | 1.350%, 08/18/17 (e) | | | 2,203 | |
| | 4,120 | | | 1.600%, 05/29/18 (e) | | | 4,138 | |
| | 4,417 | | | 2.550%, 11/24/20 (e) | | | 4,538 | |
SEE NOTES TO FINANCIAL STATEMENTS.
| | | | | | |
| | | |
| 256 | | | | J.P. MORGAN INCOME FUNDS | | AUGUST 31, 2016 |
| | | | | | | | |
PRINCIPAL
AMOUNT($) | | | SECURITY DESCRIPTION | | VALUE($) | |
| Corporate Bonds — continued | |
| | | | Insurance — continued | | | | |
| | 3,298 | | | Principal Financial Group, Inc., 1.850%, 11/15/17 | | | 3,318 | |
| | | | Principal Life Global Funding II, | | | | |
| | 2,178 | | | 1.125%, 02/24/17 (e) | | | 2,179 | |
| | 2,040 | | | 1.500%, 04/18/19 (e) | | | 2,039 | |
| | 3,984 | | | 2.250%, 10/15/18 (e) | | | 4,053 | |
| | 1,388 | | | Reliance Standard Life Global Funding II, 3.050%, 01/20/21 (e) | | | 1,423 | |
| | | | Travelers Cos., Inc. (The), | | | | |
| | 600 | | | 3.900%, 11/01/20 | | | 655 | |
| | 1,000 | | | 5.750%, 12/15/17 | | | 1,056 | |
| | | | | | | | |
| | | | | | | 105,337 | |
| | | | | | | | |
| | | | Thrifts & Mortgage Finance — 0.1% | | | | |
| | 6,030 | | | BPCE S.A., (France), 1.625%, 01/26/18 | | | 6,044 | |
| | | | | | | | |
| | | | Total Financials | | | 1,342,213 | |
| | | | | | | | |
| | | | Health Care — 1.6% | | | | |
| | | | Biotechnology — 0.3% | | | | |
| | | | Amgen, Inc., | | | | |
| | 2,205 | | | 1.250%, 05/22/17 | | | 2,207 | |
| | 6,344 | | | 2.125%, 05/15/17 | | | 6,387 | |
| | 6,948 | | | 2.200%, 05/22/19 | | | 7,094 | |
| | 100 | | | 5.850%, 06/01/17 | | | 103 | |
| | 870 | | | Baxalta, Inc., 2.875%, 06/23/20 | | | 884 | |
| | | | Biogen, Inc., | | | | |
| | 1,672 | | | 2.900%, 09/15/20 | | | 1,742 | |
| | 3,140 | | | 6.875%, 03/01/18 | | | 3,391 | |
| | | | Celgene Corp., | | | | |
| | 1,501 | | | 2.300%, 08/15/18 | | | 1,524 | |
| | 4,170 | | | 2.875%, 08/15/20 | | | 4,328 | |
| | | | Gilead Sciences, Inc., | | | | |
| | 2,073 | | | 2.050%, 04/01/19 | | | 2,115 | |
| | 1,490 | | | 2.550%, 09/01/20 | | | 1,546 | |
| | | | | | | | |
| | | | | | | 31,321 | |
| | | | | | | | |
| | | | Health Care Equipment & Supplies — 0.2% | | | | |
| | | | Becton, Dickinson & Co., | | | | |
| | 580 | | | 1.800%, 12/15/17 | | | 583 | |
| | 1,380 | | | 2.675%, 12/15/19 | | | 1,428 | |
| | 3,257 | | | 4.900%, 04/15/18 | | | 3,437 | |
| | 1,335 | | | 6.375%, 08/01/19 | | | 1,513 | |
| | | | Covidien International Finance S.A., (Luxembourg), | | | | |
| | 520 | | | 4.200%, 06/15/20 | | | 568 | |
| | 1,480 | | | 6.000%, 10/15/17 | | | 1,559 | |
| | 19 | | | Danaher Corp., 1.650%, 09/15/18 | | | 19 | |
| | | | | | | | |
PRINCIPAL
AMOUNT($) | | | SECURITY DESCRIPTION | | VALUE($) | |
| | | | | | | | |
| | | | Health Care Equipment & Supplies — continued | |
| | 3,100 | | | Edwards Lifesciences Corp., 2.875%, 10/15/18 | | | 3,173 | |
| | 2,915 | | | Medtronic, Inc., 2.500%, 03/15/20 | | | 3,018 | |
| | | | Stryker Corp., | | | | |
| | 2,166 | | | 1.300%, 04/01/18 | | | 2,167 | |
| | 3,500 | | | 2.000%, 03/08/19 | | | 3,543 | |
| | | | | | | | |
| | | | | | | 21,008 | |
| | | | | | | | |
| | | | Health Care Providers & Services — 0.5% | | | | |
| | | | Aetna, Inc., | | | | |
| | 2,475 | | | 1.900%, 06/07/19 | | | 2,497 | |
| | 2,640 | | | 2.200%, 03/15/19 | | | 2,681 | |
| | 1,865 | | | Anthem, Inc., 2.300%, 07/15/18 | | | 1,892 | |
| | | | Cardinal Health, Inc., | | | | |
| | 1,850 | | | 1.900%, 06/15/17 | | | 1,861 | |
| | 808 | | | 1.950%, 06/15/18 | | | 816 | |
| | 4,779 | | | 2.400%, 11/15/19 | | | 4,879 | |
| | 3,280 | | | Express Scripts Holding Co., 1.250%, 06/02/17 | | | 3,283 | |
| | | | Laboratory Corp. of America Holdings, | | | | |
| | 3,782 | | | 2.200%, 08/23/17 | | | 3,817 | |
| | 2,618 | | | 2.500%, 11/01/18 | | | 2,649 | |
| | 3,250 | | | 2.625%, 02/01/20 | | | 3,312 | |
| | | | McKesson Corp., | | | | |
| | 1,790 | | | 1.400%, 03/15/18 | | | 1,791 | |
| | 2,688 | | | 2.284%, 03/15/19 | | | 2,740 | |
| | 1,425 | | | 5.700%, 03/01/17 | | | 1,458 | |
| | 3,014 | | | Medco Health Solutions, Inc., 4.125%, 09/15/20 | | | 3,248 | |
| | | | UnitedHealth Group, Inc., | | | | |
| | 1,582 | | | 1.400%, 10/15/17 | | | 1,588 | |
| | 1,587 | | | 1.625%, 03/15/19 | | | 1,596 | |
| | 509 | | | 1.700%, 02/15/19 | | | 514 | |
| | 250 | | | 1.875%, 11/15/16 | | | 251 | |
| | 2,258 | | | 2.700%, 07/15/20 | | | 2,354 | |
| | 935 | | | 6.000%, 06/15/17 | | | 969 | |
| | 440 | | | 6.000%, 11/15/17 | | | 464 | |
| | 250 | | | 6.000%, 02/15/18 | | | 267 | |
| | | | WellPoint, Inc., | | | | |
| | 2,670 | | | 2.250%, 08/15/19 | | | 2,712 | |
| | 3,118 | | | 5.875%, 06/15/17 | | | 3,228 | |
| | | | | | | | |
| | | | | | | 50,867 | |
| | | | | | | | |
| | | | Life Sciences Tools & Services — 0.1% | | | | |
| | | | Thermo Fisher Scientific, Inc., | | | | |
| | 2,703 | | | 1.300%, 02/01/17 | | | 2,705 | |
| | 1,525 | | | 1.850%, 01/15/18 | | | 1,535 | |
SEE NOTES TO FINANCIAL STATEMENTS.
| | | | | | | | |
| | | |
| AUGUST 31, 2016 | | J.P. MORGAN INCOME FUNDS | | | | | 257 | |
JPMorgan Short Duration Bond Fund
SCHEDULE OF PORTFOLIO INVESTMENTS
AS OF AUGUST 31, 2016 (Unaudited) (continued)
(Amounts in thousands)
| | | | | | | | |
PRINCIPAL
AMOUNT($) | | | SECURITY DESCRIPTION | | VALUE($) | |
| Corporate Bonds — continued | |
| | | | Life Sciences Tools & Services — continued | | | | |
| | 2,250 | | | 2.400%, 02/01/19 | | | 2,292 | |
| | 2,930 | | | 4.700%, 05/01/20 | | | 3,195 | |
| | | | | | | | |
| | | | | | | 9,727 | |
| | | | | | | | |
| | | | Pharmaceuticals — 0.5% | | | | |
| | | | AbbVie, Inc., | | | | |
| | 6,617 | | | 1.750%, 11/06/17 | | | 6,647 | |
| | 200 | | | 1.800%, 05/14/18 | | | 201 | |
| | 8,075 | | | 2.000%, 11/06/18 | | | 8,155 | |
| | 927 | | | 2.300%, 05/14/21 | | | 937 | |
| | 5,990 | | | 2.500%, 05/14/20 | | | 6,127 | |
| | | | Actavis Funding SCS, (Luxembourg), | | | | |
| | 680 | | | 2.450%, 06/15/19 | | | 692 | |
| | 3,798 | | | 3.000%, 03/12/20 | | | 3,926 | |
| | | | Actavis, Inc., | | | | |
| | 3,695 | | | 1.875%, 10/01/17 | | | 3,711 | |
| | 1,650 | | | 6.125%, 08/15/19 | | | 1,851 | |
| | | | Allergan, Inc., | | | | |
| | 1,530 | | | 1.350%, 03/15/18 | | | 1,524 | |
| | 3,482 | | | 3.375%, 09/15/20 | | | 3,652 | |
| | | | Bayer U.S. Finance LLC, | | | | |
| | 1,000 | | | 1.500%, 10/06/17 (e) | | | 1,000 | |
| | 2,600 | | | 2.375%, 10/08/19 (e) | | | 2,645 | |
| | 4,155 | | | Forest Laboratories LLC, 4.375%, 02/01/19 (e) | | | 4,383 | |
| | 1,320 | | | Merck & Co., Inc., 1.850%, 02/10/20 | | | 1,348 | |
| | 2,400 | | | Mylan, Inc., 1.350%, 11/29/16 | | | 2,403 | |
| | 369 | | | Perrigo Co. plc, (Ireland), 1.300%, 11/08/16 | | | 369 | |
| | 1,165 | | | Pfizer, Inc., 6.050%, 03/30/17 | | | 1,200 | |
| | 800 | | | Roche Holdings, Inc., 2.250%, 09/30/19 (e) | | | 822 | |
| | 5,020 | | | Teva Pharmaceutical Finance Co. B.V., (Netherlands), 2.400%, 11/10/16 | | | 5,030 | |
| | | | Zoetis, Inc., | | | | |
| | 2,055 | | | 1.875%, 02/01/18 | | | 2,060 | |
| | 531 | | | 3.450%, 11/13/20 | | | 555 | |
| | | | | | | | |
| | | | | | | 59,238 | |
| | | | | | | | |
| | | | Total Health Care | | | 172,161 | |
| | | | | | | | |
| | | | Industrials — 1.2% | | | | |
| | | | Aerospace & Defense — 0.2% | | | | |
| | 2,903 | | | BAE Systems Holdings, Inc., 6.375%, 06/01/19 (e) | | | 3,232 | |
| | 1,283 | | | General Dynamics Corp., 1.000%, 11/15/17 | | | 1,282 | |
| | | | Lockheed Martin Corp., | | | | |
| | 2,230 | | | 1.850%, 11/23/18 | | | 2,259 | |
| | 1,415 | | | 2.500%, 11/23/20 | | | 1,462 | |
| | | | | | | | |
PRINCIPAL
AMOUNT($) | | | SECURITY DESCRIPTION | | VALUE($) | |
| | | | | | | | |
| | | | Aerospace & Defense — continued | | | | |
| | 2,640 | | | Northrop Grumman Corp., 1.750%, 06/01/18 | | | 2,662 | |
| | 5,665 | | | Precision Castparts Corp., 2.250%, 06/15/20 | | | 5,810 | |
| | 520 | | | Raytheon Co., 4.400%, 02/15/20 | | | 572 | |
| | 655 | | | Textron, Inc., 5.600%, 12/01/17 | | | 686 | |
| | | | United Technologies Corp., | | | | |
| | 3,625 | | | 6.125%, 02/01/19 | | | 4,042 | |
| | 911 | | | SUB, 1.778%, 05/04/18 | | | 917 | |
| | | | | | | | |
| | | | | | | 22,924 | |
| | | | | | | | |
| | | | Air Freight & Logistics — 0.0% (g) | | | | |
| | 1,570 | | | FedEx Corp., 2.300%, 02/01/20 | | | 1,608 | |
| | | | | | | | |
| | | | Commercial Services & Supplies — 0.1% | | | | |
| | 5,940 | | | Republic Services, Inc., 3.800%, 05/15/18 | | | 6,182 | |
| | | | Waste Management, Inc., | | | | |
| | 1,220 | | | 2.600%, 09/01/16 | | | 1,220 | |
| | 2,605 | | | 4.750%, 06/30/20 | | | 2,893 | |
| | | | | | | | |
| | | | | | | 10,295 | |
| | | | | | | | |
| | | | Construction & Engineering — 0.0% (g) | | | | |
| | 1,990 | | | ABB Finance USA, Inc., 1.625%, 05/08/17 | | | 1,998 | |
| | | | | | | | |
| | | | Electrical Equipment — 0.1% | | | | |
| | 6,389 | | | Eaton Corp., 1.500%, 11/02/17 | | | 6,411 | |
| | 700 | | | Emerson Electric Co., 4.875%, 10/15/19 | | | 774 | |
| | | | | | | | |
| | | | | | | 7,185 | |
| | | | | | | | |
| | | | Industrial Conglomerates — 0.4% | | | | |
| | | | General Electric Co., | | | | |
| | 5,897 | | | 1.600%, 11/20/17 | | | 5,933 | |
| | 2,559 | | | 5.300%, 02/11/21 | | | 2,945 | |
| | 2,716 | | | 5.500%, 01/08/20 | | | 3,075 | |
| | 2,172 | | | 5.550%, 05/04/20 | | | 2,472 | |
| | 6,878 | | | 5.625%, 09/15/17 | | | 7,203 | |
| | 12,575 | | | 5.625%, 05/01/18 | | | 13,515 | |
| | 1,816 | | | 6.000%, 08/07/19 | | | 2,065 | |
| | 544 | | | Hutchison Whampoa International 12 II Ltd., (Cayman Islands), 2.000%, 11/08/17 (e) | | | 547 | |
| | 644 | | | Koninklijke Philips N.V., (Netherlands), 5.750%, 03/11/18 | | | 686 | |
| | | | Roper Technologies, Inc., | | | | |
| | 710 | | | 2.050%, 10/01/18 | | | 718 | |
| | 830 | | | 3.000%, 12/15/20 | | | 865 | |
| | | | | | | | |
| | | | | | | 40,024 | |
| | | | | | | | |
| | | | Machinery — 0.0% (g) | | | | |
| | 2,494 | | | Illinois Tool Works, Inc., 1.950%, 03/01/19 | | | 2,538 | |
| | | | | | | | |
| | | | Professional Services — 0.0% (g) | | | | |
| | 1,507 | | | Equifax, Inc., 2.300%, 06/01/21 | | | 1,515 | |
| | | | | | | | |
SEE NOTES TO FINANCIAL STATEMENTS.
| | | | | | |
| | | |
| 258 | | | | J.P. MORGAN INCOME FUNDS | | AUGUST 31, 2016 |
| | | | | | | | |
PRINCIPAL
AMOUNT($) | | | SECURITY DESCRIPTION | | VALUE($) | |
| Corporate Bonds — continued | |
| | | | Road & Rail — 0.4% | | | | |
| | | | Burlington Northern Santa Fe LLC, | | | | |
| | 3,268 | | | 5.650%, 05/01/17 | | | 3,366 | |
| | 1,750 | | | 5.750%, 03/15/18 | | | 1,872 | |
| | 465 | | | 8.125%, 04/15/20 | | | 570 | |
| | | | Canadian Pacific Railway Co., (Canada), | | | | |
| | 2,900 | | | 6.500%, 05/15/18 | | | 3,124 | |
| | 1,720 | | | 7.250%, 05/15/19 | | | 1,966 | |
| | | | CSX Corp., | | | | |
| | 1,045 | | | 5.600%, 05/01/17 | | | 1,076 | |
| | 1,168 | | | 6.250%, 03/15/18 | | | 1,252 | |
| | 555 | | | 7.375%, 02/01/19 | | | 631 | |
| | 1,456 | | | 7.900%, 05/01/17 | | | 1,519 | |
| | | | ERAC USA Finance LLC, | | | | |
| | 1,012 | | | 2.750%, 03/15/17 (e) | | | 1,019 | |
| | 1,841 | | | 6.200%, 11/01/16 (e) | | | 1,856 | |
| | 2,819 | | | 6.375%, 10/15/17 (e) | | | 2,965 | |
| | 1,500 | | | Norfolk Southern Corp., 5.900%, 06/15/19 | | | 1,673 | |
| | | | Penske Truck Leasing Co. LP/PTL Finance Corp., | | | | |
| | 927 | | | 2.500%, 06/15/19 (e) | | | 934 | |
| | 3,594 | | | 3.375%, 03/15/18 (e) | | | 3,683 | |
| | | | Ryder System, Inc., | | | | |
| | 1,865 | | | 2.450%, 09/03/19 | | | 1,893 | |
| | 2,294 | | | 2.500%, 03/01/17 | | | 2,302 | |
| | 2,315 | | | 2.500%, 03/01/18 | | | 2,345 | |
| | 1,320 | | | 2.500%, 05/11/20 | | | 1,329 | |
| | 885 | | | 2.550%, 06/01/19 | | | 898 | |
| | | | Union Pacific Corp., | | | | |
| | 696 | | | 1.800%, 02/01/20 | | | 704 | |
| | 1,075 | | | 5.650%, 05/01/17 | | | 1,107 | |
| | 4,448 | | | 5.750%, 11/15/17 | | | 4,708 | |
| | | | | | | | |
| | | | | | | 42,792 | |
| | | | | | | | |
| | | | Trading Companies & Distributors — 0.0% (g) | |
| | 3,303 | | | Air Lease Corp., 2.125%, 01/15/18 | | | 3,306 | |
| | | | | | | | |
| | | | Total Industrials | | | 134,185 | |
| | | | | | | | |
| | | | Information Technology — 0.4% | | | | |
| | | | Communications Equipment — 0.0% (g) | | | | |
| | 5,302 | | | Cisco Systems, Inc., 2.125%, 03/01/19 | | | 5,422 | |
| | | | | | | | |
| | | | Electronic Equipment, Instruments &
Components — 0.0% (g) | |
| | | | Arrow Electronics, Inc., | | | | |
| | 1,382 | | | 3.000%, 03/01/18 | | | 1,400 | |
| | 464 | | | 6.875%, 06/01/18 | | | 496 | |
| | | | | | | | |
| | | | | | | 1,896 | |
| | | | | | | | |
| | | | | | | | |
PRINCIPAL
AMOUNT($) | | | SECURITY DESCRIPTION | | VALUE($) | |
| | | | | | | | |
| | | | Internet Software & Services — 0.0% (g) | | | | |
| | 2,379 | | | eBay, Inc., 2.200%, 08/01/19 | | | 2,409 | |
| | | | | | | | |
| | | | IT Services — 0.1% | | | | |
| | 2,930 | | | International Business Machines Corp., 1.800%, 05/17/19 | | | 2,975 | |
| | | | Total System Services, Inc., | | | | |
| | 1,350 | | | 2.375%, 06/01/18 | | | 1,359 | |
| | 2,080 | | | 3.800%, 04/01/21 | | | 2,205 | |
| | | | | | | | |
| | | | | | | 6,539 | |
| | | | | | | | |
| | | | Semiconductors & Semiconductor Equipment — 0.0% (g) | |
| | 1,318 | | | Intel Corp., 2.450%, 07/29/20 | | | 1,368 | |
| | 1,781 | | | Texas Instruments, Inc., 1.750%, 05/01/20 | | | 1,799 | |
| | | | | | | | |
| | | | | | | 3,167 | |
| | | | | | | | |
| | | | Software — 0.2% | | | | |
| | 8,282 | | | Intuit, Inc., 5.750%, 03/15/17 | | | 8,482 | |
| | | | Microsoft Corp., | | | | |
| | 349 | | | 0.875%, 11/15/17 | | | 349 | |
| | 3,455 | | | 1.850%, 02/12/20 | | | 3,514 | |
| | | | Oracle Corp., | | | | |
| | 3,250 | | | 2.250%, 10/08/19 | | | 3,351 | |
| | 1,985 | | | 2.375%, 01/15/19 | | | 2,039 | |
| | 735 | | | 5.000%, 07/08/19 | | | 810 | |
| | | | | | | | |
| | | | | | | 18,545 | |
| | | | | | | | |
| | | | Technology Hardware, Storage & Peripherals — 0.1% | |
| | | | Apple, Inc., | | | | |
| | 3,589 | | | 1.550%, 02/07/20 | | | 3,612 | |
| | 5,915 | | | 2.100%, 05/06/19 | | | 6,052 | |
| | 2,210 | | | 2.250%, 02/23/21 | | | 2,268 | |
| | | | | | | | |
| | | | | | | 11,932 | |
| | | | | | | | |
| | | | Total Information Technology | | | 49,910 | |
| | | | | | | | |
| | | | Materials — 0.4% | | | | |
| | | | Chemicals — 0.3% | | | | |
| | 1,540 | | | Agrium, Inc., (Canada), 6.750%, 01/15/19 | | | 1,705 | |
| | 4,340 | | | CF Industries, Inc., 6.875%, 05/01/18 | | | 4,672 | |
| | 805 | | | Dow Chemical Co. (The), 8.550%, 05/15/19 | | | 950 | |
| | | | Ecolab, Inc., | | | | |
| | 2,254 | | | 1.450%, 12/08/17 | | | 2,260 | |
| | 3,765 | | | 3.000%, 12/08/16 | | | 3,786 | |
| | 4,866 | | | Potash Corp. of Saskatchewan, Inc., (Canada), 3.250%, 12/01/17 | | | 4,979 | |
| | | | PPG Industries, Inc., | | | | |
| | 5,482 | | | 2.300%, 11/15/19 | | | 5,567 | |
| | 1,470 | | | 3.600%, 11/15/20 | | | 1,554 | |
| | 146 | | | 6.650%, 03/15/18 | | | 156 | |
SEE NOTES TO FINANCIAL STATEMENTS.
| | | | | | | | |
| | | |
| AUGUST 31, 2016 | | J.P. MORGAN INCOME FUNDS | | | | | 259 | |
JPMorgan Short Duration Bond Fund
SCHEDULE OF PORTFOLIO INVESTMENTS
AS OF AUGUST 31, 2016 (Unaudited) (continued)
(Amounts in thousands)
| | | | | | | | |
PRINCIPAL
AMOUNT($) | | | SECURITY DESCRIPTION | | VALUE($) | |
| Corporate Bonds — continued | |
| | | | Chemicals — continued | | | | |
| | 740 | | | Praxair, Inc., 4.500%, 08/15/19 | | | 807 | |
| | 502 | | | Rohm & Haas Co., 6.000%, 09/15/17 | | | 525 | |
| | | | | | | | |
| | | | | | | 26,961 | |
| | | | | | | | |
| | | | Metals & Mining — 0.1% | | | | |
| | | | BHP Billiton Finance USA Ltd., (Australia), | | | | |
| | 5,095 | | | 1.625%, 02/24/17 | | | 5,107 | |
| | 1,500 | | | 2.050%, 09/30/18 | | | 1,521 | |
| | 2,745 | | | Freeport-McMoRan, Inc., 2.375%, 03/15/18 | | | 2,700 | |
| | | | Nucor Corp., | | | | |
| | 1,500 | | | 5.750%, 12/01/17 | | | 1,565 | |
| | 1,260 | | | 5.850%, 06/01/18 | | | 1,348 | |
| | | | | | | | |
| | | | | | | 12,241 | |
| | | | | | | | |
| | | | Total Materials | | | 39,202 | |
| | | | | | | | |
| | | | Real Estate — 0.4% | | | | |
| | | | Equity Real Estate Investment Trusts (REITs) — 0.4% | |
| | | | Boston Properties LP, | | | | |
| | 4,267 | | | 4.125%, 05/15/21 | | | 4,658 | |
| | 4,031 | | | 5.875%, 10/15/19 | | | 4,489 | |
| | 1,926 | | | Crown Castle International Corp., 2.250%, 09/01/21 | | | 1,923 | |
| | | | ERP Operating LP, | | | | |
| | 3,118 | | | 2.375%, 07/01/19 | | | 3,177 | |
| | 767 | | | 5.750%, 06/15/17 | | | 793 | |
| | | | HCP, Inc., | | | | |
| | 5,410 | | | 2.625%, 02/01/20 | | | 5,487 | |
| | 400 | | | 5.375%, 02/01/21 | | | 449 | |
| | 390 | | | 6.700%, 01/30/18 | | | 417 | |
| | 1,500 | | | Prologis LP, 4.000%, 01/15/18 | | | 1,541 | |
| | | | Realty Income Corp., | | | | |
| | 2,625 | | | 2.000%, 01/31/18 | | | 2,641 | |
| | 2,080 | | | 5.375%, 09/15/17 | | | 2,162 | |
| | | | Simon Property Group LP, | | | | |
| | 4,585 | | | 1.500%, 02/01/18 (e) | | | 4,602 | |
| | 1,511 | | | 2.150%, 09/15/17 | | | 1,522 | |
| | 3,739 | | | 2.200%, 02/01/19 | | | 3,811 | |
| | 1,569 | | | Ventas Realty LP/Ventas Capital Corp., 2.000%, 02/15/18 | | | 1,578 | |
| | | | Welltower, Inc., | | | | |
| | 735 | | | 2.250%, 03/15/18 | | | 742 | |
| | 1,870 | | | 6.125%, 04/15/20 | | | 2,121 | |
| | | | | | | | |
| | | | Total Real Estate | | | 42,113 | |
| | | | | | | | |
| | | | | | | | |
PRINCIPAL
AMOUNT($) | | | SECURITY DESCRIPTION | | VALUE($) | |
| | | | | | | | |
| | | | Telecommunication Services — 1.1% | | | | |
| | | | Diversified Telecommunication Services — 0.9% | |
| | | | AT&T, Inc., | | | | |
| | 3,260 | | | 1.700%, 06/01/17 | | | 3,272 | |
| | 8,095 | | | 1.750%, 01/15/18 | | | 8,139 | |
| | 17,375 | | | 2.450%, 06/30/20 | | | 17,725 | |
| | 4,754 | | | 2.800%, 02/17/21 | | | 4,899 | |
| | 1,900 | | | 5.000%, 03/01/21 | | | 2,135 | |
| | 13,484 | | | 5.500%, 02/01/18 | | | 14,246 | |
| | 1,134 | | | 5.600%, 05/15/18 | | | 1,214 | |
| | 1,992 | | | British Telecommunications plc, (United Kingdom), 2.350%, 02/14/19 | | | 2,033 | |
| | | | Deutsche Telekom International Finance B.V., (Netherlands), | | | | |
| | 2,865 | | | 2.250%, 03/06/17 (e) | | | 2,883 | |
| | 3,580 | | | 6.750%, 08/20/18 | | | 3,954 | |
| | 1,533 | | | Nippon Telegraph & Telephone Corp., (Japan), 1.400%, 07/18/17 | | | 1,537 | |
| | 1,391 | | | Orange S.A., (France), 2.750%, 02/06/19 | | | 1,431 | |
| | | | Telefonica Emisiones S.A.U., (Spain), | | | | |
| | 3,516 | | | 3.192%, 04/27/18 | | | 3,606 | |
| | 740 | | | 5.462%, 02/16/21 | | | 845 | |
| | 849 | | | 6.221%, 07/03/17 | | | 882 | |
| | | | Verizon Communications, Inc., | | | | |
| | 9,634 | | | 2.625%, 02/21/20 | | | 9,936 | |
| | 8,848 | | | 3.650%, 09/14/18 | | | 9,254 | |
| | 5,830 | | | 4.500%, 09/15/20 | | | 6,434 | |
| | 6,440 | | | 6.100%, 04/15/18 | | | 6,931 | |
| | | | | | | | |
| | | | | | | 101,356 | |
| | | | | | | | |
| | | | Wireless Telecommunication Services — 0.2% | |
| | | | America Movil S.A.B. de C.V., (Mexico), | | | | |
| | 6,915 | | | 5.000%, 03/30/20 | | | 7,642 | |
| | 2,056 | | | 5.625%, 11/15/17 | | | 2,159 | |
| | 5,520 | | | Rogers Communications, Inc., (Canada), 6.800%, 08/15/18 | | | 6,063 | |
| | | | Vodafone Group plc, (United Kingdom), | | | | |
| | 1,555 | | | 1.250%, 09/26/17 | | | 1,555 | |
| | 4,871 | | | 1.500%, 02/19/18 | | | 4,870 | |
| | 2,144 | | | 1.625%, 03/20/17 | | | 2,149 | |
| | 1,396 | | | 5.625%, 02/27/17 | | | 1,425 | |
| | | | | | | | |
| | | | | | | 25,863 | |
| | | | | | | | |
| | | | Total Telecommunication Services | | | 127,219 | |
| | | | | | | | |
| | | | Utilities — 1.2% | | | | |
| | | | Electric Utilities — 0.7% | | | | |
| | 4,123 | | | American Electric Power Co., Inc., 1.650%, 12/15/17 | | | 4,131 | |
SEE NOTES TO FINANCIAL STATEMENTS.
| | | | | | |
| | | |
| 260 | | | | J.P. MORGAN INCOME FUNDS | | AUGUST 31, 2016 |
| | | | | | | | |
PRINCIPAL
AMOUNT($) | | | SECURITY DESCRIPTION | | VALUE($) | |
| Corporate Bonds — continued | |
| | | | Electric Utilities — continued | | | | |
| | | | Arizona Public Service Co., | | | | |
| | 1,938 | | | 2.200%, 01/15/20 | | | 1,968 | |
| | 400 | | | 8.750%, 03/01/19 | | | 468 | |
| | 500 | | | Atlantic City Electric Co., 7.750%, 11/15/18 | | | 567 | |
| | 4,610 | | | Cleveland Electric Illuminating Co. (The), 8.875%, 11/15/18 | | | 5,301 | |
| | | | Commonwealth Edison Co., | | | | |
| | 880 | | | 4.000%, 08/01/20 | | | 957 | |
| | 1,000 | | | 5.800%, 03/15/18 | | | 1,069 | |
| | 1,000 | | | 6.150%, 09/15/17 | | | 1,051 | |
| | | | Duke Energy Carolinas LLC, | | | | |
| | 460 | | | 1.750%, 12/15/16 | | | 461 | |
| | 1,480 | | | 5.250%, 01/15/18 | | | 1,559 | |
| | | | Duke Energy Corp., | | | | |
| | 1,105 | | | 2.100%, 06/15/18 | | | 1,118 | |
| | 505 | | | 2.150%, 11/15/16 | | | 506 | |
| | 1,240 | | | Duke Energy Florida LLC, 5.650%, 06/15/18 | | | 1,336 | |
| | 708 | | | Duke Energy Indiana LLC, 3.750%, 07/15/20 | | | 765 | |
| | 4,140 | | | Electricite de France S.A., (France), 1.150%, 01/20/17 (e) | | | 4,138 | |
| | 965 | | | Entergy Gulf States Louisiana LLC, 6.000%, 05/01/18 | | | 1,033 | |
| | 735 | | | Entergy Louisiana LLC, 6.500%, 09/01/18 | | | 805 | |
| | 565 | | | Kansas City Power & Light Co., 5.850%, 06/15/17 | | | 583 | |
| | 445 | | | Kentucky Power Co., 6.000%, 09/15/17 (e) | | | 465 | |
| | 530 | | | Kentucky Utilities Co., 3.250%, 11/01/20 | | | 559 | |
| | 1,952 | | | MidAmerican Energy Co., 2.400%, 03/15/19 | | | 2,003 | |
| | | | NextEra Energy Capital Holdings, Inc., | | | | |
| | 224 | | | 2.700%, 09/15/19 | | | 230 | |
| | 250 | | | 6.000%, 03/01/19 | | | 275 | |
| | 631 | | | Niagara Mohawk Power Corp., 4.881%, 08/15/19 (e) | | | 689 | |
| | 1,425 | | | Northern States Power Co., 2.200%, 08/15/20 | | | 1,452 | |
| | 985 | | | Ohio Power Co., 6.050%, 05/01/18 | | | 1,055 | |
| | | | Pacific Gas & Electric Co., | | | | |
| | 2,675 | | | 5.625%, 11/30/17 | | | 2,817 | |
| | 1,579 | | | 8.250%, 10/15/18 | | | 1,795 | |
| | 250 | | | PacifiCorp, 5.650%, 07/15/18 | | | 270 | |
| | 1,567 | | | PECO Energy Co., 1.200%, 10/15/16 | | | 1,568 | |
| | 875 | | | Pennsylvania Electric Co., 6.050%, 09/01/17 | | | 910 | |
| | 455 | | | PPL Capital Funding, Inc., 1.900%, 06/01/18 | | | 456 | |
| | | | Progress Energy, Inc., | | | | |
| | 5,000 | | | 4.400%, 01/15/21 | | | 5,483 | |
| | 5,969 | | | 4.875%, 12/01/19 | | | 6,523 | |
| | | | | | | | |
PRINCIPAL
AMOUNT($) | | | SECURITY DESCRIPTION | | VALUE($) | |
| | | | | �� | | | |
| | | | Electric Utilities — continued | | | | |
| | 535 | | | Public Service Co. of Colorado, 5.800%, 08/01/18 | | | 580 | |
| | 1,246 | | | Public Service Co. of New Mexico, 7.950%, 05/15/18 | | | 1,371 | |
| | 510 | | | Public Service Co. of Oklahoma, 5.150%, 12/01/19 | | | 562 | |
| | 2,135 | | | Public Service Electric & Gas Co., 2.000%, 08/15/19 | | | 2,174 | |
| | | | Southern California Edison Co., | | | | |
| | 1,306 | | | 1.845%, 02/01/22 | | | 1,307 | |
| | 1,005 | | | 5.500%, 08/15/18 | | | 1,089 | |
| | 5,610 | | | Southern Co. (The), 2.750%, 06/15/20 | | | 5,786 | |
| | | | Southwestern Electric Power Co., | | | | |
| | 765 | | | 6.450%, 01/15/19 | | | 846 | |
| | 1,045 | | | Series F, 5.875%, 03/01/18 | | | 1,107 | |
| | 577 | | | State Grid Overseas Investment 2013 Ltd., (United Kingdom), 1.750%, 05/22/18 (e) | | | 578 | |
| | | | Virginia Electric & Power Co., | | | | |
| | 1,387 | | | 1.200%, 01/15/18 | | | 1,387 | |
| | 1,268 | | | 5.000%, 06/30/19 | | | 1,376 | |
| | 1,215 | | | 5.400%, 04/30/18 | | | 1,295 | |
| | 2,620 | | | Xcel Energy, Inc., 2.400%, 03/15/21 | | | 2,690 | |
| | | | | | | | |
| | | | | | | 76,514 | |
| | | | | | | | |
| | | | Gas Utilities — 0.1% | | | | |
| | | | Atmos Energy Corp., | | | | |
| | 400 | | | 6.350%, 06/15/17 | | | 415 | |
| | 314 | | | 8.500%, 03/15/19 | | | 366 | |
| | 1,492 | | | CenterPoint Energy Resources Corp., 4.500%, 01/15/21 | | | 1,616 | |
| | | | Dominion Gas Holdings LLC, | | | | |
| | 210 | | | 2.500%, 12/15/19 | | | 215 | |
| | 7,023 | | | 2.800%, 11/15/20 | | | 7,252 | |
| | 320 | | | Southern California Gas Co., 1.550%, 06/15/18 | | | 322 | |
| | | | | | | | |
| | | | | | | 10,186 | |
| | | | | | | | |
| | | | Independent Power & Renewable Electricity
Producers — 0.1% | |
| | | | Exelon Generation Co. LLC, | | | | |
| | 1,798 | | | 2.950%, 01/15/20 | | | 1,849 | |
| | 260 | | | 5.200%, 10/01/19 | | | 285 | |
| | 5,923 | | | PSEG Power LLC, 2.450%, 11/15/18 | | | 5,993 | |
| | | | Southern Power Co., | | | | |
| | 2,684 | | | 1.850%, 12/01/17 | | | 2,702 | |
| | 495 | | | Series 15A, 1.500%, 06/01/18 | | | 496 | |
| | | | | | | | |
| | | | | | | 11,325 | |
| | | | | | | | |
SEE NOTES TO FINANCIAL STATEMENTS.
| | | | | | | | |
| | | |
| AUGUST 31, 2016 | | J.P. MORGAN INCOME FUNDS | | | | | 261 | |
JPMorgan Short Duration Bond Fund
SCHEDULE OF PORTFOLIO INVESTMENTS
AS OF AUGUST 31, 2016 (Unaudited) (continued)
(Amounts in thousands)
| | | | | | | | |
PRINCIPAL
AMOUNT($) | | | SECURITY DESCRIPTION | | VALUE($) | |
| Corporate Bonds — continued | |
| | | | Multi-Utilities — 0.3% | | | | |
| | | | Berkshire Hathaway Energy Co., | | | | |
| | 2,385 | | | 1.100%, 05/15/17 | | | 2,386 | |
| | 1,015 | | | 2.400%, 02/01/20 | | | 1,038 | |
| | 1,207 | | | CenterPoint Energy, Inc., Series B, 5.950%, 02/01/17 | | | 1,229 | |
| | | | CMS Energy Corp., | | | | |
| | 2,455 | | | 5.050%, 02/15/18 | | | 2,575 | |
| | 470 | | | 6.250%, 02/01/20 | | | 536 | |
| | 330 | | | 8.750%, 06/15/19 | | | 392 | |
| | 2,725 | | | Consolidated Edison Co. of New York, Inc., Series 08-A, 5.850%, 04/01/18 | | | 2,917 | |
| | 455 | | | Consumers Energy Co., 6.125%, 03/15/19 | | | 508 | |
| | | | Dominion Resources, Inc., | | | | |
| | 748 | | | 1.250%, 03/15/17 | | | 749 | |
| | 1,100 | | | 6.400%, 06/15/18 | | | 1,192 | |
| | 1,778 | | | Series A, 1.400%, 09/15/17 | | | 1,781 | |
| | 5,199 | | | DTE Energy Co., 2.400%, 12/01/19 | | | 5,305 | |
| | | | NiSource Finance Corp., | | | | |
| | 1,057 | | | 6.400%, 03/15/18 | | | 1,131 | |
| | 4,750 | | | 6.800%, 01/15/19 | | | 5,302 | |
| | | | Sempra Energy, | | | | |
| | 1,645 | | | 2.300%, 04/01/17 | | | 1,656 | |
| | 820 | | | 6.150%, 06/15/18 | | | 883 | |
| | 1,300 | | | 9.800%, 02/15/19 | | | 1,548 | |
| | | | TECO Finance, Inc., | | | | |
| | 475 | | | 5.150%, 03/15/20 | | | 523 | |
| | 1,660 | | | 6.572%, 11/01/17 | | | 1,755 | |
| | | | WEC Energy Group, Inc., | | | | |
| | 1,230 | | | 1.650%, 06/15/18 | | | 1,237 | |
| | 2,200 | | | 2.450%, 06/15/20 | | | 2,247 | |
| | | | | | | | |
| | | | | | | 36,890 | |
| | | | | | | | |
| | | | Total Utilities | | | 134,915 | |
| | | | | | | | |
| | | | Total Corporate Bonds
(Cost $2,465,778) | | | 2,488,385 | |
| | | | | | | | |
| Mortgage Pass-Through Securities — 2.6% | |
| | | | Federal Home Loan Mortgage Corp., | | | | |
| | 337 | | | ARM, 1.960%, 08/01/37 | | | 356 | |
| | 1,941 | | | ARM, 2.429%, 05/01/37 | | | 2,023 | |
| | 2,454 | | | ARM, 2.490%, 10/01/36 | | | 2,592 | |
| | 1,729 | | | ARM, 2.492%, 03/01/37 | | | 1,808 | |
| | 788 | | | ARM, 2.515%, 11/01/36 | | | 829 | |
| | 1,178 | | | ARM, 2.528%, 12/01/36 | | | 1,242 | |
| | 337 | | | ARM, 2.565%, 12/01/36 | | | 355 | |
| | 42 | | | ARM, 2.572%, 01/01/27 | | | 44 | |
| | 850 | | | ARM, 2.615%, 12/01/36 | | | 901 | |
| | | | | | | | |
PRINCIPAL
AMOUNT($) | | | SECURITY DESCRIPTION | | VALUE($) | |
| | | | | | | | |
| | 701 | | | ARM, 2.619%, 10/01/37 | | | 748 | |
| | 1,901 | | | ARM, 2.650%, 01/01/37 | | | 2,001 | |
| | 165 | | | ARM, 2.652%, 02/01/37 | | | 174 | |
| | 717 | | | ARM, 2.655%, 03/01/37 | | | 750 | |
| | 153 | | | ARM, 2.664%, 03/01/35 | | | 160 | |
| | 1,014 | | | ARM, 2.675%, 04/01/37 | | | 1,066 | |
| | 58 | | | ARM, 2.687%, 12/01/27 | | | 61 | |
| | 1,170 | | | ARM, 2.704%, 08/01/37 | | | 1,248 | |
| | 358 | | | ARM, 2.759%, 06/01/36 | | | 376 | |
| | 1 | | | ARM, 2.768%, 12/01/17 | | | 1 | |
| | 555 | | | ARM, 2.787%, 11/01/37 | | | 587 | |
| | 1,141 | | | ARM, 2.794%, 08/01/36 | | | 1,194 | |
| | 1,400 | | | ARM, 2.843%, 08/01/36 | | | 1,487 | |
| | 198 | | | ARM, 2.901%, 04/01/37 | | | 210 | |
| | 264 | | | ARM, 3.035%, 08/01/37 | | | 275 | |
| | 157 | | | ARM, 3.071%, 07/01/36 | | | 167 | |
| | 2,009 | | | ARM, 3.101%, 04/01/38 | | | 2,137 | |
| | 3,675 | | | ARM, 3.110%, 03/01/35 | | | 3,909 | |
| | 1,389 | | | ARM, 3.141%, 03/01/36 | | | 1,467 | |
| | 1,714 | | | ARM, 3.161%, 01/01/38 | | | 1,827 | |
| | 2,194 | | | ARM, 3.199%, 10/01/35 | | | 2,331 | |
| | 928 | | | ARM, 3.218%, 03/01/37 | | | 990 | |
| | 5,046 | | | ARM, 3.227%, 06/01/37 | | | 5,358 | |
| | 2,584 | | | ARM, 3.230%, 06/01/37 | | | 2,748 | |
| | 750 | | | ARM, 3.255%, 02/01/37 | | | 803 | |
| | 2,282 | | | ARM, 3.442%, 03/01/36 | | | 2,402 | |
| | 2 | | | ARM, 5.751%, 01/01/27 | | | 2 | |
| | | | Federal Home Loan Mortgage Corp. Gold Pools, 15 Year, Single Family, | | | | |
| | 18,407 | | | 4.000%, 07/01/18 - 06/01/26 | | | 19,500 | |
| | 143 | | | 4.500%, 10/01/18 | | | 147 | |
| | 3,236 | | | 5.000%, 03/01/18 - 01/01/21 | | | 3,328 | |
| | 10,764 | | | 5.500%, 08/01/19 - 01/01/24 | | | 11,591 | |
| | 2,091 | | | 6.000%, 08/01/17 - 12/01/23 | | | 2,179 | |
| | 599 | | | 6.500%, 04/01/17 - 08/01/21 | | | 607 | |
| | 58 | | | 7.000%, 03/01/17 | | | 58 | |
| | | | Federal Home Loan Mortgage Corp. Gold Pools, 20 Year, Single Family, | | | | |
| | 592 | | | 6.000%, 01/01/19 - 10/01/24 | | | 673 | |
| | 15 | | | 6.500%, 08/01/18 - 05/01/21 | | | 17 | |
| | 11 | | | 7.500%, 10/01/16 - 07/01/18 | | | 11 | |
| | | | Federal Home Loan Mortgage Corp. Gold Pools, 30 Year, Single Family, | | | | |
| | 17,443 | | | 5.500%, 03/01/34 - 07/01/37 | | | 19,794 | |
| | 237 | | | 6.000%, 09/01/17 - 07/01/32 | | | 271 | |
| | 348 | | | 7.000%, 08/01/38 | | | 405 | |
SEE NOTES TO FINANCIAL STATEMENTS.
| | | | | | |
| | | |
| 262 | | | | J.P. MORGAN INCOME FUNDS | | AUGUST 31, 2016 |
| | | | | | | | |
PRINCIPAL
AMOUNT($) | | | SECURITY DESCRIPTION | | VALUE($) | |
| Mortgage Pass-Through Securities — continued | |
| | | | Federal Home Loan Mortgage Corp. Gold Pools, FHA/VA, | | | | |
| | 7,487 | | | 7.500%, 12/01/36 | | | 8,828 | |
| | 1,374 | | | 10.000%, 10/01/30 | | | 1,503 | |
| | | | Federal Home Loan Mortgage Corp., 30 Year, Single Family, | | | | |
| | 2 | | | 8.000%, 04/01/17 - 05/01/19 | | | 2 | |
| | 2 | | | 8.250%, 08/01/17 | | | 2 | |
| | | | Federal National Mortgage Association, | | | | |
| | 7 | | | ARM, 1.875%, 01/01/19 | | | 7 | |
| | 46 | | | ARM, 1.876%, 08/01/37 | | | 47 | |
| | 2,095 | | | ARM, 2.007%, 08/01/37 | | | 2,149 | |
| | 870 | | | ARM, 2.082%, 04/01/37 | | | 897 | |
| | 8 | | | ARM, 2.155%, 07/01/27 | | | 8 | |
| | 5 | | | ARM, 2.242%, 03/01/19 | | | 6 | |
| | 2,013 | | | ARM, 2.281%, 07/01/37 | | | 2,086 | |
| | 259 | | | ARM, 2.309%, 10/01/36 | | | 274 | |
| | 692 | | | ARM, 2.368%, 09/01/34 | | | 722 | |
| | 1,812 | | | ARM, 2.369%, 01/01/37 | | | 1,882 | |
| | 1,180 | | | ARM, 2.386%, 02/01/37 | | | 1,227 | |
| | 140 | | | ARM, 2.395%, 01/01/35 | | | 146 | |
| | 255 | | | ARM, 2.422%, 01/01/37 | | | 269 | |
| | 10 | | | ARM, 2.450%, 05/01/25 | | | 10 | |
| | — | (h) | | ARM, 2.470%, 10/01/27 | | | — | (h) |
| | 1,670 | | | ARM, 2.477%, 11/01/37 | | | 1,773 | |
| | — | (h) | | ARM, 2.480%, 08/01/17 | | | — | (h) |
| | 94 | | | ARM, 2.493%, 12/01/36 | | | 99 | |
| | 720 | | | ARM, 2.509%, 10/01/36 | | | 762 | |
| | 307 | | | ARM, 2.541%, 07/01/37 | | | 324 | |
| | 2,511 | | | ARM, 2.561%, 12/01/36 | | | 2,637 | |
| | 1,431 | | | ARM, 2.575%, 11/01/37 | | | 1,524 | |
| | 417 | | | ARM, 2.582%, 05/01/36 | | | 438 | |
| | 671 | | | ARM, 2.586%, 12/01/35 | | | 705 | |
| | 60 | | | ARM, 2.587%, 04/01/36 | | | 62 | |
| | 1,107 | | | ARM, 2.603%, 08/01/36 | | | 1,163 | |
| | 871 | | | ARM, 2.610%, 12/01/37 | | | 918 | |
| | 897 | | | ARM, 2.617%, 08/01/36 | | | 950 | |
| | 1 | | | ARM, 2.625%, 08/01/19 | | | 1 | |
| | 1,402 | | | ARM, 2.626%, 11/01/37 | | | 1,473 | |
| | 38 | | | ARM, 2.650%, 07/01/37 | | | 40 | |
| | 17 | | | ARM, 2.694%, 06/01/27 | | | 17 | |
| | 185 | | | ARM, 2.719%, 12/01/36 | | | 196 | |
| | 532 | | | ARM, 2.816%, 04/01/37 | | | 561 | |
| | 5 | | | ARM, 2.821%, 08/01/36 | | | 5 | |
| | 458 | | | ARM, 2.825%, 07/01/36 | | | 481 | |
| | 2,254 | | | ARM, 2.846%, 03/01/37 | | | 2,394 | |
| | | | | | | | |
PRINCIPAL
AMOUNT($) | | | SECURITY DESCRIPTION | | VALUE($) | |
| | | | | | | | |
| | 26 | | | ARM, 2.882%, 06/01/36 | | | 27 | |
| | 439 | | | ARM, 2.915%, 12/01/36 | | | 467 | |
| | 190 | | | ARM, 2.925%, 08/01/36 | | | 201 | |
| | 7 | | | ARM, 2.972%, 10/01/25 | | | 7 | |
| | — | (h) | | ARM, 3.000%, 11/01/16 | | | — | (h) |
| | 278 | | | ARM, 3.080%, 03/01/47 | | | 287 | |
| | 1,046 | | | ARM, 3.124%, 08/01/36 | | | 1,098 | |
| | 2,921 | | | ARM, 3.213%, 03/01/36 | | | 3,109 | |
| | 492 | | | ARM, 3.270%, 04/01/38 | | | 498 | |
| | 2,734 | | | ARM, 3.441%, 03/01/36 | | | 2,908 | |
| | 2,300 | | | ARM, 3.456%, 10/01/35 | | | 2,450 | |
| | 3,267 | | | ARM, 3.469%, 03/01/36 | | | 3,473 | |
| | | | Federal National Mortgage Association, 15 Year, Single Family, | | | | |
| | 313 | | | 4.000%, 08/01/18 - 01/01/19 | | | 324 | |
| | 978 | | | 4.500%, 05/01/18 - 05/01/19 | | | 1,003 | |
| | 1,385 | | | 5.000%, 12/01/17 - 07/01/20 | | | 1,427 | |
| | 20,236 | | | 5.500%, 01/01/18 - 07/01/25 | | | 21,804 | |
| | 7,302 | | | 6.000%, 11/01/17 - 07/01/24 | | | 7,855 | |
| | 2,086 | | | 6.500%, 03/01/17 - 03/01/23 | | | 2,199 | |
| | 31 | | | 7.000%, 02/01/17 - 01/01/18 | | | 31 | |
| | — | (h) | | 8.000%, 10/01/16 | | | — | (h) |
| | | | Federal National Mortgage Association, 20 Year, Single Family, | | | | |
| | 655 | | | 5.500%, 05/01/27 | | | 735 | |
| | 15 | | | 6.000%, 03/01/18 - 07/01/19 | | | 17 | |
| | 1,659 | | | 6.500%, 03/01/17 - 03/01/25 | | | 1,906 | |
| | 365 | | | 7.000%, 08/01/20 - 08/01/21 | | | 383 | |
| | | | Federal National Mortgage Association, 30 Year, FHA/VA, | | | | |
| | 133 | | | 5.500%, 08/01/34 | | | 149 | |
| | 11 | | | 8.500%, 03/01/27 | | | 12 | |
| | | | Federal National Mortgage Association, 30 Year, Single Family, | | | | |
| | 17,215 | | | 5.000%, 10/01/39 | | | 19,389 | |
| | 23,056 | | | 5.500%, 12/01/32 - 04/01/37 | | | 26,274 | |
| | 14,619 | | | 6.000%, 04/01/35 - 01/01/38 | | | 16,933 | |
| | 9,057 | | | 6.500%, 03/01/26 - 10/01/38 | | | 10,469 | |
| | 3,735 | | | 7.000%, 04/01/37 - 08/01/37 | | | 4,400 | |
| | 65 | | | 8.000%, 12/01/30 | | | 72 | |
| | 3 | | | 8.500%, 09/01/21 | | | 3 | |
| | 23 | | | 9.000%, 02/01/31 | | | 24 | |
| | 16 | | | 9.500%, 07/01/28 | | | 17 | |
| | 4 | | | 10.000%, 02/01/24 | | | 4 | |
| | | | Federal National Mortgage Association, Other, | | | | |
| | 27 | | | 4.000%, 07/01/17 | | | 28 | |
| | 79 | | | 4.500%, 12/01/19 | | | 82 | |
| | | | | | | | |
| | | |
| AUGUST 31, 2016 | | J.P. MORGAN INCOME FUNDS | | | | | 263 | |
JPMorgan Short Duration Bond Fund
SCHEDULE OF PORTFOLIO INVESTMENTS
AS OF AUGUST 31, 2016 (Unaudited) (continued)
(Amounts in thousands)
| | | | | | | | |
PRINCIPAL
AMOUNT($) | | | SECURITY DESCRIPTION | | VALUE($) | |
| Mortgage Pass-Through Securities — continued | |
| | 94 | | | 5.500%, 09/01/17 | | | 95 | |
| | 52 | | | 6.000%, 09/01/17 | | | 52 | |
| | | | Government National Mortgage Association II, | | | | |
| | 21 | | | ARM, 1.875%, 07/20/21 | | | 22 | |
| | 126 | | | ARM, 2.000%, 09/20/17 - 01/20/28 | | | 129 | |
| | — | (h) | | ARM, 2.125%, 05/20/17 | | | — | (h) |
| | 5 | | | ARM, 2.500%, 12/20/17 - 05/20/21 | | | 5 | |
| | 7 | | | ARM, 3.000%, 04/20/18 - 05/20/20 | | | 7 | |
| | 1 | | | ARM, 3.500%, 10/20/17 - 12/20/17 | | | 1 | |
| | 2 | | | ARM, 4.000%, 08/20/18 | | | 3 | |
| | | | Government National Mortgage Association II, 30 Year, Single Family, | | | | |
| | 3,225 | | | 6.000%, 09/20/38 | | | 3,682 | |
| | 7,598 | | | 7.000%, 08/20/38 - 09/20/38 | | | 8,870 | |
| | 11 | | | 7.500%, 09/20/28 | | | 13 | |
| | 24 | | | 8.000%, 09/20/26 - 12/20/27 | | | 28 | |
| | 28 | | | 8.500%, 03/20/25 - 04/20/25 | | | 32 | |
| | 982 | | | Government National Mortgage Association, 15 Year, Single Family, 6.500%, 10/15/23 | | | 1,061 | |
| | | | Government National Mortgage Association, 30 Year, Single Family, | | | | |
| | 3,785 | | | 6.500%, 09/15/38 | | | 4,680 | |
| | 8 | | | 8.500%, 04/15/25 | | | 10 | |
| | 7 | | | 9.000%, 09/15/24 - 10/15/26 | | | 8 | |
| | 124 | | | 9.500%, 07/15/20 - 12/15/25 | | | 136 | |
| | | | | | | | |
| | | | Total Mortgage Pass-Through Securities
(Cost $280,788) | | | 288,697 | |
| | | | | | | | |
| U.S. Government Agency Securities — 3.9% | |
| | 8,500 | | | Federal Farm Credit Banks, 1.000%, 09/25/17 | | | 8,514 | |
| | | | Federal Home Loan Banks, | | | | |
| | 7,500 | | | 0.875%, 06/29/18 | | | 7,499 | |
| | 28,365 | | | 0.875%, 08/05/19 | | | 28,222 | |
| | 30,855 | | | 1.250%, 06/08/18 | | | 31,028 | |
| | 39,150 | | | 4.750%, 12/16/16 | | | 39,649 | |
| | 20,000 | | | 5.000%, 11/17/17 | | | 21,008 | |
| | | | Federal Home Loan Mortgage Corp., | | | | |
| | 21,940 | | | 0.750%, 07/14/17 | | | 21,949 | |
| | 25,650 | | | 0.750%, 04/09/18 | | | 25,596 | |
| | 10,000 | | | 0.875%, 07/19/19 | | | 9,945 | |
| | 32,050 | | | 1.000%, 03/08/17 | | | 32,119 | |
| | 20,000 | | | 4.875%, 06/13/18 | | | 21,406 | |
| | | | Federal National Mortgage Association, | | | | |
| | 48,325 | | | 1.125%, 04/27/17 | | | 48,490 | |
| | 19,105 | | | 1.125%, 07/20/18 | | | 19,187 | |
| | 15,000 | | | 1.250%, 09/28/16 | | | 15,010 | |
| | | | | | | | |
PRINCIPAL
AMOUNT($) | | | SECURITY DESCRIPTION | | VALUE($) | |
| | | | | | | | |
| | 12,500 | | | 1.250%, 08/17/21 | | | 12,435 | |
| | 10,355 | | | 1.508%, 10/09/19 (n) | | | 9,916 | |
| | 5,000 | | | 5.000%, 02/13/17 | | | 5,101 | |
| | 21,155 | | | 5.375%, 06/12/17 | | | 21,930 | |
| | 50,000 | | | Residual Funding Corp. STRIPS, 1.445%, 10/15/19 (n) | | | 48,234 | |
| | | | | | | | |
| | | | Total U.S. Government Agency Securities
(Cost $426,598) | | | 427,238 | |
| | | | | | | | |
| U.S. Treasury Obligations — 56.3% | |
| | | | U.S. Treasury Notes, | | | | |
| | 281,670 | | | 0.500%, 07/31/17 | | | 281,230 | |
| | 121,620 | | | 0.625%, 05/31/17 | | | 121,620 | |
| | 75,000 | | | 0.625%, 06/30/17 | | | 74,985 | |
| | 10,000 | | | 0.625%, 07/31/17 | | | 9,995 | |
| | 370,820 | | | 0.625%, 08/31/17 | | | 370,588 | |
| | 246,695 | | | 0.625%, 09/30/17 | | | 246,444 | |
| | 200,745 | | | 0.625%, 11/30/17 | | | 200,455 | |
| | 282,250 | | | 0.625%, 04/30/18 | | | 281,467 | |
| | 115,380 | | | 0.750%, 06/30/17 | | | 115,470 | |
| | 271,280 | | | 0.750%, 10/31/17 | | | 271,354 | |
| | 371,830 | | | 0.750%, 12/31/17 | | | 371,801 | |
| | 20,000 | | | 0.750%, 02/28/18 | | | 19,990 | |
| | 65,070 | | | 0.750%, 03/31/18 | | | 65,039 | |
| | 50,000 | | | 0.750%, 04/15/18 | | | 49,963 | |
| | 10,000 | | | 0.750%, 04/30/18 | | | 9,992 | |
| | 30,000 | | | 0.875%, 07/15/17 | | | 30,054 | |
| | 40,000 | | | 0.875%, 11/30/17 | | | 40,069 | |
| | 185,200 | | | 0.875%, 01/31/18 | | | 185,497 | |
| | 130,200 | | | 0.875%, 07/15/18 | | | 130,332 | |
| | 70,000 | | | 0.875%, 10/15/18 | | | 70,044 | |
| | 30,000 | | | 0.875%, 05/15/19 | | | 29,981 | |
| | 90,395 | | | 0.875%, 07/31/19 | | | 90,268 | |
| | 45,000 | | | 1.000%, 03/15/18 | | | 45,151 | |
| | 200,000 | | | 1.000%, 05/31/18 | | | 200,648 | |
| | 25,000 | | | 1.000%, 08/15/18 | | | 25,083 | |
| | 40,000 | | | 1.000%, 09/15/18 | | | 40,133 | |
| | 10,180 | | | 1.000%, 06/30/19 | | | 10,205 | |
| | 50,570 | | | 1.000%, 08/31/19 | | | 50,661 | |
| | 55,000 | | | 1.000%, 09/30/19 | | | 55,073 | |
| | 30,200 | | | 1.000%, 11/30/19 | | | 30,212 | |
| | 130,000 | | | 1.125%, 06/15/18 | | | 130,706 | |
| | 226,195 | | | 1.250%, 10/31/18 | | | 228,095 | |
| | 25,000 | | | 1.250%, 11/15/18 | | | 25,209 | |
| | 60,550 | | | 1.250%, 11/30/18 | | | 61,077 | |
| | 40,000 | | | 1.250%, 12/15/18 | | | 40,347 | |
| | 175,860 | | | 1.250%, 01/31/19 | | | 177,412 | |
SEE NOTES TO FINANCIAL STATEMENTS.
| | | | | | |
| | | |
| 264 | | | | J.P. MORGAN INCOME FUNDS | | AUGUST 31, 2016 |
| | | | | | | | |
PRINCIPAL
AMOUNT($) | | | SECURITY DESCRIPTION | | VALUE($) | |
| U.S. Treasury Obligations — continued | |
| | 30,000 | | | 1.250%, 01/31/20 | | | 30,223 | |
| | 20,000 | | | 1.375%, 06/30/18 | | | 20,201 | |
| | 50,920 | | | 1.375%, 07/31/18 | | | 51,453 | |
| | 90,400 | | | 1.375%, 09/30/18 | | | 91,392 | |
| | 10,910 | | | 1.375%, 12/31/18 | | | 11,037 | |
| | 146,725 | | | 1.375%, 02/28/19 | | | 148,513 | |
| | 15,000 | | | 1.375%, 01/31/20 | | | 15,175 | |
| | 20,270 | | | 1.375%, 02/29/20 | | | 20,504 | |
| | 25,140 | | | 1.375%, 03/31/20 | | | 25,424 | |
| | 25,165 | | | 1.375%, 04/30/20 | | | 25,449 | |
| | 35,000 | | | 1.375%, 08/31/20 | | | 35,342 | |
| | 35,000 | | | 1.375%, 09/30/20 | | | 35,331 | |
| | 30,530 | | | 1.500%, 08/31/18 | | | 30,928 | |
| | 95,495 | | | 1.500%, 12/31/18 | | | 96,883 | |
| | 80,690 | | | 1.500%, 01/31/19 | | | 81,888 | |
| | 75,440 | | | 1.500%, 02/28/19 | | | 76,592 | |
| | 277,010 | | | 1.500%, 05/31/19 | | | 281,425 | |
| | 20,000 | | | 1.500%, 10/31/19 | | | 20,323 | |
| | 50,450 | | | 1.500%, 11/30/19 | | | 51,262 | |
| | 100,490 | | | 1.625%, 03/31/19 | | | 102,359 | |
| | 105,650 | | | 1.625%, 04/30/19 | | | 107,660 | |
| | 55,000 | | | 1.625%, 06/30/19 | | | 56,081 | |
| | 130,225 | | | 1.625%, 07/31/19 | | | 132,814 | |
| | 10,000 | | | 1.750%, 09/30/19 | | | 10,239 | |
| | 30,000 | | | 1.750%, 10/31/20 | | | 30,724 | |
| | 80,270 | | | 1.875%, 09/30/17 | | | 81,277 | |
| | | | | | | | |
PRINCIPAL
AMOUNT($) | | | SECURITY DESCRIPTION | | VALUE($) | |
| | | | | | | | |
| | 55,210 | | | 2.000%, 11/30/20 | | | 57,114 | |
| | 25,000 | | | 2.125%, 08/31/20 | | | 25,972 | |
| | 15,000 | | | 2.250%, 11/30/17 | | | 15,277 | |
| | 70,000 | | | 2.250%, 07/31/18 | | | 71,903 | |
| | 40,520 | | | 2.375%, 07/31/17 | | | 41,140 | |
| | 20,000 | | | 2.375%, 05/31/18 | | | 20,542 | |
| | 40,200 | | | 2.625%, 01/31/18 | | | 41,243 | |
| | 40,000 | | | 2.750%, 02/28/18 | | | 41,170 | |
| | 55,000 | | | 2.875%, 03/31/18 | | | 56,777 | |
| | | | | | | | |
| | | | Total U.S. Treasury Obligations
(Cost $6,208,127) | | | 6,228,287 | |
| | | | | | | | |
| | |
| SHARES | | | | | | |
| Short-Term Investment — 0.4% | |
| | | | Investment Company — 0.4% | | | | |
| | 42,185 | | | JPMorgan U.S. Government Money Market Fund, Institutional Class Shares, 0.310% (b) (l)
(Cost $42,185) | | | 42,185 | |
| | | | | | | | |
| | | | Total Investments — 99.9% (Cost $10,999,861) | | | 11,051,491 | |
| | | | Other Assets in Excess of
Liabilities — 0.1% | | | 13,682 | |
| | | | | | | | |
| | | | NET ASSETS — 100.0% | | $ | 11,065,173 | |
| | | | | | | | |
Percentages indicated are based on net assets.
SEE NOTES TO FINANCIAL STATEMENTS.
| | | | | | | | |
| | | |
| AUGUST 31, 2016 | | J.P. MORGAN INCOME FUNDS | | | | | 265 | |
JPMorgan Short Duration High Yield Fund
SCHEDULE OF PORTFOLIO INVESTMENTS
AS OF AUGUST 31, 2016 (Unaudited)
(Amounts in thousands)
| | | | | | | | |
PRINCIPAL
AMOUNT($) | | | SECURITY DESCRIPTION | | VALUE($) | |
| Corporate Bonds — 73.2% | |
| | | | Consumer Discretionary — 14.9% | |
| | | | Auto Components — 0.5% | |
| | 515 | | | Icahn Enterprises LP/Icahn Enterprises Finance Corp., 4.875%, 03/15/19 | | | 510 | |
| | 304 | | | ZF North America Capital, Inc., 4.000%, 04/29/20 (e) | | | 323 | |
| | | | | | | | |
| | | | | | | 833 | |
| | | | | | | | |
| | | | Automobiles — 0.7% | |
| | 293 | | | Fiat Chrysler Automobiles N.V., (Netherlands), 4.500%, 04/15/20 | | | 300 | |
| | 767 | | | Jaguar Land Rover Automotive plc, (United Kingdom), 4.125%, 12/15/18 (e) | | | 790 | |
| | | | | | | | |
| | | | | | | 1,090 | |
| | | | | | | | |
| | | | Hotels, Restaurants & Leisure — 4.0% | |
| | 325 | | | CCM Merger, Inc., 9.125%, 05/01/19 (e) | | | 341 | |
| | 300 | | | Downstream Development Authority of the Quapaw Tribe of Oklahoma, 10.500%, 07/01/19 (e) | | | 308 | |
| | | | GLP Capital LP/GLP Financing II, Inc., | | | | |
| | 465 | | | 4.375%, 11/01/18 | | | 484 | |
| | 40 | | | 4.375%, 04/15/21 | | | 42 | |
| | 790 | | | 4.875%, 11/01/20 | | | 845 | |
| | 360 | | | International Game Technology, 7.500%, 06/15/19 | | | 406 | |
| | 400 | | | International Game Technology plc, (United Kingdom), 5.625%, 02/15/20 (e) | | | 429 | |
| | | | MGM Resorts International, | | | | |
| | 1,040 | | | 5.250%, 03/31/20 | | | 1,110 | |
| | 575 | | | 8.625%, 02/01/19 | | | 651 | |
| | 540 | | | NCL Corp., Ltd., (Bermuda), 5.250%, 11/15/19 (e) | | | 549 | |
| | 143 | | | Rivers Pittsburgh Borrower LP/Rivers Pittsburgh Finance Corp., 6.125%, 08/15/21 (e) | | | 147 | |
| | 675 | | | Royal Caribbean Cruises Ltd., (Liberia), 7.250%, 03/15/18 | | | 727 | |
| | 156 | | | Ruby Tuesday, Inc., 7.625%, 05/15/20 | | | 148 | |
| | 314 | | | Shingle Springs Tribal Gaming Authority, 9.750%, 09/01/21 (e) | | | 344 | |
| | 155 | | | Yum! Brands, Inc., 3.875%, 11/01/20 | | | 161 | |
| | | | | | | | |
| | | | | | | 6,692 | |
| | | | | | | | |
| | | | Household Durables — 2.4% | |
| | | | CalAtlantic Group, Inc., | | | | |
| | 415 | | | 8.375%, 05/15/18 | | | 457 | |
| | 225 | | | 8.375%, 01/15/21 | | | 268 | |
| | 675 | | | D.R. Horton, Inc., 4.000%, 02/15/20 | | | 707 | |
| | 1,400 | | | Lennar Corp., 4.500%, 06/15/19 | | | 1,470 | |
| | | | | | | | |
PRINCIPAL
AMOUNT($) | | | SECURITY DESCRIPTION | | VALUE($) | |
| | | | | | | | |
| | | | Household Durables — continued | |
| | 287 | | | Mattamy Group Corp., (Canada), 6.500%, 11/15/20 (e) | | | 283 | |
| | 250 | | | PulteGroup, Inc., 4.250%, 03/01/21 | | | 262 | |
| | 435 | | | Toll Brothers Finance Corp., 6.750%, 11/01/19 | | | 490 | |
| | | | | | | | |
| | | | | | | 3,937 | |
| | | | | | | | |
| | | | Media — 6.2% | |
| | | | Cablevision Systems Corp., | | | | |
| | 800 | | | 7.750%, 04/15/18 | | | 854 | |
| | 519 | | | 8.000%, 04/15/20 | | | 553 | |
| | 1,430 | | | 8.625%, 09/15/17 | | | 1,520 | |
| | 175 | | | Clear Channel Worldwide Holdings, Inc., Series B, 7.625%, 03/15/20 | | | 176 | |
| | | | DISH DBS Corp., | | | | |
| | 1,205 | | | 4.250%, 04/01/18 | | | 1,237 | |
| | 650 | | | 4.625%, 07/15/17 | | | 665 | |
| | 1,479 | | | 7.875%, 09/01/19 | | | 1,649 | |
| | 850 | | | Gray Television, Inc., 7.500%, 10/01/20 | | | 884 | |
| | 871 | | | NAI Entertainment Holdings/NAI Entertainment Holdings Finance Corp., 5.000%, 08/01/18 (e) | | | 884 | |
| | 250 | | | Nielsen Finance LLC/Nielsen Finance Co., 4.500%, 10/01/20 | | | 256 | |
| | 860 | | | Sirius XM Radio, Inc., 4.250%, 05/15/20 (e) | | | 877 | |
| | 250 | | | Starz LLC/Starz Finance Corp., 5.000%, 09/15/19 | | | 254 | |
| | 500 | | | TEGNA, Inc., 5.125%, 10/15/19 | | | 514 | |
| | | | | | | | |
| | | | | | | 10,323 | |
| | | | | | | | |
| | | | Multiline Retail — 0.3% | |
| | 500 | | | Dollar Tree, Inc., 5.250%, 03/01/20 | | | 521 | |
| | | | | | | | |
| | | | Specialty Retail — 0.8% | |
| | 750 | | | Michaels Stores, Inc., 5.875%, 12/15/20 (e) | | | 777 | |
| | 454 | | | Serta Simmons Bedding LLC, 8.125%, 10/01/20 (e) | | | 473 | |
| | | | | | | | |
| | | | | | | 1,250 | |
| | | | | | | | |
| | | | Total Consumer Discretionary | | | 24,646 | |
| | | | | | | | |
| | | | Consumer Staples — 3.8% | |
| | | | Beverages — 0.2% | |
| | 250 | | | Cott Beverages, Inc., 6.750%, 01/01/20 | | | 262 | |
| | | | | | | | |
| | | | Food & Staples Retailing — 1.9% | | | | |
| | | | Safeway, Inc., | | | | |
| | 37 | | | 3.950%, 08/15/20 | | | 36 | |
| | 2,740 | | | 5.000%, 08/15/19 | | | 2,780 | |
SEE NOTES TO FINANCIAL STATEMENTS.
| | | | | | |
| | | |
| 266 | | | | J.P. MORGAN INCOME FUNDS | | AUGUST 31, 2016 |
| | | | | | | | |
PRINCIPAL
AMOUNT($) | | | SECURITY DESCRIPTION | | VALUE($) | |
| Corporate Bonds — continued | |
| | | | Food & Staples Retailing — continued | | | | |
| | 540 | | | SUPERVALU, Inc., 6.750%, 06/01/21 | | | 508 | |
| | | | | | | | |
| | | | | | | 3,324 | |
| | | | | | | | |
| | | | Food Products — 1.6% | |
| | 1,947 | | | Bumble Bee Holdings, Inc., 9.000%, 12/15/17 (e) | | | 1,981 | |
| | 444 | | | JBS USA LUX S.A./JBS USA Finance, Inc., 8.250%, 02/01/20 (e) | | | 459 | |
| | 216 | | | Smithfield Foods, Inc., 5.250%, 08/01/18 (e) | | | 218 | |
| | | | | | | | |
| | | | | | | 2,658 | |
| | | | | | | | |
| | | | Personal Products — 0.1% | |
| | 100 | | | NBTY, Inc., 7.625%, 05/15/21 (e) | | | 102 | |
| | | | | | | | |
| | | | Total Consumer Staples | | | 6,346 | |
| | | | | | | | |
| | | | Energy — 7.8% | |
| | | | Energy Equipment & Services — 0.4% | |
| | 600 | | | Trinidad Drilling Ltd., (Canada), 7.875%, 01/15/19 (e) | | | 552 | |
| | 81 | | | Weatherford International Ltd., (Bermuda), 7.750%, 06/15/21 | | | 80 | |
| | | | | | | | |
| | | | | | | 632 | |
| | | | | | | | |
| | | | Oil, Gas & Consumable Fuels — 7.4% | |
| | 543 | | | Antero Resources Corp., 6.000%, 12/01/20 | | | 556 | |
| | 175 | | | Buckeye Partners LP, 6.050%, 01/15/18 | | | 184 | |
| | 266 | | | California Resources Corp., 8.000%, 12/15/22 (e) | | | 180 | |
| | 735 | | | Cenovus Energy, Inc., (Canada), 5.700%, 10/15/19 | | | 789 | |
| | 55 | | | Chesapeake Energy Corp., 8.000%, 12/15/22 (e) | | | 52 | |
| | 290 | | | Cloud Peak Energy Resources LLC/Cloud Peak Energy Finance Corp., 8.500%, 12/15/19 | | | 186 | |
| | 215 | | | Continental Resources, Inc., 7.125%, 04/01/21 | | | 223 | |
| | 400 | | | Crestwood Midstream Partners LP/Crestwood Midstream Finance Corp., 6.000%, 12/15/20 | | | 394 | |
| | 400 | | | Energy Transfer Equity LP, 7.500%, 10/15/20 | | | 438 | |
| | 500 | | | Freeport-McMoran Oil & Gas LLC/FCX Oil & Gas, Inc., 6.500%, 11/15/20 | | | 501 | |
| | 500 | | | Holly Energy Partners LP/Holly Energy Finance Corp., 6.500%, 03/01/20 | | | 515 | |
| | 270 | | | NGL Energy Partners LP/NGL Energy Finance Corp., 5.125%, 07/15/19 | | | 253 | |
| | | | NGPL PipeCo LLC, | | | | |
| | 1,600 | | | 7.119%, 12/15/17 (e) | | | 1,667 | |
| | 800 | | | 9.625%, 06/01/19 (e) | | | 836 | |
| | 248 | | | Oasis Petroleum, Inc., 7.250%, 02/01/19 | | | 244 | |
| | | | | | | | |
PRINCIPAL
AMOUNT($) | | | SECURITY DESCRIPTION | | VALUE($) | |
| | | | | | | | |
| | | | Oil, Gas & Consumable Fuels — continued | | | | |
| | 185 | | | ONEOK Partners LP, 3.200%, 09/15/18 | | | 188 | |
| | 170 | | | Plains All American Pipeline LP/PAA Finance Corp., 6.500%, 05/01/18 | | | 181 | |
| | 366 | | | QEP Resources, Inc., 6.800%, 04/01/18 | | | 371 | |
| | 800 | | | Rockies Express Pipeline LLC, 6.000%, 01/15/19 (e) | | | 842 | |
| | | | Sunoco LP/Sunoco Finance Corp., | | | | |
| | 1,000 | | | 5.500%, 08/01/20 (e) | | | 1,015 | |
| | 211 | | | 6.250%, 04/15/21 (e) | | | 217 | |
| | 800 | | | Targa Resources Partners LP/Targa Resources Partners Finance Corp., 4.125%, 11/15/19 | | | 806 | |
| | 1,000 | | | Tesoro Logistics LP/Tesoro Logistics Finance Corp., 5.500%, 10/15/19 | | | 1,065 | |
| | 650 | | | Western Gas Partners LP, 2.600%, 08/15/18 | | | 650 | |
| | 77 | | | Whiting Petroleum Corp., 5.000%, 03/15/19 | | | 71 | |
| | | | | | | | |
| | | | | | | 12,424 | |
| | | | | | | | |
| | | | Total Energy | | | 13,056 | |
| | | | | | | | |
| | | | Financials — 4.7% | |
| | | | Banks — 1.5% | |
| | 2,461 | | | CIT Group, Inc., 3.875%, 02/19/19 | | | 2,515 | |
| | | | | | | | |
| | | | Consumer Finance — 1.5% | |
| | | | Ally Financial, Inc., | |
| | 556 | | | 3.250%, 11/05/18 | | | 561 | |
| | 1,700 | | | 4.750%, 09/10/18 | | | 1,766 | |
| | | | Springleaf Finance Corp., | | | | |
| | 26 | | | 7.750%, 10/01/21 | | | 27 | |
| | 119 | | | 8.250%, 12/15/20 | | | 130 | |
| | | | | | | | |
| | | | | | | 2,484 | |
| | | | | | | | |
| | | | Diversified Financial Services — 0.7% | |
| | 300 | | | CNG Holdings, Inc., 9.375%, 05/15/20 (e) | | | 167 | |
| | | | Nationstar Mortgage LLC/Nationstar Capital Corp., | | | | |
| | 505 | | | 6.500%, 08/01/18 | | | 504 | |
| | 485 | | | 9.625%, 05/01/19 | | | 507 | |
| | | | | | | | |
| | | | | | | 1,178 | |
| | | | | | | | |
| | | | Insurance — 0.6% | |
| | 850 | | | Hartford Financial Services Group, Inc. (The), VAR, 8.125%, 06/15/38 | | | 929 | |
| | | | | | | | |
| | | | Thrifts & Mortgage Finance — 0.4% | | | | |
| | 675 | | | Radian Group, Inc., 5.500%, 06/01/19 | | | 716 | |
| | | | | | | | |
| | | | Total Financials | | | 7,822 | |
| | | | | | | | |
SEE NOTES TO FINANCIAL STATEMENTS.
| | | | | | | | |
| | | |
| AUGUST 31, 2016 | | J.P. MORGAN INCOME FUNDS | | | | | 267 | |
JPMorgan Short Duration High Yield Fund
SCHEDULE OF PORTFOLIO INVESTMENTS
AS OF AUGUST 31, 2016 (Unaudited) (continued)
(Amounts in thousands)
| | | | | | | | |
PRINCIPAL
AMOUNT($) | | | SECURITY DESCRIPTION | | VALUE($) | |
| Corporate Bonds — continued | |
| | | | Health Care — 8.6% | |
| | | | Health Care Equipment & Supplies — 1.2% | |
| | 1,050 | | | ConvaTec Healthcare E S.A., (Luxembourg), 10.500%, 12/15/18 (e) | | | 1,079 | |
| | 700 | | | Mallinckrodt International Finance S.A., (Luxembourg), 3.500%, 04/15/18 | | | 701 | |
| | 270 | | | Mallinckrodt International Finance S.A./Mallinckrodt CB LLC, (Luxembourg), 4.875%, 04/15/20 (e) | | | 276 | |
| | | | | | | | |
| | | | | | | 2,056 | |
| | | | | | | | |
| | | | Health Care Providers & Services — 5.4% | |
| | 450 | | | Centene Corp., 5.625%, 02/15/21 | | | 479 | |
| | | | CHS/Community Health Systems, Inc., | | | | |
| | 191 | | | 5.125%, 08/15/18 | | | 193 | |
| | 375 | | | 7.125%, 07/15/20 | | | 335 | |
| | 700 | | | 8.000%, 11/15/19 | | | 663 | |
| | 580 | | | Fresenius Medical Care U.S. Finance, Inc., 5.750%, 02/15/21 (e) | | | 658 | |
| | 325 | | | HCA Holdings, Inc., 6.250%, 02/15/21 | | | 352 | |
| | | | HCA, Inc., | | | | |
| | 521 | | | 3.750%, 03/15/19 | | | 537 | |
| | 620 | | | 4.250%, 10/15/19 | | | 650 | |
| | 700 | | | 6.500%, 02/15/20 | | | 773 | |
| | 2,200 | | | IASIS Healthcare LLC/IASIS Capital Corp., 8.375%, 05/15/19 | | | 1,994 | |
| | | | Tenet Healthcare Corp., | | | | |
| | 830 | | | 5.000%, 03/01/19 | | | 806 | |
| | 350 | | | 6.250%, 11/01/18 | | | 374 | |
| | 965 | | | VAR, 4.153%, 06/15/20 | | | 962 | |
| | | | | | | | |
| | | | | | | 8,776 | |
| | | | | | | | |
| | | | Health Care Technology — 1.3% | |
| | 2,045 | | | Change Healthcare Holdings, Inc., 11.000%, 12/31/19 | | | 2,163 | |
| | | | | | | | |
| | | | Pharmaceuticals — 0.7% | |
| | | | Valeant Pharmaceuticals International, Inc., (Canada), | | | | |
| | 355 | | | 5.375%, 03/15/20 (e) | | | 335 | |
| | 635 | | | 6.375%, 10/15/20 (e) | | | 606 | |
| | 300 | | | 7.000%, 10/01/20 (e) | | | 293 | |
| | | | | | | | |
| | | | | | | 1,234 | |
| | | | | | | | |
| | | | Total Health Care | | | 14,229 | |
| | | | | | | | |
| | | | Industrials — 7.0% | |
| | | | Aerospace & Defense — 0.6% | |
| | 752 | | | Bombardier, Inc., (Canada), 5.500%, 09/15/18 (e) | | | 773 | |
| | | | | | | | |
PRINCIPAL
AMOUNT($) | | | SECURITY DESCRIPTION | | VALUE($) | |
| | | | | | | | |
| | | | Aerospace & Defense — continued | |
| | 79 | | | Huntington Ingalls Industries, Inc., 5.000%, 12/15/21 (e) | | | 83 | |
| | 80 | | | TransDigm, Inc., 5.500%, 10/15/20 | | | 82 | |
| | | | | | | | |
| | | | | | | 938 | |
| | | | | | | | |
| | | | Airlines — 0.3% | | | | |
| | 79 | | | American Airlines Group, Inc., 5.500%, 10/01/19 (e) | | | 81 | |
| | 444 | | | Continental Airlines 2003-ERJ1 Pass-Through Trust, 7.875%, 07/02/18 | | | 463 | |
| | 7 | | | Continental Airlines 2006-ERJ1 Pass-Through Trust, 9.318%, 11/01/19 (e) | | | 8 | |
| | | | | | | | |
| | | | | | | 552 | |
| | | | | | | | |
| | | | Building Products — 0.5% | | | | |
| | 750 | | | Standard Industries, Inc., 5.125%, 02/15/21 (e) | | | 791 | |
| | | | | | | | |
| | | | Commercial Services & Supplies — 3.6% | |
| | 518 | | | ACCO Brands Corp., 6.750%, 04/30/20 | | | 549 | |
| | 1,165 | | | ADT Corp. (The), 6.250%, 10/15/21 | | | 1,276 | |
| | 1,159 | | | Casella Waste Systems, Inc., 7.750%, 02/15/19 | | | 1,185 | |
| | 965 | | | Garda World Security Corp., (Canada), 7.250%, 11/15/21 (e) | | | 881 | |
| | 1,770 | | | ILFC E-Capital Trust I, VAR, 3.980%, 12/21/65 (e) | | | 1,412 | |
| | 300 | | | R.R. Donnelley & Sons Co., 7.250%, 05/15/18 | | | 320 | |
| | 392 | | | West Corp., 4.750%, 07/15/21 (e) | | | 400 | |
| | | | | | | | |
| | | | | | | 6,023 | |
| | | | | | | | |
| | | | Construction & Engineering — 0.6% | |
| | 1,033 | | | Tutor Perini Corp., 7.625%, 11/01/18 | | | 1,043 | |
| | | | | | | | |
| | | | Electrical Equipment — 0.3% | |
| | 450 | | | Wise Metals Group LLC/Wise Alloys Finance Corp., 8.750%, 12/15/18 (e) | | | 464 | |
| | | | | | | | |
| | | | Machinery — 0.4% | |
| | 534 | | | BlueLine Rental Finance Corp., 7.000%, 02/01/19 (e) | | | 462 | |
| | 300 | | | Bluewater Holding B.V., (Netherlands), Reg. S, 10.000%, 12/10/19 (e) | | | 132 | |
| | | | | | | | |
| | | | | | | 594 | |
| | | | | | | | |
| | | | Trading Companies & Distributors — 0.7% | |
| | 445 | | | Aircastle Ltd., (Bermuda), 6.250%, 12/01/19 | | | 492 | |
| | 710 | | | HD Supply, Inc., 7.500%, 07/15/20 | | | 740 | |
| | | | | | | | |
| | | | | | | 1,232 | |
| | | | | | | | |
| | | | Total Industrials | | | 11,637 | |
| | | | | | | | |
SEE NOTES TO FINANCIAL STATEMENTS.
| | | | | | |
| | | |
| 268 | | | | J.P. MORGAN INCOME FUNDS | | AUGUST 31, 2016 |
| | | | | | | | |
PRINCIPAL
AMOUNT($) | | | SECURITY DESCRIPTION | | VALUE($) | |
| Corporate Bonds — continued | |
| | | | Information Technology — 4.4% | |
| | | | Electronic Equipment, Instruments & Components — 0.3% | |
| | 550 | | | Anixter, Inc., 5.625%, 05/01/19 | | | 582 | |
| | | | | | | | |
| | | �� | Internet Software & Services — 0.2% | |
| | 314 | | | IAC/InterActiveCorp., 4.875%, 11/30/18 | | | 322 | |
| | | | | | | | |
| | | | Semiconductors & Semiconductor Equipment — 1.3% | |
| | 612 | | | Advanced Micro Devices, Inc., 6.750%, 03/01/19 | | | 615 | |
| | | | NXP B.V./NXP Funding LLC, (Netherlands), | | | | |
| | 1,000 | | | 4.125%, 06/15/20 (e) | | | 1,036 | |
| | 455 | | | 4.125%, 06/01/21 (e) | | | 476 | |
| | | | | | | | |
| | | | | | | 2,127 | |
| | | | | | | | |
| | | | Software — 1.0% | |
| | 750 | | | Infor U.S., Inc., 5.750%, 08/15/20 (e) | | | 792 | |
| | 825 | | | Nuance Communications, Inc., 5.375%, 08/15/20 (e) | | | 844 | |
| | | | | | | | |
| | | | | | | 1,636 | |
| | | | | | | | |
| | | | Technology Hardware, Storage & Peripherals — 1.6% | |
| | | | Diamond 1 Finance Corp./Diamond 2 Finance Corp., | | | | |
| | 1,060 | | | 3.480%, 06/01/19 (e) | | | 1,089 | |
| | 489 | | | 4.420%, 06/15/21 (e) | | | 512 | |
| | 260 | | | 5.875%, 06/15/21 (e) | | | 275 | |
| | 750 | | | NCR Corp., 4.625%, 02/15/21 | | | 758 | |
| | | | | | | | |
| | | | | | | 2,634 | |
| | | | | | | | |
| | | | Total Information Technology | | | 7,301 | |
| | | | | | | | |
| | | | Materials — 9.1% | |
| | | | Chemicals — 0.9% | |
| | 400 | | | Eagle Spinco, Inc., 4.625%, 02/15/21 | | | 419 | |
| | 805 | | | Hexion, Inc., 6.625%, 04/15/20 | | | 698 | |
| | 425 | | | Rain CII Carbon LLC/CII Carbon Corp., 8.000%, 12/01/18 (e) | | | 411 | |
| | | | | | | | |
| | | | | | | 1,528 | |
| | | | | | | | |
| | | | Construction Materials — 0.7% | |
| | 350 | | | Cemex S.A.B. de C.V., (Mexico), 6.500%, 12/10/19 (e) | | | 374 | |
| | 776 | | | Headwaters, Inc., 7.250%, 01/15/19 | | | 805 | |
| | | | | | | | |
| | | | | | | 1,179 | |
| | | | | | | | |
| | | | Containers & Packaging — 1.5% | |
| | 300 | | | Ball Corp., 4.375%, 12/15/20 | | | 323 | |
| | 375 | | | Graphic Packaging International, Inc., 4.750%, 04/15/21 | | | 402 | |
| | 550 | | | Owens-Illinois, Inc., 7.800%, 05/15/18 | | | 602 | |
| | | | | | | | |
PRINCIPAL
AMOUNT($) | | | SECURITY DESCRIPTION | | VALUE($) | |
| | | | | | | | |
| | | | Containers & Packaging — continued | |
| | 520 | | | Reynolds Group Issuer, Inc./Reynolds Group Issuer LLC, VAR, 4.127%, 07/15/21 (e) | | | 528 | |
| | 500 | | | Sealed Air Corp., 6.500%, 12/01/20 (e) | | | 571 | |
| | | | | | | | |
| | | | | | | 2,426 | |
| | | | | | | | |
| | | | Metals & Mining — 6.0% | |
| | 2,140 | | | Alcoa, Inc., 5.720%, 02/23/19 | | | 2,295 | |
| | | | Anglo American Capital plc, (United Kingdom), | | | | |
| | 745 | | | 3.625%, 05/14/20 (e) | | | 738 | |
| | 500 | | | 4.450%, 09/27/20 (e) | | | 505 | |
| | | | ArcelorMittal, (Luxembourg), | | | | |
| | 270 | | | 6.500%, 03/01/21 | | | 293 | |
| | 1,570 | | | 10.850%, 06/01/19 | | | 1,872 | |
| | 91 | | | BlueScope Steel Finance Ltd./BlueScope Steel Finance USA LLC, (Australia), 7.125%, 05/01/18 (e) | | | 93 | |
| | 71 | | | Commercial Metals Co., 7.350%, 08/15/18 | | | 76 | |
| | 940 | | | Freeport-McMoRan, Inc., 2.375%, 03/15/18 | | | 925 | |
| | 430 | | | New Gold, Inc., (Canada), 7.000%, 04/15/20 (e) | | | 443 | |
| | 600 | | | Novelis, Inc., (Canada), 8.375%, 12/15/17 | | | 613 | |
| | 182 | | | Prince Mineral Holding Corp., 11.500%, 12/15/19 (e) | | | 165 | |
| | 550 | | | Steel Dynamics, Inc., 6.125%, 08/15/19 | | | 568 | |
| | | | Teck Resources Ltd., (Canada), | | | | |
| | 840 | | | 3.000%, 03/01/19 | | | 815 | |
| | 25 | | | 8.000%, 06/01/21 (e) | | | 27 | |
| | 310 | | | United States Steel Corp., 8.375%, 07/01/21 (e) | | | 337 | |
| | | | | | | | |
| | | | | | | 9,765 | |
| | | | | | | | |
| | | | Total Materials | | | 14,898 | |
| | | | | | | | |
| | | | Real Estate — 0.8% | |
| | | | Equity Real Estate Investment Trusts (REITs) — 0.8% | |
| | 700 | | | Equinix, Inc., 5.375%, 01/01/22 | | | 748 | |
| | 543 | | | Iron Mountain, Inc., 6.000%, 10/01/20 (e) | | | 577 | |
| | 104 | | | VEREIT Operating Partnership LP, 4.125%, 06/01/21 | | | 109 | |
| | | | | | | | |
| | | | Total Real Estate | | | 1,434 | |
| | | | | | | | |
| | | | Telecommunication Services — 8.3% | |
| | | | Diversified Telecommunication Services — 4.1% | |
| | 575 | | | CCO Holdings LLC/CCO Holdings Capital Corp., 6.625%, 01/31/22 | | | 605 | |
| | 610 | | | CenturyLink, Inc., Series R, 5.150%, 06/15/17 | | | 625 | |
| | 683 | | | Cincinnati Bell, Inc., 8.375%, 10/15/20 | | | 707 | |
| | | | Frontier Communications Corp., | | | | |
| | 900 | | | 7.125%, 03/15/19 | | | 970 | |
SEE NOTES TO FINANCIAL STATEMENTS.
| | | | | | | | |
| | | |
| AUGUST 31, 2016 | | J.P. MORGAN INCOME FUNDS | | | | | 269 | |
JPMorgan Short Duration High Yield Fund
SCHEDULE OF PORTFOLIO INVESTMENTS
AS OF AUGUST 31, 2016 (Unaudited) (continued)
(Amounts in thousands)
| | | | | | | | |
PRINCIPAL
AMOUNT($) | | | SECURITY DESCRIPTION | | VALUE($) | |
| Corporate Bonds — continued | |
| | | | Diversified Telecommunication Services — continued | |
| | 845 | | | 8.125%, 10/01/18 | | | 930 | |
| | 1,600 | | | 8.500%, 04/15/20 | | | 1,726 | |
| | 523 | | | Intelsat Jackson Holdings S.A., (Luxembourg), 7.250%, 04/01/19 | | | 419 | |
| | 820 | | | Sprint Capital Corp., 6.900%, 05/01/19 | | | 828 | |
| | | | | | | | |
| | | | | | | 6,810 | |
| | | | | | | | |
| | | | Wireless Telecommunication Services — 4.2% | |
| | 750 | | | SoftBank Group Corp., (Japan), 4.500%, 04/15/20 (e) | | | 780 | |
| | | | Sprint Communications, Inc., | | | | |
| | 1,000 | | | 8.375%, 08/15/17 | | | 1,042 | |
| | 1,200 | | | 9.000%, 11/15/18 (e) | | | 1,321 | |
| | | | T-Mobile USA, Inc., | | | | |
| | 525 | | | 6.250%, 04/01/21 | | | 548 | |
| | 1,000 | | | 6.464%, 04/28/19 | | | 1,020 | |
| | 2,275 | | | 6.542%, 04/28/20 | | | 2,349 | |
| | | | | | | | |
| | | | | | | 7,060 | |
| | | | | | | | |
| | | | Total Telecommunication Services | | | 13,870 | |
| | | | | | | | |
| | | | Utilities — 3.8% | |
| | | | Independent Power & Renewable Electricity Producers — 3.8% | |
| | 965 | | | AES Corp., VAR, 3.842%, 06/01/19 | | | 965 | |
| | 1,500 | | | Calpine Corp., 6.000%, 01/15/22 (e) | | | 1,573 | |
| | 600 | | | Dynegy, Inc., 6.750%, 11/01/19 | | | 615 | |
| | 1,000 | | | GenOn Energy, Inc., 9.875%, 10/15/20 | | | 705 | |
| | 1,500 | | | NRG Energy, Inc., 8.250%, 09/01/20 | | | 1,541 | |
| | 1,033 | | | Talen Energy Supply LLC, 4.625%, 07/15/19 (e) | | | 971 | |
| | | | | | | | |
| | | | Total Utilities | | | 6,370 | |
| | | | | | | | |
| | | | Total Corporate Bonds
(Cost $121,320) | | | 121,609 | |
| | | | | | | | |
| Preferred Securities — 0.8% (x) | |
| | | | Financials — 0.8% | |
| | | | Banks — 0.7% | |
| | 545 | | | Barclays plc, (United Kingdom), VAR, 8.250%, 12/15/18 | | | 558 | |
| | 575 | | | Citigroup, Inc., Series Q, VAR, 5.950%, 08/15/20 | | | 586 | |
| | | | | | | | |
| | | | | | | 1,144 | |
| | | | | | | | |
| | | | Capital Markets — 0.1% | |
| | 204 | | | Goldman Sachs Group, Inc. (The), Series L, VAR, 5.700%, 05/10/19 | | | 208 | |
| | | | | | | | |
| | | | Total Preferred Securities
(Cost $1,357) | | | 1,352 | |
| | | | | | | | |
| | | | | | | | |
SHARES | | | SECURITY DESCRIPTION | | VALUE($) | |
| Common Stock — 0.0% (g) | |
| | | | Energy — 0.0% (g) | | | | |
| | | | Oil, Gas & Consumable Fuels — 0.0% (g) | | | | |
| | — | (h) | | Federal Home Loan Mortgage Corp.
(Cost $31) | | | 33 | |
| | | | | | | | |
| Preferred Stocks — 0.8% | |
| | | | Financials — 0.8% | |
| | | | Consumer Finance — 0.4% | |
| | 23 | | | GMAC Capital Trust I, Series 2, VAR, 6.602%, 02/15/40 ($25 par value) | | | 591 | |
| | | | | | | | |
| | | | Insurance — 0.4% | |
| | 1 | | | XLIT Ltd., (Cayman Islands), Series D, VAR, 3.800%, 10/03/16 ($1,000 par value) @ | | | 794 | |
| | | | | | | | |
| | | | Total Preferred Stocks
(Cost $1,493) | | | 1,385 | |
| | | | | | | | |
| | |
PRINCIPAL
AMOUNT($) | | | | | | |
| Loan Assignments — 20.8% | |
| | | | Consumer Discretionary — 7.1% | |
| | | | Auto Components — 1.1% | |
| | 1,367 | | | CS Intermediate Holdco 2 LLC, Term Loan, VAR, 4.000%, 04/04/21 | | | 1,372 | |
| | 395 | | | Key Safety Systems, Inc., Initial Term Loan, VAR, 5.500%, 08/29/21 | | | 395 | |
| | | | | | | | |
| | | | | | | 1,767 | |
| | | | | | | | |
| | | | Hotels, Restaurants & Leisure — 1.5% | |
| | 746 | | | CBAC Borrower LLC, Term Loan B, VAR, 8.250%, 07/02/20 | | | 728 | |
| | 772 | | | Golden Nugget, Inc., Closing Date Facility Term Loan, VAR, 5.500%, 11/21/19 | | | 776 | |
| | 331 | | | Golden Nugget, Inc., Delayed Draw Term Loan, VAR, 5.500%, 11/21/19 | | | 332 | |
| | 595 | | | Intrawest Operations Group LLC, Initial Term Loan, VAR, 5.000%, 12/09/20 | | | 597 | |
| | | | | | | | |
| | | | | | | 2,433 | |
| | | | | | | | |
| | | | Internet & Direct Marketing Retail — 0.6% | |
| | 1,283 | | | Lands’ End, Inc., Initial Term B Loan, VAR, 4.250%, 04/04/21 | | | 1,024 | |
| | | | | | | | |
| | | | Leisure Products — 0.5% | |
| | 760 | | | Delta 2 Sarl, USD Facility B-3, VAR, 4.750%, 07/30/21 | | | 756 | |
| | | | | | | | |
| | | | Media — 3.1% | |
| | 305 | | | Charter Communications Operating LLC, Term Loan, VAR, 3.500%, 01/24/23 | | | 307 | |
| | 720 | | | iHeartCommunications, Inc., Term Loan D, VAR, 7.274%, 01/30/19 | | | 552 | |
SEE NOTES TO FINANCIAL STATEMENTS.
| | | | | | |
| | | |
| 270 | | | | J.P. MORGAN INCOME FUNDS | | AUGUST 31, 2016 |
| | | | | | | | |
PRINCIPAL
AMOUNT($) | | | SECURITY DESCRIPTION | | VALUE($) | |
| Loan Assignments — continued | |
| | | | Media — continued | |
| | 142 | | | iHeartCommunications, Inc., Tranche E Term Loan, VAR, 8.024%, 07/30/19 | | | 109 | |
| | 488 | | | Mission Broadcasting, Inc., Incremental Tranche B-1 Term Loan, VAR, 3.750%, 10/01/20 | | | 487 | |
| | 553 | | | Nexstar Broadcasting, Inc., Term B-2 Loan, VAR, 3.750%, 10/01/20 | | | 553 | |
| | 1,836 | | | Univision Communications, Inc., 2013 Incremental Term Loan, VAR, 4.000%, 03/01/20 | | | 1,834 | |
| | 1,402 | | | Univision Communications, Inc., Replacement 1st Lien Term Loan, VAR, 4.000%, 03/01/20 | | | 1,401 | |
| | | | | | | | |
| | | | | | | 5,243 | |
| | | | | | | | |
| | | | Specialty Retail — 0.3% | |
| | 508 | | | PetSmart, Inc., Term Loan B, VAR, 4.250%, 03/11/22 | | | 509 | |
| | | | | | | | |
| | | | Total Consumer Discretionary | | | 11,732 | |
| | | | | | | | |
| | | | Consumer Staples — 3.3% | |
| | | | Food & Staples Retailing — 1.0% | |
| | 360 | | | Albertson’s LLC, 2016-1 Term Loan B-4, VAR, 4.500%, 08/25/21 | | | 361 | |
| | 274 | | | Albertson’s LLC, 2016-1 Term Loan B-5, VAR, 4.750%, 12/21/22 | | | 276 | |
| | 644 | | | Rite Aid Corp., Tranche 2 Term Loan, VAR, 4.875%, 06/21/21 | | | 645 | |
| | 420 | | | SUPERVALU, Inc., Term Loan B, VAR, 5.500%, 03/21/19 | | | 420 | |
| | | | | | | | |
| | | | | | | 1,702 | |
| | | | | | | | |
| | | | Food Products — 2.3% | |
| | 2,765 | | | Dole Food Co., Inc., Tranche B Term Loan, VAR, 4.501%, 11/01/18 | | | 2,772 | |
| | 358 | | | Hearthside Group Holdings LLC, Term Loan, VAR, 4.500%, 06/02/21 | | | 358 | |
| | 206 | | | Pinnacle Foods Finance LLC, 1st Lien Term Loan G, VAR, 3.250%, 04/29/20 | | | 206 | |
| | 534 | | | Pinnacle Foods Finance LLC, Tranche H Term Loan, VAR, 3.250%, 04/29/20 | | | 536 | |
| | | | | | | | |
| | | | | | | 3,872 | |
| | | | | | | | |
| | | | Total Consumer Staples | | | 5,574 | |
| | | | | | | | |
| | | | Energy — 2.1% | |
| | | | Energy Equipment & Services — 0.4% | |
| | 97 | | | Drillships Ocean Ventures, Inc., Tranche B-1 Term Loan, VAR, 6.000%, 03/31/21 | | | 44 | |
| | 292 | | | Floatel International Ltd., Initial Term Loan, (Bermuda), VAR, 6.000%, 06/27/20 | | | 183 | |
| | 1,073 | | | Seadrill Partners LP, Initial Term Loan, VAR, 4.000%, 02/21/21 | | | 514 | |
| | | | | | | | |
| | | | | | | 741 | |
| | | | | | | | |
| | | | | | | | |
PRINCIPAL
AMOUNT($) | | | SECURITY DESCRIPTION | | VALUE($) | |
| | | | | | | | |
| | | | Oil, Gas & Consumable Fuels — 1.7% | |
| | 97 | | | Alon USA Partners LP, MLP Term Loans, VAR, 9.250%, 11/26/18 | | | 96 | |
| | 117 | | | Citgo Holding, Inc., Term Loan, VAR, 9.500%, 05/12/18 | | | 118 | |
| | 405 | | | CITGO Petroleum Corp., Term B Loan, VAR, 4.500%, 07/29/21 | | | 398 | |
| | 875 | | | Energy Transfer Equity LP, Term Loan, VAR, 3.292%, 12/02/19 | | | 858 | |
| | 715 | | | Fieldwood Energy LLC, 2nd Lien Closing Date Loan, VAR, 8.375%, 09/30/20 (d) | | | 257 | |
| | 795 | | | Peabody Energy Corp., Term Loan, VAR, 4.250%, 09/24/20 (d) | | | 547 | |
| | 201 | | | Sabine Oil & Gas Corp., Term Loan, VAR, 12.000%, 12/31/18 (d) ^ | | | 6 | |
| | 81 | | | Southcross Holdings Borrower LP, Tranche B Term Loan, VAR, 3.500%, 04/23/23 | | | 69 | |
| | 400 | | | Western Refining, Inc., 1st Lien Term Loan B, VAR, 5.500%, 06/23/23 | | | 389 | |
| | | | | | | | |
| | | | | | | 2,738 | |
| | | | | | | | |
| | | | Total Energy | | | 3,479 | |
| | | | | | | | |
| | | | Financials — 0.9% | |
| | | | Capital Markets — 0.4% | |
| | 680 | | | UFC Holdings LLC, 1st Lien Guaranteed Senior Secured Term Loan, VAR, 5.000%, 07/22/23 | | | 681 | |
| | | | | | | | |
| | | | Diversified Financial Services — 0.5% | |
| | 753 | | | ROC Finance LLC, Funded Term B Loan, VAR, 5.000%, 06/20/19 | | | 734 | |
| | | | | | | | |
| | | | Total Financials | | | 1,415 | |
| | | | | | | | |
| | | | Health Care — 1.5% | |
| | | | Health Care Providers & Services — 0.8% | |
| | 139 | | | Acadia Healthcare Co., Inc., Tranche B-2 Term Loan, VAR, 4.500%, 02/16/23 | | | 140 | |
| | 479 | | | CHG Healthcare Services, Inc., Term Loan B, VAR, 4.750%, 06/07/23 | | | 481 | |
| | 221 | | | MultiPlan, Inc., 1st Lien Term Loan B, VAR, 5.000%, 06/07/23 | | | 223 | |
| | 508 | | | National Mentor Holdings, Inc., Tranche B Term Loan, VAR, 4.250%, 01/31/21 | | | 509 | |
| | | | | | | | |
| | | | | | | 1,353 | |
| | | | | | | | |
| | | | Pharmaceuticals — 0.7% | |
| | 399 | | | Endo Pharmaceutical, 2015 Incremental Term B Loan, VAR, 3.750%, 09/26/22 | | | 397 | |
| | 469 | | | Grifols Worldwide Operations Ltd., U.S. Tranche B Term Loan, VAR, 3.443%, 02/27/21 | | | 472 | |
SEE NOTES TO FINANCIAL STATEMENTS.
| | | | | | | | |
| | | |
| AUGUST 31, 2016 | | J.P. MORGAN INCOME FUNDS | | | | | 271 | |
JPMorgan Short Duration High Yield Fund
SCHEDULE OF PORTFOLIO INVESTMENTS
AS OF AUGUST 31, 2016 (Unaudited) (continued)
(Amounts in thousands)
| | | | | | | | |
PRINCIPAL
AMOUNT($) | | | SECURITY DESCRIPTION | | VALUE($) | |
| Loan Assignments — continued | |
| | | | Pharmaceuticals — 0.7% | |
| | 333 | | | Valeant Pharmaceuticals International, Inc., Series F-1 Tranche B Term Loan, (Canada), VAR, 5.500%, 04/01/22 | | | 333 | |
| | | | | | | | |
| | | | | | | 1,202 | |
| | | | | | | | |
| | | | Total Health Care | | | 2,555 | |
| | | | | | | | |
| | | | Industrials — 1.4% | |
| | | | Airlines — 0.2% | |
| | 386 | | | Delta Air Lines, Inc., Term Loan B-1, VAR, 3.250%, 10/18/18 | | | 387 | |
| | | | | | | | |
| | | | Building Products — 0.2% | |
| | 394 | | | Stardust Finance, Senior Lien Term Loan, VAR, 6.500%, 03/14/22 | | | 391 | |
| | | | | | | | |
| | | | Commercial Services & Supplies — 0.5% | |
| | 310 | | | Prime Security Services Borrower LLC, 1st Lien Term Loan, VAR, 4.750%, 04/07/22 | | | 312 | |
| | 400 | | | University Support Services LLC, 1st Lien Term Loan B, VAR, 6.250%, 07/06/22 | | | 401 | |
| | | | | | | | |
| | | | | | | 713 | |
| | | | | | | | |
| | | | Construction & Engineering — 0.0% (g) | |
| | 71 | | | Stonewall Gas Gathering LLC, Term Loan, VAR, 8.750%, 01/28/22 | | | 73 | |
| | | | | | | | |
| | | | Industrial Conglomerates — 0.2% | |
| | 285 | | | Hudson Products Holdings, Inc., Term Loan, VAR, 5.000%, 03/15/19 | | | 260 | |
| | | | | | | | |
| | | | Marine — 0.3% | |
| | 414 | | | Drillships Ocean Ventures, Inc., Term Loan, VAR, 5.500%, 07/25/21 | | | 278 | |
| | 460 | | | Shelf Drilling Holdings Ltd., Term Loan, (Cayman Islands), VAR, 10.000%, 10/08/18 (d) | | | 258 | |
| | | | | | | | |
| | | | | | | 536 | |
| | | | | | | | |
| | | | Total Industrials | | | 2,360 | |
| | | | | | | | |
| | | | Materials — 1.4% | |
| | | | Chemicals — 0.9% | |
| | 946 | | | Axalta Coating Systems U.S. Holdings, Inc., Term Loan, VAR, 3.750%, 02/01/20 | | | 951 | |
| | 499 | | | Gemini HDPE LLC, Advance, VAR, 4.750%, 08/06/21 | | | 498 | |
| | | | | | | | |
| | | | | | | 1,449 | |
| | | | | | | | |
| | | | Metals & Mining — 0.5% | |
| | 836 | | | FMG Resources Pty, Ltd., Term Loan B, (Australia), VAR, 3.750%, 06/30/19 | | | 831 | |
| | | | | | | | |
| | | | Total Materials | | | 2,280 | |
| | | | | | | | |
| | | | | | | | |
PRINCIPAL
AMOUNT($) | | | SECURITY DESCRIPTION | | VALUE($) | |
| | | | | | | | |
| | | | Real Estate — 0.3% | |
| | | | Equity Real Estate Investment Trusts (REITs) — 0.3% | |
| | 539 | | | MGM Growth Properties, Term Loan B, VAR, 4.000%, 04/25/23 | | | 543 | |
| | | | | | | | |
| | | | Telecommunication Services — 1.5% | | | | |
| | | | Diversified Telecommunication Services — 1.5% | |
| | 240 | | | Cincinnati Bell, Inc., Term Loan, VAR, 4.000%, 09/10/20 | | | 240 | |
| | 1,045 | | | Level 3 Financing, Inc., Term Loan B-3, VAR, 4.000%, 08/01/19 | | | 1,050 | |
| | 717 | | | UPC Financing Partnership, Senior Secured Term Loan AN, VAR, 4.080%, 08/31/24 | | | 714 | |
| | 379 | | | Virgin Media Investments Holdings Ltd., F Facility, (United Kingdom), VAR, 3.649%, 06/30/23 | | | 379 | |
| | 140 | | | XO Communications LLC, Initial Term Loan, VAR, 4.250%, 03/20/21 | | | 140 | |
| | | | | | | | |
| | | | Total Telecommunication Services | | | 2,523 | |
| | | | | | | | |
| | | | Utilities — 1.3% | |
| | | | Electric Utilities — 1.3% | |
| | 194 | | | Calpine Construction Finance Co., Term B-1 Loan, VAR, 3.000%, 05/03/20 | | | 191 | |
| | 512 | | | Energy Future Intermediate Holding Co. LLC, Term Loan, VAR, 4.250%, 12/19/16 | | | 514 | |
| | 103 | | | Texas Competitive Electric Holdings Co. LLC, 1st Lien Term Loan C, VAR, 5.000%, 10/31/17 | | | 104 | |
| | 1,750 | | | Texas Competitive Electric Holdings Co. LLC, Extended Term Loan, VAR, 4.970%, 10/10/17 (d) | | | 559 | |
| | 1,175 | | | Texas Competitive Electric Holdings Co. LLC, Non-Extended Term Loan, VAR, 4.970%, 10/10/17 (d) | | | 370 | |
| | 454 | | | Texas Competitive Electric Holdings Co. LLC, Term Loan B, VAR, 5.000%, 07/26/23 | | | 455 | |
| | | | | | | | |
| | | | Total Utilities | | | 2,193 | |
| | | | | | | | |
| | | | Total Loan Assignments
(Cost $38,419) | | | 34,654 | |
| | | | | | | | |
| | |
| SHARES | | | | | | |
| Short-Term Investment — 3.3% | |
| | | | Investment Company — 3.3% | |
| | 5,501 | | | JPMorgan U.S. Government Money Market Fund, Institutional Class Shares, 0.310% (b) (l)
(Cost $5,501) | | | 5,501 | |
| | | | | | | | |
| | | | Total Investments — 98.9%
(Cost $168,121) | | | 164,534 | |
| | | | Other Assets in Excess of
Liabilities — 1.1% | | | 1,908 | |
| | | | | | | | |
| | | | NET ASSETS — 100.0% | | $ | 166,442 | |
| | | | | | | | |
Percentages indicated are based on net assets.
SEE NOTES TO FINANCIAL STATEMENTS.
| | | | | | |
| | | |
| 272 | | | | J.P. MORGAN INCOME FUNDS | | AUGUST 31, 2016 |
JPMorgan Treasury & Agency Fund
SCHEDULE OF PORTFOLIO INVESTMENTS
AS OF AUGUST 31, 2016 (Unaudited)
(Amounts in thousands)
| | | | | | | | |
PRINCIPAL
AMOUNT($) | | | SECURITY DESCRIPTION | | VALUE($) | |
| U.S. Government Agency Securities — 12.2% | |
| | 4,000 | | | Financing Corp. STRIPS, 1.383%, 11/30/17 (n) | | | 3,952 | |
| | 5,663 | | | New Valley Generation I, 7.299%, 03/15/19 | | | 6,201 | |
| | 2,236 | | | New Valley Generation II, 5.572%, 05/01/20 | | | 2,432 | |
| | | | | | | | |
| | | | Total U.S. Government Agency Securities
(Cost $12,348) | | | 12,585 | |
| | | | | | | | |
| U.S. Treasury Obligations — 86.4% | |
| | | | U.S. Treasury Notes, | | | | |
| | 8,500 | | | 0.625%, 04/30/18 | | | 8,476 | |
| | 10,000 | | | 0.750%, 10/31/17 | | | 10,003 | |
| | 10,000 | | | 0.875%, 04/30/17 | | | 10,021 | |
| | 675 | | | 0.875%, 07/31/19 | | | 674 | |
| | 1,325 | | | 1.000%, 06/30/19 | | | 1,328 | |
| | 2,000 | | | 1.000%, 08/31/19 | | | 2,004 | |
| | 3,000 | | | 1.125%, 03/31/20 | | | 3,008 | |
| | 9,000 | | | 1.250%, 10/31/18 | | | 9,076 | |
| | 4,000 | | | 1.250%, 02/29/20 | | | 4,029 | |
| | 3,000 | | | 1.375%, 08/31/20 | | | 3,029 | |
| | 8,000 | | | 1.500%, 10/31/19 | | | 8,129 | |
| | 8,000 | | | 1.750%, 10/31/18 | | | 8,154 | |
| | 5,000 | | | 2.125%, 08/31/20 | | | 5,194 | |
| | 2,000 | | | 2.125%, 01/31/21 | | | 2,081 | |
| | 6,000 | | | 2.625%, 11/15/20 | | | 6,360 | |
| | 4,405 | | | 3.125%, 01/31/17 | | | 4,454 | |
| | 3,000 | | | 3.250%, 12/31/16 | | | 3,028 | |
| | | | | | | | |
| | | | Total U.S. Treasury Obligations
(Cost $88,437) | | | 89,048 | |
| | | | | | | | |
| | | | | | | | |
SHARES | | | SECURITY DESCRIPTION | | VALUE($) | |
| Short-Term Investment — 1.0% | |
| | | | Investment Company — 1.0% | |
| | 1,078 | | | JPMorgan Federal Money Market Fund, Institutional Class Shares, 0.210% (b) (l)
(Cost $1,078) | | | 1,078 | |
| | | | | | | | |
| | | | Total Investments — 99.6%
(Cost $101,863) | | | 102,711 | |
| | | | Other Assets in Excess of
Liabilities — 0.4% | | | 367 | |
| | | | | | | | |
| | | | NET ASSETS — 100.0% | | $ | 103,078 | |
| | | | | | | | |
Percentages indicated are based on net assets.
SEE NOTES TO FINANCIAL STATEMENTS.
| | | | | | | | |
| | | |
| AUGUST 31, 2016 | | J.P. MORGAN INCOME FUNDS | | | | | 273 | |
J.P. Morgan Income Funds
NOTES TO SCHEDULE OF PORTFOLIO INVESTMENTS
AS OF AUGUST 31, 2016
| | |
| ACES | | — Alternative Credit Enhancement Securities |
| ADR | | — American Depositary Receipt |
| ARM | | — Adjustable Rate Mortgage. The interest rate shown is the rate in effect as of August 31, 2016. |
| AUD | | — Australian Dollar |
| BRL | | — Brazilian Real |
| CMBS | | — Commercial Mortgage-Backed Security |
| CMO | | — Collateralized Mortgage Obligation |
| CPI-U | | — Consumer Price Index for All Urban Customers |
| CSMC | | — Credit Suisse Mortgage Trust |
| ESOP | | — Employee Stock Ownership Program |
| EUR | | — Euro |
| FHA | | — Federal Housing Administration |
| FHLMC | | — Federal Home Loan Mortgage Corp. |
| GMAC | | — General Motors Acceptance Corp. |
| GO | | — General Obligation |
| HB | | — High Coupon Bonds (a.k.a. “IOettes”) represent the right to receive interest payments on an underlying pool of mortgages with similar features as those associated with IO securities. Unlike IO’s the owner also has a right to receive a very small portion of principal. The high interest rates result from taking interest payments from other classes in the Real Estate Mortgage Investment Conduit trust and allocating them to the small principal of the HB class. |
| IF | | — Inverse Floaters represent securities that pay interest at a rate that increases (decreases) with a decline (incline) in a specified index. The interest rate shown is the rate in effect as of August 31, 2016. The rate may be subject to a cap and floor. |
| IO | | — Interest Only represents the right to receive the monthly interest payments on an underlying pool of mortgage loans. The principal amount shown represents the par value on the underlying pool. The yields on these securities are subject to accelerated principal paydowns as a result of prepayment or refinancing of the underlying pool of mortgage instruments. As a result, interest income may be reduced considerably. |
| JPY | | — Japanese Yen |
| MLP | | — Master Limited Partnership. |
| NOK | | — Norwegian Krone |
| NZD | | — New Zealand Dollar |
| PAC | | — Planned Amortization Class |
| PO | | — Principal Only represents the right to receive the principal portion only on an underlying pool of mortgage loans. The market value of these securities is extremely volatile in response to changes in market interest rates. As prepayments on the underlying mortgages of these securities increase, the yield on these securities increases. |
| Reg. S | | — Security was purchased pursuant to Regulation S under the Securities Act of 1933, which exempts from registration securities offered and sold outside of the United States. Such a security cannot be sold in the United States without either an effective registration statement filed pursuant to the Securities Act of 1933, or pursuant to an exemption from registration. |
| REIT | | — Real Estate Investment Trust |
| REMIC | | — Real Estate Mortgage Investment Conduit |
| Rev. | | — Revenue |
| STRIPS | | — Separate Trading of Registered Interest and Principal of Securities. The STRIPS Program lets investors hold and trade individual interest and principal components of eligible notes and bonds as separate securities. |
| | |
| SUB | | — Step-Up Bond. The interest rate shown is the rate in effect as of August 31, 2016. |
| TBA | | — To Be Announced |
| USD | | — United States Dollar |
| VA | | — Veterans Administration |
| VAR | | — Variable Rate Security. The interest rate shown is the rate in effect as of August 31, 2016. |
| ZAR | | — South African Rand |
| |
| (a) | | — Non-income producing security. |
| (b) | | — Investment in affiliate. Money market fund is registered under the Investment Company Act of 1940, as amended, and advised by J.P. Morgan Investment Management Inc. |
| (d) | | — Defaulted Security. |
| (e) | | — Security is exempt from registration under Rule 144A of the Securities Act of 1933, as amended. Unless otherwise indicated, this security has been determined to be liquid under procedures established by the Board of Trustees and may be resold in transactions exempt from registration, normally to qualified institutional buyers. |
| (g) | | — Amount rounds to less than 0.05%. |
| (h) | | — Amount rounds to less than 500. |
| (k) | | — All or a portion of this security is deposited with the broker as initial margin for future contracts. |
| (l) | | — The rate shown is the current yield as of August 31, 2016. |
| (n) | | — The rate shown is the effective yield at the date of purchase. |
| (r) | | — Rates shown are per annum and payments are as described. |
| (t) | | — The date shown represents the earliest of the next put date, next demand date or final maturity date. |
| (w) | | — All or a portion of the security is a when-issued security, delayed delivery security, or forward commitment. |
| (x) | | — Securities are perpetual and thus, do not have a predetermined maturity date. The coupon rates for these securities are fixed for a period of time and may be structured to adjust thereafter. The dates shown, if applicable, reflects the next call date. The coupon rates shown are the rates in effect as of August 31, 2016. |
| @ | | — The date shown reflects the next call date on which the issuer may redeem the security at par value. The coupon rate for this security is based on par value and is currently in effect as of August 31, 2016. |
| ^ | | — All or a portion of the security is unsettled as of August 31, 2016. Unless otherwise indicated, the coupon rate is undetermined. The coupon rate shown may not be accrued for the entire position. |
| † | | — The following approximates the value of investments restricted as collateral for swaps to various brokers (amounts in thousands): |
| | | | | | |
| | | Fund | | Value | |
| | Inflation Managed Bond Fund | | $ | 54,390 | |
| | |
| |
| †† | | — Non-deliverable forward. |
| 1 | | — Security matures in 2115. |
| 2 | | — Security matures in 2110. |
| 3 | | — Security matures in 2105. |
| 4 | | — Security matures in 2111. |
| 5 | | — Security matures in 2114. |
| 6 | | — Security matures in 2112. |
SEE NOTES TO FINANCIAL STATEMENTS.
| | | | | | |
| | | |
| 274 | | | | J.P. MORGAN INCOME FUNDS | | AUGUST 31, 2016 |
THIS PAGE IS INTENTIONALLY LEFT BLANK
| | | | | | | | |
| | | |
| AUGUST 31, 2016 | | J.P. MORGAN INCOME FUNDS | | | | | 275 | |
STATEMENTS OF ASSETS AND LIABILITIES
AS OF AUGUST 31, 2016 (Unaudited)
(Amounts in thousands, except per share amounts)
| | | | | | | | | | | | |
| | |
Core
Bond Fund | | | Core Plus
Bond Fund | | | Government
Bond Fund | |
ASSETS: | |
Investments in non-affiliates, at value | | $ | 28,632,968 | | | $ | 6,439,530 | | | $ | 1,321,100 | |
Investments in affiliates, at value | | | 856,578 | | | | 346,277 | | | | 75,648 | |
| | | | | | | | | | | | |
Total investment securities, at value | | | 29,489,546 | | | | 6,785,807 | | | | 1,396,748 | |
Foreign currency, at value | | | — | | | | 119 | | | | — | |
Deposits at broker for futures contracts | | | — | | | | 15 | | | | — | |
Receivables: | | | | | | | | | | | | |
Investment securities sold | | | 9,895 | | | | 1,101 | | | | 63 | |
Investment securities sold — delayed delivery securities | | | — | | | | 44,248 | | | | — | |
Fund shares sold | | | 46,694 | | | | 183,213 | | | | 4,099 | |
Interest and dividends from non-affiliates | | | 115,407 | | | | 37,467 | | | | 3,987 | |
Dividends from affiliates | | | 218 | | | | 94 | | | | 17 | |
Tax reclaims | | | — | | | | 47 | | | | — | |
Variation margin on futures contracts | | | — | | | | 26 | | | | — | |
Unrealized appreciation on forward foreign currency exchange contracts | | | — | | | | 35 | | | | — | |
| | | | | | | | | | | | |
Total Assets | | | 29,661,760 | | | | 7,052,172 | | | | 1,404,914 | |
| | | | | | | | | | | | |
|
LIABILITIES: | |
Payables: | | | | | | | | | | | | |
Due to custodian | | | 65 | | | | 18 | | | | — | (a) |
Investment securities purchased | | | 38,241 | | | | 99,643 | | | | 12 | |
Investment securities purchased — delayed delivery securities | | | 10,005 | | | | 101,506 | | | | 11,489 | |
Fund shares redeemed | | | 71,808 | | | | 3,870 | | | | 4,390 | |
Unrealized depreciation on forward foreign currency exchange contracts | | | — | | | | 296 | | | | — | |
Variation margin on centrally cleared swaps | | | — | | | | 20 | | | | — | |
Accrued liabilities: | | | | | | | | | | | | |
Investment advisory fees | | | 6,672 | | | | 1,570 | | | | 276 | |
Administration fees | | | 1,543 | | | | 441 | | | | 66 | |
Distribution fees | | | 1,388 | | | | 440 | | | | 199 | |
Shareholder servicing fees | | | 2,245 | | | | 121 | | | | 16 | |
Custodian and accounting fees | | | 351 | | | | 94 | | | | 25 | |
Collateral management fees | | | — | | | | 20 | | | | — | |
Trustees’ and Chief Compliance Officer’s fees | | | 31 | | | | 18 | | | | — | |
Other | | | 4,291 | | | | 513 | | | | 669 | |
| | | | | | | | | | | | |
Total Liabilities | | | 136,640 | | | | 208,570 | | | | 17,142 | |
| | | | | | | | | | | | |
Net Assets | | $ | 29,525,120 | | | $ | 6,843,602 | | | $ | 1,387,772 | |
| | | | | | | | | | | | |
| (a) | Amount rounds to less than 500. |
SEE NOTES TO FINANCIAL STATEMENTS.
| | | | | | |
| | | |
| 276 | | | | J.P. MORGAN INCOME FUNDS | | AUGUST 31, 2016 |
| | | | | | | | | | | | |
| | |
Core
Bond Fund | | | Core Plus
Bond Fund | | | Government
Bond Fund | |
NET ASSETS: | | | | | | | | | | | | |
Paid-in-Capital | | $ | 28,016,863 | | | $ | 6,674,524 | | | $ | 1,306,984 | |
Accumulated undistributed (distributions in excess of) net investment income | | | 1,840 | | | | 1,412 | | | | 7 | |
Accumulated net realized gains (losses) | | | 76,306 | | | | (17,750 | ) | | | 4,769 | |
Net unrealized appreciation (depreciation) | | | 1,430,111 | | | | 185,416 | | | | 76,012 | |
| | | | | | | | | | | | |
Total Net Assets | | $ | 29,525,120 | | | $ | 6,843,602 | | | $ | 1,387,772 | |
| | | | | | | | | | | | |
| | | |
Net Assets: | | | | | | | | | | | | |
Class A | | $ | 3,144,567 | | | $ | 1,121,133 | | | $ | 572,720 | |
Class C | | | 1,042,392 | | | | 301,696 | | | | 77,714 | |
Class R2 | | | 121,239 | | | | 32,897 | | | | 65,745 | |
Class R5 | | | 473,292 | | | | — | | | | — | |
Class R6 | | | 12,626,222 | | | | 3,596,661 | | | | 74,411 | |
Institutional Class | | | — | | | | 1,164,902 | | | | — | |
Select Class | | | 12,117,408 | | | | 626,313 | | | | 597,182 | |
| | | | | | | | | | | | |
Total | | $ | 29,525,120 | | | $ | 6,843,602 | | | $ | 1,387,772 | |
| | | | | | | | | | | | |
| | | |
Outstanding units of beneficial interest (shares) | | | | | | | | | | | | |
($0.0001 par value; unlimited number of shares authorized): | | | | | | | | | | | | |
Class A | | | 262,249 | | | | 133,068 | | | | 52,387 | |
Class C | | | 86,404 | | | | 35,612 | | | | 7,132 | |
Class R2 | | | 10,124 | | | | 3,905 | | | | 6,019 | |
Class R5 | | | 39,550 | | | | — | | | | — | |
Class R6 | | | 1,052,525 | | | | 426,649 | | | | 6,812 | |
Institutional Class | | | — | | | | 138,118 | | | | — | |
Select Class | | | 1,011,246 | | | | 74,353 | | | | 54,650 | |
| | | |
Net Asset Value (a): | | | | | | | | | | | | |
Class A — Redemption price per share | | $ | 11.99 | | | $ | 8.43 | | | $ | 10.93 | |
Class C — Offering price per share (b) | | | 12.06 | | | | 8.47 | | | | 10.90 | |
Class R2 — Offering and redemption price per share | | | 11.98 | | | | 8.42 | | | | 10.92 | |
Class R5 — Offering and redemption price per share | | | 11.97 | | | | — | | | | — | |
Class R6 — Offering and redemption price per share | | | 12.00 | | | | 8.43 | | | | 10.92 | |
Institutional Class — Offering and redemption price per share | | | — | | | | 8.43 | | | | — | |
Select Class — Offering and redemption price per share | | | 11.98 | | | | 8.42 | | | | 10.93 | |
Class A maximum sales charge | | | 3.75 | % | | | 3.75 | % | | | 3.75 | % |
Class A maximum public offering price per share
[net asset value per share/(100% — maximum sales charge)] | | $ | 12.46 | | | $ | 8.76 | | | $ | 11.36 | |
| | | | | | | | | | | | |
| | | |
Cost of investments in non-affiliates | | $ | 27,202,857 | | | $ | 6,252,991 | | | $ | 1,245,088 | |
Cost of investments in affiliates | | | 856,578 | | | | 346,277 | | | | 75,648 | |
Cost of foreign currency | | | — | | | | 120 | | | | — | |
Premiums paid on swaps | | | — | | | | 4,487 | | | | — | |
| (a) | Per share amounts may not recalculate due to rounding of net assets and/or shares outstanding. |
| (b) | Redemption price for Class C shares varies based upon length of time the shares are held. |
SEE NOTES TO FINANCIAL STATEMENTS.
| | | | | | | | |
| | | |
| AUGUST 31, 2016 | | J.P. MORGAN INCOME FUNDS | | | | | 277 | |
STATEMENTS OF ASSETS AND LIABILITIES
AS OF AUGUST 31, 2016 (Unaudited) (continued)
(Amounts in thousands, except per share amounts)
| | | | | | | | | | | | |
| | | High Yield
Fund | | |
Inflation
Managed
Bond Fund | | | Limited
Duration
Bond Fund | |
ASSETS: | | | | | | | | | | | | |
Investments in non-affiliates, at value | | $ | 11,450,838 | | | $ | 1,386,663 | | | $ | 1,149,463 | |
Investments in affiliates, at value | | | 616,479 | | | | 25,421 | | | | 106,063 | |
Investments in affiliates — restricted, at value | | | — | | | | 54,390 | | | | — | |
| | | | | | | | | | | | |
Total investment securities, at value | | | 12,067,317 | | | | 1,466,474 | | | | 1,255,526 | |
Cash | | | 1,083 | | | | — | | | | 508 | |
Receivables: | | | | | | | | | | | | |
Investment securities sold | | | 9,823 | | | | — | | | | 1,828 | |
Fund shares sold | | | 17,693 | | | | 826 | | | | 4,893 | |
Interest and dividends from non-affiliates | | | 185,693 | | | | 8,295 | | | | 1,714 | |
Dividends from affiliates | | | 148 | | | | 4 | | | | 26 | |
Tax reclaims | | | 750 | | | | — | | | | — | |
Outstanding swap contracts, at value | | | — | | | | 247 | | | | — | |
| | | | | | | | | | | | |
Total Assets | | | 12,282,507 | | | | 1,475,846 | | | | 1,264,495 | |
| | | | | | | | | | | | |
| | | |
LIABILITIES: | | | | | | | | | | | | |
Payables: | | | | | | | | | | | | |
Due to custodian | | | — | | | | — | (a) | | | — | |
Investment securities purchased | | | 159,038 | | | | 873 | | | | — | |
Fund shares redeemed | | | 15,419 | | | | 1,189 | | | | 1,460 | |
Variation margin on centrally cleared swaps | | | 401 | | | | — | | | | — | |
Outstanding swap contracts, at value | | | — | | | | 54,254 | | | | — | |
Accrued liabilities: | | | | | | | | | | | | |
Investment advisory fees | | | 6,071 | | | | 405 | | | | 178 | |
Administration fees | | | 596 | | | | 97 | | | | 35 | |
Distribution fees | | | 343 | | | | 8 | | | | 69 | |
Shareholder servicing fees | | | 36 | | | | 58 | | | | 60 | |
Custodian and accounting fees | | | 92 | | | | 27 | | | | 31 | |
Collateral management fees | | | 3 | | | | 27 | | | | — | |
Trustees’ and Chief Compliance Officer’s fees | | | 33 | | | | 1 | | | | — | (a) |
Other | | | 2,727 | | | | 576 | | | | 144 | |
| | | | | | | | | | | | |
Total Liabilities | | | 184,759 | | | | 57,515 | | | | 1,977 | |
| | | | | | | | | | | | |
Net Assets | | $ | 12,097,748 | | | $ | 1,418,331 | | | $ | 1,262,518 | |
| | | | | | | | | | | | |
| (a) | Amount rounds to less than 500. |
SEE NOTES TO FINANCIAL STATEMENTS.
| | | | | | |
| | | |
| 278 | | | | J.P. MORGAN INCOME FUNDS | | AUGUST 31, 2016 |
| | | | | | | | | | | | |
| | | High Yield
Fund | | |
Inflation
Managed
Bond Fund | | | Limited
Duration
Bond Fund | |
NET ASSETS: | | | | | | | | | | | | |
Paid-in-Capital | | $ | 12,448,127 | | | $ | 1,458,531 | | | $ | 1,335,874 | |
Accumulated undistributed (distributions in excess of) net investment income | | | 3,302 | | | | (291 | ) | | | (399 | ) |
Accumulated net realized gains (losses) | | | (350,957 | ) | | | (27,799 | ) | | | (71,113 | ) |
Net unrealized appreciation (depreciation) | | | (2,724 | ) | | | (12,110 | ) | | | (1,844 | ) |
| | | | | | | | | | | | |
Total Net Assets | | $ | 12,097,748 | | | $ | 1,418,331 | | | $ | 1,262,518 | |
| | | | | | | | | | | | |
| | | |
Net Assets: | | | | | | | | | | | | |
Class A | | $ | 953,627 | | | $ | 23,913 | | | $ | 181,470 | |
Class C | | | 221,579 | | | | 3,944 | | | | 47,474 | |
Class R2 | | | 8,746 | | | | 777 | | | | — | |
Class R5 | | | 65,007 | | | | 760 | | | | — | |
Class R6 | | | 4,394,000 | | | | 796,648 | | | | 765,924 | |
Select Class | | | 6,454,789 | | | | 592,289 | | | | 267,650 | |
| | | | | | | | | | | | |
Total | | $ | 12,097,748 | | | $ | 1,418,331 | | | $ | 1,262,518 | |
| | | | | | | | | | | | |
| | | |
Outstanding units of beneficial interest (shares) | | | | | | | | | | | | |
($0.0001 par value; unlimited number of shares authorized): | | | | | | | | | | | | |
Class A | | | 130,465 | | | | 2,317 | | | | 18,117 | |
Class C | | | 30,262 | | | | 384 | | | | 4,792 | |
Class R2 | | | 1,198 | | | | 75 | | | | — | |
Class R5 | | | 8,835 | | | | 73 | | | | — | |
Class R6 | | | 597,943 | | | | 77,081 | | | | 76,364 | |
Select Class | | | 878,280 | | | | 57,393 | | | | 26,726 | |
| | | |
Net Asset Value (a): | | | | | | | | | | | | |
Class A — Redemption price per share | | $ | 7.31 | | | $ | 10.32 | | | $ | 10.02 | |
Class C — Offering price per share (b) | | | 7.32 | | | | 10.27 | | | | 9.91 | |
Class R2 — Offering and redemption price per share | | | 7.30 | | | | 10.33 | | | | — | |
Class R5 — Offering and redemption price per share | | | 7.36 | | | | 10.36 | | | | — | |
Class R6 — Offering and redemption price per share | | | 7.35 | | | | 10.34 | | | | 10.03 | |
Select Class — Offering and redemption price per share | | | 7.35 | | | | 10.32 | | | | 10.01 | |
Class A maximum sales charge | | | 3.75 | % | | | 3.75 | % | | | 2.25 | % |
Class A maximum public offering price per share
[net asset value per share/(100% — maximum sales charge)] | | $ | 7.59 | | | $ | 10.72 | | | $ | 10.25 | |
| | | | | | | | | | | | |
| | | |
Cost of investments in non-affiliates | | $ | 11,455,115 | | | $ | 1,344,766 | | | $ | 1,151,307 | |
Cost of investments in affiliates | | | 616,479 | | | | 25,421 | | | | 106,063 | |
Cost of investments in affiliates — restricted | | | — | | | | 54,390 | | | | — | |
Premiums paid on swaps | | | 9,374 | | | | — | | | | — | |
| (a) | Per share amounts may not recalculate due to rounding of net assets and/or shares outstanding. |
| (b) | Redemption price for Class C Shares varies based upon length of time the shares are held. |
SEE NOTES TO FINANCIAL STATEMENTS.
| | | | | | | | |
| | | |
| AUGUST 31, 2016 | | J.P. MORGAN INCOME FUNDS | | | | | 279 | |
STATEMENTS OF ASSETS AND LIABILITIES
AS OF AUGUST 31, 2016 (Unaudited) (continued)
(Amounts in thousands, except per share amounts)
| | | | | | | | | | | | | | | | |
| | | Mortgage-Backed
Securities Fund | | |
Short
Duration
Bond Fund | | | Short
Duration
High Yield Fund | | | Treasury &
Agency Fund | |
ASSETS: | | | | | | | | | | | | | | | | |
Investments in non-affiliates, at value | | $ | 2,610,354 | | | $ | 11,009,306 | | | $ | 159,033 | | | $ | 101,633 | |
Investments in affiliates, at value | | | 188,596 | | | | 42,185 | | | | 5,501 | | | | 1,078 | |
| | | | | | | | | | | | | | | | |
Total investment securities, at value | | | 2,798,950 | | | | 11,051,491 | | | | 164,534 | | | | 102,711 | |
Cash | | | — | | | | — | | | | 53 | | | | — | |
Receivables: | | | | | | | | | | | | | | | | |
Investment securities sold | | | 141 | | | | 32,915 | | | | 5 | | | | — | |
Fund shares sold | | | 3,500 | | | | 7,698 | | | | 17 | | | | 33 | |
Interest and dividends from non-affiliates | | | 6,982 | | | | 41,065 | | | | 2,205 | | | | 527 | |
Dividends from affiliates | | | 56 | | | | 14 | | | | 2 | | | | — | (a) |
Tax reclaims | | | — | | | | — | | | | 17 | | | | — | |
| | | | | | | | | | | | | | | | |
Total Assets | | | 2,809,629 | | | | 11,133,183 | | | | 166,833 | | | | 103,271 | |
| | | | | | | | | | | | | | | | |
| | | | |
LIABILITIES: | | | | | | | | | | | | | | | | |
Payables: | | | | | | | | | | | | | | | | |
Due to custodian | | | 120 | | | | 32 | | | | — | | | | — | (a) |
Investment securities purchased | | | 11,234 | | | | 26,465 | | | | 168 | | | | — | |
Investment securities purchased — delayed delivery securities | | | 13,065 | | | | — | | | | — | | | | — | |
Fund shares redeemed | | | 1,739 | | | | 35,934 | | | | 72 | | | | 96 | |
Accrued liabilities: | | | | | | | | | | | | | | | | |
Investment advisory fees | | | 492 | | | | 2,072 | | | | 45 | | | | 1 | |
Administration fees | | | — | | | | 574 | | | | — | | | | — | |
Distribution fees | | | 54 | | | | 175 | | | | 1 | | | | 5 | |
Shareholder servicing fees | | | 120 | | | | 1,356 | | | | 17 | | | | 22 | |
Custodian and accounting fees | | | 100 | | | | 104 | | | | 14 | | | | 6 | |
Trustees’ and Chief Compliance Officer’s fees | | | 4 | | | | 36 | | | | — | (a) | | | — | (a) |
Audit fees | | | 47 | | | | 51 | | | | 63 | | | | 38 | |
Other | | | 156 | | | | 1,211 | | | | 11 | | | | 25 | |
| | | | | | | | | | | | | | | | |
Total Liabilities | | | 27,131 | | | | 68,010 | | | | 391 | | | | 193 | |
| | | | | | | | | | | | | | | | |
Net Assets | | $ | 2,782,498 | | | $ | 11,065,173 | | | $ | 166,442 | | | $ | 103,078 | |
| | | | | | | | | | | | | | | | |
| (a) | Amount rounds to less than 500. |
SEE NOTES TO FINANCIAL STATEMENTS.
| | | | | | |
| | | |
| 280 | | | | J.P. MORGAN INCOME FUNDS | | AUGUST 31, 2016 |
| | | | | | | | | | | | | | | | |
| | | Mortgage-Backed
Securities Fund | | |
Short
Duration
Bond Fund | | | Short
Duration
High Yield Fund | | | Treasury &
Agency Fund | |
NET ASSETS: | | | | | | | | | | | | | | | | |
Paid-in-Capital | | $ | 2,692,484 | | | $ | 11,012,554 | | | $ | 183,505 | | | $ | 102,189 | |
Accumulated undistributed (distributions in excess of) net investment income | | | (25 | ) | | | (2,220 | ) | | | 11 | | | | (8 | ) |
Accumulated net realized gains (losses) | | | 1,504 | | | | 3,209 | | | | (13,487 | ) | | | 49 | |
Net unrealized appreciation (depreciation) | | | 88,535 | | | | 51,630 | | | | (3,587 | ) | | | 848 | |
| | | | | | | | | | | | | | | | |
Total Net Assets | | $ | 2,782,498 | | | $ | 11,065,173 | | | $ | 166,442 | | | $ | 103,078 | |
| | | | | | | | | | | | | | | | |
| | | | |
Net Assets: | | | | | | | | | | | | | | | | |
Class A | | $ | 185,082 | | | $ | 531,168 | | | $ | 3,122 | | | $ | 23,505 | |
Class C | | | 21,759 | | | | 97,792 | | | | 305 | | | | — | |
Class R6 | | | 1,386,596 | | | | 3,107,116 | | | | 33,353 | | | | — | |
Select Class | | | 1,189,061 | | | | 7,329,097 | | | | 129,662 | | | | 79,573 | |
| | | | | | | | | | | | | | | | |
Total | | $ | 2,782,498 | | | $ | 11,065,173 | | | $ | 166,442 | | | $ | 103,078 | |
| | | | | | | | | | | | | | | | |
| | | | |
Outstanding units of beneficial interest (shares) | | | | | | | | | | | | | | | | |
($0.0001 par value; unlimited number of shares authorized): | | | | | | | | | | | | | | | | |
Class A | | | 15,825 | | | | 48,815 | | | | 332 | | | | 2,489 | |
Class C | | | 1,910 | | | | 8,930 | | | | 33 | | | | — | |
Class R6 | | | 121,467 | | | | 285,225 | | | | 3,545 | | | | — | |
Select Class | | | 104,137 | | | | 672,676 | | | | 13,786 | | | | 8,428 | |
| | | | |
Net Asset Value (a): | | | | | | | | | | | | | | | | |
Class A — Redemption price per share | | $ | 11.70 | | | $ | 10.88 | | | $ | 9.41 | | | $ | 9.44 | |
Class C — Offering price per share (b) | | | 11.39 | | | | 10.95 | | | | 9.40 | | | | — | |
Class R6 — Offering and redemption price per share | | | 11.42 | | | | 10.89 | | | | 9.41 | | | | — | |
Select Class — Offering and redemption price per share | | | 11.42 | | | | 10.90 | | | | 9.41 | | | | 9.44 | |
Class A maximum sales charge | | | 3.75 | % | | �� | 2.25 | % | | | 2.25 | % | | | 2.25 | % |
Class A maximum public offering price per share
[net asset value per share/(100% — maximum sales charge)] | | $ | 12.16 | | | $ | 11.13 | | | $ | 9.63 | | | $ | 9.66 | |
| | | | | | | | | | | | | | | | |
| | | | |
Cost of investments in non-affiliates | | $ | 2,521,819 | | | $ | 10,957,676 | | | $ | 162,620 | | | $ | 100,785 | |
Cost of investments in affiliates | | | 188,596 | | | | 42,185 | | | | 5,501 | | | | 1,078 | |
| (a) | Per share amounts may not recalculate due to rounding of net assets and/or shares outstanding. |
| (b) | Redemption price for Class C Shares varies based upon length of time the shares are held. |
SEE NOTES TO FINANCIAL STATEMENTS.
| | | | | | | | |
| | | |
| AUGUST 31, 2016 | | J.P. MORGAN INCOME FUNDS | | | | | 281 | |
STATEMENTS OF OPERATIONS
FOR THE SIX MONTHS ENDED AUGUST 31, 2016 (Unaudited)
(Amounts in thousands)
| | | | | | | | | | | | |
| | |
Core
Bond Fund | | | Core Plus
Bond Fund | | | Government
Bond Fund | |
INVESTMENT INCOME: | |
Interest income from non-affiliates | | $ | 438,799 | | | $ | 90,222 | | | $ | 19,778 | |
Interest income from affiliates | | | — | | | | — | (a) | | | — | |
Dividend income from non-affiliates | | | — | | | | 82 | | | | — | |
Dividend income from affiliates | | | 2,431 | | | | 623 | | | | 66 | |
| | | | | | | | | | | | |
Total investment income | | | 441,230 | | | | 90,927 | | | | 19,844 | |
| | | | | | | | | | | | |
|
EXPENSES: | |
Investment advisory fees | | | 45,457 | | | | 8,504 | | | | 2,006 | |
Administration fees | | | 12,429 | | | | 2,324 | | | | 549 | |
Distribution fees: | | | | | | | | | | | | |
Class A | | | 4,049 | | | | 1,232 | | | | 708 | |
Class C | | | 3,820 | | | | 1,066 | | | | 282 | |
Class R2 | | | 297 | | | | 89 | | | | 164 | |
Shareholder servicing fees: | | | | | | | | | | | | |
Class A | | | 4,049 | | | | 1,232 | | | | 708 | |
Class C | | | 1,273 | | | | 355 | | | | 94 | |
Class R2 | | | 148 | | | | 44 | | | | 82 | |
Class R5 | | | 114 | | | | — | | | | — | |
Institutional Class | | | — | | | | 479 | | | | — | |
Select Class | | | 15,250 | | | | 648 | | | | 779 | |
Custodian and accounting fees | | | 652 | | | | 233 | | | | 58 | |
Interest expense to affiliates | | | — | | | | — | (a) | | | — | |
Professional fees | | | 225 | | | | 186 | | | | 43 | |
Collateral management fees | | | — | | | | 20 | | | | — | |
Trustees’ and Chief Compliance Officer’s fees | | | 67 | | | | 31 | | | | 13 | |
Printing and mailing costs | | | 1,445 | | | | 170 | | | | 43 | |
Registration and filing fees | | | 227 | | | | 142 | | | | 50 | |
Transfer agency fees (See Note 2.I.) | | | 262 | | | | 59 | | | | 139 | |
Sub-transfer agency fees (See Note 2.I.) | | | 5,376 | | | | 885 | | | | 1,046 | |
Other | | | 205 | | | | 49 | | | | 10 | |
| | | | | | | | | | | | |
Total expenses | | | 95,345 | | | | 17,748 | | | | 6,774 | |
| | | | | | | | | | | | |
Less fees waived | | | (17,044 | ) | | | (2,698 | ) | | | (1,818 | ) |
Less earnings credits | | | (1 | ) | | | — | (a) | | | — | |
Less expense reimbursements | | | (33 | ) | | | (52 | ) | | | (444 | ) |
| | | | | | | | | | | | |
Net expenses | | | 78,267 | | | | 14,998 | | | | 4,512 | |
| | | | | | | | | | | | |
Net investment income (loss) | | | 362,963 | | | | 75,929 | | | | 15,332 | |
| | | | | | | | | | | | |
| | | |
REALIZED/UNREALIZED GAINS (LOSSES): | | | | | | | | | | | | |
Net realized gain (loss) on transactions from: | |
Investments in non-affiliates | | | 62,002 | | | | 7,216 | | | | 4,383 | |
Futures | | | — | | | | 1,302 | | | | — | |
Foreign currency transactions | | | — | | | | (341 | ) | | | — | |
Swaps | | | — | | | | (6,418 | ) | | | — | |
| | | | | | | | | | | | |
Net realized gain (loss) | | | 62,002 | | | | 1,759 | | | | 4,383 | |
| | | | | | | | | | | | |
Change in net unrealized appreciation/depreciation on: | |
Investments in non-affiliates | | | 566,572 | | | | 184,371 | | | | 4,370 | |
Futures | | | — | | | | 167 | | | | — | |
Foreign currency translations | | | — | | | | (128 | ) | | | — | |
Swaps | | | — | | | | (968 | ) | | | — | |
Unfunded commitments | | | 7 | | | | — | | | | — | |
| | | | | | | | | | | | |
Change in net unrealized appreciation/depreciation | | | 566,579 | | | | 183,442 | | | | 4,370 | |
| | | | | | | | | | | | |
Net realized/unrealized gains (losses) | | | 628,581 | | | | 185,201 | | | | 8,753 | |
| | | | | | | | | | | | |
Change in net assets resulting from operations | | $ | 991,544 | | | $ | 261,130 | | | $ | 24,085 | |
| | | | | | | | | | | | |
| (a) | Amount rounds to less than 500. |
SEE NOTES TO FINANCIAL STATEMENTS.
| | | | | | |
| | | |
| 282 | | | | J.P. MORGAN INCOME FUNDS | | AUGUST 31, 2016 |
| | | | | | | | | | | | |
| | |
High Yield
Fund | | | Inflation
Managed
Bond Fund | | | Limited
Duration
Bond Fund | |
INVESTMENT INCOME: | | | | | | | | | | | | |
Interest income from non-affiliates | | $ | 348,897 | | | $ | 20,282 | | | $ | 9,930 | |
Interest income from affiliates | | | — | | | | 57 | | | | — | |
Dividend income from non-affiliates | | | 1,471 | | | | — | | | | — | |
Dividend income from affiliates | | | 845 | | | | 28 | | | | 189 | |
| | | | | | | | | | | | |
Total investment income | | | 351,213 | | | | 20,367 | | | | 10,119 | |
| | | | | | | | | | | | |
| | | |
EXPENSES: | | | | | | | | | | | | |
Investment advisory fees | | | 35,400 | | | | 2,629 | | | | 1,621 | |
Administration fees | | | 4,466 | | | | 616 | | | | 532 | |
Distribution fees: | | | | | | | | | | | | |
Class A | | | 1,188 | | | | 43 | | | | 241 | |
Class C | | | 802 | | | | 15 | | | | 186 | |
Class R2 | | | 22 | | | | 2 | | | | — | |
Shareholder servicing fees: | | | | | | | | | | | | |
Class A | | | 1,188 | | | | 43 | | | | 241 | |
Class C | | | 267 | | | | 5 | | | | 62 | |
Class R2 | | | 11 | | | | 1 | | | | — | |
Class R5 | | | 16 | | | | 1 | | | | — | |
Select Class | | | 6,913 | | | | 810 | | | | 375 | |
Custodian and accounting fees | | | 188 | | | | 85 | | | | 94 | |
Professional fees | | | 103 | | | | 45 | | | | 37 | |
Collateral management fees | | | 3 | | | | 27 | | | | — | |
Trustees’ and Chief Compliance Officer’s fees | | | 50 | | | | 12 | | | | 12 | |
Printing and mailing costs | | | 709 | | | | — | | | | 39 | |
Registration and filing fees | | | 136 | | | | 54 | | | | 31 | |
Transfer agency fees (See Note 2.I.) | | | 581 | | | | 13 | | | | 20 | |
Sub-transfer agency fees (See Note 2.I.) | | | 3,260 | | | | 107 | | | | 127 | |
Other | | | 60 | | | | 18 | | | | 11 | |
| | | | | | | | | | | | |
Total expenses | | | 55,363 | | | | 4,526 | | | | 3,629 | |
| | | | | | | | | | | | |
Less fees waived | | | (11,792 | ) | | | (491 | ) | | | (1,130 | ) |
Less earnings credits | | | (1 | ) | | | — | | | | — | |
Less expense reimbursements | | | (716 | ) | | | (48 | ) | | | — | |
| | | | | | | | | | | | |
Net expenses | | | 42,854 | | | | 3,987 | | | | 2,499 | |
| | | | | | | | | | | | |
Net investment income (loss) | | | 308,359 | | | | 16,380 | | | | 7,620 | |
| | | | | | | | | | | | |
| | | |
REALIZED/UNREALIZED GAINS (LOSSES): | | | | | | | | | | | | |
Net realized gain (loss) on transactions from: | | | | | | | | | | | | |
Investments in non-affiliates | | | (89,267 | ) | | | 4,981 | | | | (6 | ) |
Investments in affiliates | | | — | (a) | | | — | | | | — | |
Swaps | | | 7,360 | | | | (23,228 | ) | | | — | |
| | | | | | | | | | | | |
Net realized gain (loss) | | | (81,907 | ) | | | (18,247 | ) | | | (6 | ) |
| | | | | | | | | | | | |
Change in net unrealized appreciation/depreciation on: | | | | | | | | | | | | |
Investments in non-affiliates | | | 1,062,575 | | | | 18,727 | | | | 6,625 | |
Swaps | | | 1,553 | | | | 27,683 | | | | — | |
| | | | | | | | | | | | |
Change in net unrealized appreciation/depreciation | | | 1,064,128 | | | | 46,410 | | | | 6,625 | |
| | | | | | | | | | | | |
Net realized/unrealized gains (losses) | | | 982,221 | | | | 28,163 | | | | 6,619 | |
| | | | | | | | | | | | |
Change in net assets resulting from operations | | $ | 1,290,580 | | | $ | 44,543 | | | $ | 14,239 | |
| | | | | | | | | | | | |
| (a) | Amount rounds to less than 500. |
SEE NOTES TO FINANCIAL STATEMENTS.
| | | | | | | | |
| | | |
| AUGUST 31, 2016 | | J.P. MORGAN INCOME FUNDS | | | | | 283 | |
STATEMENTS OF OPERATIONS
FOR THE SIX MONTHS ENDED AUGUST 31, 2016 (Unaudited) (continued)
(Amounts in thousands)
| | | | | | | | | | | | | | | | |
| | |
Mortgage-Backed
Securities Fund | | | Short Duration
Bond Fund | | | Short Duration
High Yield Fund | | | Treasury &
Agency Fund | |
INVESTMENT INCOME: | | | | | | | | | | | | | | | | |
Interest income from non-affiliates | | $ | 42,785 | | | $ | 76,472 | | | $ | 4,121 | | | $ | 513 | |
Dividend income from non-affiliates | | | — | | | | — | | | | 36 | | | | — | |
Dividend income from affiliates | | | 502 | | | | 70 | | | | 13 | | | | 2 | |
| | | | | | | | | | | | | | | | |
Total investment income | | | 43,287 | | | | 76,542 | | | | 4,170 | | | | 515 | |
| | | | | | | | | | | | | | | | |
| | | | |
EXPENSES: | | | | | | | | | | | | | | | | |
Investment advisory fees | | | 4,886 | | | | 14,294 | | | | 386 | | | | 156 | |
Administration fees | | | 1,145 | | | | 4,690 | | | | 63 | | | | 43 | |
Distribution fees: | | | | | | | | | | | | | | | | |
Class A | | | 251 | | | | 681 | | | | 4 | | | | 36 | |
Class C | | | 78 | | | | 392 | | | | 1 | | | | — | |
Shareholder servicing fees: | | | | | | | | | | | | | | | | |
Class A | | | 251 | | | | 681 | | | | 4 | | | | 36 | |
Class C | | | 26 | | | | 130 | | | | — | (a) | | | — | |
Select Class | | | 1,462 | | | | 9,502 | | | | 148 | | | | 94 | |
Custodian and accounting fees | | | 184 | | | | 250 | | | | 29 | | | | 12 | |
Professional fees | | | 84 | | | | 68 | | | | 57 | | | | 32 | |
Trustees’ and Chief Compliance Officer’s fees | | | 15 | | | | 54 | | | | 10 | | | | 10 | |
Printing and mailing costs | | | 84 | | | | 577 | | | | 6 | | | | 5 | |
Registration and filing fees | | | 36 | | | | 57 | | | | 38 | | | | 15 | |
Transfer agency fees (See Note 2.I.) | | | 23 | | | | 59 | | | | 3 | | | | 3 | |
Sub-transfer agency fees (See Note 2.I.) | | | 293 | | | | 2,098 | | | | 1 | | | | 14 | |
Other | | | 22 | | | | 89 | | | | 3 | | | | 3 | |
| | | | | | | | | | | | | | | | |
Total expenses | | | 8,840 | | | | 33,622 | | | | 753 | | | | 459 | |
| | | | | | | | | | | | | | | | |
Less fees waived | | | (4,204 | ) | | | (5,108 | ) | | | (278 | ) | | | (188 | ) |
Less earnings credits | | | — | (a) | | | — | (a) | | | — | | | | — | |
Less expense reimbursements | | | — | | | | — | | | | — | (a) | | | — | |
| | | | | | | | | | | | | | | | |
Net expenses | | | 4,636 | | | | 28,514 | | | | 475 | | | | 271 | |
| | | | | | | | | | | | | | | | |
Net investment income (loss) | | | 38,651 | | | | 48,028 | | | | 3,695 | | | | 244 | |
| | | | | | | | | | | | | | | | |
| | | | |
REALIZED/UNREALIZED GAINS (LOSSES): | | | | | | | | | | | | | | | | |
Net realized gain (loss) on transactions from investments in non-affiliates | | | 1,439 | | | | 2,973 | | | | (3,411 | ) | | | 48 | |
Change in net unrealized appreciation/depreciation on: | | | | | | | | | | | | | | | | |
Investments in non-affiliates | | | 8,254 | | | | 53,505 | | | | 12,530 | | | | 190 | |
Unfunded commitments | | | — | (a) | | | 2 | | | | — | | | | — | |
| | | | | | | | | | | | | | | | |
Change in net unrealized appreciation/depreciation | | | 8,254 | | | | 53,507 | | | | 12,530 | | | | 190 | |
| | | | | | | | | | | | | | | | |
Net realized/unrealized gains (losses) | | | 9,693 | | | | 56,480 | | | | 9,119 | | | | 238 | |
| | | | | | | | | | | | | | | | |
Change in net assets resulting from operations | | $ | 48,344 | | | $ | 104,508 | | | $ | 12,814 | | | $ | 482 | |
| | | | | | | | | | | | | | | | |
| (a) | Amount rounds to less than 500. |
SEE NOTES TO FINANCIAL STATEMENTS.
| | | | | | |
| | | |
| 284 | | | | J.P. MORGAN INCOME FUNDS | | AUGUST 31, 2016 |
STATEMENTS OF CHANGES IN NET ASSETS
FOR THE PERIODS INDICATED
(Amounts in thousands)
| | | | | | | | | | | | | | | | |
| | | Core Bond Fund | | | Core Plus Bond Fund | |
| | | Six Months Ended
August 31, 2016
(Unaudited) | | | Year Ended
February 29, 2016 | | | Six Months Ended
August 31, 2016
(Unaudited) | | | Year Ended
February 29, 2016 | |
CHANGE IN NET ASSETS RESULTING FROM OPERATIONS: | | | | | | | | | | | | | | | | |
Net investment income (loss) | | $ | 362,963 | | | $ | 674,007 | | | $ | 75,929 | | | $ | 130,807 | |
Net realized gain (loss) | | | 62,002 | | | | 65,200 | | | | 1,759 | | | | (17,927 | ) |
Change in net unrealized appreciation/depreciation | | | 566,579 | | | | (230,536 | ) | | | 183,442 | | | | (96,909 | ) |
| | | | | | | | | | | | | | | | |
Change in net assets resulting from operations | | | 991,544 | | | | 508,671 | | | | 261,130 | | | | 15,971 | |
| | | | | | | | | | | | | | | | |
| | | | |
DISTRIBUTIONS TO SHAREHOLDERS: | | | | | | | | | | | | | | | | |
Class A | | | | | | | | | | | | | | | | |
From net investment income | | | (35,905 | ) | | | (77,176 | ) | | | (12,489 | ) | | | (20,653 | ) |
From net realized gains | | | — | | | | (5,773 | ) | | | — | | | | (1,670 | ) |
Class B (a) | | | | | | | | | | | | | | | | |
From net investment income | | | — | | | | (58 | ) | | | — | | | | (6 | ) |
Class C | | | | | | | | | | | | | | | | |
From net investment income | | | (7,811 | ) | | | (14,251 | ) | | | (2,577 | ) | | | (5,609 | ) |
From net realized gains | | | — | | | | (1,845 | ) | | | — | | | | (548 | ) |
Class R2 | | | | | | | | | | | | | | | | |
From net investment income | | | (1,172 | ) | | | (2,105 | ) | | | (365 | ) | | | (678 | ) |
From net realized gains | | | — | | | | (213 | ) | | | — | | | | (66 | ) |
Class R5 | | | | | | | | | | | | | | | | |
From net investment income | | | (5,785 | ) | | | (9,514 | ) | | | — | | | | — | |
From net realized gains | | | — | | | | (735 | ) | | | — | | | | — | |
Class R6 | | | | | | | | | | | | | | | | |
From net investment income | | | (173,293 | ) | | | (283,647 | ) | | | (40,196 | ) | | | (47,065 | ) |
From net realized gains | | | — | | | | (24,825 | ) | | | — | | | | (5,085 | ) |
Institutional Class | | | | | | | | | | | | | | | | |
From net investment income | | | — | | | | — | | | | (13,169 | ) | | | (21,960 | ) |
From net realized gains | | | — | | | | — | | | | — | | | | (1,564 | ) |
Select Class | | | | | | | | | | | | | | | | |
From net investment income | | | (144,864 | ) | | | (295,000 | ) | | | (7,250 | ) | | | (36,145 | ) |
From net realized gains | | | — | | | | (21,607 | ) | | | — | | | | (758 | ) |
| | | | | | | | | | | | | | | | |
Total distributions to shareholders | | | (368,830 | ) | | | (736,749 | ) | | | (76,046 | ) | | | (141,807 | ) |
| | | | | | | | | | | | | | | | |
| | | | |
CAPITAL TRANSACTIONS: | | | | | | | | | | | | | | | | |
Change in net assets resulting from capital transactions | | | (612,148 | ) | | | 1,376,925 | | | | 1,897,916 | | | | 1,022,920 | |
| | | | | | | | | | | | | | | | |
| | | | |
NET ASSETS: | | | | | | | | | | | | | | | | |
Change in net assets | | | 10,566 | | | | 1,148,847 | | | | 2,083,000 | | | | 897,084 | |
Beginning of period | | | 29,514,554 | | | | 28,365,707 | | | | 4,760,602 | | | | 3,863,518 | |
| | | | | | | | | | | | | | | | |
End of period | | $ | 29,525,120 | | | $ | 29,514,554 | | | $ | 6,843,602 | | | $ | 4,760,602 | |
| | | | | | | | | | | | | | | | |
Accumulated undistributed (distributions in excess of) net investment income | | $ | 1,840 | | | $ | 7,707 | | | $ | 1,412 | | | $ | 1,529 | |
| | | | | | | | | | | | | | | | |
| (a) | All remaining Class B Shares converted to Class A Shares on June 19, 2015. |
SEE NOTES TO FINANCIAL STATEMENTS.
| | | | | | | | |
| | | |
| AUGUST 31, 2016 | | J.P. MORGAN INCOME FUNDS | | | | | 285 | |
STATEMENTS OF CHANGES IN NET ASSETS
FOR THE PERIODS INDICATED (continued)
(Amounts in thousands)
| | | | | | | | | | | | | | | | |
| | | Government Bond Fund | | | High Yield Fund | |
| | | Six Months Ended
August 31, 2016
(Unaudited) | | | Year Ended
February 29, 2016 | | | Six Months Ended
August 31, 2016
(Unaudited) | | | Year Ended
February 29, 2016 | |
CHANGE IN NET ASSETS RESULTING FROM OPERATIONS: | | | | | | | | | | | | | | | | |
Net investment income (loss) | | $ | 15,332 | | | $ | 28,463 | | | $ | 308,359 | | | $ | 558,430 | |
Net realized gain (loss) | | | 4,383 | | | | 618 | | | | (81,907 | ) | | | (218,886 | ) |
Change in net unrealized appreciation/depreciation | | | 4,370 | | | | 1,041 | | | | 1,064,128 | | | | (1,242,298 | ) |
| | | | | | | | | | | | | | | | |
Change in net assets resulting from operations | | | 24,085 | | | | 30,122 | | | | 1,290,580 | | | | (902,754 | ) |
| | | | | | | | | | | | | | | | |
| | | | |
DISTRIBUTIONS TO SHAREHOLDERS: | | | | | | | | | | | | | | | | |
Class A | | | | | | | | | | | | | | | | |
From net investment income | | | (6,367 | ) | | | (13,051 | ) | | | (25,817 | ) | | | (45,574 | ) |
From net realized gains | | | — | | | | (8,104 | ) | | | — | | | | (492 | ) |
Class B (a) | | | | | | | | | | | | | | | | |
From net investment income | | | — | | | | (13 | ) | | | — | | | | (41 | ) |
Class C | | | | | | | | | | | | | | | | |
From net investment income | | | (573 | ) | | | (1,092 | ) | | | (5,258 | ) | | | (11,837 | ) |
From net realized gains | | | — | | | | (968 | ) | | | — | | | | (126 | ) |
Class R2 | | | | | | | | | | | | | | | | |
From net investment income | | | (656 | ) | | | (1,080 | ) | | | (226 | ) | | | (525 | ) |
From net realized gains | | | — | | | | (757 | ) | | | — | | | | (6 | ) |
Class R5 | | | | | | | | | | | | | | | | |
From net investment income | | | — | | | | — | | | | (1,763 | ) | | | (3,813 | ) |
From net realized gains | | | — | | | | — | | | | — | | | | (36 | ) |
Class R6 (b) | | | | | | | | | | | | | | | | |
From net investment income | | | (149 | ) | | | — | | | | (117,895 | ) | | | (161,050 | ) |
From net realized gains | | | — | | | | — | | | | — | | | | (2,073 | ) |
Select Class | | | | | | | | | | | | | | | | |
From net investment income | | | (7,838 | ) | | | (14,519 | ) | | | (159,385 | ) | | | (337,926 | ) |
From net realized gains | | | — | | | | (8,055 | ) | | | — | | | | (3,062 | ) |
| | | | | | | | | | | | | | | | |
Total distributions to shareholders | | | (15,583 | ) | | | (47,639 | ) | | | (310,344 | ) | | | (566,561 | ) |
| | | | | | | | | | | | | | | | |
| | | | |
CAPITAL TRANSACTIONS: | | | | | | | | | | | | | | | | |
Change in net assets resulting from capital transactions | | | 72,488 | | | | 49,839 | | | | 1,828,841 | | | | 483,159 | |
| | | | | | | | | | | | | | | | |
| | | | |
NET ASSETS: | | | | | | | | | | | | | | | | |
Change in net assets | | | 80,990 | | | | 32,322 | | | | 2,809,077 | | | | (986,156 | ) |
Beginning of period | | | 1,306,782 | | | | 1,274,460 | | | | 9,288,671 | | | | 10,274,827 | |
| | | | | | | | | | | | | | | | |
End of period | | $ | 1,387,772 | | | $ | 1,306,782 | | | $ | 12,097,748 | | | $ | 9,288,671 | |
| | | | | | | | | | | | | | | | |
Accumulated undistributed (distributions in excess of) net investment income | | $ | 7 | | | $ | 258 | | | $ | 3,302 | | | $ | 5,287 | |
| | | | | | | | | | | | | | | | |
| (a) | All remaining Class B Shares converted to Class A Shares on June 19, 2015. |
| (b) | Commencement of offering of class of shares effective August 1, 2016 for Government Bond Fund. |
SEE NOTES TO FINANCIAL STATEMENTS.
| | | | | | |
| | | |
| 286 | | | | J.P. MORGAN INCOME FUNDS | | AUGUST 31, 2016 |
| | | | | | | | | | | | | | | | |
| | | Inflation Managed Bond Fund | | | Limited Duration Bond Fund | |
| | | Six Months Ended
August 31, 2016
(Unaudited) | | | Year Ended
February 29, 2016 | | | Six Months Ended
August 31, 2016
(Unaudited) | | | Year Ended
February 29, 2016 | |
CHANGE IN NET ASSETS RESULTING FROM OPERATIONS: | | | | | | | | | | | | | | | | |
Net investment income (loss) | | $ | 16,380 | | | $ | 25,755 | | | $ | 7,620 | | | $ | 11,408 | |
Net realized gain (loss) | | | (18,247 | ) | | | (6,288 | ) | | | (6 | ) | | | (165 | ) |
Change in net unrealized appreciation/depreciation | | | 46,410 | | | | (32,951 | ) | | | 6,625 | | | | (6,628 | ) |
| | | | | | | | | | | | | | | | |
Change in net assets resulting from operations | | | 44,543 | | | | (13,484 | ) | | | 14,239 | | | | 4,615 | |
| | | | | | | | | | | | | | | | |
| | | | |
DISTRIBUTIONS TO SHAREHOLDERS: | | | | | | | | | | | | | | | | |
Class A | | | | | | | | | | | | | | | | |
From net investment income | | | (311 | ) | | | (751 | ) | | | (854 | ) | | | (1,452 | ) |
Class C | | | | | | | | | | | | | | | | |
From net investment income | | | (27 | ) | | | (30 | ) | | | (100 | ) | | | (97 | ) |
Class R2 | | | | | | | | | | | | | | | | |
From net investment income | | | (6 | ) | | | (2 | ) | | | — | | | | — | |
Class R5 | | | | | | | | | | | | | | | | |
From net investment income | | | (28 | ) | | | (196 | ) | | | — | | | | — | |
Class R6 | | | | | | | | | | | | | | | | |
From net investment income | | | (9,191 | ) | | | (10,023 | ) | | | (5,138 | ) | | | (3,706 | ) |
Select Class | | | | | | | | | | | | | | | | |
From net investment income | | | (6,879 | ) | | | (15,877 | ) | | | (1,682 | ) | | | (6,303 | ) |
| | | | | | | | | | | | | | | | |
Total distributions to shareholders | | | (16,442 | ) | | | (26,879 | ) | | | (7,774 | ) | | | (11,558 | ) |
| | | | | | | | | | | | | | | | |
| | | | |
CAPITAL TRANSACTIONS: | | | | | | | | | | | | | | | | |
Change in net assets resulting from capital transactions | | | (169,600 | ) | | | (183,626 | ) | | | 2,807 | | | | 322,424 | |
| | | | | | | | | | | | | | | | |
| | | | |
NET ASSETS: | | | | | | | | | | | | | | | | |
Change in net assets | | | (141,499 | ) | | | (223,989 | ) | | | 9,272 | | | | 315,481 | |
Beginning of period | | | 1,559,830 | | | | 1,783,819 | | | | 1,253,246 | | | | 937,765 | |
| | | | | | | | | | | | | | | | |
End of period | | $ | 1,418,331 | | | $ | 1,559,830 | | | $ | 1,262,518 | | | $ | 1,253,246 | |
| | | | | | | | | | | | | | | | |
Accumulated undistributed (distributions in excess of) net investment income | | $ | (291 | ) | | $ | (229 | ) | | $ | (399 | ) | | $ | (245 | ) |
| | | | | | | | | | | | | | | | |
SEE NOTES TO FINANCIAL STATEMENTS.
| | | | | | | | |
| | | |
| AUGUST 31, 2016 | | J.P. MORGAN INCOME FUNDS | | | | | 287 | |
STATEMENTS OF CHANGES IN NET ASSETS
FOR THE PERIODS INDICATED (continued)
(Amounts in thousands)
| | | | | | | | | | | | | | | | |
| | | Mortgage-Backed Securities Fund | | | Short Duration Bond Fund | |
| | | Six Months Ended
August 31, 2016
(Unaudited) | | | Year Ended
February 29, 2016 | | | Six Months Ended
August 31, 2016
(Unaudited) | | | Year Ended
February 29, 2016 | |
CHANGE IN NET ASSETS RESULTING FROM OPERATIONS: | | | | | | | | | | | | | | | | |
Net investment income (loss) | | $ | 38,651 | | | $ | 74,201 | | | $ | 48,028 | | | $ | 100,522 | |
Net realized gain (loss) | | | 1,439 | | | | 1,786 | | | | 2,973 | | | | 6,262 | |
Change in net unrealized appreciation/depreciation | | | 8,254 | | | | 2,402 | | | | 53,507 | | | | (41,779 | ) |
| | | | | | | | | | | | | | | | |
Change in net assets resulting from operations | | | 48,344 | | | | 78,389 | | | | 104,508 | | | | 65,005 | |
| | | | | | | | | | | | | | | | |
| | | | |
DISTRIBUTIONS TO SHAREHOLDERS: | | | | | | | | | | | | | | | | |
Class A | | | | | | | | | | | | | | | | |
From net investment income | | | (2,455 | ) | | | (4,236 | ) | | | (1,598 | ) | | | (2,421 | ) |
From net realized gains | | | — | | | | (150 | ) | | | — | | | | (425 | ) |
Class B (a) | | | | | | | | | | | | | | | | |
From net investment income | | | — | | | | — | | | | — | | | | — | (b) |
Class C | | | | | | | | | | | | | | | | |
From net investment income | | | (215 | ) | | | (225 | ) | | | (38 | ) | | | (147 | ) |
From net realized gains | | | — | | | | (9 | ) | | | — | | | | (87 | ) |
Class R6 | | | | | | | | | | | | | | | | |
From net investment income | | | (20,519 | ) | | | (41,985 | ) | | | (17,552 | ) | | | (33,410 | ) |
From net realized gains | | | — | | | | (1,179 | ) | | | — | | | | (2,444 | ) |
Select Class | | | | | | | | | | | | | | | | |
From net investment income | | | (16,325 | ) | | | (30,537 | ) | | | (32,705 | ) | | | (64,725 | ) |
From net realized gains | | | — | | | | (880 | ) | | | — | | | | (5,599 | ) |
| | | | | | | | | | | | | | | | |
Total distributions to shareholders | | | (39,514 | ) | | | (79,201 | ) | | | (51,893 | ) | | | (109,258 | ) |
| | | | | | | | | | | | | | | | |
| | | | |
CAPITAL TRANSACTIONS: | | | | | | | | | | | | | | | | |
Change in net assets resulting from capital transactions | | | 87,379 | | | | 101,972 | | | | 56,656 | | | | (101,531 | ) |
| | | | | | | | | | | | | | | | |
| | | | |
NET ASSETS: | | | | | | | | | | | | | | | | |
Change in net assets | | | 96,209 | | | | 101,160 | | | | 109,271 | | | | (145,784 | ) |
Beginning of period | | | 2,686,289 | | | | 2,585,129 | | | | 10,955,902 | | | | 11,101,686 | |
| | | | | | | | | | | | | | | | |
End of period | | $ | 2,782,498 | | | $ | 2,686,289 | | | $ | 11,065,173 | | | $ | 10,955,902 | |
| | | | | | | | | | | | | | | | |
Accumulated undistributed (distributions in excess of) net investment income | | $ | (25 | ) | | $ | 838 | | | $ | (2,220 | ) | | $ | 1,645 | |
| | | | | | | | | | | | | | | | |
| (a) | All remaining Class B Shares converted to Class A Shares on June 19, 2015. |
| (b) | Amount rounds to less than 500. |
SEE NOTES TO FINANCIAL STATEMENTS.
| | | | | | |
| | | |
| 288 | | | | J.P. MORGAN INCOME FUNDS | | AUGUST 31, 2016 |
| | | | | | | | | | | | | | | | |
| | | Short Duration High Yield Fund | | | Treasury & Agency Fund | |
| | | Six Months Ended
August 31, 2016
(Unaudited) | | | Year Ended
February 29, 2016 | | | Six Months Ended
August 31, 2016
(Unaudited) | | | Year Ended
February 29, 2016 | |
CHANGE IN NET ASSETS RESULTING FROM OPERATIONS: | | | | | | | | | | | | | | | | |
Net investment income (loss) | | $ | 3,695 | | | $ | 9,551 | | | $ | 244 | | | $ | 695 | |
Net realized gain (loss) | | | (3,411 | ) | | | (6,895 | ) | | | 48 | | | | 93 | |
Change in net unrealized appreciation/depreciation | | | 12,530 | | | | (12,081 | ) | | | 190 | | | | 259 | |
| | | | | | | | | | | | | | | | |
Change in net assets resulting from operations | | | 12,814 | | | | (9,425 | ) | | | 482 | | | | 1,047 | |
| | | | | | | | | | | | | | | | |
| | | | |
DISTRIBUTIONS TO SHAREHOLDERS: | | | | | | | | | | | | | | | | |
Class A | | | | | | | | | | | | | | | | |
From net investment income | | | (67 | ) | | | (134 | ) | | | (43 | ) | | | (134 | ) |
From net realized gains | | | — | | | | — | | | | — | | | | (26 | ) |
Class C | | | | | | | | | | | | | | | | |
From net investment income | | | (6 | ) | | | (11 | ) | | | — | | | | — | |
Class R6 | | | | | | | | | | | | | | | | |
From net investment income | | | (797 | ) | | | (2,816 | ) | | | — | | | | — | |
Select Class | | | | | | | | | | | | | | | | |
From net investment income | | | (2,915 | ) | | | (6,607 | ) | | | (211 | ) | | | (586 | ) |
From net realized gains | | | — | | | | — | | | | — | | | | (84 | ) |
| | | | | | | | | | | | | | | | |
Total distributions to shareholders | | | (3,785 | ) | | | (9,568 | ) | | | (254 | ) | | | (830 | ) |
| | | | | | | | | | | | | | | | |
| | | | |
CAPITAL TRANSACTIONS: | | | | | | | | | | | | | | | | |
Change in net assets resulting from capital transactions | | | 114 | | | | (79,606 | ) | | | (2,861 | ) | | | (24,709 | ) |
| | | | | | | | | | | | | | | | |
| | | | |
NET ASSETS: | | | | | | | | | | | | | | | | |
Change in net assets | | | 9,143 | | | | (98,599 | ) | | | (2,633 | ) | | | (24,492 | ) |
Beginning of period | | | 157,299 | | | | 255,898 | | | | 105,711 | | | | 130,203 | |
| | | | | | | | | | | | | | | | |
End of period | | $ | 166,442 | | | $ | 157,299 | | | $ | 103,078 | | | $ | 105,711 | |
| | | | | | | | | | | | | | | | |
Accumulated undistributed (distributions in excess of) net investment income | | $ | 11 | | | $ | 101 | | | $ | (8 | ) | | $ | 2 | |
| | | | | | | | | | | | | | | | |
SEE NOTES TO FINANCIAL STATEMENTS.
| | | | | | | | |
| | | |
| AUGUST 31, 2016 | | J.P. MORGAN INCOME FUNDS | | | | | 289 | |
STATEMENTS OF CHANGES IN NET ASSETS
FOR THE PERIODS INDICATED (continued)
(Amounts in thousands)
| | | | | | | | | | | | | | | | |
| | | Core Bond Fund | | | Core Plus Bond Fund | |
| | | Six Months Ended
August 31, 2016
(Unaudited) | | | Year Ended
February 29, 2016 | | | Six Months Ended
August 31, 2016
(Unaudited) | | | Year Ended
February 29, 2016 | |
CAPITAL TRANSACTIONS: | | | | | | | | | | | | | | | | |
Class A | | | | | | | | | | | | | | | | |
Proceeds from shares issued | | $ | 681,511 | | | $ | 1,289,184 | | | $ | 376,044 | | | $ | 461,853 | |
Distributions reinvested | | | 34,226 | | | | 77,471 | | | | 12,087 | | | | 21,470 | |
Cost of shares redeemed | | | (710,006 | ) | | | (3,307,992 | ) | | | (135,144 | ) | | | (224,501 | ) |
Conversion from Class B Shares | | | — | | | | 16,134 | | | | — | | | | 1,021 | |
| | | | | | | | | | | | | | | | |
Change in net assets resulting from Class A capital transactions | | $ | 5,731 | | | $ | (1,925,203 | ) | | $ | 252,987 | | | $ | 259,843 | |
| | | | | | | | | | | | | | | | |
Class B (a) | | | | | | | | | | | | | | | | |
Proceeds from shares issued | | $ | — | | | $ | 35 | | | $ | — | | | $ | 12 | |
Distributions reinvested | | | — | | | | 57 | | | | — | | | | 6 | |
Cost of shares redeemed | | | — | | | | (3,500 | ) | | | — | | | | (322 | ) |
Conversion to Class A Shares | | | — | | | | (16,134 | ) | | | — | | | | (1,021 | ) |
| | | | | | | | | | | | | | | | |
Change in net assets resulting from Class B capital transactions | | $ | — | | | $ | (19,542 | ) | | $ | — | | | $ | (1,325 | ) |
| | | | | | | | | | | | | | | | |
Class C | | | | | | | | | | | | | | | | |
Proceeds from shares issued | | $ | 139,904 | | | $ | 153,635 | | | $ | 58,696 | | | $ | 82,689 | |
Distributions reinvested | | | 7,208 | | | | 14,985 | | | | 2,423 | | | | 5,774 | |
Cost of shares redeemed | | | (104,131 | ) | | | (230,260 | ) | | | (32,823 | ) | | | (71,859 | ) |
| | | | | | | | | | | | | | | | |
Change in net assets resulting from Class C capital transactions | | $ | 42,981 | | | $ | (61,640 | ) | | $ | 28,296 | | | $ | 16,604 | |
| | | | | | | | | | | | | | | | |
Class R2 | | | | | | | | | | | | | | | | |
Proceeds from shares issued | | $ | 19,628 | | | $ | 34,628 | | | $ | 8,804 | | | $ | 27,876 | |
Distributions reinvested | | | 1,068 | | | | 2,138 | | | | 191 | | | | 471 | |
Cost of shares redeemed | | | (15,356 | ) | | | (40,726 | ) | | | (11,931 | ) | | | (12,096 | ) |
| | | | | | | | | | | | | | | | |
Change in net assets resulting from Class R2 capital transactions | | $ | 5,340 | | | $ | (3,960 | ) | | $ | (2,936 | ) | | $ | 16,251 | |
| | | | | | | | | | | | | | | | |
Class R5 | | | | | | | | | | | | | | | | |
Proceeds from shares issued | | $ | 73,726 | | | $ | 206,211 | | | $ | — | | | $ | — | |
Distributions reinvested | | | 4,462 | | | | 7,651 | | | | — | | | | — | |
Cost of shares redeemed | | | (60,772 | ) | | | (126,009 | ) | | | — | | | | — | |
| | | | | | | | | | | | | | | | |
Change in net assets resulting from Class R5 capital transactions | | $ | 17,416 | | | $ | 87,853 | | | $ | — | | | $ | — | |
| | | | | | | | | | | | | | | | |
Class R6 | | | | | | | | | | | | | | | | |
Proceeds from shares issued | | $ | 1,276,227 | | | $ | 6,249,156 | | | $ | 1,401,424 | | | $ | 1,783,621 | |
Distributions reinvested | | | 163,470 | | | | 296,498 | | | | 38,896 | | | | 48,212 | |
Cost of shares redeemed | | | (2,227,743 | ) | | | (2,896,201 | ) | | | (327,553 | ) | | | (236,828 | ) |
| | | | | | | | | | | | | | | | |
Change in net assets resulting from Class R6 capital transactions | | $ | (788,046 | ) | | $ | 3,649,453 | | | $ | 1,112,767 | | | $ | 1,595,005 | |
| | | | | | | | | | | | | | | | |
Institutional Class | | | | | | | | | | | | | | | | |
Proceeds from shares issued | | $ | — | | | $ | — | | | $ | 472,663 | | | $ | 343,641 | |
Distributions reinvested | | | — | | | | — | | | | 12,574 | | | | 22,760 | |
Cost of shares redeemed | | | — | | | | — | | | | (155,536 | ) | | | (161,023 | ) |
| | | | | | | | | | | | | | | | |
Change in net assets resulting from Institutional Class capital transactions | | $ | — | | | $ | — | | | $ | 329,701 | | | $ | 205,378 | |
| | | | | | | | | | | | | | | | |
Select Class | | | | | | | | | | | | | | | | |
Proceeds from shares issued | | $ | 2,173,872 | | | $ | 5,814,466 | | | $ | 238,484 | | | $ | 308,123 | |
Distributions reinvested | | | 115,094 | | | | 267,721 | | | | 6,080 | | | | 35,211 | |
Cost of shares redeemed | | | (2,184,536 | ) | | | (6,432,223 | ) | | | (67,463 | ) | | | (1,412,170 | ) |
| | | | | | | | | | | | | | | | |
Change in net assets resulting from Select Class capital transactions | | $ | 104,430 | | | $ | (350,036 | ) | | $ | 177,101 | | | $ | (1,068,836 | ) |
| | | | | | | | | | | | | | | | |
Total change in net assets resulting from capital transactions | | $ | (612,148 | ) | | $ | 1,376,925 | | | $ | 1,897,916 | | | $ | 1,022,920 | |
| | | | | | | | | | | | | | | | |
| (a) | All remaining Class B Shares converted to Class A Shares on June 19, 2015. |
SEE NOTES TO FINANCIAL STATEMENTS.
| | | | | | |
| | | |
| 290 | | | | J.P. MORGAN INCOME FUNDS | | AUGUST 31, 2016 |
| | | | | | | | | | | | | | | | |
| | | Core Bond Fund | | | Core Plus Bond Fund | |
| | | Six Months Ended
August 31, 2016
(Unaudited) | | | Year Ended
February 29, 2016 | | | Six Months Ended
August 31, 2016
(Unaudited) | | | Year Ended
February 29, 2016 | |
SHARE TRANSACTIONS: | |
Class A | |
Issued | | | 57,373 | | | | 110,021 | | | | 45,204 | | | | 56,139 | |
Reinvested | | | 2,877 | | | | 6,617 | | | | 1,453 | | | | 2,618 | |
Redeemed | | | (59,509 | ) | | | (281,776 | ) | | | (16,204 | ) | | | (27,302 | ) |
Conversion from Class B Shares | | | — | | | | 1,378 | | | | — | | | | 123 | |
| | | | | | | | | | | | | | | | |
Change in Class A Shares | | | 741 | | | | (163,760 | ) | | | 30,453 | | | | 31,578 | |
| | | | | | | | | | | | | | | | |
Class B (a) | |
Issued | | | — | | | | 3 | | | | — | | | | 1 | |
Reinvested | | | — | | | | 5 | | | | — | | | | 1 | |
Redeemed | | | — | | | | (298 | ) | | | — | | | | (39 | ) |
Conversion to Class A Shares | | | — | | | | (1,378 | ) | | | — | | | | (122 | ) |
| | | | | | | | | | | | | | | | |
Change in Class B Shares | | | — | | | | (1,668 | ) | | | — | | | | (159 | ) |
| | | | | | | | | | | | | | | | |
Class C | |
Issued | | | 11,698 | | | | 13,038 | | | | 7,022 | | | | 10,016 | |
Reinvested | | | 602 | | | | 1,274 | | | | 290 | | | | 700 | |
Redeemed | | | (8,703 | ) | | | (19,545 | ) | | | (3,927 | ) | | | (8,692 | ) |
| | | | | | | | | | | | | | | | |
Change in Class C Shares | | | 3,597 | | | | (5,233 | ) | | | 3,385 | | | | 2,024 | |
| | | | | | | | | | | | | | | | |
Class R2 | |
Issued | | | 1,655 | | | | 2,961 | | | | 1,063 | | | | 3,383 | |
Reinvested | | | 90 | | | | 183 | | | | 23 | | | | 57 | |
Redeemed | | | (1,295 | ) | | | (3,480 | ) | | | (1,432 | ) | | | (1,466 | ) |
| | | | | | | | | | | | | | | | |
Change in Class R2 Shares | | | 450 | | | | (336 | ) | | | (346 | ) | | | 1,974 | |
| | | | | | | | | | | | | | | | |
Class R5 | |
Issued | �� | | 6,209 | | | | 17,692 | | | | — | | | | — | |
Reinvested | | | 376 | | | | 655 | | | | — | | | | — | |
Redeemed | | | (5,135 | ) | | | (10,781 | ) | | | — | | | | — | |
| | | | | | | | | | | | | | | | |
Change in Class R5 Shares | | | 1,450 | | | | 7,566 | | | | — | | | | — | |
| | | | | | | | | | | | | | | | |
Class R6 | |
Issued | | | 107,984 | | | | 533,969 | | | | 168,236 | | | | 217,064 | |
Reinvested | | | 13,738 | | | | 25,344 | | | | 4,670 | | | | 5,900 | |
Redeemed | | | (187,561 | ) | | | (247,410 | ) | | | (39,337 | ) | | | (28,834 | ) |
| | | | | | | | | | | | | | | | |
Change in Class R6 Shares | | | (65,839 | ) | | | 311,903 | | | | 133,569 | | | | 194,130 | |
| | | | | | | | | | | | | | | | |
Institutional Class | |
Issued | | | — | | | | — | | | | 56,652 | | | | 41,799 | |
Reinvested | | | — | | | | — | | | | 1,510 | | | | 2,772 | |
Redeemed | | | — | | | | — | | | | (18,678 | ) | | | (19,545 | ) |
| | | | | | | | | | | | | | | | |
Change in Institutional Class Shares | | | — | | | | — | | | | 39,484 | | | | 25,026 | |
| | | | | | | | | | | | | | | | |
Select Class | |
Issued | | | 183,201 | | | | 495,668 | | | | 28,627 | | | | 37,482 | |
Reinvested | | | 9,683 | | | | 22,898 | | | | 731 | | | | 4,271 | |
Redeemed | | | (183,708 | ) | | | (550,438 | ) | | | (8,124 | ) | | | (172,400 | ) |
| | | | | | | | | | | | | | | | |
Change in Select Class Shares | | | 9,176 | | | | (31,872 | ) | | | 21,234 | | | | (130,647 | ) |
| | | | | | | | | | | | | | | | |
| (a) | All remaining Class B Shares converted to Class A Shares on June 19, 2015. |
SEE NOTES TO FINANCIAL STATEMENTS.
| | | | | | | | |
| | | |
| AUGUST 31, 2016 | | J.P. MORGAN INCOME FUNDS | | | | | 291 | |
STATEMENTS OF CHANGES IN NET ASSETS
FOR THE PERIODS INDICATED (continued)
(Amounts in thousands)
| | | | | | | | | | | | | | | | |
| | | Government Bond Fund | | | High Yield Fund | |
| | | Six Months Ended
August 31, 2016
(Unaudited) | | | Year Ended
February 29, 2016 | | | Six Months Ended
August 31, 2016
(Unaudited) | | | Year Ended
February 29, 2016 | |
CAPITAL TRANSACTIONS: | | | | | | | | | | | | | | | | |
Class A | | | | | | | | | | | | | | | | |
Proceeds from shares issued | | $ | 114,445 | | | $ | 275,090 | | | $ | 358,733 | | | $ | 672,055 | |
Distributions reinvested | | | 3,587 | | | | 12,237 | | | | 24,935 | | | | 42,259 | |
Cost of shares redeemed | | | (123,122 | ) | | | (291,606 | ) | | | (375,224 | ) | | | (567,419 | ) |
Conversion from Class B Shares | | | — | | | | 2,720 | | | | — | | | | 3,096 | |
| | | | | | | | | | | | | | | | |
Change in net assets resulting from Class A capital transactions | | $ | (5,090 | ) | | $ | (1,559 | ) | | $ | 8,444 | | | $ | 149,991 | |
| | | | | | | | | | | | | | | | |
Class B (a) | | | | | | | | | | | | | | | | |
Proceeds from shares issued | | $ | — | | | $ | 30 | | | $ | — | | | $ | 43 | |
Distributions reinvested | | | — | | | | 11 | | | | — | | | | 38 | |
Cost of shares redeemed | | | — | | | | (671 | ) | | | — | | | | (1,333 | ) |
Conversion to Class A Shares | | | — | | | | (2,720 | ) | | | — | | | | (3,096 | ) |
| | | | | | | | | | | | | | | | |
Change in net assets resulting from Class B capital transactions | | $ | — | | | $ | (3,350 | ) | | $ | — | | | $ | (4,348 | ) |
| | | | | | | | | | | | | | | | |
Class C | | | | | | | | | | | | | | | | |
Proceeds from shares issued | | $ | 15,820 | | | $ | 19,726 | | | $ | 24,656 | | | $ | 26,897 | |
Distributions reinvested | | | 489 | | | | 1,634 | | | | 4,881 | | | | 10,999 | |
Cost of shares redeemed | | | (12,516 | ) | | | (24,327 | ) | | | (25,207 | ) | | | (84,351 | ) |
| | | | | | | | | | | | | | | | |
Change in net assets resulting from Class C capital transactions | | $ | 3,793 | | | $ | (2,967 | ) | | $ | 4,330 | | | $ | (46,455 | ) |
| | | | | | | | | | | | | | | | |
Class R2 | | | | | | | | | | | | | | | | |
Proceeds from shares issued | | $ | 17,619 | | | $ | 28,842 | | | $ | 1,489 | | | $ | 3,650 | |
Distributions reinvested | | | 427 | | | | 1,175 | | | | 170 | | | | 431 | |
Cost of shares redeemed | | | (13,962 | ) | | | (21,862 | ) | | | (2,273 | ) | | | (4,621 | ) |
| | | | | | | | | | | | | | | | |
Change in net assets resulting from Class R2 capital transactions | | $ | 4,084 | | | $ | 8,155 | | | $ | (614 | ) | | $ | (540 | ) |
| | | | | | | | | | | | | | | | |
Class R5 | | | | | | | | | | | | | | | | |
Proceeds from shares issued | | $ | — | | | $ | — | | | $ | 10,317 | | | $ | 19,127 | |
Distributions reinvested | | | — | | | | — | | | | 1,612 | | | | 3,552 | |
Cost of shares redeemed | | | — | | | | — | | | | (9,802 | ) | | | (32,841 | ) |
| | | | | | | | | | | | | | | | |
Change in net assets resulting from Class R5 capital transactions | | $ | — | | | $ | — | | | $ | 2,127 | | | $ | (10,162 | ) |
| | | | | | | | | | | | | | | | |
Class R6 (b) | | | | | | | | | | | | | | | | |
Proceeds from shares issued | | $ | 74,425 | | | $ | — | | | $ | 729,453 | | | $ | 2,263,337 | |
Distributions reinvested | | | 149 | | | | — | | | | 111,502 | | | | 149,887 | |
Cost of shares redeemed | | | (1 | ) | | | — | | | | (511,154 | ) | | | (276,392 | ) |
| | | | | | | | | | | | | | | | |
Change in net assets resulting from Class R6 capital transactions | | $ | 74,573 | | | $ | — | | | $ | 329,801 | | | $ | 2,136,832 | |
| | | | | | | | | | | | | | | | |
Select Class | | | | | | | | | | | | | | | | |
Proceeds from shares issued | | $ | 140,452 | | | $ | 207,849 | | | $ | 2,140,085 | | | $ | 2,078,892 | |
Distributions reinvested | | | 6,588 | | | | 17,840 | | | | 100,789 | | | | 228,026 | |
Cost of shares redeemed | | | (151,912 | ) | | | (176,129 | ) | | | (756,121 | ) | | | (4,049,077 | ) |
| | | | | | | | | | | | | | | | |
Change in net assets resulting from Select Class capital transactions | | $ | (4,872 | ) | | $ | 49,560 | | | $ | 1,484,753 | | | $ | (1,742,159 | ) |
| | | | | | | | | | | | | | | | |
Total change in net assets resulting from capital transactions | | $ | 72,488 | | | $ | 49,839 | | | $ | 1,828,841 | | | $ | 483,159 | |
| | | | | | | | | | | | | | | | |
| (a) | All remaining Class B Shares converted to Class A Shares on June 19, 2015. |
| (b) | Commencement of offering of class of shares effective August 1, 2016 for Government Bond Fund. |
SEE NOTES TO FINANCIAL STATEMENTS.
| | | | | | |
| | | |
| 292 | | | | J.P. MORGAN INCOME FUNDS | | AUGUST 31, 2016 |
| | | | | | | | | | | | | | | | |
| | | Government Bond Fund | | | High Yield Fund | |
| | | Six Months Ended
August 31, 2016
(Unaudited) | | | Year Ended
February 29, 2016 | | | Six Months Ended
August 31, 2016
(Unaudited) | | | Year Ended
February 29, 2016 | |
SHARE TRANSACTIONS: | | | | | | | | | | | | | | | | |
Class A | | | | | | | | | | | | | | | | |
Issued | | | 10,497 | | | | 25,337 | | | | 50,618 | | | | 94,167 | |
Reinvested | | | 329 | | | | 1,132 | | | | 3,527 | | | | 5,918 | |
Redeemed | | | (11,313 | ) | | | (26,828 | ) | | | (52,904 | ) | | | (79,106 | ) |
Conversion from Class B Shares | | | — | | | | 249 | | | | — | | | | 407 | |
| | | | | | | | | | | | | | | | |
Change in Class A Shares | | | (487 | ) | | | (110 | ) | | | 1,241 | | | | 21,386 | |
| | | | | | | | | | | | | | | | |
Class B (a) | | | | | | | | | | | | | | | | |
Issued | | | — | | | | 3 | | | | — | | | | 6 | |
Reinvested | | | — | | | | 1 | | | | — | | | | 5 | |
Redeemed | | | — | | | | (62 | ) | | | — | | | | (174 | ) |
Conversion to Class A Shares | | | — | | | | (249 | ) | | | — | | | | (406 | ) |
| | | | | | | | | | | | | | | | |
Change in Class B Shares | | | — | | | | (307 | ) | | | — | | | | (569 | ) |
| | | | | | | | | | | | | | | | |
Class C | | | | | | | | | | | | | | | | |
Issued | | | 1,456 | | | | 1,820 | | | | 3,493 | | | | 3,719 | |
Reinvested | | | 45 | | | | 152 | | | | 689 | | | | 1,526 | |
Redeemed | | | (1,152 | ) | | | (2,245 | ) | | | (3,565 | ) | | | (11,691 | ) |
| | | | | | | | | | | | | | | | |
Change in Class C Shares | | | 349 | | | | (273 | ) | | | 617 | | | | (6,446 | ) |
| | | | | | | | | | | | | | | | |
Class R2 | | | | | | | | | | | | | | | | |
Issued | | | 1,619 | | | | 2,662 | | | | 212 | | | | 506 | |
Reinvested | | | 39 | | | | 109 | | | | 24 | | | | 60 | |
Redeemed | | | (1,281 | ) | | | (2,015 | ) | | | (322 | ) | | | (652 | ) |
| | | | | | | | | | | | | | | | |
Change in Class R2 Shares | | | 377 | | | | 756 | | | | (86 | ) | | | (86 | ) |
| | | | | | | | | | | | | | | | |
Class R5 | | | | | | | | | | | | | | | | |
Issued | | | — | | | | — | | | | 1,450 | | | | 2,616 | |
Reinvested | | | — | | | | — | | | | 227 | | | | 490 | |
Redeemed | | | — | | | | — | | | | (1,378 | ) | | | (4,483 | ) |
| | | | | | | | | | | | | | | | |
Change in Class R5 Shares | | | — | | | | — | | | | 299 | | | | (1,377 | ) |
| | | | | | | | | | | | | | | | |
Class R6 (b) | | | | | | | | | | | | | | | | |
Issued | | | 6,798 | | | | — | | | | 102,550 | | | | 313,320 | |
Reinvested | | | 14 | | | | — | | | | 15,688 | | | | 21,110 | |
Redeemed | | | — | (c) | | | — | | | | (71,903 | ) | | | (39,034 | ) |
| | | | | | | | | | | | | | | | |
Change in Class R6 Shares | | | 6,812 | | | | — | | | | 46,335 | | | | 295,396 | |
| | | | | | | | | | | | | | | | |
Select Class | | | | | | | | | | | | | | | | |
Issued | | | 12,887 | | | | 19,141 | | | | 300,293 | | | | 288,780 | |
Reinvested | | | 605 | | | | 1,650 | | | | 14,158 | | | | 31,426 | |
Redeemed | | | (13,912 | ) | | | (16,199 | ) | | | (106,580 | ) | | | (564,957 | ) |
| | | | | | | | | | | | | | | | |
Change in Select Class Shares | | | (420 | ) | | | 4,592 | | | | 207,871 | | | | (244,751 | ) |
| | | | | | | | | | | | | | | | |
| (a) | All remaining Class B Shares converted to Class A Shares on June 19, 2015. |
| (b) | Commencement of offering of class of shares effective August 1, 2016 for Government Bond Fund. |
| (c) | Amount rounds to less than 500. |
SEE NOTES TO FINANCIAL STATEMENTS.
| | | | | | | | |
| | | |
| AUGUST 31, 2016 | | J.P. MORGAN INCOME FUNDS | | | | | 293 | |
STATEMENTS OF CHANGES IN NET ASSETS
FOR THE PERIODS INDICATED (continued)
(Amounts in thousands)
| | | | | | | | | | | | | | | | |
| | | Inflation Managed Bond Fund | | | Limited Duration Bond Fund | |
| | | Six Months Ended
August 31, 2016
(Unaudited) | | | Year Ended
February 29, 2016 | | | Six Months Ended
August 31, 2016
(Unaudited) | | | Year Ended
February 29, 2016 | |
CAPITAL TRANSACTIONS: | | | | | | | | | | | | | | | | |
Class A | | | | | | | | | | | | | | | | |
Proceeds from shares issued | | $ | 5,518 | | | $ | 15,190 | | | $ | 23,081 | | | $ | 92,942 | |
Distributions reinvested | | | 311 | | | | 751 | | | | 817 | | | | 1,391 | |
Cost of shares redeemed | | | (33,827 | ) | | | (22,673 | ) | | | (41,736 | ) | | | (99,104 | ) |
Conversion from Class B Shares | | | — | | | | — | | | | — | | | | 122 | |
| | | | | | | | | | | | | | | | |
Change in net assets resulting from Class A capital transactions | | $ | (27,998 | ) | | $ | (6,732 | ) | | $ | (17,838 | ) | | $ | (4,649 | ) |
| | | | | | | | | | | | | | | | |
Class B (a) | | | | | | | | | | | | | | | | |
Proceeds from shares issued | | $ | — | | | $ | — | | | $ | — | | | $ | 4 | |
Cost of shares redeemed | | | — | | | | — | | | | — | | | | (86 | ) |
Conversion to Class A Shares | | | — | | | | — | | | | — | | | | (122 | ) |
| | | | | | | | | | | | | | | | |
Change in net assets resulting from Class B capital transactions | | $ | — | | | $ | — | | | $ | — | | | $ | (204 | ) |
| | | | | | | | | | | | | | | | |
Class C | | | | | | | | | | | | | | | | |
Proceeds from shares issued | | $ | 1,299 | | | $ | 622 | | | $ | 3,630 | | | $ | 14,826 | |
Distributions reinvested | | | 27 | | | | 30 | | | | 95 | | | | 92 | |
Cost of shares redeemed | | | (985 | ) | | | (1,485 | ) | | | (7,410 | ) | | | (17,520 | ) |
| | | | | | | | | | | | | | | | |
Change in net assets resulting from Class C capital transactions | | $ | 341 | | | $ | (833 | ) | | $ | (3,685 | ) | | $ | (2,602 | ) |
| | | | | | | | | | | | | | | | |
Class R2 | | | | | | | | | | | | | | | | |
Proceeds from shares issued | | $ | 466 | | | $ | 358 | | | $ | — | | | $ | — | |
Distributions reinvested | | | 6 | | | | 2 | | | | — | | | | — | |
Cost of shares redeemed | | | (66 | ) | | | (80 | ) | | | — | | | | — | |
| | | | | | | | | | | | | | | | |
Change in net assets resulting from Class R2 capital transactions | | $ | 406 | | | $ | 280 | | | $ | — | | | $ | — | |
| | | | | | | | | | | | | | | | |
Class R5 | | | | | | | | | | | | | | | | |
Proceeds from shares issued | | $ | 243 | | | $ | 1,524 | | | $ | — | | | $ | — | |
Distributions reinvested | | | 28 | | | | 196 | | | | — | | | | — | |
Cost of shares redeemed | | | (11,521 | ) | | | (2,211 | ) | | | — | | | | — | |
| | | | | | | | | | | | | | | | |
Change in net assets resulting from Class R5 capital transactions | | $ | (11,250 | ) | | $ | (491 | ) | | $ | — | | | $ | — | |
| | | | | | | | | | | | | | | | |
Class R6 | | | | | | | | | | | | | | | | |
Proceeds from shares issued | | $ | 47,972 | | | $ | 424,960 | | | $ | 87,841 | | | $ | 734,862 | |
Distributions reinvested | | | 8,982 | | | | 9,688 | | | | 4,794 | | | | 3,224 | |
Cost of shares redeemed | | | (73,819 | ) | | | (128,254 | ) | | | (11,032 | ) | | | (97,953 | ) |
| | | | | | | | | | | | | | | | |
Change in net assets resulting from Class R6 capital transactions | | $ | (16,865 | ) | | $ | 306,394 | | | $ | 81,603 | | | $ | 640,133 | |
| | | | | | | | | | | | | | | | |
Select Class | | | | | | | | | | | | | | | | |
Proceeds from shares issued | | $ | 86,993 | | | $ | 156,573 | | | $ | 74,809 | | | $ | 411,901 | |
Distributions reinvested | | | 2,975 | | | | 9,612 | | | | 1,180 | | | | 5,449 | |
Cost of shares redeemed | | | (204,202 | ) | | | (648,429 | ) | | | (133,262 | ) | | | (727,604 | ) |
| | | | | | | | | | | | | | | | |
Change in net assets resulting from Select Class capital transactions | | $ | (114,234 | ) | | $ | (482,244 | ) | | $ | (57,273 | ) | | $ | (310,254 | ) |
| | | | | | | | | | | | | | | | |
Total change in net assets resulting from capital transactions | | $ | (169,600 | ) | | $ | (183,626 | ) | | $ | 2,807 | | | $ | 322,424 | |
| | | | | | | | | | | | | | | | |
| (a) | All remaining Class B Shares converted to Class A Shares on June 19, 2015. |
SEE NOTES TO FINANCIAL STATEMENTS.
| | | | | | |
| | | |
| 294 | | | | J.P. MORGAN INCOME FUNDS | | AUGUST 31, 2016 |
| | | | | | | | | | | | | | | | |
| | | Inflation Managed Bond Fund | | | Limited Duration Bond Fund | |
| | | Six Months Ended
August 31, 2016
(Unaudited) | | | Year Ended
February 29, 2016 | | | Six Months Ended
August 31, 2016
(Unaudited) | | | Year Ended
February 29, 2016 | |
SHARE TRANSACTIONS: | | | | | | | | | | | | | | | | |
Class A | | | | | | | | | | | | | | | | |
Issued | | | 539 | | | | 1,480 | | | | 2,310 | | | | 9,289 | |
Reinvested | | | 30 | | | | 74 | | | | 82 | | | | 139 | |
Redeemed | | | (3,292 | ) | | | (2,217 | ) | | | (4,175 | ) | | | (9,915 | ) |
Conversion from Class B Shares | | | — | | | | — | | | | — | | | | 12 | |
| | | | | | | | | | | | | | | | |
Change in Class A Shares | | | (2,723 | ) | | | (663 | ) | | | (1,783 | ) | | | (475 | ) |
| | | | | | | | | | | | | | | | |
Class B (a) | | | | | | | | | | | | | | | | |
Issued | | | — | | | | — | | | | — | | | | — | (b) |
Redeemed | | | — | | | | — | | | | — | | | | (9 | ) |
Conversion to Class A Shares | | | — | | | | — | | | | — | | | | (12 | ) |
| | | | | | | | | | | | | | | | |
Change in Class B Shares | | | — | | | | — | | | | — | | | | (21 | ) |
| | | | | | | | | | | | | | | | |
Class C | | | | | | | | | | | | | | | | |
Issued | | | 127 | | | | 61 | | | | 367 | | | | 1,499 | |
Reinvested | | | 3 | | | | 3 | | | | 10 | | | | 9 | |
Redeemed | �� | | (96 | ) | | | (145 | ) | | | (749 | ) | | | (1,771 | ) |
| | | | | | | | | | | | | | | | |
Change in Class C Shares | | | 34 | | | | (81 | ) | | | (372 | ) | | | (263 | ) |
| | | | | | | | | | | | | | | | |
Class R2 | | | | | | | | | | | | | | | | |
Issued | | | 45 | | | | 36 | | | | — | | | | — | |
Reinvested | | | — | (b) | | | — | (b) | | | — | | | | — | |
Redeemed | | | (6 | ) | | | (8 | ) | | | — | | | | — | |
| | | | | | | | | | | | | | | | |
Change in Class R2 Shares | | | 39 | | | | 28 | | | | — | | | | — | |
| | | | | | | | | | | | | | | | |
Class R5 | | | | | | | | | | | | | | | | |
Issued | | | 23 | | | | 149 | | | | — | | | | — | |
Reinvested | | | 3 | | | | 19 | | | | — | | | | — | |
Redeemed | | | (1,117 | ) | | | (217 | ) | | | — | | | | — | |
| | | | | | | | | | | | | | | | |
Change in Class R5 Shares | | | (1,091 | ) | | | (49 | ) | | | — | | | | — | |
| | | | | | | | | | | | | | | | |
Class R6 | | | | | | | | | | | | | | | | |
Issued | | | 4,655 | | | | 41,783 | | | | 8,794 | | | | 73,445 | |
Reinvested | | | 872 | | | | 950 | | | | 478 | | | | 323 | |
Redeemed | | | (7,146 | ) | | | (12,685 | ) | | | (1,101 | ) | | | (9,797 | ) |
| | | | | | | | | | | | | | | | |
Change in Class R6 Shares | | | (1,619 | ) | | | 30,048 | | | | 8,171 | | | | 63,971 | |
| | | | | | | | | | | | | | | | |
Select Class | | | | | | | | | | | | | | | | |
Issued | | | 8,471 | | | | 15,343 | | | | 7,481 | | | | 41,154 | |
Reinvested | | | 289 | | | | 941 | | | | 118 | | | | 545 | |
Redeemed | | | (19,857 | ) | | | (63,764 | ) | | | (13,328 | ) | | | (72,883 | ) |
| | | | | | | | | | | | | | | | |
Change in Select Class Shares | | | (11,097 | ) | | | (47,480 | ) | | | (5,729 | ) | | | (31,184 | ) |
| | | | | | | | | | | | | | | | |
| (a) | All remaining Class B Shares converted to Class A Shares on June 19, 2015. |
| (b) | Amount rounds to less than 500. |
SEE NOTES TO FINANCIAL STATEMENTS.
| | | | | | | | |
| | | |
| AUGUST 31, 2016 | | J.P. MORGAN INCOME FUNDS | | | | | 295 | |
STATEMENTS OF CHANGES IN NET ASSETS
FOR THE PERIODS INDICATED (continued)
(Amounts in thousands)
| | | | | | | | | | | | | | | | |
| | | Mortgage-Backed Securities Fund | | | Short Duration Bond Fund | |
| | | Six Months Ended
August 31, 2016
(Unaudited) | | | Year Ended
February 29, 2016 | | | Six Months Ended
August 31, 2016
(Unaudited) | | | Year Ended
February 29, 2016 | |
CAPITAL TRANSACTIONS: | | | | | | | | | | | | | | | | |
Class A | | | | | | | | | | | | | | | | |
Proceeds from shares issued | | $ | 60,298 | | | $ | 122,386 | | | $ | 93,188 | | | $ | 473,231 | |
Distributions reinvested | | | 2,324 | | | | 4,295 | | | | 1,562 | | | | 2,760 | |
Cost of shares redeemed | | | (87,452 | ) | | | (56,848 | ) | | | (94,252 | ) | | | (172,446 | ) |
Conversion from Class B Shares | | | — | | | | — | | | | — | | | | 363 | |
| | | | | | | | | | | | | | | | |
Change in net assets resulting from Class A capital transactions | | $ | (24,830 | ) | | $ | 69,833 | | | $ | 498 | | | $ | 303,908 | |
| | | | | | | | | | | | | | | | |
Class B (a) | | | | | | | | | | | | | | | | |
Proceeds from shares issued | | $ | — | | | $ | — | | | $ | — | | | $ | 35 | |
Distributions reinvested | | | — | | | | — | | | | — | | | | — | (b) |
Cost of shares redeemed | | | — | | | | — | | | | — | | | | (151 | ) |
Conversion to Class A Shares | | | — | | | | — | | | | — | | | | (363 | ) |
| | | | | | | | | | | | | | | | |
Change in net assets resulting from Class B capital transactions | | $ | — | | | $ | — | | | $ | — | | | $ | (479 | ) |
| | | | | | | | | | | | | | | | |
Class C | | | | | | | | | | | | | | | | |
Proceeds from shares issued | | $ | 6,277 | | | $ | 14,586 | | | $ | 6,226 | | | $ | 23,148 | |
Distributions reinvested | | | 180 | | | | 217 | | | | 37 | | | | 226 | |
Cost of shares redeemed | | | (4,036 | ) | | | (3,258 | ) | | | (19,867 | ) | | | (36,175 | ) |
| | | | | | | | | | | | | | | | |
Change in net assets resulting from Class C capital transactions | | $ | 2,421 | | | $ | 11,545 | | | $ | (13,604 | ) | | $ | (12,801 | ) |
| | | | | | | | | | | | | | | | |
Class R6 | | | | | | | | | | | | | | | | |
Proceeds from shares issued | | $ | 72,975 | | | $ | 177,261 | | | $ | 917,390 | | | $ | 2,124,251 | |
Subscriptions in-kind (See Note X) | | | — | | | | — | | | | 44,995 | | | | — | |
Distributions reinvested | | | 19,230 | | | | 40,071 | | | | 7,049 | | | | 21,544 | |
Cost of shares redeemed | | | (94,704 | ) | | | (229,992 | ) | | | (1,049,516 | ) | | | (1,929,940 | ) |
| | | | | | | | | | | | | | | | |
Change in net assets resulting from Class R6 capital transactions | | $ | (2,499 | ) | | $ | (12,660 | ) | | $ | (80,082 | ) | | $ | 215,855 | |
| | | | | | | | | | | | | | | | |
Select Class | | | | | | | | | | | | | | | | |
Proceeds from shares issued | | $ | 314,880 | | | $ | 412,165 | | | $ | 1,676,720 | | | $ | 2,488,315 | |
Distributions reinvested | | | 12,059 | | | | 21,595 | | | | 24,063 | | | | 44,385 | |
Cost of shares redeemed | | | (214,652 | ) | | | (400,506 | ) | | | (1,550,939 | ) | | | (3,140,714 | ) |
| | | | | | | | | | | | | | | | |
Change in net assets resulting from Select Class capital transactions | | $ | 112,287 | | | $ | 33,254 | | | $ | 149,844 | | | $ | (608,014 | ) |
| | | | | | | | | | | | | | | | |
Total change in net assets resulting from capital transactions | | $ | 87,379 | | | $ | 101,972 | | | $ | 56,656 | | | $ | (101,531 | ) |
| | | | | | | | | | | | | | | | |
| (a) | All remaining Class B Shares converted to Class A Shares on June 19, 2015. |
| (b) | Amount rounds to less than 500. |
SEE NOTES TO FINANCIAL STATEMENTS.
| | | | | | |
| | | |
| 296 | | | | J.P. MORGAN INCOME FUNDS | | AUGUST 31, 2016 |
| | | | | | | | | | | | | | | | |
| | | Mortgage-Backed Securities Fund | | | Short Duration Bond Fund | |
| | | Six Months Ended
August 31, 2016
(Unaudited) | | | Year Ended
February 29, 2016 | | | Six Months Ended
August 31, 2016
(Unaudited) | | | Year Ended
February 29, 2016 | |
SHARE TRANSACTIONS: | | | | | | | | | | | | | | | | |
Class A | | | | | | | | | | | | | | | | |
Issued | | | 5,161 | | | | 10,533 | | | | 8,578 | | | | 43,602 | |
Reinvested | | | 199 | | | | 370 | | | | 144 | | | | 254 | |
Redeemed | | | (7,485 | ) | | | (4,892 | ) | | | (8,667 | ) | | | (15,900 | ) |
Conversion from Class B Shares | | | — | | | | — | | | | — | | | | 33 | |
| | | | | | | | | | | | | | | | |
Change in Class A Shares | | | (2,125 | ) | | | 6,011 | | | | 55 | | | | 27,989 | |
| | | | | | | | | | | | | | | | |
Class B (a) | | | | | | | | | | | | | | | | |
Issued | | | — | | | | — | | | | — | | | | 4 | |
Reinvested | | | — | | | | — | | | | — | | | | — | (b) |
Redeemed | | | — | | | | — | | | | — | | | | (14 | ) |
Conversion to Class A Shares | | | — | | | | — | | | | — | | | | (33 | ) |
| | | | | | | | | | | | | | | | |
Change in Class B Shares | | | — | | | | — | | | | — | | | | (43 | ) |
| | | | | | | | | | | | | | | | |
Class C | | | | | | | | | | | | | | | | |
Issued | | | 552 | | | | 1,288 | | | | 569 | | | | 2,122 | |
Reinvested | | | 16 | | | | 19 | | | | 3 | | | | 21 | |
Redeemed | | | (355 | ) | | | (288 | ) | | | (1,816 | ) | | | (3,312 | ) |
| | | | | | | | | | | | | | | | |
Change in Class C Shares | | | 213 | | | | 1,019 | | | | (1,244 | ) | | | (1,169 | ) |
| | | | | | | | | | | | | | | | |
Class R6 | | | | | | | | | | | | | | | | |
Issued | | | 6,413 | | | | 15,585 | | | | 84,227 | | | | 195,339 | |
Subscriptions in-kind (See Note X) | | | — | | | | — | | | | 4,128 | | | | — | |
Reinvested | | | 1,688 | | | | 3,535 | | | | 648 | | | | 1,983 | |
Redeemed | | | (8,309 | ) | | | (20,216 | ) | | | (96,336 | ) | | | (177,528 | ) |
| | | | | | | | | | | | | | | | |
Change in Class R6 Shares | | | (208 | ) | | | (1,096 | ) | | | (7,333 | ) | | | 19,794 | |
| | | | | | | | | | | | | | | | |
Select Class | | | | | | | | | | | | | | | | |
Issued | | | 27,623 | | | | 36,302 | | | | 154,014 | | | | 228,970 | |
Reinvested | | | 1,058 | | | | 1,905 | | | | 2,210 | | | | 4,084 | |
Redeemed | | | (18,810 | ) | | | (35,316 | ) | | | (142,400 | ) | | | (288,919 | ) |
| | | | | | | | | | | | | | | | |
Change in Select Class Shares | | | 9,871 | | | | 2,891 | | | | 13,824 | | | | (55,865 | ) |
| | | | | | | | | | | | | | | | |
| (a) | All remaining Class B Shares converted to Class A Shares on June 19, 2015. |
| (b) | Amount rounds to less than 500. |
SEE NOTES TO FINANCIAL STATEMENTS.
| | | | | | | | |
| | | |
| AUGUST 31, 2016 | | J.P. MORGAN INCOME FUNDS | | | | | 297 | |
STATEMENTS OF CHANGES IN NET ASSETS
FOR THE PERIODS INDICATED (continued)
(Amounts in thousands)
| | | | | | | | | | | | | | | | |
| | | Short Duration High Yield Fund | | | Treasury & Agency Fund | |
| | | Six Months Ended
August 31, 2016
(Unaudited) | | | Year Ended
February 29, 2016 | | | Six Months Ended
August 31, 2016
(Unaudited) | | | Year Ended
February 29, 2016 | |
CAPITAL TRANSACTIONS: | | | | | | | | | | | | | | | | |
Class A | | | | | | | | | | | | | | | | |
Proceeds from shares issued | | $ | 590 | | | $ | 12,531 | | | $ | 2,610 | | | $ | 21,299 | |
Distributions reinvested | | | 67 | | | | 134 | | | | 43 | | | | 155 | |
Cost of shares redeemed | | | (269 | ) | | | (11,651 | ) | | | (13,837 | ) | | | (13,558 | ) |
Conversion from Class B Shares | | | — | | | | — | | | | — | | | | — | (a) |
| | | | | | | | | | | | | | | | |
Change in net assets resulting from Class A capital transactions | | $ | 388 | | | $ | 1,014 | | | $ | (11,184 | ) | | $ | 7,896 | |
| | | | | | | | | | | | | | | | |
Class B (b) | | | | | | | | | | | | | | | | |
Cost of shares redeemed | | $ | — | | | $ | — | | | $ | — | | | $ | (36 | ) |
Conversion to Class A Shares | | | — | | | | — | | | | — | | | | — | (a) |
| | | | | | | | | | | | | | | | |
Change in net assets resulting from Class B capital transactions | | $ | — | | | $ | — | | | $ | — | | | $ | (36 | ) |
| | | | | | | | | | | | | | | | |
Class C | | | | | | | | | | | | | | | | |
Proceeds from shares issued | | $ | 183 | | | $ | 260 | | | $ | — | | | $ | — | |
Distributions reinvested | | | 6 | | | | 11 | | | | — | | | | — | |
Cost of shares redeemed | | | (163 | ) | | | (303 | ) | | | — | | | | — | |
| | | | | | | | | | | | | | | | |
Change in net assets resulting from Class C capital transactions | | $ | 26 | | | $ | (32 | ) | | $ | — | | | $ | — | |
| | | | | | | | | | | | | | | | |
Class R6 | | | | | | | | | | | | | | | | |
Proceeds from shares issued | | $ | 5,790 | | | $ | 1,999 | | | $ | — | | | $ | — | |
Distributions reinvested | | | 1 | | | | 1 | | | | — | | | | — | |
Cost of shares redeemed | | | (20,000 | ) | | | (31,670 | ) | | | — | | | | — | |
| | | | | | | | | | | | | | | | |
Change in net assets resulting from Class R6 capital transactions | | $ | (14,209 | ) | | $ | (29,670 | ) | | $ | — | | | $ | — | |
| | | | | | | | | | | | | | | | |
Select Class | | | | | | | | | | | | | | | | |
Proceeds from shares issued | | $ | 33,544 | | | $ | 37,758 | | | $ | 19,555 | | | $ | 13,981 | |
Distributions reinvested | | | 616 | | | | 1,247 | | | | 111 | | | | 413 | |
Cost of shares redeemed | | | (20,251 | ) | | | (89,923 | ) | | | (11,343 | ) | | | (46,963 | ) |
| | | | | | | | | | | | | | | | |
Change in net assets resulting from Select Class capital transactions | | $ | 13,909 | | | $ | (50,918 | ) | | $ | 8,323 | | | $ | (32,569 | ) |
| | | | | | | | | | | | | | | | |
Total change in net assets resulting from capital transactions | | $ | 114 | | | $ | (79,606 | ) | | $ | (2,861 | ) | | $ | (24,709 | ) |
| | | | | | | | | | | | | | | | |
| (a) | Amount rounds to less than 500. |
| (b) | All remaining Class B Shares converted to Class A Shares on June 19, 2015. |
SEE NOTES TO FINANCIAL STATEMENTS.
| | | | | | |
| | | |
| 298 | | | | J.P. MORGAN INCOME FUNDS | | AUGUST 31, 2016 |
| | | | | | | | | | | | | | | | |
| | | Short Duration High Yield Fund | | | Treasury & Agency Fund | |
| | | Six Months Ended
August 31, 2016
(Unaudited) | | | Year Ended
February 29, 2016 | | | Six Months Ended
August 31, 2016
(Unaudited) | | | Year Ended
February 29, 2016 | |
SHARE TRANSACTIONS: | | | | | | | | | | | | | | | | |
Class A | | | | | | | | | | | | | | | | |
Issued | | | 64 | | | | 1,294 | | | | 277 | | | | 2,265 | |
Reinvested | | | 7 | | | | 15 | | | | 4 | | | | 16 | |
Redeemed | | | (29 | ) | | | (1,220 | ) | | | (1,465 | ) | | | (1,439 | ) |
Conversion from Class B Shares | | | — | | | | — | | | | — | | | | — | (a) |
| | | | | | | | | | | | | | | | |
Change in Class A Shares | | | 42 | | | | 89 | | | | (1,184 | ) | | | 842 | |
| | | | | | | | | | | | | | | | |
Class B (b) | | | | | | | | | | | | | | | | |
Redeemed | | | — | | | | — | | | | — | | | | (4 | ) |
Conversion to Class A Shares | | | — | | | | — | | | | — | | | | — | (a) |
| | | | | | | | | | | | | | | | |
Change in Class B Shares | | | — | | | | — | | | | — | | | | (4 | ) |
| | | | | | | | | | | | | | | | |
Class C | | | | | | | | | | | | | | | | |
Issued | | | 20 | | | | 28 | | | | — | | | | — | |
Reinvested | | | 1 | | | | 1 | | | | — | | | | — | |
Redeemed | | | (18 | ) | | | (32 | ) | | | — | | | | — | |
| | | | | | | | | | | | | | | | |
Change in Class C Shares | | | 3 | | | | (3 | ) | | | — | | | | — | |
| | | | | | | | | | | | | | | | |
Class R6 | | | | | | | | | | | | | | | | |
Issued | | | 638 | | | | 215 | | | | — | | | | — | |
Reinvested | | | — | (a) | | | — | (a) | | | — | | | | — | |
Redeemed | | | (2,225 | ) | | | (3,298 | ) | | | — | | | | — | |
| | | | | | | | | | | | | | | | |
Change in Class R6 Shares | | | (1,587 | ) | | | (3,083 | ) | | | — | | | | — | |
| | | | | | | | | | | | | | | | |
Select Class | | | | | | | | | | | | | | | | |
Issued | | | 3,633 | | | | 3,987 | | | | 2,068 | | | | 1,485 | |
Reinvested | | | 67 | | | | 133 | | | | 12 | | | | 44 | |
Redeemed | | | (2,211 | ) | | | (9,581 | ) | | | (1,201 | ) | | | (4,987 | ) |
| | | | | | | | | | | | | | | | |
Change in Select Class Shares | | | 1,489 | | | | (5,461 | ) | | | 879 | | | | (3,458 | ) |
| | | | | | | | | | | | | | | | |
| (a) | Amount rounds to less than 500. |
| (b) | All remaining Class B Shares converted to Class A Shares on June 19, 2015. |
SEE NOTES TO FINANCIAL STATEMENTS.
| | | | | | | | |
| | | |
| AUGUST 31, 2016 | | J.P. MORGAN INCOME FUNDS | | | | | 299 | |
FINANCIAL HIGHLIGHTS
FOR THE PERIODS INDICATED
| | | | | | | | | | | | | | | | | | | | | | | | | | | | |
| | | Per share operating performance | |
| | | | | | Investment operations | | | Distributions | |
| | | Net asset
value,
beginning
of period | | | Net
investment
income
(loss) (b) | | | Net realized
and unrealized
gains
(losses) on
investments | | | Total from
investment
operations | | | Net
investment
income | | | Net
realized
gain | | | Total
distributions | |
Core Bond Fund | | | | | | | | | | | | | | | | | | | | | | | | | | | | |
Class A | | | | | | | | | | | | | | | | | | | | | | | | | | | | |
Six Months Ended August 31, 2016 (Unaudited) | | $ | 11.75 | | | $ | 0.13 | | | $ | 0.24 | | | $ | 0.37 | | | $ | (0.13 | ) | | $ | — | | | $ | (0.13 | ) |
Year Ended February 29, 2016 | | | 11.84 | | | | 0.25 | | | | (0.07 | ) | | | 0.18 | | | | (0.25 | ) | | | (0.02 | ) | | | (0.27 | ) |
Year Ended February 28, 2015 | | | 11.65 | | | | 0.27 | | | | 0.20 | | | | 0.47 | | | | (0.27 | ) | | | (0.01 | ) | | | (0.28 | ) |
Year Ended February 28, 2014 | | | 12.02 | | | | 0.30 | | | | (0.32 | ) | | | (0.02 | ) | | | (0.29 | ) | | | (0.06 | ) | | | (0.35 | ) |
Year Ended February 28, 2013 | | | 11.93 | | | | 0.32 | | | | 0.11 | | | | 0.43 | | | | (0.32 | ) | | | (0.02 | ) | | | (0.34 | ) |
Year Ended February 29, 2012 | | | 11.46 | | | | 0.40 | | | | 0.49 | | | | 0.89 | | | | (0.40 | ) | | | (0.02 | ) | | | (0.42 | ) |
Class C | | | | | | | | | | | | | | | | | | | | | | | | | | | | |
Six Months Ended August 31, 2016 (Unaudited) | | | 11.82 | | | | 0.09 | | | | 0.24 | | | | 0.33 | | | | (0.09 | ) | | | — | | | | (0.09 | ) |
Year Ended February 29, 2016 | | | 11.90 | | | | 0.17 | | | | (0.06 | ) | | | 0.11 | | | | (0.17 | ) | | | (0.02 | ) | | | (0.19 | ) |
Year Ended February 28, 2015 | | | 11.71 | | | | 0.19 | | | | 0.21 | | | | 0.40 | | | | (0.20 | ) | | | (0.01 | ) | | | (0.21 | ) |
Year Ended February 28, 2014 | | | 12.07 | | | | 0.22 | | | | (0.31 | ) | | | (0.09 | ) | | | (0.21 | ) | | | (0.06 | ) | | | (0.27 | ) |
Year Ended February 28, 2013 | | | 11.98 | | | | 0.25 | | | | 0.10 | | | | 0.35 | | | | (0.24 | ) | | | (0.02 | ) | | | (0.26 | ) |
Year Ended February 29, 2012 | | | 11.51 | | | | 0.33 | | | | 0.48 | | | | 0.81 | | | | (0.32 | ) | | | (0.02 | ) | | | (0.34 | ) |
Class R2 | | | | | | | | | | | | | | | | | | | | | | | | | | | | |
Six Months Ended August 31, 2016 (Unaudited) | | | 11.73 | | | | 0.11 | | | | 0.26 | | | | 0.37 | | | | (0.12 | ) | | | — | | | | (0.12 | ) |
Year Ended February 29, 2016 | | | 11.82 | | | | 0.22 | | | | (0.07 | ) | | | 0.15 | | | | (0.22 | ) | | | (0.02 | ) | | | (0.24 | ) |
Year Ended February 28, 2015 | | | 11.63 | | | | 0.24 | | | | 0.20 | | | | 0.44 | | | | (0.24 | ) | | | (0.01 | ) | | | (0.25 | ) |
Year Ended February 28, 2014 | | | 12.00 | | | | 0.27 | | | | (0.32 | ) | | | (0.05 | ) | | | (0.26 | ) | | | (0.06 | ) | | | (0.32 | ) |
Year Ended February 28, 2013 | | | 11.91 | | | | 0.29 | | | | 0.11 | | | | 0.40 | | | | (0.29 | ) | | | (0.02 | ) | | | (0.31 | ) |
Year Ended February 29, 2012 | | | 11.45 | | | | 0.37 | | | | 0.48 | | | | 0.85 | | | | (0.37 | ) | | | (0.02 | ) | | | (0.39 | ) |
Class R5 | | | | | | | | | | | | | | | | | | | | | | | | | | | | |
Six Months Ended August 31, 2016 (Unaudited) | | | 11.72 | | | | 0.15 | | | | 0.25 | | | | 0.40 | | | | (0.15 | ) | | | — | | | | (0.15 | ) |
Year Ended February 29, 2016 | | | 11.82 | | | | 0.28 | | | | (0.07 | ) | | | 0.21 | | | | (0.29 | ) | | | (0.02 | ) | | | (0.31 | ) |
Year Ended February 28, 2015 | | | 11.63 | | | | 0.30 | | | | 0.21 | | | | 0.51 | | | | (0.31 | ) | | | (0.01 | ) | | | (0.32 | ) |
Year Ended February 28, 2014 | | | 12.00 | | | | 0.33 | | | | (0.31 | ) | | | 0.02 | | | | (0.33 | ) | | | (0.06 | ) | | | (0.39 | ) |
Year Ended February 28, 2013 | | | 11.91 | | | | 0.36 | | | | 0.10 | | | | 0.46 | | | | (0.35 | ) | | | (0.02 | ) | | | (0.37 | ) |
Year Ended February 29, 2012 | | | 11.44 | | | | 0.43 | | | | 0.49 | | | | 0.92 | | | | (0.43 | ) | | | (0.02 | ) | | | (0.45 | ) |
Class R6 | | | | | | | | | | | | | | | | | | | | | | | | | | | | |
Six Months Ended August 31, 2016 (Unaudited) | | | 11.75 | | | | 0.15 | | | | 0.26 | | | | 0.41 | | | | (0.16 | ) | | | — | | | | (0.16 | ) |
Year Ended February 29, 2016 | | | 11.84 | | | | 0.30 | | | | (0.07 | ) | | | 0.23 | | | | (0.30 | ) | | | (0.02 | ) | | | (0.32 | ) |
Year Ended February 28, 2015 | | | 11.65 | | | | 0.31 | | | | 0.21 | | | | 0.52 | | | | (0.32 | ) | | | (0.01 | ) | | | (0.33 | ) |
Year Ended February 28, 2014 | | | 12.02 | | | | 0.34 | | | | (0.32 | ) | | | 0.02 | | | | (0.33 | ) | | | (0.06 | ) | | | (0.39 | ) |
Year Ended February 28, 2013 | | | 11.92 | | | | 0.36 | | | | 0.12 | | | | 0.48 | | | | (0.36 | ) | | | (0.02 | ) | | | (0.38 | ) |
Year Ended February 29, 2012 | | | 11.46 | | | | 0.44 | | | | 0.48 | | | | 0.92 | | | | (0.44 | ) | | | (0.02 | ) | | | (0.46 | ) |
Select Class | | | | | | | | | | | | | | | | | | | | | | | | | | | | |
Six Months Ended August 31, 2016 (Unaudited) | | | 11.74 | | | | 0.14 | | | | 0.24 | | | | 0.38 | | | | (0.14 | ) | | | — | | | | (0.14 | ) |
Year Ended February 29, 2016 | | | 11.83 | | | | 0.27 | | | | (0.07 | ) | | | 0.20 | | | | (0.27 | ) | | | (0.02 | ) | | | (0.29 | ) |
Year Ended February 28, 2015 | | | 11.64 | | | | 0.28 | | | | 0.21 | | | | 0.49 | | | | (0.29 | ) | | | (0.01 | ) | | | (0.30 | ) |
Year Ended February 28, 2014 | | | 12.01 | | | | 0.32 | | | | (0.32 | ) | | | — | (g) | | | (0.31 | ) | | | (0.06 | ) | | | (0.37 | ) |
Year Ended February 28, 2013 | | | 11.92 | | | | 0.34 | | | | 0.11 | | | | 0.45 | | | | (0.34 | ) | | | (0.02 | ) | | | (0.36 | ) |
Year Ended February 29, 2012 | | | 11.45 | | | | 0.42 | | | | 0.49 | | | | 0.91 | | | | (0.42 | ) | | | (0.02 | ) | | | (0.44 | ) |
| (a) | Annualized for periods less than one year, unless otherwise noted. |
| (b) | Calculated based upon average shares outstanding. |
| (c) | Not annualized for periods less than one year. |
| (d) | Includes adjustments in accordance with accounting principles generally accepted in the United States of America and as such, the net asset values for financial reporting purposes and the returns based upon those net asset values may differ from the net asset values and returns for shareholder transactions. |
| (e) | Includes earnings credits and interest expense, if applicable, each of which is less than 0.005% unless otherwise noted. |
| (f) | Portfolio turnover is calculated by dividing the lesser of total purchases or sales of portfolio securities for the reporting period by the monthly average value of portfolio securities owned during the reporting period. Excluded from both the numerator and denominator are amounts relating to derivatives and securities whose maturities or expiration dates at the time of acquisition were one year or less. |
| (g) | Amount rounds to less than $0.005. |
SEE NOTES TO FINANCIAL STATEMENTS.
| | | | | | |
| | | |
| 300 | | | | J.P. MORGAN INCOME FUNDS | | AUGUST 31, 2016 |
| | | | | | | | | | | | | | | | | | | | | | | | | | |
| | | Ratios/Supplemental data | |
| | | | | | | | | | Ratios to average net assets (a) | | | | |
Net asset
value,
end of
period | | | Total return
(excludes
sales charge) (c)(d) | | |
Net assets,
end of
period
(000’s) | | | Net
expenses (e) | | | Net
investment
income
(loss) | | | Expenses
without waivers,
reimbursements and
earnings credits | | | Portfolio
turnover
rate (c)(f) | |
| | | | | | | | | | | | | | | | | | | | | | | | | | |
| | | | | | | | | | | | | | | | | | | | | | | | | | |
| $ | 11.99 | | | | 3.19 | % | | $ | 3,144,567 | | | | 0.74 | % | | | 2.16 | % | | | 0.98 | % | | | 12 | % |
| | 11.75 | | | | 1.57 | | | | 3,071,916 | | | | 0.74 | | | | 2.11 | | | | 0.98 | | | | 22 | |
| | 11.84 | | | | 4.16 | | | | 5,034,237 | | | | 0.74 | | | | 2.27 | | | | 0.96 | | | | 15 | |
| | 11.65 | | | | (0.08 | ) | | | 5,237,738 | | | | 0.75 | | | | 2.52 | | | | 0.97 | | | | 15 | |
| | 12.02 | | | | 3.56 | | | | 6,347,063 | | | | 0.74 | | | | 2.68 | | | | 0.97 | | | | 15 | |
| | 11.93 | | | | 7.89 | | | | 5,937,341 | | | | 0.75 | | | | 3.40 | | | | 0.98 | | | | 20 | |
| | | | | | | | | | | | | | | | | | | | | | | | | | |
| | 12.06 | | | | 2.82 | | | | 1,042,392 | | | | 1.39 | | | | 1.52 | | | | 1.45 | | | | 12 | |
| | 11.82 | | | | 0.98 | | | | 978,417 | | | | 1.39 | | | | 1.47 | | | | 1.45 | | | | 22 | |
| | 11.90 | | | | 3.45 | | | | 1,047,962 | | | | 1.39 | | | | 1.62 | | | | 1.46 | | | | 15 | |
| | 11.71 | | | | (0.69 | ) | | | 1,216,032 | | | | 1.40 | | | | 1.84 | | | | 1.47 | | | | 15 | |
| | 12.07 | | | | 2.91 | | | | 2,549,712 | | | | 1.39 | | | | 2.03 | | | | 1.47 | | | | 15 | |
| | 11.98 | | | | 7.15 | | | | 2,400,830 | | | | 1.40 | | | | 2.76 | | | | 1.48 | | | | 20 | |
| | | | | | | | | | | | | | | | | | | | | | | | | | |
| | 11.98 | | | | 3.15 | | | | 121,239 | | | | 0.99 | | | | 1.92 | | | | 1.35 | | | | 12 | |
| | 11.73 | | | | 1.32 | | | | 113,488 | | | | 0.99 | | | | 1.87 | | | | 1.34 | | | | 22 | |
| | 11.82 | | | | 3.90 | | | | 118,352 | | | | 0.99 | | | | 2.01 | | | | 1.24 | | | | 15 | |
| | 11.63 | | | | (0.33 | ) | | | 110,094 | | | | 1.00 | | | | 2.28 | | | | 1.23 | | | | 15 | |
| | 12.00 | | | | 3.32 | | | | 112,812 | | | | 0.99 | | | | 2.40 | | | | 1.22 | | | | 15 | |
| | 11.91 | | | | 7.54 | | | | 67,044 | | | | 1.00 | | | | 3.14 | | | | 1.23 | | | | 20 | |
| | | | | | | | | | | | | | | | | | | | | | | | | | |
| | 11.97 | | | | 3.44 | | | | 473,292 | | | | 0.44 | | | | 2.47 | | | | 0.52 | | | | 12 | |
| | 11.72 | | | | 1.83 | | | | 446,658 | | | | 0.44 | | | | 2.42 | | | | 0.52 | | | | 22 | |
| | 11.82 | | | | 4.49 | | | | 360,868 | | | | 0.44 | | | | 2.56 | | | | 0.52 | | | | 15 | |
| | 11.63 | | | | 0.21 | | | | 325,239 | | | | 0.45 | | | | 2.84 | | | | 0.53 | | | | 15 | |
| | 12.00 | | | | 3.87 | | | | 286,302 | | | | 0.44 | | | | 2.96 | | | | 0.52 | | | | 15 | |
| | 11.91 | | | | 8.21 | | | | 190,711 | | | | 0.45 | | | | 3.70 | | | | 0.53 | | | | 20 | |
| | | | | | | | | | | | | | | | | | | | | | | | | | |
| | 12.00 | | | | 3.48 | | | | 12,626,222 | | | | 0.34 | | | | 2.56 | | | | 0.40 | | | | 12 | |
| | 11.75 | | | | 2.00 | | | | 13,142,391 | | | | 0.34 | | | | 2.52 | | | | 0.41 | | | | 22 | |
| | 11.84 | | | | 4.53 | | | | 9,552,192 | | | | 0.38 | | | | 2.62 | | | | 0.44 | | | | 15 | |
| | 11.65 | | | | 0.24 | | | | 6,635,284 | | | | 0.40 | | | | 2.90 | | | | 0.48 | | | | 15 | |
| | 12.02 | | | | 3.98 | | | | 5,132,037 | | | | 0.39 | | | | 3.01 | | | | 0.47 | | | | 15 | |
| | 11.92 | | | | 8.16 | | | | 3,221,144 | | | | 0.40 | | | | 3.75 | | | | 0.48 | | | | 20 | |
| | | | | | | | | | | | | | | | | | | | | | | | | | |
| | 11.98 | | | | 3.27 | | | | 12,117,408 | | | | 0.57 | | | | 2.33 | | | | 0.71 | | | | 12 | |
| | 11.74 | | | | 1.77 | | | | 11,761,684 | | | | 0.57 | | | | 2.29 | | | | 0.71 | | | | 22 | |
| | 11.83 | | | | 4.32 | | | | 12,232,357 | | | | 0.57 | | | | 2.43 | | | | 0.71 | | | | 15 | |
| | 11.64 | | | | 0.08 | | | | 9,526,541 | | | | 0.58 | | | | 2.68 | | | | 0.72 | | | | 15 | |
| | 12.01 | | | | 3.73 | | | | 14,911,091 | | | | 0.57 | | | | 2.84 | | | | 0.72 | | | | 15 | |
| | 11.92 | | | | 8.09 | | | | 12,717,750 | | | | 0.58 | | | | 3.58 | | | | 0.73 | | | | 20 | |
SEE NOTES TO FINANCIAL STATEMENTS.
| | | | | | | | |
| | | |
| AUGUST 31, 2016 | | J.P. MORGAN INCOME FUNDS | | | | | 301 | |
FINANCIAL HIGHLIGHTS
FOR THE PERIODS INDICATED (continued)
| | | | | | | | | | | | | | | | | | | | | | | | | | | | |
| | | Per share operating performance | |
| | | | | | Investment operations | | | Distributions | |
| | | Net asset
value,
beginning
of period | | | Net
investment
income
(loss) (b) | | | Net realized
and unrealized
gains
(losses) on
investments | | | Total from
investment
operations | | | Net
investment
income | | | Net
realized
gain | | | Total
distributions | |
Core Plus Bond Fund | | | | | | | | | | | | | | | | | | | | | | | | | | | | |
Class A | | | | | | | | | | | | | | | | | | | | | | | | | | | | |
Six Months Ended August 31, 2016 (Unaudited) | | $ | 8.15 | | | $ | 0.10 | | | $ | 0.29 | | | $ | 0.39 | | | $ | (0.11 | ) | | $ | — | | | $ | (0.11 | ) |
Year Ended February 29, 2016 | | | 8.40 | | | | 0.24 | | | | (0.23 | ) | | | 0.01 | | | | (0.24 | ) | | | (0.02 | ) | | | (0.26 | ) |
Year Ended February 28, 2015 | | | 8.31 | | | | 0.27 | | | | 0.15 | | | | 0.42 | | | | (0.27 | ) | | | (0.06 | ) | | | (0.33 | ) |
Year Ended February 28, 2014 | | | 8.49 | | | | 0.30 | | | | (0.12 | ) | | | 0.18 | | | | (0.30 | ) | | | (0.06 | ) | | | (0.36 | ) |
Year Ended February 28, 2013 | | | 8.38 | | | | 0.31 | | | | 0.10 | | | | 0.41 | | | | (0.30 | ) | | | — | (g) | | | (0.30 | ) |
Year Ended February 29, 2012 | | | 8.19 | | | | 0.38 | | | | 0.19 | | | | 0.57 | | | | (0.38 | ) | | | — | (g) | | | (0.38 | ) |
| | | | | | | |
Class C | | | | | | | | | | | | | | | | | | | | | | | | | | | | |
Six Months Ended August 31, 2016 (Unaudited) | | | 8.19 | | | | 0.08 | | | | 0.28 | | | | 0.36 | | | | (0.08 | ) | | | — | | | | (0.08 | ) |
Year Ended February 29, 2016 | | | 8.44 | | | | 0.18 | | | | (0.23 | ) | | | (0.05 | ) | | | (0.18 | ) | | | (0.02 | ) | | | (0.20 | ) |
Year Ended February 28, 2015 | | | 8.35 | | | | 0.22 | | | | 0.14 | | | | 0.36 | | | | (0.21 | ) | | | (0.06 | ) | | | (0.27 | ) |
Year Ended February 28, 2014 | | | 8.52 | | | | 0.24 | | | | (0.11 | ) | | | 0.13 | | | | (0.24 | ) | | | (0.06 | ) | | | (0.30 | ) |
Year Ended February 28, 2013 | | | 8.42 | | | | 0.26 | | | | 0.09 | | | | 0.35 | | | | (0.25 | ) | | | — | (g) | | | (0.25 | ) |
Year Ended February 29, 2012 | | | 8.23 | | | | 0.33 | | | | 0.19 | | | | 0.52 | | | | (0.33 | ) | | | — | (g) | | | (0.33 | ) |
| | | | | | | |
Class R2 | | | | | | | | | | | | | | | | | | | | | | | | | | | | |
Six Months Ended August 31, 2016 (Unaudited) | | | 8.14 | | | | 0.09 | | | | 0.28 | | | | 0.37 | | | | (0.09 | ) | | | — | | | | (0.09 | ) |
Year Ended February 29, 2016 | | | 8.39 | | | | 0.20 | | | | (0.23 | ) | | | (0.03 | ) | | | (0.20 | ) | | | (0.02 | ) | | | (0.22 | ) |
Year Ended February 28, 2015 | | | 8.30 | | | | 0.23 | | | | 0.15 | | | | 0.38 | | | | (0.23 | ) | | | (0.06 | ) | | | (0.29 | ) |
Year Ended February 28, 2014 | | | 8.48 | | | | 0.26 | | | | (0.12 | ) | | | 0.14 | | | | (0.26 | ) | | | (0.06 | ) | | | (0.32 | ) |
Year Ended February 28, 2013 | | | 8.38 | | | | 0.28 | | | | 0.09 | | | | 0.37 | | | | (0.27 | ) | | | — | (g) | | | (0.27 | ) |
Year Ended February 29, 2012 | | | 8.20 | | | | 0.35 | | | | 0.18 | | | | 0.53 | | | | (0.35 | ) | | | — | (g) | | | (0.35 | ) |
| | | | | | | |
Class R6 | | | | | | | | | | | | | | | | | | | | | | | | | | | | |
Six Months Ended August 31, 2016 (Unaudited) | | | 8.15 | | | | 0.12 | | | | 0.28 | | | | 0.40 | | | | (0.12 | ) | | | — | | | | (0.12 | ) |
Year Ended February 29, 2016 | | | 8.40 | | | | 0.26 | | | | (0.22 | ) | | | 0.04 | | | | (0.27 | ) | | | (0.02 | ) | | | (0.29 | ) |
Year Ended February 28, 2015 | | | 8.31 | | | | 0.29 | | | | 0.15 | | | | 0.44 | | | | (0.29 | ) | | | (0.06 | ) | | | (0.35 | ) |
Year Ended February 28, 2014 | | | 8.49 | | | | 0.33 | | | | (0.12 | ) | | | 0.21 | | | | (0.33 | ) | | | (0.06 | ) | | | (0.39 | ) |
Year Ended February 28, 2013 | | | 8.38 | | | | 0.34 | | | | 0.10 | | | | 0.44 | | | | (0.33 | ) | | | — | (g) | | | (0.33 | ) |
Year Ended February 29, 2012 | | | 8.19 | | | | 0.41 | | | | 0.19 | | | | 0.60 | | | | (0.41 | ) | | | — | (g) | | | (0.41 | ) |
| | | | | | | |
Institutional Class | | | | | | | | | | | | | | | | | | | | | | | | | | | | |
Six Months Ended August 31, 2016 (Unaudited) | | | 8.16 | | | | 0.11 | | | | 0.27 | | | | 0.38 | | | | (0.11 | ) | | | — | | | | (0.11 | ) |
Year Ended February 29, 2016 | | | 8.40 | | | | 0.26 | | | | (0.22 | ) | | | 0.04 | | | | (0.26 | ) | | | (0.02 | ) | | | (0.28 | ) |
Year Ended February 28, 2015 | | | 8.32 | | | | 0.28 | | | | 0.15 | | | | 0.43 | | | | (0.29 | ) | | | (0.06 | ) | | | (0.35 | ) |
Year Ended February 28, 2014 | | | 8.49 | | | | 0.32 | | | | (0.11 | ) | | | 0.21 | | | | (0.32 | ) | | | (0.06 | ) | | | (0.38 | ) |
Year Ended February 28, 2013 | | | 8.39 | | | | 0.33 | | | | 0.10 | | | | 0.43 | | | | (0.33 | ) | | | — | (g) | | | (0.33 | ) |
Year Ended February 29, 2012 | | | 8.20 | | | | 0.40 | | | | 0.20 | | | | 0.60 | | | | (0.41 | ) | | | — | (g) | | | (0.41 | ) |
| | | | | | | |
Select Class | | | | | | | | | | | | | | | | | | | | | | | | | | | | |
Six Months Ended August 31, 2016 (Unaudited) | | | 8.14 | | | | 0.12 | | | | 0.28 | | | | 0.40 | | | | (0.12 | ) | | | — | | | | (0.12 | ) |
Year Ended February 29, 2016 | | | 8.39 | | | | 0.25 | | | | (0.23 | ) | | | 0.02 | | | | (0.25 | ) | | | (0.02 | ) | | | (0.27 | ) |
Year Ended February 28, 2015 | | | 8.30 | | | | 0.28 | | | | 0.14 | | | | 0.42 | | | | (0.27 | ) | | | (0.06 | ) | | | (0.33 | ) |
Year Ended February 28, 2014 | | | 8.48 | | | | 0.30 | | | | (0.11 | ) | | | 0.19 | | | | (0.31 | ) | | | (0.06 | ) | | | (0.37 | ) |
Year Ended February 28, 2013 | | | 8.38 | | | | 0.32 | | | | 0.09 | | | | 0.41 | | | | (0.31 | ) | | | — | (g) | | | (0.31 | ) |
Year Ended February 29, 2012 | | | 8.19 | | | | 0.39 | | | | 0.19 | | | | 0.58 | | | | (0.39 | ) | | | — | (g) | | | (0.39 | ) |
| (a) | Annualized for periods less than one year, unless otherwise noted. |
| (b) | Calculated based upon average shares outstanding. |
| (c) | Not annualized for periods less than one year. |
| (d) | Includes adjustments in accordance with accounting principles generally accepted in the United States of America and as such, the net asset values for financial reporting purposes and the returns based upon those net asset values may differ from the net asset values and returns for shareholder transactions. |
| (e) | Includes earnings credits and interest expense, if applicable, each of which is less than 0.005% unless otherwise noted. |
| (f) | Portfolio turnover is calculated by dividing the lesser of total purchases or sales of portfolio securities for the reporting period by the monthly average value of portfolio securities owned during the reporting period. Excluded from both the numerator and denominator are amounts relating to derivatives and securities whose maturities or expiration dates at the time of acquisition were one year or less. |
| (g) | Amount rounds to less than $0.005. |
SEE NOTES TO FINANCIAL STATEMENTS.
| | | | | | |
| | | |
| 302 | | | | J.P. MORGAN INCOME FUNDS | | AUGUST 31, 2016 |
| | | | | | | | | | | | | | | | | | | | | | | | | | |
| | | Ratios/Supplemental data (a) | |
| | | | | | | | | | Ratios to average net assets | | | | |
Net asset
value,
end of
period | | | Total return
(excludes
sales charge) (c)(d) | | | Net assets,
end of
period
(000’s) | | | Net
expenses (e) | | | Net
investment
income
(loss) | | | Expenses
without waivers,
reimbursements and
earnings credits | | | Portfolio
turnover
rate (c)(f) | |
| | | | | | | | | | | | | | | | | | | | | | | | | | |
| | | | | | | | | | | | | | | | | | | | | | | | | | |
| $ | 8.43 | | | | 4.75 | % | | $ | 1,121,133 | | | | 0.74 | % | | | 2.46 | % | | | 1.01 | % | | | 34 | % |
| | 8.15 | | | | 0.09 | | | | 836,190 | | | | 0.75 | | | | 2.88 | | | | 1.02 | | | | 45 | |
| | 8.40 | | | | 5.10 | | | | 596,507 | | | | 0.74 | | | | 3.18 | | | | 0.97 | | | | 52 | |
| | 8.31 | | | | 2.12 | | | | 334,499 | | | | 0.75 | | | | 3.54 | | | | 0.95 | | | | 25 | |
| | 8.49 | | | | 5.06 | | | | 568,987 | | | | 0.73 | | | | 3.67 | | | | 0.95 | | | | 25 | |
| | 8.38 | | | | 7.19 | | | | 424,254 | | | | 0.75 | | | | 4.63 | | | | 0.97 | | | | 23 | |
| | | | | | |
| | | | | | | | | | | | | | | | | | | | | | | | | | |
| | 8.47 | | | | 4.36 | | | | 301,696 | | | | 1.39 | | | | 1.83 | | | | 1.47 | | | | 34 | |
| | 8.19 | | | | (0.60 | ) | | | 263,986 | | | | 1.40 | | | | 2.23 | | | | 1.49 | | | | 45 | |
| | 8.44 | | | | 4.37 | | | | 254,815 | | | | 1.39 | | | | 2.58 | | | | 1.46 | | | | 52 | |
| | 8.35 | | | | 1.54 | | | | 254,763 | | | | 1.40 | | | | 2.88 | | | | 1.45 | | | | 25 | |
| | 8.52 | | | | 4.27 | | | | 559,441 | | | | 1.38 | | | | 3.02 | | | | 1.45 | | | | 25 | |
| | 8.42 | | | | 6.48 | | | | 398,777 | | | | 1.40 | | | | 3.97 | | | | 1.47 | | | | 23 | |
| | | | | | |
| | | | | | | | | | | | | | | | | | | | | | | | | | |
| | 8.42 | | | | 4.52 | | | | 32,897 | | | | 1.14 | | | | 2.09 | | | | 1.40 | | | | 34 | |
| | 8.14 | | | | (0.34 | ) | | | 34,621 | | | | 1.15 | | | | 2.48 | | | | 1.41 | | | | 45 | |
| | 8.39 | | | | 4.70 | | | | 19,108 | | | | 1.14 | | | | 2.79 | | | | 1.31 | | | | 52 | |
| | 8.30 | | | | 1.72 | | | | 12,063 | | | | 1.15 | | | | 3.16 | | | | 1.20 | | | | 25 | |
| | 8.48 | | | | 4.56 | | | | 9,675 | | | | 1.13 | | | | 3.25 | | | | 1.20 | | | | 25 | |
| | 8.38 | | | | 6.66 | | | | 927 | | | | 1.15 | | | | 4.21 | | | | 1.22 | | | | 23 | |
| | | | | | |
| | | | | | | | | | | | | | | | | | | | | | | | | | |
| | 8.43 | | | | 4.90 | | | | 3,596,661 | | | | 0.39 | | | | 2.80 | | | | 0.41 | | | | 34 | |
| | 8.15 | | | | 0.43 | | | | 2,388,798 | | | | 0.40 | | | | 3.22 | | | | 0.42 | | | | 45 | |
| | 8.40 | | | | 5.44 | | | | 830,958 | | | | 0.39 | | | | 3.48 | | | | 0.43 | | | | 52 | |
| | 8.31 | | | | 2.48 | | | | 326,452 | | | | 0.40 | | | | 3.92 | | | | 0.45 | | | | 25 | |
| | 8.49 | | | | 5.40 | | | | 243,671 | | | | 0.39 | | | | 3.99 | | | | 0.45 | | | | 25 | |
| | 8.38 | | | | 7.57 | | | | 64,170 | | | | 0.39 | | | | 5.01 | | | | 0.46 | | | | 23 | |
| | | | | | |
| | | | | | | | | | | | | | | | | | | | | | | | | | |
| | 8.43 | | | | 4.73 | | | | 1,164,902 | | | | 0.48 | | | | 2.72 | | | | 0.54 | | | | 34 | |
| | 8.16 | | | | 0.49 | | | | 804,375 | | | | 0.49 | | | | 3.14 | | | | 0.55 | | | | 45 | |
| | 8.40 | | | | 5.24 | | | | 618,643 | | | | 0.48 | | | | 3.39 | | | | 0.54 | | | | 52 | |
| | 8.32 | | | | 2.51 | | | | 260,210 | | | | 0.49 | | | | 3.86 | | | | 0.56 | | | | 25 | |
| | 8.49 | | | | 5.20 | | | | 51,964 | | | | 0.47 | | | | 3.94 | | | | 0.55 | | | | 25 | |
| | 8.39 | | | | 7.47 | | | | 39,168 | | | | 0.48 | | | | 4.90 | | | | 0.57 | | | | 23 | |
| | | | | | |
| | | | | | | | | | | | | | | | | | | | | | | | | | |
| | 8.42 | | | | 4.88 | | | | 626,313 | | | | 0.45 | | | | 2.75 | | | | 0.72 | | | | 34 | |
| | 8.14 | | | | 0.21 | | | | 432,632 | | | | 0.64 | | | | 3.00 | | | | 0.69 | | | | 45 | |
| | 8.39 | | | | 5.20 | | | | 1,542,145 | | | | 0.64 | | | | 3.32 | | | | 0.69 | | | | 52 | |
| | 8.30 | | | | 2.23 | | | | 1,275,145 | | | | 0.65 | | | | 3.66 | | | | 0.70 | | | | 25 | |
| | 8.48 | | | | 5.05 | | | | 1,516,099 | | | | 0.63 | | | | 3.78 | | | | 0.70 | | | | 25 | |
| | 8.38 | | | | 7.28 | | | | 1,340,341 | | | | 0.64 | | | | 4.74 | | | | 0.72 | | | | 23 | |
SEE NOTES TO FINANCIAL STATEMENTS.
| | | | | | | | |
| | | |
| AUGUST 31, 2016 | | J.P. MORGAN INCOME FUNDS | | | | | 303 | |
FINANCIAL HIGHLIGHTS
FOR THE PERIODS INDICATED (continued)
| | | | | | | | | | | | | | | | | | | | | | | | | | | | |
| | | Per share operating performance | |
| | | | | | Investment operations | | | Distributions | |
| | | Net asset
value,
beginning
of period | | | Net
investment
income
(loss) | | | Net realized
and unrealized
gains
(losses) on
investments | | | Total from
investment
operations | | | Net
investment
income | | | Net
realized
gain | | | Total
distributions | |
Government Bond Fund | | | | | | | | | | | | | | | | | | | | | | | | | | | | |
Class A | | | | | | | | | | | | | | | | | | | | | | | | | | | | |
Six Months Ended August 31, 2016 (Unaudited) | | $ | 10.86 | | | $ | 0.12 | (f)(g) | | $ | 0.07 | | | $ | 0.19 | | | $ | (0.12 | ) | | $ | — | | | $ | (0.12 | ) |
Year Ended February 29, 2016 | | | 11.02 | | | | 0.23 | (f) | | | — | (h) | | | 0.23 | | | | (0.24 | ) | | | (0.15 | ) | | | (0.39 | ) |
Year Ended February 28, 2015 | | | 11.03 | | | | 0.27 | | | | 0.19 | | | | 0.46 | | | | (0.26 | ) | | | (0.21 | ) | | | (0.47 | ) |
Year Ended February 28, 2014 | | | 11.56 | | | | 0.29 | | | | (0.47 | ) | | | (0.18 | ) | | | (0.30 | ) | | | (0.05 | ) | | | (0.35 | ) |
Year Ended February 28, 2013 | | | 11.55 | | | | 0.30 | | | | 0.01 | | | | 0.31 | | | | (0.30 | ) | | | — | | | | (0.30 | ) |
Year Ended February 29, 2012 | | | 10.81 | | | | 0.38 | | | | 0.76 | | | | 1.14 | | | | (0.38 | ) | | | (0.02 | ) | | | (0.40 | ) |
| | | | | | | |
Class C | | | | | | | | | | | | | | | | | | | | | | | | | | | | |
Six Months Ended August 31, 2016 (Unaudited) | | | 10.83 | | | | 0.08 | (f)(g) | | | 0.07 | | | | 0.15 | | | | (0.08 | ) | | | — | | | | (0.08 | ) |
Year Ended February 29, 2016 | | | 10.98 | | | | 0.15 | (f) | | | 0.01 | | | | 0.16 | | | | (0.16 | ) | | | (0.15 | ) | | | (0.31 | ) |
Year Ended February 28, 2015 | | | 10.99 | | | | 0.19 | | | | 0.19 | | | | 0.38 | | | | (0.18 | ) | | | (0.21 | ) | | | (0.39 | ) |
Year Ended February 28, 2014 | | | 11.52 | | | | 0.20 | | | | (0.47 | ) | | | (0.27 | ) | | | (0.21 | ) | | | (0.05 | ) | | | (0.26 | ) |
Year Ended February 28, 2013 | | | 11.51 | | | | 0.22 | | | | — | (h) | | | 0.22 | | | | (0.21 | ) | | | — | | | | (0.21 | ) |
Year Ended February 29, 2012 | | | 10.78 | | | | 0.30 | | | | 0.75 | | | | 1.05 | | | | (0.30 | ) | | | (0.02 | ) | | | (0.32 | ) |
| | | | | | | |
Class R2 | | | | | | | | | | | | | | | | | | | | | | | | | | | | |
Six Months Ended August 31, 2016 (Unaudited) | | | 10.85 | | | | 0.11 | (f)(g) | | | 0.07 | | | | 0.18 | | | | (0.11 | ) | | | — | | | | (0.11 | ) |
Year Ended February 29, 2016 | | | 11.01 | | | | 0.20 | (f) | | | 0.01 | | | | 0.21 | | | | (0.22 | ) | | | (0.15 | ) | | | (0.37 | ) |
Year Ended February 28, 2015 | | | 11.02 | | | | 0.25 | | | | 0.18 | | | | 0.43 | | | | (0.23 | ) | | | (0.21 | ) | | | (0.44 | ) |
Year Ended February 28, 2014 | | | 11.55 | | | | 0.26 | | | | (0.47 | ) | | | (0.21 | ) | | | (0.27 | ) | | | (0.05 | ) | | | (0.32 | ) |
Year Ended February 28, 2013 | | | 11.54 | | | | 0.28 | | | | — | (h) | | | 0.28 | | | | (0.27 | ) | | | — | | | | (0.27 | ) |
Year Ended February 29, 2012 | | | 10.80 | | | | 0.35 | | | | 0.76 | | | | 1.11 | | | | (0.35 | ) | | | (0.02 | ) | | | (0.37 | ) |
| | | | | | | |
Class R6 | | | | | | | | | | | | | | | | | | | | | | | | | | | | |
August 1, 2016 (i) through August 31, 2016 (Unaudited) | | | 10.97 | | | | 0.02 | (f)(g) | | | (0.05 | ) | | | (0.03 | ) | | | (0.02 | ) | | | — | | | | (0.02 | ) |
| | | | | | | |
Select Class | | | | | | | | | | | | | | | | | | | | | | | | | | | | |
Six Months Ended August 31, 2016 (Unaudited) | | | 10.86 | | | | 0.14 | (f)(g) | | | 0.07 | | | | 0.21 | | | | (0.14 | ) | | | — | | | | (0.14 | ) |
Year Ended February 29, 2016 | | | 11.02 | | | | 0.26 | (f) | | | — | (h) | | | 0.26 | | | | (0.27 | ) | | | (0.15 | ) | | | (0.42 | ) |
Year Ended February 28, 2015 | | | 11.03 | | | | 0.31 | | | | 0.18 | | | | 0.49 | | | | (0.29 | ) | | | (0.21 | ) | | | (0.50 | ) |
Year Ended February 28, 2014 | | | 11.56 | | | | 0.32 | | | | (0.48 | ) | | | (0.16 | ) | | | (0.32 | ) | | | (0.05 | ) | | | (0.37 | ) |
Year Ended February 28, 2013 | | | 11.54 | | | | 0.33 | | | | 0.02 | | | | 0.35 | | | | (0.33 | ) | | | — | | | | (0.33 | ) |
Year Ended February 29, 2012 | | | 10.80 | | | | 0.41 | | | | 0.76 | | | | 1.17 | | | | (0.41 | ) | | | (0.02 | ) | | | (0.43 | ) |
| (a) | Annualized for periods less than one year, unless otherwise noted. |
| (b) | Not annualized for periods less than one year. |
| (c) | Includes adjustments in accordance with accounting principles generally accepted in the United States of America and as such, the net asset values for financial reporting purposes and the returns based upon those net asset values may differ from the net asset values and returns for shareholder transactions. |
| (d) | Includes earnings credits and interest expense, if applicable, each of which is less than 0.005% unless otherwise noted. |
| (e) | Portfolio turnover is calculated by dividing the lesser of total purchases or sales of portfolio securities for the reporting period by the monthly average value of portfolio securities owned during the reporting period. Excluded from both the numerator and denominator are amounts relating to derivatives and securities whose maturities or expiration dates at the time of acquisition were one year or less. |
| (f) | Calculated based upon average shares outstanding. |
| (g) | Net investment income (loss) may appear disproportionate among the classes due to the timing of recognition of income and changes in the relative size of the classes. |
| (h) | Amount rounds to less than $0.005. |
| (i) | Commencement of offering of class of shares. |
SEE NOTES TO FINANCIAL STATEMENTS.
| | | | | | |
| | | |
| 304 | | | | J.P. MORGAN INCOME FUNDS | | AUGUST 31, 2016 |
| | | | | | | | | | | | | | | | | | | | | | | | | | |
| | | Ratios/Supplemental data | |
| | | | | | | | | | Ratios to average net assets (a) | | | | |
Net asset
value,
end of
period | | | Total return
(excludes
sales charge) (b)(c) | | | Net assets,
end of
period
(000’s) | | | Net
expenses (d) | | | Net
investment
income
(loss) | | | Expenses
without waivers,
reimbursements and
earnings credits | | | Portfolio
turnover
rate (b)(e) | |
| | | | | | | | | | | | | | | | | | | | | | | | | | |
| | | | | | | | | | | | | | | | | | | | | | | | | | |
| $ | 10.93 | | | | 1.79 | % | | $ | 572,720 | | | | 0.75 | % | | | 2.21 | %(g) | | | 1.14 | % | | | 7 | % |
| | 10.86 | | | | 2.16 | | | | 574,262 | | | | 0.75 | | | | 2.13 | | | | 1.13 | | | | 15 | |
| | 11.02 | | | | 4.23 | | | | 583,764 | | | | 0.75 | | | | 2.47 | | | | 1.09 | | | | 18 | |
| | 11.03 | | | | (1.60 | ) | | | 681,612 | | | | 0.74 | | | | 2.55 | | | | 1.05 | | | | 5 | |
| | 11.56 | | | | 2.67 | | | | 777,517 | | | | 0.74 | | | | 2.61 | | | | 1.01 | | | | 12 | |
| | 11.55 | | | | 10.67 | | | | 615,219 | | | | 0.74 | | | | 3.33 | | | | 1.03 | | | | 15 | |
| | | | | | |
| | | | | | | | | | | | | | | | | | | | | | | | | | |
| | 10.90 | | | | 1.42 | | | | 77,714 | | | | 1.47 | | | | 1.49 | (g) | | | 1.51 | | | | 7 | |
| | 10.83 | | | | 1.49 | | | | 73,435 | | | | 1.48 | | | | 1.40 | | | | 1.52 | | | | 15 | |
| | 10.98 | | | | 3.47 | | | | 77,471 | | | | 1.48 | | | | 1.74 | | | | 1.57 | | | | 18 | |
| | 10.99 | | | | (2.35 | ) | | | 86,180 | | | | 1.47 | | | | 1.80 | | | | 1.54 | | | | 5 | |
| | 11.52 | | | | 1.94 | | | | 186,164 | | | | 1.47 | | | | 1.89 | | | | 1.51 | | | | 12 | |
| | 11.51 | | | | 9.81 | | | | 201,498 | | | | 1.47 | | | | 2.61 | | | | 1.53 | | | | 15 | |
| | | | | | |
| | | | | | | | | | | | | | | | | | | | | | | | | | |
| | 10.92 | | | | 1.66 | | | | 65,745 | | | | 1.00 | | | | 1.96 | (g) | | | 1.39 | | | | 7 | |
| | 10.85 | | | | 1.92 | | | | 61,217 | | | | 1.00 | | | | 1.88 | | | | 1.41 | | | | 15 | |
| | 11.01 | | | | 3.95 | | | | 53,792 | | | | 1.00 | | | | 2.21 | | | | 1.37 | | | | 18 | |
| | 11.02 | | | | (1.84 | ) | | | 50,214 | | | | 0.99 | | | | 2.31 | | | | 1.30 | | | | 5 | |
| | 11.55 | | | | 2.44 | | | | 49,501 | | | | 0.99 | | | | 2.34 | | | | 1.26 | | | | 12 | |
| | 11.54 | | | | 10.41 | | | | 25,147 | | | | 0.99 | | | | 3.07 | | | | 1.28 | | | | 15 | |
| | | | | | |
| | | | | | | | | | | | | | | | | | | | | | | | | | |
| | 10.92 | | | | (0.26 | ) | | | 74,411 | | | | 0.35 | | | | 2.38 | (g) | | | 0.41 | | | | 7 | |
| | | | | | |
| | | | | | | | | | | | | | | | | | | | | | | | | | |
| | 10.93 | | | | 1.93 | | | | 597,182 | | | | 0.48 | | | | 2.48 | (g) | | | 0.80 | | | | 7 | |
| | 10.86 | | | | 2.46 | | | | 597,868 | | | | 0.48 | | | | 2.40 | | | | 0.81 | | | | 15 | |
| | 11.02 | | | | 4.51 | | | | 556,051 | | | | 0.48 | | | | 2.74 | | | | 0.82 | | | | 18 | |
| | 11.03 | | | | (1.36 | ) | | | 685,750 | | | | 0.47 | | | | 2.82 | | | | 0.80 | | | | 5 | |
| | 11.56 | | | | 3.02 | | | | 859,946 | | | | 0.47 | | | | 2.88 | | | | 0.76 | | | | 12 | |
| | 11.54 | | | | 10.96 | | | | 769,531 | | | | 0.47 | | | | 3.62 | | | | 0.78 | | | | 15 | |
SEE NOTES TO FINANCIAL STATEMENTS.
| | | | | | | | |
| | | |
| AUGUST 31, 2016 | | J.P. MORGAN INCOME FUNDS | | | | | 305 | |
FINANCIAL HIGHLIGHTS
FOR THE PERIODS INDICATED (continued)
| | | | | | | | | | | | | | | | | | | | | | | | | | | | | | | | |
| | | Per share operating performance | |
| | | | | | Investment operations | | | Distributions | | | | |
| | | Net asset
value,
beginning
of period | | | Net
investment
income
(loss) (b) | | | Net realized
and unrealized
gains
(losses) on
investments | | | Total from
investment
operations | | | Net
investment
income | | | Net
realized
gain | | | Total
distributions | | | Redemption
fees | |
High Yield Fund | | | | | | | | | | | | | | | | | | | | | | | | | | | | | | | | |
Class A | | | | | | | | | | | | | | | | | | | | | | | | | | | | | | | | |
Six Months Ended August 31, 2016 (Unaudited) | | $ | 6.65 | | | $ | 0.19 | | | $ | 0.67 | | | $ | 0.86 | | | $ | (0.20 | ) | | $ | — | | | $ | (0.20 | ) | | $ | — | |
Year Ended February 29, 2016 | | | 7.71 | | | | 0.40 | | | | (1.06 | ) | | | (0.66 | ) | | | (0.40 | ) | | | — | (g) | | | (0.40 | ) | | | — | |
Year Ended February 28, 2015 | | | 8.08 | | | | 0.41 | | | | (0.19 | ) | | | 0.22 | | | | (0.42 | ) | | | (0.17 | ) | | | (0.59 | ) | | | — | |
Year Ended February 28, 2014 | | | 8.17 | | | | 0.47 | | | | 0.12 | | | | 0.59 | | | | (0.47 | ) | | | (0.21 | ) | | | (0.68 | ) | | | — | |
Year Ended February 28, 2013 | | | 7.89 | | | | 0.51 | | | | 0.32 | | | | 0.83 | | | | (0.50 | ) | | | (0.05 | ) | | | (0.55 | ) | | | — | |
Year Ended February 29, 2012 | | | 8.33 | | | | 0.55 | | | | (0.27 | ) | | | 0.28 | | | | (0.56 | ) | | | (0.16 | ) | | | (0.72 | ) | | | — | (g) |
| | | | | | | | |
Class C | | | | | | | | | | | | | | | | | | | | | | | | | | | | | | | | |
Six Months Ended August 31, 2016 (Unaudited) | | | 6.66 | | | | 0.17 | | | | 0.67 | | | | 0.84 | | | | (0.18 | ) | | | — | | | | (0.18 | ) | | | — | |
Year Ended February 29, 2016 | | | 7.72 | | | | 0.36 | | | | (1.06 | ) | | | (0.70 | ) | | | (0.36 | ) | | | — | (g) | | | (0.36 | ) | | | — | |
Year Ended February 28, 2015 | | | 8.09 | | | | 0.36 | | | | (0.19 | ) | | | 0.17 | | | | (0.37 | ) | | | (0.17 | ) | | | (0.54 | ) | | | — | |
Year Ended February 28, 2014 | | | 8.18 | | | | 0.43 | | | | 0.12 | | | | 0.55 | | | | (0.43 | ) | | | (0.21 | ) | | | (0.64 | ) | | | — | |
Year Ended February 28, 2013 | | | 7.90 | | | | 0.46 | | | | 0.33 | | | | 0.79 | | | | (0.46 | ) | | | (0.05 | ) | | | (0.51 | ) | | | — | |
Year Ended February 29, 2012 | | | 8.34 | | | | 0.50 | | | | (0.27 | ) | | | 0.23 | | | | (0.51 | ) | | | (0.16 | ) | | | (0.67 | ) | | | — | (g) |
| | | | | | | | |
Class R2 | | | | | | | | | | | | | | | | | | | | | | | | | | | | | | | | |
Six Months Ended August 31, 2016 (Unaudited) | | | 6.64 | | | | 0.18 | | | | 0.67 | | | | 0.85 | | | | (0.19 | ) | | | — | | | | (0.19 | ) | | | — | |
Year Ended February 29, 2016 | | | 7.70 | | | | 0.38 | | | | (1.06 | ) | | | (0.68 | ) | | | (0.38 | ) | | | — | (g) | | | (0.38 | ) | | | — | |
Year Ended February 28, 2015 | | | 8.06 | | | | 0.38 | | | | (0.18 | ) | | | 0.20 | | | | (0.39 | ) | | | (0.17 | ) | | | (0.56 | ) | | | — | |
Year Ended February 28, 2014 | | | 8.15 | | | | 0.45 | | | | 0.11 | | | | 0.56 | | | | (0.44 | ) | | | (0.21 | ) | | | (0.65 | ) | | | — | |
Year Ended February 28, 2013 | | | 7.88 | | | | 0.49 | | | | 0.31 | | | | 0.80 | | | | (0.48 | ) | | | (0.05 | ) | | | (0.53 | ) | | | — | |
Year Ended February 29, 2012 | | | 8.32 | | | | 0.53 | | | | (0.27 | ) | | | 0.26 | | | | (0.54 | ) | | | (0.16 | ) | | | (0.70 | ) | | | — | (g) |
| | | | | | | | |
Class R5 | | | | | | | | | | | | | | | | | | | | | | | | | | | | | | | | |
Six Months Ended August 31, 2016 (Unaudited) | | | 6.69 | | | | 0.20 | | | | 0.67 | | | | 0.87 | | | | (0.20 | ) | | | — | | | | (0.20 | ) | | | — | |
Year Ended February 29, 2016 | | | 7.75 | | | | 0.42 | | | | (1.06 | ) | | | (0.64 | ) | | | (0.42 | ) | | | — | (g) | | | (0.42 | ) | | | — | |
Year Ended February 28, 2015 | | | 8.12 | | | | 0.43 | | | | (0.19 | ) | | | 0.24 | | | | (0.44 | ) | | | (0.17 | ) | | | (0.61 | ) | | | — | |
Year Ended February 28, 2014 | | | 8.21 | | | | 0.50 | | | | 0.11 | | | | 0.61 | | | | (0.49 | ) | | | (0.21 | ) | | | (0.70 | ) | | | — | |
Year Ended February 28, 2013 | | | 7.93 | | | | 0.53 | | | | 0.33 | | | | 0.86 | | | | (0.53 | ) | | | (0.05 | ) | | | (0.58 | ) | | | — | |
Year Ended February 29, 2012 | | | 8.36 | | | | 0.58 | | | | (0.27 | ) | | | 0.31 | | | | (0.58 | ) | | | (0.16 | ) | | | (0.74 | ) | | | — | (g) |
| | | | | | | | |
Class R6 | | | | | | | | | | | | | | | | | | | | | | | | | | | | | | | | |
Six Months Ended August 31, 2016 (Unaudited) | | | 6.68 | | | | 0.21 | | | | 0.67 | | | | 0.88 | | | | (0.21 | ) | | | — | | | | (0.21 | ) | | | — | |
Year Ended February 29, 2016 | | | 7.74 | | | | 0.42 | | | | (1.06 | ) | | | (0.64 | ) | | | (0.42 | ) | | | — | (g) | | | (0.42 | ) | | | — | |
Year Ended February 28, 2015 | | | 8.11 | | | | 0.43 | | | | (0.19 | ) | | | 0.24 | | | | (0.44 | ) | | | (0.17 | ) | | | (0.61 | ) | | | — | |
Year Ended February 28, 2014 | | | 8.20 | | | | 0.50 | | | | 0.11 | | | | 0.61 | | | | (0.49 | ) | | | (0.21 | ) | | | (0.70 | ) | | | — | |
Year Ended February 28, 2013 | | | 7.91 | | | | 0.53 | | | | 0.34 | | | | 0.87 | | | | (0.53 | ) | | | (0.05 | ) | | | (0.58 | ) | | | — | |
Year Ended February 29, 2012 | | | 8.35 | | | | 0.58 | | | | (0.28 | ) | | | 0.30 | | | | (0.58 | ) | | | (0.16 | ) | | | (0.74 | ) | | | — | (g) |
| | | | | | | | |
Select Class | | | | | | | | | | | | | | | | | | | | | | | | | | | | | | | | |
Six Months Ended August 31, 2016 (Unaudited) | | | 6.68 | | | | 0.20 | | | | 0.67 | | | | 0.87 | | | | (0.20 | ) | | | — | | | | (0.20 | ) | | | — | |
Year Ended February 29, 2016 | | | 7.75 | | | | 0.42 | | | | (1.07 | ) | | | (0.65 | ) | | | (0.42 | ) | | | — | (g) | | | (0.42 | ) | | | — | |
Year Ended February 28, 2015 | | | 8.11 | | | | 0.42 | | | | (0.18 | ) | | | 0.24 | | | | (0.43 | ) | | | (0.17 | ) | | | (0.60 | ) | | | — | |
Year Ended February 28, 2014 | | | 8.20 | | | | 0.49 | | | | 0.12 | | | | 0.61 | | | | (0.49 | ) | | | (0.21 | ) | | | (0.70 | ) | | | — | |
Year Ended February 28, 2013 | | | 7.92 | | | | 0.53 | | | | 0.32 | | | | 0.85 | | | | (0.52 | ) | | | (0.05 | ) | | | (0.57 | ) | | | — | |
Year Ended February 29, 2012 | | | 8.36 | | | | 0.58 | | | | (0.28 | ) | | | 0.30 | | | | (0.58 | ) | | | (0.16 | ) | | | (0.74 | ) | | | — | (g) |
| (a) | Annualized for periods less than one year, unless otherwise noted. |
| (b) | Calculated based upon average shares outstanding. |
| (c) | Not annualized for periods less than one year. |
| (d) | Includes adjustments in accordance with accounting principles generally accepted in the United States of America and as such, the net asset values for financial reporting purposes and the returns based upon those net asset values may differ from the net asset values and returns for shareholder transactions. |
| (e) | Includes earnings credits and interest expense, if applicable, each of which is less than 0.01% unless otherwise noted. |
| (f) | Portfolio turnover is calculated by dividing the lesser of total purchases or sales of portfolio securities for the reporting period by the monthly average value of portfolio securities owned during the reporting period. Excluded from both the numerator and denominator are amounts relating to derivatives and securities whose maturities or expiration dates at the time of acquisition were one year or less. |
| (g) | Amount rounds to less than $0.005. |
SEE NOTES TO FINANCIAL STATEMENTS.
| | | | | | |
| | | |
| 306 | | | | J.P. MORGAN INCOME FUNDS | | AUGUST 31, 2016 |
| | | | | | | | | | | | | | | | | | | | | | | | | | |
| | | Ratios/Supplemental data | |
| | | | | | | | | | Ratios to average net assets (a) | | | | |
Net asset
value,
end of
period | | | Total return
(excludes
sales charge) (c)(d) | | | Net assets,
end of
period
(000’s) | | | Net
expenses (e) | | | Net
investment
income
(loss) | | | Expenses
without waivers,
reimbursements and
earnings credits | | | Portfolio
turnover
rate (c)(f) | |
| | | | | | | | | | | | | | | | | | | | | | | | | | |
| | | | | | | | | | | | | | | | | | | | | | | | | | |
| $ | 7.31 | | | | 13.01 | % | | $ | 953,627 | | | | 0.99 | % | | | 5.45 | % | | | 1.34 | % | | | 23 | % |
| | 6.65 | | | | (8.73 | ) | | | 859,215 | | | | 1.00 | | | | 5.52 | | | | 1.37 | | | | 52 | |
| | 7.71 | | | | 2.86 | | | | 831,346 | | | | 0.99 | | | | 5.14 | | | | 1.35 | | | | 52 | |
| | 8.08 | | | | 7.57 | | | | 1,066,865 | | | | 1.04 | | | | 5.84 | | | | 1.32 | | | | 54 | |
| | 8.17 | | | | 10.98 | | | | 964,864 | | | | 1.12 | | | | 6.32 | | | | 1.33 | | | | 65 | |
| | 7.89 | | | | 3.69 | | | | 1,103,966 | | | | 1.15 | | | | 6.98 | | | | 1.34 | | | | 41 | |
| | | | | | |
| | | | | | | | | | | | | | | | | | | | | | | | | | |
| | 7.32 | | | | 12.66 | | | | 221,579 | | | | 1.54 | | | | 4.90 | | | | 1.84 | | | | 23 | |
| | 6.66 | | | | (9.26 | ) | | | 197,406 | | | | 1.55 | | | | 4.92 | | | | 1.85 | | | | 52 | |
| | 7.72 | | | | 2.27 | | | | 278,495 | | | | 1.58 | | | | 4.55 | | | | 1.84 | | | | 52 | |
| | 8.09 | | | | 7.00 | | | | 315,026 | | | | 1.59 | | | | 5.29 | | | | 1.81 | | | | 54 | |
| | 8.18 | | | | 10.33 | | | | 348,508 | | | | 1.68 | | | | 5.75 | | | | 1.84 | | | | 65 | |
| | 7.90 | | | | 3.03 | | | | 280,078 | | | | 1.80 | | | | 6.33 | | | | 1.84 | | | | 41 | |
| | | | | | |
| | | | | | | | | | | | | | | | | | | | | | | | | | |
| | 7.30 | | | | 12.85 | | | | 8,746 | | | | 1.29 | | | | 5.15 | | | | 1.88 | | | | 23 | |
| | 6.64 | | | | (9.06 | ) | | | 8,533 | | | | 1.30 | | | | 5.19 | | | | 1.82 | | | | 52 | |
| | 7.70 | | | | 2.62 | | | | 10,544 | | | | 1.33 | | | | 4.8 | | | | 1.68 | | | | 52 | |
| | 8.06 | | | | 7.24 | | | | 11,019 | | | | 1.34 | | | | 5.54 | | | | 1.56 | | | | 54 | |
| | 8.15 | | | | 10.58 | | | | 16,384 | | | | 1.36 | | | | 6.06 | | | | 1.59 | | | | 65 | |
| | 7.88 | | | | 3.46 | | | | 6,968 | | | | 1.40 | | | | 6.72 | | | | 1.59 | | | | 41 | |
| | | | | | |
| | | | | | | | | | | | | | | | | | | | | | | | | | |
| | 7.36 | | | | 13.21 | | | | 65,007 | | | | 0.74 | | | | 5.69 | | | | 0.88 | | | | 23 | |
| | 6.69 | | | | (8.46 | ) | | | 57,112 | | | | 0.75 | | | | 5.73 | | | | 0.88 | | | | 52 | |
| | 7.75 | | | | 3.06 | | | | 76,869 | | | | 0.78 | | | | 5.36 | | | | 0.90 | | | | 52 | |
| | 8.12 | | | | 7.82 | | | | 103,378 | | | | 0.79 | | | | 6.09 | | | | 0.86 | | | | 54 | |
| | 8.21 | | | | 11.26 | | | | 102,404 | | | | 0.82 | | | | 6.59 | | | | 0.89 | | | | 65 | |
| | 7.93 | | | | 4.11 | | | | 50,747 | | | | 0.86 | | | | 7.28 | | | | 0.89 | | | | 41 | |
| | | | | | |
| | | | | | | | | | | | | | | | | | | | | | | | | | |
| | 7.35 | | | | 13.24 | | | | 4,394,000 | | | | 0.69 | | | | 5.74 | | | | 0.75 | | | | 23 | |
| | 6.68 | | | | (8.44 | ) | | | 3,685,406 | | | | 0.70 | | | | 5.91 | | | | 0.76 | | | | 52 | |
| | 7.74 | | | | 3.10 | | | | 1,983,909 | | | | 0.73 | | | | 5.41 | | | | 0.80 | | | | 52 | |
| | 8.11 | | | | 7.86 | | | | 2,202,757 | | | | 0.74 | | | | 6.13 | | | | 0.81 | | | | 54 | |
| | 8.20 | | | | 11.42 | | | | 1,746,074 | | | | 0.77 | | | | 6.66 | | | | 0.84 | | | | 65 | |
| | 7.91 | | | | 4.01 | | | | 1,461,496 | | | | 0.81 | | | | 7.32 | | | | 0.84 | | | | 41 | |
| | | | | | |
| | | | | | | | | | | | | | | | | | | | | | | | | | |
| | 7.35 | | | | 13.21 | | | | 6,454,789 | | | | 0.79 | | | | 5.63 | | | | 1.12 | | | | 23 | |
| | 6.68 | | | | (8.64 | ) | | | 4,480,999 | | | | 0.80 | | | | 5.66 | | | | 1.12 | | | | 52 | |
| | 7.75 | | | | 3.16 | | | | 7,089,261 | | | | 0.83 | | | | 5.30 | | | | 1.09 | | | | 52 | |
| | 8.11 | | | | 7.76 | | | | 7,329,642 | | | | 0.84 | | | | 6.04 | | | | 1.06 | | | | 54 | |
| | 8.20 | | | | 11.18 | | | | 8,127,147 | | | | 0.87 | | | | 6.57 | | | | 1.08 | | | | 65 | |
| | 7.92 | | | | 3.95 | | | | 8,616,283 | | | | 0.90 | | | | 7.23 | | | | 1.09 | | | | 41 | |
SEE NOTES TO FINANCIAL STATEMENTS.
| | | | | | | | |
| | | |
| AUGUST 31, 2016 | | J.P. MORGAN INCOME FUNDS | | | | | 307 | |
FINANCIAL HIGHLIGHTS
FOR THE PERIODS INDICATED (continued)
| | | | | | | | | | | | | | | | | | | | | | | | | | | | |
| | | Per share operating performance | |
| | | | | | Investment operations | | | Distributions | |
| | | Net asset
value,
beginning
of period | | | Net
investment
income
(loss) (b) | | | Net realized
and unrealized
gains
(losses) on
investments | | | Total from
investment
operations | | | Net
investment
income | | | Net
realized
gain | | | Total
distributions | |
Inflation Managed Bond Fund | | | | | | | | | | | | | | | | | | | | | | | | | | | | |
Class A | | | | | | | | | | | | | | | | | | | | | | | | | | | | |
Six Months Ended August 31, 2016 (Unaudited) | | $ | 10.14 | | | $ | 0.10 | | | $ | 0.18 | | | $ | 0.28 | | | $ | (0.10 | ) | | $ | — | | | $ | (0.10 | ) |
Year Ended February 29, 2016 | | | 10.37 | | | | 0.13 | | | | (0.22 | ) | | | (0.09 | ) | | | (0.14 | ) | | | — | | | | (0.14 | ) |
Year Ended February 28, 2015 | | | 10.51 | | | | 0.12 | (g) | | | (0.14 | ) | | | (0.02 | ) | | | (0.12 | ) | | | — | | | | (0.12 | ) |
Year Ended February 28, 2014 | | | 10.81 | | | | 0.12 | | | | (0.30 | ) | | | (0.18 | ) | | | (0.11 | ) | | | (0.01 | ) | | | (0.12 | ) |
Year Ended February 28, 2013 | | | 10.74 | | | | 0.15 | | | | 0.13 | | | | 0.28 | | | | (0.16 | ) | | | (0.05 | ) | | | (0.21 | ) |
Year Ended February 29, 2012 | | | 10.34 | | | | 0.22 | | | | 0.44 | | | | 0.66 | | | | (0.21 | ) | | | (0.05 | ) | | | (0.26 | ) |
| | | | | | | |
Class C | | | | | | | | | | | | | | | | | | | | | | | | | | | | |
Six Months Ended August 31, 2016 (Unaudited) | | | 10.09 | | | | 0.07 | | | | 0.18 | | | | 0.25 | | | | (0.07 | ) | | | — | | | | (0.07 | ) |
Year Ended February 29, 2016 | | | 10.33 | | | | 0.07 | | | | (0.23 | ) | | | (0.16 | ) | | | (0.08 | ) | | | — | | | | (0.08 | ) |
Year Ended February 28, 2015 | | | 10.48 | | | | 0.05 | (g) | | | (0.13 | ) | | | (0.08 | ) | | | (0.07 | ) | | | — | | | | (0.07 | ) |
Year Ended February 28, 2014 | | | 10.78 | | | | 0.04 | | | | (0.29 | ) | | | (0.25 | ) | | | (0.04 | ) | | | (0.01 | ) | | | (0.05 | ) |
Year Ended February 28, 2013 | | | 10.73 | | | | 0.08 | | | | 0.12 | | | | 0.20 | | | | (0.10 | ) | | | (0.05 | ) | | | (0.15 | ) |
Year Ended February 29, 2012 | | | 10.34 | | | | 0.16 | | | | 0.43 | | | | 0.59 | | | | (0.15 | ) | | | (0.05 | ) | | | (0.20 | ) |
| | | | | | | |
Class R2 | | | | | | | | | | | | | | | | | | | | | | | | | | | | |
Six Months Ended August 31, 2016 (Unaudited) | | | 10.14 | | | | 0.09 | | | | 0.19 | | | | 0.28 | | | | (0.09 | ) | | | — | | | | (0.09 | ) |
Year Ended February 29, 2016 | | | 10.37 | | | | 0.09 | | | | (0.20 | ) | | | (0.11 | ) | | | (0.12 | ) | | | — | | | | (0.12 | ) |
Year Ended February 28, 2015 | | | 10.51 | | | | 0.10 | (g) | | | (0.14 | ) | | | (0.04 | ) | | | (0.10 | ) | | | — | | | | (0.10 | ) |
Year Ended February 28, 2014 | | | 10.81 | | | | 0.10 | | | | (0.32 | ) | | | (0.22 | ) | | | (0.07 | ) | | | (0.01 | ) | | | (0.08 | ) |
Year Ended February 28, 2013 | | | 10.74 | | | | 0.13 | | | | 0.12 | | | | 0.25 | | | | (0.13 | ) | | | (0.05 | ) | | | (0.18 | ) |
Year Ended February 29, 2012 | | | 10.35 | | | | 0.20 | | | | 0.42 | | | | 0.62 | | | | (0.18 | ) | | | (0.05 | ) | | | (0.23 | ) |
| | | | | | | |
Class R5 | | | | | | | | | | | | | | | | | | | | | | | | | | | | |
Six Months Ended August 31, 2016 (Unaudited) | | | 10.18 | | | | 0.10 | | | | 0.19 | | | | 0.29 | | | | (0.11 | ) | | | — | | | | (0.11 | ) |
Year Ended February 29, 2016 | | | 10.41 | | | | 0.16 | | | | (0.23 | ) | | | (0.07 | ) | | | (0.16 | ) | | | — | | | | (0.16 | ) |
Year Ended February 28, 2015 | | | 10.55 | | | | 0.14 | (g) | | | (0.14 | ) | | | — | (h) | | | (0.14 | ) | | | — | | | | (0.14 | ) |
Year Ended February 28, 2014 | | | 10.85 | | | | 0.11 | | | | (0.27 | ) | | | (0.16 | ) | | | (0.13 | ) | | | (0.01 | ) | | | (0.14 | ) |
Year Ended February 28, 2013 | | | 10.77 | | | | 0.18 | | | | 0.12 | | | | 0.30 | | | | (0.17 | ) | | | (0.05 | ) | | | (0.22 | ) |
Year Ended February 29, 2012 | | | 10.37 | | | | 0.24 | | | | 0.44 | | | | 0.68 | | | | (0.23 | ) | | | (0.05 | ) | | | (0.28 | ) |
| | | | | | | |
Class R6 | | | | | | | | | | | | | | | | | | | | | | | | | | | | |
Six Months Ended August 31, 2016 (Unaudited) | | | 10.15 | | | | 0.12 | | | | 0.19 | | | | 0.31 | | | | (0.12 | ) | | | — | | | | (0.12 | ) |
Year Ended February 29, 2016 | | | 10.38 | | | | 0.16 | | | | (0.22 | ) | | | (0.06 | ) | | | (0.17 | ) | | | — | | | | (0.17 | ) |
Year Ended February 28, 2015 | | | 10.52 | | | | 0.14 | (g) | | | (0.13 | ) | | | 0.01 | | | | (0.15 | ) | | | — | | | | (0.15 | ) |
Year Ended February 28, 2014 | | | 10.82 | | | | 0.14 | | | | (0.30 | ) | | | (0.16 | ) | | | (0.13 | ) | | | (0.01 | ) | | | (0.14 | ) |
Year Ended February 28, 2013 | | | 10.74 | | | | 0.17 | | | | 0.14 | | | | 0.31 | | | | (0.18 | ) | | | (0.05 | ) | | | (0.23 | ) |
Year Ended February 29, 2012 | | | 10.34 | | | | 0.25 | | | | 0.44 | | | | 0.69 | | | | (0.24 | ) | | | (0.05 | ) | | | (0.29 | ) |
| | | | | | | |
Select Class | | | | | | | | | | | | | | | | | | | | | | | | | | | | |
Six Months Ended August 31, 2016 (Unaudited) | | | 10.14 | | | | 0.11 | | | | 0.18 | | | | 0.29 | | | | (0.11 | ) | | | — | | | | (0.11 | ) |
Year Ended February 29, 2016 | | | 10.37 | | | | 0.16 | | | | (0.23 | ) | | | (0.07 | ) | | | (0.16 | ) | | | — | | | | (0.16 | ) |
Year Ended February 28, 2015 | | | 10.51 | | | | 0.13 | (g) | | | (0.13 | ) | | | — | (h) | | | (0.14 | ) | | | — | | | | (0.14 | ) |
Year Ended February 28, 2014 | | | 10.81 | | | | 0.13 | | | | (0.29 | ) | | | (0.16 | ) | | | (0.13 | ) | | | (0.01 | ) | | | (0.14 | ) |
Year Ended February 28, 2013 | | | 10.74 | | | | 0.17 | | | | 0.12 | | | | 0.29 | | | | (0.17 | ) | | | (0.05 | ) | | | (0.22 | ) |
Year Ended February 29, 2012 | | | 10.34 | | | | 0.24 | | | | 0.44 | | | | 0.68 | | | | (0.23 | ) | | | (0.05 | ) | | | (0.28 | ) |
| (a) | Annualized for periods less than one year, unless otherwise noted. |
| (b) | Calculated based upon average shares outstanding. |
| (c) | Not annualized for periods less than one year. |
| (d) | Includes adjustments in accordance with accounting principles generally accepted in the United States of America and as such, the net asset values for financial reporting purposes and the returns based upon those net asset values may differ from the net asset values and returns for shareholder transactions. |
| (e) | Includes earnings credits and interest expense, if applicable, each of which is less than 0.005% unless otherwise noted. |
| (f) | Portfolio turnover is calculated by dividing the lesser of total purchases or sales of portfolio securities for the reporting period by the monthly average value of portfolio securities owned during the reporting period. Excluded from both the numerator and denominator are amounts relating to derivatives and securities whose maturities or expiration dates at the time of acquisition were one year or less. |
| (g) | Net investment income (loss) may appear disproportionate among the classes due to the timing of recognition of income and changes in the relative size of the classes. |
| (h) | Amount rounds to less than $0.005. |
SEE NOTES TO FINANCIAL STATEMENTS.
| | | | | | |
| | | |
| 308 | | | | J.P. MORGAN INCOME FUNDS | | AUGUST 31, 2016 |
| | | | | | | | | | | | | | | | | | | | | | | | | | |
| | | Ratios/Supplemental data | |
| | | | | | | | | | Ratios to average net assets (a) | | | | |
Net asset
value,
end of
period | | | Total return
(excludes
sales charge) (c)(d) | | | Net assets,
end of
period
(000’s) | | | Net
expenses (e) | | | Net
investment
income
(loss) | | | Expenses
without waivers,
reimbursements and
earnings credits | | | Portfolio
turnover
rate (c)(f) | |
| | | | | | | | | | | | | | | | | | | | | | | | | | |
| | | | | | | | | | | | | | | | | | | | | | | | | | |
| $ | 10.32 | | | | 2.77 | % | | $ | 23,913 | | | | 0.75 | % | | | 1.92 | % | | | 1.27 | % | | | 17 | % |
| | 10.14 | | | | (0.85 | ) | | | 51,090 | | | | 0.75 | | | | 1.32 | | | | 1.15 | | | | 27 | |
| | 10.37 | | | | (0.18 | ) | | | 59,129 | | | | 0.75 | | | | 1.15 | (g) | | | 1.05 | | | | 28 | |
| | 10.51 | | | | (1.66 | ) | | | 67,620 | | | | 0.75 | | | | 1.15 | | | | 1.05 | | | | 35 | |
| | 10.81 | | | | 2.60 | | | | 160,110 | | | | 0.74 | | | | 1.41 | | | | 1.01 | | | | 16 | |
| | 10.74 | | | | 6.42 | | | | 134,099 | | | | 0.74 | | | | 2.09 | | | | 1.02 | | | | 36 | |
| | | | | | |
| | | | | | | | | | | | | | | | | | | | | | | | | | |
| | 10.27 | | | | 2.47 | | | | 3,944 | | | | 1.39 | | | | 1.32 | | | | 1.57 | | | | 17 | |
| | 10.09 | | | | (1.53 | ) | | | 3,534 | | | | 1.40 | | | | 0.67 | | | | 1.53 | | | | 27 | |
| | 10.33 | | | | (0.82 | ) | | | 4,453 | | | | 1.40 | | | | 0.51 | (g) | | | 1.52 | | | | 28 | |
| | 10.48 | | | | (2.27 | ) | | | 5,253 | | | | 1.40 | | | | 0.42 | | | | 1.56 | | | | 35 | |
| | 10.78 | | | | 1.89 | | | | 6,580 | | | | 1.39 | | | | 0.72 | | | | 1.51 | | | | 16 | |
| | 10.73 | | | | 5.68 | | | | 4,302 | | | | 1.39 | | | | 1.47 | | | | 1.53 | | | | 36 | |
| | | | | | |
| | | | | | | | | | | | | | | | | | | | | | | | | | |
| | 10.33 | | | | 2.76 | | | | 777 | | | | 1.00 | | | | 1.73 | | | | 1.37 | | | | 17 | |
| | 10.14 | | | | (1.08 | ) | | | 363 | | | | 1.00 | | | | 0.87 | | | | 1.67 | | | | 27 | |
| | 10.37 | | | | (0.41 | ) | | | 86 | | | | 1.00 | | | | 0.94 | (g) | | | 1.28 | | | | 28 | |
| | 10.51 | | | | (1.96 | ) | | | 131 | | | | 1.00 | | | | 0.94 | | | | 1.29 | | | | 35 | |
| | 10.81 | | | | 2.37 | | | | 11,476 | | | | 0.99 | | | | 1.18 | | | | 1.26 | | | | 16 | |
| | 10.74 | | | | 6.04 | | | | 11,174 | | | | 0.99 | | | | 1.85 | | | | 1.27 | | | | 36 | |
| | | | | | |
| | | | | | | | | | | | | | | | | | | | | | | | | | |
| | 10.36 | | | | 2.88 | | | | 760 | | | | 0.52 | | | | 2.00 | | | | 0.53 | | | | 17 | |
| | 10.18 | | | | (0.64 | ) | | | 11,844 | | | | 0.55 | | | | 1.54 | | | | 0.58 | | | | 27 | |
| | 10.41 | | | | 0.02 | | | | 12,619 | | | | 0.54 | | | | 1.34 | (g) | | | 0.60 | | | | 28 | |
| | 10.55 | | | | (1.44 | ) | | | 12,774 | | | | 0.55 | | | | 1.05 | | | | 0.65 | | | | 35 | |
| | 10.85 | | | | 2.82 | | | | 58 | | | | 0.54 | | | | 1.62 | | | | 0.56 | | | | 16 | |
| | 10.77 | | | | 6.57 | | | | 56 | | | | 0.53 | | | | 2.23 | | | | 0.57 | | | | 36 | |
| | | | | | |
| | | | | | | | | | | | | | | | | | | | | | | | | | |
| | 10.34 | | | | 3.03 | | | | 796,648 | | | | 0.46 | | | | 2.25 | | | | 0.46 | | | | 17 | |
| | 10.15 | | | | (0.56 | ) | | | 798,786 | | | | 0.46 | | | | 1.55 | | | | 0.46 | | | | 27 | |
| | 10.38 | | | | 0.07 | | | | 505,064 | | | | 0.48 | | | | 1.32 | (g) | | | 0.50 | | | | 28 | |
| | 10.52 | | | | (1.41 | ) | | | 337,208 | | | | 0.50 | | | | 1.29 | | | | 0.57 | | | | 35 | |
| | 10.82 | | | | 2.88 | | | | 243,756 | | | | 0.49 | | | | 1.62 | | | | 0.51 | | | | 16 | |
| | 10.74 | | | | 6.68 | | | | 167,997 | | | | 0.49 | | | | 2.37 | | | | 0.53 | | | | 36 | |
| | | | | | |
| | | | | | | | | | | | | | | | | | | | | | | | | | |
| | 10.32 | | | | 2.88 | | | | 592,289 | | | | 0.60 | | | | 2.11 | | | | 0.73 | | | | 17 | |
| | 10.14 | | | | (0.70 | ) | | | 694,213 | | | | 0.60 | | | | 1.52 | | | | 0.72 | | | | 27 | |
| | 10.37 | | | | (0.04 | ) | | | 1,202,468 | | | | 0.60 | | | | 1.26 | (g) | | | 0.75 | | | | 28 | |
| | 10.51 | | | | (1.47 | ) | | | 1,090,324 | | | | 0.60 | | | | 1.20 | | | | 0.81 | | | | 35 | |
| | 10.81 | | | | 2.71 | | | | 1,141,000 | | | | 0.59 | | | | 1.53 | | | | 0.76 | | | | 16 | |
| | 10.74 | | | | 6.56 | | | | 870,400 | | | | 0.59 | | | | 2.22 | | | | 0.77 | | | | 36 | |
SEE NOTES TO FINANCIAL STATEMENTS.
| | | | | | | | |
| | | |
| AUGUST 31, 2016 | | J.P. MORGAN INCOME FUNDS | | | | | 309 | |
FINANCIAL HIGHLIGHTS
FOR THE PERIODS INDICATED (continued)
| | | | | | | | | | | | | | | | | | | | |
| | | Per share operating performance | |
| | | | | | Investment operations | | | Distributions | |
| | | Net asset
value,
beginning
of period | | | Net
investment
income
(loss) (b) | | | Net realized
and unrealized
gains
(losses) on
investments | | | Total from
investment
operations | | | Net
investment
income | |
Limited Duration Bond Fund | | | | | | | | | | | | | | | | | | | | |
Class A | | | | | | | | | | | | | | | | | | | | |
Six Months Ended August 31, 2016 (Unaudited) | | $ | 9.97 | | | $ | 0.04 | | | $ | 0.06 | | | $ | 0.10 | | | $ | (0.05 | ) |
Year Ended February 29, 2016 | | | 10.02 | | | | 0.07 | | | | (0.05 | ) | | | 0.02 | | | | (0.07 | ) |
Year Ended February 28, 2015 | | | 9.96 | | | | 0.07 | | | | 0.06 | | | | 0.13 | | | | (0.07 | ) |
Year Ended February 28, 2014 | | | 9.84 | | | | 0.06 | | | | 0.14 | | | | 0.20 | | | | (0.08 | ) |
Year Ended February 28, 2013 | | | 9.46 | | | | 0.13 | | | | 0.37 | | | | 0.50 | | | | (0.12 | ) |
Year Ended February 29, 2012 | | | 9.46 | | | | 0.18 | | | | (0.01 | ) | | | 0.17 | | | | (0.17 | ) |
| | | | | |
Class C | | | | | | | | | | | | | | | | | | | | |
Six Months Ended August 31, 2016 (Unaudited) | | | 9.86 | | | | 0.02 | | | | 0.05 | | | | 0.07 | | | | (0.02 | ) |
Year Ended February 29, 2016 | | | 9.91 | | | | 0.02 | | | | (0.05 | ) | | | (0.03 | ) | | | (0.02 | ) |
Year Ended February 28, 2015 | | | 9.86 | | | | 0.02 | | | | 0.05 | | | | 0.07 | | | | (0.02 | ) |
Year Ended February 28, 2014 | | | 9.74 | | | | 0.01 | | | | 0.14 | | | | 0.15 | | | | (0.03 | ) |
Year Ended February 28, 2013 | | | 9.37 | | | | 0.08 | | | | 0.37 | | | | 0.45 | | | | (0.08 | ) |
Year Ended February 29, 2012 | | | 9.37 | | | | 0.13 | | | | (0.01 | ) | | | 0.12 | | | | (0.12 | ) |
| | | | | |
Class R6 | | | | | | | | | | | | | | | | | | | | |
Six Months Ended August 31, 2016 (Unaudited) | | | 9.98 | | | | 0.07 | | | | 0.05 | | | | 0.12 | | | | (0.07 | ) |
Year Ended February 29, 2016 | | | 10.03 | | | | 0.11 | | | | (0.04 | ) | | | 0.07 | | | | (0.12 | ) |
Year Ended February 28, 2015 | | | 9.98 | | | | 0.12 | | | | 0.04 | | | | 0.16 | | | | (0.11 | ) |
Year Ended February 28, 2014 | | | 9.85 | | | | 0.10 | | | | 0.15 | | | | 0.25 | | | | (0.12 | ) |
Year Ended February 28, 2013 | | | 9.47 | | | | 0.17 | | | | 0.38 | | | | 0.55 | | | | (0.17 | ) |
Year Ended February 29, 2012 | | | 9.47 | | | | 0.22 | | | | (0.01 | ) | | | 0.21 | | | | (0.21 | ) |
| | | | | |
Select Class | | | | | | | | | | | | | | | | | | | | |
Six Months Ended August 31, 2016 (Unaudited) | | | 9.96 | | | | 0.06 | | | | 0.05 | | | | 0.11 | | | | (0.06 | ) |
Year Ended February 29, 2016 | | | 10.02 | | | | 0.10 | | | | (0.06 | ) | | | 0.04 | | �� | | (0.10 | ) |
Year Ended February 28, 2015 | | | 9.96 | | | | 0.10 | | | | 0.05 | | | | 0.15 | | | | (0.09 | ) |
Year Ended February 28, 2014 | | | 9.84 | | | | 0.08 | | | | 0.14 | | | | 0.22 | | | | (0.10 | ) |
Year Ended February 28, 2013 | | | 9.46 | | | | 0.16 | | | | 0.37 | | | | 0.53 | | | | (0.15 | ) |
Year Ended February 29, 2012 | | | 9.46 | | | | 0.20 | | | | (0.01 | ) | | | 0.19 | | | | (0.19 | ) |
| (a) | Annualized for periods less than one year, unless otherwise noted. |
| (b) | Calculated based upon average shares outstanding. |
| (c) | Not annualized for periods less than one year. |
| (d) | Includes adjustments in accordance with accounting principles generally accepted in the United States of America and as such, the net asset values for financial reporting purposes and the returns based upon those net asset values may differ from the net asset values and returns for shareholder transactions. |
| (e) | Includes earnings credits and interest expense, if applicable, each of which is less than 0.005% unless otherwise noted. |
| (f) | Portfolio turnover is calculated by dividing the lesser of total purchases or sales of portfolio securities for the reporting period by the monthly average value of portfolio securities owned during the reporting period. Excluded from both the numerator and denominator are amounts relating to derivatives and securities whose maturities or expiration dates at the time of acquisition were one year or less. |
SEE NOTES TO FINANCIAL STATEMENTS.
| | | | | | |
| | | |
| 310 | | | | J.P. MORGAN INCOME FUNDS | | AUGUST 31, 2016 |
| | | | | | | | | | | | | | | | | | | | | | | | | | |
| | | Ratios/Supplemental data | |
| | | | | | | | | | Ratios to average net assets (a) | | | | |
Net asset
value,
end of
period | | | Total return
(excludes
sales charge) (c)(d) | | | Net assets,
end of
period
(000’s) | | | Net
expenses (e) | | | Net
investment
income
(loss) | | | Expenses
without waivers,
reimbursements and
earnings credits | | | Portfolio
turnover
rate (c)(f) | |
| | | | | | | | | | | | | | | | | | | | | | | | | | |
| | | | | | | | | | | | | | | | | | | | | | | | | | |
| $ | 10.02 | | | | 0.95 | % | | $ | 181,470 | | | | 0.68 | % | | | 0.87 | % | | | 0.96 | % | | | 12 | % |
| | 9.97 | | | | 0.19 | | | | 198,338 | | | | 0.68 | | | | 0.70 | | | | 0.95 | | | | 23 | |
| | 10.02 | | | | 1.28 | | | | 204,080 | | | | 0.68 | | | | 0.74 | | | | 0.93 | | | | 24 | |
| | 9.96 | | | | 2.01 | | | | 185,550 | | | | 0.67 | | | | 0.60 | | | | 0.93 | | | | 23 | |
| | 9.84 | | | | 5.36 | | | | 63,879 | | | | 0.67 | | | | 1.37 | | | | 0.95 | | | | 24 | |
| | 9.46 | | | | 1.80 | | | | 48,120 | | | | 0.68 | | | | 1.89 | | | | 0.94 | | | | 21 | |
| | | | | | |
| | | | | | | | | | | | | | | | | | | | | | | | | | |
| | 9.91 | | | | 0.71 | | | | 47,474 | | | | 1.18 | | | | 0.37 | | | | 1.43 | | | | 12 | |
| | 9.86 | | | | (0.31 | ) | | | 50,910 | | | | 1.18 | | | | 0.20 | | | | 1.44 | | | | 23 | |
| | 9.91 | | | | 0.72 | | | | 53,773 | | | | 1.18 | | | | 0.24 | | | | 1.42 | | | | 24 | |
| | 9.86 | | | | 1.49 | | | | 57,659 | | | | 1.17 | | | | 0.10 | | | | 1.42 | | | | 23 | |
| | 9.74 | | | | 4.80 | | | | 63,760 | | | | 1.17 | | | | 0.87 | | | | 1.45 | | | | 24 | |
| | 9.37 | | | | 1.33 | | | | 54,348 | | | | 1.18 | | | | 1.39 | | | | 1.44 | | | | 21 | |
| | | | | | |
| | | | | | | | | | | | | | | | | | | | | | | | | | |
| | 10.03 | | | | 1.19 | | | | 765,924 | | | | 0.24 | | | | 1.32 | | | | 0.37 | | | | 12 | |
| | 9.98 | | | | 0.66 | | | | 680,614 | | | | 0.23 | | | | 1.14 | | | | 0.37 | | | | 23 | |
| | 10.03 | | | | 1.63 | | | | 42,352 | | | | 0.23 | | | | 1.21 | | | | 0.39 | | | | 24 | |
| | 9.98 | | | | 2.51 | | | | 18,305 | | | | 0.22 | | | | 1.05 | | | | 0.42 | | | | 23 | |
| | 9.85 | | | | 5.80 | | | | 8,301 | | | | 0.22 | | | | 1.79 | | | | 0.45 | | | | 24 | |
| | 9.47 | | | | 2.27 | | | | 3,642 | | | | 0.23 | | | | 2.34 | | | | 0.44 | | | | 21 | |
| | | | | | |
| | | | | | | | | | | | | | | | | | | | | | | | | | |
| | 10.01 | | | | 1.08 | | | | 267,650 | | | | 0.43 | | | | 1.12 | | | | 0.64 | | | | 12 | |
| | 9.96 | | | | 0.35 | | | | 323,384 | | | | 0.43 | | | | 0.95 | | | | 0.63 | | | | 23 | |
| | 10.02 | | | | 1.55 | | | | 637,355 | | | | 0.43 | | | | 1.00 | | | | 0.65 | | | | 24 | |
| | 9.96 | | | | 2.23 | | | | 548,277 | | | | 0.42 | | | | 0.85 | | | | 0.67 | | | | 23 | |
| | 9.84 | | | | 5.61 | | | | 377,532 | | | | 0.42 | | | | 1.61 | | | | 0.70 | | | | 24 | |
| | 9.46 | | | | 2.08 | | | | 292,294 | | | | 0.43 | | | | 2.13 | | | | 0.69 | | | | 21 | |
SEE NOTES TO FINANCIAL STATEMENTS.
| | | | | | | | |
| | | |
| AUGUST 31, 2016 | | J.P. MORGAN INCOME FUNDS | | | | | 311 | |
FINANCIAL HIGHLIGHTS
FOR THE PERIODS INDICATED (continued)
| | | | | | | | | | | | | | | | | | | | | | | | | | | | |
| | | Per share operating performance | |
| | | | | | Investment operations | | | Distributions | |
| | | Net asset
value,
beginning
of period | | | Net
investment
income
(loss) | | | Net realized
and unrealized
gains
(losses) on
investments | | | Total from
investment
operations | | | Net
investment
income | | | Net
realized
gain | | | Total
distributions | |
Mortgage-Backed Securities Fund | | | | | | | | | | | | | | | | | | | | | | | | | | | | |
Class A | | | | | | | | | | | | | | | | | | | | | | | | | | | | |
Six Months Ended August 31, 2016 (Unaudited) | | $ | 11.66 | | | $ | 0.14 | (f) | | $ | 0.05 | | | $ | 0.19 | | | $ | (0.15 | ) | | $ | — | �� | | $ | (0.15 | ) |
Year Ended February 29, 2016 | | | 11.65 | | | | 0.30 | (f) | | | 0.02 | | | | 0.32 | | | | (0.30 | ) | | | (0.01 | ) | | | (0.31 | ) |
Year Ended February 28, 2015 | | | 11.58 | | | | 0.34 | | | | 0.08 | | | | 0.42 | | | | (0.34 | ) | | | (0.01 | ) | | | (0.35 | ) |
Year Ended February 28, 2014 | | | 11.84 | | | | 0.35 | | | | (0.30 | ) | | | 0.05 | | | | (0.30 | ) | | | (0.01 | ) | | | (0.31 | ) |
Year Ended February 28, 2013 | | | 11.75 | | | | 0.34 | | | | 0.08 | | | | 0.42 | | | | (0.33 | ) | | | — | | | | (0.33 | ) |
Year Ended February 29, 2012 | | | 11.50 | | | | 0.49 | | | | 0.25 | | | | 0.74 | | | | (0.49 | ) | | | — | | | | (0.49 | ) |
| | | | | | | |
Class C | | | | | | | | | | | | | | | | | | | | | | | | | | | | |
Six Months Ended August 31, 2016 (Unaudited) | | | 11.36 | | | | 0.11 | (f) | | | 0.04 | | | | 0.15 | | | | (0.12 | ) | | | — | | | | (0.12 | ) |
Year Ended February 29, 2016 | | | 11.36 | | | | 0.23 | (f) | | | 0.03 | | | | 0.26 | | | | (0.25 | ) | | | (0.01 | ) | | | (0.26 | ) |
Year Ended February 28, 2015 | | | 11.30 | | | | 0.27 | | | | 0.09 | | | | 0.36 | | | | (0.29 | ) | | | (0.01 | ) | | | (0.30 | ) |
Year Ended February 28, 2014 | | | 11.57 | | | | 0.26 | | | | (0.27 | ) | | | (0.01 | ) | | | (0.25 | ) | | | (0.01 | ) | | | (0.26 | ) |
July 2, 2012 (g) through February 28, 2013 | | | 11.55 | | | | 0.17 | | | | 0.04 | | | | 0.21 | | | | (0.19 | ) | | | — | | | | (0.19 | ) |
| | | | | | | |
Class R6 | | | | | | | | | | | | | | | | | | | | | | | | | | | | |
Six Months Ended August 31, 2016 (Unaudited) | | | 11.38 | | | | 0.16 | (f) | | | 0.05 | | | | 0.21 | | | | (0.17 | ) | | | — | | | | (0.17 | ) |
Year Ended February 29, 2016 | | | 11.39 | | | | 0.34 | (f) | | | 0.01 | | | | 0.35 | | | | (0.35 | ) | | | (0.01 | ) | | | (0.36 | ) |
Year Ended February 28, 2015 | | | 11.32 | | | | 0.38 | | | | 0.09 | | | | 0.47 | | | | (0.39 | ) | | | (0.01 | ) | | | (0.40 | ) |
Year Ended February 28, 2014 | | | 11.59 | | | | 0.36 | | | | (0.27 | ) | | | 0.09 | | | | (0.35 | ) | | | (0.01 | ) | | | (0.36 | ) |
Year Ended February 28, 2013 | | | 11.51 | | | | 0.38 | | | | 0.07 | | | | 0.45 | | | | (0.37 | ) | | | — | | | | (0.37 | ) |
Year Ended February 29, 2012 | | | 11.28 | | | | 0.54 | | | | 0.23 | | | | 0.77 | | | | (0.54 | ) | | | — | | | | (0.54 | ) |
| | | | | | | |
Select Class | | | | | | | | | | | | | | | | | | | | | | | | | | | | |
Six Months Ended August 31, 2016 (Unaudited) | | | 11.38 | | | | 0.16 | (f) | | | 0.04 | | | | 0.20 | | | | (0.16 | ) | | | — | | | | (0.16 | ) |
Year Ended February 29, 2016 | | | 11.39 | | | | 0.32 | (f) | | | 0.01 | | | | 0.33 | | | | (0.33 | ) | | | (0.01 | ) | | | (0.34 | ) |
Year Ended February 28, 2015 | | | 11.32 | | | | 0.35 | | | | 0.10 | | | | 0.45 | | | | (0.37 | ) | | | (0.01 | ) | | | (0.38 | ) |
Year Ended February 28, 2014 | | | 11.59 | | | | 0.35 | | | | (0.28 | ) | | | 0.07 | | | | (0.33 | ) | | | (0.01 | ) | | | (0.34 | ) |
Year Ended February 28, 2013 | | | 11.51 | | | | 0.36 | | | | 0.08 | | | | 0.44 | | | | (0.36 | ) | | | — | | | | (0.36 | ) |
Year Ended February 29, 2012 | | | 11.27 | | | | 0.53 | | | | 0.23 | | | | 0.76 | | | | (0.52 | ) | | | — | | | | (0.52 | ) |
| (a) | Annualized for periods less than one year, unless otherwise noted. |
| (b) | Not annualized for periods less than one year. |
| (c) | Includes adjustments in accordance with accounting principles generally accepted in the United States of America and as such, the net asset values for financial reporting purposes and the returns based upon those net asset values may differ from the net asset values and returns for shareholder transactions. |
| (d) | Includes earnings credits and interest expense, if applicable, each of which is less than 0.005% unless otherwise noted. |
| (e) | Portfolio turnover is calculated by dividing the lesser of total purchases or sales of portfolio securities for the reporting period by the monthly average value of portfolio securities owned during the reporting period. Excluded from both the numerator and denominator are amounts relating to derivatives and securities whose maturities or expiration dates at the time of acquisition were one year or less. |
| (f) | Calculated based upon average shares outstanding. |
| (g) | Commencement of offering of class of shares. |
SEE NOTES TO FINANCIAL STATEMENTS.
| | | | | | |
| | | |
| 312 | | | | J.P. MORGAN INCOME FUNDS | | AUGUST 31, 2016 |
| | | | | | | | | | | | | | | | | | | | | | | | | | |
| | | Ratios/Supplemental data | |
| | | | | | | | | | Ratios to average net assets (a) | | | | |
Net asset
value,
end of
period | | | Total return
(excludes
sales charge) (b)(c) | | | Net assets,
end of
period
(000’s) | | | Net
expenses (d) | | | Net
investment
income
(loss) | | | Expenses
without waivers,
reimbursements and
earnings credits | | | Portfolio
turnover
rate (b)(e) | |
| | | | | | | | | | | | | | | | | | | | | | | | | | |
| | | | | | | | | | | | | | | | | | | | | | | | | | |
| $ | 11.70 | | | | 1.60 | % | | $ | 185,082 | | | | 0.63 | % | | | 2.46 | % | | | 1.03 | % | | | 9 | % |
| | 11.66 | | | | 2.82 | | | | 209,213 | | | | 0.64 | | | | 2.56 | | | | 0.99 | | | | 16 | |
| | 11.65 | | | | 3.69 | | | | 139,104 | | | | 0.65 | | | | 2.85 | | | | 1.02 | | | | 7 | |
| | 11.58 | | | | 0.45 | | | | 149,964 | | | | 0.65 | | | | 2.66 | | | | 0.99 | | | | 9 | |
| | 11.84 | | | | 3.57 | | | | 294,739 | | | | 0.64 | | | | 2.88 | | | | 0.98 | | | | 19 | |
| | 11.75 | | | | 6.57 | | | | 255,946 | | | | 0.64 | | | | 4.29 | | | | 0.98 | | | | 21 | |
| | | | | | |
| | | | | | | | | | | | | | | | | | | | | | | | | | |
| | 11.39 | | | | 1.31 | | | | 21,759 | | | | 1.13 | | | | 1.96 | | | | 1.52 | | | | 9 | |
| | 11.36 | | | | 2.31 | | | | 19,275 | | | | 1.14 | | | | 2.06 | | | | 1.51 | | | | 16 | |
| | 11.36 | | | | 3.21 | | | | 7,704 | | | | 1.15 | | | | 2.36 | | | | 1.52 | | | | 7 | |
| | 11.30 | | | | (0.10 | ) | | | 6,322 | | | | 1.15 | | | | 2.22 | | | | 1.50 | | | | 9 | |
| | 11.57 | | | | 1.81 | | | | 6,592 | | | | 1.14 | | | | 2.08 | | | | 1.49 | | | | 19 | |
| | | | | | |
| | | | | | | | | | | | | | | | | | | | | | | | | | |
| | 11.42 | | | | 1.85 | | | | 1,386,596 | | | | 0.23 | | | | 2.86 | | | | 0.46 | | | | 9 | |
| | 11.38 | | | | 3.14 | | | | 1,384,768 | | | | 0.24 | | | | 2.98 | | | | 0.46 | | | | 16 | |
| | 11.39 | | | | 4.20 | | | | 1,397,901 | | | | 0.25 | | | | 3.25 | | | | 0.49 | | | | 7 | |
| | 11.32 | | | | 0.81 | | | | 1,604,557 | | | | 0.25 | | | | 3.12 | | | | 0.50 | | | | 9 | |
| | 11.59 | | | | 3.97 | | | | 1,864,649 | | | | 0.24 | | | | 3.29 | | | | 0.48 | | | | 19 | |
| | 11.51 | | | | 6.96 | | | | 1,538,507 | | | | 0.24 | | | | 4.72 | | | | 0.48 | | | | 21 | |
| | | | | | |
| | | | | | | | | | | | | | | | | | | | | | | | | | |
| | 11.42 | | | | 1.77 | | | | 1,189,061 | | | | 0.38 | | | | 2.71 | | | | 0.75 | | | | 9 | |
| | 11.38 | | | | 2.97 | | | | 1,073,033 | | | | 0.39 | | | | 2.83 | | | | 0.72 | | | | 16 | |
| | 11.39 | | | | 4.05 | | | | 1,040,420 | | | | 0.40 | | | | 3.10 | | | | 0.75 | | | | 7 | |
| | 11.32 | | | | 0.63 | | | | 1,043,527 | | | | 0.40 | | | | 2.89 | | | | 0.74 | | | | 9 | |
| | 11.59 | | | | 3.83 | | | | 2,242,411 | | | | 0.39 | | | | 3.09 | | | | 0.73 | | | | 19 | |
| | 11.51 | | | | 6.89 | | | | 1,264,766 | | | | 0.39 | | | | 4.51 | | | | 0.73 | | | | 21 | |
SEE NOTES TO FINANCIAL STATEMENTS.
| | | | | | | | |
| | | |
| AUGUST 31, 2016 | | J.P. MORGAN INCOME FUNDS | | | | | 313 | |
FINANCIAL HIGHLIGHTS
FOR THE PERIODS INDICATED (continued)
| | | | | | | | | | | | | | | | | | | | | | | | | | | | |
| | | Per share operating performance | |
| | | | | | Investment operations | | | Distributions | |
| | | Net asset
value,
beginning
of period | | | Net
investment
income
(loss) (b) | | | Net realized
and unrealized
gains
(losses) on
investments | | | Total from
investment
operations | | | Net
investment
income | | | Net
realized
gain | | | Total
distributions | |
Short Duration Bond Fund | | | | | | | | | | | | | | | | | | | | | | | | | | | | |
Class A | | | | | | | | | | | | | | | | | | | | | | | | | | | | |
Six Months Ended August 31, 2016 (Unaudited) | | $ | 10.83 | | | $ | 0.03 | | | $ | 0.05 | | | $ | 0.08 | | | $ | (0.03 | ) | | $ | — | | | $ | (0.03 | ) |
Year Ended February 29, 2016 | | | 10.87 | | | | 0.07 | | | | (0.03 | ) | | | 0.04 | | | | (0.07 | ) | | | (0.01 | ) | | | (0.08 | ) |
Year Ended February 28, 2015 | | | 10.90 | | | | 0.07 | | | | (0.02 | ) | | | 0.05 | | | | (0.07 | ) | | | (0.01 | ) | | | (0.08 | ) |
Year Ended February 28, 2014 | | | 10.97 | | | | 0.07 | | | | (0.06 | ) | | | 0.01 | | | | (0.07 | ) | | | (0.01 | ) | | | (0.08 | ) |
Year Ended February 28, 2013 | | | 10.97 | | | | 0.11 | | | | — | (g) | | | 0.11 | | | | (0.11 | ) | | | — | (g) | | | (0.11 | ) |
Year Ended February 29, 2012 | | | 10.95 | | | | 0.15 | | | | 0.04 | | | | 0.19 | | | | (0.15 | ) | | | (0.02 | ) | | | (0.17 | ) |
| | | | | | | |
Class C | | | | | | | | | | | | | | | | | | | | | | | | | | | | |
Six Months Ended August 31, 2016 (Unaudited) | | | 10.90 | | | | — | (g) | | | 0.05 | | | | 0.05 | | | | — | (g) | | | — | | | | — | (g) |
Year Ended February 29, 2016 | | | 10.94 | | | | 0.01 | | | | (0.03 | ) | | | (0.02 | ) | | | (0.01 | ) | | | (0.01 | ) | | | (0.02 | ) |
Year Ended February 28, 2015 | | | 10.97 | | | | 0.01 | | | | (0.02 | ) | | | (0.01 | ) | | | (0.01 | ) | | | (0.01 | ) | | | (0.02 | ) |
Year Ended February 28, 2014 | | | 11.04 | | | | 0.01 | | | | (0.05 | ) | | | (0.04 | ) | | | (0.02 | ) | | | (0.01 | ) | | | (0.03 | ) |
Year Ended February 28, 2013 | | | 11.04 | | | | 0.05 | | | | — | (g) | | | 0.05 | | | | (0.05 | ) | | | — | (g) | | | (0.05 | ) |
Year Ended February 29, 2012 | | | 11.02 | | | | 0.09 | | | | 0.04 | | | | 0.13 | | | | (0.09 | ) | | | (0.02 | ) | | | (0.11 | ) |
| | | | | | | |
Class R6 | | | | | | | | | | | | | | | | | | | | | | | | | | | | |
Six Months Ended August 31, 2016 (Unaudited) | | | 10.84 | | | | 0.06 | | | | 0.05 | | | | 0.11 | | | | (0.06 | ) | | | — | | | | (0.06 | ) |
Year Ended February 29, 2016 | | | 10.89 | | | | 0.12 | | | | (0.03 | ) | | | 0.09 | | | | (0.13 | ) | | | (0.01 | ) | | | (0.14 | ) |
Year Ended February 28, 2015 | | | 10.91 | | | | 0.12 | | | | (0.01 | ) | | | 0.11 | | | | (0.12 | ) | | | (0.01 | ) | | | (0.13 | ) |
Year Ended February 28, 2014 | | | 10.98 | | | | 0.12 | | | | (0.05 | ) | | | 0.07 | | | | (0.13 | ) | | | (0.01 | ) | | | (0.14 | ) |
Year Ended February 28, 2013 | | | 10.99 | | | | 0.16 | | | | (0.01 | ) | | | 0.15 | | | | (0.16 | ) | | | — | (g) | | | (0.16 | ) |
Year Ended February 29, 2012 | | | 10.97 | | | | 0.20 | | | | 0.05 | | | | 0.25 | | | | (0.21 | ) | | | (0.02 | ) | | | (0.23 | ) |
| | | | | | | |
Select Class | | | | | | | | | | | | | | | | | | | | | | | | | | | | |
Six Months Ended August 31, 2016 (Unaudited) | | | 10.84 | | | | 0.04 | | | | 0.07 | | | | 0.11 | | | | (0.05 | ) | | | — | | | | (0.05 | ) |
Year Ended February 29, 2016 | | | 10.89 | | | | 0.10 | | | | (0.04 | ) | | | 0.06 | | | | (0.10 | ) | | | (0.01 | ) | | | (0.11 | ) |
Year Ended February 28, 2015 | | | 10.91 | | | | 0.10 | | | | (0.02 | ) | | | 0.08 | | | | (0.09 | ) | | | (0.01 | ) | | | (0.10 | ) |
Year Ended February 28, 2014 | | | 10.98 | | | | 0.10 | | | | (0.06 | ) | | | 0.04 | | | | (0.10 | ) | | | (0.01 | ) | | | (0.11 | ) |
Year Ended February 28, 2013 | | | 10.99 | | | | 0.13 | | | | (0.01 | ) | | | 0.12 | | | | (0.13 | ) | | | — | (g) | | | (0.13 | ) |
Year Ended February 29, 2012 | | | 10.96 | | | | 0.18 | | | | 0.05 | | | | 0.23 | | | | (0.18 | ) | | | (0.02 | ) | | | (0.20 | ) |
| (a) | Annualized for periods less than one year, unless otherwise noted. |
| (b) | Calculated based upon average shares outstanding. |
| (c) | Not annualized for periods less than one year. |
| (d) | Includes adjustments in accordance with accounting principles generally accepted in the United States of America and as such, the net asset values for financial reporting purposes and the returns based upon those net asset values may differ from the net asset values and returns for shareholder transactions. |
| (e) | Includes earnings credits and interest expense, if applicable, each of which is less than 0.005% unless otherwise noted. |
| (f) | Portfolio turnover is calculated by dividing the lesser of total purchases or sales of portfolio securities for the reporting period by the monthly average value of portfolio securities owned during the reporting period. Excluded from both the numerator and denominator are amounts relating to derivatives and securities whose maturities or expiration dates at the time of acquisition were one year or less. |
| (g) | Amount rounds to less than $0.005. |
SEE NOTES TO FINANCIAL STATEMENTS.
| | | | | | |
| | | |
| 314 | | | | J.P. MORGAN INCOME FUNDS | | AUGUST 31, 2016 |
| | | | | | | | | | | | | | | | | | | | | | | | | | |
| | | Ratios/Supplemental data | |
| | | | | | | | | | Ratios to average net assets (a) | | | | |
Net asset
value,
end of
period | | | Total return
(excludes
sales charge) (c)(d) | | | Net assets,
end of
period
(000’s) | | | Net
expenses (e) | | | Net
investment
income
(loss) | | | Expenses
without waivers,
reimbursements and
earnings credits | | | Portfolio
turnover
rate (c)(f) | |
| | | | | | | | | | | | | | | | | | | | | | | | | | |
| | | | | | | | | | | | | | | | | | | | | | | | | | |
| $ | 10.88 | | | | 0.76 | % | | $ | 531,168 | | | | 0.80 | % | | | 0.54 | % | | | 0.90 | % | | | 24 | % |
| | 10.83 | | | | 0.35 | | | | 528,045 | | | | 0.80 | | | | 0.63 | | | | 0.92 | | | | 45 | |
| | 10.87 | | | | 0.38 | | | | 225,852 | | | | 0.80 | | | | 0.63 | | | | 0.92 | | | | 41 | |
| | 10.90 | | | | 0.11 | | | | 240,174 | | | | 0.80 | | | | 0.63 | | | | 0.89 | | | | 38 | |
| | 10.97 | | | | 0.99 | | | | 281,110 | | | | 0.80 | | | | 0.97 | | | | 0.86 | | | | 33 | |
| | 10.97 | | | | 1.76 | | | | 260,098 | | | | 0.80 | | | | 1.36 | | | | 0.86 | | | | 40 | |
| | | | | | |
| | | | | | | | | | | | | | | | | | | | | | | | | | |
| | 10.95 | | | | 0.50 | | | | 97,792 | | | | 1.30 | | | | 0.04 | | | | 1.41 | | | | 24 | |
| | 10.90 | | | | (0.16 | ) | | | 110,872 | | | | 1.30 | | | | 0.13 | | | | 1.41 | | | | 45 | |
| | 10.94 | | | | (0.10 | ) | | | 124,100 | | | | 1.30 | | | | 0.13 | | | | 1.40 | | | | 41 | |
| | 10.97 | | | | (0.39 | ) | | | 154,636 | | | | 1.30 | | | | 0.14 | | | | 1.39 | | | | 38 | |
| | 11.04 | | | | 0.50 | | | | 237,782 | | | | 1.30 | | | | 0.48 | | | | 1.36 | | | | 33 | |
| | 11.04 | | | | 1.23 | | | | 297,098 | | | | 1.30 | | | | 0.86 | | | | 1.37 | | | | 40 | |
| | | | | | |
| | | | | | | | | | | | | | | | | | | | | | | | | | |
| | 10.89 | | | | 1.02 | | | | 3,107,116 | | | | 0.30 | | | | 1.04 | | | | 0.35 | | | | 24 | |
| | 10.84 | | | | 0.77 | | | | 3,171,892 | | | | 0.30 | | | | 1.13 | | | | 0.35 | | | | 45 | |
| | 10.89 | | | | 0.98 | | | | 2,969,476 | | | | 0.30 | | | | 1.12 | | | | 0.38 | | | | 41 | |
| | 10.91 | | | | 0.60 | | | | 2,819,549 | | | | 0.30 | | | | 1.14 | | | | 0.39 | | | | 38 | |
| | 10.98 | | | | 1.40 | | | | 4,077,991 | | | | 0.30 | | | | 1.46 | | | | 0.36 | | | | 33 | |
| | 10.99 | | | | 2.28 | | | | 3,530,135 | | | | 0.30 | | | | 1.86 | | | | 0.36 | | | | 40 | |
| | | | | | |
| | | | | | | | | | | | | | | | | | | | | | | | | | |
| | 10.90 | | | | 0.99 | | | | 7,329,097 | | | | 0.55 | | | | 0.79 | | | | 0.65 | | | | 24 | |
| | 10.84 | | | | 0.50 | | | | 7,145,093 | | | | 0.55 | | | | 0.88 | | | | 0.66 | | | | 45 | |
| | 10.89 | | | | 0.72 | | | | 7,781,780 | | | | 0.55 | | | | 0.88 | | | | 0.65 | | | | 41 | |
| | 10.91 | | | | 0.36 | | | | 7,800,036 | | | | 0.55 | | | | 0.88 | | | | 0.64 | | | | 38 | |
| | 10.98 | | | | 1.13 | | | | 7,712,342 | | | | 0.55 | | | | 1.22 | | | | 0.61 | | | | 33 | |
| | 10.99 | | | | 2.10 | | | | 6,946,436 | | | | 0.55 | | | | 1.61 | | | | 0.61 | | | | 40 | |
SEE NOTES TO FINANCIAL STATEMENTS.
| | | | | | | | |
| | | |
| AUGUST 31, 2016 | | J.P. MORGAN INCOME FUNDS | | | | | 315 | |
FINANCIAL HIGHLIGHTS
FOR THE PERIODS INDICATED (continued)
| | | | | | | | | | | | | | | | | | | | | | | | | | | | |
| | | Per share operating performance | |
| | | | | | Investment operations | | | Distributions | |
| | | Net asset
value,
beginning
of period | | | Net
investment
income
(loss) (b) | | | Net realized
and unrealized
gains
(losses) on
investments | | | Total from
investment
operations | | | Net
investment
income | | | Net
realized
gain | | | Total
distributions | |
Short Duration High Yield Fund | | | | | | | | | | | | | | | | | | | | | | | | | | | | |
Class A | | | | | | | | | | | | | | | | | | | | | | | | | | | | |
Six Months Ended August 31, 2016 (Unaudited) | | $ | 8.87 | | | $ | 0.21 | | | $ | 0.55 | | | $ | 0.76 | | | $ | (0.22 | ) | | $ | — | | | $ | (0.22 | ) |
Year Ended February 29, 2016 | | | 9.76 | | | | 0.41 | | | | (0.89 | ) | | | (0.48 | ) | | | (0.41 | ) | | | — | | | | (0.41 | ) |
Year Ended February 28, 2015 | | | 10.05 | | | | 0.41 | | | | (0.28 | ) | | | 0.13 | | | | (0.41 | ) | | | (0.01 | ) | | | (0.42 | ) |
March 1, 2013 (g) through February 28, 2014 | | | 10.00 | | | | 0.41 | | | | (0.02 | ) | | | 0.39 | | | | (0.34 | ) | | | — | | | | (0.34 | ) |
| | | | | | | |
Class C | | | | | | | | | | | | | | | | | | | | | | | | | | | | |
Six Months Ended August 31, 2016 (Unaudited) | | | 8.85 | | | | 0.19 | | | | 0.55 | | | | 0.74 | | | | (0.19 | ) | | | — | | | | (0.19 | ) |
Year Ended February 29, 2016 | | | 9.75 | | | | 0.36 | | | | (0.89 | ) | | | (0.53 | ) | | | (0.37 | ) | | | — | | | | (0.37 | ) |
Year Ended February 28, 2015 | | | 10.05 | | | | 0.36 | | | | (0.28 | ) | | | 0.08 | | | | (0.37 | ) | | | (0.01 | ) | | | (0.38 | ) |
March 1, 2013 (g) through February 28, 2014 | | | 10.00 | | | | 0.36 | | | | (0.02 | ) | | | 0.34 | | | | (0.29 | ) | | | — | | | | (0.29 | ) |
| | | | | | | |
Class R6 | | | | | | | | | | | | | | | | | | | | | | | | | | | | |
Six Months Ended August 31, 2016 (Unaudited) | | | 8.86 | | | | 0.23 | | | | 0.55 | | | | 0.78 | | | | (0.23 | ) | | | — | | | | (0.23 | ) |
Year Ended February 29, 2016 | | | 9.77 | | | | 0.44 | | | | (0.90 | ) | | | (0.46 | ) | | | (0.45 | ) | | | — | | | | (0.45 | ) |
Year Ended February 28, 2015 | | | 10.06 | | | | 0.45 | | | | (0.28 | ) | | | 0.17 | | | | (0.45 | ) | | | (0.01 | ) | | | (0.46 | ) |
March 1, 2013 (g) through February 28, 2014 | | | 10.00 | | | | 0.45 | | | | (0.01 | ) | | | 0.44 | | | | (0.38 | ) | | | — | | | | (0.38 | ) |
| | | | | | | |
Select Class | | | | | | | | | | | | | | | | | | | | | | | | | | | | |
Six Months Ended August 31, 2016 (Unaudited) | | | 8.86 | | | | 0.22 | | | | 0.56 | | | | 0.78 | | | | (0.23 | ) | | | — | | | | (0.23 | ) |
Year Ended February 29, 2016 | | | 9.76 | | | | 0.43 | | | | (0.89 | ) | | | (0.46 | ) | | | (0.44 | ) | | | — | | | | (0.44 | ) |
Year Ended February 28, 2015 | | | 10.05 | | | | 0.44 | | | | (0.28 | ) | | | 0.16 | | | | (0.44 | ) | | | (0.01 | ) | | | (0.45 | ) |
March 1, 2013 (g) through February 28, 2014 | | | 10.00 | | | | 0.43 | | | | (0.01 | ) | | | 0.42 | | | | (0.37 | ) | | | — | | | | (0.37 | ) |
| (a) | Annualized for periods less than one year, unless otherwise noted. |
| (b) | Calculated based upon average shares outstanding. |
| (c) | Not annualized for periods less than one year. |
| (d) | Includes adjustments in accordance with accounting principles generally accepted in the United States of America and as such, the net asset values for financial reporting purposes and the returns based upon those net asset values may differ from the net asset values and returns for shareholder transactions. |
| (e) | Includes earnings credits and interest expense, if applicable, each of which is less than 0.005% unless otherwise noted. |
| (f) | Portfolio turnover is calculated by dividing the lesser of total purchases or sales of portfolio securities for the reporting period by the monthly average value of portfolio securities owned during the reporting period. Excluded from both the numerator and denominator are amounts relating to derivatives and securities whose maturities or expiration dates at the time of acquisition were one year or less. |
| (g) | Commencement of operations. |
| (h) | Certain non-recurring expenses incurred by the Fund were not annualized for the period ended February 28, 2014. |
SEE NOTES TO FINANCIAL STATEMENTS.
| | | | | | |
| | | |
| 316 | | | | J.P. MORGAN INCOME FUNDS | | AUGUST 31, 2016 |
| | | | | | | | | | | | | | | | | | | | | | | | | | |
| | | Ratios/Supplemental data | |
| | | | | | | | | | Ratios to average net assets (a) | | | | |
Net asset
value,
end of
period | | | Total return
(excludes
sales charge) (c)(d) | | | Net assets,
end of
period
(000’s) | | | Net
expenses (e) | | | Net
investment
income
(loss) | | | Expenses
without waivers,
reimbursements and
earnings credits | | | Portfolio
turnover
rate (c)(f) | |
| | | | | | | | | | | | | | | | | | | | | | | | | | |
| | | | | | | | | | | | | | | | | | | | | | | | | | |
| $ | 9.41 | | | | 8.59 | % | | $ | 3,122 | | | | 0.89 | % | | | 4.50 | % | | | 1.39 | % | | | 36 | % |
| | 8.87 | | | | (5.03 | ) | | | 2,570 | | | | 0.90 | | | | 4.34 | | | | 1.25 | | | | 42 | |
| | 9.76 | | | | 1.31 | | | | 1,965 | | | | 0.89 | | | | 4.15 | | | | 1.21 | | | | 73 | |
| | 10.05 | | | | 4.02 | | | | 1,415 | | | | 0.89 | (h) | | | 4.13 | (h) | | | 1.45 | (h) | | | 66 | |
| | | | | | |
| | | | | | | | | | | | | | | | | | | | | | | | | | |
| | 9.40 | | | | 8.45 | | | | 305 | | | | 1.39 | | | | 4.00 | | | | 2.07 | | | | 36 | |
| | 8.85 | | | | (5.61 | ) | | | 264 | | | | 1.40 | | | | 3.82 | | | | 1.88 | | | | 42 | |
| | 9.75 | | | | 0.80 | | | | 324 | | | | 1.39 | | | | 3.63 | | | | 1.73 | | | | 73 | |
| | 10.05 | | | | 3.48 | | | | 55 | | | | 1.39 | (h) | | | 3.62 | (h) | | | 2.15 | (h) | | | 66 | |
| | | | | | |
| | | | | | | | | | | | | | | | | | | | | | | | | | |
| | 9.41 | | | | 8.93 | | | | 33,353 | | | | 0.49 | | | | 4.90 | | | | 0.77 | | | | 36 | |
| | 8.86 | | | | (4.81 | ) | | | 45,491 | | | | 0.50 | | | | 4.65 | | | | 0.69 | | | | 42 | |
| | 9.77 | | | | 1.72 | | | | 80,234 | | | | 0.49 | | | | 4.53 | | | | 0.70 | | | | 73 | |
| | 10.06 | | | | 4.47 | | | | 41,712 | | | | 0.48 | (h) | | | 4.49 | (h) | | | 0.78 | (h) | | | 66 | |
| | | | | | |
| | | | | | | | | | | | | | | | | | | | | | | | | | |
| | 9.41 | | | | 8.86 | | | | 129,662 | | | | 0.64 | | | | 4.75 | | | | 1.02 | | | | 36 | |
| | 8.86 | | | | (4.86 | ) | | | 108,974 | | | | 0.65 | | | | 4.55 | | | | 0.94 | | | | 42 | |
| | 9.76 | | | | 1.54 | | | | 173,375 | | | | 0.64 | | | | 4.40 | | | | 0.95 | | | | 73 | |
| | 10.05 | | | | 4.24 | | | | 201,219 | | | | 0.63 | (h) | | | 4.36 | (h) | | | 1.15 | (h) | | | 66 | |
SEE NOTES TO FINANCIAL STATEMENTS.
| | | | | | | | |
| | | |
| AUGUST 31, 2016 | | J.P. MORGAN INCOME FUNDS | | | | | 317 | |
FINANCIAL HIGHLIGHTS
FOR THE PERIODS INDICATED (continued)
| | | | | | | | | | | | | | | | | | | | | | | | | | | | |
| | | Per share operating performance | |
| | | | | | Investment operations | | | Distributions | |
| | | Net asset
value,
beginning
of period | | | Net
investment
income
(loss) (b) | | | Net realized
and unrealized
gains
(losses) on
investments | | | Total from
investment
operations | | | Net
investment
income | | | Net
realized
gain | | | Total
distributions | |
Treasury & Agency Fund | | | | | | | | | | | | | | | | | | | | | | | | | | | | |
Class A | | | | | | | | | | | | | | | | | | | | | | | | | | | | |
Six Months Ended August 31, 2016 (Unaudited) | | $ | 9.42 | | | $ | 0.01 | | | $ | 0.03 | | | $ | 0.04 | | | $ | (0.02 | ) | | $ | — | | | $ | (0.02 | ) |
Year Ended February 29, 2016 | | | 9.41 | | | | 0.04 | | | | 0.03 | | | | 0.07 | | | | (0.05 | ) | | | (0.01 | ) | | | (0.06 | ) |
Year Ended February 28, 2015 | | | 9.49 | | | | 0.06 | | | | (0.05 | ) | | | 0.01 | | | | (0.06 | ) | | | (0.03 | ) | | | (0.09 | ) |
Year Ended February 28, 2014 | | | 9.63 | | | | 0.08 | | | | (0.10 | ) | | | (0.02 | ) | | | (0.09 | ) | | | (0.03 | ) | | | (0.12 | ) |
Year Ended February 28, 2013 | | | 9.74 | | | | 0.09 | | | | (0.06 | ) | | | 0.03 | | | | (0.09 | ) | | | (0.05 | ) | | | (0.14 | ) |
Year Ended February 29, 2012 | | | 9.78 | | | | 0.12 | | | | 0.05 | | | | 0.17 | | | | (0.11 | ) | | | (0.10 | ) | | | (0.21 | ) |
| | | | | | | |
Select Class | | | | | | | | | | | | | | | | | | | | | | | | | | | | |
Six Months Ended August 31, 2016 (Unaudited) | | | 9.42 | | | | 0.03 | | | | 0.02 | | | | 0.05 | | | | (0.03 | ) | | | — | | | | (0.03 | ) |
Year Ended February 29, 2016 | | | 9.40 | | | | 0.06 | | | | 0.04 | | | | 0.10 | | | | (0.07 | ) | | | (0.01 | ) | | | (0.08 | ) |
Year Ended February 28, 2015 | | | 9.48 | | | | 0.08 | | | | (0.05 | ) | | | 0.03 | | | | (0.08 | ) | | | (0.03 | ) | | | (0.11 | ) |
Year Ended February 28, 2014 | | | 9.62 | | | | 0.10 | | | | (0.10 | ) | | | — | (g) | | | (0.11 | ) | | | (0.03 | ) | | | (0.14 | ) |
Year Ended February 28, 2013 | | | 9.73 | | | | 0.11 | | | | (0.06 | ) | | | 0.05 | | | | (0.11 | ) | | | (0.05 | ) | | | (0.16 | ) |
Year Ended February 29, 2012 | | | 9.77 | | | | 0.14 | | | | 0.05 | | | | 0.19 | | | | (0.13 | ) | | | (0.10 | ) | | | (0.23 | ) |
| (a) | Annualized for periods less than one year, unless otherwise noted. |
| (b) | Calculated based upon average shares outstanding. |
| (c) | Not annualized for periods less than one year. |
| (d) | Includes adjustments in accordance with accounting principles generally accepted in the United States of America and as such, the net asset values for financial reporting purposes and the returns based upon those net asset values may differ from the net asset values and returns for shareholder transactions. |
| (e) | Includes earnings credits and interest expense, if applicable, each of which is less than 0.005% unless otherwise noted. |
| (f) | Portfolio turnover is calculated by dividing the lesser of total purchases or sales of portfolio securities for the reporting period by the monthly average value of portfolio securities owned during the reporting period. Excluded from both the numerator and denominator are amounts relating to derivatives and securities whose maturities or expiration dates at the time of acquisition were one year or less. |
| (g) | Amount rounds to less than $0.005. |
SEE NOTES TO FINANCIAL STATEMENTS.
| | | | | | |
| | | |
| 318 | | | | J.P. MORGAN INCOME FUNDS | | AUGUST 31, 2016 |
| | | | | | | | | | | | | | | | | | | | | | | | | | |
| | | Ratios/Supplemental data | |
| | | | | | | | | | Ratios to average net assets (a) | | | | |
Net asset
value,
end of
period | | | Total return
(excludes
sales charge) (c)(d) | | | Net assets,
end of
period
(000’s) | | | Net
expenses (e) | | | Net
investment
income
(loss) | | | Expenses
without waivers,
reimbursements and
earnings credits | | | Portfolio
turnover
rate (c)(f) | |
| | | | | | | | | | | | | | | | | | | | | | | | | | |
| | | | | | | | | | | | | | | | | | | | | | | | | | |
| $ | 9.44 | | | | 0.39 | % | | $ | 23,505 | | | | 0.70 | % | | | 0.29 | % | | | 1.06 | % | | | 16 | % |
| | 9.42 | | | | 0.73 | | | | 34,618 | | | | 0.70 | | | | 0.42 | | | | 1.03 | | | | 24 | |
| | 9.41 | | | | 0.12 | | | | 26,654 | | | | 0.70 | | | | 0.64 | | | | 1.02 | | | | 23 | |
| | 9.49 | | | | (0.20 | ) | | | 44,375 | | | | 0.70 | | | | 0.85 | | | | 0.98 | | | | 15 | |
| | 9.63 | | | | 0.23 | | | | 73,424 | | | | 0.69 | | | | 0.89 | | | | 0.95 | | | | 19 | |
| | 9.74 | | | | 1.72 | | | | 90,893 | | | | 0.70 | | | | 1.17 | | | | 0.95 | | | | 35 | |
| | | | | | |
| | | | | | | | | | | | | | | | | | | | | | | | | | |
| | 9.44 | | | | 0.49 | | | | 79,573 | | | | 0.45 | | | | 0.54 | | | | 0.81 | | | | 16 | |
| | 9.42 | | | | 1.05 | | | | 71,093 | | | | 0.45 | | | | 0.66 | | | | 0.77 | | | | 24 | |
| | 9.40 | | | | 0.38 | | | | 103,513 | | | | 0.45 | | | | 0.87 | | | | 0.78 | | | | 23 | |
| | 9.48 | | | | 0.05 | | | | 132,599 | | | | 0.45 | | | | 1.09 | | | | 0.73 | | | | 15 | |
| | 9.62 | | | | 0.48 | | | | 235,447 | | | | 0.44 | | | | 1.14 | | | | 0.70 | | | | 19 | |
| | 9.73 | | | | 1.97 | | | | 313,699 | | | | 0.45 | | | | 1.42 | | | | 0.70 | | | | 35 | |
SEE NOTES TO FINANCIAL STATEMENTS.
| | | | | | | | |
| | | |
| AUGUST 31, 2016 | | J.P. MORGAN INCOME FUNDS | | | | | 319 | |
NOTES TO FINANCIAL STATEMENTS
AS OF AUGUST 31, 2016 (Unaudited)
1. Organization
JPMorgan Trust I (“JPM I”) and JPMorgan Trust II (“JPM II”) (collectively, the “Trusts”) were formed on November 12, 2004, as Delaware statutory trusts, pursuant to Declarations of Trust dated November 5, 2004 and are registered under the Investment Company Act of 1940, as amended (the “1940 Act”), as open-end management investment companies.
The following are 10 separate funds of the Trusts (collectively, the “Funds”) covered by this report:
| | | | | | |
| | | Classes Offered | | Trust | | Diversified/Non-Diversified |
| Core Bond Fund | | Class A, Class C, Class R2, Class R3**, Class R4**, Class R5, Class R6 and Select Class | | JPM II | | Diversified |
| Core Plus Bond Fund | | Class A, Class C, Class R2, Class R3**, Class R4**, Class R5**, Class R6, Institutional Class and Select Class | | JPM II | | Diversified |
| Government Bond Fund | | Class A, Class C, Class R2, Class R3**, Class R4**, Class R6* and Select Class | | JPM II | | Diversified |
| High Yield Fund | | Class A, Class C, Class R2, Class R5, Class R6 and Select Class | | JPM II | | Diversified |
| Inflation Managed Bond Fund | | Class A, Class C, Class R2***, Class R5, Class R6 and Select Class | | JPM I | | Diversified |
| Limited Duration Bond Fund | | Class A, Class C, Class R6 and Select Class | | JPM II | | Diversified |
| Mortgage-Backed Securities Fund | | Class A, Class C, Class R6 and Select Class | | JPM II | | Diversified |
| Short Duration Bond Fund | | Class A, Class C, Class R6 and Select Class | | JPM II | | Diversified |
| Short Duration High Yield Fund | | Class A, Class C, Class R6 and Select Class | | JPM I | | Diversified |
| Treasury & Agency Fund | | Class A and Select Class | | JPM II | | Diversified |
| * | Commenced operations on August 1, 2016. |
| ** | Expected to commence operations on September 9, 2016. |
| *** | Class will liquidate on or about December 8, 2016. |
The investment objective of Core Bond Fund is to seek to maximize total return by investing primarily in a diversified portfolio of intermediate- and long-term debt securities.
The investment objective of Core Plus Bond Fund is to seek a high level of current income by investing primarily in a diversified portfolio of high-, medium- and low-grade debt securities.
The investment objective of Government Bond Fund is to seek a high level of current income with liquidity and safety of principal.
The investment objective of High Yield Fund is to seek a high level of current income by investing primarily in a diversified portfolio of debt securities which are rated below investment grade or unrated. Capital appreciation is a secondary objective.
The investment objective of Inflation Managed Bond Fund is to seek to maximize inflation protected total return.
The investment objective of Limited Duration Bond Fund is to seek a high level of current income consistent with low volatility of principal.
The investment objective of Mortgage-Backed Securities Fund is to seek to maximize total return by investing primarily in a diversified portfolio of debt securities backed by pools of residential and/or commercial mortgages.
The investment objective of Short Duration Bond Fund is to seek current income consistent with preservation of capital through investment in high- and medium-grade fixed income securities.
The investment objective of Short Duration High Yield Fund is to seek current income with a secondary objective of capital appreciation.
The investment objective of Treasury & Agency Fund is to seek a high level of current income by investing in U.S. Treasury and other U.S. agency obligations with a primary, but not exclusive, focus on issues that produce income exempt from state income taxes.
Class A Shares generally provide for a front-end sales charge while Class C Shares provide for a contingent deferred sales charge (“CDSC”). No sales charges are assessed with respect to Class R2, Class R5, Class R6, Institutional Class and Select Class Shares. All classes of shares have equal rights as to earnings, assets and voting privileges, except that each class may bear different transfer agency, sub-transfer agency, distribution and shareholder servicing fees and each class has exclusive voting rights with respect to its distribution plan and shareholder servicing agreements. Certain Class A Shares, for which front-end sales charges have been waived, may be subject to a CDSC as described in the Funds’ prospectus.
On June 19, 2015, all remaining Class B Shares converted to Class A Shares of the same Fund. Prior to June 19, 2015, Class B Shares automatically converted to Class A Shares after eight years (except for Limited Duration Bond Fund, Short Duration Bond Fund and Treasury & Agency Fund whose Class B Shares converted to Class A Shares after six years) and provided for a CDSC.
J.P. Morgan Investment Management Inc. (“JPMIM”) an indirect, wholly-owned subsidiary of JPMorgan Chase & Co. (“JPMorgan”) acts as Adviser (the “Adviser”) and Administrator (the “Administrator”) to the Funds. Prior to April 1, 2016, JPMorgan Funds Management, Inc. (“JPMFM”) served as the Funds’ administrator. Effective April 1, 2016, JPMFM merged into JPMIM and JPMIM became the Funds’ Administrator under the Administration Agreement.
| | | | | | |
| | | |
| 320 | | | | J.P. MORGAN INCOME FUNDS | | AUGUST 31, 2016 |
2. Significant Accounting Policies
The following is a summary of significant accounting policies followed by the Funds in the preparation of their financial statements. The Funds are investment companies and, accordingly, follow the investment company accounting and reporting guidance of the Financial Accounting Standards Board Accounting Standards Codification Topic 946 — Investment Companies, which is part of U.S. generally accepted accounting principles (“GAAP”). The preparation of financial statements in conformity with GAAP requires management to make estimates and assumptions that affect the reported amounts of assets and liabilities and disclosure of contingent assets and liabilities at the date of the financial statements and the reported amounts of increases and decreases in net assets from operations during the reporting period. Actual results could differ from those estimates.
A. Valuation of Investments — The valuation of investments is in accordance with GAAP and the Funds’ valuation policies set forth by and under the supervision and responsibility of the Board of Trustees (the “Board”), which established the following approach to valuation, as described more fully below: (i) investments for which market quotations are readily available shall be valued at such unadjusted quoted prices and (ii) all other investments for which market quotations are not readily available shall be valued at their fair value as determined in good faith by the Board.
The Administrator has established the J.P. Morgan Asset Management Americas Valuation Committee (“AVC”) to assist the Board with the oversight and monitoring of the valuation of the Funds’ investments. The Administrator implements the valuation policies of the Funds’ investments, as directed by the Board. The AVC oversees and carries out the policies for the valuation of investments held in the Funds. This includes monitoring the appropriateness of fair values based on results of ongoing valuation oversight, including but not limited to consideration of macro or security specific events, market events and pricing vendor and broker due diligence. The Administrator is responsible for discussing and assessing the potential impacts to the fair values on an ongoing basis, and at least on a quarterly basis with the AVC and the Board.
A market-based approach is primarily used to value the Funds’ investments. Investments for which market quotations are not readily available are fair valued by approved affiliated and unaffiliated pricing vendors or third party broker-dealers (collectively referred to as “Pricing Services”) or may be internally fair valued using methods set forth by the valuation policies approved by the Board. This may include related or comparable assets or liabilities, recent transactions, market multiples, book values, and other relevant information for the investment to determine the fair value of the investment. An income-based valuation approach may be used in which the anticipated future cash flows of the investment are discounted to calculate the fair value. Discounts may also be applied due to the nature or duration of any restrictions on the disposition of the investments. Valuations may be based upon current market prices of securities that are comparable in coupon, rating, maturity and industry. It is possible that the estimated values may differ significantly from the values that would have been used, had a ready market for the investments existed, and such differences could be material.
Fixed income instruments are valued based on prices received from Pricing Services. The Pricing Services use multiple valuation techniques to determine the valuation of fixed income instruments. In instances where sufficient market activity exists, the Pricing Services may utilize a market-based approach through which trades or quotes from market makers are used to determine the valuation of these instruments. In instances where sufficient market activity may not exist, the Pricing Services also utilize proprietary valuation models which may consider market transactions in comparable securities and the various relationships between securities in determining fair value and/or market characteristics in order to estimate the relevant cash flows, which are then discounted to calculate the fair values.
Equities and other exchange-traded instruments are valued at the last sale price or official market closing price on the primary exchange on which the instrument is traded before the net asset values (“NAV”) of the Funds are calculated on a valuation date. Investments in open-end investment companies (the “Underlying Funds”) are valued at each Underlying Fund’s NAV per share as of the report date.
Futures and options are generally valued on the basis of available market quotations. Swaps and forward foreign currency exchange contracts are valued utilizing market quotations from approved Pricing Services.
See the tables on “Quantitative Information about Level 3 Fair Value Measurements” for information on the valuation techniques and inputs used to value level 3 securities held by Core Bond Fund, Core Plus Bond Fund, High Yield Fund, Limited Duration Bond Fund and Mortgage-Backed Securities Fund at August 31, 2016.
Valuations reflected in this report are as of the report date. As a result, changes in valuation due to market events and/or issuer related events after the report date and prior to issuance of the report are not reflected herein.
The various inputs that are used in determining the valuation of the Funds’ investments are summarized into the three broad levels listed below.
| • | | Level 1 — Unadjusted inputs using quoted prices in active markets for identical investments. |
| • | | Level 2 — Other significant observable inputs including, but not limited to, quoted prices for similar investments, inputs other than quoted prices that are observable for investments (such as interest rates, prepayment speeds, credit risk, etc.) or other market corroborated inputs. |
| • | | Level 3 — Significant inputs based on the best information available in the circumstances, to the extent observable inputs are not available (including the Funds’ assumptions in determining the fair value of investments). |
A financial instrument’s level within the fair value hierarchy is based on the lowest level of any input, both individually and in the aggregate, that is significant to the fair value measurement. The inputs or methodology used for valuing instruments are not necessarily an indication of the risk associated with investing in those instruments.
| | | | | | | | |
| | | |
| AUGUST 31, 2016 | | J.P. MORGAN INCOME FUNDS | | | | | 321 | |
NOTES TO FINANCIAL STATEMENTS
AS OF AUGUST 31, 2016 (Unaudited) (continued)
The following tables represent each valuation input as presented on the Schedules of Portfolio Investments (“SOIs”) (amounts in thousands):
Core Bond Fund
| | | | | | | | | | | | | | | | |
| | | Level 1
Quoted prices | | | Level 2
Other significant
observable inputs | | | Level 3
Significant
unobservable inputs | | | Total | |
Investments in Securities | | | | | | | | | | | | | | | | |
Debt Securities | | | | | | | | | | | | | | | | |
Asset-Backed Securities | | $ | — | | | $ | 2,181,618 | | | $ | 988,577 | | | $ | 3,170,195 | |
Collateralized Mortgage Obligations | | | | | | | | | | | | | | | | |
Agency CMO | | | — | | | | 3,740,087 | | | | 12 | | | | 3,740,099 | |
Non-Agency CMO | | | — | | | | 581,085 | | | | 120,874 | | | | 701,959 | |
| | | | | | | | | | | | | | | | |
Total Collateralized Mortgage Obligations | | | — | | | | 4,321,172 | | | | 120,886 | | | | 4,442,058 | |
| | | | | | | | | | | | | | | | |
Commercial Mortgage-Backed Securities | | | — | | | | 769,938 | | | | 91,409 | | | | 861,347 | |
Corporate Bonds | | | | | | | | | | | | | | | | |
Consumer Discretionary | | | — | | | | 457,312 | | | | — | | | | 457,312 | |
Consumer Staples | | | — | | | | 357,568 | | | | — | | | | 357,568 | |
Energy | | | — | | | | 634,024 | | | | — | | | | 634,024 | |
Financials | | | — | | | | 2,664,947 | | | | — | | | | 2,664,947 | |
Health Care | | | — | | | | 380,767 | | | | — | | | | 380,767 | |
Industrials | | | — | | | | 487,458 | | | | — | | | | 487,458 | |
Information Technology | | | — | | | | 405,473 | | | | — | | | | 405,473 | |
Materials | | | — | | | | 184,179 | | | | — | | | | 184,179 | |
Real Estate | �� | | — | | | | 163,206 | | | | — | | | | 163,206 | |
Telecommunication Services | | | — | | | | 424,405 | | | | — | | | | 424,405 | |
Utilities | | | — | | | | 546,437 | | | | — | | | | 546,437 | |
| | | | | | | | | | | | | | | | |
Total Corporate Bonds | | | — | | | | 6,705,776 | | | | — | | | | 6,705,776 | |
| | | | | | | | | | | | | | | | |
Foreign Government Securities | | | — | | | | 305,083 | | | | — | | | | 305,083 | |
Mortgage Pass-Through Securities | | | — | | | | 4,834,777 | | | | — | | | | 4,834,777 | |
Municipal Bonds | | | — | | | | 91,002 | | | | — | | | | 91,002 | |
Preferred Security | | | | | | | | | | | | | | | | |
Financials | | | — | | | | 10,128 | | | | — | | | | 10,128 | |
Supranational | | | — | | | | 28,544 | | | | — | | | | 28,544 | |
U.S. Government Agency Securities | | | — | | | | 723,835 | | | | — | | | | 723,835 | |
U.S. Treasury Obligations | | | — | | | | 7,415,024 | | | | — | | | | 7,415,024 | |
Loan Assignment | | | | | | | | | | | | | | | | |
Consumer Discretionary | | | — | | | | 45,199 | | | | — | | | | 45,199 | |
Short-Term Investment | | | | | | | | | | | | | | | | |
Investment Company | | | 856,578 | | | | — | | | | — | | | | 856,578 | |
| | | | | | | | | | | | | | | | |
Total Investments in Securities | | $ | 856,578 | | | $ | 27,432,096 | | | $ | 1,200,872 | | | $ | 29,489,546 | |
| | | | | | | | | | | | | | | | |
|
| Core Plus Bond Fund | |
| | | Level 1
Quoted prices | | | Level 2
Other significant
observable inputs | | | Level 3
Significant
unobservable inputs | | | Total | |
Investments in Securities | | | | | | | | | | | | | | | | |
Common Stocks | | | | | | | | | | | | | | | | |
Consumer Discretionary | | $ | — | | | $ | — | | | $ | 43 | | | $ | 43 | |
Financials | | | — | | | | — | | | | 16 | | | | 16 | |
Industrials | | | 2 | | | | — | | | | — | | | | 2 | |
Materials | | | — | | | | — | | | | — | (a) | | | — | (a) |
Telecommunication Services | | | 226 | | | | — | | | | — | | | | 226 | |
Utilities | | | 50 | | | | — | | | | — | | | | 50 | |
| | | | | | | | | | | | | | | | |
Total Common Stocks | | | 278 | | | | — | | | | 59 | | | | 337 | |
| | | | | | | | | | | | | | | | |
| | | | | | |
| | | |
| 322 | | | | J.P. MORGAN INCOME FUNDS | | AUGUST 31, 2016 |
| | | | | | | | | | | | | | | | |
Core Plus Bond Fund (continued) | |
| | | Level 1
Quoted prices | | | Level 2
Other significant
observable inputs | | | Level 3
Significant
unobservable inputs | | | Total | |
Preferred Stocks | | | | | | | | | | | | | | | | |
Financials | | $ | 346 | | | $ | — | | | $ | 1,886 | | | $ | 2,232 | |
Industrials | | | — | | | | 1,028 | | | | — | | | | 1,028 | |
Materials | | | — | | | | — | | | | — | (b) | | | — | (b) |
| | | | | | | | | | | | | | | | |
Total Preferred Stocks | | | 346 | | | | 1,028 | | | | 1,886 | | | | 3,260 | |
| | | | | | | | | | | | | | | | |
Debt Securities | | | | | | | | | | | | | | | | |
Asset-Backed Securities | | | — | | | | 430,561 | | | | 333,792 | | | | 764,353 | |
Collateralized Mortgage Obligations | | | | | | | | | | | | | | | | |
Agency CMO | | | — | | | | 502,261 | | | | — | | | | 502,261 | |
Non-Agency CMO | | | — | | | | 71,994 | | | | 17,935 | | | | 89,929 | |
| | | | | | | | | | | | | | | | |
Total Collateralized Mortgage Obligations | | | — | | | | 574,255 | | | | 17,935 | | | | 574,255 | |
| | | | | | | | | | | | | | | | |
Commercial Mortgage-Backed Securities | | | — | | | | 300,517 | | | | 71,108 | | | | 371,625 | |
Convertible Bonds | | | — | | | | — | | | | — | (a) | | | — | (a) |
Corporate Bonds | | | | | | | | | | | | | | | | |
Consumer Discretionary | | | — | | | | 187,883 | | | | 118 | | | | 188,001 | |
Consumer Staples | | | — | | | | 106,036 | | | | — | | | | 106,036 | |
Energy | | | — | | | | 187,675 | | | | 8,983 | | | | 196,658 | |
Financials | | | — | | | | 454,872 | | | | — | | | | 454,372 | |
Health Care | | | — | | | | 135,280 | | | | — | | | | 135,280 | |
Health Care Providers & Services | | | — | | | | 425 | | | | — | | | | 425 | |
Industrials | | | — | | | | 135,117 | | | | — | (a) | | | 135,117 | |
Information Technology | | | — | | | | 126,661 | | | | — | | | | 126,661 | |
Materials | | | — | | | | 109,493 | | | | 50 | | | | 109,543 | |
Oil, Gas & Consumable Fuels | | | — | | | | 220 | | | | — | | | | 220 | |
Real Estate | | | — | | | | 29,165 | | | | — | | | | 29,165 | |
Telecommunication Services | | | — | | | | 122,706 | | | | — | | | | 122,706 | |
Utilities | | | — | | | | 105,639 | | | | — | | | | 105,639 | |
| | | | | | | | | | | | | | | | |
Total Corporate Bonds | | | — | | | | 1,701,172 | | | | 9,151 | | | | 1,710,323 | |
| | | | | | | | | | | | | | | | |
Foreign Government Securities | | | — | | | | 69,264 | | | | — | | | | 69,264 | |
Mortgage Pass-Through Securities | | | — | | | | 1,110,935 | | | | — | | | | 1,110,935 | |
Municipal Bonds | | | — | | | | 17,670 | | | | — | | | | 17,670 | |
Preferred Securities | | | | | | | | | | | | | | | | |
Financials | | | — | | | | 19,040 | | | | — | | | | 19,040 | |
Supranational | | | — | | | | 2,309 | | | | — | | | | 2,309 | |
U.S. Government Agency Securities | | | — | | | | 39,420 | | | | — | | | | 39,420 | |
U.S. Treasury Obligations | | | — | | | | 1,691,359 | | | | — | | | | 1,691,359 | |
Loan Assignments | | | | | | | | | | | | | | | | |
Consumer Discretionary | | | — | | | | 22,045 | | | | — | (a) | | | 22,045 | |
Consumer Staples | | | — | | | | 6,615 | | | | — | | | | 6,615 | |
Energy | | | — | | | | 3,698 | | | | — | | | | 3,698 | |
Financials | | | — | | | | 1,088 | | | | — | | | | 1,088 | |
Health Care | | | — | | | | 1,817 | | | | — | | | | 1,817 | |
Industrials | | | — | | | | 1,188 | | | | — | | | | 1,188 | |
Information Technology | | | — | | | | 3,050 | | | | — | | | | 3,050 | |
Materials | | | — | | | | 623 | | | | — | | | | 623 | |
Telecommunication Services | | | — | | | | 1,988 | | | | — | | | | 1,988 | |
Utilities | | | — | | | | 4,757 | | | | — | | | | 4,757 | |
| | | | | | | | | | | | | | | | |
Total Loan Assignments | | | — | | | | 46,869 | | | | — | (a) | | | 46,869 | |
| | | | | | | | | | | | | | | | |
Warrants | | | | | | | | | | | | | | | | |
Consumer Discretionary | | | — | | | | — | | | | — | (a) | | | — | (a) |
Energy | | | — | | | | — | | | | 576 | | | | 576 | |
| | | | | | | | | | | | | | | | |
Total Warrants | | | — | | | | — | | | | 576 | | | | 576 | |
| | | | | | | | | | | | | | | | |
| | | | | | | | |
| | | |
| AUGUST 31, 2016 | | J.P. MORGAN INCOME FUNDS | | | | | 323 | |
NOTES TO FINANCIAL STATEMENTS
AS OF AUGUST 31, 2016 (Unaudited) (continued)
| | | | | | | | | | | | | | | | |
Core Plus Bond Fund (continued) | |
| | | Level 1
Quoted prices | | | Level 2
Other significant
observable inputs | | | Level 3
Significant
unobservable inputs | | | Total | |
Short-Term Investment | | | | | | | | | | | | | | | | |
Investment Company | | $ | 346,277 | | | $ | — | | | $ | — | | | $ | 346,277 | |
| | | | | | | | | | | | | | | | |
Total Investments in Securities | | $ | 346,901 | | | $ | 6,004,399 | | | $ | 434,507 | | | $ | 6,785,807 | |
| | | | | | | | | | | | | | | | |
Appreciation in Other Financial Instruments | | | | | | | | | | | | | | | | |
Forward Foreign Currency Exchange Contracts | | $ | — | | | $ | 35 | | | $ | — | | | $ | 35 | |
Futures Contracts | | | 116 | | | | — | | | | — | | | | 116 | |
| | | | | | | | | | | | | | | | |
Total Appreciation in Other Financial Instruments | | $ | 116 | | | $ | 35 | | | $ | — | | | $ | 151 | |
| | | | | | | | | | | | | | | | |
Depreciation in Other Financial Instruments | | | | | | | | | | | | | | | | |
Forward Foreign Currency Exchange Contracts | | $ | — | | | $ | (296 | ) | | $ | — | | | $ | (296 | ) |
Futures Contracts | | | (209 | ) | | | — | | | | — | | | | (209 | ) |
Swaps | | | — | | | | (870 | ) | | | — | | | | (870 | ) |
| | | | | | | | | | | | | | | | |
Total Depreciation in Other Financial Instruments | | $ | (209 | ) | | $ | (1,166 | ) | | $ | — | | | $ | (1,375 | ) |
| | | | | | | | | | | | | | | | |
| | | | |
| Government Bond Fund | | | | | | | | | | | | | | | | |
| | | Level 1
Quoted prices | | | Level 2
Other significant
observable inputs | | | Level 3
Significant
unobservable inputs | | | Total | |
Total Investments in Securities (c) | | $ | 75,648 | | | $ | 1,321,100 | | | $ | — | | | $ | 1,396,748 | |
| | | | | | | | | | | | | | | | |
|
| High Yield Fund | |
| | | Level 1
Quoted prices | | | Level 2
Other significant
observable inputs | | | Level 3
Significant
unobservable inputs | | | Total | |
Investments in Securities | | | | | | | | | | | | | | | | |
Common Stocks | | | | | | | | | | | | | | | | |
Consumer Discretionary | | $ | — | | | $ | — | | | $ | 1,472 | | | $ | 1,472 | |
Financials | | | — | | | | — | | | | 71 | | | | 71 | |
Industrials | | | 17 | | | | — | | | | — | | | | 17 | |
Materials | | | — | | | | — | | | | — | (a) | | | — | (a) |
Telecommunication Services | | | 4,964 | | | | — | | | | — | | | | 4,964 | |
Utilities | | | 1,267 | | | | — | | | | — | | | | 1,267 | |
| | | | | | | | | | | | | | | | |
Total Common Stocks | | | 6,248 | | | | — | | | | 1,543 | | | | 7,791 | |
| | | | | | | | | | | | | | | | |
Preferred Stocks | | | | | | | | | | | | | | | | |
Consumer Discretionary | | | 713 | | | | — | | | | — | | | | 713 | |
Financials | | | 16,386 | | | | — | | | | 26,323 | | | | 42,709 | |
Industrials | | | — | | | | 13,047 | | | | — | | | | 13,047 | |
Materials | | | — | | | | — | | | | — | (a) | | | — | (a) |
| | | | | | | | | | | | | | | | |
Total Preferred Stocks | | | 17,099 | | | | 13,047 | | | | 26,323 | | | | 56,469 | |
| | | | | | | | | | | | | | | | |
Debt Securities | | | | | | | | | | | | | | | | |
Asset-Backed Securities | | | — | | | | — | | | | 1,764 | | | | 1,764 | |
Convertible Bonds | | | | | | | | | | | | | | | | |
Consumer Discretionary | | | — | | | | 1,570 | | | | — | | | | 1,570 | |
Utilities | | | — | | | | 6,358 | | | | — | | | | 6,358 | |
| | | | | | | | | | | | | | | | |
Total Convertible Bonds | | | — | | | | 7,928 | | | | — | | | | 7,928 | |
| | | | | | | | | | | | | | | | |
| | | | | | |
| | | |
| 324 | | | | J.P. MORGAN INCOME FUNDS | | AUGUST 31, 2016 |
| | | | | | | | | | | | | | | | |
| High Yield Fund (continued) | | | | | | | | | | | | | | | | |
| | | Level 1
Quoted prices | | | Level 2
Other significant
observable inputs | | | Level 3
Significant
unobservable inputs | | | Total | |
Corporate Bonds | | | | | | | | | | | | | | | | |
Consumer Discretionary | | $ | — | | | $ | 2,122,565 | | | $ | 5,844 | | | $ | 2,128,409 | |
Consumer Staples | | | — | | | | 693,575 | | | | — | | | | 693,575 | |
Energy | | | — | | | | 1,151,748 | | | | 18,829 | | | | 1,170,577 | |
Financials | | | — | | | | 604,255 | | | | 7,653 | | | | 611,908 | |
Health Care | | | — | | | | 1,113,200 | | | | 1 | | | | 1,113,201 | |
Industrials | | | — | | | | 1,016,232 | | | | — | (a) | | | 1,016,232 | |
Information Technology | | | — | | | | 639,602 | | | | — | | | | 639,602 | |
Materials | | | — | | | | 1,223,846 | | | | 324 | | | | 1,224,170 | |
Real Estate | | | — | | | | 95,252 | | | | — | | | | 95,252 | |
Telecommunication Services | | | — | | | | 1,256,792 | | | | 8,290 | | | | 1,265,082 | |
Utilities | | | — | | | | 515,556 | | | | — | | | | 515,556 | |
| | | | | | | | | | | | | | | | |
Total Corporate Bonds | | | — | | | | 10,432,623 | | | | 40,941 | | | | 10,473,564 | |
| | | | | | | | | | | | | | | | |
Preferred Securities | | | | | | | | | | | | | | | | |
Financials | | | — | | | | 104,540 | | | | — | | | | 104,540 | |
Loan Assignments | | | | | | | | | | | | | | | | |
Consumer Discretionary | | | — | | | | 206,624 | | | | — | | | | 206,624 | |
Consumer Staples | | | — | | | | 68,522 | | | | — | | | | 68,522 | |
Energy | | | — | | | | 124,094 | | | | — | | | | 124,094 | |
Financials | | | — | | | | 24,850 | | | | — | | | | 24,850 | |
Health Care | | | — | | | | 22,467 | | | | — | | | | 22,467 | |
Industrials | | | — | | | | 43,878 | | | | — | | | | 43,878 | |
Information Technology | | | — | | | | 91,462 | | | | — | | | | 91,462 | |
Materials | | | — | | | | 43,788 | | | | — | | | | 43,788 | |
Telecommunication Services | | | — | | | | 53,232 | | | | — | | | | 53,232 | |
Utilities | | | — | | | | 109,561 | | | | — | | | | 109,561 | |
| | | | | | | | | | | | | | | | |
Total Loan Assignments | | | — | | | | 788,478 | | | | — | | | | 788,478 | |
| | | | | | | | | | | | | | | | |
Warrants | | | | | | | | | | | | | | | | |
Consumer Discretionary | | | — | | | | — | | | | — | (a) | | | — | (a) |
Energy | | | — | | | | — | | | | — | (a) | | | — | (a) |
| | | | | | | | | | | | | | | | |
Total Warrants | | | — | | | | — | | | | — | (a) | | | — | (a) |
| | | | | | | | | | | | | | | | |
Short-Term Investments | | | | | | | | | | | | | | | | |
Investment Company | | | 616,479 | | | | — | | | | — | | | | 616,479 | |
U.S. Treasury Obligations | | | — | | | | 10,304 | | | | — | | | | 10,304 | |
| | | | | | | | | | | | | | | | |
Total Investments in Securities | | $ | 639,826 | | | $ | 11,356,920 | | | $ | 70,571 | | | $ | 12,067,317 | |
| | | | | | | | | | | | | | | | |
Appreciation in Other Financial Instruments | | | | | | | | | | | | | | | | |
Swaps | | $ | — | | | $ | 9,374 | | | $ | — | | | $ | 9,374 | |
| | | | | | | | | | | | | | | | |
|
| Inflation Managed Bond Fund | |
| | | Level 1
Quoted prices | | | Level 2
Other significant
observable inputs | | | Level 3
Significant
unobservable inputs | | | Total | |
Investments in Securities | | | | | | | | | | | | | | | | |
Debt Securities | | | | | | | | | | | | | | | | |
Asset-Backed Securities | | $ | — | | | $ | 75,431 | | | $ | 15,627 | | | $ | 91,058 | |
Collateralized Mortgage Obligations | | | | | | | | | | | | | | | | |
Agency CMO | | | — | | | | 239,557 | | | | — | | | | 239,557 | |
Non-Agency CMO | | | — | | | | 6,825 | | | | 76 | | | | 6,901 | |
| | | | | | | | | | | | | | | | |
Total Collateralized Mortgage Obligations | | | — | | | | 246,382 | | | | 76 | | | | 246,458 | |
| | | | | | | | | | | | | | | | |
| | | | | | | | |
| | | |
| AUGUST 31, 2016 | | J.P. MORGAN INCOME FUNDS | | | | | 325 | |
NOTES TO FINANCIAL STATEMENTS
AS OF AUGUST 31, 2016 (Unaudited) (continued)
| | | | | | | | | | | | | | | | |
| Inflation Managed Bond Fund (continued) | | | | | | | | | | | | | |
| | | Level 1
Quoted prices | | | Level 2
Other significant
observable inputs | | | Level 3
Significant
unobservable inputs | | | Total | |
Commercial Mortgage-Backed Securities | | $ | — | | | $ | 45,231 | | | $ | 133 | | | $ | 45,364 | |
Corporate Bonds | | | | | | | | | | | | | | | | |
Consumer Discretionary | | | — | | | | 30,790 | | | | — | | | | 30,790 | |
Consumer Staples | | | — | | | | 35,141 | | | | — | | | | 35,141 | |
Energy | | | — | | | | 43,754 | | | | — | | | | 43,754 | |
Financials | | | — | | | | 152,968 | | | | — | | | | 152,968 | |
Health Care | | | — | | | | 25,925 | | | | — | | | | 25,925 | |
Industrials | | | — | | | | 51,537 | | | | — | | | | 51,537 | |
Information Technology | | | — | | | | 21,799 | | | | — | | | | 21,799 | |
Materials | | | — | | | | 13,387 | | | | — | | | | 13,387 | |
Real Estate | | | — | | | | 12,787 | | | | — | | | | 12,787 | |
Telecommunication Services | | | — | | | | 19,079 | | | | — | | | | 19,079 | |
Utilities | | | — | | | | 60,011 | | | | — | | | | 60,011 | |
| | | | | | | | | | | | | | | | |
Total Corporate Bonds | | | — | | | | 467,178 | | | | — | | | | 467,178 | |
| | | | | | | | | | | | | | | | |
Foreign Government Securities | | | — | | | | 5,109 | | | | — | | | | 5,109 | |
Mortgage Pass-Through Securities | | | — | | | | 129,062 | | | | — | | | | 129,062 | |
U.S. Government Agency Securities | | | — | | | | 224,492 | | | | — | | | | 224,492 | |
U.S. Treasury Obligations | | | — | | | | 177,942 | | | | — | | | | 177,942 | |
Short-Term Investments | | | | | | | | | | | | | | | | |
Investment Company | | | 79,811 | | | | — | | | | — | | | | 79,811 | |
| | | | | | | | | | | | | | | | |
Total Investments in Securities | | $ | 79,811 | | | $ | 1,370,827 | | | $ | 15,836 | | | $ | 1,466,474 | |
| | | | | | | | | | | | | | | | |
Appreciation in Other Financial Instruments | | | | | | | | | | | | | | | | |
Swaps | | $ | — | | | $ | 247 | | | $ | — | | | $ | 247 | |
| | | | | | | | | | | | | | | | |
Total Appreciation in Other Financial Instruments | | $ | — | | | $ | 247 | | | $ | — | | | $ | 247 | |
| | | | | | | | | | | | | | | | |
Depreciation in Other Financial Instruments | | | | | | | | | | | | | | | | |
Swaps | | $ | — | | | $ | (54,254 | ) | | $ | — | | | $ | (54,254 | ) |
| | | | | | | | | | | | | | | | |
Total Depreciation in Other Financial Instruments | | $ | — | | | $ | (54,254 | ) | | $ | — | | | $ | (54,254 | ) |
| | | | | | | | | | | | | | | | |
|
| Limited Duration Bond Fund | |
| | | Level 1
Quoted prices | | | Level 2
Other significant
observable inputs | | | Level 3
Significant
unobservable inputs | | | Total | |
Investments in Securities | | | | | | | | | | | | | | | | |
Debt Securities | | | | | | | | | | | | | | | | |
Asset-Backed Securities | | $ | — | | | $ | 182,021 | | | $ | 66,043 | | | $ | 248,064 | |
Collateralized Mortgage Obligations | | | | | | | | | | | | | | | | |
Agency CMO | | | — | | | | 623,945 | | | | — | | | | 623,945 | |
Non-Agency CMO | | | — | | | | 56,414 | | | | 15,935 | | | | 72,349 | |
| | | | | | | | | | | | | | | | |
Total Collateralized Mortgage Obligations | | | — | | | | 680,359 | | | | 15,935 | | | | 696,294 | |
| | | | | | | | | | | | | | | | |
Commercial Mortgage-Backed Securities | | | — | | | | 34,316 | | | | 6,138 | | | | 40,454 | |
Corporate Bonds | | | | | | | | | | | | | | | | |
Consumer Discretionary | | | — | | | | 4,009 | | | | — | | | | 4,009 | |
Consumer Staples | | | — | | | | 610 | | | | — | | | | 610 | |
Energy | | | — | | | | 20,584 | | | | — | | | | 20,584 | |
Financials | | | — | | | | 64,255 | | | | — | | | | 64,255 | |
Health Care | | | — | | | | 4,824 | | | | — | | | | 4,824 | |
Industrials | | | — | | | | 2,226 | | | | — | | | | 2,226 | |
Information Technology | | | — | | | | 7,598 | | | | — | | | | 7,598 | |
Telecommunication Services | | | — | | | | 4,337 | | | | — | | | | 4,337 | |
Utilities | | | — | | | | 4,922 | | | | — | | | | 4,922 | |
| | | | | | | | | | | | | | | | |
Total Corporate Bonds | | | — | | | | 113,365 | | | | — | | | | 113,365 | |
| | | | | | | | | | | | | | | | |
| | | | | | |
| | | |
| 326 | | | | J.P. MORGAN INCOME FUNDS | | AUGUST 31, 2016 |
| | | | | | | | | | | | | | | | |
| Limited Duration Bond Fund (continued) | | | | | | | | | | | | | |
| | | Level 1
Quoted prices | | | Level 2
Other significant
observable inputs | | | Level 3
Significant
unobservable inputs | | | Total | |
Mortgage Pass-Through Securities | | $ | — | | | $ | 50,416 | | | $ | — | | | $ | 50,416 | |
Municipal Bond | | | — | | | | 870 | | | | — | | | | 870 | |
Short-Term Investment | | | | | | | | | | | | | | | | |
Investment Company | | | 106,063 | | | | — | | | | — | | | | 106,063 | |
| | | | | | | | | | | | | | | | |
Total Investments in Securities | | $ | 106,063 | | | $ | 1,061,347 | | | $ | 88,116 | | | $ | 1,255,526 | |
| | | | | | | | | | | | | | | | |
| | | | |
| Mortgage-Backed Securities Fund | | | | | �� | | | | | | | | | | | |
| | | Level 1
Quoted prices | | | Level 2
Other significant
observable inputs | | | Level 3
Significant
unobservable inputs | | | Total | |
Investments in Securities | | | | | | | | | | | | | | | | |
Debt Securities | | | | | | | | | | | | | | | | |
Asset-Backed Securities | | $ | — | | | $ | 115,897 | | | $ | 143,455 | | | $ | 259,352 | |
Collateralized Mortgage Obligations | | | | | | | | | | | | | | | | |
Agency CMO | | | — | | | | 872,802 | | | | 5 | | | | 872,807 | |
Non-Agency CMO | | | — | | | | 161,820 | | | | 38,619 | | | | 200,439 | |
| | | | | | | | | | | | | | | | |
Total Collateralized Mortgage Obligations | | | — | | | | 1,034,622 | | | | 38,624 | | | | 1,073,246 | |
| | | | | | | | | | | | | | | | |
Commercial Mortgage-Backed Securities | | | — | | | | 124,281 | | | | 19,694 | | | | 143,975 | |
Mortgage Pass-Through Securities | | | — | | | | 1,100,967 | | | | — | | | | 1,100,967 | |
U.S. Treasury Obligations | | | — | | | | 27,481 | | | | — | | | | 27,481 | |
Loan Assignment | | | | | | | | | | | | | | | | |
Consumer Discretionary | | | — | | | | 5,333 | | | | — | | | | 5,333 | |
Short-Term Investment | | | | | | | | | | | | | | | | |
Investment Company | | | 188,596 | | | | — | | | | — | | | | 188,596 | |
| | | | | | | | | | | | | | | | |
Total Investments in Securities | | $ | 188,596 | | | $ | 2,408,581 | | | $ | 201,773 | | | $ | 2,798,950 | |
| | | | | | | | | | | | | | | | |
|
| Short Duration Bond Fund | |
| | | Level 1
Quoted prices | | | Level 2
Other significant
observable inputs | | | Level 3
Significant
unobservable inputs | | | Total | |
Investments in Securities | | | | | | | | | | | | | | | | |
Debt Securities | | | | | | | | | | | | | | | | |
Asset-Backed Securities | | $ | — | | | $ | 835,849 | | | $ | 145,040 | | | $ | 980,889 | |
Collateralized Mortgage Obligations | | | | | | | | | | | | | | | | |
Agency CMO | | | — | | | | 404,629 | | | | — | | | | 404,629 | |
Non-Agency CMO | | | — | | | | 51,663 | | | | 4,341 | | | | 56,004 | |
| | | | | | | | | | | | | | | | |
Total Collateralized Mortgage Obligations | | | — | | | | 456,292 | | | | 4,341 | | | | 460,633 | |
| | | | | | | | | | | | | | | | |
Commercial Mortgage-Backed Securities | | | — | | | | 134,337 | | | | 840 | | | | 135,177 | |
Corporate Bonds | | | | | | | | | | | | | | | | |
Consumer Discretionary | | | — | | | | 101,886 | | | | — | | | | 101,886 | |
Consumer Staples | | | — | | | | 113,966 | | | | — | | | | 113,966 | |
Energy | | | — | | | | 230,615 | | | | — | | | | 230,615 | |
Financials | | | — | | | | 1,342,213 | | | | — | | | | 1,342,213 | |
Health Care | | | — | | | | 172,161 | | | | — | | | | 172,161 | |
Industrials | | | — | | | | 134,185 | | | | — | | | | 134,185 | |
Information Technology | | | — | | | | 49,910 | | | | — | | | | 49,910 | |
Materials | | | — | | | | 39,202 | | | | — | | | | 39,202 | |
Real Estate | | | — | | | | 42,113 | | | | — | | | | 42,113 | |
Telecommunication Services | | | — | | | | 127,219 | | | | — | | | | 127,219 | |
Utilities | | | — | | | | 134,915 | | | | — | | | | 134,915 | |
| | | | | | | | | | | | | | | | |
Total Corporate Bonds | | | — | | | | 2,488,385 | | | | — | | | | 2,488,385 | |
| | | | | | | | | | | | | | | | |
| | | | | | | | |
| | | |
| AUGUST 31, 2016 | | J.P. MORGAN INCOME FUNDS | | | | | 327 | |
NOTES TO FINANCIAL STATEMENTS
AS OF AUGUST 31, 2016 (Unaudited) (continued)
| | | | | | | | | | | | | | | | |
| Short Duration Bond Fund (continued) | | | | | | | | | | | | | |
| | | Level 1
Quoted prices | | | Level 2
Other significant
observable inputs | | | Level 3
Significant
unobservable inputs | | | Total | |
Mortgage Pass-Through Securities | | $ | — | | | $ | 288,697 | | | $ | — | | | $ | 288,697 | |
U.S. Government Agency Securities | | | — | | | | 427,238 | | | | — | | | | 427,238 | |
U.S. Treasury Obligations | | | — | | | | 6,228,287 | | | | — | | | | 6,228,287 | |
Short-Term Investment | | | | | | | | | | | | | | | | |
Investment Company | | | 42,185 | | | | — | | | | — | | | | 42,185 | |
| | | | | | | | | | | | | | | | |
Total Investments in Securities | | $ | 42,185 | | | $ | 10,859,085 | | | $ | 150,221 | | | $ | 11,051,491 | |
| | | | | | | | | | | | | | | | |
|
| Short Duration High Yield Fund | |
| | | Level 1
Quoted prices | | | Level 2
Other significant
observable inputs | | | Level 3
Significant
unobservable inputs | | | Total | |
Investments in Securities | | | | | | | | | | | | | | | | |
Debt Securities | | | | | | | | | | | | | | | | |
Corporate Bonds | | | | | | | | | |
Consumer Discretionary | | $ | — | | | $ | 24,646 | | | $ | — | | | $ | 24,646 | |
Consumer Staples | | | — | | | | 6,346 | | | | — | | | | 6,346 | |
Energy | | | — | | | | 13,056 | | | | — | | | | 13,056 | |
Financials | | | — | | | | 7,822 | | | | — | | | | 7,822 | |
Health Care | | | — | | | | 14,229 | | | | — | | | | 14,229 | |
Industrials | | | — | | | | 11,637 | | | | — | | | | 11,637 | |
Information Technology | | | — | | | | 7,301 | | | | — | | | | 7,301 | |
Materials | | | — | | | | 14,898 | | | | — | | | | 14,898 | |
Real Estate | | | — | | | | 1,434 | | | | — | | | | 1,434 | |
Telecommunication Services | | | — | | | | 13,870 | | | | — | | | | 13,870 | |
Utilities | | | — | | | | 6,370 | | | | — | | | | 6,370 | |
| | | | | | | | | | | | | | | | |
Total Corporate Bonds | | | — | | | | 121,609 | | | | — | | | | 121,609 | |
| | | | | | | | | | | | | | | | |
Preferred Securities | | | | | | | | | | | | | | | | |
Financials | | | — | | | | 1,352 | | | | — | | | | 1,352 | |
Common Stock | | | | | | | | | |
Energy | | | — | | | | — | | | | 33 | | | | 33 | |
Preferred Stocks | | | | | | | | | | | | | | | | |
Financials | | | 591 | | | | — | | | | 794 | | | | 1,385 | |
Loan Assignments | | | | | | | | | | | | | | | | |
Consumer Discretionary | | | — | | | | 11,732 | | | | — | | | | 11,732 | |
Consumer Staples | | | — | | | | 5,574 | | | | — | | | | 5,574 | |
Energy | | | — | | | | 3,479 | | | | — | | | | 3,479 | |
Financials | | | — | | | | 1,415 | | | | — | | | | 1,415 | |
Health Care | | | — | | | | 2,555 | | | | — | | | | 2,555 | |
Industrials | | | — | | | | 2,360 | | | | — | | | | 2,360 | |
Materials | | | — | | | | 2,280 | | | | — | | | | 2,280 | |
Real Estate | | | — | | | | 543 | | | | — | | | | 543 | |
Telecommunication Services | | | — | | | | 2,523 | | | | — | | | | 2,523 | |
Utilities | | | — | | | | 2,193 | | | | — | | | | 2,193 | |
| | | | | | | | | | | | | | | | |
Total Loan Assignments | | | — | | | | 34,654 | | | | — | | | | 34,654 | |
| | | | | | | | | | | | | | | | |
Short-Term Investment | | | | | | | | | | | | | | | | |
Investment Company | | | 5,501 | | | | — | | | | — | | | | 5,501 | |
| | | | | | | | | | | | | | | | |
Total Investments in Securities | | $ | 6,092 | | | $ | 157,615 | | | $ | 827 | | | $ | 164,534 | |
| | | | | | | | | | | | | | | | |
| | | | | | |
| | | |
| 328 | | | | J.P. MORGAN INCOME FUNDS | | AUGUST 31, 2016 |
| | | | | | | | | | | | | | | | |
| Treasury & Agency Fund | | | | | | | | | | | | | | | | |
| | | Level 1
Quoted prices | | | Level 2
Other significant
observable inputs | | | Level 3
Significant
unobservable inputs | | | Total | |
Total Investments in Securities (c) | | $ | 1,078 | | | $ | 101,633 | | | $ | — | | | $ | 102,711 | |
| | | | | | | | | | | | | | | | |
| (a) | Amount rounds to less than 500. |
| (c) | Portfolio holdings designated as level 1 and level 2 are disclosed individually on the SOIs. Level 1 consists of a money market mutual fund that is held for daily investments of cash. Please refer to the SOIs for industry specifics of portfolio holdings. |
Transfers between fair value levels are valued utilizing values as of the beginning of the year.
There were no transfers between level 1 and level 2 during the six months ended August 31, 2016.
The following is a summary of investments for which significant unobservable inputs (level 3) were used in determining fair value (amounts in thousands):
| | | | | | | | | | | | | | | | | | | | | | | | | | | | | | | | | | | | |
| Core Bond Fund | | Balance as of February 29,
2016 | | | Realized
gain (loss) | | | Change in net
unrealized
appreciation
(depreciation) | | | Net accretion
(amortization) | | | Purchases1 | | | Sales2 | | | Transfers
into Level 3 | | | Transfers out of Level 3 | | | Balance as of August 31,
2016 | |
Investments in Securities | | | | | | | | | | | | | | | | | | | | | | | | | | | | | | | | | | | | |
Asset-Backed Securities | | $ | 291,801 | | | $ | — | | | $ | 9,087 | | | $ | (3,468 | ) | | $ | 118,207 | | | $ | (163,285 | ) | | $ | 746,734 | | | $ | (10,499 | ) | | $ | 988,577 | |
Collateralized Mortgage Obligations — Agency CMO | | | — | | | | — | | | | 12 | | | | — | | | | — | (b) | | | — | | | | — | | | | — | | | | 12 | |
Collateralized Mortgage Obligations —
Non-Agency CMO | | | 67,974 | | | | — | (a) | | | (1,331 | ) | | | (359 | ) | | | 32,002 | | | | (12,056 | ) | | | 38,080 | | | | (3,436 | ) | | | 120,874 | |
Commercial Mortgage-Backed Securities | | | 106,750 | | | | — | | | | (634 | ) | | | (7,462 | ) | | | — | | | | (5,675 | ) | | | — | | | | (1,570 | ) | | | 91,409 | |
Loan Assignment — Financials | | | 10,289 | | | | — | | | | 52 | | | | — | (a) | | | 995 | | | | (11,336 | ) | | | — | | | | — | | | | — | |
| | | | | | | | | | | | | | | | | | | | | | | | | | | | | | | | | | | | |
Total | | $ | 476,814 | | | $ | — | | | $ | 7,186 | | | $ | (11,289 | ) | | $ | 151,204 | | | $ | (192,352 | ) | | $ | 784,814 | | | $ | (15,505 | ) | | $ | 1,200,872 | |
| | | | | | | | | | | | | | | | | | | | | | | | | | | | | | | | | | | | |
| | | | | | | | | | | | | | | | | | | | | | | | | | | | | | | | | | | | |
| Core Plus Bond Fund | | Balance as of
February 29,
2016 | | | Realized
gain
(loss) | | | Change in net
unrealized
appreciation
(depreciation) | | | Net accretion
(amortization) | | | Purchases1 | | | Sales2 | | | Transfers
into Level 3 | | | Transfers out of Level 3 | | | Balance as of August 31,
2016 | |
Investments in Securities | | | | | | | | | | | | | | | | | | | | | | | | | | | | | | | | | | | | |
Asset-Backed Securities | | $ | 106,212 | | | $ | — | | | $ | 2,865 | | | $ | (792 | ) | | $ | 68,318 | | | $ | (60,905 | ) | | $ | 218,094 | | | $ | — | | | $ | 333,792 | |
Collateralized Mortgage Obligations —
Non-Agency CMO | | | 12,664 | | | | — | (a) | | | (132 | ) | | | (26 | ) | | | 4,830 | | | | (3,456 | ) | | | 4,172 | | | | (117 | ) | | | 17,935 | |
Commercial Mortgage-Backed Securities | | | 66,932 | | | | 33 | | | | 2,626 | | | | (1,336 | ) | | | 10,400 | | | | (6,727 | ) | | | — | | | | (820 | ) | | | 71,108 | |
Common Stocks — Consumer Discretionary | | | 76 | | | | — | | | | (33 | ) | | | — | | | | — | | | | — | | | | — | | | | — | | | | 43 | |
Common Stocks — Financials | | | 165 | | | | 44 | | | | (59 | ) | | | — | | | | 528 | | | | (662 | ) | | | — | | | | — | | | | 16 | |
Common Stocks — Materials | | | — | (a) | | | — | | | | — | | | | — | | | | — | | | | — | | | | — | | | | — | | | | — | (a) |
Convertible Bonds — Consumer Discretionary | | | — | (b) | | | (104 | ) | | | 104 | | | | — | | | | — | | | | — | | | | — | | | | — | | | | — | (a) |
Convertible Bonds — Utilities | | | 511 | | | | 247 | | | | (245 | ) | | | — | | | | — | | | | (513 | ) | | | — | | | | — | | | | — | |
Corporate Bonds — Consumer Discretionary | | | 1,165 | | | | (61 | ) | | | (513 | ) | | | 2 | | | | — | (a) | | | (475 | ) | | | — | | | | — | | | | 118 | |
Corporate Bonds —
Energy | | | — | | | | (214 | ) | | | 907 | | | | 123 | | | | 7,684 | | | | (182 | ) | | | 665 | | | | — | | | | 8,983 | |
| | | | | | | | |
| | | |
| AUGUST 31, 2016 | | J.P. MORGAN INCOME FUNDS | | | | | 329 | |
NOTES TO FINANCIAL STATEMENTS
AS OF AUGUST 31, 2016 (Unaudited) (continued)
| | | | | | | | | | | | | | | | | | | | | | | | | | | | | | | | | | | | |
| Core Plus Bond Fund | | Balance as of
February 29,
2016 | | | Realized
gain
(loss) | | | Change in net
unrealized
appreciation
(depreciation) | | | Net accretion
(amortization) | | | Purchases1 | | | Sales2 | | | Transfers
into Level 3 | | | Transfers out of Level 3 | | | Balance as of August 31,
2016 | |
Corporate Bonds — Industrials | | $ | 596 | | | $ | — | | | $ | — | | | $ | — | | | $ | — | | | $ | — | | | $ | — | | | $ | (596 | ) | | $ | — | (a) |
Corporate Bonds — Materials | | | 538 | | | | (85 | ) | | | 131 | | | | (2 | ) | | | — | | | | (532 | ) | | | — | | | | — | | | | 50 | |
Loan Assignment — Consumer Discretionary | | | — | (a) | | | — | | | | — | | | | — | | | | — | | | | — | | | | — | | | | — | | | | — | (a) |
Preferred Stocks — Financials | | | — | | | | — | | | | (53 | ) | | | — | | | | — | | | | — | | | | 1,939 | | | | — | | | | 1,886 | |
Preferred Stocks — Materials | | | — | (b) | | | — | | | | — | | | | — | | | | — | | | | — | | | | — | | | | — | | | | — | (b) |
Warrants — Consumer Discretionary | | | — | (a) | | | — | | | | — | | | | — | | | | — | | | | — | | | | — | | | | — | | | | — | (a) |
Warrants — Energy | | | — | (a) | | | — | | | | 576 | | | | — | | | | — | | | | — | | | | — | | | | — | | | | 576 | |
| | | | | | | | | | | | | | | | | | | | | | | | | | | | | | | | | | | | |
Total | | $ | 188,859 | | | $ | (140 | ) | | $ | 6,174 | | | $ | (2,031 | ) | | $ | 91,760 | | | $ | (73,452 | ) | | $ | 224,870 | | | $ | (1,533 | ) | | $ | 434,507 | |
| | | | | | | | | | | | | | | | | | | | | | | | | | | | | | | | | | | | |
| | | | | | | | | | | | | | | | | | | | | | | | | | | | | | | | | | | | |
| High Yield Fund | | Balance as of
February 29,
2016 | | | Realized
gain
(loss) | | | Change in net
unrealized
appreciation
(depreciation) | | | Net accretion
(amortization) | | | Purchases1 | | | Sales2 | | | Transfers
into Level 3 | | | Transfers out of Level 3 | | | Balance as of August 31,
2016 | |
Investments in Securities | | | | | | | | | | | | | | | | | | | | | | | | | | | | | | | | | | | | |
Asset-Backed Securities | | $ | 2,424 | | | $ | — | | | $ | 178 | | | $ | (29 | ) | | $ | — | (a) | | $ | (809 | ) | | $ | — | | | $ | — | | | $ | 1,764 | |
Common Stocks — Consumer Discretionary | | | 1,355 | | | | — | | | | 117 | | | | — | | | | — | | | | — | | | | — | | | | — | | | | 1,472 | |
Common Stocks — Financials | | | 2,465 | | | | 656 | | | | (878 | ) | | | — | | | | 7,753 | | | | (9,925 | ) | | | — | | | | — | | | | 71 | |
Common Stocks — Materials | | | — | (a) | | | — | | | | — | | | | — | | | | — | | | | — | | | | — | | | | — | | | | — | (a) |
Convertible Bonds — Consumer Discretionary | | | — | (a) | | | (1,654 | ) | | | 1,654 | | | | — | | | | — | | | | — | (a) | | | — | | | | — | | | | — | |
Convertible Bonds — Utilities | | | 7,656 | | | | 3,694 | | | | (3,668 | ) | | | — | | | | — | | | | (7,682 | ) | | | — | | | | — | | | | — | |
Corporate Bonds — Consumer Discretionary | | | 14,819 | | | | (786 | ) | | | 229 | | | | 7 | | | | 1 | | | | (12,326 | ) | | | 3,900 | | | | — | | | | 5,844 | |
Corporate Bonds — Energy | | | 9,600 | | | | (3,435 | ) | | | 11,658 | | | | 13 | | | | — | | | | (3,108 | ) | | | 13,701 | | | | (9,600 | ) | | | 18,829 | |
Corporate Bonds — Financials | | | 8,426 | | | | — | | | | (9 | ) | | | 8 | | | | — | | | | (772 | ) | | | — | | | | — | | | | 7,653 | |
Corporate Bonds —
Health Care | | | 1 | | | | — | | | | — | | | | — | | | | — | | | | — | | | | — | | | | — | | | | 1 | |
Corporate Bonds — Industrials | | | 25,565 | | | | (45 | ) | | | 45 | | | | — | | | | — | | | | (4,488 | ) | | | — | | | | (21,077 | ) | | | — | (a) |
Corporate Bonds — Materials | | | 6,962 | | | | — | | | | — | | | | — | | | | — | | | | — | | | | — | | | | (6,638 | ) | | | 324 | |
Corporate Bonds — Telecommunication Services | | | 5,626 | | | | — | | | | (46 | ) | | | 49 | | | | 2,661 | | | | — | | | | — | | | | — | | | | 8,290 | |
Loan Assignments — Industrials | | | 1,384 | | | | (205 | ) | | | 174 | | | | 1 | | | | — | | | | (1,354 | ) | | | — | | | | — | | | | — | |
Loan Assignments — Materials | | | 9,121 | | | | — | | | | 926 | | | | (2 | ) | | | — | | | | (10,045 | ) | | | — | | | | — | | | | — | |
Preferred Stocks — Financials | | | — | | | | — | | | | (747 | ) | | | — | | | | — | | | | — | | | | 27,070 | | | | — | | | | 26,323 | |
Preferred Stocks — Materials | | | — | (a) | | | — | | | | — | | | | — | | | | — | | | | — | | | | — | | | | — | | | | — | (a) |
Warrants — Consumer Discretionary | | | — | (a) | | | — | | | | — | | | | — | | | | — | | | | — | | | | — | | | | — | | | | — | (a) |
Warrants — Energy | | | — | (a) | | | — | | | | — | (a) | | | — | | | | — | | | | — | | | | — | | | | — | | | | — | (a) |
| | | | | | | | | | | | | | | | | | | | | | | | | | | | | | | | | | | | |
Total | | $ | 95,404 | | | $ | (1,775 | ) | | $ | 9,633 | | | $ | 47 | | | $ | 10,415 | | | $ | (50,509 | ) | | $ | 44,671 | | | $ | (37,315 | ) | | $ | 70,571 | |
| | | | | | | | | | | | | | | | | | | | | | | | | | | | | | | | | | | | |
| | | | | | |
| | | |
| 330 | | | | J.P. MORGAN INCOME FUNDS | | AUGUST 31, 2016 |
| | | | | | | | | | | | | | | | | | | | | | | | | | | | | | | | | | | | |
| Inflation Managed Bond Fund | | Balance as of
February 29,
2016 | | | Realized
gain
(loss) | | | Change in net
unrealized
appreciation
(depreciation) | | | Net accretion
(amortization) | | | Purchases1 | | | Sales2 | | | Transfers
into Level 3 | | | Transfers out of Level 3 | | | Balance as of August 31,
2016 | |
Investments in Securities | | | | | | | | | | | | | | | | | | | | | | | | | | | | | | | | | | | | |
Asset-Backed Securities | | $ | 3,402 | | | $ | — | | | $ | 155 | | | $ | 1 | | | $ | — | | | $ | (3,828 | ) | | $ | 15,897 | | | $ | — | | | $ | 15,627 | |
Collateralized Mortgage Obligation —
Non-Agency CMO | | | 82 | | | | — | | | | — | (a) | | | — | (a) | | | — | | | | (6 | ) | | | — | | | | — | | | | 76 | |
Commercial Mortgage-Backed Securities | | | 559 | | | | — | | | | (2 | ) | | | (139 | ) | | | — | | | | (285 | ) | | | — | | | | — | | | | 133 | |
| | | | | | | | | | | | | | | | | | | | | | | | | | | | | | | | | | | | |
Total | | $ | 4,043 | | | $ | — | | | $ | 153 | | | $ | (138 | ) | | $ | — | | | $ | (4,119 | ) | | $ | 15,897 | | | $ | — | | | $ | 15,836 | |
| | | | | | | | | | | | | | | | | | | | | | | | | | | | | | | | | | | | |
| | | | | | | | | | | | | | | | | | | | | | | | | | | | | | | | | | | | |
| Limited Duration Bond Fund | | Balance as of
February 29,
2016 | | | Realized
gain
(loss) | | | Change in net
unrealized
appreciation
(depreciation) | | | Net accretion
(amortization) | | | Purchases1 | | | Sales2 | | | Transfers
into Level 3 | | | Transfers out of Level 3 | | | Balance as of August 31,
2016 | |
Investments in Securities | | | | | | | | | | | | | | | | | | | | | | | | | | | | | | | | | | | | |
Asset-Backed Securities | | $ | 41,425 | | | $ | — | | | $ | 962 | | | $ | 18 | | | $ | — | (a) | | $ | (12,425 | ) | | $ | 36,063 | | | $ | — | | | $ | 66,043 | |
Collateralized Mortgage Obligations —
Non-Agency CMO | | | 17,334 | | | | — | | | | 134 | | | | (4 | ) | | | — | | | | (4,042 | ) | | | 2,513 | | | | — | | | | 15,935 | |
Commercial Mortgage-Backed Securities | | | 6,074 | | | | — | | | | 81 | | | | — | | | | — | | | | (17 | ) | | | — | | | | — | | | | 6,138 | |
| | | | | | | | | | | | | | | | | | | | | | | | | | | | | | | | | | | | |
Total | | $ | 64,833 | | | $ | — | | | $ | 1,177 | | | $ | 14 | | | $ | — | | | $ | (16,484 | ) | | $ | 38,576 | | | $ | — | | | $ | 88,116 | |
| | | | | | | | | | | | | | | | | | | | | | | | | | | | | | | | | | | | |
| | | | | | | | | | | | | | | | | | | | | | | | | | | | | | | | | | | | |
| Mortgage-Backed Securities Fund | | Balance as of
February 29,
2016 | | | Realized
gain
(loss) | | | Change in net
unrealized
appreciation
(depreciation) | | | Net accretion
(amortization) | | | Purchases1 | | | Sales2 | | | Transfers
into Level 3 | | | Transfers out of Level 3 | | | Balance as of August 31,
2016 | |
Investments in Securities | | | | | | | | | | | | | | | | | | | | | | | | | | | | | | | | | | | | |
Asset-Backed Securities | | $ | 42,546 | | | $ | — | | | $ | 2,031 | | | $ | (286 | ) | | $ | 43,527 | | | $ | (15,920 | ) | | $ | 74,517 | | | $ | (2,960 | ) | | $ | 143,455 | |
Collateralized Mortgage Obligations —
Agency CMO | | | — | | | | — | | | | 5 | | | | — | | | | — | | | | — | | | | — | | | | — | | | | 5 | |
Collateralized Mortgage Obligations —
Non-Agency CMO | | | 33,778 | | | | — | | | | (1,160 | ) | | | (167 | ) | | | 3,152 | | | | (4,062 | ) | | | 8,809 | | | | (1,731 | ) | | | 38,619 | |
Commercial Mortgage-Backed Securities | | | 16,470 | | | | — | | | | 185 | | | | (372 | ) | | | 4,376 | | | | (265 | ) | | | — | | | | (700 | ) | | | 19,694 | |
Loan Assignment — Financials | | | 704 | | | | — | | | | 4 | | | | — | (a) | | | 68 | | | | (776 | ) | | | — | | | | — | | | | — | |
| | | | | | | | | | | | | | | | | | | | | | | | | | | | | | | | | | | | |
Total | | $ | 93,498 | | | $ | — | | | $ | 1,065 | | | $ | (825 | ) | | $ | 51,123 | | | $ | (21,023 | ) | | $ | 83,326 | | | $ | (5,391 | ) | | $ | 201,773 | |
| | | | | | | | | | | | | | | | | | | | | | | | | | | | | | | | | | | | |
| | | | | | | | | | | | | | | | | | | | | | | | | | | | | | | | | | | | |
| Short Duration Bond Fund | | Balance as of
February 29,
2016 | | | Realized
gain
(loss) | | | Change in net
unrealized
appreciation
(depreciation) | | | Net
accretion
(amortization) | | | Purchases1 | | | Sales2 | | | Transfers
into Level 3 | | | Transfers out of Level 3 | | | Balance as of August 31,
2016 | |
Investments in Securities | | | | | | | | | | | | | | | | | | | | | | | | | | | | | | | | | | | | |
Asset-Backed Securities | | $ | 25,508 | | | $ | — | | | $ | 1,134 | | | $ | 22 | | | $ | 10,210 | | | $ | (30,274 | ) | | $ | 138,448 | | | $ | (8 | ) | | $ | 145,040 | |
Collateralized Mortgage Obligations — Non-Agency CMO | | | — | (a) | | | — | | | | 59 | | | | — | (a) | | | — | | | | (772 | ) | | | 5,054 | | | | — | | | | 4,341 | |
Commercial Mortgage-Backed Securities | | | 7,890 | | | | — | | | | (14 | ) | | | — | (a) | | | — | | | | (7,036 | ) | | | — | | | | — | | | | 840 | |
Loan Assignment — Financials | | | 2,638 | | | | — | | | | 13 | | | | — | (a) | | | 255 | | | | (2,906 | ) | | | — | | | | — | | | | — | |
| | | | | | | | | | | | | | | | | | | | | | | | | | | | | | | | | | | | |
Total | | $ | 36,036 | | | $ | — | | | $ | 1,192 | | | $ | 22 | | | $ | 10,465 | | | $ | (40,988 | ) | | $ | 143,502 | | | $ | (8 | ) | | $ | 150,221 | |
| | | | | | | | | | | | | | | | | | | | | | | | | | | | | | | | | | | | |
| | | | | | | | |
| | | |
| AUGUST 31, 2016 | | J.P. MORGAN INCOME FUNDS | | | | | 331 | |
NOTES TO FINANCIAL STATEMENTS
AS OF AUGUST 31, 2016 (Unaudited) (continued)
| | | | | | | | | | | | | | | | | | | | | | | | | | | | | | | | | | | | |
| Short Duration High Yield Fund | | Balance as of
February 29,
2016 | | | Realized
gain
(loss) | | | Change in net
unrealized
appreciation
(depreciation) | | | Net
accretion
(amortization) | | | Purchases1 | | | Sales2 | | | Transfers
into Level 3 | | | Transfers out of Level 3 | | | Balance as of August 31,
2016 | |
Investments in Securities | | | | | | | | | | | | | | | | | | | | | | | | | | | | | | | | | | | | |
Corporate Bonds — Industrials | | $ | 525 | | | $ | (16 | ) | | $ | 24 | | | $ | (8 | ) | | $ | — | | | $ | (525 | ) | | $ | — | | | $ | — | | | $ | — | |
Corporate Bonds — Materials | | | 536 | | | | — | | | | — | | | | — | | | | — | | | | — | | | | — | | | | (536 | ) | | | — | |
Loan Assignments — Industrials | | | 194 | | | | — | | | | — | | | | — | | | | — | | | | — | | | | — | | | | (194 | ) | | | — | |
Loan Assignments — Materials | | | 208 | | | | 9 | | | | 21 | | | | — | (a) | | | — | | | | (238 | ) | | | — | | | | — | | | | — | |
Common Stock —
Energy | | | — | | | | — | | | | 2 | | | | — | | | | 31 | | | | — | | | | — | | | | — | | | | 33 | |
Preferred Stock — Financials | | | — | | | | — | | | | (22 | ) | | | — | | | | — | | | | — | | | | 816 | | | | — | | | | 794 | |
| | | | | | | | | | | | | | | | | | | | | | | | | | | | | | | | | | | | |
Total | | $ | 1,463 | | | $ | (7 | ) | | $ | 25 | | | $ | (8 | ) | | $ | 31 | | | $ | (763 | ) | | $ | 816 | | | $ | (730 | ) | | $ | 827 | |
| | | | | | | | | | | | | | | | | | | | | | | | | | | | | | | | | | | | |
| 1 | Purchases include all purchases of securities and securities received in corporate actions. |
| 2 | Sales include all sales of securities, maturities, paydowns and securities tendered in corporate actions. |
| (a) | Amount rounds to less than 500. |
Transfers between level 2 and level 3 are due to a decline or an increase in market activity (e.g. frequency of trades), which resulted in a lack or increase of available market inputs to determine the price for the six months ended August 31, 2016 for Core Bond Fund, Core Plus Bond Fund, Inflation Managed Bond Fund, Limited Duration Bond Fund, Mortgage-Backed Securities Fund, Short Duration Bond Fund and Short Duration High Yield Fund.
There were no significant transfers among any levels during the six months ended August 31, 2016 for High Yield Fund.
The changes in net unrealized appreciation (depreciation) attributable to securities owned at August 31, 2016, which were valued using significant unobservable inputs (level 3), were as follows (amounts in thousands):
| | | | |
Core Bond Fund | | $ | 9,207 | |
Core Plus Bond Fund | | | 6,805 | |
High Yield Fund | | | 10,895 | |
Inflation Managed Bond Fund | | | 168 | |
Limited Duration Bond Fund | | | 1,177 | |
Mortgage-Backed Securities Fund | | | 1,134 | |
Short Duration Bond Fund | | | 1,192 | |
Short Duration High Yield Fund | | | (20 | ) |
These amounts are included in Change in net unrealized appreciation/depreciation of investments in non-affiliates on the Statements of Operations.
| | | | | | |
| | | |
| 332 | | | | J.P. MORGAN INCOME FUNDS | | AUGUST 31, 2016 |
Core Bond Fund
Quantitative Information about Level 3 Fair Value Measurements #
(Amounts in thousands)
| | | | | | | | | | | | |
| | | Fair Value at
August 31, 2016 | | | Valuation Technique(s) | | Unobservable Input | | Range (Weighted Average) | |
| | $ | 695,517 | | | Discounted Cash Flow | | Constant Prepayment Rate | | | 0.00% - 30.00% (3.10%) | |
| | | | | | | | Constant Default Rate | | | 0.00% - 50.00% (13.76%) | |
| | | | | | | | Yield (Discount Rate of Cash Flows) | | | 1.39% - 7.80% (3.80%) | |
| | | | | | | | Projected Principal Writedown | | | 83.00% (83.00%) | |
| | | | | | | | | | | | |
| Asset-Backed Securities | | | 695,517 | | | | | | | | | |
| | | | | | | | | | | | |
| | | 101,482 | | | Discounted Cash Flow | | PSA Prepayment Model | | | 393.00% (393.00%) | |
| | | | | | | | Constant Prepayment Rate | | | 1.00% - 37.14% (10.63%) | |
| | | | | | | | Constant Default Rate | | | 0.00% - 9.64% (2.81%) | |
| | | | | | | | Yield (Discount Rate of Cash Flows) | | | 0.61% - 142.13% (5.35%) | |
| | | | | | | | | | | | |
| Collateralized Mortgage Obligations | | | 101,482 | | | | | | | | | |
| | | | | | | | | | | | |
| | | 59,425 | | | Discounted Cash Flow | | Constant Prepayment Rate | | | 0.00% - 100.00% (22.24%) | |
| | | | | | | | Yield (Discount Rate of Cash Flows) | | | (10.90%) - 30.76% (4.31%) | |
| | | | | | | | | | | | |
| Commercial Mortgage-Backed Securities | | | 59,425 | | | | | | | | | |
| | | | | | | | | | | | |
| Total | | $ | 856,424 | | | | | | | | | |
| | | | | | | | | | | | |
| # | The table above does not include certain level 3 investments that are valued by brokers and pricing services. At August 31, 2016, the value of these investments was approximately $344,448,000. The inputs for these investments are not readily available or cannot be reasonably estimated and are generally those inputs described in Note 2.A. |
The significant unobservable inputs used in the fair value measurement of the Fund’s investments are listed above. Generally, a change in the assumptions used in any input in isolation may be accompanied by a change in another input. Significant changes in any of the unobservable inputs may significantly impact the fair value measurement. The impact is based on the relationship between each unobservable input and the fair value measurement. Significant increases (decreases) in the yield and default rate may decrease (increase) the fair value measurement. A significant change in the prepayment rate (Constant Prepayment Rate or PSA Prepayment Model) may decrease or increase the fair value measurement.
Core Plus Bond Fund
Quantitative Information about Level 3 Fair Value Measurements #
(Amounts in thousands)
| | | | | | | | | | | | |
| | | Fair Value at
August 31, 2016 | | | Valuation Technique(s) | | Unobservable Input | | Range (Weighted Average) | |
| | $ | 16 | | | Terms of Exchange Offer | | Expected Recovery | | | $0.01 ($0.01) | |
| | | — | (a) | | Pending Distribution Amount | | Discount for potential outcome (b) | | | 100.00% (100.00%) | |
| | | | | | | | | | | | |
| Common Stock | | | 16 | | | | | | | | | |
| | | | | | | | | | | | |
| | | 1,886 | | | Discounted Cash Flow | | Yield (Discount Rate of Cash Flows) | | | 4.73% (4.73%) | |
| | | — | | | Pending Distribution Amount | | Discount for potential outcome (b) | | | 100.00% (100.00%) | |
| | | | | | | | | | | | |
| Preferred Stock | | | 1,886 | | | | | | | | | |
| | | | | | | | | | | | |
| | | 9,101 | | | Discounted Cash Flow | | Yield (Discount Rate of Cash Flows) | | | 11.32% - 18.50% (7.41%) | |
| | | 50 | | | Pending Distribution Amount | | Discount for potential outcome (b) | | | 15.00 - 99.99% (25.87%) | |
| | | | | | | | | | | | |
| Corporate Bond | | | 9,151 | | | | | | | | | |
| | | | | | | | | | | | |
| | | 233,190 | | | Discounted Cash Flow | | Liquidity Discount | | | 4.50% (4.50%) | |
| | | | | | | | Implied Spread to Index | | | 2.00% (2.00%) | |
| | | | | | | | Projected Principal Writedown | | | 94.00% (94.00%) | |
| | | | | | | | Constant Prepayment Rate | | | 0.00% - 40.00% (7.51%) | |
| | | | | | | | Constant Default Rate | | | 0.00% - 50.00% (14.14%) | |
| | | | | | | | Yield (Discount Rate of Cash Flows) | | | 1.52% - 12.00% (4.57%) | |
| | | | | | | | | | | | |
| Asset-Backed Securities | | | 233,190 | | | | | | | | | |
| | | | | | | | | | | | |
| | | | | | | | |
| | | |
| AUGUST 31, 2016 | | J.P. MORGAN INCOME FUNDS | | | | | 333 | |
NOTES TO FINANCIAL STATEMENTS
AS OF AUGUST 31, 2016 (Unaudited) (continued)
| | | | | | | | | | | | |
| | | Fair Value at
August 31, 2016 | | | Valuation Technique(s) | | Unobservable Input | | Range (Weighted Average) | |
| | | 15,359 | | | Discounted Cash Flow | | Constant Prepayment Rate | | | 1.00% - 30.57% (10.01%) | |
| | | | | | | | Constant Default Rate | | | 0.00% - 7.99% (2.18%) | |
| | | | | | | | Yield (Discount Rate of Cash Flows) | | | 2.43% - 24.83% (4.91%) | |
| | | | | | | | | | | | |
| Collateralized Mortgage Obligations | | | 15,359 | | | | | | | | | |
| | | | | | | | | | | | |
| | | 66,057 | | | Discounted Cash Flow | | Constant Prepayment Rate | | | 0.00% - 100.00% (8.73%) | |
| | | | | | | | Yield (Discount Rate of Cash Flows) | | | 0.97% - 30.76% (4.85%) | |
| | | | | | | | | | | | |
| Commercial Mortgage-Backed Securities | | | 66,057 | | | | | | | | | |
| | | | | | | | | | | | |
| Warrants | | | 576 | | | Intrinsic Value | | Implied Minority / Liquidity Discount | | | 20.00% (20.00%) | |
| | | | | | | | | | | | |
| | | — | (a) | | Discounted Cash Flow | | Projected Principal Writedown | | | 99.99% (99.99%) | |
| | | | | | | | | | | | |
| Loan Assignments | | | — | (a) | | | | | | | | |
| | | | | | | | | | | | |
| Total | | $ | 326,235 | | | | | | | | | |
| | | | | | | | | | | | |
| # | The table above does not include certain level 3 investments that are valued by brokers and pricing services. At August 31, 2016, the value of these investments was approximately $108,272,000. The inputs for these investments are not readily available or cannot be reasonably estimated and are generally those inputs described in Note 2.A. |
| (a) | Amount rounds to less than 500. |
| (b) | Represents amounts used when the reporting entity has determined that market participants would take into account discounts, as applicable, when pricing the investments. |
The significant unobservable inputs used in the fair value measurement of the Fund’s investments are listed above. Generally, a change in the assumptions used in any input in isolation may be accompanied by a change in another input. Significant changes in any of the unobservable inputs may significantly impact the fair value measurement. The impact is based on the relationship between each unobservable input and the fair value measurement. Significant increases (decreases) in enterprise multiples may increase (decrease) the fair value measurement. Significant increases (decreases) in the discount for lack of marketability, liquidity discount, probability of default, yield, and default rate may decrease (increase) the fair value measurement. A significant change in the prepayment rate (Constant Prepayment Rate or PSA Prepayment Model) may decrease or increase the fair value measurement. A significant change in broker pricing information could result in a significantly higher or lower value in such level 3 instruments.
High Yield Fund
Quantitative Information about Level 3 Fair Value Measurements #
(Amounts in thousands)
| | | | | | | | | | | | |
| | | Fair Value at
August 31, 2016 | | | Valuation Technique(s) | | Unobservable Input | | Range (Weighted Average) | |
| | $ | 71 | | | Terms of Exchange Offer | | Expected Recovery | | | $0.01 ($0.01) | |
| | | — | (a) | | Pending Distribution Amount | | Discount for potential outcome (b) | | | 100.00% (100.00%) | |
| | | | | | | | | | | | |
| Common Stocks | | | 71 | | | | | | | | | |
| | | | | | | | | | | | |
| | | 26,323 | | | Discounted Cash Flow | | Yield (Discount Rate of Cash Flows) | | | 4.73% (4.73%) | |
| | | — | (a) | | Pending Distribution Amount | | Discount for potential outcome (b) | | | 100.00% (100.00%) | |
| | | | | | | | | | | | |
| Preferred Stocks | | | 26,323 | | | | | | | | | |
| | | | | | | | | | | | |
| | | 32,963 | | | Discounted Cash Flow | | Yield (Discount Rate of Cash Flows) | | | 7.96% - 18.50% (12.40%) | |
| | | 325 | | | Pending Distribution Amount | | Discount for potential outcome (b) | | | 15.00% - 99.99% (26.18%) | |
| | | | | | | | | | | | |
| Corporate Bonds | | | 33,288 | | | | | | | | | |
| | | | | | | | | | | | |
| | | 1,764 | | | Discounted Cash Flow | | Liquidity Discount | | | 4.50% (4.50%) | |
| | | | | | | | Implied Spread to Index | | | 2.00% (2.00%) | |
| | | | | | | | Constant Prepayment Rate | | | 3.00% - 7.00% (4.22%) | |
| | | | | | | | Constant Default Rate | | | 5.52% - 6.10% (5.92%) | |
| | | | | | | | Yield (Discount Rate of Cash Flows) | | | 8.11% - 12.00% (10.82%) | |
| | | | | | | | | | | | |
| Asset-Backed Securities | | | 1,764 | | | | | | | | | |
| | | | | | | | | | | | |
| Warrants | | | — | (a) | | Intrinsic Value | | Issue Price vs. Stock Price | | | (N/A) | |
| | | | | | | | | | | | |
| Total | | $ | 61,446 | | | | | | | | | |
| | | | | | | | | | | | |
| | | | | | |
| | | |
| 334 | | | | J.P. MORGAN INCOME FUNDS | | AUGUST 31, 2016 |
| # | The table above does not include certain level 3 investments that are valued by brokers and pricing services. At August 31, 2016, the value of these investments was approximately $9,125,000. The inputs for these investments are not readily available or cannot be reasonably estimated and are generally those inputs described in Note 2.A. |
| (a) | Amount rounds to less than 500. |
| (b) | Represents amounts used when the reporting entity has determined that market participants would take into account discounts, as applicable, when pricing the investments. |
The significant unobservable inputs used in the fair value measurement of the Fund’s investments are listed above. Generally, a change in the assumptions used in any input in isolation may be accompanied by a change in another input. Significant changes in any of the unobservable inputs may significantly impact the fair value measurement. The impact is based on the relationship between each unobservable input and the fair value measurement. Significant increases (decreases) in enterprise multiples may increase (decrease) the fair value measurement. Significant increases (decreases) in the discount for lack of marketability, liquidity discount, probability of default, and default rate may decrease (increase) the fair value measurement. A significant change in the discount rate or in the prepayment rate (Constant Prepayment Rate or PSA Prepayment Model) may decrease or increase the fair value measurement.
Inflation Managed Bond Fund
Quantitative Information about Level 3 Fair Value Measurements #
(Amounts in thousands)
| | | | | | | | | | | | |
| | | Fair Value at
August 31, 2016 | | | Valuation Technique(s) | | Unobservable Input | | Range (Weighted Average) | |
| | $ | 15,627 | | | Discounted Cash Flow | | Constant Prepayment Rate | | | 0.00% - 15.00% (1.00%) | |
| | | | | | | | Constant Default Rate | | | 0.00% - 36.00% (25.59%) | |
| | | | | | | | Yield (Discount Rate of Cash Flows) | | | 2.06% - 4.51% (3.65%) | |
| | | | | | | | | | | | |
| Asset-Backed Securities | | | 15,627 | | | | | | | | | |
| | | | | | | | | | | | |
| | | 76 | | | Discounted Cash Flow | | Constant Prepayment Rate | | | 8.00%(8.00%) | |
| | | | | | | | Constant Default Rate | | | 0.25% (0.25%) | |
| | | | | | | | Yield (Discount Rate of Cash Flows) | | | 3.58% (3.58%) | |
| | | | | | | | | | | | |
| Collateralized Mortgage Obligations | | | 76 | | | | | | | | | |
| | | | | | | | | | | | |
| | | 24 | | | Discounted Cash Flow | | Constant Prepayment Rate | | | 0.00% - 90.00% (55.47%) | |
| | | | | | | | Yield (Discount Rate of Cash Flows) | | | 2.67% - 4.69% (3.44%) | |
| | | | | | | | | | | | |
| Commercial Mortgage-Backed Securities | | | 24 | | | | | | | | | |
| | | | | | | | | | | | |
| Total | | $ | 15,727 | | | | | | | | | |
| | | | | | | | | | | | |
| # | The table above does not include certain level 3 investments that are valued by brokers and pricing services. At August 31, 2016, the value of these investments was approximately $109,000. The inputs for these investments are not readily available or cannot be reasonably estimated and are generally those inputs described in Note 2.A. |
The significant unobservable inputs used in the fair value measurement of the Fund’s investments are listed above. Generally, a change in the assumptions used in any input in isolation may be accompanied by a change in another input. Significant changes in any of the unobservable inputs may significantly impact the fair value measurement. The impact is based on the relationship between each unobservable input and the fair value measurement. Significant increases (decreases) in the yield and default rate may decrease (increase) the fair value measurement. A significant change in the discount rate or prepayment rate (Constant Prepayment Rate or PSA Prepayment Model) may decrease or increase the fair value measurement.
| | | | | | | | |
| | | |
| AUGUST 31, 2016 | | J.P. MORGAN INCOME FUNDS | | | | | 335 | |
NOTES TO FINANCIAL STATEMENTS
AS OF AUGUST 31, 2016 (Unaudited) (continued)
Limited Duration Bond Fund
Quantitative Information about Level 3 Fair Value Measurements #
(Amounts in thousands)
| | | | | | | | | | | | |
| | | Fair Value at
August 31, 2016 | | | Valuation Technique(s) | | Unobservable Input | | Range (Weighted Average) | |
| | $ | 62,667 | | | Discounted Cash Flow | | Constant Prepayment Rate | | | 0.00% - 20.00% (2.33%) | |
| | | | | | | | Constant Default Rate | | | 0.00% - 50.00% (13.75%) | |
| | | | | | | | Yield (Discount Rate of Cash Flows) | | | 1.59% - 25.00% (4.34%) | |
| | | | | | | | | | | | |
| Asset-Backed Securities | | | 62,667 | | | | | | | | | |
| | | | | | | | | | | | |
| | | 15,935 | | | Discounted Cash Flow | | PSA Prepayment Model | | | 393.00% (393.00%) | |
| | | | | | | | Constant Prepayment Rate | | | 0.50% - 14.62% (9.83%) | |
| | | | | | | | Constant Default Rate | | | 0.00% - 7.30% (0.09%) | |
| | | | | | | | Yield (Discount Rate of Cash Flows) | | | 1.39% - 6.70% (1.93%) | |
| | | | | | | | | | | | |
| Collateralized Mortgage Obligations | | | 15,935 | | | | | | | | | |
| | | | | | | | | | | | |
| | | 6,138 | | | Discounted Cash Flow | | Constant Prepayment Rate | | | 0.00% - 5.00% (0.18%) | |
| | | | | | | | Constant Default Rate | | | 0.00% - 3.00% (0.11%) | |
| | | | | | | | Yield (Discount Rate of Cash Flows) | | | 3.26% - 5.42% (3.34%) | |
| | | | | | | | | | | | |
| Commercial Mortgage-Backed Securities | | | 6,138 | | | | | | | | | |
| | | | | | | | | | | | |
| Total | | $ | 84,740 | | | | | | | | | |
| | | | | | | | | | | | |
| # | The table above does not include certain level 3 investments that are valued by brokers and pricing services. At August 31, 2016, the value of these investments was approximately $3,376,000. The inputs for these investments are not readily available or cannot be reasonably estimated and are generally those inputs described in Note 2.A. |
The significant unobservable inputs used in the fair value measurement of the Fund’s investments are listed above. Generally, a change in the assumptions used in any input in isolation may be accompanied by a change in another input. Significant changes in any of the unobservable inputs may significantly impact the fair value measurement. The impact is based on the relationship between each unobservable input and the fair value measurement. Significant increases (decreases) in the default rate may decrease (increase) the fair value measurement. A significant change in the discount rate or prepayment rate (Constant Prepayment Rate or PSA Prepayment Model) may decrease or increase the fair value measurement.
Mortgage-Backed Securities Fund
Quantitative Information about Level 3 Fair Value Measurements #
(Amounts in thousands)
| | | | | | | | | | | | |
| | | Fair Value at
August 31, 2016 | | | Valuation Technique(s) | | Unobservable Input | | Range (Weighted Average) | |
| | $ | 109,943 | | | Discounted Cash Flow | | Constant Prepayment Rate | | | 0.00% - 18.00% (2.00%) | |
| | | | | | | | Constant Default Rate | | | 0.00% - 50.00% (8.19%) | |
| | | | | | | | Yield (Discount Rate of Cash Flows) | | | 1.39%% - 7.53% (3.76%) | |
| | | | | | | | Projected Principal Writedown | | | 83.00% (83.00%) | |
| | | | | | | | | | | | |
| Asset-Backed Securities | | | 109,943 | | | | | | | | | |
| | | | | | | | | | | | |
| | | 33,826 | | | Discounted Cash Flow | | PSA Prepayment Model | | | 393.00% (393.00%) | |
| | | | | | | | Constant Prepayment Rate | | | 1.00% - 37.14% (8.51%) | |
| | | | | | | | Constant Default Rate | | | 0.00% - 14.25% (4.94%) | |
| | | | | | | | Yield (Discount Rate of Cash Flows) | | | (12.14)% - 142.13% (6.13%) | |
| | | | | | | | | | | | |
| Collateralized Mortgage Obligations | | | 33,826 | | | | | | | | | |
| | | | | | | | | | | | |
| | | 10,784 | | | Discounted Cash Flow | | Constant Prepayment Rate | | | 0.00% - 100.00% (17.26%) | |
| | | | | | | | Yield (Discount Rate of Cash Flows) | | | 0.93% - 30.76% (4.28%) | |
| | | | | | | | | | | | |
| Commercial Mortgage-Backed Securities | | | 10,784 | | | | | | | | | |
| | | | | | | | | | | | |
| Total | | $ | 154,553 | | | | | | | | | |
| | | | | | | | | | | | |
| # | The table above does not include certain level 3 investments that are valued by brokers and pricing services. At August 31, 2016, the value of these investments was approximately $47,220,000. The inputs for these investments are not readily available or cannot be reasonably estimated and are generally those inputs described in Note 2.A. |
The significant unobservable inputs used in the fair value measurement of the Fund’s investments are listed above. Generally, a change in the assumptions used in any input in isolation may be accompanied by a change in another input. Significant changes in any of the unobservable inputs
| | | | | | |
| | | |
| 336 | | | | J.P. MORGAN INCOME FUNDS | | AUGUST 31, 2016 |
may significantly impact the fair value measurement. The impact is based on the relationship between each unobservable input and the fair value measurement. Significant increases (decreases) in the default rate may decrease (increase) the fair value measurement. A significant change in the discount rate or prepayment rate (Constant Prepayment Rate or PSA Prepayment Model) may decrease or increase the fair value measurement.
Short Duration Bond Fund
Quantitative Information about Level 3 Fair Value Measurements #
(Amounts in thousands)
| | | | | | | | | | | | |
| | | Fair Value at
August 31, 2016 | | | Valuation Technique(s) | | Unobservable Input | | Range (Weighted Average) | |
| | $ | 122,299 | | | Discounted Cash Flow | | Constant Prepayment Rate | | | 0.00% - 18.00% (2.01%) | |
| | | | | | | | Constant Default Rate | | | 0.00% - 36.00% (22.70%) | |
| | | | | | | | Yield (Discount Rate of Cash Flows) | | | 1.52% - 7.80% (3.66%) | |
| | | | | | | | | | | | |
| Asset-Backed Securities | | | 122,299 | | | | | | | | | |
| | | | | | | | | | | | |
| | | — | (a) | | Discounted Cash Flow | | PSA Prepayment Model | | | 393.00% (393.00%) | |
| | | | | | | | Yield (Discount Rate of Cash Flows) | | | 1.74% (1.74%) | |
| | | | | | | | | | | | |
| Collateralized Mortgage Obligations | | | — | (a) | | | | | | | | |
| | | | | | | | | | | | |
| Total | | $ | 122,299 | | | | | | | | | |
| | | | | | | | | | | | |
| # | The table above does not include certain level 3 investments that are valued by brokers and pricing services. At August 31, 2016, the value of these investments was approximately $27,922,000. The inputs for these investments are not readily available or cannot be reasonably estimated and are generally those inputs described in Note 2.A. |
| (a) | Amount rounds to less than 500. |
The significant unobservable inputs used in the fair value measurement of the Fund’s investments are listed above. Generally, a change in the assumptions used in any input in isolation may be accompanied by a change in another input. Significant changes in any of the unobservable inputs may significantly impact the fair value measurement. The impact is based on the relationship between each unobservable input and the fair value measurement. Significant increases (decreases) in the default rate may decrease (increase) the fair value measurement. A significant change in the discount rate or prepayment rate (Constant Prepayment Rate or PSA Prepayment Model) may decrease or increase the fair value measurement.
Short Duration High Yield Fund
Quantitative Information about Level 3 Fair Value Measurements
(Amounts in thousands)
| | | | | | | | | | | | |
| | | Fair Value at
August 31, 2016 | | | Valuation Technique(s) | | Unobservable Input | | Range (Weighted Average) | |
| | $ | 33 | | | Broker Quote | | Mid Price | | $ | 355.00 - $370.00 ($362.50) | |
| | | | | | | | | | | | |
Common Stock | | | 33 | | | | | | | | | |
| | | | | | | | | | | | |
| | | 794 | | | Discounted Cash Flow | | Yield (Discount Rate of Cash Flows) | | | 4.79% (4.79%) | |
| | | | | | | | | | | | |
| Preferred Stock | | | 794 | | | | | | | | | |
| | | | | | | | | | | | |
| Total | | $ | 827 | | | | | | | | | |
| | | | | | | | | | | | |
The significant unobservable inputs used in the fair value measurement of the Fund’s investments are listed above. Generally, a change in the assumptions used in any input in isolation may be accompanied by a change in another input. Significant changes in any of the unobservable inputs may significantly impact the fair value measurement. The impact is based on the relationship between each unobservable input and the fair value measurement. Significant increases (decreases) in the default rate may decrease (increase) the fair value measurement. A significant change in the discount rate or prepayment rate (Constant Prepayment Rate or PSA Prepayment Model) may decrease or increase the fair value measurement.
B. Restricted Securities — Certain securities held by the Funds may be subject to legal or contractual restrictions on resale. Restricted securities generally are resold in transactions exempt from registration under the Securities Act of 1933 (the “Securities Act”). Disposal of these securities may involve time-consuming negotiations and expense. Prompt sale at the current valuation may be difficult and could adversely affect the net assets of the Funds.
As of August 31, 2016, the Funds had no investments in restricted securities other than securities sold to the Funds under Rule 144A and Regulation S under the Securities Act.
| | | | | | | | |
| | | |
| AUGUST 31, 2016 | | J.P. MORGAN INCOME FUNDS | | | | | 337 | |
NOTES TO FINANCIAL STATEMENTS
AS OF AUGUST 31, 2016 (Unaudited) (continued)
C. When Issued, Delayed Delivery Securities and Forward Commitments — Core Bond Fund, Core Plus Bond Fund, Government Bond Fund and Mortgage-Backed Securities Fund purchased when issued securities, including To Be Announced (“TBA”) securities, and entered into contracts to purchase or sell securities for a fixed price that may be settled a month or more after the trade date, or purchased delayed delivery securities which generally settle seven days after the trade date. When issued securities are securities that have been authorized, but not issued in the market. A forward commitment involves entering into a contract to purchase or sell securities for a fixed price at a future date that may be settled a month or more after the trade date. A delayed delivery security is agreed upon in advance between the buyer and the seller of the security and is generally delivered beyond seven days of the agreed upon date. The purchase of securities on a when issued, delayed delivery, or forward commitment basis involves the risk that the value of the security to be purchased declines before the settlement date. The sale of securities on a forward commitment basis involves the risk that the value of the securities sold may increase before the settlement date. The Funds may be exposed to credit risk if the counterparty fails to perform under the terms of the transaction. Interest income for securities purchased on a when issued, delayed delivery, or forward commitment basis is not accrued until the settlement date.
Core Bond Fund, Core Plus Bond Fund, Government Bond Fund and Mortgage-Backed Securities Fund had delayed delivery securities outstanding as of August 31, 2016, which are shown as Payable for investment securities purchased-delayed delivery securities on the Statements of Assets and Liabilities. The values of these securities held at August 31, 2016 are detailed on the SOIs.
D. Loan Assignments — Core Bond Fund, Core Plus Bond Fund, High Yield Fund, Mortgage-Backed Securities Fund, Short Duration Bond Fund and Short Duration High Yield Fund invested in debt instruments that are interests in amounts owed to lenders or lending syndicates (a “Lender”) by corporate, governmental, or other borrowers (a “Borrower”). A loan is often administered by a bank or other financial institution (the “Agent”) that acts as agent for all holders. The Agent administers the terms of the loan, as specified in the loan agreement. The Funds invest in loan assignments of all or a portion of the loans. When a fund purchases a loan assignment, the fund has direct rights against the borrower on a loan, provided, however, the fund’s rights may be more limited than the lender from which it acquired the assignment and the fund may be able to enforce its rights only through the Agent. As a result, a fund assumes the credit risk of the Borrower as well as any other persons interpositioned between the fund and the Borrower (“Intermediate Participants”). A fund may incur certain costs and delays in realizing payment on a loan assignment or suffer a loss of principal and/or interest if assets or interests held by the Agent or other Intermediate Participants are determined to be subject to the claims of the Agent’s or other Intermediate Participant’s creditors. In addition, it is unclear whether loan assignments and other forms of direct indebtedness offer securities law protections against fraud and misrepresentation. Also, because JPMIM may wish to invest in publicly traded securities of a Borrower, it may not have access to material non-public information regarding the Borrower to which other investors have access. Although certain loan assignments are secured by collateral, a fund could experience delays or limitations in realizing the value on such collateral or have its interest subordinated to other indebtedness of the Borrower. Loan assignments are vulnerable to market conditions such that economic conditions or other events may reduce the demand for assignments and certain assignments which were liquid, when purchased, may become illiquid and they may be difficult to value. In addition, the settlement period for loans is uncertain as there is no standardized settlement schedule applicable to such investments. Therefore, a fund may not receive the proceeds from a sale of such investments for a period after the sale.
Certain loan assignments are also subject to the risks associated with high yield securities described under Note 7.
At August 31, 2016, Short Duration High Yield Fund had investments in Loan Assignments that amounted to more than 5% of the Fund’s net assets, by agent bank as follows:
| | | | |
| Agent Bank | | Percentage | |
Deutsche Bank AG | | | 7.0 | % |
E. Unfunded Commitments — Core Bond Fund, Mortgage-Backed Securities Fund and Short Duration Bond Fund have entered into commitments to buy and sell investments including commitments to buy loan assignments to settle on future dates as part of their normal investment activities. Unfunded commitments may include revolving loan facilities which may obligate the Funds to provide cash to the borrower on demand. Unfunded commitments are generally traded and priced as part of a related loan assignment (Note 2.D.). The value of the unfunded portion of the investment is determined using a pro-rata allocation, based on its par value relative to the par value of the entire investment. The unrealized appreciation/depreciation from unfunded commitments is reported on the Statements of Assets and Liabilities. Credit risk exists on these commitments to the extent of any difference between the sales price and current value of the underlying securities sold. Market risk exists on these commitments to buy to the same extent as if the securities were owned on a settled basis and gains and losses are recorded and reported in the same manner. The Funds may receive an ongoing commitment fee based on the undrawn portion of the underlying loan facility, which is recorded as a component of interest income on the Statements of Operations.
At August 31, 2016, the Funds did not have any outstanding unfunded loan commitments.
F. Derivatives — Core Plus Bond Fund, High Yield Fund and Inflation Managed Bond Fund used derivative instruments including futures, forward foreign currency exchange contracts and swaps, in connection with their respective investment strategies. Derivative instruments may be used as substitutes for securities in which the Funds can invest, to hedge portfolio investments or to generate income or gain to the Funds. Derivatives may also be used to manage duration, sector and yield curve exposures and credit and spread volatility.
The Funds may be subject to various risks from the use of derivatives including the risk that changes in the value of a derivative may not correlate perfectly with the underlying asset, rate or index; counterparty credit risk related to derivatives counterparties’ failure to perform under contract
| | | | | | |
| | | |
| 338 | | | | J.P. MORGAN INCOME FUNDS | | AUGUST 31, 2016 |
terms; liquidity risk related to the lack of a liquid market for these contracts allowing a Fund to close out its position(s); and, documentation risk relating to disagreement over contract terms. Investing in certain derivatives also results in a form of leverage and as such, the Funds’ risk of loss associated with these instruments may exceed their value, as recorded on the Statements of Assets and Liabilities.
The Funds are party to various derivative contracts governed by International Swaps and Derivatives Association master agreements (“ISDA agreements”). The Funds’ ISDA agreements, which are separately negotiated with each dealer counterparty, may contain provisions allowing, absent other considerations, a counterparty to exercise rights, to the extent not otherwise waived, against the Funds in the event the Funds’ net assets decline over time by a pre-determined percentage or fall below a pre-determined floor. The ISDA agreements also contain provisions allowing, absent other conditions, the Funds to exercise rights, to the extent not otherwise waived, against the counterparties (i.e., decline in a counterparty’s credit rating below a specified level). Such rights for both the counterparty and Funds often include the ability to terminate (i.e., close out) open contracts at prices which may favor the counterparty, which could have an adverse effect on the Funds. The ISDA agreements give the Funds and counterparty the right, upon an event of default, to close out all transactions traded under such agreements and to net amounts owed or due across all transactions and offset such net payable or receivable with collateral posted to a segregated account by one party to the other.
Counterparty credit risk may be mitigated to the extent a counterparty posts collateral for mark to market gains to the Funds.
Notes F(1) — F(3) below describe the various derivatives used by the Funds.
(1). Futures Contracts — Core Plus Bond Fund used treasury futures contracts to manage and hedge interest rate risk associated with portfolio investments. The Fund also used futures contracts to lengthen or shorten the duration of the overall investment portfolio.
Futures contracts provide for the delayed delivery of the underlying instrument at a fixed price or are settled for a cash amount based on the change in the value of the underlying instrument at a specific date in the future. Upon entering into a futures contract, the Fund is required to deposit with the broker, cash or securities in an amount equal to a certain percentage of the contract amount, which is referred to as the initial margin deposit. Subsequent payments, referred to as variation margin, are made or received by the Fund periodically and are based on changes in the market value of open futures contracts. Changes in the market value of open futures contracts are recorded as Change in net unrealized appreciation/depreciation on the Statements of Operations. Realized gains or losses, representing the difference between the value of the contract at the time it was opened and the value at the time it was closed, are reported on the Statements of Operations at the closing or expiration of the futures contract. Securities deposited as initial margin are designated in the SOIs and cash deposited is recorded on the Statements of Assets and Liabilities. A receivable from and/or a payable to brokers for the daily variation margin is also recorded on the Statements of Assets and Liabilities.
The use of futures exposes the Fund to interest risk. The Fund may be subject to the risk that the change in the value of the futures contract may not correlate perfectly with the underlying instrument. Use of long futures contracts subjects the Fund to risk of loss in excess of the amounts shown on the Statements of Assets and Liabilities, up to the notional amount of the futures contracts. Use of short futures contracts subjects the Fund to unlimited risk of loss. The Fund may enter into futures contracts only on exchanges or boards of trade. The exchange or board of trade acts as the counterparty to each futures transaction; therefore, the Fund’s credit risk is limited to failure of the exchange or board of trade. Under some circumstances, futures exchanges may establish daily limits on the amount that the price of a futures contract can vary from the previous day’s settlement price, which could effectively prevent liquidation of positions.
The Fund’s futures contracts are not subject to master netting arrangements (the right to close out all transactions traded with a counterparty and net amounts owed or due across transactions).
(2). Forward Foreign Currency Exchange Contracts — Core Plus Bond Fund may be exposed to foreign currency risks associated with portfolio investments and therefore, at times, used forward foreign currency exchange contracts to hedge or manage these exposures. The Funds also bought forward foreign currency exchange contracts to gain exposure to currencies. Forward foreign currency exchange contracts represent obligations to purchase or sell foreign currency on a specified future date at a price fixed at the time the contracts are entered into. Non-deliverable forward foreign currency exchange contracts are settled with the counterparty in U.S. Dollar without the delivery of foreign currency.
The values of the forward foreign currency exchange contracts are adjusted daily based on the applicable exchange rate of the underlying currency. Changes in the value of these contracts are recorded as unrealized appreciation or depreciation until the contract settlement date. When the forward foreign currency exchange contract is closed, the Funds record a realized gain or loss equal to the difference between the value at the time the contract was opened and the value at the time it was closed. The Funds also record a realized gain or loss when a forward foreign currency exchange contract offsets another forward foreign currency exchange contract with the same counterparty upon settlement.
The Funds’ forward foreign currency exchange contracts are subject to master netting arrangements (the right to close out all transactions with a counterparty and net amounts owed or due across transactions). As of August 31, 2016, the Funds did not receive or post collateral for forward foreign currency exchange contracts.
(3). Swaps — Core Plus Bond Fund, High Yield Fund and Inflation Managed Bond Fund engaged in various swap transactions, including interest rate and credit default swaps, to manage interest rate (e.g., duration, yield curve) and credit risks within their respective portfolios. The Funds also used swaps as alternatives to direct investments. Swap transactions are negotiated contracts over the counter (“OTC swaps”) between a fund and a counterparty or centrally cleared (“centrally cleared swaps”) with a central clearinghouse through a Futures Commission Merchant (“FCM”), to exchange investment cash flows, assets, foreign currencies or market-linked returns at specified, future intervals.
Upfront payments made and/or received are recorded as assets or liabilities, respectively on the Statement of Assets and Liabilities and amortized over the term of the swap. The value of an OTC swap agreement is recorded as either an asset or a liability on the Statements of Assets and Liabilities at the beginning of the measurement period. Upon entering into a centrally cleared swap, the Funds are required to deposit with the FCM
| | | | | | | | |
| | | |
| AUGUST 31, 2016 | | J.P. MORGAN INCOME FUNDS | | | | | 339 | |
NOTES TO FINANCIAL STATEMENTS
AS OF AUGUST 31, 2016 (Unaudited) (continued)
cash or securities, which is referred to as initial margin deposit. Securities deposited as initial margin are designated on the SOIs and cash deposited is recorded on the Statements of Assets and Liabilities. Daily changes in valuation of centrally cleared swaps, if any, are recorded as a variation margin receivable or payable on the Statements of Assets and Liabilities. The change in the value of swaps, including accruals of periodic amounts of interest to be paid or received on swaps, is reported as change in net unrealized appreciation/depreciation on the Statements of Operations. A realized gain or loss is recorded upon payment or receipt of a periodic payment or payment made upon termination of a swap agreement.
The Funds may be required to post or receive collateral based on the net value of the Funds’ outstanding OTC swap contracts with the counterparty in the form of cash or securities. Daily movement of cash collateral is subject to minimum threshold amounts. Collateral posted by the Funds is held in a segregated account at the Funds’ custodian bank. Cash collateral posted by the Funds is invested in an affiliated money market fund (See Note 3.G.) and is reported on the Statements of Assets and Liabilities as Investments in affiliates — restricted. Collateral received by the Funds is held in escrow in segregated accounts maintained by JPMorgan Chase Bank, N.A. (“JPMCB”), an affiliate of the Funds, which provides collateral management services to the Funds (See Note 3.F.).
Inflation Managed Bond Fund’s swap contracts at net value and collateral posted by counterparty as of August 31, 2016 are as follows (amounts in thousands):
| | | | | | | | | | | | |
| Fund | | | | Counterparty | | Value of swap contracts | | | Collateral
amount | |
Inflation Managed Bond Fund | | Collateral Posted | | Barclays Bank plc | | $ | (5,396 | ) | | $ | 5,210 | |
| | | | BNP Paribas | | | (8,092 | ) | | | 8,220 | |
| | | | Citibank, N.A. | | | (8,077 | ) | | | 8,280 | |
| | | | Credit Suisse International | | | (6,740 | ) | | | 6,610 | |
| | | | Deutsche Bank AG, New York | | | (11,694 | ) | | | 11,700 | |
| | | | Goldman Sachs International | | | (6,657 | ) | | | 6,500 | |
| | | | Morgan Stanley Capital Services | | | (5,240 | ) | | | 5,890 | |
| | | | Royal Bank of Scotland | | | (2,111 | ) | | | 1,980 | |
The central clearing house acts as the counterparty to each centrally cleared swap transaction, therefore credit risk is limited to the failure of the clearing house.
The Funds’ swap contracts (excluding centrally cleared swaps) are subject to master netting arrangements.
Credit Default Swaps
Core Plus Bond Fund and High Yield Fund entered into credit default swaps to simulate long and short bond positions or to take an active long or short position with respect to the likelihood of a default or credit event by the issuer of the underlying reference obligation.
The underlying reference obligation may be a single issuer of corporate or sovereign debt, a basket of issuers or a credit index. A credit index is a list of credit instruments or exposures that reference a fixed number of obligors with shared characteristics that represents some part of the credit market as a whole. Index credit default swaps have standardized terms including a fixed spread and standard maturity dates. The composition of the obligations within a particular index changes periodically.
Credit default swaps involve one party, the protection buyer, making a stream of payments to another party, the protection seller, in exchange for the right to receive a contingent payment if there is a credit event related to the underlying reference obligation. In the event that the reference obligation matures prior to the termination date of the contract, a similar security will be substituted for the duration of the contract term. Credit events are defined under individual swap agreements and generally include bankruptcy, failure to pay, restructuring, repudiation/moratorium, obligation acceleration and obligation default.
If a credit event occurs, the Funds, as protection sellers, would be obligated to make a payment, which may be either: (i) a net cash settlement equal to the notional amount of the swap less the auction value of the reference obligation or (ii) the notional amount of the swap in exchange for the delivery of the reference obligation. Selling protection effectively adds leverage to a Fund’s portfolio up to the notional amount of swap agreements. The notional amount represents the maximum potential liability under a contract and is not reflected on the Statements of Assets and Liabilities. Potential liabilities under these contracts may be reduced by: the auction rates of the underlying reference obligations; upfront payments received at the inception of a swap; and net amounts received from credit default swaps purchased with the identical reference obligation.
Interest Rate Swaps
Core Plus Bond Fund entered into interest rate swap contracts to manage fund exposure to interest rates or to either preserve or generate a return on a particular investment or portion of its portfolio. These are agreements between counterparties to exchange periodic interest payments based on interest rates. One cash flow stream will typically be a floating rate payment based upon a specified interest rate while the other is typically a fixed interest rate.
Inflation-Linked Swaps
Inflation Managed Bond Fund used inflation-linked swaps to provide inflation protection within its portfolio. The use of swaps exposes the Fund to interest rate risk.
| | | | | | |
| | | |
| 340 | | | | J.P. MORGAN INCOME FUNDS | | AUGUST 31, 2016 |
(5). Summary of Derivatives Information
The following table presents the value of derivatives held as of August 31, 2016, by their primary underlying risk exposure and respective location on the Statements of Assets and Liabilities (amounts in thousands):
Core Plus Bond Fund
| | | | | | | | | | | | | | | | | | |
| Derivative Contracts | | Statements of Assets and Liabilities Location | | | | | | | | | | | | |
| Gross Assets: | | | | Futures
Contracts (a) | | | Forward Foreign
Currency Exchange
Contracts | | | Centrally
Cleared
Swaps (b) | | | Total | |
Interest rate contracts | | Receivables, Net Assets — Unrealized Appreciation | | $ | 116 | | | $ | — | | | $ | — | | | $ | 116 | |
Foreign exchange contracts | | Receivables | | | — | | | | 35 | | | | — | | | | 35 | |
Credit contracts | | Receivables | | | — | | | | — | | | | 3,719 | | | | 3,719 | |
| | | | | | | | | | | | | | | | | | |
Total | | | | $ | 116 | | | $ | 35 | | | $ | 3,719 | | | $ | 3,870 | |
| | | | | | | | | | | | | | | | | | |
| | | | | |
Gross Liabilities: | | | | | | | | | | | | | | |
Interest rate contracts | | Payables, Net Assets — Unrealized Depreciation | | $ | (209 | ) | | $ | — | | | $ | — | | | $ | (209 | ) |
Foreign exchange contracts | | Payables | | | — | | | | (296 | ) | | | — | | | | (296 | ) |
Credit contracts | | Payables | | | — | | | | — | | | | — | | | | — | |
| | | | | | | | | | | | | | | | | | |
Total | | | | $ | (209 | ) | | $ | (296 | ) | | $ | — | | | $ | (505 | ) |
| | | | | | | | | | | | | | | | | | |
| (a) | This amount represents the cumulative appreciation (depreciation) of futures contracts as reported on the SOIs. The Statements of Assets and Liabilities only reflect the current day variation margin receivable/payable from/to brokers. |
| (b) | This amount represents the value of centrally cleared swaps as reported on the SOIs. The Statements of Assets and Liabilities only reflect the current day variation margin receivable/payable from/to brokers. |
The following table presents the value of derivatives held as of August 31, 2016, by their primary underlying risk exposure and respective location on the Statements of Assets and Liabilities (amounts in thousands):
High Yield Fund
| | | | | | |
| Derivative Contracts | | Statements of Assets and Liabilities Location | | | |
| Gross Assets: | | | | Centrally
Cleared
Swaps (a) | |
Credit contracts | | Receivables | | $ | 10,927 | |
| | | | | | |
| (a) | This amount represents the value of centrally cleared swaps as reported on the SOIs. The Statements of Assets and Liabilities only reflect the current day variation margin receivable/payable from/to brokers. |
The following table presents the value of derivatives held as of August 31, 2016, by their primary underlying risk exposure and respective location on the Statements of Assets and Liabilities (amounts in thousands):
Inflation Managed Bond Fund
| | | | | | |
| Derivative Contracts | | Statements of Assets and Liabilities Location | | | |
| Gross Assets: | | | | OTC
Swaps | |
Interest rate contracts | | Receivables | | $ | 247 | |
| | | | | | |
| | |
Gross Liabilities: | | | | | |
Interest rate contracts | | Payables | | $ | (54,254 | ) |
| | | | | | |
The Fund did not have derivative assets as of August 31, 2016. The following table presents the Fund’s gross derivative liabilities by counterparty net of amounts available for offset under netting arrangements and any related collateral posted by the Fund as of August 31, 2016 (amounts in thousands):
| | | | | | | | |
| | | |
| AUGUST 31, 2016 | | J.P. MORGAN INCOME FUNDS | | | | | 341 | |
NOTES TO FINANCIAL STATEMENTS
AS OF AUGUST 31, 2016 (Unaudited) (continued)
Inflation Managed Bond Fund
| | | | | | | | | | | | | | | | |
| Counterparty | | Gross Amount of
Derivative Liabilities
Subject to Netting
Arrangements
Presented on the
Statement of Assets
and Liabilities (a) | | | Derivatives
Available
for offset | | | Collateral
Posted (b) | | | Net Amount Due
To Counterparty
(Not less than zero) | |
Barclays Bank plc | | $ | 5,396 | | | $ | — | | | $ | (5,210 | ) | | $ | 186 | |
BNP Paribas | | | 8,092 | | | | — | | | | (8,092 | ) | | | — | |
Citibank, N.A. | | | 8,077 | | | | — | | | | (8,077 | ) | | | — | |
Credit Suisse International | | | 6,740 | | | | — | | | | (6,610 | ) | | | 130 | |
Deutsche Bank AG, New York | | | 11,694 | | | | — | | | | (11,694 | ) | | | — | |
Goldman Sachs International | | | 6,657 | | | | — | | | | (6,500 | ) | | | 157 | |
Morgan Stanley Capital Services | | | 5,240 | | | | — | | | | (5,240 | ) | | | — | |
Royal Bank of Scotland | | | 2,111 | | | | — | | | | (1,980 | ) | | | 131 | |
| | | | | | | | | | | | | | | | |
| | $ | 54,007 | | | $ | — | | | $ | (53,403 | ) | | $ | 604 | |
| | | | | | | | | | | | | | | | |
| (a) | For financial reporting purposes, the Fund does not offset derivative assets and derivative liabilities subject to master netting arrangements on the Statements of Assets and Liabilities. |
| (b) | Collateral received or posted is limited to the net derivative asset or net derivative liability amounts. See Note 2.F.(3). for actual swap collateral received or posted. |
The following tables present the effect of derivatives on the Statements of Operations for the six month ended August 31, 2016, by primary underlying risk exposure (amounts in thousands):
Core Plus Bond Fund
| | | | | | | | | | | | | | | | |
| Amount of Realized Gain (Loss) on Derivatives Recognized on the Statements of Operations | |
| Derivative Contracts | | Futures Contracts | | | Forward Foreign
Currency Exchange
Contracts | | | Swaps | | | Total | |
Interest rate contracts | | $ | 1,302 | | | $ | — | | | $ | (119 | ) | | $ | 1,183 | |
Foreign exchange contracts | | | — | | | | (405 | ) | | | — | | | | (405 | ) |
Credit contracts | | | — | | | | — | | | | (6,299 | ) | | | (6,299 | ) |
| | | | | | | | | | | | | | | | |
Total | | $ | 1,302 | | | $ | (405 | ) | | $ | (6,418 | ) | | $ | (5,521 | ) |
| | | | | | | | | | | | | | | | |
| | | | | | | | | | | | | | | | |
| Amount of Change in Unrealized Appreciation (Depreciation) on Derivatives Recognized on the Statements of Operations | |
| Derivative Contracts | | Futures Contracts | | | Forward Foreign
Currency Exchange
Contracts | | | Swaps | | | Total | |
Interest rate contracts | | $ | 167 | | | $ | — | | | $ | 143 | | | $ | 310 | |
Foreign exchange contracts | | | — | | | | (128 | ) | | | — | | | | (128 | ) |
Credit contracts | | | — | | | | — | | | | (1,111 | ) | | | (1,111 | ) |
| | | | | | | | | | | | | | | | |
Total | | $ | 167 | | | $ | (128 | ) | | $ | (968 | ) | | $ | (929 | ) |
| | | | | | | | | | | | | | | | |
High Yield Fund
| | | | |
| Amount of Realized Gain (Loss) on Derivatives Recognized on the Statements of Operations | |
| Derivative Contracts | | Swaps | |
Credit contracts | | $ | 7,360 | |
| | | | |
|
| Amount of Change in Unrealized Appreciation (Depreciation) on Derivatives Recognized on the Statements of Operations | |
| Derivative Contracts | | Swaps | |
Credit contracts | | $ | 1,553 | |
| | | | |
| | | | | | |
| | | |
| 342 | | | | J.P. MORGAN INCOME FUNDS | | AUGUST 31, 2016 |
Inflation Managed Bond Fund
| | | | |
| Amount of Realized Gain (Loss) on Derivatives Recognized on the Statements of Operations | |
| Derivative Contracts | | Swaps | |
Interest rate contracts | | $ | (23,228 | ) |
| | | | |
|
| Amount of Change in Unrealized Appreciation (Depreciation) on Derivatives Recognized on the Statements of Operations | |
| Derivative Contracts | | Swaps | |
Interest rate contracts | | $ | 27,683 | |
| | | | |
Derivatives Volume
The tables below disclose the volume of the Funds’ futures contracts, forward foreign currency exchange contracts and swaps activity during the six month ended August 31, 2016 (amounts in thousands, except number of contracts). Please refer to the tables in the Summary of Derivatives Information for derivative-related gains and losses associated with volume activity.
| | | | | | | | | | | | |
| | | Core Plus
Bond Fund | | | High Yield
Fund | | | Inflation
Managed Bond
Fund | |
Futures Contracts: | | | | | | | | | | | | |
Average Notional Balance Long | | $ | 188,471 | | | $ | — | | | $ | — | |
Average Notional Balance Short | | | 46,418 | | | | — | | | | — | |
Ending Notional Balance Long | | | 286,594 | | | | — | | | | — | |
Ending Notional Balance Short | | | 102,761 | | | | — | | | | — | |
| | | |
Forward Foreign Currency Exchange Contracts: | | | | | | | | | | | | |
Average Settlement Value Purchased | | | 1,837 | | | | — | | | | — | |
Average Settlement Value Sold | | | 8,348 | | | | — | | | | — | |
Ending Settlement Value Purchased | | | 2,231 | | | | — | | | | — | |
Ending Settlement Value Sold | | | 8,700 | | | | — | | | | — | |
| | | |
Credit Default Swaps: | | | | | | | | | | | | |
Average Notional Balance — Buy Protection | | | 85,000 | | | | — | | | | — | |
Average Notional Balance — Sell Protection | | | 14,857 | | | | 150,000 | (a) | | | — | |
Ending Notional Balance — Buy Protection | | | 50,000 | | | | — | | | | — | |
Ending Notional Balance — Sell Protection | | | 43,000 | | | | 200,000 | | | | — | |
| | | |
Interest Rate-Related Swaps (Inflation-Linked Swaps): | | | | | | | | | | | | |
Average Notional Balance — Pays Fixed Rate | | | 5,000 | (b) | | | — | | | | 1,086,286 | |
Ending Notional Balance — Pays Fixed Rate | | | — | | | | — | | | | 992,000 | |
| (a) | For the period March 1, 2016 through August 31, 2016. |
| (b) | For the period March 1, 2016 through March 31, 2016. |
The Funds’ derivatives contracts held at August 31, 2016 are not accounted for as hedging instruments under GAAP.
G. Foreign Currency Translation — The books and records of the Funds are maintained in U.S. dollars. Foreign currency amounts are translated into U.S. dollars at the prevailing exchange rates of such currencies against the U.S. dollar. The market value of investment securities and other assets and liabilities are translated at the exchange rate as of the valuation date. Purchases and sales of investment securities, income and expenses are translated at the exchange rate prevailing on the respective dates of such transactions.
The Funds do not isolate the effect of changes in foreign exchange rates from changes in market prices on securities held. Accordingly, such changes are included within Change in net unrealized appreciation/depreciation on the Statements of Operations.
Reported realized foreign currency gains and losses arise from the disposition of foreign currency, currency gains or losses realized between the trade and settlement dates on securities transactions, and the difference between the amounts of dividends, interest and foreign withholding taxes recorded on each Fund’s books on the transaction date and the U.S. dollar equivalent of the amounts actually received or paid. These reported realized foreign currency gains and losses are included in Net realized gain (loss) on foreign currency transactions on the Statements of Operations. Unrealized foreign currency gains and losses arise from changes (due to changes in exchange rates) in the value of foreign currency and other assets and liabilities denominated in foreign currencies, which are held at year end and are included in Change in net unrealized appreciation/depreciation on foreign currency translations on the Statements of Operations.
H. Security Transactions and Investment Income — Investment transactions are accounted for on the trade date (the date the order to buy or sell is executed). Securities gains and losses are calculated on a specifically identified cost basis. Interest income is determined on the basis of coupon
| | | | | | | | |
| | | |
| AUGUST 31, 2016 | | J.P. MORGAN INCOME FUNDS | | | | | 343 | |
NOTES TO FINANCIAL STATEMENTS
AS OF AUGUST 31, 2016 (Unaudited) (continued)
interest accrued using the effective interest method which adjusts for amortization of premiums and accretion of discounts. Dividend income is recorded on the ex-dividend date or when a Fund first learns of the dividend.
Inflation Managed Bond Fund invests in treasury inflation protected securities (TIPS). The principal amount of TIPS is adjusted periodically and is increased for inflation or decreased for deflation based on a monthly published index. These adjustments are recorded as increases or decreases to interest income on the Statements of Operations. Coupon payments are based on the adjusted principal at the time the interest is paid.
I. Allocation of Income and Expenses — Expenses directly attributable to a fund are charged directly to that fund, while the expenses attributable to more than one fund of the Trusts are allocated among the respective funds. In calculating the NAV of each class, investment income, realized and unrealized gains and losses and expenses, other than class specific expenses, are allocated daily to each class of shares based upon the proportion of net assets of each class at the beginning of each day.
Transfer agency fees and sub-transfer agency fees are class-specific expenses. The amount of the transfer agency fees and sub-transfer agency fees charged to each class of the Funds for the six months ended August 31, 2016 are as follows (amounts in thousands):
| | | | | | | | | | | | | | | | | | | | | | | | | | | | | | | | |
| | | Class A | | | Class C | | | Class R2 | | | Class R5 | | | Class R6 | | | Institutional Class | | | Select Class | | | Total | |
Core Bond Fund | | | | | | | | | | | | | | | | | | | | | | | | | | | | | | | | |
Transfer agency fees | | $ | 84 | | | $ | 21 | | | $ | 6 | | | $ | 3 | | | $ | 56 | | | | n/a | | | $ | 92 | | | $ | 262 | |
Sub-transfer agency fees | | | 1,312 | | | | 269 | | | | 117 | | | | 151 | | | | — | | | | n/a | | | | 3,527 | | | | 5,376 | |
| | | | | | | | |
Core Plus Bond Fund | | | | | | | | | | | | | | | | | | | | | | | | | | | | | | | | |
Transfer agency fees | | | 29 | | | | 6 | | | | 2 | | | | n/a | | | | 12 | | | $ | 5 | | | | 5 | | | | 59 | |
Sub-transfer agency fees | | | 456 | | | | 91 | | | | 42 | | | | n/a | | | | — | | | | 140 | | | | 156 | | | | 885 | |
| | | | | | | | |
Government Bond Fund | | | | | | | | | | | | | | | | | | | | | | | | | | | | | | | | |
Transfer agency fees | | | 121 | | | | 3 | | | | 8 | | | | n/a | | | | — | (a) | | | n/a | | | | 7 | | | | 139 | |
Sub-transfer agency fees | | | 525 | | | | 33 | | | | 67 | | | | n/a | | | | — | | | | n/a | | | | 421 | | | | 1,046 | |
| | | | | | | | |
High Yield Fund | | | | | | | | | | | | | | | | | | | | | | | | | | | | | | | | |
Transfer agency fees | | | 51 | | | | 8 | | | | 5 | | | | 2 | | | | 15 | | | | n/a | | | | 500 | | | | 581 | |
Sub-transfer agency fees | | | 367 | | | | 87 | | | | 12 | | | | 23 | | | | — | | | | n/a | | | | 2,771 | | | | 3,260 | |
| | | | | | | | |
Inflation Managed Bond Fund | | | | | | | | | | | | | | | | | | | | | | | | | | | | | | | | |
Transfer agency fees | | | 5 | | | | 1 | | | | — | (a) | | | — | (a) | | | 3 | | | | n/a | | | | 4 | | | | 13 | |
Sub-transfer agency fees | | | 49 | | | | 2 | | | | — | (a) | | | — | | | | — | | | | n/a | | | | 56 | | | | 107 | |
| | | | | | | | |
Limited Duration Bond Fund | | | | | | | | | | | | | | | | | | | | | | | | | | | | | | | | |
Transfer agency fees | | | 9 | | | | 3 | | | | n/a | | | | n/a | | | | 5 | | | | n/a | | | | 3 | | | | 20 | |
Sub-transfer agency fees | | | 80 | | | | 14 | | | | n/a | | | | n/a | | | | — | | | | n/a | | | | 33 | | | | 127 | |
| | | | | | | | |
Mortgage-Backed Securities Fund | | | | | | | | | | | | | | | | | | | | | | | | | | | | | | | | |
Transfer agency fees | | | 10 | | | | 1 | | | | n/a | | | | n/a | | | | 6 | | | | n/a | | | | 6 | | | | 23 | |
Sub-transfer agency fees | | | 62 | | | | 5 | | | | n/a | | | | n/a | | | | — | | | | n/a | | | | 226 | | | | 293 | |
| | | | | | | | |
Short Duration Bond Fund | | | | | | | | | | | | | | | | | | | | | | | | | | | | | | | | |
Transfer agency fees | | | 11 | | | | 4 | | | | n/a | | | | n/a | | | | 13 | | | | n/a | | | | 31 | | | | 59 | |
Sub-transfer agency fees | | | 118 | | | | 29 | | | | n/a | | | | n/a | | | | — | | | | n/a | | | | 1,951 | | | | 2,098 | |
| | | | | | | | |
Short Duration High Yield Fund | | | | | | | | | | | | | | | | | | | | | | | | | | | | | | | | |
Transfer agency fees | | | 1 | | | | — | (a) | | | n/a | | | | n/a | | | | 1 | | | | n/a | | | | 1 | | | | 3 | |
Sub-transfer agency fees | | | 1 | | | | — | (a) | | | n/a | | | | n/a | | | | — | | | | n/a | | | | — | (a) | | | 1 | |
| | | | | | | | |
Treasury & Agency Fund | | | | | | | | | | | | | | | | | | | | | | | | | | | | | | | | |
Transfer agency fees | | | 2 | | | | n/a | | | | n/a | | | | n/a | | | | n/a | | | | n/a | | | | 1 | | | | 3 | |
Sub-transfer agency fees | | | 3 | | | | n/a | | | | n/a | | | | n/a | | | | n/a | | | | n/a | | | | 11 | | | | 14 | |
| (a) | Amount rounds to less than 500. |
J. Federal Income Taxes — Each Fund is treated as a separate taxable entity for Federal income tax purposes. Each Fund’s policy is to comply with the provisions of the Internal Revenue Code of 1986, as amended (the “Code”), applicable to regulated investment companies and to distribute to shareholders all of its distributable net investment income and net realized capital gains on investments. Accordingly, no provision for Federal income tax is necessary. Management has reviewed the Funds’ tax positions for all open tax years and has determined that as of August 31, 2016, no liability for income tax is required in the Funds’ financial statements for net unrecognized tax benefits. However, management’s conclusions may be subject to future review based on changes in, or the interpretation of, the accounting standards or tax laws and regulations. Each of the Funds’ Federal tax returns for the prior three fiscal years remains subject to examination by the Internal Revenue Service.
| | | | | | |
| | | |
| 344 | | | | J.P. MORGAN INCOME FUNDS | | AUGUST 31, 2016 |
K. Foreign Taxes — The Funds may be subject to foreign taxes on income, gains on investments or currency purchases/repatriation, a portion of which may be recoverable. The Funds will accrue such taxes and recoveries as applicable, based upon their current interpretation of tax rules and regulations that exist in the markets in which they invest.
L. Distributions to Shareholders — Distributions from net investment income are generally declared and paid monthly and are declared separately for each class. No class has preferential dividend rights; differences in per share rates are due to differences in separate class expenses. Net realized capital gains, if any, are distributed by each Fund at least annually. The amount of distributions from net investment income and net realized capital gains is determined in accordance with Federal income tax regulations, which may differ from GAAP. To the extent these “book/tax” differences are permanent in nature (i.e., that they result from other than timing of recognition — “temporary differences”), such amounts are reclassified within the capital accounts based on their Federal tax-basis treatment.
3. Fees and Other Transactions with Affiliates
A. Investment Advisory Fee — Pursuant to Investment Advisory Agreements, the Adviser supervises the investments of each Fund and for such services is paid a fee. The fee is accrued daily and paid monthly based on each Fund’s respective average daily net assets. The annual rate for each Fund is as follows:
| | | | |
Core Bond Fund | | | 0.30 | % |
Core Plus Bond Fund | | | 0.30 | |
Government Bond Fund | | | 0.30 | |
High Yield Fund | | | 0.65 | * |
Inflation Managed Bond Fund | | | 0.35 | |
Limited Duration Bond Fund | | | 0.25 | |
Mortgage-Backed Securities Fund | | | 0.35 | |
Short Duration Bond Fund | | | 0.25 | |
Short Duration High Yield Fund | | | 0.50 | |
Treasury & Agency Fund | | | 0.30 | |
| * | Effective November 1, 2016, the annual rate will be 0.60%. |
The Adviser waived Investment Advisory fees and/or reimbursed expenses as outlined in Note 3.G.
B. Administration Fee — Pursuant to Administration Agreements, the Administrator provides certain administration services to the Funds. In consideration of these services, the Administrator receives a fee accrued daily and paid monthly at an annual rate of 0.15% of the first $25 billion of the average daily net assets of all funds in the J.P. Morgan Funds Complex covered by the Administration Agreement (excluding certain funds of funds and money market funds) and 0.075% of the average daily net assets in excess of $25 billion of all such funds. For the six months ended August 31, 2016, the effective annualized rate was 0.08% of each Fund’s average daily net assets, notwithstanding any fee waivers and/or expense reimbursements.
The Administrator waived Administration fees as outlined in Note 3.G.
JPMCB, a wholly-owned subsidiary of JPMorgan, serves as the Funds’ sub-administrator (the “Sub-administrator”). For its services as Sub-administrator, JPMCB receives a portion of the fees payable to the Administrator.
C. Distribution Fees — Pursuant to a Distribution Agreement, JPMorgan Distribution Services, Inc. (the “Distributor”), a wholly-owned subsidiary of JPMorgan, serves as the Trusts’ exclusive underwriter and promotes and arranges for the sale of each Fund’s shares. The Board has adopted a Distribution Plan (the “Distribution Plan”) for Class A, Class C and Class R2 Shares of the Funds, as applicable, in accordance with Rule 12b-1 under the 1940 Act. The Distribution Plan provides that each Fund shall pay distribution fees, including payments to the Distributor, at annual rates of the average daily net assets as shown in the table below:
| | | | | | | | | | | | |
| | | Class A | | | Class C | | | Class R2 | |
| | | 0.25 | % | | | 0.75 | % | | | 0.50 | % |
In addition, the Distributor is entitled to receive the front-end sales charges from purchases of Class A Shares and the CDSC from redemptions of Class C Shares (except for Class C Shares of Limited Duration Bond Fund and Short Duration Bond Fund purchased prior to September 3, 2013) and
| | | | | | | | |
| | | |
| AUGUST 31, 2016 | | J.P. MORGAN INCOME FUNDS | | | | | 345 | |
NOTES TO FINANCIAL STATEMENTS
AS OF AUGUST 31, 2016 (Unaudited) (continued)
certain Class A Shares for which front-end sales charges have been waived. For the six months ended August 31, 2016, the Distributor retained the following amounts (in thousands):
| | | | | | | | |
| | | Front-End Sales Charge | | | CDSC | |
Core Bond Fund | | $ | 353 | | | $ | 1 | |
Core Plus Bond Fund | | | 288 | | | | 1 | |
Government Bond Fund | | | 30 | | | | — | (a) |
High Yield Fund | | | 99 | | | | — | (a) |
Inflation Managed Bond Fund | | | 2 | | | | — | (a) |
Limited Duration Bond Fund | | | 5 | | | | — | (a) |
Mortgage-Backed Securities Fund | | | 25 | | | | 1 | |
Short Duration Bond Fund | | | 28 | | | | — | (a) |
Short Duration High Yield Fund | | | — | (a) | | | — | |
Treasury & Agency Fund | | | — | (a) | | | — | |
| (a) | Amount rounds to less than 500. |
D. Shareholder Servicing Fees — The Trusts, on behalf of the Funds, have entered into a Shareholder Servicing Agreement with the Distributor under which the Distributor provides certain support services to the shareholders. The Class R6 Shares do not charge a shareholder servicing fee. For performing these services, the Distributor receives a fee that is accrued daily and paid monthly equal to a percentage of the average daily net assets as shown in the table below:
| | | | | | | | | | | | | | | | | | | | | | | | |
| | | Class A | | | Class C | | | Class R2 | | | Class R5 | | | Institutional Class | | | Select Class | |
Core Bond Fund | | | 0.25 | % | | | 0.25 | % | | | 0.25 | % | | | 0.05 | % | | | n/a | | | | 0.25 | % |
Core Plus Bond Fund | | | 0.25 | | | | 0.25 | | | | 0.25 | | | | n/a | | | | 0.10 | % | | | 0.25 | |
Government Bond Fund | | | 0.25 | | | | 0.25 | | | | 0.25 | | | | n/a | | | | n/a | | | | 0.25 | |
High Yield Fund | | | 0.25 | | | | 0.25 | | | | 0.25 | | | | 0.05 | | | | n/a | | | | 0.25 | |
Inflation Managed Bond Fund | | | 0.25 | | | | 0.25 | | | | 0.25 | | | | 0.05 | | | | n/a | | | | 0.25 | |
Limited Duration Bond Fund | | | 0.25 | | | | 0.25 | | | | n/a | | | | n/a | | | | n/a | | | | 0.25 | |
Mortgage-Backed Securities Fund | | | 0.25 | | | | 0.25 | | | | n/a | | | | n/a | | | | n/a | | | | 0.25 | |
Short Duration Bond Fund | | | 0.25 | | | | 0.25 | | | | n/a | | | | n/a | | | | n/a | | | | 0.25 | |
Short Duration High Yield Fund | | | 0.25 | | | | 0.25 | | | | n/a | | | | n/a | | | | n/a | | | | 0.25 | |
Treasury & Agency Fund | | | 0.25 | | | | n/a | | | | n/a | | | | n/a | | | | n/a | | | | 0.25 | |
The Distributor has entered into shareholder services contracts with affiliated and unaffiliated financial intermediaries who provide shareholder services and other related services to their clients or customers who invest in the Funds under which the Distributor will pay all or a portion of such fees earned to financial intermediaries for performing such services.
The Distributor waived Shareholder Servicing fees as outlined in Note 3.G.
E. Custodian and Accounting Fees — JPMCB provides portfolio custody and accounting services to the Funds. For performing these services, the Funds pay JPMCB transaction and asset-based fees that vary according to the number of transactions and positions, plus out-of-pocket expenses. The amounts paid directly to JPMCB by the Funds for custody and accounting services are included in Custodian and accounting fees on the Statements of Operations. Payments to the custodian may be reduced by credits earned by each Fund, based on uninvested cash balances held by the custodian. Such earnings credits, if any, are presented separately on the Statements of Operations.
Interest expense paid to the custodian related to cash overdrafts, if any, is included in Interest expense to affiliates on the Statements of Operations.
F. Collateral Management Fees — JPMCB provides derivatives collateral management services for Core Plus Bond Fund and Inflation Managed Bond Fund. The amounts paid directly to JPMCB by the Funds for these services are included in Collateral management fees on the Statements of Operations.
G. Waivers and Reimbursements — The Adviser, Administrator and/or Distributor have contractually agreed to waive fees and/or reimburse the Funds to the extent that total annual operating expenses (excluding acquired fund fees and expenses, dividend and interest expenses related to
| | | | | | |
| | | |
| 346 | | | | J.P. MORGAN INCOME FUNDS | | AUGUST 31, 2016 |
short sales, interest, taxes, expenses related to litigation and potential litigation and extraordinary expenses) exceed the percentages of the Funds’ respective average daily net assets as shown in the table below:
| | | | | | | | | | | | | | | | | | | | | | | | | | | | |
| | | Class A | | | Class C | | | Class R2 | | | Class R5 | | | Class R6 | | | Institutional Class | | | Select Class | |
Core Bond Fund* | | | 0.75 | % | | | 1.40 | % | | | 1.00 | % | | | 0.45 | % | | | 0.35 | % | | | n/a | | | | 0.58 | % |
Core Plus Bond Fund^ | | | 0.75 | | | | 1.40 | | | | 1.15 | | | | n/a | | | | 0.40 | | | | 0.49 | % | | | 0.46 | |
Government Bond Fund | | | 0.75 | | | | 1.48 | | | | 1.00 | | | | n/a | | | | 0.35 | | | | n/a | | | | 0.48 | |
High Yield Fund** | | | 1.00 | | | | 1.55 | | | | 1.30 | | | | 0.75 | | | | 0.70 | | | | n/a | | | | 0.80 | |
Inflation Managed Bond Fund | | | 0.75 | | | | 1.40 | | | | 1.00 | | | | 0.55 | | | | 0.50 | | | | n/a | | | | 0.60 | |
Limited Duration Bond Fund | | | 0.70 | | | | 1.20 | | | | n/a | | | | n/a | | | | 0.25 | | | | n/a | | | | 0.45 | |
Mortgage-Backed Securities Fund | | | 0.65 | | | | 1.15 | | | | n/a | | | | n/a | | | | 0.25 | | | | n/a | | | | 0.40 | |
Short Duration Bond Fund | | | 0.80 | | | | 1.30 | | | | n/a | | | | n/a | | | | 0.30 | | | | n/a | | | | 0.55 | |
Short Duration High Yield Fund | | | 0.90 | | | | 1.40 | | | | n/a | | | | n/a | | | | 0.50 | | | | n/a | | | | 0.65 | |
Treasury & Agency Fund | | | 0.70 | | | | n/a | | | | n/a | | | | n/a | | | | n/a | | | | n/a | | | | 0.45 | |
| ^ | Prior to January 6, 2016, the contractual expense limitation for Core Plus Bond Fund was 0.65% for Select Class Shares. |
| * | Effective November 1, 2016, the contractual expense limitation is 0.50% for Select Shares. Effective July 1, 2017, the contractual expense limitation for Class R2 Shares will be 1.10%. |
| ** | Effective November 1, 2016, the contractual expense limitations are 1.50%, 0.75%, 0.70%, and 0.60% for Class C, Select, Class R5 and Class R6 shares, respectively. Effective July 1, 2017, the contractual expense limitation for Class R2 Shares will be 1.35%. |
Except as noted above, the expense limitation agreements were in effect for the six months ended August 31, 2016 and are in place until at least June 30, 2017, except for Class B Shares which are no longer operating and all share classes of Core Bond Fund and High Yield Fund which are in place until at least October 31, 2018.
For the six months ended August 31, 2016, the Funds’ service providers waived fees and/or reimbursed expenses for each of the Funds as follows (amounts in thousands). None of these parties expect the Funds to repay any such waived fees and/or reimbursed expenses in future years.
| | | | | | | | | | | | | | | | | | | | |
| | | Contractual Waivers | | | | |
| | | Investment
Advisory | | | Administration | | | Shareholder
Servicing | | | Total | | | Contractual
Reimbursements | |
Core Bond Fund | | $ | 4,628 | | | $ | 3,079 | | | $ | 8,007 | | | $ | 15,714 | | | $ | 33 | |
Core Plus Bond Fund | | | 151 | | | | 100 | | | | 2,150 | | | | 2,401 | | | | 52 | |
Government Bond Fund | | | 149 | | | | 99 | | | | 1,570 | | | | 1,818 | | | | 444 | |
High Yield Fund | | | 1,832 | | | | 1,219 | | | | 8,351 | | | | 11,402 | | | | 716 | |
Inflation Managed Bond Fund | | | — | | | | — | | | | 478 | | | | 478 | | | | 48 | |
Limited Duration Bond Fund | | | 459 | | | | 305 | | | | 274 | | | | 1,038 | | | | — | |
Mortgage-Backed Securities Fund | | | 1,802 | | | | 1,145 | | | | 1,000 | | | | 3,947 | | | | — | |
Short Duration Bond Fund | | | 1,800 | | | | 1,198 | | | | 2,110 | | | | 5,108 | | | | — | |
Short Duration High Yield Fund | | | 145 | | | | 63 | | | | 63 | | | | 271 | | | | — | (a) |
Treasury & Agency Fund | | | 143 | | | | 43 | | | | 2 | | | | 188 | | | | — | |
| (a) | Amount rounds to less than 500. |
Additionally, the Funds may invest in one or more money market funds advised by the Adviser or its affiliates (affiliated money market funds). For all funds with the exception of Core Plus Bond Fund, effective July 1, 2016, the Adviser, Administrator and Distributor, as shareholder servicing agent, waive fees in an amount sufficient to offset the respective net fees each collects from the affiliated money market fund on the applicable Funds’ investment in such affiliated money market fund. Prior to July 1, 2016, a portion of the waiver and/or reimbursement is voluntary.
For Core Plus Bond Fund, effective January 6, 2016, the Adviser, Administrator and/or Distributor, as shareholder servicing agent, have contractually agreed to waive fees and/or reimburse expenses in an amount sufficient to offset the respective net fees each collects from the affiliated money market fund on the Fund’s investment in such affiliated money market fund. Prior to January 6, 2016, a portion of the waiver was voluntary.
| | | | | | | | |
| | | |
| AUGUST 31, 2016 | | J.P. MORGAN INCOME FUNDS | | | | | 347 | |
NOTES TO FINANCIAL STATEMENTS
AS OF AUGUST 31, 2016 (Unaudited) (continued)
The amounts of waivers resulting from investments in these money market funds for the six months ended August 31, 2016 were as follows (amounts in thousands):
| | | | |
Core Bond Fund | | $ | 1,330 | |
Core Plus Bond Fund | | | 297 | |
High Yield Fund | | | 390 | |
Inflation Managed Bond Fund | | | 13 | |
Limited Duration Bond Fund | | | 92 | |
Mortgage-Backed Securities Fund | | | 257 | |
Short Duration High Yield Fund | | | 7 | |
H. Other — Certain officers of the Trusts are affiliated with the Adviser, the Administrator and the Distributor. Such officers, with the exception of the Chief Compliance Officer, receive no compensation from the Funds for serving in their respective roles.
The Board’s appointed a Chief Compliance Officer to the Funds in accordance with Federal securities regulations. Each Fund, along with other affiliated funds, makes reimbursement payments, on a pro-rata basis, to the Administrator for a portion of the fees associated with the Office of the Chief Compliance Officer. Such fees are included in Trustees’ and Chief Compliance Officer’s fees on the Statements of Operations.
The Trusts adopted a Trustee Deferred Compensation Plan (the “Plan”) which allows the Independent Trustees to defer the receipt of all or a portion of compensation related to performance of their duties as Trustees. The deferred fees are invested in various J.P. Morgan Funds until distribution in accordance with the Plan.
During the six months ended August 31, 2016, Core Bond Fund, Core Plus Bond Fund, High Yield Fund, Inflation Managed Bond Fund, Limited Duration Bond Fund, Mortgage-Backed Securities Fund, Short Duration Bond Fund and Short Duration High Yield Fund purchased securities from an underwriting syndicate in which the principal underwriter or members of the syndicate are affiliated with the Adviser.
The Funds may use related party broker-dealers. For the six months ended August 31, 2016, the Funds did not incur any brokerage commissions with broker-dealers affiliated with the Adviser.
The Securities and Exchange Commission (“SEC”) has granted an exemptive order permitting the Funds to engage in principal transactions with J.P. Morgan Securities, Inc., an affiliated broker, involving taxable money market instruments, subject to certain conditions.
4. Investment Transactions
During the six months ended August 31, 2016, purchases and sales of investments (excluding short-term investments) were as follows (amounts in thousands):
| | | | | | | | | | | | | | | | |
| | | Purchases
(excluding U.S.
Government) | | | Sales
(excluding U.S.
Government) | | | Purchases
of U.S.
Government | | | Sales
of U.S.
Government | |
Core Bond Fund | | $ | 3,085,703 | | | $ | 2,432,499 | | | $ | 698,532 | | | $ | 1,043,116 | |
Core Plus Bond Fund | | | 2,411,431 | | | | 1,267,577 | | | | 1,153,033 | | | | 581,599 | |
Government Bond Fund | | | 93,008 | | | | 76,916 | | | | 50,037 | | | | 14,330 | |
High Yield Fund | | | 4,125,437 | | | | 2,364,154 | | | | — | | | | — | |
Inflation Managed Bond Fund | | | 122,946 | | | | 232,229 | | | | 122,772 | | | | 192,132 | |
Limited Duration Bond Fund | | | 141,834 | | | | 167,215 | | | | — | | | | — | |
Mortgage-Backed Securities Fund | | | 418,504 | | | | 230,335 | | | | — | | | | — | |
Short Duration Bond Fund | | | 1,083,213 | | | | 1,235,722 | | | | 1,640,810 | | | | 1,464,622 | |
Short Duration High Yield Fund | | | 52,362 | | | | 53,371 | | | | — | | | | — | |
Treasury & Agency Fund | | | — | | | | 2,310 | | | | 15,999 | | | | 16,335 | |
| | | | | | |
| | | |
| 348 | | | | J.P. MORGAN INCOME FUNDS | | AUGUST 31, 2016 |
5. Federal Income Tax Matters
For Federal income tax purposes, the cost and unrealized appreciation (depreciation) in value of investment securities held at August 31, 2016 were as follows (amounts in thousands):
| | | | | | | | | | | | | | | | |
| | | Aggregate
Cost | | | Gross
Unrealized
Appreciation | | | Gross
Unrealized
Depreciation | | | Net Unrealized
Appreciation
(Depreciation) | |
Core Bond Fund | | $ | 28,059,435 | | | $ | 1,484,168 | | | $ | 54,057 | | | $ | 1,430,111 | |
Core Plus Bond Fund | | | 6,599,268 | | | | 230,169 | | | | 43,630 | | | | 186,539 | |
Government Bond Fund | | | 1,320,736 | | | | 78,042 | | | | 2,030 | | | | 76,012 | |
High Yield Fund | | | 12,071,594 | | | | 432,730 | | | | 437,007 | | | | (4,277 | ) |
Inflation Managed Bond Fund | | | 1,424,577 | | | | 43,761 | | | | 1,864 | | | | 41,897 | |
Limited Duration Bond Fund | | | 1,257,370 | | | | 6,902 | | | | 8,746 | | | | (1,844 | ) |
Mortgage-Backed Securities Fund | | | 2,710,415 | | | | 101,582 | | | | 13,047 | | | | 88,535 | |
Short Duration Bond Fund | | | 10,999,861 | | | | 66,648 | | | | 15,018 | | | | 51,630 | |
Short Duration High Yield Fund | | | 168,121 | | | | 2,500 | | | | 6,087 | | | | (3,587 | ) |
Treasury & Agency Fund | | | 101,863 | | | | 854 | | | | 6 | | | | 848 | |
Under the Regulated Investment Company Modernization Act of 2010 (the “Act”), net capital losses recognized by the Funds after February 28, 2011 are carried forward indefinitely, and retain their character as short-term and/or long-term losses. Prior to the Act, net capital losses incurred by the Funds were carried forward for eight years and treated as short-term losses. The Act requires that post-enactment net capital losses be used before pre-enactment net capital losses.
At February 29, 2016, Core Bond Fund, Government Bond Fund, Mortgage-Backed Securities Fund, Short Duration Bond Fund and Treasury & Agency Fund did not have any net capital loss carryforwards.
At February 29, 2016, the Funds had the following pre-enactment net capital loss carryforwards, expiring during the years indicated, which are available to offset future realized gains (amounts in thousands):
| | | | | | | | | | | | | | | | |
| | | 2017 | | | 2018 | | | 2019 | | | Total | |
Limited Duration Bond Fund | | $ | 42,572 | | | $ | 10,531 | | | $ | 6,963 | | | $ | 60,066 | |
As of February 29, 2016, the Funds had the following post-enactment net capital loss carryforwards (amounts in thousands):
| | | | | | | | |
| | | Capital Loss Carryforward Character | |
| | | Short-Term | | | Long-Term | |
Core Plus Bond Fund | | $ | 1,406 | | | $ | — | |
High Yield Fund | | | 39,756 | | | | 44,932 | |
Inflation Managed Bond Fund | | | 8,757 | | | | 316 | |
Limited Duration Bond Fund | | | — | (a) | | | 11,012 | |
Short Duration High Yield Fund | | | 3,057 | | | | 2,013 | |
| (a) | Amount rounds to less than 500. |
6. Borrowings
The Funds rely upon an exemptive order granted by the SEC (the “Order”) permitting the establishment and operation of an Interfund Lending Facility (the “Facility”). The Facility allows the Funds to directly lend and borrow money to or from any other fund relying upon the Order at rates beneficial to both the borrowing and lending funds. Advances under the Facility are taken primarily for temporary or emergency purposes, including the meeting of redemption requests that otherwise might require the untimely disposition of securities, and are subject to each Fund’s borrowing restrictions. The Interfund loan rate is determined, as specified in the Order, by averaging the current repurchase agreement rate and the current bank loan rate. The Order was granted to JPMorgan Trust II and may be relied upon by the Funds because the Funds and the series of JPMorgan Trust II are all investment companies in the same “group of investment companies” (as defined in Section 12(d)(1)(G) of the 1940 Act).
The Trusts and JPMCB have entered into a financing arrangement. Under this arrangement, JPMCB provides an unsecured, uncommitted credit facility in the aggregate amount of $100 million to certain of the J.P. Morgan Funds, including the Funds. Advances under the arrangement are taken primarily for temporary or emergency purposes, including the meeting of redemption requests that otherwise might require the untimely disposition of securities, and are subject to each Fund’s borrowing restrictions. Interest on borrowings is payable at a rate determined by JPMCB at the time of borrowing. This agreement has been extended until November 7, 2016.
The Funds had no borrowings outstanding from another fund or from the unsecured, uncommitted credit facility during the six months ended August 31, 2016.
| | | | | | | | |
| | | |
| AUGUST 31, 2016 | | J.P. MORGAN INCOME FUNDS | | | | | 349 | |
NOTES TO FINANCIAL STATEMENTS
AS OF AUGUST 31, 2016 (Unaudited) (continued)
In addition, effective August 16, 2016, the Trusts along with certain other trusts (“Borrowers”) entered into a joint syndicated senior unsecured revolving credit facility totaling $1.5 billion (“Credit Facility”) with various lenders and The Bank of New York Mellon, as administrative agent for the lenders. This Credit Facility provides a source of funds to the Borrowers for temporary and emergency purposes, including the meeting of redemption requests that otherwise might require the untimely disposition of securities. Under the terms of the Credit Facility, a borrowing fund must have a minimum of $25,000,000 in adjusted net asset value and not exceed certain adjusted net asset coverage ratios prior to and during the time in which and any borrowings are outstanding. If a fund does not comply with the aforementioned requirements, the Fund must remediate within three business days with respect to the $25,000,000 minimum adjusted net asset value or within one business day with respect to certain asset coverage ratios or the administrative agent at the request of, or with the consent of, the lenders may terminate the Credit Facility and declare any outstanding borrowings to be due and payable immediately.
Interest associated with any borrowing under the Credit Facility is charged to the borrowing fund at a rate of interest equal to 1.00% plus the greater of the federal funds effective rate or one month LIBOR. The annual commitment fee to maintain the Credit Facility is 0.15% and is incurred on the unused portion of the Credit Facility and is allocated to all participating funds pro rata based on their respective net assets. The initial term of the Credit Facility is 364 days, unless extended. The Funds did not utilize the Credit Facility during the period ended August 31, 2016.
7. Risks, Concentrations and Indemnifications
In the normal course of business, the Funds enter into contracts that contain a variety of representations which provide general indemnifications. Each Fund’s maximum exposure under these arrangements is unknown. The amount of exposure would depend on future claims that may be made against each Fund that have not yet occurred. However, based on experience, the Funds expect the risk of loss to be remote.
As of August 31, 2016, J.P. Morgan Investor Funds and JPMorgan SmartRetirement Funds, which are affiliated funds of funds, owned in the aggregate, shares representing more than 10% of the net assets of certain Funds as follows:
| | | | | | | | |
| | | J.P. Morgan
Investor
Funds | | | JPMorgan
SmartRetirement
Funds | |
Core Bond Fund | | | — | % | | | 20.9 | % |
Core Plus Bond Fund | | | 19.8 | | | | 16.7 | |
High Yield Fund | | | — | | | | 22.2 | |
Inflation Managed Bond Fund | | | 16.3 | | | | 27.2 | |
Limited Duration Bond Fund | | | 46.5 | | | | — | |
As of August 31, 2016, the Funds had omnibus accounts which represented the following percentage of each Fund’s net assets:
| | | | | | | | | | | | | | | | |
| | | Number of
Affiliated
Omnibus
Accounts | | | % of the Fund | | | Number of
Non-affiliated
Omnibus
Accounts | | | % of the Fund | |
Core Plus Bond Fund | | | 1 | | | | 13.6 | % | | | — | | | | — | % |
Government Bond Fund | | | — | | | | — | | | | 1 | | | | 17.8 | |
High Yield Fund | | | 1 | | | | 10.8 | | | | — | | | | — | |
Inflation Managed Bond Fund | | | 1 | | | | 24.4 | | | | — | | | | — | |
Short Duration Bond Fund | | | 2 | | | | 64.6 | | | | 1 | | | | 11.7 | |
Short Duration High Yield Fund | | | 1 | | | | 82.3 | | | | 1 | | | | 11.0 | |
Treasury & Agency Fund | | | 2 | | | | 64.4 | | | | — | | | | — | |
Significant shareholder transactions by these shareholders may impact the Funds’ performance.
The Funds are subject to risks associated with securities with contractual cash flows including asset-backed and mortgage related securities such as collateralized mortgage obligations, mortgage pass-through securities and commercial mortgage-backed securities, including securities backed by sub-prime mortgage loans. The value, liquidity and related income of these securities are sensitive to changes in economic conditions, including real estate value, pre-payments, delinquencies and/or defaults, and may be adversely affected by shifts in the market’s perception of the issuers and changes in interest rates.
Core Plus Bond Fund, High Yield Fund and Short Duration High Yield Fund invest in high yield securities that are not rated or rated below investment grade (commonly known as “junk bonds.”) These securities are considered to be high risk investments. Investments in lower-rated securities or unrated securities of comparable quality tend to be more sensitive to economic conditions than higher rated securities. Junk bonds involve a greater risk of default by the issuer because such securities are generally unsecured and are often subordinated to other creditors’ claims. The market price of these securities can change suddenly and unexpectedly. As a result, the Funds are intended for investors who are able and willing to assume a high degree of risk.
A significant portion of the Funds’ (except High Yield Fund, Short Duration High Yield Fund and Treasury & Agency Fund) investments are comprised of asset-backed or mortgage related securities, including securities backed by sub-prime mortgages.
| | | | | | |
| | | |
| 350 | | | | J.P. MORGAN INCOME FUNDS | | AUGUST 31, 2016 |
High Yield Fund and Short Duration High Yield Fund may invest up to 100% of the Funds’ total assets in below investment grade securities or unrated securities that JPMIM deems to be of equivalent quality. Such securities may include so called “distressed debt”.
The Funds are subject to the risk that, should the Funds decide to sell an illiquid investment when a ready buyer is not available at a price the Funds deem to be representative of its value, the value of the Funds’ net assets could be adversely affected.
Derivatives may be riskier than other types of investments because they may be more sensitive to changes in economic and market conditions and could result in losses that significantly exceed the Funds’ original investment. Many derivatives create leverage thereby causing the Funds to be more volatile than they would have been if they had not used derivatives. Derivatives also expose the Funds to counterparty risk (the risk that the derivative counterparty will not fulfill its contractual obligations), including credit risk of the derivative counterparty.
The Funds are also subject to counterparty credit risk, which is the risk that a counterparty fails to perform on agreements with the Funds such as swap contracts and forward foreign currency exchange contracts.
The Funds are subject to interest rate and credit risk. The value of debt securities may decline as interest rates increase. The Funds could lose money if the issuer of a fixed income security is unable to pay interest or repay principal when it is due. The Funds invest in floating rate loans and other floating rate debt securities. Although these investments are generally less sensitive to interest rate changes than other fixed rate instruments, the value of floating rate loans and other floating rate investments may decline if their interest rates do not rise as quickly, or as much, as general interest rates. Many factors can cause interest rates to rise. Some examples include central bank monetary policy, rising inflation rates and general economic conditions. Given the historically low interest rate environment, risks associated with rising rates are heightened. The ability of the issuers of debt to meet their obligations may be affected by the economic and political developments in a specific industry or region.
8. Subscription in-Kind
During the six months ended August 31, 2016, certain Short Duration Bond Fund Class R6 shareholders purchased shares of Short Duration Bond Fund. The portfolio securities were received primarily by means of a subscription in-kind exchange for shares of the Fund. Cash and portfolio securities were transferred as of the close of business on the date and at the market value listed below (amount in thousands):
| | | | | | | | |
| May 9, 2016 | | Value | | | Type | |
Class R6 | | $ | 44,995 | | | | Subscription in-kind | |
| | | | | | | | |
| | | |
| AUGUST 31, 2016 | | J.P. MORGAN INCOME FUNDS | | | | | 351 | |
SCHEDULE OF SHAREHOLDER EXPENSES
(Unaudited)
Hypothetical $1,000 Investment
As a shareholder of the Funds, you incur two types of costs: (1) transaction costs, including sales charges (loads) on purchase payments and (2) ongoing costs, including investment advisory fees, administration fees, distribution fees and other Fund expenses. The examples below are intended to help you understand your ongoing costs (in dollars) of investing in the Funds and to compare these ongoing costs with the ongoing costs of investing in other mutual funds. The examples assume that you had a $1,000 investment in each Class at the beginning of the reporting period, March 1, 2016, and continued to hold your shares at the end of the reporting period, August 31, 2016.
Actual Expenses
For each Class of each Fund in the table below, the first line provides information about actual account values and actual expenses. You may use the information in this line, together with the amount you invested, to estimate the expenses that you paid over the period. Simply divide your account value by $1,000 (for example, an $8,600 account value divided by $1,000 = 8.6), then multiply the result by the number in the first line of each Class under the heading entitled “Expenses Paid During the Period” to estimate the expenses you paid on your account during this period.
Hypothetical Example for Comparison Purposes
The second line of each Class in the table below provides information about hypothetical account values and hypothetical expenses based on the Class’ actual expense ratio and an assumed rate of return of 5% per year before expenses, which is not the Class’ actual return. The hypothetical account values and expenses may not be used to estimate the actual ending account balance or expenses you paid for the period. You may use this information to compare the ongoing costs of investing in the Class of the Fund and other funds. To do so, compare this 5% hypothetical example with the 5% hypothetical examples that appear in the shareholder reports of the other funds. Please note that the expenses shown in the table are meant to highlight your ongoing costs only and do not reflect any transaction costs, such as sales charges (loads) or redemption fees. Therefore, the second line for each Class in the table is useful in comparing ongoing costs only, and will not help you determine the relative total costs of owning different funds. In addition, if these transaction costs were included, your costs would have been higher. The examples also assume all dividends and distributions have been reinvested.
| | | | | | | | | | | | | | | | |
| | | Beginning
Account Value
March 1, 2016 | | | Ending
Account Value
August 31, 2016 | | | Expenses
Paid During
the Period | | | Annualized
Expense
Ratio | |
Core Bond Fund | | | | | | | | | | | | | | | | |
Class A | | | | | | | | | | | | | | | | |
Actual* | | $ | 1,000.00 | | | $ | 1,031.90 | | | $ | 3.79 | | | | 0.74 | % |
Hypothetical* | | | 1,000.00 | | | | 1,021.48 | | | | 3.77 | | | | 0.74 | |
Class C | | | | | | | | | | | | | | | | |
Actual* | | | 1,000.00 | | | | 1,028.20 | | | | 7.11 | | | | 1.39 | |
Hypothetical* | | | 1,000.00 | | | | 1,018.20 | | | | 7.07 | | | | 1.39 | |
Class R2 | | | | | | | | | | | | | | | | |
Actual* | | | 1,000.00 | | | | 1,031.50 | | | | 5.07 | | | | 0.99 | |
Hypothetical* | | | 1,000.00 | | | | 1,020.21 | | | | 5.04 | | | | 0.99 | |
Class R5 | | | | | | | | | | | | | | | | |
Actual* | | | 1,000.00 | | | | 1,034.40 | | | | 2.26 | | | | 0.44 | |
Hypothetical* | | | 1,000.00 | | | | 1,022.99 | | | | 2.24 | | | | 0.44 | |
Class R6 | | | | | | | | | | | | | | | | |
Actual* | | | 1,000.00 | | | | 1,034.80 | | | | 1.74 | | | | 0.34 | |
Hypothetical* | | | 1,000.00 | | | | 1,023.49 | | | | 1.73 | | | | 0.34 | |
Select Class | | | | | | | | | | | | | | | | |
Actual* | | | 1,000.00 | | | | 1,032.70 | | | | 2.92 | | | | 0.57 | |
Hypothetical* | | | 1,000.00 | | | | 1,022.33 | | | | 2.91 | | | | 0.57 | |
| | | | |
Core Plus Bond Fund | | | | | | | | | | | | | | | | |
Class A | | | | | | | | | | | | | | | | |
Actual* | | | 1,000.00 | | | | 1,047.50 | | | | 3.82 | | | | 0.74 | |
Hypothetical* | | | 1,000.00 | | | | 1,021.48 | | | | 3.77 | | | | 0.74 | |
Class C | | | | | | | | | | | | | | | | |
Actual* | | | 1,000.00 | | | | 1,043.60 | | | | 7.16 | | | | 1.39 | |
Hypothetical* | | | 1,000.00 | | | | 1,018.20 | | | | 7.07 | | | | 1.39 | |
Class R2 | | | | | | | | | | | | | | | | |
Actual* | | | 1,000.00 | | | | 1,045.20 | | | | 5.88 | | | | 1.14 | |
Hypothetical* | | | 1,000.00 | | | | 1,019.46 | | | | 5.80 | | | | 1.14 | |
| | | | | | |
| | | |
| 352 | | | | J.P. MORGAN INCOME FUNDS | | AUGUST 31, 2016 |
| | | | | | | | | | | | | | | | |
| | | Beginning
Account Value
March 1, 2016 | | | Ending
Account Value
August 31, 2016 | | | Expenses
Paid During
the Period | | | Annualized
Expense
Ratio | |
Core Plus Bond Fund (continued) | | | | | | | | | | | | | | | | |
Class R6 | | | | | | | | | | | | | | | | |
Actual* | | $ | 1,000.00 | | | $ | 1,049.00 | | | $ | 2.01 | | | | 0.39 | % |
Hypothetical* | | | 1,000.00 | | | | 1,023.24 | | | | 1.99 | | | | 0.39 | |
Institutional Class | | | | | | | | | | | | | | | | |
Actual* | | | 1,000.00 | | | | 1,047.30 | | | | 2.48 | | | | 0.48 | |
Hypothetical* | | | 1,000.00 | | | | 1,022.79 | | | | 2.45 | | | | 0.48 | |
Select Class | | | | | | | | | | | | | | | | |
Actual* | | | 1,000.00 | | | | 1,048.80 | | | | 2.32 | | | | 0.45 | |
Hypothetical* | | | 1,000.00 | | | | 1,022.94 | | | | 2.29 | | | | 0.45 | |
| | | | |
Government Bond Fund | | | | | | | | | | | | | | | | |
Class A | | | | | | | | | | | | | | | | |
Actual* | | | 1,000.00 | | | | 1,017.90 | | | | 3.81 | | | | 0.75 | |
Hypothetical* | | | 1,000.00 | | | | 1,021.42 | | | | 3.82 | | | | 0.75 | |
Class C | | | | | | | | | | | | | | | | |
Actual* | | | 1,000.00 | | | | 1,014.20 | | | | 7.46 | | | | 1.47 | |
Hypothetical* | | | 1,000.00 | | | | 1,017.80 | | | | 7.48 | | | | 1.47 | |
Class R2 | | | | | | | | | | | | | | | | |
Actual* | | | 1,000.00 | | | | 1,016.60 | | | | 5.08 | | | | 1.00 | |
Hypothetical* | | | 1,000.00 | | | | 1,020.16 | | | | 5.09 | | | | 1.00 | |
Class R6 | | | | | | | | | | | | | | | | |
Actual** | | | 1,000.00 | | | | 997.40 | | | | 0.29 | | | | 0.35 | |
Hypothetical* | | | 1,000.00 | | | | 1,023.44 | | | | 1.79 | | | | 0.35 | |
Select Class | | | | | | | | | | | | | | | | |
Actual* | | | 1,000.00 | | | | 1,019.30 | | | | 2.44 | | | | 0.48 | |
Hypothetical* | | | 1,000.00 | | | | 1,022.79 | | | | 2.45 | | | | 0.48 | |
| | | | |
High Yield Fund | | | | | | | | | | | | | | | | |
Class A | | | | | | | | | | | | | | | | |
Actual* | | | 1,000.00 | | | | 1,130.10 | | | | 5.32 | | | | 0.99 | |
Hypothetical* | | | 1,000.00 | | | | 1,020.21 | | | | 5.04 | | | | 0.99 | |
Class C | | | | | | | | | | | | | | | | |
Actual* | | | 1,000.00 | | | | 1,126.60 | | | | 8.25 | | | | 1.54 | |
Hypothetical* | | | 1,000.00 | | | | 1,017.44 | | | | 7.83 | | | | 1.54 | |
Class R2 | | | | | | | | | | | | | | | | |
Actual* | | | 1,000.00 | | | | 1,128.50 | | | | 6.92 | | | | 1.29 | |
Hypothetical* | | | 1,000.00 | | | | 1,018.70 | | | | 6.56 | | | | 1.29 | |
Class R5 | | | | | | | | | | | | | | | | |
Actual* | | | 1,000.00 | | | | 1,132.10 | | | | 3.98 | | | | 0.74 | |
Hypothetical* | | | 1,000.00 | | | | 1,021.48 | | | | 3.77 | | | | 0.74 | |
Class R6 | | | | | | | | | | | | | | | | |
Actual* | | | 1,000.00 | | | | 1,132.40 | | | | 3.71 | | | | 0.69 | |
Hypothetical* | | | 1,000.00 | | | | 1,021.73 | | | | 3.52 | | | | 0.69 | |
Select Class | | | | | | | | | | | | | | | | |
Actual* | | | 1,000.00 | | | | 1,132.10 | | | | 4.25 | | | | 0.79 | |
Hypothetical* | | | 1,000.00 | | | | 1,021.22 | | | | 4.02 | | | | 0.79 | |
| | | | |
Inflation Managed Bond Fund | | | | | | | | | | | | | | | | |
Class A | | | | | | | | | | | | | | | | |
Actual* | | | 1,000.00 | | | | 1,027.70 | | | | 3.83 | | | | 0.75 | |
Hypothetical* | | | 1,000.00 | | | | 1,021.42 | | | | 3.82 | | | | 0.75 | |
Class C | | | | | | | | | | | | | | | | |
Actual* | | | 1,000.00 | | | | 1,024.70 | | | | 7.09 | | | | 1.39 | |
Hypothetical* | | | 1,000.00 | | | | 1,018.20 | | | | 7.07 | | | | 1.39 | |
Class R2 | | | | | | | | | | | | | | | | |
Actual* | | | 1,000.00 | | | | 1,027.60 | | | | 5.11 | | | | 1.00 | |
Hypothetical* | | | 1,000.00 | | | | 1,020.16 | | | | 5.09 | | | | 1.00 | |
| | | | | | | | |
| | | |
| AUGUST 31, 2016 | | J.P. MORGAN INCOME FUNDS | | | | | 353 | |
SCHEDULE OF SHAREHOLDER EXPENSES
(Unaudited) (continued)
Hypothetical $1,000 Investment
| | | | | | | | | | | | | | | | |
| | | Beginning
Account Value
March 1, 2016 | | | Ending
Account Value
August 31, 2016 | | | Expenses
Paid During
the Period | | | Annualized
Expense
Ratio | |
Inflation Managed Bond Fund (continued) | | | | | | | | | | | | | | | | |
Class R5 | | | | | | | | | | | | | | | | |
Actual* | | $ | 1,000.00 | | | $ | 1,028.80 | | | $ | 2.66 | | | | 0.52 | % |
Hypothetical* | | | 1,000.00 | | | | 1,022.58 | | | | 2.65 | | | | 0.52 | |
Class R6 | | | | | | | | | | | | | | | | |
Actual* | | | 1,000.00 | | | | 1,030.30 | | | | 2.35 | | | | 0.46 | |
Hypothetical* | | | 1,000.00 | | | | 1,022.89 | | | | 2.35 | | | | 0.46 | |
Select Class | | | | | | | | | | | | | | | | |
Actual* | | | 1,000.00 | | | | 1,028.80 | | | | 3.07 | | | | 0.60 | |
Hypothetical* | | | 1,000.00 | | | | 1,022.18 | | | | 3.06 | | | | 0.60 | |
| | | | |
Limited Duration Bond Fund | | | | | | | | | | | | | | | | |
Class A | | | | | | | | | | | | | | | | |
Actual* | | | 1,000.00 | | | | 1,009.50 | | | | 3.44 | | | | 0.68 | |
Hypothetical* | | | 1,000.00 | | | | 1,021.78 | | | | 3.47 | | | | 0.68 | |
Class C | | | | | | | | | | | | | | | | |
Actual* | | | 1,000.00 | | | | 1,007.10 | | | | 5.97 | | | | 1.18 | |
Hypothetical* | | | 1,000.00 | | | | 1,019.26 | | | | 6.01 | | | | 1.18 | |
Class R6 | | | | | | | | | | | | | | | | |
Actual* | | | 1,000.00 | | | | 1,011.90 | | | | 1.22 | | | | 0.24 | |
Hypothetical* | | | 1,000.00 | | | | 1,024.00 | | | | 1.22 | | | | 0.24 | |
Select Class | | | | | | | | | | | | | | | | |
Actual* | | | 1,000.00 | | | | 1,010.80 | | | | 2.18 | | | | 0.43 | |
Hypothetical* | | | 1,000.00 | | | | 1,023.04 | | | | 2.19 | | | | 0.43 | |
| | | | |
Mortgage-Backed Securities Fund | | | | | | | | | | | | | | | | |
Class A | | | | | | | | | | | | | | | | |
Actual* | | | 1,000.00 | | | | 1,016.00 | | | | 3.20 | | | | 0.63 | |
Hypothetical* | | | 1,000.00 | | | | 1,022.03 | | | | 3.21 | | | | 0.63 | |
Class C | | | | | | | | | | | | | | | | |
Actual* | | | 1,000.00 | | | | 1,013.10 | | | | 5.73 | | | | 1.13 | |
Hypothetical* | | | 1,000.00 | | | | 1,019.51 | | | | 5.75 | | | | 1.13 | |
Class R6 | | | | | | | | | | | | | | | | |
Actual* | | | 1,000.00 | | | | 1,018.50 | | | | 1.17 | | | | 0.23 | |
Hypothetical* | | | 1,000.00 | | | | 1,024.05 | | | | 1.17 | | | | 0.23 | |
Select Class | | | | | | | | | | | | | | | | |
Actual* | | | 1,000.00 | | | | 1,017.70 | | | | 1.93 | | | | 0.38 | |
Hypothetical* | | | 1,000.00 | | | | 1,023.29 | | | | 1.94 | | | | 0.38 | |
| | | | |
Short Duration Bond Fund | | | | | | | | | | | | | | | | |
Class A | | | | | | | | | | | | | | | | |
Actual* | | | 1,000.00 | | | | 1,007.60 | | | | 4.05 | | | | 0.80 | |
Hypothetical* | | | 1,000.00 | | | | 1,021.17 | | | | 4.08 | | | | 0.80 | |
Class C | | | | | | | | | | | | | | | | |
Actual* | | | 1,000.00 | | | | 1,005.00 | | | | 6.57 | | | | 1.30 | |
Hypothetical* | | | 1,000.00 | | | | 1,018.65 | | | | 6.61 | | | | 1.30 | |
Class R6 | | | | | | | | | | | | | | | | |
Actual* | | | 1,000.00 | | | | 1,010.20 | | | | 1.52 | | | | 0.30 | |
Hypothetical* | | | 1,000.00 | | | | 1,023.69 | | | | 1.53 | | | | 0.30 | |
Select Class | | | | | | | | | | | | | | | | |
Actual* | | | 1,000.00 | | | | 1,009.90 | | | | 2.79 | | | | 0.55 | |
Hypothetical* | | | 1,000.00 | | | | 1,022.43 | | | | 2.80 | | | | 0.55 | |
| | | | | | |
| | | |
| 354 | | | | J.P. MORGAN INCOME FUNDS | | AUGUST 31, 2016 |
| | | | | | | | | | | | | | | | |
| | | Beginning
Account Value
March 1, 2016 | | | Ending
Account Value
August 31, 2016 | | | Expenses
Paid During
the Period | | | Annualized
Expense
Ratio | |
Short Duration High Yield Fund | | | | | | | | | | | | | | | | |
Class A | | | | | | | | | | | | | | | | |
Actual* | | $ | 1,000.00 | | | $ | 1,085.90 | | | $ | 4.68 | | | | 0.89 | % |
Hypothetical* | | | 1,000.00 | | | | 1,020.72 | | | | 4.53 | | | | 0.89 | |
Class C | | | | | | | | | | | | | | | | |
Actual* | | | 1,000.00 | | | | 1,084.50 | | | | 7.30 | | | | 1.39 | |
Hypothetical* | | | 1,000.00 | | | | 1,018.20 | | | | 7.07 | | | | 1.39 | |
Class R6 | | | | | | | | | | | | | | | | |
Actual* | | | 1,000.00 | | | | 1,089.30 | | | | 2.58 | | | | 0.49 | |
Hypothetical* | | | 1,000.00 | | | | 1,022.74 | | | | 2.50 | | | | 0.49 | |
Select Class | | | | | | | | | | | | | | | | |
Actual* | | | 1,000.00 | | | | 1,088.60 | | | | 3.37 | | | | 0.64 | |
Hypothetical* | | | 1,000.00 | | | | 1,021.98 | | | | 3.26 | | | | 0.64 | |
| | | | |
Treasury & Agency Fund | | | | | | | | | | | | | | | | |
Class A | | | | | | | | | | | | | | | | |
Actual* | | | 1,000.00 | | | | 1,003.90 | | | | 3.54 | | | | 0.70 | |
Hypothetical* | | | 1,000.00 | | | | 1,021.68 | | | | 3.57 | | | | 0.70 | |
Select Class | | | | | | | | | | | | | | | | |
Actual* | | | 1,000.00 | | | | 1,004.90 | | | | 2.27 | | | | 0.45 | |
Hypothetical* | | | 1,000.00 | | | | 1,022.94 | | | | 2.29 | | | | 0.45 | |
| * | Expenses are equal to each Class’ respective annualized expense ratio, multiplied by the average account value over the period, multiplied by 184/365 (to reflect the one-half year period). |
| ** | Expenses are equal to each Class’ respective annualized expense ratio, multiplied by the average account value over the period, multiplied by 30/365 (to reflect the actual period). Commencement of operations was August 1, 2016. |
| | | | | | | | |
| | | |
| AUGUST 31, 2016 | | J.P. MORGAN INCOME FUNDS | | | | | 355 | |
BOARD APPROVAL OF INVESTMENT ADVISORY AGREEMENTS
(Unaudited)
The Board of Trustees has established various standing committees composed of Trustees with diverse backgrounds, to which the Board of Trustees has assigned specific subject matter responsibilities to further enhance the effectiveness of the Board’s oversight and decision making. The Board of Trustees and its investment committees (money market and alternative products, equity, and fixed income) meet regularly throughout the year and consider factors that are relevant to their annual consideration of investment advisory agreements at each meeting. They also meet for the specific purpose of considering investment advisory agreement annual renewals. The Board of Trustees held meetings in person in June and August 2016, at which the Trustees considered the continuation of the investment advisory agreements for each of the Funds whose semi-annual report is contained herein (each an “Advisory Agreement” and collectively, the “Advisory Agreements”). At the June meeting, the Board’s investment committees met to review and consider performance, expense and related information for the J.P. Morgan Funds. Each investment committee reported to the full Board, which then considered the investment committee’s preliminary findings. At the August meeting, the Trustees continued their review and consideration. The Trustees, including a majority of the Trustees who are not “interested persons” (as defined in the 1940 Act) of any party to the Advisory Agreements or any of their affiliates, approved the continuation of each Advisory Agreement on August 17, 2016.
As part of their review of the Advisory Agreements, the Trustees considered and reviewed performance and other information about the Funds received from the Adviser. This information includes the Funds’ performance as compared to the performance of their peers and benchmarks and analyses by the Adviser of the Funds’ performance. In addition, the Trustees have engaged an independent management consulting firm (“independent consultant”) to report on the performance of certain J.P. Morgan Funds at each of the Trustees’ regular meetings. The Adviser also periodically provides comparative information regarding the Funds’ expense ratios and those of their peer groups. In addition, in preparation for the June and August meetings, the Trustees requested, received and evaluated extensive materials from the Adviser, including performance and expense information compiled by Broadridge, using data from Lipper Inc., independent providers of investment company data (together, “Broadridge/Lipper”). The Trustees’ independent consultant also provided additional analyses of the performance of Funds with greater than two years of performance history, as well as a risk/return assessment of certain Funds as compared to the Fund’s objectives and peers, in connection with the Trustees’ review of the Advisory Agreements. Before voting on the proposed Advisory Agreements, the Trustees reviewed the proposed Advisory Agreements with representatives of the Adviser, counsel to the Trusts and independent legal counsel and received a memo-
randum from independent legal counsel to the Trustees discussing the legal standards for their consideration of the proposed Advisory Agreements. The Trustees also discussed the proposed Advisory Agreements in executive sessions with independent legal counsel at which no representatives of the Adviser were present. Set forth below is a summary of the material factors evaluated by the Trustees in determining whether to approve each Advisory Agreement.
The Trustees considered information provided with respect to the Funds over the course of the year. Each Trustee attributed different weights to the various factors and no factor alone was considered determinative. From year to year, the Trustees consider and place emphasis on relevant information in light of changing circumstances in market and economic conditions. The Trustees determined that the compensation to be received by the Adviser from each Fund under the applicable Advisory Agreement was fair and reasonable and that the continuance of each Advisory Agreement was in the best interests of each Fund and its shareholders.
The factors summarized below were considered and discussed by the Trustees in reaching their conclusions:
Nature, Extent and Quality of Services Provided by the Adviser
The Trustees received and considered information regarding the nature, extent and quality of the services provided to each Fund under the Advisory Agreement. The Trustees took into account information furnished throughout the year at Trustee meetings, as well as the materials furnished specifically in connection with this annual review process. The Trustees considered the background and experience of the Adviser’s senior management and the expertise of, and the amount of attention given to each Fund by, investment personnel of the Adviser. In addition, the Trustees reviewed the qualifications, backgrounds and responsibilities of the portfolio management team primarily responsible for the day-to-day management of each Fund and the infrastructure supporting the team. The Trustees also considered information provided by the Adviser and JPMorgan Distribution Services, Inc. (“JPMDS”) about the structure and distribution strategy of each Fund. The Trustees reviewed information relating to the Adviser’s risk governance model and reports showing the Adviser’s compliance structure and ongoing compliance processes. The Trustees also considered the quality of administrative services provided by J.P. Morgan Investment Management Inc. in its role as administrator (“JPMIM”).
The Trustees also considered their knowledge of the nature and quality of the services provided by the Adviser and its affiliates to the Funds gained from their experience as Trustees of the J.P. Morgan Funds. In addition, they considered the overall reputation and capabilities of the Adviser and its affiliates, the commitment of the Adviser to provide high quality service to the Funds, their overall confidence in the Adviser’s integrity
| | | | | | |
| | | |
| 356 | | | | J.P. MORGAN INCOME FUNDS | | AUGUST 31, 2016 |
and the Adviser’s responsiveness to questions or concerns raised by them, including the Adviser’s willingness to consider and implement organizational and operational changes designed to improve investment results and the services provided to each Fund.
Based upon these considerations and other factors, the Trustees concluded that they were satisfied with the nature, extent and quality of the investment advisory services provided to the Funds by the Adviser.
Costs of Services Provided and Profitability to the Adviser and its Affiliates
The Trustees received and considered information regarding the profitability to the Adviser and its affiliates in providing services to each of the Funds. The Trustees reviewed and discussed this data. The Trustees recognized that this data is not audited and represents the Adviser’s determination of its and its affiliates’ revenues from the contractual services provided to the Funds, less expenses of providing such services. Expenses include direct and indirect costs and are calculated using an allocation methodology developed by the Adviser. The Trustees also recognized that it is difficult to make comparisons of profitability from fund investment advisory contracts because comparative information is not generally publicly available and is affected by numerous factors, including the structure of the particular adviser, the types of funds it manages, its business mix, numerous assumptions regarding allocations and the fact that publicly-traded fund managers’ operating profits and net income are net of distribution and marketing expenses. Based upon their review, the Trustees concluded that the profitability to the Adviser under each of the Advisory Agreements was not unreasonable in light of the services and benefits provided to each Fund.
Fall-Out Benefits
The Trustees reviewed information regarding potential “fallout” or ancillary benefits received by the Adviser and its affiliates as a result of their relationship with the Funds. The Trustees also reviewed the Adviser’s allocation of fund brokerage for the J.P. Morgan Funds complex, including allocations to brokers who provide research to the Adviser.
The Trustees also considered that JPMDS, an affiliate of the Adviser, and JPMIM earn fees from the Funds for providing shareholder and administrative services, respectively. These fees were shown separately in the profitability analysis presented to the Trustees. The Trustees also considered the payments of Rule 12b-1 fees to JPMDS, which also acts as the Funds’ distributor and that these fees are in turn generally paid to financial intermediaries that sell the Funds, including financial intermediaries that are affiliates of the Adviser. The Trustees also considered the fees paid to JPMorgan Chase Bank, N.A. (“JPMCB”) for custody and fund accounting, and other related services.
Economies of Scale
The Trustees considered the extent to which the Funds may benefit from economies of scale. The Trustees considered that there may not be a direct relationship between economies of scale realized by the Funds and those realized by the Adviser as assets increase. The Trustees noted that the proposed investment advisory fee schedule for each Fund does not contain breakpoints, but that the fees remain competitive with peer funds. The Trustees also considered that the Adviser has implemented fee waivers and expense limitations (“Fee Caps”) which allow each Fund’s shareholders to share potential economies of scale from a Fund’s inception. The Trustees also considered that the Adviser has shared economies of scale by adding or enhancing services to the Funds over time, noting the Adviser’s substantial investments in its business in support of the Funds, including investments in trading systems and technology (including cybersecurity improvements), retention of key talent, additions to analyst and portfolio management teams, and regulatory support enhancements. The Trustees also considered whether it would be appropriate to add advisory fee breakpoints and the Trustees concluded that the current fee structure was reasonable in light of the Fee Caps that the Adviser has in place that serve to limit the overall net expense ratios of each Fund at competitive levels. The Trustees concluded that the Funds’ shareholders received the benefits of potential economies of scale through the Fee Caps and the Adviser’s reinvestment in its operations to serve the Funds and their shareholders.
Independent Written Evaluation of the Funds’ Senior/Chief Compliance Officer
The Trustees noted that, upon their direction, the Senior Officer for the Core Bond Fund, Core Plus Bond Fund, Government Bond Fund, High Yield Fund, Limited Duration Bond Fund, Mortgage-Backed Securities Fund, Short Duration Bond Fund, and Treasury & Agency Fund had prepared an independent written evaluation in order to assist the Trustees in determining the reasonableness of the proposed management fees. In determining whether to continue the Advisory Agreements, the Trustees considered the Senior Officer’s report.
The Trustees noted that, upon their direction, the Chief Compliance Officer for the Inflation Managed Bond Fund and Short Duration High Yield Fund had prepared an independent written evaluation in order to assist the Trustees in determining the reasonableness of the proposed management fees. The Trustees considered the written evaluation in determining whether to continue the Advisory Agreements.
Fees Relative to Adviser’s Other Clients
The Trustees received and considered information about the nature and extent of investment advisory services and fee rates offered to other clients of the Adviser, including institutional separate accounts and/or funds sub-advised by the Adviser,
| | | | | | | | |
| | | |
| AUGUST 31, 2016 | | J.P. MORGAN INCOME FUNDS | | | | | 357 | |
BOARD APPROVAL OF INVESTMENT ADVISORY AGREEMENTS
(Unaudited) (continued)
and for investment management styles substantially similar to that of each Fund. The Trustees considered the complexity of investment management for registered mutual funds relative to the Adviser’s other clients and noted differences in the regulatory, legal and other risks and responsibilities of providing services to the different clients. The Trustees considered that serving as an adviser to a registered mutual fund involves greater responsibilities and risks than acting as a sub-adviser and observed that sub-advisory fees may be lower than those charged by the Adviser to each Fund. The Trustees also noted that the adviser, not the mutual fund, pays the sub-advisory fee and that many responsibilities related to the advisory function are retained by the primary adviser. The Trustees concluded that the fee rates charged to each Fund in comparison to those charged to the Adviser’s other clients were reasonable.
Investment Performance
The Trustees received and considered absolute and/or relative performance for the Funds in a report prepared by Broadridge/Lipper. The Trustees considered the total return performance information, which included the ranking of the Funds within a performance universe made up of funds with the same Broadridge/Lipper investment classification and objective (the “Universe”), as well as a sub-set of funds within the Universe (the “Peer Group”), by total return for applicable one-, three- and five-year periods. The Trustees reviewed a description of Broadridge/Lipper’s methodology for selecting mutual funds in each Fund’s Peer Group and Universe. The Broadridge/Lipper materials provided to the Trustees highlighted information with respect to certain representative classes to assist the Trustees in their review. As part of this review, the Trustees also reviewed each Fund’s performance against its benchmark and considered the performance information provided for the Funds at regular Board meetings by the Adviser and the Trustees’ independent consultant and also considered the special analysis prepared by the Trustees’ independent consultant. For certain Funds, the Trustees and Adviser determined that the Peer Group and/or Universe were less meaningful and the independent consultant prepared an analysis of those Funds across various risk and return metrics including tracking error, volatility, total/excess return versus various indices and customized peer groups of funds with similar portfolio objectives (as selected by the independent consultant). The Broadridge/Lipper performance data noted by the Trustees as part of their review and the determinations made by the Trustees with respect to each Fund’s performance for certain representative classes are summarized below:
The Trustees noted that the Core Bond Fund’s performance for Class A shares was in the first, third and fifth quintiles based upon the Peer Group, and in the first, third and third quintiles based upon the Universe for the one-, three-, and five-year periods ended December 31, 2015, respectively. The Trustees noted that the performance for Select Class shares was in the
first, third and fourth quintiles based upon the Peer Group, and in the first, second and third quintiles based upon the Universe, for the one-, three-, and five-year periods ended December 31, 2015, respectively. The Trustees discussed the performance and investment strategy of the Fund with the Adviser and reviewed the performance analysis and evaluation prepared by the independent consultant. Based upon these discussions and various other factors, the Trustees concluded that the Fund’s performance was reasonable.
The Trustees noted that the Core Plus Bond Fund’s performance for Class A shares was in the first quintile based upon the Peer Group, and in the second, first and second quintiles based upon the Universe, for the one-, three-, and five-year periods ended December 31, 2015, respectively. The Trustees noted that the performance for Select Class shares was in the fourth, first and second quintiles based upon the Peer Group, and in the second, first and second quintiles based upon the Universe, for the one-, three-, and five-year periods ended December 31, 2015, respectively. The Trustees discussed the performance and investment strategy of the Fund with the Adviser and reviewed the performance analysis and evaluation prepared by the independent consultant. Based upon these discussions and various other factors, the Trustees concluded that the Fund’s performance was reasonable.
The Trustees noted that the Government Bond Fund’s performance for Class A shares was in the first, fourth and first quintiles based upon the Peer Group, and in the second, third, and first quintiles based upon the Universe, for the one-, three-, and five-year periods ended December 31, 2015, respectively. The Trustees noted that the performance for Select Class shares was in the first, fifth and first quintiles based upon the Peer Group and in the first, second and first quintiles based upon the Universe, for the one-, three-, and five-year periods ended December 31, 2015, respectively. The Trustees discussed the performance and investment strategy of the Fund with the Adviser and reviewed the performance analysis and evaluation prepared by the independent consultant. Based upon these discussions and various other factors, the Trustees concluded that the Fund’s performance was reasonable.
The Trustees noted that the High Yield Fund’s performance for Class A shares was in the third, third and fourth quintiles based upon the Peer Group, and in the fourth, third, and third quintiles based upon the Universe, for the one-, three-, and five-year periods ended December 31, 2015, respectively. The Trustees noted that the performance for Select Class shares was in the third, third and fourth quintiles based upon the Peer Group, and in the third quintile based on the Universe, for the one-, three-, and five-year periods ended December 31, 2015, respectively. The Trustees discussed the performance and investment strategy of the Fund with the Adviser and reviewed the performance analysis and evaluation prepared by the independent consultant. Based upon these discussions and
| | | | | | |
| | | |
| 358 | | | | J.P. MORGAN INCOME FUNDS | | AUGUST 31, 2016 |
various other factors, the Trustees concluded that the Fund’s performance was reasonable.
The Trustees noted that the Inflation Managed Bond Fund’s performance for Class A shares was in the first, first, and fifth quintiles based upon the Peer Group, and in the first, first and fourth quintiles based upon the Universe, for the one-, three- and five-year periods ended December 31, 2015, respectively. The Trustees noted that the performance for Select Class shares was in the first quintile for both the one- and three-year periods ended December 31, 2015 based upon the Peer Group, and in the first, first, and fourth quintiles based upon the Universe, for the one-, three-, and five-year periods ended December 31, 2015, respectively. The Trustees discussed the performance and investment strategy of the Fund with the Adviser and reviewed the performance analysis and evaluation prepared by the independent consultant. Based upon these discussions and various other factors, the Trustees concluded that the Fund’s performance was reasonable.
The Trustees noted that the Limited Duration Bond Fund’s performance for Class A shares was in the fourth, first and second quintiles based upon the Peer Group, and in the third, first and second quintiles based upon the Universe, for the one-, three-, and five-year periods ended December 31, 2015, respectively. The Trustees noted that the performance for Select Class shares was in the first quintile for each of the one-, three-, and five-year periods ended December 31, 2015 based upon the Peer Group, and in the third, first, and second quintiles based upon the Universe, for the one-, three-, and five-year periods ended December 31, 2015, respectively. The Trustees discussed the performance and investment strategy of the Fund with the Adviser and reviewed the performance analysis and evaluation prepared by the independent consultant. Based upon these discussions and various other factors, the Trustees concluded that the performance was reasonable.
The Trustees noted that the Mortgage-Backed Securities Fund’s performance for Class A shares was in the first, second and second quintiles based upon the Peer Group, and in the first, third, and second quintiles based upon the Universe, for the one-, three-, and five-year periods ended December 31, 2015, respectively. The Trustees noted that performance for Select Class shares was in the first, second, and second quintiles based upon the Universe for the one-, three-, and five-year periods ended December 31, 2015, respectively. The Trustees discussed the performance and investment strategy of the Fund with the Adviser and reviewed the performance analysis and evaluation prepared by the independent consultant. Based upon these discussions and various other factors, the Trustees concluded that the Fund’s performance was reasonable.
The Trustees noted that, based upon the Universe, the Short Duration Bond Fund’s performance was in the third, third, and
second quintiles for Class A shares, and in the first quintile for Select Class shares for the one-, three-, and five-year periods ended December 31, 2015. The Trustees discussed the performance and investment strategy of the Fund with the Adviser and reviewed the performance analysis and evaluation prepared by the independent consultant. Based upon these discussions and various other factors, the Trustees concluded that the Fund’s performance was reasonable.
The Trustees noted that the Short Duration High Yield Fund’s performance for Class A shares was in the fourth and second quintiles based upon the Peer Group and Universe, respectively, and in the third and second quintiles based upon the Peer Group and Universe, respectively, for Select Class shares for the one-year period ended December 31, 2015. The Trustees discussed the performance and investment strategy of the Fund with the Adviser and reviewed the performance analysis and evaluation prepared by the independent consultant. Based upon these discussions and various other factors, the Trustees concluded that the Fund’s performance was reasonable. They requested, however, that the Fund’s Adviser provide additional Fund performance information to be reviewed with members of the fixed income committee at each of their regular meetings over the course of the next year.
The Trustees noted that, based upon the Universe, the Treasury & Agency Fund’s performance was in the third, fourth and third quintiles for Class A shares, and in the second, third, and second quintiles for Select Class shares, for the one-, three-, and five-year periods ended December 31, 2015, respectively. The Trustees discussed the performance and investment strategy of the Fund with the Adviser and reviewed the performance analysis and evaluation prepared by the independent consultant. Based upon these discussions and various other factors, the Trustees concluded that the Fund’s performance was reasonable.
Advisory Fees and Expense Ratios
The Trustees considered the contractual advisory fee rate paid by each Fund to the Adviser and compared that rate to the information prepared by Broadridge/Lipper concerning management fee rates paid by other funds in the same Broadridge/Lipper category as each Fund. The Trustees recognized that Broadridge/Lipper reported each Fund’s management fee rate as the combined contractual advisory fee and administration fee rates. The Trustees also reviewed information about other expenses and the expense ratios for each Fund. The Trustees considered the fee waiver and/or expense reimbursement arrangements currently in place for each Fund and considered the net advisory fee rate after taking into account any waivers and/or reimbursements. The Trustees recognized that it is difficult to make comparisons of advisory fees because there are variations in the services that are included in the fees paid by other funds. The Trustees’ determinations as a result of the
| | | | | | | | |
| | | |
| AUGUST 31, 2016 | | J.P. MORGAN INCOME FUNDS | | | | | 359 | |
BOARD APPROVAL OF INVESTMENT ADVISORY AGREEMENTS
(Unaudited) (continued)
review of each Fund’s advisory fees and expense ratios for certain representative classes are summarized below:
The Trustees noted that the Core Bond Fund’s net advisory fee for Class A shares was in the second quintile based upon both the Peer Group and Universe, and that the actual total expenses for Class A shares were in the first quintile based upon both the Peer Group and Universe. The Trustees noted that the net advisory fee for Select Class shares was in the second quintile based upon both the Peer Group and Universe, and that the actual total expenses for Select Class shares were in the first and third quintiles based upon the Peer Group and Universe, respectively. After considering the factors identified above, in light of this information, the Trustees concluded that the advisory fees were reasonable.
The Trustees noted that the Core Plus Bond Fund’s net advisory fee for Class A shares was in the first and third quintiles based upon the Peer Group and Universe, respectively, and that the actual total expenses for Class A shares were in the first quintile based upon both the Peer Group and Universe. The Trustees noted that the net advisory fee for Select Class shares was in the second and third quintiles based upon the Peer Group and Universe, respectively, and that the actual total expenses for Select Class shares were in the first quintile based upon both the Peer Group and Universe. After considering the factors identified above, in light of this information, the Trustees concluded that the advisory fee was reasonable.
The Trustees noted that the Government Bond Fund’s net advisory fee for Class A shares was in the first and second quintiles based upon the Peer Group and Universe, respectively, and that the actual total expenses for Class A shares were in the first quintile based upon both the Peer Group and Universe. The Trustees noted that the net advisory fee for Select Class shares was in the second quintile based upon both the Peer Group and Universe, and that the actual total expenses for Select Class shares were in the first quintile based upon both the Peer Group and Universe. After considering the factors identified above, in light of this information, the Trustees concluded that the advisory fees were reasonable.
The Trustees noted that the High Yield Fund’s net advisory fee for Class A shares was in the fifth and fourth quintiles based upon the Peer Group and Universe, respectively, and that the actual total expenses for Class A shares were in the fourth and second quintiles based upon the Peer Group and Universe, respectively. The Trustees noted that the net advisory fee for Select Class shares was in the fifth quintile based upon both the Peer Group and Universe and that the actual total expenses for Select Class shares were in the first and third quintiles based upon the Peer Group and Universe, respectively. After considering the factors identified above, including the changes to the Fund’s contractual advisory fee and Fee Caps effective November 1, 2016, in light of this information, the Trustees concluded that the advisory fee was reasonable.
The Trustees noted that the Inflation Managed Bond Fund’s net advisory fee for both Class A and Select Class shares was in the fifth quintile based upon both the Peer Group and Universe. The Trustees noted that that the actual total expenses for Class A shares were in the first quintile based upon both the Peer Group and Universe, and in the first and third quintiles for Select Class shares based upon the Peer Group and Universe, respectively. After considering the factors identified above, in light of this information, the Trustees concluded that the advisory fee was reasonable.
The Trustees noted that the Limited Duration Bond Fund’s net advisory fee and actual total expenses for Class A shares were in the first quintile based upon both the Peer Group and Universe. The Trustees noted that the net advisory fee for Select Class shares was in the first and second quintiles based upon the Peer Group and Universe, respectively, and that the actual total expenses for Select Class Shares were in the first quintile based upon both the Peer Group and Universe. After considering the factors identified above, in light of this information, the Trustees concluded that the advisory fee was reasonable.
The Trustees noted that the Mortgage-Backed Securities Fund’s net advisory fee and actual total expenses for Class A shares were in the first quintile based upon both the Peer Group and Universe, and that the net advisory fee and actual total expenses for Select Class shares were in the first quintile based upon the Universe. After considering the factors identified above, in light of this information, the Trustees concluded that the advisory fees were reasonable.
The Trustees noted that the Short Duration Bond Fund’s net advisory fee for Class A shares was in the first quintile based upon both the Peer Group and Universe, and that actual total expenses for Class A shares were in the third and second quintiles based upon the Peer Group and Universe, respectively. The Trustees noted that the net advisory fee and actual total expenses for Select Class shares were in the second quintile based upon the Universe. After considering the factors identified above, in light of this information, the Trustees concluded that the advisory fee was reasonable.
The Trustees noted that the Short Duration High Yield Fund’s net advisory fee and actual total expenses for both Class A and Select Class shares were in the first quintile based upon both the Peer Groups and Universe. After considering the factors identified above, in light of this information, the Trustees concluded that the advisory fee was reasonable.
The Trustees noted that the Treasury & Agency Fund’s net advisory fee and actual total expenses for both Class A and Select Class shares were in the first quintile based upon both the Peer Groups and Universe. After considering the factors identified above, in light of this information, the Trustees concluded that the advisory fee was reasonable.
| | | | | | |
| | | |
| 360 | | | | J.P. MORGAN INCOME FUNDS | | AUGUST 31, 2016 |
J.P. Morgan Funds are distributed by JPMorgan Distribution Services, Inc., which is an affiliate of JPMorgan Chase & Co. Affiliates of JPMorgan Chase & Co. receive fees for providing various services to the funds.
Contact JPMorgan Distribution Services, Inc. at 1-800-480-4111 for a fund prospectus. You can also visit us at www.jpmorganfunds.com. Investors should carefully consider the investment objectives and risk as well as charges and expenses of the mutual fund before investing. The prospectus contains this and other information about the mutual fund. Read the prospectus carefully before investing.
Investors may obtain information about the Securities Investor Protection Corporation (SIPC), including the SIPC brochure by visiting www.sipc.org or by calling SIPC at 202-371-8300.
Each Fund files a complete schedule of its fund holdings for the first and third quarters of its fiscal year with the SEC on Form N-Q. The Funds’ Forms N-Q are available on the SEC’s website at http://www.sec.gov and may be reviewed and copied at the SEC’s Public Reference Room in Washington, DC. Information on the operation of the SEC’s Public Reference Room may be obtained by calling 1-800-SEC-0330. Shareholders may request the Form N-Q without charge by calling 1-800-480-4111 or by visiting the J.P. Morgan Funds’ website at www.jpmorganfunds.com.
A description of each Fund’s policies and procedures with respect to the disclosure of each Fund’s holdings is available in the prospectus and Statement of Additional Information.
A copy of proxy policies and procedures is available without charge upon request by calling 1-800-480-4111 and on the Funds’ website at www.jpmorganfunds.com. A description of such policies and procedures is on the SEC’s website at www.sec.gov. The Trustees have delegated the authority to vote proxies for securities owned by the Funds to the Adviser. A copy of the Funds’ voting record for the most recent 12-month period ended June 30 is available on the SEC’s website at www.sec.gov or at the Funds’ website at www.jpmorganfunds.com no later than August 31 of each year. The Funds’ proxy voting record will include, among other things, a brief description of the matter voted on for each fund security, and will state how each vote was cast, for example, for or against the proposal.

J.P. Morgan Asset Management is the marketing name for the asset management businesses of JPMorgan Chase & Co. Those businesses include, but are not limited to, J.P. Morgan Investment Management Inc., Security Capital Research & Management Incorporated and J.P. Morgan Alternative Asset Management, Inc.
| | | | |
| | © JPMorgan Chase & Co., 2016. All rights reserved. August 2016. | | SAN-INC2-816 |
ITEM 2. CODE OF ETHICS.
Disclose whether, as of the end of the period covered by the report, the registrant has adopted a code of ethics that applies to the registrant’s principal executive officer, principal financial officer, principal accounting officer or controller, or persons performing similar functions, regardless of whether these individuals are employed by the registrant or a third party. If the registrant has not adopted such a code of ethics, explain why it has not done so.
The registrant must briefly describe the nature of any amendment, during the period covered by the report, to a provision of its code of ethics that applies to the registrant’s principal executive officer, principal financial officer, principal accounting officer or controller, or persons performing similar functions, regardless of whether these individuals are employed by the registrant or a third party, and that relates to any element of the code of ethics definition enumerated in paragraph (b) of this Item. The registrant must file a copy of any such amendment as an exhibit pursuant to Item 12(a)(1), unless the registrant has elected to satisfy paragraph (f) of this Item by positing its code of ethics on its website pursuant to paragraph (f)(2) of this Item, or by undertaking to provide its code of ethics to any person without charge, upon request, pursuant to paragraph (f)(3) of this Item.
If the registrant has, during the period covered by the report, granted a waiver, including an implicit waiver, from a provision of the code of ethics that applies to the registrant’s principal executive officer, principal financial officer, principal accounting officer or controller, or persons performing similar functions, regardless of whether these individuals are employed by the registrant or third party, that relates to one or more items set forth in paragraph (b) of this Item, the registrant must briefly describe the nature of the waiver, the name of the person to whom the waiver was granted, and the date of the waiver.
Not applicable to a semi-annual report.
ITEM 3. AUDIT COMMITTEE FINANCIAL EXPERT.
(a) (1) Disclose that the registrant’s board of directors has determined that the registrant either:
(i) Has at least one audit committee financial expert serving on its audit committee; or
(ii) Does not have an audit committee financial expert serving on its audit committee.
(2) If the registrant provides the disclosure required by paragraph (a)(1)(i) of this Item, it must disclose the name of the audit committee financial expert and whether that person is “independent.” In order to be considered “independent” for purposes of this Item, a member of an audit committee may not, other than in his or her capacity as a member of the audit committee, the board of directors, or any other board committee:
(i) Accept directly or indirectly any consulting, advisory, or other compensatory fee from the issuer; or
(ii) Be an “interested person” of the investment company as defined in Section 2(a)(19) of the Act (15 U.S.C. 80a-2(a)(19)).
(3) If the registrant provides the disclosure required by paragraph (a)(1)(ii) of this Item, it must explain why it does not have an audit committee financial expert.
Not applicable to a semi-annual report.
ITEM 4. PRINCIPAL ACCOUNTANT FEES AND SERVICES.
(a) Disclose, under the caption Audit Fees, the aggregate fees billed for each of the last two fiscal years for professional
services rendered by the principal accountant for the audit of the registrant’s annual financial statements or services that are normally provided by the accountant in connection with statutory and regulatory filings or engagements for those fiscal years.
(b) Disclose, under the caption Audit-Related Fees, the aggregate fees billed in each of the last two fiscal years for assurance and related services by the principal accountant that are reasonably related to the performance of the audit of the registrant’s financial statements and are not reported under paragraph (a) of this Item. Registrants shall describe the nature of the services comprising the fees disclosed under this category.
(c) Disclose, under the caption Tax Fees, the aggregate fees billed in each of the last two fiscal years for professional services rendered by the principal accountant for tax compliance, tax advice, and tax planning. Registrants shall describe the nature of the services comprising the fees disclosed under this category.
(d) Disclose, under the caption All Other Fees, the aggregate fees billed in each of the last two fiscal years for products and services provided by the principal accountant, other than the services reported in paragraphs (a) through (c) of this Item. Registrants shall describe the nature of the services comprising the fees disclosed under this category.
(e) (1) Disclose the audit committee’s pre-approval policies and procedures described in paragraph (c)(7) of Rule 2-01 of Regulation S-X.
(2) Disclose the percentage of services described in each of paragraphs (b) through (d) of this Item that were approved by the audit committee pursuant to paragraph (c)(7)(i)(C) of Rule 2-01 of Regulation S-X.
(f) If greater than 50 percent, disclose the percentage of hours expended on the principal accountant’s engagement to audit the registrant’s financial statements for the most recent fiscal year that were attributed to work performed by persons other than the principal accountant’s full-time, permanent employees.
Not applicable to a semi-annual report.
(g) Disclose the aggregate non-audit fees billed by the registrant’s accountant for services rendered to the registrant, and rendered to the registrant’s investment adviser (not including any sub-adviser whose role is primarily portfolio management and is subcontracted with or overseen by another investment adviser), and any entity controlling, controlled by, or under common control with the adviser that provides ongoing services to the registrant for each of the last two fiscal years of the registrant.
(h) Disclose whether the registrant’s audit committee of the board of directors has considered whether the provision of non-audit services that were rendered to the registrant’s investment adviser (not including any subadviser whose role is primarily portfolio management and is subcontracted with or overseen by another investment adviser), and any entity controlling, controlled by, or under common control with the investment adviser that provides ongoing services to the registrant that were not pre-approved pursuant to paragraph (c)(7)(ii) of Rule 2-01 of Regulation S-X is compatible with maintaining the principal accountant’s independence.
Not applicable to a semi-annual report.
ITEM 5. AUDIT COMMITTEE OF LISTED REGISTRANTS.
(a) If the registrant is a listed issuer as defined in Rule 10A-3 under the Exchange Act (17CFR 240.10A-3), state whether or not the registrant has a separately-designated standing audit committee established in accordance with Section 3(a)(58)(A) of the Exchange Act (15 U.S.C. 78c(a)(58)(A)). If the registrant has such a committee, however designated, identify each committee member. If the entire board of directors is acting as the registrant’s audit committee as specified in Section 3(a)(58)(B) of the Exchange Act (15 U.S.C. 78c(a)(58)(B)), so state.
(b) If applicable, provide the disclosure required by Rule 10A-3(d) under the Exchange Act (17CFR 240.10A-3(d)) regarding an exemption from the listing standards for all audit committees.
Not applicable to a semi-annual report.
ITEM 6. SCHEDULE OF INVESTMENTS.
File Schedule I – Investments in securities of unaffiliated issuers as of the close of the reporting period as set forth in Section 210.12-12 of Regulation S-X, unless the schedule is included as part of the report to shareholders filed under Item 1 of this Form.
Included in Item 1.
ITEM 7. DISCLOSURE OF PROXY VOTING POLICIES AND PROCEDURES FOR CLOSED-END MANAGEMENT INVESTMENT COMPANIES.
A closed-end management investment company that is filing an annual report on this Form N-CSR must, unless it invests exclusively in non-voting securities, describe the policies and procedures that it uses to determine how to vote proxies relating to portfolio securities, including the procedures that the company uses when a vote presents a conflict between the interests of its shareholders, on the one hand, and those of the company’s investment adviser; principal underwriter; or any affiliated person (as defined in Section 2(a)(3) of the Investment Company Act of 1940 (15 U.S.C. 80a-2(a)(3)) and the rules thereunder) of the company, its investment adviser, or its principal underwriter, on the other. Include any policies and procedures of the company’s investment adviser, or any other third party, that the company uses, or that are used on the company’s behalf, to determine how to vote proxies relating to portfolio securities.
Not applicable.
ITEM 8. PORTFOLIO MANAGERS OF CLOSED-END MANAGEMENT INVESTMENT COMPANIES.
Not applicable.
ITEM 9. PURCHASE OF EQUITY SECURITIES BY CLOSED-END MANAGEMENT INVESTMENT COMPANY AND AFFILIATED PURCHASERS.
(a) If the registrant is a closed-end management investment company, provide the information specified in paragraph (b) of this Item with respect to any purchase made by or on behalf of the registrant or any “affiliated purchaser,” as defined in Rule 10b-18(a)(3) under the Exchange Act (17 CFR 240.10b-18(a)(3)), of shares or other units of any class of the registrant’s equity securities that is registered by the registrant pursuant to Section 12 of the Exchange Act (15 U.S.C. 781).
Not applicable.
ITEM 10. SUBMISSION OF MATTERS TO A VOTE OF SECURITY HOLDERS.
Describe any material changes to the procedures by which shareholders may recommend nominees to the registrant’s board of directors, where those changes were implemented after the registrant last provided disclosure in response to the requirements of Item 7(d)(2)(ii)(G) of Schedule 14A (17 CFR 240.14a-101), or this Item.
No material changes to report.
ITEM 11. CONTROLS AND PROCEDURES.
(a) Disclose the conclusions of the registrant’s principal executive and principal financial officers, or persons performing similar functions, regarding the effectiveness of the registrant’s disclosure controls and procedures (as defined in Rule 30a-3(c) under the Act (17 CFR 270.30a-3(c))) as of a date within 90 days of the filing date of the report that includes the disclosure required by this paragraph, based on the evaluation of these controls and procedures required by Rule 30a-3(b) under the Act (17 CFR 270.30a-3(b)) and Rules 13a-15(b) or 15d-15(b) under the Exchange Act (17 CFR 240.13a-15(b) or 240.15d-15(b)).
The Registrant’s principal executive and principal financial officers have concluded, based on their evaluation of the Registrant’s disclosure controls and procedures as of a date within 90 days of the filing date of this report, that the
Registrant’s disclosure controls and procedures are reasonably designed to ensure that information required to be disclosed by the Registrant on Form N-CSR is recorded, processed, summarized and reported within the required time periods and that information required to be disclosed by the Registrant in the reports that it files or submits on Form N-CSR is accumulated and communicated to the Registrant’s management, including its principal executive and principal financial officers, as appropriate to allow timely decisions regarding required disclosure.
(b) Disclose any change in the registrant’s internal control over financial reporting (as defined in Rule 30a-3(d) under the Act (17 CFR 270.30a-3(d)) that occurred during the registrant’s second fiscal quarter of the period covered by this report that has materially affected, or is reasonably likely to materially affect, the registrant’s internal control over financial reporting.
There were no changes in the Registrant’s internal control over financial reporting that occurred during the last fiscal quarter covered by this report that have materially affected, or are reasonably likely to materially affect, the Registrant’s internal control over financial reporting.
ITEM 12. EXHIBITS.
(a) File the exhibits listed below as part of this Form. Letter or number the exhibits in the sequence indicated.
(a)(1) Any code of ethics, or amendment thereto, that is the subject of the disclosure required by Item 2, to the extent that the registrant intends to satisfy the Item 2 requirements through filing of an exhibit.
Not applicable.
(a)(2) A separate certification for each principal executive officer and principal financial officer of the registrant as required by Rule 30a-2(a) under the Act (17 CFR 270.30a-2).
Certifications pursuant to Rule 30a-2(a) under the Investment Company Act of 1940 are attached hereto.
(a)(3) Any written solicitation to purchase securities under Rule 23c-1 under the Act (17 CFR 270.23c-1) sent or given during the period covered by the report by or on behalf of the registrant to 10 or more persons.
Not applicable.
(b) A separate or combined certification for each principal executive officer and principal officer of the registrant as required by Rule 30a-2(b) under the Act of 1940.
Certifications pursuant to Rule 30a-2(b) under the Investment Company Act of 1940 are attached hereto.
SIGNATURES
Pursuant to the requirements of the Securities Exchange Act of 1934 and the Investment Company Act of 1940, the registrant has duly caused this report to be signed on its behalf by the undersigned, thereunto duly authorized.
JPMorgan Trust II
| | |
| By: | | /s/ Brian S. Shlissel |
| | Brian S. Shlissel |
| | President and Principal Executive Officer |
| | November 4, 2016 |
Pursuant to the requirements of the Securities Exchange Act of 1934 and the Investment Company Act of 1940, this report has been signed below by the following persons on behalf of the registrant and in the capacities and on the dates indicated.
| | |
| By: | | /s/ Brian S. Shlissel |
| | Brian S. Shlissel |
| | President and Principal Executive Officer |
| | November 4, 2016 |
| | |
| By: | | /s/ Laura M. Del Prato |
| | Laura M. Del Prato |
| | Treasurer and Principal Financial Officer |
| |
| | November 4, 2016 |