UNITED STATES
SECURITIES AND EXCHANGE COMMISSION
Washington, D.C. 20549
FORM N-CSR
CERTIFIED SHAREHOLDER REPORT OF REGISTERED
MANAGEMENT INVESTMENT COMPANIES
Investment Company Act file number: 811-04236
JPMorgan Trust II
(Exact name of registrant as specified in charter)
270 Park Avenue
New York, NY 10017
(Address of principal executive offices) (Zip code)
Frank J. Nasta
270 Park Avenue
New York, NY 10017
(Name and Address of Agent for Service)
Registrant’s telephone number, including area code: (800) 480-4111
Date of fiscal year end: October 31
Date of reporting period: November 1, 2016 through April 30, 2017
Form N-CSR is to be used by management investment companies to file reports with the Commission not later than 10 days after the transmission to stockholders of any report that is required to be transmitted to stockholders under Rule 30e-1 under the Investment Company Act of 1940 (17 CFR 270.30e-1). The Commission may use the information provided on Form N-CSR in its regulatory, disclosure review, inspection, and policymaking roles.
A registrant is required to disclose the information specified by Form N-CSR, and the Commission will make this information public. A registrant is not required to respond to the collection of information contained in Form N-CSR unless the Form displays a currently valid Office of Management and Budget (“OMB”) control number. Please direct comments concerning the accuracy of the information collection burden estimate and any suggestions for reducing the burden to Secretary, Securities and Exchange Commission, 450 Fifth Street, NW, Washington, DC 20549-0609. The OMB has reviewed this collection of information under the clearance requirements of 44 U.S.C. Section 3507.
ITEM 1. REPORTS TO STOCKHOLDERS.
The following is a copy of the report transmitted to shareholders pursuant to Rule 30e-1 under the Investment Company Act of 1940 (17 CFR 270.30e-1).
Semi-Annual Report
J.P. Morgan International Equity Funds
April 30, 2017 (Unaudited)
JPMorgan Emerging Economies Fund
JPMorgan Emerging Markets Equity Fund
JPMorgan Emerging Markets Equity Income Fund
JPMorgan Global Research Enhanced Index Fund
JPMorgan Global Unconstrained Equity Fund
JPMorgan International Discovery Fund
JPMorgan International Equity Fund
JPMorgan International Equity Income Fund
JPMorgan International Opportunities Fund
JPMorgan International Research Enhanced Equity Fund
JPMorgan International Unconstrained Equity Fund
JPMorgan International Value Fund
JPMorgan Intrepid International Fund

CONTENTS
Investments in a Fund are not deposits or obligations of, or guaranteed or endorsed by, any bank and are not insured or guaranteed by the FDIC, the Federal Reserve Board or any other government agency. You could lose money if you sell when a Fund’s share price is lower than when you invested.
Past performance is no guarantee of future performance. The general market views expressed in this report are opinions based on market and other conditions through the end of the reporting period and are subject to change without notice. These views are not intended to predict the future performance of a Fund or the securities markets. References to specific securities and their issuers are for illustrative purposes only and are not intended to be, and should not be interpreted as, recommendations to purchase or sell such securities. Such views are not meant as investment advice and may not be relied on as an indication of trading intent on behalf of any Fund.
Prospective investors should refer to the Funds’ prospectus for a discussion of the Funds’ investment objectives, strategies and risks. Call J.P. Morgan Funds Service Center at 1-800-480-4111 for a prospectus containing more complete information about a Fund, including management fees and other expenses. Please read it carefully before investing.
CEO’S LETTER
May 25, 2017 (Unaudited)
Dear Shareholder,
The world’s leading economies continued their upward trajectory over the six months ended April 30, 2017, bolstered by central bank policies, growth in corporate earnings and buoyant consumer and business sentiment.
| | |
 | | “While bond markets provided a mixed performance over the six months ended April 30, 2017, equity markets rewarded investors with solid returns.” — George C.W. Gatch |
While the U.S. and China had been leading drivers of growth for most of the current economic expansion, by late 2016 and into 2017 the world’s other leading economies began to strengthen. Each of the world’s 20 largest economies was forecast to increase output of goods and services through 2017 and the variation in growth rates among those economies was forecast to be the lowest since 1980, according to Bloomberg News.
The U.S. economy slowed somewhat in the first quarter of 2017, but unemployment dropped to 4.4% in April 2017 and the U.S. Federal Reserve reiterated its intent to raise interest rates amid continued economic growth and rising inflation. Throughout the six month reporting period, U.S. financial markets — particularly U.S. equities — generally outperformed other developed markets and emerging markets.
China’s economy continued to grow and posted a 6.9% rise in gross domestic product (GDP) in the first quarter of 2017, amid strength in housing, infrastructure investment, exports and retail sales. Notably, financial markets in China remained largely stable for the six month reporting period. For the 86 trading days through April 24, 2017, the Shanghai Stock Exchange Composite Index hadn’t fallen by more than 1%, thanks in large part to government efforts to prevent a recurrence of the sharp sell-offs that hit Chinese markets in mid-2015 and early 2016.
Meanwhile, Chinese officials sought to reduce financial system risk by tightening money-market rules and pushing to reduce the use of leverage and financial market speculation.
In the European Union (EU), rising consumer spending and manufacturing led to 0.6% growth in first quarter GDP. In particular, Germany’s economy continued to accelerate into 2017, with positive growth in factory orders and an estimated 14% increase in corporate earnings in the first quarter of 2017. Surveys of consumer sentiment across the EU were more upbeat than in recent years. At the end of March 2017, EU unemployment stood at 9.5%, the lowest level since April 2009.
In emerging markets, economic strength in China and a rebound in commodities prices, which began in the latter half of 2016, helped lift economic growth. Moreover, the economies of Brazil, Argentina, Russia, Turkey and South Africa — which were seen as weak links in the global economy — all showed positive growth by the end of April 2017.
While bond markets provided a mixed performance over the six months ended April 30, 2017, equity markets rewarded investors with solid returns. The Standard & Poor’s 500 Index returned 13.32% for the reporting period, while the Morgan Stanley Capital International (“MSCI”) Europe, Australasia and Far East Index (net of foreign withholding taxes) returned 11.73% and the MSCI Emerging Markets Index (net of foreign withholding taxes) returned 9.03%.
We look forward to managing your investment needs for years to come. Should you have any questions, please visit www.jpmorganfunds.com or contact the J.P. Morgan Funds Service Center at 1-800-480-4111.
Sincerely yours,

George C.W. Gatch
CEO, Investment Funds Management,
J.P. Morgan Asset Management
J.P. Morgan International Equity Funds
MARKET OVERVIEW
SIX MONTHS ENDED APRIL 30, 2017 (Unaudited)
Global financial markets generally provided positive returns for the six month reporting period as the world’s leading economies continued to grow in a more uniform fashion and investors sought returns in many developed and emerging markets.
During the final quarter of 2016 and into 2017, certain leading U.S. equity indexes hit multiple record highs amid solid corporate earnings and expectations that the Republican majorities in the U.S. Congress and President Trump’s administration would work to ease business regulations, reduce taxes and increase infrastructure spending.
In Europe, a pickup in corporate earnings and improvements in consumer sentiment also proved attractive to investors during the reporting period. Electoral defeats of anti-European Union (EU) politicians in Austria and the Netherlands also helped lift investor sentiment across the EU and other developed markets.
Emerging markets also saw investment inflows during the six month reporting period amid economic and financial market stability in China. Notably, the Chinese government’s efforts to curb excessive leverage in its financial markets appeared to adversely impact the Shanghai Stock Exchange Composite Index in April 2017. Meanwhile, several previously underperforming economies – particularly Brazil, Argentina, Russia, Turkey and South Africa – showed signs of improvement toward the end of the reporting period.
Commodities prices showed signs of stabilization during the reporting period and global oil prices reached 15-month highs in October 2016. Oil prices were further bolstered by the December 2016 decision by the Organization of Petroleum Exporting Countries’ to curb production. However, by the end of the reporting period, overproduction pushed global oil prices lower.
For the six months ended April 30, 2017, the MSCI Europe Australasia and Far East Index (net of foreign withholding taxes) returned 11.47% and the MSCI Emerging Markets Index (net of foreign withholding taxes) returned 8.88%.
| | | | | | |
| | | |
| 2 | | | | J.P. MORGAN INTERNATIONAL EQUITY FUNDS | | APRIL 30, 2017 |
JPMorgan Emerging Economies Fund
FUND COMMENTARY
SIX MONTHS ENDED APRIL 30, 2017 (Unaudited)
| | | | |
| REPORTING PERIOD RETURN: | |
| Fund (Class I Shares)1* | | | 11.03% | |
| Morgan Stanley Capital International (“MSCI”) Emerging Markets Index (net of foreign withholding taxes) | | | 8.88% | |
| |
| Net Assets as of 4/30/2017 (In Thousands) | | $ | 1,881,826 | |
INVESTMENT OBJECTIVE**
The JPMorgan Emerging Economies Fund (the “Fund”) seeks long-term capital growth.
WHAT WERE THE MAIN DRIVERS OF THE FUND’S PERFORMANCE?
The Fund’s Class I Shares outperformed the MSCI Emerging Markets Index (net of foreign withholding taxes) (the “Benchmark”) for the six months ended April 30, 2017.
The Fund’s security selection in the energy sector and its security selection and overweight position in the materials sector were leading contributors to performance relative to the Benchmark. The Fund’s security selection in the utilities sector and its security selection and overweight position in the consumer staples sector were leading detractors from relative performance.
Leading individual contributors to relative performance included the Fund’s overweight positions in Polski Koncern Naftowy SA, KGHM Polska Miedz SA and AAC Technologies Holdings Inc. Shares of Polski Koncern Naftowy, a Polish crude oil processor, benefitted from rising oil prices during most of the reporting period. Shares of KGHM Polska Miedz, a Polish metals mining and smelting company, rose amid investor expectations for higher demand for base metals. Shares of AAC Technologies Holdings, a Chinese maker of acoustical components for consumer electronics, rose on expectations for continued growth in smartphone sales.
Leading individual detractors from relative performance included the Fund’s underweight position in Samsung Electronics Co. and its overweight positions in Micro-Star International Co. and Emlak Konut Gayrimenkul Yatiri
Ortakligi AS. Shares of Samsung Electronics, a South Korean consumer electronics manufacturer, rose after the company reported strong earnings growth. Shares of Micro-Star International, a Taiwanese maker of computer hardware, declined as the company transitioned to new products, which reduced sales. Shares of Emlak Konus Gayrimenkul, a Turkish real estate investment trust, fell after the company announced it would eliminate regular dividend payments.
HOW WAS THE FUND POSITIONED?
The Fund’s portfolio managers used a combination of top-down and bottom-up research, seeking what they believed to be attractively priced countries, sectors and securities with positive catalysts. As a result of this process, the Fund’s largest average country exposures during the six months ended April 30, 2017, were to China, South Korea and Taiwan and its smallest average country exposures were to Chile, Singapore and Vietnam. From a sector perspective, the Fund’s largest average weightings were in the financials, information technology and energy sectors, while its smallest average weightings were in the telecommunication services, health care and real estate sectors.
| 1 | | On April 3, 2017, the Fund’s Select Class Shares were renamed Class I Shares. |
| * | | The return shown is based on net asset values calculated for shareholder transactions and may differ from the return shown in the financial highlights, which reflects adjustments made to the net asset values in accordance with accounting principles generally accepted in the United States of America. |
| ** | | The adviser seeks to achieve the Fund’s objective. There can be no guarantee it will be achieved. |
| | | | | | | | |
| | | |
| APRIL 30, 2017 | | J.P. MORGAN INTERNATIONAL EQUITY FUNDS | | | | | 3 | |
JPMorgan Emerging Economies Fund
FUND COMMENTARY
SIX MONTHS ENDED APRIL 30, 2017 (Unaudited) (continued)
| | | | | | | | |
| TOP TEN EQUITY HOLDINGS OF THE PORTFOLIO*** | |
| | 1. | | | Samsung Electronics Co. Ltd. (South Korea) | | | 2.3 | % |
| | 2. | | | Industrial & Commercial Bank of China Ltd., Class H (China) | | | 2.2 | |
| | 3. | | | Itau Unibanco Holding SA, ADR (Brazil) | | | 1.9 | |
| | 4. | | | Tencent Holdings Ltd. (China) | | | 1.7 | |
| | 5. | | | Alibaba Group Holding Ltd., ADR (China) | | | 1.6 | |
| | 6. | | | Polski Koncern Naftowy ORLEN SA (Poland) | | | 1.5 | |
| | 7. | | | NetEase, Inc., ADR (China) | | | 1.5 | |
| | 8. | | | China Construction Bank Corp., Class H (China) | | | 1.5 | |
| | 9. | | | Bank of China Ltd., Class H (China) | | | 1.4 | |
| | 10. | | | Copa Holdings SA, Class A (Panama) | | | 1.4 | |
| | | | |
PORTFOLIO COMPOSITION BY COUNTRY*** | |
| China | | | 21.9 | % |
| South Korea | | | 17.0 | |
| Taiwan | | | 14.1 | |
| Brazil | | | 9.4 | |
| Russia | | | 8.6 | |
| Thailand | | | 4.6 | |
| Turkey | | | 4.3 | |
| India | | | 3.1 | |
| Hong Kong | | | 2.8 | |
| Poland | | | 2.5 | |
| South Africa | | | 2.5 | |
| Hungary | | | 1.5 | |
| Panama | | | 1.4 | |
| Malaysia | | | 1.3 | |
| United Arab Emirates | | | 1.2 | |
| Others (each less than 1.0%) | | | 2.1 | |
| Short-Term Investment | | | 1.7 | |
| *** | | Percentages indicated are based on total investments as of April 30, 2017. The Fund’s portfolio composition is subject to change. |
| | | | | | |
| | | |
| 4 | | | | J.P. MORGAN INTERNATIONAL EQUITY FUNDS | | APRIL 30, 2017 |
| | | | | | | | | | | | | | | | | | |
AVERAGE ANNUAL TOTAL RETURNS AS OF APRIL 30, 2017 | |
| | | | | |
| | | INCEPTION DATE OF
CLASS | | 6 MONTH* | | | 1 YEAR | | | 5 YEAR | | | SINCE
INCEPTION | |
CLASS A SHARES | | February 28, 2008 | | | | | | | | | | | | | | | | |
With Sales Charge** | | | | | 5.03 | % | | | 14.62 | % | | | (1.33 | )% | | | (0.97 | )% |
Without Sales Charge | | | | | 10.85 | | | | 21.01 | | | | (0.26 | ) | | | (0.39 | ) |
CLASS C SHARES | | February 28, 2008 | | | | | | | | | | | | | | | | |
With CDSC*** | | | | | 9.64 | | | | 19.45 | | | | (0.74 | ) | | | (0.88 | ) |
Without CDSC | | | | | 10.64 | | | | 20.45 | | | | (0.74 | ) | | | (0.88 | ) |
CLASS I SHARES (FORMERLY SELECT CLASS SHARES) | | February 28, 2008 | | | 11.03 | | | | 21.31 | | | | 0.00 | (a) | | | (0.13 | ) |
CLASS R5 SHARES | | February 28, 2008 | | | 11.10 | | | | 21.52 | | | | 0.20 | | | | 0.06 | |
CLASS R6 SHARES | | September 1, 2015 | | | 11.10 | | | | 21.54 | | | | 0.22 | | | | 0.07 | |
| ** | | Sales Charge for Class A Shares is 5.25%. |
| *** | | Assumes a 1% CDSC (contingent deferred sales charge) for the 6 month and one year periods and 0% CDSC thereafter. |
| (a) | | Amount rounds to less than 0.005%. |
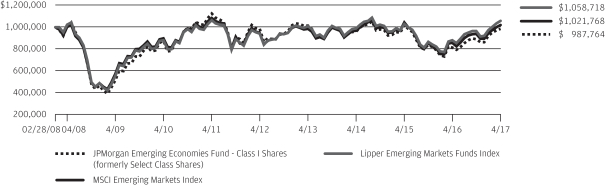
LIFE OF FUND PERFORMANCE (2/28/08 TO 4/30/17)
The performance quoted is past performance and is not a guarantee of future results. Mutual funds are subject to certain market risks. Investment returns and principal value of an investment will fluctuate so that an investor’s shares, when redeemed, may be worth more or less than their original cost. Current performance may be higher or lower than the performance data shown. For up-to-date month-end performance information please call 1-800-480-4111.
The Fund commenced operations on February 28, 2008.
Returns for Class R6 Shares prior to its inception date are based on the performance of Class R5 Shares. The actual returns for Class R6 Shares would have been different than those shown because Class R6 Shares have different expenses than Class R5 Shares.
The graph illustrates comparative performance for $1,000,000 invested in Class I Shares of the JPMorgan Emerging Economies Fund, the MSCI Emerging Markets Index and the Lipper Emerging Markets Funds Index from February 28, 2008 to April 30, 2017. The performance of the Fund assumes reinvestment of all dividends and capital gain distributions, if any, and does not include a sales charge. The performance of the MSCI Emerging Markets Index does not reflect the deduction of expenses or a sales charge associated with a mutual fund and approximates the minimum possible dividend reinvestment of the securities included in the benchmark, if applicable. The dividend is reinvested after deduction of withholding tax, applying the maximum rate to non-resident individual investors who do not benefit from double taxation treaties. The performance of the Lipper Emerging Markets Funds Index includes
expenses associated with a mutual fund, such as investment management fees. These expenses are not identical to the expenses incurred by the Fund. The MSCI Emerging Markets Index is a free float-adjusted market capitalization weighted index that is designed to measure the equity market performance of emerging markets. The Lipper Emerging Markets Funds Index is an index based on the total returns of certain mutual funds within the Fund’s designated category as determined by Lipper, Inc. Investors cannot invest directly in an index.
Class I Shares have a $1,000,000 minimum initial investment.
Fund performance may reflect the waiver of the Fund’s fees and reimbursement of expenses for certain periods since the inception date. Without these waivers and reimbursements, performance would have been lower. Also, performance shown in this section does not reflect the deduction of taxes that a shareholder would pay on Fund distributions or redemptions of Fund shares.
International investing involves a greater degree of risk and increased volatility. Changes in currency exchange rates and differences in accounting and taxation policies outside the United States can raise or lower returns. Also, some overseas markets may not be as politically and economically stable as the U.S. and other nations.
The returns shown are based on net asset values calculated for shareholder transactions and may differ from the returns shown in the financial highlights, which reflect adjustments made to the net asset values in accordance with accounting principles generally accepted in the United States of America.
| | | | | | | | |
| | | |
| APRIL 30, 2017 | | J.P. MORGAN INTERNATIONAL EQUITY FUNDS | | | | | 5 | |
JPMorgan Emerging Markets Equity Fund
FUND COMMENTARY
SIX MONTHS ENDED APRIL 30, 2017 (Unaudited)
| | | | |
| REPORTING PERIOD RETURN: | |
| Fund (Class L Shares)1* | | | 10.00% | |
| Morgan Stanley Capital International (“MSCI”) Emerging Markets Index (net of foreign withholding taxes) | | | 8.88% | |
| |
| Net Assets as of 4/30/2017 (In Thousands) | | $ | 3,562,217 | |
INVESTMENT OBJECTIVE**
The JPMorgan Emerging Markets Equity Fund (the “Fund”) seeks to provide high total return from a portfolio of equity securities from emerging markets issuers.
WHAT WERE THE MAIN DRIVERS OF THE FUND’S PERFORMANCE?
The Fund’s Class L Shares outperformed the MSCI Emerging Markets Index (net of foreign withholding taxes) (the “Benchmark”) for the six months ended April 30, 2017.
The Fund’s security selection in the financials and consumer staples sectors was a leading contributor to performance relative to the Benchmark, while the Fund’s security selection in the information technology and energy sectors was a leading detractor from relative performance.
Leading individual contributors to relative performance included the Fund’s overweight positions in Sberbank of Russia OJSC, JD.com Inc. and AAC Technologies Holdings Inc. Shares of Sberbank, a Russian bank, rose along with a general rebound in Russian equities during the reporting period. Shares of JD.com, a Chinese retailer of consumer electronics, rose on revenue growth and expanding profit margins. Shares of AAC Technologies Holdings, a Chinese maker of acoustical components for consumer electronics, rose on expectations for continued growth in smartphone sales.
Leading individual detractors from relative performance included the Fund’s underweight position in Samsung Electronics Co. and its overweight positions in Magnit PJSC and BB Seguridade Participacoes SA. Shares of Samsung Electronics, a South Korean consumer electronics manufacturer, rose after
the company reported strong earnings growth. Shares of Magnit, a Russian operator of retail stores, fell on weak sales growth. Shares of BB Seguridade Participacoes, a Brazilian insurance company, fell after the company forecast slower profit growth.
HOW WAS THE FUND POSITIONED?
The Fund’s portfolio managers employed an active strategy in which portfolio construction was focused on the highest-conviction ideas found at the security level. The Fund’s portfolio managers used bottom-up fundamental research to determine the Fund’s security weightings, researching companies in an attempt to determine their underlying value and potential for future earnings growth. As a result of this process, the Fund’s largest average sector positions during the reporting period were in the financials, information technology and consumer discretionary sectors, while the Fund’s smallest average sector positions were in the utilities, materials and health care sectors. The Fund’s largest average country positions were in China, India and South Africa and its smallest average positions were in Turkey, Egypt and Papua New Guinea.
| 1 | | Effective December 1, 2016, the Fund’s Institutional Class Shares were renamed Class L Shares. |
| * | | The return shown is based on net asset values calculated for shareholder transactions and may differ from the return shown in the financial highlights, which reflects adjustments made to the net asset values in accordance with accounting principles generally accepted in the United States of America. |
| ** | | The adviser seeks to achieve the Fund’s objective. There can be no guarantee it will be achieved. |
| | | | | | |
| | | |
| 6 | | | | J.P. MORGAN INTERNATIONAL EQUITY FUNDS | | APRIL 30, 2017 |
| | | | | | | | |
| TOP TEN EQUITY HOLDINGS OF THE PORTFOLIO*** | |
| | 1. | | | Tencent Holdings Ltd. (China) | | | 6.5 | % |
| | 2. | | | Alibaba Group Holding Ltd., ADR (China) | | | 4.0 | |
| | 3. | | | Taiwan Semiconductor Manufacturing Co. Ltd., ADR (Taiwan) | | | 4.0 | |
| | 4. | | | AIA Group Ltd. (Hong Kong) | | | 3.7 | |
| | 5. | | | Housing Development Finance Corp. Ltd. (India) | | | 3.5 | |
| | 6. | | | Samsung Electronics Co. Ltd. (South Korea) | | | 3.2 | |
| | 7. | | | Bid Corp. Ltd. (South Africa) | | | 2.6 | |
| | 8. | | | Tata Consultancy Services Ltd. (India) | | | 2.3 | |
| | 9. | | | JD.com, Inc., ADR (China) | | | 2.2 | |
| | 10. | | | HDFC Bank Ltd., ADR (India) | | | 2.0 | |
| | | | |
PORTFOLIO COMPOSITION BY COUNTRY*** | |
| India | | | 18.6 | % |
| China | | | 18.5 | |
| South Africa | | | 11.1 | |
| Brazil | | | 10.1 | |
| Taiwan | | | 7.7 | |
| Hong Kong | | | 6.6 | |
| South Korea | | | 5.1 | |
| Russia | | | 4.1 | |
| United States | | | 3.4 | |
| Indonesia | | | 3.1 | |
| Mexico | | | 2.6 | |
| Argentina | | | 1.6 | |
| Panama | | | 1.3 | |
| Peru | | | 1.2 | |
| Switzerland | | | 1.0 | |
| Others (each less than 1.0%) | | | 2.7 | |
| Short-Term Investment | | | 1.3 | |
| *** | | Percentages indicated are based on total investments as of April 30, 2017. The Fund’s portfolio composition is subject to change. |
| | | | | | | | |
| | | |
| APRIL 30, 2017 | | J.P. MORGAN INTERNATIONAL EQUITY FUNDS | | | | | 7 | |
JPMorgan Emerging Markets Equity Fund
FUND COMMENTARY
SIX MONTHS ENDED APRIL 30, 2017 (Unaudited) (continued)
| | | | | | | | | | | | | | | | | | |
AVERAGE ANNUAL TOTAL RETURNS AS OF APRIL 30, 2017 | |
| | | | | |
| | | INCEPTION DATE OF
CLASS | | 6 MONTH* | | | 1 YEAR | | | 5 YEAR | | | 10 YEAR | |
CLASS A SHARES | | September 28, 2001 | | | | | | | | | | | | | | | | |
With Sales Charge** | | | | | 4.14 | % | | | 15.38 | % | | | 0.86 | % | | | 1.90 | % |
Without Sales Charge | | | | | 9.92 | | | | 21.77 | | | | 1.95 | | | | 2.45 | |
CLASS C SHARES | | February 28, 2006 | | | | | | | | | | | | | | | | |
With CDSC*** | | | | | 8.62 | | | | 20.12 | | | | 1.44 | | | | 1.94 | |
Without CDSC | | | | | 9.62 | | | | 21.12 | | | | 1.44 | | | | 1.94 | |
CLASS I SHARES (FORMERLY SELECT CLASS SHARES) | | September 10, 2001 | | | 10.00 | | | | 22.02 | | | | 2.20 | | | | 2.70 | |
CLASS L SHARES (FORMERLY INSTITUTIONAL CLASS SHARES) | | November 15, 1993 | | | 10.06 | | | | 22.17 | | | | 2.35 | | | | 2.87 | |
CLASS R5 SHARES | | September 9, 2016 | | | 10.09 | | | | 22.20 | | | | 2.36 | | | | 2.87 | |
CLASS R6 SHARES | | December 23, 2013 | | | 10.16 | | | | 22.37 | | | | 2.43 | | | | 2.90 | |
| ** | | Sales Charge for Class A Shares is 5.25%. |
| *** | | Assumes a 1% CDSC (contingent deferred sales charge) for the 6 month and one year periods and 0% CDSC thereafter. |
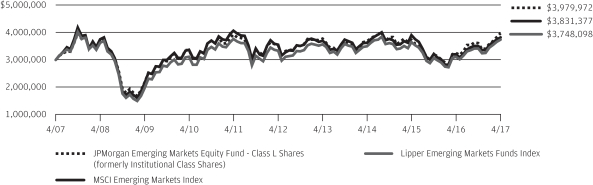
TEN YEAR PERFORMANCE (4/30/07 TO 4/30/17)
The performance quoted is past performance and is not a guarantee of future results. Mutual funds are subject to certain market risks. Investment returns and principal value of an investment will fluctuate so that an investor’s shares, when redeemed, may be worth more or less than their original cost. Current performance may be higher or lower than the performance data shown. For up-to-date month-end performance information please call 1-800-480-4111.
Returns for Class R6 Shares prior to its inception date are based on the performance of Class L Shares. The actual returns of R6 Shares would have been different than those shown because R6 Shares have different expenses than Class L Shares.
Returns for Class R5 Shares prior to its inception date are based on the performance of Class L Shares. The actual returns of Class R5 Shares would have been different than those shown because Class R5 Shares have different expenses than Class L Shares.
The graph illustrates comparative performance for $3,000,000 invested in Class L Shares of the JPMorgan Emerging Markets Equity Fund, the MSCI Emerging Markets Index and the Lipper Emerging Markets Funds Index from April 30, 2007 to April 30, 2017. The performance of the Fund assumes reinvestment of all dividends and capital gain distributions, if any, and does not include a sales charge. The performance of the MSCI Emerging Markets Index does not reflect the deduction of expenses or a sales charge associated with a mutual fund and approximates the minimum possible dividend reinvestment of the securities included in the benchmark, if applicable. The dividend is reinvested after deduction of withholding tax, applying the maximum rate to non-resident individual investors who do not benefit from double taxation treaties. The
performance of the Lipper Emerging Markets Funds Index includes expenses associated with a mutual fund, such as investment management fees. These expenses are not identical to the expenses incurred by the Fund. The MSCI Emerging Markets Index is a free float-adjusted market capitalization weighted index that is designed to measure the equity market performance of emerging markets. The Lipper Emerging Markets Funds Index is an index based on the total returns of certain mutual funds within the Fund’s designated category, as determined by Lipper, Inc. Investors cannot invest directly in an index.
Class L Shares have a $3,000,000 minimum initial investment.
Fund performance may reflect the waiver of the Fund’s fees and reimbursement of expenses for certain periods since the inception date. Without these waivers and reimbursements, performance would have been lower. Also, performance shown in this section does not reflect the deduction of taxes that a shareholder would pay on Fund distributions or redemptions of Fund shares.
International investing involves a greater degree of risk and increased volatility. Changes in currency exchange rates and differences in accounting and taxation policies outside the U.S. can raise or lower returns. Also, some overseas markets may not be as politically and economically stable as the United States and other nations.
The returns shown are based on net asset values calculated for shareholder transactions and may differ from the returns shown in the financial highlights, which reflect adjustments made to the net asset values in accordance with accounting principles generally accepted in the United States of America.
| | | | | | |
| | | |
| 8 | | | | J.P. MORGAN INTERNATIONAL EQUITY FUNDS | | APRIL 30, 2017 |
JPMorgan Emerging Markets Equity Income Fund
FUND COMMENTARY
SIX MONTHS ENDED APRIL 30, 2017 (Unaudited)
| | | | |
| Reporting Period Return: | | | |
| Fund (Class I Shares)(1)* | | | 5.55% | |
| Morgan Stanley Capital International (“MSCI”) Emerging Markets Index (net of foreign withholding taxes) | | | 8.88% | |
| |
| Net Assets as of 4/30/2017 (In Thousands) | | $ | 16,087 | |
INVESTMENT OBJECTIVE**
The JPMorgan Emerging Markets Equity Income Fund (the “Fund”) seeks to provide both current income and long-term capital appreciation.
WHAT WERE THE MAIN DRIVERS OF THE FUND’S PERFORMANCE?
The Fund’s Class I Shares underperformed the MSCI Emerging Markets Index (net of foreign withholding taxes) (the “Benchmark”) for the six months ended April 30, 2017.
The Fund’s security selection and underweight position in the information technology sector and its security selection in the financials sector were leading detractors from performance relative to the Benchmark. The Fund’s security selection in the consumer discretionary and energy sectors was a leading contributor to relative performance.
Leading individual detractors from relative performance included the Fund’s underweight position in Samsung Electronics Co. and its overweight positions in Engie Brasil Energia SA and BB Seguridade Participacoes SA. Shares of Samsung Electronics, a South Korean consumer electronics manufacturer that was not held in the Fund, rose after the company reported strong earnings growth. Shares of Engie Brasil Energia, a Brazilian electricity generator, fell amid investor concerns about the company’s transition toward renewable energy and electricity transmission. Shares of BB Seguridade Participacoes, a Brazilian insurance company, fell after the company forecast slower profit growth.
Leading individual contributors to relative performance included the Fund’s overweight positions in Fuyao Glass Industry Group Co. and GD Midea Holding Co. and its underweight position in Petroleo Brasiliero SA. Shares of Fuyao Glass Industry Group, a Chinese maker of glass for the automobile industry, rose on investor expectations for growing auto sales. Shares of GD Midea Holding, a Chinese appliance manufacturer not held in the Benchmark, rose on investor expectations for growth in the retail market for home appliances. Shares of Petroleo Brasiliero, Brazil’s state-controlled petroleum company, which was not held in the Fund, fell amid a global oversupply of oil at the end of the reporting period.
HOW THE FUND WAS MANAGED?
The Fund’s portfolio managers employed a bottom-up fundamental approach to security selection, rigorously researching companies in an attempt to determine their underlying value and potential for future growth. The Fund’s portfolio managers looked for dividend yielding equity securities that they believed were undervalued and possessed the long-term earnings power and strong cash flow generation that would enable them to grow their dividends.
| (1) | | On April 3, 2017, the Fund’s Select Class Shares were renamed Class I Shares. |
| * | | The return shown is based on net asset values calculated for shareholder transactions and may differ from the return shown in the financial highlights, which reflects adjustments made to the net asset values in accordance with accounting principles generally accepted in the United States of America. |
| ** | | The adviser seeks to achieve the Fund’s objective. There can be no guarantee it will be achieved. |
| | | | | | | | |
| | | |
| APRIL 30, 2017 | | J.P. MORGAN INTERNATIONAL EQUITY FUNDS | | | | | 9 | |
JPMorgan Emerging Markets Equity Income Fund
FUND COMMENTARY
SIX MONTHS ENDED APRIL 30, 2017 (Unaudited) (continued)
| | | | | | | | |
| TOP TEN EQUITY HOLDINGS OF THE PORTFOLIO*** | |
| | 1. | | | Taiwan Semiconductor Manufacturing Co. Ltd., ADR (Taiwan) | | | 5.0 | % |
| | 2. | | | Kimberly-Clark de Mexico SAB de CV, Class A (Mexico) | | | 3.0 | |
| | 3. | | | Banco Santander Chile, ADR (Chile) | | | 3.0 | |
| | 4. | | | Moscow Exchange MICEX-RTS PJSC (Russia) | | | 2.7 | |
| | 5. | | | Fuyao Glass Industry Group Co. Ltd., Class A (China) | | | 2.7 | |
| | 6. | | | China Mobile Ltd. (China) | | | 2.7 | |
| | 7. | | | Ambev SA, ADR (Brazil) | | | 2.7 | |
| | 8. | | | Samsung Electronics Co. Ltd. (South Korea) | | | 2.5 | |
| | 9. | | | BB Seguridade Participacoes SA (Brazil) | | | 2.5 | |
| | 10. | | | China Resources Power Holdings Co. Ltd. (China) | | | 2.4 | |
| | | | |
SUMMARY OF INVESTMENTS BY COUNTRY*** | |
| Taiwan | | | 19.5 | % |
| China | | | 13.1 | |
| South Africa | | | 12.2 | |
| Brazil | | | 7.4 | |
| Russia | | | 7.4 | |
| South Korea | | | 6.6 | |
| Mexico | | | 6.3 | |
| Hong Kong | | | 6.0 | |
| Thailand | | | 4.3 | |
| Turkey | | | 3.4 | |
| Czech Republic | | | 3.0 | |
| Chile | | | 3.0 | |
| Indonesia | | | 2.1 | |
| Hungary | | | 1.7 | |
| United Arab Emirates | | | 1.5 | |
| United States | | | 1.4 | |
| France | | | 0.9 | |
| Short-Term Investment | | | 0.2 | |
| *** | | Percentages indicated are based on total investments as of April 30, 2017. The Fund’s portfolio composition is subject to change. |
| | | | | | |
| | | |
| 10 | | | | J.P. MORGAN INTERNATIONAL EQUITY FUNDS | | APRIL 30, 2017 |
| | | | | | | | | | | | | | |
AVERAGE ANNUAL TOTAL RETURNS AS OF APRIL 30, 2017 | |
| | | | |
| | | INCEPTION DATE OF
CLASS | | 6 MONTH* | | | 1 YEAR | | | SINCE
INCEPTION | |
CLASS A SHARES | | December 12, 2014 | | | | | | | | | | | | |
With Sales Charge** | | | | | (0.17 | )% | | | 7.99 | % | | | (2.42 | )% |
Without Sales Charge | | | | | 5.39 | | | | 13.98 | | | | (0.18 | ) |
CLASS C SHARES | | December 12, 2014 | | | | | | | | | | | | |
With CDSC*** | | | | | 4.18 | | | | 12.33 | | | | (0.68 | ) |
Without CDSC | | | | | 5.18 | | | | 13.33 | | | | (0.68 | ) |
CLASS I SHARES (FORMERLY SELECT CLASS SHARES) | | December 12, 2014 | | | 5.55 | | | | 14.18 | | | | 0.07 | |
CLASS R5 SHARES | | December 12, 2014 | | | 5.72 | | | | 14.47 | | | | 0.28 | |
CLASS R6 SHARES | | December 12, 2014 | | | 5.67 | | | | 14.52 | | | | 0.32 | |
| ** | | Sales Charge for Class A Shares is 5.25%. |
| *** | | Assumes a 1% CDSC (contingent deferred sales charge) for the 6 month and one year periods and 0% CDSC thereafter. |
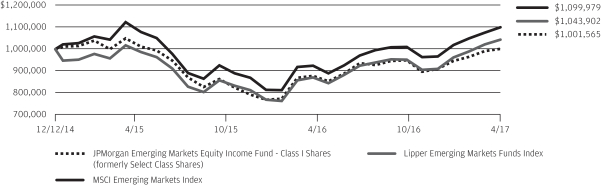
LIFE OF FUND PERFORMANCE (12/12/14 TO 4/30/17)
The performance quoted is past performance and is not a guarantee of future results. Mutual funds are subject to certain market risks. Investment returns and principal value of an investment will fluctuate so that an investor’s shares, when redeemed, may be worth more or less than their original cost. Current performance may be higher or lower than the performance data shown. For up-to-date month-end performance information please call 1-800-480-4111.
The Fund commenced operations on December 12, 2014.
The graph illustrates comparative performance for $1,000,000 invested in Class I Shares of the JPMorgan Emerging Markets Equity Income Fund, the MSCI Emerging Markets Index and the Lipper Emerging Markets Funds Index from December 12, 2014 to April 30, 2017. The performance of the Fund assumes reinvestment of all dividends and capital gain distributions, if any, and does not include a sales charge. The performance of the MSCI Emerging Markets Index does not reflect the deduction of expenses or a sales charge associated with a mutual fund and approximates the minimum possible dividend reinvestment of the securities included in the benchmark, if applicable. The dividend is reinvested after deduction of withholding tax, applying the maximum rate to non-resident individual investors who do not benefit from double taxation treaties. The performance of the Lipper Emerging Markets Funds Index includes expenses associated with a mutual fund, such as investment management fees. These expenses are not identical to the expenses incurred by the Fund. The
MSCI Emerging Markets Index is a free float-adjusted market capitalization weighted index that is designed to measure the equity market performance of emerging markets. The Lipper Emerging Markets Funds Index is an index based on the total returns of certain mutual funds within the Fund’s designated category, as determined by Lipper, Inc. Investors cannot invest directly in an index.
Class I Shares have a $1,000,000 minimum initial investment.
Fund performance may reflect the waiver of the Fund’s fees and reimbursement of expenses for certain periods since the inception date. Without these waivers and reimbursements, performance would have been lower. Also, performance shown in this section does not reflect the deduction of taxes that a shareholder would pay on Fund distributions or redemptions of Fund shares.
International investing involves a greater degree of risk and increased volatility. Changes in currency exchange rates and differences in accounting and taxation policies outside the U.S. can raise or lower returns. Also, some overseas markets may not be as politically and economically stable as the United States and other nations.
The returns shown are based on net asset values calculated for shareholder transactions and may differ from the returns shown in the financial highlights, which reflect adjustments made to the net asset values in accordance with accounting principles generally accepted in the United States of America.
| | | | | | | | |
| | | |
| APRIL 30, 2017 | | J.P. MORGAN INTERNATIONAL EQUITY FUNDS | | | | | 11 | |
JPMorgan Global Research Enhanced Index Fund
FUND COMMENTARY
SIX MONTHS ENDED APRIL 30, 2017 (Unaudited)
| | | | |
| REPORTING PERIOD RETURN: | |
| Fund (Class I Shares)1* | | | 12.78% | |
| Morgan Stanley Capital International (“MSCI”) World Index (net of foreign withholding taxes)2 | | | 12.12% | |
| |
| Net Assets as of 4/30/2017 (In Thousands) | | $ | 7,716,152 | |
INVESTMENT OBJECTIVE**
The JPMorgan Global Research Enhanced Index Fund (the “Fund”) seeks to provide long-term capital appreciation.
WHAT WERE THE MAIN DRIVERS OF THE FUND’S PERFORMANCE?
The Fund’s Class I Shares outperformed the MSCI World Index (net of foreign withholding taxes) (the “Benchmark”) for the six months ended April 30, 2017.
By sector, the Fund’s security selection in the telecommunications and banks-finance sectors was a leading contributor to performance relative to the Benchmark, while the Fund’s security selection in the banks-capital markets and basic industries sectors was a leading detractor from relative performance. By region, the Fund’s security selection in North America was the leading contributor to relative performance, while the Fund’s underweight allocation to Europe and its overweight allocation to Japan detracted from relative performance.
Due to the Fund holding a relatively large number of securities during the period, the impact of individual holdings on the Fund’s relative performance tended to be small.
HOW WAS THE FUND POSITIONED?
The Fund sought to outperform the Benchmark over time, while seeking to achieve sector, geographic and risk characteristics similar to that of the Benchmark. Using the fundamental equity insights generated by JPMorgan’s team of analysts, the Fund’s portfolio managers took marginally overweight positions in securities that they considered undervalued, while being marginally underweight in or not holding securities in the Benchmark that they considered overvalued. During the reporting period, the Fund’s portfolio managers used exchange-traded funds and futures to help manage cash flows.
| | | | | | | | |
| TOP TEN EQUITY HOLDINGS OF THE PORTFOLIO*** | |
| | 1. | | | Apple, Inc. (United States) | | | 2.3 | % |
| | 2. | | | Microsoft Corp. (United States) | | | 1.7 | |
| | 3. | | | Amazon.com, Inc. (United States) | | | 1.2 | |
| | 4. | | | Facebook, Inc., Class A (United States) | | | 1.2 | |
| | 5. | | | Alphabet, Inc., Class C (United States) | | | 1.0 | |
| | 6. | | | Wells Fargo & Co. (United States) | | | 0.9 | |
| | 7. | | | Bank of America Corp. (United States) | | | 0.9 | |
| | 8. | | | Alphabet, Inc., Class A (United States) | | | 0.8 | |
| | 9. | | | Exxon Mobil Corp. (United States) | | | 0.8 | |
| | 10. | | | General Electric Co. (United States) | | | 0.8 | |
| | | | |
PORTFOLIO COMPOSITION BY COUNTRY*** | |
| United States | | | 59.8 | % |
| Japan | | | 8.7 | |
| United Kingdom | | | 5.6 | |
| France | | | 4.1 | |
| Germany | | | 3.7 | |
| Canada | | | 3.4 | |
| Switzerland | | | 2.9 | |
| Australia | | | 2.6 | |
| Netherlands | | | 2.0 | |
| Spain | | | 1.4 | |
| Hong Kong | | | 1.2 | |
| Others (each less than 1.0%) | | | 4.0 | |
| Short-Term Investment | | | 0.6 | |
| 1 | | On April 3, 2017, the Fund’s Select Class Shares were renamed Class I Shares. |
| 2 | | MSCI World Index is a registered service mark of Morgan Stanley Capital International, which does not sponsor and is in no way affiliated with the Fund. |
| * | | The return shown is based on net asset values calculated for shareholder transactions and may differ from the return shown in the financial highlights, which reflects adjustments made to the net asset values in accordance with accounting principles generally accepted in the United States of America. |
| ** | | The adviser seeks to achieve the Fund’s objective. There can be no guarantee it will be achieved. |
| *** | | Percentages indicated are based on total investments as of April 30, 2017. The Fund’s portfolio composition is subject to change. |
| | | | | | |
| | | |
| 12 | | | | J.P. MORGAN INTERNATIONAL EQUITY FUNDS | | APRIL 30, 2017 |
| | | | | | | | | | | | | | | | | | |
AVERAGE ANNUAL TOTAL RETURNS AS OF APRIL 30, 2017 | |
| | | | | |
| | | INCEPTION DATE OF
CLASS | | 6 MONTH* | | | 1 YEAR | | | 3 YEAR | | | SINCE
INCEPTION | |
CLASS A SHARES | | February 28, 2013 | | | | | | | | | | | | | | | | |
With Sales Charge** | | | | | 6.72 | % | | | 9.36 | % | | | 3.84 | % | | | 8.05 | % |
Without Sales Charge | | | | | 12.62 | | | | 15.44 | | | | 5.72 | | | | 9.46 | |
CLASS C SHARES | | February 28, 2013 | | | | | | | | | | | | | | | | |
With CDSC*** | | | | | 11.36 | | | | 13.84 | | | | 5.20 | | | | 8.91 | |
Without CDSC | | | | | 12.36 | | | | 14.84 | | | | 5.20 | | | | 8.91 | |
CLASS I SHARES (FORMERLY SELECT CLASS SHARES) | | February 28, 2013 | | | 12.78 | | | | 15.74 | | | | 5.99 | | | | 9.73 | |
CLASS R2 SHARES | | February 28, 2013 | | | 12.46 | | | | 15.14 | | | | 5.45 | | | | 9.18 | |
| ** | | Sales Charge for Class A Shares is 5.25%. |
| *** | | Assumes a 1% CDSC (contingent deferred sales charge) for the 6 month and one year periods and 0% CDSC thereafter. |
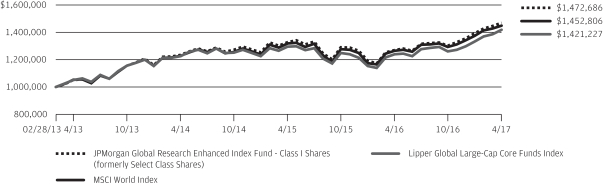
LIFE OF FUND PERFORMANCE (2/28/13 TO 4/30/17)
The performance quoted is past performance and is not a guarantee of future results. Mutual funds are subject to certain market risks. Investment returns and principal value of an investment will fluctuate so that an investor’s shares, when redeemed, may be worth more or less than their original cost. Current performance may be higher or lower than the performance data shown. For up-to-date, month-end performance information please call 1-800-480-4111.
The Fund commenced operations on February 28, 2013.
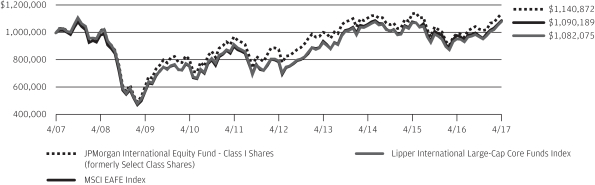
The graph illustrates comparative performance for $1,000,000 invested in Class I Shares of the JPMorgan Global Research Enhanced Index Fund, the MSCI World Index and the Lipper Global Large-Cap Core Funds Index from February 28, 2013 to April 30, 2017. The performance of the Fund assumes reinvestment of all dividends and capital gain distributions, if any, and does not include a sales charge. The performance of the MSCI World Index does not reflect the deduction of expenses or a sales charge associated with a mutual fund and has been adjusted to reflect reinvestment of all dividends and capital gain distributions of the securities included in the benchmark, if applicable. The performance of the Lipper Global Large-Cap Core Funds Index includes expenses associated with a mutual fund, such as investment management fees. These expenses are not identical to the expenses incurred by the Fund. The MSCI World Index is a free float-adjusted market capitalization weighted index that is designed to measure the equity market performance of developed markets. The Lipper Global Large-Cap Core Funds Index is an index based on the total returns of certain mutuals funds within the Fund’s designated category, as determined by Lipper, Inc. Investors cannot invest directly in an index.
Class I Shares have a $1,000,000 minimum initial investment.
Fund performance may reflect the waiver of the Fund’s fees and reimbursement of expenses for certain periods since the inception date. Without these waivers and reimbursements, performance would have been lower. Also,
performance shown in this section does not reflect the deduction of taxes that a shareholder would pay on Fund distributions or redemptions of Fund shares.
International investing involves a greater degree of risk and increased volatility. Changes in currency exchange rates and differences in accounting and taxation policies outside the U.S. can raise or lower returns. Also, some overseas markets may not be as politically and economically stable as the United States and other nations.
The returns shown are based on net asset values calculated for shareholder transactions and may differ from the returns shown in the financial highlights, which reflect adjustments made to the net asset values in accordance with accounting principles generally accepted in the United States of America.
The MSCI information may only be used for your internal use, may not be reproduced or redisseminated in any form and may not be used as a basis for or a component of any financial instruments or products or indices. None of the MSCI information is intended to constitute investment advice or a recommendation to make (or refrain from making) any kind of investment decision and may not be relied on as such. Historical data and analysis should not be taken as an indication or guarantee of any future performance analysis, forecast or prediction. The MSCI information is provided on an “as is” basis and the user of this information assumes the entire risk of any use made of this information. MSCI, each of its affiliates and each other person involved in or related to compiling, computing or creating any MSCI information (collectively, the “MSCI Parties”) expressly disclaims all warranties (including, without limitation, any warranties of originality, accuracy, completeness, timeliness, non-infringement, merchantability and fitness for a particular purpose) with respect to this information. Without limiting any of the foregoing, in no event shall any MSCI Party have any liability for any direct, indirect, special, incidental, punitive, consequential (including, without limitation, lost profits) or any other damages. (www.msci.com)
| | | | | | | | |
| | | |
| APRIL 30, 2017 | | J.P. MORGAN INTERNATIONAL EQUITY FUNDS | | | | | 13 | |
JPMorgan Global Unconstrained Equity Fund
FUND COMMENTARY
SIX MONTHS ENDED APRIL 30, 2017 (Unaudited)
| | | | |
| REPORTING PERIOD RETURN: | |
| Fund (Class I Shares)1* | | | 14.34% | |
| Morgan Stanley Capital International (“MSCI”) All Country World Index (net of foreign withholding taxes) | | | 11.76% | |
| |
| Net Assets as of 4/30/2017 (In Thousands) | | | $2,125 | |
INVESTMENT OBJECTIVE**
The JPMorgan Global Unconstrained Equity Fund (the “Fund”) seeks to provide long-term capital appreciation.
WHAT WERE THE MAIN DRIVERS OF THE FUND’S PERFORMANCE?
The Fund’s Class I Shares outperformed the MSCI All Country World Index (net of foreign withholding taxes) (the “Benchmark”) for the six months ended April 30, 2017.
By sector, the Fund’s security selection in the consumer discretionary and financials sectors was a leading contributor to performance relative to the Benchmark. The Fund’s security selection in the health care and energy sectors was a leading detractor from relative performance.
By region, the Fund’s security selection in North America and its security selection and underweight position in Japan were leading contributors to relative performance, while the Fund’s security selection in Europe, including the U.K., was a leading detractor from relative performance.
Leading individual contributors to the Fund’s relative performance included its overweight positions in Time Inc., Harman International Industries Inc. and Vertex Pharmaceuticals Inc. Shares of Time, a magazine publisher not held in the Benchmark, rose on news that the company was soliciting takeover offers. Shares of Harman International, an auto parts manufacturer, rose ahead of its takeover by Samsung Electronics Co. Shares of Vertex Pharmaceuticals, a drug maker, rose following positive results from clinical trials of its treatment for cystic fibrosis.
Leading individual detractors from the Fund’s relative performance included its overweight positions in Teva Pharmaceutical Industries Ltd., Alexion Pharmaceuticals Inc. and BT Group PLC. Shares of Teva Pharmaceutical, an Israel-based maker of generic and specialty drugs, fell amid investor concerns about the company’s patent on a key drug and general concerns about pricing pressure on generic drugs. Shares of Alexion Pharmaceuticals, a drug maker, fell amid management changes and investor concerns about increased competition for the company’s drugs. Share of BT Group, a telecommunications provider, fell after the company significantly reduced its earnings forecast.
HOW WAS THE FUND POSITIONED?
The Fund’s portfolio managers combined a contrarian approach with bottom-up fundamental research to construct a global portfolio of what they believed were undervalued companies, characterized by sustainability of earnings, strong free cash flow and the ability to increase earnings faster than their sector peers.
| | | | | | | | |
| TOP TEN EQUITY HOLDINGS OF THE PORTFOLIO*** | |
| | 1. | | | Alphabet, Inc., Class C (United States) | | | 5.0 | % |
| | 2. | | | Citigroup, Inc. (United States) | | | 3.3 | |
| | 3. | | | Molson Coors Brewing Co., Class B (United States) | | | 3.1 | |
| | 4. | | | Vodafone Group plc (United Kingdom) | | | 3.1 | |
| | 5. | | | Amazon.com, Inc. (United States) | | | 2.7 | |
| | 6. | | | Teva Pharmaceutical Industries Ltd., ADR (Israel) | | | 2.6 | |
| | 7. | | | Shire plc, ADR (United States) | | | 2.5 | |
| | 8. | | | Novartis AG (Registered) (Switzerland) | | | 2.4 | |
| | 9. | | | AXA SA (France) | | | 2.4 | |
| | 10. | | | Kroger Co. (The) (United States) | | | 2.4 | |
| | | | |
PORTFOLIO COMPOSITION BY COUNTRY*** | |
| United States | | | 49.4 | % |
| United Kingdom | | | 10.1 | |
| China | | | 8.9 | |
| France | | | 7.8 | |
| Japan | | | 5.7 | |
| Switzerland | | | 3.9 | |
| Israel | | | 2.6 | |
| Denmark | | | 1.8 | |
| Hong Kong | | | 1.6 | |
| Canada | | | 1.5 | |
| Luxembourg | | | 1.5 | |
| Netherlands | | | 1.4 | |
| India | | | 1.1 | |
| Others (each less than 1.0%) | | | 0.8 | |
| Short-Term Investment | | | 1.9 | |
| 1 | | On April 3, 2017, the Fund’s Select Class Shares were renamed Class I Shares. |
| * | | The return shown is based on net asset values calculated for shareholder transactions and may differ from the return shown in the financial highlights, which reflects adjustments made to the net asset values in accordance with accounting principles generally accepted in the United States of America. |
| ** | | The adviser seeks to achieve the Fund’s objective. There can be no guarantee it will be achieved. |
| *** | | Percentages indicated are based on total investments as of April 30, 2017. The Fund’s portfolio composition is subject to change. |
| | | | | | |
| | | |
| 14 | | | | J.P. MORGAN INTERNATIONAL EQUITY FUNDS | | APRIL 30, 2017 |
| | | | | | | | | | | | | | | | | | | | | | |
AVERAGE ANNUAL TOTAL RETURNS AS OF APRIL 30, 2017 | |
| | | | | | |
| | | INCEPTION DATE OF
CLASS | | 6 MONTH* | | | 1 YEAR | | | 3 YEAR | | | 5 YEAR | | | SINCE
INCEPTION | |
CLASS A SHARES | | November 30, 2011 | | | | | | | | | | | | | | | | | | | | |
With Sales Charge** | | | | | 8.12 | % | | | 11.26 | % | | | 3.67 | % | | | 8.24 | % | | | 9.55 | % |
Without Sales Charge | | | | | 14.09 | | | | 17.42 | | | | 5.55 | | | | 9.42 | | | | 10.65 | |
CLASS C SHARES | | November 30, 2011 | | | | | | | | | | | | | | | | | | | | |
With CDSC*** | | | | | 12.84 | | | | 15.84 | | | | 5.04 | | | | 8.88 | | | | 10.10 | |
Without CDSC | | | | | 13.84 | | | | 16.84 | | | | 5.04 | | | | 8.88 | | | | 10.10 | |
CLASS I SHARES (FORMERLY SELECT CLASS SHARES) | | November 30, 2011 | | | 14.34 | | | | 17.82 | | | | 5.90 | | | | 9.75 | | | | 10.98 | |
CLASS R2 SHARES | | November 30, 2011 | | | 14.05 | | | | 17.18 | | | | 5.30 | | | | 9.15 | | | | 10.38 | |
CLASS R5 SHARES | | November 30, 2011 | | | 14.35 | | | | 18.00 | | | | 6.03 | | | | 9.92 | | | | 11.15 | |
CLASS R6 SHARES | | November 30, 2011 | | | 14.41 | | | | 18.07 | | | | 6.09 | | | | 9.97 | | | | 11.21 | |
| ** | | Sales Charge for Class A Shares is 5.25%. |
| *** | | Assumes a 1% CDSC (contingent deferred sales charge) for the 6 month and one year periods and 0% CDSC thereafter. |
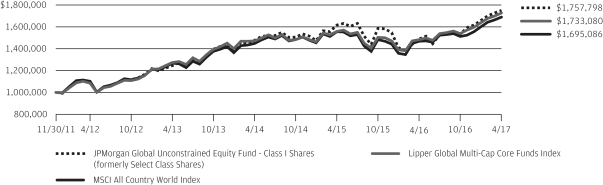
LIFE OF FUND PERFORMANCE (11/30/11 TO 4/30/17)
The performance quoted is past performance and is not a guarantee of future results. Mutual funds are subject to certain market risks. Investment returns and principal value of an investment will fluctuate so that an investor’s shares, when redeemed, may be worth more or less than their original cost. Current performance may be higher or lower than the performance data shown. For up-to-date month-end performance information please call 1-800-480-4111.
The Fund commenced operations on November 30, 2011.
The graph illustrates comparative performance for $1,000,000 invested in Class I Shares of the JPMorgan Global Unconstrained Equity Fund, the MSCI All Country World Index and the Lipper Global Multi-Cap Core Funds Index from November 30, 2011 to April 30, 2017. The performance of the Fund assumes reinvestment of all dividends and capital gain distributions, if any, and does not include a sales charge. The performance of the MSCI All Country World Index does not reflect the deduction of expenses or a sales charge associated with a mutual fund and approximates the minimum possible dividend reinvestment of the securities included in the benchmark, if applicable. The dividend is reinvested after deduction of withholding tax, applying the maximum rate to non-resident institutional investors who do not benefit from double taxation treaties. The MSCI All Country World Index is a free float-adjusted market capitalization weighted index that is designed to measure the equity market performance of developed and emerging markets. The Lipper Global Multi-Cap Core Funds Index is an index based on the total returns of certain mutual funds
within the Fund’s designated category, as determined by Lipper, Inc. Investors cannot invest directly in an index.
Class I Shares have a $1,000,000 minimum initial investment.
Subsequent to the inception date of the Fund and through January 5, 2015, the Fund did not experience any shareholder activity. If such shareholder activity had occurred, the Fund’s performance may have been impacted.
Fund performance may reflect the waiver of the Fund’s fees and reimbursement of expenses for certain periods since the inception date. Without these waivers and reimbursements, performance would have been lower. Also, performance shown in this section does not reflect the deduction of taxes that a shareholder would pay on Fund distributions or redemptions of Fund shares.
International investing involves a greater degree of risk and increased volatility. Changes in currency exchange rates and differences in accounting and taxation policies outside the U.S. can raise or lower returns. Also, some overseas markets may not be as politically and economically stable as the U.S. and other nations.
The returns shown are based on net asset values calculated for shareholder transactions and may differ from the returns shown in the financial highlights, which reflect adjustments made to the net asset values in accordance with accounting principles generally accepted in the United States of America.
| | | | | | | | |
| | | |
| APRIL 30, 2017 | | J.P. MORGAN INTERNATIONAL EQUITY FUNDS | | | | | 15 | |
JPMorgan International Discovery Fund
FUND COMMENTARY
SIX MONTHS ENDED APRIL 30, 2017 (Unaudited)
| | | | |
| REPORTING PERIOD RETURN: | |
| Fund (Class I Shares)1* | | | 12.11% | |
| MSCI Europe, Australasia and Far East Small and Mid Cap Index (“MSCI EAFE SMID Cap Index”) | | | 12.29% | |
| |
| Net Assets as of 4/30/2017 (In Thousands) | | | $6,762 | |
INVESTMENT OBJECTIVE**
The JPMorgan International Discovery Fund (the “Fund”) seeks to provide long-term capital appreciation.
WHAT WERE THE MAIN DRIVERS OF THE FUND’S PERFORMANCE?
The Fund’s Class I Shares underperformed the MSCI EAFE SMID Cap Index (net of foreign withholding taxes) (the “Benchmark”) for the six months ended April 30, 2017.
Relative to the Benchmark, the Fund’s security selection in the materials and diversified financials sectors was a leading detractor from performance, while the Fund’s overweight position and security selection in the capital goods sector and its security selection in the retailing sector were leading contributors to relative performance.
By region, the Fund’s security selection in the Pacific, excluding Japan, was a leading detractor from relative performance, while its security selection in emerging markets was a leading contributor to relative performance.
Leading individual detractors included the Fund’s underweight positions in Plus500 Ltd., Noble Group Ltd. and M3 Inc. Shares of Plus500, a U.K. online securities trading platform operator, rose after the company named a new chairwoman and reached a settlement in a dispute with Belgian regulators. Shares of Noble Group, a Chinese commodities supply chain operator, rose on news reports that Sinochem was seeking to buy a stake in the company. Shares of M3, a Japanese provider of online
health care services, rose after Sony Corp. announced plans to sell its stake in the company.
Leading individual contributors to relative performance included the Fund’s positions in JD Sports Fashion PLC, Ashtead Group PLC and Ipsen. Shares of JD Sports Fashion, a U.K.
apparel retailer, rose after the company reported better-than-expected earnings. Shares of Ashtead Group, a U.K. equipment rental company, rose after the company reported strong earnings growth. Shares of Ipsen, a French drug maker, rose amid the company’s successful launch of two new drugs.
HOW WAS THE FUND POSITIONED?
The Fund’s assets were primarily invested in equity and equity-like securities of foreign companies, including foreign subsidiaries of U.S. companies. At April 30, 2017, the Fund’s largest sector holdings were in the industrials, consumer discretionary and materials sectors, while the Fund’s smallest sector holdings were in the utilities, telecommunications services and energy sectors. By region, the Fund’s largest positions were in Europe and Japan.
| 1 | | On April 3, 2017, the Fund’s Select Class Shares were renamed Class I Shares. |
| * | | The return shown is based on net asset values calculated for shareholder transactions and may differ from the return shown in the financial highlights, which reflects adjustments made to the net asset values in accordance with accounting principles generally accepted in the United States of America. |
| ** | | The adviser seeks to achieve the Fund’s objective. There can be no guarantee it will be achieved. |
| | | | | | |
| | | |
| 16 | | | | J.P. MORGAN INTERNATIONAL EQUITY FUNDS | | APRIL 30, 2017 |
| | | | | | | | |
| TOP TEN EQUITY HOLDINGS OF THE PORTFOLIO*** | |
| | 1. | | | Ashtead Group plc (United Kingdom) | | | 1.8 | % |
| | 2. | | | JD Sports Fashion plc (United Kingdom) | | | 1.7 | |
| | 3. | | | Micro Focus International plc (United Kingdom) | | | 1.4 | |
| | 4. | | | Aristocrat Leisure Ltd. (Australia) | | | 1.4 | |
| | 5. | | | AAC Technologies Holdings, Inc. (China) | | | 1.4 | |
| | 6. | | | Electrocomponents plc (United Kingdom) | | | 1.4 | |
| | 7. | | | Treasury Wine Estates Ltd. (Australia) | | | 1.3 | |
| | 8. | | | Challenger Ltd. (Australia) | | | 1.3 | |
| | 9. | | | Mitsubishi Motors Corp. (Japan) | | | 1.2 | |
| | 10. | | | Domino’s Pizza Enterprises Ltd. (Australia) | | | 1.2 | |
| | | | |
PORTFOLIO COMPOSITION BY COUNTRY*** | |
| Japan | | | 24.9 | % |
| United Kingdom | | | 16.4 | |
| France | | | 8.5 | |
| Australia | | | 8.4 | |
| Switzerland | | | 7.1 | |
| Italy | | | 6.8 | |
| Hong Kong | | | 4.7 | |
| Germany | | | 4.1 | |
| China | | | 3.5 | |
| Sweden | | | 3.2 | |
| Finland | | | 2.2 | |
| Norway | | | 2.1 | |
| United States | | | 1.4 | |
| Denmark | | | 1.3 | |
| Georgia | | | 1.1 | |
| Others (each less than 1.0%) | | | 4.3 | |
| *** | | Percentages indicated are based upon total investments as of April 30, 2017. The Fund’s composition is subject to change. |
| | | | | | | | |
| | | |
| APRIL 30, 2017 | | J.P. MORGAN INTERNATIONAL EQUITY FUNDS | | | | | 17 | |
JPMorgan International Discovery Fund
FUND COMMENTARY
SIX MONTHS ENDED APRIL 30, 2017 (Unaudited) (continued)
| | | | | | | | | | |
AVERAGE ANNUAL TOTAL RETURNS AS OF APRIL 30, 2017 | |
| | | | |
| | | INCEPTION DATE OF
CLASS | | 6 MONTH* | | 1 YEAR | | SINCE
INCEPTION | |
CLASS A SHARES | | December 21, 2015 | | | | | | | | |
With Sales Charge** | | | | 6.06% | | 9.55% | | | 3.84 | % |
Without Sales Charge | | | | 11.91 | | 15.64 | | | 8.04 | |
CLASS C SHARES | | December 21, 2015 | | | | | | | | |
With CDSC*** | | | | 10.62 | | 14.12 | | | 7.50 | |
Without CDSC | | | | 11.62 | | 15.12 | | | 7.50 | |
CLASS I SHARES (FORMERLY SELECT CLASS SHARES) | | December 21, 2015 | | 12.11 | | 16.08 | | | 8.40 | |
CLASS R5 SHARES | | December 21, 2015 | | 12.15 | | 16.19 | | | 8.54 | |
CLASS R6 SHARES | | December 21, 2015 | | 12.19 | | 16.31 | | | 8.62 | |
| ** | | Sales Charge for Class A Shares is 5.25%. |
| *** | | Assumes a 1% CDSC (contingent deferred sales charge) for the 6 month and one year periods and 0% CDSC thereafter. |
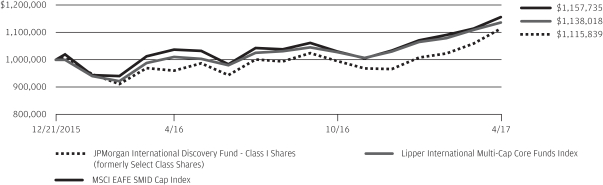
LIFE OF FUND PERFORMANCE (12/21/15 TO 04/30/17)
The performance quoted is past performance and is not a guarantee of future results. Mutual funds are subject to certain market risks. Investment returns and principal value of an investment will fluctuate so that an investor’s shares, when redeemed, may be worth more or less than their original cost. Current performance may be higher or lower than the performance data shown. For up-to-date, month-end performance information please call 1-800-480-4111.
The Fund commenced operations on December 21, 2015.
The graph illustrates comparative performance for $1,000,000 invested in Class I Shares of the JPMorgan International Discovery Fund, the MSCI EAFE SMID Cap Index (net of foreign withholding taxes) and the Lipper international Multi-Cap Core Funds Index from December 21, 2015 to April 30, 2017. The performance of the Fund assumes reinvestment of all dividends and capital gain distributions, if any, and does not include a sales charge. The performance of the MSCI EAFE SMID Cap Index (net of foreign withholding taxes) does not reflect the deduction of expenses or a sales charge associated with a mutual fund and approximates the minimum possible dividend reinvestment of the securities included in the benchmark, if applicable. The dividend is reinvested after deduction of withholding tax, applying the maximum rate to non-resident institutional investors who do not benefit from double taxation treaties. The performance of the Lipper international Multi-Cap Core Funds Index includes expenses associated with a mutual fund, such as investment management fees. These expenses are not identical to the expenses incurred by the Fund. The MSCI EAFE SMID Cap Index captures mid and small cap representation across Developed Markets countries around the world, excluding the U.S. and Canada. The Lipper International Multi-Cap Core Funds Index is an index based on the
total returns of certain mutual funds within the Fund’s designated category, as determined by Lipper, Inc. Investors cannot invest directly in an index.
The MSCI information may only be used for your internal use, may not be reproduced or redisseminated in any form and may not be used as a basis for or a component of any financial instruments or products or indices. None of the MSCI information is intended to constitute investment advice or a recommendation to make (or refrain from making) any kind of investment decision and may not be relied on as such. Historical data and analysis should not be taken as an indication or guarantee of any future performance analysis, forecast or prediction. The MSCI information is provided on an “as is” basis and the user of this information assumes the entire risk of any use made of this information. MSCI, each of its affiliates and each other person involved in or related to compiling, computing or creating any MSCI information (collectively, the “MSCI Parties”) expressly disclaims all warranties (including, without limitation, any warranties of originality, accuracy, completeness, timeliness, noninfringement, merchantability and fitness for a particular purpose) with respect to this information. Without limiting any of the foregoing, in no event shall any MSCI Party have any liability for any direct, indirect, special, incidental, punitive, consequential (including, without limitation, lost profits) or any other damages. (www.msci.com)
Class I Shares have a $1,000,000 minimum initial investment.
Fund performance may reflect the waiver of the Fund’s fees and reimbursement of expenses for certain periods since the inception date. Without these waivers and reimbursements, performance would have been lower. Also, performance shown in this section does not reflect the deduction of taxes that a shareholder would pay on Fund distributions or redemptions of Fund shares.
| | | | | | |
| | | |
| 18 | | | | J.P. MORGAN INTERNATIONAL EQUITY FUNDS | | APRIL 30, 2017 |
International investing involves a greater degree of risk and increased volatility. Changes in currency exchange rates and differences in accounting and taxation policies outside the U.S. can raise or lower returns. Also, some overseas markets may not be as politically and economically stable as the U.S. and other nations.
The returns shown are based on net asset values calculated for shareholder transactions and may differ from the returns shown in the financial highlights, which reflect adjustments made to the net asset values in accordance with accounting principles generally accepted in the United States of America.
| | | | | | | | |
| | | |
| APRIL 30, 2017 | | J.P. MORGAN INTERNATIONAL EQUITY FUNDS | | | | | 19 | |
JPMorgan International Equity Fund
FUND COMMENTARY
SIX MONTHS ENDED APRIL 30, 2017 (Unaudited)
| | | | |
| REPORTING PERIOD RETURN: | |
| Fund (Class I Shares)1* | | | 11.03% | |
| Morgan Stanley Capital International (“MSCI”) Europe, Australasia and Far East (“EAFE”) Index (net of foreign withholding taxes) | | | 11.47% | |
| |
| Net Assets as of 4/30/2017 (In Thousands) | | $ | 3,688,410 | |
INVESTMENT OBJECTIVE**
The JPMorgan International Equity Fund (the “Fund”) seeks total return from long-term capital growth and income. Total return consists of capital growth and current income.
WHAT WERE THE MAIN DRIVERS OF THE FUND’S PERFORMANCE?
The Fund’s Class I Shares underperformed the MSCI EAFE Index (net of foreign withholding taxes) (the “Benchmark”) for the six months ended April 30, 2017.
The Fund’s security selection in the industrials and energy sectors was a leading detractor from performance relative to the Benchmark, while the Fund’s security selection in the information technology and consumer discretionary sectors was a leading contributor to relative performance.
Leading individual detractors from the Fund’s relative performance included its overweight positions in Japan Tobacco Inc., CNOOC Ltd. and Vodafone Group PLC. Shares of Japan Tobacco, a maker of tobacco products, fell amid investor concerns about the company’s domestic sales volume and competition for its next-generation products. Shares of CNOOC, a Chinese offshore petroleum company that was not held in the Benchmark, fell after the company issued a lower-than-expected forecast for production and capital expenditures. Shares of Vodafone, a U.K. telecommunications company, fell after the company reported slower revenue growth, driven by low cost competition in its Indian business.
Leading individual contributors to the Fund’s relative performance included the Fund’s overweight positions in Samsung Electronics Co., Prudential PLC and Akzo Nobel NV.
Shares of Samsung Electronics, a South Korean consumer electronics manufacturer not held in the Benchmark, rose after the company reported strong earnings growth. Shares of Prudential, a U.K. insurance and financial services company, rose after the company reported better-than-expected results from its U.S. and Asia businesses. Shares of Akzo Nobel, a Dutch paint and coatings manufacturer, rose following news reports that PPG Industries Inc. was seeking to acquire the company.
HOW WAS THE FUND POSITIONED?
The Fund’s portfolio managers continued to focus on security selection to build a portfolio of international equities. They used bottom-up fundamental research to identify what they
believed were attractively priced securities of companies with solid financial positions that possessed the potential to increase their earnings faster than their industry peers.
| | | | | | | | |
| TOP TEN EQUITY HOLDINGS OF THE PORTFOLIO*** | |
| | 1. | | | Samsung Electronics Co. Ltd., GDR (South Korea) | | | 2.2 | % |
| | 2. | | | HSBC Holdings plc (United Kingdom) | | | 2.1 | |
| | 3. | | | Roche Holding AG (Switzerland) | | | 2.1 | |
| | 4. | | | Prudential plc (United Kingdom) | | | 2.1 | |
| | 5. | | | Novartis AG (Registered) (Switzerland) | | | 2.0 | |
| | 6. | | | SAP SE (Germany) | | | 1.9 | |
| | 7. | | | UBS Group AG (Registered) (Switzerland) | | | 1.8 | |
| | 8. | | | Vodafone Group plc (United Kingdom) | | | 1.7 | |
| | 9. | | | Sumitomo Mitsui Financial Group, Inc. (Japan) | | | 1.7 | |
| | 10. | | | Royal Dutch Shell plc, Class A (Netherlands) | | | 1.7 | |
| | | | |
PORTFOLIO COMPOSITION BY COUNTRY*** | |
| Japan | | | 20.8 | % |
| United Kingdom | | | 19.1 | |
| France | | | 12.2 | |
| Switzerland | | | 10.5 | |
| Germany | | | 8.0 | |
| Netherlands | | | 5.6 | |
| Hong Kong | | | 4.5 | |
| China | | | 3.1 | |
| South Korea | | | 2.7 | |
| Belgium | | | 1.6 | |
| Spain | | | 1.2 | |
| Taiwan | | | 1.2 | |
| Australia | | | 1.2 | |
| India | | | 1.1 | |
| South Africa | | | 1.1 | |
| Denmark | | | 1.0 | |
| United States | | | 1.0 | |
| Others (each less than 1.0%) | | | 2.0 | |
| Short-Term Investment | | | 2.1 | |
| 1 | | On April 3, 2017, the Fund’s Select Class Shares were renamed Class I Shares. |
| * | | The return shown is based on net asset values calculated for shareholder transactions and may differ from the return shown in the financial highlights, which reflects adjustments made to the net asset values in accordance with accounting principles generally accepted in the United States of America. |
| ** | | The adviser seeks to achieve the Fund’s objective. There can be no guarantee it will be achieved. |
| *** | | Percentages indicated are based on total investments as of April 30, 2017. The Fund’s portfolio composition is subject to change. |
| | | | | | |
| | | |
| 20 | | | | J.P. MORGAN INTERNATIONAL EQUITY FUNDS | | APRIL 30, 2017 |
| | | | | | | | | | | | | | | | | | |
AVERAGE ANNUAL TOTAL RETURNS AS OF APRIL 30, 2017 | |
| | | | | |
| | | INCEPTION DATE OF
CLASS | | 6 MONTH* | | | 1 YEAR | | | 5 YEAR | | | 10 YEAR | |
CLASS A SHARES | | February 28, 2002 | | | | | | | | | | | | | | | | |
With Sales Charge** | | | | | 5.16 | % | | | 8.78 | % | | | 3.99 | % | | | 0.54 | % |
Without Sales Charge | | | | | 10.99 | | | | 14.78 | | | | 5.12 | | | | 1.08 | |
CLASS C SHARES | | January 31, 2003 | | | | | | | | | | | | | | | | |
With CDSC*** | | | | | 9.70 | | | | 13.22 | | | | 4.59 | | | | 0.56 | |
Without CDSC | | | | | 10.70 | | | | 14.22 | | | | 4.59 | | | | 0.56 | |
CLASS I SHARES (FORMERLY SELECT CLASS SHARES) | | January 1, 1997 | | | 11.03 | | | | 15.01 | | | | 5.37 | | | | 1.33 | |
CLASS R2 SHARES | | November 3, 2008 | | | 10.84 | | | | 14.45 | | | | 4.85 | | | | 0.85 | |
CLASS R5 SHARES | | May 15, 2006 | | | 11.09 | | | | 15.19 | | | | 5.57 | | | | 1.52 | |
CLASS R6 SHARES | | November 30, 2010 | | | 11.23 | | | | 15.28 | | | | 5.63 | | | | 1.55 | |
| ** | | Sales Charge for Class A Shares is 5.25%. |
| *** | | Assumes a 1% CDSC (contingent deferred sales charge) for the 6 month and one year periods and 0% CDSC thereafter. |
TEN YEAR PERFORMANCE (4/30/07 TO 4/30/17)
The performance quoted is past performance and is not a guarantee of future results. Mutual funds are subject to certain market risks. Investment returns and principal value of an investment will fluctuate so that an investor’s shares, when redeemed, may be worth more or less than their original cost. Current performance may be higher or lower than the performance data shown. For up-to-date month-end performance information please call 1-800-480-4111.
Returns for Class R2 Shares prior to its inception date are based on the performance of Class A Shares. The actual returns of R2 Shares would have been lower than those shown because R2 Shares have higher expenses than Class A Shares.
Returns for Class R6 Shares prior to its inception date are based on the performance of Class R5 Shares. The actual returns of Class R6 Shares would have been different than those shown because Class R6 Shares have different expenses than Class R5 Shares.
The graph illustrates comparative performance for $1,000,000 invested in Class I Shares of the JPMorgan International Equity Fund, the MSCI EAFE Index and the Lipper International Large-Cap Core Funds Index from April 30, 2007 to April 30, 2017. The performance of the Fund assumes reinvestment of all dividends and capital gain distributions, if any, and does not include a sales charge. The performance of the MSCI EAFE Index does not reflect the deduction of expenses or a sales charge associated with a mutual fund and approximates the minimum possible dividend reinvestment of the securities included in the benchmark, if applicable. The dividend is reinvested after deduction of withholding tax, applying the maximum rate to non-resident institutional investors who do not benefit from double taxation treaties. The performance of the
Lipper International Large-Cap Core Funds Index includes expenses associated with a mutual fund, such as investment management fees. These expenses are not identical to the expenses incurred by the Fund. The MSCI EAFE Index is a free float-adjusted market capitalization weighted index that is designed to measure the equity market performance of developed markets, excluding the U.S. and Canada. The Lipper International Large-Cap Core Funds Index is an index based on the total returns of certain mutual funds within the Fund’s designated category, as determined by Lipper, Inc. Investors cannot invest directly in an index.
Class I Shares have a $1,000,000 minimum initial investment.
Fund performance may reflect the waiver of the Fund’s fees and reimbursement of expenses for certain periods since the inception date. Without these waivers and reimbursements, performance would have been lower. Also, performance shown in this section does not reflect the deduction of taxes that a shareholder would pay on Fund distributions or redemptions of Fund shares.
International investing involves a greater degree of risk and increased volatility. Changes in currency exchange rates and differences in accounting and taxation policies outside the U.S. can raise or lower returns. Also, some overseas markets may not be as politically and economically stable as the United States and other nations.
The returns shown are based on net asset values calculated for shareholder transactions and may differ from the returns shown in the financial highlights, which reflect adjustments made to the net asset values in accordance with accounting principles generally accepted in the United States of America.
| | | | | | | | |
| | | |
| APRIL 30, 2017 | | J.P. MORGAN INTERNATIONAL EQUITY FUNDS | | | | | 21 | |
JPMorgan International Equity Income Fund
FUND COMMENTARY
SIX MONTHS ENDED APRIL 30, 2017 (Unaudited)
| | | | |
| REPORTING PERIOD RETURN: | |
| Fund (Class I Shares)1* | | | 8.87% | |
| Morgan Stanley Capital International (“MSCI”) Europe, Australasia and Far East (“EAFE”) Index (net of foreign withholding taxes) | |
| 11.47%
|
|
| |
| Net Assets as of 4/30/2017 (In Thousands) | | $ | 175,872 | |
INVESTMENT OBJECTIVE**
The JPMorgan International Equity Income Fund (the “Fund”) seeks to provide both current income and long-term capital appreciation.
WHAT WERE THE MAIN DRIVERS OF THE FUND’S PERFORMANCE?
The Fund’s Class I Shares underperformed the MSCI EAFE Index (net of foreign withholding taxes) (the “Benchmark”) for the six months ended April 30, 2017.
By sector, the Fund’s security selection in the banks and insurance sectors was a leading detractor from performance relative to the Benchmark. The Fund’s security selection in the industrial cyclical sector and its underweight position in the utilities sector, where the Fund had no holdings, were leading positive contributors to relative performance.
By region, the Fund’s underweight positions and security selection in the Pacific and in Japan detracted from relative performance, while the Fund’s holdings in emerging markets, where the Benchmark had no exposure, and its security selection and underweight position in Continental Europe made positive contributions to relative performance.
Leading individual detractors from relative performance included the Fund’s overweight positions in Royal Ahold Delhaize NV, Daiwa Securities Group Inc. and Severstal PAO. Shares of Royal Ahold Delhaize, a Netherlands grocery chain, fell after the company reported a decline in earnings. Shares of Daiwa Securities Group, a Japanese financial services company, fell amid investor expectations for low returns in Japanese financial markets. Shares of Severstal, a Russian an iron ore producer and steelmaker, fell amid a decline in global prices for iron ore.
Leading individual contributors to relative performance included the Fund’s underweight position in Toyota Motor Corp. and its overweight positions in Michelin SCA and Samsung Electronics Co. Shares of Toyota, a Japanese automaker, fell amid a slowdown in U.S. auto sales and ongoing litigation related to faulty air bags. Shares of Michelin, a French maker of automotive tires and maps and guides, rose amid investor expectations for increased auto sales. Shares of Samsung Electronics, a South Korean consumer electronics manufacturer not held in the Benchmark, rose after the company reported strong earnings growth.
HOW THE FUND WAS MANAGED?
The Fund’s portfolio managers employed a bottom-up fundamental approach to security selection, rigorously researching companies in an attempt to determine their underlying value and potential for future growth. The Fund’s portfolio managers looked for dividend yielding equity securities that they believed were undervalued and possessed the long-term earnings power and strong cash flow generation that would enable them to grow their dividends.
| 1 | | On April 3, 2017, the Fund’s Select Class Shares were renamed Class I Shares. |
| * | | The return shown is based on net asset values calculated for shareholder transactions and may differ from the return shown in the financial highlights, which reflects adjustments made to the net asset values in accordance with accounting principles generally accepted in the United States of America. |
| ** | | The adviser seeks to achieve the Fund’s objective. There can be no guarantee it will be achieved. |
| | | | | | |
| | | |
| 22 | | | | J.P. MORGAN INTERNATIONAL EQUITY FUNDS | | APRIL 30, 2017 |
| | | | | | | | |
| TOP TEN EQUITY HOLDINGS OF THE PORTFOLIO*** | |
| | 1. | | | GlaxoSmithKline plc (United Kingdom) | | | 3.5 | % |
| | 2. | | | British American Tobacco plc (United Kingdom) | | | 3.0 | |
| | 3. | | | Anheuser-Busch InBev SA/NV (Belgium) | | | 3.0 | |
| | 4. | | | Danske Bank A/S (Denmark) | | | 2.7 | |
| | 5. | | | HSBC Holdings plc, ADR (United Kingdom) | | | 2.4 | |
| | 6. | | | WPP plc (United Kingdom) | | | 2.3 | |
| | 7. | | | Siemens AG (Registered) (Germany) | | | 2.3 | |
| | 8. | | | Cie Generale des Etablissements Michelin (France) | | | 2.2 | |
| | 9. | | | Mitsubishi UFJ Financial Group, Inc., ADR (Japan) | | | 2.2 | |
| | 10. | | | Bridgestone Corp. (Japan) | | | 2.2 | |
| | | | |
PORTFOLIO COMPOSITION BY COUNTRY*** | |
| United Kingdom | | | 24.4 | % |
| Germany | | | 12.2 | |
| Japan | | | 10.8 | |
| Switzerland | | | 7.6 | |
| France | | | 7.5 | |
| Netherlands | | | 5.7 | |
| Russia | | | 4.9 | |
| Finland | | | 3.9 | |
| Belgium | | | 3.0 | |
| Denmark | | | 2.7 | |
| South Korea | | | 2.0 | |
| Canada | | | 1.9 | |
| Czech Republic | | | 1.8 | |
| China | | | 1.6 | |
| Norway | | | 1.5 | |
| New Zealand | | | 1.3 | |
| Hong Kong | | | 1.1 | |
| Spain | | | 1.0 | |
| Others (each less than 1.0%) | | | 3.2 | |
| Short-Term Investment | | | 1.9 | |
| *** | | Percentages indicated are based on total investments as of April 30, 2017. The Fund’s portfolio composition is subject to change. |
| | | | | | | | |
| | | |
| APRIL 30, 2017 | | J.P. MORGAN INTERNATIONAL EQUITY FUNDS | | | | | 23 | |
JPMorgan International Equity Income Fund
FUND COMMENTARY
SIX MONTHS ENDED APRIL 30, 2017 (Unaudited) (continued)
| | | | | | | | | | | | | | | | | | |
AVERAGE ANNUAL TOTAL RETURNS AS OF APRIL 30, 2017 | |
| | | | | |
| | | INCEPTION DATE OF
CLASS | | 6 MONTH* | | | 1 YEAR | | | 5 YEAR | | | SINCE
INCEPTION | |
CLASS A SHARES | | February 28, 2011 | | | | | | | | | | | | | | | | |
With Sales Charge** | | | | | 2.96 | % | | | 1.71 | % | | | 5.29 | % | | | 3.57 | % |
Without Sales Charge | | | | | 8.69 | | | | 7.33 | | | | 6.43 | | | | 4.48 | |
CLASS C SHARES | | February 28, 2011 | | | | | | | | | | | | | | | | |
With CDSC*** | | | | | 7.42 | | | | 5.87 | | | | 5.91 | | | | 3.95 | |
Without CDSC | | | | | 8.42 | | | | 6.87 | | | | 5.91 | | | | 3.95 | |
CLASS I SHARES (FORMERLY SELECT CLASS SHARES) | | February 28, 2011 | | | 8.87 | | | | 7.70 | | | | 6.74 | | | | 4.77 | |
CLASS R2 SHARES | | February 28, 2011 | | | 8.56 | | | | 7.10 | | | | 6.16 | | | | 4.21 | |
CLASS R5 SHARES | | February 28, 2011 | | | 8.91 | | | | 7.81 | | | | 6.90 | | | | 4.94 | |
CLASS R6 SHARES | | January 30, 2015 | | | 8.95 | | | | 7.86 | | | | 6.91 | | | | 4.94 | |
| ** | | Sales Charge for Class A Shares is 5.25%. |
| *** | | Assumes a 1% CDSC (contingent deferred sales charge) for the 6 month and one year periods and 0% CDSC thereafter. |
LIFE OF FUND PERFORMANCE (2/28/11 TO 4/30/17)
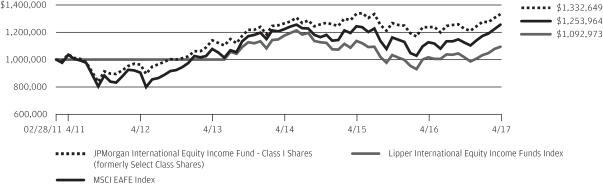
The performance quoted is past performance and is not a guarantee of future results. Mutual funds are subject to certain market risks. Investment returns and principal value of an investment will fluctuate so that an investor’s shares, when redeemed, may be worth more or less than their original cost. Current performance may be higher or lower than the performance data shown. For up-to-date, month-end performance information please call 1-800-480-4111.
The Fund commenced operations on February 28, 2011.
Returns for Class R6 Shares prior to its inception date are based on the performance of Class R5 Shares. The actual returns for Class R6 Shares would have been different than those shown because Class R6 Shares have different expenses than Class R5 Shares.
The graph illustrates comparative performance for $1,000,000 invested in Class I Shares of the JPMorgan International Equity Income Fund, the MSCI EAFE Index and the Lipper International Equity Income Funds Index from February 28, 2011 to April 30, 2017. Return information prior to July 31, 2013 for the Lipper International Equity Income Funds Index is not provided by Lipper, Inc. The performance of the Fund assumes reinvestment of all dividends and capital gain distributions, if any, and does not include a sales charge. The performance of the MSCI EAFE Index does not reflect the deduction of expenses or a sales charge associated with a mutual fund and approximates the minimum possible dividend reinvestment of the securities included in the benchmarks, if applicable. The dividend is reinvested after deduction of withholding tax, applying the maximum rate to non-resident institutional investors who do not benefit from double taxation treaties. The performance of the Lipper Inter-
national Equity Income Funds Index includes expenses associated with a mutual fund, such as investment management fees. These expenses are not identical to the expenses incurred by the Fund. The MSCI EAFE Index is a free float-adjusted market capitalization weighted index that is designed to measure the equity market performance of developed markets, excluding the U.S. and Canada. The Lipper International Equity Income Funds Index is an index based on the total returns of certain mutual funds within the Fund’s designated category as determined by Lipper, Inc. Investors cannot invest directly in an index.
Class I Shares have a $1,000,000 minimum initial investment.
Fund performance may reflect the waiver of the Fund’s fees and reimbursement of expenses for certain periods since the inception date. Without these waivers and reimbursements, performance would have been lower. Also, performance shown in this section does not reflect the deduction of taxes that a shareholder would pay on Fund distributions or redemptions of Fund shares.
International investing involves a greater degree of risk and increased volatility. Changes in currency exchange rates and differences in accounting and taxation policies outside the United States can raise or lower returns. Also, some overseas markets may not be as politically and economically stable as the United States and other nations.
The returns shown are based on net asset values calculated for shareholder transactions and may differ from the returns shown in the financial highlights, which reflect adjustments made to the net asset values in accordance with accounting principles generally accepted in the United States of America.
The MSCI information may only be used for your internal use, may not be
| | | | | | |
| | | |
| 24 | | | | J.P. MORGAN INTERNATIONAL EQUITY FUNDS | | APRIL 30, 2017 |
reproduced or redisseminated in any form and may not be used as a basis for or a component of any financial instruments or products or indices. None of the MSCI information is intended to constitute investment advice or a recommendation to make (or refrain from making) any kind of investment decision and may not be relied on as such. Historical data and analysis should not be taken as an indication or guarantee of any future performance analysis, forecast or prediction. The MSCI information is provided on an “as is” basis and the user of this information assumes the entire risk of any use made of this information. MSCI, each of its affiliates and each other person involved in or
related to compiling, computing or creating any MSCI information (collectively, the “MSCI Parties”) expressly disclaims all warranties (including, without limitation, any warranties of originality, accuracy, completeness, timeliness, non-infringement, merchantability and fitness for a particular purpose) with respect to this information. Without limiting any of the foregoing, in no event shall any MSCI Party have any liability for any direct, indirect, special, incidental, punitive, consequential (including, without limitation, lost profits) or any other damages. (www.msci.com)
| | | | | | | | |
| | | |
| APRIL 30, 2017 | | J.P. MORGAN INTERNATIONAL EQUITY FUNDS | | | | | 25 | |
JPMorgan International Opportunities Fund
FUND COMMENTARY
SIX MONTHS ENDED APRIL 30, 2017 (Unaudited)
| | | | |
| REPORTING PERIOD RETURN: | |
| Fund (Class A Shares, without a sales charge)* | | | 12.51% | |
| Morgan Stanley Capital International (“MSCI”) Europe, Australasia and Far East (“EAFE”) Index (net of foreign withholding taxes) | | | 11.47% | |
| |
| Net Assets as of 4/30/2017 (In Thousands) | | $ | 2,971,751 | |
INVESTMENT OBJECTIVE**
The JPMorgan International Opportunities Fund (the “Fund”) seeks to provide high total return from a portfolio of equity securities of foreign companies in developed and, to a lesser extent, emerging markets.
WHAT WERE THE MAIN DRIVERS OF THE FUND’S PERFORMANCE?
The Fund’s Class A Shares, without a sales charge, outperformed the MSCI EAFE Index (net of foreign withholding taxes) (the “Benchmark”) for the six months ended April 30, 2017.
By sector, the Fund’s security selection in the industrial cyclical and basic industries sectors was a leading contributor to performance relative to the Benchmark. The Fund’s security selection in the transportation services and consumer cyclical sector and the banks sector was a leading detractor from relative performance.
The Fund’s regional allocations made positive contributions to relative performance, with the Fund’s security selection in Europe, excluding the U.K., and Japan providing the leading contributions and the Fund’s security selection in the U.K. and emerging markets providing the smallest contribution. The Benchmark had no allocation to emerging markets.
Leading individual contributors to relative performance included the Fund’s overweight positions in DMG Mori Co., Norsk Hydro ASA and Goodman Group. Shares of DMG Mori, a Japanese maker of industrial cutting machine tools that was not held in the Benchmark, rose on investor expectations for increased demand from the robotics sector. Shares of Norsk Hydro, a Norwegian aluminum and renewable energy company, rose on increased aluminum prices and weakness in Norway’s
currency. Shares of Goodman Group, an Australian real estate company, rose amid strong tenant demand and the company’s reduced debt obligations.
Leading individual detractors from relative performance included the Fund’s overweight positions in Orix Corp. and Yamato Holdings Co. and its underweight position in LMH Moet Hennessy Louis Vuitton SE. Shares of Orix, a Japanese financial services company, fell amid a slowdown in the company’s growth. Shares of Yamato Holdings, a Japanese parcel delivery and logistics company, fell after the company reported lower-than-expected earnings and higher-than-expected costs. Shares of LVMH Moet Hennessy, a luxury goods manufacturer that was not held in the Fund, rose on increased sales and improved consumer sentiment.
HOW WAS THE FUND POSITIONED?
The Fund’s portfolio managers employed a bottom-up fundamental approach to security selection, seeking to identify what they believed were the most attractive investment opportunities within each sector. The Fund’s portfolio managers looked for securities that they believed possessed an attractive valuation signal (as measured by a proprietary dividend discount model) and a timely catalyst that would enable the security to realize its inherent value. In addition, the Fund employed futures and currency forwards to help manage cash flows and the Fund’s currency exposure.
| * | | The return shown is based on net asset values calculated for shareholder transactions and may differ from the return shown in the financial highlights, which reflects adjustments made to the net asset values in accordance with accounting principles generally accepted in the United States of America. |
| ** | | The adviser seeks to achieve the Fund’s objective. There can be no guarantee it will be achieved. |
| | | | | | |
| | | |
| 26 | | | | J.P. MORGAN INTERNATIONAL EQUITY FUNDS | | APRIL 30, 2017 |
| | | | | | | | |
| TOP TEN EQUITY HOLDINGS OF THE PORTFOLIO*** | |
| | 1. | | | Royal Dutch Shell plc, Class A (Netherlands) | | | 2.6 | % |
| | 2. | | | Roche Holding AG (Switzerland) | | | 2.4 | |
| | 3. | | | British American Tobacco plc (United Kingdom) | | | 2.2 | |
| | 4. | | | Siemens AG (Registered) (Germany) | | | 2.1 | |
| | 5. | | | Mitsubishi UFJ Financial Group, Inc. (Japan) | | | 1.7 | |
| | 6. | | | ING Groep NV (Netherlands) | | | 1.7 | |
| | 7. | | | TOTAL SA (France) | | | 1.7 | |
| | 8. | | | BNP Paribas SA (France) | | | 1.7 | |
| | 9. | | | Unilever NV, CVA (United Kingdom) | | | 1.6 | |
| | 10. | | | Anheuser-Busch InBev SA/NV (Belgium) | | | 1.6 | |
| | | | |
PORTFOLIO COMPOSITION BY COUNTRY*** | |
Japan | | | 23.6 | % |
United Kingdom | | | 16.5 | |
France | | | 13.9 | |
Germany | | | 9.0 | |
Netherlands | | | 6.9 | |
Switzerland | | | 5.3 | |
Australia | | | 3.8 | |
China | | | 2.8 | |
Italy | | | 2.4 | |
Denmark | | | 2.4 | |
Finland | | | 2.2 | |
Spain | | | 1.6 | |
Belgium | | | 1.6 | |
India | | | 1.5 | |
United States | | | 1.4 | |
Norway | | | 1.4 | |
Sweden | | | 1.3 | |
Chile | | | 1.1 | |
Short-Term Investment | | | 1.3 | |
| *** | | Percentages indicated are based on total investments as of April 30, 2017. The Fund’s portfolio composition is subject to change. |
| | | | | | | | |
| | | |
| APRIL 30, 2017 | | J.P. MORGAN INTERNATIONAL EQUITY FUNDS | | | | | 27 | |
JPMorgan International Opportunities Fund
FUND COMMENTARY
SIX MONTHS ENDED APRIL 30, 2017 (Unaudited) (continued)
| | | | | | | | | | | | | | | | | | |
AVERAGE ANNUAL TOTAL RETURNS AS OF APRIL 30, 2017 | |
| | | | | |
| | | INCEPTION DATE OF
CLASS | | 6 MONTH* | | | 1 YEAR | | | 5 YEAR | | | 10 YEAR | |
CLASS A SHARES | | September 10, 2001 | | | | | | | | | | | | | | | | |
With Sales Charge** | | | | | 6.63 | % | | | 5.61 | % | | | 4.45 | % | | | 0.09 | % |
Without Sales Charge | | | | | 12.51 | | | | 11.46 | | | | 5.58 | | | | 0.64 | |
CLASS C SHARES | | July 31, 2007 | | | | | | | | | | | | | | | | |
With CDSC*** | | | | | 11.21 | | | | 9.88 | | | | 5.03 | | | | 0.12 | |
Without CDSC | | | | | 12.21 | | | | 10.88 | | | | 5.03 | | | | 0.12 | |
CLASS I SHARES (FORMERLY SELECT CLASS SHARES) | | September 10, 2001 | | | 12.52 | | | | 11.65 | | | | 5.85 | | | | 0.88 | |
CLASS R6 SHARES | | November 30, 2010 | | | 12.74 | | | | 12.02 | | | | 6.16 | | | | 1.14 | |
| ** | | Sales Charge for Class A Shares is 5.25%. |
| *** | | Assumes a 1% CDSC (contingent deferred sales charge) for the 6 month and one year periods and 0% CDSC thereafter. |
TEN YEAR PERFORMANCE (4/30/07 TO 4/30/17)
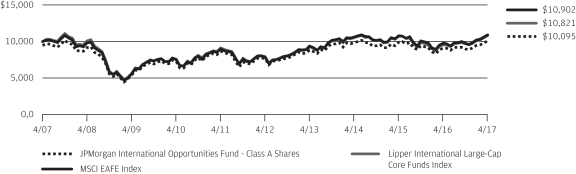
The performance quoted is past performance and is not a guarantee of future results. Mutual funds are subject to certain market risks. Investment returns and principal value of an investment will fluctuate so that an investor’s shares, when redeemed, may be worth more or less than their original cost. Current performance may be higher or lower than the performance data shown. For up-to-date month-end performance information please call 1-800-480-4111.
Returns for Class C Shares prior to its inception date are based on the performance of Class B Shares, all of which converted to Class A Shares on June 19, 2015. The actual returns of Class C Shares would have been similar to those shown because Class C Shares had similar expenses to Class B Shares.
Returns for Class R6 Shares prior to its inception date are based on the performance of Institutional Class Shares. The actual returns of Class R6 Shares would have been different than those shown because Class R6 Shares have different expenses than Institutional Class Shares.
The graph illustrates comparative performance for $10,000 invested in Class A Shares of the JPMorgan International Opportunities Fund, the MSCI EAFE Index and the Lipper International Large-Cap Core Funds Index from April 30, 2007 to April 30, 2017. The performance of the Fund assumes reinvestment of all dividends and capital gain distributions, if any, and does not include a sales charge. The performance of the MSCI EAFE Index does not reflect the deduction of expenses or a sales charge associated with a mutual fund and approximates the minimum possible dividend reinvestment of the securities included in the benchmark, if applicable. The dividend is reinvested after deduction of withholding tax, applying the maximum rate to non-resident institutional investors who do not benefit from double taxation treaties. The performance of the
Lipper International Large-Cap Core Funds Index includes expenses associated with a mutual fund, such as investment management fees. These expenses are not identical to the expenses incurred by the Fund. The MSCI EAFE Index is a free float-adjusted market capitalization weighted index that is designed to measure the equity market performance of developed markets, excluding the U.S. and Canada. The Lipper International Large-Cap Core Funds Index is an index based on the total returns of certain mutual funds within the Fund’s designated category, as determined by Lipper, Inc. Investors cannot invest directly in an index.
Class A Shares have a $1,000 minimum initial investment.
Fund performance may reflect the waiver of the Fund’s fees and reimbursement of expenses for certain periods since the inception date. Without these waivers and reimbursements, performance would have been lower. Also, performance shown in this section does not reflect the deduction of taxes that a shareholder would pay on Fund distributions or redemptions of Fund shares.
International investing involves a greater degree of risk and increased volatility. Changes in currency exchange rates and differences in accounting and taxation policies outside the U.S. can raise or lower returns. Also, some overseas markets may not be as politically and economically stable as the United States and other nations.
The returns shown are based on net asset values calculated for shareholder transactions and may differ from the returns shown in the financial highlights, which reflect adjustments made to the net asset values in accordance with accounting principles generally accepted in the United States of America.
| | | | | | |
| | | |
| 28 | | | | J.P. MORGAN INTERNATIONAL EQUITY FUNDS | | APRIL 30, 2017 |
JPMorgan International Research Enhanced Equity Fund
FUND COMMENTARY
SIX MONTHS ENDED APRIL 30, 2017 (Unaudited)
| | | | |
| REPORTING PERIOD RETURN: | | | |
| Fund (Class I Shares)1* | | | 12.66% | |
| Morgan Stanley Capital International (“MSCI”) Europe, Australasia and Far East (“EAFE”) Index (net of foreign withholding taxes) | | | 11.47% | |
| |
| Net Assets as of 4/30/2017 (In Thousands) | | $ | 1,715,944 | |
INVESTMENT OBJECTIVE**
The JPMorgan International Research Enhanced Equity Fund (the “Fund”) seeks to provide long-term capital appreciation.
WHAT WERE THE MAIN DRIVERS OF THE FUND’S PERFORMANCE?
The Fund’s Class I Shares outperformed the MSCI EAFE Index (net of foreign withholding taxes) (the “Benchmark”) for the six months ended April 30, 2017.
By sector, the Fund’s security selection in the industrial cyclical and banks sectors was a leading positive contributor to relative performance. The Fund’s security selection in the automobiles sector and overweight position in the telecommunications sector were leading detractors from relative performance.
Each of the Fund’s regional allocations made a positive contribution to relative performance. The Fund’s security selection in Europe, excluding the U.K., was a leading contributor to relative performance, while the Fund’s security selection in the Pacific, excluding Japan, was the smallest contributor to relative performance.
Due to the Fund holding a relatively large number of securities during the period, the impact of individual holdings on the Fund’s relative performance tended to be small.
HOW WAS THE FUND POSITIONED?
The Fund sought to outperform the Benchmark over time, while seeking to achieve sector, geographic and risk characteristics similar to that of the Benchmark. Using the fundamental equity insights generated by analysts, the Fund’s portfolio managers took a marginally overweight position in securities included within the universe of the Benchmark that they considered undervalued, while marginally underweighting or not holding securities in the Benchmark that they considered overvalued.
| | | | | | | | |
| TOP TEN EQUITY HOLDINGS OF THE PORTFOLIO*** | |
| | 1. | | | Nestle SA (Registered) (Switzerland) | | | 2.6 | % |
| | 2. | | | Roche Holding AG (Switzerland) | | | 1.9 | |
| | 3. | | | British American Tobacco plc (United Kingdom) | | | 1.6 | |
| | 4. | | | Siemens AG (Registered) (Germany) | | | 1.4 | |
| | 5. | | | Bayer AG (Registered) (Germany) | | | 1.4 | |
| | 6. | | | SAP SE (Germany) | | | 1.2 | |
| | 7. | | | HSBC Holdings plc (United Kingdom) | | | 1.2 | |
| | 8. | | | Toyota Motor Corp. (Japan) | | | 1.2 | |
| | 9. | | | Commonwealth Bank of Australia (Australia) | | | 1.2 | |
| | 10. | | | Anheuser-Busch InBev SA/NV (Belgium) | | | 1.2 | |
| | | | |
PORTFOLIO COMPOSITION BY COUNTRY*** | |
Japan | | | 21.4 | % |
United Kingdom | | | 15.7 | |
Germany | | | 10.9 | |
France | | | 10.1 | |
Switzerland | | | 9.7 | |
Australia | | | 6.6 | |
Netherlands | | | 5.2 | |
Italy | | | 3.1 | |
Hong Kong | | | 2.6 | |
Spain | | | 2.4 | |
Finland | | | 2.0 | |
Belgium | | | 1.2 | |
United States | | | 1.1 | |
Denmark | | | 1.1 | |
Others (each less than 1.0%) | | | 4.7 | |
| Short-Term Investment | | | 2.2 | |
| 1 | | On April 3, 2017, the Fund’s Select Class Shares were renamed Class I Shares. |
| * | | The return shown is based on net asset values calculated for shareholder transactions and may differ from the return shown in the financial highlights, which reflects adjustments made to the net asset values in accordance with accounting principles generally accepted in the United States of America. |
| ** | | The adviser seeks to achieve the Fund’s objective. There can be no guarantee it will be achieved. |
| *** | | Percentages indicated are based on total investments as of April 30, 2017. The Fund’s portfolio composition is subject to change. |
| | | | | | | | |
| | | |
| APRIL 30, 2017 | | J.P. MORGAN INTERNATIONAL EQUITY FUNDS | | | | | 29 | |
JPMorgan International Research Enhanced Equity Fund
FUND COMMENTARY
SIX MONTHS ENDED APRIL 30, 2017 (Unaudited) (continued)
| | | | | | | | | | | | | | | | | | |
AVERAGE ANNUAL TOTAL RETURNS AS OF APRIL 30, 2017 | |
| | | | | |
| | | INCEPTION DATE OF
CLASS | | 6 MONTH* | | | 1 YEAR | | | 5 YEAR | | | 10 YEAR | |
CLASS A SHARES | | April 23, 1993 | | | | | | | | | | | | | | | | |
With Sales Charge** | | | | | 6.59 | % | | | 7.38 | % | | | 5.90 | % | | | (0.09 | )% |
Without Sales Charge | | | | | 12.49 | | | | 13.30 | | | | 7.05 | | | | 0.45 | |
CLASS C SHARES | | November 4, 1997 | | | | | | | | | | | | | | | | |
With CDSC*** | | | | | 11.20 | | | | 11.66 | | | | 6.48 | | | | (0.18 | ) |
Without CDSC | | | | | 12.20 | | | | 12.66 | | | | 6.48 | | | | (0.18 | ) |
CLASS I SHARES (FORMERLY SELECT CLASS SHARES) | | October 28, 1992 | | | 12.66 | | | | 13.60 | | | | 7.33 | | | | 0.70 | |
CLASS R2 SHARES | | November 3, 2008 | | | 12.40 | | | | 12.99 | | | | 6.79 | | | | 0.19 | |
| ** | | Sales Charge for Class A Shares is 5.25%. |
| *** | | Assumes a 1% CDSC (contingent deferred sales charge) for the 6 month and one year periods and 0% CDSC thereafter. |
TEN YEAR PERFORMANCE (4/30/07 to 4/30/17)
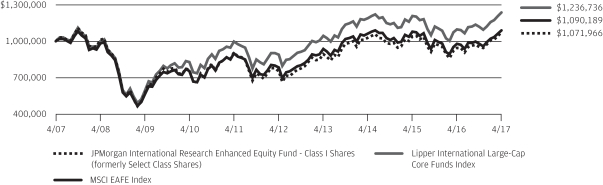
The performance quoted is past performance and is not a guarantee of future results. Mutual funds are subject to certain market risks. Investment returns and principal value of an investment will fluctuate so that an investor’s shares, when redeemed, may be worth more or less than their original cost. Current performance may be higher or lower than the performance data shown. For up-to-date month-end performance information please call 1-800-480-4111.
Returns for Class R2 Shares prior to its inception date are based on the performance of Class I Shares. Class R2 Shares performance has been adjusted to reflect the difference in expenses between classes.
The graph illustrates comparative performance for $1,000,000 invested in Class I Shares of the JPMorgan International Research Enhanced Equity Fund, the MSCI EAFE Index and the Lipper International Large-Cap Core Funds Index from April 30, 2007 to April 30, 2017. The performance of the Fund assumes reinvestment of all dividends and capital gain distributions, if any, and does not include a sales charge. The performance of the MSCI EAFE Index does not reflect the deduction of expenses or a sales charge associated with a mutual fund and approximates the minimum possible dividend reinvestment of the securities included in the benchmark, if applicable. The dividend is reinvested after deduction of withholding tax, applying the maximum rate to non-resident institutional investors who do not benefit from double taxation treaties. The performance of the Lipper International Large-Cap Core Funds Index includes expenses associated with a mutual fund, such as investment management fees. These expenses are not identical to the expenses incurred by the Fund. The MSCI EAFE Index is a free float-adjusted market capitalization weighted index that is designed to measure the equity market performance of developed markets, excluding the U.S. and Canada. The Lipper International Large-Cap Core Funds Index is an index based on the total returns of certain mutual funds within the Fund’s designated category as determined by Lipper, Inc. Investors cannot invest directly in an index.
Class I Shares have a $1,000,000 minimum initial investment.
Fund performance may reflect the waiver of the Fund’s fees and reimbursement of expenses for certain periods since the inception date. Without these waivers and reimbursements, performance would have been lower. Also, performance shown in this section does not reflect the deduction of taxes that a shareholder would pay on Fund distributions or redemptions of Fund shares.
International investing involves a greater degree of risk and increased volatility. Changes in currency exchange rates and differences in accounting and taxation policies outside of the U.S. can raise or lower returns. Also, some overseas markets may not be as politically and economically stable as the United States and other nations.
The returns shown are based on net asset values calculated for shareholder transactions and may differ from the returns shown in the financial highlights, which reflect adjustments made to the net asset values in accordance with accounting principles generally accepted in the United States of America.
The MSCI information may only be used for your internal use, may not be reproduced or redisseminated in any form and may not be used as a basis for or a component of any financial instruments or products or indices. None of the MSCI information is intended to constitute investment advice or a recommendation to make (or refrain from making) any kind of investment decision and may not be relied on as such. Historical data and analysis should not be taken as an indication or guarantee of any future performance analysis, forecast or prediction. The MSCI information is provided on an “as is” basis and the user of this information assumes the entire risk of any use made of this information. MSCI, each of its affiliates and each other person involved in or related to compiling, computing or creating any MSCI information (collectively, the “MSCI Parties”) expressly disclaims all warranties (including, without limitation, any warranties of originality, accuracy, completeness, timeliness, non-infringement, merchantability and fitness for a particular purpose) with respect to this information. Without limiting any of the foregoing, in no event shall any MSCI Party have any liability for any direct, indirect, special, incidental, punitive, consequential (including, without limitation, lost profits) or any other damages. (www.msci.com)
| | | | | | |
| | | |
| 30 | | | | J.P. MORGAN INTERNATIONAL EQUITY FUNDS | | APRIL 30, 2017 |
JPMorgan International Unconstrained Equity Fund
FUND COMMENTARY
SIX MONTHS ENDED APRIL 30, 2017 (Unaudited)
| | | | |
| REPORTING PERIOD RETURN: | | | |
| Fund (Class I Shares)1* | | | 11.76% | |
| Morgan Stanley Capital International (“MSCI”) All Country World Index, Ex-U.S. (net of foreign withholding taxes) | | | 10.37% | |
| |
| Net Assets as of 4/30/2017 (In Thousands) | | $ | 174,359 | |
INVESTMENT OBJECTIVE**
The JPMorgan International Unconstrained Equity Fund (the “Fund”) seeks to provide long-term capital appreciation.
WHAT WERE THE MAIN DRIVERS OF THE FUND’S PERFORMANCE?
The Fund’s Class I Shares outperformed the MSCI All Country World Index, ex-U.S. (net of foreign withholding taxes) (the “Benchmark”) for the six months ended April 30, 2017.
By sector, the Fund’s security selection in the consumer discretionary and materials sectors was a leading contributor to performance relative to the Benchmark, while the Fund’s security selection in the energy and telecommunication services sectors was a leading detractor from relative performance.
By region, the Fund’s security selection in Europe and the U.K. was a leading contributor to performance relative to the Benchmark, while the Fund’s security selection in the Pacific, excluding Japan, and in North America was a leading detractor from relative performance.
Leading individual contributors to the relative performance included the Fund’s overweight positions in Altice NV, Actelion Ltd. and Wartsila Oyj. Shares of Altice, a Dutch telecommunications and media company, rose on news reports that it would sell a minority interest in its U.S. operations through an initial public offering. Shares of Actelion, a Swiss drug maker, rose on news reports of a $30 billion takeover offer by Johnson & Johnson. Shares of Wartsila, a Finnish maker of engines and generators, rose after the company won several large contracts for supply and maintenance.
Leading individual detractors from the Fund’s relative performance included its overweight positions in Teva Pharmaceutical Industries Ltd., CNOOC Ltd and Alimentation Couche-Tard Inc. Shares of Teva Pharmaceutical, an Israel-based maker of generic and specialty drugs, fell amid investor concerns about the company’s patent on a key drug and general concerns about pricing pressure on generic drugs. Shares of CNOOC, a Chinese offshore petroleum company, fell after the company reported a decline in earnings and revenue. Shares of Alimentation Couche-Tard, a Canadian operator of convenience stores, rose after the company reported growth in sales and earnings.
HOW WAS THE FUND POSITIONED?
By harnessing their team’s global sector specialists, the Fund’s portfolio managers sought to build a high-conviction, benchmark-agnostic portfolio of growth, value and unique companies, whose future prospects, the managers believed, were under-appreciated by the market and thus possessed the potential to deliver higher-than-expected earnings that could have a positive effect on the share price.
| 1 | | On April 3, 2017, the Fund’s Select Class Shares were renamed Class I Shares. |
| * | | The return shown is based on net asset values calculated for shareholder transactions and may differ from the return shown in the financial highlights, which reflects adjustments made to the net asset values in accordance with accounting principles generally accepted in the United States of America. |
| ** | | The adviser seeks to achieve the Fund’s objective. There can be no guarantee it will be achieved. |
| | | | | | | | |
| | | |
| APRIL 30, 2017 | | J.P. MORGAN INTERNATIONAL EQUITY FUNDS | | | | | 31 | |
JPMorgan International Unconstrained Equity Fund
FUND COMMENTARY
SIX MONTHS ENDED APRIL 30, 2017 (Unaudited) (continued)
| | | | | | | | |
| TOP TEN EQUITY HOLDINGS OF THE PORTFOLIO*** | |
| | 1. | | | Altice NV, Class A (Netherlands) | | | 4.1 | % |
| | 2. | | | British American Tobacco plc (United Kingdom) | | | 3.5 | |
| | 3. | | | Continental AG (Germany) | | | 2.8 | |
| | 4. | | | Nokia OYJ (Finland) | | | 2.7 | |
| | 5. | | | Banco Bilbao Vizcaya Argentaria SA (Spain) | | | 2.7 | |
| | 6. | | | Samsung Electronics Co. Ltd., GDR (South Korea) | | | 2.6 | |
| | 7. | | | NN Group NV (Netherlands) | | | 2.6 | |
| | 8. | | | Vodafone Group plc (United Kingdom) | | | 2.6 | |
| | 9. | | | CNOOC Ltd. (China) | | | 2.6 | |
| | 10. | | | LafargeHolcim Ltd. (Registered) (Switzerland) | | | 2.5 | |
| | | | |
PORTFOLIO COMPOSITION BY COUNTRY*** | |
United Kingdom | | | 18.4 | % |
Netherlands | | | 10.8 | |
Japan | | | 10.2 | |
China | | | 7.8 | |
Switzerland | | | 7.8 | |
South Korea | | | 6.4 | |
Hong Kong | | | 5.9 | |
Finland | | | 4.8 | |
Germany | | | 4.6 | |
Canada | | | 4.0 | |
Spain | | | 2.7 | |
India | | | 2.3 | |
Belgium | | | 2.0 | |
Israel | | | 2.0 | |
Denmark | | | 1.6 | |
Macau | | | 1.5 | |
Italy | | | 1.5 | |
South Africa | | | 1.3 | |
United States | | | 1.2 | |
Short-Term Investment | | | 3.2 | |
| *** | | Percentages indicated are based on total investments as of April 30, 2017. The Fund’s portfolio composition is subject to change. |
| | | | | | |
| | | |
| 32 | | | | J.P. MORGAN INTERNATIONAL EQUITY FUNDS | | APRIL 30, 2017 |
| | | | | | | | | | | | | | | | | | | | | | |
AVERAGE ANNUAL TOTAL RETURNS AS OF APRIL 30, 2017 | |
| | | | | | |
| | | INCEPTION DATE OF
CLASS | | | 6 MONTH* | | 1 YEAR | | | 3 YEAR | | | 5 YEAR | | | SINCE
INCEPTION | |
CLASS A SHARES | | | November 30, 2011 | | | | | | | | | | | | | | | | | | | |
With Sales Charge** | | | | | | 5.66% | | | 7.49 | % | | | 1.45 | % | | | 5.38 | % | | | 7.34 | % |
Without Sales Charge | | | | | | 11.54 | | | 13.45 | | | | 3.29 | | | | 6.52 | | | | 8.41 | |
CLASS C SHARES | | | November 30, 2011 | | | | | | | | | | | | | | | | | | | |
With CDSC*** | | | | | | 10.29 | | | 11.95 | | | | 2.78 | | | | 6.00 | | | | 7.87 | |
Without CDSC | | | | | | 11.29 | | | 12.95 | | | | 2.78 | | | | 6.00 | | | | 7.87 | |
CLASS I SHARES (FORMERLY SELECT CLASS SHARES) | | | November 30, 2011 | | | 11.76 | | | 13.85 | | | | 3.63 | | | | 6.84 | | | | 8.73 | |
CLASS R2 SHARES | | | November 30, 2011 | | | 11.43 | | | 13.20 | | | | 3.04 | | | | 6.26 | | | | 8.14 | |
CLASS R5 SHARES | | | November 30, 2011 | | | 11.81 | | | 13.96 | | | | 3.76 | | | | 7.00 | | | | 8.90 | |
CLASS R6 SHARES | | | November 30, 2011 | | | 11.80 | | | 14.02 | | | | 3.81 | | | | 7.06 | | | | 8.96 | |
| ** | | Sales Charge for Class A Shares is 5.25%. |
| *** | | Assumes a 1% CDSC (contingent deferred sales charge) for the one year period and 0% CDSC thereafter. |
LIFE OF FUND PERFORMANCE (11/30/11 TO 4/30/17)
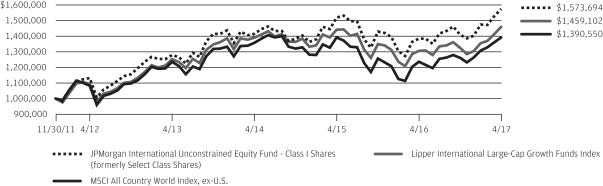
The performance quoted is past performance and is not a guarantee of future results. Mutual funds are subject to certain market risks. Investment returns and principal value of an investment will fluctuate so that an investor’s shares, when redeemed, may be worth more or less than their original cost. Current performance may be higher or lower than the performance data shown. For up-to-date, month-end performance information please call 1-800-480-4111.
The Fund commenced operations on November 30, 2011.
The graph illustrates comparative performance for $1,000,000 invested in Class I Shares of the JPMorgan International Unconstrained Equity Fund, the MSCI All Country World Index, ex-U.S. and the Lipper International Large-Cap Growth Funds Index from November 30, 2011 to April 30, 2017. The performance of the Fund assumes reinvestment of all dividends and capital gain distributions, if any, and does not include a sales charge. The performance of the MSCI All Country World Index, ex-U.S. does not reflect the deduction of expenses or a sales charge associated with a mutual fund and approximates the minimum possible dividend reinvestment of the securities included in the benchmark, if applicable. The dividend is reinvested after deduction of withholding tax, applying the maximum rate to non-resident institutional investors who do not benefit from double taxation treaties. The performance of the Lipper International Large-Cap Growth Funds Index includes expenses associated with a mutual fund, such as investment management fees. These expenses are not identical to the expenses incurred by the Fund. The MSCI All Country World Index, ex-U.S. is a free float-adjusted market capitalization weighted index that is designed to measure the equity market performance of developed and
emerging markets, excluding the United States. The Lipper International Large-Cap Growth Funds Index is an index based on the total returns of certain mutual funds within the Fund’s designated category, as determined by Lipper, Inc. Investors cannot invest directly in an index.
Class I Shares have a $1,000,000 minimum initial investment.
Subsequent to the inception date of the Fund and through May 30, 2013, the Fund did not experience any shareholder activity. If such shareholder activity had occurred, the Fund’s performance may have been impacted.
Fund performance may reflect the waiver of the Fund’s fees and reimbursement of expenses for certain periods since the inception date. Without these waivers and reimbursements, performance would have been lower. Also, performance shown in this section does not reflect the deduction of taxes that a shareholder would pay on Fund distributions or redemptions of Fund shares.
International investing involves a greater degree of risk and increased volatility. Changes in currency exchange rates and differences in accounting and taxation policies outside the U.S. can raise or lower returns. Also, some overseas markets may not be as politically and economically stable as the United States and other nations.
The returns shown are based on net asset values calculated for shareholder transactions and may differ from the returns shown in the financial highlights, which reflect adjustments made to the net asset values in accordance with accounting principles generally accepted in the United States of America.
| | | | | | | | |
| | | |
| APRIL 30, 2017 | | J.P. MORGAN INTERNATIONAL EQUITY FUNDS | | | | | 33 | |
JPMorgan International Value Fund
FUND COMMENTARY
SIX MONTHS ENDED APRIL 30, 2017 (Unaudited)
| | | | |
| REPORTING PERIOD RETURN: | |
| Fund (Class L Shares)1* | | | 12.89% | |
| Morgan Stanley Capital International (“MSCI”) Europe, Australasia and Far East (“EAFE”) Value Index (net of foreign withholding taxes) | | | 12.53% | |
| |
| Net Assets as of 4/30/2017 (In Thousands) | | $ | 824,857 | |
INVESTMENT OBJECTIVE**
The JPMorgan International Value Fund (the “Fund”) seeks to provide high total return from a portfolio of foreign company equity securities.
WHAT WERE THE MAIN DRIVERS OF THE FUND’S PERFORMANCE?
The Fund’s Class L Shares outperformed the MSCI EAFE Value Index (net of foreign withholding taxes) (the “Benchmark”) for the six months ended April 30, 2017.
By sector, the Fund’s security selection in the insurance and utilities sectors was a leading contributor to performance relative to the Benchmark, while the Fund’s security selection in the energy and health care sectors was a leading detractor from relative performance.
By region, the Fund’s security selection in Japan, Europe and the U.K. was a leading contributor to relative performance, while the Fund’s underweight allocation to the Pacific, excluding Japan, and its security selection in emerging markets and North America were leading detractors from relative performance.
Leading individual contributors to relative performance included the Fund’s overweight positions in Prudential PLC and Bankia SA and its underweight position in Toyota Motor Corp.
Shares of Prudential, a U.K. insurance and financial services company that was not held in the Benchmark, rose after the company’s chief executive said there were “significant” growth opportunities for the company’s business abroad. Shares of Bankia, a Spanish financial services company, rose on better-than-expected earnings. Shares of Toyota, a Japanese automaker, fell amid a slowdown in U.S. auto sales and ongoing litigation related to faulty air bags.
Leading individual detractors from relative performance included the Fund’s overweight positions in Teva Pharmaceutical Industries Ltd., Daikin Industries Ltd. and CNOOC Ltd. Shares of Teva Pharmaceuticals, an Israeli maker of generic and specialty drugs, fell amid investor concerns about the company’s patent on a key drug and general concerns about pricing pressure on generic drugs. Shares of Daikin Industries, a maker of air conditioning systems that was not held in the Benchmark, fell after the company reported a decline in revenue. Shares of CNOOC, a Chinese offshore petroleum company that was not held in the Benchmark, fell after the company reported a decline in earnings and revenue.
HOW WAS THE FUND POSITIONED?
The Fund’s portfolio managers employed a bottom-up fundamental approach to security selection, seeking to identify what they believed were the most attractive value investment opportunities within each sector. The Fund’s portfolio managers looked for securities that they believed possessed an attractive valuation signal (as measured by a proprietary dividend discount model) and a timely catalyst that would enable the securities to realize their inherent value. In addition, the Fund employed futures and currency forwards to help manage cash flows and currency exposure.
| 1 | | Effective December 1, 2016, the Fund’s Institutional Class Shares were renamed Class L Shares. |
| * | | The return shown is based on net asset values calculated for shareholder transactions and may differ from the return shown in the financial highlights, which reflects adjustments made to the net asset values in accordance with accounting principles generally accepted in the United States of America. |
| ** | | The adviser seeks to achieve the Fund’s objective. There can be no guarantee it will be achieved. |
| | | | | | |
| | | |
| 34 | | | | J.P. MORGAN INTERNATIONAL EQUITY FUNDS | | APRIL 30, 2017 |
| | | | | | | | |
| TOP TEN HOLDINGS OF THE PORTFOLIO*** | |
| | 1. | | | Royal Dutch Shell plc, Class A (Netherlands) | | | 3.9 | % |
| | 2. | | | TOTAL SA (France) | | | 3.4 | |
| | 3. | | | Siemens AG (Registered) (Germany) | | | 2.8 | |
| | 4. | | | Australia & New Zealand Banking Group Ltd. (Australia) | | | 2.8 | |
| | 5. | | | Mitsubishi UFJ Financial Group, Inc. (Japan) | | | 2.8 | |
| | 6. | | | BNP Paribas SA (France) | | | 2.2 | |
| | 7. | | | AXA SA (France) | | | 2.2 | |
| | 8. | | | ING Groep NV (Netherlands) | | | 2.0 | |
| | 9. | | | Zurich Insurance Group AG (Switzerland) | | | 1.9 | |
| | 10. | | | Rio Tinto plc (United Kingdom) | | | 1.8 | |
| | | | |
PORTFOLIO COMPOSITION BY COUNTRY*** | |
| Japan | | | 22.7 | % |
| France | | | 15.9 | |
| United Kingdom | | | 10.1 | |
| Germany | | | 8.4 | |
| Netherlands | | | 7.7 | |
| Switzerland | | | 4.5 | |
| Australia | | | 3.9 | |
| Italy | | | 3.3 | |
| Spain | | | 3.0 | |
| Belgium | | | 2.2 | |
| Sweden | | | 1.8 | |
| United States | | | 1.5 | |
| Hong Kong | | | 1.3 | |
| Israel | | | 1.3 | |
| Singapore | | | 1.2 | |
| Austria | | | 1.1 | |
| South Korea | | | 1.1 | |
| Canada | | | 1.0 | |
| Norway | | | 1.0 | |
| Finland | | | 1.0 | |
| Luxembourg | | | 1.0 | |
| Others (each less than 1.0%) | | | 2.3 | |
| Short-Term Investment | | | 2.7 | |
| *** | | Percentages indicated are based on total investments as of April 30, 2017. The Fund’s portfolio composition is subject to change. |
| | | | | | | | |
| | | |
| APRIL 30, 2017 | | J.P. MORGAN INTERNATIONAL EQUITY FUNDS | | | | | 35 | |
JPMorgan International Value Fund
FUND COMMENTARY
SIX MONTHS ENDED APRIL 30, 2017 (Unaudited) (continued)
| | | | | | | | | | | | | | | | | | |
AVERAGE ANNUAL TOTAL RETURNS AS OF APRIL 30, 2017 | |
| | | | | |
| | | INCEPTION DATE
OF CLASS | | 6 MONTH* | | | 1 YEAR | | | 5 YEAR | | | 10 YEAR | |
CLASS A SHARES | | September 28, 2001 | | | | | | | | | | | | | | | | |
With Sales Charge** | | | | | 6.73 | % | | | 7.56 | % | | | 3.39 | % | | | (0.99 | )% |
Without Sales Charge | | | | | 12.66 | | | | 13.50 | | | | 4.51 | | | | (0.46 | ) |
CLASS C SHARES | | July 11, 2006 | | | | | | | | | | | | | | | | |
With CDSC*** | | | | | 11.35 | | | | 11.82 | | | | 4.00 | | | | (0.95 | ) |
Without CDSC | | | | | 12.35 | | | | 12.82 | | | | 4.00 | | | | (0.95 | ) |
CLASS I SHARES (FORMERLY SELECT CLASS SHARES) | | September 10, 2001 | | | 12.75 | | | | 13.75 | | | | 4.80 | | | | (0.20 | ) |
CLASS L SHARES (FORMERLY INSTITUTIONAL CLASS SHARES) | | November 4, 1993 | | | 12.89 | | | | 13.89 | | | | 4.95 | | | | (0.05 | ) |
CLASS R2 SHARES | | November 3, 2008 | | | 12.48 | | | | 13.14 | | | | 4.25 | | | | (0.68 | ) |
CLASS R5 SHARES | | September 9, 2016 | | | 12.80 | | | | 13.89 | | | | 4.95 | | | | (0.05 | ) |
CLASS R6 SHARES | | November 30, 2010 | | | 12.90 | | | | 14.08 | | | | 5.07 | | | | 0.03 | |
| ** | | Sales Charge for Class A Shares is 5.25%. |
| *** | | Assumes a 1% CDSC (contingent deferred sales charge) for the 6 month and one year period and 0% CDSC thereafter. |
TEN YEAR PERFORMANCE (4/30/07 TO 4/30/17)
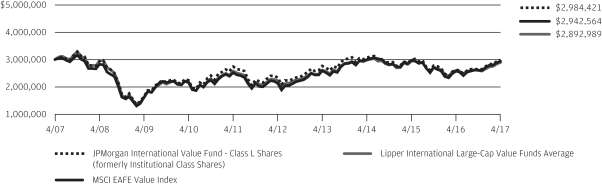
The performance quoted is past performance and is not a guarantee of future results. Mutual funds are subject to certain market risks. Investment returns and principal value of an investment will fluctuate so that an investor’s shares, when redeemed, may be worth more or less than their original cost. Current performance may be higher or lower than the performance data shown. For up-to-date month-end performance information please call 1-800-480-4111.
Returns for Class R2 Shares prior to its inception date are based on the performance of Class A Shares. The actual returns of R2 Shares would have been lower than those shown because R2 Shares have higher expenses than Class A Shares.
Returns for Class R5 Shares prior to its inception date are based on the performance of Class L Shares. The actual returns of Class R5 shares would have been different than those shown because Class R5 Shares have different expenses than Class L Shares.
Returns for Class R6 Shares prior to its inception date are based on the performance of Class L Shares. The actual returns of Class R6 Shares would have been different than those shown because Class R6 Shares have different expenses than Class L Shares.
The graph illustrates comparative performance for $3,000,000 invested in Class L Shares of the JPMorgan International Value Fund, the MSCI EAFE Value Index and the Lipper International Large-Cap Value Funds Average from April 30, 2007 to April 30, 2017. The performance of the Fund assumes reinvestment of all dividends and capital gain distributions, if any, and does not include a sales charge. The performance of the MSCI EAFE Value Index does not reflect the deduction of expenses or a sales charge associated with a mutual fund and approximates the minimum possible dividend reinvestment of the securities included in the benchmark, if
applicable. The dividend is reinvested after deduction of withholding tax, applying the maximum rate to non-resident institutional investors who do not benefit from double taxation treaties. The performance of the Lipper International Large-Cap Value Funds Average includes expenses associated with a mutual fund, such as investment management fees. These expenses are not identical to the expenses incurred by the Fund. The MSCI EAFE Value Index is a free float-adjusted market capitalization weighted index that is designed to measure the performance of value-oriented stocks in the world’s equity markets, excluding the U.S. and Canada. Investors cannot invest directly in an index. The Lipper International Large-Cap Value Funds Average is an average based on the total returns of all mutual funds within the Fund’s designated category as determined by Lipper, Inc.
Class L Shares have a $3,000,000 minimum initial investment.
Fund performance may reflect the waiver of the Fund’s fees and reimbursement of expenses for certain periods since the inception date. Without these waivers and reimbursements, performance would have been lower. Also, performance shown in this section does not reflect the deduction of taxes that a shareholder would pay on Fund distributions or redemptions of Fund shares.
International investing involves a greater degree of risk and increased volatility. Changes in currency exchange rates and differences in accounting and taxation policies outside the U.S. can raise or lower returns. Also, some overseas markets may not be as politically and economically stable as the United States and other nations.
The returns shown are based on net asset values calculated for shareholder transactions and may differ from the returns shown in the financial highlights, which reflect adjustments made to the net asset values in accordance with accounting principles generally accepted in the United States of America.
| | | | | | |
| | | |
| 36 | | | | J.P. MORGAN INTERNATIONAL EQUITY FUNDS | | APRIL 30, 2017 |
JPMorgan Intrepid International Fund
FUND COMMENTARY
SIX MONTHS ENDED APRIL 30, 2017 (Unaudited)
| | | | |
| REPORTING PERIOD RETURN: | |
| Fund (Class A Shares, without a sales charge)* | | | 11.08% | |
| Morgan Stanley Capital International (“MSCI”) Europe, Australasia and Far East (“EAFE”) Index (net of foreign withholding taxes) | | | 11.47% | |
| |
| Net Assets as of 4/30/2017 (In Thousands) | | $ | 2,922,753 | |
INVESTMENT OBJECTIVE**
The JPMorgan Intrepid International Fund (the “Fund”) seeks to maximize long-term capital growth by investing primarily in equity securities in developed markets outside the U.S.
WHAT WERE THE MAIN DRIVERS OF THE FUND’S PERFORMANCE?
The Fund’s Class A Shares, without a sales charge, underperformed the MSCI EAFE Index (net of foreign withholding taxes) (the “Benchmark”) for the six months ended April 30, 2017. The Fund’s portfolio managers attempted to construct the Fund so that security selection and style factors (i.e., growth, value and quality characteristics) would be the primary drivers of returns.
The Fund’s security selection in the consumer discretionary and telecommunication services sectors was a leading detractor from performance relative to the Benchmark, while the Fund’s security selection in the materials and health care sectors was a leading contributor to relative performance.
The Fund targeted investments in companies that exhibited specific growth, value and quality characteristics during the
period. The Fund held a range of 150 to 250 securities. Consequently, the impact of any individual security on the Fund’s overall performance tended to be small.
HOW WAS THE FUND POSITIONED?
The Fund’s portfolio managers believe that attractively valued, high quality securities with positive momentum have the potential to outperform the market. During the reporting period, the Fund’s portfolio managers invested in securities that they believed were attractive based on their proprietary multifactor model.
| * | | The return shown is based on net asset values calculated for shareholder transactions and may differ from the return shown in the financial highlights, which reflects adjustments made to the net asset values in accordance with accounting principles generally accepted in the United States of America. |
| ** | | The adviser seeks to achieve the Fund’s objective. There can be no guarantee it will be achieved. |
| | | | | | | | |
| | | |
| APRIL 30, 2017 | | J.P. MORGAN INTERNATIONAL EQUITY FUNDS | | | | | 37 | |
JPMorgan Intrepid International Fund
FUND COMMENTARY
SIX MONTHS ENDED APRIL 30, 2017 (Unaudited) (continued)
| | | | | | | | |
| TOP TEN EQUITY HOLDINGS OF THE PORTFOLIO*** | |
| | 1. | | | Roche Holding AG (Switzerland) | | | 1.8 | % |
| | 2. | | | Unilever NV, CVA (United Kingdom) | | | 1.5 | |
| | 3. | | | Nestle SA (Registered) (Switzerland) | | | 1.5 | |
| | 4. | | | British American Tobacco plc (United Kingdom) | | | 1.4 | |
| | 5. | | | Siemens AG (Registered) (Germany) | | | 1.2 | |
| | 6. | | | Sanofi (France) | | | 1.2 | |
| | 7. | | | Bayer AG (Registered) (Germany) | | | 1.0 | |
| | 8. | | | BHP Billiton Ltd. (Australia) | | | 1.0 | |
| | 9. | | | ING Groep NV (Netherlands) | | | 1.0 | |
| | 10. | | | Banco Santander SA (Spain) | | | 1.0 | |
| | | | |
PORTFOLIO COMPOSITION BY COUNTRY*** | |
| Japan | | | 23.6 | % |
| United Kingdom | | | 16.0 | |
| Switzerland | | | 11.3 | |
| France | | | 10.2 | |
| Germany | | | 7.4 | |
| Australia | | | 6.9 | |
| Netherlands | | | 3.2 | |
| Denmark | | | 3.0 | |
| Spain | | | 2.9 | |
| Sweden | | | 2.8 | |
| Hong Kong | | | 2.3 | |
| Italy | | | 1.1 | |
| Norway | | | 1.1 | |
| United States | | | 1.0 | |
| Others (each less than 1.0%) | | | 4.6 | |
| Short-Term Investment | | | 2.6 | |
| *** | | Percentages indicated are based on total investments as of April 30, 2017. The Fund’s portfolio composition is subject to change. |
| | | | | | |
| | | |
| 38 | | | | J.P. MORGAN INTERNATIONAL EQUITY FUNDS | | APRIL 30, 2017 |
| | | | | | | | | | | | | | | | | | |
AVERAGE ANNUAL TOTAL RETURNS AS OF APRIL 30, 2017 | |
| | | | | |
| | | INCEPTION DATE OF
CLASS | | 6 MONTH* | | | 1 YEAR | | | 5 YEAR | | | 10 YEAR | |
CLASS A SHARES | | April 30, 2001 | | | | | | | | | | | | | | | | |
With Sales Charge** | | | | | 5.26 | % | | | 6.85 | % | | | 5.34 | % | | | (0.30 | )% |
Without Sales Charge | | | | | 11.08 | | | | 12.79 | | | | 6.49 | | | | 0.24 | |
CLASS C SHARES | | February 28, 2006 | | | | | | | | | | | | | | | | |
With CDSC*** | | | | | 9.83 | | | | 11.28 | | | | 5.96 | | | | (0.26 | ) |
Without CDSC | | | | | 10.83 | | | | 12.28 | | | | 5.96 | | | | (0.26 | ) |
CLASS I SHARES (FORMERLY SELECT CLASS SHARES) | | February 28, 2006 | | | 11.33 | | | | 13.21 | | | | 6.80 | | | | 0.51 | |
CLASS R2 SHARES | | November 3, 2008 | | | 10.99 | | | | 12.53 | | | | 6.22 | | | | 0.02 | |
CLASS R6 SHARES | | May 29, 2015 | | | 11.39 | | | | 13.42 | | | | 7.03 | | | | 0.74 | |
| ** | | Sales Charge for Class A Shares is 5.25%. |
| *** | | Assumes a 1% CDSC (contingent deferred sales charge) for the 6 month and one year periods and 0% CDSC thereafter. |
TEN YEAR PERFORMANCE (4/30/07/ TO 4/30/17)
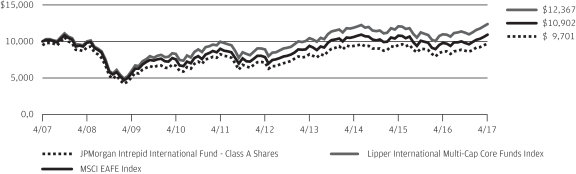
The performance quoted is past performance and is not a guarantee of future results. Mutual funds are subject to certain market risks. Investment returns and principal value of an investment will fluctuate so that an investor’s shares, when redeemed, may be worth more or less than their original cost. Current performance may be higher or lower than the performance data shown. For up-to-date month-end performance information please call 1-800-480-4111.
Returns for Class R2 Shares prior to its inception date are based on the performance of Class A Shares. The actual returns for Class R2 Shares would have been lower than those shown because Class R2 Shares have higher expenses than Class A Shares.
Returns for Class R6 Shares prior to its inception date are based on the performance of Institutional Class Shares. The actual returns of R6 Shares would have been different than those shown because R6 Shares have different expenses than Class A Shares.
The graph illustrates comparative performance for $10,000 invested in Class A Shares of the JPMorgan Intrepid International Fund, the MSCI EAFE Index and the Lipper International Multi-Cap Core Funds Index from April 30, 2007 to April 30, 2017. The performance of the Fund assumes reinvestment of all dividends and capital gain distributions, if any, and does not include a sales charge. The performance of the MSCI EAFE Index does not reflect the deduction of expenses or a sales charge associated with a mutual fund and approximates the minimum possible dividend reinvestment of the securities included in the benchmark, if applicable. The dividend is reinvested after deduction of withholding tax, applying the maximum rate to non-resident institutional investors who do not benefit from double taxation
treaties. The performance of the Lipper International Multi-Cap Core Funds Index includes expenses associated with a mutual fund, such as investment management fees. These expenses are not identical to the expenses incurred by the Fund. The MSCI EAFE Index is a free float-adjusted market capitalization weighted index that is designed to measure the equity market performance of developed markets, excluding the U.S. and Canada. The Lipper International Multi-Cap Core Funds Index is an index based on the total returns of certain mutual funds within the Fund’s designated category, as determined by Lipper, Inc. Investors cannot invest directly in an index.
Class A Shares have a $1,000 minimum initial investment.
Fund performance may reflect the waiver of the Fund’s fees and reimbursement of expenses for certain periods since the inception date. Without these waivers and reimbursements, performance would have been lower. Also, performance shown in this section does not reflect the deduction of taxes that a shareholder would pay on Fund distributions or redemptions of Fund shares.
International investing involves a greater degree of risk and increased volatility. Changes in currency exchange rates and differences in accounting and taxation policies outside the U.S. can raise or lower returns. Also, some overseas markets may not be as politically and economically stable as the United States and other nations.
The returns shown are based on net asset values calculated for shareholder transactions and may differ from the returns shown in the financial highlights, which reflect adjustments made to the net asset values in accordance with accounting principles generally accepted in the United States of America.
| | | | | | | | |
| | | |
| APRIL 30, 2017 | | J.P. MORGAN INTERNATIONAL EQUITY FUNDS | | | | | 39 | |
JPMorgan Emerging Economies Fund
SCHEDULE OF PORTFOLIO INVESTMENTS
AS OF APRIL 30, 2017 (Unaudited)
(Amounts in thousands)
| | | | | | | | |
| SHARES | | | SECURITY DESCRIPTION | | VALUE($) | |
| | Common Stocks — 95.6% | |
| | | | Brazil — 7.7% | |
| | 1,984 | | | Banco Bradesco SA, ADR (a) | | | 20,930 | |
| | 2,275 | | | Banco do Brasil SA (a) | | | 23,496 | |
| | 1,278 | | | Cia de Saneamento Basico do Estado de Sao Paulo, ADR (a) | | | 11,759 | |
| | 249 | | | Cia de Saneamento de Minas Gerais-COPASA (a) | | | 2,820 | |
| | 766 | | | Cosan SA Industria e Comercio | | | 8,901 | |
| | 1,773 | | | EDP — Energias do Brasil SA (a) | | | 7,534 | |
| | 2,839 | | | Itau Unibanco Holding SA, ADR | | | 34,917 | |
| | 307 | | | M Dias Branco SA (a) | | | 4,721 | |
| | 2,270 | | | MRV Engenharia e Participacoes SA | | | 11,345 | |
| | 763 | | | Qualicorp SA | | | 5,408 | |
| | 782 | | | Transmissora Alianca de Energia Eletrica SA | | | 5,783 | |
| | 908 | | | Vale SA, ADR (a) | | | 7,792 | |
| | | | | | | | |
| | | | | | | 145,406 | |
| | | | | | | | |
| | | | China — 21.8% | |
| | 1,582 | | | AAC Technologies Holdings, Inc. | | | 23,191 | |
| | 261 | | | Alibaba Group Holding Ltd., ADR (a) | | | 30,095 | |
| | 4,921 | | | Anhui Conch Cement Co. Ltd., Class H | | | 17,209 | |
| | 54,916 | | | Bank of China Ltd., Class H | | | 26,564 | |
| | 6,007 | | | BYD Electronic International Co. Ltd. | | | 9,168 | |
| | 9,726 | | | China CITIC Bank Corp. Ltd., Class H | | | 6,157 | |
| | 34,451 | | | China Construction Bank Corp., Class H | | | 27,963 | |
| | 6,498 | | | China Lesso Group Holdings Ltd. | | | 5,174 | |
| | 4,600 | | | China Mengniu Dairy Co. Ltd. | | | 8,887 | |
| | 7,860 | | | China Merchants Bank Co. Ltd., Class H | | | 20,365 | |
| | 3,092 | | | China Overseas Land & Investment Ltd. | | | 8,969 | |
| | 17,654 | | | China Power International Development Ltd. | | | 6,577 | |
| | 479 | | | Chlitina Holding Ltd. | | | 2,299 | |
| | 3,812 | | | COSCO SHIPPING Ports Ltd. | | | 4,173 | |
| | 9,925 | | | Geely Automobile Holdings Ltd. | | | 13,372 | |
| | 5,646 | | | Guangzhou Automobile Group Co. Ltd., Class H | | | 8,774 | |
| | 15,346 | | | Huadian Power International Corp. Ltd., Class H | | | 6,465 | |
| | 15,510 | | | Huaneng Power International, Inc., Class H | | | 10,691 | |
| | 63,095 | | | Industrial & Commercial Bank of China Ltd., Class H | | | 41,129 | |
| | 107 | | | NetEase, Inc., ADR | | | 28,374 | |
| | 11,070 | | | PICC Property & Casualty Co. Ltd., Class H | | | 17,795 | |
| | 3,280 | | | Ping An Insurance Group Co. of China Ltd., Class H | | | 18,438 | |
| | 5,888 | | | Shenzhen Expressway Co. Ltd., Class H | | | 5,362 | |
| | 3,027 | | | Sinopharm Group Co. Ltd., Class H | | | 13,567 | |
| | 1,034 | | | Tencent Holdings Ltd. | | | 32,386 | |
| | 2,996 | | | TravelSky Technology Ltd., Class H | | | 7,886 | |
| | 11,252 | | | Xinyi Solar Holdings Ltd. (a) | | | 3,512 | |
| | 4,944 | | | Zhejiang Expressway Co. Ltd., Class H | | | 6,150 | |
| | | | | | | | |
| | | | | | | 410,692 | |
| | | | | | | | |
| | | | | | | | |
| SHARES | | | SECURITY DESCRIPTION | | VALUE($) | |
| | | | | | | | |
| | | | Hong Kong — 2.7% | |
| | 4,387 | | | China High Speed Transmission Equipment Group Co. Ltd. | | | 4,261 | |
| | 1,628 | | | Haier Electronics Group Co. Ltd. | | | 3,775 | |
| | 2,198 | | | Kingboard Chemical Holdings Ltd. | | | 7,916 | |
| | 2,759 | | | Kingboard Laminates Holdings Ltd. | | | 3,325 | |
| | 6,136 | | | Lee & Man Paper Manufacturing Ltd. | | | 4,805 | |
| | 4,680 | | | Nine Dragons Paper Holdings Ltd. | | | 5,047 | |
| | 19,207 | | | WH Group Ltd. (e) | | | 17,136 | |
| | 6,160 | | | Xinyi Glass Holdings Ltd. (a) | | | 5,459 | |
| | | | | | | | |
| | | | | | | 51,724 | |
| | | | | | | | |
| | | | Hungary — 1.5% | |
| | 127 | | | MOL Hungarian Oil & Gas plc | | | 9,550 | |
| | 644 | | | OTP Bank plc | | | 18,119 | |
| | | | | | | | |
| | | | | | | 27,669 | |
| | | | | | | | |
| | | | India — 3.1% | |
| | 1,782 | | | Apollo Tyres Ltd. | | | 6,758 | |
| | 921 | | | Bharat Petroleum Corp. Ltd. | | | 10,298 | |
| | 1,127 | | | Hindustan Petroleum Corp. Ltd. | | | 9,395 | |
| | 7,703 | | | Oil & Natural Gas Corp. Ltd. | | | 22,319 | |
| | 2,937 | | | Rural Electrification Corp. Ltd. | | | 9,241 | |
| | | | | | | | |
| | | | | | | 58,011 | |
| | | | | | | | |
| | | | Indonesia — 0.7% | |
| | 14,292 | | | Bank Rakyat Indonesia Persero Tbk. PT | | | 13,805 | |
| | | | | | | | |
| | | | Malaysia — 1.3% | |
| | 13,704 | | | AirAsia Bhd. | | | 10,570 | |
| | 4,031 | | | Tenaga Nasional Bhd. | | | 12,940 | |
| | | | | | | | |
| | | | | | | 23,510 | |
| | | | | | | | |
| | | | Mexico — 0.6% | |
| | 3,736 | | | Grupo Mexico SAB de CV, Series B | | | 10,989 | |
| | | | | | | | |
| | | | Panama — 1.4% | |
| | 228 | | | Copa Holdings SA, Class A | | | 26,498 | |
| | | | | | | | |
| | | | Poland — 2.5% | |
| | 344 | | | KGHM Polska Miedz SA | | | 10,911 | |
| | 971 | | | Polski Koncern Naftowy ORLEN SA | | | 29,030 | |
| | 4,582 | | | Polskie Gornictwo Naftowe i Gazownictwo SA | | | 7,813 | |
| | | | | | | | |
| | | | | | | 47,754 | |
| | | | | | | | |
| | | | Qatar — 0.5% | |
| | 223 | | | Qatar National Bank QPSC | | | 8,821 | |
| | | | | | | | |
| | | | Russia — 8.0% | |
| | 8,222 | | | Alrosa PJSC | | | 14,174 | |
| | 297 | | | LUKOIL PJSC, ADR | | | 14,738 | |
| | 11,250 | | | Magnitogorsk Iron & Steel OJSC | | | 6,697 | |
SEE NOTES TO FINANCIAL STATEMENTS.
| | | | | | |
| | | |
| 40 | | | | J.P. MORGAN INTERNATIONAL EQUITY FUNDS | | APRIL 30, 2017 |
| | | | | | | | |
| SHARES | | | SECURITY DESCRIPTION | | VALUE($) | |
| | Common Stocks — continued | |
| | | | Russia — continued | | | | |
| | 1,163 | | | MMC Norilsk Nickel PJSC, ADR | | | 17,869 | |
| | 1,450 | | | Mobile TeleSystems PJSC, ADR | | | 14,965 | |
| | 3,187 | | | Moscow Exchange MICEX-RTS PJSC | | | 6,445 | |
| | 180 | | | Ros Agro plc, GDR | | | 2,211 | |
| | 2,530 | | | Rosneft Oil Co. PJSC, GDR | | | 13,996 | |
| | 344,413 | | | RusHydro PJSC | | | 5,416 | |
| | 1,449 | | | Sberbank of Russia PJSC, ADR | | | 17,280 | |
| | 361 | | | Sberbank of Russia PJSC, ADR | | | 4,288 | |
| | 978 | | | Severstal PJSC, GDR | | | 13,356 | |
| | 157 | | | Tatneft PJSC, ADR | | | 6,163 | |
| | 150 | | | Tatneft PJSC, ADR | | | 5,898 | |
| | 163 | | | X5 Retail Group NV, GDR (a) | | | 5,750 | |
| | | | | | | | |
| | | | | | | 149,246 | |
| | | | | | | | |
| | | | South Africa — 2.5% | |
| | 648 | | | Barloworld Ltd. | | | 5,839 | |
| | 404 | | | Imperial Holdings Ltd. | | | 5,111 | |
| | 672 | | | Nedbank Group Ltd. | | | 11,326 | |
| | 514 | | | Sappi Ltd. | | | 3,820 | |
| | 1,923 | | | Standard Bank Group Ltd. | | | 21,351 | |
| | | | | | | | |
| | | | | | | 47,447 | |
| | | | | | | | |
| | | | South Korea — 16.9% | |
| | 696 | | | Hana Financial Group, Inc. | | | 23,914 | |
| | 103 | | | Hyosung Corp. | | | 13,013 | |
| | 254 | | | Hyundai Engineering & Construction Co. Ltd. | | | 10,814 | |
| | 262 | | | Hyundai Marine & Fire Insurance Co. Ltd. | | | 8,450 | |
| | 66 | | | Hyundai Mobis Co. Ltd. | | | 12,858 | |
| | 512 | | | Korea Electric Power Corp. | | | 20,409 | |
| | 27 | | | KT Corp. | | | 751 | |
| | 175 | | | KT&G Corp. | | | 15,583 | |
| | 454 | | | LG Uplus Corp. | | | 5,764 | |
| | 42 | | | Mando Corp. | | | 8,579 | |
| | 70 | | | NCSoft Corp. | | | 22,067 | |
| | 310 | | | Partron Co. Ltd. | | | 2,963 | |
| | 90 | | | POSCO | | | 21,255 | |
| | 22 | | | Samsung Electronics Co. Ltd. | | | 42,569 | |
| | 411 | | | Shinhan Financial Group Co. Ltd. | | | 17,139 | |
| | 490 | | | SK Hynix, Inc. | | | 23,203 | |
| | 148 | | | SK Innovation Co. Ltd. | | | 22,234 | |
| | 34 | | | SK Materials Co. Ltd. | | | 5,331 | |
| | 191 | | | S-Oil Corp. | | | 16,706 | |
| | 1,859 | | | Woori Bank | | | 24,370 | |
| | | | | | | | |
| | | | | | | 317,972 | |
| | | | | | | | |
| | | | | | | | |
| SHARES | | | SECURITY DESCRIPTION | | VALUE($) | |
| | | | | | | | |
| | | | Taiwan — 14.0% | |
| | 5,653 | | | Accton Technology Corp. | | | 12,823 | |
| | 37,792 | | | CTBC Financial Holding Co. Ltd. | | | 23,600 | |
| | 1,921 | | | Elite Material Co. Ltd. | | | 7,662 | |
| | 2,703 | | | FLEXium Interconnect, Inc. (a) | | | 10,032 | |
| | 12,721 | | | Fubon Financial Holding Co. Ltd. | | | 19,914 | |
| | 1,687 | | | General Interface Solution Holding Ltd. | | | 9,406 | |
| | 665 | | | Grape King Bio Ltd. | | | 4,284 | |
| | 7,991 | | | Hon Hai Precision Industry Co. Ltd. | | | 26,154 | |
| | 7,938 | | | King Yuan Electronics Co. Ltd. (a) | | | 7,166 | |
| | 148 | | | Largan Precision Co. Ltd. | | | 24,578 | |
| | 2,051 | | | Merry Electronics Co. Ltd. | | | 12,141 | |
| | 7,104 | | | Micro-Star International Co. Ltd. | | | 14,229 | |
| | 3,497 | | | Pegatron Corp. | | | 10,299 | |
| | 3,549 | | | Powertech Technology, Inc. | | | 11,134 | |
| | 1,468 | | | Realtek Semiconductor Corp. | | | 4,964 | |
| | 369 | | | Silicon Motion Technology Corp., ADR | | | 17,923 | |
| | 266 | | | St Shine Optical Co. Ltd. | | | 5,149 | |
| | 593 | | | Taiwan Semiconductor Manufacturing Co. Ltd., ADR | | | 19,619 | |
| | 2,515 | | | Tong Yang Industry Co. Ltd. | | | 4,268 | |
| | 1,690 | | | Wistron NeWeb Corp. | | | 4,848 | |
| | 22,560 | | | Yuanta Financial Holding Co. Ltd. | | | 9,646 | |
| | 1,900 | | | Zhen Ding Technology Holding Ltd. | | | 4,443 | |
| | | | | | | | |
| | | | | | | 264,282 | |
| | | | | | | | |
| | | | Thailand — 4.6% | |
| | 11,586 | | | Charoen Pokphand Foods PCL, NVDR | | | 8,949 | |
| | 3,512 | | | Kiatnakin Bank PCL, NVDR | | | 6,921 | |
| | 34,101 | | | Krung Thai Bank PCL, NVDR | | | 19,497 | |
| | 1,781 | | | PTT PCL, NVDR | | | 19,989 | |
| | 19,213 | | | Star Petroleum Refining PCL, NVDR | | | 7,324 | |
| | 3,487 | | | Thai Oil PCL, NVDR | | | 7,857 | |
| | 6,681 | | | Thanachart Capital PCL, NVDR | | | 9,118 | |
| | 3,005 | | | Tisco Financial Group PCL, NVDR | | | 6,620 | |
| | | | | | | | |
| | | | | | | 86,275 | |
| | | | | | | | |
| | | | Turkey — 4.3% | |
| | 6,367 | | | Akbank TAS | | | 17,042 | |
| | 18,162 | | | Emlak Konut Gayrimenkul Yatirim Ortakligi A/S | | | 15,079 | |
| | 5,476 | | | Eregli Demir ve Celik Fabrikalari TAS | | | 10,031 | |
| | 940 | | | KOC Holding A/S | | | 4,418 | |
| | 3,513 | | | Tekfen Holding A/S | | | 9,054 | |
| | 253 | | | Tupras Turkiye Petrol Rafinerileri A/S | | | 6,376 | |
| | 4,207 | | | Turkiye Halk Bankasi A/S | | | 13,949 | |
| | 3,687 | | | Turkiye Sise ve Cam Fabrikalari A/S | | | 4,628 | |
| | | | | | | | |
| | | | | | | 80,577 | |
| | | �� | | | | | |
SEE NOTES TO FINANCIAL STATEMENTS.
| | | | | | | | |
| | | |
| APRIL 30, 2017 | | J.P. MORGAN INTERNATIONAL EQUITY FUNDS | | | | | 41 | |
JPMorgan Emerging Economies Fund
SCHEDULE OF PORTFOLIO INVESTMENTS
AS OF APRIL 30, 2017 (Unaudited) (continued)
(Amounts in thousands, except number of Futures contracts)
| | | | | | | | |
| SHARES | | | SECURITY DESCRIPTION | | VALUE($) | |
| | Common Stocks — continued | |
| | | | United Arab Emirates — 1.2% | |
| | 9,836 | | | Aldar Properties PJSC | | | 5,726 | |
| | 8,804 | | | Emaar Properties PJSC | | | 17,192 | |
| | | | | | | | |
| | | | | | | 22,918 | |
| | | | | | | | |
| | | | Vietnam — 0.3% | |
| | 4,185 | | | Hoa Phat Group JSC | | | 5,407 | |
| | | | | | | | |
| | | | Total Common Stocks
(Cost $1,560,658) | | | 1,799,003 | |
| | | | | | | | |
| | Preferred Stocks — 2.3% | |
| | | | Brazil — 1.7% | |
| | 644 | | | Braskem SA (Preference), Class A | | | 6,918 | |
| | 2,586 | | | Cia de Saneamento do Parana (Preference) | | | 8,311 | |
| | 2,824 | | | Cia Energetica de Minas Gerais (Preference) | | | 7,866 | |
| | 5,510 | | | Metalurgica Gerdau SA (Preference) | | | 7,933 | |
| | | | | | | | |
| | | | | | | 31,028 | |
| | | | | | | | |
| | | | Russia — 0.6% | |
| | 22,079 | | | Surgutneftegas OJSC (Preference) | | | 11,831 | |
| | | | | | | | |
| | | | Total Preferred Stocks
(Cost $46,046) | | | 42,859 | |
| | | | | | | | |
| | Short-Term Investment — 1.7% | |
| | | | Investment Company — 1.7% | |
| | 32,084 | | | JPMorgan U.S. Government Money Market Fund, Institutional Class Shares,
0.620% (b) (l)
(Cost $32,084) | | | 32,084 | |
| | | | | | | | |
| | | | Total Investments — 99.6%
(Cost $1,638,788) | | | 1,873,946 | |
| | | | Other Assets in Excess of
Liabilities — 0.4% | | | 7,880 | |
| | | | | | | | |
| | | | NET ASSETS — 100.0% | | $ | 1,881,826 | |
| | | | | | | | |
Percentages indicated are based on net assets.
Summary of Investments by Industry, April 30, 2017
The following table represents the portfolio investments of the Fund by industry classifications as a percentage of total investments:
| | | | |
| INDUSTRY | | PERCENTAGE | |
Banks | | | 24.5 | % |
Oil, Gas & Consumable Fuels | | | 12.3 | |
Electronic Equipment, Instruments & Components | | | 7.0 | |
Metals & Mining | | | 6.7 | |
Internet Software & Services | | | 4.8 | |
Semiconductors & Semiconductor Equipment | | | 4.7 | |
Technology Hardware, Storage & Peripherals | | | 3.6 | |
Electric Utilities | | | 3.2 | |
Insurance | | | 2.4 | |
Food Products | | | 2.2 | |
Auto Components | | | 2.0 | |
Airlines | | | 2.0 | |
Real Estate Management & Development | | | 1.7 | |
Diversified Financial Services | | | 1.6 | |
Communications Equipment | | | 1.4 | |
Chemicals | | | 1.3 | |
Independent Power & Renewable Electricity Producers | | | 1.3 | |
Water Utilities | | | 1.2 | |
Automobiles | | | 1.2 | |
Software | | | 1.2 | |
Construction & Engineering | | | 1.1 | |
Health Care Providers & Services | | | 1.0 | |
Others (each less than 1.0%) | | | 9.9 | |
Short-Term Investment | | | 1.7 | |
| | | | | | | | | | | | | | | | | | | | |
| Futures Contracts | | | | | | | | | | | | |
NUMBER OF
CONTRACTS | | | DESCRIPTION | | EXPIRATION
DATE | | | TRADING
CURRENCY | | | NOTIONAL
VALUE AT
APRIL 30, 2017 | | | NET
UNREALIZED
APPRECIATION
(DEPRECIATION) | |
| | | | Long Futures Outstanding | | | | | | | | | | | | | | | | |
| | 154 | | | Mini MSCI Emerging Markets Mini Index | | | 06/16/17 | | | | USD | | | $ | 7,538 | | | $ | 42 | |
| | | | | | | | | | | | | | | | | | | | |
SEE NOTES TO FINANCIAL STATEMENTS.
| | | | | | |
| | | |
| 42 | | | | J.P. MORGAN INTERNATIONAL EQUITY FUNDS | | APRIL 30, 2017 |
JPMorgan Emerging Markets Equity Fund
SCHEDULE OF PORTFOLIO INVESTMENTS
AS OF APRIL 30, 2017 (Unaudited)
(Amounts in thousands)
| | | | | | | | |
| SHARES | | | SECURITY DESCRIPTION | | VALUE($) | |
| | Common Stocks — 96.6% | |
| | | | Argentina — 1.7% | |
| | 257 | | | MercadoLibre, Inc. | | | 58,887 | |
| | | | | | | | |
| | | | Australia — 0.6% | |
| | 4,119 | | | Oil Search Ltd. | | | 22,225 | |
| | | | | | | | |
| | | | Brazil — 9.5% | |
| | 6,193 | | | Ambev SA, ADR | | | 35,487 | |
| | 3,895 | | | BB Seguridade Participacoes SA | | | 36,568 | |
| | 5,596 | | | CCR SA | | | 31,100 | |
| | 3,273 | | | Cielo SA | | | 24,853 | |
| | 3,647 | | | Itau Unibanco Holding SA, ADR | | | 44,857 | |
| | 4,759 | | | Kroton Educacional SA | | | 22,519 | |
| | 5,578 | | | Lojas Renner SA | | | 51,841 | |
| | 846 | | | Marcopolo SA (a) | | | 554 | |
| | 1,313 | | | Raia Drogasil SA (a) | | | 27,793 | |
| | 2,258 | | | Ultrapar Participacoes SA | | | 50,447 | |
| | 2,451 | | | WEG SA | | | 13,653 | |
| | | | | | | | |
| | | | | | | 339,672 | |
| | | | | | | | |
| | | | China — 18.5% | |
| | 3,047 | | | AAC Technologies Holdings, Inc. | | | 44,659 | |
| | 1,242 | | | Alibaba Group Holding Ltd., ADR (a) | | | 143,431 | |
| | 150 | | | Baidu, Inc., ADR (a) | | | 27,098 | |
| | 5,271 | | | CNOOC Ltd. | | | 6,145 | |
| | 2,222 | | | JD.com, Inc., ADR (a) | | | 77,936 | |
| | 11,165 | | | Ping An Insurance Group Co. of China Ltd., Class H | | | 62,770 | |
| | 4,527 | | | Shenzhou International Group Holdings Ltd. | | | 29,787 | |
| | 7,358 | | | Tencent Holdings Ltd. | | | 230,541 | |
| | 2,710 | | | Vipshop Holdings Ltd., ADR (a) | | | 37,591 | |
| | | | | | | | |
| | | | | | | 659,958 | |
| | | | | | | | |
| | | | Cyprus — 0.3% | |
| | 1,207 | | | Globaltrans Investment plc, GDR | | | 9,140 | |
| | | | | | | | |
| | | | Egypt — 0.7% | |
| | 5,592 | | | Commercial International Bank Egypt SAE, GDR | | | 23,906 | |
| | | | | | | | |
| | | | Hong Kong — 6.6% | |
| | 19,196 | | | AIA Group Ltd. | | | 132,864 | |
| | 517 | | | Jardine Matheson Holdings Ltd. | | | 33,277 | |
| | 8,783 | | | Sands China Ltd. | | | 39,780 | |
| | 7,133 | | | Techtronic Industries Co. Ltd. | | | 30,603 | |
| | | | | | | | |
| | | | | | | 236,524 | |
| | | | | | | | |
| | | | India — 18.6% | |
| | 1,756 | | | Asian Paints Ltd. | | | 30,610 | |
| | 2,198 | | | HDFC Bank Ltd. | | | 53,697 | |
| | 903 | | | HDFC Bank Ltd., ADR | | | 71,917 | |
| | 5,303 | | | Housing Development Finance Corp. Ltd. | | | 126,621 | |
| | | | | | | | |
| SHARES | | | SECURITY DESCRIPTION | | VALUE($) | |
| | | | | | | | |
| | | | India — continued | | | | |
| | 2,002 | | | IndusInd Bank Ltd. | | | 44,956 | |
| | 2,686 | | | Infosys Ltd., ADR | | | 39,112 | |
| | 15,007 | | | ITC Ltd. | | | 64,796 | |
| | 2,407 | | | Kotak Mahindra Bank Ltd. | | | 33,742 | |
| | 1,676 | | | Lupin Ltd. | | | 34,832 | |
| | 2,334 | | | Tata Consultancy Services Ltd. | | | 82,417 | |
| | 754 | | | Tata Motors Ltd., ADR | | | 26,879 | |
| | 801 | | | UltraTech Cement Ltd. | | | 52,904 | |
| | | | | | | | |
| | | | | | | 662,483 | |
| | | | | | | | |
| | | | Indonesia — 3.2% | |
| | 71,609 | | | Astra International Tbk. PT | | | 47,992 | |
| | 31,120 | | | Bank Central Asia Tbk. PT | | | 41,388 | |
| | 23,468 | | | Bank Rakyat Indonesia Persero Tbk. PT | | | 22,667 | |
| | | | | | | | |
| | | | | | | 112,047 | |
| | | | | | | | |
| | | | Mexico — 2.6% | |
| | 9,980 | | | Becle SAB de CV (a) | | | 16,699 | |
| | 9,928 | | | Grupo Financiero Banorte SAB de CV, Class O | | | 57,458 | |
| | 3,708 | | | Infraestructura Energetica Nova SAB de CV | | | 17,323 | |
| | | | | | | | |
| | | | | | | 91,480 | |
| | | | | | | | |
| | | | Panama — 1.3% | |
| | 406 | | | Copa Holdings SA, Class A | | | 47,278 | |
| | | | | | | | |
| | | | Peru — 1.2% | |
| | 278 | | | Credicorp Ltd. | | | 42,716 | |
| | | | | | | | |
| | | | Russia — 4.1% | |
| | 412 | | | LUKOIL PJSC, ADR | | | 20,448 | |
| | 408 | | | Magnit PJSC | | | 62,916 | |
| | 181 | | | Magnit PJSC, GDR | | | 6,328 | |
| | 19,497 | | | Sberbank of Russia PJSC | | | 56,630 | |
| | | | | | | | |
| | | | | | | 146,322 | |
| | | | | | | | |
| | | | South Africa — 11.1% | |
| | 1,755 | | | Aspen Pharmacare Holdings Ltd. | | | 36,393 | |
| | 4,360 | | | Bid Corp. Ltd. | | | 92,360 | |
| | 3,907 | | | Bidvest Group Ltd. (The) | | | 46,629 | |
| | 331 | | | Capitec Bank Holdings Ltd. | | | 18,897 | |
| | 9,183 | | | FirstRand Ltd. | | | 34,259 | |
| | 1,738 | | | Mr Price Group Ltd. | | | 20,435 | |
| | 3,174 | | | Remgro Ltd. | | | 52,691 | |
| | 9,054 | | | Sanlam Ltd. | | | 48,083 | |
| | 8,592 | | | Woolworths Holdings Ltd. | | | 46,574 | |
| | | | | | | | |
| | | | | | | 396,321 | |
| | | | | | | | |
| | | | South Korea — 5.1% | |
| | 164 | | | Hyundai Motor Co. | | | 20,702 | |
| | 127 | | | Netmarble Games Corp. (a) (e) | | | 17,540 | |
SEE NOTES TO FINANCIAL STATEMENTS.
| | | | | | | | |
| | | |
| APRIL 30, 2017 | | J.P. MORGAN INTERNATIONAL EQUITY FUNDS | | | | | 43 | |
JPMorgan Emerging Markets Equity Fund
SCHEDULE OF PORTFOLIO INVESTMENTS
AS OF APRIL 30, 2017 (Unaudited) (continued)
(Amounts in thousands)
| | | | | | | | |
| SHARES | | | SECURITY DESCRIPTION | | VALUE($) | |
| | Common Stocks — continued | |
| | | | South Korea — continued | |
| | 194 | | | Samsung Biologics Co. Ltd. (a) | | | 29,764 | |
| | 58 | | | Samsung Electronics Co. Ltd. | | | 113,225 | |
| | | | | | | | |
| | | | | | | 181,231 | |
| | | | | | | | |
| | | | Taiwan — 7.7% | |
| | 5,115 | | | Delta Electronics, Inc. | | | 28,790 | |
| | 1,732 | | | Eclat Textile Co. Ltd. | | | 18,943 | |
| | 239 | | | Largan Precision Co. Ltd. | | | 39,691 | |
| | 5,095 | | | President Chain Store Corp. | | | 44,338 | |
| | 4,294 | | | Taiwan Semiconductor Manufacturing Co. Ltd., ADR | | | 142,012 | |
| | | | | | | | |
| | | | | | | 273,774 | |
| | | | | | | | |
| | | | Thailand — 0.8% | |
| | 5,060 | | | Kasikornbank PCL, NVDR | | | 27,038 | |
| | | | | | | | |
| | | | Turkey — 0.3% | |
| | 1,022 | | | Ford Otomotiv Sanayi A/S | | | 11,363 | |
| | | | | | | | |
| | | | United States — 2.7% | |
| | 493 | | | EPAM Systems, Inc. (a) | | | 37,986 | |
| | 443 | | | Luxoft Holding, Inc. (a) | | | 27,298 | |
| | 947 | | | Yum China Holdings, Inc. (a) | | | 32,326 | |
| | | | | | | | |
| | | | | | | 97,610 | |
| | | | | | | | |
| | | | Total Common Stocks
(Cost $2,724,226) | | | 3,439,975 | |
| | | | | | | | |
| | Preferred Stocks — 0.5% | |
| | | | Brazil — 0.5% | |
| | 1,178 | | | Itau Unibanco Holding SA (Preference) | | | 14,561 | |
| | 6,706 | | | Marcopolo SA (Preference) | | | 5,049 | |
| | | | | | | | |
| | | | Total Preferred Stocks
(Cost $18,886) | | | 19,610 | |
| | | | | | | | |
| | Structured Instrument — 0.9% | |
| | | | China — 0.9% | | | | |
| | | | Low Exercise Cash Settled Call Warrant — 0.9% | |
| | 4,302 | | | Hangzhou Robam Appliances Co. Ltd., expiring 10/27/17 (Strike Price $0.00) (issued through UBS AG) (a) (Cost $23,518) | | | 33,989 | |
| | | | | | | | |
| | |
NUMBER OF
WARRANTS | | | | | | |
| | Warrants — 0.7% | | | | |
| | | | United States — 0.7% | |
| | 1,278 | | | Almarai Co., expiring 07/24/17
(Strike Price $1.00) (a)
(Cost $17,678) | | | 24,753 | |
| | | | | | | | |
| | | | | | | | |
| SHARES | | | SECURITY DESCRIPTION | | VALUE($) | |
| | Short-Term Investment — 1.3% | |
| | | | Investment Company — 1.3% | |
| | 45,041 | | | JPMorgan U.S. Government Money Market Fund, Institutional Class Shares, 0.620% (b) (l)
(Cost $45,041) | | | 45,041 | |
| | | | | | | | |
| | | | Total Investments — 100.0%
(Cost $2,829,349) | | | 3,563,368 | |
| | | | Liabilities in Excess of
Other Assets — 0.0% (g) | | | (1,151 | ) |
| | | | | | | | |
| | | | NET ASSETS — 100.0% | | $ | 3,562,217 | |
| | | | | | | | |
Percentages indicated are based on net assets.
Summary of Investments by Industry, April 30, 2017
The following table represents the portfolio investments of the Fund by industry classifications as a percentage of total investments:
| | | | |
| INDUSTRY | | PERCENTAGE | |
Banks | | | 15.5 | % |
Internet Software & Services | | | 12.9 | |
Insurance | | | 7.9 | |
Food & Staples Retailing | | | 7.3 | |
IT Services | | | 5.9 | |
Semiconductors & Semiconductor Equipment | | | 4.0 | |
Thrifts & Mortgage Finance | | | 3.5 | |
Internet & Direct Marketing Retail | | | 3.2 | |
Technology Hardware, Storage & Peripherals | | | 3.2 | |
Electronic Equipment, Instruments & Components | | | 3.2 | |
Automobiles | | | 3.0 | |
Oil, Gas & Consumable Fuels | | | 2.8 | |
Multiline Retail | | | 2.8 | |
Diversified Financial Services | | | 2.4 | |
Industrial Conglomerates | | | 2.2 | |
Hotels, Restaurants & Leisure | | | 2.0 | |
Pharmaceuticals | | | 2.0 | |
Tobacco | | | 1.8 | |
Construction Materials | | | 1.5 | |
Beverages | | | 1.5 | |
Textiles, Apparel & Luxury Goods | | | 1.4 | |
Airlines | | | 1.3 | |
Capital Markets | | | 1.0 | |
Others (each less than 1.0%) | | | 6.4 | |
Short-Term Investment | | | 1.3 | |
SEE NOTES TO FINANCIAL STATEMENTS.
| | | | | | |
| | | |
| 44 | | | | J.P. MORGAN INTERNATIONAL EQUITY FUNDS | | APRIL 30, 2017 |
JPMorgan Emerging Markets Equity Income Fund
SCHEDULE OF PORTFOLIO INVESTMENTS
AS OF APRIL 30, 2017 (Unaudited)
(Amounts in thousands)
| | | | | | | | |
| SHARES | | | SECURITY DESCRIPTION | | VALUE($) | |
| | Common Stocks — 96.2% | | | | |
| | | | Brazil — 7.3% | |
| | 74 | | | Ambev SA, ADR | | | 423 | |
| | 43 | | | BB Seguridade Participacoes SA | | | 399 | |
| | 24 | | | Engie Brasil Energia SA | | | 260 | |
| | 4 | | | Smiles SA | | | 94 | |
| | | | | | | | |
| | | | | | | 1,176 | |
| | | | | | | | |
| | | | Chile — 2.9% | |
| | 20 | | | Banco Santander Chile, ADR | | | 470 | |
| | | | | | | | |
| | | | China — 13.0% | |
| | 41 | | | China Mobile Ltd. | | | 431 | |
| | 214 | | | China Resources Power Holdings Co. Ltd. | | | 385 | |
| | 204 | | | CNOOC Ltd. | | | 238 | |
| | 132 | | | Fuyao Glass Industry Group Co. Ltd., Class A | | | 431 | |
| | 16 | | | Fuyao Glass Industry Group Co. Ltd., Class H (e) | | | 58 | |
| | 192 | | | Lenovo Group Ltd. | | | 123 | |
| | 52 | | | Midea Group Co. Ltd., Class A | | | 255 | |
| | 56 | | | Zhengzhou Yutong Bus Co. Ltd., Class A | | | 164 | |
| | | | | | | | |
| | | | | | | 2,085 | |
| | | | | | | | |
| | | | Czech Republic — 3.0% | |
| | 9 | | | Komercni banka A/S | | | 349 | |
| | 40 | | | Moneta Money Bank A/S (e) | | | 130 | |
| | | | | | | | |
| | | | | | | 479 | |
| | | | | | | | |
| | | | Hong Kong — 5.9% | |
| | 14 | | | Hang Seng Bank Ltd. | | | 292 | |
| | 231 | | | HKT Trust & HKT Ltd. | | | 295 | |
| | 62 | | | Sands China Ltd. | | | 282 | |
| | 6 | | | VTech Holdings Ltd. | | | 75 | |
| | | | | | | | |
| | | | | | | 944 | |
| | | | | | | | |
| | | | Hungary — 1.7% | |
| | 10 | | | OTP Bank plc | | | 272 | |
| | | | | | | | |
| | | | Indonesia — 2.1% | |
| | 1,002 | | | Telekomunikasi Indonesia Persero Tbk. PT | | | 331 | |
| | | | | | | | |
| | | | Mexico — 6.2% | |
| | 71 | | | Bolsa Mexicana de Valores SAB de CV (a) | | | 123 | |
| | 137 | | | Fibra Uno Administracion SA de CV | | | 239 | |
| | 221 | | | Kimberly-Clark de Mexico SAB de CV, Class A | | | 472 | |
| | 74 | | | Wal-Mart de Mexico SAB de CV | | | 168 | |
| | | | | | | | |
| | | | | | | 1,002 | |
| | | | | | | | |
| | | | Russia — 7.3% | |
| | 5 | | | LUKOIL PJSC, ADR | | | 236 | |
| | 6 | | | MegaFon PJSC, GDR | | | 61 | |
| | 9 | | | MMC Norilsk Nickel PJSC, ADR | | | 131 | |
| | 7 | | | Mobile TeleSystems PJSC, ADR | | | 77 | |
| | | | | | | | |
| SHARES | | | SECURITY DESCRIPTION | | VALUE($) | |
| | | | | | | | |
| | | | Russia — continued | |
| | 214 | | | Moscow Exchange MICEX-RTS PJSC | | | 433 | |
| | 9 | | | PhosAgro PJSC, GDR | | | 128 | |
| | 8 | | | Severstal PJSC, GDR | | | 108 | |
| | | | | | | | |
| | | | | | | 1,174 | |
| | | | | | | | |
| | | | South Africa — 12.1% | |
| | 46 | | | AVI Ltd. | | | 339 | |
| | 26 | | | Barclays Africa Group Ltd. | | | 283 | |
| | 9 | | | Bid Corp. Ltd. | | | 196 | |
| | 97 | | | FirstRand Ltd. | | | 361 | |
| | 118 | | | MMI Holdings Ltd. | | | 205 | |
| | 25 | | | Vodacom Group Ltd. | | | 278 | |
| | 52 | | | Woolworths Holdings Ltd. | | | 280 | |
| | | | | | | | |
| | | | | | | 1,942 | |
| | | | | | | | |
| | | | South Korea — 6.5% | |
| | 3 | | | Kangwon Land, Inc. | | | 103 | |
| | 4 | | | KT&G Corp. | | | 345 | |
| | — | (h) | | Samsung Electronics Co. Ltd. | | | 400 | |
| | 9 | | | SK Telecom Co. Ltd., ADR | | | 203 | |
| | | | | | | | |
| | | | | | | 1,051 | |
| | | | | | | | |
| | | | Taiwan — 19.2% | |
| | 23 | | | Asustek Computer, Inc. | | | 230 | |
| | 41 | | | Chicony Electronics Co. Ltd. | | | 108 | |
| | 42 | | | Delta Electronics, Inc. | | | 235 | |
| | 44 | | | Far EasTone Telecommunications Co. Ltd. | | | 108 | |
| | 35 | | | MediaTek, Inc. | | | 252 | |
| | 102 | | | Mega Financial Holding Co. Ltd. | | | 82 | |
| | 53 | | | Novatek Microelectronics Corp. | | | 204 | |
| | 32 | | | President Chain Store Corp. | | | 278 | |
| | 96 | | | Quanta Computer, Inc. | | | 199 | |
| | 97 | | | Taiwan Mobile Co. Ltd. | | | 358 | |
| | 24 | | | Taiwan Semiconductor Manufacturing Co. Ltd., ADR | | | 802 | |
| | 122 | | | Vanguard International Semiconductor Corp. | | | 233 | |
| | | | | | | | |
| | | | | | | 3,089 | |
| | | | | | | | |
| | | | Thailand — 4.2% | |
| | 21 | | | Siam Cement PCL (The) (Registered) | | | 327 | |
| | 13 | | | Siam Commercial Bank PCL (The) | | | 60 | |
| | 38 | | | Siam Commercial Bank PCL (The), NVDR | | | 169 | |
| | 36 | | | Thai Oil PCL | | | 81 | |
| | 19 | | | Thai Oil PCL, NVDR | | | 43 | |
| | | | | | | | |
| | | | | | | 680 | |
| | | | | | | | |
SEE NOTES TO FINANCIAL STATEMENTS.
| | | | | | | | |
| | | |
| APRIL 30, 2017 | | J.P. MORGAN INTERNATIONAL EQUITY FUNDS | | | | | 45 | |
JPMorgan Emerging Markets Equity Income Fund
SCHEDULE OF PORTFOLIO INVESTMENTS
AS OF APRIL 30, 2017 (Unaudited) (continued)
(Amounts in thousands)
| | | | | | | | |
| SHARES | | | SECURITY DESCRIPTION | | VALUE($) | |
| | Common Stocks — continued | |
| | | | Turkey — 3.3% | |
| | 8 | | | Ford Otomotiv Sanayi A/S | | | 88 | |
| | 32 | | | Tofas Turk Otomobil Fabrikasi A/S | | | 265 | |
| | 7 | | | Tupras Turkiye Petrol Rafinerileri A/S | | | 183 | |
| | | | | | | | |
| | | | | | | 536 | |
| | | | | | | | |
| | | | United Arab Emirates — 1.5% | |
| | 82 | | | National Bank of Abu Dhabi PJSC | | | 245 | |
| | | | | | | | |
| | | | Total Common Stocks
(Cost $14,489) | | | 15,476 | |
| | | | | | | | |
| | Structured Instrument — 0.9% | |
| | 29 | | | Midea Group Co. Ltd., expiring 10/13/2017 (issued through BNP Paribas) (a)
(Cost $115) | | | 141 | |
| | | | | | | | |
| | |
NUMBER OF
WARRANTS | | | | | | |
| | Warrant — 1.4% | |
| | | | United States — 1.4% | |
| | 13 | | | Al Rajhi Bank, expiring 01/22/18 (Strike Price $ 1.00) (a)
(Cost $207) | | | 225 | |
| | | | | | | | |
| | |
| SHARES | | | | | | |
| | Short-Term Investment — 0.1% | |
| | | | Investment Company — 0.1% | |
| | 24 | | | JPMorgan U.S. Government Money Market Fund, Institutional Class Shares, 0.620% (b) (l) (Cost $24) | | | 24 | |
| | | | | | | | |
| | | | Total Investments — 98.6%
(Cost $14,835) | | | 15,866 | |
| | | | Other Assets in Excess of
Liabilities — 1.4% | | | 221 | |
| | | | | | | | |
| | | | NET ASSETS — 100.0% | | $ | 16,087 | |
| | | | | | | | |
Percentages indicated are based on net assets.
Summary of Investments by Industry, April 30, 2017
The following table represents the portfolio investments of the Fund by industry classifications as a percentage of total investments:
| | | | |
| INDUSTRY | | PERCENTAGE | |
Banks | | | 17.1 | % |
Wireless Telecommunication Services | | | 9.5 | |
Semiconductors & Semiconductor Equipment | | | 9.4 | |
Technology Hardware, Storage & Peripherals | | | 6.7 | |
Oil, Gas & Consumable Fuels | | | 4.9 | |
Independent Power & Renewable Electricity Producers | | | 4.1 | |
Food & Staples Retailing | | | 4.0 | |
Diversified Telecommunication Services | | | 3.9 | |
Insurance | | | 3.8 | |
Capital Markets | | | 3.5 | |
Auto Components | | | 3.1 | |
Household Products | | | 3.0 | |
Beverages | | | 2.7 | |
Hotels, Restaurants & Leisure | | | 2.4 | |
Diversified Financial Services | | | 2.3 | |
Automobiles | | | 2.2 | |
Tobacco | | | 2.2 | |
Food Products | | | 2.1 | |
Construction Materials | | | 2.1 | |
Multiline Retail | | | 1.8 | |
Household Durables | | | 1.6 | |
Metals & Mining | | | 1.5 | |
Equity Real Estate Investment Trusts (REITs) | | | 1.5 | |
Electronic Equipment, Instruments & Components | | | 1.5 | |
Machinery | | | 1.0 | |
Others (each less than 1.0%) | | | 1.9 | |
Short-Term Investment | | | 0.2 | |
SEE NOTES TO FINANCIAL STATEMENTS.
| | | | | | |
| | | |
| 46 | | | | J.P. MORGAN INTERNATIONAL EQUITY FUNDS | | APRIL 30, 2017 |
JPMorgan Global Research Enhanced Index Fund
SCHEDULE OF PORTFOLIO INVESTMENTS
AS OF APRIL 30, 2017 (Unaudited)
(Amounts in thousands)
| | | | | | | | |
| SHARES | | | SECURITY DESCRIPTION | | VALUE($) | |
| | Common Stocks — 98.6% | |
| | | | Australia — 2.6% | |
| | 119 | | | AGL Energy Ltd. | | | 2,388 | |
| | 987 | | | Alumina Ltd. | | | 1,355 | |
| | 299 | | | Amcor Ltd. | | | 3,515 | |
| | 531 | | | AMP Ltd. | | | 2,128 | |
| | 306 | | | APA Group | | | 2,099 | |
| | 60 | | | Aristocrat Leisure Ltd. | | | 887 | |
| | 19 | | | ASX Ltd. | | | 702 | |
| | 637 | | | Aurizon Holdings Ltd. | | | 2,457 | |
| | 683 | | | Australia & New Zealand Banking Group Ltd. | | | 16,722 | |
| | 61 | | | Bendigo & Adelaide Bank Ltd. | | | 563 | |
| | 649 | | | BHP Billiton Ltd. | | | 11,551 | |
| | 131 | | | BHP Billiton plc | | | 1,993 | |
| | 237 | | | Boral Ltd. | | | 1,093 | |
| | 297 | | | Brambles Ltd. | | | 2,301 | |
| | 71 | | | Caltex Australia Ltd. | | | 1,581 | |
| | 71 | | | Challenger Ltd. | | | 701 | |
| | 209 | | | Coca-Cola Amatil Ltd. | | | 1,464 | |
| | 19 | | | Cochlear Ltd. | | | 1,945 | |
| | 349 | | | Commonwealth Bank of Australia | | | 22,811 | |
| | 166 | | | Computershare Ltd. | | | 1,835 | |
| | 23 | | | Crown Resorts Ltd. | | | 217 | |
| | 92 | | | CSL Ltd. | | | 9,102 | |
| | 341 | | | Dexus Property Group | | | 2,606 | |
| | 266 | | | DUET Group | | | 601 | |
| | 127 | | | Fortescue Metals Group Ltd. | | | 504 | |
| | 449 | | | Goodman Group | | | 2,727 | |
| | 211 | | | GPT Group (The) | | | 831 | |
| | 184 | | | Incitec Pivot Ltd. | | | 522 | |
| | 352 | | | Insurance Australia Group Ltd. | | | 1,636 | |
| | 175 | | | LendLease Group | | | 2,102 | |
| | 72 | | | Macquarie Group Ltd. | | | 5,013 | |
| | 487 | | | Medibank Pvt Ltd. | | | 1,059 | |
| | 1,368 | | | Mirvac Group | | | 2,324 | |
| | 521 | | | National Australia Bank Ltd. | | | 13,229 | |
| | 148 | | | Newcrest Mining Ltd. | | | 2,375 | |
| | 339 | | | Oil Search Ltd. | | | 1,829 | |
| | 112 | | | Orica Ltd. | | | 1,555 | |
| | 267 | | | Origin Energy Ltd. | | | 1,439 | |
| | 341 | | | Qantas Airways Ltd. | | | 1,082 | |
| | 357 | | | QBE Insurance Group Ltd. | | | 3,427 | |
| | 40 | | | Ramsay Health Care Ltd. | | | 2,168 | |
| | 25 | | | REA Group Ltd. | | | 1,131 | |
| | 317 | | | Santos Ltd. (a) | | | 822 | |
| | 958 | | | Scentre Group | | | 3,090 | |
| | 15 | | | SEEK Ltd. | | | 186 | |
| | | | | | | | |
| SHARES | | | SECURITY DESCRIPTION | | VALUE($) | |
| | | | | | | | |
| | | | Australia — continued | |
| | 44 | | | Sonic Healthcare Ltd. | | | 733 | |
| | 1,438 | | | South32 Ltd. | | | 2,980 | |
| | 490 | | | Stockland | | | 1,779 | |
| | 338 | | | Suncorp Group Ltd. | | | 3,486 | |
| | 319 | | | Sydney Airport | | | 1,648 | |
| | 341 | | | Tabcorp Holdings Ltd. | | | 1,211 | |
| | 166 | | | Tatts Group Ltd. | | | 533 | |
| | 869 | | | Telstra Corp. Ltd. | | | 2,746 | |
| | 131 | | | TPG Telecom Ltd. | | | 578 | |
| | 499 | | | Transurban Group | | | 4,558 | |
| | 110 | | | Treasury Wine Estates Ltd. | | | 985 | |
| | 1,285 | | | Vicinity Centres | | | 2,769 | |
| | 215 | | | Wesfarmers Ltd. | | | 6,914 | |
| | 342 | | | Westfield Corp. | | | 2,326 | |
| | 675 | | | Westpac Banking Corp. | | | 17,694 | |
| | 156 | | | Woodside Petroleum Ltd. | | | 3,763 | |
| | 293 | | | Woolworths Ltd. | | | 5,888 | |
| | | | | | | | |
| | | | | | | 202,259 | |
| | | | | | | | |
| | | | Austria — 0.1% | |
| | 317 | | | Erste Group Bank AG (a) | | | 11,337 | |
| | — | (h) | | Telekom Austria AG (a) | | | — | (h) |
| | | | | | | | |
| | | | | | | 11,337 | |
| | | | | | | | |
| | | | Belgium — 0.5% | |
| | 207 | | | Anheuser-Busch InBev SA/NV | | | 23,305 | |
| | 166 | | | KBC Group NV | | | 11,993 | |
| | | | | | | | |
| | | | | | | 35,298 | |
| | | | | | | | |
| | | | Bermuda — 0.1% | |
| | 90 | | | Marvell Technology Group Ltd. | | | 1,349 | |
| | 91 | | | XL Group Ltd. | | | 3,789 | |
| | | | | | | | |
| | | | | | | 5,138 | |
| | | | | | | | |
| | | | Canada — 3.4% | |
| | 52 | | | Agnico Eagle Mines Ltd. | | | 2,489 | |
| | 33 | | | Agrium, Inc. | | | 3,056 | |
| | 104 | | | Alimentation Couche-Tard, Inc., Class B | | | 4,792 | |
| | 85 | | | ARC Resources Ltd. | | | 1,110 | |
| | 155 | | | Bank of Montreal | | | 10,971 | |
| | 280 | | | Bank of Nova Scotia (The) | | | 15,583 | |
| | 275 | | | Barrick Gold Corp. | | | 4,605 | |
| | 36 | | | BCE, Inc. | | | 1,655 | |
| | 221 | | | Brookfield Asset Management, Inc., Class A | | | 8,162 | |
| | 98 | | | Canadian Imperial Bank of Commerce | | | 7,914 | |
| | 188 | | | Canadian National Railway Co. | | | 13,569 | |
| | 270 | | | Canadian Natural Resources Ltd. | | | 8,608 | |
SEE NOTES TO FINANCIAL STATEMENTS.
| | | | | | | | |
| | | |
| APRIL 30, 2017 | | J.P. MORGAN INTERNATIONAL EQUITY FUNDS | | | | | 47 | |
JPMorgan Global Research Enhanced Index Fund
SCHEDULE OF PORTFOLIO INVESTMENTS
AS OF APRIL 30, 2017 (Unaudited) (continued)
(Amounts in thousands)
| | | | | | | | |
| SHARES | | | SECURITY DESCRIPTION | | VALUE($) | |
| | Common Stocks — continued | |
| | | | Canada — continued | |
| | 98 | | | Canadian Pacific Railway Ltd. | | | 15,045 | |
| | 17 | | | Canadian Tire Corp. Ltd., Class A | | | 2,097 | |
| | 209 | | | Cenovus Energy, Inc. | | | 2,083 | |
| | 55 | | | CGI Group, Inc., Class A (a) | | | 2,643 | |
| | 5 | | | Constellation Software, Inc. | | | 2,153 | |
| | 126 | | | Crescent Point Energy Corp. | | | 1,243 | |
| | 29 | | | Dollarama, Inc. | | | 2,514 | |
| | 194 | | | Enbridge, Inc. | | | 8,042 | |
| | 211 | | | Encana Corp. | | | 2,261 | |
| | 6 | | | Fairfax Financial Holdings Ltd. | | | 2,525 | |
| | 69 | | | Fortis, Inc. | | | 2,246 | |
| | 43 | | | Franco-Nevada Corp. | | | 2,896 | |
| | 57 | | | Gildan Activewear, Inc. | | | 1,594 | |
| | 198 | | | Goldcorp, Inc. | | | 2,756 | |
| | 73 | | | Great-West Lifeco, Inc. | | | 1,969 | �� |
| | 73 | | | Imperial Oil Ltd. | | | 2,133 | |
| | 32 | | | Intact Financial Corp. | | | 2,218 | |
| | 84 | | | Inter Pipeline Ltd. | | | 1,705 | |
| | 294 | | | Kinross Gold Corp. (a) | | | 1,023 | |
| | 56 | | | Loblaw Cos. Ltd. | | | 3,140 | |
| | 98 | | | Magna International, Inc. | | | 4,106 | |
| | 486 | | | Manulife Financial Corp. | | | 8,521 | |
| | 59 | | | Metro, Inc. | | | 2,034 | |
| | 82 | | | National Bank of Canada | | | 3,193 | |
| | 60 | | | Open Text Corp. | | | 2,072 | |
| | 93 | | | Pembina Pipeline Corp. | | | 2,972 | |
| | 207 | | | Potash Corp. of Saskatchewan, Inc. | | | 3,486 | |
| | 92 | | | Power Corp. of Canada | | | 2,141 | |
| | 62 | | | Power Financial Corp. | | | 1,567 | |
| | 54 | | | Restaurant Brands International, Inc. | | | 3,038 | |
| | 89 | | | Rogers Communications, Inc., Class B | | | 4,097 | |
| | 336 | | | Royal Bank of Canada | | | 22,990 | |
| | 63 | | | Saputo, Inc. | | | 2,077 | |
| | 101 | | | Shaw Communications, Inc., Class B | | | 2,133 | |
| | 103 | | | Silver Wheaton Corp. | | | 2,058 | |
| | 37 | | | SNC-Lavalin Group, Inc. | | | 1,480 | |
| | 152 | | | Sun Life Financial, Inc. | | | 5,365 | |
| | 383 | | | Suncor Energy, Inc. | | | 11,994 | |
| | 133 | | | Teck Resources Ltd., Class B | | | 2,755 | |
| | 423 | | | Toronto-Dominion Bank (The) | | | 19,917 | |
| | 175 | | | TransCanada Corp. | | | 8,116 | |
| | 40 | | | Waste Connections, Inc. | | | 3,648 | |
| | | | | | | | |
| | | | | | | 264,560 | |
| | | | | | | | |
| | | | | | | | |
| SHARES | | | SECURITY DESCRIPTION | | VALUE($) | |
| | | | | | | | |
| | | | China — 0.0% (g) | |
| | 925 | | | BOC Hong Kong Holdings Ltd. | | | 3,799 | |
| | 412 | | | Yangzijiang Shipbuilding Holdings Ltd. | | | 339 | |
| | | | | | | | |
| | | | | | | 4,138 | |
| | | | | | | | |
| | | | Denmark — 0.7% | |
| | 131 | | | Chr Hansen Holding A/S | | | 8,854 | |
| | 241 | | | Danske Bank A/S | | | 8,777 | |
| | 631 | | | Novo Nordisk A/S, Class B | | | 24,587 | |
| | 75 | | | Pandora A/S | | | 8,058 | |
| | 1,274 | | | TDC A/S | | | 6,836 | |
| | | | | | | | |
| | | | | | | 57,112 | |
| | | | | | | | |
| | | | Finland — 0.2% | |
| | 153 | | | Cargotec OYJ, Class B | | | 9,135 | |
| | — | (h) | | Nokian Renkaat OYJ | | | — | (h) |
| | 131 | | | UPM-Kymmene OYJ | | | 3,454 | |
| | 2 | | | Wartsila OYJ Abp | | | 105 | |
| | | | | | | | |
| | | | | | | 12,694 | |
| | | | | | | | |
| | | | France — 4.1% | |
| | 194 | | | Air Liquide SA | | | 23,409 | |
| | 256 | | | Airbus SE | | | 20,702 | |
| | 102 | | | Arkema SA | | | 10,825 | |
| | 896 | | | AXA SA | | | 23,912 | |
| | 345 | | | BNP Paribas SA | | | 24,361 | |
| | 51 | | | Bouygues SA | | | 2,134 | |
| | 109 | | | Cap Gemini SA | | | 10,890 | |
| | 98 | | | Cie Generale des Etablissements Michelin | | | 12,866 | |
| | 45 | | | Kering | | | 14,054 | |
| | 23 | | | L’Oreal SA | | | 4,509 | |
| | 29 | | | LVMH Moet Hennessy Louis Vuitton SE | | | 7,198 | |
| | 1,735 | | | Natixis SA | | | 12,072 | |
| | 69 | | | Nexans SA (a) | | | 3,833 | |
| | 105 | | | Pernod Ricard SA | | | 13,174 | |
| | 128 | | | Renault SA | | | 11,977 | |
| | 252 | | | Sanofi | | | 23,798 | |
| | 256 | | | Schneider Electric SE | | | 20,257 | |
| | 75 | | | Societe Generale SA | | | 4,098 | |
| | 110 | | | Sodexo SA | | | 13,944 | |
| | 41 | | | Thales SA | | | 4,313 | |
| | 592 | | | TOTAL SA | | | 30,379 | |
| | 6 | | | Unibail-Rodamco SE | | | 1,563 | |
| | 243 | | | Vinci SA | | | 20,729 | |
| | | | | | | | |
| | | | | | | 314,997 | |
| | | | | | | | |
SEE NOTES TO FINANCIAL STATEMENTS.
| | | | | | |
| | | |
| 48 | | | | J.P. MORGAN INTERNATIONAL EQUITY FUNDS | | APRIL 30, 2017 |
| | | | | | | | |
| SHARES | | | SECURITY DESCRIPTION | | VALUE($) | |
| | Common Stocks — continued | |
| | | | Germany — 3.2% | |
| | 80 | | | adidas AG | | | 15,947 | |
| | 65 | | | Allianz SE (Registered) | | | 12,379 | |
| | 140 | | | BASF SE | | | 13,687 | |
| | 232 | | | Bayer AG (Registered) | | | 28,753 | |
| | 38 | | | Bayerische Motoren Werke AG | | | 3,628 | |
| | 64 | | | Continental AG | | | 14,389 | |
| | 115 | | | Daimler AG (Registered) | | | 8,551 | |
| | 285 | | | Deutsche Post AG (Registered) | | | 10,233 | |
| | 691 | | | Deutsche Telekom AG (Registered) | | | 12,124 | |
| | 153 | | | Evonik Industries AG | | | 5,093 | |
| | 165 | | | Fresenius SE & Co. KGaA | | | 13,351 | |
| | 519 | | | Infineon Technologies AG | | | 10,721 | |
| | 32 | | | Linde AG | | | 5,736 | |
| | 73 | | | Muenchener Rueckversicherungs-Gesellschaft AG in Muenchen (Registered) | | | 14,060 | |
| | 297 | | | SAP SE | | | 29,796 | |
| | 247 | | | Siemens AG (Registered) | | | 35,367 | |
| | 1,335 | | | Telefonica Deutschland Holding AG | | | 6,472 | |
| | 97 | | | Uniper SE (a) | | | 1,592 | |
| | 198 | | | Vonovia SE | | | 7,183 | |
| | | | | | | | |
| | | | | | | 249,062 | |
| | | | | | | | |
| | | | Hong Kong — 1.1% | |
| | 2,496 | | | AIA Group Ltd. | | | 17,279 | |
| | 53 | | | ASM Pacific Technology Ltd. | | | 794 | |
| | 85 | | | Bank of East Asia Ltd. (The) | | | 353 | |
| | 572 | | | Cathay Pacific Airways Ltd. | | | 823 | |
| | 176 | | | Cheung Kong Infrastructure Holdings Ltd. | | | 1,541 | |
| | 464 | | | Cheung Kong Property Holdings Ltd. | | | 3,320 | |
| | 650 | | | CK Hutchison Holdings Ltd. | | | 8,114 | |
| | 446 | | | CLP Holdings Ltd. | | | 4,704 | |
| | 409 | | | Galaxy Entertainment Group Ltd. | | | 2,272 | |
| | 153 | | | Hang Lung Properties Ltd. | | | 401 | |
| | 192 | | | Hang Seng Bank Ltd. | | | 3,895 | |
| | 350 | | | Henderson Land Development Co. Ltd. | | | 2,217 | |
| | 322 | | | HKT Trust & HKT Ltd. | | | 412 | |
| | 1,806 | | | Hong Kong & China Gas Co. Ltd. | | | 3,607 | |
| | 229 | | | Hong Kong Exchanges & Clearing Ltd. | | | 5,620 | |
| | 49 | | | Hong kong Land Holdings Ltd. | | | 376 | |
| | 2,431 | | | Hutchison Port Holdings Trust, Class U | | | 984 | |
| | 38 | | | Jardine Matheson Holdings Ltd. | | | 2,465 | |
| | 342 | | | Kerry Properties Ltd. | | | 1,278 | |
| | 908 | | | Li & Fung Ltd. | | | 380 | |
| | 349 | | | Link REIT | | | 2,505 | |
| | 240 | | | MTR Corp. Ltd. | | | 1,381 | |
| | 499 | | | New World Development Co. Ltd. | | | 621 | |
| | | | | | | | |
| SHARES | | | SECURITY DESCRIPTION | | VALUE($) | |
| | | | | | | | |
| | | | Hong Kong — continued | | | | |
| | 311 | | | NWS Holdings Ltd. | | | 584 | |
| | 293 | | | Power Assets Holdings Ltd. | | | 2,631 | |
| | 653 | | | Sands China Ltd. | | | 2,958 | |
| | 1,068 | | | Sino Land Co. Ltd. | | | 1,807 | |
| | 330 | | | Sun Hung Kai Properties Ltd. | | | 4,945 | |
| | 204 | | | Swire Pacific Ltd., Class A | | | 1,962 | |
| | 99 | | | Techtronic Industries Co. Ltd. | | | 423 | |
| | 699 | | | WH Group Ltd. (e) | | | 623 | |
| | 412 | | | Wharf Holdings Ltd. (The) | | | 3,513 | |
| | 388 | | | Wheelock & Co. Ltd. | | | 3,022 | |
| | 223 | | | Yue Yuen Industrial Holdings Ltd. | | | 880 | |
| | | | | | | | |
| | | | | | | 88,690 | |
| | | | | | | | |
| | | | Ireland — 0.2% | |
| | 148 | | | James Hardie Industries plc, CDI | | | 2,505 | |
| | 104 | | | Ryanair Holdings plc, ADR (a) | | | 9,586 | |
| | | | | | | | |
| | | | | | | 12,091 | |
| | | | | | | | |
| | | | Israel — 0.1% | |
| | 155 | | | Teva Pharmaceutical Industries Ltd., ADR | | | 4,887 | |
| | | | | | | | |
| | | | Italy — 0.7% | |
| | 382 | | | Atlantia SpA | | | 9,689 | |
| | 3,226 | | | Enel SpA | | | 15,337 | |
| | 48 | | | Eni SpA | | | 743 | |
| | 1,239 | | | Intesa Sanpaolo SpA | | | 3,616 | |
| | 197 | | | Italgas SpA (a) | | | 890 | |
| | 8,659 | | | Telecom Italia SpA (a) | | | 7,685 | |
| | 834 | | | UniCredit SpA (a) | | | 13,581 | |
| | | | | | | | |
| | | | | | | 51,541 | |
| | | | | | | | |
| | | | Japan — 8.7% | |
| | 208 | | | Air Water, Inc. | | | 4,010 | |
| | 227 | | | Ajinomoto Co., Inc. | | | 4,421 | |
| | 61 | | | Alfresa Holdings Corp. | | | 1,092 | |
| | 245 | | | Amada Holdings Co. Ltd. | | | 2,918 | |
| | 32 | | | Asahi Group Holdings Ltd. | | | 1,220 | |
| | 400 | | | Asahi Kasei Corp. | | | 3,814 | |
| | 243 | | | Astellas Pharma, Inc. | | | 3,204 | |
| | 123 | | | Bandai Namco Holdings, Inc. | | | 3,857 | |
| | 217 | | | Bridgestone Corp. | | | 9,064 | |
| | 128 | | | Canon, Inc. | | | 4,255 | |
| | 131 | | | Casio Computer Co. Ltd. | | | 1,845 | |
| | 13 | | | Central Japan Railway Co. | | | 2,247 | |
| | 141 | | | Chubu Electric Power Co., Inc. | | | 1,896 | |
| | 54 | | | Chugai Pharmaceutical Co. Ltd. | | | 1,912 | |
| | 619 | | | Concordia Financial Group Ltd. | | | 2,849 | |
SEE NOTES TO FINANCIAL STATEMENTS.
| | | | | | | | |
| | | |
| APRIL 30, 2017 | | J.P. MORGAN INTERNATIONAL EQUITY FUNDS | | | | | 49 | |
JPMorgan Global Research Enhanced Index Fund
SCHEDULE OF PORTFOLIO INVESTMENTS
AS OF APRIL 30, 2017 (Unaudited) (continued)
(Amounts in thousands)
| | | | | | | | |
| SHARES | | | SECURITY DESCRIPTION | | VALUE($) | |
| | Common Stocks — continued | |
| | | | Japan — continued | |
| | 67 | | | Dai Nippon Printing Co. Ltd. | | | 746 | |
| | 318 | | | Daicel Corp. | | | 3,647 | |
| | 336 | | | Dai-ichi Life Holdings, Inc. | | | 5,732 | |
| | 272 | | | Daiichi Sankyo Co. Ltd. | | | 6,052 | |
| | 84 | | | Daikin Industries Ltd. | | | 8,157 | |
| | 40 | | | Daito Trust Construction Co. Ltd. | | | 5,886 | |
| | 226 | | | Daiwa House Industry Co. Ltd. | | | 6,719 | |
| | — | (h) | | Daiwa House REIT Investment Corp. | | | 817 | |
| | 104 | | | DeNA Co. Ltd. | | | 2,232 | |
| | 61 | | | Denso Corp. | | | 2,611 | |
| | 52 | | | Dentsu, Inc. | | | 2,918 | |
| | 58 | | | DIC Corp. | | | 2,072 | |
| | 78 | | | East Japan Railway Co. | | | 6,955 | |
| | 3 | | | Eisai Co. Ltd. | | | 142 | |
| | 155 | | | Electric Power Development Co. Ltd. | | | 3,593 | |
| | 32 | | | FANUC Corp. | | | 6,556 | |
| | 8 | | | Fast Retailing Co. Ltd. | | | 2,646 | |
| | 267 | | | Fuji Electric Co. Ltd. | | | 1,463 | |
| | 171 | | | FUJIFILM Holdings Corp. | | | 6,343 | |
| | 427 | | | Fujitsu Ltd. | | | 2,665 | |
| | 72 | | | Hankyu Hanshin Holdings, Inc. | | | 2,382 | |
| | 27 | | | Hisamitsu Pharmaceutical Co., Inc. | | | 1,367 | |
| | 1,575 | | | Hitachi Ltd. | | | 8,701 | |
| | 11 | | | Hokuriku Electric Power Co. | | | 99 | |
| | 452 | | | Honda Motor Co. Ltd. | | | 13,153 | |
| | 104 | | | Hoya Corp. | | | 4,966 | |
| | 318 | | | Hulic Co. Ltd. | | | 2,996 | |
| | 521 | | | Inpex Corp. | | | 4,989 | |
| | 510 | | | ITOCHU Corp. | | | 7,216 | |
| | 207 | | | J Front Retailing Co. Ltd. | | | 2,978 | |
| | 123 | | | Japan Airlines Co. Ltd. | | | 3,875 | |
| | 58 | | | Japan Exchange Group, Inc. | | | 816 | |
| | — | (h) | | Japan Prime Realty Investment Corp. | | | 728 | |
| | — | (h) | | Japan Real Estate Investment Corp. | | | 1,675 | |
| | 1 | | | Japan Retail Fund Investment Corp. | | | 1,303 | |
| | 339 | | | Japan Tobacco, Inc. | | | 11,280 | |
| | 152 | | | JFE Holdings, Inc. | | | 2,596 | �� |
| | 155 | | | JGC Corp. | | | 2,703 | |
| | 54 | | | JTEKT Corp. | | | 849 | |
| | 1,100 | | | JXTG Holdings, Inc. | | | 4,963 | |
| | 588 | | | Kajima Corp. | | | 3,993 | |
| | 296 | | | Kansai Electric Power Co., Inc. (The) | | | 3,999 | |
| | 62 | | | Kao Corp. | | | 3,394 | |
| | 961 | | | Kawasaki Heavy Industries Ltd. | | | 2,910 | |
| | 307 | | | KDDI Corp. | | | 8,142 | |
| | 67 | | | Keikyu Corp. | | | 769 | |
| | | | | | | | |
| SHARES | | | SECURITY DESCRIPTION | | VALUE($) | |
| | | | | | | | |
| | | | Japan — continued | |
| | 78 | | | Kewpie Corp. | | | 1,980 | |
| | 27 | | | Keyence Corp. | | | 10,734 | |
| | 214 | | | Kintetsu Group Holdings Co. Ltd. | | | 781 | |
| | 310 | | | Kirin Holdings Co. Ltd. | | | 6,029 | |
| | 128 | | | Komatsu Ltd. | | | 3,426 | |
| | 43 | | | Kubota Corp. | | | 674 | |
| | 13 | | | Kyocera Corp. | | | 759 | |
| | 275 | | | Kyowa Hakko Kirin Co. Ltd. | | | 4,725 | |
| | 155 | | | Kyushu Electric Power Co., Inc. | | | 1,669 | |
| | 3 | | | Lawson, Inc. | | | 226 | |
| | 126 | | | M3, Inc. | | | 3,208 | |
| | 45 | | | Mabuchi Motor Co. Ltd. | | | 2,552 | |
| | 296 | | | Marubeni Corp. | | | 1,827 | |
| | 235 | | | Marui Group Co. Ltd. | | | 3,217 | |
| | 334 | | | Mazda Motor Corp. | | | 4,929 | |
| | 809 | | | Mebuki Financial Group, Inc. | | | 3,174 | |
| | 24 | | | Mitsubishi Chemical Holdings Corp. | | | 189 | |
| | 457 | | | Mitsubishi Corp. | | | 9,851 | |
| | 609 | | | Mitsubishi Electric Corp. | | | 8,495 | |
| | 107 | | | Mitsubishi Estate Co. Ltd. | | | 2,049 | |
| | 115 | | | Mitsubishi Tanabe Pharma Corp. | | | 2,332 | |
| | 3,201 | | | Mitsubishi UFJ Financial Group, Inc. | | | 20,283 | |
| | 633 | | | Mitsubishi UFJ Lease & Finance Co. Ltd. | | | 3,307 | |
| | 216 | | | Mitsui & Co. Ltd. | | | 3,053 | |
| | 646 | | | Mitsui Chemicals, Inc. | | | 3,305 | |
| | 81 | | | Mitsui Fudosan Co. Ltd. | | | 1,782 | |
| | 3,513 | | | Mizuho Financial Group, Inc. | | | 6,422 | |
| | 38 | | | MS&AD Insurance Group Holdings, Inc. | | | 1,232 | |
| | 26 | | | Murata Manufacturing Co. Ltd. | | | 3,425 | |
| | 139 | | | NGK Insulators Ltd. | | | 2,972 | |
| | 136 | | | NGK Spark Plug Co. Ltd. | | | 2,945 | |
| | 135 | | | NH Foods Ltd. | | | 3,848 | |
| | 85 | | | Nidec Corp. | | | 7,836 | |
| | 27 | | | Nintendo Co. Ltd. | | | 6,757 | |
| | — | (h) | | Nippon Building Fund, Inc. | | | 1,708 | |
| | — | (h) | | Nippon Prologis REIT, Inc. | | | 543 | |
| | 265 | | | Nippon Steel & Sumitomo Metal Corp. | | | 5,961 | |
| | 219 | | | Nippon Telegraph & Telephone Corp. | | | 9,385 | |
| | 258 | | | Nippon Yusen KK | | | 519 | |
| | 641 | | | Nissan Motor Co. Ltd. | | | 6,103 | |
| | 206 | | | Nisshin Seifun Group, Inc. | | | 3,159 | |
| | 32 | | | Nitori Holdings Co. Ltd. | | | 4,216 | |
| | 45 | | | Nitto Denko Corp. | | | 3,419 | |
| | 633 | | | Nomura Holdings, Inc. | | | 3,802 | |
| | 1 | | | Nomura Real Estate Master Fund, Inc. | | | 1,067 | |
| | 118 | | | NSK Ltd. | | | 1,607 | |
SEE NOTES TO FINANCIAL STATEMENTS.
| | | | | | |
| | | |
| 50 | | | | J.P. MORGAN INTERNATIONAL EQUITY FUNDS | | APRIL 30, 2017 |
| | | | | | | | |
| SHARES | | | SECURITY DESCRIPTION | | VALUE($) | |
| | Common Stocks — continued | |
| | | | Japan — continued | |
| | 359 | | | NTT DOCOMO, Inc. | | | 8,675 | |
| | 65 | | | Obayashi Corp. | | | 627 | |
| | 33 | | | Obic Co. Ltd. | | | 1,756 | |
| | 110 | | | Olympus Corp. | | | 4,230 | |
| | 37 | | | Omron Corp. | | | 1,566 | |
| | 84 | | | Oriental Land Co. Ltd. | | | 4,801 | |
| | 475 | | | ORIX Corp. | | | 7,262 | |
| | 75 | | | Otsuka Corp. | | | 4,007 | |
| | 149 | | | Otsuka Holdings Co. Ltd. | | | 6,840 | |
| | 478 | | | Panasonic Corp. | | | 5,714 | |
| | 194 | | | Rakuten, Inc. | | | 1,989 | |
| | 19 | | | Recruit Holdings Co. Ltd. | | | 955 | |
| | 363 | | | Resona Holdings, Inc. | | | 2,019 | |
| | 65 | | | Rohm Co. Ltd. | | | 4,537 | |
| | 5 | | | Ryohin Keikaku Co. Ltd. | | | 1,218 | |
| | 61 | | | Santen Pharmaceutical Co. Ltd. | | | 851 | |
| | 7 | | | Secom Co. Ltd. | | | 472 | |
| | 147 | | | Seibu Holdings, Inc. | | | 2,565 | |
| | 86 | | | Sekisui House Ltd. | | | 1,422 | |
| | 149 | | | Seven & i Holdings Co. Ltd. | | | 6,272 | |
| | 53 | | | Shimadzu Corp. | | | 906 | |
| | 19 | | | Shimamura Co. Ltd. | | | 2,600 | |
| | 11 | | | Shimano, Inc. | | | 1,638 | |
| | 80 | | | Shimizu Corp. | | | 767 | |
| | 102 | | | Shin-Etsu Chemical Co. Ltd. | | | 8,822 | |
| | 65 | | | Shionogi & Co. Ltd. | | | 3,342 | |
| | 267 | | | Shizuoka Bank Ltd. (The) | | | 2,254 | |
| | 13 | | | SMC Corp. | | | 3,749 | |
| | 222 | | | SoftBank Group Corp. | | | 16,809 | |
| | 64 | | | Sompo Holdings, Inc. | | | 2,422 | |
| | 326 | | | Sony Corp. | | | 11,176 | |
| | 27 | | | Stanley Electric Co. Ltd. | | | 788 | |
| | 86 | | | Subaru Corp. | | | 3,241 | |
| | 214 | | | Sumitomo Chemical Co. Ltd. | | | 1,208 | |
| | 35 | | | Sumitomo Corp. | | | 464 | |
| | 216 | | | Sumitomo Electric Industries Ltd. | | | 3,533 | |
| | 107 | | | Sumitomo Metal Mining Co. Ltd. | | | 1,449 | |
| | 368 | | | Sumitomo Mitsui Financial Group, Inc. | | | 13,679 | |
| | 152 | | | Sumitomo Mitsui Trust Holdings, Inc. | | | 5,214 | |
| | 187 | | | Sumitomo Realty & Development Co. Ltd. | | | 5,052 | |
| | 101 | | | Suntory Beverage & Food Ltd. | | | 4,568 | |
| | 33 | | | Suruga Bank Ltd. | | | 686 | |
| | 70 | | | Suzuken Co. Ltd. | | | 2,300 | |
| | 144 | | | Suzuki Motor Corp. | | | 6,028 | |
| | 59 | | | Sysmex Corp. | | | 3,575 | |
| | | | | | | | |
| SHARES | | | SECURITY DESCRIPTION | | VALUE($) | |
| | | | | | | | |
| | | | Japan — continued | |
| | 45 | | | T&D Holdings, Inc. | | | 675 | |
| | 90 | | | Takeda Pharmaceutical Co. Ltd. | | | 4,337 | |
| | 61 | | | Tohoku Electric Power Co., Inc. | | | 807 | |
| | 208 | | | Tokio Marine Holdings, Inc. | | | 8,778 | |
| | 282 | | | Tokyo Electric Power Co. Holdings, Inc. (a) | | | 1,097 | |
| | 48 | | | Tokyo Electron Ltd. | | | 5,839 | |
| | 259 | | | Tokyo Gas Co. Ltd. | | | 1,202 | |
| | 262 | | | Tokyo Tatemono Co. Ltd. | | | 3,574 | |
| | 641 | | | Tokyu Corp. | | | 4,591 | |
| | 387 | | | Toppan Printing Co. Ltd. | | | 3,896 | |
| | 19 | | | Toyo Suisan Kaisha Ltd. | | | 729 | |
| | 67 | | | Toyota Industries Corp. | | | 3,347 | |
| | 579 | | | Toyota Motor Corp. | | | 31,352 | |
| | 27 | | | Toyota Tsusho Corp. | | | 849 | |
| | 45 | | | Trend Micro, Inc. | | | 1,998 | |
| | 1 | | | United Urban Investment Corp. | | | 813 | |
| | 84 | | | West Japan Railway Co. | | | 5,606 | |
| | 192 | | | Yahoo Japan Corp. | | | 823 | |
| | 630 | | | Yamada Denki Co. Ltd. | | | 3,308 | |
| | 116 | | | Yamato Holdings Co. Ltd. | | | 2,513 | |
| | | | | | | | |
| | | | | | | 671,062 | |
| | | | | | | | |
| | | | Jersey — 0.1% | |
| | 49 | | | Randgold Resources Ltd. | | | 4,307 | |
| | | | | | | | |
| | | | Luxembourg — 0.1% | |
| | 1,102 | | | ArcelorMittal (a) | | | 8,664 | |
| | | | | | | | |
| | | | Netherlands — 1.9% | |
| | 136 | | | ASML Holding NV | | | 18,040 | |
| | 130 | | | Heineken Holding NV | | | 10,921 | |
| | 39 | | | Heineken NV | | | 3,464 | |
| | 1,354 | | | ING Groep NV | | | 22,073 | |
| | 701 | | | Koninklijke Ahold Delhaize NV | | | 14,516 | |
| | 3,643 | | | Koninklijke KPN NV | | | 10,531 | |
| | 97 | | | Koninklijke Philips NV | | | 3,356 | |
| | 342 | | | NN Group NV | | | 11,354 | |
| | 1,343 | | | Royal Dutch Shell plc, Class A | | | 34,872 | |
| | 805 | | | Royal Dutch Shell plc, Class B | | | 21,426 | |
| | | | | | | | |
| | | | | | | 150,553 | |
| | | | | | | | |
| | | | New Zealand — 0.1% | |
| | 291 | | | Auckland International Airport Ltd. | | | 1,380 | |
| | 192 | | | Contact Energy Ltd. | | | 686 | |
| | 262 | | | Fletcher Building Ltd. | | | 1,539 | |
| | 102 | | | Ryman Healthcare Ltd. | | | 605 | |
| | 579 | | | Spark New Zealand Ltd. | | | 1,467 | |
| | | | | | | | |
| | | | | | | 5,677 | |
| | | | | | | | |
SEE NOTES TO FINANCIAL STATEMENTS.
| | | | | | | | |
| | | |
| APRIL 30, 2017 | | J.P. MORGAN INTERNATIONAL EQUITY FUNDS | | | | | 51 | |
JPMorgan Global Research Enhanced Index Fund
SCHEDULE OF PORTFOLIO INVESTMENTS
AS OF APRIL 30, 2017 (Unaudited) (continued)
(Amounts in thousands)
| | | | | | | | |
| SHARES | | | SECURITY DESCRIPTION | | VALUE($) | |
| | Common Stocks — continued | |
| | | | Norway — 0.1% | |
| | 942 | | | Norsk Hydro ASA | | | 5,366 | |
| | | | | | | | |
| | | | Portugal — 0.1% | |
| | 677 | | | Galp Energia SGPS SA | | | 10,524 | |
| | | | | | | | |
| | | | Singapore — 0.4% | |
| | 169 | | | Ascendas REIT | | | 310 | |
| | 335 | | | CapitaLand Ltd. | | | 901 | |
| | 379 | | | CapitaLand Mall Trust | | | 534 | |
| | 390 | | | ComfortDelGro Corp. Ltd. | | | 764 | |
| | 472 | | | DBS Group Holdings Ltd. | | | 6,524 | |
| | 771 | | | Genting Singapore plc | | | 614 | |
| | 866 | | | Global Logistic Properties Ltd. | | | 1,785 | |
| | 17 | | | Jardine Cycle & Carriage Ltd. | | | 565 | |
| | 449 | | | Keppel Corp. Ltd. | | | 2,089 | |
| | 796 | | | Oversea-Chinese Banking Corp. Ltd. | | | 5,576 | |
| | 79 | | | Singapore Exchange Ltd. | | | 421 | |
| | 153 | | | Singapore Press Holdings Ltd. | | | 380 | |
| | 1,756 | | | Singapore Telecommunications Ltd. | | | 4,702 | |
| | 304 | | | United Overseas Bank Ltd. | | | 4,728 | |
| | 618 | | | Wilmar International Ltd. | | | 1,570 | |
| | | | | | | | |
| | | | | | | 31,463 | |
| | | | | | | | |
| | | | Spain — 1.3% | |
| | 762 | | | Banco Bilbao Vizcaya Argentaria SA | | | 6,104 | |
| | 2,517 | | | Banco Santander SA | | | 16,400 | |
| | 9,046 | | | Bankia SA | | | 10,983 | |
| | 1,157 | | | Distribuidora Internacional de Alimentacion SA | | | 6,877 | |
| | 2,486 | | | Iberdrola SA | | | 17,875 | |
| | 487 | | | Industria de Diseno Textil SA | | | 18,651 | |
| | 446 | | | Red Electrica Corp. SA | | | 8,702 | |
| | 444 | | | Repsol SA | | | 7,003 | |
| | 1,020 | | | Telefonica SA | | | 11,286 | |
| | | | | | | | |
| | | | | | | 103,881 | |
| | | | | | | | |
| | | | Sweden — 0.7% | |
| | 63 | | | Assa Abloy AB, Class B | | | 1,371 | |
| | 265 | | | Atlas Copco AB, Class A | | | 9,908 | |
| | 1,431 | | | Nordea Bank AB | | | 17,599 | |
| | 748 | | | Sandvik AB | | | 11,992 | |
| | 978 | | | Skandinaviska Enskilda Banken AB, Class A | | | 11,259 | |
| | | | | | | | |
| | | | | | | 52,129 | |
| | | | | | | | |
| | | | Switzerland — 2.9% | |
| | 186 | | | ABB Ltd. (Registered) | | | 4,556 | |
| | 19 | | | Actelion Ltd. (a) | | | 5,517 | |
| | 125 | | | Adecco Group AG (Registered) | | | 9,251 | |
| | 91 | | | Cie Financiere Richemont SA (Registered) | | | 7,604 | |
| | | | | | | | |
| SHARES | | | SECURITY DESCRIPTION | | VALUE($) | |
| | | | | | | | |
| | | | Switzerland — continued | |
| | 266 | | | Credit Suisse Group AG (Registered) (a) | | | 4,057 | |
| | 657 | | | Glencore plc (a) | | | 2,584 | |
| | 291 | | | LafargeHolcim Ltd. (Registered) (a) | | | 16,501 | |
| | 754 | | | Nestle SA (Registered) | | | 58,074 | |
| | 453 | | | Novartis AG (Registered) | | | 34,850 | |
| | 180 | | | Roche Holding AG | | | 47,023 | |
| | 10 | | | Syngenta AG (a) | | | 4,605 | |
| | 485 | | | UBS Group AG (Registered) (a) | | | 8,275 | |
| | 151 | | | Wolseley plc | | | 9,573 | |
| | 47 | | | Zurich Insurance Group AG | | | 13,064 | |
| | | | | | | | |
| | | | | | | 225,534 | |
| | | | | | | | |
| | | | United Kingdom — 5.6% | |
| | 1,116 | | | 3i Group plc | | | 11,473 | |
| | 82 | | | Anglo American plc (a) | | | 1,177 | |
| | 191 | | | Associated British Foods plc | | | 6,946 | |
| | 191 | | | AstraZeneca plc | | | 11,441 | |
| | 515 | | | BAE Systems plc | | | 4,187 | |
| | 1,804 | | | Barclays plc | | | 4,941 | |
| | 852 | | | Barratt Developments plc | | | 6,391 | |
| | 2,539 | | | BP plc | | | 14,537 | |
| | 589 | | | British American Tobacco plc | | | 39,767 | |
| | 615 | | | BT Group plc | | | 2,425 | |
| | 11 | | | Capita plc | | | 76 | |
| | 3,957 | | | Centrica plc | | | 10,140 | |
| | 586 | | | Compass Group plc | | | 11,830 | |
| | 281 | | | Diageo plc | | | 8,178 | |
| | 1,175 | | | Dixons Carphone plc | | | 5,103 | |
| | 1,292 | | | GlaxoSmithKline plc | | | 26,008 | |
| | 3,121 | | | HSBC Holdings plc | | | 25,736 | |
| | 157 | | | Imperial Brands plc | | | 7,672 | |
| | 228 | | | InterContinental Hotels Group plc | | | 12,094 | |
| | 2,138 | | | ITV plc | | | 5,815 | |
| | 52 | | | Liberty Global plc, Class A (a) | | | 1,855 | |
| | 1 | | | Liberty Global plc, Class C (a) | | | 28 | |
| | 119 | | | Liberty Global plc, Series C (a) | | | 4,110 | |
| | 2,000 | | | Lloyds Banking Group plc | | | 1,797 | |
| | 275 | | | London Stock Exchange Group plc | | | 12,028 | |
| | 450 | | | National Grid plc | | | 5,829 | |
| | 1,115 | | | Prudential plc | | | 24,739 | |
| | 99 | | | Reckitt Benckiser Group plc | | | 9,111 | |
| | 446 | | | RELX plc | | | 9,048 | |
| | 98 | | | Rio Tinto Ltd. | | | 4,459 | |
| | 377 | | | Rio Tinto plc | | | 14,854 | |
| | 1,401 | | | RSA Insurance Group plc | | | 10,807 | |
| | 906 | | | Sage Group plc (The) | | | 7,860 | |
SEE NOTES TO FINANCIAL STATEMENTS.
| | | | | | |
| | | |
| 52 | | | | J.P. MORGAN INTERNATIONAL EQUITY FUNDS | | APRIL 30, 2017 |
| | | | | | | | |
| SHARES | | | SECURITY DESCRIPTION | | VALUE($) | |
| | Common Stocks — continued | |
| | | | United Kingdom — continued | |
| | 1,517 | | | Standard Chartered plc (a) | | | 14,173 | |
| | 4,085 | | | Taylor Wimpey plc | | | 10,582 | |
| | 533 | | | Unilever NV, CVA | | | 27,910 | |
| | 8,726 | | | Vodafone Group plc | | | 22,475 | |
| | 273 | | | Whitbread plc | | | 14,266 | |
| | 797 | | | WPP plc | | | 17,056 | |
| | | | | | | | |
| | | | | | | 428,924 | |
| | | | | | | | |
| | | | United States — 59.6% | |
| | 19 | | | 3M Co. | | | 3,754 | |
| | 524 | | | Abbott Laboratories | | | 22,851 | |
| | 35 | | | AbbVie, Inc. | | | 2,283 | |
| | 319 | | | Accenture plc, Class A | | | 38,659 | |
| | 46 | | | Activision Blizzard, Inc. | | | 2,425 | |
| | 9 | | | Acuity Brands, Inc. | | | 1,507 | |
| | 283 | | | Adobe Systems, Inc. (a) | | | 37,851 | |
| | 175 | | | Aetna, Inc. | | | 23,648 | |
| | 242 | | | Agilent Technologies, Inc. | | | 13,345 | |
| | 108 | | | Alexion Pharmaceuticals, Inc. (a) | | | 13,756 | |
| | 209 | | | Allegion plc | | | 16,404 | |
| | 135 | | | Allergan plc | | | 32,856 | |
| | 69 | | | Alphabet, Inc., Class A (a) | | | 63,726 | |
| | 88 | | | Alphabet, Inc., Class C (a) | | | 80,165 | |
| | 411 | | | Altria Group, Inc. | | | 29,511 | |
| | 101 | | | Amazon.com, Inc. (a) | | | 93,493 | |
| | 261 | | | Ameren Corp. | | | 14,264 | |
| | 46 | | | American Express Co. | | | 3,637 | |
| | 289 | | | American International Group, Inc. | | | 17,596 | |
| | 38 | | | American Water Works Co., Inc. | | | 3,021 | |
| | 71 | | | Ameriprise Financial, Inc. | | | 9,059 | |
| | 37 | | | Amgen, Inc. | | | 6,058 | |
| | 263 | | | Anadarko Petroleum Corp. | | | 14,982 | |
| | 339 | | | Analog Devices, Inc. | | | 25,849 | |
| | 32 | | | Antero Resources Corp. (a) | | | 675 | |
| | 1,222 | | | Apple, Inc. | | | 175,536 | |
| | 38 | | | Aramark | | | 1,393 | |
| | 123 | | | Archer-Daniels-Midland Co. | | | 5,635 | |
| | 20 | | | Arrow Electronics, Inc. (a) | | | 1,405 | |
| | 256 | | | Arthur J Gallagher & Co. | | | 14,275 | |
| | 1,132 | | | AT&T, Inc. | | | 44,872 | |
| | 138 | | | Automatic Data Processing, Inc. | | | 14,445 | |
| | 13 | | | AutoZone, Inc. (a) | | | 9,040 | |
| | 82 | | | AvalonBay Communities, Inc. | | | 15,552 | |
| | 29 | | | Avery Dennison Corp. | | | 2,383 | |
| | 37 | | | Ball Corp. | | | 2,873 | |
| | 3,061 | | | Bank of America Corp. | | | 71,435 | |
| | | | | | | | |
| SHARES | | | SECURITY DESCRIPTION | | VALUE($) | |
| | | | | | | | |
| | | | United States — continued | |
| | 370 | | | Bank of New York Mellon Corp. (The) | | | 17,397 | |
| | 44 | | | Becton Dickinson and Co. | | | 8,307 | |
| | 263 | | | Berkshire Hathaway, Inc., Class B (a) | | | 43,377 | |
| | 60 | | | Best Buy Co., Inc. | | | 3,126 | |
| | 100 | | | Biogen, Inc. (a) | | | 27,149 | |
| | 59 | | | BioMarin Pharmaceutical, Inc. (a) | | | 5,678 | |
| | 49 | | | BlackRock, Inc. | | | 18,709 | |
| | 41 | | | Boston Properties, Inc. | | | 5,146 | |
| | 900 | | | Boston Scientific Corp. (a) | | | 23,750 | |
| | 559 | | | Bristol-Myers Squibb Co. | | | 31,353 | |
| | 66 | | | Brixmor Property Group, Inc. | | | 1,312 | |
| | 171 | | | Broadcom Ltd. | | | 37,777 | |
| | 26 | | | Broadridge Financial Solutions, Inc. | | | 1,825 | |
| | 96 | | | Brown-Forman Corp., Class B | | | 4,565 | |
| | 71 | | | CA, Inc. | | | 2,320 | |
| | 166 | | | Cabot Oil & Gas Corp. | | | 3,860 | |
| | 61 | | | Cadence Design Systems, Inc. (a) | | | 1,993 | |
| | 16 | | | Camden Property Trust | | | 1,339 | |
| | 252 | | | Capital One Financial Corp. | | | 20,240 | |
| | 88 | | | Carnival Corp. | | | 5,428 | |
| | 24 | | | Caterpillar, Inc. | | | 2,435 | |
| | 67 | | | CBRE Group, Inc., Class A (a) | | | 2,390 | |
| | 29 | | | CDK Global, Inc. | | | 1,890 | |
| | 32 | | | CDW Corp. | | | 1,894 | |
| | 56 | | | Celanese Corp., Series A | | | 4,917 | |
| | 293 | | | Celgene Corp. (a) | | | 36,338 | |
| | 37 | | | Centene Corp. (a) | | | 2,759 | |
| | 621 | | | Charles Schwab Corp. (The) | | | 24,132 | |
| | 1 | | | Charter Communications, Inc. (a) | | | 290 | |
| | 98 | | | Charter Communications, Inc., Class A (a) | | | 33,868 | |
| | 342 | | | Chevron Corp. | | | 36,502 | |
| | 187 | | | Chubb Ltd. | | | 25,644 | |
| | 36 | | | Cigna Corp. | | | 5,661 | |
| | 19 | | | Cintas Corp. | | | 2,371 | |
| | 713 | | | Cisco Systems, Inc. | | | 24,291 | |
| | 912 | | | Citigroup, Inc. | | | 53,894 | |
| | 89 | | | Citizens Financial Group, Inc. | | | 3,253 | |
| | 354 | | | CMS Energy Corp. | | | 16,070 | |
| | 510 | | | Coca-Cola Co. (The) | | | 22,007 | |
| | 128 | | | Cognizant Technology Solutions Corp., Class A (a) | | | 7,715 | |
| | 62 | | | Colgate-Palmolive Co. | | | 4,446 | |
| | 1,365 | | | Comcast Corp., Class A | | | 53,479 | |
| | 140 | | | Concho Resources, Inc. (a) | | | 17,731 | |
| | 142 | | | Constellation Brands, Inc., Class A | | | 24,566 | |
| | 10 | | | Cooper Cos., Inc. (The) | | | 2,053 | |
SEE NOTES TO FINANCIAL STATEMENTS.
| | | | | | | | |
| | | |
| APRIL 30, 2017 | | J.P. MORGAN INTERNATIONAL EQUITY FUNDS | | | | | 53 | |
JPMorgan Global Research Enhanced Index Fund
SCHEDULE OF PORTFOLIO INVESTMENTS
AS OF APRIL 30, 2017 (Unaudited) (continued)
(Amounts in thousands)
| | | | | | | | |
| SHARES | | | SECURITY DESCRIPTION | | VALUE($) | |
| | Common Stocks — continued | |
| | | | United States — continued | |
| | 7 | | | Core Laboratories NV | | | 826 | |
| | 206 | | | Corning, Inc. | | | 5,943 | |
| | 162 | | | Costco Wholesale Corp. | | | 28,771 | |
| | 198 | | | Crown Holdings, Inc. (a) | | | 11,121 | |
| | 47 | | | Cummins, Inc. | | | 7,127 | |
| | 94 | | | CVS Health Corp. | | | 7,710 | |
| | 134 | | | Danaher Corp. | | | 11,150 | |
| | 53 | | | Deere & Co. | | | 5,957 | |
| | 141 | | | Delphi Automotive plc | | | 11,361 | |
| | 221 | | | Delta Air Lines, Inc. | | | 10,030 | |
| | 125 | | | Diamondback Energy, Inc. (a) | | | 12,451 | |
| | 21 | | | Dick’s Sporting Goods, Inc. | | | 1,055 | |
| | 279 | | | Discover Financial Services | | | 17,451 | |
| | 238 | | | DISH Network Corp., Class A (a) | | | 15,311 | |
| | 92 | | | Dollar General Corp. | | | 6,673 | |
| | 332 | | | Dow Chemical Co. (The) | | | 20,825 | |
| | 415 | | | DR Horton, Inc. | | | 13,662 | |
| | 66 | | | Dr Pepper Snapple Group, Inc. | | | 6,016 | |
| | 63 | | | DXC Technology Co. (a) | | | 4,768 | |
| | 60 | | | E*TRADE Financial Corp. (a) | | | 2,061 | |
| | 261 | | | Eastman Chemical Co. | | | 20,811 | |
| | 308 | | | Eaton Corp. plc | | | 23,331 | |
| | 11 | | | Edgewell Personal Care Co. (a) | | | 772 | |
| | 243 | | | Edison International | | | 19,448 | |
| | 393 | | | EI du Pont de Nemours & Co. | | | 31,358 | |
| | 399 | | | Eli Lilly & Co. | | | 32,741 | |
| | 319 | | | EOG Resources, Inc. | | | 29,498 | |
| | 145 | | | EQT Corp. | | | 8,452 | |
| | 26 | | | Equinix, Inc. | | | 11,039 | |
| | 81 | | | Equity Residential | | | 5,227 | |
| | 8 | | | Essex Property Trust, Inc. | | | 1,956 | |
| | 18 | | | Everest Re Group Ltd. | | | 4,579 | |
| | 137 | | | Exelon Corp. | | | 4,746 | |
| | 37 | | | Extra Space Storage, Inc. | | | 2,776 | |
| | 756 | | | Exxon Mobil Corp. | | | 61,694 | |
| | 14 | | | F5 Networks, Inc. (a) | | | 1,747 | |
| | 636 | | | Facebook, Inc., Class A (a) | | | 95,539 | |
| | 55 | | | FedEx Corp. | | | 10,343 | |
| | 279 | | | Fidelity National Information Services, Inc. | | | 23,507 | |
| | 60 | | | First Data Corp., Class A (a) | | | 935 | |
| | 24 | | | FLIR Systems, Inc. | | | 869 | |
| | 31 | | | Foot Locker, Inc. | | | 2,382 | |
| | 806 | | | Ford Motor Co. | | | 9,250 | |
| | 65 | | | Fortive Corp. | | | 4,125 | |
| | 116 | | | General Dynamics Corp. | | | 22,551 | |
| | | | | | | | |
| SHARES | | | SECURITY DESCRIPTION | | VALUE($) | |
| | | | | | | | |
| | | | United States — continued | |
| | 2,107 | | | General Electric Co. | | | 61,080 | |
| | 113 | | | General Motors Co. | | | 3,910 | |
| | 347 | | | Gilead Sciences, Inc. | | | 23,772 | |
| | 120 | | | Goldman Sachs Group, Inc. (The) | | | 26,824 | |
| | 44 | | | H&R Block, Inc. | | | 1,085 | |
| | 184 | | | Halliburton Co. | | | 8,421 | |
| | 333 | | | Hartford Financial Services Group, Inc. (The) | | | 16,125 | |
| | 391 | | | HCP, Inc. | | | 12,262 | |
| | 115 | | | HD Supply Holdings, Inc. (a) | | | 4,647 | |
| | 353 | | | Hewlett Packard Enterprise Co. | | | 6,584 | |
| | 38 | | | Hilton Worldwide Holdings, Inc. | | | 2,218 | |
| | 40 | | | Hologic, Inc. (a) | | | 1,807 | |
| | 371 | | | Home Depot, Inc. (The) | | | 57,850 | |
| | 333 | | | Honeywell International, Inc. | | | 43,614 | |
| | 996 | | | HP, Inc. | | | 18,751 | |
| | 96 | | | Humana, Inc. | | | 21,379 | |
| | 9 | | | Huntington Ingalls Industries, Inc. | | | 1,872 | |
| | 18 | | | IDEXX Laboratories, Inc. (a) | | | 2,999 | |
| | 66 | | | Illumina, Inc. (a) | | | 12,156 | |
| | 35 | | | Incyte Corp. (a) | | | 4,331 | |
| | 225 | | | Ingersoll-Rand plc | | | 19,971 | |
| | 14 | | | Ingredion, Inc. | | | 1,731 | |
| | 411 | | | Intel Corp. | | | 14,866 | |
| | 323 | | | Intercontinental Exchange, Inc. | | | 19,431 | |
| | 143 | | | International Business Machines Corp. | | | 22,989 | |
| | 457 | | | Johnson & Johnson | | | 56,400 | |
| | 192 | | | Johnson Controls International plc | | | 7,988 | |
| | 8 | | | Jones Lang LaSalle, Inc. | | | 964 | |
| | 716 | | | KeyCorp | | | 13,064 | |
| | 112 | | | Kimberly-Clark Corp. | | | 14,468 | |
| | 420 | | | Kimco Realty Corp. | | | 8,520 | |
| | 254 | | | Kinder Morgan, Inc. | | | 5,233 | |
| | 253 | | | Kraft Heinz Co. (The) | | | 22,897 | |
| | 71 | | | L3 Technologies, Inc. | | | 12,206 | |
| | 23 | | | Laboratory Corp. of America Holdings (a) | | | 3,229 | |
| | 56 | | | Lam Research Corp. | | | 8,045 | |
| | 16 | | | Lear Corp. | | | 2,287 | |
| | — | (h) | | Lennox International, Inc. | | | 23 | |
| | 24 | | | Liberty Broadband Corp., Class C (a) | | | 2,174 | |
| | 24 | | | Liberty Media Corp.-Liberty SiriusXM, Class A (a) | | | 930 | |
| | 30 | | | Liberty Property Trust | | | 1,202 | |
| | 47 | | | Lincoln National Corp. | | | 3,128 | |
| | 443 | | | Lowe’s Cos., Inc. | | | 37,595 | |
| | 25 | | | Macerich Co. (The) | | | 1,551 | |
| | 207 | | | Macy’s, Inc. | | | 6,056 | |
| | 16 | | | ManpowerGroup, Inc. | | | 1,592 | |
SEE NOTES TO FINANCIAL STATEMENTS.
| | | | | | |
| | | |
| 54 | | | | J.P. MORGAN INTERNATIONAL EQUITY FUNDS | | APRIL 30, 2017 |
| | | | | | | | |
| SHARES | | | SECURITY DESCRIPTION | | VALUE($) | |
| | Common Stocks — continued | |
| | | | United States — continued | |
| | 113 | | | Marathon Petroleum Corp. | | | 5,760 | |
| | 393 | | | Masco Corp. | | | 14,553 | |
| | 1 | | | Mastercard, Inc. | | | 73 | |
| | 73 | | | Mastercard, Inc., Class A | | | 8,547 | |
| | 41 | | | McDonald’s Corp. | | | 5,678 | |
| | 35 | | | McKesson Corp. | | | 4,792 | |
| | 101 | | | Medtronic plc | | | 8,410 | |
| | 553 | | | Merck & Co., Inc. | | | 34,473 | |
| | 452 | | | MetLife, Inc. | | | 23,434 | |
| | 170 | | | Microchip Technology, Inc. | | | 12,851 | |
| | 1,939 | | | Microsoft Corp. | | | 132,755 | |
| | 217 | | | Molson Coors Brewing Co., Class B | | | 20,802 | |
| | 686 | | | Mondelez International, Inc., Class A | | | 30,884 | |
| | 739 | | | Morgan Stanley | | | 32,037 | |
| | 377 | | | Mosaic Co. (The) | | | 10,163 | |
| | 14 | | | Mylan NV (a) | | | 522 | |
| | 30 | | | National Retail Properties, Inc. | | | 1,259 | |
| | 143 | | | Newell Brands, Inc. | | | 6,831 | |
| | 45 | | | Newfield Exploration Co. (a) | | | 1,555 | |
| | 110 | | | Newmont Mining Corp. | | | 3,705 | |
| | 233 | | | NextEra Energy, Inc. | | | 31,139 | |
| | 408 | | | NIKE, Inc., Class B | | | 22,581 | |
| | 77 | | | Norfolk Southern Corp. | | | 9,004 | |
| | 73 | | | Northrop Grumman Corp. | | | 18,002 | |
| | 53 | | | Nuance Communications, Inc. (a) | | | 950 | |
| | 72 | | | NVIDIA Corp. | | | 7,537 | |
| | 321 | | | Occidental Petroleum Corp. | | | 19,733 | |
| | 339 | | | Oracle Corp. | | | 15,235 | |
| | 71 | | | O’Reilly Automotive, Inc. (a) | | | 17,703 | |
| | 191 | | | PACCAR, Inc. | | | 12,778 | |
| | 53 | | | Parsley Energy, Inc., Class A (a) | | | 1,569 | |
| | 69 | | | Paychex, Inc. | | | 4,109 | |
| | 491 | | | PepsiCo, Inc. | | | 55,645 | |
| | 1,752 | | | Pfizer, Inc. | | | 59,418 | |
| | 355 | | | PG&E Corp. | | | 23,784 | |
| | 414 | | | Philip Morris International, Inc. | | | 45,864 | |
| | 150 | | | Phillips 66 | | | 11,926 | |
| | 165 | | | Pinnacle West Capital Corp. | | | 14,067 | |
| | 138 | | | Pioneer Natural Resources Co. | | | 23,845 | |
| | 25 | | | Plains GP Holdings LP, Class A | | | 749 | |
| | 122 | | | PNC Financial Services Group, Inc. (The) | | | 14,563 | |
| | 1 | | | Priceline Group, Inc. (The) (a) | | | 2,733 | |
| | 398 | | | Procter & Gamble Co. (The) | | | 34,769 | |
| | 283 | | | Prologis, Inc. | | | 15,411 | |
| | 91 | | | Prudential Financial, Inc. | | | 9,756 | |
| | 53 | | | Public Storage | | | 11,068 | |
| | 500 | | | PulteGroup, Inc. | | | 11,341 | |
| | 16 | | | PVH Corp. | | | 1,620 | |
| | | | | | | | |
| SHARES | | | SECURITY DESCRIPTION | | VALUE($) | |
| | | | | | | | |
| | | | United States — continued | |
| | 83 | | | QUALCOMM, Inc. (a) | | | 4,440 | |
| | 29 | | | Quest Diagnostics, Inc. | | | 3,023 | |
| | 29 | | | Raymond James Financial, Inc. | | | 2,153 | |
| | 53 | | | Realty Income Corp. | | | 3,107 | |
| | 33 | | | Regency Centers Corp. | | | 2,116 | |
| | 3 | | | Regeneron Pharmaceuticals, Inc. (a) | | | 1,057 | |
| | 574 | | | Regions Financial Corp. | | | 7,891 | |
| | 14 | | | Reinsurance Group of America, Inc. | | | 1,724 | |
| | 27 | | | Robert Half International, Inc. | | | 1,251 | |
| | 7 | | | Rockwell Collins, Inc. | | | 692 | |
| | 146 | | | Ross Stores, Inc. | | | 9,481 | |
| | 150 | | | Royal Caribbean Cruises Ltd. | | | 16,040 | |
| | 33 | | | Sabre Corp. | | | 781 | |
| | – | (h) | | SBA Communications Corp. (a) | | | 49 | |
| | 26 | | | SBA Communications Corp., Class A (a) | | | 3,251 | |
| | 213 | | | Schlumberger Ltd. | | | 15,489 | |
| | 89 | | | Sealed Air Corp. | | | 3,909 | |
| | 33 | | | Sensata Technologies Holding NV (a) | | | 1,365 | |
| | 37 | | | ServiceNow, Inc. (a) | | | 3,513 | |
| | 5 | | | Sherwin-Williams Co. (The) | | | 1,777 | |
| | 330 | | | Shire plc | | | 19,465 | |
| | 55 | | | Simon Property Group, Inc. | | | 9,055 | |
| | 861 | | | Sirius XM Holdings, Inc. | | | 4,263 | |
| | 51 | | | SL Green Realty Corp. | | | 5,376 | |
| | 81 | | | Snap, Inc., Class A (a) | | | 1,836 | |
| | 76 | | | Snap-on, Inc. | | | 12,776 | |
| | 7 | | | Spectrum Brands Holdings, Inc. | | | 1,045 | |
| | 200 | | | Stanley Black & Decker, Inc. | | | 27,180 | |
| | 568 | | | Starbucks Corp. | | | 34,123 | |
| | 172 | | | State Street Corp. | | | 14,415 | |
| | 190 | | | SunTrust Banks, Inc. | | | 10,793 | |
| | 26 | | | SVB Financial Group (a) | | | 4,493 | |
| | 63 | | | Symantec Corp. | | | 1,990 | |
| | 32 | | | Synopsys, Inc. (a) | | | 2,350 | |
| | 51 | | | TD Ameritrade Holding Corp. | | | 1,956 | |
| | 311 | | | TE Connectivity Ltd. | | | 24,066 | |
| | 37 | | | TEGNA, Inc. | | | 950 | |
| | 8 | | | Teleflex, Inc. | | | 1,696 | |
| | 509 | | | Texas Instruments, Inc. | | | 40,322 | |
| | 66 | | | Textron, Inc. | | | 3,085 | |
| | 127 | | | Thermo Fisher Scientific, Inc. | | | 20,936 | |
| | 85 | | | Thomson Reuters Corp. | | | 3,857 | |
| | 164 | | | Time Warner, Inc. | | | 16,242 | |
| | 349 | | | TJX Cos., Inc. (The) | | | 27,452 | |
| | 171 | | | T-Mobile US, Inc. (a) | | | 11,527 | |
| | 65 | | | Toll Brothers, Inc. | | | 2,356 | |
| | 884 | | | Twenty-First Century Fox, Inc., Class A | | | 26,997 | |
| | 90 | | | Twenty-First Century Fox, Inc., Class B | | | 2,694 | |
| | 372 | | | Union Pacific Corp. | | | 41,650 | |
SEE NOTES TO FINANCIAL STATEMENTS.
| | | | | | | | |
| | | |
| APRIL 30, 2017 | | J.P. MORGAN INTERNATIONAL EQUITY FUNDS | | | | | 55 | |
JPMorgan Global Research Enhanced Index Fund
SCHEDULE OF PORTFOLIO INVESTMENTS
AS OF APRIL 30, 2017 (Unaudited) (continued)
(Amounts in thousands, except number of Futures contracts)
| | | | | | | | |
| SHARES | | | SECURITY DESCRIPTION | | VALUE($) | |
| | Common Stocks — continued | |
| | | | United States — continued | |
| | 210 | | | United Continental Holdings, Inc. (a) | | | 14,778 | |
| | 37 | | | United Parcel Service, Inc., Class B | | | 4,016 | |
| | 129 | | | United Technologies Corp. | | | 15,301 | |
| | 10 | | | United Therapeutics Corp. (a) | | | 1,217 | |
| | 340 | | | UnitedHealth Group, Inc. | | | 59,425 | |
| | 49 | | | Unum Group | | | 2,288 | |
| | 52 | | | US Bancorp | | | 2,657 | |
| | 96 | | | Valero Energy Corp. | | | 6,216 | |
| | 174 | | | Vantiv, Inc., Class A (a) | | | 10,788 | |
| | 260 | | | VEREIT, Inc. | | | 2,175 | |
| | 21 | | | VeriSign, Inc. (a) | | | 1,889 | |
| | 564 | | | Verizon Communications, Inc. | | | 25,895 | |
| | 102 | | | Vertex Pharmaceuticals, Inc. (a) | | | 12,106 | |
| | 610 | | | Visa, Inc., Class A | | | 55,619 | |
| | 35 | | | Voya Financial, Inc. | | | 1,293 | |
| | 28 | | | Vulcan Materials Co. | | | 3,365 | |
| | 351 | | | Walgreens Boots Alliance, Inc. | | | 30,399 | |
| | 81 | | | Wal-Mart Stores, Inc. | | | 6,085 | |
| | 447 | | | Walt Disney Co. (The) | | | 51,682 | |
| | 1,328 | | | Wells Fargo & Co. | | | 71,520 | |
| | 199 | | | WestRock Co. | | | 10,660 | |
| | 71 | | | WEX, Inc. (a) | | | 7,185 | |
| | 93 | | | Workday, Inc., Class A (a) | | | 8,140 | |
| | 423 | | | Xcel Energy, Inc. | | | 19,075 | |
| | 187 | | | Xerox Corp. | | | 1,345 | |
| | 40 | | | Zimmer Biomet Holdings, Inc. | | | 4,803 | |
| | | | | | | | |
| | | | | | | 4,599,598 | |
| | | | | | | | |
| | | | Total Common Stocks
(Cost $6,295,356) | | | 7,611,486 | |
| | | | | | | | |
| | Preferred Stocks — 0.5% | |
| | | | Germany — 0.5% | |
| | 139 | | | Henkel AG & Co. KGaA (Preference) | | | 18,855 | |
| | 104 | | | Volkswagen AG (Preference) | | | 16,484 | |
| | | | | | | | |
| | | | Total Preferred Stocks
(Cost $31,296) | | | 35,339 | |
| | | | | | | | |
| | |
NUMBER OF
RIGHTS | | | | | | |
| | Rights — 0.0% (g) | |
| | | | Australia — 0.0% (g) | |
| | 12 | | | TPG Telecom Ltd., expiring 05/12/17 (Strike Price $1.00) (a)
(Cost $—) | | | 6 | |
| | | | | | | | |
| | | | | | | | |
| SHARES | | | SECURITY DESCRIPTION | | VALUE($) | |
| | Short-Term Investment — 0.6% | |
| | | | Investment Company — 0.6% | |
| | 46,476 | | | JPMorgan U.S. Government Money Market Fund, Institutional Class Shares, 0.620% (b) (l)
(Cost $46,476) | | | 46,476 | |
| | | | | | | | |
| | | | Total Investments — 99.7%
(Cost $6,373,128) | | | 7,693,307 | |
| | | | Other Assets in Excess of
Liabilities — 0.3% | | | 22,845 | |
| | | | | | | | |
| | | | NET ASSETS — 100.0% | | $ | 7,716,152 | |
| | | | | | | | |
Percentages indicated are based on net assets.
SEE NOTES TO FINANCIAL STATEMENTS.
| | | | | | |
| | | |
| 56 | | | | J.P. MORGAN INTERNATIONAL EQUITY FUNDS | | APRIL 30, 2017 |
Summary of Investments by Industry, April 30, 2017
The following table represents the portfolio investments of the Fund by industry classifications as a percentage of total investments:
| | | | |
| INDUSTRY | | PERCENTAGE | |
Banks | | | 9.2 | % |
Pharmaceuticals | | | 6.3 | |
Oil, Gas & Consumable Fuels | | | 5.9 | |
Insurance | | | 3.9 | |
Software | | | 3.4 | |
Internet Software & Services | | | 3.2 | |
Media | | | 3.2 | |
Capital Markets | | | 3.0 | |
IT Services | | | 2.9 | |
Technology Hardware, Storage & Peripherals | | | 2.8 | |
Beverages | | | 2.7 | |
Specialty Retail | | | 2.6 | |
Chemicals | | | 2.6 | |
Semiconductors & Semiconductor Equipment | | | 2.5 | |
Electric Utilities | | | 2.3 | |
Biotechnology | | | 2.2 | |
Industrial Conglomerates | | | 2.1 | |
Equity Real Estate Investment Trusts (REITs) | | | 2.0 | |
Machinery | | | 2.0 | |
| | | | |
| INDUSTRY | | PERCENTAGE | |
Diversified Telecommunication Services | | | 1.9 | % |
Food Products | | | 1.9 | |
Health Care Providers & Services | | | 1.9 | |
Tobacco | | | 1.7 | |
Hotels, Restaurants & Leisure | | | 1.7 | |
Food & Staples Retailing | | | 1.6 | |
Automobiles | | | 1.5 | |
Road & Rail | | | 1.4 | |
Aerospace & Defense | | | 1.3 | |
Health Care Equipment & Supplies | | | 1.3 | |
Internet & Direct Marketing Retail | | | 1.3 | |
Metals & Mining | | | 1.2 | |
Household Products | | | 1.1 | |
Textiles, Apparel & Luxury Goods | | | 1.1 | |
Electrical Equipment | | | 1.0 | |
Others (each less than 1.0%) | | | 12.7 | |
Short-Term Investment | | | 0.6 | |
| | | | | | | | | | | | | | | | | | | | |
| Futures Contracts | | | | | | | | | | | | |
NUMBER OF
CONTRACTS | | | DESCRIPTION | | EXPIRATION
DATE | | | TRADING
CURRENCY | | | NOTIONAL
VALUE AT
APRIL 30, 2017 | | | NET
UNREALIZED
APPRECIATION
(DEPRECIATION) | |
| | | | Long Futures Outstanding | | | | | | | | | | | | | | | | |
| | 442 | | | Euro STOXX 50 Index | | | 06/16/17 | | | | EUR | | | $ | 16,892 | | | $ | 646 | |
| | | | | | | | | | | | | | | | | | | | |
SEE NOTES TO FINANCIAL STATEMENTS.
| | | | | | | | |
| | | |
| APRIL 30, 2017 | | J.P. MORGAN INTERNATIONAL EQUITY FUNDS | | | | | 57 | |
JPMorgan Global Unconstrained Equity Fund
SCHEDULE OF PORTFOLIO INVESTMENTS
AS OF APRIL 30, 2017 (Unaudited)
(Amounts in thousands)
| | | | | | | | |
| SHARES | | | SECURITY DESCRIPTION | | VALUE($) | |
| | Common Stocks — 93.4% | |
| | | | Canada — 1.4% | | | | |
| | — | (h) | | Canadian Pacific Railway Ltd. | | | 30 | |
| | | | | | | | |
| | | | China — 8.5% | | | | |
| | — | (h) | | Baidu, Inc., ADR (a) | | | 30 | |
| | 6 | | | China Overseas Land & Investment Ltd. | | | 17 | |
| | 18 | | | China Unicom Hong Kong Ltd. | | | 23 | |
| | — | (h) | | CNOOC Ltd., ADR | | | 37 | |
| | 1 | | | JD.com, Inc., ADR (a) | | | 27 | |
| | 4 | | | Ping An Insurance Group Co. of China Ltd., Class H | | | 23 | |
| | 2 | | | Vipshop Holdings Ltd., ADR (a) | | | 23 | |
| | | | | | | | |
| | | | | | | 180 | |
| | | | | | | | |
| | | | Denmark — 1.7% | |
| | 1 | | | Novo Nordisk A/S, Class B | | | 36 | |
| | | | | | | | |
| | | | France — 7.4% | | | | |
| | — | (h) | | Airbus SE | | | 36 | |
| | 2 | | | AXA SA | | | 48 | |
| | — | (h) | | Sanofi | | | 38 | |
| | — | (h) | | Schneider Electric SE | | | 35 | |
| | | | | | | | |
| | | | | | | 157 | |
| | | | | | | | |
| | | | Hong Kong — 1.5% | |
| | 5 | | | AIA Group Ltd. | | | 32 | |
| | | | | | | | |
| | | | India — 1.0% | |
| | 3 | | | ICICI Bank Ltd., ADR | | | 22 | |
| | | | | | | | |
| | | | Israel — 2.5% | |
| | 2 | | | Teva Pharmaceutical Industries Ltd., ADR | | | 53 | |
| | | | | | | | |
| | | | Italy — 0.8% | |
| | 1 | | | UniCredit SpA (a) | | | 17 | |
| | | | | | | | |
| | | | Japan — 5.4% | | | | |
| | 2 | | | Inpex Corp. | | | 16 | |
| | 1 | | | Japan Airlines Co. Ltd. | | | 31 | |
| | 1 | | | Japan Tobacco, Inc. | | | 27 | |
| | 1 | | | Sumitomo Mitsui Financial Group, Inc. | | | 41 | |
| | | | | | | | |
| | | | | | | 115 | |
| | | | | | | | |
| | | | Luxembourg — 1.4% | | | | |
| | 4 | | | ArcelorMittal (a) | | | 30 | |
| | | | | | | | |
| | | | Netherlands — 1.3% | | | | |
| | — | (h) | | NXP Semiconductors NV (a) | | | 28 | |
| | | | | | | | |
| | | | Switzerland — 3.7% | | | | |
| | 1 | | | LafargeHolcim Ltd. (Registered) (a) | | | 30 | |
| | 1 | | | Novartis AG (Registered) | | | 49 | |
| | | | | | | | |
| | | | | | | 79 | |
| | | | | | | | |
| | | | United Kingdom — 9.7% | | | | |
| | 1 | | | British American Tobacco plc | | | 40 | |
| | 12 | | | BT Group plc | | | 47 | |
| | | | | | | | |
| SHARES | | | SECURITY DESCRIPTION | | VALUE($) | |
| | | | | | | | |
| | | | United Kingdom — continued | | | | |
| | 9 | | | ITV plc | | | 25 | |
| | 1 | | | Liberty Global plc, Class A (a) | | | 31 | |
| | 24 | | | Vodafone Group plc | | | 62 | |
| | | | | | | | |
| | | | | | | 205 | |
| | | | | | | | |
| | | | United States — 47.1% | |
| | — | (h) | | Activision Blizzard, Inc. | | | 23 | |
| | — | (h) | | Aetna, Inc. | | | 25 | |
| | — | (h) | | Affiliated Managers Group, Inc. | | | 23 | |
| | — | (h) | | Alexion Pharmaceuticals, Inc. (a) | | | 34 | |
| | — | (h) | | Allergan plc | | | 44 | |
| | — | (h) | | Alphabet, Inc., Class C (a) | | | 101 | |
| | — | (h) | | Amazon.com, Inc. (a) | | | 55 | |
| | — | (h) | | Broadcom Ltd. | | | 32 | |
| | 1 | | | CBRE Group, Inc., Class A (a) | | | 29 | |
| | 1 | | | Citigroup, Inc. | | | 68 | |
| | 1 | | | DISH Network Corp., Class A (a) | | | 38 | |
| | — | (h) | | Eastman Chemical Co. | | | 33 | |
| | — | (h) | | EQT Corp. | | | 20 | |
| | 1 | | | Globant SA (a) | | | 24 | |
| | — | (h) | | Honeywell International, Inc. | | | 30 | |
| | 2 | | | Kroger Co. (The) | | | 48 | |
| | 1 | | | MetLife, Inc. | | | 31 | |
| | 1 | | | Molson Coors Brewing Co., Class B | | | 64 | |
| | 1 | | | Morgan Stanley | | | 30 | |
| | — | (h) | | Occidental Petroleum Corp. | | | 29 | |
| | — | (h) | | Pioneer Natural Resources Co. | | | 40 | |
| | — | (h) | | Shire plc, ADR | | | 50 | |
| | 1 | | | Snap, Inc., Class A (a) | | | 23 | |
| | 1 | | | Time, Inc. | | | 12 | |
| | 1 | | | TripAdvisor, Inc. (a) | | | 28 | |
| | 1 | | | Twenty-First Century Fox, Inc., Class A | | | 39 | |
| | — | (h) | | Vertex Pharmaceuticals, Inc. (a) | | | 27 | |
| | | | | | | | |
| | | | | | | 1,000 | |
| | | | | | | | |
| | | | Total Common Stocks
(Cost $1,857) | | | 1,984 | |
| | | | | | | | |
| | Short-Term Investment — 1.8% | |
| | | | Investment Company — 1.8% | | | | |
| | 39 | | | JPMorgan U.S. Government Money Market Fund, Institutional Class Shares, 0.620% (b) (l)
(Cost $39) | | | 39 | |
| | | | | | | | |
| | | | Total Investments — 95.2%
(Cost $1,896) | | | 2,023 | |
| | | | Other Assets in Excess of
Liabilities — 4.8% | | | 102 | |
| | | | | | | | |
| | | | NET ASSETS — 100.0% | | $ | 2,125 | |
| | | | | | | | |
Percentages indicated are based on net assets.
SEE NOTES TO FINANCIAL STATEMENTS.
| | | | | | |
| | | |
| 58 | | | | J.P. MORGAN INTERNATIONAL EQUITY FUNDS | | APRIL 30, 2017 |
Summary of Investments by Industry, April 30, 2017
The following table represents the portfolio investments of the Fund by industry classifications as a percentage of total investments:
| | | | |
| INDUSTRY | | PERCENTAGE | |
Pharmaceuticals | | | 10.9 | % |
Banks | | | 7.2 | |
Media | | | 7.2 | |
Oil, Gas & Consumable Fuels | | | 7.0 | |
Insurance | | | 6.6 | |
Internet & Direct Marketing Retail | | | 6.6 | |
Internet Software & Services | | | 6.5 | |
Biotechnology | | | 5.5 | |
Diversified Telecommunication Services | | | 3.5 | |
Software | | | 3.5 | |
Tobacco | | | 3.3 | |
Beverages | | | 3.1 | |
Wireless Telecommunication Services | | | 3.1 | |
Semiconductors & Semiconductor Equipment | | | 2.9 | |
| | | | |
| INDUSTRY | | PERCENTAGE | |
Capital Markets | | | 2.6 | % |
Food & Staples Retailing | | | 2.4 | |
Real Estate Management & Development | | | 2.3 | |
Aerospace & Defense | | | 1.8 | |
Electrical Equipment | | | 1.7 | |
Chemicals | | | 1.6 | |
Airlines | | | 1.6 | |
Construction Materials | | | 1.5 | |
Road & Rail | | | 1.5 | |
Industrial Conglomerates | | | 1.5 | |
Metals & Mining | | | 1.5 | |
Health Care Providers & Services | | | 1.2 | |
Short-Term Investment | | | 1.9 | |
SEE NOTES TO FINANCIAL STATEMENTS.
| | | | | | | | |
| | | |
| APRIL 30, 2017 | | J.P. MORGAN INTERNATIONAL EQUITY FUNDS | | | | | 59 | |
JPMorgan International Discovery Fund
SCHEDULE OF PORTFOLIO INVESTMENTS
AS OF APRIL 30, 2017 (Unaudited)
(Amounts in thousands)
| | | | | | | | |
| SHARES | | | SECURITY DESCRIPTION | | VALUE($) | |
| | Common Stocks — 98.8% | |
| | | | Australia — 8.3% | |
| | 3 | | | ALS Ltd. | | | 15 | |
| | 11 | | | Alumina Ltd. | | | 16 | |
| | 7 | | | Aristocrat Leisure Ltd. | | | 96 | |
| | 42 | | | Ausdrill Ltd. | | | 43 | |
| | 6 | | | BlueScope Steel Ltd. | | | 53 | |
| | 9 | | | Challenger Ltd. | | | 85 | |
| | 2 | | | Domino’s Pizza Enterprises Ltd. | | | 82 | |
| | 10 | | | Fortescue Metals Group Ltd. | | | 38 | |
| | 23 | | | South32 Ltd. | | | 48 | |
| | 10 | | | Treasury Wine Estates Ltd. | | | 87 | |
| | | | | | | | |
| | | | | | | 563 | |
| | | | | | | | |
| | | | Austria — 0.9% | |
| | 1 | | | ams AG | | | 63 | |
| | | | | | | | |
| | | | China — 3.4% | |
| | 7 | | | AAC Technologies Holdings, Inc. | | | 95 | |
| | 153 | | | Lonking Holdings Ltd. | | | 43 | |
| | 40 | | | MMG Ltd. (a) | | | 14 | |
| | 52 | | | Nexteer Automotive Group Ltd. | | | 81 | |
| | | | | | | | |
| | | | | | | 233 | |
| | | | | | | | |
| | | | Denmark — 1.3% | |
| | 1 | | | FLSmidth & Co. A/S | | | 56 | |
| | — | (h) | | Royal Unibrew A/S | | | 17 | |
| | 1 | | | Spar Nord Bank A/S | | | 12 | |
| | | | | | | | |
| | | | | | | 85 | |
| | | | | | | | |
| | | | Finland — 2.1% | |
| | 1 | | | Huhtamaki OYJ | | | 29 | |
| | 2 | | | Metso OYJ | | | 59 | |
| | 1 | | | Nokian Renkaat OYJ | | | 55 | |
| | | | | | | | |
| | | | | | | 143 | |
| | | | | | | | |
| | | | France — 8.4% | |
| | 1 | | | Alten SA | | | 59 | |
| | 1 | | | Ipsen SA | | | 58 | |
| | 1 | | | IPSOS | | | 47 | |
| | 1 | | | Remy Cointreau SA | | | 55 | |
| | 3 | | | Rexel SA | | | 52 | |
| | — | (h) | | SEB SA | | | 63 | |
| | — | (h) | | Sopra Steria Group | | | 57 | |
| | 1 | | | Tarkett SA | | | 54 | |
| | 1 | | | Trigano SA | | | 60 | |
| | 1 | | | Ubisoft Entertainment SA (a) | | | 61 | |
| | | | | | | | |
| | | | | | | 566 | |
| | | | | | | | |
| | | | Georgia — 1.1% | |
| | 2 | | | BGEO Group plc | | | 75 | |
| | | | | | | | |
| | | | | | | | |
| SHARES | | | SECURITY DESCRIPTION | | VALUE($) | |
| | | | | | | | |
| | | | Germany — 4.1% | |
| | 1 | | | Covestro AG (e) | | | 53 | |
| | 1 | | | HUGO BOSS AG | | | 55 | |
| | — | (h) | | MTU Aero Engines AG | | | 60 | |
| | 1 | | | Stabilus SA | | | 56 | |
| | 2 | | | Wacker Neuson SE | | | 51 | |
| | | | | | | | |
| | | | | | | 275 | |
| | | | | | | | |
| | | | Hong Kong — 4.7% | |
| | 43 | | | HKT Trust & HKT Ltd. | | | 55 | |
| | 15 | | | Kerry Properties Ltd. | | | 54 | |
| | 23 | | | New World Development Co. Ltd. | | | 29 | |
| | 50 | | | Nine Dragons Paper Holdings Ltd. | | | 54 | |
| | 482 | | | Noble Group Ltd. (a) | | | 49 | |
| | 20 | | | SJM Holdings Ltd. | | | 19 | |
| | 13 | | | Techtronic Industries Co. Ltd. | | | 54 | |
| | | | | | | | |
| | | | | | | 314 | |
| | | | | | | | |
| | | | Ireland — 0.5% | |
| | — | (h) | | Paddy Power Betfair plc | | | 33 | |
| | | | | | | | |
| | | | Israel — 0.6% | | | | |
| | 7 | | | Plus500 Ltd. | | | 40 | |
| | | | | | | | |
| | | | Italy — 6.7% | |
| | 4 | | | Amplifon SpA | | | 57 | |
| | 1 | | | Brembo SpA | | | 57 | |
| | 2 | | | De’ Longhi SpA | | | 55 | |
| | 8 | | | FinecoBank Banca Fineco SpA | | | 57 | |
| | 1 | | | Industria Macchine Automatiche SpA | | | 54 | |
| | 2 | | | Recordati SpA | | | 58 | |
| | 2 | | | Salvatore Ferragamo SpA | | | 58 | |
| | 1 | | | Tod’s SpA | | | 59 | |
| | | | | | | | |
| | | | | | | 455 | |
| | | | | | | | |
| | | | Japan — 24.6% | |
| | 3 | | | Alpine Electronics, Inc. | | | 49 | |
| | 3 | | | Alps Electric Co. Ltd. | | | 73 | |
| | 4 | | | Chiba Bank Ltd. (The) | | | 27 | |
| | 2 | | | Ebara Corp. | | | 55 | |
| | 2 | | | Electric Power Development Co. Ltd. | | | 44 | |
| | 3 | | | en-japan, Inc. | | | 60 | |
| | 17 | | | Fukuoka Financial Group, Inc. | | | 78 | |
| | 3 | | | Hitachi Metals Ltd. | | | 39 | |
| | 2 | | | Japan Exchange Group, Inc. | | | 21 | |
| | 4 | | | Lifull Co. Ltd. | | | 27 | |
| | 3 | | | LIXIL Group Corp. | | | 67 | |
| | 3 | | | M3, Inc. | | | 69 | |
| | 2 | | | MINEBEA MITSUMI, Inc. | | | 22 | |
SEE NOTES TO FINANCIAL STATEMENTS.
| | | | | | |
| | | |
| 60 | | | | J.P. MORGAN INTERNATIONAL EQUITY FUNDS | | APRIL 30, 2017 |
| | | | | | | | |
| SHARES | | | SECURITY DESCRIPTION | | VALUE($) | |
| | Common Stocks — continued | |
| | | | Japan — continued | |
| | 4 | | | Mitsubishi Chemical Holdings Corp. | | | 32 | |
| | 13 | | | Mitsubishi Motors Corp. | | | 82 | |
| | 9 | | | Mitsubishi UFJ Lease & Finance Co. Ltd. | | | 46 | |
| | 13 | | | Mitsui Chemicals, Inc. | | | 67 | |
| | 1 | | | Nihon M&A Center, Inc. | | | 48 | |
| | 1 | | | Nitori Holdings Co. Ltd. | | | 78 | |
| | 6 | | | NSK Ltd. | | | 75 | |
| | 12 | | | NTN Corp. | | | 61 | |
| | 1 | | | Rohm Co. Ltd. | | | 77 | |
| | 2 | | | Sekisui Chemical Co. Ltd. | | | 32 | |
| | 3 | | | Shizuoka Bank Ltd. (The) | | | 25 | |
| | 5 | | | Sumco Corp. | | | 79 | |
| | 2 | | | Suruga Bank Ltd. | | | 38 | |
| | 5 | | | Tadano Ltd. | | | 61 | |
| | 1 | | | TDK Corp. | | | 56 | |
| | 4 | | | Temp Holdings Co. Ltd. | | | 66 | |
| | 2 | | | Toridoll Holdings Corp. | | | 55 | |
| | 1 | | | Ulvac, Inc. | | | 56 | |
| | | | | | | | |
| | | | | | | 1,665 | |
| | | | | | | | |
| | | | Netherlands — 0.8% | |
| | 1 | | | Aalberts Industries NV | | | 57 | |
| | | | | | | | |
| | | | Norway — 2.1% | |
| | 3 | | | Salmar ASA | | | 60 | |
| | 5 | | | Skandiabanken ASA (a) (e) | | | 47 | |
| | 2 | | | TGS Nopec Geophysical Co. ASA | | | 36 | |
| | | | | | | | |
| | | | | | | 143 | |
| | | | | | | | |
| | | | South Africa — 0.7% | |
| | 2 | | | Mondi plc | | | 45 | |
| | | | | | | | |
| | | | Spain — 0.8% | |
| | 15 | | | Mapfre SA | | | 53 | |
| | | | | | | | |
| | | | Sweden — 3.2% | |
| | 6 | | | Husqvarna AB, Class B | | | 60 | |
| | 4 | | | Sandvik AB | | | 60 | |
| | 2 | | | Thule Group AB (e) | | | 37 | |
| | 2 | | | Trelleborg AB, Class B, | | | 57 | |
| | | | | | | | |
| | | | | | | 214 | |
| | | | | | | | |
| | | | Switzerland — 7.0% | |
| | — | (h) | | Baloise Holding AG (Registered) | | | 54 | |
| | — | (h) | | Bucher Industries AG (Registered) | | | 60 | |
| | — | (h) | | dormakaba Holding AG (a) | | | 54 | |
| | — | (h) | | Forbo Holding AG (Registered) | | | 57 | |
| | 1 | | | Oriflame Holding AG (a) | | | 51 | |
| | — | (h) | | Sika AG | | | 58 | |
| | | | | | | | |
| SHARES | | | SECURITY DESCRIPTION | | VALUE($) | |
| | | | | | | | |
| | | | Switzerland — continued | |
| | — | (h) | | Sulzer AG (Registered) | | | 55 | |
| | 1 | | | Temenos Group AG (Registered) (a) | | | 54 | |
| | — | (h) | | Wolseley plc | | | 29 | |
| | | | | | | | |
| | | | | | | 472 | |
| | | | | | | | |
| | | | United Kingdom — 16.2% | |
| | 5 | | | 3i Group plc | | | 49 | |
| | 7 | | | 888 Holdings plc | | | 25 | |
| | 3 | | | Anglo American plc (a) | | | 41 | |
| | 6 | | | Ashtead Group plc | | | 122 | |
| | 3 | | | Barratt Developments plc | | | 26 | |
| | 6 | | | BBA Aviation plc | | | 24 | |
| | 5 | | | CNH Industrial NV | | | 59 | |
| | — | (h) | | DCC plc | | | 18 | |
| | 14 | | | Electrocomponents plc | | | 95 | |
| | 1 | | | Fevertree Drinks plc | | | 21 | |
| | 6 | | | G4S plc | | | 23 | |
| | 6 | | | GKN plc | | | 27 | |
| | 1 | | | Intermediate Capital Group plc | | | 14 | |
| | 14 | | | ITV plc | | | 37 | |
| | 19 | | | JD Sports Fashion plc | | | 112 | |
| | 4 | | | Just Eat plc (a) | | | 31 | |
| | 25 | | | Melrose Industries plc | | | 77 | |
| | 3 | | | Micro Focus International plc | | | 97 | |
| | 11 | | | OneSavings Bank plc | | | 65 | |
| | 2 | | | RPC Group plc | | | 17 | |
| | 2 | | | Smiths Group plc | | | 34 | |
| | 3 | | | Subsea 7 SA | | | 56 | |
| | 4 | | | Vesuvius plc | | | 25 | |
| | | | | | | | |
| | | | | | | 1,095 | |
| | | | | | | | |
| | | | United States — 1.3% | |
| | 1 | | | Carnival plc | | | 34 | |
| | 2 | | | Yum China Holdings, Inc. (a) | | | 57 | |
| | | | | | | | |
| | | | | | | 91 | |
| | | | | | | | |
| | | | Total Investments — 98.8%
(Cost $5,564) | | | 6,680 | |
| | | | Other Assets in Excess of
Liabilities — 1.2% | | | 82 | |
| | | | | | | | |
| | | | NET ASSETS — 100.0% | | $ | 6,762 | |
| | | | | | | | |
Percentages indicated are based on net assets.
SEE NOTES TO FINANCIAL STATEMENTS.
| | | | | | | | |
| | | |
| APRIL 30, 2017 | | J.P. MORGAN INTERNATIONAL EQUITY FUNDS | | | | | 61 | |
JPMorgan International Discovery Fund
SCHEDULE OF PORTFOLIO INVESTMENTS
AS OF APRIL 30, 2017 (Unaudited) (continued)
Summary of Investments by Industry, April 30, 2017
The following table represents the portfolio investments of the Fund by industry classifications as a percentage of total investments:
| | | | |
| INDUSTRY | | PERCENTAGE | |
Machinery | | | 13.6 | % |
Hotels, Restaurants & Leisure | | | 6.0 | |
Household Durables | | | 5.9 | |
Banks | | | 5.4 | |
Electronic Equipment, Instruments & Components | | | 4.8 | |
Semiconductors & Semiconductor Equipment | | | 4.1 | |
Trading Companies & Distributors | | | 3.8 | |
Metals & Mining | | | 3.7 | |
Auto Components | | | 3.3 | |
Software | | | 3.1 | |
Chemicals | | | 3.1 | |
Specialty Retail | | | 2.8 | |
Professional Services | | | 2.8 | |
Beverages | | | 2.7 | |
Textiles, Apparel & Luxury Goods | | | 2.6 | |
Diversified Financial Services | | | 2.6 | |
Building Products | | | 1.8 | |
| | | | |
| INDUSTRY | | PERCENTAGE | |
IT Services | | | 1.7 | % |
Pharmaceuticals | | | 1.7 | |
Media | | | 1.7 | |
Insurance | | | 1.6 | |
Paper & Forest Products | | | 1.5 | |
Construction & Engineering | | | 1.5 | |
Leisure Products | | | 1.5 | |
Energy Equipment & Services | | | 1.4 | |
Capital Markets | | | 1.3 | |
Real Estate Management & Development | | | 1.2 | |
Automobiles | | | 1.2 | |
Commercial Services & Supplies | | | 1.2 | |
Electrical Equipment | | | 1.2 | |
Health Care Technology | | | 1.0 | |
Thrifts & Mortgage Finance | | | 1.0 | |
Others (each less than 1.0%) | | | 7.2 | |
SEE NOTES TO FINANCIAL STATEMENTS.
| | | | | | |
| | | |
| 62 | | | | J.P. MORGAN INTERNATIONAL EQUITY FUNDS | | APRIL 30, 2017 |
JPMorgan International Equity Fund
SCHEDULE OF PORTFOLIO INVESTMENTS
AS OF APRIL 30, 2017 (Unaudited)
(Amounts in thousands)
| | | | | | | | |
| SHARES | | | SECURITY DESCRIPTION | | VALUE($) | |
| | | | | | | | |
| | Common Stocks — 97.0% | | | | |
| | | | Australia — 1.2% | | | | |
| | 1,574 | | | BHP Billiton Ltd. | | | 28,029 | |
| | 768 | | | BHP Billiton plc | | | 11,716 | |
| | 1,794 | | | South32 Ltd. | | | 3,717 | |
| | | | | | | | |
| | | | | | | 43,462 | |
| | | | | | | | |
| | | | Belgium — 1.6% | | | | |
| | 511 | | | Anheuser-Busch InBev SA/NV | | | 57,669 | |
| | | | | | | | |
| | | | China — 3.1% | | | | |
| | 181 | | | Baidu, Inc., ADR (a) | | | 32,538 | |
| | 5,578 | | | China Overseas Land & Investment Ltd. | | | 16,179 | |
| | 30,300 | | | CNOOC Ltd. | | | 35,348 | |
| | 5,321 | | | Ping An Insurance Group Co. of China Ltd., Class H | | | 29,913 | |
| | | | | | | | |
| | | | | | | 113,978 | |
| | | | | | | | |
| | | | Denmark — 1.0% | | | | |
| | 974 | | | Novo Nordisk A/S, Class B | | | 37,917 | |
| | | | | | | | |
| | | | France — 12.2% | | | | |
| | 855 | | | Accor SA | | | 38,988 | |
| | 1,834 | | | AXA SA | | | 48,919 | |
| | 681 | | | BNP Paribas SA | | | 48,035 | |
| | 243 | | | Essilor International SA | | | 31,448 | |
| | 305 | | | Imerys SA | | | 26,202 | |
| | 66 | | | Kering | | | 20,404 | |
| | 203 | | | LVMH Moet Hennessy Louis Vuitton SE | | | 50,046 | |
| | 273 | | | Pernod Ricard SA | | | 34,105 | |
| | 490 | | | Safran SA | | | 40,588 | |
| | 570 | | | Sanofi | | | 53,829 | |
| | 733 | | | Schneider Electric SE | | | 58,067 | |
| | | | | | | | |
| | | | | | | 450,631 | |
| | | | | | | | |
| | | | Germany — 6.9% | | | | |
| | 327 | | | Allianz SE (Registered) | | | 62,328 | |
| | 405 | | | Bayer AG (Registered) | | | 50,164 | |
| | 249 | | | Continental AG | | | 55,862 | |
| | 165 | | | Fresenius Medical Care AG & Co. KGaA | | | 14,642 | |
| | 700 | | | SAP SE | | | 70,098 | |
| | | | | | | | |
| | | | | | | 253,094 | |
| | | | | | | | |
| | | | Hong Kong — 4.5% | | | | |
| | 6,716 | | | AIA Group Ltd. | | | 46,483 | |
| | 5,301 | | | Cheung Kong Property Holdings Ltd. | | | 37,951 | |
| | 4,030 | | | CK Hutchison Holdings Ltd. | | | 50,318 | |
| | 7,070 | | | Sands China Ltd. | | | 32,021 | |
| | | | | | | | |
| | | | | | | 166,773 | |
| | | | | | | | |
| | | | | | | | |
| SHARES | | | SECURITY DESCRIPTION | | VALUE($) | |
| | | | | | | | |
| | | | India — 1.1% | | | | |
| | 520 | | | HDFC Bank Ltd., ADR | | | 41,364 | |
| | | | | | | | |
| | | | | | | | |
| | | | Indonesia — 0.7% | | | | |
| | 40,823 | | | Astra International Tbk. PT | | | 27,359 | |
| | | | | | | | |
| | | | Israel — 0.6% | | | | |
| | 699 | | | Teva Pharmaceutical Industries Ltd., ADR | | | 22,073 | |
| | | | | | | | |
| | | | Japan — 20.8% | | | | |
| | 2,593 | | | Astellas Pharma, Inc. | | | 34,189 | |
| | 328 | | | Daikin Industries Ltd. | | | 31,880 | |
| | 214 | | | FANUC Corp. | | | 43,590 | |
| | 1,490 | | | Honda Motor Co. Ltd. | | | 43,373 | |
| | 3,680 | | | Inpex Corp. | | | 35,259 | |
| | 1,625 | | | Japan Tobacco, Inc. | | | 54,076 | |
| | 1,311 | | | KDDI Corp. | | | 34,752 | |
| | 93 | | | Keyence Corp. | | | 37,226 | |
| | 1,346 | | | Komatsu Ltd. | | | 35,954 | |
| | 3,232 | | | Kubota Corp. | | | 50,915 | |
| | 1,108 | | | Makita Corp. | | | 39,519 | |
| | 1,362 | | | Mitsui Fudosan Co. Ltd. | | | 29,967 | |
| | 397 | | | Nidec Corp. | | | 36,463 | |
| | 235 | | | Nitto Denko Corp. | | | 17,673 | |
| | 581 | | | Shin-Etsu Chemical Co. Ltd. | | | 50,456 | |
| | 149 | | | SMC Corp. | | | 42,026 | |
| | 1,692 | | | Sumitomo Mitsui Financial Group, Inc. | | | 62,821 | |
| | 315 | | | Tokyo Electron Ltd. | | | 38,239 | |
| | 912 | | | Toyota Motor Corp. | | | 49,374 | |
| | | | | | | | |
| | | | | | | 767,752 | |
| | | | | | | | |
| | | | Macau — 0.8% | | | | |
| | 12,614 | | | Wynn Macau Ltd. | | | 27,651 | |
| | | | | | | | |
| | | | Netherlands — 5.6% | | | | |
| | 463 | | | Akzo Nobel NV | | | 40,490 | |
| | 332 | | | ASML Holding NV | | | 43,844 | |
| | 3,621 | | | ING Groep NV | | | 59,025 | |
| | 2,413 | | | Royal Dutch Shell plc, Class A | | | 62,673 | |
| | | | | | | | |
| | | | | | | 206,032 | |
| | | | | | | | |
| | | | South Africa — 1.1% | | | | |
| | 216 | | | Naspers Ltd., Class N | | | 41,151 | |
| | | | | | | | |
| | | | South Korea — 2.7% | | | | |
| | 95 | | | Hyundai Mobis Co. Ltd. | | | 18,455 | |
| | 83 | | | Samsung Electronics Co. Ltd., GDR | | | 80,965 | |
| | | | | | | | |
| | | | | | | 99,420 | |
| | | | | | | | |
| | | | Spain — 1.2% | | | | |
| | 5,649 | | | Banco Bilbao Vizcaya Argentaria SA | | | 45,257 | |
| | | | | | | | |
SEE NOTES TO FINANCIAL STATEMENTS.
| | | | | | | | |
| | | |
| APRIL 30, 2017 | | J.P. MORGAN INTERNATIONAL EQUITY FUNDS | | | | | 63 | |
JPMorgan International Equity Fund
SCHEDULE OF PORTFOLIO INVESTMENTS
AS OF APRIL 30, 2017 (Unaudited) (continued)
(Amounts in thousands)
| | | | | | | | |
| SHARES | | | SECURITY DESCRIPTION | | VALUE($) | |
| | Common Stocks — continued | | | | |
| | | | Switzerland — 10.6% | | | | |
| | 505 | | | Cie Financiere Richemont SA (Registered) | | | 42,161 | |
| | 9,313 | | | Glencore plc (a) | | | 36,603 | |
| | 835 | | | LafargeHolcim Ltd. (Registered) (a) | | | 47,388 | |
| | 945 | | | Novartis AG (Registered) | | | 72,759 | |
| | 298 | | | Roche Holding AG | | | 78,098 | |
| | 3,814 | | | UBS Group AG (Registered) (a) | | | 65,108 | |
| | 170 | | | Zurich Insurance Group AG | | | 47,053 | |
| | | | | | | | |
| | | | | | | 389,170 | |
| | | | | | | | |
| | | | Taiwan — 1.2% | | | | |
| | 1,335 | | | Taiwan Semiconductor Manufacturing Co. Ltd., ADR | | | 44,155 | |
| | | | | | | | |
| | | | United Kingdom — 19.1% | | | | |
| | 890 | | | British American Tobacco plc | | | 60,120 | |
| | 2,137 | | | Burberry Group plc | | | 44,651 | |
| | 9,626 | | | HSBC Holdings plc | | | 79,325 | |
| | 717 | | | Imperial Brands plc | | | 35,107 | |
| | 32,579 | | | Lloyds Banking Group plc | | | 29,273 | |
| | 4,681 | | | Meggitt plc | | | 28,033 | |
| | 890 | | | Persimmon plc | | | 26,868 | |
| | 3,465 | | | Prudential plc | | | 76,895 | |
| | 1,467 | | | RELX NV | | | 28,341 | |
| | 703 | | | Rio Tinto Ltd. | | | 31,804 | |
| | 543 | | | Rio Tinto plc | | | 21,415 | |
| | 4,743 | | | Standard Chartered plc (a) | | | 44,324 | |
| | 975 | | | TechnipFMC plc (a) | | | 29,320 | |
| | 865 | | | Travis Perkins plc | | | 18,048 | |
| | 949 | | | Unilever plc | | | 48,843 | |
| | 24,977 | | | Vodafone Group plc | | | 64,332 | |
| | 1,839 | | | WPP plc | | | 39,370 | |
| | | | | | | | |
| | | | | | | 706,069 | |
| | | | | | | | |
| | | | United States — 1.0% | | | | |
| | 600 | | | Shire plc | | | 35,393 | |
| | | | | | | | |
| | | | Total Common Stocks
(Cost $$3,044,043) | | | 3,576,370 | |
| | | | | | | | |
| | Preferred Stocks — 1.1% | |
| | | | Germany — 1.1% | | | | |
| | 315 | | | Henkel AG & Co. KGaA (Preference)
(Cost $27,580) | | | 42,841 | |
| | | | | | | | |
| | | | | | | | |
| SHARES | | | SECURITY DESCRIPTION | | VALUE($) | |
| | Short-Term Investment — 2.1% | |
| | | | Investment Company — 2.1% | | | | |
| | 76,383 | | | JPMorgan U.S. Government Money Market Fund, Institutional Class Shares, 0.620% (b) (l)
(Cost $76,383) | | | 76,383 | |
| | | | | | | | |
| | | | Total Investments — 100.2%
(Cost $3,148,006) | | | 3,695,594 | |
| | | | Liabilities in Excess of
Other Assets — (0.2)% | | | (7,184 | ) |
| | | | | | | | |
| | | | NET ASSETS — 100.0% | | $ | 3,688,410 | |
| | | | | | | | |
Percentages indicated are based on net assets.
SEE NOTES TO FINANCIAL STATEMENTS.
| | | | | | |
| | | |
| 64 | | | | J.P. MORGAN INTERNATIONAL EQUITY FUNDS | | APRIL 30, 2017 |
Summary of Investments by Industry, April 30, 2017
The following table represents the portfolio investments of the Fund by industry classifications as a percentage of total investments:
| | | | |
| INDUSTRY | | PERCENTAGE | |
Banks | | | 11.1 | % |
Pharmaceuticals | | | 9.4 | |
Insurance | | | 8.4 | |
Machinery | | | 5.7 | |
Textiles, Apparel & Luxury Goods | | | 4.3 | |
Tobacco | | | 4.0 | |
Metals & Mining | | | 3.6 | |
Oil, Gas & Consumable Fuels | | | 3.6 | |
Semiconductors & Semiconductor Equipment | | | 3.4 | |
Automobiles | | | 3.2 | |
Chemicals | | | 2.9 | |
Wireless Telecommunication Services | | | 2.7 | |
Hotels, Restaurants & Leisure | | | 2.7 | |
Electrical Equipment | | | 2.5 | |
Beverages | | | 2.5 | |
| | | | |
| INDUSTRY | | PERCENTAGE | |
Real Estate Management & Development | | | 2.3 | % |
Technology Hardware, Storage & Peripherals | | | 2.2 | |
Media | | | 2.2 | |
Auto Components | | | 2.0 | |
Construction Materials | | | 2.0 | |
Software | | | 1.9 | |
Aerospace & Defense | | | 1.9 | |
Capital Markets | | | 1.8 | |
Industrial Conglomerates | | | 1.4 | |
Personal Products | | | 1.3 | |
Household Products | | | 1.2 | |
Electronic Equipment, Instruments & Components | | | 1.0 | |
Biotechnology | | | 1.0 | |
Others (each less than 1.0%) | | | 5.7 | |
Short-Term Investment | | | 2.1 | |
| | | | | | | | | | | | | | | | | | | | | | | | |
| Forward Foreign Currency Exchange Contracts | |
CONTRACTS
TO BUY | | CURRENCY | | | COUNTERPARTY | | | SETTLEMENT
DATE | | | SETTLEMENT
VALUE | | | VALUE AT
APRIL 30, 2017 | | | NET UNREALIZED
APPRECIATION
(DEPRECIATION) | |
| 14,635 | | | EUR | | | | BNP Paribas | | | | 05/03/17 | | | $ | 15,947 | | | $ | 15,942 | | | $ | (5 | ) |
SEE NOTES TO FINANCIAL STATEMENTS.
| | | | | | | | |
| | | |
| APRIL 30, 2017 | | J.P. MORGAN INTERNATIONAL EQUITY FUNDS | | | | | 65 | |
JPMorgan International Equity Income Fund
SCHEDULE OF PORTFOLIO INVESTMENTS
AS OF APRIL 30, 2017 (Unaudited)
(Amounts in thousands)
| | | | | | | | |
| SHARES | | | SECURITY DESCRIPTION | | VALUE($) | |
| | | | | | | | |
| | Common Stocks — 97.0% | |
| | | | Belgium — 2.9% | | | | |
| | 46 | | | Anheuser-Busch InBev SA/NV | | | 5,177 | |
| | | | | | | | |
| | | | Brazil — 0.7% | | | | |
| | 149 | | | Vale SA, ADR (a) | | | 1,279 | |
| | | | | | | | |
| | | | Canada — 1.9% | | | | |
| | 29 | | | Toronto-Dominion Bank (The) | | | 1,353 | |
| | 43 | | | TransCanada Corp. | | | 1,976 | |
| | | | | | | | |
| | | | | | | 3,329 | |
| | | | | | | | |
| | | | China — 1.6% | | | | |
| | 2,343 | | | CNOOC Ltd. | | | 2,733 | |
| | | | | | | | |
| | | | Czech Republic — 1.8% | | | | |
| | 962 | | | Moneta Money Bank A/S (e) | | | 3,110 | |
| | | | | | | | |
| | | | Denmark — 2.7% | | | | |
| | 131 | | | Danske Bank A/S | | | 4,749 | |
| | | | | | | | |
| | | | Finland — 3.9% | | | | |
| | 31 | | | Cargotec OYJ, Class B | | | 1,860 | |
| | 231 | | | Nokia OYJ, ADR | | | 1,325 | |
| | 139 | | | UPM-Kymmene OYJ | | | 3,660 | |
| | | | | | | | |
| | | | | | | 6,845 | |
| | | | | | | | |
| | | | France — 7.5% | | | | |
| | 11 | | | Airbus SE | | | 862 | |
| | 30 | | | Cie Generale des Etablissements Michelin | | | 3,889 | |
| | 36 | | | Sanofi | | | 3,400 | |
| | 7 | | | Unibail-Rodamco SE | | | 1,746 | |
| | 38 | | | Vinci SA | | | 3,244 | |
| | | | | | | | |
| | | | | | | 13,141 | |
| | | | | | | | |
| | | | Germany — 12.1% | | | | |
| | 17 | | | Allianz SE (Registered) | | | 3,180 | |
| | 25 | | | BASF SE | | | 2,450 | |
| | 11 | | | Continental AG | | | 2,573 | |
| | 46 | | | Daimler AG (Registered) | | | 3,420 | |
| | 22 | | | Deutsche Boerse AG | | | 2,156 | |
| | 76 | | | Deutsche Wohnen AG | | | 2,607 | |
| | 25 | | | Evonik Industries AG | | | 848 | |
| | 28 | | | Siemens AG (Registered) | | | 3,974 | |
| | | | | | | | |
| | | | | | | 21,208 | |
| | | | | | | | |
| | | | Hong Kong — 1.0% | | | | |
| | 406 | | | Sands China Ltd. | | | 1,841 | |
| | | | | | | | |
| | | | Israel — 0.7% | | | | |
| | 38 | | | Teva Pharmaceutical Industries Ltd., ADR | | | 1,201 | |
| | | | | | | | |
| | | | Japan — 10.7% | | | | |
| | 90 | | | Bridgestone Corp. | | | 3,754 | |
| | 104 | | | Daiwa House Industry Co. Ltd. | | | 3,095 | |
| | | | | | | | |
| SHARES | | | SECURITY DESCRIPTION | | VALUE($) | |
| | | | | | | | |
| | | | | | | | |
| | | | Japan — continued | | | | |
| | 535 | | | Daiwa Securities Group, Inc. | | | 3,255 | |
| | 128 | | | Mitsubishi Corp. | | | 2,771 | |
| | 592 | | | Mitsubishi UFJ Financial Group, Inc., ADR | | | 3,755 | |
| | 52 | | | Nippon Telegraph & Telephone Corp. | | | 2,237 | |
| | | | | | | | |
| | | | | | | 18,867 | |
| | | | | | | | |
| | | | Netherlands — 5.6% | | | | |
| | 192 | | | ING Groep NV | | | 3,128 | |
| | 165 | | | Koninklijke Ahold Delhaize NV | | | 3,417 | |
| | 99 | | | NN Group NV | | | 3,293 | |
| | | | | | | | |
| | | | | | | 9,838 | |
| | | | | | | | |
| | | | New Zealand — 1.3% | | | | |
| | 879 | | | Spark New Zealand Ltd. | | | 2,229 | |
| | | | | | | | |
| | | | Norway — 1.5% | | | | |
| | 172 | | | DNB ASA | | | 2,692 | |
| | | | | | | | |
| | | | Russia — 4.8% | | | | |
| | 63 | | | LUKOIL PJSC, ADR | | | 3,130 | |
| | 164 | | | MMC Norilsk Nickel PJSC, ADR | | | 2,512 | |
| | 210 | | | Severstal PJSC, GDR | | | 2,864 | |
| | | | | | | | |
| | | | | | | 8,506 | |
| | | | | | | | |
| | | | South Korea — 1.9% | | | | |
| | 2 | | | Samsung Electronics Co. Ltd. | | | 3,433 | |
| | | | | | | | |
| | | | Spain — 1.0% | | | | |
| | 152 | | | Telefonica SA | | | 1,681 | |
| | | | | | | | |
| | | | Sweden — 0.9% | | | | |
| | 68 | | | Skandinaviska Enskilda Banken AB, Class A | | | 779 | |
| | 121 | | | Telefonaktiebolaget LM Ericsson, Class B | | | 788 | |
| | | | | | | | |
| | | | | | | 1,567 | |
| | | | | | | | |
| | | | Switzerland — 7.5% | | | | |
| | 27 | | | Galenica Sante Ltd. (a) (e) | | | 1,193 | |
| | 522 | | | Glencore plc (a) | | | 2,052 | |
| | 30 | | | LafargeHolcim Ltd. (Registered) (a) | | | 1,682 | |
| | 23 | | | Novartis AG (Registered) | | | 1,781 | |
| | 34 | | | Swiss Re AG | | | 2,924 | |
| | 56 | | | Wolseley plc | | | 3,533 | |
| | | | | | | | |
| | | | | | | 13,165 | |
| | | | | | | | |
| | | | Taiwan — 0.9% | | | | |
| | 47 | | | Taiwan Semiconductor Manufacturing Co. Ltd., ADR | | | 1,562 | |
| | | | | | | | |
| | | | United Kingdom — 24.1% | | | | |
| | 190 | | | 3i Group plc | | | 1,956 | |
| | 351 | | | BAE Systems plc | | | 2,850 | |
| | 275 | | | Beazley plc | | | 1,566 | |
SEE NOTES TO FINANCIAL STATEMENTS.
| | | | | | |
| | | |
| 66 | | | | J.P. MORGAN INTERNATIONAL EQUITY FUNDS | | APRIL 30, 2017 |
| | | | | | | | |
| SHARES | | | SECURITY DESCRIPTION | | VALUE($) | |
| | | | | | | | |
| | Common Stocks — continued | | | | |
| | | | United Kingdom — continued | | | | |
| | 67 | | | Berkeley Group Holdings plc | | | 2,844 | |
| | 78 | | | British American Tobacco plc | | | 5,262 | |
| | 695 | | | Direct Line Insurance Group plc | | | 3,141 | |
| | 300 | | | GlaxoSmithKline plc | | | 6,033 | |
| | 100 | | | HSBC Holdings plc, ADR | | | 4,102 | |
| | 62 | | | Imperial Brands plc | | | 3,032 | |
| | 32 | | | InterContinental Hotels Group plc | | | 1,683 | |
| | 628 | | | ITV plc | | | 1,708 | |
| | 31 | | | Persimmon plc | | | 927 | |
| | 73 | | | Prudential plc | | | 1,630 | |
| | 219 | | | RSA Insurance Group plc | | | 1,693 | |
| | 187 | | | WPP plc | | | 4,012 | |
| | | | | | | | |
| | | | | | | 42,439 | |
| | | | | | | | |
| | | | Total Common Stocks
(Cost $155,245) | | | 170,592 | |
| | | | | | | | |
| | Short-Term Investment — 1.9% | |
| | | | Investment Company — 1.9% | | | | |
| | 3,386 | | | JPMorgan U.S. Government Money Market Fund, Institutional Class Shares, 0.620% (b) (l)
(Cost $3,386) | | | 3,386 | |
| | | | | | | | |
| | | | Total Investments — 98.9%
(Cost $158,631) | | | 173,978 | |
| | | | Other Assets in Excess of
Liabilities — 1.1% | | | 1,894 | |
| | | | | | | | |
| | | | NET ASSETS — 100.0% | | $ | 175,872 | |
| | | | | | | | |
Percentages indicated are based on net assets.
Summary of Investments by Industry, April 30, 2017
The following table represents the portfolio investments of the Fund by industry classifications as a percentage of total investments:
| | | | |
| INDUSTRY | | PERCENTAGE | |
Banks | | | 13.6 | % |
Insurance | | | 10.0 | |
Pharmaceuticals | | | 7.8 | |
Auto Components | | | 5.9 | |
Metals & Mining | | | 5.0 | |
Tobacco | | | 4.8 | |
Oil, Gas & Consumable Fuels | | | 4.5 | |
Capital Markets | | | 4.2 | |
Trading Companies & Distributors | | | 3.6 | |
Diversified Telecommunication Services | | | 3.5 | |
Media | | | 3.3 | |
Real Estate Management & Development | | | 3.3 | |
Beverages | | | 3.0 | |
Industrial Conglomerates | | | 2.3 | |
Household Durables | | | 2.2 | |
Aerospace & Defense | | | 2.1 | |
Paper & Forest Products | | | 2.1 | |
Hotels, Restaurants & Leisure | | | 2.0 | |
Technology Hardware, Storage & Peripherals | | | 2.0 | |
Automobiles | | | 2.0 | |
Food & Staples Retailing | | | 2.0 | |
Chemicals | | | 1.9 | |
Construction & Engineering | | | 1.9 | |
Communications Equipment | | | 1.2 | |
Machinery | | | 1.1 | |
Equity Real Estate Investment Trusts (REITs) | | | 1.0 | |
Construction Materials | | | 1.0 | |
Others (each less than 1.0%) | | | 0.8 | |
Short-Term Investment | | | 1.9 | |
SEE NOTES TO FINANCIAL STATEMENTS.
| | | | | | | | |
| | | |
| APRIL 30, 2017 | | J.P. MORGAN INTERNATIONAL EQUITY FUNDS | | | | | 67 | |
JPMorgan International Opportunities Fund
SCHEDULE OF PORTFOLIO INVESTMENTS
AS OF APRIL 30, 2017 (Unaudited)
(Amounts in thousands)
| | | | | | | | |
| SHARES | | | SECURITY DESCRIPTION | | VALUE($) | |
| | | | | | | | |
| | Common Stocks — 97.7% | |
| | | | Australia — 3.8% | | | | |
| | 1,372 | | | Australia & New Zealand Banking Group Ltd. | | | 33,592 | |
| | 260 | | | Commonwealth Bank of Australia | | | 17,009 | |
| | 7,729 | | | Goodman Group | | | 46,928 | |
| | 2,832 | | | Oil Search Ltd. | | | 15,280 | |
| | | | | | | | |
| | | | | | | 112,809 | |
| | | | | | | | |
| | | | Belgium — 1.6% | | | | |
| | 416 | | | Anheuser-Busch InBev SA/NV | | | 46,945 | |
| | | | | | | | |
| | | | Chile — 1.1% | | | | |
| | 3,018 | | | Antofagasta plc | | | 32,747 | |
| | | | | | | | |
| | | | China — 2.8% | | | | |
| | 8,276 | | | China Resources Gas Group Ltd. | | | 27,891 | |
| | 12,100 | | | China Resources Land Ltd. | | | 33,529 | |
| | 663 | | | Tencent Holdings Ltd. | | | 20,768 | |
| | | | | | | | |
| | | | | | | 82,188 | |
| | | | | | | | |
| | | | Denmark — 2.4% | | | | |
| | 436 | | | Chr Hansen Holding A/S | | | 29,388 | |
| | 205 | | | Genmab A/S (a) | | | 40,740 | |
| | | | | | | | |
| | | | | | | 70,128 | |
| | | | | | | | |
| | | | Finland — 2.2% | | | | |
| | 1,300 | | | UPM-Kymmene OYJ | | | 34,254 | |
| | 491 | | | Wartsila OYJ Abp | | | 29,835 | |
| | | | | | | | |
| | | | | | | 64,089 | |
| | | | | | | | |
| | | | France — 13.9% | | | | |
| | 535 | | | Airbus SE | | | 43,244 | |
| | 1,353 | | | AXA SA | | | 36,106 | |
| | 709 | | | BNP Paribas SA | | | 50,050 | |
| | 393 | | | Cap Gemini SA | | | 39,319 | |
| | 102 | | | Kering | | | 31,718 | |
| | 1,044 | | | Klepierre | | | 40,982 | |
| | 252 | | | Pernod Ricard SA | | | 31,563 | |
| | 301 | | | Renault SA | | | 28,086 | |
| | 252 | | | Sanofi | | | 23,843 | |
| | 370 | | | Thales SA | | | 38,866 | |
| | 979 | | | TOTAL SA | | | 50,266 | |
| | | | | | | | |
| | | | | | | 414,043 | |
| | | | | | | | |
| | | | Germany — 7.8% | | | | |
| | 197 | | | adidas AG | | | 39,582 | |
| | 140 | | | Continental AG | | | 31,400 | |
| | 271 | | | Deutsche Boerse AG | | | 26,534 | |
| | 406 | | | Fresenius SE & Co. KGaA | | | 32,950 | |
| | 1,962 | | | Infineon Technologies AG | | | 40,555 | |
| | 434 | | | Siemens AG (Registered) | | | 62,267 | |
| | | | | | | | |
| | | | | | | 233,288 | |
| | | | | | | | |
| | | | | | | | |
| SHARES | | | SECURITY DESCRIPTION | | VALUE($) | |
| | | | | | | | |
| | |
| | | | India — 1.5% | | | | |
| | 566 | | | HDFC Bank Ltd., ADR | | | 45,077 | |
| | | | | | | | |
| | | | Italy — 2.4% | | | | |
| | 8,724 | | | Enel SpA | | | 41,475 | |
| | 35,094 | | | Telecom Italia SpA (a) | | | 31,150 | |
| | | | | | | | |
| | | | | | | 72,625 | |
| | | | | | | | |
| | | | Japan — 23.7% | | | | |
| | 384 | | | Daikin Industries Ltd. | | | 37,373 | |
| | 295 | | | Dentsu, Inc. | | | 16,641 | |
| | 1,815 | | | DMG Mori Co. Ltd. | | | 29,971 | |
| | 978 | | | Honda Motor Co. Ltd. | | | 28,457 | |
| | 468 | | | Izumi Co. Ltd. | | | 23,402 | |
| | 1,135 | | | Japan Airlines Co. Ltd. | | | 35,829 | |
| | 2,405 | | | Kajima Corp. | | | 16,330 | |
| | 108 | | | Keyence Corp. | | | 43,578 | |
| | 1,574 | | | Marui Group Co. Ltd. | | | 21,561 | |
| | 1,773 | | | Mitsubishi Corp. | | | 38,255 | |
| | 8,201 | | | Mitsubishi UFJ Financial Group, Inc. | | | 51,963 | |
| | 1,596 | | | Mitsui Fudosan Co. Ltd. | | | 35,116 | |
| | 1,332 | | | Nippon Steel & Sumitomo Metal Corp. | | | 30,000 | |
| | 898 | | | Nippon Telegraph & Telephone Corp. | | | 38,467 | |
| | 428 | | | Oriental Land Co. Ltd. | | | 24,599 | |
| | 2,633 | | | ORIX Corp. | | | 40,235 | |
| | 453 | | | Sompo Holdings, Inc. | | | 17,108 | |
| | 1,102 | | | Sumitomo Mitsui Financial Group, Inc. | | | 40,922 | |
| | 455 | | | Suntory Beverage & Food Ltd. | | | 20,495 | |
| | 1,028 | | | Suzuki Motor Corp. | | | 42,952 | |
| | 961 | | | Tokio Marine Holdings, Inc. | | | 40,502 | |
| | 1,386 | | | Yamato Holdings Co. Ltd. | | | 29,959 | |
| | | | | | | | |
| | | | | | | 703,715 | |
| | | | | | | | |
| | | | Netherlands — 6.9% | | | | |
| | 278 | | | ASML Holding NV | | | 36,744 | |
| | 3,085 | | | ING Groep NV | | | 50,291 | |
| | 1,885 | | | Koninklijke Ahold Delhaize NV | | | 39,050 | |
| | 2,990 | | | Royal Dutch Shell plc, Class A | | | 77,952 | |
| | | | | | | | |
| | | | | | | 204,037 | |
| | | | | | | | |
| | | | Norway — 1.4% | | | | |
| | 7,211 | | | Norsk Hydro ASA | | | 41,096 | |
| | | | | | | | |
| | | | Spain — 1.6% | | | | |
| | 3,774 | | | Distribuidora Internacional de Alimentacion SA | | | 22,439 | |
| | 674 | | | Industria de Diseno Textil SA | | | 25,821 | |
| | | | | | | | |
| | | | | | | 48,260 | |
| | | | | | | | |
SEE NOTES TO FINANCIAL STATEMENTS.
| | | | | | |
| | | |
| 68 | | | | J.P. MORGAN INTERNATIONAL EQUITY FUNDS | | APRIL 30, 2017 |
| | | | | | | | |
| SHARES | | | SECURITY DESCRIPTION | | VALUE($) | |
| | | | | | | | |
| | Common Stocks — continued | | | | |
| | | | Sweden — 1.3% | | | | |
| | 2,753 | | | Svenska Handelsbanken AB, Class A | | | 39,055 | |
| | | | | | | | |
| | | | Switzerland — 5.4% | | | | |
| | 269 | | | Roche Holding AG | | | 70,321 | |
| | 2,541 | | | UBS Group AG (Registered) (a) | | | 43,384 | |
| | 718 | | | Wolseley plc | | | 45,607 | |
| | | | | | | | |
| | | | | | | 159,312 | |
| | | | | | | | |
| | | | United Kingdom — 16.5% | | | | |
| | 789 | | | Associated British Foods plc | | | 28,730 | |
| | 554 | | | AstraZeneca plc | | | 33,156 | |
| | 948 | | | British American Tobacco plc | | | 64,030 | |
| | 7,012 | | | Dixons Carphone plc | | | 30,460 | |
| | 1,727 | | | GlaxoSmithKline plc | | | 34,762 | |
| | 5,276 | | | Kingfisher plc | | | 23,343 | |
| | 2,061 | | | Prudential plc | | | 45,732 | |
| | 1,174 | | | Rio Tinto plc | | | 46,310 | |
| | 4,741 | | | Standard Chartered plc (a) | | | 44,307 | |
| | 8,587 | | | Taylor Wimpey plc | | | 22,242 | |
| | 930 | | | TechnipFMC plc (a) | | | 27,948 | |
| | 906 | | | Unilever NV, CVA | | | 47,460 | |
| | 16,568 | | | Vodafone Group plc | | | 42,674 | |
| | | | | | | | |
| | | | | | | 491,154 | |
| | | | | | | | |
| | | | United States — 1.4% | | | | |
| | 699 | | | Shire plc | | | 41,186 | |
| | | | | | | | |
| | | | Total Common Stocks
(Cost $2,514,603) | | | 2,901,754 | |
| | | | | | | | |
| | Preferred Stock — 1.2% | |
| | | | Germany — 1.2% | | | | |
| | 265 | | | Henkel AG & Co. KGaA (Preference)
(Cost $23,526) | | | 36,068 | |
| | | | | | | | |
| | Short-Term Investment — 1.3% | |
| | | | Investment Company — 1.3% | | | | |
| | 38,835 | | | JPMorgan U.S. Government Money Market Fund, Institutional Class Shares, 0.620% (b) (l)
(Cost $38,835) | | | 38,835 | |
| | | | | | | | |
| | | | Total Investments — 100.2%
(Cost $2,576,964) | | | 2,976,657 | |
| | | | Liabilities in Excess of
Other Assets — (0.2)% | | | (4,906 | ) |
| | | | | | | | |
| | | | NET ASSETS — 100.0% | | $ | 2,971,751 | |
| | | | | | | | |
Percentages indicated are based on net assets.
Summary of Investments by Industry, April 30, 2017
The following table represents the portfolio investments of the Fund by industry classifications as a percentage of total investments:
| | | | |
| INDUSTRY | | PERCENTAGE | |
Banks | | | 12.5 | % |
Pharmaceuticals | | | 5.4 | |
Metals & Mining | | | 5.0 | |
Oil, Gas & Consumable Fuels | | | 4.8 | |
Insurance | | | 4.6 | |
Automobiles | | | 3.3 | |
Beverages | | | 3.3 | |
Equity Real Estate Investment Trusts (REITs) | | | 3.0 | |
Trading Companies & Distributors | | | 2.8 | |
Aerospace & Defense | | | 2.8 | |
Biotechnology | | | 2.7 | |
Specialty Retail | | | 2.7 | |
Semiconductors & Semiconductor Equipment | | | 2.6 | |
Textiles, Apparel & Luxury Goods | | | 2.4 | |
Capital Markets | | | 2.3 | |
Diversified Telecommunication Services | | | 2.3 | |
Real Estate Management & Development | | | 2.3 | |
Tobacco | | | 2.2 | |
Industrial Conglomerates | | | 2.1 | |
Food & Staples Retailing | | | 2.1 | |
Machinery | | | 2.0 | |
Personal Products | | | 1.6 | |
Multiline Retail | | | 1.5 | |
Electronic Equipment, Instruments & Components | | | 1.5 | |
Wireless Telecommunication Services | | | 1.4 | |
Electric Utilities | | | 1.4 | |
Diversified Financial Services | | | 1.4 | |
IT Services | | | 1.3 | |
Building Products | | | 1.3 | |
Household Products | | | 1.2 | |
Airlines | | | 1.2 | |
Paper & Forest Products | | | 1.2 | |
Health Care Providers & Services | | | 1.1 | |
Auto Components | | | 1.1 | |
Air Freight & Logistics | | | 1.0 | |
Chemicals | | | 1.0 | |
Food Products | | | 1.0 | |
Others (each less than 1.0%) | | | 5.3 | |
Short-Term Investment | | | 1.3 | |
SEE NOTES TO FINANCIAL STATEMENTS.
| | | | | | | | |
| | | |
| APRIL 30, 2017 | | J.P. MORGAN INTERNATIONAL EQUITY FUNDS | | | | | 69 | |
JPMorgan International Opportunities Fund
SCHEDULE OF PORTFOLIO INVESTMENTS
AS OF APRIL 30, 2017 (Unaudited) (continued)
(Amounts in thousands)
| | | | | | | | | | | | | | | | | | | | | | | | |
| Forward Foreign Currency Exchange Contracts | |
CONTRACTS
TO BUY | | | CURRENCY | | | COUNTERPARTY | | SETTLEMENT
DATE | | | SETTLEMENT
VALUE | | | VALUE AT
APRIL 30, 2017 | | | NET
UNREALIZED
APPRECIATION
(DEPRECIATION) | |
| 13,310
11,312 |
| |
| EUR
for GBP |
| | BNP Paribas | | | 05/10/17 | | | $ | 14,655 | # | | $ | 14,504 | # | | $ | (151 | ) |
| 1,058,538
7,664 |
| |
| JPY
for GBP |
| | Goldman Sachs International | | | 05/10/17 | | | | 9,928 | # | | | 9,498 | # | | | (430 | ) |
| | 141,926 | | | | AUD | | | Australia & New Zealand Banking Group Ltd. | | | 05/10/17 | | | | 108,010 | | | | 106,259 | | | | (1,751 | ) |
| | 15,086 | | | | CHF | | | HSBC Bank, NA | | | 05/10/17 | | | | 15,148 | | | | 15,169 | | | | 21 | |
| | 21,459 | | | | CHF | | | Standard Chartered Bank | | | 05/10/17 | | | | 21,343 | | | | 21,577 | | | | 234 | |
| | 104,016 | | | | CHF | | | TD Bank Financial Group | | | 05/10/17 | | | | 105,119 | | | | 104,590 | | | | (529 | ) |
| | 37,812 | | | | EUR | | | HSBC Bank, NA | | | 05/10/17 | | | | 40,080 | | | | 41,204 | | | | 1,124 | |
| | 29,473 | | | | EUR | | | State Street Corp. | | | 05/10/17 | | | | 31,467 | | | | 32,117 | | | | 650 | |
| | 44,592 | | | | EUR | | | Union Bank of Switzerland AG | | | 05/10/17 | | | | 47,852 | | | | 48,593 | | | | 741 | |
| | 36,687 | | | | GBP | | | Barclays Bank plc | | | 05/10/17 | | | | 46,161 | | | | 47,528 | | | | 1,367 | |
| | 7,952 | | | | GBP | | | Goldman Sachs International | | | 05/10/17 | | | | 9,899 | | | | 10,302 | | | | 403 | |
| | 24,590 | | | | GBP | | | HSBC Bank, NA | | | 05/10/17 | | | | 30,512 | | | | 31,856 | | | | 1,344 | |
| | 10,844 | | | | GBP | | | National Australia Bank | | | 05/10/17 | | | | 13,585 | | | | 14,048 | | | | 463 | |
| | 160,969 | | | | HKD | | | HSBC Bank, NA | | | 05/10/17 | | | | 20,771 | | | | 20,698 | | | | (73 | ) |
| | 2,659,164 | | | | JPY | | | HSBC Bank, NA | | | 05/10/17 | | | | 23,294 | | | | 23,862 | | | | 568 | |
| | 2,210,477 | | | | JPY | | | Merrill Lynch International | | | 05/10/17 | | | | 19,749 | | | | 19,835 | | | | 86 | |
| | 3,796,863 | | | | JPY | | | National Australia Bank | | | 05/10/17 | | | | 34,101 | | | | 34,070 | | | | (31 | ) |
| | 1,696,022 | | | | JPY | | | Societe Generale | | | 05/10/17 | | | | 14,961 | | | | 15,219 | | | | 258 | |
| | 1,963,262 | | | | JPY | | | State Street Corp. | | | 05/10/17 | | | | 17,713 | | | | 17,617 | | | | (96 | ) |
| | 118,421 | | | | SEK | | | Barclays Bank plc | | | 05/10/17 | | | | 13,102 | | | | 13,375 | | | | 273 | |
| | 59,817 | | | | SEK | | | National Australia Bank | | | 05/10/17 | | | | 6,651 | | | | 6,756 | | | | 105 | |
| | 306,528 | | | | SEK | | | Union Bank of Switzerland AG | | | 05/10/17 | | | | 34,839 | | | | 34,622 | | | | (217 | ) |
| | 48,233 | | | | SGD | | | HSBC Bank, NA | | | 05/11/17 | | | | 34,092 | | | | 34,526 | | | | 434 | |
| | | | | | | | | | | | | | $ | 713,032 | | | $ | 717,825 | | | $ | 4,793 | |
| | |
| | | | | | | | | | | | | | | | | | | | | | |
CONTRACTS
TO SELL | | | CURRENCY | | COUNTERPARTY | | SETTLEMENT
DATE | | | SETTLEMENT
VALUE | | | VALUE AT
APRIL 30, 2017 | | | NET
UNREALIZED
APPRECIATION
(DEPRECIATION) | |
| | 185,329 | | | DKK | | Merrill Lynch International | | | 05/10/17 | | | $ | 26,807 | | | $ | 27,152 | | | $ | (345 | ) |
| | 7,156 | | | EUR | | Australia & New Zealand Banking Group Ltd. | | | 05/10/17 | | | | 7,604 | | | | 7,797 | | | | (193 | ) |
| | 195,316 | | | EUR | | Barclays Bank plc | | | 05/10/17 | | | | 209,803 | | | | 212,840 | | | | (3,037 | ) |
| | 6,788 | | | EUR | | Citibank, NA | | | 05/10/17 | | | | 7,341 | | | | 7,397 | | | | (56 | ) |
| | 29,693 | | | EUR | | Goldman Sachs International | | | 05/10/17 | | | | 31,390 | | | | 32,358 | | | | (968 | ) |
| | 37,740 | | | EUR | | Merrill Lynch International | | | 05/10/17 | | | | 40,289 | | | | 41,126 | | | | (837 | ) |
| | 5,440 | | | EUR | | National Australia Bank | | | 05/10/17 | | | | 5,775 | | | | 5,928 | | | | (153 | ) |
| | 46,665 | | | EUR | | State Street Corp. | | | 05/10/17 | | | | 49,276 | | | | 50,853 | | | | (1,577 | ) |
| | 10,821 | | | EUR | | TD Bank Financial Group | | | 05/10/17 | | | | 11,453 | | | | 11,792 | | | | (339 | ) |
| | 10,617 | | | GBP | | Australia & New Zealand Banking Group Ltd. | | | 05/10/17 | | | | 13,119 | | | | 13,754 | | | | (635 | ) |
| | 5,801 | | | GBP | | BNP Paribas | | | 05/10/17 | | | | 7,252 | | | | 7,515 | | | | (263 | ) |
| | 6,868 | | | GBP | | Goldman Sachs International | | | 05/10/17 | | | | 8,541 | | | | 8,897 | | | | (356 | ) |
| | 42,591 | | | GBP | | HSBC Bank, NA | | | 05/10/17 | | | | 52,982 | | | | 55,176 | | | | (2,194 | ) |
| | 85,561 | | | HKD | | Union Bank of Switzerland AG | | | 05/10/17 | | | | 11,041 | | | | 11,002 | | | | 39 | |
SEE NOTES TO FINANCIAL STATEMENTS.
| | | | | | |
| | | |
| 70 | | | | J.P. MORGAN INTERNATIONAL EQUITY FUNDS | | APRIL 30, 2017 |
| | | | | | | | | | | | | | | | | | | | | | | | |
CONTRACTS
TO SELL | | | CURRENCY | | | COUNTERPARTY | | SETTLEMENT
DATE | | | SETTLEMENT
VALUE | | | VALUE AT
APRIL 30, 2017 | | | NET
UNREALIZED
APPRECIATION
(DEPRECIATION) | |
| | 8,401,047 | | | | JPY | | | Barclays Bank plc | | | 05/10/17 | | | $ | 75,054 | | | $ | 75,385 | | | $ | (331 | ) |
| | 2,878,121 | | | | JPY | | | BNP Paribas | | | 05/10/17 | | | | 25,949 | | | | 25,826 | | | | 123 | |
| | 2,509,034 | | | | JPY | | | Royal Bank of Canada | | | 05/10/17 | | | | 22,420 | | | | 22,515 | | | | (95 | ) |
| | 978,456 | | | | JPY | | | Standard Chartered Bank | | | 05/10/17 | | | | 8,881 | | | | 8,780 | | | | 101 | |
| | 1,786,001 | | | | JPY | | | State Street Corp. | | | 05/10/17 | | | | 15,671 | | | | 16,026 | | | | (355 | ) |
| | 190,241 | | | | NOK | | | TD Bank Financial Group | | | 05/10/17 | | | | 22,941 | | | | 22,160 | | | | 781 | |
| | | | | | | | | | | | | | $ | 653,589 | | | $ | 664,279 | | | $ | (10,690 | ) |
| | |
| # | For cross-currency exchange contracts, the settlement value is the U.S. Dollar market value at April 30, 2017 of the currency being sold, and the value at April 30, 2017 is the U.S. dollar market value of the currency being purchased. |
SEE NOTES TO FINANCIAL STATEMENTS.
| | | | | | | | |
| | | |
| APRIL 30, 2017 | | J.P. MORGAN INTERNATIONAL EQUITY FUNDS | | | | | 71 | |
JPMorgan International Research Enhanced Equity Fund
SCHEDULE OF PORTFOLIO INVESTMENTS
AS OF APRIL 30, 2017 (Unaudited)
(Amounts in U.S. Dollars, unless otherwise noted)
(Amounts in thousands)
| | | | | | | | |
| SHARES | | | SECURITY DESCRIPTION | | VALUE($) | |
| | | | | | | | |
| | Common Stocks — 93.4% | |
| | | | Australia — 6.4% | | | | |
| | 1,039 | | | AMP Ltd. | | | 4,164 | |
| | 761 | | | Australia & New Zealand Banking Group Ltd. | | | 18,622 | |
| | 449 | | | BGP Holdings Beneficial (a) | | | 6 | |
| | 924 | | | BHP Billiton Ltd. | | | 16,453 | |
| | 298 | | | Commonwealth Bank of Australia | | | 19,461 | |
| | 52 | | | CSL Ltd. | | | 5,118 | |
| | 998 | | | Dexus Property Group | | | 7,619 | |
| | 1,794 | | | Goodman Group | | | 10,891 | |
| | 132 | | | Macquarie Group Ltd. | | | 9,194 | |
| | 52 | | | National Australia Bank Ltd. | | | 1,324 | |
| | 394 | | | Wesfarmers Ltd. | | | 12,694 | |
| | 168 | | | Westpac Banking Corp. | | | 4,406 | |
| | | | | | | | |
| | | | | | | 109,952 | |
| | | | | | | | |
| | | | Austria — 0.4% | | | | |
| | 212 | | | Erste Group Bank AG (a) | | | 7,574 | |
| | | | | | | | |
| | | | Belgium — 1.1% | | | | |
| | 171 | | | Anheuser-Busch InBev SA/NV | | | 19,309 | |
| | | | | | | | |
| | | | Denmark — 1.0% | | | | |
| | 77 | | | Chr Hansen Holding A/S | | | 5,207 | |
| | 318 | | | Novo Nordisk A/S, Class B | | | 12,375 | |
| | | | | | | | |
| | | | | | | 17,582 | |
| | | | | | | | |
| | | | Finland — 2.0% | | | | |
| | 117 | | | Cargotec OYJ, Class B | | | 6,964 | |
| | 2,145 | | | Nokia OYJ | | | 12,264 | |
| | 668 | | | Outokumpu OYJ | | | 6,399 | |
| | 135 | | | Wartsila OYJ Abp | | | 8,205 | |
| | | | | | | | |
| | | | | | | 33,832 | |
| | | | | | | | |
| | | | France — 9.7% | | | | |
| | 156 | | | Air Liquide SA | | | 18,774 | |
| | 198 | | | Airbus SE | | | 15,996 | |
| | 619 | | | AXA SA | | | 16,521 | |
| | 215 | | | BNP Paribas SA | | | 15,206 | |
| | 68 | | | Cap Gemini SA | | | 6,834 | |
| | 745 | | | Natixis SA | | | 5,183 | |
| | 80 | | | Pernod Ricard SA | | | 9,962 | |
| | 112 | | | Renault SA | | | 10,484 | |
| | 201 | | | Sanofi | | | 19,011 | |
| | 191 | | | Schneider Electric SE | | | 15,094 | |
| | 69 | | | Sodexo SA | | | 8,706 | |
| | 313 | | | TOTAL SA | | | 16,043 | |
| | 466 | | | Vivendi SA | | | 9,239 | |
| | | | | | | | |
| | | | | | | 167,053 | |
| | | | | | | | |
| | | | | | | | |
| SHARES | | | SECURITY DESCRIPTION | | VALUE($) | |
| | | | | | | | |
| | |
| | | | Germany — 9.5% | | | | |
| | 51 | | | adidas AG | | | 10,215 | |
| | 15 | | | Allianz SE (Registered) | | | 2,915 | |
| | 26 | | | BASF SE | | | 2,542 | |
| | 183 | | | Bayer AG (Registered) | | | 22,653 | |
| | 160 | | | Brenntag AG | | | 9,463 | |
| | 238 | | | Daimler AG (Registered) | | | 17,731 | |
| | 85 | | | Deutsche Bank AG (Registered) (a) | | | 1,531 | |
| | 103 | | | Deutsche Boerse AG | | | 10,056 | |
| | 317 | | | Deutsche Post AG (Registered) | | | 11,408 | |
| | 612 | | | Deutsche Telekom AG (Registered) | | | 10,738 | |
| | 45 | | | HeidelbergCement AG | | | 4,143 | |
| | 431 | | | Infineon Technologies AG | | | 8,904 | |
| | 40 | | | Linde AG | | | 7,187 | |
| | 205 | | | SAP SE | | | 20,561 | |
| | 160 | | | Siemens AG (Registered) | | | 22,890 | |
| | | | | | | | |
| | | | | | | 162,937 | |
| | | | | | | | |
| | | | Hong Kong — 2.5% | | | | |
| | 778 | | | AIA Group Ltd. | | | 5,382 | |
| | 701 | | | Cheung Kong Property Holdings Ltd. | | | 5,020 | |
| | 960 | | | CK Hutchison Holdings Ltd. | | | 11,990 | |
| | 153 | | | Hang Seng Bank Ltd. | | | 3,092 | |
| | 858 | | | Power Assets Holdings Ltd. | | | 7,717 | |
| | 766 | | | Sands China Ltd. | | | 3,468 | |
| | 811 | | | Wharf Holdings Ltd. (The) | | | 6,917 | |
| | | | | | | | |
| | | | | | | 43,586 | |
| | | | | | | | |
| | | | Ireland — 0.4% | | | | |
| | 81 | | | Ryanair Holdings plc, ADR (a) | | | 7,417 | |
| | | | | | | | |
| | | | Israel — 0.6% | | | | |
| | 318 | | | Teva Pharmaceutical Industries Ltd., ADR | | | 10,056 | |
| | | | | | | | |
| | | | Italy — 3.0% | | | | |
| | 486 | | | Assicurazioni Generali SpA | | | 7,703 | |
| | 315 | | | Atlantia SpA | | | 7,981 | |
| | 2,544 | | | Enel SpA | | | 12,096 | |
| | 1,244 | | | Intesa Sanpaolo SpA | | | 3,631 | |
| | 9,768 | | | Telecom Italia SpA (a) | | | 8,670 | |
| | 708 | | | UniCredit SpA (a) | | | 11,524 | |
| | | | | | | | |
| | | | | | | 51,605 | |
| | | | | | | | |
| | | | Japan — 20.6% | | | | |
| | 238 | | | Bridgestone Corp. | | | 9,923 | |
| | 54 | | | Central Japan Railway Co. | | | 9,056 | |
| | 97 | | | Daikin Industries Ltd. | | | 9,391 | |
| | 93 | | | Dentsu, Inc. | | | 5,266 | |
| | 355 | | | DMG Mori Co. Ltd. | | | 5,867 | |
SEE NOTES TO FINANCIAL STATEMENTS.
| | | | | | |
| | | |
| 72 | | | | J.P. MORGAN INTERNATIONAL EQUITY FUNDS | | APRIL 30, 2017 |
| | | | | | | | |
| SHARES | | | SECURITY DESCRIPTION | | VALUE($) | |
| | | | | | | | |
| | Common Stocks — continued | |
| | | | Japan — continued | | | | |
| | 129 | | | East Japan Railway Co. | | | 11,550 | |
| | 112 | | | Electric Power Development Co. Ltd. | | | 2,594 | |
| | 1,205 | | | Fujitsu Ltd. | | | 7,523 | |
| | 1,698 | | | Hitachi Ltd. | | | 9,380 | |
| | 374 | | | Honda Motor Co. Ltd. | | | 10,888 | |
| | 438 | | | J Front Retailing Co. Ltd. | | | 6,311 | |
| | 241 | | | Japan Airlines Co. Ltd. | | | 7,621 | |
| | 73 | | | Japan Tobacco, Inc. | | | 2,412 | |
| | 254 | | | JFE Holdings, Inc. | | | 4,338 | |
| | 1,290 | | | JXTG Holdings, Inc. | | | 5,820 | |
| | 987 | | | Kajima Corp. | | | 6,702 | |
| | 213 | | | KDDI Corp. | | | 5,658 | |
| | 10 | | | Keyence Corp. | | | 3,899 | |
| | 561 | | | Kirin Holdings Co. Ltd. | | | 10,913 | |
| | 378 | | | Kyowa Hakko Kirin Co. Ltd. | | | 6,498 | |
| | 322 | | | Kyushu Electric Power Co., Inc. | | | 3,478 | |
| | 144 | | | Mabuchi Motor Co. Ltd. | | | 8,129 | |
| | 495 | | | Mazda Motor Corp. | | | 7,314 | |
| | 318 | | | Medipal Holdings Corp. | | | 5,267 | |
| | 2,332 | | | Mitsubishi UFJ Financial Group, Inc. | | | 14,775 | |
| | 410 | | | Mitsui Fudosan Co. Ltd. | | | 9,013 | |
| | 188 | | | MS&AD Insurance Group Holdings, Inc. | | | 6,120 | |
| | 413 | | | NGK Spark Plug Co. Ltd. | | | 8,963 | |
| | 85 | | | Nidec Corp. | | | 7,836 | |
| | 203 | | | Nippon Steel & Sumitomo Metal Corp. | | | 4,569 | |
| | 279 | | | Nippon Telegraph & Telephone Corp. | | | 11,944 | |
| | 47 | | | Nishi-Nippon Financial Holdings, Inc. | | | 443 | |
| | — | (h) | | Nitori Holdings Co. Ltd. | | | 11 | |
| | 325 | | | ORIX Corp. | | | 4,964 | |
| | 129 | | | Otsuka Corp. | | | 6,883 | |
| | 110 | | | Otsuka Holdings Co. Ltd. | | | 5,062 | |
| | 293 | | | Seiko Epson Corp. | | | 5,999 | |
| | 313 | | | Seven & i Holdings Co. Ltd. | | | 13,207 | |
| | 88 | | | Shin-Etsu Chemical Co. Ltd. | | | 7,666 | |
| | 323 | | | Sony Corp. | | | 11,069 | |
| | 1,053 | | | Sumitomo Bakelite Co. Ltd. | | | 6,767 | |
| | 347 | | | Sumitomo Mitsui Financial Group, Inc. | | | 12,892 | |
| | 214 | | | Sumitomo Realty & Development Co. Ltd. | | | 5,781 | |
| | 170 | | | Suntory Beverage & Food Ltd. | | | 7,637 | |
| | 423 | | | Takashimaya Co. Ltd. | | | 3,895 | |
| | 990 | | | Tokyo Gas Co. Ltd. | | | 4,596 | |
| | 371 | | | Toyota Motor Corp. | | | 20,068 | |
| | 380 | | | Yamato Holdings Co. Ltd. | | | 8,216 | |
| | | | | | | | |
| | | | | | | 354,174 | |
| | | | | | | | |
| | | | | | | | |
| SHARES | | | SECURITY DESCRIPTION | | VALUE($) | |
| | | | | | | | |
| | | | | | | | |
| | | | Luxembourg — 0.5% | | | | |
| | 1,128 | | | ArcelorMittal (a) | | | 8,867 | |
| | | | | | | | |
| | | | Netherlands — 5.0% | | | | |
| | 68 | | | ASML Holding NV | | | 8,963 | |
| | 127 | | | Heineken NV | | | 11,336 | |
| | 888 | | | ING Groep NV | | | 14,473 | |
| | 354 | | | Koninklijke Philips NV | | | 12,225 | |
| | 187 | | | NN Group NV | | | 6,210 | |
| | 519 | | | Royal Dutch Shell plc, Class A | | | 13,465 | |
| | 704 | | | Royal Dutch Shell plc, Class B | | | 18,720 | |
| | | | | | | | |
| | | | | | | 85,392 | |
| | | | | | | | |
| | | | New Zealand — 0.3% | | | | |
| | 2,237 | | | Spark New Zealand Ltd. | | | 5,669 | |
| | | | | | | | |
| | | | Norway — 0.4% | | | | |
| | 1,088 | | | Norsk Hydro ASA | | | 6,199 | |
| | | | | | | | |
| | | | Portugal — 0.3% | | | | |
| | 330 | | | Galp Energia SGPS SA | | | 5,127 | |
| | | | | | | | |
| | | | Singapore — 0.9% | | | | |
| | 942 | | | DBS Group Holdings Ltd. | | | 13,003 | |
| | 371 | | | Singapore Exchange Ltd. | | | 1,966 | |
| | | | | | | | |
| | | | | | | 14,969 | |
| | | | | | | | |
| | | | Spain — 2.3% | | | | |
| | 1,361 | | | Banco Santander SA | | | 8,873 | |
| | 7,584 | | | Bankia SA | | | 9,208 | |
| | 1,364 | | | Iberdrola SA | | | 9,804 | |
| | 302 | | | Repsol SA | | | 4,768 | |
| | 654 | | | Telefonica SA | | | 7,233 | |
| | | | | | | | |
| | | | | | | 39,886 | |
| | | | | | | | |
| | | | Sweden — 0.8% | | | | |
| | 1,086 | | | Nordea Bank AB | | | 13,358 | |
| | | | | | | | |
| | | | Switzerland — 9.4% | | | | |
| | 172 | | | Cie Financiere Richemont SA (Registered) | | | 14,382 | |
| | 166 | | | Credit Suisse Group AG (Registered) (a) | | | 2,532 | |
| | 164 | | | LafargeHolcim Ltd. (Registered) (a) | | | 9,318 | |
| | 36 | | | LafargeHolcim Ltd. (Registered) (a) | | | 2,041 | |
| | 550 | | | Nestle SA (Registered) | | | 42,338 | |
| | 213 | | | Novartis AG (Registered) | | | 16,405 | |
| | 121 | | | Roche Holding AG | | | 31,593 | |
| | 13 | | | Syngenta AG (a) | | | 5,826 | |
| | 754 | | | UBS Group AG (Registered) (a) | | | 12,875 | |
| | 203 | | | Wolseley plc | | | 12,899 | |
| | 38 | | | Zurich Insurance Group AG | | | 10,386 | |
| | | | | | | | |
| | | | | | | 160,595 | |
| | | | | | | | |
SEE NOTES TO FINANCIAL STATEMENTS.
| | | | | | | | |
| | | |
| APRIL 30, 2017 | | J.P. MORGAN INTERNATIONAL EQUITY FUNDS | | | | | 73 | |
JPMorgan International Research Enhanced Equity Fund
SCHEDULE OF PORTFOLIO INVESTMENTS
AS OF APRIL 30, 2017 (Unaudited) (continued)
(Amounts in U.S. Dollars, unless otherwise noted)
(Amounts in thousands, except number of Futures contracts)
| | | | | | | | |
| SHARES | | | SECURITY DESCRIPTION | | VALUE($) | |
| | | | | | | | |
| | Common Stocks — continued | |
| | | | United Kingdom — 15.2% | | | | |
| | 692 | | | 3i Group plc | | | 7,112 | |
| | 185 | | | Associated British Foods plc | | | 6,746 | |
| | 206 | | | AstraZeneca plc | | | 12,309 | |
| | 1,421 | | | Aviva plc | | | 9,665 | |
| | 791 | | | Barratt Developments plc | | | 5,939 | |
| | 2,108 | | | BP plc | | | 12,069 | |
| | 400 | | | British American Tobacco plc | | | 27,006 | |
| | 3,632 | | | Centrica plc | | | 9,308 | |
| | 1,574 | | | Debenhams plc | | | 1,044 | |
| | 1,288 | | | Dixons Carphone plc | | | 5,596 | |
| | 756 | | | GlaxoSmithKline plc | | | 15,211 | |
| | 2,475 | | | HSBC Holdings plc | | | 20,412 | |
| | 249 | | | HSBC Holdings plc | | | 2,050 | |
| | 224 | | | InterContinental Hotels Group plc | | | 11,880 | |
| | 2,738 | | | ITV plc | | | 7,446 | |
| | 11,115 | | | Lloyds Banking Group plc | | | 9,987 | |
| | 623 | | | Prudential plc | | | 13,819 | |
| | 99 | | | Reckitt Benckiser Group plc | | | 9,136 | |
| | 143 | | | Rio Tinto Ltd. | | | 6,489 | |
| | 76 | | | Rio Tinto plc | | | 2,979 | |
| | 1,298 | | | Standard Chartered plc (a) | | | 12,131 | |
| | 2,396 | | | Taylor Wimpey plc | | | 6,205 | |
| | 180 | | | TechnipFMC plc (a) | | | 5,422 | |
| | 174 | | | Unilever NV, CVA | | | 9,094 | |
| | 6,783 | | | Vodafone Group plc | | | 17,471 | |
| | 81 | | | Whitbread plc | | | 4,226 | |
| | 435 | | | WPP plc | | | 9,320 | |
| | | | | | | | |
| | | | | | | 260,072 | |
| | | | | | | | |
| | | | United States — 1.1% | | | | |
| | 304 | | | Shire plc | | | 17,928 | |
| | | | | | | | |
| | | | Total Common Stocks
(Cost $1,438,943) | | | 1,603,139 | |
| | | | | | | | |
| | |
PRINCIPAL
AMOUNT($) | | | | | | |
| | Corporate Bond — 0.0% (g) | |
| | | | Materials — 0.0% (g) | | | | |
| | | | Metals & Mining — 0.0% (g) | | | | |
| | BRL 11 | | | Vale SA, Series A6, VAR, 0.000% (x) (y)
(Cost $—) | | | — | (h) |
| | | | | | | | |
| | |
| SHARES | | | | | | |
| | Preferred Stocks — 1.0% | |
| | | | Germany — 1.0% | | | | |
| | 98 | | | Henkel AG & Co. KGaA (Preference) | | | 13,270 | |
| | 24 | | | Volkswagen AG (Preference) | | | 3,828 | |
| | | | | | | | |
| | | | Total Preferred Stocks
(Cost $12,862) | | | 17,098 | |
| | | | | | | | |
| | | | | | | | |
| SHARES | | | SECURITY DESCRIPTION | | VALUE($) | |
| | | | | | | | |
| | Short-Term Investment — 2.1% | |
| | | | Investment Company — 2.1% | | | | |
| | 36,122 | | | JPMorgan U.S. Government Money Market Fund, Institutional Class Shares, 0.620% (b) (l)
(Cost $36,122) | | | 36,122 | |
| | | | | | | | |
| | | | Total Investments — 96.5%
(Cost $1,487,927) | | | 1,656,359 | |
| | | | Other Assets in Excess of
Liabilities — 3.5% | | | 59,585 | |
| | | | | | | | |
| | | | NET ASSETS — 100.0% | | $ | 1,715,944 | |
| | | | | | | | |
Percentages indicated are based on net assets.
SEE NOTES TO FINANCIAL STATEMENTS.
| | | | | | |
| | | |
| 74 | | | | J.P. MORGAN INTERNATIONAL EQUITY FUNDS | | APRIL 30, 2017 |
Summary of Investments by Industry, April 30, 2017
The following table represents the portfolio investments of the Fund by industry classifications as a percentage of total investments:
| | | | |
| INDUSTRY | | PERCENTAGE | |
Banks | | | 13.4 | % |
Pharmaceuticals | | | 9.1 | |
Insurance | | | 4.7 | |
Oil, Gas & Consumable Fuels | | | 4.6 | |
Automobiles | | | 4.2 | |
Beverages | | | 3.6 | |
Metals & Mining | | | 3.4 | |
Chemicals | | | 3.3 | |
Diversified Telecommunication Services | | | 3.2 | |
Food Products | | | 3.0 | |
Industrial Conglomerates | | | 2.8 | |
Capital Markets | | | 2.7 | |
Electric Utilities | | | 2.0 | |
Electrical Equipment | | | 1.9 | |
Tobacco | | | 1.8 | |
Hotels, Restaurants & Leisure | | | 1.7 | |
Real Estate Management & Development | | | 1.6 | |
Food & Staples Retailing | | | 1.6 | |
| | | | |
| INDUSTRY | | PERCENTAGE | |
Textiles, Apparel & Luxury Goods | | | 1.5 | % |
Household Durables | | | 1.4 | |
Wireless Telecommunication Services | | | 1.4 | |
Biotechnology | | | 1.4 | |
Household Products | | | 1.4 | |
Trading Companies & Distributors | | | 1.3 | |
Media | | | 1.3 | |
IT Services | | | 1.3 | |
Machinery | | | 1.3 | |
Road & Rail | | | 1.2 | |
Software | | | 1.2 | |
Air Freight & Logistics | | | 1.2 | |
Auto Components | | | 1.1 | |
Equity Real Estate Investment Trusts (REITs) | | | 1.1 | |
Semiconductors & Semiconductor Equipment | | | 1.1 | |
Aerospace & Defense | | | 1.0 | |
Others (each less than 1.0%) | | | 9.0 | |
Short-Term Investment | | | 2.2 | |
| | | | | | | | | | | | | | | | | | | | |
| Futures Contracts | | | | | | | | | | |
NUMBER OF
CONTRACTS | | | DESCRIPTION | | EXPIRATION
DATE | | | TRADING
CURRENCY | | | NOTIONAL
VALUE AT
APRIL 30, 2017 | | | NET
UNREALIZED
APPRECIATION
(DEPRECIATION) | |
| | | | Long Futures Outstanding | | | | | | | | | | | | | | | | |
| | 41 | | | TOPIX Index | | | 06/08/17 | | | | JPY | | | $ | 5,636 | | | $ | 157 | |
| | 195 | | | Euro STOXX 50 Index | | | 06/16/17 | | | | USD | | | | 7,452 | | | | 396 | |
| | 72 | | | FTSE 100 Index | | | 06/16/17 | | | | USD | | | | 6,681 | | | | (67 | ) |
| | | | | | | | | | | | | | | | | | | | |
| | | | | | | | | | | | | | | | | | $ | 486 | |
| | | | | | | | | | | | | | | | | | | | |
| | | | | | | | | | | | | | | | | | | | | | |
| Forward Foreign Currency Exchange Contracts | |
CONTRACTS
TO BUY | | | CURRENCY | | COUNTERPARTY | | SETTLEMENT
DATE | | | SETTLEMENT
VALUE | | | VALUE AT
APRIL 30, 2017 | | | NET
UNREALIZED
APPRECIATION
(DEPRECIATION) | |
| | 1,260 | | | EUR | | Goldman Sachs International | | | 05/02/17 | | | $ | 1,370 | | | $ | 1,373 | | | $ | 3 | |
SEE NOTES TO FINANCIAL STATEMENTS.
| | | | | | | | |
| | | |
| APRIL 30, 2017 | | J.P. MORGAN INTERNATIONAL EQUITY FUNDS | | | | | 75 | |
JPMorgan International Unconstrained Equity Fund
SCHEDULE OF PORTFOLIO INVESTMENTS
AS OF APRIL 30, 2017 (Unaudited)
(Amounts in thousands)
| | | | | | | | |
| SHARES | | | SECURITY DESCRIPTION | | VALUE($) | |
| | Common Stocks — 95.8% | |
| | | | Belgium — 2.0% | |
| | 31 | | | Anheuser-Busch InBev SA/NV | | | 3,492 | |
| | | | | | | | |
| | | | Canada — 3.9% | |
| | 76 | | | Alimentation Couche-Tard, Inc., Class B | | | 3,476 | |
| | 47 | | | Canadian National Railway Co. | | | 3,375 | |
| | | | | | | | |
| | | | | | | 6,851 | |
| | | | | | | | |
| | | | China — 7.7% | |
| | 20 | | | Baidu, Inc., ADR (a) | | | 3,545 | |
| | 2,298 | | | China Unicom Hong Kong Ltd. | | | 2,974 | |
| | 3,785 | | | CNOOC Ltd. | | | 4,413 | |
| | 72 | | | JD.com, Inc., ADR (a) | | | 2,516 | |
| | | | | | | | |
| | | | | | | 13,448 | |
| | | | | | | | |
| | | | Denmark — 1.5% | |
| | 69 | | | Novo Nordisk A/S, Class B | | | 2,701 | |
| | | | | | | | |
| | | | Finland — 4.8% | |
| | 812 | | | Nokia OYJ | | | 4,641 | |
| | 61 | | | Wartsila OYJ Abp | | | 3,685 | |
| | | | | | | | |
| | | | | | | 8,326 | |
| | | | | | | | |
| | | | Germany — 4.6% | |
| | 22 | | | Continental AG | | | 4,843 | |
| | 71 | | | Zalando SE (a) (e) | | | 3,113 | |
| | | | | | | | |
| | | | | | | 7,956 | |
| | | | | | | | |
| | | | Hong Kong — 5.8% | |
| | 605 | | | AIA Group Ltd. | | | 4,186 | |
| | 355 | | | Cheung Kong Property Holdings Ltd. | | | 2,538 | |
| | 273 | | | CK Hutchison Holdings Ltd. | | | 3,403 | |
| | | | | | | | |
| | | | | | | 10,127 | |
| | | | | | | | |
| | | | India — 2.3% | |
| | 51 | | | HDFC Bank Ltd., ADR | | | 4,054 | |
| | | | | | | | |
| | | | Israel — 2.0% | |
| | 109 | | | Teva Pharmaceutical Industries Ltd., ADR | | | 3,433 | |
| | | | | | | | |
| | | | Italy — 1.5% | |
| | 157 | | | UniCredit SpA (a) | | | 2,560 | |
| | | | | | | | |
| | | | Japan — 10.1% | |
| | 4 | | | Keyence Corp. | | | 1,608 | |
| | 159 | | | Komatsu Ltd. | | | 4,257 | |
| | 248 | | | Kubota Corp. | | | 3,903 | |
| | 263 | | | ORIX Corp. | | | 4,024 | |
| | 44 | | | Shin-Etsu Chemical Co. Ltd. | | | 3,790 | |
| | | | | | | | |
| | | | | | | 17,582 | |
| | | | | | | | |
| | | | | | | | |
| SHARES | | | SECURITY DESCRIPTION | | VALUE($) | |
| | | | | | | | |
| | | | Macau — 1.5% | |
| | 1,196 | | | Wynn Macau Ltd. | | | 2,623 | |
| | | | | | | | |
| | | | Netherlands — 10.7% | |
| | 41 | | | Akzo Nobel NV | | | 3,570 | |
| | 284 | | | Altice NV, Class A (a) | | | 7,052 | |
| | 218 | | | ING Groep NV | | | 3,554 | |
| | 135 | | | NN Group NV | | | 4,484 | |
| | | | | | | | |
| | | | | | | 18,660 | |
| | | | | | | | |
| | | | South Africa — 1.3% | |
| | 12 | | | Naspers Ltd., Class N | | | 2,245 | |
| | | | | | | | |
| | | | South Korea — 6.3% | |
| | 20 | | | Hyundai Motor Co. | | | 2,514 | |
| | 17 | | | LG Chem Ltd. | | | 4,021 | |
| | 5 | | | Samsung Electronics Co. Ltd., GDR | | | 4,504 | |
| | | | | | | | |
| | | | | | | 11,039 | |
| | | | | | | | |
| | | | Spain — 2.6% | |
| | 573 | | | Banco Bilbao Vizcaya Argentaria SA | | | 4,591 | |
| | | | | | | | |
| | | | Switzerland — 7.7% | |
| | 41 | | | Cie Financiere Richemont SA (Registered) | | | 3,461 | |
| | 638 | | | Glencore plc (a) | | | 2,506 | |
| | 77 | | | LafargeHolcim Ltd. (Registered) (a) | | | 4,363 | |
| | 180 | | | UBS Group AG (Registered) (a) | | | 3,072 | |
| | | | | | | | |
| | | | | | | 13,402 | |
| | | | | | | | |
| | | | United Kingdom — 18.3% | |
| | 88 | | | British American Tobacco plc | | | 5,978 | |
| | 1,099 | | | ITV plc | | | 2,990 | |
| | 480 | | | Meggitt plc | | | 2,876 | |
| | 180 | | | RELX NV | | | 3,476 | |
| | 69 | | | Rio Tinto plc | | | 2,740 | |
| | 162 | | | Smith & Nephew plc | | | 2,662 | |
| | 432 | | | Standard Chartered plc (a) | | | 4,040 | |
| | 88 | | | TechnipFMC plc (a) | | | 2,648 | |
| | 1,722 | | | Vodafone Group plc | | | 4,434 | |
| | | | | | | | |
| | | | | | | 31,844 | |
| | | | | | | | |
| | | | United States — 1.2% | |
| | 35 | | | Shire plc | | | 2,066 | |
| | | | | | | | |
| | | | Total Common Stocks
(Cost $152,822) | | | 167,000 | |
| | | | | | | | |
SEE NOTES TO FINANCIAL STATEMENTS.
| | | | | | |
| | | |
| 76 | | | | J.P. MORGAN INTERNATIONAL EQUITY FUNDS | | APRIL 30, 2017 |
| | | | | | | | |
| SHARES | | | SECURITY DESCRIPTION | | VALUE($) | |
| | Short-Term Investment — 3.2% | | | | |
| | | | Investment Company — 3.2% | |
| | 5,532 | | | JPMorgan U.S. Government Money Market Fund, Institutional Class Shares, 0.620% (b) (l) (Cost $5,532) | | | 5,532 | |
| | | | | | | | |
| | | | Total Investments — 99.0%
(Cost $158,354) | | | 172,532 | |
| | | | Other Assets in Excess of
Liabilities — 1.0% | | | 1,827 | |
| | | | | | | | |
| | | | NET ASSETS — 100.0% | | $ | 174,359 | |
| | | | | | | | |
Percentages indicated are based on net assets.
Summary of Investments by Industry, April 30, 2017
The following table represents the portfolio investments of the Fund by industry classifications as a percentage of total investments:
| | | | |
| INDUSTRY | | PERCENTAGE | |
Banks | | | 10.9 | % |
Media | | | 7.0 | |
Machinery | | | 6.9 | |
Chemicals | | | 6.6 | |
Insurance | | | 5.0 | |
Pharmaceuticals | | | 3.6 | |
Tobacco | | | 3.5 | |
Internet & Direct Marketing Retail | | | 3.3 | |
Metals & Mining | | | 3.0 | |
Auto Components | | | 2.8 | |
Communications Equipment | | | 2.7 | |
Technology Hardware, Storage & Peripherals | | | 2.6 | |
Wireless Telecommunication Services | | | 2.6 | |
Oil, Gas & Consumable Fuels | | | 2.6 | |
Construction Materials | | | 2.5 | |
Diversified Financial Services | | | 2.3 | |
Internet Software & Services | | | 2.1 | |
Beverages | | | 2.0 | |
Professional Services | | | 2.0 | |
Food & Staples Retailing | | | 2.0 | |
Textiles, Apparel & Luxury Goods | | | 2.0 | |
Industrial Conglomerates | | | 2.0 | |
Road & Rail | | | 2.0 | |
Capital Markets | | | 1.8 | |
Diversified Telecommunication Services | | | 1.7 | |
Aerospace & Defense | | | 1.7 | |
Health Care Equipment & Supplies | | | 1.5 | |
Energy Equipment & Services | | | 1.5 | |
Hotels, Restaurants & Leisure | | | 1.5 | |
Real Estate Management & Development | | | 1.5 | |
Automobiles | | | 1.5 | |
Biotechnology | | | 1.2 | |
Others (each less than 1.0%) | | | 0.9 | |
Short-Term Investment | | | 3.2 | |
SEE NOTES TO FINANCIAL STATEMENTS.
| | | | | | | | |
| | | |
| APRIL 30, 2017 | | J.P. MORGAN INTERNATIONAL EQUITY FUNDS | | | | | 77 | |
JPMorgan International Value Fund
SCHEDULE OF PORTFOLIO INVESTMENTS
AS OF APRIL 30, 2017 (Unaudited)
(Amounts in thousands)
| | | | | | | | |
| SHARES | | | SECURITY DESCRIPTION | | VALUE($) | |
| | Common Stocks — 97.1% | | | | |
| | | | Australia — 3.9% | | | | |
| | 935 | | | Australia & New Zealand Banking Group Ltd. | | | 22,888 | |
| | 1,529 | | | Goodman Group | | | 9,282 | |
| | | | | | | | |
| | | | | | | 32,170 | |
| | | | | | | | |
| | | | Austria — 1.1% | | | | |
| | 258 | | | Erste Group Bank AG (a) | | | 9,249 | |
| | | | | | | | |
| | | | Belgium — 2.2% | | | | |
| | 79 | | | Anheuser-Busch InBev SA/NV | | | 8,965 | |
| | 125 | | | KBC Group NV | | | 9,024 | |
| | | | | | | | |
| | | | | | | 17,989 | |
| | | | | | | | |
| | | | Canada — 1.0% | | | | |
| | 185 | | | TransCanada Corp. | | | 8,589 | |
| | | | | | | | |
| | | | Chile — 0.6% | | | | |
| | 200 | | | Banco Santander Chile, ADR | | | 4,722 | |
| | | | | | | | |
| | | | China — 0.8% | | | | |
| | 5,684 | | | CNOOC Ltd. | | | 6,631 | |
| | | | | | | | |
| | | | Finland — 1.0% | | | | |
| | 855 | | | Outokumpu OYJ | | | 8,183 | |
| | | | | | | | |
| | | | France — 15.9% | | | | |
| | 104 | | | Air Liquide SA | | | 12,494 | |
| | 123 | | | Airbus SE | | | 9,912 | |
| | 667 | | | AXA SA | | | 17,792 | |
| | 260 | | | BNP Paribas SA | | | 18,347 | |
| | 1,270 | | | Natixis SA | | | 8,840 | |
| | 126 | | | Renault SA | | | 11,766 | |
| | 145 | | | Sanofi | | | 13,730 | |
| | 129 | | | Schneider Electric SE | | | 10,243 | |
| | 545 | | | TOTAL SA | | | 27,984 | |
| | | | | | | | |
| | | | | | | 131,108 | |
| | | | | | | | |
| | | | Germany — 8.3% | |
| | 59 | | | Bayer AG (Registered) | | | 7,250 | |
| | 120 | | | Brenntag AG | | | 7,135 | |
| | 184 | | | Daimler AG (Registered) | | | 13,726 | |
| | 94 | | | Deutsche Boerse AG | | | 9,208 | |
| | 33 | | | HeidelbergCement AG | | | 3,070 | |
| | 235 | | | Infineon Technologies AG | | | 4,858 | |
| | 164 | | | Siemens AG (Registered) | | | 23,490 | |
| | | | | | | | |
| | | | | | | 68,737 | |
| | | | | | | | |
| | | | Hong Kong — 1.3% | |
| | 863 | | | CK Hutchison Holdings Ltd. | | | 10,772 | |
| | | | | | | | |
| | | | Ireland — 0.9% | |
| | 78 | | | Ryanair Holdings plc, ADR (a) | | | 7,138 | |
| | | | | | | | |
| | | | | | | | |
| SHARES | | | SECURITY DESCRIPTION | | VALUE($) | |
| | | | | | | | |
| | | | Israel — 1.3% | |
| | 327 | | | Teva Pharmaceutical Industries Ltd., ADR | | | 10,338 | |
| | | | | | | | |
| | | | Italy — 3.3% | |
| | 2,970 | | | Enel SpA | | | 14,121 | |
| | 2,497 | | | Intesa Sanpaolo SpA | | | 7,290 | |
| | 6,452 | | | Telecom Italia SpA (a) | | | 5,726 | |
| | | | | | | | |
| | | | | | | 27,137 | |
| | | | | | | | |
| | | | Japan — 22.7% | |
| | 298 | | | Bridgestone Corp. | | | 12,434 | |
| | 98 | | | Daikin Industries Ltd. | | | 9,567 | |
| | 65 | | | Dentsu, Inc. | | | 3,669 | |
| | 351 | | | DMG Mori Co. Ltd. | | | 5,788 | |
| | 455 | | | Honda Motor Co. Ltd. | | | 13,255 | |
| | 275 | | | Japan Airlines Co. Ltd. | | | 8,675 | |
| | 178 | | | Mabuchi Motor Co. Ltd. | | | 10,020 | |
| | 497 | | | Mitsubishi Corp. | | | 10,715 | |
| | 3,604 | | | Mitsubishi UFJ Financial Group, Inc. | | | 22,836 | |
| | 265 | | | Mitsui Fudosan Co. Ltd. | | | 5,831 | |
| | 458 | | | NGK Spark Plug Co. Ltd. | | | 9,928 | |
| | 325 | | | Nippon Telegraph & Telephone Corp. | | | 13,945 | |
| | 177 | | | Otsuka Corp. | | | 9,481 | |
| | 74 | | | Sompo Holdings, Inc. | | | 2,804 | |
| | 171 | | | Sony Corp. | | | 5,881 | |
| | 716 | | | Sumitomo Electric Industries Ltd. | | | 11,697 | |
| | 180 | | | Sumitomo Mitsui Financial Group, Inc. | | | 6,695 | |
| | 233 | | | Sumitomo Mitsui Trust Holdings, Inc. | | | 7,964 | |
| | 158 | | | Suzuki Motor Corp. | | | 6,605 | |
| | 71 | | | Toyota Motor Corp. | | | 3,864 | |
| | 262 | | | Yamato Holdings Co. Ltd. | | | 5,662 | |
| | | | | | | | |
| | | | | | | 187,316 | |
| | | | | | | | |
| | | | Luxembourg — 1.0% | |
| | 1,038 | | | ArcelorMittal (a) | | | 8,154 | |
| | | | | | | | |
| | | | Netherlands — 7.7% | |
| | 267 | | | ASR Nederland NV (a) | | | 7,908 | |
| | 1,007 | | | ING Groep NV | | | 16,413 | |
| | 212 | | | NN Group NV | | | 7,031 | |
| | 1,248 | | | Royal Dutch Shell plc, Class A | | | 32,398 | |
| | | | | | | | |
| | | | | | | 63,750 | |
| | | | | | | | |
| | | | Norway — 1.0% | |
| | 1,497 | | | Norsk Hydro ASA | | | 8,529 | |
| | | | | | | | |
| | | | Singapore — 1.2% | |
| | 741 | | | DBS Group Holdings Ltd. | | | 10,235 | |
| | | | | | | | |
| | | | South Korea — 1.1% | |
| | 5 | | | Samsung Electronics Co. Ltd. | | | 9,202 | |
| | | | | | | | |
SEE NOTES TO FINANCIAL STATEMENTS.
| | | | | | |
| | | |
| 78 | | | | J.P. MORGAN INTERNATIONAL EQUITY FUNDS | | APRIL 30, 2017 |
| | | | | | | | |
| SHARES | | | SECURITY DESCRIPTION | | VALUE($) | |
| | Common Stocks — continued | | | | |
| | | | Spain — 3.0% | |
| | 10,323 | | | Bankia SA | | | 12,534 | |
| | 1,698 | | | Iberdrola SA | | | 12,203 | |
| | | | | | | | |
| | | | | | | 24,737 | |
| | | | | | | | |
| | | | Sweden — 1.8% | |
| | 1,179 | | | Nordea Bank AB | | | 14,499 | |
| | | | | | | | |
| | | | Switzerland — 4.5% | |
| | 102 | | | LafargeHolcim Ltd. (Registered) (a) | | | 5,810 | |
| | 29 | | | Roche Holding AG | | | 7,577 | |
| | 127 | | | Wolseley plc | | | 8,097 | |
| | 57 | | | Zurich Insurance Group AG | | | 15,675 | |
| | | | | | | | |
| | | | | | | 37,159 | |
| | | | | | | | |
| | | | United Kingdom — 10.1% | |
| | 752 | | | Barratt Developments plc | | | 5,642 | |
| | 98 | | | InterContinental Hotels Group plc | | | 5,184 | |
| | 2,550 | | | ITV plc | | | 6,936 | |
| | 3,889 | | | Lloyds Banking Group plc | | | 3,495 | |
| | 268 | | | National Grid plc | | | 3,466 | |
| | 606 | | | Prudential plc | | | 13,453 | |
| | 371 | | | Rio Tinto plc | | | 14,618 | |
| | 1,457 | | | Standard Chartered plc (a) | | | 13,621 | |
| | 162 | | | TechnipFMC plc (a) | | | 4,880 | |
| | 4,639 | | | Vodafone Group plc | | | 11,949 | |
| | | | | | | | |
| | | | | | | 83,244 | |
| | | | | | | | |
| | | | United States — 1.4% | |
| | 203 | | | Shire plc | | | 11,982 | |
| | | | | | | | |
| | | | Total Common Stocks
(Cost $762,383) | | | 801,570 | |
| | | | | | | | |
| | Short-Term Investment — 2.7% | | | | |
| | | | Investment Company — 2.7% | |
| | 22,045 | | | JPMorgan U.S. Government Money Market Fund, Institutional Class Shares, 0.620% (b) (l) (Cost $22,045) | | | 22,045 | |
| | | | | | | | |
| | | | Total Investments — 99.8%
(Cost $784,428) | | | 823,615 | |
| | | | Other Assets in Excess of
Liabilities — 0.2% | | | 1,242 | |
| | | | | | | | |
| | | | NET ASSETS — 100.0% | | $ | 824,857 | |
| | | | | | | | |
Percentages indicated are based on net assets.
Summary of Investments by Industry, April 30, 2017
The following table represents the portfolio investments of the Fund by industry classifications as a percentage of total investments:
| | | | |
| INDUSTRY | | PERCENTAGE | |
Banks | | | 22.9 | % |
Oil, Gas & Consumable Fuels | | | 9.2 | |
Insurance | | | 7.8 | |
Automobiles | | | 6.0 | |
Metals & Mining | | | 4.8 | |
Pharmaceuticals | | | 4.7 | |
Industrial Conglomerates | | | 4.2 | |
Auto Components | | | 4.1 | |
Electric Utilities | | | 3.2 | |
Trading Companies & Distributors | | | 3.1 | |
Electrical Equipment | | | 2.5 | |
Diversified Telecommunication Services | | | 2.4 | |
Airlines | | | 1.9 | |
Chemicals | | | 1.5 | |
Biotechnology | | | 1.5 | |
Wireless Telecommunication Services | | | 1.4 | |
Household Durables | | | 1.4 | |
Media | | | 1.3 | |
Aerospace & Defense | | | 1.2 | |
Building Products | | | 1.2 | |
IT Services | | | 1.2 | |
Equity Real Estate Investment Trusts (REITs) | | | 1.1 | |
Capital Markets | | | 1.1 | |
Technology Hardware, Storage & Peripherals | | | 1.1 | |
Beverages | | | 1.1 | |
Construction Materials | | | 1.1 | |
Others (each less than 1.0%) | | | 4.3 | |
Short-Term Investment | | | 2.7 | |
SEE NOTES TO FINANCIAL STATEMENTS.
| | | | | | | | |
| | | |
| APRIL 30, 2017 | | J.P. MORGAN INTERNATIONAL EQUITY FUNDS | | | | | 79 | |
JPMorgan International Value Fund
SCHEDULE OF PORTFOLIO INVESTMENTS
AS OF APRIL 30, 2017 (Unaudited) (continued)
(Amounts in thousands)
| | | | | | | | | | | | | | | | | | | | | | |
| Forward Foreign Currency Exchange Contracts | |
CONTRACTS
TO BUY | | | CURRENCY | | COUNTERPARTY | | SETTLEMENT
DATE | | | SETTLEMENT
VALUE | | | VALUE AT
APRIL 30, 2017 | | | NET
UNREALIZED
APPRECIATION
(DEPRECIATION) | |
| | 2,442 | | | EUR | | | | | | | | | | | | | | | | | | |
| | 2,106 | | | for GBP | | Goldman Sachs International | | | 05/26/17 | | | $ | 2,729 | # | | $ | 2,663 | # | | $ | (66 | ) |
| | 4,401 | | | EUR | | | | | | | | | | | | | | | | | | |
| | 512,473 | | | for JPY | | Australia and New Zealand Banking Group Ltd. | | | 05/26/17 | | | | 4,601 | # | | | 4,799 | # | | | 198 | |
| | 4,067 | | | EUR | | | | | | | | | | | | | | | | | | |
| | 6,100 | | | for SGD | | Standard Chartered Bank | | | 05/26/17 | | | | 4,367 | # | | | 4,436 | # | | | 69 | |
| | 12,622 | | | AUD | | Australia and New Zealand Banking Group Ltd. | | | 05/26/17 | | | | 9,595 | | | | 9,448 | | | | (147 | ) |
| | 52,319 | | | AUD | | HSBC Bank, N.A. | | | 05/26/17 | | | | 40,101 | | | | 39,159 | | | | (942 | ) |
| | 3,489 | | | CAD | | Australia and New Zealand Banking Group Ltd. | | | 05/26/17 | | | | 2,616 | | | | 2,557 | | | | (59 | ) |
| | 24,284 | | | CHF | | National Australia Bank | | | 05/26/17 | | | | 24,543 | | | | 24,446 | | | | (97 | ) |
| | 40,063 | | | DKK | | Societe Generale | | | 05/30/17 | | | | 5,769 | | | | 5,876 | | | | 107 | |
| | 8,154 | | | EUR | | BNP Paribas | | | 05/26/17 | | | | 8,895 | | | | 8,893 | | | | (2 | ) |
| | 3,924 | | | EUR | | Citibank, NA | | | 05/26/17 | | | | 4,166 | | | | 4,280 | | | | 114 | |
| | 5,562 | | | EUR | | Goldman Sachs International | | | 05/26/17 | | | | 6,052 | | | | 6,066 | | | | 14 | |
| | 2,251 | | | EUR | | National Australia Bank | | | 05/26/17 | | | | 2,435 | | | | 2,455 | | | | 20 | |
| | 7,642 | | | EUR | | Standard Chartered Bank | | | 05/26/17 | | | | 8,320 | | | | 8,335 | | | | 15 | |
| | 81,124 | | | EUR | | State Street Corp. | | | 05/26/17 | | | | 88,388 | | | | 88,479 | | | | 91 | |
| | 2,910 | | | EUR | | TD Bank Financial Group | | | 05/26/17 | | | | 3,123 | | | | 3,173 | | | | 50 | |
| | 11,128 | | | GBP | | Citibank, NA | | | 05/26/17 | | | | 13,826 | | | | 14,424 | | | | 598 | |
| | 4,653 | | | GBP | | Goldman Sachs International | | | 05/26/17 | | | | 5,950 | | | | 6,030 | | | | 80 | |
| | 8,146 | | | GBP | | Standard Chartered Bank | | | 05/26/17 | | | | 10,124 | | | | 10,558 | | | | 434 | |
| | 30,752 | | | GBP | | TD Bank Financial Group | | | 05/26/17 | | | | 38,773 | | | | 39,858 | | | | 1,085 | |
| | 54,356 | | | HKD | | Standard Chartered Bank | | | 05/26/17 | | | | 7,011 | | | | 6,992 | | | | (19 | ) |
| | 41,308 | | | HKD | | State Street Corp. | | | 05/26/17 | | | | 5,324 | | | | 5,313 | | | | (11 | ) |
| | 514,464 | | | JPY | | National Australia Bank | | | 05/26/17 | | | | 4,676 | | | | 4,619 | | | | (57 | ) |
| | 6,291,513 | | | JPY | | Standard Chartered Bank | | | 05/26/17 | | | | 57,006 | | | | 56,490 | | | | (516 | ) |
| | 308,285 | | | JPY | | TD Bank Financial Group | | | 05/26/17 | | | | 2,741 | | | | 2,768 | | | | 27 | |
| | 26,567 | | | NOK | | Goldman Sachs International | | | 05/26/17 | | | | 3,123 | | | | 3,095 | | | | (28 | ) |
| | 14,489 | | | NOK | | National Australia Bank | | | 05/26/17 | | | | 1,690 | | | | 1,688 | | | | (2 | ) |
| | 35,516 | | | SEK | | Merrill Lynch International | | | 05/26/17 | | | | 4,058 | | | | 4,015 | | | | (43 | ) |
| | 102,553 | | | SEK | | National Australia Bank | | | 05/26/17 | | | | 11,582 | | | | 11,594 | | | | 12 | |
| | 4,167 | | | SGD | | Australia and New Zealand Banking Group Ltd. | | | 05/26/17 | | | | 2,989 | | | | 2,983 | | | | (6 | ) |
| | 1,933 | | | SGD | | Societe Generale | | | 05/26/17 | | | | 1,366 | | | | 1,384 | | | | 18 | |
| | | | | | | | | | | | $ | 385,939 | | | $ | 386,876 | | | $ | 937 | |
| | |
| | | | | | | | | | | | | | | | | | | | | | |
CONTRACTS
TO SELL | | | CURRENCY | | COUNTERPARTY | | SETTLEMENT
DATE | | | SETTLEMENT
VALUE | | | VALUE AT
APRIL 30, 2017 | | | NET
UNREALIZED
APPRECIATION
(DEPRECIATION) | |
| | 8,278 | | | AUD | | BNP Paribas | | | 05/26/17 | | | $ | 6,213 | | | $ | 6,195 | | | $ | 18 | |
| | 17,405 | | | AUD | | Royal Bank of Canada | | | 05/26/17 | | | | 13,316 | | | | 13,027 | | | | 289 | |
| | 4,652 | | | CAD | | National Australia Bank | | | 05/26/17 | | | | 3,482 | | | | 3,409 | | | | 73 | |
| | 10,497 | | | CAD | | State Street Corp. | | | 05/26/17 | | | | 8,029 | | | | 7,692 | | | | 337 | |
| | 3,655 | | | CHF | | National Australia Bank | | | 05/26/17 | | | | 3,639 | | | | 3,679 | | | | (40 | ) |
| | 10,087 | | | CHF | | TD Bank Financial Group | | | 05/26/17 | | | | 10,150 | | | | 10,154 | | | | (4 | ) |
SEE NOTES TO FINANCIAL STATEMENTS.
| | | | | | |
| | | |
| 80 | | | | J.P. MORGAN INTERNATIONAL EQUITY FUNDS | | APRIL 30, 2017 |
| | | | | | | | | | | | | | | | | | | | | | |
CONTRACTS
TO SELL | | | CURRENCY | | COUNTERPARTY | | SETTLEMENT
DATE | | | SETTLEMENT
VALUE | | | VALUE AT
APRIL 30, 2017 | | | NET
UNREALIZED
APPRECIATION
(DEPRECIATION) | |
| | 4,160 | | | EUR | | Australia and New Zealand Banking Group Ltd. | | | 05/26/17 | | | $ | 4,414 | | | $ | 4,537 | | | $ | (123 | ) |
| | 38,842 | | | EUR | | BNP Paribas | | | 05/26/17 | | | | 41,534 | | | | 42,364 | | | | (830 | ) |
| | 64,804 | | | EUR | | Citibank, NA | | | 05/26/17 | | | | 69,859 | | | | 70,679 | | | | (820 | ) |
| | 55,565 | | | EUR | | Goldman Sachs International | | | 05/26/17 | | | | 59,373 | | | | 60,602 | | | | (1,229 | ) |
| | 9,616 | | | EUR | | State Street Corp. | | | 05/26/17 | | | | 10,202 | | | | 10,488 | | | | (286 | ) |
| | 38,433 | | | GBP | | HSBC Bank, N.A. | | | 05/26/17 | | | | 47,897 | | | | 49,814 | | | | (1,917 | ) |
| | 7,281,631 | | | JPY | | Credit Suisse International | | | 05/26/17 | | | | 65,594 | | | | 65,381 | | | | 213 | |
| | 40,565 | | | NOK | | Goldman Sachs International | | | 05/26/17 | | | | 4,878 | | | | 4,727 | | | | 151 | |
| | 27,968 | | | NOK | | TD Bank Financial Group | | | 05/26/17 | | | | 3,244 | | | | 3,258 | | | | (14 | ) |
| | 35,719 | | | SEK | | Merrill Lynch International | | | 05/26/17 | | | | 3,956 | | | | 4,038 | | | | (82 | ) |
| | | | | | | | | | | | $ | 355,780 | | | $ | 360,044 | | | $ | (4,264 | ) |
| | |
| # | For cross-currency exchange contracts, the settlement value is the U.S. Dollar market value at April 30, 2017 of the currency being sold, and the value at April 30, 2017 is the U.S. Dollar market value of the currency being purchased. |
SEE NOTES TO FINANCIAL STATEMENTS.
| | | | | | | | |
| | | |
| APRIL 30, 2017 | | J.P. MORGAN INTERNATIONAL EQUITY FUNDS | | | | | 81 | |
JPMorgan Intrepid International Fund
SCHEDULE OF PORTFOLIO INVESTMENTS
AS OF APRIL 30, 2017 (Unaudited)
(Amounts in thousands)
| | | | | | | | |
| SHARES | | | SECURITY DESCRIPTION | | VALUE($) | |
| | Common Stocks — 95.3% | |
| | | | Australia — 6.8% | |
| | 1,209 | | | AGL Energy Ltd. | | | 24,204 | |
| | 954 | | �� | Australia & New Zealand Banking Group Ltd. | | | 23,360 | |
| | 1,162 | | | Bendigo & Adelaide Bank Ltd. | | | 10,696 | |
| | 1,589 | | | BHP Billiton Ltd. | | | 28,290 | |
| | 1,219 | | | Challenger Ltd. | | | 12,044 | |
| | 39 | | | Commonwealth Bank of Australia | | | 2,567 | |
| | 1,170 | | | Computershare Ltd. | | | 12,897 | |
| | 1,401 | | | CSR Ltd. | | | 5,136 | |
| | 208 | | | Flight Centre Travel Group Ltd. | | | 4,882 | |
| | 2,155 | | | Fortescue Metals Group Ltd. | | | 8,540 | |
| | 2,569 | | | GPT Group (The) | | | 10,090 | |
| | 157 | | | LendLease Group | | | 1,881 | |
| | 2,294 | | | Metcash Ltd. (a) | | | 3,693 | |
| | 4,858 | | | South32 Ltd. | | | 10,067 | |
| | 1,035 | | | Westpac Banking Corp. | | | 27,131 | |
| | 535 | | | Woodside Petroleum Ltd. | | | 12,874 | |
| | | | | | | | |
| | | | | | | 198,352 | |
| | | | | | | | |
| | | | Austria — 0.4% | |
| | 254 | | | Erste Group Bank AG (a) | | | 9,080 | |
| | 14 | | | Lenzing AG | | | 2,648 | |
| | | | | | | | |
| | | | | | | 11,728 | |
| | | | | | | | |
| | | | Belgium — 0.8% | |
| | 334 | | | bpost SA | | | 7,998 | |
| | 223 | | | KBC Group NV | | | 16,115 | |
| | | | | | | | |
| | | | | | | 24,113 | |
| | | | | | | | |
| | | | China — 0.8% | |
| | 5,289 | | | BOC Hong Kong Holdings Ltd. | | | 21,735 | |
| | 806 | | | China Overseas Land & Investment Ltd. | | | 2,338 | |
| | | | | | | | |
| | | | | | | 24,073 | |
| | | | | | | | |
| | | | Denmark — 2.9% | |
| | 754 | | | Danske Bank A/S | | | 27,405 | |
| | 9 | | | Dfds A/S | | | 538 | |
| | 598 | | | Novo Nordisk A/S, Class B | | | 23,270 | |
| | 62 | | | Pandora A/S | | | 6,661 | |
| | 3 | | | Schouw & Co. AB | | | 314 | |
| | 234 | | | Sydbank A/S | | | 8,509 | |
| | 1,794 | | | TDC A/S | | | 9,626 | |
| | 105 | | | Vestas Wind Systems A/S | | | 9,077 | |
| | | | | | | | |
| | | | | | | 85,400 | |
| | | | | | | | |
| | | | Finland — 0.4% | |
| | 429 | | | UPM-Kymmene OYJ | | | 11,298 | |
| | | | | | | | |
| | | | | | | | |
| SHARES | | | SECURITY DESCRIPTION | | VALUE($) | |
| | |
| | | | France — 10.0% | |
| | 105 | | | Arkema SA | | | 11,115 | |
| | 655 | | | AXA SA | | | 17,467 | |
| | 371 | | | BNP Paribas SA | | | 26,210 | |
| | 107 | | | Cap Gemini SA | | | 10,716 | |
| | 148 | | | Cie Generale des Etablissements Michelin | | | 19,311 | |
| | 224 | | | Faurecia | | | 10,923 | |
| | 64 | | | LVMH Moet Hennessy Louis Vuitton SE | | | 15,884 | |
| | 174 | | | Metropole Television S.A. | | | 3,953 | |
| | 1,546 | | | Natixis SA | | | 10,762 | |
| | 10 | | | Nexans SA (a) | | | 561 | |
| | 881 | | | Orange SA | | | 13,636 | |
| | 526 | | | Peugeot SA (a) | | | 11,031 | |
| | 349 | | | Sanofi | | | 33,017 | |
| | 243 | | | Schneider Electric SE | | | 19,238 | |
| | 349 | | | Societe Generale SA | | | 19,120 | |
| | 83 | | | Sodexo SA | | | 10,551 | |
| | 12 | | | Sopra Steria Group | | | 1,806 | |
| | 104 | | | Thales SA | | | 10,975 | |
| | 241 | | | TOTAL SA | | | 12,356 | |
| | 207 | | | Valeo SA | | | 14,882 | |
| | 221 | | | Vinci SA | | | 18,859 | |
| | | | | | | | |
| | | | | | | 292,373 | |
| | | | | | | | |
| | | | Germany — 7.2% | |
| | 144 | | | Allianz SE (Registered) | | | 27,416 | |
| | 234 | | | Bayer AG (Registered) | | | 28,904 | |
| | 17 | | | Bayerische Motoren Werke AG | | | 1,666 | |
| | 136 | | | Covestro AG (e) | | | 10,626 | |
| | 275 | | | Evonik Industries AG | | | 9,185 | |
| | 233 | | | Freenet AG | | | 7,306 | |
| | 168 | | | Fresenius SE & Co. KGaA | | | 13,618 | |
| | 93 | | | Hannover Rueck SE | | | 11,147 | |
| | 54 | | | HeidelbergCement AG | | | 5,022 | |
| | 514 | | | Infineon Technologies AG | | | 10,634 | |
| | 603 | | | Innogy SE (e) | | | 22,182 | |
| | 19 | | | Jenoptik AG | | | 504 | |
| | 96 | | | Merck KGaA | | | 11,245 | |
| | 154 | | | OSRAM Licht AG | | | 10,300 | |
| | 235 | | | Siemens AG (Registered) | | | 33,683 | |
| | 376 | | | Uniper SE (a) | | | 6,174 | |
| | | | | | | | |
| | | | | | | 209,612 | |
| | | | | | | | |
| | | | Hong Kong — 2.3% | |
| | 1,375 | | | Cheung Kong Property Holdings Ltd. | | | 9,840 | |
| | 1,087 | | | Chow Tai Fook Jewellery Group Ltd. | | | 1,195 | |
| | 1,151 | | | CK Hutchison Holdings Ltd. | | | 14,373 | |
SEE NOTES TO FINANCIAL STATEMENTS.
| | | | | | |
| | | |
| 82 | | | | J.P. MORGAN INTERNATIONAL EQUITY FUNDS | | APRIL 30, 2017 |
| | | | | | | | |
| SHARES | | | SECURITY DESCRIPTION | | VALUE($) | |
| | Common Stocks — continued | |
| | | | Hong Kong — continued | |
| | 573 | | | Hongkong Land Holdings Ltd. | | | 4,417 | |
| | 6,862 | | | New World Development Co. Ltd. | | | 8,533 | |
| | 1,123 | | | Wharf Holdings Ltd. (The) | | | 9,575 | |
| | 1,055 | | | Wheelock & Co. Ltd. | | | 8,218 | |
| | 11,166 | | | Xinyi Glass Holdings Ltd. (a) | | | 9,895 | |
| | | | | | | | |
| | | | | | | 66,046 | |
| | | | | | | | |
| | | | Indonesia — 0.2% | |
| | 220 | | | Telekomunikasi Indonesia Persero Tbk. PT, ADR | | | 7,195 | |
| | | | | | | | |
| | | | Italy — 1.1% | |
| | 621 | | | Enel SpA | | | 2,954 | |
| | 2,997 | | | Intesa Sanpaolo SpA | | | 8,749 | |
| | 1,159 | | | Mediobanca SpA | | | 11,148 | |
| | 343 | | | Prysmian SpA | | | 9,897 | |
| | | | | | | | |
| | | | | | | 32,748 | |
| | | | | | | | |
| | | | Japan — 23.1% | |
| | 741 | | | Amada Holdings Co. Ltd. | | | 8,805 | |
| | 1,498 | | | Asahi Glass Co. Ltd. | | | 12,979 | |
| | 918 | | | Astellas Pharma, Inc. | | | 12,100 | |
| | 347 | | | Bandai Namco Holdings, Inc. | | | 10,897 | |
| | 323 | | | Bridgestone Corp. | | | 13,460 | |
| | 98 | | | Central Japan Railway Co. | | | 16,402 | |
| | 1,998 | | | Concordia Financial Group Ltd. | | | 9,189 | |
| | 97 | | | Daikin Industries Ltd. | | | 9,421 | |
| | 56 | | | Family Mart UNY Holdings Co. Ltd. | | | 3,177 | |
| | 1,911 | | | Fuji Electric Co. Ltd. | | | 10,475 | |
| | 196 | | | Hazama Ando Corp. | | | 1,396 | |
| | 98 | | | Hikari Tsushin, Inc. | | | 9,422 | |
| | 391 | | | Hitachi Chemical Co. Ltd. | | | 11,192 | |
| | 2,151 | | | Hitachi Ltd. | | | 11,883 | |
| | 821 | | | Hitachi Metals Ltd. | | | 11,499 | |
| | 606 | | | Honda Motor Co. Ltd. | | | 17,641 | |
| | 240 | | | Hoya Corp. | | | 11,465 | |
| | 375 | | | Idemitsu Kosan Co. Ltd. | | | 11,977 | |
| | 429 | | | ITOCHU Corp. | | | 6,069 | |
| | 1,028 | | | Kansai Electric Power Co., Inc. (The) | | | 13,894 | |
| | 617 | | | KDDI Corp. | | | 16,357 | |
| | 205 | | | Koito Manufacturing Co. Ltd. | | | 10,598 | |
| | 717 | | | Kuraray Co. Ltd. | | | 11,570 | |
| | 344 | | | LIXIL Group Corp. | | | 8,605 | |
| | 192 | | | Matsumotokiyoshi Holdings Co. Ltd. | | | 9,634 | |
| | 717 | | | Mazda Motor Corp. | | | 10,586 | |
| | 17 | | | Meitec Corp. | | | 722 | |
| | 631 | | | Mitsubishi Corp. | | | 13,624 | |
| | | | | | | | |
| SHARES | | | SECURITY DESCRIPTION | | VALUE($) | |
| | |
| | | | Japan — continued | |
| | 865 | | | Mitsubishi Electric Corp. | | | 12,071 | |
| | 4,239 | | | Mitsubishi UFJ Financial Group, Inc. | | | 26,858 | |
| | 1,920 | | | Mitsubishi UFJ Lease & Finance Co. Ltd. | | | 10,032 | |
| | 225 | | | Mitsui Fudosan Co. Ltd. | | | 4,951 | |
| | 309 | | | NH Foods Ltd. | | | 8,807 | |
| | 82 | | | Nichias Corp. | | | 837 | |
| | 94 | | | Nichirei Corp. | | | 2,350 | |
| | 310 | | | Nippon Telegraph & Telephone Corp. | | | 13,294 | |
| | 18 | | | Nitori Holdings Co. Ltd. | | | 2,368 | |
| | 108 | | | Nitto Denko Corp. | | | 8,110 | |
| | 791 | | | NTT DOCOMO, Inc. | | | 19,147 | |
| | 1,326 | | | Obayashi Corp. | | | 12,871 | |
| | 753 | | | ORIX Corp. | | | 11,502 | |
| | 113 | | | Otsuka Holdings Co. Ltd. | | | 5,191 | |
| | 269 | | | Penta-Ocean Construction Co. Ltd. | | | 1,363 | |
| | 336 | | | Pola Orbis Holdings, Inc. | | | 7,748 | |
| | 148 | | | SCREEN Holdings Co. Ltd. | | | 10,757 | |
| | 608 | | | Sekisui Chemical Co. Ltd. | | | 10,196 | |
| | 51 | | | Shin-Etsu Chemical Co. Ltd. | | | 4,450 | |
| | 209 | | | Shionogi & Co. Ltd. | | | 10,758 | |
| | 237 | | | SoftBank Group Corp. | | | 17,947 | |
| | 348 | | | Sompo Holdings, Inc. | | | 13,162 | |
| | 569 | | | Sony Corp. | | | 19,518 | |
| | 280 | | | Subaro Corp. | | | 10,631 | |
| | 203 | | | Sumitomo Bakelite Co. Ltd. | | | 1,305 | |
| | 2,050 | | | Sumitomo Chemical Co. Ltd. | | | 11,569 | |
| | 683 | | | Sumitomo Electric Industries Ltd. | | | 11,148 | |
| | 1,300 | | | Sumitomo Heavy Industries Ltd. | | | 9,069 | |
| | 477 | | | Sumitomo Mitsui Financial Group, Inc. | | | 17,696 | |
| | 260 | | | Sumitomo Mitsui Trust Holdings, Inc. | | | 8,917 | |
| | 720 | | | T&D Holdings, Inc. | | | 10,702 | |
| | 2,376 | | | Taiheiyo Cement Corp. | | | 7,896 | |
| | 1,724 | | | Taisei Corp. | | | 13,146 | |
| | 106 | | | Tokyo Electron Ltd. | | | 12,807 | |
| | 799 | | | Tokyo Tatemono Co. Ltd. | | | 10,917 | |
| | 351 | | | Toyota Motor Corp. | | | 19,007 | |
| | 32 | | | TS Tech Co., Ltd. | | | 830 | |
| | | | | | | | |
| | | | | | | 674,967 | |
| | | | | | | | |
| | | | Luxembourg — 0.6% | |
| | 218 | | | APERAM SA | | | 10,944 | |
| | 1,022 | | | ArcelorMittal (a) | | | 8,034 | |
| | | | | | | | |
| | | | | | | 18,978 | |
| | | | | | | | |
| | | | Netherlands — 3.2% | |
| | 1,500 | | | Aegon NV | | | 7,655 | |
SEE NOTES TO FINANCIAL STATEMENTS.
| | | | | | | | |
| | | |
| APRIL 30, 2017 | | J.P. MORGAN INTERNATIONAL EQUITY FUNDS | | | | | 83 | |
JPMorgan Intrepid International Fund
SCHEDULE OF PORTFOLIO INVESTMENTS
AS OF APRIL 30, 2017 (Unaudited) (continued)
(Amounts in thousands)
| | | | | | | | |
| SHARES | | | SECURITY DESCRIPTION | | VALUE($) | |
| | Common Stocks — continued | |
| | | | Netherlands — continued | |
| | 274 | | | ASR Nederland NV (a) | | | 8,116 | |
| | 1,707 | | | ING Groep NV | | | 27,829 | |
| | 587 | | | Koninklijke Ahold Delhaize NV | | | 12,157 | |
| | 16 | | | NN Group NV | | | 524 | |
| | 280 | | | Philips Lighting NV (a) (e) | | | 9,461 | |
| | 1,026 | | | Royal Dutch Shell plc, Class B | | | 27,300 | |
| | | | | | | | |
| | | | | | | 93,042 | |
| | | | | | | | |
| | | | Norway — 1.1% | |
| | 740 | | | DNB ASA | | | 11,551 | |
| | 1,638 | | | Norsk Hydro ASA | | | 9,336 | |
| | 614 | | | Telenor ASA | | | 9,917 | |
| | | | | | | | |
| | | | | | | 30,804 | |
| | | | | | | | |
| | | | Portugal — 0.1% | |
| | 842 | | | EDP — Energias de Portugal SA | | | 2,779 | |
| | | | | | | | |
| | | | Singapore — 0.6% | |
| | 786 | | | DBS Group Holdings Ltd. | | | 10,861 | |
| | 209 | | | Jardine Cycle & Carriage Ltd. | | | 7,086 | |
| | 130 | | | Venture Corp., Ltd. | | | 1,136 | |
| | | | | | | | |
| | | | | | | 19,083 | |
| | | | | | | | |
| | | | South Africa — 0.3% | |
| | 1,556 | | | Steinhoff International Holdings NV | | | 7,916 | |
| | | | | | | | |
| | | | South Korea — 0.1% | |
| | 51 | | | POSCO, ADR | | | 2,983 | |
| | | | | | | | |
| | | | Spain — 2.8% | |
| | 336 | | | ACS Actividades de Construccion y Servicios SA | | | 12,440 | |
| | 242 | | | Amadeus IT Group SA | | | 13,035 | |
| | 4,248 | | | Banco Santander SA | | | 27,685 | |
| | 2,191 | | | Iberdrola SA | | | 15,750 | |
| | 874 | | | Repsol SA | | | 13,798 | |
| | | | | | | | |
| | | | | | | 82,708 | |
| | | | | | | | |
| | | | Sweden — 2.7% | |
| | 373 | | | Atlas Copco AB, Class A | | | 13,941 | |
| | 377 | | | Boliden AB | | | 10,778 | |
| | 463 | | | Castellum AB | | | 6,344 | |
| | 182 | | | JM AB | | | 6,405 | |
| | 410 | | | Skanska AB, Class B | | | 9,800 | |
| | 1,095 | | | Swedbank AB, Class A | | | 25,961 | |
| | 236 | | | Trelleborg AB, Class B, | | | 5,541 | |
| | | | | | | | |
| | | | | | | 78,770 | |
| | | | | | | | |
| | | | Switzerland — 11.1% | |
| | 607 | | | ABB Ltd. (Registered) | | | 14,875 | |
| | 319 | | | Adecco Group AG (Registered) | | | 23,683 | |
| | | | | | | | |
| SHARES | | | SECURITY DESCRIPTION | | VALUE($) | |
| | |
| | | | Switzerland — continued | |
| | 207 | | | Cie Financiere Richemont SA (Registered) | | | 17,259 | |
| | 356 | | | Coca-Cola HBC AG (a) | | | 9,885 | |
| | 10 | | | Flughafen Zuerich AG (Registered) | | | 2,184 | |
| | – | (h) | | Forbo Holding AG (Registered) | | | 586 | |
| | 11 | | | Georg Fischer AG (Registered) | | | 10,012 | |
| | 4,075 | | | Glencore plc (a) | | | 16,014 | |
| | 269 | | | Logitech International SA (Registered) | | | 8,993 | |
| | 49 | | | Lonza Group AG (Registered) (a) | | | 10,091 | |
| | 546 | | | Nestle SA (Registered) | | | 42,046 | |
| | 345 | | | Novartis AG (Registered) | | | 26,559 | |
| | 197 | | | Roche Holding AG | | | 51,524 | |
| | 52 | | | Schindler Holding AG | | | 10,638 | |
| | 4 | | | Sika AG | | | 24,285 | |
| | 36 | | | Swiss Life Holding AG (Registered) (a) | | | 11,624 | |
| | 151 | | | Swiss Re AG | | | 13,134 | |
| | 1,258 | | | UBS Group AG (Registered) (a) | | | 21,483 | |
| | 133 | | | Wolseley plc | | | 8,442 | |
| | | | | | | | |
| | | | | | | 323,317 | |
| | | | | | | | |
| | | | United Kingdom — 15.7% | |
| | 1,161 | | | 3i Group plc | | | 11,935 | |
| | 646 | | | Anglo American plc (a) | | | 9,243 | |
| | 1,688 | | | Aviva plc | | | 11,477 | |
| | 1,672 | | | Barratt Developments plc | | | 12,544 | |
| | 464 | | | Beazley plc | | | 2,646 | |
| | 2,450 | | | BP plc | | | 14,024 | |
| | 603 | | | British American Tobacco plc | | | 40,709 | |
| | 1,033 | | | BT Group plc | | | 4,074 | |
| | 515 | | | Burberry Group plc | | | 10,772 | |
| | 3,265 | | | Centrica plc | | | 8,366 | |
| | 3,362 | | | ConvaTec Group plc (a) (e) | | | 13,371 | |
| | 61 | | | DCC plc | | | 5,654 | |
| | 715 | | | Diageo plc | | | 20,822 | |
| | 233 | | | Dialog Semiconductor plc (a) | | | 10,909 | |
| | 2,123 | | | GKN plc | | | 9,864 | |
| | 510 | | | GlaxoSmithKline plc | | | 10,256 | |
| | 66 | | | Hiscox Ltd. | | | 970 | |
| | 2,174 | | | HSBC Holdings plc | | | 17,928 | |
| | 393 | | | Imperial Brands plc | | | 19,223 | |
| | 100 | | | InterContinental Hotels Group plc | | | 5,296 | |
| | 1,930 | | | International Consolidated Airlines Group SA | | | 13,994 | |
| | 1,127 | | | JD Sports Fashion plc | | | 6,497 | |
| | 477 | | | John Wood Group plc | | | 4,693 | |
| | 22,714 | | | Lloyds Banking Group plc | | | 20,410 | |
| | 398 | | | Pagegroup plc | | | 2,581 | |
SEE NOTES TO FINANCIAL STATEMENTS.
| | | | | | |
| | | |
| 84 | | | | J.P. MORGAN INTERNATIONAL EQUITY FUNDS | | APRIL 30, 2017 |
| | | | | | | | |
| SHARES | | | SECURITY DESCRIPTION | | VALUE($) | |
| | Common Stocks — continued | |
| | | | United Kingdom — continued | |
| | 709 | | | Persimmon plc | | | 21,396 | |
| | 997 | | | Prudential plc | | | 22,131 | |
| | 58 | | | Reckitt Benckiser Group plc | | | 5,306 | |
| | 297 | | | Redrow plc | | | 2,215 | |
| | 643 | | | Rio Tinto plc | | | 25,369 | |
| | 96 | | | Savills plc | | | 1,160 | |
| | 260 | | | Schroders plc | | | 10,729 | |
| | 54 | | | Segro plc | | | 342 | |
| | 802 | | | Subsea 7 SA | | | 13,221 | |
| | 21 | | | TechnipFMC plc (a) | | | 628 | |
| | 976 | | | UBM plc | | | 8,972 | |
| | 812 | | | Unilever NV, CVA | | | 42,545 | |
| | 1,408 | | | Vodafone Group plc | | | 3,627 | |
| | 608 | | | WPP plc | | | 13,017 | |
| | | | | | | | |
| | | | | | | 458,916 | |
| | | | | | | | |
| | | | United States — 1.0% | |
| | 399 | | | Carnival plc | | | 24,599 | |
| | 84 | | | Shire plc | | | 4,974 | |
| | | | | | | | |
| | | | | | | 29,573 | |
| | | | | | | | |
| | | | Total Common Stocks
(Cost $2,601,672) | | | 2,786,774 | |
| | | | | | | | |
| | Preferred Stock — 0.1% | |
| | | | Germany — 0.1% | |
| | 15 | | | Henkel AG & Co. KGaA (Preference)
(Cost $1,833) | | | 2,052 | |
| | | | | | | | |
| | Short-Term Investment — 2.5% | |
| | | | Investment Company — 2.5% | |
| | 73,458 | | | JPMorgan U.S. Government Money Market Fund, Institutional Class Shares, 0.620% (b) (l)
(Cost $73,458) | | | 73,458 | |
| | | | | | | | |
| | | | Total Investments — 97.9%
(Cost $2,676,963) | | | 2,862,284 | |
| | | | Other Assets in Excess of
Liabilities — 2.1% | | | 60,469 | |
| | | | | | | | |
| | | | NET ASSETS — 100.0% | | $ | 2,922,753 | |
| | | | | | | | |
Percentages indicated are based on net assets.
Summary of Investments by Industry, April 30, 2017
The following table represents the portfolio investments of the Fund by industry classifications as a percentage of total investments:
| | | | |
| INDUSTRY | | PERCENTAGE | |
Banks | | | 14.9 | % |
Pharmaceuticals | | | 7.4 | |
Insurance | | | 5.5 | |
Metals & Mining | | | 5.3 | |
Chemicals | | | 3.7 | |
Auto Components | | | 3.5 | |
Electrical Equipment | | | 3.4 | |
Oil, Gas & Consumable Fuels | | | 3.2 | |
Household Durables | | | 2.8 | |
Automobiles | | | 2.5 | |
Construction & Engineering | | | 2.4 | |
Real Estate Management & Development | | | 2.4 | |
Wireless Telecommunication Services | | | 2.3 | |
Tobacco | | | 2.1 | |
Machinery | | | 2.0 | |
Diversified Telecommunication Services | | | 2.0 | |
Multi-Utilities | | | 1.9 | |
Industrial Conglomerates | | | 1.9 | |
Food Products | | | 1.9 | |
Textiles, Apparel & Luxury Goods | | | 1.8 | |
Personal Products | | | 1.8 | |
Hotels, Restaurants & Leisure | | | 1.6 | |
Semiconductors & Semiconductor Equipment | | | 1.6 | |
Capital Markets | | | 1.5 | |
IT Services | | | 1.3 | |
Electric Utilities | | | 1.2 | |
Diversified Financial Services | | | 1.2 | |
Building Products | | | 1.1 | |
Beverages | | | 1.1 | |
Food & Staples Retailing | | | 1.0 | |
Trading Companies & Distributors | | | 1.0 | |
Others (each less than 1.0%) | | | 10.1 | |
Short-Term Investment | | | 2.6 | |
SEE NOTES TO FINANCIAL STATEMENTS.
| | | | | | | | |
| | | |
| APRIL 30, 2017 | | J.P. MORGAN INTERNATIONAL EQUITY FUNDS | | | | | 85 | |
JPMorgan Intrepid International Fund
SCHEDULE OF PORTFOLIO INVESTMENTS
AS OF APRIL 30, 2017 (Unaudited) (continued)
(Amounts in thousands, except number of Futures contracts)
| | | | | | | | | | | | | | | | | | | | | | |
| Futures Contracts | | | | |
| | | | NUMBER OF
CONTRACTS | | DESCRIPTION | | EXPIRATION
DATE | | | TRADING
CURRENCY | | | NOTIONAL
VALUE AT
APRIL 30, 2017 | | | NET
UNREALIZED
APPRECIATION
(DEPRECIATION) | |
| | | | | | Long Futures Outstanding | | | | | |
| | | | 568 | | Euro STOXX 50 Index | | | 06/16/17 | | | | USD | | | $ | 21,707 | | | $ | 51 | |
| | | | 175 | | FTSE 100 Index | | | 06/16/17 | | | | USD | | | | 16,239 | | | | 34 | |
| | | | | | | | | | | | | | | | | | | | | | |
| | | | | | | | $ | 85 | |
| | | | | | | | | | | | | | | | | | | | | | |
SEE NOTES TO FINANCIAL STATEMENTS.
| | | | | | |
| | | |
| 86 | | | | J.P. MORGAN INTERNATIONAL EQUITY FUNDS | | APRIL 30, 2017 |
J.P. Morgan International Equity Funds
NOTES TO SCHEDULE OF PORTFOLIO INVESTMENTS
AS OF APRIL 30, 2017 (Unaudited)
| | |
| ADR | | — American Depositary Receipt |
| AUD | | — Australian Dollar |
| BRL | | — Brazilian Real |
| CAD | | — Canadian Dollar |
| CDI | | — CHESS Depository Interest |
| CHF | | — Swiss Franc |
| CVA | | — Dutch Certification |
| DKK | | — Danish Krone |
| EUR | | — Euro |
| FTSE | | — Financial Times Stock Exchange |
| GBP | | — British Pound |
| GDR | | — Global Depositary Receipt |
| HKD | | — Hong Kong Dollar |
| JPY | | — Japanese Yen |
| MSCI | | — Morgan Stanley Capital International |
| NOK | | — Norwegian Krone |
| NVDR | | — Non Voting Depositary Receipt |
| REIT | | — Real Estate Investment Trust |
| SEK | | — Swedish Krona |
| SGD | | — Singapore Dollar |
| TOPIX | | — Tokyo Stock Price Index |
| USD | | — United States Dollar |
| | |
| VAR | | — Variable Rate Security. The interest rate shown is the rate in effect as of April 30, 2017. |
| |
| (a) | | — Non-income producing security. |
| (b) | | — Investment in affiliate. Money market fund is registered under the Investment Company Act of 1940, as amended, and advised by J.P. Morgan Investment Management Inc. |
| (e) | | — Security is exempt from registration under Rule 144A of the Securities Act of 1933, as amended. Unless otherwise indicated, this security has been determined to be liquid under procedures established by the Board of Trustees and may be resold in transactions exempt from registration, normally to qualified institutional buyers. |
| (g) | | — Amount rounds to less than 0.05%. |
| (h) | | — Amount rounds to less than 500. |
| (l) | | — The rate shown is the current yield as of April 30, 2017. |
| (x) | | — Securities are perpetual and thus, do not have a predetermined maturity date. The coupon rates for these securities are fixed for a period of time and may be structured to adjust thereafter. The dates shown, if applicable, reflect the next call date. The coupon rates shown are the rates in effect as of April 30, 2017. |
| (y) | | — Preferred Security. |
SEE NOTES TO FINANCIAL STATEMENTS.
| | | | | | | | |
| | | |
| APRIL 30, 2017 | | J.P. MORGAN INTERNATIONAL EQUITY FUNDS | | | | | 87 | |
STATEMENTS OF ASSETS AND LIABILITIES
AS OF APRIL 30, 2017 (Unaudited)
(Amounts in thousands, except per share amounts)
| | | | | | | | | | | | |
| | | Emerging
Economies
Fund | | | Emerging
Markets
Equity Fund | | |
Emerging
Markets
Equity
Income Fund | |
ASSETS: | |
Investments in non-affiliates, at value | | $ | 1,841,862 | | | $ | 3,518,327 | | | $ | 15,842 | |
Investments in affiliates, at value | | | 32,084 | | | | 45,041 | | | | 24 | |
| | | | | | | | | | | | |
Total investment securities, at value | | | 1,873,946 | | | | 3,563,368 | | | | 15,866 | |
Cash | | | 1,151 | | | | 1,496 | | | | 159 | |
Foreign currency, at value | | | 573 | | | | 18,233 | | | | 28 | |
Deposits at broker for futures contracts | | | 339 | | | | — | | | | — | |
Receivables: | | | | | | | | | | | | |
Investment securities sold | | | 17,358 | | | | — | | | | 51 | |
Fund shares sold | | | 1,996 | | | | 7,315 | | | | 38 | |
Dividends from non-affiliates | | | 4,324 | | | | 2,993 | | | | 49 | |
Dividends from affiliates | | | 14 | | | | 32 | | | | — | (a) |
Tax reclaims | | | 65 | | | | 279 | | | | 2 | |
Variation margin on futures contracts | | | 25 | | | | — | | | | — | (a) |
Due from adviser | | | — | | | | — | | | | 28 | |
Other assets | | | — | | | | — | | | | 30 | |
| | | | | | | | | | | | |
Total Assets | | | 1,899,791 | | | | 3,593,716 | | | | 16,251 | |
| | | | | | | | | | | | |
| | | |
LIABILITIES: | | | | | | | | | | | | |
Payables: | | | | | | | | | | | | |
Investment securities purchased | | | 8,195 | | | | 17,717 | | | | 80 | |
Fund shares redeemed | | | 6,312 | | | | 5,845 | | | | 11 | |
Accrued liabilities: | | | | | | | | | | | | |
Investment advisory fees | | | 1,009 | | | | 2,146 | | | | — | |
Administration fees | | | 4 | | | | 55 | | | | — | |
Distribution fees | | | 33 | | | | 113 | | | | 2 | |
Service fees | | | 41 | | | | 201 | | | | 3 | |
Custodian and accounting fees | | | 82 | | | | 276 | | | | 12 | |
Trustees’ and Chief Compliance Officer’s fees | | | 2 | | | | 2 | | | | 1 | |
Deferred India capital gains tax | | | 2,193 | | | | 4,937 | | | | — | |
Audit fees | | | 51 | | | | 49 | | | | 53 | |
Printing and mailing cost | | | 16 | | | | 86 | | | | — | |
Other | | | 27 | | | | 72 | | | | 2 | |
| | | | | | | | | | | | |
Total Liabilities | | | 17,965 | | | | 31,499 | | | | 164 | |
| | | | | | | | | | | | |
Net Assets | | $ | 1,881,826 | | | $ | 3,562,217 | | | $ | 16,087 | |
| | | | | | | | | | | | |
| (a) | Amount rounds to less than 500. |
SEE NOTES TO FINANCIAL STATEMENTS.
| | | | | | |
| | | |
| 88 | | | | J.P. MORGAN INTERNATIONAL EQUITY FUNDS | | APRIL 30, 2017 |
| | | | | | | | | | | | |
| | | Emerging
Economies
Fund | | | Emerging
Markets
Equity Fund | | |
Emerging
Markets
Equity
Income Fund | |
NET ASSETS: | |
Paid-in-Capital | | $ | 1,832,468 | | | $ | 2,956,136 | | | $ | 15,489 | |
Accumulated undistributed (distributions in excess of) net investment income | | | 6,320 | | | | 2,227 | | | | 111 | |
Accumulated net realized gains (losses) | | | (190,011 | ) | | | (125,223 | ) | | | (544 | ) |
Net unrealized appreciation (depreciation) | | | 233,049 | | | | 729,077 | | | | 1,031 | |
| | | | | | | | | | | | |
Total Net Assets | | $ | 1,881,826 | | | $ | 3,562,217 | | | $ | 16,087 | |
| | | | | | | | | | | | |
| | | |
Net Assets: | | | | | | | | | | | | |
Class A | | $ | 152,637 | | | $ | 454,739 | | | $ | 10,671 | |
Class C | | | 2,723 | | | | 37,694 | | | | 113 | |
Class I (formerly Select Class) | | | 59,491 | | | | 402,793 | | | | 5,227 | |
Class L (formerly Institutional Class) | | | — | | | | 511,475 | | | | — | |
Class R5 | | | 1,356 | | | | 22 | | | | 20 | |
Class R6 | | | 1,665,619 | | | | 2,155,494 | | | | 56 | |
| | | | | | | | | | | | |
Total | | $ | 1,881,826 | | | $ | 3,562,217 | | | $ | 16,087 | |
| | | | | | | | | | | | |
| | | |
Outstanding units of beneficial interest (shares) | | | | | | | | | | | | |
($0.0001 par value; unlimited number of shares authorized): | | | | | | | | | | | | |
Class A | | | 12,083 | | | | 19,089 | | | | 755 | |
Class C | | | 217 | | | | 1,624 | | | | 8 | |
Class I (formerly Select Class) | | | 4,651 | | | | 16,510 | | | | 368 | |
Class L (formerly Institutional Class) | | | — | | | | 20,834 | | | | — | |
Class R5 | | | 105 | | | | 1 | | | | 1 | |
Class R6 | | | 130,910 | | | | 87,931 | | | | 4 | |
| | | |
Net Asset Value (a): | | | | | | | | | | | | |
Class A — Redemption price per share | | $ | 12.63 | | | $ | 23.82 | | | $ | 14.13 | |
Class C — Offering price per share (b) | | | 12.55 | | | | 23.20 | | | | 14.10 | |
Class I (formerly Select Class) — Offering and redemption price per share | | | 12.79 | | | | 24.40 | | | | 14.19 | |
Class L (formerly Institutional Class) — Offering and redemption price per share | | | — | | | | 24.55 | | | | — | |
Class R5 — Offering and redemption price per share | | | 12.90 | | | | 24.54 | | | | 14.20 | |
Class R6 — Offering and redemption price per share | | | 12.72 | | | | 24.51 | | | | 14.20 | |
Class A maximum sales charge | | | 5.25 | % | | | 5.25 | % | | | 5.25 | % |
Class A maximum public offering price per share | | | | | | | | | | | | |
[net asset value per share/(100% — maximum sales charge)] | | $ | 13.33 | | | $ | 25.14 | | | $ | 14.91 | |
| | | | | | | | | | | | |
| | | |
Cost of investments in non-affiliates | | $ | 1,606,704 | | | $ | 2,784,308 | | | $ | 14,811 | |
Cost of investments in affiliates | | | 32,084 | | | | 45,041 | | | | 24 | |
Cost of foreign currency | | | 579 | | | | 18,237 | | | | 28 | |
| (a) | Per share amounts may not recalculate due to rounding of net assets and/or shares outstanding. |
| (b) | Redemption price for Class C Shares varies based upon length of time the shares are held. |
SEE NOTES TO FINANCIAL STATEMENTS.
| | | | | | | | |
| | | |
| APRIL 30, 2017 | | J.P. MORGAN INTERNATIONAL EQUITY FUNDS | | | | | 89 | |
STATEMENTS OF ASSETS AND LIABILITIES
AS OF APRIL 30, 2017 (Unaudited) (continued)
(Amounts in thousands, except per share amounts)
| | | | | | | | | | | | |
| | |
Global
Research
Enhanced
Index Fund | | | Global
Unconstrained
Equity Fund | | | International
Discovery
Fund | |
ASSETS: | |
Investments in non-affiliates, at value | | $ | 7,646,831 | | | $ | 1,984 | | | $ | 6,680 | |
Investments in affiliates, at value | | | 46,476 | | | | 39 | | | | — | |
| | | | | | | | | | | | |
Total investment securities, at value | | | 7,693,307 | | | | 2,023 | | | | 6,680 | |
Cash | | | 2,392 | | | | 70 | | | | 186 | |
Foreign currency, at value | | | 3,446 | | | | 11 | | | | 5 | |
Deposits at broker for futures contracts | | | 1,296 | | | | — | | | | — | |
Receivables: | | | | | | | | | | | | |
Investment securities sold | | | 1,604 | | | | 24 | | | | 119 | |
Fund shares sold | | | 7,554 | | | | 22 | | | | — | |
Dividends from non-affiliates | | | 13,789 | | | | 4 | | | | 29 | |
Dividends from affiliates | | | 27 | | | | — | (a) | | | — | |
Tax reclaims | | | 6,358 | | | | 14 | | | | 2 | |
Due from adviser | | | — | | | | 24 | | | | 33 | |
Other assets | | | — | | | | 22 | | | | — | |
| | | | | | | | | | | | |
Total Assets | | | 7,729,773 | | | | 2,214 | | | | 7,054 | |
| | | | | | | | | | | | |
| | | |
LIABILITIES: | | | | | | | | | | | | |
Payables: | | | | | | | | | | | | |
Investment securities purchased | | | 6,021 | | | | 20 | | | | 214 | |
Fund shares redeemed | | | 5,332 | | | | — | | | | — | |
Variation margin on futures contracts | | | 32 | | | | — | | | | — | |
Accrued liabilities: | | | | | | | | | | | | |
Investment advisory fees | | | 465 | | | | — | | | | — | |
Distribution fees | | | — | (a) | | | — | (a) | | | — | (a) |
Service fees | | | 1,543 | | | | — | (a) | | | 1 | |
Custodian and accounting fees | | | 99 | | | | 7 | | | | 18 | |
Trustees’ and Chief Compliance Officer’s fees | | | 18 | | | | — | (a) | | | — | (a) |
Audit fees | | | 46 | | | | 54 | | | | 53 | |
Printing and mailing cost | | | 65 | | | | 5 | | | | 4 | |
Other | | | — | | | | 3 | | | | 2 | |
| | | | | | | | | | | | |
Total Liabilities | | | 13,621 | | | | 89 | | | | 292 | |
| | | | | | | | | | | | |
Net Assets | | $ | 7,716,152 | | | $ | 2,125 | | | $ | 6,762 | |
| | | | | | | | | | | | |
| (a) | Amount rounds to less than 500. |
SEE NOTES TO FINANCIAL STATEMENTS.
| | | | | | |
| | | |
| 90 | | | | J.P. MORGAN INTERNATIONAL EQUITY FUNDS | | APRIL 30, 2017 |
| | | | | | | | | | | | |
| | |
Global
Research
Enhanced
Index Fund | | | Global
Unconstrained
Equity Fund | | | International
Discovery
Fund | |
NET ASSETS: | |
Paid-in-Capital | | $ | 6,649,649 | | | $ | 1,944 | | | $ | 6,041 | |
Accumulated undistributed (distributions in excess of) net investment income | | | 39,651 | | | | (1 | ) | | | 31 | |
Accumulated net realized gains (losses) | | | (293,804 | ) | | | 55 | | | | (426 | ) |
Net unrealized appreciation (depreciation) | | | 1,320,656 | | | | 127 | | | | 1,116 | |
| | | | | | | | | | | | |
Total Net Assets | | $ | 7,716,152 | | | $ | 2,125 | | | $ | 6,762 | |
| | | | | | | | | | | | |
| | | |
Net Assets: | | | | | | | | | | | | |
Class A | | $ | 23 | | | $ | 679 | | | $ | 133 | |
Class C | | | 22 | | | | 263 | | | | 22 | |
Class I (formerly Select Class) | | | 7,716,084 | | | | 1,123 | | | | 6,563 | |
Class R2 | | | 23 | | | | 20 | | | | — | |
Class R5 | | | — | | | | 20 | | | | 22 | |
Class R6 | | | — | | | | 20 | | | | 22 | |
| | | | | | | | | | | | |
Total | | $ | 7,716,152 | | | $ | 2,125 | | | $ | 6,762 | |
| | | | | | | | | | | | |
| | | |
Outstanding units of beneficial interest (shares) | | | | | | | | | | | | |
($0.0001 par value; unlimited number of shares authorized): | | | | | | | | | | | | |
Class A | | | 1 | | | | 42 | | | | 8 | |
Class C | | | 1 | | | | 17 | | | | 1 | |
Class I (formerly Select Class) | | | 380,697 | | | | 69 | | | | 397 | |
Class R2 | | | 1 | | | | 1 | | | | — | |
Class R5 | | | — | | | | 1 | | | | 1 | |
Class R6 | | | — | | | | 1 | | | | 1 | |
| | | |
Net Asset Value (a): | | | | | | | | | | | | |
Class A — Redemption price per share | | $ | 20.38 | | | $ | 16.12 | | | $ | 16.52 | |
Class C — Offering price per share (b) | | | 20.44 | | | | 15.96 | | | | 16.48 | |
Class I (formerly Select Class) — Offering and redemption price per share | | | 20.27 | | | | 16.24 | | | | 16.55 | |
Class R2 — Offering and redemption price per share | | | 20.41 | | | | 16.23 | | | | — | |
Class R5 — Offering and redemption price per share | | | — | | | | 16.18 | | | | 16.56 | |
Class R6 — Offering and redemption price per share | | | — | | | | 16.17 | | | | 16.56 | |
Class A maximum sales charge | | | 5.25 | % | | | 5.25 | % | | | 5.25 | % |
Class A maximum public offering price per share | | | | | | | | | | | | |
[net asset value per share/(100% — maximum sales charge)] | | $ | 21.51 | | | $ | 17.01 | | | $ | 17.44 | |
| | | | | | | | | | | | |
| | | |
Cost of investments in non-affiliates | | $ | 6,326,652 | | | $ | 1,857 | | | $ | 5,564 | |
Cost of investments in affiliates | | | 46,476 | | | | 39 | | | | — | |
Cost of foreign currency | | | 3,430 | | | | 11 | | | | 5 | |
| (a) | Per share amounts may not recalculate due to rounding of net assets and/or shares outstanding. |
| (b) | Redemption price for Class C Shares varies based upon length of time the shares are held. |
SEE NOTES TO FINANCIAL STATEMENTS.
| | | | | | | | |
| | | |
| APRIL 30, 2017 | | J.P. MORGAN INTERNATIONAL EQUITY FUNDS | | | | | 91 | |
STATEMENTS OF ASSETS AND LIABILITIES
AS OF APRIL 30, 2017 (Unaudited) (continued)
(Amounts in thousands, except per share amounts)
| | | | | | | | | | | | |
| | | International
Equity Fund | | |
International
Equity
Income Fund | | | International
Opportunities
Fund | |
ASSETS: | |
Investments in non-affiliates, at value | | $ | 3,619,211 | | | $ | 170,592 | | | $ | 2,937,822 | |
Investments in affiliates, at value | | | 76,383 | | | | 3,386 | | | | 38,835 | |
| | | | | | | | | | | | |
Total investment securities, at value | | | 3,695,594 | | | | 173,978 | | | | 2,976,657 | |
Cash | | | 132 | | | | 111 | | | | 50 | |
Foreign currency, at value | | | 722 | | | | 444 | | | | 17 | |
Receivables: | | | | | | | | | | | | |
Investment securities sold | | | — | | | | — | | | | — | (a) |
Fund shares sold | | | 693 | | | | 751 | | | | 491 | |
Interest and dividends from non-affiliates | | | 12,468 | | | | 1,017 | | | | 10,286 | |
Dividends from affiliates | | | 31 | | | | 3 | | | | 28 | |
Tax reclaims | | | 5,167 | | | | 247 | | | | 2,944 | |
Unrealized appreciation on forward foreign currency exchange contracts | | | — | | | | — | | | | 9,115 | |
| | | | | | | | | | | | |
Total Assets | | | 3,714,807 | | | | 176,551 | | | | 2,999,588 | |
| | | | | | | | | | | | |
| | | |
LIABILITIES: | | | | | | | | | | | | |
Payables: | | | | | | | | | | | | |
Investment securities purchased | | | 16,564 | | | | — | | | | — | |
Fund shares redeemed | | | 7,326 | | | | 473 | | | | 10,990 | |
Unrealized depreciation on forward foreign currency exchange contracts | | | 5 | | | | — | | | | 15,012 | |
Accrued liabilities: | | | | | | | | | | | | |
Investment advisory fees | | | 1,929 | | | | 68 | | | | 1,423 | |
Administration fees | | | 154 | | | | — | | | | 194 | |
Distribution fees | | | 66 | | | | 23 | | | | 42 | |
Service fees | | | 75 | | | | 27 | | | | 50 | |
Custodian and accounting fees | | | 75 | | | | 16 | | | | 60 | |
Trustees’ and Chief Compliance Officer’s fees | | | 6 | | | | 1 | | | | 2 | |
Audit fees | | | 58 | | | | 57 | | | | 19 | |
Printing and mailing cost | | | 67 | | | | 10 | | | | 18 | |
Other | | | 72 | | | | 4 | | | | 27 | |
| | | | | | | | | | | | |
Total Liabilities | | | 26,397 | | | | 679 | | | | 27,837 | |
| | | | | | | | | | | | |
Net Assets | | $ | 3,688,410 | | | $ | 175,872 | | | $ | 2,971,751 | |
| | | | | | | | | | | | |
| (a) | Amount rounds to less than 500. |
SEE NOTES TO FINANCIAL STATEMENTS.
| | | | | | |
| | | |
| 92 | | | | J.P. MORGAN INTERNATIONAL EQUITY FUNDS | | APRIL 30, 2017 |
| | | | | | | | | | | | |
| | | International
Equity Fund | | |
International
Equity
Income Fund | | | International
Opportunities
Fund | |
NET ASSETS: | |
Paid-in-Capital | | $ | 3,196,752 | | | $ | 171,876 | | | $ | 2,693,240 | |
Accumulated undistributed (distributions in excess of) net investment income | | | 10,013 | | | | (57 | ) | | | 11,077 | |
Accumulated net realized gains (losses) | | | (65,934 | ) | | | (11,305 | ) | | | (126,303 | ) |
Net unrealized appreciation (depreciation) | | | 547,579 | | | | 15,358 | | | | 393,737 | |
| | | | | | | | | | | | |
Total Net Assets | | $ | 3,688,410 | | | $ | 175,872 | | | $ | 2,971,751 | |
| | | | | | | | | | | | |
| | | |
Net Assets: | | | | | | | | | | | | |
Class A | | $ | 257,057 | | | $ | 74,610 | | | $ | 204,929 | |
Class C | | | 23,139 | | | | 13,128 | | | | 1,484 | |
Class I (formerly Select Class) | | | 112,377 | | | | 85,893 | | | | 47,653 | |
Class R2 | | | 1,533 | | | | 472 | | | | — | |
Class R5 | | | 19,619 | | | | 1,637 | | | | — | |
Class R6 | | | 3,274,685 | | | | 132 | | | | 2,717,685 | |
| | | | | | | | | | | | |
Total | | $ | 3,688,410 | | | $ | 175,872 | | | $ | 2,971,751 | |
| | | | | | | | | | | | |
| | | |
Outstanding units of beneficial interest (shares) | | | | | | | | | | | | |
($0.0001 par value; unlimited number of shares authorized): | | | | | | | | | | | | |
Class A | | | 16,316 | | | | 4,857 | | | | 13,637 | |
Class C | | | 1,551 | | | | 860 | | | | 102 | |
Class I (formerly Select Class) | | | 7,031 | | | | 5,576 | | | | 3,128 | |
Class R2 | | | 98 | | | | 31 | | | | — | |
Class R5 | | | 1,226 | | | | 106 | | | | — | |
Class R6 | | | 204,657 | | | | 9 | | | | 177,853 | |
| | | |
Net Asset Value (a): | | | | | | | | | | | | |
Class A — Redemption price per share | | $ | 15.75 | | | $ | 15.36 | | | $ | 15.03 | |
Class C — Offering price per share (b) | | | 14.93 | | | | 15.26 | | | | 14.54 | |
Class I (formerly Select Class) — Offering and redemption price per share | | | 15.98 | | | | 15.40 | | | | 15.23 | |
Class R2 — Offering and redemption price per share | | | 15.68 | | | | 15.33 | | | | — | |
Class R5 — Offering and redemption price per share | | | 16.00 | | | | 15.41 | | | | — | |
Class R6 — Offering and redemption price per share | | | 16.00 | | | | 15.40 | | | | 15.28 | |
Class A maximum sales charge | | | 5.25 | % | | | 5.25 | % | | | 5.25 | % |
Class A maximum public offering price per share | | | | | | | | | | | | |
[net asset value per share/(100% — maximum sales charge)] | | $ | 16.62 | | | $ | 16.21 | | | $ | 15.86 | |
| | | | | | | | | | | | |
| | | |
Cost of investments in non-affiliates | | $ | 3,071,623 | | | $ | 155,245 | | | $ | 2,538,129 | |
Cost of investments in affiliates | | | 76,383 | | | | 3,386 | | | | 38,835 | |
Cost of foreign currency | | | 722 | | | | 444 | | | | 19 | |
| (a) | Per share amounts may not recalculate due to rounding of net assets and/or shares outstanding. |
| (b) | Redemption price for Class C Shares varies based upon length of time the shares are held. |
SEE NOTES TO FINANCIAL STATEMENTS.
| | | | | | | | |
| | | |
| APRIL 30, 2017 | | J.P. MORGAN INTERNATIONAL EQUITY FUNDS | | | | | 93 | |
STATEMENTS OF ASSETS AND LIABILITIES
AS OF APRIL 30, 2017 (Unaudited) (continued)
(Amounts in thousands, except per share amounts)
| | | | | | | | | | | | | | | | |
| | |
International
Research
Enhanced
Equity Fund | | | International
Unconstrained
Equity Fund | | | International
Value Fund | | | Intrepid
International
Fund | |
ASSETS: | |
Investments in non-affiliates, at value | | $ | 1,620,237 | | | $ | 167,000 | | | $ | 801,570 | | | $ | 2,788,826 | |
Investments in affiliates, at value | | | 36,122 | | | | 5,532 | | | | 22,045 | | | | 73,458 | |
| | | | | | | | | | | | | | | | |
Total investment securities, at value | | | 1,656,359 | | | | 172,532 | | | | 823,615 | | | | 2,862,284 | |
Cash | | | 7,961 | | | | 510 | | | | 181 | | | | — | |
Foreign currency, at value | | | 1,923 | | | | 48 | | | | 85 | | | | 2,108 | |
Deposits at broker for futures contracts | | | 1,598 | | | | — | | | | — | | | | — | |
Due from custodian | | | 2,015 | | | | — | | | | 2,464 | | | | — | |
Receivables: | | | | | | | | | | | | | | | | |
Investment securities sold | | | 13,153 | | | | — | (a) | | | — | | | | 428,136 | |
Fund shares sold | | | 62,845 | | | | 1,906 | | | | 2,050 | | | | 445 | |
Interest and dividends from non-affiliates | | | 4,664 | | | | 541 | | | | 2,424 | | | | 11,787 | |
Dividends from affiliates | | | 26 | | | | 2 | | | | 7 | | | | 38 | |
Tax reclaims | | | 2,361 | | | | 63 | | | | 2,418 | | | | 4,171 | |
Variation margin on futures contracts | | | — | | | | — | | | | — | | | | 85 | |
Unrealized appreciation on forward foreign currency exchange contracts | | | 3 | | | | — | | | | 4,013 | | | | — | |
Other assets | | | 71 | | | | 25 | | | | — | | | | — | |
| | | | | | | | | | | | | | | | |
Total Assets | | | 1,752,979 | | | | 175,627 | | | | 837,257 | | | | 3,309,054 | |
| | | | | | | | | | | | | | | | |
| | | | |
LIABILITIES: | | | | | | | | | | | | | | | | |
Payables: | | | | | | | | | | | | | | | | |
Due to custodian | | | — | | | | — | | | | — | | | | 11 | |
Investment securities purchased | | | 35,854 | | | | 1,088 | | | | 2,464 | | | | 378,560 | |
Fund shares redeemed | | | 656 | | | | 7 | | | | 1,457 | | | | 5,916 | |
Variation margin on futures contracts | | | 19 | | | | — | | | | — | | | | — | |
Unrealized depreciation on forward foreign currency exchange contracts | | | — | | | | — | | | | 7,340 | | | | — | |
Accrued liabilities: | | | | | | | | | | | | | | | | |
Investment advisory fees | | | 54 | | | | 78 | | | | 388 | | | | 1,396 | |
Administration fees | | | — | | | | 1 | | | | 53 | | | | 191 | |
Distribution fees | | | 27 | | | | 8 | | | | 73 | | | | 41 | |
Service fees | | | 308 | | | | 8 | | | | 118 | | | | 48 | |
Custodian and accounting fees | | | 37 | | | | 11 | | | | 54 | | | | 75 | |
Trustees’ and Chief Compliance Officer’s fees | | | 1 | | | | 1 | | | | — | (a) | | | 1 | |
Audit fees | | | 45 | | | | 56 | | | | 1 | | | | 31 | |
Printing and mailing cost | | | 17 | | | | 1 | | | | 183 | | | | 16 | |
Other | | | 17 | | | | 9 | | | | 269 | | | | 15 | |
| | | | | | | | | | | | | | | | |
Total Liabilities | | | 37,035 | | | | 1,268 | | | | 12,400 | | | | 386,301 | |
| | | | | | | | | | | | | | | | |
Net Assets | | $ | 1,715,944 | | | $ | 174,359 | | | $ | 824,857 | | | $ | 2,922,753 | |
| | | | | | | | | | | | | | | | |
| (a) | Amount rounds to less than 500. |
SEE NOTES TO FINANCIAL STATEMENTS.
| | | | | | |
| | | |
| 94 | | | | J.P. MORGAN INTERNATIONAL EQUITY FUNDS | | APRIL 30, 2017 |
| | | | | | | | | | | | | | | | |
| | |
International
Research
Enhanced
Equity Fund | | | International
Unconstrained
Equity Fund | | | International
Value Fund | | | Intrepid
International
Fund | |
NET ASSETS: | |
Paid-in-Capital | | $ | 1,536,841 | | | $ | 163,452 | | | $ | 1,124,355 | | | $ | 2,939,893 | |
Accumulated undistributed (distributions in excess of) net investment income | | | 11,227 | | | | 496 | | | | 3,696 | | | | 20,112 | |
Accumulated net realized gains (losses) | | | (1,026 | ) | | | (3,772 | ) | | | (338,806 | ) | | | (222,672 | ) |
Net unrealized appreciation (depreciation) | | | 168,902 | | | | 14,183 | | | | 35,612 | | | | 185,420 | |
| | | | | | | | | | | | | | | | |
Total Net Assets | | $ | 1,715,944 | | | $ | 174,359 | | | $ | 824,857 | | | $ | 2,922,753 | |
| | | | | | | | | | | | | | | | |
| | | | |
Net Assets: | | | | | | | | | | | | | | | | |
Class A | | $ | 71,210 | | | $ | 26,032 | | | $ | 294,864 | | | $ | 199,735 | |
Class C | | | 12,585 | | | | 5,735 | | | | 22,320 | | | | 1,914 | |
Class I (formerly Select Class) | | | 1,619,251 | | | | 30,034 | | | | 151,737 | | | | 49,895 | |
Class L (formerly Institutional Class) | | | — | | | | — | | | | 323,408 | | | | — | |
Class R2 | | | 12,898 | | | | 22 | | | | 1,276 | | | | 536 | |
Class R5 | | | — | | | | 22 | | | | 23 | | | | — | |
Class R6 | | | — | | | | 112,514 | | | | 31,229 | | | | 2,670,673 | |
| | | | | | | | | | | | | | | | |
Total | | $ | 1,715,944 | | | $ | 174,359 | | | $ | 824,857 | | | $ | 2,922,753 | |
| | | | | | | | | | | | | | | | |
| | | | |
Outstanding units of beneficial interest (shares) ($0.0001 par value; unlimited number of shares authorized): | | | | | | | | | | | | | | | | |
Class A | | | 4,163 | | | | 1,381 | | | | 22,637 | | | | 9,948 | |
Class C | | | 767 | | | | 307 | | | | 1,769 | | | | 94 | |
Class I (formerly Select Class) | | | 93,996 | | | | 1,577 | | | | 11,380 | | | | 2,392 | |
Class L (formerly Institutional Class) | | | — | | | | — | | | | 24,393 | | | | — | |
Class R2 | | | 773 | | | | 1 | | | | 100 | | | | 27 | |
Class R5 | | | — | | | | 1 | | | | 2 | | | | — | |
Class R6 | | | — | | | | 5,913 | | | | 2,360 | | | | 130,041 | |
| | | | |
Net Asset Value (a): | | | | | | | | | | | | | | | | |
Class A — Redemption price per share | | $ | 17.10 | | | $ | 18.84 | | | $ | 13.03 | | | $ | 20.08 | |
Class C — Offering price per share (b) | | | 16.41 | | | | 18.68 | | | | 12.62 | | | | 20.30 | |
Class I (formerly Select Class) — Offering and redemption price per share | | | 17.23 | | | | 19.05 | | | | 13.33 | | | | 20.86 | |
Class L (formerly Institutional Class) — Offering and redemption price per share | | | — | | | | — | | | | 13.26 | | | | — | |
Class R2 — Offering and redemption price per share | | | 16.68 | | | | 18.84 | | | | 12.81 | | | | 19.91 | |
Class R5 — Offering and redemption price per share | | | — | | | | 19.03 | | | | 13.22 | | | | — | |
Class R6 — Offering and redemption price per share | | | — | | | | 19.03 | | | | 13.23 | | | | 20.54 | |
Class A maximum sales charge | | | 5.25 | % | | | 5.25 | % | | | 5.25 | % | | | 5.25 | % |
Class A maximum public offering price per share | | | | | | | | | | | | | | | | |
[net asset value per share/(100% — maximum sales charge)] | | $ | 18.05 | | | $ | 19.88 | | | $ | 13.75 | | | $ | 21.19 | |
| | | | | | | | | | | | | | | | |
| | | | |
Cost of investments in non-affiliates | | $ | 1,451,805 | | | $ | 152,822 | | | $ | 762,383 | | | $ | 2,603,505 | |
Cost of investments in affiliates | | | 36,122 | | | | 5,532 | | | | 22,045 | | | | 73,458 | |
Cost of foreign currency | | | 1,933 | | | | 48 | | | | 85 | | | | 2,108 | |
| (a) | Per share amounts may not recalculate due to rounding of net assets and/or shares outstanding. |
| (b) | Redemption price for Class C Shares varies based upon length of time the shares are held. |
SEE NOTES TO FINANCIAL STATEMENTS.
| | | | | | | | |
| | | |
| APRIL 30, 2017 | | J.P. MORGAN INTERNATIONAL EQUITY FUNDS | | | | | 95 | |
STATEMENTS OF OPERATIONS
FOR THE SIX MONTHS ENDED APRIL 30, 2017 (Unaudited)
(Amounts in thousands)
| | | | | | | | | | | | |
| | | Emerging
Economies
Fund | | | Emerging
Markets
Equity Fund | | |
Emerging
Markets
Equity
Income Fund | |
INVESTMENT INCOME: | | | | | | | | | | | | |
Interest income from non-affiliates | | $ | — | | | $ | — | | | $ | — | (a) |
Interest income from affiliates | | | 1 | | | | 6 | | | | — | (a) |
Dividend income from non-affiliates | | | 21,984 | | | | 23,912 | | | | 256 | |
Dividend income from affiliates | | | 71 | | | | 135 | | | | — | (a) |
Foreign taxes withheld | | | (1,911 | ) | | | (1,674 | ) | | | (19 | ) |
| | | | | | | | | | | | |
Total investment income | | | 20,145 | | | | 22,379 | | | | 237 | |
| | | | | | | | | | | | |
| | | |
EXPENSES: | | | | | | | | | | | | |
Investment advisory fees | | | 7,646 | | | | 13,500 | | | | 64 | |
Administration fees | | | 736 | | | | 1,299 | | | | 5 | |
Distribution fees: | | | | | | | | | | | | |
Class A | | | 182 | | | | 504 | | | | 11 | |
Class C | | | 9 | | | | 133 | | | | — | (a) |
Service fees: | | | | | | | | | | | | |
Class A | | | 182 | | | | 504 | | | | 11 | |
Class C | | | 3 | | | | 44 | | | | — | (a) |
Class I (formerly Select Class) | | | 68 | | | | 402 | | | | 5 | |
Class L (formerly Institutional Class) | | | — | | | | 214 | | | | — | |
Class R5 | | | 1 | | | | — | (a) | | | — | (a) |
Custodian and accounting fees | | | 796 | | | | 901 | | | | 39 | |
Interest expense to affiliates | | | 8 | | | | 2 | | | | — | (a) |
Professional fees | | | 62 | | | | 50 | | | | 46 | |
Trustees’ and Chief Compliance Officer’s fees | | | 18 | | | | 19 | | | | 13 | |
Printing and mailing costs | | | 26 | | | | 115 | | | | 1 | |
Registration and filing fees | | | 32 | | | | 56 | | | | 39 | |
Transfer agency fees (See Note 2.J.) | | | 12 | | | | 58 | | | | — | (a) |
Sub-transfer agency fees (See Note 2.J.) | | | 61 | | | | 503 | | | | 2 | |
Other | | | 20 | | | | 27 | | | | 4 | |
| | | | | | | | | | | | |
Total expenses | | | 9,862 | | | | 18,331 | | | | 240 | |
| | | | | | | | | | | | |
Less fees waived | | | (1,784 | ) | | | (3,080 | ) | | | (72 | ) |
Less expense reimbursements | | | (4 | ) | | | (3 | ) | | | (75 | ) |
| | | | | | | | | | | | |
Net expenses | | | 8,074 | | | | 15,248 | | | | 93 | |
| | | | | | | | | | | | |
Net investment income (loss) | | | 12,071 | | | | 7,131 | | | | 144 | |
| | | | | | | | | | | | |
| | | |
REALIZED/UNREALIZED GAINS (LOSSES): | | | | | | | | | | | | |
Net realized gain (loss) on transactions from: | | | | | | | | | | | | |
Investments in non-affiliates | | | 55,131 | | | | (12,964 | ) | | | (16 | ) |
Futures | | | (195 | ) | | | — | | | | (1 | ) |
Foreign currency transactions | | | 82 | | | | 199 | | | | (3 | ) |
| | | | | | | | | | | | |
Net realized gain (loss) | | | 55,018 | | | | (12,765 | ) | | | (20 | ) |
| | | | | | | | | | | | |
Change in net unrealized appreciation/depreciation on: | | | | | | | | | | | | |
Investments in non-affiliates | | | 128,449 | (b) | | | 336,523 | (c) | | | 614 | |
Futures | | | 324 | | | | — | | | | — | |
Foreign currency translations | | | 5 | | | | (15 | ) | | | — | (a) |
| | | | | | | | | | | | |
Change in net unrealized appreciation/depreciation | | | 128,778 | | | | 336,508 | | | | 614 | |
| | | | | | | | | | | | |
Net realized/unrealized gains (losses) | | | 183,796 | | | | 323,743 | | | | 594 | |
| | | | | | | | | | | | |
Change in net assets resulting from operations | | $ | 195,867 | | | $ | 330,874 | | | $ | 738 | |
| | | | | | | | | | | | |
| (a) | Amount rounds to less than 500. |
| (b) | Net of change in India capital gains tax of approximately $(1,356,000) for Emerging Economies Fund. |
| (c) | Net of change in India capital gains tax of approximately $(309,000) for Emerging Markets Equity Fund. |
SEE NOTES TO FINANCIAL STATEMENTS.
| | | | | | |
| | | |
| 96 | | | | J.P. MORGAN INTERNATIONAL EQUITY FUNDS | | APRIL 30, 2017 |
| | | | | | | | | | | | |
| | |
Global
Research
Enhanced
Index Fund | | | Global
Unconstrained
Equity Fund | | | International
Discovery
Fund | |
INVESTMENT INCOME: | |
Interest income from non-affiliates | | $ | — | (a) | | $ | — | (a) | | $ | — | (a) |
Interest income from affiliates | | | 6 | | | | — | (a) | | | — | |
Dividend income from non-affiliates | | | 85,954 | | | | 14 | | | | 70 | |
Dividend income from affiliates | | | 102 | | | | — | (a) | | | — | |
Foreign taxes withheld | | | (4,017 | ) | | | (1 | ) | | | (7 | ) |
| | | | | | | | | | | | |
Total investment income | | | 82,045 | | | | 13 | | | | 63 | |
| | | | | | | | | | | | |
| | | |
EXPENSES: | | | | | | | | | | | | |
Investment advisory fees | | | 7,237 | | | | 6 | | | | 21 | |
Administration fees | | | 2,960 | | | | 1 | | | | 2 | |
Distribution fees: | | | | | | | | | | | | |
Class A | | | — | (a) | | | 1 | | | | — | (a) |
Class C | | | — | (a) | | | 1 | | | | — | (a) |
Class R2 | | | — | (a) | | | — | (a) | | | — | |
Service fees: | | | | | | | | | | | | |
Class A | | | — | (a) | | | 1 | | | | — | (a) |
Class C | | | — | (a) | | | — | (a) | | | — | (a) |
Class I (formerly Select Class) | | | 9,046 | | | | 1 | | | | 7 | |
Class R2 | | | — | (a) | | | — | (a) | | | — | |
Class R5 | | | — | | | | — | (a) | | | — | (a) |
Custodian and accounting fees | | | 281 | | | | 19 | | | | 49 | |
Interest expense to affiliates | | | 13 | | | | — | (a) | | | — | (a) |
Professional fees | | | 80 | | | | 38 | | | | 36 | |
Trustees’ and Chief Compliance Officer’s fees | | | 6 | | | | 13 | | | | 13 | |
Printing and mailing costs | | | 87 | | | | 7 | | | | 13 | |
Registration and filing fees | | | 19 | | | | 50 | | | | 7 | |
Transfer agency fees (See Note 2.J.) | | | 27 | | | | 1 | | | | — | (a) |
Sub-transfer agency fees (See Note 2.J.) | | | 115 | | | | 1 | | | | — | (a) |
Offering costs | | | — | | | | — | | | | 93 | |
Other | | | 42 | | | | 4 | | | | 3 | |
| | | | | | | | | | | | |
Total expenses | | | 19,913 | | | | 144 | | | | 244 | |
| | | | | | | | | | | | |
Less fees waived | | | (7,632 | ) | | | (9 | ) | | | (25 | ) |
Less expense reimbursements | | | — | (a) | | | (129 | ) | | | (192 | ) |
| | | | | | | | | | | | |
Net expenses | | | 12,281 | | | | 6 | | | | 27 | |
| | | | | | | | | | | | |
Net investment income (loss) | | | 69,764 | | | | 7 | | | | 36 | |
| | | | | | | | | | | | |
| | | |
REALIZED/UNREALIZED GAINS (LOSSES): | | | | | | | | | | | | |
Net realized gain (loss) on transactions from: | | | | | | | | | | | | |
Investments in non-affiliates | | | 29,869 | | | | 108 | | | | 2 | |
Foreign currency transactions | | | (222 | ) | | | (1 | ) | | | (2 | ) |
| | | | | | | | | | | | |
Net realized gain (loss) | | | 29,647 | | | | 107 | | | | — | (a) |
| | | | | | | | | | | | |
Change in net unrealized appreciation/depreciation on: | | | | | | | | | | | | |
Investments in non-affiliates | | | 773,038 | | | | 128 | | | | 687 | |
Futures | | | 646 | | | | — | | | | — | |
Foreign currency translations | | | 378 | | | | — | (a) | | | — | (a) |
| | | | | | | | | | | | |
Change in net unrealized appreciation/depreciation | | | 774,062 | | | | 128 | | | | 687 | |
| | | | | | | | | | | | |
Net realized/unrealized gains (losses) | | | 803,709 | | | | 235 | | | | 687 | |
| | | | | | | | | | | | |
Change in net assets resulting from operations | | $ | 873,473 | | | $ | 242 | | | $ | 723 | |
| | | | | | | | | | | | |
| (a) | Amount rounds to less than 500. |
SEE NOTES TO FINANCIAL STATEMENTS.
| | | | | | | | |
| | | |
| APRIL 30, 2017 | | J.P. MORGAN INTERNATIONAL EQUITY FUNDS | | | | | 97 | |
STATEMENTS OF OPERATIONS
FOR THE SIX MONTHS ENDED APRIL 30, 2017 (Unaudited) (continued)
(Amounts in thousands)
| | | | | | | | | | | | |
| | | International
Equity Fund | | |
International
Equity
Income Fund | | | International
Opportunities
Fund | |
INVESTMENT INCOME: | |
Interest income from non-affiliates | | $ | — | (a) | | $ | — | (a) | | $ | 1 | |
Interest income from affiliates | | | 3 | | | | 1 | | | | 1 | |
Dividend income from non-affiliates | | | 39,480 | | | | 3,760 | | | | 39,139 | |
Dividend income from affiliates | | | 123 | | | | 8 | | | | 118 | |
Foreign taxes withheld | | | (3,067 | ) | | | (349 | ) | | | (3,674 | ) |
| | | | | | | | | | | | |
Total investment income | | | 36,539 | | | | 3,420 | | | | 35,585 | |
| | | | | | | | | | | | |
| | | |
EXPENSES: | | | | | | | | | | | | |
Investment advisory fees | | | 12,172 | | | | 524 | | | | 8,457 | |
Administration fees | | | 1,423 | | | | 61 | | | | 1,153 | |
Distribution fees: | | | | | | | | | | | | |
Class A | | | 275 | | | | 88 | | | | 218 | |
Class C | | | 81 | | | | 45 | | | | 6 | |
Class R2 | | | 4 | | | | 1 | | | | — | |
Service fees: | | | | | | | | | | | | |
Class A | | | 275 | | | | 88 | | | | 218 | |
Class C | | | 27 | | | | 15 | | | | 2 | |
Class I (formerly Select Class) | | | 123 | | | | 82 | | | | 47 | |
Class R2 | | | 2 | | | | 1 | | | | — | |
Class R5 | | | 9 | | | | — | (a) | | | — | |
Institutional Class | | | — | | | | — | | | | 5 | |
Custodian and accounting fees | | | 256 | | | | 44 | | | | 211 | |
Interest expense to affiliates | | | 7 | | | | — | (a) | | | 10 | |
Professional fees | | | 75 | | | | 43 | | | | 74 | |
Trustees’ and Chief Compliance Officer’s fees | | | 17 | | | | 14 | | | | 15 | |
Printing and mailing costs | | | 58 | | | | 4 | | | | 32 | |
Registration and filing fees | | | 34 | | | | 54 | | | | 41 | |
Transfer agency fees (See Note 2.J.) | | | 35 | | | | 6 | | | | 20 | |
Sub-transfer agency fees (See Note 2.J.) | | | 136 | | | | 50 | | | | 34 | |
Other | | | 30 | | | | 6 | | | | 22 | |
| | | | | | | | | | | | |
Total expenses | | | 15,039 | | | | 1,126 | | | | 10,565 | |
| | | | | | | | | | | | |
Less fees waived | | | (1,402 | ) | | | (279 | ) | | | (66 | ) |
Less expense reimbursements | | | (3 | ) | | | — | (a) | | | — | |
| | | | | | | | | | | | |
Net expenses | | | 13,634 | | | | 847 | | | | 10,499 | |
| | | | | | | | | | | | |
Net investment income (loss) | | | 22,905 | | | | 2,573 | | | | 25,086 | |
| | | | | | | | | | | | |
| | | |
REALIZED/UNREALIZED GAINS (LOSSES): | | | | | | | | | | | | |
Net realized gain (loss) on transactions from: | | | | | | | | | | | | |
Investments in non-affiliates | | | (20,107 | ) | | | (425 | ) | | | (17,182 | ) |
Futures | | | — | | | | — | | | | (151 | ) |
Foreign currency transactions | | | (325 | ) | | | (341 | ) | | | 10,453 | |
| | | | | | | | | | | | |
Net realized gain (loss) | | | (20,432 | ) | | | (766 | ) | | | (6,880 | ) |
| | | | | | | | | | | | |
Change in net unrealized appreciation/depreciation on: | | | | | | | | | | | | |
Investments in non-affiliates | | | 375,260 | | | | 11,038 | | | | 336,470 | |
Futures | | | — | | | | — | | | | (386 | ) |
Foreign currency translations | | | 362 | | | | 135 | | | | (8,981 | ) |
| | | | | | | | | | | | |
Change in net unrealized appreciation/depreciation | | | 375,622 | | | | 11,173 | | | | 327,103 | |
| | | | | | | | | | | | |
Net realized/unrealized gains (losses) | | | 355,190 | | | | 10,407 | | | | 320,223 | |
| | | | | | | | | | | | |
Change in net assets resulting from operations | | $ | 378,095 | | | $ | 12,980 | | | $ | 345,309 | |
| | | | | | | | | | | | |
| (a) | Amount rounds to less than 500. |
SEE NOTES TO FINANCIAL STATEMENTS.
| | | | | | |
| | | |
| 98 | | | | J.P. MORGAN INTERNATIONAL EQUITY FUNDS | | APRIL 30, 2017 |
| | | | | | | | | | | | | | | | |
| | |
International
Research
Enhanced
Equity Fund | | | International
Unconstrained
Equity Fund | | | International
Value Fund | | | Intrepid
International
Fund | |
INVESTMENT INCOME: | |
Interest income from non-affiliates | | $ | 5 | | | $ | — | (a) | | $ | — | (a) | | $ | — | |
Interest income from affiliates | | | 4 | | | | — | (a) | | | 3 | | | | 1 | |
Dividend income from non-affiliates | | | 21,140 | | | | 1,123 | | | | 14,329 | | | | 43,589 | |
Dividend income from affiliates | | | 92 | | | | 7 | | | | 42 | | | | 117 | |
Foreign taxes withheld | | | (1,707 | ) | | | (66 | ) | | | (1,471 | ) | | | (3,354 | ) |
| | | | | | | | | | | | | | | | |
Total investment income | | | 19,534 | | | | 1,064 | | | | 12,903 | | | | 40,353 | |
| | | | | | | | | | | | | | | | |
| | | | |
EXPENSES: | | | | | | | | | | | | | | | | |
Investment advisory fees | | | 1,439 | | | | 449 | | | | 3,020 | | | | 8,362 | |
Administration fees | | | 589 | | | | 52 | | | | 412 | | | | 1,140 | |
Distribution fees: | | | | | | | | | | | | | | | | |
Class A | | | 87 | | | | 21 | | | | 410 | | | | 212 | |
Class C | | | 48 | | | | 17 | | | | 87 | | | | 8 | |
Class R2 | | | 29 | | | | — | (a) | | | 3 | | | | 1 | |
Service fees: | | | | | | | | | | | | | | | | |
Class A | | | 87 | | | | 21 | | | | 410 | | | | 212 | |
Class C | | | 16 | | | | 6 | | | | 29 | | | | 2 | |
Class I (formerly Select Class) | | | 1,682 | | | | 20 | | | | 186 | | | | 50 | |
Class L (formerly Institutional Class) | | | — | | | | — | | | | 238 | | | | — | |
Class R2 | | | 14 | | | | — | (a) | | | 2 | | | | 1 | |
Class R5 | | | — | | | | — | (a) | | | — | (a) | | | — | |
Institutional Class | | | — | | | | — | | | | — | | | | 2 | |
Custodian and accounting fees | | | 116 | | | | 32 | | | | 102 | | | | 217 | |
Interest expense to affiliates | | | 3 | | | | — | (a) | | | 5 | | | | 11 | |
Professional fees | | | 70 | | | | 40 | | | | 59 | | | | 74 | |
Trustees’ and Chief Compliance Officer’s fees | | | 16 | | | | 14 | | | | 13 | | | | 15 | |
Printing and mailing costs | | | 38 | | | | 4 | | | | 155 | | | | 26 | |
Registration and filing fees | | | 58 | | | | 38 | | | | 92 | | | | 42 | |
Transfer agency fees (See Note 2.J.) | | | 42 | | | | 5 | | | | 21 | | | | 14 | |
Sub-transfer agency fees (See Note 2.J.) | | | 172 | | | | 8 | | | | 272 | | | | 18 | |
Other | | | 11 | | | | 4 | | | | 16 | | | | 27 | |
| | | | | | | | | | | | | | | | |
Total expenses | | | 4,517 | | | | 731 | | | | 5,532 | | | | 10,434 | |
| | | | | | | | | | | | | | | | |
Less fees waived | | | (1,862 | ) | | | (176 | ) | | | (156 | ) | | | (61 | ) |
Less expense reimbursements | | | (4 | ) | | | — | (a) | | | — | (a) | | | — | |
| | | | | | | | | | | | | | | | |
Net expenses | | | 2,651 | | | | 555 | | | | 5,376 | | | | 10,373 | |
| | | | | | | | | | | | | | | | |
Net investment income (loss) | | | 16,883 | | | | 509 | | | | 7,527 | | | | 29,980 | |
| | | | | | | | | | | | | | | | |
| | | | |
REALIZED/UNREALIZED GAINS (LOSSES): | | | | | | | | | | | | | | | | |
Net realized gain (loss) on transactions from: | | | | | | | | | | | | | | | | |
Investments in non-affiliates | | | 7,712 | | | | 1,311 | | | | 39,322 | | | | 80,285 | |
Futures | | | 4,772 | | | | — | | | | 825 | | | | — | |
Foreign currency transactions | | | (174 | ) | | | 12 | | | | 4,435 | | | | (84 | ) |
| | | | | | | | | | | | | | | | |
Net realized gain (loss) | | | 12,310 | | | | 1,323 | | | | 44,582 | | | | 80,201 | |
| | | | | | | | | | | | | | | | |
Change in net unrealized appreciation/depreciation on: | | | | | | | | | | | | | | | | |
Investments in non-affiliates | | | 146,693 | | | | 13,724 | | | | 73,859 | | | | 198,759 | |
Futures | | | (212 | ) | | | — | | | | — | | | | 85 | |
Foreign currency translations | | | 257 | | | | 7 | | | | (2,787 | ) | | | 367 | |
| | | | | | | | | | | | | | | | |
Change in net unrealized appreciation/depreciation | | | 146,738 | | | | 13,731 | | | | 71,072 | | | | 199,211 | |
| | | | | | | | | | | | | | | | |
Net realized/unrealized gains (losses) | | | 159,048 | | | | 15,054 | | | | 115,654 | | | | 279,412 | |
| | | | | | | | | | | | | | | | |
Change in net assets resulting from operations | | $ | 175,931 | | | $ | 15,563 | | | $ | 123,181 | | | $ | 309,392 | |
| | | | | | | | | | | | | | | | |
| (a) | Amount rounds to less than 500. |
SEE NOTES TO FINANCIAL STATEMENTS.
| | | | | | | | |
| | | |
| APRIL 30, 2017 | | J.P. MORGAN INTERNATIONAL EQUITY FUNDS | | | | | 99 | |
STATEMENTS OF CHANGES IN NET ASSETS
FOR THE PERIODS INDICATED
(Amounts in thousands)
| | | | | | | | | | | | | | | | |
| | |
Emerging Economies Fund | | | Emerging Markets Equity Fund | |
| | | Six Months Ended
April 30, 2017
(Unaudited) | | | Year Ended
October 31, 2016 | | | Six Months Ended
April 30, 2017
(Unaudited) | | | Year Ended
October 31, 2016 | |
CHANGE IN NET ASSETS RESULTING FROM OPERATIONS: | | | | | | | | | | | | | | | | |
Net investment income (loss) | | $ | 12,071 | | | $ | 24,658 | | | $ | 7,131 | | | $ | 20,045 | |
Net realized gain (loss) | | | 55,018 | | | | (59,529 | ) | | | (12,765 | ) | | | (68,841 | ) |
Change in net unrealized appreciation/depreciation | | | 128,778 | | | | 133,106 | | | | 336,508 | | | | 346,979 | |
| | | | | | | | | | | | | | | | |
Change in net assets resulting from operations | | | 195,867 | | | | 98,235 | | | | 330,874 | | | | 298,183 | |
| | | | | | | | | | | | | | | | |
|
DISTRIBUTIONS TO SHAREHOLDERS: | |
Class A | | | | | | | | | | | | | | | | |
From net investment income | | | (1,900 | ) | | | (378 | ) | | | (1,930 | ) | | | (1,590 | ) |
Class C | | | | | | | | | | | | | | | | |
From net investment income | | | (14 | ) | | | (1 | ) | | | (12 | ) | | | — | |
Class I (formerly Select Class) | | | | | | | | | | | | | | | | |
From net investment income | | | (709 | ) | | | (168 | ) | | | (1,895 | ) | | | (1,894 | ) |
Class L (formerly Institutional Class) | | | | | | | | | | | | | | | | |
From net investment income | | | — | | | | — | | | | (3,193 | ) | | | (2,796 | ) |
Class R5 (b) | | | | | | | | | | | | | | | | |
From net investment income | | | (23 | ) | | | — | | | | — | (a) | | | — | |
Class R6 | | | | | | | | | | | | | | | | |
From net investment income | | | (24,949 | ) | | | (12,736 | ) | | | (16,962 | ) | | | (13,982 | ) |
| | | | | | | | | | | | | | | | |
Total distributions to shareholders | | | (27,595 | ) | | | (13,283 | ) | | | (23,992 | ) | | | (20,262 | ) |
| | | | | | | | | | | | | | | | |
|
CAPITAL TRANSACTIONS: | |
Change in net assets resulting from capital transactions | | | (66,158 | ) | | | 593,917 | | | | 130,757 | | | | 580,806 | |
| | | | | | | | | | | | | | | | |
|
NET ASSETS: | |
Change in net assets | | | 102,114 | | | | 678,869 | | | | 437,639 | | | | 858,727 | |
Beginning of period | | | 1,779,712 | | | | 1,100,843 | | | | 3,124,578 | | | | 2,265,851 | |
| | | | | | | | | | | | | | | | |
End of period | | $ | 1,881,826 | | | $ | 1,779,712 | | | $ | 3,562,217 | | | $ | 3,124,578 | |
| | | | | | | | | | | | | | | | |
Accumulated undistributed (distributions in excess of) net investment income | | $ | 6,320 | | | $ | 21,844 | | | $ | 2,227 | | | $ | 19,088 | |
| | | | | | | | | | | | | | | | |
| (a) | Amount rounds to less than 500. |
| (b) | Commencement of offering of class of shares effective September 9, 2016, for Emerging Markets Equity Fund. |
SEE NOTES TO FINANCIAL STATEMENTS.
| | | | | | |
| | | |
| 100 | | | | J.P. MORGAN INTERNATIONAL EQUITY FUNDS | | APRIL 30, 2017 |
| | | | | | | | | | | | | | | | |
| | |
Emerging Markets Equity Income Fund | | | Global Research Enhanced Index Fund | |
| | | Six Months Ended
April 30, 2017
(Unaudited) | | | Year Ended
October 31, 2016 | | | Six Months Ended
April 30, 2017
(Unaudited) | | | Year Ended
October 31, 2016 | |
CHANGE IN NET ASSETS RESULTING FROM OPERATIONS: | | | | | | | | | | | | | | | | |
Net investment income (loss) | | $ | 144 | | | $ | 151 | | | $ | 69,764 | | | $ | 152,165 | |
Net realized gain (loss) | | | (20 | ) | | | (403 | ) | | | 29,647 | | | | (222,262 | ) |
Change in net unrealized appreciation/depreciation | | | 614 | | | | 811 | | | | 774,062 | | | | 116,394 | |
| | | | | | | | | | | | | | | | |
Change in net assets resulting from operations | | | 738 | | | | 559 | | | | 873,473 | | | | 46,297 | |
| | | | | | | | | | | | | | | | |
|
DISTRIBUTIONS TO SHAREHOLDERS: | |
Class A | | | | | | | | | | | | | | | | |
From net investment income | | | (32 | ) | | | (85 | ) | | | (1 | ) | | | — | (a) |
Class C | | | | | | | | | | | | | | | | |
From net investment income | | | — | (a) | | | (1 | ) | | | — | (a) | | | — | |
Class I (formerly Select Class) | | | | | | | | | | | | | | | | |
From net investment income | | | (16 | ) | | | (54 | ) | | | (155,975 | ) | | | (138,054 | ) |
Class R2 | | | | | | | | | | | | | | | | |
From net investment income | | | — | | | | — | | | | — | (a) | | | — | (a) |
Class R5 | | | | | | | | | | | | | | | | |
From net investment income | | | — | (a) | | | — | (a) | | | — | | | | — | |
Class R6 | | | | | | | | | | | | | | | | |
From net investment income | | | — | (a) | | | (1 | ) | | | — | | | | — | |
| | | | | | | | | | | | | | | | |
Total distributions to shareholders | | | (48 | ) | | | (141 | ) | | | (155,976 | ) | | | (138,054 | ) |
| | | | | | | | | | | | | | | | |
|
CAPITAL TRANSACTIONS: | |
Change in net assets resulting from capital transactions | | | 3,821 | | | | 8,465 | | | | 91,349 | | | | (416,215 | ) |
| | | | | | | | | | | | | | | | |
|
NET ASSETS: | |
Change in net assets | | | 4,511 | | | | 8,883 | | | | 808,846 | | | | (507,972 | ) |
Beginning of period | | | 11,576 | | | | 2,693 | | | | 6,907,306 | | | | 7,415,278 | |
| | | | | | | | | | | | | | | | |
End of period | | $ | 16,087 | | | $ | 11,576 | | | $ | 7,716,152 | | | $ | 6,907,306 | |
| | | | | | | | | | | | | | | | |
Accumulated undistributed (distributions in excess of) net investment income | | $ | 111 | | | $ | 15 | | | $ | 39,651 | | | $ | 125,863 | |
| | | | | | | | | | | | | | | | |
| (a) | Amount rounds to less than 500. |
SEE NOTES TO FINANCIAL STATEMENTS.
| | | | | | | | |
| | | |
| APRIL 30, 2017 | | J.P. MORGAN INTERNATIONAL EQUITY FUNDS | | | | | 101 | |
STATEMENTS OF CHANGES IN NET ASSETS
FOR THE PERIODS INDICATED (continued)
(Amounts in thousands)
| | | | | | | | | | | | | | | | |
| | |
Global Unconstrained Equity Fund | | | International Discovery Fund | |
| | | Six Months Ended
April 30, 2017
(Unaudited) | | | Year Ended
October 31, 2016 | | | Six Months Ended
April 30, 2017
(Unaudited) | | | Period Ended
October 31, 2016 (a) | |
CHANGE IN NET ASSETS RESULTING FROM OPERATIONS: | | | | | | | | | | | | | | | | |
Net investment income (loss) | | $ | 7 | | | $ | 334 | | | $ | 36 | | | $ | 60 | |
Net realized gain (loss) | | | 107 | | | | 5,782 | | | | — | (b) | | | (427 | ) |
Change in net unrealized appreciation/depreciation | | | 128 | | | | (108 | ) | | | 687 | | | | 429 | |
| | | | | | | | | | | | | | | | |
Change in net assets resulting from operations | | | 242 | | | | 6,008 | | | | 723 | | | | 62 | |
| | | | | | | | | | | | | | | | |
|
DISTRIBUTIONS TO SHAREHOLDERS: | |
Class A | | | | | | | | | | | | | | | | |
From net investment income | | | — | | | | (443 | ) | | | — | (b) | | | — | (b) |
From net realized gains | | | — | | | | (5,070 | ) | | | — | | | | — | |
Return of capital | | | — | | | | (841 | ) | | | — | | | | — | |
Class C | | | | | | | | | | | | | | | | |
From net investment income | | | — | | | | (4 | ) | | | — | (b) | | | — | (b) |
From net realized gains | | | — | | | | (7 | ) | | | — | | | | — | |
Return of capital | | | — | | | | (17 | ) | | | — | | | | — | |
Class I (formerly Select Class) | | | | | | | | | | | | | | | | |
From net investment income | | | (3 | ) | | | (78 | ) | | | (60 | ) | | | (3 | ) |
From net realized gains | | | — | | | | (590 | ) | | | — | | | | — | |
Return of capital | | | — | | | | (169 | ) | | | — | | | | — | |
Class R2 | | | | | | | | | | | | | | | | |
From net investment income | | | — | | | | — | (b) | | | — | | | | — | |
From net realized gains | | | — | | | | (1 | ) | | | — | | | | — | |
Return of capital | | | — | | | | (1 | ) | | | — | | | | — | |
Class R5 | | | | | | | | | | | | | | | | |
From net investment income | | | — | (b) | | | — | (b) | �� | | — | (b) | | | — | (b) |
From net realized gains | | | — | | | | — | (b) | | | — | | | | — | |
Return of capital | | | — | | | | (1 | ) | | | — | | | | — | |
Class R6 | | | | | | | | | | | | | | | | |
From net investment income | | | — | (b) | | | — | (b) | | | — | (b) | | | — | (b) |
From net realized gains | | | — | | | | — | (b) | | | — | | | | — | |
Return of capital | | | — | | | | (1 | ) | | | — | | | | — | |
| | | | | | | | | | | | | | | | |
Total distributions to shareholders | | | (3 | ) | | | (7,223 | ) | | | (60 | ) | | | (3 | ) |
| | | | | | | | | | | | | | | | |
|
CAPITAL TRANSACTIONS: | |
Change in net assets resulting from capital transactions | | | 214 | | | | 1,246 | | | | 205 | | | | 5,835 | |
| | | | | | | | | | | | | | | | |
|
NET ASSETS: | |
Change in net assets | | | 453 | | | | 31 | | | | 868 | | | | 5,894 | |
Beginning of period | | | 1,672 | | | | 1,641 | | | | 5,894 | | | | — | |
| | | | | | | | | | | | | | | | |
End of period | | $ | 2,125 | | | $ | 1,672 | | | $ | 6,762 | | | $ | 5,894 | |
| | | | | | | | | | | | | | | | |
Accumulated undistributed (distributions in excess of) net investment income | | $ | (1 | ) | | $ | (5 | ) | | $ | 31 | | | $ | 55 | |
| | | | | | | | | | | | | | | | |
| (a) | Commencement of operations was December 21, 2015. |
| (b) | Amount rounds to less than 500. |
SEE NOTES TO FINANCIAL STATEMENTS.
| | | | | | |
| | | |
| 102 | | | | J.P. MORGAN INTERNATIONAL EQUITY FUNDS | | APRIL 30, 2017 |
| | | | | | | | | | | | | | | | |
| | |
International Equity Fund | | | International Equity Income Fund | |
| | | Six Months Ended
April 30, 2017
(Unaudited) | | | Year Ended
October 31, 2016 | | | Six Months Ended
April 30, 2017
(Unaudited) | | | Year Ended
October 31, 2016 | |
CHANGE IN NET ASSETS RESULTING FROM OPERATIONS: | | | | | | | | | | | | | | | | |
Net investment income (loss) | | $ | 22,905 | | | $ | 64,099 | | | $ | 2,573 | | | $ | 3,443 | |
Net realized gain (loss) | | | (20,432 | ) | | | (22,289 | ) | | | (766 | ) | | | (9,171 | ) |
Change in net unrealized appreciation/depreciation | | | 375,622 | | | | (25,645 | ) | | | 11,173 | | | | 1,423 | |
| | | | | | | | | | | | | | | | |
Change in net assets resulting from operations | | | 378,095 | | | | 16,165 | | | | 12,980 | | | | (4,305 | ) |
| | | | | | | | | | | | | | | | |
|
DISTRIBUTIONS TO SHAREHOLDERS: | |
Class A | | | | | | | | | | | | | | | | |
From net investment income | | | (611 | ) | | | (3,550 | ) | | | (1,252 | ) | | | (2,121 | ) |
From net realized gains | | | — | | | | — | | | | — | | | | (1,055 | ) |
Class C | | | | | | | | | | | | | | | | |
From net investment income | | | (22 | ) | | | (328 | ) | | | (200 | ) | | | (297 | ) |
From net realized gains | | | — | | | | — | | | | — | | | | (151 | ) |
Class I (formerly Select Class) | | | | | | | | | | | | | | | | |
From net investment income | | | (394 | ) | | | (2,129 | ) | | | (1,392 | ) | | | (1,237 | ) |
From net realized gains | | | — | | | | — | | | | — | | | | (534 | ) |
Class R2 | | | | | | | | | | | | | | | | |
From net investment income | | | (2 | ) | | | (21 | ) | | | (7 | ) | | | (4 | ) |
From net realized gains | | | — | | | | — | | | | — | | | | (1 | ) |
Class R5 | | | | | | | | | | | | | | | | |
From net investment income | | | (165 | ) | | | (1,103 | ) | | | (24 | ) | | | (14 | ) |
From net realized gains | | | — | | | | — | | | | — | | | | — | (a) |
Class R6 | | | | | | | | | | | | | | | | |
From net investment income | | | (16,643 | ) | | | (57,230 | ) | | | (3 | ) | | | (1 | ) |
From net realized gains | | | — | | | | — | | | | — | | | | (1 | ) |
| | | | | | | | | | | | | | | | |
Total distributions to shareholders | | | (17,837 | ) | | | (64,361 | ) | | | (2,878 | ) | | | (5,416 | ) |
| | | | | | | | | | | | | | | | |
|
CAPITAL TRANSACTIONS: | |
Change in net assets resulting from capital transactions | | | (96,314 | ) | | | 550,039 | | | | 31,615 | | | | 33,459 | |
| | | | | | | | | | | | | | | | |
|
NET ASSETS: | |
Change in net assets | | | 263,944 | | | | 501,843 | | | | 41,717 | | | | 23,738 | |
Beginning of period | | | 3,424,466 | | | | 2,922,623 | | | | 134,155 | | | | 110,417 | |
| | | | | | | | | | | | | | | | |
End of period | | $ | 3,688,410 | | | $ | 3,424,466 | | | $ | 175,872 | | | $ | 134,155 | |
| | | | | | | | | | | | | | | | |
Accumulated undistributed (distributions in excess of) net investment income | | $ | 10,013 | | | $ | 4,945 | | | $ | (57 | ) | | $ | 248 | |
| | | | | | | | | | | | | | | | |
| (a) | Amount rounds to less than 500. |
SEE NOTES TO FINANCIAL STATEMENTS.
| | | | | | | | |
| | | |
| APRIL 30, 2017 | | J.P. MORGAN INTERNATIONAL EQUITY FUNDS | | | | | 103 | |
STATEMENTS OF CHANGES IN NET ASSETS
FOR THE PERIODS INDICATED (continued)
(Amounts in thousands)
| | | | | | | | | | | | | | | | |
| | | International Opportunities Fund | | | International Research Enhanced
Equity Fund | |
| | | Six Months Ended
April 30, 2017
(Unaudited) | | | Year Ended
October 31, 2016 | | | Six Months Ended
April 30, 2017
(Unaudited) | | | Year Ended
October 31, 2016 | |
CHANGE IN NET ASSETS RESULTING FROM OPERATIONS: | | | | | | | | | | | | | | | | |
Net investment income (loss) | | $ | 25,086 | | | $ | 58,073 | | | $ | 16,883 | | | $ | 31,541 | |
Net realized gain (loss) | | | (6,880 | ) | | | (47,823 | ) | | | 12,310 | | | | (7,725 | ) |
Change in net unrealized appreciation/depreciation | | | 327,103 | | | | (77,418 | ) | | | 146,738 | | | | (35,894 | ) |
| | | | | | | | | | | | | | | | |
Change in net assets resulting from operations | | | 345,309 | | | | (67,168 | ) | | | 175,931 | | | | (12,078 | ) |
| | | | | | | | | | | | | | | | |
|
DISTRIBUTIONS TO SHAREHOLDERS: | |
Class A | | | | | | | | | | | | | | | | |
From net investment income | | | (4,762 | ) | | | (362 | ) | | | (1,511 | ) | | | (1,772 | ) |
From net realized gains | | | — | | | | — | | | | — | | | | (738 | ) |
Class C | | | | | | | | | | | | | | | | |
From net investment income | | | (39 | ) | | | — | (a) | | | (227 | ) | | | (316 | ) |
From net realized gains | | | — | | | | — | | | | — | | | | (169 | ) |
Class I (formerly Select Class) | | | | | | | | | | | | | | | | |
From net investment income | | | (1,226 | ) | | | (55 | ) | | | (32,213 | ) | | | (19,237 | ) |
From net realized gains | | | — | | | | — | | | | — | | | | (7,017 | ) |
Class R2 | | | | | | | | | | | | | | | | |
From net investment income | | | — | | | | — | | | | (254 | ) | | | (80 | ) |
From net realized gains | | | — | | | | — | | | | — | | | | (35 | ) |
Class R6 | | | | | | | | | | | | | | | | |
From net investment income | | | (92,823 | ) | | | (13,758 | ) | | | — | | | | — | |
Institutional Class | | | | | | | | | | | | | | | | |
From net investment income | | | — | | | | (312 | ) | | | — | | | | — | |
| | | | | | | | | | | | | | | | |
Total distributions to shareholders | | | (98,850 | ) | | | (14,487 | ) | | | (34,205 | ) | | | (29,364 | ) |
| | | | | | | | | | | | | | | | |
|
CAPITAL TRANSACTIONS: | |
Change in net assets resulting from capital transactions | | | (44,578 | ) | | | 611,155 | | | | 239,007 | | | | 492,324 | |
| | | | | | | | | | | | | | | | |
|
NET ASSETS: | |
Change in net assets | | | 201,881 | | | | 529,500 | | | | 380,733 | | | | 450,882 | |
Beginning of period | | | 2,769,870 | | | | 2,240,370 | | | | 1,335,211 | | | | 884,329 | |
| | | | | | | | | | | | | | | | |
End of period | | $ | 2,971,751 | | | $ | 2,769,870 | | | $ | 1,715,944 | | | $ | 1,335,211 | |
| | | | | | | | | | | | | | | | |
Accumulated undistributed (distributions in excess of) net investment income | | $ | 11,077 | | | $ | 84,841 | | | $ | 11,227 | | | $ | 28,549 | |
| | | | | | | | | | | | | | | | |
| (a) | Amount rounds to less than 500. |
SEE NOTES TO FINANCIAL STATEMENTS.
| | | | | | |
| | | |
| 104 | | | | J.P. MORGAN INTERNATIONAL EQUITY FUNDS | | APRIL 30, 2017 |
| | | | | | | | | | | | | | | | |
| | | International Unconstrained
Equity Fund | | | International Value Fund | |
| | | Six Months Ended
April 30, 2017
(Unaudited) | | | Year Ended
October 31, 2016 | | | Six Months Ended
April 30, 2017
(Unaudited) | | | Year Ended
October 31, 2016 | |
CHANGE IN NET ASSETS RESULTING FROM OPERATIONS: | | | | | | | | | | | | | | | | |
Net investment income (loss) | | $ | 509 | | | $ | 1,438 | | | $ | 7,527 | | | $ | 42,906 | |
Net realized gain (loss) | | | 1,323 | | | | (3,109 | ) | | | 44,582 | | | | (34,758 | ) |
Change in net unrealized appreciation/depreciation | | | 13,731 | | | | 2,169 | | | | 71,072 | | | | (142,738 | ) |
| | | | | | | | | | | | | | | | |
Change in net assets resulting from operations | | | 15,563 | | | | 498 | | | | 123,181 | | | | (134,590 | ) |
| | | | | | | | | | | | | | | | |
|
DISTRIBUTIONS TO SHAREHOLDERS: | |
Class A | | | | | | | | | | | | | | | | |
From net investment income | | | (259 | ) | | | (18 | ) | | | (18,922 | ) | | | (7,469 | ) |
Class C | | | | | | | | | | | | | | | | |
From net investment income | | | (67 | ) | | | (3 | ) | | | (1,312 | ) | | | (176 | ) |
Class I (formerly Select Class) | | | | | | | | | | | | | | | | |
From net investment income | | | (257 | ) | | | — | | | | (8,933 | ) | | | (2,865 | ) |
Class L (formerly Institutional Class) | | | | | | | | | | | | | | | | |
From net investment income | | | — | | | | — | | | | (30,468 | ) | | | (19,068 | ) |
Class R2 | | | | | | | | | | | | | | | | |
From net investment income | | | — | (a) | | | — | | | | (59 | ) | | | (18 | ) |
Class R5 (b) | | | | | | | | | | | | | | | | |
From net investment income | | | — | (a) | | | — | (a) | | | (1 | ) | | | — | |
Class R6 | | | | | | | | | | | | | | | | |
From net investment income | | | (1,980 | ) | | | (253 | ) | | | (1,834 | ) | | | (61 | ) |
| | | | | | | | | | | | | | | | |
Total distributions to shareholders | | | (2,563 | ) | | | (274 | ) | | | (61,529 | ) | | | (29,657 | ) |
| | | | | | | | | | | | | | | | |
|
CAPITAL TRANSACTIONS: | |
Change in net assets resulting from capital transactions | | | 51,584 | | | | 35,055 | | | | (545,015 | ) | | | (971,729 | ) |
| | | | | | | | | | | | | | | | |
|
NET ASSETS: | |
Change in net assets | | | 64,584 | | | | 35,279 | | | | (483,363 | ) | | | (1,135,976 | ) |
Beginning of period | | | 109,775 | | | | 74,496 | | | | 1,308,220 | | | | 2,444,196 | |
| | | | | | | | | | | | | | | | |
End of period | | $ | 174,359 | | | $ | 109,775 | | | $ | 824,857 | | | $ | 1,308,220 | |
| | | | | | | | | | | | | | | | |
Accumulated undistributed (distributions in excess of) net investment income | | $ | 496 | | | $ | 2,550 | | | $ | 3,696 | | | $ | 57,698 | |
| | | | | | | | | | | | | | | | |
| (a) | Amount rounds to less than 500. |
| (b) | Commencement of offering of class shares effective September 9, 2016, for International Value Fund. |
SEE NOTES TO FINANCIAL STATEMENTS.
| | | | | | | | |
| | | |
| APRIL 30, 2017 | | J.P. MORGAN INTERNATIONAL EQUITY FUNDS | | | | | 105 | |
STATEMENTS OF CHANGES IN NET ASSETS
FOR THE PERIODS INDICATED (continued)
(Amounts in thousands)
| | | | | | | | |
| | |
Intrepid International Fund | |
| | | Six Months Ended
April 30, 2017
(Unaudited) | | | Year Ended
October 31, 2016 | |
CHANGE IN NET ASSETS RESULTING FROM OPERATIONS: | | | | | | | | |
Net investment income (loss) | | $ | 29,980 | | | $ | 63,699 | |
Net realized gain (loss) | | | 80,201 | | | | (12,289 | ) |
Change in net unrealized appreciation/depreciation | | | 199,211 | | | | (67,747 | ) |
| | | | | | | | |
Change in net assets resulting from operations | | | 309,392 | | | | (16,337 | ) |
| | | | | | | | |
|
DISTRIBUTIONS TO SHAREHOLDERS: | |
Class A | | | | | | | | |
From net investment income | | | (3,117 | ) | | | (2,746 | ) |
Class C | | | | | | | | |
From net investment income | | | (28 | ) | | | (35 | ) |
Class I (formerly Select Class) | | | | | | | | |
From net investment income | | | (1,014 | ) | | | (365 | ) |
Class R2 | | | | | | | | |
From net investment income | | | (9 | ) | | | (3 | ) |
Class R6 | | | | | | | | |
From net investment income | | | (66,113 | ) | | | (39,523 | ) |
Institutional Class | | | | | | | | |
From net investment income | | | — | | | | (210 | ) |
| | | | | | | | |
Total distributions to shareholders | | | (70,281 | ) | | | (42,882 | ) |
| | | | | | | | |
|
CAPITAL TRANSACTIONS: | |
Change in net assets resulting from capital transactions | | | (10,672 | ) | | | 671,617 | |
| | | | | | | | |
|
NET ASSETS: | |
Change in net assets | | | 228,439 | | | | 612,398 | |
Beginning of period | | | 2,694,314 | | | | 2,081,916 | |
| | | | | | | | |
End of period | | $ | 2,922,753 | | | $ | 2,694,314 | |
| | | | | | | | |
Accumulated undistributed (distributions in excess of) net investment income | | $ | 20,112 | | | $ | 60,413 | |
| | | | | | | | |
SEE NOTES TO FINANCIAL STATEMENTS.
| | | | | | |
| | | |
| 106 | | | | J.P. MORGAN INTERNATIONAL EQUITY FUNDS | | APRIL 30, 2017 |
| | | | | | | | | | | | | | | | |
| | | Emerging Economies Fund | | |
Emerging Markets Equity Fund | |
| | | Six Months Ended
April 30, 2017
(Unaudited) | | | Year Ended
October 31, 2016 | | | Six Months Ended
April 30, 2017
(Unaudited) | | | Year Ended
October 31, 2016 | |
CAPITAL TRANSACTIONS: | | | | | | | | | | | | | | | | |
Class A | | | | | | | | | | | | | | | | |
Proceeds from shares issued | | $ | 24,140 | | | $ | 124,070 | | | $ | 83,490 | | | $ | 206,821 | |
Distributions reinvested | | | 1,899 | | | | 378 | | | | 1,872 | | | | 1,541 | |
Cost of shares redeemed | | | (35,200 | ) | | | (24,840 | ) | | | (80,108 | ) | | | (105,922 | ) |
| | | | | | | | | | | | | | | | |
Change in net assets resulting from Class A capital transactions | | $ | (9,161 | ) | | $ | 99,608 | | | $ | 5,254 | | | $ | 102,440 | |
| | | | | | | | | | | | | | | | |
Class C | | | | | | | | | | | | | | | | |
Proceeds from shares issued | | $ | 303 | | | $ | 283 | | | $ | 4,172 | | | $ | 7,659 | |
Distributions reinvested | | | 14 | | | | 1 | | | | 12 | | | | — | |
Cost of shares redeemed | | | (284 | ) | | | (1,482 | ) | | | (9,137 | ) | | | (15,484 | ) |
| | | | | | | | | | | | | | | | |
Change in net assets resulting from Class C capital transactions | | $ | 33 | | | $ | (1,198 | ) | | $ | (4,953 | ) | | $ | (7,825 | ) |
| | | | | | | | | | | | | | | | |
Class I (formerly Select Class) | | | | | | | | | | | | | | | | |
Proceeds from shares issued | | $ | 9,733 | | | $ | 21,815 | | | $ | 115,722 | | | $ | 115,950 | |
Distributions reinvested | | | 360 | | | | 86 | | | | 1,623 | | | | 1,651 | |
Cost of shares redeemed | | | (9,262 | ) | | | (216,425 | ) | | | (49,421 | ) | | | (350,209 | ) |
| | | | | | | | | | | | | | | | |
Change in net assets resulting from Class I capital transactions | | $ | 831 | | | $ | (194,524 | ) | | $ | 67,924 | | | $ | (232,608 | ) |
| | | | | | | | | | | | | | | | |
Class L (formerly Institutional Class) | | | | | | | | | | | | | | | | |
Proceeds from shares issued | | $ | — | | | $ | — | | | $ | 179,479 | | | $ | 177,616 | |
Distributions reinvested | | | — | | | | — | | | | 2,481 | | | | 1,936 | |
Cost of shares redeemed | | | — | | | | — | | | | (104,952 | ) | | | (138,231 | ) |
| | | | | | | | | | | | | | | | |
Change in net assets resulting from Class L capital transactions | | $ | — | | | $ | — | | | $ | 77,008 | | | $ | 41,321 | |
| | | | | | | | | | | | | | | | |
Class R5 (b) | | | | | | | | | | | | | | | | |
Proceeds from shares issued | | $ | 183 | | | $ | 79,836 | | | $ | — | | | $ | 20 | |
Distributions reinvested | | | 23 | | | | — | | | | — | (a) | | | — | |
Cost of shares redeemed | | | (562 | ) | | | (158,991 | ) | | | — | | | | — | |
| | | | | | | | | | | | | | | | |
Change in net assets resulting from Class R5 capital transactions | | $ | (356 | ) | | $ | (79,155 | ) | | $ | — | (a) | | $ | 20 | |
| | | | | | | | | | | | | | | | |
Class R6 | | | | | | | | | | | | | | | | |
Proceeds from shares issued | | $ | 69,557 | | | $ | 962,670 | | | $ | 103,294 | | | $ | 895,741 | |
Distributions reinvested | | | 24,949 | | | | 12,736 | | | | 16,658 | | | | 13,982 | |
Cost of shares redeemed | | | (152,011 | ) | | | (206,220 | ) | | | (134,428 | ) | | | (232,265 | ) |
| | | | | | | | | | | | | | | | |
Change in net assets resulting from Class R6 capital transactions | | $ | (57,505 | ) | | $ | 769,186 | | | $ | (14,476 | ) | | $ | 677,458 | |
| | | | | | | | | | | | | | | | |
Total change in net assets resulting from capital transactions | | $ | (66,158 | ) | | $ | 593,917 | | | $ | 130,757 | | | $ | 580,806 | |
| | | | | | | | | | | | | | | | |
| (a) | Amount rounds to less than 500. |
| (b) | Commencement of offering of class of shares effective September 9, 2016, for Emerging Markets Equity Fund. |
SEE NOTES TO FINANCIAL STATEMENTS.
| | | | | | | | |
| | | |
| APRIL 30, 2017 | | J.P. MORGAN INTERNATIONAL EQUITY FUNDS | | | | | 107 | |
STATEMENTS OF CHANGES IN NET ASSETS
FOR THE PERIODS INDICATED (continued)
(Amounts in thousands)
| | | | | | | | | | | | | | | | |
| | |
| | | Emerging Economies Fund | | | Emerging Markets Equity Fund | |
| | | Six Months Ended
April 30, 2017
(Unaudited) | | | Year Ended
October 31, 2016 | | | Six Months Ended
April 30, 2017
(Unaudited) | | | Year Ended
October 31, 2016 | |
SHARE TRANSACTIONS: | |
Class A | |
Issued | | | 2,060 | | | | 11,197 | | | | 3,827 | | | | 10,198 | |
Reinvested | | | 173 | | | | 36 | | | | 93 | | | | 84 | |
Redeemed | | | (2,994 | ) | | | (2,309 | ) | | | (3,722 | ) | | | (5,454 | ) |
| | | | | | | | | | | | | | | | |
Change in Class A Shares | | | (761 | ) | | | 8,924 | | | | 198 | | | | 4,828 | |
| | | | | | | | | | | | | | | | |
Class C | |
Issued | | | 26 | | | | 28 | | | | 193 | | | | 402 | |
Reinvested | | | 1 | | | | — | (a) | | | 1 | | | | — | |
Redeemed | | | (25 | ) | | | (145 | ) | | | (438 | ) | | | (822 | ) |
| | | | | | | | | | | | | | | | |
Change in Class C Shares | | | 2 | | | | (117 | ) | | | (244 | ) | | | (420 | ) |
| | | | | | | | | | | | | | | | |
Class I (formerly Select Class) | |
Issued | | | 808 | | | | 2,004 | | | | 5,133 | | | | 5,865 | |
Reinvested | | | 32 | | | | 8 | | | | 79 | | | | 88 | |
Redeemed | | | (770 | ) | | | (19,109 | ) | | | (2,226 | ) | | | (17,594 | ) |
| | | | | | | | | | | | | | | | |
Change in Class I Shares | | | 70 | | | | (17,097 | ) | | | 2,986 | | | | (11,641 | ) |
| | | | | | | | | | | | | | | | |
Class L (formerly Institutional Class) | |
Issued | | | — | | | | — | | | | 8,038 | | | | 8,547 | |
Reinvested | | | — | | | | — | | | | 119 | | | | 103 | |
Redeemed | | | — | | | | — | | | | (4,697 | ) | | | (6,992 | ) |
| | | | | | | | | | | | | | | | |
Change in Class L Shares | | | — | | | | — | | | | 3,460 | | | | 1,658 | |
| | | | | | | | | | | | | | | | |
Class R5 (b) | |
Issued | | | 15 | | | | 7,225 | | | | — | | | | 1 | |
Reinvested | | | 2 | | | | — | | | | — | (a) | | | — | |
Redeemed | | | (48 | ) | | | (14,428 | ) | | | — | | | | — | |
| | | | | | | | | | | | | | | | |
Change in Class R5 Shares | | | (31 | ) | | | (7,203 | ) | | | — | (a) | | | 1 | |
| | | | | | | | | | | | | | | | |
Class R6 | |
Issued | | | 5,811 | | | | 87,032 | | | | 4,719 | | | | 42,972 | |
Reinvested | | | 2,258 | | | | 1,219 | | | | 804 | | | | 745 | |
Redeemed | | | (12,419 | ) | | | (18,962 | ) | | | (5,782 | ) | | | (11,576 | ) |
| | | | | | | | | | | | | | | | |
Change in Class R6 Shares | | | (4,350 | ) | | | 69,289 | | | | (259 | ) | | | 32,141 | |
| | | | | | | | | | | | | | | | |
| (a) | Amount rounds to less than 500. |
| (b) | Commencement of offering of class of shares effective September 9, 2016, for Emerging Markets Equity Fund. |
SEE NOTES TO FINANCIAL STATEMENTS.
| | | | | | |
| | | |
| 108 | | | | J.P. MORGAN INTERNATIONAL EQUITY FUNDS | | APRIL 30, 2017 |
| | | | | | | | | | | | | | | | |
| | | Emerging Markets
Equity Income Fund | | | Global Research
Enhanced Index Fund | |
| | | Six Months Ended
April 30, 2017
(Unaudited) | | | Year Ended
October 31, 2016 | | | Six Months Ended
April 30, 2017
(Unaudited) | | | Year Ended
October 31, 2016 | |
CAPITAL TRANSACTIONS: | | | | | | | | | | | | | | | | |
Class A | | | | | | | | | | | | | | | | |
Proceeds from shares issued | | $ | 3,743 | | | $ | 8,578 | | | $ | — | | | $ | — | (a) |
Distributions reinvested | | | 32 | | | | 85 | | | | 1 | | | | — | (a) |
Cost of shares redeemed | | | (1,829 | ) | | | (653 | ) | | | — | | | | — | |
| | | | | | | | | | | | | | | | |
Change in net assets resulting from Class A capital transactions | | $ | 1,946 | | | $ | 8,010 | | | $ | 1 | | | $ | — | (a) |
| | | | | | | | | | | | | | | | |
Class C | | | | | | | | | | | | | | | | |
Proceeds from shares issued | | $ | 14 | | | $ | 57 | | | $ | — | | | $ | — | |
Distributions reinvested | | | — | (a) | | | 1 | | | | — | (a) | | | — | |
Cost of shares redeemed | | | — | (a) | | | — | (a) | | | — | | | | — | |
| | | | | | | | | | | | | | | | |
Change in net assets resulting from Class C capital transactions | | $ | 14 | | | $ | 58 | | | $ | — | (a) | | $ | — | |
| | | | | | | | | | | | | | | | |
Class I (formerly Select Class) | | | | | | | | | | | | | | | | |
Proceeds from shares issued | | $ | 1,877 | | | $ | 397 | | | $ | 728,946 | | | $ | 1,314,724 | |
Distributions reinvested | | | 16 | | | | 54 | | | | 19,299 | | | | 9,477 | |
Cost of shares redeemed | | | (62 | ) | | | (59 | ) | | | (656,897 | ) | | | (1,740,416 | ) |
| | | | | | | | | | | | | | | | |
Change in net assets resulting from Class I capital transactions | | $ | 1,831 | | | $ | 392 | | | $ | 91,348 | | | $ | (416,215 | ) |
| | | | | | | | | | | | | | | | |
Class R2 | | | | | | | | | | | | | | | | |
Distributions reinvested | | | — | | | | — | | | | — | (a) | | | — | (a) |
| | | | | | | | | | | | | | | | |
Change in net assets resulting from Class R2 capital transactions | | $ | — | | | $ | — | | | $ | — | (a) | | $ | — | (a) |
| | | | | | | | | | | | | | | | |
Class R5 | | | | | | | | | | | | | | | | |
Proceeds from shares issued | | $ | — | | | $ | — | (a) | | $ | — | | | $ | — | |
Distributions reinvested | | | — | (a) | | | — | (a) | | | — | | | | — | |
Cost of shares redeemed | | | — | | | | — | (a) | | | — | | | | — | |
| | | | | | | | | | | | | | | | |
Change in net assets resulting from Class R5 capital transactions | | $ | — | (a) | | $ | — | (a) | | $ | — | | | $ | — | |
| | | | | | | | | | | | | | | | |
Class R6 | | | | | | | | | | | | | | | | |
Proceeds from shares issued | | $ | 30 | | | $ | 8 | | | $ | — | | | $ | — | |
Distributions reinvested | | | — | (a) | | | 1 | | | | — | | | | — | |
Cost of shares redeemed | | | — | (a) | | | (4 | ) | | | — | | | | — | |
| | | | | | | | | | | | | | | | |
Change in net assets resulting from Class R6 capital transactions | | $ | 30 | | | $ | 5 | | | $ | — | | | $ | — | |
| | | | | | | | | | | | | | | | |
Total change in net assets resulting from capital transactions | | $ | 3,821 | | | $ | 8,465 | | | $ | 91,349 | | | $ | (416,215 | ) |
| | | | | | | | | | | | | | | | |
| (a) | Amount rounds to less than 500. |
SEE NOTES TO FINANCIAL STATEMENTS.
| | | | | | | | |
| | | |
| APRIL 30, 2017 | | J.P. MORGAN INTERNATIONAL EQUITY FUNDS | | | | | 109 | |
STATEMENTS OF CHANGES IN NET ASSETS
FOR THE PERIODS INDICATED (continued)
(Amounts in thousands)
| | | | | | | | | | | | | | | | |
| | | Emerging Markets
Equity Income Fund | | | Global Research
Enhanced Index Fund | |
| | | Six Months Ended
April 30, 2017
(Unaudited) | | | Year Ended
October 31, 2016 | | | Six Months Ended
April 30, 2017
(Unaudited) | | | Year Ended
October 31, 2016 | |
SHARE TRANSACTIONS: | |
Class A | |
Issued | | | 273 | | | | 652 | | | | — | | | | — | |
Reinvested | | | 3 | | | | 7 | | | | — | (a) | | | — | (a) |
Redeemed | | | (137 | ) | | | (50 | ) | | | — | | | | — | |
| | | | | | | | | | | | | | | | |
Change in Class A Shares | | | 139 | | | | 609 | | | | — | (a) | | | — | (a) |
| | | | | | | | | | | | | | | | |
Class C | |
Issued | | | 1 | | | | 4 | | | | — | | | | — | |
Reinvested | | | — | (a) | | | — | (a) | | | — | (a) | | | — | |
Redeemed | | | — | (a) | | | — | | | | — | | | | — | |
| | | | | | | | | | | | | | | | |
Change in Class C Shares | | | 1 | | | | 4 | | | | — | (a) | | | — | |
| | | | | | | | | | | | | | | | |
Class I (formerly Select Class) | |
Issued | | | 139 | | | | 30 | | | | 37,667 | | | | 74,956 | |
Reinvested | | | 1 | | | | 4 | | | | 1,023 | | | | 538 | |
Redeemed | | | (5 | ) | | | (4 | ) | | | (33,996 | ) | | | (99,095 | ) |
| | | | | | | | | | | | | | | | |
Change in Class I Shares | | | 135 | | | | 30 | | | | 4,694 | | | | (23,601 | ) |
| | | | | | | | | | | | | | | | |
Class R2 | |
Reinvested | | | — | | | | — | | | | — | (a) | | | — | (a) |
| | | | | | | | | | | | | | | | |
Change in Class R2 Shares | | | — | | | | — | | | | — | (a) | | | — | (a) |
| | | | | | | | | | | | | | | | |
Class R5 | |
Reinvested | | | — | (a) | | | — | (a) | | | — | | | | — | |
| | | | | | | | | | | | | | | | |
Change in Class R5 Shares | | | — | (a) | | | — | (a) | | | — | | | | — | |
| | | | | | | | | | | | | | | | |
Class R6 | |
Issued | | | 2 | | | | 1 | | | | — | | | | — | |
Reinvested | | | — | (a) | | | — | (a) | | | — | | | | — | |
Redeemed | | | — | (a) | | | — | (a) | | | — | | | | — | |
| | | | | | | | | | | | | | | | |
Change in Class R6 Shares | | | 2 | | | | 1 | | | | — | | | | — | |
| | | | | | | | | | | | | | | | |
| (a) | Amount rounds to less than 500. |
SEE NOTES TO FINANCIAL STATEMENTS.
| | | | | | |
| | | |
| 110 | | | | J.P. MORGAN INTERNATIONAL EQUITY FUNDS | | APRIL 30, 2017 |
| | | | | | | | | | | | | | | | |
| | | Global Unconstrained Equity Fund | | |
International Discovery Fund | |
| | | Six Months Ended
April 30, 2017
(Unaudited) | | | Year Ended
October 31, 2016 | | | Six Months Ended
April 30, 2017
(Unaudited) | | | Period Ended
October 31, 2016 (a) | |
CAPITAL TRANSACTIONS: | | | | | | | | | | | | | | | | |
Class A | | | | | | | | | | | | | | | | |
Proceeds from shares issued | | $ | 278 | | | $ | 121,461 | | | $ | 106 | | | $ | 20 | |
Distributions reinvested | | | — | | | | 6,351 | | | | — | (b) | | | — | (b) |
Cost of shares redeemed | | | (81 | ) | | | (126,936 | ) | | | (2 | ) | | | — | |
| | | | | | | | | | | | | | | | |
Change in net assets resulting from Class A capital transactions | | $ | 197 | | | $ | 876 | | | $ | 104 | | | $ | 20 | |
| | | | | | | | | | | | | | | | |
Class C | | | | | | | | | | | | | | | | |
Proceeds from shares issued | | $ | 112 | | | $ | 50 | | | $ | — | (b) | | $ | 20 | |
Distributions reinvested | | | — | | | | 26 | | | | — | (b) | | | — | (b) |
Cost of shares redeemed | | | (89 | ) | | | (146 | ) | | | — | | | | — | |
| | | | | | | | | | | | | | | | |
Change in net assets resulting from Class C capital transactions | | $ | 23 | | | $ | (70 | ) | | $ | — | (b) | | $ | 20 | |
| | | | | | | | | | | | | | | | |
Class I (formerly Select Class) | | | | | | | | | | | | | | | | |
Proceeds from shares issued | | $ | 167 | | | $ | 15,051 | | | $ | 764 | | | $ | 5,752 | |
Distributions reinvested | | | 2 | | | | 803 | | | | 60 | | | | 3 | |
Cost of shares redeemed | | | (175 | ) | | | (15,414 | ) | | | (723 | ) | | | — | |
| | | | | | | | | | | | | | | | |
Change in net assets resulting from Class I capital transactions | | $ | (6 | ) | | $ | 440 | | | $ | 101 | | | $ | 5,755 | |
| | | | | | | | | | | | | | | | |
Class R2 | | | | | | | | | | | | | | | | |
Proceeds from shares issued | | $ | — | | | $ | — | (b) | | $ | — | | | $ | — | |
Cost of shares redeemed | | | — | | | | — | (b) | | | — | | | | — | |
| | | | | | | | | | | | | | | | |
Change in net assets resulting from Class R2 capital transactions | | $ | — | | | $ | — | (b) | | $ | — | | | $ | — | |
| | | | | | | | | | | | | | | | |
Class R5 | | | | | | | | | | | | | | | | |
Proceeds from shares issued | | $ | — | | | $ | — | (b) | | $ | — | (b) | | $ | 20 | |
Distributions reinvested | | | — | | | | — | | | | — | (b) | | | — | (b) |
Cost of shares redeemed | | | — | | | | — | (b) | | | — | | | | — | |
| | | | | | | | | | | | | | | | |
Change in net assets resulting from Class R5 capital transactions | | $ | — | | | $ | — | (b) | | $ | — | (b) | | $ | 20 | |
| | | | | | | | | | | | | | | | |
Class R6 | | | | | | | | | | | | | | | | |
Proceeds from shares issued | | $ | — | | | $ | — | | | $ | — | (b) | | $ | 20 | |
Distributions reinvested | | | — | | | | — | | | | — | (b) | | | — | (b) |
Cost of shares redeemed | | | — | | | | — | (b) | | | — | | | | — | |
| | | | | | | | | | | | | | | | |
Change in net assets resulting from Class R6 capital transactions | | $ | — | | | $ | — | (b) | | $ | — | (b) | | $ | 20 | |
| | | | | | | | | | | | | | | | |
Total change in net assets resulting from capital transactions | | $ | 214 | | | $ | 1,246 | | | $ | 205 | | | $ | 5,835 | |
| | | | | | | | | | | | | | | | |
| (a) | Commencement of operations was December 21, 2015. |
| (b) | Amount rounds to less than 500. |
SEE NOTES TO FINANCIAL STATEMENTS.
| | | | | | | | |
| | | |
| APRIL 30, 2017 | | J.P. MORGAN INTERNATIONAL EQUITY FUNDS | | | | | 111 | |
STATEMENTS OF CHANGES IN NET ASSETS
FOR THE PERIODS INDICATED (continued)
(Amounts in thousands)
| | | | | | | | | | | | | | | | |
| | |
Global Unconstrained Equity Fund | | | International Discovery Fund | |
| | | Six Months Ended
April 30, 2017
(Unaudited) | | | Year Ended
October 31, 2016 | | | Six Months Ended
April 30, 2017
(Unaudited) | | | Period Ended
October 31, 2016 (a) | |
SHARE TRANSACTIONS: | |
Class A | |
Issued | | | 17 | | | | 9,129 | | | | 7 | | | | 1 | |
Reinvested | | | — | | | | 478 | | | | — | (b) | | | — | (b) |
Redeemed | | | (5 | ) | | | (9,592 | ) | | | — | (b) | | | — | |
| | | | | | | | | | | | | | | | |
Change in Class A Shares | | | 12 | | | | 15 | | | | 7 | | | | 1 | |
| | | | | | | | | | | | | | | | |
Class C | |
Issued | | | 8 | | | | 3 | | | | — | | | | 1 | |
Reinvested | | | — | | | | 2 | | | | — | (b) | | | — | (b) |
Redeemed | | | (6 | ) | | | (10 | ) | | | — | | | | — | |
| | | | | | | | | | | | | | | | |
Change in Class C Shares | | | 2 | | | | (5 | ) | | | — | (b) | | | 1 | |
| | | | | | | | | | | | | | | | |
Class I (formerly Select Class) | |
Issued | | | 10 | | | | 1,096 | | | | 51 | | | | 390 | |
Reinvested | | | — | (b) | | | 60 | | | | 4 | | | | — | (b) |
Redeemed | | | (11 | ) | | | (1,149 | ) | | | (48 | ) | | | — | |
| | | | | | | | | | | | | | | | |
Change in Class I Shares | | | (1 | ) | | | 7 | | | | 7 | | | | 390 | |
| | | | | | | | | | | | | | | | |
Class R5 | |
Issued | | | — | | | | — | | | | — | | | | 1 | |
Reinvested | | | — | | | | — | | | | — | (b) | | | — | (b) |
| | | | | | | | | | | | | | | | |
Change in Class R5 Shares | | | — | | | | — | | | | — | (b) | | | 1 | |
| | | | | | | | | | | | | | | | |
Class R6 | |
Issued | | | — | | | | — | | | | — | | | | 2 | |
Reinvested | | | — | | | | — | | | | — | (b) | | | — | (b) |
| | | | | | | | | | | | | | | | |
Change in Class R6 Shares | | | — | | | | — | | | | — | (b) | | | 2 | |
| | | | | | | | | | | | | | | | |
| (a) | Commencement of operations was December 21, 2015. |
| (b) | Amount rounds to less than 500. |
SEE NOTES TO FINANCIAL STATEMENTS.
| | | | | | |
| | | |
| 112 | | | | J.P. MORGAN INTERNATIONAL EQUITY FUNDS | | APRIL 30, 2017 |
| | | | | | | | | | | | | | | | |
| | |
International Equity Fund | | | International Equity Income Fund | |
| | | Six Months Ended
April 30, 2017
(Unaudited) | | | Year Ended
October 31, 2016 | | | Six Months Ended
April 30, 2017
(Unaudited) | | | Year Ended
October 31, 2016 | |
CAPITAL TRANSACTIONS: | | | | | | | | | | | | | | | | |
Class A | | | | | | | | | | | | | | | | |
Proceeds from shares issued | | $ | 66,057 | | | $ | 110,321 | | | $ | 24,036 | | | $ | 47,652 | |
Distributions reinvested | | | 605 | | | | 3,515 | | | | 1,250 | | | | 3,171 | |
Cost of shares redeemed | | | (49,431 | ) | | | (113,970 | ) | | | (21,979 | ) | | | (45,371 | ) |
| | | | | | | | | | | | | | | | |
Change in net assets resulting from Class A capital transactions | | $ | 17,231 | | | $ | (134 | ) | | $ | 3,307 | | | $ | 5,452 | |
| | | | | | | | | | | | | | | | |
Class C | | | | | | | | | | | | | | | | |
Proceeds from shares issued | | $ | 2,194 | | | $ | 2,485 | | | $ | 2,698 | | | $ | 7,012 | |
Distributions reinvested | | | 19 | | | | 272 | | | | 199 | | | | 445 | |
Cost of shares redeemed | | | (3,510 | ) | | | (7,667 | ) | | | (2,327 | ) | | | (3,519 | ) |
| | | | | | | | | | | | | | | | |
Change in net assets resulting from Class C capital transactions | | $ | (1,297 | ) | | $ | (4,910 | ) | | $ | 570 | | | $ | 3,938 | |
| | | | | | | | | | | | | | | | |
Class I (formerly Select Class) | | | | | | | | | | | | | | | | |
Proceeds from shares issued | | $ | 22,843 | | | $ | 32,905 | | | $ | 40,951 | | | $ | 54,317 | |
Distributions reinvested | | | 321 | | | | 1,578 | | | | 1,262 | | | | 1,598 | |
Cost of shares redeemed | | | (15,539 | ) | | | (460,051 | ) | | | (15,559 | ) | | | (32,820 | ) |
| | | | | | | | | | | | | | | | |
Change in net assets resulting from Class I capital transactions | | $ | 7,625 | | | $ | (425,568 | ) | | $ | 26,654 | | | $ | 23,095 | |
| | | | | | | | | | | | | | | | |
Class R2 | | | | | | | | | | | | | | | | |
Proceeds from shares issued | | $ | 197 | | | $ | 883 | | | $ | 148 | | | $ | 282 | |
Distributions reinvested | | | 1 | | | | 10 | | | | 7 | | | | 5 | |
Cost of shares redeemed | | | (277 | ) | | | (596 | ) | | | (28 | ) | | | (12 | ) |
| | | | | | | | | | | | | | | | |
Change in net assets resulting from Class R2 capital transactions | | $ | (79 | ) | | $ | 297 | | | $ | 127 | | | $ | 275 | |
| | | | | | | | | | | | | | | | |
Class R5 | | | | | | | | | | | | | | | | |
Proceeds from shares issued | | $ | 1,285 | | | $ | 6,787 | | | $ | 905 | | | $ | 696 | |
Distributions reinvested | | | 165 | | | | 1,103 | | | | 24 | | | | 14 | |
Cost of shares redeemed | | | (43,203 | ) | | | (4,763 | ) | | | (74 | ) | | | (14 | ) |
| | | | | | | | | | | | | | | | |
Change in net assets resulting from Class R5 capital transactions | | $ | (41,753 | ) | | $ | 3,127 | | | $ | 855 | | | $ | 696 | |
| | | | | | | | | | | | | | | | |
Class R6 | | | | | | | | | | | | | | | | |
Proceeds from shares issued | | $ | 255,711 | | | $ | 1,159,108 | | | $ | 112 | | | $ | 1 | |
Distributions reinvested | | | 16,643 | | | | 57,229 | | | | 3 | | | | 2 | |
Cost of shares redeemed | | | (350,395 | ) | | | (239,110 | ) | | | (13 | ) | | | — | (a) |
| | | | | | | | | | | | | | | | |
Change in net assets resulting from Class R6 capital transactions | | $ | (78,041 | ) | | $ | 977,227 | | | $ | 102 | | | $ | 3 | |
| | | | | | | | | | | | | | | | |
Total change in net assets resulting from capital transactions | | $ | (96,314 | ) | | $ | 550,039 | | | $ | 31,615 | | | $ | 33,459 | |
| | | | | | | | | | | | | | | | |
| (a) | Amount rounds to less than 500. |
SEE NOTES TO FINANCIAL STATEMENTS.
| | | | | | | | |
| | | |
| APRIL 30, 2017 | | J.P. MORGAN INTERNATIONAL EQUITY FUNDS | | | | | 113 | |
STATEMENTS OF CHANGES IN NET ASSETS
FOR THE PERIODS INDICATED (continued)
(Amounts in thousands)
| | | | | | | | | | | | | | | | |
| | |
International Equity Fund | | | International Equity Income Fund | |
| | | Six Months Ended
April 30, 2017
(Unaudited) | | | Year Ended
October 31, 2016 | | | Six Months Ended
April 30, 2017
(Unaudited) | | | Year Ended
October 31, 2016 | |
SHARE TRANSACTIONS: | |
Class A | |
Issued | | | 4,424 | | | | 8,046 | | | | 1,620 | | | | 3,246 | |
Reinvested | | | 42 | | | | 265 | | | | 84 | | | | 216 | |
Redeemed | | | (3,380 | ) | | | (8,294 | ) | | | (1,486 | ) | | | (3,069 | ) |
| | | | | | | | | | | | | | | | |
Change in Class A Shares | | | 1,086 | | | | 17 | | | | 218 | | | | 393 | |
| | | | | | | | | | | | | | | | |
Class C | |
Issued | | | 155 | | | | 189 | | | | 183 | | | | 479 | |
Reinvested | | | 1 | | | | 22 | | | | 13 | | | | 31 | |
Redeemed | | | (252 | ) | | | (584 | ) | | | (158 | ) | | | (243 | ) |
| | | | | | | | | | | | | | | | |
Change in Class C Shares | | | (96 | ) | | | (373 | ) | | | 38 | | | | 267 | |
| | | | | | | | | | | | | | | | |
Class I (formerly Select Class) | |
Issued | | | 1,520 | | | | 2,347 | | | | 2,755 | | | | 3,700 | |
Reinvested | | | 22 | | | | 117 | | | | 84 | | | | 108 | |
Redeemed | | | (1,043 | ) | | | (30,864 | ) | | | (1,054 | ) | | | (2,258 | ) |
| | | | | | | | | | | | | | | | |
Change in Class I Shares | | | 499 | | | | (28,400 | ) | | | 1,785 | | | | 1,550 | |
| | | | | | | | | | | | | | | | |
Class R2 | |
Issued | | | 14 | | | | 64 | | | | 10 | | | | 19 | |
Reinvested | | | — | (a) | | | 1 | | | | 1 | | | | — | (a) |
Redeemed | | | (19 | ) | | | (44 | ) | | | (2 | ) | | | (1 | ) |
| | | | | | | | | | | | | | | | |
Change in Class R2 Shares | | | (5 | ) | | | 21 | | | | 9 | | | | 18 | |
| | | | | | | | | | | | | | | | |
Class R5 | |
Issued | | | 89 | | | | 483 | | | | 60 | | | | 48 | |
Reinvested | | | 11 | | | | 81 | | | | 2 | | | | 1 | |
Redeemed | | | (2,941 | ) | | | (338 | ) | | | (5 | ) | | | (1 | ) |
| | | | | | | | | | | | | | | | |
Change in Class R5 Shares | | | (2,841 | ) | | | 226 | | | | 57 | | | | 48 | |
| | | | | | | | | | | | | | | | |
Class R6 | |
Issued | | | 17,337 | | | | 82,405 | | | | 9 | | | | — | (a) |
Reinvested | | | 1,123 | | | | 4,227 | | | | — | (a) | | | — | (a) |
Redeemed | | | (23,335 | ) | | | (16,681 | ) | | | (1 | ) | | | — | (a) |
| | | | | | | | | | | | | | | | |
Change in Class R6 Shares | | | (4,875 | ) | | | 69,951 | | | | 8 | | | | — | (a) |
| | | | | | | | | | | | | | | | |
| (a) | Amount rounds to less than 500. |
SEE NOTES TO FINANCIAL STATEMENTS.
| | | | | | |
| | | |
| 114 | | | | J.P. MORGAN INTERNATIONAL EQUITY FUNDS | | APRIL 30, 2017 |
| | | | | | | | | | | | | | | | |
| | | International Opportunities Fund | | | International Research Enhanced
Equity Fund | |
| | | Six Months Ended
April 30, 2017
(Unaudited) | | | Year Ended
October 31, 2016 | | | Six Months Ended
April 30, 2017
(Unaudited) | | | Year Ended
October 31, 2016 | |
CAPITAL TRANSACTIONS: | | | | | | | | | | | | | | | | |
Class A | | | | | | | | | | | | | | | | |
Proceeds from shares issued | | $ | 58,284 | | | $ | 107,477 | | | $ | 6,125 | | | $ | 9,158 | |
Distributions reinvested | | | 4,754 | | | | 362 | | | | 1,449 | | | | 2,436 | |
Cost of shares redeemed | | | (46,279 | ) | | | (84,187 | ) | | | (12,722 | ) | | | (19,422 | ) |
| | | | | | | | | | | | | | | | |
Change in net assets resulting from Class A capital transactions | | $ | 16,759 | | | $ | 23,652 | | | $ | (5,148 | ) | | $ | (7,828 | ) |
| | | | | | | | | | | | | | | | |
Class C | | | | | | | | | | | | | | | | |
Proceeds from shares issued | | $ | 70 | | | $ | 469 | | | $ | 429 | | | $ | 998 | |
Distributions reinvested | | | 36 | | | | — | (a) | | | 221 | | | | 467 | |
Cost of shares redeemed | | | (321 | ) | | | (554 | ) | | | (2,825 | ) | | | (5,171 | ) |
| | | | | | | | | | | | | | | | |
Change in net assets resulting from Class C capital transactions | | $ | (215 | ) | | $ | (85 | ) | | $ | (2,175 | ) | | $ | (3,706 | ) |
| | | | | | | | | | | | | | | | |
Class I (formerly Select Class) | | | | | | | | | | | | | | | | |
Proceeds from shares issued | | $ | 25,843 | | | $ | 8,676 | | | $ | 364,310 | | | $ | 568,584 | |
Distributions reinvested | | | 933 | | | | 35 | | | | 31,067 | | | | 25,196 | |
Cost of shares redeemed | | | (6,778 | ) | | | (8,351 | ) | | | (150,603 | ) | | | (96,905 | ) |
| | | | | | | | | | | | | | | | |
Change in net assets resulting from Class I capital transactions | | $ | 19,998 | | | $ | 360 | | | $ | 244,774 | | | $ | 496,875 | |
| | | | | | | | | | | | | | | | |
Class R2 | | | | | | | | | | | | | | | | |
Proceeds from shares issued | | $ | — | | | $ | — | | | $ | 4,057 | | | $ | 8,693 | |
Distributions reinvested | | | — | | | | — | | | | 189 | | | | 28 | |
Cost of shares redeemed | | | — | | | | — | | | | (2,690 | ) | | | (1,738 | ) |
| | | | | | | | | | | | | | | | |
Change in net assets resulting from Class R2 capital transactions | | $ | — | | | $ | — | | | $ | 1,556 | | | $ | 6,983 | |
| | | | | | | | | | | | | | | | |
Class R6 | | | | | | | | | | | | | | | | |
Proceeds from shares issued | | $ | 157,755 | | | $ | 871,518 | | | $ | — | | | $ | — | |
Distributions reinvested | | | 92,823 | | | | 13,758 | | | | — | | | | — | |
Cost of shares redeemed | | | (281,444 | ) | | | (295,100 | ) | | | — | | | | — | |
| | | | | | | | | | | | | | | | |
Change in net assets resulting from Class R6 capital transactions | | $ | (30,866 | ) | | $ | 590,176 | | | $ | — | | | $ | — | |
| | | | | | | | | | | | | | | | |
Institutional Class | | | | | | | | | | | | | | | | |
Proceeds from shares issued | | $ | 207 | | | $ | 11,992 | | | $ | — | | | $ | — | |
Distributions reinvested | | | — | | | | 243 | | | | — | | | | — | |
Cost of shares redeemed | | | (50,461 | ) | | | (15,183 | ) | | | — | | | | — | |
| | | | | | | | | | | | | | | | |
Change in net assets resulting from Institutional Class capital transactions | | $ | (50,254 | ) | | $ | (2,948 | ) | | $ | — | | | $ | — | |
| | | | | | | | | | | | | | | | |
Total change in net assets resulting from capital transactions | | $ | (44,578 | ) | | $ | 611,155 | | | $ | 239,007 | | | $ | 492,324 | |
| | | | | | | | | | | | | | | | |
| (a) | Amount rounds to less than 500. |
SEE NOTES TO FINANCIAL STATEMENTS.
| | | | | | | | |
| | | |
| APRIL 30, 2017 | | J.P. MORGAN INTERNATIONAL EQUITY FUNDS | | | | | 115 | |
STATEMENTS OF CHANGES IN NET ASSETS
FOR THE PERIODS INDICATED (continued)
(Amounts in thousands)
| | | | | | | | | | | | | | | | |
| | | International Opportunities Fund | | | International Research Enhanced
Equity Fund | |
| | | Six Months Ended
April 30, 2017
(Unaudited) | | | Year Ended
October 31, 2016 | | | Six Months Ended
April 30, 2017
(Unaudited) | | | Year Ended
October 31, 2016 | |
SHARE TRANSACTIONS: | |
Class A | |
Issued | | | 4,083 | | | | 7,900 | | | | 380 | | | | 600 | |
Reinvested | | | 349 | | | | 26 | | | | 93 | | | | 157 | |
Redeemed | | | (3,277 | ) | | | (6,175 | ) | | | (789 | ) | | | (1,276 | ) |
| | | | | | | | | | | | | | | | |
Change in Class A Shares | | | 1,155 | | | | 1,751 | | | | (316 | ) | | | (519 | ) |
| | | | | | | | | | | | | | | | |
Class C | |
Issued | | | 4 | | | | 36 | | | | 27 | | | | 67 | |
Reinvested | | | 3 | | | | — | (a) | | | 15 | | | | 32 | |
Redeemed | | | (23 | ) | | | (42 | ) | | | (183 | ) | | | (353 | ) |
| | | | | | | | | | | | | | | | |
Change in Class C Shares | | | (16 | ) | | | (6 | ) | | | (141 | ) | | | (254 | ) |
| | | | | | | | | | | | | | | | |
Class I (formerly Select Class) | |
Issued | | | 1,820 | | | | 636 | | | | 22,174 | | | | 37,181 | |
Reinvested | | | 67 | | | | 3 | | | | 1,983 | | | | 1,614 | |
Redeemed | | | (474 | ) | | | (596 | ) | | | (9,356 | ) | | | (6,312 | ) |
| | | | | | | | | | | | | | | | |
Change in Class I Shares | | | 1,413 | | | | 43 | | | | 14,801 | | | | 32,483 | |
| | | | | | | | | | | | | | | | |
Class R2 | |
Issued | | | — | | | | — | | | | 259 | | | | 581 | |
Reinvested | | | — | | | | — | | | | 12 | | | | 2 | |
Redeemed | | | — | | | | — | | | | (171 | ) | | | (115 | ) |
| | | | | | | | | | | | | | | | |
Change in Class R2 Shares | | | — | | | | — | | | | 100 | | | | 468 | |
| | | | | | | | | | | | | | | | |
Class R6 | |
Issued | | | 10,976 | | | | 63,733 | | | | — | | | | — | |
Reinvested | | | 6,707 | | | | 975 | | | | — | | | | — | |
Redeemed | | | (19,419 | ) | | | (20,913 | ) | | | — | | | | — | |
| | | | | | | | | | | | | | | | |
Change in Class R6 Shares | | | (1,736 | ) | | | 43,795 | | | | — | | | | — | |
| | | | | | | | | | | | | | | | |
Institutional Class | |
Issued | | | 15 | | | | 861 | | | | — | | | | — | |
Reinvested | | | — | | | | 17 | | | | — | | | | — | |
Redeemed | | | (3,536 | ) | | | (1,102 | ) | | | — | | | | — | |
| | | | | | | | | | | | | | | | |
Change in Institutional Class Shares | | | (3,521 | ) | | | (224 | ) | | | — | | | | — | |
| | | | | | | | | | | | | | | | |
| (a) | Amount rounds to less than 500. |
SEE NOTES TO FINANCIAL STATEMENTS.
| | | | | | |
| | | |
| 116 | | | | J.P. MORGAN INTERNATIONAL EQUITY FUNDS | | APRIL 30, 2017 |
| | | | | | | | | | | | | | | | |
| | | International Unconstrained
Equity Fund | | | International Value Fund | |
| | | Six Months Ended
April 30, 2017
(Unaudited) | | | Year Ended
October 31, 2016 | | | Six Months Ended
April 30, 2017
(Unaudited) | | | Year Ended
October 31, 2016 | |
CAPITAL TRANSACTIONS: | | | | | | | | | | | | | | | | |
Class A | | | | | | | | | | | | | | | | |
Proceeds from shares issued | | $ | 15,302 | | | $ | 11,592 | | | $ | 41,862 | | | $ | 205,683 | |
Distributions reinvested | | | 257 | | | | 18 | | | | 18,745 | | | | 7,392 | |
Cost of shares redeemed | | | (5,248 | ) | | | (3,467 | ) | | | (359,972 | ) | | | (291,409 | ) |
| | | | | | | | | | | | | | | | |
Change in net assets resulting from Class A capital transactions | | $ | 10,311 | | | $ | 8,143 | | | $ | (299,365 | ) | | $ | (78,334 | ) |
| | | | | | | | | | | | | | | | |
Class C | | | | | | | | | | | | | | | | |
Proceeds from shares issued | | $ | 1,733 | | | $ | 2,759 | | | $ | 1,199 | | | $ | 5,220 | |
Distributions reinvested | | | 66 | | | | 3 | | | | 1,151 | | | | 154 | |
Cost of shares redeemed | | | (1,128 | ) | | | (1,551 | ) | | | (5,890 | ) | | | (10,150 | ) |
| | | | | | | | | | | | | | | | |
Change in net assets resulting from Class C capital transactions | | $ | 671 | | | $ | 1,211 | | | $ | (3,540 | ) | | $ | (4,776 | ) |
| | | | | | | | | | | | | | | | |
Class I (formerly Select Class) | | | | | | | | | | | | | | | | |
Proceeds from shares issued | | $ | 21,514 | | | $ | 7,331 | | | $ | 16,866 | | | $ | 57,659 | |
Distributions reinvested | | | 198 | | | | — | | | | 4,900 | | | | 1,701 | |
Cost of shares redeemed | | | (3,561 | ) | | | (57,428 | ) | | | (37,031 | ) | | | (119,752 | ) |
| | | | | | | | | | | | | | | | |
Change in net assets resulting from Class I capital transactions | | $ | 18,151 | | | $ | (50,097 | ) | | $ | (15,265 | ) | | $ | (60,392 | ) |
| | | | | | | | | | | | | | | | |
Class L (formerly Institutional Class) | | | | | | | | | | | | | | | | |
Proceeds from shares issued | | $ | — | | | $ | — | | | $ | 133,242 | | | $ | 320,955 | |
Distributions reinvested | | | — | | | | — | | | | 20,403 | | | | 13,888 | |
Cost of shares redeemed | | | — | | | | — | | | | (381,988 | ) | | | (1,188,471 | ) |
| | | | | | | | | | | | | | | | |
Change in net assets resulting from Class L capital transactions | | $ | — | | | $ | — | | | $ | (228,343 | ) | | $ | (853,628 | ) |
| | | | | | | | | | | | | | | | |
Class R2 | | | | | | | | | | | | | | | | |
Proceeds from shares issued | | $ | — | | | $ | — | | | $ | 225 | | | $ | 765 | |
Distributions reinvested | | | — | (a) | | | — | | | | 24 | | | | 8 | |
Cost of shares redeemed | | | — | | | | — | (a) | | | (234 | ) | | | (1,410 | ) |
| | | | | | | | | | | | | | | | |
Change in net assets resulting from Class R2 capital transactions | | $ | — | (a) | | $ | — | (a) | | $ | 15 | | | $ | (637 | ) |
| | | | | | | | | | | | | | | | |
Class R5 (b) | | | | | | | | | | | | | | | | |
Proceeds from shares issued | | $ | — | | | $ | — | | | $ | — | (a) | | $ | 20 | |
Distributions reinvested | | | — | (a) | | | — | (a) | | | 1 | | | | — | |
Cost of shares redeemed | | | — | | | | — | (a) | | | — | | | | — | |
| | | | | | | | | | | | | | | | |
Change in net assets resulting from Class R5 capital transactions | | $ | — | (a) | | $ | — | (a) | | $ | 1 | | | $ | 20 | |
| | | | | | | | | | | | | | | | |
Class R6 | | | | | | | | | | | | | | | | |
Proceeds from shares issued | | $ | 20,478 | | | $ | 75,541 | | | $ | 219 | | | $ | 28,014 | |
Distributions reinvested | | | 1,980 | | | | 253 | | | | 1,834 | | | | 61 | |
Cost of shares redeemed | | | (7 | ) | | | 4 | | | | (571 | ) | | | (2,057 | ) |
| | | | | | | | | | | | | | | | |
Change in net assets resulting from Class R6 capital transactions | | $ | 22,451 | | | $ | 75,798 | | | $ | 1,482 | | | $ | 26,018 | |
| | | | | | | | | | | | | | | | |
Total change in net assets resulting from capital transactions | | $ | 51,584 | | | $ | 35,055 | | | $ | (545,015 | ) | | $ | (971,729 | ) |
| | | | | | | | | | | | | | | | |
| (a) | Amount rounds to less than 500. |
| (b) | Commencement of offering of class shares effective September 9, 2016, for International Value Fund. |
SEE NOTES TO FINANCIAL STATEMENTS.
| | | | | | | | |
| | | |
| APRIL 30, 2017 | | J.P. MORGAN INTERNATIONAL EQUITY FUNDS | | | | | 117 | |
STATEMENTS OF CHANGES IN NET ASSETS
FOR THE PERIODS INDICATED (continued)
(Amounts in thousands)
| | | | | | | | | | | | | | | | |
| | | International Unconstrained
Equity Fund | | | International Value Fund | |
| | | Six Months Ended
April 30, 2017
(Unaudited) | | | Year Ended
October 31, 2016 | | | Six Months Ended
April 30, 2017
(Unaudited) | | | Year Ended
October 31, 2016 | |
SHARE TRANSACTIONS: | |
Class A | |
Issued | | | 855 | | | | 688 | | | | 3,342 | | | | 17,288 | |
Reinvested | | | 15 | | | | 1 | | | | 1,558 | | | | 600 | |
Redeemed | | | (303 | ) | | | (206 | ) | | | (29,149 | ) | | | (24,382 | ) |
| | | | | | | | | | | | | | | | |
Change in Class A Shares | | | 567 | | | | 483 | | | | (24,249 | ) | | | (6,494 | ) |
| | | | | | | | | | | | | | | | |
Class C | |
Issued | | | 96 | | | | 167 | | | | 99 | | | | 445 | |
Reinvested | | | 4 | | | | — | (a) | | | 99 | | | | 13 | |
Redeemed | | | (65 | ) | | | (92 | ) | | | (488 | ) | | | (874 | ) |
| | | | | | | | | | | | | | | | |
Change in Class C Shares | | | 35 | | | | 75 | | | | (290 | ) | | | (416 | ) |
| | | | | | | | | | | | | | | | |
Class I (formerly Select Class) | |
Issued | | | 1,198 | | | | 438 | | | | 1,337 | | | | 4,708 | |
Reinvested | | | 12 | | | | — | | | | 399 | | | | 135 | |
Redeemed | | | (202 | ) | | | (3,248 | ) | | | (2,912 | ) | | | (9,716 | ) |
| | | | | | | | | | | | | | | | |
Change in Class I Shares | | | 1,008 | | | | (2,810 | ) | | | (1,176 | ) | | | (4,873 | ) |
| | | | | | | | | | | | | | | | |
Class L (formerly Institutional Class) | |
Issued | | | — | | | | — | | | | 10,486 | | | | 26,460 | |
Reinvested | | | — | | | | — | | | | 1,668 | | | | 1,108 | |
Redeemed | | | — | | | | — | | | | (29,609 | ) | | | (97,097 | ) |
| | | | | | | | | | | | | | | | |
Change in Class L Shares | | | — | | | | — | | | | (17,455 | ) | | | (69,529 | ) |
| | | | | | | | | | | | | | | | |
Class R2 | |
Issued | | | — | | | | — | | | | 19 | | | | 65 | |
Reinvested | | | — | (a) | | | — | | | | 2 | | | | 1 | |
Redeemed | | | — | | | | — | | | | (19 | ) | | | (118 | ) |
| | | | | | | | | | | | | | | | |
Change in Class R2 Shares | | | — | (a) | | | — | | | | 2 | | | | (52 | ) |
| | | | | | | | | | | | | | | | |
Class R5 (b) | |
Issued | | | — | | | | — | | | | — | | | | 2 | |
Reinvested | | | — | (a) | | | — | (a) | | | — | (a) | | | — | |
| | | | | | | | | | | | | | | | |
Change in Class R5 Shares | | | — | (a) | | | — | (a) | | | — | (a) | | | 2 | |
| | | | | | | | | | | | | | | | |
Class R6 | |
Issued | | | 1,145 | | | | 4,336 | | | | 18 | | | | 2,230 | |
Reinvested | | | 117 | | | | 15 | | | | 150 | | | | 5 | |
Redeemed | | | — | (a) | | | (1 | ) | | | (46 | ) | | | (174 | ) |
| | | | | | | | | | | | | | | | |
Change in Class R6 Shares | | | 1,262 | | | | 4,350 | | | | 122 | | | | 2,061 | |
| | | | | | | | | | | | | | | | |
| (a) | Amount rounds to less than 500. |
| (b) | Commencement of offering of class shares effective September 9, 2016, for International Value Fund. |
SEE NOTES TO FINANCIAL STATEMENTS.
| | | | | | |
| | | |
| 118 | | | | J.P. MORGAN INTERNATIONAL EQUITY FUNDS | | APRIL 30, 2017 |
| | | | | | | | |
| | |
Intrepid International Fund | |
| | | Six Months Ended
April 30, 2017
(Unaudited) | | | Year Ended
October 31, 2016 | |
CAPITAL TRANSACTIONS: | | | | | | | | |
Class A | | | | | | | | |
Proceeds from shares issued | | $ | 56,818 | | | $ | 102,499 | |
Distributions reinvested | | | 3,114 | | | | 2,734 | |
Cost of shares redeemed | | | (39,731 | ) | | | (87,263 | ) |
| | | | | | | | |
Change in net assets resulting from Class A capital transactions | | $ | 20,201 | | | $ | 17,970 | |
| | | | | | | | |
Class C | | | | | | | | |
Proceeds from shares issued | | $ | 126 | | | $ | 651 | |
Distributions reinvested | | | 27 | | | | 32 | |
Cost of shares redeemed | | | (699 | ) | | | (1,054 | ) |
| | | | | | | | |
Change in net assets resulting from Class C capital transactions | | $ | (546 | ) | | $ | (371 | ) |
| | | | | | | | |
Class I (formerly Select Class) | | | | | | | | |
Proceeds from shares issued | | $ | 32,967 | | | $ | 6,578 | |
Distributions reinvested | | | 451 | | | | 221 | |
Cost of shares redeemed | | | (3,756 | ) | | | (8,803 | ) |
| | | | | | | | |
Change in net assets resulting from Class I capital transactions | | $ | 29,662 | | | $ | (2,004 | ) |
| | | | | | | | |
Class R2 | | | | | | | | |
Proceeds from shares issued | | $ | 45 | | | $ | 318 | |
Distributions reinvested | | | 4 | | | | 3 | |
Cost of shares redeemed | | | (59 | ) | | | (41 | ) |
| | | | | | | | |
Change in net assets resulting from Class R2 capital transactions | | $ | (10 | ) | | $ | 280 | |
| | | | | | | | |
Class R6 | | | | | | | | |
Proceeds from shares issued | | $ | 199,247 | | | $ | 900,498 | |
Distributions reinvested | | | 66,113 | | | | 39,523 | |
Cost of shares redeemed | | | (301,583 | ) | | | (259,983 | ) |
| | | | | | | | |
Change in net assets resulting from Class R6 capital transactions | | $ | (36,223 | ) | | $ | 680,038 | |
| | | | | | | | |
Institutional Class | | | | | | | | |
Proceeds from shares issued | | $ | 39 | | | $ | 3,104 | |
Distributions reinvested | | | — | | | | 50 | |
Cost of shares redeemed | | | (23,795 | ) | | | (27,450 | ) |
| | | | | | | | |
Change in net assets resulting from Institutional Class capital transactions | | $ | (23,756 | ) | | $ | (24,296 | ) |
| | | | | | | | |
Total change in net assets resulting from capital transactions | | $ | (10,672 | ) | | $ | 671,617 | |
| | | | | | | | |
SEE NOTES TO FINANCIAL STATEMENTS.
| | | | | | | | |
| | | |
| APRIL 30, 2017 | | J.P. MORGAN INTERNATIONAL EQUITY FUNDS | | | | | 119 | |
STATEMENTS OF CHANGES IN NET ASSETS
FOR THE PERIODS INDICATED (continued)
(Amounts in thousands)
| | | | | | | | |
| | |
Intrepid International Fund | |
| | | Six Months Ended
April 30, 2017
(Unaudited) | | | Year Ended
October 31, 2016 | |
SHARE TRANSACTIONS: | |
Class A | |
Issued | | | 2,971 | | | | 5,754 | |
Reinvested | | | 171 | | | | 148 | |
Redeemed | | | (2,106 | ) | | | (4,883 | ) |
| | | | | | | | |
Change in Class A Shares | | | 1,036 | | | | 1,019 | |
| | | | | | | | |
Class C | | | | | | | | |
Issued | | | 7 | | | | 35 | |
Reinvested | | | 1 | | | | 2 | |
Redeemed | | | (37 | ) | | | (57 | ) |
| | | | | | | | |
Change in Class C Shares | | | (29 | ) | | | (20 | ) |
| | | | | | | | |
Class I (formerly Select Class) | | | | | | | | |
Issued | | | 1,707 | | | | 354 | |
Reinvested | | | 24 | | | | 12 | |
Redeemed | | | (191 | ) | | | (472 | ) |
| | | | | | | | |
Change in Class I Shares | | | 1,540 | | | | (106 | ) |
| | | | | | | | |
Class R2 | | | | | | | | |
Issued | | | 2 | | | | 18 | |
Reinvested | | | — | (a) | | | — | (a) |
Redeemed | | | (3 | ) | | | (2 | ) |
| | | | | | | | |
Change in Class R2 Shares | | | (1 | ) | | | 16 | |
| | | | | | | | |
Class R6 | | | | | | | | |
Issued | | | 10,410 | | | | 49,855 | |
Reinvested | | | 3,555 | | | | 2,101 | |
Redeemed | | | (15,445 | ) | | | (13,945 | ) |
| | | | | | | | |
Change in Class R6 Shares | | | (1,480 | ) | | | 38,011 | |
| | | | | | | | |
Institutional Class | | | | | | | | |
Issued | | | 2 | | | | 170 | |
Reinvested | | | — | | | | 3 | |
Redeemed | | | (1,238 | ) | | | (1,551 | ) |
| | | | | | | | |
Change in Institutional Class Shares | | | (1,236 | ) | | | (1,378 | ) |
| | | | | | | | |
| (a) | Amount rounds to less than 500. |
SEE NOTES TO FINANCIAL STATEMENTS.
| | | | | | |
| | | |
| 120 | | | | J.P. MORGAN INTERNATIONAL EQUITY FUNDS | | APRIL 30, 2017 |
THIS PAGE IS INTENTIONALLY LEFT BLANK
| | | | | | | | |
| | | |
| APRIL 30, 2017 | | J.P. MORGAN INTERNATIONAL EQUITY FUNDS | | | | | 121 | |
FINANCIAL HIGHLIGHTS
FOR THE PERIODS INDICATED
| | | | | | | | | | | | | | | | | | | | |
| | | Per share operating performance | |
| | | | | | Investment operations | | | Distributions | |
| | | Net asset
value,
beginning
of period | | | Net
investment
income
(loss) (b) | | | Net realized
and unrealized
gains
(losses) on
investments | | | Total from
investment
operations | | | Net
investment
income | |
Emerging Economies Fund | |
Class A | |
Six Months Ended April 30, 2017 (Unaudited) | | $ | 11.55 | | | $ | 0.05 | | | $ | 1.18 | | | $ | 1.23 | | | $ | (0.15 | ) |
Year Ended October 31, 2016 | | | 11.03 | | | | 0.15 | | | | 0.46 | | | | 0.61 | | | | (0.09 | ) |
Year Ended October 31, 2015 | | | 13.13 | | | | 0.13 | (f) | | | (2.03 | ) | | | (1.90 | ) | | | (0.20 | ) |
Year Ended October 31, 2014 | | | 13.63 | | | | 0.22 | | | | (0.57 | ) | | | (0.35 | ) | | | (0.15 | ) |
Year Ended October 31, 2013 | | | 12.88 | | | | 0.19 | | | | 0.67 | | | | 0.86 | | | | (0.11 | ) |
Year Ended October 31, 2012 | | | 12.65 | | | | 0.17 | | | | 0.21 | | | | 0.38 | | | | (0.15 | ) |
|
Class C | |
Six Months Ended April 30, 2017 (Unaudited) | | | 11.41 | | | | 0.02 | | | | 1.18 | | | | 1.20 | | | | (0.06 | ) |
Year Ended October 31, 2016 | | | 10.86 | | | | 0.09 | | | | 0.46 | | | | 0.55 | | | | — | (g) |
Year Ended October 31, 2015 | | | 12.92 | | | | 0.10 | (f) | | | (2.03 | ) | | | (1.93 | ) | | | (0.13 | ) |
Year Ended October 31, 2014 | | | 13.44 | | | | 0.15 | | | | (0.57 | ) | | | (0.42 | ) | | | (0.10 | ) |
Year Ended October 31, 2013 | | | 12.72 | | | | 0.13 | | | | 0.66 | | | | 0.79 | | | | (0.07 | ) |
Year Ended October 31, 2012 | | | 12.58 | | | | 0.15 | | | | 0.15 | | | | 0.30 | | | | (0.16 | ) |
|
Class I (formerly Select Class) | |
Six Months Ended April 30, 2017 (Unaudited) | | | 11.68 | | | | 0.07 | | | | 1.20 | | | | 1.27 | | | | (0.16 | ) |
Year Ended October 31, 2016 | | | 11.06 | | | | 0.18 | | | | 0.47 | | | | 0.65 | | | | (0.03 | ) |
Year Ended October 31, 2015 | | | 13.17 | | | | 0.18 | (f) | | | (2.06 | ) | | | (1.88 | ) | | | (0.23 | ) |
Year Ended October 31, 2014 | | | 13.67 | | | | 0.26 | | | | (0.58 | ) | | | (0.32 | ) | | | (0.18 | ) |
Year Ended October 31, 2013 | | | 12.91 | | | | 0.21 | | | | 0.70 | | | | 0.91 | | | | (0.15 | ) |
Year Ended October 31, 2012 | | | 12.68 | | | | 0.22 | | | | 0.18 | | | | 0.40 | | | | (0.17 | ) |
|
Class R5 | |
Six Months Ended April 30, 2017 (Unaudited) | | | 11.78 | | | | 0.08 | | | | 1.21 | | | | 1.29 | | | | (0.17 | ) |
Year Ended October 31, 2016 | | | 11.11 | | | | 0.05 | | | | 0.62 | | | | 0.67 | | | | — | |
Year Ended October 31, 2015 | | | 13.22 | | | | 0.20 | (f) | | | (2.06 | ) | | | (1.86 | ) | | | (0.25 | ) |
Year Ended October 31, 2014 | | | 13.71 | | | | 0.29 | | | | (0.58 | ) | | | (0.29 | ) | | | (0.20 | ) |
Year Ended October 31, 2013 | | | 12.94 | | | | 0.25 | | | | 0.68 | | | | 0.93 | | | | (0.16 | ) |
Year Ended October 31, 2012 | | | 12.71 | | | | 0.25 | | | | 0.18 | | | | 0.43 | | | | (0.20 | ) |
|
Class R6 | |
Six Months Ended April 30, 2017 (Unaudited) | | | 11.64 | | | | 0.08 | | | | 1.18 | | | | 1.26 | | | | (0.18 | ) |
Year Ended October 31, 2016 | | | 11.11 | | | | 0.21 | | | | 0.46 | | | | 0.67 | | | | (0.14 | ) |
September 1, 2015 (h) through October 31, 2015 | | | 10.46 | | | | (0.02 | )(f) | | | 0.67 | | | | 0.65 | | | | — | |
| (a) | Annualized for periods less than one year, unless otherwise noted. |
| (b) | Calculated based upon average shares outstanding. |
| (c) | Not annualized for periods less than one year. |
| (d) | Includes adjustments in accordance with accounting principles generally accepted in the United States of America and as such, the net asset values for financial reporting purposes and the returns based upon those net asset values may differ from the net asset values and returns for shareholder transactions. |
| (e) | Includes interest expense, if applicable, which is less than 0.005% unless otherwise noted. |
| (f) | Net investment income (loss) may appear disproportionate among the classes due to the timing of recognition of income and changes in the relative size of the classes. |
| (g) | Amount rounds to less than $0.005. |
| (h) | Commencement of offering of class of shares. |
SEE NOTES TO FINANCIAL STATEMENTS.
| | | | | | |
| | | |
| 122 | | | | J.P. MORGAN INTERNATIONAL EQUITY FUNDS | | APRIL 30, 2017 |
| | | | | | | | | | | | | | | | | | | | | | | | | | |
| | | Ratios/Supplemental data | |
| | | | | | | | | | Ratios to average net assets (a) | | | | |
Net asset
value,
end of
period | | | Total return
(excludes
sales charge) (c)(d) | | | Net assets,
end of
period
(000’s) | | | Net
expenses (e) | | | Net
investment
income
(loss) | | | Expenses
without waivers
and reimbursements | | | Portfolio
turnover
rate (c) | |
| | | | | | | | | | | | | | | | | | | | | | | | | | |
| | | | | | | | | | | | | | | | | | | | | | | | | | |
| $ | 12.63 | | | | 10.85 | % | | $ | 152,637 | | | | 1.35 | % | | | 0.88 | % | | | 1.62 | % | | | 33 | % |
| | 11.55 | | | | 5.62 | | | | 148,331 | | | | 1.42 | | | | 1.42 | | | | 1.70 | | | | 72 | |
| | 11.03 | | | | (14.60 | ) | | | 43,220 | | | | 1.58 | | | | 1.06 | (f) | | | 1.99 | | | | 118 | |
| | 13.13 | | | | (2.56 | ) | | | 80,806 | | | | 1.60 | | | | 1.71 | | | | 1.73 | | | | 79 | |
| | 13.63 | | | | 6.67 | | | | 69,690 | | | | 1.60 | | | | 1.45 | | | | 1.72 | | | | 43 | |
| | 12.88 | | | | 3.15 | | | | 30,356 | | | | 1.65 | | | | 1.37 | | | | 1.76 | | | | 72 | |
| | | | | | |
| | | | | | | | | | | | | | | | | | | | | | | | | | |
| | 12.55 | | | | 10.64 | | | | 2,723 | | | | 1.85 | | | | 0.40 | | | | 2.25 | | | | 33 | |
| | 11.41 | | | | 5.11 | | | | 2,448 | | | | 1.96 | | | | 0.82 | | | | 2.37 | | | | 72 | |
| | 10.86 | | | | (15.02 | ) | | | 3,614 | | | | 2.09 | | | | 0.80 | (f) | | | 2.36 | | | | 118 | |
| | 12.92 | | | | (3.12 | ) | | | 5,331 | | | | 2.10 | | | | 1.13 | | | | 2.23 | | | | 79 | |
| | 13.44 | | | | 6.25 | | | | 5,089 | | | | 2.10 | | | | 1.02 | | | | 2.22 | | | | 43 | |
| | 12.72 | | | | 2.54 | | | | 2,088 | | | | 2.12 | | | | 1.21 | | | | 2.27 | | | | 72 | |
| | | | | | |
| | | | | | | | | | | | | | | | | | | | | | | | | | |
| | 12.79 | | | | 11.03 | | | | 59,491 | | | | 1.10 | | | | 1.14 | | | | 1.30 | | | | 33 | |
| | 11.68 | | | | 5.93 | | | | 53,509 | | | | 1.21 | | | | 1.67 | | | | 1.40 | | | | 72 | |
| | 11.06 | | | | (14.45 | ) | | | 239,866 | | | | 1.34 | | | | 1.51 | (f) | | | 1.46 | | | | 118 | |
| | 13.17 | | | | (2.35 | ) | | | 288,059 | | | | 1.35 | | | | 1.96 | | | | 1.48 | | | | 79 | |
| | 13.67 | | | | 7.04 | | | | 277,822 | | | | 1.35 | | | | 1.61 | | | | 1.47 | | | | 43 | |
| | 12.91 | | | | 3.34 | | | | 82,457 | | | | 1.39 | | | | 1.70 | | | | 1.51 | | | | 72 | |
| | | | | | |
| | | | | | | | | | | | | | | | | | | | | | | | | | |
| | 12.90 | | | | 11.18 | | | | 1,356 | | | | 0.92 | | | | 1.37 | | | | 1.17 | | | | 33 | |
| | 11.78 | | | | 6.03 | | | | 1,602 | | | | 1.08 | | | | 0.49 | | | | 1.25 | | | | 72 | |
| | 11.11 | | | | (14.20 | ) | | | 81,516 | | | | 1.14 | | | | 1.65 | (f) | | | 1.25 | | | | 118 | |
| | 13.22 | | | | (2.12 | ) | | | 852,477 | | | | 1.15 | | | | 2.19 | | | | 1.28 | | | | 79 | |
| | 13.71 | | | | 7.21 | | | | 676,985 | | | | 1.15 | | | | 1.84 | | | | 1.27 | | | | 43 | |
| | 12.94 | | | | 3.53 | | | | 331,032 | | | | 1.19 | | | | 1.99 | | | | 1.31 | | | | 72 | |
| | | | | | |
| | | | | | | | | | | | | | | | | | | | | | | | | | |
| | 12.72 | | | | 11.10 | | | | 1,665,619 | | | | 0.85 | | | | 1.39 | | | | 1.04 | | | | 33 | |
| | 11.64 | | | | 6.16 | | | | 1,573,822 | | | | 0.94 | | | | 1.99 | | | | 1.09 | | | | 72 | |
| | 11.11 | | | | 6.21 | | | | 732,627 | | | | 1.07 | | | | (0.92 | )(f) | | | 1.17 | | | | 118 | |
SEE NOTES TO FINANCIAL STATEMENTS.
| | | | | | | | |
| | | |
| APRIL 30, 2017 | | J.P. MORGAN INTERNATIONAL EQUITY FUNDS | | | | | 123 | |
FINANCIAL HIGHLIGHTS
FOR THE PERIODS INDICATED (continued)
| | | | | | | | | | | | | | | | | | | | |
| | | Per share operating performance | |
| | | | | | Investment operations | | | Distributions | |
| | | Net asset
value,
beginning
of period | | | Net
investment
income
(loss) (b) | | | Net realized
and unrealized
gains
(losses) on
investments | | | Total from
investment
operations | | | Net
investment
income | |
Emerging Markets Equity Fund | |
Class A | |
Six Months Ended April 30, 2017 (Unaudited) | | $ | 21.79 | | | $ | 0.01 | | | $ | 2.12 | | | $ | 2.13 | | | $ | (0.10 | ) |
Year Ended October 31, 2016 | | | 19.53 | | | | 0.09 | | | | 2.28 | | | | 2.37 | | | | (0.11 | ) |
Year Ended October 31, 2015 | | | 23.72 | | | | 0.12 | (f) | | | (4.12 | ) | | | (4.00 | ) | | | (0.19 | ) |
Year Ended October 31, 2014 | | | 23.05 | | | | 0.16 | (f) | | | 0.59 | | | | 0.75 | | | | (0.08 | ) |
Year Ended October 31, 2013 | | | 22.01 | | | | 0.10 | | | | 1.02 | | | | 1.12 | | | | (0.08 | ) |
Year Ended October 31, 2012 | | | 21.09 | | | | 0.07 | | | | 0.85 | | | | 0.92 | | | | — | |
|
Class C | |
Six Months Ended April 30, 2017 (Unaudited) | | | 21.18 | | | | (0.05 | ) | | | 2.08 | | | | 2.03 | | | | (0.01 | ) |
Year Ended October 31, 2016 | | | 18.96 | | | | (0.01 | ) | | | 2.23 | | | | 2.22 | | | | — | |
Year Ended October 31, 2015 | | | 23.03 | | | | 0.03 | (f) | | | (4.02 | ) | | | (3.99 | ) | | | (0.08 | ) |
Year Ended October 31, 2014 | | | 22.41 | | | | 0.05 | (f) | | | 0.57 | | | | 0.62 | | | | — | |
Year Ended October 31, 2013 | | | 21.44 | | | | (0.01 | ) | | | 0.99 | | | | 0.98 | | | | (0.01 | ) |
Year Ended October 31, 2012 | | | 20.65 | | | | (0.04 | ) | | | 0.83 | | | | 0.79 | | | | — | |
|
Class I (formerly Select Class) | |
Six Months Ended April 30, 2017 (Unaudited) | | | 22.33 | | | | 0.04 | | | | 2.17 | | | | 2.21 | | | | (0.14 | ) |
Year Ended October 31, 2016 | | | 19.98 | | | | 0.13 | | | | 2.35 | | | | 2.48 | | | | (0.13 | ) |
Year Ended October 31, 2015 | | | 24.24 | | | | 0.19 | (f) | | | (4.21 | ) | | | (4.02 | ) | | | (0.24 | ) |
Year Ended October 31, 2014 | | | 23.47 | | | | 0.18 | (f) | | | 0.64 | | | | 0.82 | | | | (0.05 | ) |
Year Ended October 31, 2013 | | | 22.40 | | | | 0.17 | | | | 1.03 | | | | 1.20 | | | | (0.13 | ) |
Year Ended October 31, 2012 | | | 21.42 | | | | 0.13 | | | | 0.86 | | | | 0.99 | | | | (0.01 | ) |
|
Class L (formerly Institutional Class) | |
Six Months Ended April 30, 2017 (Unaudited) | | | 22.49 | | | | 0.05 | | | | 2.18 | | | | 2.23 | | | | (0.17 | ) |
Year Ended October 31, 2016 | | | 20.15 | | | | 0.17 | | | | 2.35 | | | | 2.52 | | | | (0.18 | ) |
Year Ended October 31, 2015 | | | 24.42 | | | | 0.23 | (f) | | | (4.26 | ) | | | (4.03 | ) | | | (0.24 | ) |
Year Ended October 31, 2014 | | | 23.73 | | | | 0.17 | (f) | | | 0.70 | | | | 0.87 | | | | (0.18 | ) |
Year Ended October 31, 2013 | | | 22.65 | | | | 0.20 | | | | 1.04 | | | | 1.24 | | | | (0.16 | ) |
Year Ended October 31, 2012 | | | 21.66 | | | | 0.16 | | | | 0.87 | | | | 1.03 | | | | (0.04 | ) |
|
Class R5 | |
Six Months Ended April 30, 2017 (Unaudited) | | | 22.49 | | | | 0.05 | | | | 2.18 | | | | 2.23 | | | | (0.18 | ) |
September 9, 2016 (g) through October 31, 2016 | | | 22.40 | | | | 0.01 | | | | 0.08 | | | | 0.09 | | | | — | |
|
Class R6 | |
Six Months Ended April 30, 2017 (Unaudited) | | | 22.46 | | | | 0.06 | | | | 2.18 | | | | 2.24 | | | | (0.19 | ) |
Year Ended October 31, 2016 | | | 20.13 | | | | 0.19 | | | | 2.35 | | | | 2.54 | | | | (0.21 | ) |
Year Ended October 31, 2015 | | | 24.44 | | | | 0.22 | (f) | | | (4.23 | ) | | | (4.01 | ) | | | (0.30 | ) |
December 23, 2013 (g) through October 31, 2014 | | | 22.47 | | | | 0.38 | (f) | | | 1.59 | | | | 1.97 | | | | — | |
| (a) | Annualized for periods less than one year, unless otherwise noted. |
| (b) | Calculated based upon average shares outstanding. |
| (c) | Not annualized for periods less than one year. |
| (d) | Includes adjustments in accordance with accounting principles generally accepted in the United States of America and as such, the net asset values for financial reporting purposes and the returns based upon those net asset values may differ from the net asset values and returns for shareholder transactions. |
| (e) | Includes interest expense, if applicable, which is less than 0.005% unless otherwise noted. |
| (f) | Net investment income (loss) may appear disproportionate among the classes due to the timing of recognition of income and changes in the relative size of the classes. |
| (g) | Commencement of offering of class of shares. |
SEE NOTES TO FINANCIAL STATEMENTS.
| | | | | | |
| | | |
| 124 | | | | J.P. MORGAN INTERNATIONAL EQUITY FUNDS | | APRIL 30, 2017 |
| | | | | | | | | | | | | | | | | | | | | | | | | | |
| | | Ratios/Supplemental data | |
| | | | | | | | | | Ratios to average net assets (a) | | | | |
Net asset
value,
end of
period | | | Total return
(excludes
sales charge) (c)(d) | | | Net assets,
end of
period
(000’s) | | | Net
expenses (e) | | | Net
investment
income
(loss) | | | Expenses
without waivers
and reimbursements | | | Portfolio
turnover
rate (c) | |
| | | | | | | | | | | | | | | | | | | | | | | | | | |
| | | | | | | | | | | | | | | | | | | | | | | | | | |
| $ | 23.82 | | | | 9.88 | % | | $ | 454,739 | | | | 1.34 | % | | | 0.06 | % | | | 1.65 | % | | | 8 | % |
| | 21.79 | | | | 12.25 | | | | 411,713 | | | | 1.44 | | | | 0.44 | | | | 1.76 | | | | 23 | |
| | 19.53 | | | | (16.95 | ) | | | 274,710 | | | | 1.61 | | | | 0.57 | (f) | | | 1.88 | | | | 35 | |
| | 23.72 | | | | 3.26 | | | | 350,555 | | | | 1.70 | | | | 0.72 | (f) | | | 1.81 | | | | 33 | |
| | 23.05 | | | | 5.08 | | | | 327,090 | | | | 1.76 | | | | 0.46 | | | | 1.79 | | | | 34 | |
| | 22.01 | | | | 4.36 | | | | 281,194 | | | | 1.82 | | | | 0.33 | | | | 1.82 | | | | 20 | |
| | | | | | |
| | | | | | | | | | | | | | | | | | | | | | | | | | |
| | 23.20 | | | | 9.58 | | | | 37,694 | | | | 1.84 | | | | (0.46 | ) | | | 2.16 | | | | 8 | |
| | 21.18 | | | | 11.71 | | | | 39,568 | | | | 1.95 | | | | (0.06 | ) | | | 2.26 | | | | 23 | |
| | 18.96 | | | | (17.38 | ) | | | 43,387 | | | | 2.10 | | | | 0.13 | (f) | | | 2.33 | | | | 35 | |
| | 23.03 | | | | 2.77 | | | | 56,732 | | | | 2.20 | | | | 0.22 | (f) | | | 2.31 | | | | 33 | |
| | 22.41 | | | | 4.56 | | | | 56,119 | | | | 2.26 | | | | (0.06 | ) | | | 2.29 | | | | 34 | |
| | 21.44 | | | | 3.83 | | | | 44,643 | | | | 2.32 | | | | (0.17 | ) | | | 2.32 | | | | 20 | |
| | | | | | |
| | | | | | | | | | | | | | | | | | | | | | | | | | |
| | 24.40 | | | | 10.00 | | | | 402,793 | | | | 1.10 | | | | 0.33 | | | | 1.32 | | | | 8 | |
| | 22.33 | | | | 12.51 | | | | 301,959 | | | | 1.20 | | | | 0.66 | | | | 1.43 | | | | 23 | |
| | 19.98 | | | | (16.70 | ) | | | 502,729 | | | | 1.35 | | | | 0.88 | (f) | | | 1.48 | | | | 35 | |
| | 24.24 | | | | 3.51 | | | | 583,501 | | | | 1.45 | | | | 0.78 | (f) | | | 1.56 | | | | 33 | |
| | 23.47 | | | | 5.34 | | | | 1,900,639 | | | | 1.51 | | | | 0.74 | | | | 1.54 | | | | 34 | |
| | 22.40 | | | | 4.65 | | | | 1,291,326 | | | | 1.57 | | | | 0.60 | | | | 1.57 | | | | 20 | |
| | | | | | |
| | | | | | | | | | | | | | | | | | | | | | | | | | |
| | 24.55 | | | | 10.06 | | | | 511,475 | | | | 0.95 | | | | 0.48 | | | | 1.16 | | | | 8 | |
| | 22.49 | | | | 12.71 | | | | 390,647 | | | | 1.04 | | | | 0.84 | | | | 1.22 | | | | 23 | |
| | 20.15 | | | | (16.60 | ) | | | 316,635 | | | | 1.21 | | | | 1.05 | (f) | | | 1.31 | | | | 35 | |
| | 24.42 | | | | 3.72 | | | | 411,449 | | | | 1.30 | | | | 0.72 | (f) | | | 1.40 | | | | 33 | |
| | 23.73 | | | | 5.47 | | | | 1,123,600 | | | | 1.36 | | | | 0.88 | | | | 1.39 | | | | 34 | |
| | 22.65 | | | | 4.80 | | | | 629,223 | | | | 1.41 | | | | 0.73 | | | | 1.42 | | | | 20 | |
| | | | | | |
| | | | | | | | | | | | | | | | | | | | | | | | | | |
| | 24.54 | | | | 10.09 | | | | 22 | | | | 0.94 | | | | 0.46 | | | | 1.16 | | | | 8 | |
| | 22.49 | | | | 0.40 | | | | 20 | | | | 0.90 | | | | 0.28 | | | | 1.08 | | | | 23 | |
| | | | | | |
| | | | | | | | | | | | | | | | | | | | | | | | | | |
| | 24.51 | | | | 10.12 | | | | 2,155,494 | | | | 0.85 | | | | 0.56 | | | | 1.00 | | | | 8 | |
| | 22.46 | | | | 12.83 | | | | 1,980,671 | | | | 0.94 | | | | 0.96 | | | | 1.08 | | | | 23 | |
| | 20.13 | | | | (16.54 | ) | | | 1,128,390 | | | | 1.10 | | | | 0.99 | (f) | | | 1.16 | | | | 35 | |
| | 24.44 | | | | 8.77 | | | | 1,130,050 | | | | 1.20 | | | | 1.85 | (f) | | | 1.33 | | | | 33 | |
SEE NOTES TO FINANCIAL STATEMENTS.
| | | | | | | | |
| | | |
| APRIL 30, 2017 | | J.P. MORGAN INTERNATIONAL EQUITY FUNDS | | | | | 125 | |
FINANCIAL HIGHLIGHTS
FOR THE PERIODS INDICATED (continued)
| | | | | | | | | | | | | | | | | | | | |
| | | Per share operating performance | |
| | | | | | Investment operations | | | Distributions | |
| | | Net asset
value,
beginning
of period | | | Net
investment
income
(loss) (b) | | | Net realized
and unrealized
gains
(losses) on
investments | | | Total from
investment
operations | | | Net
investment
income | |
Emerging Markets Equity Income Fund | |
Class A | |
Six Months Ended April 30, 2017 (Unaudited) | | $ | 13.46 | | | $ | 0.14 | | | $ | 0.58 | | | $ | 0.72 | | | $ | (0.05 | ) |
Year Ended October 31, 2016 | | | 12.50 | | | | 0.44 | | | | 0.76 | | | | 1.20 | | | | (0.24 | ) |
December 12, 2014 (g) through October 31, 2015 | | | 15.00 | | | | 0.45 | | | | (2.52 | ) | | | (2.07 | ) | | | (0.43 | ) |
|
Class C | |
Six Months Ended April 30, 2017 (Unaudited) | | | 13.44 | | | | 0.10 | | | | 0.59 | | | | 0.69 | | | | (0.03 | ) |
Year Ended October 31, 2016 | | | 12.51 | | | | 0.27 | | | | 0.85 | | | | 1.12 | | | | (0.19 | ) |
December 12, 2014 (g) through October 31, 2015 | | | 15.00 | | | | 0.42 | | | | (2.55 | ) | | | (2.13 | ) | | | (0.36 | ) |
|
Class I (formerly Select Class) | |
Six Months Ended April 30, 2017 (Unaudited) | | | 13.51 | | | | 0.17 | | | | 0.57 | | | | 0.74 | | | | (0.06 | ) |
Year Ended October 31, 2016 | | | 12.53 | | | | 0.38 | | | | 0.85 | | | | 1.23 | | | | (0.25 | ) |
December 12, 2014 (g) through October 31, 2015 | | | 15.00 | | | | 0.49 | | | | (2.53 | ) | | | (2.04 | ) | | | (0.43 | ) |
|
Class R5 | |
Six Months Ended April 30, 2017 (Unaudited) | | | 13.51 | | | | 0.16 | | | | 0.60 | | | | 0.76 | | | | (0.07 | ) |
Year Ended October 31, 2016 | | | 12.53 | | | | 0.40 | | | | 0.85 | | | | 1.25 | | | | (0.27 | ) |
December 12, 2014 (g) through October 31, 2015 | | | 15.00 | | | | 0.51 | | | | (2.53 | ) | | | (2.02 | ) | | | (0.45 | ) |
|
Class R6 | |
Six Months Ended April 30, 2017 (Unaudited) | | | 13.52 | | | | 0.22 | | | | 0.54 | | | | 0.76 | | | | (0.08 | ) |
Year Ended October 31, 2016 | | | 12.53 | | | | 0.41 | | | | 0.85 | | | | 1.26 | | | | (0.27 | ) |
December 12, 2014 (g) through October 31, 2015 | | | 15.00 | | | | 0.52 | | | | (2.53 | ) | | | (2.01 | ) | | | (0.46 | ) |
| (a) | Annualized for periods less than one year, unless otherwise noted. |
| (b) | Calculated based upon average shares outstanding. |
| (c) | Not annualized for periods less than one year. |
| (d) | Includes adjustments in accordance with accounting principles generally accepted in the United States of America and as such, the net asset values for financial reporting purposes and the returns based upon those net asset values may differ from the net asset values and returns for shareholder transactions. |
| (e) | Includes interest expense, if applicable, which is less than 0.005% unless otherwise noted. |
| (f) | Certain non-recurring expenses incurred by the Fund were not annualized for the year ended October 31, 2016 and for the period ended October 31, 2015. |
| (g) | Commencement of operations. |
SEE NOTES TO FINANCIAL STATEMENTS.
| | | | | | |
| | | |
| 126 | | | | J.P. MORGAN INTERNATIONAL EQUITY FUNDS | | APRIL 30, 2017 |
| | | | | | | | | | | | | | | | | | | | | | | | | | |
| | | Ratios/Supplemental data (a) | |
| | | | | | | | | | Ratios to average net assets | | | | |
Net asset
value,
end of
period | | | Total return
(excludes
sales charge) (c)(d) | | | Net assets,
end of
period
(000’s) | | | Net
expenses (e) | | | Net
investment
income
(loss) | | | Expenses
without waivers
and reimbursements | | | Portfolio
turnover
rate (c) | |
| | | | | | | | | | | | | | | | | | | | | | | | | | |
| | | | | | | | | | | | | | | | | | | | | | | | | | |
| $ | 14.13 | | | | 5.39 | % | | $ | 10,671 | | | | 1.55 | % | | | 2.07 | % | | | 3.81 | % | | | 12 | % |
| | 13.46 | | | | 9.76 | | | | 8,291 | | | | 1.54 | (f) | | | 3.36 | (f) | | | 3.29 | (f) | | | 21 | |
| | 12.50 | | | | (13.93 | ) | | | 86 | | | | 1.57 | (f) | | | 3.72 | (f) | | | 10.55 | (f) | | | 25 | |
| | | | | | |
| | | | | | | | | | | | | | | | | | | | | | | | | | |
| | 14.10 | | | | 5.18 | | | | 113 | | | | 2.05 | | | | 1.55 | | | | 4.43 | | | | 12 | |
| | 13.44 | | | | 9.10 | | | | 94 | | | | 2.05 | (f) | | | 2.15 | (f) | | | 8.18 | (f) | | | 21 | |
| | 12.51 | | | | (14.26 | ) | | | 32 | | | | 2.08 | (f) | | | 3.32 | (f) | | | 12.02 | (f) | | | 25 | |
| | | | | | |
| | | | | | | | | | | | | | | | | | | | | | | | | | |
| | 14.19 | | | | 5.55 | | | | 5,227 | | | | 1.30 | | | | 2.50 | | | | 3.61 | | | | 12 | |
| | 13.51 | | | | 9.96 | | | | 3,148 | | | | 1.30 | (f) | | | 3.05 | (f) | | | 8.02 | (f) | | | 21 | |
| | 12.53 | | | | (13.70 | ) | | | 2,541 | | | | 1.33 | (f) | | | 3.85 | (f) | | | 10.36 | (f) | | | 25 | |
| | | | | | |
| | | | | | | | | | | | | | | | | | | | | | | | | | |
| | 14.20 | | | | 5.72 | | | | 20 | | | | 1.10 | | | | 2.40 | | | | 3.49 | | | | 12 | |
| | 13.51 | | | | 10.15 | | | | 19 | | | | 1.10 | (f) | | | 3.22 | (f) | | | 9.72 | (f) | | | 21 | |
| | 12.53 | | | | (13.55 | ) | | | 17 | | | | 1.14 | (f) | | | 4.05 | (f) | | | 10.84 | (f) | | | 25 | |
| | | | | | |
| | | | | | | | | | | | | | | | | | | | | | | | | | |
| | 14.20 | | | | 5.67 | | | | 56 | | | | 1.05 | | | | 3.31 | | | | 3.62 | | | | 12 | |
| | 13.52 | | | | 10.26 | | | | 24 | | | | 1.05 | (f) | | | 3.32 | (f) | | | 9.33 | (f) | | | 21 | |
| | 12.53 | | | | (13.51 | ) | | | 17 | | | | 1.08 | (f) | | | 4.10 | (f) | | | 10.82 | (f) | | | 25 | |
SEE NOTES TO FINANCIAL STATEMENTS.
| | | | | | | | |
| | | |
| APRIL 30, 2017 | | J.P. MORGAN INTERNATIONAL EQUITY FUNDS | | | | | 127 | |
FINANCIAL HIGHLIGHTS
FOR THE PERIODS INDICATED (continued)
| | | | | | | | | | | | | | | | | | | | | | | | | | | | |
| | | Per share operating performance | |
| | | | | | Investment operations | | | Distributions | |
| | | Net asset
value,
beginning
of period | | | Net
investment
income
(loss) (b) | | | Net realized
and unrealized
gains
(losses) on
investments | | | Total from
investment
operations | | | Net
investment
income | | | Net
realized
gain | | | Total
distributions | |
Global Research Enhanced Index Fund | | | | | | | | | | | | | | | | | | | | | |
Class A | | | | | | | | | | | | | | | | | | | | | | | | | | | | |
Six Months Ended April 30, 2017 (Unaudited) | | $ | 18.45 | | | $ | 0.16 | | | $ | 2.14 | | | $ | 2.30 | | | $ | (0.37 | ) | | $ | — | | | $ | (0.37 | ) |
Year Ended October 31, 2016 | | | 18.52 | | | | 0.35 | | | | (0.23 | ) | | | 0.12 | | | | (0.19 | ) | | | — | | | | (0.19 | ) |
Year Ended October 31, 2015 | | | 18.77 | | | | 0.37 | | | | (0.15 | ) | | | 0.22 | | | | (0.22 | ) | | | (0.25 | ) | | | (0.47 | ) |
Year Ended October 31, 2014 | | | 17.33 | | | | 0.34 | | | | 1.35 | | | | 1.69 | | | | (0.15 | ) | | | (0.10 | ) | | | (0.25 | ) |
February 28, 2013 (f) through October 31, 2013 | | | 15.00 | | | | 0.19 | | | | 2.14 | | | | 2.33 | | | | — | | | | — | | | | — | |
| | | | | | | |
Class C | | | | | | | | | | | | | | | | | | | | | | | | | | | | |
Six Months Ended April 30, 2017 (Unaudited) | | | 18.46 | | | | 0.11 | | | | 2.15 | | | | 2.26 | | | | (0.28 | ) | | | — | | | | (0.28 | ) |
Year Ended October 31, 2016 | | | 18.43 | | | | 0.26 | | | | (0.23 | ) | | | 0.03 | | | | — | | | | — | | | | — | |
Year Ended October 31, 2015 | | | 18.68 | | | | 0.28 | | | | (0.15 | ) | | | 0.13 | | | | (0.13 | ) | | | (0.25 | ) | | | (0.38 | ) |
Year Ended October 31, 2014 | | | 17.28 | | | | 0.25 | | | | 1.33 | | | | 1.58 | | | | (0.08 | ) | | | (0.10 | ) | | | (0.18 | ) |
February 28, 2013 (f) through October 31, 2013 | | | 15.00 | | | | 0.14 | | | | 2.14 | | | | 2.28 | | | | — | | | | — | | | | — | |
| | | | | | | |
Class I (formerly Select Class) | | | | | | | | | | | | | | | | | | | | | | | | | | | | |
Six Months Ended April 30, 2017 (Unaudited) | | | 18.37 | | | | 0.18 | | | | 2.14 | | | | 2.32 | | | | (0.42 | ) | | | — | | | | (0.42 | ) |
Year Ended October 31, 2016 | | | 18.56 | | | | 0.39 | | | | (0.24 | ) | | | 0.15 | | | | (0.34 | ) | | | — | | | | (0.34 | ) |
Year Ended October 31, 2015 | | | 18.81 | | | | 0.39 | | | | (0.12 | ) | | | 0.27 | | | | (0.27 | ) | | | (0.25 | ) | | | (0.52 | ) |
Year Ended October 31, 2014 | | | 17.37 | | | | 0.39 | | | | 1.33 | | | | 1.72 | | | | (0.18 | ) | | | (0.10 | ) | | | (0.28 | ) |
February 28, 2013 (f) through October 31, 2013 | | | 15.00 | | | | 0.19 | | | | 2.18 | | | | 2.37 | | | | — | | | | — | | | | — | |
| | | | | | | |
Class R2 | | | | | | | | | | | | | | | | | | | | | | | | | | | | |
Six Months Ended April 30, 2017 (Unaudited) | | | 18.46 | | | | 0.14 | | | | 2.14 | | | | 2.28 | | | | (0.33 | ) | | | — | | | | (0.33 | ) |
Year Ended October 31, 2016 | | | 18.47 | | | | 0.30 | | | | (0.22 | ) | | | 0.08 | | | | (0.09 | ) | | | — | | | | (0.09 | ) |
Year Ended October 31, 2015 | | | 18.72 | | | | 0.32 | | | | (0.15 | ) | | | 0.17 | | | | (0.17 | ) | | | (0.25 | ) | | | (0.42 | ) |
Year Ended October 31, 2014 | | | 17.30 | | | | 0.29 | | | | 1.35 | | | | 1.64 | | | | (0.12 | ) | | | (0.10 | ) | | | (0.22 | ) |
February 28, 2013 (f) through October 31, 2013 | | | 15.00 | | | | 0.17 | | | | 2.13 | | | | 2.30 | | | | — | | | | — | | | | — | |
| (a) | Annualized for periods less than one year, unless otherwise noted. |
| (b) | Calculated based upon average shares outstanding. |
| (c) | Not annualized for periods less than one year. |
| (d) | Includes adjustments in accordance with accounting principles generally accepted in the United States of America and as such, the net asset values for financial reporting purposes and the returns based upon those net asset values may differ from the net asset values and returns for shareholder transactions. |
| (e) | Includes interest expense, if applicable, which is less than 0.005% unless otherwise noted. |
| (f) | Commencement of operations. |
| (g) | Certain non-recurring expenses incurred by the Fund were not annualized for the period ended October 31, 2013. |
| (h) | Ratios are disproportionate among classes due to the size of net assets and fixed expenses. |
SEE NOTES TO FINANCIAL STATEMENTS.
| | | | | | |
| | | |
| 128 | | | | J.P. MORGAN INTERNATIONAL EQUITY FUNDS | | APRIL 30, 2017 |
| | | | | | | | | | | | | | | | | | | | | | | | | | |
| | | Ratios/Supplemental data | |
| | | | | | | | | | Ratios to average net assets (a) | | | | |
Net asset
value,
end of
period | | | Total return
(excludes
sales charge) (c)(d) | | | Net assets,
end of
period
(000’s) | | | Net
expenses (e) | | |
Net
investment
income
(loss) | | | Expenses
without waivers
and reimbursements | | | Portfolio
turnover
rate (c) | |
| | | | | | | | | | | | | | | | | | | | | | | | | | |
| | | | | | | | | | | | | | | | | | | | | | | | | | |
| $ | 20.38 | | | | 12.62 | % | | $ | 23 | | | | 0.59 | % | | | 1.68 | % | | | 0.98 | % | | | 17 | % |
| | 18.45 | | | | 0.68 | | | | 20 | | | | 0.59 | | | | 1.95 | | | | 3.30 | | | | 35 | |
| | 18.52 | | | | 1.22 | | | | 20 | | | | 0.58 | | | | 1.98 | | | | 0.99 | | | | 44 | |
| | 18.77 | | | | 9.90 | | | | 64 | | | | 0.58 | | | | 1.87 | | | | 0.81 | | | | 40 | |
| | 17.33 | | | | 15.53 | | | | 58 | | | | 0.58 | (g) | | | 1.79 | (g) | | | 1.62 | (g)(h) | | | 25 | |
| | | | | | |
| | | | | | | | | | | | | | | | | | | | | | | | | | |
| | 20.44 | | | | 12.36 | | | | 22 | | | | 1.09 | | | | 1.17 | | | | 1.48 | | | | 17 | |
| | 18.46 | | | | 0.16 | | | | 20 | | | | 1.09 | | | | 1.44 | | | | 3.81 | | | | 35 | |
| | 18.43 | | | | 0.73 | | | | 20 | | | | 1.08 | | | | 1.48 | | | | 1.50 | | | | 44 | |
| | 18.68 | | | | 9.27 | | | | 63 | | | | 1.08 | | | | 1.37 | | | | 1.31 | | | | 40 | |
| | 17.28 | | | | 15.20 | | | | 58 | | | | 1.08 | (g) | | | 1.29 | (g) | | | 2.12 | (g)(h) | | | 25 | |
| | | | | | |
| | | | | | | | | | | | | | | | | | | | | | | | | | |
| | 20.27 | | | | 12.78 | | | | 7,716,084 | | | | 0.34 | | | | 1.93 | | | | 0.55 | | | | 17 | |
| | 18.37 | | | | 0.91 | | | | 6,907,246 | | | | 0.34 | | | | 2.19 | | | | 0.55 | | | | 35 | |
| | 18.56 | | | | 1.51 | | | | 7,415,218 | | | | 0.33 | | | | 2.06 | | | | 0.56 | | | | 44 | |
| | 18.81 | | | | 10.09 | | | | 3,577,523 | | | | 0.33 | | | | 2.16 | | | | 0.56 | | | | 40 | |
| | 17.37 | | | | 15.80 | | | | 1,895,025 | | | | 0.33 | (g) | | | 1.73 | (g) | | | 0.60 | (g)(h) | | | 25 | |
| | | | | | |
| | | | | | | | | | | | | | | | | | | | | | | | | | |
| | 20.41 | | | | 12.46 | | | | 23 | | | | 0.83 | | | | 1.42 | | | | 1.23 | | | | 17 | |
| | 18.46 | | | | 0.46 | | | | 20 | | | | 0.84 | | | | 1.70 | | | | 3.55 | | | | 35 | |
| | 18.47 | | | | 0.98 | | | | 20 | | | | 0.83 | | | | 1.73 | | | | 1.25 | | | | 44 | |
| | 18.72 | | | | 9.58 | | | | 63 | | | | 0.83 | | | | 1.62 | | | | 1.06 | | | | 40 | |
| | 17.30 | | | | 15.33 | | | | 58 | | | | 0.83 | (g) | | | 1.54 | (g) | | | 1.87 | (g)(h) | | | 25 | |
SEE NOTES TO FINANCIAL STATEMENTS.
| | | | | | | | |
| | | |
| APRIL 30, 2017 | | J.P. MORGAN INTERNATIONAL EQUITY FUNDS | | | | | 129 | |
FINANCIAL HIGHLIGHTS
FOR THE PERIODS INDICATED (continued)
| | | | | | | | | | | | | | | | | | | | | | | | | | | | | | | | |
| | | Per share operating performance | |
| | | | | | Investment operations | | | Distributions | |
| | | Net asset
value,
beginning
of period | | | Net
investment
income
(loss) | | | Net realized
and unrealized
gains
(losses) on
investments | | | Total from
investment
operations | | | Net
investment
income | | | Net
realized
gain | | | Return
of
capital | | | Total
distributions | |
Global Unconstrained Equity Fund | |
Class A | |
Six Months Ended April 30, 2017 (Unaudited) | | $ | 14.12 | | | $ | 0.05 | (e) | | $ | 1.95 | | | $ | 2.00 | | | $ | — | | | $ | — | | | $ | — | | | $ | — | |
Year Ended October 31, 2016 | | | 16.12 | | | | 0.27 | (e) | | | (0.88 | ) | | | (0.61 | ) | | | (0.30 | ) | | | (0.27 | ) | | | (0.82 | ) | | | (1.39 | ) |
Year Ended October 31, 2015 | | | 19.55 | | | | 0.11 | (e) | | | 0.66 | | | | 0.77 | | | | (0.31 | ) | | | (3.89 | ) | | | — | | | | (4.20 | ) |
Year Ended October 31, 2014 | | | 20.11 | | | | 0.23 | | | | 1.17 | | | | 1.40 | | | | (0.17 | ) | | | (1.79 | ) | | | — | | | | (1.96 | ) |
Year Ended October 31, 2013 | | | 16.73 | | | | 0.24 | | | | 3.77 | | | | 4.01 | | | | (0.22 | ) | | | (0.41 | ) | | | — | | | | (0.63 | ) |
November 30, 2011 (g) through October 31, 2012 | | | 15.00 | | | | 0.17 | | | | 1.56 | | | | 1.73 | | | | — | (h) | | | — | | | | — | | | | — | (h) |
| | | | | | | | |
Class C | | | | | | | | | | | | | | | | | | | | | | | | | | | | | | | | |
Six Months Ended April 30, 2017 (Unaudited) | | | 14.02 | | | | 0.02 | (e) | | | 1.92 | | | | 1.94 | | | | — | | | | — | | | | — | | | | — | |
Year Ended October 31, 2016 | | | 16.01 | | | | 0.11 | (e) | | | (0.79 | ) | | | (0.68 | ) | | | (0.22 | ) | | | (0.27 | ) | | | (0.82 | ) | | | (1.31 | ) |
Year Ended October 31, 2015 | | | 19.43 | | | | 0.04 | (e) | | | 0.64 | | | | 0.68 | | | | (0.21 | ) | | | (3.89 | ) | | | — | | | | (4.10 | ) |
Year Ended October 31, 2014 | | | 20.01 | | | | 0.14 | | | | 1.16 | | | | 1.30 | | | | (0.09 | ) | | | (1.79 | ) | | | — | | | | (1.88 | ) |
Year Ended October 31, 2013 | | | 16.65 | | | | 0.16 | | | | 3.76 | | | | 3.92 | | | | (0.15 | ) | | | (0.41 | ) | | | — | | | | (0.56 | ) |
November 30, 2011 (g) through October 31, 2012 | | | 15.00 | | | | 0.09 | | | | 1.56 | | | | 1.65 | | | | — | | | | — | | | | — | | | | — | |
| | | | | | | | |
Class I (formerly Select Class) | | | | | | | | | | | | | | | | | | | | | | | | | | | | | | | | |
Six Months Ended April 30, 2017 (Unaudited) | | | 14.23 | | | | 0.08 | (e) | | | 1.97 | | | | 2.05 | | | | (0.04 | ) | | | — | | | | — | | | | (0.04 | ) |
Year Ended October 31, 2016 | | | 16.18 | | | | 0.26 | (e) | | | (0.83 | ) | | | (0.57 | ) | | | (0.29 | ) | | | (0.27 | ) | | | (0.82 | ) | | | (1.38 | ) |
Year Ended October 31, 2015 | | | 19.60 | | | | 0.19 | (e) | | | 0.64 | | | | 0.83 | | | | (0.36 | ) | | | (3.89 | ) | | | — | | | | (4.25 | ) |
Year Ended October 31, 2014 | | | 20.15 | | | | 0.27 | | | | 1.19 | | | | 1.46 | | | | (0.22 | ) | | | (1.79 | ) | | | — | | | | (2.01 | ) |
Year Ended October 31, 2013 | | | 16.76 | | | | 0.29 | | | | 3.77 | | | | 4.06 | | | | (0.26 | ) | | | (0.41 | ) | | | — | | | | (0.67 | ) |
November 30, 2011 (g) through October 31, 2012 | | | 15.00 | | | | 0.20 | | | | 1.57 | | | | 1.77 | | | | (0.01 | ) | | | — | | | | — | | | | (0.01 | ) |
| | | | | | | | |
Class R2 | | | | | | | | | | | | | | | | | | | | | | | | | | | | | | | | |
Six Months Ended April 30, 2017 (Unaudited) | | | 14.24 | | | | 0.03 | (e) | | | 1.96 | | | | 1.99 | | | | — | | | | — | | | | — | | | | — | |
Year Ended October 31, 2016 | | | 16.11 | | | | 0.14 | (e) | | | (0.79 | ) | | | (0.65 | ) | | | (0.13 | ) | | | (0.27 | ) | | | (0.82 | ) | | | (1.22 | ) |
Year Ended October 31, 2015 | | | 19.49 | | | | 0.08 | (e) | | | 0.65 | | | | 0.73 | | | | (0.22 | ) | | | (3.89 | ) | | | — | | | | (4.11 | ) |
Year Ended October 31, 2014 | | | 20.06 | | | | 0.18 | | | | 1.17 | | | | 1.35 | | | | (0.13 | ) | | | (1.79 | ) | | | — | | | | (1.92 | ) |
Year Ended October 31, 2013 | | | 16.69 | | | | 0.20 | | | | 3.77 | | | | 3.97 | | | | (0.19 | ) | | | (0.41 | ) | | | — | | | | (0.60 | ) |
November 30, 2011 (g) through October 31, 2012 | | | 15.00 | | | | 0.13 | | | | 1.56 | | | | 1.69 | | | | — | | | | — | | | | — | | | | — | |
| | | | | | | | |
Class R5 | | | | | | | | | | | | | | | | | | | | | | | | | | | | | | | | |
Six Months Ended April 30, 2017 (Unaudited) | | | 14.24 | | | | 0.08 | (e) | | | 1.96 | | | | 2.04 | | | | (0.10 | ) | | | — | | | | — | | | | (0.10 | ) |
Year Ended October 31, 2016 | | | 16.21 | | | | 0.24 | (e) | | | (0.80 | ) | | | (0.56 | ) | | | (0.32 | ) | | | (0.27 | ) | | | (0.82 | ) | | | (1.41 | ) |
Year Ended October 31, 2015 | | | 19.65 | | | | 0.21 | (e) | | | 0.64 | | | | 0.85 | | | | (0.40 | ) | | | (3.89 | ) | | | — | | | | (4.29 | ) |
Year Ended October 31, 2014 | | | 20.19 | | | | 0.31 | | | | 1.19 | | | | 1.50 | | | | (0.25 | ) | | | (1.79 | ) | | | — | | | | (2.04 | ) |
Year Ended October 31, 2013 | | | 16.79 | | | | 0.32 | | | | 3.79 | | | | 4.11 | | | | (0.30 | ) | | | (0.41 | ) | | | — | | | | (0.71 | ) |
November 30, 2011 (g) through October 31, 2012 | | | 15.00 | | | | 0.23 | | | | 1.57 | | | | 1.80 | | | | (0.01 | ) | | | — | | | | — | | | | (0.01 | ) |
| | | | | | | | |
Class R6 | | | | | | | | | | | | | | | | | | | | | | | | | | | | | | | | |
Six Months Ended April 30, 2017 (Unaudited) | | | 14.23 | | | | 0.09 | (e) | | | 1.95 | | | | 2.04 | | | | (0.10 | ) | | | — | | | | — | | | | (0.10 | ) |
Year Ended October 31, 2016 | | | 16.22 | | | | 0.25 | (e) | | | (0.80 | ) | | | (0.55 | ) | | | (0.35 | ) | | | (0.27 | ) | | | (0.82 | ) | | | (1.44 | ) |
Year Ended October 31, 2015 | | | 19.66 | | | | 0.21 | (e) | | | 0.66 | | | | 0.87 | | | | (0.42 | ) | | | (3.89 | ) | | | — | | | | (4.31 | ) |
Year Ended October 31, 2014 | | | 20.20 | | | | 0.32 | | | | 1.19 | | | | 1.51 | | | | (0.26 | ) | | | (1.79 | ) | | | — | | | | (2.05 | ) |
Year Ended October 31, 2013 | | | 16.80 | | | | 0.33 | | | | 3.78 | | | | 4.11 | | | | (0.30 | ) | | | (0.41 | ) | | | — | | | | (0.71 | ) |
November 30, 2011 (g) through October 31, 2012 | | | 15.00 | | | | 0.24 | | | | 1.57 | | | | 1.81 | | | | (0.01 | ) | | | — | | | | — | | | | (0.01 | ) |
| (a) | Annualized for periods less than one year, unless otherwise noted. |
| (b) | Not annualized for periods less than one year. |
| (c) | Includes adjustments in accordance with accounting principles generally accepted in the United States of America and as such, the net asset values for financial reporting purposes and the returns based upon those net asset values may differ from the net asset values and returns for shareholder transactions. |
| (d) | Includes interest expense, if applicable, which is less than 0.005% unless otherwise noted. |
| (e) | Calculated based upon average shares outstanding. |
| (f) | Certain non-recurring expenses incurred by the Fund were not annualized for the year ended October 31, 2013 and for the period ended October 31, 2012. |
| (g) | Commencement of operations. |
| (h) | Amount rounds to less than $0.005. |
SEE NOTES TO FINANCIAL STATEMENTS.
| | | | | | |
| | | |
| 130 | | | | J.P. MORGAN INTERNATIONAL EQUITY FUNDS | | APRIL 30, 2017 |
| | | | | | | | | | | | | | | | | | | | | | | | | | |
| | | Ratios/Supplemental data | |
| | | | | | | | | | Ratios to average net assets (a) | | | | |
Net asset
value,
end of
period | | | Total return
(excludes
sales charge) (b)(c) | | | Net assets,
end of
period
(000’s) | | | Net
expenses (d) | | | Net
investment
income
(loss) | | | Expenses
without waivers
and reimbursements | | | Portfolio
turnover
rate (b) | |
| | | | | | | | | | | | | | | | | | | | | | | | | | |
| | | | | | | | | | | | | | | | | | | | | | | | | | |
| $ | 16.12 | | | | 14.16 | % | | $ | 679 | | | | 0.74 | % | | | 0.70 | % | | | 15.87 | % | | | 51 | % |
| | 14.12 | | | | (3.53 | ) | | | 417 | | | | 0.74 | | | | 1.95 | | | | 1.90 | | | | 1256 | |
| | 16.12 | | | | 4.76 | | | | 244 | | | | 1.00 | | | | 0.67 | | | | 7.57 | | | | 132 | |
| | 19.55 | | | | 7.83 | | | | 75 | | | | 1.35 | | | | 1.27 | | | | 4.32 | | | | 97 | |
| | 20.11 | | | | 24.74 | | | | 70 | | | | 1.35 | (f) | | | 1.37 | (f) | | | 5.36 | (f) | | | 71 | |
| | 16.73 | | | | 11.55 | | | | 56 | | | | 1.35 | (f) | | | 1.14 | (f) | | | 6.89 | (f) | | | 49 | |
| | | | | | |
| | | | | | | | | | | | | | | | | | | | | | | | | | |
| | 15.96 | | | | 13.84 | | | | 263 | | | | 1.24 | | | | 0.21 | | | | 16.30 | | | | 51 | |
| | 14.02 | | | | (4.02 | ) | | | 210 | | | | 1.17 | | | | 0.78 | | | | 11.83 | | | | 1256 | |
| | 16.01 | | | | 4.26 | | | | 317 | | | | 1.48 | | | | 0.21 | | | | 9.92 | | | | 132 | |
| | 19.43 | | | | 7.28 | | | | 74 | | | | 1.85 | | | | 0.77 | | | | 4.82 | | | | 97 | |
| | 20.01 | | | | 24.16 | | | | 69 | | | | 1.85 | (f) | | | 0.87 | (f) | | | 5.85 | (f) | | | 71 | |
| | 16.65 | | | | 11.00 | | | | 56 | | | | 1.85 | (f) | | | 0.65 | (f) | | | 7.38 | (f) | | | 49 | |
| | | | | | |
| | | | | | | | | | | | | | | | | | | | | | | | | | |
| | 16.24 | | | | 14.41 | | | | 1,123 | | | | 0.40 | | | | 1.02 | | | | 15.35 | | | | 51 | |
| | 14.23 | | | | (3.23 | ) | | | 991 | | | | 0.36 | | | | 1.86 | | | | 5.37 | | | | 1256 | |
| | 16.18 | | | | 5.13 | | | | 1,020 | | | | 0.88 | | | | 1.06 | | | | 7.34 | | | | 132 | |
| | 19.60 | | | | 8.11 | | | | 4,156 | | | | 1.10 | | | | 1.52 | | | | 4.06 | | | | 97 | |
| | 20.15 | | | | 25.04 | | | | 3,844 | | | | 1.10 | (f) | | | 1.62 | (f) | | | 5.10 | (f) | | | 71 | |
| | 16.76 | | | | 11.77 | | | | 3,075 | | | | 1.10 | (f) | | | 1.40 | (f) | | | 6.64 | (f) | | | 49 | |
| | | | | | |
| | | | | | | | | | | | | | | | | | | | | | | | | | |
| | 16.23 | | | | 13.97 | | | | 20 | | | | 1.00 | | | | 0.41 | | | | 15.92 | | | | 51 | |
| | 14.24 | | | | (3.79 | ) | | | 18 | | | | 0.92 | | | | 1.00 | | | | 13.46 | | | | 1256 | |
| | 16.11 | | | | 4.55 | | | | 20 | | | | 1.46 | | | | 0.45 | | | | 8.67 | | | | 132 | |
| | 19.49 | | | | 7.55 | | | | 75 | | | | 1.60 | | | | 1.02 | | | | 4.56 | | | | 97 | |
| | 20.06 | | | | 24.45 | | | | 69 | | | | 1.60 | (f) | | | 1.12 | (f) | | | 5.60 | (f) | | | 71 | |
| | 16.69 | | | | 11.27 | | | | 56 | | | | 1.60 | (f) | | | 0.90 | (f) | | | 7.14 | (f) | | | 49 | |
| | | | | | |
| | | | | | | | | | | | | | | | | | | | | | | | | | |
| | 16.18 | | | | 14.35 | | | | 20 | | | | 0.30 | | | | 1.11 | | | | 15.23 | | | | 51 | |
| | 14.24 | | | | (3.12 | ) | | | 18 | | | | 0.22 | | | | 1.70 | | | | 12.77 | | | | 1256 | |
| | 16.21 | | | | 5.26 | | | | 20 | | | | 0.76 | | | | 1.15 | | | | 7.97 | | | | 132 | |
| | 19.65 | | | | 8.34 | | | | 76 | | | | 0.90 | | | | 1.72 | | | | 3.86 | | | | 97 | |
| | 20.19 | | | | 25.29 | | | | 70 | | | | 0.90 | (f) | | | 1.82 | (f) | | | 4.89 | (f) | | | 71 | |
| | 16.79 | | | | 11.99 | | | | 56 | | | | 0.90 | (f) | | | 1.60 | (f) | | | 6.45 | (f) | | | 49 | |
| | | | | | |
| | | | | | | | | | | | | | | | | | | | | | | | | | |
| | 16.17 | | | | 14.41 | | | | 20 | | | | 0.24 | | | | 1.16 | | | | 15.18 | | | | 51 | |
| | 14.23 | | | | (3.10 | ) | | | 18 | | | | 0.17 | | | | 1.75 | | | | 12.75 | | | | 1256 | |
| | 16.22 | | | | 5.34 | | | | 20 | | | | 0.71 | | | | 1.20 | | | | 7.91 | | | | 132 | |
| | 19.66 | | | | 8.39 | | | | 76 | | | | 0.85 | | | | 1.77 | | | | 3.81 | | | | 97 | |
| | 20.20 | | | | 25.33 | | | | 70 | | | | 0.85 | (f) | | | 1.87 | (f) | | | 4.85 | (f) | | | 71 | |
| | 16.80 | | | | 12.06 | | | | 56 | | | | 0.85 | (f) | | | 1.65 | (f) | | | 6.40 | (f) | | | 49 | |
SEE NOTES TO FINANCIAL STATEMENTS.
| | | | | | | | |
| | | |
| APRIL 30, 2017 | | J.P. MORGAN INTERNATIONAL EQUITY FUNDS | | | | | 131 | |
FINANCIAL HIGHLIGHTS
FOR THE PERIODS INDICATED (continued)
| | | | | | | | | | | | | | | | | | | | |
| | | Per share operating performance | |
| | | | | | Investment operations | | | Distributions | |
| | | Net asset
value,
beginning
of period | | | Net
investment
income
(loss) (b) | | | Net realized
and unrealized
gains
(losses) on
investments | | | Total from
investment
operations | | | Net
investment
income | |
International Discovery Fund | |
Class A | |
Six Months Ended April 30, 2017 (Unaudited) | | $ | 14.88 | | | $ | 0.13 | | | $ | 1.62 | | | $ | 1.75 | | | $ | (0.11 | ) |
December 21, 2015 (g) through October 31, 2016 | | | 15.00 | | | | 0.13 | | | | (0.24 | )(h)(i) | | | (0.11 | ) | | | (0.01 | ) |
|
Class C | |
Six Months Ended April 30, 2017 (Unaudited) | | | 14.82 | | | | 0.03 | | | | 1.68 | | | | 1.71 | | | | (0.05 | ) |
December 21, 2015 (g) through October 31, 2016 | | | 15.00 | | | | 0.07 | | | | (0.24 | )(h)(i) | | | (0.17 | ) | | | (0.01 | ) |
|
Class I (formerly Select Class) | |
Six Months Ended April 30, 2017 (Unaudited) | | | 14.92 | | | | 0.09 | | | | 1.69 | | | | 1.78 | | | | (0.15 | ) |
December 21, 2015 (g) through October 31, 2016 | | | 15.00 | | | | 0.17 | | | | (0.24 | )(h)(i) | | | (0.07 | ) | | | (0.01 | ) |
|
Class R5 | |
Six Months Ended April 30, 2017 (Unaudited) | | | 14.94 | | | | 0.10 | | | | 1.69 | | | | 1.79 | | | | (0.17 | ) |
December 21, 2015 (g) through October 31, 2016 | | | 15.00 | | | | 0.19 | | | | (0.24 | )(h)(i) | | | (0.05 | ) | | | (0.01 | ) |
|
Class R6 | |
Six Months Ended April 30, 2017 (Unaudited) | | | 14.94 | | | | 0.10 | | | | 1.69 | | | | 1.79 | | | | (0.17 | ) |
December 21, 2015 (g) through October 31, 2016 | | | 15.00 | | | | 0.20 | | | | (0.25 | )(h)(i) | | | (0.05 | ) | | | (0.01 | ) |
| (a) | Annualized for periods less than one year, unless otherwise noted. |
| (b) | Calculated based upon average shares outstanding. |
| (c) | Not annualized for periods less than one year. |
| (d) | Includes adjustments in accordance with accounting principles generally accepted in the United States of America and as such, the net asset values for financial reporting purposes and the returns based upon those net asset values may differ from the net asset values and returns for shareholder transactions. |
| (e) | Includes interest expense, if applicable, which is less than 0.005% unless otherwise noted. |
| (f) | Certain non-recurring expenses incurred by the Fund were not annualized for the period ended April 30, 2017 and for the period ended October 31, 2016. |
| (g) | Commencement of operations. |
| (h) | An affiliate of JPMorgan Chase & Co. reimbursed the Fund for losses incurred from an operational error. Without the reimbursement, the net realized and unrealized gains (losses) on investments per share would have been $(0.26), $(0.27), $(0.27), $(0.27) and $(0.28), and the total return would have been (0.88)%, (1.36)%, (0.67)%, (0.53)% and (0.53)% for Class A, Class C, Class I, Class R5 and Class R6, respectively. |
| (i) | Calculation of the net realized and unrealized gains (losses) per share do not correlate with the Fund’s net realized and unrealized gains (losses) presented in the Statement of Operations due to the timing of capital transactions in relation to the fluctuating market values of the Fund’s investments. |
SEE NOTES TO FINANCIAL STATEMENTS.
| | | | | | |
| | | |
| 132 | | | | J.P. MORGAN INTERNATIONAL EQUITY FUNDS | | APRIL 30, 2017 |
| | | | | | | | | | | | | | | | | | | | | | | | | | |
| | | Ratios/Supplemental data | |
| | | | | | | | | | Ratios to average net assets (a) | | | | |
Net asset
value,
end of
period | | | Total return
(excludes
sales charge) (c)(d) | | | Net assets,
end of
period
(000’s) | | | Net
expenses (e)(f) | | | Net
investment
income
(loss) (b)(f) | | | Expenses
without waivers
and reimbursements | | | Portfolio
turnover
rate (c) | |
| | | | | | | | | | | | | | | | | | | | | | | | | | |
| | | | | | | | | | | | | | | | | | | | | | | | | | |
| $ | 16.52 | | | | 11.91 | % | | $ | 133 | | | | 1.25 | % | | | 1.67 | % | | | 7.53 | % | | | 76 | % |
| | 14.88 | | | | (0.75 | )(i) | | | 20 | | | | 1.25 | | | | 1.07 | | | | 9.33 | | | | 200 | |
| | | | | | |
| | | | | | | | | | | | | | | | | | | | | | | | | | |
| | 16.48 | | | | 11.62 | | | | 22 | | | | 1.75 | | | | 0.36 | | | | 8.70 | | | | 76 | |
| | 14.82 | | | | (1.16 | )(i) | | | 20 | | | | 1.75 | | | | 0.57 | | | | 9.78 | | | | 200 | |
| | | | | | |
| | | | | | | | | | | | | | | | | | | | | | | | | | |
| | 16.55 | | | | 12.11 | | | | 6,563 | | | | 0.95 | | | | 1.16 | | | | 7.91 | | | | 76 | |
| | 14.92 | | | | (0.47 | )(i) | | | 5,815 | | | | 0.95 | | | | 1.34 | | | | 5.54 | | | | 200 | |
| | | | | | |
| | | | | | | | | | | | | | | | | | | | | | | | | | |
| | 16.56 | | | | 12.15 | | | | 22 | | | | 0.80 | | | | 1.30 | | | | 7.77 | | | | 76 | |
| | 14.94 | | | | (0.33 | )(i) | | | 20 | | | | 0.80 | | | | 1.52 | | | | 8.83 | | | | 200 | |
| | | | | | |
| | | | | | | | | | | | | | | | | | | | | | | | | | |
| | 16.56 | | | | 12.20 | | | | 22 | | | | 0.75 | | | | 1.36 | | | | 7.71 | | | | 76 | |
| | 14.94 | | | | (0.33 | )(i) | | | 19 | | | | 0.75 | | | | 1.57 | | | | 8.77 | | | | 200 | |
SEE NOTES TO FINANCIAL STATEMENTS.
| | | | | | | | |
| | | |
| APRIL 30, 2017 | | J.P. MORGAN INTERNATIONAL EQUITY FUNDS | | | | | 133 | |
FINANCIAL HIGHLIGHTS
FOR THE PERIODS INDICATED (continued)
| | | | | | | | | | | | | | | | | | | | |
| | | Per share operating performance | |
| | | | | | Investment operations | | | Distributions | |
| | | Net asset
value,
beginning
of period | | | Net
investment
income
(loss) (b) | | | Net realized
and unrealized
gains
(losses) on
investments | | | Total from
investment
operations | | | Net
investment
income | |
International Equity Fund | |
Class A | |
Six Months Ended April 30, 2017 (Unaudited) | | $ | 14.24 | | | $ | 0.07 | | | $ | 1.48 | | | $ | 1.55 | | | $ | (0.04 | ) |
Year Ended October 31, 2016 | | | 14.75 | | | | 0.22 | | | | (0.51 | ) | | | (0.29 | ) | | | (0.22 | ) |
Year Ended October 31, 2015 | | | 15.25 | | | | 0.23 | | | | (0.50 | ) | | | (0.27 | ) | | | (0.23 | ) |
Year Ended October 31, 2014 | | | 15.92 | | | | 0.37 | (f) | | | (0.68 | ) | | | (0.31 | ) | | | (0.36 | ) |
Year Ended October 31, 2013 | | | 13.36 | | | | 0.20 | | | | 2.56 | | | | 2.76 | | | | (0.20 | ) |
Year Ended October 31, 2012 | | | 12.61 | | | | 0.22 | | | | 0.74 | | | | 0.96 | | | | (0.21 | ) |
|
Class C | |
Six Months Ended April 30, 2017 (Unaudited) | | | 13.50 | | | | 0.02 | | | | 1.42 | | | | 1.44 | | | | (0.01 | ) |
Year Ended October 31, 2016 | | | 14.02 | | | | 0.13 | | | | (0.47 | ) | | | (0.34 | ) | | | (0.18 | ) |
Year Ended October 31, 2015 | | | 14.52 | | | | 0.15 | | | | (0.48 | ) | | | (0.33 | ) | | | (0.17 | ) |
Year Ended October 31, 2014 | | | 15.20 | | | | 0.26 | (f) | | | (0.64 | ) | | | (0.38 | ) | | | (0.30 | ) |
Year Ended October 31, 2013 | | | 12.78 | | | | 0.12 | | | | 2.45 | | | | 2.57 | | | | (0.15 | ) |
Year Ended October 31, 2012 | | | 12.08 | | | | 0.16 | | | | 0.69 | | | | 0.85 | | | | (0.15 | ) |
|
Class I (formerly Select Class) | |
Six Months Ended April 30, 2017 (Unaudited) | | | 14.45 | | | | 0.08 | | | | 1.51 | | | | 1.59 | | | | (0.06 | ) |
Year Ended October 31, 2016 | | | 14.95 | | | | 0.24 | | | | (0.48 | ) | | | (0.24 | ) | | | (0.26 | ) |
Year Ended October 31, 2015 | | | 15.45 | | | | 0.29 | | | | (0.53 | ) | | | (0.24 | ) | | | (0.26 | ) |
Year Ended October 31, 2014 | | | 16.13 | | | | 0.39 | (f) | | | (0.67 | ) | | | (0.28 | ) | | | (0.40 | ) |
Year Ended October 31, 2013 | | | 13.52 | | | | 0.23 | | | | 2.61 | | | | 2.84 | | | | (0.23 | ) |
Year Ended October 31, 2012 | | | 12.76 | | | | 0.26 | | | | 0.74 | | | | 1.00 | | | | (0.24 | ) |
|
Class R2 | |
Six Months Ended April 30, 2017 (Unaudited) | | | 14.17 | | | | 0.04 | | | | 1.49 | | | | 1.53 | | | | (0.02 | ) |
Year Ended October 31, 2016 | | | 14.69 | | | | 0.18 | | | | (0.50 | ) | | | (0.32 | ) | | | (0.20 | ) |
Year Ended October 31, 2015 | | | 15.19 | | | | 0.20 | | | | (0.51 | ) | | | (0.31 | ) | | | (0.19 | ) |
Year Ended October 31, 2014 | | | 15.87 | | | | 0.30 | (f) | | | (0.65 | ) | | | (0.35 | ) | | | (0.33 | ) |
Year Ended October 31, 2013 | | | 13.31 | | | | 0.11 | | | | 2.61 | | | | 2.72 | | | | (0.16 | ) |
Year Ended October 31, 2012 | | | 12.58 | | | | 0.15 | | | | 0.77 | | | | 0.92 | | | | (0.19 | ) |
|
Class R5 | |
Six Months Ended April 30, 2017 (Unaudited) | | | 14.47 | | | | 0.06 | | | | 1.54 | | | | 1.60 | | | | (0.07 | ) |
Year Ended October 31, 2016 | | | 14.97 | | | | 0.27 | | | | (0.49 | ) | | | (0.22 | ) | | | (0.28 | ) |
Year Ended October 31, 2015 | | | 15.46 | | | | 0.29 | | | | (0.49 | ) | | | (0.20 | ) | | | (0.29 | ) |
Year Ended October 31, 2014 | | | 16.13 | | | | 0.44 | (f) | | | (0.69 | ) | | | (0.25 | ) | | | (0.42 | ) |
Year Ended October 31, 2013 | | | 13.52 | | | | 0.27 | | | | 2.60 | | | | 2.87 | | | | (0.26 | ) |
Year Ended October 31, 2012 | | | 12.75 | | | | 0.29 | | | | 0.74 | | | | 1.03 | | | | (0.26 | ) |
|
Class R6 | |
Six Months Ended April 30, 2017 (Unaudited) | | | 14.46 | | | | 0.10 | | | | 1.52 | | | | 1.62 | | | | (0.08 | ) |
Year Ended October 31, 2016 | | | 14.97 | | | | 0.29 | | | | (0.51 | ) | | | (0.22 | ) | | | (0.29 | ) |
Year Ended October 31, 2015 | | | 15.46 | | | | 0.32 | | | | (0.52 | ) | | | (0.20 | ) | | | (0.29 | ) |
Year Ended October 31, 2014 | | | 16.13 | | | | 0.45 | (f) | | | (0.69 | ) | | | (0.24 | ) | | | (0.43 | ) |
Year Ended October 31, 2013 | | | 13.52 | | | | 0.28 | | | | 2.59 | | | | 2.87 | | | | (0.26 | ) |
Year Ended October 31, 2012 | | | 12.75 | | | | 0.29 | | | | 0.74 | | | | 1.03 | | | | (0.26 | ) |
| (a) | Annualized for periods less than one year, unless otherwise noted. |
| (b) | Calculated based upon average shares outstanding. |
| (c) | Not annualized for periods less than one year. |
| (d) | Includes adjustments in accordance with accounting principles generally accepted in the United States of America and as such, the net asset values for financial reporting purposes and the returns based upon those net asset values may differ from the net asset values and returns for shareholder transactions. |
| (e) | Includes interest expense, if applicable, which is less than 0.005% unless otherwise noted. |
| (f) | Reflects special dividends paid out during the period by several of the Fund’s holdings. Had the Fund not received the special dividends, the net investment income (loss) per share would have been $0.32, $0.21, $0.34, $0.25, $0.39 and $0.40 for Class A, Class C, Class I, Class R2, Class R5 and Class R6, respectively, and the net investment income (loss) ratio would have been 2.01%, 1.40%, 2.08%, 1.59%, 2.40% and 2.48% for Class A, Class C, Class I, Class R2, Class R5 and Class R6, respectively. |
SEE NOTES TO FINANCIAL STATEMENTS.
| | | | | | |
| | | |
| 134 | | | | J.P. MORGAN INTERNATIONAL EQUITY FUNDS | | APRIL 30, 2017 |
| | | | | | | | | | | | | | | | | | | | | | | | | | |
| | | Ratios/Supplemental data | |
| | | | | | | | | | Ratios to average net assets (a) | | | | |
Net asset
value,
end of
period | | | Total return
(excludes
sales charge) (c)(d) | | | Net assets,
end of
period
(000’s) | | | Net
expenses (e) | | |
Net
investment
income
(loss) | | | Expenses
without waivers
and reimbursements | | | Portfolio
turnover
rate (c) | |
| | | | | | | | | | | | | | | | | | | | | | | | | | |
| | | | | | | | | | | | | | | | | | | | | | | | | | |
| $ | 15.75 | | | | 10.92 | % | | $ | 257,057 | | | | 1.24 | % | | | 0.93 | % | | | 1.39 | % | | | 5 | % |
| | 14.24 | | | | (1.83 | ) | | | 216,932 | | | | 1.31 | | | | 1.62 | | | | 1.49 | | | | 11 | |
| | 14.75 | | | | (1.89 | ) | | | 224,370 | | | | 1.31 | | | | 1.50 | | | | 1.59 | | | | 13 | |
| | 15.25 | | | | (2.06 | ) | | | 186,242 | | | | 1.31 | | | | 2.34 | (f) | | | 1.45 | | | | 6 | |
| | 15.92 | | | | 20.85 | | | | 188,590 | | | | 1.30 | | | | 1.33 | | | | 1.47 | | | | 8 | |
| | 13.36 | | | | 7.70 | | | | 98,274 | | | | 1.30 | | | | 1.72 | | | | 1.51 | | | | 5 | |
| | | | | | |
| | | | | | | | | | | | | | | | | | | | | | | | | | |
| | 14.93 | | | | 10.70 | | | | 23,139 | | | | 1.74 | | | | 0.33 | | | | 1.94 | | | | 5 | |
| | 13.50 | | | | (2.31 | ) | | | 22,235 | | | | 1.81 | | | | 0.97 | | | | 2.06 | | | | 11 | |
| | 14.02 | | | | (2.36 | ) | | | 28,313 | | | | 1.81 | | | | 1.02 | | | | 2.05 | | | | 13 | |
| | 14.52 | | | | (2.59 | ) | | | 26,299 | | | | 1.81 | | | | 1.73 | (f) | | | 1.95 | | | | 6 | |
| | 15.20 | | | | 20.25 | | | | 23,655 | | | | 1.80 | | | | 0.83 | | | | 1.97 | | | | 8 | |
| | 12.78 | | | | 7.16 | | | | 17,873 | | | | 1.80 | | | | 1.31 | | | | 2.01 | | | | 5 | |
| | | | | | |
| | | | | | | | | | | | | | | | | | | | | | | | | | |
| | 15.98 | | | | 11.03 | | | | 112,377 | | | | 0.99 | | | | 1.14 | | | | 1.15 | | | | 5 | |
| | 14.45 | | | | (1.50 | ) | | | 94,362 | | | | 1.06 | | | | 1.69 | | | | 1.24 | | | | 11 | |
| | 14.95 | | | | (1.66 | ) | | | 522,402 | | | | 1.06 | | | | 1.84 | | | | 1.19 | | | | 13 | |
| | 15.45 | | | | (1.88 | ) | | | 494,344 | | | | 1.06 | | | | 2.41 | (f) | | | 1.20 | | | | 6 | |
| | 16.13 | | | | 21.23 | | | | 434,316 | | | | 1.05 | | | | 1.51 | | | | 1.22 | | | | 8 | |
| | 13.52 | | | | 7.91 | | | | 210,375 | | | | 1.05 | | | | 2.02 | | | | 1.25 | | | | 5 | |
| | | | | | |
| | | | | | | | | | | | | | | | | | | | | | | | | | |
| | 15.68 | | | | 10.84 | | | | 1,533 | | | | 1.49 | | | | 0.61 | | | | 1.84 | | | | 5 | |
| | 14.17 | | | | (2.08 | ) | | | 1,461 | | | | 1.56 | | | | 1.28 | | | | 1.95 | | | | 11 | |
| | 14.69 | | | | (2.14 | ) | | | 1,203 | | | | 1.56 | | | | 1.28 | | | | 1.92 | | | | 13 | |
| | 15.19 | | | | (2.33 | ) | | | 1,405 | | | | 1.56 | | | | 1.92 | (f) | | | 1.70 | | | | 6 | |
| | 15.87 | | | | 20.58 | | | | 1,230 | | | | 1.55 | | | | 0.78 | | | | 1.72 | | | | 8 | |
| | 13.31 | | | | 7.45 | | | | 721 | | | | 1.55 | | | | 1.16 | | | | 1.74 | | | | 5 | |
| | | | | | |
| | | | | | | | | | | | | | | | | | | | | | | �� | | | |
| | 16.00 | | | | 11.09 | | | | 19,619 | | | | 0.84 | | | | 0.84 | | | | 0.94 | | | | 5 | |
| | 14.47 | | | | (1.34 | ) | | | 58,836 | | | | 0.86 | | | | 1.93 | | | | 1.02 | | | | 11 | |
| | 14.97 | | | | (1.42 | ) | | | 57,500 | | | | 0.86 | | | | 1.88 | | | | 1.06 | | | | 13 | |
| | 15.46 | | | | (1.65 | ) | | | 95,749 | | | | 0.86 | | | | 2.73 | (f) | | | 1.00 | | | | 6 | |
| | 16.13 | | | | 21.42 | | | | 106,963 | | | | 0.85 | | | | 1.79 | | | | 1.02 | | | | 8 | |
| | 13.52 | | | | 8.19 | | | | 63,767 | | | | 0.85 | | | | 2.24 | | | | 1.05 | | | | 5 | |
| | | | | | |
| | | | | | | | | | | | | | | | | | | | | | | | | | |
| | 16.00 | | | | 11.23 | | | | 3,274,685 | | | | 0.74 | | | | 1.36 | | | | 0.81 | | | | 5 | |
| | 14.46 | | | | (1.36 | ) | | | 3,030,640 | | | | 0.81 | | | | 2.05 | | | | 0.91 | | | | 11 | |
| | 14.97 | | | | (1.37 | ) | | | 2,088,835 | | | | 0.80 | | | | 2.03 | | | | 0.91 | | | | 13 | |
| | 15.46 | | | | (1.60 | ) | | | 1,681,788 | | | | 0.81 | | | | 2.81 | (f) | | | 0.95 | | | | 6 | |
| | 16.13 | | | | 21.47 | | | | 1,248,489 | | | | 0.80 | | | | 1.85 | | | | 0.97 | | | | 8 | |
| | 13.52 | | | | 8.23 | | | | 682,861 | | | | 0.80 | | | | 2.26 | | | | 1.00 | | | | 5 | |
SEE NOTES TO FINANCIAL STATEMENTS.
| | | | | | | | |
| | | |
| APRIL 30, 2017 | | J.P. MORGAN INTERNATIONAL EQUITY FUNDS | | | | | 135 | |
FINANCIAL HIGHLIGHTS
FOR THE PERIODS INDICATED (continued)
| | | | | | | | | | | | | | | | | | | | | | | | | | | | |
| | | Per share operating performance | |
| | | | | | Investment operations | | | Distributions | |
| | | Net asset
value,
beginning
of period | | | Net
investment
income
(loss) (b) | | | Net realized
and unrealized
gains
(losses) on
investments | | | Total from
investment
operations | | | Net
investment
income | | | Net
realized
gain | | | Total
distributions | |
International Equity Income Fund | |
Class A | |
Six Months Ended April 30, 2017 (Unaudited) | | $ | 14.38 | | | $ | 0.23 | | | $ | 1.01 | | | $ | 1.24 | | | $ | (0.26 | ) | | $ | — | | | $ | (0.26 | ) |
Year Ended October 31, 2016 | | | 15.66 | | | | 0.45 | (f) | | | (1.01 | ) | | | (0.56 | ) | | | (0.46 | ) | | | (0.26 | ) | | | (0.72 | ) |
Year Ended October 31, 2015 | | | 16.41 | | | | 0.39 | (f) | | | (0.33 | ) | | | 0.06 | | | | (0.65 | ) | | | (0.16 | ) | | | (0.81 | ) |
Year Ended October 31, 2014 | | | 16.67 | | | | 0.91 | (g) | | | (0.38 | ) | | | 0.53 | | | | (0.66 | ) | | | (0.13 | ) | | | (0.79 | ) |
Year Ended October 31, 2013 | | | 14.12 | | | | 0.43 | | | | 2.55 | | | | 2.98 | | | | (0.41 | ) | | | (0.02 | ) | | | (0.43 | ) |
Year Ended October 31, 2012 | | | 13.37 | | | | 0.31 | | | | 0.88 | | | | 1.19 | | | | (0.44 | ) | | | — | | | | (0.44 | ) |
|
Class C | |
Six Months Ended April 30, 2017 (Unaudited) | | | 14.30 | | | | 0.20 | | | | 1.00 | | | | 1.20 | | | | (0.24 | ) | | | — | | | | (0.24 | ) |
Year Ended October 31, 2016 | | | 15.59 | | | | 0.38 | (f) | | | (1.01 | ) | | | (0.63 | ) | | | (0.40 | ) | | | (0.26 | ) | | | (0.66 | ) |
Year Ended October 31, 2015 | | | 16.36 | | | | 0.39 | (f) | | | (0.42 | ) | | | (0.03 | ) | | | (0.58 | ) | | | (0.16 | ) | | | (0.74 | ) |
Year Ended October 31, 2014 | | | 16.63 | | | | 0.84 | (g) | | | (0.40 | ) | | | 0.44 | | | | (0.58 | ) | | | (0.13 | ) | | | (0.71 | ) |
Year Ended October 31, 2013 | | | 14.11 | | | | 0.34 | | | | 2.55 | | | | 2.89 | | | | (0.35 | ) | | | (0.02 | ) | | | (0.37 | ) |
Year Ended October 31, 2012 | | | 13.35 | | | | 0.36 | | | | 0.77 | | | | 1.13 | | | | (0.37 | ) | | | — | | | | (0.37 | ) |
|
Class I (formerly Select Class) | |
Six Months Ended April 30, 2017 (Unaudited) | | | 14.41 | | | | 0.29 | | | | 0.98 | | | | 1.27 | | | | (0.28 | ) | | | — | | | | (0.28 | ) |
Year Ended October 31, 2016 | | | 15.70 | | | | 0.46 | (f) | | | (0.98 | ) | | | (0.52 | ) | | | (0.51 | ) | | | (0.26 | ) | | | (0.77 | ) |
Year Ended October 31, 2015 | | | 16.45 | | | | 0.49 | (f) | | | (0.37 | ) | | | 0.12 | | | | (0.71 | ) | | | (0.16 | ) | | | (0.87 | ) |
Year Ended October 31, 2014 | | | 16.71 | | | | 0.96 | (g) | | | (0.40 | ) | | | 0.56 | | | | (0.69 | ) | | | (0.13 | ) | | | (0.82 | ) |
Year Ended October 31, 2013 | | | 14.14 | | | | 0.47 | | | | 2.55 | | | | 3.02 | | | | (0.43 | ) | | | (0.02 | ) | | | (0.45 | ) |
Year Ended October 31, 2012 | | | 13.37 | | | | 0.47 | | | | 0.76 | | | | 1.23 | | | | (0.46 | ) | | | — | | | | (0.46 | ) |
|
Class R2 | |
Six Months Ended April 30, 2017 (Unaudited) | | | 14.36 | | | | 0.22 | | | | 1.00 | | | | 1.22 | | | | (0.25 | ) | | | — | | | | (0.25 | ) |
Year Ended October 31, 2016 | | | 15.65 | | | | 0.39 | (f) | | | (0.98 | ) | | | (0.59 | ) | | | (0.44 | ) | | | (0.26 | ) | | | (0.70 | ) |
Year Ended October 31, 2015 | | | 16.41 | | | | 0.61 | (f) | | | (0.60 | ) | | | 0.01 | | | | (0.61 | ) | | | (0.16 | ) | | | (0.77 | ) |
Year Ended October 31, 2014 | | | 16.67 | | | | 0.87 | (g) | | | (0.39 | ) | | | 0.48 | | | | (0.61 | ) | | | (0.13 | ) | | | (0.74 | ) |
Year Ended October 31, 2013 | | | 14.12 | | | | 0.40 | | | | 2.54 | | | | 2.94 | | | | (0.37 | ) | | | (0.02 | ) | | | (0.39 | ) |
Year Ended October 31, 2012 | | | 13.36 | | | | 0.40 | | | | 0.76 | | | | 1.16 | | | | (0.40 | ) | | | — | | | | (0.40 | ) |
|
Class R5 | |
Six Months Ended April 30, 2017 (Unaudited) | | | 14.42 | | | | 0.30 | | | | 0.97 | | | | 1.27 | | | | (0.28 | ) | | | — | | | | (0.28 | ) |
Year Ended October 31, 2016 | | | 15.70 | | | | 0.49 | (f) | | | (0.98 | ) | | | (0.49 | ) | | | (0.53 | ) | | | (0.26 | ) | | | (0.79 | ) |
Year Ended October 31, 2015 | | | 16.46 | | | | 0.76 | (f) | | | (0.63 | ) | | | 0.13 | | | | (0.73 | ) | | | (0.16 | ) | | | (0.89 | ) |
Year Ended October 31, 2014 | | | 16.72 | | | | 0.99 | (g) | | | (0.39 | ) | | | 0.60 | | | | (0.73 | ) | | | (0.13 | ) | | | (0.86 | ) |
Year Ended October 31, 2013 | | | 14.15 | | | | 0.51 | | | | 2.54 | | | | 3.05 | | | | (0.46 | ) | | | (0.02 | ) | | | (0.48 | ) |
Year Ended October 31, 2012 | | | 13.38 | | | | 0.50 | | | | 0.76 | | | | 1.26 | | | | (0.49 | ) | | | — | | | | (0.49 | ) |
|
Class R6 | |
Six Months Ended April 30, 2017 (Unaudited) | | | 14.41 | | | | 0.28 | | | | 1.00 | | | | 1.28 | | | | (0.29 | ) | | | — | | | | (0.29 | ) |
Year Ended October 31, 2016 | | | 15.69 | | | | 0.51 | (f) | | | (0.99 | ) | | | (0.48 | ) | | | (0.54 | ) | | | (0.26 | ) | | | (0.80 | ) |
January 30, 2015 (h) through October 31, 2015 | | | 15.82 | | | | 0.69 | (f) | | | (0.41 | ) | | | 0.28 | | | | (0.41 | ) | | | — | | | | (0.41 | ) |
| (a) | Annualized for periods less than one year, unless otherwise noted. |
| (b) | Calculated based upon average shares outstanding. |
| (c) | Not annualized for periods less than one year. |
| (d) | Includes adjustments in accordance with accounting principles generally accepted in the United States of America and as such, the net asset values for financial reporting purposes and the returns based upon those net asset values may differ from the net asset values and returns for shareholder transactions. |
| (e) | Includes interest expense, if applicable, which is less than 0.005% unless otherwise noted. |
| (f) | Net investment income (loss) may appear disproportionate among the classes due to the timing of recognition of income and changes in the relative size of the classes. |
| (g) | Reflects special dividends paid out during the period by several of the Fund’s holdings. Had the Fund not received the special dividends, the net investment income (loss) per share would have been $0.66, $0.59, $0.71, $0.62 and $0.74 for Class A, Class C, Class I, Class R2 and Class R5, respectively, and the net investment income (loss) ratio would have been 3.94%, 3.53%, 4.25%, 3.74% and 4.44% for Class A, Class C, Class I, Class R2 and Class R5, respectively. |
| (h) | Commencement of offering of class of shares. |
SEE NOTES TO FINANCIAL STATEMENTS.
| | | | | | |
| | | |
| 136 | | | | J.P. MORGAN INTERNATIONAL EQUITY FUNDS | | APRIL 30, 2017 |
| | | | | | | | | | | | | | | | | | | | | | | | | | |
| | | Ratios/Supplemental data | |
| | | | | | | | | | Ratios to average net assets (a) | | | | |
Net asset
value,
end of
period | | | Total return
(excludes
sales charge) (c)(d) | | | Net assets,
end of
period
(000’s) | | | Net
expenses (e) | | |
Net
investment
income
(loss) | | | Expenses
without waivers
and reimbursements | | | Portfolio
turnover
rate (c) | |
| | | | | | | | | | | | | | | | | | | | | | | | | | |
| | | | | | | | | | | | | | | | | | | | | | | | | | |
| $ | 15.36 | | | | 8.69 | % | | $ | 74,610 | | | | 1.25 | % | | | 3.13 | % | | | 1.57 | % | | | 42 | % |
| | 14.38 | | | | (3.60 | ) | | | 66,722 | | | | 1.24 | | | | 3.06 | (f) | | | 1.57 | | | | 162 | |
| | 15.66 | | | | 0.29 | | | | 66,499 | | | | 1.25 | | | | 2.42 | (f) | | | 1.67 | | | | 238 | |
| | 16.41 | | | | 3.18 | | | | 74,652 | | | | 1.25 | | | | 5.44 | (g) | | | 1.67 | | | | 138 | |
| | 16.67 | | | | 21.40 | | | | 49,118 | | | | 1.24 | | | | 2.77 | | | | 1.82 | | | | 63 | |
| | 14.12 | | | | 9.09 | | | | 9,003 | | | | 1.25 | | | | 2.21 | | | | 2.31 | | | | 52 | |
| | | | | | |
| | | | | | | | | | | | | | | | | | | | | | | | | | |
| | 15.26 | | | | 8.42 | | | | 13,128 | | | | 1.74 | | | | 2.70 | | | | 2.10 | | | | 42 | |
| | 14.30 | | | | (4.09 | ) | | | 11,754 | | | | 1.75 | | | | 2.59 | (f) | | | 2.12 | | | | 162 | |
| | 15.59 | | | | (0.23 | ) | | | 8,649 | | | | 1.75 | | | | 2.45 | (f) | | | 2.20 | | | | 238 | |
| | 16.36 | | | | 2.67 | | | | 3,530 | | | | 1.75 | | | | 5.03 | (g) | | | 2.17 | | | | 138 | |
| | 16.63 | | | | 20.74 | | | | 1,957 | | | | 1.74 | | | | 2.16 | | | | 2.32 | | | | 63 | |
| | 14.11 | | | | 8.66 | | | | 646 | | | | 1.75 | | | | 2.69 | | | | 2.95 | | | | 52 | |
| | | | | | |
| | | | | | | | | | | | | | | | | | | | | | | | | | |
| | 15.40 | | | | 8.87 | | | | 85,893 | | | | 0.90 | | | | 3.89 | | | | 1.32 | | | | 42 | |
| | 14.41 | | | | (3.31 | ) | | | 54,642 | | | | 0.89 | | | | 3.13 | (f) | | | 1.31 | | | | 162 | |
| | 15.70 | | | | 0.66 | | | | 35,177 | | | | 0.91 | | | | 3.00 | (f) | | | 1.41 | | | | 238 | |
| | 16.45 | | | | 3.39 | | | | 34,719 | | | | 1.00 | | | | 5.75 | (g) | | | 1.42 | | | | 138 | |
| | 16.71 | | | | 21.73 | | | | 55,485 | | | | 0.99 | | | | 3.04 | | | | 1.59 | | | | 63 | |
| | 14.14 | | | | 9.43 | | | | 27,292 | | | | 1.00 | | | | 3.44 | | | | 2.20 | | | | 52 | |
| | | | | | |
| | | | | | | | | | | | | | | | | | | | | | | | | | |
| | 15.33 | | | | 8.56 | | | | 472 | | | | 1.49 | | | | 3.05 | | | | 1.85 | | | | 42 | |
| | 14.36 | | | | (3.84 | ) | | | 316 | | | | 1.49 | | | | 2.66 | (f) | | | 2.39 | | | | 162 | |
| | 15.65 | | | | (0.01 | ) | | | 52 | | | | 1.50 | | | | 3.74 | (f) | | | 1.89 | | | | 238 | |
| | 16.41 | | | | 2.90 | | | | 574 | | | | 1.50 | | | | 5.24 | (g) | | | 1.92 | | | | 138 | |
| | 16.67 | | | | 21.12 | | | | 558 | | | | 1.49 | | | | 2.60 | | | | 2.11 | | | | 63 | |
| | 14.12 | | | | 8.87 | | | | 461 | | | | 1.50 | | | | 2.95 | | | | 2.70 | | | | 52 | |
| | | | | | |
| | | | | | | | | | | | | | | | | | | | | | | | | | |
| | 15.41 | | | | 8.91 | | | | 1,637 | | | | 0.80 | | | | 4.09 | | | | 1.09 | | | | 42 | |
| | 14.42 | | | | (3.14 | ) | | | 700 | | | | 0.79 | | | | 3.33 | (f) | | | 1.29 | | | | 162 | |
| | 15.70 | | | | 0.71 | | | | 19 | | | | 0.80 | | | | 4.59 | (f) | | | 1.16 | | | | 238 | |
| | 16.46 | | | | 3.60 | | | | 587 | | | | 0.80 | | | | 5.94 | (g) | | | 1.22 | | | | 138 | |
| | 16.72 | | | | 21.94 | | | | 566 | | | | 0.79 | | | | 3.31 | | | | 1.41 | | | | 63 | |
| | 14.15 | | | | 9.62 | | | | 465 | | | | 0.80 | | | | 3.65 | | | | 2.00 | | | | 52 | |
| | | | | | |
| | | | | | | | | | | | | | | | | | | | | | | | | | |
| | 15.40 | | | | 8.95 | | | | 132 | | | | 0.75 | | | | 3.76 | | | | 1.10 | | | | 42 | |
| | 14.41 | | | | (3.09 | ) | | | 21 | | | | 0.75 | | | | 3.48 | (f) | | | 3.06 | | | | 162 | |
| | 15.69 | | | | 1.66 | | | | 21 | | | | 0.75 | | | | 5.70 | (f) | | | 1.15 | | | | 238 | |
SEE NOTES TO FINANCIAL STATEMENTS.
| | | | | | | | |
| | | |
| APRIL 30, 2017 | | J.P. MORGAN INTERNATIONAL EQUITY FUNDS | | | | | 137 | |
FINANCIAL HIGHLIGHTS
FOR THE PERIODS INDICATED (continued)
| | | | | | | | | | | | | | | | | | | | |
| | | Per share operating performance | |
| | | | | | Investment operations | | | Distributions | |
| | | Net asset
value,
beginning
of period | | | Net
investment
income
(loss) (b) | | | Net realized
and unrealized
gains
(losses) on
investments | | | Total from
investment
operations | | | Net
investment
income | |
International Opportunities Fund | |
Class A | |
Six Months Ended April 30, 2017 (Unaudited) | | $ | 13.77 | | | $ | 0.10 | | | $ | 1.58 | | | $ | 1.68 | | | $ | (0.42 | ) |
Year Ended October 31, 2016 | | | 14.48 | | | | 0.25 | | | | (0.93 | ) | | | (0.68 | ) | | | (0.03 | ) |
Year Ended October 31, 2015 | | | 14.80 | | | | 0.20 | | | | (0.23 | ) | | | (0.03 | ) | | | (0.29 | ) |
Year Ended October 31, 2014 | | | 15.25 | | | | 0.36 | | | | (0.69 | ) | | | (0.33 | ) | | | (0.12 | ) |
Year Ended October 31, 2013 | | | 12.45 | | | | 0.25 | | | | 2.83 | | | | 3.08 | | | | (0.28 | ) |
Year Ended October 31, 2012 | | | 12.00 | | | | 0.23 | | | | 0.56 | | | | 0.79 | | | | (0.34 | ) |
|
Class C | |
Six Months Ended April 30, 2017 (Unaudited) | | | 13.30 | | | | 0.05 | | | | 1.54 | | | | 1.59 | | | | (0.35 | ) |
Year Ended October 31, 2016 | | | 14.04 | | | | 0.14 | | | | (0.88 | ) | | | (0.74 | ) | | | — | (f) |
Year Ended October 31, 2015 | | | 14.41 | | | | 0.10 | | | | (0.19 | ) | | | (0.09 | ) | | | (0.28 | ) |
Year Ended October 31, 2014 | | | 14.88 | | | | 0.27 | | | | (0.66 | ) | | | (0.39 | ) | | | (0.08 | ) |
Year Ended October 31, 2013 | | | 12.15 | | | | 0.16 | | | | 2.77 | | | | 2.93 | | | | (0.20 | ) |
Year Ended October 31, 2012 | | | 11.65 | | | | 0.18 | | | | 0.55 | | | | 0.73 | | | | (0.23 | ) |
|
Class I (formerly Select Class) | |
Six Months Ended April 30, 2017 (Unaudited) | | | 14.00 | | | | 0.12 | | | | 1.58 | | | | 1.70 | | | | (0.47 | ) |
Year Ended October 31, 2016 | | | 14.68 | | | | 0.28 | | | | (0.93 | ) | | | (0.65 | ) | | | (0.03 | ) |
Year Ended October 31, 2015 | | | 15.06 | | | | 0.25 | | | | (0.24 | ) | | | 0.01 | | | | (0.39 | ) |
Year Ended October 31, 2014 | | | 15.50 | | | | 0.40 | | | | (0.69 | ) | | | (0.29 | ) | | | (0.15 | ) |
Year Ended October 31, 2013 | | | 12.64 | | | | 0.29 | | | | 2.87 | | | | 3.16 | | | | (0.30 | ) |
Year Ended October 31, 2012 | | | 12.15 | | | | 0.28 | | | | 0.56 | | | | 0.84 | | | | (0.35 | ) |
|
Class R6 | |
Six Months Ended April 30, 2017 (Unaudited) | | | 14.05 | | | | 0.13 | | | | 1.61 | | | | 1.74 | | | | (0.51 | ) |
Year Ended October 31, 2016 | | | 14.75 | | | | 0.32 | | | | (0.92 | ) | | | (0.60 | ) | | | (0.10 | ) |
Year Ended October 31, 2015 | | | 15.13 | | | | 0.26 | | | | (0.21 | ) | | | 0.05 | | | | (0.43 | ) |
Year Ended October 31, 2014 | | | 15.57 | | | | 0.44 | | | | (0.70 | ) | | | (0.26 | ) | | | (0.18 | ) |
Year Ended October 31, 2013 | | | 12.69 | | | | 0.32 | | | | 2.88 | | | | 3.20 | | | | (0.32 | ) |
Year Ended October 31, 2012 | | | 12.20 | | | | 0.31 | | | | 0.56 | | | | 0.87 | | | | (0.38 | ) |
| (a) | Annualized for periods less than one year, unless otherwise noted. |
| (b) | Calculated based upon average shares outstanding. |
| (c) | Not annualized for periods less than one year. |
| (d) | Includes adjustments in accordance with accounting principles generally accepted in the United States of America and as such, the net asset values for financial reporting purposes and the returns based upon those net asset values may differ from the net asset values and returns for shareholder transactions. |
| (e) | Includes interest expense, if applicable, which is less than 0.005% unless otherwise noted. |
| (f) | Amount rounds to less than $0.005. |
SEE NOTES TO FINANCIAL STATEMENTS.
| | | | | | |
| | | |
| 138 | | | | J.P. MORGAN INTERNATIONAL EQUITY FUNDS | | APRIL 30, 2017 |
| | | | | | | | | | | | | | | | | | | | | | | | | | |
| | | Ratios/Supplemental data | |
| | | | | | | | | | Ratios to average net assets (a) | | | | |
Net asset
value,
end of
period | | | Total return
(excludes
sales charge) (c)(d) | | | Net assets,
end of
period
(000’s) | | | Net
expenses (e) | | |
Net
investment
income
(loss) | | | Expenses
without waivers
and reimbursements | | | Portfolio
turnover
rate (c) | |
| | | | | | | | | | | | | | | | | | | | | | | | | | |
| | | | | | | | | | | | | | | | | | | | | | | | | | |
| $ | 15.03 | | | | 12.51 | % | | $ | 204,929 | | | | 1.23 | % | | | 1.39 | % | | | 1.25 | % | | | 29 | % |
| | 13.77 | | | | (4.69 | ) | | | 171,940 | | | | 1.29 | | | | 1.83 | | | | 1.29 | | | | 48 | |
| | 14.48 | | | | (0.15 | ) | | | 155,397 | | | | 1.31 | | | | 1.34 | | | | 1.43 | | | | 43 | |
| | 14.80 | | | | (2.18 | ) | | | 110,667 | | | | 1.23 | | | | 2.39 | | | | 1.24 | | | | 55 | |
| | 15.25 | | | | 25.09 | | | | 123,807 | | | | 1.25 | | | | 1.78 | | | | 1.26 | | | | 36 | |
| | 12.45 | | | | 6.95 | | | | 67,472 | | | | 1.29 | | | | 1.91 | | | | 1.30 | | | | 45 | |
| | | | | | |
| | | | | | | | | | | | | | | | | | | | | | | | | | |
| | 14.54 | | | | 12.21 | | | | 1,484 | | | | 1.73 | | | | 0.75 | | | | 1.87 | | | | 29 | |
| | 13.30 | | | | (5.26 | ) | | | 1,565 | | | | 1.89 | | | | 1.06 | | | | 1.91 | | | | 48 | |
| | 14.04 | | | | (0.63 | ) | | | 1,743 | | | | 1.83 | | | | 0.70 | | | | 1.83 | | | | 43 | |
| | 14.41 | | | | (2.65 | ) | | | 1,441 | | | | 1.73 | | | | 1.80 | | | | 1.74 | | | | 55 | |
| | 14.88 | | | | 24.41 | | | | 1,109 | | | | 1.75 | | | | 1.19 | | | | 1.76 | | | | 36 | |
| | 12.15 | | | | 6.47 | | | | 531 | | | | 1.79 | | | | 1.55 | | | | 1.80 | | | | 45 | |
| | | | | | |
| | | | | | | | | | | | | | | | | | | | | | | | | | |
| | 15.23 | | | | 12.52 | | | | 47,653 | | | | 0.98 | | | | 1.64 | | | | 1.02 | | | | 29 | |
| | 14.00 | | | | (4.40 | ) | | | 23,999 | | | | 1.05 | | | | 1.99 | | | | 1.05 | | | | 48 | |
| | 14.68 | | | | 0.13 | | | | 24,548 | | | | 1.00 | | | | 1.71 | | | | 1.01 | | | | 43 | |
| | 15.06 | | | | (1.91 | ) | | | 47,581 | | | | 0.98 | | | | 2.55 | | | | 0.99 | | | | 55 | |
| | 15.50 | | | | 25.38 | | | | 47,743 | | | | 0.99 | | | | 2.04 | | | | 1.01 | | | | 36 | |
| | 12.64 | | | | 7.28 | | | | 33,029 | | | | 1.04 | | | | 2.35 | | | | 1.05 | | | | 45 | |
| | | | | | |
| | | | | | | | | | | | | | | | | | | | | | | | | | |
| | 15.28 | | | | 12.74 | | | | 2,717,685 | | | | 0.71 | | | | 1.81 | | | | 0.71 | | | | 29 | |
| | 14.05 | | | | (4.09 | ) | | | 2,522,883 | | | | 0.71 | | | | 2.29 | | | | 0.71 | | | | 48 | |
| | 14.75 | | | | 0.41 | | | | 2,003,409 | | | | 0.71 | | | | 1.75 | | | | 0.72 | | | | 43 | |
| | 15.13 | | | | (1.67 | ) | | | 1,539,613 | | | | 0.73 | | | | 2.82 | | | | 0.74 | | | | 55 | |
| | 15.57 | | | | 25.71 | | | | 1,204,314 | | | | 0.75 | | | | 2.27 | | | | 0.76 | | | | 36 | |
| | 12.69 | | | | 7.59 | | | | 692,117 | | | | 0.79 | | | | 2.58 | | | | 0.79 | | | | 45 | |
SEE NOTES TO FINANCIAL STATEMENTS.
| | | | | | | | |
| | | |
| APRIL 30, 2017 | | J.P. MORGAN INTERNATIONAL EQUITY FUNDS | | | | | 139 | |
FINANCIAL HIGHLIGHTS
FOR THE PERIODS INDICATED (continued)
| | | | | | | | | | | | | | | | | | | | | | | | | | | | |
| | | Per share operating performance | |
| | | | | | Investment operations | | | Distributions | |
| | | Net asset
value,
beginning
of period | | | Net
investment
income
(loss) (b) | | | Net realized
and unrealized
gains
(losses) on
investments | | | Total from
investment
operations | | | Net
investment
income | | | Net
realized
gain | | | Total
distributions | |
International Research Enhanced Equity Fund | |
Class A | |
Six Months Ended April 30, 2017 (Unaudited) | | $ | 15.54 | | | $ | 0.16 | | | $ | 1.75 | | | $ | 1.91 | | | $ | (0.35 | ) | | $ | — | | | $ | (0.35 | ) |
Year Ended October 31, 2016 | | | 16.54 | | | | 0.40 | (f) | | | (0.89 | ) | | | (0.49 | ) | | | (0.36 | ) | | | (0.15 | ) | | | (0.51 | ) |
Year Ended October 31, 2015 | | | 20.38 | | | | 0.43 | | | | (0.60 | ) | | | (0.17 | ) | | | (0.40 | ) | | | (3.27 | ) | | | (3.67 | ) |
Year Ended October 31, 2014 | | | 21.20 | | | | 0.47 | | | | (0.56 | ) | | | (0.09 | ) | | | (0.39 | ) | | | (0.34 | ) | | | (0.73 | ) |
Year Ended October 31, 2013 | | | 17.24 | | | | 0.38 | | | | 4.00 | | | | 4.38 | | | | (0.42 | ) | | | — | | | | (0.42 | ) |
Year Ended October 31, 2012 | | | 16.83 | | | | 0.37 | | | | 0.45 | | | | 0.82 | | | | (0.41 | ) | | | — | | | | (0.41 | ) |
|
Class C | |
Six Months Ended April 30, 2017 (Unaudited) | | | 14.88 | | | | 0.12 | | | | 1.67 | | | | 1.79 | | | | (0.26 | ) | | | — | | | | (0.26 | ) |
Year Ended October 31, 2016 | | | 15.85 | | | | 0.31 | (f) | | | (0.85 | ) | | | (0.54 | ) | | | (0.28 | ) | | | (0.15 | ) | | | (0.43 | ) |
Year Ended October 31, 2015 | | | 19.68 | | | | 0.33 | | | | (0.58 | ) | | | (0.25 | ) | | | (0.31 | ) | | | (3.27 | ) | | | (3.58 | ) |
Year Ended October 31, 2014 | | | 20.51 | | | | 0.36 | | | | (0.56 | ) | | | (0.20 | ) | | | (0.29 | ) | | | (0.34 | ) | | | (0.63 | ) |
Year Ended October 31, 2013 | | | 16.68 | | | | 0.27 | | | | 3.86 | | | | 4.13 | | | | (0.30 | ) | | | — | | | | (0.30 | ) |
Year Ended October 31, 2012 | | | 16.27 | | | | 0.25 | | | | 0.44 | | | | 0.69 | | | | (0.28 | ) | | | — | | | | (0.28 | ) |
|
Class I (formerly Select Class) | |
Six Months Ended April 30, 2017 (Unaudited) | | | 15.68 | | | | 0.19 | | | | 1.76 | | | | 1.95 | | | | (0.40 | ) | | | — | | | | (0.40 | ) |
Year Ended October 31, 2016 | | | 16.70 | | | | 0.46 | (f) | | | (0.92 | ) | | | (0.46 | ) | | | (0.41 | ) | | | (0.15 | ) | | | (0.56 | ) |
Year Ended October 31, 2015 | | | 20.54 | | | | 0.48 | | | | (0.60 | ) | | | (0.12 | ) | | | (0.45 | ) | | | (3.27 | ) | | | (3.72 | ) |
Year Ended October 31, 2014 | | | 21.36 | | | | 0.52 | | | | (0.56 | ) | | | (0.04 | ) | | | (0.44 | ) | | | (0.34 | ) | | | (0.78 | ) |
Year Ended October 31, 2013 | | | 17.36 | | | | 0.40 | | | | 4.06 | | | | 4.46 | | | | (0.46 | ) | | | — | | | | (0.46 | ) |
Year Ended October 31, 2012 | | | 16.96 | | | | 0.41 | | | | 0.45 | | | | 0.86 | | | | (0.46 | ) | | | — | | | | (0.46 | ) |
|
Class R2 | |
Six Months Ended April 30, 2017 (Unaudited) | | | 15.19 | | | | 0.14 | | | | 1.71 | | | | 1.85 | | | | (0.36 | ) | | | — | | | | (0.36 | ) |
Year Ended October 31, 2016 | | | 16.21 | | | | 0.31 | (f) | | | (0.84 | ) | | | (0.53 | ) | | | (0.34 | ) | | | (0.15 | ) | | | (0.49 | ) |
Year Ended October 31, 2015 | | | 20.07 | | | | 0.37 | | | | (0.58 | ) | | | (0.21 | ) | | | (0.38 | ) | | | (3.27 | ) | | | (3.65 | ) |
Year Ended October 31, 2014 | | | 20.91 | | | | 0.40 | | | | (0.54 | ) | | | (0.14 | ) | | | (0.36 | ) | | | (0.34 | ) | | | (0.70 | ) |
Year Ended October 31, 2013 | | | 17.03 | | | | 0.35 | | | | 3.92 | | | | 4.27 | | | | (0.39 | ) | | | — | | | | (0.39 | ) |
Year Ended October 31, 2012 | | | 16.66 | | | | 0.32 | | | | 0.45 | | | | 0.77 | | | | (0.40 | ) | | | — | | | | (0.40 | ) |
| (a) | Annualized for periods less than one year, unless otherwise noted. |
| (b) | Calculated based upon average shares outstanding. |
| (c) | Not annualized for periods less than one year. |
| (d) | Includes adjustments in accordance with accounting principles generally accepted in the United States of America and as such, the net asset values for financial reporting purposes and the returns based upon those net asset values may differ from the net asset values and returns for shareholder transactions. |
| (e) | Includes interest expense, if applicable, which is less than 0.005% unless otherwise noted. |
| (f) | Net investment income may appear disproportionate among the classes due to the timing of recognition of income and changes in the relative size of the classes. |
| (g) | Amount rounds to less than 0.005%. |
SEE NOTES TO FINANCIAL STATEMENTS.
| | | | | | |
| | | |
| 140 | | | | J.P. MORGAN INTERNATIONAL EQUITY FUNDS | | APRIL 30, 2017 |
| | | | | | | | | | | | | | | | | | | | | | | | | | |
| | | Ratios/Supplemental data | |
| | | | | | | | | | Ratios to average net assets (a) | | | | |
Net asset
value,
end of
period | | | Total return
(excludes
sales charge) (c)(d) | | | Net assets,
end of
period
(000’s) | | | Net
expenses (e) | | |
Net
investment
income
(loss) | | | Expenses
without waivers
and reimbursements | | | Portfolio
turnover
rate | |
| | | | | | | | | | | | | | | | | | | | | | | | | | |
| | | | | | | | | | | | | | | | | | | | | | | | | | |
| $ | 17.10 | | | | 12.49 | % | | $ | 71,210 | | | | 0.59 | % | | | 2.06 | % | | | 0.98 | % | | | 9 | % |
| | 15.54 | | | | (2.94 | ) | | | 69,626 | | | | 0.60 | | | | 2.60 | (f) | | | 1.02 | | | | 24 | |
| | 16.54 | | | | (0.29 | ) | | | 82,667 | | | | 0.60 | | | | 2.51 | | | | 0.99 | | | | 39 | |
| | 20.38 | | | | (0.40 | ) | | | 96,325 | | | | 0.59 | | | | 2.23 | | | | 1.10 | | | | 63 | |
| | 21.20 | | | | 25.84 | | | | 108,193 | | | | 0.75 | | | | 2.04 | | | | 1.35 | | | | 51 | |
| | 17.24 | | | | 5.16 | | | | 96,191 | | | | 1.07 | | | | 2.27 | | | | 1.31 | | | | 19 | |
| | | | | | |
| | | | | | | | | | | | | | | | | | | | | | | | | | |
| | 16.41 | | | | 12.20 | | | | 12,585 | | | | 1.09 | | | | 1.53 | | | | 1.47 | | | | 9 | |
| | 14.88 | | | | (3.41 | ) | | | 13,507 | | | | 1.10 | | | | 2.14 | (f) | | | 1.55 | | | | 24 | |
| | 15.85 | | | | (0.77 | ) | | | 18,423 | | | | 1.10 | | | | 2.01 | | | | 1.52 | | | | 39 | |
| | 19.68 | | | | (0.93 | ) | | | 20,724 | | | | 1.09 | | | | 1.75 | | | | 1.60 | | | | 63 | |
| | 20.51 | | | | 25.09 | | | | 21,802 | | | | 1.30 | | | | 1.49 | | | | 1.85 | | | | 51 | |
| | 16.68 | | | | 4.43 | | | | 16,291 | | | | 1.79 | | | | 1.57 | | | | 1.81 | | | | 19 | |
| | | | | | |
| | | | | | | | | | | | | | | | | | | | | | | | | | |
| | 17.23 | | | | 12.66 | | | | 1,619,251 | | | | 0.35 | | | | 2.37 | | | | 0.59 | | | | 9 | |
| | 15.68 | | | | (2.72 | ) | | | 1,241,856 | | | | 0.34 | | | | 2.98 | (f) | | | 0.59 | | | | 24 | |
| | 16.70 | | | | 0.00 | (g) | | | 779,908 | | | | 0.35 | | | | 2.79 | | | | 0.60 | | | | 39 | |
| | 20.54 | | | | (0.16 | ) | | | 562,180 | | | | 0.34 | | | | 2.45 | | | | 0.84 | | | | 63 | |
| | 21.36 | | | | 26.18 | | | | 464,273 | | | | 0.53 | | | | 2.10 | | | | 1.09 | | | | 51 | |
| | 17.36 | | | | 5.40 | | | | 469,065 | | | | 0.82 | | | | 2.51 | | | | 1.06 | | | | 19 | |
| | | | | | |
| | | | | | | | | | | | | | | | | | | | | | | | | | |
| | 16.68 | | | | 12.40 | | | | 12,898 | | | | 0.84 | | | | 1.86 | | | | 1.37 | | | | 9 | |
| | 15.19 | | | | (3.22 | ) | | | 10,222 | | | | 0.84 | | | | 2.08 | (f) | | | 1.34 | | | | 24 | |
| | 16.21 | | | | (0.50 | ) | | | 3,331 | | | | 0.85 | | | | 2.22 | | | | 1.41 | | | | 39 | |
| | 20.07 | | | | (0.66 | ) | | | 2,521 | | | | 0.84 | | | | 1.95 | | | | 1.33 | | | | 63 | |
| | 20.91 | | | | 25.52 | | | | 1,957 | | | | 0.95 | | | | 1.88 | | | | 1.61 | | | | 51 | |
| | 17.03 | | | | 4.94 | | | | 786 | | | | 1.32 | | | | 1.97 | | | | 1.56 | | | | 19 | |
SEE NOTES TO FINANCIAL STATEMENTS.
| | | | | | | | |
| | | |
| APRIL 30, 2017 | | J.P. MORGAN INTERNATIONAL EQUITY FUNDS | | | | | 141 | |
FINANCIAL HIGHLIGHTS
FOR THE PERIODS INDICATED (continued)
| | | | | | | | | | | | | | | | | | | | | | | | | | | | |
| | | Per share operating performance | |
| | | | | | Investment operations | | | Distributions | |
| | | Net asset
value,
beginning
of period | | | Net
investment
income
(loss) | | | Net realized
and unrealized
gains
(losses) on
investments | | | Total from
investment
operations | | | Net
investment
income | | | Net
realized
gain | | | Total
distributions | |
International Unconstrained Equity Fund | |
Class A | |
Six Months Ended April 30, 2017 (Unaudited) | | $ | 17.24 | | | $ | 0.04 | (e) | | $ | 1.91 | | | $ | 1.95 | | | $ | (0.35 | ) | | $ | — | | | $ | (0.35 | ) |
Year Ended October 31, 2016 | | | 17.61 | | | | 0.22 | (e)(f) | | | (0.55 | ) | | | (0.33 | ) | | | (0.04 | ) | | | — | | | | (0.04 | ) |
Year Ended October 31, 2015 | | | 18.59 | | | | 0.09 | (e)(f) | | | 0.39 | | | | 0.48 | | | | (0.17 | ) | | | (1.29 | ) | | | (1.46 | ) |
Year Ended October 31, 2014 | | | 20.59 | | | | 0.13 | (g) | | | (0.65 | ) | | | (0.52 | ) | | | (0.17 | ) | | | (1.31 | ) | | | (1.48 | ) |
Year Ended October 31, 2013 | | | 17.28 | | | | 0.15 | | | | 3.62 | | | | 3.77 | | | | (0.11 | ) | | | (0.35 | ) | | | (0.46 | ) |
November 30, 2011 (i) through October 31, 2012 | | | 15.00 | | | | 0.17 | | | | 2.11 | | | | 2.28 | | | | — | | | | — | | | | — | |
|
Class C | |
Six Months Ended April 30, 2017 (Unaudited) | | | 17.04 | | | | (0.02 | )(e) | | | 1.91 | | | | 1.89 | | | | (0.25 | ) | | | — | | | | (0.25 | ) |
Year Ended October 31, 2016 | | | 17.45 | | | | 0.13 | (e)(f) | | | (0.53 | ) | | | (0.40 | ) | | | (0.01 | ) | | | — | | | | (0.01 | ) |
Year Ended October 31, 2015 | | | 18.44 | | | | (0.02 | )(e)(f) | | | 0.39 | | | | 0.37 | | | | (0.07 | ) | | | (1.29 | ) | | | (1.36 | ) |
Year Ended October 31, 2014 | | | 20.47 | | | | 0.09 | (g) | | | (0.69 | ) | | | (0.60 | ) | | | (0.12 | ) | | | (1.31 | ) | | | (1.43 | ) |
Year Ended October 31, 2013 | | | 17.20 | | | | 0.07 | | | | 3.59 | | | | 3.66 | | | | (0.04 | ) | | | (0.35 | ) | | | (0.39 | ) |
November 30, 2011 (i) through October 31, 2012 | | | 15.00 | | | | 0.10 | | | | 2.10 | | | | 2.20 | | | | — | | | | — | | | | — | |
|
Class I (formerly Select Class) | |
Six Months Ended April 30, 2017 (Unaudited) | | | 17.45 | | | | 0.08 | (e) | | | 1.92 | | | | 2.00 | | | | (0.40 | ) | | | — | | | | (0.40 | ) |
Year Ended October 31, 2016 | | | 17.71 | | | | 0.24 | (e)(f) | | | (0.50 | ) | | | (0.26 | ) | | | — | | | | — | | | | — | |
Year Ended October 31, 2015 | | | 18.67 | | | | 0.15 | (e)(f) | | | 0.38 | | | | 0.53 | | | | (0.20 | ) | | | (1.29 | ) | | | (1.49 | ) |
Year Ended October 31, 2014 | | | 20.64 | | | | 0.21 | (g) | | | (0.67 | ) | | | (0.46 | ) | | | (0.20 | ) | | | (1.31 | ) | | | (1.51 | ) |
Year Ended October 31, 2013 | | | 17.32 | | | | 0.21 | | | | 3.60 | | | | 3.81 | | | | (0.14 | ) | | | (0.35 | ) | | | (0.49 | ) |
November 30, 2011 (i) through October 31, 2012 | | | 15.00 | | | | 0.21 | | | | 2.11 | | | | 2.32 | | | | — | | | | — | | | | — | |
|
Class R2 | |
Six Months Ended April 30, 2017 (Unaudited) | | | 17.21 | | | | — | (e)(j) | | | 1.93 | | | | 1.93 | | | | (0.30 | ) | | | — | | | | (0.30 | ) |
Year Ended October 31, 2016 | | | 17.57 | | | | 0.15 | (e)(f) | | | (0.51 | ) | | | (0.36 | ) | | | — | | | | — | | | | — | |
Year Ended October 31, 2015 | | | 18.55 | | | | 0.03 | (e)(f) | | | 0.39 | | | | 0.42 | | | | (0.11 | ) | | | (1.29 | ) | | | (1.40 | ) |
Year Ended October 31, 2014 | | | 20.53 | | | | 0.12 | (g) | | | (0.68 | ) | | | (0.56 | ) | | | (0.11 | ) | | | (1.31 | ) | | | (1.42 | ) |
Year Ended October 31, 2013 | | | 17.24 | | | | 0.12 | | | | 3.59 | | | | 3.71 | | | | (0.07 | ) | | | (0.35 | ) | | | (0.42 | ) |
November 30, 2011 (i) through October 31, 2012 | | | 15.00 | | | | 0.14 | | | | 2.10 | | | | 2.24 | | | | — | | | | — | | | | — | |
|
Class R5 | |
Six Months Ended April 30, 2017 (Unaudited) | | | 17.44 | | | | 0.06 | (e) | | | 1.95 | | | | 2.01 | | | | (0.42 | ) | | | — | | | | (0.42 | ) |
Year Ended October 31, 2016 | | | 17.75 | | | | 0.27 | (e)(f) | | | (0.52 | ) | | | (0.25 | ) | | | (0.06 | ) | | | — | | | | (0.06 | ) |
Year Ended October 31, 2015 | | | 18.72 | | | | 0.16 | (e)(f) | | | 0.39 | | | | 0.55 | | | | (0.23 | ) | | | (1.29 | ) | | | (1.52 | ) |
Year Ended October 31, 2014 | | | 20.69 | | | | 0.24 | (g) | | | (0.67 | ) | | | (0.43 | ) | | | (0.23 | ) | | | (1.31 | ) | | | (1.54 | ) |
Year Ended October 31, 2013 | | | 17.35 | | | | 0.25 | | | | 3.61 | | | | 3.86 | | | | (0.17 | ) | | | (0.35 | ) | | | (0.52 | ) |
November 30, 2011 (i) through October 31, 2012 | | | 15.00 | | | | 0.24 | | | | 2.11 | | | | 2.35 | | | | — | | | | — | | | | — | |
|
Class R6 | |
Six Months Ended April 30, 2017 (Unaudited) | | | 17.45 | | | | 0.08 | (e) | | | 1.93 | | | | 2.01 | | | | (0.43 | ) | | | — | | | | (0.43 | ) |
Year Ended October 31, 2016 | | | 17.76 | | | | 0.29 | (e)(f) | | | (0.52 | ) | | | (0.23 | ) | | | (0.08 | ) | | | — | | | | (0.08 | ) |
Year Ended October 31, 2015 | | | 18.73 | | | | (0.01 | )(e)(f) | | | 0.57 | | | | 0.56 | | | | (0.24 | ) | | | (1.29 | ) | | | (1.53 | ) |
Year Ended October 31, 2014 | | | 20.70 | | | | 0.25 | (g) | | | (0.67 | ) | | | (0.42 | ) | | | (0.24 | ) | | | (1.31 | ) | | | (1.55 | ) |
Year Ended October 31, 2013 | | | 17.36 | | | | 0.26 | | | | 3.61 | | | | 3.87 | | | | (0.18 | ) | | | (0.35 | ) | | | (0.53 | ) |
November 30, 2011 (i) through October 31, 2012 | | | 15.00 | | | | 0.25 | | | | 2.11 | | | | 2.36 | | | | — | | | | — | | | | — | |
| (a) | Annualized for periods less than one year, unless otherwise noted. |
| (b) | Not annualized for periods less than one year. |
| (c) | Includes adjustments in accordance with accounting principles generally accepted in the United States of America and as such, the net asset values for financial reporting purposes and the returns based upon those net asset values may differ from the net asset values and returns for shareholder transactions. |
| (d) | Includes interest expense, if applicable, which is less than 0.005% unless otherwise noted. |
| (e) | Calculated based upon average shares outstanding. |
| (f) | Net investment income (loss) may appear disproportionate among the classes due to the timing of recognition of income and changes in the relative size of the classes. |
| (g) | Reflects special dividends paid out during the period by one of the Fund’s holdings. Had the Fund not received the special dividend, the net investment income (loss) per share would have been $0.10, $0.06, $0.17, $0.08, $0.20 and $0.22 for Class A, Class C, Class I, Class R2, Class R5 and Class R6, respectively and the net investment income (loss) ratio would have been 0.80%, 0.37%, 0.99%, 0.48%, 1.18% and 1.23% for Class A, Class C, Class I, Class R2, Class R5 and Class R6, respectively. |
| (h) | Certain non-recurring expenses incurred by the Fund were not annualized for the year ended October 31, 2013 and for the period ended October 31, 2012. |
| (i) | Commencement of operations. |
| (j) | Amount rounds to less than $0.005. |
SEE NOTES TO FINANCIAL STATEMENTS.
| | | | | | |
| | | |
| 142 | | | | J.P. MORGAN INTERNATIONAL EQUITY FUNDS | | APRIL 30, 2017 |
| | | | | | | | | | | | | | | | | | | | | | | | | | |
| | | Ratios/Supplemental data | |
| | | | | | | | | | Ratios to average net assets (a) | | | | |
Net asset
value,
end of
period | | | Total return
(excludes
sales charge) (b)(c) | | | Net assets,
end of
period
(000’s) | | | Net
expenses (d) | | |
Net
investment
income
(loss) | | | Expenses
without waivers
and reimbursements | | | Portfolio
turnover
rate (b) | |
| | | | | | | | | | | | | | | | | | | | | | | | | | |
| | | | | | | | | | | | | | | | | | | | | | | | | | |
| $ | 18.84 | | | | 11.54 | % | | $ | 26,032 | | | | 1.24 | % | | | 0.48 | % | | | 1.57 | % | | | 24 | % |
| | 17.24 | | | | (1.86 | ) | | | 14,034 | | | | 1.24 | | | | 1.28 | (f) | | | 1.61 | | | | 51 | |
| | 17.61 | | | | 3.04 | | | | 5,824 | | | | 1.24 | | | | 0.49 | (f) | | | 2.31 | | | | 42 | |
| | 18.59 | | | | (2.47 | ) | | | 351 | | | | 1.32 | | | | 0.98 | (g) | | | 5.09 | | | | 63 | |
| | 20.59 | | | | 22.23 | | | | 83 | | | | 1.32 | (h) | | | 0.89 | (h) | | | 7.99 | (h) | | | 65 | |
| | 17.28 | | | | 15.20 | | | | 58 | | | | 1.32 | (h) | | | 1.17 | (h) | | | 6.99 | (h) | | | 40 | |
| | | | | | |
| | | | | | | | | | | | | | | | | | | | | | | | | | |
| | 18.68 | | | | 11.29 | | | | 5,735 | | | | 1.74 | | | | (0.20 | ) | | | 2.09 | | | | 24 | |
| | 17.04 | | | | (2.28 | ) | | | 4,626 | | | | 1.74 | | | | 0.75 | (f) | | | 2.14 | | | | 51 | |
| | 17.45 | | | | 2.39 | | | | 3,439 | | | | 1.74 | | | | (0.12 | )(f) | | | 2.79 | | | | 42 | |
| | 18.44 | | | | (2.91 | ) | | | 137 | | | | 1.82 | | | | 0.55 | (g) | | | 6.19 | | | | 63 | |
| | 20.47 | | | | 21.61 | | | | 76 | | | | 1.82 | (h) | | | 0.40 | (h) | | | 8.35 | (h) | | | 65 | |
| | 17.20 | | | | 14.67 | | | | 57 | | | | 1.82 | (h) | | | 0.67 | (h) | | | 7.47 | (h) | | | 40 | |
| | | | | | |
| | | | | | | | | | | | | | | | | | | | | | | | | | |
| | 19.05 | | | | 11.76 | | | | 30,034 | | | | 0.89 | | | | 0.94 | | | | 1.28 | | | | 24 | |
| | 17.45 | | | | (1.47 | ) | | | 9,929 | | | | 0.89 | | | | 1.41 | (f) | | | 1.35 | | | | 51 | |
| | 17.71 | | | | 3.29 | | | | 59,858 | | | | 0.89 | | | | 0.83 | (f) | | | 1.84 | | | | 42 | |
| | 18.67 | | | | (2.18 | ) | | | 3,868 | | | | 1.07 | | | | 1.17 | (g) | | | 5.55 | | | | 63 | |
| | 20.64 | | | | 22.49 | | | | 3,925 | | | | 1.07 | (h) | | | 1.17 | (h) | | | 7.52 | (h) | | | 65 | |
| | 17.32 | | | | 15.47 | | | | 3,175 | | | | 1.07 | (h) | | | 1.42 | (h) | | | 6.74 | (h) | | | 40 | |
| | | | | | |
| | | | | | | | | | | | | | | | | | | | | | | | | | |
| | 18.84 | | | | 11.43 | | | | 22 | | | | 1.49 | | | | 0.02 | | | | 1.95 | | | | 24 | |
| | 17.21 | | | | (2.05 | ) | | | 20 | | | | 1.49 | | | | 0.87 | (f) | | | 4.37 | | | | 51 | |
| | 17.57 | | | | 2.67 | | | | 20 | | | | 1.51 | | | | 0.19 | (f) | | | 5.11 | | | | 42 | |
| | 18.55 | | | | (2.68 | ) | | | 68 | | | | 1.57 | | | | 0.66 | (g) | | | 6.05 | | | | 63 | |
| | 20.53 | | | | 21.92 | | | | 70 | | | | 1.57 | (h) | | | 0.67 | (h) | | | 8.01 | (h) | | | 65 | |
| | 17.24 | | | | 14.93 | | | | 57 | | | | 1.57 | (h) | | | 0.92 | (h) | | | 7.23 | (h) | | | 40 | |
| | | | | | |
| | | | | | | | | | | | | | | | | | | | | | | | | | |
| | 19.03 | | | | 11.81 | | | | 22 | | | | 0.80 | | | | 0.72 | | | | 1.24 | | | | 24 | |
| | 17.44 | | | | (1.38 | ) | | | 20 | | | | 0.80 | | | | 1.57 | (f) | | | 3.59 | | | | 51 | |
| | 17.75 | | | | 3.43 | | | | 20 | | | | 0.81 | | | | 0.89 | (f) | | | 4.43 | | | | 42 | |
| | 18.72 | | | | (1.99 | ) | | | 70 | | | | 0.87 | | | | 1.36 | (g) | | | 5.34 | | | | 63 | |
| | 20.69 | | | | 22.76 | | | | 71 | | | | 0.87 | (h) | | | 1.37 | (h) | | | 7.31 | (h) | | | 65 | |
| | 17.35 | | | | 15.67 | | | | 58 | | | | 0.87 | (h) | | | 1.62 | (h) | | | 6.54 | (h) | | | 40 | |
| | | | | | |
| | | | | | | | | | | | | | | | | | | | | | | | | | |
| | 19.03 | | | | 11.80 | | | | 112,514 | | | | 0.75 | | | | 0.88 | | | | 0.99 | | | | 24 | |
| | 17.45 | | | | (1.29 | ) | | | 81,146 | | | | 0.74 | | | | 1.70 | (f) | | | 1.02 | | | | 51 | |
| | 17.76 | | | | 3.48 | | | | 5,335 | | | | 0.74 | | | | (0.05 | )(f) | | | 2.87 | | | | 42 | |
| | 18.73 | | | | (1.95 | ) | | | 70 | | | | 0.82 | | | | 1.41 | (g) | | | 5.29 | | | | 63 | |
| | 20.70 | | | | 22.80 | | | | 71 | | | | 0.82 | (h) | | | 1.42 | (h) | | | 7.26 | (h) | | | 65 | |
| | 17.36 | | | | 15.73 | | | | 58 | | | | 0.82 | (h) | | | 1.67 | (h) | | | 6.49 | (h) | | | 40 | |
SEE NOTES TO FINANCIAL STATEMENTS.
| | | | | | | | |
| | | |
| APRIL 30, 2017 | | J.P. MORGAN INTERNATIONAL EQUITY FUNDS | | | | | 143 | |
FINANCIAL HIGHLIGHTS
FOR THE PERIODS INDICATED (continued)
| | | | | | | | | | | | | | | | | | | | |
| | | Per share operating performance | |
| | | Investment operations | | | Distributions | |
| | | Net asset
value,
beginning of period | | | Net
investment
income
(loss) (b) | | | Net realized and unrealized
gains
(losses) on
investments | | | Total from
investment
operations | | | Net
investment
income | |
International Value Fund | |
Class A | |
Six Months Ended April 30, 2017 (Unaudited) | | $ | 12.23 | | | $ | 0.08 | | | $ | 1.41 | | | $ | 1.49 | | | $ | (0.69 | ) |
Year Ended October 31, 2016 | | | 13.02 | | | | 0.23 | | | | (0.88 | ) | | | (0.65 | ) | | | (0.14 | ) |
Year Ended October 31, 2015 | | | 14.14 | | | | 0.18 | (f) | | | (0.83 | ) | | | (0.65 | ) | | | (0.47 | ) |
Year Ended October 31, 2014 | | | 15.02 | | | | 0.47 | (f)(g) | | | (1.07 | ) | | | (0.60 | ) | | | (0.28 | ) |
Year Ended October 31, 2013 | | | 12.18 | | | | 0.22 | | | | 2.91 | | | | 3.13 | | | | (0.29 | ) |
Year Ended October 31, 2012 | | | 12.05 | | | | 0.31 | | | | 0.21 | | | | 0.52 | | | | (0.39 | ) |
|
Class C | |
Six Months Ended April 30, 2017 (Unaudited) | | | 11.88 | | | | 0.05 | | | | 1.36 | | | | 1.41 | | | | (0.67 | ) |
Year Ended October 31, 2016 | | | 12.65 | | | | 0.17 | | | | (0.87 | ) | | | (0.70 | ) | | | (0.07 | ) |
Year Ended October 31, 2015 | | | 13.72 | | | | 0.10 | (f) | | | (0.78 | ) | | | (0.68 | ) | | | (0.39 | ) |
Year Ended October 31, 2014 | | | 14.61 | | | | 0.38 | (f)(g) | | | (1.05 | ) | | | (0.67 | ) | | | (0.22 | ) |
Year Ended October 31, 2013 | | | 11.84 | | | | 0.16 | | | | 2.83 | | | | 2.99 | | | | (0.22 | ) |
Year Ended October 31, 2012 | | | 11.72 | | | | 0.25 | | | | 0.19 | | | | 0.44 | | | | (0.32 | ) |
|
Class I (formerly Select Class) | |
Six Months Ended April 30, 2017 (Unaudited) | | | 12.57 | | | | 0.10 | | | | 1.44 | | | | 1.54 | | | | (0.78 | ) |
Year Ended October 31, 2016 | | | 13.37 | | | | 0.28 | | | | (0.91 | ) | | | (0.63 | ) | | | (0.17 | ) |
Year Ended October 31, 2015 | | | 14.48 | | | | 0.23 | (f) | | | (0.84 | ) | | | (0.61 | ) | | | (0.50 | ) |
Year Ended October 31, 2014 | | | 15.19 | | | | 0.45 | (f)(g) | | | (1.04 | ) | | | (0.59 | ) | | | (0.12 | ) |
Year Ended October 31, 2013 | | | 12.31 | | | | 0.27 | | | | 2.93 | | | | 3.20 | | | | (0.32 | ) |
Year Ended October 31, 2012 | | | 12.19 | | | | 0.34 | | | | 0.21 | | | | 0.55 | | | | (0.43 | ) |
|
Class L (formerly Institutional Class) | |
Six Months Ended April 30, 2017 (Unaudited) | | | 12.50 | | | | 0.10 | | | | 1.45 | | | | 1.55 | | | | (0.79 | ) |
Year Ended October 31, 2016 | | | 13.29 | | | | 0.31 | | | | (0.93 | ) | | | (0.62 | ) | | | (0.17 | ) |
Year Ended October 31, 2015 | | | 14.41 | | | | 0.23 | (f) | | | (0.83 | ) | | | (0.60 | ) | | | (0.52 | ) |
Year Ended October 31, 2014 | | | 15.29 | | | | 0.53 | (f)(g) | | | (1.09 | ) | | | (0.56 | ) | | | (0.32 | ) |
Year Ended October 31, 2013 | | | 12.38 | | | | 0.29 | | | | 2.95 | | | | 3.24 | | | | (0.33 | ) |
Year Ended October 31, 2012 | | | 12.26 | | | | 0.36 | | | | 0.20 | | | | 0.56 | | | | (0.44 | ) |
|
Class R2 | |
Six Months Ended April 30, 2017 (Unaudited) | | | 12.04 | | | | 0.07 | | | | 1.38 | | | | 1.45 | | | | (0.68 | ) |
Year Ended October 31, 2016 | | | 12.83 | | | | 0.19 | | | | (0.87 | ) | | | (0.68 | ) | | | (0.11 | ) |
Year Ended October 31, 2015 | | | 13.93 | | | | 0.14 | (f) | | | (0.81 | ) | | | (0.67 | ) | | | (0.43 | ) |
Year Ended October 31, 2014 | | | 14.78 | | | | 0.42 | (f)(g) | | | (1.05 | ) | | | (0.63 | ) | | | (0.22 | ) |
Year Ended October 31, 2013 | | | 11.99 | | | | 0.18 | | | | 2.88 | | | | 3.06 | | | | (0.27 | ) |
Year Ended October 31, 2012 | | | 11.86 | | | | 0.28 | | | | 0.19 | | | | 0.47 | | | | (0.34 | ) |
|
Class R5 | |
Six Months Ended April 30, 2017 (Unaudited) | | | 12.51 | | | | 0.11 | | | | 1.42 | | | | 1.53 | | | | (0.82 | ) |
September 9, 2016 (h) through October 31, 2016 | | | 12.55 | | | | 0.03 | | | | (0.07 | ) | | | (0.04 | ) | | | — | |
|
Class R6 | |
Six Months Ended April 30, 2017 (Unaudited) | | | 12.51 | | | | 0.12 | | | | 1.42 | | | | 1.54 | | | | (0.82 | ) |
Year Ended October 31, 2016 | | | 13.31 | | | | 0.37 | | | | (0.96 | ) | | | (0.59 | ) | | | (0.21 | ) |
Year Ended October 31, 2015 | | | 14.42 | | | | 0.18 | (f) | | | (0.76 | ) | | | (0.58 | ) | | | (0.53 | ) |
Year Ended October 31, 2014 | | | 15.29 | | | | 0.54 | (f)(g) | | | (1.09 | ) | | | (0.55 | ) | | | (0.32 | ) |
Year Ended October 31, 2013 | | | 12.38 | | | | 0.30 | | | | 2.96 | | | | 3.26 | | | | (0.35 | ) |
Year Ended October 31, 2012 | | | 12.26 | | | | 0.37 | | | | 0.21 | | | | 0.58 | | | | (0.46 | ) |
| (a) | Annualized for periods less than one year, unless otherwise noted. |
| (b) | Calculated based upon average shares outstanding. |
| (c) | Not annualized for periods less than one year. |
| (d) | Includes adjustments in accordance with accounting principles generally accepted in the United States of America and as such, the net asset values for financial reporting purposes and the returns based upon those net asset values may differ from the net asset values and returns for shareholder transactions. |
| (e) | Includes interest expense, if applicable, which is less than 0.005% unless otherwise noted. |
| (f) | Net investment income (loss) may appear disproportionate among the classes due to the timing of recognition of income and changes in the relative size of the classes. |
| (g) | Reflects special dividends paid out during the period by several of the Fund’s holdings. Had the Fund not received the special dividends, the net investment income (loss) per share would have been $0.39, $0.30, $0.37, $0.45, $0.34 and $0.46 for Class A, Class C, Class I, Class L, Class R2 and Class R6, respectively and the net investment income (loss) ratio would have been 2.67%, 2.13%, 2.44%, 2.99%, 2.39% and 3.06% for Class A, Class C, Class I, Class L, Class R2 and Class R6, respectively. |
| (h) | Commencement of offering of class of shares. |
SEE NOTES TO FINANCIAL STATEMENTS.
| | | | | | |
| | | |
| 144 | | | | J.P. MORGAN INTERNATIONAL EQUITY FUNDS | | APRIL 30, 2017 |
| | | | | | | | | | | | | | | | | | | | | | | | | | |
| | | Ratios/Supplemental data | |
| | | | | | | | | | Ratios to average net assets (a) | | | | |
Net asset
value,
end of
period | | | Total return
(excludes
sales charge) (c)(d) | | | Net assets,
end of
period
(000’s) | | | Net
expenses (e) | | |
Net
investment
income
(loss) | | | Expenses
without waivers
and reimbursements | | | Portfolio
turnover
rate (c) | |
| | | | | | | | | | | | | | | | | | | | | | | | | | |
| | | | | | | | | | | | | | | | | | | | | | | | | | |
| $ | 13.03 | | | | 12.66 | % | | $ | 294,864 | | | | 1.33 | % | | | 1.34 | % | | | 1.42 | % | | | 16 | % |
| | 12.23 | | | | (5.01 | ) | | | 573,449 | | | | 1.35 | | | | 1.91 | | | | 1.43 | | | | 61 | |
| | 13.02 | | | | (4.63 | ) | | | 695,251 | | | | 1.35 | | | | 1.31 | (f) | | | 1.45 | | | | 74 | |
| | 14.14 | | | | (4.09 | ) | | | 491,010 | | | | 1.33 | | | | 3.19 | (f)(g) | | | 1.36 | | | | 59 | |
| | 15.02 | | | | 26.13 | | | | 221,077 | | | | 1.33 | | | | 1.66 | | | | 1.35 | | | | 66 | |
| | 12.18 | | | | 4.64 | | | | 124,691 | | | | 1.35 | | | | 2.66 | | | | 1.37 | | | | 62 | |
| | | | | | |
| | | | | | | | | | | | | | | | | | | | | | | | | | |
| | 12.62 | | | | 12.35 | | | | 22,320 | | | | 1.83 | | | | 0.79 | | | | 1.93 | | | | 16 | |
| | 11.88 | | | | (5.54 | ) | | | 24,453 | | | | 1.85 | | | | 1.43 | | | | 1.91 | | | | 61 | |
| | 12.65 | | | | (5.01 | ) | | | 31,296 | | | | 1.85 | | | | 0.79 | (f) | | | 1.90 | | | | 74 | |
| | 13.72 | | | | (4.64 | ) | | | 31,176 | | | | 1.83 | | | | 2.65 | (f)(g) | | | 1.86 | | | | 59 | |
| | 14.61 | | | | 25.58 | | | | 22,682 | | | | 1.83 | | | | 1.19 | | | | 1.85 | | | | 66 | |
| | 11.84 | | | | 4.04 | | | | 14,311 | | | | 1.85 | | | | 2.23 | | | | 1.87 | | | | 62 | |
| | | | | | |
| | | | | | | | | | | | | | | | | | | | | | | | | | |
| | 13.33 | | | | 12.75 | | | | 151,737 | | | | 1.04 | | | | 1.62 | | | | 1.05 | | | | 16 | |
| | 12.57 | | | | (4.74 | ) | | | 157,867 | | | | 1.01 | | | | 2.28 | | | | 1.02 | | | | 61 | |
| | 13.37 | | | | (4.28 | ) | | | 233,045 | | | | 1.03 | | | | 1.62 | (f) | | | 1.03 | | | | 74 | |
| | 14.48 | | | | (3.90 | ) | | | 300,712 | | | | 1.08 | | | | 2.96 | (f)(g) | | | 1.10 | | | | 59 | |
| | 15.19 | | | | 26.46 | | | | 1,634,392 | | | | 1.09 | | | | 1.99 | | | | 1.10 | | | | 66 | |
| | 12.31 | | | | 4.87 | | | | 1,458,864 | | | | 1.10 | | | | 2.92 | | | | 1.12 | | | | 62 | |
| | | | | | |
| | | | | | | | | | | | | | | | | | | | | | | | | | |
| | 13.26 | | | | 12.89 | | | | 323,408 | | | | 0.87 | | | | 1.57 | | | | 0.87 | | | | 16 | |
| | 12.50 | | | | (4.63 | ) | | | 523,251 | | | | 0.90 | | | | 2.53 | | | | 0.91 | | | | 61 | |
| | 13.29 | | | | (4.23 | ) | | | 1,480,321 | | | | 0.95 | | | | 1.63 | (f) | | | 0.99 | | | | 74 | |
| | 14.41 | | | | (3.75 | ) | | | 2,932,420 | | | | 0.93 | | | | 3.51 | (f)(g) | | | 0.96 | | | | 59 | |
| | 15.29 | | | | 26.72 | | | | 1,087,334 | | | | 0.94 | | | | 2.08 | | | | 0.95 | | | | 66 | |
| | 12.38 | | | | 5.00 | | | | 639,798 | | | | 0.94 | | | | 3.03 | | | | 0.97 | | | | 62 | |
| | | | | | |
| | | | | | | | | | | | | | | | | | | | | | | | | | |
| | 12.81 | | | | 12.48 | | | | 1,276 | | | | 1.59 | | | | 1.11 | | | | 1.85 | | | | 16 | |
| | 12.04 | | | | (5.28 | ) | | | 1,182 | | | | 1.59 | | | | 1.65 | | | | 1.91 | | | | 61 | |
| | 12.83 | | | | (4.84 | ) | | | 1,929 | | | | 1.60 | | | | 1.01 | (f) | | | 2.01 | | | | 74 | |
| | 13.93 | | | | (4.33 | ) | | | 1,768 | | | | 1.58 | | | | 2.91 | (f)(g) | | | 1.61 | | | | 59 | |
| | 14.78 | | | | 25.91 | | | | 1,249 | | | | 1.59 | | | | 1.39 | | | | 1.60 | | | | 66 | |
| | 11.99 | | | | 4.27 | | | | 881 | | | | 1.60 | | | | 2.43 | | | | 1.62 | | | | 62 | |
| | | | | | |
| | | | | | | | | | | | | | | | | | | | | | | | | | |
| | 13.22 | | | | 12.80 | | | | 23 | | | | 0.91 | | | | 1.77 | | | | 0.92 | | | | 16 | |
| | 12.51 | | | | (0.32 | ) | | | 20 | | | | 0.79 | | | | 1.52 | | | | 0.79 | | | | 61 | |
| | | | | | |
| | | | | | | | | | | | | | | | | | | | | | | | | | |
| | 13.23 | | | | 12.90 | | | | 31,229 | | | | 0.77 | | | | 1.91 | | | | 0.77 | | | | 16 | |
| | 12.51 | | | | (4.45 | ) | | | 27,998 | | | | 0.72 | | | | 3.00 | | | | 0.73 | | | | 61 | |
| | 13.31 | | | | (4.04 | ) | | | 2,354 | | | | 0.73 | | | | 1.32 | (f) | | | 0.73 | | | | 74 | |
| | 14.42 | | | | (3.64 | ) | | | 30,992 | | | | 0.83 | | | | 3.58 | (f)(g) | | | 0.84 | | | | 59 | |
| | 15.29 | | | | 26.84 | | | | 107,313 | | | | 0.84 | | | | 2.12 | | | | 0.85 | | | | 66 | |
| | 12.38 | | | | 5.11 | | | | 25,945 | | | | 0.84 | | | | 3.06 | | | | 0.87 | | | | 62 | |
SEE NOTES TO FINANCIAL STATEMENTS.
| | | | | | | | |
| | | |
| APRIL 30, 2017 | | J.P. MORGAN INTERNATIONAL EQUITY FUNDS | | | | | 145 | |
FINANCIAL HIGHLIGHTS
FOR THE PERIODS INDICATED (continued)
| | | | | | | | | | | | | | | | | | | | |
| | | Per share operating performance | |
| | | | | | Investment operations | | | Distributions | |
| | | Net asset
value,
beginning
of period | | | Net
investment
income
(loss) (b) | | | Net realized
and unrealized
gains
(losses) on
investments | | | Total from
investment
operations | | | Net
investment
income | |
Intrepid International Fund | |
Class A | |
Six Months Ended April 30, 2017 (Unaudited) | | $ | 18.44 | | | $ | 0.17 | | | $ | 1.85 | | | $ | 2.02 | | | $ | (0.38 | ) |
Year Ended October 31, 2016 | | | 19.36 | | | | 0.40 | (f) | | | (0.99 | ) | | | (0.59 | ) | | | (0.33 | ) |
Year Ended October 31, 2015 | | | 19.49 | | | | 0.34 | (f) | | | (0.26 | ) | | | 0.08 | | | | (0.21 | ) |
Year Ended October 31, 2014 | | | 19.79 | | | | 0.39 | (f) | | | (0.45 | ) | | | (0.06 | ) | | | (0.24 | ) |
Year Ended October 31, 2013 | | | 15.90 | | | | 0.25 | | | | 3.88 | | | | 4.13 | | | | (0.24 | ) |
Year Ended October 31, 2012 | | | 15.32 | | | | 0.25 | | | | 0.49 | | | | 0.74 | | | | (0.16 | ) |
|
Class C | |
Six Months Ended April 30, 2017 (Unaudited) | | | 18.57 | | | | 0.10 | | | | 1.89 | | | | 1.99 | | | | (0.26 | ) |
Year Ended October 31, 2016 | | | 19.52 | | | | 0.28 | (f) | | | (0.97 | ) | | | (0.69 | ) | | | (0.26 | ) |
Year Ended October 31, 2015 | | | 19.63 | | | | 0.23 | (f) | | | (0.24 | ) | | | (0.01 | ) | | | (0.10 | ) |
Year Ended October 31, 2014 | | | 19.92 | | | | 0.36 | (f) | | | (0.52 | ) | | | (0.16 | ) | | | (0.13 | ) |
Year Ended October 31, 2013 | | | 16.00 | | | | 0.17 | | | | 3.90 | | | | 4.07 | | | | (0.15 | ) |
Year Ended October 31, 2012 | | | 15.36 | | | | 0.18 | | | | 0.50 | | | | 0.68 | | | | (0.04 | ) |
|
Class I (formerly Select Class) | |
Six Months Ended April 30, 2017 (Unaudited) | | | 19.20 | | | | 0.21 | | | | 1.92 | | | | 2.13 | | | | (0.47 | ) |
Year Ended October 31, 2016 | | | 20.13 | | | | 0.46 | (f) | | | (1.01 | ) | | | (0.55 | ) | | | (0.38 | ) |
Year Ended October 31, 2015 | | | 20.22 | | | | 0.42 | (f) | | | (0.26 | ) | | | 0.16 | | | | (0.25 | ) |
Year Ended October 31, 2014 | | | 20.51 | | | | 0.51 | (f) | | | (0.53 | ) | | | (0.02 | ) | | | (0.27 | ) |
Year Ended October 31, 2013 | | | 16.46 | | | | 0.31 | | | | 4.01 | | | | 4.32 | | | | (0.27 | ) |
Year Ended October 31, 2012 | | | 15.85 | | | | 0.30 | | | | 0.51 | | | | 0.81 | | | | (0.20 | ) |
|
Class R2 | |
Six Months Ended April 30, 2017 (Unaudited) | | | 18.29 | | | | 0.13 | | | | 1.85 | | | | 1.98 | | | | (0.36 | ) |
Year Ended October 31, 2016 | | | 19.21 | | | | 0.36 | (f) | | | (1.01 | ) | | | (0.65 | ) | | | (0.27 | ) |
Year Ended October 31, 2015 | | | 19.31 | | | | 0.38 | (f) | | | (0.34 | ) | | | 0.04 | | | | (0.14 | ) |
Year Ended October 31, 2014 | | | 19.61 | | | | 0.40 | (f) | | | (0.53 | ) | | | (0.13 | ) | | | (0.17 | ) |
Year Ended October 31, 2013 | | | 15.74 | | | | 0.20 | | | | 3.86 | | | | 4.06 | | | | (0.19 | ) |
Year Ended October 31, 2012 | | | 15.21 | | | | 0.19 | | | | 0.50 | | | | 0.69 | | | | (0.16 | ) |
|
Class R6 | |
Six Months Ended April 30, 2017 (Unaudited) | | | 18.91 | | | | 0.21 | | | | 1.90 | | | | 2.11 | | | | (0.48 | ) |
Year Ended October 31, 2016 | | | 19.84 | | | | 0.49 | (f) | | | (1.01 | ) | | | (0.52 | ) | | | (0.41 | ) |
May 29, 2015 (g) through October 31, 2015 | | | 21.08 | | | | 0.12 | (f) | | | (1.36 | ) | | | (1.24 | ) | | | — | |
| (a) | Annualized for periods less than one year, unless otherwise noted. |
| (b) | Calculated based upon average shares outstanding. |
| (c) | Not annualized for periods less than one year. |
| (d) | Includes adjustments in accordance with accounting principles generally accepted in the United States of America and as such, the net asset values for financial reporting purposes and the returns based upon those net asset values may differ from the net asset values and returns for shareholder transactions. |
| (e) | Includes interest expense, if applicable, which is less than 0.005% unless otherwise noted. |
| (f) | Net investment income (loss) may appear disproportionate among the classes due to the timing of recognition of income and changes in the relative size of the classes. |
| (g) | Commencement of offering of class of shares. |
SEE NOTES TO FINANCIAL STATEMENTS.
| | | | | | |
| | | |
| 146 | | | | J.P. MORGAN INTERNATIONAL EQUITY FUNDS | | APRIL 30, 2017 |
| | | | | | | | | | | | | | | | | | | | | | | | | | |
| | | Ratios/Supplemental data | |
| | | | | | | | | | Ratios to average net assets (a) | | | | |
Net asset
value,
end of
period | | | Total return
(excludes
sales charge) (c)(d) | | | Net assets,
end of
period
(000’s) | | | Net
expenses (e) | | |
Net
investment
income
(loss) | | | Expenses
without waivers
and reimbursements | | | Portfolio
turnover
rate (c) | |
| | | | | | | | | | | | | | | | | | | | | | | | | | |
| | | | | | | | | | | | | | | | | | | | | | | | | | |
| $ | 20.08 | | | | 11.14 | % | | $ | 199,735 | | | | 1.21 | % | | | 1.80 | % | | | 1.22 | % | | | 30 | % |
| | 18.44 | | | | (3.07 | ) | | | 164,327 | | | | 1.25 | | | | 2.21 | (f) | | | 1.29 | | | | 38 | |
| | 19.36 | | | | 0.45 | | | | 152,834 | | | | 1.29 | | | | 1.75 | (f) | | | 1.49 | | | | 33 | |
| | 19.49 | | | | (0.33 | ) | | | 101,114 | | | | 1.39 | | | | 1.96 | (f) | | | 1.46 | | | | 48 | |
| | 19.79 | | | | 26.25 | | | | 60,135 | | | | 1.47 | | | | 1.42 | | | | 1.54 | | | | 49 | |
| | 15.90 | | | | 4.97 | | | | 32,231 | | | | 1.50 | | | | 1.65 | | | | 1.62 | | | | 46 | |
| | | | | | |
| | | | | | | | | | | | | | | | | | | | | | | | | | |
| | 20.30 | | | | 10.83 | | | | 1,914 | | | | 1.75 | | | | 1.07 | | | | 1.83 | | | | 30 | |
| | 18.57 | | | | (3.56 | ) | | | 2,287 | | | | 1.75 | | | | 1.52 | (f) | | | 1.87 | | | | 38 | |
| | 19.52 | | | | (0.05 | ) | | | 2,789 | | | | 1.78 | | | | 1.17 | (f) | | | 1.91 | | | | 33 | |
| | 19.63 | | | | (0.84 | ) | | | 1,318 | | | | 1.89 | | | | 1.79 | (f) | | | 1.96 | | | | 48 | |
| | 19.92 | | | | 25.60 | | | | 1,131 | | | | 1.98 | | | | 0.94 | | | | 2.04 | | | | 49 | |
| | 16.00 | | | | 4.45 | | | | 875 | | | | 2.00 | | | | 1.18 | | | | 2.12 | | | | 46 | |
| | | | | | |
| | | | | | | | | | | | | | | | | | | | | | | | | | |
| | 20.86 | | | | 11.33 | | | | 49,895 | | | | 0.90 | | | | 2.10 | | | | 1.00 | | | | 30 | |
| | 19.20 | | | | (2.73 | ) | | | 16,363 | | | | 0.90 | | | | 2.44 | (f) | | | 1.08 | | | | 38 | |
| | 20.13 | | | | 0.80 | | | | 19,292 | | | | 0.97 | | | | 2.04 | (f) | | | 1.12 | | | | 33 | |
| | 20.22 | | | | (0.13 | ) | | | 15,963 | | | | 1.14 | | | | 2.47 | (f) | | | 1.21 | | | | 48 | |
| | 20.51 | | | | 26.56 | | | | 13,916 | | | | 1.23 | | | | 1.68 | | | | 1.29 | | | | 49 | |
| | 16.46 | | | | 5.24 | | | | 9,467 | | | | 1.25 | | | | 1.94 | | | | 1.37 | | | | 46 | |
| | | | | | |
| | | | | | | | | | | | | | | | | | | | | | | | | | |
| | 19.91 | | | | 10.99 | | | | 536 | | | | 1.49 | | | | 1.41 | | | | 1.59 | | | | 30 | |
| | 18.29 | | | | (3.36 | ) | | | 503 | | | | 1.50 | | | | 2.02 | (f) | | | 1.75 | | | | 38 | |
| | 19.21 | | | | 0.24 | | | | 227 | | | | 1.52 | | | | 1.91 | (f) | | | 1.69 | | | | 33 | |
| | 19.31 | | | | (0.66 | ) | | | 98 | | | | 1.64 | | | | 2.03 | (f) | | | 1.71 | | | | 48 | |
| | 19.61 | | | | 26.02 | | | | 98 | | | | 1.72 | | | | 1.16 | | | | 1.79 | | | | 49 | |
| | 15.74 | | | | 4.64 | | | | 81 | | | | 1.75 | | | | 1.29 | | | | 1.87 | | | | 46 | |
| | | | | | |
| | | | | | | | | | | | | | | | | | | | | | | | | | |
| | 20.54 | | | | 11.44 | | | | 2,670,673 | | | | 0.71 | | | | 2.17 | | | | 0.71 | | | | 30 | |
| | 18.91 | | | | (2.59 | ) | | | 2,487,086 | | | | 0.71 | | | | 2.65 | (f) | | | 0.72 | | | | 38 | |
| | 19.84 | | | | (5.88 | ) | | | 1,854,941 | | | | 0.73 | | | | 1.47 | (f) | | | 0.74 | | | | 33 | |
SEE NOTES TO FINANCIAL STATEMENTS.
| | | | | | | | |
| | | |
| APRIL 30, 2017 | | J.P. MORGAN INTERNATIONAL EQUITY FUNDS | | | | | 147 | |
NOTES TO FINANCIAL STATEMENTS
AS OF APRIL 30, 2017 (Unaudited)
1. Organization
JPMorgan Trust I (“JPM I”) and JPMorgan Trust II (“JPM II”) (collectively, the “Trusts”) were formed on November 12, 2004, as Delaware statutory trusts, pursuant to Declarations of Trust dated November 5, 2004 and are registered under the Investment Company Act of 1940, as amended (the “1940 Act”), as open-end management investment companies.
The following are 13 separate funds of the Trusts (collectively, the “Funds”) covered by this report:
| | | | | | |
| | | Classes Offered | | Trust | | Diversified/Non-Diversified |
| Emerging Economies Fund | | Class A, Class C, Class I*, Class R5 and Class R6 | | JPM I | | Diversified |
| Emerging Markets Equity Fund | | Class A, Class C, Class I*, Class L**, Class R5*** and Class R6 | | JPM I | | Diversified |
| Emerging Markets Equity Income Fund | | Class A, Class C, Class I*, Class R5 and Class R6 | | JPM I | | Diversified |
| Global Research Enhanced Index Fund | | Class A, Class C, Class I* and Class R2 | | JPM I | | Diversified |
| Global Unconstrained Equity Fund | | Class A, Class C, Class I*, Class R2, Class R5 and Class R6 | | JPM I | | Diversified |
| International Discovery Fund | | Class A, Class C, Class I*, Class R5 and Class R6 | | JPM I | | Diversified |
| International Equity Fund | | Class A, Class C, Class I*, Class R2, Class R5 and Class R6 | | JPM I | | Diversified |
| International Equity Income Fund | | Class A, Class C, Class I*, Class R2, Class R5 and Class R6 | | JPM I | | Diversified |
| International Opportunities Fund | | Class A, Class C, Class I*, Class R6 and Institutional**** | | JPM I | | Diversified |
| International Research Enhanced Equity Fund | | Class A, Class C, Class I* and Class R2 | | JPM II | | Diversified |
| International Unconstrained Equity Fund | | Class A, Class C, Class I*, Class R2, Class R5 and Class R6 | | JPM I | | Diversified |
| International Value Fund | | Class A, Class C, Class I*, Class L**, Class R2, Class R5*** and Class R6 | | JPM I | | Diversified |
| Intrepid International Fund | | Class A, Class C, Class I*, Class R2, Class R6 and Institutional**** | | JPM I | | Diversified |
| * | Effective April 3, 2017, Select Class was renamed Class I. |
| ** | Effective December 1, 2016, Institutional Class was renamed Class L and is publicly offered on a limited basis. |
| *** | Class R5 Shares commenced operations on September 9, 2016, for Emerging Markets Equity Fund and International Value Fund. |
| **** | Effective December 1, 2016, Institutional Class was renamed Class L and subsequently liquidated on December 8, 2016. |
As of April 30, 2017, Class A, Class C and Class R2 Shares of Global Research Enhanced Index Fund and Class R2 shares of the Global Unconstrained Equity Fund were not publicly offered for investment.
The investment objective of Emerging Economies Fund is to seek long-term capital growth.
The investment objective of Emerging Markets Equity Fund is to seek to provide high total return from a portfolio of equity securities from emerging markets issuers.
The investment objective of Emerging Markets Equity Income Fund and the International Equity Income Fund is to seek to provide both current income and long-term capital appreciation.
The investment objective of Global Research Enhanced Index Fund, Global Unconstrained Equity Fund, International Discovery Fund, International Research Enhanced Equity Fund and International Unconstrained Equity Fund is to seek to provide long-term capital appreciation.
The investment objective of International Equity Fund is to seek total return from long-term capital growth and income. Total return consists of capital growth and current income.
The investment objective of International Opportunities Fund is to seek to provide high total return from a portfolio of equity securities of foreign companies in developed and, to a lesser extent, emerging markets.
The investment objective of International Value Fund is to seek to provide high total return from a portfolio of foreign company equity securities.
The investment objective of Intrepid International Fund is to seek to maximize long-term capital growth by investing primarily in equity securities in developed markets outside the U.S.
Class A Shares generally provide for a front-end sales charge while Class C Shares provide for a contingent deferred sales charge (“CDSC”). No sales charges are assessed with respect to Class I, Class L, Class R2, Class R5 and Class R6 Shares. All classes of shares have equal rights as to earnings, assets and voting privileges, except that each class may bear different transfer agency, sub-transfer agency (through April 2, 2017), distribution and service fees and each class has exclusive voting rights with respect to its distribution plan and shareholder servicing agreements. Effective April 3, 2017 sub-transfer agency and shareholder servicing fees were consolidated in to a single service fee. Certain Class A Shares, for which front-end sales charges have been waived, may be subject to a CDSC as described in the Funds’ prospectus. Beginning on November 14, 2017, Class C Shares will automatically convert to Class A Shares after ten years.
| | | | | | |
| | | |
| 148 | | | | J.P. MORGAN INTERNATIONAL EQUITY FUNDS | | APRIL 30, 2017 |
J.P. Morgan Investment Management Inc. (“JPMIM”) an indirect, wholly owned subsidiary of JPMorgan Chase & Co. (“JPMorgan”) acts as Adviser (the “Adviser”) and Administrator (the “Administrator”) to the Funds.
2. Significant Accounting Policies
The following is a summary of significant accounting policies followed by the Funds in the preparation of their financial statements. The Funds are investment companies and, accordingly, follow the investment company accounting and reporting guidance of the Financial Accounting Standards Board Accounting Standards Codification Topic 946 — Investment Companies, which is part of U.S. generally accepted accounting principles (“GAAP”). The preparation of financial statements in conformity with GAAP requires management to make estimates and assumptions that affect the reported amounts of assets and liabilities and disclosure of contingent assets and liabilities at the date of the financial statements and the reported amounts of increases and decreases in net assets from operations during the reporting period. Actual results could differ from those estimates.
A. Valuation of Investments — The valuation of investments is in accordance with GAAP and the Funds’ valuation policies set forth by and under the supervision and responsibility of the Board of Trustees (the “Board”), which established the following approach to valuation, as described more fully below: (i) investments for which market quotations are readily available shall be valued at such unadjusted quoted prices and (ii) all other investments for which market quotations are not readily available shall be valued at their fair value as determined in good faith by the Board.
The Administrator has established the J.P. Morgan Investment Management Americas Valuation Committee (“AVC”) to assist the Board with the oversight and monitoring of the valuation of the Funds’ investments. The Administrator implements the valuation policies of the Funds’ investments, as directed by the Board. The AVC oversees and carries out the policies for the valuation of investments held in the Funds. This includes monitoring the appropriateness of fair values based on results of ongoing valuation oversight, including but not limited to consideration of macro or security specific events, market events and pricing vendor and broker due diligence. The Administrator is responsible for discussing and assessing the potential impacts to the fair values on an ongoing basis, and at least on a quarterly basis with the AVC and the Board.
A market-based approach is primarily used to value the Funds’ investments. Investments for which market quotations are not readily available are fair valued by approved affiliated and unaffiliated pricing vendors or third party broker-dealers (collectively referred to as “Pricing Services”) or may be internally fair valued using methods set forth by the valuation policies approved by the Board. This may include related or comparable assets or liabilities, recent transactions, market multiples, book values, and other relevant information for the investment to determine the fair value of the investment. An income-based valuation approach may be used in which the anticipated future cash flows of the investment are discounted to calculate the fair value. Discounts may also be applied due to the nature or duration of any restrictions on the disposition of the investments. Valuations may be based upon current market prices of securities that are comparable in coupon, rating, maturity and industry. It is possible that the estimated values may differ significantly from the values that would have been used, had a ready market for the investments existed, and such differences could be material.
Equities and other exchange-traded instruments are valued at the last sale price or official market closing price on the primary exchange on which the instrument is traded before the net asset values (“NAV”) of the Funds are calculated on a valuation date. Certain foreign equity instruments, as well as certain derivatives with equity reference obligations, are valued by applying international fair value factors provided by approved Pricing Services. The factors seek to adjust the local closing price for movements of local markets post closing, but prior to the time the NAVs are calculated. Investments in open-end investment companies (the “Underlying Funds”) are valued at each Underlying Fund’s NAV per share as of the report date.
Futures are generally valued on the basis of available market quotations. Forward foreign currency exchange contracts are valued utilizing market quotations from approved Pricing Services.
Valuations reflected in this report are as of the report date. As a result, changes in valuation due to market events and/or issuer related events after the report date and prior to issuance of the report are not reflected herein.
The various inputs that are used in determining the valuation of the Funds’ investments are summarized into the three broad levels listed below.
| • | | Level 1 — Unadjusted inputs using quoted prices in active markets for identical investments. |
| • | | Level 2 — Other significant observable inputs including, but not limited to, quoted prices for similar investments, inputs other than quoted prices that are observable for investments (such as interest rates, prepayment speeds, credit risk, etc.) or other market corroborated inputs. |
| • | | Level 3 — Significant inputs based on the best information available in the circumstances, to the extent observable inputs are not available (including the Funds’ assumptions in determining the fair value of investments). |
A financial instrument’s level within the fair value hierarchy is based on the lowest level of any input, both individually and in the aggregate, that is significant to the fair value measurement. The inputs or methodology used for valuing instruments are not necessarily an indication of the risk associated with investing in those instruments.
| | | | | | | | |
| | | |
| APRIL 30, 2017 | | J.P. MORGAN INTERNATIONAL EQUITY FUNDS | | | | | 149 | |
NOTES TO FINANCIAL STATEMENTS
AS OF APRIL 30, 2017 (Unaudited) (continued)
The following tables represent each valuation input as presented on the Schedules of Portfolio Investments (“SOIs”) (amounts in thousands):
Emerging Economies Fund
| | | | | | | | | | | | | | | | |
| | | Level 1
Quoted prices | | | Level 2
Other significant
observable inputs | | | Level 3
Significant
unobservable inputs | | | Total | |
Investments in Securities | | | | | | | | | | | | | | | | |
Common Stocks | | | | | | | | | | | | | | | | |
Brazil | | $ | 145,406 | | | $ | — | | | $ | — | | | $ | 145,406 | |
China | | | 58,469 | | | | 352,223 | | | | — | | | | 410,692 | |
Hong Kong | | | — | | | | 51,724 | | | | — | | | | 51,724 | |
Hungary | | | — | | | | 27,669 | | | | — | | | | 27,669 | |
India | | | — | | | | 58,011 | | | | — | | | | 58,011 | |
Indonesia | | | — | | | | 13,805 | | | | — | | | | 13,805 | |
Malaysia | | | — | | | | 23,510 | | | | — | | | | 23,510 | |
Mexico | | | 10,989 | | | | — | | | | — | | | | 10,989 | |
Panama | | | 26,498 | | | | — | | | | — | | | | 26,498 | |
Poland | | | — | | | | 47,754 | | | | — | | | | 47,754 | |
Qatar | | | — | | | | 8,821 | | | | — | | | | 8,821 | |
Russia | | | 52,717 | | | | 96,529 | | | | — | | | | 149,246 | |
South Africa | | | 5,839 | | | | 41,608 | | | | — | | | | 47,447 | |
South Korea | | | — | | | | 317,972 | | | | — | | | | 317,972 | |
Taiwan | | | 37,542 | | | | 226,740 | | | | — | | | | 264,282 | |
Thailand | | | — | | | | 86,275 | | | | — | | | | 86,275 | |
Turkey | | | — | | | | 80,577 | | | | — | | | | 80,577 | |
United Arab Emirates | | | — | | | | 22,918 | | | | — | | | | 22,918 | |
Vietnam | | | — | | | | 5,407 | | | | — | | | | 5,407 | |
| | | | | | | | | | | | | | | | |
Total Common Stocks | | | 337,460 | | | | 1,461,543 | | | | — | | | | 1,799,003 | |
| | | | | | | | | | | | | | | | |
Preferred Stocks | | | | | | | | | | | | | | | | |
Brazil | | | 31,028 | | | | — | | | | — | | | | 31,028 | |
Russia | | | 11,831 | | | | — | | | | — | | | | 11,831 | |
| | | | | | | | | | | | | | | | |
Total Preferred Stocks | | | 42,859 | | | | — | | | | — | | | | 42,859 | |
| | | | | | | | | | | | | | | | |
Short-Term Investment | | | | | | | | | | | | | | | | |
Investment Company | | | 32,084 | | | | — | | | | — | | | | 32,084 | |
| | | | | | | | | | | | | | | | |
Total Investments in Securities | | $ | 412,403 | | | $ | 1,461,543 | | | $ | — | | | $ | 1,873,946 | |
| | | | | | | | | | | | | | | | |
Appreciation in Other Financial Instruments | | | | | | | | | | | | | | | | |
Futures Contracts | | $ | 42 | | | $ | — | | | $ | — | | | $ | 42 | |
| | | | | | | | | | | | | | | | |
| | | | | | |
| | | |
| 150 | | | | J.P. MORGAN INTERNATIONAL EQUITY FUNDS | | APRIL 30, 2017 |
Emerging Markets Equity Fund
| | | | | | | | | | | | | | | | |
| | | Level 1
Quoted prices | | | Level 2
Other significant
observable inputs | | | Level 3
Significant
unobservable inputs | | | Total | |
Investments in Securities | | | | | | | | | | | | | | | | |
Common Stocks | | | | | | | | | | | | | | | | |
Argentina | | $ | 58,887 | | | $ | — | | | $ | — | | | $ | 58,887 | |
Australia | | | — | | | | 22,225 | | | | — | | | | 22,225 | |
Brazil | | | 339,672 | | | | — | | | | — | | | | 339,672 | |
China | | | 286,056 | | | | 373,902 | | | | — | | | | 659,958 | |
Cyprus | | | 9,140 | | | | — | | | | — | | | | 9,140 | |
Egypt | | | 23,906 | | | | — | | | | — | | | | 23,906 | |
Hong Kong | | | — | | | | 236,524 | | | | — | | | | 236,524 | |
India | | | 137,908 | | | | 524,575 | | | | — | | | | 662,483 | |
Indonesia | | | — | | | | 112,047 | | | | — | | | | 112,047 | |
Mexico | | | 91,480 | | | | — | | | | — | | | | 91,480 | |
Panama | | | 47,278 | | | | — | | | | — | | | | 47,278 | |
Peru | | | 42,716 | | | | — | | | | — | | | | 42,716 | |
Russia | | | — | | | | 146,322 | | | | — | | | | 146,322 | |
South Africa | | | — | | | | 396,321 | | | | — | | | | 396,321 | |
South Korea | | | — | | | | 163,691 | | | | 17,540 | | | | 181,231 | |
Taiwan | | | 142,012 | | | | 131,762 | | | | — | | | | 273,774 | |
Thailand | | | — | | | | 27,038 | | | | — | | | | 27,038 | |
Turkey | | | — | | | | 11,363 | | | | — | | | | 11,363 | |
United States | | | 97,610 | | | | — | | | | — | | | | 97,610 | |
| | | | | | | | | | | | | | | | |
Total Common Stocks | | | 1,276,665 | | | | 2,145,770 | | | | 17,540 | | | | 3,439,975 | |
| | | | | | | | | | | | | | | | |
Preferred Stocks | | | | | | | | | | | | | | | | |
Brazil | | | 19,610 | | | | — | | | | — | | | | 19,610 | |
Structured Instruments | | | | | | | | | | | | | | | | |
China | | | — | | | | 33,989 | | | | — | | | | 33,989 | |
Warrants | | | | | | | | | | | | | | | | |
United States | | | — | | | | 24,753 | | | | — | | | | 24,753 | |
Short-Term Investment | | | | | | | | | | | | | | | | |
Investment Company | | | 45,041 | | | | — | | | | — | | | | 45,041 | |
| | | | | | | | | | | | | | | | |
Total Investments in Securities | | $ | 1,341,316 | | | $ | 2,204,512 | | | $ | 17,540 | * | | $ | 3,563,368 | |
| | | | | | | | | | | | | | | | |
| * | Level 3 securities are valued by brokers and pricing services. At April 30, 2017, the value of these securities was approximately $17,540,000. The inputs for these securities are not readily available or cannot be reasonably estimated and are generally those inputs described in Note 2.A. The appropriateness of fair values for these securities is monitored on an ongoing basis which may include results of back testing, results of broker and vendor due diligence, unchanged price review and consideration of macro or security specific events. |
| | | | | | | | | | | | | | | | |
| | | |
| Emerging Markets Equity Income Fund | | | | | | | | | | | | | |
| | | | |
| | | Level 1
Quoted prices | | | Level 2
Other significant observable inputs | | | Level 3
Significant unobservable inputs | | | Total | |
Investments in Securities | | | | | | | | | | | | | | | | |
Common Stocks | | | | | | | | | | | | | | | | |
Brazil | | $ | 1,176 | | | $ | — | | | $ | — | | | $ | 1,176 | |
Chile | | | 470 | | | | — | | | | — | | | | 470 | |
China | | | — | | | | 2,085 | | | | — | | | | 2,085 | |
Czech Republic | | | 349 | | | | 130 | | | | — | | | | 479 | |
Hong Kong | | | 295 | | | | 649 | | | | — | | | | 944 | |
Hungary | | | — | | | | 272 | | | | — | | | | 272 | |
Indonesia | | | — | | | | 331 | | | | — | | | | 331 | |
Mexico | | | 1,002 | | | | — | | | | — | | | | 1,002 | |
Russia | | | 571 | | | | 603 | | | | — | | | | 1,174 | |
South Africa | | | 544 | | | | 1,398 | | | | — | | | | 1,942 | |
South Korea | | | 203 | | | | 848 | | | | — | | | | 1,051 | |
| | | | | | | | |
| | | |
| APRIL 30, 2017 | | J.P. MORGAN INTERNATIONAL EQUITY FUNDS | | | | | 151 | |
NOTES TO FINANCIAL STATEMENTS
AS OF APRIL 30, 2017 (Unaudited) (continued)
Emerging Markets Equity Income Fund (continued)
| | | | | | | | | | | | | | | | |
| | | | |
| | | Level 1
Quoted prices | | | Level 2
Other significant observable inputs | | | Level 3
Significant unobservable inputs | | | Total | |
Taiwan | | $ | 802 | | | $ | 2,287 | | | $ | — | | | $ | 3,089 | |
Thailand | | | 141 | | | | 539 | | | | — | | | | 680 | |
Turkey | | | — | | | | 536 | | | | — | | | | 536 | |
United Arab Emirates | | | 245 | | | | — | | | | — | | | | 245 | |
| | | | | | | | | | | | | | | | |
Total Common Stocks | | | 5,798 | | | | 9,678 | | | | — | | | | 15,476 | |
| | | | | | | | | | | | | | | | |
Structured Instruments | | | | | | | | | | | | | | | | |
France | | | — | | | | 141 | | | | — | | | | 141 | |
Warrant | | | | | | | | | | | | | | | | |
United States | | | — | | | | 225 | | | | — | | | | 225 | |
Short-Term Investment | | | | | | | | | | | | | | | | |
Investment Company | | | 24 | | | | — | | | | — | | | | 24 | |
| | | | | | | | | | | | | | | | |
Total Investments in Securities | | $ | 5,822 | | | $ | 10,044 | | | $ | — | | | $ | 15,866 | |
| | | | | | | | | | | | | | | | |
| | | |
| Global Research Enhanced Index Fund | | | | | | | | | | | | | |
| | | | |
| | | Level 1
Quoted prices | | | Level 2
Other significant
observable inputs | | | Level 3
Significant
unobservable inputs | | | Total | |
Investments in Securities | | | | | | | | | | | | | | | | |
Common Stocks | | | | | | | | | | | | | | | | |
Australia | | $ | — | | | $ | 202,259 | | | $ | — | | | $ | 202,259 | |
Austria | | | — | (a) | | | 11,337 | | | | — | | | | 11,337 | |
Belgium | | | — | | | | 35,298 | | | | — | | | | 35,298 | |
Bermuda | | | 5,138 | | | | — | | | | — | | | | 5,138 | |
Canada | | | 264,560 | | | | — | | | | — | | | | 264,560 | |
China | | | — | | | | 4,138 | | | | — | | | | 4,138 | |
Denmark | | | — | | | | 57,112 | | | | — | | | | 57,112 | |
Finland | | | — | | | | 12,694 | | | | — | | | | 12,694 | |
France | | | — | | | | 314,997 | | | | — | | | | 314,997 | |
Germany | | | — | | | | 249,062 | | | | — | | | | 249,062 | |
Hong Kong | | | 2,086 | | | | 86,604 | | | | — | | | | 88,690 | |
Ireland | | | 9,586 | | | | 2,505 | | | | — | | | | 12,091 | |
Israel | | | 4,887 | | | | — | | | | — | | | | 4,887 | |
Italy | | | 890 | | | | 50,651 | | | | — | | | | 51,541 | |
Japan | | | 2,521 | | | | 668,541 | | | | — | | | | 671,062 | |
Jersey | | | — | | | | 4,307 | | | | — | | | | 4,307 | |
Luxembourg | | | — | | | | 8,664 | | | | — | | | | 8,664 | |
Netherlands | | | — | | | | 150,553 | | | | — | | | | 150,553 | |
New Zealand | | | — | | | | 5,677 | | | | — | | | | 5,677 | |
Norway | | | — | | | | 5,366 | | | | — | | | | 5,366 | |
Portugal | | | — | | | | 10,524 | | | | — | | | | 10,524 | |
Singapore | | | — | | | | 31,463 | | | | — | | | | 31,463 | |
Spain | | | — | | | | 103,881 | | | | — | | | | 103,881 | |
Sweden | | | — | | | | 52,129 | | | | — | | | | 52,129 | |
Switzerland | | | 5,517 | | | | 220,017 | | | | — | | | | 225,534 | |
United Kingdom | | | 5,993 | | | | 422,931 | | | | — | | | | 428,924 | |
United States | | | 4,580,133 | | | | 19,465 | | | | — | | | | 4,599,598 | |
| | | | | | | | | | | | | | | | |
Total Common Stocks | | | 4,881,311 | | | | 2,730,175 | | | | — | | | | 7,611,486 | |
| | | | | | | | | | | | | | | | |
Preferred Stocks | | | | | | | | | | | | | | | | |
Germany | | | — | | | | 35,339 | | | | — | | | | 35,339 | |
Rights | | | | | | | | | | | | | | | | |
Australia | | | — | | | | 6 | | | | — | | | | 6 | |
Short-Term Investment | | | | | | | | | | | | | | | | |
Investment Company | | | 46,476 | | | | — | | | | — | | | | 46,476 | |
| | | | | | | | | | | | | | | | |
Total Investments in Securities | | $ | 4,927,787 | | | $ | 2,765,520 | | | $ | — | | | $ | 7,693,307 | |
| | | | | | | | | | | | | | | | |
Appreciation in Other Financial Instruments | | | | | | | | | | | | | | | | |
Futures Contracts | | $ | — | | | $ | 646 | | | $ | — | | | $ | 646 | |
| | | | | | | | | | | | | | | | |
| | | | | | |
| | | |
| 152 | | | | J.P. MORGAN INTERNATIONAL EQUITY FUNDS | | APRIL 30, 2017 |
Global Unconstrained Equity Fund
| | | | | | | | | | | | | | | | |
| | | Level 1
Quoted prices | | | Level 2
Other significant
observable inputs | | | Level 3
Significant
unobservable inputs | | | Total | |
Investments in Securities | | | | | | | | | | | | | | | | |
Common Stocks | | | | | | | | | | | | | | | | |
Canada | | $ | 30 | | | $ | — | | | $ | — | | | $ | 30 | |
China | | | 117 | | | | 63 | | | | — | | | | 180 | |
Denmark | | | — | | | | 36 | | | | — | | | | 36 | |
France | | | — | | | | 157 | | | | — | | | | 157 | |
Hong Kong | | | — | | | | 32 | | | | — | | | | 32 | |
India | | | 22 | | | | — | | | | — | | | | 22 | |
Israel | | | 53 | | | | — | | | | — | | | | 53 | |
Italy | | | — | | | | 17 | | | | — | | | | 17 | |
Japan | | | — | | | | 115 | | | | — | | | | 115 | |
Luxembourg | | | — | | | | 30 | | | | — | | | | 30 | |
Netherlands | | | 28 | | | | — | | | | — | | | | 28 | |
Switzerland | | | — | | | | 79 | | | | — | | | | 79 | |
United Kingdom | | | 31 | | | | 174 | | | | — | | | | 205 | |
United States | | | 1,000 | | | | — | | | | — | | | | 1,000 | |
| | | | | | | | | | | | | | | | |
Total Common Stocks | | | 1,281 | | | | 703 | | | | — | | | | 1,984 | |
| | | | | | | | | | | | | | | | |
Short-Term Investment | | | | | | | | | | | | | | | | |
Investment Company | | | 39 | | | | — | | | | — | | | | 39 | |
| | | | | | | | | | | | | | | | |
Total Investments in Securities | | $ | 1,320 | | | $ | 703 | | | $ | — | | | $ | 2,023 | |
| | | | | | | | | | | | | | | | |
| | | |
| International Discovery Fund | | | | | | | | | | | | | |
| | | | |
| | | Level 1
Quoted prices | | | Level 2
Other significant
observable inputs | | | Level 3
Significant
unobservable inputs | | | Total | |
Investments in Securities | | | | | | | | | | | | | | | | |
Common Stocks | | | | | | | | | | | | | | | | |
Australia | | $ | — | | | $ | 563 | | | $ | — | | | $ | 563 | |
Austria | | | — | | | | 63 | | | | — | | | | 63 | |
China | | | — | | | | 233 | | | | — | | | | 233 | |
Denmark | | | 17 | | | | 68 | | | | — | | | | 85 | |
Finland | | | — | | | | 143 | | | | — | | | | 143 | |
France | | | 106 | | | | 460 | | | | — | | | | 566 | |
Georgia | | | — | | | | 75 | | | | — | | | | 75 | |
Germany | | | 56 | | | | 219 | | | | — | | | | 275 | |
Hong Kong | | | 55 | | | | 259 | | | | — | | | | 314 | |
Ireland | | | — | | | | 33 | | | | — | | | | 33 | |
Israel | | | 40 | | | | — | | | | — | | | | 40 | |
Italy | | | 117 | | | | 338 | | | | — | | | | 455 | |
Japan | | | — | | | | 1,665 | | | | — | | | | 1,665 | |
Netherlands | | | — | | | | 57 | | | | — | | | | 57 | |
Norway | | | — | | | | 143 | | | | — | | | | 143 | |
South Africa | | | — | | | | 45 | | | | — | | | | 45 | |
Spain | | | — | | | | 53 | | | | — | | | | 53 | |
Sweden | | | — | | | | 214 | | | | — | | | | 214 | |
Switzerland | | | 106 | | | | 366 | | | | — | | | | 472 | |
United Kingdom | | | 167 | | | | 928 | | | | — | | | | 1,095 | |
United States | | | 56 | | | | 35 | | | | — | | | | 91 | |
| | | | | | | | | | | | | | | | |
Total Investments in Securities | | $ | 720 | | | $ | 5,960 | | | $ | — | | | $ | 6,680 | |
| | | | | | | | | | | | | | | | |
| | | | | | | | |
| | | |
| APRIL 30, 2017 | | J.P. MORGAN INTERNATIONAL EQUITY FUNDS | | | | | 153 | |
NOTES TO FINANCIAL STATEMENTS
AS OF APRIL 30, 2017 (Unaudited) (continued)
International Equity Fund
| | | | | | | | | | | | | | | | |
| | | Level 1
Quoted prices | | | Level 2
Other significant
observable inputs | | | Level 3
Significant
unobservable inputs | | | Total | |
Investments in Securities | | | | | | | | | | | | | | | | |
Common Stocks | | | | | | | | | | | | | | | | |
Australia | | $ | — | | | $ | 43,462 | | | $ | — | | | $ | 43,462 | |
Belgium | | | — | | | | 57,669 | | | | — | | | | 57,669 | |
China | | | 32,538 | | | | 81,440 | | | | — | | | | 113,978 | |
Denmark | | | — | | | | 37,917 | | | | — | | | | 37,917 | |
France | | | — | | | | 450,631 | | | | — | | | | 450,631 | |
Germany | | | — | | | | 253,094 | | | | — | | | | 253,094 | |
Hong Kong | | | — | | | | 166,773 | | | | — | | | | 166,773 | |
India | | | 41,364 | | | | — | | | | — | | | | 41,364 | |
Indonesia | | | — | | | | 27,359 | | | | — | | | | 27,359 | |
Israel | | | 22,073 | | | | — | | | | — | | | | 22,073 | |
Japan | | | — | | | | 767,752 | | | | — | | | | 767,752 | |
Macau | | | — | | | | 27,651 | | | | — | | | | 27,651 | |
Netherlands | | | — | | | | 206,032 | | | | — | | | | 206,032 | |
South Africa | | | — | | | | 41,151 | | | | — | | | | 41,151 | |
South Korea | | | — | | | | 99,420 | | | | — | | | | 99,420 | |
Spain | | | — | | | | 45,257 | | | | — | | | | 45,257 | |
Switzerland | | | — | | | | 389,170 | | | | — | | | | 389,170 | |
Taiwan | | | 44,155 | | | | — | | | | — | | | | 44,155 | |
United Kingdom | | | — | | | | 706,069 | | | | — | | | | 706,069 | |
United States | | | — | | | | 35,393 | | | | — | | | | 35,393 | |
| | | | | | | | | | | | | | | | |
Total Common Stocks | | | 140,130 | | | | 3,436,240 | | | | — | | | | 3,576,370 | |
| | | | | | | | | | | | | | | | |
Preferred Stocks | | | | | | | | | | | | | | | | |
Germany | | | — | | | | 42,841 | | | | — | | | | 42,841 | |
Short-Term Investment | | | | | | | | | | | | | | | | |
Investment Company | | | 76,383 | | | | — | | | | — | | | | 76,383 | |
| | | | | | | | | | | | | | | | |
Total Investments in Securities | | $ | 216,513 | | | $ | 3,479,081 | | | $ | — | | | $ | 3,695,594 | |
| | | | | | | | | | | | | | | | |
Depreciation in Other Financial Instruments | | | | | | | | | | | | | | | | |
Forward Foreign Currency Exchange Contracts | | $ | — | | | $ | (5 | ) | | $ | — | | | $ | (5 | ) |
| | | | | | | | | | | | | | | | |
| | | | | | |
| | | |
| 154 | | | | J.P. MORGAN INTERNATIONAL EQUITY FUNDS | | APRIL 30, 2017 |
| | | | | | | | | | | | | | | | |
| International Equity Income Fund | |
| | | | |
| | | Level 1
Quoted prices | | | Level 2
Other significant
observable inputs | | | Level 3
Significant
unobservable inputs | | | Total | |
Investments in Securities | |
Common Stocks | | | | | | | | | | | | | | | | |
Belgium | | $ | — | | | $ | 5,177 | | | $ | — | | | $ | 5,177 | |
Brazil | | | 1,279 | | | | — | | | | — | | | | 1,279 | |
Canada | | | 3,329 | | | | — | | | | — | | | | 3,329 | |
China | | | — | | | | 2,733 | | | | — | | | | 2,733 | |
Czech Republic | | | — | | | | 3,110 | | | | — | | | | 3,110 | |
Denmark | | | — | | | | 4,749 | | | | — | | | | 4,749 | |
Finland | | | 1,325 | | | | 5,520 | | | | — | | | | 6,845 | |
France | | | — | | | | 13,141 | | | | — | | | | 13,141 | |
Germany | | | — | | | | 21,208 | | | | — | | | | 21,208 | |
Hong Kong | | | — | | | | 1,841 | | | | — | | | | 1,841 | |
Israel | | | 1,201 | | | | — | | | | — | | | | 1,201 | |
Japan | | | 3,755 | | | | 15,112 | | | | — | | | | 18,867 | |
Netherlands | | | — | | | | 9,838 | | | | — | | | | 9,838 | |
New Zealand | | | — | | | | 2,229 | | | | — | | | | 2,229 | |
Norway | | | — | | | | 2,692 | | | | — | | | | 2,692 | |
Russia | | | — | | | | 8,506 | | | | — | | | | 8,506 | |
South Korea | | | — | | | | 3,433 | | | | — | | | | 3,433 | |
Spain | | | — | | | | 1,681 | | | | — | | | | 1,681 | |
Sweden | | | — | | | | 1,567 | | | | — | | | | 1,567 | |
Switzerland | | | 1,193 | | | | 11,972 | | | | — | | | | 13,165 | |
Taiwan | | | 1,562 | | | | — | | | | — | | | | 1,562 | |
United Kingdom | | | 4,102 | | | | 38,337 | | | | — | | | | 42,439 | |
| | | | | | | | | | | | | | | | |
Total Common Stocks | | | 17,746 | | | | 152,846 | | | | — | | | | 170,592 | |
| | | | | | | | | | | | | | | | |
Short-Term Investment | | | | | | | | | | | | | | | | |
Investment Company | | | 3,386 | | | | — | | | | — | | | | 3,386 | |
| | | | | | | | | | | | | | | | |
Total Investments in Securities | | $ | 21,132 | | | $ | 152,846 | | | $ | — | | | $ | 173,978 | |
| | | | | | | | | | | | | | | | |
| International Opportunities Fund | |
| | | | |
| | | Level 1
Quoted prices | | | Level 2
Other significant
observable inputs | | | Level 3
Significant
unobservable inputs | | | Total | |
Investments in Securities | | | | | | | | | | | | | | | | |
Common Stocks | | | | | | | | | | | | | | | | |
Australia | | $ | — | | | $ | 112,809 | | | $ | — | | | $ | 112,809 | |
Belgium | | | — | | | | 46,945 | | | | — | | | | 46,945 | |
Chile | | | — | | | | 32,747 | | | | — | | | | 32,747 | |
China | | | — | | | | 82,188 | | | | — | | | | 82,188 | |
Denmark | | | — | | | | 70,128 | | | | — | | | | 70,128 | |
Finland | | | — | | | | 64,089 | | | | — | | | | 64,089 | |
France | | | — | | | | 414,043 | | | | — | | | | 414,043 | |
Germany | | | — | | | | 233,288 | | | | — | | | | 233,288 | |
India | | | 45,077 | | | | — | | | | — | | | | 45,077 | |
Italy | | | — | | | | 72,625 | | | | — | | | | 72,625 | |
Japan | | | — | | | | 703,715 | | | | — | | | | 703,715 | |
Netherlands | | | — | | | | 204,037 | | | | — | | | | 204,037 | |
Norway | | | — | | | | 41,096 | | | | — | | | | 41,096 | |
Spain | | | — | | | | 48,260 | | | | — | | | | 48,260 | |
Sweden | | | — | | | | 39,055 | | | | — | | | | 39,055 | |
Switzerland | | | — | | | | 159,312 | | | | — | | | | 159,312 | |
United Kingdom | | | — | | | | 491,154 | | | | — | | | | 491,154 | |
United States | | | — | | | | 41,186 | | | | — | | | | 41,186 | |
| | | | | | | | | | | | | | | | |
Total Common Stocks | | | 45,077 | | | | 2,856,677 | | | | — | | | | 2,901,754 | |
| | | | | | | | | | | | | | | | |
| | | | | | | | |
| | | |
| APRIL 30, 2017 | | J.P. MORGAN INTERNATIONAL EQUITY FUNDS | | | | | 155 | |
NOTES TO FINANCIAL STATEMENTS
AS OF APRIL 30, 2017 (Unaudited) (continued)
| | | | | | | | | | | | | | | | |
| International Opportunities Fund (continued) | |
| | | Level 1
Quoted prices | | | Level 2
Other significant
observable inputs | | | Level 3
Significant
unobservable inputs | | | Total | |
Preferred Stocks | | | | | | | | | | | | | | | | |
Germany | | $ | — | | | $ | 36,068 | | | $ | — | | | $ | 36,068 | |
Short-Term Investment | | | | | | | | | | | | | | | | |
Investment Company | | | 38,835 | | | | — | | | | — | | | | 38,835 | |
| | | | | | | | | | | | | | | | |
Total Investments in Securities | | $ | 83,912 | | | $ | 2,892,745 | | | $ | — | | | $ | 2,976,657 | |
| | | | | | | | | | | | | | | | |
Appreciation in Other Financial Instruments | | | | | | | | | | | | | | | | |
Forward Foreign Currency Exchange Contracts | | $ | — | | | $ | 9,115 | | | $ | — | | | $ | 9,115 | |
| | | | | | | | | | | | | | | | |
Depreciation in Other Financial Instruments | | | | | | | | | | | | | | | | |
Forward Foreign Currency Exchange Contracts | | $ | — | | | $ | (15,012 | ) | | $ | — | | | $ | (15,012 | ) |
| | | | | | | | | | | | | | | | |
| | | |
| International Research Enhanced Equity Fund | | | | | | | | | | | | | |
| | | | |
| | | Level 1
Quoted prices | | | Level 2
Other significant
observable inputs | | | Level 3
Significant
unobservable inputs | | | Total | |
Investments in Securities | | | | | | | | | | | | | | | | |
Common Stocks | | | | | | | | | | | | | | | | |
Australia | | $ | — | | | $ | 109,946 | | | $ | 6 | | | $ | 109,952 | |
Austria | | | — | | | | 7,574 | | | | — | | | | 7,574 | |
Belgium | | | — | | | | 19,309 | | | | — | | | | 19,309 | |
Denmark | | | — | | | | 17,582 | | | | — | | | | 17,582 | |
Finland | | | — | | | | 33,832 | | | | — | | | | 33,832 | |
France | | | — | | | | 167,053 | | | | — | | | | 167,053 | |
Germany | | | — | | | | 162,937 | | | | — | | | | 162,937 | |
Hong Kong | | | — | | | | 43,586 | | | | — | | | | 43,586 | |
Ireland | | | 7,417 | | | | — | | | | — | | | | 7,417 | |
Israel | | | 10,056 | | | | — | | | | — | | | | 10,056 | |
Italy | | | — | | | | 51,605 | | | | — | | | | 51,605 | |
Japan | | | — | | | | 354,174 | | | | — | | | | 354,174 | |
Luxembourg | | | — | | | | 8,867 | | | | — | | | | 8,867 | |
Netherlands | | | — | | | | 85,392 | | | | — | | | | 85,392 | |
New Zealand | | | — | | | | 5,669 | | | | — | | | | 5,669 | |
Norway | | | — | | | | 6,199 | | | | — | | | | 6,199 | |
Portugal | | | — | | | | 5,127 | | | | — | | | | 5,127 | |
Singapore | | | — | | | | 14,969 | | | | — | | | | 14,969 | |
Spain | | | — | | | | 39,886 | | | | — | | | | 39,886 | |
Sweden | | | — | | | | 13,358 | | | | — | | | | 13,358 | |
Switzerland | | | — | | | | 160,595 | | | | — | | | | 160,595 | |
United Kingdom | | | 1,044 | | | | 259,028 | | | | — | | | | 260,072 | |
United States | | | — | | | | 17,928 | | | | — | | | | 17,928 | |
| | | | | | | | | | | | | | | | |
Total Common Stocks | | | 18,517 | | | | 1,584,616 | | | | 6 | | | | 1,603,139 | |
| | | | | | | | | | | | | | | | |
Preferred Stocks | | | | | | | | | | | | | | | | |
Germany | | | — | | | | 17,098 | | | | — | | | | 17,098 | |
Debt Securities | | | | | | | | | | | | | | | | |
Corporate Bonds | | | | | | | | | | | | | | | | |
Brazil | | | — | | | | — | | | | — | (b) | | | — | (b) |
Short-Term Investment | | | | | | | | | | | | | | | | |
Investment Company | | | 36,122 | | | | — | | | | — | | | | 36,122 | |
| | | | | | | | | | | | | | | | |
Total Investments in Securities | | $ | 54,639 | | | $ | 1,601,714 | | | $ | 6 | | | $ | 1,656,359 | |
| | | | | | | | | | | | | | | | |
| | | | | | |
| | | |
| 156 | | | | J.P. MORGAN INTERNATIONAL EQUITY FUNDS | | APRIL 30, 2017 |
| | | | | | | | | | | | | | | | |
| International Research Enhanced Equity Fund (continued) | |
| | | Level 1
Quoted prices | | | Level 2
Other significant
observable inputs | | | Level 3
Significant
unobservable inputs | | | Total | |
Appreciation in Other Financial Instruments | | | | | | | | | | | | | | | | |
Forward Foreign Currency Exchange Contracts | | $ | — | | | $ | 3 | | | $ | — | | | $ | 3 | |
Futures Contracts | | | — | | | | 553 | | | | — | | | | 553 | |
| | | | | | | | | | | | | | | | |
Total Appreciation in Other Financial Instruments | | $ | — | | | $ | 556 | | | $ | — | | | $ | 556 | |
| | | | | | | | | | | | | | | | |
Depreciation in Other Financial Instruments | | | | | | | | | | | | | | | | |
Futures Contracts | | $ | — | | | $ | (67 | ) | | $ | — | | | $ | (67 | ) |
| | | | | | | | | | | | | | | | |
| | | |
| International Unconstrained Equity Fund | | | | | | | | | | | | | |
| | | | |
| | | Level 1
Quoted prices | | | Level 2
Other significant
observable inputs | | | Level 3
Significant
unobservable inputs | | | Total | |
Investments in Securities | | | | | | | | | | | | | | | | |
Common Stocks | | | | | | | | | | | | | | | | |
Belgium | | $ | — | | | $ | 3,492 | | | $ | — | | | $ | 3,492 | |
Canada | | | 6,851 | | | | — | | | | — | | | | 6,851 | |
China | | | 6,061 | | | | 7,387 | | | | — | | | | 13,448 | |
Denmark | | | — | | | | 2,701 | | | | — | | | | 2,701 | |
Finland | | | — | | | | 8,326 | | | | — | | | | 8,326 | |
Germany | | | — | | | | 7,956 | | | | — | | | | 7,956 | |
Hong Kong | | | — | | | | 10,127 | | | | — | | | | 10,127 | |
India | | | 4,054 | | | | — | | | | — | | | | 4,054 | |
Israel | | | 3,433 | | | | — | | | | — | | | | 3,433 | |
Italy | | | — | | | | 2,560 | | | | — | | | | 2,560 | |
Japan | | | — | | | | 17,582 | | | | — | | | | 17,582 | |
Macau | | | — | | | | 2,623 | | | | — | | | | 2,623 | |
Netherlands | | | — | | | | 18,660 | | | | — | | | | 18,660 | |
South Africa | | | — | | | | 2,245 | | | | — | | | | 2,245 | |
South Korea | | | — | | | | 11,039 | | | | — | | | | 11,039 | |
Spain | | | — | | | | 4,591 | | | | — | | | | 4,591 | |
Switzerland | | | — | | | | 13,402 | | | | — | | | | 13,402 | |
United Kingdom | | | — | | | | 31,844 | | | | — | | | | 31,844 | |
United States | | | — | | | | 2,066 | | | | — | | | | 2,066 | |
| | | | | | | | | | | | | | | | |
Total Common Stocks | | | 20,399 | | | | 146,601 | | | | — | | | | 167,000 | |
| | | | | | | | | | | | | | | | |
Short-Term Investment | | | | | | | | | | | | | | | | |
Investment Company | | | 5,532 | | | | — | | | | — | | | | 5,532 | |
| | | | | | | | | | | | | | | | |
Total Investments in Securities | | $ | 25,931 | | | $ | 146,601 | | | $ | — | | | $ | 172,532 | |
| | | | | | | | | | | | | | | | |
| | | | | | | | |
| | | |
| APRIL 30, 2017 | | J.P. MORGAN INTERNATIONAL EQUITY FUNDS | | | | | 157 | |
NOTES TO FINANCIAL STATEMENTS
AS OF APRIL 30, 2017 (Unaudited) (continued)
International Value Fund
| | | | | | | | | | | | | | | | |
| | | Level 1
Quoted prices | | | Level 2
Other significant
observable inputs | | | Level 3
Significant
unobservable inputs | | | Total | |
Investments in Securities | | | | | | | | | | | | | | | | |
Common Stocks | | | | | | | | | | | | | | | | |
Australia | | $ | — | | | $ | 32,170 | | | $ | — | | | $ | 32,170 | |
Austria | | | — | | | | 9,249 | | | | — | | | | 9,249 | |
Belgium | | | — | | | | 17,989 | | | | — | | | | 17,989 | |
Canada | | | 8,589 | | | | — | | | | — | | | | 8,589 | |
Chile | | | 4,722 | | | | — | | | | — | | | | 4,722 | |
China | | | — | | | | 6,631 | | | | — | | | | 6,631 | |
Finland | | | — | | | | 8,183 | | | | — | | | | 8,183 | |
France | | | — | | | | 131,108 | | | | — | | | | 131,108 | |
Germany | | | — | | | | 68,737 | | | | — | | | | 68,737 | |
Hong Kong | | | — | | | | 10,772 | | | | — | | | | 10,772 | |
Ireland | | | 7,138 | | | | — | | | | — | | | | 7,138 | |
Israel | | | 10,338 | | | | — | | | | — | | | | 10,338 | |
Italy | | | — | | | | 27,137 | | | | — | | | | 27,137 | |
Japan | | | — | | | | 187,316 | | | | — | | | | 187,316 | |
Luxembourg | | | — | | | | 8,154 | | | | — | | | | 8,154 | |
Netherlands | | | — | | | | 63,750 | | | | — | | | | 63,750 | |
Norway | | | — | | | | 8,529 | | | | — | | | | 8,529 | |
Singapore | | | — | | | | 10,235 | | | | — | | | | 10,235 | |
South Korea | | | — | | | | 9,202 | | | | — | | | | 9,202 | |
Spain | | | — | | | | 24,737 | | | | — | | | | 24,737 | |
Sweden | | | — | | | | 14,499 | | | | — | | | | 14,499 | |
Switzerland | | | — | | | | 37,159 | | | | — | | | | 37,159 | |
United Kingdom | | | — | | | | 83,244 | | | | — | | | | 83,244 | |
United States | | | — | | | | 11,982 | | | | — | | | | 11,982 | |
| | | | | | | | | | | | | | | | |
Total Common Stocks | | | 30,787 | | | | 770,783 | | | | — | | | | 801,570 | |
| | | | | | | | | | | | | | | | |
Short-Term Investment | | | | | | | | | | | | | | | | |
Investment Company | | | 22,045 | | | | — | | | | — | | | | 22,045 | |
| | | | | | | | | | | | | | | | |
Total Investments in Securities | | $ | 52,832 | | | $ | 770,783 | | | $ | — | | | $ | 823,615 | |
| | | | | | | | | | | | | | | | |
Appreciation in Other Financial Instruments | | | | | | | | | | | | | | | | |
Forward Foreign Currency Exchange Contracts | | $ | — | | | $ | 4,013 | | | $ | — | | | $ | 4,013 | |
| | | | | | | | | | | | | | | | |
Depreciation in Other Financial Instruments | | | | | | | | | | | | | | | | |
Forward Foreign Currency Exchange Contracts | | $ | — | | | $ | (7,340 | ) | | $ | — | | | $ | (7,340 | ) |
| | | | | | | | | | | | | | | | |
| | | | | | |
| | | |
| 158 | | | | J.P. MORGAN INTERNATIONAL EQUITY FUNDS | | APRIL 30, 2017 |
Intrepid International Fund
| | | | | | | | | | | | | | | | |
| | | Level 1
Quoted prices | | | Level 2
Other significant
observable inputs | | | Level 3
Significant
unobservable inputs | | | Total | |
Investments in Securities | | | | | | | | | | | | | | | | |
Common Stocks | | | | | | | | | | | | | | | | |
Australia | | $ | — | | | $ | 198,352 | | | $ | — | | | $ | 198,352 | |
Austria | | | 2,648 | | | | 9,080 | | | | — | | | | 11,728 | |
Belgium | | | — | | | | 24,113 | | | | — | | | | 24,113 | |
China | | | — | | | | 24,073 | | | | — | | | | 24,073 | |
Denmark | | | — | | | | 85,400 | | | | — | | | | 85,400 | |
Finland | | | — | | | | 11,298 | | | | — | | | | 11,298 | |
France | | | — | | | | 292,373 | | | | — | | | | 292,373 | |
Germany | | | 22,182 | | | | 187,430 | | | | — | | | | 209,612 | |
Hong Kong | | | 4,417 | | | | 61,629 | | | | — | | | | 66,046 | |
Indonesia | | | 7,195 | | | | — | | | | — | | | | 7,195 | |
Italy | | | — | | | | 32,748 | | | | — | | | | 32,748 | |
Japan | | | — | | | | 674,967 | | | | — | | | | 674,967 | |
Luxembourg | | | — | | | | 18,978 | | | | — | | | | 18,978 | |
Netherlands | | | 9,461 | | | | 83,581 | | | | — | | | | 93,042 | |
Norway | | | — | | | | 30,804 | | | | — | | | | 30,804 | |
Portugal | | | — | | | | 2,779 | | | | — | | | | 2,779 | |
Singapore | | | — | | | | 19,083 | | | | — | | | | 19,083 | |
South Africa | | | — | | | | 7,916 | | | | — | | | | 7,916 | |
South Korea | | | 2,983 | | | | — | | | | — | | | | 2,983 | |
Spain | | | — | | | | 82,708 | | | | — | | | | 82,708 | |
Sweden | | | — | | | | 78,770 | | | | — | | | | 78,770 | |
Switzerland | | | — | | | | 323,317 | | | | — | | | | 323,317 | |
United Kingdom | | | 16,746 | | | | 442,170 | | | | — | | | | 458,916 | |
United States | | | — | | | | 29,573 | | | | — | | | | 29,573 | |
| | | | | | | | | | | | | | | | |
Total Common Stocks | | | 65,632 | | | | 2,721,142 | | | | — | | | | 2,786,774 | |
| | | | | | | | | | | | | | | | |
Preferred Stock | | | | | | | | | | | | | | | | |
Germany | | | — | | | | 2,052 | | | | — | | | | 2,052 | |
Short-Term Investment | | | | | | | | | | | | | | | | |
Investment Company | | | 73,458 | | | | — | | | | — | | | | 73,458 | |
| | | | | | | | | | | | | | | | |
Total Investments in Securities | | $ | 139,090 | | | $ | 2,723,194 | | | $ | — | | | $ | 2,862,284 | |
| | | | | | | | | | | | | | | | |
Appreciation in Other Financial Instruments | | | | | | | | | | | | | | | | |
Futures Contracts | | $ | — | | | $ | 85 | | | $ | — | | | $ | 85 | |
| | | | | | | | | | | | | | | | |
| (b) | Amount rounds to less than 500. |
For the Emerging Economies Fund, Emerging Markets Equity Fund, International Equity Fund, International Equity Income Fund, International Opportunities Fund, International Research Enhanced Equity Fund, International Unconstrained Equity Fund, International Value Fund and Intrepid International Fund the transfers from level 1 to level 2 in the amounts of approximately $14,600,000, $31,497,000, $60,798,000, $4,725,000, $56,617,000, $15,755,000, $2,901,000, $13,046,000 and $15,844,000, respectively, are due to applying the fair value factors to certain securities during the six months ended April 30, 2017.
For the Emerging Markets Equity Income Fund the transfers from level 2 to level 1 in the amount of approximately $412,000 are due to the non-application of the fair value factors to certain securities during the six months ended April 30, 2017.
For the International Discovery Fund the transfers from level 2 to level 1 in the amount of approximately $71,000 and the transfers from level 2 to level 1 in the amount of approximately $268,000 are due to the application and non-application of the fair value factors to certain securities during the six months ended April 30, 2017.
For the Global Research Enhanced Index Fund there were no significant transfers among any levels during the six months ended April 30, 2017.
For the Global Unconstrained Equity Fund there were no transfers among any levels during the six months ended April 30, 2017.
| | | | | | | | |
| | | |
| APRIL 30, 2017 | | J.P. MORGAN INTERNATIONAL EQUITY FUNDS | | | | | 159 | |
NOTES TO FINANCIAL STATEMENTS
AS OF APRIL 30, 2017 (Unaudited) (continued)
The following is a summary of investments for which significant unobservable inputs (level 3) were used in determining fair value (amounts in thousands):
Emerging Markets Equity Fund
| | | | | | | | | | | | | | | | | | | | | | | | | | | | | | | | | | | | |
| | | Balance as
of October 31, 2016 | | | Realized
gain (loss) | | | Change in net
unrealized
appreciation
(depreciation) | | | Net accretion
(amortization) | | | Purchases1 | | | Sales2 | | | Transfers
into Level 3 | | | Transfers
out of Level 3 | | | Balance as
of April 30, 2017 | |
Common Stock — Information Technology | | $ | — | | | $ | — | | | $ | (231 | ) | | $ | — | | | $ | 17,771 | | | $ | — | | | $ | — | | | $ | — | | | $ | 17,540 | |
| | | | | | | | | | | | | | | | | | | | | | | | | | | | | | | | | | | | |
| 1 | Purchases include all purchases of securities and securities received in corporate actions. |
| 2 | Sales include all sales of securities, maturities, paydowns and securities tendered in corporate actions. |
The changes in net unrealized appreciation (depreciation) attributable to securities owned at April 30, 2017, which were valued using significant unobservable inputs (level 3) amounted to approximately $(231,000).
B. Restricted Securities — Certain securities held by the Funds may be subject to legal or contractual restrictions on resale. Restricted securities generally are resold in transactions exempt from registration under the Securities Act of 1933 (the “Securities Act”). Disposal of these securities may involve time-consuming negotiations and expense. Prompt sale at the current valuation may be difficult and could adversely affect the net asset value of the Funds.
As of April 30, 2017, the Funds had no investments in restricted securities other than securities sold to the Funds under Rule 144A or Regulation S under the Securities Act.
C. Futures Contracts — Emerging Economies Fund, Emerging Markets Equity Income Fund, Global Research Enhanced Index Fund, International Opportunities Fund, International Research Enhanced Equity Fund, International Value Fund and Intrepid International Fund used index futures contracts to gain or reduce exposure to the stock market, maintain liquidity or minimize transaction costs. The Funds also bought futures contracts to invest incoming cash in the market or sold futures in response to cash outflows, thereby simulating an invested position in the underlying index.
Futures contracts provide for the delayed delivery of the underlying instrument at a fixed price or are settled for a cash amount based on the change in the value of the underlying instrument at a specific date in the future. Upon entering into a futures contract, the Funds are required to deposit with the broker, cash or securities in an amount equal to a certain percentage of the contract amount, which is referred to as the initial margin deposit. Subsequent payments, referred to as variation margin, are made or received by the Funds periodically and are based on changes in the market value of open futures contracts. Changes in the market value of open futures contracts are recorded as Change in net unrealized appreciation/depreciation on the Statements of Operations. Realized gains or losses, representing the difference between the value of the contract at the time it was opened and the value at the time it was closed, are reported on the Statements of Operations at the closing or expiration of the futures contract. Securities deposited as initial margin are designated on the SOIs and cash deposited is recorded on the Statements of Assets and Liabilities. A receivable from and/or a payable to brokers for the daily variation margin is also recorded on the Statements of Assets and Liabilities.
The Funds may be subject to the risk that the change in the value of the futures contract may not correlate perfectly with the underlying instrument. Use of long futures contracts subjects the Funds to risk of loss in excess of the amounts shown on the Statements of Assets and Liabilities, up to the notional amount of the futures contracts. Use of short futures contracts subjects the Funds to unlimited risk of loss. The Funds may enter into futures contracts only on exchanges or boards of trade. The exchange or board of trade acts as the counterparty to each futures transaction; therefore, the Funds’ credit risk is limited to failure of the exchange or board of trade. Under some circumstances, futures exchanges may establish daily limits on the amount that the price of a futures contract can vary from the previous day’s settlement price, which could effectively prevent liquidation of positions.
The Funds’ futures contracts are not subject to master netting arrangements (the right to close out all transactions traded with a counterparty and net amounts owed or due across transactions).
The table below discloses the volume of the Funds’ futures contracts activity during the six months ended April 30, 2017 (amounts in thousands):
| | | | | | | | | | | | | | | | | | | | | | | | | | | | |
| | | Emerging
Economies
Fund | | | Emerging
Markets Equity
Income Fund | | | Global Research
Enhanced Index
Fund | | | International
Opportunities
Fund | | | International
Research Enhanced
Equity Fund | | | International
Value Fund | | | Intrepid
International
Fund | |
Futures Contracts: | | | | | | | | | | | | | | | | | | | | | | | | | | | | |
Average Notional Balance Long | | $ | 14,011 | | | $ | 320 | (a) | | $ | 16,522 | (b) | | $ | 77,007 | (c) | | $ | 26,083 | | | $ | 15,417 | (d) | | $ | 37,946 | (e) |
Ending Notional Balance Long | | | 7,538 | | | | — | | | | 16,892 | | | | — | | | | 19,769 | | | | — | | | | 37,946 | |
| (a) | For the period from January 1, 2017 to January 31, 2017. |
| (b) | For the period from March 1, 2017 to April 30, 2017. |
| | | | | | |
| | | |
| 160 | | | | J.P. MORGAN INTERNATIONAL EQUITY FUNDS | | APRIL 30, 2017 |
| (c) | For the period from October 1, 2016 to November 30, 2016. |
| (d) | For the period January 1, 2017 to March 31, 2017. |
| (e) | For the period April 1, 2017 to April 30, 2017. |
D. Forward Foreign Currency Exchange Contracts — Emerging Economies Fund, Emerging Markets Equity Income Fund, International Equity Fund, International Equity Income Fund, International Opportunities Fund, International Research Enhanced Equity Fund and International Value Fund may be exposed to foreign currency risks associated with some or all of their portfolio investments and used forward foreign currency exchange contracts to hedge or manage certain of these exposures as part of an investment strategy. Emerging Economies Fund, Emerging Markets Equity Income Fund, International Equity Fund, International Equity Income Fund, International Opportunities Fund, International Research Enhanced Equity Fund and International Value Fund also bought forward currency exchange contracts to gain exposure to currencies. Forward foreign currency exchange contracts represent obligations to purchase or sell foreign currency on a specified future date at a price fixed at the time the contracts are entered into. Non-deliverable forward foreign currency exchange contracts are settled with the counterparty in U.S. dollars without the delivery of foreign currency.
The values of the forward foreign currency exchange contracts are adjusted daily based on the applicable exchange rate of the underlying currency. Changes in the value of these contracts are recorded as unrealized appreciation or depreciation until the contract settlement date. When the forward foreign currency exchange contract is closed, the Funds record a realized gain or loss equal to the difference between the value at the time the contract was opened and the value at the time it was closed. The Funds also record a realized gain or loss when a forward foreign currency exchange contract offsets another forward foreign currency exchange contract with the same counterparty upon settlement.
The Funds may be required to post or receive collateral for Non-Deliverable forward foreign currency exchange contracts.
The table below discloses the volume of the Funds’ forward foreign currency exchange contracts activity during the six months ended April 30, 2017 (amounts in thousands):
| | | | | | | | | | | | | | | | | | | | | | | | | | | | |
| | | Emerging
Economies
Fund | | | Emerging
Markets Equity
Income Fund | | | International
Equity Fund | | | International
Equity
Income Fund | | | International
Opportunities
Fund | | | International
Research Enhanced
Equity Fund | | | International
Value Fund | |
Forward Foreign Currency Exchange Contracts: | | | | | | | | | | | | | | | | | |
Average Settlement Value Purchased | | $ | 3,175 | (a) | | $ | 83 | (a) | | $ | 15,947 | (b) | | $ | 6,494 | (c) | | $ | 542,166 | | | $ | 1,370 | (b) | | $ | 286,215 | |
Average Settlement Value Sold | | | — | | | | — | | | | — | | | | 5,898 | (c) | | | 477,851 | | | | — | | | | 248,963 | |
Ending Settlement Value Purchased | | | — | | | | — | | | | 15,947 | | | | — | | | | 713,032 | | | | 1,370 | | | | 385,939 | |
Ending Settlement Value Sold | | | — | | | | — | | | | — | | | | — | | | | 653,589 | | | | — | | | | 355,780 | |
| (a) | For the period from January 1, 2017 to January 31, 2017. |
| (b) | For the period from April 1, 2017 to April 30, 2017. |
| (c) | For the period from October 1, 2016 to November 30, 2016. |
E. Summary of Derivatives Information
The following table presents the value of derivatives held as of April 30, 2017, by their primary underlying risk exposure and respective location on the Statements of Assets and Liabilities (amounts in thousands):
Emerging Economies Fund
| | | | | | |
| Derivative Contracts | | Statements of Assets and Liabilities Location | | | |
| Gross Assets: | | | | Futures Contracts (a) | |
Equity contracts | | Receivables, Net Assets — Unrealized Appreciation | | $ | 42 | |
| | | | | | |
| (a) | This amount represents the cumulative appreciation (depreciation) of futures contracts as reported on the SOIs. The Statements of Assets and Liabilities only reflect the current day variation margin receivable/payable from/to brokers. |
The following table presents the value of derivatives held as of April 30, 2017, by their primary underlying risk exposure and respective location on the Statements of Assets and Liabilities (amounts in thousands):
Global Research Enhanced Index Fund
| | | | | | |
| Derivative Contracts | | Statements of Assets and Liabilities Location | | | |
| Gross Assets: | | | | Futures Contracts (a) | |
Equity contracts | | Receivables, Net Assets — Unrealized Appreciation | | $ | 646 | |
| | | | | | |
| (a) | This amount represents the cumulative appreciation (depreciation) of futures contracts as reported on the SOIs. The Statements of Assets and Liabilities only reflect the current day variation margin receivable/payable from/to brokers. |
| | | | | | | | |
| | | |
| APRIL 30, 2017 | | J.P. MORGAN INTERNATIONAL EQUITY FUNDS | | | | | 161 | |
NOTES TO FINANCIAL STATEMENTS
AS OF APRIL 30, 2017 (Unaudited) (continued)
The following table presents the value of derivatives held as of April 30, 2017, by their primary underlying risk exposure and respective location on the Statements of Assets and Liabilities (amounts in thousands):
International Equity Fund
| | | | | | |
| Derivative Contracts | | Statements of Assets and Liabilities Location | | | |
| Gross Liabilities: | | | | Forward Foreign
Currency Exchange
Contracts | |
Foreign exchange contracts | | Payables | | $ | (5 | ) |
| | | | | | |
The following table presents the value of derivatives held as of April 30, 2017, by their primary underlying risk exposure and respective location on the Statements of Assets and Liabilities (amounts in thousands):
International Opportunities Fund
| | | | | | |
| Derivative Contracts | | Statements of Assets and Liabilities Location | | | |
| Gross Assets: | | | | Forward Foreign
Currency Exchange
Contracts | |
Foreign exchange contracts | | Receivables | | $ | 9,115 | |
| | | | | | |
| | |
Gross Liabilities: | | | | | |
Foreign exchange contracts | | Payables | | $ | (15,012 | ) |
| | | | | | |
| (a) | This amount represents the cumulative appreciation (depreciation) of futures contracts as reported on the SOIs. The Statements of Assets and Liabilities only reflect the current day variation margin receivable/payable from/to brokers. |
The following table presents the Fund’s gross derivative assets and liabilities by counterparty net of amounts available for offset under netting arrangements and any related collateral received or posted by the Fund as of April 30, 2017:
International Opportunities Fund
| | | | | | | | | | | | | | | | |
| Counterparty | | Gross Amount of
Derivative Assets
Presented on the
Statement of Assets
and Liabilities (a) | | | Derivatives
Available
for offset | | | Collateral
Received | | | Net Amount Due
From Counterparty
(Not less than zero) | |
Barclays Bank plc | | $ | 1,640 | | | $ | (1,640 | ) | | $ | — | | | $ | — | |
BNP Paribas | | | 123 | | | | (123 | ) | | | — | | | | — | |
Goldman Sachs International | | | 403 | | | | (403 | ) | | | — | | | | — | |
HSBC Bank N.A. | | | 3,491 | | | | (2,267 | ) | | | — | | | | 1,224 | |
Merrill Lynch International | | | 86 | | | | (86 | ) | | | — | | | | — | |
National Australia Bank | | | 568 | | | | (184 | ) | | | — | | | | 384 | |
Societe Generale | | | 258 | | | | — | | | | — | | | | 258 | |
Standard Chartered Bank | | | 335 | | | | — | | | | — | | | | 335 | |
State Street Corp. | | | 650 | | | | (650 | ) | | | — | | | | — | |
TD Bank Financial Group | | | 781 | | | | (781 | ) | | | — | | | | — | |
Union Bank of Switzerland AG | | | 780 | | | | (217 | ) | | | — | | | | 563 | |
| | | | | | | | | | | | | | | | |
| | $ | 9,115 | | | $ | (6,351 | ) | | $ | — | | | $ | 2,764 | |
| | | | | | | | | | | | | | | | |
| | | | | | |
| | | |
| 162 | | | | J.P. MORGAN INTERNATIONAL EQUITY FUNDS | | APRIL 30, 2017 |
| | | | | | | | | | | | | | | | |
| Counterparty | | Gross Amount of Derivative Liabilities
Presented on the
Statement of Assets
and Liabilities (a) | | | Derivatives
Available
for offset | | | Collateral
Posted | | | Net Amount Due
To Counterparty
(Not less than zero) | |
Australia and New Zealand Banking Group Limited | | $ | 2,579 | | | $ | — | | | $ | — | | | $ | 2,579 | |
Barclays Bank plc | | | 3,368 | | | | (1,640 | ) | | | — | | | | 1,728 | |
BNP Paribas | | | 414 | | | | (123 | ) | | | — | | | | 291 | |
Citibank, N.A. | | | 56 | | | | — | | | | — | | | | 56 | |
Goldman Sachs International | | | 1,754 | | | | (403 | ) | | | — | | | | 1,351 | |
HSBC Bank N.A. | | | 2,267 | | | | (2,267 | ) | | | — | | | | — | |
Merrill Lynch International | | | 1,182 | | | | (86 | ) | | | — | | | | 1,096 | |
National Australia Bank | | | 184 | | | | (184 | ) | | | — | | | | — | |
Royal Bank of Canada | | | 95 | | | | — | | | | — | | | | 95 | |
State Street Corp. | | | 2,028 | | | | (650 | ) | | | — | | | | 1,378 | |
TD Bank Financial Group | | | 868 | | | | (781 | ) | | | — | | | | 87 | |
Union Bank of Switzerland AG | | | 217 | | | | (217 | ) | | | — | | | | — | |
| | | | | | | | | | | | | | | | |
| | $ | 15,012 | | | $ | (6,351 | ) | | $ | — | | | $ | 8,661 | |
| | | | | | | | | | | | | | | | |
| (a) | For financial reporting purposes, the Fund does not offset derivative assets and derivative liabilities subject to master netting arrangements on the Statements of Assets and Liabilities. |
The following table presents the value of derivatives held as of April 30, 2017, by their primary underlying risk exposure and respective location on the Statements of Assets and Liabilities (amounts in thousands):
International Research Enhanced Equity Fund
| | | | | | | | | | | | | | |
| Derivative Contracts | | Statements of Assets and Liabilities Location | | | | | | | | | |
| Gross Assets: | | | | Futures
Contracts (a) | | | Forward Foreign
Currency Exchange
Contracts | | | Total | |
Equity contracts | | Receivables, Net Assets — Unrealized Appreciation | | $ | 553 | | | $ | — | | | $ | 553 | |
Foreign exchange contracts | | Receivables | | | — | | | | 3 | | | | 3 | |
| | | | | | | | | | | | | | |
Total | | | | $ | 553 | | | $ | 3 | | | $ | 556 | |
| | | | | | | | | | | | | | |
| | | | |
Gross Liabilities: | | | | | | | | | | | |
Equity contracts | | Payables, Net Assets — Unrealized Depreciation | | $ | (67 | ) | | $ | — | | | $ | (67 | ) |
| | | | | | | | | | | | | | |
| (a) | This amount represents the cumulative appreciation (depreciation) of futures contracts as reported on the SOIs. The Statements of Assets and Liabilities only reflect the current day variation margin receivable/payable from/to brokers. |
The following table presents the value of derivatives held as of April 30, 2017, by their primary underlying risk exposure and respective location on the Statements of Assets and Liabilities (amounts in thousands):
International Value Fund
| | | | | | |
| Derivative Contracts | | Statements of Assets and Liabilities Location | | | |
| Gross Assets: | | | | Forward Foreign
Currency Exchange
Contracts | |
Foreign exchange contracts | | Receivables | | $ | 4,013 | |
| | | | | | |
| | |
Gross Liabilities: | | | | | |
Foreign exchange contracts | | Payables | | $ | (7,340 | ) |
| | | | | | |
| | | | | | | | |
| | | |
| APRIL 30, 2017 | | J.P. MORGAN INTERNATIONAL EQUITY FUNDS | | | | | 163 | |
NOTES TO FINANCIAL STATEMENTS
AS OF APRIL 30, 2017 (Unaudited) (continued)
The following table presents the Fund’s gross derivative assets and liabilities by counterparty net of amounts available for offset under netting arrangements and any related collateral received or posted by the Fund as of April 30, 2017:
International Value Fund
| | | | | | | | | | | | | | | | |
| Counterparty | | Gross Amount of Derivative Assets
Presented on the
Statement of Assets
and Liabilities (a) | | | Derivatives
Available
for offset | | | Collateral
Received | | | Net Amount Due
From Counterparty
(Not less than zero) | |
Australia and New Zealand Banking Group Limited | | $ | 198 | | | $ | (198 | ) | | $ | — | | | $ | — | |
BNP Paribas | | | 18 | | | | (18 | ) | | | — | | | | — | |
Citibank, N.A. | | | 712 | | | | (712 | ) | | | — | | | | — | |
Credit Suisse International | | | 213 | | | | — | | | | — | | | | 213 | |
Goldman Sachs International | | | 245 | | | | (245 | ) | | | — | | | | — | |
National Australia Bank | | | 105 | | | | (105 | ) | | | — | | | | — | |
Royal Bank of Canada | | | 289 | | | | — | | | | — | | | | 289 | |
Societe Generale | | | 125 | | | | — | | | | — | | | | 125 | |
Standard Chartered Bank | | | 518 | | | | (518 | ) | | | — | | | | — | |
State Street Corp. | | | 428 | | | | (297 | ) | | | — | | | | 131 | |
TD Bank Financial Group | | | 1,162 | | | | (18 | ) | | | — | | | | 1,144 | |
| | | | | | | | | | | | | | | | |
| | $ | 4,013 | | | $ | (2,111 | ) | | $ | — | | | $ | 1,902 | |
| | | | | | | | | | | | | | | | |
| | | | |
| Counterparty | | Gross Amount of
Derivative Liabilities
Presented on the
Statement of Assets
and Liabilities (a) | | | Derivatives
Available
for offset | | | Collateral
Posted | | | Net Amount Due
To Counterparty
(Not less than zero) | |
Australia and New Zealand Banking Group Limited | | $ | 335 | | | $ | (198 | ) | | $ | — | | | $ | 137 | |
BNP Paribas | | | 832 | | | | (18 | ) | | | | | | | 814 | |
Citibank, N.A. | | | 820 | | | | (712 | ) | | | — | | | | 108 | |
Goldman Sachs International | | | 1,323 | | | | (245 | ) | | | — | | | | 1,078 | |
HSBC Bank, N.A. | | | 2,859 | | | | — | | | | — | | | | 2,859 | |
Merrill Lynch International | | | 125 | | | | — | | | | — | | | | 125 | |
National Australia Bank | | | 196 | | | | (105 | ) | | | | | | | 91 | |
Standard Chartered Bank | | | 535 | | | | (518 | ) | | | — | | | | 17 | |
State Street Corp. | | | 297 | | | | (297 | ) | | | — | | | | — | |
TD Bank Financial Group | | | 18 | | | | (18 | ) | | | — | | | | — | |
| | | | | | | | | | | | | | | | |
| | $ | 7,340 | | | $ | (2,111 | ) | | $ | — | | | $ | 5,229 | |
| | | | | | | | | | | | | | | | |
| (a) | For financial reporting purposes, the Fund does not offset derivative assets and derivative liabilities subject to master netting arrangements on the Statements of Assets and Liabilities. |
The following table presents the value of derivatives held at April 30, 2017, by their primary underlying risk exposure and respective location on the Statements of Assets and Liabilities (amounts in thousands):
Intrepid International Fund
| | | | | | |
| Derivative Contracts | | Statements of Assets and Liabilities Location | | | |
| Gross Assets: | | | | Futures Contracts (a) | |
Equity contracts | | Receivables, Net Assets — Unrealized Appreciation | | $ | 85 | |
| | | | | | |
| (a) | This amount represents the cumulative appreciation (depreciation) of futures contracts as reported on the SOIs. The Statements of Assets and Liabilities only reflect the current day variation margin receivable/payable from/to brokers. |
The Funds are party to various derivative contracts governed by International Swaps and Derivatives Association master agreements (“ISDA agreements”). The Funds’ ISDA agreements, which are separately negotiated with each dealer counterparty, may contain provisions allowing, absent other considerations, a counterparty to exercise rights, to the extent not otherwise waived, against the Funds in the event the Funds’ net assets decline over time by a pre-determined percentage or fall below a pre-determined floor. The ISDA agreements may also contain provisions allowing, absent other conditions, the Funds to exercise rights, to the extent not otherwise waived, against the counterparty (e.g., decline in a counterparty’s
| | | | | | |
| | | |
| 164 | | | | J.P. MORGAN INTERNATIONAL EQUITY FUNDS | | APRIL 30, 2017 |
credit rating below a specified level). Such rights for both the counterparty and Funds often include the ability to terminate (i.e., close out) open contracts at prices which may favor the counterparty, which could have an adverse effect on the Funds. The ISDA agreements give the Funds and counterparty the right, upon an event of default, to close out all transactions traded under such agreements and to net amounts owed or due across all transactions and offset such net payable or receivable with collateral posted to a segregated account by one party to the other.
The following tables present the effect of derivatives on the Statements of Operations for the six months ended April 30, 2017, by primary underlying risk exposure (amounts in thousands):
Emerging Economies Fund
| | | | | | | | | | | | |
| Amount of Realized Gain (Loss) on Derivatives Recognized on the Statements of Operations | |
| Derviative Contracts | | Futures Contracts | | | Forward Foreign
Currency Exchange
Contracts | | | Total | |
Equity contracts | | $ | (195 | ) | | $ | — | | | $ | (195 | ) |
Foreign exchange contracts | | | — | | | | 180 | | | | 180 | |
| | | | | | | | | | | | |
| | $ | (195 | ) | | $ | 180 | | | $ | (15 | ) |
| | | | | | | | | | | | |
| | | | |
| Amount of Change in Unrealized Appreciation (Depreciation) on Derivatives Recognized on the Statements of Operations | |
| Derviative Contracts | | Futures Contracts | |
Equity contracts | | $ | 324 | |
| | | | |
Emerging Markets Equity Income Fund
| | | | | | | | | | | | |
| Amount of Realized Gain (Loss) on Derivatives Recognized on the Statements of Operations | |
| Derviative Contracts | | Futures Contracts | | | Forward Foreign
Currency Exchange
Contracts | | | Total | |
Equity contracts | | $ | (1 | ) | | $ | — | | | $ | (1 | ) |
Foreign exchange contracts | | | — | | | | — | (a) | | | — | (a) |
| | | | | | | | | | | | |
| | $ | (1 | ) | | $ | — | (a) | | $ | (1 | ) |
| | | | | | | | | | | | |
| (a) | Amount rounds to less than 500. |
Global Research Enhanced Index Fund
| | | | |
| Amount of Change in Unrealized Appreciation (Depreciation) on Derivatives Recognized on the Statements of Operations | |
| Derviative Contracts | | Futures Contracts | |
Equity contracts | | $ | 646 | |
| | | | |
International Equity Fund
| | | | |
| Amount of Realized Gain (Loss) on Derivatives Recognized on the Statements of Operations | |
| Derviative Contracts | | Forward Foreign
Currency Exchange Contracts | |
Foreign exchange contracts | | $ | (320 | ) |
| | | | |
| | | | |
| Amount of Change in Unrealized Appreciation (Depreciation) on Derivatives Recognized on the Statements of Operations | |
| Derviative Contracts | | Forward Foreign
Currency Exchange
Contracts | |
Foreign exchange contracts | | $ | (5 | ) |
| | | | |
International Equity Income Fund
| | | | |
| Amount of Realized Gain (Loss) on Derivatives Recognized on the Statements of Operations | |
| Derviative Contracts | | Forward Foreign
Currency Exchange
Contracts | |
Foreign exchange contracts | | $ | (393 | ) |
| | | | |
| | | | | | | | |
| | | |
| APRIL 30, 2017 | | J.P. MORGAN INTERNATIONAL EQUITY FUNDS | | | | | 165 | |
NOTES TO FINANCIAL STATEMENTS
AS OF APRIL 30, 2017 (Unaudited) (continued)
| | | | |
| Amount of Change in Unrealized Appreciation (Depreciation) on Derivatives Recognized on the Statements of Operations | |
| Derviative Contracts | | Forward Foreign
Currency Exchange
Contracts | |
Foreign exchange contracts | | $ | 113 | |
| | | | |
International Opportunities Fund
| | | | | | | | | | | | |
| Amount of Realized Gain (Loss) on Derivatives Recognized on the Statements of Operations | |
| Derviative Contracts | | Futures Contracts | | | Forward Foreign
Currency Exchange
Contracts | | | Total | |
Equity contracts | | $ | (151 | ) | | $ | — | | | $ | (151 | ) |
Foreign exchange contracts | | | — | | | | 10,449 | | | | 10,449 | |
| | | | | | | | | | | | |
| | $ | (151 | ) | | $ | 10,449 | | | $ | 10,298 | |
| | | | | | | | | | | | |
| | | | | | | | | | | | |
| Amount of Change in Unrealized Appreciation (Depreciation) on Derivatives Recognized on the Statements of Operations | |
| Derviative Contracts | | Futures Contracts | | | Forward Foreign
Currency Exchange
Contracts | | | Total | |
Equity contracts | | $ | (386 | ) | | $ | — | | | $ | (386 | ) |
Foreign exchange contracts | | | — | | | | (9,236 | ) | | | (9,236 | ) |
| | | | | | | | | | | | |
| | $ | (386 | ) | | $ | (9,236 | ) | | $ | (9,622 | ) |
| | | | | | | | | | | | |
International Research Enhanced Equity Fund
| | | | |
| Amount of Realized Gain (Loss) on Derivatives Recognized on the Statements of Operations | |
| Derviative Contracts | | Futures Contracts | |
Equity contracts | | $ | 4,772 | |
| | | | |
| | | | | | | | | | | | |
| Amount of Change in Unrealized Appreciation (Depreciation) on Derivatives Recognized on the Statements of Operations | |
| Derviative Contracts | | Futures Contracts | | | Forward Foreign
Currency Exchange
Contracts | | | Total | |
Equity contracts | | $ | (212 | ) | | $ | — | | | $ | (212 | ) |
Foreign exchange contracts | | | — | | | | 3 | | | | 3 | |
| | | | | | | | | | | | |
| | $ | (212 | ) | | $ | 3 | | | $ | (209 | ) |
| | | | | | | | | | | | |
International Unconstrained Equity Fund
| | | | |
| Amount of Realized Gain (Loss) on Derivatives Recognized on the Statements of Operations | |
| Derviative Contracts | | Forward Foreign
Currency Exchange
Contracts | |
Foreign exchange contracts | | $ | (18 | ) |
| | | | |
International Value Fund
| | | | | | | | | | | | |
| Amount of Realized Gain (Loss) on Derivatives Recognized on the Statements of Operations | |
| Derviative Contracts | | Futures Contracts | | | Forward Foreign
Currency Exchange Contracts | | | Total | |
Equity contracts | | $ | 825 | | | $ | — | | | $ | 825 | |
Foreign exchange contracts | | | — | | | | 4,157 | | | | 4,157 | |
| | | | | | | | | | | | |
| | $ | 825 | | | $ | 4,157 | | | $ | 4,982 | |
| | | | | | | | | | | | |
| | | | | | |
| | | |
| 166 | | | | J.P. MORGAN INTERNATIONAL EQUITY FUNDS | | APRIL 30, 2017 |
| | | | |
| Amount of Change in Unrealized Appreciation (Depreciation) on Derivatives Recognized on the Statements of Operations | |
| Derviative Contracts | | Forward Foreign
Currency Exchange
Contracts | |
Foreign exchange contracts | | $ | (2,888 | ) |
| | | | |
Intrepid International Fund
| | | | |
| Amount of Change in Unrealized Appreciation (Depreciation) on Derivatives Recognized on the Statements of Operations | |
| Derviative Contracts | | Futures Contracts | |
Equity contracts | | $ | 85 | |
| | | | |
The Funds’ derivatives contracts held at April 30, 2017 are not accounted for as hedging instruments under GAAP.
F. Structured Instruments — Emerging Markets Equity Fund and Emerging Markets Equity Income Fund invested in structured instruments that have similar economic characteristics to equity securities. These instruments often seek to replicate the performance of an underlying reference asset such as an equity security or market (“reference asset”). The value of these instruments is generally derived from the price movements of the reference asset. If the Fund holds the structured instrument to maturity, the Fund will be entitled to receive payment from the instrument’s issuing entity based on the value of the reference asset with any necessary adjustments, and record a realized gain or loss. The instrument may receive dividends paid in connection with the reference asset which are reported as Net realized gain (loss) on investment transactions on the Statements of Operations.
Structured instruments may be issued by banks, broker dealers or their affiliates or other entities and typically constitute unsecured contractual obligations of the issuing entity. In addition to credit risk, investments in structured instruments generally have the same risks associated with a direct investment in the reference asset. However, there can be no assurance that structured instruments will trade at the same price or have the same value as the reference asset. In addition, structured instruments may be subject to transfer restrictions and a liquid market may not exist for these instruments.
The lack of a liquid market may make it difficult to sell the structured instruments or accurately value them. Investments in structured instruments subject the Funds to counterparty risk.
G. Foreign Currency Translation — The books and records of the Funds are maintained in U.S. dollars. Foreign currency amounts are translated into U.S. dollars at the prevailing exchange rates of such currencies against the U.S. dollar. The market value of investment securities and other assets and liabilities are translated at the exchange rate as of the valuation date. Purchases and sales of investment securities, income and expenses are translated at the exchange rate prevailing on the respective dates of such transactions.
The Funds do not isolate the effect of changes in foreign exchange rates from changes in market prices on securities held. Accordingly, such changes are included within Change in net unrealized appreciation/depreciation on investments on the Statements of Operations.
Reported realized foreign currency gains and losses arise from the disposition of foreign currency, currency gains or losses realized between the trade and settlement dates on securities transactions, and the difference between the amounts of dividends, interest and foreign withholding taxes recorded on each Fund’s books on the transaction date and the U.S. dollar equivalent of the amounts actually received or paid. These reported realized foreign currency gains and losses are included in Net realized gain (loss) on foreign currency transactions on the Statements of Operations. Unrealized foreign currency gains and losses arise from changes (due to changes in exchange rates) in the value of foreign currency and other assets and liabilities denominated in foreign currencies, which are held at period end and are included in Change in net unrealized appreciation/depreciation on foreign currency translations on the Statements of Operations.
H. Offering and Organizational Costs — Total offering costs of approximately $112,000 incurred in connection with the offering of shares of International Discovery Fund were amortized on a straight line basis over 12 months from the date the Fund commenced operations. For the six months ended April 30, 2017, total offering costs amortized were approximately $93,000.
I. Security Transactions and Investment Income — Investment transactions are accounted for on the trade date (the date the order to buy or sell is executed). Securities gains and losses are calculated on a specifically identified cost basis. Interest income is determined on the basis of coupon interest accrued using the effective interest method which adjusts for amortization of premiums and accretion of discounts. Dividend income net of foreign taxes withheld, if any, is recorded on the ex-dividend date or when a fund first learns of the dividend. Certain Funds may receive other income from investments in loan assignments and/or unfunded commitments, including amendment fees, consent fees and commitment fees. These fees are recorded as income when received by the Fund. These amounts are included in Interest Income in the Statement of Operations.
J. Allocation of Income and Expenses — Expenses directly attributable to a fund are charged directly to that fund, while the expenses attributable to more than one fund of the Trusts are allocated among the respective funds. In calculating the NAV of each class, investment income, realized and unrealized gains and losses and expenses, other than class specific expenses, are allocated daily to each class of shares based upon the proportion of net assets of each class at the beginning of each day.
| | | | | | | | |
| | | |
| APRIL 30, 2017 | | J.P. MORGAN INTERNATIONAL EQUITY FUNDS | | | | | 167 | |
NOTES TO FINANCIAL STATEMENTS
AS OF APRIL 30, 2017 (Unaudited) (continued)
Transfer agency fees are class-specific expenses and sub-transfer agency fees were class specific expenses up through April 2, 2017. Effective April 3, 2017, the Funds ceased making direct payments to financial intermediaries for any applicable sub-transfer agency services. Payments to financial intermediaries for sub-transfer agency services are made by JPMorgan Distribution Services, Inc. from the Shareholder Servicing Fee which has been renamed as the Service Fee.
The amount of the transfer agency fees and sub-transfer agency fees charged to each class of the Funds for the six months ended April 30, 2017 are as follows (amounts in thousands):
| | | | | | | | | | | | | | | | | | | | | | | | | | | | | | | | |
| | | Class A | | | Class C | | | Class I | | | Class L | | | Class R2 | | | Class R5 | | | Class R6 | | | Total | |
Emerging Economies Fund | | | | | | | | | | | | | | | | | | | | | | | | | | | | | | | | |
Transfer agency fees | | $ | 4 | | | $ | 1 | | | $ | 2 | | | | n/a | | | | n/a | | | $ | — | (a) | | $ | 5 | | | $ | 12 | |
Sub-transfer agency fees | | | 57 | | | | 2 | | | | 1 | | | | n/a | | | | n/a | | | | 1 | | | | — | | | | 61 | |
| | | | | | | |
Emerging Markets Equity Fund | | | | | | | | | | | | | | | | | | | | | | | | | | | | | |
Transfer agency fees | | | 30 | | | | 5 | | | | 9 | | | $ | 8 | | | | n/a | | | | — | (a) | | | 6 | | | | 58 | |
Sub-transfer agency fees | | | 269 | | | | 24 | | | | 96 | | | | 114 | | | | n/a | | | | — | | | | — | | | | 503 | |
| | | | | | | |
Emerging Markets Equity Income Fund | | | | | | | | | | | | | | | | | | | | | | | | | | | | | |
Transfer agency fees | | | — | (a) | | | — | (a) | | | — | (a) | | | n/a | | | | n/a | | | | — | (a) | | | — | (a) | | | — | (a) |
Sub-transfer agency fees | | | 2 | | | | — | (a) | | | — | (a) | | | n/a | | | | n/a | | | | — | | | | — | | | | 2 | |
| | | | | | | |
Global Research Enhanced Index Fund | | | | | | | | | | | | | | | | | | | | | | | | | | | | | |
Transfer agency fees | | | — | (a) | | | — | (a) | | | 27 | | | | n/a | | | $ | — | (a) | | | n/a | | | | n/a | | | | 27 | |
Sub-transfer agency fees | | | — | | | | — | | | | 115 | | | | n/a | | | | — | | | | n/a | | | | n/a | | | | 115 | |
| | | | | | | |
Global Unconstrained Equity Fund | | | | | | | | | | | | | | | | | | | | | | | | | | | | | |
Transfer agency fees | | | 1 | | | | — | (a) | | | — | (a) | | | n/a | | | | — | (a) | | | — | (a) | | | — | (a) | | | 1 | |
Sub-transfer agency fees | | | 1 | | | | — | (a) | | | — | (a) | | | n/a | | | | — | | | | — | | | | — | | | | 1 | |
| | | | | | | |
International Discovery Fund | | | | | | | | | | | | | | | | | | | | | | | | | | | | | |
Transfer agency fees | | | — | (a) | | | — | (a) | | | — | (a) | | | n/a | | | | n/a | | | | — | (a) | | | — | (a) | | | — | (a) |
Sub-transfer agency fees | | | — | (a) | | | — | | | | — | (a) | | | n/a | | | | n/a | | | | — | | | | — | | | | — | (a) |
| | | | | | | |
International Equity Fund | | | | | | | | | | | | | | | | | | | | | | | | | | | | | |
Transfer agency fees | | | 16 | | | | 3 | | | | 5 | | | | n/a | | | | — | (a) | | | 1 | | | | 10 | | | | 35 | |
Sub-transfer agency fees | | | 69 | | | | 11 | | | | 41 | | | | n/a | | | | 2 | | | | 13 | | | | — | | | | 136 | |
| | | | | | | |
International Equity Income Fund | | | | | | | | | | | | | | | | | | | | | | | | | | | | | |
Transfer agency fees | | | 2 | | | | 1 | | | | 3 | | | | n/a | | | | — | (a) | | | — | (a) | | | — | (a) | | | 6 | |
Sub-transfer agency fees | | | 23 | | | | 5 | | | | 22 | | | | n/a | | | | — | | | | — | (a) | | | — | | | | 50 | |
| | | | | | | |
International Opportunities Fund | | | | | | | | | | | | | | | | | | | | | | | | | | | | | |
Transfer agency fees | | | 9 | | | | — | (a) | | | 4 | | | | — | (a) | | | n/a | | | | n/a | | | | 7 | | | | 20 | |
Sub-transfer agency fees | | | 24 | | | | 1 | | | | 7 | | | | 2 | | | | n/a | | | | n/a | | | | — | | | | 34 | |
| | | | | | | |
International Research Enhanced Equity Fund | | | | | | | | | | | | | | | | | | | | | | | | | | | | | |
Transfer agency fees | | | 20 | | | | 2 | | | | 6 | | | | n/a | | | | 14 | | | | n/a | | | | n/a | | | | 42 | |
Sub-transfer agency fees | | | 35 | | | | 9 | | | | 125 | | | | n/a | | | | 3 | | | | n/a | | | | n/a | | | | 172 | |
International Unconstrained Equity Fund | | | | | | | | | | | | | | | | | | | | | | | | | | | | | |
Transfer agency fees | | | 2 | | | | 1 | | | | 2 | | | | n/a | | | | — | (a) | | | — | (a) | | | — | | | | 5 | |
Sub-transfer agency fees | | | 5 | | | | 1 | | | | 2 | | | | n/a | | | | — | | | | — | | | | — | | | | 8 | |
| | | | | | | |
International Value Fund | | | | | | | | | | | | | | | | | | | | | | | | | | | | | |
Transfer agency fees | | | 11 | | | | 2 | | | | 4 | | | | 4 | | | | — | (a) | | | — | (a) | | | — | (a) | | | 21 | |
Sub-transfer agency fees | | | 235 | | | | 17 | | | | 18 | | | | — | | | | 2 | | | | — | | | | — | | | | 272 | |
| | | | | | | |
Intrepid International Fund | | | | | | | | | | | | | | | | | | | | | | | | | | | | | |
Transfer agency fees | | | 5 | | | | — | (a) | | | 1 | | | | — | | | | — | (a) | | | n/a | | | | 8 | | | | 14 | |
Sub-transfer agency fees | | | 10 | | | | 1 | | | | 7 | | | | — | (a) | | | — | (a) | | | n/a | | | | — | | | | 18 | |
| (a) | Amount rounds to less than 500. |
K. Federal Income Taxes — Each Fund is treated as a separate taxable entity for Federal income tax purposes. Each Fund’s policy is to comply with the provisions of the Internal Revenue Code of 1986, as amended (the “Code”), applicable to regulated investment companies and to distribute to shareholders all of its distributable net investment income and net realized capital gains on investments. Accordingly, no provision for Federal
| | | | | | |
| | | |
| 168 | | | | J.P. MORGAN INTERNATIONAL EQUITY FUNDS | | APRIL 30, 2017 |
income tax is necessary. Management has reviewed the Funds’ tax positions for all open tax years and has determined that as of April 30, 2017, no liability for income tax is required in the Funds’ financial statements for net unrecognized tax benefits. However, management’s conclusions may be subject to future review based on changes in, or the interpretation of, the accounting standards or tax laws and regulations. Each of the Funds’ Federal tax returns for the prior three fiscal years, or since inception if shorter, remains subject to examination by the Internal Revenue Service.
L. Foreign Taxes — The Funds may be subject to foreign taxes on income, gains on investments or currency purchases/repatriation, a portion of which may be recoverable. The Funds will accrue such taxes and recoveries as applicable, based upon their current interpretation of tax rules and regulations that exist in the markets in which they invest. Certain Funds are subject to a tax imposed on short-term capital gains on securities of issuers domiciled in India. The Funds record an estimated deferred tax liability for these securities that have been held for less than one year at the end of the reporting period, assuming those positions were disposed of at the end of the period. This amount, if any, is reported as Deferred India capital gains tax in the accompanying Statements of Assets and Liabilities. Short-term realized capital losses on the sale of securities of issuers domiciled in India can be carried forward for eight years to offset potential future short-term realized capital gains.
India has enacted rules imposing a tax on the indirect transfers of Indian shares. Based upon current guidance from the Indian tax authorities, management does not believe that such tax will be applicable to the Funds. However, management’s conclusion, regarding this and other foreign tax matters, may be subject to future review based on changes in, or the interpretation of, the accounting standards and the tax laws and regulations.
M. Distributions to Shareholders — Distributions from net investment income if any, are generally declared and paid annually, except for International Equity Income Fund, which are declared and paid monthly. Distributions are declared separately for each class. No class has preferential dividend rights; differences in per share rates are due to differences in separate class expenses. Net realized capital gains, if any, are distributed by each Fund at least annually. The amount of distributions from net investment income and net realized capital gains is determined in accordance with Federal income tax regulations, which may differ from GAAP. To the extent these “book/tax” differences are permanent in nature (i.e., that they result from other than timing of recognition — “temporary differences”), such amounts are reclassified within the capital accounts based on their Federal tax-basis treatment.
3. Fees and Other Transactions with Affiliates
A. Investment Advisory Fee — Pursuant to Investment Advisory Agreements, the Adviser supervises the investments of each Fund and for such services is paid a fee. The fee is accrued daily and paid monthly based on each Fund’s respective average daily net assets.
The annual rate for each Fund is as follows:
| | | | |
Emerging Economies Fund | | | 0.85 | % |
Emerging Markets Equity Fund | | | 0.85 | |
Emerging Markets Equity Income Fund | | | 1.00 | |
Global Research Enhanced Index Fund | | | 0.20 | |
Global Unconstrained Equity Fund | | | 0.70 | |
International Discovery Fund | | | 0.70 | |
International Equity Fund* | | | 0.70 | |
International Equity Income Fund | | | 0.70 | |
International Opportunities Fund | | | 0.60 | |
International Research Enhanced Equity Fund | | | 0.20 | |
International Unconstrained Equity Fund | | | 0.70 | |
International Value Fund | | | 0.60 | |
Intrepid International Fund | | | 0.60 | |
| * | Prior to November 1, 2016, the annual rate was 0.80%. |
The Adviser waived Investment Advisory fees and/or reimbursed expenses as outlined in Note 3.F.
B. Administration Fee — Pursuant to Administration Agreements, the Administrator provides certain administration services to the Funds. In consideration of these services, the Administrator receives a fee accrued daily and paid monthly at an annual rate of 0.15% of the first $25 billion of the average daily net assets of all funds in the J.P. Morgan Funds Complex covered by the Administration Agreement (excluding certain funds of funds and money market funds) and 0.075% of the average daily net assets in excess of $25 billion of all such funds. For the six months ended April 30, 2017, the effective rate was 0.08% of each Fund’s average daily net assets, notwithstanding any fee waivers and/or expense reimbursements.
The Administrator waived Administration fees as outlined in Note 3.F.
JPMorgan Chase Bank, N.A. (“JPMCB”), a wholly-owned subsidiary of JPMorgan, serves as the Funds’ sub-administrator (the “Sub-administrator”). For its services as Sub-administrator, JPMCB receives a portion of the fees payable to the Administrator.
| | | | | | | | |
| | | |
| APRIL 30, 2017 | | J.P. MORGAN INTERNATIONAL EQUITY FUNDS | | | | | 169 | |
NOTES TO FINANCIAL STATEMENTS
AS OF APRIL 30, 2017 (Unaudited) (continued)
C. Distribution Fees — Pursuant to a Distribution Agreement, JPMorgan Distribution Services, Inc. (“JPMDS”), a wholly-owned subsidiary of JPMorgan, serves as the Trusts’ principal underwriter and promotes and arranges for the sale of each Fund’s shares. The Board has adopted a Distribution Plan (the “Distribution Plan”) for Class A, Class C and Class R2 Shares of the Funds, as applicable, in accordance with Rule 12b-1 under the 1940 Act. The Class R5, Class R6, Class I and Institutional Class Shares do not charge a distribution fee. The Distribution Plan provides that each Fund shall pay distribution fees, including payments to JPMDS, at annual rates of the average daily net assets as shown in the table below:
| | | | | | | | | | | | |
| | | Class A | | | Class C | | | Class R2 | |
Emerging Economies Fund | | | 0.25 | % | | | 0.75 | % | | | n/a | |
Emerging Markets Equity Fund | | | 0.25 | | | | 0.75 | | | | n/a | |
Emerging Markets Equity Income Fund | | | 0.25 | | | | 0.75 | | | | n/a | |
Global Research Enhanced Index Fund | | | 0.25 | | | | 0.75 | | | | 0.50 | % |
Global Unconstrained Equity Fund | | | 0.25 | | | | 0.75 | | | | 0.50 | |
International Discovery Fund | | | 0.25 | | | | 0.75 | | | | n/a | |
International Equity Fund | | | 0.25 | | | | 0.75 | | | | 0.50 | |
International Equity Income Fund | | | 0.25 | | | | 0.75 | | | | 0.50 | |
International Opportunities Fund | | | 0.25 | | | | 0.75 | | | | n/a | |
International Research Enhanced Equity Fund | | | 0.25 | | | | 0.75 | | | | 0.50 | |
International Unconstrained Equity Fund | | | 0.25 | | | | 0.75 | | | | 0.50 | |
International Value Fund | | | 0.25 | | | | 0.75 | | | | 0.50 | |
Intrepid International Fund | | | 0.25 | | | | 0.75 | | | | 0.50 | |
In addition, JPMDS is entitled to receive the front-end sales charges from purchases of Class A Shares and the CDSC from redemptions of Class C Shares and certain Class A Shares for which front-end sales charges have been waived. For the six months ended April 30, 2017, JPMDS retained the following amounts (in thousands):
| | | | | | | | |
| | | Front-End
Sales Charge | | | CDSC | |
Emerging Economies Fund | | $ | 1 | | | $ | — | |
Emerging Markets Equity Fund | | | 37 | | | | — | (a) |
Emerging Markets Equity Income Fund | | | — | (a) | | | — | |
Global Unconstrained Equity Fund | | | — | (a) | | | — | |
International Equity Fund | | | 4 | | | | — | (a) |
International Equity Income Fund | | | 14 | | | | — | (a) |
International Opportunities Fund | | | 1 | | | | — | (a) |
International Research Enhanced Equity Fund | | | 2 | | | | — | |
International Unconstrained Equity Fund | | | 11 | | | | — | (a) |
International Value Fund | | | 66 | | | | — | |
Intrepid International Fund | | | 1 | | | | — | |
| (a) | Amount rounds to less than 500. |
D. Service Fees — The Trusts, on behalf of the Funds, have entered into a Shareholder Servicing Agreement with JPMDS under which JPMDS provides certain support services to the shareholders. The Class R6 Shares do not charge service fees. For performing these services, JPMDS receives a fee that is accrued daily and paid monthly equal to a percentage of the average daily net assets as shown in the table below:
| | | | | | | | | | | | | | | | | | | | | | | | |
| | | Class A | | | Class C | | | Class I | | | Class L | | | Class R2 | | | Class R5 | |
Emerging Economies Fund | | | 0.25 | % | | | 0.25 | % | | | 0.25 | % | | | n/a | | | | n/a | | | | 0.10 | % |
Emerging Markets Equity Fund | | | 0.25 | | | | 0.25 | | | | 0.25 | | | | 0.10 | % | | | n/a | | | | 0.10 | |
Emerging Markets Equity Income Fund | | | 0.25 | | | | 0.25 | | | | 0.25 | | | | n/a | | | | n/a | | | | 0.10 | |
Global Research Enhanced Index Fund | | | 0.25 | | | | 0.25 | | | | 0.25 | | | | n/a | | | | 0.25 | % | | | n/a | |
Global Unconstrained Equity Fund | | | 0.25 | | | | 0.25 | | | | 0.25 | | | | n/a | | | | 0.25 | | | | 0.10 | |
International Discovery Fund | | | 0.25 | | | | 0.25 | | | | 0.25 | | | | n/a | | | | n/a | | | | 0.10 | |
International Equity Fund | | | 0.25 | | | | 0.25 | | | | 0.25 | | | | n/a | | | | 0.25 | | | | 0.10 | |
International Equity Income Fund | | | 0.25 | | | | 0.25 | | | | 0.25 | | | | n/a | | | | 0.25 | | | | 0.10 | |
International Opportunities Fund | | | 0.25 | | | | 0.25 | | | | 0.25 | | | | 0.10 | * | | | n/a | | | | n/a | |
International Research Enhanced Equity Fund | | | 0.25 | | | | 0.25 | | | | 0.25 | | | | n/a | | | | 0.25 | | | | n/a | |
International Unconstrained Equity Fund | | | 0.25 | | | | 0.25 | | | | 0.25 | | | | n/a | | | | 0.25 | | | | 0.10 | |
International Value Fund | | | 0.25 | | | | 0.25 | | | | 0.25 | | | | 0.10 | | | | 0.25 | | | | 0.10 | |
Intrepid International Fund | | | 0.25 | | | | 0.25 | | | | 0.25 | | | | 0.10 | * | | | 0.25 | | | | n/a | |
| * | Liquidated on December 8, 2016. |
| | | | | | |
| | | |
| 170 | | | | J.P. MORGAN INTERNATIONAL EQUITY FUNDS | | APRIL 30, 2017 |
JPMDS has entered into shareholder services contracts with affiliated and unaffiliated financial intermediaries who provide shareholder services and other related services to their clients or customers who invest in the Funds under which JPMDS will pay all or a portion of such fees earned to financial intermediaries for performing such services.
JPMDS waived service fees as outlined in Note 3.F.
E. Custodian and Accounting Fees — JPMCB provides portfolio and accounting services to the Funds. For performing these services, the Funds pay JPMCB transaction and asset-based fees that vary according to the number of transactions and positions, plus out-of-pocket expenses. The amounts paid directly to JPMCB by the Funds for custody and accounting services are included in Custodian and accounting fees on the Statements of Operations.
Interest income earned on cash balances at the custodian, if any, is included as Interest income from affiliates on the Statements of Operations.
Interest expense paid to the custodian related to cash overdrafts, if any, is included in Interest expense to affiliates on the Statements of Operations.
F. Waivers and Reimbursements — The Adviser, Administrator and/or JPMDS have contractually agreed to waive fees and/or reimburse the Funds to the extent that total annual operating expenses (excluding acquired fund fees and expenses other than certain money market fund fees as described below, dividend and interest expenses related to short sales, interest, taxes, expenses related to litigation and potential litigation and extraordinary expenses) exceed the percentages of the Funds’ respective average daily net assets as shown in the table below:
| | | | | | | | | | | | | | | | | | | | | | | | | | | | |
| | | Class A | | | Class C | | | Class I | | | Class L | | | Class R2 | | | Class R5 | | | Class R6 | |
Emerging Economies Fund* | | | 1.35 | % | | | 1.85 | % | | | 1.10 | % | | | n/a | | | | n/a | | | | 0.95 | % | | | 0.85 | % |
Emerging Markets Equity Fund** | | | 1.35 | | | | 1.85 | | | | 1.10 | | | | 0.95 | % | | | n/a | | | | 0.95 | | | | 0.85 | |
Emerging Markets Equity Income Fund | | | 1.55 | | | | 2.05 | | | | 1.30 | | | | n/a | | | | n/a | | | | 1.10 | | | | 1.05 | |
Global Research Enhanced Index Fund | | | 0.59 | | | | 1.09 | | | | 0.34 | | | | n/a | | | | 0.84 | % | | | n/a | | | | n/a | |
Global Unconstrained Equity Fund*** | | | 1.25 | | | | 1.75 | | | | 0.90 | | | | n/a | | | | 1.50 | | | | 0.80 | | | | 0.75 | |
International Discovery Fund | | | 1.25 | | | | 1.75 | | | | 0.95 | | | | n/a | | | | n/a | | | | 0.80 | | | | 0.75 | |
International Equity Fund**** | | | 1.24 | | | | 1.74 | | | | 0.99 | | | | n/a | | | | 1.49 | | | | 0.84 | | | | 0.74 | |
International Equity Income Fund | | | 1.25 | | | | 1.75 | | | | 0.90 | | | | n/a | | | | 1.50 | | | | 0.80 | | | | 0.75 | |
International Opportunities Fund***** | | | 1.24 | | | | 1.74 | | | | 0.99 | | | | n/a | | | | n/a | | | | n/a | | | | 0.74 | |
International Research Enhanced Equity Fund | | | 0.60 | | | | 1.10 | | | | 0.35 | | | | n/a | | | | 0.85 | | | | n/a | | | | n/a | |
International Unconstrained Equity Fund | | | 1.25 | | | | 1.75 | | | | 0.90 | | | | n/a | | | | 1.50 | | | | 0.80 | | | | 0.75 | |
International Value Fund | | | 1.35 | | | | 1.85 | | | | 1.10 | | | | 0.95 | | | | 1.60 | | | | 0.95 | | | | 0.85 | |
Intrepid International Fund | | | 1.25 | | | | 1.75 | | | | 0.90 | | | | 0.85 | | | | 1.50 | | | | n/a | | | | 0.75 | |
| * | Prior to May 20, 2016, the contractual expense limitations for Emerging Economies Fund were 1.55%, 2.05%, 1.10%, 1.05% and 1.30% for Class A, Class C, Class I, Class R5 and Class R6, respectively. |
| ** | Prior to May 20, 2016, the contractual expense limitations for Emerging Markets Equity Fund were 1.55%, 2.05%, 1.05%, 1.15% and 1.30% for Class A, Class C, Class I, Class L and Class R6, respectively. |
| *** | Prior to February 27, 2017, the contractual expense limitations for Global Unconstrained Equity Fund were 0.75%, 1.25%, 0.40%, 1.00%, 0.30% and 0.25% for Class A, Class C, Class I, Class R2, Class R5 and Class R6, respectively. |
| **** | Prior to November 1, 2016, the contractual expense limitations for International Equity Fund were 1.31%, 1.81%, 1.06%, 1.56%, 0.86% and 0.81% for Class A, Class C, Class I, Class R2, Class R5 and Class R6, respectively. |
| ***** | Prior to November 1, 2016, the contractual expense limitations for International Opportunities Fund were 1.31%, 1.92%, 1.06% and 0.81% for Class A, Class C, Class I and Class R6, respectively. |
Except as noted above, the expense limitation agreements were in effect for the six months ended April 30, 2017 and are in place until February 28, 2018.
| | | | | | | | |
| | | |
| APRIL 30, 2017 | | J.P. MORGAN INTERNATIONAL EQUITY FUNDS | | | | | 171 | |
NOTES TO FINANCIAL STATEMENTS
AS OF APRIL 30, 2017 (Unaudited) (continued)
For the six months ended April 30, 2017, the Funds’ service providers waived fees and/or reimbursed expenses for each of the Funds as follows (amounts in thousands). None of these parties expect the Funds to repay any such waived fees and/or reimbursed expenses in future years.
| | | | | | | | | | | | | | | | | | | | |
| | | Contractual Waivers | | | | |
| | | Investment
Advisory Fees | | | Administration Fees | | | Service Fees | | | Total | | | Contractual
Reimbursements | |
Emerging Economies Fund | | $ | 1,052 | | | $ | 635 | | | $ | 67 | | | $ | 1,754 | | | $ | 4 | |
Emerging Markets Equity Fund | | | 1,483 | | | | 989 | | | | 552 | | | | 3,024 | | | | 3 | |
Emerging Markets Equity Income Fund | | | 65 | | | | 5 | | | | 2 | | | | 72 | | | | 75 | |
Global Research Enhanced Index Fund | | | 4,561 | | | | 2,960 | | | | 76 | | | | 7,597 | | | | — | (a) |
Global Unconstrained Equity Fund | | | 2 | | | | — | (a) | | | 2 | | | | 4 | | | | 129 | |
International Discovery Fund | | | 21 | | | | 3 | | | | 1 | | | | 25 | | | | 192 | |
International Equity Fund | | | 727 | | | | 482 | | | | 149 | | | | 1,358 | | | | 3 | |
International Equity Income Fund | | | 158 | | | | 61 | | | | 57 | | | | 276 | | | | — | (a) |
International Opportunities Fund | | | — | | | | — | | | | 17 | | | | 17 | | | | — | |
International Research Enhanced Equity Fund | | | 1,157 | | | | 588 | | | | 83 | | | | 1,828 | | | | 4 | |
International Unconstrained Equity Fund | | | 101 | | | | 51 | | | | 22 | | | | 174 | | | | — | (a) |
International Value Fund | | | — | | | | — | | | | 141 | | | | 141 | | | | — | (a) |
Intrepid International Fund | | | — | | | | — | | | | 21 | | | | 21 | | | | — | |
| (a) | Amount rounds to less than 500. |
| | | | |
| | | Voluntary
Waivers | |
| | | Investment
Advisory | |
Global Unconstrained Equity Fund | | $ | 5 | |
Additionally, the Funds may invest in one or more money market funds advised by the Adviser or its affiliates (affiliated money market funds). The Adviser, Administrator and/or JPMDS, as shareholder servicing agent, have contractually agreed to waive fees and/or reimburse expenses in an amount sufficient to offset the respective net fees each collects from the affiliated money market fund on the applicable Funds’ investment in such affiliated money market fund.
The amounts of these waivers resulting from investments in these money market funds for the six months ended April 30, 2017 were as follows (amounts in thousands):
| | | | |
Emerging Economies Fund | | $ | 30 | |
Emerging Markets Equity Fund | | | 56 | |
Emerging Markets Equity Income Fund | | | — | (a) |
Global Research Enhanced Index Fund | | | 35 | |
Global Unconstrained Equity Fund | | | — | (a) |
International Discovery Fund | | | — | |
International Equity Fund | | | 44 | |
International Equity Income Fund | | | 3 | |
International Opportunities Fund | | | 49 | |
International Research Enhanced Equity Fund | | | 34 | |
International Unconstrained Equity Fund | | | 2 | |
International Value Fund | | | 15 | |
Intrepid International Fund | | | 40 | |
| (a) | Amount rounds to less than 500. |
G. Other — Certain officers of the Trusts are affiliated with the Adviser, the Administrator and JPMDS. Such officers, with the exception of the Chief Compliance Officer, receive no compensation from the Funds for serving in their respective roles.
The Board appointed a Chief Compliance Officer to the Funds in accordance with Federal securities regulations. Each Fund, along with other affiliated funds, makes reimbursement payments, on a pro-rata basis, to the Administrator for a portion of the fees associated with the Office of the Chief Compliance Officer. Such fees are included in Trustees’ and Chief Compliance Officer’s fees on the Statements of Operations.
The Trusts adopted a Trustee Deferred Compensation Plan (the “Plan”) which allows the Independent Trustees to defer the receipt of all or a portion of compensation related to performance of their duties as Trustees. The deferred fees are invested in various J.P. Morgan Funds until distribution in accordance with the Plan.
| | | | | | |
| | | |
| 172 | | | | J.P. MORGAN INTERNATIONAL EQUITY FUNDS | | APRIL 30, 2017 |
During the six months ended April 30, 2017, Emerging Markets Equity Fund, Global Unconstrained Equity Fund, International Discovery Fund and International Equity Income Fund purchased securities from an underwriting syndicate in which the principal underwriter or members of the syndicate were affiliated with the Adviser.
The Funds may use related party broker-dealers. For the six months ended April 30, 2017, the Funds incurred brokerage commissions with broker-dealers affiliated with the Adviser as follows (amounts in thousands):
| | | | |
Emerging Markets Equity Fund | | $ | 1 | |
Global Research Enhanced Index Fund | | | 1 | |
Global Unconstrained Equity Fund | | | — | (a) |
| (a) | Amount rounds to less than 500. |
The Securities and Exchange Commission (“SEC”) has granted an exemptive order permitting the Funds to engage in principal transactions with J.P. Morgan Securities, Inc., an affiliated broker, involving taxable money market instruments, subject to certain conditions.
4. Investment Transactions
During the six months ended April 30, 2017, purchases and sales of investments (excluding short-term investments) were as follows (amounts in thousands):
| | | | | | | | |
| | | Purchases (excluding U.S.
Government) | | | Sales (excluding U.S.
Government) | |
Emerging Economies Fund | | $ | 586,459 | | | $ | 658,704 | |
Emerging Markets Equity Fund | | | 394,248 | | | | 246,989 | |
Emerging Markets Equity Income Fund | | | 5,471 | | | | 1,593 | |
Global Research Enhanced Index Fund | | | 1,214,594 | | | | 1,238,842 | |
Global Unconstrained Equity Fund | | | 989 | | | | 887 | |
International Discovery Fund | | | 4,816 | | | | 4,533 | |
International Equity Fund | | | 165,569 | | | | 276,433 | |
International Equity Income Fund | | | 91,253 | | | | 62,287 | |
International Opportunities Fund | | | 800,224 | | | | 862,938 | |
International Research Enhanced Equity Fund | | | 295,891 | | | | 123,461 | |
International Unconstrained Equity Fund | | | 75,184 | | | | 31,049 | |
International Value Fund | | | 154,768 | | | | 765,288 | |
Intrepid International Fund | | | 835,022 | | | | 955,486 | |
During the six months ended April 30, 2017, there were no purchases or sales of U.S. Government securities.
5. Federal Income Tax Matters
For Federal income tax purposes, the estimated cost and unrealized appreciation (depreciation) in value of investment securities held at April 30, 2017 were as follows (amounts in thousands):
| | | | | | | | | | | | | | | | |
| | | Aggregate Cost | | | Gross Unrealized Appreciation | | | Gross Unrealized Depreciation | | | Net Unrealized Appreciation (Depreciation) | |
Emerging Economies Fund | | $ | 1,638,788 | | | $ | 285,743 | | | $ | 50,585 | | | $ | 235,158 | |
Emerging Markets Equity Fund | | | 2,829,349 | | | | 834,561 | | | | 100,542 | | | | 734,019 | |
Emerging Markets Equity Income Fund | | | 14,835 | | | | 1,202 | | | | 171 | | | | 1,031 | |
Global Research Enhanced Index Fund | | | 6,373,128 | | | | 1,439,204 | | | | 119,025 | | | | 1,320,179 | |
Global Unconstrained Equity Fund | | | 1,896 | | | | 192 | | | | 65 | | | | 127 | |
International Discovery Fund | | | 5,564 | | | | 1,197 | | | | 81 | | | | 1,116 | |
International Equity Fund | | | 3,148,006 | | | | 691,992 | | | | 144,404 | | | | 547,588 | |
International Equity Income Fund | | | 158,631 | | | | 17,492 | | | | 2,145 | | | | 15,347 | |
International Opportunities Fund | | | 2,576,964 | | | | 447,151 | | | | 47,458 | | | | 399,693 | |
International Research Enhanced Equity Fund | | | 1,487,927 | | | | 201,700 | | | | 33,268 | | | | 168,432 | |
International Unconstrained Equity Fund | | | 158,354 | | | | 18,515 | | | | 4,337 | | | | 14,178 | |
International Value Fund | | | 784,428 | | | | 80,678 | | | | 41,491 | | | | 39,187 | |
Intrepid International Fund | | | 2,676,963 | | | | 281,364 | | | | 96,043 | | | | 185,321 | |
Under the Regulated Investment Company Modernization Act of 2010 (the “Act”), net capital losses recognized by the Funds after October 31, 2011, are carried forward indefinitely, and retain their character as short-term and/or long-term losses. Prior to the Act, net capital losses incurred by the Funds were carried forward for eight years and treated as short-term losses. The Act requires that post-enactment net capital losses be used before pre-enactment net capital losses.
| | | | | | | | |
| | | |
| APRIL 30, 2017 | | J.P. MORGAN INTERNATIONAL EQUITY FUNDS | | | | | 173 | |
NOTES TO FINANCIAL STATEMENTS
AS OF APRIL 30, 2017 (Unaudited) (continued)
At October 31, 2016, the Funds had the following pre-enactment net capital loss carryforwards, expiring during the years indicated, which are available to offset future realized gains as follows (amounts in thousands):
| | | | | | | | | | | | | | | | |
| | | 2017 | | | 2018 | | | 2019 | | | Total | |
Emerging Economies Fund | | $ | 1,890 | | | $ | — | | | $ | 16,730 | | | $ | 18,620 | |
Emerging Markets Equity Fund | | | 4,903 | | | | — | | | | — | | | | 4,903 | |
International Equity Fund | | | — | | | | 4,532 | | | | 3,312 | | | | 7,844 | |
International Opportunities Fund | | | — | | | | — | | | | 5,449 | | | | 5,449 | |
International Value Fund | | | 241,545 | | | | 63,767 | | | | — | | | | 305,312 | |
Intrepid International Fund | | | 250,971 | | | | — | | | | — | | | | 250,971 | |
At October 31, 2016, the following Funds had post-enactment net capital loss carryforwards as follows (amounts in thousands):
| | | | | | | | |
| | | Capital Loss Carryforward Character | |
| | | Short-Term | | | Long-Term | |
Emerging Economies Fund | | $ | 146,542 | | | $ | 75,520 | |
Emerging Markets Equity Fund | | | 10,629 | | | | 82,340 | |
Emerging Markets Equity Income Fund | | | 183 | * | | | 318 | * |
Global Research Enhanced Index Fund | | | 104,492 | | | | 132,136 | |
International Discovery Fund | | | 392 | | | | — | |
International Equity Fund | | | — | | | | 33,563 | |
International Equity Income Fund | | | 8,624 | | | | 718 | |
International Opportunities Fund | | | 82,645 | | | | 21,877 | |
International Research Enhanced Equity Fund | | | 2,467 | | | | 686 | |
International Unconstrained Equity Fund | | | 3,639 | | | | 1,080 | |
International Value Fund | | | 71,243 | | | | — | |
Intrepid International Fund | | | 46,299 | | | | — | |
| * | Amount includes capital loss carryforwards from business combinations, which are limited in future years under Internal Revenue Code Sections 381-384. |
6. Borrowings
The Funds rely upon an exemptive order granted by the SEC (the “Order”) permitting the establishment and operation of an Interfund Lending Facility (the “Facility”). The Facility allows the Funds to directly lend and borrow money to or from any other fund relying upon the Order at rates beneficial to both the borrowing and lending funds. Advances under the Facility are taken primarily for temporary or emergency purposes, including the meeting of redemption requests that otherwise might require the untimely disposition of securities, and are subject to each Fund’s borrowing restrictions. The Interfund loan rate is determined, as specified in the Order, by averaging the current repurchase agreement rate and the current bank loan rate. The Order was granted to JPMorgan Trust II and may be relied upon by the Funds because the Funds and the series of JPMorgan Trust II are all investment companies in the same “group of investment companies” (as defined in Section 12(d)(1)(G) of the 1940 Act).
The Trusts and JPMCB have entered into a financing arrangement. Under this arrangement, JPMCB provides an unsecured, uncommitted credit facility in the aggregate amount of $100 million to certain of the J.P. Morgan Funds, including the Funds. Advances under the arrangement are taken primarily for temporary or emergency purposes, including the meeting of redemption requests that otherwise might require the untimely disposition of securities, and are subject to each Fund’s borrowing restrictions. Interest on borrowings is payable at a rate determined by JPMCB at the time of borrowing. This agreement has been extended until November 6, 2017.
The Funds had no borrowings outstanding from another fund or from the unsecured, uncommitted credit facility at April 30, 2017. Average borrowings from the Facility for the six months ended April 30, 2017, were as follows (amounts in thousands):
| | | | | | | | | | | | | | | | |
| | | Average Borrowings | | | Average
Interest Rate Paid | | | Number of Days
Outstanding | | | Interest Paid | |
Emerging Economies Fund | | $ | 24,077 | | | | 1.35 | % | | | 8 | | | $ | 8 | |
Emerging Markets Equity Fund | | | 16,088 | | | | 1.45 | | | | 3 | | | | 2 | |
International Equity Fund | | | 30,293 | | | | 1.33 | | | | 6 | | | | 7 | |
International Opportunities Fund | | | 26,795 | | | | 1.03 | | | | 9 | | | | 8 | |
International Value Fund | | | 22,457 | | | | 0.61 | | | | 7 | | | | 3 | |
Intrepid International Fund | | | 43,082 | | | | 1.38 | | | | 6 | | | | 10 | |
In addition, effective August 16, 2016, the Trusts along with certain other trusts (“Borrowers”) entered into a joint syndicated senior unsecured revolving credit facility totaling $1.5 billion (“Credit Facility”) with various lenders and The Bank of New York Mellon, as administrative agent for the lenders. This Credit Facility provides a source of funds to the Borrowers for temporary and emergency purposes, including the meeting of
| | | | | | |
| | | |
| 174 | | | | J.P. MORGAN INTERNATIONAL EQUITY FUNDS | | APRIL 30, 2017 |
redemption requests that otherwise might require the untimely disposition of securities. Under the terms of the Credit Facility, a borrowing fund must have a minimum of $25,000,000 in adjusted net asset value and not exceed certain adjusted net asset coverage ratios prior to and during the time in which and any borrowings are outstanding. If a fund does not comply with the aforementioned requirements, the Fund must remediate within three business days with respect to the $25,000,000 minimum adjusted net asset value or within one business day with respect to certain asset coverage ratios or the administrative agent at the request of, or with the consent of, the lenders may terminate the Credit Facility and declare any outstanding borrowings to be due and payable immediately.
Interest associated with any borrowing under the Credit Facility is charged to the borrowing fund at a rate of interest equal to 1.00% plus the greater of the federal funds effective rate or one month LIBOR. The annual commitment fee to maintain the Credit Facility is 0.15% and is incurred on the unused portion of the Credit Facility and is allocated to all participating funds pro rata based on their respective net assets. The initial term of the Credit Facility is 364 days, unless extended.
The Funds had no borrowings outstanding from the Credit Facility at April 30, 2017. Average borrowings from the Credit Facility for, or at any time during the six months ended April 30, 2017, were as follows (amounts in thousands):
| | | | | | | | | | | | | | | | |
| | | Average
Borrowings | | | Average
Interest Rate Paid | | | Number of
Days
Outstanding | | | Interest
Paid | |
Intrepid International Fund | | $ | 5,700 | | | | 1.77 | % | | | 4 | | | $ | 1 | |
7. Risks, Concentrations and Indemnifications
In the normal course of business, the Funds enter into contracts that contain a variety of representations which provide general indemnifications. Each Fund’s maximum exposure under these arrangements is unknown. The amount of exposure would depend on future claims that may be made against each Fund that have not yet occurred. However, based on experience, the Funds expect the risk of loss to be remote.
Derivatives may be riskier than other types of investments because they may be more sensitive to changes in economic and market conditions and could result in losses that significantly exceed the Funds’ original investment. Many derivatives create leverage thereby causing the Funds to be more volatile than they would have been if they had not used derivatives. Derivatives also expose the Funds to counterparty risk (the risk that the derivative counterparty will not fulfill its contractual obligations), including credit risk of the derivative counterparty.
As of April 30, 2017, the J.P. Morgan Access Funds, J.P. Morgan Investor Funds and the JPMorgan SmartRetirement Funds, which are affiliated funds of funds, owned in the aggregate, shares representing more than 10% of the net assets of certain Funds as follows:
| | | | | | | | | | | | |
| | | JPMorgan
Access
Funds | | | J.P.
Morgan Investor Funds | | | JPMorgan SmartRetirement Funds | |
Emerging Economies Fund | | | — | | | | 10.2 | % | | | 70.6 | % |
Emerging Markets Equity Fund | | | — | | | | — | | | | 47.0 | |
International Equity Fund | | | — | | | | — | | | | 71.2 | |
International Opportunities Fund | | | — | | | | — | | | | 88.1 | |
International Research Enhanced Equity Fund | | | 17.3 | % | | | 45.5 | | | | — | |
International Unconstrained Equity Fund | | | — | | | | 61.4 | | | | — | |
Intrepid International Fund | | | — | | | | — | | | | 90.8 | |
As of April 30, 2017, the following Funds had individual shareholder accounts and/or omnibus accounts each owning more than 10% of the Fund’s outstanding shares as follows:
| | | | | | | | | | | | | | | | |
| | | Number of Individual Affiliated Shareholder Accounts and/or Affiliated Omnibus Accounts | | | % of the Fund | | | Number of Individual
Nonaffiliated Shareholder Accounts and/or Non-affiliated Omnibus Accounts | | | % of the Fund | |
Emerging Markets Equity Income Fund | | | 1 | | | | 18.7 | % | | | 2 | | | | 67.7 | % |
Global Research Enhanced Index Fund | | | 1 | | | | 84.0 | | | | — | | | | — | |
Global Unconstrained Equity Fund | | | 2 | | | | 25.6 | | | | 2 | | | | 23.1 | |
International Discovery Fund | | | 3 | | | | 97.7 | | | | — | | | | — | |
International Equity Income Fund | | | — | | | | — | | | | 3 | | | | 50.8 | |
International Research Enhanced Equity Fund | | | 1 | | | | 27.8 | | | | 1 | | | | 17.3 | |
International Value Fund | | | — | | | | — | | | | 2 | | | | 55.8 | |
Significant shareholder transactions by these shareholders may impact the Funds’ performance.
| | | | | | | | |
| | | |
| APRIL 30, 2017 | | J.P. MORGAN INTERNATIONAL EQUITY FUNDS | | | | | 175 | |
NOTES TO FINANCIAL STATEMENTS
AS OF APRIL 30, 2017 (Unaudited) (continued)
The Funds may have elements of risk not typically associated with investments in the United States of America due to concentrated investments in a limited number of countries or regions, which may vary throughout the year depending on the Fund. Such concentrations may subject the Funds to additional risks resulting from political or economic conditions in such countries or regions and the possible imposition of adverse governmental laws or currency exchange restrictions could cause the securities and their markets to be less liquid and their prices to be more volatile than those of comparable U.S. securities.
As of April 30, 2017, the following Funds had non-U.S. country allocations representing greater than 10% of total investments as follows:
| | | | | | | | | | | | | | | | | | | | | | | | | | | | |
| | | Brazil | | | China | | | France | | | Germany | | | Hong-Kong | | | India | | | Japan | |
Emerging Economies Fund | | | — | % | | | 21.9 | % | | | — | % | | | — | % | | | — | % | | | — | % | | | — | % |
Emerging Markets Equity Fund | | | 10.1 | | | | 18.5 | | | | — | | | | — | | | | — | | | | 18.6 | | | | — | |
Emerging Markets Equity Income Fund | | | — | | | | 13.1 | | | | — | | | | — | | | | — | | | | — | | | | — | |
International Discovery Fund | | | — | | | | — | | | | — | | | | — | | | | — | | | | — | | | | 24.9 | |
International Equity Fund | | | — | | | | — | | | | 12.2 | | | | — | | | | — | | | | — | | | | 20.8 | |
International Equity Income Fund | | | — | | | | — | | | | — | | | | 12.2 | | | | — | | | | — | | | | 10.8 | |
International Opportunities Fund | | | — | | | | — | | | | 13.9 | | | | — | | | | — | | | | — | | | | 23.6 | |
International Research Enhanced Equity Fund | | | — | | | | — | | | | 10.1 | | | | 10.9 | | | | — | | | | — | | | | 21.4 | |
International Unconstrained Equity Fund | | | — | | | | — | | | | — | | | | — | | | | — | | | | — | | | | 10.2 | |
International Value Fund | | | — | | | | — | | | | 15.9 | | | | — | | | | — | | | | — | | | | 22.7 | |
Intrepid International Fund | | | — | | | | — | | | | 10.2 | | | | — | | | | — | | | | — | | | | 23.6 | |
| | | | | | | | | | | | | | | | | | | | | | | | |
| | | Netherlands | | | South Africa | | | South Korea | | | Switzerland | | | Taiwan | | | United Kingdom | |
Emerging Economies Fund | | | — | % | | | — | % | | | 17.0 | % | | | — | % | | | 14.1 | % | | | — | % |
Emerging Markets Equity Fund | | | — | | | | 11.1 | | | | — | | | | — | | | | — | | | | — | |
Emerging Markets Equity Income Fund | | | — | | | | 12.2 | | | | — | | | | — | | | | 19.5 | | | | — | |
Global Unconstrained Equity Fund | | | — | | | | — | | | | — | | | | — | | | | — | | | | 10.1 | |
International Discovery Fund | | | — | | | | — | | | | — | | | | — | | | | — | | | | 16.4 | |
International Equity Fund | | | — | | | | — | | | | — | | | | 10.5 | | | | — | | | | 19.1 | |
International Equity Income Fund | | | — | | | | — | | | | — | | | | — | | | | — | | | | 24.4 | |
International Opportunities Fund | | | — | | | | — | | | | — | | | | — | | | | — | | | | 16.5 | |
International Research Enhanced Equity Fund | | | — | | | | — | | | | — | | | | — | | | | — | | | | 15.7 | |
International Unconstrained Equity Fund | | | 10.8 | | | | — | | | | — | | | | — | | | | — | | | | 18.4 | |
International Value Fund | | | — | | | | — | | | | — | | | | — | | | | — | | | | 10.1 | |
Intrepid International Fund | | | — | | | | — | | | | — | | | | 11.3 | | | | — | | | | 16.0 | |
As of April 30, 2017, a significant portion of each Fund’s investments consisted of securities that were denominated in foreign currencies. Changes in currency exchange rates will affect the value of, and investment income from, such securities.
8. Investment Company Reporting Modernization
In October 2016, the U.S. Securities and Exchange Commission adopted new rules and forms, and amendments to certain current rules and forms, to modernize the reporting and disclosure of information by registered investment companies. In part, the final rules amend Regulation S-X and will require standardized, enhanced disclosures about derivatives in investment company financial statements, as well as other amendments. The compliance date for the amendments to Regulation S-X is August 1, 2017. At this time, management is currently assessing the anticipated impact of the Regulation S-X amendments on the Fund’s financial statements and related disclosures.
| | | | | | |
| | | |
| 176 | | | | J.P. MORGAN INTERNATIONAL EQUITY FUNDS | | APRIL 30, 2017 |
SCHEDULE OF SHAREHOLDER EXPENSES
(Unaudited)
Hypothetical $1,000 Investment
As a shareholder of the Funds, you incur two types of costs: (1) transaction costs, including sales charges (loads) on purchase payments and redemption fees and (2) ongoing costs, including investment advisory fees, administration fees, distribution fees and other Fund expenses. The examples below are intended to help you understand your ongoing costs (in dollars) of investing in the Funds and to compare these ongoing costs with the ongoing costs of investing in other mutual funds. The examples assume that you had a $1,000 investment in each Class at the beginning of the reporting period, November 1, 2016, and continued to hold your shares at the end of the reporting period, April 30, 2017.
Actual Expenses
For each Class of each Fund in the table below, the first line provides information about actual account values and actual expenses. You may use the information in this line, together with the amount you invested, to estimate the expenses that you paid over the period. Simply divide your account value by $1,000 (for example, an $8,600 account value divided by $1,000 = 8.6), then multiply the result by the number in the first line of each Class under the heading entitled “Expenses Paid During the Period” to estimate the expenses you paid on your account during this period.
Hypothetical Example for Comparison Purposes
The second line of each Class in the table below provides information about hypothetical account values and hypothetical expenses based on the Class’ actual expense ratio and an assumed rate of return of 5% per year before expenses, which is not the Class’ actual return. The hypothetical account values and expenses may not be used to estimate the actual ending account balance or expenses you paid for the period. You may use this information to compare the ongoing costs of investing in the Class of the Funds and other funds. To do so, compare this 5% hypothetical example with the 5% hypothetical examples that appear in the shareholder reports of the other funds. Please note that the expenses shown in the table are meant to highlight your ongoing costs only and do not reflect any transaction costs, such as sales charges (loads) or redemption fees. Therefore, the second line for each Class in the table is useful in comparing ongoing costs only, and will not help you determine the relative total costs of owning different funds. In addition, if these transaction costs were included, your costs would have been higher. The examples also assume all dividends and distributions have been reinvested.
| | | | | | | | | | | | | | | | |
| | | Beginning
Account Value
November 1, 2016 | | | Ending
Account Value
April 30, 2017 | | | Expenses
Paid During
the Period* | | | Annualized
Expense
Ratio | |
Emerging Economies Fund | | | | | | | | | | | | | | | | |
Class A | | | | | | | | | | | | | | | | |
Actual | | $ | 1,000.00 | | | $ | 1,108.50 | | | $ | 7.06 | | | | 1.35 | % |
Hypothetical | | | 1,000.00 | | | | 1,018.10 | | | | 6.76 | | | | 1.35 | |
Class C | | | | | | | | | | | | | | | | |
Actual | | | 1,000.00 | | | | 1,106.40 | | | | 9.66 | | | | 1.85 | |
Hypothetical | | | 1,000.00 | | | | 1,015.62 | | | | 9.25 | | | | 1.85 | |
Class I (formerly Select Class) | | | | | | | | | | | | | | | | |
Actual | | | 1,000.00 | | | | 1,110.30 | | | | 5.76 | | | | 1.10 | |
Hypothetical | | | 1,000.00 | | | | 1,019.34 | | | | 5.51 | | | | 1.10 | |
Class R5 | | | | | | | | | | | | | | | | |
Actual | | | 1,000.00 | | | | 1,111.80 | | | | 4.82 | | | | 0.92 | |
Hypothetical | | | 1,000.00 | | | | 1,020.23 | | | | 4.61 | | | | 0.92 | |
Class R6 | | | | | | | | | | | | | | | | |
Actual | | | 1,000.00 | | | | 1,111.00 | | | | 4.45 | | | | 0.85 | |
Hypothetical | | | 1,000.00 | | | | 1,020.58 | | | | 4.26 | | | | 0.85 | |
| | | | |
Emerging Markets Equity Fund | | | | | | | | | | | | | | | | |
Class A | | | | | | | | | | | | | | | | |
Actual | | | 1,000.00 | | | | 1,098.80 | | | | 6.97 | | | | 1.34 | |
Hypothetical | | | 1,000.00 | | | | 1,018.15 | | | | 6.71 | | | | 1.34 | |
Class C | | | | | | | | | | | | | | | | |
Actual | | | 1,000.00 | | | | 1,095.80 | | | | 9.56 | | | | 1.84 | |
Hypothetical | | | 1,000.00 | | | | 1,015.67 | | | | 9.20 | | | | 1.84 | |
Class I (formerly Select Class) | | | | | | | | | | | | | | | | |
Actual | | | 1,000.00 | | | | 1,100.00 | | | | 5.73 | | | | 1.10 | |
Hypothetical | | | 1,000.00 | | | | 1,019.34 | | | | 5.51 | | | | 1.10 | |
Class L (formerly Institutional Class) | | | | | | | | | | | | | | | | |
Actual | | | 1,000.00 | | | | 1,100.60 | | | | 4.95 | | | | 0.95 | |
Hypothetical | | | 1,000.00 | | | | 1,020.08 | | | | 4.76 | | | | 0.95 | |
| | | | | | | | |
| | | |
| APRIL 30, 2017 | | J.P. MORGAN INTERNATIONAL EQUITY FUNDS | | | | | 177 | |
SCHEDULE OF SHAREHOLDER EXPENSES
(Unaudited) (continued)
Hypothetical $1,000 Investment
| | | | | | | | | | | | | | | | |
| | | Beginning
Account Value
November 1, 2016 | | | Ending
Account Value
April 30, 2017 | | | Expenses
Paid During
the Period* | | | Annualized
Expense
Ratio | |
Emerging Markets Equity Fund (continued) | | | | | | | | | | | | | | | | |
Class R5 | | | | | | | | | | | | | | | | |
Actual | | $ | 1,000.00 | | | $ | 1,100.90 | | | $ | 4.90 | | | | 0.94 | % |
Hypothetical | | | 1,000.00 | | | | 1,020.13 | | | | 4.71 | | | | 0.94 | |
Class R6 | | | | | | | | | | | | | | | | |
Actual | | | 1,000.00 | | | | 1,101.20 | | | | 4.43 | | | | 0.85 | |
Hypothetical | | | 1,000.00 | | | | 1,020.58 | | | | 4.26 | | | | 0.85 | |
| | | | |
Emerging Markets Equity Income Fund | | | | | | | | | | | | | | | | |
Class A | | | | | | | | | | | | | | | | |
Actual | | | 1,000.00 | | | | 1,053.90 | | | | 7.89 | | | | 1.55 | |
Hypothetical | | | 1,000.00 | | | | 1,017.11 | | | | 7.75 | | | | 1.55 | |
Class C | | | | | | | | | | | | | | | | |
Actual | | | 1,000.00 | | | | 1,051.80 | | | | 10.43 | | | | 2.05 | |
Hypothetical | | | 1,000.00 | | | | 1,014.63 | | | | 10.24 | | | | 2.05 | |
Class I (formerly Select Class) | | | | | | | | | | | | | | | | |
Actual | | | 1,000.00 | | | | 1,055.50 | | | | 6.63 | | | | 1.30 | |
Hypothetical | | | 1,000.00 | | | | 1,018.35 | | | | 6.51 | | | | 1.30 | |
Class R5 | | | | | | | | | | | | | | | | |
Actual | | | 1,000.00 | | | | 1,057.20 | | | | 5.61 | | | | 1.10 | |
Hypothetical | | | 1,000.00 | | | | 1,019.34 | | | | 5.51 | | | | 1.10 | |
Class R6 | | | | | | | | | | | | | | | | |
Actual | | | 1,000.00 | | | | 1,056.70 | | | | 5.35 | | | | 1.05 | |
Hypothetical | | | 1,000.00 | | | | 1,019.59 | | | | 5.26 | | | | 1.05 | |
| | | | |
Global Research Enhanced Index Fund | | | | | | | | | | | | | | | | |
Class A | | | | | | | | | | | | | | | | |
Actual | | | 1,000.00 | | | | 1,126.20 | | | | 3.11 | | | | 0.59 | |
Hypothetical | | | 1,000.00 | | | | 1,021.87 | | | | 2.96 | | | | 0.59 | |
Class C | | | | | | | | | | | | | | | | |
Actual | | | 1,000.00 | | | | 1,123.60 | | | | 5.74 | | | | 1.09 | |
Hypothetical | | | 1,000.00 | | | | 1,019.39 | | | | 5.46 | | | | 1.09 | |
Class I (formerly Select Class) | | | | | | | | | | | | | | | | |
Actual | | | 1,000.00 | | | | 1,127.80 | | | | 1.79 | | | | 0.34 | |
Hypothetical | | | 1,000.00 | | | | 1,023.11 | | | | 1.71 | | | | 0.34 | |
Class R2 | | | | | | | | | | | | | | | | |
Actual | | | 1,000.00 | | | | 1,124.60 | | | | 4.37 | | | | 0.83 | |
Hypothetical | | | 1,000.00 | | | | 1,020.68 | | | | 4.16 | | | | 0.83 | |
| | | | |
Global Unconstrained Equity Fund | | | | | | | | | | | | | | | | |
Class A | | | | | | | | | | | | | | | | |
Actual | | | 1,000.00 | | | | 1,141.60 | | | | 3.93 | | | | 0.74 | |
Hypothetical | | | 1,000.00 | | | | 1,021.12 | | | | 3.71 | | | | 0.74 | |
Class C | | | | | | | | | | | | | | | | |
Actual | | | 1,000.00 | | | | 1,138.40 | | | | 6.57 | | | | 1.24 | |
Hypothetical | | | 1,000.00 | | | | 1,018.65 | | | | 6.21 | | | | 1.24 | |
Class I (formerly Select Class) | | | | | | | | | | | | | | | | |
Actual | | | 1,000.00 | | | | 1,144.10 | | | | 2.13 | | | | 0.40 | |
Hypothetical | | | 1,000.00 | | | | 1,022.81 | | | | 2.01 | | | | 0.40 | |
Class R2 | | | | | | | | | | | | | | | | |
Actual | | | 1,000.00 | | | | 1,140.50 | | | | 5.31 | | | | 1.00 | |
Hypothetical | | | 1,000.00 | | | | 1,019.84 | | | | 5.01 | | | | 1.00 | |
Class R5 | | | | | | | | | | | | | | | | |
Actual | | | 1,000.00 | | | | 1,143.50 | | | | 1.59 | | | | 0.30 | |
Hypothetical | | | 1,000.00 | | | | 1,023.31 | | | | 1.51 | | | | 0.30 | |
Class R6 | | | | | | | | | | | | | | | | |
Actual | | | 1,000.00 | | | | 1,144.10 | | | | 1.28 | | | | 0.24 | |
Hypothetical | | | 1,000.00 | | | | 1,023.60 | | | | 1.20 | | | | 0.24 | |
| | | | | | |
| | | |
| 178 | | | | J.P. MORGAN INTERNATIONAL EQUITY FUNDS | | APRIL 30, 2017 |
| | | | | | | | | | | | | | | | |
| | | Beginning
Account Value
November 1, 2016 | | | Ending
Account Value
April 30, 2017 | | | Expenses
Paid During
the Period* | | | Annualized
Expense
Ratio | |
International Discovery Fund | | | | | | | | | | | | | | | | |
Class A | | | | | | | | | | | | | | | | |
Actual | | $ | 1,000.00 | | | $ | 1,119.10 | | | $ | 6.57 | | | | 1.25 | % |
Hypothetical | | | 1,000.00 | | | | 1,018.60 | | | | 6.26 | | | | 1.25 | |
Class C | | | | | | | | | | | | | | | | |
Actual | | | 1,000.00 | | | | 1,116.20 | | | | 9.18 | | | | 1.75 | |
Hypothetical | | | 1,000.00 | | | | 1,016.12 | | | | 8.75 | | | | 1.75 | |
Class I (formerly Select Class) | | | | | | | | | | | | | | | | |
Actual | | | 1,000.00 | | | | 1,121.10 | | | | 5.00 | | | | 0.95 | |
Hypothetical | | | 1,000.00 | | | | 1,020.08 | | | | 4.76 | | | | 0.95 | |
Class R5 | | | | | | | | | | | | | | | | |
Actual | | | 1,000.00 | | | | 1,121.50 | | | | 4.21 | | | | 0.80 | |
Hypothetical | | | 1,000.00 | | | | 1,020.83 | | | | 4.01 | | | | 0.80 | |
Class R6 | | | | | | | | | | | | | | | | |
Actual | | | 1,000.00 | | | | 1,121.90 | | | | 3.95 | | | | 0.75 | |
Hypothetical | | | 1,000.00 | | | | 1,021.08 | | | | 3.76 | | | | 0.75 | |
| | | | |
International Equity Fund | | | | | | | | | | | | | | | | |
Class A | | | | | | | | | | | | | | | | |
Actual | | | 1,000.00 | | | | 1,109.20 | | | | 6.48 | | | | 1.24 | |
Hypothetical | | | 1,000.00 | | | | 1,018.65 | | | | 6.21 | | | | 1.24 | |
Class C | | | | | | | | | | | | | | | | |
Actual | | | 1,000.00 | | | | 1,107.00 | | | | 9.09 | | | | 1.74 | |
Hypothetical | | | 1,000.00 | | | | 1,016.17 | | | | 8.70 | | | | 1.74 | |
Class I (formerly Select Class) | | | | | | | | | | | | | | | | |
Actual | | | 1,000.00 | | | | 1,110.30 | | | | 5.18 | | | | 0.99 | |
Hypothetical | | | 1,000.00 | | | | 1,019.89 | | | | 4.96 | | | | 0.99 | |
Class R2 | | | | | | | | | | | | | | | | |
Actual | | | 1,000.00 | | | | 1,108.40 | | | | 7.79 | | | | 1.49 | |
Hypothetical | | | 1,000.00 | | | | 1,017.41 | | | | 7.45 | | | | 1.49 | |
Class R5 | | | | | | | | | | | | | | | | |
Actual | | | 1,000.00 | | | | 1,110.90 | | | | 4.40 | | | | 0.84 | |
Hypothetical | | | 1,000.00 | | | | 1,020.63 | | | | 4.21 | | | | 0.84 | |
Class R6 | | | | | | | | | | | | | | | | |
Actual | | | 1,000.00 | | | | 1,112.30 | | | | 3.88 | | | | 0.74 | |
Hypothetical | | | 1,000.00 | | | | 1,021.12 | | | | 3.71 | | | | 0.74 | |
| | | | |
International Equity Income Fund | | | | | | | | | | | | | | | | |
Class A | | | | | | | | | | | | | | | | |
Actual | | | 1,000.00 | | | | 1,086.90 | | | | 6.47 | | | | 1.25 | |
Hypothetical | | | 1,000.00 | | | | 1,018.60 | | | | 6.26 | | | | 1.25 | |
Class C | | | | | | | | | | | | | | | | |
Actual | | | 1,000.00 | | | | 1,084.20 | | | | 8.99 | | | | 1.74 | |
Hypothetical | | | 1,000.00 | | | | 1,016.17 | | | | 8.70 | | | | 1.74 | |
Class I (formerly Select Class) | | | | | | | | | | | | | | | | |
Actual | | | 1,000.00 | | | | 1,088.70 | | | | 4.66 | | | | 0.90 | |
Hypothetical | | | 1,000.00 | | | | 1,020.33 | | | | 4.51 | | | | 0.90 | |
Class R2 | | | | | | | | | | | | | | | | |
Actual | | | 1,000.00 | | | | 1,085.60 | | | | 7.71 | | | | 1.49 | |
Hypothetical | | | 1,000.00 | | | | 1,017.41 | | | | 7.45 | | | | 1.49 | |
Class R5 | | | | | | | | | | | | | | | | |
Actual | | | 1,000.00 | | | | 1,089.10 | | | | 4.14 | | | | 0.80 | |
Hypothetical | | | 1,000.00 | | | | 1,020.83 | | | | 4.01 | | | | 0.80 | |
Class R6 | | | | | | | | | | | | | | | | |
Actual | | | 1,000.00 | | | | 1,089.50 | | | | 3.89 | | | | 0.75 | |
Hypothetical | | | 1,000.00 | | | | 1,021.08 | | | | 3.76 | | | | 0.75 | |
| | | | | | | | |
| | | |
| APRIL 30, 2017 | | J.P. MORGAN INTERNATIONAL EQUITY FUNDS | | | | | 179 | |
SCHEDULE OF SHAREHOLDER EXPENSES
(Unaudited) (continued)
Hypothetical $1,000 Investment
| | | | | | | | | | | | | | | | |
| | | Beginning
Account Value
November 1, 2016 | | | Ending
Account Value
April 30, 2017 | | | Expenses
Paid During
the Period* | | | Annualized
Expense
Ratio | |
International Opportunities Fund | | | | | | | | | | | | | | | | |
Class A | | | | | | | | | | | | | | | | |
Actual | | $ | 1,000.00 | | | $ | 1,125.10 | | | $ | 6.48 | | | | 1.23 | % |
Hypothetical | | | 1,000.00 | | | | 1,018.70 | | | | 6.16 | | | | 1.23 | |
Class C | | | | | | | | | | | | | | | | |
Actual | | | 1,000.00 | | | | 1,122.10 | | | | 9.10 | | | | 1.73 | |
Hypothetical | | | 1,000.00 | | | | 1,016.22 | | | | 8.65 | | | | 1.73 | |
Class I (formerly Select Class) | | | | | | | | | | | | | | | | |
Actual | | | 1,000.00 | | | | 1,125.20 | | | | 5.16 | | | | 0.98 | |
Hypothetical | | | 1,000.00 | | | | 1,019.93 | | | | 4.91 | | | | 0.98 | |
Class R6 | | | | | | | | | | | | | | | | |
Actual | | | 1,000.00 | | | | 1,127.40 | | | | 3.75 | | | | 0.71 | |
Hypothetical | | | 1,000.00 | | | | 1,021.27 | | | | 3.56 | | | | 0.71 | |
| | | | |
International Research Enhanced Equity Fund | | | | | | | | | | | | | | | | |
Class A | | | | | | | | | | | | | | | | |
Actual | | | 1,000.00 | | | | 1,124.90 | | | | 3.11 | | | | 0.59 | |
Hypothetical | | | 1,000.00 | | | | 1,021.87 | | | | 2.96 | | | | 0.59 | |
Class C | | | | | | | | | | | | | | | | |
Actual | | | 1,000.00 | | | | 1,122.00 | | | | 5.73 | | | | 1.09 | |
Hypothetical | | | 1,000.00 | | | | 1,019.39 | | | | 5.46 | | | | 1.09 | |
Class I (formerly Select Class) | | | | | | | | | | | | | | | | |
Actual | | | 1,000.00 | | | | 1,126.60 | | | | 1.85 | | | | 0.35 | |
Hypothetical | | | 1,000.00 | | | | 1,023.06 | | | | 1.76 | | | | 0.35 | |
Class R2 | | | | | | | | | | | | | | | | |
Actual | | | 1,000.00 | | | | 1,124.00 | | | | 4.42 | | | | 0.84 | |
Hypothetical | | | 1,000.00 | | | | 1,020.63 | | | | 4.21 | | | | 0.84 | |
| | | | |
International Unconstrained Equity Fund | | | | | | | | | | | | | | | | |
Class A | | | | | | | | | | | | | | | | |
Actual | | | 1,000.00 | | | | 1,115.40 | | | | 6.50 | | | | 1.24 | |
Hypothetical | | | 1,000.00 | | | | 1,018.65 | | | | 6.21 | | | | 1.24 | |
Class C | | | | | | | | | | | | | | | | |
Actual | | | 1,000.00 | | | | 1,112.90 | | | | 9.12 | | | | 1.74 | |
Hypothetical | | | 1,000.00 | | | | 1,016.17 | | | | 8.70 | | | | 1.74 | |
Class I (formerly Select Class) | | | | | | | | | | | | | | | | |
Actual | | | 1,000.00 | | | | 1,117.60 | | | | 4.67 | | | | 0.89 | |
Hypothetical | | | 1,000.00 | | | | 1,020.38 | | | | 4.46 | | | | 0.89 | |
Class R2 | | | | | | | | | | | | | | | | |
Actual | | | 1,000.00 | | | | 1,114.30 | | | | 7.81 | | | | 1.49 | |
Hypothetical | | | 1,000.00 | | | | 1,017.41 | | | | 7.45 | | | | 1.49 | |
Class R5 | | | | | | | | | | | | | | | | |
Actual | | | 1,000.00 | | | | 1,118.10 | | | | 4.20 | | | | 0.80 | |
Hypothetical | | | 1,000.00 | | | | 1,020.83 | | | | 4.01 | | | | 0.80 | |
Class R6 | | | | | | | | | | | | | | | | |
Actual | | | 1,000.00 | | | | 1,118.00 | | | | 3.94 | | | | 0.75 | |
Hypothetical | | | 1,000.00 | | | | 1,021.08 | | | | 3.76 | | | | 0.75 | |
| | | | |
International Value Fund | | | | | | | | | | | | | | | | |
Class A | | | | | | | | | | | | | | | | |
Actual | | | 1,000.00 | | | | 1,126.60 | | | | 7.01 | | | | 1.33 | |
Hypothetical | | | 1,000.00 | | | | 1,018.20 | | | | 6.66 | | | | 1.33 | |
Class C | | | | | | | | | | | | | | | | |
Actual | | | 1,000.00 | | | | 1,123.50 | | | | 9.64 | | | | 1.83 | |
Hypothetical | | | 1,000.00 | | | | 1,015.72 | | | | 9.15 | | | | 1.83 | |
Class I (formerly Select Class) | | | | | | | | | | | | | | | | |
Actual | | | 1,000.00 | | | | 1,127.50 | | | | 5.49 | | | | 1.04 | |
Hypothetical | | | 1,000.00 | | | | 1,019.64 | | | | 5.21 | | | | 1.04 | |
| | | | | | |
| | | |
| 180 | | | | J.P. MORGAN INTERNATIONAL EQUITY FUNDS | | APRIL 30, 2017 |
| | | | | | | | | | | | | | | | |
| | | Beginning
Account Value
November 1, 2016 | | | Ending
Account Value
April 30, 2017 | | | Expenses
Paid During
the Period* | | | Annualized
Expense
Ratio | |
International Value Fund (continued) | | | | | | | | | | | | | | | | |
Class L (formerly Institutional Class) | | | | | | | | | | | | | | | | |
Actual | | $ | 1,000.00 | | | $ | 1,128.90 | | | $ | 4.59 | | | | 0.87 | % |
Hypothetical | | | 1,000.00 | | | | 1,020.48 | | | | 4.36 | | | | 0.87 | |
Class R2 | | | | | | | | | | | | | | | | |
Actual | | | 1,000.00 | | | | 1,124.80 | | | | 8.38 | | | | 1.59 | |
Hypothetical | | | 1,000.00 | | | | 1,016.91 | | | | 7.95 | | | | 1.59 | |
Class R5 | | | | | | | | | | | | | | | | |
Actual | | | 1,000.00 | | | | 1,128.00 | | | | 4.80 | | | | 0.91 | |
Hypothetical | | | 1,000.00 | | | | 1,020.28 | | | | 4.56 | | | | 0.91 | |
Class R6 | | | | | | | | | | | | | | | | |
Actual | | | 1,000.00 | | | | 1,129.00 | | | | 4.06 | | | | 0.77 | |
Hypothetical | | | 1,000.00 | | | | 1,020.98 | | | | 3.86 | | | | 0.77 | |
| | | | |
Intrepid International Fund | | | | | | | | | | | | | | | | |
Class A | | | | | | | | | | | | | | | | |
Actual | | | 1,000.00 | | | | 1,111.40 | | | | 6.33 | | | | 1.21 | |
Hypothetical | | | 1,000.00 | | | | 1,018.79 | | | | 6.06 | | | | 1.21 | |
Class C | | | | | | | | | | | | | | | | |
Actual | | | 1,000.00 | | | | 1,108.30 | | | | 9.15 | | | | 1.75 | |
Hypothetical | | | 1,000.00 | | | | 1,016.12 | | | | 8.75 | | | | 1.75 | |
Class I (formerly Select Class) | | | | | | | | | | | | | | | | |
Actual | | | 1,000.00 | | | | 1,113.30 | | | | 4.72 | | | | 0.90 | |
Hypothetical | | | 1,000.00 | | | | 1,020.33 | | | | 4.51 | | | | 0.90 | |
Class R2 | | | | | | | | | | | | | | | | |
Actual | | | 1,000.00 | | | | 1,109.90 | | | | 7.79 | | | | 1.49 | |
Hypothetical | | | 1,000.00 | | | | 1,017.41 | | | | 7.45 | | | | 1.49 | |
Class R6 | | | | | | | | | | | | | | | | |
Actual | | | 1,000.00 | | | | 1,114.40 | | | | 3.72 | | | | 0.71 | |
Hypothetical | | | 1,000.00 | | | | 1,021.27 | | | | 3.56 | | | | 0.71 | |
| * | Expenses are equal to each Class’ respective annualized expense ratio, multiplied by the average account value over the period, multiplied by 181/365 (to reflect the one-half year period). |
| | | | | | | | |
| | | |
| APRIL 30, 2017 | | J.P. MORGAN INTERNATIONAL EQUITY FUNDS | | | | | 181 | |
J.P. Morgan Funds are distributed by JPMorgan Distribution Services, Inc., which is an affiliate of JPMorgan Chase & Co. Affiliates of JPMorgan Chase & Co. receive fees for providing various services to the funds.
Contact JPMorgan Distribution Services, Inc. at 1-800-480-4111 for a fund prospectus. You can also visit us at www.jpmorganfunds.com. Investors should carefully consider the investment objectives and risk as well as charges and expenses of the mutual fund before investing. The prospectus contains this and other information about the mutual fund. Read the prospectus carefully before investing.
Investors may obtain information about the Securities Investor Protection Corporation (SIPC), including the SIPC brochure by visiting www.sipc.org or by calling SIPC at 202-371-8300.
Each Fund files a complete schedule of its fund holdings for the first and third quarters of its fiscal year with the SEC on Form N-Q. The Funds’ Forms N-Q are available on the SEC’s website at http://www.sec.gov and may be reviewed and copied at the SEC’s Public Reference Room in Washington, DC. Information on the operation of the SEC’s Public Reference Room may be obtained by calling 1-800-SEC-0330. Shareholders may request the Form N-Q without charge by calling 1-800-480-4111 or by visiting the J.P. Morgan Funds’ website at www.jpmorganfunds.com.
A description of each Fund’s policies and procedures with respect to the disclosure of each Fund’s holdings is available in the prospectus and Statement of Additional Information.
A copy of proxy policies and procedures is available without charge upon request by calling 1-800-480-4111 and on the Funds’ website at www.jpmorganfunds.com. A description of such policies and procedures is on the SEC’s website at www.sec.gov. The Trustees have delegated the authority to vote proxies for securities owned by the Funds to the Adviser. A copy of the Funds’ voting record for the most recent 12-month period ended June 30 is available on the SEC’s website at www.sec.gov or at the Funds’ website at www.jpmorganfunds.com no later than August 31 of each year. The Funds’ proxy voting record will include, among other things, a brief description of the matter voted on for each fund security, and will state how each vote was cast, for example, for or against the proposal.


J.P. Morgan Asset Management is the marketing name for the asset management business of JPMorgan Chase & Co. Those businesses include, but are not limited to, J.P. Morgan Investment Management Inc., Security Capital Research & Management Incorporated and J.P. Morgan Alternative Asset Management, Inc.
| | | | |
| | © JPMorgan Chase & Co., 2017. All rights reserved. April 2017. | | SAN-INTEQ-417 |
ITEM 2. CODE OF ETHICS.
Disclose whether, as of the end of the period covered by the report, the registrant has adopted a code of ethics that applies to the registrant’s principal executive officer, principal financial officer, principal accounting officer or controller, or persons performing similar functions, regardless of whether these individuals are employed by the registrant or a third party. If the registrant has not adopted such a code of ethics, explain why it has not done so.
The registrant must briefly describe the nature of any amendment, during the period covered by the report, to a provision of its code of ethics that applies to the registrant’s principal executive officer, principal financial officer, principal accounting officer or controller, or persons performing similar functions, regardless of whether these individuals are employed by the registrant or a third party, and that relates to any element of the code of ethics definition enumerated in paragraph (b) of this Item. The registrant must file a copy of any such amendment as an exhibit pursuant to Item 12(a)(1), unless the registrant has elected to satisfy paragraph (f) of this Item by positing its code of ethics on its website pursuant to paragraph (f)(2) of this Item, or by undertaking to provide its code of ethics to any person without charge, upon request, pursuant to paragraph (f)(3) of this Item.
If the registrant has, during the period covered by the report, granted a waiver, including an implicit waiver, from a provision of the code of ethics that applies to the registrant’s principal executive officer, principal financial officer, principal accounting officer or controller, or persons performing similar functions, regardless of whether these individuals are employed by the registrant or third party, that relates to one or more items set forth in paragraph (b) of this Item, the registrant must briefly describe the nature of the waiver, the name of the person to whom the waiver was granted, and the date of the waiver.
Not applicable to a semi-annual report.
ITEM 3. AUDIT COMMITTEE FINANCIAL EXPERT.
(a) (1) Disclose that the registrant’s board of directors has determined that the registrant either:
(i) Has at least one audit committee financial expert serving on its audit committee; or
(ii) Does not have an audit committee financial expert serving on its audit committee.
(2) If the registrant provides the disclosure required by paragraph (a)(1)(i) of this Item, it must disclose the name of the audit committee financial expert and whether that person is “independent.” In order to be considered “independent” for purposes of this Item, a member of an audit committee may not, other than in his or her capacity as a member of the audit committee, the board of directors, or any other board committee:
(i) Accept directly or indirectly any consulting, advisory, or other compensatory fee from the issuer; or
(ii) Be an “interested person” of the investment company as defined in Section 2(a)(19) of the Act (15 U.S.C. 80a-2(a)(19)).
(3) If the registrant provides the disclosure required by paragraph (a)(1)(ii) of this Item, it must explain why it does not have an audit committee financial expert.
Not applicable to a semi-annual report.
ITEM 4. PRINCIPAL ACCOUNTANT FEES AND SERVICES.
(a) Disclose, under the caption Audit Fees, the aggregate fees billed for each of the last two fiscal years for professional services rendered by the principal accountant for the audit of the registrant’s annual financial statements or services that are normally provided by the accountant in connection with statutory and regulatory filings or engagements for those fiscal years.
(b) Disclose, under the caption Audit-Related Fees, the aggregate fees billed in each of the last two fiscal years for assurance and related services by the principal accountant that are reasonably related to the performance of the audit of the registrant’s financial statements and are not reported under paragraph (a) of this Item. Registrants shall describe the nature of the services comprising the fees disclosed under this category.
(c) Disclose, under the caption Tax Fees, the aggregate fees billed in each of the last two fiscal years for professional services rendered by the principal accountant for tax compliance, tax advice, and tax planning. Registrants shall describe the nature of the services comprising the fees disclosed under this category.
(d) Disclose, under the caption All Other Fees, the aggregate fees billed in each of the last two fiscal years for products and services provided by the principal accountant, other than the services reported in paragraphs (a) through (c) of this Item. Registrants shall describe the nature of the services comprising the fees disclosed under this category.
(e) (1) Disclose the audit committee’s pre-approval policies and procedures described in paragraph (c)(7) of Rule 2-01 of Regulation S-X.
(2) Disclose the percentage of services described in each of paragraphs (b) through (d) of this Item that were approved by the audit committee pursuant to paragraph (c)(7)(i)(C) of Rule 2-01 of Regulation S-X.
(f) If greater than 50 percent, disclose the percentage of hours expended on the principal accountant’s engagement to audit the registrant’s financial statements for the most recent fiscal year that were attributed to work performed by persons other than the principal accountant’s full-time, permanent employees.
Not applicable to a semi-annual report.
(g) Disclose the aggregate non-audit fees billed by the registrant’s accountant for services rendered to the registrant, and rendered to the registrant’s investment adviser (not including any sub-adviser whose role is primarily portfolio management and is subcontracted with or overseen by another investment adviser), and any entity controlling, controlled by, or under common control with the adviser that provides ongoing services to the registrant for each of the last two fiscal years of the registrant.
(h) Disclose whether the registrant’s audit committee of the board of directors has considered whether the provision of non-audit services that were rendered to the registrant’s investment adviser (not including any subadviser whose role is primarily portfolio management and is subcontracted with or overseen by another investment adviser), and any entity controlling, controlled by, or under common control with the investment adviser that provides ongoing services to the registrant that were not pre-approved pursuant to paragraph (c)(7)(ii) of Rule 2-01 of Regulation S-X is compatible with maintaining the principal accountant’s independence.
Not applicable to a semi-annual report.
ITEM 5. AUDIT COMMITTEE OF LISTED REGISTRANTS.
(a) If the registrant is a listed issuer as defined in Rule 10A-3 under the Exchange Act (17CFR 240.10A-3), state whether or not the registrant has a separately-designated standing audit committee established in accordance with Section 3(a)(58)(A) of the Exchange Act (15 U.S.C. 78c(a)(58)(A)). If the registrant has such a committee, however designated, identify each committee member. If the entire board of directors is acting as the registrant’s audit committee as specified in Section 3(a)(58)(B) of the Exchange Act (15 U.S.C. 78c(a)(58)(B)), so state.
(b) If applicable, provide the disclosure required by Rule 10A-3(d) under the Exchange Act (17CFR 240.10A-3(d)) regarding an exemption from the listing standards for all audit committees.
Not applicable to a semi-annual report.
ITEM 6. SCHEDULE OF INVESTMENTS.
File Schedule I – Investments in securities of unaffiliated issuers as of the close of the reporting period as set forth in Section 210.12-12 of Regulation S-X, unless the schedule is included as part of the report to shareholders filed under Item 1 of this Form.
Included in Item 1.
ITEM 7. DISCLOSURE OF PROXY VOTING POLICIES AND PROCEDURES FOR CLOSED-END MANAGEMENT INVESTMENT COMPANIES.
A closed-end management investment company that is filing an annual report on this Form N-CSR must, unless it invests exclusively in non-voting securities, describe the policies and procedures that it uses to determine how to vote proxies relating to portfolio securities, including the procedures that the company uses when a vote presents a conflict between the interests of its shareholders, on the one hand, and those of the company’s investment adviser; principal underwriter; or any affiliated person (as defined in Section 2(a)(3) of the Investment Company Act of 1940 (15 U.S.C. 80a-2(a)(3)) and the rules thereunder) of the company, its investment adviser, or its principal underwriter, on the other. Include any policies and procedures of the company’s investment adviser, or any other third party, that the company uses, or that are used on the company’s behalf, to determine how to vote proxies relating to portfolio securities.
Not applicable.
ITEM 8. PORTFOLIO MANAGERS OF CLOSED-END MANAGEMENT INVESTMENT COMPANIES.
Not applicable.
ITEM 9. PURCHASE OF EQUITY SECURITIES BY CLOSED-END MANAGEMENT INVESTMENT COMPANY AND AFFILIATED PURCHASERS.
(a) If the registrant is a closed-end management investment company, provide the information specified in paragraph (b) of this Item with respect to any purchase made by or on behalf of the registrant or any “affiliated purchaser,” as defined in Rule 10b-18(a)(3) under the Exchange Act (17 CFR 240.10b-18(a)(3)), of shares or other units of any class of the registrant’s equity securities that is registered by the registrant pursuant to Section 12 of the Exchange Act (15 U.S.C. 781).
Not applicable.
ITEM 10. SUBMISSION OF MATTERS TO A VOTE OF SECURITY HOLDERS.
Describe any material changes to the procedures by which shareholders may recommend nominees to the registrant’s board of directors, where those changes were implemented after the registrant last provided disclosure in response to the requirements of Item 7(d)(2)(ii)(G) of Schedule 14A (17 CFR 240.14a-101), or this Item.
No material changes to report.
ITEM 11. CONTROLS AND PROCEDURES.
(a) Disclose the conclusions of the registrant’s principal executive and principal financial officers, or persons performing similar functions, regarding the effectiveness of the registrant’s disclosure controls and procedures (as defined in Rule 30a-3(c) under the Act (17 CFR 270.30a-3(c))) as of a date within 90 days of the filing date of the report that includes the disclosure required by this paragraph, based on the evaluation of these controls and procedures required by Rule 30a-3(b) under the Act (17 CFR 270.30a-3(b)) and Rules 13a-15(b) or 15d-15(b) under the Exchange Act (17 CFR 240.13a-15(b) or 240.15d-15(b)).
The Registrant’s principal executive and principal financial officers have concluded, based on their evaluation of the Registrant’s disclosure controls and procedures as of a date within 90 days of the filing date of this report, that the Registrant’s disclosure controls and procedures are reasonably designed to ensure that information required to be disclosed by the Registrant on Form N-CSR is recorded, processed, summarized and reported within the required time periods and that information required to be disclosed by the Registrant in the reports that it files or submits on Form N-CSR is accumulated and communicated to the Registrant’s management, including its principal executive and principal financial officers, as appropriate to allow timely decisions regarding required disclosure.
(b) Disclose any change in the registrant’s internal control over financial reporting (as defined in Rule 30a-3(d) under the Act (17 CFR 270.30a-3(d)) that occurred during the registrant’s second fiscal quarter of the period covered by this report that has materially affected, or is reasonably likely to materially affect, the registrant’s internal control over financial reporting.
There were no changes in the Registrant’s internal control over financial reporting that occurred during the last fiscal quarter covered by this report that have materially affected, or are reasonably likely to materially affect, the Registrant’s internal control over financial reporting.
ITEM 12. EXHIBITS.
(a) File the exhibits listed below as part of this Form. Letter or number the exhibits in the sequence indicated.
(a)(1) Any code of ethics, or amendment thereto, that is the subject of the disclosure required by Item 2, to the extent that the registrant intends to satisfy the Item 2 requirements through filing of an exhibit.
Not applicable.
(a)(2) A separate certification for each principal executive officer and principal financial officer of the registrant as required by Rule 30a-2(a) under the Act (17 CFR 270.30a-2).
Certifications pursuant to Rule 30a-2(a) under the Investment Company Act of 1940 are attached hereto.
(a)(3) Any written solicitation to purchase securities under Rule 23c-1 under the Act (17 CFR 270.23c-1) sent or given during the period covered by the report by or on behalf of the registrant to 10 or more persons.
Not applicable.
(b) A separate or combined certification for each principal executive officer and principal officer of the registrant as required by Rule 30a-2(b) under the Act of 1940.
Certifications pursuant to Rule 30a-2(b) under the Investment Company Act of 1940 are attached hereto.
SIGNATURES
Pursuant to the requirements of the Securities Exchange Act of 1934 and the Investment Company Act of 1940, the registrant has duly caused this report to be signed on its behalf by the undersigned, thereunto duly authorized.
| | |
| JPMorgan Trust II |
| |
| By: | | /s/ Brian S. Shlissel |
| | Brian S. Shlissel |
| | President and Principal Executive Office |
| | July 5, 2017 |
Pursuant to the requirements of the Securities Exchange Act of 1934 and the Investment Company Act of 1940, this report has been signed below by the following persons on behalf of the registrant and in the capacities and on the dates indicated.
| | |
| By: | | /s/ Brian S. Shlissel |
| | Brian S. Shlissel |
| | President and Principal Executive Officer |
| | July 5, 2017 |
| |
By: | | /s/ Laura M. Del Prato |
| | Laura M. Del Prato |
| | Treasurer and Principal Financial Officer |
| | July 5, 2017 |