UNITED STATES
SECURITIES AND EXCHANGE COMMISSION
Washington, D.C. 20549
FORM N-CSR
CERTIFIED SHAREHOLDER REPORT OF REGISTERED
MANAGEMENT INVESTMENT COMPANIES
Investment Company Act file number: 811-04236
JPMorgan Trust II
(Exact name of registrant as specified in charter)
270 Park Avenue
New York, NY 10017
(Address of principal executive offices) (Zip code)
Frank J. Nasta
270 Park Avenue
New York, NY 10017
(Name and Address of Agent for Service)
Registrant’s telephone number, including area code: (800) 480-4111
Date of fiscal year end: June 30
Date of reporting period: July 1, 2016 through December 31, 2016
Form N-CSR is to be used by management investment companies to file reports with the Commission not later than 10 days after the transmission to stockholders of any report that is required to be transmitted to stockholders under Rule 30e-1 under the Investment Company Act of 1940 (17 CFR 270.30e-1). The Commission may use the information provided on Form N-CSR in its regulatory, disclosure review, inspection, and policymaking roles.
A registrant is required to disclose the information specified by Form N-CSR, and the Commission will make this information public. A registrant is not required to respond to the collection of information contained in Form N-CSR unless the Form displays a currently valid Office of Management and Budget (“OMB”) control number. Please direct comments concerning the accuracy of the information collection burden estimate and any suggestions for reducing the burden to Secretary, Securities and Exchange Commission, 450 Fifth Street, NW, Washington, DC 20549-0609. The OMB has reviewed this collection of information under the clearance requirements of 44 U.S.C. Section 3507.
ITEM 1. REPORTS TO STOCKHOLDERS.
The following is a copy of the report transmitted to shareholders pursuant to Rule 30e-1 under the Investment Company Act of 1940 (17 CFR 270.30e-1).
Semi-Annual Report
J.P. Morgan Small Cap Funds
December 31, 2016 (Unaudited)
JPMorgan Dynamic Small Cap Growth Fund
JPMorgan Small Cap Core Fund
JPMorgan Small Cap Equity Fund
JPMorgan Small Cap Growth Fund
JPMorgan Small Cap Value Fund
JPMorgan U.S. Small Company Fund

CONTENTS
Investments in a Fund are not deposits or obligations of, or guaranteed or endorsed by, any bank and are not insured or guaranteed by the FDIC, the Federal Reserve Board or any other government agency. You could lose money if you sell when a Fund’s share price is lower than when you invested.
Past performance is no guarantee of future performance. The general market views expressed in this report are opinions based on market and other conditions through the end of the reporting period and are subject to change without notice. These views are not intended to predict the future performance of a Fund or the securities markets. References to specific securities and their issuers are for illustrative purposes only and are not intended to be, and should not be interpreted as, recommendations to purchase or sell such securities. Such views are not meant as investment advice and may not be relied on as an indication of trading intent on behalf of any Fund.
Prospective investors should refer to the Funds’ prospectus for a discussion of the Funds’ investment objectives, strategies and risks. Call J.P. Morgan Funds Service Center at 1-800-480-4111 for a prospectus containing more complete information about a Fund, including management fees and other expenses. Please read it carefully before investing.
CEO’S LETTER
January 25, 2017 (Unaudited)
Dear Shareholder,
The continued expansion of the U.S. economy through the second half of 2016 helped support U.S. equity prices and spurred the U.S. Federal Reserve (the “Fed”) to raise interest rates in December. During the period, corporate earnings overall showed positive growth and by the end of the year the unemployment rate had reached it lowest levels since 2007.
| | |
 | | “We believe the market performance over the past year has further validated both patience and diversification as fundamental components of a sound investment strategy.” |
Gross domestic product in the U.S. rose by an estimated 3.5% in the third quarter of 2016, surpassing other developed markets. Global oil prices also continued to rise for most of the reporting period and the price of West Texas Intermediate crude reached a 15-month high in November. The Standard & Poor’s 500 Index reached fresh closing highs in July and August and remained buoyant through October.
The November 8th victory of Republican Party presidential candidate Donald Trump surprised many investors and led to brief declines in global equities. However, within 24 hours
global share prices had largely recovered. U.S. equity prices rallied through the end of the year, reaching new highs in December.
Against this backdrop, the Fed raised interest rates by a quarter of a percentage point on December 14th. “Economic growth has picked up since the middle of the year,” said Fed Chairwoman Janet Yellen. “We expect the economy will continue to perform well.”
While the prospect of further interest rate increases put pressure on U.S. bond prices, equities provided investors with positive returns. We believe the market performance over the past year has further validated both patience and diversification as fundamental components of a sound investment strategy.
We look forward to managing your investment needs for years to come. Should you have any questions, please visit www.jpmorganfunds.com or contact the J.P. Morgan Funds Service Center at 1-800-480-4111.
Sincerely yours,

George C.W. Gatch
CEO, Investment Funds Management,
J.P. Morgan Asset Management
| | | | | | | | |
| | | |
| DECEMBER 31, 2016 | | J.P. MORGAN SMALL CAP FUNDS | | | | | 1 | |
J.P. Morgan Small Cap Funds
MARKET OVERVIEW
SIX MONTHS ENDED DECEMBER 31, 2016 (Unaudited)
U.S. equity investments generally continued to outperform both other developed markets and emerging markets during the second half of 2016. Rebounding in the wake of the U.K.’s vote to exit from the European Union, the Standard & Poor’s 500 (the “S&P 500”) reached new closing highs in July and August. Global oil prices also continued to rise during the reporting period and reached 15-month highs in advance of the November 30th meeting of the Organization of Petroleum Exporting Countries.
Meanwhile, the November 8th victory of Republican Party presidential candidate Donald Trump surprised many investors and led to brief declines in global equities. The U.S. equity market recovered within a day and in the following weeks. The S&P 500 surpassed 2,200 points for the first time and reached eight new closing highs by the end of 2016. The Dow Jones Industrial Average surpassed 19,000 points for the first time and reached 17 new closing highs between the election and the end of the year. In particular, energy, pharmaceutical and financial sector stocks generally rose amid investor expectations that a Trump administration’s policies would be beneficial for those industries.
During the reporting period, value stocks generally outperformed growth stocks and small-cap and mid-cap stocks outperformed large cap stocks. By sector, the energy and financials sectors were top performers, while the health care and real estate sectors underperformed other sectors. For the six months ended December 31, 2016, the Russell 2000 Index returned 18.68%.
| | | | | | |
| | | |
| 2 | | | | J.P. MORGAN SMALL CAP FUNDS | | DECEMBER 31, 2016 |
JPMorgan Dynamic Small Cap Growth Fund
FUND COMMENTARY
SIX MONTHS ENDED DECEMBER 31, 2016 (Unaudited)
| | | | |
| REPORTING PERIOD RETURN: | |
| Fund (Class A Shares, without a sales charge)* | | | 12.32% | |
| Russell 2000 Growth Index | | | 13.12% | |
| |
| Net Assets as of 12/31/16 (In Thousands) | | $ | 148,716 | |
INVESTMENT OBJECTIVE**
The JPMorgan Dynamic Small Cap Growth Fund (the “Fund”) seeks capital growth over the long term.
WHAT WERE THE MAIN DRIVERS OF THE FUND’S PERFORMANCE?
The Fund’s Class A Shares, without a sales charge, underperformed the Russell 2000 Growth Index (the “Benchmark”) for the six months ended December 31, 2016. The Fund’s security selection in both the materials & processing and technology sectors was a leading detractor from performance relative to the Benchmark, while the Fund’s security selection in the financials and energy sectors was a leading contributor to relative performance.
Leading individual detractors from relative performance included the Fund’s overweight positions in Acadia Healthcare Co., Novadaq Technologies and TherapeuticsMD Inc. Shares of Acadia Healthcare, an operator of inpatient psychiatric and substance abuse treatment centers that was not held in the Benchmark, fell after the company forecast lower-than-expected earnings and revenue. Novadaq Technologies, a manufacturer of surgical imaging products not held in the benchmark, fell amid negative investor sentiment for high growth companies. Shares of TherapeuticsMD, a drug maker, fell early in the reporting period after the company reported lower-than-expected sales and earnings.
Leading individual contributors to relative performance included the Fund’s overweight positions in Texas Capital Bancshares Inc., Evercore Partners Inc. and Cavium Inc. Shares of Texas Capital Bancshares, a U.S. regional bank, rose amid a recovery in oil prices and better-than-expected earnings. Shares of Evercore Partners, an investment management company, rose on better-than-expected earnings. Shares of Cavium, a maker of semiconductors for the telecommunications industry, rose on better-than-expected earnings.
HOW WAS THE FUND POSITIONED?
The Fund’s portfolio managers utilized a bottom-up approach to stock selection, researching individual companies in an effort to construct portfolios of stocks that have strong fundamentals.
The Fund’s portfolio managers preferred to invest in high quality companies with durable franchises that, in their view, possessed the ability to generate strong future earnings growth.
| | | | | | | | |
| TOP TEN EQUITY HOLDINGS OF THE PORTFOLIO*** | |
| | 1. | | | Cavium, Inc. | | | 1.7 | % |
| | 2. | | | Evercore Partners, Inc., Class A | | | 1.7 | |
| | 3. | | | John Bean Technologies Corp. | | | 1.5 | |
| | 4. | | | Boyd Gaming Corp. | | | 1.5 | |
| | 5. | | | Take-Two Interactive Software, Inc. | | | 1.5 | |
| | 6. | | | RE/MAX Holdings, Inc., Class A | | | 1.5 | |
| | 7. | | | Littelfuse, Inc. | | | 1.5 | |
| | 8. | | | Texas Capital Bancshares, Inc. | | | 1.5 | |
| | 9. | | | Masonite International Corp. | | | 1.4 | |
| | 10. | | | Monolithic Power Systems, Inc. | | | 1.4 | |
| | | | |
PORTFOLIO COMPOSITION BY SECTOR*** | |
| Information Technology | | | 27.7 | % |
| Health Care | | | 21.2 | |
| Industrials | | | 17.4 | |
| Consumer Discretionary | | | 14.2 | |
| Financials | | | 6.6 | |
| Consumer Staples | | | 4.4 | |
| Real Estate | | | 2.7 | |
| Materials | | | 2.4 | |
| Energy | | | 2.0 | |
Short-Term Investment | | | 1.4 | |
| * | | The return shown is based on net asset values calculated for shareholder transactions and may differ from the return shown in the financial highlights, which reflects adjustments made to the net asset values in accordance with accounting principles generally accepted in the United States of America. |
| ** | | The adviser seeks to achieve the Fund’s objective. There can be no guarantee it will be achieved. |
| *** | | Percentages indicated are based on total investments as of December 31, 2016. The Fund’s portfolio composition is subject to change. |
| | | | | | | | |
| | | |
| DECEMBER 31, 2016 | | J.P. MORGAN SMALL CAP FUNDS | | | | | 3 | |
JPMorgan Dynamic Small Cap Growth Fund
FUND COMMENTARY
SIX MONTHS ENDED DECEMBER 31, 2016 (Unaudited) (continued)
| | | | | | | | | | | | | | | | | | | | |
AVERAGE ANNUAL TOTAL RETURNS AS OF DECEMBER 31, 2016 | |
| | | | | |
| | | INCEPTION DATE OF
CLASS | | | 6 MONTH* | | | 1 YEAR | | | 5 YEAR | | | 10 YEAR | |
CLASS A SHARES | | | May 19, 1997 | | | | | | | | | | | | | | | | | |
With Sales Charge** | | | | | | | 6.42 | % | | | 2.22 | % | | | 10.38 | % | | | 5.48 | % |
Without Sales Charge | | | | | | | 12.32 | | | | 7.86 | | | | 11.57 | | | | 6.05 | |
CLASS C SHARES | | | January 7, 1998 | | | | | | | | | | | | | | | | | |
With CDSC*** | | | | | | | 11.05 | | | | 6.30 | | | | 11.02 | | | | 5.48 | |
Without CDSC | | | | | | | 12.05 | | | | 7.30 | | | | 11.02 | | | | 5.48 | |
SELECT CLASS SHARES | | | April 5, 1999 | | | | 12.46 | | | | 8.12 | | | | 11.89 | | | | 6.40 | |
| ** | | Sales Charge for Class A Shares is 5.25%. |
| *** | | Assumes a 1% CDSC (contingent deferred sales charge) for the 6 month and one year periods and 0% CDSC thereafter. |
TEN YEAR PERFORMANCE (12/31/06 TO 12/31/16)
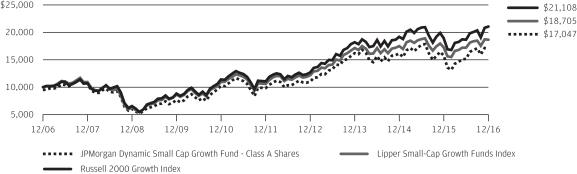
The performance quoted is past performance and is not a guarantee of future results. Mutual funds are subject to certain market risks. Investment returns and principal value of an investment will fluctuate so that an investor’s shares, when redeemed, may be worth more or less than their original cost. Current performance may be higher or lower than the performance data shown. For up-to-date month-end performance information please call 1-800-480-4111.
The graph illustrates comparative performance for $10,000 invested in Class A Shares of the JPMorgan Dynamic Small Cap Growth Fund, the Russell 2000 Growth Index and the Lipper Small-Cap Growth Funds Index from December 31, 2006 to December 31, 2016. The performance of the Fund assumes reinvestment of all dividends and capital gain distributions, if any, and includes a sales charge. The performance of the Russell 2000 Growth Index does not reflect the deduction of expenses or a sales charge associated with a mutual fund and has been adjusted to reflect reinvestment of all dividends and capital gain distributions of the securities included in the benchmark, if applicable. The performance of the Lipper Small-Cap Growth Funds Index includes expenses associated with a mutual fund, such as investment management fees. These expenses are not identical to the expenses incurred by the Fund. The Russell
2000 Growth Index is an unmanaged index which measures the performance of those Russell 2000 companies with higher price-to-book ratios and higher forecasted growth values. The Lipper Small-Cap Growth Funds Index is an index based on the total returns of certain mutual funds within the Fund’s designated category as determined by Lipper, Inc. Investors cannot invest directly in an index.
Class A Shares have a $1,000 minimum initial investment and carry a 5.25% sales charge.
Fund performance may reflect the waiver of the Fund’s fees and reimbursement of expenses for certain periods since the inception date. Without these waivers and reimbursements, performance would have been lower. Also, performance shown in this section does not reflect the deduction of taxes that a shareholder would pay on Fund distributions or redemption of Fund shares.
The returns shown are based on net asset values calculated for shareholder transactions and may differ from the returns shown in the financial highlights, which reflect adjustments made to the net asset values in accordance with accounting principles generally accepted in the United States of America.
| | | | | | |
| | | |
| 4 | | | | J.P. MORGAN SMALL CAP FUNDS | | DECEMBER 31, 2016 |
JPMorgan Small Cap Core Fund
FUND COMMENTARY
SIX MONTHS ENDED DECEMBER 31, 2016 (Unaudited)
| | | | |
| REPORTING PERIOD RETURN: | |
| Fund (Class R5 Shares)* (1) | | | 20.97% | |
| Russell 2000 Index | | | 18.68% | |
| |
| Net Assets as of 12/31/2016 (In Thousands) | | $ | 190,528 | |
INVESTMENT OBJECTIVE**
The JPMorgan Small Cap Core Fund (the “Fund”) seeks capital growth over the long term.
WHAT WERE THE MAIN DRIVERS OF THE FUND’S PERFORMANCE?
The Fund’s Class R5 Shares outperformed the Russell 2000 Index (the “Benchmark”) for the six months ended December 31, 2016. The Fund’s security selection in the consumer cyclical and industrial cyclical sectors was a leading contributor to performance relative to the Benchmark, while the Fund’s security selection in the energy and real estate investment trusts sector was a leading detractor from relative performance.
Leading individual contributors to relative performance included the Fund’s overweight positions in Nutanix Inc., Unisys Corp. and Barrett Business Services Inc. Shares of Nutanix, a provider of so-called cloud computing technology, rose following its September 2016 initial public offering. Shares of Unisys, an information technology company, rose on better-than-expected earnings. Barrett Business Services, a provider of business management services, rose after the company announced it would maintain its quarterly dividend payment rate.
Leading individual detractors from relative performance included the Fund’s overweight positions in Firstcash Inc., First Solar Inc. and Vectrus Inc. Shares of FirstCash, an operator of pawn shops, fell after the company reported a third-quarter loss. Shares of First Solar, a provider of solar energy systems, fell after the company reported that lower prices for solar panels would hurt revenue. Shares of Vectrus, a logistics provider to the U.S. military, fell after the U.S. government declined to renew a large contract with the company.
HOW WAS THE FUND POSITIONED?
In accordance with its investment process, the Fund’s portfolio managers take limited sector bets and construct the Fund so that stock selection is typically the primary driver of its relative performance versus the Benchmark. The Fund’s portfolio managers employ a bottom-up approach to stock selection, using quantitative screening and proprietary analysis to construct a portfolio of companies that they believe are attractively
valued and possess strong momentum. During the reporting period, the Fund was managed and positioned in accordance with this investment process.
| | | | | | | | |
| TOP TEN EQUITY HOLDINGS OF THE PORTFOLIO*** | |
| | 1. | | | Sanmina Corp. | | | 1.2 | % |
| | 2. | | | TCF Financial Corp. | | | 1.0 | |
| | 3. | | | Trinseo SA | | | 1.0 | |
| | 4. | | | East West Bancorp, Inc. | | | 1.0 | |
| | 5. | | | Barrett Business Services, Inc. | | | 1.0 | |
| | 6. | | | SkyWest, Inc. | | | 1.0 | |
| | 7. | | | General Cable Corp. | | | 1.0 | |
| | 8. | | | Huntington Bancshares, Inc. | | | 1.0 | |
| | 9. | | | Global Brass & Copper Holdings, Inc. | | | 1.0 | |
| | 10. | | | Insight Enterprises, Inc. | | | 1.0 | |
| | | | |
PORTFOLIO COMPOSITION BY SECTOR*** | |
| Financials | | | 18.8 | % |
| Industrials | | | 18.8 | |
| Information Technology | | | 17.2 | |
| Health Care | | | 12.4 | |
| Consumer Discretionary | | | 9.4 | |
| Real Estate | | | 7.5 | |
| Materials | | | 4.1 | |
| Energy | | | 3.6 | |
| Utilities | | | 3.2 | |
| Consumer Staples | | | 2.8 | |
| Telecommunication Services | | | 0.8 | |
| Short-Term Investment | | | 1.4 | |
| * | | The return shown is based on net asset values calculated for shareholder transactions and may differ from the return shown in the financial highlights, which reflects adjustments made to the net asset values in accordance with accounting principles generally accepted in the United States of America. |
| ** | | The adviser seeks to achieve the Fund’s objective. There can be no guarantee it will be achieved. |
| *** | | Percentages indicated are based on total investments as of December 31, 2016. The Fund’s portfolio composition is subject to change. |
| (1) | | On September 15, 2016, the Fund’s Select Class Shares were re-designated and renamed as Class R5 Shares. |
| | | | | | | | |
| | | |
| DECEMBER 31, 2016 | | J.P. MORGAN SMALL CAP FUNDS | | | | | 5 | |
JPMorgan Small Cap Core Fund
FUND COMMENTARY
SIX MONTHS ENDED DECEMBER 31, 2016 (Unaudited) (continued)
| | | | | | | | | | | | | | | | | | |
AVERAGE ANNUAL TOTAL RETURNS AS OF DECEMBER 31, 2016 | |
| | | | | |
| | | INCEPTION DATE OF
CLASS | | 6 MONTH* | | | 1 YEAR | | | 5 YEAR | | | 10 YEAR | |
CLASS A SHARES | | May 31, 2016 | | | | | | | | | | | | | | | | |
With Sales Charge** | | | | | 14.36 | % | | | 13.72 | % | | | 15.06 | % | | | 6.89 | % |
Without Sales Charge | | | | | 20.69 | | | | 20.04 | | | | 16.30 | | | | 7.47 | |
CLASS C SHARES | | May 31, 2016 | | | | | | | | | | | | | | | | |
With CDSC*** | | | | | 19.40 | | | | 18.70 | | | | 16.24 | | | | 7.44 | |
Without CDSC | | | | | 20.40 | | | | 19.70 | | | | 16.24 | | | | 7.44 | |
CLASS R5 SHARES (FORMERLY SELECT CLASS SHARES) | | January 1, 1997 | | | 20.97 | | | | 20.37 | | | | 16.37 | | | | 7.50 | |
CLASS R6 SHARES | | May 31, 2016 | | | 21.02 | | | | 20.42 | | | | 16.38 | | | | 7.50 | |
| ** | | Sales Charge for Class A Shares is 5.25%. |
| *** | | Assumes a 1% CDSC (contingent deferred sales charge) for the 6 month and one year periods and 0% CDSC thereafter. |
TEN YEAR PERFORMANCE (12/31/06 TO 12/31/16)
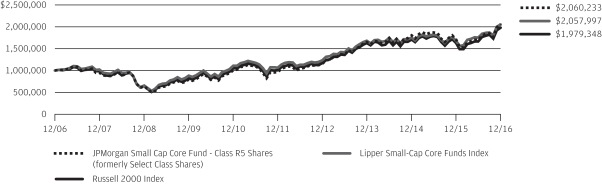
The performance quoted is past performance and is not a guarantee of future results. Mutual funds are subject to certain market risks. Investment returns and principal value of an investment will fluctuate so that an investor’s shares, when redeemed, may be worth more or less than their original cost. Current performance may be higher or lower than the performance data shown. For up-to-date month-end performance information please call 1-800-480-4111.
Returns for Class A, Class C and Class R6 Shares prior to their inception date are based on the performance of Class R5 Shares, formerly named the Select Class Shares. The actual returns of Class A and Class C Shares would have been lower than those shown because Class A and Class C Shares have higher expenses than Class R5 Shares. The actual returns of the Class R6 Shares would have been different than those shown because Class R6 Shares have different expenses than Class R5 Shares.
The graph illustrates comparative performance for $1,000,000 invested in Class R5 Shares of the JPMorgan Small Cap Core Fund, the Russell 2000 Index and the Lipper Small-Cap Core Funds Index from December 31, 2006 to December 31, 2016. The performance of the Fund assumes reinvestment of all dividends and capital gain distributions, if any, and does not include a sales charge. The performance of the Russell 2000 Index does not reflect the deduction of expenses or a sales charge associated with a mutual fund and has been adjusted to reflect reinvestment of all dividends and capital gain
distributions of the securities included in the benchmark, if applicable. The performance of the Lipper Small-Cap Core Funds Index includes expenses associated with a mutual fund, such as investment management fees. These expenses are not identical to the expenses incurred by the Fund. The Russell 2000 Index is an unmanaged index which measures the performance of the 2000 smallest stocks (on the basis of capitalization) in the Russell 3000 Index. The Lipper Small-Cap Core Funds Index is an index based on the total returns of certain mutual funds within the Fund’s designated category as determined by Lipper, Inc. Investors cannot invest directly in an index.
Class R5 Shares have a $1,000,000 minimum initial investment.
Fund performance may reflect the waiver of the Fund’s fees and reimbursement of expenses for certain periods since the inception date. Without these waivers and reimbursements, performance would have been lower. Also, performance shown in this section does not reflect the deduction of taxes that a shareholder would pay on Fund distributions or redemption of Fund shares.
The returns shown are based on net asset values calculated for shareholder transactions and may differ from the returns shown in the financial highlights, which reflect adjustments made to the net asset values in accordance with accounting principles generally accepted in the United States of America.
| | | | | | |
| | | |
| 6 | | | | J.P. MORGAN SMALL CAP FUNDS | | DECEMBER 31, 2016 |
JPMorgan Small Cap Equity Fund
FUND COMMENTARY
SIX MONTHS ENDED DECEMBER 31, 2016 (Unaudited)
| | | | |
| REPORTING PERIOD RETURN: | |
| Fund (Class A Shares, without a sales charge)* | | | 12.80% | |
| Russell 2000 Index | | | 18.68% | |
| |
| Net Assets as of 12/31/2015 (In Thousands) | | | $5,858,356 | |
INVESTMENT OBJECTIVE**
The JPMorgan Small Cap Equity Fund (the “Fund”) seeks capital growth over the long term.
WHAT WERE THE MAIN DRIVERS OF THE FUND’S PERFORMANCE?
The Fund’s Class A Shares, without a sales charge, underperformed the Russell 2000 Index (the “Benchmark”) for the six months ended December 31, 2016. The Fund’s security selection and underweight position in the technology sector and its security selection in the financials sector were leading detractors from relative performance. The Fund’s security selection in the health care and producer durables sectors was a leading contributor to performance relative to the Benchmark.
Leading individual detractors from relative performance included the Fund’s overweight positions in Crocs Inc., Aptargroup Inc. and National Retail Properties Inc. Shares of Crocs, a footwear maker, fell on weaker-than-expected earnings. Shares of Aptargroup, a packaging products maker that was not held in the Benchmark, fell on lower-than-expected earnings. Shares of National Retail Properties, a real estate investment trust, fell after the company’s chief executive announced his retirement.
Leading individual contributors to relative performance included the Fund’s overweight positions in NetSuite Inc., Associated Banc-Corp. and First Horizon National Co. Shares of NetSuite, a software maker not held in the Benchmark, rose ahead of the company’s $9.3 billion acquisition by Oracle Corp. Shares of Associated Banc, a financial services company not held in the Benchmark, rose amid investor expectations of an improved business environment for the financials sector. Shares of First Horizon National, a Tennessee-based regional bank that was not held in the Benchmark, rose along with other regional banks on investor expectations that rising interest rates in the U.S. would lift banking revenues.
HOW WAS THE FUND POSITIONED?
The Fund’s portfolio managers employed a bottom-up approach to stock selection, constructing portfolios based on company fundamentals and proprietary analysis. The Fund’s portfolio
managers looked for companies that, in their view, had leading competitive advantages, predictable and durable business models, and sustainable free cash flow generation with management teams committed to increasing intrinsic value.
| | | | | | | | |
| TOP TEN EQUITY HOLDINGS OF THE PORTFOLIO*** | |
| | 1. | | | Toro Co. (The) | | | 2.8 | % |
| | 2. | | | AptarGroup, Inc. | | | 2.0 | |
| | 3. | | | Spectrum Brands Holdings, Inc. | | | 1.8 | |
| | 4. | | | Pool Corp. | | | 1.8 | |
| | 5. | | | West Pharmaceutical Services, Inc. | | | 1.7 | |
| | 6. | | | Patterson-UTI Energy, Inc. | | | 1.6 | |
| | 7. | | | Landstar System, Inc. | | | 1.5 | |
| | 8. | | | HealthSouth Corp. | | | 1.5 | |
| | 9. | | | Allison Transmission Holdings, Inc. | | | 1.5 | |
| | 10. | | | Brinker International, Inc. | | | 1.5 | |
| | | | |
PORTFOLIO COMPOSITION BY SECTOR*** | |
| Industrials | | | 19.2 | % |
| Financials | | | 17.2 | |
| Consumer Discretionary | | | 14.9 | |
| Health Care | | | 12.1 | |
| Information Technology | | | 9.1 | |
| Real Estate | | | 6.2 | |
| Materials | | | 5.5 | |
| Energy | | | 4.2 | |
| Consumer Staples | | | 3.9 | |
| Utilities | | | 2.6 | |
| Mutual Funds | | | 1.1 | |
| Short-Term Investment | | | 4.0 | |
| * | | The return shown is based on net asset values calculated for shareholder transactions and may differ from the return shown in the financial highlights, which reflects adjustments made to the net asset values in accordance with accounting principles generally accepted in the United States of America. |
| ** | | The adviser seeks to achieve the Fund’s objective. There can be no guarantee it will be achieved. |
| *** | | Percentages indicated are based on total investments as of December 31, 2016. The Fund’s portfolio composition is subject to change. |
| | | | | | | | |
| | | |
| DECEMBER 31, 2016 | | J.P. MORGAN SMALL CAP FUNDS | | | | | 7 | |
JPMorgan Small Cap Equity Fund
FUND COMMENTARY
SIX MONTHS ENDED DECEMBER 31, 2016 (Unaudited) (continued)
| | | | | | | | | | | | | | | | | | |
AVERAGE ANNUAL TOTAL RETURNS AS OF DECEMBER 31, 2016 | |
| | | | | |
| | | INCEPTION DATE OF
CLASS | | 6 MONTH* | | | 1 YEAR | | | 5 YEAR | | | 10 YEAR | |
CLASS A SHARES | | December 20, 1994 | | | | | | | | | | | | | | | | |
With Sales Charge** | | | | | 6.88 | % | | | 15.38 | % | | | 14.14 | % | | | 9.53 | % |
Without Sales Charge | | | | | 12.80 | | | | 21.77 | | | | 15.38 | | | | 10.12 | |
CLASS C SHARES | | February 19, 2005 | | | | | | | | | | | | | | | | |
With CDSC*** | | | | | 11.50 | | | | 20.20 | | | | 14.81 | | | | 9.58 | |
Without CDSC | | | | | 12.50 | | | | 21.20 | | | | 14.81 | | | | 9.58 | |
CLASS R2 SHARES | | November 3, 2008 | | | 12.66 | | | | 21.50 | | | | 15.09 | | | | 9.90 | |
CLASS R3 SHARES | | September 9, 2016 | | | 12.82 | | | | 21.79 | | | | 15.38 | | | | 10.13 | |
CLASS R4 SHARES | | September 9, 2016 | | | 12.97 | | | | 22.15 | | | | 15.72 | | | | 10.45 | |
CLASS R5 SHARES | | May 15, 2006 | | | 13.09 | | | | 22.40 | | | | 15.96 | | | | 10.68 | |
CLASS R6 SHARES | | May 31, 2016 | | | 13.12 | | | | 22.43 | | | | 15.96 | | | | 10.68 | |
SELECT CLASS SHARES | | May 7, 1996 | | | 12.97 | | | | 22.15 | | | | 15.72 | | | | 10.45 | |
| ** | | Sales Charge for Class A Shares is 5.25%. |
| *** | | Assumes a 1% CDSC (contingent deferred sales charge) for the 6 month and one year periods and 0% CDSC thereafter. |
TEN YEAR PERFORMANCE (12/31/06 TO 12/31/16)
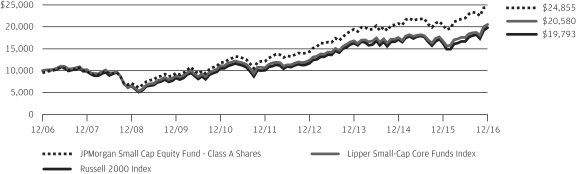
The performance quoted is past performance and is not a guarantee of future results. Mutual funds are subject to certain market risks. Investment returns and principal value of an investment will fluctuate so that an investor’s shares, when redeemed, may be worth more or less than their original cost. Current performance may be higher or lower than the performance data shown. For up-to-date month-end performance information please call 1-800-480-4111.
Returns for Class R2 and Class R3 Shares prior to their inception date are based on the performance of Class A Shares. The actual returns of Class R2 Shares would have been lower than those shown because Class R2 Shares have higher expenses than Class A Shares. The actual returns of Class R3 Shares would have been different than those shown because Class R3 Shares have different expenses than Class A Shares.
Returns for Class R4 Shares prior to their inception date are based on the performance of the Select Class Shares. The actual returns for Class R4 Shares would have been similar to those shown because Class R4 Shares have similar expenses to Select Class Shares.
Returns for Class R6 Shares prior to their inception date are based on the performance of the Class R5 Shares. The actual returns of Class R6 Shares would have been different than those shown because Class R6 Shares have different expenses than Class R5 Shares.
The graph illustrates comparative performance for $10,000 invested in Class A Shares of the JPMorgan Small Cap Equity Fund, the Russell 2000 Index and the Lipper Small-Cap Core Funds Index from December 31, 2006 to December 31,
2016. The performance of the Fund assumes reinvestment of all dividends and capital gain distributions, if any, and includes a sales charge. The performance of the Russell 2000 Index does not reflect the deduction of expenses or a sales charge associated with a mutual fund and has been adjusted to reflect reinvestment of all dividends and capital gain distributions of the securities included in the benchmark, if applicable. The performance of the Lipper Small-Cap Core Funds Index includes expenses associated with a mutual fund, such as investment management fees. These expenses are not identical to the expenses incurred by the Fund. The Russell 2000 Index is an unmanaged index which measures the performance of the 2000 smallest stocks (on the basis of capitalization) in the Russell 3000 Index. The Lipper Small-Cap Core Funds Index is an index based on the total returns of certain mutual funds within the Fund’s designated category as determined by Lipper, Inc. Investors cannot invest directly in an index.
Class A Shares have a $1,000 minimum initial investment and carry a 5.25% sales charge.
Fund performance may reflect the waiver of the Fund’s fees and reimbursement of expenses for certain periods since the inception date. Without these waivers and reimbursements, performance would have been lower. Also, performance shown in this section does not reflect the deduction of taxes that a shareholder would pay on Fund distributions or redemption of Fund shares.
The returns shown are based on net asset values calculated for shareholder transactions and may differ from the returns shown in the financial highlights, which reflect adjustments made to the net asset values in accordance with accounting principles generally accepted in the United States of America.
| | | | | | |
| | | |
| 8 | | | | J.P. MORGAN SMALL CAP FUNDS | | DECEMBER 31, 2016 |
JPMorgan Small Cap Growth Fund
FUND COMMENTARY
SIX MONTHS ENDED DECEMBER 31, 2016 (Unaudited)
| | | | |
| REPORTING PERIOD RETURN: | |
| Fund (Class A Shares, without a sales charge)* | | | 12.14% | |
| Russell 2000 Growth Index | | | 13.12% | |
| |
| Net Assets as of 12/31/2016 (In Thousands) | | | $1,084,059 | |
INVESTMENT OBJECTIVE**
The JPMorgan Small Cap Growth Fund (the “Fund”) seeks long-term capital growth primarily by investing in a portfolio of equity securities of small-capitalization and emerging growth companies.
WHAT WERE THE MAIN DRIVERS OF THE FUND’S PERFORMANCE?
The Fund’s Class A Shares, without a sales charge, underperformed the Russell 2000 Growth Index (the “Benchmark”) for the six months ended December 31, 2016. The Fund’s security selection in the materials & processing sector and the technology sector was a leading detractor from performance relative to the Benchmark, while the Fund’s security selection in the financials and energy sectors was a leading contributor to relative performance.
Leading individual detractors from relative performance included the Fund’s overweight positions in Acadia Healthcare Co., Evolent Health Inc. and TherapeuticsMD Inc. Shares of Acadia Healthcare, an operator of inpatient psychiatric and substance abuse treatment centers that was not held in the Benchmark, fell after the company forecast lower-than-expected earnings and revenue. Shares of Evolent Health, a health care data systems provider not held in the Benchmark, fell amid investor expectations that federal health care policy would be less supportive of the company’s business model. Shares of TherapeuticsMD, a drug maker, fell early in the reporting period after the company reported lower-than-expected sales and earnings.
Leading individual contributors to relative performance included the Fund’s overweight positions in Texas Capital Bancshares Inc., Evercore Partners Inc. and Cavium Inc. Shares of Texas Capital Bancshares, a U.S. regional bank, rose amid a recovery in oil prices and better-than-expected earnings. Shares of Evercore Partners, an investment management company, rose on better-than-expected earnings. Shares of Cavium, a maker of semiconductors for the telecommunications industry, rose on better-than-expected earnings.
HOW WAS THE FUND POSITIONED?
The Fund’s portfolio managers utilized a bottom-up approach to stock selection, researching individual companies in an effort to construct portfolios of stocks that have strong fundamentals.
The Fund’s portfolio managers preferred to invest in high quality companies with durable franchises that, in their view, possessed the ability to generate strong future earnings growth.
| | | | | | | | |
| TOP TEN EQUITY HOLDINGS OF THE PORTFOLIO*** | |
| | 1. | | | Cavium, Inc. | | | 1.7 | % |
| | 2. | | | Evercore Partners, Inc., Class A | | | 1.6 | |
| | 3. | | | John Bean Technologies Corp. | | | 1.5 | |
| | 4. | | | Boyd Gaming Corp. | | | 1.5 | |
| | 5. | | | Take-Two Interactive Software, Inc. | | | 1.5 | |
| | 6. | | | RE/MAX Holdings, Inc., Class A | | | 1.5 | |
| | 7. | | | Littelfuse, Inc. | | | 1.5 | |
| | 8. | | | Texas Capital Bancshares, Inc. | | | 1.5 | |
| | 9. | | | Masonite International Corp. | | | 1.4 | |
| | 10. | | | Monolithic Power Systems, Inc. | | | 1.4 | |
| | | | |
PORTFOLIO COMPOSITION BY SECTOR*** | |
| Information Technology | | | 27.7 | % |
| Health Care | | | 21.0 | |
| Industrials | | | 17.4 | |
| Consumer Discretionary | | | 14.2 | |
| Financials | | | 6.5 | |
| Consumer Staples | | | 4.3 | |
| Real Estate | | | 2.7 | |
| Materials | | | 2.4 | |
| Energy | | | 1.9 | |
| Short-Term Investment | | | 1.9 | |
| * | | The return shown is based on net asset values calculated for shareholder transactions and may differ from the return shown in the financial highlights, which reflects adjustments made to the net asset values in accordance with accounting principles generally accepted in the United States of America. |
| ** | | The adviser seeks to achieve the Fund’s objective. There can be no guarantee it will be achieved. |
| *** | | Percentages indicated are based on total investments as of December 31, 2016. The Fund’s portfolio composition is subject to change. |
| | | | | | | | |
| | | |
| DECEMBER 31, 2016 | | J.P. MORGAN SMALL CAP FUNDS | | | | | 9 | |
JPMorgan Small Cap Growth Fund
FUND COMMENTARY
SIX MONTHS ENDED DECEMBER 31, 2016 (Unaudited) (continued)
| | | | | | | | | | | | | | | | | | |
AVERAGE ANNUAL TOTAL RETURNS AS OF DECEMBER 31, 2016 | |
| | | | | |
| | | INCEPTION DATE OF
CLASS | | 6 MONTH* | | | 1 YEAR | | | 5 YEAR | | | 10 YEAR | |
CLASS A SHARES | | July 1, 1991 | | | | | | | | | | | | | | | | |
With Sales Charge** | | | | | 6.28 | % | | | 2.13 | % | | | 10.61 | % | | | 6.56 | % |
Without Sales Charge | | | | | 12.14 | | | | 7.80 | | | | 11.80 | | | | 7.14 | |
CLASS C SHARES | | November 4, 1997 | | | | | | | | | | | | | | | | |
With CDSC*** | | | | | 10.88 | | | | 6.26 | | | | 11.25 | | | | 6.56 | |
Without CDSC | | | | | 11.88 | | | | 7.26 | | | | 11.25 | | | | 6.56 | |
CLASS L SHARES (FORMERLY INSTITUTIONAL CLASS SHARES) | | February 19, 2005 | | | 12.33 | | | | 8.16 | | | | 12.23 | | | | 7.56 | |
CLASS R2 SHARES | | November 3, 2008 | | | 11.90 | | | | 7.47 | | | | 11.53 | | | | 6.87 | |
CLASS R5 SHARES | | September 9, 2016 | | | 12.33 | | | | 8.16 | | | | 12.23 | | | | 7.56 | |
CLASS R6 SHARES | | November 30, 2010 | | | 12.40 | | | | 8.34 | | | | 12.36 | | | | 7.62 | |
SELECT CLASS SHARES | | March 26, 1996 | | | 12.21 | | | | 8.04 | | | | 12.08 | | | | 7.40 | |
| ** | | Sales Charge for Class A Shares is 5.25%. |
| *** | | Assumes a 1% CDSC (contingent deferred sales charge) for the 6 month and one year periods and 0% CDSC thereafter. |
TEN YEAR PERFORMANCE (12/31/06 TO 12/31/16)
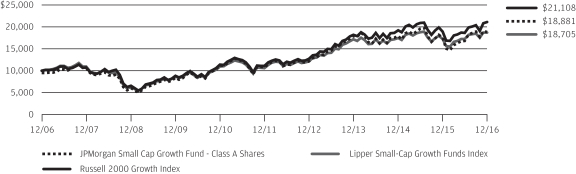
The performance quoted is past performance and is not a guarantee of future results. Mutual funds are subject to certain market risks. Investment returns and principal value of an investment will fluctuate so that an investor’s shares, when redeemed, may be worth more or less than their original cost. Current performance may be higher or lower than the performance data shown. For up-to-date month-end performance information please call 1-800-480-4111.
Returns for Class R2 Shares prior to their inception date are based on the performance of Class A Shares. All prior class performance for Class R2 Shares has been adjusted to reflect the differences in expense between classes.
Returns for Class R5 and Class R6 Shares prior to their inception date are based on the performance of Class L Shares. The actual returns for Class R5 and Class R6 Shares would have been different than those shown because Class R5 and Class R6 Shares have different expenses than Class L Shares.
The graph illustrates comparative performance for $10,000 invested in Class A Shares of the JPMorgan Small Cap Growth Fund, the Russell 2000 Growth Index and the Lipper Small-Cap Growth Funds Index from December 31, 2006 to December 31, 2016. The performance of the Fund assumes reinvestment of all dividends and capital gain distributions, if any, and includes a sales charge. The performance of the Russell 2000 Growth Index does not reflect the deduction of expenses or a sales charge associated with a mutual fund and has been
adjusted to reflect reinvestment of all dividends and capital gain distributions of the securities included in the benchmark, if applicable. The performance of the Lipper Small-Cap Growth Funds Index includes expenses associated with a mutual fund, such as investment management fees. These expenses are not identical to the expenses incurred by the Fund. The Russell 2000 Growth Index is an unmanaged index which measures the performance of those Russell 2000 companies with higher price-to-book ratios and higher forecasted growth values. The Lipper Small-Cap Growth Funds Index is an index based on the total returns of certain mutual funds within the Fund’s designated category as determined by Lipper, Inc. Investors cannot invest directly in an index.
Class A Shares have a $1,000 minimum initial investment and carry a 5.25% sales charge.
Fund performance may reflect the waiver of the Fund’s fees and reimbursement of expenses for certain periods since the inception date. Without these waivers and reimbursements, performance would have been lower. Also, performance shown in this section does not reflect the deduction of taxes that a shareholder would pay on Fund distributions or redemption of Fund shares.
The returns shown are based on net asset values calculated for shareholder transactions and may differ from the returns shown in the financial highlights, which reflect adjustments made to the net asset values in accordance with accounting principles generally accepted in the United States of America.
| | | | | | |
| | | |
| 10 | | | | J.P. MORGAN SMALL CAP FUNDS | | DECEMBER 31, 2016 |
JPMorgan Small Cap Value Fund
FUND COMMENTARY
SIX MONTHS ENDED DECEMBER 31, 2016 (Unaudited)
| | | | |
| REPORTING PERIOD RETURN: | |
| Fund (Select Class Shares)* | | | 22.32% | |
| Russell 2000 Value Index | | | 24.19% | |
| |
| Net Assets as of 12/31/2016 (In Thousands) | | | $2,103,134 | |
INVESTMENT OBJECTIVE**
The JPMorgan Small Cap Value Fund (the “Fund”) seeks long-term capital growth primarily by investing in equity securities of small-capitalization companies.
WHAT WERE THE MAIN DRIVERS OF THE FUND’S PERFORMANCE?
The Fund’s Select Class Shares underperformed the Russell 2000 Value Index (the “Benchmark”) for the six months ended December 31, 2016. The Fund’s security selection in the utilities and insurance sectors was a leading detractor from performance relative to the Benchmark, while the Fund’s security selection in the consumer cyclical and software & services sectors was a leading contributor to relative performance.
Leading individual detractors from relative performance included the Fund’s overweight positions in Abercrombie & Fitch Co., USA Truck Inc. and Cypress Semiconductor Corp. Shares of Abercrombie & Fitch, a specialty apparel retailer, declined following weak earnings results due to poor performance at flagship stores. Shares of USA Truck, a transport carrier company, fell on continued quarterly losses and low sales growth. Shares of Cypress Semiconductor, a maker of computer chips that was not held in the Benchmark, fell on investor concerns about elevated debt levels and low operating margins.
Leading individual contributors to relative performance included the Fund’s overweight positions in Unisys Corp., Rex American Resources Corp. and Pier 1 Imports Inc. Shares of Unisys, an information technology provider, rose on better-than-expected earnings. Shares of Rex American Resources, an ethanol producer, rose on expectations that it will benefit from the policies of the incoming U.S. Congress. Shares of Pier 1 Imports, a home décor retailer, rose on better-than-expected sales and signs of a turnaround in its business.
HOW WAS THE FUND POSITIONED?
In accordance with its investment process, the Fund’s portfolio managers take limited sector bets and construct the Fund so that stock selection is typically the primary driver of its relative performance versus the Benchmark. The Fund’s portfolio managers use a quantitative ranking methodology to identify stocks in each sector that, in their view, trade at attractive levels. Through bottom-up fundamental research, they seek
companies that they believe have attractive valuations, exhibit high earnings quality and have management teams that make effective capital deployment decisions. During the reporting period, the Fund was managed and positioned in accordance with this investment process.
| | | | | | | | |
| TOP TEN EQUITY HOLDINGS OF THE PORTFOLIO*** | |
| | 1. | | | Westamerica Bancorp | | | 1.1 | % |
| | 2. | | | EMCOR Group, Inc. | | | 1.1 | |
| | 3. | | | Benchmark Electronics, Inc. | | | 1.1 | |
| | 4. | | | DigitalGlobe, Inc. | | | 1.0 | |
| | 5. | | | ACCO Brands Corp. | | | 1.0 | |
| | 6. | | | REX American Resources Corp. | | | 1.0 | |
| | 7. | | | FTI Consulting, Inc. | | | 0.9 | |
| | 8. | | | Primerica, Inc. | | | 0.9 | |
| | 9. | | | FCB Financial Holdings, Inc., Class A | | | 0.9 | |
| | 10. | | | Cooper Tire & Rubber Co. | | | 0.9 | |
| | | | |
PORTFOLIO COMPOSITION BY SECTOR*** | |
| Financials | | | 30.4 | % |
| Industrials | | | 15.2 | |
| Information Technology | | | 10.7 | |
| Real Estate | | | 9.4 | |
| Consumer Discretionary | | | 8.3 | |
| Utilities | | | 5.7 | |
| Energy | | | 5.1 | |
| Health Care | | | 4.6 | |
| Materials | | | 4.1 | |
| Consumer Staples | | | 2.2 | |
| Telecommunication Services | | | 0.5 | |
| Short-Term Investment | | | 3.8 | |
| * | | The return shown is based on net asset values calculated for shareholder transactions and may differ from the return shown in the financial highlights, which reflects adjustments made to the net asset values in accordance with accounting principles generally accepted in the United States of America. |
| ** | | The adviser seeks to achieve the Fund’s objective. There can be no guarantee it will be achieved. |
| *** | | Percentages indicated are based on total investments as of December 31, 2016. The Fund’s portfolio composition is subject to change. |
| | | | | | | | |
| | | |
| DECEMBER 31, 2016 | | J.P. MORGAN SMALL CAP FUNDS | | | | | 11 | |
JPMorgan Small Cap Value Fund
FUND COMMENTARY
SIX MONTHS ENDED DECEMBER 31, 2016 (Unaudited) (continued)
| | | | | | | | | | | | | | | | | | |
AVERAGE ANNUAL TOTAL RETURNS AS OF DECEMBER 31, 2016 | |
| | | | | |
| | | INCEPTION DATE OF
CLASS | | 6 MONTH* | | | 1 YEAR | | | 5 YEAR | | | 10 YEAR | |
CLASS A SHARES | | January 27, 1995 | | | | | | | | | | | | | | | | |
With Sales Charge** | | | | | 15.76 | % | | | 23.03 | % | | | 14.06 | % | | | 6.52 | % |
Without Sales Charge | | | | | 22.20 | | | | 29.86 | | | | 15.30 | | | | 7.10 | |
CLASS C SHARES | | March 22, 1999 | | | | | | | | | | | | | | | | |
With CDSC*** | | | | | 20.84 | | | | 28.09 | | | | 14.59 | | | | 6.45 | |
Without CDSC | | | | | 21.84 | | | | 29.09 | | | | 14.59 | | | | 6.45 | |
CLASS R2 SHARES | | November 3, 2008 | | | 22.04 | | | | 29.50 | | | | 15.01 | | | | 6.83 | |
CLASS R3 SHARES | | September 9, 2016 | | | 22.19 | | | | 29.85 | | | | 15.29 | | | | 7.08 | |
CLASS R4 SHARES | | September 9, 2016 | | | 22.32 | | | | 30.14 | | | | 15.57 | | | | 7.35 | |
CLASS R5 SHARES | | May 15, 2006 | | | 22.41 | | | | 30.30 | | | | 15.69 | | | | 7.47 | |
CLASS R6 SHARES | | February 22, 2005 | | | 22.51 | | | | 30.48 | | | | 15.79 | | | | 7.53 | |
SELECT CLASS SHARES | | January 27, 1995 | | | 22.32 | | | | 30.14 | | | | 15.58 | | | | 7.36 | |
| ** | | Sales Charge for Class A Shares is 5.25%. |
| *** | | Assumes a 1% CDSC (contingent deferred sales charge) for the 6 month and one year periods and 0% CDSC thereafter. |
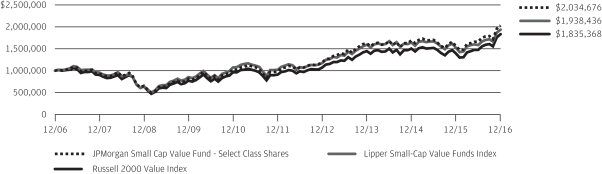
TEN YEAR PERFORMANCE (12/31/06 TO 12/31/16)
The performance quoted is past performance and is not a guarantee of future results. Mutual funds are subject to certain market risks. Investment returns and principal value of an investment will fluctuate so that an investor’s shares, when redeemed, may be worth more or less than their original cost. Current performance may be higher or lower than the performance data shown. For up-to-date month-end performance information please call 1-800-480-4111.
Returns for Class R2 and Class R4 Shares prior to their inception date are based on the performance of the Select Class Shares. Returns for the Class R3 Shares prior to their inception dates are based on the performance of Class A Shares. Prior performance for Class R2, Class R3 and Class R4 Shares has been adjusted to reflect the differences in expenses between classes.
The graph illustrates comparative performance for $1,000,000 invested in Select Class Shares of the JPMorgan Small Cap Value Fund, the Russell 2000 Value Index and the Lipper Small-Cap Value Funds Index from December 31, 2006 to December 31, 2016. The performance of the Fund assumes reinvestment of all dividends and capital gain distributions, if any, and does not include a sales charge. The performance of the Russell 2000 Value Index does not reflect the deduction of expenses or a sales charge associated with a mutual fund and has been adjusted to reflect reinvestment of all dividends and capital
gain distributions of the securities included in the benchmark, if applicable. The performance of the Lipper Small-Cap Value Funds Index includes expenses associated with a mutual fund, such as investment management fees. These expenses are not identical to the expenses incurred by the Fund. The Russell 2000 Value Index is an unmanaged index which measures the performance of those Russell 2000 companies with lower price-to-book ratios and lower forecasted growth values. The Lipper Small-Cap Value Funds Index is an index based on the total returns of certain mutual funds within the Fund’s designated category as determined by Lipper, Inc. Investors cannot invest directly in an index.
Select Class Shares have a $1,000,000 minimum initial investment.
Fund performance may reflect the waiver of the Fund’s fees and reimbursement of expenses for certain periods since the inception date. Without these waivers and reimbursements, performance would have been lower. Also, performance shown in this section does not reflect the deduction of taxes that a shareholder would pay on Fund distributions or redemption of Fund shares.
The returns shown are based on net asset values calculated for shareholder transactions and may differ from the returns shown in the financial highlights, which reflect adjustments made to the net asset values in accordance with accounting principles generally accepted in the United States of America.
| | | | | | |
| | | |
| 12 | | | | J.P. MORGAN SMALL CAP FUNDS | | DECEMBER 31, 2016 |
JPMorgan U.S. Small Company Fund
FUND COMMENTARY
SIX MONTHS ENDED DECEMBER 31, 2016 (Unaudited)
| | | | |
| REPORTING PERIOD RETURN: | |
| Fund (Class L Shares)* (1) | | | 19.46% | |
| Russell 2000 Index | | | 18.68% | |
| |
| Net Assets as of 12/31/2016 (In Thousands) | | | $1,700,886 | |
INVESTMENT OBJECTIVE**
The JPMorgan U.S. Small Company Fund (the “Fund”) seeks to provide high total return from a portfolio of small company stocks.
WHAT WERE THE MAIN DRIVERS OF THE FUND’S PERFORMANCE?
The Fund’s L Class Shares outperformed the Russell 2000 Index (the “Benchmark”) for the six months ended December 31, 2016. The Fund’s security selection in the software & services sector and the semiconductor sector was a leading contributor to performance relative to the Benchmark, while the Fund’s security selection in the health services & systems sector and the financial services sector was a leading detractor from relative performance.
Leading individual contributors to relative performance included the Fund’s overweight positions in Rex American Resources Corp., InvenSense Inc. and Nutanix Inc. Shares of Rex American Resources, an ethanol producer, rose on expectations that it will benefit from the policies of the incoming U.S. Congress. Shares of InvenSense, a maker of motion tracking systems and gyroscopes for consumer electronics, rose after the company agreed to a $1.3 billion takeover by TDK Corp. Shares of Nutanix, a provider of so-called cloud computing technology, rose following its September 2016 initial public offering of stock.
Leading individual detractors from relative performance included the Fund’s underweight positions in Community Health Systems Inc. and its overweight positions in Huron Consulting Group Inc. and GNC Holdings Inc. Shares of Community Health Systems, a hospitals operator, rose on the company’s divestiture of some of its businesses. Shares of Huron Consulting Group, a provider of management consulting, fell following declining revenue from its health care business. Shares of GNC Holdings, a retailer of health supplements, fell after the company reported a larger-than-expected decline in earnings.
HOW WAS THE FUND POSITIONED?
In accordance with its investment process, the Fund’s portfolio managers take limited sector bets and construct the Fund so that stock selection is typically the primary driver of its relative performance versus the Benchmark. The Fund’s portfolio managers use a quantitative ranking methodology to identify stocks in each sector that, in their view, trade at attractive lev-
els. Through bottom-up fundamental research, they seek companies that exhibit high earnings quality and have management teams that make effective capital deployment decisions. During the reporting period, the Fund was managed and positioned in accordance with this investment process.
| | | | | | | | |
| TOP TEN EQUITY HOLDINGS OF THE PORTFOLIO*** | |
| | 1. | | | FCB Financial Holdings, Inc., Class A | | | 1.3 | % |
| | 2. | | | Take-Two Interactive Software, Inc. | | | 1.2 | |
| | 3. | | | REX American Resources Corp. | | | 1.2 | |
| | 4. | | | Children’s Place, Inc. (The) | | | 1.2 | |
| | 5. | | | DigitalGlobe, Inc. | | | 1.2 | |
| | 6. | | | ACCO Brands Corp. | | | 1.1 | |
| | 7. | | | InvenSense, Inc. | | | 1.1 | |
| | 8. | | | Aspen Technology, Inc. | | | 1.1 | |
| | 9. | | | Cooper Tire & Rubber Co. | | | 1.1 | |
| | 10. | | | InterDigital, Inc. | | | 1.0 | |
| | | | |
PORTFOLIO COMPOSITION BY SECTOR*** | |
| Financials | | | 18.4 | % |
| Information Technology | | | 17.9 | |
| Industrials | | | 16.0 | |
| Health Care | | | 12.7 | |
| Consumer Discretionary | | | 10.9 | |
| Real Estate | | | 6.8 | |
| Energy | | | 3.8 | |
| Materials | | | 3.7 | |
| Utilities | | | 3.2 | |
| Consumer Staples | | | 2.7 | |
| Telecommunication Services | | | 0.7 | |
| Short-Term Investment | | | 3.2 | |
| * | | The return shown is based on net asset values calculated for shareholder transactions and may differ from the return shown in the financial highlights, which reflects adjustments made to the net asset values in accordance with accounting principles generally accepted in the United States of America. |
| ** | | The adviser seeks to achieve the Fund’s objective. There can be no guarantee it will be achieved. |
| *** | | Percentages indicated are based on total investments as of December 31, 2016. The Fund’s portfolio composition is subject to change. |
| (1) | | On December 1, 2016, the Fund’s Institutional Class Shares were re-designated and renamed Class L Shares. |
| | | | | | | | |
| | | |
| DECEMBER 31, 2016 | | J.P. MORGAN SMALL CAP FUNDS | | | | | 13 | |
JPMorgan U.S. Small Company Fund
FUND COMMENTARY
SIX MONTHS ENDED DECEMBER 31, 2016 (Unaudited) (continued)
| | | | | | | | | | | | | | | | | | |
AVERAGE ANNUAL TOTAL RETURNS AS OF DECEMBER 31, 2016 | |
| | | | | |
| | | INCEPTION DATE OF
CLASS | | 6 MONTH* | | | 1 YEAR | | | 5 YEAR | | | 10 YEAR | |
CLASS A SHARES | | November 1, 2007 | | | | | | | | | | | | | | | | |
With Sales Charge** | | | | | 12.96 | % | | | 13.96 | % | | | 15.03 | % | | | 7.23 | % |
Without Sales Charge | | | | | 19.24 | | | | 20.28 | | | | 16.28 | | | | 7.80 | |
CLASS C SHARES | | November 1, 2007 | | | | | | | | | | | | | | | | |
With CDSC*** | | | | | 17.95 | | | | 18.61 | | | | 15.69 | | | | 7.32 | |
Without CDSC | | | | | 18.95 | | | | 19.61 | | | | 15.69 | | | | 7.32 | |
CLASS L SHARES (FORMERLY INSTITUTIONAL CLASS SHARES) | | November 4, 1993 | | | 19.46 | | | | 20.71 | | | | 16.78 | | | | 8.27 | |
CLASS R2 SHARES | | November 1, 2011 | | | 19.09 | | | | 19.90 | | | | 15.99 | | | | 7.67 | |
CLASS R3 SHARES | | September 9, 2016 | | | 19.24 | | | | 20.28 | | | | 16.28 | | | | 7.80 | |
CLASS R4 SHARES | | September 9, 2016 | | | 19.39 | | | | 20.56 | | | | 16.58 | | | | 8.07 | |
CLASS R5 SHARES | | September 9, 2016 | | | 19.47 | | | | 20.72 | | | | 16.78 | | | | 8.27 | |
CLASS R6 SHARES | | November 1, 2011 | | | 19.53 | | | | 20.87 | | | | 16.86 | | | | 8.31 | |
SELECT CLASS SHARES | | September 10, 2001 | | | 19.37 | | | | 20.55 | | | | 16.58 | | | | 8.07 | |
| ** | | Sales Charge for Class A Shares is 5.25%. |
| *** | | Assumes a 1% CDSC (contingent deferred sales charge) for the 6 month and one year periods and 0% CDSC thereafter. |
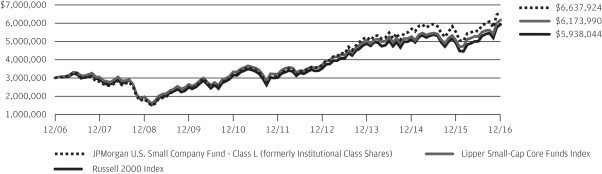
TEN YEAR PERFORMANCE (12/31/06 TO 12/31/16)
The performance quoted is past performance and is not a guarantee of future results. Mutual funds are subject to certain market risks. Investment returns and principal value of an investment will fluctuate so that an investor’s shares, when redeemed, may be worth more or less than their original cost. Current performance may be higher or lower than the performance data shown. For up-to-date month-end performance information please call 1-800-480-4111.
Returns for Class A, Class C and Class R4 Shares prior to their inception dates are based on the performance of the Select Class Shares. The actual returns for Class A and Class C Shares would have been lower than those shown because Class A and Class C Shares have higher expenses than Select Class Shares. The actual returns for Class R4 Shares would have been similar to those shown because Class R4 Shares have similar expenses to Select Class Shares.
Returns for Class R2 and R3 Shares prior to their inception date are based on the performance of the Class A Shares from November 1, 2007 to October 31, 2011 and the performance of Select Class Shares prior to November 1, 2007. The actual returns of Class R2 Shares would have been lower than those shown because Class R2 Shares have higher expenses than Class A Shares and Select Class Shares. The actual returns for Class R3 Shares would have been lower than those shown because Class R3 Shares have similar expenses to Class A Shares and higher expenses than Select Class Shares.
Returns for Class R5 and Class R6 Shares prior to their inception date are based on the performance of the Class L Shares. The actual returns of Class R5 Shares would have been lower than those shown because Class R5 Shares have higher expenses than Class L Shares. The actual returns of Class R6 Shares would have been different than these shown because Class R6 Shares have different expenses than Class L Shares.
The graph illustrates comparative performance for $3,000,000 invested in Class L Shares of the JPMorgan U.S. Small Company Fund, the Russell 2000 Index and the Lipper Small-Cap Core Funds Index from December 31, 2006 to December 31, 2016. The performance of the Fund assumes reinvestment of all dividends and capital gain distributions, if any, and does not include a sales charge. The performance of the Russell 2000 Index does not reflect the deduction of expenses associated with a mutual fund and has been adjusted to reflect reinvestment of all dividends and capital gain distributions of the securities included in the benchmark, if applicable. The performance of the Lipper Small-Cap Core Funds Index includes expenses associated with a mutual fund, such as investment management fees. These expenses are not identical to the expenses incurred by the Fund. The Russell 2000 Index is an unmanaged index which measures the performance of the 2000 smallest stocks (on the basis of capitalization) in the Russell 3000 Index. The Lipper Small-Cap Core Funds Index is an index based on the total returns of certain mutual funds within the Fund’s designated category as determined by Lipper, Inc. Investors cannot invest directly in an index.
Class L Shares have a $3,000,000 minimum initial investment.
Fund performance may reflect the waiver of the Fund’s fees and reimbursement of expenses for certain periods since the inception date. Without these waivers and reimbursements, performance would have been lower. Also, performance shown in this section does not reflect the deduction of taxes that a shareholder would pay on Fund distributions or redemptions of Fund shares.
The returns shown are based on net asset values calculated for shareholder transactions and may differ from the returns shown in the financial highlights, which reflect adjustments made to the net asset values in accordance with accounting principles generally accepted in the United States of America.
| | | | | | |
| | | |
| 14 | | | | J.P. MORGAN SMALL CAP FUNDS | | DECEMBER 31, 2016 |
JPMorgan Dynamic Small Cap Growth Fund
SCHEDULE OF PORTFOLIO INVESTMENTS
AS OF DECEMBER 31, 2016 (Unaudited)
(Amounts in thousands)
| | | | | | | | |
| SHARES | | | SECURITY DESCRIPTION | | VALUE($) | |
| | Common Stocks — 99.0% | |
| | | | Consumer Discretionary — 14.3% | |
| | | | Distributors — 1.1% | |
| | 15 | | | Pool Corp. | | | 1,614 | |
| | | | | | | | |
| | | | Hotels, Restaurants & Leisure — 3.8% | |
| | 113 | | | Boyd Gaming Corp. (a) | | | 2,288 | |
| | 36 | | | Texas Roadhouse, Inc. | | | 1,742 | |
| | 10 | | | Vail Resorts, Inc. | | | 1,649 | |
| | | | | | | | |
| | | | | | | 5,679 | |
| | | | | | | | |
| | | | Household Durables — 0.6% | |
| | 81 | | | TRI Pointe Group, Inc. (a) | | | 932 | |
| | | | | | | | |
| | | | Internet & Direct Marketing Retail — 0.9% | |
| | 36 | | | Wayfair, Inc., Class A (a) | | | 1,269 | |
| | | | | | | | |
| | | | Multiline Retail — 1.0% | |
| | 52 | | | Ollie’s Bargain Outlet Holdings, Inc. (a) | | | 1,474 | |
| | | | | | | | |
| | | | Specialty Retail — 5.1% | |
| | 19 | | | Burlington Stores, Inc. (a) | | | 1,642 | |
| | 20 | | | Lithia Motors, Inc., Class A | | | 1,971 | |
| | 18 | | | Monro Muffler Brake, Inc. | | | 1,004 | |
| | 17 | | | Penske Automotive Group, Inc. | | | 903 | |
| | 37 | | | Tailored Brands, Inc. | | | 940 | |
| | 56 | | | Tile Shop Holdings, Inc. (a) | | | 1,091 | |
| | | | | | | | |
| | | | | | | 7,551 | |
| | | | | | | | |
| | | | Textiles, Apparel & Luxury Goods — 1.8% | |
| | 25 | | | G-III Apparel Group Ltd. (a) | | | 729 | |
| | 37 | | | Kate Spade & Co. (a) | | | 688 | |
| | 61 | | | Wolverine World Wide, Inc. | | | 1,333 | |
| | | | | | | | |
| | | | | | | 2,750 | |
| | | | | | | | |
| | | | Total Consumer Discretionary | | | 21,269 | |
| | | | | | | | |
| | | | Consumer Staples — 4.4% | |
| | | | Food & Staples Retailing — 2.4% | |
| | 12 | | | Casey’s General Stores, Inc. | | | 1,428 | |
| | 48 | | | Performance Food Group Co. (a) | | | 1,148 | |
| | 49 | | | Sprouts Farmers Market, Inc. (a) | | | 924 | |
| | | | | | | | |
| | | | | | | 3,500 | |
| | | | | | | | |
| | | | Food Products — 1.2% | |
| | 96 | | | Freshpet, Inc. (a) | | | 976 | |
| | 23 | | | Snyder’s-Lance, Inc. | | | 866 | |
| | | | | | | | |
| | | | | | | 1,842 | |
| | | | | | | | |
| | | | Personal Products — 0.8% | |
| | 39 | | | elf Beauty, Inc. (a) | | | 1,139 | |
| | | | | | | | |
| | | | Total Consumer Staples | | | 6,481 | |
| | | | | | | | |
| | | | | | | | |
| SHARES | | | SECURITY DESCRIPTION | | VALUE($) | |
| | | | | | | | |
| | | | Energy — 1.9% | |
| | | | Oil, Gas & Consumable Fuels — 1.9% | |
| | 30 | | | Delek US Holdings, Inc. | | | 724 | |
| | 10 | | | Diamondback Energy, Inc. (a) | | | 1,038 | |
| | 25 | | | RSP Permian, Inc. (a) | | | 1,122 | |
| | | | | | | | |
| | | | Total Energy | | | 2,884 | |
| | | | | | | | |
| | | | Financials — 6.6% | |
| | | | Banks — 2.2% | |
| | 7 | | | Signature Bank (a) | | | 1,061 | |
| | 28 | | | Texas Capital Bancshares, Inc. (a) | | | 2,188 | |
| | | | | | | | |
| | | | | | | 3,249 | |
| | | | | | | | |
| | | | Capital Markets — 3.7% | |
| | 36 | | | Evercore Partners, Inc., Class A | | | 2,466 | |
| | 46 | | | Financial Engines, Inc. | | | 1,707 | |
| | 125 | | | PennantPark Investment Corp. | | | 960 | |
| | 40 | | | WisdomTree Investments, Inc. | | | 445 | |
| | | | | | | | |
| | | | | | | 5,578 | |
| | | | | | | | |
| | | | Thrifts & Mortgage Finance — 0.7% | |
| | 34 | | | BofI Holding, Inc. (a) | | | 969 | |
| | | | | | | | |
| | | | Total Financials | | | 9,796 | |
| | | | | | | | |
| | | | Health Care — 21.3% | |
| | | | Biotechnology — 9.2% | |
| | 23 | | | ACADIA Pharmaceuticals, Inc. (a) | | | 676 | |
| | 26 | | | Acceleron Pharma, Inc. (a) | | | 655 | |
| | 33 | | | Axovant Sciences Ltd. (a) | | | 415 | |
| | 55 | | | Bellicum Pharmaceuticals, Inc. (a) | | | 746 | |
| | 41 | | | Coherus Biosciences, Inc. (a) | | | 1,141 | |
| | 68 | | | Exact Sciences Corp. (a) | | | 912 | |
| | 29 | | | FibroGen, Inc. (a) | | | 620 | |
| | 96 | | | Halozyme Therapeutics, Inc. (a) | | | 950 | |
| | 64 | | | Ignyta, Inc. (a) | | | 337 | |
| | 53 | | | Insmed, Inc. (a) | | | 701 | |
| | 24 | | | Kite Pharma, Inc. (a) | | | 1,081 | |
| | 18 | | | Neurocrine Biosciences, Inc. (a) | | | 684 | |
| | 37 | | | Portola Pharmaceuticals, Inc. (a) | | | 838 | |
| | 33 | | | REGENXBIO, Inc. (a) | | | 605 | |
| | 25 | | | Sage Therapeutics, Inc. (a) | | | 1,260 | |
| | 17 | | | Spark Therapeutics, Inc. (a) | | | 871 | |
| | 9 | | | Ultragenyx Pharmaceutical, Inc. (a) | | | 598 | |
| | 38 | | | Versartis, Inc. (a) | | | 568 | |
| | | | | | | | |
| | | | | | | 13,658 | |
| | | | | | | | |
| | | | Health Care Equipment & Supplies — 4.6% | |
| | 140 | | | GenMark Diagnostics, Inc. (a) | | | 1,710 | |
| | 29 | | | Insulet Corp. (a) | | | 1,089 | |
SEE NOTES TO FINANCIAL STATEMENTS.
| | | | | | | | |
| | | |
| DECEMBER 31, 2016 | | J.P. MORGAN SMALL CAP FUNDS | | | | | 15 | |
JPMorgan Dynamic Small Cap Growth Fund
SCHEDULE OF PORTFOLIO INVESTMENTS
AS OF DECEMBER 31, 2016 (Unaudited) (continued)
(Amounts in thousands)
| | | | | | | | |
| SHARES | | | SECURITY DESCRIPTION | | VALUE($) | |
| | Common Stocks — continued | |
| | | | Health Care Equipment & Supplies — continued | |
| | 64 | | | K2M Group Holdings, Inc. (a) | | | 1,284 | |
| | 19 | | | Nevro Corp. (a) | | | 1,365 | |
| | 170 | | | Novadaq Technologies, Inc., (Canada) (a) | | | 1,205 | |
| | 58 | | | Unilife Corp. (a) | | | 133 | |
| | | | | | | | |
| | | | | | | 6,786 | |
| | | | | | | | |
| | | | Health Care Providers & Services — 3.2% | |
| | 42 | | | Acadia Healthcare Co., Inc. (a) | | | 1,405 | |
| | 36 | | | Surgical Care Affiliates, Inc. (a) | | | 1,661 | |
| | 13 | | | WellCare Health Plans, Inc. (a) | | | 1,755 | |
| | | | | | | | |
| | | | | | | 4,821 | |
| | | | | | | | |
| | | | Health Care Technology — 1.6% | |
| | 84 | | | Evolent Health, Inc., Class A (a) | | | 1,250 | |
| | 30 | | | Veeva Systems, Inc., Class A (a) | | | 1,204 | |
| | | | | | | | |
| | | | | | | 2,454 | |
| | | | | | | | |
| | | | Pharmaceuticals — 2.7% | |
| | 89 | | | Horizon Pharma plc (a) | | | 1,443 | |
| | 49 | | | Nektar Therapeutics (a) | | | 597 | |
| | 43 | | | Revance Therapeutics, Inc. (a) | | | 894 | |
| | 185 | | | TherapeuticsMD, Inc. (a) | | | 1,068 | |
| | | | | | | | |
| | | | | | | 4,002 | |
| | | | | | | | |
| | | | Total Health Care | | | 31,721 | |
| | | | | | | | |
| | | | Industrials — 17.5% | |
| | | | Aerospace & Defense — 2.2% | |
| | 26 | | | HEICO Corp. | | | 1,973 | |
| | 27 | | | Hexcel Corp. | | | 1,368 | |
| | | | | | | | |
| | | | | | | 3,341 | |
| | | | | | | | |
| | | | Air Freight & Logistics — 0.7% | |
| | 25 | | | XPO Logistics, Inc. (a) | | | 1,084 | |
| | | | | | | | |
| | | | Building Products — 5.4% | |
| | 52 | | | Advanced Drainage Systems, Inc. | | | 1,077 | |
| | 21 | | | Fortune Brands Home & Security, Inc. | | | 1,112 | |
| | 11 | | | Lennox International, Inc. | | | 1,725 | |
| | 32 | | | Masonite International Corp. (a) | | | 2,075 | |
| | 31 | | | Trex Co., Inc. (a) | | | 2,000 | |
| | | | | | | | |
| | | | | | | 7,989 | |
| | | | | | | | |
| | | | Commercial Services & Supplies — 0.8% | |
| | 55 | | | Advanced Disposal Services, Inc. (a) | | | 1,224 | |
| | | | | | | | |
| | | | Industrial Conglomerates — 0.7% | |
| | 10 | | | Carlisle Cos., Inc. | | | 1,069 | |
| | | | | | | | |
| | | | Machinery — 4.2% | |
| | 20 | | | Graco, Inc. | | | 1,637 | |
| | 27 | | | John Bean Technologies Corp. | | | 2,293 | |
| | | | | | | | |
| SHARES | | | SECURITY DESCRIPTION | | VALUE($) | |
| | | | | | | | |
| | | | Machinery — continued | |
| | 12 | | | Middleby Corp. (The) (a) | | | 1,515 | |
| | 12 | | | Oshkosh Corp. | | | 754 | |
| | | | | | | | |
| | | | | | | 6,199 | |
| | | | | | | | |
| | | | Road & Rail — 1.1% | |
| | 19 | | | Old Dominion Freight Line, Inc. (a) | | | 1,598 | |
| | | | | | | | |
| | | | Trading Companies & Distributors — 2.4% | |
| | 28 | | | H&E Equipment Services, Inc. | | | 660 | |
| | 48 | | | Rush Enterprises, Inc., Class A (a) | | | 1,522 | |
| | 9 | | | Watsco, Inc. | | | 1,347 | |
| | | | | | | | |
| | | | | | | 3,529 | |
| | | | | | | | |
| | | | Total Industrials | | | 26,033 | |
| | | | | | | | |
| | | | Information Technology — 27.9% | |
| | | | Communications Equipment — 1.0% | |
| | 37 | | | Ciena Corp. (a) | | | 901 | |
| | 35 | | | Quantenna Communications, Inc. (a) | | | 628 | |
| | | | | | | | |
| | | | | | | 1,529 | |
| | | | | | | | |
| | | | Electronic Equipment, Instruments & Components — 1.5% | |
| | 15 | | | Littelfuse, Inc. | | | 2,229 | |
| | | | | | | | |
| | | | Internet Software & Services — 9.4% | |
| | 46 | | | 2U, Inc. (a) | | | 1,373 | |
| | 34 | | | Benefitfocus, Inc. (a) | | | 997 | |
| | 33 | | | Cornerstone OnDemand, Inc. (a) | | | 1,416 | |
| | 7 | | | CoStar Group, Inc. (a) | | | 1,346 | |
| | 51 | | | Envestnet, Inc. (a) | | | 1,791 | |
| | 52 | | | GoDaddy, Inc., Class A (a) | | | 1,832 | |
| | 45 | | | GrubHub, Inc. (a) | | | 1,674 | |
| | 38 | | | Instructure, Inc. (a) | | | 751 | |
| | 21 | | | Nutanix, Inc., Class A (a) | | | 567 | |
| | 35 | | | Shopify, Inc., (Canada), Class A (a) | | | 1,516 | |
| | 24 | | | Trade Desk, Inc. (The), Class A (a) | | | 670 | |
| | | | | | | | |
| | | | | | | 13,933 | |
| | | | | | | | |
| | | | Semiconductors & Semiconductor Equipment — 7.3% | |
| | 67 | | | Advanced Micro Devices, Inc. (a) | | | 758 | |
| | 41 | | | Cavium, Inc. (a) | | | 2,548 | |
| | 39 | | | Inphi Corp. (a) | | | 1,727 | |
| | 40 | | | MACOM Technology Solutions Holdings, Inc. (a) | | | 1,832 | |
| | 31 | | | MKS Instruments, Inc. | | | 1,856 | |
| | 25 | | | Monolithic Power Systems, Inc. | | | 2,057 | |
| | | | | | | | |
| | | | | | | 10,778 | |
| | | | | | | | |
| | | | Software — 8.4% | |
| | 45 | | | Atlassian Corp. plc, (Australia), Class A (a) | | | 1,089 | |
| | 26 | | | Guidewire Software, Inc. (a) | | | 1,275 | |
SEE NOTES TO FINANCIAL STATEMENTS.
| | | | | | |
| | | |
| 16 | | | | J.P. MORGAN SMALL CAP FUNDS | | DECEMBER 31, 2016 |
| | | | | | | | |
| SHARES | | | SECURITY DESCRIPTION | | VALUE($) | |
| | Common Stocks — continued | |
| | | | Software — continued | |
| | 23 | | | HubSpot, Inc. (a) | | | 1,102 | |
| | 22 | | | Imperva, Inc. (a) | | | 831 | |
| | 21 | | | Paycom Software, Inc. (a) | | | 944 | |
| | 20 | | | Proofpoint, Inc. (a) | | | 1,393 | |
| | 79 | | | RingCentral, Inc., Class A (a) | | | 1,618 | |
| | 46 | | | Take-Two Interactive Software, Inc. (a) | | | 2,269 | |
| | 5 | | | Tyler Technologies, Inc. (a) | | | 724 | |
| | 60 | | | Zendesk, Inc. (a) | | | 1,266 | |
| | | | | | | | |
| | | | | | | 12,511 | |
| | | | | | | | |
| | | | Technology Hardware, Storage & Peripherals — 0.3% | |
| | 59 | | | Nimble Storage, Inc. (a) | | | 469 | |
| | | | | | | | |
| | | | Total Information Technology | | | 41,449 | |
| | | | | | | | |
| | | | Materials — 2.4% | |
| | | | Construction Materials — 2.4% | |
| | 21 | | | Eagle Materials, Inc. | | | 2,034 | |
| | 66 | | | Summit Materials, Inc., Class A (a) | | | 1,577 | |
| | | | | | | | |
| | | | Total Materials | | | 3,611 | |
| | | | | | | | |
| | | | Real Estate — 2.7% | |
| | | | Equity Real Estate Investment Trusts (REITs) — 1.2% | |
| | 31 | | | CubeSmart | | | 827 | |
| | 20 | | | Highwoods Properties, Inc. | | | 1,002 | |
| | | | | | | | |
| | | | | | | 1,829 | |
| | | | | | | | |
| | | | | | | | |
| SHARES | | | SECURITY DESCRIPTION | | VALUE($) | |
| | | | | | | | |
| | | | Real Estate Management & Development — 1.5% | |
| | 40 | | | RE/MAX Holdings, Inc., Class A | | | 2,246 | |
| | | | | | | | |
| | | | Total Real Estate | | | 4,075 | |
| | | | | | | | |
| | | | Total Common Stocks
(Cost $101,763) | | | 147,319 | |
| | | | | | | | |
| | Short-Term Investment — 1.5% | |
| | | | Investment Company — 1.5% | |
| | 2,158 | | | JPMorgan U.S. Government Money Market Fund, Institutional Class Shares, 0.410% (b) (l) (Cost $2,158) | | | 2,158 | |
| | | | | | | | |
| | | | Total Investments — 100.5%
(Cost $103,921) | | | 149,477 | |
| | | | Liabilities in Excess of
Other Assets — (0.5)% | | | (761 | ) |
| | | | | | | | |
| | | | NET ASSETS — 100.0% | | $ | 148,716 | |
| | | | | | | | |
Percentages indicated are based on net assets.
SEE NOTES TO FINANCIAL STATEMENTS.
| | | | | | | | |
| | | |
| DECEMBER 31, 2016 | | J.P. MORGAN SMALL CAP FUNDS | | | | | 17 | |
JPMorgan Small Cap Core Fund
SCHEDULE OF PORTFOLIO INVESTMENTS
AS OF DECEMBER 31, 2016 (Unaudited)
(Amounts in thousands)
| | | | | | | | |
| SHARES | | | SECURITY DESCRIPTION | | VALUE($) | |
| | Common Stocks — 99.4% | |
| | | | Consumer Discretionary — 9.4% | |
| | | | Auto Components — 2.7% | |
| | 57 | | | American Axle & Manufacturing Holdings, Inc. (a) | | | 1,103 | |
| | 41 | | | Cooper Tire & Rubber Co. | | | 1,574 | |
| | 17 | | | Cooper-Standard Holdings, Inc. (a) | | | 1,742 | |
| | 9 | | | Dana, Inc. | | | 167 | |
| | 16 | | | Horizon Global Corp. (a) | | | 388 | |
| | 2 | | | Stoneridge, Inc. (a) | | | 35 | |
| | 5 | | | Tower International, Inc. | | | 143 | |
| | | | | | | | |
| | | | | | | 5,152 | |
| | | | | | | | |
| | | | Diversified Consumer Services — 0.3% | |
| | 2 | | | Capella Education Co. | | | 160 | |
| | 21 | | | K12, Inc. (a) | | | 358 | |
| | | | | | | | |
| | | | | | | 518 | |
| | | | | | | | |
| | | | Hotels, Restaurants & Leisure — 1.4% | |
| | 94 | | | Bloomin’ Brands, Inc. | | | 1,701 | |
| | 7 | | | DineEquity, Inc. | | | 547 | |
| | 1 | | | Jack in the Box, Inc. | | | 56 | |
| | 16 | | | Ruth’s Hospitality Group, Inc. | | | 289 | |
| | | | | | | | |
| | | | | | | 2,593 | |
| | | | | | | | |
| | | | Household Durables — 0.9% | |
| | 14 | | | Helen of Troy Ltd. (a) | | | 1,164 | |
| | 3 | | | Libbey, Inc. | | | 50 | |
| | 19 | | | Lifetime Brands, Inc. | | | 342 | |
| | 2 | | | NACCO Industries, Inc., Class A | | | 165 | |
| | | | | | | | |
| | | | | | | 1,721 | |
| | | | | | | | |
| | | | Internet & Direct Marketing Retail — 0.1% | |
| | 20 | | | Liberty TripAdvisor Holdings, Inc., Class A (a) | | | 296 | |
| | | | | | | | |
| | | | Leisure Products — 0.1% | |
| | 8 | | | Acushnet Holdings Corp. (a) | | | 166 | |
| | | | | | | | |
| | | | Media — 0.5% | |
| | 7 | | | Gray Television, Inc. (a) | | | 79 | |
| | 3 | | | Nexstar Broadcasting Group, Inc., Class A | | | 204 | |
| | 22 | | | Sinclair Broadcast Group, Inc., Class A | | | 747 | |
| | | | | | | | |
| | | | | | | 1,030 | |
| | | | | | | | |
| | | | Specialty Retail — 3.1% | |
| | 27 | | | Caleres, Inc. | | | 886 | |
| | 18 | | | Cato Corp. (The), Class A | | | 535 | |
| | 18 | | | Children’s Place, Inc. (The) | | | 1,767 | |
| | 18 | | | Express, Inc. (a) | | | 195 | |
| | 339 | | | Office Depot, Inc. | | | 1,532 | |
| | 64 | | | Rent-A-Center, Inc. | | | 716 | |
| | 2 | | | Tailored Brands, Inc. | | | 51 | |
| | | | | | | | |
| SHARES | | | SECURITY DESCRIPTION | | VALUE($) | |
| | | | | | | | |
| | | | Specialty Retail — continued | |
| | 13 | | | Tilly’s, Inc., Class A (a) | | | 178 | |
| | | | | | | | |
| | | | | | | 5,860 | |
| | | | | | | | |
| | | | Textiles, Apparel & Luxury Goods — 0.3% | |
| | 13 | | | Movado Group, Inc. | | | 385 | |
| | 9 | | | Perry Ellis International, Inc. (a) | | | 227 | |
| | | | | | | | |
| | | | | | | 612 | |
| | | | | | | | |
| | | | Total Consumer Discretionary | | | 17,948 | |
| | | | | | | | |
| | | | Consumer Staples — 2.8% | |
| | | | Food & Staples Retailing — 1.0% | |
| | 37 | | | SpartanNash Co. | | | 1,478 | |
| | 38 | | | SUPERVALU, Inc. (a) | | | 178 | |
| | 11 | | | US Foods Holding Corp. (a) | | | 291 | |
| | 1 | | | Village Super Market, Inc., Class A | | | 27 | |
| | | | | | | | |
| | | | | | | 1,974 | |
| | | | | | | | |
| | | | Food Products — 1.3% | |
| | 34 | | | Dean Foods Co. | | | 741 | |
| | 27 | | | Pilgrim’s Pride Corp. | | | 522 | |
| | 4 | | | Pinnacle Foods, Inc. | | | 199 | |
| | 6 | | | Post Holdings, Inc. (a) | | | 474 | |
| | 3 | | | Sanderson Farms, Inc. | | | 302 | |
| | 2 | | | TreeHouse Foods, Inc. (a) | | | 166 | |
| | | | | | | | |
| | | | | | | 2,404 | |
| | | | | | | | |
| | | | Household Products — 0.4% | |
| | 24 | | | Central Garden & Pet Co., Class A (a) | | | 738 | |
| | | | | | | | |
| | | | Personal Products — 0.1% | | | | |
| | 3 | | | elf Beauty, Inc. (a) | | | 98 | |
| | 2 | | | USANA Health Sciences, Inc. (a) | | | 97 | |
| | | | | | | | |
| | | | | | | 195 | |
| | | | | | | | |
| | | | Total Consumer Staples | | | 5,311 | |
| | | | | | | | |
| | | | Energy — 3.7% | |
| | | | Energy Equipment & Services — 1.5% | |
| | 31 | | | Archrock, Inc. | | | 404 | |
| | 60 | | | Atwood Oceanics, Inc. (a) | | | 782 | |
| | 2 | | | Helix Energy Solutions Group, Inc. (a) | | | 21 | |
| | 13 | | | Matrix Service Co. (a) | | | 304 | |
| | 6 | | | PHI, Inc. (Non-Voting) (a) | | | 116 | |
| | 3 | | | Pioneer Energy Services Corp. (a) | | | 20 | |
| | 35 | | | RigNet, Inc. (a) | | | 815 | |
| | 48 | | | Seadrill Ltd., (United Kingdom) (a) | | | 163 | |
| | 13 | | | Superior Energy Services, Inc. (a) | | | 216 | |
| | | | | | | | |
| | | | | | | 2,841 | |
| | | | | | | | |
SEE NOTES TO FINANCIAL STATEMENTS.
| | | | | | |
| | | |
| 18 | | | | J.P. MORGAN SMALL CAP FUNDS | | DECEMBER 31, 2016 |
| | | | | | | | |
| SHARES | | | SECURITY DESCRIPTION | | VALUE($) | |
| | Common Stocks — continued | |
| | | | Oil, Gas & Consumable Fuels — 2.2% | |
| | 135 | | | Abraxas Petroleum Corp. (a) | | | 348 | |
| | 29 | | | Bill Barrett Corp. (a) | | | 201 | |
| | 8 | | | Callon Petroleum Co. (a) | | | 116 | |
| | 6 | | | Carrizo Oil & Gas, Inc. (a) | | | 224 | |
| | 3 | | | Clayton Williams Energy, Inc. (a) | | | 358 | |
| | 35 | | | Delek US Holdings, Inc. | | | 853 | |
| | 110 | | | Denbury Resources, Inc. (a) | | | 406 | |
| | 43 | | | Eclipse Resources Corp. (a) | | | 115 | |
| | 70 | | | EP Energy Corp., Class A (a) | | | 457 | |
| | 8 | | | Green Plains, Inc. | | | 219 | |
| | 27 | | | Renewable Energy Group, Inc. (a) | | | 262 | |
| | 1 | | | REX American Resources Corp. (a) | | | 60 | |
| | 1 | | | SemGroup Corp., Class A | | | 58 | |
| | 20 | | | Westmoreland Coal Co. (a) | | | 350 | |
| | 3 | | | World Fuel Services Corp. | | | 131 | |
| | | | | | | | |
| | | | | | | 4,158 | |
| | | | | | | | |
| | | | Total Energy | | | 6,999 | |
| | | | | | | | |
| | | | Financials — 18.9% | |
| | | | Banks — 11.2% | |
| | 15 | | | Banc of California, Inc. | | | 261 | |
| | 8 | | | Cathay General Bancorp | | | 297 | |
| | 2 | | | Community Trust Bancorp, Inc. | | | 85 | |
| | 3 | | | CU Bancorp (a) | | | 115 | |
| | 4 | | | Customers Bancorp, Inc. (a) | | | 134 | |
| | 39 | | | East West Bancorp, Inc. | | | 1,986 | |
| | 31 | | | Fidelity Southern Corp. | | | 744 | |
| | 5 | | | Financial Institutions, Inc. | | | 167 | |
| | 159 | | | First BanCorp, (Puerto Rico) (a) | | | 1,052 | |
| | 5 | | | First Business Financial Services, Inc. | | | 114 | |
| | 23 | | | First Commonwealth Financial Corp. | | | 319 | |
| | 6 | | | First Community Bancshares, Inc. | | | 171 | |
| | 5 | | | First Financial Bancorp | | | 141 | |
| | 7 | | | First Hawaiian, Inc. | | | 258 | |
| | 4 | | | First Merchants Corp. | | | 169 | |
| | 5 | | | Franklin Financial Network, Inc. (a) | | | 218 | |
| | 50 | | | Fulton Financial Corp. | | | 938 | |
| | 12 | | | Hancock Holding Co. | | | 517 | |
| | 33 | | | Hanmi Financial Corp. | | | 1,148 | |
| | 13 | | | Hilltop Holdings, Inc. | | | 400 | |
| | 59 | | | Hope Bancorp, Inc. | | | 1,291 | |
| | 146 | | | Huntington Bancshares, Inc. | | | 1,925 | |
| | 1 | | | IBERIABANK Corp. | | | 111 | |
| | 4 | | | MainSource Financial Group, Inc. | | | 142 | |
| | 3 | | | NBT Bancorp, Inc. | | | 124 | |
| | 24 | | | PacWest Bancorp | | | 1,319 | |
| | | | | | | | |
| SHARES | | | SECURITY DESCRIPTION | | VALUE($) | |
| | | | | | | | |
| | | | Banks — continued | |
| | 42 | | | Popular, Inc., (Puerto Rico) | | | 1,827 | |
| | 10 | | | Preferred Bank | | | 543 | |
| | 2 | | | Premier Financial Bancorp, Inc. | | | 42 | |
| | 5 | | | PrivateBancorp, Inc. | | | 280 | |
| | 3 | | | Sierra Bancorp | | | 73 | |
| | 4 | | | Southern National Bancorp of Virginia, Inc. | | | 65 | |
| | 2 | | | Stonegate Bank | | | 83 | |
| | 2 | | | SVB Financial Group (a) | | | 276 | |
| | 102 | | | TCF Financial Corp. | | | 2,002 | |
| | 2 | | | Towne Bank | | | 70 | |
| | 15 | | | TriCo Bancshares | | | 525 | |
| | 15 | | | TriState Capital Holdings, Inc. (a) | | | 327 | |
| | 6 | | | Triumph Bancorp, Inc. (a) | | | 156 | |
| | 21 | | | Zions Bancorp | | | 904 | |
| | | | | | | | |
| | | | | | | 21,319 | |
| | | | | | | | |
| | | | Capital Markets — 1.1% | |
| | 65 | | | BGC Partners, Inc., Class A | | | 667 | |
| | 3 | | | Evercore Partners, Inc., Class A | | | 209 | |
| | 5 | | | Houlihan Lokey, Inc. | | | 153 | |
| | 14 | | | INTL. FCStone, Inc. (a) | | | 558 | |
| | 1 | | | MarketAxess Holdings, Inc. | | | 176 | |
| | 4 | | | Piper Jaffray Cos. (a) | | | 291 | |
| | 1 | | | Stifel Financial Corp. (a) | | | 72 | |
| | | | | | | | |
| | | | | | | 2,126 | |
| | | | | | | | |
| | | | Consumer Finance — 1.2% | |
| | 70 | | | EZCORP, Inc., Class A (a) | | | 741 | |
| | 34 | | | FirstCash, Inc. | | | 1,594 | |
| | | | | | | | |
| | | | | | | 2,335 | |
| | | | | | | | |
| | | | Diversified Financial Services — 0.1% | |
| | 12 | | | FNFV Group (a) | | | 160 | |
| | 3 | | | Marlin Business Services Corp. | | | 57 | |
| | | | | | | | |
| | | | | | | 217 | |
| | | | | | | | |
| | | | Insurance — 2.7% | |
| | 38 | | | American Equity Investment Life Holding Co. | | | 848 | |
| | 7 | | | Aspen Insurance Holdings Ltd., (Bermuda) | | | 400 | |
| | 50 | | | CNO Financial Group, Inc. | | | 960 | |
| | 11 | | | First American Financial Corp. | | | 403 | |
| | 6 | | | HCI Group, Inc. | | | 239 | |
| | 2 | | | Horace Mann Educators Corp. | | | 74 | |
| | 8 | | | Kinsale Capital Group, Inc. | | | 262 | |
| | 5 | | | Maiden Holdings Ltd. | | | 86 | |
| | 3 | | | National General Holdings Corp. | | | 84 | |
| | 4 | | | Selective Insurance Group, Inc. | | | 152 | |
SEE NOTES TO FINANCIAL STATEMENTS.
| | | | | | | | |
| | | |
| DECEMBER 31, 2016 | | J.P. MORGAN SMALL CAP FUNDS | | | | | 19 | |
JPMorgan Small Cap Core Fund
SCHEDULE OF PORTFOLIO INVESTMENTS
AS OF DECEMBER 31, 2016 (Unaudited) (continued)
(Amounts in thousands)
| | | | | | | | |
| SHARES | | | SECURITY DESCRIPTION | | VALUE($) | |
| | Common Stocks — continued | |
| | | | Insurance — continued | |
| | 20 | | | Stewart Information Services Corp. | | | 935 | |
| | 4 | | | United Fire Group, Inc. | | | 196 | |
| | 14 | | | Universal Insurance Holdings, Inc. | | | 408 | |
| | | | | | | | |
| | | | | | | 5,047 | |
| | | | | | | | |
| | | | Mortgage Real Estate Investment Trusts (REITs) — 0.6% | |
| | 33 | | | Capstead Mortgage Corp. | | | 336 | |
| | 59 | | | Redwood Trust, Inc. | | | 899 | |
| | | | | | | | |
| | | | | | | 1,235 | |
| | | | | | | | |
| | | | Thrifts & Mortgage Finance — 2.0% | |
| | 7 | | | Dime Community Bancshares, Inc. | | | 139 | |
| | 36 | | | Flagstar Bancorp, Inc. (a) | | | 965 | |
| | 47 | | | HomeStreet, Inc. (a) | | | 1,473 | |
| | 7 | | | Meta Financial Group, Inc. | | | 741 | |
| | 9 | | | PennyMac Financial Services, Inc., Class A (a) | | | 142 | |
| | 9 | | | Walker & Dunlop, Inc. (a) | | | 267 | |
| | 2 | | | Washington Federal, Inc. | | | 61 | |
| | | | | | | | |
| | | | | | | 3,788 | |
| | | | | | | | |
| | | | Total Financials | | | 36,067 | |
| | | | | | | | |
| | | | Health Care — 12.6% | |
| | | | Biotechnology — 4.7% | |
| | 8 | | | Acceleron Pharma, Inc. (a) | | | 194 | |
| | 13 | | | Achillion Pharmaceuticals, Inc. (a) | | | 55 | |
| | 10 | | | Acorda Therapeutics, Inc. (a) | | | 192 | |
| | 5 | | | Adamas Pharmaceuticals, Inc. (a) | | | 86 | |
| | 10 | | | Aduro Biotech, Inc. (a) | | | 108 | |
| | 1 | | | Adverum Biotechnologies, Inc. (a) | | | 3 | |
| | 2 | | | Agios Pharmaceuticals, Inc. (a) | | | 67 | |
| | 18 | | | AMAG Pharmaceuticals, Inc. (a) | | | 619 | |
| | 74 | | | Amicus Therapeutics, Inc. (a) | | | 365 | |
| | 10 | | | Audentes Therapeutics, Inc. (a) | | | 177 | |
| | 7 | | | Bellicum Pharmaceuticals, Inc. (a) | | | 94 | |
| | 7 | | | Bluebird Bio, Inc. (a) | | | 432 | |
| | 12 | | | Blueprint Medicines Corp. (a) | | | 345 | |
| | 18 | | | Cara Therapeutics, Inc. (a) | | | 168 | |
| | 39 | | | Celldex Therapeutics, Inc. (a) | | | 138 | |
| | 8 | | | Clovis Oncology, Inc. (a) | | | 342 | |
| | 7 | | | Coherus Biosciences, Inc. (a) | | | 191 | |
| | 9 | | | Corvus Pharmaceuticals, Inc. (a) | | | 129 | |
| | 3 | | | Dimension Therapeutics, Inc. (a) | | | 15 | |
| | 14 | | | Dynavax Technologies Corp. (a) | | | 54 | |
| | 21 | | | Epizyme, Inc. (a) | | | 248 | |
| | 8 | | | Esperion Therapeutics, Inc. (a) | | | 96 | |
| | 27 | | | Exelixis, Inc. (a) | | | 401 | |
| | 7 | | | FibroGen, Inc. (a) | | | 152 | |
| | | | | | | | |
| SHARES | | | SECURITY DESCRIPTION | | VALUE($) | |
| | | | | | | | |
| | | | Biotechnology — continued | |
| | 1 | | | Five Prime Therapeutics, Inc. (a) | | | 30 | |
| | 7 | | | Global Blood Therapeutics, Inc. (a) | | | 104 | |
| | 5 | | | Immune Design Corp. (a) | | | 28 | |
| | 18 | | | Insmed, Inc. (a) | | | 239 | |
| | 19 | | | Karyopharm Therapeutics, Inc. (a) | | | 181 | |
| | 1 | | | Loxo Oncology, Inc. (a) | | | 29 | |
| | 8 | | | MacroGenics, Inc. (a) | | | 166 | |
| | 9 | | | Neurocrine Biosciences, Inc. (a) | | | 329 | |
| | 7 | | | Ophthotech Corp. (a) | | | 34 | |
| | 5 | | | Puma Biotechnology, Inc. (a) | | | 157 | |
| | 13 | | | Ra Pharmaceuticals, Inc. (a) | | | 194 | |
| | 3 | | | Radius Health, Inc. (a) | | | 110 | |
| | 7 | | | Sage Therapeutics, Inc. (a) | | | 347 | |
| | 7 | | | Sarepta Therapeutics, Inc. (a) | | | 189 | |
| | 15 | | | Selecta Biosciences, Inc. (a) | | | 259 | |
| | 3 | | | Seres Therapeutics, Inc. (a) | | | 29 | |
| | 5 | | | Spark Therapeutics, Inc. (a) | | | 235 | |
| | 53 | | | Synergy Pharmaceuticals, Inc. (a) | | | 325 | |
| | 13 | | | Syros Pharmaceuticals, Inc. (a) | | | 163 | |
| | 2 | | | TESARO, Inc. (a) | | | 242 | |
| | 5 | | | Ultragenyx Pharmaceutical, Inc. (a) | | | 366 | |
| | 10 | | | Vanda Pharmaceuticals, Inc. (a) | | | 158 | |
| | 10 | | | Voyager Therapeutics, Inc. (a) | | | 125 | |
| | 12 | | | Xencor, Inc. (a) | | | 311 | |
| | | | | | | | |
| | | | | | | 9,021 | |
| | | | | | | | |
| | | | Health Care Equipment & Supplies — 3.4% | |
| | 20 | | | AngioDynamics, Inc. (a) | | | 332 | |
| | 13 | | | Cardiovascular Systems, Inc. (a) | | | 322 | |
| | 9 | | | Cutera, Inc. (a) | | | 156 | |
| | 3 | | | Glaukos Corp. (a) | | | 96 | |
| | 3 | | | ICU Medical, Inc. (a) | | | 464 | |
| | 15 | | | Inogen, Inc. (a) | | | 1,011 | |
| | 6 | | | iRhythm Technologies, Inc. (a) | | | 192 | |
| | 25 | | | Masimo Corp. (a) | | | 1,678 | |
| | 12 | | | NuVasive, Inc. (a) | | | 788 | |
| | 65 | | | OraSure Technologies, Inc. (a) | | | 569 | |
| | 9 | | | Orthofix International NV (a) | | | 308 | |
| | 5 | | | West Pharmaceutical Services, Inc. | | | 450 | |
| | | | | | | | |
| | | | | | | 6,366 | |
| | | | | | | | |
| | | | Health Care Providers & Services — 3.1% | |
| | 2 | | | BioTelemetry, Inc. (a) | | | 51 | |
| | 93 | | | Cross Country Healthcare, Inc. (a) | | | 1,447 | |
| | 2 | | | Envision Healthcare Corp. (a) | | | 136 | |
| | 48 | | | Healthways, Inc. (a) | | | 1,085 | |
SEE NOTES TO FINANCIAL STATEMENTS.
| | | | | | |
| | | |
| 20 | | | | J.P. MORGAN SMALL CAP FUNDS | | DECEMBER 31, 2016 |
| | | | | | | | |
| SHARES | | | SECURITY DESCRIPTION | | VALUE($) | |
| | Common Stocks — continued | |
| | | | Health Care Providers & Services — continued | |
| | 27 | | | Kindred Healthcare, Inc. | | | 214 | |
| | 21 | | | Molina Healthcare, Inc. (a) | | | 1,124 | |
| | 10 | | | Owens & Minor, Inc. | | | 354 | |
| | 14 | | | PharMerica Corp. (a) | | | 346 | |
| | 13 | | | RadNet, Inc. (a) | | | 83 | |
| | 27 | | | Surgery Partners, Inc. (a) | | | 425 | |
| | 2 | | | Surgical Care Affiliates, Inc. (a) | | | 101 | |
| | 3 | | | WellCare Health Plans, Inc. (a) | | | 475 | |
| | | | | | | | |
| | | | | | | 5,841 | |
| | | | | | | | |
| | | | Health Care Technology — 0.3% | |
| | 33 | | | HMS Holdings Corp. (a) | | | 598 | |
| | | | | | | | |
| | | | Life Sciences Tools & Services — 0.2% | | | | |
| | 3 | | | Cambrex Corp. (a) | | | 173 | |
| | 5 | | | Medpace Holdings, Inc. (a) | | | 191 | |
| | | | | | | | |
| | | | | | | 364 | |
| | | | | | | | |
| | | | Pharmaceuticals — 0.9% | |
| | 8 | | | Amphastar Pharmaceuticals, Inc. (a) | | | 153 | |
| | 6 | | | Cempra, Inc. (a) | | | 18 | |
| | 6 | | | Flex Pharma, Inc. (a) | | | 31 | |
| | 28 | | | Horizon Pharma plc (a) | | | 447 | |
| | 22 | | | Lipocine, Inc. (a) | | | 82 | |
| | 6 | | | Medicines Co. (The) (a) | | | 217 | |
| | 7 | | | Pacira Pharmaceuticals, Inc. (a) | | | 239 | |
| | 7 | | | Reata Pharmaceuticals, Inc., Class A (a) | | | 155 | |
| | 9 | | | Revance Therapeutics, Inc. (a) | | | 186 | |
| | 5 | | | Theravance Biopharma, Inc., (Cayman Islands) (a) | | | 159 | |
| | | | | | | | |
| | | | | | | 1,687 | |
| | | | | | | | |
| | | | Total Health Care | | | 23,877 | |
| | | | | | | | |
| | | | Industrials — 18.9% | |
| | | | Aerospace & Defense — 1.5% | |
| | 16 | | | AAR Corp. | | | 527 | |
| | 13 | | | Engility Holdings, Inc. (a) | | | 426 | |
| | 6 | | | HEICO Corp., Class A | | | 387 | |
| | 3 | | | Moog, Inc., Class A (a) | | | 204 | |
| | 51 | | | Vectrus, Inc. (a) | | | 1,228 | |
| | | | | | | | |
| | | | | | | 2,772 | |
| | | | | | | | |
| | | | Air Freight & Logistics — 0.3% | |
| | 7 | | | Atlas Air Worldwide Holdings, Inc. (a) | | | 353 | |
| | 4 | | | Park-Ohio Holdings Corp. | | | 155 | |
| | | | | | | | |
| | | | | | | 508 | |
| | | | | | | | |
| | | | | | | | |
| | | | | | | | |
| SHARES | | | SECURITY DESCRIPTION | | VALUE($) | |
| | | | | | | | |
| | | | Airlines — 1.3% | |
| | 10 | | | Hawaiian Holdings, Inc. (a) | | | 564 | |
| | 54 | | | SkyWest, Inc. | | | 1,964 | |
| | | | | | | | |
| | | | | | | 2,528 | |
| | | | | | | | |
| | | | Building Products — 0.9% | |
| | 2 | | | American Woodmark Corp. (a) | | | 187 | |
| | 23 | | | NCI Building Systems, Inc. (a) | | | 361 | |
| | 12 | | | Universal Forest Products, Inc. | | | 1,216 | |
| | | | | | | | |
| | | | | | | 1,764 | |
| | | | | | | | |
| | | | Commercial Services & Supplies — 3.4% | |
| | 14 | | | ABM Industries, Inc. | | | 563 | |
| | 142 | | | ACCO Brands Corp. (a) | | | 1,853 | |
| | 18 | | | CECO Environmental Corp. | | | 244 | |
| | 26 | | | Essendant, Inc. | | | 537 | |
| | 2 | | | Herman Miller, Inc. | | | 85 | |
| | 16 | | | Interface, Inc. | | | 297 | |
| | 12 | | | Kimball International, Inc., Class B | | | 206 | |
| | 58 | | | Quad/Graphics, Inc. | | | 1,569 | |
| | 29 | | | Steelcase, Inc., Class A | | | 526 | |
| | 4 | | | Viad Corp. | | | 164 | |
| | 2 | | | VSE Corp. | | | 63 | |
| | 15 | | | West Corp. | | | 377 | |
| | | | | | | | |
| | | | | | | 6,484 | |
| | | | | | | | |
| | | | Construction & Engineering — 1.5% | |
| | 14 | | | EMCOR Group, Inc. | | | 1,018 | |
| | 33 | | | HC2 Holdings, Inc. (a) | | | 193 | |
| | 32 | | | MasTec, Inc. (a) | | | 1,213 | |
| | 5 | | | Orion Group Holdings, Inc. (a) | | | 53 | |
| | 13 | | | Tutor Perini Corp. (a) | | | 356 | |
| | | | | | | | |
| | | | | | | 2,833 | |
| | | | | | | | |
| | | | Electrical Equipment — 1.3% | |
| | 102 | | | General Cable Corp. | | | 1,942 | |
| | 8 | | | Powell Industries, Inc. | | | 293 | |
| | 3 | | | Regal Beloit Corp. | | | 224 | |
| | | | | | | | |
| | | | | | | 2,459 | |
| | | | | | | | |
| | | | Machinery — 3.7% | |
| | 6 | | | Barnes Group, Inc. | | | 268 | |
| | 17 | | | Columbus McKinnon Corp. | | | 452 | |
| | 15 | | | Federal Signal Corp. | | | 241 | |
| | 54 | | | Global Brass & Copper Holdings, Inc. | | | 1,867 | |
| | 5 | | | Greenbrier Cos., Inc. (The) | | | 214 | |
| | 2 | | | Hurco Cos., Inc. | | | 63 | |
| | 4 | | | Hyster-Yale Materials Handling, Inc. | | | 242 | |
| | 9 | | | Joy Global, Inc. | | | 258 | |
SEE NOTES TO FINANCIAL STATEMENTS.
| | | | | | | | |
| | | |
| DECEMBER 31, 2016 | | J.P. MORGAN SMALL CAP FUNDS | | | | | 21 | |
JPMorgan Small Cap Core Fund
SCHEDULE OF PORTFOLIO INVESTMENTS
AS OF DECEMBER 31, 2016 (Unaudited) (continued)
(Amounts in thousands)
| | | | | | | | |
| SHARES | | | SECURITY DESCRIPTION | | VALUE($) | |
| | Common Stocks — continued | |
| | | | Machinery — continued | |
| | 7 | | | Kadant, Inc. | | | 445 | |
| | 3 | | | Kennametal, Inc. | | | 97 | |
| | 103 | | | Meritor, Inc. (a) | | | 1,281 | |
| | 1 | | | Standex International Corp. | | | 109 | |
| | 9 | | | TriMas Corp. (a) | | | 223 | |
| | 82 | | | Wabash National Corp. (a) | | | 1,292 | |
| | | | | | | | |
| | | | | | | 7,052 | |
| | | | | | | | |
| | | | Professional Services — 3.2% | |
| | 61 | | | Acacia Research Corp. (a) | | | 393 | |
| | 31 | | | Barrett Business Services, Inc. | | | 1,981 | |
| | 5 | | | CRA International, Inc. | | | 171 | |
| | 18 | | | Insperity, Inc. | | | 1,248 | |
| | 2 | | | Kelly Services, Inc., Class A | | | 43 | |
| | 38 | | | TriNet Group, Inc. (a) | | | 966 | |
| | 31 | | | TrueBlue, Inc. (a) | | | 765 | |
| | 7 | | | WageWorks, Inc. (a) | | | 529 | |
| | | | | | | | |
| | | | | | | 6,096 | |
| | | | | | | | |
| | | | Road & Rail — 1.2% | |
| | 66 | | | ArcBest Corp. | | | 1,816 | |
| | 2 | | | Universal Logistics Holdings, Inc. | | | 40 | |
| | 37 | | | YRC Worldwide, Inc. (a) | | | 487 | |
| | | | | | | | |
| | | | | | | 2,343 | |
| | | | | | | | |
| | | | Trading Companies & Distributors — 0.6% | |
| | 8 | | | Applied Industrial Technologies, Inc. | | | 493 | |
| | 34 | | | MRC Global, Inc. (a) | | | 694 | |
| | | | | | | | |
| | | | | | | 1,187 | |
| | | | | | | | |
| | | | Total Industrials | | | 36,026 | |
| | | | | | | | |
| | | | Information Technology — 17.3% | |
| | | | Communications Equipment — 1.4% | |
| | 7 | | | Bel Fuse, Inc., Class B | | | 223 | |
| | 40 | | | EMCORE Corp. | | | 345 | |
| | 269 | | | Extreme Networks, Inc. (a) | | | 1,352 | |
| | 35 | | | Oclaro, Inc. (a) | | | 316 | |
| | 21 | | | Quantenna Communications, Inc. (a) | | | 388 | |
| | | | | | | | |
| | | | | | | 2,624 | |
| | | | | | | | |
| | | | Electronic Equipment, Instruments & Components — 3.6% | |
| | 33 | | | Benchmark Electronics, Inc. (a) | | | 1,017 | |
| | 46 | | | Insight Enterprises, Inc. (a) | | | 1,862 | |
| | 28 | | | Kimball Electronics, Inc. (a) | | | 511 | |
| | 2 | | | Littelfuse, Inc. | | | 361 | |
| | 8 | | | Methode Electronics, Inc. | | | 342 | |
| | 64 | | | Sanmina Corp. (a) | | | 2,327 | |
| | 5 | | | Tech Data Corp. (a) | | | 416 | |
| | | | | | | | |
| | | | | | | 6,836 | |
| | | | | | | | |
| | | | | | | | |
| SHARES | | | SECURITY DESCRIPTION | | VALUE($) | |
| | | | | | | | |
| | | | Internet Software & Services — 2.1% | |
| | 23 | | | Bankrate, Inc. (a) | | | 250 | |
| | 9 | | | Carbonite, Inc. (a) | | | 149 | |
| | 9 | | | Cornerstone OnDemand, Inc. (a) | | | 370 | |
| | 11 | | | Coupa Software, Inc. (a) | | | 263 | |
| | 31 | | | Five9, Inc. (a) | | | 438 | |
| | 13 | | | Intralinks Holdings, Inc. (a) | | | 178 | |
| | 18 | | | Nutanix, Inc., Class A (a) | | | 486 | |
| | 3 | | | Q2 Holdings, Inc. (a) | | | 85 | |
| | 151 | | | RetailMeNot, Inc. (a) | | | 1,401 | |
| | 6 | | | Web.com Group, Inc. (a) | | | 132 | |
| | 30 | | | Xactly Corp. (a) | | | 326 | |
| | | | | | | | |
| | | | | | | 4,078 | |
| | | | | | | | |
| | | | IT Services — 2.6% | |
| | 2 | | | Blackhawk Network Holdings, Inc. (a) | | | 70 | |
| | 11 | | | Euronet Worldwide, Inc. (a) | | | 786 | |
| | 2 | | | EVERTEC, Inc., (Puerto Rico) | | | 40 | |
| | 9 | | | ExlService Holdings, Inc. (a) | | | 436 | |
| | 21 | | | Planet Payment, Inc. (a) | | | 84 | |
| | 5 | | | Science Applications International Corp. | | | 464 | |
| | 14 | | | Sykes Enterprises, Inc. (a) | | | 399 | |
| | 109 | | | Travelport Worldwide Ltd. | | | 1,537 | |
| | 83 | | | Unisys Corp. (a) | | | 1,244 | |
| | | | | | | | |
| | | | | | | 5,060 | |
| | | | | | | | |
| | | | Semiconductors & Semiconductor Equipment — 4.4% | |
| | 2 | | | Acacia Communications, Inc. (a) | | | 105 | |
| | 12 | | | Advanced Energy Industries, Inc. (a) | | | 648 | |
| | 79 | | | Advanced Micro Devices, Inc. (a) | | | 896 | |
| | 29 | | | Alpha & Omega Semiconductor Ltd. (a) | | | 609 | |
| | 29 | | | Amkor Technology, Inc. (a) | | | 302 | |
| | 17 | | | Cirrus Logic, Inc. (a) | | | 961 | |
| | 29 | | | Cohu, Inc. | | | 407 | |
| | 97 | | | Cypress Semiconductor Corp. | | | 1,105 | |
| | 14 | | | First Solar, Inc. (a) | | | 458 | |
| | 65 | | | IXYS Corp. | | | 768 | |
| | 5 | | | Nanometrics, Inc. (a) | | | 114 | |
| | 14 | | | NeoPhotonics Corp. (a) | | | 152 | |
| | 5 | | | PDF Solutions, Inc. (a) | | | 106 | |
| | 7 | | | Rudolph Technologies, Inc. (a) | | | 157 | |
| | 55 | | | Sigma Designs, Inc. (a) | | | 329 | |
| | 79 | | | Ultra Clean Holdings, Inc. (a) | | | 764 | |
| | 55 | | | Xcerra Corp. (a) | | | 424 | |
| | | | | | | | |
| | | | | | | 8,305 | |
| | | | | | | | |
| | | | Software — 3.2% | |
| | 6 | | | 8x8, Inc. (a) | | | 89 | |
SEE NOTES TO FINANCIAL STATEMENTS.
| | | | | | |
| | | |
| 22 | | | | J.P. MORGAN SMALL CAP FUNDS | | DECEMBER 31, 2016 |
| | | | | | | | |
| SHARES | | | SECURITY DESCRIPTION | | VALUE($) | |
| | Common Stocks — continued | |
| | | | Software — continued | |
| | 93 | | | A10 Networks, Inc. (a) | | | 773 | |
| | 2 | | | Blackline, Inc. (a) | | | 52 | |
| | 15 | | | CommVault Systems, Inc. (a) | | | 766 | |
| | 4 | | | Manhattan Associates, Inc. (a) | | | 228 | |
| | 9 | | | PTC, Inc. (a) | | | 405 | |
| | 3 | | | QAD, Inc., Class A | | | 76 | |
| | 3 | | | Qualys, Inc. (a) | | | 95 | |
| | 42 | | | RingCentral, Inc., Class A (a) | | | 857 | |
| | 38 | | | Take-Two Interactive Software, Inc. (a) | | | 1,850 | |
| | 31 | | | TiVo Corp. (a) | | | 641 | |
| | 4 | | | VASCO Data Security International, Inc. (a) | | | 60 | |
| | 8 | | | Zendesk, Inc. (a) | | | 172 | |
| | | | | | | | |
| | | | | | | 6,064 | |
| | | | | | | | |
| | | | Total Information Technology | | | 32,967 | |
| | | | | | | | |
| | | | Materials — 4.1% | |
| | | | Chemicals — 2.3% | |
| | 18 | | | FutureFuel Corp. | | | 248 | |
| | 18 | | | Innophos Holdings, Inc. | | | 915 | |
| | 1 | | | Innospec, Inc. | | | 86 | |
| | 12 | | | Minerals Technologies, Inc. | | | 959 | |
| | 14 | | | OMNOVA Solutions, Inc. (a) | | | 140 | |
| | 34 | | | Trinseo SA | | | 1,987 | |
| | | | | | | | |
| | | | | | | 4,335 | |
| | | | | | | | |
| | | | Construction Materials — 0.1% | |
| | 6 | | | Forterra, Inc. (a) | | | 136 | |
| | | | | | | | |
| | | | Containers & Packaging — 0.6% | |
| | 3 | | | AEP Industries, Inc. | | | 360 | |
| | 9 | | | Berry Plastics Group, Inc. (a) | | | 453 | |
| | 35 | | | Graphic Packaging Holding Co. | | | 435 | |
| | | | | | | | |
| | | | | | | 1,248 | |
| | | | | | | | |
| | | | Metals & Mining — 0.5% | |
| | 55 | | | AK Steel Holding Corp. (a) | | | 557 | |
| | 6 | | | Commercial Metals Co. | | | 126 | |
| | 4 | | | Ryerson Holding Corp. (a) | | | 57 | |
| | 4 | | | Worthington Industries, Inc. | | | 202 | |
| | | | | | | | |
| | | | | | | 942 | |
| | | | | | | | |
| | | | Paper & Forest Products — 0.6% | |
| | 13 | | | Boise Cascade Co. (a) | | | 297 | |
| | 19 | | | Schweitzer-Mauduit International, Inc. | | | 876 | |
| | | | | | | | |
| | | | | | | 1,173 | |
| | | | | | | | |
| | | | Total Materials | | | 7,834 | |
| | | | | | | | |
| | | | | | | | |
| | | | | | | | |
| SHARES | | | SECURITY DESCRIPTION | | VALUE($) | |
| | | | | | | | |
| | | | Real Estate — 7.6% | |
| | | | Equity Real Estate Investment Trusts (REITs) — 7.6% | |
| | 1 | | | Agree Realty Corp. | | | 60 | |
| | 12 | | | American Assets Trust, Inc. | | | 505 | |
| | 4 | | | American Campus Communities, Inc. | | | 223 | |
| | 9 | | | Armada Hoffler Properties, Inc. | | | 138 | |
| | 121 | | | Ashford Hospitality Trust, Inc. | | | 941 | |
| | 29 | | | Bluerock Residential Growth REIT, Inc. | | | 396 | |
| | 9 | | | Chatham Lodging Trust | | | 184 | |
| | 8 | | | Chesapeake Lodging Trust | | | 203 | |
| | 9 | | | CoreSite Realty Corp. | | | 680 | |
| | 28 | | | Cousins Properties, Inc. | | | 236 | |
| | 10 | | | CubeSmart | | | 254 | |
| | 2 | | | CyrusOne, Inc. | | | 107 | |
| | 8 | | | DCT Industrial Trust, Inc. | | | 397 | |
| | 9 | | | DDR Corp. | | | 145 | |
| | 16 | | | DiamondRock Hospitality Co. | | | 185 | |
| | 9 | | | DuPont Fabros Technology, Inc. | | | 391 | |
| | 6 | | | Easterly Government Properties, Inc. | | | 110 | |
| | 8 | | | Education Realty Trust, Inc. | | | 332 | |
| | 4 | | | EPR Properties | | | 280 | |
| | 3 | | | Equity One, Inc. | | | 77 | |
| | 42 | | | First Industrial Realty Trust, Inc. | | | 1,191 | |
| | 3 | | | Franklin Street Properties Corp. | | | 40 | |
| | 5 | | | Government Properties Income Trust | | | 101 | |
| | 28 | | | Gramercy Property Trust | | | 261 | |
| | 7 | | | Highwoods Properties, Inc. | | | 362 | |
| | 6 | | | Hudson Pacific Properties, Inc. | | | 199 | |
| | 8 | | | InfraREIT, Inc. | | | 147 | |
| | 1 | | | Life Storage, Inc. | | | 51 | |
| | 13 | | | LTC Properties, Inc. | | | 615 | |
| | 29 | | | New Senior Investment Group, Inc. | | | 284 | |
| | 20 | | | NexPoint Residential Trust, Inc. | | | 456 | |
| | 3 | | | Parkway, Inc. (a) | | | 77 | |
| | 2 | | | PS Business Parks, Inc. | | | 210 | |
| | 9 | | | RAIT Financial Trust | | | 30 | |
| | 3 | | | Ramco-Gershenson Properties Trust | | | 46 | |
| | 54 | | | Retail Opportunity Investments Corp. | | | 1,134 | |
| | 22 | | | Rexford Industrial Realty, Inc. | | | 508 | |
| | 21 | | | RLJ Lodging Trust | | | 512 | |
| | 23 | | | Silver Bay Realty Trust Corp. | | | 389 | |
| | 48 | | | Summit Hotel Properties, Inc. | | | 765 | |
| | 3 | | | Sun Communities, Inc. | | | 192 | |
| | 37 | | | Sunstone Hotel Investors, Inc. | | | 567 | |
| | 22 | | | Xenia Hotels & Resorts, Inc. | | | 433 | |
| | | | | | | | |
| | | | Total Real Estate | | | 14,414 | |
| | | | | | | | |
SEE NOTES TO FINANCIAL STATEMENTS.
| | | | | | | | |
| | | |
| DECEMBER 31, 2016 | | J.P. MORGAN SMALL CAP FUNDS | | | | | 23 | |
JPMorgan Small Cap Core Fund
SCHEDULE OF PORTFOLIO INVESTMENTS
AS OF DECEMBER 31, 2016 (Unaudited) (continued)
(Amounts in thousands, except number of Futures contracts)
| | | | | | | | |
| SHARES | | | SECURITY DESCRIPTION | | VALUE($) | |
| | Common Stocks — continued | |
| | | | Telecommunication Services — 0.8% | |
| | | | Diversified Telecommunication Services — 0.8% | |
| | 7 | | | IDT Corp., Class B | | | 132 | |
| | 63 | | | Inteliquent, Inc. | | | 1,448 | |
| | | | | | | | |
| | | | Total Telecommunication Services | | | 1,580 | |
| | | | | | | | |
| | | | Utilities — 3.3% | |
| | | | Electric Utilities — 1.9% | |
| | 2 | | | El Paso Electric Co. | | | 74 | |
| | 6 | | | IDACORP, Inc. | | | 518 | |
| | 3 | | | MGE Energy, Inc. | | | 213 | |
| | 37 | | | Portland General Electric Co. | | | 1,584 | |
| | 39 | | | Spark Energy, Inc., Class A | | | 1,196 | |
| | 2 | | | Westar Energy, Inc. | | | 122 | |
| | | | | | | | |
| | | | | | | 3,707 | |
| | | | | | | | |
| | | | Gas Utilities — 0.8% | |
| | 13 | | | New Jersey Resources Corp. | | | 474 | |
| | 9 | | | Southwest Gas Corp. | | | 727 | |
| | 5 | | | WGL Holdings, Inc. | | | 351 | |
| | | | | | | | |
| | | | | | | 1,552 | |
| | | | | | | | |
| | | | Independent Power & Renewable Electricity
Producers — 0.5% | |
| | 14 | | | Atlantic Power Corp. (a) | | | 34 | |
| | 11 | | | Ormat Technologies, Inc. | | | 574 | |
| | 64 | | | TerraForm Global, Inc., Class A (a) | | | 254 | |
| | | | | | | | |
| | | | | | | 862 | |
| | | | | | | | |
| | | | Water Utilities — 0.1% | |
| | 2 | | | American States Water Co. | | | 89 | |
| | | | | | | | |
| SHARES | | | SECURITY DESCRIPTION | | VALUE($) | |
| | | | | | | | |
| | | | Water Utilities — continued | |
| | 2 | | | Consolidated Water Co. Ltd., (Cayman Islands) | | | 25 | |
| | | | | | | | |
| | | | | | | 114 | |
| | | | | | | | |
| | | | Total Utilities | | | 6,235 | |
| | | | | | | | |
| | | | Total Common Stocks
(Cost $132,495) | | | 189,258 | |
| | | | | | | | |
| | |
NUMBER OF
WARRANTS | | | | | | |
| | Warrant — 0.0% (g) | |
| | | | Financials — 0.0% (g) | |
| | | | Consumer Finance — 0.0% (g) | |
| | 2 | | | Emergent Capital, Inc., expiring 10/01/19 (Strike Price $10.75) (a)
(Cost $—) | | | — | |
| | | | | | | | |
| | |
| SHARES | | | | | | |
| | Short-Term Investment — 1.4% | |
| | | | Investment Company — 1.4% | |
| | 2,737 | | | JPMorgan U.S. Government Money Market Fund, Institutional Class Shares, 0.410% (b) (l)
(Cost $2,737) | | | 2,737 | |
| | | | | | | | |
| | | | Total Investments — 100.8%
(Cost $135,232) | | | 191,995 | |
| | | | Liabilities in Excess of
Other Assets — (0.8)% | | | (1,467 | ) |
| | | | | | | | |
| | | | NET ASSETS — 100.0% | | $ | 190,528 | |
| | | | | | | | |
Percentages indicated are based on net assets.
| | | | | | | | | | | | | | | | | | | | |
| Futures Contracts | | | | | | | | | | |
NUMBER OF
CONTRACTS | | | DESCRIPTION | | EXPIRATION
DATE | | | TRADING
CURRENCY | | | NOTIONAL
VALUE AT
DECEMBER 31, 2016 | | | NET UNREALIZED
APPRECIATION
(DEPRECIATION) | |
| | | | Long Futures Outstanding | |
| | 28 | | | Mini Russell 2000 | | | 03/17/17 | | | | USD | | | $ | 1,900 | | | $ | (42 | ) |
| | | | | | | | | | | | | | | | | | | | |
SEE NOTES TO FINANCIAL STATEMENTS.
| | | | | | |
| | | |
| 24 | | | | J.P. MORGAN SMALL CAP FUNDS | | DECEMBER 31, 2016 |
JPMorgan Small Cap Equity Fund
SCHEDULE OF PORTFOLIO INVESTMENTS
AS OF DECEMBER 31, 2016 (Unaudited)
(Amounts in thousands)
| | | | | | | | |
| SHARES | | | SECURITY DESCRIPTION | | VALUE($) | |
| | Common Stocks — 93.4% | |
| | | | Consumer Discretionary — 14.6% | |
| | | | Auto Components — 0.9% | |
| | 474 | | | Drew Industries, Inc. | | | 51,022 | |
| | | | | | | | |
| | | | Distributors — 1.7% | |
| | 980 | | | Pool Corp. | | | 102,249 | |
| | | | | | | | |
| | | | Diversified Consumer Services — 1.0% | |
| | 1,577 | | | ServiceMaster Global Holdings, Inc. (a) | | | 59,419 | |
| | | | | | | | |
| | | | Hotels, Restaurants & Leisure — 3.5% | |
| | 1,696 | | | Brinker International, Inc. | | | 83,997 | |
| | 611 | | | Monarch Casino & Resort, Inc. (a) | | | 15,742 | |
| | 804 | | | Papa John’s International, Inc. | | | 68,798 | |
| | 1,423 | | | Zoe’s Kitchen, Inc. (a) | | | 34,148 | |
| | | | | | | | |
| | | | | | | 202,685 | |
| | | | | | | | |
| | | | Leisure Products — 2.2% | |
| | 1,637 | | | Acushnet Holdings Corp. (a) | | | 32,274 | |
| | 1,455 | | | Brunswick Corp. | | | 79,362 | |
| | 1,013 | | | Malibu Boats, Inc., Class A (a) | | | 19,322 | |
| | | | | | | | |
| | | | | | | 130,958 | |
| | | | | | | | |
| | | | Media — 2.4% | |
| | 1,885 | | | Cinemark Holdings, Inc. | | | 72,306 | |
| | 3,664 | | | EW Scripps Co. (The), Class A (a) | | | 70,823 | |
| | | | | | | | |
| | | | | | | 143,129 | |
| | | | | | | | |
| | | | Specialty Retail — 1.9% | |
| | 2,968 | | | American Eagle Outfitters, Inc. | | | 45,018 | |
| | 4,453 | | | Chico’s FAS, Inc. | | | 64,073 | |
| | | | | | | | |
| | | | | | | 109,091 | |
| | | | | | | | |
| | | | Textiles, Apparel & Luxury Goods — 1.0% | |
| | 361 | | | Carter’s, Inc. | | | 31,199 | |
| | 4,103 | | | Crocs, Inc. (a) | | | 28,145 | |
| | | | | | | | |
| | | | | | | 59,344 | |
| | | | | | | | |
| | | | Total Consumer Discretionary | | | 857,897 | |
| | | | | | | | |
| | | | Consumer Staples — 3.9% | |
| | | | Food & Staples Retailing — 1.0% | |
| | 2,520 | | | Performance Food Group Co. (a) | | | 60,489 | |
| | | | | | | | |
| | | | Food Products — 1.1% | |
| | 1,103 | | | AdvancePierre Foods Holdings, Inc. | | | 32,846 | |
| | 213 | | | J&J Snack Foods Corp. | | | 28,359 | |
| | | | | | | | |
| | | | | | | 61,205 | |
| | | | | | | | |
| | | | Household Products — 1.8% | |
| | 848 | | | Spectrum Brands Holdings, Inc. | | | 103,708 | |
| | | | | | | | |
| | | | Total Consumer Staples | | | 225,402 | |
| | | | | | | | |
| | | | | | | | |
| SHARES | | | SECURITY DESCRIPTION | | VALUE($) | |
| | | | | | | | |
| | | | Energy — 4.1% | |
| | | | Energy Equipment & Services — 2.7% | |
| | 269 | | | Core Laboratories NV | | | 32,340 | |
| | 642 | | | Dril-Quip, Inc. (a) | | | 38,570 | |
| | 3,351 | | | Patterson-UTI Energy, Inc. | | | 90,202 | |
| | | | | | | | |
| | | | | | | 161,112 | |
| | | | | | | | |
| | | | Oil, Gas & Consumable Fuels — 1.4% | |
| | 174 | | | Cimarex Energy Co. | | | 23,591 | |
| | 6,474 | | | Synergy Resources Corp. (a) | | | 57,680 | |
| | | | | | | | |
| | | | | | | 81,271 | |
| | | | | | | | |
| | | | Total Energy | | | 242,383 | |
| | | | | | | | |
| | | | Financials — 16.9% | |
| | | | Banks — 11.4% | |
| | 3,209 | | | Associated Banc-Corp. | | | 79,267 | |
| | 2,120 | | | BankUnited, Inc. | | | 79,889 | |
| | 789 | | | Commerce Bancshares, Inc. | | | 45,613 | |
| | 1,294 | | | First Financial Bancorp | | | 36,827 | |
| | 1,098 | | | First Hawaiian, Inc. | | | 38,218 | |
| | 3,615 | | | First Horizon National Corp. | | | 72,344 | |
| | 388 | | | First Republic Bank | | | 35,765 | |
| | 1,234 | | | Glacier Bancorp, Inc. | | | 44,718 | |
| | 1,284 | | | Great Western Bancorp, Inc. | | | 55,978 | |
| | 866 | | | IBERIABANK Corp. | | | 72,523 | |
| | 1,898 | | | Umpqua Holdings Corp. | | | 35,645 | |
| | 1,202 | | | Western Alliance Bancorp (a) | | | 58,556 | |
| | 136 | | | Wintrust Financial Corp. | | | 9,880 | |
| | | | | | | | |
| | | | | | | 665,223 | |
| | | | | | | | |
| | | | Capital Markets — 4.2% | |
| | 1,089 | | | Eaton Vance Corp. | | | 45,610 | |
| | 281 | | | FactSet Research Systems, Inc. | | | 45,855 | |
| | 1,344 | | | Janus Capital Group, Inc. | | | 17,833 | |
| | 1,300 | | | Lazard Ltd., Class A | | | 53,420 | |
| | 761 | | | Moelis & Co., Class A | | | 25,785 | |
| | 812 | | | Morningstar, Inc. | | | 59,702 | |
| | | | | | | | |
| | | | | | | 248,205 | |
| | | | | | | | |
| | | | Insurance — 1.3% | |
| | 416 | | | Kinsale Capital Group, Inc. | | | 14,138 | |
| | 1,109 | | | ProAssurance Corp. | | | 62,308 | |
| | | | | | | | |
| | | | | | | 76,446 | |
| | | | | | | | |
| | | | Total Financials | | | 989,874 | |
| | | | | | | | |
| | | | Health Care — 11.9% | |
| | | | Health Care Equipment & Supplies — 3.5% | |
| | 244 | | | ICU Medical, Inc. (a) | | | 35,960 | |
SEE NOTES TO FINANCIAL STATEMENTS.
| | | | | | | | |
| | | |
| DECEMBER 31, 2016 | | J.P. MORGAN SMALL CAP FUNDS | | | | | 25 | |
JPMorgan Small Cap Equity Fund
SCHEDULE OF PORTFOLIO INVESTMENTS
AS OF DECEMBER 31, 2016 (Unaudited) (continued)
(Amounts in thousands)
| | | | | | | | |
| SHARES | | | SECURITY DESCRIPTION | | VALUE($) | |
| | Common Stocks — continued | |
| | | | Health Care Equipment & Supplies — continued | |
| | 589 | | | IDEXX Laboratories, Inc. (a) | | | 69,091 | |
| | 1,171 | | | West Pharmaceutical Services, Inc. | | | 99,361 | |
| | | | | | | | |
| | | | | | | 204,412 | |
| | | | | | | | |
| | | | Health Care Providers & Services — 4.2% | |
| | 592 | | | Centene Corp. (a) | | | 33,481 | |
| | 744 | | | HealthEquity, Inc. (a) | | | 30,158 | |
| | 2,081 | | | HealthSouth Corp. | | | 85,814 | |
| | 461 | | | Magellan Health, Inc. (a) | | | 34,714 | |
| | 460 | | | WellCare Health Plans, Inc. (a) | | | 62,999 | |
| | | | | | | | |
| | | | | | | 247,166 | |
| | | | | | | | |
| | | | Health Care Technology — 1.5% | |
| | 1,063 | | | Cotiviti Holdings, Inc. (a) | | | 36,568 | |
| | 1,042 | | | Medidata Solutions, Inc. (a) | | | 51,732 | |
| | | | | | | | |
| | | | | | | 88,300 | |
| | | | | | | | |
| | | | Life Sciences Tools & Services — 1.3% | |
| | 1,241 | | | Patheon NV (a) | | | 35,628 | |
| | 1,678 | | | VWR Corp. (a) | | | 42,007 | |
| | | | | | | | |
| | | | | | | 77,635 | |
| | | | | | | | |
| | | | Pharmaceuticals — 1.4% | |
| | 3,002 | | | Catalent, Inc. (a) | | | 80,926 | |
| | | | | | | | |
| | | | Total Health Care | | | 698,439 | |
| | | | | | | | |
| | | | Industrials — 18.9% | |
| | | | Commercial Services & Supplies — 5.0% | |
| | 1,887 | | | Brady Corp., Class A | | | 70,841 | |
| | 327 | | | G&K Services, Inc., Class A | | | 31,527 | |
| | 1,423 | | | Herman Miller, Inc. | | | 48,656 | |
| | 1,391 | | | KAR Auction Services, Inc. | | | 59,294 | |
| | 660 | | | US Ecology, Inc. | | | 32,429 | |
| | 611 | | | Waste Connections, Inc., (Canada) | | | 47,988 | |
| | | | | | | | |
| | | | | | | 290,735 | |
| | | | | | | | |
| | | | Electrical Equipment — 0.7% | |
| | 1,077 | | | Generac Holdings, Inc. (a) | | | 43,886 | |
| | | | | | | | |
| | | | Machinery — 8.5% | |
| | 2,511 | | | Allison Transmission Holdings, Inc. | | | 84,599 | |
| | 1,077 | | | Altra Industrial Motion Corp. | | | 39,742 | |
| | 996 | | | Douglas Dynamics, Inc. | | | 33,511 | |
| | 746 | | | Lincoln Electric Holdings, Inc. | | | 57,195 | |
| | 769 | | | Proto Labs, Inc. (a) | | | 39,478 | |
| | 894 | | | RBC Bearings, Inc. (a) | | | 82,948 | |
| | 2,843 | | | Toro Co. (The) | | | 159,057 | |
| | | | | | | | |
| | | | | | | 496,530 | |
| | | | | | | | |
| | | | | | | | |
| SHARES | | | SECURITY DESCRIPTION | | VALUE($) | |
| | | | | | | | |
| | | | Road & Rail — 2.6% | |
| | 2,048 | | | Knight Transportation, Inc. | | | 67,670 | |
| | 1,007 | | | Landstar System, Inc. | | | 85,901 | |
| | | | | | | | |
| | | | | | | 153,571 | |
| | | | | | | | |
| | | | Trading Companies & Distributors — 2.1% | |
| | 1,029 | | | Applied Industrial Technologies, Inc. | | | 61,098 | |
| | 399 | | | Watsco, Inc. | | | 59,070 | |
| | | | | | | | |
| | | | | | | 120,168 | |
| | | | | | | | |
| | | | Total Industrials | | | 1,104,890 | |
| | | | | | | | |
| | | | Information Technology — 8.9% | |
| | | | Internet Software & Services — 1.9% | |
| | 1,298 | | | GrubHub, Inc. (a) | | | 48,830 | |
| | 961 | | | Instructure, Inc. (a) | | | 18,779 | |
| | 1,620 | | | Q2 Holdings, Inc. (a) | | | 46,739 | |
| | | | | | | | |
| | | | | | | 114,348 | |
| | | | | | | | |
| | | | IT Services — 0.8% | | | | |
| | 1,248 | | | CoreLogic, Inc. (a) | | | 45,957 | |
| | | | | | | | |
| | | | Semiconductors & Semiconductor Equipment — 1.1% | |
| | 1,026 | | | Cabot Microelectronics Corp. | | | 64,839 | |
| | | | | | | | |
| | | | Software — 5.1% | |
| | 876 | | | Aspen Technology, Inc. (a) | | | 47,926 | |
| | 539 | | | Blackbaud, Inc. | | | 34,506 | |
| | 954 | | | Guidewire Software, Inc. (a) | | | 47,038 | |
| | 763 | | | Imperva, Inc. (a) | | | 29,282 | |
| | 213 | | | Manhattan Associates, Inc. (a) | | | 11,295 | |
| | 176 | | | MicroStrategy, Inc., Class A (a) | | | 34,823 | |
| | 720 | | | Monotype Imaging Holdings, Inc. | | | 14,301 | |
| | 587 | | | Splunk, Inc. (a) | | | 30,044 | |
| | 341 | | | Tyler Technologies, Inc. (a) | | | 48,684 | |
| | | | | | | | |
| | | | | | | 297,899 | |
| | | | | | | | |
| | | | Total Information Technology | | | 523,043 | |
| | | | | | | | |
| | | | Materials — 5.4% | |
| | | | Chemicals — 1.8% | |
| | 1,493 | | | GCP Applied Technologies, Inc. (a) | | | 39,929 | |
| | 309 | | | Quaker Chemical Corp. | | | 39,575 | |
| | 1,177 | | | Valvoline, Inc. | | | 25,295 | |
| | | | | | | | |
| | | | | | | 104,799 | |
| | | | | | | | |
| | | | Containers & Packaging — 3.6% | |
| | 1,603 | | | AptarGroup, Inc. | | | 117,734 | |
| | 1,190 | | | Crown Holdings, Inc. (a) | | | 62,572 | |
| | 592 | | | Silgan Holdings, Inc. | | | 30,284 | |
| | | | | | | | |
| | | | | | | 210,590 | |
| | | | | | | | |
| | | | Total Materials | | | 315,389 | |
| | | | | | | | |
SEE NOTES TO FINANCIAL STATEMENTS.
| | | | | | |
| | | |
| 26 | | | | J.P. MORGAN SMALL CAP FUNDS | | DECEMBER 31, 2016 |
| | | | | | | | |
| SHARES | | | SECURITY DESCRIPTION | | VALUE($) | |
| | Common Stocks — continued | |
| | | | Real Estate — 6.2% | |
| | | | Equity Real Estate Investment Trusts (REITs) — 4.5% | |
| | 794 | | | EastGroup Properties, Inc. | | | 58,633 | |
| | 455 | | | Mid-America Apartment Communities, Inc. | | | 44,581 | |
| | 1,448 | | | National Retail Properties, Inc. | | | 63,980 | |
| | 1,542 | | | Outfront Media, Inc. | | | 38,359 | |
| | 2,347 | | | RLJ Lodging Trust | | | 57,486 | |
| | | | | | | | |
| | | | | | | 263,039 | |
| | | | | | | | |
| | | | Real Estate Management & Development — 1.7% | |
| | 1,636 | | | HFF, Inc., Class A | | | 49,482 | |
| | 1,898 | | | Realogy Holdings Corp. | | | 48,834 | |
| | | | | | | | |
| | | | | | | 98,316 | |
| | | | | | | | |
| | | | Total Real Estate | | | 361,355 | |
| | | | | | | | |
| | | | Utilities — 2.6% | |
| | | | Electric Utilities — 1.3% | |
| | 1,785 | | | Portland General Electric Co. | | | 77,325 | |
| | | | | | | | |
| | | | Multi-Utilities — 1.3% | |
| | 1,275 | | | NorthWestern Corp. | | | 72,505 | |
| | | | | | | | |
| | | | Total Utilities | | | 149,830 | |
| | | | | | | | |
| | | | Total Common Stocks
(Cost $4,111,324) | | | 5,468,502 | |
| | | | | | | | |
| | | | | | | | |
| SHARES | | | SECURITY DESCRIPTION | | VALUE($) | |
| | Exchange Traded Fund — 1.1% | |
| | | | U.S. Equity — 1.1% | |
| | 490 | | | iShares Russell 2000 Fund
(Cost $62,319) | | | 66,085 | |
| | | | | | | | |
| | Short-Term Investment — 3.9% | |
| | | | Investment Company — 3.9% | |
| | 228,747 | | | JPMorgan U.S. Government Money Market Fund, Institutional Class Shares,
0.410% (b) (l)
(Cost $228,747) | | | 228,747 | |
| | | | | | | | |
| | | | Total Investments — 98.4%
(Cost $4,402,390) | | | 5,763,334 | |
| | | | Other Assets in Excess of
Liabilities — 1.6% | | | 95,022 | |
| | | | | | | | |
| | | | NET ASSETS — 100.0% | | $ | 5,858,356 | |
| | | | | | | | |
Percentages indicated are based on net assets.
SEE NOTES TO FINANCIAL STATEMENTS.
| | | | | | | | |
| | | |
| DECEMBER 31, 2016 | | J.P. MORGAN SMALL CAP FUNDS | | | | | 27 | |
JPMorgan Small Cap Growth Fund
SCHEDULE OF PORTFOLIO INVESTMENTS
AS OF DECEMBER 31, 2016 (Unaudited)
(Amounts in thousands)
| | | | | | | | |
| SHARES | | | SECURITY DESCRIPTION | | VALUE($) | |
| | Common Stocks — 98.6% | |
| | | | Consumer Discretionary — 14.3% | |
| | | | Distributors — 1.1% | |
| | 112 | | | Pool Corp. | | | 11,734 | |
| | | | | | | | |
| | | | Hotels, Restaurants & Leisure — 3.8% | |
| | 824 | | | Boyd Gaming Corp. (a) | | | 16,624 | |
| | 262 | | | Texas Roadhouse, Inc. | | | 12,660 | |
| | 74 | | | Vail Resorts, Inc. | | | 11,983 | |
| | | | | | | | |
| | | | | | | 41,267 | |
| | | | | | | | |
| | | | Household Durables — 0.6% | |
| | 591 | | | TRI Pointe Group, Inc. (a) | | | 6,784 | |
| | | | | | | | |
| | | | Internet & Direct Marketing Retail — 0.9% | |
| | 263 | | | Wayfair, Inc., Class A (a) | | | 9,229 | |
| | | | | | | | |
| | | | Multiline Retail — 1.0% | |
| | 377 | | | Ollie’s Bargain Outlet Holdings, Inc. (a) | | | 10,718 | |
| | | | | | | | |
| | | | Specialty Retail — 5.1% | |
| | 141 | | | Burlington Stores, Inc. (a) | | | 11,935 | |
| | 148 | | | Lithia Motors, Inc., Class A | | | 14,326 | |
| | 128 | | | Monro Muffler Brake, Inc. | | | 7,305 | |
| | 127 | | | Penske Automotive Group, Inc. | | | 6,570 | |
| | 268 | | | Tailored Brands, Inc. | | | 6,840 | |
| | 406 | | | Tile Shop Holdings, Inc. (a) | | | 7,938 | |
| | | | | | | | |
| | | | | | | 54,914 | |
| | | | | | | | |
| | | | Textiles, Apparel & Luxury Goods — 1.8% | |
| | 180 | | | G-III Apparel Group Ltd. (a) | | | 5,307 | |
| | 269 | | | Kate Spade & Co. (a) | | | 5,020 | |
| | 441 | | | Wolverine World Wide, Inc. | | | 9,690 | |
| | | | | | | | |
| | | | | | | 20,017 | |
| | | | | | | | |
| | | | Total Consumer Discretionary | | | 154,663 | |
| | | | | | | | |
| | | | Consumer Staples — 4.4% | |
| | | | Food & Staples Retailing — 2.4% | |
| | 87 | | | Casey’s General Stores, Inc. | | | 10,380 | |
| | 348 | | | Performance Food Group Co. (a) | | | 8,355 | |
| | 355 | | | Sprouts Farmers Market, Inc. (a) | | | 6,725 | |
| | | | | | | | |
| | | | | | | 25,460 | |
| | | | | | | | |
| | | | Food Products — 1.2% | |
| | 700 | | | Freshpet, Inc. (a) | | | 7,108 | |
| | 164 | | | Snyder’s-Lance, Inc. | | | 6,304 | |
| | | | | | | | |
| | | | | | | 13,412 | |
| | | | | | | | |
| | | | Personal Products — 0.8% | |
| | 286 | | | elf Beauty, Inc. (a) | | | 8,284 | |
| | | | | | | | |
| | | | Total Consumer Staples | | | 47,156 | |
| | | | | | | | |
| | | | | | | | |
| SHARES | | | SECURITY DESCRIPTION | | VALUE($) | |
| | | | | | | | |
| | | | Energy — 1.9% | |
| | | | Oil, Gas & Consumable Fuels — 1.9% | |
| | 219 | | | Delek US Holdings, Inc. | | | 5,277 | |
| | 75 | | | Diamondback Energy, Inc. (a) | | | 7,551 | |
| | 183 | | | RSP Permian, Inc. (a) | | | 8,168 | |
| | | | | | | | |
| | | | Total Energy | | | 20,996 | |
| | | | | | | | |
| | | | Financials — 6.5% | |
| | | | Banks — 2.1% | |
| | 48 | | | Signature Bank (a) | | | 7,242 | |
| | 203 | | | Texas Capital Bancshares, Inc. (a) | | | 15,900 | |
| | | | | | | | |
| | | | | | | 23,142 | |
| | | | | | | | |
| | | | Capital Markets — 3.7% | |
| | 261 | | | Evercore Partners, Inc., Class A | | | 17,913 | |
| | 338 | | | Financial Engines, Inc. | | | 12,408 | |
| | 913 | | | PennantPark Investment Corp. | | | 6,990 | |
| | 292 | | | WisdomTree Investments, Inc. | | | 3,252 | |
| | | | | | | | |
| | | | | | | 40,563 | |
| | | | | | | | |
| | | | Thrifts & Mortgage Finance — 0.7% | |
| | 247 | | | BofI Holding, Inc. (a) | | | 7,051 | |
| | | | | | | | |
| | | | Total Financials | | | 70,756 | |
| | | | | | | | |
| | | | Health Care — 21.1% | |
| | | | Biotechnology — 9.2% | |
| | 171 | | | ACADIA Pharmaceuticals, Inc. (a) | | | 4,932 | |
| | 187 | | | Acceleron Pharma, Inc. (a) | | | 4,771 | |
| | 244 | | | Axovant Sciences Ltd. (a) | | | 3,032 | |
| | 399 | | | Bellicum Pharmaceuticals, Inc. (a) | | | 5,429 | |
| | 295 | | | Coherus Biosciences, Inc. (a) | | | 8,303 | |
| | 497 | | | Exact Sciences Corp. (a) | | | 6,642 | |
| | 211 | | | FibroGen, Inc. (a) | | | 4,524 | |
| | 694 | | | Halozyme Therapeutics, Inc. (a) | | | 6,859 | |
| | 465 | | | Ignyta, Inc. (a) | | | 2,463 | |
| | 386 | | | Insmed, Inc. (a) | | | 5,111 | |
| | 175 | | | Kite Pharma, Inc. (a) | | | 7,867 | |
| | 129 | | | Neurocrine Biosciences, Inc. (a) | | | 4,981 | |
| | 272 | | | Portola Pharmaceuticals, Inc. (a) | | | 6,109 | |
| | 238 | | | REGENXBIO, Inc. (a) | | | 4,409 | |
| | 178 | | | Sage Therapeutics, Inc. (a) | | | 9,098 | |
| | 127 | | | Spark Therapeutics, Inc. (a) | | | 6,341 | |
| | 62 | | | Ultragenyx Pharmaceutical, Inc. (a) | | | 4,360 | |
| | 278 | | | Versartis, Inc. (a) | | | 4,144 | |
| | | | | | | | |
| | | | | | | 99,375 | |
| | | | | | | | |
| | | | Health Care Equipment & Supplies — 4.4% | |
| | 1,016 | | | GenMark Diagnostics, Inc. (a) | | | 12,434 | |
| | 210 | | | Insulet Corp. (a) | | | 7,923 | |
SEE NOTES TO FINANCIAL STATEMENTS.
| | | | | | |
| | | |
| 28 | | | | J.P. MORGAN SMALL CAP FUNDS | | DECEMBER 31, 2016 |
| | | | | | | | |
| SHARES | | | SECURITY DESCRIPTION | | VALUE($) | |
| | Common Stocks — continued | |
| | | | Health Care Equipment & Supplies — continued | |
| | 466 | | | K2M Group Holdings, Inc. (a) | | | 9,340 | |
| | 137 | | | Nevro Corp. (a) | | | 9,926 | |
| | 981 | | | Novadaq Technologies, Inc., (Canada) (a) | | | 6,956 | |
| | 395 | | | Unilife Corp. (a) | | | 909 | |
| | | | | | | | |
| | | | | | | 47,488 | |
| | | | | | | | |
| | | | Health Care Providers & Services — 3.2% | |
| | 309 | | | Acadia Healthcare Co., Inc. (a) | | | 10,218 | |
| | 261 | | | Surgical Care Affiliates, Inc. (a) | | | 12,074 | |
| | 93 | | | WellCare Health Plans, Inc. (a) | | | 12,753 | |
| | | | | | | | |
| | | | | | | 35,045 | |
| | | | | | | | |
| | | | Health Care Technology — 1.6% | |
| | 614 | | | Evolent Health, Inc., Class A (a) | | | 9,088 | |
| | 215 | | | Veeva Systems, Inc., Class A (a) | | | 8,763 | |
| | | | | | | | |
| | | | | | | 17,851 | |
| | | | | | | | |
| | | | Pharmaceuticals — 2.7% | |
| | 648 | | | Horizon Pharma plc (a) | | | 10,491 | |
| | 355 | | | Nektar Therapeutics (a) | | | 4,355 | |
| | 312 | | | Revance Therapeutics, Inc. (a) | | | 6,454 | |
| | 1,347 | | | TherapeuticsMD, Inc. (a) | | | 7,773 | |
| | | | | | | | |
| | | | | | | 29,073 | |
| | | | | | | | |
| | | | Total Health Care | | | 228,832 | |
| | | | | | | | |
| | | | Industrials — 17.5% | |
| | | | Aerospace & Defense — 2.2% | |
| | 186 | | | HEICO Corp. | | | 14,337 | |
| | 193 | | | Hexcel Corp. | | | 9,950 | |
| | | | | | | | |
| | | | | | | 24,287 | |
| | | | | | | | |
| | | | Air Freight & Logistics — 0.7% | |
| | 183 | | | XPO Logistics, Inc. (a) | | | 7,885 | |
| | | | | | | | |
| | | | Building Products — 5.4% | |
| | 380 | | | Advanced Drainage Systems, Inc. | | | 7,836 | |
| | 151 | | | Fortune Brands Home & Security, Inc. | | | 8,088 | |
| | 82 | | | Lennox International, Inc. | | | 12,537 | |
| | 229 | | | Masonite International Corp. (a) | | | 15,082 | |
| | 226 | | | Trex Co., Inc. (a) | | | 14,531 | |
| | | | | | | | |
| | | | | | | 58,074 | |
| | | | | | | | |
| | | | Commercial Services & Supplies — 0.8% | |
| | 401 | | | Advanced Disposal Services, Inc. (a) | | | 8,905 | |
| | | | | | | | |
| | | | Industrial Conglomerates — 0.7% | |
| | 70 | | | Carlisle Cos., Inc. | | | 7,775 | |
| | | | | | | | |
| | | | Machinery — 4.2% | |
| | 143 | | | Graco, Inc. | | | 11,900 | |
| | 194 | | | John Bean Technologies Corp. | | | 16,660 | |
| | | | | | | | |
| SHARES | | | SECURITY DESCRIPTION | | VALUE($) | |
| | | | | | | | |
| | | | Machinery — continued | | | | |
| | 85 | | | Middleby Corp. (The) (a) | | | 11,011 | |
| | 85 | | | Oshkosh Corp. | | | 5,489 | |
| | | | | | | | |
| | | | | | | 45,060 | |
| | | | | | | | |
| | | | Road & Rail — 1.1% | |
| | 135 | | | Old Dominion Freight Line, Inc. (a) | | | 11,619 | |
| | | | | | | | |
| | | | Trading Companies & Distributors — 2.4% | |
| | 207 | | | H&E Equipment Services, Inc. | | | 4,804 | |
| | 347 | | | Rush Enterprises, Inc., Class A (a) | | | 11,064 | |
| | 66 | | | Watsco, Inc. | | | 9,793 | |
| | | | | | | | |
| | | | | | | 25,661 | |
| | | | | | | | |
| | | | Total Industrials | | | 189,266 | |
| | | | | | | | |
| | | | Information Technology — 27.8% | |
| | | | Communications Equipment — 1.0% | |
| | 269 | | | Ciena Corp. (a) | | | 6,559 | |
| | 252 | | | Quantenna Communications, Inc. (a) | | | 4,576 | |
| | | | | | | | |
| | | | | | | 11,135 | |
| | | | | | | | |
| | | | Electronic Equipment, Instruments & Components — 1.5% | |
| | 107 | | | Littelfuse, Inc. | | | 16,196 | |
| | | | | | | | |
| | | | Internet Software & Services — 9.4% | |
| | 330 | | | 2U, Inc. (a) | | | 9,935 | |
| | 244 | | | Benefitfocus, Inc. (a) | | | 7,257 | |
| | 243 | | | Cornerstone OnDemand, Inc. (a) | | | 10,294 | |
| | 52 | | | CoStar Group, Inc. (a) | | | 9,787 | |
| | 369 | | | Envestnet, Inc. (a) | | | 13,015 | |
| | 381 | | | GoDaddy, Inc., Class A (a) | | | 13,316 | |
| | 324 | | | GrubHub, Inc. (a) | | | 12,172 | |
| | 280 | | | Instructure, Inc. (a) | | | 5,475 | |
| | 156 | | | Nutanix, Inc., Class A (a) | | | 4,135 | |
| | 257 | | | Shopify, Inc., (Canada), Class A (a) | | | 11,023 | |
| | 176 | | | Trade Desk, Inc. (The), Class A (a) | | | 4,881 | |
| | | | | | | | |
| | | | | | | 101,290 | |
| | | | | | | | |
| | | | Semiconductors & Semiconductor Equipment — 7.2% | |
| | 483 | | | Advanced Micro Devices, Inc. (a) | | | 5,473 | |
| | 296 | | | Cavium, Inc. (a) | | | 18,510 | |
| | 281 | | | Inphi Corp. (a) | | | 12,556 | |
| | 288 | | | MACOM Technology Solutions Holdings, Inc. (a) | | | 13,312 | |
| | 227 | | | MKS Instruments, Inc. | | | 13,487 | |
| | 182 | | | Monolithic Power Systems, Inc. | | | 14,952 | |
| | | | | | | | |
| | | | | | | 78,290 | |
| | | | | | | | |
| | | | Software — 8.4% | |
| | 329 | | | Atlassian Corp. plc, (Australia), Class A (a) | | | 7,922 | |
| | 188 | | | Guidewire Software, Inc. (a) | | | 9,272 | |
SEE NOTES TO FINANCIAL STATEMENTS.
| | | | | | | | |
| | | |
| DECEMBER 31, 2016 | | J.P. MORGAN SMALL CAP FUNDS | | | | | 29 | |
JPMorgan Small Cap Growth Fund
SCHEDULE OF PORTFOLIO INVESTMENTS
AS OF DECEMBER 31, 2016 (Unaudited) (continued)
(Amounts in thousands)
| | | | | | | | |
| SHARES | | | SECURITY DESCRIPTION | | VALUE($) | |
| | Common Stocks — continued | |
| | | | Software — continued | |
| | 171 | | | HubSpot, Inc. (a) | | | 8,021 | |
| | 158 | | | Imperva, Inc. (a) | | | 6,049 | |
| | 151 | | | Paycom Software, Inc. (a) | | | 6,874 | |
| | 143 | | | Proofpoint, Inc. (a) | | | 10,127 | |
| | 571 | | | RingCentral, Inc., Class A (a) | | | 11,758 | |
| | 335 | | | Take-Two Interactive Software, Inc. (a) | | | 16,488 | |
| | 37 | | | Tyler Technologies, Inc. (a) | | | 5,272 | |
| | 434 | | | Zendesk, Inc. (a) | | | 9,209 | |
| | | | | | | | |
| | | | | | | 90,992 | |
| | | | | | | | |
| | | | Technology Hardware, Storage & Peripherals — 0.3% | |
| | 432 | | | Nimble Storage, Inc. (a) | | | 3,422 | |
| | | | | | | | |
| | | | Total Information Technology | | | 301,325 | |
| | | | | | | | |
| | | | Materials — 2.4% | |
| | | | Construction Materials — 2.4% | |
| | 150 | | | Eagle Materials, Inc. | | | 14,782 | |
| | 482 | | | Summit Materials, Inc., Class A (a) | | | 11,462 | |
| | | | | | | | |
| | | | Total Materials | | | 26,244 | |
| | | | | | | | |
| | | | Real Estate — 2.7% | |
| | | | Equity Real Estate Investment Trusts (REITs) — 1.2% | |
| | 225 | | | CubeSmart | | | 6,026 | |
| | 143 | | | Highwoods Properties, Inc. | | | 7,288 | |
| | | | | | | | |
| | | | | | | 13,314 | |
| | | | | | | | |
| | | | | | | | |
| SHARES | | | SECURITY DESCRIPTION | | VALUE($) | |
| | | | | | | | |
| | | | Real Estate Management & Development — 1.5% | |
| | 291 | | | RE/MAX Holdings, Inc., Class A | | | 16,318 | |
| | | | | | | | |
| | | | Total Real Estate | | | 29,632 | |
| | | | | | | | |
| | | | Total Common Stocks
(Cost $807,763) | | | 1,068,870 | |
| | | | | | | | |
| | Short-Term Investment — 1.9% | |
| | | | Investment Company — 1.9% | |
| | 20,862 | | | JPMorgan U.S. Government Money Market Fund, Institutional Class Shares, 0.410% (b) (l)
(Cost $20,862) | | | 20,862 | |
| | | | | | | | |
| | | | Total Investments — 100.5%
(Cost $828,625) | | | 1,089,732 | |
| | | | Liabilities in Excess of
Other Assets — (0.5)% | | | (5,673 | ) |
| | | | | | | | |
| | | | NET ASSETS — 100.0% | | $ | 1,084,059 | |
| | | | | | | | |
Percentages indicated are based on net assets.
SEE NOTES TO FINANCIAL STATEMENTS.
| | | | | | |
| | | |
| 30 | | | | J.P. MORGAN SMALL CAP FUNDS | | DECEMBER 31, 2016 |
JPMorgan Small Cap Value Fund
SCHEDULE OF PORTFOLIO INVESTMENTS
AS OF DECEMBER 31, 2016 (Unaudited)
(Amounts in thousands)
| | | | | | | | |
| SHARES | | | SECURITY DESCRIPTION | | VALUE($) | |
| | Common Stocks — 96.5% | |
| | | | Consumer Discretionary — 8.3% | |
| | | | Auto Components — 1.6% | |
| | 491 | | | Cooper Tire & Rubber Co. | | | 19,087 | |
| | 638 | | | Dana, Inc. | | | 12,107 | |
| | 170 | | | Stoneridge, Inc. (a) | | | 2,999 | |
| | | | | | | | |
| | | | | | | 34,193 | |
| | | | | | | | |
| | | | Diversified Consumer Services — 1.1% | |
| | 75 | | | American Public Education, Inc. (a) | | | 1,844 | |
| | 310 | | | Ascent Capital Group, Inc., Class A (a) | | | 5,036 | |
| | 32 | | | DeVry Education Group, Inc. | | | 989 | |
| | 305 | | | K12, Inc. (a) | | | 5,235 | |
| | 607 | | | Regis Corp. (a) | | | 8,811 | |
| | | | | | | | |
| | | | | | | 21,915 | |
| | | | | | | | |
| | | | Hotels, Restaurants & Leisure — 1.2% | |
| | 81 | | | Bob Evans Farms, Inc. | | | 4,283 | |
| | 44 | | | Intrawest Resorts Holdings, Inc. (a) | | | 782 | |
| | 886 | | | La Quinta Holdings, Inc. (a) | | | 12,586 | |
| | 85 | | | Pinnacle Entertainment, Inc. (a) | | | 1,234 | |
| | 70 | | | Ruby Tuesday, Inc. (a) | | | 226 | |
| | 299 | | | Ruth’s Hospitality Group, Inc. | | | 5,476 | |
| | 45 | | | Speedway Motorsports, Inc. | | | 969 | |
| | | | | | | | |
| | | | | | | 25,556 | |
| | | | | | | | |
| | | | Household Durables — 0.3% | |
| | 46 | | | CSS Industries, Inc. | | | 1,245 | |
| | 268 | | | Hovnanian Enterprises, Inc., Class A (a) | | | 730 | |
| | 38 | | | NACCO Industries, Inc., Class A | | | 3,423 | |
| | 35 | | | UCP, Inc., Class A (a) | | | 418 | |
| | | | | | | | |
| | | | | | | 5,816 | |
| | | | | | | | |
| | | | Internet & Direct Marketing Retail — 0.2% | |
| | 332 | | | Liberty TripAdvisor Holdings, Inc., Class A (a) | | | 4,995 | |
| | | | | | | | |
| | | | Leisure Products — 0.1% | |
| | 59 | | | Acushnet Holdings Corp. (a) | | | 1,155 | |
| | 236 | | | JAKKS Pacific, Inc. (a) | | | 1,218 | |
| | | | | | | | |
| | | | | | | 2,373 | |
| | | | | | | | |
| | | | Media — 0.3% | |
| | 165 | | | Central European Media Enterprises Ltd., (Bermuda), Class A (a) | | | 421 | |
| | 246 | | | Entercom Communications Corp., Class A | | | 3,765 | |
| | 290 | | | Radio One, Inc., Class D (a) | | | 840 | |
| | | | | | | | |
| | | | | | | 5,026 | |
| | | | | | | | |
| | | | Multiline Retail — 0.2% | |
| | 73 | | | Dillard’s, Inc., Class A | | | 4,589 | |
| | | | | | | | |
| | | | | | | | |
| SHARES | | | SECURITY DESCRIPTION | | VALUE($) | |
| | | | | | | | |
| | | | Specialty Retail — 2.7% | |
| | 278 | | | Aaron’s, Inc. | | | 8,883 | |
| | 885 | | | Abercrombie & Fitch Co., Class A | | | 10,620 | |
| | 183 | | | Children’s Place, Inc. (The) | | | 18,514 | |
| | 1,078 | | | Office Depot, Inc. | | | 4,871 | |
| | 1,164 | | | Pier 1 Imports, Inc. | | | 9,944 | |
| | 398 | | | Rent-A-Center, Inc. | | | 4,480 | |
| | | | | | | | |
| | | | | | | 57,312 | |
| | | | | | | | |
| | | | Textiles, Apparel & Luxury Goods — 0.6% | |
| | 537 | | | Iconix Brand Group, Inc. (a) | | | 5,015 | |
| | 248 | | | Movado Group, Inc. | | | 7,116 | |
| | | | | | | | |
| | | | | | | 12,131 | |
| | | | | | | | |
| | | | Total Consumer Discretionary | | | 173,906 | |
| | | | | | | | |
| | | | Consumer Staples — 2.2% | |
| | | | Food & Staples Retailing — 0.2% | |
| | 100 | | | SpartanNash Co. | | | 3,970 | |
| | 17 | | | Village Super Market, Inc., Class A | | | 522 | |
| | | | | | | | |
| | | | | | | 4,492 | |
| | | | | | | | |
| | | | Food Products — 0.5% | |
| | 577 | | | Darling Ingredients, Inc. (a) | | | 7,453 | |
| | 64 | | | Dean Foods Co. | | | 1,403 | |
| | 47 | | | Fresh Del Monte Produce, Inc. | | | 2,849 | |
| | | | | | | | |
| | | | | | | 11,705 | |
| | | | | | | | |
| | | | Household Products — 0.6% | |
| | 405 | | | Central Garden & Pet Co., Class A (a) | | | 12,505 | |
| | | | | | | | |
| | | | Tobacco — 0.9% | |
| | 50 | | | Alliance One International, Inc. (a) | | | 956 | |
| | 270 | | | Universal Corp. | | | 17,181 | |
| | | | | | | | |
| | | | | | | 18,137 | |
| | | | | | | | |
| | | | Total Consumer Staples | | | 46,839 | |
| | | | | | | | |
| | | | Energy — 5.1% | |
| | | | Energy Equipment & Services — 2.0% | |
| | 44 | | | Archrock, Inc. | | | 578 | |
| | 134 | | | Atwood Oceanics, Inc. (a) | | | 1,757 | |
| | 37 | | | Geospace Technologies Corp. (a) | | | 745 | |
| | 339 | | | Parker Drilling Co. (a) | | | 882 | |
| | 1,436 | | | Pioneer Energy Services Corp. (a) | | | 9,833 | |
| | 82 | | | SEACOR Holdings, Inc. (a) | | | 5,838 | |
| | 4,117 | | | Seadrill Ltd., (United Kingdom) (a) | | | 14,038 | |
| | 292 | | | Unit Corp. (a) | | | 7,835 | |
| | | | | | | | |
| | | | | | | 41,506 | |
| | | | | | | | |
SEE NOTES TO FINANCIAL STATEMENTS.
| | | | | | | | |
| | | |
| DECEMBER 31, 2016 | | J.P. MORGAN SMALL CAP FUNDS | | | | | 31 | |
JPMorgan Small Cap Value Fund
SCHEDULE OF PORTFOLIO INVESTMENTS
AS OF DECEMBER 31, 2016 (Unaudited) (continued)
(Amounts in thousands)
| | | | | | | | |
| SHARES | | | SECURITY DESCRIPTION | | VALUE($) | |
| | Common Stocks — continued | |
| | | | Oil, Gas & Consumable Fuels — 3.1% | |
| | 3 | | | Adams Resources & Energy, Inc. | | | 135 | |
| | 101 | | | Alon USA Energy, Inc. | | | 1,145 | |
| | 1,654 | | | Bill Barrett Corp. (a) | | | 11,559 | |
| | 371 | | | Delek US Holdings, Inc. | | | 8,920 | |
| | 2,070 | | | Denbury Resources, Inc. (a) | | | 7,616 | |
| | 1,870 | | | EP Energy Corp., Class A (a) | | | 12,248 | |
| | 229 | | | Jones Energy, Inc., Class A (a) | | | 1,147 | |
| | 202 | | | REX American Resources Corp. (a) | | | 19,987 | |
| | 428 | | | Sanchez Energy Corp. (a) | | | 3,864 | |
| | | | | | | | |
| | | | | | | 66,621 | |
| | | | | | | | |
| | | | Total Energy | | | 108,127 | |
| | | | | | | | |
| | | | Financials — 30.5% | |
| | | | Banks — 19.6% | |
| | 119 | | | 1st Source Corp. | | | 5,297 | |
| | 7 | | | American National Bankshares, Inc. | | | 240 | |
| | 71 | | | BancFirst Corp. | | | 6,560 | |
| | 411 | | | BancorpSouth, Inc. | | | 12,749 | |
| | 180 | | | Bank of Hawaii Corp. | | | 15,938 | |
| | 82 | | | Brookline Bancorp, Inc. | | | 1,351 | |
| | 34 | | | Bryn Mawr Bank Corp. | | | 1,429 | |
| | 201 | | | Capital Bank Financial Corp., Class A | | | 7,881 | |
| | 91 | | | Cascade Bancorp (a) | | | 741 | |
| | 227 | | | Cathay General Bancorp | | | 8,618 | |
| | 532 | | | Central Pacific Financial Corp. | | | 16,715 | |
| | 27 | | | Central Valley Community Bancorp | | | 531 | |
| | 9 | | | Century Bancorp, Inc., Class A | | | 540 | |
| | 21 | | | Citizens & Northern Corp. | | | 553 | |
| | 159 | | | City Holding Co. | | | 10,748 | |
| | 60 | | | Columbia Banking System, Inc. | | | 2,673 | |
| | 149 | | | Community Bank System, Inc. | | | 9,213 | |
| | 134 | | | Community Trust Bancorp, Inc. | | | 6,669 | |
| | 114 | | | Customers Bancorp, Inc. (a) | | | 4,091 | |
| | 14 | | | East West Bancorp, Inc. | | | 688 | |
| | 404 | | | FCB Financial Holdings, Inc., Class A (a) | | | 19,271 | |
| | 76 | | | Financial Institutions, Inc. | | | 2,613 | |
| | 33 | | | First Bancorp | | | 901 | |
| | 1,331 | | | First BanCorp, (Puerto Rico) (a) | | | 8,797 | |
| | 83 | | | First Busey Corp. | | | 2,558 | |
| | 9 | | | First Citizens BancShares, Inc., Class A | | | 3,230 | |
| | 1,335 | | | First Commonwealth Financial Corp. | | | 18,923 | |
| | 66 | | | First Community Bancshares, Inc. | | | 1,995 | |
| | 119 | | | First Financial Bancorp | | | 3,383 | |
| | 83 | | | First Financial Bankshares, Inc. | | | 3,761 | |
| | 23 | | | First Financial Corp. | | | 1,204 | |
| | 106 | | | First Hawaiian, Inc. | | | 3,691 | |
| | | | | | | | |
| SHARES | | | SECURITY DESCRIPTION | | VALUE($) | |
| | |
| | | | Banks — continued | |
| | 97 | | | First Interstate BancSystem, Inc., Class A | | | 4,136 | |
| | 161 | | | Flushing Financial Corp. | | | 4,717 | |
| | 388 | | | Fulton Financial Corp. | | | 7,302 | |
| | 233 | | | Glacier Bancorp, Inc. | | | 8,445 | |
| | 40 | | | Great Southern Bancorp, Inc. | | | 2,208 | |
| | 163 | | | Great Western Bancorp, Inc. | | | 7,092 | |
| | 50 | | | Guaranty Bancorp | | | 1,208 | |
| | 366 | | | Hancock Holding Co. | | | 15,754 | |
| | 27 | | | Heritage Financial Corp. | | | 689 | |
| | 867 | | | Hope Bancorp, Inc. | | | 18,986 | |
| | 23 | | | Independent Bank Corp. | | | 495 | |
| | 1,070 | | | Investors Bancorp, Inc. | | | 14,919 | |
| | 46 | | | Lakeland Financial Corp. | | | 2,174 | |
| | 184 | | | MainSource Financial Group, Inc. | | | 6,322 | |
| | 21 | | | Mercantile Bank Corp. | | | 788 | |
| | 619 | | | OFG Bancorp, (Puerto Rico) | | | 8,105 | |
| | 86 | | | Pacific Continental Corp. | | | 1,879 | |
| | 171 | | | PacWest Bancorp | | | 9,309 | |
| | 58 | | | Park Sterling Corp. | | | 625 | |
| | 19 | | | Preferred Bank | | | 1,017 | |
| | 22 | | | Republic Bancorp, Inc., Class A | | | 850 | |
| | 24 | | | S&T Bancorp, Inc. | | | 941 | |
| | 29 | | | Sandy Spring Bancorp, Inc. | | | 1,172 | |
| | 19 | | | Sierra Bancorp | | | 497 | |
| | 83 | | | Southside Bancshares, Inc. | | | 3,133 | |
| | 134 | | | Southwest Bancorp, Inc. | | | 3,874 | |
| | 63 | | | State Bank Financial Corp. | | | 1,695 | |
| | 21 | | | Stock Yards Bancorp, Inc. | | | 981 | |
| | 19 | | | Suffolk Bancorp | | | 818 | |
| | 24 | | | Tompkins Financial Corp. | | | 2,297 | |
| | 28 | | | TriState Capital Holdings, Inc. (a) | | | 621 | |
| | 389 | | | Trustmark Corp. | | | 13,882 | |
| | 245 | | | UMB Financial Corp. | | | 18,863 | |
| | 648 | | | Umpqua Holdings Corp. | | | 12,175 | |
| | 442 | | | Union Bankshares Corp. | | | 15,782 | |
| | 13 | | | Univest Corp. of Pennsylvania | | | 407 | |
| | 83 | | | Valley National Bancorp | | | 968 | |
| | 42 | | | Washington Trust Bancorp, Inc. | | | 2,343 | |
| | 123 | | | Webster Financial Corp. | | | 6,660 | |
| | 25 | | | West Bancorporation, Inc. | | | 625 | |
| | 378 | | | Westamerica Bancorp | | | 23,775 | |
| | 17 | | | Western Alliance Bancorp (a) | | | 834 | |
| | | | | | | | |
| | | | | | | 412,915 | |
| | | | | | | | |
| | | | Capital Markets — 1.3% | |
| | 48 | | | Arlington Asset Investment Corp., Class A | | | 708 | |
SEE NOTES TO FINANCIAL STATEMENTS.
| | | | | | |
| | | |
| 32 | | | | J.P. MORGAN SMALL CAP FUNDS | | DECEMBER 31, 2016 |
| | | | | | | | |
| SHARES | | | SECURITY DESCRIPTION | | VALUE($) | |
| | Common Stocks — continued | |
| | | | Capital Markets — continued | |
| | 53 | | | Cowen Group, Inc., Class A (a) | | | 826 | |
| | 55 | | | Investment Technology Group, Inc. | | | 1,092 | |
| | 809 | | | KCG Holdings, Inc., Class A (a) | | | 10,719 | |
| | 50 | | | Oppenheimer Holdings, Inc., Class A | | | 934 | |
| | 152 | | | Stifel Financial Corp. (a) | | | 7,572 | |
| | 30 | | | Virtus Investment Partners, Inc. | | | 3,553 | |
| | 50 | | | Waddell & Reed Financial, Inc., Class A | | | 970 | |
| | | | | | | | |
| | | | | | | 26,374 | |
| | | | | | | | |
| | | | Consumer Finance — 0.8% | |
| | 371 | | | EZCORP, Inc., Class A (a) | | | 3,948 | |
| | 123 | | | FirstCash, Inc. | | | 5,804 | |
| | 99 | | | Nelnet, Inc., Class A | | | 5,044 | |
| | 62 | | | Regional Management Corp. (a) | | | 1,635 | |
| | | | | | | | |
| | | | | | | 16,431 | |
| | | | | | | | |
| | | | Diversified Financial Services — 0.1% | |
| | 73 | | | FNFV Group (a) | | | 1,003 | |
| | 36 | | | Marlin Business Services Corp. | | | 744 | |
| | | | | | | | |
| | | | | | | 1,747 | |
| | | | | | | | |
| | | | Insurance — 4.1% | |
| | 37 | | | Arch Capital Group Ltd. (a) | | | 3,231 | |
| | 72 | | | Argo Group International Holdings Ltd. | | | 4,718 | |
| | 767 | | | CNO Financial Group, Inc. | | | 14,688 | |
| | 13 | | | Global Indemnity Ltd., (Cayman Islands) (a) | | | 482 | |
| | 80 | | | Hallmark Financial Services, Inc. (a) | | | 934 | |
| | 257 | | | Horace Mann Educators Corp. | | | 11,012 | |
| | 1,520 | | | MBIA, Inc. (a) | | | 16,266 | |
| | 39 | | | Navigators Group, Inc. (The) | | | 4,604 | |
| | 280 | | | Primerica, Inc. | | | 19,383 | |
| | 193 | | | ProAssurance Corp. | | | 10,824 | |
| | 16 | | | Universal Insurance Holdings, Inc. | | | 460 | |
| | | | | | | | |
| | | | | | | 86,602 | |
| | | | | | | | |
| | | | Mortgage Real Estate Investment Trusts (REITs) — 1.7% | |
| | 103 | | | AG Mortgage Investment Trust, Inc. | | | 1,761 | |
| | 244 | | | ARMOUR Residential REIT, Inc. | | | 5,286 | |
| | 1,123 | | | Capstead Mortgage Corp. | | | 11,438 | |
| | 2,202 | | | CYS Investments, Inc. | | | 17,024 | |
| | | | | | | | |
| | | | | | | 35,509 | |
| | | | | | | | |
| | | | Thrifts & Mortgage Finance — 2.9% | |
| | 26 | | | BankFinancial Corp. | | | 391 | |
| | 985 | | | Beneficial Bancorp, Inc. | | | 18,119 | |
| | 287 | | | Charter Financial Corp. | | | 4,783 | |
| | 38 | | | First Defiance Financial Corp. | | | 1,913 | |
| | 22 | | | Kearny Financial Corp. | | | 336 | |
| | | | | | | | |
| SHARES | | | SECURITY DESCRIPTION | | VALUE($) | |
| | |
| | | | Thrifts & Mortgage Finance — continued | |
| | 361 | | | Meridian Bancorp, Inc. | | | 6,819 | |
| | 648 | | | Northfield Bancorp, Inc. | | | 12,938 | |
| | 30 | | | Oritani Financial Corp. | | | 570 | |
| | 17 | | | Territorial Bancorp, Inc. | | | 568 | |
| | 106 | | | United Financial Bancorp, Inc. | | | 1,929 | |
| | 255 | | | Walker & Dunlop, Inc. (a) | | | 7,968 | |
| | 97 | | | Waterstone Financial, Inc. | | | 1,787 | |
| | 84 | | | WSFS Financial Corp. | | | 3,875 | |
| | | | | | | | |
| | | | | | | 61,996 | |
| | | | | | | | |
| | | | Total Financials | | | 641,574 | |
| | | | | | | | |
| | | | Health Care — 4.6% | |
| | | | Biotechnology — 1.5% | |
| | 37 | | | ACADIA Pharmaceuticals, Inc. (a) | | | 1,073 | |
| | 64 | | | Acorda Therapeutics, Inc. (a) | | | 1,194 | |
| | 8 | | | Adverum Biotechnologies, Inc. (a) | | | 24 | |
| | 72 | | | AMAG Pharmaceuticals, Inc. (a) | | | 2,495 | |
| | 229 | | | Ardelyx, Inc. (a) | | | 3,256 | |
| | 43 | | | Cara Therapeutics, Inc. (a) | | | 398 | |
| | 328 | | | Chimerix, Inc. (a) | | | 1,509 | |
| | 91 | | | Enanta Pharmaceuticals, Inc. (a) | | | 3,062 | |
| | 14 | | | Epizyme, Inc. (a) | | | 165 | |
| | 49 | | | Five Prime Therapeutics, Inc. (a) | | | 2,440 | |
| | 1,828 | | | Idera Pharmaceuticals, Inc. (a) | | | 2,741 | |
| | 15 | | | Immune Design Corp. (a) | | | 84 | |
| | 46 | | | Insmed, Inc. (a) | | | 611 | |
| | 6 | | | Karyopharm Therapeutics, Inc. (a) | | | 58 | |
| | 16 | | | MacroGenics, Inc. (a) | | | 321 | |
| | 81 | | | NantKwest, Inc. (a) | | | 462 | |
| | 172 | | | PTC Therapeutics, Inc. (a) | | | 1,873 | |
| | 69 | | | Radius Health, Inc. (a) | | | 2,609 | |
| | 666 | | | Rigel Pharmaceuticals, Inc. (a) | | | 1,584 | |
| | 6 | | | Sage Therapeutics, Inc. (a) | | | 281 | |
| | 82 | | | Seres Therapeutics, Inc. (a) | | | 813 | |
| | 13 | | | Ultragenyx Pharmaceutical, Inc. (a) | | | 886 | |
| | 146 | | | Versartis, Inc. (a) | | | 2,172 | |
| | 66 | | | Voyager Therapeutics, Inc. (a) | | | 845 | |
| | 15 | | | Zafgen, Inc. (a) | | | 49 | |
| | | | | | | | |
| | | | | | | 31,005 | |
| | | | | | | | |
| | | | Health Care Equipment & Supplies — 0.9% | |
| | 250 | | | Halyard Health, Inc. (a) | | | 9,227 | |
| | 44 | | | Inogen, Inc. (a) | | | 2,962 | |
| | 188 | | | Quidel Corp. (a) | | | 4,027 | |
| | 102 | | | Surmodics, Inc. (a) | | | 2,588 | |
| | | | | | | | |
| | | | | | | 18,804 | |
| | | | | | | | |
SEE NOTES TO FINANCIAL STATEMENTS.
| | | | | | | | |
| | | |
| DECEMBER 31, 2016 | | J.P. MORGAN SMALL CAP FUNDS | | | | | 33 | |
JPMorgan Small Cap Value Fund
SCHEDULE OF PORTFOLIO INVESTMENTS
AS OF DECEMBER 31, 2016 (Unaudited) (continued)
(Amounts in thousands)
| | | | | | | | |
| SHARES | | | SECURITY DESCRIPTION | | VALUE($) | |
| | Common Stocks — continued | |
| | | | Health Care Providers & Services — 1.7% | |
| | 34 | | | Addus HomeCare Corp. (a) | | | 1,185 | |
| | 542 | | | Cross Country Healthcare, Inc. (a) | | | 8,457 | |
| | 596 | | | Healthways, Inc. (a) | | | 13,554 | |
| | 60 | | | Molina Healthcare, Inc. (a) | | | 3,256 | |
| | 59 | | | Owens & Minor, Inc. | | | 2,079 | |
| | 312 | | | Triple-S Management Corp., (Puerto Rico), Class B (a) | | | 6,450 | |
| | 17 | | | WellCare Health Plans, Inc. (a) | | | 2,317 | |
| | | | | | | | |
| | | | | | | 37,298 | |
| | | | | | | | |
| | | | Pharmaceuticals — 0.5% | |
| | 88 | | | Amphastar Pharmaceuticals, Inc. (a) | | | 1,621 | |
| | 474 | | | Endocyte, Inc. (a) | | | 1,210 | |
| | 155 | | | Medicines Co. (The) (a) | | | 5,274 | |
| | 113 | | | MyoKardia, Inc. (a) | | | 1,467 | |
| | 27 | | | Revance Therapeutics, Inc. (a) | | | 553 | |
| | | | | | | | |
| | | | | | | 10,125 | |
| | | | | | | | |
| | | | Total Health Care | | | 97,232 | |
| | | | | | | | |
| | | | Industrials — 15.2% | |
| | | | Aerospace & Defense — 2.1% | |
| | 246 | | | AAR Corp. | | | 8,120 | |
| | 89 | | | Curtiss-Wright Corp. | | | 8,705 | |
| | 732 | | | DigitalGlobe, Inc. (a) | | | 20,966 | |
| | 95 | | | Moog, Inc., Class A (a) | | | 6,207 | |
| | | | | | | | |
| | | | | | | 43,998 | |
| | | | | | | | |
| | | | Air Freight & Logistics — 0.2% | |
| | 80 | | | Atlas Air Worldwide Holdings, Inc. (a) | | | 4,193 | |
| | | | | | | | |
| | | | Airlines — 0.4% | |
| | 92 | | | Alaska Air Group, Inc. | | | 8,137 | |
| | | | | | | | |
| | | | Building Products — 0.1% | |
| | 26 | | | Gibraltar Industries, Inc. (a) | | | 1,100 | |
| | | | | | | | |
| | | | Commercial Services & Supplies — 2.7% | |
| | 1,596 | | | ACCO Brands Corp. (a) | | | 20,824 | |
| | 815 | | | ARC Document Solutions, Inc. (a) | | | 4,142 | |
| | 137 | | | CECO Environmental Corp. | | | 1,915 | |
| | 92 | | | Ennis, Inc. | | | 1,591 | |
| | 132 | | | Essendant, Inc. | | | 2,763 | |
| | 377 | | | Quad/Graphics, Inc. | | | 10,136 | |
| | 143 | | | VSE Corp. | | | 5,542 | |
| | 367 | | | West Corp. | | | 9,080 | |
| | | | | | | | |
| | | | | | | 55,993 | |
| | | | | | | | |
| | | | Construction & Engineering — 1.4% | |
| | 39 | | | Argan, Inc. | | | 2,772 | |
| | 335 | | | EMCOR Group, Inc. | | | 23,733 | |
| | | | | | | | |
| SHARES | | | SECURITY DESCRIPTION | | VALUE($) | |
| | | | | | | | |
| | | | Construction & Engineering — continued | |
| | 96 | | | MYR Group, Inc. (a) | | | 3,624 | |
| | | | | | | | |
| | | | | | | 30,129 | |
| | | | | | | | |
| | | | Electrical Equipment — 0.3% | |
| | 205 | | | General Cable Corp. | | | 3,911 | |
| | 66 | | | Powell Industries, Inc. | | | 2,562 | |
| | | | | | | | |
| | | | | | | 6,473 | |
| | | | | | | | |
| | | | Machinery — 3.0% | |
| | 104 | | | AGCO Corp. | | | 6,040 | |
| | 295 | | | Briggs & Stratton Corp. | | | 6,560 | |
| | 390 | | | Douglas Dynamics, Inc. | | | 13,120 | |
| | 28 | | | Graham Corp. | | | 625 | |
| | 81 | | | Greenbrier Cos., Inc. (The) | | | 3,357 | |
| | 58 | | | Hurco Cos., Inc. | | | 1,920 | |
| | 17 | | | Hyster-Yale Materials Handling, Inc. | | | 1,081 | |
| | 403 | | | Joy Global, Inc. | | | 11,295 | |
| | 111 | | | Kadant, Inc. | | | 6,793 | |
| | 21 | | | Kennametal, Inc. | | | 663 | |
| | 794 | | | Wabash National Corp. (a) | | | 12,558 | |
| | | | | | | | |
| | | | | | | 64,012 | |
| | | | | | | | |
| | | | Marine — 0.2% | |
| | 144 | | | Matson, Inc. | | | 5,086 | |
| | | | | | | | |
| | | | Professional Services — 2.8% | |
| | 1,044 | | | Acacia Research Corp. (a) | | | 6,788 | |
| | 134 | | | Barrett Business Services, Inc. | | | 8,565 | |
| | 54 | | | Franklin Covey Co. (a) | | | 1,084 | |
| | 431 | | | FTI Consulting, Inc. (a) | | | 19,434 | |
| | 326 | | | Huron Consulting Group, Inc. (a) | | | 16,487 | |
| | 163 | | | RPX Corp. (a) | | | 1,758 | |
| | 198 | | | TriNet Group, Inc. (a) | | | 5,083 | |
| | | | | | | | |
| | | | | | | 59,199 | |
| | | | | | | | |
| | | | Road & Rail — 0.9% | |
| | 5 | | | AMERCO | | | 1,811 | |
| | 350 | | | ArcBest Corp. | | | 9,675 | |
| | 345 | | | USA Truck, Inc. (a) | | | 3,000 | |
| | 368 | | | YRC Worldwide, Inc. (a) | | | 4,882 | |
| | | | | | | | |
| | | | | | | 19,368 | |
| | | | | | | | |
| | | | Trading Companies & Distributors — 1.1% | |
| | 160 | | | DXP Enterprises, Inc. (a) | | | 5,562 | |
| | 584 | | | MRC Global, Inc. (a) | | | 11,830 | |
| | 335 | | | Titan Machinery, Inc. (a) | | | 4,876 | |
| | | | | | | | |
| | | | | | | 22,268 | |
| | | | | | | | |
| | | | Total Industrials | | | 319,956 | |
| | | | | | | | |
SEE NOTES TO FINANCIAL STATEMENTS.
| | | | | | |
| | | |
| 34 | | | | J.P. MORGAN SMALL CAP FUNDS | | DECEMBER 31, 2016 |
| | | | | | | | |
| SHARES | | | SECURITY DESCRIPTION | | VALUE($) | |
| | Common Stocks — continued | |
| | | | Information Technology — 10.8% | |
| | | | Communications Equipment — 1.5% | |
| | 242 | | | Bel Fuse, Inc., Class B | | | 7,462 | |
| | 416 | | | Black Box Corp. | | | 6,349 | |
| | 165 | | | Comtech Telecommunications Corp. | | | 1,954 | |
| | 74 | | | InterDigital, Inc. | | | 6,742 | |
| | 175 | | | NETGEAR, Inc. (a) | | | 9,533 | |
| | | | | | | | |
| | | | | | | 32,040 | |
| | | | | | | | |
| | | | Electronic Equipment, Instruments & Components — 3.5% | |
| | 733 | | | Benchmark Electronics, Inc. (a) | | | 22,353 | |
| | 224 | | | Insight Enterprises, Inc. (a) | | | 9,055 | |
| | 741 | | | InvenSense, Inc. (a) | | | 9,481 | |
| | 67 | | | Sanmina Corp. (a) | | | 2,448 | |
| | 61 | | | SYNNEX Corp. | | | 7,406 | |
| | 134 | | | Tech Data Corp. (a) | | | 11,330 | |
| | 710 | | | Vishay Intertechnology, Inc. | | | 11,509 | |
| | | | | | | | |
| | | | | | | 73,582 | |
| | | | | | | | |
| | | | Internet Software & Services — 0.4% | |
| | 183 | | | Bazaarvoice, Inc. (a) | | | 888 | |
| | 338 | | | EarthLink Holdings Corp. | | | 1,906 | |
| | 87 | | | Intralinks Holdings, Inc. (a) | | | 1,180 | |
| | 60 | | | Liquidity Services, Inc. (a) | | | 587 | |
| | 387 | | | RetailMeNot, Inc. (a) | | | 3,596 | |
| | | | | | | | |
| | | | | | | 8,157 | |
| | | | | | | | |
| | | | IT Services — 1.0% | |
| | 21 | | | Convergys Corp. | | | 514 | |
| | 224 | | | Datalink Corp. (a) | | | 2,522 | |
| | 38 | | | EVERTEC, Inc., (Puerto Rico) | | | 671 | |
| | 1,100 | | | Unisys Corp. (a) | | | 16,439 | |
| | | | | | | | |
| | | | | | | 20,146 | |
| | | | | | | | |
| | | | Semiconductors & Semiconductor Equipment — 2.5% | |
| | 289 | | | Advanced Energy Industries, Inc. (a) | | | 15,817 | |
| | 318 | | | Alpha & Omega Semiconductor Ltd. (a) | | | 6,762 | |
| | 820 | | | Amkor Technology, Inc. (a) | | | 8,653 | |
| | 915 | | | Cypress Semiconductor Corp. | | | 10,465 | |
| | 224 | | | IXYS Corp. | | | 2,669 | |
| | 1,043 | | | Xcerra Corp. (a) | | | 7,966 | |
| | | | | | | | |
| | | | | | | 52,332 | |
| | | | | | | | |
| | | | Software — 1.9% | |
| | 31 | | | Aspen Technology, Inc. (a) | | | 1,712 | |
| | 70 | | | Fair Isaac Corp. | | | 8,357 | |
| | 223 | | | Mentor Graphics Corp. | | | 8,219 | |
| | 91 | | | Progress Software Corp. | | | 2,896 | |
| | | | | | | | |
| SHARES | | | SECURITY DESCRIPTION | | VALUE($) | |
| | | | | | | | |
| | | | Software — continued | |
| | 297 | | | Rubicon Project, Inc. (The) (a) | | | 2,203 | |
| | 293 | | | Take-Two Interactive Software, Inc. (a) | | | 14,457 | |
| | 105 | | | TiVo Corp. (a) | | | 2,188 | |
| | | | | | | | |
| | | | | | | 40,032 | |
| | | | | | | | |
| | | | Total Information Technology | | | 226,289 | |
| | | | | | | | |
| | | | Materials — 4.2% | |
| | | | Chemicals — 1.5% | |
| | 103 | | | American Vanguard Corp. | | | 1,968 | |
| | 23 | | | Innophos Holdings, Inc. | | | 1,223 | |
| | 49 | | | Innospec, Inc. | | | 3,377 | |
| | 115 | | | Minerals Technologies, Inc. | | | 8,876 | |
| | 970 | | | Rayonier Advanced Materials, Inc. | | | 15,001 | |
| | | | | | | | |
| | | | | | | 30,445 | |
| | | | | | | | |
| | | | Construction Materials — 0.1% | |
| | 81 | | | Forterra, Inc. (a) | | | 1,755 | |
| | | | | | | | |
| | | | Containers & Packaging — 0.3% | |
| | 402 | | | Graphic Packaging Holding Co. | | | 5,021 | |
| | 60 | | | Myers Industries, Inc. | | | 859 | |
| | | | | | | | |
| | | | | | | 5,880 | |
| | | | | | | | |
| | | | Metals & Mining — 1.8% | |
| | 780 | | | AK Steel Holding Corp. (a) | | | 7,968 | |
| | 273 | | | Carpenter Technology Corp. | | | 9,885 | |
| | 125 | | | Cliffs Natural Resources, Inc. (a) | | | 1,050 | |
| | 61 | | | Olympic Steel, Inc. | | | 1,471 | |
| | 24 | | | Ryerson Holding Corp. (a) | | | 319 | |
| | 219 | | | Schnitzer Steel Industries, Inc., Class A | | | 5,628 | |
| | 256 | | | Worthington Industries, Inc. | | | 12,154 | |
| | | | | | | | |
| | | | | | | 38,475 | |
| | | | | | | | |
| | | | Paper & Forest Products — 0.5% | |
| | 109 | | | Domtar Corp. | | | 4,239 | |
| | 145 | | | Schweitzer-Mauduit International, Inc. | | | 6,579 | |
| | | | | | | | |
| | | | | | | 10,818 | |
| | | | | | | | |
| | | | Total Materials | | | 87,373 | |
| | | | | | | | |
| | | | Real Estate — 9.4% | |
| | | | Equity Real Estate Investment Trusts (REITs) — 8.5% | |
| | 25 | | | American Assets Trust, Inc. | | | 1,090 | |
| | 216 | | | Apartment Investment & Management Co., Class A | | | 9,800 | |
| | 980 | | | Ashford Hospitality Trust, Inc. | | | 7,603 | |
| | 396 | | | CBL & Associates Properties, Inc. | | | 4,559 | |
| | 301 | | | Cedar Realty Trust, Inc. | | | 1,964 | |
| | 91 | | | CoreSite Realty Corp. | | | 7,231 | |
SEE NOTES TO FINANCIAL STATEMENTS.
| | | | | | | | |
| | | |
| DECEMBER 31, 2016 | | J.P. MORGAN SMALL CAP FUNDS | | | | | 35 | |
JPMorgan Small Cap Value Fund
SCHEDULE OF PORTFOLIO INVESTMENTS
AS OF DECEMBER 31, 2016 (Unaudited) (continued)
(Amounts in thousands, except number of Futures contracts)
| | | | | | | | |
| SHARES | | | SECURITY DESCRIPTION | | VALUE($) | |
| | Common Stocks — continued | |
| | | | Equity Real Estate Investment Trusts (REITs) — continued | |
| | 345 | | | DCT Industrial Trust, Inc. | | | 16,539 | |
| | 349 | | | DiamondRock Hospitality Co. | | | 4,025 | |
| | 76 | | | DuPont Fabros Technology, Inc. | | | 3,339 | |
| | 72 | | | EPR Properties | | | 5,182 | |
| | 778 | | | FelCor Lodging Trust, Inc. | | | 6,234 | |
| | 138 | | | First Industrial Realty Trust, Inc. | | | 3,871 | |
| | 535 | | | First Potomac Realty Trust | | | 5,866 | |
| | 53 | | | Franklin Street Properties Corp. | | | 691 | |
| | 160 | | | Getty Realty Corp. | | | 4,079 | |
| | 80 | | | Gladstone Commercial Corp. | | | 1,608 | |
| | 500 | | | Government Properties Income Trust | | | 9,523 | |
| | 216 | | | Gramercy Property Trust | | | 1,986 | |
| | 33 | | | Highwoods Properties, Inc. | | | 1,658 | |
| | 174 | | | Hospitality Properties Trust | | | 5,535 | |
| | 233 | | | InfraREIT, Inc. | | | 4,168 | |
| | 133 | | | Kite Realty Group Trust | | | 3,125 | |
| | 87 | | | LaSalle Hotel Properties | | | 2,648 | |
| | 108 | | | LTC Properties, Inc. | | | 5,083 | |
| | 139 | | | Mack-Cali Realty Corp. | | | 4,042 | |
| | 16 | | | Mid-America Apartment Communities, Inc. | | | 1,544 | |
| | 256 | | | Monogram Residential Trust, Inc. | | | 2,766 | |
| | 141 | | | Pebblebrook Hotel Trust | | | 4,186 | |
| | 329 | | | Pennsylvania REIT | | | 6,228 | |
| | 201 | | | Potlatch Corp. | | | 8,367 | |
| | 92 | | | PS Business Parks, Inc. | | | 10,731 | |
| | 505 | | | RAIT Financial Trust | | | 1,696 | |
| | 347 | | | RLJ Lodging Trust | | | 8,508 | |
| | 13 | | | Saul Centers, Inc. | | | 866 | |
| | 71 | | | Silver Bay Realty Trust Corp. | | | 1,215 | |
| | 493 | | | Sunstone Hotel Investors, Inc. | | | 7,525 | |
| | 15 | | | Taubman Centers, Inc. | | | 1,109 | |
| | 85 | | | Urstadt Biddle Properties, Inc., Class A | | | 2,054 | |
| | 7 | | | Washington Prime Group, Inc. | | | 69 | |
| | 10 | | | Washington REIT | | | 330 | |
| | | | | | | | |
| | | | | | | 178,643 | |
| | | | | | | | |
| | | | Real Estate Management & Development — 0.9% | |
| | 151 | | | Alexander & Baldwin, Inc. | | | 6,789 | |
| | 497 | | | Forestar Group, Inc. (a) | | | 6,612 | |
| | 358 | | | St Joe Co. (The) (a) | | | 6,794 | |
| | | | | | | | |
| | | | | | | 20,195 | |
| | | | | | | | |
| | | | Total Real Estate | | | 198,838 | |
| | | | | | | | |
| | | | Telecommunication Services — 0.5% | |
| | | | Diversified Telecommunication Services — 0.5% | |
| | 230 | | | Intelsat SA (a) | | | 615 | |
| | | | | | | | |
| SHARES | | | SECURITY DESCRIPTION | | VALUE($) | |
| | | | | | | | |
| | | | Diversified Telecommunication Services — continued | |
| | 1,372 | | | Windstream Holdings, Inc. | | | 10,055 | |
| | | | | | | | |
| | | | Total Telecommunication Services | | | 10,670 | |
| | | | | | | | |
| | | | Utilities — 5.7% | |
| | | | Electric Utilities — 1.5% | |
| | 326 | | | El Paso Electric Co. | | | 15,164 | |
| | 362 | | | Portland General Electric Co. | | | 15,685 | |
| | 24 | | | Spark Energy, Inc., Class A | | | 721 | |
| | | | | | | | |
| | | | | | | 31,570 | |
| | | | | | | | |
| | | | Gas Utilities — 1.9% | |
| | 245 | | | Northwest Natural Gas Co. | | | 14,651 | |
| | 165 | | | Southwest Gas Corp. | | | 12,635 | |
| | 195 | | | Spire, Inc. | | | 12,600 | |
| | | | | | | | |
| | | | | | | 39,886 | |
| | | | | | | | |
| | | | Independent Power & Renewable Electricity Producers — 0.7% | |
| | 2,285 | | | Atlantic Power Corp. (a) | | | 5,712 | |
| | 746 | | | Dynegy, Inc. (a) | | | 6,312 | |
| | 49 | | | Ormat Technologies, Inc. | | | 2,633 | |
| | | | | | | | |
| | | | | | | 14,657 | |
| | | | | | | | |
| | | | Multi-Utilities — 1.0% | |
| | 272 | | | Avista Corp. | | | 10,877 | |
| | 144 | | | NorthWestern Corp. | | | 8,184 | |
| | 57 | | | Unitil Corp. | | | 2,566 | |
| | | | | | | | |
| | | | | | | 21,627 | |
| | | | | | | | |
| | | | Water Utilities — 0.6% | |
| | 177 | | | American States Water Co. | | | 8,060 | |
| | 122 | | | California Water Service Group | | | 4,136 | |
| | | | | | | 12,196 | |
| | | | | | | | |
| | | | Total Utilities | | | 119,936 | |
| | | | | | | | |
| | | | Total Common Stocks
(Cost $1,502,795) | | | 2,030,740 | |
| | | | | | | | |
| | |
NUMBER OF
WARRANTS | | | | | | |
| | Warrant — 0.0% (g) | |
| | | | Financials — 0.0% (g) | |
| | | | Consumer Finance — 0.0% (g) | |
| | 3 | | | Emergent Capital, Inc., expiring 10/01/19
(Strike Price $10.75) (a)
(Cost $—) | | | — | |
| | | | | | | | |
SEE NOTES TO FINANCIAL STATEMENTS.
| | | | | | |
| | | |
| 36 | | | | J.P. MORGAN SMALL CAP FUNDS | | DECEMBER 31, 2016 |
| | | | | | | | |
| SHARES | | | SECURITY DESCRIPTION | | VALUE($) | |
| | Short-Term Investment — 3.8% | |
| | | | Investment Company — 3.8% | |
| | 79,623 | | | JPMorgan U.S. Government Money Market Fund, Institutional Class Shares, 0.410% (b) (l)
(Cost $79,623) | | | 79,623 | |
| | | | | | | | |
| | | | Total Investments — 100.3%
(Cost $1,582,418) | | | 2,110,363 | |
| | | | Liabilities in Excess of
Other Assets — (0.3)% | | | (7,229 | ) |
| | | | | | | | |
| | | | NET ASSETS — 100.0% | | $ | 2,103,134 | |
| | | | | | | | |
Percentages indicated are based on net assets.
| | | | | | | | | | | | | | | | | | | | |
| Futures Contracts | | | | | | | | | | |
NUMBER OF
CONTRACTS | | | DESCRIPTION | | EXPIRATION
DATE | | | TRADING
CURRENCY | | | NOTIONAL
VALUE AT
DECEMBER 31, 2016 | | | NET UNREALIZED
APPRECIATION
(DEPRECIATION) | |
| | | | Long Futures Outstanding | |
| | 1,103 | | | Mini Russell 2000 | | | 03/17/17 | | | | USD | | | $ | 74,833 | | | $ | (1,495 | ) |
| | | | | | | | | | | | | | | | | | | | |
SEE NOTES TO FINANCIAL STATEMENTS.
| | | | | | | | |
| | | |
| DECEMBER 31, 2016 | | J.P. MORGAN SMALL CAP FUNDS | | | | | 37 | |
JPMorgan U.S. Small Company Fund
SCHEDULE OF PORTFOLIO INVESTMENTS
AS OF DECEMBER 31, 2016 (Unaudited)
(Amounts in thousands)
| | | | | | | | |
| SHARES | | | SECURITY DESCRIPTION | | VALUE($) | |
| | Common Stocks — 97.3% | |
| | | | Consumer Discretionary — 11.0% | |
| | | | Auto Components — 2.5% | |
| | 42 | | | American Axle & Manufacturing Holdings, Inc. (a) | | | 801 | |
| | 474 | | | Cooper Tire & Rubber Co. | | | 18,426 | |
| | 281 | | | Dana, Inc. | | | 5,341 | |
| | 372 | | | Stoneridge, Inc. (a) | | | 6,588 | |
| | 188 | | | Tenneco, Inc. (a) | | | 11,726 | |
| | | | | | | | |
| | | | | | | 42,882 | |
| | | | | | | | |
| | | | Diversified Consumer Services — 1.0% | |
| | 187 | | | Ascent Capital Group, Inc., Class A (a) | | | 3,039 | |
| | 282 | | | Houghton Mifflin Harcourt Co. (a) | | | 3,062 | |
| | 9 | | | K12, Inc. (a) | | | 153 | |
| | 437 | | | Regis Corp. (a) | | | 6,351 | |
| | 60 | | | Strayer Education, Inc. (a) | | | 4,862 | |
| | | | | | | | |
| | | | | | | 17,467 | |
| | | | | | | | |
| | | | Hotels, Restaurants & Leisure — 1.9% | |
| | 580 | | | Bloomin’ Brands, Inc. | | | 10,454 | |
| | 42 | | | Boyd Gaming Corp. (a) | | | 841 | |
| | 11 | | | DineEquity, Inc. | | | 808 | |
| | 25 | | | Intrawest Resorts Holdings, Inc. (a) | | | 451 | |
| | 326 | | | La Quinta Holdings, Inc. (a) | | | 4,637 | |
| | 313 | | | Ruby Tuesday, Inc. (a) | | | 1,012 | |
| | 69 | | | Scientific Games Corp., Class A (a) | | | 970 | |
| | 429 | | | Sonic Corp. | | | 11,381 | |
| | 95 | | | Speedway Motorsports, Inc. | | | 2,050 | |
| | | | | | | | |
| | | | | | | 32,604 | |
| | | | | | | | |
| | | | Household Durables — 0.7% | |
| | 96 | | | Leggett & Platt, Inc. | | | 4,698 | |
| | 68 | | | NACCO Industries, Inc., Class A | | | 6,130 | |
| | 43 | | | UCP, Inc., Class A (a) | | | 512 | |
| | | | | | | | |
| | | | | | | 11,340 | |
| | | | | | | | |
| | | | Internet & Direct Marketing Retail — 0.2% | |
| | 158 | | | Liberty TripAdvisor Holdings, Inc., Class A (a) | | | 2,376 | |
| | | | | | | | |
| | | | Leisure Products — 0.2% | |
| | 51 | | | Acushnet Holdings Corp. (a) | | | 1,003 | |
| | 409 | | | JAKKS Pacific, Inc. (a) | | | 2,106 | |
| | | | | | | | |
| | | | | | | 3,109 | |
| | | | | | | | |
| | | | Media — 0.9% | |
| | 84 | | | Nexstar Broadcasting Group, Inc., Class A | | | 5,298 | |
| | 315 | | | Sinclair Broadcast Group, Inc., Class A | | | 10,519 | |
| | | | | | | | |
| | | | | | | 15,817 | |
| | | | | | | | |
| | | | | | | | |
| SHARES | | | SECURITY DESCRIPTION | | VALUE($) | |
| | | | | | | | |
| | | | Multiline Retail — 0.5% | |
| | 153 | | | Big Lots, Inc. | | | 7,672 | |
| | 18 | | | Dillard’s, Inc., Class A | | | 1,147 | |
| | | | | | | | |
| | | | | | | 8,819 | |
| | | | | | | | |
| | | | Specialty Retail — 2.8% | |
| | 57 | | | Aaron’s, Inc. | | | 1,823 | |
| | 112 | | | Abercrombie & Fitch Co., Class A | | | 1,339 | |
| | 207 | | | Children’s Place, Inc. (The) | | | 20,877 | |
| | 523 | | | GNC Holdings, Inc., Class A | | | 5,768 | |
| | 393 | | | Office Depot, Inc. | | | 1,778 | |
| | 1,101 | | | Pier 1 Imports, Inc. | | | 9,401 | |
| | 242 | | | Select Comfort Corp. (a) | | | 5,483 | |
| | | | | | | | |
| | | | | | | 46,469 | |
| | | | | | | | |
| | | | Textiles, Apparel & Luxury Goods — 0.3% | |
| | 244 | | | Iconix Brand Group, Inc. (a) | | | 2,281 | |
| | 107 | | | Movado Group, Inc. | | | 3,062 | |
| | | | | | | | |
| | | | | | | 5,343 | |
| | | | | | | | |
| | | | Total Consumer Discretionary | | | 186,226 | |
| | | | | | | | |
| | | | Consumer Staples — 2.7% | |
| | | | Food & Staples Retailing — 0.3% | |
| | 102 | | | Ingles Markets, Inc., Class A | | | 4,925 | |
| | | | | | | | |
| | | | Food Products — 1.8% | |
| | 1,021 | | | Darling Ingredients, Inc. (a) | | | 13,185 | |
| | 293 | | | Dean Foods Co. | | | 6,371 | |
| | 187 | | | Pilgrim’s Pride Corp. | | | 3,553 | |
| | 56 | | | Post Holdings, Inc. (a) | | | 4,494 | |
| | 24 | | | Sanderson Farms, Inc. | | | 2,243 | |
| | 23 | | | Seneca Foods Corp., Class A (a) | | | 909 | |
| | | | | | | | |
| | | | | | | 30,755 | |
| | | | | | | | |
| | | | Personal Products — 0.1% | |
| | 35 | | | elf Beauty, Inc. (a) | | | 998 | |
| | 20 | | | Herbalife Ltd. (a) | | | 963 | |
| | 15 | | | Medifast, Inc. | | | 629 | |
| | | | | | | | |
| | | | | | | 2,590 | |
| | | | | | | | |
| | | | Tobacco — 0.5% | |
| | 44 | | | Alliance One International, Inc. (a) | | | 837 | |
| | 117 | | | Universal Corp. | | | 7,484 | |
| | | | | | | | |
| | | | | | | 8,321 | |
| | | | | | | | |
| | | | Total Consumer Staples | | | 46,591 | |
| | | | | | | | |
| | | | Energy — 3.8% | |
| | | | Energy Equipment & Services — 1.0% | |
| | 71 | | | Archrock, Inc. | | | 941 | |
| | 354 | | | Parker Drilling Co. (a) | | | 921 | |
SEE NOTES TO FINANCIAL STATEMENTS.
| | | | | | |
| | | |
| 38 | | | | J.P. MORGAN SMALL CAP FUNDS | | DECEMBER 31, 2016 |
| | | | | | | | |
| SHARES | | | SECURITY DESCRIPTION | | VALUE($) | |
| | Common Stocks — continued | |
| | | | Energy Equipment & Services — continued | |
| | 297 | | | Pioneer Energy Services Corp. (a) | | | 2,037 | |
| | 121 | | | SEACOR Holdings, Inc. (a) | | | 8,646 | |
| | 321 | | | Seadrill Ltd., (United Kingdom) (a) | | | 1,095 | |
| | 137 | | | Unit Corp. (a) | | | 3,671 | |
| | | | | | | | |
| | | | | | | 17,311 | |
| | | | | | | | |
| | | | Oil, Gas & Consumable Fuels — 2.8% | |
| | 16 | | | Adams Resources & Energy, Inc. | | | 642 | |
| | 1,196 | | | Bill Barrett Corp. (a) | | | 8,362 | |
| | 1,495 | | | Denbury Resources, Inc. (a) | | | 5,501 | |
| | 781 | | | EP Energy Corp., Class A (a) | | | 5,118 | |
| | 251 | | | Renewable Energy Group, Inc. (a) | | | 2,434 | |
| | 212 | | | REX American Resources Corp. (a) | | | 20,965 | |
| | 367 | | | Sanchez Energy Corp. (a) | | | 3,313 | |
| | 44 | | | Western Refining, Inc. | | | 1,669 | |
| | | | | | | | |
| | | | | | | 48,004 | |
| | | | | | | | |
| | | | Total Energy | | | 65,315 | |
| | | | | | | | |
| | | | Financials — 18.5% | |
| | | | Banks — 10.4% | |
| | 60 | | | 1st Source Corp. | | | 2,679 | |
| | 93 | | | BancFirst Corp. | | | 8,607 | |
| | 246 | | | BancorpSouth, Inc. | | | 7,626 | |
| | 192 | | | Capital Bank Financial Corp., Class A | | | 7,540 | |
| | 96 | | | Cathay General Bancorp | | | 3,655 | |
| | 337 | | | Central Pacific Financial Corp. | | | 10,576 | |
| | 23 | | | Central Valley Community Bancorp | | | 449 | |
| | 38 | | | Chemical Financial Corp. | | | 2,042 | |
| | 25 | | | Citizens & Northern Corp. | | | 655 | |
| | 61 | | | City Holding Co. | | | 4,130 | |
| | 396 | | | CVB Financial Corp. | | | 9,087 | |
| | 4 | | | East West Bancorp, Inc. | | | 205 | |
| | 478 | | | FCB Financial Holdings, Inc., Class A (a) | | | 22,791 | |
| | 421 | | | First Commonwealth Financial Corp. | | | 5,964 | |
| | 27 | | | First Community Bancshares, Inc. | | | 808 | |
| | 66 | | | First Financial Bancorp | | | 1,881 | |
| | 89 | | | First Hawaiian, Inc. | | | 3,085 | |
| | 67 | | | First Interstate BancSystem, Inc., Class A | | | 2,864 | |
| | 82 | | | Flushing Financial Corp. | | | 2,395 | |
| | 103 | | | Fulton Financial Corp. | | | 1,938 | |
| | 33 | | | Great Western Bancorp, Inc. | | | 1,438 | |
| | 41 | | | Guaranty Bancorp | | | 980 | |
| | 196 | | | Hope Bancorp, Inc. | | | 4,295 | |
| | 59 | | | IBERIABANK Corp. | | | 4,929 | |
| | 95 | | | Independent Bank Corp. | | | 2,666 | |
| | 270 | | | Investors Bancorp, Inc. | | | 3,759 | |
| | | | | | | | |
| SHARES | | | SECURITY DESCRIPTION | | VALUE($) | |
| | | | | | | | |
| | | | Banks — continued | |
| | 29 | | | MainSource Financial Group, Inc. | | | 1,008 | |
| | 22 | | | National Bank Holdings Corp., Class A | | | 716 | |
| | 232 | | | OFG Bancorp, (Puerto Rico) | | | 3,039 | |
| | 66 | | | PacWest Bancorp | | | 3,577 | |
| | 28 | | | Sierra Bancorp | | | 737 | |
| | 39 | | | Simmons First National Corp., Class A | | | 2,436 | |
| | 19 | | | Southside Bancshares, Inc. | | | 709 | |
| | 20 | | | Southwest Bancorp, Inc. | | | 592 | |
| | 82 | | | Suffolk Bancorp | | | 3,498 | |
| | 247 | | | TCF Financial Corp. | | | 4,839 | |
| | 85 | | | Trustmark Corp. | | | 3,020 | |
| | 59 | | | UMB Financial Corp. | | | 4,581 | |
| | 318 | | | Union Bankshares Corp. | | | 11,358 | |
| | 56 | | | Webster Financial Corp. | | | 3,040 | |
| | 69 | | | West Bancorporation, Inc. | | | 1,707 | |
| | 255 | | | Westamerica Bancorp | | | 16,022 | |
| | | | | | | | |
| | | | | | | 177,923 | |
| | | | | | | | |
| | | | Capital Markets — 1.0% | |
| | 24 | | | Cowen Group, Inc., Class A (a) | | | 374 | |
| | 35 | | | Federated Investors, Inc., Class B | | | 995 | |
| | 13 | | | Houlihan Lokey, Inc. | | | 392 | |
| | 193 | | | KCG Holdings, Inc., Class A (a) | | | 2,563 | |
| | 52 | | | MarketAxess Holdings, Inc. | | | 7,625 | |
| | 54 | | | Stifel Financial Corp. (a) | | | 2,702 | |
| | 20 | | | Virtus Investment Partners, Inc. | | | 2,385 | |
| | 33 | | | Waddell & Reed Financial, Inc., Class A | | | 644 | |
| | | | | | | | |
| | | | | | | 17,680 | |
| | | | | | | | |
| | | | Consumer Finance — 0.9% | |
| | 11 | | | Credit Acceptance Corp. (a) | | | 2,327 | |
| | 504 | | | EZCORP, Inc., Class A (a) | | | 5,370 | |
| | 52 | | | FirstCash, Inc. | | | 2,440 | |
| | 81 | | | Nelnet, Inc., Class A | | | 4,090 | |
| | 19 | | | Regional Management Corp. (a) | | | 510 | |
| | | | | | | | |
| | | | | | | 14,737 | |
| | | | | | | | |
| | | | Insurance — 2.5% | |
| | 18 | | | Ambac Financial Group, Inc. (a) | | | 403 | |
| | 74 | | | American Equity Investment Life Holding Co. | | | 1,659 | |
| | 28 | | | Aspen Insurance Holdings Ltd., (Bermuda) | | | 1,523 | |
| | 339 | | | CNO Financial Group, Inc. | | | 6,498 | |
| | 62 | | | First American Financial Corp. | | | 2,278 | |
| | 23 | | | Global Indemnity Ltd., (Cayman Islands) (a) | | | 867 | |
| | 79 | | | Kemper Corp. | | | 3,513 | |
| | 581 | | | MBIA, Inc. (a) | | | 6,217 | |
| | 53 | | | Navigators Group, Inc. (The) | | | 6,241 | |
SEE NOTES TO FINANCIAL STATEMENTS.
| | | | | | | | |
| | | |
| DECEMBER 31, 2016 | | J.P. MORGAN SMALL CAP FUNDS | | | | | 39 | |
JPMorgan U.S. Small Company Fund
SCHEDULE OF PORTFOLIO INVESTMENTS
AS OF DECEMBER 31, 2016 (Unaudited) (continued)
(Amounts in thousands)
| | | | | | | | |
| SHARES | | | SECURITY DESCRIPTION | | VALUE($) | |
| | Common Stocks — continued | |
| | | | Insurance — continued | |
| | 98 | | | Primerica, Inc. | | | 6,790 | |
| | 78 | | | ProAssurance Corp. | | | 4,400 | |
| | 15 | | | Stewart Information Services Corp. | | | 696 | |
| | 28 | | | Universal Insurance Holdings, Inc. | | | 787 | |
| | | | | | | | |
| | | | | | | 41,872 | |
| | | | | | | | |
| | | | Mortgage Real Estate Investment Trusts (REITs) — 1.2% | |
| | 675 | | | Capstead Mortgage Corp. | | | 6,874 | |
| | 1,666 | | | CYS Investments, Inc. | | | 12,876 | |
| | | | | | | | |
| | | | | | | 19,750 | |
| | | | | | | | |
| | | | Thrifts & Mortgage Finance — 2.5% | |
| | 21 | | | BankFinancial Corp. | | | 307 | |
| | 432 | | | Beneficial Bancorp, Inc. | | | 7,941 | |
| | 22 | | | Capitol Federal Financial, Inc. | | | 367 | |
| | 72 | | | Charter Financial Corp. | | | 1,195 | |
| | 22 | | | First Defiance Financial Corp. | | | 1,116 | |
| | 612 | | | Meridian Bancorp, Inc. | | | 11,565 | |
| | 252 | | | MGIC Investment Corp. (a) | | | 2,566 | |
| | 117 | | | NMI Holdings, Inc., Class A (a) | | | 1,246 | |
| | 584 | | | Northfield Bancorp, Inc. | | | 11,665 | |
| | 148 | | | Walker & Dunlop, Inc. (a) | | | 4,602 | |
| | | | | | | | |
| | | | | | | 42,570 | |
| | | | | | | | |
| | | | Total Financials | | | 314,532 | |
| | | | | | | | |
| | | | Health Care — 12.7% | |
| | | | Biotechnology — 5.1% | |
| | 99 | | | ACADIA Pharmaceuticals, Inc. (a) | | | 2,867 | |
| | 97 | | | Adamas Pharmaceuticals, Inc. (a) | | | 1,636 | |
| | 16 | | | Aduro Biotech, Inc. (a) | | | 185 | |
| | 157 | | | Aimmune Therapeutics, Inc. (a) | | | 3,217 | |
| | 104 | | | AMAG Pharmaceuticals, Inc. (a) | | | 3,616 | |
| | 616 | | | Amicus Therapeutics, Inc. (a) | | | 3,064 | |
| | 33 | | | Ardelyx, Inc. (a) | | | 473 | |
| | 359 | | | Arrowhead Pharmaceuticals, Inc. (a) | | | 556 | |
| | 24 | | | Audentes Therapeutics, Inc. (a) | | | 431 | |
| | 30 | | | Avexis, Inc. (a) | | | 1,422 | |
| | 128 | | | Bellicum Pharmaceuticals, Inc. (a) | | | 1,739 | |
| | 38 | | | Blueprint Medicines Corp. (a) | | | 1,055 | |
| | 93 | | | Cara Therapeutics, Inc. (a) | | | 862 | |
| | 40 | | | Chimerix, Inc. (a) | | | 184 | |
| | 85 | | | Clovis Oncology, Inc. (a) | | | 3,758 | |
| | 77 | | | Coherus Biosciences, Inc. (a) | | | 2,176 | |
| | 46 | | | Dimension Therapeutics, Inc. (a) | | | 201 | |
| | 108 | | | Edge Therapeutics, Inc. (a) | | | 1,351 | |
| | 158 | | | Exelixis, Inc. (a) | | | 2,356 | |
| | 89 | | | FibroGen, Inc. (a) | | | 1,913 | |
| | | | | | | | |
| | | | | | | | |
| SHARES | | | SECURITY DESCRIPTION | | VALUE($) | |
| | | | | | | | |
| | | | Biotechnology — continued | |
| | 43 | | | Five Prime Therapeutics, Inc. (a) | | | 2,150 | |
| | 102 | | | Flexion Therapeutics, Inc. (a) | | | 1,948 | |
| | 96 | | | Global Blood Therapeutics, Inc. (a) | | | 1,390 | |
| | 132 | | | Halozyme Therapeutics, Inc. (a) | | | 1,302 | |
| | 55 | | | Heron Therapeutics, Inc. (a) | | | 724 | |
| | 195 | | | Idera Pharmaceuticals, Inc. (a) | | | 293 | |
| | 143 | | | Immune Design Corp. (a) | | | 788 | |
| | 202 | | | Infinity Pharmaceuticals, Inc. (a) | | | 273 | |
| | 157 | | | Karyopharm Therapeutics, Inc. (a) | | | 1,477 | |
| | 39 | | | Kite Pharma, Inc. (a) | | | 1,762 | |
| | 156 | | | Lexicon Pharmaceuticals, Inc. (a) | | | 2,160 | |
| | 106 | | | Neurocrine Biosciences, Inc. (a) | | | 4,110 | |
| | 44 | | | Ophthotech Corp. (a) | | | 211 | |
| | 52 | | | Portola Pharmaceuticals, Inc. (a) | | | 1,165 | |
| | 149 | | | Proteostasis Therapeutics, Inc. (a) | | | 1,822 | |
| | 81 | | | Prothena Corp. plc, (Ireland) (a) | | | 3,965 | |
| | 319 | | | PTC Therapeutics, Inc. (a) | | | 3,481 | |
| | 36 | | | Puma Biotechnology, Inc. (a) | | | 1,108 | |
| | 34 | | | Ra Pharmaceuticals, Inc. (a) | | | 513 | |
| | 56 | | | Radius Health, Inc. (a) | | | 2,134 | |
| | 59 | | | Sage Therapeutics, Inc. (a) | | | 3,018 | |
| | 101 | | | Selecta Biosciences, Inc. (a) | | | 1,729 | |
| | 45 | | | Seres Therapeutics, Inc. (a) | | | 449 | |
| | 21 | | | Spark Therapeutics, Inc. (a) | | | 1,023 | |
| | 684 | | | Synergy Pharmaceuticals, Inc. (a) | | | 4,163 | |
| | 17 | | | TESARO, Inc. (a) | | | 2,313 | |
| | 89 | | | Tokai Pharmaceuticals, Inc. (a) | | | 87 | |
| | 48 | | | Ultragenyx Pharmaceutical, Inc. (a) | | | 3,389 | |
| | 56 | | | Versartis, Inc. (a) | | | 834 | |
| | 157 | | | Xencor, Inc. (a) | | | 4,122 | |
| | 12 | | | Zafgen, Inc. (a) | | | 38 | |
| | | | | | | | |
| | | | | | | 87,003 | |
| | | | | | | | |
| | | | Health Care Equipment & Supplies — 2.4% | |
| | 175 | | | Halyard Health, Inc. (a) | | | 6,475 | |
| | 120 | | | Inogen, Inc. (a) | | | 8,047 | |
| | 196 | | | Orthofix International NV (a) | | | 7,088 | |
| | 284 | | | Quidel Corp. (a) | | | 6,087 | |
| | 205 | | | Surmodics, Inc. (a) | | | 5,202 | |
| | 22 | | | Utah Medical Products, Inc. | | | 1,586 | |
| | 271 | | | Wright Medical Group NV (a) | | | 6,223 | |
| | | | | | | | |
| | | | | | | 40,708 | |
| | | | | | | | |
| | | | Health Care Providers & Services — 4.0% | |
| | 266 | | | Civitas Solutions, Inc. (a) | | | 5,286 | |
| | 560 | | | Cross Country Healthcare, Inc. (a) | | | 8,734 | |
| | 101 | | | Genesis Healthcare, Inc. (a) | | | 429 | |
SEE NOTES TO FINANCIAL STATEMENTS.
| | | | | | |
| | | |
| 40 | | | | J.P. MORGAN SMALL CAP FUNDS | | DECEMBER 31, 2016 |
| | | | | | | | |
| SHARES | | | SECURITY DESCRIPTION | | VALUE($) | |
| | Common Stocks — continued | |
| | | | Health Care Providers & Services — continued | |
| | 717 | | | Healthways, Inc. (a) | | | 16,300 | |
| | 73 | | | Landauer, Inc. | | | 3,521 | |
| | 72 | | | Molina Healthcare, Inc. (a) | | | 3,923 | |
| | 234 | | | Owens & Minor, Inc. | | | 8,272 | |
| | 817 | | | Quorum Health Corp. (a) | | | 5,937 | |
| | 94 | | | Surgical Care Affiliates, Inc. (a) | | | 4,359 | |
| | 281 | | | Triple-S Management Corp., (Puerto Rico), Class B (a) | | | 5,825 | |
| | 37 | | | WellCare Health Plans, Inc. (a) | | | 5,099 | |
| | | | | | | | |
| | | | | | | 67,685 | |
| | | | | | | | |
| | | | Health Care Technology — 0.2% | |
| | 249 | | | HMS Holdings Corp. (a) | | | 4,524 | |
| | | | | | | | |
| | | | Life Sciences Tools & Services — 0.3% | |
| | 28 | | | Cambrex Corp. (a) | | | 1,527 | |
| | 70 | | | INC Research Holdings, Inc., Class A (a) | | | 3,692 | |
| | | | | | | | |
| | | | | | | 5,219 | |
| | | | | | | | |
| | | | Pharmaceuticals — 0.7% | |
| | 107 | | | Amphastar Pharmaceuticals, Inc. (a) | | | 1,965 | |
| | 138 | | | Axsome Therapeutics, Inc. (a) | | | 933 | |
| | 75 | | | Horizon Pharma plc (a) | | | 1,218 | |
| | 82 | | | Pacira Pharmaceuticals, Inc. (a) | | | 2,633 | |
| | 34 | | | Prestige Brands Holdings, Inc. (a) | | | 1,756 | |
| | 63 | | | Reata Pharmaceuticals, Inc., Class A (a) | | | 1,375 | |
| | 80 | | | Revance Therapeutics, Inc. (a) | | | 1,664 | |
| | | | | | | | |
| | | | | | | 11,544 | |
| | | | | | | | |
| | | | Total Health Care | | | 216,683 | |
| | | | | | | | |
| | | | Industrials — 16.1% | |
| | | | Aerospace & Defense — 2.0% | |
| | 92 | | | AAR Corp. | | | 3,047 | |
| | 76 | | | Curtiss-Wright Corp. | | | 7,466 | |
| | 688 | | | DigitalGlobe, Inc. (a) | | | 19,723 | |
| | 70 | | | Moog, Inc., Class A (a) | | | 4,571 | |
| | | | | | | | |
| | | | | | | 34,807 | |
| | | | | | | | |
| | | | Air Freight & Logistics — 0.1% | |
| | 32 | | | Atlas Air Worldwide Holdings, Inc. (a) | | | 1,643 | |
| | | | | | | | |
| | | | Airlines — 0.7% | |
| | 128 | | | Alaska Air Group, Inc. | | | 11,313 | |
| | | | | | | | |
| | | | Building Products — 0.8% | |
| | 232 | | | Continental Building Products, Inc. (a) | | | 5,368 | |
| | 141 | | | Gibraltar Industries, Inc. (a) | | | 5,885 | |
| | 176 | | | Ply Gem Holdings, Inc. (a) | | | 2,857 | |
| | | | | | | | |
| | | | | | | 14,110 | |
| | | | | | | | |
| | | | | | | | |
| SHARES | | | SECURITY DESCRIPTION | | VALUE($) | |
| | | | | | | | |
| | | | Commercial Services & Supplies — 2.8% | |
| | 1,433 | | | ACCO Brands Corp. (a) | | | 18,704 | |
| | 151 | | | CECO Environmental Corp. | | | 2,109 | |
| | 119 | | | Deluxe Corp. | | | 8,507 | |
| | 336 | | | Ennis, Inc. | | | 5,828 | |
| | 68 | | | Essendant, Inc. | | | 1,413 | |
| | 73 | | | Interface, Inc. | | | 1,352 | |
| | 115 | | | VSE Corp. | | | 4,467 | |
| | 222 | | | West Corp. | | | 5,502 | |
| | | | | | | | |
| | | | | | | 47,882 | |
| | | | | | | | |
| | | | Construction & Engineering — 1.5% | |
| | 247 | | | EMCOR Group, Inc. | | | 17,485 | |
| | 122 | | | MasTec, Inc. (a) | | | 4,674 | |
| | 93 | | | MYR Group, Inc. (a) | | | 3,510 | |
| | | | | | | | |
| | | | | | | 25,669 | |
| | | | | | | | |
| | | | Electrical Equipment — 0.2% | |
| | 84 | | | Powell Industries, Inc. | | | 3,288 | |
| | | | | | | | |
| | | | Machinery — 2.1% | |
| | 287 | | | Actuant Corp., Class A | | | 7,448 | |
| | 364 | | | Briggs & Stratton Corp. | | | 8,091 | |
| | 314 | | | Douglas Dynamics, Inc. | | | 10,576 | |
| | 41 | | | Graham Corp. | | | 901 | |
| | 19 | | | Hurco Cos., Inc. | | | 626 | |
| | 10 | | | Hyster-Yale Materials Handling, Inc. | | | 607 | |
| | 20 | | | Joy Global, Inc. | | | 566 | |
| | 80 | | | Kadant, Inc. | | | 4,890 | |
| | 29 | | | Kennametal, Inc. | | | 913 | |
| | 57 | | | Wabash National Corp. (a) | | | 906 | |
| | | | | | | | |
| | | | | | | 35,524 | |
| | | | | | | | |
| | | | Marine — 0.6% | |
| | 304 | | | Matson, Inc. | | | 10,751 | |
| | | | | | | | |
| | | | Professional Services — 3.0% | |
| | 719 | | | Acacia Research Corp. (a) | | | 4,674 | |
| | 217 | | | Barrett Business Services, Inc. | | | 13,937 | |
| | 119 | | | Franklin Covey Co. (a) | | | 2,402 | |
| | 338 | | | Huron Consulting Group, Inc. (a) | | | 17,125 | |
| | 39 | | | Insperity, Inc. | | | 2,760 | |
| | 32 | | | TriNet Group, Inc. (a) | | | 830 | |
| | 118 | | | WageWorks, Inc. (a) | | | 8,526 | |
| | | | | | | | |
| | | | | | | 50,254 | |
| | | | | | | | |
| | | | Road & Rail — 0.7% | |
| | 129 | | | ArcBest Corp. | | | 3,556 | |
| | 248 | | | Swift Transportation Co. (a) | | | 6,029 | |
| | 307 | | | USA Truck, Inc. (a) | | | 2,670 | |
| | | | | | | | |
| | | | | | | 12,255 | |
| | | | | | | | |
SEE NOTES TO FINANCIAL STATEMENTS.
| | | | | | | | |
| | | |
| DECEMBER 31, 2016 | | J.P. MORGAN SMALL CAP FUNDS | | | | | 41 | |
JPMorgan U.S. Small Company Fund
SCHEDULE OF PORTFOLIO INVESTMENTS
AS OF DECEMBER 31, 2016 (Unaudited) (continued)
(Amounts in thousands)
| | | | | | | | |
| SHARES | | | SECURITY DESCRIPTION | | VALUE($) | |
| | Common Stocks — continued | |
| | | | Trading Companies & Distributors — 1.6% | |
| | 84 | | | Applied Industrial Technologies, Inc. | | | 4,972 | |
| | 163 | | | DXP Enterprises, Inc. (a) | | | 5,662 | |
| | 426 | | | MRC Global, Inc. (a) | | | 8,625 | |
| | 133 | | | NOW, Inc. (a) | | | 2,729 | |
| | 323 | | | Titan Machinery, Inc. (a) | | | 4,712 | |
| | | | | | | | |
| | | | | | | 26,700 | |
| | | | | | | | |
| | | | Total Industrials | | | 274,196 | |
| | | | | | | | |
| | | | Information Technology — 18.0% | |
| | | | Communications Equipment — 3.0% | |
| | 108 | | | Bel Fuse, Inc., Class B | | | 3,340 | |
| | 145 | | | Black Box Corp. | | | 2,210 | |
| | 192 | | | InterDigital, Inc. | | | 17,521 | |
| | 129 | | | NETGEAR, Inc. (a) | | | 7,022 | |
| | 206 | | | Plantronics, Inc. | | | 11,275 | |
| | 195 | | | Quantenna Communications, Inc. (a) | | | 3,526 | |
| | 105 | | | Ubiquiti Networks, Inc. (a) | | | 6,058 | |
| | | | | | | | |
| | | | | | | 50,952 | |
| | | | | | | | |
| | | | Electronic Equipment, Instruments & Components — 2.5% | |
| | 246 | | | Benchmark Electronics, Inc. (a) | | | 7,503 | |
| | 21 | | | Coherent, Inc. (a) | | | 2,858 | |
| | 1,459 | | | InvenSense, Inc. (a) | | | 18,654 | |
| | 151 | | | Sanmina Corp. (a) | | | 5,516 | |
| | 25 | | | Tech Data Corp. (a) | | | 2,125 | |
| | 369 | | | Vishay Intertechnology, Inc. | | | 5,984 | |
| | | | | | | | |
| | | | | | | 42,640 | |
| | | | | | | | |
| | | | Internet Software & Services — 2.2% | |
| | 1,805 | | | Bazaarvoice, Inc. (a) | | | 8,754 | |
| | 90 | | | Coupa Software, Inc. (a) | | | 2,246 | |
| | 195 | | | DHI Group, Inc. (a) | | | 1,218 | |
| | 818 | | | EarthLink Holdings Corp. | | | 4,616 | |
| | 116 | | | Intralinks Holdings, Inc. (a) | | | 1,566 | |
| | 99 | | | Liquidity Services, Inc. (a) | | | 965 | |
| | 177 | | | MINDBODY, Inc., Class A (a) | | | 3,774 | |
| | 146 | | | Nutanix, Inc., Class A (a) | | | 3,888 | |
| | 316 | | | RetailMeNot, Inc. (a) | | | 2,939 | |
| | 324 | | | Web.com Group, Inc. (a) | | | 6,855 | |
| | 60 | | | Xactly Corp. (a) | | | 657 | |
| | | | | | | | |
| | | | | | | 37,478 | |
| | | | | | | | |
| | | | IT Services — 1.9% | |
| | 191 | | | Convergys Corp. | | | 4,679 | |
| | 199 | | | CSG Systems International, Inc. | | | 9,622 | |
| | 29 | | | Euronet Worldwide, Inc. (a) | | | 2,108 | |
| | 38 | | | EVERTEC, Inc., (Puerto Rico) | | | 669 | |
| | | | | | | | |
| SHARES | | | SECURITY DESCRIPTION | | VALUE($) | |
| | |
| | | | IT Services — continued | |
| | 48 | | | Science Applications International Corp. | | | 4,036 | |
| | 713 | | | Unisys Corp. (a) | | | 10,664 | |
| | | | | | | | |
| | | | | | | 31,778 | |
| | | | | | | | |
| | | | Semiconductors & Semiconductor Equipment — 3.5% | |
| | 208 | | | Advanced Energy Industries, Inc. (a) | | | 11,410 | |
| | 356 | | | Alpha & Omega Semiconductor Ltd. (a) | | | 7,568 | |
| | 351 | | | Cohu, Inc. | | | 4,880 | |
| | 337 | | | Integrated Device Technology, Inc. (a) | | | 7,930 | |
| | 205 | | | Intersil Corp., Class A | | | 4,576 | |
| | 131 | | | MaxLinear, Inc., Class A (a) | | | 2,849 | |
| | 21 | | | Silicon Laboratories, Inc. (a) | | | 1,346 | |
| | 199 | | | Synaptics, Inc. (a) | | | 10,679 | |
| | 64 | | | Tessera Holding Corp. | | | 2,824 | |
| | 621 | | | Xcerra Corp. (a) | | | 4,743 | |
| | | | | | | | |
| | | | | | | 58,805 | |
| | | | | | | | |
| | | | Software — 4.9% | |
| | 261 | | | ACI Worldwide, Inc. (a) | | | 4,730 | |
| | 338 | | | Aspen Technology, Inc. (a) | | | 18,460 | |
| | 149 | | | Barracuda Networks, Inc. (a) | | | 3,191 | |
| | 18 | | | Blackline, Inc. (a) | | | 483 | |
| | 88 | | | Fair Isaac Corp. | | | 10,539 | |
| | 49 | | | Manhattan Associates, Inc. (a) | | | 2,593 | |
| | 293 | | | Mentor Graphics Corp. | | | 10,809 | |
| | 226 | | | Progress Software Corp. | | | 7,206 | |
| | 50 | | | Qualys, Inc. (a) | | | 1,586 | |
| | 433 | | | Take-Two Interactive Software, Inc. (a) | | | 21,357 | |
| | 129 | | | VASCO Data Security International, Inc. (a) | | | 1,754 | |
| | 246 | | | Zix Corp. (a) | | | 1,215 | |
| | | | | | | | |
| | | | | | | 83,923 | |
| | | | | | | | |
| | | | Total Information Technology | | | 305,576 | |
| | | | | | | | |
| | | | Materials — 3.7% | |
| | | | Chemicals — 1.9% | |
| | 75 | | | Koppers Holdings, Inc. (a) | | | 3,019 | |
| | 124 | | | Minerals Technologies, Inc. | | | 9,602 | |
| | 287 | | | OMNOVA Solutions, Inc. (a) | | | 2,868 | |
| | 501 | | | Rayonier Advanced Materials, Inc. | | | 7,738 | |
| | 148 | | | Trinseo SA | | | 8,800 | |
| | | | | | | | |
| | | | | | | 32,027 | |
| | | | | | | | |
| | | | Construction Materials — 0.0% (g) | |
| | 58 | | | Forterra, Inc. (a) | | | 1,258 | |
| | | | | | | | |
| | | | Containers & Packaging — 0.6% | |
| | 754 | | | Graphic Packaging Holding Co. | | | 9,404 | |
SEE NOTES TO FINANCIAL STATEMENTS.
| | | | | | |
| | | |
| 42 | | | | J.P. MORGAN SMALL CAP FUNDS | | DECEMBER 31, 2016 |
| | | | | | | | |
| SHARES | | | SECURITY DESCRIPTION | | VALUE($) | |
| | Common Stocks — continued | |
| | | | Containers & Packaging — continued | |
| | 35 | | | Myers Industries, Inc. | | | 500 | |
| | | | | | | | |
| | | | | | | 9,904 | |
| | | | | | | | |
| | | | Metals & Mining — 1.1% | |
| | 365 | | | AK Steel Holding Corp. (a) | | | 3,730 | |
| | 58 | | | Carpenter Technology Corp. | | | 2,109 | |
| | 56 | | | Commercial Metals Co. | | | 1,220 | |
| | 82 | | | Olympic Steel, Inc. | | | 1,994 | |
| | 23 | | | Ryerson Holding Corp. (a) | | | 312 | |
| | 193 | | | Worthington Industries, Inc. | | | 9,165 | |
| | | | | | | | |
| | | | | | | 18,530 | |
| | | | | | | | |
| | | | Paper & Forest Products — 0.1% | |
| | 45 | | | Domtar Corp. | | | 1,768 | |
| | | | | | | | |
| | | | Total Materials | | | 63,487 | |
| | | | | | | | |
| | | | Real Estate — 6.9% | |
| | | | Equity Real Estate Investment Trusts (REITs) — 6.4% | |
| | 106 | | | American Assets Trust, Inc. | | | 4,566 | |
| | 15 | | | Armada Hoffler Properties, Inc. | | | 219 | |
| | 365 | | | Ashford Hospitality Trust, Inc. | | | 2,834 | |
| | 116 | | | CBL & Associates Properties, Inc. | | | 1,333 | |
| | 210 | | | CoreSite Realty Corp. | | | 16,684 | |
| | 76 | | | CubeSmart | | | 2,045 | |
| | 23 | | | CyrusOne, Inc. | | | 1,033 | |
| | 92 | | | DCT Industrial Trust, Inc. | | | 4,388 | |
| | 113 | | | DiamondRock Hospitality Co. | | | 1,303 | |
| | 50 | | | EastGroup Properties, Inc. | | | 3,685 | |
| | 5 | | | EPR Properties | | | 380 | |
| | 29 | | | Equity LifeStyle Properties, Inc. | | | 2,098 | |
| | 24 | | | Equity One, Inc. | | | 749 | |
| | 57 | | | First Industrial Realty Trust, Inc. | | | 1,593 | |
| | 98 | | | Franklin Street Properties Corp. | | | 1,271 | |
| | 22 | | | Gladstone Commercial Corp. | | | 450 | |
| | 107 | | | Government Properties Income Trust | | | 2,042 | |
| | 142 | | | Gramercy Property Trust | | | 1,304 | |
| | 199 | | | Hersha Hospitality Trust | | | 4,270 | |
| | 43 | | | Highwoods Properties, Inc. | | | 2,168 | |
| | 116 | | | Hospitality Properties Trust | | | 3,679 | |
| | 182 | | | LTC Properties, Inc. | | | 8,550 | |
| | 102 | | | Mack-Cali Realty Corp. | | | 2,972 | |
| | 33 | | | Mid-America Apartment Communities, Inc. | | | 3,249 | |
| | 101 | | | Monogram Residential Trust, Inc. | | | 1,087 | |
| | 14 | | | National Retail Properties, Inc. | | | 636 | |
| | 60 | | | Pennsylvania REIT | | | 1,139 | |
| | 159 | | | Potlatch Corp. | | | 6,631 | |
| | 20 | | | PS Business Parks, Inc. | | | 2,354 | |
| | | | | | | | |
| SHARES | | | SECURITY DESCRIPTION | | VALUE($) | |
| | | | | | | | |
| | | | Equity Real Estate Investment Trusts (REITs) — continued | |
| | 209 | | | Ramco-Gershenson Properties Trust | | | 3,472 | |
| | 545 | | | RLJ Lodging Trust | | | 13,345 | |
| | 56 | | | Saul Centers, Inc. | | | 3,710 | |
| | 25 | | | Silver Bay Realty Trust Corp. | | | 434 | |
| | 36 | | | Summit Hotel Properties, Inc. | | | 582 | |
| | 38 | | | Taubman Centers, Inc. | | | 2,787 | |
| | | | | | | | |
| | | | | | | 109,042 | |
| | | | | | | | |
| | | | Real Estate Management & Development — 0.5% | |
| | 34 | | | Alexander & Baldwin, Inc. | | | 1,544 | |
| | 458 | | | Forestar Group, Inc. (a) | | | 6,087 | |
| | 22 | | | St Joe Co. (The) (a) | | | 426 | |
| | | | | | | | |
| | | | | | | 8,057 | |
| | | | | | | | |
| | | | Total Real Estate | | | 117,099 | |
| | | | | | | | |
| | | | Telecommunication Services — 0.7% | |
| | | | Diversified Telecommunication Services — 0.7% | |
| | 128 | | | Cincinnati Bell, Inc. (a) | | | 2,871 | |
| | 27 | | | General Communication, Inc., Class A (a) | | | 529 | |
| | 1,067 | | | Windstream Holdings, Inc. | | | 7,818 | |
| | | | | | | | |
| | | | Total Telecommunication Services | | | 11,218 | |
| | | | | | | | |
| | | | Utilities — 3.2% | |
| | | | Electric Utilities — 1.2% | |
| | 116 | | | El Paso Electric Co. | | | 5,394 | |
| | 86 | | | PNM Resources, Inc. | | | 2,943 | |
| | 204 | | | Portland General Electric Co. | | | 8,843 | |
| | 89 | | | Spark Energy, Inc., Class A | | | 2,694 | |
| | | | | | | | |
| | | | | | | 19,874 | |
| | | | | | | | |
| | | | Gas Utilities — 0.5% | |
| | 58 | | | Southwest Gas Corp. | | | 4,436 | |
| | 68 | | | Spire, Inc. | | | 4,390 | |
| | | | | | | | |
| | | | | | | 8,826 | |
| | | | | | | | |
| | | | Independent Power & Renewable Electricity
Producers — 0.7% | |
| | 1,181 | | | Atlantic Power Corp. (a) | | | 2,953 | |
| | 583 | | | Dynegy, Inc. (a) | | | 4,931 | |
| | 65 | | | Ormat Technologies, Inc. | | | 3,485 | |
| | | | | | | | |
| | | | | | | 11,369 | |
| | | | | | | | |
| | | | Multi-Utilities — 0.2% | |
| | 29 | | | Avista Corp. | | | 1,156 | |
| | 32 | | | NorthWestern Corp. | | | 1,797 | |
| | | | | | | | |
| | | | | | | 2,953 | |
| | | | | | | | |
SEE NOTES TO FINANCIAL STATEMENTS.
| | | | | | | | |
| | | |
| DECEMBER 31, 2016 | | J.P. MORGAN SMALL CAP FUNDS | | | | | 43 | |
JPMorgan U.S. Small Company Fund
SCHEDULE OF PORTFOLIO INVESTMENTS
AS OF DECEMBER 31, 2016 (Unaudited) (continued)
(Amounts in thousands, except number of Futures contracts)
| | | | | | | | |
| SHARES | | | SECURITY DESCRIPTION | | VALUE($) | |
| | Common Stocks — continued | |
| | | | Water Utilities — 0.6% | |
| | 246 | | | American States Water Co. | | | 11,198 | |
| | | | | | | | |
| | | | Total Utilities | | | 54,220 | |
| | | | | | | | |
| | | | Total Common Stocks
(Cost $1,356,146) | | | 1,655,143 | |
| | | | | | | | |
| | |
NUMBER OF
RIGHTS | | | | | | |
| | Rights — 0.0% (g) | | | | |
| | | | Health Care — 0.0% (g) | |
| | | | Biotechnology — 0.0% (g) | |
| | 63 | | | Trius Therapeutics LLC
(Cost $—) (a) | | | — | (h) |
| | | | | | | | |
| | |
NUMBER OF
WARRANTS | | | | | | |
| | Warrant — 0.0% (g) | | | | |
| | | | Financials — 0.0% (g) | |
| | | | Consumer Finance — 0.0% (g) | |
| | — | (h) | | Emergent Capital, Inc., expiring 10/01/19 (Strike Price $10.75) (a)
(Cost $—) | | | — | |
| | | | | | | | |
| | | | | | | | |
| SHARES | | | SECURITY DESCRIPTION | | VALUE($) | |
| | Short-Term Investment — 3.2% | | | | |
| | | | Investment Company — 3.2% | |
| | 54,028 | | | JPMorgan U.S. Government Money Market Fund, Institutional Class Shares, 0.410% (b) (l)
(Cost $54,028) | | | 54,028 | |
| | | | | | | | |
| | | | Total Investments — 100.5%
(Cost $1,410,174) | | | 1,709,171 | |
| | | | Liabilities in Excess of
Other Assets — (0.5)% | | | (8,285 | ) |
| | | | | | | | |
| | | | NET ASSETS — 100.0% | | $ | 1,700,886 | |
| | | | | | | | |
Percentages indicated are based on net assets.
| | | | | | | | | | | | | | | | | | | | |
| Futures Contracts | | | | | | | | | | | | |
NUMBER OF
CONTRACTS | | | DESCRIPTION | | EXPIRATION
DATE | | | TRADING
CURRENCY | | | NOTIONAL
VALUE AT
DECEMBER 31, 2016 | | | NET UNREALIZED
APPRECIATION
(DEPRECIATION) | |
| | | | Long Futures Outstanding | |
| | 732 | | | Mini Russell 2000 | | | 03/17/17 | | | | USD | | | $ | 49,663 | | | $ | (987 | ) |
| | | | | | | | | | | | | | | | | | | | |
SEE NOTES TO FINANCIAL STATEMENTS.
| | | | | | |
| | | |
| 44 | | | | J.P. MORGAN SMALL CAP FUNDS | | DECEMBER 31, 2016 |
J.P. Morgan Small Cap Funds
NOTES TO SCHEDULES OF PORTFOLIO INVESTMENTS
AS OF DECEMBER 31, 2016 (Unaudited)
| | |
| REIT | | — Real Estate Investment Trust |
| USD | | — United States Dollar |
| |
| (a) | | — Non-income producing security. |
| (b) | | — Investment in affiliate. Money market fund is registered under the Investment Company Act of 1940, as amended, and advised by J.P. Morgan Investment Management Inc. |
| | |
| (g) | | — Amount rounds to less than 0.05%. |
| (h) | | — Amount rounds to less than 500. |
| (l) | | — The rate shown is the current yield as of December 31, 2016. |
SEE NOTES TO FINANCIAL STATEMENTS.
| | | | | | | | |
| | | |
| DECEMBER 31, 2016 | | J.P. MORGAN SMALL CAP FUNDS | | | | | 45 | |
STATEMENTS OF ASSETS AND LIABILITIES
AS OF DECEMBER 31, 2016 (Unaudited)
(Amounts in thousands, except per share amounts)
| | | | | | | | | | | | |
| | |
Dynamic
Small Cap
Growth Fund | | | Small Cap
Core Fund | | | Small Cap
Equity Fund | |
ASSETS: | |
Investments in non-affiliates, at value | | $ | 147,319 | | | $ | 189,258 | | | $ | 5,534,587 | |
Investments in affiliates, at value | | | 2,158 | | | | 2,737 | | | | 228,747 | |
| | | | | | | | | | | | |
Total investment securities, at value | | | 149,477 | | | | 191,995 | | | | 5,763,334 | |
Cash | | | — | (a) | | | 4 | | | | — | (a) |
Deposits at broker for futures contracts | | | — | | | | 295 | | | | — | |
Receivables: | | | | | | | | | | | | |
Investment securities sold | | | 19 | | | | 206 | | | | 392 | |
Fund shares sold | | | 562 | | | | 293 | | | | 190,175 | |
Dividends from non-affiliates | | | 89 | | | | 251 | | | | 11,221 | |
Dividends from affiliates | | | 1 | | | | 1 | | | | 89 | |
| | | | | | | | | | | | |
Total Assets | | | 150,148 | | | | 193,045 | | | | 5,965,211 | |
| | | | | | | | | | | | |
| | | |
LIABILITIES: | | | | | | | | | | | | |
Payables: | | | | | | | | | | | | |
Investment securities purchased | | | 295 | | | | 923 | | | | 58,330 | |
Fund shares redeemed | | | 813 | | | | 1,419 | | | | 43,596 | |
Variation margin on futures contracts | | | — | | | | 10 | | | | — | |
Accrued liabilities: | | | | | | | | | | | | |
Investment advisory fees | | | 73 | | | | 65 | | | | 2,992 | |
Administration fees | | | 3 | | | | — | | | | 380 | |
Distribution fees | | | 34 | | | | — | (a) | | | 358 | |
Shareholder servicing fees | | | 25 | | | | 8 | | | | 546 | |
Custodian and accounting fees | | | 10 | | | | 14 | | | | 27 | |
Trustees’ and Chief Compliance Officer’s fees | | | — | (a) | | | 1 | | | | 10 | |
Printing and mailing cost | | | 92 | | | | 21 | | | | 340 | |
Other | | | 87 | | | | 56 | | | | 276 | |
| | | | | | | | | | | | |
Total Liabilities | | | 1,432 | | | | 2,517 | | | | 106,855 | |
| | | | | | | | | | | | |
Net Assets | | $ | 148,716 | | | $ | 190,528 | | | $ | 5,858,356 | |
| | | | | | | | | | | | |
| (a) | Amount rounds to less than 500. |
SEE NOTES TO FINANCIAL STATEMENTS.
| | | | | | |
| | | |
| 46 | | | | J.P. MORGAN SMALL CAP FUNDS | | DECEMBER 31, 2016 |
| | | | | | | | | | | | |
| | |
Dynamic
Small Cap
Growth Fund | | | Small Cap
Core Fund | | | Small Cap
Equity Fund | |
NET ASSETS: | |
Paid-in-Capital | | $ | 107,119 | | | $ | 132,054 | | | $ | 4,489,748 | |
Accumulated undistributed (distributions in excess of) net investment income | | | (1,259 | ) | | | (109 | ) | | | (75 | ) |
Accumulated net realized gains (losses) | | | (2,700 | ) | | | 1,862 | | | | 7,739 | |
Net unrealized appreciation (depreciation) | | | 45,556 | | | | 56,721 | | | | 1,360,944 | |
| | | | | | | | | | | | |
Total Net Assets | | $ | 148,716 | | | $ | 190,528 | | | $ | 5,858,356 | |
| | | | | | | | | | | | |
| | | |
Net Assets: | | | | | | | | | | | | |
Class A | | $ | 57,647 | | | $ | 93 | | | $ | 1,272,775 | |
Class C | | | 33,786 | | | | 53 | | | | 167,427 | |
Class R2 | | | — | | | | — | | | | 10,617 | |
Class R3 | | | — | | | | — | | | | 22 | |
Class R4 | | | — | | | | — | | | | 22 | |
Class R5 | | | — | | | | 190,358 | | | | 1,171,021 | |
Class R6 | | | — | | | | 24 | | | | 772,378 | |
Select Class | | | 57,283 | | | | — | | | | 2,464,094 | |
| | | | | | | | | | | | |
Total | | $ | 148,716 | | | $ | 190,528 | | | $ | 5,858,356 | |
| | | | | | | | | | | | |
| | | |
Outstanding units of beneficial interest (shares) ($0.0001 par value; unlimited number of shares authorized): | | | | | | | | | | | | |
Class A | | | 3,145 | | | | 2 | | | | 27,871 | |
Class C | | | 2,366 | | | | 1 | | | | 4,798 | |
Class R2 | | | — | | | | — | | | | 236 | |
Class R3 | | | — | | | | — | | | | 1 | |
Class R4 | | | — | | | | — | | | | — | (a) |
Class R5 | | | — | | | | 3,792 | | | | 22,389 | |
Class R6 | | | — | | | | 1 | | | | 14,773 | |
Select Class | | | 2,776 | | | | — | | | | 47,193 | |
| | | |
Net Asset Value (b): | | | | | | | | | | | | |
Class A — Redemption price per share | | $ | 18.33 | | | $ | 50.01 | | | $ | 45.67 | |
Class C — Offering price per share (c) | | | 14.28 | | | | 49.96 | | | | 34.90 | |
Class R2 — Offering and redemption price per share | | | — | | | | — | | | | 44.94 | |
Class R3 — Offering and redemption price per share | | | — | | | | — | | | | 45.56 | |
Class R4 — Offering and redemption price per share | | | — | | | | — | | | | 52.17 | |
Class R5 — Offering and redemption price per share | | | — | | | | 50.19 | | | | 52.30 | |
Class R6 — Offering and redemption price per share | | | — | | | | 50.12 | | | | 52.28 | |
Select Class — Offering and redemption price per share | | | 20.63 | | | | — | | | | 52.21 | |
Class A maximum sales charge | | | 5.25 | % | | | 5.25 | % | | | 5.25 | % |
Class A maximum public offering price per share
[net asset value per share/(100% — maximum sales charge)] | | $ | 19.35 | | | $ | 52.78 | | | $ | 48.20 | |
| | | | | | | | | | | | |
| | | |
Cost of investments in non-affiliates | | $ | 101,763 | | | $ | 132,495 | | | $ | 4,173,643 | |
Cost of investments in affiliates | | | 2,158 | | | | 2,737 | | | | 228,747 | |
| (a) | Amount rounds to less than 500. |
| (b) | Per share amounts may not recalculate due to rounding of net assets and/or shares outstanding. |
| (c) | Redemption price for Class C Shares varies based upon length of time the shares are held. |
SEE NOTES TO FINANCIAL STATEMENTS.
| | | | | | | | |
| | | |
| DECEMBER 31, 2016 | | J.P. MORGAN SMALL CAP FUNDS | | | | | 47 | |
STATEMENTS OF ASSETS AND LIABILITIES
AS OF DECEMBER 31, 2016 (Unaudited) (continued)
(Amounts in thousands, except per share amounts)
| | | | | | | | | | | | |
| | | Small Cap
Growth Fund | | | Small Cap
Value Fund | | | U.S. Small
Company Fund | |
ASSETS: | |
Investments in non-affiliates, at value | | $ | 1,068,870 | | | $ | 2,030,740 | | | $ | 1,655,143 | |
Investments in affiliates, at value | | | 20,862 | | | | 79,623 | | | | 54,028 | |
| | | | | | | | | | | | |
Total investment securities, at value | | | 1,089,732 | | | | 2,110,363 | | | | 1,709,171 | |
Cash | | | — | | | | — | (a) | | | — | |
Deposits at broker for futures contracts | | | — | | | | 3,843 | | | | 2,842 | |
Receivables: | | | | | | | | | | | | |
Investment securities sold | | | 142 | | | | 682 | | | | 686 | |
Fund shares sold | | | 5,779 | | | | 13,783 | | | | 25,478 | |
Dividends from non-affiliates | | | 648 | | | | 3,806 | | | | 1,934 | |
Dividends from affiliates | | | 5 | | | | 23 | | | | 21 | |
| | | | | | | | | | | | |
Total Assets | | | 1,096,306 | | | | 2,132,500 | | | | 1,740,132 | |
| | | | | | | | | | | | |
| | | |
LIABILITIES: | | | | | | | | | | | | |
Payables: | | | | | | | | | | | | |
Due to custodian | | | — | (a) | | | — | | | | — | |
Investment securities purchased | | | 2,147 | | | | 3,690 | | | | 6,227 | |
Fund shares redeemed | | | 8,979 | | | | 23,103 | | | | 31,337 | |
Variation margin on futures contracts | | | — | | | | 314 | | | | 209 | |
Accrued liabilities: | | | | | | | | | | | | |
Investment advisory fees | | | 601 | | | | 1,149 | | | | 852 | |
Administration fees | | | 72 | | | | 145 | | | | 117 | |
Distribution fees | | | 59 | | | | 183 | | | | 107 | |
Shareholder servicing fees | | | 35 | | | | 58 | | | | 89 | |
Custodian and accounting fees | | | 11 | | | | 14 | | | | 10 | |
Trustees’ and Chief Compliance Officer’s fees | | | — | (a) | | | 5 | | | | 2 | |
Printing and mailing cost | | | 46 | | | | 105 | | | | 24 | |
Other | | | 297 | | | | 600 | | | | 272 | |
| | | | | | | | | | | | |
Total Liabilities | | | 12,247 | | | | 29,366 | | | | 39,246 | |
| | | | | | | | | | | | |
Net Assets | | $ | 1,084,059 | | | $ | 2,103,134 | | | $ | 1,700,886 | |
| | | | | | | | | | | | |
| (a) | Amount rounds to less than 500. |
SEE NOTES TO FINANCIAL STATEMENTS.
| | | | | | |
| | | |
| 48 | | | | J.P. MORGAN SMALL CAP FUNDS | | DECEMBER 31, 2016 |
| | | | | | | | | | | | |
| | | Small Cap
Growth Fund | | | Small Cap
Value Fund | | | U.S. Small
Company Fund | |
NET ASSETS: | |
Paid-in-Capital | | $ | 842,609 | | | $ | 1,556,043 | | | $ | 1,414,768 | |
Accumulated undistributed (distributions in excess of) net investment income | | | (4,169 | ) | | | (856 | ) | | | (581 | ) |
Accumulated net realized gains (losses) | | | (15,488 | ) | | | 21,497 | | | | (11,311 | ) |
Net unrealized appreciation (depreciation) | | | 261,107 | | | | 526,450 | | | | 298,010 | |
| | | | | | | | | | | | |
Total Net Assets | | $ | 1,084,059 | | | $ | 2,103,134 | | | $ | 1,700,886 | |
| | | | | | | | | | | | |
| | | |
Net Assets: | | | | | | | | | | | | |
Class A | | $ | 174,807 | | | $ | 608,179 | | | $ | 260,469 | |
Class C | | | 18,570 | | | | 47,039 | | | | 50,807 | |
Class L (formerly Institutional Class) | | | 280,206 | | | | — | | | | 784,140 | |
Class R2 | �� | | 21,002 | | | | 57,880 | | | | 42,500 | |
Class R3 | | | — | | | | 23 | | | | 22 | |
Class R4 | | | — | | | | 23 | | | | 22 | |
Class R5 | | | 878 | | | | 112,141 | | | | 23 | |
Class R6 | | | 487,982 | | | | 928,746 | | | | 237,692 | |
Select Class | | | 100,614 | | | | 349,103 | | | | 325,211 | |
| | | | | | | | | | | | |
Total | | $ | 1,084,059 | | | $ | 2,103,134 | | | $ | 1,700,886 | |
| | | | | | | | | | | | |
| | | |
Outstanding units of beneficial interest (shares)
($0.0001 par value; unlimited number of shares authorized): | | | | | | | | | | | | |
Class A | | | 14,145 | | | | 20,301 | | | | 14,489 | |
Class C | | | 1,976 | | | | 1,861 | | | | 2,932 | |
Class L (formerly Institutional Class) | | | 20,272 | | | | — | | | | 42,845 | |
Class R2 | | | 1,747 | | | | 1,945 | | | | 2,399 | |
Class R3 | | | — | | | | 1 | | | | 1 | |
Class R4 | | | — | | | | 1 | | | | 1 | |
Class R5 | | | 63 | | | | 3,550 | | | | 1 | |
Class R6 | | | 35,041 | | | | 29,374 | | | | 12,981 | |
Select Class | | | 7,463 | | | | 11,053 | | | | 17,744 | |
| | | |
Net Asset Value (a): | | | | | | | | | | | | |
Class A — Redemption price per share | | $ | 12.36 | | | $ | 29.96 | | | $ | 17.98 | |
Class C — Offering price per share (b) | | | 9.40 | | | | 25.28 | | | | 17.33 | |
Class L (formerly Institutional Class) — Offering and redemption price per share | | | 13.82 | | | | — | | | | 18.30 | |
Class R2 — Offering and redemption price per share | | | 12.02 | | | | 29.76 | | | | 17.72 | |
Class R3 — Offering and redemption price per share | | | — | | | | 29.93 | | | | 17.92 | |
Class R4 — Offering and redemption price per share | | | — | | | | 31.57 | | | | 18.30 | |
Class R5 — Offering and redemption price per share | | | 13.82 | | | | 31.59 | | | | 18.29 | |
Class R6 — Offering and redemption price per share | | | 13.93 | | | | 31.62 | | | | 18.31 | |
Select Class — Offering and redemption price per share | | | 13.48 | | | | 31.58 | | | | 18.33 | |
Class A maximum sales charge | | | 5.25 | % | | | 5.25 | % | | | 5.25 | % |
Class A maximum public offering price per share
[net asset value per share/(100% — maximum sales charge)] | | $ | 13.04 | | | $ | 31.62 | | | $ | 18.98 | |
| | | | | | | | | | | | |
| | | |
Cost of investments in non-affiliates | | $ | 807,763 | | | $ | 1,502,795 | | | $ | 1,356,146 | |
Cost of investments in affiliates | | | 20,862 | | | | 79,623 | | | | 54,028 | |
| (a) | Per share amounts may not recalculate due to rounding of net assets and/or shares outstanding. |
| (b) | Redemption price for Class C Shares varies based upon length of time the shares are held. |
SEE NOTES TO FINANCIAL STATEMENTS.
| | | | | | | | |
| | | |
| DECEMBER 31, 2016 | | J.P. MORGAN SMALL CAP FUNDS | | | | | 49 | |
STATEMENTS OF OPERATIONS
FOR THE SIX MONTHS ENDED DECEMBER 31, 2016 (Unaudited)
(Amounts in thousands)
| | | | | | | | | | | | |
| | |
Dynamic
Small Cap
Growth Fund | | | Small Cap
Core Fund | | | Small Cap
Equity Fund | |
INVESTMENT INCOME: | |
Dividend income from non-affiliates | | $ | 393 | | | $ | 1,217 | | | $ | 35,626 | |
Dividend income from affiliates | | | 3 | | | | 7 | | | | 380 | |
Interest income from affiliates | | | — | (a) | | | — | (a) | | | 14 | |
| | | | | | | | | | | | |
Total investment income | | | 396 | | | | 1,224 | | | | 36,020 | |
| | | | | | | | | | | | |
| | | |
EXPENSES: | | | | | | | | | | | | |
Investment advisory fees | | | 517 | | | | 575 | | | | 14,364 | |
Administration fees | | | 65 | | | | 72 | | | | 1,809 | |
Distribution fees: | | | | | | | | | | | | |
Class A | | | 74 | | | | — | (a) | | | 1,209 | |
Class C | | | 129 | | | | — | (a) | | | 406 | |
Class R2 | | | — | | | | — | | | | 19 | |
Class R3 (b) | | | — | | | | — | | | | — | (a) |
Shareholder servicing fees: | | | | | | | | | | | | |
Class A | | | 74 | | | | — | (a) | | | 1,208 | |
Class C | | | 43 | | | | — | (a) | | | 135 | |
Class R2 | | | — | | | | — | | | | 10 | |
Class R3 (b) | | | — | | | | — | | | | — | (a) |
Class R4 (b) | | | — | | | | — | | | | — | (a) |
Class R5 (c) | | | — | | | | 115 | | | | 325 | |
Select Class | | | 82 | | | | — | | | | 2,248 | |
Custodian and accounting fees | | | 20 | | | | 28 | | | | 71 | |
Professional fees | | | 21 | | | | 37 | | | | 49 | |
Trustees’ and Chief Compliance Officer’s fees | | | 13 | | | | 13 | | | | 24 | |
Printing and mailing costs | | | 49 | | | | 52 | | | | 180 | |
Registration and filing fees | | | 14 | | | | 63 | | | | 99 | |
Transfer agency fees (See Note 2.D.) | | | 15 | | | | 4 | | | | 53 | |
Sub-transfer agency fees (See Note 2.D.) | | | 122 | | | | 106 | | | | 1,320 | |
Other | | | 4 | | | | 4 | | | | 42 | |
| | | | | | | | | | | | |
Total expenses | | | 1,242 | | | | 1,069 | | | | 23,571 | |
| | | | | | | | | | | | |
Less fees waived | | | (245 | ) | | | (335 | ) | | | (1,325 | ) |
Less earnings credits | | | — | | | | — | | | | — | (a) |
Less expense reimbursements | | | — | | | | (31 | ) | | | (6 | ) |
| | | | | | | | | | | | |
Net expenses | | | 997 | | | | 703 | | | | 22,240 | |
| | | | | | | | | | | | |
Net investment income (loss) | | | (601 | ) | | | 521 | | | | 13,780 | |
| | | | | | | | | | | | |
| | | |
REALIZED/UNREALIZED GAINS (LOSSES): | | | | | | | | | | | | |
Net realized gain (loss) on transactions from: | | | | | | | | | | | | |
Investments in non-affiliates | | | 12,860 | | | | 8,585 | | | | 25,109 | |
Futures | | | — | | | | 655 | | | | — | |
| | | | | | | | | | | | |
Net realized gain (loss) | | | 12,860 | | | | 9,240 | | | | 25,109 | |
| | | | | | | | | | | | |
Change in net unrealized appreciation/depreciation on: | | | | | | | | | | | | |
Investments in non-affiliates | | | 6,202 | | | | 23,901 | | | | 494,356 | |
Futures | | | — | | | | (127 | ) | | | — | |
| | | | | | | | | | | | |
Change in net unrealized appreciation/depreciation | | | 6,202 | | | | 23,774 | | | | 494,356 | |
| | | | | | | | | | | | |
Net realized/unrealized gains (losses) | | | 19,062 | | | | 33,014 | | | | 519,465 | |
| | | | | | | | | | | | |
Change in net assets resulting from operations | | $ | 18,461 | | | $ | 33,535 | | | $ | 533,245 | |
| | | | | | | | | | | | |
| (a) | Amount rounds to less than 500. |
| (b) | Commencement of offering of class of shares effective September 9, 2016 for Small Cap Equity Fund. |
| (c) | Effective September 15, 2016, Select Class was renamed Class R5 for Small Cap Core Fund. |
SEE NOTES TO FINANCIAL STATEMENTS.
| | | | | | |
| | | |
| 50 | | | | J.P. MORGAN SMALL CAP FUNDS | | DECEMBER 31, 2016 |
| | | | | | | | | | | | |
| | | Small Cap
Growth Fund | | | Small Cap
Value Fund | | | U.S. Small
Company Fund | |
INVESTMENT INCOME: | |
Dividend income from non-affiliates | | $ | 2,727 | | | $ | 16,765 | | | $ | 10,051 | |
Dividend income from affiliates | | | 26 | | | | 86 | | | | 90 | |
Interest income from affiliates | | | — | (a) | | | 1 | | | | 2 | |
| | | | | | | | | | | | |
Total investment income | | | 2,753 | | | | 16,852 | | | | 10,143 | |
| | | | | | | | | | | | |
| | | |
EXPENSES: | | | | | | | | | | | | |
Investment advisory fees | | | 3,566 | | | | 6,180 | | | | 4,540 | |
Administration fees | | | 449 | | | | 778 | | | | 619 | |
Distribution fees: | | | | | | | | | | | | |
Class A | | | 227 | | | | 706 | | | | 309 | |
Class C | | | 71 | | | | 163 | | | | 182 | |
Class R2 | | | 54 | | | | 129 | | | | 95 | |
Class R3 (b) | | | — | | | | — | (a) | | | — | (a) |
Shareholder servicing fees: | | | | | | | | | | | | |
Class A | | | 227 | | | | 706 | | | | 309 | |
Class C | | | 24 | | | | 55 | | | | 61 | |
Class L (formerly Institutional Class) | �� | | 146 | | | | — | | | | 349 | |
Class R2 | | | 27 | | | | 64 | | | | 47 | |
Class R3 (b) | | | — | | | | — | (a) | | | — | (a) |
Class R4 (b) | | | — | | | | — | (a) | | | — | (a) |
Class R5 (c) | | | — | (a) | | | 26 | | | | — | (a) |
Select Class | | | 133 | | | | 388 | | | | 394 | |
Custodian and accounting fees | | | 27 | | | | 49 | | | | 33 | |
Professional fees | | | 30 | | | | 37 | | | | 32 | |
Trustees’ and Chief Compliance Officer’s fees | | | 13 | | | | 20 | | | | 16 | |
Printing and mailing costs | | | 41 | | | | 108 | | | | 70 | |
Registration and filing fees | | | 38 | | | | 48 | | | | 54 | |
Transfer agency fees (See Note 2.D.) | | | 39 | | | | 197 | | | | 34 | |
Sub-transfer agency fees (See Note 2.D.) | | | 420 | | | | 816 | | | | 661 | |
Other | | | 17 | | | | 30 | | | | 17 | |
| | | | | | | | | | | | |
Total expenses | | | 5,549 | | | | 10,500 | | | | 7,822 | |
| | | | | | | | | | | | |
Less fees waived | | | (532 | ) | | | (1,016 | ) | | | (505 | ) |
Less expense reimbursements | | | (7 | ) | | | (17 | ) | | | (1 | ) |
| | | | | | | | | | | | |
Net expenses | | | 5,010 | | | | 9,467 | | | | 7,316 | |
| | | | | | | | | | | | |
Net investment income (loss) | | | (2,257 | ) | | | 7,385 | | | | 2,827 | |
| | | | | | | | | | | | |
| | | |
REALIZED/UNREALIZED GAINS (LOSSES): | | | | | | | | | | | | |
Net realized gain (loss) on transactions from: | | | | | | | | | | | | |
Investments in non-affiliates | | | 38,584 | | | | 44,950 | | | | 25,649 | |
Futures | | | — | | | | 11,241 | | | | 10,424 | |
| | | | | | | | | | | | |
Net realized gain (loss) | | | 38,584 | | | | 56,191 | | | | 36,073 | |
| | | | | | | | | | | | |
Change in net unrealized appreciation/depreciation on: | | | | | | | | | | | | |
Investments in non-affiliates | | | 87,992 | | | | 324,318 | | | | 228,360 | |
Futures | | | — | | | | (2,051 | ) | | | (1,508 | ) |
| | | | | | | | | | | | |
Change in net unrealized appreciation/depreciation | | | 87,992 | | | | 322,267 | | | | 226,852 | |
| | | | | | | | | | | | |
Net realized/unrealized gains (losses) | | | 126,576 | | | | 378,458 | | | | 262,925 | |
| | | | | | | | | | | | |
Change in net assets resulting from operations | | $ | 124,319 | | | $ | 385,843 | | | $ | 265,752 | |
| | | | | | | | | | | | |
| (a) | Amount rounds to less than 500. |
| (b) | Commencement of offering of class of shares effective September 9, 2016 for Small Cap Value Fund and U.S. Small Company Fund. |
| (c) | Commencement of offering of class of shares effective September 9, 2016 for Small Cap Growth Fund and U.S. Small Company Fund. |
SEE NOTES TO FINANCIAL STATEMENTS.
| | | | | | | | |
| | | |
| DECEMBER 31, 2016 | | J.P. MORGAN SMALL CAP FUNDS | | | | | 51 | |
STATEMENTS OF CHANGES IN NET ASSETS
FOR THE PERIODS INDICATED
(Amounts in thousands)
| | | | | | | | | | | | | | | | |
| | | Dynamic Small Cap Growth Fund | | | Small Cap Core Fund | |
| | | Six Months Ended
December 31, 2016
(Unaudited) | | | Year Ended
June 30, 2016 | | | Six Months Ended
December 31, 2016
(Unaudited) | | | Year Ended
June 30, 2016 | |
CHANGE IN NET ASSETS RESULTING FROM OPERATIONS: | | | | | | | | | | | | | | | | |
Net investment income (loss) | | $ | (601 | ) | | $ | (2,182 | ) | | $ | 521 | | | $ | 1,397 | |
Net realized gain (loss) | | | 12,860 | | | | 28,187 | | | | 9,240 | | | | 67,374 | |
Change in net unrealized appreciation/depreciation | | | 6,202 | | | | (117,590 | ) | | | 23,774 | | | | (151,923 | ) |
| | | | | | | | | | | | | | | | |
Change in net assets resulting from operations | | | 18,461 | | | | (91,585 | ) | | | 33,535 | | | | (83,152 | ) |
| | | | | | | | | | | | | | | | |
| | | | |
DISTRIBUTIONS TO SHAREHOLDERS: | | | | | | | | | | | | | | | | |
Class A (a) | | | | | | | | | | | | | | | | |
From net investment income | | | — | | | | — | | | | — | (b) | | | — | |
From net realized gains | | | (8,616 | ) | | | (8,870 | ) | | | (7 | ) | | | — | |
Class C (a) | | | | | | | | | | | | | | | | |
From net investment income | | | — | | | | — | | | | — | (b) | | | — | |
From net realized gains | | | (6,161 | ) | | | (6,681 | ) | | | (5 | ) | | | — | |
Class R5 (c) | | | | | | | | | | | | | | | | |
From net investment income | | | — | | | | — | | | | (599 | ) | | | (4,787 | ) |
From net realized gains | | | — | | | | — | | | | (17,764 | ) | | | (69,898 | ) |
Class R6 (a) | | | | | | | | | | | | | | | | |
From net investment income | | | — | | | | — | | | | — | (b) | | | — | |
From net realized gains | | | — | | | | — | | | | (2 | ) | | | — | |
Select Class | | | | | | | | | | | | | | | | |
From net investment income | | | — | | | | — | | | | — | | | | — | |
From net realized gains | | | (8,471 | ) | | | (40,293 | ) | | | — | | | | — | |
| | | | | | | | | | | | | | | | |
Total distributions to shareholders | | | (23,248 | ) | | | (55,844 | ) | | | (18,377 | ) | | | (74,685 | ) |
| | | | | | | | | | | | | | | | |
| | | | |
CAPITAL TRANSACTIONS: | | | | | | | | | | | | | | | | |
Change in net assets resulting from capital transactions | | | 597 | | | | (209,461 | ) | | | 10,734 | | | | (493,179 | ) |
| | | | | | | | | | | | | | | | |
| | | | |
NET ASSETS: | | | | | | | | | | | | | | | | |
Change in net assets | | | (4,190 | ) | | | (356,890 | ) | | | 25,892 | | | | (651,016 | ) |
Beginning of period | | | 152,906 | | | | 509,796 | | | | 164,636 | | | | 815,652 | |
| | | | | | | | | | | | | | | | |
End of period | | $ | 148,716 | | | $ | 152,906 | | | $ | 190,528 | | | $ | 164,636 | |
| | | | | | | | | | | | | | | | |
Accumulated undistributed (distributions in excess of) net investment income | | $ | (1,259 | ) | | $ | (658 | ) | | $ | (109 | ) | | $ | (31 | ) |
| | | | | | | | | | | | | | | | |
| (a) | Commencement of offering of class of shares effective May 31, 2016 for Small Cap Core Fund. |
| (b) | Amount rounds to less than 500. |
| (c) | Effective September 15, 2016, Select Class was renamed Class R5 for Small Cap Core Fund. |
SEE NOTES TO FINANCIAL STATEMENTS.
| | | | | | |
| | | |
| 52 | | | | J.P. MORGAN SMALL CAP FUNDS | | DECEMBER 31, 2016 |
| | | | | | | | | | | | | | | | |
| | | Small Cap Equity Fund | | | Small Cap Growth Fund | |
| | | Six Months Ended
December 31, 2016
(Unaudited) | | | Year Ended
June 30, 2016 | | | Six Months Ended
December 31, 2016
(Unaudited) | | | Year Ended
June 30, 2016 | |
CHANGE IN NET ASSETS RESULTING FROM OPERATIONS: | | | | | | | | | | | | | | | | |
Net investment income (loss) | | $ | 13,780 | | | $ | 17,832 | | | $ | (2,257 | ) | | $ | (4,817 | ) |
Net realized gain (loss) | | | 25,109 | | | | 399,193 | | | | 38,584 | | | | 3,683 | |
Change in net unrealized appreciation/depreciation | | | 494,356 | | | | (343,741 | ) | | | 87,992 | | | | (172,393 | ) |
| | | | | | | | | | | | | | | | |
Change in net assets resulting from operations | | | 533,245 | | | | 73,284 | | | | 124,319 | | | | (173,527 | ) |
| | | | | | | | | | | | | | | | |
| | | | |
DISTRIBUTIONS TO SHAREHOLDERS: | | | | | | | | | | | | | | | | |
Class A | | | | | | | | | | | | | | | | |
From net investment income | | | (3,188 | ) | | | (2,634 | ) | | | — | | | | — | |
From net realized gains | | | (32,659 | ) | | | (51,657 | ) | | | (6,279 | ) | | | (17,982 | ) |
Class C | | | | | | | | | | | | | | | | |
From net investment income | | | (479 | ) | | | — | | | | — | | | | — | |
From net realized gains | | | (5,074 | ) | | | (2,993 | ) | | | (877 | ) | | | (2,222 | ) |
Class L (formerly Institutional Class) | | | | | | | | | | | | | | | | |
From net realized gains | | | — | | | | — | | | | (9,811 | ) | | | (19,628 | ) |
Class R2 | | | | | | | | | | | | | | | | |
From net investment income | | | (23 | ) | | | — | | | | — | | | | — | |
From net realized gains | | | (276 | ) | | | (211 | ) | | | (772 | ) | | | (1,956 | ) |
Class R3 (a) | | | | | | | | | | | | | | | | |
From net investment income | | | — | (b) | | | — | | | | — | | | | — | |
From net realized gains | | | (1 | ) | | | — | | | | — | | | | — | |
Class R4 (a) | | | | | | | | | | | | | | | | |
From net investment income | | | — | (b) | | | — | | | | — | | | | — | |
From net realized gains | | | — | (b) | | | — | | | | — | | | | — | |
Class R5 (c) | | | | | | | | | | | | | | | | |
From net investment income | | | (5,428 | ) | | | (7,998 | ) | | | — | | | | — | |
From net realized gains | | | (25,600 | ) | | | (77,242 | ) | | | (28 | ) | | | — | |
Class R6 (d) | | | | | | | | | | | | | | | | |
From net investment income | | | (3,830 | ) | | | — | | | | — | | | | — | |
From net realized gains | | | (15,853 | ) | | | — | | | | (15,304 | ) | | | (34,132 | ) |
Select Class | | | | | | | | | | | | | | | | |
From net investment income | | | (9,633 | ) | | | (3,556 | ) | | | — | | | | — | |
From net realized gains | | | (53,162 | ) | | | (59,055 | ) | | | (3,529 | ) | | | (8,776 | ) |
| | | | | | | | | | | | | | | | |
Total distributions to shareholders | | | (155,206 | ) | | | (205,346 | ) | | | (36,600 | ) | | | (84,696 | ) |
| | | | | | | | | | | | | | | | |
| | | | |
CAPITAL TRANSACTIONS: | | | | | | | | | | | | | | | | |
Change in net assets resulting from capital transactions | | | 2,031,387 | | | | 187,154 | | | | (40,798 | ) | | | 50,292 | |
| | | | | | | | | | | | | | | | |
| | | | |
NET ASSETS: | | | | | | | | | | | | | | | | |
Change in net assets | | | 2,409,426 | | | | 55,092 | | | | 46,921 | | | | (207,931 | ) |
Beginning of period | | | 3,448,930 | | | | 3,393,838 | | | | 1,037,138 | | | | 1,245,069 | |
| | | | | | | | | | | | | | | | |
End of period | | $ | 5,858,356 | | | $ | 3,448,930 | | | $ | 1,084,059 | | | $ | 1,037,138 | |
| | | | | | | | | | | | | | | | |
Accumulated undistributed (distributions in excess of) net investment income | | $ | (75 | ) | | $ | 8,726 | | | $ | (4,169 | ) | | $ | (1,912 | ) |
| | | | | | | | | | | | | | | | |
| (a) | Commencement of offering of class of shares effective September 9, 2016 for Small Cap Equity Fund. |
| (b) | Amount rounds to less than 500. |
| (c) | Commencement of offering of class of shares effective September 9, 2016 for Small Cap Growth Fund. |
| (d) | Commencement of offering of class of shares effective September 9, 2016 for Small Cap Equity Fund. |
SEE NOTES TO FINANCIAL STATEMENTS.
| | | | | | | | |
| | | |
| DECEMBER 31, 2016 | | J.P. MORGAN SMALL CAP FUNDS | | | | | 53 | |
STATEMENTS OF CHANGES IN NET ASSETS
FOR THE PERIODS INDICATED (continued)
(Amounts in thousands)
| | | | | | | | | | | | | | | | |
| | | Small Cap Value Fund | | | U.S. Small Company Fund | |
| | | Six Months Ended
December 31, 2016
(Unaudited) | | | Year Ended
June 30, 2016 | | | Six Months Ended
December 31, 2016
(Unaudited) | | | Year Ended
June 30, 2016 | |
CHANGE IN NET ASSETS RESULTING FROM OPERATIONS: | | | | | | | | | | | | | | | | |
Net investment income (loss) | | $ | 7,385 | | | $ | 16,276 | | | $ | 2,827 | | | $ | 4,777 | |
Net realized gain (loss) | | | 56,191 | | | | (11,621 | ) | | | 36,073 | | | | (25,653 | ) |
Change in net unrealized appreciation/depreciation | | | 322,267 | | | | (52,243 | ) | | | 226,852 | | | | (37,299 | ) |
| | | | | | | | | | | | | | | | |
Change in net assets resulting from operations | | | 385,843 | | | | (47,588 | ) | | | 265,752 | | | | (58,175 | ) |
| | | | | | | | | | | | | | | | |
| | | | |
DISTRIBUTIONS TO SHAREHOLDERS: | | | | | | | | | | | | | | | | |
Class A | | | | | | | | | | | | | | | | |
From net investment income | | | (2,556 | ) | | | (3,316 | ) | | | (192 | ) | | | (375 | ) |
From net realized gains | | | (390 | ) | | | (24,024 | ) | | | (15 | ) | | | (9,859 | ) |
Class C | | | | | | | | | | | | | | | | |
From net investment income | | | (124 | ) | | | (138 | ) | | | — | | | | — | |
From net realized gains | | | (36 | ) | | | (2,266 | ) | | | (3 | ) | | | (1,985 | ) |
Class L (formerly Institutional Class) | | | | | | | | | | | | | | | | |
From net investment income | | | — | | | | — | | | | (3,751 | ) | | | (2,157 | ) |
From net realized gains | | | — | | | | — | | | | (45 | ) | | | (16,302 | ) |
Class R2 | | | | | | | | | | | | | | | | |
From net investment income | | | (182 | ) | | | (176 | ) | | | — | | | | (36 | ) |
From net realized gains | | | (37 | ) | | | (2,034 | ) | | | (2 | ) | | | (1,197 | ) |
Class R3 (a) | | | | | | | | | | | | | | | | |
From net investment income | | | — | (b) | | | — | | | | — | (b) | | | — | |
From net realized gains | | | — | (b) | | | — | | | | — | (b) | | | — | |
Class R4 (a) | | | | | | | | | | | | | | | | |
From net investment income | | | — | (b) | | | — | | | | — | (b) | | | — | |
From net realized gains | | | — | (b) | | | — | | | | — | (b) | | | — | |
Class R5 (c) | | | | | | | | | | | | | | | | |
From net investment income | | | (643 | ) | | | (877 | ) | | | — | (b) | | | — | |
From net realized gains | | | (73 | ) | | | (4,226 | ) | | | — | (b) | | | — | |
Class R6 | | | | | | | | | | | | | | | | |
From net investment income | | | (5,587 | ) | | | (7,344 | ) | | | (1,045 | ) | | | (620 | ) |
From net realized gains | | | (552 | ) | | | (33,390 | ) | | | (11 | ) | | | (4,031 | ) |
Select Class | | | | | | | | | | | | | | | | |
From net investment income | | | (1,792 | ) | | | (2,589 | ) | | | (967 | ) | | | (1,045 | ) |
From net realized gains | | | (217 | ) | | | (11,883 | ) | | | (19 | ) | | | (11,139 | ) |
| | | | | | | | | | | | | | | | |
Total distributions to shareholders | | | (12,189 | ) | | | (92,263 | ) | | | (6,050 | ) | | | (48,746 | ) |
| | | | | | | | | | | | | | | | |
| | | | |
CAPITAL TRANSACTIONS: | | | | | | | | | | | | | | | | |
Change in net assets resulting from capital transactions | | | (23,852 | ) | | | 22,440 | | | | 117,872 | | | | 458,685 | |
| | | | | | | | | | | | | | | | |
| | | | |
NET ASSETS: | | | | | | | | | | | | | | | | |
Change in net assets | | | 349,802 | | | | (117,411 | ) | | | 377,574 | | | | 351,764 | |
Beginning of period | | | 1,753,332 | | | | 1,870,743 | | | | 1,323,312 | | | | 971,548 | |
| | | | | | | | | | | | | | | | |
End of period | | $ | 2,103,134 | | | $ | 1,753,332 | | | $ | 1,700,886 | | | $ | 1,323,312 | |
| | | | | | | | | | | | | | | | |
Accumulated undistributed (distributions in excess of) net investment income | | $ | (856 | ) | | $ | 2,643 | | | $ | (581 | ) | | $ | 2,547 | |
| | | | | | | | | | | | | | | | |
| (a) | Commencement of offering of class of shares effective September 9, 2016. |
| (b) | Amount rounds to less than 500. |
| (c) | Commencement of offering of class of shares effective September 9, 2016 for U.S. Small Company Fund. |
SEE NOTES TO FINANCIAL STATEMENTS.
| | | | | | |
| | | |
| 54 | | | | J.P. MORGAN SMALL CAP FUNDS | | DECEMBER 31, 2016 |
| | | | | | | | | | | | | | | | |
| | | Dynamic Small Cap Growth Fund | | | Small Cap Core Fund | |
| | | Six Months Ended
December 31, 2016
(Unaudited) | | | Year Ended
June 30, 2016 | | | Six Months Ended
December 31, 2016
(Unaudited) | | | Year Ended
June 30, 2016 | |
CAPITAL TRANSACTIONS: | | | | | | | | | | | | | | | | |
Class A (a) | | | | | | | | | | | | | | | | |
Proceeds from shares issued | | $ | 5,567 | | | $ | 10,070 | | | $ | 66 | | | $ | 23 | |
Distributions reinvested | | | 6,122 | | | | 6,411 | | | | 7 | | | | — | |
Cost of shares redeemed | | | (7,725 | ) | | | (14,402 | ) | | | (5 | ) | | | — | |
| | | | | | | | | | | | | | | | |
Change in net assets resulting from Class A capital transactions | | $ | 3,964 | | | $ | 2,079 | | | $ | 68 | | | $ | 23 | |
| | | | | | | | | | | | | | | | |
Class C (a) | | | | | | | | | | | | | | | | |
Proceeds from shares issued | | $ | 8,079 | | | $ | 13,161 | | | $ | 30 | | | $ | 20 | |
Distributions reinvested | | | 888 | | | | 856 | | | | 5 | | | | — | |
Cost of shares redeemed | | | (5,636 | ) | | | (17,151 | ) | | | (3 | ) | | | — | |
| | | | | | | | | | | | | | | | |
Change in net assets resulting from Class C capital transactions | | $ | 3,331 | | | $ | (3,134 | ) | | $ | 32 | | | $ | 20 | |
| | | | | | | | | | | | | | | | |
Class R5 (b) | | | | | | | | | | | | | | | | |
Proceeds from shares issued | | $ | — | | | $ | — | | | $ | 22,673 | | | $ | 82,011 | |
Distributions reinvested | | | — | | | | — | | | | 15,728 | | | | 71,593 | |
Cost of shares redeemed | | | — | | | | — | | | | (27,769 | ) | | | (116,062 | ) |
Redemptions in-kind (See Note 7) | | | — | | | | — | | | | — | | | | (530,784 | ) |
| | | | | | | | | | | | | | | | |
Change in net assets resulting from Class R5 capital transactions | | $ | — | | | $ | — | | | $ | 10,632 | | | $ | (493,242 | ) |
| | | | | | | | | | | | | | | | |
Class R6 (a) | | | | | | | | | | | | | | | | |
Proceeds from shares issued | | $ | — | | | $ | — | | | $ | — | | | $ | 20 | |
Distributions reinvested | | | — | | | | — | | | | 2 | | | | — | |
| | | | | | | | | | | | | | | | |
Change in net assets resulting from Class R6 capital transactions | | $ | — | | | $ | — | | | $ | 2 | | | $ | 20 | |
| | | | | | | | | | | | | | | | |
Select Class | | | | | | | | | | | | | | | | |
Proceeds from shares issued | | $ | 5,881 | | | $ | 68,912 | | | $ | — | | | $ | — | |
Distributions reinvested | | | 8,203 | | | | 39,841 | | | | — | | | | — | |
Cost of shares redeemed | | | (20,782 | ) | | | (317,159 | ) | | | — | | | | — | |
| | | | | | | | | | | | | | | | |
Change in net assets resulting from Select Class capital transactions | | $ | (6,698 | ) | | $ | (208,406 | ) | | $ | 10,632 | | | $ | (493,242 | ) |
| | | | | | | | | | | | | | | | |
Total change in net assets resulting from capital transactions | | $ | 597 | | | $ | (209,461 | ) | | $ | 10,734 | | | $ | (493,179 | ) |
| | | | | | | | | | | | | | | | |
| (a) | Commencement of offering of class of shares effective May 31, 2016 for Small Cap Core Fund. |
| (b) | Effective September 15, 2016, Select Class was renamed Class R5 for Small Cap Core Fund. |
SEE NOTES TO FINANCIAL STATEMENTS.
| | | | | | | | |
| | | |
| DECEMBER 31, 2016 | | J.P. MORGAN SMALL CAP FUNDS | | | | | 55 | |
STATEMENTS OF CHANGES IN NET ASSETS
FOR THE PERIODS INDICATED (continued)
(Amounts in thousands)
| | | | | | | | | | | | | | | | |
| | | Dynamic Small Cap Growth Fund | | | Small Cap Core Fund | |
| | | Six Months Ended
December 31, 2016
(Unaudited) | | | Year Ended
June 30, 2016 | | | Six Months Ended
December 31, 2016
(Unaudited) | | | Year Ended
June 30, 2016 | |
SHARE TRANSACTIONS: | | | | | | | | | | | | | | | | |
Class A (a) | | | | | | | | | | | | | | | | |
Issued | | | 284 | | | | 478 | | | | 1 | | | | 1 | |
Reinvested | | | 331 | | | | 327 | | | | — | (b) | | | — | |
Redeemed | | | (374 | ) | | | (712 | ) | | | — | (b) | | | — | |
| | | | | | | | | | | | | | | | |
Change in Class A Shares | | | 241 | | | | 93 | | | | 1 | | | | 1 | |
| | | | | | | | | | | | | | | | |
Class C (a) | | | | | | | | | | | | | | | | |
Issued | | | 535 | | | | 780 | | | | — | (b) | | | 1 | |
Reinvested | | | 62 | | | | 54 | | | | — | (b) | | | — | |
Redeemed | | | (333 | ) | | | (1,015 | ) | | | — | (b) | | | — | |
| | | | | | | | | | | | | | | | |
Change in Class C Shares | | | 264 | | | | (181 | ) | | | — | (b) | | | 1 | |
| | | | | | | | | | | | | | | | |
Class R5 (c) | | | | | | | | | | | | | | | | |
Issued | | | — | | | | — | | | | 452 | | | | 1,600 | |
Reinvested | | | — | | | | — | | | | 315 | | | | 1,578 | |
Redeemed | | | — | | | | — | | | | (560 | ) | | | (2,421 | ) |
Redemptions in-kind (See Note 7) | | | — | | | | — | | | | — | | | | (11,691 | ) |
| | | | | | | | | | | | | | | | |
Change in Class R5 Shares | | | — | | | | — | | | | 207 | | | | (10,934 | ) |
| | | | | | | | | | | | | | | | |
Class R6 (a) | | | | | | | | | | | | | | | | |
Issued | | | — | | | | — | | | | — | | | | 1 | |
Reinvested | | | — | | | | — | | | | — | (b) | | | — | |
| | | | | | | | | | | | | | | | |
Change in Class R6 Shares | | | — | | | | — | | | | — | (b) | | | 1 | |
| | | | | | | | | | | | | | | | |
Select Class | | | | | | | | | | | | | | | | |
Issued | | | 258 | | | | 3,027 | | | | — | | | | — | |
Reinvested | | | 395 | | | | 1,842 | | | | — | | | | — | |
Redeemed | | | (928 | ) | | | (15,456 | ) | | | — | | | | — | |
| | | | | | | | | | | | | | | | |
Change in Select Class Shares | | | (275 | ) | | | (10,587 | ) | | | — | | | | (10,934 | ) |
| | | | | | | | | | | | | | | | |
| (a) | Commencement of offering of class of shares effective May 31, 2016 for Small Cap Core Fund. |
| (b) | Amount rounds to less than 500. |
| (c) | Effective September 15, 2016, Select Class was renamed Class R5 for Small Cap Core Fund. |
SEE NOTES TO FINANCIAL STATEMENTS.
| | | | | | |
| | | |
| 56 | | | | J.P. MORGAN SMALL CAP FUNDS | | DECEMBER 31, 2016 |
| | | | | | | | | | | | | | | | |
| | | Small Cap Equity Fund | | | Small Cap Growth Fund | |
| | | Six Months Ended
December 31, 2016 (Unaudited) | | | Year Ended
June 30, 2016 | | | Six Months Ended
December 31, 2016 (Unaudited) | | | Year Ended
June 30, 2016 | |
CAPITAL TRANSACTIONS: | | | | | | | | | | | | | | | | |
Class A | | | | | | | | | | | | | | | | |
Proceeds from shares issued | | $ | 568,894 | | | $ | 797,670 | | | $ | 14,591 | | | $ | 34,331 | |
Distributions reinvested | | | 33,701 | | | | 49,673 | | | | 5,928 | | | | 17,120 | |
Cost of shares redeemed | | | (145,303 | ) | | | (225,187 | ) | | | (39,415 | ) | | | (82,368 | ) |
Redemptions in-kind (See Note 7) | | | — | | | | (545,339 | ) | | | — | | | | — | |
| | | | | | | | | | | | | | | | |
Change in net assets resulting from Class A capital transactions | | $ | 457,292 | | | $ | 76,817 | | | $ | (18,896 | ) | | $ | (30,917 | ) |
| | | | | | | | | | | | | | | | |
Class C | | | | | | | | | | | | | | | | |
Proceeds from shares issued | | $ | 92,817 | | | $ | 39,875 | | | $ | 1,087 | | | $ | 1,342 | |
Distributions reinvested | | | 5,234 | | | | 2,583 | | | | 747 | | | | 1,891 | |
Cost of shares redeemed | | | (7,847 | ) | | | (7,079 | ) | | | (2,692 | ) | | | (5,168 | ) |
| | | | | | | | | | | | | | | | |
Change in net assets resulting from Class C capital transactions | | $ | 90,204 | | | $ | 35,379 | | | $ | (858 | ) | | $ | (1,935 | ) |
| | | | | | | | | | | | | | | | |
Class L (formerly Institutional Class) | | | | | | | | | | | | | | | | |
Proceeds from shares issued | | $ | — | | | $ | — | | | $ | 45,916 | | | $ | 114,481 | |
Distributions reinvested | | | — | | | | — | | | | 8,911 | | | | 18,231 | |
Cost of shares redeemed | | | — | | | | — | | | | (69,483 | ) | | | (81,578 | ) |
| | | | | | | | | | | | | | | | |
Change in net assets resulting from Class L capital transactions | | $ | — | | | $ | — | | | $ | (14,656 | ) | | $ | 51,134 | |
| | | | | | | | | | | | | | | | |
Class R2 | | | | | | | | | | | | | | | | |
Proceeds from shares issued | | $ | 6,063 | | | $ | 3,684 | | | $ | 1,287 | | | $ | 3,627 | |
Distributions reinvested | | | 156 | | | | 147 | | | | 749 | | | | 1,908 | |
Cost of shares redeemed | | | (1,562 | ) | | | (1,850 | ) | | | (3,993 | ) | | | (6,699 | ) |
| | | | | | | | | | | | | | | | |
Change in net assets resulting from Class R2 capital transactions | | $ | 4,657 | | | $ | 1,981 | | | $ | (1,957 | ) | | $ | (1,164 | ) |
| | | | | | | | | | | | | | | | |
Class R3 (a) | | | | | | | | | | | | | | | | |
Proceeds from shares issued | | $ | 20 | | | $ | — | | | $ | — | | | $ | — | |
Distributions reinvested | | | 1 | | | | — | | | | — | | | | — | |
Cost of shares redeemed | | | — | (b) | | | — | | | | — | | | | — | |
| | | | | | | | | | | | | | | | |
Change in net assets resulting from Class R3 capital transactions | | $ | 21 | | | $ | — | | | $ | — | | | $ | — | |
| | | | | | | | | | | | | | | | |
Class R4 (a) | | | | | | | | | | | | | | | | |
Proceeds from shares issued | | $ | 20 | | | $ | — | | | $ | — | | | $ | — | |
Distributions reinvested | | | — | (b) | | | — | | | | — | | | | — | |
Cost of shares redeemed | | | — | (b) | | | — | | | | — | | | | — | |
| | | | | | | | | | | | | | | | |
Change in net assets resulting from Class R4 capital transactions | | $ | 20 | | | $ | — | | | $ | — | | | $ | — | |
| | | | | | | | | | | | | | | | |
Class R5 (c) | | | | | | | | | | | | | | | | |
Proceeds from shares issued | | $ | 306,702 | | | $ | 327,668 | | | $ | 1,208 | | | $ | — | |
Distributions reinvested | | | 28,546 | | | | 80,413 | | | | 28 | | | | — | |
Cost of shares redeemed | | | (610,243 | ) | | | (243,746 | ) | | | (353 | ) | | | — | |
| | | | | | | | | | | | | | | | |
Change in net assets resulting from Class R5 capital transactions | | $ | (274,995 | ) | | $ | 164,335 | | | $ | 883 | | | $ | — | |
| | | | | | | | | | | | | | | | |
Class R6 (d) | | | | | | | | | | | | | | | | |
Proceeds from shares issued | | $ | 701,731 | | | $ | 25,790 | | | $ | 30,949 | | | $ | 130,485 | |
Distributions reinvested | | | 19,663 | | | | — | | | | 15,304 | | | | 34,132 | |
Cost of shares redeemed | | | (16,038 | ) | | | (173 | ) | | | (41,625 | ) | | | (105,409 | ) |
| | | | | | | | | | | | | | | | |
Change in net assets resulting from Class R6 capital transactions | | $ | 705,356 | | | $ | 25,617 | | | $ | 4,628 | | | $ | 59,208 | |
| | | | | | | | | | | | | | | | |
Select Class | | | | | | | | | | | | | | | | |
Proceeds from shares issued | | $ | 1,245,493 | | | $ | 643,933 | | | $ | 15,723 | | | $ | 29,505 | |
Distributions reinvested | | | 56,261 | | | | 55,589 | | | | 3,133 | | | | 7,984 | |
Cost of shares redeemed | | | (252,922 | ) | | | (816,497 | ) | | | (28,798 | ) | | | (63,523 | ) |
| | | | | | | | | | | | | | | | |
Change in net assets resulting from Select Class capital transactions | | $ | 1,048,832 | | | $ | (116,975 | ) | | $ | (9,942 | ) | | $ | (26,034 | ) |
| | | | | | | | | | | | | | | | |
Total change in net assets resulting from capital transactions | | $ | 2,031,387 | | | $ | 187,154 | | | $ | (40,798 | ) | | $ | 50,292 | |
| | | | | | | | | | | | | | | | |
| (a) | Commencement of offering of class of shares effective September 9, 2016 for Small Cap Equity Fund. |
| (b) | Amount rounds to less than 500. |
| (c) | Commencement of offering of class of shares effective September 9, 2016 for Small Cap Growth Fund. |
| (d) | Commencement of offering of class of shares effective May 31, 2016 for Small Cap Equity Fund. |
SEE NOTES TO FINANCIAL STATEMENTS.
| | | | | | | | |
| | | |
| DECEMBER 31, 2016 | | J.P. MORGAN SMALL CAP FUNDS | | | | | 57 | |
STATEMENTS OF CHANGES IN NET ASSETS
FOR THE PERIODS INDICATED (continued)
(Amounts in thousands)
| | | | | | | | | | | | | | | | |
| | | Small Cap Equity Fund | | | Small Cap Growth Fund | |
| | | Six Months Ended
December 31, 2016 (Unaudited) | | | Year Ended
June 30, 2016 | | | Six Months Ended
December 31, 2016 (Unaudited) | | | Year Ended
June 30, 2016 | |
SHARE TRANSACTIONS: | | | | | | | | | | | | | | | | |
Class A | | | | | | | | | | | | | | | | |
Issued | | | 12,764 | | | | 20,677 | | | | 1,161 | | | | 2,821 | |
Reinvested | | | 733 | | | | 1,292 | | | | 476 | | | | 1,466 | |
Redeemed | | | (3,299 | ) | | | (5,663 | ) | | | (3,154 | ) | | | (7,028 | ) |
Redemptions in-kind (See Note 7) | | | — | | | | (13,733 | ) | | | — | | | | — | |
| | | | | | | | | | | | | | | | |
Change in Class A Shares | | | 10,198 | | | | 2,573 | | | | (1,517 | ) | | | (2,741 | ) |
| | | | | | | | | | | | | | | | |
Class C | | | | | | | | | | | | | | | | |
Issued | | | 2,700 | | | | 1,307 | | | | 112 | | | | 143 | |
Reinvested | | | 149 | | | | 87 | | | | 79 | | | | 210 | |
Redeemed | | | (230 | ) | | | (228 | ) | | | (282 | ) | | | (572 | ) |
| | | | | | | | | | | | | | | | |
Change in Class C Shares | | | 2,619 | | | | 1,166 | | | | (91 | ) | | | (219 | ) |
| | | | | | | | | | | | | | | | |
Class L (formerly Institutional Class) | | | | | | | | | | | | | | | | |
Issued | | | — | | | | — | | | | 3,281 | | | | 8,718 | |
Reinvested | | | — | | | | — | | | | 640 | | | | 1,407 | |
Redeemed | | | — | | | | — | | | | (4,991 | ) | | | (6,315 | ) |
| | | | | | | | | | | | | | | | |
Change in Class L Shares | | | — | | | | — | | | | (1,070 | ) | | | 3,810 | |
| | | | | | | | | | | | | | | | |
Class R2 | | | | | | | | | | | | | | | | |
Issued | | | 140 | | | | 93 | | | | 105 | | | | 309 | |
Reinvested | | | 3 | | | | 4 | | | | 62 | | | | 167 | |
Redeemed | | | (36 | ) | | | (46 | ) | | | (328 | ) | | | (566 | ) |
| | | | | | | | | | | | | | | | |
Change in Class R2 Shares | | | 107 | | | | 51 | | | | (161 | ) | | | (90 | ) |
| | | | | | | | | | | | | | | | |
Class R3 (a) | | | | | | | | | | | | | | | | |
Issued | | | 1 | | | | — | | | | — | | | | — | |
Reinvested | | | — | (b) | | | — | | | | — | | | | — | |
| | | | | | | | | | | | | | | | |
Change in Class R3 Shares | | | 1 | | | | — | | | | — | | | | — | |
| | | | | | | | | | | | | | | | |
Class R4 (a) | | | | | | | | | | | | | | | | |
Issued | | | — | (b) | | | — | | | | — | | | | — | |
Reinvested | | | — | (b) | | | — | | | | — | | | | — | |
| | | | | | | | | | | | | | | | |
Change in Class R4 Shares | | | — | (b) | | | — | | | | — | | | | — | |
| | | | | | | | | | | | | | | | |
Class R5 (c) | | | | | | | | | | | | | | | | |
Issued | | | 5,978 | | | | 7,138 | | | | 85 | | | | — | |
Reinvested | | | 541 | | | | 1,832 | | | | 2 | | | | — | |
Redeemed | | | (12,491 | ) | | | (5,295 | ) | | | (24 | ) | | | — | |
| | | | | | | | | | | | | | | | |
Change in Class R5 Shares | | | (5,972 | ) | | | 3,675 | | | | 63 | | | | — | |
| | | | | | | | | | | | | | | | |
Class R6 (d) | | | | | | | | | | | | | | | | |
Issued | | | 14,173 | | | | 549 | | | | 2,174 | | | | 10,137 | |
Reinvested | | | 372 | | | | — | | | | 1,091 | | | | 2,617 | |
Redeemed | | | (317 | ) | | | (4 | ) | | | (2,987 | ) | | | (8,387 | ) |
| | | | | | | | | | | | | | | | |
Change in Class R6 Shares | | | 14,228 | | | | 545 | | | | 278 | | | | 4,367 | |
| | | | | | | | | | | | | | | | |
Select Class | | | | | | | | | | | | | | | | |
Issued | | | 24,518 | | | | 14,082 | | | | 1,144 | | | | 2,235 | |
Reinvested | | | 1,069 | | | | 1,270 | | | | 231 | | | | 630 | |
Redeemed | | | (4,960 | ) | | | (17,314 | ) | | | (2,138 | ) | | | (4,737 | ) |
| | | | | | | | | | | | | | | | |
Change in Select Class Shares | | | 20,627 | | | | (1,962 | ) | | | (763 | ) | | | (1,872 | ) |
| | | | | | | | | | | | | | | | |
| (a) | Commencement of offering of class of shares effective September 9, 2016 for Small Cap Equity Fund. |
| (b) | Amount rounds to less than 500. |
| (c) | Commencement of offering of class of shares effective September 9, 2016 for Small Cap Growth Fund. |
| (d) | Commencement of offering of class of shares effective May 31, 2016 for Small Cap Equity Fund. |
SEE NOTES TO FINANCIAL STATEMENTS.
| | | | | | |
| | | |
| 58 | | | | J.P. MORGAN SMALL CAP FUNDS | | DECEMBER 31, 2016 |
| | | | | | | | | | | | | | | | |
| | | Small Cap Value Fund | | | U.S. Small Company Fund | |
| | | Six Months Ended
December 31, 2016 (Unaudited) | | | Year Ended
June 30, 2016 | | | Six Months Ended
December 31, 2016 (Unaudited) | | | Year Ended
June 30, 2016 | |
CAPITAL TRANSACTIONS: | | | | | | | | | | | | | | | | |
Class A | | | | | | | | | | | | | | | | |
Proceeds from shares issued | | $ | 77,818 | | | $ | 138,661 | | | $ | 48,913 | | | $ | 112,560 | |
Distributions reinvested | | | 2,757 | | | | 25,666 | | | | 184 | | | | 9,251 | |
Cost of shares redeemed | | | (135,168 | ) | | | (186,013 | ) | | | (57,409 | ) | | | (108,488 | ) |
| | | | | | | | | | | | | | | | |
Change in net assets resulting from Class A capital transactions | | $ | (54,593 | ) | | $ | (21,686 | ) | | $ | (8,312 | ) | | $ | 13,323 | |
| | | | | | | | | | | | | | | | |
Class C | | | | | | | | | | | | | | | | |
Proceeds from shares issued | | $ | 2,911 | | | $ | 3,797 | | | $ | 4,169 | | | $ | 17,408 | |
Distributions reinvested | | | 144 | | | | 2,160 | | | | 3 | | | | 1,817 | |
Cost of shares redeemed | | | (5,594 | ) | | | (10,313 | ) | | | (7,673 | ) | | | (12,981 | ) |
| | | | | | | | | | | | | | | | |
Change in net assets resulting from Class C capital transactions | | $ | (2,539 | ) | | $ | (4,356 | ) | | $ | (3,501 | ) | | $ | 6,244 | |
| | | | | | | | | | | | | | | | |
Class L (formerly Institutional Class) | | | | | | | | | | | | | | | | |
Proceeds from shares issued | | $ | — | | | $ | — | | | $ | 199,697 | | | $ | 366,693 | |
Distributions reinvested | | | — | | | | — | | | | 3,378 | | | | 17,359 | |
Cost of shares redeemed | | | — | | | | — | | | | (125,976 | ) | | | (113,529 | ) |
| | | | | | | | | | | | | | | | |
Change in net assets resulting from Class L capital transactions | | $ | — | | | $ | — | | | $ | 77,099 | | | $ | 270,523 | |
| | | | | | | | | | | | | | | | |
Class R2 | | | | | | | | | | | | | | | | |
Proceeds from shares issued | | $ | 10,031 | | | $ | 16,117 | | | $ | 8,027 | | | $ | 25,767 | |
Distributions reinvested | | | 203 | | | | 2,028 | | | | 2 | | | | 944 | |
Cost of shares redeemed | | | (9,691 | ) | | | (15,854 | ) | | | (6,483 | ) | | | (7,774 | ) |
| | | | | | | | | | | | | | | | |
Change in net assets resulting from Class R2 capital transactions | | $ | 543 | | | $ | 2,291 | | | $ | 1,546 | | | $ | 18,937 | |
| | | | | | | | | | | | | | | | |
Class R3 (a) | | | | | | | | | | | | | | | | |
Proceeds from shares issued | | $ | 20 | | | $ | — | | | $ | 20 | | | $ | — | |
Distributions reinvested | | | — | (b) | | | — | | | | — | (b) | | | — | |
| | | | | | | | | | | | | | | | |
Change in net assets resulting from Class R3 capital transactions | | $ | 20 | | | $ | — | | | $ | 20 | | | $ | — | |
| | | | | | | | | | | | | | | | |
Class R4 (a) | | | | | | | | | | | | | | | | |
Proceeds from shares issued | | $ | 20 | | | $ | — | | | $ | 20 | | | $ | — | |
Distributions reinvested | | | — | (b) | | | — | | | | — | (b) | | | — | |
| | | | | | | | | | | | | | | | |
Change in net assets resulting from Class R4 capital transactions | | $ | 20 | | | $ | — | | | $ | 20 | | | $ | — | |
| | | | | | | | | | | | | | | | |
Class R5 (c) | | | | | | | | | | | | | | | | |
Proceeds from shares issued | | $ | 23,272 | | | $ | 31,169 | | | $ | 20 | | | $ | — | |
Distributions reinvested | | | 655 | | | | 4,681 | | | | — | (b) | | | — | |
Cost of shares redeemed | | | (29,038 | ) | | | (34,423 | ) | | | — | | | | — | |
| | | | | | | | | | | | | | | | |
Change in net assets resulting from Class R5 capital transactions | | $ | (5,111 | ) | | $ | 1,427 | | | $ | 20 | | | $ | — | |
| | | | | | | | | | | | | | | | |
Class R6 | | | | | | | | | | | | | | | | |
Proceeds from shares issued | | $ | 110,556 | | | $ | 383,830 | | | $ | 85,747 | | | $ | 100,275 | |
Distributions reinvested | | | 6,139 | | | | 40,732 | | | | 1,023 | | | | 4,436 | |
Cost of shares redeemed | | | (104,129 | ) | | | (173,847 | ) | | | (16,783 | ) | | | (26,418 | ) |
| | | | | | | | | | | | | | | | |
Change in net assets resulting from Class R6 capital transactions | | $ | 12,566 | | | $ | 250,715 | | | $ | 69,987 | | | $ | 78,293 | |
| | | | | | | | | | | | | | | | |
Select Class | | | | | | | | | | | | | | | | |
Proceeds from shares issued | | $ | 81,372 | | | $ | 106,814 | | | $ | 38,925 | | | $ | 166,060 | |
Distributions reinvested | | | 1,881 | | | | 12,987 | | | | 921 | | | | 11,293 | |
Cost of shares redeemed | | | (58,011 | ) | | | (325,752 | ) | | | (58,853 | ) | | | (105,988 | ) |
| | | | | | | | | | | | | | | | |
Change in net assets resulting from Select Class capital transactions | | $ | 25,242 | | | $ | (205,951 | ) | | $ | (19,007 | ) | | $ | 71,365 | |
| | | | | | | | | | | | | | | | |
Total change in net assets resulting from capital transactions | | $ | (23,852 | ) | | $ | 22,440 | | | $ | 117,872 | | | $ | 458,685 | |
| | | | | | | | | | | | | | | | |
| (a) | Commencement of offering of class of shares effective September 9, 2016. |
| (b) | Amount rounds to less than 500. |
| (c) | Commencement of offering of class of shares effective September 9, 2016 for U.S. Small Company Fund. |
SEE NOTES TO FINANCIAL STATEMENTS.
| | | | | | | | |
| | | |
| DECEMBER 31, 2016 | | J.P. MORGAN SMALL CAP FUNDS | | | | | 59 | |
STATEMENTS OF CHANGES IN NET ASSETS
FOR THE PERIODS INDICATED (continued)
(Amounts in thousands)
| | | | | | | | | | | | | | | | |
| | | Small Cap Value Fund | | | U.S. Small Company Fund | |
| | | Six Months Ended
December 31, 2016 (Unaudited) | | | Year Ended
June 30, 2016 | | | Six Months Ended
December 31, 2016 (Unaudited) | | | Year Ended
June 30, 2016 | |
SHARE TRANSACTIONS: | | | | | | | | | | | | | | | | |
Class A | | | | | | | | | | | | | | | | |
Issued | | | 2,853 | | | | 5,761 | | | | 2,953 | | | | 7,413 | |
Reinvested | | | 95 | | | | 1,114 | | | | 10 | | | | 626 | |
Redeemed | | | (5,021 | ) | | | (7,728 | ) | | | (3,470 | ) | | | (7,196 | ) |
| | | | | | | | | | | | | | | | |
Change in Class A Shares | | | (2,073 | ) | | | (853 | ) | | | (507 | ) | | | 843 | |
| | | | | | | | | | | | | | | | |
Class C | | | | | | | | | | | | | | | | |
Issued | | | 125 | | | | 184 | | | | 258 | | | | 1,176 | |
Reinvested | | | 6 | | | | 111 | | | | — | (a) | | | 127 | |
Redeemed | | | (247 | ) | | | (506 | ) | | | (478 | ) | | | (897 | ) |
| | | | | | | | | | | | | | | | |
Change in Class C Shares | | | (116 | ) | | | (211 | ) | | | (220 | ) | | | 406 | |
| | | | | | | | | | | | | | | | |
Class L (formerly Institutional Class) | | | | | | | | | | | | | | | | |
Issued | | | — | | | | — | | | | 11,777 | | | | 24,199 | |
Reinvested | | | — | | | | — | | | | 181 | | | | 1,150 | |
Redeemed | | | — | | | | — | | | | (7,274 | ) | | | (7,566 | ) |
| | | | | | | | | | | | | | | | |
Change in Class L Shares | | | — | | | | — | | | | 4,684 | | | | 17,783 | |
| | | | | | | | | | | | | | | | |
Class R2 | | | | | | | | | | | | | | | | |
Issued | | | 369 | | | | 675 | | | | 487 | | | | 1,706 | |
Reinvested | | | 7 | | | | 89 | | | | — | (a) | | | 65 | |
Redeemed | | | (363 | ) | | | (669 | ) | | | (395 | ) | | | (528 | ) |
| | | | | | | | | | | | | | | | |
Change in Class R2 Shares | | | 13 | | | | 95 | | | | 92 | | | | 1,243 | |
| | | | | | | | | | | | | | | | |
Class R3 (b) | | | | | | | | | | | | | | | | |
Issued | | | 1 | | | | — | | | | 1 | | | | — | |
Reinvested | | | — | (a) | | | — | | | | — | (a) | | | — | |
| | | | | | | | | | | | | | | | |
Change in Class R3 Shares | | | 1 | | | | — | | | | 1 | | | | — | |
| | | | | | | | | | | | | | | | |
Class R4 (b) | | | | | | | | | | | | | | | | |
Issued | | | 1 | | | | — | | | | 1 | | | | — | |
Reinvested | | | — | (a) | | | — | | | | — | (a) | | | — | |
| | | | | | | | | | | | | | | | |
Change in Class R4 Shares | | | 1 | | | | — | | | | 1 | | | | — | |
| | | | | | | | | | | | | | | | |
Class R5 (c) | | | | | | | | | | | | | | | | |
Issued | | | 795 | | | | 1,223 | | | | 1 | | | | — | |
Reinvested | | | 21 | | | | 193 | | | | — | (a) | | | — | |
Redeemed | | | (989 | ) | | | (1,376 | ) | | | — | | | | — | |
| | | | | | | | | | | | | | | | |
Change in Class R5 Shares | | | (173 | ) | | | 40 | | | | 1 | | | | — | |
| | | | | | | | | | | | | | | | |
Class R6 | | | | | | | | | | | | | | | | |
Issued | | | 3,771 | | | | 14,544 | | | | 4,837 | | | | 6,414 | |
Reinvested | | | 201 | | | | 1,675 | | | | 55 | | | | 294 | |
Redeemed | | | (3,584 | ) | | | (7,015 | ) | | | (991 | ) | | | (1,663 | ) |
| | | | | | | | | | | | | | | | |
Change in Class R6 Shares | | | 388 | | | | 9,204 | | | | 3,901 | | | | 5,045 | |
| | | | | | | | | | | | | | | | |
Select Class | | | | | | | | | | | | | | | | |
Issued | | | 2,841 | | | | 4,250 | | | | 2,288 | | | | 10,694 | |
Reinvested | | | 62 | | | | 535 | | | | 50 | | | | 748 | |
Redeemed | | | (1,994 | ) | | | (12,338 | ) | | | (3,403 | ) | | | (6,898 | ) |
| | | | | | | | | | | | | | | | |
Change in Select Class Shares | | | 909 | | | | (7,553 | ) | | | (1,065 | ) | | | 4,544 | |
| | | | | | | | | | | | | | | | |
| (a) | Amount rounds to less than 500. |
| (b) | Commencement of offering of class of shares effective September 9, 2016. |
| (c) | Commencement of offering of class of shares effective September 9, 2016 for U.S. Small Company Fund. |
SEE NOTES TO FINANCIAL STATEMENTS.
| | | | | | |
| | | |
| 60 | | | | J.P. MORGAN SMALL CAP FUNDS | | DECEMBER 31, 2016 |
THIS PAGE IS INTENTIONALLY LEFT BLANK
| | | | | | | | |
| | | |
| DECEMBER 31, 2016 | | J.P. MORGAN SMALL CAP FUNDS | | | | | 61 | |
FINANCIAL HIGHLIGHTS
FOR THE PERIODS INDICATED
| | | | | | | | | | | | | | | | | | | | |
| | | Per share operating performance | |
| | | | | | Investment operations | | | Distributions | |
| | | Net asset
value,
beginning
of period | | | Net
investment
income
(loss) (b) | | | Net realized
and unrealized
gains
(losses) on
investments | | | Total from
investment
operations | | | Net
realized
gain | |
Dynamic Small Cap Growth Fund | | | | | | | | | | | | | | | | | | | | |
Class A | | | | | | | | | | | | | | | | | | | | |
Six Months Ended December 31, 2016 (Unaudited) | | $ | 19.14 | | | $ | (0.08 | ) | | $ | 2.46 | | | $ | 2.38 | | | $ | (3.19 | ) |
Year Ended June 30, 2016 | | | 26.04 | | | | (0.16 | ) | | | (3.52 | ) | | | (3.68 | ) | | | (3.22 | ) |
Year Ended June 30, 2015 | | | 25.11 | | | | (0.20 | ) | | | 3.17 | | | | 2.97 | | | | (2.04 | ) |
Year Ended June 30, 2014 | | | 23.10 | | | | (0.24 | ) | | | 4.44 | | | | 4.20 | | | | (2.19 | ) |
Year Ended June 30, 2013 | | | 18.83 | | | | (0.14 | )(g) | | | 5.17 | | | | 5.03 | | | | (0.76 | ) |
Year Ended June 30, 2012 | | | 20.20 | | | | (0.13 | )(h) | | | (1.24 | ) | | | (1.37 | ) | | | — | |
| | | | | |
Class C | | | | | | | | | | | | | | | | | | | | |
Six Months Ended December 31, 2016 (Unaudited) | | | 15.58 | | | | (0.11 | ) | | | 2.00 | | | | 1.89 | | | | (3.19 | ) |
Year Ended June 30, 2016 | | | 21.97 | | | | (0.22 | ) | | | (2.95 | ) | | | (3.17 | ) | | | (3.22 | ) |
Year Ended June 30, 2015 | | | 21.61 | | | | (0.28 | ) | | | 2.68 | | | | 2.40 | | | | (2.04 | ) |
Year Ended June 30, 2014 | | | 20.25 | | | | (0.32 | ) | | | 3.87 | | | | 3.55 | | | | (2.19 | ) |
Year Ended June 30, 2013 | | | 16.68 | | | | (0.22 | )(g) | | | 4.55 | | | | 4.33 | | | | (0.76 | ) |
Year Ended June 30, 2012 | | | 17.98 | | | | (0.20 | )(h) | | | (1.10 | ) | | | (1.30 | ) | | | — | |
| | | | | |
Select Class | | | | | | | | | | | | | | | | | | | | |
Six Months Ended December 31, 2016 (Unaudited) | | | 21.17 | | | | (0.06 | ) | | | 2.71 | | | | 2.65 | | | | (3.19 | ) |
Year Ended June 30, 2016 | | | 28.34 | | | | (0.14 | ) | | | (3.81 | ) | | | (3.95 | ) | | | (3.22 | ) |
Year Ended June 30, 2015 | | | 27.08 | | | | (0.15 | ) | | | 3.45 | | | | 3.30 | | | | (2.04 | ) |
Year Ended June 30, 2014 | | | 24.70 | | | | (0.19 | ) | | | 4.76 | | | | 4.57 | | | | (2.19 | ) |
Year Ended June 30, 2013 | | | 20.02 | | | | (0.07 | )(g) | | | 5.51 | | | | 5.44 | | | | (0.76 | ) |
Year Ended June 30, 2012 | | | 21.39 | | | | (0.06 | )(h) | | | (1.31 | ) | | | (1.37 | ) | | | — | |
| (a) | Annualized for periods less than one year, unless otherwise noted. |
| (b) | Calculated based upon average shares outstanding. |
| (c) | Not annualized for periods less than one year. |
| (d) | Includes adjustments in accordance with accounting principles generally accepted in the United States of America and as such, the net asset values for financial reporting purposes and the returns based upon those net asset values may differ from the net asset values and returns for shareholder transactions. |
| (e) | Includes earnings credits and interest expense, if applicable, each of which is less than 0.005% unless otherwise noted. |
| (f) | Portfolio turnover is calculated by dividing the lesser of total purchases or sales of portfolio securities for the reporting period by the monthly average value of portfolio securities owned during the reporting period. Excluded from both the numerator and denominator are amounts relating to derivatives and securities whose maturities or expiration dates at the time of acquisition were one year or less. |
| (g) | Reflects special dividends paid out during the period by one of the Fund’s holdings. Had the Fund not received the special dividends, the net investment income (loss) per share would have been $(0.20), $(0.27) and $(0.14) for Class A, Class C and Select Class Shares, respectively, and the net investment income (loss) ratio would have been (1.00)%, (1.51)% and (0.64)% for Class A, Class C and Select Class Shares, respectively. |
| (h) | Reflects special dividends paid out during the period by one of the Fund’s holdings. Had the Fund not received the special dividends, the net investment income (loss) per share would have been $(0.17), $(0.23) and $(0.10) for Class A, Class C and Select Class Shares, respectively, and the net investment income (loss) ratio would have been (0.94)%, (1.43)% and (0.53)% for Class A, Class C and Select Class Shares, respectively. |
SEE NOTES TO FINANCIAL STATEMENTS.
| | | | | | |
| | | |
| 62 | | | | J.P. MORGAN SMALL CAP FUNDS | | DECEMBER 31, 2016 |
| | | | | | | | | | | | | | | | | | | | | | | | | | |
| | | Ratios/Supplemental data | |
| | | | | | | | | | Ratios to average net assets (a) | | | | |
Net asset
value,
end of
period | | | Total return (excludes sales charge) (c)(d) | | | Net assets,
end of
period
(000’s) | | | Net
expenses (e) | | | Net
investment
income
(loss) | | |
Expenses
without waivers,
reimbursements and
earnings credits | | | Portfolio turnover rate (c)(f) | |
| | | | | | | | | | | | | | | | | | | | | | | | | | |
| | | | | | | | | | | | | | | | | | | | | | | | | | |
| $ | 18.33 | | | | 12.32 | % | | $ | 57,647 | | | | 1.25 | % | | | (0.75 | )% | | | 1.55 | % | | | 23 | % |
| | 19.14 | | | | (14.42 | ) | | | 55,583 | | | | 1.25 | | | | (0.76 | ) | | | 1.51 | | | | 56 | |
| | 26.04 | | | | 13.02 | | | | 73,175 | | | | 1.25 | | | | (0.82 | ) | | | 1.44 | | | | 48 | |
| | 25.11 | | | | 18.56 | | | | 86,997 | | | | 1.33 | | | | (0.95 | ) | | | 1.38 | | | | 65 | |
| | 23.10 | | | | 27.61 | | | | 77,408 | | | | 1.44 | | | | (0.70 | )(g) | | | 1.44 | | | | 65 | |
| | 18.83 | | | | (6.78 | ) | | | 64,997 | | | | 1.47 | | | | (0.72 | )(h) | | | 1.48 | | | | 63 | |
| | | | | | |
| | | | | | | | | | | | | | | | | | | | | | | | | | |
| | 14.28 | | | | 11.98 | | | | 33,786 | | | | 1.74 | | | | (1.24 | ) | | | 2.17 | | | | 23 | |
| | 15.58 | | | | (14.80 | ) | | | 32,734 | | | | 1.75 | | | | (1.27 | ) | | | 2.12 | | | | 56 | |
| | 21.97 | | | | 12.46 | | | | 50,162 | | | | 1.75 | | | | (1.32 | ) | | | 2.02 | | | | 48 | |
| | 21.61 | | | | 17.93 | | | | 55,458 | | | | 1.83 | | | | (1.45 | ) | | | 1.88 | | | | 65 | |
| | 20.25 | | | | 26.96 | | | | 54,171 | | | | 1.94 | | | | (1.20 | )(g) | | | 1.94 | | | | 65 | |
| | 16.68 | | | | (7.23 | ) | | | 50,144 | | | | 1.97 | | | | (1.21 | )(h) | | | 1.98 | | | | 63 | |
| | | | | | |
| | | | | | | | | | | | | | | | | | | | | | | | | | |
| | 20.63 | | | | 14.29 | | | | 57,283 | | | | 1.00 | | | | (0.50 | ) | | | 1.24 | | | | 23 | |
| | 21.17 | | | | (14.19 | ) | | | 64,589 | | | | 1.00 | | | | (0.57 | ) | | | 1.09 | | | | 56 | |
| | 28.34 | | | | 13.30 | | | | 386,459 | | | | 1.00 | | | | (0.57 | ) | | | 1.11 | | | | 48 | |
| | 27.08 | | | | 18.87 | | | | 417,048 | | | | 1.06 | | | | (0.69 | ) | | | 1.13 | | | | 65 | |
| | 24.70 | | | | 28.02 | | | | 387,402 | | | | 1.09 | | | | (0.33 | )(g) | | | 1.19 | | | | 65 | |
| | 20.02 | | | | (6.40 | ) | | | 219,805 | | | | 1.10 | | | | (0.32 | )(h) | | | 1.22 | | | | 63 | |
SEE NOTES TO FINANCIAL STATEMENTS.
| | | | | | | | |
| | | |
| DECEMBER 31, 2016 | | J.P. MORGAN SMALL CAP FUNDS | | | | | 63 | |
FINANCIAL HIGHLIGHTS
FOR THE PERIODS INDICATED (continued)
| | | | | | | | | | | | | | | | | | | | | | | | | | | | |
| | | | | | Per share operating performance | |
| | | | | | Investment operations | | | Distributions | |
| | | Net asset
value,
beginning of
period | | | Net
investment
income
(loss) | | | Net realized
and unrealized
gains
(losses) on
investments | | | Total from
investment
operations | | | Net
investment
income | | | Net
realized
gain | | | Total
distributions | |
Small Cap Core Fund | | | | | | | | | | | | | | | | | | | | | | | | | | | | |
Class A | | | | | | | | | | | | | | | | | | | | | | | | | | | | |
Six Months Ended December 31, 2016 (Unaudited) | | $ | 45.88 | | | $ | 0.07 | (g) | | $ | 9.39 | | | $ | 9.46 | | | $ | (0.20 | ) | | $ | (5.13 | ) | | $ | (5.33 | ) |
May 31, 2016 (f) through June 30, 2016 | | | 45.81 | | | | 0.02 | (g)(h) | | | 0.05 | | | | 0.07 | | | | — | | | | — | | | | — | |
| | | | | | | |
Class C | | | | | | | | | | | | | | | | | | | | | | | | | | | | |
Six Months Ended December 31, 2016 (Unaudited) | | | 45.86 | | | | (0.07 | )(g) | | | 9.39 | | | | 9.32 | | | | (0.09 | ) | | | (5.13 | ) | | | (5.22 | ) |
May 31, 2016 (f) through June 30, 2016 | | | 45.81 | | | | — | (g)(h)(i) | | | 0.05 | | | | 0.05 | | | | — | | | | — | | | | — | |
| | | | | | | |
Class R5 (formerly Select Class) | | | | | | | | | | | | | | | | | | | | | | | | | | | | |
Six Months Ended December 31, 2016 (Unaudited) | | | 45.90 | | | | 0.15 | (g) | | | 9.43 | | | | 9.58 | | | | (0.16 | ) | | | (5.13 | ) | | | (5.29 | ) |
Year Ended June 30, 2016 | | | 56.18 | | | | 0.15 | (g)(h) | | | (5.25 | ) | | | (5.10 | ) | | | (0.32 | ) | | | (4.86 | ) | | | (5.18 | ) |
Year Ended June 30, 2015 | | | 58.70 | | | | 0.37 | (g) | | | 3.20 | | | | 3.57 | | | | (0.10 | ) | | | (5.99 | ) | | | (6.09 | ) |
Year Ended June 30, 2014 | | | 48.11 | | | | 0.15 | (j) | | | 13.44 | | | | 13.59 | | | | (0.27 | ) | | | (2.73 | ) | | | (3.00 | ) |
Year Ended June 30, 2013 | | | 37.54 | | | | 0.37 | (k) | | | 10.63 | | | | 11.00 | | | | (0.43 | ) | | | — | | | | (0.43 | ) |
Year Ended June 30, 2012 | | | 39.44 | | | | 0.27 | (l) | | | (1.98 | ) | | | (1.71 | ) | | | (0.19 | ) | | | — | | | | (0.19 | ) |
| | | | | | | |
Class R6 | | | | | | | | | | | | | | | | | | | | | | | | | | | | |
Six Months Ended December 31, 2016 (Unaudited) | | | 45.90 | | | | 0.16 | (g) | | | 9.44 | | | | 9.60 | | | | (0.25 | ) | | | (5.13 | ) | | | (5.38 | ) |
May 31, 2016 (f) through June 30, 2016 | | | 45.81 | | | | 0.04 | (g)(h) | | | 0.05 | | | | 0.09 | | | | — | | | | — | | | | — | |
| (a) | Annualized for periods less than one year, unless otherwise noted. |
| (b) | Not annualized for periods less than one year. |
| (c) | Includes adjustments in accordance with accounting principles generally accepted in the United States of America and as such, the net asset values for financial reporting purposes and the returns based upon those net asset values may differ from the net asset values and returns for shareholder transactions. |
| (d) | Includes earnings credits and interest expense, if applicable, each of which is less than 0.005% unless otherwise noted. |
| (e) | Portfolio turnover is calculated by dividing the lesser of total purchases or sales of portfolio securities for the reporting period by the monthly average value of portfolio securities owned during the reporting period. Excluded from both the numerator and denominator are amounts relating to derivatives and securities whose maturities or expiration dates at the time of acquisition were one year or less. |
| (f) | Commencement of offering of class of shares. |
| (g) | Calculated based upon average shares outstanding. |
| (h) | Net investment income (loss) may appear disproportionate among classes due to the timing of recognition of income and changes in the relative size of the classes. |
| (i) | Amount rounds to less than $0.005. |
| (j) | Reflects special dividends paid out during the period by one of the Fund’s holdings. Had the Fund not received the special dividends, the net investment income (loss) per share would have been $0.09 and the net investment income (loss) ratio would have been 0.17% for Class R5 Shares. |
| (k) | Reflects special dividends paid out during the period by one of the Fund’s holdings. Had the Fund not received the special dividends, the net investment income (loss) per share would have been $0.19 and the net investment income (loss) ratio would have been 0.44% for Class R5 Shares. |
| (l) | Reflects special dividends paid out during the period by one of the Fund’s holdings. Had the Fund not received the special dividends, the net investment income (loss) per share would have been $0.14 and the net investment income (loss) ratio would have been 0.39% for Class R5 Shares. |
SEE NOTES TO FINANCIAL STATEMENTS.
| | | | | | |
| | | |
| 64 | | | | J.P. MORGAN SMALL CAP FUNDS | | DECEMBER 31, 2016 |
| | | | | | | | | | | | | | | | | | | | | | | | | | |
| | | Ratios/Supplemental data | |
| | | | | | | | | | Ratios to average net assets (a) | | | | |
Net asset
value,
end of
period | | | Total return
(excludes
sales charge) (b)(c) | | | Net assets,
end of
period
(000’s) | | | Net
expenses (d) | | | Net
investment
income
(loss) | | |
Expenses
without waivers,
reimbursements and
earnings credits | | | Portfolio
turnover
rate (b)(e) | |
| | | | | | | | | | | | | | | | | | | | | | | | | | |
| | | | | | | | | | | | | | | | | | | | | | | | | | |
| $ | 50.01 | | | | 20.71 | % | | $ | 93 | | | | 1.24 | % | | | 0.27 | % | | | 1.60 | % | | | 22 | % |
| | 45.88 | | | | 0.15 | | | | 23 | | | | 1.25 | | | | 0.56 | (h) | | | 1.39 | | | | 58 | |
| | | | | | |
| | | | | | | | | | | | | | | | | | | | | | | | | | |
| | 49.96 | | | | 20.43 | | | | 53 | | | | 1.74 | | | | (0.28 | ) | | | 2.03 | | | | 22 | |
| | 45.86 | | | | 0.11 | | | | 20 | | | | 1.74 | | | | 0.06 | (h) | | | 1.89 | | | | 58 | |
| | | | | | |
| | | | | | | | | | | | | | | | | | | | | | | | | | |
| | 50.19 | | | | 20.97 | | | | 190,358 | | | | 0.79 | | | | 0.59 | | | | 1.21 | | | | 22 | |
| | 45.90 | | | | (8.97 | ) | | | 164,573 | | | | 0.80 | | | | 0.30 | (h) | | | 1.16 | | | | 58 | |
| | 56.18 | | | | 7.01 | | | | 815,652 | | | | 0.80 | | | | 0.66 | | | | 1.13 | | | | 56 | |
| | 58.70 | | | | 28.95 | | | | 703,307 | | | | 0.79 | | | | 0.28 | (j) | | | 1.12 | | | | 51 | |
| | 48.11 | | | | 29.50 | | | | 522,295 | | | | 0.79 | | | | 0.84 | (k) | | | 1.19 | | | | 55 | |
| | 37.54 | | | | (4.29 | ) | | | 406,590 | | | | 0.80 | | | | 0.64 | (l) | | | 1.02 | | | | 45 | |
| | | | | | |
| | | | | | | | | | | | | | | | | | | | | | | | | | |
| | 50.12 | | | | 21.02 | | | | 24 | | | | 0.74 | | | | 0.64 | | | | 1.03 | | | | 22 | |
| | 45.90 | | | | 0.20 | | | | 20 | | | | 0.74 | | | | 1.06 | (h) | | | 0.88 | | | | 58 | |
SEE NOTES TO FINANCIAL STATEMENTS.
| | | | | | | | |
| | | |
| DECEMBER 31, 2016 | | J.P. MORGAN SMALL CAP FUNDS | | | | | 65 | |
FINANCIAL HIGHLIGHTS
FOR THE PERIODS INDICATED (continued)
| | | | | | | | | | | | | | | | | | | | | | | | | | | | |
| | | | | | Per share operating performance | |
| | | | | | Investment operations | | | Distributions | |
| | | Net asset
value,
beginning
of period | | | Net
investment
income
(loss) (b) | | | Net realized
and unrealized
gains
(losses) on
investments | | | Total from
investment
operations | | | Net
investment
income | | | Net
realized
gain | | | Total
distributions | |
Small Cap Equity Fund | | | | | | | | | | | | | | | | | | | | | | | | | | | | |
Class A | | | | | | | | | | | | | | | | | | | | | | | | | | | | |
Six Months Ended December 31, 2016 (Unaudited) | | $ | 41.68 | | | $ | 0.08 | (g) | | $ | 5.28 | | | $ | 5.36 | | | $ | (0.12 | ) | | $ | (1.25 | ) | | $ | (1.37 | ) |
Year Ended June 30, 2016 | | | 44.68 | | | | 0.13 | (g) | | | 0.08 | | | | 0.21 | | | | (0.14 | ) | | | (3.07 | ) | | | (3.21 | ) |
Year Ended June 30, 2015 | | | 46.56 | | | | 0.08 | | | | 2.98 | | | | 3.06 | | | | (0.08 | ) | | | (4.86 | ) | | | (4.94 | ) |
Year Ended June 30, 2014 | | | 39.94 | | | | 0.10 | (h) | | | 8.97 | | | | 9.07 | | | | (0.07 | ) | | | (2.38 | ) | | | (2.45 | ) |
Year Ended June 30, 2013 | | | 36.02 | | | | 0.29 | (i) | | | 7.39 | | | | 7.68 | | | | (0.36 | ) | | | (3.40 | ) | | | (3.76 | ) |
Year Ended June 30, 2012 | | | 36.72 | | | | 0.07 | | | | 1.09 | | | | 1.16 | | | | (0.10 | ) | | | (1.76 | ) | | | (1.86 | ) |
| | | | | | | |
Class C | | | | | | | | | | | | | | | | | | | | | | | | | | | | |
Six Months Ended December 31, 2016 (Unaudited) | | | 32.21 | | | | (0.02 | )(g) | | | 4.07 | | | | 4.05 | | | | (0.11 | ) | | | (1.25 | ) | | | (1.36 | ) |
Year Ended June 30, 2016 | | | 35.32 | | | | (0.06 | )(g) | | | 0.02 | | | | (0.04 | ) | | | — | | | | (3.07 | ) | | | (3.07 | ) |
Year Ended June 30, 2015 | | | 37.96 | | | | (0.12 | ) | | | 2.34 | | | | 2.22 | | | | — | | | | (4.86 | ) | | | (4.86 | ) |
Year Ended June 30, 2014 | | | 33.06 | | | | (0.10 | )(h) | | | 7.38 | | | | 7.28 | | | | — | | | | (2.38 | ) | | | (2.38 | ) |
Year Ended June 30, 2013 | | | 30.46 | | | | 0.09 | (i) | | | 6.15 | | | | 6.24 | | | | (0.24 | ) | | | (3.40 | ) | | | (3.64 | ) |
Year Ended June 30, 2012 | | | 31.41 | | | | (0.08 | ) | | | 0.89 | | | | 0.81 | | | | — | | | | (1.76 | ) | | | (1.76 | ) |
| | | | | | | |
Class R2 | | | | | | | | | | | | | | | | | | | | | | | | | | | | |
Six Months Ended December 31, 2016 (Unaudited) | | | 41.08 | | | | 0.03 | (g) | | | 5.18 | | | | 5.21 | | | | (0.10 | ) | | | (1.25 | ) | | | (1.35 | ) |
Year Ended June 30, 2016 | | | 44.04 | | | | 0.01 | (g) | | | 0.10 | | | | 0.11 | | | | — | | | | (3.07 | ) | | | (3.07 | ) |
Year Ended June 30, 2015 | | | 45.99 | | | | (0.04 | ) | | | 2.95 | | | | 2.91 | | | | — | | | | (4.86 | ) | | | (4.86 | ) |
Year Ended June 30, 2014 | | | 39.52 | | | | (0.01 | )(h) | | | 8.86 | | | | 8.85 | | | | — | | | | (2.38 | ) | | | (2.38 | ) |
Year Ended June 30, 2013 | | | 35.67 | | | | 0.20 | (i) | | | 7.31 | | | | 7.51 | | | | (0.26 | ) | | | (3.40 | ) | | | (3.66 | ) |
Year Ended June 30, 2012 | | | 36.41 | | | | (0.01 | ) | | | 1.07 | | | | 1.06 | | | | (0.04 | ) | | | (1.76 | ) | | | (1.80 | ) |
| | | | | | | |
Class R3 | | | | | | | | | | | | | | | | | | | | | | | | | | | | |
September 9, 2016 (j) through December 31, 2016 (Unaudited) | | | 43.22 | | | | 0.08 | (g) | | | 3.74 | | | | 3.82 | | | | (0.23 | ) | | | (1.25 | ) | | | (1.48 | ) |
| | | | | | | |
Class R4 | | | | | | | | | | | | | | | | | | | | | | | | | | | | |
September 9, 2016 (j) through December 31, 2016 (Unaudited) | | | 49.28 | | | | 0.13 | (g) | | | 4.26 | | | | 4.39 | | | | (0.25 | ) | | | (1.25 | ) | | | (1.50 | ) |
| | | | | | | |
Class R5 | | | | | | | | | | | | | | | | | | | | | | | | | | | | |
Six Months Ended December 31, 2016 (Unaudited) | | | 47.57 | | | | 0.18 | (g) | | | 6.06 | | | | 6.24 | | | | (0.26 | ) | | | (1.25 | ) | | | (1.51 | ) |
Year Ended June 30, 2016 | | | 50.43 | | | | 0.36 | (g) | | | 0.15 | | | | 0.51 | | | | (0.30 | ) | | | (3.07 | ) | | | (3.37 | ) |
Year Ended June 30, 2015 | | | 51.88 | | | | 0.34 | | | | 3.37 | | | | 3.71 | | | | (0.30 | ) | | | (4.86 | ) | | | (5.16 | ) |
Year Ended June 30, 2014 | | | 44.21 | | | | 0.36 | (h) | | | 9.96 | | | | 10.32 | | | | (0.27 | ) | | | (2.38 | ) | | | (2.65 | ) |
Year Ended June 30, 2013 | | | 39.47 | | | | 0.52 | (i) | | | 8.16 | | | | 8.68 | | | | (0.54 | ) | | | (3.40 | ) | | | (3.94 | ) |
Year Ended June 30, 2012 | | | 40.04 | | | | 0.28 | | | | 1.19 | | | | 1.47 | | | | (0.28 | ) | | | (1.76 | ) | | | (2.04 | ) |
| | | | | | | |
Class R6 | | | | | | | | | | | | | | | | | | | | | | | | | | | | |
Six Months Ended December 31, 2016 (Unaudited) | | | 47.57 | | | | 0.36 | (g) | | | 5.89 | | | | 6.25 | | | | (0.29 | ) | | | (1.25 | ) | | | (1.54 | ) |
May 31, 2016 (j) through June 30, 2016 | | | 47.04 | | | | 0.06 | (g) | | | 0.47 | | | | 0.53 | | | | — | | | | — | | | | — | |
| | | | | | | |
Select Class | | | | | | | | | | | | | | | | | | | | | | | | | | | | |
Six Months Ended December 31, 2016 (Unaudited) | | | 47.50 | | | | 0.17 | (g) | | | 6.00 | | | | 6.17 | | | | (0.21 | ) | | | (1.25 | ) | | | (1.46 | ) |
Year Ended June 30, 2016 | | | 50.31 | | | | 0.25 | (g) | | | 0.17 | | | | 0.42 | | | | (0.16 | ) | | | (3.07 | ) | | | (3.23 | ) |
Year Ended June 30, 2015 | | | 51.78 | | | | 0.24 | | | | 3.36 | | | | 3.60 | | | | (0.21 | ) | | | (4.86 | ) | | | (5.07 | ) |
Year Ended June 30, 2014 | | | 44.14 | | | | 0.26 | (h) | | | 9.94 | | | | 10.20 | | | | (0.18 | ) | | | (2.38 | ) | | | (2.56 | ) |
Year Ended June 30, 2013 | | | 39.41 | | | | 0.44 | (i) | | | 8.15 | | | | 8.59 | | | | (0.46 | ) | | | (3.40 | ) | | | (3.86 | ) |
Year Ended June 30, 2012 | | | 39.98 | | | | 0.19 | | | | 1.20 | | | | 1.39 | | | | (0.20 | ) | | | (1.76 | ) | | | (1.96 | ) |
| (a) | Annualized for periods less than one year, unless otherwise noted. |
| (b) | Calculated based upon average shares outstanding. |
| (c) | Not annualized for periods less than one year. |
| (d) | Includes adjustments in accordance with accounting principles generally accepted in the United States of America and as such, the net asset values for financial reporting purposes and the returns based upon those net asset values may differ from the net asset values and returns for shareholder transactions. |
| (e) | Includes earnings credits and interest expense, if applicable, each of which is less than 0.005% unless otherwise noted. |
| (f) | Portfolio turnover is calculated by dividing the lesser of total purchases or sales of portfolio securities for the reporting period by the monthly average value of portfolio securities owned during the reporting period. Excluded from both the numerator and denominator are amounts relating to derivatives and securities whose maturities or expiration dates at the time of acquisition were one year or less. |
| (g) | Net investment income (loss) may appear disproportionate among classes due to the timing of recognition of income and changes in the relative size of the classes. |
| (h) | Reflects special dividends paid out during the period by several of the Fund’s holdings. Had the Fund not received the special dividends, the net investment income (loss) per share would have been $(0.04), $(0.21), $(0.15), $0.20 and $0.10 for Class A, Class C, Class R2, Class R5 and Select Class Shares, respectively, and the net investment income (loss) ratio would have been (0.09)%, (0.59)%, (0.34)%, 0.41% and 0.21% for Class A, Class C, Class R2, Class R5 and Select Class Shares, respectively. |
| (i) | Reflects special dividends paid out during the period by several of the Fund’s holdings. Had the Fund not received the special dividends, the net investment income (loss) per share would have been $0.05, $(0.11), $(0.04), $0.26 and $0.18 for Class A, Class C, Class R2, Class R5 and Select Class Shares, respectively, and the net investment income (loss) ratio would have been 0.14%, (0.36)%, (0.10)%, 0.62% and 0.44% for Class A, Class C, Class R2, Class R5 and Select Class Shares, respectively. |
| (j) | Commencement of offering of class of shares. |
SEE NOTES TO FINANCIAL STATEMENTS.
| | | | | | |
| | | |
| 66 | | | | J.P. MORGAN SMALL CAP FUNDS | | DECEMBER 31, 2016 |
| | | | | | | | | | | | | | | | | | | | | | | | | | |
| | | Ratios/Supplemental data | |
| | | | | | | | | | Ratios to average net assets (a) | | | | |
Net asset
value,
end of
period | | | Total return
(excludes
sales charge) (c)(d) | | | Net assets,
end of
period
(000’s) | | | Net
expenses (e) | | | Net
investment
income
(loss) | | |
Expenses
without waivers,
reimbursements and
earnings credits | | | Portfolio
turnover
rate (c)(f) | |
| | | | | | | | | | | | | | | | | | | | | | | | | | |
| | | | | | | | | | | | | | | | | | | | | | | | | | |
| $ | 45.67 | | | | 12.83 | % | | $ | 1,272,775 | | | | 1.29 | % | | | 0.34 | %(g) | | | 1.36 | % | | | 7 | % |
| | 41.68 | | | | 1.10 | | | | 736,629 | | | | 1.29 | | | | 0.31 | (g) | | | 1.38 | | | | 32 | |
| | 44.68 | | | | 7.49 | | | | 674,619 | | | | 1.29 | | | | 0.17 | | | | 1.39 | | | | 20 | |
| | 46.56 | | | | 23.27 | | | | 738,967 | | | | 1.29 | | | | 0.23 | (h) | | | 1.37 | | | | 30 | |
| | 39.94 | | | | 23.11 | | | | 696,784 | | | | 1.29 | | | | 0.78 | (i) | | | 1.39 | | | | 25 | |
| | 36.02 | | | | 3.79 | | | | 618,705 | | | | 1.30 | | | | 0.21 | | | | 1.41 | | | | 27 | |
| | | | | | |
| | | | | | | | | | | | | | | | | | | | | | | | | | |
| | 34.90 | | | | 12.54 | | | | 167,427 | | | | 1.79 | | | | (0.10 | )(g) | | | 1.83 | | | | 7 | |
| | 32.21 | | | | 0.63 | | | | 70,176 | | | | 1.79 | | | | (0.20 | )(g) | | | 1.85 | | | | 32 | |
| | 35.32 | | | | 6.92 | | | | 35,783 | | | | 1.79 | | | | (0.33 | ) | | | 1.87 | | | | 20 | |
| | 37.96 | | | | 22.67 | | | | 39,824 | | | | 1.79 | | | | (0.26 | )(h) | | | 1.87 | | | | 30 | |
| | 33.06 | | | | 22.50 | | | | 37,039 | | | | 1.79 | | | | 0.28 | (i) | | | 1.88 | | | | 25 | |
| | 30.46 | | | | 3.26 | | | | 34,994 | | | | 1.80 | | | | (0.29 | ) | | | 1.91 | | | | 27 | |
| | | | | | |
| | | | | | | | | | | | | | | | | | | | | | | | | | |
| | 44.94 | | | | 12.66 | | | | 10,617 | | | | 1.54 | | | | 0.12 | (g) | | | 1.66 | | | | 7 | |
| | 41.08 | | | | 0.85 | | | | 5,313 | | | | 1.54 | | | | 0.03 | (g) | | | 1.72 | | | | 32 | |
| | 44.04 | | | | 7.23 | | | | 3,446 | | | | 1.54 | | | | (0.08 | ) | | | 1.73 | | | | 20 | |
| | 45.99 | | | | 22.95 | | | | 3,883 | | | | 1.54 | | | | (0.02 | )(h) | | | 1.62 | | | | 30 | |
| | 39.52 | | | | 22.80 | | | | 4,909 | | | | 1.54 | | | | 0.53 | (i) | | | 1.64 | | | | 25 | |
| | 35.67 | | | | 3.51 | | | | 5,587 | | | | 1.55 | | | | (0.03 | ) | | | 1.66 | | | | 27 | |
| | | | | | |
| | | | | | | | | | | | | | | | | | | | | | | | | | |
| | 45.56 | | | | 8.80 | | | | 22 | | | | 1.24 | | | | 0.61 | (g) | | | 1.25 | | | | 7 | |
| | | | | | |
| | | | | | | | | | | | | | | | | | | | | | | | | | |
| | 52.17 | | | | 8.89 | | | | 22 | | | | 0.99 | | | | 0.86 | (g) | | | 1.00 | | | | 7 | |
| | | | | | |
| | | | | | | | | | | | | | | | | | | | | | | | | | |
| | 52.30 | | | | 13.09 | | | | 1,171,021 | | | | 0.79 | | | | 0.70 | (g) | | | 0.85 | | | | 7 | |
| | 47.57 | | | | 1.62 | | | | 1,349,107 | | | | 0.79 | | | | 0.78 | (g) | | | 0.86 | | | | 32 | |
| | 50.43 | | | | 8.03 | | | | 1,244,878 | | | | 0.79 | | | | 0.68 | | | | 0.89 | | | | 20 | |
| | 51.88 | | | | 23.90 | | | | 1,177,534 | | | | 0.79 | | | | 0.73 | (h) | | | 0.92 | | | | 30 | |
| | 44.21 | | | | 23.71 | | | | 814,942 | | | | 0.79 | | | | 1.25 | (i) | | | 0.94 | | | | 25 | |
| | 39.47 | | | | 4.31 | | | | 696,200 | | | | 0.79 | | | | 0.73 | | | | 0.96 | | | | 27 | |
| | | | | | |
| | | | | | | | | | | | | | | | | | | | | | | | | | |
| | 52.28 | | | | 13.12 | | | | 772,378 | | | | 0.74 | | | | 1.37 | (g) | | | 0.75 | | | | 7 | |
| | 47.57 | | | | 1.13 | | | | 25,933 | | | | 0.73 | | | | 1.60 | (g) | | | 0.75 | | | | 32 | |
| | | | | | |
| | | | | | | | | | | | | | | | | | | | | | | | | | |
| | 52.21 | | | | 12.97 | | | | 2,464,094 | | | | 0.99 | | | | 0.66 | (g) | | | 1.05 | | | | 7 | |
| | 47.50 | | | | 1.41 | | | | 1,261,772 | | | | 0.99 | | | | 0.54 | (g) | | | 1.14 | | | | 32 | |
| | 50.31 | | | | 7.81 | | | | 1,435,112 | | | | 0.99 | | | | 0.48 | | | | 1.14 | | | | 20 | |
| | 51.78 | | | | 23.65 | | | | 1,443,768 | | | | 0.99 | | | | 0.53 | (h) | | | 1.12 | | | | 30 | |
| | 44.14 | | | | 23.48 | | | | 1,134,887 | | | | 0.99 | | | | 1.07 | (i) | | | 1.14 | | | | 25 | |
| | 39.41 | | | | 4.09 | | | | 1,076,509 | | | | 1.00 | | | | 0.51 | | | | 1.16 | | | | 27 | |
SEE NOTES TO FINANCIAL STATEMENTS.
| | | | | | | | |
| | | |
| DECEMBER 31, 2016 | | J.P. MORGAN SMALL CAP FUNDS | | | | | 67 | |
FINANCIAL HIGHLIGHTS
FOR THE PERIODS INDICATED (continued)
| | | | | | | | | | | | | | | | | | | | |
| | | Per share operating performance | |
| | | | | | Investment operations | | | Distributions | |
| | | Net asset
value,
beginning
of period | | | Net
investment
income
(loss) (b) | | | Net realized
and unrealized
gains
(losses) on
investments | | | Total from
investment
operations | | | Net
realized
gain | |
Small Cap Growth Fund | | | | | | | | | | | | | | | | | | | | |
Class A | | | | | | | | | | | | | | | | | | | | |
Six Months Ended December 31, 2016 (Unaudited) | | $ | 11.43 | | | $ | (0.05 | )(g) | | $ | 1.44 | | | $ | 1.39 | | | $ | (0.46 | ) |
Year Ended June 30, 2016 | | | 14.50 | | | | (0.09 | ) | | | (1.94 | ) | | | (2.03 | ) | | | (1.04 | ) |
Year Ended June 30, 2015 | | | 13.96 | | | | (0.11 | )(g) | | | 1.77 | | | | 1.66 | | | | (1.12 | ) |
Year Ended June 30, 2014 | | | 13.00 | | | | (0.12 | ) | | | 2.52 | | | | 2.40 | | | | (1.44 | ) |
Year Ended June 30, 2013 | | | 11.13 | | | | (0.06 | )(h) | | | 2.94 | | | | 2.88 | | | | (1.01 | ) |
Year Ended June 30, 2012 | | | 12.17 | | | | (0.05 | )(i) | | | (0.77 | ) | | | (0.82 | ) | | | (0.22 | ) |
| | | | | |
Class C | | | | | | | | | | | | | | | | | | | | |
Six Months Ended December 31, 2016 (Unaudited) | | | 8.82 | | | | (0.06 | )(g) | | | 1.10 | | | | 1.04 | | | | (0.46 | ) |
Year Ended June 30, 2016 | | | 11.50 | | | | (0.12 | ) | | | (1.52 | ) | | | (1.64 | ) | | | (1.04 | ) |
Year Ended June 30, 2015 | | | 11.36 | | | | (0.14 | )(g) | | | 1.40 | | | | 1.26 | | | | (1.12 | ) |
Year Ended June 30, 2014 | | | 10.87 | | | | (0.16 | ) | | | 2.09 | | | | 1.93 | | | | (1.44 | ) |
Year Ended June 30, 2013 | | | 9.51 | | | | (0.10 | )(h) | | | 2.47 | | | | 2.37 | | | | (1.01 | ) |
Year Ended June 30, 2012 | | | 10.48 | | | | (0.09 | )(i) | | | (0.66 | ) | | | (0.75 | ) | | | (0.22 | ) |
| | | | | |
Class L (formerly Institutional Class) | | | | | | | | | | | | | | | | | | | | |
Six Months Ended December 31, 2016 (Unaudited) | | | 12.72 | | | | (0.02 | )(g) | | | 1.58 | | | | 1.56 | | | | (0.46 | ) |
Year Ended June 30, 2016 | | | 15.93 | | | | (0.05 | ) | | | (2.12 | ) | | | (2.17 | ) | | | (1.04 | ) |
Year Ended June 30, 2015 | | | 15.17 | | | | (0.06 | )(g) | | | 1.94 | | | | 1.88 | | | | (1.12 | ) |
Year Ended June 30, 2014 | | | 13.96 | | | | (0.07 | ) | | | 2.72 | | | | 2.65 | | | | (1.44 | ) |
Year Ended June 30, 2013 | | | 11.84 | | | | (0.01 | )(h) | | | 3.14 | | | | 3.13 | | | | (1.01 | ) |
Year Ended June 30, 2012 | | | 12.87 | | | | (0.01 | )(i) | | | (0.80 | ) | | | (0.81 | ) | | | (0.22 | ) |
| | | | | |
Class R2 | | | | | | | | | | | | | | | | | | | | |
Six Months Ended December 31, 2016 (Unaudited) | | | 11.15 | | | | (0.06 | )(g) | | | 1.39 | | | | 1.33 | | | | (0.46 | ) |
Year Ended June 30, 2016 | | | 14.20 | | | | (0.12 | ) | | | (1.89 | ) | | | (2.01 | ) | | | (1.04 | ) |
Year Ended June 30, 2015 | | | 13.73 | | | | (0.14 | )(g) | | | 1.73 | | | | 1.59 | | | | (1.12 | ) |
Year Ended June 30, 2014 | | | 12.84 | | | | (0.16 | ) | | | 2.49 | | | | 2.33 | | | | (1.44 | ) |
Year Ended June 30, 2013 | | | 11.03 | | | | (0.09 | )(h) | | | 2.91 | | | | 2.82 | | | | (1.01 | ) |
Year Ended June 30, 2012 | | | 12.09 | | | | (0.08 | )(i) | | | (0.76 | ) | | | (0.84 | ) | | | (0.22 | ) |
| | | | | |
Class R5 | | | | | | | | | | | | | | | | | | | | |
September 9, 2016 (j) through December 31, 2016 (Unaudited) | | | 13.75 | | | | (0.01 | )(g) | | | 0.54 | | | | 0.53 | | | | (0.46 | ) |
| | | | | |
Class R6 | | | | | | | | | | | | | | | | | | | | |
Six Months Ended December 31, 2016 (Unaudited) | | | 12.80 | | | | (0.02 | )(g) | | | 1.61 | | | | 1.59 | | | | (0.46 | ) |
Year Ended June 30, 2016 | | | 16.01 | | | | (0.03 | ) | | | (2.14 | ) | | | (2.17 | ) | | | (1.04 | ) |
Year Ended June 30, 2015 | | | 15.23 | | | | (0.05 | )(g) | | | 1.95 | | | | 1.90 | | | | (1.12 | ) |
Year Ended June 30, 2014 | | | 14.00 | | | | (0.06 | ) | | | 2.73 | | | | 2.67 | | | | (1.44 | ) |
Year Ended June 30, 2013 | | | 11.85 | | | | — | (h)(k) | | | 3.16 | | | | 3.16 | | | | (1.01 | ) |
Year Ended June 30, 2012 | | | 12.88 | | | | — | (i)(k) | | | (0.81 | ) | | | (0.81 | ) | | | (0.22 | ) |
| | | | | |
Select Class | | | | | | | | | | | | | | | | | | | | |
Six Months Ended December 31, 2016 (Unaudited) | | | 12.42 | | | | (0.03 | )(g) | | | 1.55 | | | | 1.52 | | | | (0.46 | ) |
Year Ended June 30, 2016 | | | 15.61 | | | | (0.07 | ) | | | (2.08 | ) | | | (2.15 | ) | | | (1.04 | ) |
Year Ended June 30, 2015 | | | 14.91 | | | | (0.08 | )(g) | | | 1.90 | | | | 1.82 | | | | (1.12 | ) |
Year Ended June 30, 2014 | | | 13.77 | | | | (0.09 | ) | | | 2.67 | | | | 2.58 | | | | (1.44 | ) |
Year Ended June 30, 2013 | | | 11.70 | | | | (0.03 | )(h) | | | 3.11 | | | | 3.08 | | | | (1.01 | ) |
Year Ended June 30, 2012 | | | 12.74 | | | | (0.02 | )(i) | | | (0.80 | ) | | | (0.82 | ) | | | (0.22 | ) |
| (a) | Annualized for periods less than one year, unless otherwise noted. |
| (b) | Calculated based upon average shares outstanding. |
| (c) | Not annualized for periods less than one year. |
| (d) | Includes adjustments in accordance with accounting principles generally accepted in the United States of America and as such, the net asset values for financial reporting purposes and the returns based upon those net asset values may differ from the net asset values and returns for shareholder transactions. |
| (e) | Includes earnings credits and interest expense, if applicable, each of which is less than 0.005% unless otherwise noted. |
| (f) | Portfolio turnover is calculated by dividing the lesser of total purchases or sales of portfolio securities for the reporting period by the monthly average value of portfolio securities owned during the reporting period. Excluded from both the numerator and denominator are amounts relating to derivatives and securities whose maturities or expiration dates at the time of acquisition were one year or less. |
| (g) | Net investment income (loss) may appear disproportionate among classes due to the timing of recognition of income and changes in the relative size of the classes. |
| (h) | Reflects special dividends paid out during the period by one of the Fund’s holdings. Had the Fund not received the special dividends, the net investment income (loss) per share would have been $(0.09), $(0.13), $(0.05), $(0.12), $(0.04) and $(0.07) for Class A, Class C, Class L, Class R2, Class R6 and Select Class Shares, respectively, and the net investment income (loss) ratio would have been (0.80)%, (1.30)%, (0.40)%, (1.04)%, (0.29)% and (0.54)% for Class A, Class C, Class L, Class R2, Class R6 and Select Class Shares, respectively. |
| (i) | Reflects special dividends paid out during the period by one of the Fund’s holdings. Had the Fund not received the special dividends, the net investment income (loss) per share would have been $(0.07), $(0.11), $(0.27), $(0.10), $(0.02) and $(0.40) for Class A, Class C, Class L, Class R2, Class R6 and Select Class Shares, respectively, and the net investment income (loss) ratio would have been (0.68)%, (1.18)%, (0.03)%, (0.92)%, (0.19)% and (0.05)% for Class A, Class C, Class L, Class R2, Class R6 and Select Class Shares, respectively. |
| (j) | Commencement of offering of class of shares. |
| (k) | Amount rounds to less than $0.005. |
| (l) | Amount rounds to less than 0.005%. |
SEE NOTES TO FINANCIAL STATEMENTS.
| | | | | | |
| | | |
| 68 | | | | J.P. MORGAN SMALL CAP FUNDS | | DECEMBER 31, 2016 |
| | | | | | | | | | | | | | | | | | | | | | | | | | |
| | | Ratios/Supplemental data | |
| | | | | | | | | | Ratios to average net assets (a) | | | | |
Net asset
value,
end of
period | | | Total return
(excludes
sales charge) (c)(d) | | | Net assets,
end of
period
(000’s) | | | Net
expenses (e) | | | Net
investment
income
(loss) | | |
Expenses
without waivers,
reimbursements and
earnings credits | | | Portfolio
turnover
rate (c)(f) | |
| | | | | | | | | | | | | | | | | | | | | | | | | | |
| | | | | | | | | | | | | | | | | | | | | | | | | | |
| $ | 12.36 | | | | 12.14 | % | | $ | 174,807 | | | | 1.24 | % | | | (0.75 | )%(g) | | | 1.49 | % | | | 17 | % |
| | 11.43 | | | | (14.17 | ) | | | 179,093 | | | | 1.25 | | | | (0.77 | ) | | | 1.50 | | | | 47 | |
| | 14.50 | | | | 13.04 | | | | 266,805 | | | | 1.25 | | | | (0.82 | )(g) | | | 1.42 | | | | 50 | |
| | 13.96 | | | | 18.94 | | | | 282,408 | | | | 1.25 | | | | (0.86 | ) | | | 1.37 | | | | 58 | |
| | 13.00 | | | | 27.94 | | | | 249,986 | | | | 1.24 | | | | (0.50 | )(h) | | | 1.42 | | | | 60 | |
| | 11.13 | | | | (6.59 | ) | | | 219,946 | | | | 1.25 | | | | (0.46 | )(i) | | | 1.44 | | | | 58 | |
| | | | | | |
| | | | | | | | | | | | | | | | | | | | | | | | | | |
| | 9.40 | | | | 11.76 | | | | 18,570 | | | | 1.74 | | | | (1.24 | )(g) | | | 1.89 | | | | 17 | |
| | 8.82 | | | | (14.50 | ) | | | 18,218 | | | | 1.75 | | | | (1.27 | ) | | | 1.91 | | | | 47 | |
| | 11.50 | | | | 12.47 | | | | 26,297 | | | | 1.75 | | | | (1.32 | )(g) | | | 1.87 | | | | 50 | |
| | 11.36 | | | | 18.29 | | | | 28,035 | | | | 1.75 | | | | (1.36 | ) | | | 1.87 | | | | 58 | |
| | 10.87 | | | | 27.30 | | | | 25,415 | | | | 1.74 | | | | (1.00 | )(h) | | | 1.92 | | | | 60 | |
| | 9.51 | | | | (6.99 | ) | | | 23,689 | | | | 1.75 | | | | (0.97 | )(i) | | | 1.94 | | | | 58 | |
| | | | | | |
| | | | | | | | | | | | | | | | | | | | | | | | | | |
| | 13.82 | | | | 12.24 | | | | 280,206 | | | | 0.85 | | | | (0.35 | )(g) | | | 0.94 | | | | 17 | |
| | 12.72 | | | | (13.76 | ) | | | 271,369 | | | | 0.85 | | | | (0.35 | ) | | | 0.96 | | | | 47 | |
| | 15.93 | | | | 13.47 | | | | 279,248 | | | | 0.85 | | | | (0.42 | )(g) | | | 0.95 | | | | 50 | |
| | 15.17 | | | | 19.46 | | | | 302,087 | | | | 0.85 | | | | (0.46 | ) | | | 0.97 | | | | 58 | |
| | 13.96 | | | | 28.39 | | | | 230,458 | | | | 0.85 | | | | (0.11 | )(h) | | | 1.02 | | | | 60 | |
| | 11.84 | | | | (6.15 | ) | | | 226,834 | | | | 0.85 | | | | (0.06 | )(i) | | | 1.04 | | | | 58 | |
| | | | | | |
| | | | | | | | | | | | | | | | | | | | | | | | | | |
| | 12.02 | | | | 11.90 | | | | 21,002 | | | | 1.49 | | | | (1.00 | )(g) | | | 1.75 | | | | 17 | |
| | 11.15 | | | | (14.34 | ) | | | 21,276 | | | | 1.50 | | | | (1.01 | ) | | | 1.85 | | | | 47 | |
| | 14.20 | | | | 12.74 | | | | 28,364 | | | | 1.50 | | | | (1.07 | )(g) | | | 1.72 | | | | 50 | |
| | 13.73 | | | | 18.62 | | | | 31,119 | | | | 1.50 | | | | (1.11 | ) | | | 1.62 | | | | 58 | |
| | 12.84 | | | | 27.64 | | | | 26,561 | | | | 1.49 | | | | (0.75 | )(h) | | | 1.67 | | | | 60 | |
| | 11.03 | | | | (6.80 | ) | | | 22,514 | | | | 1.50 | | | | (0.71 | )(i) | | | 1.69 | | | | 58 | |
| | | | | | |
| | | | | | | | | | | | | | | | | | | | | | | | | | |
| | 13.82 | | | | 3.83 | | | | 878 | | | | 0.80 | | | | (0.22 | )(g) | | | 0.81 | | | | 17 | |
| | | | | | |
| | | | | | | | | | | | | | | | | | | | | | | | | | |
| | 13.93 | | | | 12.40 | | | | 487,982 | | | | 0.75 | | | | (0.24 | )(g) | | | 0.76 | | | | 17 | |
| | 12.80 | | | | (13.69 | ) | | | 445,008 | | | | 0.75 | | | | (0.25 | ) | | | 0.77 | | | | 47 | |
| | 16.01 | | | | 13.55 | | | | 486,724 | | | | 0.75 | | | | (0.31 | )(g) | | | 0.79 | | | | 50 | |
| | 15.23 | | | | 19.55 | | | | 355,032 | | | | 0.75 | | | | (0.36 | ) | | | 0.87 | | | | 58 | |
| | 14.00 | | | | 28.63 | | | | 248,415 | | | | 0.75 | | | | 0.00 | (h)(l) | | | 0.92 | | | | 60 | |
| | 11.85 | | | | (6.14 | ) | | | 200,960 | | | | 0.75 | | | | 0.02 | (i) | | | 0.94 | | | | 58 | |
| | | | | | |
| | | | | | | | | | | | | | | | | | | | | | | | | | |
| | 13.48 | | | | 12.21 | | | | 100,614 | | | | 0.99 | | | | (0.49 | )(g) | | | 1.18 | | | | 17 | |
| | 12.42 | | | | (13.92 | ) | | | 102,174 | | | | 1.00 | | | | (0.52 | ) | | | 1.18 | | | | 47 | |
| | 15.61 | | | | 13.29 | | | | 157,631 | | | | 1.00 | | | | (0.57 | )(g) | | | 1.16 | | | | 50 | |
| | 14.91 | | | | 19.20 | | | | 156,585 | | | | 1.00 | | | | (0.62 | ) | | | 1.12 | | | | 58 | |
| | 13.77 | | | | 28.30 | | | | 148,078 | | | | 1.00 | | | | (0.25 | )(h) | | | 1.17 | | | | 60 | |
| | 11.70 | | | | (6.29 | ) | | | 123,887 | | | | 1.00 | | | | (0.21 | )(i) | | | 1.19 | | | | 58 | |
SEE NOTES TO FINANCIAL STATEMENTS.
| | | | | | | | |
| | | |
| DECEMBER 31, 2016 | | J.P. MORGAN SMALL CAP FUNDS | | | | | 69 | |
FINANCIAL HIGHLIGHTS
FOR THE PERIODS INDICATED (continued)
| | | | | | | | | | | | | | | | | | | | | | | | | | | | |
| | | | | | Per share operating performance | |
| | | | | | Investment operations | | | Distributions | |
| | | Net asset
value,
beginning
of period | | | Net
investment
income
(loss) (b) | | | Net realized
and unrealized
gains
(losses) on
investments | | | Total from
investment
operations | | | Net
investment
income | | | Net
realized
gain | | | Total
distributions | |
Small Cap Value Fund | |
Class A | |
Six Months Ended December 31, 2016 (Unaudited) | | $ | 24.64 | | | $ | 0.07 | (g) | | $ | 5.40 | | | $ | 5.47 | | | $ | (0.13 | ) | | $ | (0.02 | ) | | $ | (0.15 | ) |
Year Ended June 30, 2016 | | | 26.65 | | | | 0.17 | | | | (0.94 | ) | | | (0.77 | ) | | | (0.15 | ) | | | (1.09 | ) | | | (1.24 | ) |
Year Ended June 30, 2015 | | | 27.98 | | | | 0.22 | | | | (0.01 | ) | | | 0.21 | | | | (0.20 | ) | | | (1.34 | ) | | | (1.54 | ) |
Year Ended June 30, 2014 | | | 23.77 | | | | 0.12 | (h) | | | 4.87 | | | | 4.99 | | | | (0.11 | ) | | | (0.67 | ) | | | (0.78 | ) |
Year Ended June 30, 2013 | | | 18.75 | | | | 0.21 | (i) | | | 5.04 | | | | 5.25 | | | | (0.23 | ) | | | — | | | | (0.23 | ) |
Year Ended June 30, 2012 | | | 18.99 | | | | 0.14 | | | | (0.22 | ) | | | (0.08 | ) | | | (0.16 | ) | | | — | | | | (0.16 | ) |
| | | | | | | |
Class C | | | | | | | | | | | | | | | | | | | | | | | | | | | | |
Six Months Ended December 31, 2016 (Unaudited) | | | 20.82 | | | | (0.01 | )(g) | | | 4.56 | | | | 4.55 | | | | (0.07 | ) | | | (0.02 | ) | | | (0.09 | ) |
Year Ended June 30, 2016 | | | 22.77 | | | | 0.02 | | | | (0.82 | ) | | | (0.80 | ) | | | (0.06 | ) | | | (1.09 | ) | | | (1.15 | ) |
Year Ended June 30, 2015 | | | 24.19 | | | | 0.05 | | | | (0.01 | ) | | | 0.04 | | | | (0.11 | ) | | | (1.34 | ) | | | (1.45 | ) |
Year Ended June 30, 2014 | | | 20.73 | | | | (0.03 | )(h) | | | 4.22 | | | | 4.19 | | | | (0.06 | ) | | | (0.67 | ) | | | (0.73 | ) |
Year Ended June 30, 2013 | | | 16.40 | | | | 0.06 | (i) | | | 4.41 | | | | 4.47 | | | | (0.14 | ) | | | — | | | | (0.14 | ) |
Year Ended June 30, 2012 | | | 16.64 | | | | 0.03 | | | | (0.19 | ) | | | (0.16 | ) | | | (0.08 | ) | | | — | | | | (0.08 | ) |
| | | | | | | |
Class R2 | | | | | | | | | | | | | | | | | | | | | | | | | | | | |
Six Months Ended December 31, 2016 (Unaudited) | | | 24.48 | | | | 0.04 | (g) | | | 5.35 | | | | 5.39 | | | | (0.09 | ) | | | (0.02 | ) | | | (0.11 | ) |
Year Ended June 30, 2016 | | | 26.49 | | | | 0.11 | | | | (0.94 | ) | | | (0.83 | ) | | | (0.09 | ) | | | (1.09 | ) | | | (1.18 | ) |
Year Ended June 30, 2015 | | | 27.83 | | | | 0.16 | | | | (0.02 | ) | | | 0.14 | | | | (0.14 | ) | | | (1.34 | ) | | | (1.48 | ) |
Year Ended June 30, 2014 | | | 23.67 | | | | 0.07 | (h) | | | 4.83 | | | | 4.90 | | | | (0.07 | ) | | | (0.67 | ) | | | (0.74 | ) |
Year Ended June 30, 2013 | | | 18.68 | | | | 0.15 | (i) | | | 5.03 | | | | 5.18 | | | | (0.19 | ) | | | — | | | | (0.19 | ) |
Year Ended June 30, 2012 | | | 18.93 | | | | 0.10 | | | | (0.23 | ) | | | (0.13 | ) | | | (0.12 | ) | | | — | | | | (0.12 | ) |
| | | | | | | |
Class R3 | | | | | | | | | | | | | | | | | | | | | | | | | | | | |
September 9, 2016 (i) through December 31, 2016 (Unaudited) | | | 25.89 | | | | 0.07 | (g) | | | 4.14 | | | | 4.21 | | | | (0.15 | ) | | | (0.02 | ) | | | (0.17 | ) |
| | | | | | | |
Class R4 | | | | | | | | | | | | | | | | | | | | | | | | | | | | |
September 9, 2016 (i) through December 31, 2016 (Unaudited) | | | 27.30 | | | | 0.10 | | | | 4.36 | | | | 4.46 | | | | (0.17 | ) | | | (0.02 | ) | | | (0.19 | ) |
| | | | | | | |
Class R5 | | | | | | | | | | | | | | | | | | | | | | | | | | | | |
Six Months Ended December 31, 2016 (Unaudited) | | | 25.97 | | | | 0.13 | (g) | | | 5.68 | | | | 5.81 | | | | (0.17 | ) | | | (0.02 | ) | | | (0.19 | ) |
Year Ended June 30, 2016 | | | 28.01 | | | | 0.26 | | | | (0.98 | ) | | | (0.72 | ) | | | (0.23 | ) | | | (1.09 | ) | | | (1.32 | ) |
Year Ended June 30, 2015 | | | 29.31 | | | | 0.34 | | | | (0.02 | ) | | | 0.32 | | | | (0.28 | ) | | | (1.34 | ) | | | (1.62 | ) |
Year Ended June 30, 2014 | | | 24.85 | | | | 0.23 | (h) | | | 5.09 | | | | 5.32 | | | | (0.19 | ) | | | (0.67 | ) | | | (0.86 | ) |
Year Ended June 30, 2013 | | | 19.58 | | | | 0.29 | (i) | | | 5.27 | | | | 5.56 | | | | (0.29 | ) | | | — | | | | (0.29 | ) |
Year Ended June 30, 2012 | | | 19.82 | | | | 0.20 | | | | (0.22 | ) | | | (0.02 | ) | | | (0.22 | ) | | | — | | | | (0.22 | ) |
| | | | | | | |
Class R6 | | | | | | | | | | | | | | | | | | | | | | | | | | | | |
Six Months Ended December 31, 2016 (Unaudited) | | | 25.99 | | | | 0.14 | (g) | | | 5.70 | | | | 5.84 | | | | (0.19 | ) | | | (0.02 | ) | | | (0.21 | ) |
Year Ended June 30, 2016 | | | 28.03 | | | | 0.31 | | | | (1.00 | ) | | | (0.69 | ) | | | (0.26 | ) | | | (1.09 | ) | | | (1.35 | ) |
Year Ended June 30, 2015 | | | 29.33 | | | | 0.37 | | | | (0.02 | ) | | | 0.35 | | | | (0.31 | ) | | | (1.34 | ) | | | (1.65 | ) |
Year Ended June 30, 2014 | | | 24.87 | | | | 0.24 | (h) | | | 5.09 | | | | 5.33 | | | | (0.20 | ) | | | (0.67 | ) | | | (0.87 | ) |
Year Ended June 30, 2013 | | | 19.59 | | | | 0.29 | (i) | | | 5.29 | | | | 5.58 | | | | (0.30 | ) | | | — | | | | (0.30 | ) |
Year Ended June 30, 2012 | | | 19.83 | | | | 0.22 | | | | (0.23 | ) | | | (0.01 | ) | | | (0.23 | ) | | | — | | | | (0.23 | ) |
| | | | | | | |
Select Class | | | | | | | | | | | | | | | | | | | | | | | | | | | | |
Six Months Ended December 31, 2016 (Unaudited) | | | 25.97 | | | | 0.11 | (g) | | | 5.68 | | | | 5.79 | | | | (0.16 | ) | | | (0.02 | ) | | | (0.18 | ) |
Year Ended June 30, 2016 | | | 28.00 | | | | 0.23 | | | | (0.97 | ) | | | (0.74 | ) | | | (0.20 | ) | | | (1.09 | ) | | | (1.29 | ) |
Year Ended June 30, 2015 | | | 29.31 | | | | 0.31 | | | | (0.02 | ) | | | 0.29 | | | | (0.26 | ) | | | (1.34 | ) | | | (1.60 | ) |
Year Ended June 30, 2014 | | | 24.86 | | | | 0.2 | (h) | | | 5.09 | | | | 5.29 | | | | (0.17 | ) | | | (0.67 | ) | | | (0.84 | ) |
Year Ended June 30, 2013 | | | 19.58 | | | | 0.26 | (i) | | | 5.29 | | | | 5.55 | | | | (0.27 | ) | | | — | | | | (0.27 | ) |
Year Ended June 30, 2012 | | | 19.82 | | | | 0.19 | | | | (0.23 | ) | | | (0.04 | ) | | | (0.20 | ) | | | — | | | | (0.20 | ) |
| (a) | Annualized for periods less than one year, unless otherwise noted. |
| (b) | Calculated based upon average shares outstanding. |
| (c) | Not annualized for periods less than one year. |
| (d) | Includes adjustments in accordance with accounting principles generally accepted in the United States of America and as such, the net asset values for financial reporting purposes and the returns based upon those net asset values may differ from the net asset values and returns for shareholder transactions. |
| (e) | Includes earnings credits and interest expense, if applicable, each of which is less than 0.005% unless otherwise noted. |
| (f) | Portfolio turnover is calculated by dividing the lesser of total purchases or sales of portfolio securities for the reporting period by the monthly average value portfolio securities owned during the reporting period. Excluded from both the numerator and denominator are amounts relating to derivatives and securities whose maturities or expiration dates at the time of acquisition were one year or less. |
| (g) | Net investment income (loss) may appear disproportionate among classes due to the timing of recognition of income and changes in the relative size of the classes. |
| (h) | Reflects special dividends paid out during the period by one of the Fund’s holdings. Had the Fund not received the special dividends, the net investment income (loss) per share would have been $0.11, $(0.05), $0.05, $0.22, $0.23 and $0.18 for Class A, Class C, Class R2, Class R5, Class R6 and Select Class Shares, respectively, and the net investment income (loss) ratio would have been 0.41%, (0.20)%, 0.20%, 0.79%, 0.82% and 0.66% for Class A, Class C, Class R2, Class R5, Class R6 and Select Class Shares, respectively. |
| (i) | Reflects special dividends paid out during the period by one of the Fund’s holdings. Had the Fund not received the special dividends, the net investment income (loss) per share would have been $0.12, $(0.01), $0.06, $0.19, $0.20 and $0.17 for Class A, Class C, Class R2, Class R5, Class R6 and Select Class Shares, respectively, and the net investment income (loss) ratio would have been 0.57%, (0.08)%, 0.27%, 0.86%, 0.89% and 0.77% for Class A, Class C, Class R2, Class R5, Class R6 and Select Class Shares, respectively. |
| (j) | Commencement of offering of class of shares. |
SEE NOTES TO FINANCIAL STATEMENTS.
| | | | | | |
| | | |
| 70 | | | | J.P. MORGAN SMALL CAP FUNDS | | DECEMBER 31, 2016 |
| | | | | | | | | | | | | | | | | | | | | | | | | | |
| | | Ratios/Supplemental data | |
| | | | | | | | | | Ratios to average net assets (a) | | | | |
Net asset
value,
end of
period | | | Total return
(excludes sales charge) (c)(d) | | | Net assets,
end of
period
(000’s) | | | Net
expenses (e) | | | Net
investment
income
(loss) | | |
Expenses
without waivers,
reimbursements and
earnings credits | | | Portfolio
turnover
rate (c)(f) | |
| | |
| | |
| $ | 29.96 | | | | 22.20 | % | | $ | 608,179 | | | | 1.24 | % | | | 0.51 | %(g) | | | 1.49 | % | | | 11 | % |
| | 24.64 | | | | (2.54 | ) | | | 551,313 | | | | 1.25 | | | | 0.69 | | | | 1.53 | | | | 46 | |
| | 26.65 | | | | 1.04 | | | | 618,977 | | | | 1.24 | | | | 0.84 | | | | 1.44 | | | | 38 | |
| | 27.98 | | | | 21.24 | | | | 516,950 | | | | 1.24 | | | | 0.46 | (h) | | | 1.40 | | | | 40 | |
| | 23.77 | | | | 28.08 | | | | 332,177 | | | | 1.24 | | | | 0.98 | (i) | | | 1.39 | | | | 38 | |
| | 18.75 | | | | (0.36 | ) | | | 184,920 | | | | 1.25 | | | | 0.79 | | | | 1.41 | | | | 38 | |
| | | | | | |
| | | | | | | | | | | | | | | | | | | | | | | | | | |
| | 25.28 | | | | 21.84 | | | | 47,039 | | | | 1.85 | | | | (0.09 | )(g) | | | 1.90 | | | | 11 | |
| | 20.82 | | | | (3.12 | ) | | | 41,161 | | | | 1.86 | | | | 0.07 | | | | 1.94 | | | | 46 | |
| | 22.77 | | | | 0.42 | | | | 49,815 | | | | 1.85 | | | | 0.23 | | | | 1.89 | | | | 38 | |
| | 24.19 | | | | 20.45 | | | | 52,909 | | | | 1.84 | | | | (0.15 | )(h) | | | 1.89 | | | | 40 | |
| | 20.73 | | | | 27.35 | | | | 41,108 | | | | 1.85 | | | | 0.34 | (i) | | | 1.89 | | | | 38 | |
| | 16.40 | | | | (0.96 | ) | | | 28,834 | | | | 1.86 | | | | 0.18 | | | | 1.91 | | | | 38 | |
| | | | | | |
| | | | | | | | | | | | | | | | | | | | | | | | | | |
| | 29.76 | | | | 22.04 | | | | 57,880 | | | | 1.49 | | | | 0.28 | (g) | | | 1.81 | | | | 11 | |
| | 24.48 | | | | (2.78 | ) | | | 47,309 | | | | 1.50 | | | | 0.45 | | | | 1.91 | | | | 46 | |
| | 26.49 | | | | 0.77 | | | | 48,675 | | | | 1.49 | | | | 0.59 | | | | 1.76 | | | | 38 | |
| | 27.83 | | | | 20.95 | | | | 47,939 | | | | 1.49 | | | | 0.25 | (h) | | | 1.66 | | | | 40 | |
| | 23.67 | | | | 27.79 | | | | 15,500 | | | | 1.49 | | | | 0.69 | (i) | | | 1.64 | | | | 38 | |
| | 18.68 | | | | (0.64 | ) | | | 6,758 | | | | 1.50 | | | | 0.55 | | | | 1.66 | | | | 38 | |
| | | | | | |
| | | | | | | | | | | | | | | | | | | | | | | | | | |
| | 29.93 | | | | 16.29 | | | | 23 | | | | 1.26 | | | | 0.85 | (g) | | | 1.26 | | | | 11 | |
| | | | | | |
| | | | | | | | | | | | | | | | | | | | | | | | | | |
| | 31.57 | | | | 16.37 | | | | 23 | | | | 1.01 | | | | 1.10 | (g) | | | 1.01 | | | | 11 | |
| | | | | | |
| | | | | | | | | | | | | | | | | | | | | | | | | | |
| | 31.59 | | | | 22.41 | | | | 112,141 | | | | 0.89 | | | | 0.88 | (g) | | | 0.90 | | | | 11 | |
| | 25.97 | | | | (2.21 | ) | | | 96,674 | | | | 0.90 | | | | 1.04 | | | | 0.93 | | | | 46 | |
| | 28.01 | | | | 1.39 | | | | 103,149 | | | | 0.91 | | | | 1.19 | | | | 0.93 | | | | 38 | |
| | 29.31 | | | | 21.67 | | | | 79,792 | | | | 0.90 | | | | 0.85 | (h) | | | 0.95 | | | | 40 | |
| | 24.85 | | | | 28.53 | | | | 32,304 | | | | 0.90 | | | | 1.28 | (i) | | | 0.94 | | | | 38 | |
| | 19.58 | | | | (0.03 | ) | | | 15,668 | | | | 0.91 | | | | 1.09 | | | | 0.95 | | | | 38 | |
| | | | | | |
| | | | | | | | | | | | | | | | | | | | | | | | | | |
| | 31.62 | | | | 22.51 | | | | 928,746 | | | | 0.76 | | | | 1.01 | (g) | | | 0.76 | | | | 11 | |
| | 25.99 | | | | (2.07 | ) | | | 753,439 | | | | 0.77 | | | | 1.21 | | | | 0.77 | | | | 46 | |
| | 28.03 | | | | 1.49 | | | | 554,522 | | | | 0.79 | | | | 1.32 | | | | 0.81 | | | | 38 | |
| | 29.33 | | | | 21.71 | | | | 453,645 | | | | 0.85 | | | | 0.87 | (h) | | | 0.90 | | | | 40 | |
| | 24.87 | | | | 28.62 | | | | 207,613 | | | | 0.85 | | | | 1.32 | (i) | | | 0.89 | | | | 38 | |
| | 19.59 | | | | 0.02 | | | | 180,853 | | | | 0.86 | | | | 1.21 | | | | 0.91 | | | | 38 | |
| | | | | | |
| | | | | | | | | | | | | | | | | | | | | | | | | | |
| | 31.58 | | | | 22.32 | | | | 349,103 | | | | 0.99 | | | | 0.79 | (g) | | | 1.14 | | | | 11 | |
| | 25.97 | | | | (2.28 | ) | | | 263,436 | | | | 1.00 | | | | 0.88 | | | | 1.18 | | | | 46 | |
| | 28.00 | | | | 1.27 | | | | 495,605 | | | | 0.99 | | | | 1.10 | | | | 1.14 | | | | 38 | |
| | 29.31 | | | | 21.52 | | | | 404,848 | | | | 0.99 | | | | 0.71 | (h) | | | 1.15 | | | | 40 | |
| | 24.86 | | | | 28.47 | | | | 266,018 | | | | 0.99 | | | | 1.19 | (i) | | | 1.14 | | | | 38 | |
| | 19.58 | | | | (0.11 | ) | | | 196,102 | | | | 1.00 | | | | 1.04 | | | | 1.16 | | | | 38 | |
SEE NOTES TO FINANCIAL STATEMENTS.
| | | | | | | | |
| | | |
| DECEMBER 31, 2016 | | J.P. MORGAN SMALL CAP FUNDS | | | | | 71 | |
FINANCIAL HIGHLIGHTS
FOR THE PERIODS INDICATED (continued)
| | | | | | | | | | | | | | | | | | | | | | | | | | | | |
| | | | | | Per share operating performance | |
| | | | | | Investment operations | | | Distributions | |
| | | Net asset
value,
beginning
of period | | | Net
investment
income
(loss) (b) | | | Net realized
and unrealized
gains
(losses) on
investments | | | Total from
investment
operations | | | Net
investment
income | | | Net
realized
gain | | | Total
distributions | |
U.S. Small Company Fund | | | | | |
Class A | | | | | |
Six Months Ended December 31, 2016 (Unaudited) | | $ | 15.09 | | | $ | 0.01 | (g) | | $ | 2.89 | | | $ | 2.90 | | | $ | (0.01 | ) | | $ | — | (k) | | $ | (0.01 | ) |
Year Ended June 30, 2016 | | | 16.96 | | | | 0.02 | | | | (1.20 | ) | | | (1.18 | ) | | | (0.02 | ) | | | (0.67 | ) | | | (0.69 | ) |
Year Ended June 30, 2015 | | | 16.25 | | | | 0.03 | | | | 1.22 | | | | 1.25 | | | | — | | | | (0.54 | ) | | | (0.54 | ) |
Year Ended June 30, 2014 | | | 13.17 | | | | (0.01 | )(h) | | | 3.39 | | | | 3.38 | | | | (0.01 | ) | | | (0.29 | ) | | | (0.30 | ) |
Year Ended June 30, 2013 | | | 10.31 | | | | 0.04 | (i) | | | 2.89 | | | | 2.93 | | | | (0.07 | ) | | | — | | | | (0.07 | ) |
Year Ended June 30, 2012 | | | 10.62 | | | | 0.02 | | | | (0.33 | )(j) | | | (0.31 | ) | | | — | | | | — | | | | — | |
| | | | | | | |
Class C | | | | | | | | | | | | | | | | | | | | | | | | | | | | |
Six Months Ended December 31, 2016 (Unaudited) | | | 14.57 | | | | (0.03 | )(g) | | | 2.79 | | | | 2.76 | | | | — | | | | — | (k) | | | — | (k) |
Year Ended June 30, 2016 | | | 16.46 | | | | (0.05 | ) | | | (1.17 | ) | | | (1.22 | ) | | | — | | | | (0.67 | ) | | | (0.67 | ) |
Year Ended June 30, 2015 | | | 15.86 | | | | (0.05 | ) | | | 1.19 | | | | 1.14 | | | | — | | | | (0.54 | ) | | | (0.54 | ) |
Year Ended June 30, 2014 | | | 12.91 | | | | (0.08 | )(h) | | | 3.32 | | | | 3.24 | | | | — | | | | (0.29 | ) | | | (0.29 | ) |
Year Ended June 30, 2013 | | | 10.14 | | | | (0.02 | )(i) | | | 2.83 | | | | 2.81 | | | | (0.04 | ) | | | — | | | | (0.04 | ) |
Year Ended June 30, 2012 | | | 10.50 | | | | (0.02 | ) | | | (0.34 | )(j) | | | (0.36 | ) | | | — | | | | — | | | | — | |
| | | | | | | |
Class L (formerly Institutional Class) | | | | | | | | | | | | | | | | | | | | | | | | | | | | |
Six Months Ended December 31, 2016 (Unaudited) | | | 15.39 | | | | 0.04 | (g) | | | 2.96 | | | | 3.00 | | | | (0.09 | ) | | | — | (k) | | | (0.09 | ) |
Year Ended June 30, 2016 | | | 17.28 | | | | 0.10 | | | | (1.24 | ) | | | (1.14 | ) | | | (0.08 | ) | | | (0.67 | ) | | | (0.75 | ) |
Year Ended June 30, 2015 | | | 16.51 | | | | 0.11 | | | | 1.24 | | | | 1.35 | | | | (0.04 | ) | | | (0.54 | ) | | | (0.58 | ) |
Year Ended June 30, 2014 | | | 13.35 | | | | 0.06 | (h) | | | 3.44 | | | | 3.50 | | | | (0.05 | ) | | | (0.29 | ) | | | (0.34 | ) |
Year Ended June 30, 2013 | | | 10.43 | | | | 0.10 | (i) | | | 2.92 | | | | 3.02 | | | | (0.10 | ) | | | — | | | | (0.10 | ) |
Year Ended June 30, 2012 | | | 10.75 | | | | 0.06 | | | | (0.34 | )(j) | | | (0.28 | ) | | | (0.04 | ) | | | — | | | | (0.04 | ) |
| | | | | | | |
Class R2 | | | | | | | | | | | | | | | | | | | | | | | | | | | | |
Six Months Ended December 31, 2016 (Unaudited) | | | 14.88 | | | | (0.01 | )(g) | | | 2.85 | | | | 2.84 | | | | — | | | | — | (k) | | | — | (k) |
Year Ended June 30, 2016 | | | 16.77 | | | | (0.01 | ) | | | (1.19 | ) | | | (1.20 | ) | | | (0.02 | ) | | | (0.67 | ) | | | (0.69 | ) |
Year Ended June 30, 2015 | | | 16.12 | | | | (0.01 | ) | | | 1.20 | | | | 1.19 | | | | — | | | | (0.54 | ) | | | (0.54 | ) |
Year Ended June 30, 2014 | | | 13.09 | | | | (0.05 | )(h) | | | 3.38 | | | | 3.33 | | | | (0.01 | ) | | | (0.29 | ) | | | (0.30 | ) |
Year Ended June 30, 2013 | | | 10.25 | | | | (0.02 | )(i) | | | 2.90 | | | | 2.88 | | | | (0.04 | ) | | | — | | | | (0.04 | ) |
November 1, 2011 (l) through June 30, 2012 | | | 9.02 | | | | — | (k) | | | 1.27 | (j) | | | 1.27 | | | | (0.04 | ) | | | — | | | | (0.04 | ) |
| | | | | | | |
Class R3 | | | | | | | | | | | | | | | | | | | | | | | | | | | | |
September 9, 2016 (l) through December 31, 2016 (Unaudited) | | | 16.02 | | | | 0.02 | (g) | | | 1.95 | | | | 1.97 | | | | (0.07 | ) | | | — | (k) | | | (0.07 | ) |
| | | | | | | |
Class R4 | | | | | | | | | | | | | | | | | | | | | | | | | | | | |
September 9, 2016 through December 31, 2016 (Unaudited) | | | 16.36 | | | | 0.03 | (g) | | | 2.00 | | | | 2.03 | | | | (0.09 | ) | | | — | (k) | | | (0.09 | ) |
| | | | | | | |
Class R5 | | | | | | | | | | | | | | | | | | | | | | | | | | | | |
September 9, 2016 (l) through December 31, 2016 (Unaudited) | | | 16.35 | | | | 0.04 | | | | 2.00 | | | | 2.04 | | | | (0.10 | ) | | | — | | | | (0.10 | ) |
| | | | | | | |
Class R6 | | | | | | | | | | | | | | | | | | | | | | | | | | | | |
Six Months Ended December 31, 2016 (Unaudited) | | | 15.40 | | | | 0.06 | (g) | | | 2.95 | | | | 3.01 | | | | (0.10 | ) | | | — | (k) | | | (0.10 | ) |
Year Ended June 30, 2016 | | | 17.29 | | | | 0.11 | | | | (1.23 | ) | | | (1.12 | ) | | | (0.10 | ) | | | (0.67 | ) | | | (0.77 | ) |
Year Ended June 30, 2015 | | | 16.52 | | | | 0.12 | | | | 1.24 | | | | 1.36 | | | | (0.05 | ) | | | (0.54 | ) | | | (0.59 | ) |
Year Ended June 30, 2014 | | | 13.35 | | | | 0.06 | (h) | | | 3.46 | | | | 3.52 | | | | (0.06 | ) | | | (0.29 | ) | | | (0.35 | ) |
Year Ended June 30, 2013 | | | 10.43 | | | | 0.11 | (i) | | | 2.91 | | | | 3.02 | | | | (0.10 | ) | | | — | | | | (0.10 | ) |
November 1, 2011 (l) through June 30, 2012 | | | 9.13 | | | | 0.05 | | | | 1.29 | (j) | | | 1.34 | | | | (0.04 | ) | | | — | | | | (0.04 | ) |
| | | | | | | |
Select Class | | | | | | | | | | | | | | | | | | | | | | | | | | | | |
Six Months Ended December 31, 2016 (Unaudited) | | | 15.40 | | | | 0.03 | (g) | | | 2.95 | | | | 2.98 | | | | (0.05 | ) | | | — | (k) | | | (0.05 | ) |
Year Ended June 30, 2016 | | | 17.29 | | | | 0.06 | | | | (1.22 | ) | | | (1.16 | ) | | | (0.06 | ) | | | (0.67 | ) | | | (0.73 | ) |
Year Ended June 30, 2015 | | | 16.53 | | | | 0.08 | | | | 1.24 | | | | 1.32 | | | | (0.02 | ) | | | (0.54 | ) | | | (0.56 | ) |
Year Ended June 30, 2014 | | | 13.37 | | | | 0.03 | (h) | | | 3.45 | | | | 3.48 | | | | (0.03 | ) | | | (0.29 | ) | | | (0.32 | ) |
Year Ended June 30, 2013 | | | 10.45 | | | | 0.08 | (i) | | | 2.92 | | | | 3.00 | | | | (0.08 | ) | | | — | | | | (0.08 | ) |
Year Ended June 30, 2012 | | | 10.76 | | | | 0.05 | | | | (0.33 | )(j) | | | (0.28 | ) | | | (0.03 | ) | | | — | | | | (0.03 | ) |
| (a) | Annualized for periods less than one year, unless otherwise noted. |
| (b) | Calculated based upon average shares outstanding. |
| (c) | Not annualized for periods less than one year. |
| (d) | Includes adjustments in accordance with accounting principles generally accepted in the United States of America and as such, the net asset values for financial reporting purposes and the returns based upon those net asset values may differ from the net asset values and returns for shareholder transactions. |
| (e) | Includes earnings credits and interest expense, if applicable, each of which is less than 0.005% unless otherwise noted. |
| (f) | Portfolio turnover is calculated by dividing the lesser of total purchases or sales of portfolio securities for the reporting period by the monthly average value of portfolio securities owned during the reporting period. Excluded from both the numerator and denominator are amounts relating to derivatives and securities whose maturities or expiration dates at the time of acquisition were one year or less. |
| (g) | Net investment income (loss) may appear disproportionate among classes due to the timing of recognition of income and changes in the relative size of the classes. |
| (h) | Reflects special dividends paid out during the period by one of the Fund’s holdings. Had the Fund not received the special dividends, the net investment income (loss) per share would have been $(0.02), $(0.09), $0.05, $(0.05), $0.06 and $0.02 for Class A, Class C, Class L, Class R2, Class R6 and Select Class Shares, respectively, and the net investment income (loss) ratio would have been (0.12)%, (0.61)%, 0.34%, (0.36)%, 0.38% and 0.13% for Class A, Class C, Class L, Class R2, Class R6 and Select Class Shares, respectively. |
SEE NOTES TO FINANCIAL STATEMENTS.
| | | | | | |
| | | |
| 72 | | | | J.P. MORGAN SMALL CAP FUNDS | | DECEMBER 31, 2016 |
| | | | | | | | | | | | | | | | | | | | | | | | | | |
| | | Ratios/Supplemental data | |
| | | | | | | | | | Ratios to average net assets (a) | | | | |
Net asset
value,
end of
period | | | Total return
(excludes
sales charge) (c)(d) | | | Net assets,
end of
period
(000’s) | | | Net
expenses (e) | | | Net
investment
income
(loss) | | |
Expenses
without waivers,
reimbursements and
earnings credits | | | Portfolio
turnover
rate (c)(f) | |
| | | | | | | | | | | | | | | | | | | | | | | | | | |
| | | | | | | | | | | | | | | | | | | | | | | | | | |
| $ | 17.98 | | | | 19.24 | % | | $ | 260,469 | | | | 1.25 | % | | | 0.08 | %(g) | | | 1.39 | % | | | 20 | % |
| | 15.09 | | | | (6.86 | ) | | | 226,309 | | | | 1.26 | | | | 0.15 | | | | 1.44 | | | | 49 | |
| | 16.96 | | | | 7.98 | | | | 240,064 | | | | 1.25 | | | | 0.21 | | | | 1.40 | | | | 56 | |
| | 16.25 | | | | 25.86 | | | | 126,858 | | | | 1.25 | | | | (0.08 | )(h) | | | 1.34 | | | | 51 | |
| | 13.17 | | | | 28.54 | | | | 49,607 | | | | 1.25 | | | | 0.31 | (i) | | | 1.43 | | | | 54 | |
| | 10.31 | | | | (2.92 | )(j) | | | 8,411 | | | | 1.26 | | | | 0.17 | | | | 1.59 | | | | 74 | |
| | | | | | |
| | | | | | | | | | | | | | | | | | | | | | | | | | |
| | 17.33 | | | | 18.95 | | | | 50,807 | | | | 1.75 | | | | (0.42 | )(g) | | | 1.87 | | | | 20 | |
| | 14.57 | | | | (7.35 | ) | | | 45,932 | | | | 1.76 | | | | (0.34 | ) | | | 1.91 | | | | 49 | |
| | 16.46 | | | | 7.47 | | | | 45,202 | | | | 1.75 | | | | (0.28 | ) | | | 1.88 | | | | 56 | |
| | 15.86 | | | | 25.27 | | | | 22,539 | | | | 1.75 | | | | (0.57 | )(h) | | | 1.84 | | | | 51 | |
| | 12.91 | | | | 27.83 | | | | 6,972 | | | | 1.75 | | | | (0.18 | )(i) | | | 1.93 | | | | 54 | |
| | 10.14 | | | | (3.43 | )(j) | | | 1,247 | | | | 1.76 | | | | (0.26 | ) | | | 2.10 | | | | 74 | |
| | | | | | |
| | | | | | | | | | | | | | | | | | | | | | | | | | |
| | 18.30 | | | | 19.46 | | | | 784,140 | | | | 0.82 | | | | 0.52 | (g) | | | 0.87 | | | | 20 | |
| | 15.39 | | | | (6.48 | ) | | | 587,279 | | | | 0.82 | | | | 0.63 | | | | 0.90 | | | | 49 | |
| | 17.28 | | | | 8.49 | | | | 352,036 | | | | 0.82 | | | | 0.64 | | | | 0.94 | | | | 56 | |
| | 16.51 | | | | 26.42 | | | | 216,698 | | | | 0.82 | | | | 0.39 | (h) | | | 0.94 | | | | 51 | |
| | 13.35 | | | | 29.08 | | | | 30,226 | | | | 0.82 | | | | 0.79 | (i) | | | 1.05 | | | | 54 | |
| | 10.43 | | | | (2.59 | )(j) | | | 9,350 | | | | 0.83 | | | | 0.62 | | | | 1.19 | | | | 74 | |
| | | | | | |
| | | | | | | | | | | | | | | | | | | | | | | | | | |
| | 17.72 | | | | 19.09 | | | | 42,500 | | | | 1.50 | | | | (0.17 | )(g) | | | 1.71 | | | | 20 | |
| | 14.88 | | | | (7.09 | ) | | | 34,326 | | | | 1.51 | | | | (0.05 | ) | | | 1.75 | | | | 49 | |
| | 16.77 | | | | 7.66 | | | | 17,846 | | | | 1.50 | | | | (0.04 | ) | | | 1.66 | | | | 56 | |
| | 16.12 | | | | 25.66 | | | | 9,785 | | | | 1.50 | | | | (0.32 | )(h) | | | 1.59 | | | | 51 | |
| | 13.09 | | | | 28.19 | | | | 1,744 | | | | 1.50 | | | | (0.20 | )(i) | | | 1.65 | | | | 54 | |
| | 10.25 | | | | 14.17 | (j) | | | 57 | | | | 1.51 | | | | 0.02 | | | | 1.91 | | | | 74 | |
| | | | | | |
| | | | | | | | | | | | | | | | | | | | | | | | | | |
| | 17.92 | | | | 12.32 | | | | 22 | | | | 1.23 | | | | 0.32 | (g) | | | 1.24 | | | | 20 | |
| | | | | | |
| | | | | | | | | | | | | | | | | | | | | | | | | | |
| | 18.30 | | | | 12.38 | | | | 22 | | | | 0.98 | | | | 0.57 | (g) | | | 0.99 | | | | 20 | |
| | | | | | |
| | | | | | | | | | | | | | | | | | | | | | | | | | |
| | 18.29 | | | | 12.45 | | | | 23 | | | | 0.78 | | | | 0.77 | (g) | | | 0.79 | | | | 20 | |
| | | | | | |
| | | | | | | | | | | | | | | | | | | | | | | | | | |
| | 18.31 | | | | 19.53 | | | | 237,692 | | | | 0.71 | | | | 0.65 | (g) | | | 0.71 | | | | 20 | |
| | 15.40 | | | | (6.39 | ) | | | 139,835 | | | | 0.73 | | | | 0.71 | | | | 0.74 | | | | 49 | |
| | 17.29 | | | | 8.54 | | | | 69,755 | | | | 0.73 | | | | 0.73 | | | | 0.76 | | | | 56 | |
| | 16.52 | | | | 26.54 | | | | 45,604 | | | | 0.75 | | | | 0.42 | (h) | | | 0.84 | | | | 51 | |
| | 13.35 | | | | 29.17 | | | | 17,232 | | | | 0.75 | | | | 0.95 | (i) | | | 0.97 | | | | 54 | |
| | 10.43 | | | | 14.77 | (i) | | | 12,959 | | | | 0.75 | | | | 0.70 | | | | 1.08 | | | | 74 | |
| | | | | | |
| | | | | | | | | | | | | | | | | | | | | | | | | | |
| | 18.33 | | | | 19.37 | | | | 325,211 | | | | 1.00 | | | | 0.32 | (g) | | | 1.07 | | | | 20 | |
| | 15.40 | | | | (6.63 | ) | | | 289,631 | | | | 1.00 | | | | 0.42 | | | | 1.11 | | | | 49 | |
| | 17.29 | | | | 8.25 | | | | 246,645 | | | | 1.00 | | | | 0.45 | | | | 1.11 | | | | 56 | |
| | 16.53 | | | | 26.21 | | | | 160,279 | | | | 1.00 | | | | 0.17 | (h) | | | 1.09 | | | | 51 | |
| | 13.37 | | | | 28.81 | | | | 66,928 | | | | 1.00 | | | | 0.64 | (i) | | | 1.21 | | | | 54 | |
| | 10.45 | | | | (2.60 | )(i) | | | 37,935 | | | | 1.01 | | | | 0.49 | | | | 1.35 | | | | 74 | |
| (i) | Reflects special dividends paid out during the period by one of the Fund’s holdings. Had the Fund not received the special dividends, the net investment income (loss) per share would have been $(0.01), $(0.07), $0.05, $(0.07), $0.07 and $0.03 for Class A, Class C, Class L, Class R2, Class R6 and Select Class Shares, respectively, and the net investment income (loss) ratio would have been (0.08)%, (0.57)%, 0.41%, (0.58)%, 0.56% and 0.25% for Class A, Class C, Class L, Class R2, Class R6 and Select Class Shares, respectively. |
| (j) | An affiliate of JPMorgan made a payment to the Fund for losses incurred from an operational error. Without this payment, the net realized and unrealized gains (losses) on investments per share would have been $(0.34), $(0.35), $1.28 and $(0.34) for Class A, Class C, Class R6 and Select Class Shares, respectively, and the total return would have been (3.01)%, (3.52)%, 14.66% and (2.70)% for Class A, Class C, Class R6 and Select Class Shares, respectively. The impact was less than $0.01 to the net realized and unrealized gains (losses) on investments per share and less than 0.01% to total return for Class L and Class R2 Shares. |
| (k) | Amount rounds to less than $0.005. |
| (l) | Commencement of offering of class of shares. |
SEE NOTES TO FINANCIAL STATEMENTS.
| | | | | | | | |
| | | |
| DECEMBER 31, 2016 | | J.P. MORGAN SMALL CAP FUNDS | | | | | 73 | |
NOTES TO FINANCIAL STATEMENTS
AS OF DECEMBER 31, 2016 (Unaudited)
1. Organization
JPMorgan Trust I (“JPM I”) and JPMorgan Trust II (“JPM II”) (collectively, the “Trusts”) were formed on November 12, 2004, as Delaware statutory trusts, pursuant to Declarations of Trust dated November 5, 2004 and are registered under the Investment Company Act of 1940, as amended (the “1940 Act”), as open-end management investment companies.
The following are 6 separate funds of the Trusts (collectively, the “Funds”) covered by this report:
| | | | | | |
| | | Classes Offered | | Trust | | Diversified/Non-Diversified |
| Dynamic Small Cap Growth Fund | | Class A, Class C and Select Class | | JPM I | | Diversified |
| Small Cap Core Fund | | Class A*, Class C*, Class R5**, Class R6*, and Select Class*** | | JPM I | | Diversified |
| Small Cap Equity Fund | | Class A, Class C, Class R2, Class R3****, Class R4****, Class R5, Class R6^ and Select Class | | JPM I | | Diversified |
| Small Cap Growth Fund | | Class A, Class C, Class L^^, Class R2, Class R5^^^, Class R6 and Select Class | | JPM II | | Diversified |
| Small Cap Value Fund | | Class A, Class C, Class R2, Class R3****, Class R4****, Class R5, Class R6 and Select Class | | JPM II | | Diversified |
| U.S. Small Company Fund | | Class A, Class C, Class L^^, Class R2, Class R3****, Class R4****, Class R5^^^, Class R6 and Select Class | | JPM I | | Diversified |
| * | Class A, Class C and Class R6 Shares commenced operations on May 31, 2016 for Small Cap Core Fund. |
| ** | Effective September 15, 2016, Select Class was renamed Class R5 for Small Cap Core Fund. |
| *** | Select Class commenced operations on January 3, 2017 for Small Cap Core Fund. |
| **** | Class R3 and Class R4 commenced operations on September 9, 2016 for Small Cap Equity Fund, Small Cap Value Fund and U.S. Small Company Fund. |
| ^ | Class R6 Shares commenced operations on May 31, 2016 for Small Cap Equity Fund. |
| ^^ | Effective December 1, 2016, Institutional Class was renamed Class L. |
| ^^^ | Class R5 Shares commenced operations on September 9, 2016 for Small Cap Growth Fund and U.S. Small Company Fund. |
The investment objectives of Dynamic Small Cap Growth Fund, Small Cap Core Fund and Small Cap Equity Fund are to seek capital growth over the long term.
The investment objective of Small Cap Growth Fund is to seek long-term capital growth primarily by investing in a portfolio of equity securities of small-capitalization and emerging growth companies.
The investment objective of Small Cap Value Fund is to seek long-term capital growth primarily by investing in equity securities of small-capitalization companies.
The investment objective of U.S. Small Company Fund is to seek to provide high total return from a portfolio of small company stocks.
All share classes of the Dynamic Small Cap Growth Fund are publicly offered only on a limited basis. Effective December 1, 2016 Class L Shares for the Small Cap Growth Fund and U.S. Small Company Fund were publicly offered on a limited basis. Investors are not eligible to purchase shares of the Funds unless they meet certain requirements as described in the Funds’ prospectuses. Effective as of the close of business on August 12, 2016 through September 14, 2016, Class R5 Shares of the Small Cap Core Fund were publicly offered only on a limited basis. Effective August 25, 2016, all share classes of the Small Cap Growth Fund were publicly offered.
Prior to November 16, 2015, and subsequent to December 30, 2016, all share classes of the Small Cap Equity Fund were publicly offered only on a limited basis. During the period November 16, 2015 through December 29, 2016, Small Cap Equity Fund was publicly offered.
Class A Shares generally provide for a front-end sales charge while Class C Shares provide for a contingent deferred sales charge (“CDSC”). No sales charges are assessed with respect to Class L, Class R2, Class R3, Class R4, Class R5, Class R6 and Select Class Shares. All classes of shares have equal rights as to earnings, assets and voting privileges, except that each class may bear different transfer agency, sub-transfer agency, distribution and shareholder servicing fees and each class has exclusive voting rights with respect to its distribution plan and shareholder servicing agreements. Certain Class A Shares, for which front-end sales charges have been waived, may be subject to a CDSC as described in the Funds’ prospectus.
J.P. Morgan Investment Management Inc. (“JPMIM”) an indirect, wholly-owned subsidiary of JPMorgan Chase & Co. (“JPMorgan”) acts as Adviser (the “Adviser”) and Administrator (the “Administrator”) to the Funds.
2. Significant Accounting Policies
The following is a summary of significant accounting policies followed by the Funds in the preparation of their financial statements. The Funds are investment companies and, accordingly, follow the investment company accounting and reporting guidance of the Financial Accounting Standards Board Accounting Standards Codification Topic 946 — Investment Companies, which is part of U.S. generally accepted accounting principles (“GAAP”). The preparation of financial statements in conformity with GAAP requires management to make estimates and assumptions that affect the reported amounts of assets and liabilities and disclosure of contingent assets and liabilities at the date of the financial statements and the reported amounts of increases and decreases in net assets from operations during the reporting period. Actual results could differ from those estimates.
| | | | | | |
| | | |
| 74 | | | | J.P. MORGAN SMALL CAP FUNDS | | DECEMBER 31, 2016 |
A. Valuation of Investments — The valuation of investments is in accordance with GAAP and the Funds’ valuation policies set forth by and under the supervision and responsibility of the Board of Trustees (the “Board”), which established the following approach to valuation, as described more fully below: (i) investments for which market quotations are readily available shall be valued at such unadjusted quoted prices and (ii) all other investments for which market quotations are not readily available shall be valued at their fair value as determined in good faith by the Board.
The Administrator has established the J.P. Morgan Asset Management Americas Valuation Committee (“AVC”) to assist the Board with the oversight and monitoring of the valuation of the Funds’ investments. The Administrator implements the valuation policies of the Funds’ investments, as directed by the Board. The AVC oversees and carries out the policies for the valuation of investments held in the Funds. This includes monitoring the appropriateness of fair values based on results of ongoing valuation oversight, including but not limited to consideration of macro or security specific events, market events and pricing vendor and broker due diligence. The Administrator is responsible for discussing and assessing the potential impacts to the fair values on an ongoing basis, and at least on a quarterly basis with the AVC and the Board.
A market-based approach is primarily used to value the Funds’ investments. Investments for which market quotations are not readily available are fair valued by approved affiliated and unaffiliated pricing vendors or third party broker-dealers (collectively referred to as “Pricing Services”) or may be internally fair valued using methods set forth by the valuation policies approved by the Board. This may include related or comparable assets or liabilities, recent transactions, market multiples, book values, and other relevant information for the investment to determine the fair value of the investment. An income-based valuation approach may be used in which the anticipated future cash flows of the investment are discounted to calculate the fair value. Discounts may also be applied due to the nature or duration of any restrictions on the disposition of the investments. Valuations may be based upon current market prices of securities that are comparable in coupon, rating, maturity and industry. It is possible that the estimated values may differ significantly from the values that would have been used, had a ready market for the investments existed, and such differences could be material.
Equities and other exchange-traded instruments are valued at the last sale price or official market closing price on the primary exchange on which the instrument is traded before the net asset values (“NAV”) of the Funds are calculated on a valuation date. Investments in open-end investment companies (the “Underlying Funds”) are valued at each Underlying Fund’s NAV per share as of the report date.
Futures are generally valued on the basis of available market quotations.
Valuations reflected in this report are as of the report date. As a result, changes in valuation due to market events and/or issuer related events after the report date and prior to issuance of the report are not reflected herein.
The various inputs that are used in determining the valuation of the Funds’ investments are summarized into the three broad levels listed below.
| • | | Level 1 — Unadjusted inputs using quoted prices in active markets for identical investments. |
| • | | Level 2 — Other significant observable inputs including, but not limited to, quoted prices for similar investments, inputs other than quoted prices that are observable for investments (such as interest rates, prepayment speeds, credit risk, etc.) or other market corroborated inputs. |
| • | | Level 3 — Significant inputs based on the best information available in the circumstances, to the extent observable inputs are not available (including the Funds’ assumptions in determining the fair value of investments). |
A financial instrument’s level within the fair value hierarchy is based on the lowest level of any input, both individually and in the aggregate, that is significant to the fair value measurement. The inputs or methodology used for valuing instruments are not necessarily an indication of the risk associated with investing in those instruments.
The following tables represent each valuation input as presented on the Schedules of Portfolio Investments (“SOIs”) (amounts in thousands):
Dynamic Small Cap Growth Fund
| | | | | | | | | | | | | | | | |
| | | Level 1
Quoted prices | | | Level 2
Other significant
observable inputs | | | Level 3
Significant
unobservable inputs | | | Total | |
Total Investments in Securities (a) | | $ | 149,477 | | | $ | — | | | $ | — | | | $ | 149,477 | |
| | | | | | | | | | | | | | | | |
| | | | |
| Small Cap Core Fund | | | | | | | | | | | | | | | | |
| | | Level 1
Quoted prices | | | Level 2
Other significant
observable inputs | | | Level 3
Significant
unobservable inputs | | | Total | |
Total Investments in Securities (b) | | $ | 191,995 | | | $ | — | | | $ | — | (c) | | $ | 191,995 | |
| | | | | | | | | | | | | | | | |
Depreciation in Other Financial Instruments | | | | | | | | | | | | | | | | |
Futures Contracts | | $ | (42 | ) | | $ | — | | | $ | — | | | $ | (42 | ) |
| | | | | | | | | | | | | | | | |
| | | | | | | | |
| | | |
| DECEMBER 31, 2016 | | J.P. MORGAN SMALL CAP FUNDS | | | | | 75 | |
NOTES TO FINANCIAL STATEMENTS
AS OF DECEMBER 31, 2016 (Unaudited) (continued)
| | | | | | | | | | | | | | | | |
| | | | |
| Small Cap Equity Fund | | | | | | | | | | | | | | | | |
| | | Level 1
Quoted prices | | | Level 2
Other significant
observable inputs | | | Level 3
Significant
unobservable inputs | | | Total | |
Total Investments in Securities (a) | | $ | 5,763,334 | | | $ | — | | | $ | — | | | $ | 5,763,334 | |
| | | | | | | | | | | | | | | | |
| | | | |
| Small Cap Growth Fund | | | | | | | | | | | | | | | | |
| | | Level 1
Quoted prices | | | Level 2
Other significant
observable inputs | | | Level 3
Significant
unobservable inputs | | | Total | |
Total Investments in Securities (a) | | $ | 1,089,732 | | | $ | — | | | $ | — | | | $ | 1,089,732 | |
| | | | | | | | | | | | | | | | |
| | | | |
| Small Cap Value Fund | | | | | | | | | | | | | | | | |
| | | Level 1
Quoted prices | | | Level 2
Other significant
observable inputs | | | Level 3
Significant
unobservable inputs | | | Total | |
Total Investments in Securities (b) | | $ | 2,110,363 | | | $ | — | | | $ | — | (c) | | $ | 2,110,363 | |
| | | | | | | | | | | | | | | | |
Depreciation in Other Financial Instruments | | | | | | | | | | | | | | | | |
Futures Contracts | | $ | (1,495 | ) | | $ | — | | | $ | — | | | $ | (1,495 | ) |
| | | | | | | | | | | | | | | | |
| | | | |
| U.S. Small Company Fund | | | | | | | | | | | | | | | | |
| | | Level 1
Quoted prices | | | Level 2
Other significant
observable inputs | | | Level 3
Significant
unobservable inputs | | | Total | |
Total Investments in Securities (d) | | $ | 1,709,171 | | | $ | — | | | $ | — | | | $ | 1,709,171 | |
| | | | | | | | | | | | | | | | |
Depreciation in Other Financial Instruments | | | | | | | | | | | | | | | | |
Futures Contracts | | $ | (987 | ) | | $ | — | | | $ | — | | | $ | (987 | ) |
| | | | | | | | | | | | | | | | |
| (a) | Portfolio holdings designated in level 1 are disclosed individually on the SOIs. Please refer to the SOIs for industry specifics of portfolio holdings. |
| (b) | Portfolio holdings designated in level 1 and level 3 are disclosed individually on the SOIs. Level 3 consists of warrants. Please refer to the SOIs for industry specifics of portfolio holdings. |
| (d) | Portfolio holdings designated in level 1 and level 3 are disclosed individually on the SOIs. Level 3 consists of a right and warrant. Please refer to the SOIs for industry specifics of portfolio holdings. |
There were no transfers among any levels during the six months ended December 31, 2016.
B. Futures Contracts — Small Cap Core Fund, Small Cap Value Fund and U.S. Small Company Fund used index futures contracts to gain or reduce exposure to the stock market, maintain liquidity or minimize transaction costs. The Funds also bought futures contracts to invest incoming cash in the market or sold futures in response to cash outflows, thereby simulating an invested position in the underlying index while maintaining a cash balance for liquidity.
Futures contracts provide for the delayed delivery of the underlying instrument at a fixed price or are settled for a cash amount based on the change in the value of the underlying instrument at a specific date in the future. Upon entering into a futures contract, the Funds are required to deposit with the broker, cash or securities in an amount equal to a certain percentage of the contract amount, which is referred to as the initial margin deposit. Subsequent payments, referred to as variation margin, are made or received by the Funds periodically and are based on changes in the market value of open futures contracts. Changes in the market value of open futures contracts are recorded as change in net unrealized appreciation/ depreciation on the Statements of Operations. Realized gains or losses, representing the difference between the value of the contract at the time it was opened and the value at the time it was closed, are reported on the Statements of Operations at the closing or expiration of the
futures contract. Securities deposited as initial margin are designated on the SOIs and cash deposited is recorded on the Statements of Assets and Liabilities. A receivable from and/or a payable to brokers for the daily variation margin is also recorded on the Statements of Assets and Liabilities.
The use of futures contracts exposes the Funds to equity price risk. The Funds may be subject to the risk that the change in the value of the futures contract may not correlate perfectly with the underlying instrument. Use of long futures contracts subjects the Funds to risk of loss in excess of the amounts shown on the Statements of Assets and Liabilities, up to the notional amount of the futures contracts. Use of short futures contracts subjects the Funds to unlimited risk of loss. The Funds may enter into futures contracts only on exchanges or boards of trade. The exchange or board of
| | | | | | |
| | | |
| 76 | | | | J.P. MORGAN SMALL CAP FUNDS | | DECEMBER 31, 2016 |
trade acts as the counterparty to each futures transaction; therefore, the Funds’ credit risk is limited to failure of the exchange or board of trade. Under some circumstances, futures exchanges may establish daily limits on the amount that the price of a futures contract can vary from the previous day’s settlement price, which could effectively prevent liquidation of positions.
The table below discloses the volume of the Funds’ futures contracts activity during the six months ended December 31, 2016 (amounts in thousands):
| | | | | | | | | | | | |
| | | Small Cap
Core Fund | | | Small Cap
Value Fund | | | U.S. Small
Company Fund | |
Futures Contracts: | | | | | | | | | | | | |
Average Notional Balance Long | | $ | 3,931 | | | $ | 53,341 | | | $ | 49,667 | |
Ending Notional Balance Long | | | 1,900 | | | | 74,833 | | | | 49,663 | |
The Funds’ futures contracts are not subject to master netting arrangements (the right to close out all transactions traded with a counterparty and net amounts owed or due across transactions).
C. Security Transactions and Investment Income — Investment transactions are accounted for on the trade date (the date the order to buy or sell is executed). Securities gains and losses are calculated on a specifically identified cost basis. Interest income is determined on the basis of coupon interest accrued using the effective interest method which adjusts for amortization of premiums and accretion of discounts. Dividend income net of foreign taxes withheld, if any, is recorded on the ex-dividend date or when a Fund first learns of the dividend.
To the extent such information is publicly available, the Funds record distributions received in excess of income earned from underlying investments as a reduction of cost of investments and/or realized gain. Such amounts are based on estimates if actual amounts are not available and actual amounts of income, realized gain and return of capital may differ from the estimated amounts. The Funds adjust the estimated amounts of the components of distributions (and consequently their net investment income) as necessary once the issuers provide information about the actual composition of the distributions.
D. Allocation of Income and Expenses — Expenses directly attributable to a fund are charged directly to that fund, while the expenses attributable to more than one fund of the Trusts are allocated among the respective funds. In calculating the NAV of each class, investment income, realized and unrealized gains and losses and expenses, other than class specific expenses, are allocated daily to each class of shares based upon the proportion of net assets of each class at the beginning of each day.
Transfer agency fees and sub-transfer agency fees are class-specific expenses. The amount of the transfer agency fees and sub-transfer agency fees charged to each class of the Funds for the six months ended December 31, 2016 are as follows (amounts in thousands):
| | | | | | | | | | | | | | | | | | | | | | | | | | | | | | | | | | | | | | | | |
| | | Class A | | | Class C | | | Class L | | | Class R2 | | | Class R3 | | | Class R4 | | | Class R5 | | | Class R6 | | | Select Class | | | Total | |
Dynamic Small Cap Growth Fund | | | | | | | | | | | | | | | | | | | | | | | | | | | | | | | | | | | | | | | | |
Transfer agency fees | | $ | 11 | | | $ | 2 | | | | n/a | | | | n/a | | | | n/a | | | | n/a | | | | n/a | | | | n/a | | | $ | 2 | | | $ | 15 | |
Sub-transfer agency fees | | | 39 | | | | 49 | | | | n/a | | | | n/a | | | | n/a | | | | n/a | | | | n/a | | | | n/a | | | | 34 | | | | 122 | |
Small Cap Core Fund | | | | | | | | | | | | | | | | | | | | | | | | | | | | | | | | | | | | | | | | |
Transfer agency fees | | | — | (a) | | | — | (a) | | | n/a | | | | n/a | | | | n/a | | | | n/a | | | $ | 4 | | | $ | — | (a) | | | n/a | | | | 4 | |
Sub-transfer agency fees | | | — | | | | — | (a) | | | n/a | | | | n/a | | | | n/a | | | | n/a | | | | 106 | | | | — | | | | n/a | | | | 106 | |
Small Cap Equity Fund | | | | | | | | | | | | | | | | | | | | | | | | | | | | | | | | | | | | | | | | |
Transfer agency fees | | | 26 | | | | 2 | | | | n/a | | | $ | 1 | | | $ | — | (a) | | $ | — | (a) | | | 9 | | | | — | (a) | | | 15 | | | | 53 | |
Sub-transfer agency fees | | | 524 | | | | 41 | | | | n/a | | | | 6 | | | | — | | | | — | | | | 287 | | | | — | | | | 462 | | | | 1,320 | |
Small Cap Growth Fund | | | | | | | | | | | | | | | | | | | | | | | | | | | | | | | | | | | | | | | | |
Transfer agency fees | | | 27 | | | | 2 | | | $ | 3 | | | | 1 | | | | n/a | | | | n/a | | | | — | | | | 2 | | | | 4 | | | | 39 | |
Sub-transfer agency fees | | | 182 | | | | 11 | | | | 117 | | | | 26 | | | | n/a | | | | n/a | | | | — | | | | — | | | | 84 | | | | 420 | |
Small Cap Value Fund | | | | | | | | | | | | | | | | | | | | | | | | | | | | | | | | | | | | | | | | |
Transfer agency fees | | | 159 | | | | 3 | | | | n/a | | | | 19 | | | | — | (a) | | | — | (a) | | | 3 | | | | 7 | | | | 6 | | | | 197 | |
Sub-transfer agency fees | | | 486 | | | | 29 | | | | n/a | | | | 59 | | | | — | | | | — | | | | 44 | | | | — | | | | 198 | | | | 816 | |
U.S. Small Company Fund | | | | | | | | | | | | | | | | | | | | | | | | | | | | | | | | | | | | | | | | |
Transfer agency fees | | | 11 | | | | 4 | | | | 5 | | | | 4 | | | | — | (a) | | | — | (a) | | | — | (a) | | | 3 | | | | 7 | | | | 34 | |
Sub-transfer agency fees | | | 214 | | | | 35 | | | | 202 | | | | 45 | | | | — | | | | — | | | | — | | | | — | | | | 165 | | | | 661 | |
| (a) | Amount rounds to less than 500. |
E. Federal Income Taxes — Each Fund is treated as a separate taxable entity for Federal income tax purposes. Each Fund’s policy is to comply with the provisions of the Internal Revenue Code of 1986, as amended (the “Code”), applicable to regulated investment companies and to distribute to shareholders all of its distributable net investment income and net realized capital gains on investments. Accordingly, no provision for Federal income tax is necessary. Management has reviewed the Funds’ tax positions for all open tax years and has determined that as of December 31, 2016, no liability for income tax is required in the Funds’ financial statements for net unrecognized tax benefits. However, management’s conclusions may
| | | | | | | | |
| | | |
| DECEMBER 31, 2016 | | J.P. MORGAN SMALL CAP FUNDS | | | | | 77 | |
NOTES TO FINANCIAL STATEMENTS
AS OF DECEMBER 31, 2016 (Unaudited) (continued)
be subject to future review based on changes in, or the interpretation of, the accounting standards or tax laws and regulations. Each of the Funds’ Federal tax returns for the prior three fiscal years remains subject to examination by the Internal Revenue Service.
F. Distributions to Shareholders — Distributions from net investment income are generally declared and paid at least annually, except for Small Cap Value Fund, which are generally declared and paid quarterly. Distributions are declared separately for each class. No class has preferential divi-dend rights; differences in per share rates are due to differences in separate class expenses. Net realized capital gains, if any, are distributed by each Fund at least annually. The amount of distributions from net investment income and net realized capital gains is determined in accordance with Federal income tax regulations, which may differ from GAAP. To the extent these “book/tax” differences are permanent in nature (i.e., that they result from other than timing of recognition — “temporary differences”), such amounts are reclassified within the capital accounts based on their Federal tax-basis treatment.
3. Fees and Other Transactions with Affiliates
A. Investment Advisory Fee — Pursuant to Investment Advisory Agreements, the Adviser supervises the investments of each Fund and for such services is paid a fee. The fee is accrued daily and paid monthly based on each Fund’s respective average daily net assets. The annual rate for each Fund is as follows:
| | | | |
Dynamic Small Cap Growth Fund | | | 0.65 | % |
Small Cap Core Fund | | | 0.65 | |
Small Cap Equity Fund | | | 0.65 | |
Small Cap Growth Fund | | | 0.65 | |
Small Cap Value Fund | | | 0.65 | |
U.S. Small Company Fund | | | 0.60 | |
The Adviser waived Investment Advisory fees and/or reimbursed expenses as outlined in Note 3.F.
B. Administration Fee — Pursuant to Administration Agreements, the Administrator, provides certain administration services to the Funds. In consideration of these services, the Administrator receives a fee accrued daily and paid monthly at an annual rate of 0.15% of the first $25 billion of the average daily net assets of all funds in the J.P. Morgan Funds Complex covered by the Administration Agreement (excluding certain funds of funds and money market funds) and 0.075% of the average daily net assets in excess of $25 billion of all such funds. For the six months ended December 31, 2016, the effective annualized rate was 0.08% of each Fund’s average daily net assets, notwithstanding any fee waivers and/or expense reimbursements.
The Administrator waived Administration fees as outlined in Note 3.F.
JPMorgan Chase Bank, N.A. (“JPMCB”), a wholly-owned subsidiary of JPMorgan, serves as the Funds’ sub-administrator (the “Sub-administrator”). For its services as Sub-administrator, JPMCB receives a portion of the fees payable to the Administrator.
C. Distribution Fees — Pursuant to a Distribution Agreement, JPMorgan Distribution Services, Inc. (the “Distributor”), a wholly-owned subsidiary of JPMorgan, serves as the Trusts’ principal underwriter and promotes and arranges for the sale of each Fund’s shares.
The Board has adopted a Distribution Plan (the “Distribution Plan”) for Class A, Class C, Class R2 and Class R3 Shares of the Funds, as applicable, in accordance with Rule 12b-1 under the 1940 Act. Class L, Class R4, Class R5, Class R6 and Select Class Shares do not charge a distribution fee. The Distribution Plan provides that each Fund shall pay distribution fees, including payments to the Distributor, at annual rates of the average daily net assets as shown in the table below:
| | | | | | | | | | | | | | | | |
| | | Class A | | | Class C | | | Class R2 | | | Class R3 | |
Dynamic Small Cap Growth Fund | | | 0.25 | % | | | 0.75 | % | | | n/a | | | | n/a | |
Small Cap Core Fund | | | 0.25 | | | | 0.75 | | | | n/a | | | | n/a | |
Small Cap Equity Fund | | | 0.25 | | | | 0.75 | | | | 0.50 | % | | | 0.25 | % |
Small Cap Growth Fund | | | 0.25 | | | | 0.75 | | | | 0.50 | | | | n/a | |
Small Cap Value Fund | | | 0.25 | | | | 0.75 | | | | 0.50 | | | | 0.25 | |
U.S. Small Company Fund | | | 0.25 | | | | 0.75 | | | | 0.50 | | | | 0.25 | |
| | | | | | |
| | | |
| 78 | | | | J.P. MORGAN SMALL CAP FUNDS | | DECEMBER 31, 2016 |
In addition, the Distributor is entitled to receive the front-end sales charges from purchases of Class A Shares and the CDSC from redemptions of Class C Shares and certain Class A Shares for which front-end sales charges have been waived. For the six months ended December 31, 2016, the Distributor retained the following (amounts in thousands):
| | | | | | | | |
| | | Front-End Sales Charge | | | CDSC | |
Dynamic Small Cap Growth Fund | | $ | — | (a) | | $ | — | |
Small Cap Equity Fund | | | 162 | | | | — | |
Small Cap Growth Fund | | | 13 | | | | — | |
Small Cap Value Fund | | | 13 | | | | — | (a) |
U.S. Small Company Fund | | | 7 | | | | — | (a) |
| (a) | Amount rounds to less than 500. |
D. Shareholder Servicing Fees — The Trusts, on behalf of the Funds, have entered into Shareholder Servicing Agreement with the Distributor under which the Distributor provides certain support services to the shareholders. The Class R6 Shares do not charge a shareholder servicing fee. For performing these services, the Distributor receives a fee that is accrued daily and paid monthly equal to a percentage of the average daily net assets as shown in the table below:
| | | | | | | | | | | | | | | | | | | | | | | | | | | | | | | | |
| | | Class A | | | Class C | | | Class L | | | Class R2 | | | Class R3 | | | Class R4 | | | Class R5 | | | Select Class | |
Dynamic Small Cap Growth Fund | | | 0.25 | % | | | 0.25 | % | | | n/a | | | | n/a | | | | n/a | | | | n/a | | | | n/a | | | | 0.25 | % |
Small Cap Core Fund* | | | 0.25 | | | | 0.25 | | | | n/a | | | | n/a | | | | n/a | | | | n/a | | | | 0.05 | % | | | n/a | |
Small Cap Equity Fund | | | 0.25 | | | | 0.25 | | | | n/a | | | | 0.25 | % | | | 0.25 | % | | | 0.25 | % | | | 0.05 | | | | 0.25 | |
Small Cap Growth Fund | | | 0.25 | | | | 0.25 | | | | 0.10 | % | | | 0.25 | | | | n/a | | | | n/a | | | | 0.05 | | | | 0.25 | |
Small Cap Value Fund | | | 0.25 | | | | 0.25 | | | | n/a | | | | 0.25 | | | | 0.25 | | | | 0.25 | | | | 0.05 | | | | 0.25 | |
U.S. Small Company Fund | | | 0.25 | | | | 0.25 | | | | 0.10 | | | | 0.25 | | | | 0.25 | | | | 0.25 | | | | 0.05 | | | | 0.25 | |
* Prior to September 15, 2016 the shareholder servicing fee charged for Small Cap Core was 0.25% for Class R5 Shares.
The Distributor has entered into shareholder services contracts with affiliated and unaffiliated financial intermediaries who provide shareholder services and other related services to their clients or customers who invest in the Funds under which the Distributor will pay all or a portion of such fees earned to financial intermediaries for performing such services.
The Distributor waived shareholder servicing fees as outlined in Note 3.F.
E. Custodian and Accounting Fees — JPMCB provides portfolio custody and accounting services to the Funds. For performing these services, the Funds pay JPMCB transaction and asset-based fees that vary according to the number of transactions and positions, plus out-of-pocket expenses. The amounts paid directly to JPMCB by the Funds for custody and accounting services are included in Custodian and accounting fees on the Statements of Operations. Payments to the custodian may be reduced by credits earned by each Fund, based on uninvested cash balances held by the custodian. Such earnings credits, if any, are presented separately on the Statements of Operations.
Interest expense paid to the custodian related to cash overdrafts, if any, is included in Interest expense to affiliates on the Statements of Operations.
F. Waivers and Reimbursements — The Adviser, Administrator and/or Distributor have contractually agreed to waive fees and/or reimburse the Funds to the extent that total annual operating expenses (excluding acquired fund fees and expenses other than certain money market fund fees as described below, dividend and interest expenses related to short sales, interest, taxes, expenses related to litigation and potential litigation and extraordinary expenses) exceed the percentages of the Funds’ respective average daily net assets as shown in the table below:
| | | | | | | | | | | | | | | | | | | | | | | | | | | | | | | | | | | | |
| | | Class A | | | Class C | | | Class L | | | Class R2 | | | Class R3 | | | Class R4 | | | Class R5 | | | Class R6 | | | Select Class | |
Dynamic Small Cap Growth Fund | | | 1.25 | % | | | 1.75 | % | | | n/a | | | | n/a | | | | n/a | | | | n/a | | | | n/a | | | | n/a | | | | 1.00 | % |
Small Cap Core Fund | | | 1.25 | | | | 1.75 | | | | n/a | | | | n/a | | | | n/a | | | | n/a | | | | 0.80 | % | | | 0.75 | % | | | n/a | |
Small Cap Equity Fund | | | 1.30 | | | | 1.80 | | | | n/a | | | | 1.55 | % | | | 1.25 | % | | | 1.00 | % | | | 0.80 | | | | 0.75 | | | | 1.00 | |
Small Cap Growth Fund | | | 1.25 | | | | 1.75 | | | | 0.85 | % | | | 1.50 | | | | n/a | | | | n/a | | | | 0.85 | | | | 0.75 | | | | 1.00 | |
Small Cap Value Fund | | | 1.25 | | | | 1.86 | | | | n/a | | | | 1.61 | * | | | 1.36 | | | | 1.11 | | | | 0.91 | | | | 0.86 | | | | 1.00 | |
U.S. Small Company Fund | | | 1.26 | | | | 1.76 | | | | 0.83 | | | | 1.51 | | | | 1.26 | | | | 1.01 | | | | 0.86 | | | | 0.76 | | | | 1.01 | |
| * | The expense limitation agreement is in place until October 31, 2018. For Small Cap Value Fund Class R2 Shares, the Adviser, Administrator and/or Distributor contractually waived fees and/or reimbursed the Fund to the extent that total annual operating expenses (excluding acquired fund fees and expenses other than certain money market fund fees as described below, dividend and interest expenses related to short sales, interest, taxes, expenses related to litigation and potential litigation and extraordinary expenses) exceeded 1.50% of the Fund’s average daily net assets during the period July 1, 2016 through October 31, 2016. During the period November 1, 2016 through December 31, 2016 the Adviser, Administrator and/or Distributor voluntarily waived fees and/or reimbursed the Fund to the extent that total annual operating expenses exceeded 1.50%. The Fund’s service providers are under no obligation to continue the voluntary waivers and may discontinue them at any time. |
| | | | | | | | |
| | | |
| DECEMBER 31, 2016 | | J.P. MORGAN SMALL CAP FUNDS | | | | | 79 | |
NOTES TO FINANCIAL STATEMENTS
AS OF DECEMBER 31, 2016 (Unaudited) (continued)
Except as noted above, the expense limitation agreements were in effect for the six months ended December 31, 2016. The contractual expense limitation percentages in the table above are in place until at least October 31, 2018 for Class R5 Shares of Small Cap Core Fund. For all other classes, the contractual expense limitation percentages in the table above are in place until at least October 31, 2017.
For the six months ended December 31, 2016, the Funds’ service providers waived fees and/or reimbursed expenses for each of the Funds as follows (amounts in thousands). None of these parties expect the Funds to repay any such waived fees and reimbursed expenses in future years.
| | | | | | | | | | | | | | | | | | | | |
| | | Contractual Waivers | | | | |
| | | Investment
Advisory | | | Administration | | | Shareholder
Servicing | | | Total | | | Contractual
Reimbursements | |
Dynamic Small Cap Growth Fund | | $ | 133 | | | $ | 62 | | | $ | 49 | | | $ | 244 | | | $ | — | |
Small Cap Core Fund | | | 158 | | | | 72 | | | | 102 | | | | 332 | | | | 31 | |
Small Cap Equity Fund | | | 57 | | | | 38 | | | | 1,069 | | | | 1,164 | | | | 6 | |
Small Cap Growth Fund | | | 43 | | | | 28 | | | | 449 | | | | 520 | | | | 7 | |
Small Cap Value Fund | | | 2 | | | | — | | | | 968 | | | | 970 | | | | 17 | |
U.S. Small Company Fund | | | — | | | | — | | | | 466 | | | | 466 | | | | 1 | |
| | | | |
| | | Voluntary Waivers | |
| | | Shareholder Servicing | |
Small Cap Value Fund | | $ | 10 | |
Additionally, the Funds may invest in one or more money market funds advised by the Adviser or its affiliates (affiliated money market funds). The Adviser, Administrator and/or Distributor, as shareholder servicing agent, have contractually agreed to waive fees and/or reimburse expenses in an amount sufficient to offset the respective net fees each collects from the affiliated money market fund on the applicable Funds’ investment in such affiliated money market fund.
The amount of waivers resulting from investments in these money market funds for the six months ended December 31, 2016 was as follows (amounts in thousands):
| | | | |
Dynamic Small Cap Growth Fund | | $ | 1 | |
Small Cap Core Fund | | | 3 | |
Small Cap Equity Fund | | | 161 | |
Small Cap Growth Fund | | | 12 | |
Small Cap Value Fund | | | 36 | |
U.S. Small Company Fund | | | 39 | |
G. Other — Certain officers of the Trusts are affiliated with the Adviser, the Administrator and the Distributor. Such officers, with the exception of the Chief Compliance Officer, receive no compensation from the Funds for serving in their respective roles.
The Board appointed a Chief Compliance Officer to the Funds in accordance with Federal securities regulations. Each Fund, along with other affiliated funds, makes reimbursement payments, on a pro-rata basis, to the Administrator for a portion of the fees associated with the Office of the Chief Compliance Officer. Such fees are included in Trustees’ and Chief Compliance Officer’s fees on the Statements of Operations.
The Trusts adopted a Trustee Deferred Compensation Plan (the “Plan”) which allows the Independent Trustees to defer the receipt of all or a portion of compensation related to performance of their duties as Trustees. The deferred fees are invested in various J.P. Morgan Funds until distribution in accordance with the Plan.
During the six months ended December 31, 2016, the Funds purchased securities from an underwriting syndicate in which the principal underwriter or members of the syndicate were affiliated with the Adviser.
The Funds may use related party broker-dealers. For the six months ended December 31, 2016, the Funds incurred brokerage commissions with broker-dealers affiliated with the Adviser as follows (amounts in thousands):
| | | | |
Small Cap Equity Fund | | $ | — | (a) |
Small Cap Growth Fund | | | — | (a) |
| (a) | Amount rounds to less than 500. |
The Securities and Exchange Commission (“SEC”) has granted an exemptive order permitting the Funds to engage in principal transactions with J.P. Morgan Securities, Inc., an affiliated broker, involving taxable money market instruments, subject to certain conditions.
| | | | | | |
| | | |
| 80 | | | | J.P. MORGAN SMALL CAP FUNDS | | DECEMBER 31, 2016 |
4. Investment Transactions
During the six months ended December 31, 2016, purchases and sales of investments (excluding short-term investments and transfers in-kind) were as follows (amounts in thousands):
| | | | | | | | |
| | | Purchases
(excluding U.S.
Government) | | | Sales
(excluding U.S.
Government) | |
Dynamic Small Cap Growth Fund | | $ | 34,861 | | | $ | 57,060 | |
Small Cap Core Fund | | | 38,050 | | | | 38,539 | |
Small Cap Equity Fund | | | 1,997,729 | | | | 277,175 | |
Small Cap Growth Fund | | | 179,347 | | | | 255,095 | |
Small Cap Value Fund | | | 208,470 | | | | 276,558 | |
U.S. Small Company Fund | | | 405,924 | | | | 290,359 | |
During the six months ended December 31, 2016, there were no purchases or sales of U.S. Government securities.
5. Federal Income Tax Matters
For Federal income tax purposes, the estimated cost and unrealized appreciation (depreciation) in value of investment securities held at December 31, 2016 were as follows (amounts in thousands):
| | | | | | | | | | | | | | | | |
| | | Aggregate
Cost | | | Gross
Unrealized
Appreciation | | | Gross
Unrealized
Depreciation | | | Net Unrealized
Appreciation
(Depreciation) | |
Dynamic Small Cap Growth Fund | | $ | 103,921 | | | $ | 50,753 | | | $ | 5,197 | | | $ | 45,556 | |
Small Cap Core Fund | | | 135,089 | | | | 61,756 | | | | 4,850 | | | | 56,906 | |
Small Cap Equity Fund | | | 4,402,559 | | | | 1,425,184 | | | | 64,409 | | | | 1,360,775 | |
Small Cap Growth Fund | | | 828,631 | | | | 317,524 | | | | 56,423 | | | | 261,101 | |
Small Cap Value Fund | | | 1,583,618 | | | | 592,769 | | | | 66,024 | | | | 526,745 | |
U.S. Small Company Fund | | | 1,410,611 | | | | 354,649 | | | | 56,089 | | | | 298,560 | |
At June 30, 2016, the Funds did not have any capital loss carryforwards.
6. Borrowings
The Funds rely upon an exemptive order granted by the SEC (the “Order”) permitting the establishment and operation of an Interfund Lending Facility (the “Facility”). The Facility allows the Funds to directly lend and borrow money to or from any other fund relying upon the Order at rates beneficial to both the borrowing and lending funds. Advances under the Facility are taken primarily for temporary or emergency purposes, including the meeting of redemption requests that otherwise might require the untimely disposition of securities, and are subject to each Fund’s borrowing restrictions. The Interfund loan rate is determined, as specified in the Order, by averaging the current repurchase agreement rate and the current bank loan rate. The Order was granted to JPM II and may be relied upon by the Funds because the Funds and the series of JPM II are all investment companies in the same “group of investment companies” (as defined in Section 12(d)(1)(G) of the 1940 Act).
The Trusts and JPMCB have entered into a financing arrangement. Under this arrangement, JPMCB provides an unsecured, uncommitted credit facility in the aggregate amount of $100 million to certain of the J.P. Morgan Funds, including the Funds. Advances under the arrangement are taken primarily for temporary or emergency purposes, including the meeting of redemption requests that otherwise might require the untimely disposition of securities, and are subject to each Fund’s borrowing restrictions. Interest on borrowings is payable at a rate determined by JPMCB at the time of borrowing. This agreement has been extended until November 6, 2017.
The Funds had no borrowings outstanding from another fund or from the unsecured, uncommitted credit facility during the six months ended December 31, 2016.
In addition, effective August 16, 2016, the Trust along with certain other trusts (“Borrowers”) entered into a joint syndicated senior unsecured revolving credit facility totaling $1.5 billion (“Credit Facility”) with various lenders and The Bank of New York Mellon, as administrative agent for the lenders. This Credit Facility provides a source of funds to the Borrowers for temporary and emergency purposes, including the meeting of redemption requests that otherwise might require the untimely disposition of securities. Under the terms of the Credit Facility, a borrowing fund must have a minimum of $25,000,000 in adjusted net asset value and not exceed certain adjusted net asset coverage ratios prior to and during the time in which any borrowings are outstanding. If a fund does not comply with the aforementioned requirements, the fund must remediate within three business days with respect to the $25,000,000 minimum adjusted net asset value or within one business day with respect to certain asset coverage ratios or the administrative agent at the request of, or with the consent of, the lenders may terminate the Credit Facility and declare any outstanding borrowings to be due and payable immediately.
| | | | | | | | |
| | | |
| DECEMBER 31, 2016 | | J.P. MORGAN SMALL CAP FUNDS | | | | | 81 | |
NOTES TO FINANCIAL STATEMENTS
AS OF DECEMBER 31, 2016 (Unaudited) (continued)
Interest associated with any borrowing under the Credit Facility is charged to the borrowing fund at a rate of interest equal to 1.00% plus the greater of the federal funds effective annualized rate or one month LIBOR. The annual commitment fee to maintain the Credit Facility is 0.15% and is incurred on the unused portion of the Credit Facility and is allocated to all participating funds pro rata based on their respective net assets. The initial term of the Credit Facility is 364 days, unless extended.
The Funds had no borrowings outstanding from Credit Facility at December 31, 2016. Average borrowings from the Credit Facility for, or at any time during the six months ended December 31, 2016, were as follows (amounts in thousands):
| | | | | | | | | | | | | | | | |
| | | Average
Borrowings | | | Average Interest
Rate Paid | | | Number of
Days Outstanding | | | Interest
Paid | |
Small Cap Equity Fund | | $ | 500 | | | | 1.53 | % | | | 1 | | | $ | — | (a) |
| (a) | Amount rounds to less than 500. |
7. Redemptions In-Kind
During the year ended June 30, 2016, certain shareholders sold their shares of Small Cap Core Fund and Small Cap Equity Fund. The portfolio securities were delivered primarily by means of a redemption in-kind in exchange for shares of the Fund. Cash and portfolio securities were transferred as of the close of business on the date and at the market value listed below (amounts in thousands):
| | | | | | | | | | | | |
| December 18, 2015 | | Value | | | Realized Gains (Losses) | | | Type | |
Small Cap Core Fund — Class R5* | | $ | 530,784 | ** | | $ | 35,980 | | | | Redemption in-kind | |
| | | | | | | | | | | | |
| March 18, 2016 | | Value | | | Realized Gains (Losses) | | | Type | |
Small Cap Equity Fund — Class A | | $ | 545,339 | *** | | | 235,174 | | | | Redemption in-kind | |
| * | | Effective September 15, 2016, Select Class was renamed Class R5 for Small Cap Core Fund. |
| ** | | This amount includes cash of approximately $16,676,000 associated with the redemptions in-kind. |
| *** | | This amount includes cash of approximately $26,463,000 associated with the redemptions in-kind. |
8. Risks, Concentrations and Indemnifications
In the normal course of business, the Funds enter into contracts that contain a variety of representations which provide general indemnifications. Each Fund’s maximum exposure under these arrangements is unknown. The amount of exposure would depend on future claims that may be made against each Fund that have not yet occurred. However, based on experience, the Funds expect the risk of loss to be remote.
As of December 31, 2016, Dynamic Small Cap Growth Fund, Small Cap Core Fund and U.S. Small Company Fund had omnibus accounts, which collectively represented the following percentage of each Fund’s net assets:
| | | | | | | | |
| | | Number of Non-affiliated Omnibus Accounts | | | % of
the fund | |
Dynamic Small Cap Growth Fund | | | 3 | | | | 59.7 | % |
Small Cap Core Fund | | | 2 | | | | 31.1 | |
U.S. Small Company Fund | | | 3 | | | | 41.2 | |
As of December 31, 2016, the JPMorgan SmartRetirement Funds, which are affiliated funds of funds, owned in the aggregate, shares representing more than 10% of the net assets of the following Funds:
| | | | |
| | | JPMorgan
SmartRetirement
Funds | |
Small Cap Growth Fund | | | 32.7 | % |
Small Cap Value Fund | | | 18.2 | |
Significant shareholder transactions by these shareholders may impact the Funds’ performance.
Because the Funds may invest a significant portion of their assets in REITs, the Funds may be subject to certain risks similar to those associated with direct investments in real estate. REITs may be affected by changes in the value of their underlying properties and by defaults by tenants. REITs depend generally on their ability to generate cash flow to make distributions to shareholders, and certain REITs have self-liquidation provisions by which mortgages held may be paid in full and distributions of capital returns may be made at any time.
Derivatives may be riskier than other types of investments because they may be more sensitive to changes in economic and market conditions and could result in losses that significantly exceed the Funds’ original investment. Derivatives also expose the Funds to counterparty risk (the risk that the derivative counterparty will not fulfill its contractual obligations), including credit risk of the derivative counterparty.
| | | | | | |
| | | |
| 82 | | | | J.P. MORGAN SMALL CAP FUNDS | | DECEMBER 31, 2016 |
SCHEDULE OF SHAREHOLDER EXPENSES
(Unaudited)
Hypothetical $1,000 Investment
As a shareholder of the Funds, you incur two types of costs: (1) transaction costs, including sales charges (loads) on purchase payments and (2) ongoing costs, including investment advisory fees, administration fees, distribution fees and other Fund expenses. The examples below are intended to help you understand your ongoing costs (in dollars) of investing in the Funds and to compare these ongoing costs with the ongoing costs of investing in other mutual funds. The examples assume that you had a $1,000 investment in each Class at the beginning of the reporting period, July 1, 2016, and continued to hold your shares at the end of the reporting period, December 31, 2016.
Actual Expenses
For each Class of each Fund in the table below, the first line provides information about actual account values and actual expenses. You may use the information in this line, together with the amount you invested, to estimate the expenses that you paid over the period. Simply divide your account value by $1,000 (for example, an $8,600 account value divided by $1,000 = 8.6), then multiply the result by the number in the first line of each Class under the heading entitled “Expenses Paid During the period” to estimate the expenses you paid on your account during this period.
Hypothetical Example for Comparison Purposes
The second line of each Class in the table below provides information about hypothetical account values and hypothetical expenses based on the Class’ actual expense ratio and an assumed rate of return of 5% per year before expenses, which is not the Class’ actual return. The hypothetical account values and expenses may not be used to estimate the actual ending account balance or expenses you paid for the period. You may use this information to compare the ongoing costs of investing in the Class of the Funds and other funds. To do so, compare this 5% hypothetical example with the 5% hypothetical examples that appear in the shareholder reports of the other funds. Please note that the expenses shown in the table are meant to highlight your ongoing costs only and do not reflect any transaction costs, such as sales charges (loads) or redemption fees. Therefore, the second line for each Class in the table is useful in comparing ongoing costs only, and will not help you determine the relative total costs of owning different funds. In addition, if these transaction costs were included, your costs would have been higher. The examples also assume all dividends and distributions have been reinvested.
| | | | | | | | | | | | | | | | |
| | | Beginning
Account Value
July 1, 2016 | | | Ending
Account Value
December 31, 2016 | | | Expenses
Paid During the
Period | | | Annualized
Expense
Ratio | |
Dynamic Small Cap Growth Fund | | | | | | | | | | | | | | | | |
Class A | | | | | | | | | | | | | | | | |
Actual* | | $ | 1,000.00 | | | $ | 1,123.20 | | | $ | 6.69 | | | | 1.25 | % |
Hypothetical* | | | 1,000.00 | | | | 1,018.90 | | | | 6.36 | | | | 1.25 | |
Class C | | | | | | | | | | | | | | | | |
Actual* | | | 1,000.00 | | | | 1,119.80 | | | | 9.30 | | | | 1.74 | |
Hypothetical* | | | 1,000.00 | | | | 1,016.43 | | | | 8.84 | | | | 1.74 | |
Select Class | | | | | | | | | | | | | | | | |
Actual* | | | 1,000.00 | | | | 1,142.90 | | | | 5.40 | | | | 1.00 | |
Hypothetical* | | | 1,000.00 | | | | 1,020.16 | | | | 5.09 | | | | 1.00 | |
| | | | |
Small Cap Core Fund | | | | | | | | | | | | | | | | |
Class A | | | | | | | | | | | | | | | | |
Actual* | | | 1,000.00 | | | | 1,207.10 | | | | 6.90 | | | | 1.24 | |
Hypothetical* | | | 1,000.00 | | | | 1,018.95 | | | | 6.31 | | | | 1.24 | |
Class C | | | | | | | | | | | | | | | | |
Actual* | | | 1,000.00 | | | | 1,204.30 | | | | 9.67 | | | | 1.74 | |
Hypothetical* | | | 1,000.00 | | | | 1,016.43 | | | | 8.84 | | | | 1.74 | |
Class R5 (formerly Select Class) | | | | | | | | | | | | | | | | |
Actual* | | | 1,000.00 | | | | 1,209.70 | | | | 4.40 | | | | 0.79 | |
Hypothetical* | | | 1,000.00 | | | | 1,021.22 | | | | 4.02 | | | | 0.79 | |
Class R6 | | | | | | | | | | | | | | | | |
Actual* | | | 1,000.00 | | | | 1,210.20 | | | | 4.12 | | | | 0.74 | |
Hypothetical* | | | 1,000.00 | | | | 1,021.48 | | | | 3.77 | | | | 0.74 | |
| | | | |
Small Cap Equity Fund | | | | | | | | | | | | | | | | |
Class A | | | | | | | | | | | | | | | | |
Actual* | | | 1,000.00 | | | | 1,128.30 | | | | 6.92 | | | | 1.29 | |
Hypothetical* | | | 1,000.00 | | | | 1,018.70 | | | | 6.56 | | | | 1.29 | |
| | | | | | | | |
| | | |
| DECEMBER 31, 2016 | | J.P. MORGAN SMALL CAP FUNDS | | | | | 83 | |
SCHEDULE OF SHAREHOLDER EXPENSES
(Unaudited) (continued)
Hypothetical $1,000 Investment
| | | | | | | | | | | | | | | | |
| | | Beginning
Account Value
July 1, 2016 | | | Ending
Account Value
December 31, 2016 | | | Expenses
Paid During the
Period | | | Annualized
Expense
Ratio | |
Small Cap Equity Fund (continued) | | | | | | | | | | | | | | | | |
Class C | | | | | | | | | | | | | | | | |
Actual* | | $ | 1,000.00 | | | $ | 1,125.40 | | | $ | 9.59 | | | | 1.79 | % |
Hypothetical* | | | 1,000.00 | | | | 1,016.18 | | | | 9.10 | | | | 1.79 | |
Class R2 | | | | | | | | | | | | | | | | |
Actual* | | | 1,000.00 | | | | 1,126.60 | | | | 8.25 | | | | 1.54 | |
Hypothetical* | | | 1,000.00 | | | | 1,017.44 | | | | 7.83 | | | | 1.54 | |
Class R3 | | | | | | | | | | | | | | | | |
Actual** | |
| 1,000.00
|
| | | 1,088.00 | | | | 3.94 | | | | 1.24 | |
Hypothetical* | |
| 1,000.00
|
| | | 1,018.95 | | | | 6.31 | | | | 1.24 | |
Class R4 | | | | | | | | | | | | | | | | |
Actual** | | | 1,000.00 | | | | 1,088.90 | | | | 3.14 | | | | 0.99 | |
Hypothetical* | | | 1,000.00 | | | | 1,020.21 | | | | 5.04 | | | | 0.99 | |
Class R5 | | | | | | | | | | | | | | | | |
Actual* | | | 1,000.00 | | | | 1,130.90 | | | | 4.24 | | | | 0.79 | |
Hypothetical* | | | 1,000.00 | | | | 1,021.22 | | | | 4.02 | | | | 0.79 | |
Class R6 | | | | | | | | | | | | | | | | |
Actual* | | | 1,000.00 | | | | 1,131.20 | | | | 3.98 | | | | 0.74 | |
Hypothetical* | | | 1,000.00 | | | | 1,021.48 | | | | 3.77 | | | | 0.74 | |
Select Class | | | | | | | | | | | | | | | | |
Actual* | | | 1,000.00 | | | | 1,129.70 | | | | 5.31 | | | | 0.99 | |
Hypothetical* | | | 1,000.00 | | | | 1,020.21 | | | | 5.04 | | | | 0.99 | |
| | | | |
Small Cap Growth Fund | | | | | | | | | | | | | | | | |
Class A | | | | | | | | | | | | | | | | |
Actual* | | | 1,000.00 | | | | 1,121.40 | | | | 6.63 | | | | 1.24 | |
Hypothetical* | | | 1,000.00 | | | | 1,018.95 | | | | 6.31 | | | | 1.24 | |
Class C | | | | | | | | | | | | | | | | |
Actual* | | | 1,000.00 | | | | 1,117.60 | | | | 9.29 | | | | 1.74 | |
Hypothetical* | | | 1,000.00 | | | | 1,016.43 | | | | 8.84 | | | | 1.74 | |
Class L (formerly Institutional Class) | | | | | | | | | | | | | | | | |
Actual* | | | 1,000.00 | | | | 1,122.40 | | | | 4.55 | | | | 0.85 | |
Hypothetical* | | | 1,000.00 | | | | 1,020.92 | | | | 4.33 | | | | 0.85 | |
Class R2 | | | | | | | | | | | | | | | | |
Actual* | | | 1,000.00 | | | | 1,119.00 | | | | 7.96 | | | | 1.49 | |
Hypothetical* | | | 1,000.00 | | | | 1,017.69 | | | | 7.58 | | | | 1.49 | |
Class R5 | | | | | | | | | | | | | | | | |
Actual** | | | 1,000.00 | | | | 1,038.30 | | | | 2.48 | | | | 0.80 | |
Hypothetical* | | | 1,000.00 | | | | 1,021.17 | | | | 4.08 | | | | 0.80 | |
Class R6 | | | | | | | | | | | | | | | | |
Actual* | | | 1,000.00 | | | | 1,124.00 | | | | 4.02 | | | | 0.75 | |
Hypothetical* | | | 1,000.00 | | | | 1,021.42 | | | | 3.82 | | | | 0.75 | |
Select Class | | | | | | | | | | | | | | | | |
Actual* | | | 1,000.00 | | | | 1,122.10 | | | | 5.30 | | | | 0.99 | |
Hypothetical* | | | 1,000.00 | | | | 1,020.21 | | | | 5.04 | | | | 0.99 | |
| | | | |
Small Cap Value Fund | | | | | | | | | | | | | | | | |
Class A | | | | | | | | | | | | | | | | |
Actual* | |
| 1,000.00
|
| | | 1,222.00 | | | | 6.94 | | | | 1.24 | |
Hypothetical* | |
| 1,000.00
|
| | | 1,018.95 | | | | 6.31 | | | | 1.24 | |
Class C | | | | | | | | | | | | | | | | |
Actual* | | | 1,000.00 | | | | 1,218.40 | | | | 10.34 | | | | 1.85 | |
Hypothetical* | | | 1,000.00 | | | | 1,015.88 | | | | 9.40 | | | | 1.85 | |
Class R2 | | | | | | | | | | | | | | | | |
Actual* | | | 1,000.00 | | | | 1,220.40 | | | | 8.34 | | | | 1.49 | |
Hypothetical* | | | 1,000.00 | | | | 1,017.69 | | | | 7.58 | | | | 1.49 | |
| | | | | | |
| | | |
| 84 | | | | J.P. MORGAN SMALL CAP FUNDS | | DECEMBER 31, 2016 |
| | | | | | | | | | | | | | | | |
| | | Beginning
Account Value
July 1, 2016 | | | Ending
Account Value
December 31, 2016 | | | Expenses
Paid During the
Period | | | Annualized
Expense
Ratio | |
Small Cap Value Fund (continued) | | | | | | | | | | | | | | | | |
Class R3 | | | | | | | | | | | | | | | | |
Actual** | | $ | 1,000.00 | | | $ | 1,162.90 | | | $ | 4.14 | | | | 1.26 | % |
Hypothetical* | | | 1,000.00 | | | | 1,018.85 | | | | 6.41 | | | | 1.26 | |
Class R4 | | | | | | | | | | | | | | | | |
Actual** | | | 1,000.00 | | | | 1,163.70 | | | | 3.32 | | | | 1.01 | |
Hypothetical* | | | 1,000.00 | | | | 1,020.11 | | | | 5.14 | | | | 1.01 | |
Class R5 | | | | | | | | | | | | | | | | |
Actual* | | | 1,000.00 | | | | 1,224.10 | | | | 4.99 | | | | 0.89 | |
Hypothetical* | | | 1,000.00 | | | | 1,020.72 | | | | 4.53 | | | | 0.89 | |
Class R6 | | | | | | | | | | | | | | | | |
Actual* | | | 1,000.00 | | | | 1,225.10 | | | | 4.26 | | | | 0.76 | |
Hypothetical* | | | 1,000.00 | | | | 1,021.37 | | | | 3.87 | | | | 0.76 | |
Select Class | | | | | | | | | | | | | | | | |
Actual* | | | 1,000.00 | | | | 1,223.20 | | | | 5.55 | | | | 0.99 | |
Hypothetical* | | | 1,000.00 | | | | 1,020.21 | | | | 5.04 | | | | 0.99 | |
| | | | |
U.S. Small Company Fund | | | | | | | | | | | | | | | | |
Class A | | | | | | | | | | | | | | | | |
Actual* | | | 1,000.00 | | | | 1,192.40 | | | | 6.91 | | | | 1.25 | |
Hypothetical* | | | 1,000.00 | | | | 1,018.90 | | | | 6.36 | | | | 1.25 | |
Class C | | | | | | | | | | | | | | | | |
Actual* | | | 1,000.00 | | | | 1,189.50 | | | | 9.66 | | | | 1.75 | |
Hypothetical* | | | 1,000.00 | | | | 1,016.38 | | | | 8.89 | | | | 1.75 | |
Class L (formerly Institutional Class) | | | | | | | | | | | | | | | | |
Actual* | | | 1,000.00 | | | | 1,194.60 | | | | 4.54 | | | | 0.82 | |
Hypothetical* | | | 1,000.00 | | | | 1,021.07 | | | | 4.18 | | | | 0.82 | |
Class R2 | | | | | | | | | | | | | | | | |
Actual* | | | 1,000.00 | | | | 1,190.90 | | | | 8.28 | | | | 1.50 | |
Hypothetical* | | | 1,000.00 | | | | 1,017.64 | | | | 7.63 | | | | 1.50 | |
Class R3 | | | | | | | | | | | | | | | | |
Actual** | | | 1,000.00 | | | | 1,123.20 | | | | 3.97 | | | | 1.23 | |
Hypothetical* | | | 1,000.00 | | | | 1,019.00 | | | | 6.26 | | | | 1.23 | |
Class R4 | | | | | | | | | | | | | | | | |
Actual** | | | 1,000.00 | | | | 1,123.80 | | | | 3.16 | | | | 0.98 | |
Hypothetical* | | | 1,000.00 | | | | 1,020.27 | | | | 4.99 | | | | 0.98 | |
Class R5 | | | | | | | | | | | | | | | | |
Actual** | | | 1,000.00 | | | | 1,124.50 | | | | 2.52 | | | | 0.78 | |
Hypothetical* | | | 1,000.00 | | | | 1,021.27 | | | | 3.97 | | | | 0.78 | |
Class R6 | | | | | | | | | | | | | | | | |
Actual* | | | 1,000.00 | | | | 1,195.30 | | | | 3.93 | | | | 0.71 | |
Hypothetical* | | | 1,000.00 | | | | 1,021.63 | | | | 3.62 | | | | 0.71 | |
Select Class | | | | | | | | | | | | | | | | |
Actual* | | | 1,000.00 | | | | 1,193.70 | | | | 5.53 | | | | 1.00 | |
Hypothetical* | | | 1,000.00 | | | | 1,020.16 | | | | 5.09 | | | | 1.00 | |
| * | | Expenses are equal to each Class’ respective annualized expense ratio, multiplied by the average account value over the period, multiplied by 184/365 (to reflect the one-half year period). |
| ** | | Expenses are equal to each Class’ respective annualized expense ratio, multiplied by the average account value over the period, multiplied by 111/365 (to reflect the actual period). Commencement of operations was September 9, 2016. |
| | | | | | | | |
| | | |
| DECEMBER 31, 2016 | | J.P. MORGAN SMALL CAP FUNDS | | | | | 85 | |
BOARD APPROVAL OF INVESTMENT ADVISORY AGREEMENT
(Unaudited)
The Board of Trustees has established various standing committees composed of Trustees with diverse backgrounds, to which the Board of Trustees has assigned specific subject matter responsibilities to further enhance the effectiveness of the Board’s oversight and decision making. The Board of Trustees and its investment committees (money market and alternative products, equity, and fixed income) meet regularly throughout the year and consider factors that are relevant to their annual consideration of investment advisory agreements at each meeting. They also meet for the specific purpose of considering investment advisory agreement annual renewals. The Board of Trustees held meetings in person in June and August 2016, at which the Trustees considered the continuation of the investment advisory agreements for each of the Funds whose semi-annual report is contained herein (each an “Advisory Agreement” and collectively, the “Advisory Agreements”). At the June meeting, the Board’s investment committees met to review and consider performance, expense and related information for the J.P. Morgan Funds. Each investment committee reported to the full Board, which then considered the investment committee’s preliminary findings. At the August meeting, the Trustees continued their review and consideration. The Trustees, including a majority of the Trustees who are not “interested persons” (as defined in the 1940 Act) of any party to the Advisory Agreements or any of their affiliates, approved the continuation of each Advisory Agreement on August 17, 2016.
As part of their review of the Advisory Agreements, the Trustees considered and reviewed performance and other information about the Funds received from the Adviser. This information includes the Funds’ performance as compared to the performance of their peers and benchmarks and analyses by the Adviser of the Funds’ performance. In addition, the Trustees have engaged an independent management consulting firm (“independent consultant”) to report on the performance of certain J.P. Morgan Funds at each of the Trustees’ regular meetings. The Adviser also periodically provides comparative information regarding the Funds’ expense ratios and those of their peer groups. In addition, in preparation for the June and August meetings, the Trustees requested, received and evaluated extensive materials from the Adviser, including performance and expense information compiled by Broadridge, using data from Lipper Inc., independent providers of investment company data (together, “Broadridge/Lipper”). The Trustees’ independent consultant also provided additional analyses of the performance of the Funds in connection with the Trustees’ review of the Advisory Agreements. Before voting on the proposed Advisory Agreements, the Trustees reviewed the proposed Advisory Agreements with representatives of the Adviser, counsel to the Trusts and independent legal counsel and received a memorandum from independent legal counsel to the Trustees discussing the legal standards for their consideration of the proposed Advisory Agreements. The Trustees
also discussed the proposed Advisory Agreements in executive sessions with independent legal counsel at which no representatives of the Adviser were present. Set forth below is a summary of the material factors evaluated by the Trustees in determining whether to approve each Advisory Agreement.
The Trustees considered information provided with respect to the Funds over the course of the year. Each Trustee attributed different weights to the various factors and no factor alone was considered determinative. From year to year, the Trustees consider and place emphasis on relevant information in light of changing circumstances in market and economic conditions. The Trustees determined that the compensation to be received by the Adviser from each Fund under the applicable Advisory Agreement was fair and reasonable and that the continuance of each Advisory Agreement was in the best interests of each Fund and its shareholders.
The factors summarized below were considered and discussed by the Trustees in reaching their conclusions:
Nature, Extent and Quality of Services Provided by the Adviser
The Trustees received and considered information regarding the nature, extent and quality of the services provided to each Fund under the Advisory Agreement. The Trustees took into account information furnished throughout the year at Trustee meetings, as well as the materials furnished specifically in connection with this annual review process. The Trustees considered the background and experience of the Adviser’s senior management and the expertise of, and the amount of attention given to each Fund by, investment personnel of the Adviser. In addition, the Trustees reviewed the qualifications, backgrounds and responsibilities of the portfolio management team primarily responsible for the day-to-day management of each Fund and the infrastructure supporting the team. The Trustees also considered information provided by the Adviser and JPMorgan Distribution Services, Inc. (“JPMDS”) about the structure and distribution strategy of each Fund. The Trustees reviewed information relating to the Adviser’s risk governance model and reports showing the Adviser’s compliance structure and ongoing compliance processes. The Trustees also considered the quality of the administrative services provided by J.P. Morgan Investment Management Inc. in its role as administrator (“JPMIM”).
The Trustees also considered their knowledge of the nature and quality of the services provided by the Adviser and its affiliates to the Funds gained from their experience as Trustees of the J.P. Morgan Funds. In addition, they considered the overall reputation and capabilities of the Adviser and its affiliates, the commitment of the Adviser to provide high quality service to the Funds, their overall confidence in the Adviser’s integrity and the Adviser’s responsiveness to questions or concerns raised by them, including the Adviser’s willingness to consider and implement organizational and operational changes
| | | | | | |
| | | |
| 86 | | | | J.P. MORGAN SMALL CAP FUNDS | | DECEMBER 31, 2016 |
designed to improve investment results and the services provided to each Fund.
Based upon these considerations and other factors, the Trustees concluded that they were satisfied with the nature, extent and quality of the investment advisory services provided to the Funds by the Adviser.
Costs of Services Provided and Profitability to the Adviser and its Affiliates
The Trustees received and considered information regarding the profitability to the Adviser and its affiliates in providing services to each of the Funds. The Trustees reviewed and discussed this data. The Trustees recognized that this data is not audited and represents the Adviser’s determination of its and its affiliates’ revenues from the contractual services provided to the Funds, less expenses of providing such services. Expenses include direct and indirect costs and are calculated using an allocation methodology developed by the Adviser. The Trustees also recognized that it is difficult to make comparisons of profitability from fund investment advisory contracts because comparative information is not generally publicly available and is affected by numerous factors, including the structure of the particular adviser, the types of funds it manages, its business mix, numerous assumptions regarding allocations and the fact that publicly-traded fund managers’ operating profits and net income are net of distribution and marketing expenses. Based upon their review, the Trustees concluded that the profitability to the Adviser under each of the Advisory Agreements was not unreasonable in light of the services and benefits provided to each Fund.
Fall-Out Benefits
The Trustees reviewed information regarding potential “fallout” or ancillary benefits received by the Adviser and its affiliates as a result of their relationship with the Funds. The Trustees also reviewed the Adviser’s allocation of fund brokerage for the J.P. Morgan Funds complex, including allocations to brokers who provide research to the Adviser.
The Trustees also considered that JPMDS, an affiliate of the Adviser, and JPMIM earn fees from the Funds for providing shareholder and administrative services, respectively. These fees were shown separately in the profitability analysis presented to the Trustees. The Trustees also considered the payments of Rule 12b-1 fees to JPMDS, which also acts as the Funds’ distributor and that these fees are in turn generally paid to financial intermediaries that sell the Funds, including financial intermediaries that are affiliates of the Adviser. The Trustees also considered the fees paid to JPMorgan Chase Bank, N.A. (“JPMCB”) for custody and fund accounting, and other related services.
Economies of Scale
The Trustees considered the extent to which the Funds may benefit from economies of scale. The Trustees considered that there may not be a direct relationship between economies of scale realized by the Funds and those realized by the Adviser as assets increase. The Trustees noted that the proposed investment advisory fee schedule for each Fund does not contain breakpoints, but that the fees remain competitive with peer funds. The Trustees also considered that the Adviser has implemented fee waivers and expense limitations (“Fee Caps”) which allow each Fund’s shareholders to share potential economies of scale from a Fund’s inception. The Trustees also considered that the Adviser has shared economies of scale by adding or enhancing services to the Funds over time, noting the Adviser’s substantial investments in its business in support of the Funds, including investments in trading systems and technology (including cybersecurity improvements), retention of key talent, additions to analyst and portfolio management teams, and regulatory support enhancements. The Trustees also considered whether it would be appropriate to add advisory fee breakpoints and the Trustees concluded that the current fee structure was reasonable in light of the Fee Caps that the Adviser has in place that serve to limit the overall net expense ratios of each Fund at competitive levels. The Trustees concluded that the Funds’ shareholders received the benefits of potential economies of scale through the Fee Caps and the Adviser’s reinvestment in its operations to serve the Funds and their shareholders.
Independent Written Evaluation of the Funds’ Senior/Chief Compliance Officer
The Trustees noted that, upon their direction, the Senior Officer for the Small Cap Growth Fund and Small Cap Value Fund had prepared an independent written evaluation in order to assist the Trustees in determining the reasonableness of the proposed management fees. In determining whether to continue the Advisory Agreements, the Trustees considered the Senior Officer’s report.
The Trustees noted that, upon their direction, the Chief Compliance Officer for the Dynamic Small Cap Growth Fund, Small Cap Core Fund, Small Cap Equity Fund, and U.S. Small Company Fund had prepared an independent written evaluation in order to assist the Trustees in determining the reasonableness of the proposed management fees. The Trustees considered the written evaluation in determining whether to continue the Advisory Agreements.
Fees Relative to Adviser’s Other Clients
The Trustees received and considered information about the nature and extent of investment advisory services and fee rates offered to other clients of the Adviser, including institutional separate accounts and/or funds sub-advised by the Adviser, for
| | | | | | | | |
| | | |
| DECEMBER 31, 2016 | | J.P. MORGAN SMALL CAP FUNDS | | | | | 87 | |
BOARD APPROVAL OF INVESTMENT ADVISORY AGREEMENT
(Unaudited) (continued)
investment management styles substantially similar to that of each Fund. The Trustees considered the complexity of investment management for registered mutual funds relative to the Adviser’s other clients and noted differences in the regulatory, legal and other risks and responsibilities of providing services to the different clients. The Trustees considered that serving as an adviser to a registered mutual fund involves greater responsibilities and risks than acting as a sub-adviser and observed that sub-advisory fees may be lower than those charged by the Adviser to each Fund. The Trustees also noted that the adviser, not the mutual fund, pays the sub-advisory fee and that many responsibilities related to the advisory function are retained by the primary adviser. The Trustees concluded that the fee rates charged to each Fund in comparison to those charged to the Adviser’s other clients were reasonable.
Investment Performance
The Trustees received and considered absolute and/or relative performance for the Funds in a report prepared by Broadridge/Lipper. The Trustees considered the total return performance information, which included the ranking of the Funds within a performance universe made up of funds with the same Broadridge/Lipper investment classification and objective (the “Universe”), as well as a sub-set of funds within the Universe (the “Peer Group”), by total return for applicable one-, three- and five-year periods. The Trustees reviewed a description of Broadridge/Lipper’s methodology for selecting mutual funds in each Fund’s Peer Group and Universe. The Broadridge/Lipper materials provided to the Trustees highlighted information with respect to certain representative classes to assist the Trustees in their review. As part of this review, the Trustees also reviewed each Fund’s performance against its benchmark and considered the performance information provided for the Funds at regular Board meetings by the Adviser and the Trustees’ independent consultant and also considered the special analysis prepared by the Trustees’ independent consultant. The Broadridge/Lipper performance data noted by the Trustees as part of their review and the determinations made by the Trustees with respect to each Fund’s performance for certain representative classes are summarized below:
The Trustees noted that the Dynamic Small Cap Growth Fund’s performance for Class A shares was in the third, third, and fourth quintiles based upon both the Peer Group and Universe for the one-, three-, and five-year periods ended December 31, 2015, respectively. The Trustees noted that the performance for Select Class shares was in the second, third and fifth quintiles based upon the Peer Group for the one-, three-, and five-year periods ended December 31, 2015, respectively, and in the third quintile based upon the Universe for each of the one-, three-, and five-year periods ended December 31, 2015. The Trustees discussed the performance and investment strategy of the Fund with the Adviser and reviewed the performance analysis and evaluation prepared by the independent consultant. Based
upon these discussions and various other factors, the Trustees concluded that the Fund’s performance was reasonable. They requested, however, that the Adviser provide additional Fund performance information to be reviewed with the members of the equity committee at each of their regular meetings over the course of the next year.
The Trustees noted that the Small Cap Core Fund’s performance for Select Class shares was in the fourth, first and first quintiles based upon both the Peer Group and Universe, for the one-, three-, and five-year periods ended December 31, 2015, respectively . The Trustees discussed the performance and investment strategy of the Fund with the Adviser and reviewed the performance analysis and evaluation prepared by the independent consultant. Based upon these discussions and various other factors, the Trustees concluded that the Fund’s performance was reasonable.
The Trustees noted that the Small Cap Equity Fund’s performance for Class A shares was in the first quintile based upon the Peer Group for each of the one-, three-, and five-year periods ended December 31, 2015, and in the first, second and first quintiles based upon the Universe, for the one-, three-, and five-year periods ended December 31, 2015, respectively. The Trustees noted that the performance for Select Class Shares was in the first, second and first quintiles based upon the Peer Group, for the one-, three- and five-year periods ended December 31, 2015, respectively, and in the first quintile based upon the Universe for each of the one-, three-, and five-year periods ended December 31, 2015. The Trustees discussed the performance and investment strategy of the Fund with the Adviser and reviewed the performance analysis and evaluation prepared by the independent consultant. Based upon these discussions and various other factors, the Trustees concluded that the Fund’s performance was reasonable.
The Trustees noted that the Small Cap Growth Fund’s performance for Class A shares was in the fourth, second, and fourth quintiles based upon the Peer Group, for the one-, three-, and five-year periods ended December 31, 2015, respectively, and in the third quintile based upon the Universe, for each of the one-, three- and five-year periods ended December 31, 2015. The Trustees noted that the performance for Select Class Shares was in the third, second and fourth quintiles based upon the Peer Group, and in the third, second and third quintiles based upon the Universe, for the one-, three-, and five-year periods ended December 31, 2015, respectively. The Trustees discussed the performance and investment strategy of the Fund with the Adviser and reviewed the performance analysis and evaluation prepared by the independent consultant. Based upon these discussions and various other factors, the Trustees concluded that the Fund’s performance was reasonable. They requested, however, that the Adviser provide additional Fund performance information to be reviewed with the members of the equity committee at each of their regular meetings over the course of the next year.
| | | | | | |
| | | |
| 88 | | | | J.P. MORGAN SMALL CAP FUNDS | | DECEMBER 31, 2016 |
The Trustees noted that the Small Cap Value Fund’s performance for Class A shares was in the fourth, fourth and third quintiles based upon the Peer Group, and in the fourth, third and second quintiles based upon the Universe, for the one-, three-, and five-year periods ended December 31, 2015, respectively. The Trustees noted that the performance for Select Class shares was in the fifth, fifth and second quintiles based upon the Peer Group, and in the fourth, third and second quintiles based upon the Universe, for the one-, three-, and five-year periods ended December 31, 2015, respectively. The Trustees discussed the performance and investment strategy of the Fund with the Adviser and reviewed the performance analysis and evaluation prepared by the independent consultant. Based upon these discussions and various other factors, the Trustees concluded that the Fund’s performance was reasonable.
The Trustees noted that the U.S. Small Company Fund’s performance for both Class A and Select Class shares was in second, first and first quintiles for the one-, three-, and five-year periods ended December 31, 2015, respectively, based upon both the Peer Group and Universe. The Trustees discussed the performance and investment strategy of the Fund with the Adviser and reviewed the performance analysis and evaluation prepared by the independent consultant. Based upon these discussions and various other factors, the Trustees concluded that the Fund’s performance was reasonable.
Advisory Fees and Expense Ratios
The Trustees considered the contractual advisory fee rate paid by each Fund to the Adviser and compared that rate to the information prepared by Broadridge/Lipper concerning management fee rates paid by other funds in the same Broadridge/Lipper category as each Fund. The Trustees recognized that Broadridge/Lipper reported each Fund’s management fee rate as the combined contractual advisory fee and administration fee rates. The Trustees also reviewed information about other expenses and the expense ratios for each Fund. The Trustees considered the fee waiver and/or expense reimbursement arrangements currently in place for each Fund and considered the net advisory fee rate after taking into account any waivers and/or reimbursements. The Trustees recognized that it is difficult to make comparisons of advisory fees because there are variations in the services that are included in the fees paid by other funds. The Trustees’ determinations as a result of the review of each Fund’s advisory fees and expense ratios for certain representative classes are summarized below:
The Trustees noted that the Dynamic Small Cap Growth Fund’s net advisory fee for both Class A and Select Class shares was in the first and second quintiles based upon the Peer Group and Universe, respectively, and that the actual total expenses for both Class A and Select Class shares were in the second quintile of both the Peer Group and Universe. After considering the factors identified above, in light of this information, the Trustees concluded that the advisory fees were reasonable.
The Trustees noted that the Small Cap Core Fund’s net advisory fee and actual total expenses for Select Class shares were in the first quintile based upon both the Peer Group and Universe. The Trustees also noted that effective September 15, 2016, the Select Class shares were renamed Class R5 shares, at which time the shareholder servicing fees were reduced from 0.25% to 0.05%. After considering the factors identified above, in light of this information, the Trustees concluded that the advisory fee was reasonable.
The Trustees noted that the Small Cap Equity Fund’s net advisory fee for Class A shares was in the first and second quintiles based upon the Peer Group and Universe, respectively, and that the actual total expenses for Class A shares were in the second quintile based upon both the Peer Group and Universe. The Trustees noted that the net advisory fee and actual total expenses for Select Class shares were in the second quintile based upon both the Peer Group and Universe. After considering the factors identified above, in light of this information, the Trustees concluded that the advisory fees were reasonable.
The Trustees noted that the Small Cap Growth Fund’s net advisory fee and actual total expenses for Class A shares were in the second quintile based upon both the Peer Group and Universe. The Trustees noted that the net advisory fee for Select Class shares was in the second quintile based upon both the Peer Group and Universe, and that the actual total expenses for Select Class shares were in the first and second quintiles based upon the Peer Group and Universe, respectively. After considering the factors identified above, in light of this information, the Trustees concluded that the advisory fee was reasonable.
The Trustees noted that the Small Cap Value Fund’s net advisory fee and actual total expenses for Class A shares were in the second quintile based upon both the Peer Group and Universe. The Trustees noted that both the net advisory fee and actual total expenses were in the first and second quintiles based upon the Peer Group and Universe, respectively. After considering the factors identified above, in light of this information, the Trustees concluded that the advisory fees were reasonable.
The Trustees noted that the U.S. Small Company Fund’s net advisory fee for Class A shares was in the first and second quintiles based upon the Peer Group and Universe, respectively, and that the actual total expenses for Class A shares were in the third and second quintiles based upon the Peer Group and Universe, respectively. The Trustees noted that the net advisory fee for Select Class shares was in the first and second quintiles based upon the Peer Group and Universe, respectively, and that the actual total expenses for Select Class shares were in the first and third quintiles based upon the Peer Group and Universe, respectively. After considering the factors identified above, in light of this information, the Trustees concluded that the advisory fees were reasonable.
| | | | | | | | |
| | | |
| DECEMBER 31, 2016 | | J.P. MORGAN SMALL CAP FUNDS | | | | | 89 | |
J.P. Morgan Funds are distributed by JPMorgan Distribution Services, Inc., which is an affiliate of JPMorgan Chase & Co. Affiliates of JPMorgan Chase & Co. receive fees for providing various services to the funds.
Contact JPMorgan Distribution Services, Inc. at 1-800-480-4111 for a fund prospectus. You can also visit us at www.jpmorganfunds.com. Investors should carefully consider the investment objectives and risk as well as charges and expenses of the mutual fund before investing. The prospectus contains this and other information about the mutual fund. Read the prospectus carefully before investing.
Investors may obtain information about the Securities Investor Protection Corporation (SIPC), including the SIPC brochure by visiting www.sipc.org or by calling SIPC at 202-371-8300.
Each Fund files a complete schedule of its fund holdings for the first and third quarters of its fiscal year with the SEC on Form N-Q. The Funds’ Forms N-Q are available on the SEC’s website at http://www.sec.gov and may be reviewed and copied at the SEC’s Public Reference Room in Washington, DC. Information on the operation of the SEC’s Public Reference Room may be obtained by calling 1-800-SEC-0330. Shareholders may request the Form N-Q without charge by calling 1-800-480-4111 or by visiting the J.P. Morgan Funds’ website at www.jpmorganfunds.com.
A description of each Fund’s policies and procedures with respect to the disclosure of each Fund’s holdings is available in the prospectus and Statement of Additional Information.
A copy of proxy policies and procedures is available without charge upon request by calling 1-800-480-4111 and on the Funds’ website at www.jpmorganfunds.com. A description of such policies and procedures is on the SEC’s website at www.sec.gov. The Trustees have delegated the authority to vote proxies for securities owned by the Funds to the Adviser. A copy of the Funds’ voting record for the most recent 12-month period ended June 30 is available on the SEC’s website at www.sec.gov or at the Funds’ website at www.jpmorganfunds.com no later than August 31 of each year. The Funds’ proxy voting record will include, among other things, a brief description of the matter voted on for each fund security, and will state how each vote was cast, for example, for or against the proposal.


J.P. Morgan Asset Management is the marketing name for the asset management businesses of JPMorgan Chase & Co. Those businesses include, but are not limited to, J.P. Morgan Investment Management Inc., Security Capital Research & Management Incorporated and J.P. Morgan Alternative Asset Management, Inc.
| | | | |
| | © JPMorgan Chase & Co., 2017. All rights reserved. December 2016. | | SAN-SC-1216 |
Semi-Annual Report
J.P. Morgan Mid Cap/Multi-Cap Funds
December 31, 2016 (Unaudited)
JPMorgan Growth Advantage Fund
JPMorgan Mid Cap Equity Fund
JPMorgan Mid Cap Growth Fund
JPMorgan Mid Cap Value Fund
JPMorgan Multi-Cap Market Neutral Fund
JPMorgan Value Advantage Fund

CONTENTS
Investments in a Fund are not deposits or obligations of, or guaranteed or endorsed by, any bank and are not insured or guaranteed by the FDIC, the Federal Reserve Board or any other government agency. You could lose money if you sell when a Fund’s share price is lower than when you invested.
Past performance is no guarantee of future performance. The general market views expressed in this report are opinions based on market and other conditions through the end of the reporting period and are subject to change without notice. These views are not intended to predict the future performance of a Fund or the securities markets. References to specific securities and their issuers are for illustrative purposes only and are not intended to be, and should not be interpreted as, recommendations to purchase or sell such securities. Such views are not meant as investment advice and may not be relied on as an indication of trading intent on behalf of any Fund.
Prospective investors should refer to the Funds’ prospectus for a discussion of the Funds’ investment objectives, strategies and risks. Call J.P. Morgan Funds Service Center at 1-800-480-4111 for a prospectus containing more complete information about a Fund, including management fees and other expenses. Please read it carefully before investing.
CEO’S LETTER
January 25, 2017 (Unaudited)
Dear Shareholder,
The continued expansion of the U.S. economy through the second half of 2016 helped support U.S. equity prices and spurred the U.S. Federal Reserve (the “Fed”) to raise interest rates in December. During the period, corporate earnings overall showed positive growth and by the end of the year the unemployment rate had reached it lowest levels since 2007.
| | |
 | | “We believe the market performance over the past year has further validated both patience and diversification as fundamental components of a sound investment strategy.” |
Gross domestic product in the U.S. rose by an estimated 3.5% in the third quarter of 2016, surpassing other developed markets. Global oil prices also continued to rise for most of the reporting period and the price of West Texas Intermediate crude reached a 15-month high in November. The Standard & Poor’s 500 Index reached fresh closing highs in July and August and remained buoyant through October.
The November 8th victory of Republican Party presidential candidate Donald Trump surprised many investors and led to brief declines in global equities. However, within 24 hours
global share prices had largely recovered. U.S. equity prices rallied through the end of the year, reaching new highs in December.
Against this backdrop, the Fed raised interest rates by a quarter of a percentage point on December 14th. “Economic growth has picked up since the middle of the year,” said Fed Chairwoman Janet Yellen. “We expect the economy will continue to perform well.”
While the prospect of further interest rate increases put pressure on U.S. bond prices, equities provided investors with positive returns. We believe the market performance over the past year has further validated both patience and diversification as fundamental components of a sound investment strategy.
We look forward to managing your investment needs for years to come. Should you have any questions, please visit www.jpmorganfunds.com or contact the J.P. Morgan Funds Service Center at 1-800-480-4111.
Sincerely yours,

George C.W. Gatch
CEO, Investment Funds Management,
J.P. Morgan Asset Management
| | | | | | | | |
| | | |
| DECEMBER 31, 2016 | | J.P. MORGAN MID CAP/MULTI-CAP FUNDS | | | | | 1 | |
J.P. Morgan Mid Cap/Multi-Cap Funds
MARKET OVERVIEW
SIX MONTHS ENDED DECEMBER 31, 2016 (Unaudited)
U.S. equity investments generally continued to outperform both other developed markets and emerging markets during the second half of 2016. Rebounding in the wake of the U.K.’s vote to exit from the European Union, the Standard & Poor’s 500 (the “S&P 500”) reached new closing highs in July and August. Global oil prices also continued to rise during the reporting period and reached 15-month highs in advance of the November 30th meeting of the Organization of Petroleum Exporting Countries.
Meanwhile, the November 8th victory of Republican Party presidential candidate Donald Trump surprised many investors and led to brief declines in global equities. The U.S. equity market recovered within a day and in the following weeks the S&P 500 surpassed 2,200 points for the first time and reached eight new closing highs by the end of 2016. The Dow Jones Industrial Average surpassed 19,000 points for the first time and reached 17 new closing highs between the election and the end of the year. In particular, energy, pharmaceutical and financial sector stocks generally rose amid investor expectations that a Trump administration’s policies would be beneficial for those industries.
During the reporting period, value stocks generally outperformed growth stocks and small-cap and mid-cap stocks outperformed large-cap stocks. By sector, the energy and financials sectors were top performers, while the health care and real estate sectors underperformed other sectors. For the six months ended December 31, 2016, the Russell MidCap Index returned 7.87% and the Russell 3000 Index returned 8.79%.
| | | | | | |
| | | |
| 2 | | | | J.P. MORGAN MID CAP/MULTI-CAP FUNDS | | DECEMBER 31, 2016 |
JPMorgan Growth Advantage Fund
FUND COMMENTARY
SIX MONTHS ENDED DECEMBER 31, 2016 (Unaudited)
| | | | |
| REPORTING PERIOD RETURN: | |
| Fund (Class A Shares, without a sales charge)* | | | 5.20% | |
| Russell 3000 Growth Index | | | 6.18% | |
| |
| Net Assets as of 12/31/2016 (In Thousands) | | $ | 6,101,660 | |
INVESTMENT OBJECTIVE**
The JPMorgan Growth Advantage Fund (the “Fund”) seeks to provide long-term capital growth.
WHAT WERE THE MAIN DRIVERS OF THE FUND’S PERFORMANCE?
The Fund’s Class A Shares, without a sales charge, underperformed the Russell 3000 Growth Index (the “Benchmark”) for the six months ended December 31, 2016. The Fund’s security selection in the health care and consumer discretionary sectors was a leading detractor from performance relative to the Benchmark. The Fund’s security selection in the financials sector and its underweight position in the consumer staples sector were leading contributors to relative performance.
Leading individual detractors from relative performance included the Fund’s overweight position in Acadia Healthcare Co., its underweight position in Apple Inc. and its allocation to Bristol-Myers Squibb Co. Shares of Acadia Healthcare, an operator of inpatient psychiatric and substance abuse treatment centers, fell after the company forecast lower-than-expected earnings and revenue. Shares of Apple, a maker of computers and mobile devices, rose amid the broader trend of increased investment in U.S. equities during the reporting period. Shares of Bristol Myers Squibb, a drug maker, fell amid investor concerns about the company’s ability to compete in the market for lung cancer treatments.
Leading individual contributors to relative performance included the Fund’s overweight positions in Charles Schwab Co., East West Bancorp Inc. and Arista Networks Inc.
Shares of Charles Schwab, a discount securities brokerage, and East West Bancorp, a California regional bank, rose amid an increase in U.S. interest rates. Shares of Arista Networks, a maker of data network equipment, rose after the company reported earnings growth and raised its earnings forecast.
HOW WAS THE FUND POSITIONED?
The Fund’s portfolio managers utilized a bottom-up approach to stock selection, researching individual companies across
market capitalizations in an effort to construct portfolios of stocks that have strong fundamentals. The Fund’s portfolio managers sought to invest in high quality companies with durable franchises that, in their view, possessed the ability to generate strong future earnings growth.
| | | | | | | | |
| TOP TEN EQUITY HOLDINGS OF THE PORTFOLIO*** | |
| | 1. | | | Alphabet, Inc., Class C | | | 6.3 | % |
| | 2. | | | Facebook, Inc., Class A | | | 4.3 | |
| | 3. | | | Amazon.com, Inc. | | | 3.9 | |
| | 4. | | | UnitedHealth Group, Inc. | | | 3.0 | |
| | 5. | | | Waste Connections, Inc., (Canada) | | | 2.6 | |
| | 6. | | | Microsoft Corp. | | | 2.6 | |
| | 7. | | | Apple, Inc. | | | 2.4 | |
| | 8. | | | Mohawk Industries, Inc. | | | 2.3 | |
| | 9. | | | Electronic Arts, Inc. | | | 1.9 | |
| | 10. | | | Visa, Inc., Class A | | | 1.8 | |
| | | | |
PORTFOLIO COMPOSITION BY SECTOR*** | |
| Information Technology | | | 38.1 | % |
| Consumer Discretionary | | | 16.6 | |
| Industrials | | | 14.2 | |
| Health Care | | | 14.1 | |
| Financials | | | 8.0 | |
| Consumer Staples | | | 2.2 | |
| Energy | | | 2.2 | |
| Materials | | | 1.8 | |
| Real Estate | | | 1.0 | |
| Short-Term Investment | | | 1.8 | |
| * | | The return shown is based on net asset values calculated for shareholder transactions and may differ from the return shown in the financial highlights, which reflects adjustments made to the net asset values in accordance with accounting principles generally accepted in the United States of America. |
| ** | | The adviser seeks to achieve the Fund’s objective. There can be no guarantee it will be achieved. |
| *** | | Percentages indicated are based on total investments as of December 31, 2016. The Fund’s portfolio composition is subject to change. |
| | | | | | | | |
| | | |
| DECEMBER 31, 2016 | | J.P. MORGAN MID CAP/MULTI-CAP FUNDS | | | | | 3 | |
JPMorgan Growth Advantage Fund
FUND COMMENTARY
SIX MONTHS ENDED DECEMBER 31, 2016 (Unaudited) (continued)
| | | | | | | | | | | | | | | | | | |
AVERAGE ANNUAL TOTAL RETURNS AS OF DECEMBER 31, 2016 | |
| | | | | |
| | | INCEPTION DATE OF
CLASS | | 6 MONTH* | | | 1 YEAR | | | 5 YEAR | | | 10 YEAR | |
CLASS A SHARES | | October 29, 1999 | | | | | | | | | | | | | | | | |
With Sales Charge** | | | | | (0.33 | )% | | | (4.23 | )% | | | 13.76 | % | | | 8.44 | % |
Without Sales Charge | | | | | 5.20 | | | | 1.07 | | | | 14.99 | | | | 9.02 | |
CLASS C SHARES | | May 1, 2006 | | | | | | | | | | | | | | | | |
With CDSC*** | | | | | 3.96 | | | | (0.41 | ) | | | 14.42 | | | | 8.46 | |
Without CDSC | | | | | 4.96 | | | | 0.59 | | | | 14.42 | | | | 8.46 | |
CLASS R5 SHARES | | January 8, 2009 | | | 5.41 | | | | 1.41 | | | | 15.43 | | | | 9.44 | |
CLASS R6 SHARES | | December 23, 2013 | | | 5.47 | | | | 1.54 | | | | 15.50 | | | | 9.47 | |
SELECT CLASS SHARES | | May 1, 2006 | | | 5.36 | | | | 1.30 | | | | 15.20 | | | | 9.26 | |
| ** | | Sales Charge for Class A Shares is 5.25%. |
| *** | | Assumes a 1% CDSC (contingent deferred sales charge) for the 6 month and one year periods and 0% CDSC thereafter. |
TEN YEAR PERFORMANCE (12/31/06 TO 12/31/16)
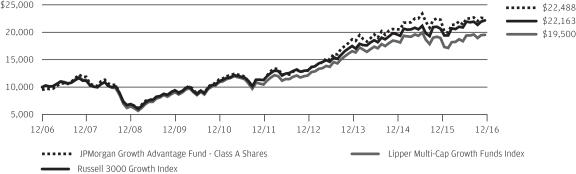
The performance quoted is past performance and is not a guarantee of future results. Mutual funds are subject to certain market risks. Investment returns and principal value of an investment will fluctuate so that an investor’s shares, when redeemed, may be worth more or less than their original cost. Current performance may be higher or lower than the performance data shown. For up-to-date month-end performance information please call 1-800-480-4111.
Returns for Class R5 Shares prior to their inception date are based on the performance of Select Class Shares. The actual returns of Class R5 Shares would have been different than those shown because Class R5 Shares have different expenses than Select Class Shares.
Returns for Class R6 Shares prior to their inception date are based on the performance of Class R5 Shares from January 8, 2009 to December 23, 2013 and Select Class Shares prior to January 8, 2009. The actual returns of Class R6 Shares would have been different than those shown because Class R6 Shares have different expenses than Class R5 Shares and Select Class Shares.
The graph illustrates comparative performance for $10,000 invested in Class A Shares of the JPMorgan Growth Advantage Fund, the Russell 3000 Growth Index and the Lipper Multi-Cap Growth Funds Index from December 31, 2006 to December 31, 2016. The performance of the Fund assumes reinvestment of all dividends and capital gain distributions, if any, and includes a sales charge. The performance of the Russell 3000 Growth Index does not reflect the deduction of expenses or a sales charge associated with a mutual fund and has been
adjusted to reflect reinvestment of all dividends and capital gain distributions of the securities included in the benchmark, if applicable. The performance of the Lipper Multi-Cap Growth Funds Index includes expenses associated with a mutual fund, such as investment management fees. These expenses are not identical to the expenses incurred by the Fund. The Russell 3000 Growth Index is an unmanaged index which measures the performance of those Russell 3000 companies (largest 3000 U.S. companies) with higher price-to-book ratios and higher forecasted growth values. The Lipper Multi-Cap Growth Funds Index is an index based on total returns of certain mutual funds within the Fund’s designated category as determined by Lipper, Inc. Investors cannot invest directly in an index.
Class A Shares have a $1,000 minimum initial investment and carry a 5.25% sales charge.
Fund performance may reflect the waiver of the Fund’s fees and reimbursement of expenses for certain periods since the inception date. Without these waivers and reimbursements, performance would have been lower. Also, performance shown in this section does not reflect the deduction of taxes that a shareholder would pay on Fund distributions or redemptions of Fund shares.
The returns shown are based on net asset values calculated for shareholder transactions and may differ from the returns shown in the financial highlights, which reflect adjustments made to the net asset values in accordance with accounting principles generally accepted in the United States of America.
| | | | | | |
| | | |
| 4 | | | | J.P. MORGAN MID CAP/MULTI-CAP FUNDS | | DECEMBER 31, 2016 |
JPMorgan Mid Cap Equity Fund
FUND COMMENTARY
SIX MONTHS ENDED DECEMBER 31, 2016 (Unaudited)
| | | | |
| REPORTING PERIOD RETURN: | |
| Fund (Select Class Shares)* | | | 5.56% | |
| Russell Midcap Index | | | 7.87% | |
| |
| Net Assets as of 12/31/2016 (In Thousands) | | $ | 2,608,317 | |
INVESTMENT OBJECTIVE**
The JPMorgan Mid Cap Equity Fund (the “Fund”) seeks long-term capital growth.
WHAT WERE THE MAIN DRIVERS OF THE FUND’S PERFORMANCE?
The Fund’s Select Class Shares underperformed the Russell Midcap Index (the “Benchmark”) for the six months ended December 31, 2016. The Fund’s overweight position and security selection in the health care sector and its underweight position and security selection in the energy sector were leading detractors from performance relative to the Benchmark. The Fund’s security selection in the financial sector and its underweight position in the utilities sectors were leading contributors to relative performance.
Leading individual detractors from relative performance included the Fund’s overweight positions in Acadia Healthcare Co., EQT Corp. and Dollar General Corp. Shares of Acadia Healthcare, an operator of inpatient psychiatric and substance abuse treatment centers, fell after the company forecast lower-than-expected earnings and revenue. Shares of EQT, a natural gas producer, fell after the company forecast higher-than-expected capital expenditures and lower product volumes for 2017. Shares of Dollar General, a discount retail chain, fell after the company reported lower-than-expected sales.
Leading individual contributors to relative performance included the Fund’s overweight positions in TD Ameritrade Holdings Co., Hilton Worldwide Holdings Inc. and Fifth Third Bancorp. Shares of both TD Ameritrade, a discount securities brokerage, and Fifth Third Bancorp, an Ohio regional bank, rose amid an increase in U.S. interest rates. Shares of Hilton Worldwide, a hotels and resorts operator, rose after management reaffirmed its forecast for revenue growth and on better-than-expected revenue per available room.
HOW WAS THE FUND POSITIONED?
The Fund’s portfolio managers employed a bottom-up approach to stock selection, constructing a portfolio based on company fundamentals, quantitative screening and proprietary fundamental analysis. The Fund’s portfolio managers sought to
identify dominant franchises with predictable business models deemed capable of achieving, in their view, sustained growth, as well as undervalued companies with the potential to grow their intrinsic value per share.
| | | | | | | | |
| TOP TEN EQUITY HOLDINGS OF THE PORTFOLIO*** | |
| | 1. | | | Mohawk Industries, Inc. | | | 2.2 | % |
| | 2. | | | Hilton Worldwide Holdings, Inc. | | | 1.8 | |
| | 3. | | | Amphenol Corp., Class A | | | 1.5 | |
| | 4. | | | Waste Connections, Inc., (Canada) | | | 1.3 | |
| | 5. | | | Electronic Arts, Inc. | | | 1.3 | |
| | 6. | | | NVIDIA Corp. | | | 1.2 | |
| | 7. | | | Energen Corp. | | | 1.1 | |
| | 8. | | | Humana, Inc. | | | 1.1 | |
| | 9. | | | Carlisle Cos., Inc. | | | 1.1 | |
| | 10. | | | Fortune Brands Home & Security, Inc. | | | 1.1 | |
| | | | |
PORTFOLIO COMPOSITION BY SECTOR*** | |
| Information Technology | | | 18.2 | % |
| Consumer Discretionary | | | 17.9 | |
| Financials | | | 15.7 | |
| Industrials | | | 13.2 | |
| Health Care | | | 9.5 | |
| Real Estate | | | 5.6 | |
| Consumer Staples | | | 4.7 | |
| Utilities | | | 4.5 | |
| Energy | | | 4.0 | |
| Materials | | | 3.3 | |
| Short-Term Investment | | | 3.4 | |
| * | | The return shown is based on net asset values calculated for shareholder transactions and may differ from the return shown in the financial highlights, which reflects adjustments made to the net asset values in accordance with accounting principles generally accepted in the United States of America. |
| ** | | The adviser seeks to achieve the Fund’s objective. There can be no guarantee it will be achieved. |
| *** | | Percentages indicated are based on total investments as of December 31, 2016. The Fund’s portfolio composition is subject to change. |
| | | | | | | | |
| | | |
| DECEMBER 31, 2016 | | J.P. MORGAN MID CAP/MULTI-CAP FUNDS | | | | | 5 | |
JPMorgan Mid Cap Equity Fund
FUND COMMENTARY
SIX MONTHS ENDED DECEMBER 31, 2016 (Unaudited) (continued)
| | | | | | | | | | | | | | | | | | |
AVERAGE ANNUAL TOTAL RETURNS AS OF DECEMBER 31, 2016 | |
| | | | | |
| | | INCEPTION DATE OF
CLASS | | 6 MONTH* | | | 1 YEAR | | | 5 YEAR | | | 10 YEAR | |
CLASS A SHARES | | November 2, 2009 | | | | | | | | | | | | | | | | |
With Sales Charge** | | | | | (0.17 | )% | | | 1.38 | % | | | 12.77 | % | | | 7.17 | % |
Without Sales Charge | | | | | 5.36 | | | | 6.98 | | | | 14.00 | | | | 7.75 | |
CLASS C SHARES | | November 2, 2009 | | | | | | | | | | | | | | | | |
With CDSC*** | | | | | 4.11 | | | | 5.46 | | | | 13.43 | | | | 7.36 | |
Without CDSC | | | | | 5.11 | | | | 6.46 | | | | 13.43 | | | | 7.36 | |
CLASS R2 SHARES | | March 14, 2014 | | | 5.25 | | | | 6.72 | | | | 13.84 | | | | 7.67 | |
CLASS R5 SHARES | | March 14, 2014 | | | 5.63 | | | | 7.48 | | | | 14.47 | | | | 8.05 | |
CLASS R6 SHARES | | March 14, 2014 | | | 5.63 | | | | 7.54 | | | | 14.50 | | | | 8.06 | |
SELECT CLASS SHARES | | January 1, 1997 | | | 5.56 | | | | 7.36 | | | | 14.40 | | | | 8.02 | |
| ** | | Sales Charge for Class A Shares is 5.25%. |
| *** | | Assumes a 1% CDSC (contingent deferred sales charge) for the 6 month and one year periods and 0% CDSC thereafter. |
TEN YEAR PERFORMANCE (12/31/06 TO 12/31/16)
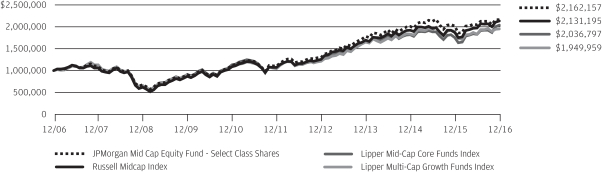
The performance quoted is past performance and is not a guarantee of future results. Mutual funds are subject to certain market risks. Investment returns and principal value of an investment will fluctuate so that an investor’s shares, when redeemed, may be worth more or less than their original cost. Current performance may be higher or lower than the performance data shown. For up-to-date month-end performance information please call 1-800-480-4111.
Returns for Class A and Class C Shares prior to their inception date are based on the performance of Select Class Shares. The actual returns of Class A and Class C Shares would have been lower than those shown because Class A and Class C Shares have higher expenses than Select Class Shares.
Returns for Class R2 Shares prior to their inception date are based of Class A Shares from November 2, 2009 to March 13, 2014 and Select Class Shares prior to November 2, 2009. The actual returns of Class R2 Shares would have been lower than those shown because Class R2 Shares have higher expenses than Class A and Select Class Shares.
Returns for Class R5 and Class R6 Shares prior to their inception date are based on the performance of Select Class Shares. The actual returns of Class R5 and Class R6 Shares would have been different because Class R5 and Class R6 Shares have different expenses than Select Class Shares.
The graph illustrates comparative performance for $1,000,000 invested in the Select Class Shares of JPMorgan Mid Cap Equity Fund, the Russell Midcap Index, and the Lipper Multi-Cap Growth Funds Index from December 31, 2006 to December 31, 2016. The performance of the Fund assumes reinvestment of all
dividends and capital gain distributions, if any, and does not include a sales charge. The performance of the Russell Midcap Index does not reflect the deduction of expenses or a sales charge associated with a mutual fund and has been adjusted to reflect reinvestment of all dividends and capital gain distributions of the securities included in the benchmark, if applicable. The performance of the Lipper Mid-Cap Core Funds Index and the Lipper Multi-Cap Growth Funds Index includes expenses associated with a mutual fund, such as investment management fees. These expenses are not identical to the expenses incurred by the Fund. The Russell Midcap Index is an unmanaged index which measures the performance of the 800 smallest companies in the Russell 1000 Index. The Lipper Mid-Cap Core Funds Index and the Lipper Multi-Cap Growth Funds Index are indices based on total returns of certain mutual funds within the mid cap fund categories as determined by Lipper, Inc. Investors cannot invest directly in an index.
Select Class Shares have a $1,000,000 minimum initial investment.
Fund performance may reflect the waiver of the Fund’s fees and reimbursement of expenses for certain periods since the inception date. Without these waivers and reimbursements, performance would have been lower. Also, performance shown in this section does not reflect the deduction of taxes that a shareholder would pay on Fund distributions or redemptions of Fund shares.
The returns shown are based on net asset values calculated for shareholder transactions and may differ from the returns shown in the financial highlights, which reflect adjustments made to the net asset values in accordance with accounting principles generally accepted in the United States of America.
| | | | | | |
| | | |
| 6 | | | | J.P. MORGAN MID CAP/MULTI-CAP FUNDS | | DECEMBER 31, 2016 |
JPMorgan Mid Cap Growth Fund
FUND COMMENTARY
SIX MONTHS ENDED DECEMBER 31, 2016 (Unaudited)
| | | | |
| REPORTING PERIOD RETURN: | |
| Fund (Select Class Shares)* | | | 3.70% | |
| Russell Midcap Growth Index . | | | 5.07% | |
| |
| Net Assets as of 12/31/2016 (In Thousands) . | | $ | 2,717,536 | |
INVESTMENT OBJECTIVE**
The JPMorgan Mid Cap Growth Fund (the “Fund”) seeks growth of capital.
WHAT WERE THE MAIN DRIVERS OF THE FUND’S PERFORMANCE?
The Fund’s Select Class Shares underperformed the Russell Midcap Growth Index (the “Benchmark”) for the six months ended December 31, 2016. The Fund’s security selection in the health care and consumer discretionary sectors was a leading detractor from performance relative to the Benchmark, while the Fund’s security selection in the financials sector and its overweight position in the technology sector were leading contributors to relative performance.
Leading individual detractors from relative performance included the Fund’s overweight positions in Acadia Healthcare Co., Dollar General Corp. and Inovalon Holdings Inc. Shares of Acadia Healthcare, an operator of inpatient psychiatric and substance abuse treatment centers, fell after the company forecast lower-than-expected earnings and revenue. Shares of Dollar General, a discount retail chain, fell following weaker-than-expected sales. Shares of Inovalon Holdings, a cloud computing technology provider, fell after the company reduced its forecast for earnings and sales.
Leading individual contributors to relative performance included the Fund’s overweight positions in TD Ameritrade Holdings Co., East West Bancorp Inc. and Cavium Inc.
Shares of both TD Ameritrade, a discount securities brokerage, and East West Bancorp, a California regional bank, rose amid an increase in U.S. interest rates. Shares of Cavium, a semiconductor manufacturer, rose after the company posted better-than-expected earnings.
HOW WAS THE FUND POSITIONED?
The Fund’s portfolio managers utilized a bottom-up approach to stock selection, researching individual companies in an effort to construct a portfolio of stocks that have strong fundamentals. The Fund’s portfolio managers sought to invest in high
quality companies with durable franchises that, in their view, possessed the ability to generate strong future earnings growth.
| | | | | | | | |
| TOP TEN EQUITY HOLDINGS OF THE PORTFOLIO*** | |
| | 1. | | | Mohawk Industries, Inc. | | | 2.8 | % |
| | 2. | | | Electronic Arts, Inc. | | | 2.7 | |
| | 3. | | | Waste Connections, Inc., (Canada) | | | 2.7 | |
| | 4. | | | NVIDIA Corp. | | | 2.4 | |
| | 5. | | | Hilton Worldwide Holdings, Inc. | | | 2.3 | |
| | 6. | | | Vantiv, Inc., Class A | | | 2.2 | |
| | 7. | | | Ross Stores, Inc. | | | 1.9 | |
| | 8. | | | O’Reilly Automotive, Inc. | | | 1.9 | |
| | 9. | | | Amphenol Corp., Class A | | | 1.8 | |
| | 10. | | | Acuity Brands, Inc. | | | 1.8 | |
| | | | |
PORTFOLIO COMPOSITION BY SECTOR*** | |
| Information Technology | | | 27.0 | % |
| Consumer Discretionary | | | 19.0 | |
| Industrials | | | 18.0 | |
| Health Care | | | 14.8 | |
| Financials | | | 9.5 | |
| Consumer Staples | | | 3.0 | |
| Materials | | | 2.6 | |
| Energy | | | 2.4 | |
| Real Estate | | | 1.4 | |
| Short-Term Investment | | | 2.3 | |
| * | | The return shown is based on net asset values calculated for shareholder transactions and may differ from the return shown in the financial highlights, which reflects adjustments made to the net asset values in accordance with accounting principles generally accepted in the United States of America. |
| ** | | The adviser seeks to achieve the Fund’s objective. There can be no guarantee it will be achieved. |
| *** | | Percentages indicated are based on total investments as of December 31, 2016. The Fund’s portfolio composition is subject to change. |
| | | | | | | | |
| | | |
| DECEMBER 31, 2016 | | J.P. MORGAN MID CAP/MULTI-CAP FUNDS | | | | | 7 | |
JPMorgan Mid Cap Growth Fund
FUND COMMENTARY
SIX MONTHS ENDED DECEMBER 31, 2016 (Unaudited) (continued)
| | | | | | | | | | | | | | | | | | |
AVERAGE ANNUAL TOTAL RETURNS AS OF DECEMBER 31, 2016 | |
| | | | | |
| | | INCEPTION DATE OF
CLASS | | 6 MONTH* | | | 1 YEAR | | | 5 YEAR | | | 10 YEAR | |
CLASS A SHARES | | February 18, 1992 | | | | | | | | | | | | | | | | |
With Sales Charge** | | | | | (1.89 | )% | | | (5.37 | )% | | | 11.98 | % | | | 6.83 | % |
Without Sales Charge | | | | | 3.55 | | | | (0.12 | ) | | | 13.19 | | | | 7.41 | |
CLASS C SHARES | | November 4, 1997 | | | | | | | | | | | | | | | | |
With CDSC*** | | | | | 2.27 | | | | (1.60 | ) | | | 12.63 | | | | 6.83 | |
Without CDSC | | | | | 3.27 | | | | (0.60 | ) | | | 12.63 | | | | 6.83 | |
CLASS R2 SHARES | | June 19, 2009 | | | 3.47 | | | | (0.26 | ) | | | 13.02 | | | | 7.24 | |
CLASS R3 SHARES | | September 9, 2016 | | | 3.57 | | | | (0.10 | ) | | | 13.20 | | | | 7.41 | |
CLASS R4 SHARES | | September 9, 2016 | | | 3.69 | | | | 0.15 | | | | 13.48 | | | | 7.68 | |
CLASS R5 SHARES | | November 1, 2011 | | | 3.75 | | | | 0.33 | | | | 13.70 | | | | 7.80 | |
CLASS R6 SHARES | | November 1, 2011 | | | 3.77 | | | | 0.37 | | | | 13.76 | | | | 7.83 | |
SELECT CLASS SHARES | | March 2, 1989 | | | 3.70 | | | | 0.19 | | | | 13.54 | | | | 7.72 | |
| ** | | Sales Charge for Class A Shares is 5.25%. |
| *** | | Assumes a 1% CDSC (contingent deferred sales charge) for the 6 month and one year periods and 0% CDSC thereafter. |
TEN YEAR PERFORMANCE (12/31/06 TO 12/31/16)
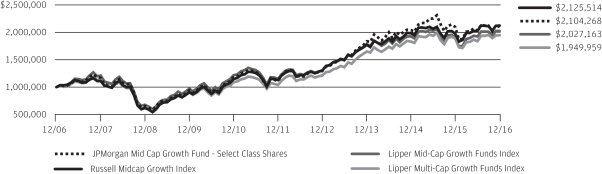
The performance quoted is past performance and is not a guarantee of future results. Mutual funds are subject to certain market risks. Investment returns and principal value of an investment will fluctuate so that an investor’s shares, when redeemed, may be worth more or less than their original cost. Current performance may be higher or lower than the performance data shown. For up-to-date month-end performance information please call 1-800-480-4111.
Returns for the Class R2, Class R3, Class R4, Class R5 and Class R6 Shares prior to their inception dates are based on the performance of Select Class Shares. Prior performance for Class R2, Class R3 and Class R4 Shares has been adjusted to reflect the differences in expenses between classes. The actual returns of Class R5 and Class R6 Shares would have been different than those shown because Class R5 and Class R6 Shares have different expenses than Select Class Shares.
The graph illustrates comparative performance for $1,000,000 invested in Select Class Shares of the JPMorgan Mid Cap Growth Fund, the Russell Midcap Growth Index, the Lipper Mid-Cap Growth Funds Index and the Lipper Multi-Cap Growth Funds Index from December 31, 2006 to December 31, 2016. The performance of the Fund assumes reinvestment of all dividends and capital gain distributions, if any, and does not include a sales charge. The performance of the Russell Midcap Growth Index does not reflect the deduction of expenses or a sales charge associated with a mutual fund and has been adjusted to reflect
reinvestment of all dividends and capital gain distributions of the securities included in the benchmark, if applicable. The performance of the Lipper Mid-Cap Growth Funds Index and the Lipper Multi-Cap Growth Funds Index includes expenses associated with a mutual fund, such as investment management fees. These expenses are not identical to the expenses incurred by the Fund. The Russell Midcap Growth Index is an unmanaged index which measures the performance of those Russell Midcap companies with higher price-to-book ratios and higher forecasted growth values. The Lipper Mid-Cap Growth Funds Index and the Lipper Multi-Cap Growth Funds Index are indices based on total returns of certain mutual funds as determined by Lipper, Inc. Investors cannot invest directly in an index.
Select Class Shares have a $1,000,000 minimum initial investment.
Fund performance may reflect the waiver of the Fund’s fees and reimbursement of expenses for certain periods since the inception date. Without these waivers and reimbursements, performance would have been lower. Also, performance shown in this section does not reflect the deduction of taxes that a shareholder would pay on Fund distributions or redemptions of Fund shares.
The returns shown are based on net asset values calculated for shareholder transactions and may differ from the returns shown in the financial highlights, which reflect adjustments made to the net asset values in accordance with accounting principles generally accepted in the United States of America.
| | | | | | |
| | | |
| 8 | | | | J.P. MORGAN MID CAP/MULTI-CAP FUNDS | | DECEMBER 31, 2016 |
JPMorgan Mid Cap Value Fund
FUND COMMENTARY
SIX MONTHS ENDED DECEMBER 31, 2016 (Unaudited)
| | | | |
| REPORTING PERIOD RETURN: | |
| Fund (Class L Shares)* (1) | | | 7.59% | |
| Russell Midcap Value Index | | | 10.22% | |
| |
| Net Assets as of 12/31/2016 (In Thousands) . | | $ | 17,139,226 | |
INVESTMENT OBJECTIVE**
The JPMorgan Mid Cap Value Fund (the “Fund”) seeks growth from capital appreciation.
WHAT WERE THE MAIN DRIVERS OF THE FUND’S PERFORMANCE?
The Fund’s Class L Shares underperformed the Russell Midcap Value Index (the “Benchmark”) for the six months ended December 31, 2016. The Fund’s security selection in the industrials sector and its overweight position and security selection in the consumer staples sector were leading detractors from performance relative to the Benchmark. The Fund’s underweight positions in both the real estate and utilities sectors were a leading contributor to relative performance.
Leading individual detractors from relative performance included the Fund’s overweight positions in EQT Corp., Marsh & McLennan Cos. and Newell Brands Inc. (formerly named Newell Rubbermaid Inc.) Shares of EQT, a natural gas producer, fell after the company forecast higher-than-expected capital expenditures and lower product volumes for 2017. Shares of Marsh & McLennan, an insurance and risk consulting company that was not held in the Benchmark, underperformed the broader financials sector during the reporting period. Shares of Newell Rubbermaid, a household products maker that was not held in the Benchmark, fell following mixed quarterly financial results and investor concerns about the company’s divestiture of assets.
Leading individual contributors to relative performance included the Fund’s overweight positions in Kohl’s Corp., Citizens Financial Group Inc. and Fifth Third Bancorp. Shares of Kohl’s, a discount apparel retailer, rose on better-than-expected earnings and strong revenue from back-to-school sales. Shares of both Fifth Third Bancorp, a regional bank based in Ohio, and Citizens Financial, a regional bank based in Rhode Island, rose amid an increase in U.S. interest rates.
HOW WAS THE FUND POSITIONED?
The Fund’s portfolio managers utilized a bottom-up approach to stock selection and sought to identify durable franchises
possessing the ability to generate, in their view, sustainable levels of free cash flow.
| | | | | | | | |
| TOP TEN EQUITY HOLDINGS OF THE PORTFOLIO*** | |
| | 1. | | | Energen Corp. | | | 2.2 | % |
| | 2. | | | EQT Corp. | | | 2.0 | |
| | 3. | | | Loews Corp. | | | 1.9 | |
| | 4. | | | M&T Bank Corp. | | | 1.7 | |
| | 5. | | | Mohawk Industries, Inc. | | | 1.7 | |
| | 6. | | | Fifth Third Bancorp | | | 1.5 | |
| | 7. | | | SunTrust Banks, Inc. | | | 1.4 | |
| | 8. | | | Arrow Electronics, Inc. | | | 1.4 | |
| | 9. | | | WestRock Co. | | | 1.4 | |
| | 10. | | | Xcel Energy, Inc. | | | 1.4 | |
| | | | |
PORTFOLIO COMPOSITION BY SECTOR*** | |
| Financials | | | 22.2 | % |
| Consumer Discretionary | | | 16.9 | |
| Information Technology | | | 9.7 | |
| Real Estate | | | 9.5 | |
| Utilities | | | 8.8 | |
| Industrials | | | 8.5 | |
| Consumer Staples | | | 6.4 | |
| Energy | | | 5.2 | |
| Health Care | | | 4.3 | |
| Materials | | | 4.0 | |
| Short-Term Investment | | | 4.5 | |
| * | | The return shown is based on net asset values calculated for shareholder transactions and may differ from the return shown in the financial highlights, which reflects adjustments made to the net asset values in accordance with accounting principles generally accepted in the United States of America. |
| ** | | The adviser seeks to achieve the Fund’s objective. There can be no guarantee it will be achieved. |
| *** | | Percentages indicated are based on total investments as of December 31, 2016. The Fund’s portfolio composition is subject to change. |
| (1) | | On December 1, 2016, the Fund’s Institutional Class Shares were redesignated and renamed Class L Shares. |
| | | | | | | | |
| | | |
| DECEMBER 31, 2016 | | J.P. MORGAN MID CAP/MULTI-CAP FUNDS | | | | | 9 | |
JPMorgan Mid Cap Value Fund
FUND COMMENTARY
SIX MONTHS ENDED DECEMBER 31, 2016 (Unaudited) (continued)
| | | | | | | | | | | | | | | | | | |
AVERAGE ANNUAL TOTAL RETURNS AS OF DECEMBER 31, 2016 | |
| | | | | |
| | | INCEPTION DATE OF
CLASS | | 6 MONTH* | | | 1 YEAR | | | 5 YEAR | | | 10 YEAR | |
CLASS A SHARES | | April 30, 2001 | | | | | | | | | | | | | | | | |
With Sales Charge** | | | | | 1.70 | % | | | 8.06 | % | | | 13.63 | % | | | 7.40 | % |
Without Sales Charge | | | | | 7.33 | | | | 14.06 | | | | 14.87 | | | | 7.99 | |
CLASS C SHARES | | April 30, 2001 | | | | | | | | | | | | | | | | |
With CDSC*** | | | | | 6.04 | | | | 12.48 | | | | 14.28 | | | | 7.44 | |
Without CDSC | | | | | 7.04 | | | | 13.48 | | | | 14.28 | | | | 7.44 | |
CLASS L SHARES (FORMERLY INSTITUTIONAL SHARES) | | November 13, 1997 | | | 7.59 | | | | 14.62 | | | | 15.43 | | | | 8.52 | |
CLASS R2 SHARES | | November 3, 2008 | | | 7.15 | | | | 13.75 | | | | 14.57 | | | | 7.75 | |
CLASS R3 SHARES | | September 9, 2016 | | | 7.32 | | | | 14.05 | | | | 14.86 | | | | 7.98 | |
CLASS R4 SHARES | | September 9, 2016 | | | 7.45 | | | | 14.35 | | | | 15.15 | | | | 8.25 | |
CLASS R5 SHARES | | September 9, 2016 | | | 7.57 | | | | 14.60 | | | | 15.43 | | | | 8.51 | |
CLASS R6 SHARES | | September 9, 2016 | | | 7.58 | | | | 14.61 | | | | 15.43 | | | | 8.51 | |
SELECT CLASS SHARES | | October 31, 2001 | | | 7.47 | | | | 14.37 | | | | 15.15 | | | | 8.25 | |
| ** | | Sales Charge for Class A Shares is 5.25%. |
| *** | | Assumes a 1% CDSC (contingent deferred sales charge) for the 6 month and one year periods and 0% CDSC thereafter. |
TEN YEAR PERFORMANCE (12/31/06 TO 12/31/16)
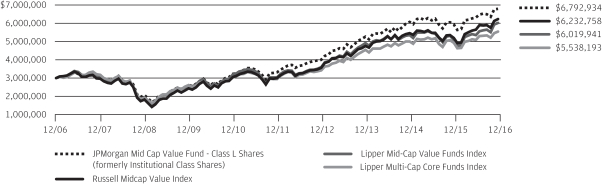
The performance quoted is past performance and is not a guarantee of future results. Mutual funds are subject to certain market risks. Investment returns and principal value of an investment will fluctuate so that an investor’s shares, when redeemed, may be worth more or less than their original cost. Current performance may be higher or lower than the performance data shown. For up-to-date month-end performance information please call 1-800-480-4111.
Returns for Class R2 and Class R3 Shares prior to their inception date are based on the performance of Class A Shares. The actual returns of Class R2 and Class R3 Shares would have been lower than those shown because Class R2 and Class R3 Shares have higher expenses than Class A Shares.
Returns for the Class R4 Shares prior to their inception date are based on the performance of Select Class Shares. The actual returns of Class R4 Shares would have been different because Class R4 Shares have different expenses than Select Class Shares.
Returns for the Class R5 and R6 Shares prior to their inception dates are based on the performance of Class L Shares. The actual returns of Class R5 Shares would have been different than those shown because Class R5 Shares have different expenses than Class L Shares.
The graph illustrates comparative performance for $3,000,000 invested in Class L Shares of the JPMorgan Mid Cap Value Fund, the Russell Midcap Value Index, the Lipper Mid-Cap Value Funds Index and the Lipper Multi-Cap Core Funds Index from December 31, 2006 to December 31, 2016. The performance of the Fund assumes reinvestment of all dividends and capital gain distributions, if any, and does not include a sales charge. The performance of the Russell Midcap Value Index does not reflect the deduction of expenses or a sales charge associated with a mutual fund and has been adjusted to reflect reinvestment of all dividends and capital gain distributions of the securities included in the benchmark, if applicable. The performance of the Lipper Mid-Cap Value Funds Index and the Lipper Multi-Cap Core Funds Index includes expenses associated with a mutual fund, such as investment management fees. These expenses are not identical to the expenses incurred by the Fund. The Russell Midcap Value Index is an unmanaged index which measures the performance of those Russell Midcap companies with lower price-to-book ratios and lower forecasted growth values. The Lipper Mid-Cap Value Funds Index and the Lipper Multi-Cap Core Funds Index are indices based on total returns of certain mutual funds within the mid cap and multi cap fund categories, respectively, as determined by Lipper, Inc. Investors cannot invest directly in an index.
| | | | | | |
| | | |
| 10 | | | | J.P. MORGAN MID CAP/MULTI-CAP FUNDS | | DECEMBER 31, 2016 |
Class L Shares have a $3,000,000 minimum initial investment.
Fund performance may reflect the waiver of the Fund’s fees and reimbursement of expenses for certain periods since the inception date. Without these waivers and reimbursements, performance would have been lower. Also, performance shown in this section does not reflect the deduction of taxes that a shareholder would pay on Fund distributions or redemptions of Fund shares.
The returns shown are based on net asset values calculated for shareholder transactions and may differ from the returns shown in the financial highlights, which reflect adjustments made to the net asset values in accordance with accounting principles generally accepted in the United States of America.
| | | | | | | | |
| | | |
| DECEMBER 31, 2016 | | J.P. MORGAN MID CAP/MULTI-CAP FUNDS | | | | | 11 | |
JPMorgan Multi-Cap Market Neutral Fund
FUND COMMENTARY
SIX MONTHS ENDED DECEMBER 31, 2016 (Unaudited)
| | | | |
| REPORTING PERIOD RETURN: | |
| Fund (Select Class Shares)* | | | 1.68% | |
| BofA Merrill Lynch 3-Month U.S. Treasury Bill Index | | | 0.18% | |
| |
| Net Assets as of 12/31/16 (In Thousands) | | $ | 168,681 | |
INVESTMENT OBJECTIVE**
The JPMorgan Multi-Cap Market Neutral Fund (the “Fund”) seeks long-term capital preservation and growth by using strategies designed to produce returns which have no correlation with general domestic market performance.
WHAT WERE THE MAIN DRIVERS OF THE FUND’S PERFORMANCE?
The Fund’s Select Class Shares outperformed the BofA Merrill Lynch 3-Month U.S. Treasury Bill Index (the “Benchmark”) for the six months ended December 31, 2016. U.S. equity securities, which were not included in the Benchmark, generally outperformed U.S. Treasury bonds during the reporting period. The Fund’s security selection in the industrials and information technology sectors helped the Fund’s performance relative to the Benchmark, while the Fund’s security selection in the consumer staples and telecom services sectors detracted from relative performance.
Leading individual contributors to Fund returns included its long positions in Steel Dynamics Inc. and NCR Corp., and its short position in Acadia Healthcare Co. Shares of Steel Dynamics, a steel making and metal recycling company, rose amid investor expectations that the domestic steel sector would benefit from the policies of the incoming Trump administration. Shares of NCR, a maker of automatic teller machines and other transaction technology, rose on an improved business environment for its financial services clients. Shares of Acadia Healthcare, an operator of inpatient psychiatric and substance abuse treatment centers, fell after the company forecast lower-than-expected earnings and revenue.
Leading individual detractors from Fund returns included its short positions in Micron Technology, NetSuite, and Cavium Inc. Shares of Micron Technology, a semiconductor manufacturer, rose after the company posted better-than-expected earnings and raised its forecast for 2017 results. Shares of NetSuite, a provider of cloud-computing services, rose following news of a $9.3 billion acquisition offer from Oracle Corp. Shares of Cavium, a maker of semiconductors for the telecommunications sector, rose on better-than-expected earnings.
HOW WAS THE FUND POSITIONED?
The Fund’s portfolio managers employed a bottom-up approach to stock selection, constructing a portfolio based on company fundamentals, quantitative screening and proprietary fundamental analysis. The Fund’s portfolio managers sought to identify dominant franchises with predictable business models deemed capable of achieving, in their view, sustained growth, as well as undervalued companies with the potential to grow their intrinsic value per share. Companies that ranked lowest in the above factors were selected by the Fund’s portfolio managers for possible short sales.
| | | | | | | | |
| TOP TEN LONG POSITIONS OF THE PORTFOLIO*** | |
| | 1. | | | NCR Corp. | | | 1.2 | % |
| | 2. | | | QUALCOMM, Inc. | | | 1.0 | |
| | 3. | | | Lam Research Corp. | | | 1.0 | |
| | 4. | | | Hologic, Inc. | | | 1.0 | |
| | 5. | | | eBay, Inc. | | | 1.0 | |
| | 6. | | | Microsoft Corp. | | | 1.0 | |
| | 7. | | | Western Union Co. (The) | | | 1.0 | |
| | 8. | | | Humana, Inc. | | | 1.0 | |
| | 9. | | | Steel Dynamics, Inc. | | | 1.0 | |
| | 10. | | | Allison Transmission Holdings, Inc. | | | 1.0 | |
| | | | | | | | |
| TOP TEN SHORT POSITIONS OF THE PORTFOLIO**** | |
| | 1. | | | Chevron Corp. | | | 1.6 | % |
| | 2. | | | People’s United Financial, Inc. | | | 1.6 | |
| | 3. | | | National Instruments Corp. | | | 1.3 | |
| | 4. | | | CDW Corp. | | | 1.3 | |
| | 5. | | | Microsemi Corp. | | | 1.3 | |
| | 6. | | | Tesla Motors, Inc. | | | 1.2 | |
| | 7. | | | Zoetis, Inc. | | | 1.2 | |
| | 8. | | | Dominion Resources, Inc. | | | 1.2 | |
| | 9. | | | AMERCO | | | 1.2 | |
| | 10. | | | Amphenol Corp., Class A | | | 1.2 | |
| | | | | | |
| | | |
| 12 | | | | J.P. MORGAN MID CAP/MULTI-CAP FUNDS | | DECEMBER 31, 2016 |
| | | | |
LONG POSITION PORTFOLIO COMPOSITION BY SECTOR*** | |
| Information Technology | | | 24.0 | % |
| Consumer Discretionary | | | 14.5 | |
| Industrials | | | 13.3 | |
| Health Care | | | 11.5 | |
| Consumer Staples | | | 5.7 | |
| Materials | | | 4.3 | |
| Energy | | | 3.7 | |
| Utilities | | | 3.6 | |
| Financials | | | 2.8 | |
| Real Estate | | | 2.0 | |
| Telecommunication Services | | | 0.9 | |
| Short-Term Investment | | | 13.7 | |
| | | | |
SHORT POSITION PORTFOLIO COMPOSITION BY SECTOR**** | |
| Information Technology | | | 28.9 | % |
| Consumer Discretionary | | | 18.5 | |
| Industrials | | | 17.2 | |
| Health Care | | | 11.3 | |
| Materials | | | 5.7 | |
| Consumer Staples | | | 5.3 | |
| Financials | | | 3.5 | |
| Energy | | | 3.3 | |
| Utilities | | | 2.7 | |
| Real Estate | | | 2.1 | |
| Telecommunication Services | | | 1.5 | |
| * | | The return shown is based on net asset values calculated for shareholder transactions and may differ from the return shown in the financial highlights, which reflects adjustments made to the net asset values in accordance with accounting principles generally accepted in the United States of America. |
| ** | | The adviser seeks to achieve the Fund’s objective. There can be no guarantee it will be achieved. |
| *** | | Percentages indicated are based on total long investments as of December 31, 2016. The Fund’s portfolio composition is subject to change. |
| **** | | Percentages indicated are based on total short investments as of December 31, 2016. The Fund’s portfolio composition is subject to change. |
| | | | | | | | |
| | | |
| DECEMBER 31, 2016 | | J.P. MORGAN MID CAP/MULTI-CAP FUNDS | | | | | 13 | |
JPMorgan Multi-Cap Market Neutral Fund
FUND COMMENTARY
SIX MONTHS ENDED DECEMBER 31, 2016 (Unaudited) (continued)
| | | | | | | | | | | | | | | | | | |
AVERAGE ANNUAL TOTAL RETURNS AS OF DECEMBER 31, 2016 | |
| | | | | |
| | | INCEPTION DATE OF
CLASS | | 6 MONTH* | | | 1 YEAR | | | 5 YEAR | | | 10 YEAR | |
CLASS A SHARES | | May 23, 2003 | | | | | | | | | | | | | | | | |
With Sales Charge** | | | | | (3.83 | )% | | | (6.51 | )% | | | (0.04 | )% | | | (0.87 | )% |
Without Sales Charge | | | | | 1.52 | | | | (1.37 | ) | | | 1.05 | | | | (0.33 | ) |
CLASS C SHARES | | May 23, 2003 | | | | | | | | | | | | | | | | |
With CDSC*** | | | | | 0.29 | | | | (2.98 | ) | | | 0.47 | | | | (0.99 | ) |
Without CDSC | | | | | 1.29 | | | | (1.98 | ) | | | 0.47 | | | | (0.99 | ) |
SELECT CLASS SHARES | | May 23, 2003 | | | 1.68 | | | | (1.15 | ) | | | 1.29 | | | | (0.08 | ) |
| ** | | Sales Charge for Class A Shares is 5.25%. |
| *** | | Assumes a 1% CDSC (contingent deferred sales charge) for the 6 month and one year periods and 0% CDSC thereafter. |
TEN YEAR PERFORMANCE (12/31/06 TO 12/31/16)
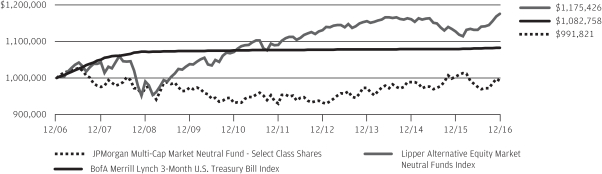
The performance quoted is past performance and is not a guarantee of future results. Mutual funds are subject to certain market risks. Investment returns and principal value of an investment will fluctuate so that an investor’s shares, when redeemed, may be worth more or less than their original cost. Current performance may be higher or lower than the performance data shown. For up-to-date month-end performance information please call 1-800-480-4111.
The graph illustrates comparative performance for $1,000,000 invested in Select Class Shares of the JPMorgan Multi-Cap Market Neutral Fund, the BofA Merrill Lynch 3-Month U.S. Treasury Bill Index and the Lipper Alternative Equity Market Neutral Funds Index from December 31, 2006 to December 31, 2016. The performance of the Fund assumes reinvestment of all dividends and capital gain distributions, if any, and does not include a sales charge. The performance of the indices reflects an initial investment at the end of the month following the Fund’s inception. The performance of the BofA Merrill Lynch 3-Month U.S. Treasury Bill Index does not reflect the deduction of expenses or a sales charge associated with a mutual fund and has been adjusted to reflect reinvestment of all dividends and capital gain distributions of the securities included in the benchmark, if applicable. The performance of the Lipper Alternative Equity Market Neutral Funds Index includes expenses associated with a mutual fund, such as investment management fees. These expenses are not identical to the
expenses incurred by the Fund. The BofA Merrill Lynch 3-Month U.S. Treasury Bill Index is comprised of a single issue purchased at the beginning of the month and held for a full month. Each month the index is rebalanced and the issue selected is the outstanding Treasury Bill that matures closest to, but not beyond, 3 months from the rebalancing date. The Lipper Alternative Equity Market Neutral Funds Index is an index based on total returns of certain mutual funds within the Fund’s designated category as determined by Lipper, Inc. Investors cannot invest directly in an index.
Select Class Shares have a $1,000,000 minimum initial investment.
Fund performance may reflect the waiver of the Fund’s fees and reimbursement of expenses for certain periods since the inception date. Without these waivers and reimbursements, performance would have been lower. Also, performance shown in this section does not reflect the deduction of taxes that a shareholder would pay on Fund distributions or redemptions of Fund shares.
The returns shown are based on net asset values calculated for shareholder transactions and may differ from the returns shown in the financial highlights, which reflect adjustments made to the net asset values in accordance with accounting principles generally accepted in the United States of America.
| | | | | | |
| | | |
| 14 | | | | J.P. MORGAN MID CAP/MULTI-CAP FUNDS | | DECEMBER 31, 2016 |
JPMorgan Value Advantage Fund
FUND COMMENTARY
SIX MONTHS ENDED DECEMBER 31, 2016 (Unaudited)
| | | | |
| REPORTING PERIOD RETURN: | |
| Fund (Class L Shares)* (1) | | | 13.25% | |
| Russell 3000 Value Index | | | 11.40% | |
| |
| Net Assets as of 12/31/2016 (In Thousands) . | | $ | 10,667,718 | |
INVESTMENT OBJECTIVE**
The JPMorgan Value Advantage Fund (the “Fund”) seeks to provide long-term total return from a combination of income and capital gains.
WHAT WERE THE MAIN DRIVERS OF THE FUND’S PERFORMANCE?
The Fund’s Class L Shares outperformed the Russell 3000 Value Index (the “Benchmark”) for the six months ended December 31, 2016. The Fund’s overweight position and security selection in the financials sector and its security selection and underweight position in the health care sector were leading contributors to performance relative to the Benchmark. The Fund’s security selection in the utilities sector and its security selection and underweight position in the industrials sector were leading detractors from relative performance.
Leading individual contributors to relative performance included the Fund’s underweight position in Berkshire Hathaway Inc. and its overweight positions in Citizens Financial Group Inc. and Delta Air Lines Inc. Shares of Berkshire Hathaway, a diversified holding company that was not held in the Fund, underperformed the broader financials sector during the reporting period. Shares of Citizens Financial, a regional bank based in Rhode Island, rose on investor expectations for increased earnings. Shares of Delta Air Lines rose on better-than-expected earnings.
Leading individual detractors from relative performance included the Fund’s overweight positions in Loews Corp. and Treehouse Foods Inc. and its underweight position in J.P.Morgan Chase & Co. Shares of Loews, a diversified holding company, underperformed the broader financials sector during the reporting period. Shares of Treehouse Foods, a packaged foods company, fell amid management changes and after the company reported lower-than-expected earnings and reduced its earnings forecast. Shares of J.P.Morgan Chase, a banking and financial services company that the Fund is prohibited from holding because of its affiliation with the Fund’s adviser, rose on investor expectations of an improved operating environment for large banks.
HOW WAS THE FUND POSITIONED?
The Fund’s portfolio managers utilized a bottom-up approach to stock selection and sought to identify durable franchises possessing the ability to generate, in the portfolio managers’
view, significant levels of free cash flow. During the reporting period, the Fund’s largest average overweight position remained the consumer discretionary sector, where the Fund’s portfolio managers found what they believed to be compelling investment opportunities. The Fund’s largest average underweight position was in the energy sector.
| | | | | | | | |
| TOP TEN EQUITY HOLDINGS OF THE PORTFOLIO*** | |
| | 1. | | | Wells Fargo & Co. | | | 4.0 | % |
| | 2. | | | Bank of America Corp. | | | 2.6 | |
| | 3. | | | Pfizer, Inc. | | | 2.4 | |
| | 4. | | | Exxon Mobil Corp. | | | 2.3 | |
| | 5. | | | Capital One Financial Corp. | | | 2.3 | |
| | 6. | | | Loews Corp. | | | 2.1 | |
| | 7. | | | American International Group, Inc. | | | 1.7 | |
| | 8. | | | Delta Air Lines, Inc. | | | 1.6 | |
| | 9. | | | Johnson & Johnson | | | 1.6 | |
| | 10. | | | PNC Financial Services Group, Inc. (The) | | | 1.5 | |
| | | | |
PORTFOLIO COMPOSITION BY SECTOR*** | |
| Financials | | | 32.4 | % |
| Consumer Discretionary | | | 15.1 | |
| Health Care | | | 9.0 | |
| Energy | | | 7.2 | |
| Information Technology | | | 7.0 | |
| Industrials | | | 6.2 | |
| Consumer Staples | | | 5.9 | |
| Utilities | | | 5.8 | |
| Real Estate | | | 4.5 | |
| Materials | | | 3.8 | |
| Telecommunication Services | | | 1.4 | |
| Short-Term Investment | | | 1.7 | |
| * | | The return shown is based on net asset values calculated for shareholder transactions and may differ from the return shown in the financial highlights, which reflects adjustments made to the net asset values in accordance with accounting principles generally accepted in the United States of America. |
| ** | | The adviser seeks to achieve the Fund’s objective. There can be no guarantee it will be achieved. |
| *** | | Percentages indicated are based on total investments as of December 31, 2016. The Fund’s portfolio composition is subject to change. |
| (1) | | On December 1, 2016, the Fund’s Institutional Class Shares were redesignated and renamed Class L Shares. |
| | | | | | | | |
| | | |
| DECEMBER 31, 2016 | | J.P. MORGAN MID CAP/MULTI-CAP FUNDS | | | | | 15 | |
JPMorgan Value Advantage Fund
FUND COMMENTARY
SIX MONTHS ENDED DECEMBER 31, 2016 (Unaudited) (continued)
| | | | | | | | | | | | | | | | | | |
AVERAGE ANNUAL TOTAL RETURNS AS OF DECEMBER 31, 2016 | |
| | | | | |
| | | INCEPTION DATE OF
CLASS | | 6 MONTH* | | | 1 YEAR | | | 5 YEAR | | | 10 YEAR | |
CLASS A SHARES | | February 28, 2005 | | | | | | | | | | | | | | | | |
With Sales Charge** | | | | | 7.05 | % | | | 10.38 | % | | | 13.15 | % | | | 7.25 | % |
Without Sales Charge | | | | | 12.98 | | | | 16.49 | | | | 14.38 | | | | 7.82 | |
CLASS C SHARES | | February 28, 2005 | | | | | | | | | | | | | | | | |
With CDSC*** | | | | | 11.68 | | | | 14.86 | | | | 13.80 | | | | 7.28 | |
Without CDSC | | | | | 12.68 | | | | 15.86 | | | | 13.80 | | | | 7.28 | |
CLASS L SHARES (FORMERLY INSTITUTIONAL SHARES) | | February 28, 2005 | | | 13.25 | | | | 17.03 | | | | 14.95 | | | | 8.37 | |
CLASS R3 SHARES | | September 9, 2016 | | | 12.95 | | | | 16.46 | | | | 14.37 | | | | 7.82 | |
CLASS R4 SHARES | | September 9, 2016 | | | 13.12 | | | | 16.73 | | | | 14.66 | | | | 8.10 | |
CLASS R5 SHARES | | September 9, 2016 | | | 13.25 | | | | 17.03 | | | | 14.95 | | | | 8.37 | |
CLASS R6 SHARES | | September 9, 2016 | | | 13.27 | | | | 17.05 | | | | 14.96 | | | | 8.37 | |
SELECT CLASS SHARES | | February 28, 2005 | | | 13.12 | | | | 16.73 | | | | 14.66 | | | | 8.10 | |
| ** | | Sales Charge for Class A Shares is 5.25%. |
| *** | | Assumes a 1% CDSC (contingent deferred sales charge) for the 6 month and one year periods and 0% CDSC thereafter. |
TEN YEAR PERFORMANCE (12/31/06 TO 12/31/16)
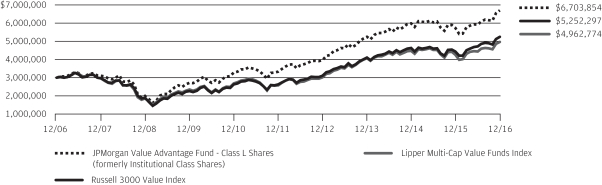
The performance quoted is past performance and is not a guarantee of future results. Mutual funds are subject to certain market risks. Investment returns and principal value of an investment will fluctuate so that an investor’s shares, when redeemed, may be worth more or less than their original cost. Current performance may be higher or lower than the performance data shown. For up-to-date month-end performance information please call 1-800-480-4111.
Returns for Class R3 Shares prior to their inception date are based on the performance of Class A Shares. The actual returns of Class R3 Shares would have been lower than those shown because Class R3 Shares have higher expenses than Class A Shares.
Returns for the Class R4 Shares prior to their inception date are based on the performance of Select Class Shares. The actual returns of Class R4 Shares would have been different because Class R4 Shares have different expenses than Select Class Shares.
Returns for the Class R5 and R6 Shares prior to their inception dates are based on the performance of Class L Shares. The actual returns of Class R5 Shares would have been different than those shown because Class R5 Shares have different expenses than Class L Shares.
The graph illustrates comparative performance for $3,000,000 invested in Class L Shares of the JPMorgan Value Advantage Fund, the Russell 3000 Value Index and the Lipper Multi-Cap Value Funds Index from December 31, 2006 to December 31, 2016. The performance of the Fund assumes reinvestment of all dividends and capital gain distributions, if any, and does not include a sales charge. The performance of the Russell 3000 Value Index does not reflect the deduction of expenses or a sales charge associated with a mutual fund and has been adjusted to reflect reinvestment of all dividends and capital gain distributions of the securities included in the benchmark, if applicable. The performance of the Lipper Multi-Cap Value Funds Index includes expenses associated with a mutual fund, such as investment management fees. These expenses are not identical to the expenses incurred by the Fund. The Russell 3000 Value Index is an unmanaged index which measures the performance of those Russell 3000 companies (largest 3000 U.S. companies) with lower price-to-book ratios and lower forecasted growth values. The Lipper Multi-Cap Value Funds Index is an index based on total returns of certain mutual funds within the Fund’s designated category as determined by Lipper, Inc. Investors cannot invest directly in an index.
Class L Shares have a $3,000,000 minimum initial investment.
Fund performance may reflect the waiver of the Fund’s fees and reimbursement of expenses for certain periods since the inception date. Without these
| | | | | | |
| | | |
| 16 | | | | J.P. MORGAN MID CAP/MULTI-CAP FUNDS | | DECEMBER 31, 2016 |
waivers and reimbursements, performance would have been lower. Also, performance shown in this section does not reflect the deduction of taxes that a shareholder would pay on Fund distributions or redemptions of Fund shares.
The returns shown are based on net asset values calculated for shareholder transactions and may differ from the returns shown in the financial highlights, which reflect adjustments made to the net asset values in accordance with accounting principles generally accepted in the United States of America.
| | | | | | | | |
| | | |
| DECEMBER 31, 2016 | | J.P. MORGAN MID CAP/MULTI-CAP FUNDS | | | | | 17 | |
JPMorgan Growth Advantage Fund
SCHEDULE OF PORTFOLIO INVESTMENTS
AS OF DECEMBER 31, 2016 (Unaudited)
(Amounts in thousands)
| | | | | | | | |
| SHARES | | | SECURITY DESCRIPTION | | VALUE($) | |
| | | | | | | | |
| Common Stocks — 98.0% | |
| | | | Consumer Discretionary — 16.6% | |
| | | | Automobiles — 0.6% | |
| | 167 | | | Tesla Motors, Inc. (a) | | | 35,750 | |
| | | | | | | | |
| | | | Distributors — 0.9% | |
| | 1,753 | | | LKQ Corp. (a) | | | 53,714 | |
| | | | | | | | |
| | | | Hotels, Restaurants & Leisure — 3.5% | |
| | 3,354 | | | Hilton Worldwide Holdings, Inc. | | | 91,215 | |
| | 1,245 | | | Norwegian Cruise Line Holdings Ltd. (a) | | | 52,958 | |
| | 1,297 | | | Starbucks Corp. | | | 72,010 | |
| | | | | | | | |
| | | | | | | 216,183 | |
| | | | | | | | |
| | | | Household Durables — 2.3% | | | | |
| | 687 | | | Mohawk Industries, Inc. (a) | | | 137,240 | |
| | | | | | | | |
| | | | Internet & Direct Marketing Retail — 7.0% | | | | |
| | 318 | | | Amazon.com, Inc. (a) | | | 238,309 | |
| | 481 | | | Netflix, Inc. (a) | | | 59,572 | |
| | 67 | | | Priceline Group, Inc. (The) (a) | | | 98,666 | |
| | 865 | | | Wayfair, Inc., Class A (a) | | | 30,308 | |
| | | | | | | | |
| | | | | | | 426,855 | |
| | | | | | | | |
| | | | Multiline Retail — 1.7% | | | | |
| | 881 | | | Dollar General Corp. | | | 65,234 | |
| | 821 | | | Nordstrom, Inc. | | | 39,331 | |
| | | | | | | | |
| | | | | | | 104,565 | |
| | | | | | | | |
| | | | Specialty Retail — 0.6% | | | | |
| | 146 | | | Ulta Salon Cosmetics & Fragrance, Inc. (a) | | | 37,119 | |
| | | | | | | | |
| | | | Total Consumer Discretionary | | | 1,011,426 | |
| | | | | | | | |
| | | | Consumer Staples — 2.2% | | | | |
| | | | Beverages — 0.6% | | | | |
| | 843 | | | Monster Beverage Corp. (a) | | | 37,374 | |
| | | | | | | | |
| | | | Food & Staples Retailing — 1.0% | | | | |
| | 318 | | | Casey’s General Stores, Inc. | | | 37,745 | |
| | 1,157 | | | Sprouts Farmers Market, Inc. (a) | | | 21,894 | |
| | | | | | | | |
| | | | | | | 59,639 | |
| | | | | | | | |
| | | | Food Products — 0.6% | | | | |
| | 634 | | | Tyson Foods, Inc., Class A | | | 39,105 | |
| | | | | | | | |
| | | | Total Consumer Staples | | | 136,118 | |
| | | | | | | | |
| | | | Energy — 2.2% | | | | |
| | | | Oil, Gas & Consumable Fuels — 2.2% | | | | |
| | 653 | | | Concho Resources, Inc. (a) | | | 86,548 | |
| | 488 | | | EOG Resources, Inc. | | | 49,317 | |
| | | | | | | | |
| | | | Total Energy | | | 135,865 | |
| | | | | | | | |
| | | | | | | | |
| SHARES | | | SECURITY DESCRIPTION | | VALUE($) | |
| | | | | | | | |
| | | | | | | | |
| | | | Financials — 8.0% | | | | |
| | | | Banks — 2.2% | | | | |
| | 1,204 | | | East West Bancorp, Inc. | | | 61,184 | |
| | 494 | | | Signature Bank (a) | | | 74,199 | |
| | | | | | | | |
| | | | | | | 135,383 | |
| | | | | | | | |
| | | | Capital Markets — 5.8% | | | | |
| | 408 | | | Affiliated Managers Group, Inc. (a) | | | 59,224 | |
| | 152 | | | BlackRock, Inc. | | | 57,652 | |
| | 2,353 | | | Charles Schwab Corp. (The) | | | 92,861 | |
| | 849 | | | Lazard Ltd., Class A | | | 34,898 | |
| | 640 | | | Nasdaq, Inc. | | | 42,923 | |
| | 592 | | | S&P Global, Inc. | | | 63,664 | |
| | | | | | | | |
| | | | | | | 351,222 | |
| | | | | | | | |
| | | | Total Financials | | | 486,605 | |
| | | | | | | | |
| | | | Health Care — 14.0% | | | | |
| | | | Biotechnology — 5.4% | | | | |
| | 151 | | | Biogen, Inc. (a) | | | 42,679 | |
| | 591 | | | Celgene Corp. (a) | | | 68,431 | |
| | 1,318 | | | Gilead Sciences, Inc. | | | 94,375 | |
| | 224 | | | Intercept Pharmaceuticals, Inc. (a) | | | 24,348 | |
| | 782 | | | Kite Pharma, Inc. (a) | | | 35,047 | |
| | 454 | | | Spark Therapeutics, Inc. (a) | | | 22,635 | |
| | 586 | | | Vertex Pharmaceuticals, Inc. (a) | | | 43,163 | |
| | | | | | | | |
| | | | | | | 330,678 | |
| | | | | | | | |
| | | | Health Care Equipment & Supplies — 0.2% | | | | |
| | 1,507 | | | Novadaq Technologies, Inc., (Canada) (a) | | | 10,686 | |
| | | | | | | | |
| | | | Health Care Providers & Services — 5.7% | | | | |
| | 2,140 | | | Acadia Healthcare Co., Inc. (a) | | | 70,837 | |
| | 413 | | | Aetna, Inc. | | | 51,241 | |
| | 225 | | | Humana, Inc. | | | 45,825 | |
| | 1,144 | | | UnitedHealth Group, Inc. | | | 183,070 | |
| | | | | | | | |
| | | | | | | 350,973 | |
| | | | | | | | |
| | | | Health Care Technology — 0.5% | | | | |
| | 717 | | | Veeva Systems, Inc., Class A (a) | | | 29,174 | |
| | | | | | | | |
| | | | Life Sciences Tools & Services — 0.7% | | | | |
| | 347 | | | Illumina, Inc. (a) | | | 44,481 | |
| | | | | | | | |
| | | | Pharmaceuticals — 1.5% | | | | |
| | 671 | | | Eli Lilly & Co. | | | 49,315 | |
| | 1,016 | | | Revance Therapeutics, Inc. (a) | | | 21,036 | |
| | 3,524 | | | TherapeuticsMD, Inc. (a) | | | 20,335 | |
| | | | | | | | |
| | | | | | | 90,686 | |
| | | | | | | | |
| | | | Total Health Care | | | 856,678 | |
| | | | | | | | |
SEE NOTES TO FINANCIAL STATEMENTS.
| | | | | | |
| | | |
| 18 | | | | J.P. MORGAN MID CAP/MULTI-CAP FUNDS | | DECEMBER 31, 2016 |
| | | | | | | | |
| SHARES | | | SECURITY DESCRIPTION | | VALUE($) | |
| | | | | | | | |
| Common Stocks — continued | |
| | | | Industrials — 14.2% | | | | |
| | | | Airlines — 1.4% | | | | |
| | 1,640 | | | Southwest Airlines Co. | | | 81,733 | |
| | | | | | | | |
| | | | Building Products — 2.4% | | | | |
| | 1,134 | | | Fortune Brands Home & Security, Inc. | | | 60,613 | |
| | 573 | | | Lennox International, Inc. | | | 87,766 | |
| | | | | | | | |
| | | | | | | 148,379 | |
| | | | | | | | |
| | | | Commercial Services & Supplies — 2.6% | | | | |
| | 2,013 | | | Waste Connections, Inc., (Canada) | | | 158,170 | |
| | | | | | | | |
| | | | Electrical Equipment — 1.4% | | | | |
| | 378 | | | Acuity Brands, Inc. | | | 87,288 | |
| | | | | | | | |
| | | | Industrial Conglomerates — 0.9% | | | | |
| | 487 | | | Carlisle Cos., Inc. | | | 53,678 | |
| | | | | | | | |
| | | | Machinery — 2.8% | | | | |
| | 297 | | | Middleby Corp. (The) (a) | | | 38,256 | |
| | 664 | | | Stanley Black & Decker, Inc. | | | 76,154 | |
| | 542 | | | WABCO Holdings, Inc. (a) | | | 57,576 | |
| | | | | | | | |
| | | | | | | 171,986 | |
| | | | | | | | |
| | | | Professional Services — 0.8% | | | | |
| | 398 | | | Equifax, Inc. | | | 47,032 | |
| | | | | | | | |
| | | | Road & Rail — 0.8% | | | | |
| | 576 | | | Old Dominion Freight Line, Inc. (a) | | | 49,394 | |
| | | | | | | | |
| | | | Trading Companies & Distributors — 1.1% | | | | |
| | 1,598 | | | HD Supply Holdings, Inc. (a) | | | 67,910 | |
| | | | | | | | |
| | | | Total Industrials | | | 865,570 | |
| | | | | | | | |
| | | | Information Technology — 38.0% | | | | |
| | | | Communications Equipment — 2.3% | | | | |
| | 441 | | | Arista Networks, Inc. (a) | | | 42,671 | |
| | 585 | | | Harris Corp. | | | 59,955 | |
| | 294 | | | Palo Alto Networks, Inc. (a) | | | 36,802 | |
| | | | | | | | |
| | | | | | | 139,428 | |
| | | | | | | | |
| | | | Electronic Equipment, Instruments & Components — 2.3% | |
| | 1,146 | | | Amphenol Corp., Class A | | | 76,998 | |
| | 2,615 | | | Corning, Inc. | | | 63,466 | |
| | | | | | | | |
| | | | | | | 140,464 | |
| | | | | | | | |
| | | | Internet Software & Services — 12.3% | | | | |
| | 500 | | | Alphabet, Inc., Class C (a) | | | 385,836 | |
| | 184 | | | CoStar Group, Inc. (a) | | | 34,757 | |
| | 2,282 | | | Facebook, Inc., Class A (a) | | | 262,498 | |
| | 1,983 | | | GoDaddy, Inc., Class A (a) | | | 69,313 | |
| | | | | | | | |
| | | | | | | 752,404 | |
| | | | | | | | |
| | | | | | | | |
| SHARES | | | SECURITY DESCRIPTION | | VALUE($) | |
| | | | | | | | |
| | | | | | | | |
| | | | IT Services — 6.0% | | | | |
| | 1,011 | | | Mastercard, Inc., Class A | | | 104,407 | |
| | 1,769 | | | PayPal Holdings, Inc. (a) | | | 69,826 | |
| | 1,426 | | | Vantiv, Inc., Class A (a) | | | 85,000 | |
| | 1,388 | | | Visa, Inc., Class A | | | 108,268 | |
| | | | | | | | |
| | | | | | | 367,501 | |
| | | | | | | | |
| | | | Semiconductors & Semiconductor Equipment — 4.4% | |
| | 1,431 | | | Applied Materials, Inc. | | | 46,169 | |
| | 470 | | | Broadcom Ltd., (Singapore) | | | 83,047 | |
| | 409 | | | Lam Research Corp. | | | 43,275 | |
| | 483 | | | NVIDIA Corp. | | | 51,598 | |
| | 464 | | | NXP Semiconductors NV, (Netherlands) (a) | | | 45,496 | |
| | | | | | | | |
| | | | | | | 269,585 | |
| | | | | | | | |
| | | | Software — 8.3% | | | | |
| | 595 | | | Adobe Systems, Inc. (a) | | | 61,266 | |
| | 1,463 | | | Electronic Arts, Inc. (a) | | | 115,210 | |
| | 583 | | | Guidewire Software, Inc. (a) | | | 28,764 | |
| | 2,515 | | | Microsoft Corp. | | | 156,276 | |
| | 684 | | | salesforce.com, Inc. (a) | | | 46,799 | |
| | 696 | | | ServiceNow, Inc. (a) | | | 51,704 | |
| | 864 | | | Splunk, Inc. (a) | | | 44,173 | |
| | | | | | | | |
| | | | | | | 504,192 | |
| | | | | | | | |
| | | | Technology Hardware, Storage & Peripherals — 2.4% | |
| | 1,271 | | | Apple, Inc. | | | 147,190 | |
| | | | | | | | |
| | | | Total Information Technology | | | 2,320,764 | |
| | | | | | | | |
| | | | Materials — 1.8% | | | | |
| | | | Construction Materials — 1.8% | | | | |
| | 638 | | | Eagle Materials, Inc. | | | 62,853 | |
| | 352 | | | Vulcan Materials Co. | | | 44,015 | |
| | | | | | | | |
| | | | Total Materials | | | 106,868 | |
| | | | | | | | |
| | | | Real Estate — 1.0% | | | | |
| | | | Real Estate Management & Development — 1.0% | |
| | 1,999 | | | CBRE Group, Inc., Class A (a) | | | 62,958 | |
| | | | | | | | |
| | | | Total Common Stocks
(Cost $4,527,223) | | | 5,982,852 | |
| | | | | | | | |
| Short-Term Investment — 1.8% | |
| | | | Investment Company — 1.8% | | | | |
| | 108,763 | | | JPMorgan U.S. Government Money Market Fund, Institutional Class Shares, 0.410% (b) (l)
(Cost $108,763) | | | 108,763 | |
| | | | Total Investments — 99.8%
(Cost $4,635,986) | | | 6,091,615 | |
| | | | Other Assets in Excess of
Liabilities — 0.2% | | | 10,045 | |
| | | | | | | | |
| | | | NET ASSETS — 100.0% | | $ | 6,101,660 | |
| | | | | | | | |
Percentages indicated are based on net assets.
SEE NOTES TO FINANCIAL STATEMENTS.
| | | | | | | | |
| | | |
| DECEMBER 31, 2016 | | J.P. MORGAN MID CAP/MULTI-CAP FUNDS | | | | | 19 | |
JPMorgan Mid Cap Equity Fund
SCHEDULE OF PORTFOLIO INVESTMENTS
AS OF DECEMBER 31, 2016 (Unaudited)
(Amounts in thousands)
| | | | | | | | |
| SHARES | | | SECURITY DESCRIPTION | | VALUE($) | |
| | | | | | | | |
| Common Stocks — 96.1% | |
| | | | Consumer Discretionary — 17.9% | |
| | | | Auto Components — 0.4% | |
| | 291 | | | BorgWarner, Inc. | | | 11,467 | |
| | | | | | | | |
| | | | Automobiles — 0.2% | |
| | 30 | | | Tesla Motors, Inc. (a) | | | 6,304 | |
| | | | | | | | |
| | | | Distributors — 1.0% | |
| | 121 | | | Genuine Parts Co. | | | 11,592 | |
| | 507 | | | LKQ Corp. (a) | | | 15,527 | |
| | | | | | | | |
| | | | | | | 27,119 | |
| | | | | | | | |
| | | | Hotels, Restaurants & Leisure — 2.9% | |
| | 341 | | | Aramark | | | 12,195 | |
| | 1,710 | | | Hilton Worldwide Holdings, Inc. | | | 46,522 | |
| | 49 | | | Marriott International, Inc., Class A | | | 4,054 | |
| | 272 | | | Norwegian Cruise Line Holdings Ltd. (a) | | | 11,572 | |
| | | | | | | | |
| | | | | | | 74,343 | |
| | | | | | | | |
| | | | Household Durables — 3.2% | |
| | 156 | | | Lennar Corp., Class A | | | 6,706 | |
| | 293 | | | Mohawk Industries, Inc. (a) | | | 58,529 | |
| | 377 | | | Newell Brands, Inc. | | | 16,847 | |
| | | | | | | | |
| | | | | | | 82,082 | |
| | | | | | | | |
| | | | Internet & Direct Marketing Retail — 1.2% | |
| | 152 | | | Expedia, Inc. | | | 17,179 | |
| | 57 | | | Netflix, Inc. (a) | | | 7,007 | |
| | 186 | | | Wayfair, Inc., Class A (a) | | | 6,506 | |
| | | | | | | | |
| | | | | | | 30,692 | |
| | | | | | | | |
| | | | Media — 1.1% | |
| | 166 | | | CBS Corp. (Non-Voting), Class B | | | 10,534 | |
| | 241 | | | DISH Network Corp., Class A (a) | | | 13,938 | |
| | 232 | | | TEGNA, Inc. | | | 4,967 | |
| | | | | | | | |
| | | | | | | 29,439 | |
| | | | | | | | |
| | | | Multiline Retail — 2.2% | |
| | 297 | | | Dollar General Corp. | | | 21,962 | |
| | 271 | | | Kohl’s Corp. | | | 13,374 | |
| | 439 | | | Nordstrom, Inc. | | | 21,032 | |
| | | | | | | | |
| | | | | | | 56,368 | |
| | | | | | | | |
| | | | Specialty Retail — 4.4% | |
| | 16 | | | AutoZone, Inc. (a) | | | 12,638 | |
| | 231 | | | Bed Bath & Beyond, Inc. | | | 9,368 | |
| | 204 | | | Best Buy Co., Inc. | | | 8,692 | |
| | 400 | | | Gap, Inc. (The) | | | 8,979 | |
| | 87 | | | O’Reilly Automotive, Inc. (a) | | | 24,277 | |
| | 372 | | | Ross Stores, Inc. | | | 24,377 | |
| | 168 | | | Tiffany & Co. | | | 12,991 | |
| | | | | | | | |
| SHARES | | | SECURITY DESCRIPTION | | VALUE($) | |
| | | | | | | | |
| | | | | | | | |
| | | | Specialty Retail — continued | |
| | 54 | | | Ulta Salon Cosmetics & Fragrance, Inc. (a) | | | 13,741 | |
| | | | | | | | |
| | | | | | | 115,063 | |
| | | | | | | | |
| | | | Textiles, Apparel & Luxury Goods — 1.3% | |
| | 466 | | | Gildan Activewear, Inc., (Canada) | | | 11,814 | |
| | 121 | | | PVH Corp. | | | 10,953 | |
| | 56 | | | Ralph Lauren Corp. | | | 5,099 | |
| | 118 | | | VF Corp. | | | 6,301 | |
| | | | | | | | |
| | | | | | | 34,167 | |
| | | | | | | | |
| | | | Total Consumer Discretionary | | | 467,044 | |
| | | | | | | | |
| | | | Consumer Staples — 4.7% | |
| | | | Beverages — 1.3% | |
| | 75 | | | Constellation Brands, Inc., Class A | | | 11,451 | |
| | 173 | | | Dr Pepper Snapple Group, Inc. | | | 15,725 | |
| | 146 | | | Monster Beverage Corp. (a) | | | 6,487 | |
| | | | | | | | |
| | | | | | | 33,663 | |
| | | | | | | | |
| | | | Food & Staples Retailing — 1.6% | |
| | 115 | | | Casey’s General Stores, Inc. | | | 13,671 | |
| | 497 | | | Kroger Co. (The) | | | 17,140 | |
| | 475 | | | Rite Aid Corp. (a) | | | 3,913 | |
| | 329 | | | Sprouts Farmers Market, Inc. (a) | | | 6,225 | |
| | | | | | | | |
| | | | | | | 40,949 | |
| | | | | | | | |
| | | | Food Products — 0.8% | |
| | 116 | | | TreeHouse Foods, Inc. (a) | | | 8,346 | |
| | 194 | | | Tyson Foods, Inc., Class A | | | 11,947 | |
| | | | | | | | |
| | | | | | | 20,293 | |
| | | | | | | | |
| | | | Household Products — 0.2% | |
| | 122 | | | Energizer Holdings, Inc. | | | 5,456 | |
| | | | | | | | |
| | | | Personal Products — 0.8% | |
| | 598 | | | Coty, Inc., Class A | | | 10,941 | |
| | 144 | | | Edgewell Personal Care Co. (a) | | | 10,519 | |
| | | | | | | | |
| | | | | | | 21,460 | |
| | | | | | | | |
| | | | Total Consumer Staples | | | 121,821 | |
| | | | | | | | |
| | | | Energy — 3.9% | |
| | | | Oil, Gas & Consumable Fuels — 3.9% | |
| | 160 | | | Concho Resources, Inc. (a) | | | 21,242 | |
| | 503 | | | Energen Corp. (a) | | | 29,025 | |
| | 405 | | | EQT Corp. | | | 26,499 | |
| | 434 | | | PBF Energy, Inc., Class A | | | 12,103 | |
| | 282 | | | Range Resources Corp. | | | 9,686 | |
| | 380 | | | Southwestern Energy Co. (a) | | | 4,109 | |
| | | | | | | | |
| | | | Total Energy | | | 102,664 | |
| | | | | | | | |
SEE NOTES TO FINANCIAL STATEMENTS.
| | | | | | |
| | | |
| 20 | | | | J.P. MORGAN MID CAP/MULTI-CAP FUNDS | | DECEMBER 31, 2016 |
| | | | | | | | |
| SHARES | | | SECURITY DESCRIPTION | | VALUE($) | |
| | | | | | | | |
| Common Stocks — continued | |
| | | | Financials — 15.3% | |
| | | | Banks — 5.4% | |
| | 420 | | | Citizens Financial Group, Inc. | | | 14,975 | |
| | 310 | | | East West Bancorp, Inc. | | | 15,747 | |
| | 725 | | | Fifth Third Bancorp | | | 19,564 | |
| | 141 | | | First Republic Bank | | | 13,034 | |
| | 752 | | | Huntington Bancshares, Inc. | | | 9,939 | |
| | 312 | | | Investors Bancorp, Inc. | | | 4,353 | |
| | 146 | | | M&T Bank Corp. | | | 22,834 | |
| | 117 | | | Signature Bank (a) | | | 17,558 | |
| | 345 | | | SunTrust Banks, Inc. | | | 18,917 | |
| | 128 | | | Zions Bancorp | | | 5,513 | |
| | | | | | | | |
| | | | | | | 142,434 | |
| | | | | | | | |
| | | | Capital Markets — 5.4% | |
| | 125 | | | Affiliated Managers Group, Inc. (a) | | | 18,133 | |
| | 75 | | | Ameriprise Financial, Inc. | | | 8,284 | |
| | 414 | | | Invesco Ltd. | | | 12,554 | |
| | 257 | | | Lazard Ltd., Class A | | | 10,540 | |
| | 191 | | | Nasdaq, Inc. | | | 12,840 | |
| | 160 | | | Northern Trust Corp. | | | 14,230 | |
| | 179 | | | Raymond James Financial, Inc. | | | 12,387 | |
| | 144 | | | S&P Global, Inc. | | | 15,496 | |
| | 186 | | | T Rowe Price Group, Inc. | | | 14,021 | |
| | 501 | | | TD Ameritrade Holding Corp. | | | 21,848 | |
| | | | | | | | |
| | | | | | | 140,333 | |
| | | | | | | | |
| | | | Consumer Finance — 0.4% | |
| | 501 | | | Ally Financial, Inc. | | | 9,528 | |
| | | | | | | | |
| | | | Insurance — 4.1% | |
| | 13 | | | Alleghany Corp. (a) | | | 7,769 | |
| | 51 | | | Chubb Ltd. | | | 6,680 | |
| | 352 | | | Hartford Financial Services Group, Inc. (The) | | | 16,789 | |
| | 531 | | | Loews Corp. | | | 24,861 | |
| | 216 | | | Marsh & McLennan Cos., Inc. | | | 14,587 | |
| | 184 | | | Progressive Corp. (The) | | | 6,545 | |
| | 225 | | | Unum Group | | | 9,905 | |
| | 87 | | | WR Berkley Corp. | | | 5,808 | |
| | 400 | | | XL Group Ltd., (Ireland) | | | 14,894 | |
| | | | | | | | |
| | | | | | | 107,838 | |
| | | | | | | | |
| | | | Total Financials | | | 400,133 | |
| | | | | | | | |
| | | | Health Care — 9.5% | |
| | | | Biotechnology — 1.9% | |
| | 184 | | | ACADIA Pharmaceuticals, Inc. (a) | | | 5,304 | |
| | 174 | | | BioMarin Pharmaceutical, Inc. (a) | | | 14,389 | |
| | | | | | | | |
| SHARES | | | SECURITY DESCRIPTION | | VALUE($) | |
| | | | | | | | |
| | | | | | | | |
| | | | Biotechnology — continued | |
| | 74 | | | Incyte Corp. (a) | | | 7,460 | |
| | 64 | | | Intercept Pharmaceuticals, Inc. (a) | | | 6,921 | |
| | 168 | | | Kite Pharma, Inc. (a) | | | 7,551 | |
| | 100 | | | Vertex Pharmaceuticals, Inc. (a) | | | 7,367 | |
| | | | | | | | |
| | | | | | | 48,992 | |
| | | | | | | | |
| | | | Health Care Equipment & Supplies — 1.1% | |
| | 255 | | | DENTSPLY SIRONA, Inc. | | | 14,729 | |
| | 73 | | | Edwards Lifesciences Corp. (a) | | | 6,807 | |
| | 13 | | | Intuitive Surgical, Inc. (a) | | | 7,991 | |
| | | | | | | | |
| | | | | | | 29,527 | |
| | | | | | | | |
| | | | Health Care Providers & Services — 4.5% | |
| | 458 | | | Acadia Healthcare Co., Inc. (a) | | | 15,173 | |
| | 142 | | | AmerisourceBergen Corp. | | | 11,091 | |
| | 173 | | | Centene Corp. (a) | | | 9,776 | |
| | 79 | | | Cigna Corp. | | | 10,514 | |
| | 178 | | | Envision Healthcare Corp. (a) | | | 11,284 | |
| | 74 | | | Henry Schein, Inc. (a) | | | 11,295 | |
| | 140 | | | Humana, Inc. | | | 28,537 | |
| | 337 | | | Premier, Inc., Class A (a) | | | 10,231 | |
| | 83 | | | Universal Health Services, Inc., Class B | | | 8,808 | |
| | | | | | | | |
| | | | | | | 116,709 | |
| | | | | | | | |
| | | | Health Care Technology — 0.3% | |
| | 193 | | | Veeva Systems, Inc., Class A (a) | | | 7,839 | |
| | | | | | | | |
| | | | Life Sciences Tools & Services — 1.0% | |
| | 131 | | | Illumina, Inc. (a) | | | 16,796 | |
| | 332 | | | Patheon NV (a) | | | 9,535 | |
| | | | | | | | |
| | | | | | | 26,331 | |
| | | | | | | | |
| | | | Pharmaceuticals — 0.7% | |
| | 480 | | | Horizon Pharma plc (a) | | | 7,761 | |
| | 86 | | | Jazz Pharmaceuticals plc (a) | | | 9,366 | |
| | | | | | | | |
| | | | | | | 17,127 | |
| | | | | | | | |
| | | | Total Health Care | | | 246,525 | |
| | | | | | | | |
| | | | Industrials — 13.2% | |
| | | | Aerospace & Defense — 0.3% | |
| | 116 | | | HEICO Corp., Class A | | | 7,890 | |
| | | | | | | | |
| | | | Airlines — 0.7% | |
| | 373 | | | Southwest Airlines Co. | | | 18,590 | |
| | | | | | | | |
| | | | Building Products — 1.9% | |
| | 526 | | | Fortune Brands Home & Security, Inc. | | | 28,142 | |
| | 138 | | | Lennox International, Inc. | | | 21,122 | |
| | | | | | | | |
| | | | | | | 49,264 | |
| | | | | | | | |
SEE NOTES TO FINANCIAL STATEMENTS.
| | | | | | | | |
| | | |
| DECEMBER 31, 2016 | | J.P. MORGAN MID CAP/MULTI-CAP FUNDS | | | | | 21 | |
JPMorgan Mid Cap Equity Fund
SCHEDULE OF PORTFOLIO INVESTMENTS
AS OF DECEMBER 31, 2016 (Unaudited) (continued)
(Amounts in thousands)
| | | | | | | | |
| SHARES | | | SECURITY DESCRIPTION | | VALUE($) | |
| | | | | | | | |
| Common Stocks — continued | |
| | | | Commercial Services & Supplies — 1.3% | |
| | 439 | | | Waste Connections, Inc., (Canada) | | | 34,517 | |
| | | | | | | | |
| | | | Electrical Equipment — 2.2% | |
| | 99 | | | Acuity Brands, Inc. | | | 22,878 | |
| | 290 | | | AMETEK, Inc. | | | 14,081 | |
| | 120 | | | Hubbell, Inc. | | | 14,004 | |
| | 94 | | | Regal Beloit Corp. | | | 6,477 | |
| | | | | | | | |
| | | | | | | 57,440 | |
| | | | | | | | |
| | | | Industrial Conglomerates — 1.1% | |
| | 256 | | | Carlisle Cos., Inc. | | | 28,207 | |
| | | | | | | | |
| | | | Machinery — 3.4% | |
| | 157 | | | IDEX Corp. | | | 14,155 | |
| | 103 | | | Middleby Corp. (The) (a) | | | 13,242 | |
| | 107 | | | Oshkosh Corp. | | | 6,933 | |
| | 381 | | | Rexnord Corp. (a) | | | 7,472 | |
| | 93 | | | Snap-on, Inc. | | | 15,896 | |
| | 149 | | | Stanley Black & Decker, Inc. | | | 17,043 | |
| | 137 | | | WABCO Holdings, Inc. (a) | | | 14,521 | |
| | | | | | | | |
| | | | | | | 89,262 | |
| | | | | | | | |
| | | | Professional Services — 0.6% | |
| | 140 | | | Equifax, Inc. | | | 16,529 | |
| | | | | | | | |
| | | | Road & Rail — 0.5% | |
| | 140 | | | Old Dominion Freight Line, Inc. (a) | | | 11,993 | |
| | | | | | | | |
| | | | Trading Companies & Distributors — 1.2% | |
| | 417 | | | HD Supply Holdings, Inc. (a) | | | 17,735 | |
| | 145 | | | MSC Industrial Direct Co., Inc., Class A | | | 13,420 | |
| | | | | | | | |
| | | | | | | 31,155 | |
| | | | | | | | |
| | | | Total Industrials | | | 344,847 | |
| | | | | | | | |
| | | | Information Technology — 18.2% | |
| | | | Communications Equipment — 1.8% | |
| | 104 | | | Arista Networks, Inc. (a) | | | 10,112 | |
| | 309 | | | CommScope Holding Co., Inc. (a) | | | 11,485 | |
| | 126 | | | Harris Corp. | | | 12,880 | |
| | 99 | | | Palo Alto Networks, Inc. (a) | | | 12,375 | |
| | | | | | | | |
| | | | | | | 46,852 | |
| | | | | | | | |
| | | | Electronic Equipment, Instruments & Components — 3.7% | |
| | 584 | | | Amphenol Corp., Class A | | | 39,241 | |
| | 258 | | | Arrow Electronics, Inc. (a) | | | 18,427 | |
| | 240 | | | CDW Corp. | | | 12,511 | |
| | 556 | | | Corning, Inc. | | | 13,492 | |
| | 342 | | | Keysight Technologies, Inc. (a) | | | 12,521 | |
| | | | | | | | |
| | | | | | | 96,192 | |
| | | | | | | | |
| | | | | | | | |
| SHARES | | | SECURITY DESCRIPTION | | VALUE($) | |
| | | | | | | | |
| | | | | | | | |
| | | | Internet Software & Services — 1.2% | | | | |
| | 52 | | | CoStar Group, Inc. (a) | | | 9,783 | |
| | 474 | | | GoDaddy, Inc., Class A (a) | | | 16,577 | |
| | 260 | | | Match Group, Inc. (a) | | | 4,450 | |
| | | | | | | | |
| | | | | | | 30,810 | |
| | | | | | | | |
| | | | IT Services — 2.9% | |
| | 187 | | | Gartner, Inc. (a) | | | 18,900 | |
| | 170 | | | Global Payments, Inc. | | | 11,800 | |
| | 185 | | | Jack Henry & Associates, Inc. | | | 16,403 | |
| | 465 | | | Vantiv, Inc., Class A (a) | | | 27,741 | |
| | | | | | | | |
| | | | | | | 74,844 | |
| | | | | | | | |
| | | | Semiconductors & Semiconductor Equipment — 4.2% | |
| | 125 | | | Analog Devices, Inc. | | | 9,080 | |
| | 437 | | | Applied Materials, Inc. | | | 14,092 | |
| | 50 | | | Broadcom Ltd., (Singapore) | | | 8,891 | |
| | 204 | | | Cavium, Inc. (a) | | | 12,731 | |
| | 120 | | | KLA-Tencor Corp. | | | 9,422 | |
| | 145 | | | Lam Research Corp. | | | 15,363 | |
| | 292 | | | NVIDIA Corp. | | | 31,179 | |
| | 100 | | | NXP Semiconductors NV, (Netherlands) (a) | | | 9,775 | |
| | | | | | | | |
| | | | | | | 110,533 | |
| | | | | | | | |
| | | | Software — 4.4% | |
| | 271 | | | Atlassian Corp. plc, (Australia), Class A (a) | | | 6,519 | |
| | 437 | | | Electronic Arts, Inc. (a) | | | 34,450 | |
| | 164 | | | Guidewire Software, Inc. (a) | | | 8,105 | |
| | 135 | | | Mobileye NV (a) | | | 5,161 | |
| | 209 | | | ServiceNow, Inc. (a) | | | 15,537 | |
| | 230 | | | Splunk, Inc. (a) | | | 11,759 | |
| | 301 | | | Synopsys, Inc. (a) | | | 17,715 | |
| | 175 | | | Take-Two Interactive Software, Inc. (a) | | | 8,606 | |
| | 116 | | | Workday, Inc., Class A (a) | | | 7,693 | |
| | | | | | | | |
| | | | | | | 115,545 | |
| | | | | | | | |
| | | | Total Information Technology | | | 474,776 | |
| | | | | | | | |
| | | | Materials — 3.3% | |
| | | | Chemicals — 0.3% | |
| | 30 | | | Sherwin-Williams Co. (The) | | | 8,037 | |
| | | | | | | | |
| | | | Construction Materials — 1.3% | |
| | 177 | | | Eagle Materials, Inc. | | | 17,390 | |
| | 131 | | | Vulcan Materials Co. | | | 16,357 | |
| | | | | | | | |
| | | | | | | 33,747 | |
| | | | | | | | |
SEE NOTES TO FINANCIAL STATEMENTS.
| | | | | | |
| | | |
| 22 | | | | J.P. MORGAN MID CAP/MULTI-CAP FUNDS | | DECEMBER 31, 2016 |
| | | | | | | | |
| SHARES | | | SECURITY DESCRIPTION | | VALUE($) | |
| | | | | | | | |
| Common Stocks — continued | |
| | | | Containers & Packaging — 1.7% | |
| | 208 | | | Ball Corp. | | | 15,614 | |
| | 209 | | | Silgan Holdings, Inc. | | | 10,687 | |
| | 361 | | | WestRock Co. | | | 18,334 | |
| | | | | | | | |
| | | | | | | 44,635 | |
| | | | | | | | |
| | | | Total Materials | | | 86,419 | |
| | | | | | | | |
| | | | Real Estate — 5.6% | |
| | | | Equity Real Estate Investment Trusts (REITs) — 4.7% | |
| | 130 | | | American Campus Communities, Inc. | | | 6,458 | |
| | 249 | | | American Homes 4 Rent, Class A | | | 5,224 | |
| | 68 | | | AvalonBay Communities, Inc. | | | 12,101 | |
| | 89 | | | Boston Properties, Inc. | | | 11,236 | |
| | 433 | | | Brixmor Property Group, Inc. | | | 10,576 | |
| | 29 | | | Essex Property Trust, Inc. | | | 6,817 | |
| | 228 | | | General Growth Properties, Inc. | | | 5,689 | |
| | 79 | | | HCP, Inc. | | | 2,351 | |
| | 473 | | | Kimco Realty Corp. | | | 11,899 | |
| | 338 | | | Outfront Media, Inc. | | | 8,405 | |
| | 299 | | | Rayonier, Inc. | | | 7,943 | |
| | 117 | | | Regency Centers Corp. | | | 8,062 | |
| | 133 | | | Vornado Realty Trust | | | 13,930 | |
| | 268 | | | Weyerhaeuser Co. | | | 8,053 | |
| | 76 | | | WP Carey, Inc. | | | 4,515 | |
| | | | | | | | |
| | | | | | | 123,259 | |
| | | | | | | | |
| | | | Real Estate Management & Development — 0.9% | |
| | 743 | | | CBRE Group, Inc., Class A (a) | | | 23,393 | |
| | | | | | | | |
| | | | Total Real Estate | | | 146,652 | |
| | | | | | | | |
| | | | Utilities — 4.5% | |
| | | | Electric Utilities — 1.6% | |
| | 224 | | | Edison International | | | 16,138 | |
| | 143 | | | Westar Energy, Inc. | | | 8,037 | |
| | 437 | | | Xcel Energy, Inc. | | | 17,786 | |
| | | | | | | | |
| | | | | | | 41,961 | |
| | | | | | | | |
| | | | | | | | |
| SHARES | | | SECURITY DESCRIPTION | | VALUE($) | |
| | | | | | | | |
| | | | Gas Utilities — 0.5% | |
| | 224 | | | National Fuel Gas Co. | | | 12,665 | |
| | | | | | | | |
| | | | Multi-Utilities — 2.4% | |
| | 539 | | | CenterPoint Energy, Inc. | | | 13,291 | |
| | 390 | | | CMS Energy Corp. | | | 16,244 | |
| | 156 | | | Sempra Energy | | | 15,704 | |
| | 272 | | | WEC Energy Group, Inc. | | | 15,967 | |
| | | | | | | | |
| | | | | | | 61,206 | |
| | | | | | | | |
| | | | Total Utilities | | | 115,832 | |
| | | | | | | | |
| | | | Total Common Stocks
(Cost $1,869,305) | | | 2,506,713 | |
| | | | | | | | |
| Master Limited Partnership — 0.4% | |
| | | | Financials — 0.4% | |
| | | | Capital Markets— 0.4% | |
| | 261 | | | Oaktree Capital Group LLC
(Cost $12,198) | | | 9,799 | |
| | | | | | | | |
| Short-Term Investment — 3.4% | |
| | | | Investment Company — 3.4% | |
| | 89,081 | | | JPMorgan U.S. Government Money Market Fund, Institutional Class Shares, 0.410% (b) (l)
(Cost $89,081) | | | 89,081 | |
| | | | | | | | |
| | | | Total Investments — 99.9%
(Cost $1,970,584) | | | 2,605,593 | |
| | | | Other Assets in Excess of
Liabilities — 0.1% | | | 2,724 | |
| | | | | | | | |
| | | | NET ASSETS — 100.0% | | $ | 2,608,317 | |
| | | | | | | | |
Percentages indicated are based on net assets.
SEE NOTES TO FINANCIAL STATEMENTS.
| | | | | | | | |
| | | |
| DECEMBER 31, 2016 | | J.P. MORGAN MID CAP/MULTI-CAP FUNDS | | | | | 23 | |
JPMorgan Mid Cap Growth Fund
SCHEDULE OF PORTFOLIO INVESTMENTS
AS OF DECEMBER 31, 2016 (Unaudited)
(Amounts in thousands)
| | | | | | | | |
| SHARES | | | SECURITY DESCRIPTION | | VALUE($) | |
| Common Stocks — 97.1% | |
| | | | Consumer Discretionary — 19.0% | | | | |
| | | | Automobiles — 0.5% | | | | |
| | 63 | | | Tesla Motors, Inc. (a) | | | 13,366 | |
| | | | | | | | |
| | | | Distributors — 1.2% | | | | |
| | 1,071 | | | LKQ Corp. (a) | | | 32,811 | |
| | | | | | | | |
| | | | Hotels, Restaurants & Leisure — 4.2% | | | | |
| | 721 | | | Aramark | | | 25,747 | |
| | 2,326 | | | Hilton Worldwide Holdings, Inc. | | | 63,260 | |
| | 574 | | | Norwegian Cruise Line Holdings Ltd. (a) | | | 24,423 | |
| | | | | | | | |
| | | | | | | 113,430 | |
| | | | | | | | |
| | | | Household Durables — 3.3% | | | | |
| | 329 | | | Lennar Corp., Class A | | | 14,111 | |
| | 379 | | | Mohawk Industries, Inc. (a) | | | 75,753 | |
| | | | | | | | |
| | | | | | | 89,864 | |
| | | | | | | | |
| | | | Internet & Direct Marketing Retail — 1.0% | | | | |
| | 119 | | | Netflix, Inc. (a) | | | 14,760 | |
| | 391 | | | Wayfair, Inc., Class A (a) | | | 13,688 | |
| | | | | | | | |
| | | | | | | 28,448 | |
| | | | | | | | |
| | | | Multiline Retail — 2.5% | | | | |
| | 627 | | | Dollar General Corp. | | | 46,452 | |
| | 473 | | | Nordstrom, Inc. | | | 22,647 | |
| | | | | | | | |
| | | | | | | 69,099 | |
| | | | | | | | |
| | | | Specialty Retail — 4.9% | | | | |
| | 184 | | | O’Reilly Automotive, Inc. (a) | | | 51,329 | |
| | 786 | | | Ross Stores, Inc. | | | 51,574 | |
| | 114 | | | Ulta Salon Cosmetics & Fragrance, Inc. (a) | | | 29,003 | |
| | | | | | | | |
| | | | | | | 131,906 | |
| | | | | | | | |
| | | | Textiles, Apparel & Luxury Goods — 1.4% | | | | |
| | 983 | | | Gildan Activewear, Inc., (Canada) | | | 24,947 | |
| | 248 | | | VF Corp. | | | 13,247 | |
| | | | | | | | |
| | | | | | | 38,194 | |
| | | | | | | | |
| | | | Total Consumer Discretionary | | | 517,118 | |
| | | | | | | | |
| | | | Consumer Staples — 3.0% | | | | |
| | | | Beverages — 0.5% | | | | |
| | 308 | | | Monster Beverage Corp. (a) | | | 13,647 | |
| | | | | | | | |
| | | | Food & Staples Retailing — 1.6% | | | | |
| | 243 | | | Casey’s General Stores, Inc. | | | 28,888 | |
| | 692 | | | Sprouts Farmers Market, Inc. (a) | | | 13,099 | |
| | | | | | | | |
| | | | | | | 41,987 | |
| | | | | | | | |
| | | | Food Products — 0.9% | | | | |
| | 409 | | | Tyson Foods, Inc., Class A | | | 25,215 | |
| | | | | | | | |
| | | | Total Consumer Staples | | | 80,849 | |
| | | | | | | | |
| | | | | | | | |
| SHARES | | | SECURITY DESCRIPTION | | VALUE($) | |
| | | | | | | | |
| | | | Energy — 2.4% | | | | |
| | | | Oil, Gas & Consumable Fuels — 2.4% | | | | |
| | 339 | | | Concho Resources, Inc. (a) | | | 44,915 | |
| | 594 | | | Range Resources Corp. | | | 20,424 | |
| | | | | | | | |
| | | | Total Energy | | | 65,339 | |
| | | | | | | | |
| | | | Financials — 8.8% | | | | |
| | | | Banks — 2.6% | | | | |
| | 667 | | | East West Bancorp, Inc. | | | 33,911 | |
| | 247 | | | Signature Bank (a) | | | 37,092 | |
| | | | | | | | |
| | | | | | | 71,003 | |
| | | | | | | | |
| | | | Capital Markets — 6.2% | | | | |
| | 264 | | | Affiliated Managers Group, Inc. (a) | | | 38,346 | |
| | 541 | | | Lazard Ltd., Class A | | | 22,233 | |
| | 404 | | | Nasdaq, Inc. | | | 27,110 | |
| | 306 | | | S&P Global, Inc. | | | 32,878 | |
| | 1,060 | | | TD Ameritrade Holding Corp. | | | 46,209 | |
| | | | | | | | |
| | | | | | | 166,776 | |
| | | | | | | | |
| | | | Total Financials | | | 237,779 | |
| | | | | | | | |
| | | | Health Care — 14.8% | | | | |
| | | | Biotechnology — 3.8% | | | | |
| | 386 | | | ACADIA Pharmaceuticals, Inc. (a) | | | 11,124 | |
| | 367 | | | BioMarin Pharmaceutical, Inc. (a) | | | 30,403 | |
| | 157 | | | Incyte Corp. (a) | | | 15,702 | |
| | 134 | | | Intercept Pharmaceuticals, Inc. (a) | | | 14,567 | |
| | 355 | | | Kite Pharma, Inc. (a) | | | 15,909 | |
| | 211 | | | Vertex Pharmaceuticals, Inc. (a) | | | 15,514 | |
| | | | | | | | |
| | | | | | | 103,219 | |
| | | | | | | | |
| | | | Health Care Equipment & Supplies — 2.3% | | | | |
| | 539 | | | DENTSPLY SIRONA, Inc. | | | 31,116 | |
| | 153 | | | Edwards Lifesciences Corp. (a) | | | 14,327 | |
| | 27 | | | Intuitive Surgical, Inc. (a) | | | 16,869 | |
| | | | | | | | |
| | | | | | | 62,312 | |
| | | | | | | | |
| | | | Health Care Providers & Services — 4.7% | | | | |
| | 969 | | | Acadia Healthcare Co., Inc. (a) | | | 32,062 | |
| | 367 | | | Centene Corp. (a) | | | 20,745 | |
| | 376 | | | Envision Healthcare Corp. (a) | | | 23,816 | |
| | 148 | | | Humana, Inc. | | | 30,296 | |
| | 711 | | | Premier, Inc., Class A (a) | | | 21,586 | |
| | | | | | | | |
| | | | | | | 128,505 | |
| | | | | | | | |
| | | | Health Care Technology — 0.6% | | | | |
| | 406 | | | Veeva Systems, Inc., Class A (a) | | | 16,518 | |
| | | | | | | | |
| | | | Life Sciences Tools & Services — 2.1% | | | | |
| | 277 | | | Illumina, Inc. (a) | | | 35,489 | |
| | 700 | | | Patheon NV (a) | | | 20,103 | |
| | | | | | | | |
| | | | | | | 55,592 | |
| | | | | | | | |
SEE NOTES TO FINANCIAL STATEMENTS.
| | | | | | |
| | | |
| 24 | | | | J.P. MORGAN MID CAP/MULTI-CAP FUNDS | | DECEMBER 31, 2016 |
| | | | | | | | |
| SHARES | | | SECURITY DESCRIPTION | | VALUE($) | |
| Common Stocks — continued | |
| | | | Pharmaceuticals — 1.3% | | | | |
| | 1,010 | | | Horizon Pharma plc (a) | | | 16,347 | |
| | 181 | | | Jazz Pharmaceuticals plc (a) | | | 19,731 | |
| | | | | | | | |
| | | | | | | 36,078 | |
| | | | | | | | |
| | | | Total Health Care | | | 402,224 | |
| | | | | | | | |
| | | | Industrials — 18.1% | | | | |
| | | | Aerospace & Defense — 0.6% | | | | |
| | 245 | | | HEICO Corp., Class A | | | 16,615 | |
| | | | | | | | |
| | | | Airlines — 1.4% | | | | |
| | 789 | | | Southwest Airlines Co. | | | 39,299 | |
| | | | | | | | |
| | | | Building Products — 3.0% | | | | |
| | 673 | | | Fortune Brands Home & Security, Inc. | | | 35,957 | |
| | 292 | | | Lennox International, Inc. | | | 44,669 | |
| | | | | | | | |
| | | | | | | 80,626 | |
| | | | | | | | |
| | | | Commercial Services & Supplies — 2.7% | | | | |
| | 922 | | | Waste Connections, Inc., (Canada) | | | 72,457 | |
| | | | | | | | |
| | | | Electrical Equipment — 1.8% | | | | |
| | 210 | | | Acuity Brands, Inc. | | | 48,372 | |
| | | | | | | | |
| | | | Industrial Conglomerates — 1.0% | | | | |
| | 244 | | | Carlisle Cos., Inc. | | | 26,881 | |
| | | | | | | | |
| | | | Machinery — 4.0% | | | | |
| | 217 | | | Middleby Corp. (The) (a) | | | 27,971 | |
| | 226 | | | Oshkosh Corp. | | | 14,589 | |
| | 312 | | | Stanley Black & Decker, Inc. | | | 35,829 | |
| | 287 | | | WABCO Holdings, Inc. (a) | | | 30,497 | |
| | | | | | | | |
| | | | | | | 108,886 | |
| | | | | | | | |
| | | | Professional Services — 1.3% | | | | |
| | 296 | | | Equifax, Inc. | | | 34,937 | |
| | | | | | | | |
| | | | Road & Rail — 0.9% | | | | |
| | 295 | | | Old Dominion Freight Line, Inc. (a) | | | 25,325 | |
| | | | | | | | |
| | | | Trading Companies & Distributors — 1.4% | | | | |
| | 882 | | | HD Supply Holdings, Inc. (a) | | | 37,480 | |
| | | | | | | | |
| | | | Total Industrials | | | 490,878 | |
| | | | | | | | |
| | | | Information Technology — 27.0% | | | | |
| | | | Communications Equipment — 2.7% | | | | |
| | 220 | | | Arista Networks, Inc. (a) | | | 21,321 | |
| | 265 | | | Harris Corp. | | | 27,192 | |
| | 209 | | | Palo Alto Networks, Inc. (a) | | | 26,125 | |
| | | | | | | | |
| | | | | | | 74,638 | |
| | | | | | | | |
| | | | Electronic Equipment, Instruments & Components — 2.9% | |
| | 747 | | | Amphenol Corp., Class A | | | 50,221 | |
| | 1,174 | | | Corning, Inc. | | | 28,491 | |
| | | | | | | | |
| | | | | | | 78,712 | |
| | | | | | | | |
| | | | | | | | |
| SHARES | | | SECURITY DESCRIPTION | | VALUE($) | |
| | | | | | | | |
| | | | Internet Software & Services — 2.1% | | | | |
| | 109 | | | CoStar Group, Inc. (a) | | | 20,635 | |
| | 1,002 | | | GoDaddy, Inc., Class A (a) | | | 35,034 | |
| | | | | | | | |
| | | | | | | 55,669 | |
| | | | | | | | |
| | | | IT Services — 4.5% | | | | |
| | 395 | | | Gartner, Inc. (a) | | | 39,951 | |
| | 359 | | | Global Payments, Inc. | | | 24,911 | |
| | 985 | | | Vantiv, Inc., Class A (a) | | | 58,698 | |
| | | | | | | | |
| | | | | | | 123,560 | |
| | | | | | | | |
| | | | Semiconductors & Semiconductor Equipment — 7.2% | |
| | 922 | | | Applied Materials, Inc. | | | 29,766 | |
| | 106 | | | Broadcom Ltd., (Singapore) | | | 18,743 | |
| | 431 | | | Cavium, Inc. (a) | | | 26,887 | |
| | 307 | | | Lam Research Corp. | | | 32,447 | |
| | 618 | | | NVIDIA Corp. | | | 65,976 | |
| | 210 | | | NXP Semiconductors NV, (Netherlands) (a) | | | 20,609 | |
| | | | | | | | |
| | | | | | | 194,428 | |
| | | | | | | | |
| | | | Software — 7.6% | | | | |
| | 570 | | | Atlassian Corp. plc, (Australia), Class A (a) | | | 13,714 | |
| | 926 | | | Electronic Arts, Inc. (a) | | | 72,916 | |
| | 346 | | | Guidewire Software, Inc. (a) | | | 17,079 | |
| | 284 | | | Mobileye NV (a) | | | 10,827 | |
| | 442 | | | ServiceNow, Inc. (a) | | | 32,827 | |
| | 485 | | | Splunk, Inc. (a) | | | 24,830 | |
| | 368 | | | Take-Two Interactive Software, Inc. (a) | | | 18,134 | |
| | 245 | | | Workday, Inc., Class A (a) | | | 16,199 | |
| | | | | | | | |
| | | | | | | 206,526 | |
| | | | | | | | |
| | | | Total Information Technology | | | 733,533 | |
| | | | | | | | |
| | | | Materials — 2.6% | | | | |
| | | | Construction Materials — 2.6% | | | | |
| | 373 | | | Eagle Materials, Inc. | | | 36,754 | |
| | 276 | | | Vulcan Materials Co. | | | 34,562 | |
| | | | | | | | |
| | | | Total Materials | | | 71,316 | |
| | | | | | | | |
| | | | Real Estate — 1.4% | | | | |
| | | | Real Estate Management & Development — 1.4% | |
| | 1,228 | | | CBRE Group, Inc., Class A (a) | | | 38,658 | |
| | | | | | | | |
| | | | Total Common Stocks
(Cost $2,214,698) | | | 2,637,694 | |
| | | | | | | | |
| Master Limited Partnership — 0.8% | |
| | | | Financials — 0.8% | | | | |
| | | | Capital Markets — 0.8% | | | | |
| | 557 | | | Oaktree Capital Group LLC
(Cost $26,473) | | | 20,891 | |
| | | | | | | | |
SEE NOTES TO FINANCIAL STATEMENTS.
| | | | | | | | |
| | | |
| DECEMBER 31, 2016 | | J.P. MORGAN MID CAP/MULTI-CAP FUNDS | | | | | 25 | |
JPMorgan Mid Cap Growth Fund
SCHEDULE OF PORTFOLIO INVESTMENTS
AS OF DECEMBER 31, 2016 (Unaudited) (continued)
(Amounts in thousands)
| | | | | | | | |
| SHARES | | | SECURITY DESCRIPTION | | VALUE($) | |
| Short-Term Investment — 2.3% | |
| | | | Investment Company — 2.3% | | | | |
| | 63,672 | | | JPMorgan U.S. Government Money Market Fund, Institutional Class Shares, 0.410% (b) (l)
(Cost $63,672) | | | 63,672 | |
| | | | | | | | |
| | | | Total Investments — 100.2%
(Cost $2,304,843) | | | 2,722,257 | |
| | | | Liabilities in Excess of
Other Assets — (0.2)% | | | (4,721 | ) |
| | | | | | | | |
| | | | NET ASSETS — 100.0% | | $ | 2,717,536 | |
| | | | | | | | |
Percentages indicated are based on net assets.
SEE NOTES TO FINANCIAL STATEMENTS.
| | | | | | |
| | | |
| 26 | | | | J.P. MORGAN MID CAP/MULTI-CAP FUNDS | | DECEMBER 31, 2016 |
JPMorgan Mid Cap Value Fund
SCHEDULE OF PORTFOLIO INVESTMENTS
AS OF DECEMBER 31, 2016 (Unaudited)
(Amounts in thousands)
| | | | | | | | |
| SHARES | | | SECURITY DESCRIPTION | | VALUE($) | |
| Common Stocks — 95.7% | |
| | | | Consumer Discretionary — 17.0% | | | | |
| | | | Auto Components — 0.9% | | | | |
| | 3,815 | | | BorgWarner, Inc. | | | 150,466 | |
| | | | | | | | |
| | | | Distributors — 0.9% | | | | |
| | 1,591 | | | Genuine Parts Co. | | | 151,978 | |
| | | | | | | | |
| | | | Hotels, Restaurants & Leisure — 1.6% | | | | |
| | 8,003 | | | Hilton Worldwide Holdings, Inc. | | | 217,674 | |
| | 636 | | | Marriott International, Inc., Class A | | | 52,621 | |
| | | | | | | | |
| | | | | | | 270,295 | |
| | | | | | | | |
| | | | Household Durables — 3.0% | | | | |
| | 1,489 | | | Mohawk Industries, Inc. (a) | | | 297,328 | |
| | 4,936 | | | Newell Brands, Inc. | | | 220,403 | |
| | | | | | | | |
| | | | | | | 517,731 | |
| | | | | | | | |
| | | | Internet & Direct Marketing Retail — 1.3% | | | | |
| | 1,984 | | | Expedia, Inc. | | | 224,699 | |
| | | | | | | | |
| | | | Media — 2.3% | | | | |
| | 2,173 | | | CBS Corp. (Non-Voting), Class B | | | 138,252 | |
| | 3,152 | | | DISH Network Corp., Class A (a) | | | 182,598 | |
| | 3,030 | | | TEGNA, Inc. | | | 64,818 | |
| | | | | | | | |
| | | | | | | 385,668 | |
| | | | | | | | |
| | | | Multiline Retail — 1.8% | | | | |
| | 3,524 | | | Kohl’s Corp. | | | 174,014 | |
| | 2,817 | | | Nordstrom, Inc. | | | 135,006 | |
| | | | | | | | |
| | | | | | | 309,020 | |
| | | | | | | | |
| | | | Specialty Retail — 4.0% | | | | |
| | 210 | | | AutoZone, Inc. (a) | | | 165,594 | |
| | 3,025 | | | Bed Bath & Beyond, Inc. | | | 122,949 | |
| | 2,674 | | | Best Buy Co., Inc. | | | 114,117 | |
| | 5,251 | | | Gap, Inc. (The) | | | 117,831 | |
| | 2,187 | | | Tiffany & Co. | | | 169,306 | |
| | | | | | | | |
| | | | | | | 689,797 | |
| | | | | | | | |
| | | | Textiles, Apparel & Luxury Goods — 1.2% | | | | |
| | 1,590 | | | PVH Corp. | | | 143,507 | |
| | 732 | | | Ralph Lauren Corp. | | | 66,125 | |
| | | | | | | | |
| | | | | | | 209,632 | |
| | | | | | | | |
| | | | Total Consumer Discretionary | | | 2,909,286 | |
| | | | | | | | |
| | | | Consumer Staples — 6.4% | | | | |
| | | | Beverages — 2.1% | | | | |
| | 979 | | | Constellation Brands, Inc., Class A | | | 150,142 | |
| | 2,271 | | | Dr Pepper Snapple Group, Inc. | | | 205,879 | |
| | | | | | | | |
| | | | | | | 356,021 | |
| | | | | | | | |
| | | | | | | | |
| SHARES | | | SECURITY DESCRIPTION | | VALUE($) | |
| | | | | | | | |
| | | | Food & Staples Retailing — 1.6% | | | | |
| | 6,500 | | | Kroger Co. (The) | | | 224,299 | |
| | 6,308 | | | Rite Aid Corp. (a) | | | 51,977 | |
| | | | | | | | |
| | | | | | | 276,276 | |
| | | | | | | | |
| | | | Food Products — 0.6% | | | | |
| | 1,520 | | | TreeHouse Foods, Inc. (a) | | | 109,732 | |
| | | | | | | | |
| | | | Household Products — 0.4% | | | | |
| | 1,616 | | | Energizer Holdings, Inc. | | | 72,083 | |
| | | | | | | | |
| | | | Personal Products — 1.7% | | | | |
| | 7,834 | | | Coty, Inc., Class A | | | 143,439 | |
| | 1,890 | | | Edgewell Personal Care Co. (a) | | | 137,925 | |
| | | | | | | | |
| | | | | | | 281,364 | |
| | | | | | | | |
| | | | Total Consumer Staples | | | 1,095,476 | |
| | | | | | | | |
| | | | Energy — 5.2% | | | | |
| | | | Oil, Gas & Consumable Fuels — 5.2% | | | | |
| | 6,575 | | | Energen Corp. (a) | | | 379,165 | |
| | 5,317 | | | EQT Corp. | | | 347,738 | |
| | 5,694 | | | PBF Energy, Inc., Class A | | | 158,755 | |
| | | | | | | | |
| | | | Total Energy | | | 885,658 | |
| | | | | | | | |
| | | | Financials — 22.2% | | | | |
| | | | Banks — 8.3% | | | | |
| | 5,305 | | | Citizens Financial Group, Inc. | | | 189,034 | |
| | 9,466 | | | Fifth Third Bancorp | | | 255,303 | |
| | 1,855 | | | First Republic Bank | | | 170,905 | |
| | 9,871 | | | Huntington Bancshares, Inc. | | | 130,498 | |
| | 4,137 | | | Investors Bancorp, Inc. | | | 57,713 | |
| | 1,905 | | | M&T Bank Corp. | | | 297,967 | |
| | 4,501 | | | SunTrust Banks, Inc. | | | 246,861 | |
| | 1,681 | | | Zions Bancorp | | | 72,352 | |
| | | | | | | | |
| | | | | | | 1,420,633 | |
| | | | | | | | |
| | | | Capital Markets — 4.7% | | | | |
| | 981 | | | Ameriprise Financial, Inc. | | | 108,865 | |
| | 5,422 | | | Invesco Ltd. | | | 164,494 | |
| | 2,088 | | | Northern Trust Corp. | | | 185,924 | |
| | 2,343 | | | Raymond James Financial, Inc. | | | 162,314 | |
| | 2,411 | | | T Rowe Price Group, Inc. | | | 181,485 | |
| | | | | | | | |
| | | | | | | 803,082 | |
| | | | | | | | |
| | | | Consumer Finance — 0.7% | | | | |
| | 6,515 | | | Ally Financial, Inc. | | | 123,913 | |
| | | | | | | | |
| | | | Insurance — 8.2% | | | | |
| | 168 | | | Alleghany Corp. (a) | | | 102,239 | |
| | 666 | | | Chubb Ltd. | | | 88,020 | |
| | 4,611 | | | Hartford Financial Services Group, Inc. (The) | | | 219,711 | |
SEE NOTES TO FINANCIAL STATEMENTS.
| | | | | | | | |
| | | |
| DECEMBER 31, 2016 | | J.P. MORGAN MID CAP/MULTI-CAP FUNDS | | | | | 27 | |
JPMorgan Mid Cap Value Fund
SCHEDULE OF PORTFOLIO INVESTMENTS
AS OF DECEMBER 31, 2016 (Unaudited) (continued)
(Amounts in thousands)
| | | | | | | | |
| SHARES | | | SECURITY DESCRIPTION | | VALUE($) | |
| Common Stocks — continued | |
| | | | Insurance — continued | | | | |
| | 6,939 | | | Loews Corp. | | | 324,956 | |
| | 2,798 | | | Marsh & McLennan Cos., Inc. | | | 189,137 | |
| | 2,431 | | | Progressive Corp. (The) | | | 86,286 | |
| | 2,960 | | | Unum Group | | | 130,032 | |
| | 1,153 | | | WR Berkley Corp. | | | 76,696 | |
| | 5,234 | | | XL Group Ltd., (Ireland) | | | 195,025 | |
| | | | | | | | |
| | | | | | | 1,412,102 | |
| | | | | | | | |
| | | | Mortgage Real Estate Investment Trusts (REITs) — 0.3% | |
| | 2,099 | | | Starwood Property Trust, Inc. | | | 46,073 | |
| | | | | | | | |
| | | | Total Financials | | | 3,805,803 | |
| | | | | | | | |
| | | | Health Care — 4.2% | | | | |
| | | | Health Care Providers & Services — 4.2% | | | | |
| | 1,821 | | | AmerisourceBergen Corp. | | | 142,406 | |
| | 1,034 | | | Cigna Corp. | | | 137,916 | |
| | 976 | | | Henry Schein, Inc. (a) | | | 148,137 | |
| | 911 | | | Humana, Inc. | | | 185,822 | |
| | 1,087 | | | Universal Health Services, Inc., Class B | | | 115,591 | |
| | | | | | | | |
| | | | Total Health Care | | | 729,872 | |
| | | | | | | | |
| | | | Industrials — 8.6% | | | | |
| | | | Building Products — 0.9% | | | | |
| | 2,729 | | | Fortune Brands Home & Security, Inc. | | | 145,876 | |
| | | | | | | | |
| | | | Electrical Equipment — 2.6% | | | | |
| | 3,795 | | | AMETEK, Inc. | | | 184,454 | |
| | 1,572 | | | Hubbell, Inc. | | | 183,460 | |
| | 1,215 | | | Regal Beloit Corp. | | | 84,112 | |
| | | | | | | | |
| | | | | | | 452,026 | |
| | | | | | | | |
| | | | Industrial Conglomerates — 1.2% | | | | |
| | 1,837 | | | Carlisle Cos., Inc. | | | 202,580 | |
| | | | | | | | |
| | | | Machinery — 2.9% | | | | |
| | 2,058 | | | IDEX Corp. | | | 185,353 | |
| | 4,992 | | | Rexnord Corp. (a) | | | 97,786 | |
| | 1,215 | | | Snap-on, Inc. | | | 208,072 | |
| | | | | | | | |
| | | | | | | 491,211 | |
| | | | | | | | |
| | | | Trading Companies & Distributors — 1.0% | | | | |
| | 1,897 | | | MSC Industrial Direct Co., Inc., Class A | | | 175,262 | |
| | | | | | | | |
| | | | Total Industrials | | | 1,466,955 | |
| | | | | | | | |
| | | | Information Technology — 9.7% | | | | |
| | | | Communications Equipment — 0.9% | | | | |
| | 4,049 | | | CommScope Holding Co., Inc. (a) | | | 150,626 | |
| | | | | | | | |
| | | | Electronic Equipment, Instruments & Components — 4.5% | |
| | 3,019 | | | Amphenol Corp., Class A | | | 202,844 | |
| | 3,378 | | | Arrow Electronics, Inc. (a) | | | 240,882 | |
| | | | | | | | |
| SHARES | | | SECURITY DESCRIPTION | | VALUE($) | |
| | | | | | | | |
| | | | Electronic Equipment, Instruments & Components — continued | |
| | 3,148 | | | CDW Corp. | | | 163,977 | |
| | 4,486 | | | Keysight Technologies, Inc. (a) | | | 164,062 | |
| | | | | | | | |
| | | | | | | 771,765 | |
| | | | | | | | |
| | | | Internet Software & Services — 0.3% | | | | |
| | 3,445 | | | Match Group, Inc. (a) | | | 58,907 | |
| | | | | | | | |
| | | | IT Services — 1.3% | | | | |
| | 2,418 | | | Jack Henry & Associates, Inc. | | | 214,684 | |
| | | | | | | | |
| | | | Semiconductors & Semiconductor Equipment — 1.4% | |
| | 1,642 | | | Analog Devices, Inc. | | | 119,235 | |
| | 1,572 | | | KLA-Tencor Corp. | | | 123,677 | |
| | | | | | | | |
| | | | | | | 242,912 | |
| | | | | | | | |
| | | | Software — 1.3% | | | | |
| | 3,937 | | | Synopsys, Inc. (a) | | | 231,750 | |
| | | | | | | | |
| | | | Total Information Technology | | | 1,670,644 | |
| | | | | | | | |
| | | | Materials — 4.0% | | | | |
| | | | Chemicals — 0.6% | | | | |
| | 393 | | | Sherwin-Williams Co. (The) | | | 105,649 | |
| | | | | | | | |
| | | | Containers & Packaging — 3.4% | | | | |
| | 2,729 | | | Ball Corp. | | | 204,876 | |
| | 2,740 | | | Silgan Holdings, Inc. | | | 140,219 | |
| | 4,718 | | | WestRock Co. | | | 239,548 | |
| | | | | | | | |
| | | | | | | 584,643 | |
| | | | | | | | |
| | | | Total Materials | | | 690,292 | |
| | | | | | | | |
| | | | Real Estate — 9.5% | | | | |
| | | | Equity Real Estate Investment Trusts (REITs) — 9.1% | |
| | 1,711 | | | American Campus Communities, Inc. | | | 85,157 | |
| | 3,289 | | | American Homes 4 Rent, Class A | | | 69,002 | |
| | 896 | | | AvalonBay Communities, Inc. | | | 158,734 | |
| | 1,172 | | | Boston Properties, Inc. | | | 147,378 | |
| | 5,682 | | | Brixmor Property Group, Inc. | | | 138,749 | |
| | 386 | | | Essex Property Trust, Inc. | | | 89,848 | |
| | 3,005 | | | General Growth Properties, Inc. | | | 75,058 | |
| | 1,063 | | | HCP, Inc. | | | 31,589 | |
| | 6,198 | | | Kimco Realty Corp. | | | 155,950 | |
| | 4,442 | | | Outfront Media, Inc. | | | 110,463 | |
| | 3,926 | | | Rayonier, Inc. | | | 104,425 | |
| | 1,538 | | | Regency Centers Corp. | | | 106,035 | |
| | 1,743 | | | Vornado Realty Trust | | | 181,892 | |
| | 3,517 | | | Weyerhaeuser Co. | | | 105,821 | |
| | | | | | | | |
| | | | | | | 1,560,101 | |
| | | | | | | | |
SEE NOTES TO FINANCIAL STATEMENTS.
| | | | | | |
| | | |
| 28 | | | | J.P. MORGAN MID CAP/MULTI-CAP FUNDS | | DECEMBER 31, 2016 |
| | | | | | | | |
| SHARES | | | SECURITY DESCRIPTION | | VALUE($) | |
| Common Stocks — continued | |
| | | | Real Estate Management & Development — 0.4% | |
| | 2,145 | | | CBRE Group, Inc., Class A (a) | | | 67,543 | |
| | | | | | | | |
| | | | Total Real Estate | | | 1,627,644 | |
| | | | | | | | |
| | | | Utilities — 8.9% | | | | |
| | | | Electric Utilities — 3.2% | | | | |
| | 2,935 | | | Edison International | | | 211,259 | |
| | 1,875 | | | Westar Energy, Inc. | | | 105,656 | |
| | 5,740 | | | Xcel Energy, Inc. | | | 233,624 | |
| | | | | | | | |
| | | | | | | 550,539 | |
| | | | | | | | |
| | | | Gas Utilities — 1.0% | | | | |
| | 2,930 | | | National Fuel Gas Co. | | | 165,976 | |
| | | | | | | | |
| | | | Multi-Utilities — 4.7% | | | | |
| | 7,086 | | | CenterPoint Energy, Inc. | | | 174,590 | |
| | 5,099 | | | CMS Energy Corp. | | | 212,215 | |
| | 2,043 | | | Sempra Energy | | | 205,587 | |
| | 3,576 | | | WEC Energy Group, Inc. | | | 209,740 | |
| | | | | | | | |
| | | | | | | 802,132 | |
| | | | | | | | |
| | | | Total Utilities | | | 1,518,647 | |
| | | | | | | | |
| | | | Total Common Stocks
(Cost $10,956,028) | | | 16,400,277 | |
| | | | | | | | |
| | | | | | | | |
| SHARES | | | SECURITY DESCRIPTION | | VALUE($) | |
| Short-Term Investment — 4.5% | |
| | | | Investment Company — 4.5% | | | | |
| | 766,568 | | | JPMorgan U.S. Government Money Market Fund, Institutional Class Shares, 0.410% (b) (l)
(Cost $766,568) | | | 766,568 | |
| | | | | | | | |
| | | | Total Investments — 100.2%
(Cost $11,722,596) | | | 17,166,845 | |
| | | | Liabilities in Excess of
Other Assets — (0.2)% | | | (27,619 | ) |
| | | | | | | | |
| | | | NET ASSETS — 100.0% | | $ | 17,139,226 | |
| | | | | | | | |
Percentages indicated are based on net assets.
SEE NOTES TO FINANCIAL STATEMENTS.
| | | | | | | | |
| | | |
| DECEMBER 31, 2016 | | J.P. MORGAN MID CAP/MULTI-CAP FUNDS | | | | | 29 | |
JPMorgan Multi-Cap Market Neutral Fund
SCHEDULE OF PORTFOLIO INVESTMENTS
AS OF DECEMBER 31, 2016 (Unaudited)
(Amounts in thousands)
| | | | | | | | |
| SHARES | | | SECURITY DESCRIPTION | | VALUE($) | |
| Long Positions — 102.6% | |
| Common Stocks — 88.5% | |
| | | | Consumer Discretionary — 14.8% | |
| | | | Automobiles — 0.4% | |
| | 21 | | | General Motors Co. | | | 734 | |
| | | | | | | | |
| | | | Hotels, Restaurants & Leisure — 5.0% | |
| | 12 | | | Darden Restaurants, Inc. | | | 876 | |
| | 29 | | | Hyatt Hotels Corp., Class A (a) | | | 1,612 | |
| | 58 | | | International Game Technology plc | | | 1,490 | |
| | 10 | | | Las Vegas Sands Corp. | | | 537 | |
| | 34 | | | Restaurant Brands International, Inc., (Canada) | | | 1,620 | |
| | 9 | | | Vail Resorts, Inc. (j) | | | 1,492 | |
| | 65 | | | Wendy’s Co. (The) | | | 880 | |
| | | | | | | | |
| | | | | | | 8,507 | |
| | | | | | | | |
| | | | Household Durables — 2.3% | |
| | 48 | | | DR Horton, Inc. | | | 1,317 | |
| | 1 | | | NVR, Inc. (a) (j) | | | 1,085 | |
| | 28 | | | Tupperware Brands Corp. | | | 1,467 | |
| | | | | | | | |
| | | | | | | 3,869 | |
| | | | | | | | |
| | | | Internet & Direct Marketing Retail — 0.1% | |
| | 39 | | | Groupon, Inc. (a) | | | 131 | |
| | | | | | | | |
| | | | Media — 1.5% | |
| | 5 | | | CBS Corp. (Non-Voting), Class B | | | 337 | |
| | 20 | | | Sinclair Broadcast Group, Inc., Class A | | | 674 | |
| | 330 | | | Sirius XM Holdings, Inc. | | | 1,467 | |
| | | | | | | | |
| | | | | | | 2,478 | |
| | | | | | | | |
| | | | Multiline Retail — 1.6% | |
| | 12 | | | Dillard’s, Inc., Class A | | | 758 | |
| | 31 | | | Kohl’s Corp. | | | 1,522 | |
| | 14 | | | Macy’s, Inc. | | | 491 | |
| | | | | | | | |
| | | | | | | 2,771 | |
| | | | | | | | |
| | | | Specialty Retail — 2.7% | |
| | 12 | | | Bed Bath & Beyond, Inc. | | | 506 | |
| | 35 | | | Best Buy Co., Inc. (j) | | | 1,493 | |
| | 7 | | | Dick’s Sporting Goods, Inc. | | | 357 | |
| | 158 | | | Staples, Inc. (j) | | | 1,427 | |
| | 27 | | | Urban Outfitters, Inc. (a) | | | 756 | |
| | | | | | | | |
| | | | | | | 4,539 | |
| | | | | | | | |
| | | | Textiles, Apparel & Luxury Goods — 1.2% | |
| | 13 | | | Michael Kors Holdings Ltd. (a) | | | 554 | |
| | 16 | | | PVH Corp. | | | 1,455 | |
| | | | | | | | |
| | | | | | | 2,009 | |
| | | | | | | | |
| | | | Total Consumer Discretionary | | | 25,038 | |
| | | | | | | | |
| | | | | | | | |
| SHARES | | | SECURITY DESCRIPTION | | VALUE($) | |
| | | | | | | | |
| | | | | | | | |
| | | | Consumer Staples — 5.8% | |
| | | | Food & Staples Retailing — 1.4% | |
| | 20 | | | Sysco Corp. | | | 1,132 | |
| | 19 | | | Wal-Mart Stores, Inc. | | | 1,296 | |
| | | | | | | | |
| | | | | | | 2,428 | |
| | | | | | | | |
| | | | Food Products — 3.0% | |
| | 8 | | | JM Smucker Co. (The) | | | 1,047 | |
| | 71 | | | Pilgrim’s Pride Corp. (j) | | | 1,356 | |
| | 6 | | | Post Holdings, Inc. (a) | | | 472 | |
| | — | (h) | | Seaboard Corp. (a) | | | 692 | |
| | 25 | | | Tyson Foods, Inc., Class A | | | 1,559 | |
| | | | | | | | |
| | | | | | | 5,126 | |
| | | | | | | | |
| | | | Household Products — 0.8% | |
| | 29 | | | Energizer Holdings, Inc. | | | 1,314 | |
| | | | | | | | |
| | | | Personal Products — 0.6% | |
| | 20 | | | Nu Skin Enterprises, Inc., Class A | | | 978 | |
| | | | | | | | |
| | | | Total Consumer Staples | | | 9,846 | |
| | | | | | | | |
| | | | Energy — 3.8% | |
| | | | Energy Equipment & Services — 1.1% | |
| | 7 | | | Baker Hughes, Inc. | | | 460 | |
| | 47 | | | Ensco plc, Class A | | | 453 | |
| | 11 | | | FMC Technologies, Inc. (a) | | | 400 | |
| | 40 | | | Seadrill Ltd., (United Kingdom) (a) (j) | | | 135 | |
| | 23 | | | Superior Energy Services, Inc. (a) | | | 388 | |
| | | | | | | | |
| | | | | | | 1,836 | |
| | | | | | | | |
| | | | Oil, Gas & Consumable Fuels — 2.7% | |
| | 76 | | | Denbury Resources, Inc. (a) | | | 279 | |
| | 28 | | | Devon Energy Corp. | | | 1,301 | |
| | 25 | | | Marathon Oil Corp. | | | 425 | |
| | 5 | | | Tesoro Corp. | | | 414 | |
| | 13 | | | Valero Energy Corp. | | | 909 | |
| | 12 | | | World Fuel Services Corp. (j) | | | 553 | |
| | 46 | | | WPX Energy, Inc. (a) (j) | | | 676 | |
| | | | | | | | |
| | | | | | | 4,557 | |
| | | | | | | | |
| | | | Total Energy | | | 6,393 | |
| | | | | | | | |
| | | | Financials — 2.9% | |
| | | | Banks — 1.1% | |
| | 9 | | | BOK Financial Corp. | | | 782 | |
| | 28 | | | Synovus Financial Corp. | | | 1,132 | |
| | | | | | | | |
| | | | | | | 1,914 | |
| | | | | | | | |
| | | | Capital Markets — 1.3% | |
| | 4 | | | Morgan Stanley | | | 164 | |
SEE NOTES TO FINANCIAL STATEMENTS.
| | | | | | |
| | | |
| 30 | | | | J.P. MORGAN MID CAP/MULTI-CAP FUNDS | | DECEMBER 31, 2016 |
| | | | | | | | |
| SHARES | | | SECURITY DESCRIPTION | | VALUE($) | |
| Long Positions — continued | |
| Common Stocks — continued | |
| | | | Capital Markets — continued | |
| | 20 | | | MSCI, Inc. | | | 1,560 | |
| | 28 | | | NorthStar Asset Management Group, Inc. | | | 411 | |
| | | | | | | | |
| | | | | | | 2,135 | |
| | | | | | | | |
| | | | Consumer Finance — 0.4% | |
| | 36 | | | Navient Corp. | | | 590 | |
| | | | | | | | |
| | | | Thrifts & Mortgage Finance — 0.1% | |
| | 18 | | | MGIC Investment Corp. (a) | | | 182 | |
| | | | | | | | |
| | | | Total Financials | | | 4,821 | |
| | | | | | | | |
| | | | Health Care — 11.8% | |
| | | | Biotechnology — 3.3% | |
| | 11 | | | Amgen, Inc. (j) | | | 1,577 | |
| | 2 | | | Biogen, Inc. (a) | | | 631 | |
| | 21 | | | Gilead Sciences, Inc. (j) | | | 1,539 | |
| | 11 | | | United Therapeutics Corp. (a) | | | 1,622 | |
| | 3 | | | Vertex Pharmaceuticals, Inc. (a) (j) | | | 231 | |
| | | | | | | | |
| | | | | | | 5,600 | |
| | | | | | | | |
| | | | Health Care Equipment & Supplies — 1.9% | |
| | 27 | | | Hill-Rom Holdings, Inc. | | | 1,523 | |
| | 43 | | | Hologic, Inc. (a) (j) | | | 1,722 | |
| | | | | | | | |
| | | | | | | 3,245 | |
| | | | | | | | |
| | | | Health Care Providers & Services — 5.1% | |
| | 7 | | | Aetna, Inc. | | | 850 | |
| | 5 | | | Anthem, Inc. (j) | | | 715 | |
| | 21 | | | Express Scripts Holding Co. (a) (j) | | | 1,470 | |
| | 8 | | | Humana, Inc. | | | 1,668 | |
| | 4 | | | Laboratory Corp. of America Holdings (a) | | | 543 | |
| | 3 | | | McKesson Corp. | | | 393 | |
| | 4 | | | Molina Healthcare, Inc. (a) | | | 237 | |
| | 7 | | | Quest Diagnostics, Inc. | | | 632 | |
| | 3 | | | UnitedHealth Group, Inc. | | | 520 | |
| | 12 | | | WellCare Health Plans, Inc. (a) | | | 1,601 | |
| | | | | | | | |
| | | | | | | 8,629 | |
| | | | | | | | |
| | | | Pharmaceuticals — 1.5% | |
| | 26 | | | Horizon Pharma plc (a) | | | 427 | |
| | 22 | | | Mallinckrodt plc (a) | | | 1,120 | |
| | 28 | | | Pfizer, Inc. (j) | | | 918 | |
| | | | | | | | |
| | | | | | | 2,465 | |
| | | | | | | | |
| | | | Total Health Care | | | 19,939 | |
| | | | | | | | |
| | | | Industrials — 13.6% | |
| | | | Aerospace & Defense — 1.4% | |
| | 16 | | | Curtiss-Wright Corp. | | | 1,564 | |
| | | | | | | | |
| SHARES | | | SECURITY DESCRIPTION | | VALUE($) | |
| | | | | | | | |
| | | | | | | | |
| | | | Aerospace & Defense — continued | |
| | 5 | | | L-3 Communications Holdings, Inc. | | | 726 | |
| | | | | | | | |
| | | | | | | 2,290 | |
| | | | | | | | |
| | | | Airlines — 1.3% | |
| | 6 | | | Copa Holdings SA, (Panama), Class A | | | 502 | |
| | 20 | | | Delta Air Lines, Inc. (j) | | | 1,001 | |
| | 10 | | | United Continental Holdings, Inc. (a) | | | 714 | |
| | | | | | | | |
| | | | | | | 2,217 | |
| | | | | | | | |
| | | | Commercial Services & Supplies — 0.8% | |
| | 88 | | | Pitney Bowes, Inc. | | | 1,340 | |
| | | | | | | | |
| | | | Construction & Engineering — 2.3% | |
| | 28 | | | Chicago Bridge & Iron Co. NV | | | 903 | |
| | 27 | | | Jacobs Engineering Group, Inc. (a) | | | 1,562 | |
| | 43 | | | Quanta Services, Inc. (a) | | | 1,489 | |
| | | | | | | | |
| | | | | | | 3,954 | |
| | | | | | | | |
| | | | Electrical Equipment — 1.9% | |
| | 21 | | | EnerSys | | | 1,607 | |
| | 23 | | | Regal Beloit Corp. | | | 1,608 | |
| | | | | | | | |
| | | | | | | 3,215 | |
| | | | | | | | |
| | | | Machinery — 1.9% | |
| | 49 | | | Allison Transmission Holdings, Inc. (j) | | | 1,652 | |
| | 11 | | | Parker-Hannifin Corp. | | | 1,540 | |
| | | | | | | | |
| | | | | | | 3,192 | |
| | | | | | | | |
| | | | Professional Services — 0.9% | |
| | 6 | | | Dun & Bradstreet Corp. (The) | | | 749 | |
| | 9 | | | ManpowerGroup, Inc. | | | 842 | |
| | | | | | | | |
| | | | | | | 1,591 | |
| | | | | | | | |
| | | | Road & Rail — 1.2% | |
| | 19 | | | Landstar System, Inc. | | | 1,610 | |
| | 17 | | | Swift Transportation Co. (a) | | | 420 | |
| | | | | | | | |
| | | | | | | 2,030 | |
| | | | | | | | |
| | | | Trading Companies & Distributors — 1.9% | |
| | 15 | | | United Rentals, Inc. (a) (j) | | | 1,623 | |
| | 23 | | | WESCO International, Inc. (a) | | | 1,503 | |
| | | | | | | | |
| | | | | | | 3,126 | |
| | | | | | | | |
| | | | Total Industrials | | | 22,955 | |
| | | | | | | | |
| | | | Information Technology — 24.6% | |
| | | | Communications Equipment — 1.2% | |
| | 33 | | | Cisco Systems, Inc. (j) | | | 986 | |
| | 7 | | | F5 Networks, Inc. (a) | | | 1,067 | |
| | | | | | | | |
| | | | | | | 2,053 | |
| | | | | | | | |
SEE NOTES TO FINANCIAL STATEMENTS.
| | | | | | | | |
| | | |
| DECEMBER 31, 2016 | | J.P. MORGAN MID CAP/MULTI-CAP FUNDS | | | | | 31 | |
JPMorgan Multi-Cap Market Neutral Fund
SCHEDULE OF PORTFOLIO INVESTMENTS
AS OF DECEMBER 31, 2016 (Unaudited) (continued)
(Amounts in thousands)
| | | | | | | | |
| SHARES | | | SECURITY DESCRIPTION | | VALUE($) | |
| Long Positions — continued | |
| Common Stocks — continued | |
| | | | Electronic Equipment, Instruments & Components — 0.7% | |
| | 50 | | | Corning, Inc. (j) | | | 1,221 | |
| | | | | | | | |
| | | | Internet Software & Services — 2.3% | |
| | 58 | | | eBay, Inc. (a) (j) | | | 1,715 | |
| | 14 | | | InterActiveCorp (a) | | | 915 | |
| | 5 | | | j2 Global, Inc. | | | 368 | |
| | 11 | | | VeriSign, Inc. (a) (j) | | | 829 | |
| | | | | | | | |
| | | | | | | 3,827 | |
| | | | | | | | |
| | | | IT Services — 5.0% | |
| | 16 | | | Computer Sciences Corp. (j) | | | 940 | |
| | 4 | | | DST Systems, Inc. | | | 466 | |
| | 91 | | | First Data Corp., Class A (a) | | | 1,298 | |
| | 9 | | | International Business Machines Corp. | | | 1,531 | |
| | 5 | | | Science Applications International Corp. | | | 413 | |
| | 60 | | | Teradata Corp. (a) | | | 1,630 | |
| | 9 | | | Vantiv, Inc., Class A (a) | | | 543 | |
| | 77 | | | Western Union Co. (The) | | | 1,680 | |
| | | | | | | | |
| | | | | | | 8,501 | |
| | | | | | | | |
| | | | Semiconductors & Semiconductor Equipment — 3.9% | |
| | 18 | | | Applied Materials, Inc. | | | 593 | |
| | 16 | | | Lam Research Corp. | | | 1,737 | |
| | 38 | | | Marvell Technology Group Ltd., (Bermuda) | | | 530 | |
| | 28 | | | ON Semiconductor Corp. (a) | | | 356 | |
| | 27 | | | QUALCOMM, Inc. | | | 1,764 | |
| | 61 | | | Teradyne, Inc. | | | 1,552 | |
| | | | | | | | |
| | | | | | | 6,532 | |
| | | | | | | | |
| | | | Software — 8.0% | |
| | 26 | | | Activision Blizzard, Inc. | | | 927 | |
| | 52 | | | CA, Inc. | | | 1,643 | |
| | 60 | | | Cadence Design Systems, Inc. (a) | | | 1,516 | |
| | 18 | | | Citrix Systems, Inc. (a) (j) | | | 1,619 | |
| | 27 | | | Microsoft Corp. (j) | | | 1,693 | |
| | 107 | | | Nuance Communications, Inc. (a) (j) | | | 1,589 | |
| | 64 | | | Symantec Corp. | | | 1,529 | |
| | 11 | | | Synopsys, Inc. (a) | | | 648 | |
| | 16 | | | Take-Two Interactive Software, Inc. (a) | | | 775 | |
| | 20 | | �� | VMware, Inc., Class A (a) | | | 1,606 | |
| | | | | | | | |
| | | | | | | 13,545 | |
| | | | | | | | |
| | | | Technology Hardware, Storage & Peripherals — 3.5% | |
| | 7 | | | Apple, Inc. (j) | | | 782 | |
| | 101 | | | HP, Inc. | | | 1,500 | |
| | 51 | | | NCR Corp. (a) | | | 2,078 | |
| | | | | | | | |
| SHARES | | | SECURITY DESCRIPTION | | VALUE($) | |
| | | | | | | | |
| | | | | | | | |
| | | | Technology Hardware, Storage & Peripherals — continued | |
| | 44 | | | NetApp, Inc. | | | 1,547 | |
| | | | | | | | |
| | | | | | | 5,907 | |
| | | | | | | | |
| | | | Total Information Technology | | | 41,586 | |
| | | | | | | | |
| | | | Materials — 4.4% | |
| | | | Chemicals — 1.6% | |
| | 30 | | | Cabot Corp. (j) | | | 1,526 | |
| | 42 | | | Huntsman Corp. | | | 798 | |
| | 4 | | | LyondellBasell Industries NV, Class A | | | 371 | |
| | | | | | | | |
| | | | | | | 2,695 | |
| | | | | | | | |
| | | | Containers & Packaging — 1.2% | |
| | 7 | | | Berry Plastics Group, Inc. (a) | | | 319 | |
| | 8 | | | International Paper Co. | | | 415 | |
| | 5 | | | Packaging Corp. of America | | | 386 | |
| | 17 | | | WestRock Co. | | | 839 | |
| | | | | | | | |
| | | | | | | 1,959 | |
| | | | | | | | |
| | | | Metals & Mining — 1.6% | |
| | 12 | | | Reliance Steel & Aluminum Co. | | | 974 | |
| | 47 | | | Steel Dynamics, Inc. | | | 1,655 | |
| | 4 | | | United States Steel Corp. | | | 146 | |
| | | | | | | | |
| | | | | | | 2,775 | |
| | | | | | | | |
| | | | Total Materials | | | 7,429 | |
| | | | | | | | |
| | | | Real Estate — 2.1% | |
| | | | Equity Real Estate Investment Trusts (REITs) — 2.1% | |
| | 38 | | | American Homes 4 Rent, Class A | | | 790 | |
| | 22 | | | DuPont Fabros Technology, Inc. | | | 973 | |
| | 18 | | | Equity Commonwealth (a) | | | 547 | |
| | 141 | | | VEREIT, Inc. | | | 1,191 | |
| | | | | | | | |
| | | | Total Real Estate | | | 3,501 | |
| | | | | | | | |
| | | | Telecommunication Services — 1.0% | |
| | | | Diversified Telecommunication Services — 0.8% | |
| | 15 | | | CenturyLink, Inc. | | | 363 | |
| | 18 | | | Verizon Communications, Inc. | | | 963 | |
| | | | | | | | |
| | | | | | | 1,326 | |
| | | | | | | | |
| | | | Wireless Telecommunication Services — 0.2% | |
| | 34 | | | Sprint Corp. (a) | | | 290 | |
| | | | | | | | |
| | | | Total Telecommunication Services | | | 1,616 | |
| | | | | | | | |
| | | | Utilities — 3.7% | |
| | | | Gas Utilities — 0.7% | |
| | 25 | | | UGI Corp. (j) | | | 1,172 | |
| | | | | | | | |
SEE NOTES TO FINANCIAL STATEMENTS.
| | | | | | |
| | | |
| 32 | | | | J.P. MORGAN MID CAP/MULTI-CAP FUNDS | | DECEMBER 31, 2016 |
| | | | | | | | |
| SHARES | | | SECURITY DESCRIPTION | | VALUE($) | |
| Long Positions — continued | |
| Common Stocks — continued | |
| | | | Independent Power & Renewable Electricity Producers — 1.7% | |
| | 134 | | | AES Corp. | | | 1,553 | |
| | 103 | | | NRG Energy, Inc. | | | 1,260 | |
| | | | | | | | |
| | | | | | | 2,813 | |
| | | | | | | | |
| | | | Multi-Utilities — 1.3% | |
| | 31 | | | CenterPoint Energy, Inc. | | | 760 | |
| | 51 | | | MDU Resources Group, Inc. | | | 1,479 | |
| | | | | | | | |
| | | | | | | 2,239 | |
| | | | | | | | |
| | | | Total Utilities | | | 6,224 | |
| | | | | | | | |
| | | | Total Common Stocks
(Cost $131,393) | | | 149,348 | |
| | | | | | | | |
| Short-Term Investment — 14.1% | |
| | | | Investment Company — 14.1% | |
| | 23,704 | | | JPMorgan U.S. Government Money Market Fund, Institutional Class Shares, 0.410% (b) (l)
(Cost $23,704) | | | 23,704 | |
| | | | | | | | |
| | | | Total Investments, Before Short Positions — 102.6%
(Cost $155,097) | | | 173,052 | |
| | | | Liabilities in Excess of
Other Assets — (2.6)% | | | (4,371 | ) |
| | | | | | | | |
| | | | NET ASSETS — 100.0% | | $ | 168,681 | |
| | | | | | | | |
| Short Positions — 88.2% | |
| Common Stocks — 88.2% | |
| | | | Consumer Discretionary — 16.3% | |
| | | | Automobiles — 1.1% | |
| | 9 | | | Tesla Motors, Inc. (a) | | | 1,816 | |
| | | | | | | | |
| | | | Diversified Consumer Services — 1.6% | |
| | 69 | | | H&R Block, Inc. | | | 1,586 | |
| | 32 | | | ServiceMaster Global Holdings, Inc. (a) | | | 1,204 | |
| | | | | | | | |
| | | | | | | 2,790 | |
| | | | | | | | |
| | | | Hotels, Restaurants & Leisure — 3.9% | |
| | 4 | | | Chipotle Mexican Grill, Inc. (a) | | | 1,500 | |
| | 11 | | | Marriott International, Inc., Class A | | | 901 | |
| | 39 | | | Norwegian Cruise Line Holdings Ltd. (a) | | | 1,655 | |
| | 13 | | | Royal Caribbean Cruises Ltd. | | | 1,095 | |
| | 13 | | | Texas Roadhouse, Inc. | | | 630 | |
| | 9 | | | Wynn Resorts Ltd. | | | 746 | |
| | | | | | | | |
| | | | | | | 6,527 | |
| | | | | | | | |
| | | | Household Durables — 0.7% | |
| | 27 | | | Newell Brands, Inc. | | | 1,207 | |
| | | | | | | | |
| | | | | | | | |
| SHARES | | | SECURITY DESCRIPTION | | VALUE($) | |
| | | | | | | | |
| | | | | | | | |
| | | | Internet & Direct Marketing Retail — 2.1% | |
| | 54 | | | Liberty Interactive Corp. QVC Group, Class A (a) | | | 1,078 | |
| | 8 | | | Netflix, Inc. (a) | | | 969 | |
| | 7 | | | TripAdvisor, Inc. (a) | | | 336 | |
| | 33 | | | Wayfair, Inc., Class A (a) | | | 1,157 | |
| | | | | | | | |
| | | | | | | 3,540 | |
| | | | | | | | |
| | | | Leisure Products — 0.2% | |
| | 5 | | | Polaris Industries, Inc. | | | 373 | |
| | | | | | | | |
| | | | Media — 2.0% | |
| | 8 | | | AMC Entertainment Holdings, Inc., Class A | | | 282 | |
| | 5 | | | Charter Communications, Inc., Class A (a) | | | 1,472 | |
| | 31 | | | Lions Gate Entertainment Corp., Class A | | | 845 | |
| | 31 | | | Lions Gate Entertainment Corp., Class B (a) | | | 771 | |
| | | | | | | | |
| | | | | | | 3,370 | |
| | | | | | | | |
| | | | Specialty Retail — 2.6% | |
| | 16 | | | CarMax, Inc. (a) | | | 1,013 | |
| | 20 | | | L Brands, Inc. | | | 1,292 | |
| | 4 | | | Signet Jewelers Ltd. | | | 386 | |
| | 8 | | | TJX Cos., Inc. (The) | | | 603 | |
| | 14 | | | Tractor Supply Co. | | | 1,051 | |
| | | | | | | | |
| | | | | | | 4,345 | |
| | | | | | | | |
| | | | Textiles, Apparel & Luxury Goods — 2.1% | |
| | 32 | | | NIKE, Inc., Class B | | | 1,633 | |
| | 45 | | | Under Armour, Inc., Class A (a) | | | 1,316 | |
| | 11 | | | VF Corp. | | | 581 | |
| | | | | | | | |
| | | | | | | 3,530 | |
| | | | | | | | |
| | | | Total Consumer Discretionary | | | 27,498 | |
| | | | | | | | |
| | | | Consumer Staples — 4.7% | |
| | | | Beverages — 1.6% | |
| | 22 | | | Brown-Forman Corp., Class B | | | 1,010 | |
| | 11 | | | Constellation Brands, Inc., Class A | | | 1,690 | |
| | | | | | | | |
| | | | | | | 2,700 | |
| | | | | | | | |
| | | | Food & Staples Retailing — 0.9% | |
| | 10 | | | Costco Wholesale Corp. | | | 1,577 | |
| | | | | | | | |
| | | | Food Products — 1.3% | |
| | 6 | | | Kraft Heinz Co. (The) | | | 539 | |
| | 41 | | | Snyder’s-Lance, Inc. | | | 1,565 | |
| | | | | | | | |
| | | | | | | 2,104 | |
| | | | | | | | |
| | | | Personal Products — 0.9% | |
| | 66 | | | Coty, Inc., Class A | | | 1,209 | |
SEE NOTES TO FINANCIAL STATEMENTS.
| | | | | | | | |
| | | |
| DECEMBER 31, 2016 | | J.P. MORGAN MID CAP/MULTI-CAP FUNDS | | | | | 33 | |
JPMorgan Multi-Cap Market Neutral Fund
SCHEDULE OF PORTFOLIO INVESTMENTS
AS OF DECEMBER 31, 2016 (Unaudited) (continued)
(Amounts in thousands)
| | | | | | | | |
| SHARES | | | SECURITY DESCRIPTION | | VALUE($) | |
| Short Positions — continued | |
| Common Stocks — continued | |
| | | | Personal Products — continued | |
| | 5 | | | Estee Lauder Cos., Inc. (The), Class A | | | 360 | |
| | | | | | | | |
| | | | | | | 1,569 | |
| | | | | | | | |
| | | | Total Consumer Staples | | | 7,950 | |
| | | | | | | | |
| | | | Energy — 2.9% | |
| | | | Oil, Gas & Consumable Fuels — 2.9% | |
| | 20 | | | Chevron Corp. | | | 2,378 | |
| | 22 | | | EQT Corp. | | | 1,411 | |
| | 52 | | | Kosmos Energy Ltd. (a) | | | 366 | |
| | 9 | | | Phillips 66 | | | 747 | |
| | | | | | | | |
| | | | Total Energy | | | 4,902 | |
| | | | | | | | |
| | | | Financials — 3.1% | |
| | | | Banks — 1.4% | |
| | 122 | | | People’s United Financial, Inc. | | | 2,354 | |
| | | | | | | | |
| | | | Capital Markets — 0.9% | |
| | 15 | | | Artisan Partners Asset Management, Inc., Class A | | | 451 | |
| | 7 | | | Franklin Resources, Inc. | | | 279 | |
| | 21 | | | Interactive Brokers Group, Inc., Class A | | | 748 | |
| | | | | | | | |
| | | | | | | 1,478 | |
| | | | | | | | |
| | | | Consumer Finance — 0.2% | |
| | 16 | | | OneMain Holdings, Inc. (a) | | | 345 | |
| | | | | | | | |
| | | | Insurance — 0.6% | |
| | 1 | | | Markel Corp. (a) | | | 995 | |
| | | | | | | | |
| | | | Total Financials | | | 5,172 | |
| | | | | | | | |
| | | | Health Care — 10.0% | |
| | | | Biotechnology — 1.8% | |
| | 13 | | | ACADIA Pharmaceuticals, Inc. (a) | | | 362 | |
| | 5 | | | Alnylam Pharmaceuticals, Inc. (a) | | | 199 | |
| | 4 | | | BioMarin Pharmaceutical, Inc. (a) | | | 307 | |
| | 5 | | | Bluebird Bio, Inc. (a) | | | 327 | |
| | 2 | | | Intercept Pharmaceuticals, Inc. (a) | | | 217 | |
| | 12 | | | Juno Therapeutics, Inc. (a) | | | 229 | |
| | 39 | | | OPKO Health, Inc. (a) | | | 360 | |
| | 5 | | | Puma Biotechnology, Inc. (a) | | | 146 | |
| | 1 | | | Regeneron Pharmaceuticals, Inc. (a) | | | 532 | |
| | 6 | | | Seattle Genetics, Inc. (a) | | | 336 | |
| | | | | | | | |
| | | | | | | 3,015 | |
| | | | | | | | |
| | | | Health Care Equipment & Supplies — 1.6% | |
| | 27 | | | DENTSPLY SIRONA, Inc. | | | 1,530 | |
| | 20 | | | DexCom, Inc. (a) | | | 1,212 | |
| | | | | | | | |
| | | | | | | 2,742 | |
| | | | | | | | |
| | | | | | | | |
| SHARES | | | SECURITY DESCRIPTION | | VALUE($) | |
| | | | | | | | |
| | | | | | | | |
| | | | Health Care Providers & Services — 3.9% | |
| | 45 | | | Acadia Healthcare Co., Inc. (a) | | | 1,475 | |
| | 10 | | | Centene Corp. (a) | | | 541 | |
| | 26 | | | Envision Healthcare Corp. (a) | | | 1,642 | |
| | 7 | | | Henry Schein, Inc. (a) | | | 1,009 | |
| | 6 | | | LifePoint Health, Inc. (a) | | | 352 | |
| | 34 | | | Team Health Holdings, Inc. (a) | | | 1,491 | |
| | | | | | | | |
| | | | | | | 6,510 | |
| | | | | | | | |
| | | | Health Care Technology — 0.1% | |
| | 19 | | | Inovalon Holdings, Inc., Class A (a) | | | 197 | |
| | | | | | | | |
| | | | Pharmaceuticals — 2.6% | |
| | 11 | | | Bristol-Myers Squibb Co. | | | 643 | |
| | 58 | | | Catalent, Inc. (a) | | | 1,571 | |
| | 4 | | | Perrigo Co. plc | | | 364 | |
| | 34 | | | Zoetis, Inc. | | | 1,808 | |
| | | | | | | | |
| | | | | | | 4,386 | |
| | | | | | | | |
| | | | Total Health Care | | | 16,850 | |
| | | | | | | | |
| | | | Industrials — 15.1% | |
| | | | Aerospace & Defense — 2.7% | |
| | 13 | | | Arconic, Inc. | | | 246 | |
| | 33 | | | Hexcel Corp. | | | 1,692 | |
| | 19 | | | Orbital ATK, Inc. | | | 1,674 | |
| | 4 | | | TransDigm Group, Inc. | | | 965 | |
| | | | | | | | |
| | | | | | | 4,577 | |
| | | | | | | | |
| | | | Airlines — 1.0% | |
| | 30 | | | Spirit Airlines, Inc. (a) | | | 1,717 | |
| | | | | | | | |
| | | | Building Products — 1.3% | |
| | 39 | | | Armstrong World Industries, Inc. (a) | | | 1,630 | |
| | 11 | | | Fortune Brands Home & Security, Inc. | | | 612 | |
| | | | | | | | |
| | | | | | | 2,242 | |
| | | | | | | | |
| | | | Commercial Services & Supplies — 1.9% | |
| | 108 | | | Covanta Holding Corp. | | | 1,679 | |
| | 31 | | | Rollins, Inc. | | | 1,052 | |
| | 6 | | | Stericycle, Inc. (a) | | | 458 | |
| | | | | | | | |
| | | | | | | 3,189 | |
| | | | | | | | |
| | | | Electrical Equipment — 0.9% | |
| | 6 | | | Acuity Brands, Inc. | | | 1,426 | |
| | | | | | | | |
| | | | Industrial Conglomerates — 0.5% | |
| | 26 | | | General Electric Co. | | | 811 | |
| | | | | | | | |
| | | | Machinery — 3.0% | |
| | 42 | | | ITT, Inc. | | | 1,611 | |
| | 7 | | | Middleby Corp. (The) (a) | | | 921 | |
SEE NOTES TO FINANCIAL STATEMENTS.
| | | | | | |
| | | |
| 34 | | | | J.P. MORGAN MID CAP/MULTI-CAP FUNDS | | DECEMBER 31, 2016 |
| | | | | | | | |
| SHARES | | | SECURITY DESCRIPTION | | VALUE($) | |
| Short Positions — continued | |
| Common Stocks — continued | |
| | | | Machinery — continued | |
| | 10 | | | Snap-on, Inc. | | | 1,648 | |
| | 33 | | | Trinity Industries, Inc. | | | 911 | |
| | | | | | | | |
| | | | | | | 5,091 | |
| | | | | | | | |
| | | | Marine — 0.2% | |
| | 5 | | | Kirby Corp. (a) | | | 359 | |
| | | | | | | | |
| | | | Road & Rail — 2.1% | |
| | 5 | | | AMERCO | | | 1,802 | |
| | 12 | | | Genesee & Wyoming, Inc., Class A (a) | | | 819 | |
| | 6 | | | Old Dominion Freight Line, Inc. (a) | | | 532 | |
| | 5 | | | Ryder System, Inc. | | | 409 | |
| | | | | | | | |
| | | | | | | 3,562 | |
| | | | | | | | |
| | | | Trading Companies & Distributors — 1.5% | |
| | 35 | | | Fastenal Co. | | | 1,647 | |
| | 4 | | | WW Grainger, Inc. | | | 912 | |
| | | | | | | | |
| | | | | | | 2,559 | |
| | | | | | | | |
| | | | Total Industrials | | | 25,533 | |
| | | | | | | | |
| | | | Information Technology — 25.5% | |
| | | | Communications Equipment — 1.1% | |
| | 6 | | | EchoStar Corp., Class A (a) | | | 313 | |
| | 23 | | | ViaSat, Inc. (a) | | | 1,520 | |
| | | | | | | | |
| | | | | | | 1,833 | |
| | | | | | | | |
| | | | Electronic Equipment, Instruments & Components — 5.0% | |
| | 26 | | | Amphenol Corp., Class A | | | 1,774 | |
| | 37 | | | CDW Corp. | | | 1,922 | |
| | 60 | | | Fitbit, Inc., Class A (a) | | | 437 | |
| | 22 | | | Keysight Technologies, Inc. (a) | | | 796 | |
| | 6 | | | Littelfuse, Inc. | | | 915 | |
| | 63 | | | National Instruments Corp. | | | 1,929 | |
| | 36 | | | VeriFone Systems, Inc. (a) | | | 641 | |
| | | | | | | | |
| | | | | | | 8,414 | |
| | | | | | | | |
| | | | Internet Software & Services — 1.7% | |
| | 2 | | | CoStar Group, Inc. (a) | | | 306 | |
| | 5 | | | Facebook, Inc., Class A (a) | | | 564 | |
| | 134 | | | Pandora Media, Inc. (a) | | | 1,744 | |
| | 8 | | | Zillow Group, Inc., Class C (a) | | | 284 | |
| | | | | | | | |
| | | | | | | 2,898 | |
| | | | | | | | |
| | | | IT Services — 6.3% | |
| | 18 | | | Broadridge Financial Solutions, Inc. | | | 1,172 | |
| | 26 | | | EPAM Systems, Inc. (a) | | | 1,698 | |
| | 21 | | | Fidelity National Information Services, Inc. | | | 1,622 | |
| | 22 | | | Genpact Ltd. (a) | | | 527 | |
| | | | | | | | |
| SHARES | | | SECURITY DESCRIPTION | | VALUE($) | |
| | | | | | | | |
| | | | | | | | |
| | | | IT Services — continued | |
| | 11 | | | Global Payments, Inc. | | | 772 | |
| | 9 | | | Jack Henry & Associates, Inc. | | | 806 | |
| | 30 | | | MAXIMUS, Inc. | | | 1,656 | |
| | 13 | | | Paychex, Inc. | | | 764 | |
| | 65 | | | Sabre Corp. | | | 1,611 | |
| | | | | | | | |
| | | | | | | 10,628 | |
| | | | | | | | |
| | | | Semiconductors & Semiconductor Equipment — 4.8% | |
| | 76 | | | Advanced Micro Devices, Inc. (a) | | | 858 | |
| | 28 | | | Cavium, Inc. (a) | | | 1,769 | |
| | 50 | | | First Solar, Inc. (a) | | | 1,620 | |
| | 38 | | | Micron Technology, Inc. (a) | | | 838 | |
| | 35 | | | Microsemi Corp. (a) | | | 1,908 | |
| | 11 | | | Monolithic Power Systems, Inc. | | | 930 | |
| | 4 | | | Versum Materials, Inc. (a) | | | 98 | |
| | | | | | | | |
| | | | | | | 8,021 | |
| | | | | | | | |
| | | | Software — 6.6% | |
| | 5 | | | Autodesk, Inc. (a) | | | 346 | |
| | 15 | | | Blackbaud, Inc. | | | 960 | |
| | 15 | | | Ellie Mae, Inc. (a) | | | 1,261 | |
| | 80 | | | FireEye, Inc. (a) | | | 949 | |
| | 30 | | | Guidewire Software, Inc. (a) | | | 1,474 | |
| | 16 | | | salesforce.com, Inc. (a) | | | 1,082 | |
| | 44 | | | SS&C Technologies Holdings, Inc. | | | 1,263 | |
| | 10 | | | Tyler Technologies, Inc. (a) | | | 1,481 | |
| | 8 | | | Ultimate Software Group, Inc. (The) (a) | | | 1,445 | |
| | 14 | | | Workday, Inc., Class A (a) | | | 907 | |
| | | | | | | | |
| | | | | | | 11,168 | |
| | | | | | | | |
| | | | Total Information Technology | | | 42,962 | |
| | | | | | | | |
| | | | Materials — 5.0% | |
| | | | Chemicals — 2.0% | |
| | 5 | | | Air Products & Chemicals, Inc. | | | 750 | |
| | 52 | | | CF Industries Holdings, Inc. | | | 1,634 | |
| | 8 | | | Praxair, Inc. | | | 957 | |
| | | | | | | | |
| | | | | | | 3,341 | |
| | | | | | | | |
| | | | Containers & Packaging — 0.9% | |
| | 21 | | | Ball Corp. | | | 1,586 | |
| | | | | | | | |
| | | | Metals & Mining — 2.1% | |
| | – | (h) | | Alcoa Corp. | | | — | (h) |
| | 19 | | | Compass Minerals International, Inc. | | | 1,492 | |
| | 48 | | | Southern Copper Corp., (Peru) | | | 1,537 | |
SEE NOTES TO FINANCIAL STATEMENTS.
| | | | | | | | |
| | | |
| DECEMBER 31, 2016 | | J.P. MORGAN MID CAP/MULTI-CAP FUNDS | | | | | 35 | |
JPMorgan Multi-Cap Market Neutral Fund
SCHEDULE OF PORTFOLIO INVESTMENTS
AS OF DECEMBER 31, 2016 (Unaudited) (continued)
(Amounts in thousands, except number of Futures contracts)
| | | | | | | | |
| SHARES | | | SECURITY DESCRIPTION | | VALUE($) | |
| Short Positions — continued | |
| Common Stocks — continued | |
| | | | Metals & Mining — continued | |
| | 52 | | | Tahoe Resources, Inc. | | | 491 | |
| | | | | | | | |
| | | | | | | 3,520 | |
| | | | | | | | |
| | | | Total Materials | | | 8,447 | |
| | | | | | | | |
| | | | Real Estate — 1.9% | |
| | | | Equity Real Estate Investment Trusts (REITs) — 0.9% | |
| | 17 | | | Life Storage, Inc. | | | 1,426 | |
| | | | | | | | |
| | | | Real Estate Management & Development — 1.0% | |
| | 38 | | | CBRE Group, Inc., Class A (a) | | | 1,193 | |
| | 5 | | | Jones Lang LaSalle, Inc. | | | 553 | |
| | | | | | | | |
| | | | | | | 1,746 | |
| | | | | | | | |
| | | | Total Real Estate | | | 3,172 | |
| | | | | | | | |
| | | | Telecommunication Services — 1.3% | |
| | | | Diversified Telecommunication Services — 0.9% | |
| | 438 | | | Frontier Communications Corp. | | | 1,482 | |
| | | | | | | | |
| | | | | | | | |
| SHARES | | | SECURITY DESCRIPTION | | VALUE($) | |
| | | | | | | | |
| | | | | | | | |
| | | | Wireless Telecommunication Services — 0.4% | |
| | 25 | | | Telephone & Data Systems, Inc. | | | 716 | |
| | | | | | | | |
| | | | Total Telecommunication Services | | | 2,198 | |
| | | | | | | | |
| | | | Utilities — 2.4% | |
| | | | Gas Utilities — 0.4% | |
| | 9 | | | Atmos Energy Corp. | | | 642 | |
| | | | | | | | |
| | | | Multi-Utilities — 2.0% | |
| | 24 | | | Dominion Resources, Inc. | | | 1,803 | |
| | 15 | | | Sempra Energy | | | 1,550 | |
| | | | | | | | |
| | | | | | | 3,353 | |
| | | | | | | | |
| | | | Total Utilities | | | 3,995 | |
| | | | | | | | |
| | | | Total Securities Sold Short
(Proceeds $146,326) | | | $148,679 | |
| | | | | | | | |
Percentages indicated are based on net assets.
| | | | | | | | | | | | | | | | | | | | |
| Futures Contracts | |
NUMBER OF
CONTRACTS | | | DESCRIPTION | | EXPIRATION
DATE | | | TRADING
CURRENCY | | | NOTIONAL
VALUE AT
DECEMBER 31, 2016 | | | NET UNREALIZED
APPRECIATION
(DEPRECIATION) | |
| | | | Short Futures Outstanding | |
| | (2 | ) | | E-mini S&P 500 | | | 03/17/17 | | | | USD | | | $ | (223 | ) | | $ | — | (h) |
| | (3 | ) | | S&P Mid Cap 400 | | | 03/17/17 | | | | USD | | | | (498 | ) | | | 11 | |
| | | | | | | | | | | | | | | | | | | | |
| | | | $ | 11 | |
| | | | | | | | | | | | | | | | | | | | |
SEE NOTES TO FINANCIAL STATEMENTS.
| | | | | | |
| | | |
| 36 | | | | J.P. MORGAN MID CAP/MULTI-CAP FUNDS | | DECEMBER 31, 2016 |
JPMorgan Value Advantage Fund
SCHEDULE OF PORTFOLIO INVESTMENTS
AS OF DECEMBER 31, 2016 (Unaudited)
(Amounts in thousands)
| | | | | | | | |
| SHARES | | | SECURITY DESCRIPTION | | VALUE($) | |
| Common Stocks — 98.5% | |
| | | | Consumer Discretionary — 15.1% | |
| | | | Distributors — 1.0% | |
| | 1,144 | | | Genuine Parts Co. | | | 109,259 | |
| | | | | | | | |
| | | | Hotels, Restaurants & Leisure — 1.9% | |
| | 880 | | | Brinker International, Inc. | | | 43,576 | |
| | 3,486 | | | Hilton Worldwide Holdings, Inc. | | | 94,819 | |
| | 2,933 | | | La Quinta Holdings, Inc. (a) | | | 41,678 | |
| | 890 | | | Red Rock Resorts, Inc., Class A | | | 20,637 | |
| | | | | | | | |
| | | | | | | 200,710 | |
| | | | | | | | |
| | | | Household Durables — 0.4% | |
| | 1,045 | | | Newell Brands, Inc. | | | 46,681 | |
| | | | | | | | |
| | | | Internet & Direct Marketing Retail — 0.7% | |
| | 681 | | | Expedia, Inc. | | | 77,166 | |
| | | | | | | | |
| | | | Media — 5.3% | |
| | 1,293 | | | CBS Corp. (Non-Voting), Class B | | | 82,254 | |
| | 316 | | | Charter Communications, Inc., Class A (a) | | | 91,094 | |
| | 3,835 | | | Clear Channel Outdoor Holdings, Inc., Class A | | | 19,369 | |
| | 2,466 | | | DISH Network Corp., Class A (a) | | | 142,862 | |
| | 2,648 | | | Entercom Communications Corp., Class A | | | 40,511 | |
| | 2,982 | | | Media General, Inc. (a) | | | 56,147 | |
| | 598 | | | Nexstar Broadcasting Group, Inc., Class A | | | 37,854 | |
| | 1,127 | | | Sinclair Broadcast Group, Inc., Class A | | | 37,592 | |
| | 605 | | | Time Warner, Inc. | | | 58,382 | |
| | | | | | | | |
| | | | | | | 566,065 | |
| | | | | | | | |
| | | | Multiline Retail — 0.8% | |
| | 1,722 | | | Kohl’s Corp. | | | 85,008 | |
| | | | | | | | |
| | | | Specialty Retail — 4.0% | |
| | 96 | | | AutoZone, Inc. (a) | | | 76,072 | |
| | 1,426 | | | Bed Bath & Beyond, Inc. | | | 57,965 | |
| | 1,632 | | | Best Buy Co., Inc. | | | 69,617 | |
| | 2,038 | | | Gap, Inc. (The) | | | 45,735 | |
| | 612 | | | Home Depot, Inc. (The) | | | 82,005 | |
| | 1,239 | | | Tiffany & Co. | | | 95,928 | |
| | | | | | | | |
| | | | | | | 427,322 | |
| | | | | | | | |
| | | | Textiles, Apparel & Luxury Goods — 1.0% | |
| | 940 | | | Columbia Sportswear Co. | | | 54,796 | |
| | 2,230 | | | Hanesbrands, Inc. | | | 48,106 | |
| | | | | | | | |
| | | | | | | 102,902 | |
| | | | | | | | |
| | | | Total Consumer Discretionary | | | 1,615,113 | |
| | | | | | | | |
| | | | Consumer Staples — 6.0% | |
| | | | Beverages — 1.0% | |
| | 798 | | | Dr Pepper Snapple Group, Inc. | | | 72,325 | |
| | 396 | | | Molson Coors Brewing Co., Class B | | | 38,505 | |
| | | | | | | | |
| | | | | | | 110,830 | |
| | | | | | | | |
| | | | | | | | |
| SHARES | | | SECURITY DESCRIPTION | | VALUE($) | |
| | | | | | | | |
| | | | Food & Staples Retailing — 1.6% | |
| | 1,291 | | | CVS Health Corp. | | | 101,834 | |
| | 2,047 | | | Kroger Co. (The) | | | 70,642 | |
| | | | | | | | |
| | | | | | | 172,476 | |
| | | | | | | | |
| | | | Food Products — 1.5% | |
| | 639 | | | Amplify Snack Brands, Inc. (a) | | | 5,628 | |
| | 958 | | | Post Holdings, Inc. (a) | | | 77,031 | |
| | 1,057 | | | TreeHouse Foods, Inc. (a) | | | 76,339 | |
| | | | | | | | |
| | | | | | | 158,998 | |
| | | | | | | | |
| | | | Household Products — 1.4% | |
| | 829 | | | Energizer Holdings, Inc. | | | 36,997 | |
| | 1,285 | | | Procter & Gamble Co. (The) | | | 108,044 | |
| | | | | | | | |
| | | | | | | 145,041 | |
| | | | | | | | |
| | | | Personal Products — 0.5% | |
| | 2,616 | | | Coty, Inc., Class A | | | 47,899 | |
| | | | | | | | |
| | | | Total Consumer Staples | | | 635,244 | |
| | | | | | | | |
| | | | Energy — 7.2% | |
| | | | Oil, Gas & Consumable Fuels — 7.2% | |
| | 1,813 | | | ConocoPhillips | | | 90,899 | |
| | 1,227 | | | EQT Corp. | | | 80,254 | |
| | 2,771 | | | Exxon Mobil Corp. | | | 250,146 | |
| | 4,403 | | | Kinder Morgan, Inc. | | | 91,188 | |
| | 1,952 | | | Marathon Petroleum Corp. | | | 98,283 | |
| | 2,118 | | | PBF Energy, Inc., Class A | | | 59,052 | |
| | 1,114 | | | Phillips 66 | | | 96,295 | |
| | | | | | | | |
| | | | Total Energy | | | 766,117 | |
| | | | | | | | |
| | | | Financials — 32.4% | |
| | | | Banks — 15.7% | |
| | 12,722 | | | Bank of America Corp. | | | 281,154 | |
| | 2,188 | | | Citigroup, Inc. | | | 130,017 | |
| | 3,393 | | | Citizens Financial Group, Inc. | | | 120,900 | |
| | 2,690 | | | Fifth Third Bancorp | | | 72,539 | |
| | 773 | | | First Republic Bank | | | 71,259 | |
| | 1,003 | | | M&T Bank Corp. | | | 156,891 | |
| | 1,360 | | | PNC Financial Services Group, Inc. (The) | | | 159,019 | |
| | 2,425 | | | SunTrust Banks, Inc. | | | 133,017 | |
| | 2,276 | | | US Bancorp | | | 116,923 | |
| | 7,827 | | | Wells Fargo & Co. | | | 431,335 | |
| | | | | | | | |
| | | | | | | 1,673,054 | |
| | | | | | | | |
| | | | Capital Markets — 3.8% | |
| | 1,920 | | | Charles Schwab Corp. (The) | | | 75,763 | |
| | 1,679 | | | Invesco Ltd. | | | 50,950 | |
| | 1,983 | | | Morgan Stanley | | | 83,765 | |
SEE NOTES TO FINANCIAL STATEMENTS.
| | | | | | | | |
| | | |
| DECEMBER 31, 2016 | | J.P. MORGAN MID CAP/MULTI-CAP FUNDS | | | | | 37 | |
JPMorgan Value Advantage Fund
SCHEDULE OF PORTFOLIO INVESTMENTS
AS OF DECEMBER 31, 2016 (Unaudited) (continued)
(Amounts in thousands)
| | | | | | | | |
| SHARES | | | SECURITY DESCRIPTION | | VALUE($) | |
| Common Stocks — continued | |
| | | | Capital Markets — continued | | | | |
| | 855 | | | Northern Trust Corp. | | | 76,166 | |
| | 1,551 | | | T Rowe Price Group, Inc. | | | 116,761 | |
| | | | | | | | |
| | | | | | | 403,405 | |
| | | | | | | | |
| | | | Consumer Finance — 3.0% | |
| | 3,982 | | | Ally Financial, Inc. | | | 75,734 | |
| | 2,841 | | | Capital One Financial Corp. | | | 247,831 | |
| | | | | | | | |
| | | | | | | 323,565 | |
| | | | | | | | |
| | | | Insurance — 9.9% | |
| | 44 | | | Alleghany Corp. (a) | | | 26,541 | |
| | 1,470 | | | Allied World Assurance Co. Holdings AG | | | 78,975 | |
| | 2,770 | | | American International Group, Inc. | | | 180,895 | |
| | 748 | | | Chubb Ltd. | | | 98,840 | |
| | 2,229 | | | CNO Financial Group, Inc. | | | 42,683 | |
| | 2,632 | | | Hartford Financial Services Group, Inc. (The) | | | 125,434 | |
| | 4,847 | | | Loews Corp. | | | 226,977 | |
| | 448 | | | Marsh & McLennan Cos., Inc. | | | 30,267 | |
| | 526 | | | Prudential Financial, Inc. | | | 54,746 | |
| | 921 | | | Travelers Cos., Inc. (The) | | | 112,798 | |
| | 1,858 | | | Unum Group | | | 81,609 | |
| | | | | | | | |
| | | | | | | 1,059,765 | |
| | | | | | | | |
| | | | Total Financials | | | 3,459,789 | |
| | | | | | | | |
| | | | Health Care — 9.0% | |
| | | | Health Care Providers & Services — 3.1% | |
| | 919 | | | Aetna, Inc. | | | 113,907 | |
| | 275 | | | Cigna Corp. | | | 36,656 | |
| | 1,059 | | | HCA Holdings, Inc. (a) | | | 78,372 | |
| | 676 | | | UnitedHealth Group, Inc. | | | 108,139 | |
| | | | | | | | |
| | | | | | | 337,074 | |
| | | | | | | | |
| | | | Pharmaceuticals — 5.9% | |
| | 250 | | | Allergan plc (a) | | | 52,586 | |
| | 1,468 | | | Johnson & Johnson | | | 169,117 | |
| | 2,577 | | | Merck & Co., Inc. | | | 151,726 | |
| | 7,793 | | | Pfizer, Inc. | | | 253,107 | |
| | | | | | | | |
| | | | | | | 626,536 | |
| | | | | | | | |
| | | | Total Health Care | | | 963,610 | |
| | | | | | | | |
| | | | Industrials — 6.3% | |
| | | | Aerospace & Defense — 1.2% | |
| | 1,101 | | | United Technologies Corp. | | | 120,681 | |
| | | | | | | | |
| | | | Airlines — 1.6% | |
| | 3,509 | | | Delta Air Lines, Inc. | | | 172,613 | |
| | | | | | | | |
| | | | Industrial Conglomerates — 2.0% | |
| | 964 | | | Carlisle Cos., Inc. | | | 106,311 | |
| | | | | | | | |
| SHARES | | | SECURITY DESCRIPTION | | VALUE($) | |
| | | | | | | | |
| | | | Industrial Conglomerates — continued | |
| | 936 | | | Honeywell International, Inc. | | | 108,482 | |
| | | | | | | | |
| | | | | | | 214,793 | |
| | | | | | | | |
| | | | Machinery — 1.5% | |
| | 1,030 | | | Dover Corp. | | | 77,170 | |
| | 670 | | | Illinois Tool Works, Inc. | | | 82,097 | |
| | | | | | | | |
| | | | | | | 159,267 | |
| | | | | | | | |
| | | | Total Industrials | | | 667,354 | |
| | | | | | | | |
| | | | Information Technology — 7.0% | |
| | | | Communications Equipment — 1.1% | |
| | 3,800 | | | Cisco Systems, Inc. | | | 114,836 | |
| | | | | | | | |
| | | | Electronic Equipment, Instruments & Components — 0.7% | |
| | 1,025 | | | Arrow Electronics, Inc. (a) | | | 73,112 | |
| | | | | | | | |
| | | | IT Services — 0.5% | |
| | 1,477 | | | PayPal Holdings, Inc. (a) | | | 58,313 | |
| | | | | | | | |
| | | | Semiconductors & Semiconductor Equipment — 2.7% | |
| | 832 | | | KLA-Tencor Corp. | | | 65,454 | |
| | 1,247 | | | QUALCOMM, Inc. | | | 81,301 | |
| | 1,941 | | | Texas Instruments, Inc. | | | 141,642 | |
| | | | | | | | |
| | | | | | | 288,397 | |
| | | | | | | | |
| | | | Software — 1.3% | |
| | 2,180 | | | Microsoft Corp. | | | 135,440 | |
| | | | | | | | |
| | | | Technology Hardware, Storage & Peripherals — 0.7% | |
| | 3,134 | | | Hewlett Packard Enterprise Co. | | | 72,514 | |
| | | | | | | | |
| | | | Total Information Technology | | | 742,612 | |
| | | | | | | | |
| | | | Materials — 3.8% | |
| | | | Chemicals — 0.2% | |
| | 1,124 | | | AdvanSix, Inc. (a) | | | 24,896 | |
| | | | | | | | |
| | | | Construction Materials — 0.8% | |
| | 369 | | | Martin Marietta Materials, Inc. | | | 81,780 | |
| | | | | | | | |
| | | | Containers & Packaging — 2.3% | |
| | 1,400 | | | Ball Corp. | | | 105,068 | |
| | 3,462 | | | Graphic Packaging Holding Co. | | | 43,206 | |
| | 2,022 | | | WestRock Co. | | | 102,667 | |
| | | | | | | | |
| | | | | | | 250,941 | |
| | | | | | | | |
| | | | Paper & Forest Products — 0.5% | |
| | 2,334 | | | KapStone Paper and Packaging Corp. | | | 51,467 | |
| | | | | | | | |
| | | | Total Materials | | | 409,084 | |
| | | | | | | | |
| | | | Real Estate — 4.5% | |
| | | | Equity Real Estate Investment Trusts (REITs) — 4.1% | |
| | 3,446 | | | American Homes 4 Rent, Class A | | | 72,306 | |
| | 2,676 | | | Brixmor Property Group, Inc. | | | 65,343 | |
SEE NOTES TO FINANCIAL STATEMENTS.
| | | | | | |
| | | |
| 38 | | | | J.P. MORGAN MID CAP/MULTI-CAP FUNDS | | DECEMBER 31, 2016 |
| | | | | | | | |
| SHARES | | | SECURITY DESCRIPTION | | VALUE($) | |
| Common Stocks — continued | |
| | | | Equity Real Estate Investment Trusts (REITs) — continued | |
| | 678 | | | EastGroup Properties, Inc. | | | 50,086 | |
| | 2,340 | | | Kimco Realty Corp. | | | 58,872 | |
| | 2,325 | | | Outfront Media, Inc. | | | 57,823 | |
| | 3,257 | | | Rayonier, Inc. | | | 86,624 | |
| | 1,414 | | | Weyerhaeuser Co. | | | 42,532 | |
| | | | | | | | |
| | | | | | | 433,586 | |
| | | | | | | | |
| | | | Real Estate Management & Development — 0.4% | |
| | 1,337 | | | CBRE Group, Inc., Class A (a) | | | 42,102 | |
| | | | | | | | |
| | | | Total Real Estate | | | 475,688 | |
| | | | | | | | |
| | | | Telecommunication Services — 1.4% | |
| | | | Diversified Telecommunication Services — 0.9% | |
| | 1,778 | | | Verizon Communications, Inc. | | | 94,905 | |
| | | | | | | | |
| | | | Wireless Telecommunication Services — 0.5% | |
| | 918 | | | T-Mobile US, Inc. (a) | | | 52,771 | |
| | | | | | | | |
| | | | Total Telecommunication Services | | | 147,676 | |
| | | | | | | | |
| | | | Utilities — 5.8% | |
| | | | Electric Utilities — 5.2% | |
| | 1,684 | | | American Electric Power Co., Inc. | | | 105,993 | |
| | 1,146 | | | Duke Energy Corp. | | | 88,945 | |
| | 1,083 | | | Edison International | | | 77,997 | |
| | 1,262 | | | Eversource Energy | | | 69,678 | |
| | | | | | | | |
| SHARES | | | SECURITY DESCRIPTION | | VALUE($) | |
| | | | | | | | |
| | | | Electric Utilities — continued | | | | |
| | 937 | | | NextEra Energy, Inc. | | | 111,910 | |
| | 2,658 | | | Xcel Energy, Inc. | | | 108,184 | |
| | | | | | | | |
| | | | | | | 562,707 | |
| | | | | | | | |
| | | | Multi-Utilities — 0.6% | |
| | 611 | | | Sempra Energy | | | 61,451 | |
| | | | | | | | |
| | | | Total Utilities | | | 624,158 | |
| | | | | | | | |
| | | | Total Common Stocks
(Cost $7,965,649) | | | 10,506,445 | |
| | | | | | | | |
| Short-Term Investment — 1.7% | |
| | | | Investment Company — 1.7% | |
| | 184,644 | | | JPMorgan U.S. Government Money Market Fund, Institutional Class Shares, 0.410% (b) (l)
(Cost $184,644) | | | 184,644 | |
| | | | | | | | |
| | | | Total Investments — 100.2%
(Cost $8,150,293) | | | 10,691,089 | |
| | | | Liabilities in Excess of
Other Assets — (0.2)% | | | (23,371 | ) |
| | | | | | | | |
| | | | NET ASSETS — 100.0% | | $ | 10,667,718 | |
| | | | | | | | |
Percentages indicated are based on net assets.
SEE NOTES TO FINANCIAL STATEMENTS.
| | | | | | | | |
| | | |
| DECEMBER 31, 2016 | | J.P. MORGAN MID CAP/MULTI-CAP FUNDS | | | | | 39 | |
J.P. Morgan Mid Cap/Multi-Cap Funds
NOTES TO SCHEDULES OF PORTFOLIO INVESTMENTS
AS OF DECEMBER 31, 2016 (Unaudited)
| | |
| USD | | — United States Dollar |
| |
| (a) | | — Non-income producing security. |
| (b) | | — Investment in affiliate. Money market fund is registered under the Investment Company Act of 1940, as amended, and advised by J.P. Morgan Investment Management Inc. |
| (h) | | — Amount rounds to less than 500. |
| (j) | | — All or a portion of the security is segregated for short sales. The total value of securities and cash segregated as collateral is approximately $26,810,000 and $150,134,000, respectively. |
| (l) | | — The rate shown is the current yield as of December 31, 2016. |
SEE NOTES TO FINANCIAL STATEMENTS.
| | | | | | |
| | | |
| 40 | | | | J.P. MORGAN MID CAP/MULTI-CAP FUNDS | | DECEMBER 31, 2016 |
THIS PAGE IS INTENTIONALLY LEFT BLANK
| | | | | | | | |
| | | |
| DECEMBER 31, 2016 | | J.P. MORGAN MID CAP/MULTI-CAP FUNDS | | | | | 41 | |
STATEMENTS OF ASSETS AND LIABILITIES
AS OF DECEMBER 31, 2016 (Unaudited)
(Amounts in thousands, except per share amounts)
| | | | | | | | | | | | |
| | |
Growth
Advantage
Fund | | | Mid Cap
Equity Fund | | | Mid Cap
Growth
Fund | |
ASSETS: | | | | | | | | | | | | |
Investments in non-affiliates, at value | | $ | 5,982,852 | | | $ | 2,516,512 | | | $ | 2,658,585 | |
Investments in affiliates, at value | | | 108,763 | | | | 89,081 | | | | 63,672 | |
| | | | | | | | | | | | |
Total investment securities, at value | | | 6,091,615 | | | | 2,605,593 | | | | 2,722,257 | |
Cash | | | — | | | | — | | | | — | (a) |
Receivables: | | | | | | | | | | | | |
Investment securities sold | | | — | | | | 932 | | | | 1,984 | |
Fund shares sold | | | 26,991 | | | | 3,738 | | | | 5,887 | |
Dividends from non-affiliates | | | 1,062 | | | | 2,372 | | | | 720 | |
Dividends from affiliates | | | 40 | | | | 27 | | | | 17 | |
| | | | | | | | | | | | |
Total Assets | | | 6,119,708 | | | | 2,612,662 | | | | 2,730,865 | |
| | | | | | | | | | | | |
| | | |
LIABILITIES: | | | | | | | | | | | | |
Payables: | | | | | | | | | | | | |
Due to custodian | | | 48 | | | | — | | | | — | |
Fund shares redeemed | | | 12,242 | | | | 1,850 | | | | 10,471 | |
Accrued liabilities: | | | | | | | | | | | | |
Investment advisory fees | | | 3,381 | | | | 1,435 | | | | 1,481 | |
Administration fees | | | 423 | | | | 182 | | | | 177 | |
Distribution fees | | | 698 | | | | 94 | | | | 259 | |
Shareholder servicing fees | | | 395 | | | | 73 | | | | 138 | |
Custodian and accounting fees | | | 39 | | | | 22 | | | | 17 | |
Trustees’ and Chief Compliance Officer’s fees | | | 23 | | | | — | (a) | | | 1 | |
Printing and mailing cost | | | 164 | | | | 302 | | | | 132 | |
Sub-transfer agency fees | | | 460 | | | | 368 | | | | 555 | |
Other | | | 175 | | | | 19 | | | | 98 | |
| | | | | | | | | | | | |
Total Liabilities | | | 18,048 | | | | 4,345 | | | | 13,329 | |
| | | | | | | | | | | | |
Net Assets | | $ | 6,101,660 | | | $ | 2,608,317 | | | $ | 2,717,536 | |
| | | | | | | | | | | | |
| (a) | Amount rounds to less than 500. |
SEE NOTES TO FINANCIAL STATEMENTS.
| | | | | | |
| | | |
| 42 | | | | J.P. MORGAN MID CAP/MULTI-CAP FUNDS | | DECEMBER 31, 2016 |
| | | | | | | | | | | | |
| | |
Growth
Advantage
Fund | | | Mid Cap
Equity Fund | | | Mid Cap
Growth
Fund | |
NET ASSETS: | |
Paid-in-Capital | | $ | 4,766,757 | | | $ | 2,002,213 | | | $ | 2,352,244 | |
Accumulated undistributed (distributions in excess of) net investment income | | | (20,692 | ) | | | (582 | ) | | | (10,014 | ) |
Accumulated net realized gains (losses) | | | (100,034 | ) | | | (28,323 | ) | | | (42,108 | ) |
Net unrealized appreciation (depreciation) | | | 1,455,629 | | | | 635,009 | | | | 417,414 | |
| | | | | | | | | | | | |
Total Net Assets | | $ | 6,101,660 | | | $ | 2,608,317 | | | $ | 2,717,536 | |
| | | | | | | | | | | | |
| | | |
Net Assets: | | | | | | | | | | | | |
Class A | | $ | 1,549,154 | | | $ | 342,456 | | | $ | 871,922 | |
Class C | | | 556,435 | | | | 30,577 | | | | 87,166 | |
Class R2 | | | — | | | | 612 | | | | 31,668 | |
Class R3 | | | — | | | | — | | | | 20 | |
Class R4 | | | — | | | | — | | | | 20 | |
Class R5 | | | 79,977 | | | | 2,788 | | | | 220,600 | |
Class R6 | | | 2,839,301 | | | | 1,550,055 | | | | 627,006 | |
Select Class | | | 1,076,793 | | | | 681,829 | | | | 879,134 | |
| | | | | | | | | | | | |
Total | | $ | 6,101,660 | | | $ | 2,608,317 | | | $ | 2,717,536 | |
| | | | | | | | | | | | |
| | | |
Outstanding units of beneficial interest (shares) | | | | | | | | | | | | |
($0.0001 par value; unlimited number of shares authorized): | | | | | | | | | | | | |
Class A | | | 102,096 | | | | 7,808 | | | | 35,957 | |
Class C | | | 41,070 | | | | 717 | | | | 4,434 | |
Class R2 | | | — | | | | 14 | | | | 1,205 | |
Class R3 | | | — | | | | — | | | | 1 | |
Class R4 | | | — | | | | — | | | | 1 | |
Class R5 | | | 5,073 | | | | 63 | | | | 7,953 | |
Class R6 | | | 179,468 | | | | 34,933 | | | | 22,534 | |
Select Class | | | 69,309 | | | | 15,376 | | | | 31,975 | |
| | | |
Net Asset Value (a): | | | | | | | | | | | | |
Class A — Redemption price per share | | $ | 15.17 | | | $ | 43.86 | | | $ | 24.25 | |
Class C — Offering price per share (b) | | | 13.55 | | | | 42.63 | | | | 19.66 | |
Class R2 — Offering and redemption price per share | | | — | | | | 43.62 | | | | 26.28 | |
Class R3 — Offering and redemption price per share | | | — | | | | — | | | | 27.47 | |
Class R4 — Offering and redemption price per share | | | — | | | | — | | | | 27.49 | |
Class R5 — Offering and redemption price per share | | | 15.77 | | | | 44.37 | | | | 27.74 | |
Class R6 — Offering and redemption price per share | | | 15.82 | | | | 44.37 | | | | 27.82 | |
Select Class — Offering and redemption price per share | | | 15.54 | | | | 44.34 | | | | 27.49 | |
Class A maximum sales charge | | | 5.25 | % | | | 5.25 | % | | | 5.25 | % |
Class A maximum public offering price per share
[net asset value per share/(100% — maximum sales charge)] | | $ | 16.01 | | | $ | 46.29 | | | $ | 25.59 | |
| | | | | | | | | | | | |
| | | |
Cost of investments in non-affiliates | | $ | 4,527,223 | | | $ | 1,881,503 | | | $ | 2,241,171 | |
Cost of investments in affiliates | | | 108,763 | | | | 89,081 | | | | 63,672 | |
| (a) | Per share amounts may not recalculate due to rounding of net assets and/or shares outstanding. |
| (b) | Redemption price for Class C Shares varies based upon length of time the shares are held. |
| | | | | | | | |
| | | |
| DECEMBER 31, 2016 | | J.P. MORGAN MID CAP/MULTI-CAP FUNDS | | | | | 43 | |
SEE NOTES TO FINANCIAL STATEMENTS.
STATEMENTS OF ASSETS AND LIABILITIES
AS OF DECEMBER 31, 2016 (Unaudited) (continued)
(Amounts in thousands, except per share amounts)
| | | | | | | | | | | | |
| | | Mid Cap
Value Fund | | |
Multi-Cap
Market
Neutral Fund | | | Value
Advantage
Fund | |
ASSETS: | |
Investments in non-affiliates, at value | | $ | 16,400,277 | | | $ | 149,348 | | | $ | 10,506,445 | |
Investments in affiliates, at value | | | 766,568 | | | | 23,704 | | | | 184,644 | |
| | | | | | | | | | | | |
Total investment securities, at value | | | 17,166,845 | | | | 173,052 | | | | 10,691,089 | |
Restricted cash | | | — | | | | 20 | | | | — | |
Cash | | | — | | | | 116 | | | | 205 | |
Deposits at broker for futures contracts | | | — | | | | 170 | | | | — | |
Deposits at broker for securities sold short | | | — | | | | 150,134 | | | | — | |
Receivables: | | | | | | | | | | | | |
Investment securities sold | | | — | | | | 4,707 | | | | — | |
Fund shares sold | | | 49,870 | | | | 111 | | | | 21,275 | |
Dividends from non-affiliates | | | 26,677 | | | | 157 | | | | 9,845 | |
Dividends from affiliates | | | 221 | | | | 7 | | | | 60 | |
Variation margin on futures contracts | | | — | | | | 3 | | | | — | |
| | | | | | | | | | | | |
Total Assets | | | 17,243,613 | | | | 328,477 | | | | 10,722,474 | |
| | | | | | | | | | | | |
| | | |
LIABILITIES: | | | | | | | | | | | | |
Payables: | | | | | | | | | | | | |
Due to custodian | | | 3 | | | | — | | | | — | |
Securities sold short, at value | | | — | | | | 148,679 | | | | — | |
Dividend expense to non-affiliates on securities sold short | | | — | | | | 97 | | | | — | |
Investment securities purchased | | | — | | | | 5,572 | | | | 8,040 | |
Interest expense to non-affiliates on securities sold short | | | — | | | | 7 | | | | — | |
Fund shares redeemed | | | 88,922 | | | | 5,258 | | | | 37,115 | |
Accrued liabilities: | | | | | | | | | | | | |
Investment advisory fees | | | 8,550 | | | | 95 | | | | 5,772 | |
Administration fees | | | 1,195 | | | | — | | | | 738 | |
Distribution fees | | | 862 | | | | 5 | | | | 888 | |
Shareholder servicing fees | | | 582 | | | | 37 | | | | 488 | |
Custodian and accounting fees | | | 27 | | | | 7 | | | | 43 | |
Trustees’ and Chief Compliance Officer’s fees | | | 92 | | | | — | | | | 52 | |
Printing and mailing cost | | | 369 | | | | 6 | | | | 205 | |
Sub-transfer agency fees | | | 3,402 | | | | 7 | | | | 1,283 | |
Other | | | 383 | | | | 26 | | | | 132 | |
| | | | | | | | | | | | |
Total Liabilities | | | 104,387 | | | | 159,796 | | | | 54,756 | |
| | | | | | | | | | | | |
Net Assets | | $ | 17,139,226 | | | $ | 168,681 | | | $ | 10,667,718 | |
| | | | | | | | | | | | |
SEE NOTES TO FINANCIAL STATEMENTS.
| | | | | | |
| | | |
| 44 | | | | J.P. MORGAN MID CAP/MULTI-CAP FUNDS | | DECEMBER 31, 2016 |
| | | | | | | | | | | | |
| | | Mid Cap
Value Fund | | |
Multi-Cap
Market
Neutral Fund | | | Value
Advantage
Fund | |
NET ASSETS: | | | | | | | | | | | | |
Paid-in-Capital | | $ | 11,684,022 | | | $ | 162,075 | | | $ | 8,286,153 | |
Accumulated undistributed (distributions in excess of) net investment income | | | (3,386 | ) | | | (1,306 | ) | | | 92 | |
Accumulated net realized gains (losses) | | | 14,341 | | | | (7,701 | ) | | | (159,323 | ) |
Net unrealized appreciation (depreciation) | | | 5,444,249 | | | | 15,613 | | | | 2,540,796 | |
| | | | | | | | | | | | |
Total Net Assets | | $ | 17,139,226 | | | $ | 168,681 | | | $ | 10,667,718 | |
| | | | | | | | | | | | |
| | | |
Net Assets: | | | | | | | | | | | | |
Class A | | $ | 2,251,296 | | | $ | 5,411 | | | $ | 1,854,162 | |
Class C | | | 531,177 | | | | 5,220 | | | | 771,589 | |
Class L (formerly Institutional Class) | | | 11,574,107 | | | | — | | | | 3,666,117 | |
Class R2 | | | 66,949 | | | | — | | | | — | |
Class R3 | | | 21 | | | | — | | | | 22 | |
Class R4 | | | 21 | | | | — | | | | 22 | |
Class R5 | | | 21 | | | | — | | | | 22 | |
Class R6 | | | 51,221 | | | | — | | | | 2,937,216 | |
Select Class | | | 2,664,413 | | | | 158,050 | | | | 1,438,568 | |
| | | | | | | | | | | | |
Total | | $ | 17,139,226 | | | $ | 168,681 | | | $ | 10,667,718 | |
| | | | | | | | | | | | |
| | | |
Outstanding units of beneficial interest (shares) | | | | | | | | | | | | |
($0.0001 par value; unlimited number of shares authorized): | | | | | | | | | | | | |
Class A | | | 63,169 | | | | 538 | | | | 57,784 | |
Class C | | | 15,463 | | | | 555 | | | | 24,131 | |
Class L (formerly Institutional Class) | | | 317,972 | | | | — | | | | 113,733 | |
Class R2 | | | 1,952 | | | | — | | | | — | |
Class R3 | | | 1 | | | | — | | | | 1 | |
Class R4 | | | 1 | | | | — | | | | 1 | |
Class R5 | | | — | (a) | | | — | | | | 1 | |
Class R6 | | | 1,408 | | | | — | | | | 91,192 | |
Select Class | | | 74,010 | | | | 15,351 | | | | 44,593 | |
| | | |
Net Asset Value (b): | | | | | | | | | | | | |
Class A — Redemption price per share | | $ | 35.64 | | | $ | 10.05 | | | $ | 32.09 | |
Class C — Offering price per share (c) | | | 34.35 | | | | 9.41 | | | | 31.97 | |
Class L (formerly Institutional Class) — Offering and redemption price per share | | | 36.40 | | | | — | | | | 32.23 | |
Class R2 — Offering and redemption price per share | | | 34.30 | | | | — | | | | — | |
Class R3 — Offering and redemption price per share | | | 35.50 | | | | — | | | | 31.94 | |
Class R4 — Offering and redemption price per share | | | 35.93 | | | | — | | | | 32.20 | |
Class R5 — Offering and redemption price per share | | | 36.38 | | | | — | | | | 32.21 | |
Class R6 — Offering and redemption price per share | | | 36.38 | | | | — | | | | 32.21 | |
Select Class — Offering and redemption price per share | | | 36.00 | | | | 10.30 | | | | 32.26 | |
Class A maximum sales charge | | | 5.25 | % | | | 5.25 | % | | | 5.25 | % |
Class A maximum public offering price per share
[net asset value per share/(100% — maximum sales charge)] | | $ | 37.61 | | | $ | 10.61 | | | $ | 33.87 | |
| | | | | | | | | | | | |
| | | |
Cost of investments in non-affiliates | | $ | 10,956,028 | | | $ | 131,393 | | | $ | 7,965,649 | |
Cost of investments in affiliates | | | 766,568 | | | | 23,704 | | | | 184,644 | |
Proceeds from securities sold short | | | — | | | | 146,326 | | | | — | |
| (a) | Amount rounds to less than 500. |
| (b) | Per share amounts may not recalculate due to rounding of net assets and/or shares outstanding. |
| (c) | Redemption price for Class C Shares varies based upon length of time the shares are held. |
| | | | | | | | |
| | | |
| DECEMBER 31, 2016 | | J.P. MORGAN MID CAP/MULTI-CAP FUNDS | | | | | 45 | |
SEE NOTES TO FINANCIAL STATEMENTS.
STATEMENTS OF OPERATIONS
FOR THE SIX MONTHS ENDED DECEMBER 31, 2016 (Unaudited)
(Amounts in thousands)
| | | | | | | | | | | | |
| | |
Growth
Advantage
Fund | | | Mid Cap
Equity Fund | | | Mid Cap
Growth
Fund | |
INVESTMENT INCOME: | |
Dividend income from non-affiliates | | $ | 19,013 | | | $ | 14,188 | | | $ | 8,513 | |
Dividend income from affiliates | | | 224 | | | | 149 | | | | 75 | |
Interest income from affiliates | | | 4 | | | | 2 | | | | 1 | |
| | | | | | | | | | | | |
Total investment income | | | 19,241 | | | | 14,339 | | | | 8,589 | |
| | | | | | | | | | | | |
| | | |
EXPENSES: | | | | | | | | | | | | |
Investment advisory fees | | | 20,035 | | | | 8,184 | | | | 9,286 | |
Administration fees | | | 2,524 | | | | 1,031 | | | | 1,170 | |
Distribution fees: | | | | | | | | | | | | |
Class A | | | 2,051 | | | | 435 | | | | 1,177 | |
Class C | | | 2,243 | | | | 121 | | | | 356 | |
Class R2 | | | — | | | | 2 | | | | 67 | |
Class R3 (a) | | | — | | | | — | | | | — | (b) |
Shareholder servicing fees: | | | | | | | | | | | | |
Class A | | | 2,051 | | | | 435 | | | | 1,177 | |
Class C | | | 748 | | | | 40 | | | | 119 | |
Class R2 | | | — | | | | 1 | | | | 33 | |
Class R3 (a) | | | — | | | | — | | | | — | (b) |
Class R4 (a) | | | — | | | | — | | | | — | (b) |
Class R5 | | | 21 | | | | 1 | | | | 56 | |
Select Class | | | 1,254 | | | | 817 | | | | 1,159 | |
Custodian and accounting fees | | | 93 | | | | 42 | | | | 46 | |
Interest expense to affiliates | | | — | (b) | | | — | | | | — | |
Professional fees | | | 57 | | | | 32 | | | | 36 | |
Trustees’ and Chief Compliance Officer’s fees | | | 34 | | | | 16 | | | | 16 | |
Printing and mailing costs | | | 142 | | | | 181 | | | | 111 | |
Registration and filing fees | | | 118 | | | | 25 | | | | 57 | |
Transfer agency fees (See Note 2.E.) | | | 103 | | | | 24 | | | | 229 | |
Sub-transfer agency fees (See Note 2.E.) | | | 1,244 | | | | 695 | | | | 1,129 | |
Other | | | 93 | | | | 25 | | | | 33 | |
| | | | | | | | | | | | |
Total expenses | | | 32,811 | | | | 12,107 | | | | 16,257 | |
| | | | | | | | | | | | |
Less fees waived | | | (1,290 | ) | | | (1,193 | ) | | | (1,811 | ) |
Less expense reimbursements | | | (2 | ) | | | (16 | ) | | | (63 | ) |
| | | | | | | | | | | | |
Net expenses | | | 31,519 | | | | 10,898 | | | | 14,383 | |
| | | | | | | | | | | | |
Net investment income (loss) | | | (12,278 | ) | | | 3,441 | | | | (5,794 | ) |
| | | | | | | | | | | | |
| | | |
REALIZED/UNREALIZED GAINS (LOSSES): | | | | | | | | | | | | |
Net realized gain (loss) on transactions from Investments in non-affiliates | | | 121,384 | | | | 28,273 | | | | 2,613 | |
Change in net unrealized appreciation/depreciation on Investments in non-affiliates | | | 206,479 | | | | 103,262 | | | | 107,428 | |
| | | | | | | | | | | | |
Net realized/unrealized gains (losses) | | | 327,863 | | | | 131,535 | | | | 110,041 | |
| | | | | | | | | | | | |
Change in net assets resulting from operations | | $ | 315,585 | | | $ | 134,976 | | | $ | 104,247 | |
| | | | | | | | | | | | |
| (a) | Commencement of offering of class of shares effective September 9, 2016 for Mid Cap Growth Fund. |
| (b) | Amount rounds to less than 500. |
SEE NOTES TO FINANCIAL STATEMENTS.
| | | | | | |
| | | |
| 46 | | | | J.P. MORGAN MID CAP/MULTI-CAP FUNDS | | DECEMBER 31, 2016 |
| | | | | | | | | | | | |
| | | Mid Cap
Value Fund | | |
Multi-Cap
Market
Neutral Fund | | | Value
Advantage
Fund | |
INVESTMENT INCOME: | |
Dividend income from non-affiliates | | $ | 136,448 | | | $ | 1,208 | | | $ | 109,051 | |
Dividend income from affiliates | | | 1,159 | | | | 28 | | | | 314 | |
Interest income from affiliates | | | 11 | | | | — | (a) | | | 7 | |
| | | | | | | | | | | | |
Total investment income | | | 137,618 | | | | 1,236 | | | | 109,372 | |
| | | | | | | | | | | | |
| | | |
EXPENSES: | | | | | | | | | | | | |
Investment advisory fees | | | 53,416 | | | | 728 | | | | 33,576 | |
Administration fees | | | 6,728 | | | | 74 | | | | 4,229 | |
Distribution fees: | | | | | | | | | | | | |
Class A | | | 2,856 | | | | 8 | | | | 2,423 | |
Class C | | | 2,054 | | | | 21 | | | | 2,795 | |
Class R2 | | | 165 | | | | — | | | | — | |
Class R3 (b) | | | — | (a) | | | — | | | | — | (a) |
Shareholder servicing fees: | | | | | | | | | | | | |
Class A | | | 2,856 | | | | 8 | | | | 2,423 | |
Class C | | | 685 | | | | 7 | | | | 931 | |
Class L (formerly Institutional Class) | | | 5,486 | | | | — | | | | 2,620 | |
Class R2 | | | 82 | | | | — | | | | — | |
Class R3 (b) | | | — | (a) | | | — | | | | — | (a) |
Class R4 (b) | | | — | (a) | | | — | | | | — | (a) |
Class R5 (b) | | | — | (a) | | | — | | | | — | (a) |
Select Class | | | 3,176 | | | | 213 | | | | 1,705 | |
Custodian and accounting fees | | | 179 | | | | 17 | | | | 129 | |
Interest expense to affiliates | | | — | (a) | | | — | | | | — | |
Professional fees | | | 250 | | | | 28 | | | | 173 | |
Trustees’ and Chief Compliance Officer’s fees | | | 91 | | | | 13 | | | | 57 | |
Printing and mailing costs | | | 476 | | | | 5 | | | | 336 | |
Registration and filing fees | | | 70 | | | | 20 | | | | 146 | |
Transfer agency fees (See Note 2.E.) | | | 510 | | | | 3 | | | | 128 | |
Sub-transfer agency fees (See Note 2.E.) | | | 7,066 | | | | 13 | | | | 2,608 | |
Other | | | 265 | | | | 5 | | | | 104 | |
Dividend expense to non-affiliates on securities sold short | | | — | | | | 1,032 | | | | — | |
Interest expense to non-affiliates on securities sold short | | | — | | | | 10 | | | | — | |
| | | | | | | | | | | | |
Total expenses | | | 86,411 | | | | 2,205 | | | | 54,383 | |
| | | | | | | | | | | | |
Less fees waived | | | (10,894 | ) | | | (246 | ) | | | (5,313 | ) |
Less expense reimbursements | | | (2,674 | ) | | | — | | | | (183 | ) |
| | | | | | | | | | | | |
Net expenses | | | 72,843 | | | | 1,959 | | | | 48,887 | |
| | | | | | | | | | | | |
Net investment income (loss) | | | 64,775 | | | | (723 | ) | | | 60,485 | |
| | | | | | | | | | | | |
| | | |
REALIZED/UNREALIZED GAINS (LOSSES): | | | | | | | | | | | | |
Net realized gain (loss) on transactions from: | | | | | | | | | | | | |
Investments in non-affiliates | | | 231,604 | | | | 12,295 | | | | 69,076 | |
Futures | | | — | | | | (180 | ) | | | — | |
Securities sold short | | | — | | | | (8,721 | ) | | | — | |
| | | | | | | | | | | | |
Net realized gain (loss) | | | 231,604 | | | | 3,394 | | | | 69,076 | |
| | | | | | | | | | | | |
Change in net unrealized appreciation/depreciation on: | | | | | | | | | | | | |
Investments in non-affiliates | | | 892,882 | | | | 4,021 | | | | 1,138,209 | |
Futures | | | — | | | | 41 | | | | — | |
Securities sold short | | | — | | | | (3,811 | ) | | | — | |
| | | | | | | | | | | | |
Change in net unrealized appreciation/depreciation | | | 892,882 | | | | 251 | | | | 1,138,209 | |
| | | | | | | | | | | | |
Net realized/unrealized gains (losses) | | | 1,124,486 | | | | 3,645 | | | | 1,207,285 | |
| | | | | | | | | | | | |
Change in net assets resulting from operations | | $ | 1,189,261 | | | $ | 2,922 | | | $ | 1,267,770 | |
| | | | | | | | | | | | |
| (a) | Amount rounds to less than 500. |
| (b) | Commencement of offering of class of shares effective September 9, 2016 for Mid Cap Value Fund and Value Advantage Fund. |
| | | | | | | | |
| | | |
| DECEMBER 31, 2016 | | J.P. MORGAN MID CAP/MULTI-CAP FUNDS | | | | | 47 | |
SEE NOTES TO FINANCIAL STATEMENTS.
STATEMENTS OF CHANGES IN NET ASSETS
FOR THE PERIODS INDICATED
(Amounts in thousands)
| | | | | | | | | | | | | | | | |
| | | Growth Advantage Fund | | | Mid Cap Equity Fund | |
| | | Six Months Ended
December 31, 2016
(Unaudited) | | | Year Ended
June 30, 2016 | | | Six Months Ended
December 31, 2016
(Unaudited) | | | Year Ended
June 30, 2016 | |
CHANGE IN NET ASSETS RESULTING FROM OPERATIONS: | | | | | | | | | | | | | | | | |
Net investment income (loss) | | $ | (12,278 | ) | | $ | (20,440 | ) | | $ | 3,441 | | | $ | 8,836 | |
Net realized gain (loss) | | | 121,384 | | | | (145,387 | ) | | | 28,273 | | | | 58,144 | |
Change in net unrealized appreciation/depreciation | | | 206,479 | | | | (181,585 | ) | | | 103,262 | | | | (300,510 | ) |
| | | | | | | | | | | | | | | | |
Change in net assets resulting from operations | | | 315,585 | | | | (347,412 | ) | | | 134,976 | | | | (233,530 | ) |
| | | | | | | | | | | | | | | | |
| | | | |
DISTRIBUTIONS TO SHAREHOLDERS: | | | | | | | | | | | | | | | | |
Class A | | | | | | | | | | | | | | | | |
From net investment income | | | — | | | | — | | | | (356 | ) | | | (182 | ) |
From net realized gains | | | — | | | | (57,173 | ) | | | (10,459 | ) | | | (12,309 | ) |
Class C | | | | | | | | | | | | | | | | |
From net realized gains | �� | | — | | | | (20,218 | ) | | | (964 | ) | | | (1,246 | ) |
Class R2 | | | | | | | | | | | | | | | | |
From net investment income | | | — | | | | — | | | | — | (a) | | | — | |
From net realized gains | | | — | | | | — | | | | (19 | ) | | | (39 | ) |
Class R5 | | | | | | | | | | | | | | | | |
From net investment income | | | — | | | | — | | | | (9 | ) | | | (7 | ) |
From net realized gains | | | — | | | | (2,457 | ) | | | (84 | ) | | | (147 | ) |
Class R6 | | | | | | | | | | | | | | | | |
From net investment income | | | — | | | | — | | | | (5,206 | ) | | | (3,761 | ) |
From net realized gains | | | — | | | | (86,200 | ) | | | (46,392 | ) | | | (61,528 | ) |
Select Class | | | | | | | | | | | | | | | | |
From net investment income | | | — | | | | — | | | | (1,827 | ) | | | (2,603 | ) |
From net realized gains | | | — | | | | (48,267 | ) | | | (20,374 | ) | | | (75,744 | ) |
| | | | | | | | | | | | | | | | |
Total distributions to shareholders | | | — | | | | (214,315 | ) | | | (85,690 | ) | | | (157,566 | ) |
| | | | | | | | | | | | | | | | |
| | | | |
CAPITAL TRANSACTIONS: | | | | | | | | | | | | | | | | |
Change in net assets resulting from capital transactions | | | (177,525 | ) | | | 1,337,047 | | | | 194,682 | | | | (547,848 | ) |
| | | | | | | | | | | | | | | | |
| | | | |
NET ASSETS: | | | | | | | | | | | | | | | | |
Change in net assets | | | 138,060 | | | | 775,320 | | | | 243,968 | | | | (938,944 | ) |
Beginning of period | | | 5,963,600 | | | | 5,188,280 | | | | 2,364,349 | | | | 3,303,293 | |
| | | | | | | | | | | | | | | | |
End of period | | $ | 6,101,660 | | | $ | 5,963,600 | | | $ | 2,608,317 | | | $ | 2,364,349 | |
| | | | | | | | | | | | | | | | |
Accumulated undistributed (distributions in excess of) net investment income | | $ | (20,692 | ) | | $ | (8,414 | ) | | $ | (582 | ) | | $ | 3,375 | |
| | | | | | | | | | | | | | | | |
| (a) | Amount rounds to less than 500. |
SEE NOTES TO FINANCIAL STATEMENTS.
| | | | | | |
| | | |
| 48 | | | | J.P. MORGAN MID CAP/MULTI-CAP FUNDS | | DECEMBER 31, 2016 |
| | | | | | | | | | | | | | | | |
| | | Mid Cap Growth Fund | | | Mid Cap Value Fund | |
| | | Six Months Ended
December 31, 2016
(Unaudited) | | | Year Ended
June 30, 2016 | | | Six Months Ended
December 31, 2016
(Unaudited) | | | Year Ended
June 30, 2016 | |
CHANGE IN NET ASSETS RESULTING FROM OPERATIONS: | | | | | | | | | | | | | | | | |
Net investment income (loss) | | $ | (5,794 | ) | | $ | (11,080 | ) | | $ | 64,775 | | | $ | 133,064 | |
Net realized gain (loss) | | | 2,613 | | | | 181,344 | | | | 231,604 | | | | 921,071 | |
Change in net unrealized appreciation/depreciation | | | 107,428 | | | | (478,421 | ) | | | 892,882 | | | | (753,064 | ) |
| | | | | | | | | | | | | | | | |
Change in net assets resulting from operations | | | 104,247 | | | | (308,157 | ) | | | 1,189,261 | | | | 301,071 | |
| | | | | | | | | | | | | | | | |
| | | | |
DISTRIBUTIONS TO SHAREHOLDERS: | | | | | | | | | | | | | | | | |
Class A | | | | | | | | | | | | | | | | |
From net investment income | | | — | | | | — | | | | (9,018 | ) | | | (9,590 | ) |
From net realized gains | | | (449 | ) | | | (56,339 | ) | | | (135,546 | ) | | | (130,210 | ) |
Class C | | | | | | | | | | | | | | | | |
From net realized gains | | | (55 | ) | | | (6,714 | ) | | | (33,147 | ) | | | (31,402 | ) |
Class L (formerly Institutional Class) | | | | | | | | | | | | | | | | |
From net investment income | | | — | | | | — | | | | (100,129 | ) | | | (89,774 | ) |
From net realized gains | | | — | | | | — | | | | (669,173 | ) | | | (526,794 | ) |
Class R2 | | | | | | | | | | | | | | | | |
From net investment income | | | — | | | | — | | | | (133 | ) | | | (113 | ) |
From net realized gains | | | (11 | ) | | | (1,533 | ) | | | (4,114 | ) | | | (3,769 | ) |
Class R3 (a) | | | | | | | | | | | | | | | | |
From net investment income | | | — | | | | — | | | | — | (b) | | | — | |
From net realized gains | | | — | (b) | | | — | | | | (1 | ) | | | — | |
Class R4 (a) | | | | | | | | | | | | | | | | |
From net investment income | | | — | | | | — | | | | — | (b) | | | — | |
From net realized gains | | | — | (b) | | | — | | | | (1 | ) | | | — | |
Class R5 (c) | | | | | | | | | | | | | | | | |
From net investment income | | | — | | | | — | | | | — | (b) | | | — | |
From net realized gains | | | (96 | ) | | | (8,974 | ) | | | (1 | ) | | | — | |
Class R6 (c) | | | | | | | | | | | | | | | | |
From net investment income | | | — | | | | — | | | | (437 | ) | | | — | |
From net realized gains | | | (275 | ) | | | (23,518 | ) | | | (2,480 | ) | | | — | |
Select Class | | | | | | | | | | | | | | | | |
From net investment income | | | — | | | | — | | | | (17,549 | ) | | | (14,584 | ) |
From net realized gains | | | (390 | ) | | | (50,435 | ) | | | (155,821 | ) | | | (117,229 | ) |
| | | | | | | | | | | | | | | | |
Total distributions to shareholders | | | (1,276 | ) | | | (147,513 | ) | | | (1,127,550 | ) | | | (923,465 | ) |
| | | | | | | | | | | | | | | | |
| | | | |
CAPITAL TRANSACTIONS: | | | | | | | | | | | | | | | | |
Change in net assets resulting from capital transactions | | | (236,918 | ) | | | 244,627 | | | | 1,513,373 | | | | 227,463 | |
| | | | | | | | | | | | | | | | |
| | | | |
NET ASSETS: | | | | | | | | | | | | | | | | |
Change in net assets | | | (133,947 | ) | | | (211,043 | ) | | | 1,575,084 | | | | (394,931 | ) |
Beginning of period | | | 2,851,483 | | | | 3,062,526 | | | | 15,564,142 | | | | 15,959,073 | |
| | | | | | | | | | | | | | | | |
End of period | | $ | 2,717,536 | | | $ | 2,851,483 | | | $ | 17,139,226 | | | $ | 15,564,142 | |
| | | | | | | | | | | | | | | | |
Accumulated undistributed (distributions in excess of) net investment income | | $ | (10,014 | ) | | $ | (4,220 | ) | | $ | (3,386 | ) | | $ | 59,105 | |
| | | | | | | | | | | | | | | | |
| (a) | Commencement of offering of class of shares effective September 9, 2016 for Mid Cap Growth and Mid Cap Value Fund. |
| (b) | Amount rounds to less than 500. |
| (c) | Commencement of offering of class of shares effective September 9, 2016 for Mid Cap Value Fund. |
| | | | | | | | |
| | | |
| DECEMBER 31, 2016 | | J.P. MORGAN MID CAP/MULTI-CAP FUNDS | | | | | 49 | |
SEE NOTES TO FINANCIAL STATEMENTS.
STATEMENTS OF CHANGES IN NET ASSETS
FOR THE PERIODS INDICATED (continued)
(Amounts in thousands)
| | | | | | | | | | | | | | | | |
| | | Multi-Cap Market Neutral Fund | | | Value Advantage Fund | |
| | | Six Months Ended
December 31, 2016
(Unaudited) | | | Year Ended
June 30, 2016 | | | Six Months Ended
December 31, 2016
(Unaudited) | | | Year Ended
June 30, 2016 | |
CHANGE IN NET ASSETS RESULTING FROM OPERATIONS: | | | | | | | | | | | | | | | | |
Net investment income (loss) | | $ | (723 | ) | | $ | (1,875 | ) | | $ | 60,485 | | | $ | 137,198 | |
Net realized gain (loss) | | | 3,394 | | | | 30,953 | | | | 69,076 | | | | (206,123 | ) |
Change in net unrealized appreciation/depreciation | | | 251 | | | | (24,115 | ) | | | 1,138,209 | | | | (248,822 | ) |
| | | | | | | | | | | | | | | | |
Change in net assets resulting from operations | | | 2,922 | | | | 4,963 | | | | 1,267,770 | | | | (317,747 | ) |
| | | | | | | | | | | | | | | | |
| | | | |
DISTRIBUTIONS TO SHAREHOLDERS: | | | | | | | | | | | | | | | | |
Class A | | | | | | | | | | | | | | | | |
From net investment income | | | — | | | | — | | | | (17,004 | ) | | | (13,377 | ) |
From net realized gains | | | — | | | | — | | | | — | | | | (22,474 | ) |
Class C | | | | | | | | | | | | | | | | |
From net investment income | | | — | | | | — | | | | (4,071 | ) | | | (1,450 | ) |
From net realized gains | | | — | | | | — | | | | — | | | | (7,412 | ) |
Class L (formerly Institutional Class) | | | | | | | | | | | | | | | | |
From net investment income | | | — | | | | — | | | | (51,645 | ) | | | (77,515 | ) |
From net realized gains | | | — | | | | — | | | | — | | | | (69,917 | ) |
Class R3 (a) | | | | | | | | | | | | | | | | |
From net investment income | | | — | | | | — | | | | — | (b) | | | — | |
Class R4 (a) | | | | | | | | | | | | | | | | |
From net investment income | | | — | | | | — | | | | — | (b) | | | — | |
Class R5 (a) | | | | | | | | | | | | | | | | |
From net investment income | | | — | | | | — | | | | — | (b) | | | — | |
Class R6 (a) | | | | | | | | | | | | | | | | |
From net investment income | | | — | | | | — | | | | (44,017 | ) | | | — | |
Select Class | | | | | | | | | | | | | | | | |
From net investment income | | | — | | | | — | | | | (17,338 | ) | | | (9,572 | ) |
From net realized gains | | | — | | | | — | | | | — | | | | (14,779 | ) |
| | | | | | | | | | | | | | | | |
Total distributions to shareholders | | | — | | | | — | | | | (134,075 | ) | | | (216,496 | ) |
| | | | | | | | | | | | | | | | |
| | | | |
CAPITAL TRANSACTIONS: | | | | | | | | | | | | | | | | |
Change in net assets resulting from capital transactions | | | (22,344 | ) | | | (107,540 | ) | | | (556,928 | ) | | | (669,313 | ) |
| | | | | | | | | | | | | | | | |
| | | | |
NET ASSETS: | | | | | | | | | | | | | | | | |
Change in net assets | | | (19,422 | ) | | | (102,577 | ) | | | 576,767 | | | | (1,203,556 | ) |
Beginning of period | | | 188,103 | | | | 290,680 | | | | 10,090,951 | | | | 11,294,507 | |
| | | | | | | | | | | | | | | | |
End of period | | $ | 168,681 | | | $ | 188,103 | | | $ | 10,667,718 | | | $ | 10,090,951 | |
| | | | | | | | | | | | | | | | |
Accumulated undistributed (distributions in excess of) net investment income | | $ | (1,306 | ) | | $ | (583 | ) | | $ | 92 | | | $ | 73,682 | |
| | | | | | | | | | | | | | | | |
| (a) | Commencement of offering of class of shares effective September 9, 2016 for Value Advantage Fund. |
| (b) | Amount rounds to less than 500. |
SEE NOTES TO FINANCIAL STATEMENTS.
| | | | | | |
| | | |
| 50 | | | | J.P. MORGAN MID CAP/MULTI-CAP FUNDS | | DECEMBER 31, 2016 |
| | | | | | | | | | | | | | | | |
| | | Growth Advantage Fund | | | Mid Cap Equity Fund | |
| | | Six Months Ended
December 31, 2016
(Unaudited) | | | Year Ended
June 30,
2016 | | | Six Months Ended
December 31, 2016
(Unaudited) | | | Year Ended
June 30, 2016 | |
CAPITAL TRANSACTIONS: | | | | | | | | | | | | | | | | |
Class A | | | | | | | | | | | | | | | | |
Proceeds from shares issued | | $ | 188,879 | | | $ | 1,090,924 | | | $ | 61,012 | | | $ | 174,026 | |
Distributions reinvested | | | — | | | | 56,255 | | | | 10,790 | | | | 12,454 | |
Cost of shares redeemed | | | (368,058 | ) | | | (535,940 | ) | | | (71,804 | ) | | | (64,301 | ) |
| | | | | | | | | | | | | | | | |
Change in net assets resulting from Class A capital transactions | | $ | (179,179 | ) | | $ | 611,239 | | | $ | (2 | ) | | $ | 122,179 | |
| | | | | | | | | | | | | | | | |
Class C | | | | | | | | | | | | | | | | |
Proceeds from shares issued | | $ | 46,807 | | | $ | 406,222 | | | $ | 3,978 | | | $ | 12,272 | |
Distributions reinvested | | | — | | | | 18,351 | | | | 964 | | | | 1,246 | |
Cost of shares redeemed | | | (113,829 | ) | | | (105,053 | ) | | | (7,018 | ) | | | (4,843 | ) |
| | | | | | | | | | | | | | | | |
Change in net assets resulting from Class C capital transactions | | $ | (67,022 | ) | | $ | 319,520 | | | $ | (2,076 | ) | | $ | 8,675 | |
| | | | | | | | | | | | | | | | |
Class R2 | | | | | | | | | | | | | | | | |
Proceeds from shares issued | | $ | — | | | $ | — | | | $ | 58 | | | $ | 235 | |
Distributions reinvested | | | — | | | | — | | | | 13 | | | | 27 | |
Cost of shares redeemed | | | — | | | | — | | | | (163 | ) | | | (320 | ) |
| | | | | | | | | | | | | | | | |
Change in net assets resulting from Class R2 capital transactions | | $ | — | | | $ | — | | | $ | (92 | ) | | $ | (58 | ) |
| | | | | | | | | | | | | | | | |
Class R5 | | | | | | | | | | | | | | | | |
Proceeds from shares issued | | $ | 6,213 | | | $ | 41,933 | | | $ | 200 | | | $ | 2,174 | |
Distributions reinvested | | | — | | | | 2,457 | | | | 93 | | | | 154 | |
Cost of shares redeemed | | | (12,969 | ) | | | (15,257 | ) | | | (400 | ) | | | (861 | ) |
| | | | | | | | | | | | | | | | |
Change in net assets resulting from Class R5 capital transactions | | $ | (6,756 | ) | | $ | 29,133 | | | $ | (107 | ) | | $ | 1,467 | |
| | | | | | | | | | | | | | | | |
Class R6 | | | | | | | | | | | | | | | | |
Proceeds from shares issued | | $ | 86,020 | | | $ | 708,587 | | | $ | 115,360 | | | $ | 260,148 | |
Distributions reinvested | | | — | | | | 83,297 | | | | 51,255 | | | | 65,041 | |
Cost of shares redeemed | | | (116,347 | ) | | | (290,712 | ) | | | (16,215 | ) | | | (112,907 | ) |
| | | | | | | | | | | | | | | | |
Change in net assets resulting from Class R6 capital transactions | | $ | (30,327 | ) | | $ | 501,172 | | | $ | 150,400 | | | $ | 212,282 | |
| | | | | | | | | | | | | | | | |
Select Class | | | | | | | | | | | | | | | | |
Proceeds from shares issued | | $ | 345,180 | | | $ | 709,570 | | | $ | 146,597 | | | $ | 250,507 | |
Distributions reinvested | | | — | | | | 31,907 | | | | 19,260 | | | | 64,677 | |
Cost of shares redeemed | | | (239,421 | ) | | | (865,494 | ) | | | (119,298 | ) | | | (1,207,577 | ) |
| | | | | | | | | | | | | | | | |
Change in net assets resulting from Select Class capital transactions | | $ | 105,759 | | | $ | (124,017 | ) | | $ | 46,559 | | | $ | (892,393 | ) |
| | | | | | | | | | | | | | | | |
Total change in net assets resulting from capital transactions | | $ | (177,525 | ) | | $ | 1,337,047 | | | $ | 194,682 | | | $ | (547,848 | ) |
| | | | | | | | | | | | | | | | |
| | | | | | | | |
| | | |
| DECEMBER 31, 2016 | | J.P. MORGAN MID CAP/MULTI-CAP FUNDS | | | | | 51 | |
SEE NOTES TO FINANCIAL STATEMENTS.
STATEMENTS OF CHANGES IN NET ASSETS
FOR THE PERIODS INDICATED (continued)
(Amounts in thousands)
| | | | | | | | | | | | | | | | |
| | | Growth Advantage Fund | | | Mid Cap Equity Fund | |
| | | Six Months Ended
December 31, 2016
(Unaudited) | | | Year Ended
June 30, 2016 | | | Six Months Ended
December 31, 2016
(Unaudited) | | | Year Ended
June 30, 2016 | |
SHARE TRANSACTIONS: | | | | | | | | | | | | | | | | |
Class A | | | | | | | | | | | | | | | | |
Issued | | | 12,479 | | | | 73,064 | | | | 1,376 | | | | 4,101 | |
Reinvested | | | — | | | | 3,824 | | | | 244 | | | | 299 | |
Redeemed | | | (24,307 | ) | | | (37,546 | ) | | | (1,621 | ) | | | (1,522 | ) |
| | | | | | | | | | | | | | | | |
Change in Class A Shares | | | (11,828 | ) | | | 39,342 | | | | (1 | ) | | | 2,878 | |
| | | | | | | | | | | | | | | | |
Class C | | | | | | | | | | | | | | | | |
Issued | | | 3,456 | | | | 30,118 | | | | 92 | | | | 297 | |
Reinvested | | | — | | | | 1,389 | | | | 22 | | | | 30 | |
Redeemed | | | (8,409 | ) | | | (8,092 | ) | | | (163 | ) | | | (116 | ) |
| | | | | | | | | | | | | | | | |
Change in Class C Shares | | | (4,953 | ) | | | 23,415 | | | | (49 | ) | | | 211 | |
| | | | | | | | | | | | | | | | |
Class R2 | | | | | | | | | | | | | | | | |
Issued | | | — | | | | — | | | | 2 | | | | 6 | |
Reinvested | | | — | | | | — | | | | — | (a) | | | 1 | |
Redeemed | | | — | | | | — | | | | (4 | ) | | | (8 | ) |
| | | | | | | | | | | | | | | | |
Change in Class R2 Shares | | | — | | | | — | | | | (2 | ) | | | (1 | ) |
| | | | | | | | | | | | | | | | |
Class R5 | | | | | | | | | | | | | | | | |
Issued | | | 396 | | | | 2,743 | | | | 5 | | | | 47 | |
Reinvested | | | — | | | | 161 | | | | 2 | | | | 4 | |
Redeemed | | | (829 | ) | | | (1,010 | ) | | | (9 | ) | | | (20 | ) |
| | | | | | | | | | | | | | | | |
Change in Class R5 Shares | | | (433 | ) | | | 1,894 | | | | (2 | ) | | | 31 | |
| | | | | | | | | | | | | | | | |
Class R6 | | | | | | | | | | | | | | | | |
Issued | | | 5,472 | | | | 47,326 | | | | 2,591 | | | | 6,062 | |
Reinvested | | | — | | | | 5,459 | | | | 1,142 | | | | 1,544 | |
Redeemed | | | (7,391 | ) | | | (19,751 | ) | | | (361 | ) | | | (2,766 | ) |
| | | | | | | | | | | | | | | | |
Change in Class R6 Shares | | | (1,919 | ) | | | 33,034 | | | | 3,372 | | | | 4,840 | |
| | | | | | | | | | | | | | | | |
Select Class | | | | | | | | | | | | | | | | |
Issued | | | 22,236 | | | | 46,757 | | | | 3,272 | | | | 5,728 | |
Reinvested | | | — | | | | 2,122 | | | | 430 | | | | 1,536 | |
Redeemed | | | (15,495 | ) | | | (62,228 | ) | | | (2,664 | ) | | | (30,292 | ) |
| | | | | | | | | | | | | | | | |
Change in Select Class Shares | | | 6,741 | | | | (13,349 | ) | | | 1,038 | | | | (23,028 | ) |
| | | | | | | | | | | | | | | | |
| (a) | Amount rounds to less than 500. |
SEE NOTES TO FINANCIAL STATEMENTS.
| | | | | | |
| | | |
| 52 | | | | J.P. MORGAN MID CAP/MULTI-CAP FUNDS | | DECEMBER 31, 2016 |
| | | | | | | | | | | | | | | | |
| | | Mid Cap Growth Fund | | | Mid Cap Value Fund | |
| | | Six Months Ended
December 31, 2016
(Unaudited) | | | Year Ended
June 30, 2016 | | | Six Months Ended
December 31, 2016
(Unaudited) | | | Year Ended
June 30, 2016 | |
CAPITAL TRANSACTIONS: | | | | | | | | | | | | | | | | |
Class A | | | | | | | | | | | | | | | | |
Proceeds from shares issued | | $ | 51,650 | | | $ | 297,295 | | | $ | 221,785 | | | $ | 358,763 | |
Distributions reinvested | | | 434 | | | | 54,215 | | | | 131,660 | | | | 127,887 | |
Cost of shares redeemed | | | (162,932 | ) | | | (221,243 | ) | | | (421,765 | ) | | | (694,701 | ) |
| | | | | | | | | | | | | | | | |
Change in net assets resulting from Class A capital transactions | | $ | (110,848 | ) | | $ | 130,267 | | | $ | (68,320 | ) | | $ | (208,051 | ) |
| | | | | | | | | | | | | | | | |
Class C | | | | | | | | | | | | | | | | |
Proceeds from shares issued | | $ | 5,972 | | | $ | 56,492 | | | $ | 15,892 | | | $ | 28,896 | |
Distributions reinvested | | | 49 | | | | 5,744 | | | | 26,948 | | | | 25,199 | |
Cost of shares redeemed | | | (18,693 | ) | | | (23,954 | ) | | | (65,004 | ) | | | (73,557 | ) |
| | | | | | | | | | | | | | | | |
Change in net assets resulting from Class C capital transactions | | $ | (12,672 | ) | | $ | 38,282 | | | $ | (22,164 | ) | | $ | (19,462 | ) |
| | | | | | | | | | | | | | | | |
Class L (formerly Institutional Class) | | | | | | | | | | | | | | | | |
Proceeds from shares issued | | $ | — | | | $ | — | | | $ | 1,871,498 | | | $ | 2,148,891 | |
Distributions reinvested | | | — | | | | — | | | | 668,444 | | | | 515,077 | |
Cost of shares redeemed | | | — | | | | — | | | | (1,312,613 | ) | | | (2,275,447 | ) |
| | | | | | | | | | | | | | | | |
Change in net assets resulting from Class L capital transactions | | $ | — | | | $ | — | | | $ | 1,227,329 | | | $ | 388,521 | |
| | | | | | | | | | | | | | | | |
Class R2 | | | | | | | | | | | | | | | | |
Proceeds from shares issued | | $ | 11,937 | | | $ | 31,035 | | | $ | 7,937 | | | $ | 14,006 | |
Distributions reinvested | | | 10 | | | | 1,494 | | | | 3,909 | | | | 3,715 | |
Cost of shares redeemed | | | (13,431 | ) | | | (6,825 | ) | | | (11,362 | ) | | | (20,042 | ) |
| | | | | | | | | | | | | | | | |
Change in net assets resulting from Class R2 capital transactions | | $ | (1,484 | ) | | $ | 25,704 | | | $ | 484 | | | $ | (2,321 | ) |
| | | | | | | | | | | | | | | | |
Class R3 (a) | | | | | | | | | | | | | | | | |
Proceeds from shares issued | | $ | 20 | | | $ | — | | | $ | 20 | | | $ | — | |
Distributions reinvested | | | — | (b) | | | — | | | | 1 | | | | — | |
| | | | | | | | | | | | | | | | |
Change in net assets resulting from Class R3 capital transactions | | $ | 20 | | | $ | — | | | $ | 21 | | | $ | — | |
| | | | | | | | | | | | | | | | |
Class R4 (a) | | | | | | | | | | | | | | | | |
Proceeds from shares issued | | $ | 20 | | | $ | — | | | $ | 20 | | | $ | — | |
Distributions reinvested | | | — | (b) | | | — | | | | 1 | | | | — | |
| | | | | | | | | | | | | | | | |
Change in net assets resulting from Class R4 capital transactions | | $ | 20 | | | $ | — | | | $ | 21 | | | $ | — | |
| | | | | | | | | | | | | | | | |
Class R5 (c) | | | | | | | | | | | | | | | | |
Proceeds from shares issued | | $ | 15,729 | | | $ | 120,489 | | | $ | 20 | | | $ | — | |
Distributions reinvested | | | 91 | | | | 8,974 | | | | 1 | | | | — | |
Cost of shares redeemed | | | (28,098 | ) | | | (42,206 | ) | | | — | | | | — | |
| | | | | | | | | | | | | | | | |
Change in net assets resulting from Class R5 capital transactions | | $ | (12,278 | ) | | $ | 87,257 | | | $ | 21 | | | $ | — | |
| | | | | | | | | | | | | | | | |
Class R6 (c) | | | | | | | | | | | | | | | | |
Proceeds from shares issued | | $ | 85,459 | | | $ | 509,276 | | | $ | 49,833 | | | $ | — | |
Distributions reinvested | | | 274 | | | | 23,176 | | | | 2,917 | | | | — | |
Cost of shares redeemed | | | (101,162 | ) | | | (120,874 | ) | | | (864 | ) | | | — | |
| | | | | | | | | | | | | | | | |
Change in net assets resulting from Class R6 capital transactions | | $ | (15,429 | ) | | $ | 411,578 | | | $ | 51,886 | | | $ | — | |
| | | | | | | | | | | | | | | | |
Select Class | | | | | | | | | | | | | | | | |
Proceeds from shares issued | | $ | 140,441 | | | $ | 596,426 | | | $ | 471,695 | | | $ | 575,208 | |
Distributions reinvested | | | 339 | | | | 41,535 | | | | 157,140 | | | | 119,621 | |
Cost of shares redeemed | | | (225,027 | ) | | | (484,304 | ) | | | (304,740 | ) | | | (626,053 | ) |
Redemptions in-kind (See Note 7) | | | — | | | | (602,118 | ) | | | — | | | | — | |
| | | | | | | | | | | | | | | | |
Change in net assets resulting from Select Class capital transactions | | $ | (84,247 | ) | | $ | (448,461 | ) | | $ | 324,095 | | | $ | 68,776 | |
| | | | | | | | | | | | | | | | |
Total change in net assets resulting from capital transactions | | $ | (236,918 | ) | | $ | 244,627 | | | $ | 1,513,373 | | | $ | 227,463 | |
| | | | | | | | | | | | | | | | |
| (a) | Commencement of offering of class of shares effective September 9, 2016 for Mid Cap Growth and Mid Cap Value Fund. |
| (b) | Amount rounds to less than 500. |
| (c) | Commencement of offering of class of shares effective September 9, 2016 for Mid Cap Value Fund. |
| | | | | | | | |
| | | |
| DECEMBER 31, 2016 | | J.P. MORGAN MID CAP/MULTI-CAP FUNDS | | | | | 53 | |
SEE NOTES TO FINANCIAL STATEMENTS.
STATEMENTS OF CHANGES IN NET ASSETS
FOR THE PERIODS INDICATED (continued)
(Amounts in thousands)
| | | | | | | | | | | | | | | | |
| | | Mid Cap Growth Fund | | | Mid Cap Value Fund | |
| | | Six Months Ended
December 31, 2016
(Unaudited) | | | Year Ended
June 30, 2016 | | | Six Months Ended
December 31, 2016
(Unaudited) | | | Year Ended
June 30, 2016 | |
SHARE TRANSACTIONS: | | | | | | | | | | | | | | | | |
Class A | | | | | | | | | | | | | | | | |
Issued | | | 2,134 | | | | 11,900 | | | | 6,105 | | | | 10,465 | |
Reinvested | | | 18 | | | | 2,266 | | | | 3,648 | | | | 3,881 | |
Redeemed | | | (6,702 | ) | | | (9,178 | ) | | | (11,605 | ) | | | (20,274 | ) |
| | | | | | | | | | | | | | | | |
Change in Class A Shares | | | (4,550 | ) | | | 4,988 | | | | (1,852 | ) | | | (5,928 | ) |
| | | | | | | | | | | | | | | | |
Class C | | | | | | | | | | | | | | | | |
Issued | | | 302 | | | | 2,722 | | | | 455 | | | | 877 | |
Reinvested | | | 3 | | | | 295 | | | | 778 | | | | 794 | |
Redeemed | | | (950 | ) | | | (1,230 | ) | | | (1,855 | ) | | | (2,221 | ) |
| | | | | | | | | | | | | | | | |
Change in Class C Shares | | | (645 | ) | | | 1,787 | | | | (622 | ) | | | (550 | ) |
| | | | | | | | | | | | | | | | |
Class L (formerly Institutional Class) | | | | | | | | | | | | | | | | |
Issued | | | — | | | | — | | | | 50,236 | | | | 61,500 | |
Reinvested | | | — | | | | — | | | | 18,060 | | | | 15,274 | |
Redeemed | | | — | | | | — | | | | (35,291 | ) | | | (65,137 | ) |
| | | | | | | | | | | | | | | | |
Change in Class L Shares | | | — | | | | — | | | | 33,005 | | | | 11,637 | |
| | | | | | | | | | | | | | | | |
Class R2 | | | | | | | | | | | | | | | | |
Issued | | | 450 | | | | 1,143 | | | | 226 | | | | 421 | |
Reinvested | | | — | (a) | | | 57 | | | | 113 | | | | 117 | |
Redeemed | | | (508 | ) | | | (266 | ) | | | (325 | ) | | | (606 | ) |
| | | | | | | | | | | | | | | | |
Change in Class R2 Shares | | | (58 | ) | | | 934 | | | | 14 | | | | (68 | ) |
| | | | | | | | | | | | | | | | |
Class R3 (b) | | | | | | | | | | | | | | | | |
Issued | | | 1 | | | | — | | | | 1 | | | | — | |
Reinvested | | | — | (a) | | | — | | | | — | (a) | | | — | |
| | | | | | | | | | | | | | | | |
Change in Class R3 Shares | | | 1 | | | | — | | | | 1 | | | | — | |
| | | | | | | | | | | | | | | | |
Class R4 (b) | | | | | | | | | | | | | | | | |
Issued | | | 1 | | | | — | | | | 1 | | | | — | |
Reinvested | | | — | (a) | | | — | | | | — | (a) | | | — | |
| | | | | | | | | | | | | | | | |
Change in Class R4 Shares | | | 1 | | | | — | | | | 1 | | | | — | |
| | | | | | | | | | | | | | | | |
Class R5 (c) | | | | | | | | | | | | | | | | |
Issued | | | 565 | | | | 4,352 | | | | — | (a) | | | — | |
Reinvested | | | 3 | | | | 329 | | | | — | (a) | | | — | |
Redeemed | | | (1,011 | ) | | | (1,554 | ) | | | — | | | | — | |
| | | | | | | | | | | | | | | | |
Change in Class R5 Shares | | | (443 | ) | | | 3,127 | | | | — | (a) | | | — | |
| | | | | | | | | | | | | | | | |
Class R6 (c) | | | | | | | | | | | | | | | | |
Issued | | | 3,074 | | | | 18,275 | | | | 1,351 | | | | — | |
Reinvested | | | 10 | | | | 849 | | | | 79 | | | | — | |
Redeemed | | | (3,652 | ) | | | (4,509 | ) | | | (22 | ) | | | — | |
| | | | | | | | | | | | | | | | |
Change in Class R6 Shares | | | (568 | ) | | | 14,615 | | | | 1,408 | | | | — | |
| | | | | | | | | | | | | | | | |
Select Class | | | | | | | | | | | | | | | | |
Issued | | | 5,108 | | | | 21,225 | | | | 12,833 | | | | 16,809 | |
Reinvested | | | 12 | | | | 1,536 | | | | 4,300 | | | | 3,589 | |
Redeemed | | | (8,188 | ) | | | (17,722 | ) | | | (8,277 | ) | | | (18,078 | ) |
Redemptions in-kind (See Note 7) | | | — | | | | (20,287 | ) | | | — | | | | — | |
| | | | | | | | | | | | | | | | |
Change in Select Class Shares | | | (3,068 | ) | | | (15,248 | ) | | | 8,856 | | | | 2,320 | |
| | | | | | | | | | | | | | | | |
| (a) | Amount rounds to less than 500. |
| (b) | Commencement of offering of class of shares effective September 9, 2016 for Mid Cap Growth and Mid Cap Value Fund. |
| (c) | Commencement of offering of class of shares effective September 9, 2016 for Mid Cap Value Fund. |
SEE NOTES TO FINANCIAL STATEMENTS.
| | | | | | |
| | | |
| 54 | | | | J.P. MORGAN MID CAP/MULTI-CAP FUNDS | | DECEMBER 31, 2016 |
| | | | | | | | | | | | | | | | |
| | | Multi-Cap Market Neutral Fund | | | Value Advantage Fund | |
| | | Six Months Ended
December 31, 2016
(Unaudited) | | | Year Ended
June 30, 2016 | | | Six Months Ended
December 31, 2016
(Unaudited) | | | Year Ended
June 30, 2016 | |
CAPITAL TRANSACTIONS: | | | | | | | | | | | | | | | | |
Class A | | | | | | | | | | | | | | | | |
Proceeds from shares issued | | $ | 358 | | | $ | 3,218 | | | $ | 249,524 | | | $ | 696,311 | |
Distributions reinvested | | | — | | | | — | | | | 16,190 | | | | 34,339 | |
Cost of shares redeemed | | | (1,641 | ) | | | (2,889 | ) | | | (667,420 | ) | | | (1,032,013 | ) |
| | | | | | | | | | | | | | | | |
Change in net assets resulting from Class A capital transactions | | $ | (1,283 | ) | | $ | 329 | | | $ | (401,706 | ) | | $ | (301,363 | ) |
| | | | | | | | | | | | | | | | |
Class C | | | | | | | | | | | | | | | | |
Proceeds from shares issued | | $ | 43 | | | $ | 1,852 | | | $ | 55,004 | | | $ | 188,939 | |
Distributions reinvested | | | — | | | | — | | | | 3,544 | | | | 7,489 | |
Cost of shares redeemed | | | (1,039 | ) | | | (2,446 | ) | | | (100,080 | ) | | | (140,118 | ) |
| | | | | | | | | | | | | | | | |
Change in net assets resulting from Class C capital transactions | | $ | (996 | ) | | $ | (594 | ) | | $ | (41,532 | ) | | $ | 56,310 | |
| | | | | | | | | | | | | | | | |
Class L (formerly Institutional Class) | | | | | | | | | | | | | | | | |
Proceeds from shares issued | | $ | — | | | $ | — | | | $ | 751,803 | | | $ | 3,435,571 | |
Distributions reinvested | | | — | | | | — | | | | 45,687 | | | | 138,955 | |
Cost of shares redeemed | | | — | | | | — | | | | (3,455,528 | ) | | | (2,438,224 | ) |
| | | | | | | | | | | | | | | | |
Change in net assets resulting from Class L capital transactions | | $ | — | | | $ | — | | | $ | (2,658,038 | ) | | $ | 1,136,302 | |
| | | | | | | | | | | | | | | | |
Class R3 (a) | | | | | | | | | | | | | | | | |
Proceeds from shares issued | | $ | — | | | $ | — | | | $ | 20 | | | $ | — | |
Distributions reinvested | | | — | | | | — | | | | — | | | | — | |
Cost of shares redeemed | | | — | | | | — | | | | — | (b) | | | — | |
| | | | | | | | | | | | | | | | |
Change in net assets resulting from Class R3 capital transactions | | $ | — | | | $ | — | | | $ | 20 | | | $ | — | |
| | | | | | | | | | | | | | | | |
Class R4 (a) | | | | | | | | | | | | | | | | |
Proceeds from shares issued | | $ | — | | | $ | — | | | $ | 20 | | | $ | — | |
Distributions reinvested | | | — | | | | — | | | | — | (b) | | | — | |
Cost of shares redeemed | | | — | | | | — | | | | — | (b) | | | — | |
| | | | | | | | | | | | | | | | |
Change in net assets resulting from Class R4 capital transactions | | $ | — | | | $ | — | | | $ | 20 | | | $ | — | |
| | | | | | | | | | | | | | | | |
Class R5 (a) | | | | | | | | | | | | | | | | |
Proceeds from shares issued | | $ | — | | | $ | — | | | $ | 20 | | | $ | — | |
Distributions reinvested | | | — | | | | — | | | | — | (b) | | | — | |
Cost of shares redeemed | | | — | | | | — | | | | — | (b) | | | — | |
| | | | | | | | | | | | | | | | |
Change in net assets resulting from Class R5 capital transactions | | $ | — | | | $ | — | | | $ | 20 | | | $ | — | |
| | | | | | | | | | | | | | | | |
Class R6 (a) | | | | | | | | | | | | | | | | |
Proceeds from shares issued | | $ | — | | | $ | — | | | $ | 2,868,862 | | | $ | — | |
Distributions reinvested | | | — | | | | — | | | | 44,017 | | | | — | |
Cost of shares redeemed | | | — | | | | — | | | | (239,419 | ) | | | — | |
| | | | | | | | | | | | | | | | |
Change in net assets resulting from Class R6 capital transactions | | $ | — | | | $ | — | | | $ | 2,673,460 | | | $ | — | |
| | | | | | | | | | | | | | | | |
Select Class | | | | | | | | | | | | | | | | |
Proceeds from shares issued | | $ | 1,146 | | | $ | 4,346 | | | $ | 271,022 | | | $ | 675,086 | |
Distributions reinvested | | | — | | | | — | | | | 12,528 | | | | 17,378 | |
Cost of shares redeemed | | | (21,211 | ) | | | (111,621 | ) | | | (412,722 | ) | | | (2,253,026 | ) |
| | | | | | | | | | | | | | | | |
Change in net assets resulting from Select Class capital transactions | | $ | (20,065 | ) | | $ | (107,275 | ) | | $ | (129,172 | ) | | $ | (1,560,562 | ) |
| | | | | | | | | | | | | | | | |
Total change in net assets resulting from capital transactions | | $ | (22,344 | ) | | $ | (107,540 | ) | | $ | (556,928 | ) | | $ | (669,313 | ) |
| | | | | | | | | | | | | | | | |
| (a) | Commencement of offering of class of shares effective September 9, 2016 for Value Advantage Fund. |
| (b) | Amount rounds to less than 500. |
| | | | | | | | |
| | | |
| DECEMBER 31, 2016 | | J.P. MORGAN MID CAP/MULTI-CAP FUNDS | | | | | 55 | |
SEE NOTES TO FINANCIAL STATEMENTS.
STATEMENTS OF CHANGES IN NET ASSETS
FOR THE PERIODS INDICATED (continued)
(Amounts in thousands)
| | | | | | | | | | | | | | | | |
| | | Multi-Cap Market Neutral Fund | | | Value Advantage Fund | |
| | | Six Months Ended
December 31, 2016
(Unaudited) | | | Year Ended
June 30, 2016 | | | Six Months Ended
December 31, 2016
(Unaudited) | | | Year Ended
June 30, 2016 | |
SHARE TRANSACTIONS: | | | | | | | | | | | | | | | | |
Class A | | | | | | | | | | | | | | | | |
Issued | | | 35 | | | | 316 | | | | 8,253 | | | | 24,694 | |
Reinvested | | | — | | | | — | | | | 497 | | | | 1,244 | |
Redeemed | | | (165 | ) | | | (284 | ) | | | (22,341 | ) | | | (36,328 | ) |
| | | | | | | | | | | | | | | | |
Change in Class A Shares | | | (130 | ) | | | 32 | | | | (13,591 | ) | | | (10,390 | ) |
| | | | | | | | | | | | | | | | |
Class C | | | | | | | | | | | | | | | | |
Issued | | | 5 | | | | 194 | | | | 1,798 | | | | 6,724 | |
Reinvested | | | — | | | | — | | | | 109 | | | | 273 | |
Redeemed | | | (112 | ) | | | (258 | ) | | | (3,328 | ) | | | (5,029 | ) |
| | | | | | | | | | | | | | | | |
Change in Class C Shares | | | (107 | ) | | | (64 | ) | | | (1,421 | ) | | | 1,968 | |
| | | | | | | | | | | | | | | | |
Class L (formerly Institutional Class) | | | | | | | | | | | | | | | | |
Issued | | | — | | | | — | | | | 24,782 | | | | 120,136 | |
Reinvested | | | — | | | | — | | | | 1,397 | | | | 5,004 | |
Redeemed | | | — | | | | — | | | | (116,928 | ) | | | (88,948 | ) |
| | | | | | | | | | | | | | | | |
Change in Class L Shares | | | — | | | | — | | | | (90,749 | ) | | | 36,192 | |
| | | | | | | | | | | | | | | | |
Class R3 (a) | | | | | | | | | | | | | | | | |
Issued | | | — | | | | — | | | | 1 | | | | — | |
Reinvested | | | — | | | | — | | | | — | (b) | | | — | |
| | | | | | | | | | | | | | | | |
Change in Class R3 Shares | | | — | | | | — | | | | 1 | | | | — | |
| | | | | | | | | | | | | | | | |
Class R4 (a) | | | | | | | | | | | | | | | | |
Issued | | | — | | | | — | | | | 1 | | | | — | |
Reinvested | | | — | | | | — | | | | — | (b) | | | — | |
| | | | | | | | | | | | | | | | |
Change in Class R4 Shares | | | — | | | | — | | | | 1 | | | | — | |
| | | | | | | | | | | | | | | | |
Class R5 (a) | | | | | | | | | | | | | | | | |
Issued | | | — | | | | — | | | | 1 | | | | — | |
Reinvested | | | — | | | | — | | | | — | (b) | | | — | |
| | | | | | | | | | | | | | | | |
Change in Class R5 Shares | | | — | | | | — | | | | 1 | | | | — | |
| | | | | | | | | | | | | | | | |
Class R6 (a) | | | | | | | | | | | | | | | | |
Issued | | | — | | | | — | | | | 97,357 | | | | — | |
Reinvested | | | — | | | | — | | | | 1,347 | | | | — | |
Redeemed | | | — | | | | — | | | | (7,512 | ) | | | — | |
| | | | | | | | | | | | | | | | |
Change in Class R6 Shares | | | — | | | | — | | | | 91,192 | | | | — | |
| | | | | | | | | | | | | | | | |
Select Class | | | | | | | | | | | | | | | | |
Issued | | | 112 | | | | 416 | | | | 8,876 | | | | 24,052 | |
Reinvested | | | — | | | | — | | | | 383 | | | | 626 | |
Redeemed | | | (2,073 | ) | | | (10,669 | ) | | | (13,678 | ) | | | (78,871 | ) |
| �� | | | | | | | | | | | | | | | |
Change in Select Class Shares | | | (1,961 | ) | | | (10,253 | ) | | | (4,419 | ) | | | (54,193 | ) |
| | | | | | | | | | | | | | | | |
| (a) | Commencement of offering of class of shares effective September 9, 2016 for Value Advantage Fund. |
| (b) | Amount rounds to less than 500. |
SEE NOTES TO FINANCIAL STATEMENTS.
| | | | | | |
| | | |
| 56 | | | | J.P. MORGAN MID CAP/MULTI-CAP FUNDS | | DECEMBER 31, 2016 |
THIS PAGE IS INTENTIONALLY LEFT BLANK
| | | | | | | | |
| | | |
| DECEMBER 31, 2016 | | J.P. MORGAN MID CAP/MULTI-CAP FUNDS | | | | | 57 | |
FINANCIAL HIGHLIGHTS
FOR THE PERIODS INDICATED
| | | | | | | | | | | | | | | | | | | | | | | | | | | | |
| | | Per share operating performance | |
| | | | | | Investment operations | | | Distributions | |
| | | Net asset
value,
beginning
of period | | | Net
investment
income
(loss) (b) | | | Net realized
and unrealized
gains
(losses) on
investments | | | Total from
investment
operations | | | Net
investment
income | | | Net
realized
gain | | | Total
distributions | |
Growth Advantage Fund | | | | | | | | | | | | | | | | | | | | | | | | | | | | |
Class A | | | | | | | | | | | | | | | | | | | | | | | | | | | | |
Six Months Ended December 31, 2016 (Unaudited) | | $ | 14.42 | | | $ | (0.05 | ) | | $ | 0.80 | | | $ | 0.75 | | | $ | — | | | $ | — | | | $ | — | |
Year Ended June 30, 2016 | | | 15.74 | | | | (0.08 | ) | | | (0.71 | ) | | | (0.79 | ) | | | — | | | | (0.53 | ) | | | (0.53 | ) |
Year Ended June 30, 2015 | | | 14.24 | | | | (0.10 | ) | | | 2.17 | | | | 2.07 | | | | — | | | | (0.57 | ) | | | (0.57 | ) |
Year Ended June 30, 2014 | | | 11.43 | | | | (0.07 | ) | | | 3.52 | | | | 3.45 | | | | — | | | | (0.64 | ) | | | (0.64 | ) |
Year Ended June 30, 2013 | | | 9.49 | | | | 0.01 | (g) | | | 1.97 | | | | 1.98 | | | | (0.01 | ) | | | (0.03 | ) | | | (0.04 | ) |
Year Ended June 30, 2012 | | | 9.28 | | | | (0.03 | )(h) | | | 0.24 | | | | 0.21 | | | | — | | | | — | | | | — | |
| | | | | | | |
Class C | | | | | | | | | | | | | | | | | | | | | | | | | | | | |
Six Months Ended December 31, 2016 (Unaudited) | | | 12.91 | | | | (0.08 | ) | | | 0.72 | | | | 0.64 | | | | — | | | | — | | | | — | |
Year Ended June 30, 2016 | | | 14.22 | | | | (0.14 | ) | | | (0.64 | ) | | | (0.78 | ) | | | — | | | | (0.53 | ) | | | (0.53 | ) |
Year Ended June 30, 2015 | | | 12.98 | | | | (0.15 | ) | | | 1.96 | | | | 1.81 | | | | — | | | | (0.57 | ) | | | (0.57 | ) |
Year Ended June 30, 2014 | | | 10.51 | | | | (0.12 | ) | | | 3.23 | | | | 3.11 | | | | — | | | | (0.64 | ) | | | (0.64 | ) |
Year Ended June 30, 2013 | | | 8.77 | | | | (0.04 | )(g) | | | 1.81 | | | | 1.77 | | | | — | | | | (0.03 | ) | | | (0.03 | ) |
Year Ended June 30, 2012 | | | 8.61 | | | | (0.07 | )(h) | | | 0.23 | | | | 0.16 | | | | — | | | | — | | | | — | |
| | | | | | | |
Class R5 | | | | | | | | | | | | | | | | | | | | | | | | | | | | |
Six Months Ended December 31, 2016 (Unaudited) | | | 14.96 | | | | (0.02 | ) | | | 0.83 | | | | 0.81 | | | | — | | | | — | | | | — | |
Year Ended June 30, 2016 | | | 16.25 | | | | (0.03 | ) | | | (0.73 | ) | | | (0.76 | ) | | | — | | | | (0.53 | ) | | | (0.53 | ) |
Year Ended June 30, 2015 | | | 14.63 | | | | (0.04 | ) | | | 2.23 | | | | 2.19 | | | | — | | | | (0.57 | ) | | | (0.57 | ) |
Year Ended June 30, 2014 | | | 11.68 | | | | (0.02 | ) | | | 3.61 | | | | 3.59 | | | | — | | | | (0.64 | ) | | | (0.64 | ) |
Year Ended June 30, 2013 | | | 9.69 | | | | 0.06 | (g) | | | 2.01 | | | | 2.07 | | | | (0.05 | ) | | | (0.03 | ) | | | (0.08 | ) |
Year Ended June 30, 2012 | | | 9.44 | | | | 0.01 | (h) | | | 0.24 | | | | 0.25 | | | | — | | | | — | | | | — | |
| | | | | | | |
Class R6 | | | | | | | | | | | | | | | | | | | | | | | | | | | | |
Six Months Ended December 31, 2016 (Unaudited) | | | 15.00 | | | | (0.01 | ) | | | 0.83 | | | | 0.82 | | | | — | | | | — | | | | — | |
Year Ended June 30, 2016 | | | 16.27 | | | | (0.01 | ) | | | (0.73 | ) | | | (0.74 | ) | | | — | | | | (0.53 | ) | | | (0.53 | ) |
Year Ended June 30, 2015 | | | 14.64 | | | | (0.03 | ) | | | 2.23 | | | | 2.20 | | | | — | | | | (0.57 | ) | | | (0.57 | ) |
December 23, 2013 (i) through June 30, 2014 | | | 13.86 | | | | (0.01 | ) | | | 0.79 | | | | 0.78 | | | | — | | | | — | | | | — | |
| | | | | | | |
Select Class | | | | | | | | | | | | | | | | | | | | | | | | | | | | |
Six Months Ended December 31, 2016 (Unaudited) | | | 14.75 | | | | (0.03 | ) | | | 0.82 | | | | 0.79 | | | | — | | | | — | | | | — | |
Year Ended June 30, 2016 | | | 16.06 | | | | (0.06 | ) | | | (0.72 | ) | | | (0.78 | ) | | | — | | | | (0.53 | ) | | | (0.53 | ) |
Year Ended June 30, 2015 | | | 14.50 | | | | (0.07 | ) | | | 2.20 | | | | 2.13 | | | | — | | | | (0.57 | ) | | | (0.57 | ) |
Year Ended June 30, 2014 | | | 11.60 | | | | (0.04 | ) | | | 3.58 | | | | 3.54 | | | | — | | | | (0.64 | ) | | | (0.64 | ) |
Year Ended June 30, 2013 | | | 9.63 | | | | 0.04 | (g) | | | 1.98 | | | | 2.02 | | | | (0.02 | ) | | | (0.03 | ) | | | (0.05 | ) |
Year Ended June 30, 2012 | | | 9.39 | | | | (0.02 | )(h) | | | 0.26 | | | | 0.24 | | | | — | | | | — | | | | — | |
| (a) | Annualized for periods less than one year, unless otherwise noted. |
| (b) | Calculated based upon average shares outstanding. |
| (c) | Not annualized for periods less than one year. |
| (d) | Includes adjustments in accordance with accounting principles generally accepted in the United States of America and as such, the net asset values for financial reporting purposes and the returns based upon those net asset values may differ from the net asset values and returns for shareholder transactions. |
| (e) | Includes earnings credits and interest expense, if applicable, each of which is less than 0.005% unless otherwise noted. |
| (f) | Portfolio turnover is calculated by dividing the lesser of total purchases or sales of portfolio securities for the reporting period by the monthly average value of portfolio securities owned during the reporting period. Excluded from both the numerator and denominator are amounts relating to derivatives and securities whose maturities or expiration dates at the time of acquisition were one year or less. |
| (g) | Reflects special dividends paid out during the period by several of the Fund’s holdings. Had the Fund not received the special dividends, the net investment income (loss) per share would have been $(0.02), $(0.06), $0.03 and $0.01 for Class A, Class C, Class R5 and Select Class Shares, respectively, and the net investment income (loss) ratio would have been (0.17)%, (0.66)%, 0.27% and 0.09% for Class A, Class C, Class R5 and Select Class Shares, respectively. |
| (h) | Reflects a special dividend paid out during the period by one of the Fund’s holdings. Had the Fund not received the special dividend, the net investment income (loss) per share would have been $(0.05), $(0.09), $(0.01) and $(0.03) for Class A, Class C, Class R5 and Select Class Shares, respectively, and the net investment income (loss) ratio would have been (0.56)%, (1.03)%, (0.12)% and (0.37)% for Class A, Class C, Class R5 and Select Class Shares, respectively. |
| (i) | Commencement of offering of class of shares. |
SEE NOTES TO FINANCIAL STATEMENTS.
| | | | | | |
| | | |
| 58 | | | | J.P. MORGAN MID CAP/MULTI-CAP FUNDS | | DECEMBER 31, 2016 |
| | | | | | | | | | | | | | | | | | | | | | | | | | |
| | | Ratios/Supplemental data | |
| | | | | | | | | | Ratios to average net assets (a) | | | | |
Net asset
value,
end of
period | | | Total return
(excludes
sales charge) (c)(d) | | | Net assets,
end of
period
(000’s) | | | Net
expenses (e) | | | Net
investment
income
(loss) | | |
Expenses
without waivers,
reimbursements and
earnings credits | | | Portfolio
turnover
rate (c)(f) | |
| | | | | | | | | | | | | | | | | | | | | | | | | | |
| | | | | | | | | | | | | | | | | | | | | | | | | | |
| $ | 15.17 | | | | 5.20 | % | | $ | 1,549,154 | | | | 1.24 | % | | | (0.62 | )% | | | 1.34 | % | | | 17 | % |
| | 14.42 | | | | (5.07 | ) | | | 1,643,136 | | | | 1.25 | | | | (0.55 | ) | | | 1.35 | | | | 46 | |
| | 15.74 | | | | 14.99 | | | | 1,174,260 | | | | 1.24 | | | | (0.65 | ) | | | 1.35 | | | | 46 | |
| | 14.24 | | | | 30.69 | | | | 717,564 | | | | 1.24 | | | | (0.51 | ) | | | 1.31 | | | | 62 | |
| | 11.43 | | | | 20.95 | | | | 276,670 | | | | 1.24 | | | | 0.11 | (g) | | | 1.28 | | | | 76 | |
| | 9.49 | | | | 2.26 | | | | 194,911 | | | | 1.25 | | | | (0.37 | )(h) | | | 1.30 | | | | 86 | |
| | | | | | |
| | | | | | | | | | | | | | | | | | | | | | | | | | |
| | 13.55 | | | | 4.96 | | | | 556,435 | | | | 1.74 | | | | (1.12 | ) | | | 1.84 | | | | 17 | |
| | 12.91 | | | | (5.55 | ) | | | 594,190 | | | | 1.75 | | | | (1.04 | ) | | | 1.85 | | | | 46 | |
| | 14.22 | | | | 14.43 | | | | 321,500 | | | | 1.74 | | | | (1.14 | ) | | | 1.84 | | | | 46 | |
| | 12.98 | | | | 30.12 | | | | 144,229 | | | | 1.74 | | | | (1.01 | ) | | | 1.81 | | | | 62 | |
| | 10.51 | | | | 20.27 | | | | 42,655 | | | | 1.74 | | | | (0.38 | )(g) | | | 1.78 | | | | 76 | |
| | 8.77 | | | | 1.86 | | | | 27,469 | | | | 1.75 | | | | (0.84 | )(h) | | | 1.80 | | | | 86 | |
| | | | | | |
| | | | | | | | | | | | | | | | | | | | | | | | | | |
| | 15.77 | | | | 5.41 | | | | 79,977 | | | | 0.87 | | | | (0.25 | ) | | | 0.89 | | | | 17 | |
| | 14.96 | | | | (4.72 | ) | | | 82,358 | | | | 0.89 | | | | (0.20 | ) | | | 0.90 | | | | 46 | |
| | 16.25 | | | | 15.42 | | | | 58,686 | | | | 0.86 | | | | (0.25 | ) | | | 0.87 | | | | 46 | |
| | 14.63 | | | | 31.25 | | | | 1,453,864 | | | | 0.85 | | | | (0.11 | ) | | | 0.86 | | | | 62 | |
| | 11.68 | | | | 21.49 | | | | 835,233 | | | | 0.83 | | | | 0.55 | (g) | | | 0.84 | | | | 76 | |
| | 9.69 | | | | 2.65 | | | | 468,064 | | | | 0.85 | | | | 0.07 | (h) | | | 0.85 | | | | 86 | |
| | | | | | |
| | | | | | | | | | | | | | | | | | | | | | | | | | |
| | 15.82 | | | | 5.47 | | | | 2,839,301 | | | | 0.74 | | | | (0.12 | ) | | | 0.75 | | | | 17 | |
| | 15.00 | | | | (4.59 | ) | | | 2,720,935 | | | | 0.76 | | | | (0.07 | ) | | | 0.76 | | | | 46 | |
| | 16.27 | | | | 15.48 | | | | 2,414,333 | | | | 0.76 | | | | (0.17 | ) | | | 0.77 | | | | 46 | |
| | 14.64 | | | | 5.63 | | | | 271,958 | | | | 0.80 | | | | (0.15 | ) | | | 0.82 | | | | 62 | |
| | | | | | |
| | | | | | | | | | | | | | | | | | | | | | | | | | |
| | 15.54 | | | | 5.36 | | | | 1,076,793 | | | | 1.02 | | | | (0.40 | ) | | | 1.05 | | | | 17 | |
| | 14.75 | | | | (4.91 | ) | | | 922,981 | | | | 1.08 | | | | (0.41 | ) | | | 1.09 | | | | 46 | |
| | 16.06 | | | | 15.14 | | | | 1,219,501 | | | | 1.09 | | | | (0.48 | ) | | | 1.09 | | | | 46 | |
| | 14.50 | | | | 31.03 | | | | 975,175 | | | | 1.05 | | | | (0.30 | ) | | | 1.06 | | | | 62 | |
| | 11.60 | | | | 21.14 | | | | 842,783 | | | | 1.03 | | | | 0.37 | (g) | | | 1.03 | | | | 76 | |
| | 9.63 | | | | 2.56 | | | | 662,786 | | | | 1.05 | | | | (0.18 | )(h) | | | 1.05 | | | | 86 | |
SEE NOTES TO FINANCIAL STATEMENTS.
| | | | | | | | |
| | | |
| DECEMBER 31, 2016 | | J.P. MORGAN MID CAP/MULTI-CAP FUNDS | | | | | 59 | |
FINANCIAL HIGHLIGHTS
FOR THE PERIODS INDICATED (continued)
| | | | | | | | | | | | | | | | | | | | | | | | | | | | |
| | | Per share operating performance | | | | |
| | | | | | Investment operations | | | Distributions | |
| | | Net asset
value,
beginning
of period | | | Net
investment
income
(loss) (b) | | | Net realized
and unrealized
gains
(losses) on
investments | | | Total from
investment
operations | | | Net
investment
income | | | Net
realized
gain | | | Total
distributions | |
Mid Cap Equity Fund | | | | | | | | | | | | | | | | | | | | | | | | | | | | |
Class A | | | | | | | | | | | | | | | | | | | | | | | | | | | | |
Six Months Ended December 31, 2016 (Unaudited) | | $ | 42.95 | | | $ | (0.02 | ) | | $ | 2.35 | | | $ | 2.33 | | | $ | (0.05 | ) | | $ | (1.37 | ) | | $ | (1.42 | ) |
Year Ended June 30, 2016 | | | 47.12 | | | | (0.01 | ) | | | (2.02 | ) | | | (2.03 | ) | | | (0.03 | ) | | | (2.11 | ) | | | (2.14 | ) |
Year Ended June 30, 2015 | | | 44.91 | | | | (0.03 | ) | | | 4.32 | | | | 4.29 | | | | (0.02 | ) | | | (2.06 | ) | | | (2.08 | ) |
Year Ended June 30, 2014 | | | 38.10 | | | | (0.04 | ) | | | 10.25 | | | | 10.21 | | | | (0.02 | ) | | | (3.38 | ) | | | (3.40 | ) |
Year Ended June 30, 2013 | | | 30.97 | | | | 0.10 | (h) | | | 7.36 | | | | 7.46 | | | | (0.07 | ) | | | (0.26 | ) | | | (0.33 | ) |
Year Ended June 30, 2012 | | | 31.29 | | | | 0.10 | (i) | | | (0.34 | ) | | | (0.24 | ) | | | (0.08 | ) | | | — | | | | (0.08 | ) |
| | | | | | | |
Class C | | | | | | | | | | | | | | | | | | | | | | | | | | | | |
Six Months Ended December 31, 2016 (Unaudited) | | | 41.85 | | | | (0.13 | ) | | | 2.28 | | | | 2.15 | | | | — | | | | (1.37 | ) | | | (1.37 | ) |
Year Ended June 30, 2016 | | | 46.16 | | | | (0.23 | ) | | | (1.97 | ) | | | (2.20 | ) | | | — | | | | (2.11 | ) | | | (2.11 | ) |
Year Ended June 30, 2015 | | | 44.21 | | | | (0.25 | ) | | | 4.23 | | | | 3.98 | | | | — | | | | (2.03 | ) | | | (2.03 | ) |
Year Ended June 30, 2014 | | | 37.71 | | | | (0.24 | ) | | | 10.12 | | | | 9.88 | | | | — | | | | (3.38 | ) | | | (3.38 | ) |
Year Ended June 30, 2013 | | | 30.75 | | | | (0.07 | )(h) | | | 7.29 | | | | 7.22 | | | | — | (g) | | | (0.26 | ) | | | (0.26 | ) |
Year Ended June 30, 2012 | | | 31.16 | | | | (0.05 | )(i) | | | (0.35 | ) | | | (0.40 | ) | | | (0.01 | ) | | | — | | | | (0.01 | ) |
| | | | | | | |
Class R2 | | | | | | | | | | | | | | | | | | | | | | | | | | | | |
Six Months Ended December 31, 2016 (Unaudited) | | | 42.75 | | | | (0.08 | ) | | | 2.33 | | | | 2.25 | | | | (0.01 | ) | | | (1.37 | ) | | | (1.38 | ) |
Year Ended June 30, 2016 | | | 46.98 | | | | (0.13 | ) | | | (1.99 | ) | | | (2.12 | ) | | | — | | | | (2.11 | ) | | | (2.11 | ) |
Year Ended June 30, 2015 | | | 44.87 | | | | (0.14 | ) | | | 4.30 | | | | 4.16 | | | | — | | | | (2.05 | ) | | | (2.05 | ) |
March 14, 2014 (j) through June 30, 2014 | | | 42.92 | | | | (0.05 | ) | | | 2.01 | | | | 1.96 | | | | (0.01 | ) | | | — | | | | (0.01 | ) |
| | | | | | | |
Class R5 | | | | | | | | | | | | | | | | | | | | | | | | | | | | |
Six Months Ended December 31, 2016 (Unaudited) | | | 43.43 | | | | 0.08 | | | | 2.37 | | | | 2.45 | | | | (0.14 | ) | | | (1.37 | ) | | | (1.51 | ) |
Year Ended June 30, 2016 | | | 47.49 | | | | 0.18 | | | | (2.03 | ) | | | (1.85 | ) | | | (0.10 | ) | | | (2.11 | ) | | | (2.21 | ) |
Year Ended June 30, 2015 | | | 45.15 | | | | 0.20 | | | | 4.33 | | | | 4.53 | | | | (0.13 | ) | | | (2.06 | ) | | | (2.19 | ) |
March 14, 2014 (j) through June 30, 2014 | | | 43.14 | | | | 0.04 | | | | 2.02 | | | | 2.06 | | | | (0.05 | ) | | | — | | | | (0.05 | ) |
| | | | | | | |
Class R6 | | | | | | | | | | | | | | | | | | | | | | | | | | | | |
Six Months Ended December 31, 2016 (Unaudited) | | | 43.44 | | | | 0.09 | | | | 2.37 | | | | 2.46 | | | | (0.16 | ) | | | (1.37 | ) | | | (1.53 | ) |
Year Ended June 30, 2016 | | | 47.49 | | | | 0.20 | | | | (2.02 | ) | | | (1.82 | ) | | | (0.12 | ) | | | (2.11 | ) | | | (2.23 | ) |
Year Ended June 30, 2015 | | | 45.15 | | | | 0.20 | | | | 4.34 | | | | 4.54 | | | | (0.14 | ) | | | (2.06 | ) | | | (2.20 | ) |
March 14, 2014 (j) through June 30, 2014 | | | 43.14 | | | | 0.04 | | | | 2.02 | | | | 2.06 | | | | (0.05 | ) | | | — | | | | (0.05 | ) |
| | | | | | | |
Select Class | | | | | | | | | | | | | | | | | | | | | | | | | | | | |
Six Months Ended December 31, 2016 (Unaudited) | | | 43.41 | | | | 0.05 | | | | 2.37 | | | | 2.42 | | | | (0.12 | ) | | | (1.37 | ) | | | (1.49 | ) |
Year Ended June 30, 2016 | | | 47.47 | | | | 0.11 | | | | (1.99 | ) | | | (1.88 | ) | | | (0.07 | ) | | | (2.11 | ) | | | (2.18 | ) |
Year Ended June 30, 2015 | | | 45.15 | | | | 0.13 | | | | 4.34 | | | | 4.47 | | | | (0.09 | ) | | | (2.06 | ) | | | (2.15 | ) |
Year Ended June 30, 2014 | | | 38.22 | | | | 0.11 | | | | 10.30 | | | | 10.41 | | | | (0.10 | ) | | | (3.38 | ) | | | (3.48 | ) |
Year Ended June 30, 2013 | | | 31.05 | | | | 0.20 | (h) | | | 7.40 | | | | 7.60 | | | | (0.17 | ) | | | (0.26 | ) | | | (0.43 | ) |
Year Ended June 30, 2012 | | | 31.36 | | | | 0.19 | (i) | | | (0.33 | ) | | | (0.14 | ) | | | (0.17 | ) | | | — | | | | (0.17 | ) |
| (a) | Annualized for periods less than one year, unless otherwise noted. |
| (b) | Calculated based upon average shares outstanding. |
| (c) | Not annualized for periods less than one year. |
| (d) | Includes adjustments in accordance with accounting principles generally accepted in the United States of America and as such, the net asset values for financial reporting purposes and the returns based upon those net asset values may differ from the net asset values and returns for shareholder transactions. |
| (e) | Includes earnings credits and interest expense, if applicable, each of which is less than 0.005% unless otherwise noted. |
| (f) | Portfolio turnover is calculated by dividing the lesser of total purchases or sales of portfolio securities for the reporting period by the monthly average value of portfolio securities owned during the reporting period. Excluded from both the numerator and denominator are amounts relating to derivatives and securities whose maturities or expiration dates at the time of acquisition were one year or less. |
| (g) | Amount rounds to less than $0.005. |
| (h) | Reflects special dividends paid out during the period by several of the Fund’s holdings. Had the Fund not received the special dividends, the net investment income (loss) per share would have been $0.03, $(0.14) and $0.14 for Class A, Class C and Select Class Shares, respectively, and the net investment income (loss) ratio would have been 0.09%, (0.39)% and 0.39% for Class A, Class C and Select Class Shares, respectively. |
| (i) | Reflects a special dividend paid out during the period by one of the Fund’s holdings. Had the Fund not received the special dividend the net investment income (loss) per share would have been $0.05, $(0.10) and $0.14 for Class A, Class C and Select Class Shares, respectively and the net investment income (loss) ratio would have been 0.18%, (0.33)% and 0.48% for Class A, Class C and Select Class Shares, respectively. |
| (j) | Commencement of offering of class of shares. |
SEE NOTES TO FINANCIAL STATEMENTS.
| | | | | | |
| | | |
| 60 | | | | J.P. MORGAN MID CAP/MULTI-CAP FUNDS | | DECEMBER 31, 2016 |
| | | | | | | | | | | | | | | | | | | | | | | | | | |
| | | Ratios/Supplemental data | |
| | | | | | | | | | Ratios to average net assets (a) | | | | |
Net asset
value,
end of
period | | | Total return
(excludes
sales charge) (c)(d) | | | Net assets,
end of
period
(000’s) | | | Net
expenses (e) | | | Net
investment
income
(loss) | | |
Expenses
without waivers,
reimbursements and
earnings credits | | | Portfolio
turnover
rate (c)(f) | |
| | | | | | | | | | | | | | | | | | | | | | | | | | |
| | | | | | | | | | | | | | | | | | | | | | | | | | |
| $ | 43.86 | | | | 5.39 | % | | $ | 342,456 | | | | 1.24 | % | | | (0.11 | )% | | | 1.40 | % | | | 18 | % |
| | 42.95 | | | | (4.17 | ) | | | 335,424 | | | | 1.25 | | | | (0.03 | ) | | | 1.43 | | | | 39 | |
| | 47.12 | | | | 9.99 | | | | 232,320 | | | | 1.24 | | | | (0.06 | ) | | | 1.44 | | | | 41 | |
| | 44.91 | | | | 27.96 | | | | 156,016 | | | | 1.24 | | | | (0.08 | ) | | | 1.41 | | | | 47 | |
| | 38.10 | | | | 24.23 | | | | 21,171 | | | | 1.24 | | | | 0.27 | (h) | | | 1.49 | | | | 67 | |
| | 30.97 | | | | (0.76 | ) | | | 6,965 | | | | 1.24 | | | | 0.34 | (i) | | | 1.54 | | | | 55 | |
| | | | | | |
| | | | | | | | | | | | | | | | | | | | | | | | | | |
| | 42.63 | | | | 5.11 | | | | 30,577 | | | | 1.74 | | | | (0.61 | ) | | | 1.96 | | | | 18 | |
| | 41.85 | | | | (4.64 | ) | | | 32,045 | | | | 1.75 | | | | (0.54 | ) | | | 1.96 | | | | 39 | |
| | 46.16 | | | | 9.44 | | | | 25,597 | | | | 1.74 | | | | (0.56 | ) | | | 1.91 | | | | 41 | |
| | 44.21 | | | | 27.34 | | | | 20,018 | | | | 1.74 | | | | (0.57 | ) | | | 1.93 | | | | 47 | |
| | 37.71 | | | | 23.60 | | | | 6,136 | | | | 1.74 | | | | (0.21 | )(h) | | | 2.00 | | | | 67 | |
| | 30.75 | | | | (1.29 | ) | | | 1,244 | | | | 1.75 | | | | (0.18 | )(i) | | | 2.03 | | | | 55 | |
| | | | | | |
| | | | | | | | | | | | | | | | | | | | | | | | | | |
| | 43.62 | | | | 5.23 | | | | 612 | | | | 1.49 | | | | (0.37 | ) | | | 1.79 | | | | 18 | |
| | 42.75 | | | | (4.38 | ) | | | 688 | | | | 1.50 | | | | (0.30 | ) | | | 1.81 | | | | 39 | |
| | 46.98 | | | | 9.71 | | | | 823 | | | | 1.49 | | | | (0.31 | ) | | | 1.69 | | | | 41 | |
| | 44.87 | | | | 4.56 | | | | 688 | | | | 1.47 | | | | (0.41 | ) | | | 1.60 | | | | 47 | |
| | | | | | |
| | | | | | | | | | | | | | | | | | | | | | | | | | |
| | 44.37 | | | | 5.63 | | | | 2,788 | | | | 0.79 | | | | 0.34 | | | | 0.89 | | | | 18 | |
| | 43.43 | | | | (3.73 | ) | | | 2,840 | | | | 0.80 | | | | 0.42 | | | | 0.91 | | | | 39 | |
| | 47.49 | | | | 10.49 | | | | 1,636 | | | | 0.79 | | | | 0.43 | | | | 0.88 | | | | 41 | |
| | 45.15 | | | | 4.77 | | | | 91 | | | | 0.78 | | | | 0.27 | | | | 0.91 | | | | 47 | |
| | | | | | |
| | | | | | | | | | | | | | | | | | | | | | | | | | |
| | 44.37 | | | | 5.63 | | | | 1,550,055 | | | | 0.74 | | | | 0.40 | | | | 0.76 | | | | 18 | |
| | 43.44 | | | | (3.66 | ) | | | 1,370,912 | | | | 0.74 | | | | 0.46 | | | | 0.77 | | | | 39 | |
| | 47.49 | | | | 10.53 | | | | 1,268,988 | | | | 0.74 | | | | 0.45 | | | | 0.80 | | | | 41 | |
| | 45.15 | | | | 4.78 | | | | 823,036 | | | | 0.73 | | | | 0.34 | | | | 0.86 | | | | 47 | |
| | | | | | |
| | | | | | | | | | | | | | | | | | | | | | | | | | |
| | 44.34 | | | | 5.56 | | | | 681,829 | | | | 0.89 | | | | 0.24 | | | | 1.13 | | | | 18 | |
| | 43.41 | | | | (3.81 | ) | | | 622,440 | | | | 0.90 | | | | 0.25 | | | | 1.20 | | | | 39 | |
| | 47.47 | | | | 10.35 | | | | 1,773,929 | | | | 0.89 | | | | 0.29 | | | | 1.16 | | | | 41 | |
| | 45.15 | | | | 28.45 | | | | 1,773,321 | | | | 0.89 | | | | 0.27 | | | | 1.18 | | | | 47 | |
| | 38.22 | | | | 24.64 | | | | 932,920 | | | | 0.89 | | | | 0.57 | (h) | | | 1.23 | | | | 67 | |
| | 31.05 | | | | (0.42 | ) | | | 813,125 | | | | 0.89 | | | | 0.64 | (i) | | | 1.30 | | | | 55 | |
SEE NOTES TO FINANCIAL STATEMENTS.
| | | | | | | | |
| | | |
| DECEMBER 31, 2016 | | J.P. MORGAN MID CAP/MULTI-CAP FUNDS | | | | | 61 | |
FINANCIAL HIGHLIGHTS
FOR THE PERIODS INDICATED (continued)
| | | | | | | | | | | | | | | | | | | | |
| | | | | | Per share operating performance | |
| | | | | | Investment operations | | | Distributions | |
| | | Net asset
value,
beginning
of period | | | Net
investment
income
(loss) (b) | | | Net realized and unrealized gains
(losses) on
investments | | | Total from
investment
operations | | | Net
realized
gain | |
Mid Cap Growth Fund | | | | | | | | | | | | | | | | | | | | |
Class A | | | | | | | | | | | | | | | | | | | | |
Six Months Ended December 31, 2016 (Unaudited) | | $ | 23.43 | | | $ | (0.08 | ) | | $ | 0.91 | | | $ | 0.83 | | | $ | (0.01 | ) |
Year Ended June 30, 2016 | | | 27.71 | | | | (0.15 | ) | | | (2.67 | ) | | | (2.82 | ) | | | (1.46 | ) |
Year Ended June 30, 2015 | | | 27.49 | | | | (0.18 | ) | | | 3.19 | | | | 3.01 | | | | (2.79 | ) |
Year Ended June 30, 2014 | | | 22.99 | | | | (0.13 | )(g) | | | 7.42 | | | | 7.29 | | | | (2.79 | ) |
Year Ended June 30, 2013 | | | 19.52 | | | | (0.04 | )(h) | | | 4.50 | | | | 4.46 | | | | (0.99 | ) |
Year Ended June 30, 2012 | | | 23.30 | | | | (0.05 | )(i) | | | (1.72 | ) | | | (1.77 | ) | | | (2.01 | ) |
| | | | | |
Class C | | | | | | | | | | | | | | | | | | | | |
Six Months Ended December 31, 2016 (Unaudited) | | | 19.05 | | | | (0.11 | ) | | | 0.73 | | | | 0.62 | | | | (0.01 | ) |
Year Ended June 30, 2016 | | | 22.93 | | | | (0.22 | ) | | | (2.20 | ) | | | (2.42 | ) | | | (1.46 | ) |
Year Ended June 30, 2015 | | | 23.35 | | | | (0.26 | ) | | | 2.63 | | | | 2.37 | | | | (2.79 | ) |
Year Ended June 30, 2014 | | | 19.97 | | | | (0.22 | )(g) | | | 6.39 | | | | 6.17 | | | | (2.79 | ) |
Year Ended June 30, 2013 | | | 17.17 | | | | (0.12 | )(h) | | | 3.91 | | | | 3.79 | | | | (0.99 | ) |
Year Ended June 30, 2012 | | | 20.88 | | | | (0.13 | )(i) | | | (1.57 | ) | | | (1.70 | ) | | | (2.01 | ) |
| | | | | |
Class R2 | | | | | | | | | | | | | | | | | | | | |
Six Months Ended December 31, 2016 (Unaudited) | | | 25.41 | | | | (0.11 | ) | | | 0.99 | | | | 0.88 | | | | (0.01 | ) |
Year Ended June 30, 2016 | | | 29.96 | | | | (0.18 | ) | | | (2.91 | ) | | | (3.09 | ) | | | (1.46 | ) |
Year Ended June 30, 2015 | | | 29.54 | | | | (0.24 | ) | | | 3.45 | | | | 3.21 | | | | (2.79 | ) |
Year Ended June 30, 2014 | | | 24.56 | | | | (0.20 | )(g) | | | 7.97 | | | | 7.77 | | | | (2.79 | ) |
Year Ended June 30, 2013 | | | 20.83 | | | | (0.07 | )(h) | | | 4.79 | | | | 4.72 | | | | (0.99 | ) |
Year Ended June 30, 2012 | | | 24.73 | | | | (0.07 | )(i) | | | (1.82 | ) | | | (1.89 | ) | | | (2.01 | ) |
| | | | | |
Class R3 | | | | | | | | | | | | | | | | | | | | |
September 9, 2016(j) through December 31, 2016 (Unaudited) | | | 27.06 | | | | (0.05 | ) | | | 0.47 | | | | 0.42 | | | | (0.01 | ) |
| | | | | |
Class R4 | | | | | | | | | | | | | | | | | | | | |
September 9, 2016(j) through December 31, 2016 (Unaudited) | | | 27.06 | | | | (0.03 | ) | | | 0.47 | | | | 0.44 | | | | (0.01 | ) |
| | | | | |
Class R5 | | | | | | | | | | | | | | | | | | | | |
Six Months Ended December 31, 2016 (Unaudited) | | | 26.74 | | | | (0.03 | ) | | | 1.04 | | | | 1.01 | | | | (0.01 | ) |
Year Ended June 30, 2016 | | | 31.26 | | | | (0.03 | ) | | | (3.03 | ) | | | (3.06 | ) | | | (1.46 | ) |
Year Ended June 30, 2015 | | | 30.52 | | | | (0.07 | ) | | | 3.60 | | | | 3.53 | | | | (2.79 | ) |
Year Ended June 30, 2014 | | | 25.15 | | | | (0.02 | )(g) | | | 8.18 | | | | 8.16 | | | | (2.79 | ) |
Year Ended June 30, 2013 | | | 21.18 | | | | 0.06 | (h) | | | 4.90 | | | | 4.96 | | | | (0.99 | ) |
November 1, 2011(j) through June 30, 2012 | | | 21.75 | | | | 0.04 | (i) | | | 1.40 | | | | 1.44 | | | | (2.01 | ) |
| | | | | |
Class R6 | | | | | | | | | | | | | | | | | | | | |
Six Months Ended December 31, 2016 (Unaudited) | | | 26.82 | | | | (0.02 | ) | | | 1.03 | | | | 1.01 | | | | (0.01 | ) |
Year Ended June 30, 2016 | | | 31.33 | | | | (0.02 | ) | | | (3.03 | ) | | | (3.05 | ) | | | (1.46 | ) |
Year Ended June 30, 2015 | | | 30.57 | | | | (0.06 | ) | | | 3.61 | | | | 3.55 | | | | (2.79 | ) |
Year Ended June 30, 2014 | | | 25.17 | | | | — | (g)(k) | | | 8.19 | | | | 8.19 | | | | (2.79 | ) |
Year Ended June 30, 2013 | | | 21.19 | | | | 0.08 | (h) | | | 4.89 | | | | 4.97 | | | | (0.99 | ) |
November 1, 2011(j) through June 30, 2012 | | | 21.75 | | | | 0.08 | (i) | | | 1.37 | | | | 1.45 | | | | (2.01 | ) |
| | | | | |
Select Class | | | | | | | | | | | | | | | | | | | | |
Six Months Ended December 31, 2016 (Unaudited) | | | 26.52 | | | | (0.05 | ) | | | 1.03 | | | | 0.98 | | | | (0.01 | ) |
Year Ended June 30, 2016 | | | 31.06 | | | | (0.09 | ) | | | (2.99 | ) | | | (3.08 | ) | | | (1.46 | ) |
Year Ended June 30, 2015 | | | 30.39 | | | | (0.11 | ) | | | 3.57 | | | | 3.46 | | | | (2.79 | ) |
Year Ended June 30, 2014 | | | 25.08 | | | | (0.06 | )(g) | | | 8.16 | | | | 8.10 | | | | (2.79 | ) |
Year Ended June 30, 2013 | | | 21.15 | | | | 0.03 | (h) | | | 4.89 | | | | 4.92 | | | | (0.99 | ) |
Year Ended June 30, 2012 | | | 24.97 | | | | 0.02 | (i) | | | (1.83 | ) | | | (1.81 | ) | | | (2.01 | ) |
| (a) | Annualized for periods less than one year, unless otherwise noted. |
| (b) | Calculated based upon average shares outstanding. |
| (c) | Not annualized for periods less than one year. |
| (d) | Includes adjustments in accordance with accounting principles generally accepted in the United States of America and as such, the net asset values for financial reporting purposes and the returns based upon those net asset values may differ from the net asset values and returns for shareholder transactions. |
| (e) | Includes earnings credits and interest expense, if applicable, each of which is less than 0.005% unless otherwise noted. |
| (f) | Portfolio turnover is calculated by dividing the lesser of total purchases or sales of portfolio securities for the reporting period by the monthly average value of portfolio securities owned during the reporting period. Excluded from both the numerator and denominator are amounts relating to derivatives and securities whose maturities or expiration dates at the time of acquisition were one year or less. |
| (g) | Reflects special dividends paid out during the period by several of the Fund’s holdings. Had the Fund not received the special dividends the net investment income (loss) per share would have been $(0.14), $(0.23), $(0.20), $(0.02), $(0.01) and $(0.06) for Class A, Class C, Class R2, Class R5, Class R6 and Select Class Shares, respectively, and the net investment income (loss) ratio would have been (0.53)%, (1.03)%, (0.73)%, (0.08)%, (0.03)% and (0.22)% for Class A, Class C, Class R2, Class R5, Class R6 and Select Class Shares, respectively. |
SEE NOTES TO FINANCIAL STATEMENTS.
| | | | | | |
| | | |
| 62 | | | | J.P. MORGAN MID CAP/MULTI-CAP FUNDS | | DECEMBER 31, 2016 |
| | | | | | | | | | | | | | | | | | | | | | | | | | |
| | | Ratios/Supplemental data | |
| | | | | | | | | | Ratios to average net assets (a) | | | | |
Net asset
value,
end of
period | | | Total return
(excludes sales charge) (c)(d) | | |
Net assets,
end of period
(000’s) | | | Net expenses (e) | | | Net
investment
income
(loss) | | | Expenses without waivers,
reimbursements and
earnings credits | | | Portfolio
turnover
rate (c)(f) | |
| | | | | | | | | | | | | | | | | | | | | | | | | | |
| | | | | | | | | | | | | | | | | | | | | | | | | | |
| $ | 24.25 | | | | 3.55 | % | | $ | 871,922 | | | | 1.23 | % | | | (0.63 | )% | | | 1.39 | % | | | 16 | % |
| | 23.43 | | | | (10.29 | ) | | | 949,148 | | | | 1.24 | | | | (0.59 | ) | | | 1.40 | | | | 56 | |
| | 27.71 | | | | 12.37 | | | | 984,262 | | | | 1.23 | | | | (0.68 | ) | | | 1.35 | | | | 57 | |
| | 27.49 | | | | 33.44 | | | | 765,310 | | | | 1.24 | | | | (0.51 | )(g) | | | 1.37 | | | | 69 | |
| | 22.99 | | | | 23.70 | | | | 586,787 | | | | 1.23 | | | | (0.17 | )(h) | | | 1.45 | | | | 70 | |
| | 19.52 | | | | (6.61 | ) | | | 538,323 | | | | 1.24 | | | | (0.23 | )(i) | | | 1.38 | | | | 70 | |
| | | | | | |
| | | | | | | | | | | | | | | | | | | | | | | | | | |
| | 19.66 | | | | 3.27 | | | | 87,166 | | | | 1.73 | | | | (1.13 | ) | | | 1.88 | | | | 16 | |
| | 19.05 | | | | (10.70 | ) | | | 96,729 | | | | 1.74 | | | | (1.08 | ) | | | 1.90 | | | | 56 | |
| | 22.93 | | | | 11.78 | | | | 75,494 | | | | 1.73 | | | | (1.19 | ) | | | 1.86 | | | | 57 | |
| | 23.35 | | | | 32.85 | | | | 41,047 | | | | 1.73 | | | | (1.01 | )(g) | | | 1.86 | | | | 69 | |
| | 19.97 | | | | 23.03 | | | | 23,745 | | | | 1.73 | | | | (0.67 | )(h) | | | 1.95 | | | | 70 | |
| | 17.17 | | | | (7.06 | ) | | | 22,190 | | | | 1.75 | | | | (0.75 | )(i) | | | 1.88 | | | | 70 | |
| | | | | | |
| | | | | | | | | | | | | | | | | | | | | | | | | | |
| | 26.28 | | | | 3.47 | | | | 31,668 | | | | 1.39 | | | | (0.82 | ) | | | 1.74 | | | | 16 | |
| | 25.41 | | | | (10.42 | ) | | | 32,092 | | | | 1.40 | | | | (0.71 | ) | | | 1.71 | | | | 56 | |
| | 29.96 | | | | 12.18 | | | | 9,868 | | | | 1.39 | | | | (0.85 | ) | | | 1.64 | | | | 57 | |
| | 29.54 | | | | 33.25 | | | | 1,852 | | | | 1.40 | | | | (0.71 | )(g) | | | 1.59 | | | | 69 | |
| | 24.56 | | | | 23.46 | | | | 320 | | | | 1.39 | | | | (0.32 | )(h) | | | 1.71 | | | | 70 | |
| | 20.83 | | | | (6.72 | ) | | | 230 | | | | 1.40 | | | | (0.35 | )(i) | | | 1.63 | | | | 70 | |
| | | | | | |
| | | | | | | | | | | | | | | | | | | | | | | | | | |
| | 27.47 | | | | 1.56 | | | | 20 | | | | 1.23 | | | | (0.63 | ) | | | 1.25 | | | | 16 | |
| | | | | | |
| | | | | | | | | | | | | | | | | | | | | | | | | | |
| | 27.49 | | | | 1.63 | | | | 20 | | | | 0.98 | | | | (0.38 | ) | | | 1.00 | | | | 16 | |
| | | | | | |
| | | | | | | | | | | | | | | | | | | | | | | | | | |
| | 27.74 | | | | 3.78 | | | | 220,600 | | | | 0.78 | | | | (0.19 | ) | | | 0.89 | | | | 16 | |
| | 26.74 | | | | (9.87 | ) | | | 224,498 | | | | 0.79 | | | | (0.13 | ) | | | 0.91 | | | | 56 | |
| | 31.26 | | | | 12.87 | | | | 164,713 | | | | 0.78 | | | | (0.25 | ) | | | 0.87 | | | | 57 | |
| | 30.52 | | | | 34.06 | | | | 27,454 | | | | 0.79 | | | | (0.06 | )(g) | | | 0.92 | | | | 69 | |
| | 25.15 | | | | 24.22 | | | | 17,848 | | | | 0.79 | | | | 0.28 | (h) | | | 1.00 | | | | 70 | |
| | 21.18 | | | | 7.71 | | | | 14,837 | | | | 0.78 | | | | 0.31 | (i) | | | 0.92 | | | | 70 | |
| | | | | | |
| | | | | | | | | | | | | | | | | | | | | | | | | | |
| | 27.82 | | | | 3.77 | | | | 627,006 | | | | 0.73 | | | | (0.13 | ) | | | 0.75 | | | | 16 | |
| | 26.82 | | | | (9.82 | ) | | | 619,527 | | | | 0.73 | | | | (0.06 | ) | | | 0.77 | | | | 56 | |
| | 31.33 | | | | 12.92 | | | | 265,905 | | | | 0.73 | | | | (0.19 | ) | | | 0.78 | | | | 57 | |
| | 30.57 | | | | 34.16 | | | | 86,150 | | | | 0.74 | | | | (0.01 | )(g) | | | 0.86 | | | | 69 | |
| | 25.17 | | | | 24.26 | | | | 47,434 | | | | 0.74 | | | | 0.34 | (h) | | | 0.98 | | | | 70 | |
| | 21.19 | | | | 7.76 | | | | 13,982 | | | | 0.73 | | | | 0.58 | (i) | | | 0.87 | | | | 70 | |
| | | | | | |
| | | | | | | | | | | | | | | | | | | | | | | | | | |
| | 27.49 | | | | 3.70 | | | | 879,134 | | | | 0.92 | | | | (0.32 | ) | | | 1.11 | | | | 16 | |
| | 26.52 | | | | (10.01 | ) | | | 929,489 | | | | 0.93 | | | | (0.31 | ) | | | 1.13 | | | | 56 | |
| | 31.06 | | | | 12.68 | | | | 1,562,284 | | | | 0.92 | | | | (0.37 | ) | | | 1.12 | | | | 57 | |
| | 30.39 | | | | 33.91 | | | | 1,254,748 | | | | 0.93 | | | | (0.20 | )(g) | | | 1.12 | | | | 69 | |
| | 25.08 | | | | 24.06 | | | | 894,740 | | | | 0.93 | | | | 0.14 | (h) | | | 1.20 | | | | 70 | |
| | 21.15 | | | | (6.31 | ) | | | 827,306 | | | | 0.93 | | | | 0.09 | (i) | | | 1.13 | | | | 70 | |
| (h) | Reflects special dividends paid out during the period by several of the Fund’s holdings. Had the Fund not received the special dividends, the net investment income (loss) per share would have been $(0.09), $(0.17), $(0.13), $0.01, $0.02 and $(0.02) for Class A, Class C, Class R2, Class R5, Class R6 and Select Class Shares, respectively, and the net investment income (loss) ratio would have been (0.42)%, (0.92)%, (0.57)%, 0.04%, 0.09% and (0.10)% for Class A, Class C, Class R2, Class R5, Class R6 and Select Class Shares, respectively. |
| (i) | Reflects a special dividend paid out during the period by one of the Fund’s holdings. Had the Fund not received the special dividend, the net investment income (loss) per share would have been $(0.09), $(0.17), $(0.12), less than $0.01, $0.03 and $(0.03) for Class A, Class C, Class R2, Class R5, Class R6 and Select Class Shares, respectively, and the net investment income (loss) ratio would have been (0.46)%, (0.97)%, (0.57)%, (0.03)%, 0.24% and (0.14)% for Class A, Class C, Class R2, Class R5, Class R6 and Select Class Shares, respectively. |
| (j) | Commencement of offering of class of shares. |
| (k) | Amount rounds to less than $0.005. |
SEE NOTES TO FINANCIAL STATEMENTS.
| | | | | | | | |
| | | |
| DECEMBER 31, 2016 | | J.P. MORGAN MID CAP/MULTI-CAP FUNDS | | | | | 63 | |
FINANCIAL HIGHLIGHTS
FOR THE PERIODS INDICATED (continued)
| | | | | | | | | | | | | | | | | | | | | | | | | | | | |
| | | Per share operating performance | |
| | | | | | Investment operations | | | Distributions | |
| | | Net asset
value,
beginning
of period | | | Net
investment
income
(loss) (b) | | | Net realized
and unrealized
gains
(losses) on
investments | | | Total from
investment
operations | | | Net
investment
income | | | Net
realized
gain | | | Total
distributions | |
Mid Cap Value Fund | | | | | | | | | | | | | | | | | | | | | | | | | | | | |
Class A | | | | | | | | | | | | | | | | | | | | | | | | | | | | |
Six Months Ended December 31, 2016 (Unaudited) | | $ | 35.41 | | | $ | 0.08 | | | $ | 2.53 | | | $ | 2.61 | | | $ | (0.14 | ) | | $ | (2.24 | ) | | $ | (2.38 | ) |
Year Ended June 30, 2016 | | | 36.98 | | | | 0.19 | | | | 0.33 | | | | 0.52 | | | | (0.14 | ) | | | (1.95 | ) | | | (2.09 | ) |
Year Ended June 30, 2015 | | | 37.25 | | | | 0.20 | | | | 2.52 | | | | 2.72 | | | | (0.20 | ) | | | (2.79 | ) | | | (2.99 | ) |
Year Ended June 30, 2014 | | | 31.68 | | | | 0.15 | (g) | | | 7.02 | | | | 7.17 | | | | (0.15 | ) | | | (1.45 | ) | | | (1.60 | ) |
Year Ended June 30, 2013 | | | 25.80 | | | | 0.19 | (h) | | | 6.20 | | | | 6.39 | | | | (0.29 | ) | | | (0.22 | ) | | | (0.51 | ) |
Year Ended June 30, 2012 | | | 24.76 | | | | 0.20 | | | | 1.00 | | | | 1.20 | | | | (0.16 | ) | | | — | | | | (0.16 | ) |
| | | | | | | |
Class C | | | | | | | | | | | | | | | | | | | | | | | | | | | | |
Six Months Ended December 31, 2016 (Unaudited) | | | 34.17 | | | | (0.01 | ) | | | 2.43 | | | | 2.42 | | | | — | | | | (2.24 | ) | | | (2.24 | ) |
Year Ended June 30, 2016 | | | 35.79 | | | | 0.01 | | | | 0.32 | | | | 0.33 | | | | — | | | | (1.95 | ) | | | (1.95 | ) |
Year Ended June 30, 2015 | | | 36.19 | | | | 0.01 | | | | 2.44 | | | | 2.45 | | | | (0.06 | ) | | | (2.79 | ) | | | (2.85 | ) |
Year Ended June 30, 2014 | | | 30.84 | | | | (0.03 | )(g) | | | 6.83 | | | | 6.80 | | | | — | (i) | | | (1.45 | ) | | | (1.45 | ) |
Year Ended June 30, 2013 | | | 25.14 | | | | 0.05 | (h) | | | 6.03 | | | | 6.08 | | | | (0.16 | ) | | | (0.22 | ) | | | (0.38 | ) |
Year Ended June 30, 2012 | | | 24.13 | | | | 0.07 | | | | 0.98 | | | | 1.05 | | | | (0.04 | ) | | | — | | | | (0.04 | ) |
| | | | | | | |
Class L (formerly Institutional Class) | | | | | | | | | | | | | | | | | | | | | | | | | | | | |
Six Months Ended December 31, 2016 (Unaudited) | | | 36.19 | | | | 0.17 | | | | 2.60 | | | | 2.77 | | | | (0.32 | ) | | | (2.24 | ) | | | (2.56 | ) |
Year Ended June 30, 2016 | | | 37.76 | | | | 0.37 | | | | 0.33 | | | | 0.70 | | | | (0.32 | ) | | | (1.95 | ) | | | (2.27 | ) |
Year Ended June 30, 2015 | | | 37.99 | | | | 0.40 | | | | 2.56 | | | | 2.96 | | | | (0.40 | ) | | | (2.79 | ) | | | (3.19 | ) |
Year Ended June 30, 2014 | | | 32.26 | | | | 0.32 | (g) | | | 7.17 | | | | 7.49 | | | | (0.31 | ) | | | (1.45 | ) | | | (1.76 | ) |
Year Ended June 30, 2013 | | | 26.24 | | | | 0.34 | (h) | | | 6.31 | | | | 6.65 | | | | (0.41 | ) | | | (0.22 | ) | | | (0.63 | ) |
Year Ended June 30, 2012 | | | 25.19 | | | | 0.32 | | | | 1.01 | | | | 1.33 | | | | (0.28 | ) | | | — | | | | (0.28 | ) |
| | | | | | | |
Class R2 | | | | | | | | | | | | | | | | | | | | | | | | | | | | |
Six Months Ended December 31, 2016 (Unaudited) | | | 34.14 | | | | 0.03 | | | | 2.44 | | | | 2.47 | | | | (0.07 | ) | | | (2.24 | ) | | | (2.31 | ) |
Year Ended June 30, 2016 | | | 35.73 | | | | 0.10 | | | | 0.32 | | | | 0.42 | | | | (0.06 | ) | | | (1.95 | ) | | | (2.01 | ) |
Year Ended June 30, 2015 | | | 36.14 | | | | 0.10 | | | | 2.43 | | | | 2.53 | | | | (0.15 | ) | | | (2.79 | ) | | | (2.94 | ) |
Year Ended June 30, 2014 | | | 30.81 | | | | 0.06 | (g) | | | 6.82 | | | | 6.88 | | | | (0.10 | ) | | | (1.45 | ) | | | (1.55 | ) |
Year Ended June 30, 2013 | | | 25.18 | | | | 0.12 | (h) | | | 6.03 | | | | 6.15 | | | | (0.30 | ) | | | (0.22 | ) | | | (0.52 | ) |
Year Ended June 30, 2012 | | | 24.27 | | | | 0.14 | | | | 0.97 | | | | 1.11 | | | | (0.20 | ) | | | — | | | | (0.20 | ) |
| | | | | | | |
Class R3 | | | | | | | | | | | | | | | | | | | | | | | | | | | | |
September 9, 2016(j) through December 31, 2016 (Unaudited) | | | 35.78 | | | | 0.06 | | | | 2.18 | | | | 2.24 | | | | (0.28 | ) | | | (2.24 | ) | | | (2.52 | ) |
| | | | | | | |
Class R4 | | | | | | | | | | | | | | | | | | | | | | | | | | | | |
September 9, 2016(j) through December 31, 2016 (Unaudited) | | | 36.18 | | | | 0.09 | | | | 2.21 | | | | 2.30 | | | | (0.31 | ) | | | (2.24 | ) | | | (2.55 | ) |
| | | | | | | |
Class R5 | | | | | | | | | | | | | | | | | | | | | | | | | | | | |
September 9, 2016(j) through December 31, 2016 (Unaudited) | | | 36.60 | | | | 0.11 | | | | 2.24 | | | | 2.35 | | | | (0.33 | ) | | | (2.24 | ) | | | (2.57 | ) |
| | | | | | | |
Class R6 | | | | | | | | | | | | | | | | | | | | | | | | | | | | |
September 9, 2016(j) through December 31, 2016 (Unaudited) | | | 36.60 | | | | 0.12 | | | | 2.23 | | | | 2.35 | | | | (0.33 | ) | | | (2.24 | ) | | | (2.57 | ) |
| | | | | | | |
Select Class | | | | | | | | | | | | | | | | | | | | | | | | | | | | |
Six Months Ended December 31, 2016 (Unaudited) | | | 35.79 | | | | 0.13 | | | | 2.56 | | | | 2.69 | | | | (0.24 | ) | | | (2.24 | ) | | | (2.48 | ) |
Year Ended June 30, 2016 | | | 37.36 | | | | 0.28 | | | | 0.33 | | | | 0.61 | | | | (0.23 | ) | | | (1.95 | ) | | | (2.18 | ) |
Year Ended June 30, 2015 | | | 37.61 | | | | 0.28 | | | | 2.55 | | | | 2.83 | | | | (0.29 | ) | | | (2.79 | ) | | | (3.08 | ) |
Year Ended June 30, 2014 | | | 31.95 | | | | 0.23 | (g) | | | 7.10 | | | | 7.33 | | | | (0.22 | ) | | | (1.45 | ) | | | (1.67 | ) |
Year Ended June 30, 2013 | | | 26.01 | | | | 0.27 | (h) | | | 6.24 | | | | 6.51 | | | | (0.35 | ) | | | (0.22 | ) | | | (0.57 | ) |
Year Ended June 30, 2012 | | | 24.97 | | | | 0.26 | | | | 1.01 | | | | 1.27 | | | | (0.23 | ) | | | — | | | | (0.23 | ) |
| (a) | Annualized for periods less than one year, unless otherwise noted. |
| (b) | Calculated based upon average shares outstanding. |
| (c) | Not annualized for periods less than one year. |
| (d) | Includes adjustments in accordance with accounting principles generally accepted in the United States of America and as such, the net asset values for financial reporting purposes and the returns based upon those net asset values may differ from the net asset values and returns for shareholder transactions. |
| (e) | Includes earnings credits and interest expense, if applicable, each of which is less than 0.005% unless otherwise noted. |
| (f) | Portfolio turnover is calculated by dividing the lesser of total purchases or sales of portfolio securities for the reporting period by the monthly average value of portfolio securities owned during the reporting period. Excluded from both the numerator and denominator are amounts relating to derivatives and securities whose maturities or expiration dates at the time of acquisition were one year or less. |
SEE NOTES TO FINANCIAL STATEMENTS.
| | | | | | |
| | | |
| 64 | | | | J.P. MORGAN MID CAP/MULTI-CAP FUNDS | | DECEMBER 31, 2016 |
| | | | | | | | | | | | | | | | | | | | | | | | | | |
| | | Ratios/Supplemental data | |
| | | | | | | | | | Ratios to average net assets (a) | | | | |
Net asset
value,
end of
period | | |
Total return
(excludes sales
charge) (c)(d) | | | Net assets,
end of
period
(000’s) | | | Net
expenses (e) | | | Net
investment
income
(loss) | | | Expenses
without waivers,
reimbursements and
earnings credits | | | Portfolio
turnover
rate (c)(f) | |
| | | | | | | | | | | | | | | | | | | | | | | | | | |
| | | | | | | | | | | | | | | | | | | | | | | | | | |
| $ | 35.64 | | | | 7.33 | % | | $ | 2,251,296 | | | | 1.23 | % | | | 0.43 | % | | | 1.40 | % | | | 14 | % |
| | 35.41 | | | | 1.85 | | | | 2,302,567 | | | | 1.24 | | | | 0.54 | | | | 1.41 | | | | 20 | |
| | 36.98 | | | | 7.68 | | | | 2,623,772 | | | | 1.23 | | | | 0.53 | | | | 1.38 | | | | 18 | |
| | 37.25 | | | | 23.25 | | | | 3,404,974 | | | | 1.23 | | | | 0.42 | (g) | | | 1.37 | | | | 25 | |
| | 31.68 | | | | 25.06 | | | | 3,157,503 | | | | 1.23 | | | | 0.67 | (h) | | | 1.38 | | | | 23 | |
| | 25.80 | | | | 4.92 | | | | 1,986,930 | | | | 1.24 | | | | 0.83 | | | | 1.41 | | | | 30 | |
| | | | | | |
| | | | | | | | | | | | | | | | | | | | | | | | | | |
| | 34.35 | | | | 7.04 | | | | 531,177 | | | | 1.74 | | | | (0.08 | ) | | | 1.82 | | | | 14 | |
| | 34.17 | | | | 1.35 | | | | 549,619 | | | | 1.75 | | | | 0.03 | | | | 1.83 | | | | 20 | |
| | 35.79 | | | | 7.12 | | | | 595,385 | | | | 1.74 | | | | 0.03 | | | | 1.84 | | | | 18 | |
| | 36.19 | | | | 22.63 | | | | 608,283 | | | | 1.74 | | | | (0.09 | )(g) | | | 1.87 | | | | 25 | |
| | 30.84 | | | | 24.43 | | | | 534,813 | | | | 1.74 | | | | 0.16 | (h) | | | 1.88 | | | | 23 | |
| | 25.14 | | | | 4.38 | | | | 370,781 | | | | 1.75 | | | | 0.32 | | | | 1.91 | | | | 30 | |
| | | | | | |
| | | | | | | | | | | | | | | | | | | | | | | | | | |
| | 36.40 | | | | 7.59 | | | | 11,574,107 | | | | 0.74 | | | | 0.93 | | | | 0.93 | | | | 14 | |
| | 36.19 | | | | 2.35 | | | | 10,313,629 | | | | 0.75 | | | | 1.04 | | | | 0.94 | | | | 20 | |
| | 37.76 | | | | 8.19 | | | | 10,320,516 | | | | 0.74 | | | | 1.05 | | | | 0.94 | | | | 18 | |
| | 37.99 | | | | 23.88 | | | | 8,581,992 | | | | 0.74 | | | | 0.92 | (g) | | | 0.97 | | | | 25 | |
| | 32.26 | | | | 25.68 | | | | 6,627,529 | | | | 0.74 | | | | 1.16 | (h) | | | 0.98 | | | | 23 | |
| | 26.24 | | | | 5.43 | | | | 3,543,900 | | | | 0.74 | | | | 1.33 | | | | 1.01 | | | | 30 | |
| | | | | | |
| | | | | | | | | | | | | | | | | | | | | | | | | | |
| | 34.30 | | | | 7.18 | | | | 66,949 | | | | 1.49 | | | | 0.17 | | | | 1.72 | | | | 14 | |
| | 34.14 | | | | 1.61 | | | | 66,167 | | | | 1.50 | | | | 0.29 | | | | 1.75 | | | | 20 | |
| | 35.73 | | | | 7.38 | | | | 71,697 | | | | 1.49 | | | | 0.28 | | | | 1.71 | | | | 18 | |
| | 36.14 | | | | 22.94 | | | | 71,958 | | | | 1.49 | | | | 0.17 | (g) | | | 1.62 | | | | 25 | |
| | 30.81 | | | | 24.71 | | | | 57,003 | | | | 1.49 | | | | 0.43 | (h) | | | 1.63 | | | | 23 | |
| | 25.18 | | | | 4.65 | | | | 14,824 | | | | 1.49 | | | | 0.59 | | | | 1.66 | | | | 30 | |
| | | | | | |
| | | | | | | | | | | | | | | | | | | | | | | | | | |
| | 35.50 | | | | 6.21 | | | | 21 | | | | 1.24 | | | | 0.54 | | | | 1.25 | | | | 14 | |
| | | | | | |
| | | | | | | | | | | | | | | | | | | | | | | | | | |
| | 35.93 | | | | 6.29 | | | | 21 | | | | 0.99 | | | | 0.79 | | | | 1.00 | | | | 14 | |
| | | | | | |
| | | | | | | | | | | | | | | | | | | | | | | | | | |
| | 36.38 | | | | 6.36 | | | | 21 | | | | 0.79 | | | | 0.99 | | | | 0.80 | | | | 14 | |
| | | | | | |
| | | | | | | | | | | | | | | | | | | | | | | | | | |
| | 36.38 | | | | 6.38 | | | | 51,221 | | | | 0.74 | | | | 1.03 | | | | 0.75 | | | | 14 | |
| | | | | | |
| | | | | | | | | | | | | | | | | | | | | | | | | | |
| | 36.00 | | | | 7.47 | | | | 2,664,413 | | | | 0.98 | | | | 0.69 | | | | 1.08 | | | | 14 | |
| | 35.79 | | | | 2.11 | | | | 2,332,160 | | | | 0.99 | | | | 0.80 | | | | 1.11 | | | | 20 | |
| | 37.36 | | | | 7.92 | | | | 2,347,703 | | | | 0.98 | | | | 0.75 | | | | 1.10 | | | | 18 | |
| | 37.61 | | | | 23.59 | | | | 2,967,759 | | | | 0.98 | | | | 0.67 | (g) | | | 1.12 | | | | 25 | |
| | 31.95 | | | | 25.35 | | | | 2,870,752 | | | | 0.98 | | | | 0.92 | (h) | | | 1.13 | | | | 23 | |
| | 26.01 | | | | 5.20 | | | | 1,836,012 | | | | 0.98 | | | | 1.09 | | | | 1.16 | | | | 30 | |
| (g) | Reflects special dividends paid out during the period by several of the Fund’s holdings. Had the Fund not received the special dividends the net investment income (loss) per share would have been $0.14, $(0.03), $0.32, $0.05 and $0.23 for Class A, Class C, Class L, Class R2 and Select Class Shares, respectively and the net investment income (loss) ratio would have been 0.41%, (0.10)%, 0.90%, 0.16% and 0.66% for Class A, Class C, Class L, Class R2 and Select Class Shares, respectively. |
| (h) | Reflects special dividends paid out during the period by several of the Fund’s holdings. Had the Fund not received the special dividends the net investment income (loss) per share would have been $0.16, $0.01, $0.31, $0.09 and $0.23 for Class A, Class C, Class L, Class R2 and Select Class Shares, respectively and the net investment income (loss) ratio would have been 0.55%, 0.04%, 1.04%, 0.31% and 0.80% for Class A, Class C, Class L, Class R2 and Select Class Shares, respectively. |
| (i) | Amount rounds to less than $0.005. |
| (j) | Commencement of offering of class of shares. |
SEE NOTES TO FINANCIAL STATEMENTS.
| | | | | | | | |
| | | |
| DECEMBER 31, 2016 | | J.P. MORGAN MID CAP/MULTI-CAP FUNDS | | | | | 65 | |
FINANCIAL HIGHLIGHTS
FOR THE PERIODS INDICATED (continued)
| | | | | | | | | | | | | | | | |
| | | | | | Per share operating performance | |
| | | | | | Investment operations | |
| | | | |
| | | Net asset
value,
beginning
of period | | | Net
investment
income
(loss) (b) | | | Net realized
and unrealized
gains
(losses) on
investments | | | Total from
investment
operations | |
Multi-Cap Market Neutral Fund | | | | | | | | | | | | | | | | |
Class A | | | | | | | | | | | | | | | | |
Six Months Ended December 31, 2016 (Unaudited) | | $ | 9.90 | | | $ | (0.05 | ) | | $ | 0.20 | | | $ | 0.15 | |
Year Ended June 30, 2016 | | | 9.87 | | | | (0.10 | ) | | | 0.13 | | | | 0.03 | |
Year Ended June 30, 2015 | | | 9.91 | | | | (0.11 | ) | | | 0.07 | | | | (0.04 | ) |
Year Ended June 30, 2014 | | | 9.79 | | | | (0.13 | ) | | | 0.25 | | | | 0.12 | |
Year Ended June 30, 2013 | | | 9.69 | | | | (0.11 | )(h) | | | 0.21 | | | | 0.10 | |
Year Ended June 30, 2012 | | | 9.81 | | | | (0.14 | ) | | | 0.02 | | | | (0.12 | ) |
| | | | |
Class C | | | | | | | | | | | | | | | | |
Six Months Ended December 31, 2016 (Unaudited) | | | 9.29 | | | | (0.07 | ) | | | 0.19 | | | | 0.12 | |
Year Ended June 30, 2016 | | | 9.31 | | | | (0.14 | ) | | | 0.12 | | | | (0.02 | ) |
Year Ended June 30, 2015 | | | 9.40 | | | | (0.15 | ) | | | 0.06 | | | | (0.09 | ) |
Year Ended June 30, 2014 | | | 9.33 | | | | (0.17 | ) | | | 0.24 | | | | 0.07 | |
Year Ended June 30, 2013 | | | 9.30 | | | | (0.17 | )(h) | | | 0.20 | | | | 0.03 | |
Year Ended June 30, 2012 | | | 9.48 | | | | (0.20 | ) | | | 0.02 | | | | (0.18 | ) |
| | | | |
Select Class | | | | | | | | | | | | | | | | |
Six Months Ended December 31, 2016 (Unaudited) | | | 10.13 | | | | (0.04 | ) | | | 0.21 | | | | 0.17 | |
Year Ended June 30, 2016 | | | 10.07 | | | | (0.08 | ) | | | 0.14 | | | | 0.06 | |
Year Ended June 30, 2015 | | | 10.09 | | | | (0.09 | ) | | | 0.07 | | | | (0.02 | ) |
Year Ended June 30, 2014 | | | 9.94 | | | | (0.11 | ) | | | 0.26 | | | | 0.15 | |
Year Ended June 30, 2013 | | | 9.82 | | | | (0.09 | )(h) | | | 0.21 | | | | 0.12 | |
Year Ended June 30, 2012 | | | 9.91 | | | | (0.12 | ) | | | 0.03 | | | | (0.09 | ) |
| (a) | Annualized for periods less than one year, unless otherwise noted. |
| (b) | Calculated based upon average shares outstanding. |
| (c) | Not annualized for periods less than one year. |
| (d) | Includes adjustments in accordance with accounting principles generally accepted in the United States of America and as such, the net asset values for financial reporting purposes and the returns based upon those net asset values may differ from the net asset values and returns for shareholder transactions. |
| (e) | Includes earnings credits and interest expense, if applicable, each of which is less than 0.005% or unless otherwise noted. |
| (f) | The net expenses and expenses without waivers, reimbursements and earnings credits (excluding dividend expense and interest expense for securities sold short) for Class A are 1.23% and 1.63% for the six months ended December 31, 2016, 1.27% and 1.69% for the year ended June 30, 2016, 1.48% and 1.95% for 2015, 1.49% and 1.91% for 2014, 1.48% and 1.88% for 2013, 1.48% and 1.94% for 2012; for Class C are 1.73% and 2.13% for the six months ended December 31, 2016, 1.77% and 2.20% for the year ended June 30, 2016, 1.98% and 2.45% for 2015, 1.99% and 2.40% for 2014, 2.15% and 2.38% for 2013, 2.23% and 2.44% for 2012; for Select Class are 0.98% and 1.23% for the six months ended December 31, 2016, 1.03% and 1.30% for the year ended June 30, 2016, 1.23% and 1.64% for 2015, 1.23% and 1.65% for 2014, 1.23% and 1.63% for 2013, 1.23% and 1.69% for 2012, respectively. |
| (g) | Portfolio turnover is calculated by dividing the lesser of total purchases or sales of portfolio securities for the reporting period by the monthly average value of portfolio securities owned during the reporting period. Excluded from both the numerator and denominator are amounts relating to derivatives and securities whose maturities or expiration dates at the time of acquisition were one year or less. |
| (h) | Reflects special dividends paid out during the period by several of the Fund’s holdings. Had the Fund not received the special dividends, the net investment income (loss) per share would have been $(0.13), $(0.19) and $(0.11) for Class A, Class C and Select Class Shares, respectively, and the net investment income (loss) ratio would have been (1.38)%, (2.06)% and (1.16)% for Class A, Class C and Select Class Shares, respectively. |
SEE NOTES TO FINANCIAL STATEMENTS.
| | | | | | |
| | | |
| 66 | | | | J.P. MORGAN MID CAP/MULTI-CAP FUNDS | | DECEMBER 31, 2016 |
| | | | | | | | | | | | | | | | | | | | | | | | | | | | | | |
| | | Ratios/Supplemental data | |
| | | | | | | | | | Ratios to average net assets (a) | | | | | | | |
Net asset
value,
end of
period | | | Total return
(excludes
sales charge) (c)(d) | | | Net assets,
end of
period
(000’s) | | | Net expenses
(including
dividend and
interest
expense for
securities sold
short) (e)(f) | | | Net
investment
income
(loss) | | | Expenses
without waivers,
reimbursements and
earnings credits
(including dividend
and interest expense
for securities sold
short) (f) | | | Portfolio
turnover
rate (g) | | | Portfolio
turnover rate
(including short
sales) (g) | |
| | | | | | | | | | | | | | | | | | | | | | | | | | | | | | |
| | | | | | | | | | | | | | | | | | | | | | | | | | | | | | |
| | $10.05 | | | | 1.52 | % | | $ | 5,411 | | | | 2.37 | % | | | (1.04 | )% | | | 2.76 | % | | | 42 | % | | | 117 | % |
| | 9.90 | | | | 0.30 | | | | 6,608 | | | | 2.52 | | | | (0.97 | ) | | | 2.94 | | | | 111 | | | | 258 | |
| | 9.87 | | | | (0.40 | ) | | | 6,273 | | | | 2.68 | | | | (1.14 | ) | | | 3.15 | | | | 74 | | | | 204 | |
| | 9.91 | | | | 1.23 | | | | 10,301 | | | | 2.78 | | | | (1.36 | ) | | | 3.20 | | | | 106 | | | | 227 | |
| | 9.79 | | | | 1.03 | | | | 14,101 | | | | 3.04 | | | | (1.13 | )(h) | | | 3.44 | | | | 94 | | | | 251 | |
| | 9.69 | | | | (1.22 | ) | | | 19,759 | | | | 2.86 | | | | (1.42 | ) | | | 3.32 | | | | 151 | | | | 316 | |
| | | | | | | |
| | | | | | | | | | | | | | | | | | | | | | | | | | | | | | |
| | 9.41 | | | | 1.29 | | | | 5,220 | | | | 2.87 | | | | (1.53 | ) | | | 3.26 | | | | 42 | | | | 117 | |
| | 9.29 | | | | (0.21 | ) | | | 6,147 | | | | 3.02 | | | | (1.47 | ) | | | 3.45 | | | | 111 | | | | 258 | |
| | 9.31 | | | | (0.96 | ) | | | 6,760 | | | | 3.18 | | | | (1.62 | ) | | | 3.65 | | | | 74 | | | | 204 | |
| | 9.40 | | | | 0.75 | | | | 8,602 | | | | 3.28 | | | | (1.85 | ) | | | 3.70 | | | | 106 | | | | 227 | |
| | 9.33 | | | | 0.32 | | | | 11,181 | | | | 3.69 | | | | (1.81 | )(h) | | | 3.92 | | | | 94 | | | | 251 | |
| | 9.30 | | | | (1.90 | ) | | | 15,677 | | | | 3.61 | | | | (2.17 | ) | | | 3.82 | | | | 151 | | | | 316 | |
| | | | | | | |
| | | | | | | | | | | | | | | | | | | | | | | | | | | | | | |
| | 10.30 | | | | 1.68 | | | | 158,050 | | | | 2.12 | | | | (0.75 | ) | | | 2.38 | | | | 42 | | | | 117 | |
| | 10.13 | | | | 0.60 | | | | 175,348 | | | | 2.28 | | | | (0.74 | ) | | | 2.55 | | | | 111 | | | | 258 | |
| | 10.07 | | | | (0.20 | ) | | | 277,647 | | | | 2.43 | | | | (0.89 | ) | | | 2.84 | | | | 74 | | | | 204 | |
| | 10.09 | | | | 1.51 | | | | 431,890 | | | | 2.52 | | | | (1.07 | ) | | | 2.94 | | | | 106 | | | | 227 | |
| | 9.94 | | | | 1.22 | | | | 317,974 | | | | 2.78 | | | | (0.90 | )(h) | | | 3.18 | | | | 94 | | | | 251 | |
| | 9.82 | | | | (0.91 | ) | | | 476,803 | | | | 2.61 | | | | (1.17 | ) | | | 3.07 | | | | 151 | | | | 316 | |
SEE NOTES TO FINANCIAL STATEMENTS.
| | | | | | | | |
| | | |
| DECEMBER 31, 2016 | | J.P. MORGAN MID CAP/MULTI-CAP FUNDS | | | | | 67 | |
FINANCIAL HIGHLIGHTS
FOR THE PERIODS INDICATED (continued)
| | | | | | | | | | | | | | | | | | | | | | | | | | | | |
| | | | | | Per share operating performance | |
| | | | | | Investment operations | | | Distributions | |
| | | Net asset
value,
beginning
of period | | | Net
investment
income
(loss) (b) | | | Net realized
and unrealized
gains
(losses) on
investments | | | Total from
investment
operations | | | Net
investment
income | | | Net
realized
gain | | | Total
distributions | |
Value Advantage Fund | | | | | | | | | | | | | | | | | |
Class A | | | | | | | | | | | | | | | | | | | | | | | | | | | | |
Six Months Ended December 31, 2016 (Unaudited) | | $ | 28.66 | | | $ | 0.13 | | | $ | 3.60 | | | $ | 3.73 | | | $ | (0.30 | ) | | $ | — | | | $ | (0.30 | ) |
Year Ended June 30, 2016 | | | 29.84 | | | | 0.27 | | | | (0.99 | ) | | | (0.72 | ) | | | (0.17 | ) | | | (0.29 | ) | | | (0.46 | ) |
Year Ended June 30, 2015 | | | 29.15 | | | | 0.19 | | | | 1.47 | | | | 1.66 | | | | (0.26 | ) | | | (0.71 | ) | | | (0.97 | ) |
Year Ended June 30, 2014 | | | 24.64 | | | | 0.34 | | | | 5.03 | | | | 5.37 | | | | (0.16 | ) | | | (0.70 | ) | | | (0.86 | ) |
Year Ended June 30, 2013 | | | 19.96 | | | | 0.22 | | | | 4.75 | | | | 4.97 | | | | (0.20 | ) | | | (0.09 | ) | | | (0.29 | ) |
Year Ended June 30, 2012 | | | 19.07 | | | | 0.25 | | | | 0.84 | | | | 1.09 | | | | (0.20 | ) | | | — | | | | (0.20 | ) |
| | | | | | | |
Class C | | | | | | | | | | | | | | | | | | | | | | | | | | | | |
Six Months Ended December 31, 2016 (Unaudited) | | | 28.52 | | | | 0.06 | | | | 3.56 | | | | 3.62 | | | | (0.17 | ) | | | — | | | | (0.17 | ) |
Year Ended June 30, 2016 | | | 29.72 | | | | 0.14 | | | | (0.99 | ) | | | (0.85 | ) | | | (0.06 | ) | | | (0.29 | ) | | | (0.35 | ) |
Year Ended June 30, 2015 | | | 29.08 | | | | 0.04 | | | | 1.47 | | | | 1.51 | | | | (0.16 | ) | | | (0.71 | ) | | | (0.87 | ) |
Year Ended June 30, 2014 | | | 24.61 | | | | 0.20 | | | | 5.02 | | | | 5.22 | | | | (0.05 | ) | | | (0.70 | ) | | | (0.75 | ) |
Year Ended June 30, 2013 | | | 19.91 | | | | 0.11 | | | | 4.74 | | | | 4.85 | | | | (0.06 | ) | | | (0.09 | ) | | | (0.15 | ) |
Year Ended June 30, 2012 | | | 19.01 | | | | 0.16 | | | | 0.84 | | | | 1.00 | | | | (0.10 | ) | | | — | | | | (0.10 | ) |
| | | | | | | |
Class L (formerly Institutional Class) | | | | | | | | | | | | | | | | | | | | | | | | | | | | |
Six Months Ended December 31, 2016 (Unaudited) | | | 28.86 | | | | 0.20 | | | | 3.63 | | | | 3.83 | | | | (0.46 | ) | | | — | | | | (0.46 | ) |
Year Ended June 30, 2016 | | | 30.06 | | | | 0.43 | | | | (1.02 | ) | | | (0.59 | ) | | | (0.32 | ) | | | (0.29 | ) | | | (0.61 | ) |
Year Ended June 30, 2015 | | | 29.31 | | | | 0.34 | | | | 1.50 | | | | 1.84 | | | | (0.38 | ) | | | (0.71 | ) | | | (1.09 | ) |
Year Ended June 30, 2014 | | | 24.74 | | | | 0.48 | | | | 5.04 | | | | 5.52 | | | | (0.25 | ) | | | (0.70 | ) | | | (0.95 | ) |
Year Ended June 30, 2013 | | | 19.99 | | | | 0.34 | | | | 4.75 | | | | 5.09 | | | | (0.25 | ) | | | (0.09 | ) | | | (0.34 | ) |
Year Ended June 30, 2012 | | | 19.11 | | | | 0.35 | | | | 0.83 | | | | 1.18 | | | | (0.30 | ) | | | — | | | | (0.30 | ) |
| | | | | | | |
Class R3 | | | | | | | | | | | | | | | | | | | | | | | | | | | | |
September 9, 2016 (g) through December 31, 2016 (Unaudited) | | | 29.33 | | | | 0.08 | | | | 2.97 | | | | 3.05 | | | | (0.44 | ) | | | — | | | | (0.44 | ) |
| | | | | | | |
Class R4 | | | | | | | | | | | | | | | | | | | | | | | | | | | | |
September 9, 2016 (g) through December 31, 2016 (Unaudited) | | | 29.56 | | | | 0.10 | | | | 3.00 | | | | 3.10 | | | | (0.46 | ) | | | — | | | | (0.46 | ) |
| | | | | | | |
Class R5 | | | | | | | | | | | | | | | | | | | | | | | | | | | | |
September 9, 2016 (g) through December 31, 2016 (Unaudited) | | | 29.57 | | | | 0.12 | | | | 3.00 | | | | 3.12 | | | | (0.48 | ) | | | — | | | | (0.48 | ) |
| | | | | | | |
Class R6 | | | | | | | | | | | | | | | | | | | | | | | | | | | | |
September 9, 2016 (g) through December 31, 2016 (Unaudited) | | | 29.57 | | | | 0.15 | | | | 2.98 | | | | 3.13 | | | | (0.49 | ) | | | — | | | | (0.49 | ) |
| | | | | | | |
Select Class | | | | | | | | | | | | | | | | | | | | | | | | | | | | |
Six Months Ended December 31, 2016 (Unaudited) | | | 28.86 | | | | 0.17 | | | | 3.62 | | | | 3.79 | | | | (0.39 | ) | | | — | | | | (0.39 | ) |
Year Ended June 30, 2016 | | | 29.99 | | | | 0.33 | | | | (0.98 | ) | | | (0.65 | ) | | | (0.19 | ) | | | (0.29 | ) | | | (0.48 | ) |
Year Ended June 30, 2015 | | | 29.27 | | | | 0.27 | | | | 1.48 | | | | 1.75 | | | | (0.32 | ) | | | (0.71 | ) | | | (1.03 | ) |
Year Ended June 30, 2014 | | | 24.72 | | | | 0.42 | | | | 5.03 | | | | 5.45 | | | | (0.20 | ) | | | (0.70 | ) | | | (0.90 | ) |
Year Ended June 30, 2013 | | | 20.00 | | | | 0.28 | | | | 4.75 | | | | 5.03 | | | | (0.22 | ) | | | (0.09 | ) | | | (0.31 | ) |
Year Ended June 30, 2012 | | | 19.12 | | | | 0.30 | | | | 0.83 | | | | 1.13 | | | | (0.25 | ) | | | — | | | | (0.25 | ) |
| (a) | Annualized for periods less than one year, unless otherwise noted. |
| (b) | Calculated based upon average shares outstanding. |
| (c) | Not annualized for periods less than one year. |
| (d) | Includes adjustments in accordance with accounting principles generally accepted in the United States of America and as such, the net asset values for financial reporting purposes and the returns based upon those net asset values may differ from the net asset values and returns for shareholder transactions. |
| (e) | Includes earnings credits and interest expense, if applicable, each of which is less than 0.005% unless otherwise noted. |
| (f) | Portfolio turnover is calculated by dividing the lesser of total purchases or sales of portfolio securities for the reporting period by the monthly average value of portfolio securities owned during the reporting period. Excluded from both the numerator and denominator are amounts relating to derivatives and securities whose maturities or expiration dates at the time of acquisition were one year or less. |
| (g) | Commencement of offering of class of shares. |
SEE NOTES TO FINANCIAL STATEMENTS.
| | | | | | |
| | | |
| 68 | | | | J.P. MORGAN MID CAP/MULTI-CAP FUNDS | | DECEMBER 31, 2016 |
| | | | | | | | | | | | | | | | | | | | | | | | | | |
| | | Ratios/Supplemental data | |
| | | | | | | Ratios to average net assets (a) | |
| | | | | | |
Net asset
value,
end of
period | | | Total return
(excludes
sales charge) (c)(d) | | | Net assets,
end of
period
(000’s) | | | Net
expenses (e) | | | Net
investment
income
(loss) | | | Expenses
without waivers,
reimbursements and
earnings credits | | | Portfolio
turnover
rate (c)(f) | |
| | | | | | | | | | | | | | | | | | | | | | | | | | |
| | | | | | | | | | | | | | | | | | | | | | | | | | |
| $ | 32.09 | | | | 12.98 | % | | $ | 1,854,162 | | | | 1.24 | % | | | 0.87 | % | | | 1.39 | % | | | 9 | % |
| | 28.66 | | | | (2.34 | ) | | | 2,045,698 | | | | 1.24 | | | | 0.98 | | | | 1.43 | | | | 26 | |
| | 29.84 | | | | 5.78 | | | | 2,440,061 | | | | 1.24 | | | | 0.64 | | | | 1.41 | | | | 17 | |
| | 29.15 | | | | 22.19 | | | | 1,701,250 | | | | 1.24 | | | | 1.26 | | | | 1.33 | | | | 36 | |
| | 24.64 | | | | 25.09 | | | | 784,359 | | | | 1.24 | | | | 0.98 | | | | 1.33 | | | | 22 | |
| | 19.96 | | | | 5.83 | | | | 206,816 | | | | 1.25 | | | | 1.34 | | | | 1.41 | | | | 49 | |
| | | | | | |
| | | | | | | | | | | | | | | | | | | | | | | | | | |
| | 31.97 | | | | 12.68 | | | | 771,589 | | | | 1.74 | | | | 0.37 | | | | 1.83 | | | | 9 | |
| | 28.52 | | | | (2.82 | ) | | | 728,800 | | | | 1.74 | | | | 0.49 | | | | 1.85 | | | | 26 | |
| | 29.72 | | | | 5.26 | | | | 701,023 | | | | 1.73 | | | | 0.14 | | | | 1.83 | | | | 17 | |
| | 29.08 | | | | 21.58 | | | | 402,880 | | | | 1.74 | | | | 0.74 | | | | 1.83 | | | | 36 | |
| | 24.61 | | | | 24.45 | | | | 212,198 | | | | 1.74 | | | | 0.49 | | | | 1.83 | | | | 22 | |
| | 19.91 | | | | 5.32 | | | | 117,937 | | | | 1.75 | | | | 0.84 | | | | 1.91 | | | | 49 | |
| | | | | | |
| | | | | | | | | | | | | | | | | | | | | | | | | | |
| | 32.23 | | | | 13.25 | | | | 3,666,117 | | | | 0.75 | | | | 1.32 | | | | 0.87 | | | | 9 | |
| | 28.86 | | | | (1.87 | ) | | | 5,901,818 | | | | 0.74 | | | | 1.50 | | | | 0.88 | | | | 26 | |
| | 30.06 | | | | 6.36 | | | | 5,058,172 | | | | 0.74 | | | | 1.15 | | | | 0.90 | | | | 17 | |
| | 29.31 | | | | 22.77 | | | | 3,042,506 | | | | 0.74 | | | | 1.77 | | | | 0.93 | | | | 36 | |
| | 24.74 | | | | 25.73 | | | | 1,455,125 | | | | 0.74 | | | | 1.50 | | | | 0.93 | | | | 22 | |
| | 19.99 | | | | 6.36 | | | | 384,525 | | | | 0.75 | | | | 1.86 | | | | 1.01 | | | | 49 | |
| | | | | | |
| | | | | | | | | | | | | | | | | | | | | | | | | | |
| | 31.94 | | | | 10.37 | | | | 22 | | | | 1.24 | | | | 0.81 | | | | 1.25 | | | | 9 | |
| | | | | | |
| | | | | | | | | | | | | | | | | | | | | | | | | | |
| | 32.20 | | | | 10.44 | | | | 22 | | | | 0.99 | | | | 1.06 | | | | 1.00 | | | | 9 | |
| | | | | | |
| | | | | | | | | | | | | | | | | | | | | | | | | | |
| | 32.21 | | | | 10.53 | | | | 22 | | | | 0.79 | | | | 1.26 | | | | 0.80 | | | | 9 | |
| | | | | | |
| | | | | | | | | | | | | | | | | | | | | | | | | | |
| | 32.21 | | | | 10.55 | | | | 2,937,216 | | | | 0.74 | | | | 1.61 | | | | 0.75 | | | | 9 | |
| | | | | | |
| | | | | | | | | | | | | | | | | | | | | | | | | | |
| | 32.26 | | | | 13.12 | | | | 1,438,568 | | | | 0.99 | | | | 1.11 | | | | 1.06 | | | | 9 | |
| | 28.86 | | | | (2.10 | ) | | | 1,414,635 | | | | 0.99 | | | | 1.16 | | | | 1.05 | | | | 26 | |
| | 29.99 | | | | 6.05 | | | | 3,095,251 | | | | 0.99 | | | | 0.89 | | | | 1.05 | | | | 17 | |
| | 29.27 | | | | 22.49 | | | | 2,546,808 | | | | 0.99 | | | | 1.53 | | | | 1.08 | | | | 36 | |
| | 24.72 | | | | 25.38 | | | | 1,245,241 | | | | 0.99 | | | | 1.23 | | | | 1.08 | | | | 22 | |
| | 20.00 | | | | 6.09 | | | | 422,861 | | | | 1.00 | | | | 1.62 | | | | 1.16 | | | | 49 | |
SEE NOTES TO FINANCIAL STATEMENTS.
| | | | | | | | |
| | | |
| DECEMBER 31, 2016 | | J.P. MORGAN MID CAP/MULTI-CAP FUNDS | | | | | 69 | |
NOTES TO FINANCIAL STATEMENTS
AS OF DECEMBER 31, 2016 (Unaudited)
1. Organization
JPMorgan Trust I (“JPM I”) and JPMorgan Trust II (“JPM II”) were formed on November 12, 2004, as Delaware statutory trusts, pursuant to Declarations of Trust dated November 5, 2004 and are registered under the Investment Company Act of 1940, as amended (the “1940 Act”), as open-end management investment companies.
J.P. Morgan Mutual Fund Investment Trust (“JPMMFIT”), an open-end management investment company, was organized as a Massachusetts business trust on September 23, 1997.
J.P. Morgan Fleming Mutual Fund Group, Inc. (“JPMFMFG”, with JPM I, JPM II and JPMMFIT (collectively, the “Trusts”)), an open-end management investment company, was organized as a Maryland corporation on August 19, 1997.
The following are 6 separate funds of the Trusts (collectively, the “Funds”) covered by this report:
| | | | | | |
| | | Classes Offered | | Trust | | Diversified/Non-Diversified |
| Growth Advantage Fund | | Class A, Class C, Class R5, Class R6 and Select Class | | JPMMFIT | | Diversified |
| Mid Cap Equity Fund | | Class A, Class C, Class R2, Class R5, Class R6 and Select Class | | JPM I | | Diversified |
| Mid Cap Growth Fund | | Class A, Class C, Class R2, Class R3*, Class R4*, Class R5, Class R6 and Select Class | | JPM II | | Diversified |
| Mid Cap Value Fund | | Class A, Class C, Class L**, Class R2, Class R3*, Class R4*, Class R5***, Class R6*** and Select Class | | JPMFMFG | | Diversified |
| Multi-Cap Market Neutral Fund | | Class A, Class C, and Select Class | | JPM II | | Diversified |
| Value Advantage Fund | | Class A, Class C, Class L**, Class R3*, Class R4*, Class R5***, Class R6*** and Select Class | | JPM I | | Diversified |
| * | Class R3 and Class R4 Shares commenced operations on September 9, 2016 for Mid Cap Growth Fund, Mid Cap Value Fund and Value Advantage Fund. |
| ** | Effective December 1, 2016, Institutional Class was renamed Class L and is publicly offered on a limited basis. |
| *** | Class R5 and Class R6 Shares commenced operations on September 9, 2016 for Mid Cap Value Fund and Value Advantage Fund. |
The investment objective of Growth Advantage Fund and Mid Cap Equity Fund is to seek to provide long-term capital growth.
The investment objective of Mid Cap Growth Fund is to seek growth of capital.
The investment objective of Mid Cap Value Fund is to seek growth from capital appreciation.
The investment objective of Multi-Cap Market Neutral Fund is to seek long-term capital preservation and growth by using strategies designed to produce returns which have no correlation with general domestic market performance.
The investment objective of Value Advantage Fund is to seek to provide long-term total return from a combination of income and capital gains.
Class A Shares generally provide for a front-end sales charge while Class C Shares provide for a contingent deferred sales charge (“CDSC”). No sales charges are assessed with respect to Class L, Class R2, Class R3, Class R4, Class R5, Class R6 and Select Class Shares. All classes of shares have equal rights as to earnings, assets and voting privileges, except that each class may bear different transfer agency, sub-transfer agency, distribution and shareholder servicing fees and each class has exclusive voting rights with respect to its distribution plan and shareholder servicing agreements. Certain Class A Shares, for which front-end sales charges have been waived, may be subject to a CDSC as described in the Funds’ prospectus.
J.P. Morgan Investment Management Inc. (“JPMIM”) an indirect, wholly-owned subsidiary of JPMorgan Chase & Co. (“JPMorgan”) acts as Adviser (the “Adviser”) and Administrator (the “Administrator”) to the Funds.
2. Significant Accounting Policies
The following is a summary of significant accounting policies followed by the Funds in the preparation of their financial statements. The Funds are investment companies and, accordingly, follow the investment company accounting and reporting guidance of the Financial Accounting Standards Board Accounting Standards Codification Topic 946 — Investment Companies, which is part of U.S. generally accepted accounting principles (“GAAP”). The preparation of financial statements in conformity with GAAP requires management to make estimates and assumptions that affect the reported amounts of assets and liabilities and disclosure of contingent assets and liabilities at the date of the financial statements and the reported amounts of increases and decreases in net assets from operations during the reporting period. Actual results could differ from those estimates.
A. Valuation of Investments — The valuation of investments is in accordance with GAAP and the Funds’ valuation policies set forth by and under the supervision and responsibility of the Board of Trustees (the “Board”), which established the following approach to valuation, as described more fully below: (i) investments for which market quotations are readily available shall be valued at such unadjusted quoted prices and (ii) all other investments for which market quotations are not readily available shall be valued at their fair value as determined in good faith by the Board.
The Administrator has established the J.P. Morgan Asset Management Americas Valuation Committee (“AVC”) to assist the Board with the oversight and monitoring of the valuation of the Funds’ investments. The Administrator implements the valuation policies of the Funds’ investments, as directed by the Board. The AVC oversees and carries out the policies for the valuation of investments held in the Funds. This includes monitoring the
| | | | | | |
| | | |
| 70 | | | | J.P. MORGAN MID CAP/MULTI-CAP FUNDS | | DECEMBER 31, 2016 |
appropriateness of fair values based on results of ongoing valuation oversight, including but not limited to consideration of macro or security specific events, market events and pricing vendor and broker due diligence. The Administrator is responsible for discussing and assessing the potential impacts to the fair values on an ongoing basis, and at least on a quarterly basis with the AVC and the Board.
Equities and other exchange-traded instruments are valued at the last sale price or official market closing price on the primary exchange on which the instrument is traded before the net asset values (“NAV”) of the Funds are calculated on a valuation date. Investments in open-end investment companies (the “Underlying Funds”), are valued at each Underlying Fund’s NAV per share as of the report date.
Futures are generally valued on the basis of available market quotations.
Valuations reflected in this report are as of the report date. As a result, changes in valuation due to market events and/or issuer related events after the report date and prior to issuance of the report are not reflected herein.
The various inputs that are used in determining the valuation of the Funds’ investments are summarized into the three broad levels listed below.
| • | | Level 1 — Unadjusted inputs using quoted prices in active markets for identical investments. |
| • | | Level 2 — Other significant observable inputs including, but not limited to, quoted prices for similar investments, inputs other than quoted prices that are observable for investments (such as interest rates, prepayment speeds, credit risk, etc.) or other market corroborated inputs. |
| • | | Level 3 — Significant inputs based on the best information available in the circumstances, to the extent observable inputs are not available (including the Funds’ assumptions in determining the fair value of investments). |
A financial instrument’s level within the fair value hierarchy is based on the lowest level of any input, both individually and in the aggregate, that is significant to the fair value measurement. The inputs or methodology used for valuing instruments are not necessarily an indication of the risk associated with investing in those instruments.
The following tables represent each valuation input as presented on the Schedules of Portfolio Investments (“SOIs”) (amounts in thousands):
Growth Advantage Fund
| | | | | | | | | | | | | | | | |
| | | Level 1
Quoted prices | | | Level 2
Other significant
observable inputs | | | Level 3
Significant
unobservable inputs | | | Total | |
Total Investments in Securities (a) | | $ | 6,091,615 | | | $ | — | | | $ | — | | | $ | 6,091,615 | |
| | | | | | | | | | | | | | | | |
| | | | |
| Mid Cap Equity Fund | | | | | | | | | | | | | | | | |
| | | Level 1
Quoted prices | | | Level 2
Other significant
observable inputs | | | Level 3
Significant
unobservable inputs | | | Total | |
Total Investments in Securities (a) | | $ | 2,605,593 | | | $ | — | | | $ | — | | | $ | 2,605,593 | |
| | | | | | | | | | | | | | | | |
| | | | |
| Mid Cap Growth Fund | | | | | | | | | | | | | | | | |
| | | Level 1
Quoted prices | | | Level 2
Other significant
observable inputs | | | Level 3
Significant
unobservable inputs | | | Total | |
Total Investments in Securities (a) | | $ | 2,722,257 | | | $ | — | | | $ | — | | | $ | 2,722,257 | |
| | | | | | | | | | | | | | | | |
| | | | |
| Mid Cap Value Fund | | | | | | | | | | | | | | | | |
| | | Level 1
Quoted prices | | | Level 2
Other significant
observable inputs | | | Level 3
Significant
unobservable inputs | | | Total | |
Total Investments in Securities (a) | | $ | 17,166,845 | | | $ | — | | | $ | — | | | $ | 17,166,845 | |
| | | | | | | | | | | | | | | | |
| | | | | | | | |
| | | |
| DECEMBER 31, 2016 | | J.P. MORGAN MID CAP/MULTI-CAP FUNDS | | | | | 71 | |
NOTES TO FINANCIAL STATEMENTS
AS OF DECEMBER 31, 2016 (Unaudited) (continued)
| | | | | | | | | | | | | | | | |
| Multi-Cap Market Neutral Fund | | | | | | | | | | | | | | | | |
| | | Level 1
Quoted prices | | | Level 2
Other significant
observable inputs | | | Level 3
Significant
unobservable inputs | | | Total | |
Total Investments in Securities (a) | | $ | 173,052 | | | $ | — | | | $ | — | | | $ | 173,052 | |
| | | | | | | | | | | | | | | | |
Total Liabilities for Securities Sold Short (a) | | $ | (148,679 | ) | | $ | — | | | $ | — | | | $ | (148,679 | ) |
| | | | | | | | | | | | | | | | |
Appreciation in Other Financial Instruments | | | | | | | | | | | | | | | | |
Futures Contracts | | $ | 11 | | | $ | — | | | $ | — | | | $ | 11 | |
| | | | | | | | | | | | | | | | |
| | | | |
| Value Advantage Fund | | | | | | | | | | | | | | | | |
| | | Level 1
Quoted prices | | | Level 2
Other significant
observable inputs | | | Level 3
Significant
unobservable inputs | | | Total | |
Total Investments in Securities (a) | | $ | 10,691,089 | | | $ | — | | | $ | — | | | $ | 10,691,089 | |
| | | | | | | | | | | | | | | | |
| (a) | All portfolio holdings designated as level 1 are disclosed individually on the SOIs. Please refer to the SOIs for industry specifics of portfolio holdings. |
There were no transfers among any levels during the six months ended December 31, 2016.
B. Short Sales — Multi-Cap Market Neutral Fund engages in short sales as part of its normal investment activities. In a short sale, the Fund sells securities it does not own in anticipation of a decline in the market value of those securities. In order to deliver securities to the purchaser, the Fund borrows securities from a broker. To close out a short position, the Fund delivers the same securities to the broker.
The Fund is required to pledge cash or securities to the broker as collateral for the securities sold short. Collateral requirements are calculated daily based on the current market value of the short positions. Cash collateral deposited with the broker is recorded as Deposits at broker for securities sold short, while cash collateral deposited at the Fund’s custodian for the benefit of the broker is recorded as Restricted Cash on the Statements of Assets and Liabilities. Securities segregated as collateral are denoted on the SOIs. The Fund may receive or pay the net of the following amounts: (i) a portion of the income from the investment of cash collateral; (ii) the broker’s fee on the borrowed securities (calculated daily based upon the market value of each borrowed security and a variable rate that is dependent on availability of the security); and (iii) a financing charge for the difference between the market value of the short position and cash collateral deposited with the broker. The net amounts of income or fees are included as Interest income or Interest expense on securities sold short on the Statements of Operations.
The Fund is obligated to pay the broker dividends declared on short positions when a position is open on the record date. Dividends on short positions are reported on ex-dividend date on the Statements of Operations as Dividend expense on securities sold short.
Liabilities for securities sold short are reported at market value on the Statements of Assets and Liabilities and the change in market value is recorded as change in net unrealized appreciation (depreciation) on the Statements of Operations. Short sale transactions may result in unlimited losses as the security’s price increases and the short position loses value. There is no upward limit on the price a borrowed security could attain. The Fund is also subject to risk of loss if the broker were to fail to perform its obligations under the contractual terms.
The Fund will record a realized loss if the price of the borrowed security increases between the date of the short sale and the date on which the Fund replaces the borrowed security. The Fund will record a realized gain if the price of the borrowed security declines between those dates.
As of December 31, 2016, the Fund had outstanding short sales as listed on the SOI.
C. Futures Contracts — Multi-Cap Market Neutral Fund used index futures contracts to gain or reduce exposure to the stock market, maintain liquidity or minimize transaction costs. The Fund also bought futures contracts to invest incoming cash in the market or sold futures in response to cash outflows, thereby simulating an invested position in the underlying index while maintaining a cash balance for liquidity.
Futures contracts provide for the delayed delivery of the underlying instrument at a fixed price or are settled for a cash amount based on the change in the value of the underlying instrument at a specific date in the future. Upon entering into a futures contract, the Fund is required to deposit with the broker, cash or securities in an amount equal to a certain percentage of the contract amount, which is referred to as the initial margin deposit. Subsequent payments, referred to as variation margin, are made or received by the Fund periodically and are based on changes in the market value of open futures contracts. Changes in the market value of open futures contracts are recorded as Change in net unrealized appreciation/depreciation on the Statements of Operations. Realized gains or losses, representing the difference between the value of the contract at the time it was opened and the value at the time it was closed, are reported on the Statements of Operations at the closing or expiration of the futures contract. Securities deposited as initial margin are designated on the SOIs and cash deposited is recorded on the Statements of Assets and Liabilities. A receivable from and/or a payable to brokers for the daily variation margin is also recorded on the Statements of Assets and Liabilities.
The use of futures contracts exposes the Fund to equity price risk. The Fund may be subject to the risk that the change in the value of the futures contract may not correlate perfectly with the underlying instrument. Use of long futures contracts subjects the Fund to risk of loss in excess of the
| | | | | | |
| | | |
| 72 | | | | J.P. MORGAN MID CAP/MULTI-CAP FUNDS | | DECEMBER 31, 2016 |
amounts shown on the Statements of Assets and Liabilities, up to the notional amount of the futures contracts. Use of short futures contracts subjects the Fund to unlimited risk of loss. The Fund may enter into futures contracts only on exchanges or boards of trade.
The exchange or board of trade acts as the counterparty to each futures transaction; therefore, the Fund’s credit risk is limited to failure of the exchange or board of trade. Under some circumstances, futures exchanges may establish daily limits on the amount that the price of a futures contract can vary from the previous day’s settlement price, which could effectively prevent liquidation of positions.
The table below discloses the volume of the Fund’s futures contracts activity during the six months ended December 31, 2016 (amounts in thousands):
| | | | |
| | | Multi-Cap Market
Neutral Fund | |
Futures Contracts: | | | | |
Average Notional Balance Short | | $ | 1,448 | |
Ending Notional Balance Short | | | 721 | |
The Fund’s futures contracts are not subject to master netting arrangements (the right to close out all transactions traded with a counterparty and net amounts owed or due across transactions).
D. Security Transactions and Investment Income — Investment transactions are accounted for on the trade date (the date the order to buy or sell is executed). Securities gains and losses are calculated on a specifically identified cost basis. Interest income is determined on the basis of coupon interest accrued using the effective interest method which adjusts for amortization of premiums and accretion of discounts. Dividend income, net of foreign taxes withheld, if any, and dividend expense on securities sold short, are recorded on the ex-dividend date or when a Fund first learns of the dividend.
To the extent such information is publicly available, the Funds record distributions received in excess of income earned from underlying investments as a reduction of cost of investments and/or realized gain. Such amounts are based on estimates if actual amounts are not available and actual amounts of income, realized gain and return of capital may differ from the estimated amounts. The Funds adjust the estimated amounts of the components of distributions (and consequently their net investment income) as necessary once the issuers provide information about the actual composition of the distributions.
E. Allocation of Income and Expenses — Expenses directly attributable to a fund are charged directly to that fund, while the expenses attributable to more than one fund of the Trusts are allocated among the respective funds. In calculating the NAV of each class, investment income, realized and unrealized gains and losses and expenses, other than class specific expenses, are allocated daily to each class of shares based upon the proportion of net assets of each class at the beginning of each day.
Transfer agency fees and sub-transfer agency fees are class-specific expenses. The amount of the transfer agency fees and sub-transfer agency fees charged to each class of the Funds for the six months ended December 31, 2016 are as follows (amounts in thousands):
| | | | | | | | | | | | | | | | | | | | | | | | | | | | | | | | | | | | | | | | |
| | | Class A | | | Class C | | | Class L
(formerly
Institutional Class) | | | Class R2 | | | Class R3 | | | Class R4 | | | Class R5 | | | Class R6 | | | Select Class | | | Total | |
Growth Advantage Fund | | | | | | | | | | | | | | | | | | | | | | | | | | | | | | | | | | | | | | | | |
Transfer agency fees | | $ | 51 | | | $ | 21 | | | | n/a | | | | n/a | | | | n/a | | | | n/a | | | $ | 3 | | | $ | 10 | | | $ | 18 | | | $ | 103 | |
Sub-transfer agency fees | | | 716 | | | | 257 | | | | n/a | | | | n/a | | | | n/a | | | | n/a | | | | 37 | | | | — | | | | 234 | | | | 1,244 | |
Mid Cap Equity Fund | | | | | | | | | | | | | | | | | | | | | | | | | | | | | | | | | | | | | | | | |
Transfer agency fees | | | 7 | | | | 1 | | | | n/a | | | $ | 1 | | | | n/a | | | | n/a | | | | — | (a) | | | 5 | | | | 10 | | | | 24 | |
Sub-transfer agency fees | | | 251 | | | | 33 | | | | n/a | | | | 1 | | | | n/a | | | | n/a | | | | 1 | | | | — | | | | 409 | | | | 695 | |
Mid Cap Growth Fund | | | | | | | | | | | | | | | | | | | | | | | | | | | | | | | | | | | | | | | | |
Transfer agency fees | | | 187 | | | | 7 | | | | n/a | | | | 3 | | | $ | — | (a) | | $ | — | (a) | | | 2 | | | | 13 | | | | 17 | | | | 229 | |
Sub-transfer agency fees | | | 455 | | | | 54 | | | | n/a | | | | 29 | | | | — | | | | — | | | | 104 | | | | — | | | | 487 | | | | 1,129 | |
Mid Cap Value Fund | | | | | | | | | | | | | | | | | | | | | | | | | | | | | | | | | | | | | | | | |
Transfer agency fees | | | 79 | | | | 13 | | | $ | 394 | | | | 4 | | | | — | (a) | | | — | (a) | | | — | (a) | | | — | (a) | | | 20 | | | | 510 | |
Sub-transfer agency fees | | | 1,727 | | | | 190 | | | | 4,000 | | | | 69 | | | | — | | | | — | | | | — | | | | — | | | | 1,080 | | | | 7,066 | |
Multi-Cap Market Neutral Fund | | | | | | | | | | | | | | | | | | | | | | | | | | | | | | | | | | | | | | | | |
Transfer agency fees | | | 1 | | | | 1 | | | | n/a | | | | n/a | | | | n/a | | | | n/a | | | | n/a | | | | n/a | | | | 1 | | | | 3 | |
Sub-transfer agency fees | | | 3 | | | | 4 | | | | n/a | | | | n/a | | | | n/a | | | | n/a | | | | n/a | | | | n/a | | | | 6 | | | | 13 | |
Value Advantage Fund | | | | | | | | | | | | | | | | | | | | | | | | | | | | | | | | | | | | | | | | |
Transfer agency fees | | | 49 | | | | 26 | | | | 31 | | | | n/a | | | | — | (a) | | | — | (a) | | | — | (a) | | | 5 | | | | 17 | | | | 128 | |
Sub-transfer agency fees | | | 1,381 | | | | 303 | | | | 533 | | | | n/a | | | | — | | | | — | | | | — | | | | — | | | | 391 | | | | 2,608 | |
| (a) | Amount rounds to less than 500. |
| | | | | | | | |
| | | |
| DECEMBER 31, 2016 | | J.P. MORGAN MID CAP/MULTI-CAP FUNDS | | | | | 73 | |
NOTES TO FINANCIAL STATEMENTS
AS OF DECEMBER 31, 2016 (Unaudited) (continued)
F. Federal Income Taxes — Each Fund is treated as a separate taxable entity for Federal income tax purposes. Each Fund’s policy is to comply with the provisions of the Internal Revenue Code of 1986, as amended (the “Code”), applicable to regulated investment companies and to distribute to shareholders all of its distributable net investment income and net realized capital gains on investments. Accordingly, no provision for Federal income tax is necessary. Management has reviewed the Funds’ tax positions for all open tax years and has determined that as of December 31, 2016, no liability for income tax is required in the Funds’ financial statements for net unrecognized tax benefits. However, management’s conclusions may be subject to future review based on changes in, or the interpretation of, the accounting standards or tax laws and regulations. Each of the Funds’ Federal tax returns for the prior three fiscal years remains subject to examination by the Internal Revenue Service.
G. Distributions to Shareholders — Distributions from net investment income are generally declared and paid at least annually, except for the Mid Cap Equity Fund, Mid Cap Growth Fund and Multi-Cap Market Neutral Fund, for which distributions are generally declared and paid at least quarterly. Distributions are declared separately for each class of each Fund. No class has preferential dividend rights; differences in per share rates are due to differences in separate class expenses. Net realized capital gains, if any, are distributed by each Fund at least annually. The amount of distributions from net investment income and net realized capital gains is determined in accordance with Federal income tax regulations, which may differ from GAAP. To the extent these “book/tax” differences are permanent in nature (i.e., that they result from other than timing of recognition — “temporary differences”), such amounts are reclassified within the capital accounts based on their Federal tax-basis treatment.
3. Fees and Other Transactions with Affiliates
A. Investment Advisory Fee — Pursuant to Investment Advisory Agreements, J.P. Morgan Investment Management Inc. the Adviser supervises the investments of each Fund and for such services is paid a fee. The fee is accrued daily and paid monthly based on each Fund’s respective average daily net assets. The annual rate for each Fund is as follows:
| | | | |
Growth Advantage Fund | | | 0.65 | % |
Mid Cap Equity Fund | | | 0.65 | |
Mid Cap Growth Fund | | | 0.65 | |
Mid Cap Value Fund | | | 0.65 | |
Multi-Cap Market Neutral Fund | | | 0.80 | |
Value Advantage Fund | | | 0.65 | |
The Adviser waived Investment Advisory fees and/or reimbursed expenses as outlined in Note 3.F.
B. Administration Fee — Pursuant to Administration Agreements, the Administrator provides certain administration services to the Funds. In consideration of these services, the Administrator receives a fee accrued daily and paid monthly at an annual rate of 0.15% of the first $25 billion of the average daily net assets of all funds in the J.P. Morgan Funds Complex covered by the Administration Agreement (excluding certain funds of funds and money market funds) and 0.075% of the average daily net assets in excess of $25 billion of all such funds. For the six months ended December 31, 2016, the effective annualized rate was 0.08% of each Fund’s average daily net assets, notwithstanding any fee waivers and/or expense reimbursements.
The Administrator waived Administration fees as outlined in Note 3.F.
JPMorgan Chase Bank, N.A. (“JPMCB”), a wholly-owned subsidiary of JPMorgan, serves as the Funds’ sub-administrator (the “Sub-administrator”). For its services as Sub-administrator, JPMCB receives a portion of the fees payable to the Administrator.
C. Distribution Fees — Pursuant to a Distribution Agreement, JPMorgan Distribution Services, Inc. (the “Distributor”), a wholly-owned subsidiary of JPMorgan, serves as the Trusts’ principal underwriter and promotes and arranges for the sale of each Fund’s shares.
The Board has adopted a Distribution Plan (the “Distribution Plan”) for Class A, Class C and Class R2 and Class R3 Shares of the Funds, as applicable, in accordance with Rule 12b-1 under the 1940 Act. Class L, Class R4, Class R5, Class R6 and Select Class Shares do not charge a distribution fee. The Distribution Plan provides that each Fund shall pay distribution fees, including payments to the Distributor, at annual rates of the average daily net assets as shown in the table below:
| | | | | | | | | | | | | | | | |
| | | Class A | | | Class C | | | Class R2 | | | Class R3 | |
Growth Advantage Fund | | | 0.25 | % | | | 0.75 | % | | | n/a | | | | n/a | |
Mid Cap Equity Fund | | | 0.25 | | | | 0.75 | | | | 0.50 | % | | | n/a | |
Mid Cap Growth Fund | | | 0.25 | | | | 0.75 | | | | 0.50 | | | | 0.25 | % |
Mid Cap Value Fund | | | 0.25 | | | | 0.75 | | | | 0.50 | | | | 0.25 | |
Multi-Cap Market Neutral Fund | | | 0.25 | | | | 0.75 | | | | n/a | | | | n/a | |
Value Advantage Fund | | | 0.25 | | | | 0.75 | | | | n/a | | | | 0.25 | |
| | | | | | |
| | | |
| 74 | | | | J.P. MORGAN MID CAP/MULTI-CAP FUNDS | | DECEMBER 31, 2016 |
In addition, the Distributor is entitled to receive the front-end sales charges from purchases of Class A Shares and the CDSC from redemptions of Class C Shares and certain Class A Shares for which front-end sales charges have been waived. For the six months ended December 31, 2016, the Distributor retained the following (amounts in thousands):
| | | | | | | | |
| | | Front-End Sales Charge | | | CDSC | |
Growth Advantage Fund | | $ | 234 | | | $ | 3 | |
Mid Cap Equity Fund | | | 122 | | | | 1 | |
Mid Cap Growth Fund | | | 44 | | | | — | (a) |
Mid Cap Value Fund | | | 21 | | | | 1 | |
Multi-Cap Market Neutral Fund | | | — | (a) | | | — | |
Value Advantage Fund | | | 147 | | | | 2 | |
| (a) | Amount rounds to less than 500. |
D. Shareholder Servicing Fees — The Trusts, on behalf of the Funds, have entered into a Shareholder Servicing Agreement with the Distributor under which the Distributor provides certain support services to the shareholders. The Class R6 Shares do not charge a shareholder servicing fee. For performing these services, the Distributor receives a fee that is accrued daily and paid monthly equal to a percentage of the average daily net assets as shown in the table below:
| | | | | | | | | | | | | | | | | | | | | | | | | | | | | | | | |
| | | Class A | | | Class C | | | Class L | | | Class R2 | | | Class R3 | | | Class R4 | | | Class R5 | | | Select Class | |
Growth Advantage Fund | | | 0.25 | % | | | 0.25 | % | | | n/a | | | | n/a | | | | n/a | | | | n/a | | | | 0.05 | % | | | 0.25 | % |
Mid Cap Equity Fund | | | 0.25 | | | | 0.25 | | | | n/a | | | | 0.25 | % | | | n/a | | | | n/a | | | | 0.05 | | | | 0.25 | |
Mid Cap Growth Fund | | | 0.25 | | | | 0.25 | | | | n/a | | | | 0.25 | | | | 0.25 | % | | | 0.25 | % | | | 0.05 | | | | 0.25 | |
Mid Cap Value Fund | | | 0.25 | | | | 0.25 | | | | 0.10 | % | | | 0.25 | | | | 0.25 | | | | 0.25 | | | | 0.05 | | | | 0.25 | |
Multi-Cap Market Neutral Fund | | | 0.25 | | | | 0.25 | | | | n/a | | | | n/a | | | | n/a | | | | n/a | | | | n/a | | | | 0.25 | |
Value Advantage Fund | | | 0.25 | | | | 0.25 | | | | 0.10 | | | | n/a | | | | 0.25 | | | | 0.25 | | | | 0.05 | | | | 0.25 | |
The Distributor has entered into shareholder services contracts with affiliated and unaffiliated financial intermediaries who provide shareholder services and other related services to their clients or customers who invest in the Funds under which the Distributor will pay all or a portion of such fees earned to financial intermediaries for performing such services.
The Distributor waived shareholder servicing fees as outlined in Note 3.F.
E. Custodian and Accounting Fees — JPMCB provides portfolio custody and accounting services to the Funds. For performing these services, the Funds pay JPMCB transaction and asset-based fees that vary according to the number of transactions and positions, plus out-of-pocket expenses. The amounts paid directly to JPMCB by the Funds for custody and accounting services are included in Custodian and accounting fees on the Statements of Operations. Payments to the custodian may be reduced by credits earned by each Fund, based on uninvested cash balances held by the custodian. Such earnings credits, if any, are presented separately on the Statements of Operations.
Interest expense paid to the custodian related to cash overdrafts, if any, is included in Interest expense to affiliates on the Statements of Operations.
F. Waivers and Reimbursements — The Adviser, Administrator and/or Distributor have contractually agreed to waive fees and/or reimburse the Funds to the extent that total annual operating expenses (excluding acquired fund fees and expenses other than certain money market fund fees as described below, dividend and interest expenses related to short sales, interest, taxes, expenses related to litigation and potential litigation and extraordinary expenses) exceed the percentages of the Funds’ respective average daily net assets as shown in the table below:
| | | | | | | | | | | | | | | | | | | | | | | | | | | | | | | | | | | | |
| | | Class A | | | Class C | | | Class L | | | Class R2 | | | Class R3 | | | Class R4 | | | Class R5 | | | Class R6 | | | Select Class | |
Growth Advantage Fund* | | | 1.24 | % | | | 1.74 | % | | | n/a | | | | n/a | | | | n/a | | | | n/a | | | | 0.85 | % | | | 0.75 | % | | | 0.99 | % |
Mid Cap Equity Fund | | | 1.25 | | | | 1.75 | | | | n/a | | | | 1.50 | % | | | n/a | | | | n/a | | | | 0.80 | | | | 0.75 | | | | 0.90 | |
Mid Cap Growth Fund | | | 1.24 | | | | 1.74 | | | | n/a | | | | 1.49 | ** | | | 1.24 | % | | | 0.99 | % | | | 0.79 | | | | 0.74 | | | | 0.93 | |
Mid Cap Value Fund | | | 1.24 | | | | 1.75 | | | | 0.75 | % | | | 1.50 | | | | 1.25 | | | | 1.00 | | | | 0.85 | | | | 0.75 | | | | 0.99 | |
Multi-Cap Market Neutral Fund | | | 1.25 | | | | 1.75 | | | | n/a | | | | n/a | | | | n/a | | | | n/a | | | | n/a | | | | n/a | | | | 0.99 | |
Value Advantage Fund | | | 1.24 | *** | | | 1.74 | *** | | | 0.75 | | | | n/a | | | | 1.25 | | | | 1.00 | | | | 0.85 | | | | 0.75 | | | | 0.99 | *** |
| * | The contractual expense percentages in the table above are in place until at least October 31, 2018. Prior to November 1, 2016, the contractual expense limitation for Growth Advantage Fund was 1.25%, 1.75%, 0.90%, 0.85% and 1.10%, for Class A, Class C, Class R5, Class R6 and Select Class Shares, respectively. |
| ** | The contractual expense percentage in the table above is in place until at least October 31, 2018. For Mid Cap Growth Fund Class R2 Shares, the Adviser, Administrator and/or Distributor contractually waived fees and/or reimbursed the Fund to the extent that total annual operating expenses (excluding acquired fund fees and expenses other than certain money market fund fees as described below, dividend and interest expenses related to short sales, interest, taxes, expenses related to litigation and potential litigation and extraordinary expenses) exceeded 1.40% of the Fund’s average daily net assets during the period July 1, 2016 through October 31, 2016. During the period November 1, 2016 |
| | | | | | | | |
| | | |
| DECEMBER 31, 2016 | | J.P. MORGAN MID CAP/MULTI-CAP FUNDS | | | | | 75 | |
NOTES TO FINANCIAL STATEMENTS
AS OF DECEMBER 31, 2016 (Unaudited) (continued)
| | through December 31, 2016 the Adviser, Administrator and/or Distributor voluntarily waived fees and/or reimbursed the Fund to the extent that total annual operating expenses for Class R2 Shares exceeded 1.40%. The Fund’s service providers are under no obligation to continue the voluntary waivers and may discontinue them at any time. |
| *** | The contractual expense percentages in the table above are in place until at least October 31, 2018. Prior to November 1, 2016, the contractual expense limitation for Value Advantage Fund was 1.25%, 1.75%, and 1.00%, for Class A, Class C and Select Class Shares, respectively. |
Except as noted above, the expense limitation agreements were in effect for the six months ended December 31, 2016 and the contractual expense limitation percentages in the table above are in place until at least October 31, 2017.
For the six months ended December 31, 2016, the Funds’ service providers waived fees and/or reimbursed expenses for each of the Funds as follows (amounts in thousands). None of these parties expect the Funds to repay any such waived fees and reimbursed expenses in future years.
| | | | | | | | | | | | | | | | | | | | |
| | | Contractual Waivers | | | | |
| | | Investment
Advisory | | | Administration | | | Shareholder
Servicing | | | Total | | | Contractual
Reimbursements | |
Growth Advantage Fund | | $ | 6 | | | $ | 4 | | | $ | 1,187 | | | $ | 1,197 | | | $ | 2 | |
Mid Cap Equity Fund | | | 68 | | | | 45 | | | | 1,016 | | | | 1,129 | | | | 16 | |
Mid Cap Growth Fund | | | 133 | | | | 87 | | | | 1,544 | | | | 1,764 | | | | 63 | |
Mid Cap Value Fund | | | 1,400 | | | | 920 | | | | 8,043 | | | | 10,363 | | | | 2,674 | |
Multi-Cap Market Neutral Fund | | | 150 | | | | 74 | | | | 8 | | | | 232 | | | | — | |
Value Advantage Fund | | | 699 | | | | 466 | | | | 4,015 | | | | 5,180 | | | | 183 | |
| | | | |
| | | Voluntary Waivers | |
| | | Shareholder
Servicing | |
Mid Cap Growth Fund | | $ | 4 | |
Additionally, the Funds may invest in one or more money market funds advised by the Adviser or its affiliates (affiliated money market funds). The Adviser, Administrator and/or Distributor, as shareholder servicing agent, have contractually agreed to waive fees and/or reimburse expenses in an amount sufficient to offset the respective net fees each collects from the affiliated money market fund on the applicable Funds’ investment in such affiliated money market fund.
The amount of waivers resulting from investments in these money market funds for the six months ended December 31, 2016 was as follows (amounts in thousands):
| | | | |
Growth Advantage Fund | | $ | 93 | |
Mid Cap Equity Fund | | | 64 | |
Mid Cap Growth Fund | | | 43 | |
Mid Cap Value Fund | | | 531 | |
Multi-Cap Market Neutral Fund | | | 14 | |
Value Advantage Fund | | | 133 | |
G. Other — Certain officers of the Trusts are affiliated with the Adviser, the Administrator and the Distributor. Such officers, with the exception of the Chief Compliance Officer, receive no compensation from the Funds for serving in their respective roles.
The Board appointed a Chief Compliance Officer to the Funds in accordance with Federal securities regulations. Each Fund, along with other affiliated funds, makes reimbursement payments, on a pro-rata basis, to the Administrator for a portion of the fees associated with the Office of the Chief Compliance Officer. Such fees are included in Trustees’ and Chief Compliance Officer’s fees on the Statements of Operations.
The Trusts adopted a Trustee Deferred Compensation Plan (the “Plan”) which allows the Independent Trustees to defer the receipt of all or a portion of compensation related to performance of their duties as Trustees. The deferred fees are invested in various J.P. Morgan Funds until distribution in accordance with the Plan.
During the six months ended December 31, 2016, Mid Cap Equity Fund and Mid Cap Growth Fund purchased securities from an underwriting syndicate in which the principal underwriter or members of the syndicate were affiliated with the Adviser.
| | | | | | |
| | | |
| 76 | | | | J.P. MORGAN MID CAP/MULTI-CAP FUNDS | | DECEMBER 31, 2016 |
The Funds may use related party broker-dealers. For the six months ended December 31, 2016, the Funds incurred brokerage commissions with broker-dealers affiliated with the Adviser as follows (amounts in thousands):
| | | | |
Growth Advantage Fund | | $ | — | (a) |
Mid Cap Equity Fund | | | — | (a) |
Mid Cap Growth Fund | | | — | (a) |
Mid Cap Value Fund | | | — | |
Multi-Cap Market Neutral Fund | | | — | |
Value Advantage Fund | | | 2 | |
| (a) | Amount rounds to less than 500. |
The Securities and Exchange Commission (“SEC”) has granted an exemptive order permitting the Funds to engage in principal transactions with J.P. Morgan Securities, Inc., an affiliated broker, involving taxable money market instruments, subject to certain conditions.
4. Investment Transactions
During the six months ended December 31, 2016, purchases and sales of investments (excluding short-term investments and transfers in-kind) were as follows (amounts in thousands):
| | | | | | | | | | | | | | | | |
| | | Purchases
(excluding
U.S. Government) | | | Sales
(excluding
U.S. Government) | | | Securities
Sold Short | | | Covers on
Securities
Sold Short | |
Growth Advantage Fund | | $ | 1,007,381 | | | $ | 1,165,228 | | | $ | — | | | $ | — | |
Mid Cap Equity Fund | | | 519,724 | | | | 437,535 | | | | — | | | | — | |
Mid Cap Growth Fund | | | 438,335 | | | | 663,504 | | | | — | | | | — | |
Mid Cap Value Fund | | | 2,563,299 | | | | 2,249,214 | | | | — | | | | — | |
Multi-Cap Market Neutral Fund | | | 68,408 | | | | 111,382 | | | | 81,812 | | | | 120,709 | |
Value Advantage Fund | | | 949,240 | | | | 1,706,245 | | | | — | | | | — | |
During the six months ended December 31, 2016, there were no purchases or sales of U.S. Government securities.
5. Federal Income Tax Matters
For Federal income tax purposes, the estimated cost and unrealized appreciation (depreciation) in value of investment securities held at December 31, 2016 were as follows (amounts in thousands):
| | | | | | | | | | | | | | | | |
| | | Aggregate
Cost | | | Gross
Unrealized
Appreciation | | | Gross
Unrealized
Depreciation | | | Net Unrealized
Appreciation
(Depreciation) | |
Growth Advantage Fund | | $ | 4,635,986 | | | $ | 1,615,703 | | | $ | 160,074 | | | | 1,455,629 | |
Mid Cap Equity Fund | | | 1,971,028 | | | | 699,682 | | | | 65,117 | | | | 634,565 | |
Mid Cap Growth Fund | | | 2,304,843 | | | | 542,753 | | | | 125,339 | | | | 417,414 | |
Mid Cap Value Fund | | | 11,728,335 | | | | 5,621,106 | | | | 182,596 | | | | 5,438,510 | |
Multi-Cap Market Neutral | | | 155,101 | | | | 21,304 | | | | 3,353 | | | | 17,951 | |
Value Advantage Fund | | | 8,149,420 | | | | 2,643,635 | | | | 101,966 | | | | 2,541,669 | |
Under the Regulated Investment Company Modernization Act of 2010 (“the “Act”), net capital losses recognized by the Funds after June 30, 2011 are carried forward indefinitely, and retain their character as short-term and/or long-term losses. Prior to the Act, net capital losses incurred by the Funds were carried forward for eight years and treated as short-term losses. The Act requires that post-enactment net capital losses be used before pre-enactment net capital losses.
At June 30, 2016, the following Funds had pre-enactment net capital loss carryforwards, expiring during the years indicated, which are available to offset future realized gains (amounts in thousands):
| | | | |
| | | 2018 | |
Mid Cap Value Fund | | $ | 14,734 | * |
| * | Amount includes capital loss carryforwards from business combinations, which are limited in future years under Internal Revenue Code Sections 381-384. |
| | | | | | | | |
| | | |
| DECEMBER 31, 2016 | | J.P. MORGAN MID CAP/MULTI-CAP FUNDS | | | | | 77 | |
NOTES TO FINANCIAL STATEMENTS
AS OF DECEMBER 31, 2016 (Unaudited) (continued)
At June 30, 2016, the following Funds had the following post-enactment net capital loss carryforwards (amounts in thousands):
| | | | | | | | |
| | | Capital Loss Carryforward Character | |
| | | Short-Term | | | Long-Term | |
Multi-Cap Market Neutral Fund | | $ | 2,351 | | | $ | — | |
Value Advantage Fund | | | 36,131 | | | | 13,093 | |
6. Borrowings
The Funds rely upon an exemptive order granted by the SEC (the “Order”) permitting the establishment and operation of an Interfund Lending Facility (the “Facility”). The Facility allows the Funds to directly lend and borrow money to or from any other fund relying upon the Order at rates beneficial to both the borrowing and lending funds. Advances under the Facility are taken primarily for temporary or emergency purposes, including the meeting of redemption requests that otherwise might require the untimely disposition of securities, and are subject to each Fund’s borrowing restrictions. The Interfund loan rate is determined, as specified in the Order, by averaging the current repurchase agreement rate and the current bank loan rate. The Order was granted to JPM II and may be relied upon by the Funds because the Funds and the series of JPM II are all investment companies in the same “group of investment companies” (as defined in Section 12(d)(1)(G) of the 1940 Act).
The Trusts and JPMCB have entered into a financing arrangement. Under this arrangement, JPMCB provides an unsecured, uncommitted credit facility in the aggregate amount of $100 million to certain of the J.P. Morgan Funds, including the Funds. Advances under the arrangement are taken primarily for temporary or emergency purposes, including the meeting of redemption requests that otherwise might require the untimely disposition of securities, and are subject to each Fund’s borrowing restrictions. Interest on borrowings is payable at a rate determined by JPMCB at the time of borrowing. This agreement has been extended until November 6, 2017.
The Funds had no borrowings outstanding from another fund or from the unsecured, uncommitted credit facility during the six months ended December 31, 2016.
In addition, effective August 16, 2016, the Trust along with certain other trusts (“Borrowers”) entered into a joint syndicated senior unsecured revolving credit facility totaling $1.5 billion (“Credit Facility”) with various lenders and The Bank of New York Mellon, as administrative agent for the lenders. This Credit Facility provides a source of funds to the Borrowers for temporary and emergency purposes, including the meeting of redemption requests that otherwise might require the untimely disposition of securities. Under the terms of the Credit Facility, a borrowing fund must have a minimum of $25,000,000 in adjusted net asset value and not exceed certain adjusted net asset coverage ratios prior to and during the time in which any borrowings are outstanding. If a fund does not comply with the aforementioned requirements, the Fund must remediate within three business days with respect to the $25,000,000 minimum adjusted net asset value or within one business day with respect to certain asset coverage ratios or the administrative agent at the request of, or with the consent of, the lenders may terminate the Credit Facility and declare any outstanding borrowings to be due and payable immediately.
Interest associated with any borrowing under the Credit Facility is charged to the borrowing fund at a rate of interest equal to 1.00% plus the greater of the federal funds effective rate or one month LIBOR. The annual commitment fee to maintain the Credit Facility is 0.15% and is incurred on the unused portion of the Credit Facility and is allocated to all participating funds pro rata based on their respective net assets. The initial term of the Credit Facility is 364 days, unless extended.
The Funds did not utilize the Credit Facility during the six months ended December 31, 2016.
7. Risks, Concentrations and Indemnifications
In the normal course of business, the Funds enter into contracts that contain a variety of representations which provide general indemnifications. Each Fund’s maximum exposure under these arrangements is unknown. The amount of exposure would depend on future claims that may be made against each Fund that have not yet occurred. However, based on experience, the Funds expect the risk of loss to be remote.
As of December 31, 2016, the J.P. Morgan Investor Funds and JPMorgan SmartRetirement Funds, which are affiliated funds of funds, owned in the aggregate, shares representing more than 10% of the net assets of the following Funds:
| | | | | | | | |
| | | J.P. Morgan
Investor Funds | | | JPMorgan
SmartRetirement
Funds | |
Growth Advantage Fund | | | n/a | | | | 39.9 | % |
Mid Cap Equity Fund | | | n/a | | | | 52.0 | |
Multi-Cap Market Neutral Fund | | | 89.3 | % | | | n/a | |
Value Advantage Fund | | | n/a | | | | 23.3 | |
| | | | | | |
| | | |
| 78 | | | | J.P. MORGAN MID CAP/MULTI-CAP FUNDS | | DECEMBER 31, 2016 |
As of December 31, 2016, the Funds had omnibus accounts which represented the percentage of each Fund’s net assets as follows:
| | | | | | | | |
| | | Number of
Non-affiliated
Omnibus
Accounts | | | % of the Fund | |
Mid Cap Equity Fund | | | 1 | | | | 16.9 | % |
Mid Cap Value Fund | | | 1 | | | | 18.6 | |
Value Advantage Fund | | | 1 | | | | 12.6 | |
Significant shareholder transactions by these shareholders may impact the Funds’ performance.
As of December 31, 2016, the Multi-Cap Market Neutral Fund pledged a significant portion of its assets for securities sold short to Citigroup Global Markets, Inc., who also held 100% of the Multi-Cap Market Neutral Fund’s cash proceeds for securities sold short.
| | | | | | | | |
| | | |
| DECEMBER 31, 2016 | | J.P. MORGAN MID CAP/MULTI-CAP FUNDS | | | | | 79 | |
SCHEDULE OF SHAREHOLDER EXPENSES
(Unaudited)
Hypothetical $1,000 Investment
As a shareholder of the Funds, you incur two types of costs: (1) transaction costs, including sales charges (loads) on purchase payments and (2) ongoing costs, including investment advisory fees, administration fees, distribution fees and other Fund expenses. The examples below are intended to help you understand your ongoing costs (in dollars) of investing in the Funds and to compare these ongoing costs with the ongoing costs of investing in other mutual funds. The examples assume that you had a $1,000 investment in each Class at the beginning of the reporting period, July 1, 2016, and continued to hold your shares at the end of the reporting period, December 31, 2016.
Actual Expenses
For each Class of each Fund in the table below, the first line provides information about actual account values and actual expenses. You may use the information in this line, together with the amount you invested, to estimate the expenses that you paid over the period. Simply divide your account value by $1,000 (for example, an $8,600 account value divided by $1,000 = 8.6), then multiply the result by the number in the first line of each Class under the heading entitled “Expenses Paid During the Period” to estimate the expenses you paid on your account during this period.
Hypothetical Example for Comparison Purposes
The second line of each Class in the table below provides information about hypothetical account values and hypothetical expenses based on the Class’ actual expense ratio and an assumed rate of return of 5% per year before expenses, which is not the Class’ actual return. The hypothetical account values and expenses may not be used to estimate the actual ending account balance or expenses you paid for the period. You may use this information to compare the ongoing costs of investing in the Class of the Fund and other funds. To do so, compare this 5% hypothetical example with the 5% hypothetical examples that appear in the shareholder reports of the other funds. Please note that the expenses shown in the table are meant to highlight your ongoing costs only and do not reflect any transaction costs, such as sales charges (loads) or redemption fees. Therefore, the second line for each Class in the table is useful in comparing ongoing costs only, and will not help you determine the relative total costs of owning different funds. In addition, if these transaction costs were included, your costs would have been higher. The examples also assume all dividends and distributions have been reinvested.
| | | | | | | | | | | | | | | | |
| | | Beginning
Account Value
July 1, 2016 | | | Ending
Account Value
December 31, 2016 | | | Expenses
Paid During
the Period | | | Annualized
Expense
Ratio | |
Growth Advantage Fund | | | | | | | | | | | | | | | | |
Class A | | | | | | | | | | | | | | | | |
Actual* | | $ | 1,000.00 | | | $ | 1,052.00 | | | $ | 6.41 | | | | 1.24 | % |
Hypothetical* | | | 1,000.00 | | | | 1,018.95 | | | | 6.31 | | | | 1.24 | |
Class C | | | | | | | | | | | | | | | | |
Actual* | | | 1,000.00 | | | | 1,049.60 | | | | 8.99 | | | | 1.74 | |
Hypothetical* | | | 1,000.00 | | | | 1,016.43 | | | | 8.84 | | | | 1.74 | |
Class R5 | | | | | | | | | | | | | | | | |
Actual* | | | 1,000.00 | | | | 1,054.10 | | | | 4.50 | | | | 0.87 | |
Hypothetical* | | | 1,000.00 | | | | 1,020.82 | | | | 4.43 | | | | 0.87 | |
Class R6 | | | | | | | | | | | | | | | | |
Actual* | | | 1,000.00 | | | | 1,054.70 | | | | 3.83 | | | | 0.74 | |
Hypothetical* | | | 1,000.00 | | | | 1,021.48 | | | | 3.77 | | | | 0.74 | |
Select Class | | | | | | | | | | | | | | | | |
Actual* | | | 1,000.00 | | | | 1,053.60 | | | | 5.28 | | | | 1.02 | |
Hypothetical* | | | 1,000.00 | | | | 1,020.06 | | | | 5.19 | | | | 1.02 | |
| | | | |
Mid Cap Equity Fund | | | | | | | | | | | | | | | | |
Class A | | | | | | | | | | | | | | | | |
Actual* | | | 1,000.00 | | | | 1,053.90 | | | | 6.42 | | | | 1.24 | |
Hypothetical* | | | 1,000.00 | | | | 1,018.95 | | | | 6.31 | | | | 1.24 | |
Class C | | | | | | | | | | | | | | | | |
Actual* | | | 1,000.00 | | | | 1,051.10 | | | | 9.00 | | | | 1.74 | |
Hypothetical* | | | 1,000.00 | | | | 1,016.43 | | | | 8.84 | | | | 1.74 | |
Class R2 | | | | | | | | | | | | | | | | |
Actual* | | | 1,000.00 | | | | 1,052.30 | | | | 7.71 | | | | 1.49 | |
Hypothetical* | | | 1,000.00 | | | | 1,017.69 | | | | 7.58 | | | | 1.49 | |
| | | | | | |
| | | |
| 80 | | | | J.P. MORGAN MID CAP/MULTI-CAP FUNDS | | DECEMBER 31, 2016 |
| | | | | | | | | | | | | | | | |
| | | Beginning
Account Value
July 1, 2016 | | | Ending
Account Value
December 31, 2016 | | | Expenses
Paid During
the Period | | | Annualized
Expense
Ratio | |
Mid Cap Equity Fund (continued) | | | | | | | | | | | | | | | | |
Class R5 | | | | | | | | | | | | | | | | |
Actual* | | $ | 1,000.00 | | | $ | 1,056.30 | | | $ | 4.09 | | | | 0.79 | % |
Hypothetical* | | | 1,000.00 | | | | 1,021.22 | | | | 4.02 | | | | 0.79 | |
Class R6 | | | | | | | | | | | | | | | | |
Actual* | | | 1,000.00 | | | | 1,056.30 | | | | 3.84 | | | | 0.74 | |
Hypothetical* | | | 1,000.00 | | | | 1,021.48 | | | | 3.77 | | | | 0.74 | |
Select Class | | | | | | | | | | | | | | | | |
Actual* | | | 1,000.00 | | | | 1,055.60 | | | | 4.61 | | | | 0.89 | |
Hypothetical* | | | 1,000.00 | | | | 1,020.72 | | | | 4.53 | | | | 0.89 | |
| | | | |
Mid Cap Growth Fund | | | | | | | | | | | | | | | | |
Class A | | | | | | | | | | | | | | | | |
Actual* | | | 1,000.00 | | | | 1,035.50 | | | | 6.31 | | | | 1.23 | |
Hypothetical* | | | 1,000.00 | | | | 1,019.00 | | | | 6.26 | | | | 1.23 | |
Class C | | | | | | | | | | | | | | | | |
Actual* | | | 1,000.00 | | | | 1,032.70 | | | | 8.86 | | | | 1.73 | |
Hypothetical* | | | 1,000.00 | | | | 1,016.48 | | | | 8.79 | | | | 1.73 | |
Class R2 | | | | | | | | | | | | | | | | |
Actual* | | | 1,000.00 | | | | 1,034.70 | | | | 7.13 | | | | 1.39 | |
Hypothetical* | | | 1,000.00 | | | | 1,018.20 | | | | 7.07 | | | | 1.39 | |
Class R3 | | | | | | | | | | | | | | | | |
Actual** | | | 1,000.00 | | | | 1,015.60 | | | | 3.77 | | | | 1.23 | |
Hypothetical* | | | 1,000.00 | | | | 1,019.00 | | | | 6.26 | | | | 1.23 | |
Class R4 | | | | | | | | | | | | | | | | |
Actual** | | | 1,000.00 | | | | 1,016.30 | | | | 3.00 | | | | 0.98 | |
Hypothetical* | | | 1,000.00 | | | | 1,020.27 | | | | 4.99 | | | | 0.98 | |
Class R5 | | | | | | | | | | | | | | | | |
Actual* | | | 1,000.00 | | | | 1,037.80 | | | | 4.01 | | | | 0.78 | |
Hypothetical* | | | 1,000.00 | | | | 1,021.27 | | | | 3.97 | | | | 0.78 | |
Class R6 | | | | | | | | | | | | | | | | |
Actual* | | | 1,000.00 | | | | 1,037.70 | | | | 3.75 | | | | 0.73 | |
Hypothetical* | | | 1,000.00 | | | | 1,021.53 | | | | 3.72 | | | | 0.73 | |
Select Class | | | | | | | | | | | | | | | | |
Actual* | | | 1,000.00 | | | | 1,037.00 | | | | 4.72 | | | | 0.92 | |
Hypothetical* | | | 1,000.00 | | | | 1,020.57 | | | | 4.69 | | | | 0.92 | |
| | | | |
Mid Cap Value Fund | | | | | | | | | | | | | | | | |
Class A | | | | | | | | | | | | | | | | |
Actual* | | | 1,000.00 | | | | 1,073.30 | | | | 6.43 | | | | 1.23 | |
Hypothetical* | | | 1,000.00 | | | | 1,019.00 | | | | 6.26 | | | | 1.23 | |
Class C | | | | | | | | | | | | | | | | |
Actual* | | | 1,000.00 | | | | 1,070.40 | | | | 9.08 | | | | 1.74 | |
Hypothetical* | | | 1,000.00 | | | | 1,016.43 | | | | 8.84 | | | | 1.74 | |
Class L (formerly Institutional Class) | | | | | | | | | | | | | | | | |
Actual* | | | 1,000.00 | | | | 1,075.90 | | | | 3.87 | | | | 0.74 | |
Hypothetical* | | | 1,000.00 | | | | 1,021.48 | | | | 3.77 | | | | 0.74 | |
Class R2 | | | | | | | | | | | | | | | | |
Actual* | | | 1,000.00 | | | | 1,071.80 | | | | 7.78 | | | | 1.49 | |
Hypothetical* | | | 1,000.00 | | | | 1,017.69 | | | | 7.58 | | | | 1.49 | |
Class R3 | | | | | | | | | | | | | | | | |
Actual** | | | 1,000.00 | | | | 1,062.10 | | | | 3.89 | | | | 1.24 | |
Hypothetical* | | | 1,000.00 | | | | 1,018.95 | | | | 6.31 | | | | 1.24 | |
Class R4 | | | | | | | | | | | | | | | | |
Actual** | | | 1,000.00 | | | | 1,062.90 | | | | 3.11 | | | | 0.99 | |
Hypothetical* | | | 1,000.00 | | | | 1,020.21 | | | | 5.04 | | | | 0.99 | |
| | | | | | | | |
| | | |
| DECEMBER 31, 2016 | | J.P. MORGAN MID CAP/MULTI-CAP FUNDS | | | | | 81 | |
SCHEDULE OF SHAREHOLDER EXPENSES
(Unaudited) (continued)
Hypothetical $1,000 Investment
| | | | | | | | | | | | | | | | |
| | | Beginning
Account Value
July 1, 2016 | | | Ending
Account Value
December 31, 2016 | | | Expenses
Paid During
the Period | | | Annualized
Expense
Ratio | |
Mid Cap Value Fund (continued) | | | | | | | | | | | | | | | | |
Class R5 | | | | | | | | | | | | | | | | |
Actual** | | $ | 1,000.00 | | | $ | 1,063.60 | | | $ | 2.48 | | | | 0.79 | % |
Hypothetical* | | | 1,000.00 | | | | 1,021.22 | | | | 4.02 | | | | 0.79 | |
Class R6 | | | | | | | | | | | | | | | | |
Actual** | | | 1,000.00 | | | | 1,063.80 | | | | 2.32 | | | | 0.74 | |
Hypothetical* | | | 1,000.00 | | | | 1,021.48 | | | | 3.77 | | | | 0.74 | |
Select Class | | | | | | | | | | | | | | | | |
Actual* | | | 1,000.00 | | | | 1,074.70 | | | | 5.12 | | | | 0.98 | |
Hypothetical* | | | 1,000.00 | | | | 1,020.27 | | | | 4.99 | | | | 0.98 | |
| | | | |
Multi-Cap Market Neutral Fund | | | | | | | | | | | | | | | | |
Class A | | | | | | | | | | | | | | | | |
Actual* | | | 1,000.00 | | | | 1,015.20 | | | | 12.04 | | | | 2.37 | |
Hypothetical* | | | 1,000.00 | | | | 1,013.26 | | | | 12.03 | | | | 2.37 | |
Class C | | | | | | | | | | | | | | | | |
Actual* | | | 1,000.00 | | | | 1,012.90 | | | | 14.56 | | | | 2.87 | |
Hypothetical* | | | 1,000.00 | | | | 1,010.74 | | | | 14.55 | | | | 2.87 | |
Select Class | | | | | | | | | | | | | | | | |
Actual* | | | 1,000.00 | | | | 1,016.80 | | | | 10.78 | | | | 2.12 | |
Hypothetical* | | | 1,000.00 | | | | 1,014.52 | | | | 10.76 | | | | 2.12 | |
| | | | |
Value Advantage Fund | | | | | | | | | | | | | | | | |
Class A | | | | | | | | | | | | | | | | |
Actual* | | | 1,000.00 | | | | 1,129.80 | | | | 6.66 | | | | 1.24 | |
Hypothetical* | | | 1,000.00 | | | | 1,018.95 | | | | 6.31 | | | | 1.24 | |
Class C | | | | | | | | | | | | | | | | |
Actual* | | | 1,000.00 | | | | 1,126.80 | | | | 9.33 | | | | 1.74 | |
Hypothetical* | | | 1,000.00 | | | | 1,016.43 | | | | 8.84 | | | | 1.74 | |
Class L (formerly Institutional Class) | | | | | | | | | | | | | | | | |
Actual* | | | 1,000.00 | | | | 1,132.50 | | | | 4.03 | | | | 0.75 | |
Hypothetical* | | | 1,000.00 | | | | 1,021.42 | | | | 3.82 | | | | 0.75 | |
Class R3 | | | | | | | | | | | | | | | | |
Actual** | | | 1,000.00 | | | | 1,103.70 | | | | 3.97 | | | | 1.24 | |
Hypothetical* | | | 1,000.00 | | | | 1,018.95 | | | | 6.31 | | | | 1.24 | |
Class R4 | | | | | | | | | | | | | | | | |
Actual** | | | 1,000.00 | | | | 1,104.40 | | | | 3.17 | | | | 0.99 | |
Hypothetical* | | | 1,000.00 | | | | 1,020.21 | | | | 5.04 | | | | 0.99 | |
Class R5 | | | | | | | | | | | | | | | | |
Actual** | | | 1,000.00 | | | | 1,105.30 | | | | 2.53 | | | | 0.79 | |
Hypothetical* | | | 1,000.00 | | | | 1,021.22 | | | | 4.02 | | | | 0.79 | |
Class R6 | | | | | | | | | | | | | | | | |
Actual** | | | 1,000.00 | | | | 1,105.50 | | | | 2.37 | | | | 0.74 | |
Hypothetical* | | | 1,000.00 | | | | 1,021.48 | | | | 3.77 | | | | 0.74 | |
Select Class | | | | | | | | | | | | | | | | |
Actual* | | | 1,000.00 | | | | 1,131.20 | | | | 5.32 | | | | 0.99 | |
Hypothetical* | | | 1,000.00 | | | | 1,020.21 | | | | 5.04 | | | | 0.99 | |
| * | Expenses are equal to each Class’ respective annualized expense ratio, multiplied by the average account value over the period, multiplied by 184/365 (to reflect the one-half year period). |
| ** | Expenses are equal to each Class’ respective annualized expense ratio, multiplied by the average account value over the period, multiplied by 111/365 (to reflect the actual period.) Commencement of operations was September 9, 2016. |
| | | | | | |
| | | |
| 82 | | | | J.P. MORGAN MID CAP/MULTI-CAP FUNDS | | DECEMBER 31, 2016 |
BOARD APPROVAL OF INVESTMENT ADVISORY AGREEMENT
(Unaudited)
The Board of Trustees has established various standing committees composed of Trustees with diverse backgrounds, to which the Board of Trustees has assigned specific subject matter responsibilities to further enhance the effectiveness of the Board’s oversight and decision making. The Board of Trustees and its investment committees (money market and alternative products, equity, and fixed income) meet regularly throughout the year and consider factors that are relevant to their annual consideration of investment advisory agreements at each meeting. They also meet for the specific purpose of considering investment advisory agreement annual renewals. The Board of Trustees held meetings in person in June and August 2016, at which the Trustees considered the continuation of the investment advisory agreements for each of the Funds whose semi-annual report is contained herein (each an “Advisory Agreement” and collectively, the “Advisory Agreements”). At the June meeting, the Board’s investment committees met to review and consider performance, expense and related information for the J.P. Morgan Funds. Each investment committee reported to the full Board, which then considered the investment committee’s preliminary findings. At the August meeting, the Trustees continued their review and consideration. The Trustees, including a majority of the Trustees who are not “interested persons” (as defined in the 1940 Act) of any party to the Advisory Agreements or any of their affiliates, approved the continuation of each Advisory Agreement on August 17, 2016.
As part of their review of the Advisory Agreements, the Trustees considered and reviewed performance and other information about the Funds received from the Adviser. This information includes the Funds’ performance as compared to the performance of their peers and benchmarks and analyses by the Adviser of the Funds’ performance. In addition, the Trustees have engaged an independent management consulting firm (“independent consultant”) to report on the performance of certain J.P. Morgan Funds at each of the Trustees’ regular meetings. The Adviser also periodically provides comparative information regarding the Funds’ expense ratios and those of their peer groups. In addition, in preparation for the June and August meetings, the Trustees requested, received and evaluated extensive materials from the Adviser, including performance and expense information compiled by Broadridge, using data from Lipper Inc., independent providers of investment company data (together, “Broadridge/Lipper”). The Trustees’ independent consultant also provided additional analyses of the performance of the Funds in connection with the Trustees’ review of the Advisory Agreements. Before voting on the proposed Advisory Agreements, the Trustees reviewed the proposed Advisory Agreements with representatives of the Adviser, counsel to the Trusts and independent legal counsel and received a memorandum from independent legal counsel to the Trustees discussing the legal standards for their consideration of the proposed Advisory Agreements. The Trustees
also discussed the proposed Advisory Agreements in executive sessions with independent legal counsel at which no representatives of the Adviser were present. Set forth below is a summary of the material factors evaluated by the Trustees in determining whether to approve each Advisory Agreement.
The Trustees considered information provided with respect to the Funds over the course of the year. Each Trustee attributed different weights to the various factors, and no factor alone was considered determinative. From year to year, the Trustees consider and place emphasis on relevant information in light of changing circumstances in market and economic conditions. The Trustees determined that the compensation to be received by the Adviser from each Fund under the applicable Advisory Agreement was fair and reasonable and that the continuance of each Advisory Agreement was in the best interests of each Fund and its shareholders.
The factors summarized below were considered and discussed by the Trustees in reaching their conclusions:
Nature, Extent and Quality of Services Provided by the Adviser
The Trustees received and considered information regarding the nature, extent and quality of the services provided to each Fund under the Advisory Agreement. The Trustees took into account information furnished throughout the year at Trustee meetings, as well as the materials furnished specifically in connection with this annual review process. The Trustees considered the background and experience of the Adviser’s senior management and the expertise of, and the amount of attention given to each Fund by, investment personnel of the Adviser. In addition, the Trustees reviewed the qualifications, backgrounds and responsibilities of the portfolio management team primarily responsible for the day-to-day management of each Fund and the infrastructure supporting the team. The Trustees also considered information provided by the Adviser and JPMorgan Distribution Services, Inc. (“JPMDS”) about the structure and distribution strategy of each Fund. The Trustees reviewed information relating to the Adviser’s risk governance model and reports showing the Adviser’s compliance structure and ongoing compliance processes. The Trustees also considered the quality of the administrative services provided by J.P. Morgan Investment Management Inc. in its role as administrator (“JPMIM”).
The Trustees also considered their knowledge of the nature and quality of the services provided by the Adviser and its affiliates to the Funds gained from their experience as Trustees of the J.P. Morgan Funds. In addition, they considered the overall reputation and capabilities of the Adviser and its affiliates, the commitment of the Adviser to provide high quality service to the Funds, their overall confidence in the Adviser’s integrity and the Adviser’s responsiveness to questions or concerns raised by them, including the Adviser’s willingness to consider and implement organizational and operational changes
| | | | | | | | |
| | | |
| DECEMBER 31, 2016 | | J.P. MORGAN MID CAP/MULTI-CAP FUNDS | | | | | 83 | |
BOARD APPROVAL OF INVESTMENT ADVISORY AGREEMENT
(Unaudited) (Continued)
designed to improve investment results and the services provided to each Fund.
Based upon these considerations and other factors, the Trustees concluded that they were satisfied with the nature, extent and quality of the investment advisory services provided to the Funds by the Adviser.
Costs of Services Provided and Profitability to the Adviser and its Affiliates
The Trustees received and considered information regarding the profitability to the Adviser and its affiliates in providing services to each of the Funds. The Trustees reviewed and discussed this data. The Trustees recognized that this data is not audited and represents the Adviser’s determination of its and its affiliates’ revenues from the contractual services provided to the Funds, less expenses of providing such services. Expenses include direct and indirect costs and are calculated using an allocation methodology developed by the Adviser. The Trustees also recognized that it is difficult to make comparisons of profitability from fund investment advisory contracts because comparative information is not generally publicly available and is affected by numerous factors, including the structure of the particular adviser, the types of funds it manages, its business mix, numerous assumptions regarding allocations and the fact that publicly-traded fund managers’ operating profits and net income are net of distribution and marketing expenses. Based upon their review, the Trustees concluded that the profitability to the Adviser under each of the Advisory Agreements was not unreasonable in light of the services and benefits provided to each Fund.
Fall-Out Benefits
The Trustees reviewed information regarding potential “fallout” or ancillary benefits received by the Adviser and its affiliates as a result of their relationship with the Funds. The Trustees also reviewed the Adviser’s allocation of fund brokerage for the J.P. Morgan Funds complex, including allocations to brokers who provide research to the Adviser.
The Trustees also considered that JPMDS, an affiliate of the Adviser, and JPMIM earn fees from the Funds for providing shareholder and administrative services, respectively. These fees were shown separately in the profitability analysis presented to the Trustees. The Trustees also considered the payments of Rule 12b-1 fees to JPMDS, which also acts as the Funds’ distributor and that these fees are in turn generally paid to financial intermediaries that sell the Funds, including financial intermediaries that are affiliates of the Adviser. The Trustees also considered the fees paid to JPMorgan Chase Bank, N.A. (“JPMCB”) for custody and fund accounting, and other related services.
Economies of Scale
The Trustees considered the extent to which the Funds may benefit from economies of scale. The Trustees considered that
there may not be a direct relationship between economies of scale realized by the Funds and those realized by the Adviser as assets increase. The Trustees noted that the proposed investment advisory fee schedule for each Fund does not contain breakpoints, but that the fees remain competitive with peer funds. The Trustees also considered that the Adviser has implemented fee waivers and expense limitations (“Fee Caps”) which allow each Fund’s shareholders to share potential economies of scale from a Fund’s inception. The Trustees also considered that the Adviser has shared economies of scale by adding or enhancing services to the Funds over time, noting the Adviser’s substantial investments in its business in support of the Funds, including investments in trading systems and technology (including cybersecurity improvements), retention of key talent, additions to analyst and portfolio management teams, and regulatory support enhancements. The Trustees also considered whether it would be appropriate to add advisory fee breakpoints and the Trustees concluded that the current fee structure was reasonable in light of the Fee Caps that the Adviser has in place that serve to limit the overall net expense ratios of each Fund at competitive levels. The Trustees concluded that the Funds’ shareholders received the benefits of potential economies of scale through the Fee Caps and the Adviser’s reinvestment in its operations to serve the Funds and their shareholders.
Independent Written Evaluation of the Funds’ Senior/Chief Compliance Officer
The Trustees noted that, upon their direction, the Senior Officer for the Mid Cap Growth Fund, Mid Cap Value Fund and Multi-Cap Market Neutral Fund had prepared an independent written evaluation in order to assist the Trustees in determining the reasonableness of the proposed management fees. In determining whether to continue the Advisory Agreements, the Trustees considered the Senior Officer’s report.
The Trustees noted that, upon their direction, the Chief Compliance Officer for the Growth Advantage Fund, Mid Cap Equity Fund, and Value Advantage Fund had prepared an independent written evaluation in order to assist the Trustees in determining the reasonableness of the proposed management fees. The Trustees considered the written evaluation in determining whether to continue the Advisory Agreements.
Fees Relative to Adviser’s Other Clients
The Trustees received and considered information about the nature and extent of investment advisory services and fee rates offered to other clients of the Adviser, including institutional separate accounts and/or funds sub-advised by the Adviser, for investment management styles substantially similar to that of each Fund. The Trustees considered the complexity of investment management for registered mutual funds relative to the Adviser’s other clients and noted differences in the regulatory, legal and other risks and responsibilities of providing services
| | | | | | |
| | | |
| 84 | | | | J.P. MORGAN MID CAP/MULTI-CAP FUNDS | | DECEMBER 31, 2016 |
to the different clients. The Trustees considered that serving as an adviser to a registered mutual fund involves greater responsibilities and risks than acting as a sub-adviser and observed that sub-advisory fees may be lower than those charged by the Adviser to each Fund. The Trustees also noted that the adviser, not the mutual fund, pays the sub-advisory fee and that many responsibilities related to the advisory function are retained by the primary adviser. The Trustees concluded that the fee rates charged to each Fund in comparison to those charged to the Adviser’s other clients were reasonable.
Investment Performance
The Trustees received and considered absolute and/or relative performance for the Funds in a report prepared by Broadridge/Lipper. The Trustees considered the total return performance information, which included the ranking of the Funds within a performance universe made up of funds with the same Broadridge/Lipper investment classification and objective (the “Universe”), as well as a sub-set of funds within the Universe (the “Peer Group”), by total return for applicable one-, three- and five-year periods. The Trustees reviewed a description of Broadridge/Lipper’s methodology for selecting mutual funds in each Fund’s Peer Group and Universe. The Broadridge/Lipper materials provided to the Trustees highlighted information with respect to certain representative classes to assist the Trustees in their review. As part of this review, the Trustees also reviewed each Fund’s performance against its benchmark and considered the performance information provided for the Funds at regular Board meetings by the Adviser and the Trustees’ independent consultant and also considered the special analysis prepared by the Trustees’ independent consultant. The Broadridge/Lipper performance data noted by the Trustees as part of their review and the determinations made by the Trustees with respect to each Fund’s performance for certain representative classes are summarized below:
The Trustees noted that the Growth Advantage Fund’s performance for Class A shares was in first quintile for each of the one-, three- and five year periods ended December 31, 2015, based upon both the Peer Group and Universe. The Trustees noted that the performance for Select Class shares was in the first, first and second quintiles based upon the Peer Group for the one-, three- and five-year periods ended December 31, 2015, respectively, and in the first quintile for each of the one-, three- and five year periods ended December 31, 2015 based upon the Universe. The Trustees discussed the performance and investment strategy of the Fund with the Adviser and reviewed the performance analysis and evaluation prepared by the independent consultant. Based upon these discussions and various other factors, the Trustees concluded that the Fund’s performance was reasonable.
The Trustees noted that the Mid Cap Equity Fund’s performance for Class A shares was in the fourth, third and second quintiles
for the one-, three-, and five-year periods ended December 31, 2015, respectively, based upon both the Peer Group and Universe. The Trustees noted that the performance for Select Class shares was in the fourth, third and third quintiles based upon the Peer Group, and in the fourth, second and second quintiles based upon the Universe, for the one-, three-, and five-year periods ended December 31, 2015, respectively. The Trustees discussed the performance and investment strategy of the Fund with the Adviser and reviewed the performance analysis and evaluation prepared by the independent consultant. Based upon these discussions and various other factors, the Trustees concluded that the Fund’s performance was reasonable.
The Trustees noted that the Mid Cap Growth Fund’s performance for Class A shares was in the fourth, second and third quintiles based upon the Peer Group, and in the third, first and third quintiles based upon the Universe, for the one-, three- and five-year periods ended December 31, 2015, respectively. The Trustees noted that the performance for Select Class shares was in the third, first and third quintiles based upon the Peer Group, and in the third, first and second quintiles based upon the Universe, for the one-, three-, and five-year periods ended December 31, 2015, respectively. The Trustees discussed the performance and investment strategy of the Fund with the Adviser and reviewed the performance analysis and evaluation prepared by the independent consultant. Based upon these discussions and various other factors, the Trustees concluded that the Fund’s performance was reasonable.
The Trustees noted that the Mid Cap Value Fund’s performance for Class A shares was in the third, third and second quintiles based upon the Peer Group, and in the fourth, third and first quintiles based upon the Universe, for the one-, three-, and five-year periods ended December 31, 2015, respectively. The Trustees noted that the performance for Select Class shares was in the second, second and first quintiles based upon the Peer Group, and in the fourth, third and first quintiles based upon the Universe, for the one-, three-, and five-year periods ended December 31, 2015, respectively. The Trustees discussed the performance and investment strategy of the Fund with the Adviser and reviewed the performance analysis and evaluation prepared by the independent consultant. Based upon these discussions and various other factors, the Trustees concluded that the Fund’s performance was reasonable.
The Trustees noted that the Multi-Cap Market Neutral Fund’s performance for both Class A and Select Class Shares was in the second, second and third quintiles based upon the Universe for the one-, three-, and five-year periods ended December 31, 2015, respectively. The Trustees discussed the performance and investment strategy of the Fund with the Adviser and reviewed the performance analysis and evaluation prepared by the independent consultant. Based upon these discussions and various other factors, the Trustees concluded that the Fund’s performance was reasonable.
| | | | | | | | |
| | | |
| DECEMBER 31, 2016 | | J.P. MORGAN MID CAP/MULTI-CAP FUNDS | | | | | 85 | |
BOARD APPROVAL OF INVESTMENT ADVISORY AGREEMENT
(Unaudited) (Continued)
The Trustees noted that the Value Advantage Fund’s performance for Class A shares was in the third quintile based upon the Peer Group for each of the one-, three-, and five-year periods ended December 31, 2015, and in the third, third and second quintiles based upon the Universe, for one-, three-, and five-year periods ended December 31, 2015, respectively. The Trustees noted that the performance for Select Class shares was in the second quintile based upon the Peer Group for both the one- and three-year periods ended December 31, 2015, and in the third, second and first quintiles based upon the Universe, for the one-, three-, and five-year periods ended December 31, 2015, respectively. The Trustees discussed the performance and investment strategy of the Fund with the Adviser and reviewed the performance analysis and evaluation prepared by the independent consultant. Based upon these discussions and various other factors, the Trustees concluded that the Fund’s performance was reasonable.
Advisory Fees and Expense Ratios
The Trustees considered the contractual advisory fee rate paid by each Fund to the Adviser and compared that rate to the information prepared by Broadridge/Lipper concerning management fee rates paid by other funds in the same Broadridge/Lipper category as each Fund. The Trustees recognized that Broadridge/Lipper reported each Fund’s management fee rate as the combined contractual advisory fee and administration fee rates. The Trustees also reviewed information about other expenses and the expense ratios for each Fund. The Trustees considered the fee waiver and/or expense reimbursement arrangements currently in place for each Fund and considered the net advisory fee rate after taking into account any waivers and/or reimbursements. The Trustees recognized that it is difficult to make comparisons of advisory fees because there are variations in the services that are included in the fees paid by other funds. The Trustees’ determinations as a result of the review of each Fund’s advisory fees and expense ratios for certain representative classes are summarized below:
The Trustees noted that the Growth Advantage Fund’s net advisory fee and actual total expenses for Class A shares were in the fourth and third quintiles based upon the Peer Group and Universe, respectively. The Trustees noted that the net advisory fee and actual total expenses for Select Class shares were in the third and fourth quintiles based upon the Peer Group and Universe, respectively. The Trustees also noted that the expense caps for certain share classes were reduced effective November 1, 2016. After considering the factors identified above, in light of this information, the Trustees concluded that the advisory fees were reasonable.
The Trustees noted that the Mid Cap Equity Fund’s net advisory fee for Class A shares was in the third quintile based upon both the Peer Group and Universe, and that the actual total expenses for Class A shares were in the fourth and third
quintiles based upon the Peer Group and Universe, respectively. The Trustees noted that the net advisory fee for Select Class shares was in the fourth quintile based upon both the Peer Group and Universe, and that the actual total expenses for Select Class shares were in the third quintile based upon both the Peer Group and Universe. After considering the factors identified above, in light of this information, the Trustees concluded that the advisory fees were reasonable.
The Trustees noted that the Mid Cap Growth Fund’s net advisory fee for Class A shares was in the third quintile based upon both the Peer Group and Universe, and that the actual total expenses for Class A shares were in the fourth and third quintiles based upon the Peer Group and Universe, respectively. The Trustees noted that the net advisory fee for Select Class Shares was in the third quintile based upon both the Peer Group and Universe, and that the actual total expenses for Select Class shares were in the second and third quintiles based upon the Peer Group and Universe, respectively. After considering the factors identified above, in light of this information, the Trustees concluded that the advisory fee was reasonable.
The Trustees noted that the Mid Cap Value Fund’s net advisory fee for Class A shares was in the fourth and third quintiles based upon the Peer Group and Universe, respectively, and that the actual total expenses for Class A shares was in the fifth and third quintiles based upon the Peer Group and Universe, respectively. The Trustees noted that the net advisory fee and actual total expenses for Select Class shares were in the fourth and third quintiles based upon the Peer Group and Universe, respectively. After considering the factors identified above, in light of this information, the Trustees concluded that the advisory fees were reasonable.
The Trustees noted that the Multi-Cap Market Neutral Fund’s net advisory fee and actual total expenses for Class A shares were in the first quintile based upon both the Peer Group and Universe. The Trustees noted that the net advisory fee for Select Class shares was in the second quintile based upon both the Peer Group and Universe, and that the actual total expenses for Select Class shares were in the first quintile based upon both the Peer Group and Universe. After considering the factors identified above, in light of this information, the Trustees concluded that the advisory fees were reasonable.
The Trustees noted that the Value Advantage Fund’s net advisory fee Class A shares was in the third quintile based upon both the Peer Group and Universe, and that the actual total expenses for Class A shares were in the fifth and third quintiles based upon the Peer Group and Universe, respectively. The Trustees noted that the net advisory fee for Select Class shares was in the fourth quintile based upon both the Peer Group and Universe, and that the actual total expenses for Select Class shares were in the third and fourth quintiles based upon the Peer Group and Universe, respectively. The Trustees also noted
| | | | | | |
| | | |
| 86 | | | | J.P. MORGAN MID CAP/MULTI-CAP FUNDS | | DECEMBER 31, 2016 |
that the expense caps for certain share classes were reduced effective November 1, 2016. After considering the factors identified above, in light of this information, the Trustees concluded that the advisory fees were reasonable.
| | | | | | | | |
| | | |
| DECEMBER 31, 2016 | | J.P. MORGAN MID CAP/MULTI-CAP FUNDS | | | | | 87 | |
J.P. Morgan Funds are distributed by JPMorgan Distribution Services, Inc., which is an affiliate of JPMorgan Chase & Co. Affiliates of JPMorgan Chase & Co. receive fees for providing various services to the funds.
Contact JPMorgan Distribution Services, Inc. at 1-800-480-4111 for a fund prospectus. You can also visit us at www.jpmorganfunds.com. Investors should carefully consider the investment objectives and risk as well as charges and expenses of the mutual fund before investing. The prospectus contains this and other information about the mutual fund. Read the prospectus carefully before investing.
Investors may obtain information about the Securities Investor Protection Corporation (SIPC), including the SIPC brochure by visiting www.sipc.org or by calling SIPC at 202-371-8300.
Each Fund files a complete schedule of its fund holdings for the first and third quarters of its fiscal year with the SEC on Form N-Q. The Funds’ Forms N-Q are available on the SEC’s website at http://www.sec.gov and may be reviewed and copied at the SEC’s Public Reference Room in Washington, DC. Information on the operation of the SEC’s Public Reference Room may be obtained by calling 1-800-SEC-0330. Shareholders may request the Form N-Q without charge by calling 1-800-480-4111 or by visiting the J.P. Morgan Funds’ website at www.jpmorganfunds.com.
A description of each Fund’s policies and procedures with respect to the disclosure of each Fund’s holdings is available in the prospectus and Statement of Additional Information.
A copy of proxy policies and procedures is available without charge upon request by calling 1-800-480-4111 and on the Funds’ website at www.jpmorganfunds.com. A description of such policies and procedures is on the SEC’s website at www.sec.gov. The Trustees have delegated the authority to vote proxies for securities owned by the Funds to the Adviser. A copy of the Funds’ voting record for the most recent 12-month period ended June 30 is available on the SEC’s website at www.sec.gov or at the Funds’ website at www.jpmorganfunds.com no later than August 31 of each year. The Funds’ proxy voting record will include, among other things, a brief description of the matter voted on for each fund security, and will state how each vote was cast, for example, for or against the proposal.

J.P. Morgan Asset Management is the marketing name for the asset management businesses of JPMorgan Chase & Co. Those businesses include, but are not limited to, J.P. Morgan Investment Management Inc., Security Capital Research & Management Incorporated and J.P. Morgan Alternative Asset Management, Inc.
| | | | |
| | © JPMorgan Chase & Co., 2017. All rights reserved. December 2016. | | SAN-MC-1216 |
Semi-Annual Report
J.P. Morgan Large Cap Funds
December 31, 2016 (Unaudited)
JPMorgan Disciplined Equity Fund
JPMorgan Dynamic Growth Fund
JPMorgan Equity Focus Fund
JPMorgan Equity Income Fund
JPMorgan Growth and Income Fund
JPMorgan Hedged Equity Fund
JPMorgan Large Cap Growth Fund
JPMorgan Large Cap Value Fund
JPMorgan U.S. Equity Fund

CONTENTS
Investments in a Fund are not deposits or obligations of, or guaranteed or endorsed by, any bank and are not insured or guaranteed by the FDIC, the Federal Reserve Board or any other government agency. You could lose money if you sell when a Fund’s share price is lower than when you invested.
Past performance is no guarantee of future performance. The general market views expressed in this report are opinions based on market and other conditions through the end of the reporting period and are subject to change without notice. These views are not intended to predict the future performance of a Fund or the securities markets. References to specific securities and their issuers are for illustrative purposes only and are not intended to be, and should not be interpreted as, recommendations to purchase or sell such securities. Such views are not meant as investment advice and may not be relied on as an indication of trading intent on behalf of any Fund.
Prospective investors should refer to the Funds’ prospectus for a discussion of the Funds’ investment objectives, strategies and risks. Call J.P. Morgan Funds Service Center at 1-800-480-4111 for a prospectus containing more complete information about a Fund, including management fees and other expenses. Please read it carefully before investing.
CEO’S LETTER
January 25, 2017 (Unaudited)
Dear Shareholder,
The continued expansion of the U.S. economy through the second half of 2016 helped support U.S. equity prices and spurred the U.S. Federal Reserve (the “Fed”) to raise interest rates in December. During the period, corporate earnings overall showed positive growth and by the end of the year the unemployment rate had reached it lowest levels since 2007.
| | |
 | | “We believe the market performance over the past year has further validated both patience and diversification as fundamental components of a sound investment strategy.” |
Gross domestic product in the U.S. rose by an estimated 3.5% in the third quarter of 2016, surpassing other developed markets. Global oil prices also continued to rise for most of the reporting period and the price of West Texas Intermediate crude reached a 15-month high in November. The Standard & Poor’s 500 Index reached fresh closing highs in July and August and remained buoyant through October.
The November 8th victory of Republican Party presidential candidate Donald Trump surprised many investors and led to brief declines in global equities. However, within 24 hours
global share prices had largely recovered. U.S. equity prices rallied through the end of the year, reaching new highs in December.
Against this backdrop, the Fed raised interest rates by a quarter of a percentage point on December 14th. “Economic growth has picked up since the middle of the year,” said Fed Chairwoman Janet Yellen. “We expect the economy will continue to perform well.”
While the prospect of further interest rate increases put pressure on U.S. bond prices, equities provided investors with positive returns. We believe the market performance over the past year has further validated both patience and diversification as fundamental components of a sound investment strategy.
We look forward to managing your investment needs for years to come. Should you have any questions, please visit www.jpmorganfunds.com or contact the J.P. Morgan Funds Service Center at 1-800-480-4111.
Sincerely yours,

George C.W. Gatch
CEO, Investment Funds Management,
J.P. Morgan Asset Management
| | | | | | | | |
| | | |
| DECEMBER 31, 2016 | | J.P. MORGAN LARGE CAP FUNDS | | | | | 1 | |
J.P. Morgan Large Cap Funds
MARKET OVERVIEW
SIX MONTHS ENDED DECEMBER 31, 2016 (Unaudited)
U.S. equity investments generally continued to outperform both other developed markets and emerging markets during the second half of 2016. Rebounding in the wake of the U.K.’s vote to exit from the European Union, the Standard & Poor’s 500 (the “S&P 500”) reached new closing highs in July and August. Global oil prices also continued to rise during the reporting period and reached 15-month highs in advance of the November 30th meeting of the Organization of Petroleum Exporting Countries.
Meanwhile, the November 8th victory of Republican Party presidential candidate Donald Trump surprised many investors and led to brief declines in global equities. The U.S. equity market recovered within a day and in the following weeks the S&P 500 surpassed 2,200 points for the first time and reached eight new closing highs by the end of 2016. The Dow Jones Industrial Average surpassed 19,000 points for the first time and reached 17 new closing highs between the election and the end of the year. In particular, energy, pharmaceutical and financial sector stocks generally rose amid investor expectations that a Trump administration’s policies would be beneficial for those industries.
During the reporting period, value stocks generally outperformed growth stocks and small-cap and mid-cap stocks outperformed large cap stocks. By sector, the energy and financials sectors were top performers, while the health care and real estate sectors underperformed other sectors. For the six months ended December 31, 2016, the S&P 500 returned 7.82%.
| | | | | | |
| | | |
| 2 | | | | J.P. MORGAN LARGE CAP FUNDS | | DECEMBER 31, 2016 |
JPMorgan Disciplined Equity Fund
FUND COMMENTARY
SIX MONTHS ENDED DECEMBER 31, 2016 (Unaudited)
| | | | |
| Reporting Period Return: | |
| Fund (Class L Shares)*1 | | | 8.91% | |
| S&P 500 Index | | | 7.82% | |
| |
| Net Assets as of 12/31/2016 (In Thousands) | | | $7,773,634 | |
INVESTMENT OBJECTIVE**
The JPMorgan Disciplined Equity Fund (the “Fund”) seeks to provide a consistently high total return from a broadly diversified portfolio of equity securities with risk characteristics similar to the Standard & Poor’s 500 Index (the “Benchmark”).
WHAT WERE THE MAIN DRIVERS OF THE FUND’S PERFORMANCE?
The Fund’s Class L Shares outperformed the Benchmark for the six months ended December 31, 2016. The Fund’s security selection in the financials and telecommunication services sectors was a leading contributor to performance relative to the Benchmark, while the Fund’s security selection in the pharmaceutical/medical technology and energy sectors was a leading detractor from relative performance.
Leading individual contributors to relative performance included the Fund’s overweight positions in United Continental Holdings Inc. and Morgan Stanley Inc. and its underweight position in Oracle Corp. Shares of United Continental Holdings, an airline operator, rose on improved traffic and capacity. Shares of Morgan Stanley, a financial services company, rose on investor expectations of an improved business environment for the financials sector. Shares of Oracle, a software maker, fell after the company reported a decline in profit and lower-than-expected revenue.
Leading individual detractors from relative performance included the Fund’s overweight positions in Bristol-Myers Squibb Co. and Accenture PLC and its underweight position in Nvidia Corp. Shares of Bristol-Myers Squibb, a drug maker, fell amid investor concerns about the company’s ability to compete in the market for lung cancer treatments. Shares of Accenture, a provider of management consulting and outsourcing, fell on lower-than-expected revenue and a weak outlook for earnings. Shares of Nvidia, a semiconductor manufacturer, rose after the company posted better-than-expected revenue.
HOW WAS THE FUND POSITIONED?
The Fund’s portfolio managers attempted to construct the portfolio so that stock selection was the principal source of potential excess return. The Fund’s portfolio managers sought
investment opportunities in companies that they believed were attractive based on valuation and strong fundamentals.
| | | | | | | | |
| TOP TEN HOLDINGS OF THE PORTFOLIO*** | |
| | 1. | | | Apple, Inc. | | | 3.2 | % |
| | 2. | | | Microsoft Corp. | | | 3.1 | |
| | 3. | | | Exxon Mobil Corp. | | | 1.9 | |
| | 4. | | | Wells Fargo & Co. | | | 1.8 | |
| | 5. | | | Facebook, Inc., Class A | | | 1.8 | |
| | 6. | | | Bank of America Corp. | | | 1.7 | |
| | 7. | | | Amazon.com, Inc. | | | 1.6 | |
| | 8. | | | Pfizer, Inc. | | | 1.6 | |
| | 9. | | | Citigroup, Inc. | | | 1.6 | |
| | 10. | | | General Electric Co. | | | 1.5 | |
| | | | |
PORTFOLIO COMPOSITION BY SECTOR*** | |
| Information Technology | | | 20.7 | % |
| Financials | | | 14.7 | |
| Health Care | | | 13.5 | |
| Consumer Discretionary | | | 12.5 | |
| Industrials | | | 9.8 | |
| Consumer Staples | | | 8.9 | |
| Energy | | | 7.3 | |
| Utilities | | | 3.1 | |
| Materials | | | 2.8 | |
| Real Estate | | | 2.4 | |
| Telecommunication Services | | | 1.7 | |
| Short-Term Investments | | | 2.6 | |
| * | | The return shown is based on net asset values calculated for shareholder transactions and may differ from the return shown in the financial highlights, which reflects adjustments made to the net asset values in accordance with accounting principles generally accepted in the United States of America. |
| ** | | The adviser seeks to achieve the Fund’s objective. There can be no guarantee it will be achieved. |
| *** | | Percentages indicated are based on total investments as of December 31, 2016. The Fund’s portfolio composition is subject to change. |
| 1 | | On December 1, 2016, the Fund’s Institutional Class Shares were redesignated as and renamed Class L Shares. |
| | | | | | | | |
| | | |
| DECEMBER 31, 2016 | | J.P. MORGAN LARGE CAP FUNDS | | | | | 3 | |
JPMorgan Disciplined Equity Fund
FUND COMMENTARY
SIX MONTHS ENDED DECEMBER 31, 2016 (Unaudited) (continued)
| | | | | | | | | | | | | | | | | | |
AVERAGE ANNUAL TOTAL RETURNS AS OF DECEMBER 31, 2016 | |
| | | | | |
| | | INCEPTION DATE OF
CLASS | | 6 MONTH* | | | 1 YEAR | | | 5 YEAR | | | 10 YEAR | |
CLASS A SHARES | | September 28, 2001 | | | | | | | | | | | | | | | | |
With Sales Charge** | | | | | 3.05 | % | | | 3.61 | % | | | 12.62 | % | | | 6.13 | % |
Without Sales Charge | | | | | 8.73 | | | | 9.33 | | | | 13.85 | | | | 6.71 | |
CLASS L SHARES (FORMERLY INSTITUTIONAL CLASS) | | January 3, 1997 | | | 8.91 | | | | 9.68 | | | | 14.30 | �� | | | 7.14 | |
CLASS R6 SHARES | | March 24, 2003 | | | 8.97 | | | | 9.84 | | | | 14.41 | | | | 7.25 | |
SELECT CLASS SHARES | | September 10, 2001 | | | 8.89 | | | | 9.57 | | | | 14.13 | | | | 6.98 | |
| ** | | Sales Charge for Class A Shares is 5.25%. |
TEN YEAR PERFORMANCE (12/31/06 TO 12/31/16)
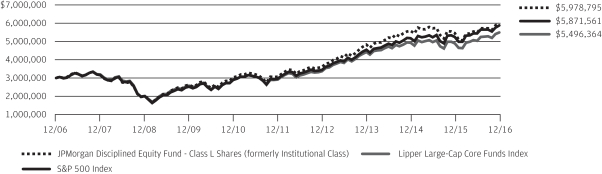
The performance quoted is past performance and is not a guarantee of future results. Mutual funds are subject to certain market risks. Investment returns and principal value of an investment will fluctuate so that an investor’s shares, when redeemed, may be worth more or less than their original cost. Current performance may be higher or lower than the performance data shown. For up-to-date month-end performance information please call 1-800-480-4111.
The graph illustrates comparative performance for $3,000,000 invested in Class L Shares of the JPMorgan Disciplined Equity Fund, the S&P 500 Index and the Lipper Large-Cap Core Funds Index from December 31, 2006 to December 31, 2016. The performance of the Fund assumes reinvestment of all dividends and capital gain distributions, if any, and does not include a sales charge. The performance of the S&P 500 Index does not reflect the deduction of expenses or a sales charge associated with a mutual fund and has been adjusted to reflect reinvestment of all dividends and capital gain distributions of the securities included in the benchmark, if applicable. The performance of the Lipper Large-Cap Core Funds Index includes expenses associated with a mutual
fund, such as investment management fees. These expenses are not identical to the expenses incurred by the Fund. The S&P 500 Index is an unmanaged index generally representative of the performance of large companies in the U.S. stock market. The Lipper Large-Cap Core Funds Index is an index based on the total returns of certain mutual funds within the Fund’s designated category as determined by Lipper, Inc. Investors cannot invest directly in an index.
Class L Shares have a $3,000,000 minimum initial investment.
Fund performance may reflect the waiver of the Fund’s fees and reimbursement of expenses for certain periods since the inception date. Without these waivers and reimbursements, performance would have been lower. Also, performance shown in this section does not reflect the deduction of taxes that a shareholder would pay on Fund distributions or redemptions of Fund shares.
The returns shown are based on net asset values calculated for shareholder transactions and may differ from the returns shown in the financial highlights, which reflect adjustments made to the net asset values in accordance with accounting principles generally accepted in the United States of America.
| | | | | | |
| | | |
| 4 | | | | J.P. MORGAN LARGE CAP FUNDS | | DECEMBER 31, 2016 |
JPMorgan Dynamic Growth Fund
FUND COMMENTARY
SIX MONTHS ENDED DECEMBER 31, 2016 (Unaudited)
| | | | |
| Reporting Period Return: | |
| Fund (Select Class Shares)* | | | 7.73% | |
| Russell 1000 Growth Index | | | 5.64% | |
| |
| Net Assets as of 12/31/2016 (In Thousands) | | $ | 341,079 | |
INVESTMENT OBJECTIVE**
The JPMorgan Dynamic Growth Fund (the “Fund”) seeks long-term capital growth.
WHAT WERE THE MAIN DRIVERS OF THE FUND’S PERFORMANCE?
The Fund’s Select Class Shares outperformed the Russell 1000 Growth Index (the “Benchmark”) for the six months ended December 31, 2016. The Fund’s security selection in the financials and consumer discretionary sectors was a leading contributor to performance relative to the Benchmark, while the Fund’s security selection in the technology sector and its underweight position in the producer durables sector were leading detractors from relative performance.
Leading individual contributors to relative performance included the Fund’s overweight positions in Charles Schwab & Co., ARM Holdings PLC and MasterCard Inc. Shares of Charles Schwab, a discount securities brokerage, rose on better-than-expected earnings and investor expectations of rising U.S. interest rates. Shares of ARM Holdings, a semiconductor manufacturer, rose ahead of the company’s $32 billion acquisition by Softbank Group Corp. Shares of MasterCard, a credit card provider, rose on better-than-expected earnings and revenue growth as well as investor expectations for an improved business climate for the broader financial services sector.
Leading individual detractors from relative performance included the Fund’s underweight positions in Apple Inc. and Microsoft Corp. and its overweight position in Vertex Pharmaceuticals Inc. Shares of both Apple, a maker of computers and mobile devices, and Microsoft, a provider of software and services, rose amid the broader trend of increased investment in U.S. equities. Shares of Microsoft also rose after the company reported better-than-expected earnings. Shares of Vertex Pharmaceuticals, a drug maker, fell amid investor expectations of increased regulatory scrutiny over industry drug pricing.
HOW WAS THE FUND POSITIONED?
The Fund’s portfolio managers utilized a bottom-up approach to stock selection, researching individual companies in an effort
to construct portfolios of stocks that have strong fundamentals
and positive price momentum. The Fund’s portfolio managers sought to invest in companies with attractive fundamentals that, in their view, possessed the potential to significantly exceed expectations for a prolonged period of time.
| | | | | | | | |
| TOP TEN EQUITY HOLDINGS OF THE PORTFOLIO*** | |
| | 1. | | | Alphabet, Inc., Class A | | | 7.1 | % |
| | 2. | | | Amazon.com, Inc. | | | 6.4 | |
| | 3. | | | Facebook, Inc., Class A | | | 6.2 | |
| | 4. | | | Mastercard, Inc., Class A | | | 5.8 | |
| | 5. | | | Charles Schwab Corp. (The) | | | 5.0 | |
| | 6. | | | UnitedHealth Group, Inc. | | | 4.0 | |
| | 7. | | | Intercontinental Exchange, Inc. | | | 3.9 | |
| | 8. | | | Ulta Salon Cosmetics & Fragrance, Inc. | | | 3.7 | |
| | 9. | | | Broadcom Ltd., (Singapore) | | | 3.6 | |
| | 10. | | | Priceline Group, Inc. (The) | | | 3.6 | |
| | | | |
PORTFOLIO COMPOSITION BY SECTOR*** | |
| Information Technology | | | 39.1 | % |
| Consumer Discretionary | | | 21.7 | |
| Health Care | | | 11.9 | |
| Financials | | | 8.9 | |
| Industrials | | | 7.9 | |
| Real Estate | | | 3.3 | |
| Materials | | | 2.2 | |
| Consumer Staples | | | 2.1 | |
| Energy | | | 2.1 | |
| Short-Term Investment | | | 0.8 | |
| * | | The return shown is based on net asset values calculated for shareholder transactions and may differ from the return shown in the financial highlights, which reflects adjustments made to the net asset values in accordance with accounting principles generally accepted in the United States of America. |
| ** | | The adviser seeks to achieve the Fund’s objective. There can be no guarantee it will be achieved. |
| *** | | Percentages indicated are based on total investments as of December 31, 2016. The Fund’s portfolio composition is subject to change. |
| | | | | | | | |
| | | |
| DECEMBER 31, 2016 | | J.P. MORGAN LARGE CAP FUNDS | | | | | 5 | |
JPMorgan Dynamic Growth Fund
FUND COMMENTARY
SIX MONTHS ENDED DECEMBER 31, 2016 (Unaudited) (continued)
| | | | | | | | | | | | | | | | | | |
|
AVERAGE ANNUAL TOTAL RETURNS AS OF DECEMBER 31, 2016 | |
| | | | | |
| | INCEPTION DATE OF
CLASS | | | 6 MONTH* | | | | 1 YEAR | | | | 5 YEAR | | |
| SINCE
INCEPTION |
|
CLASS A SHARES | | November 30, 2007 | | | | | | | | | | | | | | | | |
With Sales Charge** | | | | | 1.95 | % | | | (5.13 | )% | | | 12.38 | % | | | 5.91 | % |
Without Sales Charge | | | | | 7.61 | | | | 0.14 | | | | 13.60 | | | | 6.54 | |
CLASS C SHARES | | November 30, 2007 | | | | | | | | | | | | | | | | |
With CDSC*** | | | | | 6.34 | | | | (1.34 | ) | | | 13.03 | | | | 6.00 | |
Without CDSC | | | | | 7.34 | | | | (0.34 | ) | | | 13.03 | | | | 6.00 | |
CLASS R5 SHARES | | November 30, 2007 | | | 7.88 | | | | 0.62 | | | | 14.11 | | | | 7.02 | |
SELECT CLASS SHARES | | November 30, 2007 | | | 7.73 | | | | 0.36 | | | | 13.87 | | | | 6.80 | |
| ** | | Sales Charge for Class A Shares is 5.25%. |
| *** | | Assumes a 1% CDSC (contingent deferred sales charge) for the 6 month and one year periods and 0% CDSC thereafter. |
LIFE OF FUND PERFORMANCE (11/30/07 TO 12/31/16)
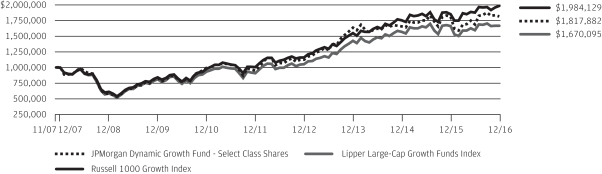
The performance quoted is past performance and is not a guarantee of future results. Mutual funds are subject to certain market risks. Investment returns and principal value of an investment will fluctuate so that an investor’s shares, when redeemed, may be worth more or less than their original cost. Current performance may be higher or lower than the performance data shown. For up-to-date, month-end performance information please call 1-800-480-4111.
The Fund commenced operations on November 30, 2007.
The graph illustrates comparative performance for $1,000,000 invested in Select Class Shares of the JPMorgan Dynamic Growth Fund, the Russell 1000 Growth Index and the Lipper Large-Cap Growth Funds Index from November 30, 2007 to December 31, 2016. The performance of the Fund assumes reinvestment of all dividends and capital gain distributions, if any, and does not include a sales charge. The performance of the Russell 1000 Growth Index does not reflect the deduction of expenses or a sales charge associated with a mutual fund and has been adjusted to reflect reinvestment of all dividends and capital gain distributions of the securities included in the benchmark, if applicable. The performance of the Lipper Large-Cap Growth Funds Index includes expenses associated with a mutual fund, such as investment management fees. These expenses are not identical to the expenses incurred by the Fund. The Russell 1000 Growth Index is an unmanaged index which measures
the performance of those Russell 1000 companies with higher price-to-book ratios and higher forecasted growth values. The Lipper Large-Cap Growth Funds Index is an index based on the total returns of certain mutual funds within the Fund’s designated category as determined by Lipper, Inc. Investors cannot invest directly in an index.
Select Class Shares have a $1,000,000 minimum initial investment.
Subsequent to the inception date of the Fund and through August 5, 2010, the Fund did not experience any shareholder activity. If such shareholder activity had occurred, the Fund’s performance may have been impacted.
Fund performance may reflect the waiver of the Fund’s fees and reimbursement of expenses for certain periods since the inception date. Without these waivers and reimbursements, performance would have been lower. Also, performance shown in this section does not reflect the deduction of taxes that a shareholder would pay on Fund distributions or redemptions of Fund shares.
The returns shown are based on net asset values calculated for shareholder transactions and may differ from the returns shown in the financial highlights, which reflect adjustments made to the net asset values in accordance with accounting principles generally accepted in the United States of America.
| | | | | | |
| | | |
| 6 | | | | J.P. MORGAN LARGE CAP FUNDS | | DECEMBER 31, 2016 |
JPMorgan Equity Focus Fund
FUND COMMENTARY
SIX MONTHS ENDED DECEMBER 31, 2016 (Unaudited)
| | | | |
| Reporting Period Return: | | | |
| Fund (Select Class Shares)* | | | 12.04% | |
| S&P 500 Index | | | 7.82% | |
| |
| Net Assets as of 12/31/2016 (In Thousands) | | $ | 146,503 | |
INVESTMENT OBJECTIVE**
The JPMorgan Equity Focus Fund (the “Fund”) seeks long term capital appreciation.
WHAT WERE THE MAIN DRIVERS OF THE FUND’S PERFORMANCE?
The Fund (Select Class Shares) outperformed the S&P 500 Index (the “Benchmark”) for the six months ended December 31, 2016. The Fund’s security selection in the consumer discretionary sector and its overweight position in the financials sector were leading contributors to performance relative to the Benchmark. The Fund’s security selection in the technology and health care sectors was a leading detractor from relative performance.
Leading individual contributors to relative performance included the Fund’s overweight positions in Capital One Financial Corp., Delta Air Lines Inc. and American International Group Inc. Shares of Capital One Financial, a financial services company, rose on investor expectations for an improved business climate for the financial services sector. Shares of Delta Air Lines, an airline operator, rose on investor expectations for improvements in industry capacity and pricing. Shares of American International Group, a re-insurance company, rose on investor expectations for an improved business climate for the broader financial services sector.
Leading individual detractors from relative performance included the Fund’s overweight positions in Gilead Sciences Inc. and Vertex Pharmaceuticals Inc. and its underweight position in Bank of America Corp. Shares of Gilead Sciences, a drug maker, fell amid a general decline in health care sector stocks. Shares of Vertex Pharmaceuticals, a drug maker, fell amid investor expectations of increased regulatory scrutiny over industry drug pricing. Shares of Bank of America, a banking and financial services company, rose on investor expectations that the bank will benefit from rising U.S. interest rates.
HOW WAS THE FUND POSITIONED?
The Fund’s portfolio managers employed a bottom-up fundamental approach to stock selection. As a result of this approach to stock selection, the Fund’s largest overweight positions
versus the Benchmark were in the consumer discretionary and financial services sectors. The Fund’s largest underweight positions versus the Benchmark were in the consumer staples and utilities sectors.
| | | | | | | | |
| TOP TEN EQUITY HOLDINGS OF THE PORTFOLIO*** | |
| | 1. | | | Amazon.com, Inc. | | | 5.4 | % |
| | 2. | | | Facebook, Inc., Class A | | | 5.1 | |
| | 3. | | | American International Group, Inc. | | | 5.1 | |
| | 4. | | | Mastercard, Inc. | | | 5.0 | |
| | 5. | | | Alphabet, Inc., Class C | | | 4.7 | |
| | 6. | | | Loews Corp. | | | 3.9 | |
| | 7. | | | Capital One Financial Corp. | | | 3.6 | |
| | 8. | | | Priceline Group, Inc. (The) | | | 3.5 | |
| | 9. | | | Wells Fargo & Co. | | | 3.2 | |
| | 10. | | | DISH Network Corp., Class A | | | 3.0 | |
| | | | |
PORTFOLIO COMPOSITION BY SECTOR*** | |
| Consumer Discretionary | | | 21.6 | % |
| Financials | | | 19.9 | |
| Information Technology | | | 19.3 | |
| Health Care | | | 9.2 | |
| Energy | | | 6.2 | |
| Industrials | | | 5.8 | |
| Materials | | | 3.5 | |
| Real Estate | | | 2.0 | |
| Utilities | | | 2.0 | |
| Consumer Staples | | | 1.7 | |
| Short-Term Investment | | | 8.8 | |
| * | | The return shown is based on net asset values calculated for shareholder transactions and may differ from the return shown in the financial highlights, which reflects adjustments made to the net asset values in accordance with accounting principles generally accepted in the United States of America. |
| ** | | The adviser seeks to achieve the Fund’s objective. There can be no guarantee it will be achieved. |
| *** | | Percentages indicated are based on total investments as of December 31, 2016. The Fund’s portfolio composition is subject to change. |
| | | | | | | | |
| | | |
| DECEMBER 31, 2016 | | J.P. MORGAN LARGE CAP FUNDS | | | | | 7 | |
JPMorgan Equity Focus Fund
FUND COMMENTARY
SIX MONTHS ENDED DECEMBER 31, 2016 (Unaudited) (continued)
| | | | | | | | | | | | | | | | | | |
AVERAGE ANNUAL TOTAL RETURNS AS OF DECEMBER 31, 2016 | |
| | | | | |
| | | INCEPTION
DATE OF CLASS | | 6 MONTH* | | | 1 YEAR | | | 5 YEAR | | | SINCE
INCEPTION | |
CLASS A SHARES | | July 29, 2011 | | | | | | | | | | | | | | | | |
With Sales Charge** | | | | | 6.03 | % | | | 2.43 | % | | | 13.61 | % | | | 11.16 | % |
Without Sales Charge | | | | | 11.89 | | | | 8.10 | | | | 14.85 | | | | 12.27 | |
CLASS C SHARES | | July 29, 2011 | | | | | | | | | | | | | | | | |
With CDSC*** | | | | | 10.57 | | | | 6.53 | | | | 14.26 | | | | 11.70 | |
Without CDSC | | | | | 11.57 | | | | 7.53 | | | | 14.26 | | | | 11.70 | |
SELECT CLASS SHARES | | July 29, 2011 | | | 12.04 | | | | 8.37 | | | | 15.14 | | | | 12.55 | |
| ** | | Sales Charge for Class A Shares is 5.25%. |
| *** | | Assumes a 1% CDSC (contingent deferred sales charge) for the 6 month and one year periods and 0% CDSC thereafter. |
LIFE OF FUND PERFORMANCE (7/29/11 TO 12/31/16)
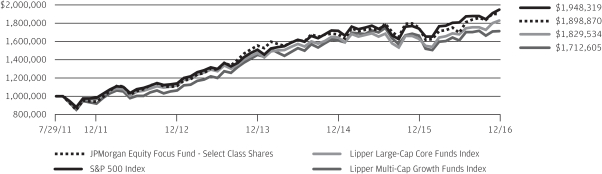
The performance quoted is past performance and is not a guarantee of future results. Mutual funds are subject to certain market risks. Investment returns and principal value of an investment will fluctuate so that an investor’s shares, when redeemed, may be worth more or less than their original cost. Current performance may be higher or lower than the performance data shown. For up-to-date, month-end performance information please call 1-800-480-4111.
The Fund commenced operations on July 29, 2011.
The graph illustrates comparative performance for $1,000,000 invested in Select Class Shares of the JPMorgan Equity Focus Fund, the S&P 500 Index, the Lipper Large-Cap Core Funds Index and the Lipper Multi-Cap Growth Funds Index from July 29, 2011 to December 31, 2016. The performance of the Fund assumes reinvestment of all dividends and capital gain distributions, if any, and does not include a sales charge. The performance of the S&P 500 Index does not reflect the deduction of expenses or a sales charge associated with a mutual fund and has been adjusted to reflect reinvestment of all dividends and capital gain distributions of securities included in the benchmark, if applicable. The performance of the Lipper Large-Cap Core Funds Index and the Lipper Multi-Cap Growth Funds Index includes expenses associated with a mutual fund, such as investment management fees. These expenses are not identical to the
expenses incurred by the Fund. The S&P 500 Index is an unmanaged index generally representative of the performance of large companies in the U.S. stock market. The Lipper Large-Cap Core Funds Index and the Lipper Multi-Cap Growth Funds Index are indexes based on the total returns of certain groups of mutual funds as determined by Lipper, Inc. Investors cannot invest directly in an index.
Select Class Shares have a $1,000,000 minimum initial investment.
Subsequent to the inception date of the Fund and through July 31, 2013, the Fund did not experience any shareholder activity. If such shareholder activity had occurred, the Fund’s performance may have been impacted.
Fund performance may reflect the waiver of the Fund’s fees and reimbursement of expenses for certain periods since the inception date. Without these waivers and reimbursements, performance would have been lower. Also, performance shown in this section does not reflect the deduction of taxes that a shareholder would pay on Fund distributions or redemptions of Fund shares.
The returns shown are based on net asset values calculated for shareholder transactions and may differ from the returns shown in the financial highlights, which reflect adjustments made to the net asset values in accordance with accounting principles generally accepted in the United States of America.
| | | | | | |
| | | |
| 8 | | | | J.P. MORGAN LARGE CAP FUNDS | | DECEMBER 31, 2016 |
JPMorgan Equity Income Fund
FUND COMMENTARY
SIX MONTHS ENDED DECEMBER 31, 2016 (Unaudited)
| | | | |
| Reporting Period Return: | |
| Fund (Select Class Shares)* | | | 8.45% | |
| Russell 1000 Value Index | | | 10.39% | |
| |
| Net Assets as of 12/31/2016 (In Thousands) | | $ | 13,787,284 | |
INVESTMENT OBJECTIVE**
The JPMorgan Equity Income Fund (the “Fund”) seeks capital appreciation and current income.
WHAT WERE THE MAIN DRIVERS OF THE FUND’S PERFORMANCE?
The Fund’s Select Class Shares underperformed the Russell 1000 Value Index (the “Benchmark”) for the six months ended December 31, 2016. The Fund’s security selection in the financials and materials sectors was a leading detractor from performance relative to the Benchmark. The Fund’s security selection in the information technology sector and its underweight position in the telecommunication services sector were leading contributors to relative performance.
Leading individual detractors from relative performance included the Fund’s overweight position in Travelers Cos. and Simon Property Group Inc. and its underweight position in J.P. Morgan Chase & Co. Shares of Travelers, an insurance company, underperformed the broader financials sector during the reporting period. Shares of Simon Property Group, a real estate insurance trust, fell amid investor concerns about the impact of rising U.S. interest rates. Shares of J.P Morgan Chase, a banking and financial services company that the Fund is prohibited from holding because of its affiliation with the Fund’s adviser, rose on investor expectations of an improved operating environment for large banks.
Leading individual contributors to relative performance included the Fund’s underweight positions in Berkshire Hathaway Inc. and its overweight position in PNC Financial Services Group Corp. and Time Warner Inc. Shares of Berkshire Hathaway, a diversified holding company that was not held in the Fund, underperformed the broader financials sector during the reporting period. Shares of PNC Financial Services, a banking and financial services company, rose on investor expectations of an improved operating environment for the financials sector. Shares of Time Warner, an entertainment provider and distributor, rose on news of an acquisition offer from AT&T Corp.
HOW WAS THE FUND POSITIONED?
The Fund’s portfolio managers’ focus remained on stock selection, as they believed that quality companies trading at attractive valuations have the greatest potential to outperform
in the long term. As the Fund aimed to purchase stocks with above average dividend yields, the research process was designed to identify companies with predictable and durable business models deemed capable of generating sustainable free cash flow.
| | | | | | | | |
| TOP TEN EQUITY HOLDINGS OF THE PORTFOLIO*** | |
| | 1. | | | Wells Fargo & Co. | | | 3.3 | % |
| | 2. | | | Bank of America Corp. | | | 2.9 | |
| | 3. | | | Exxon Mobil Corp. | | | 2.6 | |
| | 4. | | | Chevron Corp. | | | 2.5 | |
| | 5. | | | PNC Financial Services Group, Inc. (The) | | | 2.5 | |
| | 6. | | | Johnson & Johnson | | | 2.4 | |
| | 7. | | | ConocoPhillips | | | 2.2 | |
| | 8. | | | BlackRock, Inc. | | | 2.1 | |
| | 9. | | | Apple, Inc. | | | 2.0 | |
| | 10. | | | Occidental Petroleum Corp. | | | 2.0 | |
| | | | |
PORTFOLIO COMPOSITION BY SECTOR*** | |
| Financials | | | 29.8 | % |
| Energy | | | 11.3 | |
| Industrials | | | 10.4 | |
| Health Care | | | 10.1 | |
| Information Technology | | | 9.9 | |
| Consumer Discretionary | | | 8.1 | |
| Consumer Staples | | | 7.6 | |
| Utilities | | | 3.9 | |
| Materials | | | 3.1 | |
| Real Estate | | | 2.9 | |
| Telecommunication Services | | | 1.6 | |
| Short-Term Investment | | | 1.3 | |
| * | | The return shown is based on net asset values calculated for shareholder transactions and may differ from the return shown in the financial highlights, which reflects adjustments made to the net asset values in accordance with accounting principles generally accepted in the United States of America. |
| ** | | The adviser seeks to achieve the Fund’s objective. There can be no guarantee it will be achieved. |
| *** | | Percentages indicated are based on total investments as of December 31, 2016. The Fund’s portfolio composition is subject to change. |
| | | | | | | | |
| | | |
| DECEMBER 31, 2016 | | J.P. MORGAN LARGE CAP FUNDS | | | | | 9 | |
JPMorgan Equity Income Fund
FUND COMMENTARY
SIX MONTHS ENDED DECEMBER 31, 2016 (Unaudited) (continued)
| | | | | | | | | | | | | | | | | | | | |
AVERAGE ANNUAL TOTAL RETURNS AS OF DECEMBER 31, 2016 | |
| | | INCEPTION DATE OF
CLASS | | | 6 MONTH* | | | 1 YEAR | | | 5 YEAR | | | 10 YEAR | |
CLASS A SHARES | | | February 18, 1992 | | | | | | | | | | | | | | | | | |
With Sales Charge** | | | | | | | 2.69 | % | | | 8.61 | % | | | 12.27 | % | | | 6.56 | % |
Without Sales Charge | | | | | | | 8.40 | | | | 14.62 | | | | 13.48 | | | | 7.13 | |
CLASS C SHARES | | | November 4, 1997 | | | | | | | | | | | | | | | | | |
With CDSC*** | | | | | | | 7.09 | | | | 13.04 | | | | 12.92 | | �� | | 6.59 | |
Without CDSC | | | | | | | 8.09 | | | | 14.04 | | | | 12.92 | | | | 6.59 | |
CLASS R2 SHARES | | | February 28, 2011 | | | | 8.25 | | | | 14.29 | | | | 13.19 | | | | 6.93 | |
CLASS R3 SHARES | | | September 9, 2016 | | | | 8.35 | | | | 14.56 | | | | 13.47 | | | | 7.13 | |
CLASS R4 SHARES | | | September 9, 2016 | | | | 8.47 | | | | 14.86 | | | | 13.76 | | | | 7.43 | |
CLASS R5 SHARES | | | February 28, 2011 | | | | 8.63 | | | | 15.06 | | | | 13.99 | | | | 7.55 | |
CLASS R6 SHARES | | | January 31, 2012 | | | | 8.69 | | | | 15.17 | | | | 14.05 | | | | 7.58 | |
SELECT CLASS SHARES | | | July 2, 1987 | | | | 8.45 | | | | 14.84 | | | | 13.76 | | | | 7.43 | |
| ** | | Sales Charge for Class A Shares is 5.25%. |
| *** | | Assumes a 1% CDSC (contingent deferred sales charge) for the 6 month and one year periods and 0% CDSC thereafter. |
TEN YEAR PERFORMANCE (12/31/06 TO 12/31/16)
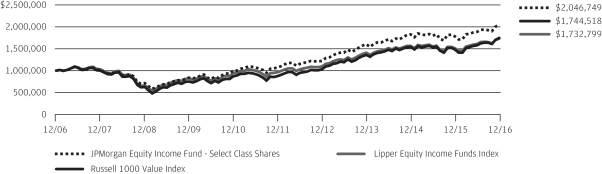
The performance quoted is past performance and is not a guarantee of future results. Mutual funds are subject to certain market risks. Investment returns and principal value of an investment will fluctuate so that an investor’s shares, when redeemed, may be worth more or less than their original cost. Current performance may be higher or lower than the performance data shown. For up-to-date month-end performance information please call 1-800-480-4111.
Returns for Class R2 Class R4, and Class R5 Shares prior to their inception dates are based on the performance of Select Class Shares. With respect to Class R2 Shares, prior class performance has been adjusted to reflect the differences in expenses between classes. The actual returns for Class R4 and Class R5 Shares would have been different than those shown because Class R4 and Class R5 Shares have different expenses than Select Class Shares.
Returns for Class R3 Shares prior to their inception date are based on the performance of Class A Shares. The actual returns for Class R3 Shares would have been similar than those shown because Class R3 currently have the same expenses as Class A Shares.
Returns for Class R6 Shares prior to their inception date are based on the performance of Class R5 Shares and, prior to February 28, 2011, Select Class Shares. The actual returns for Class R6 Shares would have been different than those shown because Class R6 Shares have different expenses than Class R5 and Select Class Shares.
The graph illustrates comparative performance for $1,000,000 invested in Select Class Shares of the JPMorgan Equity Income Fund, the Russell 1000 Value Index and the Lipper Equity Income Funds Index from December 31,
2006 to December 31, 2016. The performance of the Fund assumes reinvestment of all dividends and capital gain distributions, if any, and does not include a sales charge. The performance of the Russell 1000 Value Index does not reflect the deduction of expenses or a sales charge associated with a mutual fund and has been adjusted to reflect reinvestment of all dividends and capital gain distributions of the securities included in the benchmark, if applicable. The performance of the Lipper Equity Income Funds Index includes expenses associated with a mutual fund, such as investment management fees. These expenses are not identical to the expenses incurred by the Fund. The Russell 1000 Value Index is an unmanaged index which measures the performance of those Russell 1000 companies with lower price-to-book ratios and lower forecasted growth values. The Lipper Equity Income Funds Index is an index based on the total returns of certain mutual funds within the Fund’s designated category as determined by Lipper, Inc. Investors cannot invest directly in an index.
Select Class Shares have a $1,000,000 minimum initial investment.
Fund performance may reflect the waiver of the Fund’s fees and reimbursement of expenses for certain periods since the inception date. Without these waivers and reimbursements, performance would have been lower. Also, performance shown in this section does not reflect the deduction of taxes that a shareholder would pay on Fund distributions or redemptions of Fund shares.
The returns shown are based on net asset values calculated for shareholder transactions and may differ from the returns shown in the financial highlights, which reflect adjustments made to the net asset values in accordance with accounting principles generally accepted in the United States of America.
| | | | | | |
| | | |
| 10 | | | | J.P. MORGAN LARGE CAP FUNDS | | DECEMBER 31, 2016 |
JPMorgan Growth and Income Fund
FUND COMMENTARY
SIX MONTHS ENDED DECEMBER 31, 2016 (Unaudited)
| | | | |
| Reporting Period Return: | |
| Fund (Class A Shares, without a sales charge)* | | | 11.67% | |
| Russell 1000 Value Index | | | 10.39% | |
| |
| Net Assets as of 12/31/2016 (In Thousands) | | $ | 530,859 | |
INVESTMENT OBJECTIVE**
The JPMorgan Growth and Income Fund (the “Fund”) seeks to provide capital growth over the long term and earn income from dividends.
WHAT WERE THE MAIN DRIVERS OF THE FUND’S PERFORMANCE?
The Fund’s Class A Shares, without a sales charge, outperformed the Russell 1000 Value Index (the “Benchmark”) for the six months ended December 31, 2016. The Fund’s security selection and overweight position in the financials sector and its security selection in the information technology sector were leading contributors to performance relative to the Benchmark. The Fund’s security selection in the industrials and health care sectors was a leading detractor from relative performance.
Leading individual contributors to relative performance included the Fund’s overweight positions in Bank of America Corp., Harman International Industries Inc. and Best Buy Inc. Shares of Bank of America, a banking and financial services company, rose on investor expectations of an improved operating environment for large banks. Shares of Harman International Industries, a maker of audio systems for the consumer and commercial markets, rose on news of Samsung Electronics Co.’s $8 billion acquisition of the company. Shares of Best Buy, a consumer electronics chain, rose on better-than-expected earnings and sales.
Leading individual detractors from relative performance included the Fund’s overweight positions in Bristol-Myers Squibb Co. and T. Rowe Price Group Inc. and its underweight position in J.P. Morgan Chase & Co. Shares of Bristol-Myers Squibb, a drug maker not held in the Benchmark, fell amid investor concerns about the company’s ability to compete in the market for lung cancer treatments. Shares of T. Rowe Price Group, a mutual fund investments provider, rose during the reporting period but underperformed the broader financials sector. Shares of J.P. Morgan Chase, a banking and financial services company that the Fund is prohibited from holding because of its affiliation with the Fund’s adviser, rose on investor expectations of an improved operating environment for large banks.
HOW WAS THE FUND POSITIONED?
The Fund’s portfolio managers focused on stock selection and aimed to invest in undervalued companies with durable
franchises, strong management and the ability to grow their intrinsic value per share. The portfolio managers employed a bottom-up approach to security selection and fundamental research. During the reporting period, the Fund’s largest overweight position relative to the Benchmark was in the consumer discretionary sector, while its largest underweight position was in the consumer staples sector.
| | | | | | | | |
| TOP TEN EQUITY HOLDINGS OF THE PORTFOLIO*** | |
| | 1. | | | Bank of America Corp. | | | 4.0 | % |
| | 2. | | | Microsoft Corp. | | | 2.9 | |
| | 3. | | | Wells Fargo & Co. | | | 2.9 | |
| | 4. | | | Chevron Corp. | | | 2.6 | |
| | 5. | | | Exxon Mobil Corp. | | | 2.4 | |
| | 6. | | | Apple, Inc. | | | 2.4 | |
| | 7. | | | Berkshire Hathaway, Inc., Class B | | | 2.2 | |
| | 8. | | | Verizon Communications, Inc. | | | 2.1 | |
| | 9. | | | Honeywell International, Inc. | | | 1.9 | |
| | 10. | | | Occidental Petroleum Corp. | | | 1.9 | |
| | | | |
PORTFOLIO COMPOSITION BY SECTOR*** | |
| Financials | | | 32.7 | % |
| Energy | | | 12.8 | |
| Information Technology | | | 11.8 | |
| Consumer Discretionary | | | 11.4 | |
| Health Care | | | 9.3 | |
| Industrials | | | 8.1 | |
| Consumer Staples | | | 4.9 | |
| Telecommunication Services | | | 2.8 | |
| Utilities | | | 2.1 | |
| Real Estate | | | 1.9 | |
| Materials | | | 0.9 | |
| Short-Term Investment | | | 1.3 | |
| * | | The return shown is based on net asset values calculated for shareholder transactions and may differ from the return shown in the financial highlights, which reflects adjustments made to the net asset values in accordance with accounting principles generally accepted in the United States of America. |
| ** | | The adviser seeks to achieve the Fund’s objective. There can be no guarantee it will be achieved. |
| *** | | Percentages indicated are based on total investments as of December 31, 2016. The Fund’s portfolio composition is subject to change. |
| | | | | | | | |
| | | |
| DECEMBER 31, 2016 | | J.P. MORGAN LARGE CAP FUNDS | | | | | 11 | |
JPMorgan Growth and Income Fund
FUND COMMENTARY
SIX MONTHS ENDED DECEMBER 31, 2016 (Unaudited) (continued)
| | | | | | | | | | | | | | | | | | |
AVERAGE ANNUAL TOTAL RETURNS AS OF DECEMBER 31, 2016 | |
| | | | | |
| | | INCEPTION DATE OF
CLASS | | 6 MONTH* | | | 1 YEAR | | | 5 YEAR | | | 10 YEAR | |
CLASS A SHARES | | September 23, 1987 | | | | | | | | | | | | | | | | |
With Sales Charge** | | | | | 5.81 | % | | | 8.75 | % | | | 14.13 | % | | | 5.56 | % |
Without Sales Charge | | | | | 11.67 | | | | 14.78 | | | | 15.37 | | | | 6.13 | |
CLASS C SHARES | | January 2, 1998 | | | | | | | | | | | | | | | | |
With CDSC*** | | | | | 10.42 | | | | 13.23 | | | | 14.79 | | | | 5.60 | |
Without CDSC | | | | | 11.42 | | | | 14.23 | | | | 14.79 | | | | 5.60 | |
CLASS R2 SHARES | | November 2, 2015 | | | 11.54 | | | | 14.48 | | | | 15.30 | | | | 6.10 | |
CLASS R5 SHARES | | November 2, 2015 | | | 11.94 | | | | 15.29 | | | | 15.70 | | | | 6.45 | |
CLASS R6 SHARES | | November 2, 2015 | | | 11.97 | | | | 15.35 | | | | 15.72 | | | | 6.46 | |
SELECT CLASS SHARES | | January 25, 1996 | | | 11.83 | | | | 15.06 | | | | 15.65 | | | | 6.43 | |
| ** | | Sales Charge for Class A Shares is 5.25%. |
| *** | | Assumes a 1% CDSC (contingent deferred sales charge) for the 6 month and one year periods and 0% CDSC thereafter. |
TEN YEAR PERFORMANCE (12/31/06 TO 12/31/16)
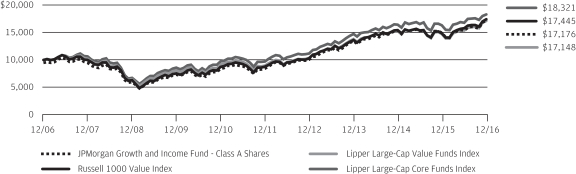
The performance quoted is past performance and is not a guarantee of future results. Mutual funds are subject to certain market risks. Investment returns and principal value of an investment will fluctuate so that an investor’s shares, when redeemed, may be worth more or less than their original cost. Current performance may be higher or lower than the performance data shown. For up-to-date month-end performance information please call 1-800-480-4111.
Returns for Class R2 Shares prior to their inception date are based on the performance of Class A Shares. The actual returns of Class R2 Shares would have been lower than those shown because Class R2 Shares have higher expenses than Class A Shares.
Returns for Class R5 and Class R6 Shares prior to their inception date are based on the performance of Select Class Shares. The actual returns of Class R5 and Class R6 Shares would have been different than those shown because Class R5 and Class R6 Shares have different expenses than Select Class Shares.
The graph illustrates comparative performance for $10,000 invested in Class A Shares of the JPMorgan Growth and Income Fund, the Russell 1000 Value Index, the Lipper Large-Cap Value Funds Index and the Lipper Large-Cap Core Funds Index from December 31, 2006 to December 31, 2016. The performance of the Fund assumes reinvestment of all dividends and capital gain distributions, if any, and includes a sales charge. The performance of the Russell 1000 Value Index does not reflect the deduction of expenses or a sales charge associated
with a mutual fund and has been adjusted to reflect reinvestment of all dividends and capital gain distributions of the securities included in the benchmarks, if applicable. The performance of the Lipper Large-Cap Value Funds Index and the Lipper Large-Cap Core Funds Index includes expenses associated with a mutual fund, such as investment management fees. These expenses are not identical to the expenses incurred by the Fund. The Russell 1000 Value Index is an unmanaged index, which measures the performance of those Russell 1000 companies with lower price-to-book ratios and lower forecasted growth values. The Lipper Large-Cap Value Funds Index and the Lipper Large-Cap Core Funds Index are indexes based on the total returns of certain groups of mutual funds as determined by Lipper, Inc. Investors cannot invest directly in an index.
Class A Shares have a $1,000 minimum initial investment and carry a 5.25% sales charge.
Fund performance may reflect the waiver of the Fund’s fees and reimbursement of expenses for certain periods since the inception date. Without these waivers and reimbursements, performance would have been lower. Also, performance shown in this section does not reflect the deduction of taxes that a shareholder would pay on Fund distributions or redemptions of Fund shares.
The returns shown are based on net asset values calculated for shareholder transactions and may differ from the returns shown in the financial highlights, which reflect adjustments made to the net asset values in accordance with accounting principles generally accepted in the United States of America.
| | | | | | |
| | | |
| 12 | | | | J.P. MORGAN LARGE CAP FUNDS | | DECEMBER 31, 2016 |
JPMorgan Hedged Equity Fund
FUND COMMENTARY
SIX MONTHS ENDED DECEMBER 31, 2016 (Unaudited)
| | | | |
| Reporting Period Return: | |
| Fund (Select Class Shares)* | | | 7.31% | |
| S&P 500 Index | | | 7.82% | |
| |
| Net Assets as of 12/31/2016 (In Thousands) | | $ | 326,938 | |
INVESTMENT OBJECTIVE**
The JPMorgan Hedged Equity Fund (the “Fund”) seeks to provide capital appreciation.
WHAT WERE THE MAIN DRIVERS OF THE FUND’S PERFORMANCE?
The Fund’s Select Class Shares underperformed the Standard & Poor’s 500 Index (the “Benchmark”) for the six months ended December 31, 2016.
The Fund’s options hedge allowed the Fund to generally perform as designed, delivering returns with less volatility than the Benchmark during the reporting period. The Fund provided a downside buffer throughout the particularly volatile market environment, exhibiting markedly less volatility than the Benchmark while capturing 93% of the market returns during the six month reporting period.
The Fund’s security selection in the pharmaceutical/medical technology and energy sectors was a leading detractor from performance relative to the Benchmark. The Fund’s security selection in the financials and telecommunication services sectors made a positive contribution to relative performance.
Leading individual detractors from relative performance included the Fund’s overweight positions in Bristol-Myers Squibb Co. and Accenture PLC and its underweight position in Nvidia Corp. Shares of Bristol-Myers Squibb, a drug maker, fell amid investor concerns about the company’s ability to compete in the market for lung cancer treatments. Shares of Accenture, a provider of management consulting and outsourcing, fell on lower-than-expected revenue and a weak outlook for earnings. Shares of Nvidia, a semiconductor manufacturer, rose after the company posted better-than-expected revenue.
Leading individual contributors to relative performance included the Fund’s overweight positions in United Continental Holdings Inc., Charter Communications Inc. and Morgan Stanley. Shares of United Continental Holdings, an airline operator, rose on improved traffic and capacity. Shares of Charter Communications, a provider of broadband communications services, rose after it was added to the S&P 500 Index and amid positive investor expectations for its merger with Time Warner Cable. Shares of Morgan Stanley, a financial services company, rose on investor expectations of an improved business environment for the financials sector.
HOW WAS THE FUND POSITIONED?
The Fund used an enhanced index strategy that invests primarily in common stocks of large capitalization U.S. companies,
while systematically purchasing and selling exchange-traded index put options and selling exchange-traded index call options. The option overlay is known as a “Put/Spread Collar” strategy. The combination of the diversified portfolio of equity securities, downside protection from index put options and income from index call options provided the Fund with a portion of the returns associated with equity market investments, while exposing the Fund to less risk than traditional long-only equity strategies.
| | | | | | | | |
| TOP TEN EQUITY HOLDINGS OF THE PORTFOLIO*** | |
| | 1. | | | Apple, Inc. | | | 3.1 | % |
| | 2. | | | Microsoft Corp. | | | 3.0 | |
| | 3. | | | Exxon Mobil Corp. | | | 1.9 | |
| | 4. | | | Wells Fargo & Co. | | | 1.8 | |
| | 5. | | | Facebook, Inc., Class A | | | 1.8 | |
| | 6. | | | Bank of America Corp. | | | 1.7 | |
| | 7. | | | Amazon.com, Inc. | | | 1.6 | |
| | 8. | | | Pfizer, Inc. | | | 1.6 | |
| | 9. | | | Citigroup, Inc. | | | 1.6 | |
| | 10. | | | General Electric Co. | | | 1.5 | |
| | | | |
PORTFOLIO COMPOSITION BY SECTOR*** | |
| Information Technology | | | 20.4 | % |
| Financials | | | 14.5 | |
| Health Care | | | 13.3 | |
| Consumer Discretionary | | | 12.4 | |
| Industrials | | | 9.6 | |
| Consumer Staples | | | 8.8 | |
| Energy | | | 7.2 | |
| Utilities | | | 3.0 | |
| Materials | | | 2.8 | |
| Real Estate | | | 2.3 | |
| Telecommunication Services | | | 1.7 | |
| Put Options | | | 1.3 | |
| Short-Term Investments | | | 2.7 | |
| * | | The return shown is based on net asset values calculated for shareholder transactions and may differ from the return shown in the financial highlights, which reflects adjustments made to the net asset values in accordance with accounting principles generally accepted in the United States of America. |
| ** | | The adviser seeks to achieve the Fund’s objective. There can be no guarantee it will be achieved. |
| *** | | Percentages indicated are based on total investments as of December 31, 2016. The Fund’s portfolio composition is subject to change. |
| | | | | | | | |
| | | |
| DECEMBER 31, 2016 | | J.P. MORGAN LARGE CAP FUNDS | | | | | 13 | |
JPMorgan Hedged Equity Fund
FUND COMMENTARY
SIX MONTHS ENDED DECEMBER 31, 2016 (Unaudited) (continued)
| | | | | | | | | | | | | | | | | | |
AVERAGE ANNUAL TOTAL RETURNS AS OF DECEMBER 31, 2016 | |
| | | | | |
| | | INCEPTION
DATE OF CLASS | | 6 MONTH* | | | 1 YEAR | | | 3 YEAR | | | SINCE
INCEPTION | |
CLASS A SHARES | | December 13, 2013 | | | | | | | | | | | | | | | | |
With Sales Charge** | | | | | 1.51 | % | | | 3.50 | % | | | 3.65 | % | | | 4.16 | % |
Without Sales Charge | | | | | 7.13 | | | | 9.26 | | | | 5.52 | | | | 6.02 | |
CLASS C SHARES | | December 13, 2013 | | | | | | | | | | | | | | | | |
With CDSC*** | | | | | 5.90 | | | | 7.73 | | | | 4.99 | | | | 5.49 | |
Without CDSC | | | | | 6.90 | | | | 8.73 | | | | 4.99 | | | | 5.49 | |
CLASS R5 SHARES | | December 13, 2013 | | | 7.40 | | | | 9.78 | | | | 6.00 | | | | 6.50 | |
CLASS R6 SHARES | | December 13, 2013 | | | 7.43 | | | | 9.83 | | | | 6.05 | | | | 6.55 | |
SELECT CLASS SHARES | | December 13, 2013 | | | 7.31 | | | | 9.58 | | | | 5.79 | | | | 6.29 | |
| ** | | Sales Charge for Class A Shares is 5.25%. |
| *** | | Assumes a 1% CDSC (contingent deferred sales charge) for the 6 month and one year periods and 0% CDSC thereafter. |
LIFE OF FUND PERFORMANCE (12/13/13 TO 12/31/16)
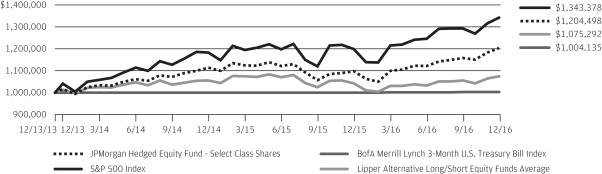
The performance quoted is past performance and is not a guarantee of future results. Mutual funds are subject to certain market risks. Investment returns and principal value of an investment will fluctuate so that an investor’s shares, when redeemed, may be worth more or less than their original cost. Current performance may be higher or lower than the performance data shown. For up-to-date month-end performance information please call 1-800-480-4111.
The Fund commenced operations on December 13, 2013.
The graph illustrates comparative performance for $1,000,000 invested in Select Class Shares of the JPMorgan Hedged Equity Fund, the S&P 500 Index, the BofA Merrill Lynch 3-Month U.S. Treasury Bill Index and the Lipper Alternative Long/Short Equity Funds Average from December 13, 2013 to December 31, 2016. The performance of the Fund assumes reinvestment of all dividends and capital gain distributions, if any, and does not include a sales charge. The performance of the S&P 500 Index and the BofA Merrill Lynch 3-Month U.S. Treasury Bill Index does not reflect the deduction of expenses or a sales charge associated with a mutual fund and approximates the minimum possible dividend reinvestment of the securities included in the benchmarks, if applicable. The performance of the Lipper Alternative Long/Short Equity Funds Average includes expenses associated with a mutual fund, such as investment management fees. These expenses are not identical to the expenses charged by the Fund. The S&P 500 Index is an unmanaged index generally representative of the performance of large companies in the U.S. stock market. The BofA
Merrill Lynch 3-Month U.S. Treasury Bill Index is comprised of a single issue purchased at the beginning of the month and held for a full month. Each month the index is rebalanced and the issue selected is the outstanding Treasury Bill that matures closest to, but not beyond, 3 months from the rebalancing date. Investors cannot invest directly in an index. The Lipper Alternative Long/Short Equity Funds Average is an average based on the total returns of all mutual funds within the funds designated category as determined by Lipper, Inc.
Select Class Shares have a $1,000,000 minimum initial investment.
Subsequent to the inception date of the Fund and through May 30, 2014, the Fund did not experience any shareholder activity. If such shareholder activity had occurred, the Fund’s performance may have been impacted.
Fund performance may reflect the waiver of the Fund’s fees and reimbursement of expenses for certain periods since the inception date. Without these waivers and reimbursements, performance would have been lower. Also, performance shown in this section does not reflect the deduction of taxes that a shareholder would pay on Fund distributions or redemptions of Fund shares.
The returns shown are based on net asset values calculated for shareholder transactions and may differ from the returns shown in the financial highlights, which reflect adjustments made to the net asset values in accordance with accounting principles generally accepted in the United States of America.
| | | | | | |
| | | |
| 14 | | | | J.P. MORGAN LARGE CAP FUNDS | | DECEMBER 31, 2016 |
JPMorgan Large Cap Growth Fund
FUND COMMENTARY
SIX MONTHS ENDED DECEMBER 31, 2016 (Unaudited)
| | | | |
| Reporting Period Return: | | | |
| Fund (Select Class Shares)* | | | 5.42% | |
| Russell 1000 Growth Index | | | 5.64% | |
| |
| Net Assets as of 12/31/2016 (In Thousands) | | $ | 11,948,776 | |
INVESTMENT OBJECTIVE**
The JPMorgan Large Cap Growth Fund (the “Fund”) seeks long-term capital appreciation.
WHAT WERE THE MAIN DRIVERS OF THE FUND’S PERFORMANCE?
The Fund’s Select Class Shares underperformed the Russell 1000 Growth Index (the “Benchmark”) for the six months ended December 31, 2016. The Fund’s security selection in the health care and materials & processing sectors was a leading detractor from performance relative to the Benchmark. The Fund’s security selection in the financials sector and its underweight position in the consumer staples sector were leading contributors to relative performance.
Leading individual detractors from relative performance included the Fund’s underweight positions in Apple Inc. and Microsoft Corp. and its overweight position in Monster Beverage Corp. Shares of Apple, a maker of computers and mobile devices, rose amid the broader trend of increased investment in U.S. equities during the reporting period. Shares of Microsoft, a provider of software and services, rose on better-than-expected earnings and the broader trend of increased investment in U.S. equities during the reporting period. Shares of Monster Beverage, a maker of energy drinks, fell after the company reported lower-than-expected earnings and revenue.
Leading individual contributors to relative performance included the Fund’s overweight positions in Nvidia Corp., Delta Air Lines Inc. and Charles Schwab Co. Shares of Nvidia, a semiconductor manufacturer, rose after the company posted better-than-expected revenue, driven by demand from computer game and data center markets. Shares of Delta Air Lines, an airline operator, rose on investor expectations for improvements in industry capacity and pricing. Shares of Charles Schwab, a discount securities brokerage, rose on better-than-expected earnings and investor expectations for an improved operating environment for the broader financial sector.
HOW WAS THE FUND POSITIONED?
The Fund’s portfolio managers utilized a bottom-up approach to stock selection, rigorously researching individual companies
in an effort to construct portfolios of stocks that have strong fundamentals and positive price momentum. The Fund’s portfolio managers sought to invest in companies with attractive fundamentals that, in their view, possessed the potential to significantly exceed expectations for a prolonged period of time.
| | | | | | | | |
| TOP TEN EQUITY HOLDINGS OF THE PORTFOLIO*** | |
| | 1. | | | Alphabet, Inc., Class C | | | 6.0 | % |
| | 2. | | | Amazon.com, Inc. | | | 5.1 | |
| | 3. | | | Home Depot, Inc. (The) | | | 3.7 | |
| | 4. | | | NVIDIA Corp. | | | 3.7 | |
| | 5. | | | Apple, Inc. | | | 3.4 | |
| | 6. | | | Mastercard, Inc., Class A | | | 3.4 | |
| | 7. | | | Facebook, Inc., Class A | | | 3.0 | |
| | 8. | | | Comcast Corp., Class A | | | 3.0 | |
| | 9. | | | Microsoft Corp. | | | 2.8 | |
| | 10. | | | Delta Air Lines, Inc. | | | 2.7 | |
| | | | |
PORTFOLIO COMPOSITION BY SECTOR*** | |
| Information Technology | | | 41.0 | % |
| Consumer Discretionary | | | 21.2 | |
| Health Care | | | 12.6 | |
| Industrials | | | 8.2 | |
| Financials | | | 6.1 | |
| Materials | | | 4.2 | |
| Consumer Staples | | | 4.0 | |
| Energy | | | 1.0 | |
| Real Estate | | | 0.7 | |
| Short-Term Investment | | | 1.0 | |
| * | | The return shown is based on net asset values calculated for shareholder transactions and may differ from the return shown in the financial highlights, which reflects adjustments made to the net asset values in accordance with accounting principles generally accepted in the United States of America. |
| ** | | The adviser seeks to achieve the Fund’s objective. There can be no guarantee it will be achieved. |
| *** | | Percentages indicated are based on total investments as of December 31, 2016. The Fund’s portfolio composition is subject to change. |
| | | | | | | | |
| | | |
| DECEMBER 31, 2016 | | J.P. MORGAN LARGE CAP FUNDS | | | | | 15 | |
JPMorgan Large Cap Growth Fund
FUND COMMENTARY
SIX MONTHS ENDED DECEMBER 31, 2016 (Unaudited) (continued)
| | | | | | | | | | | | | | | | | | |
AVERAGE ANNUAL TOTAL RETURNS AS OF DECEMBER 31, 2016 | |
| | | | | |
| | | INCEPTION DATE OF
CLASS | | 6 MONTH* | | | 1 YEAR | | | 5 YEAR | | | 10 YEAR | |
CLASS A SHARES | | February 22, 1994 | | | | | | | | | | | | | | | | |
With Sales Charge** | | | | | (0.13 | )% | | | (7.31 | )% | | | 10.32 | % | | | 7.46 | % |
Without Sales Charge | | | | | 5.38 | | | | (2.16 | ) | | | 11.51 | | | | 8.04 | |
CLASS C SHARES | | November 4, 1997 | | | | | | | | | | | | | | | | |
With CDSC*** | | | | | 4.09 | | | | (3.66 | ) | | | 10.95 | | | | 7.49 | |
Without CDSC | | | | | 5.09 | | | | (2.66 | ) | | | 10.95 | | | | 7.49 | |
CLASS R2 SHARES | | November 3, 2008 | | | 5.24 | | | | (2.43 | ) | | | 11.23 | | | | 7.78 | |
CLASS R3 SHARES | | September 9, 2016 | | | 5.32 | | | | (2.24 | ) | | | 11.48 | | | | 8.08 | |
CLASS R4 SHARES | | September 9, 2016 | | | 5.42 | | | | (2.04 | ) | | | 11.69 | | | | 8.26 | |
CLASS R5 SHARES | | April 14, 2009 | | | 5.54 | | | | (1.85 | ) | | | 11.92 | | | | 8.42 | |
CLASS R6 SHARES | | November 30, 2010 | | | 5.58 | | | | (1.74 | ) | | | 12.00 | | | | 8.47 | |
SELECT CLASS SHARES | | February 28, 1992 | | | 5.42 | | | | (2.04 | ) | | | 11.69 | | | | 8.26 | |
| ** | | Sales Charge for Class A Shares is 5.25%. |
| *** | | Assumes a 1% CDSC (contingent deferred sales charge) for the 6 month and one year periods and 0% CDSC thereafter. |
TEN YEAR PERFORMANCE (12/31/06 to 12/31/16)
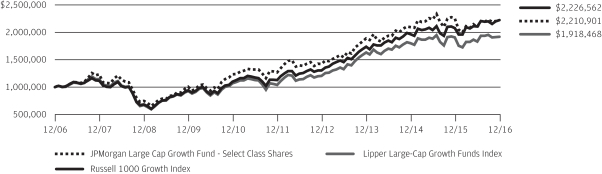
The performance quoted is past performance and is not a guarantee of future results. Mutual funds are subject to certain market risks. Investment returns and principal value of an investment will fluctuate so that an investor’s shares, when redeemed, may be worth more or less than their original cost. Current performance may be higher or lower than the performance data shown. For up-to-date month-end performance information please call 1-800-480-4111.
Returns for Class R2, Class R3, Class R4 and Class R5 Shares prior to their inception dates are based on the performance of Select Class Shares. With respect to Class R2 and Class R3 Shares, prior class performance has been adjusted to reflect the differences in expenses between classes. The actual returns for Class R4 and Class R5 Shares would have been different than those shown because Class R3, Class R4 and Class R5 Shares have different expenses than Select Class Shares.
Returns for Class R6 Shares prior to their inception date are based on the performance of Class R5 Shares and, prior to April 14, 2009, Select Class Shares. The actual returns for Class R6 Shares would have been different than those shown because Class R6 Shares have different expenses than Class R5 and Select Class Shares.
The graph illustrates comparative performance for $1,000,000 invested in Select Class Shares of the JPMorgan Large Cap Growth Fund, the Russell 1000 Growth Index and the Lipper Large-Cap Growth Funds Index from December 31, 2006 to December 31, 2016. The performance of the Fund assumes reinvestment of all dividends and capital gain distributions, if any, and does not include a sales
charge. The performance of the Russell 1000 Growth Index does not reflect the deduction of expenses or a sales charge associated with a mutual fund and has been adjusted to reflect reinvestment of all dividends and capital gain distributions of the securities included in the benchmark, if applicable. The performance of the Lipper Large-Cap Growth Funds Index includes expenses associated with a mutual fund, such as investment management fees. These expenses are not identical to the expenses incurred by the Fund. The Russell 1000 Growth Index is an unmanaged index which measures the performance of those Russell 1000 companies with higher price-to-book ratios and higher forecasted growth values. The Lipper Large-Cap Growth Funds Index is an index based on the total returns of certain mutual funds within the Fund’s designated category as determined by Lipper, Inc. Investors cannot invest directly in an index.
Select Class Shares have a $1,000,000 minimum initial investment.
Fund performance may reflect the waiver of the Fund’s fees and reimbursement of expenses for certain periods since the inception date. Without these waivers and reimbursements, performance would have been lower. Also, performance shown in this section does not reflect the deduction of taxes that a shareholder would pay on Fund distributions or redemptions of Fund shares.
The returns shown are based on net asset values calculated for shareholder transactions and may differ from the returns shown in the financial highlights, which reflect adjustments made to the net asset values in accordance with accounting principles generally accepted in the United States of America.
| | | | | | |
| | | |
| 16 | | | | J.P. MORGAN LARGE CAP FUNDS | | DECEMBER 31, 2016 |
JPMorgan Large Cap Value Fund
FUND COMMENTARY
SIX MONTHS ENDED DECEMBER 31, 2016 (Unaudited)
| | | | |
| Reporting Period Return: | |
| Fund (Select Class Shares)* | | | 21.17% | |
| Russell 1000 Value Index | | | 10.39% | |
| |
| Net Assets as of 12/31/2016 (In Thousands) | | $ | 813,684 | |
INVESTMENT OBJECTIVE**
The JPMorgan Large Cap Value Fund (the “Fund”) seeks capital appreciation with the incidental goal of achieving current income by investing primarily in equity securities.
WHAT WERE THE MAIN DRIVERS OF THE FUND’S PERFORMANCE?
The Fund’s Select Class Shares outperformed the Russell 1000 Value Index (the “Benchmark”) for the six months ended December 31, 2016. The Fund’s overweight positions and security selection in both the big banks & brokers sector and the auto & transportation sector were leading contributors to performance relative to the Benchmark. The Fund’s security selection and overweight position in the health services & systems sector were the only sector detractors from relative performance.
Leading individual contributors to performance relative to the Benchmark included the Fund’s overweight positions in Harman International Industries Inc., KeyCorp and T-Mobile US Inc. Shares of Harman International Industries, a maker of audio systems for the consumer and commercial markets, rose on news of Samsung Electronics Co.’s $8 billion acquisition of the company. Shares of KeyCorp, a banking company, rose amid an increase in U.S. interest rates and investor expectations for an improved business climate for large banks. Shares of T-Mobile US, a mobile telecommunications provider, rose amid better-than-expected earnings and investor expectations of a potential merger with Sprint increased mergers and acquisitions activity within the telecommunications sector.
Leading individual detractors from relative performance included the Fund’s overweight positions in Wells Fargo & Co. and Morgan Stanley, and its underweight position in J.P. Morgan Chase & Co. Shares of Wells Fargo, a banking and financial services company, fell amid falling mortgage revenue and higher expenses in the wake of the bank’s $185 million settlement for opening fictitious or unauthorized bank accounts. Shares of Morgan Stanley, a financial services company, underperformed the broader financials sector during the reporting period. Shares of J.P. Morgan Chase, a banking and financial services company that the Fund is prohibited from holding because of its affiliation with the Fund’s adviser, rose on investor expectations of an improved operating environment for large banks.
HOW WAS THE FUND POSITIONED?
The Fund’s portfolio managers combined a bottom-up fundamental approach to security selection with a systematic valuation process. Overall, the Fund’s portfolio managers looked to take advantage of mispriced stocks that they believed appeared attractive relative to their fair value.
| | | | | | | | |
| TOP TEN EQUITY HOLDINGS OF THE PORTFOLIO*** | |
| | 1. | | | Citigroup, Inc. | | | 4.6 | % |
| | 2. | | | Wells Fargo & Co. | | | 4.0 | |
| | 3. | | | General Motors Co. | | | 3.8 | |
| | 4. | | | Royal Caribbean Cruises Ltd. | | | 2.9 | |
| | 5. | | | Pfizer, Inc. | | | 2.6 | |
| | 6. | | | Bank of America Corp. | | | 2.6 | |
| | 7. | | | DISH Network Corp., Class A | | | 2.4 | |
| | 8. | | | Southwest Airlines Co. | | | 2.4 | |
| | 9. | | | AT&T, Inc. | | | 2.3 | |
| | 10. | | | Broadcom Ltd., (Singapore) | | | 2.0 | |
| | | | |
PORTFOLIO COMPOSITION BY SECTOR*** | |
| Financials | | | 30.6 | % |
| Consumer Discretionary | | | 22.1 | |
| Energy | | | 12.4 | |
| Health Care | | | 8.5 | |
| Industrials | | | 7.3 | |
| Information Technology | | | 6.1 | |
| Consumer Staples | | | 3.3 | |
| Materials | | | 3.2 | |
| Telecommunication Services | | | 2.8 | |
| Real Estate | | | 1.0 | |
| Short-Term Investment | | | 2.7 | |
| * | | The return shown is based on net asset values calculated for shareholder transactions and may differ from the return shown in the financial highlights, which reflects adjustments made to the net asset values in accordance with accounting principles generally accepted in the United States of America. |
| ** | | The adviser seeks to achieve the Fund’s objective. There can be no guarantee it will be achieved. |
| *** | | Percentages indicated are based on total investments as of December 31, 2016. The Fund’s portfolio composition is subject to change. |
| | | | | | | | |
| | | |
| DECEMBER 31, 2016 | | J.P. MORGAN LARGE CAP FUNDS | | | | | 17 | |
JPMorgan Large Cap Value Fund
FUND COMMENTARY
SIX MONTHS ENDED DECEMBER 31, 2016 (Unaudited) (continued)
| | | | | | | | | | | | | | | | | | |
AVERAGE ANNUAL TOTAL RETURNS AS OF DECEMBER 31, 2016 | |
| | | | | |
| | | INCEPTION DATE OF
CLASS | | 6 MONTH* | | | 1 YEAR | | | 5 YEAR | | | 10 YEAR | |
CLASS A SHARES | | February 18, 1992 | | | | | | | | | | | | | | | | |
With Sales Charge** | | | | | 14.78 | % | | | 15.52 | % | | | 15.30 | % | | | 5.61 | % |
Without Sales Charge | | | | | 21.10 | | | | 21.88 | | | | 16.56 | | | | 6.18 | |
CLASS C SHARES | | March 22, 1999 | | | | | | | | | | | | | | | | |
With CDSC*** | | | | | 19.72 | | | | 20.23 | | | | 15.97 | | | | 5.63 | |
Without CDSC | | | | | 20.72 | | | | 21.23 | | | | 15.97 | | | | 5.63 | |
CLASS R2 SHARES | | November 3, 2008 | | | 20.90 | | | | 21.53 | | | | 16.26 | | | | 5.89 | |
CLASS R5 SHARES | | May 15, 2006 | | | 21.26 | | | | 22.24 | | | | 16.96 | | | | 6.59 | |
CLASS R6 SHARES | | November 30, 2010 | | | 21.34 | | | | 22.39 | | | | 17.02 | | | | 6.62 | |
SELECT CLASS SHARES | | March 1, 1991 | | | 21.17 | | | | 22.05 | | | | 16.74 | | | | 6.37 | |
| ** | | Sales Charge for Class A Shares is 5.25%. |
| *** | | Assumes a 1% CDSC (contingent deferred sales charge) for the 6 month and one year periods and 0% CDSC thereafter. |
TEN YEAR PERFORMANCE (12/31/06 TO 12/31/16)
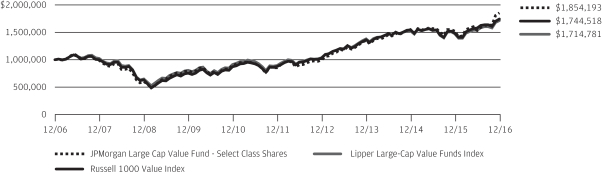
The performance quoted is past performance and is not a guarantee of future results. Mutual funds are subject to certain market risks. Investment returns and principal value of an investment will fluctuate so that an investor’s shares, when redeemed, may be worth more or less than their original cost. Current performance may be higher or lower than the performance data shown. For up-to-date month-end performance information please call 1-800-480-4111.
Returns for Class R2 Shares prior to their inception date are based on the performance of Select Class Shares. Prior class performance has been adjusted to reflect the differences in expenses between classes.
Returns for Class R6 Shares prior to their inception date are based on the performance of Class R5 Shares. The actual returns for Class R6 Shares would have been different than those shown because Class R6 Shares have different expenses than Class R5 Shares.
The graph illustrates comparative performance for $1,000,000 invested in Select Class Shares of the JPMorgan Large Cap Value Fund, the Russell 1000 Value Index and the Lipper Large-Cap Value Funds Index from December 31, 2006 to December 31, 2016. The performance of the Fund assumes reinvestment of all dividends and capital gain distributions if any, and does not include a sales charge. The performance of the Russell 1000 Value Index does not reflect the deduction of expenses or a sales charge associated with a mutual fund and
has been adjusted to reflect reinvestment of all dividends and capital gain distributions of the securities included in the benchmark, if applicable. The performance of the Lipper Large-Cap Value Funds Index includes expenses associated with a mutual fund, such as investment management fees. These expenses are not identical to the expenses incurred by the Fund. The Russell 1000 Value Index is an unmanaged index which measures the performance of those Russell 1000 companies with lower price-to-book ratios and lower forecasted growth values. The Lipper Large-Cap Value Funds Index is an index based on the total returns of certain mutual funds within the Fund’s designated category as determined by Lipper, Inc. Investors cannot invest directly in an index.
Select Class Shares have a $1,000,000 minimum initial investment.
Fund performance may reflect the waiver of the Fund’s fees and reimbursement of expenses for certain periods since the inception date. Without these waivers and reimbursements, performance would have been lower. Also, performance shown in this section does not reflect the deduction of taxes that a shareholder would pay on Fund distributions or redemptions of Fund shares.
The returns shown are based on net asset values calculated for shareholder transactions and may differ from the returns shown in the financial highlights, which reflect adjustments made to the net asset values in accordance with accounting principles generally accepted in the United States of America.
| | | | | | |
| | | |
| 18 | | | | J.P. MORGAN LARGE CAP FUNDS | | DECEMBER 31, 2016 |
JPMorgan U.S. Equity Fund
FUND COMMENTARY
SIX MONTHS ENDED DECEMBER 31, 2016 (Unaudited)
| | | | |
| Reporting Period Return: | |
| Fund (Class L Shares)*1 | | | 10.32% | |
| S&P 500 Index | | | 7.82% | |
| |
| Net Assets as of 12/31/2016 (In Thousands) | | $ | 12,344,822 | |
INVESTMENT OBJECTIVE**
The JPMorgan U.S. Equity Fund (the “Fund”) seeks to provide high total return from a portfolio of selected equity securities.
WHAT WERE THE MAIN DRIVERS OF THE FUND’S PERFORMANCE?
The Fund’s L Class Shares outperformed the S&P 500 Index (the “Benchmark”) for the six months ended December 31, 2016. The Fund’s overweight position in the big banks & brokers sector and its security selection in the telecommunications sector were leading contributors to performance relative to the Benchmark. The Fund’s security selection in the pharmaceutical/medical technology sector and the financials sector were leading detractors from relative performance.
Leading individual contributors to relative performance included the Fund’s overweight positions in UnitedHealth Group Inc. and United Continental Holdings Inc. and its underweight position in Exxon Mobil Corp. Shares of UnitedHealth, a health insurer, rose after the company issued a better-than-expected earnings forecast. Shares of United Continental Holdings, an airline operator, rose on improved traffic and capacity. Shares of Exxon Mobil, an integrated oil and gas company not held by the Fund, underperformed amid investors’ preference for energy sector companies with higher potential for growth.
Leading individual detractors from relative performance included the Fund’s overweight positions in Wells Fargo & Co., Chubb Ltd. and Bristol-Myers Squibb Co. Shares of Wells Fargo, a banking and financial services company, fell amid falling mortgage revenue and higher expenses in the wake of the bank’s $185 million settlement for opening fictitious or unauthorized bank accounts. Shares of Chubb, a property and casualty insurer, rose slightly during the reporting but underperformed the broader financials sector. Shares of Bristol-Myers Squibb, a drug maker, fell amid investor concerns about the company’s ability to compete in the market for lung cancer treatments.
HOW WAS THE FUND POSITIONED?
The Fund’s portfolio managers employed a bottom-up fundamental approach to stock selection, researching companies to determine what they believed to be their underlying value and potential for future earnings growth. As a result of this approach to stock selection, the Fund’s largest average
overweight positions relative to the Benchmark for the six months ended December 31, 2016 were in the insurance and media sectors, while the Fund’s largest underweight positions were in the consumer staples and real estate investment trust sectors.
| | | | | | | | |
| TOP TEN EQUITY HOLDINGS OF THE PORTFOLIO*** | |
| | 1. | | | Microsoft Corp. | | | 3.2 | % |
| | 2. | | | Apple, Inc. | | | 3.0 | |
| | 3. | | | UnitedHealth Group, Inc. | | | 2.7 | |
| | 4. | | | General Electric Co. | | | 2.2 | |
| | 5. | | | Pfizer, Inc. | | | 2.2 | |
| | 6. | | | Alphabet, Inc., Class A | | | 2.2 | |
| | 7. | | | Alphabet, Inc., Class C | | | 2.0 | |
| | 8. | | | Broadcom Ltd., (Singapore) | | | 1.9 | |
| | 9. | | | PepsiCo, Inc. | | | 1.9 | |
| | 10. | | | Citigroup, Inc. | | | 1.8 | |
| | | | |
PORTFOLIO COMPOSITION BY SECTOR*** | |
| Information Technology | | | 22.3 | % |
| Financials | | | 16.8 | |
| Health Care | | | 14.0 | |
| Consumer Discretionary | | | 13.6 | |
| Industrials | | | 11.0 | |
| Energy | | | 7.8 | |
| Consumer Staples | | | 6.9 | |
| Utilities | | | 2.5 | |
| Materials | | | 2.5 | |
| Telecommunication Services | | | 1.1 | |
| Real Estate | | | 0.7 | |
| Short-Term Investment | | | 0.8 | |
| * | | The return shown is based on net asset values calculated for shareholder transactions and may differ from the return shown in the financial highlights, which reflects adjustments made to the net asset values in accordance with accounting principles generally accepted in the United States of America. |
| ** | | The adviser seeks to achieve the Fund’s objective. There can be no guarantee it will be achieved. |
| *** | | Percentages indicated are based on total investments as of December 31, 2016. The Fund’s portfolio composition is subject to change. |
| 1 | | On December 1, 2016, the Fund’s Institutional Class Shares were redesignated as and renamed Class L Shares. |
| | | | | | | | |
| | | |
| DECEMBER 31, 2016 | | J.P. MORGAN LARGE CAP FUNDS | | | | | 19 | |
JPMorgan U.S. Equity Fund
FUND COMMENTARY
SIX MONTHS ENDED DECEMBER 31, 2016 (Unaudited) (continued)
| | | | | | | | | | | | | | | | | | |
AVERAGE ANNUAL TOTAL RETURNS AS OF DECEMBER 31, 2016 | |
| | | | | |
| | | INCEPTION DATE OF
CLASS | | 6 MONTH* | | | 1 YEAR | | | 5 YEAR | | | 10 YEAR | |
CLASS A SHARES | | September 10, 2001 | | | | | | | | | | | | | | | | |
With Sales Charge** | | | | | 4.34 | % | | | 4.71 | % | | | 13.59 | % | | | 7.25 | % |
Without Sales Charge | | | | | 10.10 | | | | 10.49 | | | | 14.82 | | | | 7.84 | |
CLASS C SHARES | | September 10, 2001 | | | | | | | | | | | | | | | | |
With CDSC*** | | | | | 8.89 | | | | 8.94 | | | | 14.26 | | | | 7.29 | |
Without CDSC | | | | | 9.89 | | | | 9.94 | | | | 14.26 | | | | 7.29 | |
CLASS L SHARES (FORMERLY INSTITUTIONAL CLASS) | | September 17, 1993 | | | 10.32 | | | | 10.88 | | | | 15.22 | | | | 8.23 | |
CLASS R2 SHARES | | November 3, 2008 | | | 10.05 | | | | 10.23 | | | | 14.56 | | | | 7.62 | |
CLASS R3 SHARES | | September 9, 2016 | | | 10.10 | | | | 10.49 | | | | 14.82 | | | | 7.84 | |
CLASS R4 SHARES | | September 9, 2016 | | | 10.23 | | | | 10.72 | | | | 15.04 | | | | 8.06 | |
CLASS R5 SHARES | | May 15, 2006 | | | 10.35 | | | | 10.86 | | | | 15.27 | | | | 8.26 | |
CLASS R6 SHARES | | November 30, 2010 | | | 10.37 | | | | 10.91 | | | | 15.33 | | | | 8.31 | |
SELECT CLASS SHARES | | September 10, 2001 | | | 10.18 | | | | 10.67 | | | | 15.03 | | | | 8.06 | |
| ** | | Sales Charge for Class A Shares is 5.25%. |
| *** | | Assumes a 1% CDSC (contingent deferred sales charge) for the 6 month and one year periods and 0% CDSC thereafter. |
TEN YEAR PERFORMANCE (12/31/06 TO 12/31/16)
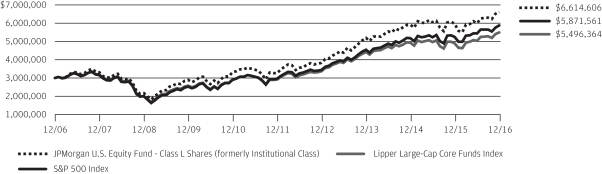
The performance quoted is past performance and is not a guarantee of future results. Mutual funds are subject to certain market risks. Investment returns and principal value of an investment will fluctuate so that an investor’s shares, when redeemed, may be worth more or less than their original cost. Current performance may be higher or lower than the performance data shown. For up-to-date month-end performance information please call 1-800-480-4111.
Returns for Class R2 Shares and Class R3 prior to their inception date are based on the performance of Class A Shares. The actual returns of Class R2 Shares and Class R3 Shares would have been lower than those shown because Class R2 Shares and Class R3 Shares have higher expenses than Class A Shares.
Returns for Class R6 Shares prior to their inception date are based on the performance of Class R5 Shares. The actual returns for Class R6 Shares would have been different than those shown because Class R6 Shares have different expenses than Class R5 Shares.
Returns for Class R4 Shares prior to their inception date are based on the performance of Select Class Shares. The actual returns for Class R4 Shares would have been different than those shown because Class R4 Shares have different expenses than Select Class Shares.
The graph illustrates comparative performance for $3,000,000 invested in Institutional Class Shares of the JPMorgan U.S. Equity Fund, the S&P 500 Index and the Lipper Large-Cap Core Funds Index from December 31, 2006 to December 31, 2016. The performance of the Fund assumes reinvestment of all
dividends and capital gain distributions, if any, and does not include a sales charge. The performance of the S&P 500 Index does not reflect the deduction of expenses or a sales charge associated with a mutual fund and has been adjusted to reflect reinvestment of all dividends and capital gain distributions of the securities included in the benchmark, if applicable. The performance of the Lipper Large-Cap Core Funds Index includes expenses associated with a mutual fund, such as investment management fees. These expenses are not identical to the expenses incurred by the Fund. The S&P 500 Index is an unmanaged index generally representative of the performance of large companies in the U.S. stock market. The Lipper Large-Cap Core Funds Index is an index based on the total returns of certain mutual funds within the Fund’s designated category as determined by Lipper, Inc. Investors cannot invest directly in an index.
Class L Shares have a $3,000,000 minimum initial investment.
Fund performance may reflect the waiver of the Fund’s fees and reimbursement of expenses for certain periods since the inception date. Without these waivers and reimbursements, performance would have been lower. Also, performance shown in this section does not reflect the deduction of taxes that a shareholder would pay on Fund distributions or redemptions of Fund shares.
The returns shown are based on net asset values calculated for shareholder transactions and may differ from the returns shown in the financial highlights, which reflect adjustments made to the net asset values in accordance with accounting principles generally accepted in the United States of America.
| | | | | | |
| | | |
| 20 | | | | J.P. MORGAN LARGE CAP FUNDS | | DECEMBER 31, 2016 |
JPMorgan Disciplined Equity Fund
SCHEDULE OF PORTFOLIO INVESTMENTS
AS OF DECEMBER 31, 2016 (Unaudited)
(Amounts in thousands)
| | | | | | | | |
| SHARES | | | SECURITY DESCRIPTION | | VALUE($) | |
| Common Stocks — 98.1% | | | | |
| | | | Consumer Discretionary — 12.6% | |
| | | | Auto Components — 0.4% | |
| | 318 | | | Delphi Automotive plc | | | 21,431 | |
| | 59 | | | Lear Corp. | | | 7,815 | |
| | | | | | | | |
| | | | | | | 29,246 | |
| | | | | | | | |
| | | | Automobiles — 0.5% | |
| | 356 | | | Ford Motor Co. | | | 4,320 | |
| | 987 | | | General Motors Co. | | | 34,397 | |
| | | | | | | | |
| | | | | | | 38,717 | |
| | | | | | | | |
| | | | Hotels, Restaurants & Leisure — 1.1% | |
| | 292 | | | Royal Caribbean Cruises Ltd. | | | 23,984 | |
| | 911 | | | Starbucks Corp. | | | 50,598 | |
| | 227 | | | Yum! Brands, Inc. | | | 14,357 | |
| | | | | | | | |
| | | | | | | 88,939 | |
| | | | | | | | |
| | | | Household Durables — 0.4% | |
| | 396 | | | DR Horton, Inc. | | | 10,817 | |
| | 88 | | | Newell Brands, Inc. | | | 3,938 | |
| | 591 | | | PulteGroup, Inc. | | | 10,866 | |
| | 126 | | | Toll Brothers, Inc. (a) | | | 3,916 | |
| | | | | | | | |
| | | | | | | 29,537 | |
| | | | | | | | |
| | | | Internet & Direct Marketing Retail — 1.6% | |
| | 170 | | | Amazon.com, Inc. (a) | | | 127,794 | |
| | | | | | | | |
| | | | Media — 4.4% | |
| | 67 | | | CBS Corp. (Non-Voting), Class B | | | 4,256 | |
| | 225 | | | Charter Communications, Inc., Class A (a) | | | 64,867 | |
| | 1,329 | | | Comcast Corp., Class A | | | 91,799 | |
| | 323 | | | DISH Network Corp., Class A (a) | | | 18,718 | |
| | 1,776 | | | Sirius XM Holdings, Inc. | | | 7,904 | |
| | 492 | | | Time Warner, Inc. | | | 47,531 | |
| | 2,804 | | | Twenty-First Century Fox, Inc., Class A | | | 78,624 | |
| | 287 | | | Walt Disney Co. (The) | | | 29,960 | |
| | | | | | | | |
| | | | | | | 343,659 | |
| | | | | | | | |
| | | | Multiline Retail — 0.3% | |
| | 318 | | | Dollar General Corp. | | | 23,571 | |
| | | | | | | | |
| | | | Specialty Retail — 3.7% | |
| | 3 | | | AutoZone, Inc. (a) | | | 2,370 | |
| | 309 | | | Best Buy Co., Inc. | | | 13,204 | |
| | 697 | | | Home Depot, Inc. (The) | | | 93,429 | |
| | 892 | | | Lowe’s Cos., Inc. | | | 63,463 | |
| | 124 | | | O’Reilly Automotive, Inc. (a) | | | 34,643 | |
| | 161 | | | Ross Stores, Inc. | | | 10,531 | |
| | 19 | | | Signet Jewelers Ltd. | | | 1,800 | |
| | 890 | | | TJX Cos., Inc. (The) | | | 66,876 | |
| | | | | | | | |
| | | | | | | 286,316 | |
| | | | | | | | |
| | | | | | | | |
| SHARES | | | SECURITY DESCRIPTION | | VALUE($) | |
| | | | | | | | |
| | | | Textiles, Apparel & Luxury Goods — 0.2% | |
| | 130 | | | NIKE, Inc., Class B | | | 6,618 | |
| | 31 | | | PVH Corp. | | | 2,770 | |
| | 42 | | | Ralph Lauren Corp. | | | 3,750 | |
| | | | | | | | |
| | | | | | | 13,138 | |
| | | | | | | | |
| | | | Total Consumer Discretionary | | | 980,917 | |
| | | | | | | | |
| | | | Consumer Staples — 9.0% | |
| | | | Beverages — 3.2% | |
| | 1,013 | | | Coca-Cola Co. (The) | | | 41,990 | |
| | 277 | | | Constellation Brands, Inc., Class A | | | 42,501 | |
| | 72 | | | Dr Pepper Snapple Group, Inc. | | | 6,527 | |
| | 487 | | | Molson Coors Brewing Co., Class B | | | 47,404 | |
| | 1,038 | | | PepsiCo, Inc. | | | 108,583 | |
| | | | | | | | |
| | | | | | | 247,005 | |
| | | | | | | | |
| | | | Food & Staples Retailing — 1.7% | |
| | 289 | | | Costco Wholesale Corp. | | | 46,305 | |
| | 937 | | | Kroger Co. (The) | | | 32,342 | |
| | 578 | | | Walgreens Boots Alliance, Inc. | | | 47,849 | |
| | 98 | | | Wal-Mart Stores, Inc. | | | 6,804 | |
| | | | | | | | |
| | | | | | | 133,300 | |
| | | | | | | | |
| | | | Food Products — 1.2% | |
| | 137 | | | Archer-Daniels-Midland Co. | | | 6,260 | |
| | 23 | | | JM Smucker Co. (The) | | | 3,001 | |
| | 244 | | | Kraft Heinz Co. (The) | | | 21,264 | |
| | 1,396 | | | Mondelez International, Inc., Class A | | | 61,863 | |
| | | | | | | | |
| | | | | | | 92,388 | |
| | | | | | | | |
| | | | Household Products — 1.6% | |
| | 441 | | | Kimberly-Clark Corp. | | | 50,328 | |
| | 900 | | | Procter & Gamble Co. (The) | | | 75,660 | |
| | | | | | | | |
| | | | | | | 125,988 | |
| | | | | | | | |
| | | | Tobacco — 1.3% | |
| | 339 | | | Altria Group, Inc. | | | 22,923 | |
| | 420 | | | Philip Morris International, Inc. | | | 38,398 | |
| | 663 | | �� | Reynolds American, Inc. | | | 37,138 | |
| | | | | | | | |
| | | | | | | 98,459 | |
| | | | | | | | |
| | | | Total Consumer Staples | | | 697,140 | |
| | | | | | | | |
| | | | Energy — 7.3% | |
| | | | Energy Equipment & Services — 0.9% | |
| | 310 | | | Halliburton Co. | | | 16,774 | |
| | 641 | | | Schlumberger Ltd. | | | 53,819 | |
| | | | | | | | |
| | | | | | | 70,593 | |
| | | | | | | | |
| | | | Oil, Gas & Consumable Fuels — 6.4% | |
| | 496 | | | Anadarko Petroleum Corp. | | | 34,551 | |
| | 84 | | | Apache Corp. | | | 5,321 | |
SEE NOTES TO FINANCIAL STATEMENTS.
| | | | | | | | |
| | | |
| DECEMBER 31, 2016 | | J.P. MORGAN LARGE CAP FUNDS | | | | | 21 | |
JPMorgan Disciplined Equity Fund
SCHEDULE OF PORTFOLIO INVESTMENTS
AS OF DECEMBER 31, 2016 (Unaudited) (continued)
(Amounts in thousands)
| | | | | | | | |
| SHARES | | | SECURITY DESCRIPTION | | VALUE($) | |
| Common Stocks — continued | |
| | | | Oil, Gas & Consumable Fuels — continued | |
| | 545 | | | Cabot Oil & Gas Corp. | | | 12,728 | |
| | 186 | | | Cheniere Energy, Inc. (a) | | | 7,702 | |
| | 524 | | | Chevron Corp. | | | 61,651 | |
| | 125 | | | Concho Resources, Inc. (a) | | | 16,549 | |
| | 318 | | | Diamondback Energy, Inc. (a) | | | 32,122 | |
| | 495 | | | EOG Resources, Inc. | | | 50,037 | |
| | 319 | | | EQT Corp. | | | 20,841 | |
| | 1,635 | | | Exxon Mobil Corp. | | | 147,575 | |
| | 603 | | | Kinder Morgan, Inc. | | | 12,493 | |
| | 214 | | | Marathon Petroleum Corp. | | | 10,753 | |
| | 306 | | | Occidental Petroleum Corp. | | | 21,825 | |
| | 299 | | | Pioneer Natural Resources Co. | | | 53,792 | |
| | 180 | | | Valero Energy Corp. | | | 12,289 | |
| | | | | | | | |
| | | | | | | 500,229 | |
| | | | | | | | |
| | | | Total Energy | | | 570,822 | |
| | | | | | | | |
| | | | Financials — 14.8% | |
| | | | Banks — 6.1% | |
| | 5,989 | | | Bank of America Corp. | | | 132,366 | |
| | 222 | | | BB&T Corp. | | | 10,419 | |
| | 2,113 | | | Citigroup, Inc. | | | 125,559 | |
| | 308 | | | Huntington Bancshares, Inc. | | | 4,073 | |
| | 1,715 | | | KeyCorp | | | 31,339 | |
| | 726 | | | Regions Financial Corp. | | | 10,421 | |
| | 71 | | | SunTrust Banks, Inc. | | | 3,867 | |
| | 59 | | | SVB Financial Group (a) | | | 10,078 | |
| | 2,606 | | | Wells Fargo & Co. | | | 143,589 | |
| | 145 | | | Zions Bancorp | | | 6,237 | |
| | | | | | | | |
| | | | | | | 477,948 | |
| | | | | | | | |
| | | | Capital Markets — 3.5% | |
| | 64 | | | Ameriprise Financial, Inc. | | | 7,111 | |
| | 761 | | | Bank of New York Mellon Corp. (The) | | | 36,049 | |
| | 70 | | | BlackRock, Inc. | | | 26,487 | |
| | 1,588 | | | Charles Schwab Corp. (The) | | | 62,682 | |
| | 26 | | | Goldman Sachs Group, Inc. (The) | | | 6,181 | |
| | 556 | | | Intercontinental Exchange, Inc. | | | 31,360 | |
| | 1,788 | | | Morgan Stanley | | | 75,530 | |
| | 378 | | | State Street Corp. | | | 29,409 | |
| | | | | | | | |
| | | | | | | 274,809 | |
| | | | | | | | |
| | | | Consumer Finance — 1.0% | |
| | 486 | | | Capital One Financial Corp. | | | 42,440 | |
| | 492 | | | Discover Financial Services | | | 35,474 | |
| | | | | | | | |
| | | | | | | 77,914 | |
| | | | | | | | |
| | | | | | | | |
| SHARES | | | SECURITY DESCRIPTION | | VALUE($) | |
| | | | | | | | |
| | | | Diversified Financial Services — 1.5% | |
| | 691 | | | Berkshire Hathaway, Inc., Class B (a) | | | 112,590 | |
| | 2 | | | Voya Financial, Inc. | | | 67 | |
| | | | | | | | |
| | | | | | | 112,657 | |
| | | | | | | | |
| | | | Insurance — 2.7% | |
| | 441 | | | American International Group, Inc. | | | 28,769 | |
| | 471 | | | Arthur J Gallagher & Co. | | | 24,481 | |
| | 362 | | | Chubb Ltd. | | | 47,858 | |
| | 60 | | | Everest Re Group Ltd. | | | 13,027 | |
| | 157 | | | Hartford Financial Services Group, Inc. (The) | | | 7,464 | |
| | 1,383 | | | MetLife, Inc. | | | 74,537 | |
| | 346 | | | XL Group Ltd., (Ireland) | | | 12,875 | |
| | | | | | | | |
| | | | | | | 209,011 | |
| | | | | | | | |
| | | | Total Financials | | | 1,152,339 | |
| | | | | | | | |
| | | | Health Care — 13.6% | |
| | | | Biotechnology — 2.8% | |
| | 87 | | | Alexion Pharmaceuticals, Inc. (a) | | | 10,681 | |
| | 197 | | | Biogen, Inc. (a) | | | 55,838 | |
| | 39 | | | BioMarin Pharmaceutical, Inc. (a) | | | 3,189 | |
| | 525 | | | Celgene Corp. (a) | | | 60,792 | |
| | 907 | | | Gilead Sciences, Inc. | | | 64,934 | |
| | 256 | | | Vertex Pharmaceuticals, Inc. (a) | | | 18,860 | |
| | | | | | | | |
| | | | | | | 214,294 | |
| | | | | | | | |
| | | | Health Care Equipment & Supplies — 1.6% | |
| | 1,373 | | | Abbott Laboratories | | | 52,718 | |
| | 44 | | | Becton Dickinson and Co. | | | 7,277 | |
| | 2,123 | | | Boston Scientific Corp. (a) | | | 45,927 | |
| | 20 | | | Cooper Cos., Inc. (The) | | | 3,583 | |
| | 161 | | | Danaher Corp. | | | 12,540 | |
| | 64 | | | Zimmer Biomet Holdings, Inc. | | | 6,595 | |
| | | | | | | | |
| | | | | | | 128,640 | |
| | | | | | | | |
| | | | Health Care Providers & Services — 2.9% | |
| | 371 | | | Aetna, Inc. | | | 46,038 | |
| | 100 | | | Cigna Corp. | | | 13,381 | |
| | 50 | | | HCA Holdings, Inc. (a) | | | 3,671 | |
| | 150 | | | Humana, Inc. | | | 30,583 | |
| | 37 | | | Laboratory Corp. of America Holdings (a) | | | 4,718 | |
| | 85 | | | McKesson Corp. | | | 11,929 | |
| | 71 | | | Quest Diagnostics, Inc. | | | 6,488 | |
| | 659 | | | UnitedHealth Group, Inc. | | | 105,544 | |
| | | | | | | | |
| | | | | | | 222,352 | |
| | | | | | | | |
| | | | Life Sciences Tools & Services — 0.6% | |
| | 290 | | | Agilent Technologies, Inc. | | | 13,200 | |
| | 122 | | | Illumina, Inc. (a) | | | 15,647 | |
SEE NOTES TO FINANCIAL STATEMENTS.
| | | | | | |
| | | |
| 22 | | | | J.P. MORGAN LARGE CAP FUNDS | | DECEMBER 31, 2016 |
| | | | | | | | |
| SHARES | | | SECURITY DESCRIPTION | | VALUE($) | |
| Common Stocks — continued | |
| | | | Life Sciences Tools & Services — continued | |
| | 150 | | | Thermo Fisher Scientific, Inc. | | | 21,109 | |
| | | | | | | | |
| | | | | | | 49,956 | |
| | | | | | | | |
| | | | Pharmaceuticals — 5.7% | |
| | 289 | | | Allergan plc (a) | | | 60,688 | |
| | 1,397 | | | Bristol-Myers Squibb Co. | | | 81,641 | |
| | 819 | | | Eli Lilly & Co. | | | 60,202 | |
| | 584 | | | Johnson & Johnson | | | 67,260 | |
| | 717 | | | Merck & Co., Inc. | | | 42,181 | |
| | 144 | | | Mylan NV (a) | | | 5,505 | |
| | 3,878 | | | Pfizer, Inc. | | | 125,963 | |
| | | | | | | | |
| | | | | | | 443,440 | |
| | | | | | | | |
| | | | Total Health Care | | | 1,058,682 | |
| | | | | | | | |
| | | | Industrials — 9.8% | |
| | | | Aerospace & Defense — 1.5% | |
| | 245 | | | General Dynamics Corp. | | | 42,310 | |
| | 93 | | | L-3 Communications Holdings, Inc. | | | 14,137 | |
| | 102 | | | Northrop Grumman Corp. | | | 23,630 | |
| | 97 | | | Textron, Inc. | | | 4,700 | |
| | 306 | | | United Technologies Corp. | | | 33,598 | |
| | | | | | | | |
| | | | | | | 118,375 | |
| | | | | | | | |
| | | | Air Freight & Logistics — 0.1% | |
| | 68 | | | United Parcel Service, Inc., Class B | | | 7,761 | |
| | | | | | | | |
| | | | Airlines — 0.8% | |
| | 470 | | | Delta Air Lines, Inc. | | | 23,142 | |
| | 521 | | | United Continental Holdings, Inc. (a) | | | 37,998 | |
| | | | | | | | |
| | | | | | | 61,140 | |
| | | | | | | | |
| | | | Building Products — 0.6% | |
| | 269 | | | Allegion plc | | | 17,196 | |
| | 172 | | | Johnson Controls International plc | | | 7,094 | |
| | 643 | | | Masco Corp. | | | 20,344 | |
| | | | | | | | |
| | | | | | | 44,634 | |
| | | | | | | | |
| | | | Construction & Engineering — 0.2% | |
| | 263 | | | Fluor Corp. | | | 13,802 | |
| | | | | | | | |
| | | | Electrical Equipment — 0.5% | |
| | 639 | | | Eaton Corp. plc | | | 42,851 | |
| | | | | | | | |
| | | | Industrial Conglomerates — 2.6% | |
| | 3,840 | | | General Electric Co. | | | 121,329 | |
| | 734 | | | Honeywell International, Inc. | | | 85,068 | |
| | | | | | | | |
| | | | | | | 206,397 | |
| | | | | | | | |
| | | | Machinery — 2.0% | |
| | 125 | | | Cummins, Inc. | | | 17,032 | |
| | 69 | | | Deere & Co. | | | 7,075 | |
| | | | | | | | |
| SHARES | | | SECURITY DESCRIPTION | | VALUE($) | |
| | | | | | | | |
| | | | Machinery — continued | |
| | 57 | | | Fortive Corp. | | | 3,030 | |
| | 210 | | | Ingersoll-Rand plc | | | 15,725 | |
| | 580 | | | PACCAR, Inc. | | | 37,053 | |
| | 55 | | | Parker-Hannifin Corp. | | | 7,652 | |
| | 70 | | | Pentair plc, (United Kingdom) | | | 3,925 | |
| | 142 | | | Snap-on, Inc. | | | 24,337 | |
| | 339 | | | Stanley Black & Decker, Inc. | | | 38,935 | |
| | | | | | | | |
| | | | | | | 154,764 | |
| | | | | | | | |
| | | | Road & Rail — 1.5% | |
| | 204 | | | Canadian Pacific Railway Ltd., (Canada) | | | 29,099 | |
| | 833 | | | Union Pacific Corp. | | | 86,333 | |
| | | | | | | | |
| | | | | | | 115,432 | |
| | | | | | | | |
| | | | Total Industrials | | | 765,156 | |
| | | | | | | | |
| | | | Information Technology — 20.9% | |
| | | | Communications Equipment — 0.4% | |
| | 933 | | | Cisco Systems, Inc. | | | 28,203 | |
| | | | | | | | |
| | | | Electronic Equipment, Instruments & Components — 0.6% | |
| | 681 | | | TE Connectivity Ltd. | | | 47,206 | |
| | | | | | | | |
| | | | Internet Software & Services — 4.7% | |
| | 144 | | | Alphabet, Inc., Class A (a) | | | 113,956 | |
| | 145 | | | Alphabet, Inc., Class C (a) | | | 111,905 | |
| | 1,223 | | | Facebook, Inc., Class A (a) | | | 140,715 | |
| | | | | | | | |
| | | | | | | 366,576 | |
| | | | | | | | |
| | | | IT Services — 3.6% | |
| | 858 | | | Accenture plc, Class A | | | 100,474 | |
| | 188 | | | Cognizant Technology Solutions Corp., Class A (a) | | | 10,556 | |
| | 485 | | | Fidelity National Information Services, Inc. | | | 36,678 | |
| | 74 | | | International Business Machines Corp. | | | 12,200 | |
| | 110 | | | Mastercard, Inc., Class A | | | 11,347 | |
| | 444 | | �� | PayPal Holdings, Inc. (a) | | | 17,540 | |
| | 102 | | | Vantiv, Inc., Class A (a) | | | 6,077 | |
| | 890 | | | Visa, Inc., Class A | | | 69,399 | |
| | 139 | | | WEX, Inc. (a) | | | 15,541 | |
| | | | | | | | |
| | | | | | | 279,812 | |
| | | | | | | | |
| | | | Semiconductors & Semiconductor Equipment — 3.5% | |
| | 743 | | | Analog Devices, Inc. | | | 53,943 | |
| | 224 | | | Applied Materials, Inc. | | | 7,234 | |
| | 498 | | | Broadcom Ltd., (Singapore) | | | 87,982 | |
| | 61 | | | KLA-Tencor Corp. | | | 4,799 | |
| | 325 | | | Lam Research Corp. | | | 34,404 | |
| | 77 | | | NVIDIA Corp. | | | 8,240 | |
| | 107 | | | NXP Semiconductors NV, (Netherlands) (a) | | | 10,486 | |
| | 643 | | | ON Semiconductor Corp. (a) | | | 8,200 | |
SEE NOTES TO FINANCIAL STATEMENTS.
| | | | | | | | |
| | | |
| DECEMBER 31, 2016 | | J.P. MORGAN LARGE CAP FUNDS | | | | | 23 | |
JPMorgan Disciplined Equity Fund
SCHEDULE OF PORTFOLIO INVESTMENTS
AS OF DECEMBER 31, 2016 (Unaudited) (continued)
(Amounts in thousands, except number of Futures contracts)
| | | | | | | | |
| SHARES | | | SECURITY DESCRIPTION | | VALUE($) | |
| Common Stocks — continued | |
| | | | Semiconductors & Semiconductor Equipment — continued | |
| | 787 | | | Texas Instruments, Inc. | | | 57,447 | |
| | | | | | | | |
| | | | | | | 272,735 | |
| | | | | | | | |
| | | | Software — 4.3% | |
| | 727 | | | Adobe Systems, Inc. (a) | | | 74,847 | |
| | 3,860 | | | Microsoft Corp. | | | 239,858 | |
| | 272 | | | Oracle Corp. | | | 10,447 | |
| | 132 | | | Workday, Inc., Class A (a) | | | 8,723 | |
| | | | | | | | |
| | | | | | | 333,875 | |
| | | | | | | | |
| | | | Technology Hardware, Storage & Peripherals — 3.8% | |
| | 2,155 | | | Apple, Inc. | | | 249,541 | |
| | 688 | | | Hewlett Packard Enterprise Co. | | | 15,913 | |
| | 2,041 | | | HP, Inc. | | | 30,288 | |
| | | | | | | | |
| | | | | | | 295,742 | |
| | | | | | | | |
| | | | Total Information Technology | | | 1,624,149 | |
| | | | | | | | |
| | | | Materials — 2.8% | |
| | | | Chemicals — 2.1% | |
| | 446 | | | Dow Chemical Co. (The) | | | 25,545 | |
| | 548 | | | Eastman Chemical Co. | | | 41,230 | |
| | 781 | | | EI du Pont de Nemours & Co. | | | 57,350 | |
| | 53 | | | Monsanto Co. | | | 5,534 | |
| | 1,019 | | | Mosaic Co. (The) | | | 29,900 | |
| | | | | | | | |
| | | | | | | 159,559 | |
| | | | | | | | |
| | | | Construction Materials — 0.1% | |
| | 47 | | | Martin Marietta Materials, Inc. | | | 10,355 | |
| | | | | | | | |
| | | | Containers & Packaging — 0.5% | |
| | 290 | | | Crown Holdings, Inc. (a) | | | 15,221 | |
| | 243 | | | Sealed Air Corp. | | | 11,029 | |
| | 297 | | | WestRock Co. | | | 15,059 | |
| | | | | | | | |
| | | | | | | 41,309 | |
| | | | | | | | |
| | | | Metals & Mining — 0.1% | |
| | 193 | | | Newmont Mining Corp. | | | 6,591 | |
| | 81 | | | United States Steel Corp. | | | 2,681 | |
| | | | | | | | |
| | | | | | | 9,272 | |
| | | | | | | | |
| | | | Total Materials | | | 220,495 | |
| | | | | | | | |
| | | | Real Estate — 2.4% | |
| | | | Equity Real Estate Investment Trusts (REITs) — 2.4% | |
| | 35 | | | American Tower Corp. | | | 3,699 | |
| | 180 | | | AvalonBay Communities, Inc. | | | 31,900 | |
| | 177 | | | Brixmor Property Group, Inc. | | | 4,317 | |
| | 28 | | | Camden Property Trust | | | 2,371 | |
| | 52 | | | Equinix, Inc. | | | 18,676 | |
| | 32 | | | Essex Property Trust, Inc. | | | 7,347 | |
| | | | | | | | |
| SHARES | | | SECURITY DESCRIPTION | | VALUE($) | |
| | | | | | | | |
| | | | Equity Real Estate Investment Trusts (REITs) — continued | |
| | 395 | | | HCP, Inc. | | | 11,730 | |
| | 598 | | | Kimco Realty Corp. | | | 15,050 | |
| | 200 | | | Liberty Property Trust | | | 7,913 | |
| | 22 | | | Macerich Co. (The) | | | 1,578 | |
| | 392 | | | Prologis, Inc. | | | 20,686 | |
| | 34 | | | Public Storage | | | 7,522 | |
| | 84 | | | Regency Centers Corp. | | | 5,792 | |
| | 137 | | | Simon Property Group, Inc. | | | 24,365 | |
| | 103 | | | SL Green Realty Corp. | | | 11,056 | |
| | 313 | | | Spirit Realty Capital, Inc. | | | 3,404 | |
| | 325 | | | STORE Capital Corp. | | | 8,023 | |
| | | | | | | | |
| | | | Total Real Estate | | | 185,429 | |
| | | | | | | | |
| | | | Telecommunication Services — 1.8% | |
| | | | Diversified Telecommunication Services — 1.7% | |
| | 2,025 | | | AT&T, Inc. | | | 86,109 | |
| | 206 | | | CenturyLink, Inc. | | | 4,903 | |
| | 765 | | | Verizon Communications, Inc. | | | 40,846 | |
| | | | | | | | |
| | | | | | | 131,858 | |
| | | | | | | | |
| | | | Wireless Telecommunication Services — 0.1% | |
| | 80 | | | T-Mobile US, Inc. (a) | | | 4,590 | |
| | | | | | | | |
| | | | Total Telecommunication Services | | | 136,448 | |
| | | | | | | | |
| | | | Utilities — 3.1% | |
| | | | Electric Utilities — 2.4% | |
| | 513 | | | Edison International | | | 36,910 | |
| | 168 | | | FirstEnergy Corp. | | | 5,200 | |
| | 489 | | | NextEra Energy, Inc. | | | 58,400 | |
| | 703 | | | PG&E Corp. | | | 42,732 | |
| | 173 | | | Pinnacle West Capital Corp. | | | 13,468 | |
| | 662 | | | Xcel Energy, Inc. | | | 26,936 | |
| | | | | | | | |
| | | | | | | 183,646 | |
| | | | | | | | |
| | | | Multi-Utilities — 0.7% | |
| | 582 | | | Ameren Corp. | | | 30,511 | |
| | 589 | | | CMS Energy Corp. | | | 24,513 | |
| | | | | | | | |
| | | | | | | 55,024 | |
| | | | | | | | |
| | | | Total Utilities | | | 238,670 | |
| | | | | | | | |
| | | | Total Common Stocks
(Cost $6,406,878) | | | 7,630,247 | |
| | | | | | | | |
PRINCIPAL AMOUNT($) | | | | | | |
| Short-Term Investments — 2.6% | |
| | | | U.S. Treasury Obligation — 0.1% | |
| | 9,422 | | | U.S. Treasury Bill, 0.492%, 03/30/17 (k) (n) | | | 9,410 | |
| | | | | | | | |
SEE NOTES TO FINANCIAL STATEMENTS.
| | | | | | |
| | | |
| 24 | | | | J.P. MORGAN LARGE CAP FUNDS | | DECEMBER 31, 2016 |
| | | | | | | | |
| SHARES | | | SECURITY DESCRIPTION | | VALUE($) | |
| Short-Term Investments — continued | |
| | | | Investment Company — 2.5% | |
| | 191,979 | | | JPMorgan U.S. Government Money Market Fund, Institutional Class Shares, 0.410% (b) (l) | | | 191,979 | |
| | | | | | | | |
| | | | Total Short-Term Investments
(Cost $201,389) | | | 201,389 | |
| | | | | | | | |
| | | | Total Investments — 100.7%
(Cost $6,608,267) | | | 7,831,636 | |
| | | | Liabilities in Excess of
Other Assets — (0.7)% | | | (58,002 | ) |
| | | | | | | | |
| | | | NET ASSETS — 100.0% | | $ | 7,773,634 | |
| | | | | | | | |
Percentages indicated are based on net assets.
| | | | | | | | | | | | | | | | | | | | |
| Futures Contracts | |
NUMBER OF
CONTRACTS | | | DESCRIPTION | | EXPIRATION
DATE | | | TRADING
CURRENCY | | | NOTIONAL
VALUE AT
DECEMBER 31, 2016 | | | NET UNREALIZED
APPRECIATION
(DEPRECIATION) | |
| | | | Long Futures Outstanding | |
| | 1,282 | | | E-mini S&P 500 | | | 03/17/17 | | | | USD | | | $ | 143,340 | | | $ | (670 | ) |
| | | | | | | | | | | | | | | | | | | | |
SEE NOTES TO FINANCIAL STATEMENTS.
| | | | | | | | |
| | | |
| DECEMBER 31, 2016 | | J.P. MORGAN LARGE CAP FUNDS | | | | | 25 | |
JPMorgan Dynamic Growth Fund
SCHEDULE OF PORTFOLIO INVESTMENTS
AS OF DECEMBER 31, 2016 (Unaudited)
(Amounts in thousands)
| | | | | | | | |
| SHARES | | | SECURITY DESCRIPTION | | VALUE($) | |
| | | | | | | | |
| Common Stocks — 98.2% | |
| | | | Consumer Discretionary — 21.5% | |
| | | | Hotels, Restaurants & Leisure — 2.4% | |
| | 155 | | | Las Vegas Sands Corp. | | | 8,281 | |
| | | | | | | | |
| | | | Internet & Direct Marketing Retail — 9.9% | |
| | 29 | | | Amazon.com, Inc. (a) | | | 21,776 | |
| | 8 | | | Priceline Group, Inc. (The) (a) | | | 12,081 | |
| | | | | | | | |
| | | | | | | 33,857 | |
| | | | | | | | |
| | | | Specialty Retail — 9.2% | |
| | 67 | | | Home Depot, Inc. (The) | | | 8,980 | |
| | 151 | | | Ross Stores, Inc. | | | 9,897 | |
| | 49 | | | Ulta Salon Cosmetics & Fragrance, Inc. (a) | | | 12,365 | |
| | | | | | | | |
| | | | | | | 31,242 | |
| | | | | | | | |
| | | | Total Consumer Discretionary | | | 73,380 | |
| | | | | | | | |
| | | | Consumer Staples — 2.1% | |
| | | | Beverages — 2.1% | |
| | 164 | | | Monster Beverage Corp. (a) | | | 7,250 | |
| | | | | | | | |
| | | | Energy — 2.0% | |
| | | | Oil, Gas & Consumable Fuels — 2.0% | |
| | 39 | | | Pioneer Natural Resources Co. | | | 6,964 | |
| | | | | | | | |
| | | | Financials — 8.8% | |
| | | | Capital Markets — 8.8% | |
| | 429 | | | Charles Schwab Corp. (The) | | | 16,916 | |
| | 232 | | | Intercontinental Exchange, Inc. | | | 13,068 | |
| | | | | | | | |
| | | | Total Financials | | | 29,984 | |
| | | | | | | | |
| | | | Health Care — 11.8% | |
| | | | Biotechnology — 4.1% | |
| | 110 | | | Gilead Sciences, Inc. | | | 7,906 | |
| | 79 | | | Vertex Pharmaceuticals, Inc. (a) | | | 5,848 | |
| | | | | | | | |
| | | | | | | 13,754 | |
| | | | | | | | |
| | | | Health Care Equipment & Supplies — 2.0% | |
| | 11 | | | Intuitive Surgical, Inc. (a) | | | 6,912 | |
| | | | | | | | |
| | | | Health Care Providers & Services — 3.9% | |
| | 84 | | | UnitedHealth Group, Inc. | | | 13,363 | |
| | | | | | | | |
| | | | Life Sciences Tools & Services — 1.8% | |
| | 48 | | | Illumina, Inc. (a) | | | 6,098 | |
| | | | | | | | |
| | | | Total Health Care | | | 40,127 | |
| | | | | | | | |
| | | | Industrials — 7.9% | |
| | | | Aerospace & Defense — 2.3% | |
| | 31 | | | TransDigm Group, Inc. | | | 7,770 | |
| | | | | | | | |
| | | | Electrical Equipment — 1.9% | |
| | 28 | | | Acuity Brands, Inc. | | | 6,534 | |
| | | | | | | | |
| | | | Machinery — 2.3% | |
| | 84 | | | Caterpillar, Inc. | | | 7,790 | |
| | | | | | | | |
| | | | | | | | |
| SHARES | | | SECURITY DESCRIPTION | | VALUE($) | |
| | | | | | | | |
| | | | Road & Rail — 1.4% | |
| | 56 | | | Kansas City Southern | | | 4,709 | |
| | | | | | | | |
| | | | Total Industrials | | | 26,803 | |
| | | | | | | | |
| | | | Information Technology — 38.7% | |
| | | | Internet Software & Services — 13.2% | |
| | 30 | | | Alphabet, Inc., Class A (a) | | | 24,138 | |
| | 181 | | | Facebook, Inc., Class A (a) | | | 20,870 | |
| | | | | | | | |
| | | | | | | 45,008 | |
| | | | | | | | |
| | | | IT Services — 8.6% | |
| | 189 | | | Mastercard, Inc., Class A | | | 19,542 | |
| | 245 | | | PayPal Holdings, Inc. (a) | | | 9,687 | |
| | | | | | | | |
| | | | | | | 29,229 | |
| | | | | | | | |
| | | | Semiconductors & Semiconductor Equipment — 6.4% | |
| | 298 | | | Applied Materials, Inc. | | | 9,607 | |
| | 69 | | | Broadcom Ltd., (Singapore) | | | 12,144 | |
| | | | | | | | |
| | | | | | | 21,751 | |
| | | | | | | | |
| | | | Software — 8.4% | |
| | 103 | | | Adobe Systems, Inc. (a) | | | 10,635 | |
| | 110 | | | Electronic Arts, Inc. (a) | | | 8,640 | |
| | 128 | | | ServiceNow, Inc. (a) | | | 9,491 | |
| | | | | | | | |
| | | | | | | 28,766 | |
| | | | | | | | |
| | | | Technology Hardware, Storage & Peripherals — 2.1% | |
| | 63 | | | Apple, Inc. | | | 7,320 | |
| | | | | | | | |
| | | | Total Information Technology | | | 132,074 | |
| | | | | | | | |
| | | | Materials — 2.1% | |
| | | | Chemicals — 2.1% | |
| | 51 | | | Air Products & Chemicals, Inc. | | | 7,310 | |
| | | | | | | | |
| | | | Real Estate — 3.3% | |
| | | | Equity Real Estate Investment Trusts (REITs) — 3.3% | |
| | 31 | | | Equinix, Inc. | | | 11,249 | |
| | | | | | | | |
| | | | Total Common Stocks
(Cost $256,998) | | | 335,141 | |
| | | | | | | | |
| Short-Term Investment — 0.8% | |
| | | | Investment Company — 0.8% | |
| | 2,597 | | | JPMorgan U.S. Government Money Market Fund, Institutional Class Shares, 0.410% (b) (l) (Cost $2,597) | | | 2,597 | |
| | | | | | | | |
| | | | Total Investments — 99.0%
(Cost $259,595) | | | 337,738 | |
| | | | Other Assets in Excess of
Liabilities — 1.0% | | | 3,341 | |
| | | | | | | | |
| | | | NET ASSETS — 100.0% | | $ | 341,079 | |
| | | | | | | | |
Percentages indicated are based on net assets.
SEE NOTES TO FINANCIAL STATEMENTS.
| | | | | | |
| | | |
| 26 | | | | J.P. MORGAN LARGE CAP FUNDS | | DECEMBER 31, 2016 |
JPMorgan Equity Focus Fund
SCHEDULE OF PORTFOLIO INVESTMENTS
AS OF DECEMBER 31, 2016 (Unaudited)
(Amounts in thousands)
| | | | | | | | |
| SHARES | | | SECURITY DESCRIPTION | | VALUE($) | |
| Common Stocks — 92.4% | |
| | | | Consumer Discretionary — 21.9% | |
| | | | Distributors — 1.9% | |
| | 29 | | | Genuine Parts Co. | | | 2,763 | |
| | | | | | | | |
| | | | Internet & Direct Marketing Retail — 8.9% | |
| | 11 | | | Amazon.com, Inc. (a) | | | 7,986 | |
| | 4 | | | Priceline Group, Inc. (The) (a) | | | 5,153 | |
| | | | | | | | |
| | | | | | | 13,139 | |
| | | | | | | | |
| | | | Media — 3.0% | |
| | 76 | | | DISH Network Corp., Class A (a) | | | 4,427 | |
| | | | | | | | |
| | | | Multiline Retail — 2.3% | |
| | 68 | | | Kohl’s Corp. | | | 3,350 | |
| | | | | | | | |
| | | | Specialty Retail — 5.8% | |
| | 56 | | | Bed Bath & Beyond, Inc. | | | 2,256 | |
| | 52 | | | Best Buy Co., Inc. | | | 2,219 | |
| | 16 | | | Ulta Salon Cosmetics & Fragrance, Inc. (a) | | | 4,000 | |
| | | | | | | | |
| | | | | | | 8,475 | |
| | | | | | | | |
| | | | Total Consumer Discretionary | | | 32,154 | |
| | | | | | | | |
| | | | Consumer Staples — 1.7% | |
| | | | Beverages — 1.7% | |
| | 56 | | | Monster Beverage Corp. (a) | | | 2,494 | |
| | | | | | | | |
| | | | Energy — 6.3% | |
| | | | Oil, Gas & Consumable Fuels — 6.3% | |
| | 116 | | | Kinder Morgan, Inc. | | | 2,403 | |
| | 69 | | | Marathon Petroleum Corp. | | | 3,462 | |
| | 19 | | | Pioneer Natural Resources Co. | | | 3,342 | |
| | | | | | | | |
| | | | Total Energy | | | 9,207 | |
| | | | | | | | |
| | | | Financials — 20.1% | |
| | | | Banks — 3.2% | |
| | 87 | | | Wells Fargo & Co. | | | 4,775 | |
| | | | | | | | |
| | | | Capital Markets — 2.7% | |
| | 52 | | | T Rowe Price Group, Inc. | | | 3,938 | |
| | | | | | | | |
| | | | Consumer Finance — 5.1% | |
| | 114 | | | Ally Financial, Inc. | | | 2,159 | |
| | 62 | | | Capital One Financial Corp. | | | 5,369 | |
| | | | | | | | |
| | | | | | | 7,528 | |
| | | | | | | | |
| | | | Insurance — 9.1% | |
| | 115 | | | American International Group, Inc. | | | 7,540 | |
| | 123 | | | Loews Corp. | | | 5,745 | |
| | | | | | | | |
| | | | | | | 13,285 | |
| | | | | | | | |
| | | | Total Financials | | | 29,526 | |
| | | | | | | | |
| | | | | | | | |
| SHARES | | | SECURITY DESCRIPTION | | VALUE($) | |
| | | | | | | | |
| | | | Health Care — 9.4% | |
| | | | Biotechnology — 4.7% | |
| | 60 | | | Gilead Sciences, Inc. | | | 4,296 | |
| | 35 | | | Vertex Pharmaceuticals, Inc. (a) | | | 2,606 | |
| | | | | | | | |
| | | | | | | 6,902 | |
| | | | | | | | |
| | | | Health Care Equipment & Supplies — 2.4% | |
| | 5 | | | Intuitive Surgical, Inc. (a) | | | 3,423 | |
| | | | | | | | |
| | | | Health Care Providers & Services — 2.3% | |
| | 21 | | | UnitedHealth Group, Inc. | | | 3,381 | |
| | | | | | | | |
| | | | Total Health Care | | | 13,706 | |
| | | | | | | | |
| | | | Industrials — 5.9% | |
| | | | Airlines — 2.3% | |
| | 69 | | | Delta Air Lines, Inc. | | | 3,389 | |
| | | | | | | | |
| | | | Machinery — 2.0% | |
| | 32 | | | Caterpillar, Inc. | | | 2,935 | |
| | | | | | | | |
| | | | Road & Rail — 1.6% | |
| | 27 | | | Kansas City Southern | | | 2,290 | |
| | | | | | | | |
| | | | Total Industrials | | | 8,614 | |
| | | | | | | | |
| | | | Information Technology — 19.5% | |
| | | | Electronic Equipment, Instruments & Components — 1.5% | |
| | 30 | | | Arrow Electronics, Inc. (a) | | | 2,159 | |
| | | | | | | | |
| | | | Internet Software & Services — 9.9% | |
| | 9 | | | Alphabet, Inc., Class C (a) | | | 6,939 | |
| | 66 | | | Facebook, Inc., Class A (a) | | | 7,628 | |
| | | | | | | | |
| | | | | | | 14,567 | |
| | | | | | | | |
| | | | IT Services — 6.8% | |
| | 72 | | | Mastercard, Inc. | | | 7,462 | |
| | 62 | | | PayPal Holdings, Inc. (a) | | | 2,433 | |
| | | | | | | | |
| | | | | | | 9,895 | |
| | | | | | | | |
| | | | Software — 1.3% | |
| | 27 | | | ServiceNow, Inc. (a) | | | 1,977 | |
| | | | | | | | |
| | | | Total Information Technology | | | 28,598 | |
| | | | | | | | |
| | | | Materials — 3.5% | |
| | | | Construction Materials — 1.5% | |
| | 10 | | | Martin Marietta Materials, Inc. | | | 2,207 | |
| | | | | | | | |
| | | | Containers & Packaging — 2.0% | |
| | 58 | | | WestRock Co. | | | 2,925 | |
| | | | | | | | |
| | | | Total Materials | | | 5,132 | |
| | | | | | | | |
| | | | Real Estate — 2.1% | |
| | | | Equity Real Estate Investment Trusts (REITs) — 2.1% | |
| | 113 | | | Rayonier, Inc. | | | 3,018 | |
| | | | | | | | |
SEE NOTES TO FINANCIAL STATEMENTS.
| | | | | | | | |
| | | |
| DECEMBER 31, 2016 | | J.P. MORGAN LARGE CAP FUNDS | | | | | 27 | |
JPMorgan Equity Focus Fund
SCHEDULE OF PORTFOLIO INVESTMENTS
AS OF DECEMBER 31, 2016 (Unaudited) (continued)
(Amounts in thousands)
| | | | | | | | |
| SHARES | | | SECURITY DESCRIPTION | | VALUE($) | |
| Common Stocks — continued | |
| | | | Utilities — 2.0% | |
| | | | Electric Utilities — 2.0% | |
| | 74 | | | Xcel Energy, Inc. | | | 3,011 | |
| | | | | | | | |
| | | | Total Common Stocks
(Cost $112,217) | | | 135,460 | |
| | | | | | | | |
| Short-Term Investment — 8.8% | |
| | | | Investment Company — 8.8% | |
| | 12,832 | | | JPMorgan U.S. Government Money Market Fund, Institutional Class Shares, 0.410% (b) (l)
(Cost $12,832) | | | 12,832 | |
| | | | | | | | |
| | | | Total Investments — 101.2%
(Cost $125,049) | | | 148,292 | |
| | | | Liabilities in Excess of
Other Assets — (1.2)% | | | (1,789 | ) |
| | | | | | | | |
| | | | NET ASSETS — 100.0% | | $ | 146,503 | |
| | | | | | | | |
Percentages indicated are based on net assets.
SEE NOTES TO FINANCIAL STATEMENTS.
| | | | | | |
| | | |
| 28 | | | | J.P. MORGAN LARGE CAP FUNDS | | DECEMBER 31, 2016 |
JPMorgan Equity Income Fund
SCHEDULE OF PORTFOLIO INVESTMENTS
AS OF DECEMBER 31, 2016 (Unaudited)
(Amounts in thousands)
| | | | | | | | |
| SHARES | | | SECURITY DESCRIPTION | | VALUE($) | |
| Common Stocks — 98.5% | |
| | | | Consumer Discretionary — 8.0% | | | | |
| | | | Distributors — 1.1% | | | | |
| | 1,638 | | | Genuine Parts Co. | | | 156,524 | |
| | | | | | | | |
| | | | Hotels, Restaurants & Leisure — 0.5% | | | | |
| | 981 | | | Wyndham Worldwide Corp. | | | 74,914 | |
| | | | | | | | |
| | | | | | | | |
| | | | Media — 2.0% | | | | |
| | 1,261 | | | Cinemark Holdings, Inc. | | | 48,383 | |
| | 1,489 | | | Comcast Corp., Class A | | | 102,845 | |
| | 1,252 | | | Time Warner, Inc. | | | 120,900 | |
| | | | | | | | |
| | | | | | | 272,128 | |
| | | | | | | | |
| | | | Specialty Retail — 3.6% | |
| | 1,846 | | | Best Buy Co., Inc. | | | 78,776 | |
| | 1,700 | | | Home Depot, Inc. (The) | | | 227,957 | |
| | 1,873 | | | L Brands, Inc. | | | 123,312 | |
| | 818 | | | Tiffany & Co. | | | 63,373 | |
| | | | | | | | |
| | | | | | | 493,418 | |
| | | | | | | | |
| | | | Textiles, Apparel & Luxury Goods — 0.8% | |
| | 2,079 | | | VF Corp. | | | 110,921 | |
| | | | | | | | |
| | | | Total Consumer Discretionary | | | 1,107,905 | |
| | | | | | | | |
| | | | Consumer Staples — 7.6% | | | | |
| | | | Beverages — 2.5% | | | | |
| | 1,696 | | | Coca-Cola Co. (The) | | | 70,306 | |
| | 1,271 | | | Dr Pepper Snapple Group, Inc. | | | 115,269 | |
| | 899 | | | Molson Coors Brewing Co., Class B | | | 87,449 | |
| | 715 | | | PepsiCo, Inc. | | | 74,766 | |
| | | | | | | | |
| | | | | | | 347,790 | |
| | | | | | | | |
| | | | Food Products — 1.4% | |
| | 652 | | | Kraft Heinz Co. (The) | | | 56,970 | |
| | 2,914 | | | Mondelez International, Inc., Class A | | | 129,181 | |
| | | | | | | | |
| | | | | | | 186,151 | |
| | | | | | | | |
| | | | Household Products — 1.1% | |
| | 1,073 | | | Kimberly-Clark Corp. | | | 122,493 | |
| | 407 | | | Procter & Gamble Co. (The) | | | 34,234 | |
| | | | | | | | |
| | | | | | | 156,727 | |
| | | | | | | | |
| | | | Tobacco — 2.6% | |
| | 2,849 | | | Altria Group, Inc. | | | 192,634 | |
| | 767 | | | Philip Morris International, Inc. | | | 70,188 | |
| | 1,711 | | | Reynolds American, Inc. | | | 95,898 | |
| | | | | | | | |
| | | | | | | 358,720 | |
| | | | | | | | |
| | | | Total Consumer Staples | | | 1,049,388 | |
| | | | | | | | |
| | | | | | | | |
| | | | | | | | |
| SHARES | | | SECURITY DESCRIPTION | | VALUE($) | |
| | | | | | | | |
| | | | Energy — 11.3% | |
| | | | Energy Equipment & Services — 1.2% | |
| | 2,005 | | | Schlumberger Ltd. | | | 168,346 | |
| | | | | | | | |
| | | | Oil, Gas & Consumable Fuels — 10.1% | |
| | 2,908 | | | Chevron Corp. | | | 342,220 | |
| | 6,144 | | | ConocoPhillips | | | 308,036 | |
| | 4,021 | | | Exxon Mobil Corp. | | | 362,940 | |
| | 3,805 | | | Occidental Petroleum Corp. | | | 271,017 | |
| | 1,507 | | | Valero Energy Corp. | | | 102,938 | |
| | | | | | | | |
| | | | | | | 1,387,151 | |
| | | | | | | | |
| | | | Total Energy | | | 1,555,497 | |
| | | | | | | | |
| | | | Financials — 29.8% | |
| | | | Banks — 12.4% | | | | |
| | 18,068 | | | Bank of America Corp. | | | 399,303 | |
| | 4,169 | | | BB&T Corp. | | | 196,032 | |
| | 876 | | | Cullen/Frost Bankers, Inc. | | | 77,269 | |
| | 431 | | | M&T Bank Corp. | | | 67,467 | |
| | 2,893 | | | PNC Financial Services Group, Inc. (The) | | | 338,347 | |
| | 3,265 | | | US Bancorp | | | 167,717 | |
| | 8,284 | | | Wells Fargo & Co. | | | 456,540 | |
| | | | | | | | |
| | | | | | | 1,702,675 | |
| | | | | | | | |
| | | | Capital Markets — 6.6% | |
| | 479 | | | Ameriprise Financial, Inc. | | | 53,154 | |
| | 750 | | | BlackRock, Inc. | | | 285,293 | |
| | 2,305 | | | CME Group, Inc. | | | 265,906 | |
| | 1,613 | | | Northern Trust Corp. | | | 143,660 | |
| | 295 | | | S&P Global, Inc. | | | 31,735 | |
| | 1,696 | | | T Rowe Price Group, Inc. | | | 127,605 | |
| | | | | | | | |
| | | | | | | 907,353 | |
| | | | | | | | |
| | | | Consumer Finance — 1.9% | |
| | 1,671 | | | Capital One Financial Corp. | | | 145,755 | |
| | 1,569 | | | Discover Financial Services | | | 113,079 | |
| | | | | | | | |
| | | | | | | 258,834 | |
| | | | | | | | |
| | | | Insurance — 8.9% | |
| | 1,424 | | | Arthur J Gallagher & Co. | | | 73,987 | |
| | 874 | | | Chubb Ltd. | | | 115,512 | |
| | 851 | | | Cincinnati Financial Corp. | | | 64,439 | |
| | 4,480 | | | Hartford Financial Services Group, Inc. (The) | | | 213,491 | |
| | 4,833 | | | MetLife, Inc. | | | 260,472 | |
| | 1,500 | | | Progressive Corp. (The) | | | 53,261 | |
| | 1,438 | | | Prudential Financial, Inc. | | | 149,635 | |
| | 2,194 | | | Travelers Cos., Inc. (The) | | | 268,648 | |
| | 618 | | | Validus Holdings Ltd. | | | 33,999 | |
| | | | | | | | |
| | | | | | | 1,233,444 | |
| | | | | | | | |
| | | | Total Financials | | | 4,102,306 | |
| | | | | | | | |
SEE NOTES TO FINANCIAL STATEMENTS.
| | | | | | | | |
| | | |
| DECEMBER 31, 2016 | | J.P. MORGAN LARGE CAP FUNDS | | | | | 29 | |
JPMorgan Equity Income Fund
SCHEDULE OF PORTFOLIO INVESTMENTS
AS OF DECEMBER 31, 2016 (Unaudited) (continued)
(Amounts in thousands)
| | | | | | | | |
| SHARES | | | SECURITY DESCRIPTION | | VALUE($) | |
| Common Stocks — continued | |
| | | | Health Care — 10.1% | |
| | | | Biotechnology — 0.6% | |
| | 383 | | | AbbVie, Inc. | | | 23,994 | |
| | 819 | | | Gilead Sciences, Inc. | | | 58,656 | |
| | | | | | | | |
| | | | | | | 82,650 | |
| | | | | | | | |
| | | | Health Care Equipment & Supplies — 1.6% | | | | |
| | 2,493 | | | Abbott Laboratories | | | 95,740 | |
| | 741 | | | Becton Dickinson and Co. | | | 122,604 | |
| | | | | | | | |
| | | | | | | 218,344 | |
| | | | | | | | |
| | | | Pharmaceuticals — 7.9% | | | | |
| | 2,301 | | | Bristol-Myers Squibb Co. | | | 134,495 | |
| | 1,397 | | | Eli Lilly & Co. | | | 102,743 | |
| | 2,916 | | | Johnson & Johnson | | | 335,963 | |
| | 4,337 | | | Merck & Co., Inc. | | | 255,314 | |
| | 7,895 | | | Pfizer, Inc. | | | 256,414 | |
| | | | | | | | |
| | | | | | | 1,084,929 | |
| | | | | | | | |
| | | | Total Health Care | | | 1,385,923 | |
| | | | | | | | |
| | | | Industrials — 10.4% | |
| | | | Aerospace & Defense — 1.3% | | | | |
| | 1,065 | | | General Dynamics Corp. | | | 183,936 | |
| | | | | | | | |
| | | | Air Freight & Logistics — 0.5% | | | | |
| | 597 | | | United Parcel Service, Inc., Class B | | | 68,439 | |
| | | | | | | | |
| | | | Commercial Services & Supplies — 1.3% | | | | |
| | 3,150 | | | Republic Services, Inc. | | | 179,725 | |
| | | | | | | | |
| | | | Industrial Conglomerates — 2.7% | | | | |
| | 663 | | | 3M Co. | | | 118,330 | |
| | 2,169 | | | Honeywell International, Inc. | | | 251,247 | |
| | | | | | | | |
| | | | | | | 369,577 | |
| | | | | | | | |
| | | | Machinery — 3.0% | |
| | 1,151 | | | Dover Corp. | | | 86,244 | |
| | 1,779 | | | Illinois Tool Works, Inc. | | | 217,912 | |
| | 185 | | | Snap-on, Inc. | | | 31,623 | |
| | 671 | | | Stanley Black & Decker, Inc. | | | 76,964 | |
| | | | | | | | |
| | | | | | | 412,743 | |
| | | | | | | | |
| | | | Road & Rail — 1.6% | |
| | 909 | | | Norfolk Southern Corp. | | | 98,248 | |
| | 1,181 | | | Union Pacific Corp. | | | 122,492 | |
| | | | | | | | |
| | | | | | | 220,740 | |
| | | | | | | | |
| | | | Total Industrials | | | 1,435,160 | |
| | | | | | | | |
| | | | Information Technology — 9.9% | |
| | | | IT Services — 2.1% | | | | |
| | 606 | | | Accenture plc, Class A | | | 70,949 | |
| | | | | | | | |
| SHARES | | | SECURITY DESCRIPTION | | VALUE($) | |
| | | | | | | | |
| | | | IT Services — continued | | | | |
| | 1,067 | | | Automatic Data Processing, Inc. | | | 109,625 | |
| | 1,417 | | | Fidelity National Information Services, Inc. | | | 107,155 | |
| | | | | | | | |
| | | | | | | 287,729 | |
| | | | | | | | |
| | | | Semiconductors & Semiconductor Equipment — 3.9% | |
| | 1,830 | | | Analog Devices, Inc. | | | 132,878 | |
| | 1,405 | | | KLA-Tencor Corp. | | | 110,515 | |
| | 1,468 | | | QUALCOMM, Inc. | | | 95,744 | |
| | 2,818 | | | Texas Instruments, Inc. | | | 205,664 | |
| | | | | | | | |
| | | | | | | 544,801 | |
| | | | | | | | |
| | | | Software — 1.9% | |
| | 4,230 | | | Microsoft Corp. | | | 262,837 | |
| | | | | | | | |
| | | | Technology Hardware, Storage & Peripherals — 2.0% | |
| | 2,347 | | | Apple, Inc. | | | 271,819 | |
| | | | | | | | |
| | | | Total Information Technology | | | 1,367,186 | |
| | | | | | | | |
| | | | Materials — 3.1% | |
| | | | Chemicals — 2.9% | |
| | 1,208 | | | EI du Pont de Nemours & Co. | | | 88,695 | |
| | 314 | | | International Flavors & Fragrances, Inc. | | | 37,012 | |
| | 1,173 | | | PPG Industries, Inc. | | | 111,179 | |
| | 771 | | | Praxair, Inc. | | | 90,314 | |
| | 1,262 | | | RPM International, Inc. | | | 67,943 | |
| | | | | | | | |
| | | | | | | 395,143 | |
| | | | | | | | |
| | | | Containers & Packaging — 0.2% | |
| | 657 | | | WestRock Co. | | | 33,375 | |
| | | | | | | | |
| | | | Total Materials | | | 428,518 | |
| | | | | | | | |
| | | | Real Estate — 2.9% | |
| | | | Equity Real Estate Investment Trusts (REITs) — 2.9% | |
| | 358 | | | Alexandria Real Estate Equities, Inc. | | | 39,759 | |
| | 635 | | | AvalonBay Communities, Inc. | | | 112,539 | |
| | 433 | | | Boston Properties, Inc. | | | 54,520 | |
| | 1,610 | | | HCP, Inc. | | | 47,860 | |
| | 784 | | | Simon Property Group, Inc. | | | 139,283 | |
| | | | | | | | |
| | | | Total Real Estate | | | 393,961 | |
| | | | | | | | |
| | | | Telecommunication Services — 1.6% | |
| | | | Diversified Telecommunication Services — 1.6% | |
| | 4,048 | | | Verizon Communications, Inc. | | | 216,090 | |
| | | | | | | | |
| | | | Utilities — 3.8% | |
| | | | Electric Utilities — 2.4% | |
| | 1,623 | | | Edison International | | | 116,838 | |
| | 823 | | | NextEra Energy, Inc. | | | 98,263 | |
| | 2,987 | | | Xcel Energy, Inc. | | | 121,554 | |
| | | | | | | | |
| | | | | | | 336,655 | |
| | | | | | | | |
SEE NOTES TO FINANCIAL STATEMENTS.
| | | | | | |
| | | |
| 30 | | | | J.P. MORGAN LARGE CAP FUNDS | | DECEMBER 31, 2016 |
| | | | | | | | |
| SHARES | | | SECURITY DESCRIPTION | | VALUE($) | |
| Common Stocks — continued | |
| | | | Multi-Utilities — 1.4% | |
| | 2,471 | | | CMS Energy Corp. | | | 102,851 | |
| | 219 | | | DTE Energy Co. | | | 21,591 | |
| | 3,123 | | | NiSource, Inc. | | | 69,143 | |
| | | | | | | | |
| | | | | | | 193,585 | |
| | | | | | | | |
| | | | Total Utilities | | | 530,240 | |
| | | | | | | | |
| | | | Total Common Stocks
(Cost $10,716,238) | | | 13,572,174 | |
| | | | | | | | |
| | | | | | | | |
| SHARES | | | SECURITY DESCRIPTION | | VALUE($) | |
| Short-Term Investment — 1.3% | | | | |
| | | | Investment Company — 1.3% | |
| | 183,286 | | | JPMorgan U.S. Government Money Market Fund, Institutional Class Shares, 0.410% (b) (l)
(Cost $183,286) | | | 183,286 | |
| | | | | | | | |
| | | | Total Investments — 99.8% (Cost $10,899,524) | | | 13,755,460 | |
| | | | Other Assets in Excess of
Liabilities — 0.2% | | | 31,824 | |
| | | | | | | | |
| | | | NET ASSETS — 100.0% | | $ | 13,787,284 | |
| | | | | | | | |
Percentages indicated are based on net assets.
SEE NOTES TO FINANCIAL STATEMENTS.
| | | | | | | | |
| | | |
| DECEMBER 31, 2016 | | J.P. MORGAN LARGE CAP FUNDS | | | | | 31 | |
JPMorgan Growth and Income Fund
SCHEDULE OF PORTFOLIO INVESTMENTS
AS OF DECEMBER 31, 2016 (Unaudited)
(Amounts in thousands)
| | | | | | | | |
| SHARES | | | SECURITY DESCRIPTION | | VALUE($) | |
| | | | | | | | |
| Common Stocks — 98.1% | |
| | | | Consumer Discretionary — 11.4% | |
| | | | Distributors — 0.5% | |
| | 29 | | | Genuine Parts Co. | | | 2,723 | |
| | | | | | | | |
| | | | Hotels, Restaurants & Leisure — 1.5% | |
| | 52 | | | Carnival Corp. | | | 2,707 | |
| | 64 | | | Royal Caribbean Cruises Ltd. | | | 5,218 | |
| | | | | | | | |
| | | | | | | 7,925 | |
| | | | | | | | |
| | | | Household Durables — 1.0% | |
| | 48 | | | Harman International Industries, Inc. | | | 5,336 | |
| | | | | | | | |
| | | | Media — 2.2% | |
| | 71 | | | DISH Network Corp., Class A (a) | | | 4,119 | |
| | 47 | | | Time Warner, Inc. | | | 4,517 | |
| | 27 | | | Walt Disney Co. (The) | | | 2,856 | |
| | | | | | | | |
| | | | | | | 11,492 | |
| | | | | | | | |
| | | | Multiline Retail — 0.8% | |
| | 87 | | | Nordstrom, Inc. | | | 4,160 | |
| | | | | | | | |
| | | | Specialty Retail — 4.5% | |
| | 6 | | | AutoZone, Inc. (a) | | | 4,983 | |
| | 117 | | | Best Buy Co., Inc. | | | 4,971 | |
| | 57 | | | Home Depot, Inc. (The) | | | 7,683 | |
| | 94 | | | L Brands, Inc. | | | 6,176 | |
| | | | | | | | |
| | | | | | | 23,813 | |
| | | | | | | | |
| | | | Textiles, Apparel & Luxury Goods — 0.9% | |
| | 91 | | | VF Corp. | | | 4,828 | |
| | | | | | | | |
| | | | Total Consumer Discretionary | | | 60,277 | |
| | | | | | | | |
| | | | Consumer Staples — 4.9% | |
| | | | Beverages — 2.3% | |
| | 81 | | | Coca-Cola Co. (The) | | | 3,342 | |
| | 30 | | | Dr Pepper Snapple Group, Inc. | | | 2,693 | |
| | 40 | | | Molson Coors Brewing Co., Class B | | | 3,921 | |
| | 24 | | | PepsiCo, Inc. | | | 2,501 | |
| | | | | | | | |
| | | | | | | 12,457 | |
| | | | | | | | |
| | | | Food & Staples Retailing — 1.5% | |
| | 26 | | | Costco Wholesale Corp. | | | 4,131 | |
| | 45 | | | Walgreens Boots Alliance, Inc. | | | 3,741 | |
| | | | | | | | |
| | | | | | | 7,872 | |
| | | | | | | | |
| | | | Food Products — 0.4% | |
| | 22 | | | Kraft Heinz Co. (The) | | | 1,956 | |
| | | | | | | | |
| | | | Household Products — 0.7% | |
| | 31 | | | Kimberly-Clark Corp. | | | 3,492 | |
| | | | | | | | |
| | | | Total Consumer Staples | | | 25,777 | |
| | | | | | | | |
| | | | | | | | |
| | | | | | | | |
| SHARES | | | SECURITY DESCRIPTION | | VALUE($) | |
| | | | | | | | |
| | | | Energy — 12.7% | |
| | | | Energy Equipment & Services — 1.3% | |
| | 83 | | | Schlumberger Ltd. | | | 6,976 | |
| | | | | | | | |
| | | | Oil, Gas & Consumable Fuels — 11.4% | |
| | 118 | | | Chevron Corp. | | | 13,842 | |
| | 184 | | | ConocoPhillips | | | 9,250 | |
| | 57 | | | EOG Resources, Inc. | | | 5,732 | |
| | 143 | | | Exxon Mobil Corp. | | | 12,879 | |
| | 141 | | | Occidental Petroleum Corp. | | | 10,072 | |
| | 41 | | | Phillips 66 | | | 3,577 | |
| | 76 | | | Valero Energy Corp. | | | 5,199 | |
| | | | | | | | |
| | | | | | | 60,551 | |
| | | | | | | | |
| | | | Total Energy | | | 67,527 | |
| | | | | | | | |
| | | | Financials — 32.5% | |
| | | | Banks — 14.6% | |
| | 957 | | | Bank of America Corp. | | | 21,143 | |
| | 139 | | | BB&T Corp. | | | 6,526 | |
| | 102 | | | Citigroup, Inc. | | | 6,059 | |
| | 57 | | | Cullen/Frost Bankers, Inc. | | | 5,011 | |
| | 37 | | | M&T Bank Corp. | | | 5,741 | |
| | 60 | | | PNC Financial Services Group, Inc. (The) | | | 6,959 | |
| | 85 | | | SunTrust Banks, Inc. | | | 4,679 | |
| | 120 | | | US Bancorp | | | 6,144 | |
| | 275 | | | Wells Fargo & Co. | | | 15,139 | |
| | | | | | | | |
| | | | | | | 77,401 | |
| | | | | | | | |
| | | | Capital Markets — 8.7% | |
| | 16 | | | Ameriprise Financial, Inc. | | | 1,797 | |
| | 24 | | | BlackRock, Inc. | | | 9,019 | |
| | 144 | | | Charles Schwab Corp. (The) | | | 5,676 | |
| | 30 | | | Goldman Sachs Group, Inc. (The) | | | 7,160 | |
| | 37 | | | Intercontinental Exchange, Inc. | | | 2,065 | |
| | 187 | | | Invesco Ltd. | | | 5,664 | |
| | 192 | | | Morgan Stanley | | | 8,095 | |
| | 88 | | | T Rowe Price Group, Inc. | | | 6,585 | |
| | | | | | | | |
| | | | | | | 46,061 | |
| | | | | | | | |
| | | | Consumer Finance — 2.5% | |
| | 76 | | | Capital One Financial Corp. | | | 6,656 | |
| | 96 | | | Discover Financial Services | | | 6,885 | |
| | | | | | | | |
| | | | | | | 13,541 | |
| | | | | | | | |
| | | | Diversified Financial Services — 2.2% | |
| | 72 | | | Berkshire Hathaway, Inc., Class B (a) | | | 11,800 | |
| | | | | | | | |
| | | | Insurance — 4.5% | |
| | 22 | | | Chubb Ltd. | | | 2,902 | |
| | 187 | | | Hartford Financial Services Group, Inc. (The) | | | 8,901 | |
SEE NOTES TO FINANCIAL STATEMENTS.
| | | | | | |
| | | |
| 32 | | | | J.P. MORGAN LARGE CAP FUNDS | | DECEMBER 31, 2016 |
| | | | | | | | |
| SHARES | | | SECURITY DESCRIPTION | | VALUE($) | |
| Common Stocks — continued | |
| | | | Insurance — continued | |
| | 54 | | | Loews Corp. | | | 2,515 | |
| | 79 | | | MetLife, Inc. | | | 4,241 | |
| | 51 | | | Prudential Financial, Inc. | | | 5,297 | |
| | | | | | | | |
| | | | | | | 23,856 | |
| | | | | | | | |
| | | | Total Financials | | | 172,659 | |
| | | | | | | | |
| | | | Health Care — 9.2% | |
| | | | Biotechnology — 0.7% | |
| | 54 | | | Gilead Sciences, Inc. | | | 3,896 | |
| | | | | | | | |
| | | | Health Care Equipment & Supplies — 0.9% | |
| | 27 | | | Becton Dickinson and Co. | | | 4,437 | |
| | | | | | | | |
| | | | Health Care Providers & Services — 1.9% | |
| | 26 | | | Aetna, Inc. | | | 3,237 | |
| | 14 | | | Humana, Inc. | | | 2,917 | |
| | 25 | | | UnitedHealth Group, Inc. | | | 4,065 | |
| | | | | | | | |
| | | | | | | 10,219 | |
| | | | | | | | |
| | | | Pharmaceuticals — 5.7% | |
| | 139 | | | Bristol-Myers Squibb Co. | | | 8,117 | |
| | 42 | | | Eli Lilly & Co. | | | 3,067 | |
| | 41 | | | Johnson & Johnson | | | 4,758 | |
| | 105 | | | Merck & Co., Inc. | | | 6,174 | |
| | 253 | | | Pfizer, Inc. | | | 8,227 | |
| | | | | | | | |
| | | | | | | 30,343 | |
| | | | | | | | |
| | | | Total Health Care | | | 48,895 | |
| | | | | | | | |
| | | | Industrials — 8.0% | |
| | | | Aerospace & Defense — 0.7% | |
| | 35 | | | United Technologies Corp. | | | 3,793 | |
| | | | | | | | |
| | | | Industrial Conglomerates — 5.2% | |
| | 44 | | | 3M Co. | | | 7,821 | |
| | 299 | | | General Electric Co. | | | 9,439 | |
| | 88 | | | Honeywell International, Inc. | | | 10,218 | |
| | | | | | | | |
| | | | | | | 27,478 | |
| | | | | | | | |
| | | | Machinery — 0.3% | |
| | 18 | | | Dover Corp. | | | 1,341 | |
| | | | | | | | |
| | | | Road & Rail — 0.9% | |
| | 138 | | | CSX Corp. | | | 4,941 | |
| | | | | | | | |
| | | | Trading Companies & Distributors — 0.9% | |
| | 34 | | | Watsco, Inc. | | | 5,036 | |
| | | | | | | | |
| | | | Total Industrials | | | 42,589 | |
| | | | | | | | |
| | | | Information Technology — 11.8% | |
| | | | Communications Equipment — 0.6% | |
| | 101 | | | Cisco Systems, Inc. | | | 3,055 | |
| | | | | | | | |
| | | | | | | | |
| | | | | | | | |
| SHARES | | | SECURITY DESCRIPTION | | VALUE($) | |
| | | | | | | | |
| | | | Electronic Equipment, Instruments & Components — 0.4% | |
| | 31 | | | TE Connectivity Ltd. | | | 2,113 | |
| | | | | | | | |
| | | | Internet Software & Services — 0.8% | |
| | 5 | | | Alphabet, Inc., Class C (a) | | | 4,028 | |
| | | | | | | | |
| | | | IT Services — 0.7% | |
| | 49 | | | Fidelity National Information Services, Inc. | | | 3,683 | |
| | | | | | | | |
| | | | Semiconductors & Semiconductor Equipment — 3.5% | |
| | 170 | | | Applied Materials, Inc. | | | 5,499 | |
| | 54 | | | KLA-Tencor Corp. | | | 4,280 | |
| | 52 | | | QUALCOMM, Inc. | | | 3,384 | |
| | 72 | | | Texas Instruments, Inc. | | | 5,283 | |
| | | | | | | | |
| | | | | | | 18,446 | |
| | | | | | | | |
| | | | Software — 2.8% | |
| | 244 | | | Microsoft Corp. | | | 15,150 | |
| | | | | | | | |
| | | | Technology Hardware, Storage & Peripherals — 3.0% | |
| | 109 | | | Apple, Inc. | | | 12,636 | |
| | 230 | | | HP, Inc. | | | 3,409 | |
| | | | | | | | |
| | | | | | | 16,045 | |
| | | | | | | | |
| | | | Total Information Technology | | | 62,520 | |
| | | | | | | | |
| | | | Materials — 0.8% | |
| | | | Chemicals — 0.8% | |
| | 61 | | | EI du Pont de Nemours & Co. | | | 4,492 | |
| | | | | | | | |
| | | | Real Estate — 1.9% | |
| | | | Equity Real Estate Investment Trusts (REITs) — 1.9% | |
| | 16 | | | AvalonBay Communities, Inc. | | | 2,764 | |
| | 54 | | | Macerich Co. (The) | | | 3,825 | |
| | 21 | | | Simon Property Group, Inc. | | | 3,678 | |
| | | | | | | | |
| | | | Total Real Estate | | | 10,267 | |
| | | | | | | | |
| | | | Telecommunication Services — 2.8% | |
| | | | Diversified Telecommunication Services — 2.1% | |
| | 206 | | | Verizon Communications, Inc. | | | 10,976 | |
| | | | | | | | |
| | | | Wireless Telecommunication Services — 0.7% | |
| | 67 | | | T-Mobile US, Inc. (a) | | | 3,865 | |
| | | | | | | | |
| | | | Total Telecommunication Services | | | 14,841 | |
| | | | | | | | |
| | | | Utilities — 2.1% | |
| | | | Electric Utilities — 1.6% | |
| | 36 | | | Edison International | | | 2,620 | |
| | 23 | | | NextEra Energy, Inc. | | | 2,700 | |
| | 74 | | | Xcel Energy, Inc. | | | 3,000 | |
| | | | | | | | |
| | | | | | | 8,320 | |
| | | | | | | | |
SEE NOTES TO FINANCIAL STATEMENTS.
| | | | | | | | |
| | | |
| DECEMBER 31, 2016 | | J.P. MORGAN LARGE CAP FUNDS | | | | | 33 | |
JPMorgan Growth and Income Fund
SCHEDULE OF PORTFOLIO INVESTMENTS
AS OF DECEMBER 31, 2016 (Unaudited) (continued)
(Amounts in thousands)
| | | | | | | | |
| SHARES | | | SECURITY DESCRIPTION | | VALUE($) | |
| Common Stocks — continued | |
| | | | Multi-Utilities — 0.5% | |
| | 64 | | | CMS Energy Corp. | | | 2,651 | |
| | | | | | | | |
| | | | Total Utilities | | | 10,971 | |
| | | | | | | | |
| | | | Total Common Stocks
(Cost $354,876) | | | 520,815 | |
| | | | | | | | |
| Short-Term Investment — 1.3% | |
| | | | Investment Company — 1.3% | |
| | 7,022 | | | JPMorgan U.S. Government Money Market Fund, Institutional Class Shares, 0.410% (b) (l) (Cost $7,022) | | | 7,022 | |
| | | | | | | | |
| | | | Total Investments — 99.4%
(Cost $361,898) | | | 527,837 | |
| | | | Other Assets in Excess of
Liabilities — 0.6% | | | 3,022 | |
| | | | | | | | |
| | | | NET ASSETS — 100.0% | | $ | 530,859 | |
| | | | | | | | |
Percentages indicated are based on net assets.
SEE NOTES TO FINANCIAL STATEMENTS.
| | | | | | |
| | | |
| 34 | | | | J.P. MORGAN LARGE CAP FUNDS | | DECEMBER 31, 2016 |
JPMorgan Hedged Equity Fund
SCHEDULE OF PORTFOLIO INVESTMENTS
AS OF DECEMBER 31, 2016 (Unaudited)
(Amounts in thousands)
| | | | | | | | |
| SHARES | | | SECURITY DESCRIPTION | | VALUE($) | |
| Common Stocks — 97.1% | |
| | | | Consumer Discretionary — 12.5% | |
| | | | Auto Components — 0.4% | |
| | 13 | | | Delphi Automotive plc | | | 892 | |
| | 2 | | | Lear Corp. | | | 325 | |
| | | | | | | | |
| | | | | | | 1,217 | |
| | | | | | | | |
| | | | Automobiles — 0.5% | |
| | 15 | | | Ford Motor Co. | | | 180 | |
| | 41 | | | General Motors Co. (o) | | | 1,431 | |
| | | | | | | | |
| | | | | | | 1,611 | |
| | | | | | | | |
| | | | Hotels, Restaurants & Leisure — 1.1% | |
| | 12 | | | Royal Caribbean Cruises Ltd. | | | 998 | |
| | 38 | | | Starbucks Corp. | | | 2,105 | |
| | 9 | | | Yum! Brands, Inc. | | | 597 | |
| | | | | | | | |
| | | | | | | 3,700 | |
| | | | | | | | |
| | | | Household Durables — 0.4% | |
| | 16 | | | DR Horton, Inc. | | | 450 | |
| | 4 | | | Newell Brands, Inc. | | | 164 | |
| | 25 | | | PulteGroup, Inc. | | | 452 | |
| | 5 | | | Toll Brothers, Inc. (a) | | | 160 | |
| | | | | | | | |
| | | | | | | 1,226 | |
| | | | | | | | |
| | | | Internet & Direct Marketing Retail — 1.6% | |
| | 7 | | | Amazon.com, Inc. (a) (o) | | | 5,316 | |
| | | | | | | | |
| | | | Media — 4.4% | |
| | 3 | | | CBS Corp. (Non-Voting), Class B | | | 178 | |
| | 9 | | | Charter Communications, Inc., Class A (a) (o) | | | 2,699 | |
| | 55 | | | Comcast Corp., Class A (o) | | | 3,819 | |
| | 13 | | | DISH Network Corp., Class A (a) | | | 779 | |
| | 74 | | | Sirius XM Holdings, Inc. | | | 329 | |
| | 20 | | | Time Warner, Inc. | | | 1,977 | |
| | 117 | | | Twenty-First Century Fox, Inc., Class A (o) | | | 3,271 | |
| | 12 | | | Walt Disney Co. (The) | | | 1,246 | |
| | | | | | | | |
| | | | | | | 14,298 | |
| | | | | | | | |
| | | | Multiline Retail — 0.3% | |
| | 13 | | | Dollar General Corp. | | | 981 | |
| | | | | | | | |
| | | | Specialty Retail — 3.6% | |
| | — | (h) | | AutoZone, Inc. (a) | | | 97 | |
| | 13 | | | Best Buy Co., Inc. | | | 549 | |
| | 29 | | | Home Depot, Inc. (The) (o) | | | 3,887 | |
| | 37 | | | Lowe’s Cos., Inc. | | | 2,641 | |
| | 5 | | | O’Reilly Automotive, Inc. (a) | | | 1,441 | |
| | 7 | | | Ross Stores, Inc. | | | 438 | |
| | 1 | | | Signet Jewelers Ltd. (o) | | | 77 | |
| | 37 | | | TJX Cos., Inc. (The) (o) | | | 2,782 | |
| | | | | | | | |
| | | | | | | 11,912 | |
| | | | | | | | |
| | | | | | | | |
| SHARES | | | SECURITY DESCRIPTION | | VALUE($) | |
| | | | | | | | |
| | | | Textiles, Apparel & Luxury Goods — 0.2% | |
| | 5 | | | NIKE, Inc., Class B | | | 276 | |
| | 1 | | | PVH Corp. | | | 115 | |
| | 2 | | | Ralph Lauren Corp. | | | 156 | |
| | | | | | | | |
| | | | | | | 547 | |
| | | | | | | | |
| | | | Total Consumer Discretionary | | | 40,808 | |
| | | | | | | | |
| | | | Consumer Staples — 8.9% | |
| | | | Beverages — 3.1% | |
| | 42 | | | Coca-Cola Co. (The) | | | 1,747 | |
| | 12 | | | Constellation Brands, Inc., Class A | | | 1,768 | |
| | 3 | | | Dr Pepper Snapple Group, Inc. | | | 272 | |
| | 20 | | | Molson Coors Brewing Co., Class B | | | 1,972 | |
| | 43 | | | PepsiCo, Inc. (o) | | | 4,517 | |
| | | | | | | | |
| | | | | | | 10,276 | |
| | | | | | | | |
| | | | Food & Staples Retailing — 1.7% | |
| | 12 | | | Costco Wholesale Corp. (o) | | | 1,926 | |
| | 39 | | | Kroger Co. (The) | | | 1,346 | |
| | 24 | | | Walgreens Boots Alliance, Inc. | | | 1,991 | |
| | 4 | | | Wal-Mart Stores, Inc. | | | 283 | |
| | | | | | | | |
| | | | | | | 5,546 | |
| | | | | | | | |
| | | | Food Products — 1.2% | |
| | 6 | | | Archer-Daniels-Midland Co. (o) | | | 260 | |
| | 1 | | | JM Smucker Co. (The) | | | 125 | |
| | 10 | | | Kraft Heinz Co. (The) | | | 880 | |
| | 58 | | | Mondelez International, Inc., Class A | | | 2,574 | |
| | | | | | | | |
| | | | | | | 3,839 | |
| | | | | | | | |
| | | | Household Products — 1.6% | |
| | 19 | | | Kimberly-Clark Corp. (o) | | | 2,114 | |
| | 37 | | | Procter & Gamble Co. (The) | | | 3,148 | |
| | | | | | | | |
| | | | | | | 5,262 | |
| | | | | | | | |
| | | | Tobacco — 1.3% | |
| | 14 | | | Altria Group, Inc. | | | 951 | |
| | 17 | | | Philip Morris International, Inc. | | | 1,600 | |
| | 28 | | | Reynolds American, Inc. (o) | | | 1,553 | |
| | | | | | | | |
| | | | | | | 4,104 | |
| | | | | | | | |
| | | | Total Consumer Staples | | | 29,027 | |
| | | | | | | | |
| | | | Energy — 7.3% | |
| | | | Energy Equipment & Services — 0.9% | |
| | 13 | | | Halliburton Co. | | | 698 | |
| | 27 | | | Schlumberger Ltd. (o) | | | 2,239 | |
| | | | | | | | |
| | | | | | | 2,937 | |
| | | | | | | | |
| | | | Oil, Gas & Consumable Fuels — 6.4% | |
| | 21 | | | Anadarko Petroleum Corp. | | | 1,437 | |
| | 3 | | | Apache Corp. | | | 221 | |
SEE NOTES TO FINANCIAL STATEMENTS.
| | | | | | | | |
| | | |
| DECEMBER 31, 2016 | | J.P. MORGAN LARGE CAP FUNDS | | | | | 35 | |
JPMorgan Hedged Equity Fund
SCHEDULE OF PORTFOLIO INVESTMENTS
AS OF DECEMBER 31, 2016 (Unaudited) (continued)
(Amounts in thousands)
| | | | | | | | |
| SHARES | | | SECURITY DESCRIPTION | | VALUE($) | |
| Common Stocks — continued | |
| | | | Oil, Gas & Consumable Fuels — continued | |
| | 23 | | | Cabot Oil & Gas Corp. | | | 530 | |
| | 8 | | | Cheniere Energy, Inc. (a) | | | 322 | |
| | 22 | | | Chevron Corp. | | | 2,561 | |
| | 5 | | | Concho Resources, Inc. (a) | | | 689 | |
| | 13 | | | Diamondback Energy, Inc. (a) | | | 1,341 | |
| | 21 | | | EOG Resources, Inc. | | | 2,082 | |
| | 13 | | | EQT Corp. | | | 867 | |
| | 68 | | | Exxon Mobil Corp. (o) | | | 6,137 | |
| | 25 | | | Kinder Morgan, Inc. | | | 520 | |
| | 9 | | | Marathon Petroleum Corp. | | | 447 | |
| | 13 | | | Occidental Petroleum Corp. | | | 900 | |
| | 12 | | | Pioneer Natural Resources Co. | | | 2,238 | |
| | 7 | | | Valero Energy Corp. | | | 511 | |
| | | | | | | | |
| | | | | | | 20,803 | |
| | | | | | | | |
| | | | Total Energy | | | 23,740 | |
| | | | | | | | |
| | | | Financials — 14.7% | |
| | | | Banks — 6.1% | |
| | 249 | | | Bank of America Corp. (o) | | | 5,507 | |
| | 9 | | | BB&T Corp. | | | 433 | |
| | 88 | | | Citigroup, Inc. | | | 5,224 | |
| | 13 | | | Huntington Bancshares, Inc. | | | 169 | |
| | 71 | | | KeyCorp | | | 1,304 | |
| | 30 | | | Regions Financial Corp. (o) | | | 433 | |
| | 3 | | | SunTrust Banks, Inc. | | | 161 | |
| | 2 | | | SVB Financial Group (a) | | | 419 | |
| | 108 | | | Wells Fargo & Co. (o) | | | 5,977 | |
| | 6 | | | Zions Bancorp | | | 260 | |
| | | | | | | | |
| | | | | | | 19,887 | |
| | | | | | | | |
| | | | Capital Markets — 3.5% | |
| | 3 | | | Ameriprise Financial, Inc. | | | 296 | |
| | 32 | | | Bank of New York Mellon Corp. (The) | | | 1,500 | |
| | 3 | | | BlackRock, Inc. | | | 1,084 | |
| | 66 | | | Charles Schwab Corp. (The) (o) | | | 2,609 | |
| | 1 | | | Goldman Sachs Group, Inc. (The) (o) | | | 257 | |
| | 23 | | | Intercontinental Exchange, Inc. | | | 1,305 | |
| | 74 | | | Morgan Stanley (o) | | | 3,137 | |
| | 16 | | | State Street Corp. (o) | | | 1,214 | |
| | | | | | | | |
| | | | | | | 11,402 | |
| | | | | | | | |
| | | | Consumer Finance — 1.0% | |
| | 20 | | | Capital One Financial Corp. | | | 1,765 | |
| | 20 | | | Discover Financial Services | | | 1,476 | |
| | | | | | | | |
| | | | | | | 3,241 | |
| | | | | | | | |
| | | | | | | | |
| SHARES | | | SECURITY DESCRIPTION | | VALUE($) | |
| | | | | | | | |
| | | | Diversified Financial Services — 1.4% | |
| | 29 | | | Berkshire Hathaway, Inc., Class B (a) (o) | | | 4,684 | |
| | — | (h) | | Voya Financial, Inc. | | | 15 | |
| | | | | | | | |
| | | | | | | 4,699 | |
| | | | | | | | |
| | | | Insurance — 2.7% | |
| | 18 | | | American International Group, Inc. (o) | | | 1,192 | |
| | 20 | | | Arthur J Gallagher & Co. | | | 1,018 | |
| | 15 | | | Chubb Ltd. | | | 1,991 | |
| | 3 | | | Everest Re Group Ltd. | | | 542 | |
| | 7 | | | Hartford Financial Services Group, Inc. (The) | | | 311 | |
| | 58 | | | MetLife, Inc. (o) | | | 3,101 | |
| | 14 | | | XL Group Ltd., (Ireland) | | | 536 | |
| | | | | | | | |
| | | | | | | 8,691 | |
| | | | | | | | |
| | | | Total Financials | | | 47,920 | |
| | | | | | | | |
| | | | Health Care — 13.5% | |
| | | | Biotechnology — 2.7% | |
| | 4 | | | Alexion Pharmaceuticals, Inc. (a) | | | 442 | |
| | 8 | | | Biogen, Inc. (a) | | | 2,323 | |
| | 2 | | | BioMarin Pharmaceutical, Inc. (a) | | | 134 | |
| | 22 | | | Celgene Corp. (a) | | | 2,527 | |
| | 38 | | | Gilead Sciences, Inc. | | | 2,701 | |
| | 11 | | | Vertex Pharmaceuticals, Inc. (a) | | | 789 | |
| | | | | | | | |
| | | | | | | 8,916 | |
| | | | | | | | |
| | | | Health Care Equipment & Supplies — 1.7% | |
| | 57 | | | Abbott Laboratories | | | 2,193 | |
| | 2 | | | Becton Dickinson and Co. | | | 303 | |
| | 88 | | | Boston Scientific Corp. (a) (o) | | | 1,911 | |
| | 1 | | | Cooper Cos., Inc. (The) | | | 149 | |
| | 7 | | | Danaher Corp. | | | 523 | |
| | 3 | | | Zimmer Biomet Holdings, Inc. | | | 274 | |
| | | | | | | | |
| | | | | | | 5,353 | |
| | | | | | | | |
| | | | Health Care Providers & Services — 2.8% | |
| | 15 | | | Aetna, Inc. (o) | | | 1,915 | |
| | 4 | | | Cigna Corp. | | | 557 | |
| | 2 | | | HCA Holdings, Inc. (a) | | | 158 | |
| | 6 | | | Humana, Inc. | | | 1,272 | |
| | 2 | | | Laboratory Corp. of America Holdings (a) | | | 196 | |
| | 4 | | | McKesson Corp. (o) | | | 496 | |
| | 3 | | | Quest Diagnostics, Inc. | | | 266 | |
| | 27 | | | UnitedHealth Group, Inc. | | | 4,391 | |
| | | | | | | | |
| | | | | | | 9,251 | |
| | | | | | | | |
| | | | Life Sciences Tools & Services — 0.6% | |
| | 12 | | | Agilent Technologies, Inc. | | | 550 | |
| | 5 | | | Illumina, Inc. (a) | | | 646 | |
SEE NOTES TO FINANCIAL STATEMENTS.
| | | | | | |
| | | |
| 36 | | | | J.P. MORGAN LARGE CAP FUNDS | | DECEMBER 31, 2016 |
| | | | | | | | |
| SHARES | | | SECURITY DESCRIPTION | | VALUE($) | |
| Common Stocks — continued | |
| | | | Life Sciences Tools & Services — continued | |
| | 6 | | | Thermo Fisher Scientific, Inc. | | | 883 | |
| | | | | | | | |
| | | | | | | 2,079 | |
| | | | | | | | |
| | | | Pharmaceuticals — 5.7% | |
| | 12 | | | Allergan plc (a) (o) | | | 2,524 | |
| | 58 | | | Bristol-Myers Squibb Co. | | | 3,396 | |
| | 34 | | | Eli Lilly & Co. | | | 2,505 | |
| | 24 | | | Johnson & Johnson | | | 2,794 | |
| | 30 | | | Merck & Co., Inc. (o) | | | 1,755 | |
| | 6 | | | Mylan NV (a) | | | 222 | |
| | 161 | | | Pfizer, Inc. (o) | | | 5,240 | |
| | | | | | | | |
| | | | | | | 18,436 | |
| | | | | | | | |
| | | | Total Health Care | | | 44,035 | |
| | | | | | | | |
| | | | Industrials — 9.7% | |
| | | | Aerospace & Defense — 1.5% | |
| | 10 | | | General Dynamics Corp. (o) | | | 1,760 | |
| | 4 | | | L-3 Communications Holdings, Inc. | | | 588 | |
| | 4 | | | Northrop Grumman Corp. | | | 985 | |
| | 4 | | | Textron, Inc. | | | 196 | |
| | 13 | | | United Technologies Corp. | | | 1,398 | |
| | | | | | | | |
| | | | | | | 4,927 | |
| | | | | | | | |
| | | | Air Freight & Logistics — 0.1% | |
| | 3 | | | United Parcel Service, Inc., Class B | | | 321 | |
| | | | | | | | |
| | | | Airlines — 0.8% | |
| | 20 | | | Delta Air Lines, Inc. | | | 963 | |
| | 22 | | | United Continental Holdings, Inc. (a) | | | 1,581 | |
| | | | | | | | |
| | | | | | | 2,544 | |
| | | | | | | | |
| | | | Building Products — 0.5% | |
| | 11 | | | Allegion plc | | | 715 | |
| | 7 | | | Johnson Controls International plc | | | 295 | |
| | 27 | | | Masco Corp. | | | 847 | |
| | | | | | | | |
| | | | | | | 1,857 | |
| | | | | | | | |
| | | | Construction & Engineering — 0.2% | |
| | 11 | | | Fluor Corp. (o) | | | 574 | |
| | | | | | | | |
| | | | Electrical Equipment — 0.5% | |
| | 27 | | | Eaton Corp. plc | | | 1,783 | |
| | | | | | | | |
| | | | Industrial Conglomerates — 2.6% | |
| | 160 | | | General Electric Co. (o) | | | 5,048 | |
| | 31 | | | Honeywell International, Inc. (o) | | | 3,539 | |
| | | | | | | | |
| | | | | | | 8,587 | |
| | | | | | | | |
| | | | Machinery — 2.0% | |
| | 5 | | | Cummins, Inc. (o) | | | 709 | |
| | 3 | | | Deere & Co. | | | 294 | |
| | | | | | | | |
| SHARES | | | SECURITY DESCRIPTION | | VALUE($) | |
| | | | | | | | |
| | | | Machinery — continued | |
| | 2 | | | Fortive Corp. (o) | | | 133 | |
| | 9 | | | Ingersoll-Rand plc | | | 654 | |
| | 24 | | | PACCAR, Inc. (o) | | | 1,542 | |
| | 2 | | | Parker-Hannifin Corp. (o) | | | 318 | |
| | 3 | | | Pentair plc, (United Kingdom) | | | 163 | |
| | 6 | | | Snap-on, Inc. | | | 1,013 | |
| | 14 | | | Stanley Black & Decker, Inc. | | | 1,620 | |
| | | | | | | | |
| | | | | | | 6,446 | |
| | | | | | | | |
| | | | Road & Rail — 1.5% | |
| | 8 | | | Canadian Pacific Railway Ltd., (Canada) | | | 1,210 | |
| | 35 | | | Union Pacific Corp. (o) | | | 3,592 | |
| | | | | | | | |
| | | | | | | 4,802 | |
| | | | | | | | |
| | | | Total Industrials | | | 31,841 | |
| | | | | | | | |
| | | | Information Technology — 20.7% | |
| | | | Communications Equipment — 0.4% | |
| | 39 | | | Cisco Systems, Inc. | | | 1,174 | |
| | | | | | | | |
| | | | Electronic Equipment, Instruments & Components — 0.6% | |
| | 28 | | | TE Connectivity Ltd. | | | 1,964 | |
| | | | | | | | |
| | | | Internet Software & Services — 4.7% | |
| | 6 | | | Alphabet, Inc., Class A (a) (o) | | | 4,741 | |
| | 6 | | | Alphabet, Inc., Class C (a) (o) | | | 4,655 | |
| | 51 | | | Facebook, Inc., Class A (a) (o) | | | 5,856 | |
| | | | | | | | |
| | | | | | | 15,252 | |
| | | | | | | | |
| | | | IT Services — 3.5% | |
| | 36 | | | Accenture plc, Class A | | | 4,180 | |
| | 8 | | | Cognizant Technology Solutions Corp., Class A (a) (o) | | | 439 | |
| | 20 | | | Fidelity National Information Services, Inc. | | | 1,526 | |
| | 3 | | | International Business Machines Corp. | | | 510 | |
| | 5 | | | Mastercard, Inc., Class A | | | 465 | |
| | 18 | | | PayPal Holdings, Inc. (a) | | | 728 | |
| | 4 | | | Vantiv, Inc., Class A (a) | | | 253 | |
| | 37 | | | Visa, Inc., Class A | | | 2,880 | |
| | 6 | | | WEX, Inc. (a) | | | 646 | |
| | | | | | | | |
| | | | | | | 11,627 | |
| | | | | | | | |
| | | | Semiconductors & Semiconductor Equipment — 3.5% | |
| | 31 | | | Analog Devices, Inc. | | | 2,244 | |
| | 9 | | | Applied Materials, Inc. | | | 301 | |
| | 21 | | | Broadcom Ltd., (Singapore) | | | 3,660 | |
| | 3 | | | KLA-Tencor Corp. | | | 200 | |
| | 14 | | | Lam Research Corp. | | | 1,431 | |
| | 3 | | | NVIDIA Corp. | | | 343 | |
| | 4 | | | NXP Semiconductors NV, (Netherlands) (a) | | | 436 | |
| | 27 | | | ON Semiconductor Corp. (a) | | | 341 | |
SEE NOTES TO FINANCIAL STATEMENTS.
| | | | | | | | |
| | | |
| DECEMBER 31, 2016 | | J.P. MORGAN LARGE CAP FUNDS | | | | | 37 | |
JPMorgan Hedged Equity Fund
SCHEDULE OF PORTFOLIO INVESTMENTS
AS OF DECEMBER 31, 2016 (Unaudited) (continued)
(Amounts in thousands, except number of Futures and Options contracts)
| | | | | | | | |
| SHARES | | | SECURITY DESCRIPTION | | VALUE($) | |
| | Common Stocks — continued | |
| | | | Semiconductors & Semiconductor Equipment — continued | |
| | 33 | | | Texas Instruments, Inc. | | | 2,390 | |
| | | | | | | | |
| | | | | | | 11,346 | |
| | | | | | | | |
| | | | Software — 4.2% | |
| | 30 | | | Adobe Systems, Inc. (a) | | | 3,114 | |
| | 161 | | | Microsoft Corp. (o) | | | 9,979 | |
| | 11 | | | Oracle Corp. (o) | | | 431 | |
| | 5 | | | Workday, Inc., Class A (a) | | | 363 | |
| | | | | | | | |
| | | | | | | 13,887 | |
| | | | | | | | |
| | | | Technology Hardware, Storage & Peripherals — 3.8% | |
| | 90 | | | Apple, Inc. (o) | | | 10,382 | |
| | 29 | | | Hewlett Packard Enterprise Co. | | | 662 | |
| | 85 | | | HP, Inc. | | | 1,260 | |
| | | | | | | | |
| | | | | | | 12,304 | |
| | | | | | | | |
| | | | Total Information Technology | | | 67,554 | |
| | | | | | | | |
| | | | Materials — 2.8% | |
| | | | Chemicals — 2.0% | |
| | 19 | | | Dow Chemical Co. (The) | | | 1,063 | |
| | 23 | | | Eastman Chemical Co. | | | 1,715 | |
| | 33 | | | EI du Pont de Nemours & Co. | | | 2,386 | |
| | 2 | | | Monsanto Co. | | | 226 | |
| | 42 | | | Mosaic Co. (The) (o) | | | 1,244 | |
| | | | | | | | |
| | | | | | | 6,634 | |
| | | | | | | | |
| | | | Construction Materials — 0.2% | |
| | 2 | | | Martin Marietta Materials, Inc. (o) | | | 431 | |
| | | | | | | | |
| | | | Containers & Packaging — 0.5% | |
| | 12 | | | Crown Holdings, Inc. (a) | | | 623 | |
| | 10 | | | Sealed Air Corp. | | | 458 | |
| | 12 | | | WestRock Co. | | | 627 | |
| | | | | | | | |
| | | | | | | 1,708 | |
| | | | | | | | |
| | | | Metals & Mining — 0.1% | |
| | 8 | | | Newmont Mining Corp. | | | 274 | |
| | 3 | | | United States Steel Corp. | | | 99 | |
| | | | | | | | |
| | | | | | | 373 | |
| | | | | | | | |
| | | | Total Materials | | | 9,146 | |
| | | | | | | | |
| | | | Real Estate — 2.3% | |
| | | | Equity Real Estate Investment Trusts (REITs) — 2.3% | |
| | 1 | | | American Tower Corp. | | | 147 | |
| | 7 | | | AvalonBay Communities, Inc. | | | 1,327 | |
| | 7 | | | Brixmor Property Group, Inc. | | | 180 | |
| | 1 | | | Camden Property Trust | | | 99 | |
| | 2 | | | Equinix, Inc. | | | 777 | |
| | 1 | | | Essex Property Trust, Inc. | | | 306 | |
| | | | | | | | |
| SHARES | | | SECURITY DESCRIPTION | | VALUE($) | |
| | | | | | | | |
| | | | Equity Real Estate Investment Trusts (REITs) — continued | |
| | 16 | | | HCP, Inc. | | | 488 | |
| | 25 | | | Kimco Realty Corp. | | | 626 | |
| | 8 | | | Liberty Property Trust | | | 329 | |
| | 1 | | | Macerich Co. (The) | | | 65 | |
| | 16 | | | Prologis, Inc. | | | 860 | |
| | 1 | | | Public Storage | | | 313 | |
| | 4 | | | Regency Centers Corp. | | | 246 | |
| | 6 | | | Simon Property Group, Inc. (o) | | | 1,014 | |
| | 4 | | | SL Green Realty Corp. | | | 454 | |
| | 13 | | | Spirit Realty Capital, Inc. | | | 142 | |
| | 14 | | | STORE Capital Corp. | | | 334 | |
| | | | | | | | |
| | | | Total Real Estate | | | 7,707 | |
| | | | | | | | |
| | | | Telecommunication Services — 1.7% | |
| | | | Diversified Telecommunication Services — 1.7% | |
| | 84 | | | AT&T, Inc. | | | 3,582 | |
| | 9 | | | CenturyLink, Inc. | | | 204 | |
| | 32 | | | Verizon Communications, Inc. | | | 1,695 | |
| | | | | | | | |
| | | | | | | 5,481 | |
| | | | | | | | |
| | | | Wireless Telecommunication Services — 0.0% (g) | |
| | 3 | | | T-Mobile US, Inc. (a) | | | 185 | |
| | | | | | | | |
| | | | Total Telecommunication Services | | | 5,666 | |
| | | | | | | | |
| | | | Utilities — 3.0% | |
| | | | Electric Utilities — 2.3% | |
| | 21 | | | Edison International | | | 1,534 | |
| | 7 | | | FirstEnergy Corp. | | | 208 | |
| | 20 | | | NextEra Energy, Inc. | | | 2,429 | |
| | 29 | | | PG&E Corp. | | | 1,778 | |
| | 7 | | | Pinnacle West Capital Corp. | | | 561 | |
| | 28 | | | Xcel Energy, Inc. | | | 1,121 | |
| | | | | | | | |
| | | | | | | 7,631 | |
| | | | | | | | |
| | | | Multi-Utilities — 0.7% | |
| | 24 | | | Ameren Corp. | | | 1,270 | |
| | 25 | | | CMS Energy Corp. | | | 1,020 | |
| | | | | | | | |
| | | | | | | 2,290 | |
| | | | | | | | |
| | | | Total Utilities | | | 9,921 | |
| | | | | | | | |
| | | | Total Common Stocks
(Cost $274,484) | | | 317,365 | |
| | | | | | | | |
| | |
NUMBER OF
CONTRACTS | | | | | | |
| | Option Purchased — 1.3% | | | | |
| | | | Put Option Purchased — 1.3% | |
| | 1,452 | | | S&P 500 Index, expiring 03/31/17 at $2,115.00, European Style
(Cost $4,360) | | | 4,320 | |
| | | | | | | | |
SEE NOTES TO FINANCIAL STATEMENTS.
| | | | | | |
| | | |
| 38 | | | | J.P. MORGAN LARGE CAP FUNDS | | DECEMBER 31, 2016 |
| | | | | | | | |
| SHARES | | | SECURITY DESCRIPTION | | VALUE($) | |
| | Short-Term Investments — 2.7% | | | | |
| | | | U.S. Treasury Obligation — 0.0% (g) | |
| | 80 | | | U.S. Treasury Bill, 0.456%,
03/30/17 (k) (n) | | | 80 | |
| | | | | | | | |
| | | | Investment Company — 2.7% | |
| | 8,687 | | | JPMorgan U.S. Government Money Market Fund, Institutional Class Shares,
0.410% (b) (l) | | | 8,687 | |
| | | | | | | | |
| | | | Total Short-Term Investments
(Cost $8,768) | | | 8,767 | |
| | | | | | | | |
| | | | Total Investments — 101.1%
(Cost $287,612) | | | 330,452 | |
| | | | Liabilities in Excess of
Other Assets — (1.1)% | | | (3,514 | ) |
| | | | | | | | |
| | | | NET ASSETS — 100.0% | | $ | 326,938 | |
| | | | | | | | |
Percentages indicated are based on net assets.
| | | | | | | | | | | | | | | | | | | | |
| Futures Contracts | |
NUMBER OF
CONTRACTS | | | DESCRIPTION | | EXPIRATION
DATE | | | TRADING
CURRENCY | | | NOTIONAL
VALUE AT
DECEMBER 31, 2016 | | | NET UNREALIZED
APPRECIATION
(DEPRECIATION) | |
| | | | Long Futures Outstanding | | | | | | | | | | | | | | | | |
| | 81 | | | E-mini S&P 500 | | | 03/17/17 | | | | USD | | | $ | 9,057 | | | $ | (65 | ) |
| | | | | | | | | | | | | | | | | | | | |
OPTIONS WRITTEN
| | | | | | | | | | | | | | | | |
| Call Option Written | |
| DESCRIPTION | | EXERCISE
PRICE | | | EXPIRATION
DATE | | | NUMBER OF
CONTRACTS | | | VALUE | |
S&P 500 Index, European Style (Premiums received of $3,597) | | $ | 2,305.000 | | | | 3/31/17 | | | | 1,452 | | | $ | (3,565 | ) |
| | | | | | | | | | | | | | | | |
|
| Put Option Written | |
| DESCRIPTION | | EXERCISE
PRICE | | | EXPIRATION
DATE | | | NUMBER OF
CONTRACTS | | | VALUE | |
S&P 500 Index, European Style (Premiums received of $678) | | $ | 1,775.000 | | | | 3/31/17 | | | | 1,452 | | | $ | (646 | ) |
| | | | | | | | | | | | | | | | |
SEE NOTES TO FINANCIAL STATEMENTS.
| | | | | | | | |
| | | |
| DECEMBER 31, 2016 | | J.P. MORGAN LARGE CAP FUNDS | | | | | 39 | |
JPMorgan Large Cap Growth Fund
SCHEDULE OF PORTFOLIO INVESTMENTS
AS OF DECEMBER 31, 2016 (Unaudited)
(Amounts in thousands)
| | | | | | | | |
| SHARES | | | SECURITY DESCRIPTION | | VALUE($) | |
| Common Stocks — 99.3% | |
| | | | Consumer Discretionary — 21.2% | |
| | | | Automobiles — 0.6% | |
| | 361 | | | Tesla Motors, Inc. (a) | | | 77,206 | |
| | | | | | | | |
| | | | Hotels, Restaurants & Leisure — 1.3% | |
| | 1,272 | | | Las Vegas Sands Corp. | | | 67,959 | |
| | 1,547 | | | Starbucks Corp. | | | 85,872 | |
| | | | | | | | |
| | | | | | | 153,831 | |
| | | | | | | | |
| | | | Household Durables — 0.8% | |
| | 2,157 | | | Newell Brands, Inc. | | | 96,328 | |
| | | | | | | | |
| | | | Internet & Direct Marketing Retail — 8.1% | |
| | 819 | | | Amazon.com, Inc. (a) | | | 614,248 | |
| | 1,483 | | | Netflix, Inc. (a) | | | 183,633 | |
| | 113 | | | Priceline Group, Inc. (The) (a) | | | 165,518 | |
| | | | | | | | |
| | | | | | | 963,399 | |
| | | | | | | | |
| | | | Media — 3.0% | |
| | 5,189 | | | Comcast Corp., Class A | | | 358,293 | |
| | | | | | | | |
| | | | Specialty Retail — 7.4% | |
| | 3,332 | | | Home Depot, Inc. (The) | | | 446,795 | |
| | 2,301 | | | Ross Stores, Inc. | | | 150,926 | |
| | 1,148 | | | Ulta Salon Cosmetics & Fragrance, Inc. (a) | | | 292,671 | |
| | | | | | | | |
| | | | | | | 890,392 | |
| | | | | | | | |
| | | | Total Consumer Discretionary | | | 2,539,449 | |
| | | | | | | | |
| | | | Consumer Staples — 4.1% | |
| | | | Beverages — 2.1% | |
| | 668 | | | Constellation Brands, Inc., Class A | | | 102,426 | |
| | 3,299 | | | Monster Beverage Corp. (a) | | | 146,291 | |
| | | | | | | | |
| | | | | | | 248,717 | |
| | | | | | | | |
| | | | Food & Staples Retailing — 0.9% | |
| | 1,507 | | | Wal-Mart Stores, Inc. | | | 104,192 | |
| | | | | | | | |
| | | | Tobacco — 1.1% | |
| | 2,365 | | | Reynolds American, Inc. | | | 132,529 | |
| | | | | | | | |
| | | | Total Consumer Staples | | | 485,438 | |
| | | | | | | | |
| | | | Energy — 1.0% | |
| | | | Oil, Gas & Consumable Fuels — 1.0% | |
| | 655 | | | Pioneer Natural Resources Co. | | | 117,946 | |
| | | | | | | | |
| | | | Financials — 6.1% | |
| | | | Capital Markets — 6.1% | |
| | 7,595 | | | Charles Schwab Corp. (The) | | | 299,782 | |
| | 2,743 | | | Intercontinental Exchange, Inc. | | | 154,771 | |
| | 896 | | | Moody’s Corp. | | | 84,438 | |
| | 1,424 | | | Morgan Stanley | | | 60,181 | |
| | 1,222 | | | S&P Global, Inc. | | | 131,414 | |
| | | | | | | | |
| | | | Total Financials | | | 730,586 | |
| | | | | | | | |
| | | | | | | | |
| SHARES | | | SECURITY DESCRIPTION | | VALUE($) | |
| | | | | | | | |
| | | | Health Care — 12.7% | |
| | | | Biotechnology — 3.4% | |
| | 474 | | | Celgene Corp. (a) | | | 54,877 | |
| | 2,648 | | | Gilead Sciences, Inc. | | | 189,638 | |
| | 328 | | | Incyte Corp. (a) | | | 32,889 | |
| | 210 | | | Regeneron Pharmaceuticals, Inc. (a) | | | 76,979 | |
| | 686 | | | Vertex Pharmaceuticals, Inc. (a) | | | 50,515 | |
| | | | | | | | |
| | | | | | | 404,898 | |
| | | | | | | | |
| | | | Health Care Equipment & Supplies — 5.4% | |
| | 1,053 | | | Becton Dickinson and Co. | | | 174,258 | |
| | 8,543 | | | Boston Scientific Corp. (a) | | | 184,789 | |
| | 453 | | | Intuitive Surgical, Inc. (a) | | | 287,279 | |
| | | | | | | | |
| | | | | | | 646,326 | |
| | | | | | | | |
| | | | Health Care Providers & Services — 1.4% | |
| | 244 | | | Humana, Inc. | | | 49,783 | |
| | 710 | | | UnitedHealth Group, Inc. | | | 113,645 | |
| | | | | | | | |
| | | | | | | 163,428 | |
| | | | | | | | |
| | | | Life Sciences Tools & Services — 1.9% | |
| | 698 | | | Illumina, Inc. (a) | | | 89,346 | |
| | 997 | | | Thermo Fisher Scientific, Inc. | | | 140,671 | |
| | | | | | | | |
| | | | | | | 230,017 | |
| | | | | | | | |
| | | | Pharmaceuticals — 0.6% | |
| | 598 | | | Johnson & Johnson | | | 68,861 | |
| | | | | | | | |
| | | | Total Health Care | | | 1,513,530 | |
| | | | | | | | |
| | | | Industrials — 8.2% | |
| | | | Aerospace & Defense — 1.2% | |
| | 601 | | | Northrop Grumman Corp. | | | 139,850 | |
| | | | | | | | |
| | | | Air Freight & Logistics — 0.0% (g) | |
| | 5 | | | FedEx Corp. | | | 931 | |
| | | | | | | | |
| | | | Airlines — 3.6% | |
| | 6,691 | | | Delta Air Lines, Inc. | | | 329,140 | |
| | 1,989 | | | Southwest Airlines Co. | | | 99,142 | |
| | | | | | | | |
| | | | | | | 428,282 | |
| | | | | | | | |
| | | | Electrical Equipment — 1.0% | |
| | 545 | | | Acuity Brands, Inc. | | | 125,772 | |
| | | | | | | | |
| | | | Industrial Conglomerates — 2.4% | |
| | 1,371 | | | Honeywell International, Inc. | | | 158,842 | |
| | 700 | | | Roper Technologies, Inc. | | | 128,138 | |
| | | | | | | | |
| | | | | | | 286,980 | |
| | | | | | | | |
| | | | Total Industrials | | | 981,815 | |
| | | | | | | | |
| | | | Information Technology — 41.1% | |
| | | | Electronic Equipment, Instruments & Components — 0.4% | |
| | 672 | | | Amphenol Corp., Class A | | | 45,138 | |
| | | | | | | | |
SEE NOTES TO FINANCIAL STATEMENTS.
| | | | | | |
| | | |
| 40 | | | | J.P. MORGAN LARGE CAP FUNDS | | DECEMBER 31, 2016 |
| | | | | | | | |
| SHARES | | | SECURITY DESCRIPTION | | VALUE($) | |
| Common Stocks — continued | |
| | | | Internet Software & Services — 10.2% | |
| | 924 | | | Alphabet, Inc., Class C (a) | | | 713,441 | |
| | 3,156 | | | Facebook, Inc., Class A (a) | | | 363,052 | |
| | 525 | | | MercadoLibre, Inc., (Argentina) | | | 82,020 | |
| | 777 | | | VeriSign, Inc. (a) | | | 59,122 | |
| | | | | | | | |
| | | | | | | 1,217,635 | |
| | | | | | | | |
| | | | IT Services — 8.9% | |
| | 1,025 | | | Accenture plc, Class A | | | 120,000 | |
| | 470 | | | Cognizant Technology Solutions Corp., Class A (a) | | | 26,323 | |
| | 3,904 | | | Mastercard, Inc., Class A | | | 403,129 | |
| | 2,760 | | | PayPal Holdings, Inc. (a) | | | 108,925 | |
| | 3,168 | | | Vantiv, Inc., Class A (a) | | | 188,882 | |
| | 2,817 | | | Visa, Inc., Class A | | | 219,759 | |
| | | | | | | | |
| | | | | | | 1,067,018 | |
| | | | | | | | |
| | | | Semiconductors & Semiconductor Equipment — 7.9% | |
| | 5,007 | | | Applied Materials, Inc. | | | 161,563 | |
| | 1,464 | | | Broadcom Ltd., (Singapore) | | | 258,703 | |
| | 4,140 | | | NVIDIA Corp. | | | 441,904 | |
| | 851 | | | NXP Semiconductors NV, (Netherlands) (a) | | | 83,377 | |
| | | | | | | | |
| | | | | | | 945,547 | |
| | | | | | | | |
| | | | Software — 10.3% | |
| | 5,374 | | | Activision Blizzard, Inc. | | | 194,059 | |
| | 2,238 | | | Adobe Systems, Inc. (a) | | | 230,402 | |
| | 2,051 | | | Electronic Arts, Inc. (a) | | | 161,552 | |
| | 5,434 | | | Microsoft Corp. | | | 337,656 | |
| | 1,256 | | | salesforce.com, Inc. (a) | | | 85,958 | |
| | 2,447 | | | ServiceNow, Inc. (a) | | | 181,903 | |
| | 769 | | | Splunk, Inc. (a) | | | 39,314 | |
| | | | | | | | |
| | | | | | | 1,230,844 | |
| | | | | | | | |
| | | | | | | | |
| SHARES | | | SECURITY DESCRIPTION | | VALUE($) | |
| | | | | | | | |
| | | | Technology Hardware, Storage & Peripherals — 3.4% | |
| | 3,481 | | | Apple, Inc. | | | 403,215 | |
| | | | | | | | |
| | | | Total Information Technology | | | 4,909,397 | |
| | | | | | | | |
| | | | Materials — 4.3% | |
| | | | Chemicals — 2.7% | |
| | 1,193 | | | Ecolab, Inc. | | | 139,809 | |
| | 476 | | | LyondellBasell Industries NV, Class A | | | 40,857 | |
| | 509 | | | Sherwin-Williams Co. (The) | | | 136,681 | |
| | | | | | | | |
| | | | | | | 317,347 | |
| | | | | | | | |
| | | | Construction Materials — 1.6% | |
| | 1,540 | | | Vulcan Materials Co. | | | 192,681 | |
| | | | | | | | |
| | | | Total Materials | | | 510,028 | |
| | | | | | | | |
| | | | Real Estate — 0.6% | |
| | | | Equity Real Estate Investment Trusts (REITs) — 0.6% | |
| | 221 | | | Equinix, Inc. | | | 78,988 | |
| | | | | | | | |
| | | | Total Common Stocks
(Cost $8,222,354) | | | 11,867,177 | |
| | | | | | | | |
| Short-Term Investment — 1.0% | | | | |
| | | | Investment Company — 1.0% | |
| | 119,519 | | | JPMorgan U.S. Government Money Market Fund, Institutional Class Shares,
0.410% (b) (l)
(Cost $119,519) | | | 119,519 | |
| | | | | | | | |
| | | | Total Investments — 100.3%
(Cost $8,341,873) | | | 11,986,696 | |
| | | | Liabilities in Excess of
Other Assets — (0.3)% | | | (37,920 | ) |
| | | | | | | | |
| | | | NET ASSETS — 100.0% | | $ | 11,948,776 | |
| | | | | | | | |
Percentages indicated are based on net assets.
SEE NOTES TO FINANCIAL STATEMENTS.
| | | | | | | | |
| | | |
| DECEMBER 31, 2016 | | J.P. MORGAN LARGE CAP FUNDS | | | | | 41 | |
JPMorgan Large Cap Value Fund
SCHEDULE OF PORTFOLIO INVESTMENTS
AS OF DECEMBER 31, 2016 (Unaudited)
(Amounts in thousands)
| | | | | | | | |
| SHARES | | | SECURITY DESCRIPTION | | VALUE($) | |
| Common Stocks — 97.5% | |
| | | | Consumer Discretionary — 22.2% | |
| | | | Auto Components — 2.7% | |
| | 127 | | | BorgWarner, Inc. | | | 5,021 | |
| | 90 | | | Delphi Automotive plc | | | 6,061 | |
| | 90 | | | Goodyear Tire & Rubber Co. (The) | | | 2,763 | |
| | 118 | | | Magna International, Inc., (Canada) | | | 5,104 | |
| | 53 | | | Tenneco, Inc. (a) | | | 3,298 | |
| | | | | | | | |
| | | | | | | 22,247 | |
| | | | | | | | |
| | | | Automobiles — 3.8% | |
| | 899 | | | General Motors Co. | | | 31,322 | |
| | | | | | | | |
| | | | Hotels, Restaurants & Leisure — 5.1% | |
| | 329 | | | Arcos Dorados Holdings, Inc., (Uruguay), Class A (a) | | | 1,777 | |
| | 147 | | | Bloomin’ Brands, Inc. | | | 2,645 | |
| | 200 | | | Carnival Corp. | | | 10,417 | |
| | 47 | | | DineEquity, Inc. | | | 3,604 | |
| | 284 | | | Royal Caribbean Cruises Ltd. | | | 23,299 | |
| | | | | | | | |
| | | | | | | 41,742 | |
| | | | | | | | |
| | | | Household Durables — 4.6% | |
| | 114 | | | CalAtlantic Group, Inc. | | | 3,877 | |
| | 217 | | | DR Horton, Inc. | | | 5,939 | |
| | 57 | | | MDC Holdings, Inc. | | | 1,472 | |
| | 41 | | | Mohawk Industries, Inc. (a) | | | 8,207 | |
| | 99 | | | PulteGroup, Inc. | | | 1,827 | |
| | 406 | | | Toll Brothers, Inc. (a) | | | 12,577 | |
| | 18 | | | Whirlpool Corp. | | | 3,290 | |
| | | | | | | | |
| | | | | | | 37,189 | |
| | | | | | | | |
| | | | Leisure Products — 1.4% | |
| | 203 | | | Brunswick Corp. | | | 11,055 | |
| | | | | | | | |
| | | | Media — 4.1% | |
| | 14 | | | Charter Communications, Inc., Class A (a) | | | 3,890 | |
| | 56 | | | Comcast Corp., Class A | | | 3,860 | |
| | 342 | | | DISH Network Corp., Class A (a) | | | 19,801 | |
| | 103 | | | Twenty-First Century Fox, Inc., Class A | | | 2,899 | |
| | 27 | | | Walt Disney Co. (The) | | | 2,772 | |
| | | | | | | | |
| | | | | | | 33,222 | |
| | | | | | | | |
| | | | Specialty Retail — 0.5% | |
| | 54 | | | Lowe’s Cos., Inc. | | | 3,819 | |
| | | | | | | | |
| | | | Total Consumer Discretionary | | | 180,596 | |
| | | | | | | | |
| | | | Consumer Staples — 3.3% | |
| | | | Beverages — 0.9% | |
| | 75 | | | Molson Coors Brewing Co., Class B | | | 7,328 | |
| | | | | | | | |
| | | | Food & Staples Retailing — 2.4% | |
| | 333 | | | Kroger Co. (The) | | | 11,488 | |
| | | | | | | | |
| SHARES | | | SECURITY DESCRIPTION | | VALUE($) | |
| | | | | | | | |
| | | | Food & Staples Retailing — continued | |
| | 94 | | | Walgreens Boots Alliance, Inc. | | | 7,763 | |
| | | | | | | | |
| | | | | | | 19,251 | |
| | | | | | | | |
| | | | Total Consumer Staples | | | 26,579 | |
| | | | | | | | |
| | | | Energy — 12.4% | |
| | | | Energy Equipment & Services — 1.0% | |
| | 95 | | | Schlumberger Ltd. | | | 7,942 | |
| | | | | | | | |
| | | | Oil, Gas & Consumable Fuels — 11.4% | |
| | 208 | | | Cabot Oil & Gas Corp. | | | 4,866 | |
| | 81 | | | Chevron Corp. | | | 9,569 | |
| | 150 | | | ConocoPhillips | | | 7,531 | |
| | 69 | | | Diamondback Energy, Inc. (a) | | | 6,963 | |
| | 88 | | | EOG Resources, Inc. | | | 8,937 | |
| | 84 | | | EQT Corp. | | | 5,500 | |
| | 86 | | | Marathon Petroleum Corp. | | | 4,310 | |
| | 128 | | | Occidental Petroleum Corp. | | | 9,132 | |
| | 71 | | | Pioneer Natural Resources Co. | | | 12,713 | |
| | 251 | | | Suncor Energy, Inc., (Canada) | | | 8,199 | |
| | 37 | | | Tesoro Corp. | | | 3,227 | |
| | 176 | | | Valero Energy Corp. | | | 12,017 | |
| | | | | | | | |
| | | | | | | 92,964 | |
| | | | | | | | |
| | | | Total Energy | | | 100,906 | |
| | | | | | | | |
| | | | Financials — 30.7% | |
| | | | Banks — 16.8% | |
| | 965 | | | Bank of America Corp. | | | 21,329 | |
| | 85 | | | BB&T Corp. | | | 4,015 | |
| | 626 | | | Citigroup, Inc. | | | 37,199 | |
| | 114 | | | East West Bancorp, Inc. | | | 5,805 | |
| | 302 | | | Huntington Bancshares, Inc. | | | 3,998 | |
| | 542 | | | ING Groep NV, (Netherlands), ADR | | | 7,642 | |
| | 879 | | | KeyCorp | | | 16,055 | |
| | 336 | | | Regions Financial Corp. | | | 4,826 | |
| | 19 | | | SVB Financial Group (a) | | | 3,176 | |
| | 588 | | | Wells Fargo & Co. | | | 32,425 | |
| | | | | | | | |
| | | | | | | 136,470 | |
| | | | | | | | |
| | | | Capital Markets — 3.7% | |
| | 34 | | | Ameriprise Financial, Inc. | | | 3,717 | |
| | 237 | | | Charles Schwab Corp. (The) | | | 9,358 | |
| | 40 | | | Goldman Sachs Group, Inc. (The) | | | 9,506 | |
| | 188 | | | Morgan Stanley | | | 7,926 | |
| | | | | | | | |
| | | | | | | 30,507 | |
| | | | | | | | |
| | | | Consumer Finance — 3.0% | |
| | 154 | | | Ally Financial, Inc. | | | 2,927 | |
| | 97 | | | Capital One Financial Corp. | | | 8,488 | |
SEE NOTES TO FINANCIAL STATEMENTS.
| | | | | | |
| | | |
| 42 | | | | J.P. MORGAN LARGE CAP FUNDS | | DECEMBER 31, 2016 |
| | | | | | | | |
| SHARES | | | SECURITY DESCRIPTION | | VALUE($) | |
| Common Stocks — continued | |
| | | | Consumer Finance — continued | |
| | 73 | | | LendingClub Corp. (a) | | | 384 | |
| | 337 | | | Synchrony Financial | | | 12,227 | |
| | | | | | | | |
| | | | | | | 24,026 | |
| | | | | | | | |
| | | | Diversified Financial Services — 1.4% | |
| | 68 | | | Berkshire Hathaway, Inc., Class B (a) | | | 11,148 | |
| | | | | | | | |
| | | | Insurance — 5.2% | |
| | 120 | | | American International Group, Inc. | | | 7,824 | |
| | 68 | | | Arthur J Gallagher & Co. | | | 3,528 | |
| | 134 | | | Hartford Financial Services Group, Inc. (The) | | | 6,395 | |
| | 84 | | | Lincoln National Corp. | | | 5,573 | |
| | 211 | | | MetLife, Inc. | | | 11,383 | |
| | 76 | | | Prudential Financial, Inc. | | | 7,940 | |
| | | | | | | | |
| | | | | | | 42,643 | |
| | | | | | | | |
| | | | Thrifts & Mortgage Finance — 0.6% | |
| | 100 | | | BofI Holding, Inc. (a) | | | 2,852 | |
| | 198 | | | MGIC Investment Corp. (a) | | | 2,020 | |
| | | | | | | | |
| | | | | | | 4,872 | |
| | | | | | | | |
| | | | Total Financials | | | 249,666 | |
| | | | | | | | |
| | | | Health Care — 8.5% | |
| | | | Biotechnology — 1.6% | |
| | 25 | | | Alexion Pharmaceuticals, Inc. (a) | | | 3,071 | |
| | 105 | | | Gilead Sciences, Inc. | | | 7,526 | |
| | 33 | | | Vertex Pharmaceuticals, Inc. (a) | | | 2,402 | |
| | | | | | | | |
| | | | | | | 12,999 | |
| | | | | | | | |
| | | | Health Care Equipment & Supplies — 0.5% | |
| | 41 | | | Zimmer Biomet Holdings, Inc. | | | 4,210 | |
| | | | | | | | |
| | | | Health Care Providers & Services — 3.0% | |
| | 101 | | | Aetna, Inc. | | | 12,525 | |
| | 49 | | | Anthem, Inc. | | | 6,973 | |
| | 24 | | | Humana, Inc. | | | 4,815 | |
| | | | | | | | |
| | | | | | | 24,313 | |
| | | | | | | | |
| | | | Pharmaceuticals — 3.4% | |
| | 30 | | | Allergan plc (a) | | | 6,321 | |
| | 660 | | | Pfizer, Inc. | | | 21,434 | |
| | | | | | | | |
| | | | | | | 27,755 | |
| | | | | | | | |
| | | | Total Health Care | | | 69,277 | |
| | | | | | | | |
| | | | Industrials — 7.3% | |
| | | | Aerospace & Defense — 2.0% | |
| | 47 | | | General Dynamics Corp. | | | 8,063 | |
| | 168 | | | Textron, Inc. | | | 8,163 | |
| | | | | | | | |
| | | | | | | 16,226 | |
| | | | | | | | |
| | | | | | | | |
| SHARES | | | SECURITY DESCRIPTION | | VALUE($) | |
| | | | | | | | |
| | | | Airlines — 4.7% | |
| | 123 | | | Delta Air Lines, Inc. | | | 6,045 | |
| | 388 | | | Southwest Airlines Co. | | | 19,313 | |
| | 157 | | | Spirit Airlines, Inc. (a) | | | 9,090 | |
| | 55 | | | United Continental Holdings, Inc. (a) | | | 3,972 | |
| | | | | | | | |
| | | | | | | 38,420 | |
| | | | | | | | |
| | | | Building Products — 0.3% | |
| | 79 | | | USG Corp. (a) | | | 2,270 | |
| | | | | | | | |
| | | | Machinery — 0.3% | |
| | 32 | | | Ingersoll-Rand plc | | | 2,402 | |
| | | | | | | | |
| | | | Total Industrials | | | 59,318 | |
| | | | | | | | |
| | | | Information Technology — 6.1% | |
| | | | Electronic Equipment, Instruments & Components — 0.5% | |
| | 54 | | | TE Connectivity Ltd. | | | 3,707 | |
| | | | | | | | |
| | | | Internet Software & Services — 0.3% | |
| | 93 | | | eBay, Inc. (a) | | | 2,758 | |
| | | | | | | | |
| | | | IT Services — 1.1% | |
| | 54 | | | International Business Machines Corp. | | | 8,963 | |
| | | | | | | | |
| | | | Semiconductors & Semiconductor Equipment — 2.8% | |
| | 32 | | | Analog Devices, Inc. | | | 2,353 | |
| | 94 | | | Broadcom Ltd., (Singapore) | | | 16,555 | |
| | 39 | | | Lam Research Corp. | | | 4,102 | |
| | | | | | | | |
| | | | | | | 23,010 | |
| | | | | | | | |
| | | | Software — 0.5% | |
| | 62 | | | Microsoft Corp. | | | 3,853 | |
| | | | | | | | |
| | | | Technology Hardware, Storage & Peripherals — 0.9% | |
| | 107 | | | Western Digital Corp. | | | 7,291 | |
| | | | | | | | |
| | | | Total Information Technology | | | 49,582 | |
| | | | | | | | |
| | | | Materials — 3.2% | |
| | | | Chemicals — 2.4% | |
| | 72 | | | Dow Chemical Co. (The) | | | 4,108 | |
| | 101 | | | Eastman Chemical Co. | | | 7,619 | |
| | 97 | | | Methanex Corp., (Canada) | | | 4,236 | |
| | 60 | | | Westlake Chemical Corp. | | | 3,348 | |
| | | | | | | | |
| | | | | | | 19,311 | |
| | | | | | | | |
| | | | Metals & Mining — 0.8% | |
| | 55 | | | Reliance Steel & Aluminum Co. | | | 4,335 | |
| | 68 | | | United States Steel Corp. | | | 2,235 | |
| | | | | | | | |
| | | | | | | 6,570 | |
| | | | | | | | |
| | | | Total Materials | | | 25,881 | |
| | | | | | | | |
| | | | Real Estate — 1.0% | |
| | | | Equity Real Estate Investment Trusts (REITs) — 1.0% | |
| | 21 | | | AvalonBay Communities, Inc. | | | 3,791 | |
SEE NOTES TO FINANCIAL STATEMENTS.
| | | | | | | | |
| | | |
| DECEMBER 31, 2016 | | J.P. MORGAN LARGE CAP FUNDS | | | | | 43 | |
JPMorgan Large Cap Value Fund
SCHEDULE OF PORTFOLIO INVESTMENTS
AS OF DECEMBER 31, 2016 (Unaudited) (continued)
(Amounts in thousands)
| | | | | | | | |
| SHARES | | | SECURITY DESCRIPTION | | VALUE($) | |
| Common Stocks — continued | |
| | | | Equity Real Estate Investment Trusts (REITs) — continued | |
| | 175 | | | Brixmor Property Group, Inc. | | | 4,278 | |
| | | | | | | | |
| | | | Total Real Estate | | | 8,069 | |
| | | | | | | | |
| | | | Telecommunication Services — 2.8% | |
| | | | Diversified Telecommunication Services — 2.3% | |
| | 438 | | | AT&T, Inc. | | | 18,632 | |
| | | | | | | | |
| | | | Wireless Telecommunication Services — 0.5% | |
| | 71 | | | T-Mobile US, Inc. (a) | | | 4,074 | |
| | | | | | | | |
| | | | Total Telecommunication Services | | | 22,706 | |
| | | | | | | | |
| | | | Total Common Stocks
(Cost $645,699) | | | 792,580 | |
| | | | | | | | |
| | |
NUMBER OF
WARRANTS | | | | | | |
| Warrant — 0.0% (g) | | | | |
| | | | Financials — 0.0% (g) | |
| | | | Consumer Finance — 0.0% (g) | |
| | 36 | | | Emergent Capital, Inc., expiring 10/01/19 (Strike Price $10.75) (a)
(Cost $—) | | | — | (h) |
| | | | | | | | |
| | | | | | | | |
| SHARES | | | SECURITY DESCRIPTION | | VALUE($) | |
| Short-Term Investment — 2.7% | | | | |
| | | | Investment Company — 2.7% | |
| | 22,367 | | | JPMorgan U.S. Government Money Market Fund, Institutional Class Shares, 0.410% (b) (l) (Cost $22,367) | | | 22,367 | |
| | | | | | | | |
| | | | Total Investments — 100.2%
(Cost $668,066) | | | 814,947 | |
| | | | Liabilities in Excess of
Other Assets — (0.2)% | | | (1,263 | ) |
| | | | | | | | |
| | | | NET ASSETS — 100.0% | | $ | 813,684 | |
| | | | | | | | |
Percentages indicated are based on net assets.
SEE NOTES TO FINANCIAL STATEMENTS.
| | | | | | |
| | | |
| 44 | | | | J.P. MORGAN LARGE CAP FUNDS | | DECEMBER 31, 2016 |
JPMorgan U.S. Equity Fund
SCHEDULE OF PORTFOLIO INVESTMENTS
AS OF DECEMBER 31, 2016 (Unaudited)
(Amounts in thousands)
| | | | | | | | |
| SHARES | | | SECURITY DESCRIPTION | | VALUE($) | |
| Common Stocks — 99.6% | |
| | | | Consumer Discretionary — 13.6% | |
| | | | Auto Components — 0.5% | |
| | 862 | | | Delphi Automotive plc | | | 58,070 | |
| | | | | | | | |
| | | | Automobiles — 0.9% | |
| | 3,078 | | | General Motors Co. | | | 107,241 | |
| | | | | | | | |
| | | | Hotels, Restaurants & Leisure — 1.2% | |
| | 194 | | | Carnival Corp. | | | 10,098 | |
| | 534 | | | Royal Caribbean Cruises Ltd. | | | 43,846 | |
| | 1,620 | | | Starbucks Corp. | | | 89,953 | |
| | 47 | | | Yum! Brands, Inc. | | | 2,986 | |
| | | | | | | | |
| | | | | | | 146,883 | |
| | | | | | | | |
| | | | Household Durables — 0.6% | |
| | 526 | | | DR Horton, Inc. | | | 14,362 | |
| | 44 | | | Harman International Industries, Inc. | | | 4,943 | |
| | 99 | | | Mohawk Industries, Inc. (a) | | | 19,751 | |
| | 601 | | | PulteGroup, Inc. | | | 11,049 | |
| | 653 | | | Toll Brothers, Inc. (a) | | | 20,255 | |
| | 64 | | | Whirlpool Corp. | | | 11,586 | |
| | | | | | | | |
| | | | | | | 81,946 | |
| | | | | | | | |
| | | | Internet & Direct Marketing Retail — 1.7% | |
| | 288 | | | Amazon.com, Inc. (a) | | | 216,303 | |
| | | | | | | | |
| | | | Media — 5.0% | |
| | 336 | | | Charter Communications, Inc., Class A (a) | | | 96,827 | |
| | 1,834 | | | Comcast Corp., Class A | | | 126,669 | |
| | 1,480 | | | DISH Network Corp., Class A (a) | | | 85,759 | |
| | 527 | | | Time Warner, Inc. | | | 50,832 | |
| | 175 | | | Time, Inc. | | | 3,132 | |
| | 1,186 | | | Twenty-First Century Fox, Inc., Class A | | | 33,244 | |
| | 469 | | | Twenty-First Century Fox, Inc., Class B | | | 12,792 | |
| | 1,982 | | | Walt Disney Co. (The) | | | 206,524 | |
| | | | | | | | |
| | | | | | | 615,779 | |
| | | | | | | | |
| | | | Specialty Retail — 3.7% | |
| | 1,401 | | | Home Depot, Inc. (The) | | | 187,795 | |
| | 1,494 | | | Lowe’s Cos., Inc. | | | 106,251 | |
| | 96 | | | O’Reilly Automotive, Inc. (a) | | | 26,651 | |
| | 1,839 | | | TJX Cos., Inc. (The) | | | 138,186 | |
| | | | | | | | |
| | | | | | | 458,883 | |
| | | | | | | | |
| | | | Total Consumer Discretionary | | | 1,685,105 | |
| | | | | | | | |
| | | | Consumer Staples — 6.9% | |
| | | | Beverages — 3.1% | |
| | 291 | | | Constellation Brands, Inc., Class A | | | 44,636 | |
| | 1,122 | | | Molson Coors Brewing Co., Class B | | | 109,134 | |
| | 2,199 | | | PepsiCo, Inc. | | | 230,046 | |
| | | | | | | | |
| | | | | | | 383,816 | |
| | | | | | | | |
| | | | | | | | |
| SHARES | | | SECURITY DESCRIPTION | | VALUE($) | |
| | | | | | | | |
| | | | Food & Staples Retailing — 1.7% | |
| | 296 | | | Costco Wholesale Corp. | | | 47,466 | |
| | 2,885 | | | Kroger Co. (The) | | | 99,545 | |
| | 696 | | | Walgreens Boots Alliance, Inc. | | | 57,581 | |
| | | | | | | | |
| | | | | | | 204,592 | |
| | | | | | | | |
| | | | Food Products — 1.4% | |
| | 373 | | | Kraft Heinz Co. (The) | | | 32,567 | |
| | 3,179 | | | Mondelez International, Inc., Class A | | | 140,931 | |
| | | | | | | | |
| | | | | | | 173,498 | |
| | | | | | | | |
| | | | Household Products — 0.4% | |
| | 177 | | | Kimberly-Clark Corp. | | | 20,194 | |
| | 375 | | | Procter & Gamble Co. (The) | | | 31,545 | |
| | | | | | | | |
| | | | | | | 51,739 | |
| | | | | | | | |
| | | | Tobacco — 0.3% | |
| | 103 | | | Philip Morris International, Inc. | | | 9,414 | |
| | 441 | | | Reynolds American, Inc. | | | 24,707 | |
| | | | | | | | |
| | | | | | | 34,121 | |
| | | | | | | | |
| | | | Total Consumer Staples | | | 847,766 | |
| | | | | | | | |
| | | | Energy — 7.9% | |
| | | | Energy Equipment & Services — 0.6% | |
| | 876 | | | Schlumberger Ltd. | | | 73,556 | |
| | | | | | | | |
| | | | Oil, Gas & Consumable Fuels — 7.3% | |
| | 960 | | | Anadarko Petroleum Corp. | | | 66,908 | |
| | 404 | | | Apache Corp. | | | 25,617 | |
| | 276 | | | Cabot Oil & Gas Corp. | | | 6,441 | |
| | 819 | | | Cheniere Energy, Inc. (a) | | | 33,918 | |
| | 183 | | | Chevron Corp. | | | 21,587 | |
| | 506 | | | Concho Resources, Inc. (a) | | | 67,075 | |
| | 661 | | | Diamondback Energy, Inc. (a) | | | 66,805 | |
| | 142 | | | Energen Corp. (a) | | | 8,195 | |
| | 2,014 | | | EOG Resources, Inc. | | | 203,656 | |
| | 1,128 | | | EQT Corp. | | | 73,791 | |
| | 1,142 | | | Occidental Petroleum Corp. | | | 81,348 | |
| | 951 | | | Pioneer Natural Resources Co. | | | 171,334 | |
| | 62 | | | Range Resources Corp. | | | 2,144 | |
| | 222 | | | RSP Permian, Inc. (a) | | | 9,906 | |
| | 208 | | | Southwestern Energy Co. (a) | | | 2,254 | |
| | 1,246 | | | TransCanada Corp., (Canada) | | | 56,279 | |
| | | | | | | | |
| | | | | | | 897,258 | |
| | | | | | | | |
| | | | Total Energy | | | 970,814 | |
| | | | | | | | |
| | | | Financials — 16.9% | |
| | | | Banks — 7.1% | |
| | 7,265 | | | Bank of America Corp. | | | 160,567 | |
| | 783 | | | BB&T Corp. | | | 36,813 | |
SEE NOTES TO FINANCIAL STATEMENTS.
| | | | | | | | |
| | | |
| DECEMBER 31, 2016 | | J.P. MORGAN LARGE CAP FUNDS | | | | | 45 | |
JPMorgan U.S. Equity Fund
SCHEDULE OF PORTFOLIO INVESTMENTS
AS OF DECEMBER 31, 2016 (Unaudited) (continued)
(Amounts in thousands)
| | | | | | | | |
| SHARES | | | SECURITY DESCRIPTION | | VALUE($) | |
| Common Stocks — continued | |
| | | | Banks — continued | |
| | 3,710 | | | Citigroup, Inc. | | | 220,510 | |
| | 173 | | | East West Bancorp, Inc. | | | 8,798 | |
| | 1,437 | | | Huntington Bancshares, Inc. | | | 19,002 | |
| | 5,722 | | | KeyCorp | | | 104,546 | |
| | 1,598 | | | Regions Financial Corp. | | | 22,951 | |
| | 1,369 | | | SunTrust Banks, Inc. | | | 75,102 | |
| | 173 | | | SVB Financial Group (a) | | | 29,722 | |
| | 3,234 | | | Wells Fargo & Co. | | | 178,205 | |
| | 307 | | | Zions Bancorp | | | 13,201 | |
| | | | | | | | |
| | | | | | | 869,417 | |
| | | | | | | | |
| | | | Capital Markets — 4.0% | |
| | 80 | | | Ameriprise Financial, Inc. | | | 8,850 | |
| | 826 | | | Bank of New York Mellon Corp. (The) | | | 39,139 | |
| | 37 | | | BlackRock, Inc. | | | 13,955 | |
| | 2,017 | | | Charles Schwab Corp. (The) | | | 79,612 | |
| | 389 | | | Goldman Sachs Group, Inc. (The) | | | 93,208 | |
| | 1,877 | | | Intercontinental Exchange, Inc. | | | 105,922 | |
| | 3,642 | | | Morgan Stanley | | | 153,888 | |
| | | | | | | | |
| | | | | | | 494,574 | |
| | | | | | | | |
| | | | Consumer Finance — 1.0% | |
| | 676 | | | Capital One Financial Corp. | | | 59,004 | |
| | 928 | | | Discover Financial Services | | | 66,927 | |
| | 60 | | | Synchrony Financial | | | 2,158 | |
| | | | | | | | |
| | | | | | | 128,089 | |
| | | | | | | | |
| | | | Insurance — 4.8% | |
| | 288 | | | American International Group, Inc. | | | 18,808 | |
| | 1,463 | | | Arthur J Gallagher & Co. | | | 76,010 | |
| | 1,456 | | | Chubb Ltd. | | | 192,322 | |
| | 41 | | | Everest Re Group Ltd. | | | 8,839 | |
| | 2,017 | | | Hartford Financial Services Group, Inc. (The) | | | 96,102 | |
| | 317 | | | Marsh & McLennan Cos., Inc. | | | 21,405 | |
| | 2,764 | | | MetLife, Inc. | | | 148,964 | |
| | 263 | | | Prudential Financial, Inc. | | | 27,336 | |
| | 119 | | | XL Group Ltd., (Ireland) | | | 4,452 | |
| | | | | | | | |
| | | | | | | 594,238 | |
| | | | | | | | |
| | | | Total Financials | | | 2,086,318 | |
| | | | | | | | |
| | | | Health Care — 14.0% | |
| | | | Biotechnology — 2.3% | |
| | 88 | | | Alexion Pharmaceuticals, Inc. (a) | | | 10,724 | |
| | 300 | | | Biogen, Inc. (a) | | | 85,089 | |
| | 372 | | | BioMarin Pharmaceutical, Inc. (a) | | | 30,809 | |
| | 605 | | | Celgene Corp. (a) | | | 70,082 | |
| | 343 | | | Gilead Sciences, Inc. | | | 24,563 | |
| | | | | | | | |
| SHARES | | | SECURITY DESCRIPTION | | VALUE($) | |
| | | | | | | | |
| | | | Biotechnology — continued | |
| | 12 | | | Incyte Corp. (a) | | | 1,251 | |
| | 951 | | | Vertex Pharmaceuticals, Inc. (a) | | | 70,058 | |
| | | | | | | | |
| | | | | | | 292,576 | |
| | | | | | | | |
| | | | Health Care Equipment & Supplies — 1.4% | |
| | 968 | | | Abbott Laboratories | | | 37,167 | |
| | 6,167 | | | Boston Scientific Corp. (a) | | | 133,402 | |
| | | | | | | | |
| | | | | | | 170,569 | |
| | | | | | | | |
| | | | Health Care Providers & Services — 3.6% | |
| | 656 | | | Aetna, Inc. | | | 81,389 | |
| | 163 | | | Humana, Inc. | | | 33,222 | |
| | 2,056 | | | UnitedHealth Group, Inc. | | | 329,108 | |
| | | | | | | | |
| | | | | | | 443,719 | |
| | | | | | | | |
| | | | Life Sciences Tools & Services — 0.6% | |
| | 1,064 | | | Agilent Technologies, Inc. | | | 48,477 | |
| | 188 | | | Illumina, Inc. (a) | | | 24,116 | |
| | | | | | | | |
| | | | | | | 72,593 | |
| | | | | | | | |
| | | | Pharmaceuticals — 6.1% | |
| | 570 | | | Allergan plc (a) | | | 119,678 | |
| | 2,202 | | | Bristol-Myers Squibb Co. | | | 128,672 | |
| | 1,783 | | | Eli Lilly & Co. | | | 131,165 | |
| | 1,730 | | | Merck & Co., Inc. | | | 101,835 | |
| | 8,470 | | | Pfizer, Inc. | | | 275,103 | |
| | | | | | | | |
| | | | | | | 756,453 | |
| | | | | | | | |
| | | | Total Health Care | | | 1,735,910 | |
| | | | | | | | |
| | | | Industrials — 11.1% | |
| | | | Aerospace & Defense — 1.7% | |
| | 337 | | | General Dynamics Corp. | | | 58,239 | |
| | 188 | | | L-3 Communications Holdings, Inc. | | | 28,648 | |
| | 539 | | | Northrop Grumman Corp. | | | 125,268 | |
| | | | | | | | |
| | | | | | | 212,155 | |
| | | | | | | | |
| | | | Airlines — 1.3% | |
| | 1,413 | | | Delta Air Lines, Inc. | | | 69,498 | |
| | 58 | | | Spirit Airlines, Inc. (a) | | | 3,379 | |
| | 1,229 | | | United Continental Holdings, Inc. (a) | | | 89,583 | |
| | | | | | | | |
| | | | | | | 162,460 | |
| | | | | | | | |
| | | | Building Products — 1.0% | |
| | 712 | | | Allegion plc | | | 45,575 | |
| | 119 | | | Johnson Controls International plc | | | 4,905 | |
| | 47 | | | Lennox International, Inc. | | | 7,138 | |
| | 1,962 | | | Masco Corp. | | | 62,052 | |
| | | | | | | | |
| | | | | | | 119,670 | |
| | | | | | | | |
SEE NOTES TO FINANCIAL STATEMENTS.
| | | | | | |
| | | |
| 46 | | | | J.P. MORGAN LARGE CAP FUNDS | | DECEMBER 31, 2016 |
| | | | | | | | |
| SHARES | | | SECURITY DESCRIPTION | | VALUE($) | |
| Common Stocks — continued | |
| | | | Commercial Services & Supplies — 0.1% | |
| | 98 | | | Waste Connections, Inc., (Canada) | | | 7,717 | |
| | | | | | | | |
| | | | Electrical Equipment — 0.2% | |
| | 333 | | | Eaton Corp. plc | | | 22,337 | |
| | | | | | | | |
| | | | Industrial Conglomerates — 3.7% | |
| | 8,787 | | | General Electric Co. | | | 277,682 | |
| | 1,514 | | | Honeywell International, Inc. | | | 175,449 | |
| | | | | | | | |
| | | | | | | 453,131 | |
| | | | | | | | |
| | | | Machinery — 1.9% | |
| | 490 | | | Ingersoll-Rand plc | | | 36,755 | |
| | 539 | | | PACCAR, Inc. | | | 34,457 | |
| | 132 | | | Snap-on, Inc. | | | 22,686 | |
| | 1,277 | | | Stanley Black & Decker, Inc. | | | 146,496 | |
| | | | | | | | |
| | | | | | | 240,394 | |
| | | | | | | | |
| | | | Road & Rail — 1.2% | |
| | 383 | | | Canadian Pacific Railway Ltd., (Canada) | | | 54,695 | |
| | 125 | | | Norfolk Southern Corp. | | | 13,499 | |
| | 776 | | | Union Pacific Corp. | | | 80,440 | |
| | | | | | | | |
| | | | | | | 148,634 | |
| | | | | | | | |
| | | | Total Industrials | | | 1,366,498 | |
| | | | | | | | |
| | | | Information Technology — 22.4% | |
| | | | Electronic Equipment, Instruments & Components — 0.2% | |
| | 422 | | | TE Connectivity Ltd. | | | 29,259 | |
| | | | | | | | |
| | | | Internet Software & Services — 5.7% | |
| | 342 | | | Alphabet, Inc., Class A (a) | | | 271,297 | |
| | 325 | | | Alphabet, Inc., Class C (a) | | | 251,001 | |
| | 1,526 | | | Facebook, Inc., Class A (a) | | | 175,604 | |
| | | | | | | | |
| | | | | | | 697,902 | |
| | | | | | | | |
| | | | IT Services — 3.8% | |
| | 1,181 | | | Accenture plc, Class A | | | 138,383 | |
| | 926 | | | Fidelity National Information Services, Inc. | | | 70,043 | |
| | 211 | | | International Business Machines Corp. | | | 35,024 | |
| | 320 | | | Mastercard, Inc., Class A | | | 33,015 | |
| | 165 | | | PayPal Holdings, Inc. (a) | | | 6,502 | |
| | 2,242 | | | Visa, Inc., Class A | | | 174,883 | |
| | 83 | | | WEX, Inc. (a) | | | 9,294 | |
| | | | | | | | |
| | | | | | | 467,144 | |
| | | | | | | | |
| | | | Semiconductors & Semiconductor Equipment — 5.2% | |
| | 1,544 | | | Analog Devices, Inc. | | | 112,137 | |
| | 1,003 | | | Applied Materials, Inc. | | | 32,362 | |
| | 1,325 | | | Broadcom Ltd., (Singapore) | | | 234,134 | |
| | 193 | | | Lam Research Corp. | | | 20,413 | |
| | 236 | | | NVIDIA Corp. | | | 25,197 | |
| | | | | | | | |
| SHARES | | | SECURITY DESCRIPTION | | VALUE($) | |
| | | | | | | | |
| | | | Semiconductors & Semiconductor Equipment — continued | |
| | 86 | | | NXP Semiconductors NV, (Netherlands) (a) | | | 8,425 | |
| | 1,582 | | | ON Semiconductor Corp. (a) | | | 20,185 | |
| | 204 | | | QUALCOMM, Inc. | | | 13,325 | |
| | 2,376 | | | Texas Instruments, Inc. | | | 173,375 | |
| | | | | | | | |
| | | | | | | 639,553 | |
| | | | | | | | |
| | | | Software — 4.2% | |
| | 942 | | | Adobe Systems, Inc. (a) | | | 96,929 | |
| | 6,307 | | | Microsoft Corp. | | | 391,940 | |
| | 465 | | | Workday, Inc., Class A (a) | | | 30,754 | |
| | | | | | | | |
| | | | | | | 519,623 | |
| | | | | | | | |
| | | | Technology Hardware, Storage & Peripherals — 3.3% | |
| | 3,219 | | | Apple, Inc. | | | 372,788 | |
| | 2,515 | | | HP, Inc. | | | 37,326 | |
| | | | | | | | |
| | | | | | | 410,114 | |
| | | | | | | | |
| | | | Total Information Technology | | | 2,763,595 | |
| | | | | | | | |
| | | | Materials — 2.5% | |
| | | | Chemicals — 1.5% | |
| | 329 | | | CF Industries Holdings, Inc. | | | 10,343 | |
| | 94 | | | Dow Chemical Co. (The) | | | 5,397 | |
| | 838 | | | Eastman Chemical Co. | | | 63,001 | |
| | 1,022 | | | EI du Pont de Nemours & Co. | | | 74,980 | |
| | 1,000 | | | Mosaic Co. (The) | | | 29,324 | |
| | 28 | | | PPG Industries, Inc. | | | 2,686 | |
| | | | | | | | |
| | | | | | | 185,731 | |
| | | | | | | | |
| | | | Construction Materials — 0.3% | |
| | 59 | | | Martin Marietta Materials, Inc. | | | 13,166 | |
| | 158 | | | Vulcan Materials Co. | | | 19,776 | |
| | | | | | | | |
| | | | | | | 32,942 | |
| | | | | | | | |
| | | | Containers & Packaging — 0.6% | |
| | 705 | | | Crown Holdings, Inc. (a) | | | 37,051 | |
| | 812 | | | WestRock Co. | | | 41,214 | |
| | | | | | | | |
| | | | | | | 78,265 | |
| | | | | | | | |
| | | | Metals & Mining — 0.1% | |
| | 112 | | | Alcoa Corp. | | | 3,159 | |
| | 41 | | | Nucor Corp. | | | 2,422 | |
| | 138 | | | United States Steel Corp. | | | 4,556 | |
| | | | | | | | |
| | | | | | | 10,137 | |
| | | | | | | | |
| | | | Total Materials | | | 307,075 | |
| | | | | | | | |
| | | | Real Estate — 0.7% | |
| | | | Equity Real Estate Investment Trusts (REITs) — 0.7% | |
| | 202 | | | AvalonBay Communities, Inc. | | | 35,783 | |
| | 745 | | | Kimco Realty Corp. | | | 18,745 | |
SEE NOTES TO FINANCIAL STATEMENTS.
| | | | | | | | |
| | | |
| DECEMBER 31, 2016 | | J.P. MORGAN LARGE CAP FUNDS | | | | | 47 | |
JPMorgan U.S. Equity Fund
SCHEDULE OF PORTFOLIO INVESTMENTS
AS OF DECEMBER 31, 2016 (Unaudited) (continued)
(Amounts in thousands, except number of Futures contracts)
| | | | | | | | |
SHARES | | | SECURITY DESCRIPTION | | VALUE($) | |
| Common Stocks — continued | |
| | | | Equity Real Estate Investment Trusts (REITs) — continued | |
| | 580 | | | Prologis, Inc. | | | 30,606 | |
| | | | | | | | |
| | | | Total Real Estate | | | 85,134 | |
| | | | | | | | |
| | | | Telecommunication Services — 1.1% | |
| | | | Diversified Telecommunication Services — 0.9% | |
| | 2,634 | | | AT&T, Inc. | | | 112,034 | |
| | | | | | | | |
| | | | Wireless Telecommunication Services — 0.2% | |
| | 466 | | | T-Mobile US, Inc. (a) | | | 26,778 | |
| | | | | | | | |
| | | | Total Telecommunication Services | | | 138,812 | |
| | | | | | | | |
| | | | Utilities — 2.5% | |
| | | | Electric Utilities — 2.2% | |
| | 1,015 | | | Edison International | | | 73,086 | |
| | 668 | | | NextEra Energy, Inc. | | | 79,778 | |
| | 1,179 | | | PG&E Corp. | | | 71,629 | |
| | 99 | | | Pinnacle West Capital Corp. | | | 7,703 | |
| | 1,009 | | | Xcel Energy, Inc. | | | 41,083 | |
| | | | | | | | |
| | | | | | | 273,279 | |
| | | | | | | | |
| | | | Multi-Utilities — 0.3% | |
| | 386 | | | Ameren Corp. | | | 20,259 | |
| | 487 | | | CMS Energy Corp. | | | 20,273 | |
| | | | | | | | |
| | | | | | | 40,532 | |
| | | | | | | | |
| | | | Total Utilities | | | 313,811 | |
| | | | | | | | |
| | | | Total Common Stocks
(Cost $8,897,252) | | | 12,300,838 | |
| | | | | | | | |
| | | | | | | | |
NUMBER OF
WARRANTS | | | SECURITY DESCRIPTION | | VALUE($)
| |
| Warrant — 0.0% (g) | | | | |
| | | | Financials — 0.0% (g) | |
| | | | Consumer Finance — 0.0% (g) | |
| | 24 | | | Emergent Capital, Inc., expiring 10/01/19 (Strike Price $10.75) (a)
(Cost $—) | | | — | (h) |
| | | | | | | | |
| | |
| SHARES | | | | | | |
| Short-Term Investment — 0.8% | | | | |
| | | | Investment Company — 0.8% | |
| | 96,084 | | | JPMorgan U.S. Government Money Market Fund, Institutional Class Shares,
0.410% (b) (l)
(Cost $96,084) | | | 96,084 | |
| | | | | | | | |
| | | | Total Investments — 100.4%
(Cost $8,993,336) | | | 12,396,922 | |
| | | | Liabilities in Excess of
Other Assets — (0.4)% | | | (52,253 | ) |
| | | | | | | | |
| | | | NET ASSETS — 100.0% | | $ | 12,344,669 | |
| | | | | | | | |
Percentages indicated are based on net assets.
| | | | | | | | | | | | | | | | | | | | |
| Futures Contracts | |
NUMBER OF
CONTRACTS | | | DESCRIPTION | | EXPIRATION
DATE | | | TRADING
CURRENCY | | | NOTIONAL
VALUE AT
DECEMBER 31, 2016 | | | NET UNREALIZED
APPRECIATION
(DEPRECIATION) | |
| | | | Long Futures Outstanding | | | | | | | | | | | | | | | | |
| | 310 | | | E-mini S&P 500 | | | 03/17/17 | | | | USD | | | $ | 34,661 | | | $ | (214 | ) |
| | | | | | | | | | | | | | | | | | | | |
SEE NOTES TO FINANCIAL STATEMENTS.
| | | | | | |
| | | |
| 48 | | | | J.P. MORGAN LARGE CAP FUNDS | | DECEMBER 31, 2016 |
J.P. Morgan Large Cap Funds
NOTES TO SCHEDULES OF PORTFOLIO INVESTMENTS
AS OF DECEMBER 31, 2016 (Unaudited)
| | |
| ADR | | — American Depositary Receipt |
| USD | | — United States Dollar |
| (a) | | — Non-income producing security. |
| (b) | | — Investment in affiliate. Money market fund is registered under the Investment Company Act of 1940, as amended, and advised by J.P. Morgan Investment Management Inc. |
| (g) | | — Amount rounds to less than 0.05%. |
| | |
| (h) | | — Amount rounds to less than 500. |
| (k) | | — All or a portion of this security is deposited with the broker as initial margin for futures contracts. |
| (l) | | — The rate shown is the current yield as of December 31, 2016. |
| (n) | | — The rate shown is the effective yield at the date of purchase. |
| (o) | | — All or a portion of the security is segregated for options written. |
SEE NOTES TO FINANCIAL STATEMENTS.
| | | | | | | | |
| | | |
| DECEMBER 31, 2016 | | J.P. MORGAN LARGE CAP FUNDS | | | | | 49 | |
STATEMENTS OF ASSETS AND LIABILITIES
AS OF DECEMBER 31, 2016 (Unaudited)
(Amounts in thousands, except per share amounts)
| | | | | | | | | | | | |
| | |
Disciplined
Equity Fund | | | Dynamic
Growth Fund | | | Equity
Focus Fund | |
ASSETS: | | | | | | | | | | | | |
Investments in non-affiliates, at value | | $ | 7,639,657 | | | $ | 335,141 | | | $ | 135,460 | |
Investments in affiliates, at value | | | 191,979 | | | | 2,597 | | | | 12,832 | |
| | | | | | | | | | | | |
Total investment securities, at value | | | 7,831,636 | | | | 337,738 | | | | 148,292 | |
Receivables: | | | | | | | | | | | | |
Investment securities sold | | | 1,362 | | | | 2,971 | | | | 964 | |
Fund shares sold | | | 6,924 | | | | 931 | | | | 909 | |
Dividends from non-affiliates | | | 9,116 | | | | 62 | | | | 53 | |
Dividends from affiliates | | | 57 | | | | 1 | | | | 3 | |
| | | | | | | | | | | | |
Total Assets | | | 7,849,095 | | | | 341,703 | | | | 150,221 | |
| | | |
Liabilities: | | | | | | | | | | | | |
Payables: | | | | | | | | | | | | |
Investment securities purchased | | | 1,040 | | | | — | | | | 3,611 | |
Fund shares redeemed | | | 71,198 | | | | 353 | | | | 16 | |
Variation margin on futures contracts | | | 805 | | | | — | | | | — | |
Accrued liabilities: | | | | | | | | | | | | |
Investment advisory fees | | | 1,212 | | | | 158 | | | | 35 | |
Administration fees | | | 275 | | | | 13 | | | | — | |
Distribution fees | | | 98 | | | | 18 | | | | 2 | |
Shareholder servicing fees | | | 69 | | | | 21 | | | | 30 | |
Custodian and accounting fees | | | 41 | | | | 4 | | | | 6 | |
Trustees’ and chief compliance officer’s fees | | | 42 | | | | 1 | | | | — | (a) |
Transfer agency fees | | | 30 | | | | 7 | | | | 2 | |
Sub-transfer agency fees | | | 513 | | | | 32 | | | | 1 | |
Other | | | 138 | | | | 17 | | | | 15 | |
| | | | | | | | | | | | |
Total Liabilities | | | 75,461 | | | | 624 | | | | 3,718 | |
| | | | | | | | | | | | |
Net Assets | | $ | 7,773,634 | | | $ | 341,079 | | | $ | 146,503 | |
| | | | | | | | | | | | |
| (a) | Amount rounds to less than 500. |
SEE NOTES TO FINANCIAL STATEMENTS.
| | | | | | |
| | | |
| 50 | | | | J.P. MORGAN LARGE CAP FUNDS | | DECEMBER 31, 2016 |
| | | | | | | | | | | | |
| | |
Disciplined
Equity Fund | | | Dynamic
Growth Fund | | | Equity
Focus Fund | |
NET ASSETS: | | | | | | | | | | | | |
Paid-in-Capital | | $ | 7,037,880 | | | $ | 263,810 | | | $ | 123,826 | |
Accumulated undistributed (distributions in excess of) net investment income | | | 8,024 | | | | 421 | | | | (44 | ) |
Accumulated net realized gains (losses) | | | (494,969 | ) | | | (1,295 | ) | | | (522 | ) |
Net unrealized appreciation (depreciation) | | | 1,222,699 | | | | 78,143 | | | | 23,243 | |
| | | | | | | | | | | | |
Total Net Assets | | $ | 7,773,634 | | | $ | 341,079 | | | $ | 146,503 | |
| | | | | | | | | | | | |
| | | |
Net Assets: | | | | | | | | | | | | |
Class A | | $ | 446,765 | | | $ | 48,570 | | | $ | 2,306 | |
Class C | | | — | | | | 11,912 | | | | 2,169 | |
Class L (formerly Institutional Class) | | | 808,633 | | | | — | | | | — | |
Class R5 | | | — | | | | 225,834 | | | | — | |
Class R6 | | | 6,271,906 | | | | — | | | | — | |
Select Class | | | 246,330 | | | | 54,763 | | | | 142,028 | |
| | | | | | | | | | | | |
Total | | $ | 7,773,634 | | | $ | 341,079 | | | $ | 146,503 | |
| | | | | | | | | | | | |
| | | |
Outstanding units of beneficial interest (shares) ($0.0001 par value; unlimited number of shares authorized): | | | | | | | | | | | | |
Class A | | | 19,043 | | | | 1,893 | | | | 88 | |
Class C | | | — | | | | 486 | | | | 85 | |
Class L (formerly Institutional Class) | | | 34,230 | | | | — | | | | — | |
Class R5 | | | — | | | | 8,444 | | | | — | |
Class R6 | | | 265,430 | | | | — | | | | — | |
Select Class | | | 10,412 | | | | 2,086 | | | | 5,376 | |
| | | |
Net Asset Value (a): | | | | | | | | | | | | |
Class A — Redemption price per share | | $ | 23.46 | | | $ | 25.65 | | | $ | 26.23 | |
Class C — Offering price per share (b) | | | — | | | | 24.48 | | | | 25.56 | |
Class L (formerly Institutional Class) — Offering and redemption price per share | | | 23.62 | | | | — | | | | — | |
Class R5 — Offering and redemption price per share | | | — | | | | 26.75 | | | | — | |
Class R6 — Offering and redemption price per share | | | 23.63 | | | | — | | | | — | |
Select Class — Offering and redemption price per share | | | 23.66 | | | | 26.26 | | | | 26.42 | |
Class A maximum sales charge | | | 5.25 | % | | | 5.25 | % | | | 5.25 | % |
Class A maximum public offering price per share
[net asset value per share/(100% — maximum sales charge)] | | $ | 24.76 | | | $ | 27.07 | | | $ | 27.68 | |
| | | | | | | | | | | | |
Cost of investments in non-affiliates | | $ | 6,416,288 | | | $ | 256,998 | | | $ | 112,217 | |
Cost of investments in affiliates | | | 191,979 | | | | 2,597 | | | | 12,832 | |
| (a) | Per share amounts may not recalculate due to rounding of net assets and/or shares outstanding. |
| (b) | Redemption price for Class C Shares varies based upon length of time the shares are held. |
SEE NOTES TO FINANCIAL STATEMENTS.
| | | | | | | | |
| | | |
| DECEMBER 31, 2016 | | J.P. MORGAN LARGE CAP FUNDS | | | | | 51 | |
STATEMENTS OF ASSETS AND LIABILITIES
AS OF DECEMBER 31, 2016 (Unaudited) (continued)
(Amounts in thousands, except per share amounts)
| | | | | | | | | | | | |
| | |
Equity
Income Fund | | | Growth and
Income Fund | | | Hedged
Equity Fund | |
ASSETS: | | | | | | | | | | | | |
Investments in non-affiliates, at value | | $ | 13,572,174 | | | $ | 520,815 | | | $ | 321,765 | |
Investments in affiliates, at value | | | 183,286 | | | | 7,022 | | | | 8,687 | |
| | | | | | | | | | | | |
Total investment securities, at value | | | 13,755,460 | | | | 527,837 | | | | 330,452 | |
Cash | | | 226 | | | | — | | | | 19 | |
Deposits at broker for futures contracts | | | — | | | | — | | | | 335 | |
Receivables: | | | | | | | | | | | | |
Investment securities sold | | | — | | | | — | | | | 4,320 | |
Fund shares sold | | | 39,542 | | | | 3,373 | | | | 1,097 | |
Dividends from non-affiliates | | | 31,264 | | | | 582 | | | | 378 | |
Dividends from affiliates | | | 68 | | | | 3 | | | | 2 | |
| | | | | | | | | | | | |
Total Assets | | | 13,826,560 | | | | 531,795 | | | | 336,603 | |
| | | | | | | | | | | | |
| | | |
LIABILITIES: | | | | | | | | | | | | |
Payables: | | | | | | | | | | | | |
Investment securities purchased | | | — | | | | — | | | | 4,962 | |
Fund shares redeemed | | | 28,203 | | | | 343 | | | | 172 | |
Variation margin on futures contracts | | | — | | | | — | | | | 37 | |
Outstanding options written, at fair value | | | — | | | | — | | | | 4,211 | |
Accrued liabilities: | | | | | | | | | | | | |
Investment advisory fees | | | 4,631 | | | | 177 | | | | 49 | |
Administration fees | | | 949 | | | | 36 | | | | 10 | |
Distribution fees | | | 1,689 | | | | 114 | | | | 23 | |
Shareholder servicing fees | | | 1,898 | | | | 83 | | | | 49 | |
Custodian and accounting fees | | | 28 | | | | 7 | | | | 16 | |
Trustees’ and Chief Compliance Officer’s fees | | | — | (a) | | | — | | | | 2 | |
Transfer agency fees | | | 67 | | | | 64 | | | | 3 | |
Sub-transfer agency fees | | | 1,609 | | | | 63 | | | | 53 | |
Other | | | 202 | | | | 49 | | | | 78 | |
| | | | | | | | | | | | |
Total Liabilities | | | 39,276 | | | | 936 | | | | 9,665 | |
| | | | | | | | | | | | |
Net Assets | | $ | 13,787,284 | | | $ | 530,859 | | | $ | 326,938 | |
| | | | | | | | | | | | |
| (a) | Amount rounds to less than 500. |
SEE NOTES TO FINANCIAL STATEMENTS.
| | | | | | |
| | | |
| 52 | | | | J.P. MORGAN LARGE CAP FUNDS | | DECEMBER 31, 2016 |
| | | | | | | | | | | | |
| | |
Equity
Income Fund | | | Growth and
Income Fund | | | Hedged
Equity Fund | |
NET ASSETS: | | | | | | | | | | | | |
Paid-in-Capital | | $ | 10,945,795 | | | $ | 361,741 | | | $ | 304,854 | |
Accumulated undistributed (distributions in excess of) net investment income | | | (11,489 | ) | | | (134 | ) | | | 231 | |
Accumulated net realized gains (losses) | | | (2,958 | ) | | | 3,313 | | | | (20,986 | ) |
Net unrealized appreciation (depreciation) | | | 2,855,936 | | | | 165,939 | | | | 42,839 | |
| | | | | | | | | | | | |
Total Net Assets | | $ | 13,787,284 | | | $ | 530,859 | | | $ | 326,938 | |
| | | | | | | | | | | | |
| | | |
Net Assets: | | | | | | | | | | | | |
Class A | | $ | 3,575,103 | | | $ | 454,501 | | | $ | 73,655 | |
Class C | | | 1,404,284 | | | | 27,931 | | | | 12,011 | |
Class R2 | | | 84,069 | | | | 22 | | | | — | |
Class R3 | | | 21 | | | | — | | | | — | |
Class R4 | | | 22 | | | | — | | | | — | |
Class R5 | | | 936,578 | | | | 30 | | | | 29 | |
Class R6 | | | 2,386,869 | | | | 1,833 | | | | 91 | |
Select Class | | | 5,400,338 | | | | 46,542 | | | | 241,152 | |
| | | | | | | | | | | | |
Total | | $ | 13,787,284 | | | $ | 530,859 | | | $ | 326,938 | |
| | | | | | | | | | | | |
| | | |
Outstanding units of beneficial interest (shares) ($0.0001 par value; unlimited number of shares authorized): | | | | | | | | | | | | |
Class A | | | 239,007 | | | | 10,048 | | | | 4,259 | |
Class C | | | 95,417 | | | | 680 | | | | 697 | |
Class R2 | | | 5,639 | | | | 1 | | | | — | |
Class R3 | | | 1 | | | | — | | | | — | |
Class R4 | | | 1 | | | | — | | | | — | |
Class R5 | | | 61,614 | | | | — | (a) | | | 2 | |
Class R6 | | | 157,116 | | | | 38 | | | | 5 | |
Select Class | | | 355,407 | | | | 980 | | | | 13,916 | |
| | | |
Net Asset Value (b): | | | | | | | | | | | | |
Class A — Redemption price per share | | $ | 14.96 | | | $ | 45.23 | | | $ | 17.29 | |
Class C — Offering price per share (c) | | | 14.72 | | | | 41.10 | | | | 17.23 | |
Class R2 — Offering and redemption price per share | | | 14.91 | | | | 45.44 | | | | — | |
Class R3 — Offering and redemption price per share | | | 14.96 | | | | — | | | | — | |
Class R4 — Offering and redemption price per share | | | 15.20 | | | | — | | | | — | |
Class R5 — Offering and redemption price per share | | | 15.20 | | | | 47.77 | | | | 17.35 | |
Class R6 — Offering and redemption price per share | | | 15.19 | | | | 47.77 | | | | 17.35 | |
Select Class — Offering and redemption price per share | | | 15.19 | | | | 47.49 | | | | 17.33 | |
Class A maximum sales charge | | | 5.25 | % | | | 5.25 | % | | | 5.25 | % |
Class A maximum public offering price per share
[net asset value per share/(100% — maximum sales charge)] | | $ | 15.79 | | | $ | 47.74 | | | $ | 18.25 | |
| | | | | | | | | | | | |
Cost of investments in non-affiliates | | $ | 10,716,238 | | | $ | 354,876 | | | $ | 278,925 | |
Cost of investments in affiliates | | | 183,286 | | | | 7,022 | | | | 8,687 | |
Premiums received from options written | | | — | | | | — | | | | 4,275 | |
| (a) | Amount rounds to less than 500. |
| (b) | Per share amounts may not recalculate due to rounding of net assets and/or shares outstanding. |
| (c) | Redemption price for Class C Shares varies based upon length of time the shares are held. |
SEE NOTES TO FINANCIAL STATEMENTS.
| | | | | | | | |
| | | |
| DECEMBER 31, 2016 | | J.P. MORGAN LARGE CAP FUNDS | | | | | 53 | |
STATEMENTS OF ASSETS AND LIABILITIES
AS OF DECEMBER 31, 2016 (Unaudited) (continued)
(Amounts in thousands, except per share amounts)
| | | | | | | | | | | | |
| | |
Large Cap
Growth Fund | | | Large Cap
Value Fund | | | U.S.
Equity Fund | |
ASSETS: | | | | | | | | | | | | |
Investments in non-affiliates, at value | | $ | 11,867,177 | | | $ | 792,580 | | | $ | 12,300,838 | |
Investments in affiliates, at value | | | 119,519 | | | | 22,367 | | | | 96,084 | |
| | | | | | | | | | | | |
Total investment securities, at value | | | 11,986,696 | | | | 814,947 | | | | 12,396,922 | |
Cash | | | 15 | | | | 21 | | | | 54 | |
Deposits at broker for futures contracts | | | — | | | | — | | | | 2,595 | |
Receivables: | | | | | | | | | | | | |
Investment securities sold | | | 25,553 | | | | 913 | | | | 24,183 | |
Fund shares sold | | | 15,906 | | | | 2,881 | | | | 14,913 | |
Dividends from non-affiliates | | | 4,687 | | | | 689 | | | | 15,037 | |
Dividends from affiliates | | | 25 | | | | 4 | | | | 28 | |
| | | | | | | | | | | | |
Total Assets | | | 12,032,882 | | | | 819,455 | | | | 12,453,732 | |
| | | | | | | | | | | | |
| | | |
LIABILITIES: | | | | | | | | | | | | |
Payables: | | | | | | | | | | | | |
Investment securities purchased | | | 11,382 | | | | — | | | | 26,577 | |
Fund shares redeemed | | | 60,834 | | | | 5,286 | | | | 73,940 | |
Variation margin on futures contracts | | | — | | | | — | | | | 179 | |
Accrued liabilities: | | | | | | | | | | | | |
Investment advisory fees | | | 5,183 | | | | 275 | | | | 4,203 | |
Administration fees | | | 848 | | | | 56 | | | | 862 | |
Distribution fees | | | 1,156 | | | | 44 | | | | 604 | |
Shareholder servicing fees | | | 746 | | | | 18 | | | | 311 | |
Custodian and accounting fees | | | 67 | | | | 13 | | | | 53 | |
Trustees’ and Chief Compliance Officer’s fees | | | — | | | | 2 | | | | 66 | |
Transfer agency fees | | | 135 | | | | 25 | | | | 100 | |
Sub-transfer agency fees | | | 2,989 | | | | 19 | | | | 1,616 | |
Other | | | 766 | | | | 33 | | | | 399 | |
| | | | | | | | | | | | |
Total Liabilities | | | 84,106 | | | | 5,771 | | | | 108,910 | |
| | | | | | | | | | | | |
Net Assets | | $ | 11,948,776 | | | $ | 813,684 | | | $ | 12,344,822 | |
| | | | | | | | | | | | |
SEE NOTES TO FINANCIAL STATEMENTS.
| | | | | | |
| | | |
| 54 | | | | J.P. MORGAN LARGE CAP FUNDS | | DECEMBER 31, 2016 |
| | | | | | | | | | | | |
| | |
Large Cap
Growth Fund | | | Large Cap
Value Fund | | | U.S.
Equity Fund | |
NET ASSETS: | | | | | | | | | | | | |
Paid-in-Capital | | $ | 7,667,293 | | | $ | 651,568 | | | $ | 9,036,601 | |
Accumulated undistributed (distributions in excess of) net investment income | | | 1,609 | | | | (128 | ) | | | 448 | |
Accumulated net realized gains (losses) | | | 635,051 | | | | 15,363 | | | | (95,599 | ) |
Net unrealized appreciation (depreciation) | | | 3,644,823 | | | | 146,881 | | | | 3,403,372 | |
| | | | | | | | | | | | |
Total Net Assets | | $ | 11,948,776 | | | $ | 813,684 | | | $ | 12,344,822 | |
| | | | | | | | | | | | |
| | | |
Net Assets: | | | | | | | | | | | | |
Class A | | $ | 3,504,003 | | | $ | 136,975 | | | $ | 1,413,179 | |
Class C | | | 485,570 | | | | 24,972 | | | | 319,680 | |
Class L (formerly Institutional Class) | | | — | | | | — | | | | 3,240,103 | |
Class R2 | | | 167,692 | | | | 4,594 | | | | 217,214 | |
Class R3 | | | 20 | | | | — | | | | 26 | |
Class R4 | | | 21 | | | | — | | | | 21 | |
Class R5 | | | 1,066,458 | | | | 6,787 | | | | 841,718 | |
Class R6 | | | 3,215,917 | | | | 592,044 | | | | 5,218,689 | |
Select Class | | | 3,509,095 | | | | 48,312 | | | | 1,094,192 | |
| | | | | | | | | | | | |
Total | | $ | 11,948,776 | | | $ | 813,684 | | | $ | 12,344,822 | |
| | | | | | | | | | | | |
| | | |
Outstanding units of beneficial interest (shares) ($0.0001 par value; unlimited number of shares authorized): | | | | | | | | | | | | |
Class A | | | 110,894 | | | | 9,348 | | | | 97,097 | |
Class C | | | 18,338 | | | | 1,766 | | | | 22,565 | |
Class L (formerly Institutional Class) | | | — | | | | — | | | | 221,949 | |
Class R2 | | | 5,426 | | | | 316 | | | | 15,035 | |
Class R3 | | | 1 | | | | — | | | | 2 | |
Class R4 | | | 1 | | | | — | | | | 2 | |
Class R5 | | | 33,108 | | | | 466 | | | | 57,633 | |
Class R6 | | | 99,396 | | | | 40,923 | | | | 356,840 | |
Select Class | | | 110,432 | | | | 3,347 | | | | 75,018 | |
| | | |
Net Asset Value (a): | | | | | | | | | | | | |
Class A — Redemption price per share | | $ | 31.60 | | | $ | 14.65 | | | $ | 14.55 | |
Class C — Offering price per share (b) | | | 26.48 | | | | 14.14 | | | | 14.17 | |
Class L (formerly Institutional Class) — Offering and redemption price per share | | | — | | | | — | | | | 14.60 | |
Class R2 — Offering and redemption price per share | | | 30.90 | | | | 14.57 | | | | 14.45 | |
Class R3 — Offering and redemption price per share | | | 31.75 | | | | — | | | | 14.54 | |
Class R4 — Offering and redemption price per share | | | 31.78 | | | | — | | | | 14.58 | |
Class R5 — Offering and redemption price per share | | | 32.21 | | | | 14.55 | | | | 14.60 | |
Class R6 — Offering and redemption price per share | | | 32.35 | | | | 14.47 | | | | 14.62 | |
Select Class — Offering and redemption price per share | | | 31.78 | | | | 14.43 | | | | 14.59 | |
Class A maximum sales charge | | | 5.25 | % | | | 5.25 | % | | | 5.25 | % |
Class A maximum public offering price per share
[net asset value per share/(100% — maximum sales charge)] | | $ | 33.35 | | | $ | 15.46 | | | $ | 15.36 | |
| | | | | | | | | | | | |
Cost of investments in non-affiliates | | $ | 8,222,354 | | | $ | 645,699 | | | $ | 8,897,252 | |
Cost of investments in affiliates | | | 119,519 | | | | 22,367 | | | | 96,084 | |
| (a) | Per share amounts may not recalculate due to rounding of net assets and/or shares outstanding. |
| (b) | Redemption price for Class C Shares varies based upon length of time the shares are held. |
SEE NOTES TO FINANCIAL STATEMENTS.
| | | | | | | | |
| | | |
| DECEMBER 31, 2016 | | J.P. MORGAN LARGE CAP FUNDS | | | | | 55 | |
STATEMENTS OF OPERATIONS
FOR THE SIX MONTHS ENDED DECEMBER 31, 2016 (Unaudited)
(Amounts in thousands)
| | | | | | | | | | | | |
| | |
Disciplined
Equity Fund | | | Dynamic
Growth Fund | | | Equity
Focus Fund | |
INVESTMENT INCOME: | | | | | | | | | | | | |
Interest income from non-affiliates | | $ | 20 | | | $ | — | | | $ | — | |
Interest income from affiliates | | | — | (a) | | | — | (a) | | | — | (a) |
Dividend income from non-affiliates | | | 82,958 | | | | 2,028 | | | | 807 | |
Dividend income from affiliates | | | 155 | | | | 11 | | | | 9 | |
| | | | | | | | | | | | |
Total investment income | | | 83,133 | | | | 2,039 | | | | 816 | |
| | | | | | | | | | | | |
| | | |
EXPENSES: | | | | | | | | | | | | |
Investment advisory fees | | | 9,766 | | | | 1,030 | | | | 438 | |
Administration fees | | | 3,199 | | | | 141 | | | | 57 | |
Distribution fees: | | | | | | | | | | | | |
Class A | | | 604 | | | | 66 | | | | 3 | |
Class C | | | — | | | | 46 | | | | 5 | |
Shareholder servicing fees: | | | | | | | | | | | | |
Class A | | | 604 | | | | 66 | | | | 3 | |
Class C | | | — | | | | 16 | | | | 2 | |
Class L (formerly Institutional Class) | | | 406 | | | | — | | | | — | |
Class R5 | | | — | | | | 58 | | | | — | |
Select Class | | | 320 | | | | 58 | | | | 168 | |
Custodian and accounting fees | | | 117 | | | | 15 | | | | 12 | |
Interest expense to affiliates | | | — | | | | — | (a) | | | — | (a) |
Professional fees | | | 58 | | | | 27 | | | | 21 | |
Trustees’ and Chief Compliance Officer’s fees | | | 43 | | | | 14 | | | | 13 | |
Printing and mailing costs | | | 85 | | | | 12 | | | | 3 | |
Registration and filing fees | | | 57 | | | | 31 | | | | 39 | |
Transfer agency fees (See Note 2.E.) | | | 54 | | | | 6 | | | | 2 | |
Sub-transfer agency fees (See Note 2.E.) | | | 769 | | | | 70 | | | | 16 | |
Other | | | 67 | | | | 6 | | | | 5 | |
| | | | | | | | | | | | |
Total expenses | | | 16,149 | | | | 1,662 | | | | 787 | |
| | | | | | | | | | | | |
Less fees waived | | | (2,081 | ) | | | (191 | ) | | | (113 | ) |
Less expense reimbursements | | | (75 | ) | | | — | | | | — | |
| | | | | | | | | | | | |
Net expenses | | | 13,993 | | | | 1,471 | | | | 674 | |
| | | | | | | | | | | | |
Net investment income (loss) | | | 69,140 | | | | 568 | | | | 142 | |
| | | | | | | | | | | | |
| | | |
REALIZED/UNREALIZED GAINS (LOSSES): | | | | | | | | | | | | |
Net realized gain (loss) on transactions from: | | | | | | | | | | | | |
Investments in non-affiliates | | | 143,840 | | | | 16,574 | | | | 2,284 | |
Futures | | | 9,527 | | | | — | | | | — | |
| | | | | | | | | | | | |
Net realized gain (loss) | | | 153,367 | | | | 16,574 | | | | 2,284 | |
| | | | | | | | | | | | |
Change in net unrealized appreciation/depreciation on: | | | | | | | | | | | | |
Investments in non-affiliates | | | 456,442 | | | | 8,425 | | | | 13,051 | |
Futures | | | (2,122 | ) | | | — | | | | — | |
| | | | | | | | | | | | |
Change in net unrealized appreciation/depreciation | | | 454,320 | | | | 8,425 | | | | 13,051 | |
| | | | | | | | | | | | |
Net realized/unrealized gains (losses) | | | 607,687 | | | | 24,999 | | | | 15,335 | |
| | | | | | | | | | | | |
Change in net assets resulting from operations | | $ | 676,827 | | | $ | 25,567 | | | $ | 15,477 | |
| | | | | | | | | | | | |
| (a) | Amount rounds to less than 500. |
SEE NOTES TO FINANCIAL STATEMENTS.
| | | | | | |
| | | |
| 56 | | | | J.P. MORGAN LARGE CAP FUNDS | | DECEMBER 31, 2016 |
| | | | | | | | | | | | |
| | |
Equity
Income Fund | | | Growth and
Income Fund | | | Hedged
Equity Fund | |
INVESTMENT INCOME: | | | | | | | | | | | | |
Interest income from non-affiliates | | $ | — | | | $ | — | | | $ | — | (b) |
Interest income from affiliates | | | 11 | | | | — | (b) | | | 1 | |
Dividend income from non-affiliates | | | 170,705 | | | | 5,819 | | | | 2,909 | |
Dividend income from affiliates | | | 448 | | | | 13 | | | | 9 | |
| | | | | | | | | | | | |
Total investment income | | | 171,164 | | | | 5,832 | | | | 2,919 | |
| | | | | | | | | | | | |
| | | |
EXPENSES: | | | | | | | | | | | | |
Investment advisory fees | | | 25,808 | | | | 1,007 | | | | 344 | |
Administration fees | | | 5,282 | | | | 206 | | | | 113 | |
Distribution fees: | | | | | | | | | | | | |
Class A | | | 4,353 | | | | 543 | | | | 92 | |
Class C | | | 5,078 | | | | 99 | | | | 40 | |
Class R2 | | | 202 | | | | — | (b) | | | — | |
Class R3 (a) | | | — | (b) | | | — | | | | — | |
Shareholder servicing fees: | | | | | | | | | | | | |
Class A | | | 4,353 | | | | 543 | | | | 92 | |
Class C | | | 1,693 | | | | 33 | (b) | | | 13 | |
Class R2 | | | 101 | | | | — | | | | — | |
Class R3 (a) | | | — | (b) | | | — | | | | — | |
Class R4 (a) | | | — | (b) | | | — | | | | — | |
Class R5 | | | 213 | | | | — | (b) | | | — | (b) |
Select Class | | | 6,260 | | | | 53 | | | | 239 | |
Custodian and accounting fees | | | 161 | | | | 19 | | | | 33 | |
Professional fees | | | 112 | | | | 24 | | | | 39 | |
Trustees’ and Chief Compliance Officer’s fees | | | 16 | | | | 13 | | | | 14 | |
Printing and mailing costs | | | 321 | | | | 26 | | | | 12 | |
Registration and filing fees | | | 161 | | | | 33 | | | | 76 | |
Transfer agency fees (See Note 2.E.) | | | 180 | | | | 114 | | | | 7 | |
Sub-transfer agency fees (See Note 2.E.) | | | 3,668 | | | | 108 | | | | 113 | |
Other | | | 121 | | | | 9 | | | | 6 | |
| | | | | | | | | | | | |
Total expenses | | | 58,083 | | | | 2,830 | | | | 1,233 | |
| | | | | | | | | | | | |
Less fees waived | | | (1,697 | ) | | | (205 | ) | | | (278 | ) |
Less expense reimbursements | | | — | | | | — | (b) | | | — | (b) |
| | | | | | | | | | | | |
Net expenses | | | 56,386 | | | | 2,625 | | | | 955 | |
| �� | | | | | | | | | | | |
Net investment income (loss) | | | 114,778 | | | | 3,207 | | | | 1,964 | |
| | | | | | | | | | | | |
| | | |
REALIZED/UNREALIZED GAINS (LOSSES): | | | | | | | | | | | | |
Net realized gain (loss) on transactions from: | | | | | | | | | | | | |
Investments in non-affiliates | | | 96,649 | | | | 16,436 | | | | (6,691 | ) |
Futures | | | — | | | | — | | | | 283 | |
Options written | | | — | | | | — | | | | 4,542 | |
| | | | | | | | | | | | |
Net realized gain (loss) | | | 96,649 | | | | 16,436 | | | | (1,866 | ) |
| | | | | | | | | | | | |
Change in net unrealized appreciation/depreciation on: | | | | | | | | | | | | |
Investments in non-affiliates | | | 846,105 | | | | 35,994 | | | | 20,443 | |
Futures | | | — | | | | — | | | | (87 | ) |
Options written | | | — | | | | — | | | | 100 | |
| | | | | | | | | | | | |
Change in net unrealized appreciation/depreciation | | | 846,105 | | | | 35,994 | | | | 20,456 | |
| | | | | | | | | | | | |
Net realized/unrealized gains (losses) | | | 942,754 | | | | 52,430 | | | | 18,590 | |
| | | | | | | | | | | | |
Change in net assets resulting from operations | | $ | 1,057,532 | | | $ | 55,637 | | | $ | 20,554 | |
| | | | | | | | | | | | |
| (a) | Commencement of offering of class of shares effective September 9, 2016 for Equity Income Fund. |
| (b) | Amount rounds to less than 500. |
SEE NOTES TO FINANCIAL STATEMENTS.
| | | | | | | | |
| | | |
| DECEMBER 31, 2016 | | J.P. MORGAN LARGE CAP FUNDS | | | | | 57 | |
STATEMENTS OF OPERATIONS
FOR THE SIX MONTHS ENDED DECEMBER 31, 2016 (Unaudited) (continued)
(Amounts in thousands)
| | | | | | | | | | | | |
| | |
Large Cap
Growth Fund | | | Large Cap
Value Fund | | | U.S.
Equity Fund | |
INVESTMENT INCOME: | | | | | | | | | | | | |
Interest income from affiliates | | $ | 4 | | | $ | — | (b) | | $ | 3 | |
Dividend income from non-affiliates | | | 60,062 | | | | 7,627 | | | | 108,960 | |
Dividend income from affiliates | | | 204 | | | | 16 | | | | 194 | |
| | | | | | | | | | | | |
Total investment income | | | 60,270 | | | | 7,643 | | | | 109,157 | |
| | | | | | | | | | | | |
| | | |
EXPENSES: | | | | | | | | | | | | |
Investment advisory fees | | | 33,152 | | | | 1,533 | | | | 24,817 | |
Administration fees | | | 5,429 | | | | 314 | | | | 5,080 | |
Distribution fees: | | | | | | | | | | | | |
Class A | | | 4,975 | | | | 129 | | | | 1,826 | |
Class C | | | 2,049 | | | | 72 | | | | 1,161 | |
Class R2 | | | 466 | | | | 10 | | | | 531 | |
Class R3 (a) | | | — | (b) | | | — | | | | — | (b) |
Shareholder servicing fees: | | | | | | | | | | | | |
Class A | | | 4,975 | | | | 129 | | | | 1,826 | |
Class C | | | 683 | | | | 24 | | | | 387 | |
Class L (formerly Institutional Class) | | | — | | | | — | | | | 1,695 | |
Class R2 | | | 233 | | | | 5 | | | | 265 | |
Class R3 (a) | | | — | (b) | | | — | | | | — | (b) |
Class R4 (a) | | | — | (b) | | | — | | | | — | (b) |
Class R5 | | | 296 | | | | 1 | | | | 224 | |
Select Class | | | 4,960 | | | | 34 | | | | 1,378 | |
Custodian and accounting fees | | | 159 | | | | 27 | | | | 186 | |
Interest expense to affiliates | | | 1 | | | | — | (b) | | | — | |
Professional fees | | | 190 | | | | 26 | | | | 213 | |
Interest expense to non-affiliates | | | — | | | | — | | | | 70 | |
Trustees’ and Chief Compliance Officer’s fees | | | 14 | | | | 16 | | | | 69 | |
Printing and mailing costs | | | 488 | | | | 9 | | | | 368 | |
Registration and filing fees | | | 199 | | | | 36 | | | | 62 | |
Transfer agency fees (See Note 2.E.) | | | 336 | | | | 34 | | | | 181 | |
Sub-transfer agency fees (See Note 2.E.) | | | 5,750 | | | | 39 | | | | 3,411 | |
Other | | | 152 | | | | 8 | | | | 90 | |
| | | | | | | | | | | | |
Total expenses | | | 64,507 | | | | 2,446 | | | | 43,840 | |
| | | | | | | | | | | | |
Less fees waived | | | (5,993 | ) | | | (128 | ) | | | (3,848 | ) |
Less expense reimbursements | | | (12 | ) | | | (1 | ) | | | (57 | ) |
| | | | | | | | | | | | |
Net expenses | | | 58,502 | | | | 2,317 | | | | 39,935 | |
| | | | | | | | | | | | |
Net investment income (loss) | | | 1,768 | | | | 5,326 | | | | 69,222 | |
| | | | | | | | | | | | |
| | | |
REALIZED/UNREALIZED GAINS (LOSSES): | | | | | | | | | | | | |
Net realized gain (loss) on transactions from: | | | | | | | | | | | | |
Investments in non-affiliates | | | 1,215,091 | | | | 40,419 | | | | 658,326 | |
Futures | | | — | | | | — | | | | 5,672 | |
| | | | | | | | | | | | |
Net realized gain (loss) | | | 1,215,091 | | | | 40,419 | | | | 663,998 | |
| | | | | | | | | | | | |
Change in net unrealized appreciation/depreciation on: | | | | | | | | | | | | |
Investments in non-affiliates | | | (474,172 | ) | | | 103,246 | | | | 481,475 | |
Futures | | | — | | | | — | | | | (1,322 | ) |
| | | | | | | | | | | | |
Change in net unrealized appreciation/depreciation | | | (474,172 | ) | | | 103,246 | | | | 480,153 | |
| | | | | | | | | | | | |
Net realized/unrealized gains (losses) | | | 740,919 | | | | 143,665 | | | | 1,144,151 | |
| | | | | | | | | | | | |
Change in net assets resulting from operations | | $ | 742,687 | | | $ | 148,991 | | | $ | 1,213,373 | |
| | | | | | | | | | | | |
| (a) | Commencement of offering of class of shares effective September 9, 2016 for Large Cap Growth Fund & U.S. Equity Fund. |
| (b) | Amount rounds to less than 500. |
SEE NOTES TO FINANCIAL STATEMENTS.
| | | | | | |
| | | |
| 58 | | | | J.P. MORGAN LARGE CAP FUNDS | | DECEMBER 31, 2016 |
STATEMENTS OF CHANGES IN NET ASSETS
FOR THE PERIODS INDICATED
(Amounts in thousands)
| | | | | | | | | | | | | | | | |
| | | Disciplined Equity Fund | | | Dynamic Growth Fund | |
| | | Six Months Ended
December 31, 2016
(Unaudited) | | | Year Ended
June 30, 2016 | | | Six Months Ended
December 31, 2016
(Unaudited) | | | Year Ended
June 30, 2016 | |
CHANGE IN NET ASSETS RESULTING FROM OPERATIONS: | | | | | | | | | | | | | | | | |
Net investment income (loss) | | $ | 69,140 | | | $ | 131,676 | | | $ | 568 | | | $ | (821 | ) |
Net realized gain (loss) | | | 153,367 | | | | (592,021 | ) | | | 16,574 | | | | (9,188 | ) |
Change in net unrealized appreciation/depreciation | | | 454,320 | | | | 151,690 | | | | 8,425 | | | | (1,272 | ) |
| | | | | | | | | | | | | | | | |
Change in net assets resulting from operations | | | 676,827 | | | | (308,655 | ) | | | 25,567 | | | | (11,281 | ) |
| | | | | | | | | | | | | | | | |
| | | | |
DISTRIBUTIONS TO SHAREHOLDERS: | | | | | | | | | | | | | | | | |
Class A | | | | | | | | | | | | | | | | |
From net investment income | | | (3,593 | ) | | | (5,440 | ) | | | — | | | | — | |
From net realized gains | | | — | | | | (25,328 | ) | | | (609 | ) | | | (551 | ) |
Class C | | | — | | | | — | | | | — | | | | — | |
From net realized gains | | | — | | | | — | | | | (157 | ) | | | (123 | ) |
Class L (formerly Institutional Class) | | | | | | | | | | | | | | | | |
From net investment income | | | (7,528 | ) | | | (11,148 | ) | | | — | | | | — | |
From net realized gains | | | — | | | | (34,112 | ) | | | — | | | | — | |
Class R5 | | | | | | | | | | | | | | | | |
From net realized gains | | | — | | | | — | | | | (2,695 | ) | | | (2,408 | ) |
Class R6 | | | | | | | | | | | | | | | | |
From net investment income | | | (61,797 | ) | | | (97,120 | ) | | | — | | | | — | |
From net realized gains | | | — | | | | (271,746 | ) | | | — | | | | — | |
Select Class | | | | | | | | | | | | | | | | |
From net investment income | | | (2,215 | ) | | | (3,481 | ) | | | — | | | | — | |
From net realized gains | | | — | | | | (12,537 | ) | | | (644 | ) | | | (615 | ) |
| | | | | | | | | | | | | | | | |
Total distributions to shareholders | | | (75,133 | ) | | | (460,912 | ) | | | (4,105 | ) | | | (3,697 | ) |
| | | | | | | | | | | | | | | | |
| | | | |
CAPITAL TRANSACTIONS: | | | | | | | | | | | | | | | | |
Change in net assets resulting from capital transactions | | | (1,049,638 | ) | | | 1,244,730 | | | | (9,790 | ) | | | 7,189 | |
| | | | | | | | | | | | | | | | |
| | | | |
NET ASSETS: | | | | | | | | | | | | | | | | |
Change in net assets | | | (447,944 | ) | | | 475,163 | | | | 11,672 | | | | (7,789 | ) |
Beginning of period | | | 8,221,578 | | | | 7,746,415 | | | | 329,407 | | | | 337,196 | |
| | | | | | | | | | | | | | | | |
End of period | | $ | 7,773,634 | | | $ | 8,221,578 | | | $ | 341,079 | | | $ | 329,407 | |
| | | | | | | | | | | | | | | | |
Accumulated undistributed (distributions in excess of) net investment income | | $ | 8,024 | | | $ | 14,017 | | | $ | 421 | | | $ | (147 | ) |
| | | | | | | | | | | | | | | | |
SEE NOTES TO FINANCIAL STATEMENTS.
| | | | | | | | |
| | | |
| DECEMBER 31, 2016 | | J.P. MORGAN LARGE CAP FUNDS | | | | | 59 | |
STATEMENTS OF CHANGES IN NET ASSETS
FOR THE PERIODS INDICATED (continued)
(Amounts in thousands)
| | | | | | | | | | | | | | | | |
| | | Equity Focus Fund | | | Equity Income Fund | |
| | | Six Months Ended
December 31, 2016
(Unaudited) | | | Year Ended
June 30, 2016 | | | Six Months Ended
December 31, 2016
(Unaudited) | | | Year Ended
June 30, 2016 | |
CHANGE IN NET ASSETS RESULTING FROM OPERATIONS: | | | | | | | | | | | | | | | | |
Net investment income (loss) | | $ | 142 | | | $ | 242 | | | $ | 114,778 | | | $ | 209,897 | |
Net realized gain (loss) | | | 2,284 | | | | (650 | ) | | | 96,649 | | | | 15,204 | |
Change in net unrealized appreciation/depreciation | | | 13,051 | | | | 2,777 | | | | 846,105 | | | | 316,575 | |
| | | | | | | | | | | | | | | | |
Change in net assets resulting from operations | | | 15,477 | | | | 2,369 | | | | 1,057,532 | | | | 541,676 | |
| | | | | | | | | | | | | | | | |
| | | | |
DISTRIBUTIONS TO SHAREHOLDERS: | | | | | | | | | | | | | | | | |
Class A | | | | | | | | | | | | | | | | |
From net investment income | | | (1 | ) | | | — | (a) | | | (32,043 | ) | | | (56,754 | ) |
From net realized gains | | | (25 | ) | | | (47 | ) | | | (21,407 | ) | | | (23,970 | ) |
Class C | | | | | | | | | | | | | | | | |
From net investment income | | | — | | | | — | | | | (9,868 | ) | | | (17,909 | ) |
From net realized gains | | | (19 | ) | | | (26 | ) | | | (8,532 | ) | | | (9,204 | ) |
Class R2 | | | | | | | | | | | | | | | | |
From net investment income | | | — | | | | — | | | | (665 | ) | | | (1,091 | ) |
From net realized gains | | | — | | | | — | | | | (512 | ) | | | (494 | ) |
Class R3 (b) | | | | | | | | | | | | | | | | |
From net investment income | | | — | | | | — | | | | — | (a) | | | — | |
From net realized gains | | | — | | | | — | | | | — | (a) | | | — | |
Class R4 (b) | | | | | | | | | | | | | | | | |
From net investment income | | | — | | | | — | | | | — | (a) | | | — | |
From net realized gains | | | — | | | | — | | | | — | (a) | | | — | |
Class R5 | | | | | | | | | | | | | | | | |
From net investment income | | | — | | | | — | | | | (9,854 | ) | | | (12,835 | ) |
From net realized gains | | | — | | | | — | | | | (5,543 | ) | | | (4,311 | ) |
Class R6 | | | | | | | | | | | | | | | | |
From net investment income | | | — | | | | — | | | | (24,849 | ) | | | (31,307 | ) |
From net realized gains | | | — | | | | — | | | | (13,934 | ) | | | (9,593 | ) |
Select Class | | | | | | | | | | | | | | | | |
From net investment income | | | (370 | ) | | | (122 | ) | | | (50,918 | ) | | | (89,550 | ) |
From net realized gains | | | (1,646 | ) | | | (2,128 | ) | | | (31,653 | ) | | | (33,863 | ) |
| | | | | | | | | | | | | | | | |
Total distributions to shareholders | | | (2,061 | ) | | | (2,323 | ) | | | (209,778 | ) | | | (290,881 | ) |
| | | | | | | | | | | | | | | | |
| | | | |
CAPITAL TRANSACTIONS: | | | | | | | | | | | | | | | | |
Change in net assets resulting from capital transactions | | | (6,402 | ) | | | 55,939 | | | | 873,209 | | | | 1,562,346 | |
| | | | | | | | | | | | | | | | |
| | | | |
NET ASSETS: | | | | | | | | | | | | | | | | |
Change in net assets | | | 7,014 | | | | 55,985 | | | | 1,720,963 | | | | 1,813,141 | |
Beginning of period | | | 139,489 | | | | 83,504 | | | | 12,066,321 | | | | 10,253,180 | |
| | | | | | | | | | | | | | | | |
End of period | | $ | 146,503 | | | $ | 139,489 | | | $ | 13,787,284 | | | $ | 12,066,321 | |
| | | | | | | | | | | | | | | | |
Accumulated undistributed (distributions in excess of) net investment income | | $ | (44 | ) | | $ | 185 | | | $ | (11,489 | ) | | $ | 1,930 | |
| | | | | | | | | | | | | | | | |
| (a) | Amount rounds to less than 500. |
| (b) | Commencement of offering of class of shares effective September 9, 2016 for Equity Income Fund. |
SEE NOTES TO FINANCIAL STATEMENTS.
| | | | | | |
| | | |
| 60 | | | | J.P. MORGAN LARGE CAP FUNDS | | DECEMBER 31, 2016 |
| | | | | | | | | | | | | | | | |
| | | Growth and Income Fund | | | Hedged Equity Fund | |
| | | Six Months Ended
December 31, 2016
(Unaudited) | | | Year Ended
June 30, 2016 | | | Six Months Ended
December 31, 2016
(Unaudited) | | | Year Ended
June 30, 2016 | |
CHANGE IN NET ASSETS RESULTING FROM OPERATIONS: | | | | | | | | | | | | | | | | |
Net investment income (loss) | | $ | 3,207 | | | $ | 6,656 | | | $ | 1,964 | | | $ | 3,505 | |
Net realized gain (loss) | | | 16,436 | | | | 20,039 | | | | (1,866 | ) | | | (16,722 | ) |
Change in net unrealized appreciation/depreciation | | | 35,994 | | | | (21,834 | ) | | | 20,456 | | | | 14,782 | |
| | | | | | | | | | | | | | | | |
Change in net assets resulting from operations | | | 55,637 | | | | 4,861 | | | | 20,554 | | | | 1,565 | |
| | | | | | | | | | | | | | | | |
| | | | |
DISTRIBUTIONS TO SHAREHOLDERS: | | | | | | | | | | | | | | | | |
Class A | | | | | | | | | | | | | | | | |
From net investment income | | | (3,084 | ) | | | (5,532 | ) | | | (518 | ) | | | (801 | ) |
From net realized gains | | | (21,085 | ) | | | (23,586 | ) | | | — | | | | — | |
Class C | | | | | | | | | | | | | | | | |
From net investment income | | | (151 | ) | | | (248 | ) | | | (50 | ) | | | (53 | ) |
From net realized gains | | | (1,409 | ) | | | (1,528 | ) | | | — | | | | — | |
Class R2 | | | | | | | | | | | | | | | | |
From net investment income | | | — | (a) | | | — | (a) | | | — | | | | — | |
From net realized gains | | | (1 | ) | | | (1 | ) | | | — | | | | — | |
Class R5 | | | | | | | | | | | | | | | | |
From net investment income | | | — | (a) | | | — | (a) | | | — | (a) | | | — | (a) |
From net realized gains | | | (1 | ) | | | (1 | ) | | | — | | | | — | |
Class R6 | | | | | | | | | | | | | | | | |
From net investment income | | | (8 | ) | | | — | (a) | | | (1 | ) | | | (1 | ) |
From net realized gains | | | (1 | ) | | | (1 | ) | | | — | | | | — | |
Select Class | | | | | | | | | | | | | | | | |
From net investment income | | | (349 | ) | | | (547 | ) | | | (1,640 | ) | | | (2,096 | ) |
From net realized gains | | | (2,037 | ) | | | (1,738 | ) | | | — | | | | — | |
| | | | | | | | | | | | | | | | |
Total distributions to shareholders | | | (28,126 | ) | | | (33,182 | ) | | | (2,209 | ) | | | (2,951 | ) |
| | | | | | | | | | | | | | | | |
| | | | |
CAPITAL TRANSACTIONS: | | | | | | | | | | | | | | | | |
Change in net assets resulting from capital transactions | | | 15,528 | | | | 20,822 | | | | 68,390 | | | | 38,895 | |
| | | | | | | | | | | | | | | | |
| | | | |
NET ASSETS: | | | | | | | | | | | | | | | | |
Change in net assets | | | 43,039 | | | | (7,499 | ) | | | 86,735 | | | | 37,509 | |
Beginning of period | | | 487,820 | | | | 495,319 | | | | 240,203 | | | | 202,694 | |
| | | | | | | | | | | | | | | | |
End of period | | $ | 530,859 | | | $ | 487,820 | | | $ | 326,938 | | | $ | 240,203 | |
| | | | | | | | | | | | | | | | |
Accumulated undistributed (distributions in excess of) net investment income | | $ | (134 | ) | | $ | 251 | | | $ | 231 | | | $ | 476 | |
| | | | | | | | | | | | | | | | |
| (a) | Amount rounds to less than 500. |
SEE NOTES TO FINANCIAL STATEMENTS.
| | | | | | | | |
| | | |
| DECEMBER 31, 2016 | | J.P. MORGAN LARGE CAP FUNDS | | | | | 61 | |
STATEMENTS OF CHANGES IN NET ASSETS
FOR THE PERIODS INDICATED (continued)
(Amounts in thousands)
| | | | | | | | | | | | | | | | |
| | | Large Cap Growth Fund | | | Large Cap Value Fund | |
| | | Six Months Ended
December 31, 2016
(Unaudited) | | | Year Ended
June 30, 2016 | | | Six Months Ended
December 31, 2016
(Unaudited) | | | Year Ended
June 30, 2016 | |
CHANGE IN NET ASSETS RESULTING FROM OPERATIONS: | | | | | | | | | | | | | | | | |
Net investment income (loss) | | $ | 1,768 | | | $ | (2,568 | ) | | $ | 5,326 | | | $ | 11,011 | |
Net realized gain (loss) | | | 1,215,091 | | | | 607,808 | | | | 40,419 | | | | 38,905 | |
Change in net unrealized appreciation/depreciation | | | (474,172 | ) | | | (1,558,068 | ) | | | 103,246 | | | | (67,018 | ) |
| | | | | | | | | | | | | | | | |
Change in net assets resulting from operations | | | 742,687 | | | | (952,828 | ) | | | 148,991 | | | | (17,102 | ) |
| | | | | | | | | | | | | | | | |
| | | | |
DISTRIBUTIONS TO SHAREHOLDERS: | | | | | | | | | | | | | | | | |
Class A | | | | | | | | | | | | | | | | |
From net investment income | | | — | | | | — | | | | (673 | ) | | | (1,101 | ) |
From net realized gains | | | (325,496 | ) | | | (204,092 | ) | | | (5,231 | ) | | | (10,979 | ) |
Class C | | | | | | | | | | | | | | | | |
From net investment income | | | — | | | | — | | | | (79 | ) | | | (116 | ) |
From net realized gains | | | (53,436 | ) | | | (31,708 | ) | | | (1,032 | ) | | | (1,856 | ) |
Class R2 | | | | | | | | | | | | | | | | |
From net investment income | | | — | | | | — | | | | (19 | ) | | | (29 | ) |
From net realized gains | | | (15,873 | ) | | | (9,889 | ) | | | (201 | ) | | | (358 | ) |
Class R3 (a) | | | | | | | | | | | | | | | | |
From net realized gains | | | (2 | ) | | | — | | | | — | | | | — | |
Class R4 (a) | | | | | | | | | | | | | | | | |
From net realized gains | | | (2 | ) | | | — | | | | — | | | | — | |
Class R5 | | | | | | | | | | | | | | | | |
From net investment income | | | — | | | | — | | | | (47 | ) | | | (36 | ) |
From net realized gains | | | (98,724 | ) | | | (55,775 | ) | | | (290 | ) | | | (267 | ) |
Class R6 | | | | | | | | | | | | | | | | |
From net investment income | | | — | | | | — | | | | (4,660 | ) | | | (7,550 | ) |
From net realized gains | | | (289,943 | ) | | | (163,685 | ) | | | (26,620 | ) | | | (71,699 | ) |
Select Class | | | | | | | | | | | | | | | | |
From net investment income | | | — | | | | — | | | | (234 | ) | | | (1,784 | ) |
From net realized gains | | | (328,427 | ) | | | (220,849 | ) | | | (1,643 | ) | | | (2,301 | ) |
| | | | | | | | | | | | | | | | |
Total distributions to shareholders | | | (1,111,903 | ) | | | (685,998 | ) | | | (40,729 | ) | | | (98,076 | ) |
| | | | | | | | | | | | | | | | |
| | | | |
CAPITAL TRANSACTIONS: | | | | | | | | | | | | | | | | |
Change in net assets resulting from capital transactions | | | (1,386,144 | ) | | | (300,688 | ) | | | (4,524 | ) | | | 73,776 | |
| | | | | | | | | | | | | | | | |
| | | | |
NET ASSETS: | | | | | | | | | | | | | | | | |
Change in net assets | | | (1,755,360 | ) | | | (1,939,514 | ) | | | 103,738 | | | | (41,402 | ) |
Beginning of period | | | 13,704,136 | | | | 15,643,650 | | | | 709,946 | | | | 751,348 | |
| | | | | | | | | | | | | | | | |
End of period | | $ | 11,948,776 | | | $ | 13,704,136 | | | $ | 813,684 | | | $ | 709,946 | |
| | | | | | | | | | | | | | | | |
Accumulated undistributed (distributions in excess of) net investment income | | $ | 1,609 | | | $ | (159 | ) | | $ | (128 | ) | | $ | 258 | |
| | | | | | | | | | | | | | | | |
| (a) | Commencement of offering of class of shares effective September 9, 2016 for Large Cap Growth Fund. |
SEE NOTES TO FINANCIAL STATEMENTS.
| | | | | | |
| | | |
| 62 | | | | J.P. MORGAN LARGE CAP FUNDS | | DECEMBER 31, 2016 |
| | | | | | | | |
| | | U.S. Equity Fund | |
| | | Six Months Ended
December 31, 2016
(Unaudited) | | | Year Ended
June 30, 2016 | |
CHANGE IN NET ASSETS RESULTING FROM OPERATIONS: | |
Net investment income (loss) | | $ | 69,222 | | | $ | 143,232 | |
Net realized gain (loss) | | | 663,998 | | | | 83,639 | |
Change in net unrealized appreciation/depreciation | | | 480,153 | | | | (349,454 | ) |
| | | | | | | | |
Change in net assets resulting from operations | | | 1,213,373 | | | | (122,583 | ) |
| | | | | | | | |
| | |
DISTRIBUTIONS TO SHAREHOLDERS: | | | | | | | | |
Class A | | | | | | | | |
From net investment income | | | (6,885 | ) | | | (10,975 | ) |
From net realized gains | | | (51,421 | ) | | | (69,017 | ) |
Class C | | | | | | | | |
From net investment income | | | (788 | ) | | | (885 | ) |
From net realized gains | | | (11,601 | ) | | | (13,589 | ) |
Class L (formerly Institutional Class) | | | | | | | | |
From net investment income | | | (20,625 | ) | | | (46,200 | ) |
From net realized gains | | | (116,356 | ) | | | (229,612 | ) |
Class R2 | | | | | | | | |
From net investment income | | | (771 | ) | | | (1,056 | ) |
From net realized gains | | | (7,793 | ) | | | (9,319 | ) |
Class R3 (a) | | | | | | | | |
From net investment income | | | — | (b) | | | — | |
From net realized gains | | | (1 | ) | | | — | |
Class R4 (a) | | | | | | | | |
From net investment income | | | — | (b) | | | — | |
From net realized gains | | | (1 | ) | | | — | |
Class R5 | | | | | | | | |
From net investment income | | | (5,859 | ) | | | (9,323 | ) |
From net realized gains | | | (30,659 | ) | | | (44,668 | ) |
Class R6 | | | | | | | | |
From net investment income | | | (35,169 | ) | | | (50,265 | ) |
From net realized gains | | | (182,725 | ) | | | (215,169 | ) |
Select Class | | | | | | | | |
From net investment income | | | (6,182 | ) | | | (12,647 | ) |
From net realized gains | | | (39,119 | ) | | | (52,720 | ) |
| | | | | | | | |
Total distributions to shareholders | | | (515,955 | ) | | | (765,445 | ) |
| | | | | | | | |
| | |
CAPITAL TRANSACTIONS: | | | | | | | | |
Change in net assets resulting from capital transactions | | | (735,083 | ) | | | 658,512 | |
| | | | | | | | |
| | |
NET ASSETS: | | | | | | | | |
Change in net assets | | | (37,665 | ) | | | (229,516 | ) |
Beginning of period | | | 12,382,487 | | | | 12,612,003 | |
| | | | | | | | |
End of period | | $ | 12,344,822 | | | $ | 12,382,487 | |
| | | | | | | | |
Accumulated undistributed (distributions in excess of) net investment income | | $ | 448 | | | $ | 7,505 | |
| | | | | | | | |
| (a) | Commencement of offering of class of shares effective September 9, 2016. |
| (b) | Amount rounds to less than 500. |
SEE NOTES TO FINANCIAL STATEMENTS.
| | | | | | | | |
| | | |
| DECEMBER 31, 2016 | | J.P. MORGAN LARGE CAP FUNDS | | | | | 63 | |
STATEMENTS OF CHANGES IN NET ASSETS
FOR THE PERIODS INDICATED (continued)
(Amounts in thousands)
| | | | | | | | | | | | | | | | |
| | | Disciplined Equity Fund | | | Dynamic Growth Fund | |
| | | Six Months Ended
December 31, 2016
(Unaudited) | | | Year Ended
June 30, 2016 | | | Six Months Ended
December 31, 2016
(Unaudited) | | | Year Ended
June 30, 2016 | |
CAPITAL TRANSACTIONS: | | | | | | | | | | | | | | | | |
Class A | | | | | | | | | | | | | | | | |
Proceeds from shares issued | | $ | 45,218 | | | $ | 313,069 | | | $ | 4,762 | | | $ | 28,692 | |
Distributions reinvested | | | 3,585 | | | | 30,719 | | | | 604 | | | | 538 | |
Cost of shares redeemed | | | (136,783 | ) | | | (274,502 | ) | | | (13,591 | ) | | | (12,209 | ) |
| | | | | | | | | | | | | | | | |
Change in net assets resulting from Class A capital transactions | | $ | (87,980 | ) | | $ | 69,286 | | | $ | (8,225 | ) | | $ | 17,021 | |
| | | | | | | | | | | | | | | | |
Class C | | | | | | | | | | | | | | | | |
Proceeds from shares issued | | $ | — | | | $ | — | | | $ | 1,564 | | | $ | 7,392 | |
Distributions reinvested | | | — | | | | — | | | | 140 | | | | 101 | |
Cost of shares redeemed | | | — | | | | — | | | | (2,601 | ) | | | (3,617 | ) |
| | | | | | | | | | | | | | | | |
Change in net assets resulting from Class C capital transactions | | $ | — | | | $ | — | | | $ | (897 | ) | | $ | 3,876 | |
| | | | | | | | | | | | | | | | |
Class L (formerly Institutional Class) | | | | | | | | | | | | | | | | |
Proceeds from shares issued | | $ | 62,897 | | | $ | 276,620 | | | $ | — | | | $ | — | |
Distributions reinvested | | | 5,852 | | | | 34,689 | | | | — | | | | — | |
Cost of shares redeemed | | | (146,831 | ) | | | (208,445 | ) | | | — | | | | — | |
| | | | | | | | | | | | | | | | |
Change in net assets resulting from Class L capital transactions | | $ | (78,082 | ) | | $ | 102,864 | | | $ | — | | | $ | — | |
| | | | | | | | | | | | | | | | |
Class R5 | | | | | | | | | | | | | | | | |
Proceeds from shares issued | | $ | — | | | $ | — | | | $ | — | (a) | | $ | 258,080 | |
Distributions reinvested | | | — | | | | — | | | | 2,694 | | | | 2,408 | |
Cost of shares redeemed | | | — | | | | — | | | | (18,690 | ) | | | (12,547 | ) |
| | | | | | | | | | | | | | | | |
Change in net assets resulting from Class R5 capital transactions | | $ | — | | | $ | — | | | $ | (15,996 | ) | | $ | 247,941 | |
| | | | | | | | | | | | | | | | |
Class R6 | | | | | | | | | | | | | | | | |
Proceeds from shares issued | | $ | 536,077 | | | $ | 2,058,427 | | | $ | — | | | $ | — | |
Distributions reinvested | | | 61,796 | | | | 368,866 | | | | — | | | | — | |
Cost of shares redeemed | | | (1,447,762 | ) | | | (1,381,896 | ) | | | — | | | | — | |
| | | | | | | | | | | | | | | | |
Change in net assets resulting from Class R6 capital transactions | | $ | (849,889 | ) | | $ | 1,045,397 | | | $ | — | | | $ | — | |
| | | | | | | | | | | | | | | | |
Select Class | | | | | | | | | | | | | | | | |
Proceeds from shares issued | | $ | 16,482 | | | $ | 117,175 | | | $ | 23,497 | | | $ | 41,622 | |
Distributions reinvested | | | 2,056 | | | | 15,046 | | | | 450 | | | | 177 | |
Cost of shares redeemed | | | (52,225 | ) | | | (105,038 | ) | | | (8,619 | ) | | | (303,448 | ) |
| | | | | | | | | | | | | | | | |
Change in net assets resulting from Select Class capital transactions | | $ | (33,687 | ) | | $ | 27,183 | | | $ | 15,328 | | | $ | (261,649 | ) |
| | | | | | | | | | | | | | | | |
Total change in net assets resulting from capital transactions | | $ | (1,049,638 | ) | | $ | 1,244,730 | | | $ | (9,790 | ) | | $ | 7,189 | |
| | | | | | | | | | | | | | | | |
| (a) | Amount rounds to less than 500. |
SEE NOTES TO FINANCIAL STATEMENTS.
| | | | | | |
| | | |
| 64 | | | | J.P. MORGAN LARGE CAP FUNDS | | DECEMBER 31, 2016 |
| | | | | | | | | | | | | | | | |
| | | Disciplined Equity Fund | | | Dynamic Growth Fund | |
| | | Six Months Ended
December 31, 2016
(Unaudited) | | | Year Ended
June 30, 2016 | | | Six Months Ended
December 31, 2016
(Unaudited) | | | Year Ended
June 30, 2016 | |
SHARE TRANSACTIONS: | | | | | | | | | | | | | | | | |
Class A | | | | | | | | | | | | | | | | |
Issued | | | 1,999 | | | | 13,968 | | | | 182 | | | | 1,144 | |
Reinvested | | | 155 | | | | 1,433 | | | | 23 | | | | 21 | |
Redeemed | | | (6,013 | ) | | | (12,641 | ) | | | (522 | ) | | | (500 | ) |
| | | | | | | | | | | | | | | | |
Change in Class A Shares | | | (3,859 | ) | | | 2,760 | | | | (317 | ) | | | 665 | |
| | | | | | | | | | | | | | | | |
Class C | | | | | | | | | | | | | | | | |
Issued | | | — | | | | — | | | | 62 | | | | 309 | |
Reinvested | | | — | | | | — | | | | 5 | | | | 4 | |
Redeemed | | | — | | | | — | | | | (104 | ) | | | (155 | ) |
| | | | | | | | | | | | | | | | |
Change in Class C Shares | | | — | | | | — | | | | (37 | ) | | | 158 | |
| | | | | | | | | | | | | | | | |
Class L (formerly Institutional Class) | | | | | | | | | | | | | | | | |
Issued | | | 2,760 | | | | 12,447 | | | | — | | | | — | |
Reinvested | | | 251 | | | | 1,607 | | | | — | | | | — | |
Redeemed | | | (6,444 | ) | | | (9,387 | ) | | | — | | | | — | |
| | | | | | | | | | | | | | | | |
Change in Class L Shares | | | (3,433 | ) | | | 4,667 | | | | — | | | | — | |
| | | | | | | | | | | | | | | | |
Class R5 | | | | | | | | | | | | | | | | |
Issued | | | — | | | | — | | | | — | | | | 9,397 | |
Reinvested | | | — | | | | — | | | | 99 | | | | 91 | |
Redeemed | | | — | | | | — | | | | (685 | ) | | | (460 | ) |
| | | | | | | | | | | | | | | | |
Change in Class R5 Shares | | | — | | | | — | | | | (586 | ) | | | 9,028 | |
| | | | | | | | | | | | | | | | |
Class R6 | | | | | | | | | | | | | | | | |
Issued | | | 23,111 | | | | 92,272 | | | | — | | | | — | |
Reinvested | | | 2,653 | | | | 17,086 | | | | — | | | | — | |
Redeemed | | | (63,495 | ) | | | (63,085 | ) | | | — | | | | — | |
| | | | | | | | | | | | | | | | |
Change in Class R6 Shares | | | (37,731 | ) | | | 46,273 | | | | — | | | | — | |
| | | | | | | | | | | | | | | | |
Select Class | | | | | | | | | | | | | | | | |
Issued | | | 720 | | | | 5,191 | | | | 877 | | | | 1,705 | |
Reinvested | | | 88 | | | | 696 | | | | 17 | | | | 7 | |
Redeemed | | | (2,278 | ) | | | (4,782 | ) | | | (324 | ) | | | (11,388 | ) |
| | | | | | | | | | | | | | | | |
Change in Select Class Shares | | | (1,470 | ) | | | 1,105 | | | | 570 | | | | (9,676 | ) |
| | | | | | | | | | | | | | | | |
SEE NOTES TO FINANCIAL STATEMENTS.
| | | | | | | | |
| | | |
| DECEMBER 31, 2016 | | J.P. MORGAN LARGE CAP FUNDS | | | | | 65 | |
STATEMENTS OF CHANGES IN NET ASSETS
FOR THE PERIODS INDICATED (continued)
(Amounts in thousands)
| | | | | | | | | | | | | | | | |
| | | Equity Focus Fund | | | Equity Income Fund | |
| | | Six Months Ended
December 31, 2016
(Unaudited) | | | Year Ended
June 30, 2016 | | | Six Months Ended
December 31, 2016
(Unaudited) | | | Year Ended
June 30, 2016 | |
CAPITAL TRANSACTIONS: | | | | | | | | | | | | | | | | |
Class A | | | | | | | | | | | | | | | | |
Proceeds from shares issued | | $ | 698 | | | $ | 1,283 | | | $ | 548,436 | | | $ | 1,145,689 | |
Distributions reinvested | | | 26 | | | | 47 | | | | 50,565 | | | | 76,806 | |
Cost of shares redeemed | | | (553 | ) | | | (756 | ) | | | (618,896 | ) | | | (929,480 | ) |
| | | | | | | | | | | | | | | | |
Change in net assets resulting from Class A capital transactions | | $ | 171 | | | $ | 574 | | | $ | (19,895 | ) | | $ | 293,015 | |
| | | | | | | | | | | | | | | | |
Class C | | | | | | | | | | | | | | | | |
Proceeds from shares issued | | $ | 1,002 | | | $ | 770 | | | $ | 155,062 | | | $ | 342,449 | |
Distributions reinvested | | | 19 | | | | 26 | | | | 15,553 | | | | 22,526 | |
Cost of shares redeemed | | | (235 | ) | | | (358 | ) | | | (157,156 | ) | | | (243,691 | ) |
| | | | | | | | | | | | | | | | |
Change in net assets resulting from Class C capital transactions | | $ | 786 | | | $ | 438 | | | $ | 13,459 | | | $ | 121,284 | |
| | | | | | | | | | | | | | | | |
Class R2 | | | | | | | | | | | | | | | | |
Proceeds from shares issued | | $ | — | | | $ | — | | | $ | 12,853 | | | $ | 33,036 | |
Distributions reinvested | | | — | | | | — | | | | 1,011 | | | | 1,417 | |
Cost of shares redeemed | | | — | | | | — | | | | (12,292 | ) | | | (15,534 | ) |
| | | | | | | | | | | | | | | | |
Change in net assets resulting from Class R2 capital transactions | | $ | — | | | $ | — | | | $ | 1,572 | | | $ | 18,919 | |
| | | | | | | | | | | | | | | | |
Class R3 (a) | | | | | | | | | | | | | | | | |
Proceeds from shares issued | | $ | — | | | $ | — | | | $ | 20 | | | $ | — | |
Distributions reinvested | | | — | | | | — | | | | — | (b) | | | — | |
| | | | | | | | | | | | | | | | |
Change in net assets resulting from Class R3 capital transactions | | $ | — | | | $ | — | | | $ | 20 | | | $ | — | |
| | | | | | | | | | | | | | | | |
Class R4 (a) | | | | | | | | | | | | | | | | |
Proceeds from shares issued | | $ | — | | | $ | — | | | $ | 20 | | | $ | — | |
Distributions reinvested | | | — | | | | — | | | | — | (b) | | | — | |
| | | | | | | | | | | | | | | | |
Change in net assets resulting from Class R4 capital transactions | | $ | — | | | $ | — | | | $ | 20 | | | $ | — | |
| | | | | | | | | | | | | | | | |
Class R5 | | | | | | | | | | | | | | | | |
Proceeds from shares issued | | $ | — | | | $ | — | | | $ | 230,423 | | | $ | 412,223 | |
Distributions reinvested | | | — | | | | — | | | | 13,106 | | | | 13,452 | |
Cost of shares redeemed | | | — | | | | — | | | | (85,235 | ) | | | (240,758 | ) |
| | | | | | | | | | | | | | | | |
Change in net assets resulting from Class R5 capital transactions | | $ | — | | | $ | — | | | $ | 158,294 | | | $ | 184,917 | |
| | | | | | | | | | | | | | | | |
Class R6 | | | | | | | | | | | | | | | | |
Proceeds from shares issued | | $ | — | | | $ | — | | | $ | 436,967 | | | $ | 1,204,396 | |
Distributions reinvested | | | — | | | | — | | | | 35,945 | | | | 37,570 | |
Cost of shares redeemed | | | — | | | | — | | | | (141,747 | ) | | | (245,859 | ) |
| | | | | | | | | | | | | | | | |
Change in net assets resulting from Class R6 capital transactions | | $ | — | | | $ | — | | | $ | 331,165 | | | $ | 996,107 | |
| | | | | | | | | | | | | | | | |
Select Class | | | | | | | | | | | | | | | | |
Proceeds from shares issued | | $ | 30,316 | | | $ | 84,242 | | | $ | 1,120,190 | | | $ | 1,604,186 | |
Distributions reinvested | | | 500 | | | | 118 | | | | 56,061 | | | | 80,801 | |
Cost of shares redeemed | | | (38,175 | ) | | | (29,433 | ) | | | (787,677 | ) | | | (1,736,883 | ) |
| | | | | | | | | | | | | | | | |
Change in net assets resulting from Select Class capital transactions | | $ | (7,359 | ) | | $ | 54,927 | | | $ | 388,574 | | | $ | (51,896 | ) |
| | | | | | | | | | | | | | | | |
Total change in net assets resulting from capital transactions | | $ | (6,402 | ) | | $ | 55,939 | | | $ | 873,209 | | | $ | 1,562,346 | |
| | | | | | | | | | | | | | | | |
| (a) | Commencement of offering of class of shares effective September 9, 2016 for Equity Income Fund. |
| (b) | Amount rounds to less than 500. |
SEE NOTES TO FINANCIAL STATEMENTS.
| | | | | | |
| | | |
| 66 | | | | J.P. MORGAN LARGE CAP FUNDS | | DECEMBER 31, 2016 |
| | | | | | | | | | | | | | | | |
| | | Equity Focus Fund | | | Equity Income Fund | |
| | | Six Months Ended
December 31, 2016
(Unaudited) | | | Year Ended
June 30, 2016 | | | Six Months Ended
December 31, 2016
(Unaudited) | | | Year Ended
June 30, 2016 | |
SHARE TRANSACTIONS: | | | | | | | | | | | | | | | | |
Class A | | | | | | | | | | | | | | | | |
Issued | | | 27 | | | | 53 | | | | 38,033 | | | | 85,185 | |
Reinvested | | | 1 | | | | 2 | | | | 3,425 | | | | 5,747 | |
Redeemed | | | (22 | ) | | | (32 | ) | | | (42,990 | ) | | | (69,349 | ) |
| | | | | | | | | | | | | | | | |
Change in Class A Shares | | | 6 | | | | 23 | | | | (1,532 | ) | | | 21,583 | |
| | | | | | | | | | | | | | | | |
Class C | | | | | | | | | | | | | | | | |
Issued | | | 38 | | | | 33 | | | | 10,907 | | | | 25,820 | |
Reinvested | | | 1 | | | | 1 | | | | 1,068 | | | | 1,712 | |
Redeemed | | | (9 | ) | | | (15 | ) | | | (11,078 | ) | | | (18,409 | ) |
| | | | | | | | | | | | | | | | |
Change in Class C Shares | | | 30 | | | | 19 | | | | 897 | | | | 9,123 | |
| | | | | | | | | | | | | | | | |
Class R2 | | | | | | | | | | | | | | | | |
Issued | | | — | | | | — | | | | 896 | | | | 2,472 | |
Reinvested | | | — | | | | — | | | | 69 | | | | 106 | |
Redeemed | | | — | | | | — | | | | (854 | ) | | | (1,164 | ) |
| | | | | | | | | | | | | | | | |
Change in Class R2 Shares | | | — | | | | — | | | | 111 | | | | 1,414 | |
| | | | | | | | | | | | | | | | |
Class R3 (a) | | | | | | | | | | | | | | | | |
Issued | | | — | | | | — | | | | 1 | | | | — | |
Reinvested | | | — | | | | — | | | | — | (b) | | | — | |
| | | | | | | | | | | | | | | | |
Change in Class R3 Shares | | | — | | | | — | | | | 1 | | | | — | |
| | | | | | | | | | | | | | | | |
Class R4 (a) | | | | | | | | | | | | | | | | |
Issued | | | — | | | | — | | | | 1 | | | | — | |
Reinvested | | | — | | | | — | | | | — | (b) | | | — | |
| | | | | | | | | | | | | | | | |
Change in Class R4 Shares | | | — | | | | — | | | | 1 | | | | — | |
| | | | | | | | | | | | | | | | |
Class R5 | | | | | | | | | | | | | | | | |
Issued | | | — | | | | — | | | | 15,777 | | | | 30,176 | |
Reinvested | | | — | | | | — | | | | 875 | | | | 990 | |
Redeemed | | | — | | | | — | | | | (5,799 | ) | | | (17,661 | ) |
| | | | | | | | | | | | | | | | |
Change in Class R5 Shares | | | — | | | | — | | | | 10,853 | | | | 13,505 | |
| | | | | | | | | | | | | | | | |
Class R6 | | | | | | | | | | | | | | | | |
Issued | | | — | | | | — | | | | 29,879 | | | | 88,149 | |
Reinvested | | | — | | | | — | | | | 2,401 | | | | 2,760 | |
Redeemed | | | — | | | | — | | | | (9,662 | ) | | | (18,113 | ) |
| | | | | | | | | | | | | | | | |
Change in Class R6 Shares | | | — | | | | — | | | | 22,618 | | | | 72,796 | |
| | | | | | | | | | | | | | | | |
Select Class | | | | | | | | | | | | | | | | |
Issued | | | 1,155 | | | | 3,648 | | | | 76,454 | | | | 117,769 | |
Reinvested | | | 18 | | | | 5 | | | | 3,739 | | | | 5,955 | |
Redeemed | | | (1,494 | ) | | | (1,210 | ) | | | (53,684 | ) | | | (126,901 | ) |
| | | | | | | | | | | | | | | | |
Change in Select Class Shares | | | (321 | ) | | | 2,443 | | | | 26,509 | | | | (3,177 | ) |
| | | | | | | | | | | | | | | | |
| (a) | Commencement of offering of class of shares effective September 9, 2016 for Equity Income Fund. |
| (b) | Amount rounds to less than 500. |
SEE NOTES TO FINANCIAL STATEMENTS.
| | | | | | | | |
| | | |
| DECEMBER 31, 2016 | | J.P. MORGAN LARGE CAP FUNDS | | | | | 67 | |
STATEMENTS OF CHANGES IN NET ASSETS
FOR THE PERIODS INDICATED (continued)
(Amounts in thousands)
| | | | | | | | | | | | | | | | |
| | | Growth and Income Fund | | | Hedged Equity Fund | |
| | | Six Months Ended
December 31, 2016
(Unaudited) | | | Year Ended
June 30, 2016 | | | Six Months Ended
December 31, 2016
(Unaudited) | | | Year Ended
June 30, 2016 | |
CAPITAL TRANSACTIONS: | | | | | | | | | | | | | | | | |
Class A | | | | | | | | | | | | | | | | |
Proceeds from shares issued | | $ | 15,141 | | | $ | 60,769 | | | $ | 18,799 | | | $ | 53,101 | |
Distributions reinvested | | | 23,390 | | | | 28,009 | | | | 517 | | | | 801 | |
Cost of shares redeemed | | | (30,090 | ) | | | (76,067 | ) | | | (21,709 | ) | | | (74,383 | ) |
| | | | | | | | | | | | | | | | |
Change in net assets resulting from Class A capital transactions | | $ | 8,441 | | | $ | 12,711 | | | $ | (2,393 | ) | | $ | (20,481 | ) |
| | | | | | | | | | | | | | | | |
Class C | | | | | | | | | | | | | | | | |
Proceeds from shares issued | | $ | 3,530 | | | $ | 6,659 | | | $ | 2,531 | | | $ | 7,643 | |
Distributions reinvested | | | 1,387 | | | | 1,582 | | | | 49 | | | | 52 | |
Cost of shares redeemed | | | (3,794 | ) | | | (5,693 | ) | | | (1,130 | ) | | | (1,302 | ) |
| | | | | | | | | | | | | | | | |
Change in net assets resulting from Class C capital transactions | | $ | 1,123 | | | $ | 2,548 | | | $ | 1,450 | | | $ | 6,393 | |
| | | | | | | | | | | | | | | | |
Class R2 | | | | | | | | | | | | | | | | |
Proceeds from shares issued | | $ | — | (a) | | $ | 20 | | | $ | — | | | $ | — | |
Distributions reinvested | | | 1 | | | | 1 | | | | — | | | | — | |
| | | | | | | | | | | | | | | | |
Change in net assets resulting from Class R2 capital transactions | | $ | 1 | | | $ | 21 | | | $ | — | | | $ | — | |
| | | | | | | | | | | | | | | | |
Class R5 | | | | | | | | | | | | | | | | |
Proceeds from shares issued | | $ | 8 | | | $ | 20 | | | $ | 3 | | | $ | 7 | |
Distributions reinvested | | | 1 | | | | 1 | | | | — | (a) | | | — | (a) |
Cost of shares redeemed | | | — | (a) | | | — | | | | (1 | ) | | | (426 | ) |
| | | | | | | | | | | | | | | | |
Change in net assets resulting from Class R5 capital transactions | | $ | 9 | | | $ | 21 | | | $ | 2 | | | $ | (419 | ) |
| | | | | | | | | | | | | | | | |
Class R6 | | | | | | | | | | | | | | | | |
Proceeds from shares issued | | $ | 1,834 | | | $ | 20 | | | $ | 12 | | | $ | 53 | |
Distributions reinvested | | | 9 | | | | 1 | | | | 1 | | | | 1 | |
Cost of shares redeemed | | | (9 | ) | | | — | | | | (2 | ) | | | (424 | ) |
| | | | | | | | | | | | | | | | |
Change in net assets resulting from Class R6 capital transactions | | $ | 1,834 | | | $ | 21 | | | $ | 11 | | | $ | (370 | ) |
| | | | | | | | | | | | | | | | |
Select Class | | | | | | | | | | | | | | | | |
Proceeds from shares issued | | $ | 7,639 | | | $ | 15,091 | | | $ | 95,853 | | | $ | 166,370 | |
Distributions reinvested | | | 2,098 | | | | 1,957 | | | | 1,600 | | | | 2,047 | |
Cost of shares redeemed | | | (5,617 | ) | | | (11,548 | ) | | | (28,133 | ) | | | (114,645 | ) |
| | | | | | | | | | | | | | | | |
Change in net assets resulting from Select Class capital transactions | | $ | 4,120 | | | $ | 5,500 | | | $ | 69,320 | | | $ | 53,772 | |
| | | | | | | | | | | | | | | | |
Total change in net assets resulting from capital transactions | | $ | 15,528 | | | $ | 20,822 | | | $ | 68,390 | | | $ | 38,895 | |
| | | | | | | | | | | | | | | | |
| (a) | Amount rounds to less than 500. |
SEE NOTES TO FINANCIAL STATEMENTS.
| | | | | | |
| | | |
| 68 | | | | J.P. MORGAN LARGE CAP FUNDS | | DECEMBER 31, 2016 |
| | | | | | | | | | | | | | | | |
| | | Growth and Income Fund | | | Hedged Equity Fund | |
| | | Six Months Ended
December 31, 2016
(Unaudited) | | | Year Ended
June 30, 2016 | | | Six Months Ended
December 31, 2016
(Unaudited) | | | Year Ended
June 30, 2016 | |
SHARE TRANSACTIONS: | | | | | | | | | | | | | | | | |
Class A | |
Issued | | | 336 | | | | 1,429 | | | | 1,111 | | | | 3,349 | |
Reinvested | | | 512 | | | | 676 | | | | 31 | | | | 51 | |
Redeemed | | | (675 | ) | | | (1,790 | ) | | | (1,284 | ) | | | (4,647 | ) |
| | | | | | | | | | | | | | | | |
Change in Class A Shares | | | 173 | | | | 315 | | | | (142 | ) | | | (1,247 | ) |
| | | | | | | | | | | | | | | | |
Class C | | | | | | | | | | | | | | | | |
Issued | | | 86 | | | | 170 | | | | 152 | | | | 482 | |
Reinvested | | | 34 | | | | 42 | | | | 3 | | | | 3 | |
Redeemed | | | (94 | ) | | | (147 | ) | | | (68 | ) | | | (82 | ) |
| | | | | | | | | | | | | | | | |
Change in Class C Shares | | | 26 | | | | 65 | | | | 87 | | | | 403 | |
| | | | | | | | | | | | | | | | |
Class R2 | | | | | | | | | | | | | | | | |
Issued | | | — | | | | 1 | | | | — | | | | — | |
Reinvested | | | — | (a) | | | — | (a) | | | — | | | | — | |
Redeemed | | | — | | | | — | | | | — | | | | — | |
| | | | | | | | | | | | | | | | |
Change in Class R2 Shares | | | — | (a) | | | 1 | | | | — | | | | — | |
| | | | | | | | | | | | | | | | |
Class R5 | | | | | | | | | | | | | | | | |
Issued | | | — | (a) | | | — | (a) | | | 1 | | | | — | (a) |
Reinvested | | | — | (a) | | | — | (a) | | | — | (a) | | | — | (a) |
Redeemed | | | — | (a) | | | — | | | | — | (a) | | | (26 | ) |
| | | | | | | | | | | | | | | | |
Change in Class R5 Shares | | | — | (a) | | | — | (a) | | | 1 | | | | (26 | ) |
| | | | | | | | | | | | | | | | |
Class R6 | | | | | | | | | | | | | | | | |
Issued | | | 38 | | | | — | (a) | | | — | (a) | | | 4 | |
Reinvested | | | — | (a) | | | — | (a) | | | — | (a) | | | — | (a) |
Redeemed | | | — | (a) | | | — | | | | — | (a) | | | (26 | ) |
| | | | | | | | | | | | | | | | |
Change in Class R6 Shares | | | 38 | | | | — | (a) | | | — | (a) | | | (22 | ) |
| | | | | | | | | | | | | | | | |
Select Class | | | | | | | | | | | | | | | | |
Issued | | | 162 | | | | 345 | | | | 5,741 | | | | 10,436 | |
Reinvested | | | 44 | | | | 45 | | | | 94 | | | | 130 | |
Redeemed | | | (121 | ) | | | (256 | ) | | | (1,686 | ) | | | (7,186 | ) |
| | | | | | | | | | | | | | | | |
Change in Select Class Shares | | | 85 | | | | 134 | | | | 4,149 | | | | 3,380 | |
| | | | | | | | | | | | | | | | |
| (a) | Amount rounds to less than 500. |
SEE NOTES TO FINANCIAL STATEMENTS.
| | | | | | | | |
| | | |
| DECEMBER 31, 2016 | | J.P. MORGAN LARGE CAP FUNDS | | | | | 69 | |
STATEMENTS OF CHANGES IN NET ASSETS
FOR THE PERIODS INDICATED (continued)
(Amounts in thousands)
| | | | | | | | | | | | | | | | |
| | | Large Cap Growth Fund | | | Large Cap Value Fund | |
| | | Six Months Ended
December 31, 2016
(Unaudited) | | | Year Ended
June 30, 2016 | | | Six Months Ended
December 31, 2016
(Unaudited) | | | Year Ended
June 30, 2016 | |
CAPITAL TRANSACTIONS: | | | | | | | | | | | | | | | | |
Class A | | | | | | | | | | | | | | | | |
Proceeds from shares issued | | $ | 349,014 | | | $ | 1,281,024 | | | $ | 37,466 | | | $ | 24,457 | |
Distributions reinvested | | | 303,623 | | | | 190,608 | | | | 5,650 | | | | 11,625 | |
Cost of shares redeemed | | | (1,298,165 | ) | | | (1,392,513 | ) | | | (15,869 | ) | | | (17,824 | ) |
| | | | | | | | | | | | | | | | |
Change in net assets resulting from Class A capital transactions | | $ | (645,528 | ) | | $ | 79,119 | | | $ | 27,247 | | | $ | 18,258 | |
| | | | | | | | | | | | | | | | |
Class C | | | | | | | | | | | | | | | | |
Proceeds from shares issued | | $ | 26,976 | | | $ | 142,471 | | | $ | 7,200 | | | $ | 7,145 | |
Distributions reinvested | | | 38,865 | | | | 22,387 | | | | 948 | | | | 1,705 | |
Cost of shares redeemed | | | (114,513 | ) | | | (130,104 | ) | | | (2,656 | ) | | | (3,753 | ) |
| | | | | | | | | | | | | | | | |
Change in net assets resulting from Class C capital transactions | | $ | (48,672 | ) | | $ | 34,754 | | | $ | 5,492 | | | $ | 5,097 | |
| | | | | | | | | | | | | | | | |
Class R2 | | | | | | | | | | | | | | | | |
Proceeds from shares issued | | $ | 19,318 | | | $ | 67,268 | | | $ | 1,024 | | | $ | 3,183 | |
Distributions reinvested | | | 11,527 | | | | 7,704 | | | | 130 | | | | 237 | |
Cost of shares redeemed | | | (49,715 | ) | | | (100,569 | ) | | | (582 | ) | | | (608 | ) |
| | | | | | | | | | | | | | | | |
Change in net assets resulting from Class R2 capital transactions | | $ | (18,870 | ) | | $ | (25,597 | ) | | $ | 572 | | | $ | 2,812 | |
| | | | | | | | | | | | | | | | |
Class R3 (a) | | | | | | | | | | | | | | | | |
Proceeds from shares issued | | $ | 20 | | | $ | — | | | $ | — | | | $ | — | |
Distributions reinvested | | | 2 | | | | — | | | | — | | | | — | |
| | | | | | | | | | | | | | | | |
Change in net assets resulting from Class R3 capital transactions | | $ | 22 | | | $ | — | | | $ | — | | | $ | — | |
| | | | | | | | | | | | | | | | |
Class R4 (a) | | | | | | | | | | | | | | | | |
Proceeds from shares issued | | $ | 20 | | | $ | — | | | $ | — | | | $ | — | |
Distributions reinvested | | | 2 | | | | — | | | | — | | | | — | |
| | | | | | | | | | | | | | | | |
Change in net assets resulting from Class R4 capital transactions | | $ | 22 | | | $ | — | | | $ | — | | | $ | — | |
| | | | | | | | | | | | | | | | |
Class R5 | | | | | | | | | | | | | | | | |
Proceeds from shares issued | | $ | 62,722 | | | $ | 514,798 | | | $ | 2,114 | | | $ | 3,673 | |
Distributions reinvested | | | 94,629 | | | | 52,449 | | | | 326 | | | | 160 | |
Cost of shares redeemed | | | (268,304 | ) | | | (607,179 | ) | | | (600 | ) | | | (3,493 | ) |
| | | | | | | | | | | | | | | | |
Change in net assets resulting from Class R5 capital transactions | | $ | (110,953 | ) | | $ | (39,932 | ) | | $ | 1,840 | | | $ | 340 | |
| | | | | | | | | | | | | | | | |
Class R6 | | | | | | | | | | | | | | | | |
Proceeds from shares issued | | $ | 301,825 | | | $ | 1,387,654 | | | $ | 10,696 | | | $ | 617,794 | |
Distributions reinvested | | | 283,753 | | | | 156,166 | | | | 31,278 | | | | 79,246 | |
Cost of shares redeemed | | | (597,672 | ) | | | (1,046,538 | ) | | | (103,576 | ) | | | (41,590 | ) |
| | | | | | | | | | | | | | | | |
Change in net assets resulting from Class R6 capital transactions | | $ | (12,094 | ) | | $ | 497,282 | | | $ | (61,602 | ) | | $ | 655,450 | |
| | | | | | | | | | | | | | | | |
Select Class | | | | | | | | | | | | | | | | |
Proceeds from shares issued | | $ | 385,483 | | | $ | 1,153,454 | | | $ | 23,923 | | | $ | 24,717 | |
Distributions reinvested | | | 250,389 | | | | 160,552 | | | | 1,574 | | | | 3,536 | |
Cost of shares redeemed | | | (1,185,943 | ) | | | (2,160,320 | ) | | | (3,570 | ) | | | (636,434 | ) |
| | | | | | | | | | | | | | | | |
Change in net assets resulting from Select Class capital transactions | | $ | (550,071 | ) | | $ | (846,314 | ) | | $ | 21,927 | | | $ | (608,181 | ) |
| | | | | | | | | | | | | | | | |
Total change in net assets resulting from capital transactions | | $ | (1,386,144 | ) | | $ | (300,688 | ) | | $ | (4,524 | ) | | $ | 73,776 | |
| | | | | | | | | | | | | | | | |
| (a) | Commencement of offering of class of shares effective September 9, 2016 for Large Cap Growth Fund. |
SEE NOTES TO FINANCIAL STATEMENTS.
| | | | | | |
| | | |
| 70 | | | | J.P. MORGAN LARGE CAP FUNDS | | DECEMBER 31, 2016 |
| | | | | | | | | | | | | | | | |
| | | Large Cap Growth Fund | | | Large Cap Value Fund | |
| | | Six Months Ended
December 31, 2016
(Unaudited) | | | Year Ended
June 30, 2016 | | | Six Months Ended
December 31, 2016
(Unaudited) | | | Year Ended
June 30, 2016 | |
SHARE TRANSACTIONS: | | | | | | | | | | | | | | | | |
Class A | |
Issued | | | 10,228 | | | | 37,172 | | | | 2,544 | | | | 1,832 | |
Reinvested | | | 9,494 | | | | 5,482 | | | | 383 | | | | 924 | |
Redeemed | | | (37,914 | ) | | | (40,416 | ) | | | (1,160 | ) | | | (1,372 | ) |
| | | | | | | | | | | | | | | | |
Change in Class A Shares | | | (18,192 | ) | | | 2,238 | | | | 1,767 | | | | 1,384 | |
| | | | | | | | | | | | | | | | |
Class C | | | | | | | | | | | | | | | | |
Issued | | | 963 | | | | 4,722 | | | | 512 | | | | 563 | |
Reinvested | | | 1,450 | | | | 751 | | | | 67 | | | | 140 | |
Redeemed | | | (3,945 | ) | | | (4,450 | ) | | | (199 | ) | | | (297 | ) |
| | | | | | | | | | | | | | | | |
Change in Class C Shares | | | (1,532 | ) | | | 1,023 | | | | 380 | | | | 406 | |
| | | | | | | | | | | | | | | | |
Class R2 | | | | | | | | | | | | | | | | |
Issued | | | 586 | | | | 1,959 | | | | 76 | | | | 228 | |
Reinvested | | | 368 | | | | 226 | | | | 9 | | | | 19 | |
Redeemed | | | (1,487 | ) | | | (2,918 | ) | | | (43 | ) | | | (45 | ) |
| | | | | | | | | | | | | | | | |
Change in Class R2 Shares | | | (533 | ) | | | (733 | ) | | | 42 | | | | 202 | |
| | | | | | | | | | | | | | | | |
Class R3 (a) | | | | | | | | | | | | | | | | |
Issued | | | 1 | | | | — | | | | — | | | | — | |
Reinvested | | | — | (b) | | | — | | | | — | | | | — | |
| | | | | | | | | | | | | | | | |
Change in Class R3 Shares | | | 1 | | | | — | | | | — | | | | — | |
| | | | | | | | | | | | | | | | |
Class R4 (a) | | | | | | | | | | | | | | | | |
Issued | | | 1 | | | | — | | | | — | | | | — | |
Reinvested | | | — | (b) | | | — | | | | — | | | | — | |
| | | | | | | | | | | | | | | | |
Change in Class R4 Shares | | | 1 | | | | — | | | | — | | | | — | |
| | | | | | | | | | | | | | | | |
Class R5 | | | | | | | | | | | | | | | | |
Issued | | | 1,809 | | | | 14,389 | | | | 158 | | | | 285 | |
Reinvested | | | 2,903 | | | | 1,488 | | | | 22 | | | | 13 | |
Redeemed | | | (7,756 | ) | | | (17,156 | ) | | | (43 | ) | | | (267 | ) |
| | | | | | | | | | | | | | | | |
Change in Class R5 Shares | | | (3,044 | ) | | | (1,279 | ) | | | 137 | | | | 31 | |
| | | | | | | | | | | | | | | | |
Class R6 | | | | | | | | | | | | | | | | |
Issued | | | 8,691 | | | | 38,341 | | | | 846 | | | | 41,745 | |
Reinvested | | | 8,667 | | | | 4,416 | | | | 2,152 | | | | 6,381 | |
Redeemed | | | (17,156 | ) | | | (29,799 | ) | | | (7,115 | ) | | | (3,365 | ) |
| | | | | | | | | | | | | | | | |
Change in Class R6 Shares | | | 202 | | | | 12,958 | | | | (4,117 | ) | | | 44,761 | |
| | | | | | | | | | | | | | | | |
Select Class | | | | | | | | | | | | | | | | |
Issued | | | 11,314 | | | | 33,270 | | | | 1,642 | | | | 1,852 | |
Reinvested | | | 7,786 | | | | 4,602 | | | | 108 | | | | 277 | |
Redeemed | | | (34,463 | ) | | | (61,477 | ) | | | (268 | ) | | | (43,139 | ) |
| | | | | | | | | | | | | | | | |
Change in Select Class Shares | | | (15,363 | ) | | | (23,605 | ) | | | 1,482 | | | | (41,010 | ) |
| | | | | | | | | | | | | | | | |
| (a) | Commencement of offering of class of shares effective September 9, 2016 for Large Cap Growth Fund. |
| (b) | Amount rounds to less than 500. |
SEE NOTES TO FINANCIAL STATEMENTS.
| | | | | | | | |
| | | |
| DECEMBER 31, 2016 | | J.P. MORGAN LARGE CAP FUNDS | | | | | 71 | |
STATEMENTS OF CHANGES IN NET ASSETS
FOR THE PERIODS INDICATED (continued)
(Amounts in thousands)
| | | | | | | | |
| | | U.S. Equity Fund | |
| | | Six Months Ended
December 31, 2016
(Unaudited) | | | Year Ended
June 30, 2016 | |
CAPITAL TRANSACTIONS: | | | | | | | | |
Class A | | | | | | | | |
Proceeds from shares issued | | $ | 143,616 | | | $ | 469,469 | |
Distributions reinvested | | | 52,170 | | | | 70,720 | |
Cost of shares redeemed | | | (310,046 | ) | | | (397,193 | ) |
| | | | | | | | |
Change in net assets resulting from Class A capital transactions | | $ | (114,260 | ) | | $ | 142,996 | |
| | | | | | | | |
Class C | | | | | | | | |
Proceeds from shares issued | | $ | 36,068 | | | $ | 102,150 | |
Distributions reinvested | | | 11,631 | | | | 13,355 | |
Cost of shares redeemed | | | (39,114 | ) | | | (56,529 | ) |
| | | | | | | | |
Change in net assets resulting from Class C capital transactions | | $ | 8,585 | | | $ | 58,976 | |
| | | | | | | | |
Class L (formerly Institutional Class) | | | | | | | | |
Proceeds from shares issued | | $ | 275,969 | | | $ | 985,884 | |
Distributions reinvested | | | 116,632 | | | | 243,871 | |
Cost of shares redeemed | | | (1,056,434 | ) | | | (2,103,943 | ) |
| | | | | | | | |
Change in net assets resulting from Class L capital transactions | | $ | (663,833 | ) | | $ | (874,188 | ) |
| | | | | | | | |
Class R2 | | | | | | | | |
Proceeds from shares issued | | $ | 22,244 | | | $ | 72,587 | |
Distributions reinvested | | | 7,843 | | | | 9,669 | |
Cost of shares redeemed | | | (29,658 | ) | | | (42,951 | ) |
| | | | | | | | |
Change in net assets resulting from Class R2 capital transactions | | $ | 429 | | | $ | 39,305 | |
| | | | | | | | |
Class R3 (a) | | | | | | | | |
Proceeds from shares issued | | $ | 25 | | | $ | — | |
Distributions reinvested | | | 1 | | | | — | |
| | | | | | | | |
Change in net assets resulting from Class R3 capital transactions | | $ | 26 | | | $ | — | |
| | | | | | | | |
Class R4 (a) | | | | | | | | |
Proceeds from shares issued | | $ | 20 | | | $ | — | |
Distributions reinvested | | | 1 | | | | — | |
| | | | | | | | |
Change in net assets resulting from Class R4 capital transactions | | $ | 21 | | | $ | — | |
| | | | | | | | |
Class R5 | | | | | | | | |
Proceeds from shares issued | | $ | 63,351 | | | $ | 610,125 | |
Distributions reinvested | | | 32,773 | | | | 48,938 | |
Cost of shares redeemed | | | (215,228 | ) | | | (195,954 | ) |
| | | | | | | | |
Change in net assets resulting from Class R5 capital transactions | | $ | (119,104 | ) | | $ | 463,109 | |
| | | | | | | | |
Class R6 | | | | | | | | |
Proceeds from shares issued | | $ | 271,732 | | | $ | 2,370,357 | |
Distributions reinvested | | | 216,433 | | | | 263,145 | |
Cost of shares redeemed | | | (302,307 | ) | | | (553,912 | ) |
| | | | | | | | |
Change in net assets resulting from Class R6 capital transactions | | $ | 185,858 | | | $ | 2,079,590 | |
| | | | | | | | |
Select Class | | | | | | | | |
Proceeds from shares issued | | $ | 99,561 | | | $ | 368,200 | |
Distributions reinvested | | | 40,147 | | | | 57,766 | |
Cost of shares redeemed | | | (172,513 | ) | | | (1,677,242 | ) |
| | | | | | | | |
Change in net assets resulting from Select Class capital transactions | | $ | (32,805 | ) | | $ | (1,251,276 | ) |
| | | | | | | | |
Total change in net assets resulting from capital transactions | | $ | (735,083 | ) | | $ | 658,512 | |
| | | | | | | | |
| (a) | Commencement of offering of class of shares effective September 9, 2016. |
SEE NOTES TO FINANCIAL STATEMENTS.
| | | | | | |
| | | |
| 72 | | | | J.P. MORGAN LARGE CAP FUNDS | | DECEMBER 31, 2016 |
| | | | | | | | |
| | | U.S. Equity Fund | |
| | | Six Months Ended
December 31, 2016
(Unaudited) | | | Year Ended
June 30, 2016 | |
SHARE TRANSACTIONS: | | | | | | | | |
Class A | |
Issued | | | 9,921 | | | | 33,923 | |
Reinvested | | | 3,550 | | | | 5,214 | |
Redeemed | | | (21,525 | ) | | | (28,824 | ) |
| | | | | | | | |
Change in Class A Shares | | | (8,054 | ) | | | 10,313 | |
| | | | | | | | |
Class C | | | | | | | | |
Issued | | | 2,552 | | | | 7,574 | |
Reinvested | | | 814 | | | | 1,010 | |
Redeemed | | | (2,778 | ) | | | (4,215 | ) |
| | | | | | | | |
Change in Class C Shares | | | 588 | | | | 4,369 | |
| | | | | | | | |
Class L (formerly Institutional Class) | | | | | | | | |
Issued | | | 18,971 | | | | 71,431 | |
Reinvested | | | 7,911 | | | | 17,924 | |
Redeemed | | | (73,357 | ) | | | (154,416 | ) |
| | | | | | | | |
Change in Class L Shares | | | (46,475 | ) | | | (65,061 | ) |
| | | | | | | | |
Class R2 | | | | | | | | |
Issued | | | 1,554 | | | | 5,242 | |
Reinvested | | | 538 | | | | 718 | |
Redeemed | | | (2,076 | ) | | | (3,104 | ) |
| | | | | | | | |
Change in Class R2 Shares | | | 16 | | | | 2,856 | |
| | | | | | | | |
Class R3 (a) | | | | | | | | |
Issued | | | 2 | | | | — | |
Reinvested | | | — | (b) | | | — | |
| | | | | | | | |
Change in Class R3 Shares | | | 2 | | | | — | |
| | | | | | | | |
Class R4 (a) | | | | | | | | |
Issued | | | 2 | | | | — | |
Reinvested | | | — | (b) | | | — | |
| | | | | | | | |
Change in Class R4 Shares | | | 2 | | | | — | |
| | | | | | | | |
Class R5 | | | | | | | | |
Issued | | | 4,363 | | | | 42,836 | |
Reinvested | | | 2,222 | | | | 3,593 | |
Redeemed | | | (14,873 | ) | | | (14,029 | ) |
| | | | | | | | |
Change in Class R5 Shares | | | (8,288 | ) | | | 32,400 | |
| | | | | | | | |
Class R6 | | | | | | | | |
Issued | | | 18,823 | | | | 164,015 | |
Reinvested | | | 14,654 | | | | 19,299 | |
Redeemed | | | (20,654 | ) | | | (40,193 | ) |
| | | | | | | | |
Change in Class R6 Shares | | | 12,823 | | | | 143,121 | |
| | | | | | | | |
Select Class | | | | | | | | |
Issued | | | 6,848 | | | | 26,575 | |
Reinvested | | | 2,726 | | | | 4,256 | |
Redeemed | | | (11,879 | ) | | | (114,285 | ) |
| | | | | | | | |
Change in Select Class Shares | | | (2,305 | ) | | | (83,454 | ) |
| | | | | | | | |
| (a) | Commencement of offering of class of shares effective September 9, 2016. |
| (b) | Amount rounds to less than 500. |
SEE NOTES TO FINANCIAL STATEMENTS.
| | | | | | | | |
| | | |
| DECEMBER 31, 2016 | | J.P. MORGAN LARGE CAP FUNDS | | | | | 73 | |
FINANCIAL HIGHLIGHTS
FOR THE PERIODS INDICATED
| | | | | | | | | | | | | | | | | | | | | | | | | | | | |
| | | Per share operating performance | |
| | | | | | Investment operations | | | Distributions | |
| | | Net asset
value,
beginning
of period | | | Net
investment
income
(loss) (b) | | | Net realized
and unrealized
gains
(losses) on
investments | | | Total from
investment
operations | | | Net
investment
income | | | Net
realized
gain | | | Total
distributions | |
Disciplined Equity Fund | | | | | | | | | | | | | | | | | | | | | | | | | | | | |
Class A | | | | | | | | | | | | | | | | | | | | | | | | | | | | |
Six Months Ended December 31, 2016 (Unaudited) | | $ | 21.74 | | | $ | 0.16 | | | $ | 1.74 | | | $ | 1.90 | | | $ | (0.18 | ) | | $ | — | | | $ | (0.18 | ) |
Year Ended June 30, 2016 | | | 23.99 | | | | 0.26 | | | | (1.32 | ) | | | (1.06 | ) | | | (0.22 | ) | | | (0.97 | ) | | | (1.19 | ) |
Year Ended June 30, 2015 | | | 23.73 | | | | 0.20 | | | | 1.85 | | | | 2.05 | | | | (0.19 | ) | | | (1.60 | ) | | | (1.79 | ) |
Year Ended June 30, 2014 | | | 20.27 | | | | 0.23 | | | | 4.79 | | | | 5.02 | | | | (0.21 | ) | | | (1.35 | ) | | | (1.56 | ) |
Year Ended June 30, 2013 | | | 17.42 | | | | 0.20 | | | | 3.56 | | | | 3.76 | | | | (0.23 | ) | | | (0.68 | ) | | | (0.91 | ) |
Year Ended June 30, 2012 | | | 16.80 | | | | 0.21 | | | | 0.61 | | | | 0.82 | | | | (0.20 | ) | | | — | | | | (0.20 | ) |
| | | | | | | |
Class L (formerly Institutional Class) | | | | | | | | | | | | | | | | | | | | | | | | | | | | |
Six Months Ended December 31, 2016 (Unaudited) | | | 21.89 | | | | 0.19 | | | | 1.76 | | | | 1.95 | | | | (0.22 | ) | | | — | | | | (0.22 | ) |
Year Ended June 30, 2016 | | | 24.15 | | | | 0.35 | | | | (1.33 | ) | | | (0.98 | ) | | | (0.31 | ) | | | (0.97 | ) | | | (1.28 | ) |
Year Ended June 30, 2015 | | | 23.85 | | | | 0.29 | | | | 1.89 | | | | 2.18 | | | | (0.28 | ) | | | (1.60 | ) | | | (1.88 | ) |
Year Ended June 30, 2014 | | | 20.36 | | | | 0.32 | | | | 4.81 | | | | 5.13 | | | | (0.29 | ) | | | (1.35 | ) | | | (1.64 | ) |
Year Ended June 30, 2013 | | | 17.48 | | | | 0.30 | | | | 3.55 | | | | 3.85 | | | | (0.29 | ) | | | (0.68 | ) | | | (0.97 | ) |
Year Ended June 30, 2012 | | | 16.83 | | | | 0.27 | | | | 0.63 | | | | 0.90 | | | | (0.25 | ) | | | — | | | | (0.25 | ) |
| | | | | | | |
Class R6 | | | | | | | | | | | | | | | | | | | | | | | | | | | | |
Six Months Ended December 31, 2016 (Unaudited) | | | 21.90 | | | | 0.21 | | | | 1.75 | | | | 1.96 | | | | (0.23 | ) | | | — | | | | (0.23 | ) |
Year Ended June 30, 2016 | | | 24.16 | | | | 0.37 | | | | (1.33 | ) | | | (0.96 | ) | | | (0.33 | ) | | | (0.97 | ) | | | (1.30 | ) |
Year Ended June 30, 2015 | | | 23.85 | | | | 0.32 | | | | 1.89 | | | | 2.21 | | | | (0.30 | ) | | | (1.60 | ) | | | (1.90 | ) |
Year Ended June 30, 2014 | | | 20.36 | | | | 0.34 | | | | 4.81 | | | | 5.15 | | | | (0.31 | ) | | | (1.35 | ) | | | (1.66 | ) |
Year Ended June 30, 2013 | | | 17.48 | | | | 0.32 | | | | 3.55 | | | | 3.87 | | | | (0.31 | ) | | | (0.68 | ) | | | (0.99 | ) |
Year Ended June 30, 2012 | | | 16.83 | | | | 0.29 | | | | 0.63 | | | | 0.92 | | | | (0.27 | ) | | | — | | | | (0.27 | ) |
| | | | | | | |
Select Class | | | | | | | | | | | | | | | | | | | | | | | | | | | | |
Six Months Ended December 31, 2016 (Unaudited) | | | 21.92 | | | | 0.19 | | | | 1.76 | | | | 1.95 | | | | (0.21 | ) | | | — | | | | (0.21 | ) |
Year Ended June 30, 2016 | | | 24.18 | | | | 0.32 | | | | (1.34 | ) | | | (1.02 | ) | | | (0.27 | ) | | | (0.97 | ) | | | (1.24 | ) |
Year Ended June 30, 2015 | | | 23.88 | | | | 0.26 | | | | 1.87 | | | | 2.13 | | | | (0.23 | ) | | | (1.60 | ) | | | (1.83 | ) |
Year Ended June 30, 2014 | | | 20.39 | | | | 0.28 | | | | 4.82 | | | | 5.10 | | | | (0.26 | ) | | | (1.35 | ) | | | (1.61 | ) |
Year Ended June 30, 2013 | | | 17.51 | | | | 0.27 | | | | 3.56 | | | | 3.83 | | | | (0.27 | ) | | | (0.68 | ) | | | (0.95 | ) |
Year Ended June 30, 2012 | | | 16.86 | | | | 0.25 | | | | 0.63 | | | | 0.88 | | | | (0.23 | ) | | | — | | | | (0.23 | ) |
| (a) | Annualized for periods less than one year, unless otherwise noted. |
| (b) | Calculated based upon average shares outstanding. |
| (c) | Not annualized for periods less than one year. |
| (d) | Includes adjustments in accordance with accounting principles generally accepted in the United States of America and as such, the net asset values for financial reporting purposes and the returns based upon those net asset values may differ from the net asset values and returns for shareholder transactions. |
| (e) | Includes earnings credits and interest expense, if applicable, each of which is less than 0.005% unless otherwise noted. |
| (f) | Portfolio turnover is calculated by dividing the lesser of total purchases or sales of portfolio securities for the reporting period by the monthly average value of portfolio securities owned during the reporting period. Excluded from both the numerator and denominator are amounts relating to derivatives and securities whose maturities or expiration dates at the time of acquisition were one year or less. |
SEE NOTES TO FINANCIAL STATEMENTS.
| | | | | | |
| | | |
| 74 | | | | J.P. MORGAN LARGE CAP FUNDS | | DECEMBER 31, 2016 |
| | | | | | | | | | | | | | | | | | | | | | | | | | |
| | | Ratios/Supplemental data | |
| | | | | | | | | | Ratios to average net assets (a) | | | | |
Net asset
value,
end of
period | | | Total return
(excludes
sales charge) (c)(d) | | | Net assets,
end of
period
(000’s) | | | Net
expenses (e) | | | Net
investment
income
(loss) | | | Expenses
without waivers,
reimbursements and
earnings credits | | | Portfolio
turnover
rate (c)(f) | |
| | | | | | | | | | | | | | | | | | | | | | | | | | |
| | | | | | | | | | | | | | | | | | | | | | | | | | |
| $ | 23.46 | | | | 8.73 | % | | $ | 446,765 | | | | 0.77 | % | | | 1.36 | % | | | 1.01 | % | | | 24 | % |
| | 21.74 | | | | (4.30 | ) | | | 497,934 | | | | 0.85 | | | | 1.20 | | | | 1.02 | | | | 122 | |
| | 23.99 | | | | 9.04 | | | | 483,296 | | | | 0.85 | | | | 0.84 | | | | 0.97 | | | | 144 | |
| | 23.73 | | | | 25.73 | | | | 206,635 | | | | 0.85 | | | | 1.02 | | | | 0.86 | | | | 113 | |
| | 20.27 | | | | 22.33 | | | | 103,755 | | | | 0.85 | | | | 1.04 | | | | 0.87 | | | | 178 | |
| | 17.42 | | | | 4.98 | | | | 20,831 | | | | 0.85 | | | | 1.21 | | | | 0.88 | | | | 198 | |
| | | | | | |
| | | | | | | | | | | | | | | | | | | | | | | | | | |
| | 23.62 | | | | 8.91 | | | | 808,633 | | | | 0.43 | | | | 1.69 | | | | 0.50 | | | | 24 | |
| | 21.89 | | | | (3.94 | ) | | | 824,559 | | | | 0.45 | | | | 1.59 | | | | 0.50 | | | | 122 | |
| | 24.15 | | | | 9.53 | | | | 796,919 | | | | 0.45 | | | | 1.21 | | | | 0.51 | | | | 144 | |
| | 23.85 | | | | 26.20 | | | | 389,507 | | | | 0.45 | | | | 1.42 | | | | 0.46 | | | | 113 | |
| | 20.36 | | | | 22.79 | | | | 221,638 | | | | 0.45 | | | | 1.57 | | | | 0.47 | | | | 178 | |
| | 17.48 | | | | 5.47 | | | | 171,872 | | | | 0.45 | | | | 1.66 | | | | 0.49 | | | | 198 | |
| | | | | | |
| | | | | | | | | | | | | | | | | | | | | | | | | | |
| | 23.63 | | | | 8.97 | | | | 6,271,906 | | | | 0.31 | | | | 1.81 | | | | 0.34 | | | | 24 | |
| | 21.90 | | | | (3.83 | ) | | | 6,638,591 | | | | 0.34 | | | | 1.69 | | | | 0.35 | | | | 122 | |
| | 24.16 | | | | 9.67 | | | | 6,205,582 | | | | 0.35 | | | | 1.33 | | | | 0.36 | | | | 144 | |
| | 23.85 | | | | 26.31 | | | | 3,598,945 | | | | 0.35 | | | | 1.52 | | | | 0.36 | | | | 113 | |
| | 20.36 | | | | 22.90 | | | | 1,460,937 | | | | 0.35 | | | | 1.67 | | | | 0.37 | | | | 178 | |
| | 17.48 | | | | 5.57 | | | | 1,024,228 | | | | 0.35 | | | | 1.76 | | | | 0.38 | | | | 198 | |
| | | | | | |
| | | | | | | | | | | | | | | | | | | | | | | | | | |
| | 23.66 | | | | 8.89 | | | | 246,330 | | | | 0.52 | | | | 1.61 | | | | 0.72 | | | | 24 | |
| | 21.92 | | | | (4.08 | ) | | | 260,494 | | | | 0.60 | | | | 1.45 | | | | 0.69 | | | | 122 | |
| | 24.18 | | | | 9.34 | | | | 260,618 | | | | 0.60 | | | | 1.09 | | | | 0.64 | | | | 144 | |
| | 23.88 | | | | 26.00 | | | | 82,899 | | | | 0.59 | | | | 1.28 | | | | 0.61 | | | | 113 | |
| | 20.39 | | | | 22.61 | | | | 40,522 | | | | 0.60 | | | | 1.40 | | | | 0.62 | | | | 178 | |
| | 17.51 | | | | 5.31 | | | | 15,979 | | | | 0.60 | | | | 1.50 | | | | 0.64 | | | | 198 | |
SEE NOTES TO FINANCIAL STATEMENTS.
| | | | | | | | |
| | | |
| DECEMBER 31, 2016 | | J.P. MORGAN LARGE CAP FUNDS | | | | | 75 | |
FINANCIAL HIGHLIGHTS
FOR THE PERIODS INDICATED (continued)
| | | | | | | | | | | | | | | | | | | | |
| | | Per share operating performance | |
| | | | | | Investment operations | | | Distributions | |
| | | Net asset
value,
beginning
of period | | | Net
investment
income
(loss) | | | Net realized
and unrealized
gains
(losses) on
investments | | | Total from
investment
operations | | | Net
realized
gain | |
Dynamic Growth Fund | | | | | | | | | | | | | | | | | | | | |
Class A | | | | | | | | | | | | | | | | | | | | |
Six Months Ended December 31, 2016 (Unaudited) | | $ | 24.13 | | | $ | — | (f)(j) | | $ | 1.84 | | | $ | 1.84 | | | $ | (0.32 | ) |
Year Ended June 30, 2016 | | | 25.34 | | | | (0.12 | )(f) | | | (0.82 | ) | | | (0.94 | ) | | | (0.27 | ) |
Year Ended June 30, 2015 | | | 23.95 | | | | (0.14 | )(f) | | | 1.90 | | | | 1.76 | | | | (0.37 | ) |
Year Ended June 30, 2014 | | | 18.94 | | | | (0.07 | )(f)(g)(h) | | | 5.08 | | | | 5.01 | | | | — | |
Year Ended June 30, 2013 | | | 15.89 | | | | (0.05 | )(f)(i) | | | 3.10 | | | | 3.05 | | | | — | |
Year Ended June 30, 2012 | | | 15.47 | | | | (0.12 | ) | | | 0.54 | | | | 0.42 | | | | — | |
| | | | | |
Class C | | | | | | | | | | | | | | | | | | | | |
Six Months Ended December 31, 2016 (Unaudited) | | | 23.10 | | | | (0.06 | )(f) | | | 1.76 | | | | 1.70 | | | | (0.32 | ) |
Year Ended June 30, 2016 | | | 24.39 | | | | (0.24 | )(f) | | | (0.78 | ) | | | (1.02 | ) | | | (0.27 | ) |
Year Ended June 30, 2015 | | | 23.19 | | | | (0.26 | )(f) | | | 1.83 | | | | 1.57 | | | | (0.37 | ) |
Year Ended June 30, 2014 | | | 18.43 | | | | (0.20 | )(f)(g)(h) | | | 4.96 | | | | 4.76 | | | | — | |
Year Ended June 30, 2013 | | | 15.54 | | | | (0.14 | )(f)(i) | | | 3.03 | | | | 2.89 | | | | — | |
Year Ended June 30, 2012 | | | 15.21 | | | | (0.19 | ) | | | 0.52 | | | | 0.33 | | | | — | |
| | | | | |
Class R5 | | | | | | | | | | | | | | | | | | | | |
Six Months Ended December 31, 2016 (Unaudited) | | | 25.09 | | | | 0.06 | (f) | | | 1.92 | | | | 1.98 | | | | (0.32 | ) |
Year Ended June 30, 2016 | | | 26.22 | | | | 0.01 | (f) | | | (0.87 | ) | | | (0.86 | ) | | | (0.27 | ) |
Year Ended June 30, 2015 | | | 24.65 | | | | (0.04 | )(f) | | | 1.98 | | | | 1.94 | | | | (0.37 | ) |
Year Ended June 30, 2014 | | | 19.42 | | | | (0.04 | )(f)(g)(h) | | | 5.27 | | | | 5.23 | | | | — | |
Year Ended June 30, 2013 | | | 16.22 | | | | 0.03 | (f)(i) | | | 3.17 | | | | 3.20 | | | | — | |
Year Ended June 30, 2012 | | | 15.72 | | | | (0.06 | ) | | | 0.56 | | | | 0.50 | | | | — | |
| | | | | |
Select Class | | | | | | | | | | | | | | | | | | | | |
Six Months Ended December 31, 2016 (Unaudited) | | | 24.66 | | | | 0.04 | (f) | | | 1.88 | | | | 1.92 | | | | (0.32 | ) |
Year Ended June 30, 2016 | | | 25.83 | | | | (0.10 | )(f) | | | (0.80 | ) | | | (0.90 | ) | | | (0.27 | ) |
Year Ended June 30, 2015 | | | 24.34 | | | | (0.08 | )(f) | | | 1.94 | | | | 1.86 | | | | (0.37 | ) |
Year Ended June 30, 2014 | | | 19.20 | | | | (0.08 | )(f)(g)(h) | | | 5.22 | | | | 5.14 | | | | — | |
Year Ended June 30, 2013 | | | 16.07 | | | | (0.03 | )(f)(i) | | | 3.16 | | | | 3.13 | | | | — | |
Year Ended June 30, 2012 | | | 15.61 | | | | (0.09 | ) | | | 0.55 | | | | 0.46 | | | | — | |
| (a) | Annualized for periods less than one year, unless otherwise noted. |
| (b) | Not annualized for periods less than one year. |
| (c) | Includes adjustments in accordance with accounting principles generally accepted in the United States of America and as such, the net asset values for financial reporting purposes and the returns based upon those net asset values may differ from the net asset values and returns for shareholder transactions. |
| (d) | Includes earnings credits and interest expense, if applicable, each of which is less than 0.005% unless otherwise noted. |
| (e) | Portfolio turnover is calculated by dividing the lesser of total purchases or sales of portfolio securities for the reporting period by the monthly average value of portfolio securities owned during the reporting period. Excluded from both the numerator and denominator are amounts relating to derivatives and securities whose maturities or expiration dates at the time of acquisition were one year or less. |
| (f) | Calculated based upon average shares outstanding. |
| (g) | Reflects special dividends paid out during the period by several of the Fund’s holdings. Had the Fund not received the special dividends, the net investment income (loss) per share would have been $(0.08), $(0.21), $(0.05) and $(0.09) for Class A, Class C, Class R5 and Select Class Shares, respectively, and the net investment income (loss) ratio would have been (0.35)%, (0.92)%, (0.23)% and (0.40)% for Class A, Class C, Class R5 and Select Class Shares, respectively. These amounts have been revised to correct a calculation error in the previously issued June 30, 2014 financial highlights’ footnote disclosure. These revisions are not considered material to the previously issued financial statements. |
| (h) | Net investment income (loss) may appear disproportionate among classes due to the timing of recognition of income and changes in the relative size of the classes. |
| (i) | Reflects special dividends paid out during the period by several of the Fund’s holdings. Had the Fund not received the special dividends, the net investment income (loss) per share would have been $(0.10), $(0.19), $(0.03) and $(0.08) for Class A, Class C, Class R5 and Select Class Shares, respectively, and the net investment income (loss) ratio would have been (0.60)%, (1.10)%, (0.15)% and (0.45)% for Class A, Class C, Class R5 and Select Class Shares, respectively. |
| (j) | Amount rounds to less than $0.005. |
| (k) | Amount rounds to less than 0.005% |
SEE NOTES TO FINANCIAL STATEMENTS.
| | | | | | |
| | | |
| 76 | | | | J.P. MORGAN LARGE CAP FUNDS | | DECEMBER 31, 2016 |
| | | | | | | | | | | | | | | | | | | | | | | | | | |
| | | Ratios/Supplemental data | |
| | | | | | | | | | Ratios to average net assets (a) | | | | |
Net asset
value,
end of
period | | | Total return
(excludes
sales charge) (b)(c) | | | Net assets,
end of
period
(000’s) | | | Net
expenses (d) | | | Net
investment
income
(loss) | | | Expenses without waivers,
reimbursements and
earnings credits | | | Portfolio
turnover
rate (b)(e) | |
| | | | | | | | | | | | | | | | | | | | | | | | | | |
| | | | | | | | | | | | | | | | | | | | | | | | | | |
| $ | 25.65 | | | | 7.61 | % | | $ | 48,570 | | | | 1.17 | % | | | 0.00 | %(k) | | | 1.43 | % | | | 29 | % |
| | 24.13 | | | | (3.77 | ) | | | 53,334 | | | | 1.19 | | | | (0.50 | ) | | | 1.43 | | | | 61 | |
| | 25.34 | | | | 7.46 | | | | 39,153 | | | | 1.20 | | | | (0.57 | ) | | | 1.43 | | | | 74 | |
| | 23.95 | | | | 26.45 | | | | 16,996 | | | | 1.24 | | | | (0.30 | )(g)(h) | | | 1.25 | | | | 55 | |
| | 18.94 | | | | 19.19 | | | | 126 | | | | 1.25 | | | | (0.30 | )(i) | | | 1.42 | | | | 82 | |
| | 15.89 | | | | 2.71 | | | | 106 | | | | 1.24 | | | | (0.81 | ) | | | 1.44 | | | | 99 | |
| | | | | | |
| | | | | | | | | | | | | | | | | | | | | | | | | | |
| | 24.48 | | | | 7.34 | | | | 11,912 | | | | 1.67 | | | | (0.50 | ) | | | 1.86 | | | | 29 | |
| | 23.10 | | | | (4.24 | ) | | | 12,077 | | | | 1.69 | | | | (0.99 | ) | | | 1.86 | | | | 61 | |
| | 24.39 | | | | 6.88 | | | | 8,894 | | | | 1.71 | | | | (1.08 | ) | | | 1.88 | | | | 74 | |
| | 23.19 | | | | 25.83 | | | | 4,416 | | | | 1.74 | | | | (0.86 | )(g)(h) | | | 1.75 | | | | 55 | |
| | 18.43 | | | | 18.60 | | | | 123 | | | | 1.74 | | | | (0.80 | )(i) | | | 1.92 | | | | 82 | |
| | 15.54 | | | | 2.17 | | | | 104 | | | | 1.74 | | | | (1.31 | ) | | | 1.94 | | | | 99 | |
| | | | | | |
| | | | | | | | | | | | | | | | | | | | | | | | | | |
| | 26.75 | | | | 7.88 | | | | 225,834 | | | | 0.72 | | | | 0.46 | | | | 0.79 | | | | 29 | |
| | 25.09 | | | | (3.33 | ) | | | 226,600 | | | | 0.74 | | | | 0.03 | | | | 0.79 | | | | 61 | |
| | 26.22 | | | | 7.99 | | | | 49 | | | | 0.76 | | | | (0.14 | ) | | | 0.90 | | | | 74 | |
| | 24.65 | | | | 26.93 | | | | 45 | | | | 0.80 | | | | (0.17 | )(g)(h) | | | 0.84 | | | | 55 | |
| | 19.42 | | | | 19.73 | | | | 32 | | | | 0.80 | | | | 0.15 | (i) | | | 0.97 | | | | 82 | |
| | 16.22 | | | | 3.18 | | | | 27 | | | | 0.79 | | | | (0.36 | ) | | | 0.99 | | | | 99 | |
| | | | | | |
| | | | | | | | | | | | | | | | | | | | | | | | | | |
| | 26.26 | | | | 7.77 | | | | 54,763 | | | | 0.92 | | | | 0.31 | | | | 1.06 | | | | 29 | |
| | 24.66 | | | | (3.54 | ) | | | 37,396 | | | | 0.94 | | | | (0.37 | ) | | | 1.00 | | | | 61 | |
| | 25.83 | | | | 7.76 | | | | 289,100 | | | | 0.96 | | | | (0.34 | ) | | | 1.01 | | | | 74 | |
| | 24.34 | | | | 26.77 | | | | 261,308 | | | | 1.00 | | | | (0.35 | )(g)(h) | | | 1.04 | | | | 55 | |
| | 19.20 | | | | 19.48 | | | | 101,999 | | | | 1.00 | | | | (0.16 | )(i) | | | 1.14 | | | | 82 | |
| | 16.07 | | | | 2.95 | | | | 38,953 | | | | 0.99 | | | | (0.56 | ) | | | 1.19 | | | | 99 | |
SEE NOTES TO FINANCIAL STATEMENTS.
| | | | | | | | |
| | | |
| DECEMBER 31, 2016 | | J.P. MORGAN LARGE CAP FUNDS | | | | | 77 | |
FINANCIAL HIGHLIGHTS
FOR THE PERIODS INDICATED (continued)
| | | | | | | | | | | | | | | | | | | | | | | | | | | | |
| | | Per share operating performance | |
| | | | | | Investment operations | | | Distributions | |
| | | Net asset
value,
beginning
of period | | | Net
investment
income
(loss) | | | Net realized
and unrealized
gains
(losses) on
investments | | | Total from
investment
operations | | | Net
investment
income | | | Net
realized
gain | | | Total
distributions | |
Equity Focus Fund | | | | | | | | | | | | | | | | | | | | | | | | | | | | |
Class A | | | | | | | | | | | | | | | | | | | | | | | | | | | | |
Six Months Ended December 31, 2016 (Unaudited) | | $ | 23.73 | | | $ | (0.01 | )(f) | | $ | 2.84 | | | $ | 2.83 | | | $ | (0.01 | ) | | $ | (0.32 | ) | | $ | (0.33 | ) |
Year Ended June 30, 2016 | | | 24.78 | | | | (0.01 | )(f) | | | (0.38 | )(h) | | | (0.39 | ) | | | — | (g) | | | (0.66 | ) | | | (0.66 | ) |
Year Ended June 30, 2015 | | | 23.56 | | | | (0.02 | )(f) | | | 1.42 | | | | 1.40 | | | | (0.02 | ) | | | (0.16 | ) | | | (0.18 | ) |
Year Ended June 30, 2014 | | | 19.18 | | | | (0.02 | )(f) | | | 4.86 | | | | 4.84 | | | | — | | | | (0.46 | ) | | | (0.46 | ) |
Year Ended June 30, 2013 | | | 15.79 | | | | (0.02 | ) | | | 3.41 | | | | 3.39 | | | | — | | | | — | | | | — | |
July 29, 2011 (j) through June 30, 2012 | | | 15.00 | | | | 0.01 | | | | 0.79 | | | | 0.80 | | | | (0.01 | ) | | | — | | | | (0.01 | ) |
| | | | | | | |
Class C | | | | | | | | | | | | | | | | | | | | | | | | | | | | |
Six Months Ended December 31, 2016 (Unaudited) | | | 23.18 | | | | (0.07 | )(f) | | | 2.77 | | | | 2.70 | | | | — | | | | (0.32 | ) | | | (0.32 | ) |
Year Ended June 30, 2016 | | | 24.34 | | | | (0.13 | )(f) | | | (0.37 | )(h) | | | (0.50 | ) | | | — | | | | (0.66 | ) | | | (0.66 | ) |
Year Ended June 30, 2015 | | | 23.24 | | | | (0.13 | )(f) | | | 1.39 | | | | 1.26 | | | | — | | | | (0.16 | ) | | | (0.16 | ) |
Year Ended June 30, 2014 | | | 19.01 | | | | (0.15 | )(f) | | | 4.84 | | | | 4.69 | | | | — | | | | (0.46 | ) | | | (0.46 | ) |
Year Ended June 30, 2013 | | | 15.73 | | | | (0.11 | ) | | | 3.39 | | | | 3.28 | | | | — | | | | — | | | | — | |
July 29, 2011 (j) through June 30, 2012 | | | 15.00 | | | | (0.06 | ) | | | 0.79 | | | | 0.73 | | | | — | (g) | | | — | | | | — | |
| | | | | | | |
Select Class | | | | | | | | | | | | | | | | | | | | | | | | | | | | |
Six Months Ended December 31, 2016 (Unaudited) | | | 23.92 | | | | 0.03 | (f) | | | 2.86 | | | | 2.89 | | | | (0.07 | ) | | | (0.32 | ) | | | (0.39 | ) |
Year Ended June 30, 2016 | | | 24.95 | | | | 0.06 | (f) | | | (0.39 | )(h) | | | (0.33 | ) | | | (0.04 | ) | | | (0.66 | ) | | | (0.70 | ) |
Year Ended June 30, 2015 | | | 23.67 | | | | 0.04 | (f) | | | 1.44 | | | | 1.48 | | | | (0.04 | ) | | | (0.16 | ) | | | (0.20 | ) |
Year Ended June 30, 2014 | | | 19.22 | | | | 0.04 | (f) | | | 4.87 | | | | 4.91 | | | | — | (g) | | | (0.46 | ) | | | (0.46 | ) |
Year Ended June 30, 2013 | | | 15.81 | | | | 0.02 | | | | 3.42 | | | | 3.44 | | | | (0.03 | ) | | | — | | | | (0.03 | ) |
July 29, 2011 (j) through June 30, 2012 | | | 15.00 | | | | 0.04 | | | | 0.80 | | | | 0.84 | | | | (0.03 | ) | | | — | | | | (0.03 | ) |
| (a) | Annualized for periods less than one year, unless otherwise noted. |
| (b) | Not annualized for periods less than one year. |
| (c) | Includes adjustments in accordance with accounting principles generally accepted in the United States of America and as such, the net asset values for financial reporting purposes and the returns based upon those net asset values may differ from the net asset values and returns for shareholder transactions. |
| (d) | Includes earnings credits and interest expense, if applicable, each of which is less than 0.005% unless otherwise noted. |
| (e) | Portfolio turnover is calculated by dividing the lesser of total purchases or sales of portfolio securities for the reporting period by the monthly average value of portfolio securities owned during the reporting period. Excluded from both the numerator and denominator are amounts relating to derivatives and securities whose maturities or expiration dates at the time of acquisition were one year or less. |
| (f) | Calculated based upon average shares outstanding. |
| (g) | Amount rounds to less than $0.005. |
| (h) | Calculation of the net realized and unrealized gains (losses) per share do not correlate with the Fund’s net realized and unrealized gains (losses) presented in the Statement of Changes in Net Assets due to the timing of capital transactions in relation to the fluctuating market values of the Fund’s investments. |
| (i) | Certain non-recurring expenses incurred by the Fund were not annualized for the year ended June 30, 2013 and for the period ended June 30, 2012. |
| (j) | Commencement of operations. |
SEE NOTES TO FINANCIAL STATEMENTS.
| | | | | | |
| | | |
| 78 | | | | J.P. MORGAN LARGE CAP FUNDS | | DECEMBER 31, 2016 |
| | | | | | | | | | | | | | | | | | | | | | | | | | |
| | | Ratios/Supplemental data | |
| | | | | | | | | | Ratios to average net assets (a) | | | | |
Net asset
value,
end of
period | | | Total return
(excludes
sales charge) (b)(c) | | | Net assets,
end of
period
(000’s) | | | Net
expenses (d) | | | Net
investment
income
(loss) (e) | | | Expenses without waivers,
reimbursements and
earnings credits | | | Portfolio
turnover
rate (b)(e) | |
| | | | | | | | | | | | | | | | | | | | | | | | | | |
| | | | | | | | | | | | | | | | | | | | | | | | | | |
| $ | 26.23 | | | | 11.89 | % | | $ | 2,306 | | | | 1.21 | % | | | (0.04 | )% | | | 1.46 | % | | | 26 | % |
| | 23.73 | | | | (1.60 | ) | | | 1,937 | | | | 1.24 | | | | (0.03 | ) | | | 1.55 | | | | 45 | |
| | 24.78 | | | | 5.98 | | | | 1,452 | | | | 1.24 | | | | (0.07 | ) | | | 1.42 | | | | 52 | |
| | 23.56 | | | | 25.43 | | | | 423 | | | | 1.24 | | | | (0.10 | ) | | | 2.11 | | | | 76 | |
| | 19.18 | | | | 21.47 | | | | 64 | | | | 1.25 | (i) | | | (0.13 | ) | | | 3.75 | (i) | | | 61 | |
| | 15.79 | | | | 5.37 | | | | 53 | | | | 1.25 | (i) | | | 0.04 | | | | 5.09 | (i) | | | 71 | |
| | | | | | |
| | | | | | | | | | | | | | | | | | | | | | | | | | |
| | 25.56 | | | | 11.61 | | | | 2,169 | | | | 1.70 | | | | (0.55 | ) | | | 1.96 | | | | 26 | |
| | 23.18 | | | | (2.10 | ) | | | 1,268 | | | | 1.74 | | | | (0.54 | ) | | | 1.96 | | | | 45 | |
| | 24.34 | | | | 5.44 | | | | 873 | | | | 1.74 | | | | (0.54 | ) | | | 1.93 | | | | 52 | |
| | 23.24 | | | | 24.86 | | | | 133 | | | | 1.74 | | | | (0.67 | ) | | | 2.82 | | | | 76 | |
| | 19.01 | | | | 20.85 | | | | 63 | | | | 1.75 | (i) | | | (0.63 | ) | | | 4.25 | (i) | | | 61 | |
| | 15.73 | | | | 4.87 | | | | 52 | | | | 1.75 | (i) | | | (0.46 | ) | | | 5.58 | (i) | | | 71 | |
| | | | | | |
| | | | | | | | | | | | | | | | | | | | | | | | | | |
| | 26.42 | | | | 12.04 | | | | 142,028 | | | | 0.96 | | | | 0.22 | | | | 1.12 | | | | 26 | |
| | 23.92 | | | | (1.37 | ) | | | 136,284 | | | | 0.99 | | | | 0.24 | | | | 1.11 | | | | 45 | |
| | 24.95 | | | | 6.26 | | | | 81,179 | | | | 0.99 | | | | 0.15 | | | | 1.12 | | | | 52 | |
| | 23.67 | | | | 25.75 | | | | 72,064 | | | | 0.99 | | | | 0.19 | | | | 1.51 | | | | 76 | |
| | 19.22 | | | | 21.77 | | | | 3,730 | | | | 1.00 | (i) | | | 0.12 | | | | 3.51 | (i) | | | 61 | |
| | 15.81 | | | | 5.61 | | | | 3,063 | | | | 1.00 | (i) | | | 0.29 | | | | 4.84 | (i) | | | 71 | |
SEE NOTES TO FINANCIAL STATEMENTS.
| | | | | | | | |
| | | |
| DECEMBER 31, 2016 | | J.P. MORGAN LARGE CAP FUNDS | | | | | 79 | |
FINANCIAL HIGHLIGHTS
FOR THE PERIODS INDICATED (continued)
| | | | | | | | | | | | | | | | | | | | | | | | | | | | |
| | | Per share operating performance | |
| | | | | | Investment operations | | | Distributions | |
| | |
Net asset
value,
beginning
of period | | | Net
investment
income
(loss) | | | Net realized
and unrealized
gains (losses) on
investments | | | Total from
investment
operations | | | Net
investment
income | | | Net
realized
gain | | | Total
distributions | |
Equity Income Fund | | | | | | | | | | | | | | | | | | | | | | | | | | | | |
Class A | | | | | | | | | | | | | | | | | | | | | | | | | | | | |
Six Months Ended December 31, 2016 (Unaudited) | | $ | 14.01 | | | $ | 0.12 | (f) | | $ | 1.05 | | | $ | 1.17 | | | $ | (0.13 | ) | | $ | (0.09 | ) | | $ | (0.22 | ) |
Year Ended June 30, 2016 | | | 13.77 | | | | 0.25 | (f) | | | 0.35 | | | | 0.60 | | | | (0.25 | ) | | | (0.11 | ) | | | (0.36 | ) |
Year Ended June 30, 2015 | | | 13.66 | | | | 0.25 | | | | 0.39 | | | | 0.64 | | | | (0.25 | ) | | | (0.28 | ) | | | (0.53 | ) |
Year Ended June 30, 2014 | | | 11.62 | | | | 0.21 | (f) | | | 2.26 | | | | 2.47 | | | | (0.21 | ) | | | (0.22 | ) | | | (0.43 | ) |
Year Ended June 30, 2013 | | | 9.84 | | | | 0.24 | (f)(g) | | | 1.84 | | | | 2.08 | | | | (0.23 | ) | | | (0.07 | ) | | | (0.30 | ) |
Year Ended June 30, 2012 | | | 9.38 | | | | 0.21 | (f) | | | 0.46 | | | | 0.67 | | | | (0.17 | ) | | | (0.04 | ) | | | (0.21 | ) |
| | | | | | | |
Class C | | | | | | | | | | | | | | | | | | | | | | | | | | | | |
Six Months Ended December 31, 2016 (Unaudited) | | | 13.80 | | | | 0.08 | (f) | | | 1.03 | | | | 1.11 | | | | (0.10 | ) | | | (0.09 | ) | | | (0.19 | ) |
Year Ended June 30, 2016 | | | 13.58 | | | | 0.18 | (f) | | | 0.35 | | | | 0.53 | | | | (0.20 | ) | | | (0.11 | ) | | | (0.31 | ) |
Year Ended June 30, 2015 | | | 13.49 | | | | 0.18 | | | | 0.38 | | | | 0.56 | | | | (0.19 | ) | | | (0.28 | ) | | | (0.47 | ) |
Year Ended June 30, 2014 | | | 11.49 | | | | 0.15 | (f) | | | 2.23 | | | | 2.38 | | | | (0.16 | ) | | | (0.22 | ) | | | (0.38 | ) |
Year Ended June 30, 2013 | | | 9.74 | | | | 0.18 | (f)(g) | | | 1.83 | | | | 2.01 | | | | (0.19 | ) | | | (0.07 | ) | | | (0.26 | ) |
Year Ended June 30, 2012 | | | 9.30 | | | | 0.16 | (f) | | | 0.45 | | | | 0.61 | | | | (0.13 | ) | | | (0.04 | ) | | | (0.17 | ) |
| | | | | | | |
Class R2 | | | | | | | | | | | | | | | | | | | | | | | | | | | | |
Six Months Ended December 31, 2016 (Unaudited) | | | 13.97 | | | | 0.10 | (f) | | | 1.05 | | | | 1.15 | | | | (0.12 | ) | | | (0.09 | ) | | | (0.21 | ) |
Year Ended June 30, 2016 | | | 13.74 | | | | 0.21 | (f) | | | 0.35 | | | | 0.56 | | | | (0.22 | ) | | | (0.11 | ) | | | (0.33 | ) |
Year Ended June 30, 2015 | | | 13.64 | | | | 0.22 | | | | 0.39 | | | | 0.61 | | | | (0.23 | ) | | | (0.28 | ) | | | (0.51 | ) |
Year Ended June 30, 2014 | | | 11.61 | | | | 0.18 | (f) | | | 2.25 | | | | 2.43 | | | | (0.18 | ) | | | (0.22 | ) | | | (0.40 | ) |
Year Ended June 30, 2013 | | | 9.84 | | | | 0.21 | (f)(g) | | | 1.84 | | | | 2.05 | | | | (0.21 | ) | | | (0.07 | ) | | | (0.28 | ) |
Year Ended June 30, 2012 | | | 9.38 | | | | 0.19 | (f) | | | 0.46 | | | | 0.65 | | | | (0.15 | ) | | | (0.04 | ) | | | (0.19 | ) |
| | | | | | | |
Class R3 | | | | | | | | | | | | | | | | | | | | | | | | | | | | |
September 9, 2016 (h) through December 31, 2016 (Unaudited) | | | 14.06 | | | | 0.08 | (f) | | | 1.01 | | | | 1.09 | | | | (0.10 | ) | | | (0.09 | ) | | | (0.19 | ) |
| | | | | | | |
Class R4 | | | | | | | | | | | | | | | | | | | | | | | | | | | | |
September 9, 2016 (h) through December 31, 2016 (Unaudited) | | | 14.28 | | | | 0.09 | (f) | | | 1.03 | | | | 1.12 | | | | (0.11 | ) | | | (0.09 | ) | | | (0.20 | ) |
| | | | | | | |
Class R5 | | | | | | | | | | | | | | | | | | | | | | | | | | | | |
Six Months Ended December 31, 2016 (Unaudited) | | | 14.23 | | | | 0.15 | (f) | | | 1.07 | | | | 1.22 | | | | (0.16 | ) | | | (0.09 | ) | | | (0.25 | ) |
Year Ended June 30, 2016 | | | 13.98 | | | | 0.31 | (f) | | | 0.35 | | | | 0.66 | | | | (0.30 | ) | | | (0.11 | ) | | | (0.41 | ) |
Year Ended June 30, 2015 | | | 13.85 | | | | 0.31 | | | | 0.41 | | | | 0.72 | | | | (0.31 | ) | | | (0.28 | ) | | | (0.59 | ) |
Year Ended June 30, 2014 | | | 11.78 | | | | 0.27 | (f) | | | 2.29 | | | | 2.56 | | | | (0.27 | ) | | | (0.22 | ) | | | (0.49 | ) |
Year Ended June 30, 2013 | | | 9.96 | | | | 0.29 | (f)(g) | | | 1.87 | | | | 2.16 | | | | (0.27 | ) | | | (0.07 | ) | | | (0.34 | ) |
Year Ended June 30, 2012 | | | 9.49 | | | | 0.26 | (f) | | | 0.46 | | | | 0.72 | | | | (0.21 | ) | | | (0.04 | ) | | | (0.25 | ) |
| | | | | | | |
Class R6 | | | | | | | | | | | | | | | | | | | | | | | | | | | | |
Six Months Ended December 31, 2016 (Unaudited) | | | 14.22 | | | | 0.16 | (f) | | | 1.07 | | | | 1.23 | | | | (0.17 | ) | | | (0.09 | ) | | | (0.26 | ) |
Year Ended June 30, 2016 | | | 13.97 | | | | 0.33 | (f) | | | 0.34 | | | | 0.67 | | | | (0.31 | ) | | | (0.11 | ) | | | (0.42 | ) |
Year Ended June 30, 2015 | | | 13.84 | | | | 0.33 | | | | 0.40 | | | | 0.73 | | | | (0.32 | ) | | | (0.28 | ) | | | (0.60 | ) |
Year Ended June 30, 2014 | | | 11.77 | | | | 0.28 | (f) | | | 2.28 | | | | 2.56 | | | | (0.27 | ) | | | (0.22 | ) | | | (0.49 | ) |
Year Ended June 30, 2013 | | | 9.96 | | | | 0.29 | (f)(g) | | | 1.87 | | | | 2.16 | | | | (0.28 | ) | | | (0.07 | ) | | | (0.35 | ) |
January 31, 2012 (h) through June 30, 2012 | | | 9.64 | | | | 0.13 | (f) | | | 0.30 | | | | 0.43 | | | | (0.11 | ) | | | — | | | | (0.11 | ) |
| | | | | | | |
Select Class | | | | | | | | | | | | | | | | | | | | | | | | | | | | |
Six Months Ended December 31, 2016 (Unaudited) | | | 14.23 | | | | 0.14 | (f) | | | 1.06 | | | | 1.20 | | | | (0.15 | ) | | | (0.09 | ) | | | (0.24 | ) |
Year Ended June 30, 2016 | | | 13.97 | | | | 0.28 | (f) | | | 0.37 | | | | 0.65 | | | | (0.28 | ) | | | (0.11 | ) | | | (0.39 | ) |
Year Ended June 30, 2015 | | | 13.85 | | | | 0.29 | | | | 0.40 | | | | 0.69 | | | | (0.29 | ) | | | (0.28 | ) | | | (0.57 | ) |
Year Ended June 30, 2014 | | | 11.77 | | | | 0.25 | (f) | | | 2.29 | | | | 2.54 | | | | (0.24 | ) | | | (0.22 | ) | | | (0.46 | ) |
Year Ended June 30, 2013 | | | 9.96 | | | | 0.27 | (f)(g) | | | 1.86 | | | | 2.13 | | | | (0.25 | ) | | | (0.07 | ) | | | (0.32 | ) |
Year Ended June 30, 2012 | | | 9.50 | | | | 0.24 | (f) | | | 0.45 | | | | 0.69 | | | | (0.19 | ) | | | (0.04 | ) | | | (0.23 | ) |
| (a) | Annualized for periods less than one year, unless otherwise noted. |
| (b) | Not annualized for periods less than one year. |
| (c) | Includes adjustments in accordance with accounting principles generally accepted in the United States of America and as such, the net asset values for financial reporting purposes and the returns based upon those net asset values may differ from the net asset values and returns for shareholder transactions. |
| (d) | Includes earnings credits and interest expense, if applicable, each of which is less than 0.005% unless otherwise noted. |
| (e) | Portfolio turnover is calculated by dividing the lesser of total purchases or sales of portfolio securities for the reporting period by the monthly average value of portfolio securities owned during the reporting period. Excluded from both the numerator and denominator are amounts relating to derivatives and securities whose maturities or expiration dates at the time of acquisition were one year or less. |
SEE NOTES TO FINANCIAL STATEMENTS.
| | | | | | |
| | | |
| 80 | | | | J.P. MORGAN LARGE CAP FUNDS | | DECEMBER 31, 2016 |
| | | | | | | | | | | | | | | | | | | | | | | | | | |
| | | Ratios/Supplemental data | |
| | | | | | | | | | Ratios to average net assets (a) | | | | |
Net asset
value, end of
period | | | Total return
(excludes
sales charge) (b)(c) | | | Net assets,
end of
period
(000’s) | | | Net
expenses (d) | | | Net
investment
income
(loss) | | | Expenses
without waivers,
reimbursements and
earnings credits | | | Portfolio
turnover
rate (b)(e) | |
| | | | | | | | | | | | | | | | | | | | | | | | | | |
| | | | | | | | | | | | | | | | | | | | | | | | | | |
| $ | 14.96 | | | | 8.40 | % | | $ | 3,575,103 | | | | 1.03 | % | | | 1.60 | % | | | 1.09 | % | | | 9 | % |
| | 14.01 | | | | 4.45 | | | | 3,370,383 | | | | 1.04 | | | | 1.83 | | | | 1.11 | | | | 20 | |
| | 13.77 | | | | 4.71 | | | | 3,014,937 | | | | 1.04 | | | | 1.83 | | | | 1.09 | | | | 22 | |
| | 13.66 | | | | 21.60 | | | | 2,360,750 | | | | 1.04 | | | | 1.68 | | | | 1.06 | | | | 20 | |
| | 11.62 | | | | 21.53 | | | | 1,285,400 | | | | 1.03 | | | | 2.22 | (g) | | | 1.08 | | | | 34 | |
| | 9.84 | | | | 7.30 | | | | 580,848 | | | | 1.04 | | | | 2.22 | | | | 1.08 | | | | 44 | |
| | | | | | |
| | | | | | | | | | | | | | | | | | | | | | | | | | |
| | 14.72 | | | | 8.09 | | | | 1,404,284 | | | | 1.53 | | | | 1.10 | | | | 1.56 | | | | 9 | |
| | 13.80 | | | | 4.01 | | | | 1,304,007 | | | | 1.54 | | | | 1.33 | | | | 1.58 | | | | 20 | |
| | 13.58 | | | | 4.18 | | | | 1,160,002 | | | | 1.54 | | | | 1.32 | | | | 1.56 | | | | 22 | |
| | 13.49 | | | | 20.95 | | | | 805,494 | | | | 1.54 | | | | 1.19 | | | | 1.56 | | | | 20 | |
| | 11.49 | | | | 20.94 | | | | 407,911 | | | | 1.53 | | | | 1.71 | (g) | | | 1.58 | | | | 34 | |
| | 9.74 | | | | 6.72 | | | | 130,366 | | | | 1.54 | | | | 1.74 | | | | 1.58 | | | | 44 | |
| | | | | | |
| | | | | | | | | | | | | | | | | | | | | | | | | | |
| | 14.91 | | | | 8.25 | | | | 84,069 | | | | 1.28 | | | | 1.36 | | | | 1.41 | | | | 9 | |
| | 13.97 | | | | 4.20 | | | | 77,230 | | | | 1.29 | | | | 1.59 | | | | 1.45 | | | | 20 | |
| | 13.74 | | | | 4.44 | | | | 56,522 | | | | 1.29 | | | | 1.59 | | | | 1.39 | | | | 22 | |
| | 13.64 | | | | 21.27 | | | | 28,733 | | | | 1.29 | | | | 1.44 | | | | 1.31 | | | | 20 | |
| | 11.61 | | | | 21.21 | | | | 13,347 | | | | 1.28 | | | | 1.92 | (g) | | | 1.34 | | | | 34 | |
| | 9.84 | | | | 7.13 | | | | 1,682 | | | | 1.29 | | | | 1.94 | | | | 1.32 | | | | 44 | |
| | | | | | |
| | | | | | | | | | | | | | | | | | | | | | | | | | |
| | 14.96 | | | | 7.68 | | | | 21 | | | | 1.02 | | | | 1.75 | | | | 1.02 | | | | 9 | |
| | | | | | |
| | | | | | | | | | | | | | | | | | | | | | | | | | |
| | 15.20 | | | | 7.76 | | | | 22 | | | | 0.77 | | | | 2.00 | | | | 0.77 | | | | 9 | |
| | | | | | |
| | | | | | | | | | | | | | | | | | | | | | | | | | |
| | 15.20 | | | | 8.63 | | | | 936,578 | | | | 0.58 | | | | 2.08 | | | | 0.61 | | | | 9 | |
| | 14.23 | | | | 4.89 | | | | 722,424 | | | | 0.59 | | | | 2.28 | | | | 0.64 | | | | 20 | |
| | 13.98 | | | | 5.23 | | | | 520,660 | | | | 0.59 | | | | 2.27 | | | | 0.63 | | | | 22 | |
| | 13.85 | | | | 22.06 | | | | 307,700 | | | | 0.59 | | | | 2.11 | | | | 0.61 | | | | 20 | |
| | 11.78 | | | | 22.17 | | | | 227,442 | | | | 0.58 | | | | 2.69 | (g) | | | 0.63 | | | | 34 | |
| | 9.96 | | | | 7.78 | | | | 111,647 | | | | 0.58 | | | | 2.77 | | | | 0.63 | | | | 44 | |
| | | | | | |
| | | | | | | | | | | | | | | | | | | | | | | | | | |
| | 15.19 | | | | 8.69 | | | | 2,386,869 | | | | 0.49 | | | | 2.16 | | | | 0.50 | | | | 9 | |
| | 14.22 | | | | 4.98 | | | | 1,913,077 | | | | 0.50 | | | | 2.43 | | | | 0.50 | | | | 20 | |
| | 13.97 | | | | 5.31 | | | | 861,809 | | | | 0.51 | | | | 2.35 | | | | 0.51 | | | | 22 | |
| | 13.84 | | | | 22.14 | | | | 551,378 | | | | 0.54 | | | | 2.20 | | | | 0.56 | | | | 20 | |
| | 11.77 | | | | 22.12 | | | | 233,034 | | | | 0.53 | | | | 2.63 | (g) | | | 0.59 | | | | 34 | |
| | 9.96 | | | | 4.47 | | | | 70,589 | | | | 0.53 | | | | 3.28 | | | | 0.58 | | | | 44 | |
| | | | | | |
| | | | | | | | | | | | | | | | | | | | | | | | | | |
| | 15.19 | | | | 8.45 | | | | 5,400,338 | | | | 0.78 | | | | 1.86 | | | | 0.80 | | | | 9 | |
| | 14.23 | | | | 4.75 | | | | 4,679,200 | | | | 0.79 | | | | 2.07 | | | | 0.81 | | | | 20 | |
| | 13.97 | | | | 4.96 | | | | 4,639,250 | | | | 0.79 | | | | 2.08 | | | | 0.80 | | | | 22 | |
| | 13.85 | | | | 21.94 | | | | 3,467,542 | | | | 0.79 | | | | 1.92 | | | | 0.81 | | | | 20 | |
| | 11.77 | | | | 21.84 | | | | 2,337,565 | | | | 0.78 | | | | 2.48 | (g) | | | 0.83 | | | | 34 | |
| | 9.96 | | | | 7.48 | | | | 1,313,214 | | | | 0.78 | | | | 2.48 | | | | 0.83 | | | | 44 | |
| (f) | Calculated based upon average shares outstanding. |
| (g) | Reflects special dividends paid out during the period by several of the Fund’s holdings. Had the Fund not received the special dividends, the net investment income (loss) per share would have been $0.21, $0.16, $0.18, $0.27, $0.26 and $0.24 for Class A, Class C, Class R2, Class R5, Class R6 and Select Class Shares, respectively, and the net investment income (loss) ratio would have been 1.97%, 1.46%, 1.67%, 2.44%, 2.38% and 2.23% for Class A, Class C, Class R2, Class R5, Class R6 and Select Class Shares, respectively. |
| (h) | Commencement of offering of class of shares. |
SEE NOTES TO FINANCIAL STATEMENTS.
| | | | | | | | |
| | | |
| DECEMBER 31, 2016 | | J.P. MORGAN LARGE CAP FUNDS | | | | | 81 | |
FINANCIAL HIGHLIGHTS
FOR THE PERIODS INDICATED (continued)
| | | | | | | | | | | | | | | | | | | | | | | | | | | | |
| | | Per share operating performance | |
| | | | | | Investment operations | | | Distributions | |
| | |
Net asset
value,
beginning
of period | | | Net
investment
income
(loss) (b) | | | Net realized
and unrealized
gains
(losses) on
investments | | | Total from
investment
operations | | | Net
investment
income | | | Net
realized
gain | | | Total
distributions | |
Growth and Income Fund | | | | | | | | | | | | | | | | | | | | | | | | | | | | |
Class A | | | | | | | | | | | | | | | | | | | | | | | | | | | | |
Six Months Ended December 31, 2016 (Unaudited) | | $ | 42.75 | | | $ | 0.29 | | | $ | 4.72 | | | $ | 5.01 | | | $ | (0.32 | ) | | $ | (2.21 | ) | | $ | (2.53 | ) |
Year Ended June 30, 2016 | | | 45.46 | | | | 0.59 | | | | (0.27 | ) | | | 0.32 | | | | (0.55 | ) | | | (2.48 | ) | | | (3.03 | ) |
Year Ended June 30, 2015 | | | 44.70 | | | | 0.59 | | | | 1.72 | | | | 2.31 | | | | (0.56 | ) | | | (0.99 | ) | | | (1.55 | ) |
Year Ended June 30, 2014 | | | 36.53 | | | | 0.47 | | | | 8.17 | | | | 8.64 | | | | (0.47 | ) | | | — | | | | (0.47 | ) |
Year Ended June 30, 2013 | | | 29.43 | | | | 0.40 | | | | 7.11 | | | | 7.51 | | | | (0.41 | ) | | | — | | | | (0.41 | ) |
Year Ended June 30, 2012 | | | 28.26 | | | | 0.35 | | | | 1.16 | | | | 1.51 | | | | (0.34 | ) | | | — | | | | (0.34 | ) |
| | | | | | | |
Class C | | | | | | | | | | | | | | | | | | | | | | | | | | | | |
Six Months Ended December 31, 2016 (Unaudited) | | | 39.07 | | | | 0.16 | | | | 4.31 | | | | 4.47 | | | | (0.23 | ) | | | (2.21 | ) | | | (2.44 | ) |
Year Ended June 30, 2016 | | | 41.83 | | | | 0.35 | | | | (0.25 | ) | | | 0.10 | | | | (0.38 | ) | | | (2.48 | ) | | | (2.86 | ) |
Year Ended June 30, 2015 | | | 41.31 | | | | 0.32 | | | | 1.59 | | | | 1.91 | | | | (0.40 | ) | | | (0.99 | ) | | | (1.39 | ) |
Year Ended June 30, 2014 | | | 33.83 | | | | 0.25 | | | | 7.55 | | | | 7.80 | | | | (0.32 | ) | | | — | | | | (0.32 | ) |
Year Ended June 30, 2013 | | | 27.32 | | | | 0.22 | | | | 6.59 | | | | 6.81 | | | | (0.30 | ) | | | — | | | | (0.30 | ) |
Year Ended June 30, 2012 | | | 26.27 | | | | 0.20 | | | | 1.08 | | | | 1.28 | | | | (0.23 | ) | | | — | | | | (0.23 | ) |
| | | | | | | |
Class R2 | | | | | | | | | | | | | | | | | | | | | | | | | | | | |
Six Months Ended December 31, 2016 (Unaudited) | | | 42.94 | | | | 0.23 | | | | 4.74 | | | | 4.97 | | | | (0.26 | ) | | | (2.21 | ) | | | (2.47 | ) |
November 2, 2015 (g) through June 30, 2016 | | | 45.92 | | | | 0.40 | | | | (0.70 | ) | | | (0.30 | ) | | | (0.20 | ) | | | (2.48 | ) | | | (2.68 | ) |
| | | | | | | |
Class R5 | | | | | | | | | | | | | | | | | | | | | | | | | | | | |
Six Months Ended December 31, 2016 (Unaudited) | | | 45.01 | | | | 0.41 | | | | 4.98 | | | | 5.39 | | | | (0.42 | ) | | | (2.21 | ) | | | (2.63 | ) |
November 2, 2015 (g) through June 30, 2016 | | | 47.95 | | | | 0.62 | | | | (0.73 | ) | | | (0.11 | ) | | | (0.35 | ) | | | (2.48 | ) | | | (2.83 | ) |
| | | | | | | |
Class R6 | | | | | | | | | | | | | | | | | | | | | | | | | | | | |
Six Months Ended December 31, 2016 (Unaudited) | | | 45.01 | | | | 0.12 | | | | 5.28 | | | | 5.40 | | | | (0.43 | ) | | | (2.21 | ) | | | (2.64 | ) |
November 2, 2015 (g) through June 30, 2016 | | | 47.95 | | | | 0.63 | | | | (0.72 | ) | | | (0.09 | ) | | | (0.37 | ) | | | (2.48 | ) | | | (2.85 | ) |
| | | | | | | |
Select Class | | | | | | | | | | | | | | | | | | | | | | | | | | | | |
Six Months Ended December 31, 2016 (Unaudited) | | | 44.77 | | | | 0.36 | | | | 4.94 | | | | 5.30 | | | | (0.37 | ) | | | (2.21 | ) | | | (2.58 | ) |
Year Ended June 30, 2016 | | | 47.45 | | | | 0.73 | | | | (0.27 | ) | | | 0.46 | | | | (0.66 | ) | | | (2.48 | ) | | | (3.14 | ) |
Year Ended June 30, 2015 | | | 46.58 | | | | 0.73 | | | | 1.79 | | | | 2.52 | | | | (0.66 | ) | | | (0.99 | ) | | | (1.65 | ) |
Year Ended June 30, 2014 | | | 38.03 | | | | 0.58 | | | | 8.52 | | | | 9.10 | | | | (0.55 | ) | | | — | | | | (0.55 | ) |
Year Ended June 30, 2013 | | | 30.63 | | | | 0.51 | | | | 7.40 | | | | 7.91 | | | | (0.51 | ) | | | — | | | | (0.51 | ) |
Year Ended June 30, 2012 | | | 29.39 | | | | 0.45 | | | | 1.21 | | | | 1.66 | | | | (0.42 | ) | | | — | | | | (0.42 | ) |
| (a) | Annualized for periods less than one year, unless otherwise noted. |
| (b) | Calculated based upon average shares outstanding. |
| (c) | Not annualized for periods less than one year. |
| (d) | Includes adjustments in accordance with accounting principles generally accepted in the United States of America and as such, the net asset values for financial reporting purposes and the returns based upon those net asset values may differ from the net asset values and returns for shareholder transactions. |
| (e) | Includes earnings credits and interest expense, if applicable, each of which is less than 0.005% unless otherwise noted. |
| (f) | Portfolio turnover is calculated by dividing the lesser of total purchases or sales of portfolio securities for the reporting period by the monthly average value of portfolio securities owned during the reporting period. Excluded from both the numerator and denominator are amounts relating to derivatives and securities whose maturities or expiration dates at the time of acquisition were one year or less. |
| (g) | Commencement of offering of class of shares. |
SEE NOTES TO FINANCIAL STATEMENTS.
| | | | | | |
| | | |
| 82 | | | | J.P. MORGAN LARGE CAP FUNDS | | DECEMBER 31, 2016 |
| | | | | | | | | | | | | | | | | | | | | | | | | | |
| | | Ratios/Supplemental data | |
| | | | | | | | | | Ratios to average net assets(a) | | | | |
Net asset
value,
end of
period | | | Total return
(excludes
sales charge) (c)(d) | | | Net assets,
end of
period
(000’s) | | | Net
expenses (e) | | | Net
investment income
(loss) | | | Expenses
without waivers,
reimbursements and
earnings credits | | | Portfolio
turnover
rate��(c)(f) | |
| | | | | | | | | | | | | | | | | | | | | | | | | | |
| | | | | | | | | | | | | | | | | | | | | | | | | | |
| $ | 45.23 | | | | 11.70 | % | | $ | 454,501 | | | | 1.03 | % | | | 1.28 | % | | | 1.12 | % | | | 19 | % |
| | 42.75 | | | | 1.02 | | | | 422,151 | | | | 1.06 | | | | 1.38 | | | | 1.13 | | | | 39 | |
| | 45.46 | | | | 5.24 | | | | 434,573 | | | | 1.10 | | | | 1.30 | | | | 1.10 | | | | 39 | |
| | 44.70 | | | | 23.74 | | | | 419,465 | | | | 1.13 | | | | 1.16 | | | | 1.15 | | | | 42 | |
| | 36.53 | | | | 25.65 | | | | 356,127 | | | | 1.15 | | | | 1.23 | | | | 1.16 | | | | 35 | |
| | 29.43 | | | | 5.45 | | | | 293,520 | | | | 1.19 | | | | 1.28 | | | | 1.19 | | | | 28 | |
| | | | | | |
| | | | | | | | | | | | | | | | | | | | | | | | | | |
| | 41.10 | | | | 11.42 | | | | 27,931 | | | | 1.53 | | | | 0.77 | | | | 1.61 | | | | 19 | |
| | 39.07 | | | | 0.54 | | | | 25,541 | | | | 1.56 | | | | 0.89 | | | | 1.62 | | | | 39 | |
| | 41.83 | | | | 4.68 | | | | 24,647 | | | | 1.62 | | | | 0.77 | | | | 1.63 | | | | 39 | |
| | 41.31 | | | | 23.12 | | | | 14,619 | | | | 1.64 | | | | 0.66 | | | | 1.65 | | | | 42 | |
| | 33.83 | | | | 25.02 | | | | 7,769 | | | | 1.65 | | | | 0.72 | | | | 1.65 | | | | 35 | |
| | 27.32 | | | | 4.94 | | | | 4,137 | | | | 1.69 | | | | 0.79 | | | | 1.69 | | | | 28 | |
| | | | | | |
| | | | | | | | | | | | | | | | | | | | | | | | | | |
| | 45.44 | | | | 11.57 | | | | 22 | | | | 1.28 | | | | 1.03 | | | | 2.88 | | | | 19 | |
| | 42.94 | | | | (0.40 | ) | | | 20 | | | | 1.28 | | | | 1.44 | | | | 3.72 | | | | 39 | |
| | | | | | |
| | | | | | | | | | | | | | | | | | | | | | | | | | |
| | 47.77 | | | | 11.97 | | | | 30 | | | | 0.59 | | | | 1.73 | | | | 2.09 | | | | 19 | |
| | 45.01 | | | | 0.05 | | | | 20 | | | | 0.59 | | | | 2.14 | | | | 3.02 | | | | 39 | |
| | | | | | |
| | | | | | | | | | | | | | | | | | | | | | | | | | |
| | 47.77 | | | | 12.00 | | | | 1,833 | | | | 0.52 | | | | 0.49 | | | | 0.70 | | | | 19 | |
| | 45.01 | | | | 0.08 | | | | 20 | | | | 0.53 | | | | 2.19 | | | | 2.96 | | | | 39 | |
| | | | | | |
| | | | | | | | | | | | | | | | | | | | | | | | | | |
| | 47.49 | | | | 11.83 | | | | 46,542 | | | | 0.79 | | | | 1.52 | | | | 0.84 | | | | 19 | |
| | 44.77 | | | | 1.28 | | | | 40,068 | | | | 0.81 | | | | 1.64 | | | | 0.86 | | | | 39 | |
| | 47.45 | | | | 5.48 | | | | 36,099 | | | | 0.88 | | | | 1.53 | | | | 0.88 | | | | 39 | |
| | 46.58 | | | | 24.05 | | | | 27,124 | | | | 0.89 | | | | 1.39 | | | | 0.90 | | | | 42 | |
| | 38.03 | | | | 25.97 | | | | 28,339 | | | | 0.88 | | | | 1.45 | | | | 0.90 | | | | 35 | |
| | 30.63 | | | | 5.78 | | | | 7,474 | | | | 0.89 | | | | 1.58 | | | | 0.94 | | | | 28 | |
SEE NOTES TO FINANCIAL STATEMENTS.
| | | | | | | | |
| | | |
| DECEMBER 31, 2016 | | J.P. MORGAN LARGE CAP FUNDS | | | | | 83 | |
FINANCIAL HIGHLIGHTS
FOR THE PERIODS INDICATED (continued)
| | | | | | | | | | | | | | | | | | | | | | | | | | | | |
| | | Per share operating performance | |
| | | | | | Investment operations | | | Distributions | |
| | | Net asset
value,
beginning
of period | | | Net
investment
income
(loss) | | | Net realized
and unrealized gains (losses) on
investments | | | Total from
investment
operations | | | Net
investment
income | | | Return of
capital | | | Total
distributions | |
Hedged Equity Fund | | | | | | | | | | | | | | | | | | | | | | | | | | | | |
Class A | | | | | | | | | | | | | | | | | | | | | | | | | | | | |
Six Months Ended December 31, 2016 (Unaudited) | | $ | 16.23 | | | $ | 0.11 | (g) | | $ | 1.07 | | | $ | 1.18 | | | $ | (0.12 | ) | | $ | — | | | $ | (0.12 | ) |
Year Ended June 30, 2016 | | | 16.47 | | | | 0.20 | (g) | | | (0.28 | ) | | | (0.08 | ) | | | (0.16 | ) | | | — | | | | (0.16 | ) |
Year Ended June 30, 2015 | | | 15.74 | | | | 0.19 | (g) | | | 0.67 | | | | 0.86 | | | | (0.13 | ) | | | — | | | | (0.13 | ) |
December 13, 2013 (h) through June 30, 2014 | | | 15.00 | | | | 0.07 | | | | 0.84 | | | | 0.91 | | | | (0.07 | ) | | | (0.10 | ) | | | (0.17 | ) |
| | | | | | | |
Class C | | | | | | | | | | | | | | | | | | | | | | | | | | | | |
Six Months Ended December 31, 2016 (Unaudited) | | | 16.17 | | | | 0.06 | (g) | | | 1.08 | | | | 1.14 | | | | (0.08 | ) | | | — | | | | (0.08 | ) |
Year Ended June 30, 2016 | | | 16.43 | | | | 0.13 | (g) | | | (0.29 | ) | | | (0.16 | ) | | | (0.10 | ) | | | — | | | | (0.10 | ) |
Year Ended June 30, 2015 | | | 15.76 | | | | 0.10 | (g) | �� | | 0.67 | | | | 0.77 | | | | (0.10 | ) | | | — | | | | (0.10 | ) |
December 13, 2013 (h) through June 30, 2014 | | | 15.00 | | | | 0.05 | | | | 0.83 | | | | 0.88 | | | | (0.02 | ) | | | (0.10 | ) | | | (0.12 | ) |
| | | | | | | |
Class R5 | | | | | | | | | | | | | | | | | | | | | | | | | | | | |
Six Months Ended December 31, 2016 (Unaudited) | | | 16.28 | | | | 0.14 | (g) | | | 1.08 | | | | 1.22 | | | | (0.15 | ) | | | — | | | | (0.15 | ) |
Year Ended June 30, 2016 | | | 16.51 | | | | 0.24 | (g) | | | (0.24 | ) | | | — | (i) | | | (0.23 | ) | | | — | | | | (0.23 | ) |
Year Ended June 30, 2015 | | | 15.76 | | | | 0.26 | (g) | | | 0.66 | | | | 0.92 | | | | (0.17 | ) | | | — | | | | (0.17 | ) |
December 13, 2013 (h) through June 30, 2014 | | | 15.00 | | | | 0.13 | | | | 0.82 | | | | 0.95 | | | | (0.09 | ) | | | (0.10 | ) | | | (0.19 | ) |
| | | | | | | |
Class R6 | | | | | | | | | | | | | | | | | | | | | | | | | | | | |
Six Months Ended December 31, 2016 (Unaudited) | | | 16.28 | | | | 0.15 | (g) | | | 1.08 | | | | 1.23 | | | | (0.16 | ) | | | — | | | | (0.16 | ) |
Year Ended June 30, 2016 | | | 16.52 | | | | 0.27 | (g) | | | (0.27 | ) | | | — | (i) | | | (0.24 | ) | | | — | | | | (0.24 | ) |
Year Ended June 30, 2015 | | | 15.76 | | | | 0.27 | (g) | | | 0.67 | | | | 0.94 | | | | (0.18 | ) | | | — | | | | (0.18 | ) |
December 13, 2013 (h) through June 30, 2014 | | | 15.00 | | | | 0.13 | | | | 0.83 | | | | 0.96 | | | | (0.10 | ) | | | (0.10 | ) | | | (0.20 | ) |
| | | | | | | |
Select Class | | | | | | | | | | | | | | | | | | | | | | | | | | | | |
Six Months Ended December 31, 2016 (Unaudited) | | | 16.26 | | | | 0.13 | (g) | | | 1.08 | | | | 1.21 | | | | (0.14 | ) | | | — | | | | (0.14 | ) |
Year Ended June 30, 2016 | | | 16.50 | | | | 0.25 | (g) | | | (0.28 | ) | | | (0.03 | ) | | | (0.21 | ) | | | — | | | | (0.21 | ) |
Year Ended June 30, 2015 | | | 15.76 | | | | 0.23 | (g) | | | 0.66 | | | | 0.89 | | | | (0.15 | ) | | | — | | | | (0.15 | ) |
December 13, 2013 (h) through June 30, 2014 | | | 15.00 | | | | 0.10 | | | | 0.84 | | | | 0.94 | | | | (0.08 | ) | | | (0.10 | ) | | | (0.18 | ) |
| (a) | Annualized for periods less than one year, unless otherwise noted. |
| (b) | Not annualized for periods less than one year. |
| (c) | Includes adjustments in accordance with accounting principles generally accepted in the United States of America and as such, the net asset values for financial reporting purposes and the returns based upon those net asset values may differ from the net asset values and returns for shareholder transactions. |
| (d) | Includes earnings credits and interest expense, if applicable, each of which is less than 0.005% unless otherwise noted. |
| (e) | Certain non-recurring expenses incurred by the Fund were not annualized for the year ended June 30, 2015 and for the period ended June 30, 2014. |
| (f) | Portfolio turnover is calculated by dividing the lesser of total purchases or sales of portfolio securities for the reporting period by the monthly average value of portfolio securities owned during the reporting period. Excluded from both the numerator and denominator are amounts relating to derivatives and securities whose maturities or expiration dates at the time of acquisition were one year or less. |
| (g) | Calculated based upon average shares outstanding. |
| (h) | Commencement of operations. |
| (i) | Amount rounds to less than $0.005. |
SEE NOTES TO FINANCIAL STATEMENTS.
| | | | | | |
| | | |
| 84 | | | | J.P. MORGAN LARGE CAP FUNDS | | DECEMBER 31, 2016 |
| | | | | | | | | | | | | | | | | | | | | | | | | | |
| | | Ratios/Supplemental data | |
| | | | | | | | | | Ratios to average net assets (a) | | | | |
Net asset
value,
end of
period | | | Total return
(excludes
sales charge) (b)(c) | | | Net assets,
end of
period
(000’s) | | | Net
expenses (d)(e) | | | Net
investment
income
(loss) (e) | | | Expenses
without waivers,
reimbursements and
earnings credits (e) | | | Portfolio
turnover
rate (b)(f) | |
| | | | | | | | | | | | | | | | | | | | | | | | | | |
| | | | | | | | | | | | | | | | | | | | | | | | | | |
| $ | 17.29 | | | | 7.26 | % | | $ | 73,655 | | | | 0.84 | % | | | 1.25 | % | | | 1.16 | % | | | 17 | % |
| | 16.23 | | | | (0.43 | ) | | | 71,417 | | | | 0.85 | | | | 1.27 | | | | 1.11 | | | | 57 | |
| | 16.47 | | | | 5.45 | | | | 93,007 | | | | 0.85 | | | | 1.14 | | | | 1.21 | | | | 42 | |
| | 15.74 | | | | 6.11 | | | | 569 | | | | 0.85 | | | | 0.96 | | | | 16.65 | | | | 36 | |
| | | | | | |
| | | | | | | | | | | | | | | | | | | | | | | | | | |
| | 17.23 | | | | 7.03 | | | | 12,011 | | | | 1.34 | | | | 0.77 | | | | 1.52 | | | | 17 | |
| | 16.17 | | | | (0.95 | ) | | | 9,867 | | | | 1.35 | | | | 0.80 | | | | 1.52 | | | | 57 | |
| | 16.43 | | | | 4.85 | | | | 3,405 | | | | 1.35 | | | | 0.59 | | | | 1.65 | | | | 42 | |
| | 15.76 | | | | 5.87 | | | | 53 | | | | 1.35 | | | | 0.56 | | | | 10.04 | | | | 36 | |
| | | | | | |
| | | | | | | | | | | | | | | | | | | | | | | | | | |
| | 17.35 | | | | 7.53 | | | | 29 | | | | 0.40 | | | | 1.71 | | | | 1.79 | | | | 17 | |
| | 16.28 | | | | 0.07 | | | | 25 | | | | 0.40 | | | | 1.49 | | | | 2.16 | | | | 57 | |
| | 16.51 | | | | 5.86 | | | | 442 | | | | 0.40 | | | | 1.58 | | | | 0.82 | | | | 42 | |
| | 15.76 | | | | 6.37 | | | | 53 | | | | 0.40 | | | | 1.51 | | | | 9.10 | | | | 36 | |
| | | | | | |
| | | | | | | | | | | | | | | | | | | | | | | | | | |
| | 17.35 | | | | 7.56 | | | | 91 | | | | 0.35 | | | | 1.75 | | | | 0.86 | | | | 17 | |
| | 16.28 | | | | 0.07 | | | | 74 | | | | 0.35 | | | | 1.66 | | | | 1.40 | | | | 57 | |
| | 16.52 | | | | 5.96 | | | | 443 | | | | 0.35 | | | | 1.63 | | | | 0.77 | | | | 42 | |
| | 15.76 | | | | 6.39 | | | | 53 | | | | 0.35 | | | | 1.56 | | | | 9.05 | | | | 36 | |
| | | | | | |
| | | | | | | | | | | | | | | | | | | | | | | | | | |
| | 17.33 | | | | 7.45 | | | | 241,152 | | | | 0.60 | | | | 1.53 | | | | 0.75 | | | | 17 | |
| | 16.26 | | | | (0.17 | ) | | | 158,820 | | | | 0.60 | | | | 1.54 | | | | 0.74 | | | | 57 | |
| | 16.50 | | | | 5.66 | | | | 105,397 | | | | 0.60 | | | | 1.39 | | | | 0.91 | | | | 42 | |
| | 15.76 | | | | 6.28 | | | | 4,307 | | | | 0.60 | | | | 1.30 | | | | 9.91 | | | | 36 | |
SEE NOTES TO FINANCIAL STATEMENTS.
| | | | | | | | |
| | | |
| DECEMBER 31, 2016 | | J.P. MORGAN LARGE CAP FUNDS | | | | | 85 | |
FINANCIAL HIGHLIGHTS
FOR THE PERIODS INDICATED (continued)
| | | | | | | | | | | | | | | | | | | | | | | | | | | | |
| | | Per share operating performance | |
| | | | | | Investment operations | | | Distributions | |
| | | Net asset
value,
beginning
of period | | | Net
investment
income
(loss) (b) | | | Net realized
and unrealized
gains (losses) on
investments | | | Total from
investment
operations | | | Net
investment
income | | | Net
realized
gain | | | Total
distributions | |
Large Cap Growth Fund | | | | | | | | | | | | | | | | | | | | | | | | | | | | |
Class A | | | | | | | | | | | | | | | | | | | | | | | | | | | | |
Six Months Ended December 31, 2016 (Unaudited) | | $ | 32.93 | | | $ | (0.03 | ) | | $ | 1.84 | | | $ | 1.81 | | | $ | — | | | $ | (3.14 | ) | | $ | (3.14 | ) |
Year Ended June 30, 2016 | | | 36.82 | | | | (0.06 | ) | | | (2.23 | ) | | | (2.29 | ) | | | — | | | | (1.60 | ) | | | (1.60 | ) |
Year Ended June 30, 2015 | | | 32.49 | | | | (0.10 | ) | | | 5.05 | | | | 4.95 | | | | — | | | | (0.62 | ) | | | (0.62 | ) |
Year Ended June 30, 2014 | | | 26.01 | | | | (0.10 | ) | | | 6.58 | | | | 6.48 | | | | — | | | | — | | | | — | |
Year Ended June 30, 2013 | | | 23.64 | | | | 0.08 | (g) | | | 2.37 | | | | 2.45 | | | | (0.08 | ) | | | — | | | | (0.08 | ) |
Year Ended June 30, 2012 | | | 22.38 | | | | (0.06 | ) | | | 1.32 | | | | 1.26 | | | | — | | | | — | | | | — | |
| | | | | | | |
Class C | | | | | | | | | | | | | | | | | | | | | | | | | | | | |
Six Months Ended December 31, 2016 (Unaudited) | | | 28.15 | | | | (0.09 | ) | | | 1.56 | | | | 1.47 | | | | — | | | | (3.14 | ) | | | (3.14 | ) |
Year Ended June 30, 2016 | | | 31.86 | | | | (0.20 | ) | | | (1.91 | ) | | | (2.11 | ) | | | — | | | | (1.60 | ) | | | (1.60 | ) |
Year Ended June 30, 2015 | | | 28.33 | | | | (0.24 | ) | | | 4.39 | | | | 4.15 | | | | — | | | | (0.62 | ) | | | (0.62 | ) |
Year Ended June 30, 2014 | | | 22.79 | | | | (0.22 | ) | | | 5.76 | | | | 5.54 | | | | — | | | | — | | | | — | |
Year Ended June 30, 2013 | | | 20.79 | | | | (0.04 | )(g) | | | 2.07 | | | | 2.03 | | | | (0.03 | ) | | | — | | | | (0.03 | ) |
Year Ended June 30, 2012 | | | 19.77 | | | | (0.15 | ) | | | 1.17 | | | | 1.02 | | | | — | | | | — | | | | — | |
| | | | | | | |
Class R2 | | | | | | | | | | | | | | | | | | | | | | | | | | | | |
Six Months Ended December 31, 2016 (Unaudited) | | | 32.31 | | | | (0.07 | ) | | | 1.80 | | | | 1.73 | | | | — | | | | (3.14 | ) | | | (3.14 | ) |
Year Ended June 30, 2016 | | | 36.24 | | | | (0.15 | ) | | | (2.18 | ) | | | (2.33 | ) | | | — | | | | (1.60 | ) | | | (1.60 | ) |
Year Ended June 30, 2015 | | | 32.07 | | | | (0.18 | ) | | | 4.97 | | | | 4.79 | | | | — | | | | (0.62 | ) | | | (0.62 | ) |
Year Ended June 30, 2014 | | | 25.74 | | | | (0.18 | ) | | | 6.51 | | | | 6.33 | | | | — | | | | — | | | | — | |
Year Ended June 30, 2013 | | | 23.44 | | | | 0.01 | (g) | | | 2.36 | | | | 2.37 | | | | (0.07 | ) | | | — | | | | (0.07 | ) |
Year Ended June 30, 2012 | | | 22.24 | | | | (0.12 | ) | | | 1.32 | | | | 1.20 | | | | — | (h) | | | — | | | | — | (h) |
| | | | | | | |
Class R3 | | | | | | | | | | | | | | | | | | | | | | | | | | | | |
September 9, 2016 (i) through December 31, 2016 (Unaudited) | | | 33.97 | | | | (0.02 | ) | | | 0.94 | | | | 0.92 | | | | — | | | | (3.14 | ) | | | (3.14 | ) |
| | | | | | | |
Class R4 | | | | | | | | | | | | | | | | | | | | | | | | | | | | |
September 9, 2016 (i) through December 31, 2016 (Unaudited) | | | 33.97 | | | | — | (h) | | | 0.95 | | | | 0.95 | | | | — | | | | (3.14 | ) | | | (3.14 | ) |
| | | | | | | |
Class R5 | | | | | | | | | | | | | | | | | | | | | | | | | | | | |
Six Months Ended December 31, 2016 (Unaudited) | | | 33.46 | | | | 0.04 | | | | 1.85 | | | | 1.89 | | | | — | | | | (3.14 | ) | | | (3.14 | ) |
Year Ended June 30, 2016 | | | 37.25 | | | | 0.06 | | | | (2.25 | ) | | | (2.19 | ) | | | — | | | | (1.60 | ) | | | (1.60 | ) |
Year Ended June 30, 2015 | | | 32.75 | | | | 0.03 | | | | 5.09 | | | | 5.12 | | | | — | | | | (0.62 | ) | | | (0.62 | ) |
Year Ended June 30, 2014 | | | 26.12 | | | | 0.01 | | | | 6.62 | | | | 6.63 | | | | — | | | | — | | | | — | |
Year Ended June 30, 2013 | | | 23.74 | | | | 0.17 | (g) | | | 2.38 | | | | 2.55 | | | | (0.17 | ) | | | — | | | | (0.17 | ) |
Year Ended June 30, 2012 | | | 22.39 | | | | 0.04 | | | | 1.32 | | | | 1.36 | | | | (0.01 | ) | | | — | | | | (0.01 | ) |
| | | | | | | |
Class R6 | | | | | | | | | | | | | | | | | | | | | | | | | | | | |
Six Months Ended December 31, 2016 (Unaudited) | | | 33.58 | | | | 0.06 | | | | 1.85 | | | | 1.91 | | | | — | | | | (3.14 | ) | | | (3.14 | ) |
Year Ended June 30, 2016 | | | 37.34 | | | | 0.10 | | | | (2.26 | ) | | | (2.16 | ) | | | — | | | | (1.60 | ) | | | (1.60 | ) |
Year Ended June 30, 2015 | | | 32.80 | | | | 0.06 | | | | 5.10 | | | | 5.16 | | | | — | | | | (0.62 | ) | | | (0.62 | ) |
Year Ended June 30, 2014 | | | 26.15 | | | | 0.02 | | | | 6.63 | | | | 6.65 | | | | — | | | | — | | | | — | |
Year Ended June 30, 2013 | | | 23.76 | | | | 0.18 | (g) | | | 2.39 | | | | 2.57 | | | | (0.18 | ) | | | — | | | | (0.18 | ) |
Year Ended June 30, 2012 | | | 22.40 | | | | 0.05 | | | | 1.33 | | | | 1.38 | | | | (0.02 | ) | | | — | | | | (0.02 | ) |
| | | | | | | |
Select Class | | | | | | | | | | | | | | | | | | | | | | | | | | | | |
Six Months Ended December 31, 2016 (Unaudited) | | | 33.08 | | | | — | (h) | | | 1.84 | | | | 1.84 | | | | — | | | | (3.14 | ) | | | (3.14 | ) |
Year Ended June 30, 2016 | | | 36.92 | | | | (0.01 | ) | | | (2.23 | ) | | | (2.24 | ) | | | — | | | | (1.60 | ) | | | (1.60 | ) |
Year Ended June 30, 2015 | | | 32.52 | | | | (0.04 | ) | | | 5.06 | | | | 5.02 | | | | — | | | | (0.62 | ) | | | (0.62 | ) |
Year Ended June 30, 2014 | | | 25.99 | | | | (0.05 | ) | | | 6.58 | | | | 6.53 | | | | — | | | | — | | | | — | |
Year Ended June 30, 2013 | | | 23.61 | | | | 0.12 | (g) | | | 2.37 | | | | 2.49 | | | | (0.11 | ) | | | — | | | | (0.11 | ) |
Year Ended June 30, 2012 | | | 22.31 | | | | (0.01 | ) | | | 1.31 | | | | 1.30 | | | | — | (h) | | | — | | | | — | (h) |
| (a) | Annualized for periods less than one year, unless otherwise noted. |
| (b) | Calculated based upon average shares outstanding. |
| (c) | Not annualized for periods less than one year. |
| (d) | Includes adjustments in accordance with accounting principles generally accepted in the United States of America and as such, the net asset values for financial reporting purposes and the returns based upon those net asset values may differ from the net asset values and returns for shareholder transactions. |
| (e) | Includes earnings credits and interest expense, if applicable, each of which is less than 0.005% unless otherwise noted. |
SEE NOTES TO FINANCIAL STATEMENTS.
| | | | | | |
| | | |
| 86 | | | | J.P. MORGAN LARGE CAP FUNDS | | DECEMBER 31, 2016 |
| | | | | | | | | | | | | | | | | | | | | | | | | | |
| | | Ratios/Supplemental data | |
| | | | | | | | | | Ratios to average net assets (a) | | | | |
Net asset
value,
end of
period | | | Total return
(excludes
sales charge) (c)(d) | | |
Net assets,
end of
period
(000’s) | | | Net
expenses (e) | | | Net
investment
income
(loss) | | | Expenses
without waivers,
reimbursements and
earnings credits | | | Portfolio
turnover
rate (c)(f) | |
| | | | | | | | | | | | | | | | | | | | | | | | | | |
| | | | | | | | | | | | | | | | | | | | | | | | | | |
| $ | 31.60 | | | | 5.38 | % | | $ | 3,504,003 | | | | 1.05 | % | | | (0.15 | )% | | | 1.28 | % | | | 16 | % |
| | 32.93 | | | | (6.45 | ) | | | 4,251,242 | | | | 1.04 | | | | (0.17 | ) | | | 1.27 | | | | 43 | |
| | 36.82 | | | | 15.40 | | | | 4,670,460 | | | | 1.06 | | | | (0.28 | ) | | | 1.21 | | | | 19 | |
| | 32.49 | | | | 24.91 | | | | 5,044,428 | | | | 1.10 | | | | (0.34 | ) | | | 1.19 | | | | 39 | |
| | 26.01 | | | | 10.40 | | | | 2,824,115 | | | | 1.09 | | | | 0.30 | (g) | | | 1.19 | | | | 47 | |
| | 23.64 | | | | 5.63 | | | | 1,660,335 | | | | 1.09 | | | | (0.25 | ) | | | 1.15 | | | | 28 | |
| | | | | | |
| | | | | | | | | | | | | | | | | | | | | | | | | | |
| | 26.48 | | | | 5.09 | | | | 485,570 | | | | 1.55 | | | | (0.64 | ) | | | 1.69 | | | | 16 | |
| | 28.15 | | | | (6.90 | ) | | | 559,238 | | | | 1.55 | | | | (0.67 | ) | | | 1.69 | | | | 43 | |
| | 31.86 | | | | 14.83 | | | | 600,404 | | | | 1.56 | | | | (0.78 | ) | | | 1.68 | | | | 19 | |
| | 28.33 | | | | 24.31 | | | | 523,972 | | | | 1.59 | | | | (0.85 | ) | | | 1.69 | | | | 39 | |
| | 22.79 | | | | 9.80 | | | | 396,862 | | | | 1.59 | | | | (0.20 | )(g) | | | 1.69 | | | | 47 | |
| | 20.79 | | | | 5.16 | | | | 205,723 | | | | 1.59 | | | | (0.75 | ) | | | 1.65 | | | | 28 | |
| | | | | | |
| | | | | | | | | | | | | | | | | | | | | | | | | | |
| | 30.90 | | | | 5.24 | | | | 167,692 | | | | 1.30 | | | | (0.39 | ) | | | 1.51 | | | | 16 | |
| | 32.31 | | | | (6.67 | ) | | | 192,560 | | | | 1.30 | | | | (0.43 | ) | | | 1.55 | | | | 43 | |
| | 36.24 | | | | 15.10 | | | | 242,550 | | | | 1.31 | | | | (0.53 | ) | | | 1.49 | | | | 19 | |
| | 32.07 | | | | 24.59 | | | | 222,421 | | | | 1.35 | | | | (0.60 | ) | | | 1.44 | | | | 39 | |
| | 25.74 | | | | 10.12 | | | | 191,876 | | | | 1.34 | | | | 0.05 | (g) | | | 1.45 | | | | 47 | |
| | 23.44 | | | | 5.41 | | | | 85,913 | | | | 1.34 | | | | (0.50 | ) | | | 1.39 | | | | 28 | |
| | | | | | |
| | | | | | | | | | | | | | | | | | | | | | | | | | |
| | 31.75 | | | | 2.60 | | | | 20 | | | | 1.10 | | | | (0.21 | ) | | | 1.10 | | | | 16 | |
| | | | | | |
| | | | | | | | | | | | | | | | | | | | | | | | | | |
| | 31.78 | | | | 2.66 | | | | 21 | | | | 0.85 | | | | 0.03 | | | | 0.85 | | | | 16 | |
| | | | | | |
| | | | | | | | | | | | | | | | | | | | | | | | | | |
| | 32.21 | | | | 5.54 | | | | 1,066,458 | | | | 0.70 | | | | 0.21 | | | | 0.74 | | | | 16 | |
| | 33.46 | | | | (6.10 | ) | | | 1,209,521 | | | | 0.69 | | | | 0.17 | | | | 0.73 | | | | 43 | |
| | 37.25 | | | | 15.80 | | | | 1,394,419 | | | | 0.70 | | | | 0.08 | | | | 0.74 | | | | 19 | |
| | 32.75 | | | | 25.38 | | | | 1,400,112 | | | | 0.73 | | | | 0.02 | | | | 0.74 | | | | 39 | |
| | 26.12 | | | | 10.78 | | | | 1,158,856 | | | | 0.71 | | | | 0.69 | (g) | | | 0.75 | | | | 47 | |
| | 23.74 | | | | 6.10 | | | | 584,866 | | | | 0.69 | | | | 0.16 | | | | 0.70 | | | | 28 | |
| | | | | | |
| | | | | | | | | | | | | | | | | | | | | | | | | | |
| | 32.35 | | | | 5.58 | | | | 3,215,917 | | | | 0.60 | | | | 0.31 | | | | 0.60 | | | | 16 | |
| | 33.58 | | | | (6.00 | ) | | | 3,330,565 | | | | 0.60 | | | | 0.28 | | | | 0.60 | | | | 43 | |
| | 37.34 | | | | 15.90 | | | | 3,220,191 | | | | 0.62 | | | | 0.17 | | | | 0.62 | | | | 19 | |
| | 32.80 | | | | 25.43 | | | | 2,709,590 | | | | 0.68 | | | | 0.07 | | | | 0.69 | | | | 39 | |
| | 26.15 | | | | 10.87 | | | | 2,170,011 | | | | 0.67 | | | | 0.72 | (g) | | | 0.70 | | | | 47 | |
| | 23.76 | | | | 6.15 | | | | 1,047,184 | | | | 0.63 | | | | 0.20 | | | | 0.64 | | | | 28 | |
| | | | | | |
| | | | | | | | | | | | | | | | | | | | | | | | | | |
| | 31.78 | | | | 5.45 | | | | 3,509,095 | | | | 0.90 | | | | 0.01 | | | | 0.93 | | | | 16 | |
| | 33.08 | | | | (6.29 | ) | | | 4,161,010 | | | | 0.89 | | | | (0.04 | ) | | | 0.93 | | | | 43 | |
| | 36.92 | | | | 15.60 | | | | 5,515,626 | | | | 0.90 | | | | (0.12 | ) | | | 0.92 | | | | 19 | |
| | 32.52 | | | | 25.13 | | | | 5,037,737 | | | | 0.93 | | | | (0.18 | ) | | | 0.94 | | | | 39 | |
| | 25.99 | | | | 10.58 | | | | 4,811,907 | | | | 0.91 | | | | 0.50 | (g) | | | 0.94 | | | | 47 | |
| | 23.61 | | | | 5.85 | | | | 3,320,683 | | | | 0.89 | | | | (0.04 | ) | | | 0.90 | | | | 28 | |
| (f) | Portfolio turnover is calculated by dividing the lesser of total purchases or sales of portfolio securities for the reporting period by the monthly average value of portfolio securities owned during the reporting period. Excluded from both the numerator and denominator are amounts relating to derivatives and securities whose maturities or expiration dates at the time of acquisition were one year or less. |
| (g) | Reflects special dividends paid out during the period by several of the Fund’s holdings. Had the Fund not received the special dividends, the net investment income (loss) per share would have been $0.02, $(0.09), $(0.04), $0.12, $0.13 and $0.07 for Class A, Class C, Class R2, Class R5, Class R6 and Select Class Shares, respectively, and the net investment income (loss) ratio would have been 0.08%, (0.42)%, (0.17)%, 0.47%, 0.50% and 0.28% for Class A, Class C, Class R2, Class R5, Class R6 and Select Class Shares, respectively. |
| (h) | Amount rounds to less than $0.005. |
| (i) | Commencement of offering of class of shares. |
SEE NOTES TO FINANCIAL STATEMENTS.
| | | | | | | | |
| | | |
| DECEMBER 31, 2016 | | J.P. MORGAN LARGE CAP FUNDS | | | | | 87 | |
FINANCIAL HIGHLIGHTS
FOR THE PERIODS INDICATED (continued)
| | | | | | | | | | | | | | | | | | | | | | | | | | | | |
| | | Per share operating performance | |
| | | | | | Investment operations | | | Distributions | |
| | | Net asset
value,
beginning
of period | | | Net
investment
income
(loss) (b) | | | Net realized
and unrealized
gains
(losses) on
investments | | | Total from
investment
operations | | | Net
investment
income | | | Net
realized
gain | | | Total
distributions | |
Large Cap Value Fund | | | | | | | | | | | | | | | | | | | | | | | | | | | | |
Class A | | | | | | | | | | | | | | | | | | | | | | | | | | | | |
Six Months Ended December 31, 2016 (Unaudited) | | $ | 12.71 | | | $ | 0.07 | | | $ | 2.61 | | | $ | 2.68 | | | $ | (0.08 | ) | | $ | (0.66 | ) | | $ | (0.74 | ) |
Year Ended June 30, 2016 | | | 15.02 | | | | 0.17 | | | | (0.59 | ) | | | (0.42 | ) | | | (0.16 | ) | | | (1.73 | ) | | | (1.89 | ) |
Year Ended June 30, 2015 | | | 16.63 | | | | 0.17 | | | | 0.94 | | | | 1.11 | | | | (0.17 | ) | | | (2.55 | ) | | | (2.72 | ) |
Year Ended June 30, 2014 | | | 13.99 | | | | 0.17 | | | | 3.16 | | | | 3.33 | | | | (0.18 | ) | | | (0.51 | ) | | | (0.69 | ) |
Year Ended June 30, 2013 | | | 11.02 | | | | 0.14 | | | | 2.97 | | | | 3.11 | | | | (0.14 | ) | | | — | | | | (0.14 | ) |
Year Ended June 30, 2012 | | | 11.45 | | | | 0.11 | | | | (0.43 | ) | | | (0.32 | ) | | | (0.11 | ) | | | — | | | | (0.11 | ) |
| | | | | | | |
Class C | | | | | | | | | | | | | | | | | | | | | | | | | | | | |
Six Months Ended December 31, 2016 (Unaudited) | | | 12.30 | | | | 0.04 | | | | 2.51 | | | | 2.55 | | | | (0.05 | ) | | | (0.66 | ) | | | (0.71 | ) |
Year Ended June 30, 2016 | | | 14.60 | | | | 0.10 | | | | (0.58 | ) | | | (0.48 | ) | | | (0.09 | ) | | | (1.73 | ) | | | (1.82 | ) |
Year Ended June 30, 2015 | | | 16.25 | | | | 0.08 | | | | 0.92 | | | | 1.00 | | | | (0.10 | ) | | | (2.55 | ) | | | (2.65 | ) |
Year Ended June 30, 2014 | | | 13.70 | | | | 0.09 | | | | 3.08 | | | | 3.17 | | | | (0.11 | ) | | | (0.51 | ) | | | (0.62 | ) |
Year Ended June 30, 2013 | | | 10.80 | | | | 0.08 | | | | 2.91 | | | | 2.99 | | | | (0.09 | ) | | | — | | | | (0.09 | ) |
Year Ended June 30, 2012 | | | 11.22 | | | | 0.05 | | | | (0.41 | ) | | | (0.36 | ) | | | (0.06 | ) | | | — | | | | (0.06 | ) |
| | | | | | | |
Class R2 | | | | | | | | | | | | | | | | | | | | | | | | | | | | |
Six Months Ended December 31, 2016 (Unaudited) | | | 12.64 | | | | 0.06 | | | | 2.59 | | | | 2.65 | | | | (0.06 | ) | | | (0.66 | ) | | | (0.72 | ) |
Year Ended June 30, 2016 | | | 14.96 | | | | 0.14 | | | | (0.60 | ) | | | (0.46 | ) | | | (0.13 | ) | | | (1.73 | ) | | | (1.86 | ) |
Year Ended June 30, 2015 | | | 16.58 | | | | 0.13 | | | | 0.94 | | | | 1.07 | | | | (0.14 | ) | | | (2.55 | ) | | | (2.69 | ) |
Year Ended June 30, 2014 | | | 13.95 | | | | 0.13 | | | | 3.14 | | | | 3.27 | | | | (0.13 | ) | | | (0.51 | ) | | | (0.64 | ) |
Year Ended June 30, 2013 | | | 10.99 | | | | 0.11 | | | | 2.96 | | | | 3.07 | | | | (0.11 | ) | | | — | | | | (0.11 | ) |
Year Ended June 30, 2012 | | | 11.42 | | | | 0.08 | | | | (0.42 | ) | | | (0.34 | ) | | | (0.09 | ) | | | — | | | | (0.09 | ) |
| | | | | | | |
Class R5 | | | | | | | | | | | | | | | | | | | | | | | | | | | | |
Six Months Ended December 31, 2016 (Unaudited) | | | 12.63 | | | | 0.10 | | | | 2.58 | | | | 2.68 | | | | (0.10 | ) | | | (0.66 | ) | | | (0.76 | ) |
Year Ended June 30, 2016 | | | 14.93 | | | | 0.21 | | | | (0.58 | ) | | | (0.37 | ) | | | (0.20 | ) | | | (1.73 | ) | | | (1.93 | ) |
Year Ended June 30, 2015 | | | 16.54 | | | | 0.22 | | | | 0.94 | | | | 1.16 | | | | (0.22 | ) | | | (2.55 | ) | | | (2.77 | ) |
Year Ended June 30, 2014 | | | 13.92 | | | | 0.19 | | | | 3.16 | | | | 3.35 | | | | (0.22 | ) | | | (0.51 | ) | | | (0.73 | ) |
Year Ended June 30, 2013 | | | 10.92 | | | | 0.17 | | | | 2.98 | | | | 3.15 | | | | (0.15 | ) | | | — | | | | (0.15 | ) |
Year Ended June 30, 2012 | | | 11.34 | | | | 0.14 | | | | (0.41 | ) | | | (0.27 | ) | | | (0.15 | ) | | | — | | | | (0.15 | ) |
| | | | | | | |
Class R6 | | | | | | | | | | | | | | | | | | | | | | | | | | | | |
Six Months Ended December 31, 2016 (Unaudited) | | | 12.56 | | | | 0.10 | | | | 2.58 | | | | 2.68 | | | | (0.11 | ) | | | (0.66 | ) | | | (0.77 | ) |
Year Ended June 30, 2016 | | | 14.86 | | | | 0.24 | | | | (0.60 | ) | | | (0.36 | ) | | | (0.21 | ) | | | (1.73 | ) | | | (1.94 | ) |
Year Ended June 30, 2015 | | | 16.48 | | | | 0.25 | | | | 0.91 | | | | 1.16 | | | | (0.23 | ) | | | (2.55 | ) | | | (2.78 | ) |
Year Ended June 30, 2014 | | | 13.87 | | | | 0.22 | | | | 3.13 | | | | 3.35 | | | | (0.23 | ) | | | (0.51 | ) | | | (0.74 | ) |
Year Ended June 30, 2013 | | | 10.92 | | | | 0.20 | | | | 2.94 | | | | 3.14 | | | | (0.19 | ) | | | — | | | | (0.19 | ) |
Year Ended June 30, 2012 | | | 11.34 | | | | 0.15 | | | | (0.42 | ) | | | (0.27 | ) | | | (0.15 | ) | | | — | | | | (0.15 | ) |
| | | | | | | |
Select Class | | | | | | | | | | | | | | | | | | | | | | | | | | | | |
Six Months Ended December 31, 2016 (Unaudited) | | | 12.53 | | | | 0.08 | | | | 2.57 | | | | 2.65 | | | | (0.09 | ) | | | (0.66 | ) | | | (0.75 | ) |
Year Ended June 30, 2016 | | | 14.79 | | | | 0.15 | | | | (0.54 | ) | | | (0.39 | ) | | | (0.14 | ) | | | (1.73 | ) | | | (1.87 | ) |
Year Ended June 30, 2015 | | | 16.42 | | | | 0.19 | | | | 0.92 | | | | 1.11 | | | | (0.19 | ) | | | (2.55 | ) | | | (2.74 | ) |
Year Ended June 30, 2014 | | | 13.82 | | | | 0.19 | | | | 3.11 | | | | 3.30 | | | | (0.19 | ) | | | (0.51 | ) | | | (0.70 | ) |
Year Ended June 30, 2013 | | | 10.88 | | | | 0.16 | | | | 2.94 | | | | 3.10 | | | | (0.16 | ) | | | — | | | | (0.16 | ) |
Year Ended June 30, 2012 | | | 11.30 | | | | 0.12 | | | | (0.41 | ) | | | (0.29 | ) | | | (0.13 | ) | | | — | | | | (0.13 | ) |
| (a) | Annualized for periods less than one year, unless otherwise noted. |
| (b) | Calculated based upon average shares outstanding. |
| (c) | Not annualized for periods less than one year. |
| (d) | Includes adjustments in accordance with accounting principles generally accepted in the United States of America and as such, the net asset values for financial reporting purposes and the returns based upon those net asset values may differ from the net asset values and returns for shareholder transactions. |
| (e) | Includes earnings credits and interest expense, if applicable, each of which is less than 0.005% unless otherwise noted. |
| (f) | Portfolio turnover is calculated by dividing the lesser of total purchases or sales of portfolio securities for the reporting period by the monthly average value of portfolio securities owned during the reporting period. Excluded from both the numerator and denominator are amounts relating to derivatives and securities whose maturities or expiration dates at the time of acquisition were one year or less. |
SEE NOTES TO FINANCIAL STATEMENTS.
| | | | | | |
| | | |
| 88 | | | | J.P. MORGAN LARGE CAP FUNDS | | DECEMBER 31, 2016 |
| | | | | | | | | | | | | | | | | | | | | | | | | | |
| | | Ratios/Supplemental data | |
| | | | | | | | | | Ratios to average net assets (a) | | | | |
Net asset
value,
end of
period | | | Total return
(excludes
sales charge) (c)(d) | | |
Net assets,
end of
period
(000’s) | | | Net
expenses (e) | | | Net
investment
income
(loss) | | | Expenses
without waivers,
reimbursements and
earnings credits | | | Portfolio
turnover
rate (c)(f) | |
| | | | | | | | | | | | | | | | | | | | | | | | | | |
| | | | | | | | | | | | | | | | | | | | | | | | | | |
| $ | 14.65 | | | | 21.10 | % | | $ | 136,975 | | | | 0.92 | % | | | 1.04 | % | | | 1.11 | % | | | 72 | % |
| | 12.71 | | | | (2.51 | ) | | | 96,373 | | | | 0.93 | | | | 1.27 | | | | 1.12 | | | | 219 | |
| | 15.02 | | | | 7.44 | | | | 93,078 | | | | 0.93 | | | | 1.07 | | | | 1.05 | | | | 143 | |
| | 16.63 | | | | 24.46 | | | | 92,161 | | | | 0.93 | | | | 1.11 | | | | 1.06 | | | | 168 | |
| | 13.99 | | | | 28.38 | | | | 35,030 | | | | 0.94 | | | | 1.11 | | | | 1.04 | | | | 119 | |
| | 11.02 | | | | (2.75 | ) | | | 25,789 | | | | 0.95 | | | | 1.00 | | | | 1.06 | | | | 144 | |
| | | | | | |
| | | | | | | | | | | | | | | | | | | | | | | | | | |
| | 14.14 | | | | 20.72 | | | | 24,972 | | | | 1.44 | | | | 0.54 | | | | 1.60 | | | | 72 | |
| | 12.30 | | | | (2.98 | ) | | | 17,041 | | | | 1.45 | | | | 0.75 | | | | 1.62 | | | | 219 | |
| | 14.60 | | | | 6.88 | | | | 14,307 | | | | 1.45 | | | | 0.55 | | | | 1.55 | | | | 143 | |
| | 16.25 | | | | 23.78 | | | | 11,646 | | | | 1.44 | | | | 0.59 | | | | 1.56 | | | | 168 | |
| | 13.70 | | | | 27.77 | | | | 4,890 | | | | 1.44 | | | | 0.62 | | | | 1.54 | | | | 119 | |
| | 10.80 | | | | (3.17 | ) | | | 3,215 | | | | 1.45 | | | | 0.50 | | | | 1.56 | | | | 144 | |
| | | | | | |
| | | | | | | | | | | | | | | | | | | | | | | | | | |
| | 14.57 | | | | 20.99 | | | | 4,594 | | | | 1.19 | | | | 0.80 | | | | 1.48 | | | | 72 | |
| | 12.64 | | | | (2.78 | ) | | | 3,462 | | | | 1.20 | | | | 1.05 | | | | 1.57 | | | | 219 | |
| | 14.96 | | | | 7.21 | | | | 1,074 | | | | 1.20 | | | | 0.82 | | | | 1.40 | | | | 143 | |
| | 16.58 | | | | 24.07 | | | | 455 | | | | 1.20 | | | | 0.83 | | | | 1.30 | | | | 168 | |
| | 13.95 | | | | 28.10 | | | | 378 | | | | 1.20 | | | | 0.87 | | | | 1.29 | | | | 119 | |
| | 10.99 | | | | (2.97 | ) | | | 142 | | | | 1.20 | | | | 0.76 | | | | 1.31 | | | | 144 | |
| | | | | | |
| | | | | | | | | | | | | | | | | | | | | | | | | | |
| | 14.55 | | | | 21.26 | | | | 6,787 | | | | 0.58 | | | | 1.42 | | | | 0.60 | | | | 72 | |
| | 12.63 | | | | (2.15 | ) | | | 4,155 | | | | 0.59 | | | | 1.52 | | | | 0.60 | | | | 219 | |
| | 14.93 | | | | 7.83 | | | | 4,443 | | | | 0.58 | | | | 1.41 | | | | 0.59 | | | | 143 | |
| | 16.54 | | | | 24.81 | | | | 4,433 | | | | 0.57 | | | | 1.30 | | | | 0.59 | | | | 168 | |
| | 13.92 | | | | 28.96 | | | | 19,410 | | | | 0.59 | | | | 1.48 | | | | 0.60 | | | | 119 | |
| | 10.92 | | | | (2.34 | ) | | | 25,965 | | | | 0.59 | | | | 1.36 | | | | 0.61 | | | | 144 | |
| | | | | | |
| | | | | | | | | | | | | | | | | | | | | | | | | | |
| | 14.47 | | | | 21.34 | | | | 592,044 | | | | 0.51 | | | | 1.48 | | | | 0.51 | | | | 72 | |
| | 12.56 | | | | (2.06 | ) | | | 565,542 | | | | 0.51 | | | | 1.90 | | | | 0.52 | | | | 219 | |
| | 14.86 | | | | 7.85 | | | | 4,145 | | | | 0.53 | | | | 1.54 | | | | 0.53 | | | | 143 | |
| | 16.48 | | | | 24.89 | | | | 50,923 | | | | 0.54 | | | | 1.48 | | | | 0.55 | | | | 168 | |
| | 13.87 | | | | 28.94 | | | | 43,781 | | | | 0.53 | | | | 1.52 | | | | 0.54 | | | | 119 | |
| | 10.92 | | | | (2.30 | ) | | | 11,269 | | | | 0.54 | | | | 1.41 | | | | 0.56 | | | | 144 | |
| | | | | | |
| | | | | | | | | | | | | | | | | | | | | | | | | | |
| | 14.43 | | | | 21.17 | | | | 48,312 | | | | 0.79 | | | | 1.15 | | | | 0.82 | | | | 72 | |
| | 12.53 | | | | (2.34 | ) | | | 23,373 | | | | 0.77 | | | | 1.07 | | | | 0.77 | | | | 219 | |
| | 14.79 | | | | 7.56 | | | | 634,301 | | | | 0.77 | | | | 1.22 | | | | 0.77 | | | | 143 | |
| | 16.42 | | | | 24.62 | | | | 662,936 | | | | 0.79 | | | | 1.24 | | | | 0.80 | | | | 168 | |
| | 13.82 | | | | 28.65 | | | | 591,749 | | | | 0.78 | | | | 1.27 | | | | 0.79 | | | | 119 | |
| | 10.88 | | | | (2.54 | ) | | | 567,551 | | | | 0.79 | | | | 1.16 | | | | 0.81 | | | | 144 | |
SEE NOTES TO FINANCIAL STATEMENTS.
| | | | | | | | |
| | | |
| DECEMBER 31, 2016 | | J.P. MORGAN LARGE CAP FUNDS | | | | | 89 | |
FINANCIAL HIGHLIGHTS
FOR THE PERIODS INDICATED (continued)
| | | | | | | | | | | | | | | | | | | | | | | | | | | | |
| | | Per share operating performance | |
| | | | | | Investment operations | | | Distributions | |
| | | Net asset
value,
beginning
of period | | | Net
investment
income
(loss) | | | Net realized
and unrealized
gains
(losses) on
investments | | | Total from
investment
operations | | | Net
investment
income | | | Net
realized
gain | | | Total
distributions | |
U.S. Equity Fund | | | | | | | | | | | | | | | | | | | | | | | | | | | | |
Class A | | | | | | | | | | | | | | | | | | | | | | | | | | | | |
Six Months Ended December 31, 2016 (Unaudited) | | $ | 13.76 | | | $ | 0.06 | (f) | | $ | 1.33 | | | $ | 1.39 | | | $ | (0.07 | ) | | $ | (0.53 | ) | | $ | (0.60 | ) |
Year Ended June 30, 2016 | | | 14.75 | | | | 0.12 | (f) | | | (0.30 | ) | | | (0.18 | ) | | | (0.11 | ) | | | (0.70 | ) | | | (0.81 | ) |
Year Ended June 30, 2015 | | | 14.92 | | | | 0.13 | | | | 1.10 | | | | 1.23 | | | | (0.13 | ) | | | (1.27 | ) | | | (1.40 | ) |
Year Ended June 30, 2014 | | | 12.80 | | | | 0.11 | (f) | | | 3.09 | | | | 3.20 | | | | (0.11 | ) | | | (0.97 | ) | | | (1.08 | ) |
Year Ended June 30, 2013 | | | 10.73 | | | | 0.13 | (f) | | | 2.31 | | | | 2.44 | | | | (0.13 | ) | | | (0.24 | ) | | | (0.37 | ) |
Year Ended June 30, 2012 | | | 10.65 | | | | 0.10 | (f) | | | 0.13 | | | | 0.23 | | | | (0.09 | ) | | | (0.06 | ) | | | (0.15 | ) |
| | | | | | | |
Class C | | | | | | | | | | | | | | | | | | | | | | | | | | | | |
Six Months Ended December 31, 2016 (Unaudited) | | | 13.41 | | | | 0.02 | (f) | | | 1.31 | | | | 1.33 | | | | (0.04 | ) | | | (0.53 | ) | | | (0.57 | ) |
Year Ended June 30, 2016 | | | 14.40 | | | | 0.05 | (f) | | | (0.30 | ) | | | (0.25 | ) | | | (0.04 | ) | | | (0.70 | ) | | | (0.74 | ) |
Year Ended June 30, 2015 | | | 14.61 | | | | 0.07 | | | | 1.06 | | | | 1.13 | | | | (0.07 | ) | | | (1.27 | ) | | | (1.34 | ) |
Year Ended June 30, 2014 | | | 12.56 | | | | 0.04 | (f) | | | 3.03 | | | | 3.07 | | | | (0.05 | ) | | | (0.97 | ) | | | (1.02 | ) |
Year Ended June 30, 2013 | | | 10.55 | | | | 0.06 | (f) | | | 2.26 | | | | 2.32 | | | | (0.07 | ) | | | (0.24 | ) | | | (0.31 | ) |
Year Ended June 30, 2012 | | | 10.47 | | | | 0.04 | (f) | | | 0.15 | | | | 0.19 | | | | (0.05 | ) | | | (0.06 | ) | | | (0.11 | ) |
| | | | | | | |
Class L (formerly Institutional Class) | | | | | | | | | | | | | | | | | | | | | | | | | | | | |
Six Months Ended December 31, 2016 (Unaudited) | | | 13.80 | | | | 0.08 | (f) | | | 1.34 | | | | 1.42 | | | | (0.09 | ) | | | (0.53 | ) | | | (0.62 | ) |
Year Ended June 30, 2016 | | | 14.79 | | | | 0.16 | (f) | | | (0.30 | ) | | | (0.14 | ) | | | (0.15 | ) | | | (0.70 | ) | | | (0.85 | ) |
Year Ended June 30, 2015 | | | 14.96 | | | | 0.19 | | | | 1.09 | | | | 1.28 | | | | (0.18 | ) | | | (1.27 | ) | | | (1.45 | ) |
Year Ended June 30, 2014 | | | 12.82 | | | | 0.16 | (f) | | | 3.10 | | | | 3.26 | | | | (0.15 | ) | | | (0.97 | ) | | | (1.12 | ) |
Year Ended June 30, 2013 | | | 10.75 | | | | 0.16 | (f) | | | 2.31 | | | | 2.47 | | | | (0.16 | ) | | | (0.24 | ) | | | (0.40 | ) |
Year Ended June 30, 2012 | | | 10.66 | | | | 0.13 | (f) | | | 0.14 | | | | 0.27 | | | | (0.12 | ) | | | (0.06 | ) | | | (0.18 | ) |
| | | | | | | |
Class R2 | | | | | | | | | | | | | | | | | | | | | | | | | | | | |
Six Months Ended December 31, 2016 (Unaudited) | | | 13.66 | | | | 0.04 | (f) | | | 1.33 | | | | 1.37 | | | | (0.05 | ) | | | (0.53 | ) | | | (0.58 | ) |
Year Ended June 30, 2016 | | | 14.66 | | | | 0.08 | (f) | | | (0.31 | ) | | | (0.23 | ) | | | (0.07 | ) | | | (0.70 | ) | | | (0.77 | ) |
Year Ended June 30, 2015 | | | 14.84 | | | | 0.10 | | | | 1.09 | | | | 1.19 | | | | (0.10 | ) | | | (1.27 | ) | | | (1.37 | ) |
Year Ended June 30, 2014 | | | 12.74 | | | | 0.07 | (f) | | | 3.08 | | | | 3.15 | | | | (0.08 | ) | | | (0.97 | ) | | | (1.05 | ) |
Year Ended June 30, 2013 | | | 10.69 | | | | 0.10 | (f) | | | 2.29 | | | | 2.39 | | | | (0.10 | ) | | | (0.24 | ) | | | (0.34 | ) |
Year Ended June 30, 2012 | | | 10.62 | | | | 0.07 | (f) | | | 0.13 | | | | 0.20 | | | | (0.07 | ) | | | (0.06 | ) | | | (0.13 | ) |
| | | | | | | |
Class R3 | | | | | | | | | | | | | | | | | | | | | | | | | | | | |
September 9, 2016 (g) through December 31, 2016 (Unaudited) | | | 14.11 | | | | 0.04 | (f) | | | 1.00 | | | | 1.04 | | | | (0.08 | ) | | | (0.53 | ) | | | (0.61 | ) |
| | | | | | | |
Class R4 | | | | | | | | | | | | | | | | | | | | | | | | | | | | |
September 9, 2016 (g) through December 31, 2016 (Unaudited) | | | 14.15 | | | | 0.05 | (f) | | | 1.00 | | | | 1.05 | | | | (0.09 | ) | | | (0.53 | ) | | | (0.62 | ) |
| | | | | | | |
Class R5 | | | | | | | | | | | | | | | | | | | | | | | | | | | | |
Six Months Ended December 31, 2016 (Unaudited) | | | 13.81 | | | | 0.09 | (f) | | | 1.33 | | | | 1.42 | | | | (0.10 | ) | | | (0.53 | ) | | | (0.63 | ) |
Year Ended June 30, 2016 | | | 14.80 | | | | 0.18 | (f) | | | (0.31 | ) | | | (0.13 | ) | | | (0.16 | ) | | | (0.70 | ) | | | (0.86 | ) |
Year Ended June 30, 2015 | | | 14.96 | | | | 0.19 | | | | 1.11 | | | | 1.30 | | | | (0.19 | ) | | | (1.27 | ) | | | (1.46 | ) |
Year Ended June 30, 2014 | | | 12.82 | | | | 0.16 | (f) | | | 3.11 | | | | 3.27 | | | | (0.16 | ) | | | (0.97 | ) | | | (1.13 | ) |
Year Ended June 30, 2013 | | | 10.75 | | | | 0.17 | (f) | | | 2.31 | | | | 2.48 | | | | (0.17 | ) | | | (0.24 | ) | | | (0.41 | ) |
Year Ended June 30, 2012 | | | 10.66 | | | | 0.14 | (f) | | | 0.14 | | | | 0.28 | | | | (0.13 | ) | | | (0.06 | ) | | | (0.19 | ) |
| | | | | | | |
Class R6 | | | | | | | | | | | | | | | | | | | | | | | | | | | | |
Six Months Ended December 31, 2016 (Unaudited) | | | 13.82 | | | | 0.09 | (f) | | | 1.34 | | | | 1.43 | | | | (0.10 | ) | | | (0.53 | ) | | | (0.63 | ) |
Year Ended June 30, 2016 | | | 14.82 | | | | 0.18 | (f) | | | (0.31 | ) | | | (0.13 | ) | | | (0.17 | ) | | | (0.70 | ) | | | (0.87 | ) |
Year Ended June 30, 2015 | | | 14.98 | | | | 0.20 | | | | 1.10 | | | | 1.30 | | | | (0.19 | ) | | | (1.27 | ) | | | (1.46 | ) |
Year Ended June 30, 2014 | | | 12.83 | | | | 0.17 | (f) | | | 3.11 | | | | 3.28 | | | | (0.16 | ) | | | (0.97 | ) | | | (1.13 | ) |
Year Ended June 30, 2013 | | | 10.76 | | | | 0.17 | (f) | | | 2.31 | | | | 2.48 | | | | (0.17 | ) | | | (0.24 | ) | | | (0.41 | ) |
Year Ended June 30, 2012 | | | 10.67 | | | | 0.14 | (f) | | | 0.14 | | | | 0.28 | | | | (0.13 | ) | | | (0.06 | ) | | | (0.19 | ) |
| | | | | | | |
Select Class | | | | | | | | | | | | | | | | | | | | | | | | | | | | |
Six Months Ended December 31, 2016 (Unaudited) | | | 13.79 | | | | 0.07 | (f) | | | 1.34 | | | | 1.41 | | | | (0.08 | ) | | | (0.53 | ) | | | (0.61 | ) |
Year Ended June 30, 2016 | | | 14.78 | | | | 0.13 | (f) | | | (0.29 | ) | | | (0.16 | ) | | | (0.13 | ) | | | (0.70 | ) | | | (0.83 | ) |
Year Ended June 30, 2015 | | | 14.94 | | | | 0.16 | | | | 1.11 | | | | 1.27 | | | | (0.16 | ) | | | (1.27 | ) | | | (1.43 | ) |
Year Ended June 30, 2014 | | | 12.80 | | | | 0.13 | (f) | | | 3.10 | | | | 3.23 | | | | (0.12 | ) | | | (0.97 | ) | | | (1.09 | ) |
Year Ended June 30, 2013 | | | 10.74 | | | | 0.15 | (f) | | | 2.30 | | | | 2.45 | | | | (0.15 | ) | | | (0.24 | ) | | | (0.39 | ) |
Year Ended June 30, 2012 | | | 10.65 | | | | 0.12 | (f) | | | 0.14 | | | | 0.26 | | | | (0.11 | ) | | | (0.06 | ) | | | (0.17 | ) |
| (a) | Annualized for periods less than one year, unless otherwise noted. |
| (b) | Not annualized for periods less than one year. |
| (c) | Includes adjustments in accordance with accounting principles generally accepted in the United States of America and as such, the net asset values for financial reporting purposes and the returns based upon those net asset values may differ from the net asset values and returns for shareholder transactions. |
| (d) | Includes earnings credits and interest expense, if applicable, each of which is less than 0.005% unless otherwise noted. |
SEE NOTES TO FINANCIAL STATEMENTS.
| | | | | | |
| | | |
| 90 | | | | J.P. MORGAN LARGE CAP FUNDS | | DECEMBER 31, 2016 |
| | | | | | | | | | | | | | | | | | | | | | | | | | |
| | | Ratios/Supplemental data | |
| | | | | | | | | | Ratios to average net assets (a) | | | | |
Net asset
value,
end of
period | | | Total return
(excludes
sales charge) (b)(c) | | |
Net assets,
end of
period
(000’s) | | | Net
expenses (d) | | | Net
investment
income
(loss) | | | Expenses
without waivers,
reimbursements and
earnings credits | | | Portfolio
turnover
rate (b)(e) | |
| | | | | | | | | | | | | | | | | | | | | | | | | | |
| | | | | | | | | | | | | | | | | | | | | | | | | | |
| $ | 14.55 | | | | 10.10 | % | | $ | 1,413,179 | | | | 0.94 | % | | | 0.81 | % | | | 1.12 | % | | | 39 | % |
| | 13.76 | | | | (1.15 | ) | | | 1,446,878 | | | | 0.94 | | | | 0.85 | | | | 1.14 | | | | 83 | |
| | 14.75 | | | | 8.70 | | | | 1,399,208 | | | | 0.95 | | | | 0.92 | | | | 1.10 | | | | 79 | |
| | 14.92 | | | | 25.90 | | | | 1,172,752 | | | | 0.97 | | | | 0.77 | | | | 1.05 | | | | 73 | |
| | 12.80 | | | | 23.14 | | | | 874,571 | | | | 0.97 | | | | 1.06 | | | | 1.06 | | | | 88 | |
| | 10.73 | | | | 2.27 | | | | 662,367 | | | | 0.97 | | | | 0.93 | | | | 1.08 | | | | 83 | |
| | | | | | |
| | | | | | | | | | | | | | | | | | | | | | | | | | |
| | 14.17 | | | | 9.89 | | | | 319,680 | | | | 1.44 | | | | 0.32 | | | | 1.57 | | | | 39 | |
| | 13.41 | | | | (1.66 | ) | | | 294,744 | | | | 1.44 | | | | 0.35 | | | | 1.59 | | | | 83 | |
| | 14.40 | | | | 8.15 | | | | 253,608 | | | | 1.45 | | | | 0.41 | | | | 1.57 | | | | 79 | |
| | 14.61 | | | | 25.30 | | | | 175,265 | | | | 1.47 | | | | 0.28 | | | | 1.55 | | | | 73 | |
| | 12.56 | | | | 22.43 | | | | 110,837 | | | | 1.46 | | | | 0.56 | | | | 1.56 | | | | 88 | |
| | 10.55 | | | | 1.83 | | | | 75,962 | | | | 1.47 | | | | 0.43 | | | | 1.58 | | | | 83 | |
| | | | | | |
| | | | | | | | | | | | | | | | | | | | | | | | | | |
| | 14.60 | | | | 10.32 | | | | 3,240,103 | | | | 0.61 | | | | 1.14 | | | | 0.69 | | | | 39 | |
| | 13.80 | | | | (0.83 | ) | | | 3,704,104 | | | | 0.61 | | | | 1.18 | | | | 0.68 | | | | 83 | |
| | 14.79 | | | | 9.01 | | | | 4,932,896 | | | | 0.62 | | | | 1.25 | | | | 0.66 | | | | 79 | |
| | 14.96 | | | | 26.41 | | | | 4,178,050 | | | | 0.64 | | | | 1.12 | | | | 0.65 | | | | 73 | |
| | 12.82 | | | | 23.48 | | | | 1,214,707 | | | | 0.64 | | | | 1.36 | | | | 0.67 | | | | 88 | |
| | 10.75 | | | | 2.67 | | | | 610,670 | | | | 0.64 | | | | 1.25 | | | | 0.68 | | | | 83 | |
| | | | | | |
| | | | | | | | | | | | | | | | | | | | | | | | | | |
| | 14.45 | | | | 10.05 | | | | 217,214 | | | | 1.19 | | | | 0.57 | | | | 1.44 | | | | 39 | |
| | 13.66 | | | | (1.47 | ) | | | 205,224 | | | | 1.19 | | | | 0.60 | | | | 1.48 | | | | 83 | |
| | 14.66 | | | | 8.45 | | | | 178,272 | | | | 1.20 | | | | 0.67 | | | | 1.41 | | | | 79 | |
| | 14.84 | | | | 25.61 | | | | 126,549 | | | | 1.22 | | | | 0.53 | | | | 1.30 | | | | 73 | |
| | 12.74 | | | | 22.81 | | | | 72,664 | | | | 1.22 | | | | 0.81 | | | | 1.31 | | | | 88 | |
| | 10.69 | | | | 2.00 | | | | 31,686 | | | | 1.22 | | | | 0.68 | | | | 1.32 | | | | 83 | |
| | | | | | |
| | | | | | | | | | | | | | | | | | | | | | | | | | |
| | 14.54 | | | | 7.37 | | | | 26 | | | | 1.01 | | | | 0.80 | | | | 1.01 | | | | 39 | |
| | | | | | |
| | | | | | | | | | | | | | | | | | | | | | | | | | |
| | 14.58 | | | | 7.43 | | | | 21 | | | | 0.76 | | | | 1.06 | | | | 0.76 | | | | 39 | |
| | | | | | |
| | | | | | | | | | | | | | | | | | | | | | | | | | |
| | 14.60 | | | | 10.27 | | | | 841,718 | | | | 0.56 | | | | 1.19 | | | | 0.62 | | | | 39 | |
| | 13.81 | | | | (0.77 | ) | | | 910,033 | | | | 0.56 | | | | 1.27 | | | | 0.63 | | | | 83 | |
| | 14.80 | | | | 9.13 | | | | 496,102 | | | | 0.57 | | | | 1.30 | | | | 0.62 | | | | 79 | |
| | 14.96 | | | | 26.45 | | | | 441,628 | | | | 0.59 | | | | 1.16 | | | | 0.60 | | | | 73 | |
| | 12.82 | | | | 23.52 | | | | 455,939 | | | | 0.59 | | | | 1.45 | | | | 0.61 | | | | 88 | |
| | 10.75 | | | | 2.72 | | | | 335,220 | | | | 0.59 | | | | 1.32 | | | | 0.63 | | | | 83 | |
| | | | | | |
| | | | | | | | | | | | | | | | | | | | | | | | | | |
| | 14.62 | | | | 10.37 | | | | 5,218,689 | | | | 0.50 | | | | 1.26 | | | | 0.50 | | | | 39 | |
| | 13.82 | | | | (0.78 | ) | | | 4,755,359 | | | | 0.50 | | | | 1.33 | | | | 0.50 | | | | 83 | |
| | 14.82 | | | | 9.17 | | | | 2,976,379 | | | | 0.51 | | | | 1.35 | | | | 0.52 | | | | 79 | |
| | 14.98 | | | | 26.57 | | | | 2,392,416 | | | | 0.54 | | | | 1.21 | | | | 0.55 | | | | 73 | |
| | 12.83 | | | | 23.56 | | | | 1,379,173 | | | | 0.54 | | | | 1.47 | | | | 0.56 | | | | 88 | |
| | 10.76 | | | | 2.76 | | | | 1,114,492 | | | | 0.54 | | | | 1.38 | | | | 0.57 | | | | 83 | |
| | | | | | |
| | | | | | | | | | | | | | | | | | | | | | | | | | |
| | 14.59 | | | | 10.25 | | | | 1,094,192 | | | | 0.76 | | | | 1.00 | | | | 0.83 | | | | 39 | |
| | 13.79 | | | | (1.00 | ) | | | 1,066,145 | | | | 0.76 | | | | 0.94 | | | | 0.81 | | | | 83 | |
| | 14.78 | | | | 8.92 | | | | 2,375,538 | | | | 0.77 | | | | 1.08 | | | | 0.79 | | | | 79 | |
| | 14.94 | | | | 26.21 | | | | 2,288,734 | | | | 0.79 | | | | 0.94 | | | | 0.80 | | | | 73 | |
| | 12.80 | | | | 23.22 | | | | 3,874,926 | | | | 0.79 | | | | 1.24 | | | | 0.81 | | | | 88 | |
| | 10.74 | | | | 2.52 | | | | 3,617,633 | | | | 0.79 | | | | 1.12 | | | | 0.83 | | | | 83 | |
| (e) | Portfolio turnover is calculated by dividing the lesser of total purchases or sales of portfolio securities for the reporting period by the monthly average value of portfolio securities owned during the reporting period. Excluded from both the numerator and denominator are amounts relating to derivatives and securities whose maturities or expiration dates at the time of acquisition were one year or less. |
| (f) | Calculated based upon average shares outstanding. |
| (g) | Commencement of offering of class of shares. |
SEE NOTES TO FINANCIAL STATEMENTS.
| | | | | | | | |
| | | |
| DECEMBER 31, 2016 | | J.P. MORGAN LARGE CAP FUNDS | | | | | 91 | |
NOTES TO FINANCIAL STATEMENTS
AS OF DECEMBER 31, 2016 (Unaudited)
1. Organization
JPMorgan Trust I (“JPM I”) and JPMorgan Trust II (“JPM II”) (collectively, the “Trusts”) were formed on November 12, 2004, as Delaware statutory trusts, pursuant to Declarations of Trust dated November 5, 2004 and are registered under the Investment Company Act of 1940, as amended (the “1940 Act”), as open-end management investment companies.
The following are 9 separate funds of the Trusts (collectively, the “Funds”) covered by this report:
| | | | | | |
| | | Classes Offered | | Trust | | Diversified/Non-Diversified |
| Disciplined Equity Fund | | Class A, Class L^, Class R6 and Select Class | | JPM I | | Diversified |
| Dynamic Growth Fund | | Class A, Class C, Class R5 and Select Class | | JPM I | | Non-Diversified |
| Equity Focus Fund | | Class A, Class C and Select Class | | JPM I | | Non-Diversified |
| Equity Income Fund | | Class A, Class C, Class R2, Class R3*, Class R4*, Class R5, Class R6 and Select Class | | JPM II | | Diversified |
| Growth and Income Fund | | Class A, Class C, Class R2, Class R5, Class R6 and Select Class | | JPM I | | Diversified |
| Hedged Equity Fund | | Class A, Class C, Class R5, Class R6 and Select Class | | JPM I | | Diversified |
| Large Cap Growth Fund | | Class A, Class C, Class R2, Class R3*, Class R4*, Class R5, Class R6 and Select Class | | JPM II | | Diversified |
| Large Cap Value Fund | | Class A, Class C, Class R2, Class R5, Class R6 and Select Class | | JPM II | | Diversified |
| U.S. Equity Fund | | Class A, Class C, Class L^, Class R2, Class R3*, Class R4*, Class R5, Class R6 and Select Class | | JPM I | | Diversified |
| * | Class R3 and Class R4 commenced operations on September 9, 2016 for Equity Income Fund, Large Cap Growth Fund and U.S. Equity Fund. |
| ^ | Effective December 1, 2016, Institutional Class was renamed Class L and is publicly offered on a limited basis. |
The investment objective of Disciplined Equity Fund is to seek to provide a consistently high total return from a broadly diversified portfolio of equity securities with risk characteristics similar to the Standard and Poor’s 500 Composite Stock Price Index.
The investment objective of Dynamic Growth Fund is to seek long-term capital growth.
The investment objective of Equity Focus Fund and Large Cap Growth Fund is to seek long-term capital appreciation.
The investment objective of Equity Income Fund is to seek capital appreciation and current income.
The investment objective of Growth and Income Fund is to seek to provide capital growth over the long-term and to earn income from dividends.
The investment objective of Hedged Equity Fund is to seek to provide capital appreciation.
The investment objective of Large Cap Value Fund is to seek capital appreciation with the incidental goal of achieving current income by investing primarily in equity securities.
The investment objective of U.S. Equity Fund is to seek to provide high total return from a portfolio of selected equity securities.
Class A Shares generally provide for a front-end sales charge while Class C Shares provide for a contingent deferred sales charge (“CDSC”). No sales charges are assessed with respect to Class L, Class R2, Class R3, Class R4, Class R5, Class R6 and Select Class Shares. All classes of shares have equal rights as to earnings, assets and voting privileges, except that each class may bear different transfer agency, sub-transfer agency, distribution and shareholder servicing fees and each class has exclusive voting rights with respect to its distribution plan and shareholder servicing agreements. Certain Class A Shares, for which front-end sales charges have been waived, may be subject to a CDSC as described in the Funds’ prospectus.
J.P. Morgan Investment Management Inc. (“JPMIM”) an indirect, wholly-owned subsidiary of JPMorgan Chase & Co. (“JPMorgan”) acts as Adviser (the “Adviser”) and Administrator (the “Administrator”) to the Funds.
2. Significant Accounting Policies
The following is a summary of significant accounting policies followed by the Funds in the preparation of their financial statements. The Funds are investment companies and, accordingly, follow the investment company accounting and reporting guidance of the Financial Accounting Standards Board Accounting Standards Codification Topic 946 — Investment Companies, which is part of U.S. generally accepted accounting principles (“GAAP”). The preparation of financial statements in conformity with GAAP requires management to make estimates and assumptions that affect the reported amounts of assets and liabilities and disclosure of contingent assets and liabilities at the date of the financial statements and the reported amounts of increases and decreases in net assets from operations during the reporting period. Actual results could differ from those estimates.
A. Valuation of Investments — The valuation of investments is in accordance with GAAP and the Funds’ valuation policies set forth by and under the supervision and responsibility of the Board of Trustees (the “Board”), which established the following approach to valuation, as described more fully below: (i) investments for which market quotations are readily available shall be valued at such unadjusted quoted prices and (ii) all other investments for which market quotations are not readily available shall be valued at their fair value as determined in good faith by the Board.
| | | | | | |
| | | |
| 92 | | | | J.P. MORGAN LARGE CAP FUNDS | | DECEMBER 31, 2016 |
The Administrator has established the J.P. Morgan Asset Management Americas Valuation Committee (“AVC”) to assist the Board with the oversight and monitoring of the valuation of the Funds’ investments. The Administrator implements the valuation policies of the Funds’ investments, as directed by the Board. The AVC oversees and carries out the policies for the valuation of investments held in the Funds. This includes monitoring the appropriateness of fair values based on results of ongoing valuation oversight, including but not limited to consideration of macro or security specific events, market events and pricing vendor and broker due diligence. The Administrator is responsible for discussing and assessing the potential impacts to the fair values on an ongoing basis, and at least on a quarterly basis with the AVC and the Board.
Equities and other exchange-traded instruments are valued at the last sale price or official market closing price on the primary exchange on which the instrument is traded before the net asset values (“NAV”) of the Funds are calculated on a valuation date. Investments in open-end investment companies (the “Underlying Funds”) are valued at each Underlying Fund’s NAV per share as of the report date.
A market-based approach is primarily used to value the Funds’ investments. Investments for which market quotations are not readily available are fair valued by approved affiliated and unaffiliated pricing vendors or third party broker-dealers (collectively referred to as “Pricing Services”) or may be internally fair valued using methods set forth by the valuation policies approved by the Board. This may include related or comparable assets or liabilities, recent transactions, market multiples, book values, and other relevant information for the investment to determine the fair value of the investment. An income-based valuation approach may be used in which the anticipated future cash flows of the investment are discounted to calculate the fair value. Discounts may also be applied due to the nature or duration of any restrictions on the disposition of the investments. Valuations may be based upon current market prices of securities that are comparable in coupon, rating, maturity and industry. It is possible that the estimated values may differ significantly from the values that would have been used, had a ready market for the investments existed, and such differences could be material.
Fixed income instruments are valued based on prices received from Pricing Services. The Pricing Services use multiple valuation techniques to determine the valuation of fixed income instruments. In instances where sufficient market activity exists, the Pricing Services may utilize a market-based approach through which trades or quotes from market makers are used to determine the valuation of these instruments. In instances where sufficient market activity may not exist, the Pricing Services also utilize proprietary valuation models which may consider market transactions in comparable securities and the various relationships between securities in determining fair value and/or market characteristics in order to estimate the relevant cash flows, which are then discounted to calculate the fair values.
Futures and options are generally valued on the basis of available market quotations.
Valuations reflected in this report are as of the report date. As a result, changes in valuation due to market events and/or issuer related events after the report date and prior to issuance of the report are not reflected herein.
The various inputs that are used in determining the valuation of the Funds’ investments are summarized into the three broad levels listed below.
| • | | Level 1 — Unadjusted inputs using quoted prices in active markets for identical investments. |
| • | | Level 2 — Other significant observable inputs including, but not limited to, quoted prices for similar investments, inputs other than quoted prices that are observable for investments (such as interest rates, prepayment speeds, credit risk, etc.) or other market corroborated inputs. |
| • | | Level 3 — Significant inputs based on the best information available in the circumstances, to the extent observable inputs are not available (including the Funds’ assumptions in determining the fair value of investments). |
A financial instrument’s level within the fair value hierarchy is based on the lowest level of any input, both individually and in the aggregate, that is significant to the fair value measurement. The inputs or methodology used for valuing instruments are not necessarily an indication of the risk associated with investing in those instruments.
The following tables represent each valuation input as presented on the Schedules of Portfolio Investments (“SOIs”) (amounts in thousands):
Disciplined Equity Fund
| | | | | | | | | | | | | | | | |
| | | Level 1 Quoted prices | | | Level 2 Other significant
observable inputs | | | Level 3 Significant
unobservable inputs | | | Total | |
Total Investments in Securities (a) | | $ | 7,822,226 | | | $ | 9,410 | | | $ | — | | | $ | 7,831,636 | |
| | | | | | | | | | | | | | | | |
Depreciation in Other Financial Instruments | | | | | | | | | | | | | | | | |
Futures Contracts | | $ | (670 | ) | | $ | — | | | $ | — | | | $ | (670 | ) |
| | | | | | | | | | | | | | | | |
| | | | |
| Dynamic Growth Fund | | | | | | | | | | | | | | | | |
| | | Level 1
Quoted prices | | | Level 2
Other significant
observable inputs | | | Level 3
Significant
unobservable inputs | | | Total | |
Total Investments in Securities (b) | | $ | 337,738 | | | $ | — | | | $ | — | | | $ | 337,738 | |
| | | | | | | | | | | | | | | | |
| | | | | | | | |
| | | |
| DECEMBER 31, 2016 | | J.P. MORGAN LARGE CAP FUNDS | | | | | 93 | |
NOTES TO FINANCIAL STATEMENTS
AS OF DECEMBER 31, 2016 (Unaudited) (continued)
| | | | | | | | | | | | | | | | |
|
| Equity Focus Fund | |
| | | Level 1
Quoted prices | | | Level 2
Other significant
observable inputs | | | Level 3 Significant
unobservable inputs | | | Total | |
Total Investments in Securities (b) | | $ | 148,292 | | | $ | — | | | $ | — | | | $ | 148,292 | |
| | | | | | | | | | | | | | | | |
|
Equity Income Fund | |
| | | Level 1 Quoted prices | | | Level 2 Other significant
observable inputs | | | Level 3 Significant
unobservable inputs | | | Total | |
Total Investments in Securities (b) | | $ | 13,755,460 | | | $ | — | | | $ | — | | | $ | 13,755,460 | |
| | | | | | | | | | | | | | | | |
|
Growth and Income Fund | |
| | | Level 1 Quoted prices | | | Level 2 Other significant
observable inputs | | | Level 3 Significant
unobservable inputs | | | Total | |
Total Investments in Securities (b) | | $ | 527,837 | | | $ | — | | | $ | — | | | $ | 527,837 | |
| | | | | | | | | | | | | | | | |
| | | | |
| Hedged Equity Fund | | | | | | | | | | | | | | | | |
| | | Level 1
Quoted prices | | | Level 2
Other significant
observable inputs | | | Level 3 Significant
unobservable inputs | | | Total | |
Total Investments in Securities (a) | | $ | 330,372 | | | $ | 80 | | | $ | — | | | $ | 330,452 | |
| | | | | | | | | | | | | | | | |
Depreciation in Other Financial Instruments | | | | | | | | | | | | | | | | |
Futures Contracts | | $ | (65 | ) | | $ | — | | | $ | — | | | $ | (65 | ) |
Options Written | | | | | | | | | | | | | | | | |
Call Option Written | | | (3,565 | ) | | | — | | | | — | | | | (3,565 | ) |
Put Option Written | | | (646 | ) | | | — | | | | — | | | | (646 | ) |
| | | | | | | | | | | | | | | | |
Total Depreciation in Other Financial Instruments | | $ | (4,276 | ) | | $ | — | | | $ | — | | | $ | (4,276 | ) |
| | | | | | | | | | | | | | | | |
| | | | |
| Large Cap Growth Fund | | | | | | | | | | | | | | | | |
| | | Level 1
Quoted prices | | | Level 2
Other significant observable inputs | | | Level 3 Significant unobservable inputs | | | Total | |
Total Investments in Securities (b) | | $ | 11,986,696 | | | $ | — | | | $ | — | | | $ | 11,986,696 | |
| | | | | | | | | | | | | | | | |
| | | | |
| Large Cap Value Fund | | | | | | | | | | | | | | | | |
| | | Level 1 Quoted prices | | | Level 2
Other significant observable inputs | | | Level 3 Significant unobservable inputs | | | Total | |
Total Investments in Securities (c) | | $ | 814,947 | | | $ | — | | | $ | — | (d) | | $ | 814,947 | |
| | | | | | | | | | | | | | | | |
| | | | |
| U.S. Equity Fund | | | | | | | | | | | | | | | | |
| | | Level 1 Quoted prices | | | Level 2 Other significant
observable inputs | | | Level 3 Significant
unobservable inputs | | | Total | |
Total Investments in Securities (c) | | $ | 12,396,922 | | | $ | — | | | $ | — | (d) | | $ | 12,396,922 | |
| | | | | | | | | | | | | | | | |
Depreciation in Other Financial Instruments | | | | | | | | | | | | | | | | |
Futures Contracts | | $ | (214 | ) | | $ | — | | | $ | — | | | $ | (214 | ) |
| | | | | | | | | | | | | | | | |
| (a) | All portfolio holdings designated as level 1 and level 2 are disclosed individually on the SOIs. Level 2 consists of U.S. Treasury Bill that is held as initial margin for futures contracts. Please refer to the SOIs for asset class specifics of portfolio holdings. |
| | | | | | |
| | | |
| 94 | | | | J.P. MORGAN LARGE CAP FUNDS | | DECEMBER 31, 2016 |
| (b) | All portfolio holdings designated as level 1 are disclosed individually on the SOIs. Please refer to the SOIs for industry specifics of portfolio holdings. |
| (c) | All portfolio holdings designated as Level 1 and Level 3 are disclosed individually on the SOIs. Level 3 consists of a warrant. Please refer to the SOIs for industry specifics of portfolio holdings. |
| (d) | Amount rounds to less than 500. |
There were no transfers among any levels during the six months ended December 31, 2016.
B. Futures Contracts — Disciplined Equity Fund, Hedged Equity Fund and U.S. Equity Fund used index futures contracts to gain or reduce exposure to the stock market, maintain liquidity or minimize transaction costs. The Funds also bought futures contracts to invest incoming cash in the market or sold futures in response to cash outflows, thereby simulating an invested position in the underlying index while maintaining a cash balance for liquidity.
Futures contracts provide for the delayed delivery of the underlying instrument at a fixed price or are settled for a cash amount based on the change in the value of the underlying instrument at a specific date in the future. Upon entering into a futures contract, the Funds are required to deposit with the broker, cash or securities in an amount equal to a certain percentage of the contract amount, which is referred to as the initial margin deposit. Subsequent payments, referred to as variation margin, are made or received by the Funds periodically and are based on changes in the market value of open futures contracts. Changes in the market value of open futures contracts are recorded as Change in net unrealized appreciation/depreciation on the Statements of Operations. Realized gains or losses, representing the difference between the value of the contract at the time it was opened and the value at the time it was closed, are reported on the Statements of Operations at the closing or expiration of the futures contract. Securities deposited as initial margin are designated on the SOIs and cash deposited is recorded on the Statements of Assets and Liabilities. A receivable from and/or a payable to brokers for the daily variation margin is also recorded on the Statements of Assets and Liabilities.
The use of futures contracts exposes the Funds to equity price risk. The Funds may be subject to the risk that the change in the value of the futures contract may not correlate perfectly with the underlying instrument. Use of long futures contracts subjects the Funds to risk of loss in excess of the amounts shown on the Statements of Assets and Liabilities, up to the notional amount of the futures contracts. Use of short futures contracts subjects the Funds to unlimited risk of loss. The Funds may enter into futures contracts only on exchanges or boards of trade. The exchange or board of trade acts as the counterparty to each futures transaction; therefore, the Funds’ credit risk is limited to failure of the exchange or board of trade. Under some circumstances, futures exchanges may establish daily limits on the amount that the price of a futures contract can vary from the previous day’s settlement price, which could effectively prevent liquidation of positions.
The table below discloses the volume of the Funds’ futures contracts activity during the six months ended December 31, 2016 (amounts in thousands):
| | | | | | | | | | | | |
| | | Disciplined
Equity Fund | | | Hedged
Equity Fund | | | U.S.
Equity Fund | |
Futures Contracts: | | | | | | | | | | | | |
Average Notional Balance Long | | $ | 101,278 | | | $ | 4,844 | | | $ | 66,531 | |
Ending Notional Balance Long | | | 143,340 | | | | 9,057 | | | | 34,661 | |
The Funds’ futures contracts are not subject to master netting arrangements (the right to close out all transactions traded with a counterparty and net amounts owed or due across transactions).
C. Options — Hedged Equity Fund purchased and sold (“wrote”) put and call options on indices to manage and hedge equity risk within its portfolio. A purchaser of a put option has the right, but not the obligation, to sell the underlying instrument at an agreed upon price (“strike price”) to the option seller. A purchaser of a call option has the right, but not the obligation, to purchase the underlying instrument at the strike price from the option seller.
Options Purchased — Premiums paid by the Fund for options purchased are included on the Statements of Assets and Liabilities as an investment. The option is adjusted daily to reflect the current market value of the option and the change is recorded as Change in net unrealized appreciation/depreciation of Investments in non-affiliates on the Statements of Operations. If the option is allowed to expire, the Fund will lose the entire premium it paid and record a loss for the premium amount. Premiums paid for options purchased which are exercised or closed are added to the amounts paid or offset against the proceeds on the underlying investment transaction to determine the realized gain (loss) or cost basis of the underlying investment.
Options Written — Premiums received by the Fund for options written are included on the Statements of Assets and Liabilities as a liability. The amount of the liability is adjusted daily to reflect the current market value of the option written and the change in market value is recorded as change in net unrealized appreciation/depreciation. Premiums received from options written that expire are treated as realized gains. If a written option is closed, the Fund records a realized gain or loss on options written based on whether the cost of the closing transaction exceeds the premium received. If a call option is exercised by the option buyer, the premium received by the Fund is added to the proceeds from the sale of the underlying security to the option buyer and compared to the cost of the closing transaction to determine whether there has been a realized gain or loss. If a put option is exercised by an option buyer, the premium received by the option seller reduces the cost basis of the purchased security.
| | | | | | | | |
| | | |
| DECEMBER 31, 2016 | | J.P. MORGAN LARGE CAP FUNDS | | | | | 95 | |
NOTES TO FINANCIAL STATEMENTS
AS OF DECEMBER 31, 2016 (Unaudited) (continued)
The Fund pledges collateral to the counterparty in the form of securities for options written. Securities designated as collateral are denoted on the SOI.
Written uncovered call options subject the Fund to unlimited risk of loss. Written covered call options limit the upside potential of a security above the strike price. Written put options subject the Fund to risk of loss if the value of the security declines below the exercise price minus the put premium.
The Fund is not subject to credit risk on options written as the counterparty has already performed its obligation by paying the premium at the inception of the contract.
Transactions in options written during the six months ended December 31, 2016 were as follows (amounts in thousands except for number of contracts):
| | | | | | | | |
| | | Options | |
| Hedged Equity Fund | | Number of Contracts | | | Premiums Received | |
Options outstanding at June 30, 2016 | | | 2,282 | | | $ | 3,838 | |
Options written | | | 6,134 | | | | 7,993 | |
Options expired | | | (2,668 | ) | | | (1,358 | ) |
Options closed | | | (2,844 | ) | | | (6,198 | ) |
| | | | | | | | |
Options outstanding at December 31, 2016 | | | 2,904 | | | $ | 4,275 | |
| | | | | | | | |
The Fund’s exchange-traded options contracts are not subject to master netting arrangements (the right to close out all transactions traded with a counterparty and net amounts owed or due across transactions).
The table below discloses the volume of the Fund’s options contracts activity during the six months ended December 31, 2016:
| | | | |
| | | Hedged
Equity Fund | |
Exchange-Traded Options: | | | | |
Average Number of Contracts Purchased | | $ | 1,264 | |
Average Number of Contracts Written | | | 2,527 | |
Ending Number of Contracts Purchased | | | 1,452 | |
Ending Number of Contracts Written | | | 2,904 | |
D. Security Transactions and Investment Income — Investment transactions are accounted for on the trade date (the date the order to buy or sell is executed). Securities gains and losses are calculated on a specifically identified cost basis. Interest income is determined on the basis of coupon interest accrued using the effective interest method which adjusts for amortization of premiums and accretion of discounts. Dividend income net of foreign taxes withheld, if any, is recorded on the ex-dividend date or when a Fund first learns of the dividend.
To the extent such information is publicly available, the Funds record distributions received in excess of income earned from underlying investments as a reduction of cost of investments and/or realized gain. Such amounts are based on estimates if actual amounts are not available and actual amounts of income, realized gain and return of capital may differ from the estimated amounts. The Funds adjust the estimated amounts of the components of distributions (and consequently their net investment income) as necessary once the issuers provide information about the actual composition of the distributions.
E. Allocation of Income and Expenses — Expenses directly attributable to a fund are charged directly to that fund, while the expenses attributable to more than one fund of the Trusts are allocated among the respective funds. In calculating the NAV of each class, investment income, realized and unrealized gains and losses and expenses, other than class specific expenses, are allocated daily to each class of shares based upon the proportion of net assets of each class at the beginning of each day.
| | | | | | |
| | | |
| 96 | | | | J.P. MORGAN LARGE CAP FUNDS | | DECEMBER 31, 2016 |
Transfer agency fees and sub-transfer agency fees are class-specific expenses. The amount of the transfer agency fees and sub-transfer agency fees charged to each class of the Funds for the six months ended December 31, 2016 are as follows (amounts in thousands):
| | | | | | | | | | | | | | | | | | | | | | | | | | | | | | | | | | | | | | | | |
| | | Class A | | | Class C | | | Class L
(formerly
Institutional
Class) | | | Class R2 | | | Class R3 | | | Class R4 | | | Class R5 | | | Class R6 | | | Select Class | | | Total | |
Disciplined Equity Fund | | | | | | | | | | | | | | | | | | | | | | | | | | | | | | | | | | | | | |
Transfer agency fees | | $ | 15 | | | | n/a | | | $ | 7 | | | | n/a | | | | n/a | | | | n/a | | | | n/a | | | $ | 27 | | | $ | 5 | | | $ | 54 | |
Sub-transfer agency fees | | | 390 | | | | n/a | | | | 224 | | | | n/a | | | | n/a | | | | n/a | | | | n/a | | | | — | | | | 155 | | | | 769 | |
Dynamic Growth Fund | | | | | | | | | | | | | | | | | | | | | | | | | | | | | | | | | | | | | | | | |
Transfer agency fees | | | 2 | | | $ | 1 | | | | n/a | | | | n/a | | | | n/a | | | | n/a | | | $ | — | | | | n/a | | | | 3 | | | | 6 | |
Sub-transfer agency fees | | | 49 | | | | 7 | | | | n/a | | | | n/a | | | | n/a | | | | n/a | | | | — | | | | n/a | | | | 14 | | | | 70 | |
Equity Focus Fund | | | | | | | | | | | | | | | | | | | | | | | | | | | | | | | | | | | | | | | | |
Transfer agency fees | | | — | (a) | | | — | (a) | | | n/a | | | | n/a | | | | n/a | | | | n/a | | | | n/a | | | | n/a | | | | 2 | | | | 2 | |
Sub-transfer agency fees | | | 1 | | | | — | (a) | | | n/a | | | | n/a | | | | n/a | | | | n/a | | | | n/a | | | | n/a | | | | 15 | | | | 16 | |
Equity Income Fund | | | | | | | | | | | | | | | | | | | | | | | | | | | | | | | | | | | | | | | | |
Transfer agency fees | | | 91 | | | | 34 | | | | n/a | | | $ | 6 | | | $ | — | (a) | | $ | — | (a) | | | 6 | | | | 12 | | | | 31 | | | | 180 | |
Sub-transfer agency fees | | | 1,617 | | | | 436 | | | | n/a | | | | 61 | | | | — | | | | — | | | | 283 | | | | — | | | | 1,271 | | | | 3,668 | |
Growth and Income Fund | | | | | | | | | | | | | | | | | | | | | | | | | | | | | | | | | | | | | | | | |
Transfer agency fees | | | 109 | | | | 2 | | | | n/a | | | | — | (a) | | | n/a | | | | n/a | | | | — | (a) | | | — | (a) | | | 3 | | | | 114 | |
Sub-transfer agency fees | | | 89 | | | | 8 | | | | n/a | | | | — | | | | n/a | | | | n/a | | | | — | | | | — | | | | 11 | | | | 108 | |
Hedged Equity Fund | | | | | | | | | | | | | | | | | | | | | | | | | | | | | | | | | | | | | | | | |
Transfer agency fees | | | 1 | | | | 1 | | | | n/a | | | | n/a | | | | n/a | | | | n/a | | | | — | (a) | | | — | (a) | | | 5 | | | | 7 | |
Sub-transfer agency fees | | | 73 | | | | 3 | | | | n/a | | | | n/a | | | | n/a | | | | n/a | | | | — | (a) | | | — | | | | 37 | | | | 113 | |
Large Cap Growth Fund | | | | | | | | | | | | | | | | | | | | | | | | | | | | | | | | | | | | | | | | |
Transfer agency fees | | | 245 | | | | 16 | | | | n/a | | | | 7 | | | | — | (a) | | | — | (a) | | | 11 | | | | 23 | | | | 34 | | | | 336 | |
Sub-transfer agency fees | | | 3,347 | | | | 238 | | | | n/a | | | | 145 | | | | — | | | | — | | | | 512 | | | | — | | | | 1,508 | | | | 5,750 | |
Large Cap Value Fund | | | | | | | | | | | | | | | | | | | | | | | | | | | | | | | | | | | | | | | | |
Transfer agency fees | | | 28 | | | | 3 | | | | n/a | | | | 1 | | | | n/a | | | | n/a | | | | — | (a) | | | — | | | | 2 | | | | 34 | |
Sub-transfer agency fees | | | 23 | | | | 6 | | | | n/a | | | | 4 | | | | n/a | | | | n/a | | | | — | (a) | | | — | | | | 6 | | | | 39 | |
U.S. Equity Fund | | | | | | | | | | | | | | | | | | | | | | | | | | | | | | | | | | | | | | | | |
Transfer agency fees | | | 61 | | | | 8 | | | | 67 | | | | 3 | | | | — | (a) | | | — | (a) | | | 6 | | | | 18 | | | | 18 | | | | 181 | |
Sub-transfer agency fees | | | 884 | | | | 105 | | | | 1,453 | | | | 208 | | | | — | | | | — | | | | 327 | | | | — | | | | 434 | | | | 3,411 | |
| (a) | Amount rounds to less than 500. |
F. Federal Income Taxes — Each Fund is treated as a separate taxable entity for Federal income tax purposes. Each Fund’s policy is to comply with the provisions of the Internal Revenue Code of 1986, as amended (the “Code”), applicable to regulated investment companies and to distribute to shareholders all of its distributable net investment income and net realized capital gains on investments. Accordingly, no provision for Federal income tax is necessary. Management has reviewed the Funds’ tax positions for all open tax years and has determined that as of December 31, 2016, no liability for income tax is required in the Funds’ financial statements for net unrecognized tax benefits. However, management’s conclusions may be subject to future review based on changes in, or the interpretation of, the accounting standards or tax laws and regulations. Each of the Funds’ Federal tax returns for the prior three fiscal years, or since inception if shorter, remains subject to examination by the Internal Revenue Service.
G. Foreign Taxes — The Funds may be subject to foreign taxes on income, gains on investments or currency purchases/repatriation, a portion of which may be recoverable. The Funds will accrue such taxes and recoveries as applicable, based upon their current interpretation of tax rules and regulations that exist in the markets in which they invest.
H. Distributions to Shareholders — Distributions from net investment income are generally declared and paid quarterly, except for Dynamic Growth Fund and Equity Focus Fund, for which distributions are generally declared and paid annually, and Equity Income Fund, for which distributions are generally declared and paid monthly. Distributions are declared separately for each class. No class has preferential dividend rights; differences in per share rates are due to differences in separate class expenses. Net realized capital gains, if any, are distributed by each Fund at least annually. The amount of distributions from net investment income and net realized capital gains is determined in accordance with Federal income tax regulations, which may differ from GAAP. To the extent these “book/tax” differences are permanent in nature (i.e., that they result from other than timing of recognition — “temporary differences”), such amounts are reclassified within the capital accounts based on their Federal tax-basis treatment.
| | | | | | | | |
| | | |
| DECEMBER 31, 2016 | | J.P. MORGAN LARGE CAP FUNDS | | | | | 97 | |
NOTES TO FINANCIAL STATEMENTS
AS OF DECEMBER 31, 2016 (Unaudited) (continued)
3. Fees and Other Transactions with Affiliates
A. Investment Advisory Fee — Pursuant to an Investment Advisory Agreement, the Adviser supervises the investments of each Fund and for such services is paid a fee. The fee is accrued daily and paid monthly based on each Fund’s average daily net assets. The annual rate for each Fund is as follows:
| | | | |
Disciplined Equity Fund | | | 0.25 | % |
Dynamic Growth Fund | | | 0.60 | |
Equity Focus Fund | | | 0.60 | * |
Equity Income Fund | | | 0.40 | |
Growth and Income Fund | | | 0.40 | |
Hedged Equity Fund | | | 0.25 | |
Large Cap Growth Fund | | | 0.50 | |
Large Cap Value Fund | | | 0.40 | |
U.S. Equity Fund | | | 0.40 | |
| * | Prior to November 1, 2016, the investment advisory fee was 0.65% for the Equity Focus Fund. |
The Adviser waived Investment Advisory fees and/or reimbursed expenses as outlined in Note 3.F.
B. Administration Fee — Pursuant to an Administration Agreement, the Administrator provides certain administration services to the Funds. In consideration of these services, the Administrator receives a fee accrued daily and paid monthly at an annual rate of 0.15% of the first $25 billion of the average daily net assets of all funds in the J.P. Morgan Funds Complex covered by the Administration Agreements (excluding certain funds of funds and money market funds) and 0.075% of the average daily net assets in excess of $25 billion of all such funds. For the six months ended December 31, 2016, the effective annualized rate was 0.08% of each Fund’s average daily net assets, notwithstanding any fee waivers and/or expense reimbursements.
The Administrator waived Administration fees as outlined in Note 3.F.
JPMorgan Chase Bank, N.A. (“JPMCB”), a wholly-owned subsidiary of JPMorgan, serves as the Funds’ sub-administrator (the “Sub-administrator”). For its services as Sub-administrator, JPMCB receives a portion of the fees payable to the Administrator.
C. Distribution Fees — Pursuant to a Distribution Agreement, JPMorgan Distribution Services, Inc. (the “Distributor”), a wholly-owned subsidiary of JPMorgan, serves as the Trusts’ principal underwriter and promotes and arranges for the sale of each Fund’s shares.
The Board has adopted a Distribution Plan (the “Distribution Plan”) for Class A, Class C, Class R2 and Class R3 Shares of the Funds, as applicable, in accordance with Rule 12b-1 under the 1940 Act. The Class L, Class R4, Class R5, Class R6 and Select Class do not charge a distribution fee. The Distribution Plan provides that each Fund shall pay distribution fees, including payments to the Distributor, at annual rates of the average daily net assets as shown in the table below:
| | | | | | | | | | | | | | | | |
| | | Class A | | | Class C | | | Class R2 | | | Class R3 | |
Disciplined Equity Fund | | | 0.25 | % | | | n/a | | | | n/a | | | | n/a | |
Dynamic Growth Fund | | | 0.25 | | | | 0.75 | % | | | n/a | | | | n/a | |
Equity Focus Fund | | | 0.25 | | | | 0.75 | | | | n/a | | | | n/a | |
Equity Income Fund | | | 0.25 | | | | 0.75 | | | | 0.50 | % | | | 0.25 | % |
Growth and Income Fund | | | 0.25 | | | | 0.75 | | | | 0.50 | | | | n/a | |
Hedged Equity Fund | | | 0.25 | | | | 0.75 | | | | n/a | | | | n/a | |
Large Cap Growth Fund | | | 0.25 | | | | 0.75 | | | | 0.50 | | | | 0.25 | |
Large Cap Value Fund | | | 0.25 | | | | 0.75 | | | | 0.50 | | | | n/a | |
U.S. Equity Fund | | | 0.25 | | | | 0.75 | | | | 0.50 | | | | 0.25 | |
In addition, the Distributor is entitled to receive the front-end sales charges from purchases of Class A Shares and the CDSC from redemptions of Class C Shares and certain Class A Shares for which front-end sales charges have been waived. For the six months ended December 31, 2016, the Distributor retained the following amounts (in thousands):
| | | | | | | | |
| | | Front-End Sales Charge | | | CDSC | |
Disciplined Equity Fund | | $ | 5 | | | $ | — | |
Dynamic Growth Fund | | | 11 | | | | — | (a) |
Equity Focus Fund | | | 1 | | | | — | |
Equity Income Fund | | | 411 | | | | 2 | |
Growth and Income Fund | | | 17 | | | | — | (a) |
Hedged Equity Fund | | | 3 | | | | — | |
Large Cap Growth Fund | | | 74 | | | | 2 | |
Large Cap Value Fund | | | 9 | | | | — | (a) |
U.S. Equity Fund | | | 69 | | | | — | (a) |
| (a) | Amount rounds to less than 500. |
| | | | | | |
| | | |
| 98 | | | | J.P. MORGAN LARGE CAP FUNDS | | DECEMBER 31, 2016 |
D. Shareholder Servicing Fees — The Trusts, on behalf of the Funds, have entered into Shareholder Servicing Agreements with the Distributor under which the Distributor provides certain support services to the shareholders. The Class R6 Shares do not charge a shareholder servicing fee. For performing these services, the Distributor receives a fee that is accrued daily and paid monthly equal to a percentage of the average daily net assets as shown in the table below:
| | | | | | | | | | | | | | | | | | | | | | | | | | | | | | | | |
| | | Class A | | | Class C | | | Class L
(formerly
Institutional
Class) | | | Class R2 | | | Class R3 | | | Class R4 | | | Class R5 | | | Select Class | |
Disciplined Equity Fund | | | 0.25 | % | | | n/a | | | | 0.10 | % | | | n/a | | | | n/a | | | | n/a | | | | n/a | | | | 0.25 | % |
Dynamic Growth Fund | | | 0.25 | | | | 0.25 | % | | | n/a | | | | n/a | | | | n/a | | | | n/a | | | | 0.05 | % | | | 0.25 | |
Equity Focus Fund | | | 0.25 | | | | 0.25 | | | | n/a | | | | n/a | | | | n/a | | | | n/a | | | | n/a | | | | 0.25 | |
Equity Income Fund | | | 0.25 | | | | 0.25 | | | | n/a | | | | 0.25 | % | | | 0.25 | % | | | 0.25 | % | | | 0.05 | | | | 0.25 | |
Growth and Income Fund | | | 0.25 | | | | 0.25 | | | | n/a | | | | 0.25 | | | | n/a | | | | n/a | | | | 0.05 | | | | 0.25 | |
Hedged Equity Fund | | | 0.25 | | | | 0.25 | | | | n/a | | | | n/a | | | | n/a | | | | n/a | | | | 0.05 | | | | 0.25 | |
Large Cap Growth Fund | | | 0.25 | | | | 0.25 | | | | n/a | | | | 0.25 | | | | 0.25 | | | | 0.25 | | | | 0.05 | | | | 0.25 | |
Large Cap Value Fund | | | 0.25 | | | | 0.25 | | | | n/a | | | | 0.25 | | | | n/a | | | | n/a | | | | 0.05 | | | | 0.25 | |
U.S. Equity Fund | | | 0.25 | | | | 0.25 | | | | 0.10 | | | | 0.25 | | | | 0.25 | | | | 0.25 | | | | 0.05 | | | | 0.25 | |
The Distributor has entered into shareholder services contracts with affiliated and unaffiliated financial intermediaries who provide shareholder services and other related services to their clients or customers who invest in the Funds under which the Distributor will pay all or a portion of such fees earned to financial intermediaries for performing such services.
The Distributor waived shareholder servicing fees as outlined in Note 3.F.
E. Custodian and Accounting Fees — JPMCB provides portfolio custody and accounting services to the Funds. For performing these services, the Funds pay JPMCB transaction and asset-based fees that vary according to the number of transactions and positions, plus out-of-pocket expenses. The amounts paid directly to JPMCB by the Funds for custody and accounting services are included in Custodian and accounting fees on the Statements of Operations. Payments to the custodian may be reduced by credits earned by each Fund, based on uninvested cash balances held by the custodian. Such earnings credits, if any, are presented separately on the Statements of Operations.
Interest expense paid to the custodian related to cash overdrafts, if any, is included in Interest expense to affiliates on the Statements of Operations.
F. Waivers and Reimbursements — The Adviser, Administrator and/or Distributor have contractually agreed to waive fees and/or reimburse the Funds to the extent that total annual operating expenses (excluding acquired fund fees and expenses other than certain money market fund fees as described below, dividend and interest expenses related to short sales, interest, taxes, expenses related to litigation and potential litigation and extraordinary expenses) exceed the percentages of the Funds’ respective average daily net assets as shown in the table below:
| | | | | | | | | | | | | | | | | | | | | | | | | | | | | | | | | | | | |
| | | Class A | | | Class C | | | Class L
(formerly
Institutional
Class) | | | Class R2 | | | Class R3 | | | Class R4 | | | Class R5 | | | Class R6 | | | Select Class | |
Disciplined Equity Fund* | | | 0.60 | % | | | n/a | | | | 0.45 | % | | | n/a | | | | n/a | | | | n/a | | | | n/a | | | | 0.25 | % | | | 0.35 | % |
Dynamic Growth Fund** | | | 1.15 | | | | 1.65 | % | | | n/a | | | | n/a | | | | n/a | | | | n/a | | | | 0.70 | % | | | n/a | | | | 0.90 | |
Equity Focus Fund*** | | | 1.15 | | | | 1.65 | | | | n/a | | | | n/a | | | | n/a | | | | n/a | | | | n/a | | | | n/a | | | | 0.90 | |
Equity Income Fund | | | 1.04 | | | | 1.54 | | | | n/a | | | | 1.29 | % | | | 1.04 | % | | | 0.79 | % | | | 0.59 | | | | 0.54 | | | | 0.79 | |
Growth and Income Fund | | | 1.04 | | | | 1.54 | | | | n/a | | | | 1.29 | | | | n/a | | | | n/a | | | | 0.59 | | | | 0.54 | | | | 0.79 | |
Hedged Equity Fund | | | 0.85 | | | | 1.35 | | | | n/a | | | | n/a | | | | n/a | | | | n/a | | | | 0.40 | | | | 0.35 | | | | 0.60 | |
Large Cap Growth Fund | | | 1.05 | | | | 1.55 | | | | n/a | | | | 1.40 | **** | | | 1.15 | | | | 0.90 | | | | 0.70 | | | | 0.65 | | | | 0.90 | |
Large Cap Value Fund | | | 0.93 | | | | 1.45 | | | | n/a | | | | 1.30 | **** | | | n/a | | | | n/a | | | | 0.60 | | | | 0.55 | | | | 0.80 | |
U.S. Equity Fund | | | 0.94 | | | | 1.44 | | | | 0.61 | | | | 1.26 | **** | | | 1.01 | | | | 0.76 | | | | 0.56 | | | | 0.51 | | | | 0.76 | |
| * | Prior to November 1, 2016, the contractual expense limitation for Disciplined Equity Fund was 0.85%, 0.45%, 0.35% and 0.60% for Class A, Class L, Class R6 and Select Class Shares respectively, The contractual expense limitation percentages in the table above are in place until at least October 31, 2018. |
| ** | Prior to November 1, 2016, the contractual expense limitation for Dynamic Growth Fund was 1.19%, 1.69%, 0.74% and 0.94% for Class A, Class C, Class R5 and Select Class Shares respectively, The contractual expense limitation percentages in the table above are in place until at least October 31, 2018. |
| *** | Prior to November 1, 2016, the contractual expense limitation for Equity Focus Fund was 1.25%, 1.75% and 1.00% for Class A, Class C and Select Class Shares respectively, The contractual expense limitation percentages in the table above are in place until at least October 31, 2018. |
| **** | The contractual expense percentages in the table above are in place until at least October 31, 2018. For Class R2 Shares of Large Cap Growth Fund, Large Cap Value Fund and U.S. Equity Fund, the Adviser, Administrator and/or Distributor contractually waived fees and/or reimbursed the Funds to the extent that total annual operating expenses (excluding acquired fund fees and expenses other than certain |
| | | | | | | | |
| | | |
| DECEMBER 31, 2016 | | J.P. MORGAN LARGE CAP FUNDS | | | | | 99 | |
NOTES TO FINANCIAL STATEMENTS
AS OF DECEMBER 31, 2016 (Unaudited) (continued)
| | money market fund fees as described below, dividend and interest expenses related to short sales, interest, taxes, expenses related to litigation and potential litigation and extraordinary expenses) exceeded 1.30%, 1.20% and 1.19% of the Fund’s average daily net assets, respectively during the period July 1, 2016 through October 31, 2016. During the period November 1, 2016 through December 31, 2016, the Adviser, Administrator and/or Distributor voluntarily waived fees and/or reimbursed the Funds to the extent that total annual operating expenses for Class R2 Shares of these Funds exceeded 1.30%, 1.20% and 1.19%, respectively. The Funds’ service providers are under no obligation to continue the voluntary waivers and may discontinue them at any time. |
Except as noted above, the expense limitation agreements were in effect for the six months ended December 31, 2016 and the contractual expense limitation percentages in the table above are in place until at least October 31, 2017.
For the six months ended December 31, 2016, the Funds’ service providers waived fees and/or reimbursed expenses for each of the Funds as follows (amounts in thousands). None of these parties expect the Funds to repay any such waived fees and reimbursed expenses in future years.
| | | | | | | | | | | | | | | | | | | | |
| | | Contractual Waivers | | | | |
| | | Investment
Advisory | | | Administration | | | Shareholder
Servicing | | | Total | | | Contractual Reimbursements | |
Disciplined Equity Fund | | $ | 739 | | | $ | 492 | | | $ | 782 | | | $ | 2,013 | | | $ | 75 | |
Dynamic Growth Fund | | | 68 | | | | 45 | | | | 76 | | | | 189 | | | | — | |
Equity Focus Fund | | | 74 | | | | 34 | | | | 1 | | | | 109 | | | | — | |
Equity Income Fund | | | 14 | | | | — | | | | 1,436 | | | | 1,450 | | | | — | |
Growth and Income Fund | | | 56 | | | | 37 | | | | 106 | | | | 199 | | | | — | (a) |
Hedged Equity Fund | | | 124 | | | | 83 | | | | 68 | | | | 275 | | | | — | (a) |
Large Cap Growth Fund | | | 17 | | | | — | | | | 5,819 | | | | 5,836 | | | | 12 | |
Large Cap Value Fund | | | 1 | | | | — | | | | 116 | | | | 117 | | | | 1 | |
U.S. Equity Fund | | | 15 | | | | — | | | | 3,712 | | | | 3,727 | | | | 57 | |
| (a) | Amount rounds to less than 500. |
| | | | |
| | | Voluntary Waivers | |
| | | Shareholder
Servicing | |
Large Cap Growth Fund | | $ | 29 | |
Large Cap Value Fund | | | 1 | |
U.S. Equity Fund | | | 25 | |
Additionally, the Funds may invest in one or more money market funds advised by the Adviser or its affiliates (affiliated money market funds). The Adviser, Administrator and/or Distributor, as shareholder servicing agent, have contractually agreed to waive fees and/or reimburse expenses in an amount sufficient to offset the respective net fees each collects from the affiliated money market fund on the applicable Funds’ investment in such affiliated money market fund.
The amounts of waivers resulting from investments in these money market funds for the six months ended December 31, 2016 were as follows (amounts in thousands):
| | | | |
Disciplined Equity Fund | | $ | 68 | |
Dynamic Growth Fund | | | 2 | |
Equity Focus Fund | | | 4 | |
Equity Income Fund | | | 247 | |
Growth and Income Fund | | | 6 | |
Hedged Equity Fund | | | 3 | |
Large Cap Growth Fund | | | 128 | |
Large Cap Value Fund | | | 10 | |
U.S. Equity Fund | | | 96 | |
G. Other — Certain officers of the Trusts are affiliated with the Adviser, the Administrator and the Distributor. Such officers, with the exception of the Chief Compliance Officer, receive no compensation from the Funds for serving in their respective roles.
The Board appointed a Chief Compliance Officer to the Funds in accordance with Federal securities regulations. Each Fund, along with other affiliated funds, makes reimbursement payments, on a pro-rata basis, to the Administrator for a portion of the fees associated with the Office of the Chief Compliance Officer. Such fees are included in Trustees’ and Chief Compliance Officer’s fees on the Statements of Operations.
The Trusts adopted a Trustee Deferred Compensation Plan (the “Plan”) which allows the Independent Trustees to defer the receipt of all or a portion of compensation related to performance of their duties as Trustees. The deferred fees are invested in various J.P. Morgan Funds until distribution in accordance with the Plan.
| | | | | | |
| | | |
| 100 | | | | J.P. MORGAN LARGE CAP FUNDS | | DECEMBER 31, 2016 |
During the six months ended December 31, 2016, Disciplined Equity Fund, Hedged Equity Fund, Large Cap Growth Fund and U.S. Equity Fund purchased securities from an underwriting syndicate in which the principal underwriter or members of the syndicate were affiliated with the Adviser.
The Funds may use related party broker-dealers. For the six months ended December 31, 2016, the Funds incurred brokerage commissions with broker dealers affiliated with the Adviser as follows (amounts in thousands):
| | | | |
Disciplined Equity Fund | | | $—(a) | |
Dynamic Growth Fund | | | —(a) | |
Equity Focus Fund | | | —(a) | |
Hedged Equity Fund | | | —(a) | |
Large Cap Growth Fund | | | —(a) | |
Large Cap Value Fund | | | —(a) | |
U.S. Equity Fund | | | 1 | |
| (a) | Amount rounds to less than 500. |
The Securities and Exchange Commission (“SEC”) has granted an exemptive order permitting the Funds to engage in principal transactions with J.P. Morgan Securities, Inc., an affiliated broker, involving taxable money market instruments, subject to certain conditions.
4. Investment Transactions
During the six months ended December 31, 2016, purchases and sales of investments (excluding short-term investments) were as follows (amounts in thousands):
| | | | | | | | |
| | | Purchases (excluding U.S. Government) | | | Sales (excluding U.S. Government) | |
Disciplined Equity Fund | | $ | 1,860,988 | | | $ | 2,944,005 | |
Dynamic Growth Fund | | | 97,476 | | | | 105,196 | |
Equity Focus Fund | | | 33,781 | | | | 48,301 | |
Equity Income Fund | | | 2,213,751 | | | | 1,088,878 | |
Growth and Income Fund | | | 95,215 | | | | 105,426 | |
Hedged Equity Fund | | | 104,648 | | | | 46,568 | |
Large Cap Growth Fund | | | 2,015,151 | | | | 4,391,351 | |
Large Cap Value Fund | | | 537,625 | | | | 579,393 | |
U.S. Equity Fund | | | 4,803,007 | | | | 5,853,323 | |
During the six months ended December 31, 2016, there were no purchases or sales of U.S. Government securities.
5. Federal Income Tax Matters
For Federal income tax purposes, the estimated cost and unrealized appreciation (depreciation) in value of investment securities held at December 31, 2016 were as follows (amounts in thousands):
| | | | | | | | | | | | | | | | |
| | | Aggregate Cost | | | Gross Unrealized Appreciation | | | Gross Unrealized Depreciation | | | Net
Unrealized Appreciation (Depreciation) | |
Disciplined Equity Fund | | $ | 6,608,267 | | | $ | 1,325,016 | | | $ | 101,647 | | | $ | 1,223,369 | |
Dynamic Growth Fund | | | 259,595 | | | | 82,681 | | | | 4,538 | | | | 78,143 | |
Equity Focus Fund | | | 125,049 | | | | 24,717 | | | | 1,474 | | | | 23,243 | |
Equity Income Fund | | | 10,899,524 | | | | 2,946,385 | | | | 90,449 | | | | 2,855,936 | |
Growth and Income Fund | | | 361,898 | | | | 171,142 | | | | 5,203 | | | | 165,939 | |
Hedged Equity Fund | | | 287,612 | | | | 46,125 | | | | 3,285 | | | | 42,840 | |
Large Cap Growth Fund | | | 8,341,873 | | | | 3,754,268 | | | | 109,445 | | | | 3,644,823 | |
Large Cap Value Fund | | | 668,066 | | | | 150,551 | | | | 3,670 | | | | 146,881 | |
U.S. Equity Fund | | | 8,993,336 | | | | 3,463,184 | | | | 59,598 | | | | 3,403,586 | |
Under the Regulated Investment Company Modernization Act of 2010 (the “Act”), net capital losses recognized by the Funds after June 30, 2011 are carried forward indefinitely, and retain their character as short-term and/or long-term losses. Prior to the Act, net capital losses incurred by the Funds were carried forward for eight years and treated as short-term losses. The Act requires that post-enactment net capital losses be used before pre-enactment net capital losses.
| | | | | | | | |
| | | |
| DECEMBER 31, 2016 | | J.P. MORGAN LARGE CAP FUNDS | | | | | 101 | |
NOTES TO FINANCIAL STATEMENTS
AS OF DECEMBER 31, 2016 (Unaudited) (continued)
At June 30, 2016, the following Fund had the following pre-enactment net capital loss carryforwards, expiring during the year indicated, which are available to offset future realized gains (amounts in thousands):
| | | | |
| | | 2017 | |
Large Cap Value Fund | | $ | 1,637 | |
At June 30, 2016, the following Funds had the following post-enactment net capital loss carryforwards (amounts in thousands):
| | | | | | | | |
| | | Capital Loss Carryforward Character | |
| | | Short-Term | | | Long-Term | |
Disciplined Equity Fund | | $ | 130,031 | | | $ | — | |
Hedged Equity Fund | | | 5,312 | | | | 7,993 | |
6. Borrowings
The Funds rely upon an exemptive order granted by the SEC (the “Order”) permitting the establishment and operation of an Interfund Lending Facility (the “Facility”). The Facility allows the Funds to directly lend and borrow money to or from any other fund relying upon the Order at rates beneficial to both the borrowing and lending funds. Advances under the Facility are taken primarily for temporary or emergency purposes, including the meeting of redemption requests that otherwise might require the untimely disposition of securities, and are subject to each Fund’s borrowing restrictions. The Interfund loan rate is determined, as specified in the Order, by averaging the current repurchase agreement rate and the current bank loan rate. The Order was granted to JPM II and may be relied upon by the Funds because the Funds and the series of JPM II are all investment companies in the same “group of investment companies” (as defined in Section 12(d)(1)(G) of the 1940 Act).
The Trusts and JPMCB have entered into a financing arrangement. Under this arrangement, JPMCB provides an unsecured, uncommitted credit facility in the aggregate amount of $100 million to certain of the J.P. Morgan Funds, including the Funds. Advances under the arrangement are taken primarily for temporary or emergency purposes, including the meeting of redemption requests that otherwise might require the untimely disposition of securities, and are subject to each Fund’s borrowing restrictions. Interest on borrowings is payable at a rate determined by JPMCB at the time of borrowing. This agreement has been extended until November 6, 2017.
The Funds had no borrowings outstanding from another fund or from the unsecured, uncommitted credit facility during the six months ended December 31, 2016. Average borrowings from the Facility for the six months ended December 31, 2016, were as follows (amounts in thousands).
| | | | | | | | | | | | | | | | |
| | | Average Borrowings | | | Average
Interest Rate Paid | | | Number of
Days Outstanding | | | Interest Paid | |
Large Cap Growth Fund | | $ | 19,026 | | | | 0.49 | % | | | 2 | | | $ | 1 | |
| (a) | Amount rounds to less than 500. |
Interest expense paid as a result of borrowings from another fund or from the unsecured, uncommitted credit facility is included in Interest expense to affiliates on the Statements of Operations.
In addition, effective August 16, 2016, the Trust along with certain other trusts (“Borrowers”) entered into a joint syndicated senior unsecured revolving credit facility totaling $1.5 billion (“Credit Facility”) with various lenders and The Bank of New York Mellon, as administrative agent for the lenders. This Credit Facility provides a source of funds to the Borrowers for temporary and emergency purposes, including the meeting of redemption requests that otherwise might require the untimely disposition of securities. Under the terms of the Credit Facility, a borrowing fund must have a minimum of $25,000,000 in adjusted net asset value and not exceed certain adjusted net asset coverage ratios prior to and during the time in which any borrowings are outstanding. If a fund does not comply with the aforementioned requirements, the fund must remediate within three business days with respect to the $25,000,000 minimum adjusted net asset value or within one business day with respect to certain asset coverage ratios or the administrative agent at the request of, or with the consent of, the lenders may terminate the Credit Facility and declare any outstanding borrowings to be due and payable immediately.
Interest associated with any borrowing under the Credit Facility is charged to the borrowing fund at a rate of interest equal to 1.00% plus the greater of the federal funds effective rate or one month LIBOR. The annual commitment fee to maintain the Credit Facility is 0.15% and is incurred on the unused portion of the Credit Facility and is allocated to all participating funds pro rata based on their respective net assets. The initial term of the Credit Facility is 364 days, unless extended.
The Funds had no borrowings outstanding from the Credit Facility at December 31, 2016. Average borrowings from the Credit Facility for, or at any time during the six months ended December 31, 2016, were as follows (amounts in thousands):
| | | | | | | | | | | | | | | | |
| | | Average
Borrowings | | | Average
Interest
Rate Paid | | | Number of
Days Outstanding | | | Interest
Paid | |
Equity Focus Fund | | $ | 500 | | | | 1.53 | % | | | 1 | | | $ | — | (a) |
| (a) | Amount rounds to less than 500. |
| | | | | | |
| | | |
| 102 | | | | J.P. MORGAN LARGE CAP FUNDS | | DECEMBER 31, 2016 |
7. Risks, Concentrations and Indemnifications
In the normal course of business, the Funds enter into contracts that contain a variety of representations which provide general indemnifications. Each Fund’s maximum exposure under these arrangements is unknown. The amount of exposure would depend on future claims that may be made against each Fund that have not yet occurred. However, based on experience, the Funds expect the risk of loss to be remote.
As of December 31, 2016, J.P. Morgan Access Funds, Investor Funds and JPMorgan SmartRetirement Funds, which are affiliated funds of funds, owned in the aggregate shares representing more than 10% of the net assets of the following Funds:
| | | | | | | | | | | | |
| | | J.P. Morgan Access Funds | | | J.P. Morgan Investor Funds | | | JPMorgan SmartRetirement Funds | |
Disciplined Equity Fund | | | n/a | | | | n/a | | | | 67.0 | % |
Dynamic Growth Fund | | | n/a | | | | 66.3 | % | | | n/a | |
Equity Focus Fund | | | 26.3 | % | | | n/a | | | | n/a | |
Large Cap Value Fund | | | n/a | | | | 72.2 | | | | n/a | |
U.S. Equity Fund | | | n/a | | | | 10.4 | | | | 18.2 | |
As of December 31, 2016, the Funds had omnibus accounts which represented the following percentage of each Fund’s net assets:
| | | | | | | | | | | | | | | | |
| | | Number of
Affiliated
Omnibus
Accounts | | | % of the
Fund | | | Number of
Non-Affiliated
Omnibus
Accounts | | | % of the
Fund | |
Disciplined Equity Fund | | | 1 | | | | 11.0 | % | | | — | | | | n/a | |
Dynamic Growth Fund | | | 3 | | | | 58.0 | | | | 1 | | | | 13.5 | % |
Equity Focus Fund | | | 4 | | | | 95.1 | | | | — | | | | n/a | |
Growth and Income Fund | | | 1 | | | | 23.5 | | | | — | | | | n/a | |
Hedged Equity Fund | | | — | | | | n/a | | | | 4 | | | | 70.1 | |
Large Cap Value Fund | | | 3 | | | | 67.0 | | | | — | | | | n/a | |
U.S. Equity Fund | | | 1 | | | | 14.1 | | | | — | | | | n/a | |
Significant shareholder transactions by these shareholders may impact the Funds’ performance.
| | | | | | | | |
| | | |
| DECEMBER 31, 2016 | | J.P. MORGAN LARGE CAP FUNDS | | | | | 103 | |
SCHEDULE OF SHAREHOLDER EXPENSES
(Unaudited)
Hypothetical $1,000 Investment
As a shareholder of the Funds, you incur two types of costs: (1) transaction costs, including sales charges (loads) on purchase payments and (2) ongoing costs, including investment advisory fees, administration fees, distribution fees and other Fund expenses. The examples below are intended to help you understand your ongoing costs (in dollars) of investing in the Funds and to compare these ongoing costs with the ongoing costs of investing in other mutual funds. The examples assume that you had a $1,000 investment in each Class at the beginning of the reporting period, July 1, 2016 and continued to hold your shares at the end of the reporting period, December 31, 2016.
Actual Expenses
For each Class of each Fund in the table below, the first line provides information about actual account values and actual expenses. You may use the information in this line, together with the amount you invested, to estimate the expenses that you paid over the period. Simply divide your account value by $1,000 (for example, an $8,600 account value divided by $1,000 = 8.6), then multiply the result by the number in the first line of each Class under the heading entitled “Expenses Paid During the Period” to estimate the expenses you paid on your account during this period.
Hypothetical Example for Comparison Purposes
The second line of each Class in the table below provides information about hypothetical account values and hypothetical expenses based on the Class’ actual expense ratio and an assumed rate of return of 5% per year before expenses, which is not the Class’ actual return. The hypothetical account values and expenses may not be used to estimate the actual ending account balance or expenses you paid for the period. You may use this information to compare the ongoing costs of investing in the Class of the Fund and other funds. To do so, compare this 5% hypothetical example with the 5% hypothetical examples that appear in the shareholder reports of the other funds. Please note that the expenses shown in the table are meant to highlight your ongoing costs only and do not reflect any transaction costs, such as sales charges (loads) or redemption fees. Therefore, the second line for each Class in the table is useful in comparing ongoing costs only, and will not help you determine the relative total costs of owning different funds. In addition, if these transaction costs were included, your costs would have been higher. The examples also assume all dividends and distributions have been reinvested.
| | | | | | | | | | | | | | | | |
| | | Beginning
Account Value
July 1, 2016 | | | Ending Account Value
December 31, 2016 | | | Expenses
Paid During
the Period | | | Annualized
Expense
Ratio | |
Disciplined Equity Fund | | | | | | | | | | | | | | | | |
Class A | | | | | | | | | | | | | | | | |
Actual* | | $ | 1,000.00 | | | $ | 1,087.30 | | | $ | 4.05 | | | | 0.77 | % |
Hypothetical* | | | 1,000.00 | | | | 1,021.32 | | | | 3.92 | | | | 0.77 | |
Class L (formerly Institutional Class) | | | | | | | | | | | | | | | | |
Actual* | | | 1,000.00 | | | | 1,089.10 | | | | 2.26 | | | | 0.43 | |
Hypothetical* | | | 1,000.00 | | | | 1,023.04 | | | | 2.19 | | | | 0.43 | |
Class R6 | | | | | | | | | | | | | | | | |
Actual* | | | 1,000.00 | | | | 1,089.70 | | | | 1.63 | | | | 0.31 | |
Hypothetical* | | | 1,000.00 | | | | 1,023.64 | | | | 1.58 | | | | 0.31 | |
Select Class | | | | | | | | | | | | | | | | |
Actual* | | | 1,000.00 | | | | 1,088.90 | | | | 2.74 | | | | 0.52 | |
Hypothetical* | | | 1,000.00 | | | | 1,022.58 | | | | 2.65 | | | | 0.52 | |
| | | | |
Dynamic Growth Fund | | | | | | | | | | | | | | | | |
Class A | | | | | | | | | | | | | | | | |
Actual* | | | 1,000.00 | | | | 1,076.10 | | | | 6.12 | | | | 1.17 | |
Hypothetical* | | | 1,000.00 | | | | 1,019.31 | | | | 5.96 | | | | 1.17 | |
Class C | | | | | | | | | | | | | | | | |
Actual* | | | 1,000.00 | | | | 1,073.40 | | | | 8.73 | | | | 1.67 | |
Hypothetical* | | | 1,000.00 | | | | 1,016.79 | | | | 8.49 | | | | 1.67 | |
Class R5 | | | | | | | | | | | | | | | | |
Actual* | | | 1,000.00 | | | | 1,078.80 | | | | 3.77 | | | | 0.72 | |
Hypothetical* | | | 1,000.00 | | | | 1,021.58 | | | | 3.67 | | | | 0.72 | |
Select Class | | | | | | | | | | | | | | | | |
Actual* | | | 1,000.00 | | | | 1,077.70 | | | | 4.82 | | | | 0.92 | |
Hypothetical* | | | 1,000.00 | | | | 1,020.57 | | | | 4.69 | | | | 0.92 | |
| | | | | | |
| | | |
| 104 | | | | J.P. MORGAN LARGE CAP FUNDS | | DECEMBER 31, 2016 |
| | | | | | | | | | | | | | | | |
| | | Beginning
Account Value
July 1, 2016 | | | Ending Account Value
December 31, 2016 | | | Expenses
Paid During
the Period | | | Annualized
Expense
Ratio | |
Equity Focus Fund | | | | | | | | | | | | | | | | |
Class A | | | | | | | | | | | | | | | | |
Actual* | | $ | 1,000.00 | | | $ | 1,118.90 | | | $ | 6.46 | | | | 1.21 | % |
Hypothetical* | | | 1,000.00 | | | | 1,019.11 | | | | 6.16 | | | | 1.21 | |
Class C | | | | | | | | | | | | | | | | |
Actual* | | | 1,000.00 | | | | 1,116.10 | | | | 9.07 | | | | 1.70 | |
Hypothetical* | | | 1,000.00 | | | | 1,016.64 | | | | 8.64 | | | | 1.70 | |
Select Class | | | | | | | | | | | | | | | | |
Actual* | | | 1,000.00 | | | | 1,120.40 | | | | 5.13 | | | | 0.96 | |
Hypothetical* | | | 1,000.00 | | | | 1,020.37 | | | | 4.89 | | | | 0.96 | |
| | | | |
Equity Income Fund | | | | | | | | | | | | | | | | |
Class A | | | | | | | | | | | | | | | | |
Actual* | | | 1,000.00 | | | | 1,084.00 | | | | 5.41 | | | | 1.03 | |
Hypothetical* | | | 1,000.00 | | | | 1,020.01 | | | | 5.24 | | | | 1.03 | |
Class C | | | | | | | | | | | | | | | | |
Actual* | | | 1,000.00 | | | | 1,080.90 | | | | 8.02 | | | | 1.53 | |
Hypothetical* | | | 1,000.00 | | | | 1,017.49 | | | | 7.78 | | | | 1.53 | |
Class R2 | | | | | | | | | | | | | | | | |
Actual* | | | 1,000.00 | | | | 1,082.50 | | | | 6.72 | | | | 1.28 | |
Hypothetical* | | | 1,000.00 | | | | 1,018.75 | | | | 6.51 | | | | 1.28 | |
Class R3 | | | | | | | | | | | | | | | | |
Actual** | | | 1,000.00 | | | | 1,076.80 | | | | 3.22 | | | | 1.02 | |
Hypothetical* | | | 1,000.00 | | | | 1,020.06 | | | | 5.19 | | | | 1.02 | |
Class R4 | | | | | | | | | | | | | | | | |
Actual** | | | 1,000.00 | | | | 1,077.60 | | | | 2.43 | | | | 0.77 | |
Hypothetical* | | | 1,000.00 | | | | 1,021.32 | | | | 3.92 | | | | 0.77 | |
Class R5 | | | | | | | | | | | | | | | | |
Actual* | | | 1,000.00 | | | | 1,086.30 | | | | 3.05 | | | | 0.58 | |
Hypothetical* | | | 1,000.00 | | | | 1,022.28 | | | | 2.96 | | | | 0.58 | |
Class R6 | | | | | | | | | | | | | | | | |
Actual* | | | 1,000.00 | | | | 1,086.90 | | | | 2.58 | | | | 0.49 | |
Hypothetical* | | | 1,000.00 | | | | 1,022.74 | | | | 2.50 | | | | 0.49 | |
Select Class | | | | | | | | | | | | | | | | |
Actual* | | | 1,000.00 | | | | 1,084.50 | | | | 4.10 | | | | 0.78 | |
Hypothetical* | | | 1,000.00 | | | | 1,021.27 | | | | 3.97 | | | | 0.78 | |
| | | | |
Growth and Income Fund | | | | | | | | | | | | | | | | |
Class A | | | | | | | | | | | | | | | | |
Actual* | | | 1,000.00 | | | | 1,117.00 | | | | 5.50 | | | | 1.03 | |
Hypothetical* | | | 1,000.00 | | | | 1,020.01 | | | | 5.24 | | | | 1.03 | |
Class C | | | | | | | | | | | | | | | | |
Actual* | | | 1,000.00 | | | | 1,114.20 | | | | 8.15 | | | | 1.53 | |
Hypothetical* | | | 1,000.00 | | | | 1,017.49 | | | | 7.78 | | | | 1.53 | |
Class R2 | | | | | | | | | | | | | | | | |
Actual* | | | 1,000.00 | | | | 1,115.70 | | | | 6.83 | | | | 1.28 | |
Hypothetical* | | | 1,000.00 | | | | 1,018.75 | | | | 6.51 | | | | 1.28 | |
Class R5 | | | | | | | | | | | | | | | | |
Actual* | | | 1,000.00 | | | | 1,119.70 | | | | 3.15 | | | | 0.59 | |
Hypothetical* | | | 1,000.00 | | | | 1,022.23 | | | | 3.01 | | | | 0.59 | |
Class R6 | | | | | | | | | | | | | | | | |
Actual* | | | 1,000.00 | | | | 1,120.00 | | | | 2.78 | | | | 0.52 | |
Hypothetical* | | | 1,000.00 | | | | 1,022.58 | | | | 2.65 | | | | 0.52 | |
Select Class | | | | | | | | | | | | | | | | |
Actual* | | | 1,000.00 | | | | 1,118.30 | | | | 4.22 | | | | 0.79 | |
Hypothetical* | | | 1,000.00 | | | | 1,021.22 | | | | 4.02 | | | | 0.79 | |
| | | | | | | | |
| | | |
| DECEMBER 31, 2016 | | J.P. MORGAN LARGE CAP FUNDS | | | | | 105 | |
SCHEDULE OF SHAREHOLDER EXPENSES
(Unaudited) (continued)
Hypothetical $1,000 Investment
| | | | | | | | | | | | | | | | |
| | | Beginning
Account Value
July 1, 2016 | | | Ending Account Value
December 31, 2016 | | | Expenses
Paid During
the Period | | | Annualized
Expense
Ratio | |
Hedged Equity Fund | | | | | | | | | | | | | | | | |
Class A | | | | | | | | | | | | | | | | |
Actual* | | $ | 1,000.00 | | | $ | 1,072.60 | | | $ | 4.39 | | | | 0.84 | % |
Hypothetical* | | | 1,000.00 | | | | 1,020.97 | | | | 4.28 | | | | 0.84 | |
Class C | | | | | | | | | | | | | | | | |
Actual* | | | 1,000.00 | | | | 1,070.30 | | | | 6.99 | | | | 1.34 | |
Hypothetical* | | | 1,000.00 | | | | 1,018.45 | | | | 6.82 | | | | 1.34 | |
Class R5 | | | | | | | | | | | | | | | | |
Actual* | | | 1,000.00 | | | | 1,075.30 | | | | 2.09 | | | | 0.40 | |
Hypothetical* | | | 1,000.00 | | | | 1,023.19 | | | | 2.04 | | | | 0.40 | |
Class R6 | | | | | | | | | | | | | | | | |
Actual* | | | 1,000.00 | | | | 1,075.60 | | | | 1.83 | | | | 0.35 | |
Hypothetical* | | | 1,000.00 | | | | 1,023.44 | | | | 1.79 | | | | 0.35 | |
Select Class | | | | | | | | | | | | | | | | |
Actual* | | | 1,000.00 | | | | 1,074.50 | | | | 3.14 | | | | 0.60 | |
Hypothetical* | | | 1,000.00 | | | | 1,022.18 | | | | 3.06 | | | | 0.60 | |
| | | | |
Large Cap Growth Fund | | | | | | | | | | | | | | | | |
Class A | | | | | | | | | | | | | | | | |
Actual* | | | 1,000.00 | | | | 1,053.80 | | | | 5.44 | | | | 1.05 | |
Hypothetical* | | | 1,000.00 | | | | 1,019.91 | | | | 5.35 | | | | 1.05 | |
Class C | | | | | | | | | | | | | | | | |
Actual* | | | 1,000.00 | | | | 1,050.90 | | | | 8.01 | | | | 1.55 | |
Hypothetical* | | | 1,000.00 | | | | 1,017.39 | | | | 7.88 | | | | 1.55 | |
Class R2 | | | | | | | | | | | | | | | | |
Actual* | | | 1,000.00 | | | | 1,052.40 | | | | 6.73 | | | | 1.30 | |
Hypothetical* | | | 1,000.00 | | | | 1,018.65 | | | | 6.61 | | | | 1.30 | |
Class R3 | | | | | | | | | | | | | | | | |
Actual** | | | 1,000.00 | | | | 1,026.00 | | | | 3.39 | | | | 1.10 | |
Hypothetical* | | | 1,000.00 | | | | 1,019.66 | | | | 5.60 | | | | 1.10 | |
Class R4 | | | | | | | | | | | | | | | | |
Actual** | | | 1,000.00 | | | | 1,026.60 | | | | 2.62 | | | | 0.85 | |
Hypothetical* | | | 1,000.00 | | | | 1,020.92 | | | | 4.33 | | | | 0.85 | |
Class R5 | | | | | | | | | | | | | | | | |
Actual* | | | 1,000.00 | | | | 1,055.40 | | | | 3.63 | | | | 0.70 | |
Hypothetical* | | | 1,000.00 | | | | 1,021.68 | | | | 3.57 | | | | 0.70 | |
Class R6 | | | | | | | | | | | | | | | | |
Actual* | | | 1,000.00 | | | | 1,055.80 | | | | 3.11 | | | | 0.60 | |
Hypothetical* | | | 1,000.00 | | | | 1,022.18 | | | | 3.06 | | | | 0.60 | |
Select Class | | | | | | | | | | | | | | | | |
Actual* | | | 1,000.00 | | | | 1,054.50 | | | | 4.66 | | | | 0.90 | |
Hypothetical* | | | 1,000.00 | | | | 1,020.67 | | | | 4.58 | | | | 0.90 | |
| | | | |
Large Cap Value Fund | | | | | | | | | | | | | | | | |
Class A | | | | | | | | | | | | | | | | |
Actual* | | | 1,000.00 | | | | 1,211.00 | | | | 5.13 | | | | 0.92 | |
Hypothetical* | | | 1,000.00 | | | | 1,020.57 | | | | 4.69 | | | | 0.92 | |
Class C | | | | | | | | | | | | | | | | |
Actual* | | | 1,000.00 | | | | 1,207.20 | | | | 8.01 | | | | 1.44 | |
Hypothetical* | | | 1,000.00 | | | | 1,017.95 | | | | 7.32 | | | | 1.44 | |
Class R2 | | | | | | | | | | | | | | | | |
Actual* | | | 1,000.00 | | | | 1,209.90 | | | | 6.63 | | | | 1.19 | |
Hypothetical* | | | 1,000.00 | | | | 1,019.21 | | | | 6.06 | | | | 1.19 | |
Class R5 | | | | | | | | | | | | | | | | |
Actual* | | | 1,000.00 | | | | 1,212.60 | | | | 3.23 | | | | 0.58 | |
Hypothetical* | | | 1,000.00 | | | | 1,022.28 | | | | 2.96 | | | | 0.58 | |
| | | | | | |
| | | |
| 106 | | | | J.P. MORGAN LARGE CAP FUNDS | | DECEMBER 31, 2016 |
| | | | | | | | | | | | | | | | |
| | | Beginning
Account Value
July 1, 2016 | | | Ending Account Value
December 31, 2016 | | | Expenses
Paid During
the Period | | | Annualized
Expense
Ratio | |
Large Cap Value Fund (continued) | | | | | | | | | | | | | | | | |
Class R6 | | | | | | | | | | | | | | | | |
Actual* | | $ | 1,000.00 | | | $ | 1,213.40 | | | $ | 2.85 | | | | 0.51 | % |
Hypothetical* | | | 1,000.00 | | | | 1,022.63 | | | | 2.60 | | | | 0.51 | |
Select Class | | | | | | | | | | | | | | | | |
Actual* | | | 1,000.00 | | | | 1,211.70 | | | | 4.40 | | | | 0.79 | |
Hypothetical* | | | 1,000.00 | | | | 1,021.22 | | | | 4.02 | | | | 0.79 | |
| | | | |
U.S. Equity Fund | | | | | | | | | | | | | | | | |
Class A | | | | | | | | | | | | | | | | |
Actual* | | | 1,000.00 | | | | 1,101.00 | | | | 4.98 | | | | 0.94 | |
Hypothetical* | | | 1,000.00 | | | | 1,020.47 | | | | 4.79 | | | | 0.94 | |
Class C | | | | | | | | | | | | | | | | |
Actual* | | | 1,000.00 | | | | 1,098.90 | | | | 7.62 | | | | 1.44 | |
Hypothetical* | | | 1,000.00 | | | | 1,017.95 | | | | 7.32 | | | | 1.44 | |
Class L (formerly Institutional Class) | | | | | | | | | | | | | | | | |
Actual* | | | 1,000.00 | | | | 1,103.20 | | | | 3.23 | | | | 0.61 | |
Hypothetical* | | | 1,000.00 | | | | 1,022.13 | | | | 3.11 | | | | 0.61 | |
Class R2 | | | | | | | | | | | | | | | | |
Actual* | | | 1,000.00 | | | | 1,100.50 | | | | 6.30 | | | | 1.19 | |
Hypothetical* | | | 1,000.00 | | | | 1,019.21 | | | | 6.06 | | | | 1.19 | |
Class R3 | | | | | | | | | | | | | | | | |
Actual** | | | 1,000.00 | | | | 1,073.70 | | | | 3.22 | | | | 1.02 | |
Hypothetical* | | | 1,000.00 | | | | 1,020.06 | | | | 5.19 | | | | 1.02 | |
Class R4 | | | | | | | | | | | | | | | | |
Actual** | | | 1,000.00 | | | | 1,074.30 | | | | 2.43 | | | | 0.77 | |
Hypothetical* | | | 1,000.00 | | | | 1,021.32 | | | | 3.92 | | | | 0.77 | |
Class R5 | | | | | | | | | | | | | | | | |
Actual* | | | 1,000.00 | | | | 1,102.70 | | | | 2.97 | | | | 0.56 | |
Hypothetical* | | | 1,000.00 | | | | 1,022.38 | | | | 2.85 | | | | 0.56 | |
Class R6 | | | | | | | | | | | | | | | | |
Actual* | | | 1,000.00 | | | | 1,103.70 | | | | 2.65 | | | | 0.50 | |
Hypothetical* | | | 1,000.00 | | | | 1,022.68 | | | | 2.55 | | | | 0.50 | |
Select Class | | | | | | | | | | | | | | | | |
Actual* | | | 1,000.00 | | | | 1,102.50 | | | | 4.03 | | | | 0.76 | |
Hypothetical* | | | 1,000.00 | | | | 1,021.37 | | | | 3.87 | | | | 0.76 | |
| * | Expenses are equal to each Class’ respective annualized expense ratio, multiplied by the average account value over the period, multiplied by 184/365 (to reflect the one-half year period). |
| ** | Expenses are equal to each Class’ respective annualized expense ratio, multiplied by the average account value over the period, multiplied by 111/365 (to reflect the actual period). Commencement of operations was September 9, 2016. |
| | | | | | | | |
| | | |
| DECEMBER 31, 2016 | | J.P. MORGAN LARGE CAP FUNDS | | | | | 107 | |
BOARD APPROVAL OF INVESTMENT ADVISORY AGREEMENT
(Unaudited)
The Board of Trustees has established various standing committees composed of Trustees with diverse backgrounds, to which the Board of Trustees has assigned specific subject matter responsibilities to further enhance the effectiveness of the Board’s oversight and decision making. The Board of Trustees and its investment committees (money market and alternative products, equity, and fixed income) meet regularly throughout the year and consider factors that are relevant to their annual consideration of investment advisory agreements at each meeting. They also meet for the specific purpose of considering investment advisory agreement annual renewals. The Board of Trustees held meetings in person in June and August 2016, at which the Trustees considered the continuation of the investment advisory agreements for each of the Funds whose semi-annual report is contained herein (each an “Advisory Agreement” and collectively, the “Advisory Agreements”). At the June meeting, the Board’s investment committees met to review and consider performance, expense and related information for the J.P. Morgan Funds. Each investment committee reported to the full Board, which then considered the investment committee’s preliminary findings. At the August meeting, the Trustees continued their review and consideration. The Trustees, including a majority of the Trustees who are not “interested persons” (as defined in the 1940 Act) of any party to the Advisory Agreements or any of their affiliates, approved the continuation of each Advisory Agreement on August 17, 2016.
As part of their review of the Advisory Agreements, the Trustees considered and reviewed performance and other information about the Funds received from the Adviser. This information includes the Funds’ performance as compared to the performance of their peers and benchmarks and analyses by the Adviser of the Funds’ performance. In addition, the Trustees have engaged an independent management consulting firm (“independent consultant”) to report on the performance of certain J.P. Morgan Funds at each of the Trustees’ regular meetings. The Adviser also periodically provides comparative information regarding the Funds’ expense ratios and those of their peer groups. In addition, in preparation for the June and August meetings, the Trustees requested, received and evaluated extensive materials from the Adviser, including performance and expense information compiled by Broadridge, using data from Lipper Inc., independent providers of investment company data (together, “Broadridge/Lipper”). The Trustees’ independent consultant also provided additional analyses of the performance of the Funds in connection with the Trustees’ review of the Advisory Agreements. Before voting on the proposed Advisory Agreements, the Trustees reviewed the proposed Advisory Agreements with representatives of the Adviser, counsel to the Trusts and independent legal counsel and received a memorandum from independent legal counsel discussing the legal standards for their consideration of the proposed Advisory Agreements. The Trustees also discussed
the proposed Advisory Agreements in executive sessions with independent legal counsel at which no representatives of the Adviser were present. Set forth below is a summary of the material factors evaluated by the Trustees in determining whether to approve each Advisory Agreement.
The Trustees considered information provided with respect to the Funds over the course of the year. Each Trustee attributed different weights to the various factors, and no factor alone was considered determinative. From year to year, the Trustees consider and place emphasis on relevant information in light of changing circumstances in market and economic conditions. The Trustees determined that the compensation to be received by the Adviser from each Fund under the applicable Advisory Agreement was fair and reasonable and that the continuance of each Advisory Agreement was in the best interests of each Fund and its shareholders.
The factors summarized below were considered and discussed by the Trustees in reaching their conclusions:
Nature, Extent and Quality of Services Provided by the Adviser
The Trustees received and considered information regarding the nature, extent and quality of the services provided to each Fund under the Advisory Agreement. The Trustees took into account information furnished throughout the year at Trustee meetings, as well as the materials furnished specifically in connection with this annual review process. The Trustees considered the background and experience of the Adviser’s senior management and the expertise of, and the amount of attention given to each Fund by, investment personnel of the Adviser. In addition, the Trustees reviewed the qualifications, backgrounds and responsibilities of the portfolio management team primarily responsible for the day-to-day management of each Fund and the infrastructure supporting the team. The Trustees also considered information provided by the Adviser and JPMorgan Distribution Services, Inc. (“JPMDS”) about the structure and distribution strategy of each Fund. The Trustees reviewed information relating to the Adviser’s risk governance model and reports showing the Adviser’s compliance structure and ongoing compliance processes. The Trustees also considered quality of the administrative services provided by J.P. Morgan Investment Management Inc. in its role as administrator (“JPMIM”).
The Trustees also considered their knowledge of the nature and quality of the services provided by the Adviser and its affiliates to the Funds gained from their experience as Trustees of the J.P. Morgan Funds. In addition, they considered the overall reputation and capabilities of the Adviser and its affiliates, the commitment of the Adviser to provide high quality service to the Funds, their overall confidence in the Adviser’s integrity and the Adviser’s responsiveness to questions or concerns raised by them, including the Adviser’s willingness to consider and implement organizational and operational changes
| | | | | | |
| | | |
| 108 | | | | J.P. MORGAN LARGE CAP FUNDS | | DECEMBER 31, 2016 |
designed to improve investment results and the services provided to each Fund.
Based upon these considerations and other factors, the Trustees concluded that they were satisfied with the nature, extent and quality of the investment advisory services provided to the Funds by the Adviser.
Costs of Services Provided and Profitability to the Adviser and its Affiliates
The Trustees received and considered information regarding the profitability to the Adviser and its affiliates in providing services to each of the Funds. The Trustees reviewed and discussed this data. The Trustees recognized that this data is not audited and represents the Adviser’s determination of its and its affiliates’ revenues from the contractual services provided to the Funds, less expenses of providing such services. Expenses include direct and indirect costs and are calculated using an allocation methodology developed by the Adviser. The Trustees also recognized that it is difficult to make comparisons of profitability from fund investment advisory contracts because comparative information is not generally publicly available and is affected by numerous factors, including the structure of the particular adviser, the types of funds it manages, its business mix, numerous assumptions regarding allocations and the fact that publicly-traded fund managers’ operating profits and net income are net of distribution and marketing expenses. Based upon their review, the Trustees concluded that the profitability to the Adviser under each of the Advisory Agreements was not unreasonable in light of the services and benefits provided to each Fund.
Fall-Out Benefits
The Trustees reviewed information regarding potential “fallout” or ancillary benefits received by the Adviser and its affiliates as a result of their relationship with the Funds. The Trustees also reviewed the Adviser’s allocation of fund brokerage for the J.P. Morgan Funds complex, including allocations to brokers who provide research to the Adviser.
The Trustees also considered that JPMDS, an affiliate of the Adviser, and JPMIM earn fees from the Funds for providing shareholder and administrative services, respectively. These fees were shown separately in the profitability analysis presented to the Trustees. The Trustees also considered the payments of Rule 12b-1 fees to JPMDS, which also acts as the Funds’ distributor and that these fees are in turn generally paid to financial intermediaries that sell the Funds, including financial intermediaries that are affiliates of the Adviser. The Trustees also considered the fees paid to JPMorgan Chase Bank, N.A. (“JPMCB”) for custody and fund accounting, and other related services.
Economies of Scale
The Trustees considered the extent to which the Funds may benefit from economies of scale. The Trustees considered that there may not be a direct relationship between economies of scale realized by the Funds and those realized by the Adviser as assets increase. The Trustees noted that the proposed investment advisory fee schedule for each Fund does not contain breakpoints, but that the fees remain competitive with peer funds. The Trustees also considered that the Adviser has implemented fee waivers and expense limitations (“Fee Caps”) which allow each Fund’s shareholders to share potential economies of scale from a Fund’s inception. The Trustees also considered that the Adviser has shared economies of scale by adding or enhancing services to the Funds over time, noting the Adviser’s substantial investments in its business in support of the Funds, including investments in trading systems and technology (including cybersecurity improvements), retention of key talent, additions to analyst and portfolio management teams, and regulatory support enhancements. The Trustees also considered whether it would be appropriate to add advisory fee breakpoints, and the Trustees concluded that the current fee structure was reasonable in light of the Fee Caps that the Adviser has in place that serve to limit the overall net expense ratios of each Fund at competitive levels. The Trustees concluded that the Funds’ shareholders received the benefits of potential economies of scale through the Fee Caps and the Adviser’s reinvestment in its operations to serve the Funds and their shareholders.
Independent Written Evaluation of the Funds’ Senior/Chief Compliance Officer
The Trustees noted that, upon their direction, the Senior Officer for the Equity Income Fund, Large Cap Growth Fund, Large Cap Value Fund and U.S. Equity Fund had prepared an independent written evaluation in order to assist the Trustees in determining the reasonableness of the proposed management fees. In determining whether to continue the Advisory Agreements, the Trustees considered the Senior Officer’s report.
The Trustees noted that, upon their direction, the Chief Compliance Officer for the Disciplined Equity Fund, Dynamic Growth Fund, Equity Focus Fund, Growth and Income Fund, and Hedged Equity Fund had prepared an independent written evaluation in order to assist the Trustees in determining the reasonableness of the proposed management fees. The Trustees considered the written evaluation in determining whether to continue the Advisory Agreements.
Fees Relative to Adviser’s Other Clients
The Trustees received and considered information about the nature and extent of investment advisory services and fee rates offered to other clients of the Adviser, including institutional separate accounts and/or funds sub-advised by the Adviser, for
| | | | | | | | |
| | | |
| DECEMBER 31, 2016 | | J.P. MORGAN LARGE CAP FUNDS | | | | | 109 | |
BOARD APPROVAL OF INVESTMENT ADVISORY AGREEMENT
(Unaudited) (continued)
investment management styles substantially similar to that of each Fund. The Trustees considered the complexity of investment management for registered mutual funds relative to the Adviser’s other clients and noted differences in the regulatory, legal and other risks and responsibilities of providing services to the different clients. The Trustees considered that serving as an adviser to a registered mutual fund involves greater responsibilities and risks than acting as a sub-adviser and observed that sub-advisory fees may be lower than those charged by the Adviser to each Fund. The Trustees also noted that the adviser, not the mutual fund, pays the sub-advisory fee and that many responsibilities related to the advisory function are retained by the primary adviser. The Trustees concluded that the fee rates charged to each Fund in comparison to those charged to the Adviser’s other clients were reasonable.
Investment Performance
The Trustees received and considered absolute and/or relative performance for the Funds in a report prepared by Broadridge/Lipper. The Trustees considered the total return performance information, which included the ranking of the Funds within a performance universe made up of funds with the same Broadridge/Lipper investment classification and objective (the “Universe”), as well as a sub-set of funds within the Universe (the “Peer Group”), by total return for applicable one-, three- and five-year periods. The Trustees reviewed a description of Broadridge/Lipper’s methodology for selecting mutual funds in each Fund’s Peer Group and Universe. The Broadridge/Lipper materials provided to the Trustees highlighted information with respect to certain representative classes to assist the Trustees in their review. As part of this review, the Trustees also reviewed each Fund’s performance against its benchmark and considered the performance information provided for the Funds at regular Board meetings by the Adviser and the Trustees’ independent consultant and also considered the special analysis prepared by the Trustees’ independent consultant. The Broadridge/Lipper performance data noted by the Trustees as part of their review and the determinations made by the Trustees with respect to each Fund’s performance for certain representative classes are summarized below:
The Trustees noted that the Disciplined Equity Fund’s performance for Class A shares was in the fifth, first and first quintiles based upon the Peer Group, and in the fourth, second and second quintiles based upon the Universe, for the one-, three-, and five-year periods ended December 31, 2015, respectively. The Trustees noted that the performance for Select Class shares was in the fourth, second and second quintiles for the one-, three-, and five-year periods ended December 31, 2015, respectively, based upon both the Peer Group and Universe. The Trustees discussed the performance and investment strategy of the Fund with the Adviser and reviewed the performance analysis and evaluation prepared by the independent consultant. Based upon these discussions and various other
factors, the Trustees concluded that the Fund’s performance was reasonable.
The Trustees noted that the Dynamic Growth Fund’s performance for Class A shares was in the first, second and third quintiles for the one-, three-, and five-year periods ended December 31, 2015, respectively, based upon both the Peer Group and Universe. The Trustees noted that the performance for Select Class shares was in the first, first, and second quintiles based upon the Peer Group, and in the first, second and third quintiles based upon the Universe, for the one-, three- and five-year periods ended December 31, 2015, respectively. The Trustees discussed the performance and investment strategy of the Fund with the Adviser and reviewed the performance analysis and evaluation prepared by the independent consultant. Based upon these discussions and various other factors, the Trustees concluded that the Fund’s performance was reasonable.
The Trustees noted that the Equity Focus Fund’s performance for Class A shares was in the second quintile for both the one- and three-year periods ended December 31, 2015 based upon both the Peer Group and Universe. The Trustees noted that the performance for Select Class shares was in the third and second quintiles for the one- and three-year periods ended December 31, 2015, respectively, based upon the Peer Group, and in the second quintile for both the one- and three-year periods ended December 31, 2015 based upon the Universe. The Trustees discussed the performance and investment strategy of the Fund with the Adviser and reviewed the performance analysis and evaluation prepared by the independent consultant. Based upon these discussions and various other factors, the Trustees concluded that the Fund’s performance was reasonable.
The Trustees noted that the Equity Income Fund’s performance for Class A shares was in the second, first and first quintiles based upon the Peer Group, and in the third, first and first quintiles based upon the Universe, for the one-, three-, and five-year periods ended December 31, 2015, respectively. The Trustees noted that the performance for Select Class shares was in the third, first and first quintiles based upon the Peer Group, and in the second, first and first quintiles based upon the Universe, for the one-, three- and five-year periods ended December 31, 2015, respectively. The Trustees discussed the performance and investment strategy of the Fund with the Adviser and reviewed the performance analysis and evaluation prepared by the independent consultant. Based upon these discussions and various other factors, the Trustees concluded that the Fund’s performance was reasonable.
The Trustees noted that the Growth and Income Fund’s performance for Class A shares was in the fourth, fourth and first quintiles based upon the Peer Group, and in the fourth, second and second quintiles based upon the Universe, for the one-, three-, and five-year periods ended December 31, 2015,
| | | | | | |
| | | |
| 110 | | | | J.P. MORGAN LARGE CAP FUNDS | | DECEMBER 31, 2016 |
respectively. The Trustees noted that the performance for Select Class shares was in the fourth, second and first quintiles based upon both the Peer Group and Universe, for the one-, three- and five-year periods ended December 31, 2015, respectively. The Trustees discussed the performance and investment strategy of the Fund with the Adviser and reviewed the performance analysis and evaluation prepared by the independent consultant. Based upon these discussions and various other factors, the Trustees concluded that the Fund’s performance was reasonable.
The Trustees noted that the Hedged Equity Fund’s performance for Class A shares was in the second and third quintiles based upon the Peer Group and Universe, respectively, for the one-year period ended December 31, 2015. The Trustees noted that the performance for Select Class shares was in the fifth and third quintiles based upon the Peer Group and Universe, respectively, for the one-year period ended December 31, 2015. The Trustees discussed the performance and investment strategy of the Fund with the Adviser and reviewed the performance analysis and evaluation prepared by the independent consultant. Based upon these discussions and various other factors, the Trustees concluded that the Fund’s performance was reasonable.
The Trustees noted that the Large Cap Growth Fund’s performance for Class A shares was in the first, third and third quintiles based upon the Peer Group, and in the second, third and third quintiles based upon the Universe, for the one-, three-, and five-year periods ended December 31, 2015, respectively. The Trustees noted that the performance for Select Class shares was in the fourth, fifth and fifth quintiles based upon the Peer Group, and in the second, third and second quintiles based upon the Universe, for the one-, three- and five-year periods ended December 31, 2015, respectively. The Trustees discussed the performance and investment strategy of the Fund with the Adviser and reviewed the performance analysis and evaluation prepared by the independent consultant. Based upon these discussions and various other factors, the Trustees concluded that the Fund’s performance was reasonable.
The Trustees noted that the Large Cap Value Fund’s performance for Class A and Select Class shares was in the first, first, and second quintiles based upon both the Peer Group and Universe, for the one-, three- and five-year periods ended December 31, 2015, respectively. The Trustees discussed the performance and investment strategy of the Fund with the Adviser and reviewed the performance analysis and evaluation prepared by the independent consultant. Based upon these discussions and various other factors, the Trustees concluded that the Fund’s performance was reasonable.
The Trustees noted that the U.S. Equity Fund’s performance for Class A shares was in the third, first, and first quintiles based upon the Peer Group, and in the second, first, and second quintiles based upon the Universe, for the one-, three- and five-year
periods ended December 31, 2015, respectively. The Trustees noted that the performance for Select Class shares was in the fourth, first and first quintiles based upon the Peer Group, and in the second, first and first quintiles based upon the Universe, for the one-, three- and five-year periods ended December 31, 2015, respectively. The Trustees discussed the performance and investment strategy of the Fund with the Adviser and reviewed the performance analysis and evaluation prepared by the independent consultant. Based upon these discussions and various other factors, the Trustees concluded that the Fund’s performance was reasonable.
Advisory Fees and Expense Ratios
The Trustees considered the contractual advisory fee rate paid by each Fund to the Adviser and compared that rate to the information prepared by Broadridge/Lipper concerning management fee rates paid by other funds in the same Broadridge/Lipper category as each Fund. The Trustees recognized that Broadridge/Lipper reported each Fund’s management fee rate as the combined contractual advisory fee and administration fee rates. The Trustees also reviewed information about other expenses and the expense ratios for each Fund. The Trustees considered the fee waiver and/or expense reimbursement arrangements currently in place for each Fund and considered the net advisory fee rate after taking into account any waivers and/or reimbursements. The Trustees recognized that it is difficult to make comparisons of advisory fees because there are variations in the services that are included in the fees paid by other funds. The Trustees’ determinations as a result of the review of each Fund’s advisory fees and expense ratios for certain representative classes are summarized below:
The Trustees noted that the Disciplined Equity Fund’s net advisory fee and actual total expenses for both Class A and Select Class shares were in the first quintile based upon both the Peer Groups and Universe. The Trustees also noted that the expense caps for certain share classes were reduced effective November 1, 2016. After considering the factors identified above, in light of this information, the Trustees concluded that the advisory fee was reasonable.
The Trustees noted that the Dynamic Growth Fund’s net advisory fee for Class A shares was in the first and second quintiles based upon the Peer Group and Universe, respectively, and that the actual total expense for Class A shares were in the third and fourth quintiles based upon the Peer Group and Universe, respectively. The Trustees noted that the net advisory fee for Select Class shares was in the third quintile based upon both the Peer Group and Universe, and that the actual total expenses for Select Class shares were in the third and fourth quintiles based upon the Peer Group and Universe, respectively. The Trustees also noted that the expense caps for certain share classes were reduced effective November 1, 2016. After considering the factors identified above, in light of this
| | | | | | | | |
| | | |
| DECEMBER 31, 2016 | | J.P. MORGAN LARGE CAP FUNDS | | | | | 111 | |
BOARD APPROVAL OF INVESTMENT ADVISORY AGREEMENT
(Unaudited) (continued)
information, the Trustees concluded that the advisory fees were reasonable.
The Trustees noted that the Equity Focus Fund’s net advisory fee for Class A shares was in the first and second quintiles based upon the Peer Group and Universe, respectively, and that the actual total expenses for Class A shares were in the first and third quintiles based upon the Peer Group and Universe, respectively. The Trustees noted that the net advisory fee for Select Class shares was in the third and second quintiles based upon the Peer Group and Universe, respectively, and that the actual total expenses for Select Class shares were in the second and third quintiles based upon the Peer Group and Universe, respectively. After considering the factors identified above, including a reduction in the contractual advisory fee from 0.65% to 0.60% and a reduction in the expense caps for certain share classes effective November 1, 2016, in light of this information, the Trustees concluded that the advisory fees were reasonable.
The Trustees noted that the Equity Income Fund’s net advisory fee for Class A shares was in the second quintile based upon both the Peer Group and Universe, and that the actual total expenses for Class A shares were in the fourth and second quintiles based upon the Peer Group and Universe, respectively. The Trustees noted that both the net advisory fee and actual total expenses for Select Class shares were in the first and second quintiles, based upon the Peer Group and Universe, respectively. After considering the factors identified above, in light of this information, the Trustees concluded that the advisory fees were reasonable.
The Trustees noted that the Growth and Income Fund’s net advisory fee for Class A shares was in the second quintile based upon both the Peer Group and Universe, and that the actual total expenses for Class A shares were in the third and second quintiles based upon the Peer Group and Universe, respectively. The Trustees noted that the net advisory fee for Select Class shares was in the first and second quintiles based upon the Peer Group and Universe, respectively, and that the actual total expenses for Select Class shares were in the first and third quintiles based upon the Peer Group and Universe, respectively. After considering the factors identified above, in
light of this information, the Trustees concluded that the advisory fee was reasonable.
The Trustees noted that the Hedged Equity Fund’s net advisory fee and actual total expenses for Class A and Select Class shares were in the first quintile based upon both the Peer Groups and Universe. After considering the factors identified above, in light of this information, the Trustees concluded that the advisory fee was reasonable.
The Trustees noted that the Large Cap Growth Fund’s net advisory fee for both Class A and Select Class shares was in the second quintile based upon both the Peer Group and Universe. The Trustees noted that the actual total expenses for Class A shares were in the third and first quintiles based upon the Peer Group and Universe, respectively, and in the third quintile for Select Class shares based upon both the Peer Group and Universe. After considering the factors identified above, in light of this information, the Trustees concluded that the advisory fee was reasonable.
The Trustees noted that the Large Cap Value Fund’s net advisory fee and actual total expenses for Class A shares were in the first quintile based upon both the Peer Group and Universe. The Trustees noted that both the net advisory fee and actual total expenses were in the first and second quintiles based upon the Peer Group and Universe, respectively. After considering the factors identified above, in light of this information, the Trustees concluded that the advisory fees were reasonable.
The Trustees noted that the U.S. Equity Fund’s net advisory fee for Class A shares was in the second quintile based upon both the Peer Group and Universe, and that the actual total expenses for Class A shares were in the third and first quintiles based upon the Peer Group and Universe, respectively. The Trustees noted that the net advisory fee for Select Class shares was in the first and second quintiles based upon the Peer Group and Universe, respectively, and that the actual total expenses for Select Class shares were in the second quintile based upon both the Peer Group and Universe. After considering the factors identified above, in light of this information, the Trustees concluded that the advisory fees were reasonable.
| | | | | | |
| | | |
| 112 | | | | J.P. MORGAN LARGE CAP FUNDS | | DECEMBER 31, 2016 |
J.P. Morgan Funds are distributed by JPMorgan Distribution Services, Inc., which is an affiliate of JPMorgan Chase & Co. Affiliates of JPMorgan Chase & Co. receive fees for providing various services to the funds.
Contact JPMorgan Distribution Services, Inc. at 1-800-480-4111 for a fund prospectus. You can also visit us at www.jpmorganfunds.com. Investors should carefully consider the investment objectives and risk as well as charges and expenses of the mutual fund before investing. The prospectus contains this and other information about the mutual fund. Read the prospectus carefully before investing.
Investors may obtain information about the Securities Investor Protection Corporation (SIPC), including the SIPC brochure by visiting www.sipc.org or by calling SIPC at 202-371-8300.
Each Fund files a complete schedule of its fund holdings for the first and third quarters of its fiscal year with the SEC on Form N-Q. The Funds’ Forms N-Q are available on the SEC’s website at http://www.sec.gov and may be reviewed and copied at the SEC’s Public Reference Room in Washington, DC. Information on the operation of the SEC’s Public Reference Room may be obtained by calling 1-800-SEC-0330. Shareholders may request the Form N-Q without charge by calling 1-800-480-4111 or by visiting the J.P. Morgan Funds’ website at www.jpmorganfunds.com.
A description of each Fund’s policies and procedures with respect to the disclosure of each Fund’s holdings is available in the prospectus and Statement of Additional Information.
A copy of proxy policies and procedures is available without charge upon request by calling 1-800-480-4111 and on the Funds’ website at www.jpmorganfunds.com. A description of such policies and procedures is on the SEC’s website at www.sec.gov. The Trustees have delegated the authority to vote proxies for securities owned by the Funds to the Adviser. A copy of the Funds’ voting record for the most recent 12-month period ended June 30 is available on the SEC’s website at www.sec.gov or at the Funds’ website at www.jpmorganfunds.com no later than August 31 of each year. The Funds’ proxy voting record will include, among other things, a brief description of the matter voted on for each fund security, and will state how each vote was cast, for example, for or against the proposal.

J.P. Morgan Asset Management is the marketing name for the asset management businesses of JPMorgan Chase & Co. Those businesses include, but are not limited to, J.P. Morgan Investment Management Inc., Security Capital Research & Management Incorporated and J.P. Morgan Alternative Asset Management, Inc.
| | | | |
| | © JPMorgan Chase & Co., 2017. All rights reserved. December 2016. | | SAN-LCE-1216 |
Semi-Annual Report
J.P. Morgan Equity Funds
December 31, 2016 (Unaudited)
JPMorgan Equity Index Fund
JPMorgan Market Expansion Enhanced Index Fund

CONTENTS
Investments in a Fund are not deposits or obligations of, or guaranteed or endorsed by, any bank and are not insured or guaranteed by the FDIC, the Federal Reserve Board or any other government agency. You could lose money if you sell when a Fund’s share price is lower than when you invested.
Past performance is no guarantee of future performance. The general market views expressed in this report are opinions based on market and other conditions through the end of the reporting period and are subject to change without notice. These views are not intended to predict the future performance of a Fund or the securities markets. References to specific securities and their issuers are for illustrative purposes only and are not intended to be, and should not be interpreted as, recommendations to purchase or sell such securities. Such views are not meant as investment advice and may not be relied on as an indication of trading intent on behalf of any Fund.
Prospective investors should refer to the Funds’ prospectus for a discussion of the Funds’ investment objectives, strategies and risks. Call J.P. Morgan Funds Service Center at 1-800-480-4111 for a prospectus containing more complete information about a Fund, including management fees and other expenses. Please read it carefully before investing.
CEO’S LETTER
January 25, 2017 (Unaudited)
Dear Shareholder,
The continued expansion of the U.S. economy through the second half of 2016 helped support U.S. equity prices and spurred the U.S. Federal Reserve (the “Fed”) to raise interest rates in December. During the period, corporate earnings overall showed positive growth and by the end of the year the unemployment rate had reached it lowest levels since 2007.
| | |
 | | “We believe the market performance over the past year has further validated both patience and diversification as fundamental components of a sound investment strategy.” |
Gross domestic product in the U.S. rose by an estimated 3.5% in the third quarter of 2016, surpassing other developed markets. Global oil prices also continued to rise for most of the reporting period and the price of West Texas Intermediate crude reached a 15-month high in November. The Standard & Poor’s 500 Index reached fresh closing highs in July and August and remained buoyant through October.
The November 8th victory of Republican Party presidential candidate Donald Trump surprised many investors and led to brief declines in global equities. However, within 24 hours global share prices had largely recovered. U.S. equity prices
rallied through the end of the year, reaching new highs in December.
Against this backdrop, the Fed raised interest rates by a quarter of a percentage point on December 14th. “Economic growth has picked up since the middle of the year,” said Fed Chairwoman Janet Yellen. “We expect the economy will continue to perform well.”
While the prospect of further interest rate increases put pressure on U.S. bond prices, equities provided investors with positive returns. We believe the market performance over the past year has further validated both patience and diversification as fundamental components of a sound investment strategy.
We look forward to managing your investment needs for years to come. Should you have any questions, please visit www.jpmorganfunds.com or contact the J.P. Morgan Funds Service Center at 1-800-480-4111.
Sincerely yours,

George C.W. Gatch
CEO, Investment Funds Management,
J.P. Morgan Asset Management
| | | | | | | | |
| | | |
| DECEMBER 31, 2016 | | J.P. MORGAN EQUITY FUNDS | | | | | 1 | |
J.P. Morgan Index Funds
MARKET OVERVIEW
SIX MONTHS ENDED DECEMBER 31, 2016 (Unaudited)
U.S. equity investments generally continued to outperform both other developed markets and emerging markets during the second half of 2016. Rebounding in the wake of the U.K.’s vote to exit from the European Union, the Standard & Poor’s 500 (the “S&P 500”) reached new closing highs in July and August. Global oil prices also continued to rise during the reporting period and reached 15-month highs in advance of the November 30th meeting of the Organization of Petroleum Exporting Countries.
Meanwhile, the November 8th victory of Republican Party presidential candidate Donald Trump surprised many investors and led to brief declines in global equities. The U.S. equity market recovered within a day and in the following weeks the S&P 500 surpassed 2,200 points for the first time and reached eight new closing highs by the end of 2016. The Dow Jones Industrial Average surpassed 19,000 points for the first time and reached 17 new closing highs between the election and the end of the year. In particular, energy, pharmaceutical and financial sector stocks generally rose amid investor expectations that a Trump administration’s policies would be beneficial for those industries.
During the reporting period, value stocks generally outperformed growth stocks and small-capitalization and mid-cap stocks outperformed large-cap stocks. By sector, the energy and financials sectors were top performers, while the health care and real estate sectors underperformed other sectors. For the six months ended December 31, 2016, the S&P 500 returned 7.82%.
| | | | | | |
| | | |
| 2 | | | | J.P. MORGAN EQUITY FUNDS | | DECEMBER 31, 2016 |
JPMorgan Equity Index Fund
FUND COMMENTARY
SIX MONTHS ENDED DECEMBER 31, 2016 (Unaudited)
| | | | |
| REPORTING PERIOD RETURN: | | | |
| Fund (Select Class Shares)* | | | 7.70% | |
| S&P 500 Index** | | | 7.82% | |
| |
| Net Assets as of 12/31/2016 (In Thousands) | | $ | 1,685,833 | |
INVESTMENT OBJECTIVE***
The JPMorgan Equity Index Fund (the “Fund”) seeks investment results that correspond to the aggregate price and dividend performance of securities in the Standard & Poor’s 500 Index (S&P 500) (the “Benchmark”).
WHAT WERE THE MAIN DRIVERS OF THE FUND’S PERFORMANCE?
The Fund’s Select Class Shares performed largely in line with the Benchmark for the six months ended December 31, 2016, before considering the effect of Fund fees and expenses. This was consistent with its indexing strategy and investment objective, as the Fund looks to generate returns that are comparable to those of the Benchmark.
Overall, U.S. equity investments continued to outperform both other developed markets and emerging markets during the second half of 2016. The S&P 500 surpassed 2,200 points for the first time and reached eight new closing highs between the U.S. presidential election and the end of 2016. The financials and information technology sectors were the largest contributors to the performance of the Fund and the Benchmark, while the consumer staples and health care sectors were the largest detractors from performance.
HOW WAS THE FUND POSITIONED?
Regardless of the market outlook, the Fund was managed in strict conformity with a full index replication strategy and aimed to hold the same stocks in nearly the same proportions as those found in the Benchmark.
| | | | | | | | |
| TOP TEN EQUITY HOLDINGS OF THE PORTFOLIO**** | |
| | 1. | | | Apple, Inc. | | | 3.2 | % |
| | 2. | | | Microsoft Corp. | | | 2.5 | |
| | 3. | | | Exxon Mobil Corp. | | | 1.9 | |
| | 4. | | | Johnson & Johnson | | | 1.6 | |
| | 5. | | | Berkshire Hathaway, Inc., Class B | | | 1.6 | |
| | 6. | | | JPMorgan Chase & Co. | | | 1.6 | |
| | 7. | | | Amazon.com, Inc. | | | 1.5 | |
| | 8. | | | General Electric Co. | | | 1.4 | |
| | 9. | | | Facebook, Inc., Class A | | | 1.4 | |
| | 10. | | | AT&T, Inc. | | | 1.4 | |
| | | | |
PORTFOLIO COMPOSITION BY SECTOR**** | |
| Information Technology | | | 20.7 | % |
| Financials | | | 14.8 | |
| Health Care | | | 13.6 | |
| Consumer Discretionary | | | 12.0 | |
| Industrials | | | 10.2 | |
| Consumer Staples | | | 9.4 | |
| Energy | | | 7.5 | |
| Utilities | | | 3.2 | |
| Real Estate | | | 2.9 | |
| Materials | | | 2.8 | |
| Telecommunication Services | | | 2.7 | |
| Short-Term Investment | | | 0.2 | |
| * | | The return shown is based on net asset values calculated for shareholder transactions and may differ from the return shown in the financial highlights, which reflects adjustments made to the net asset values in accordance with accounting principles generally accepted in the United States of America. |
| ** | | “S&P 500 Index” is a registered service mark of Standard & Poor’s Corporation, which does not sponsor and is in no way affiliated with the Fund. |
| *** | | The adviser seeks to achieve the Fund’s objective. There can be no guarantee it will be achieved. |
| **** | | Percentages indicated are based on total investments as of December 31, 2016. The Fund’s portfolio composition is subject to change. |
| | | | | | | | |
| | | |
| DECEMBER 31, 2016 | | J.P. MORGAN EQUITY FUNDS | | | | | 3 | |
JPMorgan Equity Index Fund
FUND COMMENTARY
SIX MONTHS ENDED DECEMBER 31, 2016 (Unaudited) (continued)
| | | | | | | | | | | | | | | | | | |
AVERAGE ANNUAL TOTAL RETURNS AS OF DECEMBER 31, 2016 | |
| | | | | |
| | | INCEPTION DATE OF
CLASS | | 6 MONTH* | | | 1 YEAR | | | 5 YEAR | | | 10 YEAR | |
CLASS A SHARES | | February 18, 1992 | | | | | | | | | | | | | | | | |
With Sales Charge** | | | | | 1.92 | % | | | 5.59 | % | | | 12.91 | % | | | 5.92 | % |
Without Sales Charge | | | | | 7.57 | | | | 11.46 | | | | 14.13 | | | | 6.49 | |
CLASS C SHARES | | November 4, 1997 | | | | | | | | | | | | | | | | |
With CDSC*** | | | | | 6.16 | | | | 9.61 | | | | 13.28 | | | | 5.69 | |
Without CDSC | | | | | 7.16 | | | | 10.61 | | | | 13.28 | | | | 5.69 | |
CLASS R6 SHARES | | September 1, 2016 | | | 7.76 | | | | 11.78 | | | | 14.42 | | | | 6.76 | |
SELECT CLASS SHARES | | July 2, 1991 | | | 7.70 | | | | 11.71 | | | | 14.41 | | | | 6.76 | |
| ** | | Sales Charge for Class A Shares is 5.25%. |
| *** | | Assumes a 1% CDSC (contingent deferred sales charge) for the 6 month and one year periods and 0% CDSC thereafter. |
TEN YEAR PERFORMANCE (12/31/06 TO 12/31/16)

The performance quoted is past performance and is not a guarantee of future results. Mutual funds are subject to certain market risks. Investment returns and principal value of an investment will fluctuate so that an investor’s shares, when redeemed, may be worth more or less than their original cost. Current performance may be higher or lower than the performance data shown. For up-to-date month-end performance information please call 1-800-480-4111.
Returns for Class R6 Shares prior to their inception date are based on the performance of Select Class Shares. The actual returns for Class R6 Shares would have been different than those shown because Class R6 Shares have different expenses than Select Class Shares.
The graph illustrates comparative performance for $1,000,000 invested in Select Class Shares of the JPMorgan Equity Index Fund, the S&P 500 Index and the Lipper S&P 500 Funds Index from December 31, 2006 to December 31, 2016. The performance of the Fund assumes reinvestment of all dividends and capital gain distributions, if any, and does not include a sales charge. The performance of the S&P 500 Index does not reflect the deduction of expenses or a sales charge associated with a mutual fund and has been adjusted to reflect reinvestment of all dividends and capital gain distributions of the securities
included in the benchmark, if applicable. The performance of the Lipper S&P 500 Funds Index includes expenses associated with a mutual fund, such as investment management fees. These expenses are not identical to the expenses incurred by the Fund. The S&P 500 Index is an unmanaged index generally representative of the performance of large companies in the U.S. stock market. The Lipper S&P 500 Funds Index is an index based on the total returns of certain mutual funds within the Fund’s designated category as determined by Lipper, Inc. Investors cannot invest directly in an index.
Select Class Shares have a $1,000,000 minimum initial investment.
Fund performance may reflect the waiver of the Fund’s fees and reimbursement of expenses for certain periods since the inception date. Without these waivers and reimbursements, performance would have been lower. Also, performance shown in this section does not reflect the deduction of taxes that a shareholder would pay on Fund distributions or redemptions of Fund shares.
The returns shown are based on net asset values calculated for shareholder transactions and may differ from the returns shown in the financial highlights, which reflect adjustments made to the net asset values in accordance with accounting principles generally accepted in the United States of America.
| | | | | | |
| | | |
| 4 | | | | J.P. MORGAN EQUITY FUNDS | | DECEMBER 31, 2016 |
JPMorgan Market Expansion Enhanced Index Fund
FUND COMMENTARY
SIX MONTHS ENDED DECEMBER 31, 2016 (Unaudited)
| | | | |
| REPORTING PERIOD RETURN: | | | |
| Fund (Select Class Shares)* | | | 14.90% | |
| S&P 1000 Index** | | | 14.02% | |
| |
| Net Assets as of 12/31/2016 (In Thousands) | | $ | 991,926 | |
INVESTMENT OBJECTIVE***
The JPMorgan Market Expansion Enhanced Index Fund (the “Fund”) seeks to provide investment results that correspond to or incrementally exceed the total return performance of an index that tracks the performance of the small- and mid-capitalization equity markets.
WHAT WERE THE MAIN DRIVERS OF THE FUND’S PERFORMANCE?
The Fund’s Select Class Shares outperformed the Standard & Poor’s 1000 Index (the “Benchmark”) for the six months ended December 31, 2016. The Fund’s security selection in the software & services sector and the consumer cyclical sector was a leading contributor to relative performance during the reporting period. The Fund’s security selection in the insurance sector and the health services & systems sector was a leading detractor from relative performance.
Leading individual contributors to relative performance included the Fund’s overweight positions in Dana Inc., Momenta Pharmaceuticals Inc. and ArcBest Corp. Shares of Dana Holding, an automotive parts supplier, rose amid continued strength in U.S. auto sales. Shares of Momenta Pharmaceuticals, a maker of generic drugs, rose on positive results from clinical trials of its bio-similar drug for psoriasis. Shares of ArcBest, a freight transportation company, rose after reporting better-than-expected revenue.
Leading individual detractors from relative performance included the Fund’s position in Geo Group Inc., its overweight position in Essendant Inc. and its underweight position in U.S. Steel Corp. Shares of Geo Group, an operator of private prisons, fell after the U.S. Federal Bureau of Prisons unveiled plans to
phase out the use of private prisons. Shares of Essendant, an office supply wholesaler, fell after U.S. regulators halted the company’s planned acquisition of Staples Inc.’s wholesale business. Shares of U.S. Steel, a steelmaker, rose amid investor expectations that the administration of President-elect Donald Trump would enact policies benefitting the domestic steel industry.
HOW WAS THE FUND POSITIONED?
The Fund seeks to track the sector and industry weights within the Benchmark. Because the Fund uses an enhanced index strategy, not all of the stocks in the Benchmark are held by the Fund, and the Fund’s position in an individual stock may be overweight or underweight as compared to the Benchmark. Looking at valuation and momentum, the Fund’s portfolio managers overweighted what they believed were attractively priced stocks with improving momentum and underweighted what they believed were expensive stocks with deteriorating momentum, based on their bottom-up approach to stock selection.
| | | | | | | | |
| TOP TEN EQUITY HOLDINGS OF THE PORTFOLIO**** | |
| | 1. | | | Computer Sciences Corp. | | | 0.8 | % |
| | 2. | | | Synopsys, Inc. | | | 0.7 | |
| | 3. | | | Ingredion, Inc. | | | 0.7 | |
| | 4. | | | UGI Corp. | | | 0.7 | |
| | 5. | | | Arrow Electronics, Inc. | | | 0.7 | |
| | 6. | | | Huntington Ingalls Industries, Inc. | | | 0.7 | |
| | 7. | | | Raymond James Financial, Inc. | | | 0.6 | |
| | 8. | | | East West Bancorp, Inc. | | | 0.6 | |
| | 9. | | | Reinsurance Group of America, Inc. | | | 0.6 | |
| | 10. | | | Atmos Energy Corp. | | | 0.6 | |
| | | | | | | | |
| | | |
| DECEMBER 31, 2016 | | J.P. MORGAN EQUITY FUNDS | | | | | 5 | |
JPMorgan Market Expansion Enhanced Index Fund
FUND COMMENTARY
SIX MONTHS ENDED DECEMBER 31, 2016 (Unaudited) (continued)
| | | | |
PORTFOLIO COMPOSITION BY SECTOR**** | |
| Information Technology | | | 17.8 | % |
| Financials | | | 16.0 | |
| Industrials | | | 15.3 | |
| Consumer Discretionary | | | 10.8 | |
| Health Care | | | 9.3 | |
| Real Estate | | | 9.0 | |
| Materials | | | 7.0 | |
| Utilities | | | 4.4 | |
| Energy | | | 3.5 | |
| Consumer Staples | | | 3.4 | |
| Telecommunication Services | | | 0.6 | |
| Short-Term Investment | | | 2.9 | |
| * | | The return shown is based on net asset values calculated for shareholder transactions and may differ from the return shown in the financial highlights, which reflects adjustments made to the net asset values in accordance with accounting principles generally accepted in the United States of America. |
| ** | | “S&P 1000 Index” is a registered service mark of Standard & Poor’s Corporation, which does not sponsor and is in no way affiliated with the Fund. |
| *** | | The adviser seeks to achieve the Fund’s objective. There can be no guarantee it will be achieved. |
| **** | | Percentages indicated are based on total investments as of December 31, 2016. The Fund’s portfolio composition is subject to change. |
| | | | | | |
| | | |
| 6 | | | | J.P. MORGAN EQUITY FUNDS | | DECEMBER 31, 2016 |
| | | | | | | | | | | | | | | | | | |
AVERAGE ANNUAL TOTAL RETURNS AS OF DECEMBER 31, 2016 | |
| | | | | |
| | | INCEPTION DATE OF
CLASS | | 6 MONTH* | | | 1 YEAR | | | 5 YEAR | | | 10 YEAR | |
CLASS A SHARES | | July 31, 1998 | | | | | | | | | | | | | | | | |
With Sales Charge** | | | | | 8.79 | % | | | 15.00 | % | | | 14.58 | % | | | 7.93 | % |
Without Sales Charge | | | | | 14.82 | | | | 21.37 | | | | 15.82 | | | | 8.52 | |
CLASS C SHARES | | March 22, 1999 | | | | | | | | | | | | | | | | |
With CDSC*** | | | | | 13.37 | | | | 19.58 | | | | 15.01 | | | | 7.75 | |
Without CDSC | | | | | 14.37 | | | | 20.58 | | | | 15.01 | | | | 7.75 | |
CLASS R2 SHARES | | November 3, 2008 | | | 14.69 | | | | 21.19 | | | | 15.52 | | | | 8.19 | |
SELECT CLASS SHARES | | July 31, 1998 | | | 14.90 | | | | 21.76 | | | | 16.11 | | | | 8.79 | |
| ** | | Sales Charge for Class A Shares is 5.25%. |
| *** | | Assumes a 1% CDSC (contingent deferred sales charge) for the 6 month and one year periods and 0% CDSC thereafter. |
TEN YEAR PERFORMANCE (12/31/06 TO 12/31/16)
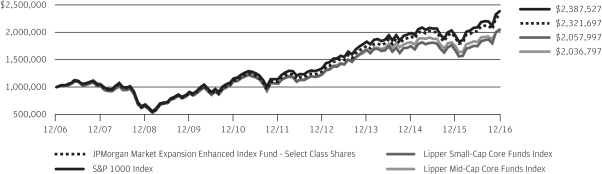
The performance quoted is past performance and is not a guarantee of future results. Mutual funds are subject to certain market risks. Investment returns and principal value of an investment will fluctuate so that an investor’s shares, when redeemed, may be worth more or less than their original cost. Current performance may be higher or lower than the performance data shown. For up-to-date month-end performance information please call 1-800-480-4111.
Returns for Class R2 Shares prior to their inception date are based on the performance of Select Class Shares. All prior class performance for Class R2 Shares has been adjusted to reflect the differences in expenses between classes.
The graph illustrates comparative performance for $1,000,000 invested in Select Class Shares of the JPMorgan Market Expansion Enhanced Index Fund, the S&P 1000 Index, the Lipper Small-Cap Core Funds Index and the Lipper Mid-Cap Core Funds Index from December 31, 2006 to December 31, 2016. The performance of the Fund assumes reinvestment of all dividends and capital gain distributions, if any, and does not include a sales charge. The performance of the S&P 1000 Index does not reflect the deduction of expenses or a sales charge associated with a mutual fund and has been adjusted to reflect reinvestment of all dividends and capital gain distributions of the securities included in the benchmark, if applicable. The performance of the Lipper
Small-Cap Core Funds Index and the Lipper Mid-Cap Core Funds Index includes expenses associated with a mutual fund, such as investment management fees. These expenses are not identical to the expenses incurred by the Fund. The S&P 1000 Index is an unmanaged index generally representative of the performance of the small and mid-size companies in the U.S. stock market. The Lipper Small-Cap Core Funds Index and the Lipper Mid-Cap Core Funds Index are indices based on total returns of certain mutual funds within the small cap and mid cap categories as determined by Lipper, Inc. Investors cannot invest directly in an index.
Select Class Shares have a $1,000,000 minimum initial investment.
Fund performance may reflect the waiver of the Fund’s fees and reimbursement of expenses for certain periods since the inception date. Without these waivers and reimbursements, performance would have been lower. Also, performance shown in this section does not reflect the deduction of taxes that a shareholder would pay on Fund distributions or redemptions of Fund shares.
The returns shown are based on net asset values calculated for shareholder transactions and may differ from the returns shown in the financial highlights, which reflect adjustments made to the net asset values in accordance with accounting principles generally accepted in the United States of America.
| | | | | | | | |
| | | |
| DECEMBER 31, 2016 | | J.P. MORGAN EQUITY FUNDS | | | | | 7 | |
JPMorgan Equity Index Fund
SCHEDULE OF PORTFOLIO INVESTMENTS
AS OF DECEMBER 31, 2016 (Unaudited)
(Amounts in thousands)
| | | | | | | | |
| SHARES | | | SECURITY DESCRIPTION | | VALUE($) | |
| Common Stocks — 99.8% | | | | |
| | | | Consumer Discretionary — 12.0% | | | | |
| | | | Auto Components — 0.2% | | | | |
| | 17 | | | BorgWarner, Inc. | | | 689 | |
| | 24 | | | Delphi Automotive plc | | | 1,593 | |
| | 23 | | | Goodyear Tire & Rubber Co. (The) | | | 704 | |
| | | | | | | | |
| | | | | | | 2,986 | |
| | | | | | | | |
| | | | Automobiles — 0.5% | | | | |
| | 341 | | | Ford Motor Co. | | | 4,134 | |
| | 121 | | | General Motors Co. | | | 4,220 | |
| | 15 | | | Harley-Davidson, Inc. | | | 901 | |
| | | | | | | | |
| | | | | | | 9,255 | |
| | | | | | | | |
| | | | Distributors — 0.1% | | | | |
| | 13 | | | Genuine Parts Co. | | | 1,241 | |
| | 27 | | | LKQ Corp. (a) | | | 823 | |
| | | | | | | | |
| | | | | | | 2,064 | |
| | | | | | | | |
| | | | Diversified Consumer Services — 0.0% (g) | | | | |
| | 18 | | | H&R Block, Inc. | | | 416 | |
| | | | | | | | |
| | | | Hotels, Restaurants & Leisure — 1.6% | | | | |
| | 37 | | | Carnival Corp. | | | 1,906 | |
| | 3 | | | Chipotle Mexican Grill, Inc. (a) | | | 954 | |
| | 11 | | | Darden Restaurants, Inc. | | | 781 | |
| | 28 | | | Marriott International, Inc., Class A | | | 2,312 | |
| | 73 | | | McDonald’s Corp. | | | 8,827 | |
| | 15 | | | Royal Caribbean Cruises Ltd. | | | 1,199 | |
| | 127 | | | Starbucks Corp. | | | 7,056 | |
| | 9 | | | Wyndham Worldwide Corp. | | | 719 | |
| | 7 | | | Wynn Resorts Ltd. | | | 599 | |
| | 30 | | | Yum! Brands, Inc. | | | 1,928 | |
| | | | | | | | |
| | | | | | | 26,281 | |
| | | | | | | | |
| | | | Household Durables — 0.5% | | | | |
| | 30 | | | DR Horton, Inc. | | | 810 | |
| | 10 | | | Garmin Ltd. | | | 487 | |
| | 6 | | | Harman International Industries, Inc. | | | 677 | |
| | 12 | | | Leggett & Platt, Inc. | | | 570 | |
| | 17 | | | Lennar Corp., Class A | | | 736 | |
| | 6 | | | Mohawk Industries, Inc. (a) | | | 1,099 | |
| | 42 | | | Newell Brands, Inc. | | | 1,881 | |
| | 26 | | | PulteGroup, Inc. | | | 478 | |
| | 7 | | | Whirlpool Corp. | | | 1,192 | |
| | | | | | | | |
| | | | | | | 7,930 | |
| | | | | | | | |
| | | | Internet & Direct Marketing Retail — 2.3% | | | | |
| | 34 | | | Amazon.com, Inc. (a) | | | 25,823 | |
| | 11 | | | Expedia, Inc. | | | 1,195 | |
| | 37 | | | Netflix, Inc. (a) | | | 4,639 | |
| | | | | | | | |
| SHARES | | | SECURITY DESCRIPTION | | VALUE($) | |
| | | | | | | | |
| | | | Internet & Direct Marketing Retail — continued | |
| | 4 | | | Priceline Group, Inc. (The) (a) | | | 6,319 | |
| | 10 | | | TripAdvisor, Inc. (a) | | | 463 | |
| | | | | | | | |
| | | | | | | 38,439 | |
| | | | | | | | |
| | | | Leisure Products — 0.1% | | | | |
| | 10 | | | Hasbro, Inc. | | | 763 | |
| | 30 | | | Mattel, Inc. | | | 823 | |
| | | | | | | | |
| | | | | | | 1,586 | |
| | | | | | | | |
| | | | Media — 3.1% | | | | |
| | 34 | | | CBS Corp. (Non-Voting), Class B | | | 2,177 | |
| | 19 | | | Charter Communications, Inc., Class A (a) | | | 5,444 | |
| | 208 | | | Comcast Corp., Class A | | | 14,371 | |
| | 13 | | | Discovery Communications, Inc., Class A (a) | | | 364 | |
| | 19 | | | Discovery Communications, Inc., Class C (a) | | | 516 | |
| | 35 | | | Interpublic Group of Cos., Inc. (The) | | | 812 | |
| | 33 | | | News Corp., Class A | | | 382 | |
| | 10 | | | News Corp., Class B | | | 123 | |
| | 21 | | | Omnicom Group, Inc. | | | 1,753 | |
| | 8 | | | Scripps Networks Interactive, Inc., Class A | | | 594 | |
| | 19 | | | TEGNA, Inc. | | | 400 | |
| | 67 | | | Time Warner, Inc. | | | 6,500 | |
| | 92 | | | Twenty-First Century Fox, Inc., Class A | | | 2,592 | |
| | 43 | | | Twenty-First Century Fox, Inc., Class B | | | 1,159 | |
| | 30 | | | Viacom, Inc., Class B | | | 1,065 | |
| | 128 | | | Walt Disney Co. (The) | | | 13,324 | |
| | | | | | | | |
| | | | | | | 51,576 | |
| | | | | | | | |
| | | | Multiline Retail — 0.5% | | | | |
| | 22 | | | Dollar General Corp. | | | 1,644 | |
| | 21 | | | Dollar Tree, Inc. (a) | | | 1,591 | |
| | 15 | | | Kohl’s Corp. | | | 761 | |
| | 27 | | | Macy’s, Inc. | | | 956 | |
| | 10 | | | Nordstrom, Inc. | | | 486 | |
| | 49 | | | Target Corp. | | | 3,542 | |
| | | | | | | | |
| | | | | | | 8,980 | |
| | | | | | | | |
| | | | Specialty Retail — 2.4% | | | | |
| | 6 | | | Advance Auto Parts, Inc. | | | 1,088 | |
| | 6 | | | AutoNation, Inc. (a) | | | 279 | |
| | 3 | | | AutoZone, Inc. (a) | | | 1,989 | |
| | 13 | | | Bed Bath & Beyond, Inc. | | | 540 | |
| | 24 | | | Best Buy Co., Inc. | | | 1,017 | |
| | 17 | | | CarMax, Inc. (a) | | | 1,070 | |
| | 12 | | | Foot Locker, Inc. | | | 838 | |
| | 19 | | | Gap, Inc. (The) | | | 430 | |
| | 106 | | | Home Depot, Inc. (The) | | | 14,262 | |
| | 21 | | | L Brands, Inc. | | | 1,381 | |
SEE NOTES TO FINANCIAL STATEMENTS.
| | | | | | |
| | | |
| 8 | | | | J.P. MORGAN EQUITY FUNDS | | DECEMBER 31, 2016 |
| | | | | | | | |
| SHARES | | | SECURITY DESCRIPTION | | VALUE($) | |
| Common Stocks — continued | | | | |
| | | | Specialty Retail — continued | | | | |
| | 76 | | | Lowe’s Cos., Inc. | | | 5,402 | |
| | 8 | | | O’Reilly Automotive, Inc. (a) | | | 2,297 | |
| | 35 | | | Ross Stores, Inc. | | | 2,272 | |
| | 6 | | | Signet Jewelers Ltd. | | | 573 | |
| | 57 | | | Staples, Inc. | | | 514 | |
| | 9 | | | Tiffany & Co. | | | 723 | |
| | 57 | | | TJX Cos., Inc. (The) | | | 4,276 | |
| | 11 | | | Tractor Supply Co. | | | 869 | |
| | 5 | | | Ulta Salon Cosmetics & Fragrance, Inc. (a) | | | 1,305 | |
| | 8 | | | Urban Outfitters, Inc. (a) | | | 220 | |
| | | | | | | | |
| | | | | | | 41,345 | |
| | | | | | | | |
| | | | Textiles, Apparel & Luxury Goods — 0.7% | | | | |
| | 24 | | | Coach, Inc. | | | 857 | |
| | 33 | | | Hanesbrands, Inc. | | | 712 | |
| | 14 | | | Michael Kors Holdings Ltd. (a) | | | 616 | |
| | 117 | | | NIKE, Inc., Class B | | | 5,931 | |
| | 7 | | | PVH Corp. | | | 625 | |
| | 5 | | | Ralph Lauren Corp. | | | 444 | |
| | 16 | | | Under Armour, Inc., Class A (a) | | | 466 | |
| | 16 | | | Under Armour, Inc., Class C (a) | | | 406 | |
| | 29 | | | VF Corp. | | | 1,542 | |
| | | | | | | | |
| | | | | | | 11,599 | |
| | | | | | | | |
| | | | Total Consumer Discretionary | | | 202,457 | |
| | | | | | | | |
| | | | Consumer Staples — 9.4% | | | | |
| | | | Beverages — 2.1% | | | | |
| | 16 | | | Brown-Forman Corp., Class B | | | 715 | |
| | 339 | | | Coca-Cola Co. (The) | | | 14,053 | |
| | 16 | | | Constellation Brands, Inc., Class A | | | 2,379 | |
| | 16 | | | Dr Pepper Snapple Group, Inc. | | | 1,455 | |
| | 16 | | | Molson Coors Brewing Co., Class B | | | 1,566 | |
| | 35 | | | Monster Beverage Corp. (a) | | | 1,570 | |
| | 125 | | | PepsiCo, Inc. | | | 13,103 | |
| | | | | | | | |
| | | | | | | 34,841 | |
| | | | | | | | |
| | | | Food & Staples Retailing — 2.1% | | | | |
| | 38 | | | Costco Wholesale Corp. | | | 6,111 | |
| | 93 | | | CVS Health Corp. | | | 7,348 | |
| | 82 | | | Kroger Co. (The) | | | 2,845 | |
| | 44 | | | Sysco Corp. | | | 2,433 | |
| | 75 | | | Walgreens Boots Alliance, Inc. | | | 6,185 | |
| | 131 | | | Wal-Mart Stores, Inc. | | | 9,089 | |
| | 28 | | | Whole Foods Market, Inc. | | | 855 | |
| | | | | | | | |
| | | | | | | 34,866 | |
| | | | | | | | |
| | | | | | | | |
| SHARES | | | SECURITY DESCRIPTION | | VALUE($) | |
| | | | | |
| | | | Food Products — 1.6% | | | | |
| | 50 | | | Archer-Daniels-Midland Co. | | | 2,294 | |
| | 17 | | | Campbell Soup Co. | | | 1,023 | |
| | 36 | | | Conagra Brands, Inc. | | | 1,436 | |
| | 52 | | | General Mills, Inc. | | | 3,190 | |
| | 12 | | | Hershey Co. (The) | | | 1,260 | |
| | 24 | | | Hormel Foods Corp. | | | 820 | |
| | 10 | | | JM Smucker Co. (The) | | | 1,302 | |
| | 22 | | | Kellogg Co. | | | 1,626 | |
| | 52 | | | Kraft Heinz Co. (The) | | | 4,548 | |
| | 10 | | | McCormick & Co., Inc. | | | 934 | |
| | 16 | | | Mead Johnson Nutrition Co. | | | 1,141 | |
| | 135 | | | Mondelez International, Inc., Class A | | | 5,978 | |
| | 25 | | | Tyson Foods, Inc., Class A | | | 1,565 | |
| | | | | | | | |
| | | | | | | 27,117 | |
| | | | | | | | |
| | | | Household Products — 1.8% | |
| | 23 | | | Church & Dwight Co., Inc. | | | 998 | |
| | 11 | | | Clorox Co. (The) | | | 1,349 | |
| | 78 | | | Colgate-Palmolive Co. | | | 5,079 | |
| | 31 | | | Kimberly-Clark Corp. | | | 3,569 | |
| | 234 | | | Procter & Gamble Co. (The) | | | 19,647 | |
| | | | | | | | |
| | | | | | | 30,642 | |
| | | | | | | | |
| | | | Personal Products — 0.1% | |
| | 41 | | | Coty, Inc., Class A | | | 752 | |
| | 19 | | | Estee Lauder Cos., Inc. (The), Class A | | | 1,484 | |
| | | | | | | | |
| | | | | | | 2,236 | |
| | | | | | | | |
| | | | Tobacco — 1.7% | |
| | 170 | | | Altria Group, Inc. | | | 11,516 | |
| | 135 | | | Philip Morris International, Inc. | | | 12,394 | |
| | 72 | | | Reynolds American, Inc. | | | 4,046 | |
| | | | | | | | |
| | | | | | | 27,956 | |
| | | | | | | | |
| | | | Total Consumer Staples | | | 157,658 | |
| | | | | | | | |
| | | | Energy — 7.5% | |
| | | | Energy Equipment & Services — 1.2% | |
| | 37 | | | Baker Hughes, Inc. | | | 2,399 | |
| | 20 | | | FMC Technologies, Inc. (a) | | | 700 | |
| | 75 | | | Halliburton Co. | | | 4,083 | |
| | 9 | | | Helmerich & Payne, Inc. | | | 731 | |
| | 33 | | | National Oilwell Varco, Inc. | | | 1,235 | |
| | 121 | | | Schlumberger Ltd. | | | 10,199 | |
| | 34 | | | Transocean Ltd. (a) | | | 501 | |
| | | | | | | | |
| | | | | | | 19,848 | |
| | | | | | | | |
SEE NOTES TO FINANCIAL STATEMENTS.
| | | | | | | | |
| | | |
| DECEMBER 31, 2016 | | J.P. MORGAN EQUITY FUNDS | | | | | 9 | |
JPMorgan Equity Index Fund
SCHEDULE OF PORTFOLIO INVESTMENTS
AS OF DECEMBER 31, 2016 (Unaudited) (continued)
(Amounts in thousands)
| | | | | | | | |
| SHARES | | | SECURITY DESCRIPTION | | VALUE($) | |
| Common Stocks — continued | | | | |
| | | | Oil, Gas & Consumable Fuels — 6.3% | | | | |
| | 49 | | | Anadarko Petroleum Corp. | | | 3,403 | |
| | 33 | | | Apache Corp. | | | 2,103 | |
| | 41 | | | Cabot Oil & Gas Corp. | | | 949 | |
| | 65 | | | Chesapeake Energy Corp. (a) | | | 457 | |
| | 165 | | | Chevron Corp. | | | 19,402 | |
| | 8 | | | Cimarex Energy Co. | | | 1,127 | |
| | 13 | | | Concho Resources, Inc. (a) | | | 1,691 | |
| | 108 | | | ConocoPhillips | | | 5,425 | |
| | 46 | | | Devon Energy Corp. | | | 2,088 | |
| | 50 | | | EOG Resources, Inc. | | | 5,089 | |
| | 15 | | | EQT Corp. | | | 986 | |
| | 362 | | | Exxon Mobil Corp. | | | 32,682 | |
| | 23 | | | Hess Corp. | | | 1,450 | |
| | 168 | | | Kinder Morgan, Inc. | | | 3,472 | |
| | 74 | | | Marathon Oil Corp. | | | 1,281 | |
| | 46 | | | Marathon Petroleum Corp. | | | 2,320 | |
| | 14 | | | Murphy Oil Corp. | | | 440 | |
| | 17 | | | Newfield Exploration Co. (a) | | | 698 | |
| | 37 | | | Noble Energy, Inc. | | | 1,425 | |
| | 67 | | | Occidental Petroleum Corp. | | | 4,753 | |
| | 18 | | | ONEOK, Inc. | | | 1,055 | |
| | 39 | | | Phillips 66 | | | 3,341 | |
| | 15 | | | Pioneer Natural Resources Co. | | | 2,669 | |
| | 16 | | | Range Resources Corp. | | | 563 | |
| | 43 | | | Southwestern Energy Co. (a) | | | 464 | |
| | 61 | | | Spectra Energy Corp. | | | 2,517 | |
| | 10 | | | Tesoro Corp. | | | 892 | |
| | 40 | | | Valero Energy Corp. | | | 2,700 | |
| | 60 | | | Williams Cos., Inc. (The) | | | 1,858 | |
| | | | | | | | |
| | | | | | | 107,300 | |
| | | | | | | | |
| | | | Total Energy | | | 127,148 | |
| | | | | | | | |
| | | | Financials — 14.8% | |
| | | | Banks — 6.7% | |
| | 882 | | | Bank of America Corp. | | | 19,500 | |
| | 71 | | | BB&T Corp. | | | 3,332 | |
| | 249 | | | Citigroup, Inc. | | | 14,789 | |
| | 45 | | | Citizens Financial Group, Inc. | | | 1,593 | |
| | 15 | | | Comerica, Inc. | | | 1,025 | |
| | 66 | | | Fifth Third Bancorp | | | 1,779 | |
| | 95 | | | Huntington Bancshares, Inc. | | | 1,252 | |
| | 312 | | | JPMorgan Chase & Co. (q) | | | 26,962 | |
| | 94 | | | KeyCorp | | | 1,724 | |
| | 14 | | | M&T Bank Corp. | | | 2,118 | |
| | 27 | | | People’s United Financial, Inc. | | | 526 | |
| | 42 | | | PNC Financial Services Group, Inc. (The) | | | 4,969 | |
| | 107 | | | Regions Financial Corp. | | | 1,543 | |
| | | | | | | | |
| SHARES | | | SECURITY DESCRIPTION | | VALUE($) | |
| | | | | |
| | | | Banks — continued | | | | |
| | 43 | | | SunTrust Banks, Inc. | | | 2,351 | |
| | 140 | | | U.S. Bancorp | | | 7,167 | |
| | 395 | | | Wells Fargo & Co. | | | 21,752 | |
| | 18 | | | Zions Bancorporation | | | 765 | |
| | | | | | | | |
| | | | | | | 113,147 | |
| | | | | | | | |
| | | | Capital Markets — 2.8% | | | | |
| | 5 | | | Affiliated Managers Group, Inc. (a) | | | 695 | |
| | 14 | | | Ameriprise Financial, Inc. | | | 1,531 | |
| | 92 | | | Bank of New York Mellon Corp. (The) | | | 4,375 | |
| | 11 | | | BlackRock, Inc. | | | 4,040 | |
| | 105 | | | Charles Schwab Corp. (The) | | | 4,158 | |
| | 30 | | | CME Group, Inc. | | | 3,418 | |
| | 24 | | | E*TRADE Financial Corp. (a) | | | 828 | |
| | 30 | | | Franklin Resources, Inc. | | | 1,199 | |
| | 32 | | | Goldman Sachs Group, Inc. (The) | | | 7,732 | |
| | 52 | | | Intercontinental Exchange, Inc. | | | 2,935 | |
| | 36 | | | Invesco Ltd. | | | 1,082 | |
| | 15 | | | Moody’s Corp. | | | 1,369 | |
| | 126 | | | Morgan Stanley | | | 5,320 | |
| | 10 | | | Nasdaq, Inc. | | | 668 | |
| | 19 | | | Northern Trust Corp. | | | 1,655 | |
| | 23 | | | S&P Global, Inc. | | | 2,433 | |
| | 32 | | | State Street Corp. | | | 2,461 | |
| | 21 | | | T Rowe Price Group, Inc. | | | 1,600 | |
| | | | | | | | |
| | | | | | | 47,499 | |
| | | | | | | | |
| | | | Consumer Finance — 0.8% | |
| | 67 | | | American Express Co. | | | 4,973 | |
| | 42 | | | Capital One Financial Corp. | | | 3,674 | |
| | 34 | | | Discover Financial Services | | | 2,483 | |
| | 26 | | | Navient Corp. | | | 435 | |
| | 68 | | | Synchrony Financial | | | 2,483 | |
| | | | | | | | |
| | | | | | | 14,048 | |
| | | | | | | | |
| | | | Diversified Financial Services — 1.7% | |
| | 166 | | | Berkshire Hathaway, Inc., Class B (a) | | | 27,023 | |
| | 28 | | | Leucadia National Corp. | | | 658 | |
| | | | | | | | |
| | | | | | | 27,681 | |
| | | | | | | | |
| | | | Insurance — 2.8% | |
| | 36 | | | Aflac, Inc. | | | 2,480 | |
| | 32 | | | Allstate Corp. (The) | | | 2,383 | |
| | 85 | | | American International Group, Inc. | | | 5,565 | |
| | 23 | | | Aon plc | | | 2,562 | |
| | 16 | | | Arthur J Gallagher & Co. | | | 808 | |
| | 5 | | | Assurant, Inc. | | | 462 | |
| | 41 | | | Chubb Ltd. | | | 5,369 | |
SEE NOTES TO FINANCIAL STATEMENTS.
| | | | | | |
| | | |
| 10 | | | | J.P. MORGAN EQUITY FUNDS | | DECEMBER 31, 2016 |
| | | | | | | | |
| SHARES | | | SECURITY DESCRIPTION | | VALUE($) | |
| Common Stocks — continued | | | | |
| | | | Insurance — continued | |
| | 13 | | | Cincinnati Financial Corp. | | | 992 | |
| | 33 | | | Hartford Financial Services Group, Inc. (The) | | | 1,572 | |
| | 20 | | | Lincoln National Corp. | | | 1,323 | |
| | 24 | | | Loews Corp. | | | 1,130 | |
| | 45 | | | Marsh & McLennan Cos., Inc. | | | 3,043 | |
| | 96 | | | MetLife, Inc. | | | 5,172 | |
| | 23 | | | Principal Financial Group, Inc. | | | 1,352 | |
| | 51 | | | Progressive Corp. (The) | | | 1,799 | |
| | 38 | | | Prudential Financial, Inc. | | | 3,907 | |
| | 10 | | | Torchmark Corp. | | | 711 | |
| | 25 | | | Travelers Cos., Inc. (The) | | | 3,036 | |
| | 20 | | | Unum Group | | | 890 | |
| | 11 | | | Willis Towers Watson plc | | | 1,372 | |
| | 23 | | | XL Group Ltd., (Ireland) | | | 875 | |
| | | | | | | | |
| | | | | | | 46,803 | |
| | | | | | | | |
| | | | Total Financials | | | 249,178 | |
| | | | | | | | |
| | | | Health Care — 13.6% | |
| | | | Biotechnology — 2.8% | |
| | 142 | | | AbbVie, Inc. | | | 8,886 | |
| | 20 | | | Alexion Pharmaceuticals, Inc. (a) | | | 2,396 | |
| | 65 | | | Amgen, Inc. | | | 9,498 | |
| | 19 | | | Biogen, Inc. (a) | | | 5,387 | |
| | 68 | | | Celgene Corp. (a) | | | 7,835 | |
| | 115 | | | Gilead Sciences, Inc. | | | 8,238 | |
| | 7 | | | Regeneron Pharmaceuticals, Inc. (a) | | | 2,423 | |
| | 22 | | | Vertex Pharmaceuticals, Inc. (a) | | | 1,595 | |
| | | | | | | | |
| | | | | | | 46,258 | |
| | | | | | | | |
| | | | Health Care Equipment & Supplies — 2.4% | |
| | 129 | | | Abbott Laboratories | | | 4,938 | |
| | 43 | | | Baxter International, Inc. | | | 1,895 | |
| | 19 | | | Becton Dickinson and Co. | | | 3,069 | |
| | 119 | | | Boston Scientific Corp. (a) | | | 2,572 | |
| | 4 | | | Cooper Cos., Inc. (The) | | | 745 | |
| | 6 | | | CR Bard, Inc. | | | 1,442 | |
| | 53 | | | Danaher Corp. | | | 4,137 | |
| | 20 | | | DENTSPLY SIRONA, Inc. | | | 1,164 | |
| | 19 | | | Edwards Lifesciences Corp. (a) | | | 1,749 | |
| | 24 | | | Hologic, Inc. (a) | | | 975 | |
| | 3 | | | Intuitive Surgical, Inc. (a) | | | 2,145 | |
| | 120 | | | Medtronic plc | | | 8,540 | |
| | 25 | | | St Jude Medical, Inc. | | | 2,001 | |
| | 27 | | | Stryker Corp. | | | 3,252 | |
| | 8 | | | Varian Medical Systems, Inc. (a) | | | 732 | |
| | 17 | | | Zimmer Biomet Holdings, Inc. | | | 1,805 | |
| | | | | | | | |
| | | | | | | 41,161 | |
| | | | | | | | |
| | | | | | | | |
| SHARES | | | SECURITY DESCRIPTION | | VALUE($) | |
| | | | | |
| | | | Health Care Providers & Services — 2.6% | |
| | 31 | | | Aetna, Inc. | | | 3,800 | |
| | 15 | | | AmerisourceBergen Corp. | | | 1,142 | |
| | 23 | | | Anthem, Inc. | | | 3,307 | |
| | 28 | | | Cardinal Health, Inc. | | | 2,011 | |
| | 15 | | | Centene Corp. (a) | | | 843 | |
| | 22 | | | Cigna Corp. | | | 2,991 | |
| | 14 | | | DaVita, Inc. (a) | | | 885 | |
| | 10 | | | Envision Healthcare Corp. (a) | | | 648 | |
| | 54 | | | Express Scripts Holding Co. (a) | | | 3,704 | |
| | 26 | | | HCA Holdings, Inc. (a) | | | 1,889 | |
| | 7 | | | Henry Schein, Inc. (a) | | | 1,066 | |
| | 13 | | | Humana, Inc. | | | 2,657 | |
| | 9 | | | Laboratory Corp. of America Holdings (a) | | | 1,155 | |
| | 20 | | | McKesson Corp. | | | 2,773 | |
| | 7 | | | Patterson Cos., Inc. | | | 299 | |
| | 12 | | | Quest Diagnostics, Inc. | | | 1,112 | |
| | 83 | | | UnitedHealth Group, Inc. | | | 13,301 | |
| | 8 | | | Universal Health Services, Inc., Class B | | | 833 | |
| | | | | | | | |
| | | | | | | 44,416 | |
| | | | | | | | |
| | | | Health Care Technology — 0.1% | |
| | 26 | | | Cerner Corp. (a) | | | 1,250 | |
| | | | | | | | |
| | | | Life Sciences Tools & Services — 0.6% | |
| | 28 | | | Agilent Technologies, Inc. | | | 1,290 | |
| | 13 | | | Illumina, Inc. (a) | | | 1,642 | |
| | 2 | | | Mettler-Toledo International, Inc. (a) | | | 959 | |
| | 10 | | | PerkinElmer, Inc. | | | 499 | |
| | 34 | | | Thermo Fisher Scientific, Inc. | | | 4,867 | |
| | 7 | | | Waters Corp. (a) | | | 946 | |
| | | | | | | | |
| | | | | | | 10,203 | |
| | | | | | | | |
| | | | Pharmaceuticals — 5.1% | |
| | 33 | | | Allergan plc (a) | | | 6,878 | |
| | 146 | | | Bristol-Myers Squibb Co. | | | 8,528 | |
| | 85 | | | Eli Lilly & Co. | | | 6,239 | |
| | 17 | | | Endo International plc (a) | | | 286 | |
| | 238 | | | Johnson & Johnson | | | 27,369 | |
| | 9 | | | Mallinckrodt plc (a) | | | 461 | |
| | 241 | | | Merck & Co., Inc. | | | 14,173 | |
| | 40 | | | Mylan NV (a) | | | 1,533 | |
| | 13 | | | Perrigo Co. plc | | | 1,042 | |
| | 530 | | | Pfizer, Inc. | | | 17,211 | |
| | 43 | | | Zoetis, Inc. | | | 2,308 | |
| | | | | | | | |
| | | | | | | 86,028 | |
| | | | | | | | |
| | | | Total Health Care | | | 229,316 | |
| | | | | | | | |
SEE NOTES TO FINANCIAL STATEMENTS.
| | | | | | | | |
| | | |
| DECEMBER 31, 2016 | | J.P. MORGAN EQUITY FUNDS | | | | | 11 | |
JPMorgan Equity Index Fund
SCHEDULE OF PORTFOLIO INVESTMENTS
AS OF DECEMBER 31, 2016 (Unaudited) (continued)
(Amounts in thousands)
| | | | | | | | |
| SHARES | | | SECURITY DESCRIPTION | | VALUE($) | |
| Common Stocks — continued | | | | |
| | | | Industrials — 10.2% | |
| | | | Aerospace & Defense — 2.2% | |
| | 38 | | | Arconic, Inc. | | | 710 | |
| | 50 | | | Boeing Co. (The) | | | 7,802 | |
| | 25 | | | General Dynamics Corp. | | | 4,316 | |
| | 7 | | | L-3 Communications Holdings, Inc. | | | 1,027 | |
| | 22 | | | Lockheed Martin Corp. | | | 5,499 | |
| | 15 | | | Northrop Grumman Corp. | | | 3,580 | |
| | 26 | | | Raytheon Co. | | | 3,641 | |
| | 11 | | | Rockwell Collins, Inc. | | | 1,055 | |
| | 24 | | | Textron, Inc. | | | 1,146 | |
| | 4 | | | TransDigm Group, Inc. | | | 1,090 | |
| | 67 | | | United Technologies Corp. | | | 7,330 | |
| | | | | | | | |
| | | | | | | 37,196 | |
| | | | | | | | |
| | | | Air Freight & Logistics — 0.7% | |
| | 12 | | | CH Robinson Worldwide, Inc. | | | 906 | |
| | 16 | | | Expeditors International of Washington, Inc. | | | 834 | |
| | 21 | | | FedEx Corp. | | | 3,975 | |
| | 60 | | | United Parcel Service, Inc., Class B | | | 6,901 | |
| | | | | | | | |
| | | | | | | 12,616 | |
| | | | | | | | |
| | | | Airlines — 0.6% | |
| | 11 | | | Alaska Air Group, Inc. | | | 955 | |
| | 45 | | | American Airlines Group, Inc. | | | 2,112 | |
| | 64 | | | Delta Air Lines, Inc. | | | 3,163 | |
| | 54 | | | Southwest Airlines Co. | | | 2,679 | |
| | 25 | | | United Continental Holdings, Inc. (a) | | | 1,838 | |
| | | | | | | | |
| | | | | | | 10,747 | |
| | | | | | | | |
| | | | Building Products — 0.3% | |
| | 8 | | | Allegion plc | | | 536 | |
| | 13 | | | Fortune Brands Home & Security, Inc. | | | 720 | |
| | 82 | | | Johnson Controls International plc | | | 3,369 | |
| | 29 | | | Masco Corp. | | | 907 | |
| | | | | | | | |
| | | | | | | 5,532 | |
| | | | | | | | |
| | | | Commercial Services & Supplies — 0.3% | |
| | 8 | | | Cintas Corp. | | | 868 | |
| | 16 | | | Pitney Bowes, Inc. | | | 246 | |
| | 20 | | | Republic Services, Inc. | | | 1,152 | |
| | 7 | | | Stericycle, Inc. (a) | | | 572 | |
| | 36 | | | Waste Management, Inc. | | | 2,518 | |
| | | | | | | | |
| | | | | | | 5,356 | |
| | | | | | | | |
| | | | Construction & Engineering — 0.1% | |
| | 12 | | | Fluor Corp. | | | 639 | |
| | 11 | | | Jacobs Engineering Group, Inc. (a) | | | 601 | |
| | 13 | | | Quanta Services, Inc. (a) | | | 460 | |
| | | | | | | | |
| | | | | | | 1,700 | |
| | | | | | | | |
| | | | | | | | |
| SHARES | | | SECURITY DESCRIPTION | | VALUE($) | |
| | | | | |
| | | | Electrical Equipment — 0.5% | |
| | 4 | | | Acuity Brands, Inc. | | | 889 | |
| | 20 | | | AMETEK, Inc. | | | 982 | |
| | 39 | | | Eaton Corp. plc | | | 2,646 | |
| | 56 | | | Emerson Electric Co. | | | 3,129 | |
| | 11 | | | Rockwell Automation, Inc. | | | 1,505 | |
| | | | | | | | |
| | | | | | | 9,151 | |
| | | | | | | | |
| | | | Industrial Conglomerates — 2.6% | |
| | 53 | | | 3M Co. | | | 9,378 | |
| | 772 | | | General Electric Co. (k) | | | 24,410 | |
| | 67 | | | Honeywell International, Inc. | | | 7,710 | |
| | 9 | | | Roper Technologies, Inc. | | | 1,622 | |
| | | | | | | | |
| | | | | | | 43,120 | |
| | | | | | | | |
| | | | Machinery — 1.5% | |
| | 51 | | | Caterpillar, Inc. | | | 4,738 | |
| | 13 | | | Cummins, Inc. | | | 1,840 | |
| | 25 | | | Deere & Co. | | | 2,603 | |
| | 14 | | | Dover Corp. | | | 1,016 | |
| | 11 | | | Flowserve Corp. | | | 547 | |
| | 26 | | | Fortive Corp. | | | 1,409 | |
| | 28 | | | Illinois Tool Works, Inc. | | | 3,378 | |
| | 23 | | | Ingersoll-Rand plc | | | 1,693 | |
| | 31 | | | PACCAR, Inc. | | | 1,956 | |
| | 12 | | | Parker-Hannifin Corp. | | | 1,631 | |
| | 15 | | | Pentair plc, (United Kingdom) | | | 818 | |
| | 5 | | | Snap-on, Inc. | | | 867 | |
| | 13 | | | Stanley Black & Decker, Inc. | | | 1,509 | |
| | 16 | | | Xylem, Inc. | | | 776 | |
| | | | | | | | |
| | | | | | | 24,781 | |
| | | | | | | | |
| | | | Professional Services — 0.3% | |
| | 3 | | | Dun & Bradstreet Corp. (The) | | | 389 | |
| | 10 | | | Equifax, Inc. | | | 1,236 | |
| | 29 | | | Nielsen Holdings plc | | | 1,231 | |
| | 11 | | | Robert Half International, Inc. | | | 549 | |
| | 14 | | | Verisk Analytics, Inc. (a) | | | 1,104 | |
| | | | | | | | |
| | | | | | | 4,509 | |
| | | | | | | | |
| | | | Road & Rail — 0.9% | |
| | 82 | | | CSX Corp. | | | 2,939 | |
| | 8 | | | JB Hunt Transport Services, Inc. | | | 742 | |
| | 9 | | | Kansas City Southern | | | 797 | |
| | 25 | | | Norfolk Southern Corp. | | | 2,755 | |
| | 5 | | | Ryder System, Inc. | | | 347 | |
| | 72 | | | Union Pacific Corp. | | | 7,461 | |
| | | | | | | | |
| | | | | | | 15,041 | |
| | | | | | | | |
SEE NOTES TO FINANCIAL STATEMENTS.
| | | | | | |
| | | |
| 12 | | | | J.P. MORGAN EQUITY FUNDS | | DECEMBER 31, 2016 |
| | | | | | | | |
| SHARES | | | SECURITY DESCRIPTION | | VALUE($) | |
| Common Stocks — continued | | | | |
| | | | Trading Companies & Distributors — 0.2% | |
| | 25 | | | Fastenal Co. | | | 1,186 | |
| | 7 | | | United Rentals, Inc. (a) | | | 777 | |
| | 5 | | | WW Grainger, Inc. | | | 1,111 | |
| | | | | | | | |
| | | | | | | 3,074 | |
| | | | | | | | |
| | | | Total Industrials | | | 172,823 | |
| | | | | | | | |
| | | | Information Technology — 20.7% | |
| | | | Communications Equipment — 1.0% | |
| | 438 | | | Cisco Systems, Inc. | | | 13,246 | |
| | 6 | | | F5 Networks, Inc. (a) | | | 825 | |
| | 11 | | | Harris Corp. | | | 1,112 | |
| | 33 | | | Juniper Networks, Inc. | | | 939 | |
| | 14 | | | Motorola Solutions, Inc. | | | 1,201 | |
| | | | | | | | |
| | | | | | | 17,323 | |
| | | | | | | | |
| | | | Electronic Equipment, Instruments & Components — 0.4% | |
| | 27 | | | Amphenol Corp., Class A | | | 1,810 | |
| | 83 | | | Corning, Inc. | | | 2,016 | |
| | 12 | | | FLIR Systems, Inc. | | | 430 | |
| | 31 | | | TE Connectivity Ltd. | | | 2,150 | |
| | | | | | | | |
| | | | | | | 6,406 | |
| | | | | | | | |
| | | | Internet Software & Services — 4.2% | |
| | 15 | | | Akamai Technologies, Inc. (a) | | | 1,009 | |
| | 26 | | | Alphabet, Inc., Class A (a) | | | 20,487 | |
| | 26 | | | Alphabet, Inc., Class C (a) | | | 20,001 | |
| | 91 | | | eBay, Inc. (a) | | | 2,695 | |
| | 204 | | | Facebook, Inc., Class A (a) | | | 23,517 | |
| | 8 | | | VeriSign, Inc. (a) | | | 605 | |
| | 77 | | | Yahoo!, Inc. (a) | | | 2,964 | |
| | | | | | | | |
| | | | | | | 71,278 | |
| | | | | | | | |
| | | | IT Services — 3.7% | |
| | 54 | | | Accenture plc, Class A | | | 6,344 | |
| | 5 | | | Alliance Data Systems Corp. | | | 1,153 | |
| | 39 | | | Automatic Data Processing, Inc. | | | 4,049 | |
| | 53 | | | Cognizant Technology Solutions Corp., Class A (a) | | | 2,968 | |
| | 13 | | | CSRA, Inc. | | | 404 | |
| | 29 | | | Fidelity National Information Services, Inc. | | | 2,168 | |
| | 19 | | | Fiserv, Inc. (a) | | | 2,014 | |
| | 13 | | | Global Payments, Inc. | | | 932 | |
| | 76 | | | International Business Machines Corp. | | | 12,542 | |
| | 83 | | | Mastercard, Inc., Class A | | | 8,582 | |
| | 28 | | | Paychex, Inc. | | | 1,711 | |
| | 98 | | | PayPal Holdings, Inc. (a) | | | 3,868 | |
| | 11 | | | Teradata Corp. (a) | | | 308 | |
| | 14 | | | Total System Services, Inc. | | | 708 | |
| | 163 | | | Visa, Inc., Class A | | | 12,723 | |
| | | | | | | | |
| SHARES | | | SECURITY DESCRIPTION | | VALUE($) | |
| | | | | |
| | | | IT Services — continued | |
| | 42 | | | Western Union Co. (The) | | | 920 | |
| | 74 | | | Xerox Corp. | | | 649 | |
| | | | | | | | |
| | | | | | | 62,043 | |
| | | | | | | | |
| | | | Semiconductors & Semiconductor Equipment — 3.4% | |
| | 27 | | | Analog Devices, Inc. | | | 1,954 | |
| | 94 | | | Applied Materials, Inc. | | | 3,046 | |
| | 35 | | | Broadcom Ltd., (Singapore) | | | 6,133 | |
| | 7 | | | First Solar, Inc. (a) | | | 218 | |
| | 414 | | | Intel Corp. | | | 15,009 | |
| | 14 | | | KLA-Tencor Corp. | | | 1,074 | |
| | 14 | | | Lam Research Corp. | | | 1,503 | |
| | 21 | | | Linear Technology Corp. | | | 1,309 | |
| | 19 | | | Microchip Technology, Inc. | | | 1,210 | |
| | 91 | | | Micron Technology, Inc. (a) | | | 1,994 | |
| | 47 | | | NVIDIA Corp. | | | 5,024 | |
| | 11 | | | Qorvo, Inc. (a) | | | 588 | |
| | 129 | | | QUALCOMM, Inc. | | | 8,408 | |
| | 16 | | | Skyworks Solutions, Inc. | | | 1,211 | |
| | 87 | | | Texas Instruments, Inc. | | | 6,369 | |
| | 22 | | | Xilinx, Inc. | | | 1,331 | |
| | | | | | | | |
| | | | | | | 56,381 | |
| | | | | | | | |
| | | | Software — 4.3% | |
| | 60 | | | Activision Blizzard, Inc. | | | 2,156 | |
| | 43 | | | Adobe Systems, Inc. (a) | | | 4,470 | |
| | 17 | | | Autodesk, Inc. (a) | | | 1,266 | |
| | 27 | | | CA, Inc. | | | 869 | |
| | 14 | | | Citrix Systems, Inc. (a) | | | 1,216 | |
| | 26 | | | Electronic Arts, Inc. (a) | | | 2,075 | |
| | 21 | | | Intuit, Inc. | | | 2,440 | |
| | 679 | | | Microsoft Corp. | | | 42,190 | |
| | 262 | | | Oracle Corp. | | | 10,063 | |
| | 16 | | | Red Hat, Inc. (a) | | | 1,093 | |
| | 56 | | | salesforce.com, Inc. (a) | | | 3,816 | |
| | 54 | | | Symantec Corp. | | | 1,301 | |
| | | | | | | | |
| | | | | | | 72,955 | |
| | | | | | | | |
| | | | Technology Hardware, Storage & Peripherals — 3.7% | |
| | 466 | | | Apple, Inc. | | | 53,928 | |
| | 145 | | | Hewlett Packard Enterprise Co. | | | 3,366 | |
| | 149 | | | HP, Inc. | | | 2,217 | |
| | 24 | | | NetApp, Inc. | | | 848 | |
| | 26 | | | Seagate Technology plc | | | 982 | |
| | 25 | | | Western Digital Corp. | | | 1,694 | |
| | | | | | | | |
| | | | | | | 63,035 | |
| | | | | | | | |
| | | | Total Information Technology | | | 349,421 | |
| | | | | | | | |
SEE NOTES TO FINANCIAL STATEMENTS.
| | | | | | | | |
| | | |
| DECEMBER 31, 2016 | | J.P. MORGAN EQUITY FUNDS | | | | | 13 | |
JPMorgan Equity Index Fund
SCHEDULE OF PORTFOLIO INVESTMENTS
AS OF DECEMBER 31, 2016 (Unaudited) (continued)
(Amounts in thousands, except number of Futures contracts )
| | | | | | | | |
| SHARES | | | SECURITY DESCRIPTION | | VALUE($) | |
| Common Stocks — continued | | | | |
| | | | Materials — 2.8% | |
| | | | Chemicals — 2.1% | |
| | 19 | | | Air Products & Chemicals, Inc. | | | 2,730 | |
| | 10 | | | Albemarle Corp. | | | 845 | |
| | 20 | | | CF Industries Holdings, Inc. | | | 641 | |
| | 98 | | | Dow Chemical Co. (The) | | | 5,603 | |
| | 13 | | | Eastman Chemical Co. | | | 964 | |
| | 23 | | | Ecolab, Inc. | | | 2,686 | |
| | 76 | | | EI du Pont de Nemours & Co. | | | 5,572 | |
| | 12 | | | FMC Corp. | | | 661 | |
| | 7 | | | International Flavors & Fragrances, Inc. | | | 817 | |
| | 29 | | | LyondellBasell Industries NV, Class A | | | 2,503 | |
| | 38 | | | Monsanto Co. | | | 4,024 | |
| | 31 | | | Mosaic Co. (The) | | | 897 | |
| | 23 | | | PPG Industries, Inc. | | | 2,184 | |
| | 25 | | | Praxair, Inc. | | | 2,920 | |
| | 7 | | | Sherwin-Williams Co. (The) | | | 1,897 | |
| | | | | | | | |
| | | | | | | 34,944 | |
| | | | | | | | |
| | | | Construction Materials — 0.1% | |
| | 6 | | | Martin Marietta Materials, Inc. | | | 1,228 | |
| | 12 | | | Vulcan Materials Co. | | | 1,446 | |
| | | | | | | | |
| | | | | | | 2,674 | |
| | | | | | | | |
| | | | Containers & Packaging — 0.3% | |
| | 8 | | | Avery Dennison Corp. | | | 546 | |
| | 15 | | | Ball Corp. | | | 1,146 | |
| | 36 | | | International Paper Co. | | | 1,905 | |
| | 17 | | | Sealed Air Corp. | | | 765 | |
| | 22 | | | WestRock Co. | | | 1,113 | |
| | | | | | | | |
| | | | | | | 5,475 | |
| | | | | | | | |
| | | | Metals & Mining — 0.3% | |
| | 109 | | | Freeport-McMoRan, Inc. (a) | | | 1,443 | |
| | 46 | | | Newmont Mining Corp. | | | 1,579 | |
| | 28 | | | Nucor Corp. | | | 1,655 | |
| | | | | | | | |
| | | | | | | 4,677 | |
| | | | | | | | |
| | | | Total Materials | | | 47,770 | |
| | | | | | | | |
| | | | Real Estate — 2.9% | |
| | | | Equity Real Estate Investment Trusts (REITs) — 2.8% | |
| | 37 | | | American Tower Corp. | | | 3,928 | |
| | 14 | | | Apartment Investment & Management Co., Class A | | | 623 | |
| | 12 | | | AvalonBay Communities, Inc. | | | 2,124 | |
| | 13 | | | Boston Properties, Inc. | | | 1,689 | |
| | 31 | | | Crown Castle International Corp. | | | 2,732 | |
| | 14 | | | Digital Realty Trust, Inc. | | | 1,364 | |
| | 6 | | | Equinix, Inc. | | | 2,228 | |
| | | | | | | | |
| SHARES | | | SECURITY DESCRIPTION | | VALUE($) | |
| | | | | |
| | | | Equity Real Estate Investment Trusts (REITs) — continued | |
| | 32 | | | Equity Residential | | | 2,055 | |
| | 6 | | | Essex Property Trust, Inc. | | | 1,330 | |
| | 11 | | | Extra Space Storage, Inc. | | | 849 | |
| | 6 | | | Federal Realty Investment Trust | | | 891 | |
| | 51 | | | General Growth Properties, Inc. | | | 1,274 | |
| | 41 | | | HCP, Inc. | | | 1,213 | |
| | 65 | | | Host Hotels & Resorts, Inc. | | | 1,217 | |
| | 21 | | | Iron Mountain, Inc. | | | 695 | |
| | 37 | | | Kimco Realty Corp. | | | 934 | |
| | 11 | | | Macerich Co. (The) | | | 747 | |
| | 10 | | | Mid-America Apartment Communities, Inc. | | | 971 | |
| | 46 | | | Prologis, Inc. | | | 2,437 | |
| | 13 | | | Public Storage | | | 2,911 | |
| | 23 | | | Realty Income Corp. | | | 1,298 | |
| | 27 | | | Simon Property Group, Inc. | | | 4,875 | |
| | 9 | | | SL Green Realty Corp. | | | 952 | |
| | 23 | | | UDR, Inc. | | | 851 | |
| | 31 | | | Ventas, Inc. | | | 1,933 | |
| | 15 | | | Vornado Realty Trust | | | 1,567 | |
| | 32 | | | Welltower, Inc. | | | 2,119 | |
| | 65 | | | Weyerhaeuser Co. | | | 1,965 | |
| | | | | | | | |
| | | | | | | 47,772 | |
| | | | | | | | |
| | | | Real Estate Management & Development — 0.1% | |
| | 26 | | | CBRE Group, Inc., Class A (a) | | | 825 | |
| | | | | | | | |
| | | | Total Real Estate | | | 48,597 | |
| | | | | | | | |
| | | | Telecommunication Services — 2.7% | |
| | | | Diversified Telecommunication Services — 2.7% | |
| | 536 | | | AT&T, Inc. | | | 22,806 | |
| | 48 | | | CenturyLink, Inc. | | | 1,135 | |
| | 102 | | | Frontier Communications Corp. | | | 346 | |
| | 25 | | | Level 3 Communications, Inc. (a) | | | 1,435 | |
| | 356 | | | Verizon Communications, Inc. | | | 19,002 | |
| | | | | | | | |
| | | | Total Telecommunication Services | | | 44,724 | |
| | | | | | | | |
| | | | Utilities — 3.2% | |
| | | | Electric Utilities — 2.0% | |
| | 20 | | | Alliant Energy Corp. | | | 753 | |
| | 43 | | | American Electric Power Co., Inc. | | | 2,703 | |
| | 60 | | | Duke Energy Corp. | | | 4,670 | |
| | 28 | | | Edison International | | | 2,048 | |
| | 16 | | | Entergy Corp. | | | 1,149 | |
| | 28 | | | Eversource Energy | | | 1,530 | |
| | 81 | | | Exelon Corp. | | | 2,861 | |
| | 37 | | | FirstEnergy Corp. | | | 1,151 | |
| | 41 | | | NextEra Energy, Inc. | | | 4,874 | |
SEE NOTES TO FINANCIAL STATEMENTS.
| | | | | | |
| | | |
| 14 | | | | J.P. MORGAN EQUITY FUNDS | | DECEMBER 31, 2016 |
| | | | | | | | |
SHARES | | | SECURITY DESCRIPTION | | VALUE($) | |
| Common Stocks — continued | | | | |
| | | | Electric Utilities — continued | |
| | 44 | | | PG&E Corp. | | | 2,683 | |
| | 10 | | | Pinnacle West Capital Corp. | | | 758 | |
| | 59 | | | PPL Corp. | | | 2,021 | |
| | 86 | | | Southern Co. (The) | | | 4,210 | |
| | 44 | | | Xcel Energy, Inc. | | | 1,805 | |
| | | | | | | | |
| | | | | | | 33,216 | |
| | | | | | | | |
| | | | Independent Power & Renewable Electricity
Producers — 0.0% (g) | |
| | 58 | | | AES Corp. | | | 669 | |
| | 28 | | | NRG Energy, Inc. | | | 338 | |
| | | | | | | | |
| | | | | | | 1,007 | |
| | | | | | | | |
| | | | Multi-Utilities — 1.1% | |
| | 21 | | | Ameren Corp. | | | 1,111 | |
| | 38 | | | CenterPoint Energy, Inc. | | | 927 | |
| | 24 | | | CMS Energy Corp. | | | 1,014 | |
| | 27 | | | Consolidated Edison, Inc. | | | 1,961 | |
| | 55 | | | Dominion Resources, Inc. | | | 4,192 | |
| | 16 | | | DTE Energy Co. | | | 1,544 | |
| | 28 | | | NiSource, Inc. | | | 624 | |
| | 44 | | | Public Service Enterprise Group, Inc. | | | 1,938 | |
| | 12 | | | SCANA Corp. | | | 914 | |
| | 22 | | | Sempra Energy | | | 2,198 | |
| | 28 | | | WEC Energy Group, Inc. | | | 1,616 | |
| | | | | | | | |
| | | | | | | 18,039 | |
| | | | | | | | |
| | | | Water Utilities — 0.1% | |
| | 16 | | | American Water Works Co., Inc. | | | 1,125 | |
| | | | | | | | |
| | | | Total Utilities | | | 53,387 | |
| | | | | | | | |
| | | | Total Common Stocks
(Cost $599,578) | | | 1,682,479 | |
| | | | | | | | |
| | | | | | | | |
NUMBER OF
RIGHTS | | | SECURITY DESCRIPTION | | VALUE($) | |
| Rights — 0.0% (g) | | | | |
| | | | Consumer Staples — 0.0% (g) | |
| | | | Food & Staples Retailing — 0.0% (g) | |
| | 25 | | | Safeway, Inc. PDC CVR, expiring 01/30/17 (a) | | | 1 | |
| | 25 | | | Safeway, Inc. Casa Ley CVR, expiring 01/30/18 (a) | | | 2 | |
| | | | | | | | |
| | | | Total Rights
(Cost $—) | | | 3 | |
| | | | | | | | |
| | |
| SHARES | | | | | | |
| Short-Term Investment — 0.2% | | | | |
| | | | Investment Company — 0.2% | | | | |
| | 3,908 | | | JPMorgan U.S. Government Money Market Fund, Institutional Class Shares, 0.410% (b) (l)
(Cost $3,908) | | | 3,908 | |
| | | | | | | | |
| | | | Total Investments — 100.0%
(Cost $603,486) | | | 1,686,390 | |
| | | | Liabilities in Excess of
Other Assets — 0.0% (g) | | | (557 | ) |
| | | | | | | | |
| | | | NET ASSETS — 100.0% | | $ | 1,685,833 | |
| | | | | | | | |
Percentages indicated are based on net assets.
| | | | | | | | | | | | | | | | | | | | |
| Futures Contracts | |
NUMBER OF
CONTRACTS | | | DESCRIPTION | | EXPIRATION
DATE | | | TRADING
CURRENCY | | | NOTIONAL VALUE AT
DECEMBER 31, 2016 | | | NET UNREALIZED
APPRECIATION
(DEPRECIATION) | |
| | | | Long Futures Outstanding | | | | | | | | | | | | | | | | |
| | 61 | | | E-mini S&P 500 | | | 03/17/17 | | | | USD | | | $ | 6,820 | | | $ | (23 | ) |
| | | | | | | | | | | | | | | | | | | | |
SEE NOTES TO FINANCIAL STATEMENTS.
| | | | | | | | |
| | | |
| DECEMBER 31, 2016 | | J.P. MORGAN EQUITY FUNDS | | | | | 15 | |
JPMorgan Market Expansion Enhanced Index Fund
SCHEDULE OF PORTFOLIO INVESTMENTS
AS OF DECEMBER 31, 2016 (Unaudited)
(Amounts in thousands)
| | | | | | | | |
| SHARES | | | SECURITY DESCRIPTION | | VALUE($) | |
| Common Stocks — 97.4% | |
| | | | Consumer Discretionary — 10.8% | |
| | | | Auto Components — 1.2% | |
| | 33 | | | American Axle & Manufacturing Holdings, Inc. (a) | | | 627 | |
| | 32 | | | Cooper-Standard Holdings, Inc. (a) | | | 3,256 | |
| | 200 | | | Dana, Inc. | | | 3,787 | |
| | 34 | | | Drew Industries, Inc. | | | 3,663 | |
| | 11 | | | Standard Motor Products, Inc. | | | 591 | |
| | 9 | | | Superior Industries International, Inc. | | | 240 | |
| | | | | | | | |
| | | | | | | 12,164 | |
| | | | | | | | |
| | | | Automobiles — 0.3% | |
| | 27 | | | Thor Industries, Inc. | | | 2,685 | |
| | 12 | | | Winnebago Industries, Inc. | | | 393 | |
| | | | | | | | |
| | | | | | | 3,078 | |
| | | | | | | | |
| | | | Distributors — 0.0% (g) | |
| | 7 | | | Core-Mark Holding Co., Inc. | | | 280 | |
| | | | | | | | |
| | | | Diversified Consumer Services — 0.4% | |
| | 6 | | | Capella Education Co. | | | 524 | |
| | 24 | | | Career Education Corp. (a) | | | 243 | |
| | 24 | | | DeVry Education Group, Inc. | | | 736 | |
| | 2 | | | Graham Holdings Co., Class B | | | 973 | |
| | 19 | | | Sotheby’s (a) | | | 737 | |
| | 5 | | | Strayer Education, Inc. (a) | | | 363 | |
| | | | | | | | |
| | | | | | | 3,576 | |
| | | | | | | | |
| | | | Hotels, Restaurants & Leisure — 2.2% | |
| | 9 | | | BJ’s Restaurants, Inc. (a) | | | 346 | |
| | 7 | | | Bob Evans Farms, Inc. | | | 388 | |
| | 34 | | | Boyd Gaming Corp. (a) | | | 692 | |
| | 63 | | | Brinker International, Inc. | | | 3,129 | |
| | 8 | | | Buffalo Wild Wings, Inc. (a) | | | 1,220 | |
| | 34 | | | Cheesecake Factory, Inc. (The) | | | 2,054 | |
| | 12 | | | Cracker Barrel Old Country Store, Inc. | | | 1,991 | |
| | 18 | | | DineEquity, Inc. | | | 1,386 | |
| | 20 | | | Domino’s Pizza, Inc. | | | 3,137 | |
| | 118 | | | ILG, Inc. | | | 2,149 | |
| | 14 | | | Jack in the Box, Inc. | | | 1,608 | |
| | 9 | | | Panera Bread Co., Class A (a) | | | 1,846 | |
| | 10 | | | Papa John’s International, Inc. | | | 822 | |
| | 12 | | | Ruth’s Hospitality Group, Inc. | | | 212 | |
| | 24 | | | Texas Roadhouse, Inc. | | | 1,160 | |
| | | | | | | | |
| | | | | | | 22,140 | |
| | | | | | | | |
| | | | Household Durables — 1.2% | |
| | 15 | | | Helen of Troy Ltd. (a) | | | 1,232 | |
| | 32 | | | KB Home | | | 500 | |
| | 94 | | | La-Z-Boy, Inc. | | | 2,931 | |
| | | | | | | | |
| SHARES | | | SECURITY DESCRIPTION | | VALUE($) | |
| | | | | | | | |
| | | | Household Durables — continued | |
| | 2 | | | NVR, Inc. (a) | | | 2,652 | |
| | 5 | | | Tempur Sealy International, Inc. (a) | | | 307 | |
| | 52 | | | Toll Brothers, Inc. (a) | | | 1,615 | |
| | 37 | | | TopBuild Corp. (a) | | | 1,331 | |
| | 21 | | | Tupperware Brands Corp. | | | 1,082 | |
| | | | | | | | |
| | | | | | | 11,650 | |
| | | | | | | | |
| | | | Internet & Direct Marketing Retail — 0.1% | |
| | 8 | | | FTD Cos., Inc. (a) | | | 188 | |
| | 12 | | | HSN, Inc. | | | 422 | |
| | 10 | | | Nutrisystem, Inc. | | | 329 | |
| | | | | | | | |
| | | | | | | 939 | |
| | | | | | | | |
| | | | Leisure Products — 0.6% | |
| | 37 | | | Brunswick Corp. | | | 2,024 | |
| | 237 | | | Callaway Golf Co. | | | 2,601 | |
| | 8 | | | Polaris Industries, Inc. | | | 690 | |
| | 24 | | | Vista Outdoor, Inc. (a) | | | 901 | |
| | | | | | | | |
| | | | | | | 6,216 | |
| | | | | | | | |
| | | | Media — 0.9% | |
| | 34 | | | AMC Networks, Inc., Class A (a) | | | 1,790 | |
| | 2 | | | Cable One, Inc. | | | 1,212 | |
| | 43 | | | Cinemark Holdings, Inc. | | | 1,630 | |
| | 15 | | | John Wiley & Sons, Inc., Class A | | | 834 | |
| | 57 | | | Live Nation Entertainment, Inc. (a) | | | 1,521 | |
| | 14 | | | Meredith Corp. | | | 849 | |
| | 42 | | | Time, Inc. | | | 753 | |
| | | | | | | | |
| | | | | | | 8,589 | |
| | | | | | | | |
| | | | Multiline Retail — 0.2% | |
| | 23 | | | Big Lots, Inc. | | | 1,156 | |
| | 126 | | | JC Penney Co., Inc. (a) | | | 1,046 | |
| | | | | | | | |
| | | | | | | 2,202 | |
| | | | | | | | |
| | | | Specialty Retail — 2.7% | |
| | 112 | | | Aaron’s, Inc. | | | 3,591 | |
| | 67 | | | American Eagle Outfitters, Inc. | | | 1,015 | |
| | 48 | | | Caleres, Inc. | | | 1,579 | |
| | 30 | | | Cato Corp. (The), Class A | | | 895 | |
| | 86 | | | Chico’s FAS, Inc. | | | 1,244 | |
| | 31 | | | Children’s Place, Inc. (The) | | | 3,123 | |
| | 28 | | | CST Brands, Inc. | | | 1,334 | |
| | 42 | | | Dick’s Sporting Goods, Inc. | | | 2,220 | |
| | 30 | | | Express, Inc. (a) | | | 318 | |
| | 20 | | | Finish Line, Inc. (The), Class A | | | 380 | |
| | 14 | | | Francesca’s Holdings Corp. (a) | | | 245 | |
| | 42 | | | GameStop Corp., Class A | | | 1,063 | |
SEE NOTES TO FINANCIAL STATEMENTS.
| | | | | | |
| | | |
| 16 | | | | J.P. MORGAN EQUITY FUNDS | | DECEMBER 31, 2016 |
| | | | | | | | |
| SHARES | | | SECURITY DESCRIPTION | | VALUE($) | |
| Common Stocks — continued | |
| | | | Specialty Retail — continued | |
| | 9 | | | Group 1 Automotive, Inc. | | | 729 | |
| | 7 | | | Haverty Furniture Cos., Inc. | | | 162 | |
| | 23 | | | Lithia Motors, Inc., Class A | | | 2,229 | |
| | 28 | | | Murphy USA, Inc. (a) | | | 1,697 | |
| | 329 | | | Office Depot, Inc. | | | 1,486 | |
| | 138 | | | Rent-A-Center, Inc. | | | 1,555 | |
| | 20 | | | Select Comfort Corp. (a) | | | 459 | |
| | 44 | | | Tailored Brands, Inc. | | | 1,111 | |
| | 12 | | | Zumiez, Inc. (a) | | | 256 | |
| | | | | | | | |
| | | | | | | 26,691 | |
| | | | | | | | |
| | | | Textiles, Apparel & Luxury Goods — 1.0% | |
| | 28 | | | Carter’s, Inc. | | | 2,454 | |
| | 11 | | | Deckers Outdoor Corp. (a) | | | 609 | |
| | 15 | | | Fossil Group, Inc. (a) | | | 388 | |
| | 20 | | | Iconix Brand Group, Inc. (a) | | | 185 | |
| | 38 | | | Kate Spade & Co. (a) | | | 715 | |
| | 34 | | | Movado Group, Inc. | | | 963 | |
| | 6 | | | Oxford Industries, Inc. | | | 331 | |
| | 40 | | | Perry Ellis International, Inc. (a) | | | 1,006 | |
| | 56 | | | Skechers USA, Inc., Class A (a) | | | 1,380 | |
| | 23 | | | Steven Madden Ltd. (a) | | | 813 | |
| | 35 | | | Wolverine World Wide, Inc. | | | 777 | |
| | | | | | | | |
| | | | | | | 9,621 | |
| | | | | | | | |
| | | | Total Consumer Discretionary | | | 107,146 | |
| | | | | | | | |
| | | | Consumer Staples — 3.4% | |
| | | | Food & Staples Retailing — 0.7% | |
| | 16 | | | Casey’s General Stores, Inc. | | | 1,874 | |
| | 68 | | | SpartanNash Co. | | | 2,699 | |
| | 8 | | | Sprouts Farmers Market, Inc. (a) | | | 157 | |
| | 184 | | | SUPERVALU, Inc. (a) | | | 859 | |
| | 22 | | | United Natural Foods, Inc. (a) | | | 1,026 | |
| | | | | | | | |
| | | | | | | 6,615 | |
| | | | | | | | |
| | | | Food Products — 2.2% | |
| | 27 | | | B&G Foods, Inc. | | | 1,181 | |
| | 65 | | | Darling Ingredients, Inc. (a) | | | 835 | |
| | 141 | | | Dean Foods Co. | | | 3,060 | |
| | 74 | | | Flowers Foods, Inc. | | | 1,468 | |
| | 28 | | | Hain Celestial Group, Inc. (The) (a) | | | 1,096 | |
| | 57 | | | Ingredion, Inc. | | | 7,093 | |
| | 6 | | | J&J Snack Foods Corp. | | | 747 | |
| | 46 | | | Post Holdings, Inc. (a) | | | 3,714 | |
| | 8 | | | Sanderson Farms, Inc. | | | 747 | |
| | 12 | | | Seneca Foods Corp., Class A (a) | | | 495 | |
| | | | | | | | |
| SHARES | | | SECURITY DESCRIPTION | | VALUE($) | |
| | | | | | | | |
| | | | Food Products — continued | |
| | 17 | | | WhiteWave Foods Co. (The) (a) | | | 967 | |
| | | | | | | | |
| | | | | | | 21,403 | |
| | | | | | | | |
| | | | Household Products — 0.4% | |
| | 16 | | | Central Garden & Pet Co. (a) | | | 543 | |
| | 83 | | | Central Garden & Pet Co., Class A (a) | | | 2,558 | |
| | 25 | | | Energizer Holdings, Inc. | | | 1,126 | |
| | | | | | | | |
| | | | | | | 4,227 | |
| | | | | | | | |
| | | | Personal Products — 0.1% | |
| | 191 | | | Avon Products, Inc. (a) | | | 963 | |
| | 5 | | | Medifast, Inc. | | | 226 | |
| | | | | | | | |
| | | | | | | 1,189 | |
| | | | | | | | |
| | | | Tobacco — 0.0% (g) | |
| | 9 | | | Universal Corp. | | | 561 | |
| | | | | | | | |
| | | | Total Consumer Staples | | | 33,995 | |
| | | | | | | | |
| | | | Energy — 3.5% | |
| | | | Energy Equipment & Services — 1.5% | |
| | 164 | | | Archrock, Inc. | | | 2,159 | |
| | 22 | | | Atwood Oceanics, Inc. (a) | | | 283 | |
| | 9 | | | Bristow Group, Inc. | | | 176 | |
| | 8 | | | Dril-Quip, Inc. (a) | | | 505 | |
| | 112 | | | Ensco plc, Class A | | | 1,093 | |
| | 13 | | | Exterran Corp. (a) | | | 300 | |
| | 45 | | | Gulf Island Fabrication, Inc. | | | 533 | |
| | 47 | | | Helix Energy Solutions Group, Inc. (a) | | | 416 | |
| | 110 | | | Nabors Industries Ltd. | | | 1,804 | |
| | 38 | | | Newpark Resources, Inc. (a) | | | 284 | |
| | 96 | | | Noble Corp. plc | | | 568 | |
| | 19 | | | Oil States International, Inc. (a) | | | 724 | |
| | 60 | | | Patterson-UTI Energy, Inc. | | | 1,608 | |
| | 49 | | | Rowan Cos. plc, Class A (a) | | | 926 | |
| | 123 | | | Superior Energy Services, Inc. (a) | | | 2,083 | |
| | 14 | | | US Silica Holdings, Inc. | | | 799 | |
| | 23 | | | Unit Corp. (a) | | | 618 | |
| | | | | | | | |
| | | | | | | 14,879 | |
| | | | | | | | |
| | | | Oil, Gas & Consumable Fuels — 2.0% | |
| | 18 | | | Bill Barrett Corp. (a) | | | 123 | |
| | 5 | | | Contango Oil & Gas Co. (a) | | | 49 | |
| | 149 | | | Denbury Resources, Inc. (a) | | | 547 | |
| | 39 | | | Energen Corp. (a) | | | 2,226 | |
| | 15 | | | Green Plains, Inc. | | | 418 | |
| | 49 | | | Gulfport Energy Corp. (a) | | | 1,054 | |
| | 127 | | | HollyFrontier Corp. | | | 4,172 | |
| | 23 | | | PDC Energy, Inc. (a) | | | 1,691 | |
SEE NOTES TO FINANCIAL STATEMENTS.
| | | | | | | | |
| | | |
| DECEMBER 31, 2016 | | J.P. MORGAN EQUITY FUNDS | | | | | 17 | |
JPMorgan Market Expansion Enhanced Index Fund
SCHEDULE OF PORTFOLIO INVESTMENTS
AS OF DECEMBER 31, 2016 (Unaudited) (continued)
(Amounts in thousands)
| | | | | | | | |
| SHARES | | | SECURITY DESCRIPTION | | VALUE($) | |
| Common Stocks — continued | |
| | | | Oil, Gas & Consumable Fuels — continued | |
| | 98 | | | QEP Resources, Inc. (a) | | | 1,810 | |
| | 3 | | | REX American Resources Corp. (a) | | | 277 | |
| | 41 | | | SM Energy Co. | | | 1,396 | |
| | 71 | | | Synergy Resources Corp. (a) | | | 635 | |
| | 26 | | | Western Refining, Inc. | | | 995 | |
| | 34 | | | World Fuel Services Corp. | | | 1,560 | |
| | 215 | | | WPX Energy, Inc. (a) | | | 3,125 | |
| | | | | | | | |
| | | | | | | 20,078 | |
| | | | | | | | |
| | | | Total Energy | | | 34,957 | |
| | | | | | | | |
| | | | Financials — 16.0% | |
| | | | Banks — 8.2% | |
| | 13 | | | Ameris Bancorp | | | 576 | |
| | 130 | | | Associated Banc-Corp. | | | 3,215 | |
| | 17 | | | Banc of California, Inc. | | | 298 | |
| | 44 | | | BancorpSouth, Inc. | | | 1,361 | |
| | 26 | | | Bank of Hawaii Corp. | | | 2,345 | |
| | 22 | | | Bank of the Ozarks, Inc. | | | 1,169 | |
| | 7 | | | Banner Corp. | | | 376 | |
| | 31 | | | Boston Private Financial Holdings, Inc. | | | 516 | |
| | 29 | | | Brookline Bancorp, Inc. | | | 482 | |
| | 32 | | | Cathay General Bancorp | | | 1,230 | |
| | 25 | | | Columbia Banking System, Inc. | | | 1,137 | |
| | 2 | | | Commerce Bancshares, Inc. | | | 116 | |
| | 17 | | | Community Bank System, Inc. | | | 1,042 | |
| | 126 | | | East West Bancorp, Inc. | | | 6,427 | |
| | 308 | | | First BanCorp, (Puerto Rico) (a) | | | 2,034 | |
| | 21 | | | First Financial Bancorp | | | 587 | |
| | 50 | | | First Horizon National Corp. | | | 1,008 | |
| | 150 | | | First Midwest Bancorp, Inc. | | | 3,782 | |
| | 84 | | | Fulton Financial Corp. | | | 1,570 | |
| | 32 | | | Hancock Holding Co. | | | 1,379 | |
| | 57 | | | Hanmi Financial Corp. | | | 1,985 | |
| | 34 | | | Home BancShares, Inc. | | | 942 | |
| | 46 | | | Hope Bancorp, Inc. | | | 1,015 | |
| | 12 | | | Independent Bank Corp. | | | 837 | |
| | 15 | | | LegacyTexas Financial Group, Inc. | | | 650 | |
| | 22 | | | MB Financial, Inc. | | | 1,037 | |
| | 14 | | | NBT Bancorp, Inc. | | | 583 | |
| | 94 | | | PacWest Bancorp | | | 5,129 | |
| | 14 | | | Pinnacle Financial Partners, Inc. | | | 945 | |
| | 26 | | | PrivateBancorp, Inc. | | | 1,392 | |
| | 18 | | | Signature Bank (a) | | | 2,689 | |
| | 15 | | | Simmons First National Corp., Class A | | | 914 | |
| | 171 | | | Sterling Bancorp | | | 4,004 | |
| | 24 | | | SVB Financial Group (a) | | | 4,103 | |
| | | | | | | | |
| SHARES | | | SECURITY DESCRIPTION | | VALUE($) | |
| | | | | | | | |
| | | | Banks — continued | |
| | 125 | | | Synovus Financial Corp. | | | 5,119 | |
| | 240 | | | TCF Financial Corp. | | | 4,709 | |
| | 53 | | | Texas Capital Bancshares, Inc. (a) | | | 4,116 | |
| | 32 | | | Trustmark Corp. | | | 1,137 | |
| | 15 | | | UMB Financial Corp. | | | 1,157 | |
| | 121 | | | Umpqua Holdings Corp. | | | 2,278 | |
| | 139 | | | United Community Banks, Inc. | | | 4,117 | |
| | 22 | | | Wintrust Financial Corp. | | | 1,569 | |
| | | | | | | | |
| | | | | | | 81,077 | |
| | | | | | | | |
| | | | Capital Markets — 2.6% | |
| | 2 | | | CBOE Holdings, Inc. | | | 174 | |
| | 29 | | | Donnelley Financial Solutions, Inc. (a) | | | 673 | |
| | 20 | | | Eaton Vance Corp. | | | 850 | |
| | 56 | | | Evercore Partners, Inc., Class A | | | 3,847 | |
| | 16 | | | FactSet Research Systems, Inc. | | | 2,680 | |
| | 19 | | | Federated Investors, Inc., Class B | | | 543 | |
| | 7 | | | INTL. FCStone, Inc. (a) | | | 269 | |
| | 54 | | | Janus Capital Group, Inc. | | | 721 | |
| | 14 | | | MarketAxess Holdings, Inc. | | | 2,086 | |
| | 38 | | | MSCI, Inc. | | | 3,010 | |
| | 6 | | | Piper Jaffray Cos. (a) | | | 421 | |
| | 93 | | | Raymond James Financial, Inc. | | | 6,440 | |
| | 63 | | | SEI Investments Co. | | | 3,112 | |
| | 23 | | | Stifel Financial Corp. (a) | | | 1,170 | |
| | | | | | | | |
| | | | | | | 25,996 | |
| | | | | | | | |
| | | | Consumer Finance — 0.4% | |
| | 19 | | | EZCORP, Inc., Class A (a) | | | 201 | |
| | 45 | | | FirstCash, Inc. | | | 2,129 | |
| | 29 | | | Green Dot Corp., Class A (a) | | | 678 | |
| | 98 | | | SLM Corp. (a) | | | 1,077 | |
| | | | | | | | |
| | | | | | | 4,085 | |
| | | | | | | | |
| | | | Insurance — 4.4% | |
| | 6 | | | Alleghany Corp. (a) | | | 3,748 | |
| | 57 | | | American Financial Group, Inc. | | | 5,046 | |
| | 5 | | | AMERISAFE, Inc. | | | 319 | |
| | 64 | | | Aspen Insurance Holdings Ltd., (Bermuda) | | | 3,538 | |
| | 36 | | | Brown & Brown, Inc. | | | 1,598 | |
| | 26 | | | Everest Re Group Ltd. | | | 5,619 | |
| | 104 | | | First American Financial Corp. | | | 3,802 | |
| | 54 | | | Hanover Insurance Group, Inc. (The) | | | 4,890 | |
| | 12 | | | Maiden Holdings Ltd. | | | 208 | |
| | 3 | | | Navigators Group, Inc. (The) | | | 335 | |
| | 206 | | | Old Republic International Corp. | | | 3,906 | |
| | 51 | | | Reinsurance Group of America, Inc. | | | 6,367 | |
SEE NOTES TO FINANCIAL STATEMENTS.
| | | | | | |
| | | |
| 18 | | | | J.P. MORGAN EQUITY FUNDS | | DECEMBER 31, 2016 |
| | | | | | | | |
| SHARES | | | SECURITY DESCRIPTION | | VALUE($) | |
| Common Stocks — continued | |
| | | | Insurance — continued | |
| | 22 | | | Selective Insurance Group, Inc. | | | 938 | |
| | 7 | | | Stewart Information Services Corp. | | | 306 | |
| | 9 | | | United Fire Group, Inc. | | | 443 | |
| | 12 | | | Universal Insurance Holdings, Inc. | | | 338 | |
| | 36 | | | WR Berkley Corp. | | | 2,386 | |
| | | | | | | | |
| | | | | | | 43,787 | |
| | | | | | | | |
| | | | Thrifts & Mortgage Finance — 0.4% | |
| | 17 | | | BofI Holding, Inc. (a) | | | 497 | |
| | 30 | | | Dime Community Bancshares, Inc. | | | 607 | |
| | 34 | | | New York Community Bancorp, Inc. | | | 534 | |
| | 21 | | | Provident Financial Services, Inc. | | | 596 | |
| | 175 | | | TrustCo Bank Corp. | | | 1,527 | |
| | 12 | | | Walker & Dunlop, Inc. (a) | | | 368 | |
| | | | | | | | |
| | | | | | | 4,129 | |
| | | | | | | | |
| | | | Total Financials | | | 159,074 | |
| | | | | | | | |
| | | | Health Care — 9.4% | |
| | | | Biotechnology — 1.1% | |
| | 57 | | | Acorda Therapeutics, Inc. (a) | | | 1,062 | |
| | 46 | | | AMAG Pharmaceuticals, Inc. (a) | | | 1,601 | |
| | 7 | | | Emergent BioSolutions, Inc. (a) | | | 233 | |
| | 222 | | | Momenta Pharmaceuticals, Inc. (a) | | | 3,341 | |
| | 34 | | | United Therapeutics Corp. (a) | | | 4,816 | |
| | | | | | | | |
| | | | | | | 11,053 | |
| | | | | | | | |
| | | | Health Care Equipment & Supplies — 3.9% | |
| | 15 | | | ABIOMED, Inc. (a) | | | 1,679 | |
| | 31 | | | Align Technology, Inc. (a) | | | 2,990 | |
| | 43 | | | AngioDynamics, Inc. (a) | | | 731 | |
| | 57 | | | CryoLife, Inc. (a) | | | 1,099 | |
| | 8 | | | Cynosure, Inc., Class A (a) | | | 360 | |
| | 22 | | | Haemonetics Corp. (a) | | | 884 | |
| | 65 | | | Halyard Health, Inc. (a) | | | 2,411 | |
| | 66 | | | Hill-Rom Holdings, Inc. | | | 3,677 | |
| | 6 | | | ICU Medical, Inc. (a) | | | 855 | |
| | 37 | | | IDEXX Laboratories, Inc. (a) | | | 4,280 | |
| | 65 | | | LivaNova plc (a) | | | 2,910 | |
| | 61 | | | Masimo Corp. (a) | | | 4,091 | |
| | 56 | | | Natus Medical, Inc. (a) | | | 1,949 | |
| | 20 | | | NuVasive, Inc. (a) | | | 1,341 | |
| | 56 | | | ResMed, Inc. | | | 3,493 | |
| | 36 | | | STERIS plc | | | 2,406 | |
| | 6 | | | Surmodics, Inc. (a) | | | 155 | |
| | 17 | | | Teleflex, Inc. | | | 2,804 | |
| | 3 | | | West Pharmaceutical Services, Inc. | | | 271 | |
| | | | | | | | |
| | | | | | | 38,386 | |
| | | | | | | | |
| | | | | | | | |
| SHARES | | | SECURITY DESCRIPTION | | VALUE($) | |
| | | | | | | | |
| | | | Health Care Providers & Services — 2.9% | |
| | 15 | | | AMN Healthcare Services, Inc. (a) | | | 591 | |
| | 13 | | | BioTelemetry, Inc. (a) | | | 282 | |
| | 31 | | | Cross Country Healthcare, Inc. (a) | | | 476 | |
| | 21 | | | Envision Healthcare Corp. (a) | | | 1,351 | |
| | 37 | | | HealthSouth Corp. | | | 1,509 | |
| | 16 | | | Healthways, Inc. (a) | | | 364 | |
| | 56 | | | Kindred Healthcare, Inc. | | | 438 | |
| | 17 | | | LifePoint Health, Inc. (a) | | | 977 | |
| | 40 | | | Magellan Health, Inc. (a) | | | 3,000 | |
| | 37 | | | MEDNAX, Inc. (a) | | | 2,458 | |
| | 37 | | | Molina Healthcare, Inc. (a) | | | 2,002 | |
| | 77 | | | Owens & Minor, Inc. | | | 2,717 | |
| | 61 | | | PharMerica Corp. (a) | | | 1,542 | |
| | 39 | | | Tenet Healthcare Corp. (a) | | | 573 | |
| | 65 | | | VCA, Inc. (a) | | | 4,487 | |
| | 40 | | | WellCare Health Plans, Inc. (a) | | | 5,483 | |
| | | | | | | | |
| | | | | | | 28,250 | |
| | | | | | | | |
| | | | Health Care Technology — 0.3% | |
| | 170 | | | Allscripts Healthcare Solutions, Inc. (a) | | | 1,732 | |
| | 37 | | | HMS Holdings Corp. (a) | | | 663 | |
| | 13 | | | Omnicell, Inc. (a) | | | 444 | |
| | | | | | | | |
| | | | | | | 2,839 | |
| | | | | | | | |
| | | | Life Sciences Tools & Services — 0.4% | |
| | 11 | | | Albany Molecular Research, Inc. (a) | | | 210 | |
| | 13 | | | Cambrex Corp. (a) | | | 690 | |
| | 22 | | | Charles River Laboratories International, Inc. (a) | | | 1,707 | |
| | 23 | | | PAREXEL International Corp. (a) | | | 1,494 | |
| | | | | | | | |
| | | | | | | 4,101 | |
| | | | | | | | |
| | | | Pharmaceuticals — 0.8% | |
| | 74 | | | Akorn, Inc. (a) | | | 1,622 | |
| | 38 | | | Catalent, Inc. (a) | | | 1,025 | |
| | 19 | | | Depomed, Inc. (a) | | | 346 | |
| | 138 | | | Impax Laboratories, Inc. (a) | | | 1,822 | |
| | 59 | | | Medicines Co. (The) (a) | | | 2,009 | |
| | 20 | | | Prestige Brands Holdings, Inc. (a) | | | 1,030 | |
| | 15 | | | Supernus Pharmaceuticals, Inc. (a) | | | 379 | |
| | | | | | | | |
| | | | | | | 8,233 | |
| | | | | | | | |
| | | | Total Health Care | | | 92,862 | |
| | | | | | | | |
| | | | Industrials — 15.4% | |
| | | | Aerospace & Defense — 1.3% | |
| | 11 | | | AAR Corp. | | | 379 | |
| | 25 | | | Aerojet Rocketdyne Holdings, Inc. (a) | | | 450 | |
| | 3 | | | B/E Aerospace, Inc. | | | 165 | |
SEE NOTES TO FINANCIAL STATEMENTS.
| | | | | | | | |
| | | |
| DECEMBER 31, 2016 | | J.P. MORGAN EQUITY FUNDS | | | | | 19 | |
JPMorgan Market Expansion Enhanced Index Fund
SCHEDULE OF PORTFOLIO INVESTMENTS
AS OF DECEMBER 31, 2016 (Unaudited) (continued)
(Amounts in thousands)
| | | | | | | | |
| SHARES | | | SECURITY DESCRIPTION | | VALUE($) | |
| Common Stocks — continued | |
| | | | Aerospace & Defense — continued | |
| | 18 | | | Curtiss-Wright Corp. | | | 1,741 | |
| | 8 | | | Engility Holdings, Inc. (a) | | | 261 | |
| | 36 | | | Huntington Ingalls Industries, Inc. | | | 6,697 | |
| | 23 | | | Moog, Inc., Class A (a) | | | 1,542 | |
| | 14 | | | Orbital ATK, Inc. | | | 1,194 | |
| | | | | | | | |
| | | | | | | 12,429 | |
| | | | | | | | |
| | | | Air Freight & Logistics — 0.3% | |
| | 78 | | | Hub Group, Inc., Class A (a) | | | 3,393 | |
| | | | | | | | |
| | | | Airlines — 0.7% | |
| | 5 | | | Allegiant Travel Co. | | | 882 | |
| | 22 | | | Hawaiian Holdings, Inc. (a) | | | 1,254 | |
| | 173 | | | JetBlue Airways Corp. (a) | | | 3,881 | |
| | 36 | | | SkyWest, Inc. | | | 1,327 | |
| | | | | | | | |
| | | | | | | 7,344 | |
| | | | | | | | |
| | | | Building Products — 1.2% | |
| | 6 | | | American Woodmark Corp. (a) | | | 437 | |
| | 102 | | | AO Smith Corp. | | | 4,811 | |
| | 13 | | | Gibraltar Industries, Inc. (a) | | | 537 | |
| | 21 | | | Lennox International, Inc. | | | 3,225 | |
| | 27 | | | Universal Forest Products, Inc. | | | 2,778 | |
| | | | | | | | |
| | | | | | | 11,788 | |
| | | | | | | | |
| | | | Commercial Services & Supplies — 1.9% | |
| | 23 | | | ABM Industries, Inc. | | | 922 | |
| | 74 | | | Brink’s Co. (The) | | | 3,044 | |
| | 40 | | | Copart, Inc. (a) | | | 2,211 | |
| | 83 | | | Essendant, Inc. | | | 1,738 | |
| | 24 | | | Herman Miller, Inc. | | | 806 | |
| | 17 | | | HNI Corp. | | | 938 | |
| | 26 | | | Interface, Inc. | | | 490 | |
| | 29 | | | LSC Communications, Inc. | | | 869 | |
| | 78 | | | RR Donnelley & Sons Co. | | | 1,280 | |
| | 106 | | | Tetra Tech, Inc. | | | 4,564 | |
| | 50 | | | Viad Corp. | | | 2,198 | |
| | | | | | | | |
| | | | | | | 19,060 | |
| | | | | | | | |
| | | | Construction & Engineering — 1.8% | |
| | 123 | | | AECOM (a) | | | 4,468 | |
| | 90 | | | Aegion Corp. (a) | | | 2,136 | |
| | 14 | | | Comfort Systems USA, Inc. | | | 474 | |
| | 56 | | | EMCOR Group, Inc. | | | 3,939 | |
| | 161 | | | KBR, Inc. | | | 2,687 | |
| | 69 | | | MYR Group, Inc. (a) | | | 2,588 | |
| | 10 | | | Orion Group Holdings, Inc. (a) | | | 100 | |
| | 9 | | | Valmont Industries, Inc. | | | 1,254 | |
| | | | | | | | |
| | | | | | | 17,646 | |
| | | | | | | | |
| | | | | | | | |
| SHARES | | | SECURITY DESCRIPTION | | VALUE($) | |
| | | | | | | | |
| | | | Electrical Equipment — 1.3% | |
| | 58 | | | EnerSys | | | 4,501 | |
| | 120 | | | General Cable Corp. | | | 2,286 | |
| | 21 | | | Hubbell, Inc. | | | 2,472 | |
| | 5 | | | Powell Industries, Inc. | | | 183 | |
| | 54 | | | Regal Beloit Corp. | | | 3,770 | |
| | | | | | | | |
| | | | | | | 13,212 | |
| | | | | | | | |
| | | | Industrial Conglomerates — 0.5% | |
| | 48 | | | Carlisle Cos., Inc. | | | 5,308 | |
| | | | | | | | |
| | | | Machinery — 3.4% | |
| | 33 | | | AGCO Corp. | | | 1,893 | |
| | 73 | | | Barnes Group, Inc. | | | 3,476 | |
| | 17 | | | Briggs & Stratton Corp. | | | 372 | |
| | 63 | | | Crane Co. | | | 4,523 | |
| | 24 | | | Federal Signal Corp. | | | 375 | |
| | 58 | | | Greenbrier Cos., Inc. (The) | | | 2,422 | |
| | 35 | | | Harsco Corp. (a) | | | 475 | |
| | 25 | | | IDEX Corp. | | | 2,269 | |
| | 83 | | | ITT, Inc. | | | 3,186 | |
| | 41 | | | Joy Global, Inc. | | | 1,134 | |
| | 31 | | | Kennametal, Inc. | | | 957 | |
| | 11 | | | Lincoln Electric Holdings, Inc. | | | 851 | |
| | 6 | | | Lydall, Inc. (a) | | | 384 | |
| | 23 | | | Mueller Industries, Inc. | | | 911 | |
| | 30 | | | Oshkosh Corp. | | | 1,945 | |
| | 15 | | | SPX Corp. (a) | | | 358 | |
| | 16 | | | SPX FLOW, Inc. (a) | | | 506 | |
| | 5 | | | Standex International Corp. | | | 457 | |
| | 74 | | | Terex Corp. | | | 2,336 | |
| | 31 | | | Timken Co. (The) | | | 1,249 | |
| | 14 | | | Toro Co. (The) | | | 761 | |
| | 61 | | | Trinity Industries, Inc. | | | 1,693 | |
| | 8 | | | Wabtec Corp. | | | 675 | |
| | 4 | | | Watts Water Technologies, Inc., Class A | | | 287 | |
| | | | | | | | |
| | | | | | | 33,495 | |
| | | | | | | | |
| | | | Marine — 0.1% | |
| | 18 | | | Matson, Inc. | | | 644 | |
| | | | | | | | |
| | | | Professional Services — 1.4% | |
| | 12 | | | CEB, Inc. | | | 750 | |
| | 18 | | | FTI Consulting, Inc. (a) | | | 828 | |
| | 44 | | | Heidrick & Struggles International, Inc. | | | 1,070 | |
| | 39 | | | Insperity, Inc. | | | 2,767 | |
| | 13 | | | Kelly Services, Inc., Class A | | | 296 | |
| | 56 | | | ManpowerGroup, Inc. | | | 5,020 | |
| | 16 | | | On Assignment, Inc. (a) | | | 724 | |
SEE NOTES TO FINANCIAL STATEMENTS.
| | | | | | |
| | | |
| 20 | | | | J.P. MORGAN EQUITY FUNDS | | DECEMBER 31, 2016 |
| | | | | | | | |
| SHARES | | | SECURITY DESCRIPTION | | VALUE($) | |
| Common Stocks — continued | |
| | | | Professional Services — continued | |
| | 48 | | | Resources Connection, Inc. | | | 932 | |
| | 44 | | | TrueBlue, Inc. (a) | | | 1,081 | |
| | 6 | | | WageWorks, Inc. (a) | | | 428 | |
| | | | | | | | |
| | | | | | | 13,896 | |
| | | | | | | | |
| | | | Road & Rail — 0.6% | |
| | 85 | | | ArcBest Corp. | | | 2,350 | |
| | 33 | | | Landstar System, Inc. | | | 2,821 | |
| | 9 | | | Saia, Inc. (a) | | | 397 | |
| | | | | | | | |
| | | | | | | 5,568 | |
| | | | | | | | |
| | | | Trading Companies & Distributors — 0.9% | |
| | 16 | | | Applied Industrial Technologies, Inc. | | | 974 | |
| | 5 | | | DXP Enterprises, Inc. (a) | | | 184 | |
| | 19 | | | MSC Industrial Direct Co., Inc., Class A | | | 1,756 | |
| | 149 | | | NOW, Inc. (a) | | | 3,042 | |
| | 28 | | | Veritiv Corp. (a) | | | 1,521 | |
| | 10 | | | Watsco, Inc. | | | 1,511 | |
| | | | | | | | |
| | | | | | | 8,988 | |
| | | | | | | | |
| | | | Total Industrials | | | 152,771 | |
| | | | | | | | |
| | | | Information Technology — 17.8% | |
| | | | Communications Equipment — 1.1% | |
| | 70 | | | ARRIS International plc (a) | | | 2,106 | |
| | 49 | | | Bel Fuse, Inc., Class B | | | 1,499 | |
| | 13 | | | Black Box Corp. | | | 201 | |
| | 47 | | | Ciena Corp. (a) | | | 1,142 | |
| | 5 | | | Comtech Telecommunications Corp. | | | 64 | |
| | 56 | | | Digi International, Inc. (a) | | | 770 | |
| | 13 | | | InterDigital, Inc. | | | 1,215 | |
| | 19 | | | Ixia (a) | | | 303 | |
| | 17 | | | Lumentum Holdings, Inc. (a) | | | 661 | |
| | 14 | | | NETGEAR, Inc. (a) | | | 742 | |
| | 17 | | | Plantronics, Inc. | | | 947 | |
| | 99 | | | Viavi Solutions, Inc. (a) | | | 809 | |
| | | | | | | | |
| | | | | | | 10,459 | |
| | | | | | | | |
| | | | Electronic Equipment, Instruments & Components — 4.9% | |
| | 11 | | | Anixter International, Inc. (a) | | | 867 | |
| | 94 | | | Arrow Electronics, Inc. (a) | | | 6,727 | |
| | 117 | | | Avnet, Inc. | | | 5,587 | |
| | 16 | | | Belden, Inc. | | | 1,205 | |
| | 21 | | | Benchmark Electronics, Inc. (a) | | | 641 | |
| | 9 | | | Coherent, Inc. (a) | | | 1,304 | |
| | 96 | | | Electro Scientific Industries, Inc. (a) | | | 567 | |
| | 56 | | | Fabrinet, (Thailand) (a) | | | 2,237 | |
| | 7 | | | FARO Technologies, Inc. (a) | | | 266 | |
| | | | | | | | |
| SHARES | | | SECURITY DESCRIPTION | | VALUE($) | |
| | | | | | | | |
| | | | Electronic Equipment, Instruments &
Components — continued | |
| | 18 | | | Gerber Scientific, Inc. (a) | | | — | |
| | 6 | | | II-VI, Inc. (a) | | | 170 | |
| | 79 | | | Insight Enterprises, Inc. (a) | | | 3,211 | |
| | 16 | | | Itron, Inc. (a) | | | 980 | |
| | 76 | | | Jabil Circuit, Inc. | | | 1,797 | |
| | 112 | | | Keysight Technologies, Inc. (a) | | | 4,081 | |
| | 9 | | | Littelfuse, Inc. | | | 1,306 | |
| | 68 | | | Methode Electronics, Inc. | | | 2,793 | |
| | 8 | | | Park Electrochemical Corp. | | | 153 | |
| | 56 | | | Plexus Corp. (a) | | | 3,037 | |
| | 6 | | | Rogers Corp. (a) | | | 484 | |
| | 62 | | | Sanmina Corp. (a) | | | 2,258 | |
| | 17 | | | SYNNEX Corp. | | | 2,082 | |
| | 33 | | | Tech Data Corp. (a) | | | 2,811 | |
| | 83 | | | Trimble, Inc. (a) | | | 2,492 | |
| | 86 | | | TTM Technologies, Inc. (a) | | | 1,172 | |
| | 55 | | | Vishay Intertechnology, Inc. | | | 899 | |
| | | | | | | | |
| | | | | | | 49,127 | |
| | | | | | | | |
| | | | Internet Software & Services — 0.6% | |
| | 17 | | | Blucora, Inc. (a) | | | 246 | |
| | 17 | | | comScore, Inc. (a) | | | 550 | |
| | 11 | | | j2 Global, Inc. | | | 883 | |
| | 35 | | | Liquidity Services, Inc. (a) | | | 341 | |
| | 126 | | | LivePerson, Inc. (a) | | | 953 | |
| | 10 | | | LogMeIn, Inc. | | | 946 | |
| | 23 | | | NIC, Inc. | | | 538 | |
| | 8 | | | Shutterstock, Inc. (a) | | | 380 | |
| | 6 | | | Stamps.com, Inc. (a) | | | 699 | |
| | 15 | | | WebMD Health Corp. (a) | | | 749 | |
| | | | | | | | |
| | | | | | | 6,285 | |
| | | | | | | | |
| | | | IT Services — 3.8% | |
| | 90 | | | Broadridge Financial Solutions, Inc. | | | 5,994 | |
| | 13 | | | CACI International, Inc., Class A (a) | | | 1,642 | |
| | 18 | | | Cardtronics plc, Class A (a) | | | 1,008 | |
| | 127 | | | Computer Sciences Corp. | | | 7,558 | |
| | 38 | | | Convergys Corp. | | | 936 | |
| | 89 | | | CoreLogic, Inc. (a) | | | 3,289 | |
| | 12 | | | DST Systems, Inc. | | | 1,318 | |
| | 38 | | | ExlService Holdings, Inc. (a) | | | 1,935 | |
| | 13 | | | Gartner, Inc. (a) | | | 1,354 | |
| | 65 | | | Leidos Holdings, Inc. | | | 3,319 | |
| | 10 | | | ManTech International Corp., Class A | | | 406 | |
| | 21 | | | NeuStar, Inc., Class A (a) | | | 712 | |
| | 12 | | | Perficient, Inc. (a) | | | 215 | |
SEE NOTES TO FINANCIAL STATEMENTS.
| | | | | | | | |
| | | |
| DECEMBER 31, 2016 | | J.P. MORGAN EQUITY FUNDS | | | | | 21 | |
JPMorgan Market Expansion Enhanced Index Fund
SCHEDULE OF PORTFOLIO INVESTMENTS
AS OF DECEMBER 31, 2016 (Unaudited) (continued)
(Amounts in thousands)
| | | | | | | | |
| SHARES | | | SECURITY DESCRIPTION | | VALUE($) | |
| Common Stocks — continued | |
| | | | IT Services — continued | |
| | 52 | | | Science Applications International Corp. | | | 4,401 | |
| | 83 | | | Sykes Enterprises, Inc. (a) | | | 2,400 | |
| | 15 | | | WEX, Inc. (a) | | | 1,685 | |
| | | | | | | | |
| | | | | | | 38,172 | |
| | | | | | | | |
| | | | Semiconductors & Semiconductor Equipment — 2.7% | |
| | 17 | | | Advanced Energy Industries, Inc. (a) | | | 947 | |
| | 246 | | | Advanced Micro Devices, Inc. (a) | | | 2,788 | |
| | 9 | | | Cabot Microelectronics Corp. | | | 584 | |
| | 25 | | | Cirrus Logic, Inc. (a) | | | 1,427 | |
| | 68 | | | Cohu, Inc. | | | 948 | |
| | 56 | | | Integrated Device Technology, Inc. (a) | | | 1,312 | |
| | 28 | | | Intersil Corp., Class A | | | 633 | |
| | 201 | | | Kulicke & Soffa Industries, Inc., (Singapore) (a) | | | 3,205 | |
| | 54 | | | Microsemi Corp. (a) | | | 2,893 | |
| | 25 | | | MKS Instruments, Inc. | | | 1,460 | |
| | 45 | | | Nanometrics, Inc. (a) | | | 1,133 | |
| | 99 | | | Rudolph Technologies, Inc. (a) | | | 2,319 | |
| | 38 | | | Semtech Corp. (a) | | | 1,212 | |
| | 14 | | | Synaptics, Inc. (a) | | | 766 | |
| | 180 | | | Teradyne, Inc. | | | 4,580 | |
| | 10 | | | Ultratech, Inc. (a) | | | 251 | |
| | | | | | | | |
| | | | | | | 26,458 | |
| | | | | | | | |
| | | | Software — 4.1% | |
| | 33 | | | 8x8, Inc. (a) | | | 476 | |
| | 49 | | | ACI Worldwide, Inc. (a) | | | 893 | |
| | 12 | | | ANSYS, Inc. (a) | | | 1,128 | |
| | 133 | | | Cadence Design Systems, Inc. (a) | | | 3,355 | |
| | 94 | | | CDK Global, Inc. | | | 5,611 | |
| | 16 | | | CommVault Systems, Inc. (a) | | | 843 | |
| | 14 | | | Fair Isaac Corp. | | | 1,699 | |
| | 68 | | | Fortinet, Inc. (a) | | | 2,048 | |
| | 77 | | | Mentor Graphics Corp. | | | 2,848 | |
| | 4 | | | MicroStrategy, Inc., Class A (a) | | | 761 | |
| | 82 | | | Progress Software Corp. | | | 2,631 | |
| | 45 | | | PTC, Inc. (a) | | | 2,069 | |
| | 10 | | | Qualys, Inc. (a) | | | 301 | |
| | 27 | | | Synchronoss Technologies, Inc. (a) | | | 1,019 | |
| | 123 | | | Synopsys, Inc. (a) | | | 7,229 | |
| | 91 | | | Take-Two Interactive Software, Inc. (a) | | | 4,508 | |
| | 80 | | | TiVo Corp. (a) | | | 1,668 | |
| | 8 | | | Tyler Technologies, Inc. (a) | | | 1,099 | |
| | 10 | | | VASCO Data Security International, Inc. (a) | | | 134 | |
| | | | | | | | |
| | | | | | | 40,320 | |
| | | | | | | | |
| | | | | | | | |
| SHARES | | | SECURITY DESCRIPTION | | VALUE($) | |
| | | | | | | | |
| | | | Technology Hardware, Storage & Peripherals — 0.6% | |
| | 44 | | | 3D Systems Corp. (a) | | | 590 | |
| | 136 | | | NCR Corp. (a) | | | 5,496 | |
| | | | | | | | |
| | | | | | | 6,086 | |
| | | | | | | | |
| | | | Total Information Technology | | | 176,907 | |
| | | | | | | | |
| | | | Materials — 7.0% | |
| | | | Chemicals — 3.3% | |
| | 12 | | | American Vanguard Corp. | | | 230 | |
| | 25 | | | Ashland Global Holdings, Inc. | | | 2,730 | |
| | 51 | | | Cabot Corp. | | | 2,580 | |
| | 100 | | | Chemours Co. (The) | | | 2,207 | |
| | 44 | | | FutureFuel Corp. | | | 607 | |
| | 21 | | | HB Fuller Co. | | | 990 | |
| | 24 | | | Ingevity Corp. (a) | | | 1,339 | |
| | 60 | | | Innophos Holdings, Inc. | | | 3,125 | |
| | 50 | | | Innospec, Inc. | | | 3,425 | |
| | 46 | | | Koppers Holdings, Inc. (a) | | | 1,846 | |
| | 15 | | | Minerals Technologies, Inc. | | | 1,193 | |
| | 8 | | | Olin Corp. | | | 196 | |
| | 34 | | | PolyOne Corp. | | | 1,102 | |
| | 5 | | | Quaker Chemical Corp. | | | 654 | |
| | 16 | | | Rayonier Advanced Materials, Inc. | | | 250 | |
| | 79 | | | RPM International, Inc. | | | 4,241 | |
| | 18 | | | Scotts Miracle-Gro Co. (The), Class A | | | 1,672 | |
| | 36 | | | Stepan Co. | | | 2,915 | |
| | 14 | | | Valspar Corp. (The) | | | 1,405 | |
| | | | | | | | |
| | | | | | | 32,707 | |
| | | | | | | | |
| | | | Construction Materials — 0.3% | |
| | 19 | | | Eagle Materials, Inc. | | | 1,911 | |
| | 29 | | | Headwaters, Inc. (a) | | | 677 | |
| | 5 | | | US Concrete, Inc. (a) | | | 341 | |
| | | | | | | | |
| | | | | | | 2,929 | |
| | | | | | | | |
| | | | Containers & Packaging — 1.1% | |
| | 7 | | | AptarGroup, Inc. | | | 529 | |
| | 21 | | | Bemis Co., Inc. | | | 1,000 | |
| | 47 | | | Greif, Inc., Class A | | | 2,391 | |
| | 66 | | | Packaging Corp. of America | | | 5,577 | |
| | 25 | | | Sonoco Products Co. | | | 1,296 | |
| | | | | | | | |
| | | | | | | 10,793 | |
| | | | | | | | |
| | | | Metals & Mining — 1.6% | |
| | 185 | | | AK Steel Holding Corp. (a) | | | 1,888 | |
| | 20 | | | Carpenter Technology Corp. | | | 712 | |
| | 97 | | | Commercial Metals Co. | | | 2,123 | |
| | 7 | | | Kaiser Aluminum Corp. | | | 572 | |
SEE NOTES TO FINANCIAL STATEMENTS.
| | | | | | |
| | | |
| 22 | | | | J.P. MORGAN EQUITY FUNDS | | DECEMBER 31, 2016 |
| | | | | | | | |
| SHARES | | | SECURITY DESCRIPTION | | VALUE($) | |
| Common Stocks — continued | |
| | | | Metals & Mining — continued | |
| | 4 | | | Olympic Steel, Inc. | | | 97 | |
| | 43 | | | Reliance Steel & Aluminum Co. | | | 3,419 | |
| | 21 | | | Royal Gold, Inc. | | | 1,337 | |
| | 126 | | | Steel Dynamics, Inc. | | | 4,481 | |
| | 27 | | | SunCoke Energy, Inc. (a) | | | 311 | |
| | 19 | | | Worthington Industries, Inc. | | | 903 | |
| | | | | | | | |
| | | | | | | 15,843 | |
| | | | | | | | |
| | | | Paper & Forest Products — 0.7% | |
| | 16 | | | Boise Cascade Co. (a) | | | 360 | |
| | 7 | | | Clearwater Paper Corp. (a) | | | 433 | |
| | 25 | | | Domtar Corp. | | | 978 | |
| | 18 | | | KapStone Paper and Packaging Corp. | | | 402 | |
| | 61 | | | Louisiana-Pacific Corp. (a) | | | 1,145 | |
| | 7 | | | Neenah Paper, Inc. | | | 622 | |
| | 17 | | | PH Glatfelter Co. | | | 404 | |
| | 63 | | | Schweitzer-Mauduit International, Inc. | | | 2,847 | |
| | | | | | | | |
| | | | | | | 7,191 | |
| | | | | | | | |
| | | | Total Materials | | | 69,463 | |
| | | | | | | | |
| | | | Real Estate — 9.1% | |
| | | | Equity Real Estate Investment Trusts (REITs) — 8.4% | |
| | 17 | | | Acadia Realty Trust | | | 570 | |
| | 25 | | | Alexandria Real Estate Equities, Inc. | | | 2,739 | |
| | 14 | | | American Assets Trust, Inc. | | | 607 | |
| | 85 | | | American Campus Communities, Inc. | | | 4,238 | |
| | 36 | | | Camden Property Trust | | | 2,998 | |
| | 58 | | | Care Capital Properties, Inc. | | | 1,457 | |
| | 28 | | | Cedar Realty Trust, Inc. | | | 182 | |
| | 21 | | | Chesapeake Lodging Trust | | | 538 | |
| | 99 | | | Communications Sales & Leasing, Inc. | | | 2,518 | |
| | 14 | | | CoreSite Realty Corp. | | | 1,127 | |
| | 111 | | | Corporate Office Properties Trust | | | 3,451 | |
| | 111 | | | Cousins Properties, Inc. | | | 946 | |
| | 27 | | | DCT Industrial Trust, Inc. | | | 1,293 | |
| | 174 | | | DiamondRock Hospitality Co. | | | 2,002 | |
| | 73 | | | Douglas Emmett, Inc. | | | 2,673 | |
| | 124 | | | Duke Realty Corp. | | | 3,304 | |
| | 4 | | | EastGroup Properties, Inc. | | | 270 | |
| | 19 | | | EPR Properties | | | 1,329 | |
| | 10 | | | Equity One, Inc. | | | 300 | |
| | 47 | | | First Industrial Realty Trust, Inc. | | | 1,304 | |
| | 28 | | | Franklin Street Properties Corp. | | | 369 | |
| | 10 | | | Getty Realty Corp. | | | 267 | |
| | 15 | | | Government Properties Income Trust | | | 289 | |
| | 23 | | | Healthcare Realty Trust, Inc. | | | 694 | |
| | 74 | | | Highwoods Properties, Inc. | | | 3,755 | |
| | | | | | | | |
| SHARES | | | SECURITY DESCRIPTION | | VALUE($) | |
| | | | | | | | |
| | | | Equity Real Estate Investment Trusts (REITs) — continued | |
| | 141 | | | Hospitality Properties Trust | | | 4,480 | |
| | 37 | | | Kilroy Realty Corp. | | | 2,735 | |
| | 119 | | | Kite Realty Group Trust | | | 2,783 | |
| | 45 | | | Liberty Property Trust | | | 1,781 | |
| | 12 | | | Life Storage, Inc. | | | 1,038 | |
| | 105 | | | Mack-Cali Realty Corp. | | | 3,061 | |
| | 96 | | | Medical Properties Trust, Inc. | | | 1,175 | |
| | 14 | | | Parkway, Inc. (a) | | | 308 | |
| | 30 | | | PS Business Parks, Inc. | | | 3,479 | |
| | 130 | | | Rayonier, Inc. | | | 3,463 | |
| | 35 | | | Regency Centers Corp. | | | 2,444 | |
| | 39 | | | Retail Opportunity Investments Corp. | | | 818 | |
| | 5 | | | Saul Centers, Inc. | | | 312 | |
| | 177 | | | Senior Housing Properties Trust | | | 3,351 | |
| | 227 | | | Summit Hotel Properties, Inc. | | | 3,637 | |
| | 37 | | | Tanger Factory Outlet Centers, Inc. | | | 1,320 | |
| | 53 | | | Taubman Centers, Inc. | | | 3,895 | |
| | 9 | | | Urstadt Biddle Properties, Inc., Class A | | | 222 | |
| | 198 | | | Washington Prime Group, Inc. | | | 2,064 | |
| | 48 | | | Weingarten Realty Investors | | | 1,717 | |
| | | | | | | | |
| | | | | | | 83,303 | |
| | | | | | | | |
| | | | Real Estate Management & Development — 0.7% | |
| | 19 | | | Alexander & Baldwin, Inc. | | | 841 | |
| | 13 | | | Forestar Group, Inc. (a) | | | 168 | |
| | 45 | | | HFF, Inc., Class A | | | 1,351 | |
| | 37 | | | Jones Lang LaSalle, Inc. | | | 3,712 | |
| | 7 | | | RE/MAX Holdings, Inc., Class A | | | 386 | |
| | | | | | | | |
| | | | | | | 6,458 | |
| | | | | | | | |
| | | | Total Real Estate | | | 89,761 | |
| | | | | | | | |
| | | | Telecommunication Services — 0.6% | |
| | | | Diversified Telecommunication Services — 0.2% | |
| | 4 | | | ATN International, Inc. | | | 345 | |
| | 62 | | | Inteliquent, Inc. | | | 1,416 | |
| | | | | | | | |
| | | | | | | 1,761 | |
| | | | | | | | |
| | | | Wireless Telecommunication Services — 0.4% | |
| | 36 | | | Spok Holdings, Inc. | | | 749 | |
| | 107 | | | Telephone & Data Systems, Inc. | | | 3,095 | |
| | | | | | | | |
| | | | | | | 3,844 | |
| | | | | | | | |
| | | | Total Telecommunication Services | | | 5,605 | |
| | | | | | | | |
| | | | Utilities — 4.4% | |
| | | | Electric Utilities — 1.8% | |
| | 31 | | | ALLETE, Inc. | | | 1,964 | |
| | 33 | | | El Paso Electric Co. | | | 1,557 | |
SEE NOTES TO FINANCIAL STATEMENTS.
| | | | | | | | |
| | | |
| DECEMBER 31, 2016 | | J.P. MORGAN EQUITY FUNDS | | | | | 23 | |
JPMorgan Market Expansion Enhanced Index Fund
SCHEDULE OF PORTFOLIO INVESTMENTS
AS OF DECEMBER 31, 2016 (Unaudited) (continued)
(Amounts in thousands, except number of Futures contracts)
| | | | | | | | |
| SHARES | | | SECURITY DESCRIPTION | | VALUE($) | |
| Common Stocks — continued | |
| | | | Electric Utilities — continued | |
| | 119 | | | Great Plains Energy, Inc. | | | 3,252 | |
| | 78 | | | Hawaiian Electric Industries, Inc. | | | 2,576 | |
| | 35 | | | IDACORP, Inc. | | | 2,833 | |
| | 153 | | | OGE Energy Corp. | | | 5,112 | |
| | 11 | | | Westar Energy, Inc. | | | 603 | |
| | | | | | | | |
| | | | | | | 17,897 | |
| | | | | | | | |
| | | | Gas Utilities — 1.6% | |
| | 82 | | | Atmos Energy Corp. | | | 6,070 | |
| | 17 | | | National Fuel Gas Co. | | | 987 | |
| | 5 | | | New Jersey Resources Corp. | | | 171 | |
| | 20 | | | Southwest Gas Corp. | | | 1,552 | |
| | 2 | | | Spire, Inc. | | | 155 | |
| | 149 | | | UGI Corp. | | | 6,888 | |
| | 4 | | | WGL Holdings, Inc. | | | 267 | |
| | | | | | | | |
| | | | | | | 16,090 | |
| | | | | | | | |
| | | | Multi-Utilities — 0.9% | |
| | 36 | | | Avista Corp. | | | 1,428 | |
| | 92 | | | MDU Resources Group, Inc. | | | 2,635 | |
| | 18 | | | NorthWestern Corp. | | | 1,015 | |
| | 75 | | | Vectren Corp. | | | 3,937 | |
| | | | | | | | |
| | | | | | | 9,015 | |
| | | | | | | | |
| | | | | | | | |
| SHARES | | | SECURITY DESCRIPTION | | VALUE($) | |
| | | | | | | | |
| | | | Water Utilities — 0.1% | |
| | 15 | | | American States Water Co. | | | 694 | |
| | | | | | | | |
| | | | Total Utilities | | | 43,696 | |
| | | | | | | | |
| | | | Total Common Stocks
(Cost $645,473) | | | 966,237 | |
| | | | | | | | |
| Short-Term Investment — 2.9% | | | | |
| | | | Investment Company — 2.9% | | | | |
| | 28,730 | | | JPMorgan U.S. Government Money Market Fund, Institutional Class Shares, 0.410% (b) (l) (Cost $28,730) | | | 28,730 | |
| | | | | | | | |
| | | | Total Investments — 100.3%
(Cost $674,203) | | | 994,967 | |
| | | | Liabilities in Excess of
Other Assets — (0.3)% | | | (3,041 | ) |
| | | | | | | | |
| | | | NET ASSETS — 100.0% | | $ | 991,926 | |
| | | | | | | | |
Percentages indicated are based on net assets.
| | | | | | | | | | | | | | | | | | | | | | | | |
| Futures Contracts | |
| | | | NUMBER OF
CONTRACTS | | | DESCRIPTION | | EXPIRATION
DATE | | | TRADING
CURRENCY | | | NOTIONAL VALUE AT
DECEMBER 31, 2016 | | | NET UNREALIZED
APPRECIATION
(DEPRECIATION) | |
| | | | | | | | Long Futures Outstanding | |
| | | | | 82 | | | E-mini Russell 2000 | | | 03/17/17 | | | | USD | | | $ | 5,563 | | | $ | (61 | ) |
| | | | | 101 | | | E-mini S&P MidCap 400 | | | 03/17/17 | | | | USD | | | | 16,757 | | | | (166 | ) |
| | | | | | | | | | | | | | | | | | | | | | | | |
| | | | | | | | | | | | | | | | | | | | | | $ | (227 | ) |
| | | | | | | | | | | | | | | | | | | | | | | | |
SEE NOTES TO FINANCIAL STATEMENTS.
| | | | | | |
| | | |
| 24 | | | | J.P. MORGAN EQUITY FUNDS | | DECEMBER 31, 2016 |
J.P. Morgan Equity Funds
NOTES TO SCHEDULES OF PORTFOLIO INVESTMENTS
AS OF DECEMBER 31, 2016 (Unaudited)
| | |
| USD | | — United States Dollar |
| |
| (a) | | — Non-income producing security. |
| (b) | | — Investment in affiliate. Money market fund is registered under the Investment Company Act of 1940, as amended, and advised by J.P. Morgan Investment Management Inc. |
| (g) | | — Amount rounds to less than 0.05%. |
| | |
| (h) | | — Amount rounds to less than 500. |
| (k) | | — All or a portion of this security is deposited with the broker as initial margin for future contracts. |
| (l) | | — The rate shown is the current yield as of December 31, 2016. |
| (q) | | — Investment in affiliate which is a security in the Fund’s index. |
SEE NOTES TO FINANCIAL STATEMENTS.
| | | | | | | | |
| | | |
| DECEMBER 31, 2016 | | J.P. MORGAN EQUITY FUNDS | | | | | 25 | |
STATEMENTS OF ASSETS AND LIABILITIES
AS OF DECEMBER 31, 2016 (Unaudited)
(Amounts in thousands, except per share amounts)
| | | | | | | | |
| | | Equity Index
Fund | | | Market
Expansion
Enhanced
Index Fund | |
ASSETS: | |
Investments in non-affiliates, at value | | $ | 1,655,520 | | | $ | 966,237 | |
Investments in affiliates, at value | | | 30,870 | | | | 28,730 | |
| | | | | | | | |
Total investment securities, at value | | | 1,686,390 | | | | 994,967 | |
Cash | | | 35 | | | | 2 | |
Deposits at broker for futures contracts | | | — | | | | 1,242 | |
Receivables: | | | | | | | | |
Investment securities sold | | | — | | | | 2,405 | |
Fund shares sold | | | 4,713 | | | | 2,588 | |
Dividends from non-affiliates | | | 2,172 | | | | 1,171 | |
Dividends from affiliates | | | 2 | | | | 7 | |
Due from Adviser | | | 4 | | | | — | |
| | | | | | | | |
Total Assets | | | 1,693,316 | | | | 1,002,382 | |
| | | | | | | | |
| | |
LIABILITIES: | | | | | | | | |
Payables: | | | | | | | | |
Investment securities purchased | | | — | | | | 938 | |
Fund shares redeemed | | | 6,754 | | | | 8,925 | |
Variation margin on futures contracts | | | 16 | | | | 121 | |
Accrued liabilities: | | | | | | | | |
Investment advisory fees | | | — | | | | 49 | |
Administration fees | | | 33 | | | | — | |
Distribution fees | | | 183 | | | | 49 | |
Shareholder servicing fees | | | 121 | | | | 202 | |
Custodian and accounting fees | | | 10 | | | | 44 | |
Trustees’ and Chief Compliance Officer’s fees | | | 2 | | | | 1 | |
Other | | | 364 | | | | 127 | |
| | | | | | | | |
Total Liabilities | | | 7,483 | | | | 10,456 | |
| | | | | | | | |
Net Assets | | $ | 1,685,833 | | | $ | 991,926 | |
| | | | | | | | |
SEE NOTES TO FINANCIAL STATEMENTS.
| | | | | | |
| | | |
| 26 | | | | J.P. MORGAN EQUITY FUNDS | | DECEMBER 31, 2016 |
| | | | | | | | |
| | | Equity Index
Fund | | | Market
Expansion
Enhanced
Index Fund | |
NET ASSETS: | | | | | | | | |
Paid-in-Capital | | $ | 632,955 | | | $ | 657,343 | |
Accumulated undistributed (distributions in excess of) net investment income | | | (8 | ) | | | (517 | ) |
Accumulated net realized gains (losses) | | | (29,995 | ) | | | 14,563 | |
Net unrealized appreciation (depreciation) | | | 1,082,881 | | | | 320,537 | |
| | | | | | | | |
Total Net Assets | | $ | 1,685,833 | | | $ | 991,926 | |
| | | | | | | | |
| | |
Net Assets: | | | | | | | | |
Class A | | $ | 586,573 | | | $ | 112,941 | |
Class C | | | 88,538 | | | | 32,116 | |
Class R2 | | | — | | | | 13,326 | |
Class R6 | | | 240,808 | | | | — | |
Select Class | | | 769,914 | | | | 833,543 | |
| | | | | | | | |
Total | | $ | 1,685,833 | | | $ | 991,926 | |
| | | | | | | | |
| | |
Outstanding units of beneficial interest (shares) | | | | | | | | |
($0.0001 par value; unlimited number of shares authorized): | | | | | | | | |
Class A | | | 16,989 | | | | 10,179 | |
Class C | | | 2,587 | | | | 3,379 | |
Class R2 | | | — | | | | 1,217 | |
Class R6 | | | 6,967 | | | | — | |
Select Class | | | 22,277 | | | | 74,323 | |
| | |
Net Asset Value (a): | | | | | | | | |
Class A — Redemption price per share | | $ | 34.53 | | | $ | 11.10 | |
Class C — Offering price per share (b) | | | 34.23 | | | | 9.50 | |
Class R2 — Offering and redemption price per share | | | — | | | | 10.95 | |
Class R6 — Offering and redemption price per share | | | 34.56 | | | | — | |
Select Class — Offering and redemption price per share | | | 34.56 | | | | 11.22 | |
Class A maximum sales charge | | | 5.25 | % | | | 5.25 | % |
Class A maximum public offering price per share
[net asset value per share/(100% — maximum sales charge)] | | $ | 36.44 | | | $ | 11.72 | |
| | | | | | | | |
| | |
Cost of investments in non-affiliates | | $ | 591,699 | | | $ | 645,473 | |
Cost of investments in affiliates | | | 11,787 | | | | 28,730 | |
| (a) | Per share amounts may not recalculate due to rounding of net assets and/or shares outstanding. |
| (b) | Redemption price for Class C Shares varies based upon length of time the shares are held. |
SEE NOTES TO FINANCIAL STATEMENTS.
| | | | | | | | |
| | | |
| DECEMBER 31, 2016 | | J.P. MORGAN EQUITY FUNDS | | | | | 27 | |
STATEMENTS OF OPERATIONS
FOR THE SIX MONTHS ENDED DECEMBER 31, 2016 (Unaudited)
(Amounts in thousands)
| | | | | | | | |
| | | Equity
Index Fund | | | Market
Expansion
Enhanced
Index Fund | |
INVESTMENT INCOME: | | | | | | | | |
Interest income from affiliates | | $ | 1 | | | $ | — | (a) |
Dividend income from non-affiliates | | | 17,369 | | | | 8,105 | |
Dividend income from affiliates | | | 305 | | | | 30 | |
| | | | | | | | |
Total investment income | | | 17,675 | | | | 8,135 | |
| | | | | | | | |
| | |
EXPENSES: | | | | | | | | |
Investment advisory fees | | | 867 | | | | 1,218 | |
Administration fees | | | 654 | | | | 399 | |
Distribution fees: | | | | | | | | |
Class A | | | 750 | | | | 125 | |
Class C | | | 340 | | | | 101 | |
Class R2 | | | — | | | | 31 | |
Shareholder servicing fees: | | | | | | | | |
Class A | | | 750 | | | | 125 | |
Class C | | | 113 | | | | 34 | |
Class R2 | | | — | | | | 15 | |
Select Class | | | 1,032 | | | | 1,044 | |
Custodian and accounting fees | | | 31 | | | | 34 | |
Interest expense to affiliates | | | — | (a) | | | — | |
Professional fees | | | 29 | | | | 31 | |
Trustees’ and Chief Compliance Officer’s fees | | | 17 | | | | 15 | |
Printing and mailing costs | | | 52 | | | | 24 | |
Registration and filing fees | | | 32 | | | | 29 | |
Transfer agency fees (See Note 2.E.) | | | 153 | | | | 27 | |
Sub-transfer agency fees (See Note 2.E.) | | | 372 | | | | 113 | |
Other | | | 16 | | | | 16 | |
| | | | | | | | |
Total expenses | | | 5,208 | | | | 3,381 | |
| | | | | | | | |
Less fees waived | | | (2,478 | ) | | | (1,126 | ) |
Less expense reimbursements | | | (23 | ) | | | (2 | ) |
| | | | | | | | |
Net expenses | | | 2,707 | | | | 2,253 | |
| | | | | | | | |
Net investment income (loss) | | | 14,968 | | | | 5,882 | |
| | | | | | | | |
| | |
REALIZED/UNREALIZED GAINS (LOSSES): | | | | | | | | |
Net realized gain (loss) on transactions from: | | | | | | | | |
Investments in non-affiliates | | | 40,419 | | | | 32,930 | |
Investments in affiliates | | | 764 | | | | — | |
Futures | | | 700 | | | | 3,219 | |
| | | | | | | | |
Net realized gain (loss) | | | 41,883 | | | | 36,149 | |
| | | | | | | | |
Change in net unrealized appreciation/depreciation on: | | | | | | | | |
Investments in non-affiliates | | | 61,487 | | | | 94,347 | |
Investments in affiliates | | | 6,940 | | | | — | |
Futures | | | (122 | ) | | | (436 | ) |
| | | | | | | | |
Change in net unrealized appreciation/depreciation | | | 68,305 | | | | 93,911 | |
| | | | | | | | |
Net realized/unrealized gains (losses) | | | 110,188 | | | | 130,060 | |
| | | | | | | | |
Change in net assets resulting from operations | | $ | 125,156 | | | $ | 135,942 | |
| | | | | | | | |
| (a) | Amount rounds to less than 500. |
SEE NOTES TO FINANCIAL STATEMENTS.
| | | | | | |
| | | |
| 28 | | | | J.P. MORGAN EQUITY FUNDS | | DECEMBER 31, 2016 |
STATEMENTS OF CHANGES IN NET ASSETS
FOR THE PERIODS INDICATED
(Amounts in thousands)
| | | | | | | | | | | | | | | | |
| | | Equity Index Fund | | | Market Expansion Enhanced Index Fund | |
| | | Six Months Ended
December 31, 2016
(Unaudited) | | | Year Ended
June 30, 2016 | | | Six Months Ended
December 31, 2016
(Unaudited) | | | Year Ended
June 30, 2016 | |
CHANGE IN NET ASSETS RESULTING FROM OPERATIONS: | | | | | | | | | | | | | | | | |
Net investment income (loss) | | $ | 14,968 | | | $ | 32,669 | | | $ | 5,882 | | | $ | 11,007 | |
Net realized gain (loss) | | | 41,883 | | | | 264,487 | | | | 36,149 | | | | 98,721 | |
Change in net unrealized appreciation/depreciation | | | 68,305 | | | | (252,514 | ) | | | 93,911 | | | | (139,614 | ) |
| | | | | | | | | | | | | | | | |
Change in net assets resulting from operations | | | 125,156 | | | | 44,642 | | | | 135,942 | | | | (29,886 | ) |
| | | | | | | | | | | | | | | | |
| | | | |
DISTRIBUTIONS TO SHAREHOLDERS: | | | | | | | | | | | | | | | | |
Class A | | | | | | | | | | | | | | | | |
From net investment income | | | (5,594 | ) | | | (11,254 | ) | | | (622 | ) | | | (779 | ) |
From net realized gains | | | (50,124 | ) | | | (93,301 | ) | | | (9,476 | ) | | | (17,264 | ) |
Class C | | | | | | | | | | | | | | | | |
From net investment income | | | (544 | ) | | | (998 | ) | | | (129 | ) | | | (66 | ) |
From net realized gains | | | (7,682 | ) | | | (13,966 | ) | | | (3,120 | ) | | | (4,521 | ) |
Class R2 | | | | | | | | | | | | | | | | |
From net investment income | | | — | | | | — | | | | (65 | ) | | | (62 | ) |
From net realized gains | | | — | | | | — | | | | (1,167 | ) | | | (1,808 | ) |
Class R6 (a) | | | | | | | | | | | | | | | | |
From net investment income | | | (1,469 | ) | | | — | | | | — | | | | — | |
From net realized gains | | | (20,272 | ) | | | — | | | | — | | | | — | |
Select Class | | | | | | | | | | | | | | | | |
From net investment income | | | (8,477 | ) | | | (18,999 | ) | | | (6,045 | ) | | | (9,512 | ) |
From net realized gains | | | (65,912 | ) | | | (137,624 | ) | | | (74,429 | ) | | | (180,035 | ) |
| | | | | | | | | | | | | | | | |
Total distributions to shareholders | | | (160,074 | ) | | | (276,142 | ) | | | (95,053 | ) | | | (214,047 | ) |
| | | | | | | | | | | | | | | | |
| | | | |
CAPITAL TRANSACTIONS: | | | | | | | | | | | | | | | | |
Change in net assets resulting from capital transactions | | | 213,369 | | | | (154,024 | ) | | | 15,679 | | | | (168,034 | ) |
| | | | | | | | | | | | | | | | |
| | | | |
NET ASSETS: | | | | | | | | | | | | | | | | |
Change in net assets | | | 178,451 | | | | (385,524 | ) | | | 56,568 | | | | (411,967 | ) |
Beginning of period | | | 1,507,382 | | | | 1,892,906 | | | | 935,358 | | | | 1,347,325 | |
| | | | | | | | | | | | | | | | |
End of period | | $ | 1,685,833 | | | $ | 1,507,382 | | | $ | 991,926 | | | $ | 935,358 | |
| | | | | | | | | | | | | | | | |
Accumulated undistributed (distributions in excess of) net investment income | | $ | (8 | ) | | $ | 1,108 | | | $ | (517 | ) | | $ | 462 | |
| | | | | | | | | | | | | | | | |
| (a) | Commencement of offering of class of shares effective September 1, 2016, for Equity Index Fund. |
SEE NOTES TO FINANCIAL STATEMENTS.
| | | | | | | | |
| | | |
| DECEMBER 31, 2016 | | J.P. MORGAN EQUITY FUNDS | | | | | 29 | |
STATEMENTS OF CHANGES IN NET ASSETS
FOR THE PERIODS INDICATED (continued)
(Amounts in thousands)
| | | | | | | | | | | | | | | | |
| | | Equity Index Fund | | | Market Expansion Enhanced Index Fund | |
| | | Six Months Ended
December 31, 2016
(Unaudited) | | | Year Ended
June 30, 2016 | | | Six Months Ended
December 31, 2016
(Unaudited) | | | Year Ended
June 30, 2016 | |
CAPITAL TRANSACTIONS: | | | | | | | | | | | | | | | | |
Class A | | | | | | | | | | | | | | | | |
Proceeds from shares issued | | $ | 42,299 | | | $ | 104,909 | | | $ | 23,782 | | | $ | 22,263 | |
Distributions reinvested | | | 55,210 | | | | 103,545 | | | | 8,992 | | | | 14,941 | |
Cost of shares redeemed | | | (97,440 | ) | | | (214,499 | ) | | | (22,944 | ) | | | (29,714 | ) |
| | | | | | | | | | | | | | | | |
Change in net assets resulting from Class A capital transactions | | $ | 69 | | | $ | (6,045 | ) | | $ | 9,830 | | | $ | 7,490 | |
| | | | | | | | | | | | | | | | |
Class C | | | | | | | | | | | | | | | | |
Proceeds from shares issued | | $ | 9,785 | | | $ | 29,257 | | | $ | 7,407 | | | $ | 7,199 | |
Distributions reinvested | | | 6,369 | | | | 11,459 | | | | 2,957 | | | | 3,945 | |
Cost of shares redeemed | | | (14,764 | ) | | | (28,073 | ) | | | (3,014 | ) | | | (5,823 | ) |
| | | | | | | | | | | | | | | | |
Change in net assets resulting from Class C capital transactions | | $ | 1,390 | | | $ | 12,643 | | | $ | 7,350 | | | $ | 5,321 | |
| | | | | | | | | | | | | | | | |
Class R2 | | | | | | | | | | | | | | | | |
Proceeds from shares issued | | $ | — | | | $ | — | | | $ | 1,722 | | | $ | 5,044 | |
Distributions reinvested | | | — | | | | — | | | | 1,020 | | | | 1,499 | |
Cost of shares redeemed | | | — | | | | — | | | | (1,405 | ) | | | (3,100 | ) |
| | | | | | | | | | | | | | | | |
Change in net assets resulting from Class R2 capital transactions | | $ | — | | | $ | — | | | $ | 1,337 | | | $ | 3,443 | |
| | | | | | | | | | | | | | | | |
Class R6 (a) | | | | | | | | | | | | | | | | |
Proceeds from shares issued | | $ | 232,974 | | | $ | — | | | $ | — | | | $ | — | |
Distributions reinvested | | | 20,081 | | | | — | | | | — | | | | — | |
Cost of shares redeemed | | | (4,619 | ) | | | — | | | | — | | | | — | |
| | | | | | | | | | | | | | | | |
Change in net assets resulting from Class R6 capital transactions | | $ | 248,436 | | | $ | — | | | $ | — | | | $ | — | |
| | | | | | | | | | | | | | | | |
Select Class | | | | | | | | | | | | | | | | |
Proceeds from shares issued | | $ | 108,526 | | | $ | 185,825 | | | $ | 55,552 | | | $ | 104,489 | |
Distributions reinvested | | | 62,486 | | | | 127,967 | | | | 71,175 | | | | 122,247 | |
Cost of shares redeemed | | | (207,538 | ) | | | (474,414 | ) | | | (129,565 | ) | | | (411,024 | ) |
| | | | | | | | | | | | | | | | |
Change in net assets resulting from Select Class capital transactions | | $ | (36,526 | ) | | $ | (160,622 | ) | | $ | (2,838 | ) | | $ | (184,288 | ) |
| | | | | | | | | | | | | | | | |
Total change in net assets resulting from capital transactions | | $ | 213,369 | | | $ | (154,024 | ) | | $ | 15,679 | | | $ | (168,034 | ) |
| | | | | | | | | | | | | | | | |
| (a) | Commencement of offering of class of shares effective September 1, 2016, for Equity Index Fund. |
SEE NOTES TO FINANCIAL STATEMENTS.
| | | | | | |
| | | |
| 30 | | | | J.P. MORGAN EQUITY FUNDS | | DECEMBER 31, 2016 |
| | | | | | | | | | | | | | | | |
| | | Equity Index Fund | | | Market Expansion Enhanced Index Fund | |
| | | Six Months Ended
December 31, 2016
(Unaudited) | | | Year Ended
June 30, 2016 | | | Six Months Ended
December 31, 2016
(Unaudited) | | | Year Ended
June 30, 2016 | |
SHARE TRANSACTIONS: | | | | | | | | | | | | | | | | |
Class A | |
Issued | | | 1,162 | | | | 2,869 | | | | 2,078 | | | | 2,064 | |
Reinvested | | | 1,578 | | | | 3,030 | | | | 806 | | | | 1,486 | |
Redeemed | | | (2,686 | ) | | | (5,724 | ) | | | (2,043 | ) | | | (2,695 | ) |
| | | | | | | | | | | | | | | | |
Change in Class A Shares | | | 54 | | | | 175 | | | | 841 | | | | 855 | |
| | | | | | | | | | | | | | | | |
Class C | | | | | | | | | | | | | | | | |
Issued | | | 273 | | | | 809 | | | | 750 | | | | 746 | |
Reinvested | | | 184 | | | | 339 | | | | 310 | | | | 451 | |
Redeemed | | | (410 | ) | | | (782 | ) | | | (308 | ) | | | (610 | ) |
| | | | | | | | | | | | | | | | |
Change in Class C Shares | | | 47 | | | | 366 | | | | 752 | | | | 587 | |
| | | | | | | | | | | | | | | | |
Class R2 | | | | | | | | | | | | | | | | |
Issued | | | — | | | | — | | | | 156 | | | | 457 | |
Reinvested | | | — | | | | — | | | | 92 | | | | 151 | |
Redeemed | | | — | | | | — | | | | (127 | ) | | | (285 | ) |
| | | | | | | | | | | | | | | | |
Change in Class R2 Shares | | | — | | | | — | | | | 121 | | | | 323 | |
| | | | | | | | | | | | | | | | |
Class R6 (a) | | | | | | | | | | | | | | | | |
Issued | | | 6,520 | | | | — | | | | — | | | | — | |
Reinvested | | | 575 | | | | — | | | | — | | | | — | |
Redeemed | | | (128 | ) | | | — | | | | — | | | | — | |
| | | | | | | | | | | | | | | | |
Change in Class R6 Shares | | | 6,967 | | | | — | | | | — | | | | — | |
| | | | | | | | | | | | | | | | |
Select Class | | | | | | | | | | | | | | | | |
Issued | | | 2,989 | | | | 5,129 | | | | 4,874 | | | | 9,599 | |
Reinvested | | | 1,783 | | | | 3,737 | | | | 6,312 | | | | 12,030 | |
Redeemed | | | (5,651 | ) | | | (12,808 | ) | | | (11,300 | ) | | | (39,168 | ) |
| | | | | | | | | | | | | | | | |
Change in Select Class Shares | | | (879 | ) | | | (3,942 | ) | | | (114 | ) | | | (17,539 | ) |
| | | | | | | | | | | | | | | | |
| (a) | Commencement of offering of class of shares effective September 1, 2016, for Equity Index Fund. |
SEE NOTES TO FINANCIAL STATEMENTS.
| | | | | | | | |
| | | |
| DECEMBER 31, 2016 | | J.P. MORGAN EQUITY FUNDS | | | | | 31 | |
FINANCIAL HIGHLIGHTS
FOR THE PERIODS INDICATED
| | | | | | | | | | | | | | | | | | | | | | | | | | | | |
| | | Per share operating performance | |
| | | | | | Investment operations | | | Distributions | |
| | | Net asset
value,
beginning
of period | | | Net
investment
income
(loss) (b) | | | Net realized
and unrealized
gains
(losses) on
investments | | | Total from
investment
operations | | | Net
investment
income | | | Net
realized
gain | | | Total
distributions | |
Equity Index Fund | | | | | | | | | | | | | | | | | | | | | | | | | | | | |
Class A | | | | | | | | | | | | | | | | | | | | | | | | | | | | |
Six Months Ended December 31, 2016 (Unaudited) | | $ | 35.36 | | | $ | 0.33 | | | $ | 2.37 | | | $ | 2.70 | | | $ | (0.34 | ) | | $ | (3.19 | ) | | $ | (3.53 | ) |
Year Ended June 30, 2016 | | | 41.12 | | | | 0.71 | | | | 0.38 | | | | 1.09 | | | | (0.67 | ) | | | (6.18 | ) | | | (6.85 | ) |
Year Ended June 30, 2015 | | | 41.94 | | | | 0.68 | | | | 2.11 | | | | 2.79 | | | | (0.66 | ) | | | (2.95 | ) | | | (3.61 | ) |
Year Ended June 30, 2014 | | | 36.43 | | | | 0.64 | | | | 7.78 | | | | 8.42 | | | | (0.63 | ) | | | (2.28 | ) | | | (2.91 | ) |
Year Ended June 30, 2013 | | | 30.92 | | | | 0.63 | | | | 5.52 | | | | 6.15 | | | | (0.64 | ) | | | — | | | | (0.64 | ) |
Year Ended June 30, 2012 | | | 29.96 | | | | 0.51 | | | | 0.96 | | | | 1.47 | | | | (0.51 | ) | | | — | | | | (0.51 | ) |
| | | | | | | |
Class C | | | | | | | | | | | | | | | | | | | | | | | | | | | | |
Six Months Ended December 31, 2016 (Unaudited) | | | 35.09 | | | | 0.20 | | | | 2.34 | | | | 2.54 | | | | (0.21 | ) | | | (3.19 | ) | | | (3.40 | ) |
Year Ended June 30, 2016 | | | 40.86 | | | | 0.43 | | | | 0.38 | | | | 0.81 | | | | (0.40 | ) | | | (6.18 | ) | | | (6.58 | ) |
Year Ended June 30, 2015 | | | 41.72 | | | | 0.37 | | | | 2.09 | | | | 2.46 | | | | (0.37 | ) | | | (2.95 | ) | | | (3.32 | ) |
Year Ended June 30, 2014 | | | 36.28 | | | | 0.35 | | | | 7.73 | | | | 8.08 | | | | (0.36 | ) | | | (2.28 | ) | | | (2.64 | ) |
Year Ended June 30, 2013 | | | 30.81 | | | | 0.37 | | | | 5.50 | | | | 5.87 | | | | (0.40 | ) | | | — | | | | (0.40 | ) |
Year Ended June 30, 2012 | | | 29.87 | | | | 0.29 | | | | 0.94 | | | | 1.23 | | | | (0.29 | ) | | | — | | | | (0.29 | ) |
| | | | | | | |
Class R6 | | | | | | | | | | | | | | | | | | | | | | | | | | | | |
September 1, 2016 (g) through December 31, 2016 (Unaudited) | | | 36.73 | | | | 0.22 | | | | 1.20 | | | | 1.42 | | | | (0.40 | ) | | | (3.19 | ) | | | (3.59 | ) |
| | | | | | | |
Select Class | | | | | | | | | | | | | | | | | | | | | | | | | | | | |
Six Months Ended December 31, 2016 (Unaudited) | | | 35.39 | | | | 0.37 | | | | 2.37 | | | | 2.74 | | | | (0.38 | ) | | | (3.19 | ) | | | (3.57 | ) |
Year Ended June 30, 2016 | | | 41.14 | | | | 0.81 | | | | 0.38 | | | | 1.19 | | | | (0.76 | ) | | | (6.18 | ) | | | (6.94 | ) |
Year Ended June 30, 2015 | | | 41.96 | | | | 0.79 | | | | 2.10 | | | | 2.89 | | | | (0.76 | ) | | | (2.95 | ) | | | (3.71 | ) |
Year Ended June 30, 2014 | | | 36.44 | | | | 0.74 | | | | 7.79 | | | | 8.53 | | | | (0.73 | ) | | | (2.28 | ) | | | (3.01 | ) |
Year Ended June 30, 2013 | | | 30.92 | | | | 0.71 | | | | 5.53 | | | | 6.24 | | | | (0.72 | ) | | | — | | | | (0.72 | ) |
Year Ended June 30, 2012 | | | 29.97 | | | | 0.58 | | | | 0.95 | | | | 1.53 | | | | (0.58 | ) | | | — | | | | (0.58 | ) |
| (a) | Annualized for periods less than one year, unless otherwise noted. |
| (b) | Calculated based upon average shares outstanding. |
| (c) | Not annualized for periods less than one year. |
| (d) | Includes adjustments in accordance with accounting principles generally accepted in the United States of America and as such, the net asset values for financial reporting purposes and the returns based upon those net asset values may differ from the net asset values and returns for shareholder transactions. |
| (e) | Includes earnings credits and interest expense, if applicable, each of which is less than 0.005% unless otherwise noted. |
| (f) | Portfolio turnover is calculated by dividing the lesser of total purchases or sales of portfolio securities for the reporting period by the monthly average value of portfolio securities owned during the reporting period. Excluded from both the numerator and denominator are amounts relating to derivatives and securities whose maturities or expiration dates at the time of acquisition were one year or less. |
| (g) | Commencement of offering of class of shares. |
SEE NOTES TO FINANCIAL STATEMENTS.
| | | | | | |
| | | |
| 32 | | | | J.P. MORGAN EQUITY FUNDS | | DECEMBER 31, 2016 |
| | | | | | | | | | | | | | | | | | | | | | | | | | |
| | | Ratios/Supplemental data | |
| | | | | | | | | | Ratios to average net assets (a) | | | | |
Net asset
value,
end of
period | | | Total return
(excludes
sales charge) (c)(d) | | | Net assets,
end of
period
(000’s) | | | Net
expenses (e) | | | Net
investment income
(loss) | | |
Expenses
without waivers,
reimbursements and
earnings credits | | | Portfolio
turnover
rate (c)(f) | |
| | | | | | | | | | | | | | | | | | | | | | | | | | |
| | | | | | | | | | | | | | | | | | | | | | | | | | |
| $ | 34.53 | | | | 7.57 | % | | $ | 586,573 | | | | 0.45 | % | | | 1.78 | % | | | 0.80 | % | | | 10 | % |
| | 35.36 | | | | 3.53 | | | | 598,815 | | | | 0.45 | | | | 1.93 | | | | 0.94 | | | | 4 | |
| | 41.12 | | | | 6.94 | | | | 689,107 | | | | 0.45 | | | | 1.63 | | | | 0.92 | | | | 5 | |
| | 41.94 | | | | 23.95 | | | | 694,974 | | | | 0.45 | | | | 1.63 | | | | 0.91 | | | | 5 | |
| | 36.43 | | | | 20.04 | | | | 585,946 | | | | 0.45 | | | | 1.86 | | | | 0.94 | | | | 4 | |
| | 30.92 | | | | 5.03 | | | | 520,294 | | | | 0.45 | | | | 1.74 | | | | 0.94 | | | | 7 | |
| | | | | | |
| | | | | | | | | | | | | | | | | | | | | | | | | | |
| | 34.23 | | | | 7.19 | | | | 88,538 | | | | 1.14 | | | | 1.08 | | | | 1.28 | | | | 10 | |
| | 35.09 | | | | 2.76 | | | | 89,104 | | | | 1.20 | | | | 1.19 | | | | 1.43 | | | | 4 | |
| | 40.86 | | | | 6.15 | | | | 88,842 | | | | 1.20 | | | | 0.88 | | | | 1.41 | | | | 5 | |
| | 41.72 | | | | 23.01 | | | | 77,644 | | | | 1.20 | | | | 0.88 | | | | 1.41 | | | | 5 | |
| | 36.28 | | | | 19.16 | | | | 58,831 | | | | 1.20 | | | | 1.10 | | | | 1.45 | | | | 4 | |
| | 30.81 | | | | 4.21 | | | | 45,854 | | | | 1.20 | | | | 0.99 | | | | 1.44 | | | | 7 | |
| | | | | | |
| | | | | | | | | | | | | | | | | | | | | | | | | | |
| | 34.56 | | | | 3.83 | | | | 240,808 | | | | 0.04 | | | | 1.83 | | | | 0.15 | | | | 10 | |
| | | | | | |
| | | | | | | | | | | | | | | | | | | | | | | | | | |
| | 34.56 | | | | 7.70 | | | | 769,914 | | | | 0.20 | | | | 2.03 | | | | 0.52 | | | | 10 | |
| | 35.39 | | | | 3.81 | | | | 819,463 | | | | 0.20 | | | | 2.17 | | | | 0.67 | | | | 4 | |
| | 41.14 | | | | 7.19 | | | | 1,114,957 | | | | 0.20 | | | | 1.88 | | | | 0.66 | | | | 5 | |
| | 41.96 | | | | 24.27 | | | | 1,120,177 | | | | 0.20 | | | | 1.89 | | | | 0.66 | | | | 5 | |
| | 36.44 | | | | 20.35 | | | | 1,087,877 | | | | 0.20 | | | | 2.11 | | | | 0.69 | | | | 4 | |
| | 30.92 | | | | 5.26 | | | | 1,188,683 | | | | 0.20 | | | | 1.99 | | | | 0.69 | | | | 7 | |
SEE NOTES TO FINANCIAL STATEMENTS.
| | | | | | | | |
| | | |
| DECEMBER 31, 2016 | | J.P. MORGAN EQUITY FUNDS | | | | | 33 | |
FINANCIAL HIGHLIGHTS
FOR THE PERIODS INDICATED (continued)
| | | | | | | | | | | | | | | | | | | | | | | | | | | | |
| | | Per share operating performance | |
| | | | | | Investment operations | | | Distributions | |
| | | Net asset
value,
beginning
of period | | | Net
investment
income
(loss)(b) | | | Net realized
and unrealized
gains
(losses) on
investments | | | Total from
investment
operations | | | Net
investment
income | | | Net
realized
gain | | | Total
distributions | |
Market Expansion Enhanced Index Fund | | | | | | | | | | | | | | | | | | | | | | | | | | | | |
Class A | | | | | | | | | | | | | | | | | | | | | | | | | | | | |
Six Months Ended December 31, 2016 (Unaudited) | | $ | 10.64 | | | $ | 0.06 | | | $ | 1.53 | | | $ | 1.59 | | | $ | (0.07 | ) | | $ | (1.06 | ) | | $ | (1.13 | ) |
Year Ended June 30, 2016 | | | 12.98 | | | | 0.09 | | | | (0.21 | ) | | | (0.12 | ) | | | (0.08 | ) | | | (2.14 | ) | | | (2.22 | ) |
Year Ended June 30, 2015 | | | 13.85 | | | | 0.10 | | | | 0.72 | | | | 0.82 | | | | (0.10 | ) | | | (1.59 | ) | | | (1.69 | ) |
Year Ended June 30, 2014 | | | 12.17 | | | | 0.09 | (g) | | | 2.81 | | | | 2.90 | | | | (0.08 | ) | | | (1.14 | ) | | | (1.22 | ) |
Year Ended June 30, 2013 | | | 10.32 | | | | 0.11 | (h) | | | 2.45 | | | | 2.56 | | | | (0.11 | ) | | | (0.60 | ) | | | (0.71 | ) |
Year Ended June 30, 2012 | | | 11.52 | | | | 0.07 | | | | (0.42 | ) | | | (0.35 | ) | | | (0.07 | ) | | | (0.78 | ) | | | (0.85 | ) |
| | | | | | | |
Class C | | | | | | | | | | | | | | | | | | | | | | | | | | | | |
Six Months Ended December 31, 2016 (Unaudited) | | | 9.27 | | | | 0.02 | | | | 1.31 | | | | 1.33 | | | | (0.04 | ) | | | (1.06 | ) | | | (1.10 | ) |
Year Ended June 30, 2016 | | | 11.62 | | | | 0.01 | | | | (0.19 | ) | | | (0.18 | ) | | | (0.03 | ) | | | (2.14 | ) | | | (2.17 | ) |
Year Ended June 30, 2015 | | | 12.58 | | | | 0.01 | | | | 0.65 | | | | 0.66 | | | | (0.03 | ) | | | (1.59 | ) | | | (1.62 | ) |
Year Ended June 30, 2014 | | | 11.18 | | | | — | (g)(i) | | | 2.56 | | | | 2.56 | | | | (0.02 | ) | | | (1.14 | ) | | | (1.16 | ) |
Year Ended June 30, 2013 | | | 9.55 | | | | 0.03 | (h) | | | 2.25 | | | | 2.28 | | | | (0.05 | ) | | | (0.60 | ) | | | (0.65 | ) |
Year Ended June 30, 2012 | | | 10.74 | | | | (0.01 | ) | | | (0.39 | ) | | | (0.40 | ) | | | (0.01 | ) | | | (0.78 | ) | | | (0.79 | ) |
| | | | | | | |
Class R2 | | | | | | | | | | | | | | | | | | | | | | | | | | | | |
Six Months Ended December 31, 2016 (Unaudited) | | | 10.52 | | | | 0.04 | | | | 1.51 | | | | 1.55 | | | | (0.06 | ) | | | (1.06 | ) | | | (1.12 | ) |
Year Ended June 30, 2016 | | | 12.87 | | | | 0.07 | | | | (0.22 | ) | | | (0.15 | ) | | | (0.06 | ) | | | (2.14 | ) | | | (2.20 | ) |
Year Ended June 30, 2015 | | | 13.74 | | | | 0.07 | | | | 0.72 | | | | 0.79 | | | | (0.07 | ) | | | (1.59 | ) | | | (1.66 | ) |
Year Ended June 30, 2014 | | | 12.09 | | | | 0.06 | (g) | | | 2.78 | | | | 2.84 | | | | (0.05 | ) | | | (1.14 | ) | | | (1.19 | ) |
Year Ended June 30, 2013 | | | 10.25 | | | | 0.08 | (h) | | | 2.44 | | | | 2.52 | | | | (0.08 | ) | | | (0.60 | ) | | | (0.68 | ) |
Year Ended June 30, 2012 | | | 11.46 | | | | 0.03 | | | | (0.42 | ) | | | (0.39 | ) | | | (0.04 | ) | | | (0.78 | ) | | | (0.82 | ) |
| | | | | | | |
Select Class | | | | | | | | | | | | | | | | | | | | | | | | | | | | |
Six Months Ended December 31, 2016 (Unaudited) | | | 10.75 | | | | 0.07 | | | | 1.54 | | | | 1.61 | | | | (0.08 | ) | | | (1.06 | ) | | | (1.14 | ) |
Year Ended June 30, 2016 | | | 13.09 | | | | 0.12 | | | | (0.21 | ) | | | (0.09 | ) | | | (0.11 | ) | | | (2.14 | ) | | | (2.25 | ) |
Year Ended June 30, 2015 | | | 13.94 | | | | 0.13 | | | | 0.74 | | | | 0.87 | | | | (0.13 | ) | | | (1.59 | ) | | | (1.72 | ) |
Year Ended June 30, 2014 | | | 12.24 | | | | 0.12 | (g) | | | 2.83 | | | | 2.95 | | | | (0.11 | ) | | | (1.14 | ) | | | (1.25 | ) |
Year Ended June 30, 2013 | | | 10.37 | | | | 0.14 | (h) | | | 2.46 | | | | 2.60 | | | | (0.13 | ) | | | (0.60 | ) | | | (0.73 | ) |
Year Ended June 30, 2012 | | | 11.57 | | | | 0.09 | | | | (0.42 | ) | | | (0.33 | ) | | | (0.09 | ) | | | (0.78 | ) | | | (0.87 | ) |
| (a) | Annualized for periods less than one year, unless otherwise noted. |
| (b) | Calculated based upon average shares outstanding. |
| (c) | Not annualized for periods less than one year. |
| (d) | Includes adjustments in accordance with accounting principles generally accepted in the United States of America and as such, the net asset values for financial reporting purposes and the returns based upon those net asset values may differ from the net asset values and returns for shareholder transactions. |
| (e) | Includes earnings credits and interest expense, if applicable, each of which is less than 0.005% unless otherwise noted. |
| (f) | Portfolio turnover is calculated by dividing the lesser of total purchases or sales of portfolio securities for the reporting period by the monthly average value of portfolio securities owned during the reporting period. Excluded from both the numerator and denominator are amounts relating to derivatives and securities whose maturities or expiration dates at the time of acquisition were one year or less. |
| (g) | Reflects special dividends paid out during the period by several of the Fund’s holdings. Had the Fund not received the special dividends, the net investment income (loss) per share remained the same for Class A, Class C, Class R2 and Select Class Shares and the net investment income (loss) ratio would have been 0.65%, (0.03)%, 0.42% and 0.90% for Class A, Class C, Class R2 and Select Class Shares, respectively. |
| (h) | Reflects special dividends paid out during the period by several of the Fund’s holdings. Had the Fund not received the special dividends, the net investment income (loss) per share would have been $0.09, $0.01, $0.06 and $0.12 for Class A, Class C, Class R2 and Select Class Shares, respectively, and the net investment income (loss) ratio would have been 0.82%, 0.13%, 0.58% and 1.07% for Class A, Class C, Class R2 and Select Class Shares, respectively. |
| (i) | Amount rounds to less than $0.005. |
| (j) | Amount rounds to less than 0.005% |
SEE NOTES TO FINANCIAL STATEMENTS.
| | | | | | |
| | | |
| 34 | | | | J.P. MORGAN EQUITY FUNDS | | DECEMBER 31, 2016 |
| | | | | | | | | | | | | | | | | | | | | | | | | | |
| | | Ratios/Supplemental data | |
| | | | | | | | | | Ratios to average net assets (a) | | | | |
Net asset
value,
end of
period | | | Total return
(excludes
sales charge) (c)(d) | | | Net assets,
end of
period
(000’s) | | | Net
expenses (e) | | | Net
investment
income
(loss) | | |
Expenses
without waivers,
reimbursements and
earnings credits | | | Portfolio
turnover
rate (c)(f) | |
| | | | | | | | | | | | | | | | | | | | | | | | | | |
| | | | | | | | | | | | | | | | | | | | | | | | | | |
| $ | 11.10 | | | | 14.93 | % | | $ | 112,941 | | | | 0.65 | % | | | 1.01 | % | | | 0.97 | % | | | 14 | % |
| | 10.64 | | | | 0.22 | | | | 99,397 | | | | 0.69 | | | | 0.81 | | | | 0.98 | | | | 39 | |
| | 12.98 | | | | 6.90 | | | | 110,138 | | | | 0.68 | | | | 0.75 | | | | 0.92 | | | | 39 | |
| | 13.85 | | | | 24.96 | | | | 116,727 | | | | 0.69 | | | | 0.68 | (g) | | | 0.87 | | | | 25 | |
| | 12.17 | | | | 25.91 | | | | 84,296 | | | | 0.69 | | | | 0.95 | (h) | | | 0.88 | | | | 51 | |
| | 10.32 | | | | (2.22 | ) | | | 62,820 | | | | 0.69 | | | | 0.64 | | | | 0.89 | | | | 77 | |
| | | | | | |
| | | | | | | | | | | | | | | | | | | | | | | | | | |
| | 9.50 | | | | 14.37 | | | | 32,116 | | | | 1.28 | | | | 0.40 | | | | 1.48 | | | | 14 | |
| | 9.27 | | | | (0.43 | ) | | | 24,343 | | | | 1.39 | | | | 0.12 | | | | 1.52 | | | | 39 | |
| | 11.62 | | | | 6.25 | | | | 23,705 | | | | 1.38 | | | | 0.06 | | | | 1.44 | | | | 39 | |
| | 12.58 | | | | 24.03 | | | | 23,248 | | | | 1.37 | | | | 0.00 | (g)(j) | | | 1.37 | | | | 25 | |
| | 11.18 | | | | 25.07 | | | | 16,636 | | | | 1.37 | | | | 0.27 | (h) | | | 1.38 | | | | 51 | |
| | 9.55 | | | | (2.85 | ) | | | 12,330 | | | | 1.39 | | | | (0.07 | ) | | | 1.39 | | | | 77 | |
| | | | | | |
| | | | | | | | | | | | | | | | | | | | | | | | | | |
| | 10.95 | | | | 14.69 | | | | 13,326 | | | | 0.88 | | | | 0.78 | | | | 1.31 | | | | 14 | |
| | 10.52 | | | | (0.05 | ) | | | 11,536 | | | | 0.92 | | | | 0.60 | | | | 1.40 | | | | 39 | |
| | 12.87 | | | | 6.75 | | | | 9,946 | | | | 0.91 | | | | 0.53 | | | | 1.26 | | | | 39 | |
| | 13.74 | | | | 24.60 | | | | 8,821 | | | | 0.92 | | | | 0.45 | (g) | | | 1.12 | | | | 25 | |
| | 12.09 | | | | 25.72 | | | | 6,985 | | | | 0.93 | | | | 0.72 | (h) | | | 1.13 | | | | 51 | |
| | 10.25 | | | | (2.64 | ) | | | 4,477 | | | | 1.07 | | | | 0.27 | | | | 1.14 | | | | 77 | |
| | | | | | |
| | | | | | | | | | | | | | | | | | | | | | | | | | |
| | 11.22 | | | | 15.00 | | | | 833,543 | | | | 0.41 | | | | 1.26 | | | | 0.62 | | | | 14 | |
| | 10.75 | | | | 0.47 | | | | 800,082 | | | | 0.44 | | | | 1.04 | | | | 0.63 | | | | 39 | |
| | 13.09 | | | | 7.26 | | | | 1,203,536 | | | | 0.43 | | | | 1.00 | | | | 0.62 | | | | 39 | |
| | 13.94 | | | | 25.26 | | | | 1,413,937 | | | | 0.44 | | | | 0.92 | (g) | | | 0.62 | | | | 25 | |
| | 12.24 | | | | 26.26 | | | | 1,296,602 | | | | 0.44 | | | | 1.21 | (h) | | | 0.63 | | | | 51 | |
| | 10.37 | | | | (1.96 | ) | | | 1,100,332 | | | | 0.44 | | | | 0.89 | | | | 0.64 | | | | 77 | |
SEE NOTES TO FINANCIAL STATEMENTS.
| | | | | | | | |
| | | |
| DECEMBER 31, 2016 | | J.P. MORGAN EQUITY FUNDS | | | | | 35 | |
NOTES TO FINANCIAL STATEMENTS
AS OF DECEMBER 31, 2016 (Unaudited)
1. Organization
JPMorgan Trust II (“JPM II” or the “Trust”) was formed on November 12, 2004, as a Delaware statutory trust, pursuant to a Declaration of Trust dated November 5, 2004 and is registered under the Investment Company Act of 1940, as amended (the “1940 Act”), as an open-end management investment company.
The following are 2 separate funds of the Trust (collectively, the “Funds”) covered by this report:
| | | | |
| | | Classes Offered | | Diversified/Non-Diversified |
| Equity Index Fund | | Class A, Class C, Class R6* and Select Class | | Diversified |
| Market Expansion Enhanced Index Fund | | Class A, Class C, Class R2 and Select Class | | Diversified |
| * | Class R6 Shares of the Equity Index Fund commenced operations on September 1, 2016. |
The investment objective of the Equity Index Fund is to seek investment results that correspond to the aggregate price and dividend performance of securities in the Standard & Poor’s 500 Composite Stock Price Index (“S&P 500 Index”).
The investment objective of the Market Expansion Enhanced Index Fund is to seek to provide investment results that correspond to or incrementally exceed the total return performance of an index that tracks the performance of the small- and mid-capitalization equity markets.
Class A Shares generally provide for a front-end sales charge while Class C Shares provide for a contingent deferred sales charge (“CDSC”). No sales charges are assessed with respect to Class R2, Class R6 and Select Class Shares. All classes of shares have equal rights as to earnings, assets and voting privileges, except that each class may bear different transfer agency, sub-transfer agency, distribution and shareholder servicing fees and each class has exclusive voting rights with respect to its distribution plan and shareholder servicing agreements. Certain Class A Shares, for which front-end sales charges have been waived, may be subject to a CDSC as described in the Funds’ prospectus.
J.P. Morgan Investment Management Inc. (“JPMIM”) an indirect, wholly-owned subsidiary of JPMorgan Chase & Co. (“JPMorgan”) acts as Adviser (the “Adviser”) and Administrator (the “Administrator”) to the Funds.
2. Significant Accounting Policies
The following is a summary of significant accounting policies followed by the Funds in the preparation of their financial statements. The Funds are investment companies and, accordingly, follow the investment company accounting and reporting guidance of the Financial Accounting Standards Board Accounting Standards Codification Topic 946—Investment Companies, which is part of U.S. generally accepted accounting principles (“GAAP”). The preparation of financial statements in conformity with GAAP requires management to make estimates and assumptions that affect the reported amounts of assets and liabilities and disclosure of contingent assets and liabilities at the date of the financial statements and the reported amounts of increases and decreases in net assets from operations during the reporting period. Actual results could differ from those estimates.
A. Valuation of Investments — The valuation of investments is in accordance with GAAP and the Funds’ valuation policies set forth by and under the supervision and responsibility of the Board of Trustees (the “Board”), which established the following approach to valuation, as described more fully below: (i) investments for which market quotations are readily available shall be valued at such unadjusted quoted prices and (ii) all other investments for which market quotations are not readily available shall be valued at their fair value as determined in good faith by the Board.
The Administrator has established the J.P. Morgan Asset Management Americas Valuation Committee (“AVC”) to assist the Board with the oversight and monitoring of the valuation of the Funds’ investments. The Administrator implements the valuation policies of the Funds’ investments, as directed by the Board. The AVC oversees and carries out the policies for the valuation of investments held in the Funds. This includes monitoring the appropriateness of fair values based on results of ongoing valuation oversight, including but not limited to consideration of macro or security specific events, market events and pricing vendor and broker due diligence. The Administrator is responsible for discussing and assessing the potential impacts to the fair values on an ongoing basis, and at least on a quarterly basis with the AVC and the Board.
A market-based approach is primarily used to value the Funds’ investments. Investments for which market quotations are not readily available are fair valued by approved affiliated and unaffiliated pricing vendors or third party broker-dealers (collectively referred to as “Pricing Services”) or may be internally fair valued using methods set forth by the valuation policies approved by the Board. This may include related or comparable assets or liabilities, recent transactions, market multiples, book values, and other relevant information for the investment to determine the fair value of the investment. An income-based valuation approach may be used in which the anticipated future cash flows of the investment are discounted to calculate the fair value. Discounts may also be applied due to the nature or duration of any restrictions on the disposition of the investments. Valuations may be based upon current market prices of securities that are comparable in coupon, rating, maturity and industry. It is possible that the estimated values may differ significantly from the values that would have been used, had a ready market for the investments existed, and such differences could be material.
Equities and other exchange-traded instruments are valued at the last sale price or official market closing price on the primary exchange on which the instrument is traded before the net asset values (“NAV”) of the Funds are calculated on a valuation date. Investments in open-end investment companies (the “Underlying Funds”) are valued at each Underlying Fund’s NAV per share as of the report date.
Futures are generally valued on the basis of available market quotations.
| | | | | | |
| | | |
| 36 | | | | J.P. MORGAN EQUITY FUNDS | | DECEMBER 31, 2016 |
Valuations reflected in this report are as of the report date. As a result, changes in valuation due to market events and/or issuer related events after the report date and prior to issuance of the report are not reflected herein.
The various inputs that are used in determining the valuation of the Funds’ investments are summarized into the three broad levels listed below.
| • | | Level 1 — Unadjusted inputs using quoted prices in active markets for identical investments. |
| • | | Level 2 — Other significant observable inputs including, but not limited to, quoted prices for similar investments, inputs other than quoted prices that are observable for investments (such as interest rates, prepayment speeds, credit risk, etc.) or other market corroborated inputs. |
| • | | Level 3 — Significant inputs based on the best information available in the circumstances, to the extent observable inputs are not available (including the Funds’ assumptions in determining the fair value of investments). |
A financial instrument’s level within the fair value hierarchy is based on the lowest level of any input, both individually and in the aggregate, that is significant to the fair value measurement. The inputs or methodology used for valuing instruments are not necessarily an indication of the risk associated with investing in those instruments.
The following tables represent each valuation input as presented on the Schedules of Portfolio Investments (“SOIs”) (amounts in thousands):
Equity Index Fund
| | | | | | | | | | | | | | | | |
| | | Level 1
Quoted prices | | | Level 2
Other significant
observable inputs | | | Level 3
Significant
unobservable inputs | | | Total | |
Total Investments in Securities (a) | | $ | 1,686,387 | | | $ | — | | | $ | 3 | | | $ | 1,686,390 | |
| | | | | | | | | | | | | | | | |
Depreciation in Other Financial Instruments | | | | | | | | | | | | | | | | |
Futures Contracts | | $ | (23 | ) | | $ | — | | | $ | — | | | $ | (23 | ) |
| | | | | | | | | | | | | | | | |
|
| Market Expansion Enhanced Index Fund | |
| | | Level 1
Quoted prices | | | Level 2
Other significant
observable inputs | | | Level 3
Significant
unobservable inputs | | | Total | |
Total Investments in Securities (a) | | $ | 994,967 | | | $ | — | | | $ | — | (b) | | $ | 994,967 | |
| | | | | | | | | | | | | | | | |
Depreciation in Other Financial Instruments | | | | | | | | | | | | | | | | |
Futures Contracts | | $ | (227 | ) | | $ | — | | | $ | — | | | $ | (227 | ) |
| | | | | | | | | | | | | | | | |
| (a) | All portfolio holdings designated as level 1 and level 3 are disclosed individually on the SOIs. Level 3 consists of rights. Please refer to the SOIs for industry specifics of portfolio holdings. |
There were no transfers among any levels during the six months ended December 31, 2016.
B. Futures Contracts — The Funds used index futures contracts to gain or reduce exposure to their respective indices, maintain liquidity or minimize transaction costs. The Funds also bought futures contracts to invest incoming cash in the market or sold futures in response to cash outflows, thereby simulating an invested position in the underlying index while maintaining a cash balance for liquidity.
Futures contracts provide for the delayed delivery of the underlying instrument at a fixed price or are settled for a cash amount based on the change in the value of the underlying instrument at a specific date in the future. Upon entering into a futures contract, the Funds are required to deposit with the broker, cash or securities in an amount equal to a certain percentage of the contract amount, which is referred to as the initial margin deposit. Subsequent payments, referred to as variation margin, are made or received by the Funds periodically and are based on changes in the market value of open futures contracts. Changes in the market value of open futures contracts are recorded as change in net unrealized appreciation/depreciation on the Statements of Operations. Realized gains or losses, representing the difference between the value of the contract at the time it was opened and the value at the time it was closed, are reported on the Statements of Operations at the closing or expiration of the futures contract. Securities deposited as initial margin are designated on the SOIs and cash deposited is recorded on the Statements of Assets and Liabilities. A receivable from and/or a payable to brokers for the daily variation margin is also recorded on the Statements of Assets and Liabilities.
The use of futures contracts exposes the Funds to equity price risk. The Funds may be subject to the risk that the change in the value of the futures contract may not correlate perfectly with the underlying instrument. Use of long futures contracts subjects the Funds to risk of loss in excess of the amounts shown on the Statements of Assets and Liabilities, up to the notional amount of the futures contracts. Use of short futures contracts subjects the Funds to unlimited risk of loss. The Funds may enter into futures contracts only on exchanges or boards of trade. The exchange or board of trade acts as the counterparty to each futures transaction; therefore, the Funds’ credit risk is limited to failure of the exchange or board of trade. Under some circumstances, futures exchanges may establish daily limits on the amount that the price of a futures contract can vary from the previous day’s settlement price, which could effectively prevent liquidation of positions.
| | | | | | | | |
| | | |
| DECEMBER 31, 2016 | | J.P. MORGAN EQUITY FUNDS | | | | | 37 | |
NOTES TO FINANCIAL STATEMENTS
AS OF DECEMBER 31, 2016 (Unaudited) (continued)
The table below discloses the volume of the Funds’ futures contracts activity during the six months ended December 31, 2016 (amounts in thousands):
| | | | | | | | |
| | | Equity Index
Fund | | | Market Expansion
Enhanced Index Fund | |
Futures Contracts: | | | | | | | | |
Average Notional Balance Long | | $ | 9,627 | | | $ | 17,876 | |
Ending Notional Balance Long | | | 6,820 | | | | 22,320 | |
The Funds’ futures contracts are not subject to master netting arrangements (the right to close out all transactions traded with a counterparty and net amounts owed or due across transactions).
C. Investment Transactions with Affiliates — An issuer which is under common control with a fund may be considered an affiliate. For the purposes of the financial statements, the Funds assume the issuers listed in the tables below to be affiliated issuers. Underlying Funds’ distributions may be reinvested into the Underlying Funds. Reinvestment amounts are included in the purchase cost amounts in the table below (amounts in thousands).
| | | | | | | | | | | | | | | | | | | | | | | | | | | | |
| | | | | | For the six months ended December 31, 2016 | | | | | | | |
| Affiliate | | Value at June 30, 2016 | | | Purchase Cost | | | Sales Proceeds | | | Realized Gain (Loss) | | | Dividend Income | | | Shares at
December 31, 2016 | | | Value at
December 31, 2016 | |
Equity Index Fund | | | | | | | | | | | | | | | | | | | | | | | | | | | | |
JPMorgan Chase & Co. (common stock)* | | $ | 18,728 | | | $ | 2,859 | | | $ | 2,329 | | | $ | 764 | | | $ | 290 | | | | 312 | | | $ | 26,962 | |
JPMorgan Liquid Assets Money Market Fund, Institutional Class Shares | | | 11,729 | | | | 22,125 | | | | 33,854 | | | | — | | | | 3 | | | | — | | | | — | |
JPMorgan U.S. Government Money Market Fund, Institutional Class Shares | | | — | | | | 301,204 | | | | 297,296 | | | | — | | | | 12 | | | | 3,908 | | | | 3,908 | |
| | | | | | | | | | | | | | | | | | | | | | | | | | | | |
| | $ | 30,457 | | | | | | | | | | | $ | 764 | | | $ | 305 | | | | | | | $ | 30,870 | |
| | | | | | | | | | | | | | | | | | | | | | | | | | | | |
| * | Investment in affiliate which is a security in the Fund’s Index. |
| | | | | | | | | | | | | | | | | | | | | | | | | | | | |
| | | | | | For the six months ended December 31, 2016 | | | | | | | |
| Affiliate | | Value at
June 30, 2016 | | | Purchase Cost | | | Sales
Proceeds | | | Realized Gain (Loss) | | | Dividend
Income | | | Shares at
December 31, 2016 | | | Value at
December 31, 2016 | |
JPMorgan Market Expansion Enhanced Index Fund | | | | | | | | | | | | | | | | | | | | | | | | | | | | |
JPMorgan Liquid Assets Money Market Fund, Institutional Class Shares | | $ | 18,310 | | | $ | 13,653 | | | $ | 31,963 | | | $ | — | | | $ | 8 | | | | — | | | $ | — | |
JPMorgan U.S. Government Money Market Fund, Institutional Class Shares | | | — | | | | 110,543 | | | | 81,813 | | | | — | | | | 22 | | | | 28,730 | | | | 28,730 | |
| | | | | | | | | | | | | | | | | | | | | | | | | | | | |
| | $ | 18,310 | | | | | | | | | | | $ | — | | | $ | 30 | | | | | | | $ | 28,730 | |
| | | | | | | | | | | | | | | | | | | | | | | | | | | | |
D. Security Transactions and Investment Income — Investment transactions are accounted for on the trade date (the date the order to buy or sell is executed). Securities gains and losses are calculated on a specifically identified cost basis. Interest income is determined on the basis of coupon interest accrued using the effective interest method which adjusts for amortization of premiums and accretion of discounts. Dividend income, net of foreign taxes withheld, if any, is recorded on the ex-dividend date or when a Fund first learns of the dividend.
To the extent such information is publicly available, the Funds record distributions received in excess of income earned from underlying investments as a reduction of cost of investments and/or realized gain. Such amounts are based on estimates if actual amounts are not available and actual amounts of income, realized gain and return of capital may differ from the estimated amounts. The Funds adjust the estimated amounts of the components of distributions (and consequently their net investment income) as necessary once the issuers provide information about the actual composition of the distributions.
E. Allocation of Income and Expenses — Expenses directly attributable to a fund are charged directly to that fund, while the expenses attributable to more than one fund of the Trust are allocated among the respective funds. In calculating the NAV of each class, investment income, realized and unrealized gains and losses and expenses, other than class specific expenses, are allocated daily to each class of shares based upon the proportion of net assets of each class at the beginning of each day.
| | | | | | |
| | | |
| 38 | | | | J.P. MORGAN EQUITY FUNDS | | DECEMBER 31, 2016 |
Transfer agency fees and sub-transfer agency fees are class-specific expenses. The amount of the transfer agency fees and sub-transfer agency fees charged to each class of the Funds for the six months ended December 31, 2016 are as follows (amounts in thousands):
| | | | | | | | | | | | | | | | | | | | | | | | |
| | | Class A | | | Class C | | | Class R2 | | | Class R6 | | | Select Class | | | Total | |
Equity Index Fund | | | | | | | | | | | | | | | | | | | | | | | | |
Transfer agency fees | | $ | 138 | | | $ | 4 | | | | n/a | | | $ | 1 | | | $ | 10 | | | | 153 | |
Sub-transfer agency fees | | | 131 | | | | 27 | | | | n/a | | | | — | | | | 214 | | | | 372 | |
Market Expansion Enhanced Index Fund | | | | | | | | | | | | | | | | | | | | | | | | |
Transfer agency fees | | | 14 | | | | 4 | | | $ | 2 | | | | n/a | | | | 7 | | | | 27 | |
Sub-transfer agency fees | | | 39 | | | | 12 | | | | 11 | | | | n/a | | | | 51 | | | | 113 | |
F. Federal Income Taxes — Each Fund is treated as a separate taxable entity for Federal income tax purposes. Each Fund’s policy is to comply with the provisions of the Internal Revenue Code of 1986, as amended (the “Code”), applicable to regulated investment companies and to distribute to shareholders all of its distributable net investment income and net realized capital gains on investments. Accordingly, no provision for Federal income tax is necessary. Management has reviewed the Funds’ tax positions for all open tax years and has determined that as of December 31, 2016, no liability for income tax is required in the Funds’ financial statements for net unrecognized tax benefits. However, management’s conclusions may be subject to future review based on changes in, or the interpretation of, the accounting standards or tax laws and regulations. Each of the Funds’ Federal tax returns for the prior three fiscal years remains subject to examination by the Internal Revenue Service.
G. Distributions to Shareholders — Distributions from net investment income are generally declared and paid quarterly and are declared separately for each class. No class has preferential dividend rights; differences in per share rates are due to differences in separate class expenses. Net realized capital gains, if any, are distributed by each Fund at least annually. The amount of distributions from net investment income and net realized capital gains is determined in accordance with Federal income tax regulations, which may differ from GAAP. To the extent these “book/tax” differences are permanent in nature (i.e., that they result from other than timing of recognition — “temporary differences”), such amounts are reclassified within the capital accounts based on their Federal tax-basis treatment.
3. Fees and Other Transactions with Affiliates
A. Investment Advisory Fee — Pursuant to an Investment Advisory Agreement, the Adviser supervises the investments of each Fund and for such services is paid a fee. The fee is accrued daily and paid monthly at an annual rate of 0.04% of the Equity Index Fund’s average daily net assets and 0.25% of the Market Expansion Enhanced Index Fund’s average daily net assets.
The Adviser waived Investment Advisory fees and/or reimbursed expenses as outlined in Note 3.F.
Prior to September 1, 2016, the fee for Equity Index Fund was 0.25% of the Fund’s average daily net assets.
B. Administration Fee — Pursuant to an Administration Agreement, the Administrator provides certain administration services to the Funds. In consideration of these services, the Administrator receives a fee accrued daily and paid monthly at an annual rate of 0.15% of the first $25 billion of the average daily net assets of all funds in the J.P. Morgan Funds Complex covered by the Administration Agreement (excluding certain funds of funds and money market funds) and 0.075% of the average daily net assets in excess of $25 billion of all such funds. For the six months ended December 31, 2016, the effective annualized rate was 0.08% of each Fund’s average daily net assets, notwithstanding any fee waivers and/or expense reimbursements.
The Administrator waived Administration fees as outlined in Note 3.F.
JPMorgan Chase Bank, N.A. (“JPMCB”), a wholly-owned subsidiary of JPMorgan, serves as the Funds’ sub-administrator (the “Sub-administrator”). For its services as Sub-administrator, JPMCB receives a portion of the fees payable to the Administrator.
C. Distribution Fees — Pursuant to a Distribution Agreement, JPMorgan Distribution Services, Inc. (the “Distributor”), a wholly-owned subsidiary of JPMorgan, serves as the Trust’s principal underwriter and promotes and arranges for the sale of each Fund’s shares.
The Board has adopted a Distribution Plan (the “Distribution Plan”) for Class A, Class C and Class R2 Shares of the Funds, as applicable, in accordance with Rule 12b-1 under the 1940 Act. The Class R6 and Select Class Shares do not charge a distribution fee. The Distribution Plan provides that each Fund shall pay distribution fees, including payments to the Distributor, at annual rates of the average daily net assets as shown in the table below:
| | | | | | | | | | | | |
| | | Class A | | | Class C | | | Class R2 | |
Equity Index Fund | | | 0.25 | % | | | 0.75 | % | | | n/a | |
Market Expansion Enhanced Index Fund | | | 0.25 | | | | 0.75 | | | | 0.50 | % |
In addition, the Distributor is entitled to receive the front-end sales charges from purchases of Class A Shares and the CDSC from redemptions of Class C Shares and certain Class A Shares for which front-end sales charges have been waived. For the six months ended December 31, 2016, the Distributor retained the following amounts (amounts in thousands):
| | | | | | | | |
| | | Front-End Sales Charge | | | CDSC | |
Equity Index Fund | | $ | 16 | | | $ | 1 | |
Market Expansion Enhanced Index Fund | | | 8 | | | | — | |
| | | | | | | | |
| | | |
| DECEMBER 31, 2016 | | J.P. MORGAN EQUITY FUNDS | | | | | 39 | |
NOTES TO FINANCIAL STATEMENTS
AS OF DECEMBER 31, 2016 (Unaudited) (continued)
D. Shareholder Servicing Fees — The Trust, on behalf of the Funds, has entered into Shareholder Servicing Agreements with the Distributor under which the Distributor provides certain support services to the shareholders. The Class R6 Shares do not charge a shareholder servicing fee. For performing these services, the Distributor receives a fee that is accrued daily and paid monthly equal to an annual rate of 0.25% of the average daily net assets of each share class.
The Distributor has entered into shareholder services contracts with affiliated and unaffiliated financial intermediaries who provide shareholder services and other related services to their clients or customers who invest in the Funds under which the Distributor will pay all or a portion of such fees earned to financial intermediaries for performing such services.
The Distributor waived shareholder servicing fees as outlined in Note 3.F.
E. Custodian and Accounting Fees — JPMCB provides portfolio custody and accounting services to the Funds. For performing these services, the Funds pay JPMCB transaction and asset-based fees that vary according to the number of transactions and positions, plus out-of-pocket expenses. The amounts paid directly to JPMCB by the Funds for custody and accounting services are included in Custodian and accounting fees on the Statements of Operations. Payments to the custodian may be reduced by credits earned by each Fund, based on uninvested cash balances held by the custodian. Such earnings credits, if any, are presented separately on the Statements of Operations.
Interest expense paid to the custodian related to cash overdrafts, if any, is included in Interest expense to affiliates on the Statements of Operations.
F. Waivers and Reimbursements — The Adviser, Administrator and/or Distributor have contractually agreed to waive fees and/or reimburse the Funds to the extent that total annual operating expenses (excluding acquired fund fees and expenses other than certain money market fund fees as described below, dividend and interest expenses related to short sales, interest, taxes, expenses related to litigation and potential litigation and extraordinary expenses) exceed the percentages of the Funds’ respective average daily net assets as shown in the table below:
| | | | | | | | | | | | | | | | | | | | |
| | | Class A | | | Class C | | | Class R2 | | | Class R6 | | | Select Class | |
Equity Index Fund | | | 0.450 | % | | | 1.200 | % | | | n/a | | | | 0.045 | % | | | 0.200 | % |
Market Expansion Enhanced Index Fund* | | | 0.600 | | | | 1.100 | | | | 0.830 | % | | | n/a | | | | 0.350 | |
| * | Prior to November 1, 2016, the contractual expense limitations for the Market Expansion Enhanced Index Fund were 0.69%, 1.39%, 0.92% and 0.44% for Class A, Class C, Class R2 and Select Class Shares, respectively. |
Except as noted above, the expense limitation agreements were in effect for the six months ended December 31, 2016 and are in place until at least October 31, 2017 for Equity Index Fund and at least October 31, 2018 for Market Expansion Enhanced Index Fund.
For the six months ended December 31, 2016, the Funds’ service providers waived fees and/or reimbursed expenses for each of the Funds as follows (amounts in thousands). None of these parties expect the Funds to repay any such waived fees and reimbursed expenses in future years.
| | | | | | | | | | | | | | | | | | | | |
| | | Contractual Waivers | | | | |
| | | Investment
Advisory | | | Administration | | | Shareholder
Servicing | | | Total | | | Contractual
Reimbursements | |
Equity Index Fund | | $ | 574 | | | $ | 529 | | | $ | 1,367 | | | $ | 2,470 | | | $ | 23 | |
Market Expansion Enhanced Index Fund | | | 502 | | | | 258 | | | | 351 | | | | 1,111 | | | | 2 | |
Additionally, the Funds may invest in one or more money market funds advised by the Adviser or its affiliates (affiliated money market funds). The Adviser, Administrator and/or the Distributor, as shareholder servicing agent, have contractually agreed to waive fees and/or reimburse expenses in an amount sufficient to offset the respective net fees each collects from the affiliated money market fund on the respective Funds’ investment in such affiliated money market fund.
The amount of waivers resulting from investments in these money market funds for the six months ended December 31, 2016 was as follows (amounts in thousands):
| | | | |
Equity Index Fund | | $ | 8 | |
Market Expansion Enhanced Index Fund | | | 15 | |
G. Other — Certain officers of the Trust are affiliated with the Adviser, the Administrator and the Distributor. Such officers, with the exception of the Chief Compliance Officer, receive no compensation from the Funds for serving in their respective roles.
The Board appointed a Chief Compliance Officer to the Funds in accordance with Federal securities regulations. Each Fund, along with other affiliated funds, makes reimbursement payments, on a pro-rata basis, to the Administrator for a portion of the fees associated with the Office of the Chief Compliance Officer. Such fees are included in Trustees’ and Chief Compliance Officer’s fees on the Statements of Operations.
The Trust adopted a Trustee Deferred Compensation Plan (the “Plan”) which allows the Independent Trustees to defer the receipt of all or a portion of compensation related to performance of their duties as Trustees. The deferred fees are invested in various J. P. Morgan Funds until distribution in accordance with the Plan.
| | | | | | |
| | | |
| 40 | | | | J.P. MORGAN EQUITY FUNDS | | DECEMBER 31, 2016 |
The Funds may use related party broker-dealers. For the six months ended December 31, 2016, the Funds did not incur any brokerage commissions with broker-dealers affiliated with the Adviser.
The Securities and Exchange Commission (“SEC”) has granted an exemptive order permitting the Funds to engage in principal transactions with J.P. Morgan Securities, Inc., an affiliated broker, involving taxable money market instruments, subject to certain conditions.
4. Investment Transactions
During the six months ended December 31, 2016, purchases and sales of investments (excluding short-term investments) were as follows (amounts in thousands):
| | | | | | | | |
| | | Purchases
(excluding U.S.
Government) | | | Sales
(excluding U.S.
Government) | |
Equity Index Fund | | $ | 235,665 | | | $ | 161,922 | |
Market Expansion Enhanced Index Fund | | | 136,506 | | | | 211,943 | |
During the six months ended December 31, 2016, there were no purchases or sales of U.S. Government securities.
5. Federal Income Tax Matters
For Federal income tax purposes, the cost and unrealized appreciation (depreciation) in value of investment securities held at December 31, 2016 were as follows (amounts in thousands):
| | | | | | | | | | | | | | | | |
| | | Aggregate
Cost | | | Gross
Unrealized
Appreciation | | | Gross
Unrealized
Depreciation | | | Net Unrealized
Appreciation
(Depreciation) | |
Equity Index Fund | | $ | 603,486 | | | $ | 1,096,768 | | | $ | 13,864 | | | $ | 1,082,904 | |
Market Expansion Enhanced Index Fund | | | 674,203 | | | | 339,358 | | | | 18,594 | | | | 320,764 | |
At June 30, 2016, the Funds did not have any net capital loss carryforwards.
6. Borrowings
The Funds rely upon an exemptive order granted by the SEC (the “Order”) permitting the establishment and operation of an Interfund Lending Facility (the “Facility”). The Facility allows the Funds to directly lend and borrow money to or from any other fund relying upon the Order at rates beneficial to both the borrowing and lending funds. Advances under the Facility are taken primarily for temporary or emergency purposes, including the meeting of redemption requests that otherwise might require the untimely disposition of securities, and are subject to each Fund’s borrowing restrictions. The Interfund loan rate is determined, as specified in the Order, by averaging the current repurchase agreement rate and the current bank loan rate. The Order was granted to JPM II and may be relied upon by the Funds because the Funds and the series of JPMorgan Trust II are all investment companies in the same “group of investment companies” (as defined in Section 12(d)(1)(G) of the 1940 Act).
The Trust and JPMCB have entered into a financing arrangement. Under this arrangement, JPMCB provides an unsecured, uncommitted credit facility in the aggregate amount of $100 million to certain of the J.P. Morgan Funds, including the Funds. Advances under the arrangement are taken primarily for temporary or emergency purposes, including the meeting of redemption requests that otherwise might require the untimely disposition of securities, and are subject to each Fund’s borrowing restrictions. Interest on borrowings is payable at a rate determined by JPMCB at the time of borrowing. This agreement has been extended until November 6, 2017.
The Funds had no borrowings outstanding from another fund or from the unsecured, uncommitted credit facility during the six months ended December 31, 2016.
In addition, effective August 16, 2016, the Trust along with certain other trusts (“Borrowers”) entered into a joint syndicated senior unsecured revolving credit facility totaling $1.5 billion (“Credit Facility”) with various lenders and The Bank of New York Mellon, as administrative agent for the lenders. This Credit Facility provides a source of funds to the Borrowers for temporary and emergency purposes, including the meeting of redemption requests that otherwise might require the untimely disposition of securities. Under the terms of the Credit Facility, a borrowing fund must have a minimum of $25,000,000 in adjusted net asset value and not exceed certain adjusted net asset coverage ratios prior to and during the time in which any borrowings are outstanding. If a fund does not comply with the aforementioned requirements, the fund must remediate within three business days with respect to the $25,000,000 minimum adjusted net asset value or within one business day with respect to certain asset coverage ratios or the administrative agent at the request of, or with the consent of, the lenders may terminate the Credit Facility and declare any outstanding borrowings to be due and payable immediately.
Interest associated with any borrowing under the Credit Facility is charged to the borrowing fund at a rate of interest equal to 1.00% plus the greater of the federal funds effective rate or one month LIBOR. The annual commitment fee to maintain the Credit Facility is 0.15% and is incurred on the unused portion of the Credit Facility and is allocated to all participating funds pro rata based on their respective net assets. The initial term of the Credit Facility is 364 days, unless extended. The Funds did not utilize the Credit Facility during the six months ended December 31, 2016.
| | | | | | | | |
| | | |
| DECEMBER 31, 2016 | | J.P. MORGAN EQUITY FUNDS | | | | | 41 | |
NOTES TO FINANCIAL STATEMENTS
AS OF DECEMBER 31, 2016 (Unaudited) (continued)
7. Risks, Concentrations and Indemnifications
In the normal course of business, the Funds enter into contracts that contain a variety of representations which provide general indemnifications. Each Fund’s maximum exposure under these arrangements is unknown. The amount of exposure would depend on future claims that may be made against each Fund that have not yet occurred. However, based on experience, the Funds expect the risk of loss to be remote.
As of December 31, 2016, the Equity Index Fund had two affiliated omnibus accounts, which represent 13.7% of the Fund’s net assets.
As of December 31, 2016, the J.P. Morgan Investor Funds, which are affiliated funds of funds, owned in the aggregate shares representing 55.5% of the net assets of Market Expansion Enhanced Index Fund.
Significant shareholder transactions by these shareholders may impact each Fund’s performance.
Because the Funds may invest a portion of their assets in REITs, the Funds may be subject to certain risks similar to those associated with direct investments in real estate. REITs may be affected by changes in the value of their underlying properties and by defaults by tenants. REITs depend generally on their ability to generate cash flow to make distributions to shareholders, and certain REITs have self-liquidation provisions by which mortgages held may be paid in full and distributions of capital returns may be made at any time.
Derivatives may be riskier than other types of investments because they may be more sensitive to changes in economic and market conditions and could result in losses that significantly exceed the Funds’ original investment. Derivatives also expose the Funds to counterparty risk (the risk that the derivative counterparty will not fulfill its contractual obligations), including credit risk of the derivative counterparty.
| | | | | | |
| | | |
| 42 | | | | J.P. MORGAN EQUITY FUNDS | | DECEMBER 31, 2016 |
SCHEDULE OF SHAREHOLDER EXPENSES
(Unaudited)
Hypothetical $1,000 Investment
As a shareholder of the Funds, you incur two types of costs: (1) transaction costs, including sales charges (loads) on purchase payments and (2) ongoing costs, including investment advisory fees, administration fees, distribution fees and other Fund expenses. The examples below are intended to help you understand your ongoing costs (in dollars) of investing in the Funds and to compare these ongoing costs with the ongoing costs of investing in other mutual funds. The examples assume that you had a $1,000 investment in each Class at the beginning of the reporting period, July 1, 2016, and continued to hold your shares at the end of the reporting period, December 31, 2016.
Actual Expenses
For each Class of each Fund in the table below, the first line provides information about actual account values and actual expenses. You may use the information in this line, together with the amount you invested, to estimate the expenses that you paid over the period. Simply divide your account value by $1,000 (for example, an $8,600 account value divided by $1,000 = 8.6), then multiply the result by the number in the first line of each Class under the heading entitled “Expenses Paid During the Period” to estimate the expenses you paid on your account during this period.
Hypothetical Example for Comparison Purposes
The second line of each Class in the table below provides information about hypothetical account values and hypothetical expenses based on the Class’ actual expense ratio and an assumed rate of return of 5% per year before expenses, which is not the Class’ actual return. The hypothetical account values and expenses may not be used to estimate the actual ending account balance or expenses you paid for the period. You may use this information to compare the ongoing costs of investing in the Class of the Funds and other funds. To do so, compare this 5% hypothetical example with the 5% hypothetical examples that appear in the shareholder reports of the other funds. Please note that the expenses shown in the table are meant to highlight your ongoing costs only and do not reflect any transaction costs, such as sales charges (loads) or redemption fees. Therefore, the second line for each Class in the table is useful in comparing ongoing costs only, and will not help you determine the relative total costs of owning different funds. In addition, if these transaction costs were included, your costs would have been higher. The examples also assume all dividends and distributions have been reinvested.
| | | | | | | | | | | | | | | | |
| | | Beginning
Account Value
July 1, 2016 | | | Ending
Account Value
December 31, 2016 | | | Expenses
Paid During
the Period | | | Annualized
Expense
Ratio | |
Equity Index Fund | | | | | | | | | | | | | | | | |
Class A | | | | | | | | | | | | | | | | |
Actual* | | $ | 1,000.00 | | | $ | 1,075.70 | | | $ | 2.35 | | | | 0.45 | % |
Hypothetical* | | | 1,000.00 | | | | 1,022.94 | | | | 2.29 | | | | 0.45 | |
Class C | | | | | | | | | | | | | | | | |
Actual* | | | 1,000.00 | | | | 1,071.60 | | | | 5.95 | | | | 1.14 | |
Hypothetical* | | | 1,000.00 | | | | 1,019.46 | | | | 5.80 | | | | 1.14 | |
Class R6 | | | | | | | | | | | | | | | | |
Actual** | | | 1,000.00 | | | | 1,038.30 | | | | 0.14 | | | | 0.04 | |
Hypothetical* | | | 1,000.00 | | | | 1,025.00 | | | | 0.20 | | | | 0.04 | |
Select Class | | | | | | | | | | | | | | | | |
Actual* | | | 1,000.00 | | | | 1,077.00 | | | | 1.05 | | | | 0.20 | |
Hypothetical* | | | 1,000.00 | | | | 1,024.20 | | | | 1.02 | | | | 0.20 | |
| | | | |
Market Expansion Enhanced Index Fund | | | | | | | | | | | | | | | | |
Class A | | | | | | | | | | | | | | | | |
Actual* | | | 1,000.00 | | | | 1,148.20 | | | | 3.52 | | | | 0.65 | |
Hypothetical* | | | 1,000.00 | | | | 1,021.93 | | | | 3.31 | | | | 0.65 | |
Class C | | | | | | | | | | | | | | | | |
Actual* | | | 1,000.00 | | | | 1,143.70 | | | | 6.92 | | | | 1.28 | |
Hypothetical* | | | 1,000.00 | | | | 1,018.75 | | | | 6.51 | | | | 1.28 | |
Class R2 | | | | | | | | | | | | | | | | |
Actual* | | | 1,000.00 | | | | 1,146.90 | | | | 4.76 | | | | 0.88 | |
Hypothetical* | | | 1,000.00 | | | | 1,020.77 | | | | 4.48 | | | | 0.88 | |
Select Class | | | | | | | | | | | | | | | | |
Actual* | | | 1,000.00 | | | | 1,149.00 | | | | 2.22 | | | | 0.41 | |
Hypothetical* | | | 1,000.00 | | | | 1,023.14 | | | | 2.09 | | | | 0.41 | |
| * | Expenses are equal to each Class’ respective annualized expense ratio, multiplied by the average account value over the period, multiplied by 184/365 (to reflect the one-half year period). |
| ** | Expenses are equal to each Class’ respective annualized expense ratio, multiplied by the average account value over the period, multiplied by 122/365 (to reflect the one-half year period). |
| | | | | | | | |
| | | |
| DECEMBER 31, 2016 | | J.P. MORGAN EQUITY FUNDS | | | | | 43 | |
BOARD APPROVAL OF INVESTMENT ADVISORY AGREEMENT
(Unaudited)
The Board of Trustees has established various standing committees composed of Trustees with diverse backgrounds, to which the Board of Trustees has assigned specific subject matter responsibilities to further enhance the effectiveness of the Board’s oversight and decision making. The Board of Trustees and its investment committees (money market and alternative products, equity, and fixed income) meet regularly throughout the year and consider factors that are relevant to their annual consideration of investment advisory agreements at each meeting. They also meet for the specific purpose of considering investment advisory agreement annual renewals. The Board of Trustees held meetings in person in June and August 2016, at which the Trustees considered the continuation of the investment advisory agreement for each of the Funds whose semi-annual report is contained herein (each an “Advisory Agreement” and collectively, the “Advisory Agreements”). At the June meeting, the Board’s investment committees met to review and consider performance, expense and related information for the J.P. Morgan Funds. Each investment committee reported to the full Board, which then considered the investment committee’s preliminary findings. At the August meeting, the Trustees continued their review and consideration. The Trustees, including a majority of the Trustees who are not “interested persons” (as defined in the 1940 Act) of any party to the Advisory Agreements or any of their affiliates, approved the continuation of each Advisory Agreement on August 17, 2016.
As part of their review of the Advisory Agreements, the Trustees considered and reviewed performance and other information about the Funds received from the Adviser. This information includes the Funds’ performance as compared to the performance of their peers and benchmarks and analyses by the Adviser of the Funds’ performance. In addition, the Trustees have engaged an independent management consulting firm (“independent consultant”) to report on the performance of certain J.P. Morgan Funds at each of the Trustees’ regular meetings. The Adviser also periodically provides comparative information regarding the Funds’ expense ratios and those of their peer groups. In addition, in preparation for the June and August meetings, the Trustees requested, received and evaluated extensive materials from the Adviser, including performance and expense information compiled by Broadridge, using data from Lipper Inc., independent providers of investment company data (together, “Broadridge/Lipper”). The Trustees’ independent consultant also provided additional analyses of the performance of the Funds in connection with the Trustees’ review of the Advisory Agreements. Before voting on the proposed Advisory Agreements, the Trustees reviewed the proposed Advisory Agreements with representatives of the Adviser, counsel to the Trust and independent legal counsel, and received a memorandum from independent legal counsel to the Trustees discussing the legal standards for their consideration of the proposed Advisory Agreements. The Trustees
also discussed the proposed Advisory Agreements in executive session with independent legal counsel at which no representatives of the Adviser were present. Set forth below is a summary of the material factors evaluated by the Trustees in determining whether to approve each Advisory Agreement.
The Trustees considered information provided with respect to the Funds over the course of the year. Each Trustee attributed different weights to the various factors, and no factor alone was considered determinative. From year to year, the Trustees consider and place emphasis on relevant information in light of changing circumstances in market and economic conditions. The Trustees determined that the compensation to be received by the Adviser from each Fund under the applicable Advisory Agreement was fair and reasonable and that the continuance of each Advisory Agreement was in the best interests of each Fund and its shareholders.
The factors summarized below were considered and discussed by the Trustees in reaching their conclusions:
Nature, Extent and Quality of Services Provided by the Adviser
The Trustees received and considered information regarding the nature, extent and quality of the services provided to each Fund under the Advisory Agreement. The Trustees took into account information furnished throughout the year at Trustee meetings, as well as the materials furnished specifically in connection with this annual review process. The Trustees considered the background and experience of the Adviser’s senior management and the expertise of, and the amount of attention given to each Fund by, investment personnel of the Adviser. In addition, the Trustees reviewed the qualifications, backgrounds and responsibilities of the portfolio management team primarily responsible for the day-to-day management of each Fund and the infrastructure supporting the team. The Trustees also considered information provided by the Adviser and JPMorgan Distribution Services, Inc. (“JPMDS”) about the structure and distribution strategy of each Fund. The Trustees reviewed information relating to the Adviser’s risk governance model and reports showing the Adviser’s compliance structure and ongoing compliance processes. The Trustees also considered the quality of the administrative services provided by J.P. Morgan Investment Management Inc. in its role as administrator (“JPMIM”).
The Trustees also considered their knowledge of the nature and quality of the services provided by the Adviser and its affiliates to the Funds gained from their experience as Trustees of the J.P. Morgan Funds. In addition, they considered the overall reputation and capabilities of the Adviser and its affiliates, the commitment of the Adviser to provide high quality service to the Funds, their overall confidence in the Adviser’s integrity and the Adviser’s responsiveness to questions or concerns raised by them, including the Adviser’s willingness to consider and implement organizational and operational changes
| | | | | | |
| | | |
| 44 | | | | J.P. MORGAN EQUITY FUNDS | | DECEMBER 31, 2016 |
designed to improve investment results and the services provided to each Fund.
Based upon these considerations and other factors, the Trustees concluded that they were satisfied with the nature, extent and quality of the investment advisory services provided to the Funds by the Adviser.
Costs of Services Provided and Profitability to the Adviser and its Affiliates
The Trustees received and considered information regarding the profitability to the Adviser and its affiliates in providing services to each of the Funds. The Trustees reviewed and discussed this data. The Trustees recognized that this data is not audited and represents the Adviser’s determination of its and its affiliates’ revenues from the contractual services provided to the Funds, less expenses of providing such services. Expenses include direct and indirect costs and are calculated using an allocation methodology developed by the Adviser. The Trustees also recognized that it is difficult to make comparisons of profitability from fund investment advisory contracts because comparative information is not generally publicly available and is affected by numerous factors, including the structure of the particular adviser, the types of funds it manages, its business mix, numerous assumptions regarding allocations and the fact that publicly-traded fund managers’ operating profits and net income are net of distribution and marketing expenses. Based upon their review, the Trustees concluded that the profitability to the Adviser under each of the Advisory Agreements was not unreasonable in light of the services and benefits provided to each Fund.
Fall-Out Benefits
The Trustees reviewed information regarding potential “fallout” or ancillary benefits received by the Adviser and its affiliates as a result of their relationship with the Funds. The Trustees also reviewed the Adviser’s allocation of fund brokerage for the J.P. Morgan Funds complex, including allocations to brokers who provide research to the Adviser.
The Trustees also considered that JPMDS, an affiliate of the Adviser, and JPMIM earn fees from the Funds for providing shareholder and administrative services, respectively. These fees were shown separately in the profitability analysis presented to the Trustees. The Trustees also considered the payments of Rule 12b-1 fees to JPMDS, which also acts as the Funds’ distributor and that these fees are in turn generally paid to financial intermediaries that sell the Funds, including financial intermediaries that are affiliates of the Adviser. The Trustees also considered the fees paid to JPMorgan Chase Bank, N.A. (“JPMCB”) for custody and fund accounting, and other related services.
Economies of Scale
The Trustees considered the extent to which the Funds may benefit from economies of scale. The Trustees considered that there may not be a direct relationship between economies of scale realized by the Funds and those realized by the Adviser as assets increase. The Trustees noted that the proposed investment advisory fee schedule for each Fund does not contain breakpoints, but that the fees remain competitive with peer funds. The Trustees also considered that the Adviser has implemented fee waivers and expense limitations (“Fee Caps”) which allow each Fund’s shareholders to share potential economies of scale from a Fund’s inception. The Trustees also considered that the Adviser has shared economies of scale by adding or enhancing services to the Funds over time, noting the Adviser’s substantial investments in its business in support of the Funds, including investments in trading systems and technology (including cybersecurity improvements), retention of key talent, additions to analyst and portfolio management teams, and regulatory support enhancements. The Trustees also considered whether it would be appropriate to add advisory fee breakpoints and the Trustees concluded that the current fee structure was reasonable in light of the Fee Caps that the Adviser has in place that serve to limit the overall net expense ratios of each Fund at competitive levels. The Trustees concluded that the Funds’ shareholders received the benefits of potential economies of scale through the Fee Caps and the Adviser’s reinvestment in its operations to serve the Funds and their shareholders.
Independent Written Evaluation of the Funds’ Senior Officer
The Trustees noted that, upon their direction, the Senior Officer for the Funds had prepared an independent written evaluation in order to assist the Trustees in determining the reasonableness of the proposed management fees. In determining whether to continue the Advisory Agreements, the Trustees considered the Senior Officer’s report.
Fees Relative to Adviser’s Other Clients
The Trustees received and considered information about the nature and extent of investment advisory services and fee rates offered to other clients of the Adviser, including institutional separate accounts and/or funds sub-advised by the Adviser, for investment management styles substantially similar to that of each Fund. The Trustees considered the complexity of investment management for registered mutual funds relative to the Adviser’s other clients and noted differences in the regulatory, legal and other risks and responsibilities of providing services to the different clients. The Trustees considered that serving as an adviser to a registered mutual fund involves greater responsibilities and risks than acting as a sub-adviser and observed that sub-advisory fees may be lower than those charged by the Adviser to each Fund. The Trustees also noted that the adviser, not the mutual fund, pays the sub-advisory fee
| | | | | | | | |
| | | |
| DECEMBER 31, 2016 | | J.P. MORGAN EQUITY FUNDS | | | | | 45 | |
BOARD APPROVAL OF INVESTMENT ADVISORY AGREEMENT
(Unaudited) (continued)
and that many responsibilities related to the advisory function are retained by the primary adviser. The Trustees concluded that the fee rates charged to each Fund in comparison to those charged to the Adviser’s other clients were reasonable.
Investment Performance
The Trustees received and considered absolute and/or relative performance for the Funds in a report prepared by Broadridge/Lipper. The Trustees considered the total return performance information, which included the ranking of the Funds within a performance universe made up of funds with the same Broadridge/Lipper investment classification and objective (the “Universe”), as well as a sub-set of funds within the Universe (the “Peer Group”), by total return for applicable one-, three- and five-year periods. The Trustees reviewed a description of Broadridge/Lipper’s methodology for selecting mutual funds in each Fund’s Peer Group and Universe. The Broadridge/Lipper materials provided to the Trustees highlighted information with respect to certain representative classes to assist the Trustees in their review. As part of this review, the Trustees also reviewed each Fund’s performance against its benchmark and considered the performance information provided for the Funds at regular Board meetings by the Adviser and the Trustees’ independent consultant and also considered the special analysis prepared by the Trustees’ independent consultant. The Broadridge/Lipper performance data noted by the Trustees as part of their review and the determinations made by the Trustees with respect to each Fund’s performance for certain representative classes are summarized below:
The Trustees noted that the Equity Index Fund’s performance for Class A shares was in the first and third quintiles based on the Peer Group and Universe, respectively, for each of the one-, three- and five-year periods ended December 31, 2015. The Trustees noted that the performance for Select Class shares was in the first and second quintiles based upon the Peer Group and Universe, respectively, for each of the one-, three- and five-year periods ended December 31, 2015. The Trustees discussed the performance and investment strategy of the Fund with the Adviser and reviewed the performance analysis and evaluation prepared by the independent consultant. Based upon these discussions and various other factors, the Trustees concluded that the Fund’s performance was reasonable.
The Trustees noted that the Market Expansion Enhanced Index Fund’s performance for both Class A and Select Class shares was in the first quintile based upon the Universe for each of the one-, three- and five-year periods ended December 31, 2015. The Trustees discussed the performance and investment
strategy of the Fund with the Adviser and reviewed the performance analysis and evaluation prepared by the independent consultant. Based upon these discussions and various other factors, the Trustees concluded that the Fund’s performance was reasonable.
Advisory Fees and Expense Ratios
The Trustees considered the contractual advisory fee rate paid by each Fund to the Adviser and compared that rate to the information prepared by Broadridge/Lipper concerning management fee rates paid by other funds in the same Broadridge/Lipper category as each Fund. The Trustees recognized that Broadridge/Lipper reported each Fund’s management fee rate as the combined contractual advisory fee and administration fee rates. The Trustees also reviewed information about other expenses and the expense ratios for each Fund. The Trustees considered the fee waiver and/or expense reimbursement arrangements currently in place for each Fund and considered the net advisory fee rate after taking into account any waivers and/or reimbursements. The Trustees recognized that it is difficult to make comparisons of advisory fees because there are variations in the services that are included in the fees paid by other funds. The Trustees’ determinations as a result of the review of each Fund’s advisory fees and expense ratios for certain representative classes are summarized below:
The Trustees noted that the Equity Index Fund’s net advisory fee and actual total expenses were in the second and first quintiles, respectively, based upon both the Peer Group and Universe. The Trustees noted that the net advisory fee for Select Class shares was in the third and second quintiles based upon the Peer Group and Universe, respectively, and that the actual total expenses for Select Class shares were in the first and second quintiles based upon the Peer Group and Universe, respectively. The Trustees also noted that effective September 1, 2016, the contractual advisory fee would be reduced from 0.25% to 0.04%. After considering the factors identified above, in light of this information, the Trustees concluded that the advisory fee was reasonable.
The Trustees noted that based upon the Universe, the Market Expansion Enhanced Index Fund’s net advisory fee and actual total expenses for Class A shares were in the second and first quintiles, respectively, and in the fourth and third quintiles, respectively, for Select Class shares. The Trustees also noted that the expense caps for certain share classes were reduced effective November 1, 2016. After considering the factors identified above, in light of this information, the Trustees concluded that the advisory fees were reasonable.
| | | | | | |
| | | |
| 46 | | | | J.P. MORGAN EQUITY FUNDS | | DECEMBER 31, 2016 |
J.P. Morgan Funds are distributed by JPMorgan Distribution Services, Inc., which is an affiliate of JPMorgan Chase & Co. Affiliates of JPMorgan Chase & Co. receive fees for providing various services to the funds.
Contact JPMorgan Distribution Services, Inc. at 1-800-480-4111 for a fund prospectus. You can also visit us at www.jpmorganfunds.com. Investors should carefully consider the investment objectives and risk as well as charges and expenses of the mutual fund before investing. The prospectus contains this and other information about the mutual fund. Read the prospectus carefully before investing.
Investors may obtain information about the Securities Investor Protection Corporation (SIPC), including the SIPC brochure by visiting www.sipc.org or by calling SIPC at 202-371-8300.
Each Fund files a complete schedule of its fund holdings for the first and third quarters of its fiscal year with the SEC on Form N-Q. The Funds’ Forms N-Q are available on the SEC’s website at http://www.sec.gov and may be reviewed and copied at the SEC’s Public Reference Room in Washington, DC. Information on the operation of the SEC’s Public Reference Room may be obtained by calling 1-800-SEC-0330. Shareholders may request the Form N-Q without charge by calling 1-800-480-4111 or by visiting the J.P. Morgan Funds’ website at www.jpmorganfunds.com.
A description of each Fund’s policies and procedures with respect to the disclosure of each Fund’s holdings is available in the prospectus and Statement of Additional Information.
A copy of proxy policies and procedures is available without charge upon request by calling 1-800-480-4111 and on the Funds’ website at www.jpmorganfunds.com. A description of such policies and procedures is on the SEC’s website at www.sec.gov. The Trustees have delegated the authority to vote proxies for securities owned by the Funds to the Adviser. A copy of the Funds’ voting record for the most recent 12-month period ended June 30 is available on the SEC’s website at www.sec.gov or at the Funds’ website at www.jpmorganfunds.com no later than August 31 of each year. The Funds’ proxy voting record will include, among other things, a brief description of the matter voted on for each fund security, and will state how each vote was cast, for example, for or against the proposal.

J.P. Morgan Asset Management is the marketing name for the asset management businesses of JPMorgan Chase & Co. Those businesses include, but are not limited to, J.P. Morgan Investment Management Inc., Security Capital Research & Management Incorporated and J.P. Morgan Alternative Asset Management, Inc.
| | | | |
| | © JPMorgan Chase & Co., 2017. All rights reserved. December 2016. | | SAN-INDEX-1216 |
Semi-Annual Report
J.P. Morgan Investor Funds
December 31, 2016 (Unaudited)
JPMorgan Investor Balanced Fund
JPMorgan Investor Conservative Growth Fund
JPMorgan Investor Growth Fund
JPMorgan Investor Growth & Income Fund

CONTENTS
Investments in a Fund are not deposits or obligations of, or guaranteed or endorsed by, any bank and are not insured or guaranteed by the FDIC, the Federal Reserve Board or any other government agency. You could lose money if you sell when a Fund’s share price is lower than when you invested.
Past performance is no guarantee of future performance. The general market views expressed in this report are opinions based on market and other conditions through the end of the reporting period and are subject to change without notice. These views are not intended to predict the future performance of a Fund or the securities markets. References to specific securities and their issuers are for illustrative purposes only and are not intended to be, and should not be interpreted as, recommendations to purchase or sell such securities. Such views are not meant as investment advice and may not be relied on as an indication of trading intent on behalf of any Fund.
Prospective investors should refer to the Funds’ prospectus for a discussion of the Funds’ investment objectives, strategies and risks. Call J.P. Morgan Funds Service Center at 1-800-480-4111 for a prospectus containing more complete information about a Fund, including management fees and other expenses. Please read it carefully before investing.
CEO’S LETTER
January 25, 2017 (Unaudited)
Dear Shareholder,
The continued expansion of the U.S. economy through the second half of 2016 helped support U.S. equity prices and spurred the U.S. Federal Reserve (the “Fed”) to raise interest rates in December. During the period, corporate earnings overall showed positive growth and by the end of the year the unemployment rate had reached it lowest levels since 2007.
| | |
 | | “We believe the market performance over the past year has further validated both patience and diversification as fundamental components of a sound investment strategy.” |
Gross domestic product in the U.S. rose by an estimated 3.5% in the third quarter of 2016, surpassing other developed markets. Global oil prices also continued to rise for most of the reporting period and the price of West Texas Intermediate crude reached a 15-month high in November. The Standard & Poor’s 500 Index reached fresh closing highs in July and August and remained buoyant through October.
The November 8th victory of Republican Party presidential candidate Donald Trump surprised many investors and led to brief declines in global equities. However, within 24 hours
global share prices had largely recovered. U.S. equity prices
rallied through the end of the year, reaching new highs in December.
Against this backdrop, the Fed raised interest rates by a quarter of a percentage point on December 14th. “Economic growth has picked up since the middle of the year,” said Fed Chairwoman Janet Yellen. “We expect the economy will continue to perform well.”
While the prospect of further interest rate increases put pressure on U.S. bond prices, equities provided investors with positive returns. We believe the market performance over the past year has further validated both patience and diversification as fundamental components of a sound investment strategy.
We look forward to managing your investment needs for years to come. Should you have any questions, please visit www.jpmorganfunds.com or contact the J.P. Morgan Funds Service Center at 1-800-480-4111.
Sincerely yours,

George C.W. Gatch
CEO, Investment Funds Management,
J.P. Morgan Asset Management
| | | | | | | | |
| | | |
| DECEMBER 31, 2016 | | J.P. MORGAN INVESTOR FUNDS | | | | | 1 | |
J.P. Morgan Investor Funds
FUND FACTS
SIX MONTHS ENDED DECEMBER 31, 2016 (Unaudited)
| | | | | | | | | | | | | | | | | | | | | | | | |
Fund | | Fund Return
(With
sales charge)* | | | Fund Return
(Without
sales charge)* | | | Bloomberg Barclays U.S.
Intermediate Aggregate
Index Return
(formerly Barclays U.S.
Intermediate Aggregate
Index)
(Broad-Based Fixed
Income Benchmark) | | | Russell 3000
Index Return
(Broad-Based
Equity Benchmark) | | | Composite
Benchmark Return | | | Fund Net
Assets as of
December 31, 2016
(in thousands) | |
| JPMorgan Investor Balanced Fund, Class A | | | (0.19 | )% | | | 4.55 | % | | | (1.74 | )% | | | 8.79 | % | | | 3.47 | %** | | $ | 5,328,194 | |
| | | | | | |
| JPMorgan Investor Conservative Growth Fund, Class A | | | (2.24 | )% | | | 2.35 | % | | | (1.74 | )% | | | 8.79 | % | | | 1.37 | %*** | | $ | 4,142,015 | |
| | | | | | |
| JPMorgan Investor Growth Fund, Class A | | | 3.76 | % | | | 8.65 | % | | | (1.74 | )% | | | 8.79 | % | | | 7.72 | %**** | | $ | 2,544,261 | |
| | | | | | |
| JPMorgan Investor Growth & Income Fund, Class A | | | 1.77 | % | | | 6.54 | % | | | (1.74 | )% | | | 8.79 | % | | | 5.58 | %***** | | $ | 3,130,106 | |
Portfolio Composition by Asset Class******
| | | | |
Investor Balanced Fund | |
| Fixed Income | | | 44.2 | % |
| U.S. Equity | | | 35.8 | |
| International Equity | | | 14.6 | |
| Alternative Assets | | | 4.5 | |
| Money Market | | | 0.9 | |
|
Investor Conservative Growth Fund | |
| Fixed Income | | | 64.5 | % |
| U.S. Equity | | | 21.6 | |
| International Equity | | | 8.5 | |
| Alternative Assets | | | 4.7 | |
| Money Market | | | 0.7 | |
|
Investor Growth Fund | |
| U.S. Equity | | | 66.6 | % |
| International Equity | | | 20.9 | |
| Fixed Income | | | 9.9 | |
| Alternative Assets | | | 1.5 | |
| Money Market | | | 1.1 | |
|
Investor Growth & Income Fund | |
| U.S. Equity | | | 49.5 | % |
| Fixed Income | | | 28.0 | |
| International Equity | | | 17.7 | |
| Alternative Assets | | | 3.8 | |
| Money Market | | | 1.0 | |
| * | | The return shown is based on net asset values calculated for shareholder transactions and may differ from the return shown in the financial highlights, which reflects adjustments made to the net asset values in accordance with accounting principles generally accepted in the United States of America. |
| ** | | The Composite Benchmark is comprised of unmanaged indices that correspond to the Investor Balanced Fund’s model allocation and consists of the Bloomberg Barclays U.S. Intermediate Aggregate Index (50%) and the Russell 3000 Index (50%). |
| *** | | The Composite Benchmark is comprised of unmanaged indices that correspond to the Investor Conservative Growth Fund’s model allocation and consists of the Bloomberg Barclays U.S. Intermediate Aggregate Index (70%) and the Russell 3000 Index (30%). |
| **** | | The Composite Benchmark is comprised of unmanaged indices that correspond to the Investor Growth Fund’s model allocation and consists of the Russell 3000 Index (90%) and the Bloomberg Barclays U.S. Intermediate Aggregate Index (10%). |
| ***** | | The Composite Benchmark is comprised of unmanaged indices that correspond to the Investor Growth & Income Fund’s model allocation and consists of the Russell 3000 Index (70%) and the Bloomberg Barclays U.S. Intermediate Aggregate Index (30%). |
| ****** | | Percentages indicated are based on total investments as of December 31, 2016. The Funds’ portfolio composition is subject to change. |
| | | | | | |
| | | |
| 2 | | | | J.P. MORGAN INVESTOR FUNDS | | DECEMBER 31, 2016 |
J.P. Morgan Investor Funds
FUNDS COMMENTARY
SIX MONTHS ENDED DECEMBER 31, 2016 (Unaudited)
INVESTMENT OBJECTIVES*
The JPMorgan Investor Balanced Fund seeks high total return consistent with the preservation of capital by investing primarily in a diversified group of mutual funds within the same group of investment companies that invest primarily in equity and fixed income securities.
The JPMorgan Investor Conservative Growth Fund seeks income and capital appreciation by investing primarily in a diversified group of mutual funds within the same group of investment companies that invest primarily in fixed income and equity securities.
The JPMorgan Investor Growth Fund seeks long-term capital appreciation by investing primarily in a diversified group of mutual funds within the same group of investment companies that invest primarily in equity securities.
The JPMorgan Investor Growth & Income Fund seeks long-term capital appreciation and growth of income by investing primarily in a diversified group of mutual funds within the same group of investment companies that invest primarily in equity securities.
HOW DID THE MARKET PERFORM?
U.S. equity investments generally continued to outperform both other developed markets and emerging markets during the second half of 2016. Rebounding in the wake of the U.K.’s vote to exit from the European Union, the Standard & Poor’s 500 (the “S&P 500”) reached new closing highs in July and August. Global oil prices also continued to rise during the reporting period and reached 15-month highs in advance of the November 30th meeting of the Organization of Petroleum Exporting Countries.
Meanwhile, the November 8th victory of Republican Party presidential candidate Donald Trump surprised many investors and led to brief declines in global equities. The U.S. equity market recovered within a day and in the following weeks the S&P 500 surpassed 2,200 points for the first time and reached eight new closing highs by the end of 2016. The Dow Jones Industrial Average surpassed 19,000 points for the first time and reached 17 new closing highs between the election and the end of the year. In particular, energy, pharmaceutical and financial sector stocks generally rose amid investor expectations that a Trump administration’s policies would be beneficial for those industries.
Overall, bond markets underperformed equity markets during the reporting period as rising stock prices attracted investors
and expectations for rising interest rates in the U.S. hurt prices for U.S. Treasury bonds and core fixed-income debt securities.
During the reporting period, value stocks generally outperformed growth stocks and small-capitalization and mid-cap stocks outperformed large-cap stocks. By sector, the energy and financials sectors were top performers, while the health care and real estate sectors underperformed other sectors.
WHAT WERE THE MAIN DRIVERS OF THE FUNDS’ PERFORMANCE?
In accordance with their model allocations, each of the JPMorgan Investor Funds (the “Investor Funds”) allocated its assets among fixed income, equity and alternative investments. For the six months ended December 31, 2016, each of the Investor Funds outperformed the Bloomberg Barclays U.S. Intermediate Aggregate Index, the Investor Funds’ broad based fixed income benchmark. Each of the Investor Funds underperformed the Russell 3000 Index, the Investor Funds’ broad based equity benchmark, mainly due to the Investor Funds’ positions in non-U.S. developed market equity and core bond securities, none of which were held in the Russell 3000 Index and generally underperformed other asset classes.
Each Investor Fund’s performance is also compared to composite benchmarks, which are constructed of different percentages of the Investor Funds’ broad based fixed income and equity benchmarks. These composite benchmarks correspond to each Investor Fund’s target allocation. All four Investor Funds outperformed their respective composite benchmarks, mainly due to equity manager outperformance and to the Funds’ exposure to U.S. high yield debt (also known as “junk bonds”) that were not held in the composite benchmarks.
HOW WERE THE FUNDS POSITIONED?
Each Investor Fund invested in underlying JPMorgan Funds (“underlying funds”). The underlying funds invest in fixed income securities, equities and other alternative fixed income and equity strategies, such as below investment-grade, high-yield bonds, commodities, equity long/short and market-neutral strategies. Among equities, the underlying funds in which the Investor Funds invested were allocated among large-cap, mid-cap, small-cap, and international stocks. The Investor Funds’ portfolio managers made investments for each Investor Fund based on an evaluation of three components: underlying fund selection, tactical asset allocation and strategic asset allocation. The portfolio managers determined the strategic weight for each asset class in the Investor Funds by making
| | | | | | | | |
| | | |
| DECEMBER 31, 2016 | | J.P. MORGAN INVESTOR FUNDS | | | | | 3 | |
J.P. Morgan Investor Funds
FUNDS COMMENTARY
SIX MONTHS ENDED DECEMBER 31, 2016 (Unaudited) (continued)
investments that they believed would perform well over the long term, and maintained a level of volatility similar to that of each Investor Fund’s composite benchmark.
During the reporting period, the Investor Funds’ portfolio managers – through their investments in underlying funds – slightly decreased their allocation to high-yield debt and
reduced their allocation to U.S. equity, particularly large capitalization stocks, amid rising equity prices. The managers also maintained their overweight position in international equity.
| * | | The adviser seeks to achieve each Fund’s objective. There can be no guarantee it will be achieved. |
| | | | | | |
| | | |
| 4 | | | | J.P. MORGAN INVESTOR FUNDS | | DECEMBER 31, 2016 |
JPMorgan Investor Balanced Fund
FUND COMMENTARY
SIX MONTHS ENDED DECEMBER 31, 2016 (Unaudited)
| | | | | | | | | | | | | | | | | | |
AVERAGE ANNUAL TOTAL RETURNS AS OF DECEMBER 31, 2016 | |
| | | | | |
| | | INCEPTION DATE OF
CLASS | | 6 MONTH* | | | 1 YEAR | | | 5 YEAR | | | 10 YEAR | |
CLASS A SHARES | | December 10, 1996 | | | | | | | | | | | | | | | | |
With Sales Charge** | | | | | (0.19 | )% | | | 1.70 | % | | | 6.39 | % | | | 4.59 | % |
Without Sales Charge | | | | | 4.55 | | | | 6.52 | | | | 7.37 | | | | 5.08 | |
CLASS C SHARES | | July 1, 1997 | | | | | | | | | | | | | | | | |
With CDSC*** | | | | | 3.24 | | | | 4.93 | | | | 6.81 | | | | 4.51 | |
Without CDSC | | | | | 4.24 | | | | 5.93 | | | | 6.81 | | | | 4.51 | |
SELECT CLASS SHARES | | December 10, 1996 | | | 4.68 | | | | 6.78 | | | | 7.62 | | | | 5.34 | |
| ** | | Sales Charge for Class A Shares is 4.50%. |
| *** | | Assumes a 1% CDSC (contingent deferred sales charge) for the 6 month and one year periods and 0% CDSC thereafter. |
TEN YEAR PERFORMANCE (12/31/06 TO 12/31/16)
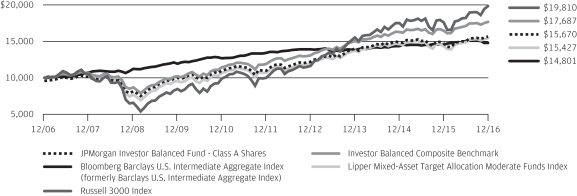
The performance quoted is past performance and is not a guarantee of future results. Mutual funds are subject to certain market risks. Investment returns and principal value of an investment will fluctuate so that an investor’s shares, when redeemed, may be worth more or less than their original cost. Current performance may be higher or lower than the performance data shown. For up-to-date month-end performance information please call 1-800-480-4111.
The graph illustrates comparative performance for $10,000 invested in Class A Shares of the JPMorgan Investor Balanced Fund, the Bloomberg Barclays U.S. Intermediate Aggregate Index, the Russell 3000 Index, the Investor Balanced Composite Benchmark and the Lipper Mixed-Asset Target Allocation Moderate Funds Index from December 31, 2006 to December 31, 2016. The performance of the Fund assumes reinvestment of all dividends and capital gain distributions, if any, and includes a sales charge. The performance of the broad-based securities indices and the Investor Balanced Composite Benchmark does not reflect the deduction of expenses or a sales charge associated with a mutual fund and has been adjusted to reflect reinvestment of all dividends and capital gain distributions of the securities included in the benchmark, if applicable. The performance of the Lipper Mixed-Asset Target Allocation Moderate Funds Index, which is not a broad-based securities index, includes expenses associated with a mutual fund, such as investment management fees. These expenses are not identical to the expenses incurred by the Fund. The Bloomberg Barclays U.S. Intermediate Aggregate Index is an unmanaged index comprised of U.S. Government, mortgage, corporate, and asset-backed
securities with maturities of one to 10 years. The Russell 3000 Index is an unmanaged index which measures the performance of the 3,000 largest U.S. companies based on total market capitalization, which represents approximately 98% of the investable U.S. equity market. The Investor Balanced Composite Benchmark is comprised of unmanaged indices that correspond to the Fund’s model allocation and consists of the Bloomberg Barclays U.S. Intermediate Aggregate Index (50%) and the Russell 3000 Index (50%). The Lipper Mixed-Asset Target Allocation Moderate Funds Index consists of funds that by portfolio practice maintain a mix of between 40% to 60% equity securities, with the remainder invested in bonds, cash and cash equivalents. Investors cannot invest directly in an index.
Class A Shares have a $500 minimum initial investment and carry a 4.50% sales charge.
Fund performance may reflect the waiver of the Fund’s fees and reimbursement of expenses for certain periods since the inception date. Without these waivers and reimbursements, performance would have been lower. Also, performance shown in this section does not reflect the deduction of taxes that a shareholder would pay on Fund distributions or redemptions of Fund shares.
The returns shown are based on net asset values calculated for shareholder transactions and may differ from the returns shown in the financial highlights, which reflect adjustments made to the net asset values in accordance with accounting principles generally accepted in the United States of America.
| | | | | | | | |
| | | |
| DECEMBER 31, 2016 | | J.P. MORGAN INVESTOR FUNDS | | | | | 5 | |
JPMorgan Investor Conservative Growth Fund
FUND COMMENTARY
SIX MONTHS ENDED DECEMBER 31, 2016 (Unaudited)
| | | | | | | | | | | | | | | | | | |
AVERAGE ANNUAL TOTAL RETURNS AS OF DECEMBER 31, 2016 | |
| | | | | |
| | | INCEPTION DATE OF
CLASS | | 6 MONTH* | | | 1 YEAR | | | 5 YEAR | | | 10 YEAR | |
CLASS A SHARES | | December 10, 1996 | | | | | | | | | | | | | | | | |
With Sales Charge** | | | | | (2.24 | )% | | | 0.40 | % | | | 4.32 | % | | | 4.00 | % |
Without Sales Charge | | | | | 2.35 | | | | 5.12 | | | | 5.28 | | | | 4.47 | |
CLASS C SHARES | | July 1, 1997 | | | | | | | | | | | | | | | | |
With CDSC*** | | | | | 1.04 | | | | 3.45 | | | | 4.71 | | | | 3.90 | |
Without CDSC | | | | | 2.04 | | | | 4.45 | | | | 4.71 | | | | 3.90 | |
SELECT CLASS SHARES | | December 10, 1996 | | | 2.44 | | | | 5.34 | | | | 5.54 | | | | 4.73 | |
| ** | | Sales Charge for Class A Shares is 4.50%. |
| *** | | Assumes a 1% CDSC (contingent deferred sales charge) for the 6 month and one year periods and 0% CDSC thereafter. |
TEN YEAR PERFORMANCE (12/31/06 TO 12/31/16)
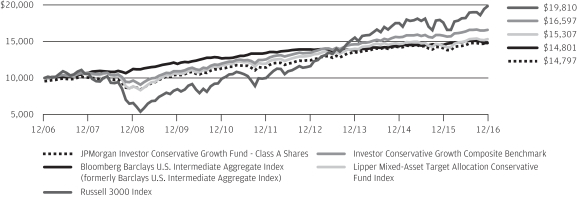
The performance quoted is past performance and is not a guarantee of future results. Mutual funds are subject to certain market risks. Investment returns and principal value of an investment will fluctuate so that an investor’s shares, when redeemed, may be worth more or less than their original cost. Current performance may be higher or lower than the performance data shown. For up-to-date month-end performance information please call 1-800-480-4111.
The graph illustrates comparative performance for $10,000 invested in Class A Shares of the JPMorgan Investor Conservative Growth Fund, the Bloomberg Barclays U.S. Intermediate Aggregate Index, the Russell 3000 Index, the Investor Conservative Growth Composite Benchmark, and the Lipper Mixed-Asset Target Allocation Conservative Funds Index from December 31, 2006 to December 31, 2016. The performance of the Fund assumes reinvestment of all dividends and capital gain distributions, if any, and includes a sales charge. The performance of the broad-based securities indices and the Investor Conservative Growth Composite Benchmark does not reflect the deduction of expenses or a sales charge associated with a mutual fund and has been adjusted to reflect reinvestment of all dividends and capital gain distributions of the securities included in the benchmark, if applicable. The performance of the Lipper Mixed-Asset Target Allocation Conservative Funds Index, which is not a broad-based securities index, includes expenses associated with a mutual fund, such as investment management fees. These expenses are not identical to the expenses incurred by the Fund. The Bloomberg Barclays U.S. Intermediate Aggregate Index is an unmanaged index comprised of U.S. Government, mortgage, corporate, and asset-backed securities with maturities of one to 10 years.
The Russell 3000 Index is an unmanaged index which measures the performance of the 3,000 largest U.S. companies based on total market capitalization, which represents approximately 98% of the investable U.S. equity market. The Investor Conservative Growth Composite Benchmark is comprised of unmanaged indices that correspond to the Fund’s model allocation and consists of the Bloomberg Barclays U.S. Intermediate Aggregate Index (70%) and the Russell 3000 Index (30%). The Lipper Mixed-Asset Target Allocation Conservative Funds Index consists of funds that by portfolio practice maintain a mix of between 20% to 40% equity securities, with the remainder invested in bonds, cash and cash equivalents. Investors cannot invest directly in an index.
Class A Shares have a $500 minimum initial investment and carry a 4.50% sales charge.
Fund performance may reflect the waiver of the Fund’s fees and reimbursement of expenses for certain periods since the inception date. Without these waivers and reimbursements, performance would have been lower. Also, performance shown in this section does not reflect the deduction of taxes that a shareholder would pay on Fund distributions or redemptions of Fund shares.
The returns shown are based on net asset values calculated for shareholder transactions and may differ from the returns shown in the financial highlights, which reflect adjustments made to the net asset values in accordance with accounting principles generally accepted in the United States of America.
| | | | | | |
| | | |
| 6 | | | | J.P. MORGAN INVESTOR FUNDS | | DECEMBER 31, 2016 |
JPMorgan Investor Growth Fund
FUND COMMENTARY
SIX MONTHS ENDED DECEMBER 31, 2016 (Unaudited)
| | | | | | | | | | | | | | | | | | |
AVERAGE ANNUAL TOTAL RETURNS AS OF DECEMBER 31, 2016 | |
| | | | | |
| | | INCEPTION DATE OF
CLASS | | 6 MONTH* | | | 1 YEAR | | | 5 YEAR | | | 10 YEAR | |
CLASS A SHARES | | December 10, 1996 | | | | | | | | | | | | | | | | |
With Sales Charge** | | | | | 3.76 | % | | | 3.83 | % | | | 10.37 | % | | | 5.12 | % |
Without Sales Charge | | | | | 8.65 | | | | 8.71 | | | | 11.39 | | | | 5.60 | |
CLASS C SHARES | | July 1, 1997 | | | | | | | | | | | | | | | | |
With CDSC*** | | | | | 7.35 | | | | 7.10 | | | | 10.81 | | | | 5.02 | |
Without CDSC | | | | | 8.35 | | | | 8.10 | | | | 10.81 | | | | 5.02 | |
SELECT CLASS SHARES | | December 10, 1996 | | | 8.79 | | | | 8.98 | | | | 11.69 | | | | 5.87 | |
| ** | | Sales Charge for Class A Shares is 4.50%. |
| *** | | Assumes a 1% CDSC (contingent deferred sales charge) for the 6 month and one year periods and 0% CDSC thereafter. |
TEN YEAR PERFORMANCE (12/31/06 TO 12/31/16)
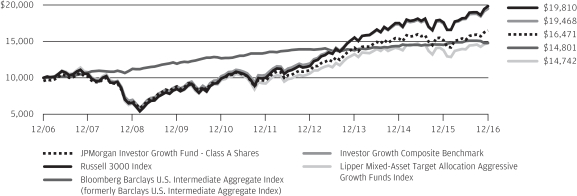
The performance quoted is past performance and is not a guarantee of future results. Mutual funds are subject to certain market risks. Investment returns and principal value of an investment will fluctuate so that an investor’s shares, when redeemed, may be worth more or less than their original cost. Current performance may be higher or lower than the performance data shown. For up-to-date month-end performance information please call 1-800-480-4111.
The graph illustrates comparative performance for $10,000 invested in Class A Shares of the JPMorgan Investor Growth Fund, the Russell 3000 Index, the Bloomberg Barclays U.S. Intermediate Aggregate Index, the Investor Growth Composite Benchmark and the Lipper Mixed-Asset Target Allocation Aggressive Growth Funds Index from December 31, 2006 to December 31, 2016. The performance of the Fund assumes reinvestment of all dividends and capital gain distributions, if any, and includes a sales charge. The performance of the broad-based securities indices and the Investor Growth Composite Benchmark does not reflect the deduction of expenses or a sales charge associated with a mutual fund and has been adjusted to reflect reinvestment of all dividends and capital gain distributions of the securities included in the benchmark, if applicable. The performance of the Lipper Mixed-Asset Target Allocation Aggressive Growth Funds Index, which is not a broad-based securities index, includes expenses associated with a mutual fund, such as investment management fees. These expenses are not identical to the expenses incurred by the Fund. The Russell 3000 Index is an unmanaged index which measures the performance of the 3,000 largest U.S. companies based on total market capitalization, which
represents approximately 98% of the investable U.S. equity market. The Bloomberg Barclays U.S. Intermediate Aggregate Index is an unmanaged index comprised of U.S. Government, mortgage, corporate, and asset-backed securities with maturities of one to 10 years. The Investor Growth Composite Benchmark is comprised of unmanaged indices that correspond to the Fund’s model allocation and consists of the Russell 3000 Index (90%) and the Bloomberg Barclays U.S. Intermediate Aggregate Index (10%). The Lipper Mixed-Asset Target Allocation Aggressive Growth Funds Index consists of funds that invest in a variety of market capitalization ranges without concentrating 75% of their equity assets in any one market capitalization range over an extended period of time. Investors cannot invest directly in an index.
Class A Shares have a $500 minimum initial investment and carry a 4.50% sales charge.
Fund performance may reflect the waiver of the Fund’s fees and reimbursement of expenses for certain periods since the inception date. Without these waivers and reimbursements, performance would have been lower. Also, performance shown in this section does not reflect the deduction of taxes that a shareholder would pay on Fund distributions or redemptions of Fund shares.
The returns shown are based on net asset values calculated for shareholder transactions and may differ from the returns shown in the financial highlights, which reflect adjustments made to the net asset values in accordance with accounting principles generally accepted in the United States of America.
| | | | | | | | |
| | | |
| DECEMBER 31, 2016 | | J.P. MORGAN INVESTOR FUNDS | | | | | 7 | |
JPMorgan Investor Growth & Income Fund
FUND COMMENTARY
SIX MONTHS ENDED DECEMBER 31, 2016 (Unaudited)
| | | | | | | | | | | | | | | | | | |
AVERAGE ANNUAL TOTAL RETURNS AS OF DECEMBER 31, 2016 | |
| | | | | |
| | | INCEPTION DATE OF
CLASS | | 6 MONTH* | | | 1 YEAR | | | 5 YEAR | | | 10 YEAR | |
CLASS A SHARES | | December 10, 1996 | | | | | | | | | | | | | | | | |
With Sales Charge** | | | | | 1.77 | % | | | 2.60 | % | | | 8.11 | % | | | 4.78 | % |
Without Sales Charge | | | | | 6.54 | | | | 7.43 | | | | 9.11 | | | | 5.26 | |
CLASS C SHARES | | July 1, 1997 | | | | | | | | | | | | | | | | |
With CDSC*** | | | | | 5.28 | | | | 5.89 | | | | 8.54 | | | | 4.69 | |
Without CDSC | | | | | 6.28 | | | | 6.89 | | | | 8.54 | | | | 4.69 | |
SELECT CLASS SHARES | | December 10, 1996 | | | 6.70 | | | | 7.75 | | | | 9.39 | | | | 5.53 | |
| ** | | Sales Charge for Class A Shares is 4.50%. |
| *** | | Assumes a 1% CDSC (contingent deferred sales charge) for the 6 month and one year periods and 0% CDSC thereafter. |
TEN YEAR PERFORMANCE (12/31/06 TO 12/31/16)
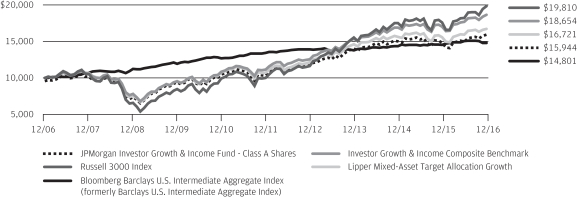
The performance quoted is past performance and is not a guarantee of future results. Mutual funds are subject to certain market risks. Investment returns and principal value of an investment will fluctuate so that an investor’s shares, when redeemed, may be worth more or less than their original cost. Current performance may be higher or lower than the performance data shown. For up-to-date month-end performance information please call 1-800-480-4111.
The graph illustrates comparative performance for $10,000 invested in Class A Shares of the JPMorgan Investor Growth & Income Fund, the Russell 3000 Index, the Bloomberg Barclays U.S. Intermediate Aggregate Index, the Investor Growth & Income Composite Benchmark and the Lipper Mixed-Asset Target Allocation Growth Funds Index from December 31, 2006 to December 31, 2016. The performance of the Fund assumes reinvestment of all dividends and capital gain distributions, if any, and includes a sales charge. The performance of the broad-based securities indices and the Investor Growth & Income Composite Benchmark does not reflect the deduction of expenses or a sales charge associated with a mutual fund and has been adjusted to reflect reinvestment of all dividends and capital gain distributions of the securities included in the benchmark, if applicable. The performance of the Lipper Mixed-Asset Target Allocation Growth Funds Index, which is not a broad-based securities index, includes expenses associated with a mutual fund, such as investment management fees. These expenses are not identical to the expenses incurred by the Fund. The Russell 3000 Index is an unmanaged index which measures the performance of the 3,000 largest U.S. companies based on total market capitalization, which
represents approximately 98% of the investable U.S. equity market. The Bloomberg Barclays U.S. Intermediate Aggregate Index is an unmanaged index comprised of U.S. Government, mortgage, corporate, and asset-backed securities with maturities of one to 10 years. The Investor Growth & Income Composite Benchmark is comprised of unmanaged indices that correspond to the Fund’s model allocation and consists of the Russell 3000 Index (70%) and the Bloomberg Barclays U.S. Intermediate Aggregate Index (30%). The Lipper Mixed-Asset Target Allocation Growth Funds Index consists of funds that by portfolio practice maintain a mix of between 60% to 80% equity securities, with the remainder invested in bonds, cash and cash equivalents. Investors cannot invest directly in an index.
Class A Shares have a $500 minimum initial investment and carry a 4.50% sales charge.
Fund performance may reflect the waiver of the Fund’s fees and reimbursement of expenses for certain periods since the inception date. Without these waivers and reimbursements, performance would have been lower. Also, performance shown in this section does not reflect the deduction of taxes that a shareholder would pay on Fund distributions or redemptions of Fund shares.
The returns shown are based on net asset values calculated for shareholder transactions and may differ from the returns shown in the financial highlights, which reflect adjustments made to the net asset values in accordance with accounting principles generally accepted in the United States of America.
| | | | | | |
| | | |
| 8 | | | | J.P. MORGAN INVESTOR FUNDS | | DECEMBER 31, 2016 |
JPMorgan Investor Balanced Fund
SCHEDULE OF PORTFOLIO INVESTMENTS
AS OF DECEMBER 31, 2016 (Unaudited)
(Amounts in thousands)
| | | | | | | | |
| SHARES | | | SECURITY DESCRIPTION | | VALUE($) | |
| Investment Companies — 99.0% (b) | |
| | | | Alternative Assets — 4.5% | |
| | 667 | | | JPMorgan Commodities Strategy Fund, Class R6 Shares (a) | | | 6,127 | |
| | 6,422 | | | JPMorgan Multi-Cap Market Neutral Fund, Select Class Shares (a) | | | 66,146 | |
| | 5,165 | | | JPMorgan Research Market Neutral Fund, Class L Shares (a) | | | 75,713 | |
| | 5,983 | | | JPMorgan Systematic Alpha Fund, Class R6 Shares | | | 92,080 | |
| | | | | | | | |
| | | | Total Alternative Assets | | | 240,066 | |
| | | | | | | | |
| | | | Fixed Income — 44.2% | |
| | 80,254 | | | JPMorgan Core Bond Fund, Class R6 Shares | | | 922,118 | |
| | 64,699 | | | JPMorgan Core Plus Bond Fund, Class R6 Shares | | | 527,945 | |
| | 6,779 | | | JPMorgan Emerging Markets Debt Fund, Class R6 Shares | | | 53,823 | |
| | 18,537 | | | JPMorgan Floating Rate Income Fund, Class R6 Shares | | | 175,174 | |
| | 1,166 | | | JPMorgan Government Bond Fund, Class R6 Shares | | | 12,234 | |
| | 34,668 | | | JPMorgan High Yield Fund, Class R6 Shares | | | 254,460 | |
| | 7,758 | | | JPMorgan Inflation Managed Bond Fund, Class R6 Shares | | | 79,754 | |
| | 21,471 | | | JPMorgan Limited Duration Bond Fund, Class R6 Shares | | | 214,496 | |
| | 7,967 | | | JPMorgan Strategic Income Opportunities Fund, Class R5 Shares | | | 92,420 | |
| | 1,970 | | | JPMorgan Unconstrained Debt Fund, Class R6 Shares | | | 19,347 | |
| | | | | | | | |
| | | | Total Fixed Income | | | 2,351,771 | |
| | | | | | | | |
| | | | International Equity — 14.6% | |
| | 5,056 | | | JPMorgan Emerging Economies Fund, Class R6 Shares | | | 56,218 | |
| | 2,630 | | | JPMorgan Emerging Markets Equity Fund, Class R6 Shares | | | 55,405 | |
| | 9,920 | | | JPMorgan Global Research Enhanced Index Fund, Select Class Shares | | | 185,703 | |
| | 5,922 | | | JPMorgan International Equity Fund, Class R6 Shares | | | 85,040 | |
| | 17,760 | | | JPMorgan International Research Enhanced Equity Fund, Select Class Shares | | | 278,294 | |
| | 4,715 | | | JPMorgan Intrepid European Fund, Class L Shares | | | 106,704 | |
| | 819 | | | JPMorgan Latin America Fund, Class R6 Shares | | | 10,119 | |
| | | | | | | | |
| | | | Total International Equity | | | 777,483 | |
| | | | | | | | |
| | | | | | | | |
| SHARES | | | SECURITY DESCRIPTION | | VALUE($) | |
| | |
| | | | U.S. Equity — 35.7% | |
| | 4,150 | | | JPMorgan Dynamic Growth Fund, Class R5 Shares (a) | | | 111,000 | |
| | 6,173 | | | JPMorgan Equity Income Fund, Class R6 Shares | | | 93,766 | |
| | 8,887 | | | JPMorgan Intrepid America Fund, Class R6 Shares | | | 324,720 | |
| | 3,936 | | | JPMorgan Intrepid Growth Fund, Class R6 Shares | | | 167,923 | |
| | 6,014 | | | JPMorgan Intrepid Mid Cap Fund, Class R6 Shares | | | 131,649 | |
| | 1,798 | | | JPMorgan Large Cap Growth Fund, Class R6 Shares (a) | | | 58,175 | |
| | 9,197 | | | JPMorgan Large Cap Value Fund, Class R6 Shares | | | 133,085 | |
| | 17,066 | | | JPMorgan Market Expansion Enhanced Index Fund, Select Class Shares | | | 191,477 | |
| | 172 | | | JPMorgan Mid Cap Growth Fund, Class R6 Shares (a) | | | 4,786 | |
| | 727 | | | JPMorgan Small Cap Value Fund, Class R6 Shares | | | 22,996 | |
| | 31,769 | | | JPMorgan U.S. Equity Fund, Class R6 Shares | | | 464,463 | |
| | 3,863 | | | JPMorgan U.S. Large Cap Core Plus Fund, Class R5 Shares | | | 109,006 | |
| | 2,817 | | | JPMorgan Value Advantage Fund, Class R6 Shares | | | 90,747 | |
| | | | | | | | |
| | | | Total U.S. Equity | | | 1,903,793 | |
| | | | | | | | |
| | | | Total Investment Companies
(Cost $4,584,046) | | | 5,273,113 | |
| | | | | | | | |
| Short-Term Investment — 0.9% | | | | |
| | | | Investment Company — 0.9% | | | | |
| | 50,526 | | | JPMorgan U.S. Government Money Market Fund, Institutional Class Shares, 0.410% (b) (l)
(Cost $50,526) | | | 50,526 | |
| | | | | | | | |
| | | | Total Investments — 99.9%
(Cost $4,634,572) | | | 5,323,639 | |
| | | | Other Assets in Excess of
Liabilities — 0.1% | | | 4,555 | |
| | | | | | | | |
| | | | NET ASSETS — 100.0% | | $ | 5,328,194 | |
| | | | | | | | |
Percentages indicated are based on net assets.
SEE NOTES TO FINANCIAL STATEMENTS.
| | | | | | | | |
| | | |
| DECEMBER 31, 2016 | | J.P. MORGAN INVESTOR FUNDS | | | | | 9 | |
JPMorgan Investor Conservative Growth Fund
SCHEDULE OF PORTFOLIO INVESTMENTS
AS OF DECEMBER 31, 2016 (Unaudited)
(Amounts in thousands)
| | | | | | | | |
| SHARES | | | SECURITY DESCRIPTION | | VALUE($) | |
| Investment Companies — 99.0% (b) | |
| | | | Alternative Assets — 4.7% | |
| | 555 | | | JPMorgan Commodities Strategy Fund, Class R6 Shares (a) | | | 5,096 | |
| | 4,770 | | | JPMorgan Multi-Cap Market Neutral Fund, Select Class Shares (a) | | | 49,135 | |
| | 3,731 | | | JPMorgan Research Market Neutral Fund, Class L Shares (a) | | | 54,700 | |
| | 5,437 | | | JPMorgan Systematic Alpha Fund, Class R6 Shares | | | 83,671 | |
| | | | | | | | |
| | | | Total Alternative Assets | | | 192,602 | |
| | | | | | | | |
| | | | Fixed Income — 64.3% | |
| | 96,502 | | | JPMorgan Core Bond Fund, Class R6 Shares | | | 1,108,810 | |
| | 66,753 | | | JPMorgan Core Plus Bond Fund, Class R6 Shares | | | 544,701 | |
| | 5,133 | | | JPMorgan Emerging Markets Debt Fund, Class R6 Shares | | | 40,758 | |
| | 18,265 | | | JPMorgan Floating Rate Income Fund, Class R6 Shares | | | 172,601 | |
| | 3,230 | | | JPMorgan Government Bond Fund, Class R6 Shares | | | 33,879 | |
| | 30,854 | | | JPMorgan High Yield Fund, Class R6 Shares | | | 226,465 | |
| | 9,492 | | | JPMorgan Inflation Managed Bond Fund, Class R6 Shares | | | 97,577 | |
| | 33,879 | | | JPMorgan Limited Duration Bond Fund, Class R6 Shares | | | 338,450 | |
| | 7,185 | | | JPMorgan Strategic Income Opportunities Fund, Class R5 Shares | | | 83,351 | |
| | 1,822 | | | JPMorgan Unconstrained Debt Fund, Class R6 Shares | | | 17,894 | |
| | | | | | | | |
| | | | Total Fixed Income | | | 2,664,486 | |
| | | | | | | | |
| | | | International Equity — 8.5% | |
| | 2,298 | | | JPMorgan Emerging Economies Fund, Class R6 Shares | | | 25,557 | |
| | 1,241 | | | JPMorgan Emerging Markets Equity Fund, Class R6 Shares | | | 26,143 | |
| | 2,777 | | | JPMorgan Global Research Enhanced Index Fund, Select Class Shares | | | 51,981 | |
| | 2,817 | | | JPMorgan International Equity Fund, Class R6 Shares | | | 40,447 | |
| | 9,709 | | | JPMorgan International Research Enhanced Equity Fund, Select Class Shares | | | 152,142 | |
| | 2,158 | | | JPMorgan Intrepid European Fund, Class L Shares | | | 48,825 | |
| | 559 | | | JPMorgan Latin America Fund, Class R6 Shares | | | 6,898 | |
| | | | | | | | |
| | | | Total International Equity | | | 351,993 | |
| | | | | | | | |
| | | | | | | | |
| SHARES | | | SECURITY DESCRIPTION | | VALUE($) | |
| | |
| | | | U.S. Equity — 21.5% | |
| | 1,795 | | | JPMorgan Dynamic Growth Fund, Class R5 Shares (a) | | | 48,008 | |
| | 4,888 | | | JPMorgan Equity Income Fund, Class R6 Shares | | | 74,242 | |
| | 5,015 | | | JPMorgan Intrepid America Fund, Class R6 Shares | | | 183,258 | |
| | 2,398 | | | JPMorgan Intrepid Growth Fund, Class R6 Shares | | | 102,288 | |
| | 2,489 | | | JPMorgan Intrepid Mid Cap Fund, Class R6 Shares | | | 54,488 | |
| | 1,623 | | | JPMorgan Large Cap Value Fund, Class R6 Shares | | | 23,489 | |
| | 5,567 | | | JPMorgan Market Expansion Enhanced Index Fund, Select Class Shares | | | 62,466 | |
| | 1,436 | | | JPMorgan Mid Cap Growth Fund, Class R6 Shares (a) | | �� | 39,945 | |
| | 937 | | | JPMorgan Small Cap Value Fund, Class R6 Shares | | | 29,614 | |
| | 11,983 | | | JPMorgan U.S. Equity Fund, Class R6 Shares | | | 175,187 | |
| | 1,253 | | | JPMorgan U.S. Large Cap Core Plus Fund, Class R5 Shares | | | 35,373 | |
| | 1,965 | | | JPMorgan Value Advantage Fund, Class R6 Shares | | | 63,290 | |
| | | | | | | | |
| | | | Total U.S. Equity | | | 891,648 | |
| | | | | | | | |
| | | | Total Investment Companies
(Cost $3,764,194) | | | 4,100,729 | |
| | | | | | | | |
| Short-Term Investment — 0.7% | | | | |
| | | | Investment Company — 0.7% | | | | |
| | 28,077 | | | JPMorgan U.S. Government Money Market Fund, Institutional Class Shares,
0.410% (b) (l)
(Cost $28,077) | | | 28,077 | |
| | | | | | | | |
| | | | Total Investments — 99.7%
(Cost $3,792,271) | | | 4,128,806 | |
| | | | Other Assets in Excess of
Liabilities — 0.3% | | | 13,209 | |
| | | | | | | | |
| | | | NET ASSETS — 100.0% | | $ | 4,142,015 | |
| | | | | | | | |
Percentages indicated are based on net assets.
SEE NOTES TO FINANCIAL STATEMENTS.
| | | | | | |
| | | |
| 10 | | | | J.P. MORGAN INVESTOR FUNDS | | DECEMBER 31, 2016 |
JPMorgan Investor Growth Fund
SCHEDULE OF PORTFOLIO INVESTMENTS
AS OF DECEMBER 31, 2016 (Unaudited)
(Amounts in thousands)
| | | | | | | | |
| SHARES | | | SECURITY DESCRIPTION | | VALUE($) | |
| Investment Companies — 98.9% (b) | |
| | | | Alternative Assets — 1.5% | |
| | 771 | | | JPMorgan Commodities Strategy Fund, Class R6 Shares (a) | | | 7,084 | |
| | 582 | | | JPMorgan Multi-Cap Market Neutral Fund, Select Class Shares (a) | | | 5,994 | |
| | 309 | | | JPMorgan Research Market Neutral Fund, Class L Shares (a) | | | 4,528 | |
| | 1,426 | | | JPMorgan Systematic Alpha Fund, Class R6 Shares | | | 21,940 | |
| | | | | | | | |
| | | | Total Alternative Assets | | | 39,546 | |
| | | | | | | | |
| | | | Fixed Income — 9.9% | |
| | 7,494 | | | JPMorgan Core Bond Fund, Class R6 Shares | | | 86,111 | |
| | 3,451 | | | JPMorgan Core Plus Bond Fund, Class R6 Shares | | | 28,161 | |
| | 1,395 | | | JPMorgan Emerging Markets Debt Fund, Class R6 Shares | | | 11,075 | |
| | 2,390 | | | JPMorgan Floating Rate Income Fund, Class R6 Shares | | | 22,589 | |
| | 11,503 | | | JPMorgan High Yield Fund, Class R6 Shares | | | 84,430 | |
| | 1,115 | | | JPMorgan Inflation Managed Bond Fund, Class R6 Shares | | | 11,458 | |
| | 431 | | | JPMorgan Strategic Income Opportunities Fund, Class R5 Shares | | | 4,995 | |
| | 415 | | | JPMorgan Unconstrained Debt Fund, Class R6 Shares | | | 4,079 | |
| | | | | | | | |
| | | | Total Fixed Income | | | 252,898 | |
| | | | | | | | |
| | | | International Equity — 20.9% | |
| | 4,009 | | | JPMorgan Emerging Economies Fund, Class R6 Shares | | | 44,580 | |
| | 2,115 | | | JPMorgan Emerging Markets Equity Fund, Class R6 Shares | | | 44,554 | |
| | 3,696 | | | JPMorgan Global Research Enhanced Index Fund, Select Class Shares | | | 69,196 | |
| | 7,296 | | | JPMorgan International Equity Fund, Class R6 Shares | | | 104,772 | |
| | 8,846 | | | JPMorgan International Research Enhanced Equity Fund, Select Class Shares | | | 138,610 | |
| | 3,175 | | | JPMorgan International Unconstrained Equity Fund, Class R6 Shares | | | 53,819 | |
| | 3,072 | | | JPMorgan Intrepid European Fund, Class L Shares | | | 69,525 | |
| | 527 | | | JPMorgan Latin America Fund, Class R6 Shares | | | 6,512 | |
| | | | | | | | |
| | | | Total International Equity | | | 531,568 | |
| | | | | | | | |
| | | | U.S. Equity — 66.6% | |
| | 923 | | | JPMorgan Dynamic Growth Fund, Class R5 Shares (a) | | | 24,695 | |
| | 2,690 | | | JPMorgan Equity Income Fund, Class R6 Shares | | | 40,865 | |
| | | | | | | | |
| SHARES | | | SECURITY DESCRIPTION | | VALUE($) | |
| | |
| | | | U.S. Equity — continued | |
| | 7,810 | | | JPMorgan Intrepid America Fund, Class R6 Shares | | | 285,382 | |
| | 3,006 | | | JPMorgan Intrepid Growth Fund, Class R6 Shares | | | 128,218 | |
| | 4,081 | | | JPMorgan Intrepid Mid Cap Fund, Class R6 Shares | | | 89,343 | |
| | 5,777 | | | JPMorgan Large Cap Growth Fund, Class R6 Shares (a) | | | 186,885 | |
| | 17,329 | | | JPMorgan Large Cap Value Fund, Class R6 Shares | | | 250,758 | |
| | 13,714 | | | JPMorgan Market Expansion Enhanced Index Fund, Select Class Shares | | | 153,873 | |
| | 1,153 | | | JPMorgan Mid Cap Growth Fund, Class R6 Shares (a) | | | 32,086 | |
| | 1,201 | | | JPMorgan Small Cap Value Fund, Class R6 Shares | | | 37,977 | |
| | 22,976 | | | JPMorgan U.S. Equity Fund, Class R6 Shares | | | 335,905 | |
| | 2,865 | | | JPMorgan U.S. Large Cap Core Plus Fund, Class R5 Shares | | | 80,860 | |
| | 1,460 | | | JPMorgan Value Advantage Fund, Class R6 Shares | | | 47,030 | |
| | | | | | | | |
| | | | Total U.S. Equity | | | 1,693,877 | |
| | | | | | | | |
| | | | Total Investment Companies
(Cost $1,953,952) | | | 2,517,889 | |
| | | | | | | | |
| Short-Term Investment — 1.1% | | | | |
| | | | Investment Company — 1.1% | | | | |
| | 26,926 | | | JPMorgan U.S. Government Money Market Fund, Institutional Class Shares,
0.410% (b) (l)
(Cost $26,926) | | | 26,926 | |
| | | | | | | | |
| | | | Total Investments — 100.0%
(Cost $1,980,878) | | | 2,544,815 | |
| | | | Liabilities in Excess of
Other Assets — 0.0% (g) | | | (554 | ) |
| | | | | | | | |
| | | | NET ASSETS — 100.0% | | $ | 2,544,261 | |
| | | | | | | | |
Percentages indicated are based on net assets.
SEE NOTES TO FINANCIAL STATEMENTS.
| | | | | | | | |
| | | |
| DECEMBER 31, 2016 | | J.P. MORGAN INVESTOR FUNDS | | | | | 11 | |
JPMorgan Investor Growth & Income Fund
SCHEDULE OF PORTFOLIO INVESTMENTS
AS OF DECEMBER 31, 2016 (Unaudited)
(Amounts in thousands)
| | | | | | | | |
| SHARES | | | SECURITY DESCRIPTION | | VALUE($) | |
| Investment Companies — 98.9% (b) | |
| | | | Alternative Assets — 3.8% | |
| | 1,126 | | | JPMorgan Commodities Strategy Fund, Class R6 Shares (a) | | | 10,351 | |
| | 2,860 | | | JPMorgan Multi-Cap Market Neutral Fund, Select Class Shares (a) | | | 29,456 | |
| | 2,099 | | | JPMorgan Research Market Neutral Fund, Class L Shares (a) | | | 30,774 | |
| | 3,072 | | | JPMorgan Systematic Alpha Fund, Class R6 Shares | | | 47,272 | |
| | | | | | | | |
| | | | Total Alternative Assets | | | 117,853 | |
| | | | | | | | |
| | | | Fixed Income — 28.0% | |
| | 25,615 | | | JPMorgan Core Bond Fund, Class R6 Shares | | | 294,314 | |
| | 23,573 | | | JPMorgan Core Plus Bond Fund, Class R6 Shares | | | 192,359 | |
| | 2,112 | | | JPMorgan Emerging Markets Debt Fund, Class R6 Shares | | | 16,772 | |
| | 12,601 | | | JPMorgan Floating Rate Income Fund, Class R6 Shares | | | 119,081 | |
| | 1,075 | | | JPMorgan Government Bond Fund, Class R6 Shares | | | 11,279 | |
| | 19,739 | | | JPMorgan High Yield Fund, Class R6 Shares | | | 144,881 | |
| | 3,931 | | | JPMorgan Inflation Managed Bond Fund, Class R6 Shares | | | 40,407 | |
| | 2,234 | | | JPMorgan Limited Duration Bond Fund, Class R6 Shares | | | 22,317 | |
| | 2,048 | | | JPMorgan Strategic Income Opportunities Fund, Class R5 Shares | | | 23,761 | |
| | 1,150 | | | JPMorgan Unconstrained Debt Fund, Class R6 Shares | | | 11,296 | |
| | | | | | | | |
| | | | Total Fixed Income | | | 876,467 | |
| | | | | | | | |
| | | | International Equity — 17.7% | |
| | 4,010 | | | JPMorgan Emerging Economies Fund, Class R6 Shares | | | 44,595 | |
| | 1,975 | | | JPMorgan Emerging Markets Equity Fund, Class R6 Shares | | | 41,614 | |
| | 6,353 | | | JPMorgan Global Research Enhanced Index Fund, Select Class Shares | | | 118,936 | |
| | 6,023 | | | JPMorgan International Equity Fund, Class R6 Shares | | | 86,488 | |
| | 9,865 | | | JPMorgan International Research Enhanced Equity Fund, Select Class Shares | | | 154,589 | |
| | 1,268 | | | JPMorgan International Unconstrained Equity Fund, Class R6 Shares | | | 21,487 | |
| | 3,644 | | | JPMorgan Intrepid European Fund, Class L Shares | | | 82,471 | |
| | 298 | | | JPMorgan Latin America Fund, Class R6 Shares | | | 3,675 | |
| | | | | | | | |
| | | | Total International Equity | | | 553,855 | |
| | | | | | | | |
| | | | | | | | |
| SHARES | | | SECURITY DESCRIPTION | | VALUE($) | |
| | |
| | | | U.S. Equity — 49.4% | |
| | 1,575 | | | JPMorgan Dynamic Growth Fund, Class R5 Shares (a) | | | 42,140 | |
| | 3,571 | | | JPMorgan Equity Income Fund, Class R6 Shares | | | 54,243 | |
| | 8,547 | | | JPMorgan Intrepid America Fund, Class R6 Shares | | | 312,309 | |
| | 2,278 | | | JPMorgan Intrepid Growth Fund, Class R6 Shares | | | 97,195 | |
| | 2,418 | | | JPMorgan Intrepid Mid Cap Fund, Class R6 Shares | | | 52,941 | |
| | 5,046 | | | JPMorgan Large Cap Growth Fund, Class R6 Shares (a) | | | 163,223 | |
| | 12,344 | | | JPMorgan Large Cap Value Fund, Class R6 Shares | | | 178,617 | |
| | 12,836 | | | JPMorgan Market Expansion Enhanced Index Fund, Select Class Shares | | | 144,019 | |
| | 1,019 | | | JPMorgan Mid Cap Growth Fund, Class R6 Shares (a) | | | 28,356 | |
| | 1,230 | | | JPMorgan Small Cap Value Fund, Class R6 Shares | | | 38,908 | |
| | 21,567 | | | JPMorgan U.S. Equity Fund, Class R6 Shares | | | 315,315 | |
| | 2,357 | | | JPMorgan U.S. Large Cap Core Plus Fund, Class R5 Shares | | | 66,523 | |
| | 1,682 | | | JPMorgan Value Advantage Fund, Class R6 Shares | | | 54,169 | |
| | | | | | | | |
| | | | Total U.S. Equity | | | 1,547,958 | |
| | | | | | | | |
| | | | Total Investment Companies
(Cost $2,525,132) | | | 3,096,133 | |
| | | | | | | | |
| Short-Term Investment — 1.0% | | | | |
| | | | Investment Company — 1.0% | | | | |
| | 31,391 | | | JPMorgan U.S. Government Money Market Fund, Institutional Class Shares,
0.410% (b) (l)
(Cost $31,391) | | | 31,391 | |
| | | | | | | | |
| | | | Total Investments — 99.9% (Cost $2,556,523) | | | 3,127,524 | |
| | | | Other Assets in Excess of
Liabilities — 0.1% | | | 2,582 | |
| | | | | | | | |
| | | | NET ASSETS — 100.0% | | $ | 3,130,106 | |
| | | | | | | | |
Percentages indicated are based on net assets.
SEE NOTES TO FINANCIAL STATEMENTS.
| | | | | | |
| | | |
| 12 | | | | J.P. MORGAN INVESTOR FUNDS | | DECEMBER 31, 2016 |
J.P. Morgan Investor Funds
NOTES TO SCHEDULES OF PORTFOLIO INVESTMENTS
AS OF DECEMBER 31, 2016 (Unaudited)
| | |
| (a) | | — Non-income producing security. |
| (b) | | — Investment in affiliate. Fund is registered under the Investment Company Act of 1940, as amended, and advised by J.P. Morgan Investment Management Inc. |
| (g) | | — Amount rounds to less than 0.05%. |
| (l) | | — The rate shown is the current yield as of December 31, 2016. |
Detailed information about investment portfolios of the underlying funds can be found in shareholder reports filed with the Securities and Exchange Commission (SEC) by each such underlying fund semi-annually on Form N-CSR and in certified portfolio holdings filed quarterly on Form N-Q, and are available for download from both the SEC’s as well as each respective underlying fund’s website. Detailed information about underlying J.P. Morgan Funds can also be found at www.jpmorganfunds.com or by calling 1-800-480-4111.
SEE NOTES TO FINANCIAL STATEMENTS.
| | | | | | | | |
| | | |
| DECEMBER 31, 2016 | | J.P. MORGAN INVESTOR FUNDS | | | | | 13 | |
STATEMENTS OF ASSETS AND LIABILITIES
AS OF DECEMBER 31, 2016 (Unaudited)
(Amounts in thousands, except per share amounts)
| | | | | | | | | | | | | | | | |
| | |
Investor
Balanced
Fund | | | Investor
Conservative
Growth Fund | | | Investor
Growth Fund | | | Investor
Growth &
Income Fund | |
ASSETS: | | | | | | | | | | | | | | | | |
Investments in affiliates, at value | | $ | 5,323,639 | | | $ | 4,128,806 | | | $ | 2,544,815 | | | $ | 3,127,524 | |
Receivables: | | | | | | | | | | | | | | | | |
Investment securities sold | | | 12,834 | | | | 21,206 | | | | 3,837 | | | | 6,282 | |
Fund shares sold | | | 5,825 | | | | 2,748 | | | | 4,010 | | | | 3,165 | |
Dividends from affiliates | | | 17 | | | | 12 | | | | 8 | | | | 10 | |
| | | | | | | | | | | | | | | | |
Total Assets | | | 5,342,315 | | | | 4,152,772 | | | | 2,552,670 | | | | 3,136,981 | |
| | | | | | | | | | | | | | | | |
| | | | |
LIABILITIES: | | | | | | | | | | | | | | | | |
Payables: | | | | | | | | | | | | | | | | |
Distributions | | | 3,055 | | | | 439 | | | | 2,184 | | | | 1,657 | |
Fund shares redeemed | | | 7,762 | | | | 7,372 | | | | 4,704 | | | | 3,325 | |
Accrued liabilities: | | | | | | | | | | | | | | | | |
Investment advisory fees | | | 185 | | | | 120 | | | | 14 | | | | 64 | |
Administration fees | | | 232 | | | | 171 | | | | 80 | | | | 122 | |
Distribution fees | | | 1,528 | | | | 1,573 | | | | 597 | | | | 796 | |
Shareholder servicing fees | | | 662 | | | | 613 | | | | 301 | | | | 366 | |
Custodian and accounting fees | | | 3 | | | | 3 | | | | 7 | | | | 8 | |
Trustees’ and Chief Compliance Officer’s fees | | | — | (a) | | | — | (a) | | | — | (a) | | | — | (a) |
Other | | | 694 | | | | 466 | | | | 522 | | | | 537 | |
| | | | | | | | | | | | | | | | |
Total Liabilities | | | 14,121 | | | | 10,757 | | | | 8,409 | | | | 6,875 | |
| | | | | | | | | | | | | | | | |
Net Assets | | $ | 5,328,194 | | | $ | 4,142,015 | | | $ | 2,544,261 | | | $ | 3,130,106 | |
| | | | | | | | | | | | | | | | |
| (a) | Amount rounds to less than 500. |
SEE NOTES TO FINANCIAL STATEMENTS.
| | | | | | |
| | | |
| 14 | | | | J.P. MORGAN INVESTOR FUNDS | | DECEMBER 31, 2016 |
| | | | | | | | | | | | | | | | |
| | |
Investor
Balanced
Fund | | | Investor
Conservative
Growth Fund | | | Investor
Growth Fund | | | Investor
Growth &
Income Fund | |
NET ASSETS: | | | | | | | | | | | | | | | | |
Paid-in-Capital | | $ | 4,631,676 | | | $ | 3,784,884 | | | $ | 1,976,995 | | | $ | 2,586,516 | |
Accumulated undistributed (distributions in excess of) net investment income | | | (1,855 | ) | | | (876 | ) | | | (2,796 | ) | | | (2,126 | ) |
Accumulated net realized gains (losses) | | | 9,306 | | | | 21,472 | | | | 6,125 | | | | (25,285 | ) |
Net unrealized appreciation (depreciation) | | | 689,067 | | | | 336,535 | | | | 563,937 | | | | 571,001 | |
| | | | | | | | | | | | | | | | |
Total Net Assets | | $ | 5,328,194 | | | $ | 4,142,015 | | | $ | 2,544,261 | | | $ | 3,130,106 | |
| | | | | | | | | | | | | | | | |
| | | | |
Net Assets: | | | | | | | | | | | | | | | | |
Class A | | $ | 3,765,839 | | | $ | 2,326,861 | | | $ | 1,961,815 | | | $ | 2,494,112 | |
Class C | | | 1,132,858 | | | | 1,680,813 | | | | 279,996 | | | | 413,869 | |
Select Class | | | 429,497 | | | | 134,341 | | | | 302,450 | | | | 222,125 | |
| | | | | | | | | | | | | | | | |
Total | | $ | 5,328,194 | | | $ | 4,142,015 | | | $ | 2,544,261 | | | $ | 3,130,106 | |
| | | | | | | | | | | | | | | | |
| | | | |
Outstanding units of beneficial interest (shares) | | | | | | | | | | | | | | | | |
($0.0001 par value; unlimited number of shares authorized): | | | | | | | | | | | | | | | | |
Class A | | | 259,126 | | | | 188,708 | | | | 105,522 | | | | 154,243 | |
Class C | | | 79,098 | | | | 136,906 | | | | 15,946 | | | | 26,287 | |
Select Class | | | 29,504 | | | | 10,836 | | | | 15,960 | | | | 13,940 | |
| | | | |
Net Asset Value (a): | | | | | | | | | | | | | | | | |
Class A — Redemption price per share | | $ | 14.53 | | | $ | 12.33 | | | $ | 18.59 | | | $ | 16.17 | |
Class C — Offering price per share (b) | | | 14.32 | | | | 12.28 | | | | 17.56 | | | | 15.74 | |
Select Class — Offering and redemption price per share | | | 14.56 | | | | 12.40 | | | | 18.95 | | | | 15.93 | |
Class A maximum sales charge | | | 4.50 | % | | | 4.50 | % | | | 4.50 | % | | | 4.50 | % |
Class A maximum public offering price per share
[net asset value per share/(100% — maximum sales charge)] | | $ | 15.21 | | | $ | 12.91 | | | $ | 19.47 | | | $ | 16.93 | |
| | | | | | | | | | | | | | | | |
| | | | |
Cost of investments in affiliates | | | 4,634,572 | | | | 3,792,271 | | | | 1,980,878 | | | | 2,556,523 | |
| (a) | Per share amounts may not recalculate due to rounding of net assets and/or shares outstanding. |
| (b) | Redemption price for Class C Shares varies based upon length of time the shares are held. |
SEE NOTES TO FINANCIAL STATEMENTS.
| | | | | | | | |
| | | |
| DECEMBER 31, 2016 | | J.P. MORGAN INVESTOR FUNDS | | | | | 15 | |
STATEMENTS OF OPERATIONS
FOR THE SIX MONTHS ENDED DECEMBER 31, 2016 (Unaudited)
(Amounts in thousands)
| | | | | | | | | | | | | | | | |
| | |
Investor
Balanced
Fund | | | Investor
Conservative
Growth Fund | | | Investor
Growth Fund | | | Investor
Growth &
Income Fund | |
INVESTMENT INCOME: | | | | | | | | | | | | | | | | |
Dividend income from affiliates | | $ | 69,986 | | | $ | 56,598 | | | $ | 27,926 | | | $ | 38,776 | |
Interest income from affiliates | | | 2 | | | | 2 | | | | 1 | | | | 1 | |
| | | | | | | | | | | | | | | | |
Total investment income | | | 69,988 | | | | 56,600 | | | | 27,927 | | | | 38,777 | |
| | | | | | | | | | | | | | | | |
| | | | |
EXPENSES: | | | | | | | | | | | | | | | | |
Investment advisory fees | | | 1,364 | | | | 1,077 | | | | 632 | | | | 795 | |
Administration fees | | | 1,552 | | | | 1,265 | | | | 823 | | | | 985 | |
Distribution fees: | | | | | | | | | | | | | | | | |
Class A | | | 4,835 | | | | 3,029 | | | | 2,444 | | | | 3,166 | |
Class C | | | 4,365 | | | | 6,546 | | | | 1,046 | | | | 1,576 | |
Shareholder servicing fees: | | | | | | | | | | | | | | | | |
Class A | | | 4,835 | | | | 3,029 | | | | 2,444 | | | | 3,166 | |
Class C | | | 1,455 | | | | 2,182 | | | | 348 | | | | 525 | |
Select Class | | | 528 | | | | 173 | | | | 368 | | | | 285 | |
Custodian and accounting fees | | | 11 | | | | 4 | | | | 13 | | | | 13 | |
Professional fees | | | 35 | | | | 23 | | | | 33 | | | | 37 | |
Trustees’ and Chief Compliance Officer’s fees | | | 17 | | | | 17 | | | | 16 | | | | 16 | |
Printing and mailing costs | | | 178 | | | | 126 | | | | 129 | | | | 134 | |
Registration and filing fees | | | 54 | | | | 47 | | | | 30 | | | | 32 | |
Transfer agency fees (See Note 2.D.) | | | 240 | | | | 136 | | | | 366 | | | | 292 | |
Sub-transfer agency fees (See Note 2.D.) | | | 787 | | | | 590 | | | | 557 | | | | 588 | |
Other | | | 39 | | | | 41 | | | | 29 | | | | 31 | |
| | | | | | | | | | | | | | | | |
Total expenses | | | 20,295 | | | | 18,285 | | | | 9,278 | | | | 11,641 | |
| | | | | | | | | | | | | | | | |
Less fees waived | | | (3,272 | ) | | | (2,202 | ) | | | (2,266 | ) | | | (2,441 | ) |
| | | | | | | | | | | | | | | | |
Net expenses | | | 17,023 | | | | 16,083 | | | | 7,012 | | | | 9,200 | |
| | | | | | | | | | | | | | | | |
Net investment income (loss) | | | 52,965 | | | | 40,517 | | | | 20,915 | | | | 29,577 | |
| | | | | | | | | | | | | | | | |
| | | | |
REALIZED/UNREALIZED GAINS (LOSSES): | | | | | | | | | | | | | | | | |
Net realized gain (loss) on investments in affiliates | | | 39,577 | | | | 33,146 | | | | 18,299 | | | | 24,545 | |
Distributions of capital gains received from investment company affiliates | | | 64,588 | | | | 24,878 | | | | 65,108 | | | | 59,914 | |
Change in net unrealized appreciation/depreciation of investments in affiliates | | | 80,213 | | | | (7,055 | ) | | | 102,938 | | | | 85,772 | |
| | | | | | | | | | | | | | | | |
Net realized/unrealized gains (losses) | | | 184,378 | | | | 50,969 | | | | 186,345 | | | | 170,231 | |
| | | | | | | | | | | | | | | | |
Change in net assets resulting from operations | | $ | 237,343 | | | $ | 91,486 | | | $ | 207,260 | | | $ | 199,808 | |
| | | | | | | | | | | | | | | | |
| (a) | Amount rounds to less than 500. |
SEE NOTES TO FINANCIAL STATEMENTS.
| | | | | | |
| | | |
| 16 | | | | J.P. MORGAN INVESTOR FUNDS | | DECEMBER 31, 2016 |
STATEMENTS OF CHANGES IN NET ASSETS
FOR THE PERIODS INDICATED
(Amounts in thousands)
| | | | | | | | | | | | | | | | |
| | | Investor Balanced Fund | | | Investor Conservative Growth Fund | |
| | | Six Months Ended
December 31, 2016
(Unaudited) | | | Year Ended
June 30, 2016 | | | Six Months Ended
December 31, 2016
(Unaudited) | | | Year Ended
June 30, 2016 | |
CHANGE IN NET ASSETS RESULTING FROM OPERATIONS: | | | | | | | | | | | | | | | | |
Net investment income (loss) | | $ | 52,965 | | | $ | 78,989 | | | $ | 40,517 | | | $ | 66,695 | |
Net realized gain (loss) on investments in affiliates | | | 39,577 | | | | (34,987 | ) | | | 33,146 | | | | (4,763 | ) |
Distributions of capital gains received from investment company affiliates | | | 64,588 | | | | 138,678 | | | | 24,878 | | | | 59,009 | |
Change in net unrealized appreciation/depreciation on investments in affiliates | | | 80,213 | | | | (220,812 | ) | | | (7,055 | ) | | | (94,409 | ) |
| | | | | | | | | | | | | | | | |
Change in net assets resulting from operations | | | 237,343 | | | | (38,132 | ) | | | 91,486 | | | | 26,532 | |
| | | | | | | | | | | | | | | | |
| | | | |
DISTRIBUTIONS TO SHAREHOLDERS: | | | | | | | | | | | | | | | | |
Class A | | | | | | | | | | | | | | | | |
From net investment income | | | (40,829 | ) | | | (66,366 | ) | | | (26,108 | ) | | | (44,516 | ) |
From net realized gains | | | (72,170 | ) | | | (121,890 | ) | | | (32,302 | ) | | | (58,389 | ) |
Class C | | | | | | | | | | | | | | | | |
From net investment income | | | (9,151 | ) | | | (14,208 | ) | | | (13,502 | ) | | | (23,185 | ) |
From net realized gains | | | (22,004 | ) | | | (38,413 | ) | | | (23,339 | ) | | | (43,262 | ) |
Select Class | | | | | | | | | | | | | | | | |
From net investment income | | | (5,138 | ) | | | (7,936 | ) | | | (1,640 | ) | | | (2,667 | ) |
From net realized gains | | | (8,132 | ) | | | (12,696 | ) | | | (1,870 | ) | | | (3,008 | ) |
| | | | | | | | | | | | | | | | |
Total distributions to shareholders | | | (157,424 | ) | | | (261,509 | ) | | | (98,761 | ) | | | (175,027 | ) |
| | | | | | | | | | | | | | | | |
| | | | |
CAPITAL TRANSACTIONS: | | | | | | | | | | | | | | | | |
Change in net assets resulting from capital transactions | | | (152,660 | ) | | | 133,100 | | | | (138,766 | ) | | | (79,747 | ) |
| | | | | | | | | | | | | | | | |
| | | | |
NET ASSETS: | | | | | | | | | | | | | | | | |
Change in net assets | | | (72,741 | ) | | | (166,541 | ) | | | (146,041 | ) | | | (228,242 | ) |
Beginning of period | | | 5,400,935 | | | | 5,567,476 | | | | 4,288,056 | | | | 4,516,298 | |
| | | | | | | | | | | | | | | | |
End of period | | $ | 5,328,194 | | | $ | 5,400,935 | | | $ | 4,142,015 | | | $ | 4,288,056 | |
| | | | | | | | | | | | | | | | |
Accumulated undistributed (distributions in excess of) net investment income | | $ | (1,855 | ) | | $ | 298 | | | $ | (876 | ) | | $ | (143 | ) |
| | | | | | | | | | | | | | | | |
SEE NOTES TO FINANCIAL STATEMENTS.
| | | | | | | | |
| | | |
| DECEMBER 31, 2016 | | J.P. MORGAN INVESTOR FUNDS | | | | | 17 | |
STATEMENTS OF CHANGES IN NET ASSETS
FOR THE PERIODS INDICATED (continued)
(Amounts in thousands)
| | | | | | | | | | | | | | | | |
| | | Investor Growth Fund | | | Investor Growth & Income Fund | |
| | | Six Months Ended
December 31, 2016
(Unaudited) | | | Year Ended
June 30, 2016 | | | Six Months Ended
December 31, 2016
(Unaudited) | | | Year Ended
June 30, 2016 | |
CHANGE IN NET ASSETS RESULTING FROM OPERATIONS: | | | | | | | | | | | | | | | | |
Net investment income (loss) | | $ | 20,915 | | | $ | 22,146 | | | $ | 29,577 | | | $ | 40,813 | |
Net realized gain (loss) on investments in affiliates | | | 18,299 | | | | (3,929 | ) | | | 24,545 | | | | (15,996 | ) |
Distributions of capital gains received from investment company affiliates | | | 65,108 | | | | 113,224 | | | | 59,914 | | | | 108,419 | |
Change in net unrealized appreciation/depreciation on investments in affiliates | | | 102,938 | | | | (223,185 | ) | | | 85,772 | | | | (207,721 | ) |
| | | | | | | | | | | | | | | | |
Change in net assets resulting from operations | | | 207,260 | | | | (91,744 | ) | | | 199,808 | | | | (74,485 | ) |
| | | | | | | | | | | | | | | | |
| | | | |
DISTRIBUTIONS TO SHAREHOLDERS: | | | | | | | | | | | | | | | | |
Class A | | | | | | | | | | | | | | | | |
From net investment income | | | (18,481 | ) | | | (24,859 | ) | | | (25,967 | ) | | | (39,844 | ) |
From net realized gains | | | (84,422 | ) | | | (94,493 | ) | | | (72,446 | ) | | | (94,772 | ) |
Class C | | | | | | | | | | | | | | | | |
From net investment income | | | (2,132 | ) | | | (2,839 | ) | | | (3,241 | ) | | | (4,619 | ) |
From net realized gains | | | (12,736 | ) | | | (14,281 | ) | | | (12,299 | ) | | | (16,453 | ) |
Select Class | | | | | | | | | | | | | | | | |
From net investment income | | | (3,162 | ) | | | (4,447 | ) | | | (2,621 | ) | | | (4,452 | ) |
From net realized gains | | | (12,791 | ) | | | (14,030 | ) | | | (6,488 | ) | | | (9,016 | ) |
| | | | | | | | | | | | | | | | |
Total distributions to shareholders | | | (133,724 | ) | | | (154,949 | ) | | | (123,062 | ) | | | (169,156 | ) |
| | | | | | | | | | | | | | | | |
| | | | |
CAPITAL TRANSACTIONS: | | | | | | | | | | | | | | | | |
Change in net assets resulting from capital transactions | | | 23,794 | | | | 170,465 | | | | (88,603 | ) | | | 51,972 | |
| | | | | | | | | | | | | | | | |
| | | | |
NET ASSETS: | | | | | | | | | | | | | | | | |
Change in net assets | | | 97,330 | | | | (76,228 | ) | | | (11,857 | ) | | | (191,669 | ) |
Beginning of period | | | 2,446,931 | | | | 2,523,159 | | | | 3,141,963 | | | | 3,333,632 | |
| | | | | | | | | | | | | | | | |
End of period | | $ | 2,544,261 | | | $ | 2,446,931 | | | $ | 3,130,106 | | | $ | 3,141,963 | |
| | | | | | | | | | | | | | | | |
Accumulated undistributed (distributions in excess of) net investment income | | $ | (2,796 | ) | | $ | 64 | | | $ | (2,126 | ) | | $ | 126 | |
| | | | | | | | | | | | | | | | |
SEE NOTES TO FINANCIAL STATEMENTS.
| | | | | | |
| | | |
| 18 | | | | J.P. MORGAN INVESTOR FUNDS | | DECEMBER 31, 2016 |
| | | | | | | | | | | | | | | | |
| | | Investor Balanced Fund | | | Investor Conservative Growth Fund | |
| | | Six Months Ended
December 31, 2016
(Unaudited) | | | Year Ended
June 30, 2016 | | | Six Months Ended
December 31, 2016
(Unaudited) | | | Year Ended
June 30, 2016 | |
CAPITAL TRANSACTIONS: | | | | | | | | | | | | | | | | |
Class A | | | | | | | | | | | | | | | | |
Proceeds from shares issued | | $ | 151,654 | | | $ | 521,159 | | | $ | 118,750 | | | $ | 334,682 | |
Distributions reinvested | | | 112,658 | | | | 187,721 | | | | 58,250 | | | | 102,662 | |
Cost of shares redeemed | | | (392,182 | ) | | | (679,873 | ) | | | (257,754 | ) | | | (496,753 | ) |
| | | | | | | | | | | | | | | | |
Change in net assets resulting from Class A capital transactions | | $ | (127,870 | ) | | $ | 29,007 | | | $ | (80,754 | ) | | $ | (59,409 | ) |
| | | | | | | | | | | | | | | | |
Class C | | | | | | | | | | | | | | | | |
Proceeds from shares issued | | $ | 78,428 | | | $ | 265,536 | | | $ | 123,104 | | | $ | 376,818 | |
Distributions reinvested | | | 30,928 | | | | 52,283 | | | | 36,702 | | | | 66,197 | |
Cost of shares redeemed | | | (149,087 | ) | | | (291,673 | ) | | | (216,610 | ) | | | (472,504 | ) |
| | | | | | | | | | | | | | | | |
Change in net assets resulting from Class C capital transactions | | $ | (39,731 | ) | | $ | 26,146 | | | $ | (56,804 | ) | | $ | (29,489 | ) |
| | | | | | | | | | | | | | | | |
Select Class | | | | | | | | | | | | | | | | |
Proceeds from shares issued | | $ | 57,618 | | | $ | 153,889 | | | $ | 18,658 | | | $ | 43,901 | |
Distributions reinvested | | | 2,821 | | | | 4,656 | | | | 1,655 | | | | 2,793 | |
Cost of shares redeemed | | | (45,498 | ) | | | (80,598 | ) | | | (21,521 | ) | | | (37,543 | ) |
| | | | | | | | | | | | | | | | |
Change in net assets resulting from Select Class capital transactions | | $ | 14,941 | | | $ | 77,947 | | | $ | (1,208 | ) | | $ | 9,151 | |
| | | | | | | | | | | | | | | | |
Total change in net assets resulting from capital transactions | | $ | (152,660 | ) | | $ | 133,100 | | | $ | (138,766 | ) | | $ | (79,747 | ) |
| | | | | | | | | | | | | | | | |
| | | | |
SHARE TRANSACTIONS: | | | | | | | | | | | | | | | | |
Class A | | | | | | | | | | | | | | | | |
Issued | | | 10,323 | | | | 36,108 | | | | 9,476 | | | | 27,128 | |
Reinvested | | | 7,699 | | | | 13,251 | | | | 4,695 | | | | 8,416 | |
Redeemed | | | (26,667 | ) | | | (47,331 | ) | | | (20,604 | ) | | | (40,276 | ) |
| | | | | | | | | | | | | | | | |
Change in Class A Shares | | | (8,645 | ) | | | 2,028 | | | | (6,433 | ) | | | (4,732 | ) |
| | | | | | | | | | | | | | | | |
Class C | | | | | | | | | | | | | | | | |
Issued | | | 5,416 | | | | 18,572 | | | | 9,871 | | | | 30,610 | |
Reinvested | | | 2,146 | | | | 3,748 | | | | 2,976 | | | | 5,462 | |
Redeemed | | | (10,294 | ) | | | (20,642 | ) | | | (17,391 | ) | | | (38,552 | ) |
| | | | | | | | | | | | | | | | |
Change in Class C Shares | | | (2,732 | ) | | | 1,678 | | | | (4,544 | ) | | | (2,480 | ) |
| | | | | | | | | | | | | | | | |
Select Class | | | | | | | | | | | | | | | | |
Issued | | | 3,911 | | | | 10,448 | | | | 1,482 | | | | 3,548 | |
Reinvested | | | 192 | | | | 328 | | | | 132 | | | | 228 | |
Redeemed | | | (3,087 | ) | | | (5,624 | ) | | | (1,713 | ) | | | (3,004 | ) |
| | | | | | | | | | | | | | | | |
Change in Select Class Shares | | | 1,016 | | | | 5,152 | | | | (99 | ) | | | 772 | |
| | | | | | | | | | | | | | | | |
SEE NOTES TO FINANCIAL STATEMENTS.
| | | | | | | | |
| | | |
| DECEMBER 31, 2016 | | J.P. MORGAN INVESTOR FUNDS | | | | | 19 | |
STATEMENTS OF CHANGES IN NET ASSETS
FOR THE PERIODS INDICATED (continued)
(Amounts in thousands)
| | | | | | | | | | | | | | | | |
| | | Investor Growth Fund | | | Investor Growth & Income Fund | |
| | | Six Months Ended
December 31, 2016
(Unaudited) | | | Year Ended
June 30, 2016 | | | Six Months Ended
December 31, 2016
(Unaudited) | | | Year Ended
June 30, 2016 | |
CAPITAL TRANSACTIONS: | | | | | | | | | | | | | | | | |
Class A | | | | | | | | | | | | | | | | |
Proceeds from shares issued | | $ | 55,426 | | | $ | 209,821 | | | $ | 65,580 | | | $ | 250,438 | |
Distributions reinvested | | | 102,339 | | | | 118,749 | | | | 98,026 | | | | 134,109 | |
Cost of shares redeemed | | | (147,093 | ) | | | (240,399 | ) | | | (219,809 | ) | | | (362,157 | ) |
| | | | | | | | | | | | | | | | |
Change in net assets resulting from Class A capital transactions | | $ | 10,672 | | | $ | 88,171 | | | $ | (56,203 | ) | | $ | 22,390 | |
| | | | | | | | | | | | | | | | |
Class C | | | | | | | | | | | | | | | | |
Proceeds from shares issued | | $ | 20,326 | | | $ | 69,494 | | | $ | 26,589 | | | $ | 94,978 | |
Distributions reinvested | | | 14,443 | | | | 16,602 | | | | 15,064 | | | | 20,410 | |
Cost of shares redeemed | | | (31,968 | ) | | | (56,521 | ) | | | (51,916 | ) | | | (98,007 | ) |
| | | | | | | | | | | | | | | | |
Change in net assets resulting from Class C capital transactions | | $ | 2,801 | | | $ | 29,575 | | | $ | (10,263 | ) | | $ | 17,381 | |
| | | | | | | | | | | | | | | | |
Select Class | | | | | | | | | | | | | | | | |
Proceeds from shares issued | | $ | 43,932 | | | $ | 111,442 | | | $ | 21,657 | | | $ | 55,582 | |
Distributions reinvested | | | 3,983 | | | | 3,969 | | | | 2,410 | | | | 4,742 | |
Cost of shares redeemed | | | (37,594 | ) | | | (62,692 | ) | | | (46,204 | ) | | | (48,123 | ) |
| | | | | | | | | | | | | | | | |
Change in net assets resulting from Select Class capital transactions | | $ | 10,321 | | | $ | 52,719 | | | $ | (22,137 | ) | | $ | 12,201 | |
| | | | | | | | | | | | | | | | |
Total change in net assets resulting from capital transactions | | $ | 23,794 | | | $ | 170,465 | | | $ | (88,603 | ) | | $ | 51,972 | |
| | | | | | | | | | | | | | | | |
| | | | |
SHARE TRANSACTIONS: | | | | | | | | | | | | | | | | |
Class A | | | | | | | | | | | | | | | | |
Issued | | | 2,939 | | | | 11,358 | | | | 4,014 | | | | 15,592 | |
Reinvested | | | 5,441 | | | | 6,595 | | | | 6,008 | | | | 8,537 | |
Redeemed | | | (7,781 | ) | | | (13,034 | ) | | | (13,423 | ) | | | (22,696 | ) |
| | | | | | | | | | | | | | | | |
Change in Class A Shares | | | 599 | | | | 4,919 | | | | (3,401 | ) | | | 1,433 | |
| | | | | | | | | | | | | | | | |
Class C | | | | | | | | | | | | | | | | |
Issued | | | 1,137 | | | | 3,961 | | | | 1,668 | | | | 6,045 | |
Reinvested | | | 813 | | | | 972 | | | | 949 | | | | 1,335 | |
Redeemed | | | (1,791 | ) | | | (3,257 | ) | | | (3,257 | ) | | | (6,328 | ) |
| | | | | | | | | | | | | | | | |
Change in Class C Shares | | | 159 | | | | 1,676 | | | | (640 | ) | | | 1,052 | |
| | | | | | | | | | | | | | | | |
Select Class | | | | | | | | | | | | | | | | |
Issued | | | 2,278 | | | | 5,783 | | | | 1,338 | | | | 3,529 | |
Reinvested | | | 208 | | | | 217 | | | | 150 | | | | 306 | |
Redeemed | | | (1,961 | ) | | | (3,386 | ) | | | (2,863 | ) | | | (3,063 | ) |
| | | | | | | | | | | | | | | | |
Change in Select Class Shares | | | 525 | | | | 2,614 | | | | (1,375 | ) | | | 772 | |
| | | | | | | | | | | | | | | | |
SEE NOTES TO FINANCIAL STATEMENTS.
| | | | | | |
| | | |
| 20 | | | | J.P. MORGAN INVESTOR FUNDS | | DECEMBER 31, 2016 |
THIS PAGE IS INTENTIONALLY LEFT BLANK
| | | | | | | | |
| | | |
| DECEMBER 31, 2016 | | J.P. MORGAN INVESTOR FUNDS | | | | | 21 | |
FINANCIAL HIGHLIGHTS
FOR THE PERIODS INDICATED
| | | | | | | | | | | | | | | | | | | | | | | | | | | | |
| | | Per share operating performance | |
| | | | | | Investment operations | | | Distributions | |
| | | Net asset
value,
beginning
of period | | | Net
investment
income
(loss) (b) | | | Net realized
and unrealized
gains
(losses) on
investments | | | Total from
investment
operations | | | Net
investment
income | | | Net
realized
gain | | | Total
distributions | |
Investor Balanced Fund | | | | | | | | | | | | | | | | | | | | | | | | | | | | |
Class A | | | | | | | | | | | | | | | | | | | | | | | | | | | | |
Six Months Ended December 31, 2016 (Unaudited) | | $ | 14.33 | | | $ | 0.15 | (h) | | $ | 0.49 | | | $ | 0.64 | | | $ | (0.16 | ) | | $ | (0.28 | ) | | $ | (0.44 | ) |
Year Ended June 30, 2016 | | | 15.12 | | | | 0.22 | (h) | | | (0.29 | ) | | | (0.07 | ) | | | (0.25 | ) | | | (0.47 | ) | | | (0.72 | ) |
Year Ended June 30, 2015 | | | 15.25 | | | | 0.19 | | | | 0.24 | | | | 0.43 | | | | (0.28 | ) | | | (0.28 | ) | | | (0.56 | ) |
Year Ended June 30, 2014 | | | 13.61 | | | | 0.17 | (h) | | | 1.74 | | | | 1.91 | | | | (0.23 | ) | | | (0.04 | ) | | | (0.27 | ) |
Year Ended June 30, 2013 | | | 12.53 | | | | 0.20 | (h) | | | 1.11 | | | | 1.31 | | | | (0.23 | ) | | | — | | | | (0.23 | ) |
Year Ended June 30, 2012 | | | 12.58 | | | | 0.22 | (h) | | | (0.05 | ) | | | 0.17 | | | | (0.22 | ) | | | — | | | | (0.22 | ) |
| | | | | | | |
Class C | | | | | | | | | | | | | | | | | | | | | | | | | | | | |
Six Months Ended December 31, 2016 (Unaudited) | | | 14.13 | | | | 0.11 | (h) | | | 0.48 | | | | 0.59 | | | | (0.12 | ) | | | (0.28 | ) | | | (0.40 | ) |
Year Ended June 30, 2016 | | | 14.92 | | | | 0.14 | (h) | | | (0.29 | ) | | | (0.15 | ) | | | (0.17 | ) | | | (0.47 | ) | | | (0.64 | ) |
Year Ended June 30, 2015 | | | 15.05 | | | | 0.13 | | | | 0.23 | | | | 0.36 | | | | (0.21 | ) | | | (0.28 | ) | | | (0.49 | ) |
Year Ended June 30, 2014 | | | 13.44 | | | | 0.09 | (h) | | | 1.71 | | | | 1.80 | | | | (0.15 | ) | | | (0.04 | ) | | | (0.19 | ) |
Year Ended June 30, 2013 | | | 12.39 | | | | 0.13 | (h) | | | 1.09 | | | | 1.22 | | | | (0.17 | ) | | | — | | | | (0.17 | ) |
Year Ended June 30, 2012 | | | 12.44 | | | | 0.15 | (h) | | | (0.04 | ) | | | 0.11 | | | | (0.16 | ) | | | — | | | | (0.16 | ) |
| | | | | | | |
Select Class | | | | | | | | | | | | | | | | | | | | | | | | | | | | |
Six Months Ended December 31, 2016 (Unaudited) | | | 14.35 | | | | 0.17 | (h) | | | 0.50 | | | | 0.67 | | | | (0.18 | ) | | | (0.28 | ) | | | (0.46 | ) |
Year Ended June 30, 2016 | | | 15.14 | | | | 0.26 | (h) | | | (0.30 | ) | | | (0.04 | ) | | | (0.28 | ) | | | (0.47 | ) | | | (0.75 | ) |
Year Ended June 30, 2015 | | | 15.27 | | | | 0.24 | | | | 0.23 | | | | 0.47 | | | | (0.32 | ) | | | (0.28 | ) | | | (0.60 | ) |
Year Ended June 30, 2014 | | | 13.62 | | | | 0.20 | (h) | | | 1.75 | | | | 1.95 | | | | (0.26 | ) | | | (0.04 | ) | | | (0.30 | ) |
Year Ended June 30, 2013 | | | 12.55 | | | | 0.23 | (h) | | | 1.10 | | | | 1.33 | | | | (0.26 | ) | | | — | | | | (0.26 | ) |
Year Ended June 30, 2012 | | | 12.60 | | | | 0.25 | (h) | | | (0.05 | ) | | | 0.20 | | | | (0.25 | ) | | | — | | | | (0.25 | ) |
| (a) | Annualized for periods less than one year, unless otherwise noted. |
| (b) | Net investment income (loss) is affected by timing of distributions from Underlying Funds. |
| (c) | Not annualized for periods less than one year. |
| (d) | Includes adjustments in accordance with accounting principles generally accepted in the United States of America and as such, the net asset values for financial reporting purposes and the returns based upon those net asset values may differ from the net asset values and returns for shareholder transactions. |
| (e) | Does not include expenses of Underlying Funds. |
| (f) | Includes earnings credits and interest expense, if applicable, each of which is less than 0.005% unless otherwise noted. |
| (g) | Portfolio turnover is calculated by dividing the lesser of total purchases or sales of portfolio securities for the reporting period by the monthly average value of portfolio securities owned during the reporting period. Excluded from both the numerator and denominator are amounts relating to derivatives and securities whose maturities or expiration dates at the time of acquisition were one year or less. |
| (h) | Calculated based upon average shares outstanding. |
SEE NOTES TO FINANCIAL STATEMENTS.
| | | | | | |
| | | |
| 22 | | | | J.P. MORGAN INVESTOR FUNDS | | DECEMBER 31, 2016 |
| | | | | | | | | | | | | | | | | | | | | | | | | | |
| | | Ratios/Supplemental data | |
| | | | | | | | | | Ratios to average net assets (a) | | | | |
Net asset
value,
end of
period | | | Total return
(excludes
sales charge) (c)(d) | | | Net assets,
end of
period
(000’s) | | | Net
expenses (e)(f) | | | Net
investment
income
(loss) (b) | | |
Expenses
without waivers,
reimbursements and
earnings credits (e) | | | Portfolio
turnover
rate (c)(g) | |
| | | | | | | | | | | | | | | | | | | | | | | | | | |
| | | | | | | | | | | | | | | | | | | | | | | | | | |
| $ | 14.53 | | | | 4.48 | % | | $ | 3,765,839 | | | | 0.52 | % | | | 2.04 | % | | | 0.66 | % | | | 3 | % |
| | 14.33 | | | | (0.40 | ) | | | 3,836,242 | | | | 0.46 | | | | 1.55 | | | | 0.67 | | | | 12 | |
| | 15.12 | | | | 2.89 | | | | 4,018,244 | | | | 0.34 | | | | 1.26 | | | | 0.66 | | | | 10 | |
| | 15.25 | | | | 14.12 | | | | 3,749,519 | | | | 0.41 | | | | 1.16 | | | | 0.67 | | | | 12 | |
| | 13.61 | | | | 10.54 | | | | 2,797,749 | | | | 0.50 | | | | 1.51 | | | | 0.69 | | | | 19 | |
| | 12.53 | | | | 1.45 | | | | 2,287,495 | | | | 0.50 | | | | 1.79 | | | | 0.69 | | | | 9 | |
| | | | | | |
| | | | | | | | | | | | | | | | | | | | | | | | | | |
| | 14.32 | | | | 4.17 | | | | 1,132,858 | | | | 1.10 | | | | 1.46 | | | | 1.15 | | | | 3 | |
| | 14.13 | | | | (0.95 | ) | | | 1,155,896 | | | | 1.01 | | | | 1.00 | | | | 1.16 | | | | 12 | |
| | 14.92 | | | | 2.45 | | | | 1,195,830 | | | | 0.80 | | | | 0.81 | | | | 1.16 | | | | 10 | |
| | 15.05 | | | | 13.50 | | | | 995,919 | | | | 0.97 | | | | 0.61 | | | | 1.17 | | | | 12 | |
| | 13.44 | | | | 9.89 | | | | 564,358 | | | | 1.01 | | | | 0.99 | | | | 1.19 | | | | 19 | |
| | 12.39 | | | | 0.94 | | | | 413,805 | | | | 1.02 | | | | 1.27 | | | | 1.19 | | | | 9 | |
| | | | | | |
| | | | | | | | | | | | | | | | | | | | | | | | | | |
| | 14.56 | | | | 4.68 | | | | 429,497 | | | | 0.27 | | | | 2.34 | | | | 0.38 | | | | 3 | |
| | 14.35 | | | | (0.15 | ) | | | 408,797 | | | | 0.20 | | | | 1.83 | | | | 0.39 | | | | 12 | |
| | 15.14 | | | | 3.15 | | | | 353,402 | | | | 0.08 | | | | 1.51 | | | | 0.40 | | | | 10 | |
| | 15.27 | | | | 14.45 | | | | 329,525 | | | | 0.16 | | | | 1.39 | | | | 0.42 | | | | 12 | |
| | 13.62 | | | | 10.71 | | | | 293,756 | | | | 0.25 | | | | 1.75 | | | | 0.44 | | | | 19 | |
| | 12.55 | | | | 1.70 | | | | 250,089 | | | | 0.25 | | | | 2.03 | | | | 0.44 | | | | 9 | |
SEE NOTES TO FINANCIAL STATEMENTS.
| | | | | | | | |
| | | |
| DECEMBER 31, 2016 | | J.P. MORGAN INVESTOR FUNDS | | | | | 23 | |
FINANCIAL HIGHLIGHTS
FOR THE PERIODS INDICATED (continued)
| | | | | | | | | | | | | | | | | | | | | | | | | | | | |
| | | Per share operating performance | |
| | | | | | Investment operations | | | Distributions | |
| | | Net asset
value,
beginning
of period | | | Net
investment
income
(loss) (b) | | | Net realized
and unrealized
gains
(losses) on
investments | | | Total from
investment
operations | | | Net
investment
income | | | Net
realized
gain | | | Total
distributions | |
Investor Conservative Growth Fund | | | | | | | | | | | | | | | | | | | | | | | | | | | | |
Class A | | | | | | | | | | | | | | | | | | | | | | | | | | | | |
Six Months Ended December 31, 2016 (Unaudited) | | $ | 12.36 | | | $ | 0.13 | (h) | | $ | 0.15 | | | $ | 0.28 | | | $ | (0.14 | ) | | $ | (0.17 | ) | | $ | (0.31 | ) |
Year Ended June 30, 2016 | | | 12.78 | | | | 0.22 | (h) | | | (0.11 | ) | | | 0.11 | | | | (0.23 | ) | | | (0.30 | ) | | | (0.53 | ) |
Year Ended June 30, 2015 | | | 13.00 | | | | 0.19 | | | | 0.05 | | | | 0.24 | | | | (0.22 | ) | | | (0.24 | ) | | | (0.46 | ) |
Year Ended June 30, 2014 | | | 12.01 | | | | 0.18 | (h) | | | 1.02 | | | | 1.20 | | | | (0.21 | ) | | | — | | | | (0.21 | ) |
Year Ended June 30, 2013 | | | 11.46 | | | | 0.19 | (h) | | | 0.58 | | | | 0.77 | | | | (0.22 | ) | | | — | | | | (0.22 | ) |
Year Ended June 30, 2012 | | | 11.40 | | | | 0.23 | (h) | | | 0.06 | | | | 0.29 | | | | (0.23 | ) | | | — | | | | (0.23 | ) |
| | | | | | | |
Class C | | | | | | | | | | | | | | | | | | | | | | | | | | | | |
Six Months Ended December 31, 2016 (Unaudited) | | | 12.30 | | | | 0.10 | (h) | | | 0.15 | | | | 0.25 | | | | (0.10 | ) | | | (0.17 | ) | | | (0.27 | ) |
Year Ended June 30, 2016 | | | 12.73 | | | | 0.15 | (h) | | | (0.12 | ) | | | 0.03 | | | | (0.16 | ) | | | (0.30 | ) | | | (0.46 | ) |
Year Ended June 30, 2015 | | | 12.95 | | | | 0.13 | | | | 0.06 | | | | 0.19 | | | | (0.17 | ) | | | (0.24 | ) | | | (0.41 | ) |
Year Ended June 30, 2014 | | | 11.97 | | | | 0.11 | (h) | | | 1.01 | | | | 1.12 | | | | (0.14 | ) | | | — | | | | (0.14 | ) |
Year Ended June 30, 2013 | | | 11.42 | | | | 0.13 | (h) | | | 0.58 | | | | 0.71 | | | | (0.16 | ) | | | — | | | | (0.16 | ) |
Year Ended June 30, 2012 | | | 11.36 | | | | 0.17 | (h) | | | 0.06 | | | | 0.23 | | | | (0.17 | ) | | | — | | | | (0.17 | ) |
| | | | | | | |
Select Class | | | | | | | | | | | | | | | | | | | | | | | | | | | | |
Six Months Ended December 31, 2016 (Unaudited) | | | 12.42 | | | | 0.15 | (h) | | | 0.15 | | | | 0.30 | | | | (0.15 | ) | | | (0.17 | ) | | | (0.32 | ) |
Year Ended June 30, 2016 | | | 12.84 | | | | 0.25 | (h) | | | (0.11 | ) | | | 0.14 | | | | (0.26 | ) | | | (0.30 | ) | | | (0.56 | ) |
Year Ended June 30, 2015 | | | 13.06 | | | | 0.22 | | | | 0.06 | | | | 0.28 | | | | (0.26 | ) | | | (0.24 | ) | | | (0.50 | ) |
Year Ended June 30, 2014 | | | 12.06 | | | | 0.21 | (h) | | | 1.03 | | | | 1.24 | | | | (0.24 | ) | | | — | | | | (0.24 | ) |
Year Ended June 30, 2013 | | | 11.51 | | | | 0.22 | (h) | | | 0.58 | | | | 0.80 | | | | (0.25 | ) | | | — | | | | (0.25 | ) |
Year Ended June 30, 2012 | | | 11.44 | | | | 0.26 | (h) | | | 0.07 | | | | 0.33 | | | | (0.26 | ) | | | — | | | | (0.26 | ) |
| (a) | Annualized for periods less than one year, unless otherwise noted. |
| (b) | Net investment income (loss) is affected by timing of distributions from Underlying Funds. |
| (c) | Not annualized for periods less than one year. |
| (d) | Includes adjustments in accordance with accounting principles generally accepted in the United States of America and as such, the net asset values for financial reporting purposes and the returns based upon those net asset values may differ from the net asset values and returns for shareholder transactions. |
| (e) | Does not include expenses of Underlying Funds. |
| (f) | Includes earnings credits and interest expense, if applicable, each of which is less than 0.005% unless otherwise noted. |
| (g) | Portfolio turnover is calculated by dividing the lesser of total purchases or sales of portfolio securities for the reporting period by the monthly average value of portfolio securities owned during the reporting period. Excluded from both the numerator and denominator are amounts relating to derivatives and securities whose maturities or expiration dates at the time of acquisition were one year or less. |
| (h) | Calculated based upon average shares outstanding. |
SEE NOTES TO FINANCIAL STATEMENTS.
| | | | | | |
| | | |
| 24 | | | | J.P. MORGAN INVESTOR FUNDS | | DECEMBER 31, 2016 |
| | | | | | | | | | | | | | | | | | | | | | | | | | |
| | | Ratios/Supplemental data | |
| | | | | | | | | | Ratios to average net assets (a) | | | | |
Net asset
value,
end of
period | | | Total return
(excludes
sales charge) (c)(d) | | | Net assets,
end of
period
(000’s) | | | Net
expenses (e)(f) | | | Net
investment
income
(loss) (b) | | |
Expenses
without waivers,
reimbursements and
earnings credits (e) | | | Portfolio
turnover
rate (c)(g) | |
| | | | | | | | | | | | | | | | | | | | | | | | | | |
| | | | | | | | | | | | | | | | | | | | | | | | | | |
| $ | 12.33 | | | | 2.26 | % | | $ | 2,326,861 | | | | 0.52 | % | | | 2.10 | % | | | 0.66 | % | | | 2 | % |
| | 12.36 | | | | 0.97 | | | | 2,411,763 | | | | 0.46 | | | | 1.76 | | | | 0.66 | | | | 12 | |
| | 12.78 | | | | 1.89 | | | | 2,554,155 | | | | 0.34 | | | | 1.46 | | | | 0.66 | | | | 11 | |
| | 13.00 | | | | 10.05 | | | | 2,516,247 | | | | 0.41 | | | | 1.41 | | | | 0.66 | | | | 20 | |
| | 12.01 | | | | 6.76 | | | | 2,220,725 | | | | 0.50 | | | | 1.63 | | | | 0.68 | | | | 14 | |
| | 11.46 | | | | 2.60 | | | | 1,847,352 | | | | 0.50 | | | | 2.03 | | | | 0.68 | | | | 9 | |
| | | | | | |
| | | | | | | | | | | | | | | | | | | | | | | | | | |
| | 12.28 | | | | 2.04 | | | | 1,680,813 | | | | 1.10 | | | | 1.52 | | | | 1.15 | | | | 2 | |
| | 12.30 | | | | 0.34 | | | | 1,740,461 | | | | 1.01 | | | | 1.21 | | | | 1.16 | | | | 12 | |
| | 12.73 | | | | 1.44 | | | | 1,831,636 | | | | 0.79 | | | | 1.02 | | | | 1.16 | | | | 11 | |
| | 12.95 | | | | 9.42 | | | | 1,580,447 | | | | 0.97 | | | | 0.87 | | | | 1.16 | | | | 20 | |
| | 11.97 | | | | 6.27 | | | | 1,142,903 | | | | 1.01 | | | | 1.12 | | | | 1.18 | | | | 14 | |
| | 11.42 | | | | 2.09 | | | | 841,332 | | | | 1.01 | | | | 1.50 | | | | 1.18 | | | | 9 | |
| | | | | | |
| | | | | | | | | | | | | | | | | | | | | | | | | | |
| | 12.40 | | | | 2.44 | | | | 134,341 | | | | 0.27 | | | | 2.37 | | | | 0.40 | | | | 2 | |
| | 12.42 | | | | 1.22 | | | | 135,832 | | | | 0.21 | | | | 2.02 | | | | 0.41 | | | | 12 | |
| | 12.84 | | | | 2.13 | | | | 130,507 | | | | 0.09 | | | | 1.71 | | | | 0.40 | | | | 11 | |
| | 13.06 | | | | 10.35 | | | | 119,664 | | | | 0.16 | | | | 1.66 | | | | 0.41 | | | | 20 | |
| | 12.06 | | | | 6.97 | | | | 112,843 | | | | 0.25 | | | | 1.87 | | | | 0.43 | | | | 14 | |
| | 11.51 | | | | 2.92 | | | | 95,175 | | | | 0.25 | | | | 2.27 | | | | 0.43 | | | | 9 | |
SEE NOTES TO FINANCIAL STATEMENTS.
| | | | | | | | |
| | | |
| DECEMBER 31, 2016 | | J.P. MORGAN INVESTOR FUNDS | | | | | 25 | |
FINANCIAL HIGHLIGHTS
FOR THE PERIODS INDICATED (continued)
| | | | | | | | | | | | | | | | | | | | | | | | | | | | |
| | | Per share operating performance | |
| | | | | | Investment operations | | | Distributions | |
| | | Net asset
value,
beginning
of period | | | Net
investment
income
(loss) (b)(c) | | | Net realized
and unrealized
gains
(losses) on
investments | | | Total from
investment
operations | | | Net
investment
income | | | Net
realized
gain | | | Total
distributions | |
Investor Growth Fund | | | | | | | | | | | | | | | | | | | | | | | | | | | | |
Class A | | | | | | | | | | | | | | | | | | | | | | | | | | | | |
Six Months Ended December 31, 2016 (Unaudited) | | $ | 18.04 | | | $ | 0.16 | | | $ | 1.41 | | | $ | 1.57 | | | $ | (0.18 | ) | | $ | (0.84 | ) | | $ | (1.02 | ) |
Year Ended June 30, 2016 | | | 19.95 | | | | 0.17 | | | | (0.89 | ) | | | (0.72 | ) | | | (0.24 | ) | | | (0.95 | ) | | | (1.19 | ) |
Year Ended June 30, 2015 | | | 19.59 | | | | 0.15 | | | | 0.91 | | | | 1.06 | | | | (0.39 | ) | | | (0.31 | ) | | | (0.70 | ) |
Year Ended June 30, 2014 | | | 16.25 | | | | 0.11 | | | | 3.45 | | | | 3.56 | | | | (0.22 | ) | | | — | | | | (0.22 | ) |
Year Ended June 30, 2013 | | | 13.88 | | | | 0.14 | | | | 2.38 | | | | 2.52 | | | | (0.15 | ) | | | — | | | | (0.15 | ) |
Year Ended June 30, 2012 | | | 14.14 | | | | 0.10 | | | | (0.25 | ) | | | (0.15 | ) | | | (0.11 | ) | | | — | | | | (0.11 | ) |
| | | | | | | |
Class C | | | | | | | | | | | | | | | | | | | | | | | | | | | | |
Six Months Ended December 31, 2016 (Unaudited) | | | 17.10 | | | | 0.10 | | | | 1.33 | | | | 1.43 | | | | (0.13 | ) | | | (0.84 | ) | | | (0.97 | ) |
Year Ended June 30, 2016 | | | 19.01 | | | | 0.07 | | | | (0.85 | ) | | | (0.78 | ) | | | (0.18 | ) | | | (0.95 | ) | | | (1.13 | ) |
Year Ended June 30, 2015 | | | 18.75 | | | | 0.05 | | | | 0.87 | | | | 0.92 | | | | (0.35 | ) | | | (0.31 | ) | | | (0.66 | ) |
Year Ended June 30, 2014 | | | 15.60 | | | | 0.01 | | | | 3.30 | | | | 3.31 | | | | (0.16 | ) | | | — | | | | (0.16 | ) |
Year Ended June 30, 2013 | | | 13.34 | | | | 0.05 | | | | 2.30 | | | | 2.35 | | | | (0.09 | ) | | | — | | | | (0.09 | ) |
Year Ended June 30, 2012 | | | 13.61 | | | | 0.02 | | | | (0.24 | ) | | | (0.22 | ) | | | (0.05 | ) | | | — | | | | (0.05 | ) |
| | | | | | | |
Select Class | | | | | | | | | | | | | | | | | | | | | | | | | | | | |
Six Months Ended December 31, 2016 (Unaudited) | | | 18.37 | | | | 0.19 | | | | 1.43 | | | | 1.62 | | | | (0.20 | ) | | | (0.84 | ) | | | (1.04 | ) |
Year Ended June 30, 2016 | | | 20.29 | | | | 0.23 | | | | (0.91 | ) | | | (0.68 | ) | | | (0.29 | ) | | | (0.95 | ) | | | (1.24 | ) |
Year Ended June 30, 2015 | | | 19.91 | | | | 0.20 | | | | 0.93 | | | | 1.13 | | | | (0.44 | ) | | | (0.31 | ) | | | (0.75 | ) |
Year Ended June 30, 2014 | | | 16.51 | | | | 0.16 | | | | 3.50 | | | | 3.66 | | | | (0.26 | ) | | | — | | | | (0.26 | ) |
Year Ended June 30, 2013 | | | 14.09 | | | | 0.17 | | | | 2.44 | | | | 2.61 | | | | (0.19 | ) | | | — | | | | (0.19 | ) |
Year Ended June 30, 2012 | | | 14.35 | | | | 0.14 | | | | (0.26 | ) | | | (0.12 | ) | | | (0.14 | ) | | | — | | | | (0.14 | ) |
| (a) | Annualized for periods less than one year, unless otherwise noted. |
| (b) | Calculated based upon average shares outstanding. |
| (c) | Net investment income (loss) is affected by timing of distributions from Underlying Funds. |
| (d) | Not annualized for periods less than one year. |
| (e) | Includes adjustments in accordance with accounting principles generally accepted in the United States of America and as such, the net asset values for financial reporting purposes and the returns based upon those net asset values may differ from the net asset values and returns for shareholder transactions. |
| (f) | Does not include expenses of Underlying Funds. |
| (g) | Includes earnings credits and interest expense, if applicable, each of which is less than 0.005% unless otherwise noted. |
| (h) | Portfolio turnover is calculated by dividing the lesser of total purchases or sales of portfolio securities for the reporting period by the monthly average value of portfolio securities owned during the reporting period. Excluded from both the numerator and denominator are amounts relating to derivatives and securities whose maturities or expiration dates at the time of acquisition were one year or less. |
SEE NOTES TO FINANCIAL STATEMENTS.
| | | | | | |
| | | |
| 26 | | | | J.P. MORGAN INVESTOR FUNDS | | DECEMBER 31, 2016 |
| | | | | | | | | | | | | | | | | | | | | | | | | | |
| | | Ratios/Supplemental data | |
| | | | | | | | | | Ratios to average net assets (a) | | | | |
Net asset
value,
end of
period | | | Total return
(excludes
sales charge) (d)(e) | | | Net assets,
end of
period
(000’s) | | | Net
expenses (f)(g) | | | Net
investment
income
(loss) (c) | | |
Expenses
without waivers,
reimbursements and
earnings credits (f) | | | Portfolio
turnover
rate (d)(h) | |
| | | | | | | | | | | | | | | | | | | | | | | | | | |
| | | | | | | | | | | | | | | | | | | | | | | | | | |
| $ | 18.59 | | | | 8.65 | % | | $ | 1,961,815 | | | | 0.52 | % | | | 1.68 | % | | | 0.71 | % | | | 4 | % |
| | 18.04 | | | | (3.54 | ) | | | 1,893,308 | | | | 0.47 | | | | 0.93 | | | | 0.72 | | | | 8 | |
| | 19.95 | | | | 5.51 | | | | 1,994,792 | | | | 0.38 | | | | 0.74 | | | | 0.71 | | | | 10 | |
| | 19.59 | | | | 21.95 | | | | 1,791,194 | | | | 0.41 | | | | 0.59 | | | | 0.71 | | | | 8 | |
| | 16.25 | | | | 18.28 | | | | 1,344,928 | | | | 0.49 | | | | 0.89 | | | | 0.76 | | | | 15 | |
| | 13.88 | | | | (1.03 | ) | | | 1,100,639 | | | | 0.50 | | | | 0.72 | | | | 0.75 | | | | 6 | |
| | | | | | |
| | | | | | | | | | | | | | | | | | | | | | | | | | |
| | 17.56 | | | | 8.35 | | | | 279,996 | | | | 1.10 | | | | 1.10 | | | | 1.20 | | | | 4 | |
| | 17.10 | | | | (4.05 | ) | | | 270,007 | | | | 1.02 | | | | 0.39 | | | | 1.21 | | | | 8 | |
| | 19.01 | | | | 4.97 | | | | 268,270 | | | | 0.85 | | | | 0.26 | | | | 1.21 | | | | 10 | |
| | 18.75 | | | | 21.30 | | | | 226,430 | | | | 0.95 | | | | 0.05 | | | | 1.21 | | | | 8 | |
| | 15.60 | | | | 17.69 | | | | 157,546 | | | | 1.04 | | | | 0.34 | | | | 1.25 | | | | 15 | |
| | 13.34 | | | | (1.57 | ) | | | 125,391 | | | | 1.05 | | | | 0.17 | | | | 1.25 | | | | 6 | |
| | | | | | |
| | | | | | | | | | | | | | | | | | | | | | | | | | |
| | 18.95 | | | | 8.79 | | | | 302,450 | | | | 0.27 | | | | 1.97 | | | | 0.40 | | | | 4 | |
| | 18.37 | | | | (3.28 | ) | | | 283,616 | | | | 0.20 | | | | 1.21 | | | | 0.40 | | | | 8 | |
| | 20.29 | | | | 5.80 | | | | 260,097 | | | | 0.10 | | | | 1.01 | | | | 0.42 | | | | 10 | |
| | 19.91 | | | | 22.25 | | | | 182,413 | | | | 0.16 | | | | 0.85 | | | | 0.46 | | | | 8 | |
| | 16.51 | | | | 18.64 | | | | 123,906 | | | | 0.24 | | | | 1.13 | | | | 0.51 | | | | 15 | |
| | 14.09 | | | | (0.77 | ) | | | 108,189 | | | | 0.25 | | | | 0.99 | | | | 0.50 | | | | 6 | |
SEE NOTES TO FINANCIAL STATEMENTS.
| | | | | | | | |
| | | |
| DECEMBER 31, 2016 | | J.P. MORGAN INVESTOR FUNDS | | | | | 27 | |
FINANCIAL HIGHLIGHTS
FOR THE PERIODS INDICATED (continued)
| | | | | | | | | | | | | | | | | | | | | | | | | | | | |
| | | Per share operating performance | |
| | | | | | Investment operations | | | Distributions | |
| | | Net asset
value,
beginning
of period | | | Net
investment
income
(loss) (b)(c) | | | Net realized
and unrealized
gains
(losses) on
investments | | | Total from
investment
operations | | | Net
investment
income | | | Net
realized
gain | | | Total
distributions | |
Investor Growth & Income Fund | | | | | | | | | | | | | | | | | | | | | | | | | | | | |
Class A | | | | | | | | | | | | | | | | | | | | | | | | | | | | |
Six Months Ended December 31, 2016 (Unaudited) | | $ | 15.79 | | | $ | 0.16 | | | $ | 0.87 | | | $ | 1.03 | | | $ | (0.17 | ) | | $ | (0.48 | ) | | $ | (0.65 | ) |
Year Ended June 30, 2016 | | | 17.02 | | | | 0.21 | | | | (0.58 | ) | | | (0.37 | ) | | | (0.25 | ) | | | (0.61 | ) | | | (0.86 | ) |
Year Ended June 30, 2015 | | | 17.11 | | | | 0.19 | | | | 0.44 | | | | 0.63 | | | | (0.33 | ) | | | (0.39 | ) | | | (0.72 | ) |
Year Ended June 30, 2014 | | | 14.78 | | | | 0.16 | | | | 2.40 | | | | 2.56 | | | | (0.23 | ) | | | — | | | | (0.23 | ) |
Year Ended June 30, 2013 | | | 13.17 | | | | 0.18 | | | | 1.64 | | | | 1.82 | | | | (0.21 | ) | | | — | | | | (0.21 | ) |
Year Ended June 30, 2012 | | | 13.28 | | | | 0.17 | | | | (0.10 | ) | | | 0.07 | | | | (0.18 | ) | | | — | | | | (0.18 | ) |
| | | | | | | |
Class C | | | | | | | | | | | | | | | | | | | | | | | | | | | | |
Six Months Ended December 31, 2016 (Unaudited) | | | 15.39 | | | | 0.11 | | | | 0.84 | | | | 0.95 | | | | (0.12 | ) | | | (0.48 | ) | | | (0.60 | ) |
Year Ended June 30, 2016 | | | 16.62 | | | | 0.12 | | | | (0.57 | ) | | | (0.45 | ) | | | (0.17 | ) | | | (0.61 | ) | | | (0.78 | ) |
Year Ended June 30, 2015 | | | 16.72 | | | | 0.11 | | | | 0.44 | | | | 0.55 | | | | (0.26 | ) | | | (0.39 | ) | | | (0.65 | ) |
Year Ended June 30, 2014 | | | 14.46 | | | | 0.07 | | | | 2.34 | | | | 2.41 | | | | (0.15 | ) | | | — | | | | (0.15 | ) |
Year Ended June 30, 2013 | | | 12.89 | | | | 0.10 | | | | 1.61 | | | | 1.71 | | | | (0.14 | ) | | | — | | | | (0.14 | ) |
Year Ended June 30, 2012 | | | 13.01 | | | | 0.10 | | | | (0.11 | ) | | | (0.01 | ) | | | (0.11 | ) | | | — | | | | (0.11 | ) |
| | | | | | | |
Select Class | | | | | | | | | | | | | | | | | | | | | | | | | | | | |
Six Months Ended December 31, 2016 (Unaudited) | | | 15.57 | | | | 0.17 | | | | 0.86 | | | | 1.03 | | | | (0.19 | ) | | | (0.48 | ) | | | (0.67 | ) |
Year Ended June 30, 2016 | | | 16.80 | | | | 0.25 | | | | (0.58 | ) | | | (0.33 | ) | | | (0.29 | ) | | | (0.61 | ) | | | (0.90 | ) |
Year Ended June 30, 2015 | | | 16.89 | | | | 0.23 | | | | 0.44 | | | | 0.67 | | | | (0.37 | ) | | | (0.39 | ) | | | (0.76 | ) |
Year Ended June 30, 2014 | | | 14.59 | | | | 0.19 | | | | 2.38 | | | | 2.57 | | | | (0.27 | ) | | | — | | | | (0.27 | ) |
Year Ended June 30, 2013 | | | 13.00 | | | | 0.21 | | | | 1.63 | | | | 1.84 | | | | (0.25 | ) | | | — | | | | (0.25 | ) |
Year Ended June 30, 2012 | | | 13.12 | | | | 0.20 | | | | (0.11 | ) | | | 0.09 | | | | (0.21 | ) | | | — | | | | (0.21 | ) |
| (a) | Annualized for periods less than one year, unless otherwise noted. |
| (b) | Calculated based upon average shares outstanding. |
| (c) | Net investment income (loss) is affected by timing of distributions from Underlying Funds. |
| (d) | Not annualized for periods less than one year. |
| (e) | Includes adjustments in accordance with accounting principles generally accepted in the United States of America and as such, the net asset values for financial reporting purposes and the returns based upon those net asset values may differ from the net asset values and returns for shareholder transactions. |
| (f) | Does not include expenses of Underlying Funds. |
| (g) | Includes earnings credits and interest expense, if applicable, each of which is less than 0.005% unless otherwise noted. |
| (h) | Portfolio turnover is calculated by dividing the lesser of total purchases or sales of portfolio securities for the reporting period by the monthly average value of portfolio securities owned during the reporting period. Excluded from both the numerator and denominator are amounts relating to derivatives and securities whose maturities or expiration dates at the time of acquisition were one year or less. |
| (i) | Amount rounds to less than 0.005%. |
SEE NOTES TO FINANCIAL STATEMENTS.
| | | | | | |
| | | |
| 28 | | | | J.P. MORGAN INVESTOR FUNDS | | DECEMBER 31, 2016 |
| | | | | | | | | | | | | | | | | | | | | | | | | | |
| | | Ratios/Supplemental data | |
| | | | | | | | | | Ratios to average net assets (a) | | | | |
Net asset
value,
end of
period | | | Total return
(excludes
sales charge) (d)(e) | | | Net assets,
end of
period
(000’s) | | | Net
expenses (f)(g) | | | Net
investment
income
(loss) (c) | | |
Expenses
without waivers,
reimbursements and
earnings credits (f) | | | Portfolio
turnover
rate (d)(h) | |
| | | | | | | | | | | | | | | | | | | | | | | | | | |
| | | | | | | | | | | | | | | | | | | | | | | | | | |
| $ | 16.17 | | | | 6.54 | % | | $ | 2,494,112 | | | | 0.52 | % | | | 1.91 | % | | | 0.69 | % | | | 4 | % |
| | 15.79 | | | | (2.06 | ) | | | 2,489,097 | | | | 0.46 | | | | 1.33 | | | | 0.69 | | | | 13 | |
| | 17.02 | | | | 3.78 | | | | 2,659,305 | | | | 0.36 | | | | 1.11 | | | | 0.69 | | | | 9 | |
| | 17.11 | | | | 17.40 | | | | 2,432,024 | | | | 0.41 | | | | 0.96 | | | | 0.68 | | | | 10 | |
| | 14.78 | | | | 13.91 | | | | 1,812,603 | | | | 0.49 | | | | 1.29 | | | | 0.72 | | | | 20 | |
| | 13.17 | | | | 0.60 | | | | 1,485,151 | | | | 0.50 | | | | 1.33 | | | | 0.71 | | | | 11 | |
| | | | | | |
| | | | | | | | | | | | | | | | | | | | | | | | | | |
| | 15.74 | | | | 6.21 | | | | 413,869 | | | | 1.10 | | | | 1.33 | | | | 1.18 | | | | 4 | |
| | 15.39 | | | | (2.63 | ) | | | 414,439 | | | | 1.02 | | | | 0.79 | | | | 1.19 | | | | 13 | |
| | 16.62 | | | | 3.37 | | | | 430,037 | | | | 0.82 | | | | 0.65 | | | | 1.19 | | | | 9 | |
| | 16.72 | | | | 16.72 | | | | 358,544 | | | | 0.96 | | | | 0.42 | | | | 1.18 | | | | 10 | |
| | 14.46 | | | | 13.34 | | | | 225,157 | | | | 1.02 | | | | 0.76 | | | | 1.21 | | | | 20 | |
| | 12.89 | | | | 0.00 | (i) | | | 179,336 | | | | 1.03 | | | | 0.80 | | | | 1.21 | | | | 11 | |
| | | | | | |
| | | | | | | | | | | | | | | | | | | | | | | | | | |
| | 15.93 | | | | 6.64 | | | | 222,125 | | | | 0.27 | | | | 2.15 | | | | 0.39 | | | | 4 | |
| | 15.57 | | | | (1.82 | ) | | | 238,427 | | | | 0.20 | | | | 1.60 | | | | 0.40 | | | | 13 | |
| | 16.80 | | | | 4.11 | | | | 244,290 | | | | 0.09 | | | | 1.38 | | | | 0.41 | | | | 9 | |
| | 16.89 | | | | 17.71 | | | | 208,836 | | | | 0.16 | | | | 1.21 | | | | 0.44 | | | | 10 | |
| | 14.59 | | | | 14.22 | | | | 156,714 | | | | 0.24 | | | | 1.53 | | | | 0.47 | | | | 20 | |
| | 13.00 | | | | 0.79 | | | | 127,295 | | | | 0.25 | | | | 1.59 | | | | 0.46 | | | | 11 | |
SEE NOTES TO FINANCIAL STATEMENTS.
| | | | | | | | |
| | | |
| DECEMBER 31, 2016 | | J.P. MORGAN INVESTOR FUNDS | | | | | 29 | |
NOTES TO FINANCIAL STATEMENTS
AS OF DECEMBER 31, 2016 (Unaudited)
1. Organization
JPMorgan Trust II (“JPM II” or the “Trust”) was formed on November 12, 2004, as a Delaware statutory trust, pursuant to a Declaration of Trust dated November 5, 2004 and is registered under the Investment Company Act of 1940, as amended (the “1940 Act”), as an open-end management investment company.
The following are 4 separate funds of the Trust (collectively, the “Funds”) covered by this report:
| | | | |
| | | Classes Offered | | Diversified/Non-Diversified |
| Investor Balanced Fund | | Class A, Class C and Select Class | | Diversified |
| Investor Conservative Growth Fund | | Class A, Class C and Select Class | | Diversified |
| Investor Growth Fund | | Class A, Class C and Select Class | | Diversified |
| Investor Growth & Income Fund | | Class A, Class C and Select Class | | Diversified |
The investment objective of the Investor Balanced Fund is to seek high total return consistent with the preservation of capital by investing primarily in a diversified group of mutual funds within the same group of investment companies that invest primarily in equity and fixed income securities.
The investment objective of the Investor Conservative Growth Fund is to seek income and capital appreciation by investing primarily in a diversified group of mutual funds within the same group of investment companies that invest primarily in fixed income and equity securities.
The investment objective of the Investor Growth Fund is to seek long-term capital appreciation by investing primarily in a diversified group of mutual funds within the same group of investment companies that invest primarily in equity securities.
The investment objective of the Investor Growth & Income Fund is to seek long-term capital appreciation and growth of income by investing primarily in a diversified group of mutual funds within the same group of investment companies that invest primarily in equity securities.
Class A Shares generally provide for a front-end sales charge while Class C Shares provide for a contingent deferred sales charge (“CDSC”). No sales charges are assessed with respect to Select Class Shares. All classes of shares have equal rights as to earnings, assets and voting privileges, except that each class may bear different transfer agency, sub-transfer agency, distribution and shareholder servicing fees and each class has exclusive voting rights with respect to its distribution plan and shareholder servicing agreements. Certain Class A Shares, for which front-end sales charges have been waived, may be subject to a CDSC as described in the Funds’ prospectus.
J.P. Morgan Investment Management Inc. (“JPMIM”) an indirect, wholly-owned subsidiary of JPMorgan Chase & Co. (“JPMorgan”) acts as Adviser (the “Adviser”) and Administrator (the “Administrator”) to the Funds.
2. Significant Accounting Policies
The following is a summary of significant accounting policies followed by the Funds in the preparation of their financial statements. The Funds are investment companies and, accordingly, follow the investment company accounting and reporting guidance of the Financial Accounting Standards Board Accounting Standards Codification Topic 946 — Investment Companies, which is part of U.S. generally accepted accounting principles (“GAAP”). The preparation of financial statements in conformity with GAAP requires management to make estimates and assumptions that affect the reported amounts of assets and liabilities and disclosure of contingent assets and liabilities at the date of the financial statements and the reported amounts of increases and decreases in net assets from operations during the reporting period. Actual results could differ from those estimates.
A. Valuation of Investments — The valuation of investments is in accordance with GAAP and the Funds’ valuation policies set forth by and under the supervision and responsibility of the Board of Trustees (the “Board”), which established the following approach to valuation, as described more fully below: (i) investments for which market quotations are readily available shall be valued at such unadjusted quoted prices and (ii) all other investments for which market quotations are not readily available shall be valued at their fair value as determined in good faith by the Board.
The Administrator has established the J.P. Morgan Asset Management Americas Valuation Committee (“AVC”) to assist the Board with the oversight and monitoring of the valuation of the Funds’ investments. The Administrator implements the valuation policies of the Funds’ investments, as directed by the Board. The AVC oversees and carries out the policies for the valuation of investments held in the Funds. This includes monitoring the appropriateness of fair values based on results of ongoing valuation oversight, including but not limited to consideration of macro or security specific events, market events and pricing vendor and broker due diligence. The Administrator is responsible for discussing and assessing the potential impacts to the fair values on an ongoing basis, and at least on a quarterly basis with the AVC and the Board.
Investments in open-end investment companies (the “Underlying Funds”) are valued at each Underlying Fund’s net asset value per share (“NAV”) as of the report date.
Valuations reflected in this report are as of the report date. As a result, changes in valuation due to market events and/or issuer related events after the report date and prior to issuance of the report are not reflected herein.
The various inputs that are used in determining the valuation of the Funds’ investments are summarized into the three broad levels listed below.
| • | | Level 1 — Unadjusted inputs using quoted prices in active markets for identical investments. |
| • | | Level 2 — Other significant observable inputs including, but not limited to, quoted prices for similar investments, inputs other than quoted prices that are observable for investments (such as interest rates, prepayment speeds, credit risk, etc.) or other market corroborated inputs. |
| | | | | | |
| | | |
| 30 | | | | J.P. MORGAN INVESTOR FUNDS | | DECEMBER 31, 2016 |
| • | | Level 3 — Significant inputs based on the best information available in the circumstances, to the extent observable inputs are not available (including the Funds’ assumptions in determining the fair value of investments). |
A financial instrument’s level within the fair value hierarchy is based on the lowest level of any input, both individually and in the aggregate, that is significant to the fair value measurement. The inputs or methodology used for valuing instruments are not necessarily an indication of the risk associated with investing in those instruments.
The following table represents each valuation input as presented on the Schedules of Portfolio Investments (“SOIs”) (amounts in thousands):
| | | | | | | | | | | | | | | | |
| | | Level 1
Quoted prices | | | Level 2
Other significant
observable inputs | | | Level 3
Significant
unobservable inputs | | | Total | |
Investor Balanced Fund Total Investments in Securities (a) | | $ | 5,323,639 | | | $ | — | | | $ | — | | | $ | 5,323,639 | |
| | | | | | | | | | | | | | | | |
Investor Conservative Growth Fund | | | | | | | | | | | | | | | | |
Total Investments in Securities (a) | | $ | 4,128,806 | | | $ | — | | | $ | — | | | $ | 4,128,806 | |
| | | | | | | | | | | | | | | | |
Investor Growth | | | | | | | | | | | | | | | | |
Total Investments in Securities (a) | | $ | 2,544,815 | | | $ | — | | | $ | — | | | $ | 2,544,815 | |
| | | | | | | | | | | | | | | | |
Investor Growth & Income Fund | | | | | | | | | | | | | | | | |
Total Investments in Securities (a) | | $ | 3,127,524 | | | $ | — | | | $ | — | | | $ | 3,127,524 | |
| | | | | | | | | | | | | | | | |
| (a) | All portfolio holdings designated as level 1 are disclosed individually on the SOIs. Please refer to the SOIs for asset class specifics of portfolio holdings. |
There were no transfers among any levels during the six months ended December 31, 2016.
B. Investment Transactions with Affiliates — The Funds invested in Underlying Funds advised by Adviser. An issuer which is under common control with a fund may be considered an affiliate. For the purposes of the financial statements, the Funds assume the issuers listed in the table below to be affiliated issuers. Underlying Funds’ distributions may be reinvested into the Underlying Funds. Reinvestment amounts are included in the purchase cost amounts in the table below. Included in the purchases and sales amounts in the table below are exchanges between certain share classes of the Underlying Funds. Such exchanges are not treated as purchases and sales for the purpose of recognizing realized gains (losses) or portfolio turnover. Included in the realized gain (loss) amounts in the tables below are distributions of realized capital gains, if any, received from the Underlying Funds (amounts in thousands).
| | | | | | | | | | | | | | | | | | | | | | | | | | | | |
| | | | | | For the six months ended December 31, 2016 | | | | | | | |
| Affiliate | | Value at
June 30,
2016 | | | Purchase
Cost | | | Sales
Proceeds | | | Realized
Gain/(Loss) | | | Dividend
Income | | | Shares at
December 31,
2016 | | | Value at
December 31,
2016 | |
Investor Balanced Fund | | | | | | | | | | | | | | | | | | | | | | | | | | | | |
JPMorgan Commodities Strategy Fund, Class R6 Shares | | $ | 6,200 | | | $ | — | | | $ | — | | | $ | — | | | $ | — | | | | 667 | | | $ | 6,127 | |
JPMorgan Core Bond Fund, Class R6 Shares | | | 938,847 | | | | 29,610 | | | | 5,412 | | | | 3,417 | | | | 12,694 | | | | 80,254 | | | | 922,118 | |
JPMorgan Core Plus Bond Fund, Class R6 Shares | | | 546,164 | | | | 7,283 | | | | 10,629 | | | | (102 | ) | | | 7,283 | | | | 64,699 | | | | 527,945 | |
JPMorgan Dynamic Growth Fund, Class R5 Shares | | | 110,509 | | | | 1,323 | | | | 8,242 | | | | 2,095 | | | | — | | | | 4,150 | | | | 111,000 | |
JPMorgan Emerging Economies Fund, Class R6 Shares | | | 54,574 | | | | 914 | | | | 1,637 | | | | (225 | ) | | | 914 | | | | 5,056 | | | | 56,218 | |
JPMorgan Emerging Markets Debt Fund, Class R6 Shares | | | 56,669 | | | | 1,561 | | | | 2,726 | | | | 35 | | | | 1,561 | | | | 6,779 | | | | 53,823 | |
JPMorgan Emerging Markets Equity Fund, Class R6 Shares | | | 55,746 | | | | 491 | | | | 2,183 | | | | 9 | | | | 491 | | | | 2,630 | | | | 55,405 | |
JPMorgan Equity Income Fund, Class R6 Shares | | | 87,879 | | | | 1,587 | | | | 1,651 | | | | 676 | | | | 1,035 | | | | 6,173 | | | | 93,766 | |
JPMorgan Floating Rate Income Fund, Class R6 Shares | | | 180,386 | | | | 4,111 | | | | 13,514 | | | | (1,121 | ) | | | 4,111 | | | | 18,537 | | | | 175,174 | |
JPMorgan Global Research Enhanced Index Fund, Select Class Shares | | | 176,802 | | | | 4,038 | | | | 3,842 | | | | 155 | | | | 4,038 | | | | 9,920 | | | | 185,703 | |
JPMorgan Government Bond Fund, Select Class Shares | | | 12,611 | | | | 25 | | | | 11,862 | | | | — | | | | 25 | | | | — | | | | — | |
JPMorgan Government Bond Fund, Class R6 Shares | | | — | | | | 12,027 | | | | — | | | | 43 | | | | 121 | | | | 1,166 | | | | 12,234 | |
JPMorgan High Yield Fund, Class R6 Shares | | | 271,608 | | | | 7,436 | | | | 32,590 | | | | (2,153 | ) | | | 7,436 | | | | 34,668 | | | | 254,460 | |
JPMorgan Inflation Managed Bond Fund, Class R6 Shares | | | 79,493 | | | | 802 | | | | — | | | | — | | | | 802 | | | | 7,758 | | | | 79,754 | |
JPMorgan International Equity Fund, Class R6 Shares | | | 91,267 | | | | 467 | | | | 12,029 | | | | (1,064 | ) | | | 467 | | | | 5,922 | | | | 85,040 | |
JPMorgan International Research Enhanced Equity Fund, Select Class Shares | | | 259,490 | | | | 6,852 | | | | — | | | | — | | | | 6,852 | | | | 17,760 | | | | 278,294 | |
| | | | | | | | |
| | | |
| DECEMBER 31, 2016 | | J.P. MORGAN INVESTOR FUNDS | | | | | 31 | |
NOTES TO FINANCIAL STATEMENTS
AS OF DECEMBER 31, 2016 (Unaudited) (continued)
| | | | | | | | | | | | | | | | | | | | | | | | | | | | |
| | | | | | For the six months ended December 31, 2016 | | | | | | | |
| Affiliate | | Value at
June 30,
2016 | | | Purchase
Cost | | | Sales
Proceeds | | | Realized
Gain/(Loss) | | | Dividend
Income | | | Shares at
December 31,
2016 | | | Value at
December 31,
2016 | |
Investor Balanced Fund (continued) | |
JPMorgan Intrepid America Fund, Class R6 Shares | | $ | 309,701 | | | $ | 13,069 | | | $ | 11,349 | | | $ | 12,192 | | | $ | 4,512 | | | | 8,887 | | | $ | 324,720 | |
JPMorgan Intrepid European Fund, Class L Shares* | | | 100,729 | | | | 2,542 | | | | — | | | | — | | | | 2,542 | | | | 4,715 | | | | 106,704 | |
JPMorgan Intrepid Growth Fund, Class R6 Shares | | | 160,300 | | | | 1,904 | | | | 2,740 | | | | 1,435 | | | | 1,904 | | | | 3,936 | | | | 167,923 | |
JPMorgan Intrepid Mid Cap Fund, Class R6 Shares | | | 122,104 | | | | 754 | | | | — | | | | 23 | | | | 730 | | | | 6,014 | | | | 131,649 | |
JPMorgan Large Cap Growth Fund, Class R6 Shares | | | 57,760 | | | | 5,153 | | | | 2,740 | | | | 5,130 | | | | — | | | | 1,798 | | | | 58,175 | |
JPMorgan Large Cap Value Fund, Class R6 Shares | | | 133,167 | | | | 6,835 | | | | 26,990 | | | | 11,519 | | | | 1,040 | | | | 9,197 | | | | 133,085 | |
JPMorgan Latin America Fund, Class R6 Shares | | | 17,757 | | | | 238 | | | | 8,128 | | | | (2,853 | ) | | | 238 | | | | 819 | | | | 10,119 | |
JPMorgan Limited Duration Bond Fund, Class R6 Shares | | | 216,563 | | | | 1,445 | | | | 2,657 | | | | (3 | ) | | | 1,444 | | | | 21,471 | | | | 214,496 | |
JPMorgan Liquid Assets Money Market Fund, Institutional Class Shares | | | 43,539 | | | | 67,642 | | | | 111,181 | | | | — | | | | 21 | | | | — | | | | — | |
JPMorgan Market Expansion Enhanced Index Fund, Select Class Shares | | | 207,074 | | | | 19,340 | | | | 45,399 | | | | 15,551 | | | | 1,492 | | | | 17,066 | | | | 191,477 | |
JPMorgan Mid Cap Growth Fund, Class R6 Shares | | | 4,612 | | | | 2 | | | | — | | | | 2 | | | | — | | | | 172 | | | | 4,786 | |
JPMorgan Multi-Cap Market Neutral Fund, Select Class Shares | | | 68,256 | | | | — | | | | 3,234 | | | | 96 | | | | — | | | | 6,422 | | | | 66,146 | |
JPMorgan Research Market Neutral Fund, Class L Shares* | | | 85,390 | | | | — | | | | 11,433 | | | | (876 | ) | | | — | | | | 5,165 | | | | 75,713 | |
JPMorgan Small Cap Value Fund, Class R6 Shares | | | 18,771 | | | | 153 | | | | — | | | | 14 | | | | 139 | | | | 727 | | | | 22,996 | |
JPMorgan Strategic Income Opportunities Fund, Class R5 Shares | | | 88,278 | | | | 2,192 | | | | — | | | | — | | | | 2,192 | | | | 7,967 | | | | 92,420 | |
JPMorgan Systematic Alpha Fund, Class R6 Shares | | | 89,078 | | | | 381 | | | | — | | | | 170 | | | | 211 | | | | 5,983 | | | | 92,080 | |
JPMorgan U.S. Dynamic Plus Fund, Select Class Shares | | | 41,714 | | | | — | | | | 43,857 | | | | 12,793 | | | | — | | | | — | | | | — | |
JPMorgan U.S. Equity Fund, Class R6 Shares | | | 432,819 | | | | 19,473 | | | | 12,559 | | | | 17,362 | | | | 3,144 | | | | 31,769 | | | | 464,463 | |
JPMorgan U.S. Government Money Market Fund, Institutional Class Shares | | | — | | | | 242,033 | | | | 191,507 | | | | — | | | | 60 | | | | 50,526 | | | | 50,526 | |
JPMorgan U.S. Large Cap Core Plus Fund, Class R5 Shares | | | 165,163 | | | | 5,966 | | | | 74,053 | | | | 28,033 | | | | 638 | | | | 3,863 | | | | 109,006 | |
JPMorgan Unconstrained Debt Fund, Class R6 Shares | | | 19,002 | | | | 502 | | | | — | | | | — | | | | 502 | | | | 1,970 | | | | 19,347 | |
JPMorgan Value Advantage Fund, Class L Shares* | | | 93,526 | | | | — | | | | 76,885 | | | | — | | | | — | | | | — | | | | — | |
JPMorgan Value Advantage Fund, Class R6 Shares | | | — | | | | 78,233 | | | | 15,054 | | | | 1,812 | | | | 1,349 | | | | 2,817 | | | | 90,747 | |
| | | | | | | | | | | | | | | | | | | | | | | | | | | | |
Total | | $ | 5,403,548 | | | | | | | | | | | $ | 104,165 | | | $ | 69,988 | | | | | | | $ | 5,323,639 | |
| | | | | | | | | | | | | | | | | | | | | | | | | | | | |
| | | | |
| | | | | | For the six months ended December 31, 2016 | | | | | | | |
| Affiliate | | Value at
June 30,
2016 | | | Purchase
Cost | | | Sales
Proceeds | | | Realized
Gain/(Loss) | | | Dividend
Income | | | Shares at
December 31,
2016 | | | Value at
December 31,
2016 | |
Investor Conservative Growth Fund | | | | | | | | | | | | | | | | | | | | | | | | | | | | |
JPMorgan Commodities Strategy Fund, Class R6 Shares | | $ | 5,157 | | | $ | — | | | $ | — | | | $ | — | | | $ | — | | | | 555 | | | $ | 5,096 | |
JPMorgan Core Bond Fund, Class R6 Shares | | | 1,153,962 | | | | 19,544 | | | | 15,033 | | | | 4,312 | | | | 15,394 | | | | 96,502 | | | | 1,108,810 | |
JPMorgan Core Plus Bond Fund, Class R6 Shares | | | 562,340 | | | | 7,517 | | | | 9,738 | | | | (132 | ) | | | 7,521 | | | | 66,753 | | | | 544,701 | |
JPMorgan Dynamic Growth Fund, Class R5 Shares | | | 46,874 | | | | 571 | | | | 2,604 | | | | 864 | | | | — | | | | 1,795 | | | | 48,008 | |
JPMorgan Emerging Economies Fund, Class R6 Shares | | | 24,918 | | | | 415 | | | | 864 | | | | (114 | ) | | | 415 | | | | 2,298 | | | | 25,557 | |
JPMorgan Emerging Markets Debt Fund, Class R6 Shares | | | 40,915 | | | | 1,165 | | | | — | | | | — | | | | 1,165 | | | | 5,133 | | | | 40,758 | |
JPMorgan Emerging Markets Equity Fund, Class R6 Shares | | | 26,155 | | | | 232 | | | | 864 | | | | 11 | | | | 232 | | | | 1,241 | | | | 26,143 | |
JPMorgan Equity Income Fund, Class R6 Shares | | | 70,211 | | | | 1,287 | | | | 2,091 | | | | 637 | | | | 837 | | | | 4,888 | | | | 74,242 | |
JPMorgan Floating Rate Income Fund, Class R6 Shares | | | 164,685 | | | | 3,964 | | | | — | | | | — | | | | 3,964 | | | | 18,265 | | | | 172,601 | |
JPMorgan Global Research Enhanced Index Fund, Select Class Shares | | | 48,469 | | | | 1,130 | | | | — | | | | — | | | | 1,130 | | | | 2,777 | | | | 51,981 | |
JPMorgan Government Bond Fund, Class R6 Shares | | | — | | | | 33,166 | | | | — | | | | 119 | | | | 336 | | | | 3,230 | | | | 33,879 | |
JPMorgan Government Bond Fund, Select Class Shares | | | 34,923 | | | | 70 | | | | 32,711 | | | | — | | | | 70 | | | | — | | | | — | |
JPMorgan High Yield Fund, Class R6 Shares | | | 236,495 | | | | 6,746 | | | | 23,686 | | | | (1,567 | ) | | | 6,746 | | | | 30,854 | | | | 226,465 | |
| | | | | | |
| | | |
| 32 | | | | J.P. MORGAN INVESTOR FUNDS | | DECEMBER 31, 2016 |
| | | | | | | | | | | | | | | | | | | | | | | | | | | | |
| | | | |
| | | | | | For the six months ended December 31, 2016 | | | | | | | |
| Affiliate | | Value at
June 30,
2016 | | | Purchase
Cost | | | Sales
Proceeds | | | Realized
Gain/(Loss) | | | Dividend
Income | | | Shares at
December 31,
2016 | | | Value at
December 31,
2016 | |
Investor Conservative Growth Fund (continued) | | | | | | | | | | | | | | | | | | | | | | | | | | | | |
JPMorgan Inflation Managed Bond Fund, Class R6 Shares | | $ | 99,359 | | | $ | 999 | | | $ | 2,100 | | | $ | (72 | ) | | $ | 999 | | | | 9,492 | | | $ | 97,577 | |
JPMorgan International Equity Fund, Class R6 Shares | | | 42,123 | | | | 217 | | | | 4,331 | | | | (408 | ) | | | 217 | | | | 2,817 | | | | 40,447 | |
JPMorgan International Research Enhanced Equity Fund, Select Class Shares | | | 145,828 | | | | 3,746 | | | | 4,205 | | | | (1,503 | ) | | | 3,746 | | | | 9,709 | | | | 152,142 | |
JPMorgan Intrepid America Fund, Class R6 Shares | | | 182,553 | | | | 7,376 | | | | 14,530 | | | | 10,200 | | | | 2,546 | | | | 5,015 | | | | 183,258 | |
JPMorgan Intrepid European Fund, Class L Shares* | | | 46,091 | | | | 1,163 | | | | — | | | | — | | | | 1,163 | | | | 2,158 | | | | 48,825 | |
JPMorgan Intrepid Growth Fund, Class R6 Shares | | | 101,993 | | | | 1,160 | | | | 6,373 | | | | 2,995 | | | | 1,160 | | | | 2,398 | | | | 102,288 | |
JPMorgan Intrepid Mid Cap Fund, Class R6 Shares | | | 50,538 | | | | 312 | | | | — | | | | 10 | | | | 302 | | | | 2,489 | | | | 54,488 | |
JPMorgan Large Cap Value Fund, Class R6 Shares | | | 19,358 | | | | 1,193 | | | | — | | | | 1,023 | | | | 170 | | | | 1,623 | | | | 23,489 | |
JPMorgan Latin America Fund, Class R6 Shares | | | 11,426 | | | | 162 | | | | 4,749 | | | | (1,931 | ) | | | 162 | | | | 559 | | | | 6,898 | |
JPMorgan Limited Duration Bond Fund, Class R6 Shares | | | 345,089 | | | | 2,301 | | | | 7,577 | | | | (19 | ) | | | 2,301 | | | | 33,879 | | | | 338,450 | |
JPMorgan Liquid Assets Money Market Fund, Institutional Class Shares | | | 38,258 | | | | 51,936 | | | | 90,194 | | | | — | | | | 18 | | | | — | | | | — | |
JPMorgan Market Expansion Enhanced Index Fund, Select Class Shares | | | 60,194 | | | | 6,041 | | | | 6,717 | | | | 5,522 | | | | 452 | | | | 5,567 | | | | 62,466 | |
JPMorgan Mid Cap Growth Fund, Class R6 Shares | | | 38,493 | | | | 17 | | | | — | | | | 17 | | | | — | | | | 1,436 | | | | 39,945 | |
JPMorgan Multi-Cap Market Neutral Fund, Select Class Shares | | | 60,135 | | | | — | | | | 11,990 | | | | 575 | | | | — | | | | 4,770 | | | | 49,135 | |
JPMorgan Research Market Neutral Fund, Class L Shares* | | | 67,488 | | | | — | | | | 14,200 | | | | (989 | ) | | | — | | | | 3,731 | | | | 54,700 | |
JPMorgan Small Cap Value Fund, Class R6 Shares | | | 32,495 | | | | 212 | | | | 9,381 | | | | 315 | | | | 194 | | | | 937 | | | | 29,614 | |
JPMorgan Strategic Income Opportunities Fund, Class R5 Shares | | | 97,157 | | | | 2,246 | | | | 18,217 | | | | (531 | ) | | | 2,246 | | | | 7,185 | | | | 83,351 | |
JPMorgan Systematic Alpha Fund, Class R6 Shares | | | 82,983 | | | | 346 | | | | 2,105 | | | | 153 | | | | 191 | | | | 5,437 | | | | 83,671 | |
JPMorgan U.S. Dynamic Plus Fund, Select Class Shares | | | 20,696 | | | | — | | | | 22,141 | | | | 8,005 | | | | — | | | | — | | | | — | |
JPMorgan U.S. Equity Fund, Class R6 Shares | | | 178,973 | | | | 7,377 | | | | 21,419 | | | | 12,749 | | | | 1,218 | | | | 11,983 | | | | 175,187 | |
JPMorgan U.S. Government Money Market Fund, Institutional Class Shares | | | — | | | | 193,093 | | | | 165,016 | | | | — | | | | 48 | | | | 28,077 | | | | 28,077 | |
JPMorgan U.S. Large Cap Core Plus Fund, Class R5 Shares | | | 69,024 | | | | 2,006 | | | | 41,111 | | | | 16,480 | | | | 219 | | | | 1,253 | | | | 35,373 | |
JPMorgan Unconstrained Debt Fund, Class R6 Shares | | | 17,575 | | | | 465 | | | | — | | | | — | | | | 465 | | | | 1,822 | | | | 17,894 | |
JPMorgan Value Advantage Fund, Class R6 Shares | | | — | | | | 45,735 | | | | 12,668 | | | | 1,303 | | | | 971 | | | | 1,965 | | | | 63,290 | |
JPMorgan Value Advantage Fund, Class L Shares* | | | 67,250 | | | | — | | | | 44,763 | | | | — | | | | — | | | | — | | | | — | |
| | | | | | | | | | | | | | | | | | | | | | | | | | | | |
Total | | $ | 4,290,183 | | | | | | | | | | | $ | 58,024 | | | $ | 56,598 | | | | | | | $ | 4,128,806 | |
| | | | | | | | | | | | | | | | | | | | | | | | | | | | |
| | | | |
| | | | | | For the six months ended December 31, 2016 | | | | | | | |
| Affiliate | | Value at
June 30,
2016 | | | Purchase
Cost | | | Sales
Proceeds | | | Realized
Gain/(Loss) | | | Dividend
Income | | | Shares at
December 31,
2016 | | | Value at
December 31,
2016 | |
Investor Growth Fund | | | | | | | | | | | | | | | | | | | | | | | | | | | | |
JPMorgan Commodities Strategy Fund, Class R6 Shares | | $ | 7,169 | | | $ | — | | | $ | — | | | $ | — | | | $ | — | | | | 771 | | | $ | 7,084 | |
JPMorgan Core Bond Fund, Class R6 Shares | | | 81,438 | | | | 8,304 | | | | — | | | | 322 | | | | 1,131 | | | | 7,494 | | | | 86,111 | |
JPMorgan Core Plus Bond Fund, Class R6 Shares | | | 28,568 | | | | 383 | | | | — | | | | — | | | | 383 | | | | 3,451 | | | | 28,161 | |
JPMorgan Dynamic Growth Fund, Class R5 Shares | | | 24,640 | | | | 295 | | | | 1,892 | | | | 487 | | | | — | | | | 923 | | | | 24,695 | |
JPMorgan Emerging Economies Fund, Class R6 Shares | | | 42,824 | | | | 725 | | | | 754 | | | | (200 | ) | | | 725 | | | | 4,009 | | | | 44,580 | |
JPMorgan Emerging Markets Debt Fund, Class R6 Shares | | | 11,118 | | | | 317 | | | | — | | | | — | | | | 317 | | | | 1,395 | | | | 11,075 | |
JPMorgan Emerging Markets Equity Fund, Class R6 Shares | | | 44,876 | | | | 395 | | | | 1,760 | | | | (103 | ) | | | 395 | | | | 2,115 | | | | 44,554 | |
JPMorgan Equity Income Fund, Class R6 Shares | | | 37,598 | | | | 692 | | | | — | | | | 241 | | | | 451 | | | | 2,690 | | | | 40,865 | |
JPMorgan Floating Rate Income Fund, Class R6 Shares | | | 21,553 | | | | 519 | | | | — | | | | — | | | | 519 | | | | 2,390 | | | | 22,589 | |
| | | | | | | | |
| | | |
| DECEMBER 31, 2016 | | J.P. MORGAN INVESTOR FUNDS | | | | | 33 | |
NOTES TO FINANCIAL STATEMENTS
AS OF DECEMBER 31, 2016 (Unaudited) (continued)
| | | | | | | | | | | | | | | | | | | | | | | | | | | | |
| | | | |
| | | | | | For the six months ended December 31, 2016 | | | | | | | |
| Affiliate | | Value at
June 30,
2016 | | | Purchase
Cost | | | Sales
Proceeds | | | Realized
Gain/(Loss) | | | Dividend
Income | | | Shares at
December 31,
2016 | | | Value at
December 31,
2016 | |
JPMorgan Global Research Enhanced Index Fund, Select Class Shares | | $ | 64,521 | | | $ | 1,503 | | | $ | — | | | $ | — | | | $ | 1,505 | | | | 3,696 | | | $ | 69,196 | |
Investor Growth Fund (continued) | | | | | | | | | | | | | | | | | | | | | | | | | | | | |
JPMorgan High Yield Fund, Class R6 Shares | | | 80,953 | | | | 2,340 | | | | 1,259 | | | | (11 | ) | | | 2,342 | | | | 11,503 | | | | 84,430 | |
JPMorgan Inflation Managed Bond Fund, Class R6 Shares | | | 11,421 | | | | 115 | | | | — | | | | — | | | | 115 | | | | 1,115 | | | | 11,458 | |
JPMorgan International Equity Fund, Class R6 Shares | | | 98,774 | | | | 562 | | | | — | | | | — | | | | 562 | | | | 7,296 | | | | 104,772 | |
JPMorgan International Research Enhanced Equity Fund, Select Class Shares | | | 129,244 | | | | 3,413 | | | | — | | | | — | | | | 3,413 | | | | 8,846 | | | | 138,610 | |
JPMorgan International Unconstrained Equity Fund, Class R6 Shares | | | 51,818 | | | | 1,319 | | | | — | | | | — | | | | 1,319 | | | | 3,175 | | | | 53,819 | |
JPMorgan Intrepid America Fund, Class R6 Shares | | | 266,407 | | | | 11,486 | | | | 3,776 | | | | 7,692 | | | | 3,964 | | | | 7,810 | | | | 285,382 | |
JPMorgan Intrepid European Fund, Class L Shares* | | | 65,631 | | | | 1,656 | | | | — | | | | — | | | | 1,656 | | | | 3,072 | | | | 69,525 | |
JPMorgan Intrepid Growth Fund, Class R6 Shares | | | 124,488 | | | | 1,454 | | | | 4,284 | | | | 2,310 | | | | 1,454 | | | | 3,006 | | | | 128,218 | |
JPMorgan Intrepid Mid Cap Fund, Class R6 Shares | | | 82,866 | | | | 512 | | | | — | | | | 16 | | | | 496 | | | | 4,081 | | | | 89,343 | |
JPMorgan Large Cap Growth Fund, Class R6 Shares | | | 182,188 | | | | 16,554 | | | | 5,368 | | | | 16,471 | | | | — | | | | 5,777 | | | | 186,885 | |
JPMorgan Large Cap Value Fund, Class R6 Shares | | | 233,933 | | | | 13,469 | | | | 32,392 | | | | 11,864 | | | | 1,962 | | | | 17,329 | | | | 250,758 | |
JPMorgan Latin America Fund, Class R6 Shares | | | 10,654 | | | | 153 | | | | 4,295 | | | | (1,685 | ) | | | 153 | | | | 527 | | | | 6,512 | |
JPMorgan Liquid Assets Money Market Fund, Institutional Class Shares | | | 24,355 | | | | 26,089 | | | | 50,444 | | | | — | | | | 10 | | | | — | | | | — | |
JPMorgan Market Expansion Enhanced Index Fund, Select Class Shares | | | 144,700 | | | | 14,490 | | | | 11,691 | | | | 12,301 | | | | 1,099 | | | | 13,714 | | | | 153,873 | |
JPMorgan Mid Cap Growth Fund, Class R6 Shares | | | 30,919 | | | | 14 | | | | — | | | | 14 | | | | — | | | | 1,153 | | | | 32,086 | |
JPMorgan Multi-Cap Market Neutral Fund, Select Class Shares | | | 5,895 | | | | — | | | | — | | | | — | | | | — | | | | 582 | | | | 5,994 | |
JPMorgan Research Market Neutral Fund, Class L Shares* | | | 6,185 | | | | — | | | | 1,769 | | | | (80 | ) | | | — | | | | 309 | | | | 4,528 | |
JPMorgan Small Cap Value Fund, Class R6 Shares | | | 45,661 | | | | 287 | | | | 16,209 | | | | 8,300 | | | | 264 | | | | 1,201 | | | | 37,977 | |
JPMorgan Strategic Income Opportunities Fund, Class R5 Shares | | | 4,771 | | | | 118 | | | | — | | | | — | | | | 118 | | | | 431 | | | | 4,995 | |
JPMorgan Systematic Alpha Fund, Class R6 Shares | | | 21,225 | | | | 91 | | | | — | | | | 41 | | | | 50 | | | | 1,426 | | | | 21,940 | |
JPMorgan U.S. Dynamic Plus Fund, Select Class Shares | | | 21,943 | | | | — | | | | 22,637 | | | | 5,725 | | | | — | | | | — | | | | — | |
JPMorgan U.S. Equity Fund, Class R6 Shares | | | 308,126 | | | | 14,085 | | | | 4,027 | | | | 12,042 | | | | 2,276 | | | | 22,976 | | | | 335,905 | |
JPMorgan U.S. Government Money Market Fund, Institutional Class Shares | | | — | | | | 93,400 | | | | 66,474 | | | | — | | | | 29 | | | | 26,926 | | | | 26,926 | |
JPMorgan U.S. Large Cap Core Plus Fund, Class R5 Shares | | | 87,118 | | | | 3,788 | | | | 15,831 | | | | 7,660 | | | | 413 | | | | 2,865 | | | | 80,860 | |
JPMorgan Unconstrained Debt Fund, Class R6 Shares | | | 4,006 | | | | 106 | | | | — | | | | — | | | | 106 | | | | 415 | | | | 4,079 | |
JPMorgan Value Advantage Fund, Class R6 Shares | | | — | | | | 31,249 | | | | — | | | | — | | | | 699 | | | | 1,460 | | | | 47,030 | |
JPMorgan Value Advantage Fund, Class L Shares* | | | 41,521 | | | | — | | | | 30,550 | | | | — | | | | — | | | | — | | | | — | |
| | | | | | | | | | | | | | | | | | | | | | | | | | | | |
Total | | $ | 2,449,107 | | | | | | | | | | | $ | 83,407 | | | $ | 27,926 | | | | | | | $ | 2,544,815 | |
| | | | | | | | | | | | | | | | | | | | | | | | | | | | |
| | | | |
| | | | | | For the six months ended December 31, 2016 | | | | | | | |
| Affiliate | | Value at
June 30,
2016 | | | Purchase
Cost | | | Sales
Proceeds | | | Realized
Gain/(Loss) | | | Dividend
Income | | | Shares at
December 31,
2016 | | | Value at
December 31,
2016 | |
Investor Growth & Income Fund | | | | | | | | | | | | | | | | | | | | | | | | | | | | |
JPMorgan Commodities Strategy Fund, Class R6 Shares | | $ | 10,475 | | | $ | — | | | $ | — | | | $ | — | | | $ | — | | | | 1,126 | | | $ | 10,351 | |
JPMorgan Core Bond Fund, Class R6 Shares | | | 292,649 | | | | 14,545 | | | | — | | | | 1,100 | | | | 3,993 | | | | 25,615 | | | | 294,314 | |
JPMorgan Core Plus Bond Fund, Class R6 Shares | | | 201,262 | | | | 2,674 | | | | 6,146 | | | | (57 | ) | | | 2,674 | | | | 23,573 | | | | 192,359 | |
JPMorgan Dynamic Growth Fund, Class R5 Shares | | | 44,525 | | | | 503 | | | | 5,952 | | | | 1,278 | | | | — | | | | 1,575 | | | | 42,140 | |
JPMorgan Emerging Economies Fund, Class R6 Shares | | | 46,267 | | | | 725 | | | | 4,476 | | | | (824 | ) | | | 725 | | | | 4,010 | | | | 44,595 | |
JPMorgan Emerging Markets Debt Fund, Class R6 Shares | | | 18,372 | | | | 493 | | | | 1,586 | | | | 33 | | | | 493 | | | | 2,112 | | | | 16,772 | |
| | | | | | |
| | | |
| 34 | | | | J.P. MORGAN INVESTOR FUNDS | | DECEMBER 31, 2016 |
| | | | | | | | | | | | | | | | | | | | | | | | | | | | |
| | | | |
| | | | | | For the six months ended December 31, 2016 | | | | | | | |
| Affiliate | | Value at
June 30,
2016 | | | Purchase
Cost | | | Sales
Proceeds | | | Realized
Gain/(Loss) | | | Dividend
Income | | | Shares at
December 31,
2016 | | | Value at
December 31,
2016 | |
JPMorgan Emerging Markets Equity Fund, Class R6 Shares | | $ | 43,901 | | | $ | 369 | | | $ | 3,835 | | | $ | (60 | ) | | $ | 369 | | | | 1,975 | | | $ | 41,614 | |
JPMorgan Equity Income Fund, Class R6 Shares | | | 51,155 | | | | 918 | | | | 1,281 | | | | 432 | | | | 599 | | | | 3,571 | | | | 54,243 | |
Investor Growth & Income Fund (continued) | | | | | | | | | | | | | | | | | | | | | | | | | | | | |
JPMorgan Floating Rate Income Fund, Class R6 Shares | | | 116,720 | | | | 2,758 | | | | 3,175 | | | | (253 | ) | | | 2,758 | | | | 12,601 | | | | 119,081 | |
JPMorgan Global Research Enhanced Index Fund, Select Class Shares | | | 113,931 | | | | 2,586 | | | | 3,194 | | | | 131 | | | | 2,586 | | | | 6,353 | | | | 118,936 | |
JPMorgan Government Bond Fund, Class R6 Shares | | | — | | | | 11,823 | | | | — | | | | 40 | | | | 112 | | | | 1,075 | | | | 11,279 | |
JPMorgan Government Bond Fund, Select Class Shares | | | 11,627 | | | | 23 | | | | 11,672 | | | | — | | | | 23 | | | | — | | | | — | |
JPMorgan High Yield Fund, Class R6 Shares | | | 153,834 | | | | 4,244 | | | | 17,775 | | | | (883 | ) | | | 4,245 | | | | 19,739 | | | | 144,881 | |
JPMorgan Inflation Managed Bond Fund, Class R6 Shares | | | 40,274 | | | | 406 | | | | — | | | | — | | | | 406 | | | | 3,931 | | | | 40,407 | |
JPMorgan International Equity Fund, Class R6 Shares | | | 103,204 | | | | 473 | | | | 23,355 | | | | (2,549 | ) | | | 473 | | | | 6,023 | | | | 86,488 | |
JPMorgan International Research Enhanced Equity Fund, Select Class Shares | | | 144,143 | | | | 3,806 | | | | — | | | | — | | | | 3,806 | | | | 9,865 | | | | 154,589 | |
JPMorgan International Unconstrained Equity Fund, Class R6 Shares | | | 10,786 | | | | 11,120 | | | | — | | | | — | | | | 526 | | | | 1,268 | | | | 21,487 | |
JPMorgan Intrepid America Fund, Class R6 Shares | | | 298,418 | | | | 12,570 | | | | 11,392 | | | | 11,339 | | | | 4,340 | | | | 8,547 | | | | 312,309 | |
JPMorgan Intrepid European Fund, Class L Shares* | | | 77,853 | | | | 1,965 | | | | — | | | | — | | | | 1,965 | | | | 3,644 | | | | 82,471 | |
JPMorgan Intrepid Growth Fund, Class R6 Shares | | | 94,346 | | | | 1,102 | | | | 3,200 | | | | 1,727 | | | | 1,102 | | | | 2,278 | | | | 97,195 | |
JPMorgan Intrepid Mid Cap Fund, Class R6 Shares | | | 49,102 | | | | 303 | | | | �� | | | | 9 | | | | 294 | | | | 2,418 | | | | 52,941 | |
JPMorgan Large Cap Growth Fund, Class R6 Shares | | | 163,865 | | | | 14,734 | | | | 9,717 | | | | 14,558 | | | | — | | | | 5,046 | | | | 163,223 | |
JPMorgan Large Cap Value Fund, Class R6 Shares | | | 174,743 | | | | 9,462 | | | | 32,822 | | | | 11,458 | | | | 1,410 | | | | 12,344 | | | | 178,617 | |
JPMorgan Latin America Fund, Class R6 Shares | | | 8,737 | | | | 86 | | | | 5,383 | | | | (1,710 | ) | | | 86 | | | | 298 | | | | 3,675 | |
JPMorgan Limited Duration Bond Fund, Class R6 Shares | | | 23,785 | | | | 156 | | | | 1,537 | | | | 1 | | | | 156 | | | | 2,234 | | | | 22,317 | |
JPMorgan Liquid Assets Money Market Fund, Institutional Class Shares | | | 27,170 | | | | 51,338 | | | | 78,508 | | | | — | | | | 12 | | | | — | | | | — | |
JPMorgan Market Expansion Enhanced Index Fund, Select Class Shares | | | 130,847 | | | | 13,400 | | | | 6,281 | | | | 12,319 | | | | 1,011 | | | | 12,836 | | | | 144,019 | |
JPMorgan Mid Cap Growth Fund, Class R6 Shares | | | 27,325 | | | | 12 | | | | — | | | | 12 | | | | — | | | | 1,019 | | | | 28,356 | |
JPMorgan Multi-Cap Market Neutral Fund, Select Class Shares | | | 32,110 | | | | — | | | | 3,131 | | | | 59 | | | | — | | | | 2,860 | | | | 29,456 | |
JPMorgan Research Market Neutral Fund, Class L Shares* | | | 37,009 | | | | — | | | | 6,926 | | | | (484 | ) | | | — | | | | 2,099 | | | | 30,774 | |
JPMorgan Small Cap Value Fund, Class R6 Shares | | | 45,192 | | | | 295 | | | | 15,234 | | | | 2,774 | | | | 270 | | | | 1,230 | | | | 38,908 | |
JPMorgan Strategic Income Opportunities Fund, Class R5 Shares | | | 22,696 | | | | 563 | | | | — | | | | — | | | | 563 | | | | 2,048 | | | | 23,761 | |
JPMorgan Systematic Alpha Fund, Class R6 Shares | | | 45,731 | | | | 195 | | | | — | | | | 87 | | | | 108 | | | | 3,072 | | | | 47,272 | |
JPMorgan U.S. Dynamic Plus Fund, Select Class Shares | | | 29,546 | | | | — | | | | 30,561 | | | | 7,928 | | | | — | | | | — | | | | — | |
JPMorgan U.S. Equity Fund, Class R6 Shares | | | 294,894 | | | | 13,234 | | | | 9,817 | | | | 11,863 | | | | 2,149 | | | | 21,567 | | | | 315,315 | |
JPMorgan U.S. Government Money Market Fund, Institutional Class Shares | | | — | | | | 148,172 | | | | 116,781 | | | | — | | | | 34 | | | | 31,391 | | | | 31,391 | |
JPMorgan U.S. Large Cap Core Plus Fund, Class R5 Shares | | | 91,877 | | | | 3,717 | | | | 35,511 | | | | 13,346 | | | | 391 | | | | 2,357 | | | | 66,523 | |
JPMorgan Unconstrained Debt Fund, Class R6 Shares | | | 11,095 | | | | 293 | | | | — | | | | — | | | | 293 | | | | 1,150 | | | | 11,296 | |
JPMorgan Value Advantage Fund, Class R6 Shares | | | — | | | | 40,790 | | | | 7,846 | | | | 785 | | | | 805 | | | | 1,682 | | | | 54,169 | |
JPMorgan Value Advantage Fund, Class L Shares* | | | 54,967 | | | | — | | | | 39,985 | | | | — | | | | — | | | | — | | | | — | |
| | | | | | | | | | | | | | | | | | | | | | | | | | | | |
Total | | $ | 3,144,433 | | | | | | | | | | | $ | 84,459 | | | $ | 38,777 | | | | | | | $ | 3,127,524 | |
| | | | | | | | | | | | | | | | | | | | | | | | | | | | |
| * | Effective on or about December 1, 2016, Institutional Class Shares were renamed Class L Shares. |
C. Security Transactions and Investment Income — Investment transactions are accounted for on the trade date (the date the order to buy or sell is executed). Securities gains and losses are calculated on a specifically identified cost basis. Distributions of net investment income and realized capital gains from the Underlying Funds are recorded on the ex-dividend date.
| | | | | | | | |
| | | |
| DECEMBER 31, 2016 | | J.P. MORGAN INVESTOR FUNDS | | | | | 35 | |
NOTES TO FINANCIAL STATEMENTS
AS OF DECEMBER 31, 2016 (Unaudited) (continued)
D. Allocation of Income and Expenses — Expenses directly attributable to a fund are charged directly to that fund, while the expenses attributable to more than one fund of the Trust are allocated among the respective funds. In calculating the NAV of each class, investment income, realized and unrealized gains and losses and expenses, other than class specific expenses, are allocated daily to each class of shares based upon the proportion of net assets of each class at the beginning of each day.
Transfer agency fees and sub-transfer agency fees are class-specific expenses. The amount of the transfer agency fees and sub-transfer agency fees charged to each class of the Funds for the six months ended December 31, 2016 are as follows (amounts in thousands):
| | | | | | | | | | | | | | | | |
| | | Class A | | | Class C | | | Select Class | | | Total | |
Investor Balanced Fund | | | | | | | | | | | | | | | | |
Transfer agency fees | | $ | 205 | | | $ | 28 | | | $ | 7 | | | $ | 240 | |
Sub-transfer agency fees | | | 583 | | | | 186 | | | | 18 | | | | 787 | |
Investor Conservative Growth Fund | | | | | | | | | | | | | | | | |
Transfer agency fees | | | 104 | | | | 24 | | | | 8 | | | | 136 | |
Sub-transfer agency fees | | | 345 | | | | 232 | | | | 13 | | | | 590 | |
Investor Growth Fund | | | | | | | | | | | | | | | | |
Transfer agency fees | | | 331 | | | | 25 | | | | 10 | | | | 366 | |
Sub-transfer agency fees | | | 471 | | | | 76 | | | | 10 | | | | 557 | |
Investor Growth & Income Fund | | | | | | | | | | | | | | | | |
Transfer agency fees | | | 266 | | | | 21 | | | | 5 | | | | 292 | |
Sub-transfer agency fees | | | 486 | | | | 89 | | | | 13 | | | | 588 | |
The Funds invest in other J.P. Morgan Funds and, as a result, bear a portion of the expenses incurred by the Underlying Funds. These expenses are not reflected in the expenses shown on the Statements of Operations and are not included in the ratios to average net assets shown on the Financial Highlights. Certain expenses of Underlying Funds are waived as described in Note 3.F.
E. Federal Income Taxes — Each Fund is treated as a separate taxable entity for Federal income tax purposes. Each Fund’s policy is to comply with the provisions of the Internal Revenue Code of 1986, as amended (the “Code”), applicable to regulated investment companies and to distribute to shareholders all of its distributable net investment income and net realized capital gains on investments. Accordingly, no provision for Federal income tax is necessary. Management has reviewed the Funds’ tax positions for all open tax years and has determined that as of December 31, 2016, no liability for income tax is required in the Funds’ financial statements for net unrecognized tax benefits. However, management’s conclusions may be subject to future review based on changes in, or the interpretation of, the accounting standards or tax laws and regulations. Each of the Funds’ Federal tax returns for the prior three fiscal years remains subject to examination by the Internal Revenue Service.
F. Distributions to Shareholders — Distributions from net investment income are generally declared and paid quarterly, except for distributions from the Investor Conservative Growth Fund, for which distributions are generally declared and paid monthly. Distributions are declared separately for each class. No class has preferential dividend rights; differences in per share rates are due to differences in separate class expenses. Net realized capital gains, if any, are distributed by each Fund at least annually. The amount of distributions from net investment income and net realized capital gains is determined in accordance with Federal income tax regulations, which may differ from GAAP. To the extent these “book/tax” differences are permanent in nature (i.e., that they result from other than timing of recognition — “temporary differences”), such amounts are reclassified within the capital accounts based on their Federal tax-basis treatment.
3. Fees and Other Transactions with Affiliates
A. Investment Advisory Fee — Pursuant to an Investment Advisory Agreement, the Adviser supervises the investments of each Fund and for such services is paid a fee. The fee is accrued daily and paid monthly at an annual rate of 0.05% of each Fund’s average daily net assets.
The Adviser waived Investment Advisory fees and/or reimbursed expenses as outlined in Note 3.F.
B. Administration Fee — Pursuant to an Administration Agreement, the Administrator provides certain administration services to the Funds. In consideration of these services, the Administrator receives a fee accrued daily and paid monthly at an annual rate of 0.10% of the first $500 million of the average daily net assets, 0.075% of the average daily net assets between $500 million and $1 billion of such funds and 0.05% of the average daily net assets in excess of $1 billion of such funds. For the six months ended December 31, 2016, the effective annualized rate was 0.06% of each Fund’s average daily net assets, notwithstanding any fee waivers and/or expense reimbursements.
The Administrator waived Administration fees as outlined in Note 3.F.
JPMorgan Chase Bank, N.A. (“JPMCB”), a wholly-owned subsidiary of JPMorgan, serves as the Funds’ sub-administrator (the “Sub-administrator”). For its services as Sub-administrator, JPMCB receives a portion of the fees payable to the Administrator.
C. Distribution Fees — Pursuant to a Distribution Agreement, JPMorgan Distribution Services, Inc. (the “Distributor”), a wholly-owned subsidiary of JPMorgan, serves as the Trust’s principal underwriter and promotes and arranges for the sale of each Fund’s shares.
| | | | | | |
| | | |
| 36 | | | | J.P. MORGAN INVESTOR FUNDS | | DECEMBER 31, 2016 |
The Board has adopted a Distribution Plan (the “Distribution Plan”) for Class A and Class C Shares of the Funds in accordance with Rule 12b-1 under the 1940 Act. Select Class Shares do not charge distribution fees. The Distribution Plan provides that each Fund shall pay distribution fees, including payments to the Distributor, at annual rates of the average daily net assets as shown in the table below:
| | | | | | |
| | | Class A | | Class C | |
| | 0.25% | | | 0.75 | % |
In addition, the Distributor is entitled to receive the front-end sales charges from purchases of Class A Shares and the CDSC from redemptions of Class C Shares and certain Class A Shares for which front-end sales charges have been waived. For the six months ended December 31, 2016, the Distributor retained the following amounts (in thousands):
| | | | | | | | |
| | | Front-End Sales Charge | | | CDSC | |
Investor Balanced Fund | | $ | 446 | | | $ | 2 | |
Investor Conservative Growth Fund | | | 295 | | | | 2 | |
Investor Growth Fund | | | 175 | | | | 1 | |
Investor Growth & Income Fund | | | 203 | | | | 2 | |
D. Shareholder Servicing Fees — The Trust, on behalf of the Funds, has entered into a Shareholder Servicing Agreement with the Distributor under which the Distributor provides certain support services to the shareholders. For performing these services, the Distributor receives a fee that is accrued daily and paid monthly at an annual rate of 0.25% of the Funds’ average daily net assets.
The Distributor has entered into shareholder services contracts with affiliated and unaffiliated financial intermediaries who provide shareholder services and other related services to their clients or customers who invest in the Funds under which the Distributor will pay all or a portion of such fees earned to financial intermediaries for performing such services.
The Distributor waived shareholder servicing fees as outlined in Note 3.F.
E. Custodian and Accounting Fees — JPMCB provides portfolio custody and accounting services to the Funds. For performing these services, the Funds pay JPMCB transaction and asset-based fees that vary according to the number of transactions and positions, plus out-of-pocket expenses. The amounts paid directly to JPMCB by the Funds for custody and accounting services are included in Custodian and accounting fees on the Statements of Operations. Payments to the custodian may be reduced by credits earned by each Fund, based on uninvested cash balances held by the custodian. Such earnings credits, if any, are presented separately on the Statements of Operations.
Interest expense paid to the custodian related to cash overdrafts, if any, is included in Interest expense to affiliates on the Statements of Operations.
F. Waivers and Reimbursements — The Adviser, Administrator and/or Distributor have contractually agreed to waive fees and/or reimburse the Funds to the extent that total annual operating expenses (excluding acquired fund fees and expenses other than certain money market fund fees as described below, dividend and interest expenses related to short sales, interest, taxes, expenses related to litigation and potential litigation and extraordinary expenses) exceed the percentages of the Funds’ respective average daily net assets as shown in the table below:
| | | | | | | | | | | | |
| | | Class A | | | Class C | | | Select Class | |
Investor Balanced Fund | | | 0.52 | % | | | 1.10 | % | | | 0.27 | % |
Investor Conservative Growth Fund | | | 0.52 | | | | 1.10 | | | | 0.27 | |
Investor Growth Fund | | | 0.52 | | | | 1.10 | | | | 0.27 | |
Investor Growth & Income Fund | | | 0.52 | | | | 1.10 | | | | 0.27 | |
The contractual expense limitation percentages are in place until at least October 31, 2017.
The Underlying Funds may impose separate advisory and shareholder servicing fees. To avoid charging a shareholder servicing fee at an effective rate above 0.25% of the Funds’ net assets, the Funds’ Distributor will waive shareholder servicing fees with respect to the Funds in an amount equal to the weighted average pro-rata amount of shareholder servicing fees charged by the Underlying Funds. This waiver may be in addition to any waivers required to meet the Funds’ contractual expense limitations, but will not exceed the Funds’ shareholder servicing fees.
For the six months ended December 31, 2016, the Funds’ service providers waived fees and/or reimbursed expenses for each of the Funds as follows (amounts in thousands). None of these parties expect the Funds to repay any such waived fees and reimbursed expenses in future years.
| | | | | | | | | | | | | | | | |
| | | Contractual Waivers | |
| | | Investment
Advisory | | | Administration | | | Shareholder
Servicing | | | Total | |
Investor Balanced Fund | | $ | 275 | | | $ | 179 | | | $ | 2,812 | | | $ | 3,266 | |
Investor Conservative Growth Fund | | | 336 | | | | 220 | | | | 1,641 | | | | 2,197 | |
Investor Growth Fund | | | 522 | | | | 346 | | | | 1,395 | | | | 2,263 | |
Investor Growth & Income Fund | | | 400 | | | | 264 | | | | 1,773 | | | | 2,437 | |
| | | | | | | | |
| | | |
| DECEMBER 31, 2016 | | J.P. MORGAN INVESTOR FUNDS | | | | | 37 | |
NOTES TO FINANCIAL STATEMENTS
AS OF DECEMBER 31, 2016 (Unaudited) (continued)
Additionally, the Funds may invest in one or more money market funds advised by the Adviser or its affiliates (affiliated money market funds). The Adviser, Administrator and/or Distributor, as shareholder servicing agent, have contractually agreed to waive fees and/or reimburse expenses in an amount sufficient to offset the respective net fees each collects from the affiliated money market fund on the applicable Funds’ investment in such affiliated money market fund.
The amounts of these waivers resulting from investments in these money market funds for the six months ended December 31, 2016 were as follows (amounts in thousands):
| | | | |
Investor Balanced Fund | | $ | 6 | |
Investor Conservative Growth Fund | | | 5 | |
Investor Growth Fund | | | 3 | |
Investor Growth & Income Fund | | | 4 | |
G. Other — Certain officers of the Trust are affiliated with the Adviser, the Administrator and the Distributor. Such officers, with the exception of the Chief Compliance Officer, receive no compensation from the Funds for serving in their respective roles.
The Board appointed a Chief Compliance Officer to the Funds in accordance with Federal securities regulations. Each Fund, along with other affiliated funds, makes reimbursement payments, on a pro-rata basis, to the Administrator for a portion of the fees associated with the Office of the Chief Compliance Officer. Such fees are included in Trustees’ and Chief Compliance Officer’s fees on the Statements of Operations.
The Trust adopted a Trustee Deferred Compensation Plan (the “Plan”) which allows the Independent Trustees to defer the receipt of all or a portion of compensation related to performance of their duties as Trustees. The deferred fees are invested in various J.P. Morgan Funds until distribution in accordance with the Plan.
4. Investment Transactions
During the six months ended December 31, 2016, purchases and sales of investments (excluding short-term investments) were as follows (amounts in thousands):
| | | | | | | | |
| | | Purchases
(excluding U.S.
Government) | | | Sales
(excluding U.S.
Government) | |
Investor Balanced Fund | | $ | 147,961 | | | $ | 354,648 | |
Investor Conservative Growth Fund | | | 81,410 | | | | 258,696 | |
Investor Growth Fund | | | 99,845 | | | | 127,944 | |
Investor Growth & Income Fund | | | 118,688 | | | | 250,136 | |
During the six months ended December 31, 2016, there were no purchases or sales of U.S. Government securities.
5. Federal Income Tax Matters
For Federal income tax purposes, the cost and unrealized appreciation (depreciation) in value of investment securities held at December 31, 2016 were as follows (amounts in thousands):
| | | | | | | | | | | | | | | | |
| | | Aggregate
Cost | | | Gross
Unrealized
Appreciation | | | Gross
Unrealized
Depreciation | | | Net Unrealized
Appreciation
(Depreciation) | |
Investor Balanced Fund | | $ | 4,634,572 | | | $ | 755,705 | | | $ | 66,638 | | | $ | 689,067 | |
Investor Conservative Growth Fund | | | 3,792,271 | | | | 383,792 | | | | 47,257 | | | | 336,535 | |
Investor Growth Fund | | | 1,980,878 | | | | 603,813 | | | | 39,876 | | | | 563,937 | |
Investor Growth & Income Fund | | | 2,556,523 | | | | 618,707 | | | | 47,706 | | | | 571,001 | |
At June 30, 2016, the Funds did not have any net capital loss carryforwards.
6. Borrowings
The Funds rely upon an exemptive order granted by the Securities and Exchange Commission (the “Order”) permitting the establishment and operation of an Interfund Lending Facility (the “Facility”). The Facility allows the Funds to directly lend and borrow money to or from any other fund relying upon the Order at rates beneficial to both the borrowing and lending funds. Advances under the Facility are taken primarily for temporary or emergency purposes, including the meeting of redemption requests that otherwise might require the untimely disposition of securities, and are subject to each Fund’s borrowing restrictions. The Interfund loan rate is determined, as specified in the Order, by averaging the current repurchase agreement rate and the current bank loan rate. The Order was granted to JPMorgan Trust II and may be relied upon by the Funds because the Funds and the series of JPMorgan Trust II are all investment companies in the same “group of investment companies” (as defined in Section 12(d)(1)(G) of the 1940 Act).
The Trust and JPMCB have entered into a financing arrangement. Under this arrangement, JPMCB provides an unsecured, uncommitted credit facility in the aggregate amount of $100 million to certain of the J.P. Morgan Funds, including the Funds. Advances under the arrangement are taken
| | | | | | |
| | | |
| 38 | | | | J.P. MORGAN INVESTOR FUNDS | | DECEMBER 31, 2016 |
primarily for temporary or emergency purposes, including the meeting of redemption requests that otherwise might require the untimely disposition of securities, and are subject to each Fund’s borrowing restrictions. Interest on borrowings is payable at a rate determined by JPMCB at the time of borrowing. This agreement has been extended until November 6, 2017.
The Funds had no borrowings outstanding from another fund or from the unsecured, uncommitted credit facility during the six months ended December 31, 2016.
In addition, effective August 16, 2016, the Trust along with certain other trusts (“Borrowers”) entered into a joint syndicated senior unsecured revolving credit facility totaling $1.5 billion (“Credit Facility”) with various lenders and The Bank of New York Mellon, as administrative agent for the lenders. This Credit Facility provides a source of funds to the Borrowers for temporary and emergency purposes, including the meeting of redemption requests that otherwise might require the untimely disposition of securities. Under the terms of the Credit Facility, a borrowing fund must have a minimum of $25,000,000 in adjusted net asset value and not exceed certain adjusted net asset coverage ratios prior to and during the time in which any borrowings are outstanding. If a fund does not comply with the aforementioned requirements, the fund must remediate within three business days with respect to the $25,000,000 minimum adjusted net asset value or within one business day with respect to certain asset coverage ratios or the administrative agent at the request of, or with the consent of, the lenders may terminate the Credit Facility and declare any outstanding borrowings to be due and payable immediately.
Interest associated with any borrowing under the Credit Facility is charged to the borrowing fund at a rate of interest equal to 1.00% plus the greater of the federal funds effective rate or one month LIBOR. The annual commitment fee to maintain the Credit Facility is 0.15% and is incurred on the unused portion of the Credit Facility and is allocated to all participating funds pro rata based on their respective net assets. The initial term of the Credit Facility is 364 days, unless extended. The Funds did not utilize the Credit Facility during the six months ended December 31, 2016.
7. Risks, Concentrations and Indemnifications
In the normal course of business, the Funds enter into contracts that contain a variety of representations which provide general indemnifications. Each Fund’s maximum exposure under these arrangements is unknown. The amount of exposure would depend on future claims that may be made against each Fund that have not yet occurred. However, based on experience, the Funds expect the risk of loss to be remote.
As of December 31, 2016, the Funds each had one affiliated omnibus accounts, which represented the following percentage of each Fund’s net assets:
| | | | |
| | | % of the Fund | |
Investor Balanced Fund | | | 79.2 | % |
Investor Conservative Growth Fund | | | 86.7 | |
Investor Growth Fund | | | 63.1 | |
Investor Growth & Income Fund | | | 72.9 | |
Significant shareholder transactions by these shareholders may impact the Funds’ performance.
| | | | | | | | |
| | | |
| DECEMBER 31, 2016 | | J.P. MORGAN INVESTOR FUNDS | | | | | 39 | |
NOTES TO FINANCIAL STATEMENTS
AS OF DECEMBER 31, 2016 (Unaudited) (continued)
As of December 31, 2016, the Funds owned, in the aggregate, shares representing more than 10% of the net assets of the following Underlying Funds:
| | | | |
| | | % of Net Assets | |
JPMorgan Multi-Cap Market Neutral Fund | | | 89.3 | % |
JPMorgan Large Cap Value Fund | | | 72.2 | |
JPMorgan Systematic Alpha Fund | | | 68.3 | |
JPMorgan International Unconstrained Equity Fund | | | 68.1 | |
JPMorgan Dynamic Growth Fund | | | 66.3 | |
JPMorgan Market Expansion Enhanced Index Fund | | | 55.5 | |
JPMorgan Research Market Neutral Fund | | | 52.0 | |
JPMorgan Intrepid Growth Fund | | | 51.7 | |
JPMorgan International Research Enhanced Equity Fund | | | 51.2 | |
JPMorgan Latin America Fund | | | 50.9 | |
JPMorgan Limited Duration Bond Fund | | | 47.7 | |
JPMorgan Intrepid European Fund | | | 41.1 | |
JPMorgan Commodities Strategy Fund | | | 32.8 | |
JPMorgan Intrepid Mid Cap Fund | | | 31.3 | |
JPMorgan Intrepid America Fund | | | 28.7 | |
JPMorgan Floating Rate Income Fund | | | 26.2 | |
JPMorgan Inflation Managed Bond Fund | | | 16.4 | |
JPMorgan Core Plus Bond Fund | | | 16.1 | |
JPMorgan Emerging Markets Debt Fund | | | 12.8 | |
JPMorgan U.S. Equity Fund | | | 10.4 | |
Because of the Funds’ investments in Underlying Funds, the Funds indirectly pay a portion of the expenses incurred by the Underlying Funds. As a result, the cost of investing in the Funds may be higher than the cost of investing in a mutual fund that invests directly in individual securities and financial instruments. The Funds are also subject to certain risks related to the Underlying Funds’ investments in securities and financial instruments such as fixed income securities, including high yield, asset-backed and mortgage-related securities, equity securities, foreign and emerging markets securities, commodities and real estate securities. These securities are subject to risks specific to their structure, sector or market.
In addition, the Underlying Funds may use derivative instruments in connection with their individual investment strategies including futures, forward foreign currency exchange contracts, options, swaps and other derivatives, which are also subject to specific risks related to their structure, sector or market and may be riskier than investments in other types of securities. Specific risks and concentrations present in the Underlying Funds are disclosed within their individual financial statements and registration statements, as appropriate.
| | | | | | |
| | | |
| 40 | | | | J.P. MORGAN INVESTOR FUNDS | | DECEMBER 31, 2016 |
SCHEDULE OF SHAREHOLDER EXPENSES
(Unaudited)
Hypothetical $1,000 Investment
As a shareholder of the Funds, you incur two types of costs: (1) transaction costs, including sales charges (loads) on purchase payments and (2) ongoing costs, including investment advisory fees, administration fees, distribution fees and other Fund expenses. The examples below are intended to help you understand your ongoing costs (in dollars) of investing in the Funds (not including expenses of the Underlying Funds) and to compare these ongoing costs with the ongoing costs of investing in other mutual funds. The examples assume that you had a $1,000 investment in each Class at the beginning of the reporting period, July 1, 2016 and continued to hold your shares at the end of the reporting period, December 31, 2016.
Actual Expenses
For each Class of each Fund in the table below, the first line provides information about actual account values and actual expenses. You may use the information in this line, together with the amount you invested, to estimate the expenses that you paid over the period. Simply divide your account value by $1,000 (for example, an $8,600 account value divided by $1,000 = 8.6), then multiply the result by the number in the first line of each Class under the heading entitled “Expenses Paid During the Period” to estimate the expenses you paid on your account during this period.
Hypothetical Example for Comparison Purposes
The second line of each Class in the table below provides information about hypothetical account values and hypothetical expenses based on the Class’ actual expense ratio and an assumed rate of return of 5% per year before expenses, which is not the Class’ actual return. The hypothetical account values and expenses may not be used to estimate the actual ending account balance or expenses you paid for the period. You may use this information to compare the ongoing costs of investing in the Class of the Funds and other funds. To do so, compare this 5% hypothetical example with the 5% hypothetical examples that appear in the shareholder reports of the other funds. Please note that the expenses shown in the table are meant to highlight your ongoing costs only and do not reflect any transaction costs, such as sales charges (loads) or redemption fees, and expenses of the Underlying Funds. Therefore, the second line for each Class in the table is useful in comparing ongoing costs only, and will not help you determine the relative total costs of owning different funds. In addition, if these transaction costs were included, your costs would have been higher. The examples also assume all dividends and distributions have been reinvested.
| | | | | | | | | | | | | | | | |
| | | Beginning
Account Value
July 1, 2016 | | | Ending
Account Value
December 31, 2016 | | | Expenses
Paid During
the Period* | | | Annualized
Expense
Ratio | |
Investor Balanced Fund | | | | | | | | | | | | | | | | |
Class A | | | | | | | | | | | | | | | | |
Actual | | $ | 1,000.00 | | | $ | 1,044.80 | | | $ | 2.68 | | | | 0.52 | % |
Hypothetical | | | 1,000.00 | | | | 1,022.58 | | | | 2.65 | | | | 0.52 | |
Class C | | | | | | | | | | | | | | | | |
Actual | | | 1,000.00 | | | | 1,041.70 | | | | 5.66 | | | | 1.10 | |
Hypothetical | | | 1,000.00 | | | | 1,019.66 | | | | 5.60 | | | | 1.10 | |
Select Class | | | | | | | | | | | | | | | | |
Actual | | | 1,000.00 | | | | 1,046.80 | | | | 1.39 | | | | 0.27 | |
Hypothetical | | | 1,000.00 | | | | 1,023.84 | | | | 1.38 | | | | 0.27 | |
| | | | |
Investor Conservative Growth Fund | | | | | | | | | | | | | | | | |
Class A | | | | | | | | | | | | | | | | |
Actual | | | 1,000.00 | | | | 1,022.60 | | | | 2.65 | | | | 0.52 | |
Hypothetical | | | 1,000.00 | | | | 1,022.58 | | | | 2.65 | | | | 0.52 | |
Class C | | | | | | | | | | | | | | | | |
Actual | | | 1,000.00 | | | | 1,020.40 | | | | 5.60 | | | | 1.10 | |
Hypothetical | | | 1,000.00 | | | | 1,019.66 | | | | 5.60 | | | | 1.10 | |
Select Class | | | | | | | | | | | | | | | | |
Actual | | | 1,000.00 | | | | 1,024.40 | | | | 1.38 | | | | 0.27 | |
Hypothetical | | | 1,000.00 | | | | 1,023.84 | | | | 1.38 | | | | 0.27 | |
| | | | | | | | |
| | | |
| DECEMBER 31, 2016 | | J.P. MORGAN INVESTOR FUNDS | | | | | 41 | |
SCHEDULE OF SHAREHOLDER EXPENSES
(Unaudited) (continued)
Hypothetical $1,000 Investment
| | | | | | | | | | | | | | | | |
| | | Beginning
Account Value
July 1, 2016 | | | Ending
Account Value
December 31, 2016 | | | Expenses
Paid During
the Period* | | | Annualized
Expense
Ratio | |
Investor Growth Fund | | | | | | | | | | | | | | | | |
Class A | | | | | | | | | | | | | | | | |
Actual | | $ | 1,000.00 | | | $ | 1,086.50 | | | $ | 2.73 | | | | 0.52 | % |
Hypothetical | | | 1,000.00 | | | | 1,022.58 | | | | 2.65 | | | | 0.52 | |
Class C | | | | | | | | | | | | | | | | |
Actual | | | 1,000.00 | | | | 1,083.50 | | | | 5.78 | | | | 1.10 | |
Hypothetical | | | 1,000.00 | | | | 1,019.66 | | | | 5.60 | | | | 1.10 | |
Select Class | | | | | | | | | | | | | | | | |
Actual | | | 1,000.00 | | | | 1,087.90 | | | | 1.42 | | | | 0.27 | |
Hypothetical | | | 1,000.00 | | | | 1,023.84 | | | | 1.38 | | | | 0.27 | |
| | | | |
Investor Growth & Income Fund | | | | | | | | | | | | | | | | |
Class A | | | | | | | | | | | | | | | | |
Actual | | | 1,000.00 | | | | 1,065.40 | | | | 2.71 | | | | 0.52 | |
Hypothetical | | | 1,000.00 | | | | 1,022.58 | | | | 2.65 | | | | 0.52 | |
Class C | | | | | | | | | | | | | | | | |
Actual | | | 1,000.00 | | | | 1,062.10 | | | | 5.72 | | | | 1.10 | |
Hypothetical | | | 1,000.00 | | | | 1,019.66 | | | | 5.60 | | | | 1.10 | |
Select Class | | | | | | | | | | | | | | | | |
Actual | | | 1,000.00 | | | | 1,066.40 | | | | 1.41 | | | | 0.27 | |
Hypothetical | | | 1,000.00 | | | | 1,023.84 | | | | 1.38 | | | | 0.27 | |
| * | Expenses are equal to each Class’ respective annualized expense ratio, multiplied by the average account value over the period, multiplied by 184/365 (to reflect the one-half year period). |
| | | | | | |
| | | |
| 42 | | | | J.P. MORGAN INVESTOR FUNDS | | DECEMBER 31, 2016 |
BOARD APPROVAL OF INVESTMENT ADVISORY AGREEMENT
(Unaudited)
The Board of Trustees has established various standing committees composed of Trustees with diverse backgrounds, to which the Board of Trustees has assigned specific subject matter responsibilities to further enhance the effectiveness of the Board’s oversight and decision making. The Board of Trustees and its investment committees (money market and alternative products, equity, and fixed income) meet regularly throughout the year and consider factors that are relevant to their annual consideration of investment advisory agreements at each meeting. They also meet for the specific purpose of considering investment advisory agreement annual renewals. The Board of Trustees held meetings in person in June and August 2016, at which the Trustees considered the continuation of the investment advisory agreement for each of the Funds whose semi-annual report is contained herein (each an “Advisory Agreement” and collectively, the “Advisory Agreements”). At the June meeting, the Board’s investment committees met to review and consider performance, expense and related information concerning the Funds and the underlying J.P. Morgan Funds in which each of the Funds invests (the “Underlying Funds”). Each investment committee reported to the full Board, which then considered the investment committee’s preliminary findings. At the August meeting, the Trustees continued their review and consideration. The Trustees, including a majority of the Trustees who are not “interested persons” (as defined in the 1940 Act) of any party to the Advisory Agreements or any of their affiliates, approved the continuation of each Advisory Agreement on August 17, 2016.
As part of their review of the Advisory Agreements, the Trustees considered and reviewed performance and other information about the Funds and Underlying Funds received from the Adviser. This information includes the Funds’ and Underlying Funds’ performance as compared to the performance of the Funds’ and Underlying Funds’ peers and benchmarks and analyses by the Adviser of the Funds’ and the Underlying Funds’ performance. In addition, the Trustees have engaged an independent management consulting firm (“independent consultant”) to report on the performance of certain J.P. Morgan Funds at each of the Trustees’ regular meetings. The Adviser also periodically provides comparative information regarding the Funds’ and Underlying Funds’ expense ratios and those of their peer groups. In addition, in preparation for the June and August meetings, the Trustees requested, received and evaluated extensive materials from the Adviser, including, with respect to the Funds and/or Underlying Funds, performance and expense information compiled by Broadridge, using data from Lipper Inc., independent providers of investment company data (together, “Broadridge/Lipper”). The Trustees’ independent consultant also provided additional analyses of the performance of the Funds in connection with the Trustees’ review of the Advisory Agreements. Before voting on the proposed Advisory Agreements, the Trustees reviewed the proposed Advisory Agreements with representatives of the
Adviser, counsel to the Trust and independent legal counsel and received a memorandum from independent legal counsel to the Trustees discussing the legal standards for their consideration of the proposed Advisory Agreements. The Trustees also discussed the proposed Advisory Agreements in executive sessions with independent legal counsel at which no representatives of the Adviser were present. Set forth below is a summary of the material factors evaluated by the Trustees in determining whether to approve each Advisory Agreement.
The Trustees considered information provided with respect to the Funds and Underlying Funds over the course of the year. Each Trustee attributed different weights to the various factors and no factor alone was considered determinative. From year to year, the Trustees consider and place emphasis on relevant information in light of changing circumstances in market and economic conditions. The Trustees determined that the compensation to be received by the Adviser from each Fund under the applicable Advisory Agreement was fair and reasonable and that the continuance of the Advisory Agreements was in the best interests of each Fund and its shareholders.
The factors summarized below were considered and discussed by the Trustees in reaching their conclusions:
Nature, Extent and Quality of Services Provided by the Adviser
The Trustees received and considered information regarding the nature, extent and quality of the services provided to each Fund under the Advisory Agreement. The Trustees took into account information furnished throughout the year at Trustee meetings, as well as the materials furnished specifically in connection with this annual review process. The Trustees considered the background and experience of the Adviser’s senior management and the expertise of, and the amount of attention given to each Fund by, investment personnel of the Adviser. In addition, the Trustees reviewed the qualifications, backgrounds and responsibilities of the portfolio management team primarily responsible for the day-to-day management of each Fund and the infrastructure supporting the team. The Trustees also considered information provided by the Adviser and JPMorgan Distribution Services, Inc. (“JPMDS”) about the structure and distribution strategy of each Fund. The Trustees also reviewed information relating to the Adviser’s risk governance model and reports showing the Adviser’s compliance structure and ongoing compliance processes. The Trustees also considered the quality of the administrative services provided by J.P. Morgan Investment Management Inc. in its role as administrator (“JPMIM”).
The Trustees also considered their knowledge of the nature and quality of the services provided by the Adviser and its affiliates to the Funds and Underlying Funds gained from their experience as Trustees of the J.P. Morgan Funds. In addition, they considered the overall reputation and capabilities of the Adviser and its affiliates, the commitment of the Adviser to
| | | | | | | | |
| | | |
| DECEMBER 31, 2016 | | J.P. MORGAN INVESTOR FUNDS | | | | | 43 | |
BOARD APPROVAL OF INVESTMENT ADVISORY AGREEMENT
(Unaudited) (continued)
provide high quality service to the Funds and Underlying Funds, their overall confidence in the Adviser’s integrity and the Adviser’s responsiveness to questions or concerns raised by them, including the Adviser’s willingness to consider and implement organizational and operational changes designed to improve investment results and the services provided to each Fund and Underlying Fund.
Based upon these considerations and other factors, the Trustees concluded that they were satisfied with the nature, extent and quality of the investment advisory services provided to the Funds by the Adviser.
Costs of Services Provided and Profitability to the Adviser and its Affiliates
The Trustees received and considered information regarding the profitability to the Adviser and its affiliates in providing services to the Funds and Underlying Funds. The Trustees reviewed and discussed this data. The Trustees recognized that this data is not audited and represents the Adviser’s determination of its and its affiliates’ revenues from the contractual services provided to the Funds and Underlying Funds, less expenses of providing such services. Expenses include direct and indirect costs and are calculated using an allocation methodology developed by the Adviser. The Trustees also recognized that it is difficult to make comparisons of profitability from fund investment advisory contracts because comparative information is not generally publicly available and is affected by numerous factors, including the structure of the particular adviser, the types of funds it manages, its business mix, numerous assumptions regarding allocations and the fact that publicly-traded fund managers’ operating profits and net income are net of distribution and marketing expenses. Based upon their review, the Trustees concluded that the profitability to the Adviser under each of the Advisory Agreements was not unreasonable in light of the services and benefits provided to each Fund and Underlying Fund.
Fall-Out Benefits
The Trustees reviewed information regarding potential “fallout” or ancillary benefits received by the Adviser and its affiliates as a result of their relationship with the Funds including the benefits received by the Adviser and its affiliates in connection with the Funds’ investments in the Underlying Funds. The Trustees also reviewed the Adviser’s allocation of fund brokerage for the J.P. Morgan Funds complex, including allocations to brokers who provide research to the Adviser.
The Trustees also considered that JPMDS, an affiliate of the Adviser, and JPMIM earn fees from the Funds and/or Underlying Funds for providing shareholder and administrative services, respectively. These fees were shown separately in the profitability analysis presented to the Trustees. The Trustees also considered the payments of Rule 12b-1 fees to JPMDS,
which also acts as the Funds’ distributor and that these fees are in turn generally paid to financial intermediaries that sell the Funds, including financial intermediaries that are affiliates of the Adviser. The Trustees also considered the fees paid to JPMorgan Chase Bank, N.A. (“JPMCB”) for custody and fund accounting and other related services.
Economies of Scale
The Trustees considered the extent to which the Funds may benefit from economies of scale. The Trustees considered that there may not be a direct relationship between economies of scale realized by the Funds and those realized by the Adviser as assets increase. The Trustees noted that the proposed investment advisory fee schedule for each Fund does not contain breakpoints, but that the fees remain competitive with peer funds. The Trustees also considered that the Adviser has implemented fee waivers and expense limitations (“Fee Caps”) which allow each Fund’s shareholders to share potential economies of scale from a Fund’s inception. The Trustees also considered that the Adviser has shared economies of scale by adding or enhancing services to the Funds over time, noting the Adviser’s substantial investments in its business in support of the Funds, including investments in trading systems and technology (including cybersecurity improvements), retention of key talent, additions to analyst and portfolio management teams, and regulatory support enhancements. The Trustees also considered whether it would be appropriate to add advisory fee breakpoints and the Trustees concluded that the current fee structure was reasonable in light of the Fee Caps that the Adviser has in place that serve to limit the overall net expense ratios of each Fund at competitive levels. The Trustees concluded that the Funds’ shareholders received the benefits of potential economies of scale through the Fee Caps and the Adviser’s reinvestment in its operations to serve the Funds and their shareholders.
Independent Written Evaluation of the Funds’ Senior Officer
The Trustees noted that, upon their direction, the Senior Officer for the Funds had prepared an independent written evaluation in order to assist the Trustees in determining the reasonableness of the proposed management fees. In determining whether to continue the Advisory Agreements, the Trustees considered the Senior Officer’s report.
Fees Relative to Adviser’s Other Clients
The Trustees received and considered information about the nature and extent of investment advisory services and fee rates offered to other clients of the Adviser, including institutional separate accounts and/or funds sub-advised by the Adviser, and for investment management styles substantially similar to that of each Fund. The Trustees considered the complexity of investment management for registered mutual funds relative to the Adviser’s other clients and noted differences in the
| | | | | | |
| | | |
| 44 | | | | J.P. MORGAN INVESTOR FUNDS | | DECEMBER 31, 2016 |
BOARD APPROVAL OF INVESTMENT ADVISORY AGREEMENT
(Unaudited) (continued)
regulatory, legal and other risks and responsibilities of providing services to the different clients. The Trustees considered that serving as an adviser to a registered mutual fund involves greater responsibilities and risks than acting as a sub-adviser and observed that sub-advisory fees may be lower than those charged by the Adviser to each Fund. The Trustees also noted that the adviser, not the mutual fund, pays the sub-advisory fee and that many responsibilities related to the advisory function are retained by the primary adviser. The Trustees concluded that the fee rates charged to each Fund in comparison to those charged to the Adviser’s other clients were reasonable.
Investment Performance
The Trustees received and considered absolute and/or relative performance for the Funds in a report prepared by Broadridge/Lipper. The Trustees considered the total return performance information, which included the ranking of the Funds within a performance universe made up of funds with the same Broadridge/Lipper investment classification and objective (the “Universe”), as well as a sub-set of funds within the Universe (the “Peer Group”), by total return for applicable one-, three- and five-year periods. The Trustees reviewed a description of Broadridge/Lipper’s methodology for selecting mutual funds in each Fund’s Peer Group and Universe . The Broadridge/Lipper materials provided to the Trustees highlighted information with respect to certain representative classes to assist the Trustees in their review. As part of this review, the Trustees also reviewed each Fund’s performance against its benchmark and considered the performance information provided for the Funds at regular Board meetings by the Adviser and the Trustees’ independent consultant and also considered the special analysis prepared by the Trustees’ independent consultant. The Broadridge/Lipper performance data noted by the Trustees as part of their review and the determinations made by the Trustees with respect to each Fund’s performance for certain representative classes are summarized below:
The Trustees noted that the Investor Balanced Fund’s performance for Class A shares was in the third, first and first quintiles based upon the Peer Group, and in the second, first and first quintiles based upon the Universe, for the one-, three-, and five-year periods ended December 31, 2015. The Trustees noted that the performance for Select Class shares was in second, first, and first quintiles based upon the Peer Group, and in the second, second, and second quintiles based upon the Universe, for the one-, three-, and five-year periods ended December 31, 2015, respectively. The Trustees discussed the performance and investment strategy of the Fund with the Adviser and reviewed the performance analysis prepared by the independent consultant. Based upon these discussions, and various other factors, the Trustees concluded that the Fund’s performance was reasonable.
The Trustees noted that the Investor Conservative Growth Fund’s performance for Class A shares was in the first, first and fourth quintiles based upon the Peer Group, and in the second, second and third quintiles based upon the Universe for the one-, three-, and five-year periods ended December 31, 2015, respectively. The Trustees noted that the performance for the Select Class shares was in the first, first and second quintiles based upon the Peer Group and in the second, first and second quintiles based upon the Universe for the one-, three-, and five-year periods ended December 31, 2015, respectively. The Trustees discussed the performance and investment strategy of the Fund with the Adviser and reviewed the performance analysis prepared by the independent consultant. Based upon these discussions, and various other factors, the Trustees concluded that the Fund’s performance was reasonable.
The Trustees noted that the Investor Growth Fund’s performance for Class A shares was in the third, first, and first quintiles based upon the Peer Group and the Universe, for each of the one-, three-, and five-year periods ended December 31, 2015, respectively. The Trustees noted that the Investor Growth Fund’s performance for Select shares was in the second, first, and first quintiles based upon the Universe, for each of the one-, three-, and five-year periods ended December 31, 2015, respectively. The Trustees discussed the performance and investment strategy of the Fund with the Adviser and reviewed the performance analysis prepared by the independent consultant. Based upon these discussions, and various other factors, the Trustees concluded that the Fund’s performance was reasonable.
The Trustees noted that the Investor Growth & Income Fund’s performance for Class A shares was in the third, first and first quintiles based upon the Peer Group, and in the third quintile based upon the Universe for each of the one-, three-, and five-year periods ended December 31, 2015, respectively. The Trustees noted that the performance for the Select Class shares was in the third quintile based upon the Peer Group for the one-year period and in the third, second, and second quintiles based upon the Universe for the one-, three-, and five-year periods ended December 31, 2015, respectively. The Trustees discussed the performance and investment strategy of the Fund with the Adviser and reviewed the performance analysis prepared by the independent consultant. Based upon these discussions, and various other factors, the Trustees concluded that the Fund’s performance was reasonable.
Advisory Fees and Expense Ratios
The Trustees considered the contractual advisory fee rate paid by each Fund to the Adviser and compared that rate to the information prepared by Broadridge/Lipper concerning management fee rates paid by other funds in the same Broadridge/Lipper category as each Fund. The Trustees recognized that Broadridge/Lipper reported each Fund’s management fee
| | | | | | | | |
| | | |
| DECEMBER 31, 2016 | | J.P. MORGAN INVESTOR FUNDS | | | | | 45 | |
BOARD APPROVAL OF INVESTMENT ADVISORY AGREEMENT
(Unaudited) (continued)
rate as the combined contractual advisory fee and the administration fee rates. The Trustees also reviewed information about other expenses and the expense ratios for each Fund. The Trustees considered the fee waiver and/or expense reimbursement arrangements currently in place for each Fund and considered the net advisory fee rate after taking into account any waivers and/or reimbursements. The Trustees recognized that it is difficult to make comparisons of advisory fees because there are variations in the services that are included in the fees paid by other funds. The Trustees’ determinations as a result of the review of each Fund’s advisory fees and expense ratios for certain representative classes are summarized below:
The Trustees noted that the Investor Balanced Fund’s net advisory fee and total expenses for Class A shares was in the first and third quintiles based upon the Peer Group and Universe. The Trustees noted that the net advisory fee and total expenses for the Select Class was in the first and third quintiles based upon the Peer Group and in the first and second quintiles based upon the Universe, respectively. After considering the factors identified above, in light of the information, the Trustees concluded that the advisory fee was reasonable and that such fees would be for services provided in addition to, rather than duplicative of, services provided under the advisory contract of the Underlying Funds in which the Fund invests.
The Trustees noted that the Investor Conservative Growth Fund’s net advisory fee and total expenses for Class A shares was in the first and third quintiles, respectively for both Peer Group and Universe. The Trustees noted that the net advisory fee and total expenses for the Select Class was in the first and
second quintiles based upon the Peer group and the Universe, respectively. After considering the factors identified above, in light of the information, the Trustees concluded that the advisory fees were reasonable and that such fees would be for services provided in addition to, rather than duplicative of, services provided under the advisory contract of the Underlying Funds in which the Fund invests.
The Trustees noted that the Investor Growth Fund’s net advisory fee and total expenses for Class A were in the first quintile for the Peer Group and in the first and second quintiles, respectively, for the Universe. The Trustees noted that the net advisory fee and total expenses for the Select Class was in the second and first quintiles, respectively, for the Universe. After considering the factors identified above, in light of the information, the Trustees concluded that the advisory fee was reasonable and that such fees would be for services provided in addition to, rather than duplicative of, services provided under the advisory contract of the Underlying Funds in which the Fund invests.
The Trustees noted that the Investor Growth & Income Fund’s net advisory fee and total expenses for Class A and Select shares was in the first and third quintiles, respectively for the Peer Group, and in the first and second quintiles respectively, for the Universe. After considering the factors identified above, in light of the information, the Trustees concluded that the advisory fees were reasonable and that such fees would be for services provided in addition to, rather than duplicative of, services provided under the advisory contract of the Underlying Funds in which the Fund invests.
| | | | | | |
| | | |
| 46 | | | | J.P. MORGAN INVESTOR FUNDS | | DECEMBER 31, 2016 |
TAX LETTER
(Unaudited)
Certain tax information for the J.P. Morgan Funds is required to be provided to shareholders based upon the Funds’ income and distributions for the taxable year ended June 30, 2016. The information and distributions reported in this letter may differ from the information and taxable distributions reported to the shareholders for the calendar year ending December 31, 2016. The information necessary to complete your income tax returns for the calendar year ending December 31, 2016 will be provided under separate cover.
Foreign Source Income and Foreign Tax Credit Pass Through
For the fiscal year ended June 30, 2016, the Funds elected to pass through to shareholders taxes paid to foreign countries. Gross income and foreign tax expenses were as follows or amounts as finally determined (amounts in thousands):
| | | | | | | | |
| | | Total Foreign
Source Income | | | Total Foreign
Tax Credit | |
Investor Balanced Fund | | $ | 12,700 | | | $ | 1,212 | |
Investor Conservative Growth Fund | | | 6,773 | | | | 627 | |
Investor Growth Fund | | | 8,946 | | | | 901 | |
Investor Growth & Income Fund | | | 9,495 | | | | 951 | |
| | | | | | | | |
| | | |
| DECEMBER 31, 2016 | | J.P. MORGAN INVESTOR FUNDS | | | | | 47 | |
J.P. Morgan Funds are distributed by JPMorgan Distribution Services, Inc., which is an affiliate of JPMorgan Chase & Co. Affiliates of JPMorgan Chase & Co. receive fees for providing various services to the funds.
Contact JPMorgan Distribution Services, Inc. at 1-800-480-4111 for a fund prospectus. You can also visit us at www.jpmorganfunds.com. Investors should carefully consider the investment objectives and risk as well as charges and expenses of the mutual fund before investing. The prospectus contains this and other information about the mutual fund. Read the prospectus carefully before investing.
Investors may obtain information about the Securities Investor Protection Corporation (SIPC), including the SIPC brochure by visiting www.sipc.org or by calling SIPC at 202-371-8300.
Each Fund files a complete schedule of its fund holdings for the first and third quarters of its fiscal year with the SEC on Form N-Q. The Funds’ Forms N-Q are available on the SEC’s website at http://www.sec.gov and may be reviewed and copied at the SEC’s Public Reference Room in Washington, DC. Information on the operation of the SEC’s Public Reference Room may be obtained by calling 1-800-SEC-0330. Shareholders may request the Form N-Q without charge by calling 1-800-480-4111 or by visiting the J.P. Morgan Funds’ website at www.jpmorganfunds.com.
A description of each Fund’s policies and procedures with respect to the disclosure of each Fund’s holdings is available in the prospectus and Statement of Additional Information.
A copy of proxy policies and procedures is available without charge upon request by calling 1-800-480-4111 and on the Funds’ website at www.jpmorganfunds.com. A description of such policies and procedures is on the SEC’s website at www.sec.gov. The Trustees have delegated the authority to vote proxies for securities owned by the Funds to the Adviser. A copy of the Funds’ voting record for the most recent 12-month period ended June 30 is available on the SEC’s website at www.sec.gov or at the Funds’ website at www.jpmorganfunds.com no later than August 31 of each year. The Funds’ proxy voting record will include, among other things, a brief description of the matter voted on for each fund security, and will state how each vote was cast, for example, for or against the proposal.

J.P. Morgan Asset Management is the marketing name for the asset management businesses of JPMorgan Chase & Co. Those businesses include, but are not limited to, J.P. Morgan Investment Management Inc., Security Capital Research & Management Incorporated and J.P. Morgan Alternative Asset Management, Inc.
| | | | |
| | © JPMorgan Chase & Co., 2017. All rights reserved. December 2016. | | SAN-INV-1216 |
Semi-Annual Report
J.P. Morgan Intrepid Funds
December 31, 2016 (Unaudited)
JPMorgan Intrepid Advantage Fund
JPMorgan Intrepid America Fund
JPMorgan Intrepid Growth Fund
JPMorgan Intrepid Mid Cap Fund
JPMorgan Intrepid Value Fund
CONTENTS
Investments in a Fund are not deposits or obligations of, or guaranteed or endorsed by, any bank and are not insured or guaranteed by the FDIC, the Federal Reserve Board or any other government agency. You could lose money if you sell when a Fund’s share price is lower than when you invested.
Past performance is no guarantee of future performance. The general market views expressed in this report are opinions based on market and other conditions through the end of the reporting period and are subject to change without notice. These views are not intended to predict the future performance of a Fund or the securities markets. References to specific securities and their issuers are for illustrative purposes only and are not intended to be, and should not be interpreted as, recommendations to purchase or sell such securities. Such views are not meant as investment advice and may not be relied on as an indication of trading intent on behalf of any Fund.
Prospective investors should refer to the Funds’ prospectus for a discussion of the Funds’ investment objectives, strategies and risks. Call J.P. Morgan Funds Service Center at 1–800–480–4111 for a prospectus containing more complete information about a Fund, including management fees and other expenses. Please read it carefully before investing.
CEO’S LETTER
January 25, 2017 (Unaudited)
Dear Shareholder,
The continued expansion of the U.S. economy through the second half of 2016 helped support U.S. equity prices and spurred the U.S. Federal Reserve (the “Fed”) to raise interest rates in December. During the period, corporate earnings overall showed positive growth and by the end of the year the unemployment rate had reached it lowest levels since 2007.
| | |
 | | “We believe the market performance over the past year has further validated both patience and diversification as fundamental components of a sound investment strategy.” |
Gross domestic product in the U.S. rose by an estimated 3.5% in the third quarter of 2016, surpassing other developed markets. Global oil prices also continued to rise for most of the reporting period and the price of West Texas Intermediate crude reached a 15-month high in November. The Standard & Poor’s 500 Index reached fresh closing highs in July and August and remained buoyant through October.
The November 8th victory of Republican Party presidential candidate Donald Trump surprised many investors and led to brief declines in global equities. However, within 24 hours
global share prices had largely recovered. U.S. equity prices rallied through the end of the year, reaching new highs in December.
Against this backdrop, the Fed raised interest rates by a quarter of a percentage point on December 14th. “Economic growth has picked up since the middle of the year,” said Fed Chairwoman Janet Yellen. “We expect the economy will continue to perform well.”
While the prospect of further interest rate increases put pressure on U.S. bond prices, equities provided investors with positive returns. We believe the market performance over the past year has further validated both patience and diversification as fundamental components of a sound investment strategy.
We look forward to managing your investment needs for years to come. Should you have any questions, please visit www.jpmorganfunds.com or contact the J.P. Morgan Funds Service Center at 1-800-480-4111.
Sincerely yours,

George C.W. Gatch
CEO, Investment Funds Management,
J.P. Morgan Asset Management
| | | | | | | | |
| | | |
| DECEMBER 31, 2016 | | J.P. MORGAN INTREPID FUNDS | | | | | 1 | |
J.P. Morgan Intrepid Funds
MARKET OVERVIEW
SIX MONTHS ENDED DECEMBER 31, 2016 (Unaudited)
U.S. equity investments generally continued to outperform both other developed markets and emerging markets during the second half of 2016. Rebounding in the wake of the U.K.’s vote to exit from the European Union, the S&P 500 reached new closing highs in July and August. Global oil prices continued to rise and reached 15-month highs in November, ahead of the meeting of the Organization of Petroleum Exporting Countries (OPEC). Despite previous failures to agree to limits on oil production, investors correctly anticipated an OPEC agreement at its November 30th meeting.
Meanwhile, the November 8th victory of Republican Party presidential candidate Donald Trump surprised many investors and led to brief declines in global equities. On the day after the election, Japan’s Nikkei Index closed down 5.4% and European equity indexes opened lower. U.S. stock futures indicated a decline of more than 5%, which triggered U.S. market “circuit breakers” in pre-opening hours to prevent further declines. Within hours, share prices in Europe had largely recovered, and the S&P 500 closed with a 1.11% gain on November 9th.
Notably, between the election result in November and the end of the year, the S&P 500 in surpassed 2,200 points for the first time and reached eight new closing highs, while the Dow Industrial in November surpassed 19,000 points and reached 17 new closing highs. In particular, energy, pharmaceutical and financial sector stocks rose amid investor expectations that a Trump administration’s policies would be beneficial for those industries.
In U.S. equity markets, value stocks generally outperformed growth stocks and small-cap and mid-cap stocks outperformed large-cap stocks. By sector, the energy and financials sectors were top performers, while the health care and real estate sectors underperformed other sectors. For the six months ended December 31, 2016, the S&P 500 returned 7.82%.
Intrepid Investment Philosophy and Process
The JPMorgan Behavioral Finance Team employs a philosophy that is rooted in behavioral finance, a field of study that emphasizes the importance of human psychology in financial markets. Behavioral finance examines how investor behavior can be affected by emotional biases and reactions. The field theorizes that inefficiencies arise in the stock market because investors are consistently irrational in making many investment decisions.
The Team aims to capitalize on these market inefficiencies by targeting high quality, attractively valued stocks of companies that it believes have positive momentum characteristics, and looks to sell these stocks when they no longer exhibit these criteria. A disciplined quantitative ranking methodology is utilized to identify attractive stocks in each sector, a process that is combined with qualitative research and value-added trading.
The Intrepid Advantage Fund incorporates environmental, social and corporate governance (ESG) practices into its investment process. The Fund primarily invests in the securities of companies that the Fund’s portfolio managers believe are sustainable leaders that generally approach ESG factors in a thoughtful manner, while also having attractive value, quality and momentum characteristics.
During the reporting period, the Funds were managed and positioned in accordance with these investment philosophies and processes.
| | | | | | |
| | | |
| 2 | | | | J.P. MORGAN INTREPID FUNDS | | DECEMBER 31, 2016 |
JPMorgan Intrepid Advantage Fund(1)
FUND COMMENTARY
SIX MONTHS ENDED DECEMBER 31, 2016 (Unaudited)
| | | | |
| REPORTING PERIOD RETURN: | |
| Fund (Select Class Shares)* | | | 9.38% | |
| Standard & Poor’s 500 Index (2) | | | 7.82% | |
| Russell 3000 Index | | | 8.79% | |
| |
| Net Assets as of 12/31/2016 (In Thousands) | | $ | 17,702 | |
INVESTMENT OBJECTIVE**
The JPMorgan Intrepid Advantage Fund (the “Fund”) seeks to provide long-term capital appreciation.
WHAT WERE THE MAIN DRIVERS OF THE FUND’S PERFORMANCE?
The Fund’s Select Class Shares outperformed the Standard & Poor’s 500 Index (the “Benchmark”) for the six months ended December 31, 2016. The Fund’s security selection in the energy sector and its security selection and underweight position in the consumer staples sector were leading contributors to performance relative to the Benchmark. The Fund’s overweight position in the health care sector and its security selection in the consumer discretionary sector were leading detractors from relative performance.
For the six month reporting period, the Fund also outperformed the Russell 3000 Index, which was the Fund’s primary benchmark until November 1, 2016. The outperformance was largely due to the Fund’s security selection in the information technology and energy sectors and its underweight position in the real estate sector.
Leading individual contributors to performance relative to the Benchmark included the Fund’s overweight positions in Humana Inc. and Citigroup Inc., and its underweight position in Exxon Mobil Corp. Shares of Humana, a health insurer, rose on news of a potential merger with Aetna Inc. Shares of Citigroup, a banking and financial services company, rose amid an improved business environment for financial sectors companies. Shares of Exxon Mobil, an integrated oil and gas company, fell on investor expectations that it would lag behind its competitors on production growth.
Leading individual detractors from relative performance included the Fund’s overweight positions in Gilead Sciences Inc. and Travelers Cos., and its underweight position in UnitedHealth Group Inc. Shares of Gilead Sciences, a drug maker, fell amid declining sales of its Hepatitis C treatments. Shares of Travelers, a property and casualty insurer, fell after the company posted a 23% drop in earnings. Shares of UnitedHealth, a health insurer, rose after the company issued a better-than-expected earnings forecast.
During the reporting period, the Fund experienced a relatively high level of turnover among its securities holdings, which was largely driven by the change in the Fund’s strategy during the period. The turnover had no significant impact on Fund performance during the reporting period.
| | | | | | | | |
| TOP TEN EQUITY HOLDINGS OF THE PORTFOLIO*** | |
| | 1. | | | Apple, Inc. | | | 5.0 | % |
| | 2. | | | Microsoft Corp. | | | 4.9 | |
| | 3. | | | Citigroup, Inc. | | | 3.7 | |
| | 4. | | | Verizon Communications, Inc. | | | 2.6 | |
| | 5. | | | PepsiCo, Inc. | | | 2.5 | |
| | 6. | | | Parker-Hannifin Corp. | | | 2.3 | |
| | 7. | | | Gilead Sciences, Inc. | | | 2.3 | |
| | 8. | | | Humana, Inc. | | | 2.1 | |
| | 9. | | | PNC Financial Services Group, Inc. (The) | |
| 2.1
|
|
| | 10. | | | Bank of America Corp. | | | 2.1 | |
| | | | |
PORTFOLIO COMPOSITION BY SECTOR*** | |
| Information Technology | | | 24.2 | % |
| Health Care | | | 15.1 | |
| Financials | | | 14.7 | |
| Industrials | | | 10.6 | |
| Consumer Discretionary | | | 9.2 | |
| Consumer Staples | | | 8.5 | |
| Energy | | | 6.9 | |
| Telecommunication Services | | | 3.6 | |
| Utilities | | | 3.2 | |
| Materials | | | 1.4 | |
| Real Estate | | | 0.4 | |
| Short-Term Investment | | | 2.2 | |
| * | | The return shown is based on net asset values calculated for shareholder transactions and may differ from the return shown in the financial highlights, which reflects adjustments made to the net asset values in accordance with accounting principles generally accepted in the United States of America. |
| ** | | The adviser seeks to achieve the Fund’s objective. There can be no guarantee it will be achieved. |
| *** | | Percentages indicated are based on total investments as of December 31, 2016. The Fund’s portfolio composition is subject to change. |
| (1) | | On November 1, 2016, the Fund incorporated environmental, social and corporate governance (ESG) practices into its investment process. Under the revised strategy, the Fund will primarily invest in the securities of companies that the Fund’s portfolio managers believe are sustainable leaders that generally approach ESG factors in a thoughtful manner, while also having attractive value, quality and momentum characteristics. |
| (2) | | On November 1, 2016, the Fund adopted the Standard & Poor’s 500 Index as its primary benchmark because the adviser believes that the Benchmark is a more appropriate comparison in light of the Fund’s new investment strategies. |
| | | | | | | | |
| | | |
| DECEMBER 31, 2016 | | J.P. MORGAN INTREPID FUNDS | | | | | 3 | |
JPMorgan Intrepid Advantage Fund
FUND COMMENTARY
SIX MONTHS ENDED DECEMBER 31, 2016 (Unaudited) (continued)
| | | | | | | | | | | | | | | | | | | | |
AVERAGE ANNUAL TOTAL RETURNS AS OF DECEMBER 31, 2016 | |
| | | | | |
| | | INCEPTION DATE OF
CLASS | | | 6 MONTH* | | | 1 YEAR | | | 5 YEAR | | | 10 YEAR | |
CLASS A SHARES | | | February 19, 2005 | | | | | | | | | | | | | | | | | |
With Sales Charge** | | | | | | | 3.50 | % | | | 3.92 | % | | | 13.61 | % | | | 5.25 | % |
Without Sales Charge | | | | | | | 9.24 | | | | 9.67 | | | | 14.84 | | | | 5.82 | |
CLASS C SHARES | | | February 19, 2005 | | | | | | | | | | | | | | | | | |
With CDSC*** | | | | | | | 7.95 | | | | 8.11 | | | | 14.27 | | | | 5.30 | |
Without CDSC | | | | | | | 8.95 | | | | 9.11 | | | | 14.27 | | | | 5.30 | |
SELECT CLASS SHARES | | | February 28, 2003 | | | | 9.38 | | | | 9.94 | | | | 15.12 | | | | 6.09 | |
| ** | | Sales Charge for Class A Shares is 5.25%. |
| *** | | Assumes a 1% CDSC (contingent deferred sales charge) for the 6 month and one year periods and 0% CDSC thereafter. |
TEN YEAR PERFORMANCE (12/31/06 TO 12/31/16)
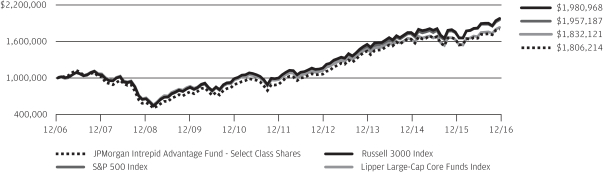
The performance quoted is past performance and is not a guarantee of future results. Mutual funds are subject to certain market risks. Investment returns and principal value of an investment will fluctuate so that an investor’s shares, when redeemed, may be worth more or less than their original cost. Current performance may be higher or lower than the performance data shown. For up-to-date month-end performance information please call 1-800-480-4111.
The graph illustrates comparative performance for $1,000,000 invested in Select Class Shares of the JPMorgan Intrepid Advantage Fund, the S&P 500 Index, the Russell 3000 Index and the Lipper Large-Cap Core Funds Index from December 31, 2006 to December 31, 2016. The performance of the Fund assumes reinvestment of all dividends and capital gain distributions, if any, and does not include a sales charge. The performance of the S&P 500 Index and the Russell 3000 Index does not reflect the deduction of expenses or a sales charge associated with a mutual fund and has been adjusted to reflect reinvestment of all dividends and capital gain distributions of the securities included in the benchmark, if applicable. The performance of the Lipper Large-Cap Core Funds Index includes expenses associated with a mutual fund, such as investment management fees. These expenses are not identical to the expenses incurred by the Fund. The S&P 500 Index is an unmanaged index generally representative of the performance of large companies in the U.S. stock market. The Russell 3000 Index is an unmanaged index which measures the performance of the 3,000 largest U.S. companies based on total market capitalization, which represents approximately 98% of the investable U.S. equity market.
The Lipper Large-Cap Core Funds Index is an index based on the total returns of certain mutual funds within the Fund’s designated category as determined by Lipper, Inc. Investors cannot invest directly in an index.
Select Class Shares have a $1,000,000 minimum initial investment.
Fund performance may reflect the waiver of the Fund’s fees and reimbursement of expenses for certain periods since the inception date. Without these waivers and reimbursements, performance would have been lower. Also, performance shown in this section does not reflect the deduction of taxes that a shareholder would pay on Fund distributions or redemptions of Fund shares.
Effective November 1, 2016, the Fund changed its investment strategies. Although past performance is not necessarily an indication of how the Fund will perform in the future, in view of these changes, the Fund’s performance record prior to this date might be less relevant for investors considering whether to purchase shares of the Fund. Also on November 1, 2016, the Fund’s index changed from the Russell 3000 Index to the S&P 500 Index to reflect the change in the Fund’s investment strategies.
The returns shown are based on net asset values calculated for shareholder transactions and may differ from the returns shown in the financial highlights, which reflect adjustments made to the net asset values in accordance with accounting principles generally accepted in the United States of America.
| | | | | | |
| | | |
| 4 | | | | J.P. MORGAN INTREPID FUNDS | | DECEMBER 31, 2016 |
JPMorgan Intrepid America Fund
FUND COMMENTARY
SIX MONTHS ENDED DECEMBER 31, 2016 (Unaudited)
| | | | |
| REPORTING PERIOD RETURN: | |
| Fund (Select Class Shares)* | | | 8.43% | |
| S&P 500 Index | | | 7.82% | |
| |
| Net Assets as of 12/31/2016 (In Thousands) | | $ | 3,856,430 | |
INVESTMENT OBJECTIVE**
The JPMorgan Intrepid America Fund (the “Fund”) seeks to provide long-term capital growth.
WHAT WERE THE MAIN DRIVERS OF THE FUND’S PERFORMANCE?
The Fund’s Select Class Shares outperformed the Standard & Poor’s 500 Index (the “Benchmark”) for the six months ended December 31, 2016. The Fund’s security selection in the energy and industrials sectors was a leading contributor to performance relative to the Benchmark, while the Fund’s security selection in the consumer discretionary and consumer staples sectors was a leading detractor from relative performance.
Leading individual contributors to the Fund’s relative performance included its overweight positions in Valero Energy Corp., Steel Dynamics Inc. and Delta Air Lines Inc. Shares of Valero, an operator of oil and gas refineries and pipelines, rose after it reported better-than-expected earnings. Shares of Steel Dynamics, a steelmaker and metals recycling company not held in the Benchmark, rose on investor expectations that the company would benefit from the policies of then-President-elect Donald Trump. Shares of Delta Air Lines rose amid investor expectations for improved earnings.
Leading individual detractors from the Fund’s relative performance included its underweight positions in Lowe’s Cos. and Public Storage Inc. and its overweight position in Oracle Corp. Shares of Lowe’s, a home improvement retail chain, rose amid growth in earnings and revenue, as well as increased dividends. Shares of Public Storage, a real estate investment trust, rose after the company posted strong cash flow. Shares of Oracle, a provider of software products, fell on lower-than-expected revenue.
| | | | | | | | |
| TOP TEN EQUITY HOLDINGS OF THE PORTFOLIO*** | |
| | 1. | | | Microsoft Corp. | | | 3.7 | % |
| | 2. | | | Bank of America Corp. | | | 3.0 | |
| | 3. | | | Citigroup, Inc. | | | 2.5 | |
| | 4. | | | eBay, Inc. | | | 2.2 | |
| | 5. | | | Valero Energy Corp. | | | 2.1 | |
| | 6. | | | Baker Hughes, Inc. | | | 2.1 | |
| | 7. | | | Wal-Mart Stores, Inc. | | | 2.1 | |
| | 8. | | | Ross Stores, Inc. | | | 2.0 | |
| | 9. | | | Applied Materials, Inc. | | | 2.0 | |
| | 10. | | | Verizon Communications, Inc. | | | 2.0 | |
| | | | |
PORTFOLIO COMPOSITION BY SECTOR*** | |
| Information Technology | | | 22.5 | % |
| Financials | | | 14.8 | |
| Health Care | | | 13.8 | |
| Consumer Discretionary | | | 11.0 | |
| Industrials | | | 8.9 | |
| Consumer Staples | | | 8.5 | |
| Energy | | | 7.7 | |
| Utilities | | | 3.4 | |
| Telecommunication Services | | | 3.2 | |
| Materials | | | 2.4 | |
| Real Estate | | | 2.3 | |
| Short-Term Investment | | | 1.5 | |
| * | | The return shown is based on net asset values calculated for shareholder transactions and may differ from the return shown in the financial highlights, which reflects adjustments made to the net asset values in accordance with accounting principles generally accepted in the United States of America. |
| ** | | The adviser seeks to achieve the Fund’s objective. There can be no guarantee it will be achieved. |
| *** | | Percentages indicated are based on total investments as of December 31, 2016. The Fund’s portfolio composition is subject to change. |
| | | | | | | | |
| | | |
| DECEMBER 31, 2016 | | J.P. MORGAN INTREPID FUNDS | | | | | 5 | |
JPMorgan Intrepid America Fund
FUND COMMENTARY
SIX MONTHS ENDED DECEMBER 31, 2016 (Unaudited) (continued)
| | | | | | | | | | | | | | | | | | |
AVERAGE ANNUAL TOTAL RETURNS AS OF DECEMBER 31, 2016 | |
| | | | | |
| | | INCEPTION DATE OF
CLASS | | 6 MONTH* | | | 1 YEAR | | | 5 YEAR | | | 10 YEAR | |
CLASS A SHARES | | February 19, 2005 | | | | | | | | | | | | | | | | |
With Sales Charge** | | | | | 2.57 | % | | | 2.01 | % | | | 12.98 | % | | | 5.44 | % |
Without Sales Charge | | | | | 8.27 | | | | 7.68 | | | | 14.20 | | | | 6.01 | |
CLASS C SHARES | | February 19, 2005 | | | | | | | | | | | | | | | | |
With CDSC*** | | | | | 7.02 | | | | 6.17 | | | | 13.65 | | | | 5.49 | |
Without CDSC | | | | | 8.02 | | | | 7.17 | | | | 13.65 | | | | 5.49 | |
CLASS R2 SHARES | | November 3, 2008 | | | 8.15 | | | | 7.45 | | | | 13.93 | | | | 5.80 | |
CLASS R5 SHARES | | May 15, 2006 | | | 8.50 | | | | 8.17 | | | | 14.73 | | | | 6.50 | |
CLASS R6 SHARES | | November 2, 2015 | | | 8.59 | | | | 8.31 | | | | 14.76 | | | | 6.51 | |
SELECT CLASS SHARES | | February 28, 2003 | | | 8.43 | | | | 8.00 | | | | 14.51 | | | | 6.29 | |
| ** | | Sales Charge for Class A Shares is 5.25%. |
| *** | | Assumes a 1% CDSC (contingent deferred sales charge) for the 6 month and one year periods and 0% CDSC thereafter. |
TEN YEAR PERFORMANCE (12/31/06 TO 12/31/16)
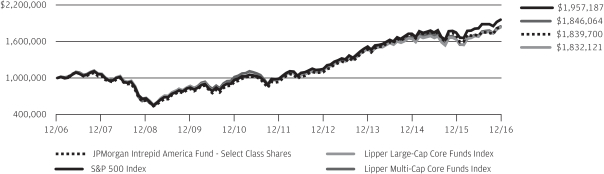
The performance quoted is past performance and is not a guarantee of future results. Mutual funds are subject to certain market risks. Investment returns and principal value of an investment will fluctuate so that an investor’s shares, when redeemed, may be worth more or less than their original cost. Current performance may be higher or lower than the performance data shown. For up-to-date month-end performance information please call 1-800-480-4111.
Returns for Class R2 Shares prior to their inception date are based on the performance of Class A Shares. The actual returns for Class R2 Shares would have been lower than those shown because Class R2 Shares have higher expenses than Class A Shares.
Returns for Class R6 Shares prior to their inception date are based on the performance of Class R5 Shares. The actual returns for Class R6 Shares would have been different than those shown because Class R6 Shares have different expenses than Class R5 Shares.
The graph illustrates comparative performance for $1,000,000 invested in Select Class Shares of the JPMorgan Intrepid America Fund, the S&P 500 Index, the Lipper Large-Cap Core Funds Index and the Lipper Multi-Cap Core Funds Index from December 31, 2006 to December 31, 2016. The performance of the Fund assumes reinvestment of all dividends and capital gain distributions, if any, and does not include a sales charge. The performance of the S&P 500 Index does not reflect the deduction of expenses or a sales charge associated with a
mutual fund and has been adjusted to reflect reinvestment of all dividends and capital gain distributions of the securities included in the benchmark, if applicable. The performance of the Lipper Large-Cap Core Funds Index and the Lipper Multi-Cap Core Funds Index includes expenses associated with a mutual fund, such as investment management fees. These expenses are not identical to the expenses incurred by the Fund. The S&P 500 Index is an unmanaged index generally representative of the performance of large companies in the U.S. stock market. The Lipper Large-Cap Core Funds Index and the Lipper Multi-Cap Core Funds Index are indexes based on the total returns of certain mutual funds within the Fund’s designated category as determined by Lipper, Inc. Investors cannot invest directly in an index.
Select Class Shares have a $1,000,000 minimum initial investment.
Fund performance may reflect the waiver of the Fund’s fees and reimbursement of expenses for certain periods since the inception date. Without these waivers and reimbursements, performance would have been lower. Also, performance shown in this section does not reflect the deduction of taxes that a shareholder would pay on Fund distributions or redemptions of Fund shares.
The returns shown are based on net asset values calculated for shareholder transactions and may differ from the returns shown in the financial highlights, which reflect adjustments made to the net asset values in accordance with accounting principles generally accepted in the United States of America.
| | | | | | |
| | | |
| 6 | | | | J.P. MORGAN INTREPID FUNDS | | DECEMBER 31, 2016 |
JPMorgan Intrepid Growth Fund
FUND COMMENTARY
SIX MONTHS ENDED DECEMBER 31, 2016 (Unaudited)
| | | | |
| REPORTING PERIOD RETURN: | |
| Fund (Select Class Shares)* | | | 6.39% | |
| Russell 1000 Growth Index | | | 5.64% | |
| |
| Net Assets as of 12/31/2016 (In Thousands) | | $ | 965,520 | |
INVESTMENT OBJECTIVE**
The JPMorgan Intrepid Growth Fund (the “Fund”) seeks to provide long-term capital growth.
WHAT WERE THE MAIN DRIVERS OF THE FUND’S PERFORMANCE?
The Fund’s Select Class Shares outperformed the Russell 1000 Growth Index (the “Benchmark”) for the six months ended December 31, 2016. The Fund’s security selection in the industrials and materials sectors was a leading contributor to performance relative to the Benchmark, while the Fund’s security selection in the consumer discretionary and financials sectors was a leading detractor from relative performance.
Leading individual contributors to relative performance included the Fund’s overweight positions in United Continental Holdings Inc., Steel Dynamics Inc. and WellCare Health Plans Inc. Shares of United Continental Holdings, an airline operator not held in the Benchmark, rose on improved traffic and capacity. Shares of Steel Dynamics, a steelmaker and metals recycling company, and WellCare Health Plans, a managed care provider, rose on investor expectations that both companies would benefit from policies of the incoming administration of U.S. President Donald Trump.
Leading individual detractors from the Fund’s relative performance included its overweight positions in Activision Blizzard Inc. and Gilead Sciences Inc. and its underweight position in Lowe’s Cos. Shares of Activision Blizzard, a video game maker, fell on lower-than-expected holiday season sales. Shares of Gilead Sciences, a drug maker, fell on declining sales for its Hepatitis C treatments. Shares of Lowe’s, a home improvement retail chain, rose amid growth in earnings and revenue, as well as increased dividends.
| | | | | | | | |
| TOP TEN EQUITY HOLDINGS OF THE PORTFOLIO*** | |
| | 1. | | | Microsoft Corp. | | | 4.8 | % |
| | 2. | | | Apple, Inc. | | | 3.7 | |
| | 3. | | | Home Depot, Inc. (The) | | | 3.2 | |
| | 4. | | | Visa, Inc., Class A | | | 2.9 | |
| | 5. | | | Amgen, Inc. | | | 2.8 | |
| | 6. | | | Gilead Sciences, Inc. | | | 2.5 | |
| | 7. | | | eBay, Inc. | | | 2.4 | |
| | 8. | | | Applied Materials, Inc. | | | 2.2 | |
| | 9. | | | Ross Stores, Inc. | | | 2.1 | |
| | 10. | | | McDonald’s Corp. | | | 2.1 | |
| | | | |
PORTFOLIO COMPOSITION BY SECTOR*** | |
| Information Technology | | | 32.6 | % |
| Consumer Discretionary | | | 20.0 | |
| Health Care | | | 15.9 | |
| Industrials | | | 9.5 | |
| Consumer Staples | | | 8.8 | |
| Materials | | | 3.2 | |
| Real Estate | | | 2.6 | |
| Financials | | | 1.8 | |
| Telecommunication Services | | | 1.7 | |
| Others (each less than 1.0%) | | | 1.2 | |
| Short-Term Investment | | | 2.7 | |
| * | | The return shown is based on net asset values calculated for shareholder transactions and may differ from the return shown in the financial highlights, which reflects adjustments made to the net asset values in accordance with accounting principles generally accepted in the United States of America. |
| ** | | The adviser seeks to achieve the Fund’s objective. There can be no guarantee it will be achieved. |
| *** | | Percentages indicated are based on total investments as of December 31, 2016. The Fund’s portfolio composition is subject to change. |
| | | | | | | | |
| | | |
| DECEMBER 31, 2016 | | J.P. MORGAN INTREPID FUNDS | | | | | 7 | |
JPMorgan Intrepid Growth Fund
FUND COMMENTARY
SIX MONTHS ENDED DECEMBER 31, 2016 (Unaudited) (continued)
| | | | | | | | | | | | | | | | | | |
AVERAGE ANNUAL TOTAL RETURNS AS OF DECEMBER 31, 2016 | |
| | | | | |
| | | INCEPTION DATE OF
CLASS | | 6 MONTH* | | | 1 YEAR | | | 5 YEAR | | | 10 YEAR | |
CLASS A SHARES | | February 19, 2005 | | | | | | | | | | | | | | | | |
With Sales Charge** | | | | | 0.68 | % | | | (0.07 | )% | | | 12.86 | % | | | 6.74 | % |
Without Sales Charge | | | | | 6.26 | | | | 5.45 | | | | 14.09 | | | | 7.32 | |
CLASS C SHARES | | February 19, 2005 | | | | | | | | | | | | | | | | |
With CDSC*** | | | | | 4.97 | | | | 3.91 | | | | 13.52 | | | | 6.79 | |
Without CDSC | | | | | 5.97 | | | | 4.91 | | | | 13.52 | | | | 6.79 | |
CLASS R2 SHARES | | November 3, 2008 | | | 6.12 | | | | 5.19 | | | | 13.80 | | | | 7.10 | |
CLASS R5 SHARES | | May 15, 2006 | | | 6.48 | | | | 5.91 | | | | 14.60 | | | | 7.80 | |
CLASS R6 SHARES | | November 2, 2015 | | | 6.52 | | | | 5.97 | | | | 14.61 | | | | 7.81 | |
SELECT CLASS SHARES | | February 28, 2003 | | | 6.39 | | | | 5.70 | | | | 14.37 | | | | 7.59 | |
| ** | | Sales Charge for Class A Shares is 5.25%. |
| *** | | Assumes a 1% CDSC (contingent deferred sales charge) for the 6 month and one year periods and 0% CDSC thereafter. |
TEN YEAR PERFORMANCE (12/31/06 TO 12/31/16)
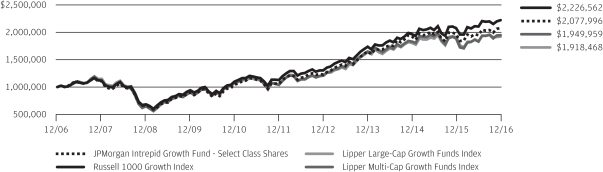
The performance quoted is past performance and is not a guarantee of future results. Mutual funds are subject to certain market risks. Investment returns and principal value of an investment will fluctuate so that an investor’s shares, when redeemed, may be worth more or less than their original cost. Current performance may be higher or lower than the performance data shown. For up-to-date month-end performance information please call 1-800-480-4111.
Returns for Class R2 Shares prior to their inception date are based on the performance of Class A Shares. The actual returns for Class R2 Shares would have been lower than those shown because Class R2 Shares have higher expenses than Class A Shares.
Returns for Class R6 Shares prior to their inception date are based on the performance of Class R5 Shares. The actual returns for Class R6 Shares would have been different than those shown because Class R6 Shares have different expenses than Class R5 Shares.
The graph illustrates comparative performance for $1,000,000 invested in Select Class Shares of the JPMorgan Intrepid Growth Fund, the Russell 1000 Growth Index, the Lipper Large-Cap Growth Funds Index and the Lipper Multi-Cap Growth Funds Index from December 31, 2006 to December 31, 2016. The performance of the Fund assumes reinvestment of all dividends and capital gain distributions, if any, and does not include a sales charge. The performance of the Russell 1000 Growth Index does not reflect the deduction of expenses or a sales
charge associated with a mutual fund and has been adjusted to reflect reinvestment of all dividends and capital gain distributions of the securities included in the benchmark, if applicable. The performance of the Lipper Large-Cap Growth Funds Index and the Lipper Multi-Cap Growth Funds Index includes expenses associated with a mutual fund, such as investment management fees. These expenses are not identical to the expenses incurred by the Fund. The Russell 1000 Growth Index is an unmanaged index which measures the performance of those Russell 1000 companies with higher price-to-book ratios and higher forecasted growth values. The Lipper Large-Cap Growth Funds Index and the Lipper Multi-Cap Growth Funds Index are indexes based on the total returns of certain mutual funds within the Fund’s designated category as determined by Lipper, Inc. Investors cannot invest directly in an index.
Select Class Shares have a $1,000,000 minimum initial investment.
Fund performance may reflect the waiver of the Fund’s fees and reimbursement of expenses for certain periods since the inception date. Without these waivers and reimbursements, performance would have been lower. Also, performance shown in this section does not reflect the deduction of taxes that a shareholder would pay on Fund distributions or redemptions of Fund shares.
The returns shown are based on net asset values calculated for shareholder transactions and may differ from the returns shown in the financial highlights, which reflect adjustments made to the net asset values in accordance with accounting principles generally accepted in the United States of America.
| | | | | | |
| | | |
| 8 | | | | J.P. MORGAN INTREPID FUNDS | | DECEMBER 31, 2016 |
JPMorgan Intrepid Mid Cap Fund
FUND COMMENTARY
SIX MONTHS ENDED DECEMBER 31, 2016 (Unaudited)
| | | | |
| REPORTING PERIOD RETURN: | |
| Fund (Select Class Shares)* | | | 7.74% | |
| Russell Midcap Index | | | 7.87% | |
| |
| Net Assets as of 12/31/2016 (In Thousands) | | $ | 1,049,799 | |
INVESTMENT OBJECTIVE**
The JPMorgan Intrepid Mid Cap Fund (the “Fund”) seeks long-term capital growth by investing primarily in equity securities of companies with intermediate capitalizations.
WHAT WERE THE MAIN DRIVERS OF THE FUND’S PERFORMANCE?
The Fund’s Select Class Shares underperformed the Russell Midcap Index (the “Benchmark”) for the six months ended December 31, 2016. The Fund’s security selection in real estate investment trusts and the consumer staples sector was a leading detractor from performance relative to the Benchmark. The Fund’s security selection in the software & services sector and the materials sector was a leading contributor to relative performance.
Leading individual detractors from relative performance included the Fund’s overweight positions in Tenet Healthcare Co. and D.R. Horton Inc. and its underweight position in CoreCivic Inc. Shares of Tenet Healthcare, an operator of hospitals and outpatient health centers, fell after the company forecast a larger-than-expected loss. Shares of D.R. Horton, a home builder, fell after the company reported lower-than-expected earnings and slowing growth in new orders. Shares of CoreCivic, an operator of prisons and formerly known as Corrections Corp. of America, fell after the U.S. federal government unveiled plans to phase out the use of private prison contracts.
Leading individual contributors to relative performance included the Fund’s overweight positions in Best Buy Inc., NCR Corp. and International Game Technology Inc. Shares of Best Buy, a consumer electronics chain, rose on better-than-expected earnings and sales. Shares of NCR, a maker of automatic teller machines and other transaction technology, rose on an improved business environment for its financial services clients. Shares of International Gaming Technology, a maker of casino gaming devices, rose on better-than-expected earnings.
| | | | | | | | |
| TOP TEN EQUITY HOLDINGS OF THE PORTFOLIO*** | |
| | 1. | | | Equinix, Inc. | | | 2.1 | % |
| | 2. | | | NCR Corp. | | | 2.0 | |
| | 3. | | | Huntington Ingalls Industries, Inc. | | | 1.9 | |
| | 4. | | | Marvell Technology Group Ltd., (Bermuda) | | | 1.9 | |
| | 5. | | | Xerox Corp. | | | 1.8 | |
| | 6. | | | Tyson Foods, Inc., Class A | | | 1.8 | |
| | 7. | | | United Continental Holdings, Inc. | | | 1.7 | |
| | 8. | | | Ingredion, Inc. | | | 1.6 | |
| | 9. | | | Popular, Inc., (Puerto Rico) | | | 1.6 | |
| | 10. | | | Western Digital Corp. | | | 1.6 | |
| | | | |
PORTFOLIO COMPOSITION BY SECTOR*** | |
| Information Technology | | | 16.7 | % |
| Industrials | | | 14.1 | |
| Financials | | | 11.3 | |
| Consumer Discretionary | | | 10.6 | |
| Real Estate | | | 10.0 | |
| Health Care | | | 9.4 | |
| Energy | | | 6.9 | |
| Consumer Staples | | | 6.9 | |
| Utilities | | | 6.1 | |
| Materials | | | 5.5 | |
| Telecommunication Services | | | 0.6 | |
| Short-Term Investment | | | 1.9 | |
| * | | The return shown is based on net asset values calculated for shareholder transactions and may differ from the return shown in the financial highlights, which reflects adjustments made to the net asset values in accordance with accounting principles generally accepted in the United States of America. |
| ** | | The adviser seeks to achieve the Fund’s objective. There can be no guarantee it will be achieved. |
| *** | | Percentages indicated are based on total investments as of December 31, 2016. The Fund’s portfolio composition is subject to change. |
| | | | | | | | |
| | | |
| DECEMBER 31, 2016 | | J.P. MORGAN INTREPID FUNDS | | | | | 9 | |
JPMorgan Intrepid Mid Cap Fund
FUND COMMENTARY
SIX MONTHS ENDED DECEMBER 31, 2016 (Unaudited) (continued)
| | | | | | | | | | | | | | | | | | |
AVERAGE ANNUAL TOTAL RETURNS AS OF DECEMBER 31, 2016 | |
| | | | | |
| | | INCEPTION DATE OF
CLASS | | 6 MONTH* | | | 1 YEAR | | | 5 YEAR | | | 10 YEAR | |
CLASS A SHARES | | May 1, 1992 | | | | | | | | | | | | | | | | |
With Sales Charge** | | | | | 1.87 | % | | | 5.94 | % | | | 13.21 | % | | | 6.24 | % |
Without Sales Charge | | | | | 7.52 | | | | 11.81 | | | | 14.44 | | | | 6.82 | |
CLASS C SHARES | | March 22, 1999 | | | | | | | | | | | | | | | | |
With CDSC*** | | | | | 6.21 | | | | 10.09 | | | | 13.74 | | | | 6.15 | |
Without CDSC | | | | | 7.21 | | | | 11.09 | | | | 13.74 | | | | 6.15 | |
CLASS R3 SHARES | | September 9, 2016 | | | 7.52 | | | | 11.81 | | | | 14.44 | | | | 6.82 | |
CLASS R4 SHARES | | September 9, 2016 | | | 7.69 | | | | 12.07 | | | | 14.73 | | | | 7.08 | |
CLASS R6 SHARES | | November 2, 2015 | | | 7.82 | | | | 12.37 | | | | 14.80 | | | | 7.11 | |
SELECT CLASS SHARES | | June 1, 1991 | | | 7.74 | | | | 12.12 | | | | 14.74 | | | | 7.09 | |
| ** | | Sales Charge for Class A Shares is 5.25%. |
| *** | | Assumes a 1% CDSC (contingent deferred sales charge) for the 6 month and one year periods and 0% CDSC thereafter. |
TEN YEAR PERFORMANCE (12/31/06 TO 12/31/16)
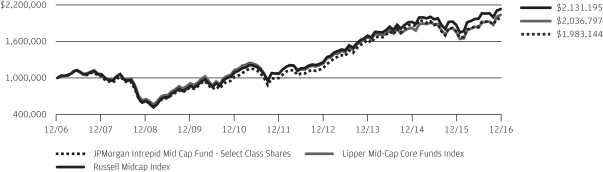
The performance quoted is past performance and is not a guarantee of future results. Mutual funds are subject to certain market risks. Investment returns and principal value of an investment will fluctuate so that an investor’s shares, when redeemed, may be worth more or less than their original cost. Current performance may be higher or lower than the performance data shown. For up-to-date month-end performance information please call 1-800-480-4111.
Returns for Class R3 Shares prior to their inception date are based on the performance of Class A Shares. Returns for Class R4 Shares prior to their inception date are based on the performance of Select Class Shares. The actual returns for Class R3 Shares and Class R4 Shares would have been similar to those shown because Class R3 Shares and Class R4 Shares have similar expenses as Class A and Select Class Shares, respectively.
Returns for Class R6 Shares prior to their inception date are based on the performance of Select Class Shares. The actual returns for Class R6 Shares would have been different than those shown because Class R6 Shares have different expenses than Select Class Shares.
The graph illustrates comparative performance for $1,000,000 invested in Select Class Shares of the JPMorgan Intrepid Mid Cap Fund, the Russell Midcap Index and the Lipper Mid-Cap Core Funds Index from December 31, 2006 to December 31, 2016. The performance of the Fund assumes reinvestment of all dividends and capital gain distributions, if any, and does not include a sales
charge. The performance of the Russell Midcap Index does not reflect the deduction of expenses or a sales charge associated with a mutual fund and has been adjusted to reflect reinvestment of all dividends and capital gain distributions of the securities included in the benchmark, if applicable. The performance of the Lipper Mid-Cap Core Funds Index includes expenses associated with a mutual fund, such as investment management fees. These expenses are not identical to the expenses incurred by the Fund. The Russell Midcap Index is
an unmanaged index which measures the performance of the 800 smallest companies of the Russell 1000 Index. The Lipper Mid-Cap Core Funds Index is an index based on the total returns of certain mutual funds within the Fund’s designated category as determined by Lipper, Inc. Investors cannot invest directly in an index.
Select Class Shares have a $1,000,000 minimum initial investment.
Fund performance may reflect the waiver of the Fund’s fees and reimbursement of expenses for certain periods since the inception date. Without these waivers and reimbursements, performance would have been lower. Also, performance shown in this section does not reflect the deduction of taxes that a shareholder would pay on Fund distributions or redemptions of Fund shares.
The returns shown are based on net asset values calculated for shareholder transactions and may differ from the returns shown in the financial highlights, which reflect adjustments made to the net asset values in accordance with accounting principles generally accepted in the United States of America.
| | | | | | |
| | | |
| 10 | | | | J.P. MORGAN INTREPID FUNDS | | DECEMBER 31, 2016 |
JPMorgan Intrepid Value Fund
FUND COMMENTARY
SIX MONTHS ENDED DECEMBER 31, 2016 (Unaudited)
| | | | |
| REPORTING PERIOD RETURN: | |
| Fund (Select Class Shares)* | | | 12.55% | |
| Russell 1000 Value Index | | | 10.39% | |
| |
| Net Assets as of 12/31/2016 (In Thousands) | | $ | 1,253,203 | |
INVESTMENT OBJECTIVE**
The JPMorgan Intrepid Value Fund (the “Fund”) seeks to provide long-term capital appreciation.
WHAT WERE THE MAIN DRIVERS OF THE FUND’S PERFORMANCE?
The Fund’s Select Class Shares outperformed the Russell 1000 Value Index (the “Benchmark”) for the six months ended December 31, 2016. The Fund’s security selection in the information technology and energy sectors was a leading contributor to performance relative to the Benchmark, while the Fund’s security selection in the consumer staples and consumer discretionary sectors was a leading detractor from performance.
Leading individual contributors to relative performance included the Fund’s overweight position in Valero Energy Corp. and its underweight positions in Berkshire Hathaway Inc. and Exxon Mobil Corp. Shares of Valero, an operator of oil and gas refineries and pipelines, rose after it reported better-than-expected earnings. Shares of Berkshire Hathaway, an investment management company that was not held by the Fund, fell on lower-than-expected earnings. Shares of Exxon Mobil, an integrated oil and gas company, fell on investor expectations that it would lag behind its competitors on production growth.
Leading individual detractors from relative performance included the Fund’s overweight positions in Allstate Corp. and Gilead Sciences Inc. and its underweight position in J.P. Morgan Chase & Co. Shares of Allstate, a life, property and casualty insurer, fell after the company announced its $1.4 billion purchase of Squaretrade. Shares of Gilead Sciences, a drug maker, fell on declining sales for its Hepatitis C treatments. Shares of J.P. Morgan Chase, a banking and financial services company that the Fund is prohibited from holding because of its affiliation with the Fund’s adviser, rose on better-than-expected earnings and strong growth in loans.
| | | | | | | | |
| TOP TEN EQUITY HOLDINGS OF THE PORTFOLIO*** | |
| | 1. | | | Bank of America Corp. | | | 4.0 | % |
| | 2. | | | Citigroup, Inc. | | | 3.5 | |
| | 3. | | | QUALCOMM, Inc. | | | 2.5 | |
| | 4. | | | PNC Financial Services Group, Inc. (The) | | | 2.3 | |
| | 5. | | | HP, Inc. | | | 2.2 | |
| | 6. | | | Valero Energy Corp. | | | 2.1 | |
| | 7. | | | eBay, Inc. | | | 2.0 | |
| | 8. | | | Archer-Daniels-Midland Co. | | | 2.0 | |
| | 9. | | | Pfizer, Inc. | | | 2.0 | |
| | 10. | | | Baker Hughes, Inc. | | | 1.9 | |
| | | | |
PORTFOLIO COMPOSITION BY SECTOR*** | |
| Financials | | | 28.3 | % |
| Energy | | | 12.9 | |
| Information Technology | | | 10.7 | |
| Health Care | | | 10.3 | |
| Industrials | | | 8.9 | |
| Consumer Staples | | | 7.7 | |
| Utilities | | | 6.0 | |
| Consumer Discretionary | | | 5.2 | |
| Telecommunication Services | | | 2.9 | |
| Real Estate | | | 2.9 | |
| Materials | | | 2.4 | |
| Short-Term Investment | | | 1.8 | |
| * | | The return shown is based on net asset values calculated for shareholder transactions and may differ from the return shown in the financial highlights, which reflects adjustments made to the net asset values in accordance with accounting principles generally accepted in the United States of America. |
| ** | | The adviser seeks to achieve the Fund’s objective. There can be no guarantee it will be achieved. |
| *** | | Percentages indicated are based on total investments as of December 31, 2016. The Fund’s portfolio composition is subject to change. |
| | | | | | | | |
| | | |
| DECEMBER 31, 2016 | | J.P. MORGAN INTREPID FUNDS | | | | | 11 | |
JPMorgan Intrepid Value Fund
FUND COMMENTARY
SIX MONTHS ENDED DECEMBER 31, 2016 (Unaudited) (continued)
| | | | | | | | | | | | | | | | | | |
AVERAGE ANNUAL TOTAL RETURNS AS OF DECEMBER 31, 2016 | |
| | | | | |
| | | INCEPTION DATE OF
CLASS | | 6 MONTH* | | | 1 YEAR | | | 5 YEAR | | | 10 YEAR | |
CLASS A SHARES | | February 19, 2005 | | | | | | | | | | | | | | | | |
With Sales Charge** | | | | | 6.56 | % | | | 6.01 | % | | | 12.50 | % | | | 4.68 | % |
Without Sales Charge | | | | | 12.47 | | | | 11.88 | | | | 13.72 | | | | 5.25 | |
CLASS C SHARES | | February 19, 2005 | | | | | | | | | | | | | | | | |
With CDSC*** | | | | | 11.21 | | | | 10.33 | | | | 13.16 | | | | 4.73 | |
Without CDSC | | | | | 12.21 | | | | 11.33 | | | | 13.16 | | | | 4.73 | |
CLASS R2 SHARES | | November 3, 2008 | | | 12.32 | | | | 11.61 | | | | 13.44 | | | | 5.04 | |
CLASS R5 SHARES | | May 15, 2006 | | | 12.66 | | | | 12.27 | | | | 14.13 | | | | 5.66 | |
CLASS R6 SHARES | | November 30, 2010 | | | 12.68 | | | | 12.32 | | | | 14.18 | | | | 5.69 | |
SELECT CLASS SHARES | | February 28, 2003 | | | 12.55 | | | | 12.05 | | | | 13.89 | | | | 5.45 | |
| ** | | Sales Charge for Class A Shares is 5.25%. |
| *** | | Assumes a 1% CDSC (contingent deferred sales charge) for the 6 month and one year periods and 0% CDSC thereafter. |
TEN YEAR PERFORMANCE (12/31/06 TO 12/31/16)
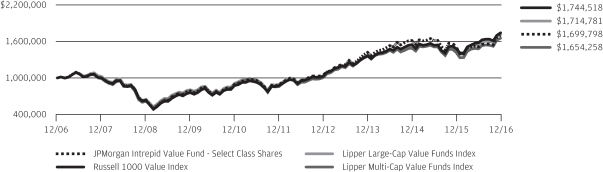
The performance quoted is past performance and is not a guarantee of future results. Mutual funds are subject to certain market risks. Investment returns and principal value of an investment will fluctuate so that an investor’s shares, when redeemed, may be worth more or less than their original cost. Current performance may be higher or lower than the performance data shown. For up-to-date month-end performance information please call 1-800-480-4111.
Returns for Class R2 Shares prior to their inception date are based on the performance of Class A Shares. The actual returns for Class R2 Shares would have been lower than those shown because Class R2 Shares have higher expenses than Class A and Select Class Shares.
Returns for Class R6 Shares prior to their inception date are based on the performance of Class R5 Shares. The actual returns for Class R6 Shares would have been different than those shown because Class R6 Shares have different expenses than Class R5 Shares.
The graph illustrates comparative performance for $1,000,000 invested in Select Class Shares of the JPMorgan Intrepid Value Fund, the Russell 1000 Value Index, the Lipper Large-Cap Value Funds Index and the Lipper Multi-Cap Value Funds Index from December 31, 2006 to December 31, 2016. The performance of the Fund assumes reinvestment of all dividends and capital gain distributions, if any, and does not include a sales charge. The performance of the Russell 1000 Value Index does not reflect the deduction of expenses or a sales charge
associated with a mutual fund and has been adjusted to reflect reinvestment of all dividends and capital gain distributions of the securities included in the benchmark, if applicable. The performance of the Lipper Large-Cap Value Funds Index and the Lipper Multi-Cap Value Funds Index includes expenses associated with a mutual fund, such as investment management fees. These expenses are not identical to the expenses incurred by the Fund. The Russell 1000 Value Index is an unmanaged index which measures the performance of those Russell 1000 companies with lower price-to-book ratios and lower forecasted growth values. Lipper Large-Cap Value Funds Index and the Lipper Multi-Cap Value Funds Index are indexes based on the total returns of certain mutual funds within the Fund’s designated category as determined by Lipper, Inc. Investors cannot invest directly in an index.
Select Class Shares have a $1,000,000 minimum initial investment.
Fund performance may reflect the waiver of the Fund’s fees and reimbursement of expenses for certain periods since the inception date. Without these waivers and reimbursements, performance would have been lower. Also, performance shown in this section does not reflect the deduction of taxes that a shareholder would pay on Fund distributions or redemptions of Fund shares.
The returns shown are based on net asset values calculated for shareholder transactions and may differ from the returns shown in the financial highlights, which reflect adjustments made to the net asset values in accordance with accounting principles generally accepted in the United States of America.
| | | | | | |
| | | |
| 12 | | | | J.P. MORGAN INTREPID FUNDS | | DECEMBER 31, 2016 |
JPMorgan Intrepid Advantage Fund
SCHEDULE OF PORTFOLIO INVESTMENTS
AS OF DECEMBER 31, 2016 (Unaudited)
(Amounts in thousands)
| | | | | | | | |
| SHARES | | | SECURITY DESCRIPTION | | VALUE($) | |
| Common Stocks — 97.9% | | | | |
| | | | Consumer Discretionary — 9.2% | | | | |
| | | | Hotels, Restaurants & Leisure — 2.9% | | | | |
| | 3 | | | McDonald’s Corp. | | | 341 | |
| | 4 | | | Restaurant Brands International, Inc., (Canada) | | | 175 | |
| | | | | | | | |
| | | | | | | 516 | |
| | | | | | | | |
| | | | Media — 2.5% | | | | |
| | 39 | | | Sirius XM Holdings, Inc. | | | 171 | |
| | 3 | | | Time Warner, Inc. | | | 273 | |
| | | | | | | | |
| | | | | | | 444 | |
| | | | | | | | |
| | | | Specialty Retail — 3.2% | | | | |
| | 2 | | | Home Depot, Inc. (The) | | | 258 | |
| | 4 | | | Lowe’s Cos., Inc. | | | 313 | |
| | | | | | | | |
| | | | | | | 571 | |
| | | | | | | | |
| | | | Textiles, Apparel & Luxury Goods — 0.6% | | | | |
| | 1 | | | PVH Corp. | | | 102 | |
| | | | | | | | |
| | | | Total Consumer Discretionary | | | 1,633 | |
| | | | | | | | |
| | | | Consumer Staples — 8.5% | | | | |
| | | | Beverages — 4.7% | |
| | 2 | | | Dr Pepper Snapple Group, Inc. | | | 165 | |
| | 2 | | | Molson Coors Brewing Co., Class B | | | 234 | |
| | 4 | | | PepsiCo, Inc. | | | 437 | |
| | | | | | | | |
| | | | | | | 836 | |
| | | | | | | | |
| | | | Food & Staples Retailing — 2.6% | | | | |
| | 2 | | | Sysco Corp. | | | 135 | |
| | 4 | | | Walgreens Boots Alliance, Inc. | | | 335 | |
| | | | | | | | |
| | | | | | | 470 | |
| | | | | | | | |
| | | | Food Products — 0.9% | | | | |
| | 1 | | | Ingredion, Inc. | | | 153 | |
| | | | | | | | |
| | | | Household Products — 0.3% | | | | |
| | 1 | | | Energizer Holdings, Inc. | | | 49 | |
| | | | | | | | |
| | | | Total Consumer Staples | | | 1,508 | |
| | | | | | | | |
| | | | Energy — 6.9% | | | | |
| | | | Energy Equipment & Services — 4.4% | |
| | 4 | | | Baker Hughes, Inc. | | | 258 | |
| | 7 | | | FMC Technologies, Inc. (a) | | | 258 | |
| | 3 | | | Schlumberger Ltd. | | | 275 | |
| | | | | | | | |
| | | | | | | 791 | |
| | | | | | | | |
| | | | Oil, Gas & Consumable Fuels — 2.5% | | | | |
| | 3 | | | Apache Corp. | | | 192 | |
| | 4 | | | Valero Energy Corp. | | | 248 | |
| | | | | | | | |
| | | | | | | 440 | |
| | | | | | | | |
| | | | Total Energy | | | 1,231 | |
| | | | | | | | |
| | | | | | | | |
| SHARES | | | SECURITY DESCRIPTION | | VALUE($) | |
| | | | | | | | |
| | | | Financials — 14.7% | |
| | | | Banks — 7.9% | |
| | 17 | | | Bank of America Corp. | | | 367 | |
| | 11 | | | Citigroup, Inc. | | | 654 | |
| | 3 | | | PNC Financial Services Group, Inc. (The) | | | 368 | |
| | | | | | | | |
| | | | | | | 1,389 | |
| | | | | | | | |
| | | | Capital Markets — 2.4% | | | | |
| | 6 | | | Bank of New York Mellon Corp. (The) | | | 268 | |
| | 1 | | | MSCI, Inc. | | | 81 | |
| | 2 | | | Thomson Reuters Corp. | | | 84 | |
| | | | | | | | |
| | | | | | | 433 | |
| | | | | | | | |
| | | | Consumer Finance — 0.8% | | | | |
| | 2 | | | Discover Financial Services | | | 140 | |
| | | | | | | | |
| | | | Insurance — 3.6% | | | | |
| | 3 | | | Allstate Corp. (The) | | | 193 | |
| | 4 | | | Hartford Financial Services Group, Inc. (The) | | | 188 | |
| | 2 | | | Travelers Cos., Inc. (The) | | | 254 | |
| | | | | | | | |
| | | | | | | 635 | |
| | | | | | | | |
| | | | Total Financials | | | 2,597 | |
| | | | | | | | |
| | | | Health Care — 15.1% | |
| | | | Biotechnology — 7.3% | |
| | 3 | | | AbbVie, Inc. | | | 188 | |
| | 2 | | | Amgen, Inc. | | | 293 | |
| | 1 | | | Biogen, Inc. (a) | | | 191 | |
| | 2 | | | Celgene Corp. (a) | | | 211 | |
| | 6 | | | Gilead Sciences, Inc. | | | 408 | |
| | | | | | | | |
| | | | | | | 1,291 | |
| | | | | | | | |
| | | | Health Care Equipment & Supplies — 0.8% | | | | |
| | 1 | | | Becton Dickinson and Co. | | | 149 | |
| | | | | | | | |
| | | | Health Care Providers & Services — 3.9% | | | | |
| | 3 | | | Aetna, Inc. | | | 319 | |
| | 2 | | | Humana, Inc. | | | 373 | |
| | | | | | | | |
| | | | | | | 692 | |
| | | | | | | | |
| | | | Life Sciences Tools & Services — 0.5% | | | | |
| | 1 | | | Waters Corp. (a) | | | 87 | |
| | | | | | | | |
| | | | Pharmaceuticals — 2.6% | | | | |
| | 2 | | | Johnson & Johnson | | | 254 | |
| | 4 | | | Merck & Co., Inc. | | | 209 | |
| | | | | | | | |
| | | | | | | 463 | |
| | | | | | | | |
| | | | Total Health Care | | | 2,682 | |
| | | | | | | | |
SEE NOTES TO FINANCIAL STATEMENTS.
| | | | | | | | |
| | | |
| DECEMBER 31, 2016 | | J.P. MORGAN INTREPID FUNDS | | | | | 13 | |
JPMorgan Intrepid Advantage Fund
SCHEDULE OF PORTFOLIO INVESTMENTS
AS OF DECEMBER 31, 2016 (Unaudited) (continued)
(Amounts in thousands)
| | | | | | | | |
| SHARES | | | SECURITY DESCRIPTION | | VALUE($) | |
| Common Stocks — continued | | | | |
| | | | Industrials — 10.6% | |
| | | | Aerospace & Defense — 2.9% | |
| | 2 | | | Curtiss-Wright Corp. | | | 233 | |
| | 2 | | | Raytheon Co. | | | 270 | |
| | | | | | | | |
| | | | | | | 503 | |
| | | | | | | | |
| | | | Airlines — 1.2% | | | | |
| | 4 | | | Southwest Airlines Co. | | | 208 | |
| | | | | | | | |
| | | | Commercial Services & Supplies — 0.6% | | | | |
| | 7 | | | Pitney Bowes, Inc. | | | 107 | |
| | | | | | | | |
| | | | Construction & Engineering — 0.5% | | | | |
| | 2 | | | Jacobs Engineering Group, Inc. (a) | | | 92 | |
| | | | | | | | |
| | | | Machinery — 3.8% | | | | |
| | 2 | | | Allison Transmission Holdings, Inc. | | | 77 | |
| | 3 | | | Parker-Hannifin Corp. | | | 413 | |
| | 4 | | | Xylem, Inc. | | | 178 | |
| | | | | | | | |
| | | | | | | 668 | |
| | | | | | | | |
| | | | Professional Services — 0.8% | | | | |
| | 2 | | | ManpowerGroup, Inc. | | | 147 | |
| | | | | | | | |
| | | | Road & Rail — 0.8% | | | | |
| | 1 | | | Norfolk Southern Corp. | | | 146 | |
| | | | | | | | |
| | | | Total Industrials | | | 1,871 | |
| | | | | | | | |
| | | | Information Technology — 24.2% | | | | |
| | | | Communications Equipment — 1.5% | |
| | 9 | | | Cisco Systems, Inc. | | | 272 | |
| | | | | | | | |
| | | | Internet Software & Services — 2.3% | | | | |
| | — | (h) | | Alphabet, Inc., Class A (a) | | | 238 | |
| | — | (h) | | Alphabet, Inc., Class C (a) | | | 173 | |
| | | | | | | | |
| | | | | | | 411 | |
| | | | | | | | |
| | | | IT Services — 2.5% | | | | |
| | 2 | | | Mastercard, Inc., Class A | | | 207 | |
| | 3 | | | Visa, Inc., Class A | | | 236 | |
| | | | | | | | |
| | | | | | | 443 | |
| | | | | | | | |
| | | | Semiconductors & Semiconductor Equipment — 2.1% | |
| | 2 | | | Lam Research Corp. | | | 209 | |
| | 2 | | | QUALCOMM, Inc. | | | 158 | |
| | | | | | | | |
| | | | | | | 367 | |
| | | | | | | | |
| | | | Software — 9.0% | | | | |
| | 3 | | | Autodesk, Inc. (a) | | | 222 | |
| | 14 | | | Microsoft Corp. | | | 876 | |
| | 8 | | | Oracle Corp. | | | 310 | |
| | 8 | | | Symantec Corp. | | | 186 | |
| | | | | | | | |
| | | | | | | 1,594 | |
| | | | | | | | |
| | | | | | | | |
| SHARES | | | SECURITY DESCRIPTION | | VALUE($) | |
| | | | | | | | |
| | | | Technology Hardware, Storage & Peripherals — 6.8% | |
| | 8 | | | Apple, Inc. | | | 886 | |
| | 10 | | | Hewlett Packard Enterprise Co. | | | 220 | |
| | 6 | | | HP, Inc. | | | 89 | |
| | | | | | | | |
| | | | | | | 1,195 | |
| | | | | | | | |
| | | | Total Information Technology | | | 4,282 | |
| | | | | | | | |
| | | | Materials — 1.4% | |
| | | | Chemicals — 1.4% | |
| | 2 | | | EI du Pont de Nemours & Co. | | | 134 | |
| | 1 | | | International Flavors & Fragrances, Inc. | | | 112 | |
| | | | | | | | |
| | | | Total Materials | | | 246 | |
| | | | | | | | |
| | | | Real Estate — 0.5% | | | | |
| | | | Equity Real Estate Investment Trusts (REITs) — 0.5% | |
| | 2 | | | Prologis, Inc. | | | 88 | |
| | | | | | | | |
| | | | Telecommunication Services — 3.6% | |
| | | | Diversified Telecommunication Services — 3.6% | |
| | 7 | | | CenturyLink, Inc. | | | 163 | |
| | 9 | | | Verizon Communications, Inc. | | | 468 | |
| | | | | | | | |
| | | | Total Telecommunication Services | | | 631 | |
| | | | | | | | |
| | | | Utilities — 3.2% | | | | |
| | | | Electric Utilities — 3.2% | | | | |
| | 4 | | | Eversource Energy | | | 225 | |
| | 2 | | | NextEra Energy, Inc. | | | 191 | |
| | 3 | | | Portland General Electric Co. | | | 146 | |
| | | | | | | | |
| | | | Total Utilities | | | 562 | |
| | | | | | | | |
| | | | Total Common Stocks
(Cost $13,915) | | | 17,331 | |
| | | | | | | | |
| Short-Term Investment — 2.2% | | | | |
| | | | Investment Company — 2.2% | | | | |
| | 393 | | | JPMorgan U.S. Government Money Market Fund,
Institutional Class Shares, 0.410% (b) (l)
(Cost $393) | | | 393 | |
| | | | | | | | |
| | | | Total Investments — 100.1%
(Cost $14,308) | | | 17,724 | |
| | | | Liabilities in Excess of
Other Assets — (0.1)% | | | (22 | ) |
| | | | | | | | |
| | | | NET ASSETS — 100.0% | | $ | 17,702 | |
| | | | | | | | |
Percentages indicated are based on net assets.
SEE NOTES TO FINANCIAL STATEMENTS.
| | | | | | |
| | | |
| 14 | | | | J.P. MORGAN INTREPID FUNDS | | DECEMBER 31, 2016 |
JPMorgan Intrepid America Fund
SCHEDULE OF PORTFOLIO INVESTMENTS
AS OF DECEMBER 31, 2016 (Unaudited)
(Amounts in thousands)
| | | | | | | | |
| SHARES | | | SECURITY DESCRIPTION | | VALUE($) | |
| Common Stocks — 98.8% | |
| | | | Consumer Discretionary — 11.0% | |
| | | | Automobiles — 0.7% | |
| | 781 | | | General Motors Co. | | | 27,196 | |
| | | | | | | | |
| | | | Hotels, Restaurants & Leisure — 2.0% | |
| | 1,085 | | | International Game Technology plc | | | 27,687 | |
| | 164 | | | McDonald’s Corp. | | | 19,998 | |
| | 659 | | | Restaurant Brands International, Inc., (Canada) | | | 31,389 | |
| | | | | | | | |
| | | | | | | 79,074 | |
| | | | | | | | |
| | | | Household Durables — 0.6% | | | | |
| | 645 | | | DR Horton, Inc. | | | 17,634 | |
| | 2 | | | NVR, Inc. (a) | | | 4,005 | |
| | | | | | | | |
| | | | | | | 21,639 | |
| | | | | | | | |
| | | | Internet & Direct Marketing Retail — 0.6% | | | | |
| | 32 | | | Amazon.com, Inc. (a) | | | 24,296 | |
| | | | | | | | |
| | | | Media — 1.7% | |
| | 147 | | | Comcast Corp., Class A | | | 10,123 | |
| | 496 | | | Live Nation Entertainment, Inc. (a) | | | 13,188 | |
| | 1,442 | | | Twenty-First Century Fox, Inc., Class A | | | 40,439 | |
| | | | | | | | |
| | | | | | | 63,750 | |
| | | | | | | | |
| | | | Multiline Retail — 0.6% | | | | |
| | 482 | | | Kohl’s Corp. | | | 23,811 | |
| | | | | | | | |
| | | | Specialty Retail — 4.2% | | | | |
| | 691 | | | Best Buy Co., Inc. | | | 29,502 | |
| | 337 | | | Burlington Stores, Inc. (a) | | | 28,544 | |
| | 197 | | | Home Depot, Inc. (The) | | | 26,360 | |
| | 1,192 | | | Ross Stores, Inc. | | | 78,202 | |
| | | | | | | | |
| | | | | | | 162,608 | |
| | | | | | | | |
| | | | Textiles, Apparel & Luxury Goods — 0.6% | | | | |
| | 259 | | | PVH Corp. | | | 23,354 | |
| | | | | | | | |
| | | | Total Consumer Discretionary | | | 425,728 | |
| | | | | | | | |
| | | | Consumer Staples — 8.6% | | | | |
| | | | Beverages — 0.6% | |
| | 155 | | | Molson Coors Brewing Co., Class B | | | 15,093 | |
| | 66 | | | PepsiCo, Inc. | | | 6,926 | |
| | | | | | | | |
| | | | | | | 22,019 | |
| | | | | | | | |
| | | | Food & Staples Retailing — 2.3% | | | | |
| | 130 | | | CVS Health Corp. | | | 10,282 | |
| | 1,152 | | | Wal-Mart Stores, Inc. | | | 79,605 | |
| | | | | | | | |
| | | | | | | 89,887 | |
| | | | | | | | |
| | | | Food Products — 4.3% | | | | |
| | 579 | | | Archer-Daniels-Midland Co. | | | 26,440 | |
| | 211 | | | Ingredion, Inc. | | | 26,317 | |
| | 183 | | | JM Smucker Co. (The) | | | 23,422 | |
| | | | | | | | |
| SHARES | | | SECURITY DESCRIPTION | | VALUE($) | |
| | | | | | | | |
| | | | Food Products — continued | | | | |
| | 1,131 | | | Pilgrim’s Pride Corp. | | | 21,482 | |
| | 92 | | | Post Holdings, Inc. (a) | | | 7,388 | |
| | 1,011 | | | Tyson Foods, Inc., Class A | | | 62,346 | |
| | | | | | | | |
| | | | | | | 167,395 | |
| | | | | | | | |
| | | | Household Products — 0.7% | | | | |
| | 562 | | | Energizer Holdings, Inc. | | | 25,049 | |
| | | | | | | | |
| | | | Personal Products — 0.7% | | | | |
| | 528 | | | Nu Skin Enterprises, Inc., Class A | | | 25,247 | |
| | | | | | | | |
| | | | Total Consumer Staples | | | 329,597 | |
| | | | | | | | |
| | | | Energy — 7.7% | | | | |
| | | | Energy Equipment & Services — 3.1% | |
| | 1,249 | | | Baker Hughes, Inc. | | | 81,115 | |
| | 922 | | | FMC Technologies, Inc. (a) | | | 32,752 | |
| | 1,199 | | | Seadrill Ltd., (United Kingdom) (a) | | | 4,089 | |
| | | | | | | | |
| | | | | | | 117,956 | |
| | | | | | | | |
| | | | Oil, Gas & Consumable Fuels — 4.6% | | | | |
| | 233 | | | Apache Corp. | | | 14,814 | |
| | 79 | | | Cimarex Energy Co. | | | 10,750 | |
| | 1,741 | | | Denbury Resources, Inc. (a) | | | 6,406 | |
| | 115 | | | Hess Corp. | | | 7,132 | |
| | 2,391 | | | Marathon Oil Corp. | | | 41,379 | |
| | 170 | | | Tesoro Corp. | | | 14,875 | |
| | 1,200 | | | Valero Energy Corp. | | | 81,998 | |
| | | | | | | | |
| | | | | | | 177,354 | |
| | | | | | | | |
| | | | Total Energy | | | 295,310 | |
| | | | | | | | |
| | | | Financials — 14.9% | |
| | | | Banks — 7.5% | |
| | 5,312 | | | Bank of America Corp. | | | 117,402 | |
| | 1,606 | | | Citigroup, Inc. | | | 95,462 | |
| | 244 | | | Comerica, Inc. | | | 16,592 | |
| | 183 | | | PNC Financial Services Group, Inc. (The) | | | 21,415 | |
| | 1,263 | | | Regions Financial Corp. | | | 18,137 | |
| | 349 | | | Wells Fargo & Co. | | | 19,242 | |
| | | | | | | | |
| | | | | | | 288,250 | |
| | | | | | | | |
| | | | Capital Markets — 1.9% | | | | |
| | 26 | | | Ameriprise Financial, Inc. | | | 2,906 | |
| | 1,105 | | | Morgan Stanley | | | 46,695 | |
| | 321 | | | MSCI, Inc. | | | 25,312 | |
| | | | | | | | |
| | | | | | | 74,913 | |
| | | | | | | | |
| | | | Consumer Finance — 1.1% | | | | |
| | 530 | | | Discover Financial Services | | | 38,186 | |
| | 210 | | | Navient Corp. | | | 3,445 | |
| | | | | | | | |
| | | | | | | 41,631 | |
| | | | | | | | |
SEE NOTES TO FINANCIAL STATEMENTS.
| | | | | | | | |
| | | |
| DECEMBER 31, 2016 | | J.P. MORGAN INTREPID FUNDS | | | | | 15 | |
JPMorgan Intrepid America Fund
SCHEDULE OF PORTFOLIO INVESTMENTS
AS OF DECEMBER 31, 2016 (Unaudited) (continued)
(Amounts in thousands, except number of Futures contracts)
| | | | | | | | |
| SHARES | | | SECURITY DESCRIPTION | | VALUE($) | |
| Common Stocks — continued | |
| | | | Diversified Financial Services — 0.1% | | | | |
| | 72 | | | Voya Financial, Inc. | | | 2,816 | |
| | | | | | | | |
| | | | Insurance — 3.8% | | | | |
| | 336 | | | Allstate Corp. (The) | | | 24,873 | |
| | 246 | | | Assured Guaranty Ltd. | | | 9,299 | |
| | 141 | | | Everest Re Group Ltd. | | | 30,577 | |
| | 335 | | | Lincoln National Corp. | | | 22,194 | |
| | 196 | | | Prudential Financial, Inc. | | | 20,375 | |
| | 68 | | | RenaissanceRe Holdings Ltd., (Bermuda) | | | 9,290 | |
| | 85 | | | Travelers Cos., Inc. (The) | | | 10,406 | |
| | 389 | | | Validus Holdings Ltd. | | | 21,388 | |
| | | | | | | | |
| | | | | | | 148,402 | |
| | | | | | | | |
| | | | Mortgage Real Estate Investment Trusts (REITs) — 0.5% | |
| | 461 | | | Chimera Investment Corp. | | | 7,841 | |
| | 1,097 | | | Two Harbors Investment Corp. | | | 9,567 | |
| | | | | | | | |
| | | | | | | 17,408 | |
| | | | | | | | |
| | | | Total Financials | | | 573,420 | |
| | | | | | | | |
| | | | Health Care — 13.8% | |
| | | | Biotechnology — 3.6% | |
| | 466 | | | Amgen, Inc. | | | 68,105 | |
| | 989 | | | Gilead Sciences, Inc. | | | 70,808 | |
| | | | | | | | |
| | | | | | | 138,913 | |
| | | | | | | | |
| | | | Health Care Equipment & Supplies — 2.2% | | | | |
| | 232 | | | Align Technology, Inc. (a) | | | 22,264 | |
| | 543 | | | Baxter International, Inc. | | | 24,090 | |
| | 113 | | | Becton Dickinson and Co. | | | 18,773 | |
| | 207 | | | Hologic, Inc. (a) | | | 8,285 | |
| | 97 | | | IDEXX Laboratories, Inc. (a) | | | 11,316 | |
| | | | | | | | |
| | | | | | | 84,728 | |
| | | | | | | | |
| | | | Health Care Providers & Services — 6.9% | | | | |
| | 384 | | | Aetna, Inc. | | | 47,558 | |
| | 25 | | | Anthem, Inc. | | | 3,565 | |
| | 1,023 | | | Express Scripts Holding Co. (a) | | | 70,345 | |
| | 56 | | | HCA Holdings, Inc. (a) | | | 4,123 | |
| | 181 | | | Humana, Inc. | | | 36,909 | |
| | 456 | | | UnitedHealth Group, Inc. | | | 73,042 | |
| | 237 | | | WellCare Health Plans, Inc. (a) | | | 32,501 | |
| | | | | | | | |
| | | | | | | 268,043 | |
| | | | | | | | |
| | | | Pharmaceuticals — 1.1% | | | | |
| | 355 | | | Johnson & Johnson | | | 40,876 | |
| | | | | | | | |
| | | | Total Health Care | | | 532,560 | |
| | | | | | | | |
| | | | | | | | |
| SHARES | | | SECURITY DESCRIPTION | | VALUE($) | |
| | | | | | | | |
| | | | Industrials — 8.9% | | | | |
| | | | Aerospace & Defense — 1.7% | | | | |
| | 304 | | | Curtiss-Wright Corp. | | | 29,931 | |
| | 59 | | | Huntington Ingalls Industries, Inc. | | | 10,867 | |
| | 104 | | | Northrop Grumman Corp. | | | 24,142 | |
| | | | | | | | |
| | | | | | | 64,940 | |
| | | | | | | | |
| | | | Airlines — 2.4% | | | | |
| | 310 | | | Copa Holdings SA, (Panama), Class A | | | 28,194 | |
| | 738 | | | Delta Air Lines, Inc. | | | 36,280 | |
| | 413 | | | United Continental Holdings, Inc. (a) | | | 30,070 | |
| | | | | | | | |
| | | | | | | 94,544 | |
| | | | | | | | |
| | | | Construction & Engineering — 1.0% | | | | |
| | 348 | | | Jacobs Engineering Group, Inc. (a) | | | 19,813 | |
| | 530 | | | Quanta Services, Inc. (a) | | | 18,457 | |
| | | | | | | | |
| | | | | | | 38,270 | |
| | | | | | | | |
| | | | Electrical Equipment — 0.5% | | | | |
| | 236 | | | EnerSys | | | 18,463 | |
| | | | | | | | |
| | | | Machinery — 2.3% | | | | |
| | 455 | | | Illinois Tool Works, Inc. | | | 55,682 | |
| | 230 | | | Parker-Hannifin Corp. | | | 32,200 | |
| | | | | | | | |
| | | | | | | 87,882 | |
| | | | | | | | |
| | | | Trading Companies & Distributors — 1.0% | | | | |
| | 207 | | | United Rentals, Inc. (a) | | | 21,866 | |
| | 272 | | | WESCO International, Inc. (a) | | | 18,083 | |
| | | | | | | | |
| | | | | | | 39,949 | |
| | | | | | | | |
| | | | Total Industrials | | | 344,048 | |
| | | | | | | | |
| | | | Information Technology — 22.6% | |
| | | | Electronic Equipment, Instruments & Components — 0.8% | |
| | 1,240 | | | Corning, Inc. | | | 30,092 | |
| | | | | | | | |
| | | | Internet Software & Services — 2.2% | | | | |
| | 2,844 | | | eBay, Inc. (a) | | | 84,424 | |
| | | | | | | | |
| | | | IT Services — 2.9% | | | | |
| | 489 | | | Computer Sciences Corp. | | | 29,069 | |
| | 115 | | | Mastercard, Inc., Class A | | | 11,822 | |
| | 64 | | | Science Applications International Corp. | | | 5,421 | |
| | 829 | | | Visa, Inc., Class A | | | 64,694 | |
| | | | | | | | |
| | | | | | | 111,006 | |
| | | | | | | | |
| | | | Semiconductors & Semiconductor Equipment — 3.6% | |
| | 2,399 | | | Applied Materials, Inc. | | | 77,419 | |
| | 318 | | | Lam Research Corp. | | | 33,664 | |
| | 415 | | | QUALCOMM, Inc. | | | 27,078 | |
| | | | | | | | |
| | | | | | | 138,161 | |
| | | | | | | | |
SEE NOTES TO FINANCIAL STATEMENTS.
| | | | | | |
| | | |
| 16 | | | | J.P. MORGAN INTREPID FUNDS | | DECEMBER 31, 2016 |
| | | | | | | | |
| SHARES | | | SECURITY DESCRIPTION | | VALUE($) | |
| Common Stocks — continued | |
| | | | Software — 8.5% | | | | |
| | 959 | | | Activision Blizzard, Inc. | | | 34,644 | |
| | 2,314 | | | Microsoft Corp. | | | 143,817 | |
| | 371 | | | Nuance Communications, Inc. (a) | | | 5,531 | |
| | 1,341 | | | Oracle Corp. | | | 51,561 | |
| | 808 | | | Symantec Corp. | | | 19,309 | |
| | 312 | | | Take-Two Interactive Software, Inc. (a) | | | 15,369 | |
| | 749 | | | VMware, Inc., Class A (a) | | | 58,961 | |
| | | | | | | | |
| | | | | | | 329,192 | |
| | | | | | | | |
| | | | Technology Hardware, Storage & Peripherals — 4.6% | |
| | 517 | | | Apple, Inc. | | | 59,821 | |
| | 1,509 | | | Hewlett Packard Enterprise Co. | | | 34,923 | |
| | 2,567 | | | HP, Inc. | | | 38,099 | |
| | 380 | | | NCR Corp. (a) | | | 15,392 | |
| | 846 | | | NetApp, Inc. | | | 29,849 | |
| | | | | | | | |
| | | | | | | 178,084 | |
| | | | | | | | |
| | | | Total Information Technology | | | 870,959 | |
| | | | | | | | |
| | | | Materials — 2.4% | |
| | | | Chemicals — 0.2% | |
| | 134 | | | Cabot Corp. | | | 6,787 | |
| | | | | | | | |
| | | | Containers & Packaging — 0.1% | | | | |
| | 103 | | | Berry Plastics Group, Inc. (a) | | | 5,000 | |
| | | | | | | | |
| | | | Metals & Mining — 2.1% | | | | |
| | 718 | | | Newmont Mining Corp. | | | 24,452 | |
| | 415 | | | Nucor Corp. | | | 24,677 | |
| | 913 | | | Steel Dynamics, Inc. | | | 32,492 | |
| | | | | | | | |
| | | | | | | 81,621 | |
| | | | | | | | |
| | | | Total Materials | | | 93,408 | |
| | | | | | | | |
| | | | Real Estate — 2.3% | |
| | | | Equity Real Estate Investment Trusts (REITs) — 2.3% | |
| | 656 | | | American Tower Corp. | | | 69,368 | |
| | 309 | | | Equity Commonwealth (a) | | | 9,344 | |
| | 22 | | | Public Storage | | | 5,007 | |
| | 749 | | | VEREIT, Inc. | | | 6,332 | |
| | | | | | | | |
| | | | Total Real Estate | | | 90,051 | |
| | | | | | | | |
| | | | | | | | |
| SHARES | | | SECURITY DESCRIPTION | | VALUE($) | |
| | | | | | | | |
| | | | Telecommunication Services — 3.2% | |
| | | | Diversified Telecommunication Services — 3.0% | |
| | 859 | | | AT&T, Inc. | | | 36,542 | |
| | 133 | | | CenturyLink, Inc. | | | 3,151 | |
| | 1,414 | | | Verizon Communications, Inc. | | | 75,495 | |
| | | | | | | | |
| | | | | | | 115,188 | |
| | | | | | | | |
| | | | Wireless Telecommunication Services — 0.2% | |
| | 879 | | | Sprint Corp. (a) | | | 7,399 | |
| | | | | | | | |
| | | | Total Telecommunication Services | | | 122,587 | |
| | | | | | | | |
| | | | Utilities — 3.4% | | | | |
| | | | Electric Utilities — 1.3% | |
| | 660 | | | Edison International | | | 47,499 | |
| | 29 | | | NextEra Energy, Inc. | | | 3,500 | |
| | | | | | | | |
| | | | | | | 50,999 | |
| | | | | | | | |
| | | | Gas Utilities — 0.8% | | | | |
| | 660 | | | UGI Corp. | | | 30,417 | |
| | | | | | | | |
| | | | Independent Power & Renewable Electricity Producers — 0.7% | |
| | 2,361 | | | AES Corp. | | | 27,433 | |
| | | | | | | | |
| | | | Multi-Utilities — 0.6% | | | | |
| | 816 | | | MDU Resources Group, Inc. | | | 23,462 | |
| | | | | | | | |
| | | | Total Utilities | | | 132,311 | |
| | | | | | | | |
| | | | Total Common Stocks
(Cost $3,185,217) | | | 3,809,979 | |
| | | | | | | | |
| Short-Term Investment — 1.5% | | | | |
| | | | Investment Company — 1.5% | | | | |
| | 56,120 | | | JPMorgan U.S. Government Money Market Fund, Institutional Class Shares, 0.410% (b) (l)
(Cost $56,120) | | | 56,120 | |
| | | | | | | | |
| | | | Total Investments — 100.3%
(Cost $3,241,337) | | | 3,866,099 | |
| | | | Liabilities in Excess of
Other Assets — (0.3)% | | | (9,669 | ) |
| | | | | | | | |
| | | | NET ASSETS — 100.0% | | $ | 3,856,430 | |
| | | | | | | | |
Percentages indicated are based on net assets.
| | | | | | | | | | | | | | | | | | | | |
| Futures Contracts | |
NUMBER OF
CONTRACTS | | | DESCRIPTION | | EXPIRATION
DATE | | | TRADING
CURRENCY | | | NOTIONAL
VALUE AT
DECEMBER 31, 2016 | | | NET UNREALIZED
APPRECIATION
(DEPRECIATION) | |
| | | | Long Futures Outstanding | | | | | | | | | | | | | | | | |
| | 328 | | | E-mini S&P 500 | | | 03/17/17 | | | | USD | | | $ | 36,674 | | | $ | (103 | ) |
| | | | | | | | | | | | | | | | | | | | |
SEE NOTES TO FINANCIAL STATEMENTS.
| | | | | | | | |
| | | |
| DECEMBER 31, 2016 | | J.P. MORGAN INTREPID FUNDS | | | | | 17 | |
JPMorgan Intrepid Growth Fund
SCHEDULE OF PORTFOLIO INVESTMENTS
AS OF DECEMBER 31, 2016 (Unaudited)
(Amounts in thousands)
| | | | | | | | |
| SHARES | | | SECURITY DESCRIPTION | | VALUE($) | |
| Common Stocks — 96.8% | | | | |
| | | | Consumer Discretionary — 19.8% | | | | |
| | | | Auto Components — 0.5% | |
| | 33 | | | Lear Corp. | | | 4,302 | |
| | | | | | | | |
| | | | Hotels, Restaurants & Leisure — 3.7% | | | | |
| | 294 | | | International Game Technology plc | | | 7,498 | |
| | 162 | | | McDonald’s Corp. | | | 19,706 | |
| | 177 | | | Restaurant Brands International, Inc., (Canada) | | | 8,435 | |
| | | | | | | | |
| | | | | | | 35,639 | |
| | | | | | | | |
| | | | Household Durables — 1.4% | | | | |
| | 235 | | | DR Horton, Inc. | | | 6,417 | |
| | 4 | | | NVR, Inc. (a) | | | 7,344 | |
| | | | | | | | |
| | | | | | | 13,761 | |
| | | | | | | | |
| | | | Internet & Direct Marketing Retail — 1.6% | | | | |
| | 21 | | | Amazon.com, Inc. (a) | | | 15,597 | |
| | | | | | | | |
| | | | Media — 4.3% | | | | |
| | 144 | | | DISH Network Corp., Class A (a) | | | 8,336 | |
| | 212 | | | Live Nation Entertainment, Inc. (a) | | | 5,638 | |
| | 75 | | | Omnicom Group, Inc. | | | 6,392 | |
| | 1,685 | | | Sirius XM Holdings, Inc. | | | 7,500 | |
| | 489 | | | Twenty-First Century Fox, Inc., Class A | | | 13,720 | |
| | | | | | | | |
| | | | | | | 41,586 | |
| | | | | | | | |
| | | | Multiline Retail — 0.2% | | | | |
| | 43 | | | Kohl’s Corp. | | | 2,128 | |
| | | | | | | | |
| | | | Specialty Retail — 7.2% | | | | |
| | 162 | | | Best Buy Co., Inc. | | | 6,896 | |
| | 95 | | | Burlington Stores, Inc. (a) | | | 8,077 | |
| | 66 | | | Dick’s Sporting Goods, Inc. | | | 3,483 | |
| | 232 | | | Home Depot, Inc. (The) | | | 31,080 | |
| | 310 | | | Ross Stores, Inc. | | | 20,303 | |
| | | | | | | | |
| | | | | | | 69,839 | |
| | | | | | | | |
| | | | Textiles, Apparel & Luxury Goods — 0.9% | | | | |
| | 58 | | | Michael Kors Holdings Ltd. (a) | | | 2,510 | |
| | 70 | | | PVH Corp. | | | 6,281 | |
| | | | | | | | |
| | | | | | | 8,791 | |
| | | | | | | | |
| | | | Total Consumer Discretionary | | | 191,643 | |
| | | | | | | | |
| | | | Consumer Staples — 8.7% | |
| | | | Beverages — 1.3% | |
| | 18 | | | Molson Coors Brewing Co., Class B | | | 1,713 | |
| | 110 | | | PepsiCo, Inc. | | | 11,467 | |
| | | | | | | | |
| | | | | | | 13,180 | |
| | | | | | | | |
| | | | Food & Staples Retailing — 2.7% | | | | |
| | 255 | | | Sysco Corp. | | | 14,097 | |
| | 169 | | | Wal-Mart Stores, Inc. | | | 11,695 | |
| | | | | | | | |
| | | | | | | 25,792 | |
| | | | | | | | |
| | | | | | | | |
| SHARES | | | SECURITY DESCRIPTION | | VALUE($) | |
| | | | | | | | |
| | | | Food Products — 3.9% | | | | |
| | 57 | | | Ingredion, Inc. | | | 7,123 | |
| | 306 | | | Pilgrim’s Pride Corp. | | | 5,803 | |
| | 88 | | | Post Holdings, Inc. (a) | | | 7,066 | |
| | 285 | | | Tyson Foods, Inc., Class A | | | 17,548 | |
| | | | | | | | |
| | | | | | | 37,540 | |
| | | | | | | | |
| | | | Household Products — 0.2% | | | | |
| | 36 | | | Energizer Holdings, Inc. | | | 1,624 | |
| | | | | | | | |
| | | | Personal Products — 0.4% | | | | |
| | 88 | | | Nu Skin Enterprises, Inc., Class A | | | 4,190 | |
| | | | | | | | |
| | | | Tobacco — 0.2% | | | | |
| | 29 | | | Altria Group, Inc. | | | 1,948 | |
| | | | | | | | |
| | | | Total Consumer Staples | | | 84,274 | |
| | | | | | | | |
| | | | Energy — 0.8% | | | | |
| | | | Energy Equipment & Services — 0.6% | | | | |
| | 84 | | | Baker Hughes, Inc. | | | 5,477 | |
| | 225 | | | Seadrill Ltd., (United Kingdom) (a) | | | 766 | |
| | | | | | | | |
| | | | | | | 6,243 | |
| | | | | | | | |
| | | | Oil, Gas & Consumable Fuels — 0.2% | | | | |
| | 105 | | | Marathon Oil Corp. | | | 1,818 | |
| | | | | | | | |
| | | | Total Energy | | | 8,061 | |
| | | | | | | | |
| | | | Financials — 1.8% | | | | |
| | | | Capital Markets — 1.3% | | | | |
| | 39 | | | MarketAxess Holdings, Inc. | | | 5,789 | |
| | 93 | | | MSCI, Inc. | | | 7,326 | |
| | | | | | | | |
| | | | | | | 13,115 | |
| | | | | | | | |
| | | | Insurance — 0.5% | | | | |
| | 34 | | | Lincoln National Corp. | | | 2,266 | |
| | 21 | | | Prudential Financial, Inc. | | | 2,196 | |
| | | | | | | 4,462 | |
| | | | | | | | |
| | | | Total Financials | | | 17,577 | |
| | | | | | | | |
| | | | Health Care — 15.8% | | | | |
| | | | Biotechnology — 5.6% | | | | |
| | 61 | | | AbbVie, Inc. | | | 3,832 | |
| | 185 | | | Amgen, Inc. | | | 26,976 | |
| | 331 | | | Gilead Sciences, Inc. | | | 23,724 | |
| | | | | | | | |
| | | | | | | 54,532 | |
| | | | | | | | |
| | | | Health Care Equipment & Supplies — 3.1% | | | | |
| | 81 | | | Align Technology, Inc. (a) | | | 7,738 | |
| | 164 | | | Baxter International, Inc. | | | 7,254 | |
| | 190 | | | Hologic, Inc. (a) | | | 7,639 | |
| | 62 | | | IDEXX Laboratories, Inc. (a) | | | 7,271 | |
| | | | | | | | |
| | | | | | | 29,902 | |
| | | | | | | | |
SEE NOTES TO FINANCIAL STATEMENTS.
| | | | | | |
| | | |
| 18 | | | | J.P. MORGAN INTREPID FUNDS | | DECEMBER 31, 2016 |
| | | | | | | | |
| SHARES | | | SECURITY DESCRIPTION | | VALUE($) | |
| Common Stocks — continued | | | | |
| | | | Health Care Providers & Services — 6.9% | | | | |
| | 126 | | | Aetna, Inc. | | | 15,563 | |
| | 12 | | | Cigna Corp. | | | 1,627 | |
| | 224 | | | Express Scripts Holding Co. (a) | | | 15,416 | |
| | 47 | | | Humana, Inc. | | | 9,610 | |
| | 98 | | | UnitedHealth Group, Inc. | | | 15,668 | |
| | 64 | | | WellCare Health Plans, Inc. (a) | | | 8,732 | |
| | | | | | | | |
| | | | | | | 66,616 | |
| | | | | | | | |
| | | | Health Care Technology — 0.2% | | | | |
| | 41 | | | Veeva Systems, Inc., Class A (a) | | | 1,665 | |
| | | | | | | | |
| | | | Total Health Care | | | 152,715 | |
| | | | | | | | |
| | | | Industrials — 9.5% | | | | |
| | | | Aerospace & Defense — 2.1% | | | | |
| | 73 | | | Curtiss-Wright Corp. | | | 7,220 | |
| | 20 | | | Huntington Ingalls Industries, Inc. | | | 3,666 | |
| | 6 | | | L-3 Communications Holdings, Inc. | | | 958 | |
| | 35 | | | Northrop Grumman Corp. | | | 8,047 | |
| | | | | | | | |
| | | | | | | 19,891 | |
| | | | | | | | |
| | | | Airlines — 2.2% | | | | |
| | 67 | | | Copa Holdings SA, (Panama), Class A | | | 6,095 | |
| | 147 | | | Delta Air Lines, Inc. | | | 7,206 | |
| | 111 | | | United Continental Holdings, Inc. (a) | | | 8,060 | |
| | | | | | | | |
| | | | | | | 21,361 | |
| | | | | | | | |
| | | | Building Products — 0.7% | | | | |
| | 225 | | | Masco Corp. | | | 7,124 | |
| | | | | | | | |
| | | | Construction & Engineering — 1.7% | | | | |
| | 122 | | | Jacobs Engineering Group, Inc. (a) | | | 6,937 | |
| | 236 | | | Quanta Services, Inc. (a) | | | 8,221 | |
| | 6 | | | Valmont Industries, Inc. | | | 775 | |
| | | | | | | | |
| | | | | | | 15,933 | |
| | | | | | | | |
| | | | Electrical Equipment — 0.6% | | | | |
| | 70 | | | EnerSys | | | 5,490 | |
| | | | | | | | |
| | | | Machinery — 0.8% | | | | |
| | 53 | | | Parker-Hannifin Corp. | | | 7,392 | |
| | | | | | | | |
| | | | Professional Services — 0.7% | | | | |
| | 79 | | | ManpowerGroup, Inc. | | | 7,021 | |
| | | | | | | | |
| | | | Trading Companies & Distributors — 0.7% | | | | |
| | 68 | | | United Rentals, Inc. (a) | | | 7,127 | |
| | | | | | | | |
| | | | Total Industrials | | | 91,339 | |
| | | | | | | | |
| | | | Information Technology — 32.4% | | | | |
| | | | Communications Equipment — 0.2% | |
| | 15 | | | F5 Networks, Inc. (a) | | | 2,098 | |
| | | | | | | | |
| | | | | | | | |
| SHARES | | | SECURITY DESCRIPTION | | VALUE($) | |
| | | | | | | | |
| | | | Internet Software & Services — 5.6% | | | | |
| | 11 | | | Alphabet, Inc., Class A (a) | | | 8,321 | |
| | 10 | | | Alphabet, Inc., Class C (a) | | | 7,564 | |
| | 769 | | | eBay, Inc. (a) | | | 22,835 | |
| | 39 | | | Facebook, Inc., Class A (a) | | | 4,429 | |
| | 103 | | | GoDaddy, Inc., Class A (a) | | | 3,596 | |
| | 88 | | | VeriSign, Inc. (a) | | | 6,709 | |
| | | | | | | | |
| | | | | | | 53,454 | |
| | | | | | | | |
| | | | IT Services — 3.8% | | | | |
| | 112 | | | Computer Sciences Corp. | | | 6,637 | |
| | 2 | | | Mastercard, Inc., Class A | | | 207 | |
| | 25 | | | Science Applications International Corp. | | | 2,122 | |
| | 360 | | | Visa, Inc., Class A | | | 28,056 | |
| | | | | | | | |
| | | | | | | 37,022 | |
| | | | | | | | |
| | | | Semiconductors & Semiconductor Equipment — 3.3% | |
| | 658 | | | Applied Materials, Inc. | | | 21,237 | |
| | 75 | | | Lam Research Corp. | | | 7,908 | |
| | 19 | | | QUALCOMM, Inc. | | | 1,219 | |
| | 63 | | | Teradyne, Inc. | | | 1,598 | |
| | | | | | | | |
| | | | | | | 31,962 | |
| | | | | | | | |
| | | | Software — 13.1% | | | | |
| | 520 | | | Activision Blizzard, Inc. | | | 18,759 | |
| | 43 | | | Aspen Technology, Inc. (a) | | | 2,368 | |
| | 88 | | | Citrix Systems, Inc. (a) | | | 7,877 | |
| | 58 | | | Electronic Arts, Inc. (a) | | | 4,544 | |
| | 746 | | | Microsoft Corp. | | | 46,347 | |
| | 98 | | | Nuance Communications, Inc. (a) | | | 1,458 | |
| | 184 | | | Oracle Corp. | | | 7,083 | |
| | 33 | | | Red Hat, Inc. (a) | | | 2,307 | |
| | 23 | | | Symantec Corp. | | | 538 | |
| | 137 | | | Synopsys, Inc. (a) | | | 8,070 | |
| | 167 | | | Take-Two Interactive Software, Inc. (a) | | | 8,246 | |
| | 241 | | | VMware, Inc., Class A (a) | | | 18,974 | |
| | | | | | | | |
| | | | | | | 126,571 | |
| | | | | | | | |
| | | | Technology Hardware, Storage & Peripherals — 6.4% | |
| | 308 | | | Apple, Inc. | | | 35,667 | |
| | 198 | | | Hewlett Packard Enterprise Co. | | | 4,579 | |
| | 543 | | | HP, Inc. | | | 8,051 | |
| | 145 | | | NCR Corp. (a) | | | 5,873 | |
| | 209 | | | NetApp, Inc. | | | 7,379 | |
| | | | | | | | |
| | | | | | | 61,549 | |
| | | | | | | | |
| | | | Total Information Technology | | | 312,656 | |
| | | | | | | | |
SEE NOTES TO FINANCIAL STATEMENTS.
| | | | | | | | |
| | | |
| DECEMBER 31, 2016 | | J.P. MORGAN INTREPID FUNDS | | | | | 19 | |
JPMorgan Intrepid Growth Fund
SCHEDULE OF PORTFOLIO INVESTMENTS
AS OF DECEMBER 31, 2016 (Unaudited) (continued)
(Amounts in thousands, except number of Futures contracts)
| | | | | | | | |
| SHARES | | | SECURITY DESCRIPTION | | VALUE($) | |
| Common Stocks — continued | | | | |
| | | | Materials — 3.2% | |
| | | | Chemicals — 0.3% | |
| | 128 | | | Chemours Co. (The) | | | 2,832 | |
| | | | | | | | |
| | | | Containers & Packaging — 1.6% | | | | |
| | 166 | | | Berry Plastics Group, Inc. (a) | | | 8,094 | |
| | 146 | | | Crown Holdings, Inc. (a) | | | 7,691 | |
| | | | | | | | |
| | | | | | | 15,785 | |
| | | | | | | | |
| | | | Metals & Mining — 1.3% | | | | |
| | 124 | | | Newmont Mining Corp. | | | 4,208 | |
| | 222 | | | Steel Dynamics, Inc. | | | 7,888 | |
| | | | | | | | |
| | | | | | | 12,096 | |
| | | | | | | | |
| | | | Total Materials | | | 30,713 | |
| | | | | | | | |
| | | | Real Estate — 2.6% | |
| | | | Equity Real Estate Investment Trusts (REITs) — 2.6% | |
| | 193 | | | American Homes 4 Rent, Class A | | | 4,043 | |
| | 121 | | | American Tower Corp. | | | 12,798 | |
| | 113 | | | Equity Commonwealth (a) | | | 3,411 | |
| | 11 | | | Extra Space Storage, Inc. | | | 811 | |
| | 16 | | | Public Storage | | | 3,620 | |
| | | | | | | | |
| | | | Total Real Estate | | | 24,683 | |
| | | | | | | | |
| | | | Telecommunication Services — 1.7% | | | | |
| | | | Diversified Telecommunication Services — 1.7% | |
| | 313 | | | AT&T, Inc. | | | 13,322 | |
| | 52 | | | Verizon Communications, Inc. | | | 2,781 | |
| | | | | | | | |
| | | | Total Telecommunication Services | | | 16,103 | |
| | | | | | | | |
| | | | | | | | |
| SHARES | | | SECURITY DESCRIPTION | | VALUE($) | |
| | | | | | | | |
| | | | Utilities — 0.5% | | | | |
| | | | Independent Power & Renewable Electricity Producers — 0.3% | |
| | 246 | | | AES Corp. | | | 2,855 | |
| | | | | | | | |
| | | | Multi-Utilities — 0.2% | |
| | 52 | | | MDU Resources Group, Inc. | | | 1,485 | |
| | | | | | | | |
| | | | Total Utilities | | | 4,340 | |
| | | | | | | | |
| | | | Total Common Stocks
(Cost $737,265) | | | 934,104 | |
| | | | | | | | |
| Short-Term Investment — 2.7% | |
| | | | Investment Company — 2.7% | |
| | 26,136 | | | JPMorgan U.S. Government Money Market Fund, Institutional Class Shares, 0.410% (b) (l)
(Cost $26,136) | | | 26,136 | |
| | | | | | | | |
| | | | Total Investments — 99.5%
(Cost $763,401) | | | 960,240 | |
| | | | Other Assets in Excess of
Liabilities — 0.5% | | | 5,280 | |
| | | | | | | | |
| | | | NET ASSETS — 100.0% | | $ | 965,520 | |
| | | | | | | | |
Percentages indicated are based on net assets.
| | | | | | | | | | | | | | | | | | | | |
| Futures Contracts | |
NUMBER OF
CONTRACTS | | | DESCRIPTION | | EXPIRATION
DATE | | | TRADING
CURRENCY | | | NOTIONAL
VALUE AT
DECEMBER 31, 2016 | | | NET UNREALIZED
APPRECIATION
(DEPRECIATION) | |
| | | | Long Futures Outstanding | | | | | | | | | | | | | | | | |
| | 237 | | | E-mini S&P 500 | | | 03/17/17 | | | | USD | | | $ | 26,499 | | | $ | (111 | ) |
| | | | | | | | | | | | | | | | | | | | |
SEE NOTES TO FINANCIAL STATEMENTS.
| | | | | | |
| | | |
| 20 | | | | J.P. MORGAN INTREPID FUNDS | | DECEMBER 31, 2016 |
JPMorgan Intrepid Mid Cap Fund
SCHEDULE OF PORTFOLIO INVESTMENTS
AS OF DECEMBER 31, 2016 (Unaudited)
(Amounts in thousands)
| | | | | | | | |
| SHARES | | | SECURITY DESCRIPTION | | VALUE($) | |
| Common Stocks — 98.5% | | | | |
| | | | Consumer Discretionary — 10.7% | | | | |
| | | | Auto Components — 0.4% | |
| | 47 | | | Visteon Corp. | | | 3,736 | |
| | | | | | | | |
| | | | Automobiles — 1.1% | | | | |
| | 114 | | | Thor Industries, Inc. | | | 11,366 | |
| | | | | | | | |
| | | | Diversified Consumer Services — 0.1% | | | | |
| | 2 | | | Graham Holdings Co., Class B | | | 1,126 | |
| | | | | | | | |
| | | | Hotels, Restaurants & Leisure — 1.8% | | | | |
| | 76 | | | Brinker International, Inc. | | | 3,739 | |
| | 24 | | | Darden Restaurants, Inc. | | | 1,753 | |
| | 278 | | | International Game Technology plc | | | 7,102 | |
| | 41 | | | Vail Resorts, Inc. | | | 6,630 | |
| | | | | | | | |
| | | | | | | 19,224 | |
| | | | | | | | |
| | | | Household Durables — 1.3% | | | | |
| | 493 | | | DR Horton, Inc. | | | 13,482 | |
| | | | | | | | |
| | | | Internet & Direct Marketing Retail — 1.1% | |
| | 161 | | | Groupon, Inc. (a) | | | 534 | |
| | 571 | | | Liberty Interactive Corp. QVC Group, Class A (a) | | | 11,404 | |
| | | | | | | | |
| | | | | | | 11,938 | |
| | | | | | | | |
| | | | Leisure Products — 0.1% | | | | |
| | 18 | | | Hasbro, Inc. | | | 1,377 | |
| | | | | | | | |
| | | | Media — 0.4% | | | | |
| | 34 | | | Discovery Communications, Inc., Class C (a) | | | 900 | |
| | 129 | | | Interpublic Group of Cos., Inc. (The) | | | 3,013 | |
| | | | | | | | |
| | | | | | | 3,913 | |
| | | | | | | | |
| | | | Multiline Retail — 1.5% | | | | |
| | 307 | | | Macy’s, Inc. | | | 11,008 | |
| | 88 | | | Nordstrom, Inc. | | | 4,208 | |
| | | | | | | | |
| | | | | | | 15,216 | |
| | | | | | | | |
| | | | Specialty Retail — 1.5% | | | | |
| | 367 | | | Best Buy Co., Inc. | | | 15,656 | |
| | | | | | | | |
| | | | Textiles, Apparel & Luxury Goods — 1.4% | |
| | 167 | | | PVH Corp. | | | 15,088 | |
| | | | | | | | |
| | | | Total Consumer Discretionary | | | 112,122 | |
| | | | | | | | |
| | | | Consumer Staples — 6.9% | | | | |
| | | | Food & Staples Retailing — 1.7% | |
| | 377 | | | Rite Aid Corp. (a) | | | 3,106 | |
| | 220 | | | Sysco Corp. | | | 12,176 | |
| | 81 | | | US Foods Holding Corp. (a) | | | 2,226 | |
| | | | | | | | |
| | | | | | | 17,508 | |
| | | | | | | | |
| | | | Food Products — 4.2% | | | | |
| | 139 | | | Ingredion, Inc. | | | 17,394 | |
| | | | | | | | |
| SHARES | | | SECURITY DESCRIPTION | | VALUE($) | |
| | | | | | | | |
| | | | Food Products — continued | | | | |
| | 460 | | | Pilgrim’s Pride Corp. | | | 8,743 | |
| | 303 | | | Tyson Foods, Inc., Class A | | | 18,658 | |
| | | | | | | | |
| | | | | | | 44,795 | |
| | | | | | | | |
| | | | Personal Products — 1.0% | | | | |
| | 70 | | | Herbalife Ltd. (a) | | | 3,384 | |
| | 146 | | | Nu Skin Enterprises, Inc., Class A | | | 6,962 | |
| | | | | | | | |
| | | | | | | 10,346 | |
| | | | | | | | |
| | | | Total Consumer Staples | | | 72,649 | |
| | | | | | | | |
| | | | Energy — 6.9% | |
| | | | Energy Equipment & Services — 1.5% | |
| | 105 | | | Baker Hughes, Inc. | | | 6,834 | |
| | 279 | | | Ensco plc, Class A | | | 2,709 | |
| | 288 | | | Nabors Industries Ltd. | | | 4,728 | |
| | 67 | | | Rowan Cos. plc, Class A (a) | | | 1,264 | |
| | | | | | | | |
| | | | | | | 15,535 | |
| | | | | | | | |
| | | | Oil, Gas & Consumable Fuels — 5.4% | | | | |
| | 62 | | | Cimarex Energy Co. | | | 8,392 | |
| | 106 | | | Devon Energy Corp. | | | 4,855 | |
| | 29 | | | Gulfport Energy Corp. (a) | | | 628 | |
| | 537 | | | Marathon Oil Corp. | | | 9,295 | |
| | 50 | | | Marathon Petroleum Corp. | | | 2,517 | |
| | 55 | | | Murphy Oil Corp. | | | 1,706 | |
| | 8 | | | Noble Energy, Inc. | | | 308 | |
| | 27 | | | ONEOK, Inc. | | | 1,550 | |
| | 66 | | | PBF Energy, Inc., Class A | | | 1,843 | |
| | 373 | | | QEP Resources, Inc. (a) | | | 6,863 | |
| | 24 | | | Rice Energy, Inc. (a) | | | 502 | |
| | 59 | | | Tesoro Corp. | | | 5,195 | |
| | 34 | | | Valero Energy Corp. | | | 2,330 | |
| | 189 | | | World Fuel Services Corp. | | | 8,677 | |
| | 193 | | | WPX Energy, Inc. (a) | | | 2,815 | |
| | | | | | | | |
| | | | | | | 57,476 | |
| | | | | | | | |
| | | | Total Energy | | | 73,011 | |
| | | | | | | | |
| | | | Financials — 11.3% | |
| | | | Banks — 3.6% | |
| | 41 | | | Citizens Financial Group, Inc. | | | 1,447 | |
| | 62 | | | East West Bancorp, Inc. | | | 3,141 | |
| | 27 | | | Fifth Third Bancorp | | | 736 | |
| | 106 | | | KeyCorp | | | 1,944 | |
| | 378 | | | Popular, Inc., (Puerto Rico) | | | 16,568 | |
| | 335 | | | Regions Financial Corp. | | | 4,812 | |
| | 13 | | | Signature Bank (a) | | | 1,938 | |
| | 24 | | | SVB Financial Group (a) | | | 4,086 | |
SEE NOTES TO FINANCIAL STATEMENTS.
| | | | | | | | |
| | | |
| DECEMBER 31, 2016 | | J.P. MORGAN INTREPID FUNDS | | | | | 21 | |
JPMorgan Intrepid Mid Cap Fund
SCHEDULE OF PORTFOLIO INVESTMENTS
AS OF DECEMBER 31, 2016 (Unaudited) (continued)
(Amounts in thousands)
| | | | | | | | |
| SHARES | | | SECURITY DESCRIPTION | | VALUE($) | |
| Common Stocks — continued | |
| | | | Banks — continued | |
| | 67 | | | Zions Bancorp | | | 2,862 | |
| | | | | | | | |
| | | | | | | 37,534 | |
| | | | | | | | |
| | | | Capital Markets — 1.1% | | | | |
| | 4 | | | Donnelley Financial Solutions, Inc. (a) | | | 86 | |
| | 54 | | | Intercontinental Exchange, Inc. | | | 3,041 | |
| | 19 | | | Lazard Ltd., Class A | | | 797 | |
| | 78 | | | MSCI, Inc. | | | 6,169 | |
| | 16 | | | Nasdaq, Inc. | | | 1,040 | |
| | 10 | | | Raymond James Financial, Inc. | | | 720 | |
| | | | | | | | |
| | | | | | | 11,853 | |
| | | | | | | | |
| | | | Consumer Finance — 2.1% | | | | |
| | 139 | | | Discover Financial Services | | | 10,013 | |
| | 342 | | | Synchrony Financial | | | 12,394 | |
| | | | | | | | |
| | | | | | | 22,407 | |
| | | | | | | | |
| | | | Insurance — 4.5% | | | | |
| | 70 | | | Allied World Assurance Co. Holdings AG | | | 3,765 | |
| | 72 | | | American Financial Group, Inc. | | | 6,309 | |
| | 5 | | | American National Insurance Co. | | | 648 | |
| | 22 | | | Aon plc | | | 2,465 | |
| | 17 | | | Arch Capital Group Ltd. (a) | | | 1,445 | |
| | 34 | | | Aspen Insurance Holdings Ltd., (Bermuda) | | | 1,887 | |
| | 34 | | | Assurant, Inc. | | | 3,190 | |
| | 51 | | | Assured Guaranty Ltd. | | | 1,934 | |
| | 21 | | | Endurance Specialty Holdings Ltd. | | | 1,913 | |
| | 8 | | | Everest Re Group Ltd. | | | 1,710 | |
| | 16 | | | First American Financial Corp. | | | 593 | |
| | 14 | | | FNF Group | | | 480 | |
| | 74 | | | Hanover Insurance Group, Inc. (The) | | | 6,762 | |
| | 47 | | | Hartford Financial Services Group, Inc. (The) | | | 2,225 | |
| | 32 | | | Lincoln National Corp. | | | 2,107 | |
| | 42 | | | Principal Financial Group, Inc. | | | 2,453 | |
| | 22 | | | Torchmark Corp. | | | 1,588 | |
| | 98 | | | Unum Group | | | 4,305 | |
| | 21 | | | Validus Holdings Ltd. | | | 1,177 | |
| | | | | | | | |
| | | | | | | 46,956 | |
| | | | | | | | |
| | | | Mortgage Real Estate Investment Trusts (REITs) — 0.0% (g) | |
| | 24 | | | Annaly Capital Management, Inc. | | | 238 | |
| | 12 | | | Chimera Investment Corp. | | | 196 | |
| | | | | | | | |
| | | | | | | 434 | |
| | | | | | | | |
| | | | Total Financials | | | 119,184 | |
| | | | | | | | |
| | | | Health Care — 9.4% | |
| | | | Biotechnology — 1.4% | |
| | 27 | | | ACADIA Pharmaceuticals, Inc. (a) | | | 785 | |
| | 41 | | | Alkermes plc (a) | | | 2,257 | |
| | | | | | | | |
| SHARES | | | SECURITY DESCRIPTION | | VALUE($) | |
| | | | | | | | |
| | | | Biotechnology — continued | |
| | 46 | | | Alnylam Pharmaceuticals, Inc. (a) | | | 1,737 | |
| | 33 | | | BioMarin Pharmaceutical, Inc. (a) | | | 2,750 | |
| | 41 | | | Incyte Corp. (a) | | | 4,071 | |
| | 10 | | | Intercept Pharmaceuticals, Inc. (a) | | | 1,108 | |
| | 18 | | | Neurocrine Biosciences, Inc. (a) | | | 677 | |
| | 18 | | | Seattle Genetics, Inc. (a) | | | 924 | |
| | | | | | | | |
| | | | | | | 14,309 | |
| | | | | | | | |
| | | | Health Care Equipment & Supplies — 3.7% | | | | |
| | 190 | | | Hill-Rom Holdings, Inc. | | | 10,644 | |
| | 367 | | | Hologic, Inc. (a) | | | 14,732 | |
| | 132 | | | Zimmer Biomet Holdings, Inc. | | | 13,612 | |
| | | | | | | | |
| | | | | | | 38,988 | |
| | | | | | | | |
| | | | Health Care Providers & Services — 3.4% | | | | |
| | 190 | | | AmerisourceBergen Corp. | | | 14,848 | |
| | 84 | | | Centene Corp. (a) | | | 4,733 | |
| | 4 | | | Humana, Inc. | | | 714 | |
| | 287 | | | Premier, Inc., Class A (a) | | | 8,726 | |
| | 272 | | | Tenet Healthcare Corp. (a) | | | 4,032 | |
| | 22 | | | WellCare Health Plans, Inc. (a) | | | 2,961 | |
| | | | | | | | |
| | | | | | | 36,014 | |
| | | | | | | | |
| | | | Pharmaceuticals — 0.9% | | | | |
| | 170 | | | Endo International plc (a) | | | 2,803 | |
| | 63 | | | Mallinckrodt plc (a) | | | 3,154 | |
| | 41 | | | Perrigo Co. plc | | | 3,387 | |
| | | | | | | | |
| | | | | | | 9,344 | |
| | | | | | | | |
| | | | Total Health Care | | | 98,655 | |
| | | | | | | | |
| | | | Industrials — 14.2% | |
| | | | Aerospace & Defense — 3.5% | |
| | 65 | | | HEICO Corp., Class A | | | 4,393 | |
| | 110 | | | Huntington Ingalls Industries, Inc. | | | 20,282 | |
| | 42 | | | L-3 Communications Holdings, Inc. | | | 6,328 | |
| | 3 | | | Northrop Grumman Corp. | | | 790 | |
| | 77 | | | Spirit AeroSystems Holdings, Inc., Class A | | | 4,499 | |
| | | | | | | | |
| | | | | | | 36,292 | |
| | | | | | | | |
| | | | Airlines — 2.3% | | | | |
| | 263 | | | JetBlue Airways Corp. (a) | | | 5,903 | |
| | 245 | | | United Continental Holdings, Inc. (a) | | | 17,827 | |
| | | | | | | | |
| | | | | | | 23,730 | |
| | | | | | | | |
| | | | Commercial Services & Supplies — 1.3% | | | | |
| | 307 | | | KAR Auction Services, Inc. | | | 13,084 | |
| | 4 | | | LSC Communications, Inc. | | | 111 | |
| | | | | | | | |
| | | | | | | 13,195 | |
| | | | | | | | |
SEE NOTES TO FINANCIAL STATEMENTS.
| | | | | | |
| | | |
| 22 | | | | J.P. MORGAN INTREPID FUNDS | | DECEMBER 31, 2016 |
| | | | | | | | |
| SHARES | | | SECURITY DESCRIPTION | | VALUE($) | |
| Common Stocks — continued | |
| | | | Construction & Engineering — 2.1% | | | | |
| | 33 | | | Fluor Corp. | | | 1,717 | |
| | 84 | | | Jacobs Engineering Group, Inc. (a) | | | 4,777 | |
| | 966 | | | KBR, Inc. | | | 16,118 | |
| | | | | | | | |
| | | | | | | 22,612 | |
| | | | | | | | |
| | | | Electrical Equipment — 0.5% | | | | |
| | 79 | | | Regal Beloit Corp. | | | 5,478 | |
| | | | | | | | |
| | | | Machinery — 2.0% | |
| | 150 | | | Crane Co. | | | 10,832 | |
| | 69 | | | Parker-Hannifin Corp. | | | 9,709 | |
| | | | | | | | |
| | | | | | | 20,541 | |
| | | | | | | | |
| | | | Professional Services — 1.5% | | | | |
| | 121 | | | ManpowerGroup, Inc. | | | 10,709 | |
| | 173 | | | TransUnion (a) | | | 5,348 | |
| | | | | | | | |
| | | | | | | 16,057 | |
| | | | | | | | |
| | | | Road & Rail — 0.1% | | | | |
| | 19 | | | Landstar System, Inc. | | | 1,578 | |
| | | | | | | | |
| | | | Trading Companies & Distributors — 0.9% | |
| | 142 | | | WESCO International, Inc. (a) | | | 9,470 | |
| | | | | | | | |
| | | | Total Industrials | | | 148,953 | |
| | | | | | | | |
| | | | Information Technology — 16.8% | | | | |
| | | | Communications Equipment — 1.2% | |
| | 307 | | | ARRIS International plc (a) | | | 9,238 | |
| | 22 | | | F5 Networks, Inc. (a) | | | 3,198 | |
| | | | | | | | |
| | | | | | | 12,436 | |
| | | | | | | | |
| | | | Electronic Equipment, Instruments & Components — 0.5% | |
| | 9 | | | Arrow Electronics, Inc. (a) | | | 606 | |
| | 76 | | | Avnet, Inc. | | | 3,628 | |
| | 148 | | | Fitbit, Inc., Class A (a) | | | 1,084 | |
| | | | | | | | |
| | | | | | | 5,318 | |
| | | | | | | | |
| | | | Internet Software & Services — 1.6% | | | | |
| | 187 | | | InterActiveCorp (a) | | | 12,109 | |
| | 130 | | | Yelp, Inc. (a) | | | 4,946 | |
| | | | | | | | |
| | | | | | | 17,055 | |
| | | | | | | | |
| | | | IT Services — 4.5% | | | | |
| | 218 | | | CoreLogic, Inc. (a) | | | 8,025 | |
| | 43 | | | Teradata Corp. (a) | | | 1,158 | |
| | 83 | | | Total System Services, Inc. | | | 4,060 | |
| | 255 | | | Vantiv, Inc., Class A (a) | | | 15,203 | |
| | 2,177 | | | Xerox Corp. | | | 19,005 | |
| | | | | | | | |
| | | | | | | 47,451 | |
| | | | | | | | |
| | | | | | | | |
| SHARES | | | SECURITY DESCRIPTION | | VALUE($) | |
| | | | | | | | |
| | | | Semiconductors & Semiconductor Equipment — 3.7% | |
| | 310 | | | Applied Materials, Inc. | | | 10,013 | |
| | 25 | | | Lam Research Corp. | | | 2,654 | |
| | 1,434 | | | Marvell Technology Group Ltd., (Bermuda) | | | 19,891 | |
| | 91 | | | Micron Technology, Inc. (a) | | | 1,988 | |
| | 84 | | | ON Semiconductor Corp. (a) | | | 1,075 | |
| | 45 | | | Skyworks Solutions, Inc. | | | 3,337 | |
| | | | | | | | |
| | | | | | | 38,958 | |
| | | | | | | | |
| | | | Software — 1.7% | | | | |
| | 73 | | | Activision Blizzard, Inc. | | | 2,647 | |
| | 78 | | | CA, Inc. | | | 2,472 | |
| | 94 | | | Citrix Systems, Inc. (a) | | | 8,377 | |
| | 244 | | | Nuance Communications, Inc. (a) | | | 3,632 | |
| | | | | | | | |
| | | | | | | 17,128 | |
| | | | | | | | |
| | | | Technology Hardware, Storage & Peripherals — 3.6% | |
| | 526 | | | NCR Corp. (a) | | | 21,331 | |
| | 241 | | | Western Digital Corp. | | | 16,403 | |
| | | | | | | | |
| | | | | | | 37,734 | |
| | | | | | | | |
| | | | Total Information Technology | | | 176,080 | |
| | | | | | | | |
| | | | Materials — 5.5% | |
| | | | Chemicals — 1.5% | |
| | 313 | | | Cabot Corp. | | | 15,794 | |
| | 13 | | | Huntsman Corp. | | | 244 | |
| | | | | | | | |
| | | | | | | 16,038 | |
| | | | | | | | |
| | | | Containers & Packaging — 2.5% | | | | |
| | 53 | | | Avery Dennison Corp. | | | 3,743 | |
| | 237 | | | Berry Plastics Group, Inc. (a) | | | 11,559 | |
| | 82 | | | Crown Holdings, Inc. (a) | | | 4,290 | |
| | 93 | | | International Paper Co. | | | 4,918 | |
| | 31 | | | Sealed Air Corp. | | | 1,410 | |
| | | | | | | | |
| | | | | | | 25,920 | |
| | | | | | | | |
| | | | Metals & Mining — 1.5% | | | | |
| | 45 | | | Newmont Mining Corp. | | | 1,533 | |
| | 33 | | | Reliance Steel & Aluminum Co. | | | 2,625 | |
| | 321 | | | Steel Dynamics, Inc. | | | 11,414 | |
| | | | | | | | |
| | | | | | | 15,572 | |
| | | | | | | | |
| | | | Total Materials | | | 57,530 | |
| | | | | | | | |
| | | | Real Estate — 10.1% | |
| | | | Equity Real Estate Investment Trusts (REITs) — 10.1% | |
| | 63 | | | American Campus Communities, Inc. | | | 3,150 | |
| | 295 | | | American Homes 4 Rent, Class A | | | 6,189 | |
| | 57 | | | Apartment Investment & Management Co., Class A | | | 2,595 | |
| | 558 | | | Apple Hospitality REIT, Inc. | | | 11,149 | |
SEE NOTES TO FINANCIAL STATEMENTS.
| | | | | | | | |
| | | |
| DECEMBER 31, 2016 | | J.P. MORGAN INTREPID FUNDS | | | | | 23 | |
JPMorgan Intrepid Mid Cap Fund
SCHEDULE OF PORTFOLIO INVESTMENTS
AS OF DECEMBER 31, 2016 (Unaudited) (continued)
(Amounts in thousands, except number of Futures contracts)
| | | | | | | | |
| SHARES | | | SECURITY DESCRIPTION | | VALUE($) | |
| Common Stocks — continued | |
| | | | Equity Real Estate Investment Trusts (REITs) — continued | |
| | 9 | | | Boston Properties, Inc. | | | 1,094 | |
| | 128 | | | Brixmor Property Group, Inc. | | | 3,121 | |
| | 199 | | | Columbia Property Trust, Inc. | | | 4,307 | |
| | 174 | | | Corporate Office Properties Trust | | | 5,432 | |
| | 20 | | | Crown Castle International Corp. | | | 1,692 | |
| | 11 | | | CyrusOne, Inc. | | | 474 | |
| | 12 | | | Digital Realty Trust, Inc. | | | 1,150 | |
| | 32 | | | Douglas Emmett, Inc. | | | 1,166 | |
| | 62 | | | Equinix, Inc. | | | 22,053 | |
| | 298 | | | Equity Commonwealth (a) | | | 9,025 | |
| | 48 | | | Equity LifeStyle Properties, Inc. | | | 3,425 | |
| | 45 | | | Liberty Property Trust | | | 1,774 | |
| | 55 | | | Mid-America Apartment Communities, Inc. | | | 5,382 | |
| | 24 | | | Regency Centers Corp. | | | 1,669 | |
| | 146 | | | Retail Properties of America, Inc., Class A | | | 2,244 | |
| | 4 | | | SL Green Realty Corp. | | | 376 | |
| | 441 | | | Spirit Realty Capital, Inc. | | | 4,788 | |
| | 27 | | | Taubman Centers, Inc. | | | 2,004 | |
| | 3 | | | Ventas, Inc. | | | 186 | |
| | 44 | | | Vornado Realty Trust | | | 4,551 | |
| | 14 | | | Welltower, Inc. | | | 957 | |
| | 199 | | | Weyerhaeuser Co. | | | 5,985 | |
| | | | | | | | |
| | | | Total Real Estate | | | 105,938 | |
| | | | | | | | |
| | | | Telecommunication Services — 0.6% | | | | |
| | | | Diversified Telecommunication Services — 0.5% | |
| | 203 | | | CenturyLink, Inc. | | | 4,832 | |
| | | | | | | | |
| | | | Wireless Telecommunication Services — 0.1% | |
| | 170 | | | Sprint Corp. (a) | | | 1,428 | |
| | | | | | | | |
| | | | Total Telecommunication Services | | | 6,260 | |
| | | | | | | | |
| | | | Utilities — 6.1% | | | | |
| | | | Electric Utilities — 2.2% | |
| | 75 | | | Alliant Energy Corp. | | | 2,827 | |
| | 112 | | | Edison International | | | 8,085 | |
| | 76 | | | Entergy Corp. | | | 5,576 | |
| | 143 | | | FirstEnergy Corp. | | | 4,419 | |
| | 65 | | | Great Plains Energy, Inc. | | | 1,767 | |
| | 8 | | | Pinnacle West Capital Corp. | | | 593 | |
| | | | | | | | |
| | | | | | | 23,267 | |
| | | | | | | | |
| | | | | | | | |
| SHARES | | | SECURITY DESCRIPTION | | VALUE($) | |
| | | | | | | | |
| | | | Gas Utilities — 1.0% | |
| | 230 | | | UGI Corp. | | | 10,591 | |
| | | | | | | | |
| | | | Multi-Utilities — 2.9% | |
| | 46 | | | Ameren Corp. | | | 2,408 | |
| | 120 | | | CenterPoint Energy, Inc. | | | 2,954 | |
| | 112 | | | CMS Energy Corp. | | | 4,674 | |
| | 34 | | | Consolidated Edison, Inc. | | | 2,527 | |
| | 60 | | | DTE Energy Co. | | | 5,901 | |
| | 70 | | | MDU Resources Group, Inc. | | | 2,023 | |
| | 90 | | | Public Service Enterprise Group, Inc. | | | 3,954 | |
| | 55 | | | Sempra Energy | | | 5,555 | |
| | | | | | | | |
| | | | | | | 29,996 | |
| | | | | | | | |
| | | | Total Utilities | | | 63,854 | |
| | | | | | | | |
| | | | Total Common Stocks
(Cost $863,360) | | | 1,034,236 | |
| | | | | | | | |
| | |
NUMBER OF
RIGHTS | | | | | | |
| Rights — 0.0% (g) | | | | |
| | | | Consumer Staples — 0.0% (g) | | | | |
| | | | Food & Staples Retailing — 0.0% (g) | |
| | 121 | | | Safeway, Inc., expiring 01/30/17 (a) | | | 6 | |
| | 121 | | | Safeway, Inc., expiring 01/30/18 (a) | | | 8 | |
| | | | | | | | |
| | | | Total Rights
(Cost $—) | | | 14 | |
| | | | | | | | |
| | |
| SHARES | | | | | | |
| Short-Term Investment — 1.9% | | | | |
| | | | Investment Company — 1.9% | | | | |
| | 19,841 | | | JPMorgan U.S. Government Money Market Fund, Institutional Class Shares, 0.410% (b) (l)
(Cost $19,841) | | | 19,841 | |
| | | | | | | | |
| | | | Total Investments — 100.4%
(Cost $883,201) | | | 1,054,091 | |
| | | | Liabilities in Excess of
Other Assets — (0.4)% | | | (4,292 | ) |
| | | | | | | | |
| | | | NET ASSETS — 100.0% | | $ | 1,049,799 | |
| | | | | | | | |
Percentages indicated are based on net assets.
| | | | | | | | | | | | | | | | | | | | |
| Futures Contracts | |
NUMBER OF
CONTRACTS | | | DESCRIPTION | | EXPIRATION
DATE | | | TRADING
CURRENCY | | | NOTIONAL
VALUE AT
DECEMBER 31, 2016 | | | NET UNREALIZED
APPRECIATION
(DEPRECIATION) | |
| | | | Long Futures Outstanding | | | | | | | | | | | | | | | | |
| | 81 | | | E-mini S&P MidCap 400 | | | 03/17/17 | | | | USD | | | $ | 13,439 | | | $ | (240 | ) |
| | | | | | | | | | | | | | | | | | | | |
SEE NOTES TO FINANCIAL STATEMENTS.
| | | | | | |
| | | |
| 24 | | | | J.P. MORGAN INTREPID FUNDS | | DECEMBER 31, 2016 |
JPMorgan Intrepid Value Fund
SCHEDULE OF PORTFOLIO INVESTMENTS
AS OF DECEMBER 31, 2016 (Unaudited)
(Amounts in thousands)
| | | | | | | | |
| SHARES | | | SECURITY DESCRIPTION | | VALUE($) | |
| Common Stocks — 97.4% | |
| | | | Consumer Discretionary — 5.2% | | | | |
| | | | Automobiles — 1.3% | | | | |
| | 472 | | | General Motors Co. | | | 16,445 | |
| | | | | | | | |
| | | | Hotels, Restaurants & Leisure — 0.9% | | | | |
| | 346 | | | International Game Technology plc | | | 8,825 | |
| | 21 | | | McDonald’s Corp. | | | 2,532 | |
| | | | | | | | |
| | | | | | | 11,357 | |
| | | | | | | | |
| | | | Media — 1.1% | |
| | 57 | | | CBS Corp. (Non-Voting), Class B | | | 3,594 | |
| | 2,252 | | | Sirius XM Holdings, Inc. | | | 10,020 | |
| | | | | | | | |
| | | | | | | 13,614 | |
| | | | | | | | |
| | | | Multiline Retail — 0.4% | |
| | 102 | | | Kohl’s Corp. | | | 5,037 | |
| | | | | | | | |
| | | | Specialty Retail — 0.8% | |
| | 143 | | | Best Buy Co., Inc. | | | 6,080 | |
| | 65 | | | Dick’s Sporting Goods, Inc. | | | 3,425 | |
| | | | | | | | |
| | | | | | | 9,505 | |
| | | | | | | | |
| | | | Textiles, Apparel & Luxury Goods — 0.7% | |
| | 30 | | | Michael Kors Holdings Ltd. (a) | | | 1,289 | |
| | 82 | | | PVH Corp. | | | 7,427 | |
| | | | | | | | |
| | | | | | | 8,716 | |
| | | | | | | | |
| | | | Total Consumer Discretionary | | | 64,674 | |
| | | | | | | | |
| | | | Consumer Staples — 7.6% | | | | |
| | | | Food & Staples Retailing — 1.8% | |
| | 70 | | | CVS Health Corp. | | | 5,555 | |
| | 98 | | | Sysco Corp. | | | 5,449 | |
| | 171 | | | Wal-Mart Stores, Inc. | | | 11,840 | |
| | | | | | | | |
| | | | | | | 22,844 | |
| | | | | | | | |
| | | | Food Products — 4.0% | |
| | 544 | | | Archer-Daniels-Midland Co. | | | 24,824 | |
| | 335 | | | Pilgrim’s Pride Corp. | | | 6,358 | |
| | 308 | | | Tyson Foods, Inc., Class A | | | 18,985 | |
| | | | | | | | |
| | | | | | | 50,167 | |
| | | | | | | | |
| | | | Household Products — 0.8% | |
| | 217 | | | Energizer Holdings, Inc. | | | 9,685 | |
| | | | | | | | |
| | | | Personal Products — 1.0% | |
| | 80 | | | Herbalife Ltd. (a) | | | 3,837 | |
| | 182 | | | Nu Skin Enterprises, Inc., Class A | | | 8,686 | |
| | | | | | | | |
| | | | | | | 12,523 | |
| | | | | | | | |
| | | | Total Consumer Staples | | | 95,219 | |
| | | | | | | | |
| | | | Energy — 12.8% | |
| | | | Energy Equipment & Services — 4.9% | |
| | 364 | | | Baker Hughes, Inc. | | | 23,675 | |
| | 40 | | | Dril-Quip, Inc. (a) | | | 2,420 | |
| | | | | | | | |
| SHARES | | | SECURITY DESCRIPTION | | VALUE($) | |
| | | | | | | | |
| | | | Energy Equipment & Services — continued | |
| | 305 | | | Ensco plc, Class A | | | 2,964 | |
| | 283 | | | FMC Technologies, Inc. (a) | | | 10,066 | |
| | 352 | | | Rowan Cos. plc, Class A (a) | | | 6,647 | |
| | 127 | | | Schlumberger Ltd. | | | 10,623 | |
| | 359 | | | Seadrill Ltd., (United Kingdom) (a) | | | 1,225 | |
| | 179 | | | Superior Energy Services, Inc. (a) | | | 3,013 | |
| | | | | | | | |
| | | | | | | 60,633 | |
| | | | | | | | |
| | | | Oil, Gas & Consumable Fuels — 7.9% | |
| | 40 | | | Apache Corp. | | | 2,539 | |
| | 69 | | | Chevron Corp. | | | 8,128 | |
| | 52 | | | ConocoPhillips | | | 2,622 | |
| | 541 | | | Denbury Resources, Inc. (a) | | | 1,992 | |
| | 75 | | | Exxon Mobil Corp. | | | 6,743 | |
| | 36 | | | Hess Corp. | | | 2,230 | |
| | 970 | | | Marathon Oil Corp. | | | 16,794 | |
| | 192 | | | Marathon Petroleum Corp. | | | 9,642 | |
| | 218 | | | Occidental Petroleum Corp. | | | 15,542 | |
| | 80 | | | Tesoro Corp. | | | 7,022 | |
| | 383 | | | Valero Energy Corp. | | | 26,146 | |
| | | | | | | | |
| | | | | | | 99,400 | |
| | | | | | | | |
| | | | Total Energy | | | 160,033 | |
| | | | | | | | |
| | | | Financials — 28.1% | | | | |
| | | | Banks — 12.8% | |
| | 2,254 | | | Bank of America Corp. | | | 49,805 | |
| | 737 | | | Citigroup, Inc. | | | 43,799 | |
| | 37 | | | Comerica, Inc. | | | 2,513 | |
| | 243 | | | PNC Financial Services Group, Inc. (The) | | | 28,395 | |
| | 160 | | | Popular, Inc., (Puerto Rico) | | | 7,016 | |
| | 401 | | | Regions Financial Corp. | | | 5,764 | |
| | 133 | | | Synovus Financial Corp. | | | 5,476 | |
| | 312 | | | Wells Fargo & Co. | | | 17,219 | |
| | | | | | | | |
| | | | | | | 159,987 | |
| | | | | | | | |
| | | | Capital Markets — 4.2% | |
| | 76 | | | Ameriprise Financial, Inc. | | | 8,421 | |
| | 63 | | | Goldman Sachs Group, Inc. (The) | | | 15,145 | |
| | 475 | | | Morgan Stanley | | | 20,073 | |
| | 112 | | | MSCI, Inc. | | | 8,831 | |
| | | | | | | | |
| | | | | | | 52,470 | |
| | | | | | | | |
| | | | Consumer Finance — 1.4% | |
| | 14 | | | Capital One Financial Corp. | | | 1,230 | |
| | 158 | | | Discover Financial Services | | | 11,361 | |
| | 272 | | | Navient Corp. | | | 4,464 | |
| | | | | | | | |
| | | | | | | 17,055 | |
| | | | | | | | |
SEE NOTES TO FINANCIAL STATEMENTS.
| | | | | | | | |
| | | |
| DECEMBER 31, 2016 | | J.P. MORGAN INTREPID FUNDS | | | | | 25 | |
JPMorgan Intrepid Value Fund
SCHEDULE OF PORTFOLIO INVESTMENTS
AS OF DECEMBER 31, 2016 (Unaudited) (continued)
(Amounts in thousands, except number of Futures contracts)
| | | | | | | | |
| SHARES | | | SECURITY DESCRIPTION | | VALUE($) | |
| Common Stocks — continued | |
| | | | Diversified Financial Services — 0.6% | | | | |
| | 178 | | | Voya Financial, Inc. | | | 6,981 | |
| | | | | | | | |
| | | | Insurance — 7.6% | | | | |
| | 181 | | | Allstate Corp. (The) | | | 13,394 | |
| | 253 | | | American International Group, Inc. | | | 16,497 | |
| | 303 | | | Assured Guaranty Ltd. | | | 11,441 | |
| | 142 | | | Axis Capital Holdings Ltd. | | | 9,262 | |
| | 49 | | | Everest Re Group Ltd. | | | 10,690 | |
| | 157 | | | Lincoln National Corp. | | | 10,404 | |
| | 74 | | | Prudential Financial, Inc. | | | 7,711 | |
| | 26 | | | RenaissanceRe Holdings Ltd., (Bermuda) | | | 3,501 | |
| | 101 | | | Torchmark Corp. | | | 7,472 | |
| | 26 | | | Travelers Cos., Inc. (The) | | | 3,134 | |
| | 42 | | | Validus Holdings Ltd. | | | 2,310 | |
| | | | | | | | |
| | | | | | | 95,816 | |
| | | | | | | | |
| | | | Mortgage Real Estate Investment Trusts (REITs) — 1.5% | |
| | 116 | | | AGNC Investment Corp. | | | 2,094 | |
| | 494 | | | Chimera Investment Corp. | | | 8,415 | |
| | 995 | | | Two Harbors Investment Corp. | | | 8,674 | |
| | | | | | | | |
| | | | | | | 19,183 | |
| | | | | | | | |
| | | | Total Financials | | | 351,492 | |
| | | | | | | | |
| | | | Health Care — 10.2% | |
| | | | Biotechnology — 2.3% | |
| | 64 | | | Amgen, Inc. | | | 9,328 | |
| | 264 | | | Gilead Sciences, Inc. | | | 18,898 | |
| | | | | | | | |
| | | | | | | 28,226 | |
| | | | | | | | |
| | | | Health Care Equipment & Supplies — 0.4% | | | | |
| | 125 | | | Hologic, Inc. (a) | | | 5,007 | |
| | | | | | | | |
| | | | Health Care Providers & Services — 5.1% | |
| | 92 | | | Aetna, Inc. | | | 11,347 | |
| | 24 | | | Anthem, Inc. | | | 3,465 | |
| | 239 | | | Express Scripts Holding Co. (a) | | | 16,441 | |
| | 16 | | | HCA Holdings, Inc. (a) | | | 1,177 | |
| | 48 | | | Humana, Inc. | | | 9,834 | |
| | 71 | | | UnitedHealth Group, Inc. | | | 11,283 | |
| | 77 | | | WellCare Health Plans, Inc. (a) | | | 10,500 | |
| | | | | | | | |
| | | | | | | 64,047 | |
| | | | | | | | |
| | | | Pharmaceuticals — 2.4% | |
| | 122 | | | Mallinckrodt plc (a) | | | 6,063 | |
| | 756 | | | Pfizer, Inc. | | | 24,549 | |
| | | | | | | | |
| | | | | | | 30,612 | |
| | | | | | | | |
| | | | Total Health Care | | | 127,892 | |
| | | | | | | | |
| | | | | | | | |
| SHARES | | | SECURITY DESCRIPTION | | VALUE($) | |
| | | | | | | | |
| | | | Industrials — 8.8% | |
| | | | Aerospace & Defense — 1.3% | |
| | 102 | | | Curtiss-Wright Corp. | | | 10,033 | |
| | 21 | | | L-3 Communications Holdings, Inc. | | | 3,164 | |
| | 14 | | | Northrop Grumman Corp. | | | 3,209 | |
| | | | | | | | |
| | | | | | | 16,406 | |
| | | | | | | | |
| | | | Airlines — 2.6% | |
| | 12 | | | Copa Holdings SA, (Panama), Class A | | | 1,117 | |
| | 412 | | | Delta Air Lines, Inc. | | | 20,261 | |
| | 148 | | | United Continental Holdings, Inc. (a) | | | 10,772 | |
| | | | | | | | |
| | | | | | | 32,150 | |
| | | | | | | | |
| | | | Commercial Services & Supplies — 0.0% (g) | |
| | 47 | | | Pitney Bowes, Inc. | | | 716 | |
| | | | | | | | |
| | | | Construction & Engineering — 1.1% | |
| | 161 | | | Jacobs Engineering Group, Inc. (a) | | | 9,165 | |
| | 78 | | | Quanta Services, Inc. (a) | | | 2,729 | |
| | 18 | | | Valmont Industries, Inc. | | | 2,494 | |
| | | | | | | | |
| | | | | | | 14,388 | |
| | | | | | | | |
| | | | Electrical Equipment — 0.7% | |
| | 107 | | | EnerSys | | | 8,357 | |
| | | | | | | | |
| | | | Machinery — 2.2% | |
| | 132 | | | Illinois Tool Works, Inc. | | | 16,177 | |
| | 78 | | | Parker-Hannifin Corp. | | | 10,892 | |
| | | | | | | | |
| | | | | | | 27,069 | |
| | | | | | | | |
| | | | Trading Companies & Distributors — 0.9% | |
| | 77 | | | United Rentals, Inc. (a) | | | 8,109 | |
| | 55 | | | WESCO International, Inc. (a) | | | 3,657 | |
| | | | | | | | |
| | | | | | | 11,766 | |
| | | | | | | | |
| | | | Total Industrials | | | 110,852 | |
| | | | | | | | |
| | | | Information Technology — 10.6% | |
| | | | Electronic Equipment, Instruments & Components — 0.8% | |
| | 391 | | | Corning, Inc. | | | 9,492 | |
| | | | | | | | |
| | | | Internet Software & Services — 2.0% | |
| | 847 | | | eBay, Inc. (a) | | | 25,159 | |
| | | | | | | | |
| | | | IT Services — 0.5% | | | | |
| | 25 | | | Mastercard, Inc., Class A | | | 2,550 | |
| | 33 | | | Science Applications International Corp. | | | 2,790 | |
| | 57 | | | Western Union Co. (The) | | | 1,243 | |
| | | | | | | | |
| | | | | | | 6,583 | |
| | | | | | | | |
| | | | Semiconductors & Semiconductor Equipment — 3.2% | |
| | 64 | | | Applied Materials, Inc. | | | 2,068 | |
| | 485 | | | QUALCOMM, Inc. | | | 31,642 | |
SEE NOTES TO FINANCIAL STATEMENTS.
| | | | | | |
| | | |
| 26 | | | | J.P. MORGAN INTREPID FUNDS | | DECEMBER 31, 2016 |
| | | | | | | | |
| SHARES | | | SECURITY DESCRIPTION | | VALUE($) | |
| Common Stocks — continued | |
| | | | Semiconductors & Semiconductor Equipment — continued | |
| | 277 | | | Teradyne, Inc. | | | 7,041 | |
| | | | | | | | |
| | | | | | | 40,751 | |
| | | | | | | | |
| | | | Software — 1.1% | |
| | 169 | | | Microsoft Corp. | | | 10,526 | |
| | 112 | | | Nuance Communications, Inc. (a) | | | 1,672 | |
| | 31 | | | Take-Two Interactive Software, Inc. (a) | | | 1,533 | |
| | | | | | | | |
| | | | | | | 13,731 | |
| | | | | | | | |
| | | | Technology Hardware, Storage & Peripherals — 3.0% | |
| | 1,838 | | | HP, Inc. | | | 27,270 | |
| | 251 | | | NCR Corp. (a) | | | 10,172 | |
| | | | | | | | |
| | | | | | | 37,442 | |
| | | | | | | | |
| | | | Total Information Technology | | | 133,158 | |
| | | | | | | | |
| | | | Materials — 2.4% | | | | |
| | | | Chemicals — 1.5% | |
| | 46 | | | Cabot Corp. | | | 2,305 | |
| | 501 | | | Huntsman Corp. | | | 9,565 | |
| | 80 | | | LyondellBasell Industries NV, Class A | | | 6,871 | |
| | | | | | | | |
| | | | | | | 18,741 | |
| | | | | | | | |
| | | | Metals & Mining — 0.9% | |
| | 56 | | | Newmont Mining Corp. | | | 1,915 | |
| | 276 | | | Steel Dynamics, Inc. | | | 9,823 | |
| | | | | | | | |
| | | | | | | 11,738 | |
| | | | | | | | |
| | | | Total Materials | | | 30,479 | |
| | | | | | | | |
| | | | Real Estate — 2.8% | | | | |
| | | | Equity Real Estate Investment Trusts (REITs) — 2.8% | |
| | 530 | | | Brandywine Realty Trust | | | 8,749 | |
| | 87 | | | DuPont Fabros Technology, Inc. | | | 3,835 | |
| | 311 | | | Equity Commonwealth (a) | | | 9,398 | |
| | 134 | | | Hospitality Properties Trust | | | 4,250 | |
| | 443 | | | Piedmont Office Realty Trust, Inc., Class A | | | 9,255 | |
| | | | | | | | |
| | | | Total Real Estate | | | 35,487 | |
| | | | | | | | |
| | | | Telecommunication Services — 2.9% | | | | |
| | | | Diversified Telecommunication Services — 2.9% | |
| | 313 | | | AT&T, Inc. | | | 13,325 | |
| | 73 | | | CenturyLink, Inc. | | | 1,744 | |
| | | | | | | | |
| SHARES | | | SECURITY DESCRIPTION | | VALUE($) | |
| | | | | | | | |
| | | | Diversified Telecommunication Services — continued | |
| | 406 | | | Verizon Communications, Inc. | | | 21,656 | |
| | | | | | | | |
| | | | Total Telecommunication Services | | | 36,725 | |
| | | | | | | | |
| | | | Utilities — 6.0% | | | | |
| | | | Electric Utilities — 2.1% | | | | |
| | 129 | | | Edison International | | | 9,251 | |
| | 102 | | | NextEra Energy, Inc. | | | 12,149 | |
| | 116 | | | Portland General Electric Co. | | | 5,005 | |
| | | | | | | | |
| | | | | | | 26,405 | |
| | | | | | | | |
| | | | Gas Utilities — 0.8% | |
| | 202 | | | UGI Corp. | | | 9,329 | |
| | | | | | | | |
| | | | Independent Power & Renewable Electricity Producers — 0.9% | |
| | 772 | | | AES Corp. | | | 8,974 | |
| | 208 | | | NRG Energy, Inc. | | | 2,545 | |
| | | | | | | | |
| | | | | | | 11,519 | |
| | | | | | | | |
| | | | Multi-Utilities — 2.2% | |
| | 321 | | | CenterPoint Energy, Inc. | | | 7,907 | |
| | 362 | | | MDU Resources Group, Inc. | | | 10,409 | |
| | 126 | | | SCANA Corp. | | | 9,211 | |
| | | | | | | | |
| | | | | | | 27,527 | |
| | | | | | | | |
| | | | Total Utilities | | | 74,780 | |
| | | | | | | | |
| | | | Total Common Stocks
(Cost $972,663) | | | 1,220,791 | |
| | | | | | | | |
| Short-Term Investment — 1.8% | |
| | | | Investment Company — 1.8% | |
| | 22,455 | | | JPMorgan U.S. Government Money Market Fund, Institutional Class Shares,
0.410% (b) (l)
(Cost $22,455) | | | 22,455 | |
| | | | | | | | |
| | | | Total Investments — 99.2%
(Cost $995,118) | | | 1,243,246 | |
| | | | Other Assets in Excess of
Liabilities — 0.8% | | | 9,957 | |
| | | | | | | | |
| | | | NET ASSETS — 100.0% | | $ | 1,253,203 | |
| | | | | | | | |
Percentages indicated are based on net assets.
| | | | | | | | | | | | | | | | | | | | |
| Futures Contracts | |
NUMBER OF
CONTRACTS | | | DESCRIPTION | | EXPIRATION
DATE | | | TRADING
CURRENCY | | | NOTIONAL
VALUE AT
DECEMBER 31, 2016 | | | NET UNREALIZED
APPRECIATION
(DEPRECIATION) | |
| | | | Long Futures Outstanding | |
| | 274 | | | E-mini S&P 500 | | | 03/17/17 | | | | USD
| | | $ | 30,636 | | | $ | (135 | ) |
| | | | | | | | | | | | | | | | | | | | |
SEE NOTES TO FINANCIAL STATEMENTS.
| | | | | | | | |
| | | |
| DECEMBER 31, 2016 | | J.P. MORGAN INTREPID FUNDS | | | | | 27 | |
J.P. Morgan Intrepid Funds
NOTES TO SCHEDULES OF PORTFOLIO INVESTMENTS
AS OF DECEMBER 31, 2016 (Unaudited)
| | |
| USD | | — United States Dollar |
| |
| (a) | | — Non-income producing security. |
| (b) | | — Investment in affiliate. Money market fund is registered under the Investment Company Act of 1940, as amended, and advised by J.P. Morgan Investment Management Inc. |
| (g) | | — Amount rounds to less than 0.05%. |
| (h) | | — Amount rounds to less than 500. |
| (l) | | — The rate shown is the current yield as of December 31, 2016. |
SEE NOTES TO FINANCIAL STATEMENTS.
| | | | | | |
| | | |
| 28 | | | | J.P. MORGAN INTREPID FUNDS | | DECEMBER 31, 2016 |
THIS PAGE IS INTENTIONALLY LEFT BLANK
| | | | | | | | |
| | | |
| DECEMBER 31, 2016 | | J.P. MORGAN INTREPID FUNDS | | | | | 29 | |
STATEMENTS OF ASSETS AND LIABILITIES
AS OF DECEMBER 31, 2016 (Unaudited)
(Amounts in thousands, except per share amounts)
| | | | | | | | | | | | |
| | |
Intrepid
Advantage
Fund | | | Intrepid
America
Fund | | | Intrepid
Growth
Fund | |
ASSETS: | |
Investments in non-affiliates, at value | | $ | 17,331 | | | $ | 3,809,979 | | | $ | 934,104 | |
Investments in affiliates, at value | | | 393 | | | | 56,120 | | | | 26,136 | |
| | | | | | | | | | | | |
Total investment securities, at value | | | 17,724 | | | | 3,866,099 | | | | 960,240 | |
Cash | | | — | | | | 9 | | | | — | |
Deposits at broker for futures contracts | | | — | | | | 1,759 | | | | 1,082 | |
Receivables: | | | | | | | | | | | | |
Investment securities sold | | | — | | | | 37,199 | | | | 5,673 | |
Fund shares sold | | | — | (a) | | | 476 | | | | 7,958 | |
Dividends from non-affiliates | | | 17 | | | | 4,307 | | | | 595 | |
Dividends from affiliates | | | — | (a) | | | 18 | | | | 6 | |
Due from Adviser | | | 25 | | | | — | | | | — | |
| | | | | | | | | | | | |
Total Assets | | | 17,766 | | | | 3,909,867 | | | | 975,554 | |
| | | | | | | | | | | | |
| | | |
LIABILITIES: | | | | | | | | | | | | |
Payables: | | | | | | | | | | | | |
Investment securities purchased | | | — | | | | 47,987 | | | | 8,998 | |
Fund shares redeemed | | | 37 | | | | 3,532 | | | | 400 | |
Variation margin on futures contracts | | | — | | | | 146 | | | | 91 | |
Accrued liabilities: | | | | | | | | | | | | |
Investment advisory fees | | | — | | | | 1,315 | | | | 311 | |
Administration fees | | | — | | | | 269 | | | | 7 | |
Distribution fees | | | 5 | | | | 21 | | | | 49 | |
Shareholder servicing fees | | | — | | | | 56 | | | | 41 | |
Custodian and accounting fees | | | 3 | | | | 15 | | | | 10 | |
Trustees’ and Chief Compliance Officer’s fees | | | — | | | | 13 | | | | 1 | |
Audit fees | | | 10 | | | | 15 | | | | 11 | |
Registration fees | | | 5 | | | | 12 | | | | 20 | |
Sub-transfer agency fees | | | 3 | | | | 17 | | | | 22 | |
Other | | | 1 | | | | 39 | | | | 73 | |
| | | | | | | | | | | | |
Total Liabilities | | | 64 | | | | 53,437 | | | | 10,034 | |
| | | | | | | | | | | | |
Net Assets | | $ | 17,702 | | | $ | 3,856,430 | | | $ | 965,520 | |
| | | | | | | | | | | | |
| (a) | Amount rounds to less than 500. |
SEE NOTES TO FINANCIAL STATEMENTS.
| | | | | | |
| | | |
| 30 | | | | J.P. MORGAN INTREPID FUNDS | | DECEMBER 31, 2016 |
| | | | | | | | | | | | |
| | |
Intrepid
Advantage
Fund | | | Intrepid
America
Fund | | | Intrepid
Growth
Fund | |
NET ASSETS: | |
Paid-in-Capital | | $ | 14,266 | | | $ | 3,132,775 | | | $ | 875,690 | |
Accumulated undistributed (distributions in excess of) net investment income | | | (4 | ) | | | (32 | ) | | | 312 | |
Accumulated net realized gains (losses) | | | 24 | | | | 99,028 | | | | (107,210 | ) |
Net unrealized appreciation (depreciation) | | | 3,416 | | | | 624,659 | | | | 196,728 | |
| | | | | | | | | | | | |
Total Net Assets | | $ | 17,702 | | | $ | 3,856,430 | | | $ | 965,520 | |
| | | | | | | | | | | | |
| | | |
Net Assets: | | | | | | | | | | | | |
Class A | | $ | 8,300 | | | $ | 54,523 | | | $ | 91,844 | |
Class C | | | 5,380 | | | | 11,349 | | | | 44,089 | |
Class R2 | | | — | | | | 3,645 | | | | 4,850 | |
Class R5 | | | — | | | | 3,871 | | | | 169,240 | |
Class R6 | | | — | | | | 3,569,996 | | | | 496,081 | |
Select Class | | | 4,022 | | | | 213,046 | | | | 159,416 | |
| | | | | | | | | | | | |
Total | | $ | 17,702 | | | $ | 3,856,430 | | | $ | 965,520 | |
| | | | | | | | | | | | |
| | | |
Outstanding units of beneficial interest (shares) | | | | | | | | | | | | |
($0.0001 par value; unlimited number of shares authorized): | | | | | | | | | | | | |
Class A | | | 231 | | | | 1,499 | | | | 2,154 | |
Class C | | | 153 | | | | 315 | | | | 1,050 | |
Class R2 | | | — | | | | 103 | | | | 116 | |
Class R5 | | | — | | | | 104 | | | | 3,965 | |
Class R6 | | | — | | | | 97,701 | | | | 11,628 | |
Select Class | | | 111 | | | | 5,745 | | | | 3,687 | |
| | | |
Net Asset Value (a): | | | | | | | | | | | | |
Class A — Redemption price per share | | $ | 35.93 | | | $ | 36.38 | | | $ | 42.64 | |
Class C — Offering price per share (b) | | | 35.25 | | | | 36.03 | | | | 41.97 | |
Class R2 —Offering and redemption price per share | | | — | | | | 35.60 | | | | 41.87 | |
Class R5 — Offering and redemption price per share | | | — | | | | 37.09 | | | | 42.69 | |
Class R6 — Offering and redemption price per share | | | — | | | | 36.54 | | | | 42.66 | |
Select Class — Offering and redemption price per share | | | 36.10 | | | | 37.08 | | | | 43.23 | |
Class A maximum sales charge | | | 5.25 | % | | | 5.25 | % | | | 5.25 | % |
Class A maximum public offering price per share
[net asset value per share/(100% — maximum sales charge)] | | $ | 37.92 | | | $ | 38.40 | | | $ | 45.00 | |
| | | | | | | | | | | | |
| | | |
Cost of investments in non-affiliates | | $ | 13,915 | | | $ | 3,185,217 | | | $ | 737,265 | |
Cost of investments in affiliates | | | 393 | | | | 56,120 | | | | 26,136 | |
| (a) | Per share amounts may not recalculate due to rounding of net assets and/or shares outstanding. |
| (b) | Redemption price for Class C Shares varies based upon length of time the shares are held. |
SEE NOTES TO FINANCIAL STATEMENTS.
| | | | | | | | |
| | | |
| DECEMBER 31, 2016 | | J.P. MORGAN INTREPID FUNDS | | | | | 31 | |
STATEMENTS OF ASSETS AND LIABILITIES
AS OF DECEMBER 31, 2016 (Unaudited) (continued)
(Amounts in thousands, except per share amounts)
| | | | | | | | |
| | |
Intrepid
Mid Cap
Fund | | | Intrepid
Value
Fund | |
ASSETS: | |
Investments in non-affiliates, at value | | $ | 1,034,250 | | | $ | 1,220,791 | |
Investments in affiliates, at value | | | 19,841 | | | | 22,455 | |
| | | | | | | | |
Total investment securities, at value | | | 1,054,091 | | | | 1,243,246 | |
Cash | | | — | (a) | | | 1 | |
Deposits at broker for futures contracts | | | 953 | | | | 1,320 | |
Receivables: | | | | | | | | |
Investment securities sold | | | 929 | | | | 12,896 | |
Fund shares sold | | | 1,552 | | | | 1,747 | |
Dividends from non-affiliates | | | 1,554 | | | | 1,800 | |
Dividends from affiliates | | | 8 | | | | 7 | |
| | | | | | | | |
Total Assets | | | 1,059,087 | | | | 1,261,017 | |
| | | | | | | | |
| | |
LIABILITIES: | | | | | | | | |
Payables: | | | | | | | | |
Investment securities purchased | | | 5,813 | | | | 5,037 | |
Fund shares redeemed | | | 2,378 | | | | 1,481 | |
Variation margin on futures contracts | | | 72 | | | | 122 | |
Accrued liabilities: | | | | | | | | |
Investment advisory fees | | | 517 | | | | 353 | |
Administration fees | | | 32 | | | | 49 | |
Distribution fees | | | 132 | | | | 61 | |
Shareholder servicing fees | | | 77 | | | | 18 | |
Custodian and accounting fees | | | 9 | | | | 9 | |
Trustees’ and Chief Compliance Officer’s fees | | | 3 | | | | 1 | |
Audit fees | | | 11 | | | | 12 | |
Registration fees | | | — | | | | 23 | |
Sub-transfer agency fees | | | 176 | | | | 471 | |
Other | | | 68 | | | | 177 | |
| | | | | | | | |
Total Liabilities | | | 9,288 | | | | 7,814 | |
| | | | | | | | |
Net Assets | | $ | 1,049,799 | | | $ | 1,253,203 | |
| | | | | | | | |
| (a) | Amount rounds to less than 500. |
SEE NOTES TO FINANCIAL STATEMENTS.
| | | | | | |
| | | |
| 32 | | | | J.P. MORGAN INTREPID FUNDS | | DECEMBER 31, 2016 |
| | | | | | | | |
| | |
Intrepid
Mid Cap
Fund | | | Intrepid
Value
Fund | |
NET ASSETS: | | | | | | | | |
Paid-in-Capital | | $ | 883,842 | | | $ | 982,754 | |
Accumulated undistributed (distributions in excess of) net investment income | | | 49 | | | | (204 | ) |
Accumulated net realized gains (losses) | | | (4,742 | ) | | | 22,660 | |
Net unrealized appreciation (depreciation) | | | 170,650 | | | | 247,993 | |
| | | | | | | | |
Total Net Assets | | $ | 1,049,799 | | | $ | 1,253,203 | |
| | | | | | | | |
| | |
Net Assets: | | | | | | | | |
Class A | | $ | 338,522 | | | $ | 121,600 | |
Class C | | | 91,362 | | | | 40,639 | |
Class R2 | | | — | | | | 19,958 | |
Class R3 | | | 21 | | | | — | |
Class R4 | | | 21 | | | | — | |
Class R5 | | | — | | | | 93,144 | |
Class R6 | | | 332,601 | | | | 105,701 | |
Select Class | | | 287,272 | | | | 872,161 | |
| | | | | | | | |
Total | | $ | 1,049,799 | | | $ | 1,253,203 | |
| | | | | | | | |
| | |
Outstanding units of beneficial interest (shares) | | | | | | | | |
($0.0001 par value; unlimited number of shares authorized): | | | | | | | | |
Class A | | | 16,216 | | | | 3,526 | |
Class C | | | 5,105 | | | | 1,192 | |
Class R2 | | | — | | | | 582 | |
Class R3 | | | 1 | | | | — | |
Class R4 | | | 1 | | | | — | |
Class R5 | | | — | | | | 2,683 | |
Class R6 | | | 15,191 | | | | 3,045 | |
Select Class | | | 13,120 | | | | 25,185 | |
| | |
Net Asset Value (a): | | | | | | | | |
Class A — Redemption price per share | | $ | 20.88 | | | $ | 34.48 | |
Class C — Offering price per share (b) | | | 17.90 | | | | 34.10 | |
Class R2 — Offering and redemption price per share | | | — | | | | 34.28 | |
Class R3 — Offering and redemption price per share | | | 20.85 | | | | — | |
Class R4 — Offering and redemption price per share | | | 21.88 | | | | — | |
Class R5 — Offering and redemption price per share | | | — | | | | 34.71 | |
Class R6 — Offering and redemption price per share | | | 21.89 | | | | 34.72 | |
Select Class — Offering and redemption price per share | | | 21.90 | | | | 34.63 | |
Class A maximum sales charge | | | 5.25 | % | | | 5.25 | % |
Class A maximum public offering price per share
[net asset value per share/(100% — maximum sales charge)] | | $ | 22.04 | | | $ | 36.39 | |
| | | | | | | | |
| | |
Cost of investments in non-affiliates | | $ | 863,360 | | | $ | 972,663 | |
Cost of investments in affiliates | | | 19,841 | | | | 22,455 | |
| (a) | Per share amounts may not recalculate due to rounding of net assets and/or shares outstanding. |
| (b) | Redemption price for Class C Shares varies based upon length of time the shares are held. |
SEE NOTES TO FINANCIAL STATEMENTS.
| | | | | | | | |
| | | |
| DECEMBER 31, 2016 | | J.P. MORGAN INTREPID FUNDS | | | | | 33 | |
STATEMENTS OF OPERATIONS
FOR THE SIX MONTHS ENDED DECEMBER 31, 2016 (Unaudited)
(Amounts in thousands)
| | | | | | | | | | | | |
| | |
Intrepid
Advantage
Fund | | | Intrepid
America
Fund | | | Intrepid
Growth
Fund | |
INVESTMENT INCOME: | |
Interest income from affiliates | | $ | — | (a) | | $ | — | (a) | | $ | — | (a) |
Dividend income from non-affiliates | | | 178 | | | | 35,098 | | | | 7,372 | |
Dividend income from affiliates | | | — | (a) | | | 135 | | | | 26 | |
| | | | | | | | | | | | |
Total investment income | | | 178 | | | | 35,233 | | | | 7,398 | |
| | | | | | | | | | | | |
| | | |
EXPENSES: | | | | | | | | | | | | |
Investment advisory fees | | | 56 | | | | 7,605 | | | | 2,468 | |
Administration fees | | | 8 | | | | 1,557 | | | | 404 | |
Distribution fees: | | | | | | | | | | | | |
Class A | | | 11 | | | | 71 | | | | 113 | |
Class C | | | 22 | | | | 45 | | | | 179 | |
Class R2 | | | — | | | | 10 | | | | 12 | |
Shareholder servicing fees: | | | | | | | | | | | | |
Class A | | | 11 | | | | 71 | | | | 113 | |
Class C | | | 7 | | | | 15 | | | | 60 | |
Class R2 | | | — | | | | 5 | | | | 6 | |
Class R5 | | | — | | | | 1 | | | | 48 | |
Select Class | | | 5 | | | | 292 | | | | 196 | |
Custodian and accounting fees | | | 13 | | | | 54 | | | | 25 | |
Professional fees | | | 41 | | | | 40 | | | | 25 | |
Trustees’ and Chief Compliance Officer’s fees | | | 12 | | | | 19 | | | | 15 | |
Printing and mailing costs | | | 4 | | | | 17 | | | | 15 | |
Registration and filing fees | | | 18 | | | | 29 | | | | 42 | |
Transfer agency fees (See Note 2.D.) | | | 3 | | | | 20 | | | | 16 | |
Sub-transfer agency fees (See Note 2.D.) | | | 6 | | | | 54 | | | | 173 | |
Other | | | 4 | | | | 48 | | | | 15 | |
| | | | | | | | | | | | |
Total expenses | | | 221 | | | | 9,953 | | | | 3,925 | |
| | | | | | | | | | | | |
Less fees waived | | | (81 | ) | | | (102 | ) | | | (1,064 | ) |
Less expense reimbursements | | | (26 | ) | | | — | (a) | | | (25 | ) |
| | | | | | | | | | | | |
Net expenses | | | 114 | | | | 9,851 | | | | 2,836 | |
| | | | | | | | | | | | |
Net investment income (loss) | | | 64 | | | | 25,382 | | | | 4,562 | |
| | | | | | | | | | | | |
| | | |
REALIZED/UNREALIZED GAINS (LOSSES): | | | | | | | | | | | | |
Net realized gain (loss) on transactions from: | | | | | | | | | | | | |
Investments in non-affiliates | | | 1,905 | | | | 153,135 | | | | 41,052 | |
Futures | | | — | | | | 6,180 | | | | 1,966 | |
| | | | | | | | | | | | |
Net realized gain (loss) | | | 1,905 | | | | 159,315 | | | | 43,018 | |
| | | | | | | | | | | | |
Change in net unrealized appreciation/depreciation on: | | | | | | | | | | | | |
Investments in non-affiliates | | | (359 | ) | | | 128,946 | | | | 15,372 | |
Futures | | | — | | | | (1,256 | ) | | | (659 | ) |
| | | | | | | | | | | | |
Change in net unrealized appreciation/depreciation | | | (359 | ) | | | 127,690 | | | | 14,713 | |
| | | | | | | | | | | | |
Net realized/unrealized gains (losses) | | | 1,546 | | | | 287,005 | | | | 57,731 | |
| | | | | | | | | | | | |
Change in net assets resulting from operations | | $ | 1,610 | | | $ | 312,387 | | | $ | 62,293 | |
| | | | | | | | | | | | |
| (a) | Amount rounds to less than 500. |
SEE NOTES TO FINANCIAL STATEMENTS.
| | | | | | |
| | | |
| 34 | | | | J.P. MORGAN INTREPID FUNDS | | DECEMBER 31, 2016 |
| | | | | | | | |
| | |
Intrepid
Mid Cap
Fund | | | Intrepid
Value
Fund | |
INVESTMENT INCOME: | |
Interest income from affiliates | | $ | — | (a) | | $ | 1 | |
Dividend income from non-affiliates | | | 8,300 | | | | 16,330 | |
Dividend income from affiliates | | | 37 | | | | 43 | |
| | | | | | | | |
Total investment income | | | 8,337 | | | | 16,374 | |
| | | | | | | | |
| | |
EXPENSES: | | | | | | | | |
Investment advisory fees | | | 3,337 | | | | 2,829 | |
Administration fees | | | 420 | | | | 579 | |
Distribution fees: | | | | | | | | |
Class A | | | 417 | | | | 199 | |
Class C | | | 348 | | | | 156 | |
Class R2 | | | — | | | | 46 | |
Class R3 (b) | | | — | (a) | | | — | |
Shareholder servicing fees: | | | | | | | | |
Class A | | | 417 | | | | 199 | |
Class C | | | 116 | | | | 52 | |
Class R2 | | | — | | | | 23 | |
Class R3 (b) | | | — | (a) | | | — | |
Class R4 (b) | | | — | (a) | | | — | |
Class R5 | | | — | | | | 22 | |
Select Class | | | 349 | | | | 1,263 | |
Custodian and accounting fees | | | 23 | | | | 32 | |
Professional fees | | | 32 | | | | 29 | |
Trustees’ and Chief Compliance Officer’s fees | | | 16 | | | | 15 | |
Printing and mailing costs | | | 47 | | | | 84 | |
Registration and filing fees | | | 36 | | | | 35 | |
Transfer agency fees (See Note 2.D.) | | | 38 | | | | 98 | |
Sub-transfer agency fees (See Note 2.D.) | | | 417 | | | | 1,102 | |
Other | | | 15 | | | | 17 | |
| | | | | | | | |
Total expenses | | | 6,028 | | | | 6,780 | |
| | | | | | | | |
Less fees waived | | | (1,000 | ) | | | (1,854 | ) |
Less expense reimbursements | | | — | (a) | | | (58 | ) |
| | | | | | | | |
Net expenses | | | 5,028 | | | | 4,868 | |
| | | | | | | | |
Net investment income (loss) | | | 3,309 | | | | 11,506 | |
| | | | | | | | |
| | |
REALIZED/UNREALIZED GAINS (LOSSES): | | | | | | | | |
Net realized gain (loss) on transactions from: | | | | | | | | |
Investments in non-affiliates | | | 17,685 | | | | 73,607 | |
Futures | | | 3,686 | | | | 2,469 | |
| | | | | | | | |
Net realized gain (loss) | | | 21,371 | | | | 76,076 | |
| | | | | | | | |
Change in net unrealized appreciation/depreciation on: | | | | | | | | |
Investments in non-affiliates | | | 50,358 | | | | 65,197 | |
Futures | | | (458 | ) | | | (972 | ) |
| | | | | | | | |
Change in net unrealized appreciation/depreciation | | | 49,900 | | | | 64,225 | |
| | | | | | | | |
Net realized/unrealized gains (losses) | | | 71,271 | | | | 140,301 | |
| | | | | | | | |
Change in net assets resulting from operations | | $ | 74,580 | | | $ | 151,807 | |
| | | | | | | | |
| (a) | Amount rounds to less than 500. |
| (b) | Commencement of offering of class of shares effective September 9, 2016 for Intrepid Mid Cap Fund. |
SEE NOTES TO FINANCIAL STATEMENTS.
| | | | | | | | |
| | | |
| DECEMBER 31, 2016 | | J.P. MORGAN INTREPID FUNDS | | | | | 35 | |
STATEMENTS OF CHANGES IN NET ASSETS
FOR THE PERIODS INDICATED
(Amounts in thousands)
| | | | | | | | | | | | | | | | |
| | | Intrepid Advantage Fund | | | Intrepid America Fund | |
| | | Six Months Ended
December 31, 2016
(Unaudited) | | | Year Ended
June 30, 2016 | | | Six Months Ended
December 31, 2016
(Unaudited) | | | Year Ended
June 30, 2016 | |
CHANGE IN NET ASSETS RESULTING FROM OPERATIONS: | | | | | | | | | | | | | | | | |
Net investment income (loss) | | $ | 64 | | | $ | 359 | | | $ | 25,382 | | | $ | 53,527 | |
Net realized gain (loss) | | | 1,905 | | | | 176 | | | | 159,315 | | | | 91,191 | |
Change in net unrealized appreciation/depreciation | | | (359 | ) | | | (801 | ) | | | 127,690 | | | | (204,081 | ) |
| | | | | | | | | | | | | | | | |
Change in net assets resulting from operations | | | 1,610 | | | | (266 | ) | | | 312,387 | | | | (59,363 | ) |
| | | | | | | | | | | | | | | | |
| | | | |
DISTRIBUTIONS TO SHAREHOLDERS: | | | | | | | | | | | | | | | | |
Class A | | | | | | | | | | | | | | | | |
From net investment income | | | (79 | ) | | | (166 | ) | | | (398 | ) | | | (997 | ) |
From net realized gains | | | — | | | | — | | | | (1,471 | ) | | | (7,771 | ) |
Class C | | | | | | | | | | | | | | | | |
From net investment income | | | (21 | ) | | | (82 | ) | | | (34 | ) | | | (59 | ) |
From net realized gains | | | — | | | | — | | | | (311 | ) | | | (875 | ) |
Class R2 | | | | | | | | | | | | | | | | |
From net investment income | | | — | | | | — | | | | (20 | ) | | | (39 | ) |
From net realized gains | | | — | | | | — | | | | (104 | ) | | | (263 | ) |
Class R5 | | | | | | | | | | | | | | | | |
From net investment income | | | — | | | | — | | | | (49 | ) | | | — | |
From net realized gains | | | — | | | | — | | | | (100 | ) | | | (200 | ) |
Class R6 (a) | | | | | | | | | | | | | | | | |
From net investment income | | | — | | | | — | | | | (49,652 | ) | | | (47,617 | ) |
From net realized gains | | | — | | | | — | | | | (94,209 | ) | | | (196,504 | ) |
Select Class | | | | | | | | | | | | | | | | |
From net investment income | | | (47 | ) | | | (80 | ) | | | (2,317 | ) | | | (411 | ) |
From net realized gains | | | — | | | | — | | | | (5,697 | ) | | | (16,260 | ) |
| | | | | | | | | | | | | | | | |
Total distributions to shareholders | | | (147 | ) | | | (328 | ) | | | (154,362 | ) | | | (270,996 | ) |
| | | | | | | | | | | | | | | | |
| | | | |
CAPITAL TRANSACTIONS: | | | | | | | | | | | | | | | | |
Change in net assets resulting from capital transactions | | | (2,800 | ) | | | (3,007 | ) | | | 31,853 | | | | 287,274 | |
| | | | | | | | | | | | | | | | |
| | | | |
NET ASSETS: | | | | | | | | | | | | | | | | |
Change in net assets | | | (1,337 | ) | | | (3,601 | ) | | | 189,878 | | | | (43,085 | ) |
Beginning of period | | | 19,039 | | | | 22,640 | | | | 3,666,552 | | | | 3,709,637 | |
| | | | | | | | | | | | | | | | |
End of period | | $ | 17,702 | | | $ | 19,039 | | | $ | 3,856,430 | | | $ | 3,666,552 | |
| | | | | | | | | | | | | | | | |
Accumulated undistributed (distributions in excess of) net investment income | | $ | (4 | ) | | $ | 79 | | | $ | (32 | ) | | $ | 27,056 | |
| | | | | | | | | | | | | | | | |
| (a) | Commencement of offering of class of shares effective November 2, 2015 for Intrepid America Fund. |
SEE NOTES TO FINANCIAL STATEMENTS.
| | | | | | |
| | | |
| 36 | | | | J.P. MORGAN INTREPID FUNDS | | DECEMBER 31, 2016 |
| | | | | | | | | | | | | | | | |
| | | Intrepid Growth Fund | | | Intrepid Mid Cap Fund | |
| | | Six Months Ended
December 31, 2016
(Unaudited) | | | Year Ended
June 30, 2016 | | | Six Months Ended
December 31, 2016
(Unaudited) | | | Year Ended
June 30, 2016 | |
CHANGE IN NET ASSETS RESULTING FROM OPERATIONS: | | | | | | | | | | | | | | | | |
Net investment income (loss) | | $ | 4,562 | | | $ | 10,143 | | | $ | 3,309 | | | $ | 8,266 | |
Net realized gain (loss) | | | 43,018 | | | | 16,899 | | | | 21,371 | | | | (18,817 | ) |
Change in net unrealized appreciation/depreciation | | | 14,713 | | | | (34,556 | ) | | | 49,900 | | | | (2,106 | ) |
| | | | | | | | | | | | | | | | |
Change in net assets resulting from operations | | | 62,293 | | | | (7,514 | ) | | | 74,580 | | | | (12,657 | ) |
| | | | | | | | | | | | | | | | |
| | | | |
DISTRIBUTIONS TO SHAREHOLDERS: | | | | | | | | | | | | | | | | |
Class A | | | | | | | | | | | | | | | | |
From net investment income | | | (532 | ) | | | (645 | ) | | | (1,163 | ) | | | (2,230 | ) |
From net realized gains | | | — | | | | — | | | | (64 | ) | | | (27,036 | ) |
Class C | | | | | | | | | | | | | | | | |
From net investment income | | | (40 | ) | | | (111 | ) | | | (111 | ) | | | (410 | ) |
From net realized gains | | | — | | | | — | | | | (20 | ) | | | (7,872 | ) |
Class R2 | | | | | | | | | | | | | | | | |
From net investment income | | | (27 | ) | | | (19 | ) | | | — | | | | — | |
Class R3 (a) | | | | | | | | | | | | | | | | |
From net investment income | | | — | | | | — | | | | — | (b) | | | — | |
From net realized gains | | | — | | | | — | | | | — | (b) | | | — | |
Class R4 (a) | | | | | | | | | | | | | | | | |
From net investment income | | | — | | | | — | | | | — | (b) | | | — | |
From net realized gains | | | — | | | | — | | | | — | (b) | | | — | |
Class R5 | | | | | | | | | | | | | | | | |
From net investment income | | | (1,807 | ) | | | (2,127 | ) | | | — | | | | — | |
Class R6 (c) | | | | | | | | | | | | | | | | |
From net investment income | | | (5,624 | ) | | | (6,464 | ) | | | (1,834 | ) | | | (2,290 | ) |
From net realized gains | | | — | | | | — | | | | (59 | ) | | | (17,654 | ) |
Select Class | | | | | | | | | | | | | | | | |
From net investment income | | | (1,415 | ) | | | (70 | ) | | | (1,250 | ) | | | (2,298 | ) |
From net realized gains | | | — | | | | — | | | | (51 | ) | | | (19,338 | ) |
| | | | | | | | | | | | | | | | |
Total distributions to shareholders | | | (9,445 | ) | | | (9,436 | ) | | | (4,552 | ) | | | (79,128 | ) |
| | | | | | | | | | | | | | | | |
| | | | |
CAPITAL TRANSACTIONS: | | | | | | | | | | | | | | | | |
Change in net assets resulting from capital transactions | | | (75,551 | ) | | | (49,656 | ) | | | 15,176 | | | | 80,831 | |
| | | | | | | | | | | | | | | | |
| | | | |
NET ASSETS: | | | | | | | | | | | | | | | | |
Change in net assets | | | (22,703 | ) | | | (66,606 | ) | | | 85,204 | | | | (10,954 | ) |
Beginning of period | | | 988,223 | | | | 1,054,829 | | | | 964,595 | | | | 975,549 | |
| | | | | | | | | | | | | | | | |
End of period | | $ | 965,520 | | | $ | 988,223 | | | $ | 1,049,799 | | | $ | 964,595 | |
| | | | | | | | | | | | | | | | |
Accumulated undistributed (distributions in excess of) net investment income | | $ | 312 | | | $ | 5,195 | | | $ | 49 | | | $ | 1,098 | |
| | | | | | | | | | | | | | | | |
| (a) | Commencement of offering of class of shares effective September 9, 2016 for Intrepid Mid Cap Fund. |
| (b) | Amount rounds to less than 500. |
| (c) | Commencement of offering of class of shares effective November 2, 2015. |
SEE NOTES TO FINANCIAL STATEMENTS.
| | | | | | | | |
| | | |
| DECEMBER 31, 2016 | | J.P. MORGAN INTREPID FUNDS | | | | | 37 | |
STATEMENTS OF CHANGES IN NET ASSETS
FOR THE PERIODS INDICATED (continued)
(Amounts in thousands)
| | | | | | | | |
| | | Intrepid Value Fund | |
| | | Six Months Ended
December 31, 2016
(Unaudited) | | | Year Ended
June 30, 2016 | |
CHANGE IN NET ASSETS RESULTING FROM OPERATIONS: | |
Net investment income (loss) | | $ | 11,506 | | | $ | 30,165 | |
Net realized gain (loss) | | | 76,076 | | | | 3,533 | |
Change in net unrealized appreciation/depreciation | | | 64,225 | | | | (156,331 | ) |
| | | | | | | | |
Change in net assets resulting from operations | | | 151,807 | | | | (122,633 | ) |
| | | | | | | | |
| | |
DISTRIBUTIONS TO SHAREHOLDERS: | | | | | | | | |
Class A | | | | | | | | |
From net investment income | | | (1,288 | ) | | | (3,919 | ) |
From net realized gains | | | (976 | ) | | | (12,129 | ) |
Class C | | | | | | | | |
From net investment income | | | (318 | ) | | | (481 | ) |
From net realized gains | | | (328 | ) | | | (2,317 | ) |
Class R2 | | | | | | | | |
From net investment income | | | (170 | ) | | | (209 | ) |
From net realized gains | | | (158 | ) | | | (725 | ) |
Class R5 | | | | | | | | |
From net investment income | | | (1,061 | ) | | | (1,649 | ) |
From net realized gains | | | (727 | ) | | | (4,135 | ) |
Class R6 | | | | | | | | |
From net investment income | | | (1,161 | ) | | | (1,457 | ) |
From net realized gains | | | (845 | ) | | | (3,575 | ) |
Select Class | | | | | | | | |
From net investment income | | | (9,201 | ) | | | (20,675 | ) |
From net realized gains | | | (6,865 | ) | | | (58,980 | ) |
| | | | | | | | |
Total distributions to shareholders | | | (23,098 | ) | | | (110,251 | ) |
| | | | | | | | |
| | |
CAPITAL TRANSACTIONS: | | | | | | | | |
Change in net assets resulting from capital transactions | | | (572,741 | ) | | | 142,336 | |
| | | | | | | | |
| | |
NET ASSETS: | | | | | | | | |
Change in net assets | | | (444,032 | ) | | | (90,548 | ) |
Beginning of period | | | 1,697,235 | | | | 1,787,783 | |
| | | | | | | | |
End of period | | $ | 1,253,203 | | | $ | 1,697,235 | |
| | | | | | | | |
Accumulated undistributed (distributions in excess of) net investment income | | $ | (204 | ) | | $ | 1,489 | |
| | | | | | | | |
SEE NOTES TO FINANCIAL STATEMENTS.
| | | | | | |
| | | |
| 38 | | | | J.P. MORGAN INTREPID FUNDS | | DECEMBER 31, 2016 |
| | | | | | | | | | | | | | | | |
| | | Intrepid Advantage Fund | | | Intrepid America Fund | |
| | | Six Months Ended
December 31, 2016
(Unaudited) | | | Year Ended
June 30, 2016 | | | Six Months Ended
December 31, 2016
(Unaudited) | | | Year Ended
June 30, 2016 | |
CAPITAL TRANSACTIONS: | | | | | | | | | | | | | | | | |
Class A | | | | | | | | | | | | | | | | |
Proceeds from shares issued | | $ | 213 | | | $ | 1,458 | | | $ | 3,205 | | | $ | 43,942 | |
Distributions reinvested | | | 79 | | | | 166 | | | | 1,826 | | | | 8,675 | |
Cost of shares redeemed | | | (1,421 | ) | | | (3,513 | ) | | | (10,484 | ) | | | (162,708 | ) |
| | | | | | | | | | | | | | | | |
Change in net assets resulting from Class A capital transactions | | $ | (1,129 | ) | | $ | (1,889 | ) | | $ | (5,453 | ) | | $ | (110,091 | ) |
| | | | | | | | | | | | | | | | |
Class C | | | | | | | | | | | | | | | | |
Proceeds from shares issued | | $ | 116 | | | $ | 513 | | | $ | 184 | | | $ | 1,939 | |
Distributions reinvested | | | 21 | | | | 77 | | | | 319 | | | | 840 | |
Cost of shares redeemed | | | (1,376 | ) | | | (1,144 | ) | | | (2,323 | ) | | | (3,804 | ) |
| | | | | | | | | | | | | | | | |
Change in net assets resulting from Class C capital transactions | | $ | (1,239 | ) | | $ | (554 | ) | | $ | (1,820 | ) | | $ | (1,025 | ) |
| | | | | | | | | | | | | | | | |
Class R2 | | | | | | | | | | | | | | | | |
Proceeds from shares issued | | $ | — | | | $ | — | | | $ | 452 | | | $ | 3,181 | |
Distributions reinvested | | | — | | | | — | | | | 61 | | | | 206 | |
Cost of shares redeemed | | | — | | | | — | | | | (1,639 | ) | | | (1,407 | ) |
| | | | | | | | | | | | | | | | |
Change in net assets resulting from Class R2 capital transactions | | $ | — | | | $ | — | | | $ | (1,126 | ) | | $ | 1,980 | |
| | | | | | | | | | | | | | | | |
Class R5 | | | | | | | | | | | | | | | | |
Proceeds from shares issued | | $ | — | | | $ | — | | | $ | 394 | | | $ | 147,210 | |
Distributions reinvested | | | — | | | | — | | | | 80 | | | | 98 | |
Cost of shares redeemed | | | — | | | | — | | | | (687 | ) | | | (2,206,178 | ) |
| | | | | | | | | | | | | | | | |
Change in net assets resulting from Class R5 capital transactions | | $ | — | | | $ | — | | | $ | (213 | ) | | $ | (2,058,870 | ) |
| | | | | | | | | | | | | | | | |
Class R6 (a) | | | | | | | | | | | | | | | | |
Proceeds from shares issued | | $ | — | | | $ | — | | | $ | 69,207 | | | $ | 3,744,275 | |
Distributions reinvested | | | — | | | | — | | | | 143,577 | | | | 244,121 | |
Cost of shares redeemed | | | — | | | | — | | | | (127,740 | ) | | | (283,437 | ) |
| | | | | | | | | | | | | | | | |
Change in net assets resulting from Class R6 capital transactions | | $ | — | | | $ | — | | | $ | 85,044 | | | $ | 3,704,959 | |
| | | | | | | | | | | | | | | | |
Select Class | | | | | | | | | | | | | | | | |
Proceeds from shares issued | | $ | 279 | | | $ | 391 | | | $ | 15,987 | | | $ | 122,319 | |
Distributions reinvested | | | 32 | | | | 50 | | | | 1,830 | | | | 3,411 | |
Cost of shares redeemed | | | (743 | ) | | | (1,005 | ) | | | (62,396 | ) | | | (1,375,409 | ) |
| | | | | | | | | | | | | | | | |
Change in net assets resulting from Select Class capital transactions | | $ | (432 | ) | | $ | (564 | ) | | $ | (44,579 | ) | | $ | (1,249,679 | ) |
| | | | | | | | | | | | | | | | |
Total change in net assets resulting from capital transactions | | $ | (2,800 | ) | | $ | (3,007 | ) | | $ | 31,853 | | | $ | 287,274 | |
| | | | | | | | | | | | | | | | |
| (a) | Commencement of offering of class of shares effective November 2, 2015 for Intrepid America Fund. |
SEE NOTES TO FINANCIAL STATEMENTS.
| | | | | | | | |
| | | |
| DECEMBER 31, 2016 | | J.P. MORGAN INTREPID FUNDS | | | | | 39 | |
STATEMENTS OF CHANGES IN NET ASSETS
FOR THE PERIODS INDICATED (continued)
(Amounts in thousands)
| | | | | | | | | | | | | | | | |
| | | Intrepid Advantage Fund | | | Intrepid America Fund | |
| | | Six Months Ended
December 31, 2016
(Unaudited) | | | Year Ended
June 30, 2016 | | | Six Months Ended
December 31, 2016
(Unaudited) | | | Year Ended
June 30, 2016 | |
SHARE TRANSACTIONS: | |
Class A | |
Issued | | | 6 | | | | 45 | | | | 89 | | | | 1,229 | |
Reinvested | | | 2 | | | | 5 | | | | 49 | | | | 249 | |
Redeemed | | | (41 | ) | | | (107 | ) | | | (288 | ) | | | (4,667 | ) |
| | | | | | | | | | | | | | | | |
Change in Class A Shares | | | (33 | ) | | | (57 | ) | | | (150 | ) | | | (3,189 | ) |
| | | | | | | | | | | | | | | | |
Class C | | | | | | | | | | | | | | | | |
Issued | | | 3 | | | | 16 | | | | 4 | | | | 56 | |
Reinvested | | | 1 | | | | 2 | | | | 9 | | | | 24 | |
Redeemed | | | (40 | ) | | | (36 | ) | | | (65 | ) | | | (110 | ) |
| | | | | | | | | | | | | | | | |
Change in Class C Shares | | | (36 | ) | | | (18 | ) | | | (52 | ) | | | (30 | ) |
| | | | | | | | | | | | | | | | |
Class R2 | | | | | | | | | | | | | | | | |
Issued | | | — | | | | — | | | | 13 | | | | 91 | |
Reinvested | | | — | | | | — | | | | 2 | | | | 6 | |
Redeemed | | | — | | | | — | | | | (47 | ) | | | (40 | ) |
| | | | | | | | | | | | | | | | |
Change in Class R2 Shares | | | — | | | | — | | | | (32 | ) | | | 57 | |
| | | | | | | | | | | | | | | | |
Class R5 | | | | | | | | | | | | | | | | |
Issued | | | — | | | | — | | | | 11 | | | | 3,900 | |
Reinvested | | | — | | | | — | | | | 2 | | | | 3 | |
Redeemed | | | — | | | | — | | | | (19 | ) | | | (56,255 | ) |
| | | | | | | | | | | | | | | | |
Change in Class R5 Shares | | | — | | | | — | | | | (6 | ) | | | (52,352 | ) |
| | | | | | | | | | | | | | | | |
Class R6 (a) | | | | | | | | | | | | | | | | |
Issued | | | — | | | | — | | | | 1,919 | | | | 96,721 | |
Reinvested | | | — | | | | — | | | | 3,844 | | | | 6,953 | |
Redeemed | | | — | | | | — | | | | (3,444 | ) | | | (8,292 | ) |
| | | | | | | | | | | | | | | | |
Change in Class R6 Shares | | | — | | | | — | | | | 2,319 | | | | 95,382 | |
| | | | | | | | | | | | | | | | |
Select Class | | | | | | | | | | | | | | | | |
Issued | | | 8 | | | | 11 | | | | 434 | | | | 3,461 | |
Reinvested | | | 1 | | | | 2 | | | | 48 | | | | 97 | |
Redeemed | | | (22 | ) | | | (30 | ) | | | (1,689 | ) | | | (35,374 | ) |
| | | | | | | | | | | | | | | | |
Change in Select Class Shares | | | (13 | ) | | | (17 | ) | | | (1,207 | ) | | | (31,816 | ) |
| | | | | | | | | | | | | | | | |
| (a) | Commencement of offering of class of shares effective November 2, 2015 for Intrepid America Fund. |
SEE NOTES TO FINANCIAL STATEMENTS.
| | | | | | |
| | | |
| 40 | | | | J.P. MORGAN INTREPID FUNDS | | DECEMBER 31, 2016 |
| | | | | | | | | | | | | | | | |
| | | Intrepid Growth Fund | | | Intrepid Mid Cap Fund | |
| | | Six Months Ended
December 31, 2016
(Unaudited) | | | Year Ended
June 30, 2016 | | | Six Months Ended
December 31, 2016
(Unaudited) | | | Year Ended
June 30, 2016 | |
CAPITAL TRANSACTIONS: | | | | | | | | | | | | | | | | |
Class A | | | | | | | | | | | | | | | | |
Proceeds from shares issued | | $ | 17,188 | | | $ | 29,744 | | | $ | 49,866 | | | $ | 115,229 | |
Distributions reinvested | | | 357 | | | | 464 | | | | 1,110 | | | | 26,642 | |
Cost of shares redeemed | | | (21,323 | ) | | | (44,544 | ) | | | (46,839 | ) | | | (168,582 | ) |
| | | | | | | | | | | | | | | | |
Change in net assets resulting from Class A capital transactions | | $ | (3,778 | ) | | $ | (14,336 | ) | | $ | 4,137 | | | $ | (26,711 | ) |
| | | | | | | | | | | | | | | | |
Class C | | | | | | | | | | | | | | | | |
Proceeds from shares issued | | $ | 1,947 | | | $ | 10,146 | | | $ | 8,122 | | | $ | 27,150 | |
Distributions reinvested | | | 29 | | | | 81 | | | | 103 | | | | 7,265 | |
Cost of shares redeemed | | | (9,360 | ) | | | (9,970 | ) | | | (12,150 | ) | | | (22,253 | ) |
| | | | | | | | | | | | | | | | |
Change in net assets resulting from Class C capital transactions | | $ | (7,384 | ) | | $ | 257 | | | $ | (3,925 | ) | | $ | 12,162 | |
| | | | | | | | | | | | | | | | |
Class R2 | | | | | | | | | | | | | | | | |
Proceeds from shares issued | | $ | 1,152 | | | $ | 3,918 | | | $ | — | | | $ | — | |
Distributions reinvested | | | 6 | | | | 7 | | | | — | | | | — | |
Cost of shares redeemed | | | (762 | ) | | | (949 | ) | | | — | | | | — | |
| | | | | | | | | | | | | | | | |
Change in net assets resulting from Class R2 capital transactions | | $ | 396 | | | $ | 2,976 | | | $ | — | | | $ | — | |
| | | | | | | | | | | | | | | | |
Class R3 (a) | | | | | | | | | | | | | | | | |
Proceeds from shares issued | | $ | — | | | $ | — | | | $ | 20 | | | $ | — | |
Distributions reinvested | | | — | | | | — | | | | — | (b) | | | — | |
| | | | | | | | | | | | | | | | |
Change in net assets resulting from Class R3 capital transactions | | $ | — | | | $ | — | | | $ | 20 | | | $ | — | |
| | | | | | | | | | | | | | | | |
Class R4 (a) | | | | | | | | | | | | | | | | |
Proceeds from shares issued | | $ | — | | | $ | — | | | $ | 20 | | | $ | — | |
Distributions reinvested | | | — | | | | — | | | | — | (b) | | | — | |
| | | | | | | | | | | | | | | | |
Change in net assets resulting from Class R4 capital transactions | | $ | — | | | $ | — | | | $ | 20 | | | $ | — | |
| | | | | | | | | | | | | | | | |
Class R5 | | | | | | | | | | | | | | | | |
Proceeds from shares issued | | $ | 11,715 | | | $ | 54,598 | | | $ | — | | | $ | — | |
Distributions reinvested | | | 1,528 | | | | 1,858 | | | | — | | | | — | |
Cost of shares redeemed | | | (59,833 | ) | | | (38,491 | ) | | | — | | | | — | |
| | | | | | | | | | | | | | | | |
Change in net assets resulting from Class R5 capital transactions | | $ | (46,590 | ) | | $ | 17,965 | | | $ | — | | | $ | — | |
| | | | | | | | | | | | | | | | |
Class R6 (c) | | | | | | | | | | | | | | | | |
Proceeds from shares issued | | $ | 448 | | | $ | 605,936 | | | $ | 4,099 | | | $ | 296,563 | |
Distributions reinvested | | | 5,624 | | | | 6,464 | | | | 1,889 | | | | 19,944 | |
Cost of shares redeemed | | | (24,008 | ) | | | (97,049 | ) | | | (386 | ) | | | (12 | ) |
| | | | | | | | | | | | | | | | |
Change in net assets resulting from Class R6 capital transactions | | $ | (17,936 | ) | | $ | 515,351 | | | $ | 5,602 | | | $ | 316,495 | |
| | | | | | | | | | | | | | | | |
Select Class | | | | | | | | | | | | | | | | |
Proceeds from shares issued | | $ | 18,418 | | | $ | 78,959 | | | $ | 58,058 | | | $ | 146,281 | |
Distributions reinvested | | | 1,050 | | | | 46 | | | | 1,101 | | | | 17,565 | |
Cost of shares redeemed | | | (19,727 | ) | | | (650,874 | ) | | | (49,837 | ) | | | (384,961 | ) |
| | | | | | | | | | | | | | | | |
Change in net assets resulting from Select Class capital transactions | | $ | (259 | ) | | $ | (571,869 | ) | | $ | 9,322 | | | $ | (221,115 | ) |
| | | | | | | | | | | | | | | | |
Total change in net assets resulting from capital transactions | | $ | (75,551 | ) | | $ | (49,656 | ) | | $ | 15,176 | | | $ | 80,831 | |
| | | | | | | | | | | | | | | | |
| (a) | Commencement of offering of class of shares effective September 9, 2016, for Intrepid Mid Cap Fund. |
| (b) | Amount rounds to less than 500. |
| (c) | Commencement of offering of class of shares effective November 2, 2015. |
SEE NOTES TO FINANCIAL STATEMENTS.
| | | | | | | | |
| | | |
| DECEMBER 31, 2016 | | J.P. MORGAN INTREPID FUNDS | | | | | 41 | |
STATEMENTS OF CHANGES IN NET ASSETS
FOR THE PERIODS INDICATED (continued)
(Amounts in thousands)
| | | | | | | | | | | | | | | | |
| | | Intrepid Growth Fund | | | Intrepid Mid Cap Fund | |
| | | Six Months Ended
December 31, 2016
(Unaudited) | | | Year Ended
June 30, 2016 | | | Six Months Ended
December 31, 2016
(Unaudited) | | | Year Ended
June 30, 2016 | |
SHARE TRANSACTIONS: | | | | | | | | | | | | | | | | |
Class A | | | | | | | | | | | | | | | | |
Issued | | | 407 | | | | 737 | | | | 2,457 | | | | 5,728 | |
Reinvested | | | 8 | | | | 12 | | | | 53 | | | | 1,439 | |
Redeemed | | | (504 | ) | | | (1,106 | ) | | | (2,297 | ) | | | (8,481 | ) |
| | | | | | | | | | | | | | | | |
Change in Class A Shares | | | (89 | ) | | | (357 | ) | | | 213 | | | | (1,314 | ) |
| | | | | | | | | | | | | | | | |
Class C | | | | | | | | | | | | | | | | |
Issued | | | 46 | | | | 257 | | | | 466 | | | | 1,614 | |
Reinvested | | | 1 | | | | 2 | | | | 6 | | | | 457 | |
Redeemed | | | (226 | ) | | | (255 | ) | | | (695 | ) | | | (1,316 | ) |
| | | | | | | | | | | | | | | | |
Change in Class C Shares | | | (179 | ) | | | 4 | | | | (223 | ) | | | 755 | |
| | | | | | | | | | | | | | | | |
Class R2 | | | | | | | | | | | | | | | | |
Issued | | | 28 | | | | 100 | | | | — | | | | — | |
Reinvested | | | — | (a) | | | — | (a) | | | — | | | | — | |
Redeemed | | | (18 | ) | | | (24 | ) | | | — | | | | — | |
| | | | | | | | | | | | | | | | |
Change in Class R2 Shares | | | 10 | | | | 76 | | | | — | | | | — | |
| | | | | | | | | | | | | | | | |
Class R3 (b) | | | | | | | | | | | | | | | | |
Issued | | | — | | | | — | | | | 1 | | | | — | |
Reinvested | | | — | | | | — | | | | — | (a) | | | — | |
| | | | | | | | | | | | | | | | |
Change in Class R3 Shares | | | — | | | | — | | | | 1 | | | | — | |
| | | | | | | | | | | | | | | | |
Class R4 (b) | | | | | | | | | | | | | | | | |
Issued | | | — | | | | — | | | | 1 | | | | — | |
Reinvested | | | — | | | | — | | | | — | (a) | | | — | |
| | | | | | | | | | | | | | | | |
Change in Class R4 Shares | | | — | | | | — | | | | 1 | | | | — | |
| | | | | | | | | | | | | | | | |
Class R5 | | | | | | | | | | | | | | | | |
Issued | | | 276 | | | | 1,371 | | | | — | | | | — | |
Reinvested | | | 35 | | | | 46 | | | | — | | | | — | |
Redeemed | | | (1,412 | ) | | | (959 | ) | | | — | | | | — | |
| | | | | | | | | | | | | | | | |
Change in Class R5 Shares | | | (1,101 | ) | | | 458 | | | | — | | | | — | |
| | | | | | | | | | | | | | | | |
Class R6 (c) | | | | | | | | | | | | | | | | |
Issued | | | 10 | | | | 14,369 | | | | 191 | | | | 13,904 | |
Reinvested | | | 130 | | | | 160 | | | | 87 | | | | 1,028 | |
Redeemed | | | (565 | ) | | | (2,476 | ) | | | (18 | ) | | | (1 | ) |
| | | | | | | | | | | | | | | | |
Change in Class R6 Shares | | | (425 | ) | | | 12,053 | | | | 260 | | | | 14,931 | |
| | | | | | | | | | | | | | | | |
Select Class | | | | | | | | | | | | | | | | |
Issued | | | 428 | | | | 1,966 | | | | 2,719 | | | | 7,038 | |
Reinvested | | | 24 | | | | 1 | | | | 50 | | | | 904 | |
Redeemed | | | (459 | ) | | | (15,436 | ) | | | (2,323 | ) | | | (17,691 | ) |
| | | | | | | | | | | | | | | | |
Change in Select Class Shares | | | (7 | ) | | | (13,469 | ) | | | 446 | | | | (9,749 | ) |
| | | | | | | | | | | | | | | | |
| (a) | Amount rounds to less than 500. |
| (b) | Commencement of offering of class of shares effective September 9, 2016, for Intrepid Mid Cap Fund. |
| (c) | Commencement of offering of class of shares effective November 2, 2015. |
SEE NOTES TO FINANCIAL STATEMENTS.
| | | | | | |
| | | |
| 42 | | | | J.P. MORGAN INTREPID FUNDS | | DECEMBER 31, 2016 |
| | | | | | | | |
| | | Intrepid Value Fund | |
| | | Six Months Ended
December 31, 2016
(Unaudited) | | | Year Ended
June 30, 2016 | |
CAPITAL TRANSACTIONS: | | | | | | | | |
Class A | | | | | | | | |
Proceeds from shares issued | | $ | 14,217 | | | $ | 166,519 | |
Distributions reinvested | | | 2,083 | | | | 15,365 | |
Cost of shares redeemed | | | (150,973 | ) | | | (80,574 | ) |
| | | | | | | | |
Change in net assets resulting from Class A capital transactions | | $ | (134,673 | ) | | $ | 101,310 | |
| | | | | | | | |
Class C | | | | | | | | |
Proceeds from shares issued | | $ | 1,188 | | | $ | 6,903 | |
Distributions reinvested | | | 594 | | | | 2,515 | |
Cost of shares redeemed | | | (7,995 | ) | | | (13,246 | ) |
| | | | | | | | |
Change in net assets resulting from Class C capital transactions | | $ | (6,213 | ) | | $ | (3,828 | ) |
| | | | | | | | |
Class R2 | | | | | | | | |
Proceeds from shares issued | | $ | 3,403 | | | $ | 11,058 | |
Distributions reinvested | | | 278 | | | | 803 | |
Cost of shares redeemed | | | (3,331 | ) | | | (6,453 | ) |
| | | | | | | | |
Change in net assets resulting from Class R2 capital transactions | | $ | 350 | | | $ | 5,408 | |
| | | | | | | | |
Class R5 | | | | | | | | |
Proceeds from shares issued | | $ | 7,522 | | | $ | 28,926 | |
Distributions reinvested | | | 1,788 | | | | 5,784 | |
Cost of shares redeemed | | | (10,607 | ) | | | (21,596 | ) |
| | | | | | | | |
Change in net assets resulting from Class R5 capital transactions | | $ | (1,297 | ) | | $ | 13,114 | |
| | | | | | | | |
Class R6 | | | | | | | | |
Proceeds from shares issued | | $ | 24,930 | | | $ | 71,117 | |
Distributions reinvested | | | 2,006 | | | | 5,032 | |
Cost of shares redeemed | | | (17,557 | ) | | | (20,617 | ) |
| | | | | | | | |
Change in net assets resulting from Class R6 capital transactions | | $ | 9,379 | | | $ | 55,532 | |
| | | | | | | | |
Select Class | | | | | | | | |
Proceeds from shares issued | | $ | 105,277 | | | $ | 308,972 | |
Distributions reinvested | | | 14,706 | | | | 73,614 | |
Cost of shares redeemed | | | (560,270 | ) | | | (411,786 | ) |
| | | | | | | | |
Change in net assets resulting from Select Class capital transactions | | $ | (440,287 | ) | | $ | (29,200 | ) |
| | | | | | | | |
Total change in net assets resulting from capital transactions | | $ | (572,741 | ) | | $ | 142,336 | |
| | | | | | | | |
SEE NOTES TO FINANCIAL STATEMENTS.
| | | | | | | | |
| | | |
| DECEMBER 31, 2016 | | J.P. MORGAN INTREPID FUNDS | | | | | 43 | |
STATEMENTS OF CHANGES IN NET ASSETS
FOR THE PERIODS INDICATED (continued)
(Amounts in thousands)
| | | | | | | | |
| | | Intrepid Value Fund | |
| | | Six Months Ended
December 31, 2016
(Unaudited) | | | Year Ended
June 30, 2016 | |
SHARE TRANSACTIONS: | | | | | | | | |
Class A | |
Issued | | | 435 | | | | 4,888 | |
Reinvested | | | 61 | | | | 492 | |
Redeemed | | | (4,687 | ) | | | (2,519 | ) |
| | | | | | | | |
Change in Class A Shares | | | (4,191 | ) | | | 2,861 | |
| | | | | | | | |
Class C | | | | | | | | |
Issued | | | 36 | | | | 214 | |
Reinvested | | | 18 | | | | 82 | |
Redeemed | | | (248 | ) | | | (424 | ) |
| | | | | | | | |
Change in Class C Shares | | | (194 | ) | | | (128 | ) |
| | | | | | | | |
Class R2 | | | | | | | | |
Issued | | | 105 | | | | 348 | |
Reinvested | | | 8 | | | | 26 | |
Redeemed | | | (102 | ) | | | (204 | ) |
| | | | | | | | |
Change in Class R2 Shares | | | 11 | | | | 170 | |
| | | | | | | | |
Class R5 | | | | | | | | |
Issued | | | 231 | | | | 885 | |
Reinvested | | | 52 | | | | 184 | |
Redeemed | | | (325 | ) | | | (681 | ) |
| | | | | | | | |
Change in Class R5 Shares | | | (42 | ) | | | 388 | |
| | | | | | | | |
Class R6 | | | | | | | | |
Issued | | | 770 | | | | 2,159 | |
Reinvested | | | 59 | | | | 160 | |
Redeemed | | | (529 | ) | | | (661 | ) |
| | | | | | | | |
Change in Class R6 Shares | | | 300 | | | | 1,658 | |
| | | | | | | | |
Select Class | | | | | | | | |
Issued | | | 3,204 | | | | 9,586 | |
Reinvested | | | 432 | | | | 2,349 | |
Redeemed | | | (17,508 | ) | | | (12,663 | ) |
| | | | | | | | |
Change in Select Class Shares | | | (13,872 | ) | | | (728 | ) |
| | | | | | | | |
SEE NOTES TO FINANCIAL STATEMENTS.
| | | | | | |
| | | |
| 44 | | | | J.P. MORGAN INTREPID FUNDS | | DECEMBER 31, 2016 |
THIS PAGE IS INTENTIONALLY LEFT BLANK
| | | | | | | | |
| | | |
| DECEMBER 31, 2016 | | J.P. MORGAN INTREPID FUNDS | | | | | 45 | |
FINANCIAL HIGHLIGHTS
FOR THE PERIODS INDICATED
| | | | | | | | | | | | | | | | | | | | |
| | | Per share operating performance | |
| | | | | | Investment operations | | | Distributions | |
| | | Net asset
value,
beginning
of period | | | Net
investment
income
(loss) (b) | | | Net realized
and unrealized
gains
(losses) on
investments | | | Total from
investment
operations | | | Net
investment
income | |
Intrepid Advantage Fund | | | | | | | | | | | | | | | | | | | | |
Class A | | | | | | | | | | | | | | | | | | | | |
Six Months Ended December 31, 2016 (Unaudited) | | $ | 33.20 | | | $ | 0.14 | | | $ | 2.93 | | | $ | 3.07 | | | $ | (0.34 | ) |
Year Ended June 30, 2016 | | | 34.01 | | | | 0.62 | (g) | | | (0.87 | )(g) | | | (0.25 | ) | | | (0.56 | ) |
Year Ended June 30, 2015 | | | 31.93 | | | | 0.28 | | | | 2.02 | | | | 2.30 | | | | (0.22 | ) |
Year Ended June 30, 2014 | | | 25.54 | | | | 0.20 | | | | 6.37 | | | | 6.57 | | | | (0.18 | ) |
Year Ended June 30, 2013 | | | 21.13 | | | | 0.21 | (h) | | | 4.44 | | | | 4.65 | | | | (0.24 | ) |
Year Ended June 30, 2012 | | | 20.60 | | | | 0.13 | | | | 0.63 | | | | 0.76 | | | | (0.23 | ) |
| | | | | |
Class C | | | | | | | | | | | | | | | | | | | | |
Six Months Ended December 31, 2016 (Unaudited) | | | 32.48 | | | | 0.05 | | | | 2.86 | | | | 2.91 | | | | (0.14 | ) |
Year Ended June 30, 2016 | | | 33.29 | | | | 0.44 | (g) | | | (0.85 | )(g) | | | (0.41 | ) | | | (0.40 | ) |
Year Ended June 30, 2015 | | | 31.38 | | | | 0.12 | | | | 1.98 | | | | 2.10 | | | | (0.19 | ) |
Year Ended June 30, 2014 | | | 25.14 | | | | 0.05 | | | | 6.26 | | | | 6.31 | | | | (0.07 | ) |
Year Ended June 30, 2013 | | | 20.81 | | | | 0.10 | (h) | | | 4.37 | | | | 4.47 | | | | (0.14 | ) |
Year Ended June 30, 2012 | | | 20.25 | | | | 0.04 | | | | 0.62 | | | | 0.66 | | | | (0.10 | ) |
| | | | | |
Select Class | | | | | | | | | | | | | | | | | | | | |
Six Months Ended December 31, 2016 (Unaudited) | | | 33.40 | | | | 0.19 | | | | 2.95 | | | | 3.14 | | | | (0.44 | ) |
Year Ended June 30, 2016 | | | 34.22 | | | | 0.68 | (g) | | | (0.86 | )(g) | | | (0.18 | ) | | | (0.64 | ) |
Year Ended June 30, 2015 | | | 32.07 | | | | 0.37 | | | | 2.04 | | | | 2.41 | | | | (0.26 | ) |
Year Ended June 30, 2014 | | | 25.65 | | | | 0.28 | | | | 6.39 | | | | 6.67 | | | | (0.25 | ) |
Year Ended June 30, 2013 | | | 21.21 | | | | 0.28 | (h) | | | 4.45 | | | | 4.73 | | | | (0.29 | ) |
Year Ended June 30, 2012 | | | 20.70 | | | | 0.19 | | | | 0.62 | | | | 0.81 | | | | (0.30 | ) |
| (a) | Annualized for periods less than one year, unless otherwise noted. |
| (b) | Calculated based upon average shares outstanding. |
| (c) | Not annualized for periods less than one year. |
| (d) | Includes adjustments in accordance with accounting principles generally accepted in the United States of America and as such, the net asset values for financial reporting purposes and the returns based upon those net asset values may differ from the net asset values and returns for shareholder transactions. |
| (e) | Includes earnings credits and interest expense, if applicable, each of which is less than 0.005% unless otherwise noted. |
| (f) | Portfolio turnover is calculated by dividing the lesser of total purchases or sales of portfolio securities for the reporting period by the monthly average value of portfolio securities owned during the reporting period. Excluded from both the numerator and denominator are amounts relating to derivatives and securities whose maturities or expiration dates at the time of acquisition were one year or less. |
| (g) | The amount reflects an out of period adjustment related to a corporate action involving two of the Fund’s holdings. Had the Fund not recorded the out of period adjustment, the net investment income (loss) per share would have been $0.33, $0.15 and $0.38, for Class A, Class C and Select Class Shares, respectively, the net realized and unrealized gains (losses) on investment per share would have been $(0.58), $(0.56) and $(0.56) for Class A, Class C and Select Class Shares, respectively, and the net investment income (loss) ratio would have been 0.99%, 0.47% and 1.14% for Class A, Class C and Select Class Shares, respectively. |
| (h) | Reflects special dividends paid out during the period by several of the Fund’s holdings. Had the Fund not received the special dividends, the net investment income (loss) per share would have been $0.17, $0.06 and $0.23 for Class A, Class C and Select Class Shares, respectively, and the net investment income (loss) ratio would have been 0.73%, 0.24% and 1.00% for Class A, Class C and Select Class Shares, respectively. |
SEE NOTES TO FINANCIAL STATEMENTS.
| | | | | | |
| | | |
| 46 | | | | J.P. MORGAN INTREPID FUNDS | | DECEMBER 31, 2016 |
| | | | | | | | | | | | | | | | | | | | | | | | | | |
| | | Ratios/Supplemental data | |
| | | | | | | | | | Ratios to average net assets (a) | | | | |
Net asset
value,
end of
period | | | Total return
(excludes
sales charge) (c)(d) | | | Net assets,
end of
period
(000’s) | | | Net
expenses (e) | | | Net
investment
income
(loss) | | |
Expenses
without waivers,
reimbursements and
earnings credits | | | Portfolio
turnover
rate (c)(f) | |
| | | | | | | | | | | | | | | | | | | | | | | | | | |
| | | | | | | | | | | | | | | | | | | | | | | | | | |
| $ | 35.93 | | | | 9.24 | % | | $ | 8,300 | | | | 1.11 | % | | | 0.78 | % | | | 2.26 | % | | | 43 | % |
| | 33.20 | | | | (0.72 | ) | | | 8,760 | | | | 1.15 | | | | 1.90 | (g) | | | 1.95 | | | | 31 | |
| | 34.01 | | | | 7.22 | | | | 10,933 | | | | 1.15 | | | | 0.85 | | | | 1.87 | | | | 35 | |
| | 31.93 | | | | 25.78 | | | | 9,466 | | | | 1.17 | | | | 0.68 | | | | 2.19 | | | | 49 | |
| | 25.54 | | | | 22.15 | | | | 8,765 | | | | 1.25 | | | | 0.92 | (h) | | | 2.40 | | | | 82 | |
| | 21.13 | | | | 3.83 | | | | 7,329 | | | | 1.25 | | | | 0.68 | | | | 2.51 | | | | 57 | |
| | | | | | |
| | | | | | | | | | | | | | | | | | | | | | | | | | |
| | 35.25 | | | | 8.95 | | | | 5,380 | | | | 1.61 | | | | 0.29 | | | | 2.75 | | | | 43 | |
| | 32.48 | | | | (1.21 | ) | | | 6,131 | | | | 1.65 | | | | 1.38 | (g) | | | 2.46 | | | | 31 | |
| | 33.29 | | | | 6.71 | | | | 6,874 | | | | 1.65 | | | | 0.36 | | | | 2.36 | | | | 35 | |
| | 31.38 | | | | 25.13 | | | | 3,709 | | | | 1.66 | | | | 0.19 | | | | 2.66 | | | | 49 | |
| | 25.14 | | | | 21.55 | | | | 2,294 | | | | 1.75 | | | | 0.43 | (h) | | | 2.91 | | | | 82 | |
| | 20.81 | | | | 3.33 | | | | 1,747 | | | | 1.75 | | | | 0.19 | | | | 3.02 | | | | 57 | |
| | | | | | |
| | | | | | | | | | | | | | | | | | | | | | | | | | |
| | 36.10 | | | | 9.38 | | | | 4,022 | | | | 0.86 | | | | 1.04 | | | | 1.97 | | | | 43 | |
| | 33.40 | | | | (0.48 | ) | | | 4,148 | | | | 0.90 | | | | 2.05 | (g) | | | 1.65 | | | | 31 | |
| | 34.22 | | | | 7.51 | | | | 4,833 | | | | 0.90 | | | | 1.10 | | | | 1.59 | | | | 35 | |
| | 32.07 | | | | 26.10 | | | | 3,438 | | | | 0.91 | | | | 0.95 | | | | 1.90 | | | | 49 | |
| | 25.65 | | | | 22.46 | | | | 1,516 | | | | 1.00 | | | | 1.19 | (h) | | | 2.16 | | | | 82 | |
| | 21.21 | | | | 4.09 | | | | 1,164 | | | | 1.00 | | | | 0.94 | | | | 2.28 | | | | 57 | |
SEE NOTES TO FINANCIAL STATEMENTS.
| | | | | | | | |
| | | |
| DECEMBER 31, 2016 | | J.P. MORGAN INTREPID FUNDS | | | | | 47 | |
FINANCIAL HIGHLIGHTS
FOR THE PERIODS INDICATED (continued)
| | | | | | | | | | | | | | | | | | | | | | | | | | | | |
| | | Per share operating performance | |
| | | | | | Investment operations | | | Distributions | |
| | | Net asset
value,
beginning
of period | | | Net
investment
income
(loss) (b) | | | Net realized
and unrealized
gains
(losses) on
investments | | | Total from
investment
operations | | | Net
investment
income | | | Net
realized
gain | | | Total
distributions | |
Intrepid America Fund | | | | | | | | | | | | | | | | | | | | | | | | | | | | |
Class A | | | | | | | | | | | | | | | | | | | | | | | | | | | | |
Six Months Ended December 31, 2016 (Unaudited) | | $ | 34.75 | | | $ | 0.15 | | | $ | 2.75 | | | $ | 2.90 | | | $ | (0.27 | ) | | $ | (1.00 | ) | | $ | (1.27 | ) |
Year Ended June 30, 2016 | | | 38.08 | | | | 0.34 | | | | (1.15 | ) | | | (0.81 | ) | | | (0.27 | ) | | | (2.25 | ) | | | (2.52 | ) |
Year Ended June 30, 2015 | | | 37.28 | | | | 0.44 | | | | 2.57 | | | | 3.01 | | | | (0.38 | ) | | | (1.83 | ) | | | (2.21 | ) |
Year Ended June 30, 2014 | | | 29.76 | | | | 0.30 | | | | 7.49 | | | | 7.79 | | | | (0.27 | ) | | | — | | | | (0.27 | ) |
Year Ended June 30, 2013 | | | 24.68 | | | | 0.34 | | | | 5.15 | | | | 5.49 | | | | (0.41 | ) | | | — | | | | (0.41 | ) |
Year Ended June 30, 2012 | | | 24.55 | | | | 0.19 | | | | 0.10 | | | | 0.29 | | | | (0.16 | ) | | | — | | | | (0.16 | ) |
| | | | | | | |
Class C | | | | | | | | | | | | | | | | | | | | | | | | | | | | |
Six Months Ended December 31, 2016 (Unaudited) | | | 34.37 | | | | 0.06 | | | | 2.71 | | | | 2.77 | | | | (0.11 | ) | | | (1.00 | ) | | | (1.11 | ) |
Year Ended June 30, 2016 | | | 37.74 | | | | 0.18 | | | | (1.15 | ) | | | (0.97 | ) | | | (0.15 | ) | | | (2.25 | ) | | | (2.40 | ) |
Year Ended June 30, 2015 | | | 36.99 | | | | 0.22 | | | | 2.57 | | | | 2.79 | | | | (0.21 | ) | | | (1.83 | ) | | | (2.04 | ) |
Year Ended June 30, 2014 | | | 29.53 | | | | 0.13 | | | | 7.42 | | | | 7.55 | | | | (0.09 | ) | | | — | | | | (0.09 | ) |
Year Ended June 30, 2013 | | | 24.48 | | | | 0.20 | | | | 5.12 | | | | 5.32 | | | | (0.27 | ) | | | — | | | | (0.27 | ) |
Year Ended June 30, 2012 | | | 24.29 | | | | 0.07 | | | | 0.12 | | | | 0.19 | | | | — | | | | — | | | | — | |
| | | | | | | |
Class R2 | | | | | | | | | | | | | | | | | | | | | | | | | | | | |
Six Months Ended December 31, 2016 (Unaudited) | | | 34.01 | | | | 0.10 | | | | 2.68 | | | | 2.78 | | | | (0.19 | ) | | | (1.00 | ) | | | (1.19 | ) |
Year Ended June 30, 2016 | | | 37.45 | | | | 0.27 | | | | (1.15 | ) | | | (0.88 | ) | | | (0.31 | ) | | | (2.25 | ) | | | (2.56 | ) |
Year Ended June 30, 2015 | | | 36.82 | | | | 0.33 | | | | 2.55 | | | | 2.88 | | | | (0.42 | ) | | | (1.83 | ) | | | (2.25 | ) |
Year Ended June 30, 2014 | | | 29.43 | | | | 0.21 | | | | 7.40 | | | | 7.61 | | | | (0.22 | ) | | | — | | | | (0.22 | ) |
Year Ended June 30, 2013 | | | 24.43 | | | | 0.26 | | | | 5.11 | | | | 5.37 | | | | (0.37 | ) | | | — | | | | (0.37 | ) |
Year Ended June 30, 2012 | | | 24.21 | | | | 0.13 | | | | 0.12 | | | | 0.25 | | | | (0.03 | ) | | | — | | | | (0.03 | ) |
| | | | | | | |
Class R5 | | | | | | | | | | | | | | | | | | | | | | | | | | | | |
Six Months Ended December 31, 2016 (Unaudited) | | | 35.53 | | | | 0.23 | | | | 2.81 | | | | 3.04 | | | | (0.48 | ) | | | (1.00 | ) | | | (1.48 | ) |
Year Ended June 30, 2016 | | | 38.41 | | | | 0.41 | | | | (1.04 | ) | | | (0.63 | ) | | | — | | | | (2.25 | ) | | | (2.25 | ) |
Year Ended June 30, 2015 | | | 37.54 | | | | 0.60 | | | | 2.61 | | | | 3.21 | | | | (0.51 | ) | | | (1.83 | ) | | | (2.34 | ) |
Year Ended June 30, 2014 | | | 29.94 | | | | 0.46 | | | | 7.54 | | | | 8.00 | | | | (0.40 | ) | | | — | | | | (0.40 | ) |
Year Ended June 30, 2013 | | | 24.84 | | | | 0.46 | | | | 5.19 | | | | 5.65 | | | | (0.55 | ) | | | — | | | | (0.55 | ) |
Year Ended June 30, 2012 | | | 24.69 | | | | 0.30 | | | | 0.10 | | | | 0.40 | | | | (0.25 | ) | | | — | | | | (0.25 | ) |
| | | | | | | |
Class R6 | | | | | | | | | | | | | | | | | | | | | | | | | | | | |
Six Months Ended December 31, 2016 (Unaudited) | | | 35.03 | | | | 0.25 | | | | 2.77 | | | | 3.02 | | | | (0.51 | ) | | | (1.00 | ) | | | (1.51 | ) |
November 2, 2015 (g) through June 30, 2016 | | | 39.15 | | | | 0.41 | | | | (1.77 | ) | | | (1.36 | ) | | | (0.51 | ) | | | (2.25 | ) | | | (2.76 | ) |
| | | | | | | |
Select Class | | | | | | | | | | | | | | | | | | | | | | | | | | | | |
Six Months Ended December 31, 2016 (Unaudited) | | | 35.48 | | | | 0.20 | | | | 2.81 | | | | 3.01 | | | | (0.41 | ) | | | (1.00 | ) | | | (1.41 | ) |
Year Ended June 30, 2016 | | | 38.49 | | | | 0.39 | | | | (1.09 | ) | | | (0.70 | ) | | | (0.06 | ) | | | (2.25 | ) | | | (2.31 | ) |
Year Ended June 30, 2015 | | | 37.61 | | | | 0.53 | | | | 2.61 | | | | 3.14 | | | | (0.43 | ) | | | (1.83 | ) | | | (2.26 | ) |
Year Ended June 30, 2014 | | | 30.00 | | | | 0.38 | | | | 7.56 | | | | 7.94 | | | | (0.33 | ) | | | — | | | | (0.33 | ) |
Year Ended June 30, 2013 | | | 24.88 | | | | 0.41 | | | | 5.20 | | | | 5.61 | | | | (0.49 | ) | | | — | | | | (0.49 | ) |
Year Ended June 30, 2012 | | | 24.73 | | | | 0.25 | | | | 0.10 | | | | 0.35 | | | | (0.20 | ) | | | — | | | | (0.20 | ) |
| (a) | Annualized for periods less than one year, unless otherwise noted. |
| (b) | Calculated based upon average shares outstanding. |
| (c) | Not annualized for periods less than one year. |
| (d) | Includes adjustments in accordance with accounting principles generally accepted in the United States of America and as such, the net asset values for financial reporting purposes and the returns based upon those net asset values may differ from the net asset values and returns for shareholder transactions. |
| (e) | Includes earnings credits and interest expense, if applicable, each of which is less than 0.005% unless otherwise noted. |
| (f) | Portfolio turnover is calculated by dividing the lesser of total purchases or sales of portfolio securities for the reporting period by the monthly average value of portfolio securities owned during the reporting period. Excluded from both the numerator and denominator are amounts relating to derivatives and securities whose maturities or expiration dates at the time of acquisition were one year or less. |
| (g) | Commencement of offering of class of shares. |
SEE NOTES TO FINANCIAL STATEMENTS.
| | | | | | |
| | | |
| 48 | | | | J.P. MORGAN INTREPID FUNDS | | DECEMBER 31, 2016 |
| | | | | | | | | | | | | | | | | | | | | | | | | | |
| | | Ratios/Supplemental data | |
| | | | | | | | | | Ratios to average net assets (a) | | | | |
Net asset
value,
end of
period | | | Total return
(excludes
sales charge) (c)(d) | | | Net assets,
end of
period
(000’s) | | | Net
expenses (e) | | | Net
investment
income
(loss) | | | Expenses
without waivers,
reimbursements and
earnings credits | | | Portfolio
turnover
rate (c)(f) | |
| | | | | | | | | | | | | | | | | | | | | | | | | | |
| | | | | | | | | | | | | | | | | | | | | | | | | | |
| $ | 36.38 | | | | 8.30 | % | | $ | 54,523 | | | | 1.03 | % | | | 0.82 | % | | | 1.09 | % | | | 49 | % |
| | 34.75 | | | | (2.08 | ) | | | 57,303 | | | | 1.04 | | | | 0.96 | | | | 1.15 | | | | 70 | |
| | 38.08 | | | | 8.27 | | | | 184,225 | | | | 1.03 | | | | 1.16 | | | | 1.11 | | | | 49 | |
| | 37.28 | | | | 26.26 | | | | 97,155 | | | | 1.04 | | | | 0.90 | | | | 1.05 | | | | 67 | |
| | 29.76 | | | | 22.48 | | | | 87,954 | | | | 1.24 | | | | 1.25 | | | | 1.26 | | | | 68 | |
| | 24.68 | | | | 1.26 | | | | 81,139 | | | | 1.25 | | | | 0.82 | | | | 1.27 | | | | 95 | |
| | | | | | |
| | | | | | | | | | | | | | | | | | | | | | | | | | |
| | 36.03 | | | | 8.02 | | | | 11,349 | | | | 1.53 | | | | 0.31 | | | | 1.60 | | | | 49 | |
| | 34.37 | | | | (2.55 | ) | | | 12,599 | | | | 1.54 | | | | 0.50 | | | | 1.62 | | | | 70 | |
| | 37.74 | | | | 7.72 | | | | 14,978 | | | | 1.53 | | | | 0.58 | | | | 1.56 | | | | 49 | |
| | 36.99 | | | | 25.62 | | | | 8,774 | | | | 1.54 | | | | 0.39 | | | | 1.55 | | | | 67 | |
| | 29.53 | | | | 21.90 | | | | 7,336 | | | | 1.74 | | | | 0.75 | | | | 1.76 | | | | 68 | |
| | 24.48 | | | | 0.78 | | | | 7,117 | | | | 1.75 | | | | 0.31 | | | | 1.78 | | | | 95 | |
| | | | | | |
| | | | | | | | | | | | | | | | | | | | | | | | | | |
| | 35.60 | | | | 8.15 | | | | 3,645 | | | | 1.28 | | | | 0.57 | | | | 1.45 | | | | 49 | |
| | 34.01 | | | | (2.30 | ) | | | 4,584 | | | | 1.29 | | | | 0.78 | | | | 1.46 | | | | 70 | |
| | 37.45 | | | | 8.01 | | | | 2,923 | | | | 1.28 | | | | 0.88 | | | | 1.35 | | | | 49 | |
| | 36.82 | | | | 25.93 | | | | 166 | | | | 1.29 | | | | 0.64 | | | | 1.30 | | | | 67 | |
| | 29.43 | | | | 22.20 | | | | 170 | | | | 1.49 | | | | 0.96 | | | | 1.51 | | | | 68 | |
| | 24.43 | | | | 1.03 | | | | 75 | | | | 1.50 | | | | 0.56 | | | | 1.52 | | | | 95 | |
| | | | | | |
| | | | | | | | | | | | | | | | | | | | | | | | | | |
| | 37.09 | | | | 8.50 | | | | 3,871 | | | | 0.59 | | | | 1.25 | | | | 0.64 | | | | 49 | |
| | 35.53 | | | | (1.57 | ) | | | 3,920 | | | | 0.54 | | | | 1.08 | | | | 0.55 | | | | 70 | |
| | 38.41 | | | | 8.76 | | | | 2,015,302 | | | | 0.55 | | | | 1.56 | | | | 0.55 | | | | 49 | |
| | 37.54 | | | | 26.84 | | | | 1,363,358 | | | | 0.58 | | | | 1.35 | | | | 0.59 | | | | 67 | |
| | 29.94 | | | | 23.05 | | | | 710,586 | | | | 0.79 | | | | 1.66 | | | | 0.82 | | | | 68 | |
| | 24.84 | | | | 1.74 | | | | 411,202 | | | | 0.79 | | | | 1.28 | | | | 0.82 | | | | 95 | |
| | | | | | |
| | | | | | | | | | | | | | | | | | | | | | | | | | |
| | 36.54 | | | | 8.59 | | | | 3,569,996 | | | | 0.49 | | | | 1.36 | | | | 0.49 | | | | 49 | |
| | 35.03 | | | | (3.39 | ) | | | 3,341,467 | | | | 0.49 | | | | 1.78 | | | | 0.50 | | | | 70 | |
| | | | | | |
| | | | | | | | | | | | | | | | | | | | | | | | | | |
| | 37.08 | | | | 8.43 | | | | 213,046 | | | | 0.75 | | | | 1.10 | | | | 0.76 | | | | 49 | |
| | 35.48 | | | | (1.77 | ) | | | 246,679 | | | | 0.74 | | | | 1.04 | | | | 0.75 | | | | 70 | |
| | 38.49 | | | | 8.56 | | | | 1,492,209 | | | | 0.75 | | | | 1.37 | | | | 0.76 | | | | 49 | |
| | 37.61 | | | | 26.56 | | | | 1,514,180 | | | | 0.79 | | | | 1.14 | | | | 0.80 | | | | 67 | |
| | 30.00 | | | | 22.83 | | | | 1,391,748 | | | | 0.99 | | | | 1.50 | | | | 1.02 | | | | 68 | |
| | 24.88 | | | | 1.52 | | | | 1,332,607 | | | | 1.00 | | | | 1.07 | | | | 1.02 | | | | 95 | |
SEE NOTES TO FINANCIAL STATEMENTS.
| | | | | | | | |
| | | |
| DECEMBER 31, 2016 | | J.P. MORGAN INTREPID FUNDS | | | | | 49 | |
FINANCIAL HIGHLIGHTS
FOR THE PERIODS INDICATED (continued)
| | | | | | | | | | | | | | | | | | | | |
| | | Per share operating performance | |
| | | | | | Investment operations | | | Distributions | |
| | | Net asset
value,
beginning
of period | | | Net
investment
income
(loss) (b) | | | Net realized
and unrealized
gains
(losses) on
investments | | | Total from
investment
operations | | | Net
investment
income | |
Intrepid Growth Fund | |
Class A | |
Six Months Ended December 31, 2016 (Unaudited) | | $ | 40.37 | | | $ | 0.12 | | | $ | 2.41 | | | $ | 2.53 | | | $ | (0.26 | ) |
Year Ended June 30, 2016 | | | 40.99 | | | | 0.27 | | | | (0.63 | ) | | | (0.36 | ) | | | (0.26 | ) |
Year Ended June 30, 2015 | | | 37.05 | | | | 0.25 | | | | 3.88 | | | | 4.13 | | | | (0.19 | ) |
Year Ended June 30, 2014 | | | 29.36 | | | | 0.18 | (g) | | | 7.64 | | | | 7.82 | | | | (0.13 | ) |
Year Ended June 30, 2013 | | | 25.00 | | | | 0.21 | | | | 4.34 | | | | 4.55 | | | | (0.19 | ) |
Year Ended June 30, 2012 | | | 24.39 | | | | 0.10 | | | | 0.57 | | | | 0.67 | | | | (0.06 | ) |
| | | | | |
Class C | | | | | | | | | | | | | | | | | | | | |
Six Months Ended December 31, 2016 (Unaudited) | | | 39.63 | | | | 0.02 | | | | 2.36 | | | | 2.38 | | | | (0.04 | ) |
Year Ended June 30, 2016 | | | 40.26 | | | | 0.07 | | | | (0.61 | ) | | | (0.54 | ) | | | (0.09 | ) |
Year Ended June 30, 2015 | | | 36.45 | | | | 0.05 | | | | 3.81 | | | | 3.86 | | | | (0.05 | ) |
Year Ended June 30, 2014 | | | 28.93 | | | | 0.01 | (g) | | | 7.52 | | | | 7.53 | | | | (0.01 | ) |
Year Ended June 30, 2013 | | | 24.64 | | | | 0.07 | | | | 4.27 | | | | 4.34 | | | | (0.05 | ) |
Year Ended June 30, 2012 | | | 24.09 | | | | (0.02 | ) | | | 0.57 | | | | 0.55 | | | | — | |
| | | | | |
Class R2 | | | | | | | | | | | | | | | | | | | | |
Six Months Ended December 31, 2016 (Unaudited) | | | 39.66 | | | | 0.07 | | | | 2.37 | | | | 2.44 | | | | (0.23 | ) |
Year Ended June 30, 2016 | | | 40.39 | | | | 0.19 | | | | (0.63 | ) | | | (0.44 | ) | | | (0.29 | ) |
Year Ended June 30, 2015 | | | 36.49 | | | | 0.12 | | | | 3.85 | | | | 3.97 | | | | (0.07 | ) |
Year Ended June 30, 2014 | | | 28.91 | | | | 0.09 | (g) | | | 7.54 | | | | 7.63 | | | | (0.05 | ) |
Year Ended June 30, 2013 | | | 24.72 | | | | 0.13 | | | | 4.27 | | | | 4.40 | | | | (0.21 | ) |
Year Ended June 30, 2012 | | | 24.13 | | | | 0.07 | | | | 0.54 | | | | 0.61 | | | | (0.02 | ) |
| | | | | |
Class R5 | | | | | | | | | | | | | | | | | | | | |
Six Months Ended December 31, 2016 (Unaudited) | | | 40.51 | | | | 0.22 | | | | 2.42 | | | | 2.64 | | | | (0.46 | ) |
Year Ended June 30, 2016 | | | 41.12 | | | | 0.45 | | | | (0.62 | ) | | | (0.17 | ) | | | (0.44 | ) |
Year Ended June 30, 2015 | | | 37.09 | | | | 0.41 | | | | 3.91 | | | | 4.32 | | | | (0.29 | ) |
Year Ended June 30, 2014 | | | 29.41 | | | | 0.33 | (g) | | | 7.65 | | | | 7.98 | | | | (0.30 | ) |
Year Ended June 30, 2013 | | | 25.05 | | | | 0.33 | | | | 4.34 | | | | 4.67 | | | | (0.31 | ) |
Year Ended June 30, 2012 | | | 24.45 | | | | 0.21 | | | | 0.57 | | | | 0.78 | | | | (0.18 | ) |
| | | | | |
Class R6 | | | | | | | | | | | | | | | | | | | | |
Six Months Ended December 31, 2016 (Unaudited) | | | 40.50 | | | | 0.23 | | | | 2.42 | | | | 2.65 | | | | (0.49 | ) |
November 2, 2015 (h) through June 30, 2016 | | | 42.20 | | | | 0.36 | | | | (1.60 | ) | | | (1.24 | ) | | | (0.46 | ) |
| | | | | |
Select Class | | | | | | | | | | | | | | | | | | | | |
Six Months Ended December 31, 2016 (Unaudited) | | | 40.99 | | | | 0.18 | | | | 2.45 | | | | 2.63 | | | | (0.39 | ) |
Year Ended June 30, 2016 | | | 41.27 | | | | 0.29 | | | | (0.55 | ) | | | (0.26 | ) | | | (0.02 | ) |
Year Ended June 30, 2015 | | | 37.23 | | | | 0.32 | | | | 3.93 | | | | 4.25 | | | | (0.21 | ) |
Year Ended June 30, 2014 | | | 29.52 | | | | 0.26 | (g) | | | 7.69 | | | | 7.95 | | | | (0.24 | ) |
Year Ended June 30, 2013 | | | 25.15 | | | | 0.28 | | | | 4.35 | | | | 4.63 | | | | (0.26 | ) |
Year Ended June 30, 2012 | | | 24.55 | | | | 0.16 | | | | 0.57 | | | | 0.73 | | | | (0.13 | ) |
| (a) | Annualized for periods less than one year, unless otherwise noted. |
| (b) | Calculated based upon average shares outstanding. |
| (c) | Not annualized for periods less than one year. |
| (d) | Includes adjustments in accordance with accounting principles generally accepted in the United States of America and as such, the net asset values for financial reporting purposes and the returns based upon those net asset values may differ from the net asset values and returns for shareholder transactions. |
| (e) | Includes earnings credits and interest expense, if applicable, each of which is less than 0.005% unless otherwise noted. |
| (f) | Portfolio turnover is calculated by dividing the lesser of total purchases or sales of portfolio securities for the reporting period by the monthly average value of portfolio securities owned during the reporting period. Excluded from both the numerator and denominator are amounts relating to derivatives and securities whose maturities or expiration dates at the time of acquisition were one year or less. |
| (g) | Reflects special dividends paid out during the period by several of the Fund’s holdings. Had the Fund not received the special dividends, the net investment income (loss) per share would have been $0.17, $0.00, $0.09, $0.32 and $0.26 for Class A, Class C, Class R2, Class R5 and Select Class Shares, respectively, and the net investment income (loss) ratio would have been 0.51%, 0.01%, 0.26%, 0.96% and 0.76% for Class A, Class C, Class R2, Class R5 and Select Class Shares, respectively. |
| (h) | Commencement of offering of class of shares. |
SEE NOTES TO FINANCIAL STATEMENTS.
| | | | | | |
| | | |
| 50 | | | | J.P. MORGAN INTREPID FUNDS | | DECEMBER 31, 2016 |
| | | | | | | | | | | | | | | | | | | | | | | | | | |
| | | Ratios/Supplemental data | |
| | | | | | | | | | Ratios to average net assets (a) | | | | |
Net asset
value,
end of
period | | | Total return
(excludes
sales charge) (c)(d) | | | Net assets,
end of
period
(000’s) | | | Net
expenses (e) | | | Net
investment
income
(loss) | | |
Expenses
without waivers,
reimbursements and
earnings credits | | | Portfolio
turnover
rate (c)(f) | |
| | | | | | | | | | | | | | | | | | | | | | | | | | |
| | | | | | | | | | | | | | | | | | | | | | | | | | |
| | $42.64 | | | | 6.26 | % | | $ | 91,844 | | | | 0.92 | % | | | 0.57 | % | | | 1.22 | % | | | 35 | % |
| | 40.37 | | | | (0.88 | ) | | | 90,529 | | | | 0.93 | | | | 0.66 | | | | 1.23 | | | | 70 | |
| | 40.99 | | | | 11.16 | | | | 106,573 | | | | 0.96 | | | | 0.62 | | | | 1.16 | | | | 64 | |
| | 37.05 | | | | 26.68 | | | | 33,563 | | | | 1.16 | | | | 0.54 | (g) | | | 1.17 | | | | 67 | |
| | 29.36 | | | | 18.27 | | | | 33,582 | | | | 1.24 | | | | 0.76 | | | | 1.30 | | | | 67 | |
| | 25.00 | | | | 2.76 | | | | 32,027 | | | | 1.25 | | | | 0.42 | | | | 1.32 | | | | 110 | |
| | | | | | |
| | | | | | | | | | | | | | | | | | | | | | | | | | |
| | 41.97 | | | | 6.00 | | | | 44,089 | | | | 1.41 | | | | 0.08 | | | | 1.69 | | | | 35 | |
| | 39.63 | | | | (1.35 | ) | | | 48,717 | | | | 1.42 | | | | 0.19 | | | | 1.71 | | | | 70 | |
| | 40.26 | | | | 10.60 | | | | 49,309 | | | | 1.46 | | | | 0.12 | | | | 1.66 | | | | 64 | |
| | 36.45 | | | | 26.05 | | | | 19,566 | | | | 1.65 | | | | 0.03 | (g) | | | 1.67 | | | | 67 | |
| | 28.93 | | | | 17.66 | | | | 15,462 | | | | 1.74 | | | | 0.26 | | | | 1.79 | | | | 67 | |
| | 24.64 | | | | 2.28 | | | | 14,298 | | | | 1.75 | | | | (0.09 | ) | | | 1.82 | | | | 110 | |
| | | | | | |
| | | | | | | | | | | | | | | | | | | | | | | | | | |
| | 41.87 | | | | 6.14 | | | | 4,850 | | | | 1.16 | | | | 0.34 | | | | 1.75 | | | | 35 | |
| | 39.66 | | | | (1.10 | ) | | | 4,207 | | | | 1.17 | | | | 0.50 | | | | 1.76 | | | | 70 | |
| | 40.39 | | | | 10.87 | | | | 1,205 | | | | 1.22 | | | | 0.31 | | | | 1.45 | | | | 64 | |
| | 36.49 | | | | 26.41 | | | | 601 | | | | 1.41 | | | | 0.28 | (g) | | | 1.42 | | | | 67 | |
| | 28.91 | | | | 17.90 | | | | 603 | | | | 1.49 | | | | 0.49 | | | | 1.54 | | | | 67 | |
| | 24.72 | | | | 2.53 | | | | 375 | | | | 1.50 | | | | 0.29 | | | | 1.56 | | | | 110 | |
| | | | | | |
| | | | | | | | | | | | | | | | | | | | | | | | | | |
| | 42.69 | | | | 6.51 | | | | 169,240 | | | | 0.48 | | | | 1.01 | | | | 0.73 | | | | 35 | |
| | 40.51 | | | | (0.42 | ) | | | 205,213 | | | | 0.47 | | | | 1.13 | | | | 0.74 | | | | 70 | |
| | 41.12 | | | | 11.66 | | | | 189,466 | | | | 0.54 | | | | 1.02 | | | | 0.70 | | | | 64 | |
| | 37.09 | | | | 27.23 | | | | 124,489 | | | | 0.71 | | | | 0.98 | (g) | | | 0.72 | | | | 67 | |
| | 29.41 | | | | 18.79 | | | | 105,839 | | | | 0.79 | | | | 1.21 | | | | 0.85 | | | | 67 | |
| | 25.05 | | | | 3.26 | | | | 107,169 | | | | 0.80 | | | | 0.87 | | | | 0.87 | | | | 110 | |
| | | | | | |
| | | | | | | | | | | | | | | | | | | | | | | | | | |
| | 42.66 | | | | 6.52 | | | | 496,081 | | | | 0.43 | | | | 1.07 | | | | 0.61 | | | | 35 | |
| | 40.50 | | | | (2.94 | ) | | | 488,138 | | | | 0.42 | | | | 1.38 | | | | 0.61 | | | | 70 | |
| | | | | | |
| | | | | | | | | | | | | | | | | | | | | | | | | | |
| | 43.23 | | | | 6.39 | | | | 159,416 | | | | 0.68 | | | | 0.82 | | | | 0.90 | | | | 35 | |
| | 40.99 | | | | (0.63 | ) | | | 151,419 | | | | 0.68 | | | | 0.70 | | | | 0.88 | | | | 70 | |
| | 41.27 | | | | 11.43 | | | | 708,276 | | | | 0.74 | | | | 0.80 | | | | 0.87 | | | | 64 | |
| | 37.23 | | | | 27.00 | | | | 597,963 | | | | 0.91 | | | | 0.79 | (g) | | | 0.92 | | | | 67 | |
| | 29.52 | | | | 18.52 | | | | 538,378 | | | | 0.99 | | | | 1.02 | | | | 1.05 | | | | 67 | |
| | 25.15 | | | | 3.04 | | | | 502,640 | | | | 1.00 | | | | 0.67 | | | | 1.07 | | | | 110 | |
SEE NOTES TO FINANCIAL STATEMENTS.
| | | | | | | | |
| | | |
| DECEMBER 31, 2016 | | J.P. MORGAN INTREPID FUNDS | | | | | 51 | |
FINANCIAL HIGHLIGHTS
FOR THE PERIODS INDICATED (continued)
| | | | | | | | | | | | | | | | | | | | | | | | | | | | |
| | | | | | Per share operating performance | |
| | | | | | Investment operations | | | Distributions | |
| | | Net asset
value,
beginning
of period | | | Net
investment
income
(loss) (b) | | | Net realized
and unrealized
gains
(losses) on
investments | | | Total from
investment
operations | | | Net
investment
income | | | Net
realized
gain | | | Total
distributions | |
Intrepid Mid Cap Fund | | | | | | | | | | | | | | | | | | | | | | | | | | | | |
Class A | | | | | | | | | | | | | | | | | | | | | | | | | | | | |
Six Months Ended December 31, 2016 (Unaudited) | | $ | 19.48 | | | $ | 0.05 | | | $ | 1.42 | | | $ | 1.47 | | | $ | (0.07 | ) | | $ | — | (g) | | $ | (0.07 | ) |
Year Ended June 30, 2016 | | | 21.82 | | | | 0.15 | | | | (0.64 | ) | | | (0.49 | ) | | | (0.13 | ) | | | (1.72 | ) | | | (1.85 | ) |
Year Ended June 30, 2015 | | | 24.11 | | | | 0.08 | | | | 1.18 | | | | 1.26 | | | | (0.09 | ) | | | (3.46 | ) | | | (3.55 | ) |
Year Ended June 30, 2014 | | | 18.79 | | | | 0.08 | (h) | | | 5.41 | | | | 5.49 | | | | (0.07 | ) | | | (0.10 | ) | | | (0.17 | ) |
Year Ended June 30, 2013 | | | 14.99 | | | | 0.13 | (i) | | | 3.80 | | | | 3.93 | | | | (0.13 | ) | | | — | | | | (0.13 | ) |
Year Ended June 30, 2012 | | | 15.79 | | | | 0.10 | | | | (0.79 | ) | | | (0.69 | ) | | | (0.11 | ) | | | — | | | | (0.11 | ) |
| | | | | | | |
Class C | | | | | | | | | | | | | | | | | | | | | | | | | | | | |
Six Months Ended December 31, 2016 (Unaudited) | | | 16.72 | | | | (0.01 | ) | | | 1.21 | | | | 1.20 | | | | (0.02 | ) | | | — | (g) | | | (0.02 | ) |
Year Ended June 30, 2016 | | | 19.07 | | | | 0.03 | | | | (0.58 | ) | | | (0.55 | ) | | | (0.08 | ) | | | (1.72 | ) | | | (1.80 | ) |
Year Ended June 30, 2015 | | | 21.56 | | | | (0.06 | ) | | | 1.06 | | | | 1.00 | | | | (0.03 | ) | | | (3.46 | ) | | | (3.49 | ) |
Year Ended June 30, 2014 | | | 16.87 | | | | (0.05 | )(h) | | | 4.84 | | | | 4.79 | | | | — | | | | (0.10 | ) | | | (0.10 | ) |
Year Ended June 30, 2013 | | | 13.48 | | | | 0.02 | (i) | | | 3.41 | | | | 3.43 | | | | (0.04 | ) | | | — | | | | (0.04 | ) |
Year Ended June 30, 2012 | | | 14.24 | | | | 0.01 | | | | (0.72 | ) | | | (0.71 | ) | | | (0.05 | ) | | | — | | | | (0.05 | ) |
| | | | | | | |
Class R3 | | | | | | | | | | | | | | | | | | | | | | | | | | | | |
September 9, 2016 (j) through December 31, 2016 (Unaudited) | | | 19.97 | | | | 0.04 | | | | 0.93 | | | | 0.97 | | | | (0.09 | ) | | | — | (g) | | | (0.09 | ) |
| | | | | | | |
Class R4 | | | | | | | | | | | | | | | | | | | | | | | | | | | | |
September 9, 2016 (j) through December 31, 2016 (Unaudited) | | | 20.95 | | | | 0.05 | | | | 0.99 | | | | 1.04 | | | | (0.11 | ) | | | — | (g) | | | (0.11 | ) |
| | | | | | | |
Class R6 | | | | | | | | | | | | | | | | | | | | | | | | | | | | |
Six Months Ended December 31, 2016 (Unaudited) | | | 20.42 | | | | 0.10 | | | | 1.49 | | | | 1.59 | | | | (0.12 | ) | | | — | (g) | | | (0.12 | ) |
November 2, 2015 (j) through June 30, 2016 | | | 22.41 | | | | 0.20 | | | | (0.29 | ) | | | (0.09 | ) | | | (0.18 | ) | | | (1.72 | ) | | | (1.90 | ) |
| | | | | | | |
Select Class | | | | | | | | | | | | | | | | | | | | | | | | | | | | |
Six Months Ended December 31, 2016 (Unaudited) | | | 20.43 | | | | 0.08 | | | | 1.49 | | | | 1.57 | | | | (0.10 | ) | | | — | (g) | | | (0.10 | ) |
Year Ended June 30, 2016 | | | 22.77 | | | | 0.19 | | | | (0.64 | ) | | | (0.45 | ) | | | (0.17 | ) | | | (1.72 | ) | | | (1.89 | ) |
Year Ended June 30, 2015 | | | 24.97 | | | | 0.14 | | | | 1.24 | | | | 1.38 | | | | (0.12 | ) | | | (3.46 | ) | | | (3.58 | ) |
Year Ended June 30, 2014 | | | 19.45 | | | | 0.14 | (h) | | | 5.60 | | | | 5.74 | | | | (0.12 | ) | | | (0.10 | ) | | | (0.22 | ) |
Year Ended June 30, 2013 | | | 15.51 | | | | 0.18 | (i) | | | 3.93 | | | | 4.11 | | | | (0.17 | ) | | | — | | | | (0.17 | ) |
Year Ended June 30, 2012 | | | 16.33 | | | | 0.14 | | | | (0.82 | ) | | | (0.68 | ) | | | (0.14 | ) | | | — | | | | (0.14 | ) |
| (a) | Annualized for periods less than one year, unless otherwise noted. |
| (b) | Calculated based upon average shares outstanding. |
| (c) | Not annualized for periods less than one year. |
| (d) | Includes adjustments in accordance with accounting principles generally accepted in the United States of America and as such, the net asset values for financial reporting purposes and the returns based upon those net asset values may differ from the net asset values and returns for shareholder transactions. |
| (e) | Includes earnings credits and interest expense, if applicable, each of which is less than 0.005% unless otherwise noted. |
| (f) | Portfolio turnover is calculated by dividing the lesser of total purchases or sales of portfolio securities for the reporting period by the monthly average value of portfolio securities owned during the reporting period. Excluded from both the numerator and denominator are amounts relating to derivatives and securities whose maturities or expiration dates at the time of acquisition were one year or less. |
| (g) | Amount rounds to less than 0.005. |
| (h) | Reflects special dividends paid out during the period by several of the Fund’s holdings. Had the Fund not received the special dividends, the net investment income (loss) per share would have been $0.04, $(0.08) and $0.10 for Class A, Class C and Select Class Shares, respectively, and the net investment income (loss) ratio would have been 0.20%, (0.42)% and 0.45% for Class A, Class C, and Select Class Shares, respectively. |
| (i) | Reflects a special dividend paid out during the period by one of the Fund’s holdings. Had the Fund not received the special dividend, the net investment income (loss) per share would have been $0.08, $(0.03) and $0.13 for Class A, Class C and Select Class Shares, respectively, and the net investment income (loss) ratio would have been 0.47%, (0.17)% and 0.72% for Class A, Class C and Select Class Shares, respectively. |
| (j) | Commencement of offering of class of shares. |
SEE NOTES TO FINANCIAL STATEMENTS.
| | | | | | |
| | | |
| 52 | | | | J.P. MORGAN INTREPID FUNDS | | DECEMBER 31, 2016 |
| | | | | | | | | | | | | | | | | | | | | | | | | | |
| | | Ratios/Supplemental data | |
| | | | | | | | | | Ratios to average net assets (a) | | | | |
Net asset
value,
end of
period | | | Total return
(excludes
sales charge) (c)(d) | | | Net assets,
end of
period
(000’s) | | | Net
expenses (e) | | | Net
investment
income
(loss) | | |
Expenses
without waivers,
reimbursements and
earnings credits | | | Portfolio
turnover
rate (c)(f) | |
| | | | | | | | | | | | | | | | | | | | | | | | | | |
| | | | | | | | | | | | | | | | | | | | | | | | | | |
| $ | 20.88 | | | | 7.57 | % | | $ | 338,522 | | | | 1.14 | % | | | 0.48 | % | | | 1.40 | % | | | 31 | % |
| | 19.48 | | | | (1.71 | ) | | | 311,724 | | | | 1.15 | | | | 0.77 | | | | 1.44 | | | | 78 | |
| | 21.82 | | | | 5.64 | | | | 377,893 | | | | 1.14 | | | | 0.33 | | | | 1.37 | | | | 66 | |
| | 24.11 | | | | 29.30 | | | | 193,342 | | | | 1.16 | | | | 0.38 | (h) | | | 1.32 | | | | 64 | |
| | 18.79 | | | | 26.30 | | | | 144,405 | | | | 1.23 | | | | 0.78 | (i) | | | 1.38 | | | | 52 | |
| | 14.99 | | | | (4.36 | ) | | | 122,217 | | | | 1.24 | | | | 0.68 | | | | 1.38 | | | | 51 | |
| | | | | | |
| | | | | | | | | | | | | | | | | | | | | | | | | | |
| | 17.90 | | | | 7.21 | | | | 91,362 | | | | 1.78 | | | | (0.16 | ) | | | 1.90 | | | | 31 | |
| | 16.72 | | | | (2.35 | ) | | | 89,071 | | | | 1.79 | | | | 0.15 | | | | 1.96 | | | | 78 | |
| | 19.07 | | | | 5.02 | | | | 87,191 | | | | 1.78 | | | | (0.31 | ) | | | 1.87 | | | | 66 | |
| | 21.56 | | | | 28.43 | | | | 49,796 | | | | 1.79 | | | | (0.25 | )(h) | | | 1.82 | | | | 64 | |
| | 16.87 | | | | 25.51 | | | | 36,073 | | | | 1.87 | | | | 0.13 | (i) | | | 1.88 | | | | 52 | |
| | 13.48 | | | | (4.97 | ) | | | 28,079 | | | | 1.88 | | | | 0.04 | | | | 1.88 | | | | 51 | |
| | | | | | |
| | | | | | | | | | | | | | | | | | | | | | | | | | |
| | 20.85 | | | | 4.89 | | | | 21 | | | | 1.15 | | | | 0.57 | | | | 1.27 | | | | 31 | |
| | | | | | |
| | | | | | | | | | | | | | | | | | | | | | | | | | |
| | 21.88 | | | | 4.96 | | | | 21 | | | | 0.90 | | | | 0.82 | | | | 1.02 | | | | 31 | |
| | | | | | |
| | | | | | | | | | | | | | | | | | | | | | | | | | |
| | 21.89 | | | | 7.82 | | | | 332,601 | | | | 0.64 | | | | 0.98 | | | | 0.76 | | | | 31 | |
| | 20.42 | | | | 0.12 | | | | 304,934 | | | | 0.65 | | | | 1.53 | | | | 0.78 | | | | 78 | |
| | | | | | |
| | | | | | | | | | | | | | | | | | | | | | | | | | |
| | 21.90 | | | | 7.68 | | | | 287,272 | | | | 0.89 | | | | 0.72 | | | | 1.13 | | | | 31 | |
| | 20.43 | | | | (1.48 | ) | | | 258,866 | | | | 0.90 | | | | 0.93 | | | | 1.13 | | | | 78 | |
| | 22.77 | | | | 5.97 | | | | 510,465 | | | | 0.89 | | | | 0.58 | | | | 1.07 | | | | 66 | |
| | 24.97 | | | | 29.61 | | | | 348,077 | | | | 0.91 | | | | 0.62 | (h) | | | 1.08 | | | | 64 | |
| | 19.45 | | | | 26.60 | | | | 327,834 | | | | 0.98 | | | | 1.03 | (i) | | | 1.13 | | | | 52 | |
| | 15.51 | | | | (4.11 | ) | | | 269,693 | | | | 0.99 | | | | 0.94 | | | | 1.13 | | | | 51 | |
SEE NOTES TO FINANCIAL STATEMENTS.
| | | | | | | | |
| | | |
| DECEMBER 31, 2016 | | J.P. MORGAN INTREPID FUNDS | | | | | 53 | |
FINANCIAL HIGHLIGHTS
FOR THE PERIODS INDICATED (continued)
| | | | | | | | | | | | | | | | | | | | | | | | | | | | |
| | | | | | Per share operating performance | |
| | | | | | Investment operations | | | Distributions | |
| | | Net asset
value,
beginning
of period | | | Net
investment
income
(loss) (b) | | | Net realized
and unrealized
gains
(losses) on
investments | | | Total from
investment
operations | | | Net
investment
income | | | Net
realized
gain | | | Total
distributions | |
Intrepid Value Fund | | | | | | | | | | | | | | | | | | | | | | | | | | | | |
Class A | | | | | | | | | | | | | | | | | | | | | | | | | | | | |
Six Months Ended December 31, 2016 (Unaudited) | | $ | 31.20 | | | $ | 0.24 | | | $ | 3.63 | | | $ | 3.87 | | | $ | (0.32 | ) | | $ | (0.27 | ) | | $ | (0.59 | ) |
Year Ended June 30, 2016 | | | 35.66 | | | | 0.53 | | | | (2.95 | ) | | | (2.42 | ) | | | (0.49 | ) | | | (1.55 | ) | | | (2.04 | ) |
Year Ended June 30, 2015 | | | 37.13 | | | | 0.46 | | | | 1.38 | | | | 1.84 | | | | (0.44 | ) | | | (2.87 | ) | | | (3.31 | ) |
Year Ended June 30, 2014 | | | 29.76 | | | | 0.40 | | | | 7.36 | | | | 7.76 | | | | (0.39 | ) | | | — | | | | (0.39 | ) |
Year Ended June 30, 2013 | | | 23.99 | | | | 0.42 | | | | 5.79 | | | | 6.21 | | | | (0.44 | ) | | | — | | | | (0.44 | ) |
Year Ended June 30, 2012 | | | 24.35 | | | | 0.35 | | | | (0.34 | ) | | | 0.01 | | | | (0.37 | ) | | | — | | | | (0.37 | ) |
| | | | | | | |
Class C | | | | | | | | | | | | | | | | | | | | | | | | | | | | |
Six Months Ended December 31, 2016 (Unaudited) | | | 30.87 | | | | 0.16 | | | | 3.59 | | | | 3.75 | | | | (0.25 | ) | | | (0.27 | ) | | | (0.52 | ) |
Year Ended June 30, 2016 | | | 35.29 | | | | 0.36 | | | | (2.91 | ) | | | (2.55 | ) | | | (0.32 | ) | | | (1.55 | ) | | | (1.87 | ) |
Year Ended June 30, 2015 | | | 36.80 | | | | 0.27 | | | | 1.37 | | | | 1.64 | | | | (0.28 | ) | | | (2.87 | ) | | | (3.15 | ) |
Year Ended June 30, 2014 | | | 29.52 | | | | 0.23 | | | | 7.28 | | | | 7.51 | | | | (0.23 | ) | | | — | | | | (0.23 | ) |
Year Ended June 30, 2013 | | | 23.80 | | | | 0.29 | | | | 5.74 | | | | 6.03 | | | | (0.31 | ) | | | — | | | | (0.31 | ) |
Year Ended June 30, 2012 | | | 24.16 | | | | 0.24 | | | | (0.35 | ) | | | (0.11 | ) | | | (0.25 | ) | | | — | | | | (0.25 | ) |
| | | | | | | |
Class R2 | | | | | | | | | | | | | | | | | | | | | | | | | | | | |
Six Months Ended December 31, 2016 (Unaudited) | | | 31.04 | | | | 0.20 | | | | 3.61 | | | | 3.81 | | | | (0.30 | ) | | | (0.27 | ) | | | (0.57 | ) |
Year Ended June 30, 2016 | | | 35.48 | | | | 0.44 | | | | (2.92 | ) | | | (2.48 | ) | | | (0.41 | ) | | | (1.55 | ) | | | (1.96 | ) |
Year Ended June 30, 2015 | | | 37.02 | | | | 0.35 | | | | 1.40 | | | | 1.75 | | | | (0.42 | ) | | | (2.87 | ) | | | (3.29 | ) |
Year Ended June 30, 2014 | | | 29.69 | | | | 0.31 | | | | 7.33 | | | | 7.64 | | | | (0.31 | ) | | | — | | | | (0.31 | ) |
Year Ended June 30, 2013 | | | 23.95 | | | | 0.30 | | | | 5.83 | | | | 6.13 | | | | (0.39 | ) | | | — | | | | (0.39 | ) |
Year Ended June 30, 2012 | | | 24.31 | | | | 0.29 | | | | (0.33 | ) | | | (0.04 | ) | | | (0.32 | ) | | | — | | | | (0.32 | ) |
| | | | | | | |
Class R5 | | | | | | | | | | | | | | | | | | | | | | | | | | | | |
Six Months Ended December 31, 2016 (Unaudited) | | | 31.42 | | | | 0.30 | | | | 3.66 | | | | 3.96 | | | | (0.40 | ) | | | (0.27 | ) | | | (0.67 | ) |
Year Ended June 30, 2016 | | | 35.88 | | | | 0.64 | | | | (2.95 | ) | | | (2.31 | ) | | | (0.60 | ) | | | (1.55 | ) | | | (2.15 | ) |
Year Ended June 30, 2015 | | | 37.33 | | | | 0.59 | | | | 1.39 | | | | 1.98 | | | | (0.56 | ) | | | (2.87 | ) | | | (3.43 | ) |
Year Ended June 30, 2014 | | | 29.91 | | | | 0.52 | | | | 7.40 | | | | 7.92 | | | | (0.50 | ) | | | — | | | | (0.50 | ) |
Year Ended June 30, 2013 | | | 24.10 | | | | 0.52 | | | | 5.82 | | | | 6.34 | | | | (0.53 | ) | | | — | | | | (0.53 | ) |
Year Ended June 30, 2012 | | | 24.46 | | | | 0.43 | | | | (0.34 | ) | | | 0.09 | | | | (0.45 | ) | | | — | | | | (0.45 | ) |
| | | | | | | |
Class R6 | | | | | | | | | | | | | | | | | | | | | | | | | | | | |
Six Months Ended December 31, 2016 (Unaudited) | | | 31.42 | | | | 0.31 | | | | 3.66 | | | | 3.97 | | | | (0.40 | ) | | | (0.27 | ) | | | (0.67 | ) |
Year Ended June 30, 2016 | | | 35.89 | | | | 0.66 | | | | (2.97 | ) | | | (2.31 | ) | | | (0.61 | ) | | | (1.55 | ) | | | (2.16 | ) |
Year Ended June 30, 2015 | | | 37.33 | | | | 0.61 | | | | 1.39 | | | | 2.00 | | | | (0.57 | ) | | | (2.87 | ) | | | (3.44 | ) |
Year Ended June 30, 2014 | | | 29.91 | | | | 0.47 | | | | 7.46 | | | | 7.93 | | | | (0.51 | ) | | | — | | | | (0.51 | ) |
Year Ended June 30, 2013 | | | 24.10 | | | | 0.53 | | | | 5.83 | | | | 6.36 | | | | (0.55 | ) | | | — | | | | (0.55 | ) |
Year Ended June 30, 2012 | | | 24.46 | | | | 0.43 | | | | (0.33 | ) | | | 0.10 | | | | (0.46 | ) | | | — | | | | (0.46 | ) |
| | | | | | | |
Select Class | | | | | | | | | | | | | | | | | | | | | | | | | | | | |
Six Months Ended December 31, 2016 (Unaudited) | | | 31.34 | | | | 0.27 | | | | 3.65 | | | | 3.92 | | | | (0.36 | ) | | | (0.27 | ) | | | (0.63 | ) |
Year Ended June 30, 2016 | | | 35.80 | | | | 0.57 | | | | (2.95 | ) | | | (2.38 | ) | | | (0.53 | ) | | | (1.55 | ) | | | (2.08 | ) |
Year Ended June 30, 2015 | | | 37.25 | | | | 0.51 | | | | 1.40 | | | | 1.91 | | | | (0.49 | ) | | | (2.87 | ) | | | (3.36 | ) |
Year Ended June 30, 2014 | | | 29.85 | | | | 0.45 | | | | 7.38 | | | | 7.83 | | | | (0.43 | ) | | | — | | | | (0.43 | ) |
Year Ended June 30, 2013 | | | 24.06 | | | | 0.46 | | | | 5.81 | | | | 6.27 | | | | (0.48 | ) | | | — | | | | (0.48 | ) |
Year Ended June 30, 2012 | | | 24.42 | | | | 0.39 | | | | (0.35 | ) | | | 0.04 | | | | (0.40 | ) | | | — | | | | (0.40 | ) |
| (a) | Annualized for periods less than one year, unless otherwise noted. |
| (b) | Calculated based upon average shares outstanding. |
| (c) | Not annualized for periods less than one year. |
| (d) | Includes adjustments in accordance with accounting principles generally accepted in the United States of America and as such, the net asset values for financial reporting purposes and the returns based upon those net asset values may differ from the net asset values and returns for shareholder transactions. |
| (e) | Includes earnings credits and interest expense, if applicable, each of which is less than 0.005% unless otherwise noted. |
| (f) | Portfolio turnover is calculated by dividing the lesser of total purchases or sales of portfolio securities for the reporting period by the monthly average value of portfolio securities owned during the reporting period. Excluded from both the numerator and denominator are amounts relating to derivatives and securities whose maturities or expiration dates at the time of acquisition were one year or less. |
SEE NOTES TO FINANCIAL STATEMENTS.
| | | | | | |
| | | |
| 54 | | | | J.P. MORGAN INTREPID FUNDS | | DECEMBER 31, 2016 |
| | | | | | | | | | | | | | | | | | | | | | | | | | |
| | | Ratios/Supplemental data | |
| | | | | | | | | | Ratios to average net assets (a) | | | | |
Net asset
value,
end of
period | | | Total return
(excludes
sales charge) (c)(d) | | | Net assets,
end of
period
(000’s) | | | Net
expenses (e) | | | Net
investment
income
(loss) | | |
Expenses
without waivers,
reimbursements and
earnings credits | | | Portfolio
turnover
rate (c)(f) | |
| | | | | | | | | | | | | | | | | | | | | | | | | | |
| | | | | | | | | | | | | | | | | | | | | | | | | | |
| $ | 34.48 | | | | 12.47 | % | | $ | 121,600 | | | | 0.82 | % | | | 1.47 | % | | | 1.20 | % | | | 34 | % |
| | 31.20 | | | | (6.70 | ) | | | 240,808 | | | | 0.83 | | | | 1.64 | | | | 1.18 | | | | 66 | |
| | 35.66 | | | | 5.24 | | | | 173,149 | | | | 0.86 | | | | 1.26 | | | | 1.13 | | | | 52 | |
| | 37.13 | | | | 26.17 | | | | 114,036 | | | | 0.94 | | | | 1.19 | | | | 1.17 | | | | 49 | |
| | 29.76 | | | | 26.07 | | | | 71,116 | | | | 0.94 | | | | 1.57 | | | | 1.38 | | | | 48 | |
| | 23.99 | | | | 0.14 | | | | 61,097 | | | | 0.95 | | | | 1.54 | | | | 1.47 | | | | 82 | |
| | | | | | |
| | | | | | | | | | | | | | | | | | | | | | | | | | |
| | 34.10 | | | | 12.21 | | | | 40,639 | | | | 1.32 | | | | 0.96 | | | | 1.62 | | | | 34 | |
| | 30.87 | | | | (7.16 | ) | | | 42,788 | | | | 1.33 | | | | 1.12 | | | | 1.62 | | | | 66 | |
| | 35.29 | | | | 4.72 | | | | 53,413 | | | | 1.36 | | | | 0.76 | | | | 1.62 | | | | 52 | |
| | 36.80 | | | | 25.50 | | | | 35,963 | | | | 1.44 | | | | 0.69 | | | | 1.67 | | | | 49 | |
| | 29.52 | | | | 25.48 | | | | 25,538 | | | | 1.44 | | | | 1.07 | | | | 1.88 | | | | 48 | |
| | 23.80 | | | | (0.37 | ) | | | 22,086 | | | | 1.45 | | | | 1.04 | | | | 1.96 | | | | 82 | |
| | | | | | |
| | | | | | | | | | | | | | | | | | | | | | | | | | |
| | 34.28 | | | | 12.32 | | | | 19,958 | | | | 1.07 | | | | 1.22 | | | | 1.60 | | | | 34 | |
| | 31.04 | | | | (6.91 | ) | | | 17,721 | | | | 1.08 | | | | 1.39 | | | | 1.75 | | | | 66 | |
| | 35.48 | | | | 4.98 | | | | 14,237 | | | | 1.09 | | | | 0.97 | | | | 1.43 | | | | 52 | |
| | 37.02 | | | | 25.82 | | | | 1,346 | | | | 1.19 | | | | 0.92 | | | | 1.42 | | | | 49 | |
| | 29.69 | | | | 25.74 | | | | 934 | | | | 1.19 | | | | 1.06 | | | | 1.56 | | | | 48 | |
| | 23.95 | | | | (0.09 | ) | | | 70 | | | | 1.20 | | | | 1.29 | | | | 1.73 | | | | 82 | |
| | | | | | |
| | | | | | | | | | | | | | | | | | | | | | | | | | |
| | 34.71 | | | | 12.66 | | | | 93,144 | | | | 0.48 | | | | 1.81 | | | | 0.61 | | | | 34 | |
| | 31.42 | | | | (6.35 | ) | | | 85,624 | | | | 0.48 | | | | 1.98 | | | | 0.61 | | | | 66 | |
| | 35.88 | | | | 5.60 | | | | 83,859 | | | | 0.51 | | | | 1.59 | | | | 0.63 | | | | 52 | |
| | 37.33 | | | | 26.60 | | | | 80,008 | | | | 0.59 | | | | 1.53 | | | | 0.72 | | | | 49 | |
| | 29.91 | | | | 26.53 | | | | 62,685 | | | | 0.59 | | | | 1.92 | | | | 0.93 | | | | 48 | |
| | 24.10 | | | | 0.49 | | | | 52,183 | | | | 0.60 | | | | 1.88 | | | | 1.03 | | | | 82 | |
| | | | | | |
| | | | | | | | | | | | | | | | | | | | | | | | | | |
| | 34.72 | | | | 12.72 | | | | 105,701 | | | | 0.43 | | | | 1.87 | | | | 0.51 | | | | 34 | |
| | 31.42 | | | | (6.33 | ) | | | 86,255 | | | | 0.43 | | | | 2.07 | | | | 0.51 | | | | 66 | |
| | 35.89 | | | | 5.67 | | | | 39,024 | | | | 0.46 | | | | 1.65 | | | | 0.55 | | | | 52 | |
| | 37.33 | | | | 26.66 | | | | 19,495 | | | | 0.54 | | | | 1.41 | | | | 0.67 | | | | 49 | |
| | 29.91 | | | | 26.59 | | | | 10,875 | | | | 0.54 | | | | 1.99 | | | | 0.91 | | | | 48 | |
| | 24.10 | | | | 0.54 | | | | 18,840 | | | | 0.55 | | | | 1.86 | | | | 0.97 | | | | 82 | |
| | | | | | |
| | | | | | | | | | | | | | | | | | | | | | | | | | |
| | 34.63 | | | | 12.55 | | | | 872,161 | | | | 0.67 | | | | 1.64 | | | | 0.95 | | | | 34 | |
| | 31.34 | | | | (6.56 | ) | | | 1,224,039 | | | | 0.68 | | | | 1.77 | | | | 0.91 | | | | 66 | |
| | 35.80 | | | | 5.41 | | | | 1,424,101 | | | | 0.71 | | | | 1.39 | | | | 0.90 | | | | 52 | |
| | 37.25 | | | | 26.35 | | | | 1,214,765 | | | | 0.79 | | | | 1.34 | | | | 0.92 | | | | 49 | |
| | 29.85 | | | | 26.26 | | | | 926,972 | | | | 0.79 | | | | 1.71 | | | | 1.12 | | | | 48 | |
| | 24.06 | | | | 0.29 | | | | 705,545 | | | | 0.80 | | | | 1.70 | | | | 1.22 | | | | 82 | |
SEE NOTES TO FINANCIAL STATEMENTS.
| | | | | | | | |
| | | |
| DECEMBER 31, 2016 | | J.P. MORGAN INTREPID FUNDS | | | | | 55 | |
NOTES TO FINANCIAL STATEMENTS
AS OF DECEMBER 31, 2016 (Unaudited)
1. Organization
JPMorgan Trust I (“JPM I”) and JPMorgan Trust II (“JPM II”) (the “Trusts”) were formed on November 12, 2004, as Delaware statutory trusts, pursuant to Declarations of Trust dated November 5, 2004 and are registered under the Investment Company Act of 1940, as amended (the “1940 Act”), as open-end management investment companies.
The following are 5 separate funds of the Trusts (collectively, the “Funds”) covered by this report:
| | | | | | |
| | | Classes Offered | | Trust | | Diversified/Non-Diversified |
| Intrepid Advantage Fund | | Class A, Class C, and Select Class | | JPM I | | Diversified |
| Intrepid America Fund | | Class A, Class C, Class R2, Class R5, Class R6* and Select Class | | JPM I | | Diversified |
| Intrepid Growth Fund | | Class A, Class C, Class R2, Class R5, Class R6* and Select Class | | JPM I | | Diversified |
| Intrepid Mid Cap Fund | | Class A, Class C, Class R3**, Class R4**, Class R6* and Select Class | | JPM II | | Diversified |
| Intrepid Value Fund | | Class A, Class C, Class R2, Class R5, Class R6 and Select Class | | JPM I | | Diversified |
| * | Class R6 Shares commenced operations on November 2, 2015 for Intrepid America Fund, Intrepid Growth Fund and Intrepid Mid Cap Fund. |
| ** | Class R3 and Class R4 Shares commenced operations on September 9, 2016 for Intrepid Mid Cap Fund. |
The investment objective of both the Intrepid Advantage Fund and the Intrepid Value Fund is to seek to provide long-term capital appreciation.
The investment objective of both the Intrepid America Fund and the Intrepid Growth Fund is to seek to provide long-term capital growth.
The investment objective of the Intrepid Mid Cap Fund is to seek long-term capital growth by investing primarily in equity securities of companies with intermediate capitalizations.
Class A Shares generally provide for a front-end sales charge while Class C Shares provide for a contingent deferred sales charge (“CDSC”). No sales charges are assessed with respect to Class R2, Class R3, Class R4, Class R5, Class R6 and Select Class Shares. All classes of shares have equal rights as to earnings, assets and voting privileges, except that each class may bear different transfer agency, sub-transfer agency, distribution and shareholder servicing fees and each class has exclusive voting rights with respect to its distribution plan and shareholder servicing agreements. Certain Class A Shares, for which front-end sales charges have been waived, may be subject to a CDSC as described in the Funds’ prospectus.
J.P. Morgan Investment Management Inc. (“JPMIM”) an indirect, wholly-owned subsidiary of JPMorgan Chase & Co. (“JPMorgan”) acts as Adviser (the “Adviser”) and Administrator (the “Administrator”) to the Funds.
2. Significant Accounting Policies
The following is a summary of significant accounting policies followed by the Funds in the preparation of their financial statements. The Funds are investment companies and, accordingly, follow the investment company accounting and reporting guidance of the Financial Accounting Standards Board Accounting Standards Codification Topic 946 — Investment Companies, which is part of U.S. generally accepted accounting principles (“GAAP”). The preparation of financial statements in conformity with GAAP requires management to make estimates and assumptions that affect the reported amounts of assets and liabilities and disclosure of contingent assets and liabilities at the date of the financial statements and the reported amounts of increases and decreases in net assets from operations during the reporting period. Actual results could differ from those estimates.
A. Valuation of Investments — The valuation of investments is in accordance with GAAP and the Funds’ valuation policies set forth by and under the supervision and responsibility of the Board of Trustees (the “Board”), which established the following approach to valuation, as described more fully below: (i) investments for which market quotations are readily available shall be valued at such unadjusted quoted prices and (ii) all other investments for which market quotations are not readily available shall be valued at their fair value as determined in good faith by the Board.
The Administrator has established the J.P. Morgan Asset Management Americas Valuation Committee (“AVC”) to assist the Board with the oversight and monitoring of the valuation of the Funds’ investments. The Administrator implements the valuation policies of the Funds’ investments, as directed by the Board. The AVC oversees and carries out the policies for the valuation of investments held in the Funds. This includes monitoring the appropriateness of fair values based on results of ongoing valuation oversight, including but not limited to consideration of macro or security specific events, market events and pricing vendor and broker due diligence. The Administrator is responsible for discussing and assessing the potential impacts to the fair values on an ongoing basis, and at least on a quarterly basis with the AVC and the Board.
A market-based approach is primarily used to value the Funds’ investments. Investments for which market quotations are not readily available are fair valued by approved affiliated and unaffiliated pricing vendors or third party broker-dealers (collectively referred to as “Pricing Services”) or may be internally fair valued using methods set forth by the valuation policies approved by the Board. This may include related or comparable assets or liabilities, recent transactions, market multiples, book values, and other relevant information for the investment to determine the fair value of the investment. An income-based valuation approach may be used in which the anticipated future cash flows of the investment are discounted to calculate the fair value. Discounts may also be applied due to the nature or duration of any restrictions on the disposition of the investments. Valuations may be based upon current market prices of securities that are comparable in coupon, rating, maturity and industry. It is possible that the estimated values may differ significantly from the values that would have been used, had a ready market for the investments existed, and such differences could be material.
| | | | | | |
| | | |
| 56 | | | | J.P. MORGAN INTREPID FUNDS | | DECEMBER 31, 2016 |
Equities and other exchange-traded instruments are valued at the last sale price or official market closing price on the primary exchange on which the instrument is traded before the net asset values (“NAV”) of the Funds are calculated on a valuation date. Investments in open-end investment companies (the “Underlying Funds”) are valued at each Underlying Fund’s NAV per share as of the report date.
Futures are generally valued on the basis of available market quotations.
Valuations reflected in this report are as of the report date. As a result, changes in valuation due to market events and/or issuer related events after the report date and prior to issuance of the report are not reflected herein.
The various inputs that are used in determining the valuation of the Funds’ investments are summarized into the three broad levels listed below.
| • | | Level 1 — Unadjusted inputs using quoted prices in active markets for identical investments. |
| • | | Level 2 — Other significant observable inputs including, but not limited to, quoted prices for similar investments, inputs other than quoted prices that are observable for investments (such as interest rates, prepayment speeds, credit risk, etc.) or other market corroborated inputs. |
| • | | Level 3 — Significant inputs based on the best information available in the circumstances, to the extent observable inputs are not available (including the Funds’ assumptions in determining the fair value of investments). |
A financial instrument’s level within the fair value hierarchy is based on the lowest level of any input, both individually and in the aggregate, that is significant to the fair value measurement. The inputs or methodology used for valuing instruments are not necessarily an indication of the risk associated with investing in those instruments.
The following tables represent each valuation input as presented on the Schedules of Portfolio Investments (“SOIs”) (amounts in thousands):
Intrepid Advantage Fund
| | | | | | | | | | | | | | | | |
| | | Level 1 Quoted prices | | | Level 2
Other significant
observable inputs | | | Level 3
Significant
unobservable inputs | | | Total | |
Total Investments in Securities (a) | | $ | 17,724 | | | $ | — | | | $ | — | | | $ | 17,724 | |
| | | | | | | | | | | | | | | | |
| | | | |
| Intrepid America Fund | | | | | | | | | | | | | | | | |
| | | Level 1
Quoted prices | | | Level 2
Other significant
observable inputs | | | Level 3
Significant
unobservable inputs | | | Total | |
Total Investments in Securities (a) | | $ | 3,866,099 | | | $ | — | | | $ | — | | | $ | 3,866,099 | |
| | | | | | | | | | | | | | | | |
Depreciation in Other Financial Instruments | | | | | | | | | | | | | | | | |
Futures Contracts | | $ | (103 | ) | | $ | — | | | $ | — | | | $ | (103 | ) |
| | | | | | | | | | | | | | | | |
| | | | |
| Intrepid Growth Fund | | | | | | | | | | | | | | | | |
| | | Level 1
Quoted prices | | | Level 2
Other significant
observable inputs | | | Level 3
Significant
unobservable inputs | | | Total | |
Total Investments in Securities (a) | | $ | 960,240 | | | $ | — | | | $ | — | | | $ | 960,240 | |
| | | | | | | | | | | | | | | | |
Depreciation in Other Financial Instruments | | | | | | | | | | | | | | | | |
Futures Contracts | | $ | (111 | ) | | $ | — | | | $ | — | | | $ | (111 | ) |
| | | | | | | | | | | | | | | | |
| | | | |
| Intrepid Mid Cap Fund | | | | | | | | | | | | | | | | |
| | | Level 1
Quoted prices | | | Level 2
Other significant
observable inputs | | | Level 3
Significant
unobservable inputs | | | Total | |
Total Investments in Securities (a) | | $ | 1,054,077 | | | $ | — | | | $ | 14 | | | $ | 1,054,091 | |
| | | | | | | | | | | | | | | | |
Depreciation in Other Financial Instruments | | | | | | | | | | | | | | | | |
Futures Contracts | | $ | (240 | ) | | $ | — | | | $ | — | | | $ | (240 | ) |
| | | | | | | | | | | | | | | | |
| | | | | | | | |
| | | |
| DECEMBER 31, 2016 | | J.P. MORGAN INTREPID FUNDS | | | | | 57 | |
NOTES TO FINANCIAL STATEMENTS
AS OF DECEMBER 31, 2016 (Unaudited) (continued)
| | | | | | | | | | | | | | | | |
| Intrepid Value Fund | | | | | | | | | | | | | | | | |
| | | Level 1
Quoted prices | | | Level 2
Other significant
observable inputs | | | Level 3
Significant
unobservable inputs | | | Total | |
Total Investments in Securities (a) | | $ | 1,243,246 | | | $ | — | | | $ | — | | | $ | 1,243,246 | |
| | | | | | | | | | | | | | | | |
Depreciation in Other Financial Instruments | | | | | | | | | | | | | | | | |
Futures Contracts | | $ | (135 | ) | | $ | — | | | $ | — | | | $ | (135 | ) |
| | | | | | | | | | | | | | | | |
| (a) | All portfolio holdings designated as level 1 are disclosed on the SOIs. Please refer to the SOIs for industry specifics of portfolio holdings. |
There were no transfers among any levels during the six months ended December 31, 2016.
B. Futures Contracts — Intrepid America Fund, Intrepid Growth Fund, Intrepid Mid Cap Fund and Intrepid Value Fund used index futures contracts to gain or reduce exposure to the stock market, maintain liquidity or minimize transaction costs. The Funds also bought futures contracts to invest incoming cash in the market or sold futures in response to cash outflows, thereby simulating an invested position in the underlying index while maintaining a cash balance for liquidity.
Futures contracts provide for the delayed delivery of the underlying instrument at a fixed price or are settled for a cash amount based on the change in the value of the underlying instrument at a specific date in the future. Upon entering into a futures contract, the Funds are required to deposit with the broker, cash or securities in an amount equal to a certain percentage of the contract amount, which is referred to as the initial margin deposit. Subsequent payments, referred to as variation margin, are made or received by the Funds periodically and are based on changes in the market value of open futures contracts. Changes in the market value of open futures contracts are recorded as change in net unrealized appreciation/depreciation on the Statements of Operations. Realized gains or losses, representing the difference between the value of the contract at the time it was opened and the value at the time it was closed, are reported on the Statements of Operations at the closing or expiration of the futures contract. Securities deposited as initial margin are designated on the SOIs and cash deposited is recorded on the Statements of Assets and Liabilities. A receivable from and/or a payable to brokers for the daily variation margin is also recorded on the Statements of Assets and Liabilities.
The use of futures contracts exposes the Funds to equity price risk. The Funds may be subject to the risk that the change in the value of the futures contract may not correlate perfectly with the underlying instrument. Use of long futures contracts subjects the Funds to risk of loss in excess of the amounts shown on the Statements of Assets and Liabilities, up to the notional amount of the futures contracts. Use of short futures contracts subjects the Funds to unlimited risk of loss. The Funds may enter into futures contracts only on exchanges or boards of trade. The exchange or board of trade acts as the counterparty to each futures transaction; therefore, the Funds’ credit risk is limited to failure of the exchange or board of trade. Under some circumstances, futures exchanges may establish daily limits on the amount that the price of a futures contract can vary from the previous day’s settlement price, which could effectively prevent liquidation of positions.
The table below discloses the volume of the Funds’ futures contracts activity during the six months ended December 31, 2016 (amounts in thousands):
| | | | | | | | | | | | | | | | |
| | | Intrepid
America
Fund | | | Intrepid
Growth
Fund | | | Intrepid
Mid Cap
Fund | | | Intrepid
Value
Fund | |
Futures Contracts: | | | | | | | | | | | | | | | | |
Average Notional Balance Long | | $ | 70,911 | | | $ | 18,266 | | | $ | 19,611 | | | $ | 28,128 | |
Ending Notional Balance Long | | | 36,674 | | | | 26,499 | | | | 13,439 | | | | 30,636 | |
The Funds’ futures contracts are not subject to master netting agreements (the right to close out all transactions traded with a counterparty and net amounts owed or due across transactions).
C. Security Transactions and Investment Income — Investment transactions are accounted for on the trade date (the date the order to buy or sell is executed). Securities gains and losses are calculated on a specifically identified cost basis. Interest income is determined on the basis of coupon interest accrued using the effective interest method which adjusts for amortization of premiums and accretion of discounts. Dividend income, net of foreign taxes withheld, if any, is recorded on the ex-dividend date or when a Fund first learns of the dividend.
To the extent such information is publicly available, the Funds record distributions received in excess of income earned from underlying investments as a reduction of cost of investments and/or realized gain. Such amounts are based on estimates if actual amounts are not available and actual amounts of income, realized gain and return of capital may differ from the estimated amounts. The Funds adjust the estimated amounts of the components of distributions (and consequently their net investment income) as necessary once the issuers provide information about the actual composition of the distributions.
D. Allocation of Income and Expenses — Expenses directly attributable to a fund are charged directly to that fund, while the expenses attributable to more than one fund of the Trusts are allocated among the respective funds. In calculating the NAV of each class, investment income, realized and unrealized gains and losses and expenses, other than class specific expenses, are allocated daily to each class of shares based upon the proportion of net assets of each class at the beginning of each day.
| | | | | | |
| | | |
| 58 | | | | J.P. MORGAN INTREPID FUNDS | | DECEMBER 31, 2016 |
Transfer agency fees and sub-transfer agency fees are class-specific expenses. The amount of the transfer agency fees and sub-transfer agency fees charged to each class of the Funds for the six months ended December 31, 2016 are as follows (amounts in thousands):
| | | | | | | | | | | | | | | | | | | | | | | | | | | | | | | | | | | | |
| | | Class A | | | Class C | | | Class R2 | | | Class R3 | | | Class R4 | | | Class R5 | | | Class R6 | | | Select Class | | | Total | |
Intrepid Advantage Fund | | | | | | | | | | | | | | | | | | | | | | | | | | | | | | | | | | | | |
Transfer agency fees | | $ | 1 | | | $ | 1 | | | | n/a | | | | n/a | | | | n/a | | | | n/a | | | | n/a | | | $ | 1 | | | $ | 3 | |
Sub-transfer agency fees | | | 3 | | | | 2 | | | | n/a | | | | n/a | | | | n/a | | | | n/a | | | | n/a | | | | 1 | | | | 6 | |
Intrepid America Fund | | | | | | | | | | | | | | | | | | | | | | | | | | | | | | | | | | | | |
Transfer agency fees | | | 5 | | | | 1 | | | $ | — | (a) | | | n/a | | | | n/a | | | | — | | | $ | 12 | | | | 2 | | | | 20 | |
Sub-transfer agency fees | | | 24 | | | | 6 | | | | 4 | | | | n/a | | | | n/a | | | $ | 2 | | | | — | | | | 18 | | | | 54 | |
Intrepid Growth Fund | | | | | | | | | | | | | | | | | | | | | | | | | | | | | | | | | | | | |
Transfer agency fees | | | 8 | | | | 2 | | | | — | | | | n/a | | | | n/a | | | | 1 | | | | 2 | | | | 3 | | | | 16 | |
Sub-transfer agency fees | | | 43 | | | | 19 | | | | 9 | | | | n/a | | | | n/a | | | | 69 | | | | — | | | | 33 | | | | 173 | |
Intrepid Mid Cap Fund | | | | | | | | | | | | | | | | | | | | | | | | | | | | | | | | | | | | |
Transfer agency fees | | | 27 | | | | 4 | | | | n/a | | | $ | — | (a) | | $ | — | (a) | | | n/a | | | | 1 | | | | 6 | | | | 38 | |
Sub-transfer agency fees | | | 204 | | | | 60 | | | | n/a | | | | — | | | | — | | | | n/a | | | | — | | | | 153 | | | | 417 | |
Intrepid Value Fund | | | | | | | | | | | | | | | | | | | | | | | | | | | | | | | | | | | | |
Transfer agency fees | | | 72 | | | | 2 | | | | 15 | | | | n/a | | | | n/a | | | | 1 | | | | 1 | | | | 7 | | | | 98 | |
Sub-transfer agency fees | | | 85 | | | | 21 | | | | 17 | | | | n/a | | | | n/a | | | | 18 | | | | — | | | | 961 | | | | 1,102 | |
| (a) | Amount rounds to less than 500. |
E. Federal Income Taxes — Each Fund is treated as a separate taxable entity for Federal income tax purposes. Each Fund’s policy is to comply with the provisions of the Internal Revenue Code of 1986, as amended (the “Code”), applicable to regulated investment companies and to distribute to shareholders all of its distributable net investment income and net realized capital gains on investments. Accordingly, no provision for Federal income tax is necessary. Management has reviewed the Funds’ tax positions for all open tax years and has determined that as of December 31, 2016, no liability for income tax is required in the Funds’ financial statements for net unrecognized tax benefits. However, management’s conclusions may be subject to future review based on changes in, or the interpretation of, the accounting standards or tax laws and regulations. Each of the Funds’ Federal tax returns for the prior three fiscal years remains subject to examination by the Internal Revenue Service.
F. Distributions to Shareholders — Distributions from net investment income are generally declared and paid at least annually, except for the Intrepid Mid Cap Fund and Intrepid Value Fund, for which distributions are generally declared and paid at least quarterly. Distributions are declared separately for each class. No class has preferential dividend rights; differences in per share rates are due to differences in separate class expenses. Net realized capital gains, if any, are distributed by each Fund at least annually. The amount of distributions from net investment income and net realized capital gains is determined in accordance with Federal income tax regulations, which may differ from GAAP. To the extent these “book/tax” differences are permanent in nature (i.e., that they result from other than timing of recognition — “temporary differences”), such amounts are reclassified within the capital accounts based on their Federal tax-basis treatment.
3. Fees and Other Transactions with Affiliates
A. Investment Advisory Fee — Pursuant to an Investment Advisory Agreement, the Adviser supervises the investments of each Fund and for such services is paid a fee. The fee is accrued daily and paid monthly based on each Fund’s respective average daily net assets. The annual rate for each Fund is as follows:
| | | | |
Intrepid Advantage Fund* | | | 0.50 | % |
Intrepid America Fund | | | 0.40 | |
Intrepid Growth Fund | | | 0.50 | |
Intrepid Mid Cap Fund | | | 0.65 | |
Intrepid Value Fund | | | 0.40 | |
| * | Prior to November 1, 2016, the investment advisory fee for Intrepid Advantage Fund was 0.65%. |
The Adviser waived Investment Advisory fees and/or reimbursed expenses as outlined in Note 3.F.
B. Administration Fee — Pursuant to an Administration Agreement, the Administrator provides certain administration services to the Funds. In consideration of these services, the Administrator receives a fee accrued daily and paid monthly at an annual rate of 0.15% of the first $25 billion of the average daily net assets of all funds in the J.P. Morgan Funds Complex covered by the Administration Agreement (excluding certain funds of funds and money market funds) and 0.075% of the average daily net assets in excess of $25 billion of all such funds. For the six months ended December 31, 2016, the effective annualized rate was 0.08% of each Fund’s average daily net assets, notwithstanding any fee waivers and/or expense reimbursements.
The Administrator waived Administration fees as outlined in Note 3.F.
| | | | | | | | |
| | | |
| DECEMBER 31, 2016 | | J.P. MORGAN INTREPID FUNDS | | | | | 59 | |
NOTES TO FINANCIAL STATEMENTS
AS OF DECEMBER 31, 2016 (Unaudited) (continued)
JPMorgan Chase Bank, N.A. (“JPMCB”), a wholly-owned subsidiary of JPMorgan, serves as the Funds’ sub-administrator (the “Sub-administrator”). For its services as Sub-administrator, JPMCB receives a portion of the fees payable to the Administrator.
C. Distribution Fees — Pursuant to a Distribution Agreement, JPMorgan Distribution Services, Inc. (the “Distributor”), a wholly-owned subsidiary of JPMorgan, serves as the Trusts’ principal underwriter and promotes and arranges for the sale of each Fund’s shares.
The Board has adopted a Distribution Plan (the “Distribution Plan”) for Class A, Class C, Class R2 and Class R3 Shares of the Funds, as applicable, in accordance with Rule 12b-1 under the 1940 Act. The Class R4, Class R5, Class R6 and Select Class do not charge a distribution fee. The Distribution Plan provides that each Fund shall pay distribution fees, including payments to the Distributor, at annual rates of the average daily net assets as shown in the table below:
| | | | | | | | | | | | | | | | |
| | | Class A | | | Class C | | | Class R2 | | | Class R3 | |
Intrepid Advantage Fund | | | 0.25 | % | | | 0.75 | % | | | n/a | | | | n/a | |
Intrepid America Fund | | | 0.25 | | | | 0.75 | | | | 0.50 | % | | | n/a | |
Intrepid Growth Fund | | | 0.25 | | | | 0.75 | | | | 0.50 | | | | n/a | |
Intrepid Mid Cap Fund | | | 0.25 | | | | 0.75 | | | | n/a | | | | 0.25 | % |
Intrepid Value Fund | | | 0.25 | | | | 0.75 | | | | 0.50 | | | | n/a | |
In addition, the Distributor is entitled to receive the front-end sales charges from purchases of Class A Shares and the CDSC from redemptions of Class C Shares and certain Class A Shares for which front-end sales charges have been waived. For the six months ended December 31, 2016, the Distributor retained the following (amounts in thousands):
| | | | | | | | |
| | | Front-End Sales Charge | | | CDSC | |
Intrepid Advantage Fund | | $ | 1 | | | $ | — | (a) |
Intrepid America Fund | | | 1 | | | | — | (a) |
Intrepid Growth Fund | | | 5 | | | | 1 | |
Intrepid Mid Cap Fund | | | 13 | | | | 1 | |
Intrepid Value Fund | | | 3 | | | | 1 | |
| (a) | Amount rounds to less than 500. |
D. Shareholder Servicing Fees — The Trusts, on behalf of the Funds, have entered into Shareholder Servicing Agreements with the Distributor under which the Distributor provides certain support services to the shareholders. The Class R6 Shares do not participate in the Shareholder Servicing Agreement. For performing these services, the Distributor receives a fee that is accrued daily and paid monthly equal to a percentage of the average daily net assets as shown in the table below:
| | | | | | | | | | | | | | | | | | | | | | | | | | | | |
| | | Class A | | | Class C | | | Class R2 | | | Class R3 | | | Class R4 | | | Class R5 | | | Select Class | |
Intrepid Advantage Fund | | | 0.25 | % | | | 0.25 | % | | | n/a | | | | n/a | | | | n/a | | | | n/a | | | | 0.25 | % |
Intrepid America Fund | | | 0.25 | | | | 0.25 | | | | 0.25 | % | | | n/a | | | | n/a | | | | 0.05 | % | | | 0.25 | |
Intrepid Growth Fund | | | 0.25 | | | | 0.25 | | | | 0.25 | | | | n/a | | | | n/a | | | | 0.05 | | | | 0.25 | |
Intrepid Mid Cap Fund | | | 0.25 | | | | 0.25 | | | | n/a | | | | 0.25 | % | | | 0.25 | % | | | n/a | | | | 0.25 | |
Intrepid Value Fund | | | 0.25 | | | | 0.25 | | | | 0.25 | | | | n/a | | | | n/a | | | | 0.05 | | | | 0.25 | |
The Distributor has entered into shareholder services contracts with affiliated and unaffiliated financial intermediaries who provide shareholder services and other related services to their clients or customers who invest in the Funds under which the Distributor will pay all or a portion of such fees earned to financial intermediaries for performing such services.
The Distributor waived Shareholder Servicing fees as outlined in Note 3.F.
E. Custodian and Accounting Fees — JPMCB provides portfolio custody and accounting services to the Funds. For performing these services, the Funds pay JPMCB transaction and asset-based fees that vary according to the number of transactions and positions, plus out-of-pocket expenses. The amounts paid directly to JPMCB by the Funds for custody and accounting services are included in Custodian and accounting fees on the Statements of Operations. Payments to the custodian may be reduced by credits earned by each Fund, based on uninvested cash balances held by the custodian. Such earnings credits, if any, are presented separately on the Statements of Operations.
Interest expense paid to the custodian related to cash overdrafts, if any, is included in Interest expense to affiliates on the Statements of Operations.
F. Waivers and Reimbursements — The Adviser, Administrator and/or Distributor have contractually agreed to waive fees and/or reimburse the Funds to the extent that total annual operating expenses (excluding acquired fund fees and expenses other than certain money market fund fees as
| | | | | | |
| | | |
| 60 | | | | J.P. MORGAN INTREPID FUNDS | | DECEMBER 31, 2016 |
described below, dividend and interest expenses related to short sales, interest, taxes, expenses related to litigation and potential litigation and extraordinary expenses) exceed the percentages of the Funds’ respective average daily net assets as shown in the table below:
| | | | | | | | | | | | | | | | | | | | | | | | | | | | | | | | |
| | | Class A | | | Class C | | | Class R2** | | | Class R3 | | | Class R4 | | | Class R5 | | | Class R6 | | | Select Class | |
Intrepid Advantage Fund* | | | 1.05 | % | | | 1.55 | % | | | n/a | | | | n/a | | | | n/a | | | | n/a | | | | n/a | | | | 0.80 | % |
Intrepid America Fund | | | 1.04 | | | | 1.54 | | | | 1.30 | % | | | n/a | | | | n/a | | | | 0.60 | % | | | 0.55 | % | | | 0.80 | |
Intrepid Growth Fund | | | 0.93 | | | | 1.42 | | | | 1.18 | | | | n/a | | | | n/a | | | | 0.48 | | | | 0.43 | | | | 0.68 | |
Intrepid Mid Cap Fund | | | 1.15 | | | | 1.79 | | | | n/a | | | | 1.15 | % | | | 0.90 | % | | | n/a | | | | 0.65 | | | | 0.90 | |
Intrepid Value Fund | | | 0.83 | | | | 1.33 | | | | 1.18 | | | | n/a | | | | n/a | | | | 0.48 | | | | 0.43 | | | | 0.68 | |
| * | Prior to November 1, 2016, the contractual expense limitations for Intrepid Advantage Fund were 1.15%, 1.65% and 0.90% for Class A, Class C and Select Class Shares, respectively. |
| ** | The contractual expense percentages in the table above are in place until at least October 31, 2018. For Class R2 Shares of Intrepid America Fund, Intrepid Growth Fund and Intrepid Value Fund, the Adviser, Administrator and/or Distributor contractually waived fees and/or reimbursed the Funds to the extent that total annual operating expenses (excluding acquired fund fees and expenses other than certain money market fund fees as described below, dividend and interest expenses related to short sales, interest, taxes, expenses related to litigation and potential litigation and extraordinary expenses) exceeded 1.29%, 1.17% and 1.08% of the Fund’s average daily net assets, respectively during the period July 1, 2016 through October 31, 2016. During the period November 1, 2016 through December 31, 2016, the Adviser, Administrator and/or Distributor voluntarily waived fees and/or reimbursed the Funds to the extent that total annual operating expenses for Class R2 Shares exceeded 1.29%, 1.17% and 1.08%, respectively. The Funds’ service providers are under no obligation to continue the voluntary waivers and may discontinue them at any time. |
Except as noted above, the expense limitation agreements were in effect for the six months ended December 31, 2016 and are in place until at least October 31, 2017.
For the six months ended December 31, 2016, the Funds’ service providers waived fees and/or reimbursed expenses for each of the Funds as follows (amounts in thousands). None of these parties expect the Funds to repay any such waived fees and reimbursed expenses in future years.
| | | | | | | | | | | | | | | | | | | | |
| | | Contractual Waivers | | | | |
| | | Investment
Advisory | | | Administration | | | Shareholder
Servicing | | | Total | | | Contractual
Reimbursement | |
Intrepid Advantage Fund | | $ | 56 | | | $ | 8 | | | $ | 17 | | | $ | 81 | | | $ | 26 | |
Intrepid America Fund | | | — | | | | — | | | | 24 | | | | 24 | | | | — | (a) |
Intrepid Growth Fund | | | 534 | | | | 356 | | | | 162 | | | | 1,052 | | | | 25 | |
Intrepid Mid Cap Fund | | | 356 | | | | 236 | | | | 390 | | | | 982 | | | | — | (a) |
Intrepid Value Fund | | | 357 | | | | 238 | | | | 1,233 | | | | 1,828 | | | | 58 | |
| | | | |
| | | Voluntary Waivers | |
| | | Shareholder
Servicing | |
Intrepid America Fund | | $ | — | (a) |
Intrepid Growth Fund | | | — | (a) |
Intrepid Value Fund | | | 3 | |
| (a) | Amount rounds to less than 500. |
Additionally, the Funds may invest in one or more money market funds advised by the Adviser or its affiliates (affiliated money market funds). The Adviser, Administrator and/or Distributor, as shareholder servicing agent, have contractually agreed to waive fees and/or reimburse expenses in an amount sufficient to offset the respective net fees each collects from the affiliated money market fund on the applicable Funds’ investment in such affiliated money market fund.
The amounts of waivers resulting from investments in these money market funds for the six months ended December 31, 2016 were as follows (amounts in thousands):
| | | | |
Intrepid Advantage Fund | | $ | — | (a) |
Intrepid America Fund | | | 78 | |
Intrepid Growth Fund | | | 12 | |
Intrepid Mid Cap Fund | | | 18 | |
Intrepid Value Fund | | | 23 | |
| (a) | Amount rounds to less than 500. |
| | | | | | | | |
| | | |
| DECEMBER 31, 2016 | | J.P. MORGAN INTREPID FUNDS | | | | | 61 | |
NOTES TO FINANCIAL STATEMENTS
AS OF DECEMBER 31, 2016 (Unaudited) (continued)
G. Other — Certain officers of the Trusts are affiliated with the Adviser, the Administrator and the Distributor. Such officers, with the exception of the Chief Compliance Officer, receive no compensation from the Funds for serving in their respective roles.
The Board appointed a Chief Compliance Officer to the Funds in accordance with Federal securities regulations. Each Fund, along with other affiliated funds, makes reimbursement payments, on a pro-rata basis, to the Administrator for a portion of the fees associated with the Office of the Chief Compliance Officer. Such fees are included in Trustees’ and Chief Compliance Officer’s fees on the Statements of Operations.
The Trusts adopted a Trustee Deferred Compensation Plan (the “Plan”) which allows the Independent Trustees to defer the receipt of all or a portion of compensation related to performance of their duties as Trustees. The deferred fees are invested in various J.P. Morgan Funds until distribution in accordance with the Plan.
The Funds may use related party broker-dealers. For the six months ended December 31, 2016, the Funds incurred brokerage commissions with broker-dealers affiliated with the Adviser as follows (amounts in thousands):
| | | | |
Intrepid Mid Cap Fund | | $ | — | (a) |
| (a) | Amount rounds to less than 500. |
The Securities and Exchange Commission (“SEC”) has granted an exemptive order permitting the Funds to engage in principal transactions with J.P. Morgan Securities, Inc., an affiliated broker, involving taxable money market instruments, subject to certain conditions.
4. Investment Transactions
During the six months ended December 31, 2016, purchases and sales of investments (excluding short-term investments) were as follows (amounts in thousands):
| | | | | | | | |
| | | Purchases
(excluding U.S.
Government) | | | Sales
(excluding U.S.
Government) | |
Intrepid Advantage Fund | | $ | 7,773 | | | $ | 10,664 | |
Intrepid America Fund | | | 1,805,980 | | | | 1,853,230 | |
Intrepid Growth Fund | | | 333,180 | | | | 416,629 | |
Intrepid Mid Cap Fund | | | 327,561 | | | | 305,741 | |
Intrepid Value Fund | | | 476,642 | | | | 1,042,887 | |
During the six months ended December 31, 2016, there were no purchases or sales of U.S. Government securities.
5. Federal Income Tax Matters
For Federal income tax purposes, the estimated cost and unrealized appreciation (depreciation) in value of investment securities held at December 31, 2016 were as follows (amounts in thousands):
| | | | | | | | | | | | | | | | |
| | | Aggregate
Cost | | | Gross
Unrealized
Appreciation | | | Gross
Unrealized
Depreciation | | | Net Unrealized
Appreciation
(Depreciation) | |
Intrepid Advantage Fund | | $ | 14,308 | | | $ | 3,533 | | | $ | 117 | | | $ | 3,416 | |
Intrepid America Fund | | | 3,241,337 | | | | 697,000 | | | | 72,238 | | | | 624,762 | |
Intrepid Growth Fund | | | 763,401 | | | | 206,186 | | | | 9,347 | | | | 196,839 | |
Intrepid Mid Cap Fund | | | 883,201 | | | | 205,594 | | | | 34,704 | | | | 170,890 | |
Intrepid Value Fund | | | 995,118 | | | | 269,007 | | | | 20,879 | | | | 248,128 | |
Under the Regulated Investment Company Modernization Act of 2010 (the “Act”), net capital losses recognized by the Funds after June 30, 2011 are carried forward indefinitely, and retain their character as short-term and/or long-term losses. Prior to the Act, net capital losses incurred by the Funds were carried forward for eight years and treated as short-term losses. The Act requires that post-enactment net capital losses be used before pre-enactment net capital losses.
At June 30, 2016, the following Funds had the following pre-enactment net capital loss carryforwards, expiring during the years indicated, which are available to offset future realized gains (amounts in thousands):
| | | | | | | | | | | | |
| | | 2018 | | | 2019 | | | Total | |
Intrepid Advantage Fund | | $ | — | | | $ | 1,835 | | | $ | 1,835 | |
Intrepid Growth Fund | | | 121,929 | | | | — | | | | 121,929 | |
6. Borrowings
The Funds rely upon an exemptive order granted by the SEC (the “Order”) permitting the establishment and operation of an Interfund Lending Facility (the “Facility”). The Facility allows the Funds to directly lend and borrow money to or from any other fund relying upon the Order at rates
| | | | | | |
| | | |
| 62 | | | | J.P. MORGAN INTREPID FUNDS | | DECEMBER 31, 2016 |
beneficial to both the borrowing and lending funds. Advances under the Facility are taken primarily for temporary or emergency purposes, including the meeting of redemption requests that otherwise might require the untimely disposition of securities, and are subject to each Fund’s borrowing restrictions. The Interfund loan rate is determined, as specified in the Order, by averaging the current repurchase agreement rate and the current bank loan rate. The Order was granted to JPM II and may be relied upon by the Funds because the Funds and the series of JPMorgan Trust II are all investment companies in the same “group of investment companies” (as defined in Section 12(d)(1)(G) of the 1940 Act).
The Trusts and JPMCB have entered into a financing arrangement. Under this arrangement, JPMCB provides an unsecured, uncommitted credit facility in the aggregate amount of $100 million to certain of the J.P. Morgan Funds, including the Funds. Advances under the arrangement are taken primarily for temporary or emergency purposes, including the meeting of redemption requests that otherwise might require the untimely disposition of securities, and are subject to each Fund’s borrowing restrictions. Interest on borrowings is payable at a rate determined by JPMCB at the time of borrowing. This agreement has been extended until November 6, 2017.
The Funds had no borrowings outstanding from another fund or from the unsecured, uncommitted credit facility during the six months ended December 31, 2016.
In addition, effective August 16, 2016, the Trust along with certain other trusts (“Borrowers”) entered into a joint syndicated senior unsecured revolving credit facility totaling $1.5 billion (“Credit Facility”) with various lenders and The Bank of New York Mellon, as administrative agent for the lenders. This Credit Facility provides a source of funds to the Borrowers for temporary and emergency purposes, including the meeting of redemption requests that otherwise might require the untimely disposition of securities. Under the terms of the Credit Facility, a borrowing fund must have a minimum of $25,000,000 in adjusted net asset value and not exceed certain adjusted net asset coverage ratios prior to and during the time in which any borrowings are outstanding. If a fund does not comply with the aforementioned requirements, the fund must remediate within three business days with respect to the $25,000,000 minimum adjusted net asset value or within one business day with respect to certain asset coverage ratios or the administrative agent at the request of, or with the consent of, the lenders may terminate the Credit Facility and declare any outstanding borrowings to be due and payable immediately.
Interest associated with any borrowing under the Credit Facility is charged to the borrowing fund at a rate of interest equal to 1.00% plus the greater of the federal funds effective rate or one month LIBOR. The annual commitment fee to maintain the Credit Facility is 0.15% and is incurred on the unused portion of the Credit Facility and is allocated to all participating funds pro rata based on their respective net assets. The initial term of the Credit Facility is 364 days, unless extended. The Funds did not utilize the Credit Facility during the six months ended December 31, 2016.
7. Risks, Concentrations and Indemnifications
In the normal course of business, the Funds enter into contracts that contain a variety of representations which provide general indemnifications. Each Fund’s maximum exposure under these arrangements is unknown. The amount of exposure would depend on future claims that may be made against each Fund that have not yet occurred. However, based on experience, the Funds expect the risk of loss to be remote.
As of December 31, 2016, the Funds had omnibus accounts which represented the percentage of each Fund’s net assets as follows:
As of December 31, 2016, an affiliate of the Adviser had investment discretion with respect to its clients’ holdings in the Funds, which collectively represent the following percentage of each Fund’s net assets:
| | | | | | | | | | | | | | | | |
| | | Number of Affiliated
Omnibus Accounts | | | % of the Fund | | | Number of Non-Affiliated
Omnibus Accounts | | | % of the Fund | |
Intrepid Advantage Fund | | | 1 | | | | 13.0 | % | | | 2 | | | | 23.4 | % |
Intrepid America Fund | | | 2 | | | | 21.3 | | | | — | | | | n/a | |
Intrepid Growth Fund | | | 4 | | | | 51.2 | | | | — | | | | n/a | |
Intrepid Mid Cap Fund | | | 2 | | | | 24.2 | | | | — | | | | n/a | |
Intrepid Value Fund | | | — | | | | n/a | | | | 2 | | | | 58.3 | |
As of December 31, 2016, J.P. Morgan Investor Funds and JPMorgan SmartRetirement Funds, which are affiliated funds of funds, owned in the aggregate, shares representing more than 10% of the net assets of the Funds as follows:
| | | | | | | | |
| | | J.P. Morgan
Investor Funds | | | JPMorgan
SmartRetirement Funds | |
Intrepid America Fund | | | 28.7 | % | | | 62.8 | % |
Intrepid Growth Fund | | | 51.7 | | | | — | |
Intrepid Mid Cap Fund | | | 31.3 | | | | — | |
Significant shareholder transactions by these shareholders may impact the Funds’ performance.
| | | | | | | | |
| | | |
| DECEMBER 31, 2016 | | J.P. MORGAN INTREPID FUNDS | | | | | 63 | |
SCHEDULE OF SHAREHOLDER EXPENSES
(Unaudited)
Hypothetical $1,000 Investment
As a shareholder of the Funds, you incur two types of costs: (1) transaction costs, including sales charges (loads) on purchase payments and (2) ongoing costs, including investment advisory fees, administration fees, distribution fees and other Fund expenses. The examples below are intended to help you understand your ongoing costs (in dollars) of investing in the Funds and to compare these ongoing costs with the ongoing costs of investing in other mutual funds. The examples assume that you had a $1,000 investment in each Class at the beginning of the reporting period, July 1, 2016, and continued to hold your shares at the end of the reporting period, December 31, 2016.
Actual Expenses
For each Class of each Fund in the table below, the first line provides information about actual account values and actual expenses. You may use the information in this line, together with the amount you invested, to estimate the expenses that you paid over the period. Simply divide your account value by $1,000 (for example, an $8,600 account value divided by $1,000 = 8.6), then multiply the result by the number in the first line of each Class under the heading entitled “Expenses Paid During the Period” to estimate the expenses you paid on your account during this period.
Hypothetical Example for Comparison Purposes
The second line of each Class in the table below provides information about hypothetical account values and hypothetical expenses based on the Class’ actual expense ratio and an assumed rate of return of 5% per year before expenses, which is not the Class’ actual return. The hypothetical account values and expenses may not be used to estimate the actual ending account balance or expenses you paid for the period. You may use this information to compare the ongoing costs of investing in the Class of the Fund and other funds. To do so, compare this 5% hypothetical example with the 5% hypothetical examples that appear in the shareholder reports of the other funds. Please note that the expenses shown in the table are meant to highlight your ongoing costs only and do not reflect any transaction costs, such as sales charges (loads) or redemption fees. Therefore, the second line for each Class in the table is useful in comparing ongoing costs only, and will not help you determine the relative total costs of owning different funds. In addition, if these transaction costs were included, your costs would have been higher. The examples also assume all dividends and distributions have been reinvested.
| | | | | | | | | | | | | | | | |
| | | Beginning
Account Value
July 1, 2016 | | | Ending
Account Value
December 31, 2016 | | | Expenses
Paid During
the Period | | | Annualized
Expense
Ratio | |
Intrepid Advantage Fund | | | | | | | | | | | | |
Class A | | | | | | | | | | | | |
Actual* | | $ | 1,000.00 | | | $ | 1,092.40 | | | $ | 5.85 | | | | 1.11 | % |
Hypothetical* | | | 1,000.00 | | | | 1,019.61 | | | | 5.65 | | | | 1.11 | |
Class C | | | | | | | | | | | | |
Actual* | | | 1,000.00 | | | | 1,089.50 | | | | 8.48 | | | | 1.61 | |
Hypothetical* | | | 1,000.00 | | | | 1,017.09 | | | | 8.19 | | | | 1.61 | |
Select Class | | | | | | | | | | | | |
Actual* | | | 1,000.00 | | | | 1,093.80 | | | | 4.54 | | | | 0.86 | |
Hypothetical* | | | 1,000.00 | | | | 1,020.87 | | | | 4.38 | | | | 0.86 | |
| | | | |
Intrepid America Fund | | | | | | | | | | | | | | | | |
Class A | | | | | | | | | | | | |
Actual* | | | 1,000.00 | | | | 1,083.00 | | | | 5.41 | | | | 1.03 | |
Hypothetical* | | | 1,000.00 | | | | 1,020.01 | | | | 5.24 | | | | 1.03 | |
Class C | | | | | | | | | | | | |
Actual* | | | 1,000.00 | | | | 1,080.20 | | | | 8.02 | | | | 1.53 | |
Hypothetical* | | | 1,000.00 | | | | 1,017.49 | | | | 7.78 | | | | 1.53 | |
Class R2 | | | | | | | | | | | | |
Actual* | | | 1,000.00 | | | | 1,081.50 | | | | 6.72 | | | | 1.28 | |
Hypothetical* | | | 1,000.00 | | | | 1,018.75 | | | | 6.51 | | | | 1.28 | |
Class R5 | | | | | | | | | | | | |
Actual* | | | 1,000.00 | | | | 1,085.00 | | | | 3.10 | | | | 0.59 | |
Hypothetical* | | | 1,000.00 | | | | 1,022.23 | | | | 3.01 | | | | 0.59 | |
Class R6 | | | | | | | | | | | | |
Actual* | | | 1,000.00 | | | | 1,085.90 | | | | 2.58 | | | | 0.49 | |
Hypothetical* | | | 1,000.00 | | | | 1,022.74 | | | | 2.50 | | | | 0.49 | |
Select Class | | | | | | | | | | | | |
Actual* | | | 1,000.00 | | | | 1,084.30 | | | | 3.94 | | | | 0.75 | |
Hypothetical* | | | 1,000.00 | | | | 1,021.42 | | | | 3.82 | | | | 0.75 | |
| | | | | | |
| | | |
| 64 | | | | J.P. MORGAN INTREPID FUNDS | | DECEMBER 31, 2016 |
| | | | | | | | | | | | | | | | |
| | | Beginning
Account Value
July 1, 2016 | | | Ending
Account Value
December 31, 2016 | | | Expenses
Paid During
the Period | | | Annualized
Expense
Ratio | |
Intrepid Growth Fund | | | | | | | | | | | | | | | | |
Class A | | | | | | | | | | | | |
Actual* | | $ | 1,000.00 | | | $ | 1,062.60 | | | $ | 4.78 | | | | 0.92 | % |
Hypothetical* | | | 1,000.00 | | | | 1,020.57 | | | | 4.69 | | | | 0.92 | |
Class C | | | | | | | | | | | | |
Actual* | | | 1,000.00 | | | | 1,060.00 | | | | 7.32 | | | | 1.41 | |
Hypothetical* | | | 1,000.00 | | | | 1,018.10 | | | | 7.17 | | | | 1.41 | |
Class R2 | | | | | | | | | | | | |
Actual* | | | 1,000.00 | | | | 1,061.40 | | | | 6.03 | | | | 1.16 | |
Hypothetical* | | | 1,000.00 | | | | 1,019.36 | | | | 5.90 | | | | 1.16 | |
Class R5 | | | | | | | | | | | | |
Actual* | | | 1,000.00 | | | | 1,065.10 | | | | 2.50 | | | | 0.48 | |
Hypothetical* | | | 1,000.00 | | | | 1,022.79 | | | | 2.45 | | | | 0.48 | |
Class R6 | | | | | | | | | | | | |
Actual* | | | 1,000.00 | | | | 1,065.20 | | | | 2.24 | | | | 0.43 | |
Hypothetical* | | | 1,000.00 | | | | 1,023.04 | | | | 2.19 | | | | 0.43 | |
Select Class | | | | | | | | | | | | |
Actual* | | | 1,000.00 | | | | 1,063.90 | | | | 3.54 | | | | 0.68 | |
Hypothetical* | | | 1,000.00 | | | | 1,021.78 | | | | 3.47 | | | | 0.68 | |
| | | | |
Intrepid Mid Cap Fund | | | | | | | | | | | | | | | | |
Class A | | | | | | | | | | | | |
Actual* | | | 1,000.00 | | | | 1,075.70 | | | | 5.96 | | | | 1.14 | |
Hypothetical* | | | 1,000.00 | | | | 1,019.46 | | | | 5.80 | | | | 1.14 | |
Class C | | | | | | | | | | | | |
Actual* | | | 1,000.00 | | | | 1,072.10 | | | | 9.30 | | | | 1.78 | |
Hypothetical* | | | 1,000.00 | | | | 1,016.23 | | | | 9.05 | | | | 1.78 | |
Class R3 | | | | | | | | | | | | |
Actual** | | | 1,000.00 | | | | 1,048.90 | | | | 3.58 | | | | 1.15 | |
Hypothetical* | | | 1,000.00 | | | | 1,019.41 | | | | 5.85 | | | | 1.15 | |
Class R4 | | | | | | | | | | | | |
Actual** | | | 1,000.00 | | | | 1,049.60 | | | | 2.80 | | | | 0.90 | |
Hypothetical* | | | 1,000.00 | | | | 1,020.67 | | | | 4.58 | | | | 0.90 | |
Class R6 | | | | | | | | | | | | |
Actual* | | | 1,000.00 | | | | 1,078.20 | | | | 3.35 | | | | 0.64 | |
Hypothetical* | | | 1,000.00 | | | | 1,021.98 | | | | 3.26 | | | | 0.64 | |
Select Class | | | | | | | | | | | | |
Actual* | | | 1,000.00 | | | | 1,076.80 | | | | 4.66 | | | | 0.89 | |
Hypothetical* | | | 1,000.00 | | | | 1,020.72 | | | | 4.53 | | | | 0.89 | |
| | | | |
Intrepid Value Fund | | | | | | | | | | | | | | | | |
Class A | | | | | | | | | | | | |
Actual* | | | 1,000.00 | | | | 1,124.70 | | | | 4.39 | | | | 0.82 | |
Hypothetical* | | | 1,000.00 | | | | 1,021.07 | | | | 4.18 | | | | 0.82 | |
Class C | | | | | | | | | | | | |
Actual* | | | 1,000.00 | | | | 1,122.10 | | | | 7.06 | | | | 1.32 | |
Hypothetical* | | | 1,000.00 | | | | 1,018.55 | | | | 6.72 | | | | 1.32 | |
Class R2 | | | | | | | | | | | | |
Actual* | | | 1,000.00 | | | | 1,123.20 | | | | 5.73 | | | | 1.07 | |
Hypothetical* | | | 1,000.00 | | | | 1,019.81 | | | | 5.45 | | | | 1.07 | |
Class R5 | | | | | | | | | | | | |
Actual* | | | 1,000.00 | | | | 1,126.60 | | | | 2.57 | | | | 0.48 | |
Hypothetical* | | | 1,000.00 | | | | 1,022.79 | | | | 2.45 | | | | 0.48 | |
| | | | | | | | |
| | | |
| DECEMBER 31, 2016 | | J.P. MORGAN INTREPID FUNDS | | | | | 65 | |
SCHEDULE OF SHAREHOLDER EXPENSES
(Unaudited) (continued)
Hypothetical $1,000 Investment
| | | | | | | | | | | | | | | | |
| | | Beginning
Account Value
July 1, 2016 | | | Ending
Account Value
December 31, 2016 | | | Expenses
Paid During
the Period | | | Annualized
Expense
Ratio | |
Intrepid Value Fund (continued) | | | | | | | | | | | | | | | | |
Class R6 | | | | | | | | | | | | |
Actual* | | $ | 1,000.00 | | | $ | 1,127.20 | | | $ | 2.31 | | | | 0.43 | % |
Hypothetical* | | | 1,000.00 | | | | 1,023.04 | | | | 2.19 | | | | 0.43 | |
Select Class | | | | | | | | | | | | |
Actual* | | | 1,000.00 | | | | 1,125.50 | | | | 3.59 | | | | 0.67 | |
Hypothetical* | | | 1,000.00 | | | | 1,021.83 | | | | 3.41 | | | | 0.67 | |
| * | Expenses are equal to each Class’ respective annualized expense ratio, multiplied by the average account value over the period, multiplied by 184/365 (to reflect the one-half year period). |
| ** | Expenses are equal to each Class’ respective annualized expense ratio, multiplied by the average account value over the period, multiplied by 111/365 (to reflect the actual period). Commencement of operations was September 9, 2016. |
| | | | | | |
| | | |
| 66 | | | | J.P. MORGAN INTREPID FUNDS | | DECEMBER 31, 2016 |
BOARD APPROVAL OF INVESTMENT ADVISORY AGREEMENT
(Unaudited)
The Board of Trustees has established various standing committees composed of Trustees with diverse backgrounds, to which the Board of Trustees has assigned specific subject matter responsibilities to further enhance the effectiveness of the Board’s oversight and decision making. The Board of Trustees and its investment committees (money market and alternative products, equity, and fixed income) meet regularly throughout the year and consider factors that are relevant to their annual consideration of investment advisory agreements at each meeting. They also meet for the specific purpose of considering investment advisory agreement annual renewals. The Board of Trustees held meetings in person in June and August 2016, at which the Trustees considered the continuation of the investment advisory agreements for each of the Funds whose semi-annual report is contained herein (each an “Advisory Agreement” and collectively, the “Advisory Agreements”). At the June meeting, the Board’s investment committees met to review and consider performance, expense and related information for the J.P. Morgan Funds. Each investment committee reported to the full Board, which then considered the investment committee’s preliminary findings. At the August meeting, the Trustees continued their review and consideration. The Trustees, including a majority of the Trustees who are not “interested persons” (as defined in the 1940 Act) of any party to the Advisory Agreements or any of their affiliates, approved the continuation of each Advisory Agreement on August 17, 2016.
As part of their review of the Advisory Agreements, the Trustees considered and reviewed performance and other information about the Funds received from the Adviser. This information includes the Funds’ performance as compared to the performance of their peers and benchmarks and analyses by the Adviser of the Funds’ performance. In addition, the Trustees have engaged an independent management consulting firm (“independent consultant”) to report on the performance of certain J.P. Morgan Funds at each of the Trustees’ regular meetings. The Adviser also periodically provides comparative information regarding the Funds’ expense ratios and those of their peer groups. In addition, in preparation for the June and August meetings, the Trustees requested, received and evaluated extensive materials from the Adviser, including performance and expense information compiled by Broadridge, using data from Lipper Inc., independent providers of investment company data (together, “Broadridge/Lipper”). The Trustees’ independent consultant also provided additional analyses of the performance of the Funds in connection with the Trustees’ review of the Advisory Agreements. Before voting on the proposed Advisory Agreements, the Trustees reviewed the proposed Advisory Agreements with representatives of the Adviser, counsel to the Trusts and independent legal counsel and received a memorandum from independent legal counsel to the Trustees discussing the legal standards for their consideration of the proposed Advisory Agreements. The Trustees
also discussed the proposed Advisory Agreements in executive sessions with independent legal counsel at which no representatives of the Adviser were present. Set forth below is a summary of the material factors evaluated by the Trustees in determining whether to approve each Advisory Agreement.
The Trustees considered information provided with respect to the Funds over the course of the year. Each Trustee attributed different weights to the various factors and no factor alone was considered determinative. From year to year, the Trustees consider and place emphasis on relevant information in light of changing circumstances in market and economic conditions. The Trustees determined that the compensation to be received by the Adviser from each Fund under the applicable Advisory Agreement was fair and reasonable and that the continuance of the Advisory Agreements was in the best interests of each Fund and its shareholders.
The factors summarized below were considered and discussed by the Trustees in reaching their conclusions:
Nature, Extent and Quality of Services Provided by the Adviser
The Trustees received and considered information regarding the nature, extent and quality of the services provided to each Fund under the Advisory Agreement. The Trustees took into account information furnished throughout the year at Trustee meetings, as well as the materials furnished specifically in connection with this annual review process. The Trustees considered the background and experience of the Adviser’s senior management and the expertise of, and the amount of attention given to each Fund by, investment personnel of the Adviser. In addition, the Trustees reviewed the qualifications, backgrounds and responsibilities of the portfolio management team primarily responsible for the day-to-day management of each Fund and the infrastructure supporting the team. The Trustees also considered information provided by the Adviser and JPMorgan Distribution Services, Inc. (“JPMDS”) about the structure and distribution strategy of each Fund. The Trustees reviewed information relating to the Adviser’s risk governance model and reports showing the Adviser’s compliance structure and ongoing compliance processes. The Trustees also considered the quality of the administrative services provided by J.P. Morgan Investment Management Inc. in its role as administrator (“JPMIM”).
The Trustees also considered their knowledge of the nature and quality of the services provided by the Adviser and its affiliates to the Funds gained from their experience as Trustees of the J.P. Morgan Funds. In addition, they considered the overall reputation and capabilities of the Adviser and its affiliates, the commitment of the Adviser to provide high quality service to the Funds, their overall confidence in the Adviser’s integrity and the Adviser’s responsiveness to questions or concerns raised by them, including the Adviser’s willingness to consider and implement organizational and operational changes
| | | | | | | | |
| | | |
| DECEMBER 31, 2016 | | J.P. MORGAN INTREPID FUNDS | | | | | 67 | |
BOARD APPROVAL OF INVESTMENT ADVISORY AGREEMENT
(Unaudited) (continued)
designed to improve investment results and the services provided to each Fund.
Based upon these considerations and other factors, the Trustees concluded that they were satisfied with the nature, extent and quality of the investment advisory services provided to the Funds by the Adviser.
Costs of Services Provided and Profitability to the Adviser and its Affiliates
The Trustees received and considered information regarding the profitability to the Adviser and its affiliates in providing services to each of the Funds. The Trustees reviewed and discussed this data. The Trustees recognized that this data is not audited and represents the Adviser’s determination of its and its affiliates’ revenues from the contractual services provided to the Funds, less expenses of providing such services. Expenses include direct and indirect costs and are calculated using an allocation methodology developed by the Adviser. The Trustees also recognized that it is difficult to make comparisons of profitability from fund investment advisory contracts because comparative information is not generally publicly available and is affected by numerous factors, including the structure of the particular adviser, the types of funds it manages, its business mix, numerous assumptions regarding allocations and the fact that publicly-traded fund managers’ operating profits and net income are net of distribution and marketing expenses. Based upon their review, the Trustees concluded that the profitability to the Adviser under each of the Advisory Agreements was not unreasonable in light of the services and benefits provided to each Fund.
Fall-Out Benefits
The Trustees reviewed information regarding potential “fallout” or ancillary benefits received by the Adviser and its affiliates as a result of their relationship with the Funds. The Trustees also reviewed the Adviser’s allocation of fund brokerage for the J.P. Morgan Funds complex, including allocations to brokers who provide research to the Adviser.
The Trustees also considered that JPMDS, an affiliate of the Adviser, and JPMIM earn fees from the Funds for providing shareholder and administrative services, respectively. These fees were shown separately in the profitability analysis presented to the Trustees. The Trustees also considered the payments of Rule 12b-1 fees to JPMDS, which also acts as the Funds’ distributor and that these fees are in turn generally paid to financial intermediaries that sell the Funds, including financial intermediaries that are affiliates of the Adviser. The Trustees also considered the fees paid to JPMorgan Chase Bank, N.A. (“JPMCB”) for custody and fund accounting, and other related services.
Economies of Scale
The Trustees considered the extent to which the Funds may benefit from economies of scale. The Trustees considered that there may not be a direct relationship between economies of scale realized by the Funds and those realized by the Adviser as assets increase. The Trustees noted that the proposed investment advisory fee schedule for each Fund does not contain breakpoints, but that the fees remain competitive with peer funds. The Trustees also considered that the Adviser has implemented fee waivers and expense limitations (“Fee Caps”) which allow each Fund’s shareholders to share potential economies of scale from a Fund’s inception. The Trustees also considered that the Adviser has shared economies of scale by adding or enhancing services to the Funds over time, noting the Adviser’s substantial investments in its business in support of the Funds, including investments in trading systems and technology (including cybersecurity improvements), retention of key talent, additions to analyst and portfolio management teams, and regulatory support enhancements. The Trustees also considered whether it would be appropriate to add advisory fee breakpoints and the Trustees concluded that the current fee structure was reasonable in light of the Fee Caps that the Adviser has in place that serve to limit the overall net expense ratios of each Fund at competitive levels. The Trustees concluded that the Funds’ shareholders received the benefits of potential economies of scale through the Fee Caps and the Adviser’s reinvestment in its operations to serve the Funds and their shareholders.
Independent Written Evaluation of the Funds’ Senior/Chief Compliance Officer
The Trustees noted that, upon their direction, the Senior Officer for the Intrepid Mid Cap Fund had prepared an independent written evaluation in order to assist the Trustees in determining the reasonableness of the proposed management fees. In determining whether to continue the Advisory Agreements, the Trustees considered the Senior Officer’s report.
The Trustees noted that, upon their direction, the Chief Compliance Officer for the Intrepid Advantage Fund, Intrepid America Fund, Intrepid Growth Fund, and Intrepid Value Fund had prepared an independent written evaluation in order to assist the Trustees in determining the reasonableness of the proposed management fees. The Trustees considered the written evaluation in determining whether to continue the Advisory Agreements.
Fees Relative to Adviser’s Other Clients
The Trustees received and considered information about the nature and extent of investment advisory services and fee rates offered to other clients of the Adviser, including institutional separate accounts and/or funds sub-advised by the Adviser, and for investment management styles substantially similar to that of each Fund. The Trustees considered the complexity of
| | | | | | |
| | | |
| 68 | | | | J.P. MORGAN INTREPID FUNDS | | DECEMBER 31, 2016 |
BOARD APPROVAL OF INVESTMENT ADVISORY AGREEMENT
(Unaudited) (continued)
investment management for registered mutual funds relative to the Adviser’s other clients and noted differences in the regulatory, legal and other risks and responsibilities of providing services to the different clients. The Trustees considered that serving as an adviser to a registered mutual fund involves greater responsibilities and risks than acting as a sub-adviser and observed that sub-advisory fees may be lower than those charged by the Adviser to each Fund. The Trustees also noted that the adviser, not the mutual fund, pays the sub-advisory fee and that many responsibilities related to the advisory function are retained by the primary adviser. The Trustees concluded that the fee rates charged to each Fund in comparison to those charged to the Adviser’s other clients were reasonable.
Investment Performance
The Trustees received and considered absolute and/or relative performance for the Funds in a report prepared by Broadridge/Lipper. The Trustees considered the total return performance information, which included the ranking of the Funds within a performance universe made up of funds with the same Broadridge/Lipper investment classification and objective (the “Universe”), as well as a sub-set of funds within the Universe (the “Peer Group”), by total return for applicable one-, three- and five-year periods. The Trustees reviewed a description of Broadridge/Lipper’s methodology for selecting mutual funds in each Fund’s Peer Group and Universe. The Broadridge/Lipper materials provided to the Trustees highlighted information with respect to certain representative classes to assist the Trustees in their review. As part of this review, the Trustees also reviewed each Fund’s performance against its benchmark and considered the performance information provided for the Funds at regular Board meetings by the Adviser and the Trustees’ independent consultant and also considered the special analysis prepared by the Trustees’ independent consultant. The Broadridge/Lipper performance data noted by the Trustees as part of their review and the determinations made by the Trustees with respect to each Fund’s performance for certain representative classes are summarized below:
The Trustees noted that the Intrepid Advantage Fund’s performance for Class A shares was in the second, first and first quintiles based upon the Peer Group, and in the third, first and first quintiles based upon the Universe for each of the one-, three- and five-year periods ended December 31, 2015, respectively. The Trustees noted that the Intrepid Advantage Fund’s performance for Select Class shares was in the fourth and first quintiles based upon the Peer Group, for each of the one-, and three-year periods, and in the second, first and first quintiles based upon the Universe for each of the one-, three- and five-year periods ended December 31, 2015, respectively. The Trustees discussed the performance and investment strategy of the Fund with the Adviser, including the proposed changes to the Fund’s investment strategy to incorporate environmental,
social and governance factors, and reviewed the performance analysis and evaluation prepared by the independent consultant. Based upon these discussions and various other factors, the Trustees concluded that the performance was reasonable.
The Trustees noted that the Intrepid America Fund’s performance for Class A shares was in the first quintile based upon the Peer Group, and in the third, first and first quintiles based upon the Universe for each of the one-, three-, and five-year periods ended December 31, 2015, respectively. The Trustees noted that the Intrepid America Fund’s performance for Select Class shares was in the third, second, and second quintiles based upon the Peer Group, and in the second, first and first quintiles based upon the Universe for each of the one-, three-, and five-year periods ended December 31, 2015, respectively. The Trustees discussed the performance and investment strategy of the Fund with the Adviser and reviewed the performance analysis and evaluation prepared by the independent consultant. Based upon these discussions and various other factors, the Trustees concluded that the performance was reasonable.
The Trustees noted that the Intrepid Growth Fund’s performance for Class A shares was in the third, second and first quintiles based upon the Peer Group, and in the fourth, second and first quintiles based upon the Universe, for each of the one-, three- and five-year periods ended December 31, 2015, respectively. The Trustees noted that the Intrepid Growth Fund’s performance for Select Class shares was in the third, second and first quintiles based upon the both the Peer Group, and the Universe, for each of the one-, three- and five-year periods ended December 31, 2015, respectively. The Trustees discussed the performance and investment strategy of the Fund with the Adviser and reviewed the performance analysis and evaluation prepared by the independent consultant. Based upon these discussions and various other factors, the Trustees concluded that the performance was reasonable.
The Trustees noted that the Intrepid Mid Cap Fund’s performance for Class A shares was in the fourth, first, and first quintiles based upon both the Peer Group and the Universe for each of the one-, three-, and five-year periods ended December 31, 2015, respectively. The Trustees noted that the Intrepid Mid Cap Fund’s performance for Select Class shares was in the third, first, and first quintiles for the Peer Group, and in the fourth, first, and first quintiles based upon the Universe for each of the one-, three-, and five-year periods ended December 31, 2015, respectively. The Trustees discussed the performance and investment strategy of the Fund with the Adviser and reviewed the performance analysis and evaluation prepared by the independent consultant. Based upon these discussions and various other factors, the Trustees concluded that the performance was reasonable.
| | | | | | | | |
| | | |
| DECEMBER 31, 2016 | | J.P. MORGAN INTREPID FUNDS | | | | | 69 | |
The Trustees noted that the Intrepid Value Fund’s performance for Class A shares was in the third, third and second quintiles based upon the Peer Group, and in the fourth, second, and second quintiles based upon the Universe, for each of the one-, three-, and five-year periods ended December 31, 2015, respectively. The Trustees noted that the Intrepid Value Fund’s performance for Select Class shares was in the fourth and second quintiles based upon the Peer Group for each of the one- and three-year periods, and in the fourth, second, and second quintiles based upon the Universe, for each of the one-, three-, and five-year periods ended December 31, 2015, respectively. The Trustees discussed the performance and investment strategy of the Fund with the Adviser and reviewed the performance analysis and evaluation prepared by the independent consultant. Based upon these discussions and various other factors, the Trustees concluded that the performance was reasonable.
Advisory Fees and Expense Ratios
The Trustees considered the contractual advisory fee rate paid by each Fund to the Adviser and compared that rate to the information prepared by Broadridge/Lipper concerning management fee rates paid by other funds in the same Broadridge/Lipper category as each Fund. The Trustees recognized that Broadridge/Lipper reported each Fund’s management fee rate as the combined contractual advisory fee and administration fee rates. The Trustees also reviewed information about other expenses and the expense ratios for each Fund. The Trustees considered the fee waiver and/or expense reimbursement arrangements currently in place for each Fund and considered the net advisory fee rate after taking into account any waivers and/or reimbursements. The Trustees recognized that it is difficult to make comparisons of advisory fees because there are variations in the services that are included in the fees paid by other funds. The Trustees’ determinations as a result of the review of each Fund’s advisory fees and expense ratios for certain representative classes are summarized below:
The Trustees noted that the Intrepid Advantage Fund’s net advisory fee and actual total expenses for Class A Shares was in the fourth and first quintiles based upon the Peer Group, and in the fifth and fourth quintiles based upon the Universe, respectively. The Trustees noted that the Intrepid Advantage Fund’s net advisory fee and actual total expenses for Select Class shares were in the fourth and first quintiles based upon the Peer Group, and in the fifth and fourth quintiles based upon
the Universe, respectively. After considering the factors identified above, including the reduction of the contractual advisory fee and expense caps for certain share classes effective November 1, 2016, in light of this information, the Trustees concluded that the advisory fee was reasonable.
The Trustees noted that the Intrepid America Fund’s net advisory fee and actual total expenses for Class A shares was in the fifth and first quintiles based upon the Peer Group, and in the third and first quintiles based upon the Universe, respectively. The Trustees noted that the Intrepid America Fund’s net advisory fee and actual total expenses for Select Class shares was in the first quintile based upon the Peer Group, and in the first and second quintiles based upon the Universe, respectively. After considering the factors identified above, in light of this information, the Trustees concluded that the advisory fee was reasonable.
The Trustees noted that the Intrepid Growth Fund’s net advisory fee and actual total expenses for both Class A and Select Class shares were in the first quintile based upon the Peer Group and the Universe. After considering the factors identified above, in light of this information, the Trustees concluded that the advisory fee was reasonable.
The Trustees noted that the Intrepid Mid Cap Fund’s net advisory fee and actual total expenses for the Class A shares was in the second quintile based upon the Peer Group, and in the first quintile based upon the Universe. The Trustees noted that the Intrepid Mid Cap Fund’s net advisory fee and actual total expenses for the Select Class shares was in the third and first quintiles based upon the Peer Group, and in the second quintile based upon the Universe. After considering the factors identified above, in light of this information, the Trustees concluded that the advisory fee was reasonable.
The Trustees noted that the Intrepid Value Fund’s net advisory fee and actual total expenses for the Class A shares were in the second and first quintiles based upon both the Peer Group and the Universe, respectively. The Trustees noted that the Intrepid Value Fund’s net advisory fee and actual total expenses for the Select Class shares were in the fifth and first quintiles based upon the Peer Group, and in the fourth and first quintiles based upon the Universe, respectively. After considering the factors identified above, in light of this information, the Trustees concluded that the advisory fee was reasonable.
| | | | | | | | |
| | | |
| DECEMBER 31, 2016 | | J.P. MORGAN INTREPID FUNDS | | | | | 70 | |
J.P. Morgan Funds are distributed by JPMorgan Distribution Services, Inc., which is an affiliate of JPMorgan Chase & Co. Affiliates of JPMorgan Chase & Co. receive fees for providing various services to the funds.
Contact JPMorgan Distribution Services, Inc. at 1-800-480-4111 for a fund prospectus. You can also visit us at www.jpmorganfunds.com. Investors should carefully consider the investment objectives and risk as well as charges and expenses of the mutual fund before investing. The prospectus contains this and other information about the mutual fund. Read the prospectus carefully before investing.
Investors may obtain information about the Securities Investor Protection Corporation (SIPC), including the SIPC brochure by visiting www.sipc.org or by calling SIPC at 202-371-8300.
Each Fund files a complete schedule of its fund holdings for the first and third quarters of its fiscal year with the SEC on Form N-Q. The Funds’ Forms N-Q are available on the SEC’s website at http://www.sec.gov and may be reviewed and copied at the SEC’s Public Reference Room in Washington, DC. Information on the operation of the SEC’s Public Reference Room may be obtained by calling 1-800-SEC-0330. Shareholders may request the Form N-Q without charge by calling 1-800-480-4111 or by visiting the J.P. Morgan Funds’ website at www.jpmorganfunds.com.
A description of each Fund’s policies and procedures with respect to the disclosure of each Fund’s holdings is available in the prospectus and Statement of Additional Information.
A copy of proxy policies and procedures is available without charge upon request by calling 1-800-480-4111 and on the Funds’ website at www.jpmorganfunds.com. A description of such policies and procedures is on the SEC’s website at www.sec.gov. The Trustees have delegated the authority to vote proxies for securities owned by the Funds to the Adviser. A copy of the Funds’ voting record for the most recent 12-month period ended June 30 is available on the SEC’s website at www.sec.gov or at the Funds’ website at www.jpmorganfunds.com no later than August 31 of each year. The Funds’ proxy voting record will include, among other things, a brief description of the matter voted on for each fund security, and will state how each vote was cast, for example, for or against the proposal.

J.P. Morgan Asset Management is the marketing name for the asset management businesses of JPMorgan Chase & Co. Those businesses include, but are not limited to, J.P. Morgan Investment Management Inc., Security Capital Research & Management Incorporated and J.P. Morgan Alternative Asset Management, Inc.
| | | | |
| | © JPMorgan Chase & Co., 2017. All rights reserved. December 2016. | | SAN-INT-1216 |
ITEM 2. CODE OF ETHICS.
Disclose whether, as of the end of the period covered by the report, the registrant has adopted a code of ethics that applies to the registrant’s principal executive officer, principal financial officer, principal accounting officer or controller, or persons performing similar functions, regardless of whether these individuals are employed by the registrant or a third party. If the registrant has not adopted such a code of ethics, explain why it has not done so.
The registrant must briefly describe the nature of any amendment, during the period covered by the report, to a provision of its code of ethics that applies to the registrant’s principal executive officer, principal financial officer, principal accounting officer or controller, or persons performing similar functions, regardless of whether these individuals are employed by the registrant or a third party, and that relates to any element of the code of ethics definition enumerated in paragraph (b) of this Item. The registrant must file a copy of any such amendment as an exhibit pursuant to Item 12(a)(1), unless the registrant has elected to satisfy paragraph (f) of this Item by positing its code of ethics on its website pursuant to paragraph (f)(2) of this Item, or by undertaking to provide its code of ethics to any person without charge, upon request, pursuant to paragraph (f)(3) of this Item.
If the registrant has, during the period covered by the report, granted a waiver, including an implicit waiver, from a provision of the code of ethics that applies to the registrant’s principal executive officer, principal financial officer, principal accounting officer or controller, or persons performing similar functions, regardless of whether these individuals are employed by the registrant or third party, that relates to one or more items set forth in paragraph (b) of this Item, the registrant must briefly describe the nature of the waiver, the name of the person to whom the waiver was granted, and the date of the waiver.
Not applicable to a semiannual report.
ITEM 3. AUDIT COMMITTEE FINANCIAL EXPERT.
(a) (1) Disclose that the registrant’s board of directors has determined that the registrant either:
(i) Has at least one audit committee financial expert serving on its audit committee; or
(ii) Does not have an audit committee financial expert serving on its audit committee.
(2) If the registrant provides the disclosure required by paragraph (a)(1)(i) of this Item, it must disclose the name of the audit committee financial expert and whether that person is “independent.” In order to be considered “independent” for purposes of this Item, a member of an audit committee may not, other than in his or her capacity as a member of the audit committee, the board of directors, or any other board committee:
(i) Accept directly or indirectly any consulting, advisory, or other compensatory fee from the issuer; or
(ii) Be an “interested person” of the investment company as defined in Section 2(a)(19) of the Act (15 U.S.C. 80a-2(a)(19)).
(3) If the registrant provides the disclosure required by paragraph (a)(1)(ii) of this Item, it must explain why it does not have an audit committee financial expert.
Not applicable to a semiannual report.
ITEM 4. PRINCIPAL ACCOUNTANT FEES AND SERVICES.
(a) Disclose, under the caption Audit Fees, the aggregate fees billed for each of the last two fiscal years for professional services rendered by the principal accountant for the audit of the registrant’s annual financial statements or services that are normally provided by the accountant in connection with statutory and regulatory filings or engagements for those fiscal years.
(b) Disclose, under the caption Audit-Related Fees, the aggregate fees billed in each of the last two fiscal years for assurance and related services by the principal accountant that are reasonably related to the performance of the audit of the registrant’s financial statements and are not reported under paragraph (a) of this Item. Registrants shall describe the nature of the services comprising the fees disclosed under this category.
(c) Disclose, under the caption Tax Fees, the aggregate fees billed in each of the last two fiscal years for professional services rendered by the principal accountant for tax compliance, tax advice, and tax planning. Registrants shall describe the nature of the services comprising the fees disclosed under this category.
(d) Disclose, under the caption All Other Fees, the aggregate fees billed in each of the last two fiscal years for products and services provided by the principal accountant, other than the services reported in paragraphs (a) through (c) of this Item. Registrants shall describe the nature of the services comprising the fees disclosed under this category.
(e) (1) Disclose the audit committee’s pre-approval policies and procedures described in paragraph (c)(7) of Rule 2-01 of Regulation S-X.
(2) Disclose the percentage of services described in each of paragraphs (b) through (d) of this Item that were approved by the audit committee pursuant to paragraph (c)(7)(i)(C) of Rule 2-01 of Regulation S-X.
(f) If greater than 50 percent, disclose the percentage of hours expended on the principal accountant’s engagement to audit the registrant’s financial statements for the most recent fiscal year that were attributed to work performed by persons other than the principal accountant’s full-time, permanent employees.
Not applicable to a semi-annual report.
(g) Disclose the aggregate non-audit fees billed by the registrant’s accountant for services rendered to the registrant, and rendered to the registrant’s investment adviser (not including any sub-adviser whose role is primarily portfolio management and is subcontracted with or overseen by another investment adviser), and any entity controlling, controlled by, or under common control with the adviser that provides ongoing services to the registrant for each of the last two fiscal years of the registrant.
(h) Disclose whether the registrant’s audit committee of the board of directors has considered whether the provision of non-audit services that were rendered to the registrant’s investment adviser (not including any subadviser whose role is primarily portfolio management and is subcontracted with or overseen by another investment adviser), and any entity controlling, controlled by, or under common control with the investment adviser that provides ongoing services to the registrant that were not pre-approved pursuant to paragraph (c)(7)(ii) of Rule 2-01 of Regulation S-X is compatible with maintaining the principal accountant’s independence.
Not applicable to a semiannual report.
ITEM 5. AUDIT COMMITTEE OF LISTED REGISTRANTS.
(a) If the registrant is a listed issuer as defined in Rule 10A-3 under the Exchange Act (17CFR 240.10A-3), state whether or not the registrant has a separately-designated standing audit committee established in accordance with Section 3(a)(58)(A) of the Exchange Act (15 U.S.C. 78c(a)(58)(A)). If the registrant has such a committee, however designated, identify each committee member. If the entire board of directors is acting as the registrant’s audit committee as specified in Section 3(a)(58)(B) of the Exchange Act (15 U.S.C. 78c(a)(58)(B)), so state.
(b) If applicable, provide the disclosure required by Rule 10A-3(d) under the Exchange Act (17CFR 240.10A-3(d)) regarding an exemption from the listing standards for all audit committees.
Not applicable to a semiannual report.
ITEM 6. SCHEDULE OF INVESTMENTS.
File Schedule I – Investments in securities of unaffiliated issuers as of the close of the reporting period as set forth in Section 210.12-12 of Regulation S-X, unless the schedule is included as part of the report to shareholders filed under Item 1 of this Form.
Included in Item 1.
ITEM 7. DISCLOSURE OF PROXY VOTING POLICIES AND PROCEDURES FOR CLOSED-END MANAGEMENT INVESTMENT COMPANIES.
A closed-end management investment company that is filing an annual report on this Form N-CSR must, unless it invests exclusively in non-voting securities, describe the policies and procedures that it uses to determine how to vote proxies relating to portfolio securities, including the procedures that the company uses when a vote presents a conflict between the interests of its shareholders, on the one hand, and those of the company’s investment adviser; principal underwriter; or any affiliated person (as defined in Section 2(a)(3) of the Investment Company Act of 1940 (15 U.S.C. 80a-2(a)(3)) and the rules thereunder) of the company, its investment adviser, or its principal underwriter, on the other. Include any policies and procedures of the company’s investment adviser, or any other third party, that the company uses, or that are used on the company’s behalf, to determine how to vote proxies relating to portfolio securities.
Not applicable.
ITEM 8. PORTFOLIO MANAGERS OF CLOSED-END MANAGEMENT INVESTMENT COMPANIES.
Not applicable.
ITEM 9. PURCHASE OF EQUITY SECURITIES BY CLOSED-END MANAGEMENT INVESTMENT COMPANY AND AFFILIATED PURCHASERS.
(a) If the registrant is a closed-end management investment company, provide the information specified in paragraph (b) of this Item with respect to any purchase made by or on behalf of the registrant or any “affiliated purchaser,” as defined in Rule 10b-18(a)(3) under the Exchange Act (17 CFR 240.10b-18(a)(3)), of shares or other units of any class of the registrant’s equity securities that is registered by the registrant pursuant to Section 12 of the Exchange Act (15 U.S.C. 781).
Not applicable.
ITEM 10. SUBMISSION OF MATTERS TO A VOTE OF SECURITY HOLDERS.
Describe any material changes to the procedures by which shareholders may recommend nominees to the registrant’s board of directors, where those changes were implemented after the registrant last provided disclosure in response to the requirements of Item 7(d)(2)(ii)(G) of Schedule 14A (17 CFR 240.14a-101), or this Item.
No material changes to report.
ITEM 11. CONTROLS AND PROCEDURES.
(a) Disclose the conclusions of the registrant’s principal executive and principal financial officers, or persons performing similar functions, regarding the effectiveness of the registrant’s disclosure controls and procedures (as defined in Rule 30a-3(c) under the Act (17 CFR 270.30a-3(c))) as of a date within 90 days of the filing date of the report that includes the disclosure required by this paragraph, based on the evaluation of these controls and procedures required by Rule 30a-3(b) under the Act (17 CFR 270.30a-3(b)) and Rules 13a-15(b) or 15d-15(b) under the Exchange Act (17 CFR 240.13a-15(b) or 240.15d-15(b)).
The Registrant’s principal executive and principal financial officers have concluded, based on their evaluation of the Registrant’s disclosure controls and procedures as of a date within 90 days of the filing date of this report, that the Registrant’s disclosure controls and procedures are reasonably designed to ensure that information required to be disclosed by the Registrant on Form N-CSR is recorded, processed, summarized and reported within the required time periods and that information required to be disclosed by the Registrant in the reports that it files or submits on Form N-CSR is accumulated and communicated to the Registrant’s management, including its principal executive and principal financial officers, as appropriate to allow timely decisions regarding required disclosure.
(b) Disclose any change in the registrant’s internal control over financial reporting (as defined in Rule 30a-3(d) under the Act (17 CFR 270.30a-3(d)) that occurred during the registrant’s second fiscal quarter of the period covered by this report that has materially affected, or is reasonably likely to materially affect, the registrant’s internal control over financial reporting.
There were no changes in the Registrant’s internal control over financial reporting that occurred during the last fiscal quarter covered by this report that have materially affected, or are reasonably likely to materially affect, the Registrant’s internal control over financial reporting.
ITEM 12. EXHIBITS.
| (a) | File the exhibits listed below as part of this Form. Letter or number the exhibits in the sequence indicated. |
(a)(1) Any code of ethics, or amendment thereto, that is the subject of the disclosure required by Item 2, to the extent that the registrant intends to satisfy the Item 2 requirements through filing of an exhibit.
Not applicable.
(a)(2) A separate certification for each principal executive officer and principal financial officer of the registrant as required by Rule 30a-2(a) under the Act (17 CFR 270.30a-2).
Certifications pursuant to Rule 30a-2(a) under the Investment Company Act of 1940 are attached hereto.
(a)(3) Any written solicitation to purchase securities under Rule 23c-1 under the Act (17 CFR 270.23c-1) sent or given during the period covered by the report by or on behalf of the registrant to 10 or more persons.
Not applicable.
(b) A separate or combined certification for each principal executive officer and principal officer of the registrant as required by Rule 30a-2(b) under the Act of 1940.
Certifications pursuant to Rule 30a-2(b) under the Investment Company Act of 1940 are attached hereto.
SIGNATURES
Pursuant to the requirements of the Securities Exchange Act of 1934 and the Investment Company Act of 1940, the registrant has duly caused this report to be signed on its behalf by the undersigned, thereunto duly authorized.
JPMorgan Trust II
| | |
| By: | | /s/ Brian S. Shlissel |
| | Brian S. Shlissel |
| | President and Principal Executive Officer |
| | March 3, 2017 |
Pursuant to the requirements of the Securities Exchange Act of 1934 and the Investment Company Act of 1940, this report has been signed below by the following persons on behalf of the registrant and in the capacities and on the dates indicated.
| | |
| By: | | /s/ Brian S. Shlissel |
| | Brian S. Shlissel |
| | President and Principal Executive Officer |
| | March 3, 2017 |
| By: | | /s/ Laura M. Del Prato |
| | Laura M. Del Prato |
| | Treasurer and Principal Financial Officer |
| | March 3, 2017 |
