UNITED STATES
SECURITIES AND EXCHANGE COMMISSION
WASHINGTON, D. C. 20549
FORM N-CSR
Investment Company Act file number | 811-4257 |
DWS VARIABLE SERIES I (FORMERLY SCUDDER VARIABLE SERIES I)
(Exact Name of Registrant as Specified in Charter)
Two International Place, Boston, MA 02110-4103
(Address of Principal Executive Offices) (Zip Code)
Registrant's Telephone Number, including Area Code: (212) 454-7190
Paul Schubert
345 Park Avenue
New York, NY 10154
(Name and Address of Agent for Service)
Date of fiscal year end: | 12/31 |
Date of reporting period: | 12/31/05 |
ITEM 1. | REPORT TO STOCKHOLDERS |

DECEMBER 31, 2005
ANNUAL REPORT
DWS VARIABLE SERIES I
(formerly Scudder Variable Series I)
Money Market VIP
DWS Bond VIP
DWS Growth & Income VIP
DWS Capital Growth VIP
DWS Global Opportunities VIP
DWS International VIP
DWS Health Care VIP
Contents
Performance Summary, Information About Your Portfolio's Expenses, Management Summary, Portfolio Summary, Investment Portfolio, Financial Statements and Financial Highlights for:
Click Here Money Market VIP (formerly Money Market Portfolio)
Click Here DWS Bond VIP (formerly Bond Portfolio)
Click Here DWS Growth & Income VIP (formerly Growth and Income Portfolio)
Click Here DWS Capital Growth VIP (formerly Capital Growth Portfolio)
Click Here DWS Global Opportunities VIP (formerly Global Discovery Portfolio)
Click Here DWS International VIP (fomerly International Portfolio)
Click Here DWS Health Care VIP (formerly Health Sciences Portfolio)
Click Here Notes to Financial Statements
Click Here Report of Independent Registered Public Accounting Firm
Click Here Tax Information
Click Here Proxy Voting
Click Here Shareholder Meeting Results
Click Here Investment Management Agreement Approvals
Click Here Trustees and Officers
This report must be preceded or accompanied by a prospectus. To obtain a prospectus, call (800) 778-1482 or your financial representative. We advise you to consider the product's objectives, risks, charges and expenses carefully before investing. The prospectus contains this and other important information about the investment product. Please read the prospectus carefully before you invest.
NOT FDIC/NCUA INSURED NO BANK GUARANTEE MAY LOSE VALUE NOT A DEPOSIT
NOT INSURED BY ANY FEDERAL GOVERNMENT AGENCY
Investments in variable portfolios involve risk. Some portfolios have more risk than others. These include portfolios that allow exposure to or otherwise concentrate investments in certain sectors, geographic regions, security types, market capitalization or foreign securities (e.g., political or economic instability, which can be accentuated in Emerging Market countries). Please read the prospectus for specific details regarding its investments and risk profile.
DWS Scudder is part of Deutsche Asset Management, which is the marketing name in the US for the asset management activities of Deutsche Bank AG, Deutsche Bank Trust Company Americas, Deutsche Asset Management, Inc., Deutsche Investment Management Americas Inc. and DWS Trust Company.
Information About Your Portfolio's Expenses
Money Market VIP
As an investor of the Portfolio, you incur two types of costs: ongoing expenses and transaction costs. Ongoing expenses include management fees and other Portfolio expenses. Examples of transaction costs include sales charges (loads), redemption fees and account maintenance fees, which are not shown in this section. The following tables are intended to help you understand your ongoing expenses (in dollars) of investing in the Portfolio and to help you compare these expenses with the ongoing expenses of investing in other mutual funds. The tables are based on an investment of $1,000 made at the beginning of the six-month period ended December 31, 2005.
The tables illustrate your Portfolio's expenses in two ways:
Actual Portfolio Return. This helps you estimate the actual dollar amount of ongoing expenses (but not transaction costs) paid on a $1,000 investment in the Portfolio using the Portfolio's actual return during the period. To estimate the expenses you paid over the period, simply divide your account value by $1,000 (for example, an $8,600 account value divided by $1,000 = 8.6), then multiply the result by the number in the "Expenses Paid per $1,000" line under the share class you hold.
Hypothetical 5% Portfolio Return. This helps you to compare your Portfolio's ongoing expenses (but not transaction costs) with those of other mutual funds using the Portfolio's actual expense ratio and a hypothetical rate of return of 5% per year before expenses. Examples using a 5% hypothetical Portfolio return may be found in the shareholder reports of other mutual funds. The hypothetical account values and expenses may not be used to estimate the actual ending account balance or expenses you paid for the period.
Please note that the expenses shown in these tables are meant to highlight your ongoing expenses only and do not reflect any transaction costs. The "Expenses Paid per $1,000" line of the tables is useful in comparing ongoing expenses only and will not help you determine the relative total expense of owning different funds. If these transaction costs had been included, your costs would have been higher.
Expenses and Value of a $1,000 Investment for the six months ended December 31, 2005 |
Actual Portfolio Return | | |
Beginning Account Value 7/1/05 | $ 1,000.00 | |
Ending Account Value 12/31/05 | $ 1,016.00 | |
Expenses Paid per $1,000* | $ 3.20 | |
Hypothetical 5% Portfolio Return | | |
Beginning Account Value 7/1/05 | $ 1,000.00 | |
Ending Account Value 12/31/05 | $ 1,022.03 | |
Expenses Paid per $1,000* | $ 3.21 | |
* Expenses are equal to the Portfolio's annualized expense ratio, multiplied by the average account value over the period, multiplied by the number of days in the most recent six-month period, then divided by 365.
Annualized Expense Ratios | | |
DWS Variable Series I — Money Market VIP | .63% | |
For more information, please refer to the Portfolio's prospectus.
These tables do not reflect charges and fees ("contract charges") associated with the separate account that invests in the Portfolio or any variable life insurance policy or variable annuity contract for which the Portfolio is an investment option.
Management Summary December 31, 2005
Money Market VIP
During the 12-month period ended December 31, 2005, the US Federal Reserve continued its recent policy of increasing short-term interest rates in an attempt to head off a resurgence in inflation. The federal funds rate1 was raised to 4.25% in eight quarter-percentage-point increments in 2005. At the end of December 2005, the one-year LIBOR rate, an industry standard for measuring one-year money market rates, was close to a four-year high, at 4.84%.
For the 12-month period ended December 31, 2005, the Portfolio provided a total return of 2.72% (unadjusted for contract charges). The 7-day current yield was 3.74% as of December 31, 2005. For the period, our strategy was to keep the Portfolio's average maturity relatively short in order to reduce risk, generally limiting our purchases to three-month-maturity issues and shorter. (Shorter-term securities are generally less risky than longer-term securities, and are therefore potentially more attractive in a difficult environment.) From time to time, when the market offered more attractive yields at longer maturities, we added some longer-term issues. During the period, we maintained a target allocation of approximately 25% to 30% in floating-rate securities. Our decision to maintain this allocation helped performance during the period. There were no significant detractors from performance. Going forward, we will continue our insistence on the highest credit quality within the Portfolio and maintain our conservative investment strategies and standards.
A group of investment professionals is responsible for the day-to-day management of the Portfolio. These investment professionals have a broad range of experience managing money market funds.
Deutsche Investment Management Americas Inc.
All performance shown is historical, assumes reinvestment of all dividend and capital gain distributions, and does not guarantee future results. Investment return and principal value fluctuate with changing market conditions so that, when redeemed, shares may be worth more or less than their original cost. Current performance may be lower or higher than the performance data quoted. Please visit www.dws-scudder.com for the product's most recent month-end performance. Performance doesn't reflect charges and fees ("contract charges") associated with the separate account that invests in the Portfolio or any variable life insurance policy or variable annuity contract for which the Portfolio is an investment option. These charges and fees will reduce returns.
Risk Considerations
An investment in this Portfolio is not insured or guaranteed by the Federal Deposit Insurance Corporation or by any other government agency. Although the Portfolio seeks to preserve the value of your investment at $1.00 per share, it is possible to lose money by investing in the Portfolio. Please read this Portfolio's prospectus for specific details regarding its investments and risk profile.
LIBOR, the London Interbank Offered Rate, is the most widely used benchmark or reference rate for short-term interest rates. LIBOR is the rate of interest at which banks borrow funds from other banks, in large volume, in the international market.
The Lipper Money Market Funds category includes funds that invest in high-quality financial instruments rated in the top two grades with dollar-weighted average maturities of less than 90 days and that intend to keep a constant net asset value. It is not possible to invest directly in a Lipper category.
1 Federal funds rate — the overnight rate charged by banks when they borrow money from each other. Set by the Federal Open Market Committee (FOMC), the fed funds rate is the most sensitive — and closely watched — indicator concerning the direction of short-term interest rates. The FOMC is a key committee within the US Federal Reserve System, and meets every six weeks to review Fed policy on short-term rates. Based on current Fed policy, the FOMC may choose to raise or lower the fed funds rate to either add liquidity to the economy or remove it.
Yields are historical, will fluctuate and do not guarantee future performance. The 7-day current yield refers to the income paid by the Portfolio over a 7-day period expressed as an annual percentage rate of the Portfolio's shares outstanding.
Portfolio management market commentary is as of December 31, 2005, and may not come to pass. This information is subject to change at any time based on market and other conditions.
Portfolio Summary
Money Market VIP
Asset Allocation | 12/31/05 | 12/31/04 |
| | |
Commercial Paper | 35% | 42% |
Short-Term Notes | 28% | 21% |
Repurchase Agreements | 15% | 13% |
Certificates of Deposit and Bank Notes | 14% | 9% |
US Government Sponsored Agencies+ | 4% | 13% |
Funding Agreements | 4% | — |
Promissory Notes | — | 2% |
| 100% | 100% |
+ Not backed by the full faith and credit of the US Government
Weighted Average Maturity | | |
| | |
DWS Variable Series I — Money Market VIP | 37 days | 28 days |
First Tier Retail Money Fund Average* | 38 days | 36 days |
* The Portfolio is compared to its respective iMoneyNet Category: First Tier Retail Money Fund Average — Category includes a widely recognized composite of money market funds that invest in only first tier (highest rating) securities. Portfolio Holdings of First Tier funds include US Treasury, US Other, Repos, Time Deposits, Domestic Bank Obligations, Foreign Bank Obligations, First Tier Commercial Paper, Floating Rate Notes and Asset Backed Commercial Paper.
Asset allocation and weighted average maturity is subject to change.
For more complete details about the Portfolio's holdings, see page 6. A quarterly Fact Sheet is available upon request. Information concerning portfolio holdings of the Portfolio as of month-end will be posted to www.dws-scudder.com on the 15th day of the following month.
Following the Portfolio's fiscal first and third quarter-end, a complete portfolio holdings listing is filed with the SEC on Form N-Q. The form will be available on the SEC's Web site at www.sec.gov, and it also may be reviewed and copied at the SEC's Public Reference Room in Washington, D.C. Information on the operation of the SEC's Public Reference Room may be obtained by calling (800) SEC-0330.
Investment Portfolio December 31, 2005
Money Market VIP
| Principal Amount ($) | Value ($) |
| |
Certificates of Deposit and Bank Notes 14.2% |
Banco Bilbao Vizcaya Argentaria SA, 4.055%, 1/11/2006 | 2,000,000 | 1,999,823 |
Bank of Tokyo-Mitsubishi, 4.38%, 1/17/2006 | 1,500,000 | 1,500,000 |
BNP Paribas, 4.2%, 2/2/2006 | 1,000,000 | 999,828 |
Depfa Bank PLC, 3.22%, 2/6/2006 | 1,000,000 | 1,000,000 |
HBOS Treasury Services PLC, 4.25%, 2/7/2006 | 1,500,000 | 1,499,931 |
Toronto Dominion Bank, 3.75%, 5/16/2006 | 500,000 | 499,982 |
Total Certificates of Deposit and Bank Notes (Cost $7,499,564) | 7,499,564 |
|
Commercial Paper** 35.3% |
Atlantic Asset Securitization LLC, 4.32%, 1/19/2006 | 1,000,000 | 997,840 |
Atlantis One Funding Corp., 3.93%, 3/1/2006 | 750,000 | 745,169 |
Charta LLC, 4.34%, 1/13/2006 | 1,000,000 | 998,553 |
CIT Group, Inc.: | | |
4.21%, 2/2/2006 | 1,500,000 | 1,494,387 |
4.21%, 2/8/2006 | 1,000,000 | 995,556 |
Dorada Finance, Inc., 4.42%, 3/3/2006 | 1,000,000 | 992,511 |
Giro Funding US Corp.: | | |
4.14%, 1/20/2006 | 1,250,000 | 1,247,269 |
4.25%, 2/8/2006 | 1,500,000 | 1,493,271 |
Greyhawk Funding LLC, 4.23%, 2/7/2006 | 2,500,000 | 2,489,131 |
K2 (USA) LLC, 3.96%, 1/23/2006 | 500,000 | 498,790 |
Mane Funding Corp.: | | |
4.22%, 1/17/2006 | 1,000,000 | 998,124 |
4.36%, 2/13/2006 | 1,200,000 | 1,193,751 |
Perry Global Funding LLC, Series A, 4.31%, 1/26/2006 | 1,000,000 | 997,007 |
Ranger Funding Co. LLC, 4.31%, 1/27/2006 | 1,500,000 | 1,495,331 |
RWE AG, 4.31%, 1/23/2006 | 1,000,000 | 997,366 |
Sanofi-Aventis, 4.37%, 2/15/2006 | 1,000,000 | 994,537 |
Total Commercial Paper (Cost $18,628,593) | 18,628,593 |
|
US Government Sponsored Agencies 3.9% |
Federal Home Loan Bank, 3.25%, 7/21/2006 | 500,000 | 498,000 |
Federal Home Loan Mortgage Corp., 3.83%, 6/20/2006 | 750,000 | 750,000 |
| Principal Amount ($) | Value ($) |
| |
Federal National Mortgage Association, 4.03%, 7/21/2006 | 800,000 | 800,000 |
Total US Government Sponsored Agencies (Cost $2,048,000) | 2,048,000 |
|
Funding Agreements 3.8% |
New York Life Insurance Co., 4.57%*, 9/19/2006 (Cost $2,000,000) | 2,000,000 | 2,000,000 |
|
Short-Term Notes* 27.4% |
American Express Credit Corp., 4.32%, 1/9/2007 | 1,000,000 | 999,891 |
American Honda Finance Corp.: | | |
4.44%, 9/12/2006 | 1,500,000 | 1,500,000 |
4.461%, 6/22/2006 | 1,000,000 | 1,000,000 |
Credit Suisse: | | |
4.02%, 9/26/2006 | 1,000,000 | 1,000,000 |
4.49%, 9/26/2006 | 1,500,000 | 1,500,000 |
Greenwich Capital Holdings, Inc., 4.33%, 6/20/2006 | 2,000,000 | 2,000,000 |
Links Finance LLC, 4.325%, 5/22/2006 | 1,500,000 | 1,499,941 |
Merrill Lynch & Co., Inc., 4.36%, 5/5/2006 | 1,500,000 | 1,500,410 |
Skandinaviska Enskila Banken, 4.38%, 7/18/2006 | 1,000,000 | 1,000,000 |
Tango Finance Corp.: | | |
144A, 4.07%, 2/2/2006 | 1,000,000 | 1,000,000 |
144A, 4.08%, 9/18/2006 | 1,500,000 | 1,499,972 |
Total Short-Term Notes (Cost $14,500,214) | 14,500,214 |
|
Repurchase Agreements 14.8% |
State Street Bank and Trust Co., 3.2%, dated 12/30/2005, to be repurchased at $811,288 on 1/3/2006 (a) | 811,000 | 811,000 |
The Goldman Sachs & Co., 4.33%, dated 12/30/2005, to be repurchased at $7,003,368 on 1/3/2006 (b) | 7,000,000 | 7,000,000 |
Total Repurchase Agreements (Cost $7,811,000) | 7,811,000 |
| % of Net Assets | Value ($) |
| |
Total Investment Portfolio (Cost $52,487,371)+ | 99.4 | 52,487,371 |
Other Assets and Liabilities, Net | 0.6 | 292,026 |
Net Assets | 100.0 | 52,779,397 |
* Floating rate notes are securities whose yields vary with a designated market index or market rate, such as the coupon-equivalent of the US Treasury bill rate. These securities are shown at their current rate as of December 31, 2005.
** Annualized yield at time of purchase; not a coupon rate.
+ The cost for federal income tax purposes was $52,487,371.
(a) Collateralized by $835,000 US Treasury Note, 2.5%, maturing on 5/31/2006 with a value of $830,825.
(b) Collateralized by $7,461,385 Federal Home Loan Mortgage Corp., 4.5%, maturing on 10/1/2035 with a value of $7,140,001.
144A: Security exempt from registration under Rule 144A of the Securities Act of 1933. These securities may be resold in transactions exempt from registration, normally to qualified institutional buyers.
The accompanying notes are an integral part of the financial statements.
Financial Statements
Statement of Assets and Liabilities as of December 31, 2005 |
Assets |
Investments: Investments in securities, at amortized cost | $ 44,676,371 |
Repurchase agreements, at amortized cost | 7,811,000 |
Total investments in securities, at amortized cost | 52,487,371 |
Interest receivable | 151,757 |
Receivable for investments sold | 1,295,798 |
Receivable for Portfolio shares sold | 236,177 |
Other assets | 1,438 |
Total assets | 54,172,541 |
Liabilities |
Due to custodian bank | 1,295,745 |
Payable for Portfolio shares redeemed | 33,129 |
Accrued management fee | 16,984 |
Other accrued expenses and payables | 47,286 |
Total liabilities | 1,393,144 |
Net assets, at value | $ 52,779,397 |
Net Assets |
Net assets consist of: Undistributed net investment income | 3,677 |
Accumulated net realized gain (loss) | (2,650) |
Paid-in capital | 52,778,370 |
Net assets, at value | $ 52,779,397 |
Net Asset Value, offering and redemption price per share ($52,779,397 ÷ 52,769,533 outstanding shares of beneficial interest, $.01 par value, unlimited number of shares authorized) | $ 1.00 |
Statement of Operations for the year ended December 31, 2005 |
Investment Income |
Income: Interest | $ 1,765,872 |
Expenses: Management fee | 199,057 |
Custodian and accounting fees | 59,502 |
Auditing | 19,987 |
Legal | 19,482 |
Trustees' fees and expenses | 4,071 |
Reports to shareholders | 16,132 |
Other | 5,694 |
Total expenses before expense reductions | 323,925 |
Expense reductions | (2,405) |
Total expenses after expense reductions | 321,520 |
Net investment income | 1,444,352 |
Net gain (loss) on investment transactions | (8) |
Net increase (decrease) in net assets resulting from operations | $ 1,444,344 |
The accompanying notes are an integral part of the financial statements.
Statement of Changes in Net Assets |
| Years Ended December 31, |
Increase (Decrease) in Net Assets | 2005 | 2004 |
Operations: Net investment income | $ 1,444,352 | $ 544,033 |
Net realized gain (loss) on investment transactions | (8) | 1,745 |
Net increase (decrease) in net assets resulting from operations | 1,444,344 | 545,778 |
Distributions to shareholders from net investment income | (1,444,352) | (540,356) |
Portfolio share transactions: Proceeds from shares sold | 28,415,633 | 32,931,943 |
Reinvestment of distributions | 1,444,352 | 540,356 |
Cost of shares redeemed | (31,796,066) | (48,506,966) |
Net increase (decrease) in net assets from Portfolio transactions | (1,936,081) | (15,034,667) |
Increase (decrease) in net assets | (1,936,089) | (15,029,245) |
Net assets at beginning of period | 54,715,486 | 69,744,731 |
Net assets at end of period (including undistributed net investment income of $3,677 and $3,677, respectively) | $ 52,779,397 | $ 54,715,486 |
Other Information |
Shares outstanding at beginning of period | 54,705,614 | 69,740,281 |
Shares sold | 28,415,633 | 32,931,943 |
Shares issued to shareholders in reinvestment of distributions | 1,444,352 | 540,356 |
Shares redeemed | (31,796,066) | (48,506,966) |
Net increase (decrease) in Portfolio shares | (1,936,081) | (15,034,667) |
Shares outstanding at end of period | 52,769,533 | 54,705,614 |
The accompanying notes are an integral part of the financial statements.
Financial Highlights
Years Ended December 31, | 2005 | 2004 | 2003 | 2002 | 2001 |
Selected Per Share Data |
Net asset value, beginning of period | $ 1.00 | $ 1.00 | $ 1.00 | $ 1.00 | $ 1.00 |
Income (loss) from investment operations: Net investment income | .027 | .009 | .008 | .015 | .038 |
Less distributions from: Net investment income | (.027) | (.009) | (.008) | (.015) | (.038) |
Net asset value, end of period | $ 1.00 | $ 1.00 | $ 1.00 | $ 1.00 | $ 1.00 |
Total Return (%) | 2.72 | .90 | .82 | 1.49 | 3.88 |
Ratios to Average Net Assets and Supplemental Data |
Net assets, end of period ($ millions) | 53 | 55 | 70 | 101 | 139 |
Ratio of expenses before expense reductions (%) | .60 | .53 | .48 | .43 | .46a |
Ratio of expenses after expense reductions (%) | .60 | .53 | .48 | .43 | .45a |
Ratio of net investment income (%) | 2.68 | .89 | .83 | 1.49 | 3.77 |
a The ratios of expenses excluding costs incurred in connection with a fund complex reorganization before and after expense reductions were .45% and .45%, respectively. |
Performance Summary December 31, 2005
DWS Bond VIP
All performance shown is historical, assumes reinvestment of all dividend and capital gain distributions, and does not guarantee future results. Investment return and principal value fluctuate with changing market conditions so that, when redeemed, shares may be worth more or less than their original cost. Current performance may be lower or higher than the performance data quoted. Please visit www.dws-scudder.com for the Portfolio's most recent month-end performance. Performance doesn't reflect charges and fees ("contract charges") associated with the separate account that invests in the Portfolio or any variable life insurance policy or variable annuity contract for which the Portfolio is an investment option. These charges and fees will reduce returns.
Risk Considerations
Investments by the portfolio in lower-rated bonds present greater risk to principal and income than investments in higher-quality securities. This portfolio invests in individual bonds whose yields and market values fluctuate so that your investment may be worth more or less than its original cost. Bond investments are subject to interest-rate risk such that when interest rates rise, the prices of the bonds, and thus the value of the investment, can decline and the investor can lose principal value. Additionally, investing in foreign securities presents certain unique risks not associated with domestic investments, such as currency fluctuation and changes in political/economic conditions and market risks. All of these factors may result in greater share price volatility. Please see this portfolio's prospectus for specific details regarding its investments and risk profile.
Growth of an Assumed $10,000 Investment |
[] DWS Bond VIP — Class A [] LBAB Index | The Lehman Brothers Aggregate Bond (LBAB) Index is an unmanaged, market value-weighted measure of Treasury issues, agency issues, corporate bond issues and mortgage securities. Index returns assume the reinvestment of dividends and, unlike Portfolio returns, do not reflect any fees or expenses. It is not possible to invest directly into an index. |
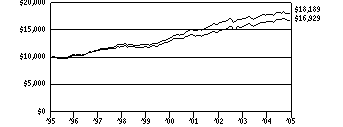 | |
Yearly periods ended December 31 | |
Comparative Results |
DWS Bond VIP | 1-Year | 3-Year | 5-Year | 10-Year |
Class A | Growth of $10,000 | $10,260 | $11,360 | $12,932 | $16,929 |
Average annual total return | 2.60% | 4.34% | 5.28% | 5.41% |
LBAB Index | Growth of $10,000 | $10,243 | $11,126 | $13,303 | $18,189 |
Average annual total return | 2.43% | 3.62% | 5.87% | 6.16% |
DWS Bond VIP | | | | Life of Class* |
Class B | Growth of $10,000 | | | | $10,131 |
Total return | | | | 1.31% |
LBAB Index | Growth of $10,000 | | | | $10,155 |
Total return | | | | 1.55% |
The growth of $10,000 is cumulative.
* The Portfolio commenced offering Class B shares on May 2, 2005. Index returns begin April 30, 2005.
Information About Your Portfolio's Expenses
DWS Bond VIP
As an investor of the Portfolio, you incur two types of costs: ongoing expenses and transaction costs. Ongoing expenses include management fees, distribution and service (12b-1) fees and other Portfolio expenses. Examples of transaction costs include sales charges (loads), redemption fees and account maintenance fees, which are not shown in this section. The following tables are intended to help you understand your ongoing expenses (in dollars) of investing in the Portfolio and to help you compare these expenses with the ongoing expenses of investing in other mutual funds. The tables are based on an investment of $1,000 made at the beginning of the six-month period ended December 31, 2005.
The tables illustrate your Portfolio's expenses in two ways:
Actual Portfolio Return. This helps you estimate the actual dollar amount of ongoing expenses (but not transaction costs) paid on a $1,000 investment in the Portfolio using the Portfolio's actual return during the period. To estimate the expenses you paid over the period, simply divide your account value by $1,000 (for example, an $8,600 account value divided by $1,000 = 8.6), then multiply the result by the number in the "Expenses Paid per $1,000" line under the share class you hold.
Hypothetical 5% Portfolio Return. This helps you to compare your Portfolio's ongoing expenses (but not transaction costs) with those of other mutual funds using the Portfolio's actual expense ratio and a hypothetical rate of return of 5% per year before expenses. Examples using a 5% hypothetical Portfolio return may be found in the shareholder reports of other mutual funds. The hypothetical account values and expenses may not be used to estimate the actual ending account balance or expenses you paid for the period.
Please note that the expenses shown in these tables are meant to highlight your ongoing expenses only and do not reflect any transaction costs. The "Expenses Paid per $1,000" line of the tables is useful in comparing ongoing expenses only and will not help you determine the relative total expense of owning different funds. If these transaction costs had been included, your costs would have been higher.
Expenses and Value of a $1,000 Investment for the six months ended December 31, 2005 |
Actual Portfolio Return | Class A | | Class B | |
Beginning Account Value 7/1/05 | $ 1,000.00 | | $ 1,000.00 | |
Ending Account Value 12/31/05 | $ 1,000.00 | | $ 997.10 | |
Expenses Paid per $1,000* | $ 3.73 | | $ 5.24 | |
Hypothetical 5% Portfolio Return | Class A | | Class B | |
Beginning Account Value 7/1/05 | $ 1,000.00 | | $ 1,000.00 | |
Ending Account Value 12/31/05 | $ 1,021.48 | | $ 1,019.96 | |
Expenses Paid per $1,000* | $ 3.77 | | $ 5.30 | |
* Expenses are equal to the Portfolio's annualized expense ratio for each share class, multiplied by the average account value over the period, multiplied by the number of days in the most recent six-month period, then divided by 365.
Annualized Expense Ratios | Class A | | Class B | |
DWS Variable Series I — DWS Bond VIP | .74% | | 1.04% | |
For more information, please refer to the Portfolio's prospectus.
These tables do not reflect charges and fees ("contract charges") associated with the separate account that invests in the Portfolio or any variable life insurance policy or variable annuity contract for which the Portfolio is an investment option.
Management Summary December 31, 2005
DWS Bond VIP
Despite several rounds of bond market speculation to the contrary, the Federal Open Market Committee has remained surprisingly consistent in their tightening regimen, raising rates 25 basis points at every meeting in 2005. The Fed target rate finished the year 2.00% higher at 4.25%. The Treasury market, for its part, has been less consistent with periods of rate volatility. Still, the flattening yield curve trend continued and intensified in 2005, even ending the year slightly inverted as measured by the 2- to 10-year Treasuries (-2 basis points). Against this backdrop, the Portfolio returned 2.60% (Class A shares, unadjusted for contract charges) for the year, outpacing the 2.43% return of its benchmark, the Lehman Brothers Aggregate Bond Index. Please see page 11 for standardized performance as of December 31, 2005.
Spread sector1 performance for the year was mixed. Credit,1 after outperforming treasuries1 every year since 2002, reversed course and underperformed by 85 basis points due largely to the meltdown in auto sector bonds.1 Our underweight strategy in autos, therefore, benefited performance, as did our holdings in insurance and utilities. Mortgage-backed securities1 also underperformed comparable treasuries. On balance, our MBS holdings detracted from returns, although our emphasis on more structured CMOs, which are less prepayment sensitive than the pass-throughs that comprise the index, fared better as volatility increased. The other high quality sectors, ABS and CMBS, delivered the best performance for the year, and our overweight to these sectors aided returns. Our allocations to plus sectors did not materially impact performance. Emerging debt, high yield and international bonds made modest contributions to performance, while currency detracted slightly.
The following members of the management team handle the day-to-day operations of the core bond and active fixed income portion of the portfolio: | | The following portfolio managers are responsible for the day-to-day management of the foreign securities, foreign currencies and related investments for the portfolio: |
Senior Portfolio Managers: | | Portfolio Managers: |
Gary W. Bartlett, CFA
Warren S. Davis, III
Thomas J. Flaherty
J. Christopher Gagnier
Daniel R. Taylor, CFA
Timothy C. Vile, CFA | | Brett Diment
Annette Fraser
Anthony Fletcher
Nik Hart
Stephen Ilott
William T. Lissenden
Ian Winship
Matthew Cobon |
The following portfolio manager handles the day-to-day management of the high yield portion of the portfolio.
Andrew P. Cestone
Co-Lead Portfolio Manager
All performance shown is historical, assumes reinvestment of all dividend and capital gain distributions, and does not guarantee future results. Investment return and principal value fluctuate with changing market conditions so that, when redeemed, shares may be worth more or less than their original cost. Current performance may be lower or higher than the performance data quoted. Please visit www.dws-scudder.com for the product's most recent month-end performance. Performance doesn't reflect charges and fees ("contract charges") associated with the separate account that invests in the Portfolio or any variable life insurance policy or variable annuity contract for which the Portfolio is an investment option. These charges and fees will reduce returns.
Risk Considerations
Investments by the Portfolio in lower-rated bonds present greater risk to principal and income than investments in higher-quality securities. This Portfolio invests in individual bonds whose yields and market values fluctuate so that your investment may be worth more or less than its original cost. Bond investments are subject to interest-rate risk such that when interest rates rise, the prices of the bonds, and thus the value of the investment fund, can decline and the investor can lose principal value. Additionally, investing in foreign securities presents certain unique risks not associated with domestic investments, such as currency fluctuation and changes in political/economic conditions and market risks. All of these factors may result in greater share price volatility. Please see this Portfolio's prospectus for specific details regarding its investments and risk profile.
1 As measured by the Lehman Brothers Aggregate Bond Index (defined below).
The Lehman Brothers Aggregate Bond (LBAB) Index is an unmanaged, market value-weighted measure of Treasury issues, agency issues, corporate bond issues and mortgage securities. Index returns assume the reinvestment of dividends and, unlike Portfolio returns, do not reflect any fees or expenses. It is not possible to invest directly into an index.
The yield curve is a graph with a left-to-right line that shows how high or low yields are, from the shortest to the longest maturities. Typically (and when the yield curve is characterized as "steep" this is especially true), the line rises from left to right as investors who are willing to tie up their money for a longer period of time are rewarded with higher yields.
Portfolio management market commentary is as of December 31, 2005, and may not come to pass. This information is subject to change at any time based on market and other conditions.
Portfolio Summary
DWS Bond VIP
Asset Allocation (Excludes Securities Lending Collateral) | 12/31/05 | 12/31/04 |
| | |
Commercial and Non-Agency Mortgage-Backed Securities | 19% | 8% |
US Treasury Obligations | 18% | 15% |
Corporate Bonds | 17% | 21% |
Collateralized Mortgage Obligations | 15% | 23% |
Foreign Bonds — US$ Denominated | 8% | 9% |
Asset Backed | 7% | 6% |
US Government Agency Sponsored Pass-Throughs | 7% | 6% |
Municipal Bonds and Notes | 5% | 4% |
Cash Equivalents | 3% | 2% |
Foreign Bonds — Non US$ Denominated | 1% | 5% |
Government National Mortgage Association | — | 1% |
| 100% | 100% |
Quality (Excludes Securities Lending Collateral) | 12/31/05 | 12/31/04 |
| | |
US Government & Treasury Obligations | 40% | 45% |
AAA* | 32% | 21% |
AA | 2% | 4% |
A | 7% | 9% |
BBB | 12% | 13% |
BB or Below | 7% | 8% |
| 100% | 100% |
Effective Maturity (Excludes Cash Equivalents and Securities Lending Collateral) | 12/31/05 | 12/31/04 |
| | |
Under 1 year | 10% | 7% |
1 - 4.99 years | 33% | 48% |
5 - 9.99 years | 39% | 24% |
10 - 14.99 years | 7% | 9% |
15 + years | 11% | 12% |
| 100% | 100% |
* Category includes cash equivalents
Asset allocation, quality and effective maturity are subject to change.
The quality ratings represent the lower of Moody's Investors Service, Inc. ("Moody's") or Standard & Poor's Corporation ("S&P") credit ratings. The ratings of Moody's and S&P represent their opinions as to the quality of the securities they rate. Ratings are relative and subjective and are not absolute standards of quality. The Portfolio's credit quality does not remove market risk.
For more complete details about the Portfolio's investment portfolio, see page 15. A quarterly Fact Sheet is available upon request. Information concerning portfolio holdings of the Portfolio as of month-end will be posted to www.dws-scudder.com on the 15th day of the following month.
Following the Portfolio's fiscal first and third quarter-end, a complete portfolio holdings listing is filed with the SEC on Form N-Q. The form will be available on the SEC's Web site at www.sec.gov, and it also may be reviewed and copied at the SEC's Public Reference Room in Washington, D.C. Information on the operation of the SEC's Public Reference Room may be obtained by calling (800) SEC-0330.
Investment Portfolio December 31, 2005
DWS Bond VIP
| Principal Amount ($)(a) | Value ($) |
| |
Corporate Bonds 17.0% |
Consumer Discretionary 2.9% |
155 East Tropicana LLC, 8.75%, 4/1/2012 (b) | 10,000 | 9,625 |
Adesa, Inc., 7.625%, 6/15/2012 | 15,000 | 14,925 |
Auburn Hills Trust, 12.375%, 5/1/2020 | 70,000 | 104,085 |
AutoNation, Inc., 9.0%, 8/1/2008 | 15,000 | 16,106 |
Aztar Corp., 7.875%, 6/15/2014 (b) | 25,000 | 26,188 |
Cablevision Systems Corp., Series B, 8.716%*, 4/1/2009 | 10,000 | 10,100 |
Caesars Entertainment, Inc.: | | |
7.875%, 3/15/2010 | 125,000 | 134,375 |
8.875%, 9/15/2008 | 10,000 | 10,813 |
9.375%, 2/15/2007 | 10,000 | 10,413 |
Comcast Cable Communications Holdings, Inc., 9.455%, 11/15/2022 | 92,000 | 120,538 |
Comcast MO of Delaware, Inc., 9.0%, 9/1/2008 | 400,000 | 437,026 |
Cooper-Standard Automotive, Inc., 8.375%, 12/15/2014 (b) | 30,000 | 22,800 |
CSC Holdings, Inc.: | | |
7.25%, 7/15/2008 | 20,000 | 19,950 |
7.875%, 12/15/2007 | 25,000 | 25,438 |
DaimlerChrysler NA Holding Corp.: | | |
4.75%, 1/15/2008 | 481,000 | 476,612 |
Series E, 4.78%*, 10/31/2008 (b) | 320,000 | 320,179 |
Dex Media East LLC/Financial, 12.125%, 11/15/2012 | 49,000 | 57,330 |
Dura Operating Corp., Series B, 8.625%, 4/15/2012 | 10,000 | 8,250 |
EchoStar DBS Corp., 6.625%, 10/1/2014 | 10,000 | 9,588 |
Foot Locker, Inc., 8.5%, 1/15/2022 | 30,000 | 31,725 |
Goodyear Tire & Rubber Co., 11.25%, 3/1/2011 | 25,000 | 28,000 |
GSC Holdings Corp., 144A, 8.0%, 10/1/2012 (b) | 20,000 | 18,800 |
Harrah's Operating Co., Inc., 5.75%, 10/1/2017 | 840,000 | 817,569 |
Hertz Corp., 144A, 8.875%, 1/1/2014 | 210,000 | 213,937 |
ITT Corp., 7.375%, 11/15/2015 | 10,000 | 10,850 |
Jacobs Entertainment, Inc., 11.875%, 2/1/2009 | 35,000 | 37,144 |
Mandalay Resort Group: | | |
6.5%, 7/31/2009 (b) | 94,000 | 95,057 |
Series B, 10.25%, 8/1/2007 | 15,000 | 15,994 |
Mediacom Broadband LLC, 144A, 8.5%, 10/15/2015 | 10,000 | 9,263 |
MGM MIRAGE: | | |
6.0%, 10/1/2009 | 195,000 | 193,781 |
6.625%, 7/15/2015 | 70,000 | 69,825 |
8.375%, 2/1/2011 (b) | 20,000 | 21,400 |
9.75%, 6/1/2007 | 15,000 | 15,806 |
MTR Gaming Group, Inc., Series B, 9.75%, 4/1/2010 | 20,000 | 21,350 |
NCL Corp., 10.625%, 7/15/2014 | 10,000 | 10,325 |
News America, Inc., 144A, 6.4%, 12/15/2035 | 410,000 | 413,254 |
| Principal Amount ($)(a) | Value ($) |
| |
Petro Stopping Centers, 9.0%, 2/15/2012 (b) | 15,000 | 15,075 |
Premier Entertainment Biloxi LLC/Finance, 10.75%, 2/1/2012 | 15,000 | 14,475 |
PRIMEDIA, Inc.: | | |
8.875%, 5/15/2011 | 10,000 | 9,225 |
9.715%*, 5/15/2010 | 20,000 | 19,225 |
Resorts International Hotel & Casino, Inc., 11.5%, 3/15/2009 | 40,000 | 44,300 |
Schuler Homes, Inc., 10.5%, 7/15/2011 | 45,000 | 48,375 |
Sinclair Broadcast Group, Inc., 8.75%, 12/15/2011 | 35,000 | 36,837 |
TCI Communications, Inc., 8.75%, 8/1/2015 | 608,000 | 736,710 |
Tele-Communications, Inc., 10.125%, 4/15/2022 | 168,000 | 229,838 |
Time Warner, Inc.: | | |
6.625%, 5/15/2029 | 105,000 | 104,852 |
7.625%, 4/15/2031 | 845,000 | 941,033 |
TRW Automotive, Inc., 11.0%, 2/15/2013 | 25,000 | 28,062 |
United Auto Group, Inc., 9.625%, 3/15/2012 | 20,000 | 21,050 |
| 6,107,478 |
Consumer Staples 0.1% |
Alliance One International, Inc., 144A, 11.0%, 5/15/2012 | 15,000 | 13,200 |
Delhaize America, Inc.: | | |
8.05%, 4/15/2027 | 10,000 | 10,260 |
9.0%, 4/15/2031 | 10,000 | 11,756 |
Harry & David Holdings, Inc., 9.41%*, 3/1/2012 | 10,000 | 10,075 |
Swift & Co.: | | |
10.125%, 10/1/2009 | 10,000 | 10,325 |
12.5%, 1/1/2010 | 15,000 | 15,788 |
Viskase Co., Inc., 11.5%, 6/15/2011 | 30,000 | 31,950 |
| 103,354 |
Energy 1.5% |
Chaparral Energy, Inc., 144A, 8.5%, 12/1/2015 | 20,000 | 20,700 |
Chesapeake Energy Corp.: | | |
6.375%, 6/15/2015 | 180,000 | 180,000 |
6.625%, 1/15/2016 | 115,000 | 116,437 |
6.875%, 1/15/2016 | 20,000 | 20,500 |
Dynegy Holdings, Inc., 144A, 9.875%, 7/15/2010 | 55,000 | 60,294 |
El Paso Production Holding Corp., 7.75%, 6/1/2013 | 15,000 | 15,563 |
Energy Transfer Partners LP: | | |
144A, 5.65%, 8/1/2012 | 230,000 | 227,364 |
5.95%, 2/1/2015 | 180,000 | 179,367 |
Enterprise Products Operating LP: | | |
Series B, 5.0%, 3/1/2015 | 125,000 | 119,073 |
7.5%, 2/1/2011 | 347,000 | 377,510 |
Frontier Oil Corp., 6.625%, 10/1/2011 | 10,000 | 10,200 |
Newpark Resources, Inc., Series B, 8.625%, 12/15/2007 | 15,000 | 15,000 |
Sempra Energy, 4.621%, 5/17/2007 | 760,000 | 754,614 |
| Principal Amount ($)(a) | Value ($) |
| |
Southern Natural Gas, 8.875%, 3/15/2010 | 20,000 | 21,374 |
Stone Energy Corp.: | | |
6.75%, 12/15/2014 | 35,000 | 33,162 |
8.25%, 12/15/2011 | 20,000 | 20,650 |
Tri-State Generation & Transmission Association, 144A, 6.04%, 1/31/2018 | 880,000 | 906,039 |
Williams Companies, Inc.: | | |
8.125%, 3/15/2012 | 65,000 | 70,850 |
8.75%, 3/15/2032 | 15,000 | 17,400 |
| 3,166,097 |
Financials 7.2% |
American General Finance Corp.: | | |
2.75%, 6/15/2008 | 1,145,000 | 1,084,017 |
Series I, 4.875%, 5/15/2010 | 105,000 | 104,098 |
AmeriCredit Corp., 9.25%, 5/1/2009 | 35,000 | 36,838 |
Ashton Woods USA LLC, 144A, 9.5%, 10/1/2015 | 20,000 | 18,025 |
ASIF Global Finance XVIII, 144A, 3.85%, 11/26/2007 | 1,101,000 | 1,079,739 |
Downey Financial Corp., 6.5%, 7/1/2014 | 365,000 | 366,170 |
Duke Capital LLC, 4.302%, 5/18/2006 | 237,000 | 236,436 |
E*TRADE Financial Corp.: | | |
144A, 7.375%, 9/15/2013 (b) | 10,000 | 10,125 |
8.0%, 6/15/2011 | 30,000 | 31,200 |
Erac USA Finance Co.: | | |
144A, 5.6%, 5/1/2015 | 455,000 | 453,111 |
144A, 8.0%, 1/15/2011 | 330,000 | 368,688 |
ERP Operating LP, 6.95%, 3/2/2011 | 305,000 | 327,354 |
Farmers Exchange Capital, 144A, 7.2%, 7/15/2048 | 385,000 | 400,753 |
Ford Motor Credit Co.: | | |
6.5%, 1/25/2007 | 942,000 | 911,357 |
6.875%, 2/1/2006 | 1,561,000 | 1,557,644 |
7.25%, 10/25/2011 | 55,000 | 47,512 |
7.375%, 10/28/2009 | 50,000 | 44,344 |
General Motors Acceptance Corp.: | | |
4.375%, 12/10/2007 | 98,000 | 87,083 |
5.22%*, 3/20/2007 | 15,000 | 14,168 |
6.125%, 9/15/2006 (b) | 100,000 | 97,136 |
6.125%, 2/1/2007 | 757,000 | 722,668 |
6.125%, 8/28/2007 | 985,000 | 913,072 |
6.15%, 4/5/2007 | 95,000 | 89,732 |
6.875%, 9/15/2011 | 25,000 | 22,799 |
8.0%, 11/1/2031 (b) | 130,000 | 124,525 |
H&E Equipment/Finance, 11.125%, 6/15/2012 | 15,000 | 16,575 |
HSBC Bank USA, 5.625%, 8/15/2035 | 306,000 | 299,292 |
HSBC Finance Capital Trust IX, 5.911%, 11/30/2035 | 600,000 | 605,104 |
ILFC E-Capital Trust I, 144A, 5.9%, 12/21/2065 | 1,085,000 | 1,089,263 |
JPMorgan Chase Capital XV, 5.875%, 3/15/2035 | 45,000 | 44,740 |
JPMorgan Chase XVII, 5.85%, 8/1/2035 (b) | 60,000 | 59,364 |
Merrill Lynch & Co., Inc., Series C, 4.79%, 8/4/2010 | 317,000 | 313,434 |
NLV Financial Corp., 144A, 6.5%, 3/15/2035 | 734,000 | 709,913 |
| Principal Amount ($)(a) | Value ($) |
| |
Ohio Casualty Corp., 7.3%, 6/15/2014 | 125,000 | 134,352 |
Pennsylvania Mutual Life Insurance Co., 144A, 6.65%, 6/15/2034 | 505,000 | 564,406 |
Poster Financial Group, Inc., 8.75%, 12/1/2011 | 20,000 | 20,600 |
PXRE Capital Trust I, 8.85%, 2/1/2027 | 30,000 | 29,475 |
R.H. Donnelly Finance Corp., 10.875%, 12/15/2012 | 40,000 | 45,100 |
Reinsurance Group of America, Inc., 6.75%, 12/15/2065 | 440,000 | 443,904 |
Simon Property Group LP, 144A, 5.75%, 12/1/2015 | 225,000 | 228,321 |
TIG Capital Holdings Trust, 144A, 8.597%, 1/15/2027 | 30,000 | 23,850 |
Triad Acquisition Corp., 144A, 11.125%, 5/1/2013 | 10,000 | 9,900 |
UGS Corp., 10.0%, 6/1/2012 | 15,000 | 16,350 |
Universal City Development, 11.75%, 4/1/2010 | 25,000 | 28,031 |
Verizon Global Funding Corp., 7.75%, 12/1/2030 | 180,000 | 213,958 |
ZFS Finance USA Trust I: | | |
144A, 6.15%, 12/15/2065 | 500,000 | 503,634 |
144A, 6.45%, 12/15/2065 | 500,000 | 506,950 |
| 15,055,110 |
Health Care 0.0% |
HEALTHSOUTH Corp., 10.75%, 10/1/2008 (b) | 30,000 | 30,000 |
Tenet Healthcare Corp., 144A, 9.25%, 2/1/2015 | 25,000 | 24,812 |
| 54,812 |
Industrials 2.1% |
Allied Waste North America, Inc., Series B, 9.25%, 9/1/2012 | 25,000 | 27,063 |
America West Airlines, Inc., Series 99-1, 7.93%, 1/2/2019 | 252,105 | 269,324 |
BAE System 2001 Asset Trust, "B", Series 2001, 144A, 7.156%, 12/15/2011 | 367,547 | 385,117 |
Beazer Homes USA, Inc.: | | |
8.375%, 4/15/2012 | 40,000 | 41,600 |
8.625%, 5/15/2011 | 15,000 | 15,675 |
Browning-Ferris Industries: | | |
7.4%, 9/15/2035 | 25,000 | 22,125 |
9.25%, 5/1/2021 | 10,000 | 10,300 |
Case New Holland, Inc., 9.25%, 8/1/2011 | 25,000 | 26,750 |
Centex Corp., 5.45%, 8/15/2012 | 655,000 | 643,836 |
Cenveo Corp., 7.875%, 12/1/2013 | 15,000 | 14,475 |
Collins & Aikman Floor Cover, Series B, 9.75%, 2/15/2010 (b) | 10,000 | 8,800 |
Columbus McKinnon Corp., 10.0%, 8/1/2010 | 7,000 | 7,753 |
Compression Polymers Corp.: | | |
144A, 10.5%, 7/1/2013 | 25,000 | 24,250 |
144A, 11.46%*, 7/1/2012 | 15,000 | 14,700 |
D.R. Horton, Inc., 5.375%, 6/15/2012 | 995,000 | 961,817 |
Dana Corp., 7.0%, 3/1/2029 (b) | 20,000 | 14,350 |
DRS Technologies, Inc., 6.875%, 11/1/2013 | 10,000 | 9,563 |
ISP Chemco, Inc., Series B, 10.25%, 7/1/2011 | 25,000 | 26,625 |
| Principal Amount ($)(a) | Value ($) |
| |
K. Hovnanian Enterprises, Inc.: | | |
6.25%, 1/15/2015 | 345,000 | 324,682 |
6.25%, 1/15/2016 | 25,000 | 23,196 |
8.875%, 4/1/2012 | 20,000 | 20,782 |
Kansas City Southern, 9.5%, 10/1/2008 | 35,000 | 37,887 |
Millennium America, Inc., 9.25%, 6/15/2008 | 30,000 | 32,362 |
Northwest Airlines Corp., Series 02-1, 6.264%, 11/20/2021 | 1,196,370 | 1,217,677 |
Securus Technologies, Inc., 11.0%, 9/1/2011 (b) | 20,000 | 17,000 |
Ship Finance International Ltd., 8.5%, 12/15/2013 | 15,000 | 14,025 |
Standard Pacific Corp., 6.5%, 8/15/2010 | 130,000 | 123,987 |
Technical Olympic USA, Inc.: | | |
7.5%, 3/15/2011 (b) | 20,000 | 17,825 |
10.375%, 7/1/2012 | 15,000 | 14,756 |
The Brickman Group Ltd., Series B, 11.75%, 12/15/2009 | 10,000 | 11,075 |
United Rentals North America, Inc., 7.0%, 2/15/2014 | 15,000 | 14,025 |
Xerox Capital Trust I, 8.0%, 2/1/2027 | 15,000 | 15,450 |
| 4,408,852 |
Information Technology 0.2% |
Activant Solutions, Inc.: | | |
10.5%, 6/15/2011 | 15,000 | 16,425 |
144A, 10.054%*, 4/1/2010 | 15,000 | 15,469 |
L-3 Communications Corp.: | | |
5.875%, 1/15/2015 | 70,000 | 67,900 |
144A, 6.375%, 10/15/2015 | 10,000 | 9,975 |
7.625%, 6/15/2012 | 145,000 | 152,612 |
Lucent Technologies, Inc., 6.45%, 3/15/2029 | 35,000 | 30,013 |
Sanmina-SCI Corp.: | | |
6.75%, 3/1/2013 (b) | 25,000 | 23,781 |
10.375%, 1/15/2010 | 28,000 | 30,940 |
| 347,115 |
Materials 0.5% |
ARCO Chemical Co., 9.8%, 2/1/2020 | 45,000 | 50,512 |
Caraustar Industries, Inc., 9.875%, 4/1/2011 (b) | 20,000 | 20,400 |
Dayton Superior Corp., 10.75%, 9/15/2008 | 20,000 | 19,300 |
GEO Specialty Chemicals, Inc., 12.565%*, 12/31/2009 | 48,000 | 39,840 |
Georgia-Pacific Corp.: | | |
8.0%, 1/15/2024 (b) | 25,000 | 23,875 |
8.875%, 5/15/2031 | 435,000 | 436,087 |
Huntsman LLC, 11.625%, 10/15/2010 | 21,000 | 23,914 |
IMC Global, Inc., 10.875%, 8/1/2013 | 30,000 | 34,462 |
International Steel Group, Inc., 6.5%, 4/15/2014 | 15,000 | 15,000 |
Massey Energy Co.: | | |
6.625%, 11/15/2010 | 10,000 | 10,163 |
144A, 6.875%, 12/15/2013 | 10,000 | 10,088 |
Omnova Solutions, Inc., 11.25%, 6/1/2010 | 50,000 | 52,125 |
Oregon Steel Mills, Inc., 10.0%, 7/15/2009 | 20,000 | 21,400 |
| Principal Amount ($)(a) | Value ($) |
| |
Pliant Corp., 11.625%, 6/15/2009 (PIK) | 7 | 7 |
Rockwood Specialties Group, Inc., 10.625%, 5/15/2011 | 11,000 | 12,059 |
TriMas Corp., 9.875%, 6/15/2012 | 20,000 | 16,500 |
UAP Holding Corp., Step-up Coupon, 0% to 1/15/2008, 10.75% to 7/15/2012 | 10,000 | 8,663 |
United States Steel Corp., 9.75%, 5/15/2010 | 20,000 | 21,750 |
Weyerhaeuser Co.: | | |
7.125%, 7/15/2023 | 100,000 | 105,724 |
7.375%, 3/15/2032 | 76,000 | 84,490 |
| 1,006,359 |
Telecommunication Services 0.5% |
AirGate PCS, Inc., 7.9%*, 10/15/2011 | 25,000 | 25,813 |
Anixter International, Inc., 5.95%, 3/1/2015 | 153,000 | 138,454 |
Bell Atlantic New Jersey, Inc., Series A, 5.875%, 1/17/2012 | 620,000 | 625,584 |
Cincinnati Bell, Inc.: | | |
7.25%, 7/15/2013 | 15,000 | 15,600 |
8.375%, 1/15/2014 (b) | 15,000 | 14,756 |
Insight Midwest LP, 9.75%, 10/1/2009 | 25,000 | 25,750 |
LCI International, Inc., 7.25%, 6/15/2007 | 15,000 | 15,075 |
MCI, Inc., 8.735%, 5/1/2014 | 50,000 | 55,312 |
Nextel Communications, Inc., Series D, 7.375%, 8/1/2015 | 60,000 | 63,319 |
Nextel Partners, Inc., 8.125%, 7/1/2011 | 30,000 | 32,063 |
Qwest Corp.: | | |
7.25%, 9/15/2025 | 25,000 | 24,875 |
144A, 7.741%*, 6/15/2013 | 15,000 | 16,181 |
SBA Telecom, Inc., Step-up Coupon, 0% to 12/15/2007, 9.75% to 12/15/2011 | 10,000 | 9,275 |
| 1,062,057 |
Utilities 2.0% |
AES Corp., 144A, 8.75%, 5/15/2013 | 35,000 | 38,106 |
Allegheny Energy Supply Co. LLC, 144A, 8.25%, 4/15/2012 | 35,000 | 39,462 |
CC Funding Trust I, 6.9%, 2/16/2007 | 758,000 | 772,580 |
CMS Energy Corp.: | | |
8.5%, 4/15/2011 | 20,000 | 21,775 |
9.875%, 10/15/2007 | 25,000 | 26,750 |
Consumers Energy Co., Series F, 4.0%, 5/15/2010 | 980,000 | 930,661 |
DPL, Inc., 6.875%, 9/1/2011 | 22,000 | 23,183 |
Entergy Louisiana, Inc., 6.3%, 9/1/2035 | 180,000 | 176,219 |
NorthWestern Corp., 5.875%, 11/1/2014 | 10,000 | 10,019 |
NRG Energy, Inc., 8.0%, 12/15/2013 | 30,000 | 33,450 |
Progress Energy, Inc., 6.75%, 3/1/2006 | 1,400,000 | 1,404,396 |
PSE&G Energy Holdings LLC, 10.0%, 10/1/2009 | 45,000 | 49,500 |
TXU Corp., Series 0, 4.8%, 11/15/2009 | 498,000 | 479,012 |
| Principal Amount ($)(a) | Value ($) |
| |
TXU Energy Co., 7.0%, 3/15/2013 | 235,000 | 250,431 |
| 4,255,544 |
Total Corporate Bonds (Cost $36,248,086) | 35,566,778 |
|
Foreign Bonds — US$ Denominated 7.5% |
Consumer Discretionary 0.2% |
Jafra Cosmetics International, Inc., 10.75%, 5/15/2011 | 24,000 | 26,280 |
Royal Caribbean Cruises Ltd., 8.75%, 2/2/2011 | 350,000 | 395,500 |
Shaw Communications, Inc., 8.25%, 4/11/2010 | 15,000 | 16,106 |
| 437,886 |
Energy 0.0% |
Secunda International Ltd., 12.15%*, 9/1/2012 | 15,000 | 15,750 |
Financials 2.6% |
Banco Do Estado De Sao Paulo, 144A, 8.7%, 9/20/2049 | 135,000 | 139,050 |
BNP Paribas SA, 144A, 5.186%, 6/29/2049 | 40,000 | 38,805 |
Chuo Mitsui Trust & Banking Co., Ltd, 144A, 5.506%, 12/29/2049 | 670,000 | 649,238 |
DBS Capital Funding Corp., 144A, 7.657%, 3/31/2049 | 181,000 | 200,268 |
Doral Financial Corp., 5.004%*, 7/20/2007 | 30,000 | 29,161 |
Mantis Reef Ltd., 144A, 4.692%, 11/14/2008 | 1,330,000 | 1,306,762 |
Mizuho Financial Group, (Cayman), 8.375%, 12/29/2049 | 1,320,000 | 1,430,220 |
Nordea Bank AB, 144A, 5.424%, 12/29/2049 | 505,000 | 500,595 |
Royal Bank of Scotland Group PLC, Series 1, 9.118%, 3/31/2049 | 364,000 | 416,999 |
SPI Electricity & Gas Australia Holdings Property Ltd., 144A, 6.15%, 11/15/2013 | 635,000 | 677,860 |
| 5,388,958 |
Health Care 0.0% |
Biovail Corp., 7.875%, 4/1/2010 (b) | 20,000 | 20,725 |
Industrials 1.0% |
Grupo Transportacion Ferroviaria Mexicana SA de CV: | | |
144A, 9.375%, 5/1/2012 | 15,000 | 16,425 |
10.25%, 6/15/2007 | 40,000 | 42,200 |
12.5%, 6/15/2012 | 30,000 | 34,200 |
LeGrand SA, 8.5%, 2/15/2025 | 25,000 | 30,062 |
Stena AB, 9.625%, 12/1/2012 | 10,000 | 10,863 |
Tyco International Group SA: | | |
6.375%, 10/15/2011 | 960,000 | 997,051 |
6.75%, 2/15/2011 | 996,000 | 1,047,183 |
7.0%, 6/15/2028 | 36,000 | 39,603 |
| 2,217,587 |
Materials 1.0% |
Alcan, Inc., 5.75%, 6/1/2035 | 79,000 | 76,920 |
Cascades, Inc., 7.25%, 2/15/2013 | 30,000 | 27,300 |
Celulosa Arauco y Constitucion SA, 5.625%, 4/20/2015 | 385,000 | 382,191 |
ISPAT Inland ULC, 9.75%, 4/1/2014 | 21,000 | 23,783 |
Novelis, Inc.: | | |
144A, 7.5%, 2/15/2015 | 35,000 | 32,638 |
| Principal Amount ($)(a) | Value ($) |
| |
Series WI, 7.5%, 2/15/2015 | 10,000 | 9,325 |
Sino-Forest Corp., 144A, 9.125%, 8/17/2011 | 10,000 | 10,725 |
Sociedad Concesionaria Autopista Central, 144A, 6.223%, 12/15/2026 | 1,365,000 | 1,433,018 |
Tembec Industries, Inc.: | | |
8.5%, 2/1/2011 | 25,000 | 13,875 |
8.625%, 6/30/2009 | 30,000 | 17,100 |
Vale Overseas Ltd., 8.25%, 1/17/2034 | 146,000 | 168,082 |
| 2,194,957 |
Sovereign Bonds 1.3% |
Aries Vermogensverwaltung GmbH, Series C, Series REG S, 9.6%, 10/25/2014 | 250,000 | 322,372 |
Government of Ukraine, Series REG S, 7.65%, 6/11/2013 | 100,000 | 107,910 |
Republic of Argentina: | | |
Zero Coupon, 12/15/2035 | 536,083 | 27,876 |
Step-up Coupon, 1.33% to 3/31/2009, 2.5% to 3/31/2019, 3.75% to 3/31/2029, 5.25% to 12/31/2038 | 180,000 | 59,400 |
8.28%, 12/31/2033 (PIK) | 127,926 | 106,499 |
Republic of Bulgaria, 8.25%, 1/15/2015 | 640,000 | 772,864 |
Republic of Ecuador, Series REG S, 9.375%, 12/15/2015 | 100,000 | 93,250 |
Republic of Philippines: | | |
9.375%, 1/18/2017 | 70,000 | 80,150 |
10.625%, 3/16/2025 | 60,000 | 76,200 |
Republic of Turkey, 7.25%, 3/15/2015 (b) | 15,000 | 15,788 |
Republic of Venezuela: | | |
7.65%, 4/21/2025 | 90,000 | 91,913 |
10.75%, 9/19/2013 | 60,000 | 73,800 |
Russian Federation, Step-up Coupon, 5.0% to 3/31/2007, 7.5% to 3/31/2030 | 150,000 | 169,335 |
Russian Ministry of Finance, Series V, 3.0%, 5/14/2008 | 300,000 | 284,520 |
State of Qatar, Series REG S, 9.75%, 6/15/2030 | 260,000 | 396,578 |
United Mexican States, 8.375%, 1/14/2011 | 40,000 | 45,600 |
| 2,724,055 |
Telecommunication Services 1.0% |
British Telecommunications PLC, 8.875%, 12/15/2030 | 540,000 | 722,489 |
Embratel, Series B, 11.0%, 12/15/2008 | 10,000 | 11,325 |
Intelsat Bermuda Ltd., 144A, 8.695%*, 1/15/2012 | 10,000 | 10,162 |
Mobifon Holdings BV, 12.5%, 7/31/2010 | 60,000 | 69,600 |
Nortel Networks Ltd., 6.125%, 2/15/2006 | 60,000 | 60,000 |
Telecom Italia Capital: | | |
4.0%, 1/15/2010 | 175,000 | 166,678 |
4.95%, 9/30/2014 | 370,000 | 353,383 |
5.25%, 11/15/2013 | 445,000 | 436,667 |
Telefonos de Mexico SA de CV, 4.75%, 1/27/2010 | 235,000 | 230,864 |
| 2,061,168 |
| Principal Amount ($)(a) | Value ($) |
| |
Utilities 0.4% |
Scottish Power PLC, 5.81%, 3/15/2025 | 745,000 | 755,636 |
Total Foreign Bonds — US$ Denominated (Cost $15,655,489) | 15,816,722 |
|
Foreign Bonds — Non-US$ Denominated 1.4% |
Financials 0.1% |
European Investment Bank, 10.0%, 1/28/2011 TRY | 210,000 | 155,265 |
Sovereign Bonds 1.3% |
Government of Malaysia, 4.305%, 2/27/2009 MYR | 3,901,208 | 1,053,763 |
Mexican Bonds: | | |
Series MI-10, 8.0%,
12/19/2013 MXN | 10,412,600 | 965,510 |
Series M-20, 8.0%,
12/7/2023 MXN | 4,510,000 | 399,103 |
Series MI-10, 9.5%,
12/18/2014 MXN | 1,000,000 | 101,208 |
Republic of Argentina: | | |
Zero Coupon, 12/15/2035 ARS | 1,246,291 | 19,898 |
5.83%, 12/31/2033 (PIK) ARS | 420,000 | 162,375 |
Republic of Uruguay, 17.75%, 2/4/2006 UYU | 6,500,000 | 127,276 |
| 2,829,133 |
Total Foreign Bonds — Non-US$ Denominated (Cost $2,758,368) | 2,984,398 |
|
Asset Backed 6.9% |
Automobile Receivables 0.8% |
Drive Auto Receivables Trust, "A2", Series 2005-2, 144A, 4.12%, 1/15/2010 | 460,000 | 454,563 |
MMCA Automobile Trust: | | |
"A4", Series 2002-3, 3.57%, 8/17/2009 | 101,032 | 100,771 |
"A4", Series 2002-2, 4.3%, 3/15/2010 | 639,371 | 637,499 |
"B", Series 2002-1, 5.37%, 1/15/2010 | 236,900 | 236,270 |
Onyx Acceptance Owner Trust, "A3", Series 2003-D, 2.4%, 12/15/2007 | 292,011 | 291,240 |
| 1,720,343 |
Home Equity Loans 6.0% |
Aegis Asset Backed Securities Trust, "N1", Series 2005-5N, 144A, 4.5%, 12/25/2023 | 699,180 | 693,499 |
Bear Stearns Asset Backed Securities NIM, "A1", Series 2005-HE2N, 144A, 5.0%, 2/25/2035 | 206,138 | 205,719 |
Credit-Based Asset Servicing and Securities, "AV2", Series 2005-CB5, 4.639%*, 8/25/2035 | 788,000 | 787,991 |
First Franklin Mortgage Loan NIM, "N4", Series 2004-FFH2, 144A, 5.926%, 8/25/2034 | 750,000 | 755,625 |
Merrill Lynch Mortgage Investors, Inc., "A1A", Series 2005-NCB, 5.451%, 7/25/2036 | 756,376 | 756,035 |
| Principal Amount ($)(a) | Value ($) |
| |
New Century Home Equity Loan Trust, "A2", Series 2005-A, 4.461%, 8/25/2035 | 1,120,000 | 1,106,537 |
Park Place Securities NIM Trust, "A", Series 2004-WHQ2, 144A, 4.0%, 2/25/2035 | 137,266 | 136,908 |
Popular ABS Mortgage Pass-Through Trust, "A1", Series 2005-6, 5.5%, 1/25/2036 | 1,877,000 | 1,877,000 |
Renaissance Home Equity Loan Trust: | | |
"AF3", Series 2004-2, 4.464%, 7/25/2034 | 820,000 | 811,926 |
"AF6", Series 2005-2, 4.781%, 8/25/2035 | 147,000 | 140,992 |
Renaissance NIM Trust: | | |
"NOTE", Series 2004-C, 144A, 4.458%, 12/25/2034 | 163,380 | 162,870 |
"NOTE", Series 2004-D, 144A, 4.459%, 2/25/2035 | 724,847 | 721,527 |
Residential Asset Mortgage Products, Inc.: | | |
"A3", Series 2003-RZ4, 3.38%, 2/25/2030 | 784,602 | 779,367 |
"AI3", Series 2004-RS4, 4.003%, 1/25/2030 | 1,032,243 | 1,025,987 |
Residential Asset Securities Corp., "AI6", Series 2000-KS1, 7.905%, 2/25/2031 | 1,003,029 | 1,007,635 |
Terwin Mortgage Trust, "AF2", Series 2005-14HE, 4.85%, 8/25/2036 | 1,525,000 | 1,510,227 |
| 12,479,845 |
Industrials 0.1% |
Northwest Airlines, Inc., "G", Series 1999-3, 7.935%, 4/1/2019 | 155,272 | 157,087 |
Total Asset Backed (Cost $14,526,792) | 14,357,275 |
|
Convertible Bond 0.0% |
Consumer Discretionary |
HIH Capital Ltd., 144A, Series DOM, 7.5%, 9/25/2006 (Cost $9,969) | 10,000 | 9,900 |
|
US Government Agency Sponsored Pass-Throughs 6.9% |
Federal Home Loan Mortgage Corp.: | | |
5.0%, 2/1/2034 (g) | 995,000 | 962,973 |
5.5%, with various maturities from 11/15/2016 until 8/1/2024 | 2,321,398 | 2,334,721 |
Federal National Mortgage Association: | | |
4.5%, with various maturities from 7/1/2018 until 6/1/2034 (g) | 2,387,617 | 2,270,961 |
5.0%, with various maturities from 3/1/2025 until 5/1/2034 | 2,679,623 | 2,612,887 |
5.5%, with various maturities from 7/1/2023 until 3/1/2035 | 2,060,171 | 2,052,728 |
6.0%, with various maturities from 3/1/2025 until 10/1/2035 | 1,759,715 | 1,772,525 |
6.31%, 6/1/2008 | 1,700,000 | 1,734,235 |
6.5%, with various maturities from 3/1/2017 until 6/1/2017 | 528,203 | 542,693 |
| Principal Amount ($)(a) | Value ($) |
| |
8.0%, 9/1/2015 | 61,899 | 66,101 |
Total US Government Agency Sponsored Pass-Throughs (Cost $14,508,233) | 14,349,824 |
|
Commercial and Non-Agency Mortgage-Backed Securities 19.2% |
Adjustable Rate Mortgage Trust, "3A31", Series 2005-10, 5.437%, 1/25/2036 | 820,000 | 814,625 |
American Home Mortgage Investment Trust, "5A3", Series 2005-2, 5.077%, 9/25/2035 | 1,050,000 | 1,034,958 |
Banc of America Mortgage Securities: | | |
"2A6", Series 2004-F, 4.156%*, 7/25/2034 | 1,180,000 | 1,155,868 |
"2A8", Series 2003-J, 4.209%*, 11/25/2033 | 820,000 | 805,156 |
"2A6", Series 2004-G, 4.657%*, 8/25/2034 | 825,000 | 816,089 |
Bear Stearns Adjustable Rate Mortgage Trust, "2A3", Series 2005-4, 4.45%*, 8/25/2035 | 580,000 | 563,281 |
Chase Commercial Mortgage Securities Corp., "A2", Series 1996-2, 6.9%, 11/19/2028 | 300,393 | 299,905 |
Citigroup Mortgage Loan Trust, Inc.: | | |
"1A3", Series 2004-NCM1, 6.75%, 7/25/2034 | 441,032 | 452,057 |
"1CB2", Series 2004-NCM2, 6.75%, 8/25/2034 | 955,864 | 984,241 |
Commercial Mortgage Asset Trust, "A2", Series 1999-C1, 6.585%, 1/17/2032 | 796,266 | 804,882 |
Countrywide Alternative Loan Trust: | | |
"1A1", Series 2004-2CB, 4.25%, 3/25/2034 | 700,170 | 691,431 |
"A1", Series 2004-1T1, 5.0%, 2/25/2034 | 774,775 | 766,830 |
"A2", Series 2002-18, 5.25%, 2/25/2033 | 1,209,097 | 1,205,196 |
"A2", Series 2003-21T1, 5.25%, 12/25/2033 | 910,627 | 907,983 |
"A2", Series 2004-1T1, 5.5%, 2/25/2034 | 514,557 | 514,090 |
"4A3", Series 2005-43, 5.763%, 10/25/2035 | 702,387 | 703,050 |
"A1", Series 2004-35T2, 6.0%, 2/25/2035 | 869,910 | 872,271 |
CS First Boston Mortgage Securities Corp.: | | |
"AMFX", Series 2005-C2, 4.877%, 4/15/2037 | 840,000 | 818,615 |
"AM", Series 2005-C5, 5.1%, 8/15/2038 | 1,154,000 | 1,143,103 |
GMAC Commercial Mortgage Securities, Inc., "A3", Series 1997-C1, 6.869%, 7/15/2029 | 442,670 | 452,475 |
GMAC Mortgage Corp. Loan Trust, "A2", Series 2003-GH2, 3.69%, 7/25/2020 | 405,939 | 403,881 |
Greenwich Capital Commercial Funding Corp., "AM", Series 2005-GG5, 5.277%, 4/10/2037 | 840,000 | 844,448 |
GS Mortgage Securities Corp. II, "AJ", Series 2005-GG4, 4.782%, 7/10/2039 | 1,501,000 | 1,443,927 |
| Principal Amount ($)(a) | Value ($) |
| |
GSR Mortgage Loan Trust, "4A5", Series 2005-AR6, 4.556%*, 9/25/2035 | 845,000 | 824,482 |
Harborview Mortgage Loan Trust, "3A1B", Series 2004-10, 5.097%, 1/19/2035 | 521,912 | 522,205 |
JPMorgan Chase Commercial Mortgage Securities, "B", Series 2005-CB12, 5.014%, 9/12/2037 | 835,000 | 817,654 |
JPMorgan Mortgage Trust, "2A1", Series 2005-A8, 4.969%, 11/25/2035 | 758,479 | 752,810 |
Master Alternative Loans Trust: | | |
"5A1", Series 2005-1, 5.5%, 1/25/2020 | 1,180,188 | 1,182,299 |
"3A1", Series 2004-5, 6.5%, 6/25/2034 | 109,198 | 111,109 |
"5A1", Series 2005-2, 6.5%, 12/25/2034 | 231,355 | 233,253 |
"8A1", Series 2004-3, 7.0%, 4/25/2034 | 134,538 | 135,689 |
Master Asset Securitization Trust: | | |
"8A1", Series 2003-6, 5.5%, 7/25/2033 | 645,411 | 634,520 |
"2A7", Series 2003-9, 5.5%, 10/25/2033 | 647,951 | 641,052 |
RAAC Series, "2A5", Series 2005-SP1, 5.25%, 9/25/2034 | 1,150,000 | 1,149,007 |
Residential Accredit Loans, Inc., "CB", Series 2004-QS2, 5.75%, 2/25/2034 | 838,429 | 832,927 |
Residential Asset Securitization Trust, "A1", Series 2003-A11, 4.25%, 11/25/2033 | 36,650 | 36,542 |
Structured Adjustable Rate Mortgage Loan: | | |
"6A3", Series 2005-21, 5.4%, 11/25/2035 | 740,000 | 735,149 |
"5A1", Series 2005-18, 5.608%*, 9/25/2035 | 770,569 | 773,314 |
"1A1", Series 2005-17, 5.729%, 8/25/2035 | 1,379,073 | 1,383,235 |
Structured Asset Securities Corp., "2A1", Series 2003-1, 6.0%, 2/25/2018 | 16,053 | 16,197 |
Wachovia Bank Commercial Mortgage Trust: | | |
"AMFX", Series 2005-C20, 5.179%, 7/15/2042 | 1,550,000 | 1,540,295 |
"A4", Series 2005-C21, 5.195%, 10/15/2044 | 1,220,000 | 1,230,064 |
Washington Mutual: | | |
"A6", Series 2004-AR7, 3.946%*, 7/25/2034 | 740,000 | 715,858 |
"A6", Series 2003-AR11, 3.985%, 10/25/2033 | 740,000 | 718,591 |
"A6", Series 2003-AR10, 4.067%*, 10/25/2033 | 1,130,000 | 1,104,317 |
"A7", Series 2004-AR9, 4.181%*, 8/25/2034 | 737,000 | 721,855 |
"2A1", Series 2002-S8, 4.5%, 1/25/2018 | 209,967 | 208,710 |
"A1", Series 2005-AR3, 4.65%, 3/25/2035 | 617,552 | 608,058 |
"1A6", Series 2005-AR12, 4.844%, 10/25/2035 | 1,540,000 | 1,515,266 |
"1A1", Series 2005-AR14, 5.082%, 12/25/2035 | 790,485 | 785,556 |
"1A3", Series 2005-AR16, 5.132%, 12/25/2035 | 825,000 | 814,358 |
| Principal Amount ($)(a) | Value ($) |
| |
Wells Fargo Mortgage Backed Securities Trust: | | |
"2A17", Series 2005-AR10, 3.5%*, 6/25/2035 | 190,000 | 182,873 |
"B1", Series 2005-AR12, 4.326%*, 7/25/2035 | 768,185 | 738,832 |
Total Commercial and Non-Agency Mortgage-Backed Securities (Cost $40,593,836) | 40,164,439 |
|
Collateralized Mortgage Obligations 14.9% |
Fannie Mae Whole Loan: | | |
"2A3", Series 2003-W15, 4.71%, 8/25/2043 | 8,138 | 8,114 |
"1A1", Series 2004-W15, 6.0%, 8/25/2044 | 750,550 | 758,489 |
Federal Home Loan Mortgage Corp.: | | |
"NR", Series 2638, 4.0%, 2/15/2020 | 1,185,000 | 1,172,686 |
"KB", Series 2552, 4.25%, 6/15/2027 | 1,104,517 | 1,096,009 |
"LC", Series 2682, 4.5%, 7/15/2032 | 570,000 | 539,382 |
"PC", Series 3026, 4.5%, 1/15/2034 | 450,000 | 418,358 |
"MD", Series 3057, 4.5%, 8/15/2034 | 570,000 | 531,164 |
"WJ", Series 2557, 5.0%, 7/15/2014 | 895,000 | 894,433 |
"OL", Series 2840, 5.0%, 11/15/2022 | 1,335,000 | 1,331,708 |
"PE", Series 2721, 5.0%, 1/15/2023 | 2,425,000 | 2,327,316 |
"EW", Series 2545, 5.0%, 3/15/2029 | 702,439 | 700,535 |
"PD", Series 2844, 5.0%, 12/15/2032 | 1,580,000 | 1,522,725 |
"EG", Series 2836, 5.0%, 12/15/2032 | 1,580,000 | 1,522,484 |
"PD", Series 2783, 5.0%, 1/15/2033 | 761,000 | 735,348 |
"TE", Series 2780, 5.0%, 1/15/2033 | 1,150,000 | 1,111,014 |
"NE", Series 2802, 5.0%, 2/15/2033 | 1,580,000 | 1,526,355 |
"PD", Series 2893, 5.0%, 2/15/2033 | 800,000 | 769,635 |
"OG", Series 2889, 5.0%, 5/15/2033 | 685,000 | 661,196 |
"PE", Series 2898, 5.0%, 5/15/2033 | 335,000 | 322,242 |
"ND", Series 2950, 5.0%, 6/15/2033 | 1,140,000 | 1,095,654 |
"BG", Series 2869, 5.0%, 7/15/2033 | 185,000 | 178,058 |
"PD", Series 2939, 5.0%, 7/15/2033 | 535,000 | 514,259 |
"KD", Series 2915, 5.0%, 9/15/2033 | 1,140,000 | 1,096,419 |
"HD", Series 3056, 5.0%, 2/15/2034 | 845,000 | 810,428 |
"ND", Series 3036, 5.0%, 5/15/2034 | 855,000 | 821,050 |
"KG", Series 2987, 5.0%, 12/15/2034 | 1,470,000 | 1,411,549 |
"CH", Series 2390, 5.5%, 12/15/2016 | 200,000 | 202,073 |
| Principal Amount ($)(a) | Value ($) |
| |
"Z", Series 2173, 6.5%, 7/15/2029 | 872,572 | 902,424 |
Federal National Mortgage Association: | | |
"WB", Series 2003-106, 4.5%, 10/25/2015 | 1,290,000 | 1,278,779 |
"PE", Series 2005-44, 5.0%, 7/25/2033 | 300,000 | 287,821 |
"ME", Series 2005-14, 5.0%, 10/25/2033 | 1,525,000 | 1,463,841 |
"EG", Series 2005-22, 5.0%, 11/25/2033 | 750,000 | 719,808 |
"OG", Series 2001-69, 5.5%, 12/25/2016 | 750,000 | 761,142 |
"PG", Series 2002-3, 5.5%, 2/25/2017 | 500,000 | 507,765 |
"QC", Series 2002-11, 5.5%, 3/25/2017 | 290,000 | 294,233 |
"MC", Series 2002-56, 5.5%, 9/25/2017 | 508,929 | 514,260 |
"VD", Series 2002-56, 6.0%, 4/25/2020 | 78,128 | 78,441 |
"PM", Series 2001-60, 6.0%, 3/25/2030 | 91,065 | 91,163 |
"ZQ", Series G92-9, 7.0%, 12/25/2021 | 201,327 | 203,509 |
Government National Mortgage Association, "KA", Series 2002-5, 6.0%, 8/16/2026 | 110,419 | 110,458 |
Total Collateralized Mortgage Obligations (Cost $31,683,958) | 31,292,327 |
|
Municipal Bonds and Notes 4.8% |
California, Statewide Communities Development Authority Revenue, Series A-1, 4.0%, 11/15/2006 (c) | 750,000 | 744,105 |
Clark-Pleasant, IN, General Obligation, Community School Corp., 5.7%, 1/5/2026 (c) | 1,190,000 | 1,219,643 |
Hoboken, NJ, Core City General Obligation, 6.5%, 4/1/2026 (c) | 1,900,000 | 2,176,488 |
Illinois, State General Obligation, 4.95%, 6/1/2023 | 195,000 | 191,334 |
Jicarilla, NM, Apache Nation Revenue, 144A, 3.85%, 12/1/2008 | 680,000 | 659,178 |
Jicarilla, NM, Sales & Tax Revenue, Apache Nation Revenue, 144A, 5.2%, 12/1/2013 | 670,000 | 672,647 |
Los Angeles, CA, Community Redevelopment Agency, Financing Authority Revenue, Bunker Hill Project, Series B, 4.99%, 12/1/2012 (c) | 680,000 | 682,101 |
Trenton, NJ, Core City General Obligation, School District Revenue, 4.7%, 4/1/2013 (c) | 745,000 | 731,046 |
Union County, NJ, Improvement Authority, Student Loan Revenue, 5.29%, 4/1/2018 (c) | 940,000 | 948,620 |
Virgin Islands, Port Authority Marine Revenue, Series B, 5.08%, 9/1/2013 (c) | 1,420,000 | 1,428,406 |
Washington, State Economic Development Finance Authority Revenue, CSC Tacoma LLC Project, Series A, 3.8%, 10/1/2011 (c) | 550,000 | 523,270 |
Total Municipal Bonds and Notes (Cost $9,709,148) | 9,976,838 |
�� | Principal Amount ($)(a) | Value ($) |
| |
US Treasury Obligations 18.2% |
US Treasury Bonds: | | |
6.0%, 2/15/2026 (b) | 4,473,000 | 5,274,647 |
7.5%, 11/15/2016 | 405,000 | 508,718 |
US Treasury Notes: | | |
3.0%, 12/31/2006 | 1,790,000 | 1,764,758 |
3.0%, 2/15/2008 | 700,000 | 680,285 |
3.375%, 2/15/2008 (b) | 4,000,000 | 3,917,656 |
4.75%, 5/15/2014 (b) | 2,860,000 | 2,929,601 |
5.0%, 2/15/2011 | 940,000 | 968,163 |
5.0%, 8/15/2011 (b) | 20,397,000 | 21,052,105 |
5.75%, 8/15/2010 | 970,000 | 1,026,191 |
Total US Treasury Obligations (Cost $38,316,136) | 38,122,124 |
|
Shares
| Value ($) |
| |
Preferred Stock 0.2% |
Axis Capital Holdings Ltd., Series B, 7.5% | 1,700 | 176,906 |
Farm Credit Bank of Texas, Series 1 | 164,000 | 179,874 |
Markel Capital Trust I, Series B, 8.71% | 88,000 | 94,588 |
Total Preferred Stocks (Cost $440,359) | 451,368 |
|
Units
| Value ($) |
| |
Other Investments 0.0% |
Hercules, Inc. (Bond Unit), 6.5%, 6/30/2029 (Cost $17,129) | 20,000 | 15,000 |
|
Shares
| Value ($) |
| |
Securities Lending Collateral 16.9% |
Daily Assets Fund Institutional, 4.28% (d) (e) (Cost $35,392,881) | 35,392,881 | 35,392,881 |
|
Cash Equivalents 2.7% |
Cash Management QP Trust, 4.26% (f) (Cost $5,687,193) | 5,687,193 | 5,687,193 |
| % of Net Assets | Value ($) |
| |
Total Investment Portfolio (Cost $245,547,577)+ | 116.6 | 244,187,067 |
Other Assets and Liabilities, Net | (16.6) | (34,822,329) |
Net Assets | 100.0 | 209,364,738 |
* Floating rate notes are securities whose yields vary with a designated market index or market rate, such as the coupon-equivalent of the US Treasury bill rate. These securities are shown at their current rate as of December 31, 2005.
+ The cost for federal income tax purposes was $245,657,073. At December 31, 2005, net unrealized depreciation for all securities based on tax cost was $1,470,006. This consisted of aggregate gross unrealized appreciation for all securities in which there was an excess of value over tax cost of $1,106,918 and aggregate gross unrealized depreciation for all securities in which there was an excess of tax cost over value of $2,576,924.
(a) Principal amount stated in US dollars unless otherwise noted.
(b) All or a portion of these securities were on loan (see Notes to Financial Statements). The value of all securities loaned at December 31, 2005 amounted to $34,080,097 which is 16.3% of net assets.
(c) Bond is insured by one of these companies:
Insurance Coverage | As a % of Total Investment Portfolio |
Ambac Financial Group | 0.3% |
Financial Guaranty Insurance Co. | 0.3% |
Financial Security Assurance, Inc. | 1.3% |
MBIA Corp. | 1.1% |
XL Capital Assurance, Inc. | 0.5% |
(d) Daily Assets Fund Institutional, an affiliated fund, is managed by Deutsche Asset Management, Inc. The rate shown is the annualized seven-day yield at period end.
(e) Represents collateral held in connection with securities lending.
(f) Cash Management QP Trust, an affiliated fund, is managed by Deutsche Investment Management Americas Inc. The rate shown is the annualized seven-day yield at period end.
(g) Mortgage dollar rolls included.
144A: Security exempt from registration under Rule 144A of the Securities Act of 1933. These securities may be resold in transactions exempt from registration, normally to qualified institutional buyers.
PIK: Denotes that all or a portion of the income is paid in kind.
Included in the portfolio are investments in mortgage or asset-backed securities which are interests in separate pools of mortgages or assets. Effective maturities of these investments may be shorter than stated maturities due to prepayments. Some separate investments in the Federal National Mortgage Association and Federal Home Loan Mortgage Corp. issues have similar coupon rates and have been aggregated for presentation purposes in the investment portfolio.
Currency Abbreviations |
ARS Argentine Peso MXN Mexican Peso MYR Malaysian Ringgit TRY New Turkish Lira UYU Uruguay Peso |
The accompanying notes are an integral part of the financial statements.
Financial Statements
Statement of Assets and Liabilities as of December 31, 2005 |
Assets |
Investments: Investments in securities, at value (cost $204,467,503), including $34,080,097 of securities loaned | $ 203,106,993 |
Investment in Daily Assets Fund Institutional (cost $35,392,881)* | 35,392,881 |
Investment in Cash Management QP Trust (cost $5,687,193) | 5,687,193 |
Total investments in securities, at value (cost $245,547,577) | 244,187,067 |
Cash | 16,038 |
Foreign currency, at value (cost $161,070) | 159,987 |
Net receivable on closed forward currency exchange contracts | 42,465 |
Interest receivable | 2,060,494 |
Receivable for Portfolio shares sold | 191,973 |
Unrealized appreciation on forward foreign currency exchange contracts | 199,541 |
Other assets | 5,023 |
Total assets | 246,862,588 |
Liabilities |
Payable for Portfolio shares redeemed | 37,656 |
Payable for investments purchased | 149,151 |
Payable for investments purchased — mortgage dollar rolls | 1,502,082 |
Payable upon return of securities loaned | 35,392,881 |
Deferred mortgage dollar roll income | 343 |
Unrealized depreciation on forward foreign currency exchange contracts | 225,754 |
Accrued management fee | 81,139 |
Accrued distribution service fees (Class B) | 87 |
Other accrued expenses and payables | 108,757 |
Total liabilities | 37,497,850 |
Net assets, at value | $ 209,364,738 |
Net Assets |
Net assets consist of: Undistributed net investment income | 8,003,780 |
Net unrealized appreciation (depreciation) on: Investments | (1,360,510) |
Foreign currency related transactions | 14,754 |
Accumulated net realized gain (loss) | 2,692 |
Paid-in capital | 202,704,022 |
Net assets, at value | $ 209,364,738 |
Class A Net Asset Value, offering and redemption price per share ($208,904,294 ÷ 29,892,841 outstanding shares of beneficial interest, no par value, unlimited number of shares authorized) | $ 6.99 |
Class B Net Asset Value, offering and redemption price per share ($460,444 ÷ 66,058 outstanding shares of beneficial interest, no par value, unlimited number of shares authorized) | $ 6.97 |
* Represents collateral on securities loaned.
The accompanying notes are an integral part of the financial statements.
Statement of Operations for the year ended December 31, 2005 |
Investment Income |
Income: Interest | $ 8,476,114 |
Mortgage dollar roll income | 16,783 |
Interest — Cash Management QP Trust | 183,543 |
Securities lending income, including income from Daily Assets Fund Institutional, net of borrower rebates | 37,232 |
Dividends | 6,418 |
Total Income | 8,720,090 |
Expenses: Management fee | 865,302 |
Custodian and accounting fees | 187,099 |
Distribution service fees (Class B) | 427 |
Record keeping fees (Class B) | 182 |
Auditing | 33,994 |
Legal | 28,181 |
Trustees' fees and expenses | 5,869 |
Reports to shareholders | 36,931 |
Pricing service fees | 62,253 |
Other | 25,427 |
Total expenses before expense reductions | 1,245,665 |
Expense reductions | (4,902) |
Total expenses after expense reductions | 1,240,763 |
Net investment income | 7,479,327 |
Realized and Unrealized Gain (Loss) on Investment Transactions |
Net realized gain (loss) from: Investments | 113,422 |
Foreign currency related transactions | (232,491) |
Net increase from payments made by affiliates and net gains (losses) realized on the disposal of investments in violation of restrictions | — |
| (119,069) |
Net unrealized appreciation (depreciation) during the period on: Investments | (3,290,040) |
Foreign currency related transactions | 768,930 |
| (2,521,110) |
Net gain (loss) on investment transactions | (2,640,179) |
Net increase (decrease) in net assets resulting from operations | $ 4,839,148 |
The accompanying notes are an integral part of the financial statements.
Statement of Changes in Net Assets |
| Years Ended December 31, |
Increase (Decrease) in Net Assets | 2005 | 2004 |
Operations: Net investment income | $ 7,479,327 | $ 7,264,637 |
Net realized gain (loss) on investment transactions | (119,069) | 1,908,061 |
Net unrealized appreciation (depreciation) during the period on investment transactions | (2,521,110) | (100,566) |
Net increase (decrease) in net assets resulting from operations | 4,839,148 | 9,072,132 |
Distributions to shareholders from: Net investment income: Class A | (6,383,141) | (6,665,081) |
Net realized gains: Class A | (1,627,075) | — |
Portfolio share transactions: Class A Proceeds from shares sold | 52,731,670 | 30,276,293 |
Reinvestment of distributions | 8,010,216 | 6,665,081 |
Cost of shares redeemed | (25,921,871) | (38,484,371) |
Net increase (decrease) in net assets from Class A share transactions | 34,820,015 | (1,542,997) |
Class B* Proceeds from shares sold | 473,041 | — |
Reinvestment of distributions | — | — |
Cost of shares redeemed | (15,935) | — |
Net increase (decrease) in net assets from Class B share transactions | 457,106 | — |
Increase (decrease) in net assets | 32,106,053 | 864,054 |
Net assets at beginning of period | 177,258,685 | 176,394,631 |
Net assets at end of period (including undistributed net investment income of $8,003,780 and $7,130,843, respectively) | $ 209,364,738 | $ 177,258,685 |
Other Information |
Class A Shares outstanding at beginning of period | 24,873,210 | 25,068,858 |
Shares sold | 7,554,171 | 4,299,192 |
Shares issued to shareholders in reinvestment of distributions | 1,165,970 | 981,603 |
Shares redeemed | (3,700,510) | (5,476,443) |
Net increase (decrease) in Class A shares | 5,019,631 | (195,648) |
Shares outstanding at end of period | 29,892,841 | 24,873,210 |
Class B* Shares outstanding at beginning of period | — | — |
Shares sold | 68,350 | — |
Shares issued to shareholders in reinvestment of distributions | — | — |
Shares redeemed | (2,292) | — |
Net increase (decrease) in Class B shares | 66,058 | — |
Shares outstanding at end of period | 66,058 | — |
* For the period May 2, 2005 (commencement of operations of Class B shares) to December 31, 2005.
The accompanying notes are an integral part of the financial statements.
Financial Highlights
Class A Years Ended December 31, | 2005 | 2004 | 2003 | 2002 | 2001a |
Selected Per Share Data |
Net asset value, beginning of period | $ 7.13 | $ 7.04 | $ 6.98 | $ 6.89 | $ 6.78 |
Income (loss) from investment operations: Net investment incomeb | .29 | .29 | .26 | .34 | .38 |
Net realized and unrealized gain (loss) on investment transactions | (.10) | .08 | .09 | .17 | .00c |
Total from investment operations | .19 | .37 | .35 | .51 | .38 |
Less distributions from: Net investment income | (.26) | (.28) | (.29) | (.42) | (.27) |
Net realized gain on investment transactions | (.07) | — | — | — | — |
Total distributions | (.33) | (.28) | (.29) | (.42) | (.27) |
Net asset value, end of period | $ 6.99 | $ 7.13 | $ 7.04 | $ 6.98 | $ 6.89 |
Total Return (%) | 2.60 | 5.38 | 5.06 | 7.66 | 5.75 |
Ratios to Average Net Assets and Supplemental Data |
Net assets, end of period ($ millions) | 209 | 177 | 176 | 165 | 182 |
Ratio of expenses before expense reductions (%) | .68 | .60 | .58 | .55 | .58d |
Ratio of expenses after expense reductions (%) | .68 | .60 | .58 | .55 | .57d |
Ratio of net investment income (%) | 4.11 | 4.18 | 3.78 | 5.03 | 5.47 |
Portfolio turnover rate (%) | 187e | 223e | 242e | 262e | 169e |
a As required, effective January 1, 2001, the Portfolio adopted the provisions of the AICPA Audit and Accounting Guide for Investment Companies and began amortizing premium on debt securities. b Based on average shares outstanding during the period. c The amount of net realized and unrealized gain shown for a share outstanding for the year ended December 31, 2001 does not correspond with the aggregate net loss on investments for the period due to the timing of sales and repurchases of Portfolio shares in relation to fluctuating market values of the investments of the Portfolio. d The ratios of operating expenses excluding costs incurred in connection with a fund complex reorganization before and after expense reductions were .57% and .57%, respectively. e The portfolio turnover rate including mortgage dollar roll transactions was 197%, 245%, 286%, 276% and 193% for the years ended December 31, 2005, December 31, 2004, December 31, 2003, December 31, 2002 and December 31, 2001, respectively. |
Class B | 2005a |
Selected Per Share Data |
Net asset value, beginning of period | $ 6.88 |
Income (loss) from investment operations: Net investment incomeb | .18 |
Net realized and unrealized gain (loss) on investment transactions | (.09) |
Total from investment operations | .09 |
Net asset value, end of period | $ 6.97 |
Total Return (%) | 1.31** |
Ratios to Average Net Assets and Supplemental Data |
Net assets, end of period ($ millions) | .5 |
Ratio of expenses (%) | 1.04* |
Ratio of net investment income (%) | 3.86* |
Portfolio turnover rate (%) | 187c |
a For the period May 2, 2005 (commencement of operations of Class B shares) to December 31, 2005. b Based on average shares outstanding during the period. c The portfolio turnover rate including mortgage dollar roll transactions was 197% for the year ended December 31, 2005. * Annualized ** Not annualized |
Performance Summary December 31, 2005
DWS Growth & Income VIP
All performance shown is historical, assumes reinvestment of all dividend and capital gain distributions, and does not guarantee future results. Investment return and principal value fluctuate with changing market conditions so that, when redeemed, shares may be worth more or less than their original cost. Current performance may be lower or higher than the performance data quoted. Please visit www.dws-scudder.com for the Portfolio's most recent month-end performance. Performance doesn't reflect charges and fees ("contract charges") associated with the separate account that invests in the Portfolio or any variable life insurance policy or variable annuity contract for which the Portfolio is an investment option. These charges and fees will reduce returns.
Portfolio returns during all periods shown reflect a fee waiver and/or expense reimbursement. Without this waiver/reimbursement, returns would have been lower.
Risk Considerations
The portfolio is subject to stock market risk, meaning stocks in the portfolio may decline in value for extended periods of time due to the activities and financial prospects of individual companies, or due to general market and economic conditions. Bond investments are subject to interest-rate risk such that when interest rates rise, the prices of the bonds, and thus the value of the investments, can decline and the investor can lose principal value. Please read this portfolio's prospectus for specific information regarding its investments and risk profile.
Growth of an Assumed $10,000 Investment |
[] DWS Growth & Income VIP — Class A [] S&P 500 Index | The Standard & Poor's 500 (S&P 500) Index is an unmanaged capitalization-weighted index of 500 stocks. The index is designed to measure performance of the broad domestic economy through changes in the aggregate market value of 500 stocks representing all major industries. Index returns assume the reinvestment of dividends and, unlike Portfolio returns, do not reflect any fees or expenses. It is not possible to invest directly into an index. |
 | |
Yearly periods ended December 31 | |
Comparative Results |
DWS Growth & Income VIP | 1-Year | 3-Year | 5-Year | 10-Year |
Class A | Growth of $10,000 | $10,607 | $14,809 | $10,098 | $17,868 |
Average annual total return | 6.07% | 13.98% | .20% | 5.98% |
S&P 500 Index | Growth of $10,000 | $10,491 | $14,970 | $10,275 | $23,836 |
Average annual total return | 4.91% | 14.39% | .54% | 9.07% |
DWS Growth & Income VIP | 1-Year | 3-Year | 5-Year | Life of Class* |
Class B | Growth of $10,000 | $10,573 | $14,689 | $9,951 | $13,473 |
Average annual total return | 5.73% | 13.67% | -.10% | 3.50% |
S&P 500 Index | Growth of $10,000 | $10,491 | $14,970 | $10,275 | $17,816 |
Average annual total return | 4.91% | 14.39% | .54% | 6.89% |
The growth of $10,000 is cumulative.
* The Portfolio commenced selling Class B shares on May 1, 1997. Index returns begin April 30, 1997.
Information About Your Portfolio's Expenses
DWS Growth & Income VIP
As an investor of the Portfolio, you incur two types of costs: ongoing expenses and transaction costs. Ongoing expenses include management fees, distribution and service (12b-1) fees and other Portfolio expenses. Examples of transaction costs include sales charges (loads), redemption fees and account maintenance fees, which are not shown in this section. The following tables are intended to help you understand your ongoing expenses (in dollars) of investing in the Portfolio and to help you compare these expenses with the ongoing expenses of investing in other mutual funds. In the most recent six-month period, the Portfolio limited these expenses; had it not done so, expenses would have been higher. The tables are based on an investment of $1,000 made at the beginning of the six-month period ended December 31, 2005.
The tables illustrate your Portfolio's expenses in two ways:
Actual Portfolio Return. This helps you estimate the actual dollar amount of ongoing expenses (but not transaction costs) paid on a $1,000 investment in the Portfolio using the Portfolio's actual return during the period. To estimate the expenses you paid over the period, simply divide your account value by $1,000 (for example, an $8,600 account value divided by $1,000 = 8.6), then multiply the result by the number in the "Expenses Paid per $1,000" line under the share class you hold.
Hypothetical 5% Portfolio Return. This helps you to compare your Portfolio's ongoing expenses (but not transaction costs) with those of other mutual funds using the Portfolio's actual expense ratio and a hypothetical rate of return of 5% per year before expenses. Examples using a 5% hypothetical Portfolio return may be found in the shareholder reports of other mutual funds. The hypothetical account values and expenses may not be used to estimate the actual ending account balance or expenses you paid for the period.
Please note that the expenses shown in these tables are meant to highlight your ongoing expenses only and do not reflect any transaction costs. The "Expenses Paid per $1,000" line of the tables is useful in comparing ongoing expenses only and will not help you determine the relative total expense of owning different funds. If these transaction costs had been included, your costs would have been higher.
Expenses and Value of a $1,000 Investment for the six months ended December 31, 2005 |
Actual Portfolio Return | Class A | | Class B | |
Beginning Account Value 7/1/05 | $ 1,000.00 | | $ 1,000.00 | |
Ending Account Value 12/31/05 | $ 1,065.80 | | $ 1,063.70 | |
Expenses Paid per $1,000* | $ 2.81 | | $ 4.58 | |
Hypothetical 5% Portfolio Return | Class A | | Class B | |
Beginning Account Value 7/1/05 | $ 1,000.00 | | $ 1,000.00 | |
Ending Account Value 12/31/05 | $ 1,022.48 | | $ 1,020.77 | |
Expenses Paid per $1,000* | $ 2.75 | | $ 4.48 | |
* Expenses are equal to the Portfolio's annualized expense ratio for each share class, multiplied by the average account value over the period, multiplied by the number of days in the most recent six-month period, then divided by 365.
Annualized Expense Ratios | Class A | | Class B | |
DWS Variable Series I — DWS Growth & Income VIP | .54% | | .89% | |
For more information, please refer to the Portfolio's prospectus.
These tables do not reflect charges and fees ("contract charges") associated with the separate account that invests in the Portfolio or any variable life insurance policy or variable annuity contract for which the Portfolio is an investment option.
Management Summary December 31, 2005
DWS Growth & Income VIP
The US economy posted positive growth for all four quarters of 2005, and concerns about inflation and the sustainability of the economic expansion seemed to abate as the year progressed. The US stock market was up modestly in 2005; the return of the S&P 500 Index was 4.91%. The Portfolio returned 6.07% (Class A shares, unadjusted for contract charges), ahead of the S&P 500 Index. The Portfolio's return was also above the 5.77% average of its peers in the Lipper Large-Cap Core Funds category.
On April 1, 2005, we applied a new investment process to the Portfolio that has served us well with other DWS products. The Portfolio's solid performance resulted from the successful application of our investment process, which combines quantitative modeling techniques with rigorous fundamental analysis. Since the Portfolio's sector weights are maintained close to those of the S&P 500 Index, essentially all differences between returns of the Portfolio and the index results from stock selection. However, in order to align the Portfolio with the new process, we had to significantly restructure the Portfolio's existing holdings, which led to a one-time, higher Portfolio turnover rate in 2005.
The energy sector, which was the strongest of the 10 sectors in the S&P 500 Index, made a major contribution to absolute return. One of the strongest contributors in this sector was Amerada Hess Corp., which is one of the largest positions in the Portfolio. Also positive were ExxonMobil Corp., Burlington Resources, Inc. and Devon Energy Corp.; we sold these last two securities during the fourth quarter after their prices reached levels that no longer appeared attractive relative to other companies in the industry.
Another strong performer was TXU Corp., an electric utility in Texas, which has reported excellent earnings this year, reflecting the success of its comprehensive restructuring program.
In the consumer discretionary sector, relative performance benefited from our decision not to own the automobile manufacturers, which performed poorly. Nordstrom, Inc. is a holding in this sector that performed well for the Portfolio. However, we sold this stock in November because we saw more upside potential in Target Corp., the new position that replaced Nordstrom.
Holdings that detracted from performance include Coca-Cola Co., which reported disappointing earnings, and Tyco International Ltd., which has had management issues and is currently undergoing restructuring.
Theresa Gusman Sal Bruno
Lead Portfolio Manager Gregory Y. Sivin, CFA
Portfolio Managers
All performance shown is historical, assumes reinvestment of all dividend and capital gain distributions, and does not guarantee future results. Investment return and principal value fluctuate with changing market conditions so that, when redeemed, shares may be worth more or less than their original cost. Current performance may be lower or higher than the performance data quoted. Please visit www.dws-scudder.com for the product's most recent month-end performance. Performance doesn't reflect charges and fees ("contract charges") associated with the separate account that invests in the Portfolio or any variable life insurance policy or variable annuity contract for which the Portfolio is an investment option. These charges and fees will reduce returns.
Risk Considerations
The Portfolio is subject to stock market risk, meaning stocks in the Portfolio may decline in value for extended periods of time due to the activities and financial prospects of individual companies, or due to general market and economic conditions. Bond investments are subject to interest-rate risk such that when interest rates rise, the prices of the bonds, and thus the value of the bond investment, can decline and the investor can lose principal value. Please read this Portfolio's prospectus for specific information regarding its investments and risk profile.
The Standard & Poor's 500 (S&P 500) Index is an unmanaged capitalization-weighted index of 500 stocks. The index is designed to measure performance of the broad domestic economy through changes in the aggregate market value of 500 stocks representing all major industries. Index returns assume the reinvestment of dividends and, unlike portfolio returns, do not reflect any fees or expenses. It is not possible to invest directly into an index.
The Lipper Large-Cap Core Funds category is an unmanaged group of mutual funds that, by portfolio practice, invest at least 75% of their equity assets in companies with market capitalizations (on a three-year weighted basis) of greater than 300% of the dollar-weighted median market capitalization of the S&P Mid-Cap 400 Index. It is not possible to invest directly into a Lipper Category.
Portfolio management market commentary is as of December 31, 2005, and may not come to pass. This information is subject to change at any time based on market and other conditions.
Portfolio Summary
DWS Growth & Income VIP
Asset Allocation | 12/31/05 | 12/31/04 |
| | |
Common Stocks | 99% | 97% |
Cash Equivalents | 1% | 3% |
| 100% | 100% |
Sector Diversification (As a % of Common Stocks) | 12/31/05 | 12/31/04 |
| | |
Financials | 21% | 18% |
Information Technology | 15% | 18% |
Health Care | 13% | 12% |
Industrials | 12% | 14% |
Consumer Discretionary | 11% | 11% |
Consumer Staples | 10% | 9% |
Energy | 9% | 8% |
Utilities | 3% | 3% |
Materials | 3% | 4% |
Telecommunication Services | 3% | 3% |
| 100% | 100% |
Asset allocation and sector diversification are subject to change.
For more complete details about the Portfolio's investment portfolio, see page 34. A quarterly Fact Sheet is available upon request. Information concerning portfolio holdings of the Portfolio as of month-end will be posted to www.dws-scudder.com on the 15th day of the following month.
Following the Portfolio's fiscal first and third quarter-end, a complete portfolio holdings listing is filed with the SEC on Form N-Q. The form will be available on the SEC's Web site at www.sec.gov, and it also may be reviewed and copied at the SEC's Public Reference Room in Washington, D.C. Information on the operation of the SEC's Public Reference Room may be obtained by calling (800) SEC-0330.
Investment Portfolio December 31, 2005
DWS Growth & Income VIP
|
Shares
| Value ($) |
| |
Common Stocks 99.0% |
Consumer Discretionary 10.5% |
Auto Components 0.6% |
Johnson Controls, Inc. | 28,160 | 2,053,146 |
Household Durables 1.6% |
Black & Decker Corp. | 41,190 | 3,581,882 |
Pulte Homes, Inc. | 44,750 | 1,761,360 |
| 5,343,242 |
Internet & Catalog Retail 0.7% |
eBay, Inc.* | 55,210 | 2,387,832 |
Media 1.9% |
CCE Spinco, Inc.* | 6,901 | 90,406 |
Clear Channel Communications, Inc. | 55,210 | 1,736,355 |
Viacom, Inc. "B"* | 137,780 | 4,491,628 |
| 6,318,389 |
Multiline Retail 3.6% |
Federated Department Stores, Inc. | 50,900 | 3,376,197 |
J.C. Penney Co., Inc. | 77,930 | 4,332,908 |
Kohl's Corp.* | 46,560 | 2,262,816 |
Target Corp. | 43,770 | 2,406,037 |
| 12,377,958 |
Specialty Retail 1.2% |
Home Depot, Inc. | 53,520 | 2,166,489 |
Staples, Inc. | 91,135 | 2,069,676 |
| 4,236,165 |
Textiles, Apparel & Luxury Goods 0.9% |
Coach, Inc.* | 42,520 | 1,417,617 |
Polo Ralph Lauren Corp. | 32,420 | 1,820,059 |
| 3,237,676 |
Consumer Staples 9.4% |
Beverages 3.8% |
Coca-Cola Co. | 214,870 | 8,661,410 |
PepsiCo, Inc. | 74,720 | 4,414,457 |
| 13,075,867 |
Food & Staples Retailing 0.9% |
Costco Wholesale Corp. | 62,070 | 3,070,603 |
Food Products 1.8% |
General Mills, Inc. | 63,710 | 3,142,177 |
Kellogg Co. | 69,700 | 3,012,434 |
| 6,154,611 |
Household Products 2.9% |
Procter & Gamble Co. | 171,000 | 9,897,480 |
Energy 9.3% |
Energy Equipment & Services 0.7% |
Cooper Cameron Corp.* | 16,520 | 683,928 |
Schlumberger Ltd. | 18,090 | 1,757,444 |
| 2,441,372 |
Oil, Gas & Consumable Fuels 8.6% |
Amerada Hess Corp. | 46,790 | 5,933,908 |
Chevron Corp. | 110,240 | 6,258,325 |
ConocoPhillips | 34,360 | 1,999,065 |
|
Shares
| Value ($) |
| |
ExxonMobil Corp. | 208,294 | 11,699,874 |
Occidental Petroleum Corp. | 19,790 | 1,580,825 |
Talisman Energy, Inc. | 31,120 | 1,645,625 |
| 29,117,622 |
Financials 21.0% |
Banks 7.4% |
Bank of America Corp. | 245,600 | 11,334,440 |
US Bancorp. | 68,900 | 2,059,421 |
Wachovia Corp. | 103,400 | 5,465,724 |
Wells Fargo & Co. | 63,990 | 4,020,491 |
Zions Bancorp. | 33,500 | 2,531,260 |
| 25,411,336 |
Capital Markets 6.3% |
Lehman Brothers Holdings, Inc. | 62,180 | 7,969,611 |
Merrill Lynch & Co., Inc. | 72,990 | 4,943,613 |
The Goldman Sachs Group, Inc. | 66,660 | 8,513,148 |
| 21,426,372 |
Diversified Financial Services 2.1% |
Citigroup, Inc. | 50,590 | 2,455,133 |
Countrywide Financial Corp. | 66,330 | 2,267,823 |
JPMorgan Chase & Co. | 62,950 | 2,498,485 |
| 7,221,441 |
Insurance 5.2% |
AFLAC, Inc. | 87,650 | 4,068,713 |
Allstate Corp. | 77,710 | 4,201,780 |
Hartford Financial Services Group, Inc. | 19,550 | 1,679,149 |
Lincoln National Corp. | 16,350 | 867,041 |
MetLife, Inc. | 140,920 | 6,905,080 |
| 17,721,763 |
Health Care 13.0% |
Biotechnology 2.3% |
Amgen, Inc.* | 40,850 | 3,221,431 |
Genzyme Corp.* | 36,940 | 2,614,613 |
Invitrogen Corp.* | 29,790 | 1,985,206 |
| 7,821,250 |
Health Care Equipment & Supplies 1.5% |
C.R. Bard, Inc. | 29,850 | 1,967,712 |
Medtronic, Inc. | 54,770 | 3,153,109 |
| 5,120,821 |
Health Care Providers & Services 5.5% |
Aetna, Inc. | 28,590 | 2,696,323 |
Cardinal Health, Inc. | 40,470 | 2,782,312 |
Caremark Rx, Inc.* | 37,050 | 1,918,819 |
UnitedHealth Group, Inc. | 134,390 | 8,350,995 |
WellPoint, Inc.* | 35,690 | 2,847,705 |
| 18,596,154 |
Pharmaceuticals 3.7% |
Allergan, Inc. | 32,430 | 3,501,143 |
Johnson & Johnson | 108,040 | 6,493,204 |
Pfizer, Inc. | 118,790 | 2,770,183 |
| 12,764,530 |
|
Shares
| Value ($) |
| |
Industrials 11.4% |
Aerospace & Defense 5.8% |
Boeing Co. | 92,670 | 6,509,141 |
Goodrich Corp. | 75,230 | 3,091,953 |
Lockheed Martin Corp. | 45,570 | 2,899,619 |
United Technologies Corp. | 132,730 | 7,420,934 |
| 19,921,647 |
Electrical Equipment 1.4% |
Emerson Electric Co. | 64,070 | 4,786,029 |
Industrial Conglomerates 4.2% |
General Electric Co. | 169,830 | 5,952,542 |
Tyco International Ltd. | 285,470 | 8,238,664 |
| 14,191,206 |
Information Technology 14.9% |
Communications Equipment 2.2% |
Cisco Systems, Inc.* | 205,370 | 3,515,934 |
Motorola, Inc. | 182,650 | 4,126,064 |
| 7,641,998 |
Computers & Peripherals 3.8% |
Apple Computer, Inc.* | 30,340 | 2,181,143 |
EMC Corp.* | 357,860 | 4,874,053 |
International Business Machines Corp. | 71,900 | 5,910,180 |
| 12,965,376 |
IT Consulting & Services 2.1% |
Accenture Ltd. "A" | 141,060 | 4,072,402 |
Affiliated Computer Services, Inc. "A"* | 52,990 | 3,135,948 |
| 7,208,350 |
Semiconductors & Semiconductor Equipment 4.6% |
Applied Materials, Inc. | 117,860 | 2,114,408 |
Intel Corp. | 239,620 | 5,980,915 |
Texas Instruments, Inc. | 231,340 | 7,419,074 |
| 15,514,397 |
Software 2.2% |
Microsoft Corp. | 217,680 | 5,692,332 |
Oracle Corp.* | 160,790 | 1,963,246 |
| 7,655,578 |
|
Shares
| Value ($) |
| |
Materials 3.1% |
Chemicals |
Dow Chemical Co. | 108,780 | 4,766,740 |
Monsanto Co. | 32,630 | 2,529,804 |
PPG Industries, Inc. | 55,420 | 3,208,818 |
| 10,505,362 |
Telecommunication Services 2.9% |
Wireless Telecommunication Services |
ALLTEL Corp. | 25,380 | 1,601,478 |
Sprint Nextel Corp. | 354,280 | 8,275,981 |
| 9,877,459 |
Utilities 3.5% |
Electric Utilities 1.9% |
Allegheny Energy, Inc.* | 44,810 | 1,418,237 |
Edison International | 50,950 | 2,221,929 |
Exelon Corp. | 52,850 | 2,808,449 |
| 6,448,615 |
Independent Power Producers & Energy Traders 1.6% |
Constellation Energy Group | 47,990 | 2,764,224 |
TXU Corp. | 54,700 | 2,745,393 |
| 5,509,617 |
Total Common Stocks (Cost $304,098,538) | 338,021,264 |
|
Cash Equivalents 1.2% |
Cash Management QP Trust, 4.26% (a) (Cost $4,108,184) | 4,108,184 | 4,108,184 |
| % of Net Assets | Value ($) |
| |
Total Investment Portfolio (Cost $308,206,722)+ | 100.2 | 342,129,448 |
Other Assets and Liabilities, Net | (0.2) | (536,609) |
Net Assets | 100.0 | 341,592,839 |
* Non-income producing security.
+ The cost for federal income tax purposes was $310,579,908. At December 31, 2005, net unrealized appreciation for all securities based on tax cost was $31,549,540. This consisted of aggregate gross unrealized appreciation for all securities in which there was an excess of value over tax cost of $36,248,456 and aggregate gross unrealized depreciation for all securities in which there was an excess of tax cost over value of $4,698,916.
(a) Cash Management QP Trust, an affiliated fund, is managed by Deutsche Investment Management Americas Inc. The rate shown is the annualized seven-day yield at period end.
The accompanying notes are an integral part of the financial statements.
Financial Statements
Statement of Assets and Liabilities as of December 31, 2005 |
Assets |
Investments: Investments in securities, at value (cost $304,098,538) | $ 338,021,264 |
Investment in Cash Management QP Trust (cost $4,108,184) | 4,108,184 |
Total investments in securities, at value (cost $308,206,722) | 342,129,448 |
Cash | 10,000 |
Receivable for Portfolio shares sold | 2,400 |
Dividends receivable | 355,794 |
Interest receivable | 15,382 |
Foreign taxes recoverable | 13,302 |
Other assets | 7,785 |
Total assets | 342,534,111 |
Liabilities |
Payable for Portfolio shares redeemed | 723,799 |
Accrued management fee | 117,887 |
Accrued distribution service fees (Class B) | 9,903 |
Other accrued expenses and payables | 89,683 |
Total liabilities | 941,272 |
Net assets, at value | $ 341,592,839 |
Net Assets |
Net assets consist of: Undistributed net investment income | 2,776,543 |
Net unrealized appreciation (depreciation) on investments | 33,922,726 |
Accumulated net realized gain (loss) | (32,601,115) |
Paid-in capital | 337,494,685 |
Net assets, at value | $ 341,592,839 |
Class A Net Asset Value, offering and redemption price per share ($294,320,825 ÷ 30,277,518 outstanding shares of beneficial interest, no par value, unlimited number of shares authorized) | $ 9.72 |
Class B Net Asset Value, offering and redemption price per share ($47,272,014 ÷ 4,883,742 outstanding shares of beneficial interest, no par value, unlimited number of shares authorized) | $ 9.68 |
The accompanying notes are an integral part of the financial statements.
Statement of Operations for the year ended December 31, 2005 |
Investment Income |
Income: Dividends | $ 4,448,496 |
Interest — Cash Management QP Trust | 194,026 |
Securities lending income, including income from Daily Assets Fund Institutional, net of borrower rebates | 5,216 |
Total Income | 4,647,738 |
Expenses: Management fee | 1,335,546 |
Custodian and accounting fees | 122,198 |
Distribution service fees (Class B) | 104,192 |
Record keeping fees (Class B) | 54,767 |
Auditing | 35,884 |
Legal | 23,901 |
Trustees' fees and expenses | 8,019 |
Reports to shareholders | 62,019 |
Other | 21,795 |
Total expenses before expense reductions | 1,768,321 |
Expense reductions | (82,526) |
Total expenses after expense reductions | 1,685,795 |
Net investment income (loss) | 2,961,943 |
Realized and Unrealized Gain (Loss) on Investment Transactions |
Net realized gain (loss) from: Investments | 23,958,487 |
Written options | 31,358 |
| 23,989,845 |
Net unrealized appreciation (depreciation) during the period on: Investments | (2,131,545) |
Written options | (9,086) |
| (2,140,631) |
Net gain (loss) on investment transactions | 21,849,214 |
Net increase (decrease) in net assets resulting from operations | $ 24,811,157 |
The accompanying notes are an integral part of the financial statements.
Statement of Changes in Net Assets |
| Years Ended December 31, |
Increase (Decrease) in Net Assets | 2005 | 2004 |
Operations: Net investment income (loss) | $ 2,961,943 | $ 2,438,934 |
Net realized gain (loss) on investment transactions | 23,989,845 | 6,835,797 |
Net unrealized appreciation (depreciation) during the period on investment transactions | (2,140,631) | 8,951,633 |
Net increase (decrease) in net assets resulting from operations | 24,811,157 | 18,226,364 |
Distributions to shareholders from: Net investment income: Class A | (2,208,887) | (1,239,211) |
Class B | (336,934) | (112,919) |
Portfolio share transactions: Class A Proceeds from shares sold | 45,563,045 | 22,740,822 |
Net assets acquired in tax-free reorganization | 99,119,857 | — |
Reinvestment of distributions | 2,208,887 | 1,239,211 |
Cost of shares redeemed | (43,761,424) | (27,224,855) |
Net increase (decrease) in net assets from Class A share transactions | 103,130,365 | (3,244,822) |
Class B Proceeds from shares sold | 16,893,009 | 16,908,894 |
Net assets acquired in tax-free reorganization | 10,376,860 | — |
Reinvestment of distributions | 336,934 | 112,919 |
Cost of shares redeemed | (16,154,081) | (4,470,402) |
Net increase (decrease) in net assets from Class B share transactions | 11,452,722 | 12,551,411 |
Increase (decrease) in net assets | 136,848,423 | 26,180,823 |
Net assets at beginning of period | 204,744,416 | 178,563,593 |
Net assets at end of period (including undistributed net investment income of $2,776,543 and $2,360,421, respectively) | $ 341,592,839 | $ 204,744,416 |
Other Information |
Class A Shares outstanding at beginning of period | 18,483,989 | 18,896,518 |
Shares sold | 4,876,623 | 2,601,316 |
Shares issued in tax-free reorganization | 11,366,540 | — |
Shares issued to shareholders in reinvestment of distributions | 253,023 | 146,478 |
Shares redeemed | (4,702,657) | (3,160,323) |
Net increase (decrease) in Class A shares | 11,793,529 | (412,529) |
Shares outstanding at end of period | 30,277,518 | 18,483,989 |
Class B Shares outstanding at beginning of period | 3,576,021 | 2,114,110 |
Shares sold | 1,896,063 | 1,958,270 |
Shares issued in tax-free reorganization | 1,191,379 | — |
Shares issued to shareholders in reinvestment of distributions | 38,684 | 13,379 |
Shares redeemed | (1,818,405) | (509,738) |
Net increase (decrease) in Class B shares | 1,307,721 | 1,461,911 |
Shares outstanding at end of period | 4,883,742 | 3,576,021 |
The accompanying notes are an integral part of the financial statements.
Financial Highlights
Class A Years Ended December 31, | 2005 | 2004 | 2003 | 2002 | 2001 |
Selected Per Share Data |
Net asset value, beginning of period | $ 9.29 | $ 8.50 | $ 6.77 | $ 8.90 | $ 10.38 |
Income (loss) from investment operations: Net investment income (loss)a | .10 | .12 | .07 | .07 | .09 |
Net realized and unrealized gain (loss) on investment transactions | .45 | .74 | 1.74 | (2.12) | (1.23) |
Total from investment operations | .55 | .86 | 1.81 | (2.05) | (1.14) |
Less distributions from: Net investment income | (.12) | (.07) | (.08) | (.08) | (.12) |
Net realized gain on investment transactions | — | — | — | — | (.22) |
Total distributions | (.12) | (.07) | (.08) | (.08) | (.34) |
Net asset value, end of period | $ 9.72 | $ 9.29 | $ 8.50 | $ 6.77 | $ 8.90 |
Total Return (%) | 6.07c | 10.16 | 26.74 | (23.13) | (11.30) |
Ratios to Average Net Assets and Supplemental Data |
Net assets, end of period ($ millions) | 294 | 172 | 161 | 135 | 185 |
Ratio of expenses before expense reductions (%) | .57 | .56 | .59 | .57 | .57b |
Ratio of expenses after expense reductions (%) | .54 | .56 | .59 | .57 | .56b |
Ratio of net investment income (loss) (%) | 1.10 | 1.37 | .91 | .92 | .94 |
Portfolio turnover rate (%) | 115 | 33 | 37 | 66 | 67 |
a Based on average shares outstanding during the period. b The ratios of operating expenses excluding costs incurred in connection with a fund complex reorganization before and after expense reductions were .56% and .56%, respectively. c Total return would have been less had certain expenses not been reduced. |
Class B Years Ended December 31, | 2005 | 2004 | 2003 | 2002 | 2001 |
Selected Per Share Data |
Net asset value, beginning of period | $ 9.25 | $ 8.47 | $ 6.75 | $ 8.87 | $ 10.35 |
Income (loss) from investment operations: Net investment income (loss)a | .07 | .09 | .05 | .05 | .06 |
Net realized and unrealized gain (loss) on investment transactions | .45 | .73 | 1.73 | (2.12) | (1.23) |
Total from investment operations | .52 | .82 | 1.78 | (2.07) | (1.17) |
Less distributions from: Net investment income | (.09) | (.04) | (.06) | (.05) | (.09) |
Net realized gain on investment transactions | — | — | — | — | (.22) |
Total distributions | (.09) | (.04) | (.06) | (.05) | (.31) |
Net asset value, end of period | $ 9.68 | $ 9.25 | $ 8.47 | $ 6.75 | $ 8.87 |
Total Return (%) | 5.73c | 9.78 | 26.55 | (23.40) | (11.56) |
Ratios to Average Net Assets and Supplemental Data |
Net assets, end of period ($ millions) | 47 | 33 | 18 | 7 | 10 |
Ratio of expenses before expense reductions (%) | .95 | .89 | .85 | .82 | .82b |
Ratio of expenses after expense reductions (%) | .89 | .89 | .85 | .82 | .81b |
Ratio of net investment income (loss) (%) | .75 | 1.04 | .65 | .67 | .69 |
Portfolio turnover rate (%) | 115 | 33 | 37 | 66 | 67 |
a Based on average shares outstanding during the period. b The ratios of operating expenses excluding costs incurred in connection with a fund complex reorganization before and after expense reductions were .81% and .81%, respectively. c Total return would have been less had certain expenses not been reduced. |
Performance Summary December 31, 2005
DWS Capital Growth VIP
All performance shown is historical, assumes reinvestment of all dividend and capital gain distributions, and does not guarantee future results. Investment return and principal value fluctuate with changing market conditions so that, when redeemed, shares may be worth more or less than their original cost. Current performance may be lower or higher than the performance data quoted. Please visit www.dws-scudder.com for the Portfolio's most recent month-end performance. Performance doesn't reflect charges and fees ("contract charges") associated with the separate account that invests in the Portfolio or any variable life insurance policy or variable annuity contract for which the Portfolio is an investment option. These charges and fees will reduce returns.
Portfolio returns during all periods shown reflect a fee waiver and/or expense reimbursement. Without this waiver/reimbursement, returns would have been lower.
Risk Considerations
The portfolio is subject to stock market risk, meaning stocks in the portfolio may decline in value for extended periods of time due to the activities and financial prospects of individual companies, or due to general market and economic conditions. Please read this portfolio's prospectus for specific information regarding its investments and risk profile.
Growth of an Assumed $10,000 Investment |
[] DWS Capital Growth VIP — Class A [] S&P 500 Index [] Russell 1000 Growth Index | The Standard & Poor's (S&P) 500 Index is an unmanaged capitalization-weighted index of 500 stocks. The index is designed to measure performance of the broad domestic economy through changes in the aggregate market value of 500 stocks representing all major industries. The Russell 1000 Growth Index is an unmanaged capitalization- weighted index containing those securities in the Russell 1000 Index with higher price-to-book ratios and higher forecasted growth values. Index returns assume the reinvestment of all distributions and do not reflect any fees or expenses. It is not possible to invest directly into an index. |
 | |
Yearly periods ended December 31 | |
Comparative Results |
DWS Capital Growth VIP | 1-Year | 3-Year | 5-Year | 10-Year |
Class A | Growth of $10,000 | $10,896 | $14,929 | $8,526 | $20,877 |
Average annual total return | 8.96% | 14.29% | -3.14% | 7.64% |
S&P 500 Index | Growth of $10,000 | $10,491 | $14,970 | $10,275 | $23,836 |
Average annual total return | 4.91% | 14.39% | .54% | 9.07% |
Russell 1000 Growth Index | Growth of $10,000 | $10,526 | $14,518 | $8,332 | $19,179 |
Average annual total return | 5.26% | 13.23% | -3.58% | 6.73% |
DWS Capital Growth VIP | 1-Year | 3-Year | 5-Year | Life of Class* |
Class B | Growth of $10,000 | $10,851 | $14,766 | $8,381 | $14,736 |
Average annual total return | 8.51% | 13.87% | -3.47% | 4.59% |
S&P 500 Index | Growth of $10,000 | $10,491 | $14,970 | $10,275 | $16,793 |
Average annual total return | 4.91% | 14.39% | .54% | 6.23% |
Russell 1000 Growth Index | Growth of $10,000 | $10,526 | $14,518 | $8,332 | $13,551 |
Average annual total return | 5.26% | 13.23% | -3.58% | 3.60% |
The growth of $10,000 is cumulative.
* The Portfolio commenced selling Class B shares on May 12, 1997. Index returns begin May 31, 1997.
Information About Your Portfolio's Expenses
DWS Capital Growth VIP
As an investor of the Portfolio, you incur two types of costs: ongoing expenses and transaction costs. Ongoing expenses include management fees, distribution and service (12b-1) fees and other Portfolio expenses. Examples of transaction costs include sales charges (loads), redemption fees and account maintenance fees, which are not shown in this section. The following tables are intended to help you understand your ongoing expenses (in dollars) of investing in the Portfolio and to help you compare these expenses with the ongoing expenses of investing in other mutual funds. In the most recent six-month period, the Portfolio limited these expenses; had it not done so, expenses would have been higher. The tables are based on an investment of $1,000 made at the beginning of the six-month period ended December 31, 2005.
The tables illustrate your Portfolio's expenses in two ways:
Actual Portfolio Return. This helps you estimate the actual dollar amount of ongoing expenses (but not transaction costs) paid on a $1,000 investment in the Portfolio using the Portfolio's actual return during the period. To estimate the expenses you paid over the period, simply divide your account value by $1,000 (for example, an $8,600 account value divided by $1,000 = 8.6), then multiply the result by the number in the "Expenses Paid per $1,000" line under the share class you hold.
Hypothetical 5% Portfolio Return. This helps you to compare your Portfolio's ongoing expenses (but not transaction costs) with those of other mutual funds using the Portfolio's actual expense ratio and a hypothetical rate of return of 5% per year before expenses. Examples using a 5% hypothetical Portfolio return may be found in the shareholder reports of other mutual funds. The hypothetical account values and expenses may not be used to estimate the actual ending account balance or expenses you paid for the period.
Please note that the expenses shown in these tables are meant to highlight your ongoing expenses only and do not reflect any transaction costs. The "Expenses Paid per $1,000" line of the tables is useful in comparing ongoing expenses only and will not help you determine the relative total expense of owning different funds. If these transaction costs had been included, your costs would have been higher.
Expenses and Value of a $1,000 Investment for the six months ended December 31, 2005 |
Actual Portfolio Return | Class A | | Class B | |
Beginning Account Value 7/1/05 | $ 1,000.00 | | $ 1,000.00 | |
Ending Account Value 12/31/05 | $ 1,074.40 | | $ 1,072.10 | |
Expenses Paid per $1,000* | $ 2.56 | | $ 4.44 | |
Hypothetical 5% Portfolio Return | Class A | | Class B | |
Beginning Account Value 7/1/05 | $ 1,000.00 | | $ 1,000.00 | |
Ending Account Value 12/31/05 | $ 1,022.74 | | $ 1,020.92 | |
Expenses Paid per $1,000* | $ 2.50 | | $ 4.33 | |
* Expenses are equal to the Portfolio's annualized expense ratio for each share class, multiplied by the average account value over the period, multiplied by the number of days in the most recent six-month period, then divided by 365.
Annualized Expense Ratios | Class A | | Class B | |
DWS Variable Series I — DWS Capital Growth VIP | .49% | | .86% | |
For more information, please refer to the Portfolio's prospectus.
These tables do not reflect charges and fees ("contract charges") associated with the separate account that invests in the Portfolio or any variable life insurance policy or variable annuity contract for which the Portfolio is an investment option.
Management Summary December 31, 2005
DWS Capital Growth VIP
A generally high level of uncertainty led to a lack of conviction that tempered equity market returns in 2005. Investors weighed robust corporate earnings growth and strong corporate balance sheets against a backdrop of tightening monetary policy, horrible natural disasters, soaring energy prices and geopolitical risks. In the end, however, the equity market proved resilient, posting positive returns for the year, as the Portfolio's two benchmark indices, the S&P 500 and the Russell 1000 Growth, returned 4.91% and 5.26%, respectively. DWS Capital Growth VIP's diversified, high-quality approach to large-cap growth management enabled the Portfolio to outperform its benchmarks by posting an 8.96% annual return (Class A shares, unadjusted for contract charges).
Both sector allocation and stock selection contributed to the Portfolio's outperformance. Most significant was the Portfolio's strategic overweight in the energy sector, based on our belief that chronic underinvestment in the exploration for and production of new oil reserves creates long-term growth opportunities. Our emphasis within the energy group is on energy equipment and services and oil and gas exploration. Energy holdings that were particularly strong in 2005 include EOG Resources, Inc., Devon Energy Corp., Valero Energy Corp. and XTO Energy, Inc.
Positioning in the health care sector produced mixed results in 2005, as some of the largest contributors and detractors were found in this sector. On the positive side, holdings in the biotechnology industry, a space that reconciles well with the Portfolio managers' emphasis on innovation, were extremely additive to returns. Genentech, Inc., and Gilead Sciences, Inc., were up significantly. Additionally, UnitedHealth Group, Inc. showed a strong gain rewarding the Portfolio's overweight position. Detracting from returns were holdings in the pharmaceuticals and health care equipment industries. Pfizer, Inc., Zimmer Holdings, Inc. and Boston Scientific Corp. were examples of this weakness.
Stock selection within the consumer discretionary sector detracted from the Portfolio's returns, as Harley-Davidson, Inc. stock dropped at midyear after the company reduced production and earnings estimates; we continue to hold this stock, which has recovered significantly from its low point. Also negative was stock selection in the technology sector, where EMC Corp. and Electronic Arts, Inc., underperformed.
While there has been no significant change to our strategic sector allocation, we have attempted to find companies that reconcile well with our key selection criteria of quality and growth and that are well-positioned to perform in the latter stages of an economic expansion. We believe that the ability to deliver consistent earnings growth will be critical to success in 2006. We continue to place a significant premium on innovation across market sectors. We feel innovation will continue to separate growth companies from value companies and winners from losers. We believe that the companies in this Portfolio possess these attributes, and we therefore believe that the Portfolio is well-positioned for continued success.
Julie M. Van Cleave, CFA Jack A. Zehner
Lead Portfolio Manager Thomas J. Schmid, CFA
Portfolio Managers
All performance shown is historical, assumes reinvestment of all dividend and capital gain distributions, and does not guarantee future results. Investment return and principal value fluctuate with changing market conditions so that, when redeemed, shares may be worth more or less than their original cost. Current performance may be lower or higher than the performance data quoted. Please visit www.dws-scudder.com for the product's most recent month-end performance. Performance doesn't reflect charges and fees ("contract charges") associated with the separate account that invests in the Portfolio or any variable life insurance policy or variable annuity contract for which the Portfolio is an investment option. These charges and fees will reduce returns.
Risk Considerations
The Portfolio is subject to stock market risk, meaning stocks in the Portfolio may decline in value for extended periods of time due to the activities and financial prospects of individual companies, or due to general market and economic conditions. Please read this Portfolio's prospectus for specific information regarding its investments and risk profile.
The Standard & Poor's 500 (S&P 500) index is an unmanaged capitalization-weighted index of 500 stocks. The index is designed to measure performance of the broad domestic economy through changes in the aggregate market value of 500 stocks representing all major industries.
The Russell 1000 Growth Index is an unmanaged, capitalization-weighted index containing those securities in the Russell 1000 Index with higher price-to-book ratios and higher forecasted growth values.
Index returns assume reinvestment of all distributions and do not reflect fees or expenses. It is not possible to invest directly in an index.
Portfolio management market commentary is as of December 31, 2005, and may not come to pass. This information is subject to change at any time based on market and other conditions.
Portfolio Summary
DWS Capital Growth VIP
Asset Allocation (Excludes Securities Lending Collateral) | 12/31/05 | 12/31/04 |
| | |
Common Stocks | 98% | 97% |
Cash Equivalents | 2% | 2% |
Exchange Traded Fund | — | 1% |
| 100% | 100% |
Sector Diversification (As a % of Common Stocks) | 12/31/05 | 12/31/04 |
| | |
Information Technology | 25% | 23% |
Health Care | 21% | 21% |
Energy | 14% | 10% |
Consumer Staples | 12% | 11% |
Consumer Discretionary | 11% | 16% |
Industrials | 9% | 8% |
Financials | 7% | 9% |
Materials | 1% | 1% |
Telecommunication Services | — | 1% |
| 100% | 100% |
Asset allocation and sector diversification are subject to change.
For more complete details about the Portfolio's investment portfolio, see page 46. A quarterly Fact Sheet is available upon request. Information concerning portfolio holdings of the Portfolio as of month-end will be posted to www.dws-scudder.com on the 15th day of the following month.
Following the Portfolio's fiscal first and third quarter-end, a complete portfolio holdings listing is filed with the SEC on Form N-Q. The form will be available on the SEC's Web site at www.sec.gov, and it also may be reviewed and copied at the SEC's Public Reference Room in Washington, D.C. Information on the operation of the SEC's Public Reference Room may be obtained by calling (800) SEC-0330.
Investment Portfolio December 31, 2005
DWS Capital Growth VIP
|
Shares
| Value ($) |
| |
Common Stocks 98.4% |
Consumer Discretionary 11.1% |
Automobiles 0.9% |
Harley-Davidson, Inc. (a) | 204,000 | 10,503,960 |
Hotels Restaurants & Leisure 0.8% |
Starbucks Corp.* | 292,800 | 8,786,928 |
Household Durables 0.7% |
Fortune Brands, Inc. | 101,300 | 7,903,426 |
Internet & Catalog Retail 1.0% |
eBay, Inc.* | 256,400 | 11,089,300 |
Media 2.7% |
McGraw-Hill Companies, Inc. | 301,900 | 15,587,097 |
Omnicom Group, Inc. | 171,540 | 14,603,200 |
| 30,190,297 |
Multiline Retail 2.7% |
Kohl's Corp.* | 195,300 | 9,491,580 |
Target Corp. | 361,200 | 19,855,164 |
| 29,346,744 |
Specialty Retail 2.3% |
Bed Bath & Beyond, Inc.* | 128,800 | 4,656,120 |
Home Depot, Inc. | 71,875 | 2,909,500 |
Lowe's Companies, Inc. | 106,300 | 7,085,958 |
Staples, Inc. | 472,400 | 10,728,204 |
| 25,379,782 |
Consumer Staples 11.6% |
Beverages 2.9% |
Diageo PLC | 299,553 | 4,342,087 |
PepsiCo, Inc. | 464,250 | 27,427,890 |
| 31,769,977 |
Food & Staples Retailing 3.0% |
Wal-Mart Stores, Inc. | 369,390 | 17,287,452 |
Walgreen Co. | 363,300 | 16,079,658 |
| 33,367,110 |
Food Products 2.2% |
Dean Foods Co.* | 169,900 | 6,398,434 |
Kellogg Co. | 234,700 | 10,143,734 |
The Hershey Co. | 138,700 | 7,663,175 |
| 24,205,343 |
Household Products 3.5% |
Colgate-Palmolive Co. | 164,440 | 9,019,534 |
Kimberly-Clark Corp. | 79,700 | 4,754,105 |
Procter & Gamble Co. | 423,800 | 24,529,544 |
| 38,303,183 |
Energy 13.9% |
Energy Equipment & Services 6.0% |
Baker Hughes, Inc. | 281,200 | 17,091,336 |
Halliburton Co. | 102,100 | 6,326,116 |
Noble Corp. | 79,200 | 5,586,768 |
Schlumberger Ltd. | 197,900 | 19,225,985 |
Transocean, Inc.* | 254,840 | 17,759,799 |
| 65,990,004 |
|
Shares
| Value ($) |
| |
Oil, Gas & Consumable Fuels 7.9% |
ConocoPhillips | 301,660 | 17,550,579 |
Devon Energy Corp. | 361,200 | 22,589,448 |
EOG Resources, Inc. | 302,000 | 22,157,740 |
Valero Energy Corp. | 291,600 | 15,046,560 |
XTO Energy, Inc. | 225,766 | 9,920,158 |
| 87,264,485 |
Financials 7.3% |
Banks 1.2% |
Bank of America Corp. | 297,500 | 13,729,625 |
Capital Markets 2.9% |
Lehman Brothers Holdings, Inc. | 107,400 | 13,765,458 |
Merrill Lynch & Co., Inc. | 99,300 | 6,725,589 |
The Goldman Sachs Group, Inc. | 90,400 | 11,544,984 |
| 32,036,031 |
Consumer Finance 0.9% |
American Express Co. | 195,400 | 10,055,284 |
Diversified Financial Services 1.1% |
Citigroup, Inc. | 243,999 | 11,841,271 |
Insurance 1.2% |
AFLAC, Inc. | 277,200 | 12,867,624 |
Health Care 20.1% |
Biotechnology 5.9% |
Amgen, Inc.* | 181,450 | 14,309,147 |
Genentech, Inc.* | 337,200 | 31,191,000 |
Gilead Sciences, Inc.* | 383,500 | 20,183,605 |
| 65,683,752 |
Health Care Equipment & Supplies 5.1% |
Baxter International, Inc. | 258,100 | 9,717,465 |
Boston Scientific Corp.* | 281,300 | 6,889,037 |
C.R. Bard, Inc. | 111,700 | 7,363,264 |
Medtronic, Inc. | 281,300 | 16,194,441 |
Zimmer Holdings, Inc.* | 232,240 | 15,662,266 |
| 55,826,473 |
Health Care Providers & Services 3.3% |
UnitedHealth Group, Inc. | 587,800 | 36,525,892 |
Pharmaceuticals 5.8% |
Abbott Laboratories | 409,100 | 16,130,813 |
Eli Lilly & Co. | 133,300 | 7,543,447 |
Johnson & Johnson | 587,186 | 35,289,878 |
Pfizer, Inc. | 224,177 | 5,227,808 |
| 64,191,946 |
Industrials 9.0% |
Aerospace & Defense 2.2% |
United Technologies Corp. | 434,000 | 24,264,940 |
Air Freight & Logistics 1.3% |
FedEx Corp. | 140,100 | 14,484,939 |
Electrical Equipment 1.2% |
Emerson Electric Co. | 184,900 | 13,812,030 |
Industrial Conglomerates 3.4% |
General Electric Co. | 1,072,190 | 37,580,260 |
|
Shares
| Value ($) |
| |
Machinery 0.9% |
Caterpillar, Inc. | 165,400 | 9,555,158 |
Information Technology 24.5% |
Communications Equipment 2.5% |
Cisco Systems, Inc.* | 757,320 | 12,965,318 |
QUALCOMM, Inc. | 345,100 | 14,866,908 |
| 27,832,226 |
Computers & Peripherals 5.1% |
Apple Computer, Inc.* | 217,700 | 15,650,453 |
Dell, Inc.* | 347,950 | 10,435,021 |
EMC Corp.* | 1,297,600 | 17,673,312 |
International Business Machines Corp. | 156,200 | 12,839,640 |
| 56,598,426 |
Internet Software & Services 1.4% |
Google, Inc. "A"* | 7,200 | 2,986,992 |
Yahoo!, Inc.* | 311,050 | 12,186,940 |
| 15,173,932 |
IT Consulting & Services 2.3% |
Accenture Ltd. "A" | 373,900 | 10,794,493 |
Fiserv, Inc.* | 203,900 | 8,822,753 |
Paychex, Inc. | 143,600 | 5,474,032 |
| 25,091,278 |
Semiconductors & Semiconductor Equipment 6.9% |
Broadcom Corp. "A"* | 343,500 | 16,196,025 |
Intel Corp. | 912,490 | 22,775,750 |
Linear Technology Corp. | 307,930 | 11,107,035 |
Maxim Integrated Products, Inc. | 294,800 | 10,683,552 |
|
Shares
| Value ($) |
| |
Texas Instruments, Inc. | 494,350 | 15,853,805 |
| 76,616,167 |
Software 6.3% |
Adobe Systems, Inc. | 309,000 | 11,420,640 |
Electronic Arts, Inc.* | 214,200 | 11,204,802 |
Microsoft Corp. | 1,568,180 | 41,007,907 |
Oracle Corp.* | 495,800 | 6,053,717 |
| 69,687,066 |
Materials 0.9% |
Chemicals |
Ecolab, Inc. | 261,700 | 9,491,859 |
Total Common Stocks (Cost $811,254,532) | 1,087,046,718 |
|
Securities Lending Collateral 0.6% |
Daily Assets Fund Institutional, 4.28% (b) (c) (Cost $6,539,400) | 6,539,400 | 6,539,400 |
|
Cash Equivalents 1.6% |
Cash Management QP Trust, 4.26% (d) (Cost $18,109,690) | 18,109,690 | 18,109,690 |
| % of Net Assets | Value ($) |
| |
Total Investment Portfolio (Cost $835,903,622)+ | 100.6 | 1,111,695,808 |
Other Assets and Liabilities, Net | (0.6) | (7,010,102) |
Net Assets | 100.0 | 1,104,685,706 |
* Non-income producing security.
+ The cost for federal income tax purposes was $841,356,883. At December 31, 2005, net unrealized appreciation for all securities based on tax cost was $270,338,925. This consisted of aggregate gross unrealized appreciation for all securities in which there was an excess of value over tax cost of $297,840,430 and aggregate gross unrealized depreciation for all securities in which there was an excess of tax cost over value of $27,501,505.
(a) All or a portion of these securities were on loan (See Notes to Financial Statements). The value of all securities loaned at December 31, 2005 amounted to $6,235,439 which is 0.6% of net assets.
(b) Daily Assets Fund Institutional, an affiliated fund, is managed by Deutsche Asset Management, Inc. The rate shown is the annualized seven-day yield at period end.
(c) Represents collateral held in connection with securities lending.
(d) Cash Management QP Trust, an affiliated fund, is managed by Deutsche Investment Management Americas Inc. The rate shown is the annualized seven-day yield at period end.
The accompanying notes are an integral part of the financial statements.
Financial Statements
Statement of Assets and Liabilities as of December 31, 2005 |
Assets |
Investments: Investments in securities, at value (cost $811,254,532), including $6,235,439 of securities loaned | $ 1,087,046,718 |
Investment in Daily Assets Fund Institutional (cost $6,539,400)* | 6,539,400 |
Investment in Cash Management QP Trust (cost $18,109,690) | 18,109,690 |
Total investments in securities, at value (cost $835,903,622) | 1,111,695,808 |
Dividends receivable | 800,054 |
Interest receivable | 70,215 |
Receivable for investments sold | 3,300,825 |
Receivable for Portfolio shares sold | 111,130 |
Other assets | 32,228 |
Total assets | 1,116,010,260 |
Liabilities |
Payable upon return of securities loaned | 6,539,400 |
Payable for investments purchased | 3,292,982 |
Payable for Portfolio shares redeemed | 1,024,459 |
Accrued management fee | 406,046 |
Accrued distribution fees (Class B) | 15,196 |
Other accrued expenses and payables | 46,471 |
Total liabilities | 11,324,554 |
Net assets, at value | $ 1,104,685,706 |
Net Assets |
Net assets consist of: Undistributed net investment income | 5,517,479 |
Net unrealized appreciation (depreciation) on investments | 275,792,186 |
Accumulated net realized gain (loss) | (370,857,451) |
Paid-in capital | 1,194,233,492 |
Net assets, at value | $ 1,104,685,706 |
Class A Net Asset Value, offering and redemption price per share ($1,031,481,514 ÷ 61,042,375 outstanding shares of beneficial interest, no par value, unlimited number of shares authorized) | $ 16.90 |
Class B Net Asset Value, offering and redemption price per share ($73,204,192 ÷ 4,353,863 outstanding shares of beneficial interest, no par value, unlimited number of shares authorized) | $ 16.81 |
* Represents collateral on securities loaned.
The accompanying notes are an integral part of the financial statements.
Statement of Operations for the year ended December 31, 2005 |
Investment Income |
Income: Dividends | $ 10,072,806 |
Interest — Cash Management QP Trust | 535,599 |
Securities lending income, including income from Daily Assets Fund Institutional, net of borrower rebates | 13,757 |
Total Income | 10,622,162 |
Expenses: Management fee | 4,421,003 |
Custodian and accounting fees | 206,366 |
Distribution service fees (Class B) | 138,501 |
Record keeping fees (Class B) | 78,741 |
Auditing | 36,339 |
Legal | 37,205 |
Trustees' fees and expenses | 25,734 |
Reports to shareholders | 40,270 |
Other | 53,533 |
Total expenses before expense reductions | 5,037,692 |
Expense reductions | (56,901) |
Total expenses after expense reductions | 4,980,791 |
Net investment income (loss) | 5,641,371 |
Realized and Unrealized Gain (Loss) on Investment Transactions |
Net realized gain (loss) from: Investments | 28,746,725 |
Foreign currency related transactions | (5,714) |
| 28,741,011 |
Net unrealized appreciation (depreciation) during the period on investments | 68,936,129 |
Net gain (loss) on investment transactions | 97,677,140 |
Net increase (decrease) in net assets resulting from operations | $ 103,318,511 |
The accompanying notes are an integral part of the financial statements.
Statement of Changes in Net Assets |
| Years Ended December 31, |
Increase (Decrease) in Net Assets | 2005 | 2004 |
Operations: Net investment income (loss) | $ 5,641,371 | $ 6,855,154 |
Net realized gain (loss) on investment transactions | 28,741,011 | (47,247,081) |
Net unrealized appreciation (depreciation) during the period on investment transactions | 68,936,129 | 94,779,509 |
Net increase (decrease) in net assets resulting from operations | 103,318,511 | 54,387,582 |
Distributions to shareholders from: Net investment income: Class A | (6,678,103) | (3,764,724) |
Class B | (143,508) | (32,841) |
Portfolio share transactions: Class A Proceeds from shares sold | 32,068,877 | 32,110,324 |
Net assets acquired in tax-free reorganization | 335,682,359 | — |
Reinvestment of distributions | 6,678,103 | 3,764,724 |
Cost of shares redeemed | (130,607,217) | (92,227,827) |
Net increase (decrease) in net assets from Class A share transactions | 243,822,122 | (56,352,779) |
Class B Proceeds from shares sold | 47,750,588 | 8,550,042 |
Net assets acquired in tax-free reorganization | 44,685,282 | — |
Reinvestment of distributions | 143,508 | 32,841 |
Cost of shares redeemed | (49,704,968) | (1,806,233) |
Net increase (decrease) in net assets from Class B share transactions | 42,874,410 | 6,776,650 |
Increase (decrease) in net assets | 383,193,432 | 1,013,888 |
Net assets at beginning of period | 721,492,274 | 720,478,386 |
Net assets at end of period (including undistributed net investment income of $5,517,479 and $6,697,719, respectively) | $ 1,104,685,706 | $ 721,492,274 |
Other Information |
Class A Shares outstanding at beginning of period | 44,544,616 | 48,332,734 |
Shares sold | 1,996,443 | 2,172,282 |
Shares issued in tax-free reorganization | 22,200,595 | — |
Shares issued to shareholders in reinvestment of distributions | 441,966 | 255,928 |
Shares redeemed | (8,141,245) | (6,216,328) |
Net increase (decrease) in Class A shares | 16,497,759 | (3,788,118) |
Shares outstanding at end of period | 61,042,375 | 44,544,616 |
Class B Shares outstanding at beginning of period | 1,503,725 | 1,044,792 |
Shares sold | 3,152,024 | 579,183 |
Shares issued in tax-free reorganization | 2,963,218 | — |
Shares issued to shareholders in reinvestment of distributions | 9,523 | 2,239 |
Shares redeemed | (3,274,627) | (122,489) |
Net increase (decrease) in Class B shares | 2,850,138 | 458,933 |
Shares outstanding at end of period | 4,353,863 | 1,503,725 |
The accompanying notes are an integral part of the financial statements.
Financial Highlights
Class A Years Ended December 31, | 2005 | 2004 | 2003 | 2002 | 2001 |
Selected Per Share Data |
Net asset value, beginning of period | $ 15.67 | $ 14.59 | $ 11.54 | $ 16.36 | $ 23.07 |
Income (loss) from investment operations: Net investment income (loss)a | .10 | .14 | .08 | .05 | .05 |
Net realized and unrealized gain (loss) on investment transactions | 1.29 | 1.02 | 3.03 | (4.82) | (4.21) |
Total from investment operations | 1.39 | 1.16 | 3.11 | (4.77) | (4.16) |
Less distributions from: Net investment income | (.16) | (.08) | (.06) | (.05) | (.08) |
Net realized gain on investment transactions | — | — | — | — | (2.47) |
Total distributions | (.16) | (.08) | (.06) | (.05) | (2.55) |
Net asset value, end of period | $ 16.90 | $ 15.67 | $ 14.59 | $ 11.54 | $ 16.36 |
Total Return (%) | 8.96c | 7.99 | 26.89 | (29.18) | (19.36) |
Ratios to Average Net Assets and Supplemental Data |
Net assets, end of period ($ millions) | 1,031 | 698 | 705 | 558 | 866 |
Ratio of expenses before expense reductions (%) | .50 | .50 | .51 | .51 | .52b |
Ratio of expenses after expense reductions (%) | .49 | .50 | .51 | .51 | .50b |
Ratio of net investment income (loss) (%) | .61 | .98 | .61 | .38 | .27 |
Portfolio turnover rate (%) | 17 | 15 | 13 | 25 | 33 |
a Based on average shares outstanding during the period. b The ratios of operating expenses excluding costs incurred in connection with a fund complex reorganization before and after expense reductions were .50% and .50%, respectively. c Total return would have been less had certain expenses not been reduced. |
Class B Years Ended December 31, | 2005 | 2004 | 2003 | 2002 | 2001 |
Selected Per Share Data |
Net asset value, beginning of period | $ 15.59 | $ 14.52 | $ 11.49 | $ 16.29 | $ 23.00 |
Income (loss) from investment operations: Net investment income (loss)a | .04 | .09 | .03 | .02 | .00b |
Net realized and unrealized gain (loss) on investment transactions | 1.28 | 1.01 | 3.02 | (4.81) | (4.21) |
Total from investment operations | 1.32 | 1.10 | 3.05 | (4.79) | (4.21) |
Less distributions from: Net investment income | (.10) | (.03) | (.02) | (.01) | (.03) |
Net realized gain on investment transactions | — | — | — | — | (2.47) |
Total distributions | (.10) | (.03) | (.02) | (.01) | (2.50) |
Net asset value, end of period | $ 16.81 | $ 15.59 | $ 14.52 | $ 11.49 | $ 16.29 |
Total Return (%) | 8.51d | 7.56 | 26.51 | (29.37) | (19.64) |
Ratios to Average Net Assets and Supplemental Data |
Net assets, end of period ($ millions) | 73 | 23 | 15 | .89 | .71 |
Ratio of expenses before expense reductions (%) | .89 | .88 | .87 | .76 | .77c |
Ratio of expenses after expense reductions (%) | .86 | .88 | .87 | .76 | .75c |
Ratio of net investment income (loss) (%) | .24 | .60 | .25 | .13 | .02 |
Portfolio turnover rate (%) | 17 | 15 | 13 | 25 | 33 |
a Based on average shares outstanding during the period. b Amount is less than $.005. c The ratios of operating expenses excluding costs incurred in connection with a fund complex reorganization before and after expense reductions were .75% and .75%, respectively. d Total return would have been less had certain expenses not been reduced. |
Performance Summary December 31, 2005
DWS Global Opportunities VIP
All performance shown is historical, assumes reinvestment of all dividend and capital gain distributions, and does not guarantee future results. Investment return and principal value fluctuate with changing market conditions so that, when redeemed, shares may be worth more or less than their original cost. Current performance may be lower or higher than the performance data quoted. Please visit www.dws-scudder.com for the Portfolio's most recent month-end performance. Performance doesn't reflect charges and fees ("contract charges") associated with the separate account that invests in the Portfolio or any variable life insurance policy or variable annuity contract for which the Portfolio is an investment option. These charges and fees will reduce returns.
Returns shown for the life of class periods reflect a fee waiver and/or reimbursement. Without this waiver/reimbursement, returns would have been lower.
Risk Considerations
This Portfolio is subject to stock market risk. Investing in foreign securities presents certain unique risks not associated with domestic investments, such as currency fluctuations, political and economic changes and market risks. Additionally, stocks of small-sized companies involve greater risk as they often have limited product lines, markets, or financial resources and may be sensitive to erratic and abrupt market movements more so than securities of larger, more-established companies. All of these factors may result in greater share price volatility. Please read this Portfolio's prospectus for specific details regarding its investments and risk profile.
Growth of an Assumed $10,000 Investment |
[] DWS Global Opportunities VIP — Class A* [] S&P/Citigroup World Equity EMI | The S&P/Citigroup World Equity Extended Market Index (Citigroup World Equity EMI), is an unmanaged index of small-capitalization stocks within 27 countries around the globe. Index returns assume the reinvestment of dividends and, unlike portfolio returns, do not reflect any fees or expenses. It is not possible to invest directly into an index. |
 | |
Yearly periods ended December 31 | |
Comparative Results |
DWS Global Opportunities VIP | 1-Year | 3-Year | 5-Year | Life of Class* |
Class A | Growth of $10,000 | $11,819 | $21,734 | $13,130 | $28,481 |
Average annual total return | 18.19% | 29.53% | 5.60% | 11.44% |
S&P/Citigroup World Equity EMI | Growth of $10,000 | $11,543 | $21,024 | $17,148 | $24,000 |
Average annual total return | 15.43% | 28.11% | 11.39% | 9.48% |
DWS Global Opportunities VIP | 1-Year | 3-Year | 5-Year | Life of Class** |
Class B | Growth of $10,000 | $11,806 | $21,625 | $12,971 | $26,920 |
Average annual total return | 18.06% | 29.32% | 5.34% | 12.11% |
S&P/Citigroup World Equity EMI | Growth of $10,000 | $11,543 | $21,024 | $17,148 | $24,313 |
Average annual total return | 15.43% | 28.11% | 11.39% | 10.79% |
The growth of $10,000 is cumulative.
* The Portfolio commenced operations on May 1,1996. Index returns begin April 30, 1996.
** The Portfolio commenced selling Class B shares on May 2, 1997. Index returns begin April 30, 1997.
Information About Your Portfolio's Expenses
DWS Global Opportunities VIP
As an investor of the Portfolio, you incur two types of costs: ongoing expenses and transaction costs. Ongoing expenses include management fees, distribution and service (12b-1) fees and other Portfolio expenses. Examples of transaction costs include sales charges (loads), redemption fees and account maintenance fees, which are not shown in this section. The following tables are intended to help you understand your ongoing expenses (in dollars) of investing in the Portfolio and to help you compare these expenses with the ongoing expenses of investing in other mutual funds. In the most recent six-month period, the Class B shares limited these expenses; had it not done so, expenses would have been higher. The tables are based on an investment of $1,000 made at the beginning of the six-month period ended December 31, 2005.
The tables illustrate your Portfolio's expenses in two ways:
Actual Portfolio Return. This helps you estimate the actual dollar amount of ongoing expenses (but not transaction costs) paid on a $1,000 investment in the Portfolio using the Portfolio's actual return during the period. To estimate the expenses you paid over the period, simply divide your account value by $1,000 (for example, an $8,600 account value divided by $1,000 = 8.6), then multiply the result by the number in the "Expenses Paid per $1,000" line under the share class you hold.
Hypothetical 5% Portfolio Return. This helps you to compare your Portfolio's ongoing expenses (but not transaction costs) with those of other mutual funds using the Portfolio's actual expense ratio and a hypothetical rate of return of 5% per year before expenses. Examples using a 5% hypothetical Portfolio return may be found in the shareholder reports of other mutual funds. The hypothetical account values and expenses may not be used to estimate the actual ending account balance or expenses you paid for the period.
Please note that the expenses shown in these tables are meant to highlight your ongoing expenses only and do not reflect any transaction costs. The "Expenses Paid per $1,000" line of the tables is useful in comparing ongoing expenses only and will not help you determine the relative total expense of owning different funds. If these transaction costs had been included, your costs would have been higher.
Expenses and Value of a $1,000 Investment for the six months ended December 31, 2005 |
Actual Portfolio Return | Class A | | Class B | |
Beginning Account Value 7/1/05 | $ 1,000.00 | | $ 1,000.00 | |
Ending Account Value 12/31/05 | $ 1,130.40 | | $ 1,130.20 | |
Expenses Paid per $1,000* | $ 6.44 | | $ 6.66 | |
Hypothetical 5% Portfolio Return | Class A | | Class B | |
Beginning Account Value 7/1/05 | $ 1,000.00 | | $ 1,000.00 | |
Ending Account Value 12/31/05 | $ 1,019.16 | | $ 1,018.95 | |
Expenses Paid per $1,000* | $ 6.11 | | $ 6.31 | |
* Expenses are equal to the Portfolio's annualized expense ratio for each share class, multiplied by the average account value over the period, multiplied by the number of days in the most recent six-month period, then divided by 365.
Annualized Expense Ratios | Class A | | Class B | |
DWS Variable Series I — DWS Global Opportunities VIP | 1.20% | | 1.24% | |
For more information, please refer to the Portfolio's prospectus.
These tables do not reflect charges and fees ("contract charges") associated with the separate account that invests in the Portfolio or any variable life insurance policy or variable annuity contract for which the Portfolio is an investment option.
Management Summary December 31, 2005
DWS Global Opportunities VIP
DWS Global Opportunities VIP provided a total return of 18.19% for 2005 (Class A shares, unadjusted for contract charges), ahead of the 15.43% return of its benchmark, the Citigroup World Equity Extended Market Index. The Portfolio's performance was the third-best among the 37 comparable annuity Portfolios in Lipper's Global Growth Funds category for the one-year period. For the same category, the Portfolio ranked three of 29 for the three-year period and five of 19 for the five-year period.
We continue to employ a disciplined, research-oriented approach to construct the Portfolio one stock at a time. Our best relative performance was in the financials sector, where top contributors included Legg Mason, Inc. (United States), Deutsche Boerse AG (Germany) and Sumitomo Realty & Development Co., Ltd. (Japan). Our stock picking in the energy sector also added value. The Portfolio's holding in EOG Resources, Inc. (United States) delivered a gain, and we elected to take profits in the position and roll the proceeds into Ultra Petroleum Corp. (United States), which subsequently doubled in price. A position in Spinnaker Exploration Co. (United States) (not held in the Portfolio at the end of the reporting period) also paid off when the company was taken over at a premium by Norsk Hydro ASA (Norway) in September. Stock selection was also strong in the utilities sector, where the top contributor was Allegheny Energy, Inc. (United States) The two largest factors detracting from the Portfolio's return were an overweight in technology stocks and an underweight in industrials.
Although small caps' long stretch of outperformance (as measured by the Citigroup World Equity Extended Market Index) raises the risk that the asset class will begin to lag, we believe our broad investment universe-which encompasses micro-, small- and mid-cap companies anywhere in the world-provides us with fertile ground in which to find the approximately 100 "best ideas" that typically make up the Portfolio.
Joseph Axtell, CFA Terrence S. Gray, CFA
Lead Portfolio Manager Portfolio Manager
All performance shown is historical, assumes reinvestment of all dividend and capital gain distributions, and does not guarantee future results. Investment return and principal value fluctuate with changing market conditions so that, when redeemed, shares may be worth more or less than their original cost. Current performance may be lower or higher than the performance data quoted. Please visit www.dws-scudder.com for the product's most recent month-end performance. Performance doesn't reflect charges and fees ("contract charges") associated with the separate account that invests in the Portfolio or any variable life insurance policy or variable annuity contract for which the Portfolio is an investment option. These charges and fees will reduce returns.
Risk Considerations
This Portfolio is subject to stock market risk. Investing in foreign securities presents certain unique risks not associated with domestic investments, such as currency fluctuations, political and economic changes and market risks. Additionally, stocks of small-sized companies involve greater risk as they often have limited product lines, markets or financial resources and may be sensitive to erratic and abrupt market movements more so than securities of larger, more established companies. All of these factors may result in greater share price volatility. Please read this Portfolio's prospectus for specific details regarding its investments and risk profile.
The S&P/Citigroup World Equity Extended Market Index (Citigroup World Equity EMI) is an unmanaged index of small-capitalization stocks within 27 countries around the globe. Index returns assume the reinvestment of dividends and, unlike portfolio returns, do not reflect any fees or expenses. It is not possible to invest directly into an index.
The Lipper Global Growth includes funds that, by portfolio practice, invest at least 75% of their equity assets in companies both inside and outside of the U.S. with market capitalizations (on a three-year weighted basis) greater than the 500th-largest company in the S&P/Citigroup World Broad Market Index. Large-cap growth funds typically have an above-average price-to-cash flow ratio, price-to-book ratio, and three-year sales-per-share growth value compared to the S&P/Citigroup World BMI. It is not possible to invest directly into a Lipper category.
Source: Lipper Inc. Rankings are historical and do not guarantee future results. Rankings are based on the Portfolio's total return unadjusted for contract charges with distributions reinvested. If contract charges had been included, results might have been less favorable. Rankings are for Class A shares; other share classes may vary.
Portfolio management market commentary is as of December 31, 2005, and may not come to pass. This information is subject to change at any time based on market and other conditions.
Portfolio Summary
DWS Global Opportunities VIP
Asset Allocation (Excludes Securities Lending Collateral) | 12/31/05 | 12/31/04 |
| | |
Common Stocks and Warrants | 99% | 94% |
Cash Equivalents | 1% | 6% |
| 100% | 100% |
Geographical Diversification (Excludes Cash Equivalents and Securities Lending Collateral) | 12/31/05 | 12/31/04 |
| | |
Europe | 38% | 41% |
United States | 37% | 35% |
Japan | 8% | 7% |
Pacific Basin | 7% | 5% |
United Kingdom | 4% | 5% |
Australia | 2% | 2% |
Latin America | 2% | 2% |
Canada | 1% | 2% |
Other | 1% | 1% |
| 100% | 100% |
Sector Diversification (As a % of Common Stocks) | 12/31/05 | 12/31/04 |
| | |
Financials | 25% | 25% |
Consumer Discretionary | 17% | 21% |
Industrials | 14% | 15% |
Health Care | 14% | 12% |
Information Technology | 14% | 16% |
Energy | 5% | 3% |
Materials | 4% | 3% |
Utilities | 3% | 2% |
Consumer Staples | 2% | 2% |
Telecommunication Services | 2% | 1% |
| 100% | 100% |
Asset allocation, geographical diversification and sector diversification are subject to change.
For more complete details about the Portfolio's investment portfolio, see page 58. A quarterly Fact Sheet is available upon request. Information concerning portfolio holdings of the Portfolio as of month-end will be posted to www.dws-scudder.com on the 15th day of the following month.
Following the Portfolio's fiscal first and third quarter-end, a complete portfolio holdings listing is filed with the SEC on Form N-Q. The form will be available on the SEC's Web site at www.sec.gov, and it also may be reviewed and copied at the SEC's Public Reference Room in Washington, D.C. Information on the operation of the SEC's Public Reference Room may be obtained by calling (800) SEC-0330.
Investment Portfolio December 31, 2005
DWS Global Opportunities VIP
|
Shares
| Value ($) |
| |
Common Stocks 98.8% |
Australia 2.4% |
Macquarie Bank Ltd. | 82,011 | 4,097,334 |
QBE Insurance Group Ltd. | 109,098 | 1,567,603 |
Sigma Pharmaceuticals Ltd. | 863,938 | 1,976,062 |
(Cost $3,537,175) | 7,640,999 |
Bermuda 0.5% |
Orient-Express Hotels Ltd. "A" (Cost $1,474,197) | 47,700 | 1,503,504 |
Brazil 1.6% |
Aracruz Celulose SA "B" (ADR) | 71,400 | 2,856,714 |
Empresa Brasiliera de Aeronautica SA (Preferred) (ADR) | 61,418 | 2,401,444 |
(Cost $3,225,777) | 5,258,158 |
Canada 1.4% |
OPTI Canada, Inc.* | 60,000 | 1,970,149 |
ZENON Environmental, Inc.* | 166,000 | 2,401,927 |
(Cost $4,057,639) | 4,372,076 |
Denmark 1.1% |
GN Store Nord AS (GN Great Nordic) (Cost $2,726,276) | 267,500 | 3,501,864 |
France 3.9% |
Autoroutes du Sud de la France | 61,108 | 3,617,288 |
Business Objects SA* | 29,188 | 1,181,458 |
Business Objects SA (ADR)* (a) | 63,900 | 2,582,199 |
Flamel Technologies SA (ADR)* (a) | 118,900 | 2,244,832 |
JC Decaux SA* | 123,622 | 2,883,215 |
(Cost $8,478,688) | 12,508,992 |
Germany 12.2% |
AWD Holding AG (a) | 128,163 | 3,558,119 |
Deutsche Boerse AG | 62,352 | 6,389,732 |
Fresenius Medical Care AG (a) | 77,847 | 8,202,512 |
Hypo Real Estate Holding AG | 97,269 | 5,064,594 |
Puma AG | 11,665 | 3,404,212 |
Rational AG | 15,511 | 2,061,667 |
Stada Arzneimittel AG | 106,086 | 3,472,708 |
United Internet AG (Registered) (a) | 87,167 | 3,328,103 |
Wincor Nixdorf AG | 32,876 | 3,478,450 |
(Cost $23,189,117) | 38,960,097 |
Greece 4.9% |
Alpha Bank AE | 53,512 | 1,562,281 |
Coca-Cola Hellenic Bottling Co. SA | 100,100 | 2,948,489 |
Dryships, Inc. | 122,800 | 1,500,604 |
Germanos SA | 148,800 | 2,505,056 |
Piraeus Bank SA | 213,900 | 4,578,510 |
Titan Cement Co. | 62,900 | 2,569,122 |
(Cost $12,132,340) | 15,664,062 |
Hong Kong 2.5% |
Kingboard Chemical Holdings Ltd. | 1,343,500 | 3,638,738 |
Midland Realty Holdings Ltd. | 2,285,800 | 1,179,212 |
Wing Hang Bank Ltd. | 428,700 | 3,085,187 |
(Cost $5,230,233) | 7,903,137 |
|
Shares
| Value ($) |
| |
India 0.7% |
Mahindra & Mahindra Ltd. (Cost $1,072,406) | 192,800 | 2,182,739 |
Indonesia 0.5% |
PT Indosat Tbk (ADR) (Cost $1,501,550) | 51,400 | 1,495,226 |
Ireland 6.2% |
Anglo Irish Bank Corp. PLC | 758,416 | 11,510,932 |
FBD Holdings PLC | 56,400 | 2,447,860 |
ICON PLC (ADR)* | 27,900 | 1,147,806 |
Irish Continental Group PLC* | 65,360 | 834,153 |
Paddy Power PLC | 143,100 | 2,049,934 |
Ryanair Holdings PLC* | 170,600 | 1,676,379 |
(Cost $7,470,452) | 19,667,064 |
Italy 0.5% |
Safilo SpA* (Cost $1,681,420) | 291,000 | 1,667,452 |
Japan 8.0% |
AEON Credit Services Co., Ltd. | 33,600 | 3,179,514 |
AEON Mall Co., Ltd. | 80,000 | 3,900,454 |
JAFCO Co., Ltd. | 22,100 | 1,973,231 |
Matsui Securities Co., Ltd. (a) | 186,000 | 2,581,778 |
Nidec Corp. | 25,600 | 2,177,199 |
Park24 Co., Ltd. (a) | 122,000 | 4,365,456 |
Sumitomo Realty & Development Co., Ltd. | 223,000 | 4,850,087 |
UFJ Central Leasing Co., Ltd. | 46,000 | 2,285,666 |
(Cost $14,514,236) | 25,313,385 |
Korea 1.2% |
Daewoo Shipbuilding & Marine Engineering Co., Ltd. | 112,200 | 3,032,964 |
Korea Information Service, Inc. | 35,000 | 677,753 |
(Cost $2,760,432) | 3,710,717 |
Netherlands 3.7% |
Chicago Bridge & Iron Co., NV (New York Shares) | 143,500 | 3,617,635 |
SBM Offshore NV | 51,485 | 4,160,048 |
Vedior NV | 264,008 | 3,913,239 |
(Cost $7,472,173) | 11,690,922 |
Norway 0.8% |
Prosafe ASA (a) | 35,600 | 1,511,179 |
Tandberg ASA (a) | 170,800 | 1,045,151 |
(Cost $2,526,848) | 2,556,330 |
Russia 0.8% |
Mobile TeleSystems (ADR) | 48,900 | 1,711,500 |
Pyaterochka Holding NV (GDR) 144A* | 55,700 | 804,865 |
(Cost $1,172,385) | 2,516,365 |
Sweden 1.7% |
Brostrom AB "B" (a) | 87,700 | 1,766,253 |
Eniro AB | 201,300 | 2,533,829 |
Micronic Laser Systems AB* | 82,800 | 1,172,509 |
(Cost $3,557,186) | 5,472,591 |
|
Shares
| Value ($) |
| |
Switzerland 1.3% |
Advanced Digital Broadcast Holdings SA* | 27,040 | 2,469,313 |
EFG International* | 20,800 | 554,012 |
Micronas Semiconductor Holdings AG (Foreign Registered)* | 35,101 | 1,161,975 |
(Cost $3,232,607) | 4,185,300 |
Taiwan 2.4% |
Optimax Technology Corp. | 1,028,000 | 1,756,837 |
Powerchip Semiconductor Corp. | 2,955,000 | 1,948,905 |
Siliconware Precision Industries Co. | 2,809,537 | 3,941,303 |
(Cost $5,395,752) | 7,647,045 |
Thailand 0.5% |
Bangkok Bank PCL (Foreign Registered) (Cost $1,528,960) | 609,900 | 1,709,653 |
United Kingdom 3.6% |
Aegis Group PLC | 610,239 | 1,280,899 |
ARM Holdings PLC | 754,483 | 1,570,688 |
Group 4 Securicor PLC | 454,660 | 1,284,187 |
John Wood Group PLC | 306,492 | 1,075,732 |
Misys PLC | 453,860 | 1,864,319 |
Taylor Nelson Sofres PLC | 586,931 | 2,269,560 |
Viridian Group PLC | 133,625 | 2,056,473 |
(Cost $12,056,523) | 11,401,858 |
United States 36.4% |
Adams Respiratory Therapeutics, Inc.* | 66,600 | 2,707,956 |
Advance Auto Parts, Inc.* | 97,350 | 4,230,831 |
Advanced Medical Optics, Inc.* | 70,600 | 2,951,080 |
Aeropostale, Inc.* | 139,900 | 3,679,370 |
Allegheny Energy, Inc.* (a) | 218,000 | 6,899,700 |
AMERIGROUP Corp.* | 122,200 | 2,378,012 |
Caribou Coffee Co., Inc.* (a) | 55,400 | 556,216 |
Carter's, Inc.* | 47,900 | 2,818,915 |
Celgene Corp.* | 75,800 | 4,911,840 |
Diamond Foods, Inc.* | 87,900 | 1,737,783 |
Dresser-Rand Group, Inc.* | 81,200 | 1,963,416 |
Euronet Worldwide, Inc.* | 110,500 | 3,071,900 |
Fiserv, Inc.* | 67,800 | 2,933,706 |
Foundation Coal Holdings, Inc. | 71,900 | 2,732,200 |
FTI Consulting, Inc.* | 84,650 | 2,322,796 |
Gentex Corp. | 115,700 | 2,256,150 |
GTECH Holdings Corp. | 157,100 | 4,986,354 |
Harman International Industries, Inc. | 29,800 | 2,915,930 |
|
Shares
| Value ($) |
| |
Harris Interactive, Inc.* | 146,700 | 632,277 |
Invitrogen Corp.* | 38,200 | 2,545,648 |
Joy Global, Inc. | 102,375 | 4,095,000 |
Kenneth Cole Productions, Inc. "A" | 68,200 | 1,739,100 |
Lam Research Corp.* | 46,700 | 1,666,256 |
LECG Corp.* | 79,400 | 1,379,972 |
Legg Mason, Inc. | 60,950 | 7,295,106 |
NeuStar, Inc. "A"* | 79,000 | 2,408,710 |
New York & Co., Inc.* | 146,700 | 3,110,040 |
NxStage Medical, Inc.* | 112,100 | 1,340,716 |
P.F. Chang's China Bistro, Inc.* | 64,500 | 3,201,135 |
Rowan Companies, Inc. | 58,800 | 2,095,632 |
Symbol Technologies, Inc. | 122,148 | 1,565,937 |
Telik, Inc.* | 114,300 | 1,941,957 |
The First Marblehead Corp. | 108,200 | 3,555,452 |
Thoratec Corp.* | 136,800 | 2,830,392 |
THQ, Inc.* | 197,100 | 4,700,835 |
Ultra Petroleum Corp.* | 120,700 | 6,735,060 |
Waters Corp.* | 65,800 | 2,487,240 |
Zions Bancorp. | 57,600 | 4,352,257 |
(Cost $83,898,810) | 115,732,877 |
Total Common Stocks (Cost $213,893,182) | 314,262,413 |
|
Warrants 0.0% |
Hong Kong |
Kingboard Chemical Holdings Ltd.* (Cost $849) | 91,640 | 31,911 |
|
Securities Lending Collateral 9.0% |
Daily Assets Fund Institutional, 4.28% (b) (c) (Cost $28,727,151) | 28,727,151 | 28,727,151 |
|
Cash Equivalents 1.4% |
Cash Management QP Trust, 4.26% (d) (Cost $4,509,408) | 4,509,408 | 4,509,408 |
| % of Net Assets | Value ($) |
| |
Total Investment Portfolio (Cost $247,130,590)+ | 109.2 | 347,530,883 |
Other Assets and Liabilities, Net | (9.2) | (29,312,480) |
Net Assets | 100.0 | 318,218,403 |
* Non-income producing security.
+ The cost for federal income tax purposes was $251,568,347. At December 31, 2005, net unrealized appreciation for all securities based on tax cost was $95,962,536. This consisted of aggregate gross unrealized appreciation for all securities in which there was an excess of value over tax cost of $107,113,761 and aggregate gross unrealized depreciation for all securities in which there was an excess of tax cost over value of $11,151,225.
(a) All or a portion of these securities were on loan (See Notes to Financial Statements). The value of all securities loaned at December 31, 2005 amounted to $27,782,850 which is 8.7% of net assets.
(b) Daily Assets Fund Institutional, an affiliated fund, is managed by Deutsche Asset Management, Inc. The rate shown is the annualized seven-day yield at period end.
(c) Represents collateral held in connection with securities lending.
(d) Cash Management QP Trust, an affiliated fund, is managed by Deutsche Investment Management Americas Inc. The rate shown is the annualized seven-day yield at period end.
144A: Security exempt from registration under Rule 144A of the Securities Act of 1933. These securities may be resold in transactions exempt from registration, normally to qualified institutional buyers.
ADR: American Depositary Receipt
GDR: Global Depositary Receipt
The accompanying notes are an integral part of the financial statements.
Financial Statements
Statement of Assets and Liabilities as of December 31, 2005 |
Assets |
Investments: Investments in securities, at value (cost $213,894,031), including $27,782,850 of securities loaned | $ 314,294,324 |
Investment in Daily Assets Fund Institutional (cost $28,727,151)* | 28,727,151 |
Investment in Cash Management QP Trust (cost $4,509,408) | 4,509,408 |
Total investments in securities, at value (cost $247,130,590) | 347,530,883 |
Foreign currency, at value (cost $773) | 792 |
Dividends receivable | 258,496 |
Interest receivable | 38,763 |
Receivable for Portfolio shares sold | 31,318 |
Foreign taxes recoverable | 19,575 |
Other assets | 9,013 |
Total assets | 347,888,840 |
Liabilities |
Payable upon return of securities loaned | 28,727,151 |
Payable for Portfolio shares redeemed | 509,812 |
Deferred foreign taxes | 731 |
Accrued management fee | 310,101 |
Other accrued expenses and payables | 122,642 |
Total liabilities | 29,670,437 |
Net assets, at value | $ 318,218,403 |
Net Assets |
Net assets consist of: Accumulated distributions in excess of net investment income | (621,811) |
Net unrealized appreciation (depreciation) on: Investments (net of deferred foreign taxes of $731) | 100,399,562 |
Foreign currency related transactions | 279 |
Accumulated net realized gain (loss) | (397,370) |
Paid-in capital | 218,837,743 |
Net assets, at value | $ 318,218,403 |
Class A Net Asset Value, offering and redemption price per share ($285,223,759 ÷ 19,013,655 outstanding shares of beneficial interest, no par value, unlimited number of shares authorized) | $ 15.00 |
Class B Net Asset Value, offering and redemption price per share ($32,994,644 ÷ 2,223,191 outstanding shares of beneficial interest, no par value, unlimited number of shares authorized) | $ 14.84 |
* Represents collateral on securities loaned.
The accompanying notes are an integral part of the financial statements.
Statement of Operations for the year ended December 31, 2005 |
Investment Income |
Income: Dividends (net of foreign taxes withheld of $300,200) | $ 3,605,712 |
Interest | 1,060 |
Interest — Cash Management QP Trust | 363,573 |
Securities lending income, including income from Daily Assets Fund Institutional, net of borrower rebates | 231,157 |
Total Income | 4,201,502 |
Expenses: Management fee | 2,754,030 |
Custodian and accounting fees | 380,323 |
Distribution service fees (Class B) | 68,421 |
Record keeping fees (Class B) | 31,465 |
Auditing | 42,909 |
Legal | 31,895 |
Trustees' fees and expenses | 10,347 |
Reports to shareholders | 57,179 |
Other | 30,789 |
Total expenses before expense reductions | 3,407,358 |
Expense reductions | (86,264) |
Total expenses after expense reductions | 3,321,094 |
Net investment income (loss) | 880,408 |
Realized and Unrealized Gain (Loss) on Investment Transactions |
Net realized gain (loss) from: Investments | 29,238,124 |
Foreign currency related transactions | (61,285) |
| 29,176,839 |
Net unrealized appreciation (depreciation) during the period on: Investments (net of deferred foreign taxes of $731) | 18,683,790 |
Foreign currency related transactions | (10,266) |
| 18,673,524 |
Net gain (loss) on investment transactions | 47,850,363 |
Net increase (decrease) in net assets resulting from operations | $ 48,730,771 |
The accompanying notes are an integral part of the financial statements.
Statement of Changes in Net Assets |
| Years Ended December 31, |
Increase (Decrease) in Net Assets | 2005 | 2004 |
Operations: Net investment income (loss) | $ 880,408 | $ 160,121 |
Net realized gain (loss) on investment transactions | 29,176,839 | 13,182,071 |
Net unrealized appreciation (depreciation) during the period on investment transactions | 18,673,524 | 33,488,081 |
Net increase (decrease) in net assets resulting from operations | 48,730,771 | 46,830,273 |
Distributions to shareholders from: Net investment income: Class A | (1,475,427) | (501,729) |
Class B | (100,297) | — |
Portfolio share transactions: Class A Proceeds from shares sold | 36,509,577 | 33,267,780 |
Reinvestment of distributions | 1,475,427 | 501,729 |
Cost of shares redeemed | (27,263,254) | (26,576,758) |
Net increase (decrease) in net assets from Class A share transactions | 10,721,750 | 7,192,751 |
Class B Proceeds from shares sold | 8,447,459 | 9,197,327 |
Reinvestment of distributions | 100,297 | — |
Cost of shares redeemed | (3,892,529) | (3,074,994) |
Net increase (decrease) in net assets from Class B share transactions | 4,655,227 | 6,122,333 |
Increase (decrease) in net assets | 62,532,024 | 59,643,628 |
Net assets at beginning of period | 255,686,379 | 196,042,751 |
Net assets at end of period (including accumulated distributions in excess of net investment income and undistributed net investment income of $621,811 and $111,958, respectively) | $ 318,218,403 | $ 255,686,379 |
Other Information |
Class A Shares outstanding at beginning of period | 18,170,922 | 17,610,512 |
Shares sold | 2,735,197 | 2,966,838 |
Shares issued to shareholders in reinvestment of distributions | 116,727 | 46,673 |
Shares redeemed | (2,009,191) | (2,453,101) |
Net increase (decrease) in Class A shares | 842,733 | 560,410 |
Shares outstanding at end of period | 19,013,655 | 18,170,922 |
Class B Shares outstanding at beginning of period | 1,871,933 | 1,289,405 |
Shares sold | 635,797 | 862,506 |
Shares issued to shareholders in reinvestment of distributions | 8,017 | — |
Shares redeemed | (292,556) | (279,978) |
Net increase (decrease) in Class B shares | 351,258 | 582,528 |
Shares outstanding at end of period | 2,223,191 | 1,871,933 |
The accompanying notes are an integral part of the financial statements.
Financial Highlights
Class A Years Ended December 31, | 2005 | 2004 | 2003 | 2002 | 2001 |
Selected Per Share Data |
Net asset value, beginning of period | $ 12.77 | $ 10.38 | $ 6.97 | $ 8.70 | $ 11.76 |
Income (loss) from investment operations: Net investment income (loss)a | .04 | .01 | .02 | (.00)b | (.00)b |
Net realized and unrealized gain (loss) on investment transactions | 2.27 | 2.41 | 3.40 | (1.73) | (2.87) |
Total from investment operations | 2.31 | 2.42 | 3.42 | (1.73) | (2.87) |
Less distributions from: Net investment income | (.08) | (.03) | (.01) | — | — |
Net realized gain on investment transactions | — | — | — | — | (.19) |
Total distributions | (.08) | (.03) | (.01) | — | (.19) |
Net asset value, end of period | $ 15.00 | $ 12.77 | $ 10.38 | $ 6.97 | $ 8.70 |
Total Return (%) | 18.19 | 23.35 | 49.09 | (19.89) | (24.59) |
Ratios to Average Net Assets and Supplemental Data |
Net assets, end of period ($ millions) | 285 | 232 | 183 | 121 | 150 |
Ratio of expenses before expense reductions (%) | 1.17 | 1.18 | 1.18 | 1.19 | 1.23c |
Ratio of expenses after expense reductions (%) | 1.17 | 1.18 | 1.18 | 1.19 | 1.22c |
Ratio of net investment income (loss) (%) | .32 | .09 | .28 | (.03) | .00d |
Portfolio turnover rate (%) | 30 | 24 | 41 | 47 | 56 |
a Based on average shares outstanding during the period. b Amount is less than $.005. c The ratios of operating expenses excluding costs incurred in connection with a fund complex reorganization before and after expense reductions were 1.22% and 1.22%, respectively. d Amount is less than .005%. |
Class B Years Ended December 31, | 2005 | 2004 | 2003 | 2002 | 2001 |
Selected Per Share Data |
Net asset value, beginning of period | $ 12.62 | $ 10.25 | $ 6.89 | $ 8.62 | $ 11.69 |
Income (loss) from investment operations: Net investment income (loss)a | .03 | (.01) | .00b | (.02) | (.02) |
Net realized and unrealized gain (loss) on investment transactions | 2.24 | 2.38 | 3.36 | (1.71) | (2.86) |
Total from investment operations | 2.27 | 2.37 | 3.36 | (1.73) | (2.88) |
Less distributions from: Net investment income | (.05) | — | — | — | — |
Net realized gain on investment transactions | — | — | — | — | (.19) |
Total distributions | (.05) | — | — | — | (.19) |
Net asset value, end of period | $ 14.84 | $ 12.62 | $ 10.25 | $ 6.89 | $ 8.62 |
Total Return (%) | 18.06d | 23.12d | 48.77 | (20.07) | (24.96) |
Ratios to Average Net Assets and Supplemental Data |
Net assets, end of period ($ millions) | 33 | 24 | 13 | 4 | 7 |
Ratio of expenses before expense reductions (%) | 1.54 | 1.52 | 1.43 | 1.44 | 1.48c |
Ratio of expenses after expense reductions (%) | 1.24 | 1.39 | 1.43 | 1.44 | 1.47c |
Ratio of net investment income (loss) (%) | .25 | (.12) | .03 | (.28) | (.25) |
Portfolio turnover rate (%) | 30 | 24 | 41 | 47 | 56 |
a Based on average shares outstanding during the period. b Amount is less than $.005. c The ratios of operating expenses excluding costs incurred in connection with a fund complex reorganization before and after expense reductions were 1.47% and 1.47%, respectively. d Total return would have been less had certain expenses not been reduced. |
Performance Summary December 31, 2005
DWS International VIP
All performance shown is historical, assumes reinvestment of all dividend and capital gain distributions, and does not guarantee future results. Investment return and principal value fluctuate with changing market conditions so that, when redeemed, shares may be worth more or less than their original cost. Current performance may be lower or higher than the performance data quoted. Please visit www.dws-scudder.com for the Portfolio's most recent month-end performance. Performance doesn't reflect charges and fees ("contract charges") associated with the separate account that invests in the Portfolio or any variable life insurance policy or variable annuity contract for which the Portfolio is an investment option. These charges and fees will reduce returns.
Returns shown for the all periods for Class B reflect a fee waiver and/or reimbursement. Without this waiver/reimbursement, returns would have been lower.
Risk Considerations
This Portfolio is subject to stock market risk. Investing in foreign securities presents certain unique risks not associated with domestic investments, such as currency fluctuation, political and economic changes and market risks. This may result in greater share price volatility. Please read this Portfolio's prospectus for specific details regarding its investments and risk profile.
Growth of an Assumed $10,000 Investment |
[] DWS International VIP — Class A [] MSCI EAFE® Index | The Morgan Stanley Capital International (MSCI) Europe, Australasia and Far East (EAFE) Index is an unmanaged capitalization-weighted measure of stock markets in Europe, Australasia and the Far East. The index is calculated using closing local market prices and converts to US dollars using the London close foreign exchange rates. Index returns assume the reinvestment of dividends net of withholding tax and, unlike portfolio returns, do not reflect any fees or expenses. It is not possible to invest directly into an index. |
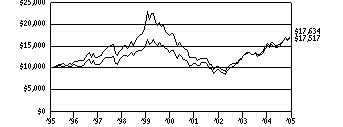 | |
Yearly periods ended December 31 | |
Comparative Results |
DWS International VIP | 1-Year | 3-Year | 5-Year | 10-Year |
Class A | Growth of $10,000 | $11,617 | $17,294 | $9,762 | $17,517 |
Average annual total return | 16.17% | 20.03% | -.48% | 5.77% |
MSCI EAFE® Index | Growth of $10,000 | $11,354 | $18,920 | $12,494 | $17,634 |
Average annual total return | 13.54% | 23.68% | 4.55% | 5.84% |
DWS International VIP | 1-Year | 3-Year | 5-Year | Life of Class* |
Class B | Growth of $10,000 | $11,571 | $17,152 | $9,658 | $14,071 |
Average annual total return | 15.71% | 19.70% | -.69% | 4.03% |
MSCI EAFE® Index | Growth of $10,000 | $11,354 | $18,920 | $12,494 | $15,777 |
Average annual total return | 13.54% | 23.68% | 4.55% | 5.46% |
The growth of $10,000 is cumulative.
* The Portfolio commenced selling Class B shares on May 8, 1997. Index returns begin May 31, 1997.
Information About Your Portfolio's Expenses
DWS International VIP
As an investor of the Portfolio, you incur two types of costs: ongoing expenses and transaction costs. Ongoing expenses include management fees, distribution and service (12b-1) fees and other Portfolio expenses. Examples of transaction costs include sales charges (loads), redemption fees and account maintenance fees, which are not shown in this section. The following tables are intended to help you understand your ongoing expenses (in dollars) of investing in the Portfolio and to help you compare these expenses with the ongoing expenses of investing in other mutual funds. In the most recent six-month period, the Class B shares limited these expenses; had it not done so, expenses would have been higher. The tables are based on an investment of $1,000 made at the beginning of the six-month period ended December 31, 2005.
The tables illustrate your Portfolio's expenses in two ways:
Actual Portfolio Return. This helps you estimate the actual dollar amount of ongoing expenses (but not transaction costs) paid on a $1,000 investment in the Portfolio using the Portfolio's actual return during the period. To estimate the expenses you paid over the period, simply divide your account value by $1,000 (for example, an $8,600 account value divided by $1,000 = 8.6), then multiply the result by the number in the "Expenses Paid per $1,000" line under the share class you hold.
Hypothetical 5% Portfolio Return. This helps you to compare your Portfolio's ongoing expenses (but not transaction costs) with those of other mutual funds using the Portfolio's actual expense ratio and a hypothetical rate of return of 5% per year before expenses. Examples using a 5% hypothetical Portfolio return may be found in the shareholder reports of other mutual funds. The hypothetical account values and expenses may not be used to estimate the actual ending account balance or expenses you paid for the period.
Please note that the expenses shown in these tables are meant to highlight your ongoing expenses only and do not reflect any transaction costs. The "Expenses Paid per $1,000" line of the tables is useful in comparing ongoing expenses only and will not help you determine the relative total expense of owning different funds. If these transaction costs had been included, your costs would have been higher.
Expenses and Value of a $1,000 Investment for the six months ended December 31, 2005 |
Actual Portfolio Return | Class A | | Class B | |
Beginning Account Value 7/1/05 | $ 1,000.00 | | $ 1,000.00 | |
Ending Account Value 12/31/05 | $ 1,164.20 | | $ 1,162.20 | |
Expenses Paid per $1,000* | $ 5.62 | | $ 7.47 | |
Hypothetical 5% Portfolio Return | Class A | | Class B | |
Beginning Account Value 7/1/05 | $ 1,000.00 | | $ 1,000.00 | |
Ending Account Value 12/31/05 | $ 1,020.01 | | $ 1,018.30 | |
Expenses Paid per $1,000* | $ 5.24 | | $ 6.97 | |
* Expenses are equal to the Portfolio's annualized expense ratio for each share class, multiplied by the average account value over the period, multiplied by the number of days in the most recent six-month period, then divided by 365.
Annualized Expense Ratios | Class A | | Class B | |
DWS Variable Series I — DWS International VIP | 1.03% | | 1.37% | |
For more information, please refer to the Portfolio's prospectus.
These tables do not reflect charges and fees ("contract charges") associated with the separate account that invests in the Portfolio or any variable life insurance policy or variable annuity contract for which the Portfolio is an investment option.
Management Summary December 31, 2005
DWS International VIP
International equities delivered strong performance in 2005 relative to most other asset classes. The MSCI EAFE® Index returned 13.54% in US dollar terms and was even stronger in local currency terms with a gain of 29.00%. All developed regions reported positive returns for the year, with Japan producing the best return among the countries represented in the MSCI EAFE® Index. The Portfolio gained 16.17% (Class A shares, unadjusted for contract charges), outperforming the benchmark.
The Portfolio's return was bolstered by outperformance in eight of 10 market sectors. The most notable contributors to return stemmed from the energy and financials sectors. Within energy, key positions including OAO Gazprom (Russia), Statoil ASA (Norway), Petroleo Brasileiro SA (Brazil), Total SA (France) and Eni SpA (Italy), were beneficiaries of the rising price of oil in 2005. Among financials, the Portfolio's positions in Mizuho Financial Group, Inc. (Japan), Mitsui Fudosan Co., Ltd. (Japan) and Credit Saison Co., Ltd. (Japan) were lifted by Japan's economic recovery. Several emerging-markets positions, including ICICI Bank Ltd. (India) and OTP Bank Rt (Hungary), ascended throughout 2005 as the need for financial services within developing economies continued to increase. The only lagging sector of note within the Portfolio was industrials, particularly stocks with homebuilding and real estate exposure such as Wienerberger (Austria) and Grafton Group (United Kingdom) (both securities were not held at the end of the reporting period).
Looking ahead, management believes investors will increasingly reward those companies that can command higher prices for their products and services based on their brand, technological capability, market position or cost advantage, as well as those which have the ability to grow amid a potentially slower global macroeconomic environment.
Matthias Knerr, CFA
Manager
All performance shown is historical, assumes reinvestment of all dividend and capital gain distributions, and does not guarantee future results. Investment return and principal value fluctuate with changing market conditions so that, when redeemed, shares may be worth more or less than their original cost. Current performance may be lower or higher than the performance data quoted. Please visit www.dws-scudder.com for the product's most recent month-end performance. Performance doesn't reflect charges and fees ("contract charges") associated with the separate account that invests in the Portfolio or any variable life insurance policy or variable annuity contract for which the Portfolio is an investment option. These charges and fees will reduce returns.
Risk Considerations
This Portfolio is subject to stock market risk. Investing in foreign securities presents certain unique risks not associated with domestic investments, such as currency fluctuation, political and economic changes and market risks. This may result in greater share price volatility. Please read this Portfolio's prospectus for specific details regarding its investments and risk profile.
The Morgan Stanley Capital International (MSCI) Europe, Australasia and Far East (EAFE) Index is an unmanaged, capitalization-weighted measure of stock markets in Europe, Australasia and the Far East. The index is calculated using closing local market prices and converts to US dollars using the London close foreign exchange rates.
Index returns assume the reinvestment of dividends net of withholding tax and, unlike portfolio returns, do not reflect any fees or expenses. It is not possible to invest directly into an index.
Portfolio Summary
DWS International VIP
Asset Allocation (Excludes Securities Lending Collateral) | 12/31/05 | 12/31/04 |
| | |
Common Stocks | 99% | 100% |
Cash Equivalents | 1% | — |
| 100% | 100% |
Geographical Diversification (Excludes Cash Equivalents and Securities Lending Collateral) | 12/31/05 | 12/31/04 |
| | |
Europe (excluding United Kingdom) | 50% | 47% |
Japan | 22% | 23% |
United Kingdom | 17% | 21% |
Pacific Basin | 5% | 6% |
Latin America | 3% | 2% |
Australia | 2% | 1% |
Other | 1% | — |
| 100% | 100% |
Sector Diversification (As a % of Common Stocks) | 12/31/05 | 12/31/04 |
| | |
Financials | 34% | 30% |
Consumer Discretionary | 15% | 13% |
Energy | 11% | 10% |
Industrials | 8% | 7% |
Consumer Staples | 7% | 5% |
Materials | 7% | 6% |
Information Technology | 6% | 7% |
Health Care | 6% | 9% |
Telecommunication Services | 4% | 8% |
Utilities | 2% | 5% |
| 100% | 100% |
Asset allocation, geographical diversification and sector diversification are subject to change.
For more complete details about the Portfolio's investment portfolio, see page 70. A quarterly Fact Sheet is available upon request. Information concerning portfolio holdings of the Portfolio as of month-end will be posted to www.dws-scudder.com on the 15th day of the following month.
Following the Portfolio's fiscal first and third quarter-end, a complete portfolio holdings listing is filed with the SEC on Form N-Q. The form will be available on the SEC's Web site at www.sec.gov, and it also may be reviewed and copied at the SEC's Public Reference Room in Washington, D.C. Information on the operation of the SEC's Public Reference Room may be obtained by calling (800) SEC-0330.
Investment Portfolio December 31, 2005
DWS International VIP
|
Shares
| Value ($) |
| |
Common Stocks 98.6% |
Australia 1.8% |
Australia & New Zealand Banking Group Ltd. | 338,192 | 5,937,891 |
Macquarie Airports | 2,089,800 | 4,856,544 |
(Cost $9,747,839) | 10,794,435 |
Brazil 1.7% |
Companhia Vale do Rio Doce (ADR) | 141,806 | 5,833,899 |
Petroleo Brasileiro SA (ADR) | 59,800 | 4,261,946 |
(Cost $3,440,902) | 10,095,845 |
Finland 3.3% |
Fortum Oyj | 276,400 | 5,183,322 |
Neste Oil Oyj* | 150,900 | 4,266,174 |
Nokia Oyj | 182,757 | 3,342,855 |
Nokia Oyj (ADR) | 72,590 | 1,328,397 |
Nokian Renkaat Oyj (a) | 435,610 | 5,492,403 |
(Cost $21,070,233) | 19,613,151 |
France 8.3% |
Axa | 236,932 | 7,646,533 |
BNP Paribas SA | 104,268 | 8,437,320 |
Pernod Ricard SA | 36,392 | 6,350,653 |
Schneider Electric SA | 47,568 | 4,243,392 |
Total SA | 67,284 | 16,903,326 |
Vivendi Universal SA | 199,731 | 6,256,772 |
(Cost $36,039,117) | 49,837,996 |
Germany 12.9% |
Adidas-Salomon AG | 35,342 | 6,694,623 |
Allianz AG (Registered) | 59,210 | 8,968,429 |
BASF AG | 88,649 | 6,791,414 |
Bayer AG | 153,513 | 6,413,747 |
Commerzbank AG | 239,036 | 7,363,522 |
Continental AG | 62,772 | 5,572,196 |
Deutsche Boerse AG | 50,067 | 5,130,785 |
E.ON AG | 97,867 | 10,125,419 |
Fresenius Medical Care AG (a) | 50,240 | 5,293,643 |
Hypo Real Estate Holding AG | 201,286 | 10,480,543 |
Siemens AG (Registered) | 48,920 | 4,193,146 |
(Cost $59,370,936) | 77,027,467 |
Greece 2.1% |
Alpha Bank AE | 165,308 | 4,826,162 |
Hellenic Telecommunications Organization SA* | 350,320 | 7,465,389 |
(Cost $8,129,933) | 12,291,551 |
Hong Kong 1.1% |
Esprit Holdings Ltd. (Cost $4,197,496) | 895,748 | 6,365,481 |
Hungary 0.5% |
OTP Bank Rt (GDR) (REG S) (Cost $1,614,557) | 47,857 | 3,139,419 |
India 1.2% |
ICICI Bank Ltd. (Cost $3,992,104) | 522,802 | 7,133,380 |
Indonesia 1.1% |
PT Telekomunikasi Indonesia (ADR) (Cost $5,674,309) | 265,300 | 6,330,058 |
|
Shares
| Value ($) |
| |
Ireland 2.0% |
Anglo Irish Bank Corp. PLC | 429,040 | 6,511,796 |
CRH PLC | 185,410 | 5,454,746 |
(Cost $10,270,239) | 11,966,542 |
Italy 5.4% |
Assicurazioni Generali SpA | 152,400 | 5,326,186 |
Banca Intesa SpA | 1,974,260 | 10,459,535 |
Capitalia SpA | 1,081,500 | 6,261,096 |
Eni SpA | 367,620 | 10,197,328 |
(Cost $23,799,147) | 32,244,145 |
Japan 21.6% |
AEON Co., Ltd. | 234,000 | 5,952,431 |
Aiful Corp. | 55,106 | 4,602,485 |
Astellas Pharma, Inc. | 143,300 | 5,589,350 |
Canon, Inc. | 191,500 | 11,204,053 |
Credit Saison Co., Ltd. | 110,700 | 5,528,664 |
Dai Nippon Printing Co., Ltd. | 210,862 | 3,754,697 |
Daito Trust Construction Co., Ltd. | 89,900 | 4,649,934 |
Mitsubishi Corp. | 541,000 | 11,972,782 |
Mitsui & Co., Ltd. | 425,000 | 5,459,575 |
Mitsui Fudosan Co., Ltd. | 400,000 | 8,123,119 |
Mitsui Sumitomo Insurance Co., Ltd. | 344,000 | 4,209,030 |
Mizuho Financial Group, Inc. | 1,631 | 12,944,554 |
Nishimatsuya Chain Co., Ltd. | 16,000 | 736,677 |
Nissan Motor Co., Ltd. | 549,157 | 5,564,443 |
Sega Sammy Holdings, Inc. | 271,800 | 9,103,405 |
Shinsei Bank Ltd. | 843,000 | 4,874,940 |
Takefuji Corp. | 69,200 | 4,699,979 |
Toyota Motor Corp. | 301,300 | 15,635,359 |
Yamada Denki Co., Ltd. | 34,500 | 4,317,802 |
(Cost $83,531,791) | 128,923,279 |
Korea 2.2% |
POSCO (ADR) (a) | 91,500 | 4,530,165 |
Samsung Electronics Co., Ltd. | 13,617 | 8,771,494 |
(Cost $8,299,221) | 13,301,659 |
Mexico 1.0% |
Fomento Economico Mexicano SA de CV (ADR) (Cost $5,857,721) | 86,400 | 6,264,864 |
Norway 1.0% |
Statoil ASA (Cost $3,370,796) | 266,968 | 6,131,012 |
Russia 1.3% |
AFK Sistema (GDR) (REG S) | 145,892 | 3,428,462 |
OAO Gazprom (ADR) (REG S) (b) | 57,107 | 4,094,572 |
OAO Gazprom (ADR) (REG S) (b) | 4,193 | 300,638 |
(Cost $4,750,449) | 7,823,672 |
Spain 1.1% |
ACS, Actividades de Construccion y Servicios SA (Cost $5,394,466) | 213,000 | 6,861,564 |
Sweden 1.7% |
ForeningsSparbanken AB | 114,360 | 3,116,488 |
Telefonaktiebolaget LM Ericsson "B" | 2,024,637 | 6,957,340 |
(Cost $4,923,390) | 10,073,828 |
|
Shares
| Value ($) |
| |
Switzerland 7.6% |
Baloise Holding AG "R" | 74,543 | 4,353,849 |
Nestle SA (Registered) | 38,002 | 11,365,463 |
Novartis AG (Registered) | 139,514 | 7,331,107 |
Roche Holding AG (Genusschein) | 70,775 | 10,626,618 |
UBS AG (Registered) | 121,441 | 11,561,409 |
(Cost $26,994,411) | 45,238,446 |
Taiwan 0.6% |
Hon Hai Precision Industry Co., Ltd. (Cost $2,278,194) | 698,091 | 3,827,895 |
United Kingdom 19.1% |
AstraZeneca PLC | 98,384 | 4,788,642 |
BHP Billiton PLC | 660,454 | 10,789,281 |
Hammerson PLC | 338,895 | 5,958,968 |
Hilton Group PLC | 900,446 | 5,631,409 |
HSBC Holdings PLC | 483,680 | 7,764,165 |
Imperial Tobacco Group PLC | 341,990 | 10,220,407 |
Informa PLC | 658,685 | 4,915,551 |
National Grid PLC | 508,474 | 4,973,409 |
Prudential PLC | 633,048 | 5,990,379 |
Punch Taverns PLC | 439,530 | 6,420,239 |
Reckitt Benckiser PLC | 181,990 | 6,011,789 |
Royal Bank of Scotland Group PLC | 432,478 | 13,058,585 |
Royal Dutch Shell PLC "B" | 402,405 | 12,863,645 |
Smiths Group PLC | 368,771 | 6,636,564 |
Vodafone Group PLC | 3,886,031 | 8,390,830 |
(Cost $89,524,304) | 114,413,863 |
Total Common Stocks (Cost $422,271,555) | 589,699,552 |
| Principal Amount ($) | Value ($) |
| |
Other Investments 0.0% |
Brazil |
Companhia Vale do Rio Doce SA* (Cost $0) | 219,880 | 4,579 |
|
Shares
| Value ($) |
| |
Securities Lending Collateral 2.0% |
Daily Assets Fund Institutional, 4.28% (c) (d) (Cost $11,892,100) | 11,892,100 | 11,892,100 |
|
Cash Equivalents 1.5% |
Cash Management QP Trust, 4.26% (e) (Cost $8,744,948) | 8,744,948 | 8,744,948 |
| % of Net Assets | Value ($) |
| |
Total Investment Portfolio (Cost $442,908,603)+ | 102.1 | 610,341,179 |
Other Assets and Liabilities, Net | (2.1) | (12,270,495) |
Net Assets | 100.0 | 598,070,684 |
* Non-income producing security.
+ The cost for federal income tax purposes was $450,056,662. At December 31, 2005, net unrealized appreciation for all securities based on tax cost was $160,284,517. This consisted of aggregate gross unrealized appreciation for all securities in which there was an excess of value over tax cost of $163,338,650 and aggregate gross unrealized depreciation for all securities in which there was an excess of tax cost over value of $3,054,133.
(a) All or a portion of these securities were on loan (see Notes to Financial Statements). The value of all securities loaned at December 31, 2005 amounted to $11,322,939 which is 1.9% of net assets.
(b) Securities with the same description are the same corporate entity but trade on different stock exchanges.
(c) Daily Assets Fund Institutional, an affiliated fund, is managed by Deutsche Asset Management, Inc. The rate shown is the annualized seven-day yield at period end.
(d) Represents collateral held in connection with securities lending.
(e) Cash Management QP Trust, an affiliated fund, is managed by Deutsche Investment Management Americas Inc. The rate shown is the annualized seven-day yield at period end.
ADR: American Depositary Receipt
GDR: Global Depositary Receipt
The accompanying notes are an integral part of the financial statements.
Financial Statements
Statement of Assets and Liabilities as of December 31, 2005 |
Assets |
Investments: Investments in securities, at value (cost $422,271,555), including $11,322,939 of securities loaned | $ 589,704,131 |
Investment in Daily Assets Fund Institutional (cost $11,892,100)* | 11,892,100 |
Investment in Cash Management QP Trust (cost $8,744,948) | 8,744,948 |
Total investments in securities, at value (cost $442,908,603) | 610,341,179 |
Cash | 63 |
Foreign currency, at value (cost $46,258) | 46,139 |
Receivable for investments sold | 3,540,353 |
Dividends receivable | 914,645 |
Interest receivable | 46,661 |
Receivable for Portfolio shares sold | 181,301 |
Foreign taxes recoverable | 115,517 |
Other assets | 17,244 |
Total assets | 615,203,102 |
Liabilities |
Payable upon return of securities loaned | 11,892,100 |
Payable for investments purchased | 3,575,642 |
Payable for Portfolio shares redeemed | 935,053 |
Deferred foreign taxes | 156,933 |
Accrued management fee | 424,572 |
Accrued distribution service fees (Class B) | 3,686 |
Other accrued expenses and payables | 144,432 |
Total liabilities | 17,132,418 |
Net assets, at value | $ 598,070,684 |
Net Assets |
Net assets consist of: Undistributed net investment income | 6,301,420 |
Net unrealized appreciation (depreciation) on: Investments (net of deferred foreign taxes of $156,933) | 167,275,643 |
Foreign currency related transactions | 28 |
Accumulated net realized gain (loss) | (170,682,258) |
Paid-in capital | 595,175,851 |
Net assets, at value | $ 598,070,684 |
Class A Net Asset Value, offering and redemption price per share ($557,616,582 ÷ 51,410,562 outstanding shares of beneficial interest, no par value, unlimited number of shares authorized) | $ 10.85 |
Class B Net Asset Value, offering and redemption price per share ($40,454,102 ÷ 3,739,529 outstanding shares of beneficial interest, no par value, unlimited number of shares authorized) | $ 10.82 |
* Represents collateral on securities loaned.
The accompanying notes are an integral part of the financial statements.
Statement of Operations for the year ended December 31, 2005 |
Investment Income |
Income: Dividends (net of foreign taxes withheld of $1,540,052) | $ 14,084,189 |
Interest | 28,260 |
Interest — Cash Management QP Trust | 215,350 |
Securities lending income, including income from Daily Assets Fund Institutional, net of borrower rebates | 411,399 |
Total Income | 14,739,198 |
Expenses: Management fee | 4,841,891 |
Custodian and accounting fees | 709,799 |
Distribution service fees (Class B) | 93,098 |
Record keeping fees (Class B) | 53,601 |
Auditing | 50,498 |
Legal | 24,066 |
Trustees' fees and expenses | 14,766 |
Reports to shareholders | 48,425 |
Other | 67,263 |
Total expenses before expense reductions | 5,903,407 |
Expense reductions | (23,983) |
Total expenses after expense reductions | 5,879,424 |
Net investment income (loss) | 8,859,774 |
Realized and Unrealized Gain (Loss) on Investment Transactions |
Net realized gain (loss) from: Investments (net of foreign taxes of $120,259) | 54,149,154 |
Foreign currency related transactions | (362,287) |
| 53,786,867 |
Net unrealized appreciation (depreciation) during the period on: Investments (net of deferred foreign taxes of $156,933) | 21,913,257 |
Foreign currency related transactions | (232,522) |
| 21,680,735 |
Net gain (loss) on investment transactions | 75,467,602 |
Net increase (decrease) in net assets resulting from operations | $ 84,327,376 |
The accompanying notes are an integral part of the financial statements.
Statement of Changes in Net Assets |
| Years Ended December 31, |
Increase (Decrease) in Net Assets | 2005 | 2004 |
Operations: Net investment income (loss) | $ 8,859,774 | $ 5,345,381 |
Net realized gain (loss) on investment transactions | 53,786,867 | 34,381,716 |
Net unrealized appreciation (depreciation) during the period on investment transactions | 21,680,735 | 41,874,166 |
Net increase (decrease) in net assets resulting from operations | 84,327,376 | 81,601,263 |
Distributions to shareholders from: Net investment income: Class A | (8,620,538) | (6,363,976) |
Class B | (480,677) | (312,686) |
Portfolio share transactions: Class A Proceeds from shares sold | 58,844,328 | 57,653,358 |
Reinvestment of distributions | 8,620,538 | 6,363,976 |
Cost of shares redeemed | (112,841,762) | (86,826,684) |
Net increase (decrease) in net assets from Class A share transactions | (45,376,896) | (22,809,350) |
Class B Proceeds from shares sold | 4,971,389 | 19,706,198 |
Reinvestment of distributions | 480,677 | 312,686 |
Cost of shares redeemed | (5,251,206) | (13,535,303) |
Net increase (decrease) in net assets from Class B share transactions | 200,860 | 6,483,581 |
Increase (decrease) in net assets | 30,050,125 | 58,598,832 |
Net assets at beginning of period | 568,020,559 | 509,421,727 |
Net assets at end of period (including undistributed net investment income of $6,301,420 and $7,025,372, respectively) | $ 598,070,684 | $ 568,020,559 |
Other Information |
Class A Shares outstanding at beginning of period | 56,078,328 | 58,747,179 |
Shares sold | 5,966,433 | 6,770,517 |
Shares issued to shareholders in reinvestment of distributions | 946,272 | 763,983 |
Shares redeemed | (11,580,471) | (10,203,351) |
Net increase (decrease) in Class A shares | (4,667,766) | (2,668,851) |
Shares outstanding at end of period | 51,410,562 | 56,078,328 |
Class B Shares outstanding at beginning of period | 3,699,485 | 2,910,661 |
Shares sold | 510,934 | 2,359,763 |
Shares issued to shareholders in reinvestment of distributions | 52,764 | 37,537 |
Shares redeemed | (523,654) | (1,608,476) |
Net increase (decrease) in Class B shares | 40,044 | 788,824 |
Shares outstanding at end of period | 3,739,529 | 3,699,485 |
The accompanying notes are an integral part of the financial statements.
Financial Highlights
Class A Years Ended December 31, | 2005 | 2004 | 2003 | 2002 | 2001 |
Selected Per Share Data |
Net asset value, beginning of period | $ 9.50 | $ 8.26 | $ 6.52 | $ 8.05 | $ 14.26 |
Income (loss) from investment operations: Net investment income (loss)a | .15 | .09 | .09 | .05 | .06 |
Net realized and unrealized gain (loss) on investment transactions | 1.36 | 1.26 | 1.70 | (1.52) | (3.97) |
Total from investment operations | 1.51 | 1.35 | 1.79 | (1.47) | (3.91) |
Less distributions from: Net investment income | (.16) | (.11) | (.05) | (.06) | (.05) |
Net realized gain on investment transactions | — | — | — | — | (2.25) |
Total distributions | (.16) | (.11) | (.05) | (.06) | (2.30) |
Net asset value, end of period | $ 10.85 | $ 9.50 | $ 8.26 | $ 6.52 | $ 8.05 |
Total Return (%) | 16.17 | 16.53 | 27.75 | (18.37) | (30.86) |
Ratios to Average Net Assets and Supplemental Data |
Net assets, end of period ($ millions) | 558 | 533 | 485 | 412 | 513 |
Ratio of expenses before expense reductions (%) | 1.02 | 1.04 | 1.05 | 1.03 | 1.01b |
Ratio of expenses after expense reductions (%) | 1.02 | 1.04 | 1.05 | 1.03 | 1.00b |
Ratio of net investment income (loss) (%) | 1.59 | 1.05 | 1.32 | .73 | .64 |
Portfolio turnover rate (%) | 59 | 73 | 119 | 123 | 105 |
a Based on average shares outstanding during the period. b The ratios of operating expenses excluding costs incurred in connection with a fund complex reorganization before and after expense reductions were 1.00% and 1.00%, respectively. |
Class B Years Ended December 31, | 2005 | 2004 | 2003 | 2002 | 2001 |
Selected Per Share Data |
Net asset value, beginning of period | $ 9.48 | $ 8.24 | $ 6.50 | $ 8.03 | $ 14.19 |
Income (loss) from investment operations: Net investment income (loss)a | .12 | .06 | .07 | .04 | .05 |
Net realized and unrealized gain (loss) on investment transactions | 1.35 | 1.27 | 1.71 | (1.53) | (3.94) |
Total from investment operations | 1.47 | 1.33 | 1.78 | (1.49) | (3.89) |
Less distributions from: Net investment income | (.13) | (.09) | (.04) | (.04) | (.02) |
Net realized gain on investment transactions | — | — | — | — | (2.25) |
Total distributions | (.13) | (.09) | (.04) | (.04) | (2.27) |
Net asset value, end of period | $ 10.82 | $ 9.48 | $ 8.24 | $ 6.50 | $ 8.03 |
Total Return (%) | 15.71c | 16.24c | 27.52 | (18.62) | (30.81) |
Ratios to Average Net Assets and Supplemental Data |
Net assets, end of period ($ millions) | 40 | 35 | 24 | 8 | 3 |
Ratio of expenses before expense reductions (%) | 1.41 | 1.38 | 1.32 | 1.28 | 1.26b |
Ratio of expenses after expense reductions (%) | 1.37 | 1.35 | 1.32 | 1.28 | 1.25b |
Ratio of net investment income (loss) (%) | 1.24 | .74 | 1.05 | .48 | .39 |
Portfolio turnover rate (%) | 59 | 73 | 119 | 123 | 105 |
a Based on average shares outstanding during the period. b The ratios of operating expenses excluding costs incurred in connection with a fund complex reorganization before and after expense reductions were 1.25% and 1.25%, respectively. c Total return would have been lower had certain expenses not been reduced. |
Performance Summary December 31, 2005
DWS Health Care VIP
All performance shown is historical, assumes reinvestment of all dividend and capital gain distributions, and does not guarantee future results. Investment return and principal value fluctuate with changing market conditions so that, when redeemed, shares may be worth more or less then their original cost. Current performance may be lower or higher than the performance data quoted. Please visit www.dws-scudder.com for the Portfolio's most recent month-end performance. Performance doesn't reflect charges and fees ("contract charges") associated with the separate account that invests in the Portfolio or any variable life insurance policy or variable annuity contract for which the Portfolio is an investment option. These charges and fees will reduce returns.
The returns shown for the life of class period for Class A reflect a fee waiver and/or reimbursement. Without this waiver/reimbursement, returns would have been lower.
Risk Considerations
This Portfolio is subject to stock market risk. The Portfolio may focus its investments on certain industry sectors, thereby increasing its vulnerability to any single industry or regulatory development. All of these factors may result in greater share price volatility. Please read this Portfolio's prospectus for specific details regarding its investments and risk profile.
Growth of an Assumed $10,000 Investment |
[] DWS Health Care VIP — Class A* [] S&P 500 Index [] Goldman Sachs Healthcare Index | The Standard & Poor's 500 (S&P 500) Index is an unmanaged capitalization-weighted index of 500 stocks. The index is designed to measure performance of the broad domestic economy through changes in the aggregate market value of 500 stocks representing all major industries. The Goldman Sachs Healthcare Index is a market capitalization-weighted index of 114 stocks designed to measure the performance of companies in the health care sector. Index returns assume the reinvestment of dividends and, unlike Portfolio returns, do not reflect any fees or expenses. It is not possible to invest directly into an index. |
 | |
| |
Comparative Results |
DWS Health Care VIP | 1-Year | 3-Year | Life of Class* |
Class A | Growth of $10,000 | $10,850 | $15,897 | $13,020 |
Average annual total return | 8.50% | 16.71% | 5.82% |
S&P 500 Index | Growth of $10,000 | $10,491 | $14,970 | $10,817 |
Average annual total return | 4.91% | 14.39% | 1.70% |
Goldman Sachs Healthcare Index | Growth of $10,000 | $11,212 | $14,680 | $11,873 |
Average annual total return | 12.12% | 13.65% | 3.75% |
DWS Health Care VIP | 1-Year | 3-Year | Life of Class* |
Class B | Growth of $10,000 | $10,806 | $15,714 | $15,909 |
Average annual total return | 8.06% | 16.26% | 14.19% |
S&P 500 Index | Growth of $10,000 | $10,491 | $14,970 | $13,428 |
Average annual total return | 4.91% | 14.39% | 8.79% |
Goldman Sachs Healthcare Index | Growth of $10,000 | $11,212 | $14,680 | $14,214 |
Average annual total return | 12.12% | 13.65% | 10.55% |
The growth of $10,000 is cumulative.
* The Portfolio commenced operations on May 1, 2001. Index returns begin April 30, 2001.
** The Portfolio commenced selling Class B shares on July 1, 2002. Index returns begin June 30, 2002.
Information About Your Portfolio's Expenses
DWS Health Care VIP
As an investor of the Portfolio, you incur two types of costs: ongoing expenses and transaction costs. Ongoing expenses include management fees, distribution and service (12b-1) fees and other Portfolio expenses. Examples of transaction costs include sales charges (loads), redemption fees and account maintenance fees, which are not shown in this section. The following tables are intended to help you understand your ongoing expenses (in dollars) of investing in the Portfolio and to help you compare these expenses with the ongoing expenses of investing in other mutual funds. The tables are based on an investment of $1,000 made at the beginning of the six-month period ended December 31, 2005.
The tables illustrate your Portfolio's expenses in two ways:
Actual Portfolio Return. This helps you estimate the actual dollar amount of ongoing expenses (but not transaction costs) paid on a $1,000 investment in the Portfolio using the Portfolio's actual return during the period. To estimate the expenses you paid over the period, simply divide your account value by $1,000 (for example, an $8,600 account value divided by $1,000 = 8.6), then multiply the result by the number in the "Expenses Paid per $1,000" line under the share class you hold.
Hypothetical 5% Portfolio Return. This helps you to compare your Portfolio's ongoing expenses (but not transaction costs) with those of other mutual funds using the Portfolio's actual expense ratio and a hypothetical rate of return of 5% per year before expenses. Examples using a 5% hypothetical Portfolio return may be found in the shareholder reports of other mutual funds. The hypothetical account values and expenses may not be used to estimate the actual ending account balance or expenses you paid for the period.
Please note that the expenses shown in these tables are meant to highlight your ongoing expenses only and do not reflect any transaction costs. The "Expenses Paid per $1,000" line of the tables is useful in comparing ongoing expenses only and will not help you determine the relative total expense of owning different funds. If these transaction costs had been included, your costs would have been higher.
Expenses and Value of a $1,000 Investment for the six months ended December 31, 2005 |
Actual Portfolio Return | Class A | | Class B | |
Beginning Account Value 7/1/05 | $ 1,000.00 | | $ 1,000.00 | |
Ending Account Value 12/31/05 | $ 1,072.50 | | $ 1,069.80 | |
Expenses Paid per $1,000* | $ 4.65 | | $ 6.73 | |
Hypothetical 5% Portfolio Return | Class A | | Class B | |
Beginning Account Value 7/1/05 | $ 1,000.00 | | $ 1,000.00 | |
Ending Account Value 12/31/05 | $ 1,020.72 | | $ 1,018.70 | |
Expenses Paid per $1,000* | $ 4.53 | | $ 6.56 | |
* Expenses are equal to the Portfolio's annualized expense ratio for each share class, multiplied by the average account value over the period, multiplied by the number of days in the most recent six-month period, then divided by 365.
Annualized Expense Ratios | Class A | | Class B | |
DWS Variable Series I — DWS Health Care VIP | .89% | | 1.29% | |
For more information, please refer to the Portfolio's prospectus.
These tables do not reflect charges and fees ("contract charges") associated with the separate account that invests in the Portfolio or any variable life insurance policy or variable annuity contract for which the Portfolio is an investment option.
Management Summary December 31, 2005
DWS Health Care VIP
Owing in part to the strong performance of managed care stocks, DWS Health Care VIP posted an 8.50% return for its most recent year ended December 31, 2005 (Class A shares, unadjusted for contract charges). In comparison, the S&P 500 Index returned 4.91%, and the Goldman Sachs Healthcare Index returned 12.12%.
Two positive performers for the Portfolio during the period were Amgen, Inc., from the biotechnology area, and UnitedHealth Group, Inc., within health care services. Investors have become more positive about Amgen's pipeline of drugs in development and seem especially enthusiastic about the company's new product designed to treat osteoporosis. UnitedHealth was the leader among several managed care companies that performed well for the Portfolio during the period. Managed care companies benefited from several major trends, including lower cost due to slower growth in drug and hospital expenditures. A major detractor from performance during the period was Abbott Laboratories, which received unfavorable clinical results on several significant products under development.
We believe some of the best opportunities in health care continue to be in the service areas such as managed care companies, which we think will continue to show strength. Major pharmaceuticals are facing major patent expirations and are lacking meaningful new product pipelines. Thus, we underweighted this sector. We believe that our focus on individual company research will enable us to build a portfolio of the most attractive companies within this industry.
James E. Fenger Leefin Lai, CFA, CPA
Lead Portfolio Manager Portfolio Manager
Thomas Bucher, CFA
Consultant to the Portfolio
All performance shown is historical, assumes reinvestment of all dividend and capital gain distributions, and does not guarantee future results. Investment return and principal value fluctuate with changing market conditions so that, when redeemed, shares may be worth more or less than their original cost. Current performance may be lower or higher than the performance data quoted. Please visit www.dws-scudder.com for the product's most recent month-end performance. Performance doesn't reflect charges and fees ("contract charges") associated with the separate account that invests in the Portfolio or any variable life insurance policy or variable annuity contract for which the Portfolio is an investment option. These charges and fees will reduce returns.
Risk Considerations
This Portfolio is subject to stock market risk. The Portfolio may focus its investments on certain industry sectors, thereby increasing its vulnerability to any single industry or regulatory development. All of these factors may result in greater share price volatility. Please read this Portfolio's prospectus for specific details regarding its investments and risk profile.
The Standard & Poor's 500 (S&P 500) Index is an unmanaged capitalization-weighted index of 500 stocks. The index is designed to measure performance of the broad domestic economy through changes in the aggregate market value of 500 stocks representing all major industries.
The Goldman Sachs Healthcare Index is an unmanaged market-capitalization-weighted index of 114 stocks designed to measure the performance of companies in the health care sector.
Index returns assume the reinvestment of dividends and, unlike portfolio returns, do not reflect any fees or expenses. It is not possible to invest directly into an index.
Portfolio management market commentary is as of December 31, 2005, and may not come to pass. This information is subject to change at any time based on market and other conditions.
Portfolio Summary
DWS Health Care VIP
Asset Allocation (Excludes Securities Lending Collateral) | 12/31/05 | 12/31/04 |
| | |
Common Stocks | 96% | 97% |
Cash Equivalents | 4% | 3% |
| 100% | 100% |
Industry Diversification (As a % of Common Stocks) | 12/31/05 | 12/31/04 |
| | |
Pharmaceuticals | 35% | 33% |
Biotechnology | 23% | 27% |
Health Care Services | 19% | 16% |
Medical Supply & Specialty | 17% | 17% |
Hospital Management | 3% | 4% |
Life Sciences Equipment | 3% | 3% |
| 100% | 100% |
Asset allocation and industry diversification are subject to change.
For more complete details about the Portfolio's investment portfolio, see page 81. A quarterly Fact Sheet is available upon request. Information concerning portfolio holdings of the Portfolio as of month-end will be posted to www.dws-scudder.com on the 15th day of the following month.
Following the Portfolio's fiscal first and third quarter-end, a complete portfolio holdings listing is filed with the SEC on Form N-Q. The form will be available on the SEC's Web site at www.sec.gov, and it also may be reviewed and copied at the SEC's Public Reference Room in Washington, D.C. Information on the operation of the SEC's Public Reference Room may be obtained by calling (800) SEC-0330.
Investment Portfolio December 31, 2005
DWS Health Care VIP
|
Shares
| Value ($) |
| |
Common Stocks 95.6% |
Health Care 95.6% |
Biotechnology 22.0% |
Amgen, Inc.* | 64,750 | 5,106,185 |
Amylin Pharmaceuticals, Inc.* | 14,500 | 578,840 |
Biogen Idec, Inc.* | 48,920 | 2,217,544 |
Celgene Corp.* | 23,200 | 1,503,360 |
Discovery Laboratories, Inc.* | 98,800 | 659,984 |
DOV Pharmaceutical, Inc.* | 72,600 | 1,065,768 |
Encysive Pharmaceuticals, Inc.* | 39,700 | 313,233 |
Gen-Probe, Inc.* | 27,800 | 1,356,362 |
Genentech, Inc.* | 40,700 | 3,764,750 |
Genzyme Corp.* | 42,900 | 3,036,462 |
Gilead Sciences, Inc.* | 44,200 | 2,326,246 |
GPC Biotech AG (ADR)* | 60,512 | 746,113 |
ImClone Systems, Inc.* | 21,600 | 739,584 |
Keryx Biopharmaceuticals, Inc.* | 46,400 | 679,296 |
Medicines Co.* | 59,000 | 1,029,550 |
MedImmune, Inc.* | 25,200 | 882,504 |
MGI Pharma, Inc.* | 59,900 | 1,027,884 |
Millennium Pharmaceuticals, Inc.* | 56,700 | 549,990 |
Myogen, Inc.* | 29,000 | 874,640 |
Rigel Pharmaceuticals, Inc.* (a) | 69,000 | 576,840 |
| 29,035,135 |
Health Care Services 18.6% |
Aetna, Inc. | 26,900 | 2,536,939 |
Caremark Rx, Inc.* | 65,900 | 3,412,961 |
Covance, Inc.* | 11,400 | 553,470 |
DaVita, Inc.* | 18,200 | 921,648 |
Fisher Scientific International, Inc.* | 27,500 | 1,701,150 |
Fresenius Medical Care AG | 8,729 | 919,749 |
Humana, Inc.* | 400 | 21,732 |
Medco Health Solutions, Inc.* | 23,984 | 1,338,307 |
Omnicare, Inc. | 16,700 | 955,574 |
UnitedHealth Group, Inc. | 104,200 | 6,474,988 |
WellPoint, Inc.* | 70,700 | 5,641,153 |
| 24,477,671 |
Hospital Management 3.2% |
Community Health Systems, Inc.* | 65,600 | 2,515,104 |
Triad Hospitals, Inc.* | 42,600 | 1,671,198 |
| 4,186,302 |
Life Sciences Equipment 2.7% |
Charles River Laboratories International, Inc.* | 18,100 | 766,897 |
Invitrogen Corp.* | 11,800 | 786,352 |
PerkinElmer, Inc. | 51,800 | 1,220,408 |
Serologicals Corp.* | 41,200 | 813,288 |
| 3,586,945 |
|
Shares
| Value ($) |
| |
Medical Supply & Specialty 15.7% |
ArthroCare Corp.* | 23,100 | 973,434 |
Bausch & Lomb, Inc. | 8,100 | 549,990 |
Baxter International, Inc. | 52,800 | 1,987,920 |
Biomet, Inc. | 45,800 | 1,674,906 |
C.R. Bard, Inc. | 23,000 | 1,516,160 |
Cardinal Health, Inc. | 37,800 | 2,598,750 |
Cytyc Corp.* | 46,400 | 1,309,872 |
Elekta AB "B" | 62,000 | 920,889 |
IntraLase Corp.* (a) | 33,800 | 602,654 |
Kyphon, Inc.* | 30,800 | 1,257,564 |
Medtronic, Inc. | 62,500 | 3,598,125 |
Nobel Biocare Holding AG | 800 | 175,944 |
St. Jude Medical, Inc.* | 8,700 | 436,740 |
Stryker Corp. | 17,600 | 781,968 |
The Cooper Companies, Inc. | 18,900 | 969,570 |
Zimmer Holdings, Inc.* | 20,300 | 1,369,032 |
| 20,723,518 |
Pharmaceuticals 33.4% |
Abbott Laboratories | 50,900 | 2,006,987 |
Allergan, Inc. | 7,900 | 852,884 |
Astellas Pharma, Inc. | 46,000 | 1,794,209 |
AstraZeneca PLC | 28,980 | 1,410,543 |
AVANIR Pharmaceuticals "A"* | 211,000 | 725,840 |
Barrier Therapeutics, Inc.* | 45,600 | 373,920 |
Cardiome Pharma Corp.* | 81,900 | 827,190 |
Eli Lilly & Co. | 23,400 | 1,324,206 |
Forest Laboratories, Inc.* | 21,500 | 874,620 |
Johnson & Johnson | 85,000 | 5,108,500 |
Medicis Pharmaceutical Corp. "A" (a) | 24,700 | 791,635 |
New River Pharmaceuticals, Inc.* (a) | 16,600 | 861,208 |
Novartis AG (Registered) | 69,696 | 3,662,348 |
Pfizer, Inc. | 127,940 | 2,983,561 |
Roche Holding AG (Genusschein) | 23,298 | 3,498,113 |
Sanofi-Aventis | 27,250 | 2,387,334 |
Schering-Plough Corp. | 180,200 | 3,757,170 |
Schwarz Pharma AG | 28,200 | 1,790,490 |
Sepracor, Inc.* | 26,900 | 1,388,040 |
Shire Pharmaceuticals Group PLC (ADR) | 24,800 | 961,992 |
Teva Pharmaceutical Industries Ltd. (ADR) | 32,100 | 1,380,621 |
ViroPharma, Inc.* | 31,300 | 580,615 |
Wyeth | 103,100 | 4,749,817 |
| 44,091,843 |
Total Common Stocks (Cost $94,012,368) | 126,101,414 |
|
|
Shares
| Value ($) |
| |
Securities Lending Collateral 1.9% |
Daily Assets Fund Institutional, 4.28% (b) (c) (Cost $2,559,800) | 2,559,800 | 2,559,800 |
|
|
Shares
| Value ($) |
| |
Cash Equivalents 4.3% |
Cash Management QP Trust, 4.26% (d) (Cost $5,628,061) | 5,628,061 | 5,628,061 |
| % of Net Assets | Value ($) |
| |
Total Investment Portfolio (Cost $102,200,229)+ | 101.8 | 134,289,275 |
Other Assets and Liabilities, Net | (1.8) | (2,362,941) |
Net Assets | 100.0 | 131,926,334 |
* Non-income producing security.
+ The cost for federal income tax purposes was $102,791,519. At December 31, 2005, net unrealized appreciation for all securities based on tax cost was $31,497,756. This consisted of aggregate gross unrealized appreciation for all securities in which there was an excess of value over tax cost of $35,056,735 and aggregate gross unrealized depreciation for all securities in which there was an excess of tax cost over value of $3,558,979.
(a) All or a portion of these securities were on loan (See Notes to Financial Statements). The value of all securities loaned at December 31, 2005 amounted to $2,491,772 which is 1.9% of net assets.
(b) Daily Assets Fund Institutional, an affiliated fund, is managed by Deutsche Asset Management, Inc. The rate shown is the annualized seven-day yield at period end.
(c) Represents collateral held in connection with securities lending.
(d) Cash Management QP Trust, an affiliated fund, is managed by Deutsche Investment Management Americas Inc. The rate shown is the annualized seven-day yield at period end.
ADR: American Depositary Receipt
The accompanying notes are an integral part of the financial statements.
Financial Statements
Statement of Assets and Liabilities as of December 31, 2005 |
Assets |
Investments: Investments in securities, at value (cost $94,012,368), including $2,491,772 of securities loaned | $ 126,101,414 |
Investment in Daily Assets Fund Institutional (cost $2,559,800)* | 2,559,800 |
Investment in Cash Management QP Trust (cost $5,628,061) | 5,628,061 |
Total investments in securities, at value (cost $102,200,229) | 134,289,275 |
Cash | 10,000 |
Foreign currency, at value (cost $105,565) | 99,672 |
Receivable for investments sold | 261,971 |
Dividends receivable | 30,189 |
Interest receivable | 21,096 |
Foreign taxes recoverable | 6,232 |
Other assets | 1,366 |
Total assets | 134,719,801 |
Liabilities |
Payable upon return of securities loaned | 2,559,800 |
Payable for Portfolio shares redeemed | 91,971 |
Accrued management fee | 83,202 |
Accrued distribution service fees (Class B) | 6,831 |
Other accrued expenses and payables | 51,663 |
Total liabilities | 2,793,467 |
Net assets, at value | $ 131,926,334 |
Net Assets |
Net assets consist of: Accumulated net investment loss | (8,982) |
Net unrealized appreciation (depreciation) on: Investments | 32,089,046 |
Foreign currency related transactions | (6,390) |
Accumulated net realized gain (loss) | (113,846) |
Paid-in capital | 99,966,506 |
Net assets, at value | $ 131,926,334 |
Class A Net Asset Value, offering and redemption price per share ($109,111,132 ÷ 8,377,800 outstanding shares of beneficial interest, no par value, unlimited number of shares authorized) | $ 13.02 |
Class B Net Asset Value, offering and redemption price per share ($22,815,202 ÷ 1,772,301 outstanding shares of beneficial interest, no par value, unlimited number of shares authorized) | $ 12.87 |
* Represents collateral on securities loaned.
The accompanying notes are an integral part of the financial statements.
Statement of Operations for the year ended December 31, 2005 |
Investment Income |
Income: Dividends (net of foreign taxes withheld of $38,227) | $ 759,842 |
Interest | 408 |
Interest — Cash Management QP Trust | 97,680 |
Securities lending income, including income from Daily Assets Fund Institutional, net of borrower rebates | 35,233 |
Total Income | 893,163 |
Expenses: Management fee | 959,087 |
Custodian fees | 85,944 |
Distribution service fees (Class B) | 52,676 |
Record keeping fees (Class B) | 29,017 |
Auditing | 34,866 |
Legal | 1,448 |
Trustees' fees and expenses | 5,818 |
Reports to shareholders | 21,990 |
Other | 17,448 |
Total expenses before expense reductions | 1,208,294 |
Expense reductions | (3,270) |
Total expenses after expense reductions | 1,205,024 |
Net investment income (loss) | (311,861) |
Realized and Unrealized Gain (Loss) on Investment Transactions |
Net realized gain (loss) from: Investments | 5,797,819 |
Foreign currency related transactions | (33,499) |
| 5,764,320 |
Net unrealized appreciation (depreciation) during the period on: Investments | 4,959,885 |
Foreign currency related transactions | (7,516) |
| 4,952,369 |
Net gain (loss) on investment transactions | 10,716,689 |
Net increase (decrease) in net assets resulting from operations | $ 10,404,828 |
Statement of Changes in Net Assets |
| Years Ended December 31, |
Increase (Decrease) in Net Assets | 2005 | 2004 |
Operations: Net investment income (loss) | $ (311,861) | $ (424,014) |
Net realized gain (loss) on investment transactions | 5,764,320 | 5,571,554 |
Net unrealized appreciation (depreciation) during the period on investment transactions | 4,952,369 | 5,777,481 |
Net increase (decrease) in net assets resulting from operations | 10,404,828 | 10,925,021 |
Portfolio share transactions: Class A Proceeds from shares sold | 8,840,510 | 14,603,543 |
Cost of shares redeemed | (17,288,593) | (16,500,791) |
Net increase (decrease) in net assets from Class A share transactions | (8,448,083) | (1,897,248) |
Class B Proceeds from shares sold | 4,364,689 | 9,015,887 |
Cost of shares redeemed | (3,728,727) | (1,312,710) |
Net increase (decrease) in net assets from Class B share transactions | 635,962 | 7,703,177 |
Increase (decrease) in net assets | 2,592,707 | 16,730,950 |
Net assets at beginning of period | 129,333,627 | 112,602,677 |
Net assets at end of period (including accumulated net investment loss of $8,982 and $283, respectively) | $ 131,926,334 | $ 129,333,627 |
Other Information |
Class A Shares outstanding at beginning of period | 9,070,686 | 9,253,001 |
Shares sold | 715,380 | 1,284,769 |
Shares redeemed | (1,408,266) | (1,467,084) |
Net increase (decrease) in Class A shares | (692,886) | (182,315) |
Shares outstanding at end of period | 8,377,800 | 9,070,686 |
Class B Shares outstanding at beginning of period | 1,720,377 | 1,034,876 |
Shares sold | 357,712 | 802,351 |
Shares redeemed | (305,788) | (116,850) |
Net increase (decrease) in Class B shares | 51,924 | 685,501 |
Shares outstanding at end of period | 1,772,301 | 1,720,377 |
The accompanying notes are an integral part of the financial statements.
Financial Highlights
Class A Years Ended December 31, | 2005 | 2004 | 2003 | 2002 | 2001a |
Selected Per Share Data |
Net asset value, beginning of period | $ 12.00 | $ 10.95 | $ 8.19 | $ 10.65 | $ 10.00 |
Income (loss) from investment operations: Net investment income (loss)b | (.02) | (.03) | (.02) | (.03) | (.02) |
Net realized and unrealized gain (loss) on investment transactions | 1.04 | 1.08 | 2.78 | (2.43) | .67 |
Total from investment operations | 1.02 | 1.05 | 2.76 | (2.46) | .65 |
Net asset value, end of period | $ 13.02 | $ 12.00 | $ 10.95 | $ 8.19 | $ 10.65 |
Total Return (%) | 8.50 | 9.59 | 33.70 | (23.10) | 6.50c** |
Ratios to Average Net Assets and Supplemental Data |
Net assets, end of period ($ millions) | 109 | 109 | 101 | 69 | 56 |
Ratio of expenses before expense reductions (%) | .88 | .88 | .87 | .91 | 1.40* |
Ratio of expenses after expense reductions (%) | .88 | .88 | .87 | .91 | .95* |
Ratio of net investment income (loss) (%) | (.18) | (.29) | (.24) | (.38) | (.25)* |
Portfolio turnover rate (%) | 43 | 77 | 64 | 53 | 34* |
a For the period May 1, 2001 (commencement of operations of Class A shares) to December 31, 2001. b Based on average shares outstanding during the period. c Total return would have been lower had certain expenses not been reduced. * Annualized ** Not annualized |
Class B Years Ended December 31, | 2005 | 2004 | 2003 | 2002a |
Selected Per Share Data |
Net asset value, beginning of period | $ 11.91 | $ 10.91 | $ 8.19 | $ 8.09 |
Income (loss) from investment operations: Net investment income (loss)b | (.07) | (.08) | (.07) | (.04) |
Net realized and unrealized gain (loss) on investment transactions | 1.03 | 1.08 | 2.79 | .14 |
Total from investment operations | .96 | 1.00 | 2.72 | .10 |
Net asset value, end of period | $ 12.87 | $ 11.91 | $ 10.91 | $ 8.19 |
Total Return (%) | 8.06 | 9.17 | 33.21 | 1.24** |
Ratios to Average Net Assets and Supplemental Data |
Net assets, end of period ($ millions) | 23 | 20 | 11 | .3 |
Ratio of expenses (%) | 1.27 | 1.27 | 1.26 | 1.16* |
Ratio of net investment income (loss) (%) | (.57) | (.68) | (.63) | (.92)* |
Portfolio turnover rate (%) | 43 | 77 | 64 | 53 |
a For the period July 1, 2002 (commencement of operations of Class B shares) to December 31, 2002. b Based on average shares outstanding during the period. * Annualized ** Not annualized |
Notes to Financial Statements
A. Significant Accounting Policies
DWS Variable Series I (formerly Scudder Variable Series I) (the "Series") is registered under the Investment Company Act of 1940, as amended (the "1940 Act"), as an open-end, registered management investment company organized as a Massachusetts business trust. The Series consists of seven diversified portfolios: Money Market VIP, DWS Bond VIP, DWS Growth & Income VIP, DWS Capital Growth VIP, DWS Global Opportunities VIP, DWS International VIP and DWS Health Care VIP (individually or collectively hereinafter referred to as a "Portfolio" or the "Portfolios" and formerly known as Money Market Portfolio, Bond Portfolio, Growth and Income Portfolio, Capital Growth Portfolio, Global Discovery Portfolio, International Portfolio and Health Sciences Portfolio, respectively). The Series is intended to be the underlying investment vehicle for variable annuity contracts and variable life insurance policies to be offered by the separate accounts of certain life insurance companies ("Participating Insurance Companies").
Multiple Classes of Shares of Beneficial Interest. The Series offers one class of shares for the Money Market VIP and two classes of shares (Class A shares and Class B shares) for each of the other Portfolios. On May 2, 2005, the DWS Bond VIP commenced offering Class B shares. Class B shares are subject to Rule 12b-1 distribution fees under the 1940 Act and record keeping fees equal to an annual rate of 0.25% and up to 0.15%, respectively, of the average daily net assets of the Class B shares of the applicable Portfolio. Class A shares are not subject to such fees.
Investment income, realized and unrealized gains and losses, and certain portfolio-level expenses and expense reductions, if any, are borne pro rata on the basis of relative net assets by the holders of all classes of shares except that each class bears certain expenses unique to that class (including the applicable 12b-1 distribution fee and record keeping fees). Differences in class-level expenses may result in payment of different per share dividends by class. All shares have equal rights with respect to voting subject to class-specific arrangements.
The Series' financial statements are prepared in accordance with accounting principles generally accepted in the United States of America, which require the use of management estimates. Actual results could differ from those estimates. The policies described below are followed consistently by the Series in the preparation of the financial statements for its Portfolios.
Security Valuation. The Money Market VIP values all securities utilizing the amortized cost method permitted in accordance with Rule 2a-7 under the 1940 Act and certain conditions therein. Under this method, which does not take into account unrealized capital gains or losses on securities, an instrument is initially valued at its cost and thereafter assumes a constant accretion/amortization to maturity of any discount or premium.
Securities in each of the remaining Portfolios are valued in the following manner:
Investments are stated at value determined as of the close of regular trading on the New York Stock Exchange on each day the exchange is open for trading. Equity securities are valued at the most recent sale price or official closing price reported on the exchange (US or foreign) or over-the-counter market on which the security is traded most extensively. Securities for which no sales are reported are valued at the calculated mean between the most recent bid and asked quotations on the relevant market or, if a mean cannot be determined, at the most recent bid quotation.
Debt securities are valued by independent pricing services approved by the Trustees of the Series. If the pricing services are unable to provide valuations, securities are valued at the most recent bid quotation or evaluated price, as applicable, obtained from a broker-dealer. Such services may use various pricing techniques which take into account appropriate factors such as yield, quality, coupon rate, maturity, type of issue, trading characteristics and other data, as well as broker quotes.
Money market instruments purchased with an original or remaining maturity of sixty days or less, maturing at par, are valued at amortized cost. Investments in open-end investment companies and Cash Management QP Trust are valued at their net asset value each business day.
Securities and other assets for which market quotations are not readily available or for which the above valuation procedures are deemed not to reflect fair value are valued in a manner that is intended to reflect their fair value as determined in accordance with procedures approved by the Trustees. The Series may use a fair valuation model to value international equity securities in order to adjust for events which may occur between the close of the foreign exchanges and the close of the New York Stock Exchange.
Securities Lending. Each Portfolio, except the Money Market VIP, may lend securities to financial institutions. The Portfolio retains beneficial ownership of the securities it has loaned and continues to receive interest and dividends paid by the securities and to participate in any changes in their market value. The Portfolio requires the borrowers of the securities to maintain collateral with the Portfolio consisting of liquid, unencumbered assets having a value at least equal to the value of the securities loaned. The Portfolio may invest the cash collateral into a joint trading account in an affiliated money market fund pursuant to an Exemptive Order issued by the SEC. The Portfolio receives compensation for lending its securities either in the form of fees or by earning interest on invested cash collateral net of fees paid to a lending agent. Either the Portfolio or the borrower may terminate the loan. The Portfolio is subject to all investment risks associated with the value of any cash collateral received, including, but not limited to, interest rate, credit and liquidity risk associated with such investments.
Options. An option contract is a contract in which the writer of the option grants the buyer of the option the right to purchase from (call option), or sell to (put option), the writer a designated instrument at a specified price within a specified period of time. Certain options, including options on indices, will require cash settlement by the Portfolio if the option is exercised. Each Portfolio, except for Money Market VIP, may enter into option contracts in order to hedge against potential adverse price movements in the value of portfolio assets; as a temporary substitute for selling selected investments; to lock in the purchase price of a security or currency which it expects to purchase in the near future; as a temporary substitute for purchasing selected investments; and to enhance potential gain.
The liability representing the Portfolio's obligation under an exchange traded written option or investment in a purchased option is valued at the last sale price or, in the absence of a sale, the mean between the closing bid and asked prices or at the most recent asked price (bid for purchased options) if no bid and asked prices are available. Over-the-counter written or purchased options are valued using dealer supplied quotations. Gain or loss is recognized when the option contract expires or is closed.
If the Portfolio writes a covered call option, the Portfolio foregoes, in exchange for the premium, the opportunity to profit during the option period from an increase in the market value of the underlying security above the exercise price. If the Portfolio writes a put option it accepts the risk of a decline in the market value of the underlying security below the exercise price. Over-the-counter options have the risk of the potential inability of counterparties to meet the terms of their contracts. The Portfolio's maximum exposure to purchased options is limited to the premium initially paid. In addition, certain risks may arise upon entering into option contracts including the risk that an illiquid secondary market will limit the Portfolio's ability to close out an option contract prior to the expiration date and that a change in the value of the option contract may not correlate exactly with changes in the value of the securities or currencies hedged.
Foreign Currency Translations. The books and records of the Portfolios are maintained in US dollars. Investment securities and other assets and liabilities denominated in a foreign currency are translated into US dollars at the prevailing exchange rates at period end. Purchases and sales of investment securities, income and expenses are translated into US dollars at the prevailing exchange rates on the respective dates of the transactions.
Net realized and unrealized gains and losses on foreign currency transactions represent net gains and losses between trade and settlement dates on securities transactions, the disposition of forward foreign currency exchange contracts and foreign currencies, and the difference between the amount of net investment income accrued and the US dollar amount actually received. That portion of both realized and unrealized gains and losses on investments that results from fluctuations in foreign currency exchange rates is not separately disclosed but is included with net realized and unrealized gains and losses on investment securities.
Forward Foreign Currency Exchange Contracts. A forward foreign currency exchange contract (forward currency contract) is a commitment to purchase or sell a foreign currency at the settlement date at a negotiated rate. The Portfolios may enter into forward currency contracts in order to hedge their exposure to changes in foreign currency exchange rates on their foreign currency denominated portfolio holdings and to facilitate transactions in foreign currency denominated securities.
Forward currency contracts are valued at the prevailing forward exchange rate of the underlying currencies and unrealized gain (loss) is recorded daily. Sales and purchases of forward currency contracts having the same settlement date and broker are offset and any gain (loss) is realized on the date of offset; otherwise, gain (loss) is realized on settlement date. Realized and unrealized gains and losses which represent the difference between the value of a forward currency contract to buy and a forward currency contract to sell are included in net realized and unrealized gain (loss) from foreign currency related transactions.
Certain risks may arise upon entering into forward currency contracts from the potential inability of counterparties to meet the terms of their contracts. Additionally, when utilizing forward currency contracts to hedge, the Portfolio gives up the opportunity to profit from favorable exchange rate movements during the term of the contract.
Repurchase Agreements. Each Portfolio may enter into repurchase agreements with certain banks and broker/dealers whereby the Portfolio, through its custodian or sub-custodian bank, receives delivery of the underlying securities, the amount of which at the time of purchase and each subsequent business day is required to be maintained at such a level that the value is equal to at least the principal amount of the repurchase price plus accrued interest. The custodial bank holds the collateral in a separate account until the agreement matures. If the value of the securities falls below the principal amount of the repurchase agreement plus accrued interest, the financial institution deposits additional collateral by the following business day. If the financial institution either fails to deposit the required additional collateral or fails to repurchase the securities as agreed, the Portfolio has the right to sell the securities and recover any resulting loss from the financial institution. If the financial institution enters into bankruptcy, the Portfolio's claims on the collateral may be subject to legal proceedings.
Mortgage Dollar Rolls. The DWS Bond VIP may enter into mortgage dollar rolls in which the Portfolio sells mortgage-backed securities for delivery in the current month and simultaneously contracts to repurchase similar, but not identical, securities on a fixed date. The Portfolio receives compensation as consideration for entering into the commitment to repurchase. The compensation is paid in the form of a lower price for the security upon its repurchase or, alternatively, a fee. Mortgage dollar rolls may be renewed with a new sale and repurchase price and a cash settlement made at each renewal without physical delivery of the securities subject to the contract.
Certain risks may arise upon entering into mortgage dollar rolls from the potential inability of counterparties to meet the terms of their commitments. Additionally, the value of such securities may change adversely before the Portfolio is able to repurchase them.
At the time the Portfolio enters into this type of transaction it is required to segregate cash or other liquid assets at least equal to the amount of the commitment.
When-Issued/Delayed Delivery Securities. Each Portfolio may purchase securities with delivery or payment to occur at a later date beyond the normal settlement period. At the time a Portfolio enters into a commitment to purchase a security, the transaction is recorded and the value of the security is reflected in the net asset value. The price of such security and the date when the security will be delivered and paid for are fixed at the time the transaction is negotiated. The value of the security may vary with market fluctuations. No interest accrues to the Portfolio until payment takes place. At the time the Portfolio enters into this type of transaction it is required to segregate cash or other liquid assets at least equal to the amount of the commitment.
Certain risks may arise upon entering into when-issued or delayed delivery securities from the potential inability of counterparties to meet the terms of their contracts or if the issuer does not issue the securities due to political, economic, or other factors. Additionally, losses may arise due to changes in the value of the underlying securities.
Loan Participations/Assignments. The DWS Bond VIP may invest in US dollar-denominated fixed and floating rate loans ("Loans") arranged through private negotiations between a foreign sovereign entity and one or more financial institutions ("Lenders"). The Portfolio invests in such Loans in the form of participations in Loans ("Participations") or assignments of all or a portion of loans from third parties ("Assignments"). Participations typically result in the Portfolio having a contractual relationship only with the Lender, not with the sovereign borrower. The Portfolio has the right to receive payments of principal, interest and any fees to which it is entitled from the Lender selling the Participation and only upon receipt by the Lender of the payments from the borrower. In connection with purchasing Participations, the Portfolio generally has no right to enforce compliance by the borrower with the terms of the loan agreement relating to the Loan, nor any rights of set-off against the borrower, and the Portfolio will not benefit directly from any collateral supporting the Loan in which it has purchased the Participation. As a result, the Portfolio assumes the credit risk of both the borrower and the Lender that is selling the Participation.
Federal Income Taxes. Each Portfolio is treated as a separate taxpayer as provided for in the Internal Revenue Code, as amended. It is each Portfolio's policy to comply with the requirements of the Internal Revenue Code, which are applicable to regulated investment companies, and to distribute all of its taxable income to the separate accounts of the Participating Insurance Companies which hold its shares. Accordingly, the Portfolios paid no federal income taxes and no federal income tax provision was required.
Additionally, based on the Series' understanding of the tax rules and rates related to income, gains and transactions for the foreign jurisdictions in which each Portfolio invests, the Series will provide for foreign taxes, and where appropriate, deferred foreign taxes.
At December 31, 2005, the following Portfolios had an approximate net tax basis capital loss carryforward which may be applied against any realized net taxable capital gains of each succeeding year until fully utilized or until the following expiration dates, whichever occurs first:
Portfolio | Capital Loss Carryforwards Utilized ($)+ | Capital Loss Carryforwards ($) | Expiration
Date |
Money Market VIP | — | 2,690 | 12/31/2009 |
| | 10 | 12/31/2013 |
DWS Growth & Income VIP | 24,492,000 | 7,548,000 | 12/31/2009 |
| | 15,651,000 | 12/31/2010 |
| | 7,030,000 | 12/31/2011 |
DWS Capital Growth VIP | 10,884,000 | 647,000 | 12/31/2007 |
| | 83,834,000 | 12/31/2008 |
| | 51,869,000 | 12/31/2009 |
| | 132,940,000 | 12/31/2010 |
| | 67,497,000 | 12/31/2011 |
| | 28,617,000 | 12/31/2012 |
DWS Global Opportunities VIP | 29,221,000 | 8,289,000 | 12/31/2010 |
| | 5,230,000 | 12/31/2011 |
DWS International VIP | 52,487,000 | 49,645,000 | 12/31/2009 |
| | 105,374,000 | 12/31/2010 |
| | 13,952,000 | 12/31/2011 |
DWS Health Care VIP | 5,204,000 | — | — |
+ Represents the amount of prior year capital loss carryforwards utilized during the year ended December 31, 2005.
The DWS Capital Growth VIP inherited approximately $176,061,000 of its capital loss carryforward from its merger with the SVS II Eagle Focused Large Cap Growth Portfolio ($22,474,000) and SVS II Growth Portfolio ($153,587,000) (Note J), which is included in the table above and may be applied against net realized taxable gains. The Portfolio utilized approximately $456,000 and $10,428,000 of the inherited amounts from SVS II Eagle Focused Large Cap Growth Portfolio and SVS II Growth Portfolio, respectively, which is also included in the table above. Due to certain limitations under Sections 381-384 of the Internal Revenue Code, approximately $32,647,000 of the losses from SVS II Growth Portfolio cannot be used. At December 31, 2005 the Portfolio had a remaining net tax basis capital loss carryforward of $132,529,000 inherited from its mergers, which may be applied against any net realized taxable gains of each succeeding year until fully utilized or until December 31, 2007 ($647,000), December 31, 2008 ($83,834,000), December 31, 2009 ($33,831,000), December 31, 2010 ($11,910,000) and December 31, 2011 ($2,307,000), the respective expiration dates, whichever occurs first.
The DWS Growth & Income VIP inherited approximately $18,794,000 of its capital loss carryforward from its merger with the SVS II Focus Value & Growth Portfolio (Note J), which is included in the table above and may be applied against net realized taxable gains. The Portfolio utilized approximately $3,700,000 of the inherited amount which is also included in the table above. At December 31, 2005 the Portfolio had a remaining net tax basis capital loss carryforward of $15,094,000 inherited from its merger, which may be applied against any net realized taxable gains of each succeeding year until fully utilized or until December 31, 2009 ($7,548,000), and December 31, 2010 ($7,546,000) the respective expiration dates, whichever occurs first.
In addition, from November 1, 2005 through December 31, 2005, DWS Bond VIP, DWS Capital Growth VIP, DWS Global Opportunities VIP, DWS International VIP and DWS Health Care VIP incurred approximately $31,400, $5,800, $12,000, $96,000 and $8,982, respectively, of net realized currency losses. In addition, DWS Bond VIP incurred approximately $152,900 of net realized capital losses. As permitted by tax regulations, the Portfolios intend to elect to defer these losses and treat them as arising in the fiscal year ended December 31, 2006.
Distribution of Income and Gains. Net investment income of Money Market VIP is declared as a daily dividend and is distributed to shareholders monthly. All other Portfolios will declare and distribute dividends from their net investment income, if any, in April, although additional distributions may be made if necessary. Net realized gains from investment transactions, in excess of available capital loss carryforwards, would be taxable to each Portfolio if not distributed, and, therefore, will be distributed to shareholders at least annually.
The timing and characterization of certain income and capital gains distributions are determined annually in accordance with federal tax regulations which may differ from accounting principles generally accepted in the United States of America. These differences primarily relate to investments in forward foreign currency exchange contracts, passive foreign investment companies, post October loss deferrals and certain securities sold at a loss. As a result, net investment income (loss) and net realized gain (loss) on investment transactions for a reporting period may differ significantly from distributions during such period. Accordingly, each Portfolio may periodically make reclassifications among certain of its capital accounts without impacting the net asset value of the Portfolio.
At December 31, 2005, the Portfolios' components of distributable earnings (accumulated losses) on a tax-basis are as follows:
Portfolio | Undistributed Ordinary Income ($)* | Undistributed Net Long-Term Capital Gains ($) | Capital Loss Carryforwards ($) | Net Unrealized Gain (Loss) on Investments ($) |
Money Market VIP | 3,677 | — | (2,700) | — |
DWS Bond VIP | 8,194,250 | 67,901 | — | (1,470,006) |
DWS Growth & Income VIP | 2,776,543 | — | (30,229,000) | 31,549,540 |
DWS Capital Growth VIP | 5,517,479 | — | (365,404,000) | 270,338,925 |
DWS Global Opportunities VIP | 3,418,577 | — | (13,519,000) | 95,962,536 |
DWS International VIP | 11,838,678 | — | (168,971,000) | 160,284,517 |
DWS Health Care VIP | — | 477,444 | — | 31,497,756 |
In addition, the tax character of distributions paid to shareholders by the Portfolios is summarized as follows:
| Distributions from Ordinary Income ($)* Years Ended December 31, | Distributions from Long-Term Capital Gains ($) Years Ended December 31, |
Portfolio | 2005 | 2004 | 2005 | 2004 |
Money Market VIP | 1,444,352 | 540,356 | — | — |
DWS Bond VIP | 6,958,800 | 6,665,081 | 1,051,416 | — |
DWS Growth & Income VIP | 2,545,821 | 1,352,130 | — | — |
DWS Capital Growth VIP | 6,821,611 | 3,797,565 | — | — |
DWS Global Opportunities VIP | 1,575,724 | 501,729 | — | — |
DWS International VIP | 9,101,215 | 6,676,662 | — | — |
DWS Health Care VIP | — | — | — | — |
* For tax purposes short-term capital gains distributions are considered ordinary income distributions.
Contingencies. In the normal course of business, each Portfolio may enter into contracts with service providers that contain general indemnification clauses. Each Portfolio's maximum exposure under these arrangements is unknown as this would involve future claims that may be made against each Portfolio that have not yet been made. However, based on experience, each Portfolio expects the risk of loss to be remote.
Expenses. Expenses of the Series arising in connection with a specific portfolio are allocated to that portfolio. Other Series expenses which cannot be directly attributed to a portfolio are apportioned among the portfolios in the Series.
Other. For the Money Market VIP, investment transactions are accounted for on trade date. For all other Portfolios, investment transactions are accounted for on a trade date plus one basis for daily net asset value calculations. However, for financial reporting purposes, investment transactions are reported on trade date. Interest income is recorded on the accrual basis. Dividend income is recorded on the ex-dividend date net of foreign withholding taxes. Certain dividends from foreign securities may be recorded subsequent to the ex-dividend date as soon as the Portfolio is informed of such dividends. Realized gains and losses from investment transactions are recorded on an identified cost basis. All discounts and premiums are accreted/amortized for both tax and financial reporting purposes.
B. Purchases and Sales of Securities
During the year ended December 31, 2005, purchases and sales of investment securities (excluding short-term investments) were as follow:
Portfolio | Purchases ($) | Sales ($) |
DWS Bond VIP excluding US Treasury Obligations and mortgage dollar roll transactions | 201,504,071 | 179,865,410 |
US Treasury Obligations | 164,280,702 | 151,765,440 |
mortgage dollar roll transactions | 16,753,582 | 17,212,507 |
DWS Growth & Income VIP | 420,132,427 | 316,238,132 |
DWS Capital Growth VIP | 164,670,736 | 261,220,617 |
DWS Global Opportunities VIP | 107,023,480 | 81,233,299 |
DWS International VIP | 327,151,600 | 372,568,000 |
DWS Health Care VIP | 53,711,178 | 63,520,618 |
For the year ended December 31, 2005, transactions for written options were as follows for the DWS Growth & Income VIP:
| Contract Amounts | Premium ($) |
Beginning of period | 119 | 9,684 |
Options written | 487 | 27,816 |
Options exercised | (222) | (5,778) |
Options closed | (29) | (2,920) |
Options expired | (355) | (28,802) |
End of period | — | — |
C. Related Parties
Under the Management Agreement with Deutsche Investment Management Americas Inc. ("DeIM" or the "Advisor"), an indirect, wholly owned subsidiary of Deutsche Bank AG, the Advisor directs the investments of the Portfolios in accordance with their investment objectives, policies and restrictions. The Advisor determines the securities, instruments and other contracts relating to investments to be purchased, sold or entered into by the Portfolios. In addition to portfolio management services, the Advisor provides certain administrative services in accordance with the Management Agreement.
Under the Series' Management Agreement with the Advisor, the Portfolios pay a monthly investment management fee, based on the average daily net assets of each Portfolio, payable monthly, at the annual rates shown below:
Portfolio | Annual Management Fee Rate |
Money Market VIP | 0.370% |
DWS Bond VIP | 0.475% |
DWS Global Opportunities VIP | 0.975% |
Prior to December 2, 2005, Deutsche Asset Management Investment Services Ltd. ("DeAMIS"), an affiliate of the Advisor, served as subadvisor with respect to the investment and reinvestment of assets in DWS Bond VIP. The Advisor compensated DeAMIS out of the management fee it receives from DWS Bond VIP. On December 1, 2005, Aberdeen Asset Management PLC ("Aberdeen PLC") acquired from Deutsche Bank AG, the parent company of the Advisor, parts of its asset management business and related assets based in London and Philadelphia. As of December 2, 2005, and pursuant to a written contract with the Advisor (the "Sub-Advisory Agreement"), Aberdeen Asset Management Inc. ("AAMI"), a direct wholly-owned subsidiary of Aberdeen PLC, serves as subadvisor to the Fund. AAMI is paid by the Advisor for its services.
For the period January 1, 2005 through April 29, 2005, the DWS Growth & Income VIP paid the Advisor a monthly investment management fee, based on the average daily net assets of the Portfolio, payable monthly, at the annual rate shown below:
Portfolio | Annual Management Fee Rate |
DWS Growth & Income VIP | 0.475% |
Effective April 30, 2005, the DWS Growth & Income VIP pays the Advisor a graduated investment management fee, based on the average daily net assets of the Portfolio, payable monthly, at the annual rates shown below:
Average Daily Net Assets of the Portfolio | Annual Management Fee Rate |
first $250 million | 0.475% |
next $750 million | 0.450% |
over $1 billion | 0.425% |
For the year ended December 31, 2005, the DWS Growth & Income VIP waived a portion of its management fees pursuant to the Management Agreement aggregating $57,047 and the amount charged aggregated $1,278,499, which was equivalent to an annual effective rate of 0.450% of the Portfolio's average daily net assets.
From January 1, 2005 through April 29, 2005, the DWS Capital Growth VIP paid the Advisor a graduated investment management fee, based on the average daily net assets of the Portfolio, payable monthly, at the annual rates shown below:
Average Daily Net Assets of the Portfolio | Annual Management Fee Rate |
first $500 million | 0.475% |
next $500 million | 0.450% |
over $1 billion | 0.425% |
Effective April 30, 2005, the DWS Capital Growth VIP pays the Advisor a graduated investment management fee, based on the average daily net assets of the Portfolio, payable monthly, at the annual rates shown below:
Average Daily Net Assets of the Portfolio | Annual Management Fee Rate |
first $250 million | 0.475% |
next $750 million | 0.450% |
over $1 billion | 0.425% |
For the year ended December 31, 2005, the DWS Capital Growth VIP waived a portion of its management fees pursuant to the Management Agreement aggregating $31,311 and the amount charged aggregated $4,389,692, which was equivalent to an annual effective rate of 0.454% of the Portfolio's average daily net assets.
DWS International VIP pays the Advisor a graduated investment management fee, based on the average daily net assets of the Portfolio, payable monthly, at the annual rates shown below:
Average Daily Net Assets of the Portfolio | Annual Management Fee Rate |
first $500 million | 0.875% |
over $500 million | 0.725% |
For the year ended December 31, 2005, DWS International VIP incurred a management fee equivalent to an annualized effective rate of 0.858% of the Portfolio's average daily net assets. Prior to September 30, 2005, Deutsche Asset Management Investment Services Limited ("DeAMIS"), an indirect wholly owned subsidiary of Deutsche Bank AG, was the subadvisor for the Fund. The subadvisor was paid by the Advisor for its services. Effective October 1, 2005, DeIM performs the services previously performed by DeAMIS.
The DWS Health Care VIP pays the Advisor a graduated investment management fee, based on the average daily net assets of the Portfolio, payable monthly, at the annual rates shown below:
Average Daily Net Assets of the Portfolio | Annual Management Fee Rate |
first $250 million | 0.750% |
next $750 million | 0.725% |
next $1.5 billion | 0.700% |
next $2.5 billion | 0.680% |
next $2.5 billion | 0.650% |
next $2.5 billion | 0.640% |
next $2.5 billion | 0.630% |
over $12.5 billion | 0.620% |
For the year ended December 31, 2005, DWS Health Care VIP incurred a management fee equivalent to an annual effective rate of 0.750% of the Portfolio's average daily net assets.
In addition, for the period January 1, 2005 through April 30, 2006 (DWS Bond VIP Class B commenced operations on May 2, 2005), the Advisor, the underwriter and accounting agent contractually agreed to waive a portion of their fee to the extent necessary to maintain the operating expenses of each class (excluding certain expenses such as extraordinary expenses, taxes, brokerage and interest) as follows:
Portfolio | Operating Expense Ratio |
Money Market VIP | 0.68% |
DWS Bond VIP Class A | 0.71% |
DWS Bond VIP Class B | 1.11% |
DWS Global Opportunities VIP Class A | 1.24% |
DWS Global Opportunities VIP Class B | 1.24% |
DWS International VIP Class A | 1.37% |
DWS International VIP Class B | 1.37% |
DWS Health Care VIP Class A | 0.95% |
DWS Health Care VIP Class B | 1.35% |
Also, for the period from January 1, 2005 through April 30, 2005, the Advisor contractually agreed to waive a portion of its fee to the extent necessary to maintain the operating expenses of each class as follows:
Portfolio | Operating Expense Ratio |
DWS Capital Growth VIP Class A | 1.08% |
DWS Capital Growth VIP Class B | 1.08% |
DWS Growth & Income VIP Class A | 1.09% |
DWS Growth & Income VIP Class B | 1.09% |
Effective May 1, 2005 through April 30, 2008, the Advisor contractually agreed to waive a portion of its fee to the extent necessary to maintain the operating expenses of each class (excluding certain expenses such as extraordinary expenses, taxes, brokerage and interest) as follows:
Portfolio | Operating Expense Ratio |
DWS Capital Growth VIP Class A | 0.49% |
DWS Capital Growth VIP Class B | 0.86% |
DWS Growth & Income VIP Class A | 0.54% |
DWS Growth & Income VIP Class B | 0.89% |
Under these arrangements, the Advisor reimbursed DWS Growth & Income VIP, DWS Capital Growth VIP, DWS Global Opportunities VIP and DWS International VIP $12,854, $11,870, $81,355 and $16,354, respectively, for expenses.
Service Provider Fees. DWS Scudder Fund Accounting Corporation ("DWS-SFAC"), a subsidiary of the Advisor, is responsible for determining the daily net asset value per share and maintaining the portfolio and general accounting records of each portfolio. In turn, DWS-SFAC has delegated certain fund accounting functions to a third-party service provider. For the year ended December 31, 2005, DWS-SFAC received the following fee for its services for the following portfolios:
Portfolio | Total Aggregated ($) | Unpaid at December 31, 2005 ($) |
Money Market VIP | 43,702 | 3,552 |
DWS Bond VIP | 135,150 | 6,200 |
DWS Growth & Income VIP | 93,605 | 9,330 |
DWS Capital Growth VIP | 146,442 | 12,889 |
DWS Global Opportunities VIP | 226,558 | 21,042 |
DWS International VIP | 374,978 | 30,499 |
DWS Health Care VIP | 63,666 | 5,685 |
DWS Scudder Investments Service Company, an affiliate of the Advisor, is the transfer agent and dividend-paying agent of the Series. These affiliated entities have in turn entered into various agreements with third-party service providers to provide these services.
DWS Scudder Distributors, Inc. ("DWS-SDI"), also an affiliate of the Advisor, is the Series' Distributor. In accordance with the Master Distribution Plan, DWS-SDI receives 12b-1 fees of 0.25% of average daily net assets of Class B shares. Pursuant to the Master Distribution Plan, DWS-SDI remits these fees to the Participating Insurance Companies for various costs incurred or paid by these companies in connection with marketing and distribution of Class B shares. These fees are detailed in each Portfolio's Statement of Operations.
Typesetting and Filing Service Fees. Under an agreement with DeIM, the Advisor is compensated for providing typesetting and regulatory filing services to the Portfolios. For the year ended December 31, 2005, the amount charged to the Portfolios by DeIM included in the reports to shareholders were as follows:
Portfolio | Amount ($) | Unpaid at December 31, 2005 ($) |
Money Market VIP | 4,114 | 1,303 |
DWS Bond VIP | 4,114 | 1,303 |
DWS Growth & Income VIP | 4,114 | 1,303 |
DWS Capital Growth VIP | 4,114 | 1,303 |
DWS Global Opportunities VIP | 4,114 | 1,303 |
DWS International VIP | 4,114 | 1,303 |
DWS Health Care VIP | 4,114 | 1,303 |
Trustees' Fees and Expenses. The Portfolios pay each Trustee not affiliated with the Advisor retainer fees plus specified amounts for attended board and committee meetings. Allocated Trustees' fees and expenses for each Portfolio for the year ended December 31, 2005 are detailed in each Portfolio's Statement of Operations.
Cash Management QP Trust. Pursuant to an Exemptive Order issued by the SEC, the Series may invest in the Cash Management QP Trust (the ``QP Trust''), and other affiliated funds managed by the Advisor. The QP Trust seeks to provide as high a level of current income as is consistent with the preservation of capital and the maintenance of liquidity. The QP Trust does not pay the Advisor a management fee for the affiliated funds' investments in the QP Trust.
D. Investing in Emerging Markets
Investing in emerging markets may involve special risks and considerations not typically associated with investing in the United States of America. These risks include revaluation of currencies, high rates of inflation, repatriation restrictions on income and capital, and future adverse political, social and economic developments. Moreover, securities issued in these markets may be less liquid, subject to government ownership controls, delayed settlements and their prices more volatile than those of comparable securities in the United States of America.
E. Expense Reductions
For the year ended December 31, 2005, the Advisor agreed to reimburse the Portfolios a portion of the fee savings expected to be realized by the Advisor related to the outsourcing by the Advisor of certain administrative services to an unaffiliated service provider as follows:
Portfolio | Amount ($) |
Money Market VIP | 2,353 |
DWS Bond VIP | 3,716 |
DWS Growth & Income VIP | 5,181 |
DWS Capital Growth VIP | 13,590 |
DWS Global Opportunities VIP | 4,909 |
DWS International VIP | 7,629 |
DWS Health Care VIP | 3,200 |
In addition, Money Market VIP, DWS Bond VIP, DWS Growth & Income VIP, DWS Capital Growth VIP and DWS Health Care VIP have entered into an arrangement with their custodian whereby credits realized as a result of uninvested cash balances are used to reduce a portion of the Portfolios' expenses. During the year ended December 31, 2005, the custodian fees were reduced as follows:
Portfolio | Custody Credits ($) |
Money Market VIP | 52 |
DWS Bond VIP | 1,186 |
DWS Growth & Income VIP | 7,444 |
DWS Capital Growth VIP | 130 |
DWS Health Care VIP | 70 |
F. Forward Foreign Currency Exchange Contracts
As of December 31, 2005, the DWS Bond VIP had entered into the following open forward foreign currency exchange contracts:
Contracts to Deliver | | In Exchange For | | Settlement Date | | Unrealized Appreciation (US$) |
CHF | 1,790,000 | | EUR | 1,163,426 | | 1/25/2006 | | 4,779 |
CHF | 1,790,000 | | EUR | 1,163,426 | | 1/25/2006 | | 8,763 |
EUR | 797,033 | | CHF | 1,230,000 | | 1/25/2006 | | 3,288 |
EUR | 420,534 | | GBP | 290,000 | | 1/25/2006 | | 1,129 |
EUR | 401,670 | | SEK | 3,800,000 | | 1/25/2006 | | 7,521 |
EUR | 400,490 | | SEK | 3,760,000 | | 1/25/2006 | | 4,348 |
EUR | 1,940,000 | | USD | 2,359,079 | | 1/25/2006 | | 59,048 |
EUR | 372,000 | | USD | 442,806 | | 1/25/2006 | | 1,770 |
EUR | 60,000 | | USD | 72,089 | | 1/25/2006 | | 954 |
GBP | 515,496 | | EUR | 759,000 | | 1/25/2006 | | 10,537 |
GBP | 515,496 | | EUR | 759,000 | | 1/25/2006 | | 2,516 |
JPY | 110,000,000 | | USD | 942,951 | | 1/25/2006 | | 7,239 |
JPY | 56,000,000 | | USD | 484,995 | | 1/25/2006 | | 8,633 |
MXN | 10,300,000 | | USD | 974,770 | | 1/25/2006 | | 9,224 |
NZD | 1,322,250 | | AUD | 1,230,000 | | 1/25/2006 | | 24,138 |
NZD | 660,445 | | AUD | 613,000 | | 1/25/2006 | | 10,048 |
USD | 1,012,233 | | EUR | 857,000 | | 1/25/2006 | | 3,812 |
USD | 897,242 | | EUR | 763,000 | | 1/25/2006 | | 7,357 |
USD | 511,098 | | JPY | 61,100,000 | | 1/25/2006 | | 8,647 |
USD | 443,060 | | RUB | 12,800,000 | | 1/25/2006 | | 1,839 |
USD | 78,071 | | RUB | 2,250,000 | | 1/25/2006 | | 134 |
USD | 451,951 | | SGD | 760,000 | | 1/25/2006 | | 5,529 |
USD | 462,613 | | SGD | 778,000 | | 1/25/2006 | | 5,702 |
USD | 77,011 | | SGD | 130,000 | | 1/25/2006 | | 1,242 |
USD | 77,368 | | TRY | 107,000 | | 1/25/2006 | | 1,344 |
Total unrealized appreciation | 199,541 |
Contracts to Deliver | | In Exchange For | | Settlement Date | | Unrealized Depreciation (US$) |
EUR | 797,033 | | CHF | 1,230,000 | | 1/25/2006 | | (9,730) |
EUR | 420,534 | | GBP | 290,000 | | 1/25/2006 | | (822) |
EUR | 401,670 | | SEK | 3,800,000 | | 1/25/2006 | | (4,489) |
EUR | 400,490 | | SEK | 3,760,000 | | 1/25/2006 | | (4,960) |
EUR | 760,000 | | USD | 890,515 | | 1/25/2006 | | (10,528) |
EUR | 274,000 | | USD | 323,560 | | 1/25/2006 | | (1,290) |
EUR | 41,000 | | USD | 48,270 | | 1/25/2006 | | (339) |
MXN | 2,540,000 | | USD | 230,553 | | 1/25/2006 | | (7,553) |
MXN | 1,100,000 | | USD | 101,196 | | 1/25/2006 | | (1,921) |
MXN | 830,000 | | USD | 77,762 | | 1/25/2006 | | (44) |
NZD | 1,322,250 | | AUD | 1,230,000 | | 1/25/2006 | | (23,964) |
NZD | 660,445 | | AUD | 613,000 | | 1/25/2006 | | (10,963) |
SEK | 7,100,000 | | EUR | 738,279 | | 1/25/2006 | | (15,849) |
SEK | 7,100,000 | | EUR | 738,279 | | 1/25/2006 | | (4,293) |
SGD | 1,668,000 | | USD | 980,061 | | 1/25/2006 | | (23,987) |
SGD | 130,000 | | USD | 76,384 | | 1/25/2006 | | (1,870) |
TRY | 210,000 | | USD | 154,253 | | 1/25/2006 | | (228) |
USD | 78,333 | | ARS | 235,000 | | 1/25/2006 | | (1,475) |
USD | 86,288 | | BRL | 202,000 | | 1/25/2006 | | (572) |
USD | 77,261 | | BRL | 176,000 | | 1/25/2006 | | (2,578) |
USD | 1,414,718 | | CHF | 1,790,000 | | 1/25/2006 | | (48,922) |
USD | 926,482 | | EUR | 767,000 | | 1/25/2006 | | (17,140) |
USD | 510,043 | | EUR | 423,000 | | 1/25/2006 | | (8,541) |
USD | 76,926 | | RUB | 2,200,000 | | 1/25/2006 | | (459) |
USD | 1,384,043 | | SEK | 10,790,000 | | 1/25/2006 | | (23,237) |
Total unrealized depreciation | (225,754) |
Currency Abbreviations |
ARS Argentine Peso AUD Australian Dollar BRL Brazilian Real CHF Swiss Franc EUR Euro Currency GBP Pound Sterling JPY Japanese Yen MXN Mexican Peso NZD New Zealand Dollar RUB Russian Ruble SEK Swedish Krona SGD Singapore Dollar TRY New Turkish Lira USD United States Dollar |
G. Ownership of the Portfolios
At the end of the period, the beneficial ownership in the Portfolios was as follows:
Money Market VIP: Three participating insurance companies were owners of record of 10% or more of the total outstanding shares of the Portfolio, each owning 47%, 14% and 14%.
DWS Bond VIP: One participating insurance company was owner of record of 10% or more of the total outstanding Class A shares of the Portfolio, owning 66%. Two participating insurance companies were owners of record each owning 75% and 25% of the total outstanding Class B shares of the Portfolio.
DWS Growth & Income VIP: Four participating insurance companies were owners of record of 10% or more of the total outstanding Class A shares of the Portfolio, each owning 27%, 27%, 16% and 11%. Two participating insurance companies were owners of record, each owning 67% and 23% of the total outstanding Class B shares of the Portfolio.
DWS Capital Growth VIP: Three participating insurance companies were owners of record of 10% or more of the total outstanding Class A shares of the Portfolio, each owning 40%, 18% and 12%. Two participating insurance companies were owners of record, each owning 84% and 15% of the total outstanding Class B shares of the Portfolio.
DWS Global Opportunities VIP: Three participating insurance companies were owners of record of 10% or more of the total outstanding Class A shares of the Portfolio, each owning 58%, 20% and 10%. Three participating insurance companies were owners of record, each owning 64%, 19% and 16% of the total outstanding Class B shares of the Portfolio.
DWS International VIP: Two participating insurance companies were owners of record of 10% or more of the total outstanding Class A shares of the Portfolio, each owning 31% and 21%. Two participating insurance companies were owners of record, each owning 83% and 16% of the total outstanding Class B shares of the Portfolio.
DWS Health Care VIP: Two participating insurance companies were owners of record of 10% or more of the total outstanding Class A shares of the Portfolio, each owning 78% and 21%. Two participating insurance companies were owners of record, each owning 75% and 25% of the total outstanding Class B shares of the Portfolio.
H. Line of Credit
The Series and several other affiliated funds (the "Participants") share in a $1.1 billion revolving credit facility administered by J.P. Morgan Chase Bank for temporary or emergency purposes, including the meeting of redemption requests that otherwise might require the untimely disposition of securities. The Participants are charged an annual commitment fee which is allocated, based upon net assets, among each of the Participants. Interest is calculated at the Federal Funds Rate plus 0.5 percent. Each Portfolio may borrow up to a maximum of 33 percent of its net assets under the agreement.
I. Regulatory Matters and Litigation
Market Timing Related Regulatory and Litigation Matters. Since at least July 2003, federal, state and industry regulators have been conducting ongoing inquiries and investigations ("inquiries") into the mutual fund industry, and have requested information from numerous mutual fund companies, including DWS Scudder. The DWS funds' advisors have been cooperating in connection with these inquiries and are in discussions with the regulators concerning proposed settlements. Publicity about mutual fund practices arising from these industry-wide inquiries serves as the general basis of a number of private lawsuits against the DWS funds. These lawsuits, which previously have been reported in the press, involve purported class action and derivative lawsuits, making various allegations and naming as defendants various persons, including certain DWS funds, the funds' investment advisors and their affiliates, and certain individuals, including in some cases fund Trustees/Directors, officers, and other parties. Each DWS fund's investment advisor has agreed to indemnify the applicable DWS funds in connection with these lawsuits, or other lawsuits or regulatory actions that may be filed making allegations similar to these lawsuits regarding market timing, revenue sharing, fund valuation or other subjects arising from or related to the pending inquiries. It is not possible to determine with certainty what the outcome of these inquiries will be or what the effect, if any, would be on the funds or their advisors.
With respect to the lawsuits, based on currently available information, the funds' investment advisors believe the likelihood that the pending lawsuits will have a material adverse financial impact on a DWS fund is remote and such actions are not likely to materially affect their ability to perform under their investment management agreements with the DWS funds.
With respect to the regulatory matters, Deutsche Asset Management ("DeAM") has advised the funds as follows:
DeAM expects to reach final agreements with regulators early in 2006 regarding allegations of improper trading in the DWS funds. DeAM expects that it will reach settlement agreements with the Securities and Exchange Commission, the New York Attorney General and the Illinois Secretary of State providing for payment of disgorgement, penalties, and investor education contributions totaling approximately $134 million. Approximately $127 million of this amount would be distributed to shareholders of the affected DWS funds in accordance with a distribution plan to be developed by an independent distribution consultant. DeAM does not believe that any of the DWS funds will be named as respondents or defendants in any proceedings. The funds' investment advisors do not believe these amounts will have a material adverse financial impact on them or materially affect their ability to perform under their investment management agreements with the DWS funds. The above-described amounts are not material to Deutsche Bank, and they have already been reserved.
Based on the settlement discussions thus far, DeAM believes that it will be able to reach a settlement with the regulators on a basis that is generally consistent with settlements reached by other advisors, taking into account the particular facts and circumstances of market timing at DeAM and at the legacy Scudder and Kemper organizations prior to their acquisition by DeAM in April 2002. Among the terms of the expected settled orders, DeAM would be subject to certain undertakings regarding the conduct of its business in the future, including maintaining existing management fee reductions for certain funds for a period of five years. DeAM expects that these settlements would resolve regulatory allegations that it violated certain provisions of federal and state securities laws (i) by entering into trading arrangements that permitted certain investors to engage in market timing in certain DWS funds and (ii) by failing more generally to take adequate measures to prevent market timing in the DWS funds, primarily during the 1999-2001 period. With respect to the trading arrangements, DeAM expects that the settlement documents will include allegations related to one legacy DeAM arrangement, as well as three legacy Scudder and six legacy Kemper arrangements. All of these trading arrangements originated in businesses that existed prior to the current DeAM organization, which came together in April 2002 as a result of the various mergers of the legacy Scudder, Kemper and Deutsche fund groups, and all of the arrangements were terminated prior to the start of the regulatory investigations that began in the summer of 2003. No current DeAM employee approved the trading arrangements.
There is no certainty that the final settlement documents will contain the foregoing terms and conditions. The independent Trustees/Directors of the DWS funds have carefully monitored these regulatory investigations with the assistance of independent legal counsel and independent economic consultants. Additional information announced by DeAM regarding the terms of the expected settlements will be made available at www.dws-scudder.com/regulatory_settlements, which will also disclose the terms of any final settlement agreements once they are announced.
Other Regulatory Matters. DeAM is also engaged in settlement discussions with the Enforcement Staffs of the SEC and the NASD regarding DeAM's practices during 2001-2003 with respect to directing brokerage commissions for portfolio transactions by certain DWS funds to broker-dealers that sold shares in the DWS funds and provided enhanced marketing and distribution for shares in the DWS funds. In addition, on January 13, 2006, DWS Scudder Distributors, Inc. received a Wells notice from the Enforcement Staff of the NASD regarding DWS Scudder Distributors' payment of non-cash compensation to associated persons of NASD member firms, as well as DWS Scudder Distributors' procedures regarding non-cash compensation regarding entertainment provided to such associated persons. Additional information announced by DeAM regarding the terms of the expected settlements will be made available at www.dws-scudder.com/regulatory_settlements, which will also disclose the terms of any final settlement agreements once they are announced.
J. Acquisition of Assets
On April 29, 2005, the DWS Growth & Income VIP acquired all of the net assets of SVS Focus Value+Growth Portfolio pursuant to a plan of reorganization approved by shareholders on April 20, 2005. The acquisition was accomplished by a tax-free exchange of 7,630,195 Class A shares and 797,917 Class B shares of the SVS Focus Value+Growth Portfolio, respectively, for 11,366,540 Class A shares and 1,191,379 Class B shares of DWS Growth & Income VIP, respectively, outstanding on April 29, 2005. SVS Focus Value+Growth Portfolio's net assets at that date of $109,496,717, including $2,627,352 of net unrealized appreciation, were combined with those of the DWS Growth & Income VIP. The aggregate net assets of the DWS Growth & Income VIP immediately before the acquisition were $196,724,411. The combined net assets of the DWS Growth & Income VIP immediately following the acquisition were $306,221,128.
On April 29, 2005, the DWS Capital Growth VIP acquired all of the net assets of Scudder Growth Portfolio and SVS Eagle Focused Large Cap Growth Portfolio pursuant to a plan of reorganization approved by shareholders on April 20, 2005. The acquisition was accomplished by a tax-free exchange of 13,922,674 Class A shares and 864,495 Class B shares of the Scudder Growth Portfolio and 9,460,787 Class A shares and 3,575,054 Class B shares of the SVS Eagle Focused Large Cap Growth Portfolio, respectively, for 17,164,853 Class A shares and 1,066,401 Class B shares and 5,035,742 Class A shares and 1,896,817 of Class B shares of the DWS Capital Growth VIP, respectively, outstanding on April 29, 2005. Scudder Growth Portfolio and SVS Eagle Focused Large Cap Growth Portfolio's net assets at that date of $275,619,467 and $104,748,174, respectively, including $53,072,812 and $4,059,393, respectively, of net unrealized appreciation, were combined with those of the DWS Capital Growth VIP. The aggregate net assets of the DWS Capital Growth VIP immediately before the acquisition were $680,032,918. The combined net assets of the DWS Capital Growth VIP immediately following the acquisition were $1,060,400,559.
K. Payments Made by Affiliates
During the year ended December 31, 2005, the Advisor fully reimbursed the DWS Bond VIP $517 for losses incurred for a trade executed in error.
L. Subsequent Event
Effective February 6, 2006, Scudder Investments changed its name to DWS Scudder and the Scudder funds were renamed DWS funds. The DWS Scudder name represents the alignment of Scudder with all of Deutsche Bank's mutual fund operations around the globe. In addition, the Web site for all Scudder funds changed to www.dws-scudder.com.
Report of Independent Registered Public Accounting Firm
To the Trustees and Shareholders of DWS Variable Series I:
In our opinion, the accompanying statements of assets and liabilities, including the investment portfolios, and the related statements of operations and of changes in net assets and the financial highlights present fairly, in all material respects, the financial position of the seven Portfolios (identified in Note A) of DWS Variable Series I (formerly Scudder Variable Series I) (the "Series") at December 31, 2005 and the results of each of their operations, the changes in each of their net assets, and the financial highlights for the periods indicated therein, in conformity with accounting principles generally accepted in the United States of America. These financial statements and financial highlights (hereafter referred to as "financial statements") are the responsibility of the Series' management; our responsibility is to express an opinion on these financial statements based on our audits. We conducted our audits of these financial statements in accordance with the standards of the Public Company Accounting Oversight Board (United States). Those standards require that we plan and perform the audit to obtain reasonable assurance about whether the financial statements are free of material misstatement. An audit includes examining, on a test basis, evidence supporting the amounts and disclosures in the financial statements, assessing the accounting principles used and significant estimates made by management, and evaluating the overall financial statement presentation. We believe that our audits, which included confirmation of securities at December 31, 2005 by correspondence with the custodians and brokers, provide a reasonable basis for our opinion.
Boston, Massachusetts PricewaterhouseCoopers LLP
February 22, 2006
Tax Information (Unaudited)
The DWS Bond VIP paid distributions of $0.042 per share from net long-term capital gains during its year ended December 31, 2005, of which 100% represents 15% rate gains.
Pursuant to Section 852 of the Internal Revenue Code, the DWS Bond VIP and DWS Health Care VIP designate approximately $141,600 and $525,100, respectively, as capital gain dividends for its year ended December 31, 2005, of which 100% represents 15% rate gains.
For corporate shareholders of DWS Growth & Income VIP, DWS Capital Growth VIP and DWS Global Opportunities VIP, had 100%, 100% and 50% of their respective income dividends paid during the Portfolios fiscal years ended December 31, 2005, qualified for the dividends received deduction.
DWS International VIP paid foreign taxes of $1,171,329 and earned $15,624,241 of foreign source income during the year ended December 31, 2005. Pursuant to Section 853 of the Internal Revenue Code, DWS International VIP designates $0.03 per share as foreign taxes paid and $0.29 per share as income earned from foreign sources for the year ended December 31, 2005.
DWS Global Opportunities VIP paid foreign taxes of $282,556 and earned $1,679,405 of foreign source income during the year ended December 31, 2005. Pursuant to Section 853 of the Internal Revenue Code, DWS Global Opportunities VIP designates $0.01 per share as foreign taxes paid and $0.08 per share as income earned from foreign sources for the year ended December 31, 2005.
Please consult a tax advisor if you have questions about federal or state income tax laws, or on how to prepare your tax returns. If you have specific questions about your account, please call 1-800-728-3337.
Proxy Voting
A description of the series' policies and procedures for voting proxies for portfolio securities and information about how the series voted proxies related to its portfolio securities during the 12-month period ended June 30 is available on our Web site — www.dws-scudder.com (type "proxy voting" in the search field) — or on the SEC's Web site — www.sec.gov. To obtain a written copy of the series' policies and procedures without charge, upon request, call us toll free at 1-800-621-1048.
Shareholder Meeting Results
A Special Meeting of Shareholders (the "Meeting") of DWS Bond VIP (the "Portfolio") was held on November 18, 2005 at the offices of Deutsche Investment Management Americas Inc. ("DeIM"), which is part of Deutsche Asset Management, 345 Park Avenue, New York, NY 10154. At the Meeting, the following matters were voted upon by the shareholders (the resulting votes are presented below):
1. To approve an Amended and Restated Investment Management Agreement between DWS Variable Series I, on behalf of the Portfolio, and DeIM:
Number of Votes: |
Affirmative | Against | Abstain |
22,755,884 | 798,631 | 2,580,662 |
2. To approve a new Sub-advisory Agreement between DeIM and Aberdeen Asset Management, Inc. ("AAMI"):
Number of Votes: |
Affirmative | Against | Abstain |
22,625,443 | 829,471 | 2,680,264 |
3. To approve a new Sub-sub-advisory Agreement between AAMI and Aberdeen Asset Management Investment Services Limited:
Number of Votes: |
Affirmative | Against | Abstain |
22,515,990 | 810,567 | 2,808,620 |
Investment Management Agreement Approvals
Money Market VIP
The Portfolio's Trustees approved the continuation of the Portfolio's current investment management agreement with DeIM in September 2005.
In terms of the process the Trustees followed prior to approving the contract, shareholders should know that:
At the present time, all of your Portfolio's Trustees — including the chair of the board — are independent of DeIM and its affiliates.
The Trustees meet frequently to discuss fund matters. Each year, the Trustees dedicate part or all of several meetings to contract review matters.
The Trustees regularly meet privately with their independent counsel (and, as needed, other advisors) to discuss contract review and other matters.
DeIM and its predecessors (Deutsche Bank acquired Scudder in 2002) have managed the Portfolio since inception, and the Trustees believe that a long-term relationship with a capable, conscientious advisor is in the best interest of shareholders. As you may know, DeIM is part of Deutsche Bank, a major global banking institution that is engaged in a wide range of financial services. The Trustees believe that there are significant advantages to being part of a global asset management business that offers a wide range of investing expertise and resources, including hundreds of portfolio managers and analysts with research capabilities in many countries throughout the world.
Shareholders may focus primarily on fund performance and fees, but the Portfolio's Trustees consider these and many other factors, including the quality and integrity of DeIM's personnel and such other issues as back-office operations, fund valuations, and compliance policies and procedures. The Trustees note approvingly that DeIM has worked with them to implement new, forward-looking policies and procedures in many important areas, such as those involving brokerage commissions and so-called "soft dollars," even when not obligated to do so by law or regulation.
In determining to approve the continuation of the Portfolio's current investment management agreement, the Board considered factors that it believes relevant to the interests of Portfolio shareholders, including:
The investment management fee schedule for the Portfolio, including (i) comparative information provided by Lipper regarding investment management fee rates paid to other investment advisors by similar funds and (ii) fee rates paid to DeIM by similar funds and institutional accounts advised by DeIM. With respect to management fees paid to other investment advisors by similar funds, the Trustees noted that the fee rates paid by the Portfolio were lower than the median (2nd quartile) of the applicable Lipper universe as of December 31, 2004. The Board gave only limited consideration to fees paid by similar institutional accounts advised by DeIM, in light of the material differences in the scope of services provided to mutual funds as compared to those provided to institutional accounts. Taking into account the foregoing, the Board concluded that the fee schedule in effect for the Portfolio represents reasonable compensation in light of the nature, extent and quality of the investment services being provided to the Portfolio.
The extent to which economies of scale would be realized as the Portfolio grows. The Board noted that the Fund's management fee does not contain breakpoints and determined that, at the present time and at current asset levels and management fee rates, fee breakpoints are not warranted. The Board continues to monitor the Fund's management fees and asset levels to determine if any breakpoints are appropriate.
The total operating expenses of the Portfolio, including relative to the Portfolio's peer group as determined by Lipper. In this regard, the Board noted that the total expenses of the Portfolio for the year ending December 31, 2004 were lower than the median (2nd quartile) of the applicable Lipper universe. The Board also considered that the various expense limitations agreed to by DeIM effectively limit the ability of the Portfolio to experience a material increase in total expenses prior to the Board's next annual review of the Portfolio's contractual arrangements, and also serve to ensure that the Portfolio's total operating expenses would be competitive relative to the applicable Lipper universe.
The investment performance of the Portfolio and DeIM, both absolute and relative to various benchmarks and industry peer groups. The Board noted that for the one-, three- and five-year periods ended June 30, 2005, the Portfolio's performance was in the 1st quartile of the applicable ImoneyNet universe for each of the one-, three- and five-ear periods. The Board also observed that the Portfolio has outperformed its benchmark in each of the one-, three- and five-year periods ended June 30, 2005. The Board recognized that DeIM has made significant changes in its investment personnel and processes in recent years in an effort to improve long-term performance.
The nature, extent and quality of the advisory services provided by DeIM. The Board considered extensive information regarding DeIM, including DeIM's personnel (including particularly those personnel with responsibilities for providing services to the Portfolio), resources, policies and investment processes. The Board also considered the terms of the current investment management agreement, including the scope of services provided under the agreement. In this regard, the Board concluded that the quality and range of services provided by DeIM have benefited and should continue to benefit the Portfolio and its shareholders.
The costs of the services to, and profits realized by, DeIM and its affiliates from their relationships with the Portfolio. The Board reviewed information concerning the costs incurred and profits realized by DeIM during 2004 from providing investment management services to the Portfolio (and, separately, to the entire Scudder fund complex), and reviewed with DeIM the cost allocation methodology used to determine DeIM's profitability. In analyzing DeIM's costs and profits, the Board also reviewed the fees paid to and services provided by DeIM and its affiliates with respect to administrative services, fund accounting, shareholder servicing and distribution (including fees paid pursuant to 12b-1 plans). As part of this review, the Board considered information provided by an independent accounting firm engaged to review DeIM's cost allocation methodology and calculations. The Board concluded that the Portfolio's investment management fee schedule represented reasonable compensation in light of the costs incurred by DeIM and its affiliates in providing services to the Portfolio. The Board also reviewed information regarding the profitability of certain similar investment management firms. The Board noted that while information regarding the profitability of such firms is limited, Deutsche Asset Management's overall profitability with respect to the Scudder fund complex (after taking into account distribution and other services provided to the funds by DeIM and its affiliates) was lower than the overall profitability levels of most comparable firms for which such data was available.
The practices of DeIM regarding the selection and compensation of brokers and dealers executing portfolio transactions for the Portfolio, including DeIM's soft dollar practices. In this regard, the Board observed that DeIM had voluntarily terminated the practice of allocating brokerage commissions to acquire research services from third-party service providers. The Board indicated that it would continue to monitor the allocation of the Portfolio's brokerage to ensure that the principle of "best price and execution" remains paramount in the portfolio trading process.
DeIM's commitment to and record of compliance, including its written compliance policies and procedures. In this regard, the Board considered DeIM's commitment to indemnify the Portfolio against any costs and liabilities related to lawsuits or regulatory actions making allegations regarding market timing, revenue sharing, fund valuation or other subjects arising from or relating to pending regulatory inquiries. The Board also considered the significant attention and resources dedicated by DeIM to documenting and enhancing its compliance processes in recent years. The Board noted in particular (i) the experience and seniority of DeIM's chief compliance officer, who reports to the Board; (ii) the large number of compliance personnel who report to DeIM's chief compliance officer; and (iii) the substantial commitment of resources by Deutsche Asset Management to compliance matters.
Deutsche Bank's commitment to restructuring and growing its US mutual fund business. The Board considered recent and ongoing efforts by Deutsche Bank to restructure its US mutual fund business to improve efficiency and competitiveness and to reduce compliance and operational risk. The Board considered assurances received from Deutsche Bank that it would commit the resources necessary to maintain high quality services to the Portfolio and its shareholders while various organizational initiatives are being implemented. The Board also considered Deutsche Bank's strategic plans for investing in the growth of its US mutual fund business, the potential benefits to Portfolio shareholders and Deutsche Bank's management of the DWS fund group, one of Europe's most successful fund groups.
Based on all of the foregoing, the Board determined to continue the Portfolio's current investment management agreement, and concluded that the continuation of such agreement was in the best interests of the Portfolio's shareholders.
In reaching this conclusion the Board did not give particular weight to any single factor identified above. The Board considered these factors over the course of numerous meetings, many of which were in executive session with only the Independent Trustees and their counsel present. It is possible that individual Trustees may have weighed these factors differently in reaching their individual decisions to approve the continuation of the current agreement.
DWS Bond VIP
Background
Prior to December 2, 2005, Deutsche Asset Management Investment Services Limited ("DeAMIS"), an affiliate of Deutsche Investment Management Americas Inc. ("DeIM" or the "Advisor"), the investment advisor of the Portfolio, was the subadvisor for the Portfolio and was responsible for managing the Portfolio's assets. DeAMIS rendered investment advisory and management services, including services related to foreign securities, foreign currency transactions and related investments with regard to the portion of the portfolio that is allocated to it by DeIM from time-to-time for management. DeAMIS provided a full range of international investment advisory services to institutional and retail clients.
On December 1, 2005, Aberdeen Asset Management PLC ("Aberdeen PLC") acquired from Deutsche Bank AG, the parent company of DeIM, parts of its asset management business and related assets based in London and Philadelphia (the "Aberdeen Transaction"). As of that date, DeAMIS became a direct wholly owned subsidiary of Aberdeen PLC and was renamed Aberdeen Asset Management Investment Services Limited ("AAMISL"), and the individuals at the Advisor's Philadelphia-based Fixed Income team who managed all or a portion of the assets of the Portfolio became employees of Aberdeen Asset Management, Inc. ("AAMI"). AAMI and AAMISL are each a direct wholly owned subsidiary of Aberdeen PLC and each a registered investment advisor under the Investment Advisors Act of 1940, as amended.
As of December 2, 2005, AAMI became the subadvisor to the Portfolio pursuant to a written contract with the Advisor ("Aberdeen Sub-Advisory Agreement"). As the subadvisor and pursuant to the Aberdeen Sub-Advisory Agreement, AAMI may delegate certain of its duties and responsibilities with respect to the services it is contacted to provide to the Portfolio. Pursuant to such authority, AAMI has entered into an investment sub-sub-advisory agreement with AAMISL to provide investment services to the Portfolio ("Sub-Sub-Advisory Agreement"). Aberdeen PLC and its asset management subsidiaries, including AAMI and AAMISL, are known as "Aberdeen."
Prior to December 2, 2005, DeIM served as investment advisor to the Portfolio pursuant to an Investment Management Agreement between DeIM and the Portfolio (the "Previous Investment Management Agreement"). On December 2, 2005, DeIM began serving as investment advisor to the Portfolio pursuant to an Amended and Restated Investment Management Agreement, which contains provisions substantially identical to the Previous Investment Management Agreement, except that the Amended and Restated Investment Management Agreement contains a specific provision authorizing DeIM to delegate some or all of its duties under the Amended and Restated Investment Management Agreement to non-affiliated sub-advisors, such as AAMI and AAMISL.
Board Considerations — Aberdeen Transaction
The Board of Trustees of the Portfolio held a meeting on August 9, 2005 to consider information about Aberdeen PLC, Aberdeen, AAMI, AAMISL and the Aberdeen Transaction. To assist the Board in its consideration of the Aberdeen Sub-Advisory Agreement and the Sub-Sub-Advisory Agreement, as discussed below, the Board received and considered extensive information about Aberdeen PLC and AAMISL and AAMI and the resources that they intended to commit to the Portfolio. The Board conducted a thorough review of the potential implications of the Aberdeen Sub-Advisory Agreement and the Sub-Sub-Advisory Agreement on the Portfolio's shareholders and was assisted in this review by its independent legal counsel. On September 9, 2005, the Board, including its Independent Trustees, approved the Amended and Restated Investment Management Agreement, the Aberdeen Sub-Advisory Agreement and the Sub-Sub-Advisory Agreement, and directed that these agreements be submitted to the Portfolio's shareholders for approval.
In approving the terms of the Aberdeen Sub-Advisory Agreement and the Sub-Sub-Advisory Agreement, the Board considered the following factors, among others:
DeIM and Aberdeen PLC have advised the Board that the same London-based and/or Philadelphia-based Fixed Income team that managed the Portfolio prior to the Aberdeen Transaction would become employees of Aberdeen and would continue to manage the Portfolio as employees of an Aberdeen PLC subsidiary. In this regard, the Board also considered Aberdeen PLC's assurances regarding the arrangements and incentives that had been established to ensure continued employment with Aberdeen of key members of this investment team. The Board concluded that continued access to the services provided by this team was in the best interests of the Portfolio and its shareholders.
The advisory fees paid by the Portfolio would not change as a result of implementing the Aberdeen Sub-Advisory Agreement and the Sub-Sub-Advisory Agreement, and the overall scope of services provided to the Portfolio and the standard of care applicable to those services would not be adversely affected. In this regard, the Board also considered DeIM's and Aberdeen PLC's representations that they do not expect any diminution in the nature or quality of services provided to the Portfolio after the Aberdeen Transaction.
The terms of the Aberdeen Sub-Advisory Agreement and the Sub-Sub-Advisory Agreement are consistent with other sub-advisory agreements considered by the Board and determined to be in the best interests of shareholders. The Board considered the fees payable to AAMISL by DeIM under the Aberdeen Sub-Advisory Agreement and the fees payable to AAMISL by AAMI under the Sub-Sub-Advisory Agreement, including relative to the fees paid to sub-advisors of other similar funds, and concluded that such fees are fair and reasonable. The Board also considered the portion of the fees retained by DeIM under the Amended and Restated Investment Management Agreement in light of the services DeIM will continue to provide and its estimated costs of providing such services and concluded that such fees are fair and reasonable.
The benefits to DeIM, Aberdeen PLC and their respective affiliates from the Aberdeen Transaction, including DeIM's conflicts of interest in recommending to the Board that they approve the Aberdeen Sub-Advisory Agreement and the Sub-Sub-Advisory Agreement.
The resources and operations of Aberdeen, including the experience and professional qualifications of Aberdeen personnel that would be providing compliance and other services to the Portfolio. The Board noted that, pursuant to the Amended and Restated Investment Management Agreement, DeIM will oversee the management of the Portfolio's portfolio by AAMI and AAMISL and will continue to provide the same administrative services that it currently provides.
DeIM's commitment to pay all costs associated with obtaining shareholder approval of the Amended and Restated Investment Management Agreement and the Aberdeen Sub-Advisory Agreement and the Sub-Sub-Advisory Agreement.
The Board evaluated the Amended and Restated Investment Management Agreement in conjunction with its broader annual review of all contractual arrangements between the Portfolio and DeIM and its affiliates. With regard to the Amended and Restated Investment Management Agreement for the Portfolio, the Board considered in particular that its terms are substantially identical to the terms of the Previous Investment Management Agreement for the Portfolio, except that the Amended and Restated Investment Management Agreement contains a provision specifically authorizing DeIM to delegate some or all of its advisory duties to an unaffiliated sub-advisor (such as AAMI). At the conclusion of this review, the Board unanimously voted to continue the current contractual arrangements between the Portfolio and DeIM and its affiliates, pending shareholder approval of the Amended and Restated Investment Management Agreement, the Aberdeen Sub-Advisory Agreement and the Sub-Sub-Advisory Agreement. The factors considered by the Board in connection with their general contract review, which are also pertinent to its approval of the Amended and Restated Investment Management Agreement, the Aberdeen Sub-Advisory Agreement and the Sub-Sub-Advisory Agreement, are set forth below.
Board Considerations — General Contract Review
In terms of the process the Trustees followed prior to approving the Previous Investment Management Agreement, shareholders should know that:
At the present time, all of the Portfolio's Trustees — including the chair of the board — are independent of DeIM and its affiliates.
The Trustees meet frequently to discuss fund matters. Each year, the Trustees dedicate part or all of several meetings to contract review matters.
The Trustees regularly meet privately with their independent counsel (and, as needed, other advisors) to discuss contract review and other matters.
DeIM and its predecessors (Deutsche Bank acquired Scudder in 2002) have managed the Portfolio since inception, and the Trustees believe that a long-term relationship with a capable, conscientious advisor is in the best interest of shareholders. DeIM is part of Deutsche Bank, a major global banking institution that is engaged in a wide range of financial services. The Trustees believe that there are significant advantages to being part of a global asset management business that offers a wide range of investing expertise and resources, including hundreds of portfolio managers and analysts with research capabilities in many countries throughout the world.
Shareholders may focus primarily on fund performance and fees, but the Portfolio's Trustees consider these and many other factors, including the quality and integrity of DeIM's personnel and such other issues as back-office operations, fund valuations, and compliance policies and procedures. The Trustees note approvingly that DeIM has worked with them to implement new, forward-looking policies and procedures in many important areas, such as those involving brokerage commissions and so-called "soft dollars," even when not obligated to do so by law or regulation.
In determining whether to provide the continuation of the Portfolio's Previous Investment Management Agreement, the Board considered factors that it believes are relevant to the interests of Portfolio shareholders, including:
The investment management fee schedule for the Portfolio, including (i) comparative information provided by Lipper regarding investment management fee rates paid to other investment advisors by similar funds and (ii) fee rates paid to DeIM by similar funds and institutional accounts advised by DeIM. With respect to management fees paid to other investment advisors by similar funds, the Trustees noted that the fee rates paid by the Portfolio (Class A shares) were higher than the median (3rd quartile) of the applicable Lipper universe as of December 31, 2004. The Board gave only limited consideration to fees paid by similar institutional accounts advised by DeIM, in light of the material differences in the scope of services provided to mutual funds as compared to those provided to institutional accounts. Taking into account the foregoing, the Board concluded that the fee schedule in effect for the Portfolio represents reasonable compensation in light of the nature, extent and quality of the investment services being provided to the Portfolio.
The extent to which economies of scale would be realized as the Portfolio grows. The Board noted that the Fund's management fee does not contain breakpoints and determined that, at the present time and at current asset levels and management fee rates, fee breakpoints are not warranted. The Board continues to monitor the Fund's management fees and asset levels to determine if any breakpoints are appropriate.
The total operating expenses of the Portfolio, including relative to the Portfolio's peer group as determined by Lipper. In this regard, the Board noted that the total expenses of the Portfolio (Class A shares) for the year ending December 31, 2004 were lower than the median (2nd quartile) of the applicable Lipper universe. The Board also considered that the various expense limitations agreed to by DeIM effectively limit the ability of the Portfolio to experience a material increase in total expenses prior to the Board's next annual review of the Portfolio's contractual arrangements, and also serve to ensure that the Portfolio's total operating expenses would be competitive relative to the applicable Lipper universe.
The investment performance of the Portfolio and DeIM, both absolute and relative to various benchmarks and industry peer groups. The Board noted that for the one-, three- and five-year periods ended June 30, 2005, the Portfolio's performance (Class A shares) was in the 1st quartile, 2nd quartile and 3rd quartile, respectively, of the applicable Lipper universe. The Board also observed that the Portfolio has outperformed its benchmark in the one- and three-year periods ended June 30, 2005 and underperformed its benchmark in the five-year period ended June 30, 2005. The Board recognized that DeIM has made significant changes in its investment personnel and processes in recent years in an effort to improve long-term performance.
The nature, extent and quality of the advisory services provided by DeIM. The Board considered extensive information regarding DeIM, including DeIM's personnel (including particularly those personnel with responsibilities for providing services to the Portfolio), resources, policies and investment processes. The Board also considered the terms of the current investment management agreement, including the scope of services provided under the agreement. In this regard, the Board concluded that the quality and range of services provided by DeIM have benefited and should continue to benefit the Portfolio and its shareholders.
The costs of the services to, and profits realized by, DeIM and its affiliates from their relationships with the Portfolio. The Board reviewed information concerning the costs incurred and profits realized by DeIM during 2004 from providing investment management services to the Portfolio (and, separately, to the entire Scudder fund complex), and reviewed with DeIM the cost allocation methodology used to determine DeIM's profitability. In analyzing DeIM's costs and profits, the Board also reviewed the fees paid to and services provided by DeIM and its affiliates with respect to administrative services, fund accounting, shareholder servicing and distribution (including fees paid pursuant to 12b-1 plans). As part of this review, the Board considered information provided by an independent accounting firm engaged to review DeIM's cost allocation methodology and calculations. The Board concluded that the Portfolio's investment management fee schedule represented reasonable compensation in light of the costs incurred by DeIM and its affiliates in providing services to the Portfolio. The Board also reviewed information regarding the profitability of certain similar investment management firms. The Board noted that while information regarding the profitability of such firms is limited, Deutsche Asset Management's overall profitability with respect to the Scudder fund complex (after taking into account distribution and other services provided to the funds by DeIM and its affiliates) was lower than the overall profitability levels of most comparable firms for which such data was available.
The practices of DeIM regarding the selection and compensation of brokers and dealers executing portfolio transactions for the Portfolio, including DeIM's soft dollar practices. In this regard, the Board observed that DeIM had voluntarily terminated the practice of allocating brokerage commissions to acquire research services from third-party service providers. The Board indicated that it would continue to monitor the allocation of the Portfolio's brokerage to ensure that the principle of "best price and execution" remains paramount in the portfolio trading process.
DeIM's commitment to and record of compliance, including its written compliance policies and procedures. In this regard, the Board considered DeIM's commitment to indemnify the Portfolio against any costs and liabilities related to lawsuits or regulatory actions making allegations regarding market timing, revenue sharing, fund valuation or other subjects arising from or relating to pending regulatory inquiries. The Board also considered the significant attention and resources dedicated by DeIM to documenting and enhancing its compliance processes in recent years. The Board noted in particular (i) the experience and seniority of DeIM's chief compliance officer, who reports to the Board; (ii) the large number of compliance personnel who report to DeIM's chief compliance officer; and (iii) the substantial commitment of resources by Deutsche Asset Management to compliance matters.
Deutsche Bank's commitment to restructuring and growing its US mutual fund business. The Board considered recent and ongoing efforts by Deutsche Bank to restructure its US mutual fund business to improve efficiency and competitiveness and to reduce compliance and operational risk. The Board considered assurances received from Deutsche Bank that it would commit the resources necessary to maintain high quality services to the Portfolio and its shareholders while various organizational initiatives are being implemented. The Board also considered Deutsche Bank's strategic plans for investing in the growth of its US mutual fund business, the potential benefits to Portfolio shareholders and Deutsche Bank's management of the DWS fund group, one of Europe's most successful fund groups.
Based on all of the foregoing, the Board concluded that the Amended and Restated Investment Management Agreement, the Aberdeen Sub-Advisory Agreement and the Sub-Sub-Advisory Agreement were in the best interests of the Portfolio's shareholders.
In reaching this conclusion the Board did not give particular weight to any single factor identified above. The Board considered these factors over the course of numerous meetings, many of which were in executive session with only the Independent Trustees and their counsel present. It is possible that individual Trustees may have weighed these factors differently in reaching their individual decisions to approve the continuation of the current agreement.
DWS Growth & Income VIP
The Portfolio's Trustees approved the continuation of the Portfolio's current investment management agreement with DeIM in September 2005.
In terms of the process the Trustees followed prior to approving the contract, shareholders should know that:
At the present time, all of your Portfolio's Trustees — including the chair of the board — are independent of DeIM and its affiliates.
The Trustees meet frequently to discuss fund matters. Each year, the Trustees dedicate part or all of several meetings to contract review matters.
The Trustees regularly meet privately with their independent counsel (and, as needed, other advisors) to discuss contract review and other matters.
DeIM and its predecessors (Deutsche Bank acquired Scudder in 2002) have managed the Portfolio since inception, and the Trustees believe that a long-term relationship with a capable, conscientious advisor is in the best interest of shareholders. As you may know, DeIM is part of Deutsche Bank, a major global banking institution that is engaged in a wide range of financial services. The Trustees believe that there are significant advantages to being part of a global asset management business that offers a wide range of investing expertise and resources, including hundreds of portfolio managers and analysts with research capabilities in many countries throughout the world.
Shareholders may focus primarily on fund performance and fees, but the Portfolio's Trustees consider these and many other factors, including the quality and integrity of DeIM's personnel and such other issues as back-office operations, fund valuations, and compliance policies and procedures. The Trustees note approvingly that DeIM has worked with them to implement new, forward-looking policies and procedures in many important areas, such as those involving brokerage commissions and so-called "soft dollars," even when not obligated to do so by law or regulation.
In determining to approve the continuation of the Portfolio's current investment management agreement, the Board considered factors that it believes relevant to the interests of Portfolio shareholders, including:
The investment management fee schedule for the Portfolio, including (i) comparative information provided by Lipper regarding investment management fee rates paid to other investment advisors by similar funds and (ii) fee rates paid to DeIM by similar funds and institutional accounts advised by DeIM. With respect to management fees paid to other investment advisors by similar funds, the Trustees noted that the fee rates paid by the Portfolio (Class A shares) were lower than the median (1st quartile) of the applicable Lipper universe as of December 31, 2004. The Board gave only limited consideration to fees paid by similar institutional accounts advised by DeIM, in light of the material differences in the scope of services provided to mutual funds as compared to those provided to institutional accounts. Taking into account the foregoing, the Board concluded that the fee schedule in effect for the Portfolio represents reasonable compensation in light of the nature, extent and quality of the investment services being provided to the Portfolio.
The extent to which economies of scale would be realized as the Portfolio grows. In this regard, the Board noted that the Portfolio's investment management fee schedule includes fee breakpoints. The Board concluded that the Portfolio's fee schedule represents an appropriate sharing between Portfolio shareholders and DeIM of such economies of scale as may exist in the management of the Portfolio at current asset levels.
The total operating expenses of the Portfolio, including relative to the Portfolio's peer group as determined by Lipper. In this regard, the Board noted that the total expenses of the Portfolio (Class A shares) for the year ending December 31, 2004 were lower than the median (1st quartile) of the applicable Lipper universe. The Board also considered that the various expense limitations agreed to by DeIM effectively limit the ability of the Portfolio to experience a material increase in total expenses prior to the Board's next annual review of the Portfolio's contractual arrangements, and also serve to ensure that the Portfolio's total operating expenses would be competitive relative to the applicable Lipper universe.
The investment performance of the Portfolio and DeIM, both absolute and relative to various benchmarks and industry peer groups. The Board noted that for the one-, three- and five-year periods ended June 30, 2005, the Portfolio's performance (Class A shares) was in the 2nd quartile of the applicable Lipper universe for each of the one-, three- and five-year periods. The Board also observed that the Portfolio has outperformed its benchmark in the five-year period ended June 30, 2005 and underperformed its benchmark in the one- and three-year periods ended June 30, 2005. The Board recognized that DeIM has made significant changes in its investment personnel and processes in recent years in an effort to improve long-term performance.
The nature, extent and quality of the advisory services provided by DeIM. The Board considered extensive information regarding DeIM, including DeIM's personnel (including particularly those personnel with responsibilities for providing services to the Portfolio), resources, policies and investment processes. The Board also considered the terms of the current investment management agreement, including the scope of services provided under the agreement. In this regard, the Board concluded that the quality and range of services provided by DeIM have benefited and should continue to benefit the Portfolio and its shareholders.
The costs of the services to, and profits realized by, DeIM and its affiliates from their relationships with the Portfolio. The Board reviewed information concerning the costs incurred and profits realized by DeIM during 2004 from providing investment management services to the Portfolio (and, separately, to the entire Scudder fund complex), and reviewed with DeIM the cost allocation methodology used to determine DeIM's profitability. In analyzing DeIM's costs and profits, the Board also reviewed the fees paid to and services provided by DeIM and its affiliates with respect to administrative services, fund accounting, shareholder servicing and distribution (including fees paid pursuant to 12b-1 plans). As part of this review, the Board considered information provided by an independent accounting firm engaged to review DeIM's cost allocation methodology and calculations. The Board concluded that the Portfolio's investment management fee schedule represented reasonable compensation in light of the costs incurred by DeIM and its affiliates in providing services to the Portfolio. The Board also reviewed information regarding the profitability of certain similar investment management firms. The Board noted that while information regarding the profitability of such firms is limited, Deutsche Asset Management's overall profitability with respect to the Scudder fund complex (after taking into account distribution and other services provided to the funds by DeIM and its affiliates) was lower than the overall profitability levels of most comparable firms for which such data was available.
The practices of DeIM regarding the selection and compensation of brokers and dealers executing portfolio transactions for the Portfolio, including DeIM's soft dollar practices. In this regard, the Board observed that DeIM had voluntarily terminated the practice of allocating brokerage commissions to acquire research services from third-party service providers. The Board indicated that it would continue to monitor the allocation of the Portfolio's brokerage to ensure that the principle of "best price and execution" remains paramount in the portfolio trading process.
DeIM's commitment to and record of compliance, including its written compliance policies and procedures. In this regard, the Board considered DeIM's commitment to indemnify the Portfolio against any costs and liabilities related to lawsuits or regulatory actions making allegations regarding market timing, revenue sharing, fund valuation or other subjects arising from or relating to pending regulatory inquiries. The Board also considered the significant attention and resources dedicated by DeIM to documenting and enhancing its compliance processes in recent years. The Board noted in particular (i) the experience and seniority of DeIM's chief compliance officer, who reports to the Board; (ii) the large number of compliance personnel who report to DeIM's chief compliance officer; and (iii) the substantial commitment of resources by Deutsche Asset Management to compliance matters.
Deutsche Bank's commitment to restructuring and growing its US mutual fund business. The Board considered recent and ongoing efforts by Deutsche Bank to restructure its US mutual fund business to improve efficiency and competitiveness and to reduce compliance and operational risk. The Board considered assurances received from Deutsche Bank that it would commit the resources necessary to maintain high quality services to the Portfolio and its shareholders while various organizational initiatives are being implemented. The Board also considered Deutsche Bank's strategic plans for investing in the growth of its US mutual fund business, the potential benefits to Portfolio shareholders and Deutsche Bank's management of the DWS fund group, one of Europe's most successful fund groups.
Based on all of the foregoing, the Board determined to continue the Portfolio's current investment management agreement, and concluded that the continuation of such agreement was in the best interests of the Portfolio's shareholders.
In reaching this conclusion the Board did not give particular weight to any single factor identified above. The Board considered these factors over the course of numerous meetings, many of which were in executive session with only the Independent Trustees and their counsel present. It is possible that individual Trustees may have weighed these factors differently in reaching their individual decisions to approve the continuation of the current agreement.
DWS Capital Growth VIP
The Portfolio's Trustees approved the continuation of the Portfolio's current investment management agreement with DeIM in September 2005.
In terms of the process the Trustees followed prior to approving the contract, shareholders should know that:
At the present time, all of your Portfolio's Trustees — including the chair of the board — are independent of DeIM and its affiliates.
The Trustees meet frequently to discuss fund matters. Each year, the Trustees dedicate part or all of several meetings to contract review matters.
The Trustees regularly meet privately with their independent counsel (and, as needed, other advisors) to discuss contract review and other matters.
DeIM and its predecessors (Deutsche Bank acquired Scudder in 2002) have managed the Portfolio since inception, and the Trustees believe that a long-term relationship with a capable, conscientious advisor is in the best interest of shareholders. As you may know, DeIM is part of Deutsche Bank, a major global banking institution that is engaged in a wide range of financial services. The Trustees believe that there are significant advantages to being part of a global asset management business that offers a wide range of investing expertise and resources, including hundreds of portfolio managers and analysts with research capabilities in many countries throughout the world.
Shareholders may focus primarily on fund performance and fees, but the Portfolio's Trustees consider these and many other factors, including the quality and integrity of DeIM's personnel and such other issues as back-office operations, fund valuations, and compliance policies and procedures. The Trustees note approvingly that DeIM has worked with them to implement new, forward-looking policies and procedures in many important areas, such as those involving brokerage commissions and so-called "soft dollars," even when not obligated to do so by law or regulation.
In determining to approve the continuation of the Portfolio's current investment management agreement, the Board considered factors that it believes relevant to the interests of Portfolio shareholders, including:
The investment management fee schedule for the Portfolio, including (i) comparative information provided by Lipper regarding investment management fee rates paid to other investment advisors by similar funds and (ii) fee rates paid to DeIM by similar funds and institutional accounts advised by DeIM. With respect to management fees paid to other investment advisors by similar funds, the Trustees noted that the fee rates paid by the Portfolio (Class A shares) were lower than the median (1st quartile) of the applicable Lipper universe as of December 31, 2004. The Board gave only limited consideration to fees paid by similar institutional accounts advised by DeIM, in light of the material differences in the scope of services provided to mutual funds as compared to those provided to institutional accounts. Taking into account the foregoing, the Board concluded that the fee schedule in effect for the Portfolio represents reasonable compensation in light of the nature, extent and quality of the investment services being provided to the Portfolio.
The extent to which economies of scale would be realized as the Portfolio grows. In this regard, the Board noted that the Portfolio's investment management fee schedule includes fee breakpoints. The Board concluded that the Portfolio's fee schedule represents an appropriate sharing between Portfolio shareholders and DeIM of such economies of scale as may exist in the management of the Portfolio at current asset levels.
The total operating expenses of the Portfolio, including relative to the Portfolio's peer group as determined by Lipper. In this regard, the Board noted that the total expenses of the Portfolio (Class A shares) for the year ending December 31, 2004 were lower than the median (1st quartile) of the applicable Lipper universe. The Board also considered that the various expense limitations agreed to by DeIM effectively limit the ability of the Portfolio to experience a material increase in total expenses prior to the Board's next annual review of the Portfolio's contractual arrangements, and also serve to ensure that the Portfolio's total operating expenses would be competitive relative to the applicable Lipper universe.
The investment performance of the Portfolio and DeIM, both absolute and relative to various benchmarks and industry peer groups. The Board noted that for the one-, three- and five-year periods ended June 30, 2005, the Portfolio's performance (Class A shares) was in the 2nd quartile of the applicable Lipper universe for each of the one-, three- and five-year periods. The Board also observed that the Portfolio has outperformed its benchmark in the one-year period ended June 30, 2005 and underperformed its benchmark in the three- and five-year periods ended June 30, 2005. The Board recognized that DeIM has made significant changes in its investment personnel and processes in recent years in an effort to improve long-term performance.
The nature, extent and quality of the advisory services provided by DeIM. The Board considered extensive information regarding DeIM, including DeIM's personnel (including particularly those personnel with responsibilities for providing services to the Portfolio), resources, policies and investment processes. The Board also considered the terms of the current investment management agreement, including the scope of services provided under the agreement. In this regard, the Board concluded that the quality and range of services provided by DeIM have benefited and should continue to benefit the Portfolio and its shareholders.
The costs of the services to, and profits realized by, DeIM and its affiliates from their relationships with the Portfolio. The Board reviewed information concerning the costs incurred and profits realized by DeIM during 2004 from providing investment management services to the Portfolio (and, separately, to the entire Scudder fund complex), and reviewed with DeIM the cost allocation methodology used to determine DeIM's profitability. In analyzing DeIM's costs and profits, the Board also reviewed the fees paid to and services provided by DeIM and its affiliates with respect to administrative services, fund accounting, shareholder servicing and distribution (including fees paid pursuant to 12b-1 plans). As part of this review, the Board considered information provided by an independent accounting firm engaged to review DeIM's cost allocation methodology and calculations. The Board concluded that the Portfolio's investment management fee schedule represented reasonable compensation in light of the costs incurred by DeIM and its affiliates in providing services to the Portfolio. The Board also reviewed information regarding the profitability of certain similar investment management firms. The Board noted that while information regarding the profitability of such firms is limited, Deutsche Asset Management's overall profitability with respect to the Scudder fund complex (after taking into account distribution and other services provided to the funds by DeIM and its affiliates) was lower than the overall profitability levels of most comparable firms for which such data was available.
The practices of DeIM regarding the selection and compensation of brokers and dealers executing portfolio transactions for the Portfolio, including DeIM's soft dollar practices. In this regard, the Board observed that DeIM had voluntarily terminated the practice of allocating brokerage commissions to acquire research services from third-party service providers. The Board indicated that it would continue to monitor the allocation of the Portfolio's brokerage to ensure that the principle of "best price and execution" remains paramount in the portfolio trading process.
DeIM's commitment to and record of compliance, including its written compliance policies and procedures. In this regard, the Board considered DeIM's commitment to indemnify the Portfolio against any costs and liabilities related to lawsuits or regulatory actions making allegations regarding market timing, revenue sharing, fund valuation or other subjects arising from or relating to pending regulatory inquiries. The Board also considered the significant attention and resources dedicated by DeIM to documenting and enhancing its compliance processes in recent years. The Board noted in particular (i) the experience and seniority of DeIM's chief compliance officer, who reports to the Board; (ii) the large number of compliance personnel who report to DeIM's chief compliance officer; and (iii) the substantial commitment of resources by Deutsche Asset Management to compliance matters.
Deutsche Bank's commitment to restructuring and growing its US mutual fund business. The Board considered recent and ongoing efforts by Deutsche Bank to restructure its US mutual fund business to improve efficiency and competitiveness and to reduce compliance and operational risk. The Board considered assurances received from Deutsche Bank that it would commit the resources necessary to maintain high quality services to the Portfolio and its shareholders while various organizational initiatives are being implemented. The Board also considered Deutsche Bank's strategic plans for investing in the growth of its US mutual fund business, the potential benefits to Portfolio shareholders and Deutsche Bank's management of the DWS fund group, one of Europe's most successful fund groups.
Based on all of the foregoing, the Board determined to continue the Portfolio's current investment management agreement, and concluded that the continuation of such agreement was in the best interests of the Portfolio's shareholders.
In reaching this conclusion the Board did not give particular weight to any single factor identified above. The Board considered these factors over the course of numerous meetings, many of which were in executive session with only the Independent Trustees and their counsel present. It is possible that individual Trustees may have weighed these factors differently in reaching their individual decisions to approve the continuation of the current agreement.
DWS Global Opportunities VIP
The Portfolio's Trustees approved the continuation of the Portfolio's current investment management agreement with DeIM in September 2005.
In terms of the process the Trustees followed prior to approving the contract, shareholders should know that:
At the present time, all of your Portfolio's Trustees — including the chair of the board — are independent of DeIM and its affiliates.
The Trustees meet frequently to discuss fund matters. Each year, the Trustees dedicate part or all of several meetings to contract review matters.
The Trustees regularly meet privately with their independent counsel (and, as needed, other advisors) to discuss contract review and other matters.
DeIM and its predecessors (Deutsche Bank acquired Scudder in 2002) have managed the Portfolio since inception, and the Trustees believe that a long-term relationship with a capable, conscientious advisor is in the best interest of shareholders. As you may know, DeIM is part of Deutsche Bank, a major global banking institution that is engaged in a wide range of financial services. The Trustees believe that there are significant advantages to being part of a global asset management business that offers a wide range of investing expertise and resources, including hundreds of portfolio managers and analysts with research capabilities in many countries throughout the world.
Shareholders may focus primarily on fund performance and fees, but the Portfolio's Trustees consider these and many other factors, including the quality and integrity of DeIM's personnel and such other issues as back-office operations, fund valuations, and compliance policies and procedures. The Trustees note approvingly that DeIM has worked with them to implement new, forward-looking policies and procedures in many important areas, such as those involving brokerage commissions and so-called "soft dollars," even when not obligated to do so by law or regulation.
In determining to approve the continuation of the Portfolio's current investment management agreement, the Board considered factors that it believes relevant to the interests of Portfolio shareholders, including:
The investment management fee schedule for the Portfolio, including (i) comparative information provided by Lipper regarding investment management fee rates paid to other investment advisors by similar funds and (ii) fee rates paid to DeIM by similar funds and institutional accounts advised by DeIM. With respect to management fees paid to other investment advisors by similar funds, the Trustees noted that the fee rates paid by the Portfolio (Class A shares) were higher than the median (4th quartile) of the applicable Lipper universe as of December 31, 2004. The Board gave only limited consideration to fees paid by similar institutional accounts advised by DeIM, in light of the material differences in the scope of services provided to mutual funds as compared to those provided to institutional accounts. Taking into account the foregoing, the Board concluded that the fee schedule in effect for the Portfolio represents reasonable compensation in light of the nature, extent and quality of the investment services being provided to the Portfolio.
The extent to which economies of scale would be realized as the Portfolio grows. The Board noted that the Fund's management fee does not contain breakpoints and determined that, at the present time and at current asset levels and management fee rates, fee breakpoints are not warranted. The Board continues to monitor the Fund's management fees and asset levels to determine if any breakpoints are appropriate.
The total operating expenses of the Portfolio, including relative to the Portfolio's peer group as determined by Lipper. In this regard, the Board noted that the total expenses of the Portfolio (Class A shares) for the year ending December 31, 2004 were higher than the median (3rd quartile) of the applicable Lipper universe. The Board also considered that the various expense limitations agreed to by DeIM effectively limit the ability of the Portfolio to experience a material increase in total expenses prior to the Board's next annual review of the Portfolio's contractual arrangements, and also serve to ensure that the Portfolio's total operating expenses would be competitive relative to the applicable Lipper universe.
The investment performance of the Portfolio and DeIM, both absolute and relative to various benchmarks and industry peer groups. The Board noted that for the one-, three- and five-year periods ended June 30, 2005, the Portfolio's performance (Class A shares) was in the 1st quartile, 1st quartile and 2nd quartile, respectively, of the applicable Lipper universe. The Board also observed that the Portfolio has outperformed its benchmark in the one- and three-year periods ended June 30, 2005 and underperformed its benchmark in the five-year period ended June 30, 2005. The Board recognized that DeIM has made significant changes in its investment personnel and processes in recent years in an effort to improve long-term performance.
The nature, extent and quality of the advisory services provided by DeIM. The Board considered extensive information regarding DeIM, including DeIM's personnel (including particularly those personnel with responsibilities for providing services to the Portfolio), resources, policies and investment processes. The Board also considered the terms of the current investment management agreement, including the scope of services provided under the agreement. In this regard, the Board concluded that the quality and range of services provided by DeIM have benefited and should continue to benefit the Portfolio and its shareholders.
The costs of the services to, and profits realized by, DeIM and its affiliates from their relationships with the Portfolio. The Board reviewed information concerning the costs incurred and profits realized by DeIM during 2004 from providing investment management services to the Portfolio (and, separately, to the entire Scudder fund complex), and reviewed with DeIM the cost allocation methodology used to determine DeIM's profitability. In analyzing DeIM's costs and profits, the Board also reviewed the fees paid to and services provided by DeIM and its affiliates with respect to administrative services, fund accounting, shareholder servicing and distribution (including fees paid pursuant to 12b-1 plans). As part of this review, the Board considered information provided by an independent accounting firm engaged to review DeIM's cost allocation methodology and calculations. The Board concluded that the Portfolio's investment management fee schedule represented reasonable compensation in light of the costs incurred by DeIM and its affiliates in providing services to the Portfolio. The Board also reviewed information regarding the profitability of certain similar investment management firms. The Board noted that while information regarding the profitability of such firms is limited, Deutsche Asset Management's overall profitability with respect to the Scudder fund complex (after taking into account distribution and other services provided to the funds by DeIM and its affiliates) was lower than the overall profitability levels of most comparable firms for which such data was available.
The practices of DeIM regarding the selection and compensation of brokers and dealers executing portfolio transactions for the Portfolio, including DeIM's soft dollar practices. In this regard, the Board observed that DeIM had voluntarily terminated the practice of allocating brokerage commissions to acquire research services from third-party service providers. The Board indicated that it would continue to monitor the allocation of the Portfolio's brokerage to ensure that the principle of "best price and execution" remains paramount in the portfolio trading process.
DeIM's commitment to and record of compliance, including its written compliance policies and procedures. In this regard, the Board considered DeIM's commitment to indemnify the Portfolio against any costs and liabilities related to lawsuits or regulatory actions making allegations regarding market timing, revenue sharing, fund valuation or other subjects arising from or relating to pending regulatory inquiries. The Board also considered the significant attention and resources dedicated by DeIM to documenting and enhancing its compliance processes in recent years. The Board noted in particular (i) the experience and seniority of DeIM's chief compliance officer, who reports to the Board; (ii) the large number of compliance personnel who report to DeIM's chief compliance officer; and (iii) the substantial commitment of resources by Deutsche Asset Management to compliance matters.
Deutsche Bank's commitment to restructuring and growing its US mutual fund business. The Board considered recent and ongoing efforts by Deutsche Bank to restructure its US mutual fund business to improve efficiency and competitiveness and to reduce compliance and operational risk. The Board considered assurances received from Deutsche Bank that it would commit the resources necessary to maintain high quality services to the Portfolio and its shareholders while various organizational initiatives are being implemented. The Board also considered Deutsche Bank's strategic plans for investing in the growth of its US mutual fund business, the potential benefits to Portfolio shareholders and Deutsche Bank's management of the DWS fund group, one of Europe's most successful fund groups.
Based on all of the foregoing, the Board determined to continue the Portfolio's current investment management agreement, and concluded that the continuation of such agreement was in the best interests of the Portfolio's shareholders.
In reaching this conclusion the Board did not give particular weight to any single factor identified above. The Board considered these factors over the course of numerous meetings, many of which were in executive session with only the Independent Trustees and their counsel present. It is possible that individual Trustees may have weighed these factors differently in reaching their individual decisions to approve the continuation of the current agreement.
DWS International VIP
The Portfolio's Trustees approved the continuation of the Portfolio's current investment management agreement with DeIM in September 2005.
In terms of the process the Trustees followed prior to approving the contract, shareholders should know that:
At the present time, all of your Portfolio's Trustees — including the chair of the board — are independent of DeIM and its affiliates.
The Trustees meet frequently to discuss fund matters. Each year, the Trustees dedicate part or all of several meetings to contract review matters.
The Trustees regularly meet privately with their independent counsel (and, as needed, other advisors) to discuss contract review and other matters.
DeIM and its predecessors (Deutsche Bank acquired Scudder in 2002) have managed the Portfolio since inception, and the Trustees believe that a long-term relationship with a capable, conscientious advisor is in the best interest of shareholders. As you may know, DeIM is part of Deutsche Bank, a major global banking institution that is engaged in a wide range of financial services. The Trustees believe that there are significant advantages to being part of a global asset management business that offers a wide range of investing expertise and resources, including hundreds of portfolio managers and analysts with research capabilities in many countries throughout the world.
Shareholders may focus primarily on fund performance and fees, but the Portfolio's Trustees consider these and many other factors, including the quality and integrity of DeIM's personnel and such other issues as back-office operations, fund valuations, and compliance policies and procedures. The Trustees note approvingly that DeIM has worked with them to implement new, forward-looking policies and procedures in many important areas, such as those involving brokerage commissions and so-called "soft dollars," even when not obligated to do so by law or regulation.
In determining to approve the continuation of the Portfolio's current investment management agreement, the Board considered factors that it believes relevant to the interests of Portfolio shareholders, including:
The investment management fee schedule for the Portfolio, including (i) comparative information provided by Lipper regarding investment management fee rates paid to other investment advisors by similar funds and (ii) fee rates paid to DeIM by similar funds and institutional accounts advised by DeIM. With respect to management fees paid to other investment advisors by similar funds, the Trustees noted that the fee rates paid by the Portfolio (Class A shares) were higher than the median (3rd quartile) of the applicable Lipper universe as of December 31, 2004. The Board gave only limited consideration to fees paid by similar institutional accounts advised by DeIM, in light of the material differences in the scope of services provided to mutual funds as compared to those provided to institutional accounts. Taking into account the foregoing, the Board concluded that the fee schedule in effect for the Portfolio represents reasonable compensation in light of the nature, extent and quality of the investment services being provided to the Portfolio.
The extent to which economies of scale would be realized as the Portfolio grows. In this regard, the Board noted that the Portfolio's investment management fee schedule includes fee breakpoints. The Board concluded that the Portfolio's fee schedule represents an appropriate sharing between Portfolio shareholders and DeIM of such economies of scale as may exist in the management of the Portfolio at current asset levels.
The total operating expenses of the Portfolio, including relative to the Portfolio's peer group as determined by Lipper. In this regard, the Board noted that the total expenses of the Portfolio (Class A shares) for the year ending December 31, 2004 were higher than the median (4th quartile) of the applicable Lipper universe. The Board also considered that the various expense limitations agreed to by DeIM effectively limit the ability of the Portfolio to experience a material increase in total expenses prior to the Board's next annual review of the Portfolio's contractual arrangements, and also serve to ensure that the Portfolio's total operating expenses would be competitive relative to the applicable Lipper universe.
The investment performance of the Portfolio and DeIM, both absolute and relative to various benchmarks and industry peer groups. The Board noted that for the one-, three- and five-year periods ended June 30, 2005, the Portfolio's performance (Class A shares) was in the 2nd quartile, 4th quartile and 4th quartile, respectively, of the applicable Lipper universe. The Board also observed that the Portfolio has outperformed its benchmark in the one-year period ended June 30, 2005 and underperformed its benchmark in the three- and five-year periods ended June 30, 2005. The Board recognized that DeIM has made significant changes in its investment personnel and processes in recent years in an effort to improve long-term performance.
The nature, extent and quality of the advisory services provided by DeIM. The Board considered extensive information regarding DeIM, including DeIM's personnel (including particularly those personnel with responsibilities for providing services to the Portfolio), resources, policies and investment processes. The Board also considered the terms of the current investment management agreement, including the scope of services provided under the agreement. In this regard, the Board concluded that the quality and range of services provided by DeIM have benefited and should continue to benefit the Portfolio and its shareholders.
The costs of the services to, and profits realized by, DeIM and its affiliates from their relationships with the Portfolio. The Board reviewed information concerning the costs incurred and profits realized by DeIM during 2004 from providing investment management services to the Portfolio (and, separately, to the entire Scudder fund complex), and reviewed with DeIM the cost allocation methodology used to determine DeIM's profitability. In analyzing DeIM's costs and profits, the Board also reviewed the fees paid to and services provided by DeIM and its affiliates with respect to administrative services, fund accounting, shareholder servicing and distribution (including fees paid pursuant to 12b-1 plans). As part of this review, the Board considered information provided by an independent accounting firm engaged to review DeIM's cost allocation methodology and calculations. The Board concluded that the Portfolio's investment management fee schedule represented reasonable compensation in light of the costs incurred by DeIM and its affiliates in providing services to the Portfolio. The Board also reviewed information regarding the profitability of certain similar investment management firms. The Board noted that while information regarding the profitability of such firms is limited, Deutsche Asset Management's overall profitability with respect to the Scudder fund complex (after taking into account distribution and other services provided to the funds by DeIM and its affiliates) was lower than the overall profitability levels of most comparable firms for which such data was available.
The practices of DeIM regarding the selection and compensation of brokers and dealers executing portfolio transactions for the Portfolio, including DeIM's soft dollar practices. In this regard, the Board observed that DeIM had voluntarily terminated the practice of allocating brokerage commissions to acquire research services from third-party service providers. The Board indicated that it would continue to monitor the allocation of the Portfolio's brokerage to ensure that the principle of "best price and execution" remains paramount in the portfolio trading process.
DeIM's commitment to and record of compliance, including its written compliance policies and procedures. In this regard, the Board considered DeIM's commitment to indemnify the Portfolio against any costs and liabilities related to lawsuits or regulatory actions making allegations regarding market timing, revenue sharing, fund valuation or other subjects arising from or relating to pending regulatory inquiries. The Board also considered the significant attention and resources dedicated by DeIM to documenting and enhancing its compliance processes in recent years. The Board noted in particular (i) the experience and seniority of DeIM's chief compliance officer, who reports to the Board; (ii) the large number of compliance personnel who report to DeIM's chief compliance officer; and (iii) the substantial commitment of resources by Deutsche Asset Management to compliance matters.
Deutsche Bank's commitment to restructuring and growing its US mutual fund business. The Board considered recent and ongoing efforts by Deutsche Bank to restructure its US mutual fund business to improve efficiency and competitiveness and to reduce compliance and operational risk. The Board considered assurances received from Deutsche Bank that it would commit the resources necessary to maintain high quality services to the Portfolio and its shareholders while various organizational initiatives are being implemented. The Board also considered Deutsche Bank's strategic plans for investing in the growth of its US mutual fund business, the potential benefits to Portfolio shareholders and Deutsche Bank's management of the DWS fund group, one of Europe's most successful fund groups.
Based on all of the foregoing, the Board determined to continue the Portfolio's current investment management agreement, and concluded that the continuation of such agreement was in the best interests of the Portfolio's shareholders.
In reaching this conclusion the Board did not give particular weight to any single factor identified above. The Board considered these factors over the course of numerous meetings, many of which were in executive session with only the Independent Trustees and their counsel present. It is possible that individual Trustees may have weighed these factors differently in reaching their individual decisions to approve the continuation of the current agreement.
DWS Health Care VIP
The Portfolio's Trustees approved the continuation of the Portfolio's current investment management agreement with DeIM in September 2005.
In terms of the process the Trustees followed prior to approving the contract, shareholders should know that:
At the present time, all of your Portfolio's Trustees — including the chair of the board —- are independent of DeIM and its affiliates.
The Trustees meet frequently to discuss fund matters. Each year, the Trustees dedicate part or all of several meetings to contract review matters.
The Trustees regularly meet privately with their independent counsel (and, as needed, other advisors) to discuss contract review and other matters.
DeIM and its predecessors (Deutsche Bank acquired Scudder in 2002) have managed the Portfolio since inception, and the Trustees believe that a long-term relationship with a capable, conscientious advisor is in the best interest of shareholders. As you may know, DeIM is part of Deutsche Bank, a major global banking institution that is engaged in a wide range of financial services. The Trustees believe that there are significant advantages to being part of a global asset management business that offers a wide range of investing expertise and resources, including hundreds of portfolio managers and analysts with research capabilities in many countries throughout the world.
Shareholders may focus primarily on fund performance and fees, but the Portfolio's Trustees consider these and many other factors, including the quality and integrity of DeIM's personnel and such other issues as back-office operations, fund valuations, and compliance policies and procedures. The Trustees note approvingly that DeIM has worked with them to implement new, forward-looking policies and procedures in many important areas, such as those involving brokerage commissions and so-called "soft dollars," even when not obligated to do so by law or regulation.
In determining to approve the continuation of the Portfolio's current investment management agreement, the Board considered factors that it believes relevant to the interests of Portfolio shareholders, including:
The investment management fee schedule for the Portfolio, including (i) comparative information provided by Lipper regarding investment management fee rates paid to other investment advisors by similar funds and (ii) fee rates paid to DeIM by similar funds and institutional accounts advised by DeIM. With respect to management fees paid to other investment advisors by similar funds, the Trustees noted that the fee rates paid by the Portfolio (Class A shares) were lower than the median (2nd quartile) of the applicable Lipper universe as of December 31, 2004. The Board gave only limited consideration to fees paid by similar institutional accounts advised by DeIM, in light of the material differences in the scope of services provided to mutual funds as compared to those provided to institutional accounts. Taking into account the foregoing, the Board concluded that the fee schedule in effect for the Portfolio represents reasonable compensation in light of the nature, extent and quality of the investment services being provided to the Portfolio.
The extent to which economies of scale would be realized as the Portfolio grows. In this regard, the Board noted that the Portfolio's investment management fee schedule includes fee breakpoints. The Board concluded that the Portfolio's fee schedule represents an appropriate sharing between Portfolio shareholders and DeIM of such economies of scale as may exist in the management of the Portfolio at current asset levels.
The total operating expenses of the Portfolio, including relative to the Portfolio's peer group as determined by Lipper. In this regard, the Board noted that the total expenses of the Portfolio (Class A shares) for the year ending December 31, 2004 were lower than the median (1st quartile) of the applicable Lipper universe. The Board also considered that the various expense limitations agreed to by DeIM effectively limit the ability of the Portfolio to experience a material increase in total expenses prior to the Board's next annual review of the Portfolio's contractual arrangements, and also serve to ensure that the Portfolio's total operating expenses would be competitive relative to the applicable Lipper universe.
The investment performance of the Portfolio and DeIM, both absolute and relative to various benchmarks and industry peer groups. The Board noted that for the one- and three-year periods ended June 30, 2005, the Portfolio's performance (Class A shares) was in the 2nd quartile and 1st quartile, respectively, of the applicable Lipper universe. The Board also observed that the Portfolio has outperformed its benchmark in the three-year period ended June 30, 2005 and underperformed its benchmark in the one-year period ended June 30, 2005. The Board recognized that DeIM has made significant changes in its investment personnel and processes in recent years in an effort to improve long-term performance.
The nature, extent and quality of the advisory services provided by DeIM. The Board considered extensive information regarding DeIM, including DeIM's personnel (including particularly those personnel with responsibilities for providing services to the Portfolio), resources, policies and investment processes. The Board also considered the terms of the current investment management agreement, including the scope of services provided under the agreement. In this regard, the Board concluded that the quality and range of services provided by DeIM have benefited and should continue to benefit the Portfolio and its shareholders.
The costs of the services to, and profits realized by, DeIM and its affiliates from their relationships with the Portfolio. The Board reviewed information concerning the costs incurred and profits realized by DeIM during 2004 from providing investment management services to the Portfolio (and, separately, to the entire Scudder fund complex), and reviewed with DeIM the cost allocation methodology used to determine DeIM's profitability. In analyzing DeIM's costs and profits, the Board also reviewed the fees paid to and services provided by DeIM and its affiliates with respect to administrative services, fund accounting, shareholder servicing and distribution (including fees paid pursuant to 12b-1 plans). As part of this review, the Board considered information provided by an independent accounting firm engaged to review DeIM's cost allocation methodology and calculations. The Board concluded that the Portfolio's investment management fee schedule represented reasonable compensation in light of the costs incurred by DeIM and its affiliates in providing services to the Portfolio. The Board also reviewed information regarding the profitability of certain similar investment management firms. The Board noted that while information regarding the profitability of such firms is limited, Deutsche Asset Management's overall profitability with respect to the Scudder fund complex (after taking into account distribution and other services provided to the funds by DeIM and its affiliates) was lower than the overall profitability levels of most comparable firms for which such data was available.
The practices of DeIM regarding the selection and compensation of brokers and dealers executing portfolio transactions for the Portfolio, including DeIM's soft dollar practices. In this regard, the Board observed that DeIM had voluntarily terminated the practice of allocating brokerage commissions to acquire research services from third-party service providers. The Board indicated that it would continue to monitor the allocation of the Portfolio's brokerage to ensure that the principle of "best price and execution" remains paramount in the portfolio trading process.
DeIM's commitment to and record of compliance, including its written compliance policies and procedures. In this regard, the Board considered DeIM's commitment to indemnify the Portfolio against any costs and liabilities related to lawsuits or regulatory actions making allegations regarding market timing, revenue sharing, fund valuation or other subjects arising from or relating to pending regulatory inquiries. The Board also considered the significant attention and resources dedicated by DeIM to documenting and enhancing its compliance processes in recent years. The Board noted in particular (i) the experience and seniority of DeIM's chief compliance officer, who reports to the Board; (ii) the large number of compliance personnel who report to DeIM's chief compliance officer; and (iii) the substantial commitment of resources by Deutsche Asset Management to compliance matters.
Deutsche Bank's commitment to restructuring and growing its US mutual fund business. The Board considered recent and ongoing efforts by Deutsche Bank to restructure its US mutual fund business to improve efficiency and competitiveness and to reduce compliance and operational risk. The Board considered assurances received from Deutsche Bank that it would commit the resources necessary to maintain high quality services to the Portfolio and its shareholders while various organizational initiatives are being implemented. The Board also considered Deutsche Bank's strategic plans for investing in the growth of its US mutual fund business, the potential benefits to Portfolio shareholders and Deutsche Bank's management of the DWS fund group, one of Europe's most successful fund groups.
Based on all of the foregoing, the Board determined to continue the Portfolio's current investment management agreement, and concluded that the continuation of such agreement was in the best interests of the Portfolio's shareholders.
In reaching this conclusion the Board did not give particular weight to any single factor identified above. The Board considered these factors over the course of numerous meetings, many of which were in executive session with only the Independent Trustees and their counsel present. It is possible that individual Trustees may have weighed these factors differently in reaching their individual decisions to approve the continuation of the current agreement.
Trustees and Officers
The following table presents certain information regarding the Trustees and Officers of the fund as of December 31, 2005. Each individual's year of birth is set forth in parentheses after his or her name. Unless otherwise noted, (i) each individual has engaged in the principal occupation(s) noted in the table for at least the most recent five years, although not necessarily in the same capacity, and (ii) the address of each Trustee is c/o Dawn-Marie Driscoll, PO Box 100176, Cape Coral, FL 33904. Unless otherwise indicated, the address of each Officer is Two International Place, Boston, Massachusetts 02110. The term of office for each Trustee is until the next meeting of shareholders called for the purpose of electing Trustees and until the election and qualification of a successor, or until such Trustee sooner dies, resigns, retires or is removed as provided in the governing documents of the fund. Because the fund does not hold an annual meeting of shareholders, each Trustee will hold office for an indeterminate period. The Trustees of the fund may also serve in similar capacities with other funds in the fund complex.
Independent Trustees |
Name, Year of Birth, Position(s) Held with the Fund and Length of Time Served1 | Principal Occupation(s) During Past 5 Years and Other Directorships Held | Number of Funds in Fund Complex Overseen |
Dawn-Marie Driscoll (1946) Chairman, 2004-present Trustee, 1987-present | President, Driscoll Associates (consulting firm); Executive Fellow, Center for Business Ethics, Bentley College; formerly, Partner, Palmer & Dodge (1988-1990); Vice President of Corporate Affairs and General Counsel, Filene's (1978-1988). Directorships: Advisory Board, Center for Business Ethics, Bentley College; Board of Governors, Investment Company Institute; Member, Executive Committee of the Independent Directors Council of the Investment Company Institute, Southwest Florida Community Foundation (charitable organization) | 41 |
Henry P. Becton, Jr. (1943) Trustee, 1990-present | President, WGBH Educational Foundation. Directorships: Becton Dickinson and Company (medical technology company); The A.H. Belo Company (media company); Concord Academy; Boston Museum of Science; Public Radio International. Former Directorships: American Public Television; New England Aquarium; Mass. Corporation for Educational Telecommunications; Committee for Economic Development; Public Broadcasting Service | 41 |
Keith R. Fox (1954) Trustee, 1996-present | Managing General Partner, Exeter Capital Partners (private equity funds). Directorships: Progressive Holding Corporation (kitchen importer and distributor); Cloverleaf Transportation Inc. (trucking); Natural History, Inc. (magazine publisher); Box Top Media Inc. (advertising) | 41 |
Kenneth C. Froewiss (1945) Trustee 2005-present | Clinical Professor of Finance, NYU Stern School of Business; Director, Scudder Global High Income Fund, Inc. (since 2001), Scudder Global Commodities Stock Fund, Inc. (since 2004), Scudder New Asia Fund, Inc. (since 1999), The Brazil Fund, Inc. (since 2000) and The Korea Fund, Inc. (since 2000); Member, Finance Committee, Association for Asian Studies (2002-present); Director, Mitsui Sumitomo Insurance Group (US) (2004-present); prior thereto, Managing Director, J.P. Morgan (investment banking firm) (until 1996) | 46 |
Jean Gleason Stromberg (1943) Trustee, 1999-present | Retired. Formerly, Consultant (1997-2001); Director, US Government Accountability Office (1996-1997); Partner, Fulbright & Jaworski, L.L.P. (law firm) (1978-1996). Directorships: The William and Flora Hewlett Foundation; Service Source, Inc.; DWS Global High Income Fund, Inc. (since October 2005), DWS Global Commodities Stock Fund, Inc. (since October 2005); Former Directorships: Mutual Fund Directors Forum (2002-2004), American Bar Retirement Association (funding vehicle for retirement plans) (1987-1990 and 1994-1996) | 41 |
Carl W. Vogt (1936) Trustee, 2002-present | Senior Partner, Fulbright & Jaworski, L.L.P. (law firm); formerly, President (interim) of Williams College (1999-2000); President, certain funds in the Deutsche Asset Management Family of Funds (formerly, Flag Investors Family of Funds) (registered investment companies) (1999-2000). Directorships: Yellow Corporation (trucking); American Science & Engineering (x-ray detection equipment); ISI Family of Funds (registered investment companies, 4 funds overseen); National Railroad Passenger Corporation (Amtrak); formerly, Chairman and Member, National Transportation Safety Board | 41 |
Officers2 |
Name, Year of Birth, Position(s) Held with the Fund and Length of Time Served1 | Principal Occupation(s) During Past 5 Years and Other Directorships Held |
Vincent J. Esposito4 (1956) President, 2005-present | Managing Director3, Deutsche Asset Management (since 2003); President and Chief Executive Officer of The Central Europe and Russia Fund, Inc., The European Equity Fund, Inc., The New Germany Fund, Inc. (since 2003) (registered investment companies); Vice Chairman and Director of The Brazil Fund, Inc. (2004-present); formerly, Managing Director, Putnam Investments (1991-2002) |
John Millette (1962) Vice President and Secretary, 1999-present | Director3, Deutsche Asset Management |
Paul H. Schubert4 (1963) Chief Financial Officer, 2004-present Treasurer, since 2005 | Managing Director3, Deutsche Asset Management (since July 2004); formerly, Executive Director, Head of Mutual Fund Services and Treasurer for UBS Family of Funds (1998-2004); Vice President and Director of Mutual Fund Finance at UBS Global Asset Management (1994-1998) |
Patricia DeFilippis4 (1963) Assistant Secretary, 2005-present | Vice President3, Deutsche Asset Management (since June 2005); Counsel, New York Life Investment Management LLC (2003-2005); legal associate, Lord, Abbett & Co. LLC (1998-2003) |
Elisa D. Metzger (1962) Assistant Secretary 2005-present | Director3, Deutsche Asset Management (since September 2005); Counsel, Morrison and Foerster LLP (1999-2005) |
Caroline Pearson (1962) Assistant Secretary, 1997-present | Managing Director3, Deutsche Asset Management |
Scott M. McHugh (1971) Assistant Treasurer, 2005-present | Director3, Deutsche Asset Management |
Kathleen Sullivan D'Eramo (1957) Assistant Treasurer, 2003-present | Director3, Deutsche Asset Management |
John Robbins4 (1966) Anti-Money Laundering Compliance Officer, 2005-present | Managing Director3, Deutsche Asset Management (since 2005); formerly, Chief Compliance Officer and Anti-Money Laundering Compliance Officer for GE Asset Management (1999-2005) |
Philip Gallo4 (1962) Chief Compliance Officer, 2004-present | Managing Director3, Deutsche Asset Management (2003-present); formerly, Co-Head of Goldman Sachs Asset Management Legal (1994-2003) |
A. Thomas Smith4 (1956) Chief Legal Officer, since 2005 | Managing Director3, Deutsche Asset Management (2004-present); formerly, General Counsel, Morgan Stanley and Van Kampen and Investments (1999-2004); Vice President and Associate General Counsel, New York Life Insurance Company (1994-1999); senior attorney, The Dreyfus Corporation (1991-1993); senior attorney, Willkie Farr & Gallagher (1989-1991); staff attorney, US Securities & Exchange Commission and the Illinois Securities Department (1986-1989) |
1 Length of time served represents the date that each Trustee was first elected to the common board of Trustees which oversees a number of investment companies, including the fund, managed by the Advisor. For the Officers of the fund, the length of time served represents the date that each officer was first elected to serve as an officer of any fund overseen by the aforementioned common board of Trustees.
2 As a result of their respective positions held with the Advisor, these individuals are considered "interested persons" of the Advisor within the meaning of the 1940 Act. Interested persons receive no compensation from the funds.
3 Executive title, not a board directorship
4 Address: 345 Park Avenue, New York, New York 10154
5 Address: One South Street, Baltimore, Maryland 21202
The fund's Statement of Additional Information ("SAI") includes additional information about the Trustees. The SAI is available, without charge, upon request. If you would like to request a copy of the SAI, you may do so by calling the following toll-free number: 1-800-SCUDDER.
 About the Series' Advisor
DWS Scudder is part of Deutsche Asset Management, which is the marketing name in the US for the asset management activities of Deutsche Bank AG, Deutsche Bank Trust Company Americas, Deutsche Asset Management, Inc., Deutsche Investment Management Americas Inc. and DWS Trust Company.
An investment in the Money Market VIP is not insured or guaranteed by the Federal Deposit Insurance Corporation or any other government agency. Although the Money Market VIP seeks to preserve the value of your investment at $1.00 per share, it is possible to lose money by investing in the Portfolio.
The views expressed in this report reflect those of the portfolio managers only through the end of the period of the report as stated on the cover. The managers' views are subject to change at any time based on market and other conditions and should not be construed as a recommendation.
This information must be preceded or accompanied by a current prospectus.
Portfolio changes should not be considered recommendations for action by individual investors.
DWS Scudder Distributors, Inc.
222 South Riverside Plaza
Chicago, IL 60606
(800) 778-1482
VS1-2 (2/06) 42920
As of the end of the period, December 31, 2005, DWS Variable Series I has adopted a code of ethics, as defined in Item 2 of Form N-CSR, that applies to its Principal Executive Officer and Principal Financial Officer.
There have been no amendments to, or waivers from, a provision of the code of ethics during the period covered by this report that would require disclosure under Item 2.
A copy of the code of ethics is filed as an exhibit to this Form N-CSR.
| ITEM 3. | AUDIT COMMITTEE FINANCIAL EXPERT. |
The Funds’ audit committee is comprised solely of trustees who are “independent” (as such term has been defined by the Securities and Exchange Commission (“SEC”) in regulations implementing Section 407 of the Sarbanes-Oxley Act (the “Regulations”)). The Funds’ Board of Trustees has determined that there are several “audit committee financial experts” serving on the Funds’ audit committee. The Board has determined that Keith R. Fox, the chair of the Funds’ audit committee, qualifies as an “audit committee financial expert” (as such term has been defined by the Regulations) based on its review of Mr. Fox’s pertinent experience and education. The SEC has stated that the designation or identification of a person as an audit committee financial expert pursuant to this Item 3 of Form N-CSR does not impose on such person any duties, obligations or liability that are greater than the duties, obligations and liability imposed on such person as a member of the audit committee and board of directors in the absence of such designation or identification. In accordance with New York Stock Exchange requirements, the Board believes that all members of the Funds’ audit committee are financially literate, as such qualification is interpreted by the Board in its business judgment, and that at least one member of the audit committee has accounting or related financial management expertise.
| ITEM 4. | PRINCIPAL ACCOUNTANT FEES AND SERVICES. |
DWS VARIABLE SERIES I
FORM N-CSR DISCLOSURE RE: AUDIT FEES
The following table shows the amount of fees that PricewaterhouseCoopers, LLP (“PWC”), the Series’ independent registered public accounting firm, billed to the Series during the Series’ last two fiscal years. The Audit Committee approved in advance all audit services and non-audit services that PWC provided to the Series.
The Audit Committee has delegated certain pre-approval responsibilities to its Chairman (or, in his absence, any other member of the Audit Committee).
Services that the Series’ Independent Registered Public Accounting Firm Billed to the Series
Fiscal Year
Ended
December 31, | Audit Fees Billed to Series | Audit-Related
Fees Billed to Series | Tax Fees Billed to Series | All
Other Fees Billed to Series |
2005 | $194,000 | $225 | $0 | $0 |
2004 | $233,000 | $185 | $35,700 | $0 |
The above “Audit- Related Fees” were billed for agreed upon procedures performed and the above "Tax Fees" were billed for professional services rendered for tax compliance and tax return preparation.
Services that the Series’ Independent Registered Public Accounting Firm Billed to the Adviser and Affiliated Fund Service Providers
The following table shows the amount of fees billed by PWC to Deutsche Investment Management Americas, Inc. (“DeIM” or the “Adviser”), and any entity controlling, controlled by or under common control with DeIM (“Control Affiliate”) that provides ongoing services to the Series (“Affiliated Fund Service Provider”), for engagements directly related to the Series’ operations and financial reporting, during the Series’ last two fiscal years.
Fiscal Year
Ended
December 31, | Audit-Related
Fees Billed to Adviser and Affiliated Fund Service Providers | Tax Fees Billed to Adviser and Affiliated Fund Service Providers | All
Other Fees Billed to Adviser and Affiliated Fund Service Providers |
2005 | $268,900 | $197,605 | $0 |
2004 | $431,907 | $0 | $0 |
The “Audit-Related Fees” were billed for services in connection with the assessment of internal controls, agreed-upon procedures and additional related procedures and the above “Tax Fees” were billed in connection with consultation services and agreed-upon procedures.
Non-Audit Services
The following table shows the amount of fees that PWC billed during the Series’ last two fiscal years for non-audit services. For engagements entered into on or after May 6, 2003, the Audit Committee pre-approved all non-audit services that PWC provided to the Adviser and any Affiliated Fund Service Provider that related directly to the Series’ operations and financial reporting. The Audit Committee requested and received information from PWC about any non-audit services that PWC rendered during the Series’ last fiscal year to the Adviser and any Affiliated Fund Service Provider. The Committee considered this information in evaluating PWC’s independence.
Fiscal Year
Ended
December 31, | Total
Non-Audit Fees Billed to Series (A) | Total Non-Audit Fees billed to Adviser and Affiliated Fund Service Providers (engagements related directly to the operations and financial reporting of the Series) (B) | Total Non-Audit Fees billed to Adviser and Affiliated Fund Service Providers (all other engagements) (C) | Total of (A), (B)
and (C) |
2005 | $0 | $197,605 | $104,635 | $302,240 |
2004 | $35,700 | $0 | $253,272 | $288,972 |
All other engagement fees were billed for services in connection with risk management, tax services and process improvement/integration initiatives for DeIM and other related entities that provide support for the operations of the Series.
| ITEM 5. | AUDIT COMMITTEE OF LISTED REGISTRANTS |
| ITEM 6. | SCHEDULE OF INVESTMENTS |
ITEM 7. | DISCLOSURE OF PROXY VOTING POLICIES AND PROCEDURES FOR CLOSED-END MANAGEMENT INVESTMENT COMPANIES. |
ITEM 8. | PORTFOLIO MANAGERS OF CLOSED-END MANAGEMENT INVESTMENT COMPANIES. |
ITEM 9. | PURCHASES OF EQUITY SECURITIES BY CLOSED-END MANAGEMENT INVESTMENT COMPANY AND AFFILIATED PURCHASERS |
| ITEM 10. | SUBMISSION OF MATTERS TO A VOTE OF SECURITY HOLDERS. |
The Committee on Independent Trustees/Directors selects and nominates Independent Trustees/Directors. Fund shareholders may also submit nominees that will be considered by the committee when a Board vacancy occurs. Submissions should be mailed to: c/o Dawn-Marie Driscoll, PO Box 100176, Cape Coral, FL 33910.
| ITEM 11. | CONTROLS AND PROCEDURES. |
(a) | The Chief Executive and Financial Officers concluded that the Registrant’s Disclosure Controls and Procedures are effective based on the evaluation of the Disclosure Controls and Procedures as of a date within 90 days of the filing date of this report. |
(b) | There have been no changes in the registrant’s internal control over financial reporting that occurred during the registrant’s last half-year (the registrant’s second fiscal half-year in the case of the annual report) that has materially affected, or is reasonably likely to materially affect, the registrant’s internal controls over financial reporting. |
(a)(1) | Code of Ethics pursuant to Item 2 of Form N-CSR is filed and attached hereto as EX-99.CODE ETH. |
(a)(2) | Certification pursuant to Rule 30a-2(a) under the Investment Company Act of 1940 (17 CFR 270.30a-2(a)) is filed and attached hereto as Exhibit 99.CERT. |
(b) | Certification pursuant to Rule 30a-2(b) under the Investment Company Act of 1940 (17 CFR 270.30a-2(b)) is furnished and attached hereto as Exhibit 99.906CERT. |
Form N-CSR Item F
SIGNATURES
Pursuant to the requirements of the Securities Exchange Act of 1934 and the Investment Company Act of 1940, the registrant has duly caused this report to be signed on its behalf by the undersigned, thereunto duly authorized.
Registrant: | DWS Variable Series I |
By: | /s/Vincent J. Esposito |
| Vincent J. Esposito | |
President
Pursuant to the requirements of the Securities Exchange Act of 1934 and the Investment Company Act of 1940, this report has been signed below by the following persons on behalf of the registrant and in the capacities and on the dates indicated.
Registrant: | DWS Variable Series I |
By: | /s/Vincent J. Esposito |
| Vincent J. Esposito | |
President
By: | /s/Paul Schubert |
| Paul Schubert | |
Chief Financial Officer and Treasurer