UNITED STATES
SECURITIES AND EXCHANGE COMMISSION
WASHINGTON, D. C. 20549
FORM N-CSR
Investment Company Act file number: 811-04257
Deutsche DWS Variable Series I
(Exact Name of Registrant as Specified in Charter)
875 Third Avenue
New York, NY 10022-6225
(Address of Principal Executive Offices) (Zip Code)
Registrant’s Telephone Number, including Area Code: (212) 454-4500
Diane Kenneally
100 Summer Street
Boston, MA 02110
(Name and Address of Agent for Service)
| Date of fiscal year end: | 12/31 |
| Date of reporting period: | 12/31/2020 |
| ITEM 1. | REPORT TO STOCKHOLDERS |
| (a) |
December 31, 2020
Annual Report
Deutsche DWS Variable Series I
DWS Bond VIP

| 3 | Performance Summary | |||
| 4 | Management Summary | |||
| 5 | Portfolio Summary | |||
| 6 | Investment Portfolio | |||
| 14 | Statement of Assets and Liabilities | |||
| 14 | Statement of Operations | |||
| 15 | Statements of Changes in Net Assets | |||
| 16 | Financial Highlights | |||
| 17 | Notes to Financial Statements | |||
| 25 | Report of Independent Registered Public Accounting Firm | |||
| 26 | Information About Your Fund’s Expenses | |||
| 27 | Tax Information | |||
| 27 | Proxy Voting | |||
| 28 | Advisory Agreement Board Considerations and Fee Evaluation | |||
| 31 | Board Members and Officers |
This report must be preceded or accompanied by a prospectus. To obtain an additional prospectus or summary prospectus, if available, call (800) 728-3337 or your financial representative. We advise you to consider the Fund’s objectives, risks, charges and expenses carefully before investing. The summary prospectus and prospectus contain this and other important information about the Fund. Please read the prospectus carefully before you invest.
Bond investments are subject to interest-rate, credit, liquidity and market risks to varying degrees. When interest rates rise, bond prices generally fall. Credit risk refers to the ability of an issuer to make timely payments of principal and interest. Investments in lower-quality (“junk bonds”) and non-rated securities present greater risk of loss than investments in higher-quality securities. Investing in foreign securities, particularly those of emerging markets, presents certain risks, such as currency fluctuations, political and economic changes, and market risks. Emerging markets tend to be more volatile and less liquid than the markets of more mature economies, and generally have less diverse and less mature economic structures and less stable political systems than those of developed countries. Investing in derivatives entails special risks relating to liquidity, leverage and credit that may reduce returns and/or increase volatility. Please read the prospectus for details.
War, terrorism, economic uncertainty, trade disputes, public health crises (including the recent pandemic spread of the novel coronavirus) and related geopolitical events could lead to increased market volatility, disruption to U.S. and world economies and markets and may have significant adverse effects on the Fund and its investments.
The brand DWS represents DWS Group GmbH & Co. KGaA and any of its subsidiaries such as DWS Distributors, Inc. which offers investment products or DWS Investment Management Americas, Inc. and RREEF America L.L.C. which offer advisory services.
DWS Distributors, Inc., 222 South Riverside Plaza, Chicago, IL 60606, (800) 621-1148
NOT FDIC/NCUA INSURED NO BANK GUARANTEE MAY LOSE VALUE NOT A DEPOSIT NOT INSURED BY ANY FEDERAL GOVERNMENT AGENCY
| 2 | | | Deutsche DWS Variable Series I — DWS Bond VIP |
| Performance Summary | December 31, 2020 (Unaudited) |
Fund performance shown is historical, assumes reinvestment of all dividend and capital gain distributions, and does not guarantee future results. Investment return and principal value fluctuate with changing market conditions so that, when redeemed, shares may be worth more or less than their original cost. Current performance may be lower or higher than the performance data quoted. Please contact your participating insurance company for the Fund’s most recent month-end performance. Performance does not reflect charges and fees (“contract charges”) associated with the separate account that invests in the Fund or any variable life insurance policy or variable annuity contract for which the Fund is an investment option. These charges and fees will reduce returns.
The gross expense ratio of the Fund, as stated in the fee table of the prospectus dated May 1, 2020 is 0.81% for Class A shares and may differ from the expense ratio disclosed in the Financial Highlights table in this report.
Generally accepted accounting principles require adjustments to be made to the net assets of the Fund at period end for financial reporting purposes only, and as such, the total return based on the unadjusted net asset value per share may differ from the total return reported in the financial highlights.
Growth of an Assumed $10,000 Investment
| The Bloomberg Barclays U.S. Aggregate Bond Index is an unmanaged index representing domestic taxable investment-grade bonds, with index components for government and corporate securities, mortgage pass-through securities, and asset-backed securities with an average maturity of one year or more.
Index returns do not reflect any fees or expenses and it is not possible to invest directly into an index. |
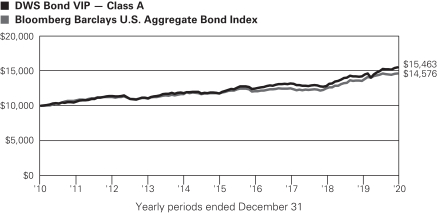
| Comparative Results | ||||||||||
| DWS Bond VIP | 1-Year | 3-Year | 5-Year | 10-Year | ||||||
| Class A | Growth of $10,000 | $10,907 | $11,746 | $13,168 | $15,463 | |||||
| Average annual total return | 9.07% | 5.51% | 5.66% | 4.45% | ||||||
| Bloomberg Barclays U.S. Aggregate Bond Index | Growth of $10,000 | $10,751 | $11,689 | $12,424 | $14,576 | |||||
| Average annual total return | 7.51% | 5.34% | 4.44% | 3.84% | ||||||
The growth of $10,000 is cumulative.
Deutsche DWS Variable Series I — DWS Bond VIP | | | 3 |
| Management Summary | December 31, 2020 (Unaudited) |
During the 12-month period ended December 31, 2020, the portfolio provided a total return of 9.07% (Class A shares, unadjusted for contract charges) compared with the 7.51% return of its benchmark, the Bloomberg Barclays U.S. Aggregate Bond Index.
Bond markets generally finished the year with strong returns, although the journey was volatile as investors struggled to come to terms with uncertainty around the COVID-19 pandemic. Risk assets declined sharply in February and March as governments sought to contain the virus by locking down economies. The U.S. Federal Reserve responded by cutting short-term interest rates to zero, expanding its lending facilities and announcing a broad-based asset-purchase program that included Treasuries, mortgage-backed securities, municipal bonds and corporate issues. Congress in turn passed a $2.2 trillion stimulus package. The result of these policy efforts was a rebound in credit-oriented assets beginning in late March. After some cooling in risk sentiment in the lead-up to the U.S. elections, the rally resumed in November on a clear resolution to the presidential race and headlines around a pair of coronavirus vaccines which raised hopes for a return to more normal economic activity in 2021. Corporate bonds led performance within the U.S. investment grade bond market for the year. The yield on the 10-year Treasury bond began the year at 1.92% and touched an historic low of 0.52% as investors sought a safe haven in the wake of the pandemic, before finishing 2020 at 0.93%.
The portfolio’s outperformance versus the benchmark for the 12-month period was driven principally by exposure to more credit-sensitive fixed-income sectors, most notably investment grade and high yield corporate bonds. Exposure to emerging market debt also contributed positively to relative performance as the asset class was supported over the latter half of the period by improving risk sentiment, a weakening dollar and firming oil prices. Finally, investments in securitized asset categories contributed modestly to relative performance. Positioning with respect to duration and corresponding interest rate sensitivity was essentially a neutral factor in performance. While there were few material detractors over the year, derivatives used to hedge currency, credit and interest rate risk weighed slightly on performance. Entering a new year, we are maintaining a constructive stance with respect to sectors that trade at a yield spread relative to Treasuries, although we are proceeding with caution given the recent narrowing of spreads and less attractive valuations.
Thomas M. Farina, CFA, Managing Director
Gregory M. Staples, CFA, Managing Director
Kelly L. Beam, CFA, Director
Portfolio Managers
The views expressed reflect those of the portfolio management team only through the end of the period of the report as stated on the cover. The management team’s views are subject to change at any time based on market and other conditions and should not be construed as a recommendation. Past performance is no guarantee of future results. Current and future portfolio holdings are subject to risk
Terms to Know
The yield curve is a graphical representation of how yields on bonds of different maturities compare. Normally, yield curves slant up, as bonds with longer maturities typically offer higher yields than short-term bonds.
The Bloomberg Barclays U.S. Aggregate Bond Index is an unmanaged index representing domestic taxable investment-grade bonds, with index components for government and corporate securities, mortgage passthrough securities, and asset-backed securities with an average maturity of one year or more.
Credit spread is the additional yield provided by bonds rated AA and below vs. comparable maturity bonds rated AAA.
Contributors and detractors incorporate both a holding’s return and its weight. If two holdings have the same return but one has a larger weighting in the Fund, it will have a larger contribution to return in the period.
A derivative is a contract whose value is based on the performance of an underlying financial asset. Derivatives afford leverage, but when used by investors who are able to handle the inherent risks, can enhance returns or protect a portfolio. Derivatives experience significant losses if the underlying security moves contrary to the investor’s expectations.
A measure of bond price volatility, duration can be defined as the approximate percentage change in price for a 100 basis point (one single percentage point) change in market interest rate levels. A duration of 5, for example, means that the price of a bond should rise by approximately 5% for a one percentage point drop in interest rates, and fall by 5% for a one percentage point rise in interest rates.
Overweight means the Fund holds a higher weighting in a given sector or security than the benchmark. Underweight means the Fund holds a lower weighting.
| 4 | | | Deutsche DWS Variable Series I — DWS Bond VIP |
| Portfolio Summary | (Unaudited) |
| Asset Allocation (As a % of Total Net Assets) | 12/31/20 | 12/31/19 | ||||||
| Corporate Bonds | 61% | 44% | ||||||
| Mortgage-Backed Securities Pass-Throughs | 12% | 18% | ||||||
| Collateralized Mortgage Obligations | 9% | 12% | ||||||
| Asset-Backed | 6% | 8% | ||||||
| Government & Agency Obligations | 6% | 13% | ||||||
| Commercial Mortgage-Backed Securities | 5% | 7% | ||||||
| Short-Term U.S. Treasury Obligations | 2% | 2% | ||||||
| Cash Equivalents, Securities Lending Collateral and other Assets and Liabilities, net | –1% | –4% | ||||||
| 100% | 100% | |||||||
| Quality (Excludes Securities Lending Collateral and Cash Equivalents) | 12/31/20 | 12/31/19 | ||||||
| AAA | 21% | 33% | ||||||
| AA | 9% | 12% | ||||||
| A | 17% | 16% | ||||||
| BBB | 37% | 27% | ||||||
| BB | 14% | 9% | ||||||
| B | 2% | 1% | ||||||
| Not Rated | — | 2% | ||||||
| 100% | 100% | |||||||
| Interest Rate Sensitivity | 12/31/20 | 12/31/19 | ||||||
| Effective Maturity | 8.1 years | 8.6 years | ||||||
| Effective Duration | 6.2 years | 5.9 years | ||||||
The quality ratings represent the higher of Moody’s Investors Service, Inc. (“Moody’s”), Fitch Ratings, Inc. (“Fitch”) or S&P Global Ratings (“S&P”) credit ratings. The ratings of Moody’s, Fitch and S&P represent their opinions as to the quality of the securities they rate. Credit quality measures a bond issuer’s ability to repay interest and principal in a timely manner. Ratings are relative and subjective and are not absolute standards of quality. Credit quality does not remove market risk and is subject to change.
Effective maturity is the weighted average of the maturity date of bonds held by the Fund taking into consideration any available maturity shortening features.
Effective duration is an approximate measure of the Fund’s sensitivity to interest rate changes taking into consideration any maturity shortening features.
Portfolio holdings and characteristics are subject to change.
For more complete details about the Fund’s investment portfolio, see page 6.
Following the Fund’s fiscal first and third quarter-end, a complete portfolio holdings listing is posted on dws.com, and is available free of charge by contacting your financial intermediary, or if you are a direct investor, by calling (800) 728-3337. In addition, the portfolio holdings listing is filed with the SEC on the Fund’s Form N-PORT and will be available on the SEC’s Web site at sec.gov. Additional portfolio holdings for the Fund are also posted on dws.com from time to time. Please see the Fund’s current prospectus for more information.
Deutsche DWS Variable Series I — DWS Bond VIP | | | 5 |
| Investment Portfolio | as of December 31, 2020 |
| Principal Amount ($) (a) | Value ($) | |||||||
| Corporate Bonds 61.0% |
| |||||||
| Communication Services 8.3% |
| |||||||
Amazon.com, Inc.: | ||||||||
2.5%, 6/3/2050 | 20,000 | 20,751 | ||||||
4.25%, 8/22/2057 | 45,000 | 64,122 | ||||||
Arches Buyer, Inc., 144A, | 30,000 | 30,381 | ||||||
AT&T, Inc.: | ||||||||
3-month USD-LIBOR + 1.180%, 1.4%*, 6/12/2024 | 207,000 | 212,067 | ||||||
1.65%, 2/1/2028 | 50,000 | 51,015 | ||||||
2.25%, 2/1/2032 | 85,000 | 86,226 | ||||||
2.75%, 6/1/2031 | 125,000 | 133,578 | ||||||
3.65%, 6/1/2051 | 100,000 | 104,709 | ||||||
CCO Holdings LLC, 144A, | 100,000 | 107,900 | ||||||
Charter Communications Operating LLC: |
| |||||||
3.7%, 4/1/2051 | 140,000 | 145,384 | ||||||
3.75%, 2/15/2028 | 75,000 | 84,092 | ||||||
5.05%, 3/30/2029 | 60,000 | 72,952 | ||||||
Comcast Corp.: |
| |||||||
1.95%, 1/15/2031 | 45,000 | 46,212 | ||||||
2.8%, 1/15/2051 | 40,000 | 41,699 | ||||||
Cox Communications, Inc., 144A, 2.95%, 10/1/2050 | 40,000 | 40,897 | ||||||
CSC Holdings LLC: | ||||||||
144A, 3.375%, 2/15/2031 | 200,000 | 196,250 | ||||||
144A, 4.125%, 12/1/2030 | 200,000 | 209,120 | ||||||
Discovery Communications LLC: | ||||||||
144A, 4.0%, 9/15/2055 | 50,000 | 55,965 | ||||||
5.3%, 5/15/2049 | 25,000 | 32,985 | ||||||
Empresa Nacional de Telecomunicaciones SA, REG S, 4.75%, 8/1/2026 | 250,000 | 279,378 | ||||||
Match Group Holdings II LLC, 144A, 4.125%, 8/1/2030 | 135,000 | 140,400 | ||||||
Netflix, Inc.: | ||||||||
144A, 3.625%, 6/15/2025 | 45,000 | 48,183 | ||||||
5.5%, 2/15/2022 | 125,000 | 130,781 | ||||||
5.875%, 11/15/2028 | 125,000 | 149,844 | ||||||
NortonLifeLock, Inc., | 225,000 | 229,781 | ||||||
T-Mobile U.S.A., Inc.: | ||||||||
144A, 2.05%, 2/15/2028 | 30,000 | 31,205 | ||||||
144A, 2.25%, 11/15/2031 | 110,000 | 112,897 | ||||||
144A, 3.3%, 2/15/2051 | 50,000 | 51,442 | ||||||
144A, 3.6%, 11/15/2060 | 30,000 | 31,843 | ||||||
144A, 4.375%, 4/15/2040 | 70,000 | 85,426 | ||||||
144A, 4.5%, 4/15/2050 | 60,000 | 74,003 | ||||||
Tencent Music Entertainment Group, 2.0%, 9/3/2030 | 211,000 | 209,752 | ||||||
VeriSign, Inc.: | ||||||||
4.625%, 5/1/2023 | 250,000 | 252,188 | ||||||
5.25%, 4/1/2025 | 250,000 | 284,063 | ||||||
Verizon Communications, Inc.: |
| |||||||
2.65%, 11/20/2040 | 55,000 | 55,537 | ||||||
3.0%, 11/20/2060 | 50,000 | 50,502 | ||||||
4.329%, 9/21/2028 | 70,000 | 84,296 | ||||||
ViacomCBS, Inc., | 50,000 | 60,257 | ||||||
Vodafone Group PLC, | 55,000 | 68,121 | ||||||
| Principal Amount ($) (a) | Value ($) | |||||||
Walt Disney Co.: | ||||||||
2.65%, 1/13/2031 | 45,000 | 49,334 | ||||||
3.6%, 1/13/2051 | 50,000 | 60,525 | ||||||
|
| |||||||
| 4,276,063 | ||||||||
| Consumer Discretionary 7.0% |
| |||||||
1011778 BC Unlimited Liability Co., 144A, 4.375%, 1/15/2028 | 210,000 | 216,300 | ||||||
Carnival Corp., 144A, | 97,000 | 105,681 | ||||||
Cummins, Inc., 2.6%, 9/1/2050 | 40,000 | 40,821 | ||||||
Dollar General Corp., | 20,000 | 25,311 | ||||||
Ford Motor Credit Co. LLC: |
| |||||||
3.37%, 11/17/2023 | 350,000 | 356,926 | ||||||
3.375%, 11/13/2025 | 261,000 | 268,141 | ||||||
5.584%, 3/18/2024 | 206,000 | 222,202 | ||||||
General Motors Co., | 30,000 | 33,592 | ||||||
General Motors Financial Co., Inc.: | ||||||||
3.15%, 6/30/2022 | 265,000 | 274,362 | ||||||
3.95%, 4/13/2024 | 120,000 | 130,705 | ||||||
4.35%, 4/9/2025 | 84,000 | 93,777 | ||||||
5.2%, 3/20/2023 | 40,000 | 43,860 | ||||||
Genuine Parts Co., | 30,000 | 29,771 | ||||||
Hilton Domestic Operating Co., Inc., 144A, 4.0%, 5/1/2031 | 125,000 | 131,889 | ||||||
Home Depot, Inc.: |
| |||||||
3.125%, 12/15/2049 | 80,000 | 92,298 | ||||||
3.35%, 4/15/2050 | 50,000 | 59,504 | ||||||
Hyundai Capital America, 144A, 1.25%, 9/18/2023 | 145,000 | 146,719 | ||||||
Lowe’s Companies, Inc.: |
| |||||||
3.0%, 10/15/2050 | 45,000 | 48,133 | ||||||
4.05%, 5/3/2047 | 40,000 | 50,073 | ||||||
McDonald’s Corp.: |
| |||||||
2.125%, 3/1/2030 | 35,000 | 36,901 | ||||||
4.2%, 4/1/2050 | 50,000 | 64,279 | ||||||
NIKE, Inc., 3.375%, 3/27/2050 | 29,000 | 35,877 | ||||||
Nissan Motor Co., Ltd., 144A, 4.345%, 9/17/2027 | 395,000 | 436,288 | ||||||
O’Reilly Automotive, Inc., | 20,000 | 20,031 | ||||||
QVC, Inc., 4.75%, 2/15/2027 | 172,000 | 184,470 | ||||||
Sands China Ltd., 4.6%, 8/8/2023 | 200,000 | 212,398 | ||||||
Tractor Supply Co., | 15,000 | 15,076 | ||||||
Walmart, Inc., 3.4%, 6/26/2023 | 175,000 | 187,940 | ||||||
|
| |||||||
| 3,563,325 | ||||||||
| Consumer Staples 2.0% |
| |||||||
Albertsons Companies, Inc.: |
| |||||||
144A, 3.25%, 3/15/2026 | 90,000 | 91,350 | ||||||
144A, 3.5%, 3/15/2029 | 50,000 | 50,593 | ||||||
Altria Group, Inc.: |
| |||||||
3.875%, 9/16/2046 | 20,000 | 21,126 | ||||||
4.45%, 5/6/2050 | 40,000 | 47,289 | ||||||
4.8%, 2/14/2029 | 25,000 | 29,952 | ||||||
Anheuser-Busch InBev Worldwide, Inc.: |
| |||||||
4.35%, 6/1/2040 | 50,000 | 61,348 | ||||||
4.439%, 10/6/2048 | 50,000 | 62,236 | ||||||
5.55%, 1/23/2049 | 55,000 | 78,203 | ||||||
The accompanying notes are an integral part of the financial statements.
| 6 | | | Deutsche DWS Variable Series I — DWS Bond VIP |
| Principal Amount ($) (a) | Value ($) | |||||||
BAT Capital Corp., | 60,000 | 62,145 | ||||||
Conagra Brands, Inc., | 30,000 | 30,277 | ||||||
Constellation Brands, Inc., 2.875%, 5/1/2030 | 40,000 | 43,831 | ||||||
Estee Lauder Companies, Inc.: | ||||||||
2.375%, 12/1/2029 | 26,000 | 28,105 | ||||||
2.6%, 4/15/2030 | 15,000 | 16,475 | ||||||
General Mills, Inc., | 65,000 | 72,071 | ||||||
Keurig Dr Pepper, Inc.: | ||||||||
3.2%, 5/1/2030 | 25,000 | 28,306 | ||||||
3.8%, 5/1/2050 | 30,000 | 35,931 | ||||||
4.597%, 5/25/2028 | 70,000 | 85,197 | ||||||
PepsiCo, Inc.: |
| |||||||
3.375%, 7/29/2049 | 55,000 | 66,739 | ||||||
3.5%, 3/19/2040 | 25,000 | 29,988 | ||||||
Philip Morris International, Inc., 2.1%, 5/1/2030 | 60,000 | 62,577 | ||||||
Smithfield Foods, Inc., 144A, 3.0%, 10/15/2030 | 40,000 | 42,323 | ||||||
|
| |||||||
| 1,046,062 | ||||||||
| Energy 2.9% |
| |||||||
BP Capital Markets America, Inc.: | ||||||||
1.749%, 8/10/2030 | 40,000 | 40,245 | ||||||
2.939%, 6/4/2051 | 100,000 | 102,153 | ||||||
3.543%, 4/6/2027 | 75,000 | 85,356 | ||||||
Devon Energy Corp., | 50,000 | 58,894 | ||||||
Energy Transfer Operating LP: | ||||||||
4.25%, 3/15/2023 | 350,000 | 371,930 | ||||||
5.0%, 5/15/2050 | 20,000 | 21,658 | ||||||
Exxon Mobil Corp.: | ||||||||
2.44%, 8/16/2029 | 87,000 | 94,438 | ||||||
3.482%, 3/19/2030 | 100,000 | 116,298 | ||||||
Hess Corp., 5.8%, 4/1/2047 | 100,000 | 127,237 | ||||||
Marathon Petroleum Corp.: | ||||||||
4.5%, 5/1/2023 | 110,000 | 119,441 | ||||||
4.7%, 5/1/2025 | 100,000 | 114,555 | ||||||
MPLX LP, 2.65%, 8/15/2030 | 35,000 | 36,680 | ||||||
Occidental Petroleum Corp.: | ||||||||
5.5%, 12/1/2025 | 15,000 | 15,639 | ||||||
6.125%, 1/1/2031 | 15,000 | 16,053 | ||||||
Phillips 66, 1.3%, 2/15/2026 | 40,000 | 40,536 | ||||||
Plains All American Pipeline LP, 3.8%, 9/15/2030 | 50,000 | 53,753 | ||||||
Total Capital International SA, 3.127%, 5/29/2050 | 60,000 | 65,025 | ||||||
|
| |||||||
| 1,479,891 | ||||||||
| Financials 16.5% |
| |||||||
AerCap Ireland Capital DAC: | ||||||||
3.15%, 2/15/2024 | 300,000 | 314,479 | ||||||
4.625%, 10/15/2027 | 300,000 | 339,720 | ||||||
Air Lease Corp., 3.0%, 2/1/2030 | 125,000 | 128,325 | ||||||
Aircastle Ltd., 4.4%, 9/25/2023 | 109,000 | 115,503 | ||||||
ANZ New Zealand Int’l Ltd., 144A, 3.4%, 3/19/2024 | 200,000 | 217,115 | ||||||
Avolon Holdings Funding Ltd.: | ||||||||
144A, 4.25%, 4/15/2026 | 40,000 | 43,095 | ||||||
144A, 5.125%, 10/1/2023 | 167,000 | 178,654 | ||||||
Banco del Estado de Chile, 144A, 2.704%, 1/9/2025 | 200,000 | 211,252 | ||||||
| Principal Amount ($) (a) | Value ($) | |||||||
Bank of America Corp.: | ||||||||
1.922%, 10/24/2031 | 160,000 | 162,115 | ||||||
2.592%, 4/29/2031 | 160,000 | 171,481 | ||||||
2.676%, 6/19/2041 | 60,000 | 62,514 | ||||||
4.3%, Perpetual (b) | 204,000 | 210,336 | ||||||
Barclays PLC, 2.852%, 5/7/2026 | 200,000 | 214,788 | ||||||
BBVA Bancomer SA, 144A, 1.875%, 9/18/2025 | 201,000 | 203,010 | ||||||
Berkshire Hathaway Finance Corp., 2.85%, 10/15/2050 | 50,000 | 53,549 | ||||||
Blackstone Secured Lending Fund, 144A, 3.625%, 1/15/2026 | 155,000 | 159,429 | ||||||
Canadian Imperial Bank of Commerce, 0.95%, 10/23/2025 | 55,000 | 55,782 | ||||||
Charles Schwab Corp., | 125,000 | 131,563 | ||||||
Citigroup, Inc.: | ||||||||
2.572%, 6/3/2031 | 125,000 | 133,233 | ||||||
3.2%, 10/21/2026 | 170,000 | 190,004 | ||||||
4.0%, Perpetual (b) | 650,000 | 667,062 | ||||||
4.412%, 3/31/2031 | 80,000 | 97,013 | ||||||
Empower Finance LP: | ||||||||
144A, 1.776%, 3/17/2031 | 24,000 | 24,617 | ||||||
144A, 3.075%, 9/17/2051 | 20,000 | 22,146 | ||||||
Global Payments, Inc., | 120,000 | 132,785 | ||||||
HSBC Holdings PLC: | ||||||||
2.633%, 11/7/2025 | 250,000 | 266,230 | ||||||
4.6%, Perpetual (b) | 250,000 | 254,405 | ||||||
Intercontinental Exchange, Inc.: | ||||||||
2.1%, 6/15/2030 | 52,000 | 53,975 | ||||||
3.0%, 6/15/2050 | 33,000 | 34,976 | ||||||
JPMorgan Chase & Co.: | ||||||||
2.522%, 4/22/2031 | 150,000 | 161,229 | ||||||
2.739%, 10/15/2030 | 100,000 | 108,733 | ||||||
2.956%, 5/13/2031 | 50,000 | 54,830 | ||||||
Kookmin Bank, 144A, | 200,000 | 207,629 | ||||||
Morgan Stanley: | ||||||||
1.794%, 2/13/2032 | 45,000 | 45,322 | ||||||
2.188%, 4/28/2026 | 105,000 | 110,905 | ||||||
3.622%, 4/1/2031 | 150,000 | 174,465 | ||||||
OneMain Finance Corp., | 30,000 | 31,128 | ||||||
Oversea-Chinese Banking Corp., Ltd., 144A, 1.832%, 9/10/2030 | 395,000 | 401,197 | ||||||
PayPal Holdings, Inc.: | ||||||||
2.65%, 10/1/2026 | 84,000 | 92,333 | ||||||
2.85%, 10/1/2029 | 25,000 | 27,770 | ||||||
Prudential Financial, Inc., | 25,000 | 32,841 | ||||||
REC Ltd., 144A, 4.75%, 5/19/2023 | 200,000 | 213,312 | ||||||
RELX Capital, Inc., | 15,000 | 16,656 | ||||||
Santander Holdings U.S.A., Inc., 3.244%, 10/5/2026 | 270,000 | 293,225 | ||||||
Societe Generale SA: | ||||||||
144A, 2.625%, 1/22/2025 | 200,000 | 211,818 | ||||||
144A, 5.375%, Perpetual (b) | 250,000 | 265,093 | ||||||
State Street Corp., | 102,000 | 111,463 | ||||||
Swiss Re Treasury U.S. Corp., 144A, 4.25%, 12/6/2042 | 70,000 | 88,163 | ||||||
Synchrony Financial, | 40,000 | 44,039 | ||||||
The accompanying notes are an integral part of the financial statements.
Deutsche DWS Variable Series I — DWS Bond VIP | | | 7 |
| Principal Amount ($) (a) | Value ($) | |||||||
The Allstate Corp., | 30,000 | 37,611 | ||||||
The Goldman Sachs Group, Inc.: |
| |||||||
3.5%, 4/1/2025 | 100,000 | 111,099 | ||||||
4.4%, Perpetual (b) (c) | 63,000 | 64,418 | ||||||
Visa, Inc., 2.05%, 4/15/2030 | 95,000 | 101,604 | ||||||
Wells Fargo & Co.: | ||||||||
2.188%, 4/30/2026 | 295,000 | 310,602 | ||||||
2.393%, 6/2/2028 | 168,000 | 178,856 | ||||||
3.196%, 6/17/2027 | 90,000 | 99,806 | ||||||
|
| |||||||
| 8,445,303 | ||||||||
| Health Care 4.3% | ||||||||
AbbVie, Inc.: | ||||||||
3.2%, 11/21/2029 | 50,000 | 56,035 | ||||||
4.25%, 11/21/2049 | 30,000 | 37,615 | ||||||
4.75%, 3/15/2045 | 25,000 | 32,673 | ||||||
Amgen, Inc.: | ||||||||
3.375%, 2/21/2050 | 50,000 | 55,864 | ||||||
4.563%, 6/15/2048 | 40,000 | 52,980 | ||||||
Anthem, Inc.: | ||||||||
2.25%, 5/15/2030 | 80,000 | 84,978 | ||||||
2.875%, 9/15/2029 | 40,000 | 44,470 | ||||||
AstraZeneca PLC, | 50,000 | 49,492 | ||||||
Bausch Health Companies, Inc., 144A, 5.25%, 2/15/2031 | 50,000 | 52,236 | ||||||
Biogen, Inc., 3.15%, 5/1/2050 | 50,000 | 51,846 | ||||||
Boston Scientific Corp., | 75,000 | 88,388 | ||||||
Bristol-Myers Squibb Co., | 85,000 | 114,946 | ||||||
Cigna Corp.: | ||||||||
2.4%, 3/15/2030 | 30,000 | 31,987 | ||||||
3.2%, 3/15/2040 | 15,000 | 16,448 | ||||||
CVS Health Corp.: | ||||||||
1.75%, 8/21/2030 | 130,000 | 130,757 | ||||||
2.7%, 8/21/2040 | 30,000 | 30,350 | ||||||
4.25%, 4/1/2050 | 20,000 | 25,018 | ||||||
5.05%, 3/25/2048 | 45,000 | 60,988 | ||||||
DH Europe Finance II Sarl, | EUR 200,000 | 251,565 | ||||||
Fresenius Medical Care U.S. Finance III, Inc., 144A, | 150,000 | 152,453 | ||||||
Gilead Sciences, Inc.: | ||||||||
1.65%, 10/1/2030 | 40,000 | 40,137 | ||||||
2.8%, 10/1/2050 | 50,000 | 49,621 | ||||||
HCA, Inc., 5.25%, 6/15/2026 | 130,000 | 153,855 | ||||||
Hologic, Inc., 144A, | 65,000 | 66,137 | ||||||
Merck & Co., Inc., | 80,000 | 82,830 | ||||||
Pfizer, Inc., 4.2%, 9/15/2048 | 60,000 | 80,738 | ||||||
Stryker Corp., 2.9%, 6/15/2050 | 60,000 | 63,677 | ||||||
Thermo Fisher Scientific, Inc., 2.6%, 10/1/2029 | 110,000 | 120,439 | ||||||
UnitedHealth Group, Inc.: | ||||||||
2.875%, 8/15/2029 | 54,000 | 61,380 | ||||||
2.9%, 5/15/2050 | 50,000 | 55,357 | ||||||
|
| |||||||
| 2,195,260 | ||||||||
| Industrials 6.7% |
| |||||||
3M Co., 3.7%, 4/15/2050 | 26,000 | 32,273 | ||||||
| Principal Amount ($) (a) | Value ($) | |||||||
Adani Ports & Special Economic Zone Ltd., 144A, | 200,000 | 214,637 | ||||||
Agilent Technologies, Inc., | 45,000 | 46,578 | ||||||
Boeing Co.: | ||||||||
1.95%, 2/1/2024 | 265,000 | 272,918 | ||||||
2.3%, 8/1/2021 | 150,000 | 151,375 | ||||||
2.7%, 5/1/2022 | 125,000 | 128,515 | ||||||
2.75%, 2/1/2026 | 375,000 | 394,331 | ||||||
4.508%, 5/1/2023 | 140,000 | 151,317 | ||||||
4.875%, 5/1/2025 | 93,000 | 106,011 | ||||||
5.04%, 5/1/2027 | 60,000 | 70,144 | ||||||
Delta Air Lines, Inc.: | ||||||||
4.375%, 4/19/2028 | 94,000 | 94,524 | ||||||
144A, 4.5%, 10/20/2025 | 30,000 | 32,066 | ||||||
FedEx Corp.: | ||||||||
3.8%, 5/15/2025 | 245,000 | 276,569 | ||||||
4.05%, 2/15/2048 | 114,000 | 137,797 | ||||||
Gartner, Inc., 144A, | 60,000 | 63,226 | ||||||
General Electric Co.: | ||||||||
3.45%, 5/1/2027 | 50,000 | 56,552 | ||||||
3.625%, 5/1/2030 | 35,000 | 40,001 | ||||||
GFL Environmental, Inc.: | ||||||||
144A, 3.75%, 8/1/2025 | 100,000 | 102,500 | ||||||
144A, 4.0%, 8/1/2028 | 150,000 | 151,125 | ||||||
Nielsen Finance LLC, 144A, 5.625%, 10/1/2028 | 110,000 | 119,521 | ||||||
Otis Worldwide Corp., | 60,000 | 64,430 | ||||||
Penske Truck Leasing Co. LP, 144A, 1.2%, 11/15/2025 | 80,000 | 80,684 | ||||||
Prime Security Services Borrower LLC: | ||||||||
144A, 5.25%, 4/15/2024 | 195,000 | 208,162 | ||||||
144A, 6.25%, 1/15/2028 | 70,000 | 75,151 | ||||||
Republic Services, Inc., | 40,000 | 40,096 | ||||||
Roper Technologies, Inc., | 40,000 | 40,885 | ||||||
XPO Logistics, Inc., 144A, | 260,000 | 279,796 | ||||||
|
| |||||||
| 3,431,184 | ||||||||
| Information Technology 3.7% |
| |||||||
Activision Blizzard, Inc., | 20,000 | 19,634 | ||||||
Apple, Inc., 3.75%, 9/12/2047 | 100,000 | 125,353 | ||||||
Booz Allen Hamilton, Inc., 144A, 3.875%, 9/1/2028 | 40,000 | 41,200 | ||||||
Broadcom, Inc.: | ||||||||
4.11%, 9/15/2028 | 212,000 | 242,631 | ||||||
5.0%, 4/15/2030 | 70,000 | 85,093 | ||||||
Dell International LLC: | ||||||||
144A, 4.9%, 10/1/2026 | 198,000 | 233,806 | ||||||
144A, 5.875%, 6/15/2021 | 159,000 | 159,286 | ||||||
144A, 8.35%, 7/15/2046 | 60,000 | 90,769 | ||||||
Intel Corp., 3.25%, 11/15/2049 | 60,000 | 67,155 | ||||||
International Business Machines Corp., 3.5%, 5/15/2029 | 100,000 | 115,708 | ||||||
KLA Corp., 3.3%, 3/1/2050 | 31,000 | 34,982 | ||||||
Lam Research Corp., | 24,000 | 25,861 | ||||||
Microchip Technology, Inc., 144A, 2.67%, 9/1/2023 | 50,000 | 52,293 | ||||||
The accompanying notes are an integral part of the financial statements.
| 8 | | | Deutsche DWS Variable Series I — DWS Bond VIP |
| Principal Amount ($) (a) | Value ($) | |||||||
Micron Technology, Inc., | 70,000 | 72,941 | ||||||
Microsoft Corp., 3.7%, 8/8/2046 | 86,000 | 109,047 | ||||||
NVIDIA Corp.: | ||||||||
3.5%, 4/1/2040 | 14,000 | 16,813 | ||||||
3.5%, 4/1/2050 | 22,000 | 26,688 | ||||||
NXP BV, 144A, 2.7%, 5/1/2025 | 15,000 | 16,145 | ||||||
Open Text Corp., 144A, | 175,000 | 182,000 | ||||||
Oracle Corp.: | ||||||||
3.6%, 4/1/2050 | 25,000 | 29,127 | ||||||
4.0%, 11/15/2047 | 35,000 | 43,221 | ||||||
Qorvo, Inc., 144A, | 60,000 | 61,950 | ||||||
Seagate HDD Cayman: | ||||||||
144A, 3.125%, 7/15/2029 | 40,000 | 40,004 | ||||||
144A, 3.375%, 7/15/2031 | 25,000 | 25,135 | ||||||
|
| |||||||
| 1,916,842 | ||||||||
| Materials 1.9% |
| |||||||
Air Products and Chemicals, Inc., 2.05%, 5/15/2030 | 30,000 | 32,002 | ||||||
AngloGold Ashanti Holdings PLC, 5.125%, 8/1/2022 | 110,000 | 115,815 | ||||||
EI du Pont de Nemours & Co., 2.3%, 7/15/2030 | 25,000 | 26,593 | ||||||
Glencore Funding LLC, 144A, 1.625%, 9/1/2025 | 275,000 | 282,915 | ||||||
LYB International Finance III LLC, 3.625%, 4/1/2051 | 30,000 | 32,782 | ||||||
MEGlobal Canada ULC, 144A, 5.0%, 5/18/2025 | 237,000 | 266,625 | ||||||
Newmont Corp., | 40,000 | 42,097 | ||||||
Nucor Corp., 2.7%, 6/1/2030 | 10,000 | 10,996 | ||||||
Nutrition & Biosciences, Inc., 144A, 3.468%, 12/1/2050 | 57,000 | 61,918 | ||||||
Reynolds Group Issuer, Inc, 144A, 4.0%, 10/15/2027 | 40,000 | 41,000 | ||||||
Valvoline, Inc., 144A, | 20,000 | 20,525 | ||||||
WRKCo., Inc., 3.0%, 6/15/2033 | 30,000 | 32,960 | ||||||
|
| |||||||
| 966,228 | ||||||||
| Real Estate 2.9% |
| |||||||
American Tower Corp.: | ||||||||
(REIT), 2.1%, 6/15/2030 | 55,000 | 56,452 | ||||||
(REIT), 2.95%, 1/15/2051 | 35,000 | 35,084 | ||||||
(REIT), 3.8%, 8/15/2029 | 55,000 | 63,945 | ||||||
Crown Castle International Corp., (REIT), 3.8%, 2/15/2028 | 50,000 | 57,626 | ||||||
Equinix, Inc.: | ||||||||
(REIT), 2.15%, 7/15/2030 | 34,000 | 34,583 | ||||||
(REIT), 3.2%, 11/18/2029 | 81,000 | 88,919 | ||||||
Iron Mountain, Inc.: | ||||||||
144A, (REIT) 5.0%, 7/15/2028 | 55,000 | 58,430 | ||||||
144A, (REIT) 5.25%, 7/15/2030 | 105,000 | 113,400 | ||||||
MPT Operating Partnership LP, 3.5%, 3/15/2031 | 195,000 | 201,338 | ||||||
Office Properties Income Trust, (REIT), 4.15%, 2/1/2022 | 80,000 | 81,451 | ||||||
Omega Healthcare Investors, Inc., (REIT), 5.25%, 1/15/2026 | 50,000 | 57,160 | ||||||
SBA Communications Corp.: | ||||||||
(REIT), 3.875%, 2/15/2027 | 155,000 | 162,750 | ||||||
(REIT), 4.0%, 10/1/2022 | 190,000 | 191,900 | ||||||
| Principal Amount ($) (a) | Value ($) | |||||||
(REIT), 4.875%, 9/1/2024 | 125,000 | 128,216 | ||||||
VEREIT Operating Partnership LP, 2.85%, 12/15/2032 | 30,000 | 31,369 | ||||||
Welltower, Inc.: | ||||||||
(REIT), 2.75%, 1/15/2031 | 40,000 | 42,325 | ||||||
(REIT), 3.1%, 1/15/2030 | 80,000 | 87,547 | ||||||
|
| |||||||
| 1,492,495 | ||||||||
| Utilities 4.8% |
| |||||||
Abu Dhabi National Energy Co. PJSC, 144A, 4.375%, 4/23/2025 | 210,000 | 237,300 | ||||||
American Electric Power Co., Inc.: | ||||||||
3.2%, 11/13/2027 | 50,000 | 55,997 | ||||||
4.3%, 12/1/2028 | 20,000 | 23,904 | ||||||
Dominion Energy, Inc., | 110,000 | 125,301 | ||||||
Duke Energy Corp.: | ||||||||
3.4%, 6/15/2029 | 30,000 | 34,058 | ||||||
4.2%, 6/15/2049 | 30,000 | 37,991 | ||||||
Duke Energy Indiana LLC, | 50,000 | 51,991 | ||||||
Edison International, | 200,000 | 239,336 | ||||||
EDP Finance BV, 144A, | 200,000 | 218,274 | ||||||
ENN Energy Holdings, Ltd., 144A, 2.625%, 9/17/2030 | 200,000 | 201,112 | ||||||
NextEra Energy Capital Holdings, Inc.: |
| |||||||
3.25%, 4/1/2026 | 36,000 | 40,313 | ||||||
3.5%, 4/1/2029 | 58,000 | 66,406 | ||||||
NextEra Energy Operating Partners LP: | ||||||||
144A, 3.875%, 10/15/2026 | 175,000 | 186,813 | ||||||
144A, 4.25%, 7/15/2024 | 250,000 | 267,500 | ||||||
Oncor Electric Delivery Co. LLC, 2.75%, 5/15/2030 | 25,000 | 27,991 | ||||||
Pacific Gas and Electric Co.: | ||||||||
2.5%, 2/1/2031 | 20,000 | 20,073 | ||||||
3.3%, 8/1/2040 | 60,000 | 59,884 | ||||||
3.5%, 8/1/2050 | 25,000 | 24,848 | ||||||
Perusahaan Listrik Negara PT, 144A, 2.875%, 10/25/2025 | EUR 222,000 | 292,406 | ||||||
Sempra Energy, 4.0%, 2/1/2048 | 55,000 | 65,534 | ||||||
Southern California Edison Co., 4.875%, 3/1/2049 | 50,000 | 65,983 | ||||||
Southern Power Co., Series F, 4.95%, 12/15/2046 | 87,000 | 104,559 | ||||||
|
| |||||||
| 2,447,574 | ||||||||
Total Corporate Bonds (Cost $29,030,854) |
| 31,260,227 | ||||||
| Mortgage-Backed Securities Pass-Throughs 11.9% |
| |||||||
Federal Home Loan Mortgage Corp.: |
| |||||||
4.0%, 8/1/2039 | 209,116 | 231,358 | ||||||
5.5%, 10/1/2023 | 4,793 | 4,989 | ||||||
Federal National Mortgage Association: | ||||||||
2.0%, 1/1/2051(d) | 1,000,000 | 1,038,620 | ||||||
12-month USD-LIBOR + 1.750%, 2.5%*, 9/1/2038 | 25,109 | 25,743 | ||||||
2.5%, with various maturities from 3/1/2050 until 10/1/2050 | 222,791 | 237,950 | ||||||
The accompanying notes are an integral part of the financial statements.
Deutsche DWS Variable Series I — DWS Bond VIP | | | 9 |
| Principal Amount ($) (a) | Value ($) | |||||||
3.5%, with various maturities from 12/1/2045 until 10/1/2048 | 1,922,541 | 2,084,012 | ||||||
4.0%, 4/1/2047 | 1,278,006 | 1,408,592 | ||||||
Government National Mortgage Association, | 1,000,000 | 1,045,230 | ||||||
Total Mortgage-Backed Securities Pass-Throughs (Cost $5,849,194) |
| 6,076,494 | ||||||
| Asset-Backed 6.3% |
| |||||||
| Automobile Receivables 2.1% |
| |||||||
AmeriCredit Automobile Receivables Trust, “C”, Series 2019-2, | 660,000 | 687,424 | ||||||
GMF Floorplan Owner Revolving Trust, “C”, Series 2019-1, 144A, 3.06%, 4/15/2024 | 230,000 | 235,897 | ||||||
Hertz Vehicle Financing II LP, “A”, Series 2017-1A, 144A, | 171,045 | 171,222 | ||||||
|
| |||||||
| 1,094,543 | ||||||||
| Credit Card Receivables 3.3% |
| |||||||
Fair Square Issuance Trust, “A”, Series 2020-AA, 144A, | 300,000 | 303,348 | ||||||
Master Credit Card Trust II, “A”, Series 2020-1A, 144A, | 350,000 | 362,972 | ||||||
World Financial Network Credit Card Master Trust, “M”, Series 2016-A, | 1,000,000 | 1,007,274 | ||||||
|
| |||||||
| 1,673,594 | ||||||||
| Miscellaneous 0.9% | ||||||||
CF Hippolyta LLC, “B1”, Series 2020-1, 144A, | 185,573 | 188,444 | ||||||
MVW Owner Trust, “A”, Series 2019-1A, 144A, | 273,004 | 283,290 | ||||||
|
| |||||||
| 471,734 | ||||||||
Total Asset-Backed (Cost $3,168,122) |
| 3,239,871 | ||||||
| Commercial Mortgage-Backed Securities 5.2% |
| |||||||
CFK Trust, “A”, Series 2020-MF2, 144A, 2.387%, 3/15/2039 | 250,000 | 260,493 | ||||||
Citigroup Commercial Mortgage Trust: | ||||||||
“A”, Series 2020-555, 144A, 2.647%, 12/10/2041 | 500,000 | 526,123 | ||||||
“D”, Series 2019-PRM, 144A, 4.35%, 5/10/2036 | 600,000 | 624,142 | ||||||
FHLMC Multifamily Structured Pass-Through Certificates: | ||||||||
“X1”, Series K043, Interest Only, 0.528%*, 12/25/2024 | 4,797,953 | 89,866 | ||||||
“X1”, Series K054, Interest Only, 1.169%*, 1/25/2026 | 1,797,173 | 93,208 | ||||||
| Principal Amount ($) (a) | Value ($) | |||||||
GS Mortgage Securities Corp. II, “B”, Series 2018-GS10, | 500,000 | 585,104 | ||||||
Morgan Stanley Capital Barclays Bank Trust, “C”, Series 2016-MART, 144A, | 500,000 | 494,690 | ||||||
Total Commercial Mortgage-Backed Securities (Cost $2,560,930) |
| 2,673,626 | ||||||
| Collateralized Mortgage Obligations 8.5% |
| |||||||
Connecticut Avenue Securities Trust, “1M2”, Series 2019-R05, 144A, 1-month USD-LIBOR + 2.000%, 2.148%*, 7/25/2039 | 240,578 | 240,364 | ||||||
Fannie Mae Connecticut Avenue Securities, “1M2”, Series 2018-C03, 1-month USD-LIBOR + 2.150%, | 369,726 | 369,022 | ||||||
Federal Home Loan Mortgage Corp., “PS”, Series 4922, Interest Only, 6.050% minus 1-month USD-LIBOR, | 839,517 | 150,189 | ||||||
Federal National Mortgage Association, “JL”, Series 2019-81, | 1,164,214 | 1,218,458 | ||||||
Freddie Mac Structured Agency Credit Risk Debt Notes: | ||||||||
“M2”, Series 2020-DNA2, 144A, 1-month USD-LIBOR + 1.850%, | 600,000 | 596,318 | ||||||
“M2”, Series 2019-DNA4, 144A, 1-month USD-LIBOR + 1.950%, | 167,958 | 167,692 | ||||||
Government National Mortgage Association: | ||||||||
“PI”, Series 2015-40, Interest Only, 4.0%, 4/20/2044 | 119,923 | 5,985 | ||||||
“IN”, Series 2009-69, Interest Only, 5.5%, 8/20/2039 | 36,416 | 5,956 | ||||||
“IV”, Series 2009-69, Interest Only, 5.5%, 8/20/2039 | 68,675 | 11,081 | ||||||
“IJ”, Series 2009-75, Interest Only, 6.0%, 8/16/2039 | 26,782 | 4,469 | ||||||
JPMorgan Mortgage Trust: | ||||||||
“A11”, Series 2020-2, 144A, 1-month USD-LIBOR + 0.800%, 0.95%*, 7/25/2050 | 625,941 | 626,411 | ||||||
“A11”, Series 2019-9, 144A, 1-month USD-LIBOR + 0.900%, 1.05%*, 5/25/2050 | 192,812 | 193,041 | ||||||
“A3”, Series 2019-INV3, 144A, 3.5%, 5/25/2050 | 303,744 | 315,588 | ||||||
“A3”, Series 2020-INV1, 144A, 3.5%, 8/25/2050 | 181,244 | 188,204 | ||||||
New Residential Mortgage Loan Trust, “A1”, Series 2019-NQM2, 144A, | 118,971 | 119,881 | ||||||
The accompanying notes are an integral part of the financial statements.
| 10 | | | Deutsche DWS Variable Series I — DWS Bond VIP |
| Principal Amount ($) (a) | Value ($) | |||||||
STACR Trust, “M2”, Series 2018-DNA3, 144A, 1-month USD-LIBOR + 2.100%, | 108,108 | 106,879 | ||||||
Total Collateralized Mortgage Obligations (Cost $4,261,574) |
| 4,319,538 | ||||||
| Government & Agency Obligations 5.7% |
| |||||||
| Other Government Related (e) 0.6% |
| |||||||
Novatek OAO, 144A, | 300,000 | 301,177 | ||||||
| Sovereign Bonds 2.0% |
| |||||||
Abu Dhabi Government International Bond, 144A, 3.125%, 4/16/2030 | 200,000 | 225,840 | ||||||
Brazilian Government International Bond, 3.875%, 6/12/2030 | 200,000 | 211,000 | ||||||
Perusahaan Penerbit SBSN Indonesia III, 144A, | 200,000 | 212,126 | ||||||
Republic of Kazakhstan, 144A, 1.55%, 11/9/2023 | EUR 290,000 | 366,368 | ||||||
|
| |||||||
| 1,015,334 | ||||||||
| U.S. Treasury Obligations 3.1% |
| |||||||
U.S. Treasury Bond, | 1,007,000 | 913,538 | ||||||
U.S. Treasury Notes: | ||||||||
0.625%, 8/15/2030 | 154,000 | 150,150 | ||||||
0.875%, 11/15/2030 | 550,000 | 548,195 | ||||||
|
| |||||||
| 1,611,883 | ||||||||
Total Government & Agency Obligations (Cost $2,920,371) |
| 2,928,394 | ||||||
| Principal Amount ($) (a) | Value ($) | |||||||
| Short-Term U.S. Treasury Obligations 2.1% |
| |||||||
U.S. Treasury Bills: | ||||||||
0.101%**, 8/12/2021 | 200,000 | 199,894 | ||||||
0.125%**, 8/12/2021 (f) | 850,000 | 849,551 | ||||||
Total Short-Term U.S. Treasury Obligations (Cost $1,049,220) |
| 1,049,445 | ||||||
| Shares | Value ($) | |||||||
| Securities Lending Collateral 0.1% |
| |||||||
DWS Government & Agency Securities Portfolio “DWS Government Cash Institutional Shares”, 0.03% (g) (h) (Cost $64,200) | 64,200 | 64,200 | ||||||
| Cash Equivalents 3.1% |
| |||||||
DWS Central Cash Management Government Fund, 0.08% (g) (Cost $1,591,076) | 1,591,076 | 1,591,076 | ||||||
| % of Net Assets | Value ($) | |||||||
Total Investment Portfolio (Cost $50,495,541) | 103.9 | 53,202,871 | ||||||
| Other Assets and Liabilities, Net | (3.9 | ) | (1,979,168 | ) | ||||
| Net Assets | 100.0 | 51,223,703 | ||||||
A summary of the Fund’s transactions with affiliated investments during the year ended December 31, 2020 are as follows:
| Value ($) at 12/31/2019 | Purchases Cost ($) | Sales Proceeds ($) | Net Realized Gain/ (Loss) ($) | Net Change in Unrealized Appreciation (Depreciation) ($) | Income ($) | Capital Gain Distributions ($) | Number of Shares at 12/31/2020 | Value ($) at 12/31/2020 | ||||||||||||||||||||||||
Securities Lending Collateral 0.1% |
| |||||||||||||||||||||||||||||||
DWS Government & Agency Securities Portfolio “DWS Government Cash Institutional Shares”, 0.03% (g) (h) |
| |||||||||||||||||||||||||||||||
| 3,030,000 | — | 2,965,800 | (i) | — | — | 2,909 | — | 64,200 | 64,200 | |||||||||||||||||||||||
Cash Equivalents 3.1% |
| |||||||||||||||||||||||||||||||
DWS Central Cash Management Government Fund, 0.08% (g) |
| |||||||||||||||||||||||||||||||
| 163,542 | 38,226,747 | 36,799,213 | — | — | 7,254 | — | 1,591,076 | 1,591,076 | ||||||||||||||||||||||||
| 3,193,542 | 38,226,747 | 39,765,013 | — | — | 10,163 | — | 1,655,276 | 1,655,276 | ||||||||||||||||||||||||
| * | Variable or floating rate security. These securities are shown at their current rate as of December 31, 2020. For securities based on a published reference rate and spread, the reference rate and spread are indicated within the description above. Certain variable rate securities are not based on a published reference rate and spread but adjust periodically based on current market conditions, prepayment of underlying positions and/or other variables. |
| ** | Annualized yield at time of purchase; not a coupon rate. |
| (a) | Principal amount stated in U.S. dollars unless otherwise noted. |
| (b) | Perpetual, callable security with no stated maturity date. |
| (c) | All or a portion of these securities were on loan. In addition, “Other Assets and Liabilities, Net” may include pending sales that are also on loan. The value of securities loaned at December 31, 2020 amounted to $61,350, which is 0.1% of net assets. |
| (d) | When-issued, delayed delivery or forward commitment securities included. |
| (e) | Government-backed debt issued by financial companies or government sponsored enterprises. |
| (f) | At December 31, 2020, this security has been pledged, in whole or in part, to cover initial margin requirements for open futures contracts. |
The accompanying notes are an integral part of the financial statements.
Deutsche DWS Variable Series I — DWS Bond VIP | | | 11 |
| (g) | Affiliated fund managed by DWS Investment Management Americas, Inc. The rate shown is the annualized seven-day yield at period end. |
| (h) | Represents cash collateral held in connection with securities lending. Income earned by the Fund is net of borrower rebates. |
| (i) | Represents the net increase (purchase cost) or decrease (sales proceeds) in the amount invested in cash collateral for the year ended December 31, 2020. |
144A: Security exempt from registration under Rule 144A of the Securities Act of 1933. These securities may be resold in transactions exempt from registration, normally to qualified institutional buyers.
Interest Only: Interest Only (IO) bonds represent the “interest only” portion of payments on a pool of underlying mortgages or mortgage-backed securities. IO securities are subject to prepayment risk of the pool of underlying mortgages.
LIBOR: London Interbank Offered Rate
OAO: Otkrytoe Aktsionernoe Obschestvo (Russian: Open Joint Stock Corporation)
PJSC: Public Joint Stock Company
REG S: Securities sold under Regulation S may not be offered, sold or delivered within the United States or to, or for the account or benefit of, U.S. persons, except pursuant to an exemption from, or in a transaction not subject to, the registration requirements of the Securities Act of 1933.
REIT: Real Estate Investment Trust
SBSN: Surat Berharga Syariah Negara (Islamic Based Government Securities)
Included in the portfolio are investments in mortgage or asset-backed securities which are interests in separate pools of mortgages or assets. Effective maturities of these investments may be shorter than stated maturities due to prepayments. Some separate investments in the Federal Home Loan Mortgage Corp. and Federal National Mortgage Association issues which have similar coupon rates have been aggregated for presentation purposes in this investment portfolio.
At December 31, 2020 open futures contracts purchased were as follows:
| Futures | Currency | Expiration Date | Contracts | Notional Amount ($) | Notional Value ($) | Unrealized Appreciation ($) | ||||||||||||||||||
| 2 Year U.S. Treasury Note | USD | 3/31/2021 | 8 | 1,765,993 | 1,767,813 | 1,820 | ||||||||||||||||||
At December 31, 2020, open futures contracts sold were as follows:
| Futures | Currency | Expiration Date | Contracts | Notional Amount ($) | Notional Value ($) | Unrealized Appreciation (Depreciation) ($) | ||||||||||||||||||
| U.S. Treasury Long Bond | USD | 3/22/2021 | 1 | 174,193 | 173,188 | 1,005 | ||||||||||||||||||
| Ultra 10 Year U.S. Treasury Note | USD | 3/22/2021 | 2 | 312,558 | 312,719 | (161 | ) | |||||||||||||||||
| Total net unrealized appreciation |
| 844 | ||||||||||||||||||||||
At December 31, 2020, the Fund had the following open forward foreign currency contracts:
| Contracts to Deliver | In Exchange For | Settlement Date | Unrealized Depreciation ($) | Counterparty | ||||||||||||||||||
| EUR | 750,000 | USD | 880,811 | 2/5/2021 | (36,203 | ) | Bank of America | |||||||||||||||
Currency Abbreviations
| EUR | Euro |
| USD | United States Dollar |
The accompanying notes are an integral part of the financial statements.
| 12 | | | Deutsche DWS Variable Series I — DWS Bond VIP |
Fair Value Measurements
Various inputs are used in determining the value of the Fund’s investments. These inputs are summarized in three broad levels. Level 1 includes quoted prices in active markets for identical securities. Level 2 includes other significant observable inputs (including quoted prices for similar securities, interest rates, prepayment speeds and credit risk). Level 3 includes significant unobservable inputs (including the Fund’s own assumptions in determining the fair value of investments). The level assigned to the securities valuations may not be an indication of the risk or liquidity associated with investing in those securities.
The following is a summary of the inputs used as of December 31, 2020 in valuing the Fund’s investments. For information on the Fund’s policy regarding the valuation of investments, please refer to the Security Valuation section of Note A in the accompanying Notes to Financial Statements.
| Assets | Level 1 | Level 2 | Level 3 | Total | ||||||||||||
| Fixed Income Investments (j) | ||||||||||||||||
Corporate Bonds | $ | — | $ | 31,260,227 | $ | — | $ | 31,260,227 | ||||||||
Mortgage-Backed Securities Pass-Throughs | — | 6,076,494 | — | 6,076,494 | ||||||||||||
Asset-Backed | — | 3,239,871 | — | 3,239,871 | ||||||||||||
Commercial Mortgage-Backed Securities | — | 2,673,626 | — | 2,673,626 | ||||||||||||
Collateralized Mortgage Obligations | — | 4,319,538 | — | 4,319,538 | ||||||||||||
Government & Agency Obligations | — | 2,928,394 | — | 2,928,394 | ||||||||||||
Short-Term U.S. Treasury Obligations | — | 1,049,445 | — | 1,049,445 | ||||||||||||
| Short-Term Investments (j) | 1,655,276 | — | — | 1,655,276 | ||||||||||||
Derivatives (k) | ||||||||||||||||
Futures Contracts | $ | 2,825 | $ | — | $ | — | $ | 2,825 | ||||||||
| Total | $ | 1,658,101 | $ | 51,547,595 | $ | — | $ | 53,205,696 | ||||||||
| Liabilities | Level 1 | Level 2 | Level 3 | Total | ||||||||||||
| Derivatives (k) | ||||||||||||||||
Futures Contracts | $ | (161 | ) | $ | — | $ | — | $ | (161 | ) | ||||||
Forward Foreign Currency Contracts | — | (36,203 | ) | — | (36,203 | ) | ||||||||||
| Total | $ | (161 | ) | $ | (36,203 | ) | $ | — | $ | (36,364 | ) | |||||
| (j) | See Investment Portfolio for additional detailed categorizations. |
| (k) | Derivatives include unrealized appreciation (depreciation) on open futures contracts and forward foreign currency contracts. |
The accompanying notes are an integral part of the financial statements.
Deutsche DWS Variable Series I — DWS Bond VIP | | | 13 |
Statement of Assets and Liabilities
| as of December 31, 2020 | ||||
| Assets | ||||
| Investments in non-affiliated securities, at value (cost $48,840,265) — including $61,350 of securities loaned | $ | 51,547,595 | ||
| Investment in DWS Government & Agency Securities Portfolio (cost $64,200)* | 64,200 | |||
| Investment in DWS Central Cash Management Government Fund (cost $1,591,076) | 1,591,076 | |||
| Cash | 10,000 | |||
| Receivable for Fund shares sold | 23,464 | |||
| Interest receivable | 284,324 | |||
| Foreign taxes recoverable | 974 | |||
| Other assets | 1,088 | |||
| Total assets | 53,522,721 | |||
| Liabilities | ||||
| Payable for securities loaned | 64,200 | |||
| Payable for investments purchased — when-issued securities | 2,095,584 | |||
| Payable for Fund shares redeemed | 4,293 | |||
| Payable for variation margin on futures contracts | 589 | |||
| Unrealized depreciation on forward foreign currency contracts | 36,203 | |||
| Accrued management fee | 16,598 | |||
| Accrued Trustees’ fees | 977 | |||
| Other accrued expenses and payables | 80,574 | |||
| Total liabilities | 2,299,018 | |||
| Net assets, at value | $ | 51,223,703 | ||
| Net Assets Consist of | ||||
| Distributable earnings (loss) | 3,625,695 | |||
| Paid-in capital | 47,598,008 | |||
| Net assets, at value | $ | 51,223,703 | ||
Net Asset Value | ||||
| Net asset value, offering and redemption price per share ($51,223,703 ÷ 8,501,854 outstanding shares of beneficial interest, $.01 par value, unlimited number of shares authorized) | $ | 6.03 | ||
| * | Represents collateral on securities loaned. |
| for the year ended December 31, 2020 |
| |||
| Investment Income | ||||
| Income: | ||||
| Interest (net of foreign taxes withheld of $224) | $ | 1,451,493 | ||
| Income distributions — DWS Central Cash Management Government Fund | 7,254 | |||
| Securities lending income, net of borrower rebates | 2,909 | |||
| Total income | 1,461,656 | |||
| Expenses: | ||||
| Management fee | 198,910 | |||
| Administration fee | 49,718 | |||
| Services to shareholders | 3,285 | |||
| Custodian fee | 7,231 | |||
| Professional fees | 68,220 | |||
| Reports to shareholders | 41,480 | |||
| Trustees’ fees and expenses | 3,364 | |||
| Other | 4,344 | |||
| Total expenses before expense reductions | 376,552 | |||
| Expense reductions | (43,827 | ) | ||
| Total expenses after expense reductions | 332,725 | |||
| Net investment income | 1,128,931 | |||
| Realized and Unrealized Gain (Loss) | ||||
Net realized gain (loss) from: Investments | 1,014,960 | |||
| Swap contracts | 864,811 | |||
| Futures | 115,238 | |||
| Forward foreign currency contracts | (51,688 | ) | ||
| Foreign currency | 9,212 | |||
| 1,952,533 | ||||
| Change in net unrealized appreciation (depreciation) on: | ||||
| Investments | 1,456,492 | |||
| Swap contracts | (6,388 | ) | ||
| Futures | (51,606 | ) | ||
| Forward foreign currency contracts | (28,346 | ) | ||
| Foreign currency | 35 | |||
| 1,370,187 | ||||
| Net gain (loss) | 3,322,720 | |||
| Net increase (decrease) in net assets resulting from operations | $ | 4,451,651 | ||
The accompanying notes are an integral part of the financial statements.
| 14 | | | Deutsche DWS Variable Series I — DWS Bond VIP |
Statements of Changes in Net Assets
| Years Ended December 31, | ||||||||
| Increase (Decrease) in Net Assets | 2020 | 2019 | ||||||
| Operations: |
| |||||||
| Net investment income | $ | 1,128,931 | $ | 1,427,830 | ||||
| Net realized gain (loss) | 1,952,533 | 951,699 | ||||||
| Change in net unrealized appreciation (depreciation) | 1,370,187 | 2,416,257 | ||||||
| Net increase (decrease) in net assets resulting from operations | 4,451,651 | 4,795,786 | ||||||
| Distributions to shareholders: | ||||||||
Class A | (1,393,009 | ) | (1,466,158 | ) | ||||
| Fund share transactions: | ||||||||
Class A | ||||||||
| Proceeds from shares sold | 9,080,131 | 5,436,154 | ||||||
| Reinvestment of distributions | 1,393,009 | 1,466,158 | ||||||
| Payments for shares redeemed | (11,255,564 | ) | (7,080,322 | ) | ||||
| Net increase (decrease) in net assets from Class A share transactions | (782,424 | ) | (178,010 | ) | ||||
| Increase (decrease) in net assets | 2,276,218 | 3,151,618 | ||||||
| Net assets at beginning of period | 48,947,485 | 45,795,867 | ||||||
| Net assets at end of period | $ | 51,223,703 | $ | 48,947,485 | ||||
| Other Information: | ||||||||
Class A | ||||||||
| Shares outstanding at beginning of period | 8,618,016 | 8,635,826 | ||||||
| Shares sold | 1,564,061 | 984,384 | ||||||
| Shares issued to shareholders in reinvestment of distributions | 248,752 | 271,511 | ||||||
| Shares redeemed | (1,928,975 | ) | (1,273,705 | ) | ||||
| Net increase (decrease) in Class A shares | (116,162 | ) | (17,810 | ) | ||||
| Shares outstanding at end of period | 8,501,854 | 8,618,016 | ||||||
The accompanying notes are an integral part of the financial statements.
Deutsche DWS Variable Series I — DWS Bond VIP | | | 15 |
| DWS Bond VIP — Class A | ||||||||||||||||||||
Years Ended December 31, | ||||||||||||||||||||
| 2020 | 2019 | 2018 | 2017 | 2016 | ||||||||||||||||
| Selected Per Share Data | ||||||||||||||||||||
| Net asset value, beginning of period | $5.68 | $5.30 | $5.70 | $ | 5.52 | $ | 5.49 | |||||||||||||
| Income (loss) from investment operations: | ||||||||||||||||||||
Net investment incomea | .13 | .16 | .17 | .17 | .15 | |||||||||||||||
Net realized and unrealized gain (loss) | .38 | .39 | (.32 | ) | .15 | .17 | ||||||||||||||
Total from investment operations | .51 | .55 | (.15 | ) | .32 | .32 | ||||||||||||||
| Less distributions from: | ||||||||||||||||||||
Net investment income | (.16 | ) | (.17 | ) | (.25 | ) | (.14 | ) | (.29 | ) | ||||||||||
| Net asset value, end of period | $6.03 | $5.68 | $5.30 | $ | 5.70 | $ | 5.52 | |||||||||||||
| Total Return (%)b | 9.07 | 10.62 | (2.65 | ) | 5.83 | 5.93 | ||||||||||||||
| Ratios to Average Net Assets and Supplemental Data | ||||||||||||||||||||
| Net assets, end of period ($ millions) | 51 | 49 | 46 | 51 | 77 | |||||||||||||||
| Ratio of expenses before expense reductions (%)c | .74 | .81 | .87 | .74 | .78 | |||||||||||||||
| Ratio of expenses after expense reductions (%)c | .65 | .66 | .69 | .65 | .64 | |||||||||||||||
| Ratio of net investment income (%) | 2.21 | 2.95 | 3.19 | 2.99 | 2.68 | |||||||||||||||
| Portfolio turnover rate (%) | 160 | 223 | 260 | 205 | 236 | |||||||||||||||
| a | Based on average shares outstanding during the period. |
| b | Total return would have been lower had certain expenses not been reduced. |
| c | Expense ratio does not reflect charges and fees associated with the separate account that invests in the Fund or any variable life insurance policy or variable annuity contract for which the Fund is an investment option. |
The accompanying notes are an integral part of the financial statements.
| 16 | | | Deutsche DWS Variable Series I — DWS Bond VIP |
| Notes to Financial Statements |
A. Organization and Significant Accounting Policies
Deutsche DWS Variable Series I (the “Trust“) is registered under the Investment Company Act of 1940, as amended (the “1940 Act“), as an open-end, registered management investment company organized as a Massachusetts business trust. The Trust consists of five diversified funds: DWS Bond VIP, DWS Capital Growth VIP, DWS Core Equity VIP, DWS CROCI® International VIP and DWS Global Small Cap VIP (individually or collectively hereinafter referred to as a “Fund“ or the “Funds“). These financial statements report on DWS Bond VIP. The Trust is intended to be the underlying investment vehicle for variable annuity contracts and variable life insurance policies to be offered by the separate accounts of certain life insurance companies (“Participating Insurance Companies“).
The Fund’s financial statements are prepared in accordance with accounting principles generally accepted in the United States of America (“U.S. GAAP”) which require the use of management estimates. Actual results could differ from those estimates. The Fund qualifies as an investment company under Topic 946 of Accounting Standards Codification of U.S. GAAP. The policies described below are followed consistently by the Fund in the preparation of its financial statements.
Security Valuation. Investments are stated at value determined as of the close of regular trading on the New York Stock Exchange on each day the exchange is open for trading.
Various inputs are used in determining the value of the Fund’s investments. These inputs are summarized in three broad levels. Level 1 includes quoted prices in active markets for identical securities. Level 2 includes other significant observable inputs (including quoted prices for similar securities, interest rates, prepayment speeds and credit risk). Level 3 includes significant unobservable inputs (including the Fund’s own assumptions in determining the fair value of investments). The level assigned to the securities valuations may not be an indication of the risk or liquidity associated with investing in those securities.
Debt securities are valued at prices supplied by independent pricing services approved by the Trustees of the Series. Such services may use various pricing techniques which take into account appropriate factors such as yield, quality, coupon rate, maturity, type of issue, trading characteristics, prepayment speeds and other data, as well as broker quotes. If the pricing services are unable to provide valuations, debt securities are valued at the average of the most recent reliable bid quotations or evaluated prices, as applicable, obtained from broker-dealers. These securities are generally categorized as Level 2.
Investments in open-end investment companies are valued at their net asset value each business day and are categorized as Level 1.
Futures contracts are generally valued at the settlement prices established each day on the exchange on which they are traded and are categorized as Level 1.
Swap contracts are valued daily based upon prices supplied by a Board approved pricing vendor, if available, and otherwise are valued at the price provided by the broker-dealer. Swap contracts are generally categorized as Level 2.
Forward currency contracts are valued at the prevailing forward exchange rate of the underlying currencies and are categorized as Level 2.
Securities and other assets for which market quotations are not readily available or for which the above valuation procedures are deemed not to reflect fair value are valued in a manner that is intended to reflect their fair value as determined in accordance with procedures approved by the Trustees and are generally categorized as Level 3. In accordance with the Fund’s valuation procedures, factors considered in determining value may include, but are not limited to, the type of the security; the size of the holding; the initial cost of the security; the existence of any contractual restrictions on the security’s disposition; the price and extent of public trading in similar securities of the issuer or of comparable companies; quotations or evaluated prices from broker-dealers and/or pricing services; information obtained from the issuer, analysts, and/or the appropriate stock exchange (for exchange-traded securities); an analysis of the company’s or issuer’s financial statements; an evaluation of the forces that influence the issuer and the market(s) in which the security is purchased and sold; and with respect to debt securities, the maturity, coupon, creditworthiness, currency denomination and the movement of the market in which the security is normally traded. The value determined under these procedures may differ from published values for the same securities.
Deutsche DWS Variable Series I — DWS Bond VIP | | | 17 |
Disclosure about the classification of fair value measurements is included in a table following the Fund’s Investment Portfolio.
Securities Lending. Deutsche Bank AG, as lending agent, lends securities of the Fund to certain financial institutions under the terms of its securities lending agreement. During the term of the loans, the Fund continues to receive interest and dividends generated by the securities and to participate in any changes in their market value. The Fund requires the borrowers of the securities to maintain collateral with the Fund consisting of either cash or liquid, unencumbered assets having a value at least equal to the value of the securities loaned. When the collateral falls below specified amounts, the lending agent will use its best effort to obtain additional collateral on the next business day to meet required amounts under the securities lending agreement. As of period end, any securities on loan were collateralized by cash. During the year ended December 31, 2020, the Fund invested the cash collateral into a joint trading account in DWS Government & Agency Securities Portfolio, an affiliated money market fund managed by DWS Investment Management Americas, Inc. DWS Investment Management Americas, Inc. receives a management/administration fee (0.06% annualized effective rate as of December 31, 2020) on the cash collateral invested in DWS Government & Agency Securities Portfolio. The Fund receives compensation for lending its securities either in the form of fees or by earning interest on invested cash collateral net of borrower rebates and fees paid to a lending agent. Either the Fund or the borrower may terminate the loan at any time and the borrower, after notice, is required to return borrowed securities within a standard time period. There may be risks of delay and costs in recovery of securities or even loss of rights in the collateral should the borrower of the securities fail financially. If the Fund is not able to recover securities lent, the Fund may sell the collateral and purchase a replacement investment in the market, incurring the risk that the value of the replacement security is greater than the value of the collateral. The Fund is also subject to all investment risks associated with the reinvestment of any cash collateral received, including, but not limited to, interest rate, credit and liquidity risk associated with such investments.
As of December 31, 2020, the Fund had securities on loan, which were classified as corporate bonds in the Investment Portfolio. The value of the related collateral exceeded the value of the securities loaned at period end. As of period end, the remaining contractual maturity of the collateral agreements was overnight and continuous.
Foreign Currency Translations. The books and records of the Fund are maintained in U.S. dollars. Investment securities and other assets and liabilities denominated in a foreign currency are translated into U.S. dollars at the prevailing exchange rates at period end. Purchases and sales of investment securities, income and expenses are translated into U.S. dollars at the prevailing exchange rates on the respective dates of the transactions.
Net realized and unrealized gains and losses on foreign currency transactions represent net gains and losses between trade and settlement dates on securities transactions, the acquisition and disposition of foreign currencies, and the difference between the amount of net investment income accrued and the U.S. dollar amount actually received. The portion of both realized and unrealized gains and losses on investments that results from fluctuations in foreign currency exchange rates is not separately disclosed but is included with net realized and unrealized gain/appreciation and loss/depreciation on investments.
When-Issued/Delayed Delivery Securities. The Fund may purchase or sell securities with delivery or payment to occur at a later date beyond the normal settlement period. At the time the Fund enters into a commitment to purchase or sell a security, the transaction is recorded and the value of the transaction is reflected in the net asset value. The price of such security and the date when the security will be delivered and paid for are fixed at the time the transaction is negotiated. The value of the security may vary with market fluctuations. At the time the Fund enters into a purchase transaction it is required to segregate cash or other liquid assets at least equal to the amount of the commitment. Additionally, the Fund may be required to post securities and/or cash collateral in accordance with the terms of the commitment.
Certain risks may arise upon entering into when-issued or delayed delivery transactions from the potential inability of counterparties to meet the terms of their contracts or if the issuer does not issue the securities due to political, economic, or other factors. Additionally, losses may arise due to changes in the value of the underlying securities.
Taxes. The Fund is treated as a separate taxpayer as provided for in the Internal Revenue Code, as amended. It is the Fund’s policy to comply with the requirements of the Internal Revenue Code, as amended, which are applicable to regulated investment companies, and to distribute all of its taxable income to the separate accounts of the Participating Insurance Companies which hold its shares.
Additionally, the Fund may be subject to taxes imposed by the governments of countries in which it invests and are generally based on income and/or capital gains earned or repatriated. Estimated tax liabilities on
| 18 | | | Deutsche DWS Variable Series I — DWS Bond VIP |
certain foreign securities are recorded on an accrual basis and are reflected as components of interest income or net change in unrealized gain/loss on investments. Tax liabilities realized as a result of security sales are reflected as a component of net realized gain/loss on investments.
At December 31, 2020, the Fund had $75,000 of long-term tax basis capital loss carryforwards, which may be applied against realized net taxable capital gains indefinitely.
The Fund has reviewed the tax positions for the open tax years as of December 31, 2020 and has determined that no provision for income tax and/or uncertain tax positions is required in the Fund’s financial statements. The Fund’s federal tax returns for the prior three fiscal years remain open subject to examination by the Internal Revenue Service.
Distribution of Income and Gains. Distributions from net investment income of the Fund, if any, are declared and distributed to shareholders annually. Net realized gains from investment transactions, in excess of available capital loss carryforwards, would be taxable to the Fund if not distributed, and, therefore, will be distributed to shareholders at least annually. The Fund may also make additional distributions for tax purposes if necessary.
The timing and characterization of certain income and capital gain distributions are determined annually in accordance with federal tax regulations, which may differ from accounting principles generally accepted in the United States of America. These differences primarily relate to investments in foreign denominated currencies, investments in forward foreign currency exchange contracts, futures contracts, swap contracts and certain securities sold at a loss. As a result, net investment income (loss) and net realized gain (loss) on investment transactions for a reporting period may differ significantly from distributions during such period. Accordingly, the Fund may periodically make reclassifications among certain of its capital accounts without impacting the net asset value of the Fund.
At December 31, 2020, the Fund’s components of distributable earnings (accumulated losses) on a tax basis are as follows:
| Undistributed ordinary income* | $ | 998,561 | ||
| Capital loss carryforwards | $ | (75,000 | ) | |
| Net unrealized appreciation (depreciation) on investments | $ | 2,702,051 |
At December 31, 2020, the aggregate cost of investments for federal income tax purposes was $50,500,820. The net unrealized appreciation for all investments based on tax cost was $2,702,051. This consisted of aggregate gross unrealized appreciation for all investments for which there was an excess of value over tax cost of $2,814,538 and aggregate gross unrealized depreciation for all investments for which there was an excess of tax cost over value of $112,487.
In addition, the tax character of distributions paid to shareholders by the Fund is summarized as follows:
| Years Ended December 31, | ||||||||
| 2020 | 2019 | |||||||
| Distributions from ordinary income* | $ | 1,393,009 | $ | 1,466,158 | ||||
| * | For tax purposes, short-term capital gain distributions are considered ordinary income distributions. |
Expenses. Expenses of the Trust arising in connection with a specific Fund are allocated to that Fund. Other Trust expenses which cannot be directly attributed to a Fund are apportioned among the Funds in the Trust based upon the relative net assets or other appropriate measures.
Contingencies. In the normal course of business, the Fund may enter into contracts with service providers that contain general indemnification clauses. The Fund’s maximum exposure under these arrangements is unknown, as this would involve future claims that may be made against the Fund that have not yet been made. However, based on experience, the Fund expects the risk of loss to be remote.
Other. Investment transactions are accounted for on a trade date plus one basis for daily net asset value calculations. However, for financial reporting purposes, investment transactions are reported on trade date. Interest income is recorded on the accrual basis net of foreign withholding taxes. Realized gains and losses from investment transactions are recorded on an identified cost basis. Proceeds from litigation payments, if any, are included in net realized gain (loss) from investments. All discounts and premiums are accreted/amortized for both tax and financial reporting purposes.
Deutsche DWS Variable Series I — DWS Bond VIP | | | 19 |
B. Derivative Instruments
Futures Contracts. A futures contract is an agreement between a buyer or seller and an established futures exchange or its clearinghouse in which the buyer or seller agrees to take or make a delivery of a specific amount of a financial instrument at a specified price on a specific date (settlement date). For the year ended December 31, 2020, the Fund invested in interest rate futures to gain exposure to different parts of the yield curve while managing the overall duration. The Fund also entered into interest rate futures contracts for non-hedging purposes to seek to enhance potential gains.
Upon entering into a futures contract, the Fund is required to deposit with a financial intermediary cash or securities (“initial margin”) in an amount equal to a certain percentage of the face value indicated in the futures contract. Subsequent payments (“variation margin”) are made or received by the Fund dependent upon the daily fluctuations in the value and are recorded for financial reporting purposes as unrealized gains or losses by the Fund. Gains or losses are realized when the contract expires or is closed. Since all futures contracts are exchange traded, counterparty risk is minimized as the exchange’s clearinghouse acts as the counterparty, and guarantees the futures against default.
Certain risks may arise upon entering into futures contracts, including the risk that an illiquid market will limit the Fund’s ability to close out a futures contract prior to the settlement date and the risk that the futures contract is not well correlated with the security, index or currency to which it relates. Risk of loss may exceed amounts disclosed in the Statement of Assets and Liabilities.
A summary of the open futures contracts as of December 31, 2020, is included in a table following the Fund’s Investment Portfolio. For the year ended December 31, 2020, the investment in futures contracts purchased had a total notional value generally indicative of a range from approximately $1,768,000 to $6,189,000, and the investment in futures contracts sold had a total notional value generally indicative of a range from approximately $436,000 to $1,998,000.
Swaps. A swap is a contract between two parties to exchange future cash flows at periodic intervals based on the notional amount of the swap. A bilateral swap is a transaction between the fund and a counterparty where cash flows are exchanged between the two parties. A centrally cleared swap is a transaction executed between the fund and a counterparty, then cleared by a clearing member through a central clearinghouse. The central clearinghouse serves as the counterparty, with whom the fund exchanges cash flows.
The value of a swap is adjusted daily, and the change in value, if any, is recorded as unrealized appreciation or depreciation in the Statement of Assets and Liabilities. Gains or losses are realized when the swap expires or is closed. Certain risks may arise when entering into swap transactions including counterparty default; liquidity; or unfavorable changes in interest rates or the value of the underlying reference security, commodity or index. In connection with bilateral swaps, securities and/or cash may be identified as collateral in accordance with the terms of the swap agreement to provide assets of value and recourse in the event of default. The maximum counterparty credit risk is the net present value of the cash flows to be received from or paid to the counterparty over the term of the swap, to the extent that this amount is beneficial to the Fund, in addition to any related collateral posted to the counterparty by the Fund. This risk may be partially reduced by a master netting arrangement between the Fund and the counterparty. Upon entering into a centrally cleared swap, the Fund is required to deposit with a financial intermediary cash or securities (“initial margin”) in an amount equal to a certain percentage of the notional amount of the swap. Subsequent payments (“variation margin”) are made or received by the Fund dependent upon the daily fluctuations in the value of the swap. In a cleared swap transaction, counterparty risk is minimized as the central clearinghouse acts as the counterparty.
An upfront payment, if any, made by the Fund is recorded as an asset in the Statement of Assets and Liabilities. An upfront payment, if any, received by the Fund is recorded as a liability in the Statement of Assets and Liabilities. Payments received or made at the end of the measurement period are recorded as realized gain or loss in the Statement of Operations.
Credit default swaps are agreements between a buyer and a seller of protection against predefined credit events for the reference entity. The Fund may enter into credit default swaps to gain exposure to an underlying issuer’s credit quality characteristics without directly investing in that issuer or to hedge against the risk of a credit event on debt securities. As a seller of a credit default swap, the Fund is required to pay the par (or other agreed-upon) value of the referenced entity to the counterparty with the occurrence of a credit event by a third party, such as a U.S. or foreign corporate issuer, on the reference entity, which would likely result in a loss to the Fund. In return, the Fund receives from the counterparty a periodic stream of payments over the term of the swap provided that no credit event has occurred. If no credit event occurs,
| 20 | | | Deutsche DWS Variable Series I — DWS Bond VIP |
the Fund keeps the stream of payments with no payment obligations. The Fund may also buy credit default swaps, in which case the Fund functions as the counterparty referenced above. This involves the risk that the swap may expire worthless. It also involves counterparty risk that the seller may fail to satisfy its payment obligations to the Fund with the occurrence of a credit event. When the Fund sells a credit default swap, it will cover its commitment. This may be achieved by, among other methods, maintaining cash or liquid assets equal to the aggregate notional value of the reference entities for all outstanding credit default swaps sold by the Fund. For the year ended December 31, 2020, the Fund entered into credit default swap agreements to gain exposure to the underlying issuer’s credit quality characteristics, or to hedge the risk of default or other specified credit events on portfolio assets.
Under the terms of a credit default swap, the Fund receives or makes periodic payments based on a specified interest rate on a fixed notional amount. These payments are recorded as a realized gain or loss in the Statement of Operations. Payments received or made as a result of a credit event or termination of the swap are recognized, net of a proportional amount of the upfront payment, as realized gains or losses in the Statement of Operations.
There were no open credit default swap contracts as of December 31, 2020. For the year ended December 31, 2020, the investment in credit default swap contracts purchased had a total notional amount generally indicative of a range from $0 to approximately $2,760,000.
Forward Foreign Currency Contracts. A forward foreign currency contract (“forward currency contract“) is a commitment to purchase or sell a foreign currency at the settlement date at a negotiated rate. The Fund is subject to foreign exchange rate risk in its securities denominated in foreign currencies. Changes in exchange rates between foreign currencies and the U.S. dollar may affect the U.S. dollar value of foreign securities or the income or gains received on these securities. To reduce the effect of currency fluctuations, the Fund may enter into forward currency contracts. For the year ended December 31, 2020, the Fund invested in forward currency contracts to hedge its exposure to changes in foreign currency exchange rates on its foreign currency denominated securities. In addition, the Fund also engaged in forward currency contracts for non-hedging purposes to seek to enhance potential gains.
Forward currency contracts are valued at the prevailing forward exchange rate of the underlying currencies and unrealized gain (loss) is recorded daily. On the settlement date of the forward currency contract, the Fund records a realized gain or loss equal to the difference between the value of the contract at the time it was opened and the value of the contract at the time it was closed. Certain risks may arise upon entering into forward currency contracts from the potential inability of counterparties to meet the terms of their contracts. The maximum counterparty credit risk to the Fund is measured by the unrealized gain on appreciated contracts. Additionally, when utilizing forward currency contracts to hedge, the Fund gives up the opportunity to profit from favorable exchange rate movements during the term of the contract.
A summary of the open forward currency contracts as of December 31, 2020, is included in a table following the Fund’s Investment Portfolio. For the year ended December 31, 2020, the investment in forward currency contracts U.S. dollars purchased had a total contract value generally indicative of a range from approximately $812,000 to $2,475,000 and the investment in forward currency contracts U.S. dollars sold had a total contract value generally indicative of a range from $0 to approximately $1,791,000.
The following tables summarize the value of the Fund’s derivative instruments held as of December 31, 2020 and the related location in the accompanying Statement of Assets and Liabilities, presented by primary underlying risk exposure:
| Asset Derivatives | Futures Contracts | |||
| Interest Rate Contracts (a) | $ | 2,825 | ||
The above derivative is located in the following Statement of Assets and Liabilities accounts:
| (a) | Includes cumulative appreciation of futures contracts as disclosed in the Investment Portfolio. Unsettled variation margin is disclosed separately within the Statement of Assets and Liabilities. |
Deutsche DWS Variable Series I — DWS Bond VIP | | | 21 |
| Liability Derivatives | Futures Contracts | Forward Contracts | Total | |||||||||
| Interest Rate Contracts (b) | $ | (161 | ) | $ | — | $ | (161 | ) | ||||
| Foreign Exchange Contracts (c) | — | (36,203 | ) | (36,203 | ) | |||||||
| $ | (161 | ) | $ | (36,203 | ) | $ | (36,364 | ) | ||||
Each of the above derivatives is located in the following Statement of Assets and Liabilities accounts:
| (b) | Includes cumulative depreciation of futures contracts as disclosed in the Investment Portfolio. Unsettled variation margin is disclosed separately within the Statement of Assets and Liabilities. |
| (c) | Unrealized depreciation on forward foreign currency contracts |
Additionally, the amount of unrealized and realized gains and losses on derivative instruments recognized in Fund earnings during the year ended December 31, 2020 and the related location in the accompanying Statement of Operations is summarized in the following tables by primary underlying risk exposure:
| Realized Gain (Loss) | Forward Contracts | Swap Contracts | Futures Contracts | Total | ||||||||||||
| Interest Rate Contract (d) | $ | — | $ | — | $ | 115,238 | $ | 115,238 | ||||||||
| Credit Contracts (d) | — | 864,811 | — | 864,811 | ||||||||||||
| Foreign Exchange Contracts (e) | (51,688 | ) | — | — | (51,688 | ) | ||||||||||
| $ | (51,688 | ) | $ | 864,811 | $ | 115,238 | $ | 928,361 | ||||||||
Each of the above derivatives is located in the following Statement of Operations accounts:
| (d) | Net realized gain (loss) from swap contracts and futures, respectively |
| (e) | Net realized gain (loss) from forward foreign currency contracts |
| Change in Net Unrealized Appreciation (Depreciation) | Forward Contracts | Swap Contracts | Futures Contracts | Total | ||||||||||||
| Interest Rate Contracts (f) | $ | — | $ | — | $ | (51,606 | ) | $ | (51,606 | ) | ||||||
| Credit Contracts (f) | — | (6,388 | ) | — | (6,388 | ) | ||||||||||
| Foreign Exchange Contracts (g) | (28,346 | ) | — | — | (28,346 | ) | ||||||||||
| $ | (28,346 | ) | $ | (6,388 | ) | $ | (51,606 | ) | $ | (86,340 | ) | |||||
Each of the above derivatives is located in the following Statement of Operations accounts:
| (f) | Change in net unrealized appreciation (depreciation) on swap contracts and futures, respectively |
| (g) | Change in net unrealized appreciation (depreciation) on forward foreign currency contracts |
As of December 31, 2020, the Fund has transactions subject to enforceable master netting agreements which govern the terms of certain transactions, and reduce the counterparty risk associated with such transactions. Master netting agreements allow a Fund to close out and net total exposure to a counterparty in the event of a deterioration in the credit quality or contractual default with respect to all of the transactions with a counterparty. As defined by the master netting agreement, the Fund may have collateral agreements with certain counterparties to mitigate risk. For financial reporting purposes the Statement of Assets and Liabilities generally shows derivatives assets and liabilities on a gross basis, which reflects the full risks and exposures prior to netting. A reconciliation of the gross amounts on the Statement of Assets and Liabilities to the net amounts by a counterparty, including any collateral exposure, is included in the following tables:
| Counterparty | Gross Amounts of Liabilities Presented in the Statement of Assets and Liabilities | Financial Instruments and Derivatives Available for Offset | Collateral Pledged | Net Amount of Derivative Liabilities | ||||||||||||
| Bank of America | $ | 36,203 | $ | — | $ | — | $ | 36,203 | ||||||||
C. Purchases and Sales of Securities
During the year ended December 31, 2020, purchases and sales of investment securities, excluding short-term investments, were as follows:
| Purchases | Sales | |||||||
| Non-U.S. Treasury Obligations | $ | 57,235,508 | $ | 54,437,754 | ||||
| U.S. Treasury Obligations | $ | 21,104,736 | $ | 25,614,824 | ||||
| 22 | | | Deutsche DWS Variable Series I — DWS Bond VIP |
D. Related Parties
Management Agreement. Under the Investment Management Agreement with DWS Investment Management Americas, Inc. (“DIMA“ or the “Advisor“), an indirect, wholly owned subsidiary of DWS Group GmbH & Co. KGaA (“DWS Group”), the Advisor directs the investments of the Fund in accordance with its investment objectives, policies and restrictions. The Advisor determines the securities, instruments and other contracts relating to investments to be purchased, sold or entered into by the Fund.
Under the Investment Management Agreement with the Advisor, the Fund pays a monthly management fee based on the Fund’s average daily net assets, computed and accrued daily and payable monthly, at the following annual rates:
| First $250 million of average daily net assets | .390 | % | ||
| Next $750 million of average daily net assets | .365 | % | ||
| Over $1 billion of average daily net assets | .340 | % |
Accordingly, for the year ended December 31, 2020, the fee pursuant to the Investment Management Agreement was equivalent to an annual rate (exclusive of any applicable waivers/reimbursements) of 0.39% of the Fund’s average daily net assets.
For the period from January 1, 2020 through September 30, 2020, the Advisor had contractually agreed to waive its fees and/or reimburse certain operating expenses to the extent necessary to maintain the total annual operating expenses (excluding certain expenses such as extraordinary expenses, taxes, brokerage and interest expense) of Class A at 0.66%.
Effective October 1, 2020 through September 30, 2021, the Advisor has contractually agreed to waive its fees and/or reimburse certain operating expenses to the extent necessary to maintain the total annual operating expenses (excluding certain expenses such as extraordinary expenses, taxes, brokerage and interest expense) of Class A at 0.63%.
For the December 31, 2020, fees waived and/or expenses reimbursed were $43,827.
Administration Fee. Pursuant to an Administrative Services Agreement, DIMA provides most administrative services to the Fund. Prior to March 1, 2020, for all services provided under the Administrative Services Agreement, the Fund paid the Advisor an annual fee (“Administration Fee“) of 0.10% of the Fund’s average daily net assets, computed and accrued daily and payable monthly. Effective March 1, 2020, for all services provided under the Administrative Services Agreement, the Fund pays the Advisor an annual Administration Fee of 0.097% of the Fund’s average daily net assets, computed and accrued daily and payable monthly. For the December 31, 2020, the Administration Fee was $49,718, of which $4,168 is unpaid.
Service Provider Fees. DWS Service Company (“DSC“), an affiliate of the Advisor, is the transfer agent, dividend-paying agent and shareholder service agent for the Fund. Pursuant to a sub-transfer agency agreement between DSC and DST Systems, Inc. (“DST“), DSC has delegated certain transfer agent, dividend-paying agent and shareholder service agent functions to DST. DSC compensates DST out of the shareholder servicing fee it receives from the Fund. For the year ended December 31, 2020, the amounts charged to the Fund by DSC aggregated $634, of which $117 is unpaid.
Other Service Fees. Under an agreement with the Fund, DIMA is compensated for providing certain pre-press and regulatory filing services to the Fund. For the year ended December 31, 2020, the amount charged to the Fund by DIMA included in the Statement of Operations under “Reports to shareholders“ aggregated $10,588, of which $4,129 is unpaid.
Trustees’ Fees and Expenses. The Fund paid retainer fees to each Trustee not affiliated with the Advisor, plus specified amounts to the Board Chairperson and to each committee Chairperson.
Affiliated Cash Management Vehicles. The Fund may invest uninvested cash balances in DWS Central Cash Management Government Fund and DWS ESG Liquidity Fund, affiliated money market funds which are managed by the Advisor. Each affiliated money market fund is managed in accordance with Rule 2a-7 under the 1940 Act, which governs the quality, maturity, diversity and liquidity of instruments in which a money market fund may invest. DWS Central Cash Management Government Fund seeks to maintain a stable net asset value, and DWS ESG Liquidity Fund maintains a floating net asset value. The Fund indirectly bears its proportionate share of the expenses of each affiliated money market fund in which it invests. DWS Central Cash Management Government Fund does not pay the Advisor an investment management fee. To the extent that DWS ESG Liquidity Fund pays an investment management fee to the Advisor, the Advisor will waive an amount of the investment management fee payable to the Advisor by the Fund equal to the
Deutsche DWS Variable Series I — DWS Bond VIP | | | 23 |
amount of the investment management fee payable on the Fund’s assets invested in DWS ESG Liquidity Fund.
Securities Lending Agent Fees. Deutsche Bank AG serves as securities lending agent for the Fund. For the year ended December 31, 2020, the Fund incurred lending agent fees to Deutsche Bank AG in the amount of $219.
E. Ownership of the Fund
At December 31, 2020, three participating insurance companies were owners of record of 10% or more of the total outstanding Class A shares of the Fund, each owning 46%, 26% and 15%, respectively.
F. Line of Credit
The Fund and other affiliated funds (the “Participants”) share in a $350 million revolving credit facility provided by a syndication of banks. The Fund may borrow for temporary or emergency purposes, including the meeting of redemption requests that otherwise might require the untimely disposition of securities. The Participants are charged an annual commitment fee, which is allocated based on net assets, among each of the Participants. Interest is calculated at a rate per annum equal to the sum of the Federal Funds Rate plus 1.25 percent plus if the one-month LIBOR exceeds the Federal Funds Rate, the amount of such excess. The Fund may borrow up to a maximum of 33 percent of its net assets under the agreement. The Fund had no outstanding loans at December 31, 2020.
G. Other — COVID-19 Pandemic
A novel coronavirus known as COVID-19, declared a pandemic by the World Health Organization, has caused significant uncertainty, market volatility, decreased economic and other activity and increased government activity. Specifically, COVID-19 has led to significant death and morbidity, and concerns about its further spread have resulted in the closing of schools and non-essential businesses, cancellations, shelter-in place orders, lower consumer spending in certain sectors, social distancing, bans on large social gatherings and travel, quarantines, government economic stimulus measures, reduced productivity, rapid increases in unemployment, increased demand for and strain on government and medical resources, border closings and global trade and supply chain interruptions, among others. The full effects, duration and costs of the COVID-19 pandemic are impossible to predict, and the circumstances surrounding the COVID-19 pandemic will continue to evolve. The pandemic may affect certain countries, industries, economic sectors, companies and investment products more than others, may exacerbate existing economic, political, or social tensions and may increase the probability of an economic recession or depression. The Fund and its investments may be adversely affected by the effects of the COVID-19 pandemic, and a prolonged pandemic may result in the Fund and its service providers experiencing operational difficulties in coordinating a remote workforce and implementing their business continuity plans, among others. Management will continue to monitor the impact COVID-19 has on the Fund and reflect the consequences as appropriate in the Fund’s accounting and financial reporting.
| 24 | | | Deutsche DWS Variable Series I — DWS Bond VIP |
Report of Independent Registered Public Accounting Firm
To the Board of Trustees of Deutsche DWS Variable Series I and Shareholders of DWS Bond VIP:
Opinion on the Financial Statements
We have audited the accompanying statement of assets and liabilities of DWS Bond VIP (the “Fund”) (one of the funds constituting Deutsche DWS Variable Series I) (the “Trust”), including the investment portfolio, as of December 31, 2020, and the related statement of operations for the year then ended, the statements of changes in net assets and the financial highlights for each of the two years in the period then ended and the related notes (collectively referred to as the “financial statements”). In our opinion, the financial statements present fairly, in all material respects, the financial position of the Fund (one of the funds constituting Deutsche DWS Variable Series I) at December 31, 2020, the results of its operations for the year then ended, the changes in its net assets and its financial highlights for each of the two years in the period then ended, in conformity with U.S. generally accepted accounting principles.
The financial highlights for the years ended December 31, 2016, December 31, 2017 and December 31, 2018, were audited by another independent registered public accounting firm whose report, dated February 14, 2019, expressed an unqualified opinion on those financial highlights.
Basis for Opinion
These financial statements are the responsibility of the Trust’s management. Our responsibility is to express an opinion on the Fund’s financial statements based on our audits. We are a public accounting firm registered with the Public Company Accounting Oversight Board (United States) (“PCAOB”) and are required to be independent with respect to the Trust in accordance with the U.S. federal securities laws and the applicable rules and regulations of the Securities and Exchange Commission and the PCAOB.
We conducted our audits in accordance with the standards of the PCAOB. Those standards require that we plan and perform the audit to obtain reasonable assurance about whether the financial statements are free of material misstatement, whether due to error or fraud. The Trust is not required to have, nor were we engaged to perform, an audit of the Trust’s internal control over financial reporting. As part of our audits, we are required to obtain an understanding of internal control over financial reporting, but not for the purpose of expressing an opinion on the effectiveness of the Trust’s internal control over financial reporting. Accordingly, we express no such opinion.
Our audits included performing procedures to assess the risks of material misstatement of the financial statements, whether due to error or fraud, and performing procedures that respond to those risks. Such procedures included examining, on a test basis, evidence regarding the amounts and disclosures in the financial statements. Our procedures included confirmation of securities owned as of December 31, 2020, by correspondence with the custodian and others or by other appropriate auditing procedures where replies from others were not received. Our audits also included evaluating the accounting principles used and significant estimates made by management, as well as evaluating the overall presentation of the financial statements. We believe that our audits provide a reasonable basis for our opinion.

We have served as the auditor of one or more investment companies in the DWS family of funds since at least 1979, but we are unable to determine the specific year.
Boston, Massachusetts
February 12, 2021
Deutsche DWS Variable Series I — DWS Bond VIP | | | 25 |
| Information About Your Fund’s Expenses | (Unaudited) |
As an investor of the Fund, you incur two types of costs: ongoing expenses and transaction costs. Ongoing expenses include management fees and other Fund expenses. Examples of transaction costs include contract charges, which are not shown in this section. The following tables are intended to help you understand your ongoing expenses (in dollars) of investing in the Fund and to help you compare these expenses with the ongoing expenses of investing in other mutual funds. In the most recent six-month period, the Fund limited these expenses; had it not done so, expenses would have been higher. The example in the table is based on an investment of $1,000 invested at the beginning of the six-month period and held for the entire period (July 1, 2020 to December 31, 2020).
The tables illustrate your Fund’s expenses in two ways:
| – | Actual Fund Return. This helps you estimate the actual dollar amount of ongoing expenses (but not transaction costs) paid on a $1,000 investment in the Fund using the Fund’s actual return during the period. To estimate the expenses you paid over the period, simply divide your account value by $1,000 (for example, an $8,600 account value divided by $1,000 = 8.6), then multiply the result by the number in the “Expenses Paid per $1,000” line under the share class you hold. |
| – | Hypothetical 5% Fund Return. This helps you to compare your Fund’s ongoing expenses (but not transaction costs) with those of other mutual funds using the Fund’s actual expense ratio and a hypothetical rate of return of 5% per year before expenses. Examples using a 5% hypothetical Fund return may be found in the shareholder reports of other mutual funds. The hypothetical account values and expenses may not be used to estimate the actual ending account balance or expenses you paid for the period. |
Please note that the expenses shown in these tables are meant to highlight your ongoing expenses only and do not reflect any transaction costs. The “Expenses Paid per $1,000” line of the tables is useful in comparing ongoing expenses only and will not help you determine the relative total expense of owning different funds. If these transaction costs had been included, your costs would have been higher.
| Expenses and Value of a $1,000 Investment for the six months ended December 31, 2020 | ||||
| Actual Fund Return Beginning | Class A | |||
| Account Value 7/1/20 | $ | 1,000.00 | ||
| Account Value 12/31/20 | $ | 1,037.90 | ||
| Expenses Paid per $1,000* | $ | 3.33 | ||
| Hypothetical 5% Fund Return | Class A | |||
| Beginning Account Value 7/1/20 | $ | 1,000.00 | ||
| Ending Account Value 12/31/20 | $ | 1,021.87 | ||
| Expenses Paid per $1,000* | $ | 3.30 | ||
| * | Expenses are equal to the Fund’s annualized expense ratio, multiplied by the average account value over the period, multiplied by 184 (the number of days in the most recent six-month period), then divided by 366. |
| Annualized Expense Ratio | Class A | |||
| Deutsche DWS Variable Series I — DWS Bond VIP | .65 | % | ||
For more information, please refer to the Fund’s prospectus.
These tables do not reflect charges and fees (“contract charges”) associated with the separate account that invests in the Fund or any variable life insurance policy or variable annuity contract for which the Fund is an investment option.
For an analysis of the fees associated with an investment in the Fund or similar funds, please refer to the current and hypothetical expense calculators for Variable Insurance Products which can be found at dws.com/calculators.
| 26 | | | Deutsche DWS Variable Series I — DWS Bond VIP |
| Tax Information | (Unaudited) |
Please consult a tax advisor if you have questions about federal or state income tax laws, or on how to prepare your tax returns. If you have specific questions about your account, please contact your insurance provider.
The Trust’s policies and procedures for voting proxies for portfolio securities and information about how the Trust voted proxies related to its portfolio securities during the most recent 12-month period ended June 30 are available on our Web site — dws.com/en-us/resources/proxy-voting — or on the SEC’s Web site — sec.gov. To obtain a written copy of the Trust’s policies and procedures without charge, upon request, call us toll free at (800) 728-3337.
Deutsche DWS Variable Series I — DWS Bond VIP | | | 27 |
Advisory Agreement Board Considerations and Fee Evaluation
The Board of Trustees (hereinafter referred to as the “Board” or “Trustees”) approved the renewal of DWS Bond VIP’s (the “Fund”) investment management agreement (the “Agreement”) with DWS Investment Management Americas, Inc. (“DIMA”) in September 2020.
In terms of the process that the Board followed prior to approving the Agreement, shareholders should know that:
| – | During the entire process, all of the Fund’s Trustees were independent of DIMA and its affiliates (the “Independent Trustees”). |
| – | The Board met frequently during the past year to discuss fund matters and dedicated a substantial amount of time to contract review matters. Over the course of several months, the Board reviewed extensive materials received from DIMA, independent third parties and independent counsel. These materials included an analysis of the Fund’s performance, fees and expenses, and profitability from a fee consultant retained by the Fund’s Independent Trustees (the “Fee Consultant”). |
| – | The Board also received extensive information throughout the year regarding performance of the Fund. |
| – | The Independent Trustees regularly met privately with counsel to discuss contract review and other matters. In addition, the Independent Trustees were advised by the Fee Consultant in the course of their review of the Fund’s contractual arrangements and considered a comprehensive report prepared by the Fee Consultant in connection with their deliberations. |
| – | In connection with reviewing the Agreement, the Board also reviewed the terms of the Fund’s distribution agreement, administrative services agreement, transfer agency agreement and other material service agreements. |
In connection with the contract review process, the Board considered the factors discussed below, among others. The Board also considered that DIMA and its predecessors have managed the Fund since its inception, and the Board believes that a long-term relationship with a capable, conscientious advisor is in the best interests of the Fund. The Board considered, generally, that shareholders chose to invest or remain invested in the Fund knowing that DIMA managed the Fund. DIMA is part of DWS Group GmbH & Co. KGaA (“DWS Group”). DWS Group is a global asset management business that offers a wide range of investing expertise and resources, including research capabilities in many countries throughout the world. In 2018, approximately 20% of DWS Group’s shares were sold in an initial public offering, with Deutsche Bank AG owning the remaining shares.
As part of the contract review process, the Board carefully considered the fees and expenses of each DWS fund overseen by the Board in light of the fund’s performance. In many cases, this led to the negotiation and implementation of expense caps.
While shareholders may focus primarily on fund performance and fees, the Fund’s Board considers these and many other factors, including the quality and integrity of DIMA’s personnel and administrative support services provided by DIMA, such as back-office operations, fund valuations, and compliance policies and procedures.
Nature, Quality and Extent of Services. The Board considered the terms of the Agreement, including the scope of advisory services provided under the Agreement. The Board noted that, under the Agreement, DIMA provides portfolio management services to the Fund and that, pursuant to a separate administrative services agreement, DIMA provides administrative services to the Fund. The Board considered the experience and skills of senior management and investment personnel and the resources made available to such personnel. The Board also considered the risks to DIMA in sponsoring or managing the Fund, including financial, operational and reputational risks, the potential economic impact to DIMA from such risks and DIMA’s approach to addressing such risks. The Board reviewed the Fund’s performance over short-term and long-term periods and compared those returns to various agreed-upon performance measures, including market index(es) and a peer universe compiled using information supplied by Morningstar Direct (“Morningstar”), an independent fund data service. The Board also noted that it has put into place a process of identifying “Funds in Review” (e.g., funds performing poorly relative to a peer universe), and receives additional reporting from DIMA regarding such funds and, where appropriate, DIMA’s plans to address underperformance. The Board believes this process is an effective manner of identifying and addressing underperforming funds. Based on the information provided, the Board noted that, for the one-, three- and five-year periods ended December 31, 2019, the Fund’s performance (Class A shares) was in the 1st quartile of the applicable Morningstar universe (the 1st quartile being the best performers and the 4th quartile being
| 28 | | | Deutsche DWS Variable Series I — DWS Bond VIP |
the worst performers). The Board also observed that the Fund has outperformed its benchmark in the one-, three- and five-year periods December 31, 2019.
Fees and Expenses. The Board considered the Fund’s investment management fee schedule, operating expenses and total expense ratios, and comparative information provided by Broadridge Financial Solutions, Inc. (“Broadridge”) and the Fee Consultant regarding investment management fee rates paid to other investment advisors by similar funds (1st quartile being the most favorable and 4th quartile being the least favorable). With respect to management fees paid to other investment advisors by similar funds, the Board noted that the contractual fee rates paid by the Fund, which include a 0.10% fee paid to DIMA under the Fund’s administrative services agreement, were lower than the median (2nd quartile) of the applicable Broadridge peer group (based on Broadridge data provided as of December 31, 2019). The Board noted that, effective March 1, 2020, the fee paid to DIMA under the Fund’s administrative services agreement was reduced to 0.097%. The Board noted that the Fund’s Class A shares total (net) operating expenses were expected to be higher than the median (3rd quartile) of the applicable Broadridge expense universe (based on Broadridge data provided as of December 31, 2019, and analyzing Broadridge expense universe Class A (net) expenses less any applicable 12b-1 fees) (“Broadridge Universe Expenses”). The Board noted that the expense limitation agreed to by DIMA was expected to help the Fund’s total (net) operating expenses remain competitive. The Board considered the Fund’s management fee rate as compared to fees charged by DIMA to a comparable DWS U.S. registered fund (“DWS Funds”) and considered differences between the Fund and the comparable DWS Fund. The information requested by the Board as part of its review of fees and expenses also included information about institutional accounts (including any sub-advised funds and accounts) and funds offered primarily to European investors (“DWS Europe Funds”) managed by DWS Group. The Board noted that DIMA indicated that DWS Group does not manage any institutional accounts or DWS Europe Funds comparable to the Fund.
On the basis of the information provided, the Board concluded that management fees were reasonable and appropriate in light of the nature, quality and extent of services provided by DIMA.
Profitability. The Board reviewed detailed information regarding revenues received by DIMA under the Agreement. The Board considered the estimated costs to DIMA, and pre-tax profits realized by DIMA, from advising the DWS Funds, as well as estimates of the pre-tax profits attributable to managing the Fund in particular. The Board also received information regarding the estimated enterprise-wide profitability of DIMA and its affiliates with respect to all fund services in totality and by fund. The Board and the Fee Consultant reviewed DIMA’s methodology in allocating its costs to the management of the Fund. Based on the information provided, the Board concluded that the pre-tax profits realized by DIMA in connection with the management of the Fund were not unreasonable. The Board also reviewed certain publicly available information regarding the profitability of certain similar investment management firms. The Board noted that, while information regarding the profitability of such firms is limited (and in some cases is not necessarily prepared on a comparable basis), DIMA and its affiliates’ overall profitability with respect to the DWS Funds (after taking into account distribution and other services provided to the funds by DIMA and its affiliates) was lower than the overall profitability levels of most comparable firms for which such data was available.
Economies of Scale. The Board considered whether there are economies of scale with respect to the management of the Fund and whether the Fund benefits from any economies of scale. The Board noted that the Fund’s investment management fee schedule includes fee breakpoints. The Board concluded that the Fund’s fee schedule represents an appropriate sharing between the Fund and DIMA of such economies of scale as may exist in the management of the Fund at current asset levels.
Other Benefits to DIMA and Its Affiliates. The Board also considered the character and amount of other incidental or “fall-out” benefits received by DIMA and its affiliates, including any fees received by DIMA for administrative services provided to the Fund and any fees received by an affiliate of DIMA for transfer agency services provided to the Fund. The Board also considered benefits to DIMA related to brokerage and soft-dollar allocations, including allocating brokerage to pay for research generated by parties other than the executing broker dealers, which pertain primarily to funds investing in equity securities. In addition, the Board considered the incidental public relations benefits to DIMA related to DWS Funds advertising and cross-selling opportunities among DIMA products and services. The Board considered these benefits in reaching its conclusion that the Fund’s management fees were reasonable.
Compliance. The Board considered the significant attention and resources dedicated by DIMA to its compliance processes in recent years. The Board noted in particular (i) the experience, seniority and time commitment of the individuals serving as DIMA’s and the Fund’s chief compliance officers and (ii) the
Deutsche DWS Variable Series I — DWS Bond VIP | | | 29 |
substantial commitment of resources by DIMA and its affiliates to compliance matters, including the retention of compliance personnel.
The Board also considered that on September 24, 2020, the SEC granted a temporary order permitting DIMA and its affiliates to continue providing investment advisory and underwriting services to the DWS Funds notwithstanding a consent order entered into by Deutsche Bank AG on June 17, 2020 (the “Consent Order”). The Board noted that the temporary order was granted effective as of the date of the Consent Order. The Board also noted various representations by DIMA to the Board relating to the Consent Order, including that the conduct giving rise to the Consent Order (unintentional conduct that resulted from a system outage that prevented Deutsche Bank AG from reporting data in accordance with applicable CFTC requirements for five days in April 2016) did not involve any DWS Fund or services DIMA and its affiliates provide to the DWS Funds, that DIMA and its personnel had no involvement in the alleged conduct giving rise to the Consent Order, and that the DWS Funds would not bear any financial impact or costs relating to the Consent Order.
Based on all of the information considered and the conclusions reached, the Board determined that the continuation of the Agreement is in the best interests of the Fund. In making this determination, the Board did not give particular weight to any single factor identified above. The Board considered these factors over the course of numerous meetings, certain of which were in executive session with only the Independent Trustees and counsel present. It is possible that individual Independent Trustees may have weighed these factors differently in reaching their individual decisions to approve the continuation of the Agreement.
| 30 | | | Deutsche DWS Variable Series I — DWS Bond VIP |
The following table presents certain information regarding the Board Members and Officers of the Trust/Corporation. Each Board Member’s year of birth is set forth in parentheses after his or her name. Unless otherwise noted, (i) each Board Member has engaged in the principal occupation(s) noted in the table for at least the most recent five years, although not necessarily in the same capacity; and (ii) the address of each Independent Board Member is Keith R. Fox, DWS Funds Board Chair, c/o Thomas R. Hiller, Ropes & Gray LLP, Prudential Tower, 800 Boylston Street, Boston, MA 02199-3600. Except as otherwise noted below, the term of office for each Board Member is until the election and qualification of a successor, or until such Board Member sooner dies, resigns, is removed or as otherwise provided in the governing documents of the Trust/Corporation. Because the Fund does not hold an annual meeting of shareholders, each Board Member will hold office for an indeterminate period.
The Board Members may also serve in similar capacities with other funds in the fund complex. The number of funds in the DWS fund complex shown in the table below includes all registered open- and closed-end funds (including all of their portfolios) advised by the Advisor and any registered funds that have an investment advisor that is an affiliated person of the Advisor.
| Independent Board Members | ||||||||
| Name, Year of Birth, Position with the Trust/ Corporation and Length of Time Served1 | Business Experience and Directorships During the Past Five Years | Number of Funds in DWS Fund Complex Overseen | Other Directorships Held by Board Member | |||||
Keith R. Fox, CFA (1954)
Chairperson since 2017, and Board Member since 1996 | Managing General Partner, Exeter Capital Partners (a series of private investment funds) (since 1986). Directorships: Progressive International Corporation (kitchen goods importer and distributor); former Chairman, National Association of Small Business Investment Companies; former Directorships: ICI Mutual Insurance Company; BoxTop Media Inc. (advertising); Sun Capital Advisers Trust (mutual funds) (2011–2012) | 73 | — | |||||
John W. Ballantine (1946)
Board Member since 1999 | Retired; formerly, Executive Vice President and Chief Risk Management Officer, First Chicago NBD Corporation/The First National Bank of Chicago (1996–1998); Executive Vice President and Head of International Banking (1995–1996); former Directorships: Director and Chairman of the Board, Healthways, Inc.2 (population well-being and wellness services) (2003–2014); Stockwell Capital Investments PLC (private equity); Enron Corporation; FNB Corporation; Tokheim Corporation; First Oak Brook Bancshares, Inc.; Oak Brook Bank; and Prisma Energy International. Not-for-Profit Director/Trustee: Palm Beach Civic Association; Window to the World Communications (public media); Life Director of Harris Theater for Music and Dance (Chicago); Life Director of Hubbard Street Dance Chicago; former Not-for-Profit Directorships: Public Radio International | 73 | Portland General Electric2 (utility company) (2003– present) | |||||
Dawn-Marie Driscoll (1946)
Board Member since 1987 | Emeritus Executive Fellow, Center for Business Ethics, Bentley University; formerly: Partner, Palmer & Dodge (law firm) (1988–1990); Vice President of Corporate Affairs and General Counsel, Filene’s (retail) (1978–1988). Directorships: Advisory Board, Center for Business Ethics, Bentley University; Trustee and former Chairman of the Board, Southwest Florida Community Foundation (charitable organization); former Directorships: ICI Mutual Insurance Company (2007–2015); Sun Capital Advisers Trust (mutual funds) (2007–2012), Investment Company Institute (audit, executive, nominating committees) and Independent Directors Council (governance, executive committees) | 73 | — | |||||
Richard J. Herring (1946)
Board Member since 1990 | Jacob Safra Professor of International Banking and Professor of Finance, The Wharton School, University of Pennsylvania (since July 1972); Director, The Wharton Financial Institutions Center (since 1994); formerly: Vice Dean and Director, Wharton Undergraduate Division (1995–2000) and Director, The Lauder Institute of International Management Studies (2000–2006); Member FDIC Systemic Risk Advisory Committee since 2011, member Systemic Risk Council since 2012 and member of the Advisory Board at the Yale Program on Financial Stability since 2013; Formerly Co-Chair of the Shadow Financial Regulatory Committee (2003–2015), Executive Director of The Financial Economists Roundtable (2008–2015), Director of The Thai Capital Fund (2007–2013), Director of The Aberdeen Singapore Fund (2007–2018), and Nonexecutive Director of Barclays Bank DE (2010–2018) | 73 | Director, Aberdeen Japan Fund (since 2007) | |||||
William McClayton (1944)
Board Member since 2004 | Private equity investor (since October 2009); previously, Managing Director, Diamond Management & Technology Consultants, Inc. (global consulting firm) (2001–2009); Directorship: Board of Managers, YMCA of Metropolitan Chicago; formerly: Senior Partner, Arthur Andersen LLP (accounting) (1966–2001); Trustee, Ravinia Festival | 73 | — | |||||
Deutsche DWS Variable Series I — DWS Bond VIP | | | 31 |
| Independent Board Members | ||||||||
| Name, Year of Birth, Position with the Trust/ Corporation and Length of Time Served1 | Business Experience and Directorships During the Past Five Years | Number of Funds in DWS Fund Complex Overseen | Other Directorships Held by Board Member | |||||
Rebecca W. Rimel (1951)
Board Member since 1995 | Senior Advisor, The Pew Charitable Trusts (charitable organization) (since July 2020); formerly: Executive Vice President, The Glenmede Trust Company (investment trust and wealth management) (1983–2004); Board Member, Investor Education (charitable organization) (2004–2005); Trustee, Executive Committee, Philadelphia Chamber of Commerce (2001–2007); Director, Viasys Health Care2 (January 2007–June 2007); Trustee, Thomas Jefferson Foundation (charitable organization) (1994–2012); President, Chief Executive Officer and Director, The Pew Charitable Trusts (charitable organization) (1994–2020) | 73 | Director, Becton Dickinson and Company2 (medical technology company) (2012– present); Director, BioTelemetry Inc.2 (health care) (2009– present) | |||||
William N. Searcy, Jr. (1946)
Board Member since 1993 | Private investor since October 2003; formerly: Pension & Savings Trust Officer, Sprint Corporation2 (telecommunications) (November 1989–September 2003); Trustee, Sun Capital Advisers Trust (mutual funds) (1998–2012) | 73 | — | |||||
| Officers4 | ||
| Name, Year of Birth, Position with the Trust/ Corporation and Length of Time Served5 | Business Experience and Directorships During the Past Five Years | |
Hepsen Uzcan6 (1974)
President and Chief Executive Officer, 2017–present | Managing Director3, DWS; Secretary, DWS USA Corporation (2018–present); Assistant Secretary, DWS Distributors, Inc. (2018–present); Director and Vice President, DWS Service Company (2018–present); Assistant Secretary, DWS Investment Management Americas, Inc. (2018–present); Director and President, DB Investment Managers, Inc. (2018–present); President and Chief Executive Officer, The European Equity Fund, Inc., The New Germany Fund, Inc. and The Central and Eastern Europe Fund, Inc. (2017–present); formerly: Vice President for the Deutsche funds (2016–2017); Assistant Secretary for the DWS funds (2013–2019); Assistant Secretary, The European Equity Fund, Inc., The New Germany Fund, Inc. and The Central and Eastern Europe Fund, Inc. (2013–2020); Directorships: Interested Director, The European Equity Fund, Inc., The New Germany Fund, Inc. and The Central and Eastern Europe Fund, Inc. (since June 25, 2020); ICI Mutual Insurance Company (since October 16, 2020); and Episcopalian Charities of New York (2018–present) | |
John Millette7 (1962)
Vice President and Secretary, 1999–present | Director,3 DWS; Chief Legal Officer, DWS Investment Management Americas, Inc. (2015–present); Director and Vice President, DWS Trust Company (2016–present); Secretary, DBX ETF Trust (2020–present); Secretary, The European Equity Fund, Inc., The New Germany Fund, Inc. and The Central and Eastern Europe Fund, Inc. (2011–present); formerly: Secretary, Deutsche Investment Management Americas Inc. (2015–2017); Assistant Secretary, DBX ETF Trust (2019–2020); Assistant Secretary (July 14, 2006–December 31, 2010) and Secretary (January 31, 2006–July 13, 2006), The European Equity Fund, Inc., The New Germany Fund, Inc. and The Central and Eastern Europe Fund, Inc. | |
Ciara Crawford8 (1984)
Assistant Secretary, (2019–present) | Associate, DWS (since 2015); previously, Legal Assistant at Accelerated Tax Solutions. | |
Diane Kenneally7 (1966)
Chief Financial Officer and Treasurer, 2018–present | Director,3 DWS; Treasurer, Chief Financial Officer and Controller, DBX ETF Trust (2019–present); Treasurer and Chief Financial Officer, The European Equity Fund, Inc., The New Germany Fund, Inc. and The Central and Eastern Europe Fund, Inc. (2018–present); formerly: Assistant Treasurer for the DWS funds (2007–2018) | |
Paul Antosca7 (1957)
Assistant Treasurer, 2007–present | Director,3 DWS; and Assistant Treasurer, DBX ETF Trust (2019–present) | |
Sheila Cadogan7 (1966)
Assistant Treasurer, 2017–present | Director,3 DWS; Director and Vice President, DWS Trust Company (2018–present); Assistant Treasurer, DBX ETF Trust (2019–present); Assistant Treasurer, The European Equity Fund, Inc., The New Germany Fund, Inc. and The Central and Eastern Europe Fund, Inc. (2018–present) | |
Scott D. Hogan7 (1970)
Chief Compliance Officer, 2016–present | Director,3 DWS; Chief Compliance Officer, The European Equity Fund, Inc., The New Germany Fund, Inc. and The Central and Eastern Europe Fund, Inc. (2016–present) | |
Caroline Pearson7 (1962)
Chief Legal Officer, 2010–present | Managing Director3, DWS; Assistant Secretary, DBX ETF Trust (2020–present); Chief Legal Officer, DBX Advisors LLC and DBX Strategic Advisors LLC (2020–present); Chief Legal Officer, The European Equity Fund, Inc., The New Germany Fund, Inc. and The Central and Eastern Europe Fund, Inc. (2012–present); formerly: Secretary, Deutsche AM Distributors, Inc. (2002–2017); and Secretary, Deutsche AM Service Company (2010–2017) |
| 32 | | | Deutsche DWS Variable Series I — DWS Bond VIP |
| Name, Year of Birth, Position with the Trust/ Corporation and Length of Time Served5 | Business Experience and Directorships During the Past Five Years | |
Michelle Goveia-Pine6 (1970)
Interim Anti-Money Laundering Compliance Officer, since July 10, 2020 | Director,3 DWS; Interim AML Officer, DWS Trust Company (since July 28, 2020); Interim AML Officer, DBX ETF Trust (since July 9, 2020); Interim AML Officer, The European Equity Fund, Inc., The New Germany Fund, Inc. and The Central and Eastern Europe Fund, Inc. (since July 24, 2020) |
| 1 | The length of time served represents the year in which the Board Member joined the board of one or more DWS funds currently overseen by the Board. |
| 2 | A publicly held company with securities registered pursuant to Section 12 of the Securities Exchange Act of 1934. |
| 3 | Executive title, not a board directorship. |
| 4 | As a result of their respective positions held with the Advisor or its affiliates, these individuals are considered “interested persons” of the Advisor within the meaning of the 1940 Act. Interested persons receive no compensation from the Fund. |
| 5 | The length of time served represents the year in which the officer was first elected in such capacity for one or more DWS funds. |
| 6 | Address: 875 Third Avenue, New York, NY 10022. |
| 7 | Address: 100 Summer Street, Boston, MA 02110. |
| 8 | Address: 5022 Gate Parkway, Suite 400, Jacksonville, FL 32256. |
The Fund’s Statement of Additional Information (“SAI”) includes additional information about the Board Members. The SAI is available, without charge, upon request. If you would like to request a copy of the SAI, you may do so by calling the following toll-free number: (800) 728-3337.
Deutsche DWS Variable Series I — DWS Bond VIP | | | 33 |
Notes
Notes
| ||
VS1bond-2 (R-025819-10 2/21) |
December 31, 2020
Annual Report
Deutsche DWS Variable Series I
DWS Capital Growth VIP

| 3 | Performance Summary | |||
| 4 | Management Summary | |||
| 6 | Portfolio Summary | |||
| 7 | Investment Portfolio | |||
| 9 | Statement of Assets and Liabilities | |||
| 9 | Statement of Operations | |||
| 10 | Statements of Changes in Net Assets | |||
| 11 | Financial Highlights | |||
| 12 | Notes to Financial Statements | |||
| 17 | Report of Independent Registered Public Accounting Firm | |||
| 18 | Information About Your Fund’s Expenses | |||
| 19 | Tax Information | |||
| 19 | Proxy Voting | |||
| 20 | Advisory Agreement Board Considerations and Fee Evaluation | |||
| 23 | Board Members and Officers |
This report must be preceded or accompanied by a prospectus. To obtain an additional prospectus or summary prospectus, if available, call (800) 728-3337 or your financial representative. We advise you to consider the Fund’s objectives, risks, charges and expenses carefully before investing. The summary prospectus and prospectus contain this and other important information about the Fund. Please read the prospectus carefully before you invest.
Stocks may decline in value. The Fund may lend securities to approved institutions. Please read the prospectus for details.
War, terrorism, economic uncertainty, trade disputes, public health crises (including the recent pandemic spread of the novel coronavirus) and related geopolitical events could lead to increased market volatility, disruption to U.S. and world economies and markets and may have significant adverse effects on the Fund and its investments.
The brand DWS represents DWS Group GmbH & Co. KGaA and any of its subsidiaries such as DWS Distributors, Inc. which offers investment products or DWS Investment Management Americas, Inc. and RREEF America L.L.C. which offer advisory services.
DWS Distributors, Inc., 222 South Riverside Plaza, Chicago, IL 60606, (800) 621-1148
NOT FDIC/NCUA INSURED NO BANK GUARANTEE MAY LOSE VALUE NOT A DEPOSIT NOT INSURED BY ANY FEDERAL GOVERNMENT AGENCY
| 2 | | | Deutsche DWS Variable Series I — DWS Capital Growth VIP |
| Performance Summary | December 31, 2020 (Unaudited) |
Fund performance shown is historical, assumes reinvestment of all dividend and capital gain distributions, and does not guarantee future results. Investment return and principal value fluctuate with changing market conditions so that, when redeemed, shares may be worth more or less than their original cost. Current performance may be lower or higher than the performance data quoted. Please contact your participating insurance company for the Fund’s most recent month-end performance. Performance does not reflect charges and fees (“contract charges”) associated with the separate account that invests in the Fund or any variable life insurance policy or variable annuity contract for which the Fund is an investment option. These charges and fees will reduce returns. While all share classes have the same underlying portfolio, their performance will differ.
The gross expense ratios of the Fund, as stated in the fee table of the prospectus dated May 1, 2020 are 0.50% and 0.76% for Class A and Class B shares, respectively, and may differ from the expense ratios disclosed in the Financial Highlights tables in this report.
Generally accepted accounting principles require adjustments to be made to the net assets of the Fund at period end for financial reporting purposes only, and as such, the total return based on the unadjusted net asset value per share may differ from the total return reported in the financial highlights.
Growth of an Assumed $10,000 Investment
| Russell 1000® Growth Index is an unmanaged index that consists of those stocks in the Russell 1000® Index that have higher price-to-book ratios and higher forecasted growth values. Russell 1000® Index is an unmanaged price-only index of the 1,000 largest capitalized companies that are domiciled in the U.S. and whose common stocks are traded.
Index returns do not reflect any fees or expenses and it is not possible to invest directly into an index. |
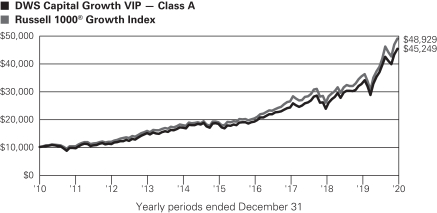
| Comparative Results | ||||||||||
| DWS Capital Growth VIP | 1-Year | 3-Year | 5-Year | 10-Year | ||||||
| Class A | Growth of $10,000 | $13,904 | $18,763 | $24,704 | $45,249 | |||||
| Average annual total return | 39.04% | 23.34% | 19.83% | 16.29% | ||||||
| Russell 1000 Growth Index | Growth of $10,000 | $13,849 | $18,603 | $25,938 | $48,929 | |||||
| Average annual total return | 38.49% | 22.99% | 21.00% | 17.21% | ||||||
| DWS Capital Growth VIP | 1-Year | 3-Year | 5-Year | 10-Year | ||||||
| Class B | Growth of $10,000 | $13,870 | $18,618 | $24,390 | $43,986 | |||||
| Average annual total return | 38.70% | 23.02% | 19.52% | 15.97% | ||||||
| Russell 1000 Growth Index | Growth of $10,000 | $13,849 | $18,603 | $25,938 | $48,929 | |||||
| Average annual total return | 38.49% | 22.99% | 21.00% | 17.21% | ||||||
The growth of $10,000 is cumulative.
Deutsche DWS Variable Series I — DWS Capital Growth VIP | | | 3 |
| Management Summary | December 31, 2020 (Unaudited) |
The Fund returned 39.04% (Class A shares, unadjusted for contract charges) in 2020, slightly ahead of the 38.49% return for the Russell 1000® Growth Index. Growth stocks, after selling off sharply in the first quarter in reaction to the spread of COVID-19 and the associated lockdowns, rebounded to post their second consecutive year with a gain of 35%-plus.
The Fund outperformed the index, also for the second year in a row, largely as a result of our focus on innovative companies and willingness to invest across the entire spectrum of the corporate life cycle. Our approach worked particularly well in the communication services sector thanks to a position in Spotify Technology SA. The company gained market share during the COVID-19 pandemic, and it reported robust subscriber growth and better-than-expected profit margins. The health care sector was another area of strength. DexCom, Inc., a maker of continuous glucose monitoring systems, benefited from high demand, increased insurance coverage, and the expansion of sales channels for its products. Thermo Fisher Scientific, Inc., a leading supplier of life science/diagnostic tools, rallied on expectations that demand for its COVID-related diagnostics, tools, and services would lead to rising sales growth. Danaher Corp. was another beneficiary of the ongoing secular tailwind surrounding diagnostics and vaccine development. Outside of these two sectors, key contributors included Progressive Corp., Twilio, Inc., and Nuance Communications, Inc.
On the negative side, we lost some relative performance through our positioning in the consumer discretionary sector. Our shortfall in the category was almost entirely the result of having a zero weighting in Tesla, Inc., which grew to become a large index component and thus a significant influence on the benchmark’s return. Since our goal is to own the most attractive long-term growth ideas in the market, we do not “chase” performance in individual stocks in an attempt to boost returns. Among stocks the Fund held, Fiserv, Inc., Becton Dickinson & Co., and McDonald’s Corp. detracted as investors gravitated away from larger, more stable growers and companies that faced specific, pandemic-induced headwinds.
The past year brought unprecedented change, revealing the value of business models with inherent resiliency and adaptability. Perhaps more important, it demonstrated the role of innovation. Even as the economy struggled under the weight of COVID-19, innovation continued to move forward at an accelerating pace. Many first-mover technologies quickly entered the stage of mass adoption as consumers and business adjusted to the new operating environment created by the virus. This raised the question whether future growth projections — and thus shareholder returns — were simply pulled forward, or whether the shifts will be permanent. For our part, we continue to see opportunity in companies that are positioned for long-term, sustainable growth as they capitalize on dynamic and widening addressable markets. We are finding this to be the case not only in growth sectors, but also in more traditional businesses — such as those in the financials, insurance, education and health care industries — that are quickly embracing new solutions to adapt to the disrupting forces.
The hope that economic conditions will return to some level of normalcy seems real with a vaccine now available, but visibility remains clouded due to renewed lock-downs and surging coronavirus cases late in the year. This fueled sharp rotations in and out of specific market segments, such as momentum stocks, cyclicals, and the growth and value styles. In this environment, we believe it’s essential to calibrate the portfolio’s risk-reward characteristics and ensure the appropriate level of diversification. We therefore remain focused on selecting the right mix of stocks for the portfolio, with an emphasis on companies we think will grow at durable, superior rates and generate long-term shareholder value. As part of our diversification across the stages of the corporate growth life cycle, we maintain positions in growth stocks that could benefit from a broad economic reopening. This includes areas as electronic payments, transportation, industrials, leisure/entertainment, and retail. We also continue to own positions in more richly valued, higher-growth stocks, even though their valuation levels may make them more vulnerable to missed expectations or rising interest rates. We typically keep a portion of the portfolio in this market segment, as long as we the valuations are supported by the strong underlying fundamental outlook of the companies in which we invest.
Sebastian P. Werner, PhD, Director
Portfolio Manager
The views expressed reflect those of the portfolio management team only through the end of the period of the report as stated on the cover. The management team’s views are subject to change at any time based on market and other conditions and should not be construed as a recommendation. Past performance is no guarantee of future results. Current and future portfolio holdings are subject to risk.
| 4 | | | Deutsche DWS Variable Series I — DWS Capital Growth VIP |
Terms to Know
Russell 1000 Growth Index is an unmanaged index that consists of those stocks in the Russell 1000® Index that have higher price-to-book ratios and higher forecasted growth values. Russell 1000 Index is an unmanaged price-only index of the 1,000 largest capitalized companies that are domiciled in the U.S. and whose common stocks are traded.
Contribution and detraction incorporate both a stock’s total return and its weighting in the Fund.
Overweight means the Fund holds a higher weighting in a given sector or security than the benchmark. Underweight means the Fund holds a lower weighting.
Deutsche DWS Variable Series I — DWS Capital Growth VIP | | | 5 |
| Portfolio Summary | (Unaudited) | |||
| Asset Allocation (As a % of Investment Portfolio excluding Securities Lending Collateral) | 12/31/20 | 12/31/19 | ||||||
| Common Stocks | 99% | 98% | ||||||
| Cash Equivalents | 1% | 2% | ||||||
| 100% | 100% | |||||||
| Sector Diversification (As of % of Investment Portfolio excluding Cash Equivalents and Securities Lending Collateral) | 12/31/20 | 12/31/19 | ||||||
| Information Technology | 43% | 38% | ||||||
| Consumer Discretionary | 14% | 14% | ||||||
| Communication Services | 13% | 13% | ||||||
| Health Care | 11% | 13% | ||||||
| Industrials | 8% | 10% | ||||||
| Financials | 5% | 6% | ||||||
| Consumer Staples | 3% | 3% | ||||||
| Real Estate | 2% | 2% | ||||||
| Materials | 1% | 1% | ||||||
| Energy | — | 0% | ||||||
| 100% | 100% | |||||||
Portfolio holdings and characteristics are subject to change.
For more complete details about the Fund’s investment portfolio, see page 7.
Following the Fund’s fiscal first and third quarter-end, a complete portfolio holdings listing is posted on dws.com, and is available free of charge by contacting your financial intermediary, or if you are a direct investor, by calling (800) 728-3337. In addition, the portfolio holdings listing is filed with the SEC on the Fund’s Form N-PORT and will be available on the SEC’s Web site at sec.gov. Additional portfolio holdings for the Fund are also posted on dws.com from time to time. Please see the Fund’s current prospectus for more information.
| 6 | | | Deutsche DWS Variable Series I — DWS Capital Growth VIP |
| Investment Portfolio | as of December 31, 2020 |
| Shares | Value ($) | |||||||
| Common Stocks 99.5% | ||||||||
| Communication Services 13.3% |
| |||||||
Entertainment 6.3% |
| |||||||
Activision Blizzard, Inc. | 180,281 | 16,739,091 | ||||||
Live Nation Entertainment, Inc.* | 92,388 | 6,788,670 | ||||||
Netflix, Inc.* | 27,664 | 14,958,755 | ||||||
Roku, Inc.* | 18,287 | 6,071,650 | ||||||
Spotify Technology SA* | 50,285 | 15,822,678 | ||||||
Walt Disney Co. | 58,200 | 10,544,676 | ||||||
|
| |||||||
| 70,925,520 | ||||||||
Interactive Media & Services 5.9% |
| |||||||
Alphabet, Inc. “A”* | 11,772 | 20,632,078 | ||||||
Alphabet, Inc. “C”* | 13,615 | 23,851,846 | ||||||
Facebook, Inc. “A”* | 40,854 | 11,159,679 | ||||||
Match Group, Inc.* | 73,308 | 11,083,436 | ||||||
|
| |||||||
| 66,727,039 | ||||||||
Wireless Telecommunication Services 1.1% |
| |||||||
T-Mobile U.S., Inc.* | 93,932 | 12,666,730 | ||||||
| Consumer Discretionary 14.2% |
| |||||||
Diversified Consumer Services 1.5% |
| |||||||
Chegg, Inc.* | 84,371 | 7,621,232 | ||||||
Terminix Global Holdings, Inc.* | 173,198 | 8,834,830 | ||||||
|
| |||||||
| 16,456,062 | ||||||||
Hotels, Restaurants & Leisure 1.5% |
| |||||||
Airbnb, Inc. “A”* (a) | 6,541 | 960,219 | ||||||
McDonald’s Corp. | 52,612 | 11,289,483 | ||||||
Planet Fitness, Inc. “A”* | 68,613 | 5,326,427 | ||||||
|
| |||||||
| 17,576,129 | ||||||||
Internet & Direct Marketing Retail 5.5% |
| |||||||
Amazon.com, Inc.* | 19,143 | 62,347,411 | ||||||
Multiline Retail 1.2% |
| |||||||
Dollar General Corp. | 65,525 | 13,779,908 | ||||||
Specialty Retail 3.9% |
| |||||||
Burlington Stores, Inc.* | 38,954 | 10,188,419 | ||||||
CarMax, Inc.* | 97,053 | 9,167,626 | ||||||
Home Depot, Inc. | 93,255 | 24,770,393 | ||||||
|
| |||||||
| 44,126,438 | ||||||||
Textiles, Apparel & Luxury Goods 0.6% |
| |||||||
Lululemon Athletica, Inc.* | 19,291 | 6,713,847 | ||||||
| Consumer Staples 2.7% |
| |||||||
Food & Staples Retailing 1.1% |
| |||||||
Costco Wholesale Corp. | 33,350 | 12,565,613 | ||||||
Food Products 1.0% |
| |||||||
Mondelez International, Inc. “A” | 187,232 | 10,947,455 | ||||||
Personal Products 0.6% |
| |||||||
Estee Lauder Companies, Inc. “A” | 26,853 | 7,148,000 | ||||||
Financials 4.7% |
| |||||||
Capital Markets 1.5% |
| |||||||
Intercontinental Exchange, Inc. | 143,931 | 16,593,805 | ||||||
Consumer Finance 0.7% |
| |||||||
American Express Co. | 67,767 | 8,193,708 | ||||||
Insurance 2.5% |
| |||||||
Progressive Corp. | 293,402 | 29,011,590 | ||||||
| Shares | Value ($) | |||||||
| Health Care 11.4% |
| |||||||
Biotechnology 0.6% |
| |||||||
Exact Sciences Corp.* | 53,651 | 7,108,221 | ||||||
Health Care Equipment & Supplies 5.8% |
| |||||||
Becton, Dickinson & Co. | 45,794 | 11,458,575 | ||||||
Danaher Corp. | 83,548 | 18,559,353 | ||||||
DexCom, Inc.* | 44,269 | 16,367,134 | ||||||
Hologic, Inc.* | 204,506 | 14,894,172 | ||||||
The Cooper Companies, Inc. | 12,584 | 4,572,019 | ||||||
|
| |||||||
| 65,851,253 | ||||||||
Life Sciences Tools & Services 3.1% |
| |||||||
Thermo Fisher Scientific, Inc. | 73,777 | 34,363,851 | ||||||
Pharmaceuticals 1.9% |
| |||||||
Bristol-Myers Squibb Co. | 127,205 | 7,890,526 | ||||||
Zoetis, Inc. | 81,692 | 13,520,026 | ||||||
|
| |||||||
| 21,410,552 | ||||||||
| Industrials 7.5% |
| |||||||
Aerospace & Defense 0.4% |
| |||||||
TransDigm Group, Inc.* | 7,134 | 4,414,876 | ||||||
Building Products 0.5% |
| |||||||
Trex Co., Inc.* | 70,541 | 5,905,693 | ||||||
Electrical Equipment 1.9% |
| |||||||
AMETEK, Inc. | 116,441 | 14,082,374 | ||||||
Generac Holdings, Inc.* | 34,990 | 7,957,076 | ||||||
|
| |||||||
| 22,039,450 | ||||||||
Industrial Conglomerates 1.2% |
| |||||||
Roper Technologies, Inc. | 31,789 | 13,703,920 | ||||||
Professional Services 2.5% |
| |||||||
TransUnion | 151,296 | 15,011,589 | ||||||
Verisk Analytics, Inc. | 64,571 | 13,404,294 | ||||||
|
| |||||||
| 28,415,883 | ||||||||
Road & Rail 1.0% |
| |||||||
Norfolk Southern Corp. | 30,199 | 7,175,584 | ||||||
Uber Technologies, Inc.* | 72,229 | 3,683,679 | ||||||
|
| |||||||
| 10,859,263 | ||||||||
| Information Technology 42.3% |
| |||||||
IT Services 7.6% |
| |||||||
Fiserv, Inc.* | 145,219 | 16,534,635 | ||||||
Global Payments, Inc. | 74,023 | 15,946,035 | ||||||
Snowflake, Inc. “A”* (a) | 1,420 | 399,588 | ||||||
Twilio, Inc. “A”* (a) | 44,326 | 15,004,351 | ||||||
Visa, Inc. “A” (a) | 174,470 | 38,161,823 | ||||||
|
| |||||||
| 86,046,432 | ||||||||
Semiconductors & Semiconductor Equipment 4.7% |
| |||||||
Advanced Micro Devices, Inc.* | 124,699 | 11,436,145 | ||||||
Analog Devices, Inc. | 60,300 | 8,908,119 | ||||||
Applied Materials, Inc. | 71,572 | 6,176,664 | ||||||
MKS Instruments, Inc. | 28,309 | 4,259,089 | ||||||
NVIDIA Corp. | 42,367 | 22,124,047 | ||||||
|
| |||||||
| 52,904,064 | ||||||||
Software 20.9% |
| |||||||
Adobe, Inc.* | 47,424 | 23,717,691 | ||||||
Avalara, Inc.* | 22,440 | 3,700,132 | ||||||
The accompanying notes are an integral part of the financial statements.
Deutsche DWS Variable Series I — DWS Capital Growth VIP | | | 7 |
| Shares | Value ($) | |||||||
DocuSign, Inc.* | 45,439 | 10,101,090 | ||||||
Dynatrace, Inc.* | 137,077 | 5,931,322 | ||||||
Intuit, Inc. | 31,506 | 11,967,554 | ||||||
Microsoft Corp. | 429,368 | 95,500,030 | ||||||
Nuance Communications, Inc.* | 344,284 | 15,179,482 | ||||||
Proofpoint, Inc.* | 70,225 | 9,579,392 | ||||||
RingCentral, Inc. “A”* | 18,500 | 7,010,945 | ||||||
Salesforce.com, Inc.* | 62,531 | 13,915,023 | ||||||
ServiceNow, Inc.* | 34,429 | 18,950,754 | ||||||
Synopsys, Inc.* | 56,944 | 14,762,163 | ||||||
VMware, Inc. “A”* (a) | 49,110 | 6,888,169 | ||||||
|
| |||||||
| 237,203,747 | ||||||||
Technology Hardware, Storage & Peripherals 9.1% |
| |||||||
Apple, Inc. | 777,527 | 103,170,058 | ||||||
| Materials 1.3% |
| |||||||
Chemicals 0.8% |
| |||||||
Ecolab, Inc. | 41,880 | 9,061,157 | ||||||
Construction Materials 0.5% |
| |||||||
Vulcan Materials Co. | 39,207 | 5,814,790 | ||||||
| Real Estate 2.1% |
| |||||||
Equity Real Estate Investment Trusts (REITs) |
| |||||||
Crown Castle International Corp. | 35,858 | 5,708,235 | ||||||
Equinix, Inc. | 14,195 | 10,137,785 | ||||||
| Shares | Value ($) | |||||||
Prologis, Inc. | 78,858 | 7,858,988 | ||||||
|
| |||||||
| 23,705,008 | ||||||||
Total Common Stocks |
| 1,127,757,473 | ||||||
| Securities Lending Collateral 5.4% |
| |||||||
DWS Government & Agency Securities Portfolio “DWS Government Cash Institutional Shares”, 0.03% (b) (c) (Cost $60,706,321) | 60,706,321 | 60,706,321 | ||||||
| Cash Equivalents 0.5% | ||||||||
DWS Central Cash Management Government Fund, 0.08% (b) (Cost $5,792,769) | 5,792,769 | 5,792,769 | ||||||
| % of Net Assets | Value ($) | |||||||
Total Investment Portfolio | 105.4 | 1,194,256,563 | ||||||
| Other Assets and Liabilities, Net | (5.4 | ) | (61,487,425 | ) | ||||
| Net Assets | 100.0 | 1,132,769,138 | ||||||
A summary of the Fund’s transactions with affiliated investments during the year ended December 31, 2020 are as follows:
| Value ($) at 12/31/2019 | Purchases Cost ($) | Sales Proceeds ($) | Net Realized Gain/ (Loss) ($) | Net Change in Unrealized Appreciation (Depreciation) ($) | Income ($) | Capital Gain Distributions ($) | Number of Shares at | Value ($) at | ||||||||||||||||||||||||
Securities Lending Collateral 5.4% |
| |||||||||||||||||||||||||||||||
DWS Government & Agency Securities Portfolio “DWS Government Cash Institutional Shares”, 0.03% (b) (c) |
| |||||||||||||||||||||||||||||||
| — | 60,706,321 | (d) | — | — | — | 28,885 | — | 60,706,321 | 60,706,321 | |||||||||||||||||||||||
Cash Equivalents 0.5% |
| |||||||||||||||||||||||||||||||
DWS Central Cash Management Government Fund, 0.08% (b) |
| |||||||||||||||||||||||||||||||
| 16,868,479 | 124,031,892 | 135,107,602 | — | — | 54,378 | — | 5,792,769 | 5,792,769 | ||||||||||||||||||||||||
| 16,868,479 | 184,738,213 | 135,107,602 | — | — | 83,263 | — | 66,499,090 | 66,499,090 | ||||||||||||||||||||||||
| * | Non-income producing security. |
| (a) | All or a portion of these securities were on loan. In addition, “Other Assets and Liabilities, Net” may include pending sales that are also on loan. The value of securities loaned at December 31, 2020 amounted to $59,210,469, which is 5.2% of net assets. |
| (b) | Affiliated fund managed by DWS Investment Management Americas, Inc. The rate shown is the annualized seven-day yield at period end. |
| (c) | Represents cash collateral held in connection with securities lending. Income earned by the Fund is net of borrower rebates. |
| (d) | Represents the net increase (purchase cost) or decrease (sales proceeds) in the amount invested in cash collateral for the year ended December 31, 2020. |
Fair Value Measurements
Various inputs are used in determining the value of the Fund’s investments. These inputs are summarized in three broad levels. Level 1 includes quoted prices in active markets for identical securities. Level 2 includes other significant observable inputs (including quoted prices for similar securities, interest rates, prepayment speeds and credit risk). Level 3 includes significant unobservable inputs (including the Fund’s own assumptions in determining the fair value of investments). The level assigned to the securities valuations may not be an indication of the risk or liquidity associated with investing in those securities.
The following is a summary of the inputs used as of December 31, 2020 in valuing the Fund’s investments. For information on the Fund’s policy regarding the valuation of investments, please refer to the Security Valuation section of Note A in the accompanying Notes to Financial Statements.
| Assets | Level 1 | Level 2 | Level 3 | Total | ||||||||||||
| Common Stocks (e) | $ | 1,127,757,473 | $ | — | $ | — | $ | 1,127,757,473 | ||||||||
| Short-Term Investments (e) | 66,499,090 | — | — | 66,499,090 | ||||||||||||
| Total | $ | 1,194,256,563 | $ | — | $ | — | $ | 1,194,256,563 | ||||||||
| (e) | See Investment Portfolio for additional detailed categorizations. |
The accompanying notes are an integral part of the financial statements.
| 8 | | | Deutsche DWS Variable Series I — DWS Capital Growth VIP |
Assets and Liabilities
| as of December 31, 2020 | ||||
| Assets | ||||
| Investments in non-affiliated securities, at value (cost $401,024,468) — including $59,210,469 of securities loaned | $ | 1,127,757,473 | ||
| Investment in DWS Government & Agency Securities Portfolio (cost $60,706,321)* | 60,706,321 | |||
| Investment in DWS Central Cash Management Government Fund (cost $5,792,769) | 5,792,769 | |||
| Receivable for Fund shares sold | 137,191 | |||
| Dividends receivable | 172,863 | |||
| Interest receivable | 4,102 | |||
| Other assets | 22,951 | |||
| Total assets | 1,194,593,670 | |||
| Liabilities | ||||
| Payable upon return of securities loaned | 60,706,321 | |||
| Payable for Fund shares redeemed | 556,220 | |||
| Accrued management fee | 347,428 | |||
| Accrued Trustees’ fees | 14,385 | |||
| Other accrued expenses and payables | 200,178 | |||
| Total liabilities | 61,824,532 | |||
| Net assets, at value | $ | 1,132,769,138 | ||
| Net Assets Consist of | ||||
| Distributable earnings (loss) | 791,693,992 | |||
| Paid-in capital | 341,075,146 | |||
| Net assets, at value | $ | 1,132,769,138 | ||
| Net Asset Value | ||||
Class A | ||||
| Net Asset Value, offering and redemption price per share ($1,126,790,271 ÷ 26,599,512 outstanding shares of beneficial interest, $0.01 par value, unlimited number of shares authorized) | $ | 42.36 | ||
Class B | ||||
| Net Asset Value, offering and redemption price per share ($5,978,867 ÷ 141,745 outstanding shares of beneficial interest, $0.01 par value, unlimited number of shares authorized) | $ | 42.18 | ||
| * | Represents collateral on securities loaned. |
| for the year ended December 31, 2020 |
| |||
| Investment Income | ||||
| Income: | ||||
| Dividends | $ | 7,079,208 | ||
| Income distributions — DWS Central Cash Management Government Fund | 54,378 | |||
| Securities lending income, net of borrower rebates | 28,885 | |||
| Total income | 7,162,471 | |||
| Expenses: | ||||
| Management fee | 3,572,761 | |||
| Administration fee | 939,450 | |||
| Services to Shareholders | 1,953 | |||
| Record keeping fee (Class B) | 253 | |||
| Distribution service fee (Class B) | 11,831 | |||
| Custodian fee | 8,365 | |||
| Professional fees | 85,119 | |||
| Reports to shareholders | 51,006 | |||
| Trustees’ fees and expenses | 31,560 | |||
| Other | 46,999 | |||
| Total expenses | 4,749,297 | |||
| Net investment income | 2,413,174 | |||
| Realized and Unrealized gain (loss) | ||||
| Net realized gain (loss) from investments | 62,781,949 | |||
| Change in net unrealized appreciation (depreciation) on investments | 260,409,153 | |||
| Net gain (loss) | 323,191,102 | |||
| Net increase (decrease) in net assets resulting from operations | $ | 325,604,276 | ||
The accompanying notes are an integral part of the financial statements.
Deutsche DWS Variable Series I — DWS Capital Growth VIP | | | 9 |
Statements of Changes in Net Assets
| Years Ended December 31, | ||||||||
| Increase (Decrease) in Net Assets | 2020 | 2019 | ||||||
| Operations: | ||||||||
| Net investment income (loss) | $ | 2,413,174 | $ | 4,570,151 | ||||
| Net realized gain (loss) | 62,781,949 | 63,513,110 | ||||||
| Change in net unrealized appreciation (depreciation) | 260,409,153 | 189,217,615 | ||||||
| Net increase (decrease) in net assets resulting from operations | 325,604,276 | 257,300,876 | ||||||
| Distributions to shareholders: | ||||||||
Class A | (67,556,274 | ) | (97,006,648 | ) | ||||
Class B | (308,190 | ) | (448,501 | ) | ||||
| Total distributions | (67,864,464 | ) | (97,455,149 | ) | ||||
| Fund share transactions: | ||||||||
Class A | ||||||||
| Proceeds from shares sold | 70,444,423 | 33,974,927 | ||||||
| Reinvestment of distributions | 67,556,274 | 97,006,648 | ||||||
| Payments for shares redeemed | (129,614,047 | ) | (152,665,013 | ) | ||||
| Net increase (decrease) in net assets from Class A share transactions | 8,386,650 | (21,683,438 | ) | |||||
Class B | ||||||||
| Proceeds from shares sold | 1,384,411 | 340,905 | ||||||
| Reinvestment of distributions | 308,190 | 448,501 | ||||||
| Payments for shares redeemed | (1,250,517 | ) | (824,586 | ) | ||||
| Net increase (decrease) in net assets from Class B share transactions | 442,084 | (35,180 | ) | |||||
| Increase (decrease) in net assets | 266,568,546 | 138,127,109 | ||||||
| Net assets at beginning of period | 866,200,592 | 728,073,483 | ||||||
| Net assets at end of period | $ | 1,132,769,138 | $ | 866,200,592 | ||||
| Other Information | ||||||||
Class A | ||||||||
| Shares outstanding at beginning of period | 25,934,145 | 26,575,319 | ||||||
| Shares sold | 2,030,040 | 1,101,903 | ||||||
| Shares issued to shareholders in reinvestment of distributions | 2,306,462 | 3,253,073 | ||||||
| Shares redeemed | (3,671,135 | ) | (4,996,150 | ) | ||||
| Net increase (decrease) in Class A shares | 665,367 | (641,174 | ) | |||||
| Shares outstanding at end of period | 26,599,512 | 25,934,145 | ||||||
Class B | ||||||||
| Shares outstanding at beginning of period | 127,162 | 127,775 | ||||||
| Shares sold | 39,019 | 11,255 | ||||||
| Shares issued to shareholders in reinvestment of distributions | 10,547 | 15,076 | ||||||
| Shares redeemed | (34,983 | ) | (26,944 | ) | ||||
| Net increase (decrease) in Class B shares | 14,583 | (613 | ) | |||||
| Shares outstanding at end of period | 141,745 | 127,162 | ||||||
The accompanying notes are an integral part of the financial statements.
| 10 | | | Deutsche DWS Variable Series I — DWS Capital Growth VIP |
| DWS Capital Growth VIP — Class A | ||||||||||||||||||||
Years Ended December 31, | ||||||||||||||||||||
2020 | 2019 | 2018 | 2017 | 2016 | ||||||||||||||||
| Selected Per Share Data | ||||||||||||||||||||
| Net asset value, beginning of period | $33.24 | $ | 27.27 | $ | 30.86 | $ | 26.70 | $ | 28.22 | |||||||||||
| Income (loss) from investment operations: | ||||||||||||||||||||
Net investment income (loss)a | .09 | .17 | .14 | .20 | .21 | |||||||||||||||
Net realized and unrealized gain (loss) | 11.69 | 9.53 | (.53 | ) | 6.47 | .83 | ||||||||||||||
Total from investment operations | 11.78 | 9.70 | (.39 | ) | 6.67 | 1.04 | ||||||||||||||
| Less distributions from: | ||||||||||||||||||||
Net investment income | (.18 | ) | (.14 | ) | (.23 | ) | (.22 | ) | (.22 | ) | ||||||||||
Net realized gains | (2.48 | ) | (3.59 | ) | (2.97 | ) | (2.29 | ) | (2.34 | ) | ||||||||||
Total distributions | (2.66 | ) | (3.73 | ) | (3.20 | ) | (2.51 | ) | (2.56 | ) | ||||||||||
| Net asset value, end of period | $42.36 | $ | 33.24 | $ | 27.27 | $ | 30.86 | $ | 26.70 | |||||||||||
| Total Return (%) | 39.04 | 37.14 | (1.60 | ) | 26.30 | 4.25 | ||||||||||||||
| Ratios to Average Net Assets and Supplemental Data | ||||||||||||||||||||
| Net assets, end of period ($ millions) | 1,127 | 862 | 725 | 776 | 745 | |||||||||||||||
| Ratio of expenses (%)b | .49 | .50 | .50 | .50 | .50 | |||||||||||||||
| Ratio of net investment income (loss) (%) | .25 | .55 | .46 | .70 | .82 | |||||||||||||||
| Portfolio turnover rate (%) | 13 | 11 | 26 | 15 | 35 | |||||||||||||||
| a | Based on average shares outstanding during the period. |
| b | Expense ratio does not reflect charges and fees associated with the separate account that invests in the Fund or any variable life insurance policy or variable annuity contract for which the Fund is an investment option. |
| DWS Capital Growth VIP — Class B | ||||||||||||||||||||
Years Ended December 31, | ||||||||||||||||||||
2020 | 2019 | 2018 | 2017 | 2016 | ||||||||||||||||
| Selected Per Share Data | ||||||||||||||||||||
| Net asset value, beginning of period | $33.10 | $ | 27.16 | $ | 30.75 | $ | 26.61 | $ | 28.12 | |||||||||||
| Income (loss) from investment operations: | ||||||||||||||||||||
Net investment income (loss)a | (0.00 | )* | .09 | .07 | .13 | .15 | ||||||||||||||
Net realized and unrealized gain (loss) | 11.66 | 9.49 | (.54 | ) | 6.44 | .83 | ||||||||||||||
Total from investment operations | 11.66 | 9.58 | (.47 | ) | 6.57 | .98 | ||||||||||||||
| Less distributions from: | ||||||||||||||||||||
Net investment income | (.10 | ) | (.05 | ) | (.15 | ) | (.14 | ) | (.15 | ) | ||||||||||
Net realized gains | (2.48 | ) | (3.59 | ) | (2.97 | ) | (2.29 | ) | (2.34 | ) | ||||||||||
Total distributions | (2.58 | ) | (3.64 | ) | (3.12 | ) | (2.43 | ) | (2.49 | ) | ||||||||||
| Net asset value, end of period | $42.18 | $ | 33.10 | $ | 27.16 | $ | 30.75 | $ | 26.61 | |||||||||||
| Total Return (%) | 38.70 | 36.79 | (1.87 | ) | 25.96 | 4.00 | ||||||||||||||
| Ratios to Average Net Assets and Supplemental Data | ||||||||||||||||||||
| Net assets, end of period ($ millions) | 6 | 4 | 3 | 6 | 5 | |||||||||||||||
| Ratio of expenses (%)b | .75 | .76 | .76 | .75 | .76 | |||||||||||||||
| Ratio of net investment income (loss) (%) | (.01 | ) | .29 | .21 | .45 | .58 | ||||||||||||||
| Portfolio turnover rate (%) | 13 | 11 | 26 | 15 | 35 | |||||||||||||||
| a | Based on average shares outstanding during the period. |
| b | Expense ratio does not reflect charges and fees associated with the separate account that invests in the Fund or any variable life insurance policy or variable annuity contract for which the Fund is an investment option. |
| * | Amount is less than $0.005. |
The accompanying notes are an integral part of the financial statements.
Deutsche DWS Variable Series I — DWS Capital Growth VIP | | | 11 |
| Notes to Financial Statements |
A. Organization and Significant Accounting Policies
Deutsche DWS Variable Series I (the “Trust“) is registered under the Investment Company Act of 1940, as amended (the “1940 Act“), as an open-end management investment company organized as a Massachusetts business trust. The Trust consists of five diversified funds: DWS Bond VIP, DWS Capital Growth VIP, DWS Core Equity VIP, DWS CROCI® International VIP and DWS Global Small Cap VIP (individually or collectively hereinafter referred to as a “Fund“ or the “Funds“). These financial statements report on DWS Capital Growth VIP. The Trust is intended to be the underlying investment vehicle for variable annuity contracts and variable life insurance policies to be offered by the separate accounts of certain life insurance companies (“Participating Insurance Companies“).
Multiple Classes of Shares of Beneficial Interest. The Fund offers two classes of shares (Class A shares and Class B shares). Sales of Class B shares are subject to recordkeeping fees of up to 0.15% and Rule 12b-1 fees under the 1940 Act equal to an annual rate of up to 0.25% of the average daily net assets of the Class B shares of the Fund. Class A shares are not subject to such fees.
Investment income, realized and unrealized gains and losses, and certain fund-level expenses and expense reductions, if any, are borne pro rata on the basis of relative net assets by the holders of all classes of shares, except that each class bears certain expenses unique to that class (including the applicable 12b-1 distribution fees and recordkeeping fees). Differences in class-level expenses may result in payment of different per share dividends by class. All shares have equal rights with respect to voting subject to class-specific arrangements.
The Fund’s financial statements are prepared in accordance with accounting principles generally accepted in the United States of America (“U.S. GAAP”) which require the use of management estimates. Actual results could differ from those estimates. The Fund qualifies as an investment company under Topic 946 of Accounting Standards Codification of U.S. GAAP. The policies described below are followed consistently by the Fund in the preparation of its financial statements.
Security Valuation. Investments are stated at value determined as of the close of regular trading on the New York Stock Exchange on each day the exchange is open for trading.
Various inputs are used in determining the value of the Fund’s investments. These inputs are summarized in three broad levels. Level 1 includes quoted prices in active markets for identical securities. Level 2 includes other significant observable inputs (including quoted prices for similar securities, interest rates, prepayment speeds and credit risk). Level 3 includes significant unobservable inputs (including the Fund’s own assumptions in determining the fair value of investments). The level assigned to the securities valuations may not be an indication of the risk or liquidity associated with investing in those securities.
Equity securities are valued at the most recent sale price or official closing price reported on the exchange (U.S. or foreign) or over-the-counter market on which they trade. Securities for which no sales are reported are valued at the calculated mean between the most recent bid and asked quotations on the relevant market or, if a mean cannot be determined, at the most recent bid quotation. Equity securities are generally categorized as Level 1.
Investments in open-end investment companies are valued at their net asset value each business day and are categorized as Level 1.
Securities and other assets for which market quotations are not readily available or for which the above valuation procedures are deemed not to reflect fair value are valued in a manner that is intended to reflect their fair value as determined in accordance with procedures approved by the Trustees and are generally categorized as Level 3. In accordance with the Fund’s valuation procedures, factors considered in determining value may include, but are not limited to, the type of the security; the size of the holding; the initial cost of the security; the existence of any contractual restrictions on the security’s disposition; the price and extent of public trading in similar securities of the issuer or of comparable companies; quotations or evaluated prices from broker-dealers and/or pricing services; information obtained from the issuer, analysts, and/or the appropriate stock exchange (for exchange-traded securities); an analysis of the company’s or issuer’s financial statements; an evaluation of the forces that influence the issuer and the market(s) in which the security is purchased and sold; and with respect to debt securities, the maturity, coupon, creditworthiness, currency denomination and the movement of the market in which the security is normally traded. The value determined under these procedures may differ from published values for the same securities.
| 12 | | | Deutsche DWS Variable Series I — DWS Capital Growth VIP |
Disclosure about the classification of fair value measurements is included in a table following the Fund’s Investment Portfolio.
Securities Lending. Deutsche Bank AG, as lending agent, lends securities of the Fund to certain financial institutions under the terms of its securities lending agreement. During the term of the loans, the Fund continues to receive interest and dividends generated by the securities and to participate in any changes in their market value. The Fund requires the borrowers of the securities to maintain collateral with the Fund consisting of either cash or liquid, unencumbered assets having a value at least equal to the value of the securities loaned. When the collateral falls below specified amounts, the lending agent will use its best effort to obtain additional collateral on the next business day to meet required amounts under the securities lending agreement. During the year ended December 31, 2020, the Fund invested the cash collateral into a joint trading account in DWS Government & Agency Securities Portfolio, an affiliated money market fund managed by DWS Investment Management Americas, Inc. DWS Investment Management Americas, Inc. receives a management/administration fee (0.06% annualized effective rate as of December 31, 2020) on the cash collateral invested in DWS Government & Agency Securities Portfolio. The Fund receives compensation for lending its securities either in the form of fees or by earning interest on invested cash collateral net of borrower rebates and fees paid to a lending agent. Either the Fund or the borrower may terminate the loan at any time and the borrower, after notice, is required to return borrowed securities within a standard time period. There may be risks of delay and costs in recovery of securities or even loss of rights in the collateral should the borrower of the securities fail financially. If the Fund is not able to recover securities lent, the Fund may sell the collateral and purchase a replacement investment in the market, incurring the risk that the value of the replacement security is greater than the value of the collateral. The Fund is also subject to all investment risks associated with the reinvestment of any cash collateral received, including, but not limited to, interest rate, credit and liquidity risk associated with such investments.
As of December 31, 2020, the Fund had securities on loan, which were classified as common stocks in the Investment Portfolio. The value of the related collateral exceeded the value of the securities loaned at period end. As of period end, the remaining contractual maturity of the collateral agreements were overnight and continuous.
Foreign Currency Translations. The books and records of the Fund are maintained in U.S. dollars. Investment securities and other assets and liabilities denominated in a foreign currency are translated into U.S. dollars at the prevailing exchange rates at period end. Purchases and sales of investment securities, income and expenses are translated into U.S. dollars at the prevailing exchange rates on the respective dates of the transactions.
Net realized and unrealized gains and losses on foreign currency transactions represent net gains and losses between trade and settlement dates on securities transactions, the acquisition and disposition of foreign currencies, and the difference between the amount of net investment income accrued and the U.S. dollar amount actually received. The portion of both realized and unrealized gains and losses on investments that results from fluctuations in foreign currency exchange rates is not separately disclosed but is included with net realized and unrealized gain/appreciation and loss/depreciation on investments.
Federal Income Taxes. The Fund is treated as a separate taxpayer as provided for in the Internal Revenue Code, as amended. It is the Fund’s policy to comply with the requirements of the Internal Revenue Code, as amended, which are applicable to regulated investment companies, and to distribute all of its taxable income to the separate accounts of the Participating Insurance Companies which hold its shares.
The Fund has reviewed the tax positions for the open tax years as of December 31, 2020 and has determined that no provision for income tax and/or uncertain tax positions is required in the Fund’s financial statements. The Fund’s federal tax returns for the prior three fiscal years remain open subject to examination by the Internal Revenue Service.
Distribution of Income and Gains. Distributions from net investment income of the Fund, if any, are declared and distributed to shareholders annually. Net realized gains from investment transactions, in excess of available capital loss carryforwards, would be taxable to the Fund if not distributed, and, therefore, will be distributed to shareholders at least annually. The Fund may also make additional distributions for tax purposes if necessary.
The timing and characterization of certain income and capital gain distributions are determined annually in accordance with federal tax regulations, which may differ from accounting principles generally accepted in the United States of America. These differences primarily relate to certain securities sold at a loss. As a result, net investment income (loss) and net realized gain (loss) on investment transactions for a reporting period may differ significantly from distributions during such period. Accordingly, the Fund may periodically
Deutsche DWS Variable Series I — DWS Capital Growth VIP | | | 13 |
make reclassifications among certain of its capital accounts without impacting the net asset value of the Fund.
At December 31, 2020, the Fund’s components of distributable earnings (accumulated losses) on a tax basis are as follows:
| Undistributed ordinary income* | $ | 5,804,483 | ||
| Undistributed net long-term capital gains | $ | 59,400,643 | ||
| Net unrealized appreciation (depreciation) on investments | $ | 726,488,866 |
At December 31, 2020, the aggregate cost of investments for federal income tax purposes was $467,767,697. The net unrealized appreciation for all investments based on tax cost was $726,488,866. This consisted of aggregate gross unrealized appreciation for all investments for which there was an excess of value over tax cost of $727,872,843 and aggregate gross unrealized depreciation for all investments for which there was an excess of tax cost over value of $1,383,977.
In addition, the tax character of distributions paid to shareholders by the Fund is summarized as follows:
| Years Ended December 31, | ||||||||
| 2020 | 2019 | |||||||
| Distributions from ordinary income* | $ | 4,641,322 | $ | 7,032,512 | ||||
| Distributions from long-term capital gains | $ | 63,223,142 | $ | 90,422,637 | ||||
| * | For tax purposes, short-term capital gain distributions are considered ordinary income distributions. |
Expenses. Expenses of the Trust arising in connection with a specific Fund are allocated to that Fund. Other Trust expenses which cannot be directly attributed to a Fund are apportioned among the Funds in the Trust based upon the relative net assets or other appropriate measures.
Contingencies. In the normal course of business, the Fund may enter into contracts with service providers that contain general indemnification clauses. The Fund’s maximum exposure under these arrangements is unknown, as this would involve future claims that may be made against the Fund that have not yet been made. However, based on experience, the Fund expects the risk of loss to be remote.
Real Estate Investment Trusts. The Fund at its fiscal year end recharacterizes distributions received from a Real Estate Investment Trust (“REIT”) investment based on information provided by the REIT into the following categories: ordinary income, long-term and short-term capital gains, and return of capital. If information is not available timely from a REIT, the recharacterization will be estimated for financial statement purposes and a recharacterization will be made within the accounting records in the following year when such information becomes available. Distributions received from REITs in excess of income are recorded as either a reduction of cost of investments or realized gains.
Other. Investment transactions are accounted for on a trade date plus one basis for daily net asset value calculations. However, for financial reporting purposes, investment transactions are reported on trade date. Interest income is recorded on the accrual basis. Dividend income is recorded on the ex-dividend date net of foreign withholding taxes. Realized gains and losses from investment transactions are recorded on an identified cost basis. Proceeds from litigation payments, if any, are included in net realized gain (loss) from investments.
B. Purchases and Sales of Securities
During the year ended December 31, 2020, purchases and sales of investment securities (excluding short-term investments) aggregated $128,069,867 and $172,564,194, respectively.
C. Related Parties
Management Agreement. Under the Investment Management Agreement with DWS Investment Management Americas, Inc. (“DIMA“ or the “Advisor“), an indirect, wholly owned subsidiary of DWS Group GmbH & Co. KGaA (“DWS Group”), the Advisor directs the investments of the Fund in accordance with its investment objectives, policies and restrictions. The Advisor determines the securities, instruments and other contracts relating to investments to be purchased, sold or entered into by the Fund.
| 14 | | | Deutsche DWS Variable Series I — DWS Capital Growth VIP |
Under the Investment Management Agreement with the Advisor, the Fund pays a monthly management fee based on the Fund’s average daily net assets, computed and accrued daily and payable monthly at the following annual rates:
| First $250 million of average daily net assets | .390 | % | ||
| Next $750 million of average daily net assets | .365 | % | ||
| Over $1 billion of average daily net assets | .340 | % |
Accordingly, for the year ended December 31, 2020, the fee pursuant to the Investment Management Agreement was equivalent to an annual rate (exclusive of any applicable waivers/reimbursements) of 0.37% of the Fund’s average daily net assets.
For the period from January 1, 2020 through September 30, 2021, the Advisor has contractually agreed to waive its fees and/or reimburse certain operating expenses to the extent necessary to maintain the total annual operating expenses (excluding certain expenses such as extraordinary expenses, taxes, brokerage and interest expense) of each class as follows:
| Class A | .75 | % | ||
| Class B | 1.00 | % |
Administration Fee. Pursuant to an Administrative Services Agreement, DIMA provides most administrative services to the Fund. Prior to March 1, 2020, for all services provided under the Administrative Services Agreement, the Fund paid the Advisor an annual fee (“Administration Fee“) of 0.10% of the Fund’s average daily net assets, computed and accrued daily and payable monthly. Effective March 1, 2020, for all services provided under the Administrative Services Agreement, the Fund pays the Advisor an annual Administration Fee of 0.097% of the Fund’s average daily net assets, computed and accrued daily and payable monthly. For the year ended December 31, 2020, the Administration Fee was $939,450, of which $91,568 is unpaid.
Service Provider Fees. DWS Service Company (“DSC“), an affiliate of the Advisor, is the transfer agent, dividend-paying agent and shareholder service agent for the Fund. Pursuant to a sub-transfer agency agreement between DSC and DST Systems, Inc. (“DST“), DSC has delegated certain transfer agent, dividend-paying agent and shareholder service agent functions to DST. DSC compensates DST out of the shareholder servicing fee it receives from the Fund. For the year ended December 31, 2020, the amounts charged to the Fund by DSC were as follows:
| Services to Shareholders | Total Aggregated | Unpaid at December 31, 2020 | ||||||
| Class A | $ | 902 | $ | 157 | ||||
| Class B | 239 | 44 | ||||||
| $ | 1,141 | $ | 201 | |||||
Distribution Service Agreement. DWS Distributors, Inc. (“DDI“), also an affiliate of the Advisor, is the Trust’s Distributor. In accordance with the Master Distribution Plan, DDI receives 12b-1 fees of up to 0.25% of the average daily net assets of Class B shares. Pursuant to the Master Distribution Plan, DDI remits these fees to the Participating Insurance Companies for various costs incurred or paid by these companies in connection with marketing and distribution of Class B shares. For the year ended December 31, 2020, the Distribution Service Fee aggregated $11,831, of which $1,248 is unpaid.
Other Service Fees. Under an agreement with the Fund, DIMA is compensated for providing certain pre-press and regulatory filing services to the Fund. For the year ended December 31, 2020, the amount charged to the Fund by DIMA included in the Statement of Operations under “Reports to shareholders“ aggregated $8,936, of which $3,240 is unpaid.
Trustees’ Fees and Expenses. The Fund paid retainer fees to each Trustee not affiliated with the Advisor, plus specified amounts to the Board Chairperson and to each committee Chairperson.
Affiliated Cash Management Vehicles. The Fund may invest uninvested cash balances in DWS Central Cash Management Government Fund and DWS ESG Liquidity Fund, affiliated money market funds which are managed by the Advisor. Each affiliated money market fund is managed in accordance with Rule 2a-7 under the 1940 Act, which governs the quality, maturity, diversity and liquidity of instruments in which a money market fund may invest. DWS Central Cash Management Government Fund seeks to maintain a stable net asset value, and DWS ESG Liquidity Fund maintains a floating net asset value. The Fund indirectly bears its proportionate share of the expenses of each affiliated money market fund in which it invests. DWS Central
Deutsche DWS Variable Series I — DWS Capital Growth VIP | | | 15 |
Cash Management Government Fund does not pay the Advisor an investment management fee. To the extent that DWS ESG Liquidity Fund pays an investment management fee to the Advisor, the Advisor will waive an amount of the investment management fee payable to the Advisor by the Fund equal to the amount of the investment management fee payable on the Fund’s assets invested in DWS ESG Liquidity Fund.
Securities Lending Agent Fees. Deutsche Bank AG serves as lending agent for the Fund. For the year ended December 31, 2020, the Fund incurred securities lending agent fees to Deutsche Bank AG in the amount of $2,174.
D. Ownership of the Fund
At December 31, 2020, two participating insurance companies were owners of record of 10% or more of the total outstanding Class A shares of the Fund, each owning 64% and 20%, respectively. Three participating insurance companies were the owners of record of 10% or more of the total outstanding Class B shares of the Fund, each owning 41%, 27% and 10%, respectively.
E. Line of Credit
The Fund and other affiliated funds (the “Participants”) share in a $350 million revolving credit facility provided by a syndication of banks. The Fund may borrow for temporary or emergency purposes, including the meeting of redemption requests that otherwise might require the untimely disposition of securities. The Participants are charged an annual commitment fee, which is allocated based on net assets, among each of the Participants. Interest is calculated at a rate per annum equal to the sum of the Federal Funds Rate plus 1.25 percent plus if the one-month LIBOR exceeds the Federal Funds Rate, the amount of such excess. The Fund may borrow up to a maximum of 33 percent of its net assets under the agreement. The Fund had no outstanding loans at December 31, 2020.
F. Other — COVID-19 Pandemic
A novel coronavirus known as COVID-19, declared a pandemic by the World Health Organization, has caused significant uncertainty, market volatility, decreased economic and other activity and increased government activity. Specifically, COVID-19 has led to significant death and morbidity, and concerns about its further spread have resulted in the closing of schools and non-essential businesses, cancellations, shelter-in place orders, lower consumer spending in certain sectors, social distancing, bans on large social gatherings and travel, quarantines, government economic stimulus measures, reduced productivity, rapid increases in unemployment, increased demand for and strain on government and medical resources, border closings and global trade and supply chain interruptions, among others. The full effects, duration and costs of the COVID-19 pandemic are impossible to predict, and the circumstances surrounding the COVID-19 pandemic will continue to evolve. The pandemic may affect certain countries, industries, economic sectors, companies and investment products more than others, may exacerbate existing economic, political, or social tensions and may increase the probability of an economic recession or depression. The Fund and its investments may be adversely affected by the effects of the COVID-19 pandemic, and a prolonged pandemic may result in the Fund and its service providers experiencing operational difficulties in coordinating a remote workforce and implementing their business continuity plans, among others. Management will continue to monitor the impact COVID-19 has on the Fund and reflect the consequences as appropriate in the Fund’s accounting and financial reporting.
| 16 | | | Deutsche DWS Variable Series I — DWS Capital Growth VIP |
Report of Independent Registered Public Accounting Firm
To the Board of Trustees of Deutsche DWS Variable Series I and Shareholders of DWS Capital Growth VIP:
Opinion on the Financial Statements
We have audited the accompanying statement of assets and liabilities of DWS Capital Growth VIP (the “Fund”) (one of the funds constituting Deutsche DWS Variable Series I) (the “Trust”), including the investment portfolio, as of December 31, 2020, and the related statement of operations for the year then ended, the statements of changes in net assets and the financial highlights for each of the two years in the period then ended and the related notes (collectively referred to as the “financial statements”). In our opinion, the financial statements present fairly, in all material respects, the financial position of the Fund (one of the funds constituting Deutsche DWS Variable Series I) at December 31, 2020, the results of its operations for the year then ended, the changes in its net assets and its financial highlights for each of the two years in the period then ended, in conformity with U.S. generally accepted accounting principles.
The financial highlights for the years ended December 31, 2016, December 31, 2017 and December 31, 2018, were audited by another independent registered public accounting firm whose report, dated February 14, 2019, expressed an unqualified opinion on those financial highlights.
Basis for Opinion
These financial statements are the responsibility of the Trust’s management. Our responsibility is to express an opinion on the Fund’s financial statements based on our audits. We are a public accounting firm registered with the Public Company Accounting Oversight Board (United States) (“PCAOB”) and are required to be independent with respect to the Trust in accordance with the U.S. federal securities laws and the applicable rules and regulations of the Securities and Exchange Commission and the PCAOB.
We conducted our audits in accordance with the standards of the PCAOB. Those standards require that we plan and perform the audit to obtain reasonable assurance about whether the financial statements are free of material misstatement, whether due to error or fraud. The Trust is not required to have, nor were we engaged to perform, an audit of the Trust’s internal control over financial reporting. As part of our audits, we are required to obtain an understanding of internal control over financial reporting, but not for the purpose of expressing an opinion on the effectiveness of the Trust’s internal control over financial reporting. Accordingly, we express no such opinion.
Our audits included performing procedures to assess the risks of material misstatement of the financial statements, whether due to error or fraud, and performing procedures that respond to those risks. Such procedures included examining, on a test basis, evidence regarding the amounts and disclosures in the financial statements. Our procedures included confirmation of securities owned as of December 31, 2020, by correspondence with the custodian and others. Our audits also included evaluating the accounting principles used and significant estimates made by management, as well as evaluating the overall presentation of the financial statements. We believe that our audits provide a reasonable basis for our opinion.

We have served as the auditor of one or more investment companies in the DWS family of funds since at least 1979, but we are unable to determine the specific year.
Boston, Massachusetts
February 12, 2021
Deutsche DWS Variable Series I — DWS Capital Growth VIP | | | 17 |
| Information About Your Fund’s Expenses | (Unaudited) |
As an investor of the Fund, you incur two types of costs: ongoing expenses and transaction costs. Ongoing expenses include management fees, distribution and service (12b-1) fees and other Fund expenses. Examples of transaction costs include contract charges, which are not shown in this section. The following tables are intended to help you understand your ongoing expenses (in dollars) of investing in the Fund and to help you compare these expenses with the ongoing expenses of investing in other mutual funds. The example in the table is based on an investment of $1,000 invested at the beginning of the six-month period and held for the entire period (July 1, 2020 to December 31, 2020).
The tables illustrate your Fund’s expenses in two ways:
| – | Actual Fund Return. This helps you estimate the actual dollar amount of ongoing expenses (but not transaction costs) paid on a $1,000 investment in the Fund using the Fund’s actual return during the period. To estimate the expenses you paid over the period, simply divide your account value by $1,000 (for example, an $8,600 account value divided by $1,000 = 8.6), then multiply the result by the number in the “Expenses Paid per $1,000” line under the share class you hold. |
| – | Hypothetical 5% Fund Return. This helps you to compare your Fund’s ongoing expenses (but not transaction costs) with those of other mutual funds using the Fund’s actual expense ratio and a hypothetical rate of return of 5% per year before expenses. Examples using a 5% hypothetical Fund return may be found in the shareholder reports of other mutual funds. The hypothetical account values and expenses may not be used to estimate the actual ending account balance or expenses you paid for the period. |
Please note that the expenses shown in these tables are meant to highlight your ongoing expenses only and do not reflect any transaction costs. The “Expenses Paid per $1,000” line of the tables is useful in comparing ongoing expenses only and will not help you determine the relative total expense of owning different funds. If these transaction costs had been included, your costs would have been higher.
| Expenses and Value of a $1,000 Investment for the six months ended December 31, 2020 | ||||||||
| Actual Fund Return | Class A | Class B | ||||||
| Beginning Account Value 7/1/2020 | $ | 1,000.00 | $ | 1,000.00 | ||||
| Ending Account Value 12/31/20 | $ | 1,227.50 | $ | 1,225.80 | ||||
| Expenses Paid per $1,000* | $ | 2.74 | $ | 4.20 | ||||
| Hypothetical 5% Fund Return | Class A | Class B | ||||||
| Beginning Account Value 7/1/20 | $ | 1,000.00 | $ | 1,000.00 | ||||
| Ending Account Value 12/31/20 | $ | 1,022.67 | $ | 1,021.37 | ||||
| Expenses Paid per $1,000* | $ | 2.49 | $ | 3.81 | ||||
| * | Expenses are equal to the Fund’s annualized expense ratio for each share class, multiplied by the average account value over the period, multiplied by 184 (the number of days in the most recent six-month period), then divided by 366. |
| Annualized Expense Ratios | Class A | Class B | ||||||
| Deutsche DWS Variable Series I — DWS Capital Growth VIP | .49 | % | .75 | % | ||||
For more information, please refer to the Fund’s prospectus.
These tables do not reflect charges and fees (“contract charges”) associated with the separate account that invests in the Fund or any variable life insurance policy or variable annuity contract for which the Fund is an investment option.
For an analysis of the fees associated with an investment in the Fund or similar funds, please refer to the current and hypothetical expense calculators for Variable Insurance Products which can be found at dws.com/calculators.
| 18 | | | Deutsche DWS Variable Series I — DWS Capital Growth VIP |
| Tax Information | (Unaudited) |
The Fund paid distributions of $2.48 per share from net long-term capital gains during its year ended December 31, 2020.
Pursuant to Section 852 of the Internal Revenue Code, the Fund designates $65,406,000 as capital gain dividends for its year ended December 31, 2020.
For corporate shareholders, 100% of the ordinary dividends (i.e., income dividends plus short-term capital gains) paid during the Fund’s fiscal year ended December 31, 2020 qualified for the dividends received deduction.
Please consult a tax advisor if you have questions about federal or state income tax laws, or on how to prepare your tax returns. If you have specific questions about your account, please contact your insurance provider.
The Trust’s policies and procedures for voting proxies for portfolio securities and information about how the Trust voted proxies related to its portfolio securities during the most recent 12-month period ended June 30 are available on our Web site — dws.com/en-us/resources/proxy-voting — or on the SEC’s Web site — sec.gov. To obtain a written copy of the Trust’s policies and procedures without charge, upon request, call us toll free at (800) 728-3337.
Deutsche DWS Variable Series I — DWS Capital Growth VIP | | | 19 |
Advisory Agreement Board Considerations and Fee Evaluation
The Board of Trustees (hereinafter referred to as the “Board” or “Trustees”) approved the renewal of DWS Capital Growth VIP’s (the “Fund”) investment management agreement (the “Agreement”) with DWS Investment Management Americas, Inc. (“DIMA”) in September 2020.
In terms of the process that the Board followed prior to approving the Agreement, shareholders should know that:
| – | During the entire process, all of the Fund’s Trustees were independent of DIMA and its affiliates (the “Independent Trustees”). |
| – | The Board met frequently during the past year to discuss fund matters and dedicated a substantial amount of time to contract review matters. Over the course of several months, the Board reviewed extensive materials received from DIMA, independent third parties and independent counsel. These materials included an analysis of the Fund’s performance, fees and expenses, and profitability from a fee consultant retained by the Fund’s Independent Trustees (the “Fee Consultant”). |
| – | The Board also received extensive information throughout the year regarding performance of the Fund. |
| – | The Independent Trustees regularly met privately with counsel to discuss contract review and other matters. In addition, the Independent Trustees were advised by the Fee Consultant in the course of their review of the Fund’s contractual arrangements and considered a comprehensive report prepared by the Fee Consultant in connection with their deliberations. |
| – | In connection with reviewing the Agreement, the Board also reviewed the terms of the Fund’s Rule 12b-1 plan, distribution agreement, administrative services agreement, transfer agency agreement and other material service agreements. |
In connection with the contract review process, the Board considered the factors discussed below, among others. The Board also considered that DIMA and its predecessors have managed the Fund since its inception, and the Board believes that a long-term relationship with a capable, conscientious advisor is in the best interests of the Fund. The Board considered, generally, that shareholders chose to invest or remain invested in the Fund knowing that DIMA managed the Fund. DIMA is part of DWS Group GmbH & Co. KGaA (“DWS Group”). DWS Group is a global asset management business that offers a wide range of investing expertise and resources, including research capabilities in many countries throughout the world. In 2018, approximately 20% of DWS Group’s shares were sold in an initial public offering, with Deutsche Bank AG owning the remaining shares.
As part of the contract review process, the Board carefully considered the fees and expenses of each DWS fund overseen by the Board in light of the fund’s performance. In many cases, this led to the negotiation and implementation of expense caps.
While shareholders may focus primarily on fund performance and fees, the Fund’s Board considers these and many other factors, including the quality and integrity of DIMA’s personnel and administrative support services provided by DIMA, such as back-office operations, fund valuations, and compliance policies and procedures.
Nature, Quality and Extent of Services. The Board considered the terms of the Agreement, including the scope of advisory services provided under the Agreement. The Board noted that, under the Agreement, DIMA provides portfolio management services to the Fund and that, pursuant to a separate administrative services agreement, DIMA provides administrative services to the Fund. The Board considered the experience and skills of senior management and investment personnel and the resources made available to such personnel. The Board also considered the risks to DIMA in sponsoring or managing the Fund, including financial, operational and reputational risks, the potential economic impact to DIMA from such risks and DIMA’s approach to addressing such risks. The Board reviewed the Fund’s performance over short-term and long-term periods and compared those returns to various agreed-upon performance measures, including market index(es) and a peer universe compiled using information supplied by Morningstar Direct (“Morningstar”), an independent fund data service. The Board also noted that it has put into place a process of identifying “Funds in Review” (e.g., funds performing poorly relative to a peer universe), and receives additional reporting from DIMA regarding such funds and, where appropriate, DIMA’s plans to address underperformance. The Board believes this process is an effective manner of identifying and addressing underperforming funds. Based on the information provided, the Board noted that, for the one-, three- and five-year periods ended December 31, 2019, the Fund’s performance (Class A shares) was in the 1st quartile,
| 20 | | | Deutsche DWS Variable Series I — DWS Capital Growth VIP |
3rd quartile and 2nd quartile, respectively, of the applicable Morningstar universe (the 1st quartile being the best performers and the 4th quartile being the worst performers). The Board also observed that the Fund has outperformed its benchmark in the one-year period and has underperformed its benchmark in the three- and five-year periods ended December 31, 2019.
Fees and Expenses. The Board considered the Fund’s investment management fee schedule, operating expenses and total expense ratios, and comparative information provided by Broadridge Financial Solutions, Inc. (“Broadridge”) and the Fee Consultant regarding investment management fee rates paid to other investment advisors by similar funds (1st quartile being the most favorable and 4th quartile being the least favorable). With respect to management fees paid to other investment advisors by similar funds, the Board noted that the contractual fee rates paid by the Fund, which include a 0.10% fee paid to DIMA under the Fund’s administrative services agreement, were lower than the median (1st quartile) of the applicable Broadridge peer group (based on Broadridge data provided as of December 31, 2019). The Board noted that, effective March 1, 2020, the fee paid to DIMA under the Fund’s administrative services agreement was reduced to 0.097%. The Board noted that the Fund’s Class A shares total (net) operating expenses were expected to be lower than the median (1st quartile) of the applicable Broadridge expense universe (based on Broadridge data provided as of December 31, 2019, and analyzing Broadridge expense universe Class A (net) expenses less any applicable 12b-1 fees) (“Broadridge Universe Expenses”). The Board also reviewed data comparing each other operational share class’s total (net) operating expenses to the applicable Broadridge Universe Expenses. The Board noted that the expense limitations agreed to by DIMA were expected to help the Fund’s total (net) operating expenses remain competitive. The Board considered the Fund’s management fee rate as compared to fees charged by DIMA to comparable DWS U.S. registered funds (“DWS Funds”) and considered differences between the Fund and the comparable DWS Funds. The information requested by the Board as part of its review of fees and expenses also included information about institutional accounts (including any sub-advised funds and accounts) and funds offered primarily to European investors (“DWS Europe Funds”) managed by DWS Group. The Board noted that DIMA indicated that DWS Group does not manage any institutional accounts or DWS Europe Funds comparable to the Fund.
On the basis of the information provided, the Board concluded that management fees were reasonable and appropriate in light of the nature, quality and extent of services provided by DIMA.
Profitability. The Board reviewed detailed information regarding revenues received by DIMA under the Agreement. The Board considered the estimated costs to DIMA, and pre-tax profits realized by DIMA, from advising the DWS Funds, as well as estimates of the pre-tax profits attributable to managing the Fund in particular. The Board also received information regarding the estimated enterprise-wide profitability of DIMA and its affiliates with respect to all fund services in totality and by fund. The Board and the Fee Consultant reviewed DIMA’s methodology in allocating its costs to the management of the Fund. Based on the information provided, the Board concluded that the pre-tax profits realized by DIMA in connection with the management of the Fund were not unreasonable. The Board also reviewed certain publicly available information regarding the profitability of certain similar investment management firms. The Board noted that, while information regarding the profitability of such firms is limited (and in some cases is not necessarily prepared on a comparable basis), DIMA and its affiliates’ overall profitability with respect to the DWS Funds (after taking into account distribution and other services provided to the funds by DIMA and its affiliates) was lower than the overall profitability levels of most comparable firms for which such data was available.
Economies of Scale. The Board considered whether there are economies of scale with respect to the management of the Fund and whether the Fund benefits from any economies of scale. The Board noted that the Fund’s investment management fee schedule includes fee breakpoints. The Board concluded that the Fund’s fee schedule represents an appropriate sharing between the Fund and DIMA of such economies of scale as may exist in the management of the Fund at current asset levels.
Other Benefits to DIMA and Its Affiliates. The Board also considered the character and amount of other incidental or “fall-out” benefits received by DIMA and its affiliates, including any fees received by DIMA for administrative services provided to the Fund, any fees received by an affiliate of DIMA for transfer agency services provided to the Fund and any fees received by an affiliate of DIMA for distribution services. The Board also considered benefits to DIMA related to brokerage and soft-dollar allocations, including allocating brokerage to pay for research generated by parties other than the executing broker dealers, which pertain primarily to funds investing in equity securities. In addition, the Board considered the incidental public relations benefits to DIMA related to DWS Funds advertising and cross-selling opportunities among DIMA products and services. The Board considered these benefits in reaching its conclusion that the Fund’s management fees were reasonable.
Deutsche DWS Variable Series I — DWS Capital Growth VIP | | | 21 |
Compliance. The Board considered the significant attention and resources dedicated by DIMA to its compliance processes in recent years. The Board noted in particular (i) the experience, seniority and time commitment of the individuals serving as DIMA’s and the Fund’s chief compliance officers and (ii) the substantial commitment of resources by DIMA and its affiliates to compliance matters, including the retention of compliance personnel.
The Board also considered that on September 24, 2020, the SEC granted a temporary order permitting DIMA and its affiliates to continue providing investment advisory and underwriting services to the DWS Funds notwithstanding a consent order entered into by Deutsche Bank AG on June 17, 2020 (the “Consent Order”). The Board noted that the temporary order was granted effective as of the date of the Consent Order. The Board also noted various representations by DIMA to the Board relating to the Consent Order, including that the conduct giving rise to the Consent Order (unintentional conduct that resulted from a system outage that prevented Deutsche Bank AG from reporting data in accordance with applicable CFTC requirements for five days in April 2016) did not involve any DWS Fund or services DIMA and its affiliates provide to the DWS Funds, that DIMA and its personnel had no involvement in the alleged conduct giving rise to the Consent Order, and that the DWS Funds would not bear any financial impact or costs relating to the Consent Order.
Based on all of the information considered and the conclusions reached, the Board determined that the continuation of the Agreement is in the best interests of the Fund. In making this determination, the Board did not give particular weight to any single factor identified above. The Board considered these factors over the course of numerous meetings, certain of which were in executive session with only the Independent Trustees and counsel present. It is possible that individual Independent Trustees may have weighed these factors differently in reaching their individual decisions to approve the continuation of the Agreement.
| 22 | | | Deutsche DWS Variable Series I — DWS Capital Growth VIP |
The following table presents certain information regarding the Board Members and Officers of the Trust/Corporation. Each Board Member’s year of birth is set forth in parentheses after his or her name. Unless otherwise noted, (i) each Board Member has engaged in the principal occupation(s) noted in the table for at least the most recent five years, although not necessarily in the same capacity; and (ii) the address of each Independent Board Member is Keith R. Fox, DWS Funds Board Chair, c/o Thomas R. Hiller, Ropes & Gray LLP, Prudential Tower, 800 Boylston Street, Boston, MA 02199-3600. Except as otherwise noted below, the term of office for each Board Member is until the election and qualification of a successor, or until such Board Member sooner dies, resigns, is removed or as otherwise provided in the governing documents of the Trust/Corporation. Because the Fund does not hold an annual meeting of shareholders, each Board Member will hold office for an indeterminate period.
The Board Members may also serve in similar capacities with other funds in the fund complex. The number of funds in the DWS fund complex shown in the table below includes all registered open- and closed-end funds (including all of their portfolios) advised by the Advisor and any registered funds that have an investment advisor that is an affiliated person of the Advisor.
| Independent Board Members | ||||||||
| Name, Year of Birth, Position with the Trust/ Corporation and Length of Time Served1 | Business Experience and Directorships During the Past Five Years | Number of Funds in DWS Fund Complex Overseen | Other Directorships Held by Board Member | |||||
Keith R. Fox, CFA (1954)
Chairperson since 2017, and Board Member since 1996 | Managing General Partner, Exeter Capital Partners (a series of private investment funds) (since 1986). Directorships: Progressive International Corporation (kitchen goods importer and distributor); former Chairman, National Association of Small Business Investment Companies; former Directorships: ICI Mutual Insurance Company; BoxTop Media Inc. (advertising); Sun Capital Advisers Trust (mutual funds) (2011–2012) | 73 | — | |||||
John W. Ballantine (1946)
Board Member since 1999 | Retired; formerly, Executive Vice President and Chief Risk Management Officer, First Chicago NBD Corporation/The First National Bank of Chicago (1996–1998); Executive Vice President and Head of International Banking (1995–1996); former Directorships: Director and Chairman of the Board, Healthways, Inc.2 (population well-being and wellness services) (2003–2014); Stockwell Capital Investments PLC (private equity); Enron Corporation; FNB Corporation; Tokheim Corporation; First Oak Brook Bancshares, Inc.; Oak Brook Bank; and Prisma Energy International. Not-for-Profit Director/Trustee: Palm Beach Civic Association; Window to the World Communications (public media); Life Director of Harris Theater for Music and Dance (Chicago); Life Director of Hubbard Street Dance Chicago; former Not-for-Profit Directorships: Public Radio International | 73 | Portland General Electric2 (utility company) (2003– present) | |||||
Dawn-Marie Driscoll (1946)
Board Member since 1987 | Emeritus Executive Fellow, Center for Business Ethics, Bentley University; formerly: Partner, Palmer & Dodge (law firm) (1988–1990); Vice President of Corporate Affairs and General Counsel, Filene’s (retail) (1978–1988). Directorships: Advisory Board, Center for Business Ethics, Bentley University; Trustee and former Chairman of the Board, Southwest Florida Community Foundation (charitable organization); former Directorships: ICI Mutual Insurance Company (2007–2015); Sun Capital Advisers Trust (mutual funds) (2007–2012), Investment Company Institute (audit, executive, nominating committees) and Independent Directors Council (governance, executive committees) | 73 | — | |||||
Richard J. Herring (1946)
Board Member since 1990 | Jacob Safra Professor of International Banking and Professor of Finance, The Wharton School, University of Pennsylvania (since July 1972); Director, The Wharton Financial Institutions Center (since 1994); formerly: Vice Dean and Director, Wharton Undergraduate Division (1995–2000) and Director, The Lauder Institute of International Management Studies (2000–2006); Member FDIC Systemic Risk Advisory Committee since 2011, member Systemic Risk Council since 2012 and member of the Advisory Board at the Yale Program on Financial Stability since 2013; Formerly Co-Chair of the Shadow Financial Regulatory Committee (2003–2015), Executive Director of The Financial Economists Roundtable (2008–2015), Director of The Thai Capital Fund (2007–2013), Director of The Aberdeen Singapore Fund (2007–2018), and Nonexecutive Director of Barclays Bank DE (2010–2018) | 73 | Director, Aberdeen Japan Fund (since 2007) | |||||
William McClayton (1944)
Board Member since 2004 | Private equity investor (since October 2009); previously, Managing Director, Diamond Management & Technology Consultants, Inc. (global consulting firm) (2001–2009); Directorship: Board of Managers, YMCA of Metropolitan Chicago; formerly: Senior Partner, Arthur Andersen LLP (accounting) (1966–2001); Trustee, Ravinia Festival | 73 | — | |||||
Deutsche DWS Variable Series I — DWS Capital Growth VIP | | | 23 |
| Name, Year of Birth, Position with the Trust/ Corporation and Length of Time Served1 | Business Experience and Directorships During the Past Five Years | Number of Funds in DWS Fund Complex Overseen | Other Directorships Held by Board Member | |||||
Rebecca W. Rimel (1951)
Board Member since 1995 | Senior Advisor, The Pew Charitable Trusts (charitable organization) (since July 2020); formerly: Executive Vice President, The Glenmede Trust Company (investment trust and wealth management) (1983–2004); Board Member, Investor Education (charitable organization) (2004–2005); Trustee, Executive Committee, Philadelphia Chamber of Commerce (2001–2007); Director, Viasys Health Care2 (January 2007–June 2007); Trustee, Thomas Jefferson Foundation (charitable organization) (1994–2012); President, Chief Executive Officer and Director, The Pew Charitable Trusts (charitable organization) (1994–2020) | 73 | Director, Becton Dickinson and Company2 (medical technology company) (2012– present); Director, BioTelemetry Inc.2 (health care) (2009– present) | |||||
William N. Searcy, Jr. (1946)
Board Member since 1993 | Private investor since October 2003; formerly: Pension & Savings Trust Officer, Sprint Corporation2 (telecommunications) (November 1989–September 2003); Trustee, Sun Capital Advisers Trust (mutual funds) (1998–2012) | 73 | — | |||||
| Officers4 | ||
| Name, Year of Birth, Position with the Trust/ Corporation and Length of Time Served5 | Business Experience and Directorships During the Past Five Years | |
Hepsen Uzcan6 (1974)
President and Chief Executive Officer, 2017–present | Managing Director3, DWS; Secretary, DWS USA Corporation (2018–present); Assistant Secretary, DWS Distributors, Inc. (2018–present); Director and Vice President, DWS Service Company (2018–present); Assistant Secretary, DWS Investment Management Americas, Inc. (2018–present); Director and President, DB Investment Managers, Inc. (2018–present); President and Chief Executive Officer, The European Equity Fund, Inc., The New Germany Fund, Inc. and The Central and Eastern Europe Fund, Inc. (2017–present); formerly: Vice President for the Deutsche funds (2016–2017); Assistant Secretary for the DWS funds (2013–2019); Assistant Secretary, The European Equity Fund, Inc., The New Germany Fund, Inc. and The Central and Eastern Europe Fund, Inc. (2013–2020); Directorships: Interested Director, The European Equity Fund, Inc., The New Germany Fund, Inc. and The Central and Eastern Europe Fund, Inc. (since June 25, 2020); ICI Mutual Insurance Company (since October 16, 2020); and Episcopalian Charities of New York (2018–present) | |
John Millette7 (1962)
Vice President and Secretary, 1999–present | Director,3 DWS; Chief Legal Officer, DWS Investment Management Americas, Inc. (2015–present); Director and Vice President, DWS Trust Company (2016–present); Secretary, DBX ETF Trust (2020–present); Secretary, The European Equity Fund, Inc., The New Germany Fund, Inc. and The Central and Eastern Europe Fund, Inc. (2011–present); formerly: Secretary, Deutsche Investment Management Americas Inc. (2015–2017); Assistant Secretary, DBX ETF Trust (2019–2020); Assistant Secretary (July 14, 2006–December 31, 2010) and Secretary (January 31, 2006–July 13, 2006), The European Equity Fund, Inc., The New Germany Fund, Inc. and The Central and Eastern Europe Fund, Inc. | |
Ciara Crawford8 (1984)
Assistant Secretary, (2019–present) | Associate, DWS (since 2015); previously, Legal Assistant at Accelerated Tax Solutions. | |
Diane Kenneally7 (1966)
Chief Financial Officer and Treasurer, 2018–present | Director,3 DWS; Treasurer, Chief Financial Officer and Controller, DBX ETF Trust (2019–present); Treasurer and Chief Financial Officer, The European Equity Fund, Inc., The New Germany Fund, Inc. and The Central and Eastern Europe Fund, Inc. (2018–present); formerly: Assistant Treasurer for the DWS funds (2007–2018) | |
Paul Antosca7 (1957)
Assistant Treasurer, 2007–present | Director,3 DWS; and Assistant Treasurer, DBX ETF Trust (2019–present) | |
Sheila Cadogan7 (1966)
Assistant Treasurer, 2017–present | Director,3 DWS; Director and Vice President, DWS Trust Company (2018–present); Assistant Treasurer, DBX ETF Trust (2019–present); Assistant Treasurer, The European Equity Fund, Inc., The New Germany Fund, Inc. and The Central and Eastern Europe Fund, Inc. (2018–present) | |
Scott D. Hogan7 (1970)
Chief Compliance Officer, 2016–present | Director,3 DWS; Chief Compliance Officer, The European Equity Fund, Inc., The New Germany Fund, Inc. and The Central and Eastern Europe Fund, Inc. (2016–present) | |
Caroline Pearson7 (1962)
Chief Legal Officer, 2010–present | Managing Director3, DWS; Assistant Secretary, DBX ETF Trust (2020–present); Chief Legal Officer, DBX Advisors LLC and DBX Strategic Advisors LLC (2020–present); Chief Legal Officer, The European Equity Fund, Inc., The New Germany Fund, Inc. and The Central and Eastern Europe Fund, Inc. (2012–present); formerly: Secretary, Deutsche AM Distributors, Inc. (2002–2017); and Secretary, Deutsche AM Service Company (2010–2017) |
| 24 | | | Deutsche DWS Variable Series I — DWS Capital Growth VIP |
| Name, Year of Birth, Position with the Trust/ Corporation and Length of Time Served5 | Business Experience and Directorships During the Past Five Years | |
Michelle Goveia-Pine6 (1970)
Interim Anti-Money Laundering Compliance Officer, since July 10, 2020 | Director,3 DWS; Interim AML Officer, DWS Trust Company (since July 28, 2020); Interim AML Officer, DBX ETF Trust (since July 9, 2020); Interim AML Officer, The European Equity Fund, Inc., The New Germany Fund, Inc. and The Central and Eastern Europe Fund, Inc. (since July 24, 2020) |
| 1 | The length of time served represents the year in which the Board Member joined the board of one or more DWS funds currently overseen by the Board. |
| 2 | A publicly held company with securities registered pursuant to Section 12 of the Securities Exchange Act of 1934. |
| 3 | Executive title, not a board directorship. |
| 4 | As a result of their respective positions held with the Advisor or its affiliates, these individuals are considered “interested persons” of the Advisor within the meaning of the 1940 Act. Interested persons receive no compensation from the Fund. |
| 5 | The length of time served represents the year in which the officer was first elected in such capacity for one or more DWS funds. |
| 6 | Address: 875 Third Avenue, New York, NY 10022. |
| 7 | Address: 100 Summer Street, Boston, MA 02110. |
| 8 | Address: 5022 Gate Parkway, Suite 400, Jacksonville, FL 32256. |
The Fund’s Statement of Additional Information (“SAI”) includes additional information about the Board Members. The SAI is available, without charge, upon request. If you would like to request a copy of the SAI, you may do so by calling the following toll-free number: (800) 728-3337.
Deutsche DWS Variable Series I — DWS Capital Growth VIP | | | 25 |
Notes
Notes
| ||
VS1capgro-2 (R-025820-10 2/21) |
December 31, 2020
Annual Report
Deutsche DWS Variable Series I
DWS Core Equity VIP

| 3 | Performance Summary | |||
| 4 | Management Summary | |||
| 6 | Portfolio Summary | |||
| 7 | Investment Portfolio | |||
| 10 | Statement of Assets and Liabilities | |||
| 10 | Statement of Operations | |||
| 11 | Statements of Changes in Net Assets | |||
| 12 | Financial Highlights | |||
| 13 | Notes to Financial Statements | |||
| 18 | Report of Independent Registered Public Accounting Firm | |||
| 19 | Information About Your Fund’s Expenses | |||
| 20 | Tax Information | |||
| 20 | Proxy Voting | |||
| 21 | Advisory Agreement Board Considerations and Fee Evaluation | |||
| 24 | Board Members and Officers |
This report must be preceded or accompanied by a prospectus. To obtain an additional prospectus or summary prospectus, if available, call (800) 728-3337 or your financial representative. We advise you to consider the Fund’s objectives, risks, charges and expenses carefully before investing. The summary prospectus and prospectus contain this and other important information about the Fund. Please read the prospectus carefully before you invest.
Stocks may decline in value. Fund management could be wrong in its analysis of industries, companies, economic trends and favor a security that underperforms the market. The Fund may lend securities to approved institutions. Investing in derivatives entails special risks relating to liquidity, leverage and credit that may reduce returns and/or increase volatility. Please read the prospectus for details.
War, terrorism, economic uncertainty, trade disputes, public health crises (including the recent pandemic spread of the novel coronavirus) and related geopolitical events could lead to increased market volatility, disruption to U.S. and world economies and markets and may have significant adverse effects on the Fund and its investments.
The brand DWS represents DWS Group GmbH & Co. KGaA and any of its subsidiaries such as DWS Distributors, Inc. which offers investment products or DWS Investment Management Americas, Inc. and RREEF America L.L.C. which offer advisory services.
DWS Distributors, Inc., 222 South Riverside Plaza, Chicago, IL 60606, (800) 621-1148
NOT FDIC/NCUA INSURED NO BANK GUARANTEE MAY LOSE VALUE NOT A DEPOSIT NOT INSURED BY ANY FEDERAL GOVERNMENT AGENCY
| 2 | | | Deutsche DWS Variable Series I — DWS Core Equity VIP |
| Performance Summary | December 31 (Unaudited) |
Fund performance shown is historical, assumes reinvestment of all dividend and capital gain distributions, and does not guarantee future results. Investment return and principal value fluctuate with changing market conditions so that, when redeemed, shares may be worth more or less than their original cost. Current performance may be lower or higher than the performance data quoted. Please contact your participating insurance company for the Fund’s most recent month-end performance. Performance does not reflect charges and fees (“contract charges”) associated with the separate account that invests in the Fund or any variable life insurance policy or variable annuity contract for which the Fund is an investment option. These charges and fees will reduce returns. While all share classes have the same underlying portfolio, their performance will differ.
The gross expense ratios of the Fund, as stated in the fee table of the prospectus dated May 1, 2020 are 0.62% and 0.94% for Class A and Class B shares, respectively, and may differ from the expense ratios disclosed in the Financial Highlights tables in this report.
Generally accepted accounting principles require adjustments to be made to the net assets of the Fund at period end for financial reporting purposes only, and as such, the total return based on the unadjusted net asset value per share may differ from the total return reported in the financial highlights.
Growth of an Assumed $10,000 Investment
| The Russell 1000 Index is an unmanaged index that measures the performance of the 1,000 largest companies in the Russell 3000® Index, which represents approximately 92% of the total market capitalization of the Russell 3000 Index.
Index returns do not reflect any fees or expenses and it is not possible to invest directly into an index. |
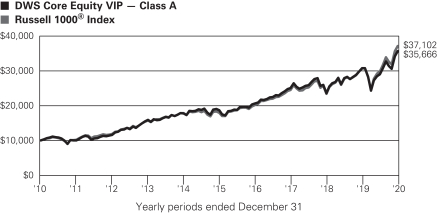
| Comparative Results | ||||||||||
| DWS Core Equity VIP | 1-Year | 3-Year | 5-Year | 10-Year | ||||||
| Class A | Growth of $10,000 | $11,613 | $14,272 | $19,082 | $35,666 | |||||
| Average annual total return | 16.13% | 12.59% | 13.80% | 13.56% | ||||||
| Russell 1000 Index | Growth of $10,000 | $12,096 | $15,137 | $20,640 | $37,102 | |||||
| Average annual total return | 20.96% | 14.82% | 15.60% | 14.01% | ||||||
| DWS Core Equity VIP | 1-Year | 3-Year | 5-Year | 10-Year | ||||||
| Class B | Growth of $10,000 | $11,567 | $14,122 | $18,791 | $34,646 | |||||
| Average annual total return | 15.67% | 12.19% | 13.45% | 13.23% | ||||||
| Russell 1000 Index | Growth of $10,000 | $12,096 | $15,137 | $20,640 | $37,102 | |||||
| Average annual total return | 20.96% | 14.82% | 15.60% | 14.01% | ||||||
The growth of $10,000 is cumulative.
Deutsche DWS Variable Series I — DWS Core Equity VIP | | | 3 |
| Management Summary | December 31, 2020 (Unaudited) |
Despite the sharp sell-off that accompanied the emergence of COVID-19 in the first quarter of 2020, the Russell 1000 Index posted a strong gain of 20.96% in 2020. The highly accommodative nature of U.S. Federal Reserve policy, highlighted by the decision to cut short-term interest rates near zero in March, was the key driver of the rally. In addition, investors were cheered by a stronger-than-expected recovery in economic growth in the second half of the year.
The Fund returned 16.13% (Class A shares, unadjusted for contract charges), underperforming the index. The Fund’s modest tilts toward value stocks and companies on the smaller end of the index’s capitalization range were the primary reasons for its underperformance. As part of our portfolio construction process, we put constraints on these factors, as well as on other factors such as growth, momentum, leverage, and yield. The factor exposures for smaller companies and the value style stayed within our tolerance bands, and in normal market conditions the modest deviation from the baseline would have little impact. The past year was different, however. The growth style outperformed value by a wide margin, with the Russell 1000® Growth and Russell 1000® Value Indexes returning 38.49% and 2.80%, respectively. In addition, larger companies strongly outpaced their smaller peers through the end of October. These trends amplified the effect of the Fund’s factor biases, weighing on performance. In an effort to counter this issue, we tightened our factor constraints to minimize, if not eliminate, any bias towards value, growth, or size. As always, we continue to revise and update our industry models to adapt to changes in the investment environment.
The Fund experienced the largest degree of underperformance in the consumer discretionary sector. Our shortfall in the category was almost entirely the result of having a zero weighting in the electric car and batter producer Tesla, Inc. The stock rallied more than 700% in 2020 thanks to the combination of mounting investor enthusiasm for green-energy plays, a 5-for-1 stock split, and its inclusion into the S&P 500® Index. The lack of a position in Tesla cost the Fund nearly 1.5 percentage points of total return. Health care was also an area of relative weakness for the Fund. Hill-Rom Holdings, Inc.,* a maker of medical equipment whose sales were hurt by the effects of COVID-19, was the most notable detractor. Positions in the biotechnology stocks Biogen, Inc. and Amgen, Inc. pressured results, as well. Consumer staples was an additional source of underperformance. Shares of U.S. Foods Holding Corp.* and Molson Coors Beverage Co.,* both of which were adversely affected by COVID-19, were the largest detractors in the sector.
On the positive side, an overweight in Apple, Inc. was a sizable contributor to relative performance. The stock rallied as investors gravitated to a business that was well positioned to generate steady growth irrespective of developments related to coronavirus or the world economy. Stock selection in the real estate sector was an additional positive thanks to a position in Digital Realty Trust, Inc. As a data-center real estate investment trust, the company capitalized on the growing demand for data usage, storage, and connectivity brought about by the shift toward more people working off-site. The Fund was also helped by its positions in T-Mobile US, Inc., which merged with its competitor Sprint Corp.,* and Roku, Inc., a video-streaming company whose shares a climbed as the COVID-19 lockdowns improved the prospects for providers of “stay-at-home” services.
Stocks performed remarkably well in the time since the March lows, which was quite impressive given how dire the investment outlook appeared in the early days of COVID-19. Although it remains to be seen whether the rollout of the vaccine will indeed lead to improving growth, investors have clearly “looked past the valley” in anticipation of stronger economic conditions in 2021. Broader-market valuations increased considerably in the second half of the year as a result. While valuations don’t necessarily correlate with near-term performance, stocks could become more volatile in the year ahead if the economic recovery isn’t as smooth as the November-December rally would indicate. With this as the backdrop, we believe our steady, rules-based strategy — which strives to evaluate companies in a disciplined and dispassionate manner — is well suited for a time characterized by both continued opportunity and potentially increased risk.
Pankaj Bhatnagar, PhD, Managing Director
Di Kumble, CFA, Managing Director
Arno V. Puskar, Director
Portfolio Managers
The views expressed reflect those of the portfolio management team only through the end of the period of the report as stated on the cover. The management team’s views are subject to change at any time based on market and other conditions and should not be construed as a recommendation. Past performance is no guarantee of future results. Current and future portfolio holdings are subject to risk.
| 4 | | | Deutsche DWS Variable Series I — DWS Core Equity VIP |
Terms to Know
Russell 1000 Index is an unmanaged index that measures the performance of the 1,000 largest companies in the Russell 3000 Index, which represents approximately 92% of the total market capitalization of the Russell 3000 Index.
The Russell 1000 Growth Index is an unmanaged index that consists of those stocks in the Russell 1000 Index that have higher price-to-book ratios and higher forecasted growth values. The Russell 1000 Value Index is an unmanaged market capitalization-weighted index of value-oriented stocks of the largest U.S. domiciled companies that are included in the Russell 1000 Index. Value-oriented stocks tend to have lower price-to-book ratios and lower forecasted growth values.
Standard & Poor’s 500 Index (S&P 500) is an unmanaged, capitalization-weighted index of 500 stocks. The index is designed to measure performance of the broad domestic economy through changes in the aggregate market value of 500 stocks representing all major industries.
Contribution and detraction incorporate both an investment’s total return and its weighting in the Fund.
Overweight means that a fund holds a higher weighting in a given sector compared with its benchmark index. Underweight means that a fund holds a lower weighting.
| * | Not held at December 31, 2020. |
Deutsche DWS Variable Series I — DWS Core Equity VIP | | | 5 |
| Portfolio Summary | (Unaudited) | |||
| Asset Allocation (As a % of Investment Portfolio excluding Securities Lending Collateral) | 12/31/20 | 12/31/19 | ||||||
| Common Stocks | 99% | 99% | ||||||
| Cash Equivalents | 1% | 1% | ||||||
| 100% | 100% | |||||||
| Sector Diversification (As a % of Investment Portfolio excluding Securities Lending Collateral and Cash Equivalents) | 12/31/20 | 12/31/19 | ||||||
| Information Technology | 27% | 22% | ||||||
| Health Care | 14% | 16% | ||||||
| Consumer Discretionary | 13% | 9% | ||||||
| Communication Services | 11% | 11% | ||||||
| Financials | 10% | 12% | ||||||
| Industrials | 9% | 10% | ||||||
| Consumer Staples | 6% | 7% | ||||||
| Real Estate | 3% | 3% | ||||||
| Utilities | 3% | 4% | ||||||
| Materials | 2% | 2% | ||||||
| Energy | 2% | 4% | ||||||
| 100% | 100% | |||||||
Portfolio holdings and characteristics are subject to change.
For more complete details about the Fund’s investment portfolio, see page 7.
Following the Fund’s fiscal first and third quarter-end, a complete portfolio holdings listing is posted on dws.com, and is available free of charge by contacting your financial intermediary, or if you are a direct investor, by calling (800) 728-3337. In addition, the portfolio holdings listing is filed with the SEC on the Fund’s Form N-PORT and will be available on the SEC’s Web site at sec.gov. Additional portfolio holdings for the Fund are also posted on dws.com from time to time. Please see the Fund’s current prospectus for more information.
| 6 | | | Deutsche DWS Variable Series I — DWS Core Equity VIP |
| Investment Portfolio | as of December 31, 2020 |
| Shares | Value ($) | |||||||
| Common Stocks 99.4% | ||||||||
| Communication Services 10.8% |
| |||||||
Diversified Telecommunication Services 0.6% |
| |||||||
Verizon Communications, Inc. | 11,413 | 670,514 | ||||||
Entertainment 4.2% |
| |||||||
Activision Blizzard, Inc. | 9,370 | 870,004 | ||||||
Netflix, Inc.* | 1,298 | 701,868 | ||||||
Roku, Inc.* | 6,219 | 2,064,832 | ||||||
Spotify Technology SA* | 3,180 | 1,000,619 | ||||||
|
| |||||||
| 4,637,323 | ||||||||
Interactive Media & Services 4.0% |
| |||||||
Alphabet, Inc. “A”* | 1,152 | 2,019,041 | ||||||
Alphabet, Inc. “C”* | 1,390 | 2,435,113 | ||||||
|
| |||||||
| 4,454,154 | ||||||||
Wireless Telecommunication Services 2.0% |
| |||||||
T-Mobile U.S., Inc.* | 16,083 | 2,168,793 | ||||||
| Consumer Discretionary 12.6% |
| |||||||
Auto Components 0.4% |
| |||||||
Gentex Corp. | 12,992 | 440,819 | ||||||
Hotels, Restaurants & Leisure 2.8% |
| |||||||
Choice Hotels International, Inc. | 6,466 | 690,116 | ||||||
Darden Restaurants, Inc. | 3,449 | 410,845 | ||||||
Vail Resorts, Inc.* | 1,416 | 395,007 | ||||||
Wyndham Hotels & Resorts, Inc. | 16,994 | 1,010,124 | ||||||
Yum China Holdings, Inc. | 9,525 | 543,782 | ||||||
|
| |||||||
| 3,049,874 | ||||||||
Household Durables 2.4% |
| |||||||
D.R. Horton, Inc. | 24,392 | 1,681,097 | ||||||
Newell Brands, Inc. | 18,007 | 382,288 | ||||||
PulteGroup, Inc. | 12,841 | 553,704 | ||||||
|
| |||||||
| 2,617,089 | ||||||||
Internet & Direct Marketing Retail 5.8% |
| |||||||
Amazon.com, Inc.* | 1,975 | 6,432,437 | ||||||
Specialty Retail 0.8% |
| |||||||
Best Buy Co., Inc. | 4,196 | 418,719 | ||||||
Carvana Co.* (a) | 2,129 | 509,980 | ||||||
|
| |||||||
| 928,699 | ||||||||
Textiles, Apparel & Luxury Goods 0.4% |
| |||||||
NIKE, Inc. “B” | 3,229 | 456,807 | ||||||
| Consumer Staples 5.8% |
| |||||||
Beverages 2.6% |
| |||||||
Coca-Cola Co. | 17,305 | 949,006 | ||||||
PepsiCo, Inc. | 13,103 | 1,943,175 | ||||||
|
| |||||||
| 2,892,181 | ||||||||
Food & Staples Retailing 2.3% |
| |||||||
Costco Wholesale Corp. | 3,625 | 1,365,828 | ||||||
Kroger Co. | 14,224 | 451,754 | ||||||
Walmart, Inc. | 4,923 | 709,650 | ||||||
|
| |||||||
| 2,527,232 | ||||||||
Personal Products 0.3% |
| |||||||
Estee Lauder Companies, Inc. “A” | 1,168 | 310,910 | ||||||
Tobacco 0.6% |
| |||||||
Altria Group, Inc. | 16,598 | 680,518 | ||||||
| Shares | Value ($) | |||||||
| Energy 2.4% |
| |||||||
Energy Equipment & Services 0.7% |
| |||||||
Baker Hughes Co. | 17,009 | 354,638 | ||||||
Nov, Inc. | 28,823 | 395,740 | ||||||
|
| |||||||
| 750,378 | ||||||||
Oil, Gas & Consumable Fuels 1.7% |
| |||||||
Devon Energy Corp. | 25,644 | 405,431 | ||||||
Hess Corp. | 9,787 | 516,656 | ||||||
Marathon Petroleum Corp. | 24,247 | 1,002,856 | ||||||
|
| |||||||
| 1,924,943 | ||||||||
| Financials 9.8% |
| |||||||
Banks 3.3% |
| |||||||
Bank of America Corp. | 27,444 | 831,828 | ||||||
JPMorgan Chase & Co. | 16,299 | 2,071,114 | ||||||
Wells Fargo & Co. | 22,239 | 671,173 | ||||||
|
| |||||||
| 3,574,115 | ||||||||
Capital Markets 4.1% |
| |||||||
Ameriprise Financial, Inc. | 5,999 | 1,165,786 | ||||||
Carlyle Group, Inc. | 19,279 | 606,132 | ||||||
Intercontinental Exchange, Inc. | 2,579 | 297,333 | ||||||
MSCI, Inc. | 3,002 | 1,340,483 | ||||||
T. Rowe Price Group, Inc. | 2,554 | 386,650 | ||||||
The Goldman Sachs Group, Inc. | 1,864 | 491,555 | ||||||
Tradeweb Markets, Inc. “A” | 4,481 | 279,838 | ||||||
|
| |||||||
| 4,567,777 | ||||||||
Insurance 2.4% |
| |||||||
Arthur J. Gallagher & Co. | 6,494 | 803,373 | ||||||
Everest Re Group Ltd. | 1,810 | 423,703 | ||||||
MetLife, Inc. | 21,480 | 1,008,486 | ||||||
Progressive Corp. | 4,478 | 442,784 | ||||||
|
| |||||||
| 2,678,346 | ||||||||
| Health Care 14.2% |
| |||||||
Biotechnology 3.4% |
| |||||||
AbbVie, Inc. | 4,155 | 445,208 | ||||||
Alexion Pharmaceuticals, Inc.* | 3,572 | 558,089 | ||||||
Amgen, Inc. | 9,993 | 2,297,591 | ||||||
Biogen, Inc.* | 1,723 | 421,894 | ||||||
|
| |||||||
| 3,722,782 | ||||||||
Health Care Providers & Services 6.5% |
| |||||||
Anthem, Inc. | 4,003 | 1,285,323 | ||||||
Centene Corp.* | 20,528 | 1,232,296 | ||||||
DaVita, Inc.* | 12,441 | 1,460,574 | ||||||
Guardant Health, Inc.* | 7,305 | 941,468 | ||||||
HCA Healthcare, Inc. | 8,950 | 1,471,917 | ||||||
Molina Healthcare, Inc.* | 2,498 | 531,275 | ||||||
Premier, Inc. “A” | 8,184 | 287,258 | ||||||
|
| |||||||
| 7,210,111 | ||||||||
Pharmaceuticals 4.3% |
| |||||||
Bristol-Myers Squibb Co. | 15,395 | 954,952 | ||||||
Johnson & Johnson | 3,262 | 513,374 | ||||||
Merck & Co., Inc. | 16,368 | 1,338,902 | ||||||
Pfizer, Inc. | 31,056 | 1,143,171 | ||||||
Viatris, Inc.* | 19,723 | 369,609 | ||||||
Zoetis, Inc. | 2,436 | 403,158 | ||||||
|
| |||||||
| 4,723,166 | ||||||||
The accompanying notes are an integral part of the financial statements.
Deutsche DWS Variable Series I — DWS Core Equity VIP | | | 7 |
| Shares | Value ($) | |||||||
| Industrials 8.8% |
| |||||||
Aerospace & Defense 2.2% |
| |||||||
Howmet Aerospace, Inc. | 20,663 | 589,722 | ||||||
L3Harris Technologies, Inc. | 3,519 | 665,161 | ||||||
Lockheed Martin Corp. | 3,271 | 1,161,140 | ||||||
|
| |||||||
| 2,416,023 | ||||||||
Building Products 0.8% |
| |||||||
Owens Corning | 12,125 | 918,590 | ||||||
Commercial Services & Supplies 1.7% |
| |||||||
Republic Services, Inc. | 2,892 | 278,500 | ||||||
Waste Management, Inc. | 13,551 | 1,598,069 | ||||||
|
| |||||||
| 1,876,569 | ||||||||
Industrial Conglomerates 0.3% |
| |||||||
Honeywell International, Inc. | 1,580 | 336,066 | ||||||
Machinery 2.0% |
| |||||||
AGCO Corp. | 3,415 | 352,052 | ||||||
Allison Transmission Holdings, Inc. | 6,515 | 280,992 | ||||||
Cummins, Inc. | 1,311 | 297,728 | ||||||
Ingersoll Rand, Inc.* | 8,819 | 401,794 | ||||||
Parker-Hannifin Corp. | 3,285 | 894,867 | ||||||
|
| |||||||
| 2,227,433 | ||||||||
Professional Services 0.6% |
| |||||||
Equifax, Inc. | 3,215 | 619,981 | ||||||
Road & Rail 1.2% |
| |||||||
Norfolk Southern Corp. | 2,509 | 596,163 | ||||||
Union Pacific Corp. | 3,790 | 789,154 | ||||||
|
| |||||||
| 1,385,317 | ||||||||
| Information Technology 27.3% |
| |||||||
IT Services 3.6% |
| |||||||
DXC Technology Co. | 16,671 | 429,278 | ||||||
Gartner, Inc.* | 3,019 | 483,614 | ||||||
Visa, Inc. “A” (a) | 14,168 | 3,098,967 | ||||||
|
| |||||||
| 4,011,859 | ||||||||
Semiconductors & Semiconductor Equipment 4.9% |
| |||||||
Intel Corp. | 22,100 | 1,101,022 | ||||||
NVIDIA Corp. | 1,199 | 626,118 | ||||||
QUALCOMM, Inc. | 13,827 | 2,106,405 | ||||||
Teradyne, Inc. | 13,173 | 1,579,311 | ||||||
|
| |||||||
| 5,412,856 | ||||||||
Software 10.9% |
| |||||||
ANSYS, Inc.* | 893 | 324,873 | ||||||
Cadence Design Systems, Inc.* | 2,417 | 329,751 | ||||||
Citrix Systems, Inc. | 1,997 | 259,810 | ||||||
Intuit, Inc. | 777 | 295,143 | ||||||
Microsoft Corp. | 32,367 | 7,199,068 | ||||||
Oracle Corp. | 31,934 | 2,065,810 | ||||||
Salesforce.com, Inc.* | 2,979 | 662,917 | ||||||
Splunk, Inc.* | 3,468 | 589,179 | ||||||
Synopsys, Inc.* | 1,211 | 313,940 | ||||||
|
| |||||||
| 12,040,491 | ||||||||
Technology Hardware, Storage & Peripherals 7.9% |
| |||||||
Apple, Inc. | 66,242 | 8,789,651 | ||||||
| Shares | Value ($) | |||||||
| Materials 2.5% |
| |||||||
Chemicals 1.3% |
| |||||||
Air Products & Chemicals, Inc. | 1,725 | 471,305 | ||||||
DuPont de Nemours, Inc. | 6,227 | 442,802 | ||||||
Westlake Chemical Corp. | 6,569 | 536,030 | ||||||
|
| |||||||
| 1,450,137 | ||||||||
Containers & Packaging 0.5% |
| |||||||
International Paper Co. | 5,835 | 290,116 | ||||||
Sonoco Products Co. | 4,367 | 258,745 | ||||||
|
| |||||||
| 548,861 | ||||||||
Metals & Mining 0.7% |
| |||||||
Arconic Corp.* | 25,751 | 767,379 | ||||||
| Real Estate 2.7% |
| |||||||
Equity Real Estate Investment Trusts (REITs) |
| |||||||
AvalonBay Communities, Inc. | 4,113 | 659,849 | ||||||
Digital Realty Trust, Inc. | 2,435 | 339,707 | ||||||
Iron Mountain, Inc. (a) | 31,937 | 941,503 | ||||||
Prologis, Inc. | 10,381 | 1,034,570 | ||||||
|
| |||||||
| 2,975,629 | ||||||||
| Utilities 2.5% |
| |||||||
Gas Utilities 0.3% |
| |||||||
UGI Corp. | 9,736 | 340,370 | ||||||
Multi-Utilities 1.4% |
| |||||||
Dominion Energy, Inc | 6,562 | 493,462 | ||||||
Public Service Enterprise Group, Inc. | 8,340 | 486,222 | ||||||
WEC Energy Group, Inc. | 5,822 | 535,799 | ||||||
|
| |||||||
| 1,515,483 | ||||||||
Water Utilities 0.8% |
| |||||||
| American Water Works Co., Inc. | 6,261 | 960,876 | ||||||
Total Common Stocks (Cost $64,669,644) |
| 110,012,539 | ||||||
Securities Lending Collateral 3.5% |
| |||||||
DWS Government & Agency Securities Portfolio “DWS Government Cash Institutional Shares”, 0.03% (b) (c) | 3,846,941 | 3,846,941 | ||||||
| Cash Equivalents 0.7% | ||||||||
DWS Central Cash Management Government Fund, 0.08% (b) | 740,536 | 740,536 | ||||||
| % of Net Assets | Value ($) | |||||||
Total Investment Portfolio | 103.6 | 114,600,016 | ||||||
| Other Assets and Liabilities, Net | (3.6 | ) | (3,983,349 | ) | ||||
| Net Assets | 100.0 | 110,616,667 | ||||||
The accompanying notes are an integral part of the financial statements.
| 8 | | | Deutsche DWS Variable Series I — DWS Core Equity VIP |
A summary of the Fund’s transactions with affiliated investments during the year ended December 31, 2020 are as follows:
| Value ($) at 12/31/2019 | Purchases Cost ($) | Sales Proceeds ($) | Net Realized Gain/ (Loss) ($) | Net Change in Unrealized Appreciation (Depreciation) ($) | Income ($) | Capital Gain Distributions ($) | Number of Shares at 12/31/2020 | Value ($) at 12/31/2020 | ||||||||||||||||||||||||
Securities Lending Collateral 3.5% |
| |||||||||||||||||||||||||||||||
DWS Government & Agency Securities Portfolio “DWS Government Cash Institutional Shares”, 0.03% (b) (c) |
| |||||||||||||||||||||||||||||||
| 1,076,250 | 2,770,691 | (d) | — | — | — | 1,486 | — | 3,846,941 | 3,846,941 | |||||||||||||||||||||||
Cash Equivalents 0.7% |
| |||||||||||||||||||||||||||||||
DWS Central Cash Management Government Fund, 0.08% (b) |
| |||||||||||||||||||||||||||||||
| 568,188 | 14,145,096 | 13,972,748 | — | — | 3,113 | — | 740,536 | 740,536 | ||||||||||||||||||||||||
| 1,644,438 | 16,915,787 | 13,972,748 | — | — | 4,599 | — | 4,587,477 | 4,587,477 | ||||||||||||||||||||||||
| * | Non-income producing security. |
| (a) | All or a portion of these securities were on loan. In addition, “Other Assets and Liabilities, Net” may include pending sales that are also on loan. The value of securities loaned at December 31, 2020 amounted to $3,771,116, which is 3.4% of net assets. |
| (b) | Affiliated fund managed by DWS Investment Management Americas, Inc. The rate shown is the annualized seven-day yield at period end. |
| (c) | Represents cash collateral held in connection with securities lending. Income earned by the Fund is net of borrower rebates. |
| (d) | Represents the net increase (purchase cost) or decrease (sales proceeds) in the amount invested in cash collateral for the year ended December 31, 2020. |
MSCI: Morgan Stanley Capital International
Fair Value Measurements
Various inputs are used in determining the value of the Fund’s investments. These inputs are summarized in three broad levels. Level 1 includes quoted prices in active markets for identical securities. Level 2 includes other significant observable inputs (including quoted prices for similar securities, interest rates, prepayment speeds and credit risk). Level 3 includes significant unobservable inputs (including the Fund’s own assumptions in determining the fair value of investments). The level assigned to the securities valuations may not be an indication of the risk or liquidity associated with investing in those securities.
The following is a summary of the inputs used as of December 31, 2020 in valuing the Fund’s investments. For information on the Fund’s policy regarding the valuation of investments, please refer to the Security Valuation section of Note A in the accompanying Notes to Financial Statements.
| Assets | Level 1 | Level 2 | Level 3 | Total | ||||||||||||
| Common Stocks (e) | $ | 110,012,539 | $ | — | $ | — | $ | 110,012,539 | ||||||||
| Short-Term Investments (e) | 4,587,477 | — | — | 4,587,477 | ||||||||||||
| Total | $ | 114,600,016 | $ | — | $ | — | $ | 114,600,016 | ||||||||
| (e) | See Investment Portfolio for additional detailed categorizations. |
The accompanying notes are an integral part of the financial statements.
Deutsche DWS Variable Series I — DWS Core Equity VIP | | | 9 |
Assets and Liabilities
| as of December 31, 2020 |
| |||
| Assets |
| |||
| Investments in non-affiliated securities, at value (cost $64,669,644) — including $3,771,116 of securities loaned | $ | 110,012,539 | ||
| Investment in DWS Government & Agency Securities Portfolio (cost $3,846,941)* | 3,846,941 | |||
| Investment in DWS Central Cash Management Government Fund (cost $740,536) | 740,536 | |||
| Cash | 10,000 | |||
| Receivable for Fund shares sold | 2,805 | |||
| Dividends receivable | 85,888 | |||
| Interest receivable | 159 | |||
| Other assets | 1,993 | |||
| Total assets | 114,700,861 | |||
| Liabilities | ||||
| Payable upon return of securities loaned | 3,846,941 | |||
| Payable for Fund shares redeemed | 111,170 | |||
| Accrued management fee | 35,977 | |||
| Accrued Trustees’ fees | 1,446 | |||
| Other accrued expenses and payables | 88,660 | |||
| Total liabilities | 4,084,194 | |||
| Net assets, at value | $ | 110,616,667 | ||
| Net Assets Consist of | ||||
| Distributable earnings (loss) | 51,189,379 | |||
| Paid-in capital | 59,427,288 | |||
| Net assets, at value | $ | 110,616,667 | ||
| Net Asset Value | ||||
Class A | ||||
| Net Asset Value, offering and redemption price per share ($107,100,146 ÷ 8,760,193 outstanding shares of beneficial interest, $.01 par value, unlimited number of shares authorized) | $ | 12.23 | ||
Class B | ||||
| Net Asset Value, offering and redemption price per share ($3,516,521 ÷ 288,118 outstanding shares of beneficial interest, $.01 par value, unlimited number of shares authorized) | $ | 12.21 | ||
| * | Represents collateral on securities loaned. |
| for the year ended December 31, 2020 |
| |||
| Investment Income |
| |||
| Income: | ||||
| Dividends (net of foreign taxes withheld of $1,478) | $ | 1,617,231 | ||
| Income distributions — DWS Central Cash Management Government Fund | 3,113 | |||
| Securities lending income, net of borrower rebates | 1,486 | |||
| Total income | 1,621,830 | |||
| Expenses: | ||||
| Management fee | 388,373 | |||
| Administration fee | 97,144 | |||
| Services to Shareholders | 1,540 | |||
| Recordkeeping fee (Class B) | 2,066 | |||
| Distribution service fee (Class B) | 7,708 | |||
| Custodian fee | 5,390 | |||
| Professional fees | 75,099 | |||
| Reports to shareholders | 34,870 | |||
| Trustees’ fees and expenses | 5,206 | |||
| Other | 7,041 | |||
| Total expenses | 624,437 | |||
| Net investment income | 997,393 | |||
| Realized and Unrealized gain (loss) | ||||
| Net realized gain (loss) from investments | 5,117,424 | |||
| Change in net unrealized appreciation (depreciation) on investments | 8,536,882 | |||
| Net gain (loss) | 13,654,306 | |||
| Net increase (decrease) in net assets resulting from operations | $ | 14,651,699 | ||
The accompanying notes are an integral part of the financial statements.
| 10 | | | Deutsche DWS Variable Series I — DWS Core Equity VIP |
Statements of Changes in Net Assets
| Years Ended December 31, | ||||||||
| Increase (Decrease) in Net Assets | 2020 | 2019 | ||||||
| Operations: | ||||||||
| Net investment income | $ | 997,393 | $ | 1,378,690 | ||||
| Net realized gain (loss) | 5,117,424 | 4,633,506 | ||||||
| Change in net unrealized appreciation (depreciation) | 8,536,882 | 21,368,817 | ||||||
| Net increase (decrease) in net assets resulting from operations | 14,651,699 | 27,381,013 | ||||||
| Distributions to shareholders : | ||||||||
Class A | (5,813,005 | ) | (12,354,795 | ) | ||||
Class B | (175,513 | ) | (374,998 | ) | ||||
| Total distributions | (5,988,518 | ) | (12,729,793 | ) | ||||
| Fund share transactions: | ||||||||
Class A | ||||||||
| Proceeds from shares sold | 2,502,706 | 2,580,344 | ||||||
| Reinvestment of distributions | 5,813,005 | 12,354,795 | ||||||
| Payments of shares redeemed | (16,323,485 | ) | (14,245,198 | ) | ||||
| Net increase (decrease) in net assets from Class A share transactions | (8,007,774 | ) | 689,941 | |||||
Class B | ||||||||
| Proceeds from shares sold | 141,998 | 20,736 | ||||||
| Reinvestment of distributions | 175,513 | 374,998 | ||||||
| Payments of shares redeemed | (428,535 | ) | (345,789 | ) | ||||
| Net increase (decrease) in net assets from Class B share transactions | (111,024 | ) | 49,945 | |||||
| Increase (decrease) in net assets | 544,383 | 15,391,106 | ||||||
| Net assets at beginning of period | 110,072,284 | 94,681,178 | ||||||
| Net assets at end of period | $ | 110,616,667 | $ | 110,072,284 | ||||
| Other Information | ||||||||
Class A | ||||||||
| Shares outstanding at beginning of period | 9,438,162 | 9,343,340 | ||||||
| Shares sold | 240,122 | 247,017 | ||||||
| Shares issued to shareholders in reinvestment of distributions | 652,414 | 1,204,171 | ||||||
| Shares redeemed | (1,570,505 | ) | (1,356,366 | ) | ||||
| Net increase (decrease) in Class A shares | (677,969 | ) | 94,822 | |||||
| Shares outstanding at end of period | 8,760,193 | 9,438,162 | ||||||
Class B | ||||||||
| Shares outstanding at beginning of period | 295,485 | 289,832 | ||||||
| Shares sold | 12,670 | 2,008 | ||||||
| Shares issued to shareholders in reinvestment of distributions | 19,676 | 36,549 | ||||||
| Shares redeemed | (39,713 | ) | (32,904 | ) | ||||
| Net increase (decrease) in Class B shares | (7,367 | ) | 5,653 | |||||
| Shares outstanding at end of period | 288,118 | 295,485 | ||||||
The accompanying notes are an integral part of the financial statements.
Deutsche DWS Variable Series I — DWS Core Equity VIP | | | 11 |
| DWS Core Equity VIP — Class A | ||||||||||||||||||||
Years Ended December 31, | ||||||||||||||||||||
2020 | 2019 | 2018 | 2017 | 2016 | ||||||||||||||||
| Selected Per Share Data | ||||||||||||||||||||
| Net asset value, beginning of period | $11.31 | $9.83 | $14.64 | $13.16 | $13.29 | |||||||||||||||
| Income (loss) from investment operations: | ||||||||||||||||||||
Net investment incomea | .11 | .14 | .14 | .17 | .17 | |||||||||||||||
Net realized and unrealized gain (loss) | 1.47 | 2.70 | (.71 | ) | 2.44 | 1.09 | ||||||||||||||
Total from investment operations | 1.58 | 2.84 | (.57 | ) | 2.61 | 1.26 | ||||||||||||||
| Less distributions from: | ||||||||||||||||||||
Net investment income | (.15 | ) | (.12 | ) | (.27 | ) | (.17 | ) | (.19 | ) | ||||||||||
Net realized gains | (.51 | ) | (1.24 | ) | (3.97 | ) | (.96 | ) | (1.20 | ) | ||||||||||
Total distributions | (.66 | ) | (1.36 | ) | (4.24 | ) | (1.13 | ) | (1.39 | ) | ||||||||||
| Net asset value, end of period | $12.23 | $11.31 | $9.83 | $14.64 | $13.16 | |||||||||||||||
| Total Return (%) | 16.13 | 30.30 | (5.69 | ) | 21.02 | 10.48 | ||||||||||||||
| Ratios to Average Net Assets and Supplemental Data | ||||||||||||||||||||
| Net assets, end of period ($ millions) | 107 | 107 | 92 | 105 | 163 | |||||||||||||||
| Ratio of expenses (%)b | .62 | .62 | .61 | .57 | .57 | |||||||||||||||
| Ratio of net investment income (%) | 1.01 | 1.32 | 1.14 | 1.22 | 1.34 | |||||||||||||||
| Portfolio turnover rate (%) | 45 | 40 | 43 | 39 | 43 | |||||||||||||||
| a | Based on average shares outstanding during the period. |
| b | Expense ratio does not reflect charges and fees associated with the separate account that invests in the Fund or any variable life insurance policy or variable annuity contract for which the Fund is an investment option. |
| DWS Core Equity VIP — Class B | ||||||||||||||||||||
Years Ended December 31, | ||||||||||||||||||||
2020 | 2019 | 2018 | 2017 | 2016 | ||||||||||||||||
| Selected Per Share Data | ||||||||||||||||||||
| Net asset value, beginning of period | $11.29 | $9.81 | $14.62 | $13.14 | $13.26 | |||||||||||||||
| Income (loss) from investment operations: | ||||||||||||||||||||
Net investment incomea | .07 | .11 | .10 | .13 | .13 | |||||||||||||||
Net realized and unrealized gain (loss) | 1.48 | 2.70 | (.72 | ) | 2.44 | 1.10 | ||||||||||||||
Total from investment operations | 1.55 | 2.81 | (.62 | ) | 2.57 | 1.23 | ||||||||||||||
| Less distributions from: | ||||||||||||||||||||
Net investment income | (.12 | ) | (.09 | ) | (.22 | ) | (.13 | ) | (.15 | ) | ||||||||||
Net realized gains | (.51 | ) | (1.24 | ) | (3.97 | ) | (.96 | ) | (1.20 | ) | ||||||||||
Total distributions | (.63 | ) | (1.33 | ) | (4.19 | ) | (1.09 | ) | (1.35 | ) | ||||||||||
| Net asset value, end of period | $12.21 | $11.29 | $9.81 | $14.62 | $13.14 | |||||||||||||||
| Total Return (%) | 15.67 | 29.92 | (6.02 | ) | 20.68 | 10.25 | ||||||||||||||
| Ratios to Average Net Assets and Supplemental Data | ||||||||||||||||||||
| Net assets, end of period ($ millions) | 4 | 3 | 3 | 3 | 2 | |||||||||||||||
| Ratio of expenses (%)b | .94 | .94 | .93 | .86 | .86 | |||||||||||||||
| Ratio of net investment income (%) | .69 | 1.00 | .82 | .94 | 1.06 | |||||||||||||||
| Portfolio turnover rate (%) | 45 | 40 | 43 | 39 | 43 | |||||||||||||||
| a | Based on average shares outstanding during the period. |
| b | Expense ratio does not reflect charges and fees associated with the separate account that invests in the Fund or any variable life insurance policy or variable annuity contract for which the Fund is an investment option. |
The accompanying notes are an integral part of the financial statements.
| 12 | | | Deutsche DWS Variable Series I — DWS Core Equity VIP |
| Notes to Financial Statements |
A. Organization and Significant Accounting Policies
Deutsche DWS Variable Series I (the “Trust“) is registered under the Investment Company Act of 1940, as amended (the “1940 Act“), as an open-end, management investment company organized as a Massachusetts business trust. The Trust consists of five diversified funds: DWS Bond VIP, DWS Capital Growth VIP, DWS Core Equity VIP, DWS CROCI® International VIP and DWS Global Small Cap VIP (individually or collectively hereinafter referred to as a “Fund“ or the “Funds“). These financial statements report on DWS Core Equity VIP. The Trust is intended to be the underlying investment vehicle for variable annuity contracts and variable life insurance policies to be offered by the separate accounts of certain life insurance companies (“Participating Insurance Companies“).
Multiple Classes of Shares of Beneficial Interest. The Fund offers two classes of shares (Class A shares and Class B shares). Class B shares are subject to Rule 12b-1 distribution fees under the 1940 Act and recordkeeping fees equal to an annual rate of up to 0.25% and of up to 0.15%, respectively, of the average daily net assets of the Class B shares of the Fund. Class A shares are not subject to such fees.
Investment income, realized and unrealized gains and losses, and certain fund-level expenses and expense reductions, if any, are borne pro rata on the basis of relative net assets by the holders of all classes of shares, except that each class bears certain expenses unique to that class (including the applicable 12b-1 distribution fees and recordkeeping fees). Differences in class-level expenses may result in payment of different per share dividends by class. All shares have equal rights with respect to voting subject to class-specific arrangements.
The Fund’s financial statements are prepared in accordance with accounting principles generally accepted in the United States of America (“U.S. GAAP”) which require the use of management estimates. Actual results could differ from those estimates. The Fund qualifies as an investment company under Topic 946 of Accounting Standards Codification of U.S. GAAP. The policies described below are followed consistently by the Fund in the preparation of its financial statements.
Security Valuation. Investments are stated at value determined as of the close of regular trading on the New York Stock Exchange on each day the exchange is open for trading.
Various inputs are used in determining the value of the Fund’s investments. These inputs are summarized in three broad levels. Level 1 includes quoted prices in active markets for identical securities. Level 2 includes other significant observable inputs (including quoted prices for similar securities, interest rates, prepayment speeds and credit risk). Level 3 includes significant unobservable inputs (including the Fund’s own assumptions in determining the fair value of investments). The level assigned to the securities valuations may not be an indication of the risk or liquidity associated with investing in those securities.
Equity securities and exchange-traded funds (“ETF’s”) are valued at the most recent sale price or official closing price reported on the exchange (U.S. or foreign) or over-the-counter market on which they trade. Securities for which no sales are reported are valued at the calculated mean between the most recent bid and asked quotations on the relevant market or, if a mean cannot be determined, at the most recent bid quotation. Equity securities and ETF’s are generally categorized as Level 1.
Investments in open-end investment companies are valued at their net asset value each business day and are categorized as Level 1.
Securities and other assets for which market quotations are not readily available or for which the above valuation procedures are deemed not to reflect fair value are valued in a manner that is intended to reflect their fair value as determined in accordance with procedures approved by the Trustees and are generally categorized as Level 3. In accordance with the Fund’s valuation procedures, factors used in determining value may include, but are not limited to, the type of the security; the size of the holding; the initial cost of the security; the existence of any contractual restrictions on the security’s disposition; the price and extent of public trading in similar securities of the issuer or of comparable companies; quotations or evaluated prices from broker-dealers and/or pricing services; information obtained from the issuer, analysts, and/or the appropriate stock exchange (for exchange-traded securities); an analysis of the company’s or issuer’s financial statements; an evaluation of the forces that influence the issuer and the market(s) in which the security is purchased and sold; and with respect to debt securities, the maturity, coupon, creditworthiness, currency denomination and the movement of the market in which the security is normally traded. The value determined under these procedures may differ from published values for the same securities.
Deutsche DWS Variable Series I — DWS Core Equity VIP | | | 13 |
Disclosure about the classification of fair value measurements is included in a table following the Fund’s Investment Portfolio.
Securities Lending. Deutsche Bank AG, as lending agent, lends securities of the Fund to certain financial institutions under the terms of its securities lending agreement. During the term of the loans, the Fund continues to receive interest and dividends generated by the securities and to participate in any changes in their market value. The Fund requires the borrowers of the securities to maintain collateral with the Fund consisting of either cash or liquid, unencumbered assets having a value at least equal to the value of the securities loaned. When the collateral falls below specified amounts, the lending agent will use its best effort to obtain additional collateral on the next business day to meet required amounts under the securities lending agreement. During the year ended December 31, 2020, the Fund invested the cash collateral into a joint trading account in DWS Government & Agency Securities Portfolio, an affiliated money market fund managed by DWS Investment Management Americas, Inc. DWS Investment Management Americas, Inc. receives a management/administration fee (0.06% annualized effective rate as of December 31, 2020) on the cash collateral invested in DWS Government & Agency Securities Portfolio. The Fund receives compensation for lending its securities either in the form of fees or by earning interest on invested cash collateral net of borrower rebates and fees paid to a lending agent. Either the Fund or the borrower may terminate the loan at any time and the borrower, after notice, is required to return borrowed securities within a standard time period. There may be risks of delay and costs in recovery of securities or even loss of rights in the collateral should the borrower of the securities fail financially. If the Fund is not able to recover securities lent, the Fund may sell the collateral and purchase a replacement investment in the market, incurring the risk that the value of the replacement security is greater than the value of the collateral. The Fund is also subject to all investment risks associated with the reinvestment of any cash collateral received, including, but not limited to, interest rate, credit and liquidity risk associated with such investments.
As of December 31, 2020, the Fund had securities on loan, which were classified as common stocks in the Investment Portfolio. The value of the related collateral exceeded the value of the securities loaned at period end. As of period end, the remaining contractual maturity of the collateral agreements was overnight and continuous.
Foreign Currency Translations. The books and records of the Fund are maintained in U.S. dollars. Investment securities and other assets and liabilities denominated in a foreign currency are translated into U.S. dollars at the prevailing exchange rates at period end. Purchases and sales of investment securities, income and expenses are translated into U.S. dollars at the prevailing exchange rates on the respective dates of the transactions.
Net realized and unrealized gains and losses on foreign currency transactions represent net gains and losses between trade and settlement dates on securities transactions, the acquisition and disposition of foreign currencies, and the difference between the amount of net investment income accrued and the U.S. dollar amount actually received. The portion of both realized and unrealized gains and losses on investments that results from fluctuations in foreign currency exchange rates is not separately disclosed but is included with net realized and unrealized gain/appreciation and loss/depreciation on investments.
Federal Income Taxes. The Fund is treated as a separate taxpayer as provided for in the Internal Revenue Code, as amended. It is the Fund’s policy to comply with the requirements of the Internal Revenue Code, as amended, which are applicable to regulated investment companies, and to distribute all of its taxable income to the separate accounts of the Participating Insurance Companies which hold its shares.
The Fund has reviewed the tax positions for the open tax years as of December 31, 2020 and has determined that no provision for income tax and/or uncertain tax positions is required in the Fund’s financial statements. The Fund’s federal tax returns for the prior three fiscal years remain open subject to examination by the Internal Revenue Service.
Distribution of Income and Gains. Distributions from net investment income of the Fund, if any, are declared and distributed to shareholders annually. Net realized gains from investment transactions, in excess of available capital loss carryforwards, would be taxable to the Fund if not distributed, and, therefore, will be distributed to shareholders at least annually. The Fund may also make additional distributions for tax purposes if necessary.
The timing and characterization of certain income and capital gain distributions are determined annually in accordance with federal tax regulations, which may differ from accounting principles generally accepted in the United States of America. These differences primarily relate to certain securities sold at a loss. As a result, net investment income (loss) and net realized gain (loss) on investment transactions for a reporting period may differ significantly from distributions during such period. Accordingly, the Fund may periodically
| 14 | | | Deutsche DWS Variable Series I — DWS Core Equity VIP |
make reclassifications among certain of its capital accounts without impacting the net asset value of the Fund.
At December 31, 2020, the Fund’s components of distributable earnings (accumulated losses) on a tax basis are as follows:
| Undistributed ordinary income* | $ | 888,776 | ||
| Undistributed net long-term capital gains | $ | 5,250,087 | ||
| Net unrealized appreciation (depreciation) on investments | $ | 45,035,131 |
At December 31, 2020, the aggregate cost of investments for federal income tax purposes was $69,564,885. The net unrealized appreciation for all investments based on tax cost was $45,035,131. This consisted of aggregate gross unrealized appreciation for all investments for which there was an excess of value over tax cost of $46,036,010 and aggregate gross unrealized depreciation for all investments for which there was an excess of tax cost over value of $1,000,879.
In addition, the tax character of distributions paid to shareholders by the Fund is summarized as follows:
| Years Ended December 31, | ||||||||
2020 | 2019 | |||||||
| Distributions from ordinary income* | $ | 1,359,627 | $ | 1,147,698 | ||||
| Distributions from long-term capital gains | $ | 4,628,891 | $ | 11,582,095 | ||||
| * | For tax purposes, short-term capital gain distributions are considered ordinary income distributions. |
Expenses. Expenses of the Trust arising in connection with a specific Fund are allocated to that Fund. Other Trust expenses which cannot be directly attributed to a Fund are apportioned among the Funds in the Trust based upon the relative net assets or other appropriate measures.
Contingencies. In the normal course of business, the Fund may enter into contracts with service providers that contain general indemnification clauses. The Fund’s maximum exposure under these arrangements is unknown, as this would involve future claims that may be made against the Fund that have not yet been made. However, based on experience, the Fund expects the risk of loss to be remote.
Other. Investment transactions are accounted for on a trade date plus one basis for daily net asset value calculations. However, for financial reporting purposes, investment transactions are reported on trade date. Interest income is recorded on the accrual basis. Dividend income is recorded on the ex-dividend date net of foreign withholding taxes. Realized gains and losses from investment transactions are recorded on an identified cost basis. Proceeds from litigation payments, if any, are included in net realized gain (loss) from investments.
B. Purchases and Sales of Securities
During the year ended December 31, 2020, purchases and sales of investment securities (excluding short-term investments) aggregated $44,581,189 and $57,763,790, respectively.
C. Related Parties
Management Agreement. Under the Investment Management Agreement with DWS Investment Management Americas, Inc. (“DIMA“ or the “Advisor“), an indirect, wholly owned subsidiary of DWS Group GmbH & Co. KGaA (“DWS Group”), the Advisor directs the investments of the Fund in accordance with its investment objectives, policies and restrictions. The Advisor determines the securities, instruments and other contracts relating to investments to be purchased, sold or entered into by the Fund.
Under the Investment Management Agreement with the Advisor, the Fund pays a monthly management fee based on the Fund’s average daily net assets, computed and accrued daily and payable monthly, at the following annual rates:
| First $250 million of average daily net assets | .390 | % | ||
| Next $750 million of average daily net assets | .365 | % | ||
| Over $1 billion of average daily net assets | .340 | % |
Accordingly, for the year ended December 31, 2020, the fee pursuant to the Investment Management Agreement was equivalent to an annual rate (exclusive of any applicable waivers/reimbursements) of 0.39% of the Fund’s average daily net assets.
Deutsche DWS Variable Series I — DWS Core Equity VIP | | | 15 |
For the period from January 1, 2020 through September 30, 2021 (through September 30, 2020 for Class B shares), the Advisor has contractually agreed to waive its fees and/or reimburse certain operating expenses of the Fund to the extent necessary to maintain the total annual operating expenses (excluding certain expenses such as extraordinary expenses, taxes, brokerage and interest) of each class as follows:
| Class A | .72 | % | ||
| Class B | 1.03 | % |
Effective October 1, 2020 through September 30, 2021, the Advisor has contractually agreed to waive its fees and/or reimburse certain operating expenses of the Fund to the extent necessary to maintain the total annual operating expenses (excluding certain expenses such as extraordinary expenses, taxes, brokerage and interest expense) of Class B shares at 1.04%.
Administration Fee. Pursuant to an Administrative Services Agreement, DIMA provides most administrative services to the Fund. Prior to March 1, 2020, for all services provided under the Administrative Services Agreement, the Fund paid the Advisor an annual fee (“Administration Fee“) of 0.10% of the Fund’s average daily net assets, computed and accrued daily and payable monthly. Effective March 1, 2020, for all services provided under the Administrative Services Agreement, the Fund pays the Advisor an annual Administration Fee of 0.097% of the Fund’s average daily net assets, computed and accrued daily and payable monthly. For the year ended December 31, 2020, the Administration Fee was $97,144, of which $8,948 is unpaid.
Service Provider Fees. DWS Service Company (“DSC“), an affiliate of the Advisor, is the transfer agent, dividend-paying agent and shareholder service agent for the Fund. Pursuant to a sub-transfer agency agreement between DSC and DST Systems, Inc. (“DST“), DSC has delegated certain transfer agent, dividend-paying agent and shareholder service agent functions to DST. DSC compensates DST out of the shareholder servicing fee it receives from the Fund. For the year ended December 31, 2020, the amounts charged to the Fund by DSC were as follows:
| Services to Shareholders | Total Aggregated | Unpaid at December 31, 2020 | ||||||
| Class A | $ | 695 | $ | 127 | ||||
| Class B | 137 | 26 | ||||||
| $ | 832 | $ | 153 | |||||
Distribution Service Agreement. DWS Distributors, Inc. (“DDI“), also an affiliate of the Advisor, is the Trust’s Distributor. In accordance with the Master Distribution Plan, DDI receives 12b-1 fees of up to 0.25% of the average daily net assets of Class B shares. Pursuant to the Master Distribution Plan, DDI remits these fees to the Participating Insurance Companies for various costs incurred or paid by these companies in connection with marketing and distribution of Class B shares. For the year ended December 31, 2020, the Distribution Service Fee aggregated $7,708, of which $731 is unpaid.
Other Service Fees. Under an agreement with the Fund, DIMA is compensated for providing certain pre-press and regulatory filing services to the Fund. For the year ended December 31, 2020, the amount charged to the Fund by DIMA included in the Statement of Operations under “Reports to shareholders“ aggregated $9,344, of which $3,289 is unpaid.
Trustees’ Fees and Expenses. The Fund paid retainer fees to each Trustee not affiliated with the Advisor, plus specified amounts to the Board Chairperson and to each committee Chairperson.
Affiliated Cash Management Vehicles. The Fund may invest uninvested cash balances in DWS Central Cash Management Government Fund and DWS ESG Liquidity Fund, affiliated money market funds which are managed by the Advisor. Each affiliated money market fund is managed in accordance with Rule 2a-7 under the 1940 Act, which governs the quality, maturity, diversity and liquidity of instruments in which a money market fund may invest. DWS Central Cash Management Government Fund seeks to maintain a stable net asset value, and DWS ESG Liquidity Fund maintains a floating net asset value. The Fund indirectly bears its proportionate share of the expenses of each affiliated money market fund in which it invests. DWS Central Cash Management Government Fund does not pay the Advisor an investment management fee. To the extent that DWS ESG Liquidity Fund pays an investment management fee to the Advisor, the Advisor will waive an amount of the investment management fee payable to the Advisor by the Fund equal to the amount of the investment management fee payable on the Fund’s assets invested in DWS ESG Liquidity Fund.
Security Lending Fees. Deutsche Bank AG serves as securities lending agent for the Fund. For the year ended December 31, 2020, the Fund incurred lending agent fees to Deutsche Bank AG for the amount of $112.
| 16 | | | Deutsche DWS Variable Series I — DWS Core Equity VIP |
D. Ownership of the Fund
At December 31, 2020, two participating insurance companies were owners of record of 10% or more of the total outstanding Class A shares of the Fund, each owning 57% and 17%, respectively. Two participating insurance companies were owners of record of 10% or more of the total outstanding Class B shares of the Fund, each owning 49% and 38%, respectively.
E. Line of Credit
The Fund and other affiliated funds (the “Participants”) share in a $350 million revolving credit facility provided by a syndication of banks. The Fund may borrow for temporary or emergency purposes, including the meeting of redemption requests that otherwise might require the untimely disposition of securities. The Participants are charged an annual commitment fee, which is allocated based on net assets, among each of the Participants. Interest is calculated at a rate per annum equal to the sum of the Federal Funds Rate plus 1.25 percent plus if the one-month LIBOR exceeds the Federal Funds Rate, the amount of such excess. The Fund may borrow up to a maximum of 33 percent of its net assets under the agreement. The Fund had no outstanding loans at December 31, 2020.
F. Other — COVID-19 Pandemic
A novel coronavirus known as COVID-19, declared a pandemic by the World Health Organization, has caused significant uncertainty, market volatility, decreased economic and other activity and increased government activity. Specifically, COVID-19 has led to significant death and morbidity, and concerns about its further spread have resulted in the closing of schools and non-essential businesses, cancellations, shelter-in place orders, lower consumer spending in certain sectors, social distancing, bans on large social gatherings and travel, quarantines, government economic stimulus measures, reduced productivity, rapid increases in unemployment, increased demand for and strain on government and medical resources, border closings and global trade and supply chain interruptions, among others. The full effects, duration and costs of the COVID-19 pandemic are impossible to predict, and the circumstances surrounding the COVID-19 pandemic will continue to evolve. The pandemic may affect certain countries, industries, economic sectors, companies and investment products more than others, may exacerbate existing economic, political, or social tensions and may increase the probability of an economic recession or depression. The Fund and its investments may be adversely affected by the effects of the COVID-19 pandemic, and a prolonged pandemic may result in the Fund and its service providers experiencing operational difficulties in coordinating a remote workforce and implementing their business continuity plans, among others. Management will continue to monitor the impact COVID-19 has on the Fund and reflect the consequences as appropriate in the Fund’s accounting and financial reporting.
Deutsche DWS Variable Series I — DWS Core Equity VIP | | | 17 |
Report of Independent Registered Public Accounting Firm
To the Board of Trustees of Deutsche DWS Variable Series I and Shareholders of DWS Core Equity VIP:
Opinion on the Financial Statements
We have audited the accompanying statement of assets and liabilities of DWS Core Equity VIP (the “Fund”) (one of the funds constituting Deutsche DWS Variable Series I) (the “Trust”), including the investment portfolio, as of December 31, 2020, and the related statement of operations for the year then ended, the statements of changes in net assets and the financial highlights for each of the two years in the period then ended and the related notes (collectively referred to as the “financial statements”). In our opinion, the financial statements present fairly, in all material respects, the financial position of the Fund (one of the funds constituting Deutsche DWS Variable Series I) at December 31, 2020, the results of its operations for the year then ended, the changes in its net assets and its financial highlights for each of the two years in the period then ended, in conformity with U.S. generally accepted accounting principles.
The financial highlights for the years ended December 31, 2016, December 31, 2017 and December 31, 2018, were audited by another independent registered public accounting firm whose report, dated February 14, 2019, expressed an unqualified opinion on those financial highlights.
Basis for Opinion
These financial statements are the responsibility of the Trust’s management. Our responsibility is to express an opinion on the Fund’s financial statements based on our audits. We are a public accounting firm registered with the Public Company Accounting Oversight Board (United States) (“PCAOB”) and are required to be independent with respect to the Trust in accordance with the U.S. federal securities laws and the applicable rules and regulations of the Securities and Exchange Commission and the PCAOB.
We conducted our audits in accordance with the standards of the PCAOB. Those standards require that we plan and perform the audit to obtain reasonable assurance about whether the financial statements are free of material misstatement, whether due to error or fraud. The Trust is not required to have, nor were we engaged to perform, an audit of the Trust’s internal control over financial reporting. As part of our audits, we are required to obtain an understanding of internal control over financial reporting, but not for the purpose of expressing an opinion on the effectiveness of the Trust’s internal control over financial reporting. Accordingly, we express no such opinion.
Our audits included performing procedures to assess the risks of material misstatement of the financial statements, whether due to error or fraud, and performing procedures that respond to those risks. Such procedures included examining, on a test basis, evidence regarding the amounts and disclosures in the financial statements. Our procedures included confirmation of securities owned as of December 31, 2020, by correspondence with the custodian and others. Our audits also included evaluating the accounting principles used and significant estimates made by management, as well as evaluating the overall presentation of the financial statements. We believe that our audits provide a reasonable basis for our opinion.

We have served as the auditor of one or more investment companies in the DWS family of funds since at least 1979, but we are unable to determine the specific year.
Boston, Massachusetts
February 12, 2021
| 18 | | | Deutsche DWS Variable Series I — DWS Core Equity VIP |
| Information About Your Fund’s Expenses | (Unaudited) |
As an investor of the Fund, you incur two types of costs: ongoing expenses and transaction costs. Ongoing expenses include management fees, distribution and service (12b-1) fees and other Fund expenses. Examples of transaction costs include contract charges, which are not shown in this section. The following tables are intended to help you understand your ongoing expenses (in dollars) of investing in the Fund and to help you compare these expenses with the ongoing expenses of investing in other mutual funds. The example in the table is based on an investment of $1,000 invested at the beginning of the six-month period and held for the entire period (July 1, 2020 to December 31, 2020).
The tables illustrate your Fund’s expenses in two ways:
| – | Actual Fund Return. This helps you estimate the actual dollar amount of ongoing expenses (but not transaction costs) paid on a $1,000 investment in the Fund using the Fund’s actual return during the period. To estimate the expenses you paid over the period, simply divide your account value by $1,000 (for example, an $8,600 account value divided by $1,000 = 8.6), then multiply the result by the number in the “Expenses Paid per $1,000” line under the share class you hold. |
| – | Hypothetical 5% Fund Return. This helps you to compare your Fund’s ongoing expenses (but not transaction costs) with those of other mutual funds using the Fund’s actual expense ratio and a hypothetical rate of return of 5% per year before expenses. Examples using a 5% hypothetical Fund return may be found in the shareholder reports of other mutual funds. The hypothetical account values and expenses may not be used to estimate the actual ending account balance or expenses you paid for the period. |
Please note that the expenses shown in these tables are meant to highlight your ongoing expenses only and do not reflect any transaction costs. The “Expenses Paid per $1,000” line of the tables is useful in comparing ongoing expenses only and will not help you determine the relative total expense of owning different funds. If these transaction costs had been included, your costs would have been higher.
| Expenses and Value of a $1,000 Investment for the six months ended December 31, 2020 | ||||||||
| Actual Fund Return | Class A | Class B | ||||||
| Beginning Account Value 7/1/20 | $ | 1,000.00 | $ | 1,000.00 | ||||
| Ending Account Value 12/31/20 | $ | 1,230.40 | $ | 1,228.60 | ||||
| Expenses Paid per $1,000* | $ | 3.36 | $ | 5.21 | ||||
| Hypothetical 5% Fund Return | Class A | Class B | ||||||
| Beginning Account Value 7/1/20 | $ | 1,000.00 | $ | 1,000.00 | ||||
| Ending Account Value 12/31/20 | $ | 1,022.12 | $ | 1,020.46 | ||||
| Expenses Paid per $1,000* | $ | 3.05 | $ | 4.72 | ||||
| * | Expenses are equal to the Fund’s annualized expense ratio for each share class, multiplied by the average account value over the period, multiplied by 184 (the number of days in the most recent six-month period), then divided by 366. |
| Annualized Expense Ratios | Class A | Class B | ||||||
| Deutsche DWS Variable Series I — DWS Core Equity VIP | .60 | % | .93 | % | ||||
For more information, please refer to the Fund’s prospectus.
These tables do not reflect charges and fees (“contract charges”) associated with the separate account that invests in the Fund or any variable life insurance policy or variable annuity contract for which the Fund is an investment option.
For an analysis of the fees associated with an investment in the Fund or similar funds, please refer to the current and hypothetical expense calculators for Variable Insurance Products which can be found at dws.com/calculators.
Deutsche DWS Variable Series I — DWS Core Equity VIP | | | 19 |
| Tax Information | (Unaudited) |
The Fund paid distributions of $0.51 per share from net long-term capital gains during its year ended December 31, 2020.
Pursuant to Section 852 of the Internal Revenue Code, the Fund designates $5,814,895 as capital gain dividends for its year ended December 31, 2020.
For corporate shareholders, 100% of the ordinary dividends (i.e., income dividends plus short-term capital gains) paid during the Fund’s fiscal year ended December 31, 2020 qualified for the dividends received deduction.
Please consult a tax advisor if you have questions about federal or state income tax laws, or on how to prepare your tax returns. If you have specific questions about your account, please contact your insurance provider.
The Trust’s policies and procedures for voting proxies for portfolio securities and information about how the Trust voted proxies related to its portfolio securities during the most recent 12-month period ended June 30 are available on our Web site — dws.com/en-us/resources/proxy-voting — or on the SEC’s Web site — sec.gov. To obtain a written copy of the Trust’s policies and procedures without charge, upon request, call us toll free at (800) 728-3337.
| 20 | | | Deutsche DWS Variable Series I — DWS Core Equity VIP |
Advisory Agreement Board Considerations and Fee Evaluation
The Board of Trustees (hereinafter referred to as the “Board” or “Trustees”) approved the renewal of DWS Core Equity VIP’s (the “Fund”) investment management agreement (the “Agreement”) with DWS Investment Management Americas, Inc. (“DIMA”) in September 2020.
In terms of the process that the Board followed prior to approving the Agreement, shareholders should know that:
| – | During the entire process, all of the Fund’s Trustees were independent of DIMA and its affiliates (the “Independent Trustees”). |
| – | The Board met frequently during the past year to discuss fund matters and dedicated a substantial amount of time to contract review matters. Over the course of several months, the Board reviewed extensive materials received from DIMA, independent third parties and independent counsel. These materials included an analysis of the Fund’s performance, fees and expenses, and profitability from a fee consultant retained by the Fund’s Independent Trustees (the “Fee Consultant”). |
| – | The Board also received extensive information throughout the year regarding performance of the Fund. |
| – | The Independent Trustees regularly met privately with counsel to discuss contract review and other matters. In addition, the Independent Trustees were advised by the Fee Consultant in the course of their review of the Fund’s contractual arrangements and considered a comprehensive report prepared by the Fee Consultant in connection with their deliberations. |
| – | In connection with reviewing the Agreement, the Board also reviewed the terms of the Fund’s Rule 12b-1 plan, distribution agreement, administrative services agreement, transfer agency agreement and other material service agreements. |
In connection with the contract review process, the Board considered the factors discussed below, among others. The Board also considered that DIMA and its predecessors have managed the Fund since its inception, and the Board believes that a long-term relationship with a capable, conscientious advisor is in the best interests of the Fund. The Board considered, generally, that shareholders chose to invest or remain invested in the Fund knowing that DIMA managed the Fund. DIMA is part of DWS Group GmbH & Co. KGaA (“DWS Group”). DWS Group is a global asset management business that offers a wide range of investing expertise and resources, including research capabilities in many countries throughout the world. In 2018, approximately 20% of DWS Group’s shares were sold in an initial public offering, with Deutsche Bank AG owning the remaining shares.
As part of the contract review process, the Board carefully considered the fees and expenses of each DWS fund overseen by the Board in light of the fund’s performance. In many cases, this led to the negotiation and implementation of expense caps.
While shareholders may focus primarily on fund performance and fees, the Fund’s Board considers these and many other factors, including the quality and integrity of DIMA’s personnel and administrative support services provided by DIMA, such as back-office operations, fund valuations, and compliance policies and procedures.
Nature, Quality and Extent of Services. The Board considered the terms of the Agreement, including the scope of advisory services provided under the Agreement. The Board noted that, under the Agreement, DIMA provides portfolio management services to the Fund and that, pursuant to a separate administrative services agreement, DIMA provides administrative services to the Fund. The Board considered the experience and skills of senior management and investment personnel and the resources made available to such personnel. The Board also considered the risks to DIMA in sponsoring or managing the Fund, including financial, operational and reputational risks, the potential economic impact to DIMA from such risks and DIMA’s approach to addressing such risks. The Board reviewed the Fund’s performance over short-term and long-term periods and compared those returns to various agreed-upon performance measures, including market index(es) and a peer universe compiled using information supplied by Morningstar Direct (“Morningstar”), an independent fund data service. The Board also noted that it has put into place a process of identifying “Funds in Review” (e.g., funds performing poorly relative to a peer universe), and receives additional reporting from DIMA regarding such funds and, where appropriate, DIMA’s plans to address underperformance. The Board believes this process is an effective manner of identifying and addressing underperforming funds. Based on the information provided, the Board noted that, for the one-, three- and five-year periods ended December 31, 2019, the Fund’s performance (Class A shares) was in the 3rd quartile,
Deutsche DWS Variable Series I — DWS Core Equity VIP | | | 21 |
3rd quartile and 1st quartile, respectively, of the applicable Morningstar universe (the 1st quartile being the best performers and the 4th quartile being the worst performers). The Board also observed that the Fund has outperformed its benchmark in the five-year period and has underperformed its benchmark in the one- and three-year periods ended December 31, 2019.
Fees and Expenses. The Board considered the Fund’s investment management fee schedule, operating expenses and total expense ratios, and comparative information provided by Broadridge Financial Solutions, Inc. (“Broadridge”) and the Fee Consultant regarding investment management fee rates paid to other investment advisors by similar funds (1st quartile being the most favorable and 4th quartile being the least favorable). With respect to management fees paid to other investment advisors by similar funds, the Board noted that the contractual fee rates paid by the Fund, which include a 0.10% fee paid to DIMA under the Fund’s administrative services agreement, were lower than the median (1st quartile) of the applicable Broadridge peer group (based on Broadridge data provided as of December 31, 2019). The Board noted that, effective March 1, 2020, the fee paid to DIMA under the Fund’s administrative services agreement was reduced to 0.097%. The Board noted that the Fund’s Class A shares total (net) operating expenses were expected to be lower than the median (2nd quartile) of the applicable Broadridge expense universe (based on Broadridge data provided as of December 31, 2019, and analyzing Broadridge expense universe Class A (net) expenses less any applicable 12b-1 fees) (“Broadridge Universe Expenses”). The Board also reviewed data comparing each other operational share class’s total (net) operating expenses to the applicable Broadridge Universe Expenses. The Board noted that the expense limitations agreed to by DIMA were expected to help the Fund’s total (net) operating expenses remain competitive. The Board considered the Fund’s management fee rate as compared to fees charged by DIMA to a comparable DWS U.S. registered fund (“DWS Funds”) and considered differences between the Fund and the comparable DWS Fund. The information requested by the Board as part of its review of fees and expenses also included information about institutional accounts (including any sub-advised funds and accounts) and funds offered primarily to European investors (“DWS Europe Funds”) managed by DWS Group. The Board noted that DIMA indicated that DWS Group does not manage any institutional accounts or DWS Europe Funds comparable to the Fund.
On the basis of the information provided, the Board concluded that management fees were reasonable and appropriate in light of the nature, quality and extent of services provided by DIMA.
Profitability. The Board reviewed detailed information regarding revenues received by DIMA under the Agreement. The Board considered the estimated costs to DIMA, and pre-tax profits realized by DIMA, from advising the DWS Funds, as well as estimates of the pre-tax profits attributable to managing the Fund in particular. The Board also received information regarding the estimated enterprise-wide profitability of DIMA and its affiliates with respect to all fund services in totality and by fund. The Board and the Fee Consultant reviewed DIMA’s methodology in allocating its costs to the management of the Fund. Based on the information provided, the Board concluded that the pre-tax profits realized by DIMA in connection with the management of the Fund were not unreasonable. The Board also reviewed certain publicly available information regarding the profitability of certain similar investment management firms. The Board noted that, while information regarding the profitability of such firms is limited (and in some cases is not necessarily prepared on a comparable basis), DIMA and its affiliates’ overall profitability with respect to the DWS Funds (after taking into account distribution and other services provided to the funds by DIMA and its affiliates) was lower than the overall profitability levels of most comparable firms for which such data was available.
Economies of Scale. The Board considered whether there are economies of scale with respect to the management of the Fund and whether the Fund benefits from any economies of scale. The Board noted that the Fund’s investment management fee schedule includes fee breakpoints. The Board concluded that the Fund’s fee schedule represents an appropriate sharing between the Fund and DIMA of such economies of scale as may exist in the management of the Fund at current asset levels.
Other Benefits to DIMA and Its Affiliates. The Board also considered the character and amount of other incidental or “fall-out” benefits received by DIMA and its affiliates, including any fees received by DIMA for administrative services provided to the Fund, any fees received by an affiliate of DIMA for transfer agency services provided to the Fund and any fees received by an affiliate of DIMA for distribution services. The Board also considered benefits to DIMA related to brokerage and soft-dollar allocations, including allocating brokerage to pay for research generated by parties other than the executing broker dealers, which pertain primarily to funds investing in equity securities. In addition, the Board considered the incidental public relations benefits to DIMA related to DWS Funds advertising and cross-selling opportunities among DIMA products and services. The Board considered these benefits in reaching its conclusion that the Fund’s management fees were reasonable.
| 22 | | | Deutsche DWS Variable Series I — DWS Core Equity VIP |
Compliance. The Board considered the significant attention and resources dedicated by DIMA to its compliance processes in recent years. The Board noted in particular (i) the experience, seniority and time commitment of the individuals serving as DIMA’s and the Fund’s chief compliance officers and (ii) the substantial commitment of resources by DIMA and its affiliates to compliance matters, including the retention of compliance personnel.
The Board also considered that on September 24, 2020, the SEC granted a temporary order permitting DIMA and its affiliates to continue providing investment advisory and underwriting services to the DWS Funds notwithstanding a consent order entered into by Deutsche Bank AG on June 17, 2020 (the “Consent Order”). The Board noted that the temporary order was granted effective as of the date of the Consent Order. The Board also noted various representations by DIMA to the Board relating to the Consent Order, including that the conduct giving rise to the Consent Order (unintentional conduct that resulted from a system outage that prevented Deutsche Bank AG from reporting data in accordance with applicable CFTC requirements for five days in April 2016) did not involve any DWS Fund or services DIMA and its affiliates provide to the DWS Funds, that DIMA and its personnel had no involvement in the alleged conduct giving rise to the Consent Order, and that the DWS Funds would not bear any financial impact or costs relating to the Consent Order.
Based on all of the information considered and the conclusions reached, the Board determined that the continuation of the Agreement is in the best interests of the Fund. In making this determination, the Board did not give particular weight to any single factor identified above. The Board considered these factors over the course of numerous meetings, certain of which were in executive session with only the Independent Trustees and counsel present. It is possible that individual Independent Trustees may have weighed these factors differently in reaching their individual decisions to approve the continuation of the Agreement.
Deutsche DWS Variable Series I — DWS Core Equity VIP | | | 23 |
The following table presents certain information regarding the Board Members and Officers of the Trust/Corporation. Each Board Member’s year of birth is set forth in parentheses after his or her name. Unless otherwise noted, (i) each Board Member has engaged in the principal occupation(s) noted in the table for at least the most recent five years, although not necessarily in the same capacity; and (ii) the address of each Independent Board Member is Keith R. Fox, DWS Funds Board Chair, c/o Thomas R. Hiller, Ropes & Gray LLP, Prudential Tower, 800 Boylston Street, Boston, MA 02199-3600. Except as otherwise noted below, the term of office for each Board Member is until the election and qualification of a successor, or until such Board Member sooner dies, resigns, is removed or as otherwise provided in the governing documents of the Trust/Corporation. Because the Fund does not hold an annual meeting of shareholders, each Board Member will hold office for an indeterminate period.
The Board Members may also serve in similar capacities with other funds in the fund complex. The number of funds in the DWS fund complex shown in the table below includes all registered open- and closed-end funds (including all of their portfolios) advised by the Advisor and any registered funds that have an investment advisor that is an affiliated person of the Advisor.
| Independent Board Members | ||||||||
| Name, Year of Birth, Position with the Trust/ Corporation and Length of Time Served1 | Business Experience and Directorships During the Past Five Years | Number of Funds in DWS Fund Complex Overseen | Other Directorships Held by Board Member | |||||
Keith R. Fox, CFA (1954)
Chairperson since 2017, and Board Member since 1996 | Managing General Partner, Exeter Capital Partners (a series of private investment funds) (since 1986). Directorships: Progressive International Corporation (kitchen goods importer and distributor); former Chairman, National Association of Small Business Investment Companies; former Directorships: ICI Mutual Insurance Company; BoxTop Media Inc. (advertising); Sun Capital Advisers Trust (mutual funds) (2011–2012) | 73 | — | |||||
John W. Ballantine (1946)
Board Member since 1999 | Retired; formerly, Executive Vice President and Chief Risk Management Officer, First Chicago NBD Corporation/The First National Bank of Chicago (1996–1998); Executive Vice President and Head of International Banking (1995–1996); former Directorships: Director and Chairman of the Board, Healthways, Inc.2 (population well-being and wellness services) (2003–2014); Stockwell Capital Investments PLC (private equity); Enron Corporation; FNB Corporation; Tokheim Corporation; First Oak Brook Bancshares, Inc.; Oak Brook Bank; and Prisma Energy International. Not-for-Profit Director/Trustee: Palm Beach Civic Association; Window to the World Communications (public media); Life Director of Harris Theater for Music and Dance (Chicago); Life Director of Hubbard Street Dance Chicago; former Not-for-Profit Directorships: Public Radio International | 73 | Portland General Electric2 (utility company) (2003– present) | |||||
Dawn-Marie Driscoll (1946)
Board Member since 1987 | Emeritus Executive Fellow, Center for Business Ethics, Bentley University; formerly: Partner, Palmer & Dodge (law firm) (1988–1990); Vice President of Corporate Affairs and General Counsel, Filene’s (retail) (1978–1988). Directorships: Advisory Board, Center for Business Ethics, Bentley University; Trustee and former Chairman of the Board, Southwest Florida Community Foundation (charitable organization); former Directorships: ICI Mutual Insurance Company (2007–2015); Sun Capital Advisers Trust (mutual funds) (2007–2012), Investment Company Institute (audit, executive, nominating committees) and Independent Directors Council (governance, executive committees) | 73 | — | |||||
Richard J. Herring (1946)
Board Member since 1990 | Jacob Safra Professor of International Banking and Professor of Finance, The Wharton School, University of Pennsylvania (since July 1972); Director, The Wharton Financial Institutions Center (since 1994); formerly: Vice Dean and Director, Wharton Undergraduate Division (1995–2000) and Director, The Lauder Institute of International Management Studies (2000–2006); Member FDIC Systemic Risk Advisory Committee since 2011, member Systemic Risk Council since 2012 and member of the Advisory Board at the Yale Program on Financial Stability since 2013; Formerly Co-Chair of the Shadow Financial Regulatory Committee (2003–2015), Executive Director of The Financial Economists Roundtable (2008–2015), Director of The Thai Capital Fund (2007–2013), Director of The Aberdeen Singapore Fund (2007–2018), and Nonexecutive Director of Barclays Bank DE (2010–2018) | 73 | Director, Aberdeen Japan Fund (since 2007) | |||||
William McClayton (1944)
Board Member since 2004 | Private equity investor (since October 2009); previously, Managing Director, Diamond Management & Technology Consultants, Inc. (global consulting firm) (2001–2009); Directorship: Board of Managers, YMCA of Metropolitan Chicago; formerly: Senior Partner, Arthur Andersen LLP (accounting) (1966–2001); Trustee, Ravinia Festival | 73 | — | |||||
| 24 | | | Deutsche DWS Variable Series I — DWS Core Equity VIP |
| Name, Year of Birth, Position with the Trust/ Corporation and Length of Time Served1 | Business Experience and Directorships During the Past Five Years | Number of Funds in DWS Fund Complex Overseen | Other Directorships Held by Board Member | |||||
Rebecca W. Rimel (1951)
Board Member since 1995 | Senior Advisor, The Pew Charitable Trusts (charitable organization) (since July 2020); formerly: Executive Vice President, The Glenmede Trust Company (investment trust and wealth management) (1983–2004); Board Member, Investor Education (charitable organization) (2004–2005); Trustee, Executive Committee, Philadelphia Chamber of Commerce (2001–2007); Director, Viasys Health Care2 (January 2007–June 2007); Trustee, Thomas Jefferson Foundation (charitable organization) (1994–2012); President, Chief Executive Officer and Director, The Pew Charitable Trusts (charitable organization) (1994–2020) | 73 | Director, Becton Dickinson and Company2 (medical technology company) (2012– present); Director, BioTelemetry Inc.2 (health care) (2009– present) | |||||
William N. Searcy, Jr. (1946)
Board Member since 1993 | Private investor since October 2003; formerly: Pension & Savings Trust Officer, Sprint Corporation2 (telecommunications) (November 1989–September 2003); Trustee, Sun Capital Advisers Trust (mutual funds) (1998–2012) | 73 | — | |||||
| Officers4 | ||
| Name, Year of Birth, Position with the Trust/ Corporation and Length of Time Served5 | Business Experience and Directorships During the Past Five Years | |
Hepsen Uzcan6 (1974)
President and Chief Executive Officer, 2017–present | Managing Director3, DWS; Secretary, DWS USA Corporation (2018–present); Assistant Secretary, DWS Distributors, Inc. (2018–present); Director and Vice President, DWS Service Company (2018–present); Assistant Secretary, DWS Investment Management Americas, Inc. (2018–present); Director and President, DB Investment Managers, Inc. (2018–present); President and Chief Executive Officer, The European Equity Fund, Inc., The New Germany Fund, Inc. and The Central and Eastern Europe Fund, Inc. (2017–present); formerly: Vice President for the Deutsche funds (2016–2017); Assistant Secretary for the DWS funds (2013–2019); Assistant Secretary, The European Equity Fund, Inc., The New Germany Fund, Inc. and The Central and Eastern Europe Fund, Inc. (2013–2020); Directorships: Interested Director, The European Equity Fund, Inc., The New Germany Fund, Inc. and The Central and Eastern Europe Fund, Inc. (since June 25, 2020); ICI Mutual Insurance Company (since October 16, 2020); and Episcopalian Charities of New York (2018–present) | |
John Millette7 (1962)
Vice President and Secretary, 1999–present | Director,3 DWS; Chief Legal Officer, DWS Investment Management Americas, Inc. (2015–present); Director and Vice President, DWS Trust Company (2016–present); Secretary, DBX ETF Trust (2020–present); Secretary, The European Equity Fund, Inc., The New Germany Fund, Inc. and The Central and Eastern Europe Fund, Inc. (2011–present); formerly: Secretary, Deutsche Investment Management Americas Inc. (2015–2017); Assistant Secretary, DBX ETF Trust (2019–2020); Assistant Secretary (July 14, 2006–December 31, 2010) and Secretary (January 31, 2006–July 13, 2006), The European Equity Fund, Inc., The New Germany Fund, Inc. and The Central and Eastern Europe Fund, Inc. | |
Ciara Crawford8 (1984)
Assistant Secretary, (2019–present) | Associate, DWS (since 2015); previously, Legal Assistant at Accelerated Tax Solutions. | |
Diane Kenneally7 (1966)
Chief Financial Officer and Treasurer, 2018–present | Director,3 DWS; Treasurer, Chief Financial Officer and Controller, DBX ETF Trust (2019–present); Treasurer and Chief Financial Officer, The European Equity Fund, Inc., The New Germany Fund, Inc. and The Central and Eastern Europe Fund, Inc. (2018–present); formerly: Assistant Treasurer for the DWS funds (2007–2018) | |
Paul Antosca7 (1957)
Assistant Treasurer, 2007–present | Director,3 DWS; and Assistant Treasurer, DBX ETF Trust (2019–present) | |
Sheila Cadogan7 (1966)
Assistant Treasurer, 2017–present | Director,3 DWS; Director and Vice President, DWS Trust Company (2018–present); Assistant Treasurer, DBX ETF Trust (2019–present); Assistant Treasurer, The European Equity Fund, Inc., The New Germany Fund, Inc. and The Central and Eastern Europe Fund, Inc. (2018–present) | |
Scott D. Hogan7 (1970)
Chief Compliance Officer, 2016–present | Director,3 DWS; Chief Compliance Officer, The European Equity Fund, Inc., The New Germany Fund, Inc. and The Central and Eastern Europe Fund, Inc. (2016–present) | |
Caroline Pearson7 (1962)
Chief Legal Officer, 2010–present | Managing Director3, DWS; Assistant Secretary, DBX ETF Trust (2020–present); Chief Legal Officer, DBX Advisors LLC and DBX Strategic Advisors LLC (2020–present); Chief Legal Officer, The European Equity Fund, Inc., The New Germany Fund, Inc. and The Central and Eastern Europe Fund, Inc. (2012–present); formerly: Secretary, Deutsche AM Distributors, Inc. (2002–2017); and Secretary, Deutsche AM Service Company (2010–2017) |
Deutsche DWS Variable Series I — DWS Core Equity VIP | | | 25 |
| Name, Year of Birth, Position with the Trust/ Corporation and Length of Time Served5 | Business Experience and Directorships During the Past Five Years | |
Michelle Goveia-Pine6 (1970)
Interim Anti-Money Laundering Compliance Officer, since July 10, 2020 | Director,3 DWS; Interim AML Officer, DWS Trust Company (since July 28, 2020); Interim AML Officer, DBX ETF Trust (since July 9, 2020); Interim AML Officer, The European Equity Fund, Inc., The New Germany Fund, Inc. and The Central and Eastern Europe Fund, Inc. (since July 24, 2020) |
| 1 | The length of time served represents the year in which the Board Member joined the board of one or more DWS funds currently overseen by the Board. |
| 2 | A publicly held company with securities registered pursuant to Section 12 of the Securities Exchange Act of 1934. |
| 3 | Executive title, not a board directorship. |
| 4 | As a result of their respective positions held with the Advisor or its affiliates, these individuals are considered “interested persons” of the Advisor within the meaning of the 1940 Act. Interested persons receive no compensation from the Fund. |
| 5 | The length of time served represents the year in which the officer was first elected in such capacity for one or more DWS funds. |
| 6 | Address: 875 Third Avenue, New York, NY 10022. |
| 7 | Address: 100 Summer Street, Boston, MA 02110. |
| 8 | Address: 5022 Gate Parkway, Suite 400, Jacksonville, FL 32256. |
The Fund’s Statement of Additional Information (“SAI”) includes additional information about the Board Members. The SAI is available, without charge, upon request. If you would like to request a copy of the SAI, you may do so by calling the following toll-free number: (800) 728-3337.
| 26 | | | Deutsche DWS Variable Series I — DWS Core Equity VIP |
Notes
| ||
VS1coreq-2 (R-025822-11 2/21) |
December 31, 2020
Annual Report
Deutsche DWS Variable Series I
DWS CROCI® International VIP

This report must be preceded or accompanied by a prospectus. To obtain an additional prospectus or summary prospectus, if available, call (800) 728-3337 or your financial representative. We advise you to consider the Fund’s objectives, risks, charges and expenses carefully before investing. The summary prospectus and prospectus contain this and other important information about the Fund. Please read the prospectus carefully before you invest.
Investing in foreign securities, presents certain risks, such as currency fluctuations, political and economic changes, and market risks. Stocks may decline in value. The Fund will be managed on the premise that stocks with lower CROCI® Economic P/E Ratios may outperform stocks with higher CROCI® Economic P/E Ratios over time. This premise may not always be correct and prospective investors should evaluate this assumption prior to investing in the Fund. Investing in derivatives entails special risks relating to liquidity, leverage and credit that may reduce returns and/or increase volatility. The Fund may lend securities to approved institutions. Please read the prospectus for details.
War, terrorism, economic uncertainty, trade disputes, public health crises (including the recent pandemic spread of the novel coronavirus) and related geopolitical events could lead to increased market volatility, disruption to U.S. and world economies and markets and may have significant adverse effects on the Fund and its investments.
In June 2016, citizens of the United Kingdom approved a referendum to leave the European Union and in March 2017, the United Kingdom initiated the formal process of withdrawing from the EU and the withdrawal is expected to take effect on January 31, 2020. Significant uncertainty exists regarding any adverse economic and political effects the United Kingdom’s withdrawal may have on the United Kingdom, other EU countries and the global economy.
The brand DWS represents DWS Group GmbH & Co. KGaA and any of its subsidiaries such as DWS Distributors, Inc. which offers investment products or DWS Investment Management Americas, Inc. and RREEF America L.L.C. which offer advisory services.
DWS Distributors, Inc., 222 South Riverside Plaza, Chicago, IL 60606, (800) 621-1148
NOT FDIC/NCUA INSURED NO BANK GUARANTEE MAY LOSE VALUE NOT A DEPOSIT
NOT INSURED BY ANY FEDERAL GOVERNMENT AGENCY
| 2 | | | Deutsche DWS Variable Series I — DWS CROCI® International VIP |
| Performance Summary | December 31, 2020 (Unaudited) |
Fund performance shown is historical, assumes reinvestment of all dividend and capital gain distributions, and does not guarantee future results. Investment return and principal value fluctuate with changing market conditions so that, when redeemed, shares may be worth more or less than their original cost. Current performance may be lower or higher than the performance data quoted. Please contact your participating insurance company for the Fund’s most recent month-end performance. Performance does not reflect charges and fees (“contract charges”) associated with the separate account that invests in the Fund or any variable life insurance policy or variable annuity contract for which the Fund is an investment option. These charges and fees will reduce returns. While all share classes have the same underlying portfolio, their performance will differ.
The gross expense ratios of the Fund, as stated in the fee table of the prospectus dated May 1, 2020 are 1.01% and 1.29% for Class A and Class B shares, respectively, and may differ from the expense ratios disclosed in the Financial Highlights tables in this report.
Generally accepted accounting principles require adjustments to be made to the net assets of the Fund at period end for financial reporting purposes only, and as such, the total return based on the unadjusted net asset value per share may differ from the total return reported in the financial highlights.
Growth of an Assumed $10,000 Investment
| MSCI EAFE (Europe, Australasia and the Far
Index returns do not reflect any fees or | |
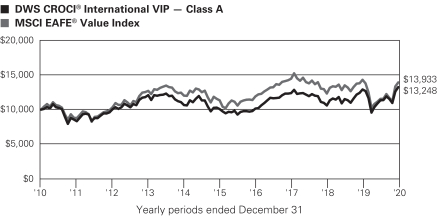
| Comparative Results | ||||||||||
| DWS CROCI® International VIP | 1-Year | 3-Year | 5-Year | 10-Year | ||||||
| Class A | Growth of $10,000 | $10,261 | $10,697 | $13,142 | $13,248 | |||||
| Average annual total return | 2.61% | 2.27% | 5.62% | 2.85% | ||||||
| MSCI EAFE Value Index | Growth of $10,000 | $9,737 | $9,633 | $12,287 | $13,933 | |||||
| Average annual total return | –2.63% | –1.24% | 4.20% | 3.37% | ||||||
| DWS CROCI® International VIP | 1-Year | 3-Year | 5-Year | 10-Year | ||||||
| Class B | Growth of $10,000 | $10,249 | $10,616 | $12,988 | $12,933 | |||||
| Average annual total return | 2.49% | 2.01% | 5.37% | 2.61% | ||||||
| MSCI EAFE Value Index | Growth of $10,000 | $9,737 | $9,633 | $12,287 | $13,933 | |||||
| Average annual total return | –2.63% | –1.24% | 4.20% | 3.37% | ||||||
The growth of $10,000 is cumulative.
Deutsche DWS Variable Series I — DWS CROCI® International VIP | | | 3 |
| Management Summary | December 31, 2020 (Unaudited) |
The Fund returned 2.61% (Class A, unadjusted for contract charges) in 2020 and outperformed the –2.63% return of its benchmark, the MSCI EAFE Value Index.
Although many segments of the world equity markets posted gains in 2020, international value stocks finished in negative territory. As was the case with most risk assets, foreign equities plunged in February and March when the spread of COVID-19 prompted governments to shut down large swaths of their economies in an effort to contain the virus. The subsequent stimulus provided by global central banks helped arrest the decline in late March, and equities went on to rally through the end of the year.
Prior to November, the gains were largely concentrated in U.S. mega-cap technology stocks and other fast-growing companies. In contrast, both value stocks and the international markets lagged. This trend changed following the approval of a vaccine for COVID-19 in early November. From that point forward, investors — seeing an improving outlook the global economy in 2021 — appeared to grow more comfortable moving beyond the largest growth stocks. While this shift led to strong relative performance for international value stocks in the final two months of the year, it was not enough to push the MSCI EAFE Value Index above the break-even mark for 2020.
The Fund was able to overcome the potential headwinds and finish 2020 with a gain even as the index lost ground. Both stock selection and sector allocations contributed to performance. In terms of selection, we produced the best results in the health care, information technology, and communication services, with smaller contributions from consumer discretionary and consumer staples. Conversely, selection in industrials and financials detracted.
Two health care stocks were among the largest contributors at the individual company level: UCB SA (Belgium), which benefited from its impressive pipeline of new drugs and its promising treatment for psoriasis, and Roche Holding AG (Switzerland), which rose as strength in several key drugs boosted its sales growth. The Fund was also helped by its positions in a number of Japanese stocks, including Toyota Industries Corp., Tokyo Electron, Ltd., and Nintendo Co., Ltd., among others. Japan was hit by COVID-19 to a much lesser extent than Europe or the United Kingdom, a factor that helped its market outperform in 2020.
On the other end of the spectrum, International Airlines Group SA* (IAG) (Spain) was the largest detractor. While all airlines were hurt by the COVID-related shutdowns, IAG was particularly vulnerable since many of its routes were to and from coronavirus hotspots. Central Japan Railway Co.* also pressured results. COVID-19 created an uncertain outlook for the company, prompting analyst downgrades and raising questions about the sustainability of its current dividend. Two banking stocks — Intesa Sanpaolo SpA (Italy) and Banco Bilbao Vizcaya Argentaria SA* (Argentina) — were notable detractors, as well.
With regard to sector allocation, an underweight in energy—which trailed the broader market due to softness in oil prices and concerns that domestic production may have peaked—was a key contributor. An underweight in financials also added value, as the sector was hurt by worries about slower economic growth and the shrinking margin between short- and long-term interest rates. The Fund was further helped by its overweight allocations to the information technology and consumer discretionary sectors. Conversely, an underweight in utilities detracted.
The markets presented a mixed picture at the end of period. Economic growth was still on a shaky footing, and the valuation of the overall market appeared somewhat extended given the outlook for weak corporate earnings in the next six to 12 months. At the same time, however, the combination of stimulative global central bank policies and ultra-low yields on government bonds remained important sources of support for stock prices. In this uncertain environment, our strategy was to stay focused on our disciplined, systematic approach to stock selection. We believe that emphasizing individual stock picking, rather than trying to construct a portfolio on the basis of economic developments or short-term market movements, is the most effective way to add value over time.
Di Kumble, CFA, Managing Director
John Moody, Vice President
Portfolio Managers
| 4 | | | Deutsche DWS Variable Series I — DWS CROCI® International VIP |
The views expressed reflect those of the portfolio management team only through the end of the period of the report as stated on the cover. The management team’s views are subject to change at any time based on market and other conditions and should not be construed as a recommendation. Past performance is no guarantee of future results. Current and future portfolio holdings are subject to risk.
Terms to Know
The Morgan Stanley Capital International (MSCI) Europe, Australasia and Far East (EAFE) Index is an equity index which captures large- and mid-cap representation across developed markets countries around the world, excluding the United States and Canada. With 928 constituents, the index covers approximately 85% of the free float-adjusted market capitalization in each country.
Stock selection refers to the performance of the fund’s holdings in a given sector relative to the sector as a whole.
Contributors and detractors incorporate both a stock’s return and its weight. If two stocks have the same return but one has a larger weighting in the Fund, it will have a larger contribution to return in the period.
Overweight means the Fund holds a higher weighting in a given sector or security than the benchmark. Underweight means the Fund holds a lower weighting.
Consumer discretionary represents industries that produce goods and services that are not necessities in everyday life.
| * | Not held at December 31, 2020 |
Deutsche DWS Variable Series I — DWS CROCI® International VIP | | | 5 |
| Portfolio Summary | (Unaudited) |
| Asset Allocation (As a % of Investment Portfolio) | 12/31/20 | 12/31/19 | ||||||
| Common Stocks | 97% | 97% | ||||||
| Preferred Stocks | 3% | 3% | ||||||
| Cash Equivalents | 0% | 0% | ||||||
| 100% | 100% | |||||||
| Geographical Diversification (As a % of Investment Portfolio excluding Cash Equivalents) | 12/31/20 | 12/31/19 | ||||||
| Japan | 27% | 30% | ||||||
| United Kingdom | 14% | 19% | ||||||
| France | 13% | 9% | ||||||
| Germany | 10% | 5% | ||||||
| Switzerland | 10% | 9% | ||||||
| Australia | 8% | 7% | ||||||
| Netherlands | 3% | 7% | ||||||
| Singapore | 3% | 2% | ||||||
| Denmark | 3% | — | ||||||
| Italy | 3% | 3% | ||||||
| Sweden | 2% | 0% | ||||||
| Belgium | 2% | 4% | ||||||
| Finland | 1% | 0% | ||||||
| Hong Kong | 1% | 1% | ||||||
| Ireland | 0% | — | ||||||
| Spain | — | 3% | ||||||
| New Zealand | — | 1% | ||||||
| 100% | 100% | |||||||
| Sector Diversification (As a % of Investment Portfolio excluding Cash Equivalents) | 12/31/20 | 12/31/19 | ||||||
| Health Care | 20% | 16% | ||||||
| Consumer Discretionary | 16% | 28% | ||||||
| Financials | 15% | 14% | ||||||
| Materials | 12% | 11% | ||||||
| Consumer Staples | 11% | 4% | ||||||
| Information Technology | 10% | 4% | ||||||
| Industrials | 8% | 15% | ||||||
| Communication Services | 5% | 4% | ||||||
| Utilities | 3% | — | ||||||
| Energy | — | 4% | ||||||
| 100% | 100% | |||||||
Portfolio holdings and characteristics are subject to change.
For more complete details about the Fund’s investment portfolio, see page 7.
Following the Fund’s fiscal first and third quarter-end, a complete portfolio holdings listing is posted on dws.com, and is available free of charge by contacting your financial intermediary, or if you are a direct investor, by calling (800) 728-3337. In addition, the portfolio holdings listing is filed with the SEC on the Fund’s Form N-PORT and will be available on the SEC’s Web site at sec.gov. Additional portfolio holdings for the Fund are also posted on dws.com from time to time. Please see the Fund’s current prospectus for more information.
| 6 | | | Deutsche DWS Variable Series I — DWS CROCI® International VIP |
| Investment Portfolio | as of December 31, 2020 |
| Shares | Value ($) | |||||||
| Common Stocks 96.5% | ||||||||
| Australia 8.5% |
| |||||||
Australia & New Zealand Banking Group Ltd. | 85,009 | 1,495,323 | ||||||
BHP Group Ltd. | 112,641 | 3,681,072 | ||||||
Commonwealth Bank of Australia | 3,525 | 224,201 | ||||||
National Australia Bank Ltd. | 61,951 | 1,087,967 | ||||||
Orica Ltd. | 25,381 | 295,208 | ||||||
|
| |||||||
(Cost $5,509,441) |
| 6,783,771 | ||||||
| Belgium 1.8% |
| |||||||
UCB SA (Cost $1,064,242) | 13,738 | 1,420,536 | ||||||
| Denmark 2.8% | ||||||||
AP Moller — Maersk AS “B” | 688 | 1,541,401 | ||||||
Novo Nordisk AS ‘‘B” | 4,309 | 299,182 | ||||||
Pandora AS | 3,296 | 370,442 | ||||||
|
| |||||||
(Cost $1,592,509) |
| 2,211,025 | ||||||
| Finland 1.0% |
| |||||||
Fortum Oyj | 11,910 | 287,931 | ||||||
Nokia Oyj* | 120,649 | 466,272 | ||||||
|
| |||||||
(Cost $667,648) |
| 754,203 | ||||||
| France 12.9% |
| |||||||
Atos SE* | 21,119 | 1,916,558 | ||||||
BNP Paribas SA* | 54,004 | 2,858,946 | ||||||
Danone SA | 12,161 | 800,444 | ||||||
Engie SA* | 78,838 | 1,210,793 | ||||||
Sanofi | 30,261 | 2,927,326 | ||||||
Television Francaise 1* | 60,591 | 489,501 | ||||||
|
| |||||||
(Cost $8,855,124) |
| 10,203,568 | ||||||
| Germany 7.3% |
| |||||||
Bayer AG (Registered) | 18,582 | 1,098,265 | ||||||
Beiersdorf AG | 12,932 | 1,495,101 | ||||||
Brenntag AG | 13,768 | 1,069,304 | ||||||
Deutsche Boerse AG | 3,838 | 654,025 | ||||||
Fresenius Medical Care AG & Co. KGaA | 4,996 | 423,292 | ||||||
Fresenius SE & Co. KGaA | 10,131 | 476,829 | ||||||
HeidelbergCement AG | 3,318 | 253,541 | ||||||
Merck KGaA | 1,967 | 342,560 | ||||||
|
| |||||||
(Cost $5,267,575) |
| 5,812,917 | ||||||
| Hong Kong 0.6% |
| |||||||
CLP Holdings Ltd. (Cost $440,815) | 47,500 | 439,337 | ||||||
| Ireland 0.5% |
| |||||||
CRH PLC* (Cost $324,257) | 10,322 | 430,535 | ||||||
| Italy 2.7% |
| |||||||
Intesa Sanpaolo SpA* | 787,944 | 1,846,646 | ||||||
Snam SpA | 55,038 | 310,660 | ||||||
|
| |||||||
(Cost $1,934,429) |
| 2,157,306 | ||||||
| Japan 26.8% |
| |||||||
Advantest Corp. | 3,400 | 256,410 | ||||||
Astellas Pharma, Inc. | 22,500 | 347,620 | ||||||
Bridgestone Corp. | 45,991 | 1,508,734 | ||||||
Dentsu Group, Inc. | 11,600 | 345,008 | ||||||
Fujitsu Ltd. | 3,000 | 434,107 | ||||||
ITOCHU Corp. | 10,200 | 293,485 | ||||||
| Shares | Value ($) | |||||||
KDDI Corp. | 8,200 | 243,760 | ||||||
Mitsubishi UFJ Financial Group, Inc. | 95,000 | 419,933 | ||||||
Nintendo Co., Ltd. | 2,500 | 1,595,231 | ||||||
Ono Pharmaceutical Co., Ltd. | 36,000 | 1,084,894 | ||||||
Otsuka Holdings Co., Ltd. | 9,200 | 393,871 | ||||||
Sekisui House Ltd. | 48,200 | 980,996 | ||||||
Seven & i Holdings Co., Ltd. | 8,300 | 294,337 | ||||||
Shin-Etsu Chemical Co., Ltd. | 6,009 | 1,051,893 | ||||||
Shionogi & Co., Ltd. | 19,800 | 1,082,693 | ||||||
Sony Corp. | 7,134 | 717,589 | ||||||
Subaru Corp. | 24,057 | 480,881 | ||||||
Sumitomo Mitsui Financial Group, Inc. | 114,056 | 3,519,175 | ||||||
Takeda Pharmaceutical Co., Ltd. | 6,500 | 236,801 | ||||||
Tokyo Electron Ltd. | 4,372 | 1,632,818 | ||||||
Toyota Industries Corp. | 42,232 | 3,356,365 | ||||||
Toyota Motor Corp. | 13,446 | 1,037,105 | ||||||
|
| |||||||
(Cost $17,381,244) |
| 21,313,706 | ||||||
| Netherlands 3.3% |
| |||||||
Koninklijke Ahold Delhaize NV | 53,367 | 1,509,081 | ||||||
Koninklijke KPN NV | 358,609 | 1,091,597 | ||||||
|
| |||||||
(Cost $2,106,657) |
| 2,600,678 | ||||||
| Singapore 2.8% |
| |||||||
Singapore Telecommunications Ltd. | 214,800 | 376,768 | ||||||
Venture Corp., Ltd. | 125,983 | 1,856,789 | ||||||
|
| |||||||
(Cost $1,845,342) |
| 2,233,557 | ||||||
| Sweden 1.9% |
| |||||||
Alfa Laval AB* | 14,333 | 393,762 | ||||||
Telefonaktiebolaget LM Ericsson “B” | 96,735 | 1,151,550 | ||||||
|
| |||||||
(Cost $1,084,952) |
| 1,545,312 | ||||||
| Switzerland 9.7% |
| |||||||
Adecco Group AG (Registered) | 26,503 | 1,778,406 | ||||||
LafargeHolcim Ltd. (Registered) | 32,856 | 1,820,928 | ||||||
Novartis AG (Registered) | 8,314 | 786,457 | ||||||
Roche Holding AG (Genusschein) | 9,454 | 3,308,983 | ||||||
|
| |||||||
(Cost $6,546,633) |
| 7,694,774 | ||||||
| United Kingdom 13.9% |
| |||||||
BAE Systems PLC | 81,617 | 544,844 | ||||||
Barratt Developments PLC* | 54,190 | 499,088 | ||||||
British American Tobacco PLC | 34,140 | 1,269,745 | ||||||
Bunzl PLC | 9,451 | 315,930 | ||||||
Ferguson PLC | 1,817 | 221,241 | ||||||
GlaxoSmithKline PLC | 61,939 | 1,139,089 | ||||||
Imperial Brands PLC | 54,629 | 1,153,030 | ||||||
Johnson Matthey PLC | 9,841 | 327,388 | ||||||
Kingfisher PLC* | 119,422 | 441,591 | ||||||
Mondi PLC | 13,758 | 324,851 | ||||||
Persimmon PLC | 53,398 | 2,025,405 | ||||||
Rio Tinto PLC | 20,720 | 1,554,211 | ||||||
Smiths Group PLC | 11,770 | 242,999 | ||||||
Taylor Wimpey PLC* | 416,816 | 949,417 | ||||||
|
| |||||||
(Cost $9,172,585) |
| 11,008,829 | ||||||
Total Common Stocks |
| 76,610,054 | ||||||
The accompanying notes are an integral part of the financial statements.
Deutsche DWS Variable Series I — DWS CROCI® International VIP | | | 7 |
| Shares | Value ($) | |||||||
| Preferred Stocks 2.9% |
| |||||||
| Germany |
| |||||||
Henkel AG & Co. KGaA | 20,356 | 2,293,699 | ||||||
| Cash Equivalents 0.3% | ||||||||
DWS Central Cash Management Government Fund, 0.08% (a) (Cost $249,295) | 249,295 | 249,295 | ||||||
| % of Net Assets | Value ($) | |||||||
Total Investment Portfolio | 99.7 | 79,153,048 | ||||||
| Other Assets and Liabilities, Net | 0.3 | 234,351 | ||||||
| Net Assets | 100.0 | 79,387,399 | ||||||
A summary of the Fund’s transactions with affiliated investments during the year ended December 31, 2020 are as follows:
| Value ($) at 12/31/2019 | Purchases Cost ($) | Sales Proceeds ($) | Net Realized Gain/ (Loss) ($) | Net Change in Unrealized Appreciation (Depreciation) ($) | Income ($) | Capital Gain Distributions ($) | Number of Shares at 12/31/2020 | Value ($) at 12/31/2020 | ||||||||||||||||||||||||
Securities Lending Collateral 0.0% |
| |||||||||||||||||||||||||||||||
DWS Government & Agency Securities Portfolio “DWS Government Cash Institutional Shares”, 0.03% (a) (b) |
| |||||||||||||||||||||||||||||||
| — | — | (c) | — | — | — | 2,874 | — | — | — | |||||||||||||||||||||||
Cash Equivalents 0.3% |
| |||||||||||||||||||||||||||||||
DWS Central Cash Management Government Fund, 0.08% (a) |
| |||||||||||||||||||||||||||||||
| 226,563 | 7,806,902 | 7,784,170 | — | — | 2,446 | — | 249,295 | 249,295 | ||||||||||||||||||||||||
| 226,563 | 7,806,902 | 7,784,170 | — | — | 5,320 | — | 249,295 | 249,295 | ||||||||||||||||||||||||
| * | Non-income producing security. |
| (a) | Affiliated fund managed by DWS Investment Management Americas, Inc. The rate shown is the annualized seven-day yield at period end. |
| (b) | Represents cash collateral held in connection with securities lending. Income earned by the Fund is net of borrower rebates. |
| (c) | Represents the net increase (purchase cost) or decrease (sales proceeds) in the amount invested in cash collateral for the year ended December 31, 2020. |
The accompanying notes are an integral part of the financial statements.
| 8 | | | Deutsche DWS Variable Series I — DWS CROCI® International VIP |
Fair Value Measurements
Various inputs are used in determining the value of the Fund’s investments. These inputs are summarized in three broad levels. Level 1 includes quoted prices in active markets for identical securities. Level 2 includes other significant observable inputs (including quoted prices for similar securities, interest rates, prepayment speeds and credit risk). Level 3 includes significant unobservable inputs (including the Fund’s own assumptions in determining the fair value of investments). The level assigned to the securities valuations may not be an indication of the risk or liquidity associated with investing in those securities.
The following is a summary of the inputs used as of December 31, 2020 in valuing the Fund’s investments. For information on the Fund’s policy regarding the valuation of investments, please refer to the Security Valuation section of Note A in the accompanying Notes to Financial Statements.
| Assets | Level 1 | Level 2 | Level 3 | Total | ||||||||||||
| Common Stocks | ||||||||||||||||
Australia | $ | — | $ | 6,783,771 | $ | — | $ | 6,783,771 | ||||||||
Belgium | — | 1,420,536 | — | 1,420,536 | ||||||||||||
Denmark | — | 2,211,025 | — | 2,211,025 | ||||||||||||
Finland | — | 754,203 | — | 754,203 | ||||||||||||
France | — | 10,203,568 | — | 10,203,568 | ||||||||||||
Germany | — | 5,812,917 | — | 5,812,917 | ||||||||||||
Hong Kong | — | 439,337 | — | 439,337 | ||||||||||||
Ireland | — | 430,535 | — | 430,535 | ||||||||||||
Italy | — | 2,157,306 | — | 2,157,306 | ||||||||||||
Japan | — | 21,313,706 | — | 21,313,706 | ||||||||||||
Netherlands | — | 2,600,678 | — | 2,600,678 | ||||||||||||
Singapore | — | 2,233,557 | — | 2,233,557 | ||||||||||||
Sweden | — | 1,545,312 | — | 1,545,312 | ||||||||||||
Switzerland | — | 7,694,774 | — | 7,694,774 | ||||||||||||
United Kingdom | — | 11,008,829 | — | 11,008,829 | ||||||||||||
| Preferred Stocks | — | 2,293,699 | — | 2,293,699 | ||||||||||||
| Short-Term Investments | 249,295 | — | — | 249,295 | ||||||||||||
| Total | $ | 249,295 | $ | 78,903,753 | $ | — | $ | 79,153,048 | ||||||||
The accompanying notes are an integral part of the financial statements.
Deutsche DWS Variable Series I — DWS CROCI® International VIP | | | 9 |
Assets and Liabilities
| as of December 31, 2020 | ||||
| Assets | ||||
| Investments in non-affiliated securities, at value (cost $66,101,969) | $ | 78,903,753 | ||
| Investment in DWS Central Cash Management Government Fund (cost $249,295) | 249,295 | |||
| Foreign currency, at value (cost $58,519) | 60,145 | |||
| Receivable for Fund shares sold | 12,379 | |||
| Dividends receivable | 83,770 | |||
| Interest receivable | 1,024 | |||
| Foreign taxes recoverable | 212,040 | |||
| Other assets | 1,549 | |||
| Total assets | 79,523,955 | |||
| Liabilities | ||||
| Payable for Fund shares redeemed | 6,302 | |||
| Accrued management fee | 34,347 | |||
| Accrued Trustees’ fees | 1,932 | |||
| Other accrued expenses and payables | 93,975 | |||
| Total liabilities | 136,556 | |||
| Net assets, at value | $ | 79,387,399 | ||
| Net Assets Consist of | ||||
| Distributable earnings (loss) | (22,496,484 | ) | ||
| Paid-in capital | 101,883,883 | |||
| Net assets, at value | $ | 79,387,399 | ||
| Net Asset Value | ||||
Class A | ||||
| Net Asset Value, offering and redemption price per share ($79,029,378 ÷ 10,909,190 outstanding shares of beneficial interest, $.01 par value, unlimited number of shares authorized) | $ | 7.24 | ||
Class B | ||||
| Net Asset Value, offering and redemption price per share ($358,021 ÷ 49,324 outstanding shares of beneficial interest, $.01 par value, unlimited number of shares authorized) | $ | 7.26 | ||
| for the year ended December 31, 2020 |
| |||
| Investment Income | ||||
| Income: | ||||
| Dividends (net of foreign taxes withheld of $166,329) | $ | 1,961,740 | ||
| Income distributions — DWS Central Cash Management Government Fund | 2,446 | |||
| Securities lending income, net of borrower rebates | 2,874 | |||
| Total income | 1,967,060 | |||
| Expenses: | ||||
| Management fee | 464,326 | |||
| Administration fee | 69,692 | |||
| Services to shareholders | 5,739 | |||
| Distribution service fee (Class B) | 766 | |||
| Custodian fee | 18,217 | |||
| Professional fees | 82,072 | |||
| Reports to shareholders | 51,674 | |||
| Trustees’ fees and expenses | 4,259 | |||
| Other | 13,166 | |||
| Total expenses before expense reductions | 709,911 | |||
| Expense reductions | (87,662 | ) | ||
| Total expenses after expense reductions | 622,249 | |||
| Net investment income | 1,344,811 | |||
| Realized and Unrealized Gain (Loss) | ||||
| Net realized gain (loss) from: | ||||
| Investments | (5,428,772 | ) | ||
| Foreign currency | (32,100 | ) | ||
| (5,460,872 | ) | |||
| Change in net unrealized appreciation (depreciation) on: | ||||
| Investments | 5,803,768 | |||
| Foreign currency | 16,599 | |||
| 5,820,367 | ||||
| Net gain (loss) | 359,495 | |||
| Net increase (decrease) in net assets resulting from operations | $ | 1,704,306 | ||
The accompanying notes are an integral part of the financial statements.
| 10 | | | Deutsche DWS Variable Series I — DWS CROCI® International VIP |
Statements of Changes in Net Assets
| Years Ended December 31, | ||||||||
| Increase (Decrease) in Net Assets | 2020 | 2019 | ||||||
| Operations: | ||||||||
| Net investment income (loss) | $ | 1,344,811 | $ | 2,461,031 | ||||
| Net realized gain (loss) | (5,460,872 | ) | (2,705,026 | ) | ||||
| Change in net unrealized appreciation (depreciation) | 5,820,367 | 15,303,338 | ||||||
| Net increase (decrease) in net assets resulting from operations | 1,704,306 | 15,059,343 | ||||||
| Distributions to shareholders: | ||||||||
Class A | (2,471,928 | ) | (2,300,083 | ) | ||||
Class B | (9,620 | ) | (8,223 | ) | ||||
| Total distributions | (2,481,548 | ) | (2,308,306 | ) | ||||
| Fund share transactions: | ||||||||
Class A | ||||||||
| Proceeds from shares sold | 3,807,686 | 3,060,066 | ||||||
| Reinvestment of distributions | 2,471,928 | 2,300,083 | ||||||
| Payments for shares redeemed | (7,817,535 | ) | (9,141,481 | ) | ||||
| Net increase (decrease) in net assets from Class A share transactions | (1,537,921 | ) | (3,781,332 | ) | ||||
Class B | ||||||||
| Proceeds from shares sold | 32,846 | 14,796 | ||||||
| Reinvestment of distributions | 9,620 | 8,223 | ||||||
| Payments for shares redeemed | (17,279 | ) | (17,636 | ) | ||||
| Net increase (decrease) in net assets from Class B share transactions | 25,187 | 5,383 | ||||||
| Increase (decrease) in net assets | (2,289,976 | ) | 8,975,088 | |||||
| Net assets at beginning of period | 81,677,375 | 72,702,287 | ||||||
| Net assets at end of period | $ | 79,387,399 | $ | 81,677,375 | ||||
| Other Information | ||||||||
Class A | ||||||||
| Shares outstanding at beginning of period | 11,073,845 | 11,634,868 | ||||||
| Shares sold | 608,760 | 460,287 | ||||||
| Shares issued to shareholders in reinvestment of distributions | 453,565 | 345,358 | ||||||
| Shares redeemed | (1,226,980 | ) | (1,366,668 | ) | ||||
| Net increase (decrease) in Class A shares | (164,655 | ) | (561,023 | ) | ||||
| Shares outstanding at end of period | 10,909,190 | 11,073,845 | ||||||
Class B | ||||||||
| Shares outstanding at beginning of period | 45,067 | 44,210 | ||||||
| Shares sold | 5,148 | 2,213 | ||||||
| Shares issued to shareholders in reinvestment of distributions | 1,759 | 1,231 | ||||||
| Shares redeemed | (2,650 | ) | (2,587 | ) | ||||
| Net increase (decrease) in Class B shares | 4,257 | 857 | ||||||
| Shares outstanding at end of period | 49,324 | 45,067 | ||||||
The accompanying notes are an integral part of the financial statements.
Deutsche DWS Variable Series I — DWS CROCI® International VIP | | | 11 |
| DWS CROCI® International VIP — Class A | ||||||||||||||||||||
Years Ended December 31, | ||||||||||||||||||||
2020 | 2019 | 2018 | 2017 | 2016 | ||||||||||||||||
| Selected Per Share Data | ||||||||||||||||||||
| Net asset value, beginning of period | $7.35 | $6.22 | $7.34 | $6.47 | $7.15 | |||||||||||||||
| Income (loss) from investment operations: | ||||||||||||||||||||
Net investment income (loss)a | .12 | .22 | .20 | .16 | .16 | |||||||||||||||
Net realized and unrealized gain (loss) | .00 | * | 1.11 | (1.25 | ) | 1.21 | (.13 | ) | ||||||||||||
Total from investment operations | .12 | 1.33 | (1.05 | ) | 1.37 | .03 | ||||||||||||||
| Less distributions from: | ||||||||||||||||||||
Net investment income | (.23 | ) | (.20 | ) | (.07 | ) | (.50 | ) | (.71 | ) | ||||||||||
| Net asset value, end of period | $7.24 | $7.35 | $6.22 | $7.34 | $6.47 | |||||||||||||||
| Total Return (%)b | 2.61 | 21.77 | (14.39 | ) | 21.96 | .74 | ||||||||||||||
| Ratios to Average Net Assets and Supplemental Data | ||||||||||||||||||||
| Net assets, end of period ($ millions) | 79 | 81 | 72 | 92 | 94 | |||||||||||||||
| Ratio of expenses before expense reductions (%)c | .99 | 1.11 | 1.13 | 1.10 | 1.12 | |||||||||||||||
| Ratio of expenses after expense reductions (%)c | .87 | .87 | .87 | .84 | .84 | |||||||||||||||
| Ratio of net investment income (loss) (%) | 1.88 | 3.22 | 2.78 | 2.24 | 2.46 | |||||||||||||||
| Portfolio turnover rate (%) | 67 | 101 | 59 | 73 | 67 | |||||||||||||||
| a | Based on average shares outstanding during the period. |
| b | Total return would have been lower had certain expenses not been reduced. |
| c | Expense ratio does not reflect charges and fees associated with the separate account that invests in the Fund or any variable life insurance policy or variable annuity contract for which the Fund is an investment option. |
| * | Amount is less than $.005. |
| DWS CROCI® International VIP — Class B | ||||||||||||||||||||
Years Ended December 31, | ||||||||||||||||||||
2020 | 2019 | 2018 | 2017 | 2016 | ||||||||||||||||
| Selected Per Share Data | ||||||||||||||||||||
| Net asset value, beginning of period | $7.36 | $6.24 | $7.36 | $6.48 | $7.16 | |||||||||||||||
| Income (loss) from investment operations: | ||||||||||||||||||||
Net investment income (loss)a | .10 | .20 | .18 | .13 | .14 | |||||||||||||||
Net realized and unrealized gain (loss) | .01 | 1.11 | (1.24 | ) | 1.23 | (.13 | ) | |||||||||||||
Total from investment operations | .11 | 1.31 | (1.06 | ) | 1.36 | .01 | ||||||||||||||
| Less distributions from: | ||||||||||||||||||||
Net investment income | (.21 | ) | (.19 | ) | (.06 | ) | (.48 | ) | (.69 | ) | ||||||||||
| Net asset value, end of period | $7.26 | $7.36 | $6.24 | $7.36 | $6.48 | |||||||||||||||
| Total Return (%)b | 2.49 | 21.24 | (14.57 | ) | 21.76 | .48 | ||||||||||||||
| Ratios to Average Net Assets and Supplemental Data | ||||||||||||||||||||
| Net assets, end of period ($ millions) | .36 | .33 | .28 | .33 | .27 | |||||||||||||||
| Ratio of expenses before expense reductions (%)c | 1.27 | 1.39 | 1.41 | 1.38 | 1.40 | |||||||||||||||
| Ratio of expenses after expense reductions (%)c | 1.12 | 1.12 | 1.12 | 1.09 | 1.10 | |||||||||||||||
| Ratio of net investment income (loss) (%) | 1.62 | 2.96 | 2.54 | 1.86 | 2.18 | |||||||||||||||
| Portfolio turnover rate (%) | 67 | 101 | 59 | 73 | 67 | |||||||||||||||
| a | Based on average shares outstanding during the period. |
| b | Total return would have been lower had certain expenses not been reduced. |
| c | Expense ratio does not reflect charges and fees associated with the separate account that invests in the Fund or any variable life insurance policy or variable annuity contract for which the Fund is an investment option. |
The accompanying notes are an integral part of the financial statements.
| 12 | | | Deutsche DWS Variable Series I — DWS CROCI® International VIP |
| Notes to Financial Statements |
A. Organization and Significant Accounting Policies
Deutsche DWS Variable Series I (the “Trust“) is registered under the Investment Company Act of 1940, as amended (the “1940 Act“), as an open-end management investment company organized as a Massachusetts business trust. The Trust consists of five diversified funds: DWS Bond VIP, DWS Capital Growth VIP, DWS Core Equity VIP, DWS CROCI® International VIP and DWS Global Small Cap VIP (individually or collectively hereinafter referred to as a “Fund“ or the “Funds“). These financial statements report on DWS CROCI® International VIP. The Trust is intended to be the underlying investment vehicle for variable annuity contracts and variable life insurance policies to be offered by the separate accounts of certain life insurance companies (“Participating Insurance Companies“).
Multiple Classes of Shares of Beneficial Interest. The Fund offers two classes of shares (Class A shares and Class B shares). Class B shares are subject to Rule 12b-1 distribution fees under the 1940 Act and recordkeeping fees equal to an annual rate of up to 0.25% and of up to 0.15%, respectively, of the average daily net assets of the Class B shares of the Fund. Class A shares are not subject to such fees.
Investment income, realized and unrealized gains and losses, and certain fund-level expenses and expense reductions, if any, are borne pro rata on the basis of relative net assets by the holders of all classes of shares, except that each class bears certain expenses unique to that class (including the applicable 12b-1 distribution fees and recordkeeping fees). Differences in class-level expenses may result in payment of different per share dividends by class. All shares have equal rights with respect to voting subject to class-specific arrangements.
The Fund’s financial statements are prepared in accordance with accounting principles generally accepted in the United States of America (“U.S. GAAP”) which require the use of management estimates. Actual results could differ from those estimates. The Fund qualifies as an investment company under Topic 946 of Accounting Standards Codification of U.S. GAAP. The policies described below are followed consistently by the Fund in the preparation of its financial statements.
Security Valuation. Investments are stated at value determined as of the close of regular trading on the New York Stock Exchange on each day the exchange is open for trading.
Various inputs are used in determining the value of the Fund’s investments. These inputs are summarized in three broad levels. Level 1 includes quoted prices in active markets for identical securities. Level 2 includes other significant observable inputs (including quoted prices for similar securities, interest rates, prepayment speeds and credit risk). Level 3 includes significant unobservable inputs (including the Fund’s own assumptions in determining the fair value of investments). The level assigned to the securities valuations may not be an indication of the risk or liquidity associated with investing in those securities.
Equity securities are valued at the most recent sale price or official closing price reported on the exchange (U.S. or foreign) or over-the-counter market on which they trade. Securities for which no sales are reported are valued at the calculated mean between the most recent bid and asked quotations on the relevant market or, if a mean cannot be determined, at the most recent bid quotation. Equity securities are generally categorized as Level 1 securities. For certain international equity securities, in order to adjust for events which may occur between the close of the foreign exchanges and the close of the New York Stock Exchange, a fair valuation model may be used. This fair valuation model takes into account comparisons to the valuation of American Depository Receipts (ADRs), exchange-traded funds, futures contracts and certain indices and these securities are categorized as Level 2.
Investments in open-end investment companies are valued at their net asset value each business day and are categorized as Level 1.
Securities and other assets for which market quotations are not readily available or for which the above valuation procedures are deemed not to reflect fair value are valued in a manner that is intended to reflect their fair value as determined in accordance with procedures approved by the Trustees and are generally categorized as Level 3. In accordance with the Fund’s valuation procedures, factors considered in determining value may include, but are not limited to, the type of the security; the size of the holding; the initial cost of the security; the existence of any contractual restrictions on the security’s disposition; the price and extent of public trading in similar securities of the issuer or of comparable companies; quotations or evaluated prices from broker-dealers and/or pricing services; information obtained from the issuer, analysts, and/or the appropriate stock exchange (for exchange-traded securities); an analysis of the company’s or
Deutsche DWS Variable Series I — DWS CROCI® International VIP | | | 13 |
issuer’s financial statements; an evaluation of the forces that influence the issuer and the market(s) in which the security is purchased and sold; and with respect to debt securities, the maturity, coupon, creditworthiness, currency denomination and the movement of the market in which the security is normally traded. The value determined under these procedures may differ from published values for the same securities.
Disclosure about the classification of fair value measurements is included in a table following the Fund’s Investment Portfolio.
Securities Lending. Brown Brothers Harriman & Co., as lending agent, lends securities of the Fund to certain financial institutions under the terms of its securities lending agreement. During the term of the loans, the Fund continues to receive interest and dividends generated by the securities and to participate in any changes in their market value. The Fund requires the borrowers of the securities to maintain collateral with the Fund consisting of either cash or liquid, unencumbered assets having a value at least equal to the value of the securities loaned. When the collateral falls below specified amounts, the lending agent will use its best effort to obtain additional collateral on the next business day to meet required amounts under the securities lending agreement. During the year ended December 31, 2020, the Fund invested the cash collateral into a joint trading account in DWS Government & Agency Securities Portfolio, an affiliated money market fund managed by DWS Investment Management Americas, Inc. DWS Investment Management Americas, Inc. receives a management/administration fee (0.06% annualized effective rate as of December 31, 2020) on the cash collateral invested in DWS Government & Agency Securities Portfolio. The Fund receives compensation for lending its securities either in the form of fees or by earning interest on invested cash collateral net of borrower rebates and fees paid to a lending agent. Either the Fund or the borrower may terminate the loan at any time, and the borrower, after notice, is required to return borrowed securities within a standard time period. There may be risks of delay and costs in recovery of securities or even loss of rights in the collateral should the borrower of the securities fail financially. If the Fund is not able to recover securities lent, the Fund may sell the collateral and purchase a replacement investment in the market, incurring the risk that the value of the replacement security is greater than the value of the collateral. The Fund is also subject to all investment risks associated with the reinvestment of any cash collateral received, including, but not limited to, interest rate, credit and liquidity risk associated with such investments.
As of December 31, 2020, the Fund had no securities on loan.
Foreign Currency Translations. The books and records of the Fund are maintained in U.S. dollars. Investment securities and other assets and liabilities denominated in a foreign currency are translated into U.S. dollars at the prevailing exchange rates at period end. Purchases and sales of investment securities, income and expenses are translated into U.S. dollars at the prevailing exchange rates on the respective dates of the transactions.
Net realized and unrealized gains and losses on foreign currency transactions represent net gains and losses between trade and settlement dates on securities transactions, the acquisition and disposition of foreign currencies, and the difference between the amount of net investment income accrued and the U.S. dollar amount actually received. The portion of both realized and unrealized gains and losses on investments that results from fluctuations in foreign currency exchange rates is not separately disclosed but is included with net realized and unrealized gain/appreciation and loss/depreciation on investments.
Taxes. The Fund is treated as a separate taxpayer as provided for in the Internal Revenue Code, as amended. It is the Fund’s policy to comply with the requirements of the Internal Revenue Code, as amended, which are applicable to regulated investment companies, and to distribute all of its taxable income to the separate accounts of the Participating Insurance Companies which hold its shares.
Additionally, the Fund may be subject to taxes imposed by the governments of countries in which it invests and are generally based on income and/or capital gains earned or repatriated, a portion of which may be recoverable. Based upon the current interpretation of the tax rules and regulations, estimated tax liabilities and recoveries on certain foreign securities are recorded on an accrual basis and are reflected as components of interest income or net change in unrealized gain/loss on investments. Tax liabilities realized as a result of security sales are reflected as a component of net realized gain/loss on investments.
At December 31, 2020, the Fund had a net tax basis capital loss carryforward of approximately $36,273,000, which may be applied against realized net taxable capital gains indefinitely, including short-term losses ($11,494,000) and long-term losses ($24,779,000).
The Fund has reviewed the tax positions for the open tax years as of December 31, 2020 and has determined that no provisions for income tax and/or uncertain tax positions is required in the Fund’s financial
| 14 | | | Deutsche DWS Variable Series I — DWS CROCI® International VIP |
statements. The Fund’s federal tax returns for the prior three fiscal years remain open subject to examination by the Internal Revenue Service.
Distribution of Income and Gains. Distributions from net investment income of the Fund, if any, are declared and distributed to shareholders annually. Net realized gains from investment transactions, in excess of available capital loss carryforwards, would be taxable to the Fund if not distributed and, therefore, will be distributed to shareholders at least annually. The Fund may also make additional distributions for tax purposes if necessary.
The timing and characterization of certain income and capital gain distributions are determined annually in accordance with federal tax regulations, which may differ from accounting principles generally accepted in the United States of America. These differences primarily relate to investments in foreign denominated investments, passive foreign investment companies and certain securities sold at a loss. As a result, net investment income (loss) and net realized gain (loss) on investment transactions for a reporting period may differ significantly from distributions during such period. Accordingly, the Fund may periodically make reclassifications among certain of its capital accounts without impacting the net asset value of the Fund.
At December 31, 2020, the Fund’s components of distributable earnings (accumulated losses) on a tax basis are as follows:
| Undistributed ordinary income* | $ | 1,966,767 | ||
| Capital loss carryforwards | $ | (36,273,000 | ) | |
| Net unrealized appreciation (depreciation) on investments | $ | 11,790,092 |
At December 31, 2020, the aggregate cost of investments for federal income tax purposes was $67,362,956. The net unrealized appreciation for all investments based on tax cost was $11,790,092. This consisted of aggregate gross unrealized appreciation for all investments for which there was an excess of value over tax cost of $13,997,897 and aggregate gross unrealized depreciation for all investments for which there was an excess of tax cost over value of $2,207,805.
In addition, the tax character of distributions paid to shareholders by the Fund is summarized as follows:
| Years Ended December 31, | ||||||||
| 2020 | 2019 | |||||||
| Distributions from ordinary income* | $ | 2,481,548 | $ | 2,308,306 | ||||
| * | For tax purposes, short-term capital gain distributions are considered ordinary income distributions. |
Expenses. Expenses of the Trust arising in connection with a specific Fund are allocated to that Fund. Other Trust expenses which cannot be directly attributed to a Fund are apportioned among the Funds in the Trust based upon the relative net assets or other appropriate measures.
Contingencies. In the normal course of business, the Fund may enter into contracts with service providers that contain general indemnification clauses. The Fund’s maximum exposure under these arrangements is unknown, as this would involve future claims that may be made against the Fund that have not yet been made. However, based on experience, the Fund expects the risk of loss to be remote.
Other. Investment transactions are accounted for on a trade date plus one basis for daily net asset value calculations. However, for financial reporting purposes, investment transactions are reported on trade date. Interest income is recorded on the accrual basis net of foreign withholding taxes. Dividend income is recorded on the ex-dividend date net of foreign withholding taxes. Certain dividends from foreign securities may be recorded subsequent to the ex-dividend date as soon as the Fund is informed of such dividends. Realized gains and losses from investment transactions are recorded on an identified cost basis. Proceeds from litigation payments, if any, are included in net realized gain (loss) from investments.
B. Purchases and Sales of Securities
During the year ended December 31, 2020, purchases and sales of investment securities (excluding short-term investments) aggregated $47,566,849 and $48,540,271, respectively.
C. Related Parties
Management Agreement. Under the Investment Management Agreement with DWS Investment Management Americas, Inc. (“DIMA“ or the “Advisor“), an indirect, wholly owned subsidiary of DWS Group GmbH & Co. KGaA (“DWS Group”), the Advisor directs the investments of the Fund in accordance with its
Deutsche DWS Variable Series I — DWS CROCI® International VIP | | | 15 |
investment objectives, policies and restrictions. The Advisor determines the securities, instruments and other contracts relating to investments to be purchased, sold or entered into by the Fund.
Under the Investment Management Agreement with the Advisor, the Fund pays a monthly management fee based on the Fund’s average daily net assets, computed and accrued daily and payable monthly, at the following annual rates:
| First $500 million of average daily net assets | .650 | % | ||
| Over $500 million of average daily net assets | .600 | % |
Accordingly, for the year ended December 31, 2020, the fee pursuant to the Investment Management Agreement was equivalent to an annual rate (exclusive of any applicable waivers/reimbursements) of 0.65% of the Fund’s average daily net assets.
For the period from January 1, 2020 through April 30, 2021, the Advisor has contractually agreed to waive all or a portion of its fees and/or reimburse certain operating expenses of the Fund to the extent necessary to maintain the total annual operating expenses (excluding certain expenses such as extraordinary expenses, taxes, brokerage and interest) of each class as follows:
| Class A | .87 | % | ||
| Class B | 1.12 | % |
For the year ended December 31, 2020, fees waived and/or expenses reimbursed for each class are as follows:
| Class A | $ | 87,201 | ||
| Class B | 461 | |||
| $ | 87,662 |
Administration Fee. Pursuant to an Administrative Services Agreement, DIMA provides most administrative services to the Fund. Prior to March 1, 2020, for all services provided under the Administrative Services Agreement, the Fund paid the Advisor an annual fee (“Administration Fee“) of 0.10% of the Fund’s average daily net assets, computed and accrued daily and payable monthly. Effective March 1, 2020, for all services provided under the Administrative Services Agreement, the Fund pays the Advisor an annual Administration Fee of 0.097% of the Fund’s average daily net assets, computed and accrued daily and payable monthly. For the year ended December 31, 2020, the Administration Fee was $69,692, of which $6,439 is unpaid.
Service Provider Fees. DWS Service Company (“DSC“), an affiliate of the Advisor, is the transfer agent, dividend-paying agent and shareholder service agent for the Fund. Pursuant to a sub-transfer agency agreement between DSC and DST Systems, Inc. (“DST“), DSC has delegated certain transfer agent, dividend-paying agent and shareholder service agent functions to DST. DSC compensates DST out of the shareholder servicing fee it receives from the Fund. For the year ended December 31, 2020, the amounts charged to the Fund by DSC were as follows:
| Services to Shareholders | Total Aggregated | Unpaid at December 31, 2020 | ||||||
| Class A | $ | 705 | $ | 131 | ||||
| Class B | 90 | 16 | ||||||
| $ | 795 | $ | 147 | |||||
Distribution Service Agreement. DWS Distributors, Inc. (“DDI“), also an affiliate of the Advisor, is the Trusts’ Distributor. In accordance with the Master Distribution Plan, DDI receives 12b-1 fees of up to 0.25% of the average daily net assets of Class B shares. Pursuant to the Master Distribution Plan, DDI remits these fees to the Participating Insurance Companies for various costs incurred or paid by these companies in connection with marketing and distribution of Class B shares. For the year ended December 31, 2020, the Distribution Service Fee aggregated $766, of which $75 is unpaid.
Other Service Fees. Under an agreement with the Fund, DIMA is compensated for providing certain pre-press and regulatory filing services to the Fund. For the year ended December 31, 2020, the amount charged to the Fund by DIMA included in the Statement of Operations under “Reports to shareholders“ aggregated $10,029, of which $3,661 is unpaid.
Trustees’ Fees and Expenses. The Fund paid retainer fees to each Trustee not affiliated with the Advisor, plus specified amounts to the Board Chairperson and to each committee Chairperson.
| 16 | | | Deutsche DWS Variable Series I — DWS CROCI® International VIP |
Affiliated Cash Management Vehicles. The Fund may invest uninvested cash balances in DWS Central Cash Management Government Fund and DWS ESG Liquidity Fund, affiliated money market funds which are managed by the Advisor. Each affiliated money market fund is managed in accordance with Rule 2a-7 under the 1940 Act, which governs the quality, maturity, diversity and liquidity of instruments in which a money market fund may invest. DWS Central Cash Management Government Fund seeks to maintain a stable net asset value, and DWS ESG Liquidity Fund maintains a floating net asset value. The Fund indirectly bears its proportionate share of the expenses of each affiliated money market fund in which it invests. DWS Central Cash Management Government Fund does not pay the Advisor an investment management fee. To the extent that DWS ESG Liquidity Fund pays an investment management fee to the Advisor, the Advisor will waive an amount of the investment management fee payable to the Advisor by the Fund equal to the amount of the investment management fee payable on the Fund’s assets invested in DWS ESG Liquidity Fund.
D. Ownership of the Fund
At December 31, 2020, five participating insurance companies were owners of record of 10% or more of the total outstanding Class A shares of the Fund, each owning 27%, 18%, 13%, 11% and 10%, respectively. Two participating insurance companies were owners of record of 10% or more of the total outstanding Class B shares of the Fund, each owning 85% and 10%, respectively.
E. Line of Credit
The Fund and other affiliated funds (the “Participants”) share in a $350 million revolving credit facility provided by a syndication of banks. The Fund may borrow for temporary or emergency purposes, including the meeting of redemption requests that otherwise might require the untimely disposition of securities. The Participants are charged an annual commitment fee, which is allocated based on net assets, among each of the Participants. Interest is calculated at a rate per annum equal to the sum of the Federal Funds Rate plus 1.25 percent plus if the one-month LIBOR exceeds the Federal Funds Rate, the amount of such excess. The Fund may borrow up to a maximum of 33 percent of its net assets under the agreement. The Fund had no outstanding loans at December 31, 2020.
F. Other — COVID-19 Pandemic
A novel coronavirus known as COVID-19, declared a pandemic by the World Health Organization, has caused significant uncertainty, market volatility, decreased economic and other activity and increased government activity. Specifically, COVID-19 has led to significant death and morbidity, and concerns about its further spread have resulted in the closing of schools and non-essential businesses, cancellations, shelter-in place orders, lower consumer spending in certain sectors, social distancing, bans on large social gatherings and travel, quarantines, government economic stimulus measures, reduced productivity, rapid increases in unemployment, increased demand for and strain on government and medical resources, border closings and global trade and supply chain interruptions, among others. The full effects, duration and costs of the COVID-19 pandemic are impossible to predict, and the circumstances surrounding the COVID-19 pandemic will continue to evolve. The pandemic may affect certain countries, industries, economic sectors, companies and investment products more than others, may exacerbate existing economic, political, or social tensions and may increase the probability of an economic recession or depression. The Fund and its investments may be adversely affected by the effects of the COVID-19 pandemic, and a prolonged pandemic may result in the Fund and its service providers experiencing operational difficulties in coordinating a remote workforce and implementing their business continuity plans, among others. Management will continue to monitor the impact COVID-19 has on the Fund and reflect the consequences as appropriate in the Fund’s accounting and financial reporting.
Deutsche DWS Variable Series I — DWS CROCI® International VIP | | | 17 |
Report of Independent Registered Public Accounting Firm
To the Board of Trustees of Deutsche DWS Variable Series I and Shareholders of DWS CROCI® International VIP:
Opinion on the Financial Statements
We have audited the accompanying statement of assets and liabilities of DWS CROCI® International VIP (the “Fund”) (one of the funds constituting Deutsche DWS Variable Series I) (the “Trust”), including the investment portfolio, as of December 31, 2020, and the related statement of operations for the year then ended, the statements of changes in net assets and the financial highlights for each of the two years in the period then ended and the related notes (collectively referred to as the “financial statements”). In our opinion, the financial statements present fairly, in all material respects, the financial position of the Fund (one of the funds constituting Deutsche DWS Variable Series I) at December 31, 2020, the results of its operations for the year then ended, the changes in its net assets and its financial highlights for each of the two years in the period then ended, in conformity with U.S. generally accepted accounting principles.
The financial highlights for the years ended December 31, 2016, December 31, 2017 and December 31, 2018, were audited by another independent registered public accounting firm whose report, dated February 14, 2019, expressed an unqualified opinion on those financial highlights.
Basis for Opinion
These financial statements are the responsibility of the Trust’s management. Our responsibility is to express an opinion on the Fund’s financial statements based on our audits. We are a public accounting firm registered with the Public Company Accounting Oversight Board (United States) (“PCAOB”) and are required to be independent with respect to the Trust in accordance with the U.S. federal securities laws and the applicable rules and regulations of the Securities and Exchange Commission and the PCAOB.
We conducted our audits in accordance with the standards of the PCAOB. Those standards require that we plan and perform the audit to obtain reasonable assurance about whether the financial statements are free of material misstatement, whether due to error or fraud. The Trust is not required to have, nor were we engaged to perform, an audit of the Trust’s internal control over financial reporting. As part of our audits, we are required to obtain an understanding of internal control over financial reporting, but not for the purpose of expressing an opinion on the effectiveness of the Trust’s internal control over financial reporting. Accordingly, we express no such opinion.
Our audits included performing procedures to assess the risks of material misstatement of the financial statements, whether due to error or fraud, and performing procedures that respond to those risks. Such procedures included examining, on a test basis, evidence regarding the amounts and disclosures in the financial statements. Our procedures included confirmation of securities owned as of December 31, 2020, by correspondence with the custodian and others. Our audits also included evaluating the accounting principles used and significant estimates made by management, as well as evaluating the overall presentation of the financial statements. We believe that our audits provide a reasonable basis for our opinion.

We have served as the auditor of one or more investment companies in the DWS family of funds since at least 1979, but we are unable to determine the specific year.
Boston, Massachusetts
February 12, 2021
| 18 | | | Deutsche DWS Variable Series I — DWS CROCI® International VIP |
| Information About Your Fund’s Expenses | (Unaudited) |
As an investor of the Fund, you incur two types of costs: ongoing expenses and transaction costs. Ongoing expenses include management fees, distribution and service (12b-1) fees and other Fund expenses. Examples of transaction costs include contract charges, which are not shown in this section. The following tables are intended to help you understand your ongoing expenses (in dollars) of investing in the Fund and to help you compare these expenses with the ongoing expenses of investing in other mutual funds. In the most recent six-month period, the Fund limited these expenses; had it not done so, expenses would have been higher. The example in the table is based on an investment of $1,000 invested at the beginning of the six-month period and held for the entire period (July 1, 2020 to December 31, 2020).
The tables illustrate your Fund’s expenses in two ways:
| – | Actual Fund Return. This helps you estimate the actual dollar amount of ongoing expenses (but not transaction costs) paid on a $1,000 investment in the Fund using the Fund’s actual return during the period. To estimate the expenses you paid over the period, simply divide your account value by $1,000 (for example, an $8,600 account value divided by $1,000 = 8.6), then multiply the result by the number in the “Expenses Paid per $1,000” line under the share class you hold. |
| – | Hypothetical 5% Fund Return. This helps you to compare your Fund’s ongoing expenses (but not transaction costs) with those of other mutual funds using the Fund’s actual expense ratio and a hypothetical rate of return of 5% per year before expenses. Examples using a 5% hypothetical Fund return may be found in the shareholder reports of other mutual funds. The hypothetical account values and expenses may not be used to estimate the actual ending account balance or expenses you paid for the period. |
Please note that the expenses shown in these tables are meant to highlight your ongoing expenses only and do not reflect any transaction costs. The “Expenses Paid per $1,000” line of the tables is useful in comparing ongoing expenses only and will not help you determine the relative total expense of owning different funds. If these transaction costs had been included, your costs would have been higher.
| Expenses and Value of a $1,000 Investment for the six months ended December 31, 2020 | ||||||||
| Actual Fund Return | Class A | Class B | ||||||
| Beginning Account Value 7/1/20 | $ | 1,000.00 | $ | 1,000.00 | ||||
| Ending Account Value 12/31/20 | $ | 1,167.70 | $ | 1,167.20 | ||||
| Expenses Paid per $1,000* | $ | 4.74 | $ | 6.10 | ||||
| Hypothetical 5% Fund Return | Class A | Class B | ||||||
| Beginning Account Value 7/1/20 | $ | 1,000.00 | $ | 1,000.00 | ||||
| Ending Account Value 12/31/20 | $ | 1,020.76 | $ | 1,019.51 | ||||
| Expenses Paid per $1,000* | $ | 4.42 | $ | 5.69 | ||||
| * | Expenses are equal to the Fund’s annualized expense ratio for each share class, multiplied by the average account value over the period, multiplied by 184 (the number of days in the most recent six-month period), then divided by 366. |
| Annualized Expense Ratios | Class A | Class B | ||||||
| Deutsche DWS Variable Series I — DWS CROCI® International VIP | .87 | % | 1.12 | % | ||||
For more information, please refer to the Fund’s prospectus.
These tables do not reflect charges and fees (“contract charges”) associated with the separate account that invests in the Fund or any variable life insurance policy or variable annuity contract for which the Fund is an investment option.
For an analysis of the fees associated with an investment in the Fund or similar funds, please refer to the current and hypothetical expense calculators for Variable Insurance Products which can be found at dws.com/calculators.
Deutsche DWS Variable Series I — DWS CROCI® International VIP | | | 19 |
| Tax Information | (Unaudited) |
The Fund paid foreign taxes of $147,055 and earned $1,553,186 of foreign source income during the year ended December 31, 2020. Pursuant to Section 853 of the Internal Revenue Code, the Fund designates $0.013 per share as foreign taxes paid and $0.142 per share as income earned from foreign sources for the year ended December 31, 2020.
Please consult a tax advisor if you have questions about federal or state income tax laws, or on how to prepare your tax returns. If you have specific questions about your account, please contact your insurance provider.
The Trusts’ policies and procedures for voting proxies for portfolio securities and information about how the Trust voted proxies related to its portfolio securities during the most recent 12-month period ended June 30 are available on our Web site — dws.com/en-us/resources/proxy-voting — or on the SEC’s Web site — sec.gov. To obtain a written copy of the Trusts’ policies and procedures without charge, upon request, call us toll free at (800) 728-3337.
| 20 | | | Deutsche DWS Variable Series I — DWS CROCI® International VIP |
Advisory Agreement Board Considerations and Fee Evaluation
The Board of Trustees (hereinafter referred to as the “Board” or “Trustees”) approved the renewal of DWS CROCI® International VIP’s (the “Fund”) investment management agreement (the “Agreement”) with DWS Investment Management Americas, Inc. (“DIMA”) in September 2020.
In terms of the process that the Board followed prior to approving the Agreement, shareholders should know that:
| – | DURING THE ENTIRE PROCESS, ALL OF THE FUND’S TRUSTEES WERE INDEPENDENT OF DIMA AND ITS AFFILIATES (THE “INDEPENDENT TRUSTEES”). |
| – | The Board met frequently during the past year to discuss fund matters and dedicated a substantial amount of time to contract review matters. Over the course of several months, the Board reviewed extensive materials received from DIMA, independent third parties and independent counsel. These materials included an analysis of the Fund’s performance, fees and expenses, and profitability from a fee consultant retained by the Fund’s Independent Trustees (the “Fee Consultant”). |
| – | The Board also received extensive information throughout the year regarding performance of the Fund. |
| – | The Independent Trustees regularly met privately with counsel to discuss contract review and other matters. In addition, the Independent Trustees were advised by the Fee Consultant in the course of their review of the Fund’s contractual arrangements and considered a comprehensive report prepared by the Fee Consultant in connection with their deliberations. |
| – | In connection with reviewing the Agreement, the Board also reviewed the terms of the Fund’s Rule 12b-1 plan, distribution agreement, administrative services agreement, transfer agency agreement and other material service agreements. |
In connection with the contract review process, the Board considered the factors discussed below, among others. The Board also considered that DIMA and its predecessors have managed the Fund since its inception, and the Board believes that a long-term relationship with a capable, conscientious advisor is in the best interests of the Fund. The Board considered, generally, that shareholders chose to invest or remain invested in the Fund knowing that DIMA managed the Fund. DIMA is part of DWS Group GmbH & Co. KGaA (“DWS Group”). DWS Group is a global asset management business that offers a wide range of investing expertise and resources, including research capabilities in many countries throughout the world. In 2018, approximately 20% of DWS Group’s shares were sold in an initial public offering, with Deutsche Bank AG owning the remaining shares.
As part of the contract review process, the Board carefully considered the fees and expenses of each DWS fund overseen by the Board in light of the fund’s performance. In many cases, this led to the negotiation and implementation of expense caps.
While shareholders may focus primarily on fund performance and fees, the Fund’s Board considers these and many other factors, including the quality and integrity of DIMA’s personnel and administrative support services provided by DIMA, such as back-office operations, fund valuations, and compliance policies and procedures.
Nature, Quality and Extent of Services. The Board considered the terms of the Agreement, including the scope of advisory services provided under the Agreement. The Board noted that, under the Agreement, DIMA provides portfolio management services to the Fund and that, pursuant to a separate administrative services agreement, DIMA provides administrative services to the Fund. The Board considered the experience and skills of senior management and investment personnel and the resources made available to such personnel. The Board also considered the risks to DIMA in sponsoring or managing the Fund, including financial, operational and reputational risks, the potential economic impact to DIMA from such risks and DIMA’s approach to addressing such risks. The Board reviewed the Fund’s performance over short-term and long-term periods and compared those returns to various agreed-upon performance measures, including market index(es) and a peer universe compiled using information supplied by Morningstar Direct (“Morningstar”), an independent fund data service. The Board also noted that it has put into place a process of identifying “Funds in Review” (e.g., funds performing poorly relative to a peer universe), and receives additional reporting from DIMA regarding such funds and, where appropriate, DIMA’s plans to address underperformance. The Board believes this process is an effective manner of identifying and addressing underperforming funds. Based on the information provided, the Board noted that, for the one-, three- and five-year periods ended December 31, 2019, the Fund’s performance (Class A shares) was in the 2nd quartile, 3rd quartile and 4th quartile, respectively, of the
Deutsche DWS Variable Series I — DWS CROCI® International VIP | | | 21 |
applicable Morningstar universe (the 1st quartile being the best performers and the 4th quartile being the worst performers). The Board also observed that the Fund has outperformed its benchmark in the one-, three-, and five-year periods ended December 31, 2019.
Fees and Expenses. The Board considered the Fund’s investment management fee schedule, operating expenses and total expense ratios, and comparative information provided by Broadridge Financial Solutions, Inc. (“Broadridge”) and the Fee Consultant regarding investment management fee rates paid to other investment advisors by similar funds (1st quartile being the most favorable and 4th quartile being the least favorable). With respect to management fees paid to other investment advisors by similar funds, the Board noted that the contractual fee rates paid by the Fund, which include a 0.10% fee paid to DIMA under the Fund’s administrative services agreement, were lower than the median (2nd quartile) of the applicable Broadridge peer group (based on Broadridge data provided as of December 31, 2019). The Board noted that, effective March 1, 2020, the fee paid to DIMA under the Fund’s administrative services agreement was reduced to 0.097%. The Board noted that, effective October 1, 2019, in connection with the 2019 contract renewal process, DIMA agreed to reduce the Fund’s contractual management fee at each breakpoint by 0.14% and 0.04%, respectively. The Board noted that the Fund’s Class A shares total (net) operating expenses were expected to be higher than the median (3rd quartile) of the applicable Broadridge expense universe (based on Broadridge data provided as of December 31, 2019, and analyzing Broadridge expense universe Class A (net) expenses less any applicable 12b-1 fees) (“Broadridge Universe Expenses”). The Board also reviewed data comparing each other operational share class’s total (net) operating expenses to the applicable Broadridge Universe Expenses. The Board noted that the expense limitations agreed to by DIMA were expected to help the Fund’s total (net) operating expenses remain competitive. The Board considered the Fund’s management fee rate as compared to fees charged by DIMA to comparable DWS U.S. registered funds (“DWS Funds”) and considered differences between the Fund and the comparable DWS Funds. The information requested by the Board as part of its review of fees and expenses also included information about institutional accounts (including any sub-advised funds and accounts) and funds offered primarily to European investors (“DWS Europe Funds”) managed by DWS Group. The Board noted that DIMA indicated that DWS Group does not manage any institutional accounts or DWS Europe Funds comparable to the Fund.
On the basis of the information provided, the Board concluded that management fees were reasonable and appropriate in light of the nature, quality and extent of services provided by DIMA.
Profitability. The Board reviewed detailed information regarding revenues received by DIMA under the Agreement. The Board considered the estimated costs to DIMA, and pre-tax profits realized by DIMA, from advising the DWS Funds, as well as estimates of the pre-tax profits attributable to managing the Fund in particular. The Board also received information regarding the estimated enterprise-wide profitability of DIMA and its affiliates with respect to all fund services in totality and by fund. The Board and the Fee Consultant reviewed DIMA’s methodology in allocating its costs to the management of the Fund. Based on the information provided, the Board concluded that the pre-tax profits realized by DIMA in connection with the management of the Fund were not unreasonable. The Board also reviewed certain publicly available information regarding the profitability of certain similar investment management firms. The Board noted that, while information regarding the profitability of such firms is limited (and in some cases is not necessarily prepared on a comparable basis), DIMA and its affiliates’ overall profitability with respect to the DWS Funds (after taking into account distribution and other services provided to the funds by DIMA and its affiliates) was lower than the overall profitability levels of most comparable firms for which such data was available.
Economies of Scale. The Board considered whether there are economies of scale with respect to the management of the Fund and whether the Fund benefits from any economies of scale. The Board noted that the Fund’s investment management fee schedule includes fee breakpoints. The Board concluded that the Fund’s fee schedule represents an appropriate sharing between the Fund and DIMA of such economies of scale as may exist in the management of the Fund at current asset levels.
Other Benefits to DIMA and Its Affiliates. The Board also considered the character and amount of other incidental or “fall-out” benefits received by DIMA and its affiliates, including any fees received by DIMA for administrative services provided to the Fund, any fees received by an affiliate of DIMA for transfer agency services provided to the Fund and any fees received by an affiliate of DIMA for distribution services. The Board noted that DIMA pays a licensing fee to an affiliate related to the Fund’s use of the CROCI® strategy. The Board also considered benefits to DIMA related to brokerage and soft-dollar allocations, including allocating brokerage to pay for research generated by parties other than the executing broker dealers, which pertain primarily to funds investing in equity securities. In addition, the Board considered the incidental public
| 22 | | | Deutsche DWS Variable Series I — DWS CROCI® International VIP |
relations benefits to DIMA related to DWS Funds advertising and cross-selling opportunities among DIMA products and services. The Board considered these benefits in reaching its conclusion that the Fund’s management fees were reasonable.
Compliance. The Board considered the significant attention and resources dedicated by DIMA to its compliance processes in recent years. The Board noted in particular (i) the experience, seniority and time commitment of the individuals serving as DIMA’s and the Fund’s chief compliance officers and (ii) the substantial commitment of resources by DIMA and its affiliates to compliance matters, including the retention of compliance personnel.
The Board also considered that on September 24, 2020, the SEC granted a temporary order permitting DIMA and its affiliates to continue providing investment advisory and underwriting services to the DWS Funds notwithstanding a consent order entered into by Deutsche Bank AG on June 17, 2020 (the “Consent Order”). The Board noted that the temporary order was granted effective as of the date of the Consent Order. The Board also noted various representations by DIMA to the Board relating to the Consent Order, including that the conduct giving rise to the Consent Order (unintentional conduct that resulted from a system outage that prevented Deutsche Bank AG from reporting data in accordance with applicable CFTC requirements for five days in April 2016) did not involve any DWS Fund or services DIMA and its affiliates provide to the DWS Funds, that DIMA and its personnel had no involvement in the alleged conduct giving rise to the Consent Order, and that the DWS Funds would not bear any financial impact or costs relating to the Consent Order.
Based on all of the information considered and the conclusions reached, the Board determined that the continuation of the Agreement is in the best interests of the Fund. In making this determination, the Board did not give particular weight to any single factor identified above. The Board considered these factors over the course of numerous meetings, certain of which were in executive session with only the Independent Trustees and counsel present. It is possible that individual Independent Trustees may have weighed these factors differently in reaching their individual decisions to approve the continuation of the Agreement.
Deutsche DWS Variable Series I — DWS CROCI® International VIP | | | 23 |
The following table presents certain information regarding the Board Members and Officers of the Trust/Corporation. Each Board Member’s year of birth is set forth in parentheses after his or her name. Unless otherwise noted, (i) each Board Member has engaged in the principal occupation(s) noted in the table for at least the most recent five years, although not necessarily in the same capacity; and (ii) the address of each Independent Board Member is Keith R. Fox, DWS Funds Board Chair, c/o Thomas R. Hiller, Ropes & Gray LLP, Prudential Tower, 800 Boylston Street, Boston, MA 02199-3600. Except as otherwise noted below, the term of office for each Board Member is until the election and qualification of a successor, or until such Board Member sooner dies, resigns, is removed or as otherwise provided in the governing documents of the Trust/Corporation. Because the Fund does not hold an annual meeting of shareholders, each Board Member will hold office for an indeterminate period.
The Board Members may also serve in similar capacities with other funds in the fund complex. The number of funds in the DWS fund complex shown in the table below includes all registered open- and closed-end funds (including all of their portfolios) advised by the Advisor and any registered funds that have an investment advisor that is an affiliated person of the Advisor.
| Independent Board Members | ||||||||
| Name, Year of Birth, Position with the Trust/ Corporation and Length of Time Served1 | Business Experience and Directorships During the Past Five Years | Number of Funds in DWS Fund Complex Overseen | Other Directorships Held by Board Member | |||||
Keith R. Fox, CFA (1954)
Chairperson since 2017, and Board Member since 1996 | Managing General Partner, Exeter Capital Partners (a series of private investment funds) (since 1986). Directorships: Progressive International Corporation (kitchen goods importer and distributor); former Chairman, National Association of Small Business Investment Companies; former Directorships: ICI Mutual Insurance Company; BoxTop Media Inc. (advertising); Sun Capital Advisers Trust (mutual funds) (2011–2012) | 73 | — | |||||
John W. Ballantine (1946)
Board Member since 1999 | Retired; formerly, Executive Vice President and Chief Risk Management Officer, First Chicago NBD Corporation/The First National Bank of Chicago (1996–1998); Executive Vice President and Head of International Banking (1995–1996); former Directorships: Director and Chairman of the Board, Healthways, Inc.2 (population well-being and wellness services) (2003–2014); Stockwell Capital Investments PLC (private equity); Enron Corporation; FNB Corporation; Tokheim Corporation; First Oak Brook Bancshares, Inc.; Oak Brook Bank; and Prisma Energy International. Not-for-Profit Director/Trustee: Palm Beach Civic Association; Window to the World Communications (public media); Life Director of Harris Theater for Music and Dance (Chicago); Life Director of Hubbard Street Dance Chicago; former Not-for-Profit Directorships: Public Radio International | 73 | Portland General Electric2 (utility company) (2003– present) | |||||
Dawn-Marie Driscoll (1946)
Board Member since 1987 | Emeritus Executive Fellow, Center for Business Ethics, Bentley University; formerly: Partner, Palmer & Dodge (law firm) (1988–1990); Vice President of Corporate Affairs and General Counsel, Filene’s (retail) (1978–1988). Directorships: Advisory Board, Center for Business Ethics, Bentley University; Trustee and former Chairman of the Board, Southwest Florida Community Foundation (charitable organization); former Directorships: ICI Mutual Insurance Company (2007–2015); Sun Capital Advisers Trust (mutual funds) (2007–2012), Investment Company Institute (audit, executive, nominating committees) and Independent Directors Council (governance, executive committees) | 73 | — | |||||
Richard J. Herring (1946)
Board Member since 1990 | Jacob Safra Professor of International Banking and Professor of Finance, The Wharton School, University of Pennsylvania (since July 1972); Director, The Wharton Financial Institutions Center (since 1994); formerly: Vice Dean and Director, Wharton Undergraduate Division (1995–2000) and Director, The Lauder Institute of International Management Studies (2000–2006); Member FDIC Systemic Risk Advisory Committee since 2011, member Systemic Risk Council since 2012 and member of the Advisory Board at the Yale Program on Financial Stability since 2013; Formerly Co-Chair of the Shadow Financial Regulatory Committee (2003–2015), Executive Director of The Financial Economists Roundtable (2008–2015), Director of The Thai Capital Fund (2007–2013), Director of The Aberdeen Singapore Fund (2007–2018), and Nonexecutive Director of Barclays Bank DE (2010–2018) | 73 | Director, Aberdeen Japan Fund (since 2007) | |||||
William McClayton (1944)
Board Member since 2004 | Private equity investor (since October 2009); previously, Managing Director, Diamond Management & Technology Consultants, Inc. (global consulting firm) (2001–2009); Directorship: Board of Managers, YMCA of Metropolitan Chicago; formerly: Senior Partner, Arthur Andersen LLP (accounting) (1966–2001); Trustee, Ravinia Festival | 73 | — | |||||
| 24 | | | Deutsche DWS Variable Series I — DWS CROCI® International VIP |
| Name, Year of Birth, Position with the Trust/ Corporation and Length of Time Served1 | Business Experience and Directorships During the Past Five Years | Number of Funds in DWS Fund Complex Overseen | Other Directorships Held by Board Member | |||||
Rebecca W. Rimel (1951)
Board Member since 1995 | Senior Advisor, The Pew Charitable Trusts (charitable organization) (since July 2020); formerly: Executive Vice President, The Glenmede Trust Company (investment trust and wealth management) (1983–2004); Board Member, Investor Education (charitable organization) (2004–2005); Trustee, Executive Committee, Philadelphia Chamber of Commerce (2001–2007); Director, Viasys Health Care2 (January 2007–June 2007); Trustee, Thomas Jefferson Foundation (charitable organization) (1994–2012); President, Chief Executive Officer and Director, The Pew Charitable Trusts (charitable organization) (1994–2020) | 73 | Director, Becton Dickinson and Company2 (medical technology company) (2012– present); Director, BioTelemetry Inc.2 (health care) (2009– present) | |||||
William N. Searcy, Jr. (1946)
Board Member since 1993 | Private investor since October 2003; formerly: Pension & Savings Trust Officer, Sprint Corporation2 (telecommunications) (November 1989–September 2003); Trustee, Sun Capital Advisers Trust (mutual funds) (1998–2012) | 73 | — | |||||
| Officers4 | ||
| Name, Year of Birth, Position with the Trust/ Corporation and Length of Time Served5 | Business Experience and Directorships During the Past Five Years | |
Hepsen Uzcan6 (1974)
President and Chief Executive Officer, 2017–present | Managing Director3, DWS; Secretary, DWS USA Corporation (2018–present); Assistant Secretary, DWS Distributors, Inc. (2018–present); Director and Vice President, DWS Service Company (2018–present); Assistant Secretary, DWS Investment Management Americas, Inc. (2018–present); Director and President, DB Investment Managers, Inc. (2018–present); President and Chief Executive Officer, The European Equity Fund, Inc., The New Germany Fund, Inc. and The Central and Eastern Europe Fund, Inc. (2017–present); formerly: Vice President for the Deutsche funds (2016–2017); Assistant Secretary for the DWS funds (2013–2019); Assistant Secretary, The European Equity Fund, Inc., The New Germany Fund, Inc. and The Central and Eastern Europe Fund, Inc. (2013–2020); Directorships: Interested Director, The European Equity Fund, Inc., The New Germany Fund, Inc. and The Central and Eastern Europe Fund, Inc. (since June 25, 2020); ICI Mutual Insurance Company (since October 16, 2020); and Episcopalian Charities of New York (2018–present) | |
John Millette7 (1962)
Vice President and Secretary, 1999–present | Director,3 DWS; Chief Legal Officer, DWS Investment Management Americas, Inc. (2015–present); Director and Vice President, DWS Trust Company (2016–present); Secretary, DBX ETF Trust (2020–present); Secretary, The European Equity Fund, Inc., The New Germany Fund, Inc. and The Central and Eastern Europe Fund, Inc. (2011–present); formerly: Secretary, Deutsche Investment Management Americas Inc. (2015–2017); Assistant Secretary, DBX ETF Trust (2019–2020); Assistant Secretary (July 14, 2006–December 31, 2010) and Secretary (January 31, 2006–July 13, 2006), The European Equity Fund, Inc., The New Germany Fund, Inc. and The Central and Eastern Europe Fund, Inc. | |
Ciara Crawford8 (1984)
Assistant Secretary, (2019–present) | Associate, DWS (since 2015); previously, Legal Assistant at Accelerated Tax Solutions. | |
Diane Kenneally7 (1966)
Chief Financial Officer and Treasurer, 2018–present | Director,3 DWS; Treasurer, Chief Financial Officer and Controller, DBX ETF Trust (2019–present); Treasurer and Chief Financial Officer, The European Equity Fund, Inc., The New Germany Fund, Inc. and The Central and Eastern Europe Fund, Inc. (2018–present); formerly: Assistant Treasurer for the DWS funds (2007–2018) | |
Paul Antosca7 (1957)
Assistant Treasurer, 2007–present | Director,3 DWS; and Assistant Treasurer, DBX ETF Trust (2019–present) | |
Sheila Cadogan7 (1966)
Assistant Treasurer, 2017–present | Director,3 DWS; Director and Vice President, DWS Trust Company (2018–present); Assistant Treasurer, DBX ETF Trust (2019–present); Assistant Treasurer, The European Equity Fund, Inc., The New Germany Fund, Inc. and The Central and Eastern Europe Fund, Inc. (2018–present) | |
Scott D. Hogan7 (1970)
Chief Compliance Officer, 2016–present | Director,3 DWS; Chief Compliance Officer, The European Equity Fund, Inc., The New Germany Fund, Inc. and The Central and Eastern Europe Fund, Inc. (2016–present) | |
Caroline Pearson7 (1962)
Chief Legal Officer, 2010–present | Managing Director3, DWS; Assistant Secretary, DBX ETF Trust (2020–present); Chief Legal Officer, DBX Advisors LLC and DBX Strategic Advisors LLC (2020–present); Chief Legal Officer, The European Equity Fund, Inc., The New Germany Fund, Inc. and The Central and Eastern Europe Fund, Inc. (2012–present); formerly: Secretary, Deutsche AM Distributors, Inc. (2002–2017); and Secretary, Deutsche AM Service Company (2010–2017) |
Deutsche DWS Variable Series I — DWS CROCI® International VIP | | | 25 |
| Name, Year of Birth, Position with the Trust/ Corporation and Length of Time Served5 | Business Experience and Directorships During the Past Five Years | |
Michelle Goveia-Pine6 (1970)
Interim Anti-Money Laundering Compliance Officer, since July 10, 2020 | Director,3 DWS; Interim AML Officer, DWS Trust Company (since July 28, 2020); Interim AML Officer, DBX ETF Trust (since July 9, 2020); Interim AML Officer, The European Equity Fund, Inc., The New Germany Fund, Inc. and The Central and Eastern Europe Fund, Inc. (since July 24, 2020) |
| 1 | The length of time served represents the year in which the Board Member joined the board of one or more DWS funds currently overseen by the Board. |
| 2 | A publicly held company with securities registered pursuant to Section 12 of the Securities Exchange Act of 1934. |
| 3 | Executive title, not a board directorship. |
| 4 | As a result of their respective positions held with the Advisor or its affiliates, these individuals are considered “interested persons” of the Advisor within the meaning of the 1940 Act. Interested persons receive no compensation from the Fund. |
| 5 | The length of time served represents the year in which the officer was first elected in such capacity for one or more DWS funds. |
| 6 | Address: 875 Third Avenue, New York, NY 10022. |
| 7 | Address: 100 Summer Street, Boston, MA 02110. |
| 8 | Address: 5022 Gate Parkway, Suite 400, Jacksonville, FL 32256. |
The Fund’s Statement of Additional Information (“SAI”) includes additional information about the Board Members. The SAI is available, without charge, upon request. If you would like to request a copy of the SAI, you may do so by calling the following toll-free number: (800) 728-3337.
| 26 | | | Deutsche DWS Variable Series I — DWS CROCI® International VIP |
Notes
 | ||
VS1cint-2 (R-025823-10 2/21) |
December 31, 2020
Annual Report
Deutsche DWS Variable Series I
DWS Global Small Cap VIP

| 3 | Performance Summary | |||
| 4 | Management Summary | |||
| 6 | Portfolio Summary | |||
| 7 | Investment Portfolio | |||
| 10 | Statement of Assets and Liabilities | |||
| 10 | Statement of Operations | |||
| 11 | Statements of Changes in Net Assets | |||
| 12 | Financial Highlights | |||
| 13 | Notes to Financial Statements | |||
| 18 | Report of Independent Registered Public Accounting Firm | |||
| 19 | Information About Your Fund’s Expenses | |||
| 20 | Tax Information | |||
| 20 | Proxy Voting | |||
| 21 | Advisory Agreement Board Considerations and Fee Evaluation | |||
| 24 | Board Members and Officers |
This report must be preceded or accompanied by a prospectus. To obtain an additional prospectus or summary prospectus, if available, call (800) 728-3337 or your financial representative. We advise you to consider the Fund’s objectives, risks, charges and expenses carefully before investing. The summary prospectus and prospectus contain this and other important information about the Fund. Please read the prospectus carefully before you invest.
Stocks may decline in value. Smaller company stocks tend to be more volatile than medium-sized or large company stocks. Investing in foreign securities, particularly those of emerging markets, presents certain risks, such as currency fluctuations, political and economic changes, and market risks. Emerging markets tend to be more volatile and less liquid than the markets of more mature economies, and generally have less diverse and less mature economic structures and less stable political systems than those of developed countries. The Fund may lend securities to approved institutions. Please read the prospectus for details.
War, terrorism, economic uncertainty, trade disputes, public health crises (including the recent pandemic spread of the novel coronavirus) and related geopolitical events could lead to increased market volatility, disruption to U.S. and world economies and markets and may have significant adverse effects on the Fund and its investments.
The brand DWS represents DWS Group GmbH & Co. KGaA and any of its subsidiaries such as DWS Distributors, Inc. which offers investment products or DWS Investment Management Americas, Inc. and RREEF America L.L.C. which offer advisory services.
DWS Distributors, Inc., 222 South Riverside Plaza, Chicago, IL 60606, (800) 621-1148
NOT FDIC/NCUA INSURED NO BANK GUARANTEE MAY LOSE VALUE NOT A DEPOSIT
NOT INSURED BY ANY FEDERAL GOVERNMENT AGENCY
| 2 | | | Deutsche DWS Variable Series I — DWS Global Small Cap VIP |
| Performance Summary | December 31, 2020 (Unaudited) |
Fund performance shown is historical, assumes reinvestment of all dividend and capital gain distributions, and does not guarantee future results. Investment return and principal value fluctuate with changing market conditions so that, when redeemed, shares may be worth more or less than their original cost. Current performance may be lower or higher than the performance data quoted. Please contact your participating insurance company for the Fund’s most recent month-end performance. Performance does not reflect charges and fees (“contract charges”) associated with the separate account that invests in the Fund or any variable life insurance policy or variable annuity contract for which the Fund is an investment option. These charges and fees will reduce returns. While all share classes have the same underlying portfolio, their performance will differ.
The gross expense ratios of the Fund, as stated in the fee table of the prospectus dated May 1, 2020, are 1.11% and 1.40% for Class A and Class B shares, respectively, and may differ from the expense ratios disclosed in the Financial Highlights tables in this report.
Generally accepted accounting principles require adjustments to be made to the net assets of the Fund at period end for financial reporting purposes only, and as such, the total return based on the unadjusted net asset value per share may differ from the total return reported in the financial highlights.
Growth of an Assumed $10,000 Investment
| S&P Developed SmallCap Index comprises the stocks representing the lowest 15% of float-adjusted market cap in each developed country. It is a subset of the S&P Global BMI, a comprehensive, rules-based index measuring global stock market performance.
Index returns do not reflect any fees or expenses and it is not possible to invest directly into an index. |
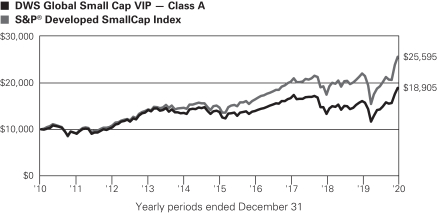
| Comparative Results | ||||||||||
| DWS Global Small Cap VIP | 1-Year | 3-Year | 5-Year | 10-Year | ||||||
| Class A | $11,736 | $11,315 | $13,795 | $18,905 | ||||||
| 17.36% | 4.21% | 6.65% | 6.58% | |||||||
| S&P Developed SmallCap Index | $11,620 | $12,634 | $17,384 | $25,595 | ||||||
| 16.20% | 8.11% | 11.69% | 9.85% | |||||||
| DWS Global Small Cap VIP | 1-Year | 3-Year | 5-Year | 10-Year | ||||||
| Class B | $11,694 | $11,222 | $13,601 | $18,413 | ||||||
| 16.94% | 3.92% | 6.34% | 6.30% | |||||||
| S&P Developed SmallCap Index | $11,620 | $12,634 | $17,384 | $25,595 | ||||||
| 16.20% | 8.11% | 11.69% | 9.85% | |||||||
The growth of $10,000 is cumulative.
Deutsche DWS Variable Series I — DWS Global Small Cap VIP | | | 3 |
| Management Summary | December 31, 2020 (Unaudited) |
DWS Global Small Cap VIP returned 17.36% in 2020 (Class A shares, unadjusted for contract charges) and outperformed the 16.20% return of its benchmark, the S&P Developed SmallCap Index.
After a benign start to the year, equities moved sharply lower beginning in mid-February amid mounting concerns about the impact of COVID-19 on the global economy. The downturn, while large in magnitude, proved relatively short in duration. In late March, world central banks slashed interest rates and announced a number of measures to promote economic growth and financial-market liquidity. In addition, governments augmented the monetary stimulus with fiscal spending packages. These actions helped foster investor confidence that government support would help keep the economy afloat until the effects of COVID-19 dissipated, sparking a rally that lasted from late March to the end of August. Although the market’s advance paused in the autumn due to rising global coronavirus cases and uncertainty surrounding the U.S. elections, it resumed in November and December following the approval of vaccines for COVID-19. Small caps performed particularly well in the final two months of 2020, as the prospect of a vaccine made investors more comfortable looking for opportunities outside of the U.S. mega-cap technology sector. Still, small companies trailed large caps for the full year.
The Fund’s relative performance improved considerably in comparison to 2019. Much of the Fund’s previous underperformance was the result of the large deviations in its regional and sector weightings from those of the benchmark. We worked to reduce these divergences gradually over the past 12 to 18 months, with the goal of limiting the effect of allocation factors so individual stock selection would be a larger driver of results. We believe the benefits of this process were visible in the Fund’s positive relative performance in 2020.
Stock selection contributed to the Fund’s results in the past year, with the largest advantage occurring in the real estate sector. Here, we benefited from an emphasis on data center and industrial real estate investment trusts (REITs) over COVID-sensitive areas such as retail and hotels/restaurants. The Fund’s top performers in the sector included PATRIZIA AG and Americold Realty Trust. Consumer discretionary was also a source of strength, primarily as a result of positions in YETI Holdings, Inc. and TopBuild Corp., a U.S.-based producer of insulation and other building materials.
The Fund’s holdings outperformed in the information technology sector, as well. Five9, Inc., a provider of cloud-based contact-center software that uses artificial intelligence to add value for its customers, was a top contributor. The company exhibited solid growth as corporations moved from call-center to at-home customer contact models. Inphi Corp., a producer of fifth generation (5G) mobile communications chips that was acquired at a premium in October, also performed very well. Varonis Systems, Inc., a designer and developer of security software solutions that experienced rising demand as corporations switched to work-from-home approaches, was an additional contributor of note.
On the negative side, we lost some relative performance in health care from positions in Sawai Pharmaceutical Co. Ltd. and Cardiovascular Systems, Inc. Elsewhere, key detractors included Thermon Group Holdings, Inc., a producer of industrial heating solutions, and Talgo SA, a Spanish train manufacturer.
The Fund closed the period with slight overweights in the United States and Europe, together with a small underweight in Asia ex-Japan. At the sector level, it had narrow overweights in higher-growth sectors — especially technology and health care — and it was modestly underweight in utilities, real estate, and materials. With this said, we continue to pursue an approach that seeks to keep the Fund’s allocations within a tighter band relative to the corresponding index weightings.
We believe the investment backdrop remains favorable for small-cap stocks. Economic growth appears set to improve in 2021, creating supportive conditions for smaller companies. Inflation pressures also appear to be mounting, which could be a tailwind given that rising inflation has been correlated with outperformance for small caps over time. In this environment, we believe our large, global investment universe provides highly fertile territory to identify growing, undervalued, and undiscovered companies.
Peter Barsa, Director*
Portfolio Manager
The views expressed reflect those of the portfolio management team only through the end of the period of the report as stated on the cover. The management team’s views are subject to change at any time based on market and other conditions and should not be construed as a recommendation. Past performance is no guarantee of future results. Current and future portfolio holdings are subject to risk.
| 4 | | | Deutsche DWS Variable Series I — DWS Global Small Cap VIP |
Terms to Know
S&P Developed SmallCap Index comprises the stocks representing the lowest 15% of float-adjusted market cap in each developed country. It is a subset of the S&P Global BMI, a comprehensive, rules-based index measuring global stock market performance.
Stock selection refers to the performance of the Fund’s holdings in a given sector relative to the sector as a whole.
Contribution and detraction incorporate both a stock’s total return and its weighting in the fund.
Overweight means the Fund holds a higher weighting in a given sector or security than the benchmark. Underweight means the Fund holds a lower weighting.
| * | Pankaj Bhatnagar, Managing Director, was added to the team on February 1, 2021. |
Deutsche DWS Variable Series I — DWS Global Small Cap VIP | | | 5 |
| Portfolio Summary | (Unaudited) |
| Asset Allocation (As a % of Investment Portfolio excluding Securities Lending Collateral) | 12/31/20 | 12/31/19 | ||||||
| Common Stocks | 94% | 94% | ||||||
| Cash Equivalents | 4% | 5% | ||||||
| Exchange-Traded Funds | 2% | 1% | ||||||
| Convertible Preferred Stock | — | 0% | ||||||
| 100% | 100% | |||||||
Geographical Diversification | 12/31/20 | 12/31/19 | ||||||
| United States | 61% | 59% | ||||||
| Japan | 10% | 10% | ||||||
| United Kingdom | 5% | 6% | ||||||
| Germany | 3% | 3% | ||||||
| Canada | 3% | 3% | ||||||
| Italy | 2% | 3% | ||||||
Sweden | 2% | 1% | ||||||
Luxembourg | 2% | 2% | ||||||
| France | 2% | 3% | ||||||
| Others | 10% | 10% | ||||||
| 100% | 100% | |||||||
| Sector Diversification (As of % of Investment Portfolio excluding Exchange-Traded Funds, Securities Lending Collateral and Cash Equivalents) | 12/31/20 | 12/31/19 | ||||||
| Industrials | 21% | 20% | ||||||
Information Technology | 19% | 17% | ||||||
Health Care | 16% | 14% | ||||||
| Consumer Discretionary | 13% | 11% | ||||||
Financials | 10% | 12% | ||||||
Real Estate | 8% | 11% | ||||||
| Materials | 6% | 6% | ||||||
| Consumer Staples | 3% | 3% | ||||||
| Communication Services | 3% | 3% | ||||||
| Energy | 1% | 3% | ||||||
| Utilities | 0% | — | ||||||
| 100% | 100% | |||||||
Portfolio holdings and characteristics are subject to change.
For more complete details about the Fund’s investment portfolio, see page 7.
Following the Fund’s fiscal first and third quarter-end, a complete portfolio holdings listing is posted on dws.com, and is available free of charge by contacting your financial intermediary, or if you are a direct investor, by calling (800) 728-3337. In addition, the portfolio holdings listing is filed with the SEC on the Fund’s Form N-PORT and will be available on the SEC’s Web site at sec.gov. Additional portfolio holdings for the Fund are also posted on dws.com from time to time. Please see the Fund’s current prospectus for more information.
| 6 | | | Deutsche DWS Variable Series I — DWS Global Small Cap VIP |
| Investment Portfolio | as of December 31, 2020 |
| Shares | Value ($) | |||||||
| Common Stocks 94.4% | ||||||||
| Austria 1.5% | ||||||||
Wienerberger AG (Cost $921,227) | 36,328 | 1,155,099 | ||||||
| Bermuda 0.9% | ||||||||
Lazard Ltd. “A” (a) | 16,265 | 688,010 | ||||||
| Canada 3.3% | ||||||||
First Quantum Minerals Ltd. | 17,977 | 322,708 | ||||||
Linamar Corp. | 12,569 | 665,725 | ||||||
Pan American Silver Corp. | 16,342 | 563,606 | ||||||
Quebecor, Inc. “B” | 39,795 | 1,024,184 | ||||||
|
| |||||||
(Cost $1,630,801) | 2,576,223 | |||||||
| France 1.7% | ||||||||
Alten SA* | 3,084 | 350,560 | ||||||
SPIE SA* | 44,518 | 967,862 | ||||||
|
| |||||||
(Cost $1,436,752) | 1,318,422 | |||||||
| Germany 3.3% | ||||||||
Deutz AG* | 88,069 | 551,819 | ||||||
PATRIZIA AG | 41,336 | 1,328,568 | ||||||
United Internet AG (Registered) | 16,617 | 699,984 | ||||||
|
| |||||||
(Cost $1,143,291) | 2,580,371 | |||||||
| Hong Kong 0.8% | ||||||||
Techtronic Industries Co., Ltd. (Cost $55,347) | 45,541 | 652,127 | ||||||
| India 0.7% | ||||||||
WNS Holdings Ltd. (ADR)* | 7,251 | 522,435 | ||||||
| Ireland 1.5% | ||||||||
Avadel Pharmaceuticals PLC (ADR)* (b) | 21,583 | 144,174 | ||||||
Dalata Hotel Group PLC* | 129,550 | 599,656 | ||||||
Ryanair Holdings PLC* | 21,445 | 425,295 | ||||||
|
| |||||||
(Cost $897,940) | 1,169,125 | |||||||
| Italy 2.3% | ||||||||
Buzzi Unicem SpA | 42,400 | 1,013,634 | ||||||
Cerved Group SpA* | 23,914 | 217,073 | ||||||
Moncler SpA* | 10,050 | 616,771 | ||||||
|
| |||||||
(Cost $1,425,848) | 1,847,478 | |||||||
| Japan 10.0% | ||||||||
Ai Holdings Corp. | 34,117 | 687,416 | ||||||
Anicom Holdings, Inc. | 92,800 | 967,934 | ||||||
Anritsu Corp. | 14,200 | 317,556 | ||||||
BML, Inc. | 27,700 | 862,271 | ||||||
Kura Sushi, Inc. | 4,800 | 291,876 | ||||||
Kusuri No Aoki Holdings Co., Ltd. | 12,158 | 1,058,889 | ||||||
Optex Group Co., Ltd. | 17,000 | 311,341 | ||||||
Sawai Pharmaceutical Co., Ltd. | 12,600 | 571,449 | ||||||
Syuppin Co., Ltd. | 49,200 | 431,265 | ||||||
Topcon Corp. | 23,400 | 291,057 | ||||||
UT Group Co., Ltd.* | 31,024 | 967,433 | ||||||
Zenkoku Hosho Co., Ltd. | 22,400 | 1,026,788 | ||||||
|
| |||||||
(Cost $4,817,419) | 7,785,275 | |||||||
| Shares | Value ($) | |||||||
| Korea 0.7% | ||||||||
i-SENS, Inc. (Cost $569,030) | 18,843 | 522,496 | ||||||
| Luxembourg 1.9% | ||||||||
B&M European Value Retail SA | 209,951 | 1,487,890 | ||||||
| Spain 1.5% | ||||||||
Fluidra SA | 28,658 | 733,120 | ||||||
Talgo SA 144A* | 88,107 | 446,762 | ||||||
|
| |||||||
(Cost $905,242) | 1,179,882 | |||||||
| Sweden 2.0% | ||||||||
MIPS AB | 7,101 | 446,306 | ||||||
Nobina AB 144A* | 129,243 | 1,091,097 | ||||||
|
| |||||||
(Cost $861,296) | 1,537,403 | |||||||
| Switzerland 0.6% | ||||||||
Landis & Gyr Group AG | 5,994 | 471,290 | ||||||
| United Kingdom 5.2% | ||||||||
Arrow Global Group PLC* | 95,792 | 268,783 | ||||||
Clinigen Group PLC | 44,130 | 407,832 | ||||||
Domino’s Pizza Group PLC | 106,754 | 461,611 | ||||||
Electrocomponents PLC | 121,547 | 1,450,187 | ||||||
Johnson Service Group PLC* | 265,435 | 509,845 | ||||||
Scapa Group PLC* | 249,121 | 636,377 | ||||||
Ultra Electronics Holdings PLC | 13,329 | 378,294 | ||||||
|
| |||||||
(Cost $3,017,442) | 4,112,929 | |||||||
| United States 56.5% | ||||||||
Advanced Drainage Systems, Inc. | 3,618 | 302,392 | ||||||
Affiliated Managers Group, Inc. | 4,203 | 427,445 | ||||||
Agilysys, Inc.* (b) | 13,712 | 526,267 | ||||||
Americold Realty Trust (REIT) | 21,223 | 792,255 | ||||||
Amicus Therapeutics, Inc.* | 16,774 | 387,312 | ||||||
Arena Pharmaceuticals, Inc.* | 8,863 | 680,944 | ||||||
AZEK Co., Inc.* | 2,537 | 97,548 | ||||||
Bandwidth, Inc. “A”* | 2,002 | 307,647 | ||||||
Blucora, Inc.* | 8,810 | 140,167 | ||||||
Builders FirstSource, Inc.* | 20,777 | 847,909 | ||||||
Cardiovascular Systems, Inc.* | 8,842 | 386,926 | ||||||
Casey’s General Stores, Inc. | 6,443 | 1,150,849 | ||||||
Cleveland-Cliffs, Inc. (b) | 46,669 | 679,501 | ||||||
CMC Materials, Inc. | 4,593 | 694,921 | ||||||
Contango Oil & Gas Co.* (b) | 121,886 | 279,119 | ||||||
Cornerstone OnDemand, Inc.* | 11,453 | 504,390 | ||||||
Dril-Quip, Inc.* | 6,783 | 200,913 | ||||||
Ducommun, Inc.* | 26,024 | 1,397,489 | ||||||
EastGroup Properties, Inc. (REIT) | 4,274 | 590,068 | ||||||
Envestnet, Inc.* | 9,595 | 789,573 | ||||||
Essential Properties Realty Trust, Inc. (REIT) | 24,757 | 524,848 | ||||||
Five9, Inc.* | 12,256 | 2,137,446 | ||||||
Four Corners Property Trust, Inc. (REIT) | 27,967 | 832,578 | ||||||
Fox Factory Holding Corp.* | 10,960 | 1,158,582 | ||||||
Green Dot Corp. “A”* | 6,498 | 362,588 | ||||||
H&E Equipment Services, Inc. | 12,714 | 379,004 | ||||||
Heron Therapeutics, Inc.* | 22,446 | 475,070 | ||||||
Hillenbrand, Inc. | 10,258 | 408,268 | ||||||
The accompanying notes are an integral part of the financial statements.
Deutsche DWS Variable Series I — DWS Global Small Cap VIP | | | 7 |
| Shares | Value ($) | |||||||
Hudson Pacific Properties, Inc. (REIT) | 8,486 | 203,834 | ||||||
Hyster-Yale Materials Handling, Inc. | 5,590 | 332,885 | ||||||
Inphi Corp.* | 12,265 | 1,968,165 | ||||||
iRhythm Technologies, Inc.* | 3,824 | 907,091 | ||||||
Jack in the Box, Inc. | 6,611 | 613,501 | ||||||
Jefferies Financial Group, Inc. | 33,124 | 814,850 | ||||||
LivePerson, Inc.* (b) | 5,940 | 369,646 | ||||||
Lumentum Holdings, Inc.* | 8,748 | 829,310 | ||||||
Masonite International Corp.* | 7,831 | 770,101 | ||||||
Molina Healthcare, Inc.* | 4,393 | 934,303 | ||||||
National Storage Affiliates Trust (REIT) | 15,303 | 551,367 | ||||||
Neurocrine Biosciences, Inc.* | 7,688 | 736,895 | ||||||
Option Care Health, Inc.* | 29,553 | 462,209 | ||||||
Outset Medical, Inc.* | 816 | 46,381 | ||||||
Pacira BioSciences, Inc.* | 15,060 | 901,190 | ||||||
Physicians Realty Trust (REIT) | 38,643 | 687,845 | ||||||
Providence Service Corp.* | 13,082 | 1,813,601 | ||||||
QAD, Inc. “A” | 15,954 | 1,007,974 | ||||||
QTS Realty Trust, Inc. “A”, (REIT) | 10,438 | 645,903 | ||||||
Quidel Corp.* | 1,819 | 326,783 | ||||||
Rush Enterprises, Inc. “A” | 35,598 | 1,474,449 | ||||||
SJW Group | 4,322 | 299,774 | ||||||
South State Corp. | 12,286 | 888,278 | ||||||
Synovus Financial Corp. | 22,074 | 714,535 | ||||||
Tandem Diabetes Care, Inc.* | 3,297 | 315,457 | ||||||
Tenneco, Inc. “A”* | 14,372 | 152,343 | ||||||
Thermon Group Holdings, Inc.* (b) | 34,510 | 539,391 | ||||||
Titan Machinery, Inc.* | 28,018 | 547,752 | ||||||
TopBuild Corp.* | 6,718 | 1,236,649 | ||||||
Translate Bio, Inc.* | 8,367 | 154,204 | ||||||
Travere Therapeutics, Inc.* | 26,114 | 711,737 | ||||||
TriState Capital Holdings, Inc.* | 27,098 | 471,505 | ||||||
Varonis Systems, Inc.* | 10,791 | 1,765,516 | ||||||
| Shares | Value ($) | |||||||
Vital Farms, Inc.* (b) | 589 | 14,908 | ||||||
Vroom, Inc.* | 1,119 | 45,845 | ||||||
WEX, Inc.* | 2,214 | 450,615 | ||||||
YETI Holdings, Inc.* | 21,295 | 1,458,069 | ||||||
Zions Bancorp. NA | 10,965 | 476,320 | ||||||
(Cost $25,574,095) | 44,103,200 | |||||||
Total Common Stocks | 73,709,655 | |||||||
| Exchange-Traded Funds 1.7% |
| |||||||
| United States | ||||||||
iShares Russell 2000 ETF | 6,798 | 1,332,816 | ||||||
| Securities Lending Collateral 1.5% | ||||||||
DWS Government & Agency Securities Portfolio “DWS Government Cash Institutional Shares”, 0.03% (c) (d) | 1,184,652 | 1,184,652 | ||||||
| Cash Equivalents 3.9% | ||||||||
DWS Central Cash Management Government Fund, 0.08% (c) | 3,011,728 | 3,011,728 | ||||||
| % of Net Assets | Value ($) | |||||||
Total Investment Portfolio | 101.5 | 79,238,851 | ||||||
| Other Assets and Liabilities, Net | (1.5 | ) | (1,141,647 | ) | ||||
| Net Assets | 100.0 | 78,097,204 | ||||||
A summary of the Fund’s transactions with affiliated investments during the year ended December 31, 2020 are as follows:
| Value ($) at 12/31/2019 | Purchases Cost ($) | Sales Proceeds ($) | Net Realized Gain/ (Loss) ($) | Net Change in Unrealized Appreciation (Depreciation) ($) | Income ($) | Capital Gain Distributions ($) | Number of Shares at 12/31/2020 | Value ($) at 12/31/2020 | ||||||||||||||||||||||||
Securities Lending Collateral 1.5% |
| |||||||||||||||||||||||||||||||
DWS Government & Agency Securities Portfolio “DWS Government Cash Institutional Shares”, 0.03% (c) (d) |
| |||||||||||||||||||||||||||||||
| 1,799,761 | — | 615,109 | (e) | — | — | 23,360 | — | 1,184,652 | 1,184,652 | |||||||||||||||||||||||
Cash Equivalents 3.9% |
| |||||||||||||||||||||||||||||||
DWS Central Cash Management Government Fund, 0.08% (c) |
| |||||||||||||||||||||||||||||||
| 3,272,911 | 7,493,713 | 7,754,896 | — | — | 14,361 | — | 3,011,728 | 3,011,728 | ||||||||||||||||||||||||
| 5,072,672 | 7,493,713 | 8,370,005 | — | — | 37,721 | — | 4,196,380 | 4,196,380 | ||||||||||||||||||||||||
| * | Non-income producing security. |
| (a) | Listed on the NASDAQ Stock Market, Inc. |
| (b) | All or a portion of these securities were on loan. In addition, “Other Assets and Liabilities, Net” may include pending sales that are also on loan. The value of securities loaned at December 31, 2020 amounted to $1,574,824, which is 2.0% of net assets. |
| (c) | Affiliated fund managed by DWS Investment Management Americas, Inc. The rate shown is the annualized seven-day yield at period end. |
| (d) | Represents cash collateral held in connection with securities lending. Income earned by the Fund is net of borrower rebates. In addition, the Fund held non-cash U.S. Treasury securities collateral having a value of $497,915. |
| (e) | Represents the net increase (purchase cost) or decrease (sales proceeds) in the amount invested in cash collateral for the year ended December 31, 2020. |
144A: Security exempt from registration under Rule 144A of the Securities Act of 1933. These securities may be resold in transactions exempt from registration, normally to qualified institutional buyers.
ADR: American Depositary Receipt
REIT: Real Estate Investment Trust
The accompanying notes are an integral part of the financial statements.
| 8 | | | Deutsche DWS Variable Series I — DWS Global Small Cap VIP |
Fair Value Measurements
Various inputs are used in determining the value of the Fund’s investments. These inputs are summarized in three broad levels. Level 1 includes quoted prices in active markets for identical securities. Level 2 includes other significant observable inputs (including quoted prices for similar securities, interest rates, prepayment speeds and credit risk). Level 3 includes significant unobservable inputs (including the Fund’s own assumptions in determining the fair value of investments). The level assigned to the securities valuations may not be an indication of the risk or liquidity associated with investing in those securities.
The following is a summary of the inputs used as of December 31, 2020 in valuing the Fund’s investments. For information on the Fund’s policy regarding the valuation of investments, please refer to the Security Valuation section of Note A in the accompanying Notes to Financial Statements.
Assets | Level 1 | Level 2 | Level 3 | Total | ||||||||||||
Common Stocks | ||||||||||||||||
Austria | $ | — | $ | 1,155,099 | $ | — | $ | 1,155,099 | ||||||||
Bermuda | 688,010 | — | — | 688,010 | ||||||||||||
Canada | 2,576,223 | — | — | 2,576,223 | ||||||||||||
France | — | 1,318,422 | — | 1,318,422 | ||||||||||||
Germany | — | 2,580,371 | — | 2,580,371 | ||||||||||||
Hong Kong | — | 652,127 | — | 652,127 | ||||||||||||
India | 522,435 | — | — | 522,435 | ||||||||||||
Ireland | 144,174 | 1,024,951 | — | 1,169,125 | ||||||||||||
Italy | — | 1,847,478 | — | 1,847,478 | ||||||||||||
Japan | — | 7,785,275 | — | 7,785,275 | ||||||||||||
Korea | — | 522,496 | — | 522,496 | ||||||||||||
Luxembourg | — | 1,487,890 | — | 1,487,890 | ||||||||||||
Spain | — | 1,179,882 | — | 1,179,882 | ||||||||||||
Sweden | — | 1,537,403 | — | 1,537,403 | ||||||||||||
Switzerland | — | 471,290 | — | 471,290 | ||||||||||||
United Kingdom | — | 4,112,929 | — | 4,112,929 | ||||||||||||
United States | 44,103,200 | — | — | 44,103,200 | ||||||||||||
Exchange-Traded Funds | 1,332,816 | — | — | 1,332,816 | ||||||||||||
Short-Term Investments (f) | 4,196,380 | — | — | 4,196,380 | ||||||||||||
Total | $ | 53,563,238 | $ | 25,675,613 | $ | — | $ | 79,238,851 | ||||||||
| (f) | See Investment Portfolio for additional detailed categorizations. |
The accompanying notes are an integral part of the financial statements.
Deutsche DWS Variable Series I — DWS Global Small Cap VIP | | | 9 |
Statement of Assets and Liabilities
| as of December 31, 2020 | ||||
| Assets | ||||
| Investments in non-affiliated securities, at value (cost $46,199,698) including — $1,574,824 of securities loaned | $ | 75,042,471 | ||
| Investment in DWS Government & Agency Securities Portfolio (cost $1,184,652)* | 1,184,652 | |||
| Investment in DWS Central Cash Management Government Fund (cost $3,011,728) | 3,011,728 | |||
| Foreign currency, at value (cost $190,237) | 194,384 | |||
| Receivable for Fund shares sold | 189 | |||
| Dividends receivable | 52,341 | |||
| Interest receivable | 914 | |||
| Foreign taxes recoverable | 17,960 | |||
| Other assets | 1,429 | |||
| Total assets | 79,506,068 | |||
| Liabilities | ||||
| Payable upon return of securities loaned | 1,184,652 | |||
| Payable for investments purchased | 38,911 | |||
| Payable for Fund shares redeemed | | 71,937 | | |
| Accrued management fee | | 34,051 | | |
| Accrued Trustees’ fees | | 1,829 | | |
| Other accrued expenses and payables | | 77,484 | | |
| Total liabilities | 1,408,864 | |||
| Net assets, at value | $ | 78,097,204 | ||
| Net Assets Consist of | ||||
| Distributable earnings (loss) | 26,906,667 | |||
| Paid-in capital | 51,190,537 | |||
| Net assets, at value | $ | 78,097,204 | ||
| Net Asset Value | ||||
Class A | ||||
| Net Asset Value, offering and redemption price per share ($75,508,783 ÷ 6,344,768 outstanding shares of beneficial interest, $.01 par value, unlimited number of shares authorized) | $ | 11.90 | ||
Class B | ||||
| Net Asset Value, offering and redemption price per share ($2,588,421 ÷ 227,196 outstanding shares of beneficial interest, $.01 par value, unlimited number of shares authorized) | $ | 11.39 | ||
| * | Represents collateral on securities loaned. In addition, the Fund held non-cash collateral having a value of $497,915. |
| for the year ended December 31, 2020 |
| |||
| Investment Income | ||||
| Income: | ||||
| Dividends (net of foreign taxes withheld of $41,501) | $ | 733,965 | ||
| Income distributions — DWS Central Cash Management Government Fund | 14,361 | |||
| Securities lending income, net of borrower rebates | 23,360 | |||
| Total income | 771,686 | |||
| Expenses: | ||||
| Management fee | 520,578 | |||
| Administration fee | 63,474 | |||
| Services to shareholders | 5,062 | |||
| Recordkeeping fee (Class B) | 657 | |||
| Distribution service fee (Class B) | 5,340 | |||
| Custodian fee | 7,430 | |||
| Professional fees | 63,181 | |||
| Reports to shareholders | 34,376 | |||
| Trustees’ fees and expenses | 3,955 | |||
| Other | 16,436 | |||
| Total expenses before expense reductions | 720,489 | |||
| Expense reductions | (187,422 | ) | ||
| Total expenses after expense reductions | 533,067 | |||
| Net investment income | 238,619 | |||
| Realized and Unrealized gain (loss) | ||||
| Net realized gain (loss) from: | ||||
| Investments | (1,084,503 | ) | ||
| Foreign currency | 6,908 | |||
| (1,077,595 | ) | |||
| Change in net unrealized appreciation (depreciation) on: | ||||
| Investments | 11,991,053 | |||
| Foreign currency | 3,898 | |||
| 11,994,951 | ||||
| Net gain (loss) | 10,917,356 | |||
| Net increase (decrease) in net assets resulting from operations | $ | 11,155,975 | ||
The accompanying notes are an integral part of the financial statements.
| 10 | | | Deutsche DWS Variable Series I — DWS Global Small Cap VIP |
Statements of Changes in Net Assets
Years Ended December 31, | ||||||||
| Increase (Decrease) in Net Assets | 2020 | 2019 | ||||||
| Operations: | ||||||||
| Net investment income (loss) | $ | 238,619 | $ | 378,623 | ||||
| Net realized gain (loss) | (1,077,595 | ) | (695,460 | ) | ||||
| Change in net unrealized appreciation (depreciation) | 11,994,951 | 13,801,763 | ||||||
| Net increase (decrease) in net assets resulting from operations | 11,155,975 | 13,484,926 | ||||||
| Distributions to shareholders: | ||||||||
Class A | (509,172 | ) | (3,709,915 | ) | ||||
Class B | (12,523 | ) | (121,306 | ) | ||||
| Total distributions | (521,695 | ) | (3,831,221 | ) | ||||
| Fund share transactions: | ||||||||
Class A | ||||||||
| Proceeds from shares sold | 2,748,177 | 2,668,513 | ||||||
| Reinvestment of distributions | 509,172 | 3,709,915 | ||||||
| Payments for shares redeemed | (8,776,264 | ) | (8,101,927 | ) | ||||
| Net increase (decrease) in net assets from Class A share transactions | (5,518,915 | ) | (1,723,499 | ) | ||||
Class B | ||||||||
| Proceeds from shares sold | 152,440 | 254,888 | ||||||
| Reinvestment of distributions | 12,523 | 121,306 | ||||||
| Payments for shares redeemed | (301,149 | ) | (426,683 | ) | ||||
| Net increase (decrease) in net assets from Class B share transactions | (136,186 | ) | (50,489 | ) | ||||
| Increase (decrease) in net assets | 4,979,179 | 7,879,717 | ||||||
| Net assets at beginning of period | 73,118,025 | 65,238,308 | ||||||
| Net assets at end of period | $ | 78,097,204 | $ | 73,118,025 | ||||
| Other Information | ||||||||
Class A | ||||||||
| Shares outstanding at beginning of period | 6,910,961 | 7,090,435 | ||||||
| Shares sold | 293,128 | 278,893 | ||||||
| Shares issued to shareholders in reinvestment of distributions | 66,298 | 383,652 | ||||||
| Shares redeemed | (925,619 | ) | (842,019 | ) | ||||
| Net increase (decrease) in Class A shares | (566,193 | ) | (179,474 | ) | ||||
| Shares outstanding at end of period | 6,344,768 | 6,910,961 | ||||||
Class B | ||||||||
| Shares outstanding at beginning of period | 238,523 | 244,229 | ||||||
| Shares sold | 18,334 | 27,955 | ||||||
| Shares issued to shareholders in reinvestment of distributions | 1,701 | 13,086 | ||||||
| Shares redeemed | (31,362 | ) | (46,747 | ) | ||||
| Net increase (decrease) in Class B shares | (11,327 | ) | (5,706 | ) | ||||
| Shares outstanding at end of period | 227,196 | 238,523 | ||||||
The accompanying notes are an integral part of the financial statements.
Deutsche DWS Variable Series I — DWS Global Small Cap VIP | | | 11 |
| DWS Global Small Cap VIP — Class A | ||||||||||||||||||||
Years Ended December 31, | ||||||||||||||||||||
| 2020 | 2019 | 2018 | 2017 | 2016 | ||||||||||||||||
| Selected Per Share Data | ||||||||||||||||||||
| Net asset value, beginning of period | $10.24 | $8.91 | $12.90 | $11.78 | $13.17 | |||||||||||||||
| Income (loss) from investment operations: | ||||||||||||||||||||
Net investment income (loss)a | .04 | .05 | .02 | .00 | * | .03 | ||||||||||||||
Net realized and unrealized gain (loss) | 1.70 | 1.82 | (2.32 | ) | 2.21 | .15 | ||||||||||||||
Total from investment operations | 1.74 | 1.87 | (2.30 | ) | 2.21 | .18 | ||||||||||||||
| Less distributions from: | ||||||||||||||||||||
Net investment income | (.08 | ) | — | (.04 | ) | — | (.05 | ) | ||||||||||||
Net realized gains | — | (.54 | ) | (1.65 | ) | (1.09 | ) | (1.52 | ) | |||||||||||
Total distributions | (.08 | ) | (.54 | ) | (1.69 | ) | (1.09 | ) | (1.57 | ) | ||||||||||
| Net asset value, end of period | $11.90 | $10.24 | $8.91 | $12.90 | $11.78 | |||||||||||||||
| Total Return (%)b | 17.36 | 21.29 | (20.51 | ) | 20.02 | 1.57 | ||||||||||||||
| Ratios to Average Net Assets and Supplemental Data | ||||||||||||||||||||
| Net assets, end of period ($ millions) | 76 | 71 | 63 | 85 | 89 | |||||||||||||||
| Ratio of expenses before expense reductions (%)c | 1.10 | 1.11 | 1.10 | 1.15 | 1.17 | |||||||||||||||
| Ratio of expenses after expense reductions (%)c | .81 | .82 | .78 | .94 | 1.02 | |||||||||||||||
| Ratio of net investment income (loss) (%) | .38 | .54 | .21 | .03 | .22 | |||||||||||||||
| Portfolio turnover rate (%) | 9 | 23 | 32 | 42 | 41 | |||||||||||||||
| a | Based on average shares outstanding during the period. |
| b | Total return would have been lower had certain expenses not been reduced. |
| c | Expense ratio does not reflect charges and fees associated with the separate account that invests in the Fund or any variable life insurance policy or variable annuity contract for which the Fund is an investment option. |
| * | Amount is less than $.005. |
| DWS Global Small Cap VIP — Class B | ||||||||||||||||||||
Years Ended December 31, | ||||||||||||||||||||
| 2020 | 2019 | 2018 | 2017 | 2016 | ||||||||||||||||
| Selected Per Share Data | ||||||||||||||||||||
| Net asset value, beginning of period | $9.81 | $8.57 | $12.47 | $11.45 | $12.85 | |||||||||||||||
| Income (loss) from investment operations: | ||||||||||||||||||||
Net investment income (loss)a | .01 | .03 | (.01 | ) | (.03 | ) | (.03 | ) | ||||||||||||
Net realized and unrealized gain (loss) | 1.62 | 1.75 | (2.24 | ) | 2.14 | .17 | ||||||||||||||
Total from investment operations | 1.63 | 1.78 | (2.25 | ) | 2.11 | .14 | ||||||||||||||
| Less distributions from: | ||||||||||||||||||||
Net investment income | (.05 | ) | — | — | — | (.02 | ) | |||||||||||||
Net realized gains | — | (.54 | ) | (1.65 | ) | (1.09 | ) | (1.52 | ) | |||||||||||
Total distributions | (.05 | ) | (.54 | ) | (1.65 | ) | (1.09 | ) | (1.54 | ) | ||||||||||
| Net asset value, end of period | $11.39 | $9.81 | $8.57 | $12.47 | $11.45 | |||||||||||||||
| Total Return (%)b | 16.94 | 21.08 | (20.74 | ) | 19.60 | 1.34 | ||||||||||||||
| Ratios to Average Net Assets and Supplemental Data | ||||||||||||||||||||
| Net assets, end of period ($ millions) | 3 | 2 | 2 | 3 | 3 | |||||||||||||||
| Ratio of expenses before expense reductions (%)c | 1.39 | 1.40 | 1.39 | 1.44 | 1.47 | |||||||||||||||
| Ratio of expenses after expense reductions (%)c | 1.09 | 1.09 | 1.06 | 1.22 | 1.30 | |||||||||||||||
| Ratio of net investment income (loss) (%) | .10 | .27 | (.08 | ) | (.26 | ) | (.23 | ) | ||||||||||||
| Portfolio turnover rate (%) | 9 | 23 | 32 | 42 | 41 | |||||||||||||||
| a | Based on average shares outstanding during the period. |
| b | Total return would have been lower had certain expenses not been reduced. |
| c | Expense ratio does not reflect charges and fees associated with the separate account that invests in the Fund or any variable life insurance policy or variable annuity contract for which the Fund is an investment option. |
The accompanying notes are an integral part of the financial statements.
| 12 | | | Deutsche DWS Variable Series I — DWS Global Small Cap VIP |
| Notes to Financial Statements |
A. Organization and Significant Accounting Policies
Deutsche DWS Variable Series I (the “Trust“) is registered under the Investment Company Act of 1940, as amended (the “1940 Act“), as an open-end management investment company organized as a Massachusetts business trust. The Trust consists of five diversified funds: DWS Bond VIP, DWS Capital Growth VIP, DWS Core Equity VIP, DWS CROCI® International VIP and DWS Global Small Cap VIP (individually or collectively hereinafter referred to as a “Fund“ or the “Funds“). These financial statements report on DWS Global Small Cap VIP. The Trust is intended to be the underlying investment vehicle for variable annuity contracts and variable life insurance policies to be offered by the separate accounts of certain life insurance companies (“Participating Insurance Companies“).
Multiple Classes of Shares of Beneficial Interest. The Fund offers two classes of shares (Class A shares and Class B shares). Class B shares are subject to Rule 12b-1 distribution fees under the 1940 Act and recordkeeping fees equal to an annual rate of up to 0.25% and up to 0.15%, respectively, of the average daily net assets of the Class B shares of the Fund. Class A shares are not subject to such fees.
Investment income, realized and unrealized gains and losses, and certain fund-level expenses and expense reductions, if any, are borne pro rata on the basis of relative net assets by the holders of all classes of shares, except that each class bears certain expenses unique to that class (including the applicable 12b-1 distribution fees). Differences in class-level expenses may result in payment of different per share dividends by class. All shares have equal rights with respect to voting subject to class-specific arrangements.
The Fund’s financial statements are prepared in accordance with accounting principles generally accepted in the United States of America (“U.S. GAAP”) which require the use of management estimates. Actual results could differ from those estimates. The Fund qualifies as an investment company under Topic 946 of Accounting Standards Codification of U.S. GAAP. The policies described below are followed consistently by the Fund in the preparation of its financial statements.
Security Valuation. Investments are stated at value determined as of the close of regular trading on the New York Stock Exchange on each day the exchange is open for trading.
Various inputs are used in determining the value of the Fund’s investments. These inputs are summarized in three broad levels. Level 1 includes quoted prices in active markets for identical securities. Level 2 includes other significant observable inputs (including quoted prices for similar securities, interest rates, prepayment speeds and credit risk). Level 3 includes significant unobservable inputs (including the Fund’s own assumptions in determining the fair value of investments). The level assigned to the securities valuations may not be an indication of the risk or liquidity associated with investing in those securities.
Equity securities and exchange-traded funds (“ETFs”) are valued at the most recent sale price or official closing price reported on the exchange (U.S. or foreign) or over-the-counter market on which they trade. Equity securities or ETFs for which no sales are reported are valued at the calculated mean between the most recent bid and asked quotations on the relevant market or, if a mean cannot be determined, at the most recent bid quotation. Equity securities or ETFs are generally categorized as Level 1 securities. For certain international equity securities, in order to adjust for events which may occur between the close of the foreign exchanges and the close of the New York Stock Exchange, a fair valuation model may be used. This fair valuation model takes into account comparisons to the valuation of American Depository Receipts (ADRs), exchange-traded funds, futures contracts and certain indices and these securities are categorized as Level 2.
Investments in open-end investment companies are valued at their net asset value each business day and are categorized as Level 1.
Securities and other assets for which market quotations are not readily available or for which the above valuation procedures are deemed not to reflect fair value are valued in a manner that is intended to reflect their fair value as determined in accordance with procedures approved by the Trustees and are generally categorized as Level 3. In accordance with the Fund’s valuation procedures, factors considered in determining value may include, but are not limited to, the type of the security; the size of the holding; the initial cost of the security; the existence of any contractual restrictions on the security’s disposition; the price and extent of public trading in similar securities of the issuer or of comparable companies; quotations or evaluated prices from broker-dealers and/or pricing services; information obtained from the issuer, analysts, and/or the appropriate stock exchange (for exchange-traded securities); an analysis of the company’s or issuer’s financial
Deutsche DWS Variable Series I — DWS Global Small Cap VIP | | | 13 |
statements; an evaluation of the forces that influence the issuer and the market(s) in which the security is purchased and sold; and with respect to debt securities, the maturity, coupon, creditworthiness, currency denomination and the movement of the market in which the security is normally traded. The value determined under these procedures may differ from published values for the same securities.
Disclosure about the classification of fair value measurements is included in a table following the Fund’s Investment Portfolio.
Securities Lending. Brown Brothers Harriman & Co., as lending agent, lends securities of the Fund to certain financial institutions under the terms of its securities lending agreement. During the term of the loans, the Fund continues to receive interest and dividends generated by the securities and to participate in any changes in their market value. The Fund requires the borrowers of the securities to maintain collateral with the Fund consisting of either cash and/or U.S. Treasury Securities having a value at least equal to the value of the securities loaned. When the collateral falls below specified amounts, the lending agent will use its best effort to obtain additional collateral on the next business day to meet required amounts under the securities lending agreement. During the year ended December 31, 2020, the Fund invested the cash collateral into a joint trading account in DWS Government & Agency Securities Portfolio, an affiliated money market fund managed by DWS Investment Management Americas, Inc. DWS Investment Management Americas, Inc. receives a management/administration fee (0.06% annualized effective rate as of December 31, 2020) on the cash collateral invested in DWS Government & Agency Securities Portfolio. The Fund receives compensation for lending its securities either in the form of fees or by earning interest on invested cash collateral net of borrower rebates and fees paid to a lending agent. Either the Fund or the borrower may terminate the loan at any time, and the borrower, after notice, is required to return borrowed securities within a standard time period. There may be risks of delay and costs in recovery of securities or even loss of rights in the collateral should the borrower of the securities fail financially. If the Fund is not able to recover securities lent, the Fund may sell the collateral and purchase a replacement investment in the market, incurring the risk that the value of the replacement security is greater than the value of the collateral. The Fund is also subject to all investment risks associated with the reinvestment of any cash collateral received, including, but not limited to, interest rate, credit and liquidity risk associated with such investments.
As of December 31, 2020, the Fund had securities on loan. The value of the related collateral exceeded the value of the securities loaned at period end.
| Remaining Contractual Maturity of the Agreements as of December 31, 2020 | ||||||||||||||||||||
| Overnight and Continuous | <30 days | Between 30 & 90 days | >90 days | Total | ||||||||||||||||
Securities Lending Transactions | ||||||||||||||||||||
| Common Stocks | $ | 1,184,652 | $ | — | $ | — | $ | 497,915 | $ | 1,682,567 | ||||||||||
Gross amount of recognized liabilities and non-cash collateral for securities lending transactions |
| $ | 1,682,567 | |||||||||||||||||
Foreign Currency Translations. The books and records of the Fund are maintained in U.S. dollars. Investment securities and other assets and liabilities denominated in a foreign currency are translated into U.S. dollars at the prevailing exchange rates at period end. Purchases and sales of investment securities, income and expenses are translated into U.S. dollars at the prevailing exchange rates on the respective dates of the transactions.
Net realized and unrealized gains and losses on foreign currency transactions represent net gains and losses between trade and settlement dates on securities transactions, the acquisition and disposition of foreign currencies, and the difference between the amount of net investment income accrued and the U.S. dollar amount actually received. The portion of both realized and unrealized gains and losses on investments that results from fluctuations in foreign currency exchange rates is not separately disclosed but is included with net realized and unrealized gain/appreciation and loss/depreciation on investments.
Taxes. The Fund is treated as a separate taxpayer as provided for in the Internal Revenue Code, as amended. It is the Fund’s policy to comply with the requirements of the Internal Revenue Code, as amended, which are applicable to regulated investment companies, and to distribute all of its taxable income to the separate accounts of the Participating Insurance Companies which hold its shares.
Additionally, the Fund may be subject to taxes imposed by the governments of countries in which it invests and are generally based on income and/or capital gains earned or repatriated, a portion of which may be recoverable. Based upon the current interpretation of the tax rules and regulations, estimated tax liabilities and recoveries on certain foreign securities are recorded on an accrual basis and are reflected as components
| 14 | | | Deutsche DWS Variable Series I — DWS Global Small Cap VIP |
of interest income or net change in unrealized gain/loss on investments. Tax liabilities realized as a result of security sales are reflected as a component of net realized gain/loss on investments.
At December 31, 2020, the Fund had a net tax basis long-term capital loss carryforward of approximately $1,907,000 which may be applied against realized net taxable capital gains indefinitely, including short-term losses ($676,000) and long-term losses ($1,231,000).
The Fund has reviewed the tax positions for the open tax years as of December 31, 2020 and has determined that no provision for income tax and/or uncertain tax positions is required in the Fund’s financial statements. The Fund’s federal tax returns for the prior three fiscal years remain open subject to examination by the Internal Revenue Service.
Distribution of Income and Gains. Distributions from net investment income of the Fund, if any, are declared and distributed to shareholders annually. Net realized gains from investment transactions, in excess of available capital loss carryforwards, would be taxable to the Fund if not distributed, and, therefore, will be distributed to shareholders at least annually. The Fund may also make additional distributions for tax purposes if necessary.
The timing and characterization of certain income and capital gain distributions are determined annually in accordance with federal tax regulations, which may differ from accounting principles generally accepted in the United States of America. These differences primarily relate to income received from passive foreign investment companies and certain securities sold at a loss. As a result, net investment income (loss) and net realized gain (loss) on investment transactions for a reporting period may differ significantly from distributions during such period. Accordingly, the Fund may periodically make reclassifications among certain of its capital accounts without impacting the net asset value of the Fund.
At December 31, 2020, the Fund’s components of distributable earnings (accumulated losses) on a tax basis are as follows:
| Undistributed ordinary income* | $ | 278,144 | ||
| Capital loss carryforward | $ | (1,907,000 | ) | |
| Net unrealized appreciation (depreciation) on investments | $ | 28,511,451 |
At December 31, 2020, the aggregate cost of investments for federal income tax purposes was $50,727,400. The net unrealized appreciation for all investments based on tax cost was $28,511,451. This consisted of aggregate gross unrealized appreciation for all investments for which there was an excess of value over tax cost of $30,864,158 and aggregate gross unrealized depreciation for all investments for which there was an excess of tax cost over value of $2,352,707.
In addition, the tax character of distributions paid to shareholders by the Fund is summarized as follows:
| Years Ended December 31, | ||||||||
| 2020 | 2019 | |||||||
| Distributions from ordinary income* | $ | 521,695 | $ | 56,074 | ||||
| Distributions from long-term capital gains | $ | — | $ | 3,775,147 | ||||
| * | For tax purposes, short-term capital gain distributions are considered ordinary income distributions. |
Expenses. Expenses of the Trust arising in connection with a specific Fund are allocated to that Fund. Other Trust expenses which cannot be directly attributed to a Fund are apportioned among the Funds in the Trust based upon the relative net assets or other appropriate measures.
Contingencies. In the normal course of business, the Fund may enter into contracts with service providers that contain general indemnification clauses. The Fund’s maximum exposure under these arrangements is unknown, as this would involve future claims that may be made against the Fund that have not yet been made. However, based on experience, the Fund expects the risk of loss to be remote.
Other. Investment transactions are accounted for on a trade date plus one basis for daily net asset value calculations. However, for financial reporting purposes, investment transactions are reported on trade date. Interest income is recorded on the accrual basis net of foreign withholding taxes. Dividend income is recorded on the ex-dividend date net of foreign withholding taxes. Certain dividends from foreign securities may be recorded subsequent to the ex-dividend date as soon as the Fund is informed of such dividends. Realized gains and losses from investment transactions are recorded on an identified cost basis. Proceeds from litigation payments, if any, are included in net realized gain (loss) from investments.
Deutsche DWS Variable Series I — DWS Global Small Cap VIP | | | 15 |
B. Purchases and Sales of Securities
During the year ended December 31, 2020, purchases and sales of investment securities (excluding short-term investments) aggregated $5,783,058 and $11,319,001 respectively.
C. Related Parties
Management Agreement. Under the Investment Management Agreement with DWS Investment Management Americas, Inc. (“DIMA“ or the “Advisor“), an indirect, wholly owned subsidiary of DWS Group GmbH & Co. KGaA (“DWS Group”), the Advisor directs the investments of the Fund in accordance with its investment objectives, policies and restrictions. The Advisor determines the securities, instruments and other contracts relating to investments to be purchased, sold or entered into by the Fund.
Under the Investment Management Agreement with the Advisor, the Fund pays the Advisor an annual fee based on its average daily net assets, computed and accrued daily and payable monthly at the annual rate (exclusive of any applicable waivers/reimbursements) of 0.80%.
For the period from January 1, 2020 through April 30, 2021, the Advisor has contractually agreed to waive all or a portion of its fees and/or reimburse certain operating expenses of the Fund to the extent necessary to maintain the total annual operating expenses (excluding certain expenses such as extraordinary expenses, taxes, brokerage and interest) of each class as follows:
| Class A | .81 | % | ||
| Class B | 1.09 | % |
For the year ended December 31, 2020, fees waived and/or expenses reimbursed for each class are as follows:
| Class A | $ | 181,107 | ||
| Class B | 6,315 | |||
| $ | 187,422 |
Administration Fee. Pursuant to an Administrative Services Agreement, DIMA provides most administrative services to the Fund. Prior to March 1, 2020, for all services provided under the Administrative Services Agreement, the Fund paid the Advisor an annual fee (“Administration Fee“) of 0.10% of the Fund’s average daily net assets, computed and accrued daily and payable monthly. Effective March 1, 2020, for all services provided under the Administrative Services Agreement, the Fund pays the Advisor an annual Administration Fee of 0.097% of the Fund’s average daily net assets, computed and accrued daily and payable monthly. For the year ended December 31, 2020, the Administration Fee was $63,474, of which $6,267 is unpaid.
Service Provider Fees. DWS Service Company (“DSC“), an affiliate of the Advisor, is the transfer agent, dividend-paying agent and shareholder service agent for the Fund. Pursuant to a sub-transfer agency agreement between DSC and DST Systems, Inc. (“DST“), DSC has delegated certain transfer agent, dividend-paying agent and shareholder service agent functions to DST. DSC compensates DST out of the shareholder servicing fee it receives from the Fund. For the year ended December 31, 2020, the amounts charged to the Fund by DSC were as follows:
| Services to Shareholders | Total Aggregated | Unpaid at December 31, 2020 | ||||||
| Class A | $ | 581 | $ | 107 | ||||
| Class B | 183 | 34 | ||||||
| $ | 764 | $ | 141 | |||||
Distribution Service Agreement. DWS Distributors, Inc. (“DDI“), also an affiliate of the Advisor, is the Trust’s Distributor. In accordance with the Master Distribution Plan, DDI receives 12b-1 fees of up to 0.25% of the average daily net assets of Class B shares. Pursuant to the Master Distribution Plan, DDI remits these fees to the Participating Insurance Companies for various costs incurred or paid by these companies in connection with marketing and distribution of Class B shares. For the year ended December 31, 2020, the Distribution Service Fee aggregated $5,340, of which $537 is unpaid.
Other Service Fees. Under an agreement with the Fund, DIMA is compensated for providing certain pre-press and regulatory filing services to the Fund. For the year ended December 31, 2020, the amount charged to the Fund by DIMA included in the Statement of Operations under “Reports to shareholders“ aggregated $9,389, of which $3,538 is unpaid.
| 16 | | | Deutsche DWS Variable Series I — DWS Global Small Cap VIP |
Trustees’ Fees and Expenses. The Fund paid retainer fees to each Trustee not affiliated with the Advisor, plus specified amounts to the Board Chairperson and to each committee Chairperson.
Affiliated Cash Management Vehicles. The Fund may invest uninvested cash balances in DWS Central Cash Management Government Fund and DWS ESG Liquidity Fund, affiliated money market funds which are managed by the Advisor. Each affiliated money market fund is managed in accordance with Rule 2a-7 under the 1940 Act, which governs the quality, maturity, diversity and liquidity of instruments in which a money market fund may invest. DWS Central Cash Management Government Fund seeks to maintain a stable net asset value, and DWS ESG Liquidity Fund maintains a floating net asset value. The Fund indirectly bears its proportionate share of the expenses of each affiliated money market fund in which it invests. DWS Central Cash Management Government Fund does not pay the Advisor an investment management fee. To the extent that DWS ESG Liquidity Fund pays an investment management fee to the Advisor, the Advisor will waive an amount of the investment management fee payable to the Advisor by the Fund equal to the amount of the investment management fee payable on the Fund’s assets invested in DWS ESG Liquidity Fund.
D. Ownership of the Fund
At December 31, 2020, three participating insurance companies were owners of record of 10% or more of the total outstanding Class A shares of the Fund, each owning 33%, 26% and 14%, respectively. Two participating insurance companies were owners of record of 10% or more of the total outstanding Class B shares of the Fund, each owning 76% and 14%, respectively.
E. Line of Credit
The Fund and other affiliated funds (the “Participants”) share in a $350 million revolving credit facility provided by a syndication of banks. The Fund may borrow for temporary or emergency purposes, including the meeting of redemption requests that otherwise might require the untimely disposition of securities. The Participants are charged an annual commitment fee, which is allocated based on net assets, among each of the Participants. Interest is calculated at a rate per annum equal to the sum of the Federal Funds Rate plus 1.25 percent plus if the one-month LIBOR exceeds the Federal Funds Rate, the amount of such excess. The Fund may borrow up to a maximum of 33 percent of its net assets under the agreement. The Fund had no outstanding loans at December 31, 2020.
F. Other — COVID-19 Pandemic
A novel coronavirus known as COVID-19, declared a pandemic by the World Health Organization, has caused significant uncertainty, market volatility, decreased economic and other activity and increased government activity. Specifically, COVID-19 has led to significant death and morbidity, and concerns about its further spread have resulted in the closing of schools and non-essential businesses, cancellations, shelter-in place orders, lower consumer spending in certain sectors, social distancing, bans on large social gatherings and travel, quarantines, government economic stimulus measures, reduced productivity, rapid increases in unemployment, increased demand for and strain on government and medical resources, border closings and global trade and supply chain interruptions, among others. The full effects, duration and costs of the COVID-19 pandemic are impossible to predict, and the circumstances surrounding the COVID-19 pandemic will continue to evolve. The pandemic may affect certain countries, industries, economic sectors, companies and investment products more than others, may exacerbate existing economic, political, or social tensions and may increase the probability of an economic recession or depression. The Fund and its investments may be adversely affected by the effects of the COVID-19 pandemic, and a prolonged pandemic may result in the Fund and its service providers experiencing operational difficulties in coordinating a remote workforce and implementing their business continuity plans, among others. Management will continue to monitor the impact COVID-19 has on the Fund and reflect the consequences as appropriate in the Fund’s accounting and financial reporting.
Deutsche DWS Variable Series I — DWS Global Small Cap VIP | | | 17 |
Report of Independent Registered Public Accounting Firm
To the Board of Trustees of Deutsche DWS Variable Series I and Shareholders of DWS Global Small Cap VIP:
Opinion on the Financial Statements
We have audited the accompanying statement of assets and liabilities of DWS Global Small Cap VIP (the “Fund”) (one of the funds constituting Deutsche DWS Variable Series I) (the “Trust”), including the investment portfolio, as of December 31, 2020, and the related statement of operations for the year then ended, the statements of changes in net assets and the financial highlights for each of the two years in the period then ended and the related notes (collectively referred to as the “financial statements”). In our opinion, the financial statements present fairly, in all material respects, the financial position of the Fund (one of the funds constituting Deutsche DWS Variable Series I) at December 31, 2020, the results of its operations for the year then ended, the changes in its net assets and its financial highlights for each of the two years in the period then ended, in conformity with U.S. generally accepted accounting principles.
The financial highlights for the years ended December 31, 2016, December 31, 2017 and December 31, 2018, were audited by another independent registered public accounting firm whose report, dated February 14, 2019, expressed an unqualified opinion on those financial highlights.
Basis for Opinion
These financial statements are the responsibility of the Trust’s management. Our responsibility is to express an opinion on the Fund’s financial statements based on our audits. We are a public accounting firm registered with the Public Company Accounting Oversight Board (United States) (“PCAOB”) and are required to be independent with respect to the Trust in accordance with the U.S. federal securities laws and the applicable rules and regulations of the Securities and Exchange Commission and the PCAOB.
We conducted our audits in accordance with the standards of the PCAOB. Those standards require that we plan and perform the audit to obtain reasonable assurance about whether the financial statements are free of material misstatement, whether due to error or fraud. The Trust is not required to have, nor were we engaged to perform, an audit of the Trust’s internal control over financial reporting. As part of our audits, we are required to obtain an understanding of internal control over financial reporting, but not for the purpose of expressing an opinion on the effectiveness of the Trust’s internal control over financial reporting. Accordingly, we express no such opinion.
Our audits included performing procedures to assess the risks of material misstatement of the financial statements, whether due to error or fraud, and performing procedures that respond to those risks. Such procedures included examining, on a test basis, evidence regarding the amounts and disclosures in the financial statements. Our procedures included confirmation of securities owned as of December 31, 2020, by correspondence with the custodian and others or by other appropriate auditing procedures where replies from others were not received. Our audits also included evaluating the accounting principles used and significant estimates made by management, as well as evaluating the overall presentation of the financial statements. We believe that our audits provide a reasonable basis for our opinion.

We have served as the auditor of one or more investment companies in the DWS family of funds since at least 1979, but we are unable to determine the specific year.
Boston, Massachusetts
February 12, 2021
| 18 | | | Deutsche DWS Variable Series I — DWS Global Small Cap VIP |
| Information About Your Fund’s Expenses | (Unaudited) |
As an investor of the Fund, you incur two types of costs: ongoing expenses and transaction costs. Ongoing expenses include management fees, distribution and service (12b-1) fees and other Fund expenses. Examples of transaction costs include contract charges, which are not shown in this section. The following tables are intended to help you understand your ongoing expenses (in dollars) of investing in the Fund and to help you compare these expenses with the ongoing expenses of investing in other mutual funds. In the most recent six-month period, the Fund limited these expenses; had it not done so, expenses would have been higher. The example in the table is based on an investment of $1,000 invested at the beginning of the six-month period and held for the entire period (July 1, 2020 to December 31, 2020).
The tables illustrate your Fund’s expenses in two ways:
| – | Actual Fund Return. This helps you estimate the actual dollar amount of ongoing expenses (but not transaction costs) paid on a $1,000 investment in the Fund using the Fund’s actual return during the period. To estimate the expenses you paid over the period, simply divide your account value by $1,000 (for example, an $8,600 account value divided by $1,000 = 8.6), then multiply the result by the number in the “Expenses Paid per $1,000” line under the share class you hold. |
| – | Hypothetical 5% Fund Return. This helps you to compare your Fund’s ongoing expenses (but not transaction costs) with those of other mutual funds using the Fund’s actual expense ratio and a hypothetical rate of return of 5% per year before expenses. Examples using a 5% hypothetical Fund return may be found in the shareholder reports of other mutual funds. The hypothetical account values and expenses may not be used to estimate the actual ending account balance or expenses you paid for the period. |
Please note that the expenses shown in these tables are meant to highlight your ongoing expenses only and do not reflect any transaction costs. The “Expenses Paid per $1,000” line of the tables is useful in comparing ongoing expenses only and will not help you determine the relative total expense of owning different funds. If these transaction costs had been included, your costs would have been higher.
| Expenses and Value of a $1,000 Investment for the six months ended December 31, 2020 | ||||||||
| Actual Fund Return | Class A | Class B | ||||||
| Beginning Account Value 7/1/20 | $ | 1,000.00 | $ | 1,000.00 | ||||
| Ending Account Value 12/31/20 | $ | 1,322.20 | $ | 1,319.80 | ||||
| Expenses Paid per $1,000* | $ | 4.73 | $ | 6.36 | ||||
| Hypothetical 5% Fund Return | Class A | Class B | ||||||
| Beginning Account Value 7/1/20 | $ | 1,000.00 | $ | 1,000.00 | ||||
| Ending Account Value 12/31/20 | $ | 1,021.06 | $ | 1,019.66 | ||||
| Expenses Paid per $1,000* | $ | 4.12 | $ | 5.53 | ||||
| * | Expenses are equal to the Fund’s annualized expense ratio for each share class, multiplied by the average account value over the period, multiplied by 184 (the number of days in the most recent six-month period), then divided by 366. |
| Annualized Expense Ratios | Class A | Class B | ||||||
| Deutsche DWS Variable Series I — DWS Global Small Cap VIP | .81 | % | 1.09 | % | ||||
For more information, please refer to the Fund’s prospectus.
These tables do not reflect charges and fees (“contract charges”) associated with the separate account that invests in the Fund or any variable life insurance policy or variable annuity contract for which the Fund is an investment option.
For an analysis of the fees associated with an investment in the Fund or similar funds, please refer to the current and hypothetical expense calculators for Variable Insurance Products which can be found at dws.com/calculators.
Deutsche DWS Variable Series I — DWS Global Small Cap VIP | | | 19 |
| Tax Information | (Unaudited) |
For corporate shareholders, 49% of the ordinary dividends (i.e., income dividends plus short-term capital gains) paid during the Fund’s fiscal year ended 12/31/20, qualified for the dividends received deduction.
Please consult a tax advisor if you have questions about federal or state income tax laws, or on how to prepare your tax returns. If you have specific questions about your account, please contact your insurance provider.
The Trust’s policies and procedures for voting proxies for portfolio securities and information about how the Trust voted proxies related to its portfolio securities during the most recent 12-month period ended June 30 are available on our Web site — dws.com/en-us/resources/proxy-voting — or on the SEC’s Web site — sec.gov. To obtain a written copy of the Trust’s policies and procedures without charge, upon request, call us toll free at (800) 728-3337.
| 20 | | | Deutsche DWS Variable Series I — DWS Global Small Cap VIP |
Advisory Agreement Board Considerations and Fee Evaluation
The Board of Trustees (hereinafter referred to as the “Board” or “Trustees”) approved the renewal of DWS Global Small Cap VIP’s (the “Fund”) investment management agreement (the “Agreement”) with DWS Investment Management Americas, Inc. (“DIMA”) in September 2020.
In terms of the process that the Board followed prior to approving the Agreement, shareholders should know that:
| – | During the entire process, all of the Fund’s Trustees were independent of DIMA and its affiliates (the “Independent Trustees”). |
| – | The Board met frequently during the past year to discuss fund matters and dedicated a substantial amount of time to contract review matters. Over the course of several months, the Board reviewed extensive materials received from DIMA, independent third parties and independent counsel. These materials included an analysis of the Fund’s performance, fees and expenses, and profitability from a fee consultant retained by the Fund’s Independent Trustees (the “Fee Consultant”). |
| – | The Board also received extensive information throughout the year regarding performance of the Fund. |
| – | The Independent Trustees regularly met privately with counsel to discuss contract review and other matters. In addition, the Independent Trustees were advised by the Fee Consultant in the course of their review of the Fund’s contractual arrangements and considered a comprehensive report prepared by the Fee Consultant in connection with their deliberations. |
| – | In connection with reviewing the Agreement, the Board also reviewed the terms of the Fund’s Rule 12b-1 plan, distribution agreement, administrative services agreement, transfer agency agreement and other material service agreements. |
In connection with the contract review process, the Board considered the factors discussed below, among others. The Board also considered that DIMA and its predecessors have managed the Fund since its inception, and the Board believes that a long-term relationship with a capable, conscientious advisor is in the best interests of the Fund. The Board considered, generally, that shareholders chose to invest or remain invested in the Fund knowing that DIMA managed the Fund. DIMA is part of DWS Group GmbH & Co. KGaA (“DWS Group”). DWS Group is a global asset management business that offers a wide range of investing expertise and resources, including research capabilities in many countries throughout the world. In 2018, approximately 20% of DWS Group’s shares were sold in an initial public offering, with Deutsche Bank AG owning the remaining shares.
As part of the contract review process, the Board carefully considered the fees and expenses of each DWS fund overseen by the Board in light of the fund’s performance. In many cases, this led to the negotiation and implementation of expense caps.
While shareholders may focus primarily on fund performance and fees, the Fund’s Board considers these and many other factors, including the quality and integrity of DIMA’s personnel and administrative support services provided by DIMA, such as back-office operations, fund valuations, and compliance policies and procedures.
Nature, Quality and Extent of Services. The Board considered the terms of the Agreement, including the scope of advisory services provided under the Agreement. The Board noted that, under the Agreement, DIMA provides portfolio management services to the Fund and that, pursuant to a separate administrative services agreement, DIMA provides administrative services to the Fund. The Board considered the experience and skills of senior management and investment personnel and the resources made available to such personnel. The Board also considered the risks to DIMA in sponsoring or managing the Fund, including financial, operational and reputational risks, the potential economic impact to DIMA from such risks and DIMA’s approach to addressing such risks. The Board reviewed the Fund’s performance over short-term and long-term periods and compared those returns to various agreed-upon performance measures, including market index(es) and a peer universe compiled using information supplied by Morningstar Direct (“Morningstar”), an independent fund data service. The Board also noted that it has put into place a process of identifying “Funds in Review” (e.g., funds performing poorly relative to a peer universe), and receives additional reporting from DIMA regarding such funds and, where appropriate, DIMA’s plans to address underperformance. The Board believes this process is an effective manner of identifying and addressing underperforming funds. Based on the information provided, the Board noted that, for the one-, three- and five-year periods ended December 31, 2019, the Fund’s performance (Class A shares) was in the 4th quartile
Deutsche DWS Variable Series I — DWS Global Small Cap VIP | | | 21 |
of the applicable Morningstar universe (the 1st quartile being the best performers and the 4th quartile being the worst performers). The Board also observed that the Fund has underperformed its benchmark in the one-, three-, and five-year periods ended December 31, 2019. The Board noted the disappointing investment performance of the Fund in recent periods and continued to discuss with senior management of DIMA the factors contributing to such underperformance and actions being taken to improve performance. The Board noted changes in the portfolio management team, effective April 19, 2018. The Board recognized the efforts by DIMA in recent years to enhance its investment platform and improve long-term performance across the DWS fund complex.
Fees and Expenses. The Board considered the Fund’s investment management fee schedule, operating expenses and total expense ratios, and comparative information provided by Broadridge Financial Solutions, Inc. (“Broadridge”) and the Fee Consultant regarding investment management fee rates paid to other investment advisors by similar funds (1st quartile being the most favorable and 4th quartile being the least favorable). With respect to management fees paid to other investment advisors by similar funds, the Board noted that the contractual fee rates paid by the Fund, which include a 0.10% fee paid to DIMA under the Fund’s administrative services agreement, were higher than the median (4th quartile) of the applicable Broadridge peer group (based on Broadridge data provided as of December 31, 2019). The Board noted that, effective March 1, 2020, the fee paid to DIMA under the Fund’s administrative services agreement was reduced to 0.097%. The Board noted that the Fund’s Class A shares total (net) operating expenses were expected to be lower than the median (2nd quartile) of the applicable Broadridge expense universe (based on Broadridge data provided as of December 31, 2019, and analyzing Broadridge expense universe Class A (net) expenses less any applicable 12b-1 fees) (“Broadridge Universe Expenses”). The Board also reviewed data comparing each other operational share class’s total (net) operating expenses to the applicable Broadridge Universe Expenses. The Board noted that the expense limitations agreed to by DIMA were expected to help the Fund’s total (net) operating expenses remain competitive. The Board considered the Fund’s management fee rate as compared to fees charged by DIMA to a comparable DWS U.S. registered fund (“DWS Funds”) and considered differences between the Fund and the comparable DWS Fund. The information requested by the Board as part of its review of fees and expenses also included information about institutional accounts (including any sub-advised funds and accounts) and funds offered primarily to European investors (“DWS Europe Funds”) managed by DWS Group. The Board noted that DIMA indicated that DWS Group does not manage any institutional accounts or DWS Europe Funds comparable to the Fund.
On the basis of the information provided, the Board concluded that management fees were reasonable and appropriate in light of the nature, quality and extent of services provided by DIMA.
Profitability. The Board reviewed detailed information regarding revenues received by DIMA under the Agreement. The Board considered the estimated costs to DIMA, and pre-tax profits realized by DIMA, from advising the DWS Funds, as well as estimates of the pre-tax profits attributable to managing the Fund in particular. The Board also received information regarding the estimated enterprise-wide profitability of DIMA and its affiliates with respect to all fund services in totality and by fund. The Board and the Fee Consultant reviewed DIMA’s methodology in allocating its costs to the management of the Fund. Based on the information provided, the Board concluded that the pre-tax profits realized by DIMA in connection with the management of the Fund were not unreasonable. The Board also reviewed certain publicly available information regarding the profitability of certain similar investment management firms. The Board noted that, while information regarding the profitability of such firms is limited (and in some cases is not necessarily prepared on a comparable basis), DIMA and its affiliates’ overall profitability with respect to the DWS Funds (after taking into account distribution and other services provided to the funds by DIMA and its affiliates) was lower than the overall profitability levels of most comparable firms for which such data was available.
Economies of Scale. The Board considered whether there are economies of scale with respect to the management of the Fund and whether the Fund benefits from any economies of scale. In this regard, the Board observed that while the Fund’s current investment management fee schedule does not include breakpoints, the Fund’s fee schedule represents an appropriate sharing between the Fund and DIMA of such economies of scale as may exist in the management of the Fund at current asset levels.
Other Benefits to DIMA and Its Affiliates. The Board also considered the character and amount of other incidental or “fall-out” benefits received by DIMA and its affiliates, including any fees received by DIMA for administrative services provided to the Fund, any fees received by an affiliate of DIMA for transfer agency services provided to the Fund and any fees received by an affiliate of DIMA for distribution services. The Board also considered benefits to DIMA related to brokerage and soft-dollar allocations, including allocating brokerage to pay for research generated by parties other than the executing broker dealers, which pertain
| 22 | | | Deutsche DWS Variable Series I — DWS Global Small Cap VIP |
primarily to funds investing in equity securities. In addition, the Board considered the incidental public relations benefits to DIMA related to DWS Funds advertising and cross-selling opportunities among DIMA products and services. The Board considered these benefits in reaching its conclusion that the Fund’s management fees were reasonable.
Compliance. The Board considered the significant attention and resources dedicated by DIMA to its compliance processes in recent years. The Board noted in particular (i) the experience, seniority and time commitment of the individuals serving as DIMA’s and the Fund’s chief compliance officers and (ii) the substantial commitment of resources by DIMA and its affiliates to compliance matters, including the retention of compliance personnel.
The Board also considered that on September 24, 2020, the SEC granted a temporary order permitting DIMA and its affiliates to continue providing investment advisory and underwriting services to the DWS Funds notwithstanding a consent order entered into by Deutsche Bank AG on June 17, 2020 (the “Consent Order”). The Board noted that the temporary order was granted effective as of the date of the Consent Order. The Board also noted various representations by DIMA to the Board relating to the Consent Order, including that the conduct giving rise to the Consent Order (unintentional conduct that resulted from a system outage that prevented Deutsche Bank AG from reporting data in accordance with applicable CFTC requirements for five days in April 2016) did not involve any DWS Fund or services DIMA and its affiliates provide to the DWS Funds, that DIMA and its personnel had no involvement in the alleged conduct giving rise to the Consent Order, and that the DWS Funds would not bear any financial impact or costs relating to the Consent Order.
Based on all of the information considered and the conclusions reached, the Board determined that the continuation of the Agreement is in the best interests of the Fund. In making this determination, the Board did not give particular weight to any single factor identified above. The Board considered these factors over the course of numerous meetings, certain of which were in executive session with only the Independent Trustees and counsel present. It is possible that individual Independent Trustees may have weighed these factors differently in reaching their individual decisions to approve the continuation of the Agreement.
Deutsche DWS Variable Series I — DWS Global Small Cap VIP | | | 23 |
The following table presents certain information regarding the Board Members and Officers of the Trust/Corporation. Each Board Member’s year of birth is set forth in parentheses after his or her name. Unless otherwise noted, (i) each Board Member has engaged in the principal occupation(s) noted in the table for at least the most recent five years, although not necessarily in the same capacity; and (ii) the address of each Independent Board Member is Keith R. Fox, DWS Funds Board Chair, c/o Thomas R. Hiller, Ropes & Gray LLP, Prudential Tower, 800 Boylston Street, Boston, MA 02199-3600. Except as otherwise noted below, the term of office for each Board Member is until the election and qualification of a successor, or until such Board Member sooner dies, resigns, is removed or as otherwise provided in the governing documents of the Trust/Corporation. Because the Fund does not hold an annual meeting of shareholders, each Board Member will hold office for an indeterminate period.
The Board Members may also serve in similar capacities with other funds in the fund complex. The number of funds in the DWS fund complex shown in the table below includes all registered open- and closed-end funds (including all of their portfolios) advised by the Advisor and any registered funds that have an investment advisor that is an affiliated person of the Advisor.
| Independent Board Members | ||||||||
| Name, Year of Birth, Position with the Trust/ Corporation and Length of Time Served1 | Business Experience and Directorships During the Past Five Years | Number of Funds in DWS Fund Complex Overseen | Other Directorships Held by Board Member | |||||
Keith R. Fox, CFA (1954)
Chairperson since 2017, and Board Member since 1996 | Managing General Partner, Exeter Capital Partners (a series of private investment funds) (since 1986). Directorships: Progressive International Corporation (kitchen goods importer and distributor); former Chairman, National Association of Small Business Investment Companies; former Directorships: ICI Mutual Insurance Company; BoxTop Media Inc. (advertising); Sun Capital Advisers Trust (mutual funds) (2011–2012) | 73 | — | |||||
John W. Ballantine (1946)
Board Member since 1999 | Retired; formerly, Executive Vice President and Chief Risk Management Officer, First Chicago NBD Corporation/The First National Bank of Chicago (1996–1998); Executive Vice President and Head of International Banking (1995–1996); former Directorships: Director and Chairman of the Board, Healthways, Inc.2 (population well-being and wellness services) (2003–2014); Stockwell Capital Investments PLC (private equity); Enron Corporation; FNB Corporation; Tokheim Corporation; First Oak Brook Bancshares, Inc.; Oak Brook Bank; and Prisma Energy International. Not-for-Profit Director/Trustee: Palm Beach Civic Association; Window to the World Communications (public media); Life Director of Harris Theater for Music and Dance (Chicago); Life Director of Hubbard Street Dance Chicago; former Not-for-Profit Directorships: Public Radio International | 73 | Portland General Electric2 (utility company) (2003– present) | |||||
Dawn-Marie Driscoll (1946)
Board Member since 1987 | Emeritus Executive Fellow, Center for Business Ethics, Bentley University; formerly: Partner, Palmer & Dodge (law firm) (1988–1990); Vice President of Corporate Affairs and General Counsel, Filene’s (retail) (1978–1988). Directorships: Advisory Board, Center for Business Ethics, Bentley University; Trustee and former Chairman of the Board, Southwest Florida Community Foundation (charitable organization); former Directorships: ICI Mutual Insurance Company (2007–2015); Sun Capital Advisers Trust (mutual funds) (2007–2012), Investment Company Institute (audit, executive, nominating committees) and Independent Directors Council (governance, executive committees) | 73 | — | |||||
Richard J. Herring (1946)
Board Member since 1990 | Jacob Safra Professor of International Banking and Professor of Finance, The Wharton School, University of Pennsylvania (since July 1972); Director, The Wharton Financial Institutions Center (since 1994); formerly: Vice Dean and Director, Wharton Undergraduate Division (1995–2000) and Director, The Lauder Institute of International Management Studies (2000–2006); Member FDIC Systemic Risk Advisory Committee since 2011, member Systemic Risk Council since 2012 and member of the Advisory Board at the Yale Program on Financial Stability since 2013; Formerly Co-Chair of the Shadow Financial Regulatory Committee (2003–2015), Executive Director of The Financial Economists Roundtable (2008–2015), Director of The Thai Capital Fund (2007–2013), Director of The Aberdeen Singapore Fund (2007–2018), and Nonexecutive Director of Barclays Bank DE (2010–2018) | 73 | Director, Aberdeen Japan Fund (since 2007) | |||||
William McClayton (1944)
Board Member since 2004 | Private equity investor (since October 2009); previously, Managing Director, Diamond Management & Technology Consultants, Inc. (global consulting firm) (2001–2009); Directorship: Board of Managers, YMCA of Metropolitan Chicago; formerly: Senior Partner, Arthur Andersen LLP (accounting) (1966–2001); Trustee, Ravinia Festival | 73 | — | |||||
| 24 | | | Deutsche DWS Variable Series I — DWS Global Small Cap VIP |
| Name, Year of Birth, Position with the Trust/ Corporation and Length of Time Served1 | Business Experience and Directorships During the Past Five Years | Number of Funds in DWS Fund Complex Overseen | Other Directorships Held by Board Member | |||||
Rebecca W. Rimel (1951)
Board Member since 1995 | Senior Advisor, The Pew Charitable Trusts (charitable organization) (since July 2020); formerly: Executive Vice President, The Glenmede Trust Company (investment trust and wealth management) (1983–2004); Board Member, Investor Education (charitable organization) (2004–2005); Trustee, Executive Committee, Philadelphia Chamber of Commerce (2001–2007); Director, Viasys Health Care2 (January 2007–June 2007); Trustee, Thomas Jefferson Foundation (charitable organization) (1994–2012); President, Chief Executive Officer and Director, The Pew Charitable Trusts (charitable organization) (1994–2020) | 73 | Director, Becton Dickinson and Company2 (medical technology company) (2012– present); Director, BioTelemetry Inc.2 (health care) (2009– present) | |||||
William N. Searcy, Jr. (1946)
Board Member since 1993 | Private investor since October 2003; formerly: Pension & Savings Trust Officer, Sprint Corporation2 (telecommunications) (November 1989–September 2003); Trustee, Sun Capital Advisers Trust (mutual funds) (1998–2012) | 73 | — | |||||
| Officers4 | ||
| Name, Year of Birth, Position with the Trust/ Corporation and Length of Time Served5 | Business Experience and Directorships During the Past Five Years | |
Hepsen Uzcan6 (1974)
President and Chief Executive Officer, 2017–present | Managing Director3, DWS; Secretary, DWS USA Corporation (2018–present); Assistant Secretary, DWS Distributors, Inc. (2018–present); Director and Vice President, DWS Service Company (2018–present); Assistant Secretary, DWS Investment Management Americas, Inc. (2018–present); Director and President, DB Investment Managers, Inc. (2018–present); President and Chief Executive Officer, The European Equity Fund, Inc., The New Germany Fund, Inc. and The Central and Eastern Europe Fund, Inc. (2017–present); formerly: Vice President for the Deutsche funds (2016–2017); Assistant Secretary for the DWS funds (2013–2019); Assistant Secretary, The European Equity Fund, Inc., The New Germany Fund, Inc. and The Central and Eastern Europe Fund, Inc. (2013–2020); Directorships: Interested Director, The European Equity Fund, Inc., The New Germany Fund, Inc. and The Central and Eastern Europe Fund, Inc. (since June 25, 2020); ICI Mutual Insurance Company (since October 16, 2020); and Episcopalian Charities of New York (2018–present) | |
John Millette7 (1962)
Vice President and Secretary, 1999–present | Director,3 DWS; Chief Legal Officer, DWS Investment Management Americas, Inc. (2015–present); Director and Vice President, DWS Trust Company (2016–present); Secretary, DBX ETF Trust (2020–present); Secretary, The European Equity Fund, Inc., The New Germany Fund, Inc. and The Central and Eastern Europe Fund, Inc. (2011–present); formerly: Secretary, Deutsche Investment Management Americas Inc. (2015–2017); Assistant Secretary, DBX ETF Trust (2019–2020); Assistant Secretary (July 14, 2006–December 31, 2010) and Secretary (January 31, 2006–July 13, 2006), The European Equity Fund, Inc., The New Germany Fund, Inc. and The Central and Eastern Europe Fund, Inc. | |
Ciara Crawford8 (1984)
Assistant Secretary, (2019–present) | Associate, DWS (since 2015); previously, Legal Assistant at Accelerated Tax Solutions. | |
Diane Kenneally7 (1966)
Chief Financial Officer and Treasurer, 2018–present | Director,3 DWS; Treasurer, Chief Financial Officer and Controller, DBX ETF Trust (2019–present); Treasurer and Chief Financial Officer, The European Equity Fund, Inc., The New Germany Fund, Inc. and The Central and Eastern Europe Fund, Inc. (2018–present); formerly: Assistant Treasurer for the DWS funds (2007–2018) | |
Paul Antosca7 (1957)
Assistant Treasurer, 2007–present | Director,3 DWS; and Assistant Treasurer, DBX ETF Trust (2019–present) | |
Sheila Cadogan7 (1966)
Assistant Treasurer, 2017–present | Director,3 DWS; Director and Vice President, DWS Trust Company (2018–present); Assistant Treasurer, DBX ETF Trust (2019–present); Assistant Treasurer, The European Equity Fund, Inc., The New Germany Fund, Inc. and The Central and Eastern Europe Fund, Inc. (2018–present) | |
Scott D. Hogan7 (1970)
Chief Compliance Officer, 2016–present | Director,3 DWS; Chief Compliance Officer, The European Equity Fund, Inc., The New Germany Fund, Inc. and The Central and Eastern Europe Fund, Inc. (2016–present) | |
Caroline Pearson7 (1962)
Chief Legal Officer, 2010–present | Managing Director3, DWS; Assistant Secretary, DBX ETF Trust (2020–present); Chief Legal Officer, DBX Advisors LLC and DBX Strategic Advisors LLC (2020–present); Chief Legal Officer, The European Equity Fund, Inc., The New Germany Fund, Inc. and The Central and Eastern Europe Fund, Inc. (2012–present); formerly: Secretary, Deutsche AM Distributors, Inc. (2002–2017); and Secretary, Deutsche AM Service Company (2010–2017) |
Deutsche DWS Variable Series I — DWS Global Small Cap VIP | | | 25 |
| Name, Year of Birth, Position with the Trust/ Corporation and Length of Time Served5 | Business Experience and Directorships During the Past Five Years | |
Michelle Goveia-Pine6 (1970)
Interim Anti-Money Laundering Compliance Officer, since July 10, 2020 | Director,3 DWS; Interim AML Officer, DWS Trust Company (since July 28, 2020); Interim AML Officer, DBX ETF Trust (since July 9, 2020); Interim AML Officer, The European Equity Fund, Inc., The New Germany Fund, Inc. and The Central and Eastern Europe Fund, Inc. (since July 24, 2020) |
| 1 | The length of time served represents the year in which the Board Member joined the board of one or more DWS funds currently overseen by the Board. |
| 2 | A publicly held company with securities registered pursuant to Section 12 of the Securities Exchange Act of 1934. |
| 3 | Executive title, not a board directorship. |
| 4 | As a result of their respective positions held with the Advisor or its affiliates, these individuals are considered “interested persons” of the Advisor within the meaning of the 1940 Act. Interested persons receive no compensation from the Fund. |
| 5 | The length of time served represents the year in which the officer was first elected in such capacity for one or more DWS funds. |
| 6 | Address: 875 Third Avenue, New York, NY 10022. |
| 7 | Address: 100 Summer Street, Boston, MA 02110. |
| 8 | Address: 5022 Gate Parkway, Suite 400, Jacksonville, FL 32256. |
The Fund’s Statement of Additional Information (“SAI”) includes additional information about the Board Members. The SAI is available, without charge, upon request. If you would like to request a copy of the SAI, you may do so by calling the following toll-free number: (800) 728-3337.
| 26 | | | Deutsche DWS Variable Series I — DWS Global Small Cap VIP |
Notes
| ||
VS1glosc-2 (R-025821-10 2/21) |
| (b) Not applicable | |
| ITEM 2. | CODE OF ETHICS |
As of the end of the period covered by this report, the registrant has adopted a code of ethics, as defined in Item 2 of Form N-CSR that applies to its Principal Executive Officer and Principal Financial Officer.
There have been no amendments to, or waivers from, a provision of the code of ethics during the period covered by this report that would require disclosure under Item 2.
A copy of the code of ethics is filed as an exhibit to this Form N-CSR. | |
| ITEM 3. | AUDIT COMMITTEE FINANCIAL EXPERT |
| The fund’s audit committee is comprised solely of trustees who are "independent" (as such term has been defined by the Securities and Exchange Commission ("SEC") in regulations implementing Section 407 of the Sarbanes-Oxley Act (the "Regulations")). The fund’s Board of Trustees has determined that there are several "audit committee financial experts" (as such term has been defined by the Regulations) serving on the fund’s audit committee including Mr. William McClayton, the chair of the fund’s audit committee. An “audit committee financial expert” is not an “expert” for any purpose, including for purposes of Section 11 of the Securities Act of 1933 and the designation or identification of a person as an “audit committee financial expert” does not impose on such person any duties, obligations or liability that are greater than the duties, obligations and liability imposed on such person as a member of the audit committee and board of directors in the absence of such designation or identification. | |
| ITEM 4. | PRINCIPAL ACCOUNTANT FEES AND SERVICES |
Deutsche DWS Variable Series I
form n-csr disclosure re: AUDIT FEES
The following table shows the amount of fees that Ernst & Young LLP (“EY”), the Fund’s Independent Registered Public Accounting Firm, billed to the Fund during the Fund’s last two fiscal years. The Audit Committee approved in advance all audit services and non-audit services that EY provided to the Fund.
Services that the Fund’s Independent Registered Public Accounting Firm Billed to the Fund
| Fiscal Year Ended December 31, | Audit Fees Billed to Fund | Audit-Related Fees Billed to Fund | Tax Fees Billed to Fund | All Other Fees Billed to Fund |
| 2020 | $255,646 | $0 | $39,360 | $0 |
| 2019 | $255,646 | $0 | $42,783 | $11,250 |
The above “Tax Fees” were billed for professional services rendered for tax preparation.
Services that the Fund’s Independent Registered Public Accounting Firm Billed to the Adviser and Affiliated Fund Service Providers
The following table shows the amount of fees billed by EY to DWS Investment Management Americas, Inc. (“DIMA” or the “Adviser”), and any entity controlling, controlled by or under common control with DIMA (“Control Affiliate”) that provides ongoing services to the Fund (“Affiliated Fund Service Provider”), for engagements directly related to the Fund’s operations and financial reporting, during the Fund’s last two fiscal years.
| Fiscal Year Ended December 31, | Audit-Related Fees Billed to Adviser and Affiliated Fund Service Providers | Tax Fees Billed to Adviser and Affiliated Fund Service Providers | All Other Fees Billed to Adviser and Affiliated Fund Service Providers |
| 2020 | $0 | $650,763 | $0 |
| 2019 | $0 | $740,482 | $0 |
The above “Tax Fees” were billed in connection with tax compliance services and agreed upon procedures.
Non-Audit Services
The following table shows the amount of fees that EY billed during the Fund’s last two fiscal years for non-audit services. The Audit Committee pre-approved all non-audit services that EY provided to the Adviser and any Affiliated Fund Service Provider that related directly to the Fund’s operations and financial reporting. The Audit Committee requested and received information from EY about any non-audit services that EY rendered during the Fund’s last fiscal year to the Adviser and any Affiliated Fund Service Provider. The Committee considered this information in evaluating EY’s independence.
| Fiscal Year Ended December 31, | Total Non-Audit Fees Billed to Fund (A) | Total Non-Audit Fees billed to Adviser and Affiliated Fund Service Providers (engagements related directly to the operations and financial reporting of the Fund) (B) | Total Non-Audit Fees billed to Adviser and Affiliated Fund Service Providers (all other engagements) (C) | Total of (A), (B) and (C) |
| 2020 | $39,360 | $650,763 | $0 | $690,123 |
| 2019 | $54,033 | $740,482 | $0 | $794,515 |
All other engagement fees were billed for services in connection with agreed upon procedures and tax compliance for DIMA and other related entities.
Audit Committee Pre-Approval Policies and Procedures. Generally, each Fund’s Audit Committee must pre approve (i) all services to be performed for a Fund by a Fund’s Independent Registered Public Accounting Firm and (ii) all non-audit services to be performed by a Fund’s Independent Registered Public Accounting Firm for the DIMA Entities with respect to operations and financial reporting of the Fund, except that the Chairperson or Vice Chairperson of each Fund’s Audit Committee may grant the pre-approval for non-audit services described in items (i) and (ii) above for non-prohibited services for engagements of less than $100,000. All such delegated pre approvals shall be presented to each Fund’s Audit Committee no later than the next Audit Committee meeting.
There were no amounts that were approved by the Audit Committee pursuant to the de minimis exception under Rule 2-01 of Regulation S-X.
According to the registrant’s principal Independent Registered Public Accounting Firm, substantially all of the principal Independent Registered Public Accounting Firm's hours spent on auditing the registrant's financial statements were attributed to work performed by full-time permanent employees of the principal Independent Registered Public Accounting Firm.
***
In connection with the audit of the 2019 and 2020 financial statements, the Fund entered into an engagement letter with EY. The terms of the engagement letter required by EY, and agreed to by the Audit Committee, include a provision mandating the use of mediation and arbitration to resolve any controversy or claim between the parties arising out of or relating to the engagement letter or services provided thereunder.
***
Pursuant to PCAOB Rule 3526, EY is required to describe in writing to the Fund’s Audit Committee, on at least an annual basis, all relationships between EY, or any of its affiliates, and the DWS Funds, including the Fund, or persons in financial reporting oversight roles at the DWS Funds that, as of the date of the communication, may reasonably be thought to bear on EY’s independence. Pursuant to PCAOB Rule 3526, EY has reported the matters set forth below that may reasonably be thought to bear on EY’s independence. With respect to each reported matter, individually and in the aggregate, EY advised the Audit Committee that, after careful consideration of the facts and circumstances and the applicable independence rules, it concluded that the matters do not and will not impair EY’s ability to exercise objective and impartial judgement in connection with the audits of the financial statements for the Fund and a reasonable investor with knowledge of all relevant facts and circumstances would conclude that EY has been and is capable of exercising objective and impartial judgment on all issues encompassed within EY’s audit engagements. EY also confirmed to the Audit Committee that it can continue act as the Independent Registered Public Accounting Firm for the Fund.
| · | EY advised the Fund’s Audit Committee that various covered persons within EY’s affiliates held investments in, or had other financial relationships with, entities within the DWS Funds “investment company complex” (as defined in Regulation S-X) (the “DWS Funds Complex”). EY informed the Audit Committee that these investments and financial relationships were inconsistent with Rule 2-01(c)(1) of Regulation S-X. EY reported that all breaches have been resolved and that none of the breaches involved any investments in the Fund or any professionals who were part of the audit engagement team for the Fund. In addition, EY noted that the independence breaches did not (i) create a mutual or conflicting interest with the Fund, (ii) place EY in the position of auditing its own work, (iii) result in EY acting as management or an employee of the Fund, or (iv) place EY in a position of being an advocate of the Fund. |
| ITEM 5. | AUDIT COMMITTEE OF LISTED REGISTRANTS | |
| Not applicable | ||
| ITEM 6. | SCHEDULE OF INVESTMENTS | |
| Not applicable | ||
| ITEM 7. | DISCLOSURE OF PROXY VOTING POLICIES AND PROCEDURES FOR CLOSED-END MANAGEMENT INVESTMENT COMPANIES | |
| Not applicable | ||
| ITEM 8. | PORTFOLIO MANAGERS OF CLOSED-END MANAGEMENT INVESTMENT COMPANIES | |
| Not applicable | ||
| ITEM 9. | PURCHASES OF EQUITY SECURITIES BY CLOSED-END MANAGEMENT INVESTMENT COMPANY AND AFFILIATED PURCHASERS | |
| Not applicable | ||
| ITEM 10. | SUBMISSION OF MATTERS TO A VOTE OF SECURITY HOLDERS | |
| There were no material changes to the procedures by which shareholders may recommend nominees to the Fund’s Board. The primary function of the Nominating and Governance Committee is to identify and recommend individuals for membership on the Board and oversee the administration of the Board Governance Guidelines. Shareholders may recommend candidates for Board positions by forwarding their correspondence by U.S. mail or courier service to Keith R. Fox, DWS Funds Board Chair, c/o Thomas R. Hiller, Ropes & Gray LLP, Prudential Tower, 800 Boylston Street, Boston, MA 02199-3600. | ||
| ITEM 11. | CONTROLS AND PROCEDURES | |
| (a) | The Chief Executive and Financial Officers concluded that the Registrant’s Disclosure Controls and Procedures are effective based on the evaluation of the Disclosure Controls and Procedures as of a date within 90 days of the filing date of this report. | |
| (b) | There have been no changes in the registrant’s internal control over financial reporting that occurred during the period covered by this report that has materially affected, or is reasonably likely to materially affect, the registrant’s internal controls over financial reporting. | |
| ITEM 12. | Disclosure of Securities Lending Activities for Closed-End Management Investment Companies | |
| Not applicable | ||
| ITEM 13. | EXHIBITS | |
| (a)(1) | Code of Ethics pursuant to Item 2 of Form N-CSR is filed and attached hereto as EX-99.CODE ETH. | |
| (a)(2) | Certification pursuant to Rule 30a-2(a) under the Investment Company Act of 1940 (17 CFR 270.30a-2(a)) is filed and attached hereto as Exhibit 99.CERT. | |
| (b) | Certification pursuant to Rule 30a-2(b) under the Investment Company Act of 1940 (17 CFR 270.30a-2(b)) is furnished and attached hereto as Exhibit 99.906CERT. | |
SIGNATURES
Pursuant to the requirements of the Securities Exchange Act of 1934 and the Investment Company Act of 1940, the registrant has duly caused this report to be signed on its behalf by the undersigned, thereunto duly authorized.
| Registrant: | Deutsche DWS Variable Series I |
| By: | /s/Hepsen Uzcan Hepsen Uzcan President |
| Date: | 2/12/2021 |
Pursuant to the requirements of the Securities Exchange Act of 1934 and the Investment Company Act of 1940, this report has been signed below by the following persons on behalf of the registrant and in the capacities and on the dates indicated.
| By: | /s/Hepsen Uzcan Hepsen Uzcan President |
| Date: | 2/12/2021 |
| By: | /s/Diane Kenneally Diane Kenneally Chief Financial Officer and Treasurer |
| Date: | 2/12/2021 |