UNITED STATES
SECURITIES AND EXCHANGE COMMISSION
WASHINGTON, D. C. 20549
FORM N-CSR
Investment Company Act file number: 811-04257
Deutsche DWS Variable Series I
(Exact Name of Registrant as Specified in Charter)
345 Park Avenue
New York, NY 10154-0004
(Address of Principal Executive Offices) (Zip Code)
Registrant’s Telephone Number, including Area Code:(212) 250-2500
Diane Kenneally
One International Place
Boston, MA 02110
(Name and Address of Agent for Service)
| Date of fiscal year end: | 12/31 |
| | |
| Date of reporting period: | 12/31/2018 |
| ITEM 1. | REPORT TO STOCKHOLDERS |
December 31, 2018
Annual Report
Deutsche DWS Variable Series I
(formerly Deutsche Variable Series I)
DWS Bond VIP
(formerly Deutsche Bond VIP)
Beginning on January 1, 2021, as permitted by regulations adopted by the Securities and Exchange Commission, you may not be receiving paper copies of the Fund’s shareholder reports from the insurance company that offers your contract unless you specifically request paper copies from your insurance company or from your financial intermediary. Instead, the shareholder reports will be made available on a Web site, and your insurance company will notify you by mail each time a report is posted and provide you with a Web site link to access the report. Instructions for requesting paper copies will be provided by your insurance company.
If you already elected to receive shareholder reports electronically, you will not be affected by this change and you need not take any action. You may elect to receive shareholder reports and other communications from your insurance company electronically by following the instructions provided by your insurance company.
You may elect to receive all future reports in paper free of charge from your insurance company. If your insurance company informs you that future reports will be delivered via Web access, you can inform your insurance company that you wish to continue receiving paper copies of your shareholder reports by following the instructions provided by your insurance company.

Contents
This report must be preceded or accompanied by a prospectus. To obtain an additional prospectus or summary prospectus, if available, call (800)728-3337 or your financial representative. We advise you to consider the Fund’s objectives, risks, charges and expenses carefully before investing. The summary prospectus and prospectus contain this and other important information about the Fund. Please read the prospectus carefully before you invest.
Bond investments are subject tointerest-rate, credit, liquidity and market risks to varying degrees. When interest rates rise, bond prices generally fall. Credit risk refers to the ability of an issuer to make timely payments of principal and interest. Investments inlower-quality (“junk bonds”) andnon-rated securities present greater risk of loss than investments in higher-quality securities. Investing in foreign securities, particularly those of emerging markets, presents certain risks, such as currency fluctuations, political and economic changes, and market risks. Emerging markets tend to be more volatile and less liquid than the markets of more mature economies, and generally have less diverse and less mature economic structures and less stable political systems than those of developed countries. Investing in derivatives entails special risks relating to liquidity, leverage and credit that may reduce returns and/or increase volatility. Please read the prospectus for details.
The brand DWS represents DWS Group GmbH & Co. KGaA and any of its subsidiaries such as DWS Distributors, Inc. which offers investment products or DWS Investment Management Americas, Inc. and RREEF America L.L.C. which offer advisory services.
DWS Distributors, Inc., 222 South Riverside Plaza, Chicago, IL 60606, (800)621-1148
NOT FDIC/NCUA INSURED NO BANK GUARANTEE MAY LOSE VALUE NOT A DEPOSIT NOT INSURED BY ANY FEDERAL GOVERNMENT AGENCY
| | | | | | |
| | 2 | | | | | | Deutsche DWS Variable Series I — DWS Bond VIP |
| | |
| Performance Summary | | December 31, 2018 (Unaudited) |
Fund performance shown is historical, assumes reinvestment of all dividend and capital gain distributions, and does not guarantee future results. Investment return and principal value fluctuate with changing market conditions so that, when redeemed, shares may be worth more or less than their original cost. Current performance may be lower or higher than the performance data quoted. Please contact your participating insurance company for the Fund’s most recentmonth-end performance. Performance does not reflect charges and fees (“contract charges”) associated with the separate account that invests in the Fund or any variable life insurance policy or variable annuity contract for which the Fund is an investment option. These charges and fees will reduce returns.
The gross expense ratio of the Fund, as stated in the fee table of the prospectus dated May 1, 2018 is 0.74% for Class A shares and may differ from the expense ratio disclosed in the Financial Highlights table in this report.
Generally accepted accounting principles require adjustments to be made to the net assets of the Fund at period end for financial reporting purposes only, and as such, the total return based on the unadjusted net asset value per share may differ from the total return reported in the financial highlights.
Growth of an Assumed $10,000 Investment
| | |
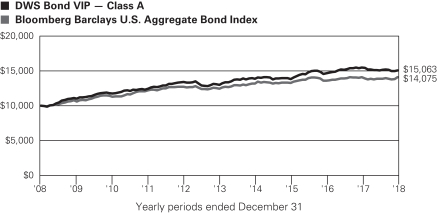 | | The Bloomberg Barclays U.S. Aggregate Bond Index is an unmanaged index representing domestic taxable investment-grade bonds, with index components for government and corporate securities, mortgage pass-through securities, and asset-backed securities with an average maturity of one year or more. Index returns do not reflect any fees or expenses and it is not possible to invest directly into an index. |
| | | | | | | | | | |
| Comparative Results | | | | | | | | | | |
| | | | | |
| DWS Bond VIP | | | | 1-Year | | 3-Year | | 5-Year | | 10-Year |
| Class A | | Growth of $10,000 | | $9,735 | | $10,913 | | $11,603 | | $15,063 |
| | | Average annual total return | | –2.65% | | 2.95% | | 3.02% | | 4.18% |
| Bloomberg Barclays U.S. Aggregate Bond Index | | Growth of $10,000 | | $10,001 | | $10,630 | | $11,326 | | $14,075 |
| | Average annual total return | | 0.01% | | 2.06% | | 2.52% | | 3.48% |
The growth of $10,000 is cumulative.
| | | | |
Deutsche DWS Variable Series I — DWS Bond VIP | | | | | 3 |
| | |
| Management Summary | | December 31, 2018 (Unaudited) |
During the 12-month period ended December 31, 2018, the Fund provided a total return of –2.65% (Class A shares, unadjusted for contract charges) compared with the 0.01% return of its benchmark, the Bloomberg Barclays U.S. Aggregate Bond Index.
Against a backdrop of steady growth, strong corporate profits and arguably full employment, the bond markets in 2018 watched closely for any indications of an acceleration in inflation that could lead the U.S. Federal Reserve (the Fed) to push forward its timetable for returning interest rates to more historically normal levels. In early February, Treasury yields moved higher as hiring and wage growth data for January came in above expectations. March saw fears of a global trade war come to the forefront as the Trump administration announced plans to impose tariffs on steel and aluminum as well as on a wide range of imports coming from China. Risk sentiment would soon stabilize, as increasingly robust economic growth and corporate earnings data outweighed concerns over protectionist U.S. trade policy. However, the fourth quarter of 2018 witnessed declining prices for credit-oriented segments of the bond market as slowing growth overseas highlighted the downside risks of a global trade war. Notwithstanding the downturn in sentiment, the Fed continued to tighten monetary policy, raising its benchmark overnight lending rate in mid-December by a quarter point to the 2.25% to 2.50% range, the fourth such hike of 2018.
For the 12 months ended December 31, 2018, yields rose along the length of the U.S. Treasury yield curve and the curve flattened as increases on the front-end were more significant. To illustrate, the two-year Treasury yield went from 1.88% to 2.48%, the five-year from 2.21% to 2.51%, the 10-year from 2.41% to 2.69%, the 20-year from 2.55% to 2.87% and the30-year from 2.74% to 3.02%.
The Fund’s underperformance versus the benchmark for the 12-month period was driven principally by exposure to more credit-sensitive fixed-income sectors, which suffered as risk sentiment deteriorated in the fourth quarter of 2018. In particular, an overweighting of investment-grade corporate bonds at the expense of U.S. Treasury securities constrained performance. In addition, out-of-benchmark exposure to U.S. high yield corporate bonds detracted as spreads widened late in the period. An overweight to energy within both investment grade and high yield corporates weighed on return as oil prices declined sharply in the fourth quarter. The Fund’s out-of-benchmark exposure to securitized assets such as asset-backed securities and commercial mortgage-backed securities was the leading positive contributor to performance relative to the benchmark.
The managers used derivatives as part of implementing the Fund’s positioning along the yield curve as well to hedge against certain risks, with a modest negative impact on performance. Credit fundamentals are currently stable and new issue supply has been relatively light for both investment grade and high yield credit. While we remain constructive on credit overall relative to Treasuries, we are somewhat cautiously positioned within each sector against a backdrop of heightened volatility. We continue to closely monitor the impact of trade tensions and other geopolitical risks on investor sentiment and the credit markets.
Thomas M. Farina, CFA, Managing Director
Gregory M. Staples, CFA, Managing Director
Kelly L. Beam, CFA, Director
Portfolio Managers
The views expressed reflect those of the portfolio management team only through the end of the period of the report as stated on the cover. The management team’s views are subject to change at any time based on market and other conditions and should not be construed as a recommendation. Past performance is no guarantee of future results. Current and future portfolio holdings are subject to risk
| | | | | | |
| | 4 | | | | | | Deutsche DWS Variable Series I — DWS Bond VIP |
Terms to Know
Theyield curve is a graphical representation of how yields on bonds of different maturities compare. Normally, yield curves slant up, as bonds with longer maturities typically offer higher yields than short-term bonds.
TheBloomberg Barclays U.S. Aggregate Index tracks the performance of the broad U.S. investment-grade, fixed-rate bond market, including both government and corporate bonds. Index returns, unlike fund returns, do not reflect any fees or expenses. It is not possible to invest directly into an index.
Overweight means the Fund holds a higher weighting in a given sector or security than the benchmark.Underweight means the Fund holds a lower weighting.
Contributors and detractors incorporate both a holding’s return and its weight. If two holdings have the same return but one has a larger weighting in the Fund, it will have a larger contribution to return in the period.
Credit spread is the additional yield provided by bonds rated AA and below vs. comparable maturity bonds rated AAA.
Commercial mortgage-backed securities are secured by loans on commercial properties.Asset-backed securities are secured by loans, credit or receivables, exclusive of mortgage debt.
| | | | |
Deutsche DWS Variable Series I — DWS Bond VIP | | | | | 5 |
| | | | |
| Portfolio Summary | | (Unaudited) | | |
| | | | | | | | |
| Asset Allocation (As a % of Total Net Assets) | | 12/31/18 | | | 12/31/17 | |
| Corporate Bonds | | | 58% | | | | 64% | |
| Mortgage-Backed Securities Pass-Throughs | | | 20% | | | | 20% | |
| Asset-Backed | | | 9% | | | | 5% | |
| Government & Agency Obligations | | | 5% | | | | 5% | |
| Commercial Mortgage-Backed Securities | | | 4% | | | | 2% | |
| Collateralized Mortgage Obligations | | | 4% | | | | 4% | |
| Short-Term U.S. Treasury Obligations | | | 3% | | | | 7% | |
| Commercial Paper | | | 1% | | | | — | |
| Cash Equivalents, Securities Lending Collateral and other Assets and Liabilities, net | | | –4% | | | | –7% | |
| | | | 100% | | | | 100% | |
| | |
| Quality (Excludes Cash Equivalents and Securities Lending Collateral) | | 12/31/18 | | | 12/31/17 | |
| AAA | | | 26% | | | | 29% | |
| AA | | | 9% | | | | 5% | |
| A | | | 19% | | | | 14% | |
| BBB | | | 33% | | | | 32% | |
| BB | | | 11% | | | | 13% | |
| B | | | 1% | | | | 5% | |
| Not Rated | | | 1% | | | | 2% | |
| | | | 100% | | | | 100% | |
| | |
| Interest Rate Sensitivity | | 12/31/18 | | | 12/31/17 | |
| Effective Maturity | | | 9.6 years | | | | 11.1 years | |
| Effective Duration | | | 5.8 years | | | | 5.9 years | |
The quality ratings represent the higher of Moody’s Investors Service, Inc. (“Moody’s”), Fitch Ratings, Inc. (“Fitch”) or Standard & Poor’s Corporation (“S&P”) credit ratings. The ratings of Moody’s, Fitch and S&P represent their opinions as to the quality of the securities they rate. Credit quality measures a bond issuer’s ability to repay interest and principal in a timely manner. Ratings are relative and subjective and are not absolute standards of quality. Credit quality does not remove market risk and is subject to change.
Effective maturity is the weighted average of the maturity date of bonds held by the Fund taking into consideration any available maturity shortening features.
Effective duration is an approximate measure of the Fund’s sensitivity to interest rate changes taking into consideration any maturity shortening features.
Portfolio holdings and characteristics are subject to change.
For more complete details about the Fund’s investment portfolio, see page 7.
Following the Fund’s fiscal first and thirdquarter-end, a complete portfolio holdings listing is filed with the SEC on FormN-Q or Form N-PORT (available for filings after March 31, 2019). The Fund’s Form N-Q or Form N-PORT will be available on the SEC’s Web site at sec.gov. The Fund’s portfolio holdings are also posted on dws.com from time to time. Please see the Fund’s current prospectus for more information.
| | | | | | |
| | 6 | | | | | | Deutsche DWS Variable Series I — DWS Bond VIP |
| | |
| Investment Portfolio | | as of December 31, 2018 |
| | | | | | | | |
| | | Principal
Amount ($)(a) | | | Value ($) | |
| Corporate Bonds 57.7% | |
| Communication Services 4.3% | |
| | |
AT&T, Inc.,3-monthUSD-LIBOR + 1.180%, 3.956%*, 6/12/2024 | | | 207,000 | | | | 200,788 | |
| | |
CCO Holdings LLC, 144A, 5.125%, 5/1/2027 | | | 330,000 | | | | 307,362 | |
| | |
Charter Communications Operating LLC: | | | | | | | | |
| | |
3.75%, 2/15/2028 | | | 110,000 | | | | 99,508 | |
| | |
5.375%, 5/1/2047 | | | 70,000 | | | | 63,432 | |
| | |
Comcast Corp.: | | | | | | | | |
| | |
3.55%, 5/1/2028 | | | 240,000 | | | | 231,659 | |
| | |
4.6%, 10/15/2038 | | | 180,000 | | | | 181,760 | |
| | |
4.95%, 10/15/2058 | | | 70,000 | | | | 71,166 | |
| | |
Empresa Nacional de Telecomunicaciones SA, REG S, 4.75%, 8/1/2026 | | | 250,000 | | | | 234,824 | |
| | |
Sprint Communications, Inc., 6.0%, 11/15/2022 | | | 250,000 | | | | 245,333 | |
| | |
Verizon Communications, Inc., 5.5%, 3/16/2047 | | | 60,000 | | | | 63,805 | |
| | |
Viacom, Inc., 5.875%, 2/28/2057 | | | 210,000 | | | | 190,573 | |
| | |
Vodafone Group PLC, 5.25%, 5/30/2048 | | | 98,000 | | | | 92,006 | |
| | | | | | | | |
| | | | | | | 1,982,216 | |
|
| Consumer Discretionary 6.5% | |
| | |
Booking Holdings, Inc., 2.75%, 3/15/2023 | | | 105,000 | | | | 100,782 | |
| | |
Expedia Group, Inc., 3.8%, 2/15/2028 | | | 100,000 | | | | 90,683 | |
| | |
Ford Motor Co., 5.291%, 12/8/2046 | | | 50,000 | | | | 41,049 | |
| | |
General Motors Financial Co., Inc.: | | | | | | | | |
| | |
3.15%, 6/30/2022 | | | 450,000 | | | | 429,821 | |
| | |
4.35%, 4/9/2025 | | | 84,000 | | | | 79,586 | |
| | |
HD Supply, Inc., 144A, 5.375%, 10/15/2026 | | | 175,000 | | | | 169,750 | |
| | |
Hilton Domestic Operating Co., Inc., 4.25%, 9/1/2024 | | | 130,000 | | | | 122,850 | |
| | |
Hilton Worldwide Finance LLC, 4.875%, 4/1/2027 | | | 220,000 | | | | 206,250 | |
| | |
Home Depot, Inc., 4.5%, 12/6/2048 | | | 50,000 | | | | 51,619 | |
| | |
KFC Holding Co., 144A, 4.75%, 6/1/2027 | | | 260,000 | | | | 241,800 | |
| | |
Netflix, Inc., 144A, 5.875%, 11/15/2028 | | | 235,000 | | | | 228,350 | |
| | |
Nordstrom, Inc., 5.0%, 1/15/2044 | | | 135,000 | | | | 116,366 | |
| | |
Sabre GLBL, Inc., 144A, 5.375%, 4/15/2023 | | | 130,000 | | | | 129,350 | |
| | |
Sands China Ltd., 144A, 4.6%, 8/8/2023 | | | 200,000 | | | | 198,676 | |
| | |
Starbucks Corp., 4.5%, 11/15/2048 | | | 100,000 | | | | 93,088 | |
| | |
Toll Brothers Finance Corp., 4.875%, 11/15/2025 | | | 80,000 | | | | 74,800 | |
| | |
Viking Cruises Ltd., 144A, 5.875%, 9/15/2027 | | | 125,000 | | | | 116,563 | |
| | | | | | | | |
| | | Principal
Amount ($)(a) | | | Value ($) | |
| | |
VOC Escrow Ltd., 144A, 5.0%, 2/15/2028 | | | 95,000 | | | | 87,638 | |
| | |
Volkswagen Group of America Finance LLC, 144A, 4.25%, 11/13/2023 | | | 200,000 | | | | 198,361 | |
|
Walgreens Boots Alliance, Inc., | |
| | |
4.8%, 11/18/2044 | | | 40,000 | | | | 36,419 | |
| | |
Walmart, Inc., 3.4%, 6/26/2023 | | | 175,000 | | | | 176,803 | |
| | | | | | | | |
| | | | | | | 2,990,604 | |
| | |
| Consumer Staples 3.5% | | | | | | | | |
| | |
Anheuser-Busch Companies LLC, 144A, 4.9%, 2/1/2046 | | | 140,000 | | | | 129,834 | |
| | |
Anheuser-Busch InBev Worldwide, Inc., 4.75%, 4/15/2058 | | | 60,000 | | | | 52,214 | |
| | |
Aramark Services, Inc., 144A, 5.0%, 2/1/2028 | | | 295,000 | | | | 275,088 | |
| | |
BAT Capital Corp., 3.557%, 8/15/2027 | | | 225,000 | | | | 199,743 | |
| | |
Campbell Soup Co., 4.8%, 3/15/2048 | | | 65,000 | | | | 55,744 | |
|
Conagra Brands, Inc.: | |
| | |
5.3%, 11/1/2038 | | | 130,000 | | | | 122,842 | |
| | |
5.4%, 11/1/2048 | | | 20,000 | | | | 18,419 | |
| | |
Constellation Brands, Inc., 5.25%, 11/15/2048 | | | 30,000 | | | | 30,104 | |
|
Keurig Dr Pepper, Inc.: | |
| | |
144A, 4.057%, 5/25/2023 | | | 90,000 | | | | 89,688 | |
| | |
144A, 4.597%, 5/25/2028 | | | 70,000 | | | | 69,472 | |
| | |
144A, 5.085%, 5/25/2048 | | | 100,000 | | | | 95,095 | |
|
Kraft Heinz Foods Co.: | |
| | |
4.375%, 6/1/2046 | | | 130,000 | | | | 107,097 | |
| | |
4.625%, 1/30/2029 | | | 90,000 | | | | 88,985 | |
| | |
Molson Coors Brewing Co., 4.2%, 7/15/2046 | | | 120,000 | | | | 99,696 | |
| | |
Nestle Holdings, Inc., 144A, 4.0%, 9/24/2048 | | | 150,000 | | | | 147,109 | |
| | | | | | | | |
| | | | | | | 1,581,130 | |
|
| Energy 8.5% | |
| | |
Baker Hughes a GE Co., LLC, 4.08%, 12/15/2047 | | | 85,000 | | | | 70,044 | |
| | |
Boardwalk Pipelines LP, 4.95%, 12/15/2024 | | | 110,000 | | | | 111,548 | |
| | |
Buckeye Partners LP, 4.125%, 12/1/2027 | | | 140,000 | | | | 125,884 | |
|
Canadian Natural Resources Ltd.: | |
| | |
3.85%, 6/1/2027 | | | 125,000 | | | | 117,915 | |
| | |
4.95%, 6/1/2047 | | | 80,000 | | | | 77,107 | |
| | |
Cenovus Energy, Inc., 5.4%, 6/15/2047 | | | 100,000 | | | | 86,106 | |
| | |
Cheniere Energy Partners LP, 144A, 5.625%, 10/1/2026 | | | 210,000 | | | | 196,350 | |
| | |
Chesapeake Energy Corp., 7.0%, 10/1/2024 (b) | | | 140,000 | | | | 121,100 | |
|
Continental Resources, Inc.: | |
| | |
4.9%, 6/1/2044 | | | 90,000 | | | | 79,656 | |
| | |
5.0%, 9/15/2022 | | | 48,000 | | | | 47,659 | |
| | |
DCP Midstream Operating LP, 5.375%, 7/15/2025 | | | 105,000 | | | | 102,638 | |
The accompanying notes are an integral part of the financial statements.
| | | | |
Deutsche DWS Variable Series I — DWS Bond VIP | | | | | 7 |
| | | | | | | | |
| | | Principal
Amount ($)(a) | | | Value ($) | |
| | |
Empresa Nacional del Petroleo, 144A, 5.25%, 11/6/2029 | | | 200,000 | | | | 203,208 | |
| | |
Enbridge, Inc., 3.5%, 6/10/2024 | | | 20,000 | | | | 19,474 | |
| | |
Energy Transfer LP, 4.25%, 3/15/2023 | | | 350,000 | | | | 336,875 | |
| | |
Energy Transfer Operating LP, 5.95%, 10/1/2043 | | | 50,000 | | | | 47,540 | |
| | |
EnLink Midstream Partners LP, 5.45%, 6/1/2047 | | | 160,000 | | | | 129,396 | |
| | |
Enterprise Products Operating LLC, 4.25%, 2/15/2048 | | | 330,000 | | | | 292,506 | |
|
EQM Midstream Partners LP: | |
| | |
4.75%, 7/15/2023 | | | 92,000 | | | | 91,802 | |
| | |
6.5%, 7/15/2048 | | | 28,000 | | | | 27,568 | |
| | |
EQT Corp., 3.9%, 10/1/2027 | | | 105,000 | | | | 90,519 | |
| | |
Hess Corp., 5.8%, 4/1/2047 | | | 140,000 | | | �� | 125,657 | |
| | |
Kinder Morgan, Inc., 4.3%, 3/1/2028 | | | 445,000 | | | | 435,538 | |
| | |
Newfield Exploration Co., 5.75%, 1/30/2022 | | | 60,000 | | | | 60,600 | |
| | |
Noble Energy, Inc., 4.95%, 8/15/2047 | | | 100,000 | | | | 86,520 | |
| | |
Petroleos Mexicanos, 6.5%, 3/13/2027 | | | 180,000 | | | | 169,200 | |
| | |
Plains All American Pipeline LP, 2.85%, 1/31/2023 | | | 165,000 | | | | 155,534 | |
| | |
Range Resources Corp., 5.0%, 3/15/2023 | | | 300,000 | | | | 264,000 | |
| | |
Sunoco Logistics Partners Operations LP, 5.3%, 4/1/2044 | | | 75,000 | | | | 66,226 | |
| | |
TransCanada PipeLines Ltd, 5.1%, 3/15/2049 | | | 170,000 | | | | 169,443 | |
| | | | | | | | |
| | | | | | | 3,907,613 | |
|
| Financials 14.9% | |
| | |
AerCap Ireland Capital DAC, 3.3%, 1/23/2023 | | | 150,000 | | | | 142,607 | |
| | |
Aflac, Inc., 4.75%, 1/15/2049 | | | 150,000 | | | | 153,067 | |
| | |
Air Lease Corp., 4.625%, 10/1/2028 | | | 160,000 | | | | 151,125 | |
|
Aircastle Ltd.: | |
| | |
4.4%, 9/25/2023 | | | 109,000 | | | | 107,204 | |
| | |
5.5%, 2/15/2022 | | | 175,000 | | | | 179,047 | |
| | |
Ares Capital Corp.: | | | | | | | | |
| | |
3.625%, 1/19/2022 | | | 130,000 | | | | 126,209 | |
| | |
3.875%, 1/15/2020 | | | 200,000 | | | | 200,420 | |
| | |
ASB Bank Ltd., 144A, 3.75%, 6/14/2023 | | | 200,000 | | | | 200,840 | |
| | |
AXA Equitable Holdings, Inc., 144A, 5.0%, 4/20/2048 | | | 100,000 | | | | 88,703 | |
| | |
Banco de Credito e Inversiones SA, 144A, 3.5%, 10/12/2027 | | | 225,000 | | | | 202,500 | |
| | |
Banco Santander Mexico SA, 144A, 5.95%, 10/1/2028 | | | 210,000 | | | | 210,788 | |
| | |
Bank of America Corp., 4.271%, 7/23/2029 | | | 150,000 | | | | 149,296 | |
| | |
BOC Aviation Ltd., 144A,3-monthUSD-LIBOR + 1.125%, 3.947%*, 9/26/2023 | | | 250,000 | | | | 248,683 | |
| | |
BPCE SA, 144A, 4.625%, 9/12/2028 | | | 250,000 | | | | 245,686 | |
| | |
Citigroup, Inc.: | | | | | | | | |
| | |
3.2%, 10/21/2026 | | | 170,000 | | | | 156,942 | |
| | |
3.887%, 1/10/2028 | | | 140,000 | | | | 135,087 | |
| | |
Credit Suisse Group AG, 144A, 4.282%, 1/9/2028 | | | 250,000 | | | | 241,176 | |
| | | | | | | | |
| | | Principal
Amount ($)(a) | | | Value ($) | |
| | |
Everest Reinsurance Holdings, Inc., 4.868%, 6/1/2044 | | | 100,000 | | | | 96,378 | |
| | |
Fairfax Financial Holdings Ltd., 144A, 4.85%, 4/17/2028 | | | 96,000 | | | | 92,245 | |
|
HSBC Holdings PLC: | |
| | |
4.375%, 11/23/2026 | | | 200,000 | | | | 193,624 | |
| | |
6.0% Perpetual (c) | | | 225,000 | | | | 202,608 | |
|
ING Groep NV: | |
| | |
4.55%, 10/2/2028 | | | 273,000 | | | | 269,899 | |
| | |
144A, 4.625%, 1/6/2026 | | | 200,000 | | | | 201,354 | |
| | |
JPMorgan Chase & Co.: | | | | | | | | |
| | |
2.95%, 10/1/2026 | | | 140,000 | | | | 129,294 | |
| | |
4.203%, 7/23/2029 | | | 135,000 | | | | 134,590 | |
| | |
KKR Group Finance Co. III LLC, 144A, 5.125%, 6/1/2044 | | | 55,000 | | | | 54,174 | |
| | |
Kookmin Bank, 144A, 2.875%, 3/25/2023 | | | 200,000 | | | | 194,166 | |
| | |
Legg Mason, Inc., 5.625%, 1/15/2044 | | | 100,000 | | | | 98,687 | |
| | |
Macquarie Group Ltd., 144A, 5.033%, 1/15/2030 | | | 300,000 | | | | 295,628 | |
| | |
Manulife Financial Corp., 4.061%, 2/24/2032 | | | 200,000 | | | | 188,603 | |
| | |
Morgan Stanley, 3.591%, 7/22/2028 | | | 100,000 | | | | 94,550 | |
| | |
Nationwide Financial Services, Inc., 144A, 5.3%, 11/18/2044 | | | 80,000 | | | | 84,467 | |
| | |
Santander Holdings U.S.A., Inc., 3.7%, 3/28/2022 | | | 270,000 | | | | 265,166 | |
| | |
State Street Corp., 4.141%, 12/3/2029 | | | 130,000 | | | | 134,185 | |
| | |
Swiss Re Treasury U.S. Corp., 144A, 4.25%, 12/6/2042 | | | 70,000 | | | | 68,210 | |
|
The Goldman Sachs Group, Inc.: | |
| | |
3.75%, 2/25/2026 | | | 290,000 | | | | 274,237 | |
| | |
3.814%, 4/23/2029 | | | 155,000 | | | | 144,712 | |
| | |
Vantiv LLC, 144A, 4.375%, 11/15/2025 | | | 200,000 | | | | 183,000 | |
| | |
Wells Fargo Bank NA, 3.55%, 8/14/2023 | | | 250,000 | | | | 248,943 | |
| | |
Woori Bank, 144A, 4.5% Perpetual (c) | | | 250,000 | | | | 242,851 | |
| | | | | | | | |
| | | | | | | 6,830,951 | |
|
| Health Care 2.7% | |
|
AbbVie, Inc.: | |
| | |
4.45%, 5/14/2046 | | | 120,000 | | | | 104,969 | |
| | |
4.875%, 11/14/2048 | | | 50,000 | | | | 46,650 | |
| | |
Allergan Funding SCS, 4.75%, 3/15/2045 | | | 70,000 | | | | 66,449 | |
| | |
Bayer U.S. Finance II LLC, 144A, 4.375%, 12/15/2028 | | | 200,000 | | | | 190,950 | |
| | |
CVS Health Corp., 4.78%, 3/25/2038 | | | 129,000 | | | | 123,615 | |
| | |
HCA, Inc.: | | | | | | | | |
| | |
5.25%, 6/15/2026 | | | 130,000 | | | | 129,025 | |
| | |
5.375%, 9/1/2026 | | | 115,000 | | | | 111,837 | |
| | |
Pfizer, Inc., 4.2%, 9/15/2048 | | | 90,000 | | | | 91,316 | |
|
Stryker Corp.: | |
| | |
3.375%, 11/1/2025 | | | 80,000 | | | | 77,342 | |
| | |
4.625%, 3/15/2046 | | | 40,000 | | | | 40,180 | |
| | |
Teva Pharmaceutical Finance Netherlands III BV, 6.0%, 4/15/2024 | | | 200,000 | | | | 192,643 | |
The accompanying notes are an integral part of the financial statements.
| | | | | | |
| | 8 | | | | | | Deutsche DWS Variable Series I — DWS Bond VIP |
| | | | | | | | |
| | | Principal
Amount ($)(a) | | | Value ($) | |
| | |
UnitedHealth Group, Inc., 4.45%, 12/15/2048 | | | 60,000 | | | | 61,760 | |
| | | | | | | | |
| | | | | | | 1,236,736 | |
|
| Industrials 2.8% | |
| | |
Avolon Holdings Funding Ltd., 144A, 5.125%, 10/1/2023 | | | 167,000 | | | | 159,485 | |
| | |
Boeing Co., 3.625%, 3/1/2048 | | | 25,000 | | | | 23,022 | |
| | |
Corning, Inc., 5.35%, 11/15/2048 | | | 150,000 | | | | 152,165 | |
| | |
CSX Corp., 4.25%, 11/1/2066 | | | 130,000 | | | | 112,389 | |
| | |
Delta Air Lines, Inc., 4.375%, 4/19/2028 | | | 154,000 | | | | 147,579 | |
| | |
FedEx Corp.: | | | | | | | | |
| | |
4.05%, 2/15/2048 | | | 220,000 | | | | 184,283 | |
| | |
4.95%, 10/17/2048 | | | 100,000 | | | | 96,637 | |
| | |
General Electric Co.: | | | | | | | | |
| | |
4.125%, 10/9/2042 | | | 45,000 | | | | 35,160 | |
| | |
4.5%, 3/11/2044 | | | 40,000 | | | | 32,623 | |
| | |
Kansas City Southern, 4.7%, 5/1/2048 | | | 80,000 | | | | 78,125 | |
| | |
Union Pacific Corp., 4.5%, 9/10/2048 | | | 125,000 | | | | 123,256 | |
| | |
United Rentals North America, Inc., 6.5%, 12/15/2026 | | | 140,000 | | | | 137,900 | |
| | | | | | | | |
| | | | | | | 1,282,624 | |
|
| Information Technology 3.3% | |
| | |
Amazon.com, Inc., 4.25%, 8/22/2057 | | | 135,000 | | | | 131,172 | |
| | |
Apple, Inc., 3.45%, 2/9/2045 | | | 60,000 | | | | 53,128 | |
|
Broadcom Corp.: | |
| | |
3.5%, 1/15/2028 | | | 115,000 | | | | 99,637 | |
| | |
3.625%, 1/15/2024 | | | 125,000 | | | | 118,263 | |
| | |
Dell International LLC, 144A, 5.875%, 6/15/2021 | | | 240,000 | | | | 239,741 | |
| | |
DXC Technology Co., 4.75%, 4/15/2027 | | | 190,000 | | | | 190,669 | |
| | |
Fair Isaac Corp., 144A, 5.25%, 5/15/2026 | | | 95,000 | | | | 91,913 | |
| | |
Fiserv, Inc., 4.2%, 10/1/2028 | | | 150,000 | | | | 149,699 | |
| | |
Microchip Technology, Inc., 144A, 3.922%, 6/1/2021 | | | 42,000 | | | | 41,663 | |
| | |
Seagate HDD Cayman, 4.25%, 3/1/2022 | | | 90,000 | | | | 86,011 | |
| | |
VMware, Inc., 3.9%, 8/21/2027 | | | 110,000 | | | | 97,572 | |
| | |
Western Digital Corp., 4.75%, 2/15/2026 | | | 245,000 | | | | 212,537 | |
| | | | | | | | |
| | | | | | | 1,512,005 | |
|
| Materials 2.8% | |
| | |
Anglo American Capital PLC, 144A, 4.75%, 4/10/2027 | | | 230,000 | | | | 220,277 | |
| | |
AngloGold Ashanti Holdings PLC, 5.125%, 8/1/2022 | | | 110,000 | | | | 110,990 | |
| | |
Celulosa Arauco y Constitucion SA, 5.5%, 11/2/2047 | | | 200,000 | | | | 188,002 | |
| | |
DowDuPont, Inc., 5.419%, 11/15/2048 | | | 150,000 | | | | 155,841 | |
| | |
Freeport-McMoRan, Inc., 4.55%, 11/14/2024 | | | 200,000 | | | | 184,500 | |
| | |
International Flavors & Fragrances, Inc., 5.0%, 9/26/2048 | | | 90,000 | | | | 89,644 | |
| | |
SASOL Financing U.S.A. LLC, 5.875%, 3/27/2024 | | | 200,000 | | | | 199,578 | |
| | |
Yamana Gold, Inc., 4.95%, 7/15/2024 | | | 110,000 | | | | 107,608 | |
| | | | | | | | |
| | | | | | | 1,256,440 | |
| | | | | | | | |
| | | Principal
Amount ($)(a) | | | Value ($) | |
| Real Estate 4.1% | |
|
Crown Castle International Corp.: | |
| | |
(REIT), 3.8%, 2/15/2028 | | | 50,000 | | | | 47,315 | |
| | |
(REIT), 5.25%, 1/15/2023 | | | 135,000 | | | | 140,187 | |
| | |
ERP Operating LP, (REIT), 4.15%, 12/1/2028 | | | 150,000 | | | | 152,847 | |
|
Government Properties Income Trust: | |
| | |
(REIT), 3.75%, 8/15/2019 | | | 60,000 | | | | 60,059 | |
| | |
(REIT), 4.0%, 7/15/2022 | | | 125,000 | | | | 123,018 | |
| | |
Hospitality Properties Trust, (REIT), 5.25%, 2/15/2026 | | | 155,000 | | | | 156,610 | |
| | |
Host Hotels & Resorts LP, (REIT), 3.875%, 4/1/2024 | | | 135,000 | | | | 133,179 | |
| | |
MGM Growth Properties Operating Partnership LP, (REIT), 4.5%, 9/1/2026 | | | 120,000 | | | | 108,600 | |
| | |
Omega Healthcare Investors, Inc., (REIT), 5.25%, 1/15/2026 | | | 50,000 | | | | 50,880 | |
| | |
Realty Income Corp., (REIT), 3.875%, 4/15/2025 | | | 250,000 | | | | 249,531 | |
| | |
SBA Communications Corp.: | | | | | | | | |
| | |
(REIT), 4.0%, 10/1/2022 | | | 190,000 | | | | 180,975 | |
| | |
(REIT), 4.875%, 9/1/2024 | | | 125,000 | | | | 117,500 | |
|
Select Income REIT: | |
| | |
(REIT), 4.15%, 2/1/2022 | | | 80,000 | | | | 79,133 | |
| | |
(REIT), 4.25%, 5/15/2024 | | | 80,000 | | | | 77,090 | |
| | |
WEA Finance LLC, 144A, (REIT), 3.75%, 9/17/2024 | | | 200,000 | | | | 198,648 | |
| | | | | | | | |
| | | | | | | 1,875,572 | |
|
| Utilities 4.3% | |
| | |
Abu Dhabi National Energy Co. PJSC, 144A, 4.375%, 4/23/2025 | | | 210,000 | | | | 208,204 | |
| | |
EDP Finance BV, 144A, 3.625%, 7/15/2024 | | | 200,000 | | | | 187,016 | |
| | |
Electricite de France SA, 144A, 4.75%, 10/13/2035 | | | 75,000 | | | | 70,653 | |
| | |
Enel Finance International NV, 144A, 4.25%, 9/14/2023 | | | 300,000 | | | | 293,336 | |
|
Israel Electric Corp., Ltd.: | |
| | |
144A, REG S, 4.25%, 8/14/2028 | | | 290,000 | | | | 275,477 | |
| | |
Series 6, 144A, REG S, 5.0%, 11/12/2024 | | | 300,000 | | | | 302,184 | |
| | |
Perusahaan Listrik Negara PT, 144A, 2.875%, 10/25/2025 | | | EUR 222,000 | | | | 252,436 | |
| | |
Sempra Energy, 4.0%, 2/1/2048 | | | 55,000 | | | | 47,208 | |
| | |
Southern California Edison Co., 3.65%, 3/1/2028 | | | 250,000 | | | | 244,299 | |
| | |
Southern Power Co., Series F, 4.95%, 12/15/2046 | | | 87,000 | | | | 81,126 | |
| | | | | | | | |
| | | | | | | | 1,961,939 | |
Total Corporate Bonds (Cost $27,473,624) | | | | 26,417,830 | |
|
| Mortgage-Backed SecuritiesPass-Throughs 20.5% | |
| Mortgage pass-through | |
|
Federal Home Loan Mortgage Corp.: | |
| | |
4.0%, 8/1/2039 | | | 363,997 | | | | 373,146 | |
| | |
5.5%, with various maturities from 10/1/2023 until 5/1/2041 | | | 545,682 | | | | 583,196 | |
| | |
6.5%, 3/1/2026 | | | 58,113 | | | | 61,884 | |
The accompanying notes are an integral part of the financial statements.
| | | | |
Deutsche DWS Variable Series I — DWS Bond VIP | | | | | 9 |
| | | | | | | | |
| | | Principal
Amount ($)(a) | | | Value ($) | |
Federal National Mortgage Association: | |
3.5%, with various maturities from 12/1/2045 until 1/1/2049 (d) | | | 3,100,992 | | | | 3,107,017 | |
4.0%, 1/1/2049 (d) | | | 1,300,000 | | | | 1,325,188 | |
12-monthUSD-LIBOR + 1.750%, 4.5%*, 9/1/2038 | | | 26,905 | | | | 28,103 | |
4.5%, 1/1/2049 (d) | | | 1,900,000 | | | | 1,967,428 | |
5.0%, 10/1/2033 | | | 29,028 | | | | 30,866 | |
5.5%, with various maturities from 12/1/2032 until 8/1/2037 | | | 547,821 | | | | 589,506 | |
6.0%, with various maturities from 4/1/2024 until 3/1/2025 | | | 138,029 | | | | 148,107 | |
6.5%, with various maturities from 11/1/2024 until 1/1/2036 | | | 53,896 | | | | 57,920 | |
Government National Mortgage Association, 4.0%, 1/1/2049 (d) | | | 1,100,000 | | | | 1,126,297 | |
Total Mortgage-Backed SecuritiesPass-Throughs (Cost $9,399,158) | | | | 9,398,658 | |
|
| Asset-Backed 9.0% | |
| Automobile Receivables 1.8% | |
Avis Budget Rental Car Funding AESOP LLC, “C”, Series2015-1A, 144A, 3.96%, 7/20/2021 | | | 500,000 | | | | 497,594 | |
CarMax Auto Owner Trust, “A4”, Series2015-1, 1.83%, 7/15/2020 | | | 305,727 | | | | 304,839 | |
| | | | | | | | |
| | | | | | | 802,433 | |
|
| Credit Card Receivables 3.2% | |
Discover Card Execution Note Trust, “A4”, Series2014-A4, 2.12%, 12/15/2021 | | | 500,000 | | | | 498,136 | |
World Financial Network Credit Card Master Trust, “M”, Series2016-A, 2.33%, 4/15/2025 | | | 1,000,000 | | | | 974,973 | |
| | | | | | | | |
| | | | | | | 1,473,109 | |
|
| Miscellaneous 4.0% | |
Goldentree Loan Opportunities X Ltd., “AJR”, Series2015-10A, 144A,3-monthUSD-LIBOR + 1.450%, 3.919%*, 7/20/2031 | | | 433,333 | | | | 427,820 | |
Hilton Grand Vacations Trust, “B”, Series2014-AA, 144A, 2.07%, 11/25/2026 | | | 83,929 | | | | 82,668 | |
Taco Bell Funding LLC, “A2I”, Series2018-1A, 144A, 4.318%, 11/25/2048 | | | 745,000 | | | | 754,193 | |
Venture XXVIII CLO Ltd., “A2”, Series2017-28A, 144A,3-monthUSD-LIBOR + 1.110%, 3.579%*, 7/20/2030 | | | 400,000 | | | | 392,769 | |
Wendy’s Funding LLC, “A2I”, Series2018-1A, 144A, 3.573%, 3/15/2048 | | | 198,000 | | | | 189,751 | |
| | | | | | | | |
| | | | | | | | 1,847,201 | |
Total Asset-Backed (Cost $4,157,582) | | | | 4,122,743 | |
| | | | | | | | |
| | | Principal
Amount ($)(a) | | | Value ($) | |
| Commercial Mortgage-Backed Securities 4.5% | |
Bank, “B”, Series 2018-BN13, 4.681%, 8/15/2061 | | | 500,000 | | | | 514,250 | |
BXP Trust, “B”, Series 2017-CQHP, 144A,1-monthUSD-LIBOR + 1.110%, 3.555%*, 11/15/2034 | | | 280,000 | | | | 276,441 | |
FHLMC Multifamily Structured Pass-Through Certificates: | | | | | | | | |
“X1”, Series K043, Interest Only, 0.542%*, 12/25/2024 | | | 4,922,343 | | | | 137,482 | |
“X1”, Series K054, Interest Only, 1.177%*, 1/25/2026 | | | 1,830,565 | | | | 126,409 | |
GS Mortgage Securities Corp. II, “B”, Series 2018-GS10, 4.374%*, 7/10/2051 | | | 500,000 | | | | 514,291 | |
Morgan Stanley Capital Barclays Bank Trust, 144A, 2.817%, 9/13/2031 | | | 500,000 | | | | 489,558 | |
Total Commercial Mortgage-Backed Securities (Cost $2,055,338) | | | | 2,058,431 | |
|
| Collateralized Mortgage Obligations 4.4% | |
Countrywide Home Loan, “A2”, Series2006-1, 6.0%, 3/25/2036 | | | 159,212 | | | | 129,718 | |
CSFB Mortgage-Backed Pass-Through Certificates, “10A3”, Series2005-10, 6.0%, 11/25/2035 | | | 79,630 | | | | 41,359 | |
Federal Home Loan Mortgage Corp.: | | | | | | | | |
“PI”, Series 4485, Interest Only, 3.5%, 6/15/2045 | | | 1,622,975 | | | | 328,865 | |
“PI”, Series 3940, Interest Only, 4.0%, 2/15/2041 | | | 248,618 | | | | 35,089 | |
“C31”, Series 303, Interest Only, 4.5%, 12/15/2042 | | | 1,149,604 | | | | 252,462 | |
Federal National Mortgage Association, “ZL”, Series2017-55, 3.0%, 10/25/2046 | | | 522,985 | | | | 466,068 | |
Government National Mortgage Association: | | | | | | | | |
“PL”, Series2013-19, 2.5%, 2/20/2043 | | | 684,500 | | | | 632,414 | |
“PI”, Series2015-40, Interest Only, 4.0%, 4/20/2044 | | | 243,340 | | | | 33,532 | |
“PI”, Series2014-108, Interest Only, 4.5%, 12/20/2039 | | | 192,512 | | | | 33,805 | |
“IN”, Series2009-69, Interest Only, 5.5%, 8/20/2039 | | | 57,364 | | | | 10,765 | |
“IV”, Series2009-69, Interest Only, 5.5%, 8/20/2039 | | | 111,382 | | | | 20,875 | |
“IJ”, Series2009-75, Interest Only, 6.0%, 8/16/2039 | | | 43,297 | | | | 7,449 | |
MASTR Alternative Loans Trust: | |
“5A1”, Series2005-1, 5.5%, 1/25/2020 | | | 6,198 | | | | 6,245 | |
“8A1”, Series2004-3, 7.0%, 4/25/2034 | | | 3,602 | | | | 3,863 | |
Total Collateralized Mortgage Obligations
(Cost $2,011,233) | | | | 2,002,509 | |
The accompanying notes are an integral part of the financial statements.
| | | | | | |
| | 10 | | | | | | Deutsche DWS Variable Series I — DWS Bond VIP |
| | | | | | | | |
| | | Principal
Amount ($)(a) | | | Value ($) | |
| Government & Agency Obligations 4.6% | |
| Other Government Related (e) 1.8% | |
| | |
Japan Bank for International Cooperation, 3.375%, 10/31/2023 | | | 500,000 | | | | 509,456 | |
| | |
Novatek OAO, 144A, 6.604%, 2/3/2021 | | | 300,000 | | | | 311,883 | |
| | | | | | | | |
| | | | | | | 821,339 | |
|
| Sovereign Bonds 1.3% | |
| | |
Republic of Argentina, 4.625%, 1/11/2023 | | | 75,000 | | | | 59,250 | |
| | |
Republic of Kazakhstan, 144A, 1.55%, 11/9/2023 | | | EUR 290,000 | | | | 333,630 | |
| | |
Republic of South Africa, 4.875%, 4/14/2026 | | | 200,000 | | | | 190,052 | |
| | | | | | | | |
| | | | | | | 582,932 | |
|
| U.S. Treasury Obligations 1.5% | |
| | |
U.S. Treasury Bond, 3.0%, 8/15/2048 | | | 145,000 | | | | 144,314 | |
| | |
U.S. Treasury Note, 3.125%, 11/15/2028 | | | 545,000 | | | | 565,310 | |
| | | | | | | | |
| | | | | | | | 709,624 | |
Total Government & Agency Obligations (Cost $2,097,991) | | | | 2,113,895 | |
| | | | | | | | |
| | | Principal
Amount ($)(a) | | | Value ($) | |
| Short-Term U.S. Treasury Obligations 2.8% | |
|
U.S. Treasury Bills: | |
| | |
2.372%**, 8/15/2019 (f) | | | 804,000 | | | | 791,356 | |
| | |
2.548%**, 10/10/2019 (g) | | | 500,000 | | | | 490,170 | |
Total Short-Term U.S. Treasury Obligations
(Cost $1,282,048) | | | | 1,281,526 | |
|
| Commercial Paper 0.9% | |
Walgreens Boots Alliance, Inc.,
2.968%, 1/9/2019
(Cost $399,740) | | | 400,000 | | | | 399,728 | |
| | |
| | | Shares | | | Value ($) | |
| Securities Lending Collateral 0.2% | |
DWS Government & Agency Securities Portfolio “DWS Government Cash Institutional Shares, 2.29% (h) (i) (Cost $111,600) | | | 111,600 | | | | 111,600 | |
|
| Cash Equivalents 4.3% | |
DWS Central Cash Management Government Fund, 2.41% (h) (Cost $1,975,521) | | | 1,975,521 | | | | 1,975,521 | |
| | |
| | | % of Net
Assets | | | Value ($) | |
Total Investment Portfolio
(Cost $50,963,835) | | | 108.9 | | | | 49,882,441 | |
| Other Assets and Liabilities, Net | | | (8.9 | ) | | | (4,086,574 | ) |
| Net Assets | | | 100.0 | | | | 45,795,867 | |
A summary of the Fund’s transactions with affiliated investments during the December 31, 2018 are as follows:
| | | | | | | | | | | | | | | | | | | | | | | | | | | | | | | | |
Value ($) at
12/31/2017 | | Purchases
Cost ($) | | | Sales
Proceeds ($) | | | Net
Realized
Gain/
(Loss) ($) | | | Net Change in
Unrealized
Appreciation
(Depreciation) ($) | | | Income ($) | | | Capital Gain
Distributions ($) | | | Number
of Shares
at
12/31/2018 | | | Value ($)
at
12/31/2018 | |
Securities Lending Collateral 0.2% | |
| DWS Government & Agency Securities Portfolio “DWS Government Cash Institutional Shares”, 2.29% (h) (i) | |
| 1,394,433 | | | — | | | | 1,282,833 | (j) | | | — | | | | — | | | | 7,730 | | | | — | | | | 111,600 | | | | 111,600 | |
Cash Equivalents 4.3% | |
DWS Central Cash Management Government Fund, 2.41% (h) | |
| 1,055,489 | | | 38,681,275 | | | | 37,761,243 | | | | — | | | | — | | | | 31,252 | | | | — | | | | 1,975,521 | | | | 1,975,521 | |
| 2,449,922 | | | 38,681,275 | | | | 39,044,076 | | | | — | | | | — | | | | 38,982 | | | | — | | | | 2,087,121 | | | | 2,087,121 | |
| * | Variable or floating rate security. These securities are shown at their current rate as of December 31, 2018. For securities based on a published reference rate and spread, the reference rate and spread are indicated within the description above. Certain variable rate securities are not based on a published reference rate and spread but adjust periodically based on current market conditions, prepayment of underlying positions and/or other variables. |
| ** | Annualized yield at time of purchase; not a coupon rate. |
| (a) | Principal amount stated in U.S. dollars unless otherwise noted. |
| (b) | All or a portion of these securities were on loan. In addition, “Other Assets and Liabilities, Net” may include pending sales that are also on loan. The value of securities loaned at December 31, 2018 amounted to $107,260, which is 0.2% of net assets. |
| (c) | Perpetual, callable security with no stated maturity date. |
| (d) | When-issued, delayed delivery or forward commitment securities included. |
| (e) | Government-backed debt issued by financial companies or government sponsored enterprises. |
| (f) | At December 31, 2018, this security has been pledged, in whole or in part, to cover initial margin requirements for open futures contracts. |
| (g) | At December 31, 2018, this security has been pledged, in whole or in part, as collateral for open centrally cleared swap contracts. |
The accompanying notes are an integral part of the financial statements.
| | | | |
Deutsche DWS Variable Series I — DWS Bond VIP | | | | | 11 |
| (h) | Affiliated fund managed by DWS Investment Management Americas, Inc. The rate shown is the annualizedseven-day yield at period end. |
| (i) | Represents collateral held in connection with securities lending. Income earned by the Fund is net of borrower rebates. |
| (j) | Represents the net increase (purchase cost) or decrease (sales proceeds) in the amount invested for the year ended December 31, 2018. |
144A: Security exempt from registration under Rule 144A of the Securities Act of 1933. These securities may be resold in transactions exempt from registration, normally to qualified institutional buyers.
CLO: Collateralized Loan Obligation
Interest Only: Interest Only (IO) bonds represent the “interest only” portion of payments on a pool of underlying mortgages or mortgage-backed securities. IO securities are subject to prepayment risk of the pool of underlying mortgages.
LIBOR: London Interbank Offered Rate
PJSC: Public Joint Stock Company
REG S: Securities sold under Regulation S may not be offered, sold or delivered within the United States or to, or for the account or benefit of, U.S. persons, except pursuant to an exemption from, or in a transaction not subject to, the registration requirements of the Securities Act of 1933.
REIT: Real Estate Investment Trust
Included in the portfolio are investments in mortgage or asset-backed securities which are interests in separate pools of mortgages or assets. Effective maturities of these investments may be shorter than stated maturities due to prepayments. Some separate investments in the Federal Home Loan Mortgage Corp. and Federal National Mortgage Association issues which have similar coupon rates have been aggregated for presentation purposes in this investment portfolio.
At December 31, 2018, open futures contracts purchased were as follows:
| | | | | | | | | | | | | | | | | | | | | | | | |
| Futures | | Currency | | | Expiration
Date | | | Contracts | | | Notional
Amount ($) | | | Notional
Value ($) | | | Unrealized
Appreciation ($) | |
| 10 Year U.S. Treasury Note | | | USD | | | | 3/20/2019 | | | | 13 | | | | 1,547,838 | | | | 1,586,203 | | | | 38,365 | |
| U.S. Treasury Long Bond | | | USD | | | | 3/20/2019 | | | | 7 | | | | 974,436 | | | | 1,022,000 | | | | 47,564 | |
| Ultra 10 Year U.S. Treasury Note | | | USD | | | | 3/20/2019 | | | | 22 | | | | 2,795,195 | | | | 2,861,719 | | | | 66,524 | |
| Total net unrealized appreciation | | | | 152,453 | |
At December 31, 2018, open futures contracts sold were as follows:
| | | | | | | | | | | | | | | | | | | | | | | | |
| Futures | | Currency | | | Expiration
Date | | | Contracts | | | Notional
Amount ($) | | | Notional
Value ($) | | | Unrealized
(Depreciation) ($) | |
| 5 Year U.S. Treasury Note | | | USD | | | | 3/29/2019 | | | | 11 | | | | 1,240,659 | | | | 1,261,562 | | | | (20,903 | ) |
| Ultra Long U.S. Treasury Bond | | | USD | | | | 3/20/2019 | | | | 17 | | | | 2,588,215 | | | | 2,731,156 | | | | (142,941 | ) |
| Total net unrealized depreciation | | | | (163,844 | ) |
At December 31, 2018, open credit default swap contracts purchased were as follows:
| | | | | | | | | | | | | | | | | | | | | | | | | | |
| Centrally Cleared Swaps | |
Underlying
Reference
Obligation | | Fixed Cash
Flows Paid/
Frequency | | Expiration
Date | | | Notional
Amount (k) | | | Currency | | | Value ($) | | | Upfront
Payments
Paid ($) | | | Unrealized
(Depreciation) ($) | |
| Markit CDX North America High Yield Index | | 5.0%/Quarterly | | | 12/20/2023 | | | | 3,300,000 | | | | USD | | | | (71,528) | | | | (50,187) | | | | (21,341) | |
| Markit CDX North America Investment Grade Index | | 1.0%/Quarterly | | | 12/20/2023 | | | | 6,600,000 | | | | USD | | | | (38,796) | | | | (35,995) | | | | (2,801) | |
| Total unrealized depreciation | | | | (24,142) | |
| (k) | The maximum potential amount of future undiscounted payments that the Fund could be required to make under a credit default swap contract would be the notional amount of the contract. These potential amounts would be partially offset by any recovery values of the referenced debt obligation or net amounts received from the settlement of buy protection credit default swap contracts entered into by the Fund for the same referenced debt obligation, if any. |
At December 31, 2018, the Fund had the following open forward foreign currency contracts:
| | | | | | | | | | | | | | | | | | | | |
| Contracts to Deliver | | | In Exchange For | | | Settlement
Date | | | Unrealized
Appreciation ($) | | | Counterparty |
| EUR | | | 522,000 | | | USD | | | 609,350 | | | | 1/18/2019 | | | | 10,325 | | | HSBC Holdings PLC |
| EUR | | | 220,000 | | | USD | | | 255,304 | | | | 1/18/2019 | | | | 2,842 | | | Australia and New Zealand Banking Group Ltd. |
| NOK | | | 7,755,000 | | | USD | | | 936,430 | | | | 1/29/2019 | | | | 38,260 | | | Danske Bank AS |
| Total unrealized appreciation | | | | | | | | 51,427 | | | |
| | | | | | | | | | | | | | | | | | | | |
| Contracts to Deliver | | | In Exchange For | | | Settlement
Date | | | Unrealized
Depreciation ($) | | | Counterparty |
| EUR | | | 290,000 | | | USD | | | 331,212 | | | | 1/18/2019 | | | | (1,579) | | | JPMorgan Chase Securities, Inc. |
| USD | | | 930,107 | | | NOK | | | 7,755,000 | | | | 1/29/2019 | | | | (31,937) | | | Danske Bank AS |
| Total unrealized depreciation | | | | | | | | (33,516) | | | |
The accompanying notes are an integral part of the financial statements.
| | | | | | |
| | 12 | | | | | | Deutsche DWS Variable Series I — DWS Bond VIP |
Currency Abbreviations
For information on the Fund’s policy and additional disclosures regarding future contracts, credit default swap contracts and forward foreign currency contracts, please refer to the Derivatives section of Note B in the accompanying Notes to Financial Statements.
Fair Value Measurements
Various inputs are used in determining the value of the Fund’s investments. These inputs are summarized in three broad levels. Level 1 includes quoted prices in active markets for identical securities. Level 2 includes other significant observable inputs (including quoted prices for similar securities, interest rates, prepayment speeds and credit risk). Level 3 includes significant unobservable inputs (including the Fund’s own assumptions in determining the fair value of investments). The level assigned to the securities valuations may not be an indication of the risk or liquidity associated with investing in those securities.
The following is a summary of the inputs used as of December 31, 2018 in valuing the Fund’s investments. For information on the Fund’s policy regarding the valuation of investments, please refer to the Security Valuation section of Note A in the accompanying Notes to Financial Statements.
| | | | | | | | | | | | | | | | |
| Assets | | Level 1 | | | Level 2 | | | Level 3 | | | Total | |
| Fixed Income Investments (l) | | | | | | | | | | | | | | | | |
Corporate Bonds | | $ | — | | | $ | 26,417,830 | | | $ | — | | | $ | 26,417,830 | |
Mortgage-Backed Securities Pass-Throughs | | | — | | | | 9,398,658 | | | | — | | | | 9,398,658 | |
Asset-Backed | | | — | | | | 4,122,743 | | | | — | | | | 4,122,743 | |
Commercial Mortgage-Backed Securities | | | — | | | | 2,058,431 | | | | — | | | | 2,058,431 | |
Collateralized Mortgage Obligations | | | — | | | | 2,002,509 | | | | — | | | | 2,002,509 | |
Government & Agency Obligations | | | — | | | | 2,113,895 | | | | — | | | | 2,113,895 | |
Short-Term U.S. Treasury Obligations | | | — | | | | 1,281,526 | | | | — | | | | 1,281,526 | |
| Commercial Paper | | | — | | | | 399,728 | | | | — | | | | 399,728 | |
| Short-Term Investments (l) | | | 2,087,121 | | | | — | | | | — | | | | 2,087,121 | |
| Derivatives (m) | | | | | | | | | | | | | | | | |
Futures Contracts | | | 152,453 | | | | — | | | | — | | | | 152,453 | |
Forward Foreign Currency Contracts | | | — | | | | 51,427 | | | | — | | | | 51,427 | |
| Total | | $ | 2,239,574 | | | $ | 47,846,747 | | | $ | — | | | $ | 50,086,321 | |
| | | | |
| Liabilities | | Level 1 | | | Level 2 | | | Level 3 | | | Total | |
| Derivatives (m) | | | | | | | | | | | | | | | | |
Futures Contracts | | $ | (163,844 | ) | | $ | — | | | $ | — | | | $ | (163,844 | ) |
Credit Default Swap Contracts | | | — | | | | (24,142 | ) | | | — | | | | (24,142 | ) |
Forward Foreign Currency Contracts | | | — | | | | (33,516 | ) | | | — | | | | (33,516 | ) |
| Total | | $ | (163,844 | ) | | $ | (57,658 | ) | | $ | — | | | $ | (221,502 | ) |
| (l) | See Investment Portfolio for additional detailed categorizations. |
| (m) | Derivatives include unrealized appreciation (depreciation) on open futures contracts, credit default swap contracts and forward foreign currency contracts. |
The accompanying notes are an integral part of the financial statements.
| | | | |
Deutsche DWS Variable Series I — DWS Bond VIP | | | | | 13 |
Statement of Assets and Liabilities
| | | | |
| as of December 31, 2018 | | | | |
| |
| Assets | | | | |
| Investments innon-affiliated securities, at value (cost $48,876,714) — including $107,260 of securities loaned | | $ | 47,795,320 | |
| Investment in DWS Government & Agency Securities Portfolio (cost $111,600)* | | | 111,600 | |
| Investment in DWS Central Cash Management Government Fund (cost $1,975,521) | | | 1,975,521 | |
| Foreign currency, at value (cost $1,145,778) | | | 1,132,135 | |
Receivable for variation margin on future contracts | | | 5,829 | |
| Receivable for Fund shares sold | | | 421 | |
| Interest receivable | | | 396,205 | |
| Unrealized appreciation on forward foreign currency contracts | | | 51,427 | |
| Foreign taxes recoverable | | | 1,122 | |
| Other assets | | | 1,593 | |
| Total assets | | | 51,471,173 | |
|
| Liabilities | |
| Cash overdraft | | | 5,509 | |
| Payable upon return of securities loaned | | | 111,600 | |
| Payable for investments purchased | | | 327,123 | |
Payable for investments purchased —
when-issued/delayed delivery securities | | | 4,996,416 | |
| Payable for Fund shares redeemed | | | 44,947 | |
| Payable for variation margin on centrally cleared swaps | | | 5,742 | |
| Unrealized depreciation on forward foreign currency contracts | | | 33,516 | |
| Accrued management fee | | | 6,321 | |
| Accrued Trustees’ fees | | | 1,057 | |
| Other accrued expenses and payables | | | 143,075 | |
| Total liabilities | | | 5,675,306 | |
| Net assets, at value | | $ | 45,795,867 | |
| |
| Net Assets Consist of | | | | |
| Distributable earnings (loss) | | | (2,762,575 | ) |
| Paid-in capital | | | 48,558,442 | |
| Net assets, at value | | $ | 45,795,867 | |
Net Asset Value | | | | |
| |
Net asset value,offering and redemption price per share ($45,795,867 ÷ 8,635,826 outstanding shares of beneficial interest, $.01 par value, unlimited number of shares authorized) | | $ | 5.30 | |
| * | Represents collateral on securities loaned. |
Statement of Operations
| | | | |
| for the year ended December 31, 2018 | |
| |
| Investment Income | | | | |
| Income: | | | | |
| Interest (net of foreign taxes withheld of $212) | | $ | 1,819,823 | |
| Income distributions — DWS Central Cash Management Government Fund | | | 31,252 | |
| Securities lending income, net of borrower rebates | | | 7,730 | |
| Total income | | | 1,858,805 | |
| Expenses: | | | | |
| Management fee | | | 187,084 | |
| Administration fee | | | 47,970 | |
| Services to shareholders | | | 1,096 | |
| Custodian fee | | | 18,076 | |
| Professional fees | | | 99,448 | |
| Reports to shareholders | | | 29,720 | |
| Trustees’ fees and expenses | | | 3,892 | |
| Pricing service fee | | | 23,458 | |
| Other | | | 5,753 | |
| Total expenses before expense reductions | | | 416,497 | |
| Expense reductions | | | (85,887 | ) |
| Total expenses after expense reductions | | | 330,610 | |
| Net investment income | | | 1,528,195 | |
|
| Realized and Unrealized Gain (Loss) | |
Net realized gain (loss) from: Investments | | | (1,190,857 | ) |
| Swap contracts | | | (137,968 | ) |
| Futures | | | (70,435 | ) |
| Forward foreign currency contracts | | | 64,397 | |
| Foreign currency | | | (8,970 | ) |
| | | | (1,343,833 | ) |
| Change in net unrealized appreciation (depreciation) on: | | | | |
| Investments | | | (1,477,760 | ) |
| Swap contracts | | | (13,638 | ) |
| Futures | | | (20,701 | ) |
| Forward foreign currency contracts | | | 12,738 | |
| Foreign currency | | | (25,180 | ) |
| | | | (1,524,541 | ) |
| Net gain (loss) | | | (2,868,374 | ) |
| Net increase (decrease) in net assets resulting from operations | | $ | (1,340,179 | ) |
The accompanying notes are an integral part of the financial statements.
| | | | | | |
| | 14 | | | | | | Deutsche DWS Variable Series I — DWS Bond VIP |
Statements of Changes in Net Assets
| | | | | | | | |
| | | Years Ended December 31, | |
| Increase (Decrease) in Net Assets | | 2018 | | | 2017 | |
| Operations: | |
| Net investment income | | $ | 1,528,195 | | | $ | 2,126,076 | |
| Net realized gain (loss) | | | (1,343,833 | ) | | | 1,507,922 | |
| Change in net unrealized appreciation (depreciation) | | | (1,524,541 | ) | | | 581,196 | |
| Net increase (decrease) in net assets resulting from operations | | | (1,340,179 | ) | | | 4,215,194 | |
| Distributions to shareholders: | |
| Class A | | | (2,159,140 | ) | | | (1,811,823 | )* |
| Fund share transactions: | | | | | | | | |
Class A | | | | | | | | |
| Proceeds from shares sold | | | 2,190,642 | | | | 5,538,840 | |
| Reinvestment of distributions | | | 2,159,140 | | | | 1,811,823 | |
| Payments for shares redeemed | | | (6,549,537 | ) | | | (35,229,871 | ) |
| Net increase (decrease) in net assets from Class A share transactions | | | (2,199,755 | ) | | | (27,879,208 | ) |
| Increase (decrease) in net assets | | | (5,699,074 | ) | | | (25,475,837 | ) |
| Net assets at beginning of period | | | 51,494,941 | | | | 76,970,778 | |
| | |
| Net assets at end of period | | $ | 45,795,867 | | | $ | 51,494,941 | ** |
| | |
| Other Information: | | | | | | | | |
Class A | | | | | | | | |
| Shares outstanding at beginning of period | | | 9,030,036 | | | | 13,944,103 | |
| Shares sold | | | 405,229 | | | | 986,189 | |
| Shares issued to shareholders in reinvestment of distributions | | | 407,385 | | | | 328,229 | |
| Shares redeemed | | | (1,206,824 | ) | | | (6,228,485 | ) |
| Net increase (decrease) in Class A shares | | | (394,210 | ) | | | (4,914,067 | ) |
| | |
| Shares outstanding at end of period | | | 8,635,826 | | | | 9,030,036 | |
| * | Includes distributions from net investment income. |
| ** | Includes undistributed net investment income of $2,119,833. |
The accompanying notes are an integral part of the financial statements.
| | | | |
Deutsche DWS Variable Series I — DWS Bond VIP | | | | | 15 |
Financial Highlights
| | | | | | | | | | | | | | | | | | | | |
| | | Years Ended December 31, | |
| Class A | | 2018 | | | 2017 | | | 2016 | | | 2015 | | | 2014 | |
| | | | | |
| Selected Per Share Data | | | | | | | | | | | | | | | | | | | | |
| Net asset value, beginning of period | | $ | 5.70 | | | $ | 5.52 | | | $ | 5.49 | | | $ | 5.67 | | | $ | 5.51 | |
| Income (loss) from investment operations: | | | | | | | | | | | | | | | | | | | | |
Net investment incomea | | | .17 | | | | .17 | | | | .15 | | | | .14 | | | | .17 | |
Net realized and unrealized gain (loss) | | | (.32 | ) | | | .15 | | | | .17 | | | | (.15 | ) | | | .19 | |
Total from investment operations | | | (.15 | ) | | | .32 | | | | .32 | | | | (.01 | ) | | | .36 | |
| Less distributions from: | | | | | | | | | | | | | | | | | | | | |
Net investment income | | | (.25 | ) | | | (.14 | ) | | | (.29 | ) | | | (.17 | ) | | | (.20 | ) |
| Net asset value, end of period | | $ | 5.30 | | | $ | 5.70 | | | $ | 5.52 | | | $ | 5.49 | | | $ | 5.67 | |
| Total Return (%)b | | | (2.65 | ) | | | 5.83 | | | | 5.93 | | | | (.29 | ) | | | 6.63 | |
| | | | | |
| Ratios to Average Net Assets and Supplemental Data | | | | | | | | | | | | | | | | | | | | |
| Net assets, end of period ($ millions) | | | 46 | | | | 51 | | | | 77 | | | | 80 | | | | 101 | |
| Ratio of expenses before expense reductions (%)c | | | .87 | | | | .74 | | | | .78 | | | | .69 | | | | .69 | |
| Ratio of expenses after expense reductions (%)c | | | .69 | | | | .65 | | | | .64 | | | | .64 | | | | .61 | |
| Ratio of net investment income (%) | | | 3.19 | | | | 2.99 | | | | 2.68 | | | | 2.54 | | | | 2.99 | |
| Portfolio turnover rate (%) | | | 260 | | | | 205 | | | | 236 | | | | 197 | | | | 273 | |
| a | Based on average shares outstanding during the period. |
| b | Total return would have been lower had certain expenses not been reduced. |
| c | Expense ratio does not reflect charges and fees associated with the separate account that invests in the Fund or any variable life insurance policy or variable annuity contract for which the Fund is an investment option. |
The accompanying notes are an integral part of the financial statements.
| | | | | | |
| | 16 | | | | | | Deutsche DWS Variable Series I — DWS Bond VIP |
| | |
| Notes to Financial Statements | | |
A. Organization and Significant Accounting Policies
Deutsche DWS Variable Series I (formerly Deutsche Variable Series I) (the “Trust“) is registered under the Investment Company Act of 1940, as amended (the “1940 Act“), as anopen-end, registered management investment company organized as a Massachusetts business trust. The Trust consists of five diversified funds: DWS Bond VIP (formerly Deutsche Bond VIP), DWS Capital Growth VIP (formerly Deutsche Capital Growth VIP), DWS Core Equity VIP (formerly Deutsche Core Equity VIP), DWS CROCI® International VIP (formerly Deutsche CROCI® International VIP) and DWS Global Small Cap VIP (formerly Deutsche Global Small Cap VIP) (individually or collectively hereinafter referred to as a “Fund“ or the “Funds“). These financial statements report on DWS Bond VIP. The Trust is intended to be the underlying investment vehicle for variable annuity contracts and variable life insurance policies to be offered by the separate accounts of certain life insurance companies (“Participating Insurance Companies“).
The Fund’s financial statements are prepared in accordance with accounting principles generally accepted in the United States of America (“U.S. GAAP”) which require the use of management estimates. Actual results could differ from those estimates. The Fund qualifies as an investment company under Topic 946 of Accounting Standards Codification of U.S. GAAP. The policies described below are followed consistently by the Fund in the preparation of its financial statements.
In October 2018, the Securities and Exchange Commission adopted amendments to certain disclosure requirements in Securities Act Release No. 33-10532, Disclosure Update and Simplification, which is intended to facilitate the disclosure of information to investors and simplify compliance without significantly altering the total mix of information provided to investors. Effective with the current reporting period, the Fund adopted the amendments with the impacts being that the Fund is no longer required to present components of distributable earnings on the Statement of Assets and Liabilities or the sources of distributable earnings and the amount of undistributed net investment income on the Statements of Changes in Net Assets.
Security Valuation. Investments are stated at value determined as of the close of regular trading on the New York Stock Exchange on each day the exchange is open for trading.
Various inputs are used in determining the value of the Fund’s investments. These inputs are summarized in three broad levels. Level 1 includes quoted prices in active markets for identical securities. Level 2 includes other significant observable inputs (including quoted prices for similar securities, interest rates, prepayment speeds and credit risk). Level 3 includes significant unobservable inputs (including the Fund’s own assumptions in determining the fair value of investments). The level assigned to the securities valuations may not be an indication of the risk or liquidity associated with investing in those securities.
Debt securities are valued at prices supplied by independent pricing services approved by the Trustees of the Series. Such services may use various pricing techniques which take into account appropriate factors such as yield, quality, coupon rate, maturity, type of issue, trading characteristics, prepayment speeds and other data, as well as broker quotes. If the pricing services are unable to provide valuations, debt securities are valued at the average of the most recent reliable bid quotations or evaluated prices, as applicable, obtained frombroker-dealers. These securities are generally categorized as Level 2.
Investments inopen-end investment companies are valued at their net asset value each business day and are categorized as Level 1.
Futures contracts are generally valued at the settlement prices established each day on the exchange on which they are traded and are categorized as Level 1.
Swap contracts are valued daily based upon prices supplied by a Board approved pricing vendor, if available, and otherwise are valued at the price provided by thebroker-dealer. Swap contracts are generally categorized as Level 2.
Forward currency contracts are valued at the prevailing forward exchange rate of the underlying currencies and are categorized as Level 2.
Securities and other assets for which market quotations are not readily available or for which the above valuation procedures are deemed not to reflect fair value are valued in a manner that is intended to reflect their fair value as determined in accordance with procedures approved by the Trustees and are generally categorized as Level 3. In accordance with the Fund’s valuation procedures, factors considered in determining value may include, but are not limited to, the type of the security; the size of the holding; the
| | | | |
Deutsche DWS Variable Series I — DWS Bond VIP | | | | | 17 |
initial cost of the security; the existence of any contractual restrictions on the security’s disposition; the price and extent of public trading in similar securities of the issuer or of comparable companies; quotations or evaluated prices frombroker-dealers and/or pricing services; information obtained from the issuer, analysts, and/or the appropriate stock exchange (forexchange-traded securities); an analysis of the company’s or issuer’s financial statements; an evaluation of the forces that influence the issuer and the market(s) in which the security is purchased and sold; and with respect to debt securities, the maturity, coupon, creditworthiness, currency denomination and the movement of the market in which the security is normally traded. The value determined under these procedures may differ from published values for the same securities.
Disclosure about the classification of fair value measurements is included in a table following the Fund’s Investment Portfolio.
Securities Lending. Deutsche Bank AG, as lending agent, lends securities of the Fund to certain financial institutions under the terms of its securities lending agreement. During the term of the loans, the Fund continues to receive interest and dividends generated by the securities and to participate in any changes in their market value. The Fund requires the borrowers of the securities to maintain collateral with the Fund consisting of either cash or liquid, unencumbered assets having a value at least equal to the value of the securities loaned. When the collateral falls below specified amounts, the lending agent will use its best effort to obtain additional collateral on the next business day to meet required amounts under the securities lending agreement. As of period end, any securities on loan were collateralized by cash. During the year ended December 31, 2018, the Fund invested the cash collateral into a joint trading account in affiliated money market funds managed by DWS Investment Management Americas, Inc. As of December 31, 2018, the Fund invested the cash collateral in DWS Government & Agency Securities Portfolio. DWS Investment Management Americas, Inc. receives a management/administration fee (0.12% annualized effective rate as of December 31, 2018) on the cash collateral invested in DWS Government & Agency Securities Portfolio. The Fund receives compensation for lending its securities either in the form of fees or by earning interest on invested cash collateral net of borrower rebates and fees paid to a lending agent. Either the Fund or the borrower may terminate the loan at any time and the borrower, after notice, is required to return borrowed securities within a standard time period. There may be risks of delay and costs in recovery of securities or even loss of rights in the collateral should the borrower of the securities fail financially. If the Fund is not able to recover securities lent, the Fund may sell the collateral and purchase a replacement investment in the market, incurring the risk that the value of the replacement security is greater than the value of the collateral. The Fund is also subject to all investment risks associated with the reinvestment of any cash collateral received, including, but not limited to, interest rate, credit and liquidity risk associated with such investments.
As of December 31, 2018, the Fund had securities on loan, which were classified as corporate bonds in the Investment Portfolio. The value of the related collateral exceeded the value of the securities loaned at period end. As of period end, the remaining contractual maturity of the collateral agreements was overnight and continuous.
Foreign Currency Translations. The books and records of the Fund are maintained in U.S. dollars. Investment securities and other assets and liabilities denominated in a foreign currency are translated into U.S. dollars at the prevailing exchange rates at period end. Purchases and sales of investment securities, income and expenses are translated into U.S. dollars at the prevailing exchange rates on the respective dates of the transactions.
Net realized and unrealized gains and losses on foreign currency transactions represent net gains and losses between trade and settlement dates on securities transactions, the acquisition and disposition of foreign currencies, and the difference between the amount of net investment income accrued and the U.S. dollar amount actually received. The portion of both realized and unrealized gains and losses on investments that results from fluctuations in foreign currency exchange rates is not separately disclosed but is included with net realized and unrealized gain/appreciation and loss/depreciation on investments.
When-Issued/Delayed Delivery Securities. The Fund may purchase or sell securities with delivery or payment to occur at a later date beyond the normal settlement period. At the time the Fund enters into a commitment to purchase or sell a security, the transaction is recorded and the value of the transaction is reflected in the net asset value. The price of such security and the date when the security will be delivered and paid for are fixed at the time the transaction is negotiated. The value of the security may vary with market fluctuations. At the time the Fund enters into a purchase transaction it is required to segregate cash or other liquid assets at least equal to the amount of the commitment. Additionally, the Fund may be required to post securities and/or cash collateral in accordance with the terms of the commitment.
| | | | | | |
| | 18 | | | | | | Deutsche DWS Variable Series I — DWS Bond VIP |
Certain risks may arise upon entering intowhen-issued or delayed delivery transactions from the potential inability of counterparties to meet the terms of their contracts or if the issuer does not issue the securities due to political, economic, or other factors. Additionally, losses may arise due to changes in the value of the underlying securities.
Taxes. The Fund is treated as a separate taxpayer as provided for in the Internal Revenue Code, as amended. It is the Fund’s policy to comply with the requirements of the Internal Revenue Code, as amended, which are applicable to regulated investment companies, and to distribute all of its taxable income to the separate accounts of the Participating Insurance Companies which hold its shares.
Additionally, the Fund may be subject to taxes imposed by the governments of countries in which it invests and are generally based on income and/or capital gains earned or repatriated. Estimated tax liabilities on certain foreign securities are recorded on an accrual basis and are reflected as components of interest income or net change in unrealized gain/loss on investments. Tax liabilities realized as a result of security sales are reflected as a component of net realized gain/loss on investments.
At December 31, 2018, the Fund had a net tax basis capital loss carryforward of approximately $3,092,000 which may be applied against realized net taxable capital gains indefinitely, including short-term losses ($887,000) and long-term losses ($2,205,000).
The Fund has reviewed the tax positions for the open tax years as of December 31, 2018 and has determined that no provision for income tax and/or uncertain tax provisions is required in the Fund’s financial statements. The Fund’s federal tax returns for the prior three fiscal years remain open subject to examination by the Internal Revenue Service.
Distribution of Income and Gains. Distributions from net investment income of the Fund, if any, are declared and distributed to shareholders annually. Net realized gains from investment transactions, in excess of available capital loss carryforwards, would be taxable to the Fund if not distributed, and, therefore, will be distributed to shareholders at least annually. The Fund may also make additional distributions for tax purposes if necessary.
The timing and characterization of certain income and capital gain distributions are determined annually in accordance with federal tax regulations which may differ from accounting principles generally accepted in the United States of America. These differences primarily relate to investments in foreign denominated investments, investments in forward foreign currency exchange contracts, futures contracts, swap contracts and certain securities sold at a loss. As a result, net investment income (loss) and net realized gain (loss) on investment transactions for a reporting period may differ significantly from distributions during such period. Accordingly, the Fund may periodically make reclassifications among certain of its capital accounts without impacting the net asset value of the Fund.
At December 31, 2018, the Fund’s components of distributable earnings (accumulated losses) on a tax basis are as follows:
| | | | |
| Undistributed ordinary income* | | $ | 1,432,215 | |
| Capital loss carryforwards | | $ | (3,092,000 | ) |
| Net unrealized appreciation (depreciation) on investments | | $ | (1,083,266 | ) |
At December 31, 2018, the aggregate cost of investments for federal income tax purposes was $50,965,707. The net unrealized depreciation for all investments based on tax cost was $1,083,266. This consisted of aggregate gross unrealized appreciation for all investments in which there was an excess of value over tax cost of $299,537 and aggregate gross unrealized depreciation for all investments in which there was an excess of tax cost over value of $1,382,803.
In addition, the tax character of distributions paid to shareholders by the Fund is summarized as follows:
| | | | | | | | |
| | | Years Ended December 31, | |
| | | 2018 | | | 2017 | |
| Distributions from ordinary income* | | $ | 2,159,140 | | | $ | 1,811,823 | |
| * | For tax purposes, short-term capital gain distributions are considered ordinary income distributions. |
Expenses. Expenses of the Trust arising in connection with a specific Fund are allocated to that Fund. Other Trust expenses which cannot be directly attributed to a Fund are apportioned among the Funds in the Trust based upon the relative net assets or other appropriate measures.
| | | | |
Deutsche DWS Variable Series I — DWS Bond VIP | | | | | 19 |
Contingencies. In the normal course of business, the Fund may enter into contracts with service providers that contain general indemnification clauses. The Fund’s maximum exposure under these arrangements is unknown, as this would involve future claims that may be made against the Fund that have not yet been made. However, based on experience, the Fund expects the risk of loss to be remote.
Other. Investment transactions are accounted for on a trade date plus one basis for daily net asset value calculations. However, for financial reporting purposes, investment transactions are reported on trade date. Interest income is recorded on the accrual basis net of foreign withholding taxes. Realized gains and losses from investment transactions are recorded on an identified cost basis. Proceeds from litigation payments, if any, are included in net realized gain (loss) from investments. All discounts and premiums are accreted/amortized for both tax and financial reporting purposes.
B. Derivative Instruments
Futures Contracts. A futures contract is an agreement between a buyer or seller and an established futures exchange or its clearinghouse in which the buyer or seller agrees to take or make a delivery of a specific amount of a financial instrument at a specified price on a specific date (settlement date). For the year ended December 31, 2018, the Fund invested in interest rate futures to gain exposure to different parts of the yield curve while managing the overall duration. The Fund also entered into interest rate futures contracts fornon-hedging purposes to seek to enhance potential gains.
Upon entering into a futures contract, the Fund is required to deposit with a financial intermediary cash or securities (“initial margin”) in an amount equal to a certain percentage of the face value indicated in the futures contract. Subsequent payments (“variation margin”) are made or received by the Fund dependent upon the daily fluctuations in the value and are recorded for financial reporting purposes as unrealized gains or losses by the Fund. Gains or losses are realized when the contract expires or is closed. Since all futures contracts are exchange traded, counterparty risk is minimized as the exchange’s clearinghouse acts as the counterparty, and guarantees the futures against default.
Certain risks may arise upon entering into futures contracts, including the risk that an illiquid market will limit the Fund’s ability to close out a futures contract prior to the settlement date and the risk that the futures contract is not well correlated with the security, index or currency to which it relates. Risk of loss may exceed amounts disclosed in the Statement of Assets and Liabilities.
A summary of the open futures contracts as of December 31, 2018, is included in a table following the Fund’s Investment Portfolio. For the year ended December 31, 2018, the investment in futures contracts purchased had a total notional value generally indicative of a range from approximately $4,135,000 to $5,824,000, and the investment in futures contracts sold had a total notional value generally indicative of a range from approximately $3,829,000 to $6,899,000.
Swaps.A swap is a contract between two parties to exchange future cash flows at periodic intervals based on the notional amount of the swap. A bilateral swap is a transaction between the fund and a counterparty where cash flows are exchanged between the two parties. A centrally cleared swap is a transaction executed between the fund and a counterparty, then cleared by a clearing member through a central clearinghouse. The central clearinghouse serves as the counterparty, with whom the fund exchanges cash flows.
The value of a swap is adjusted daily, and the change in value, if any, is recorded as unrealized appreciation or depreciation in the Statement of Assets and Liabilities. Gains or losses are realized when the swap expires or is closed. Certain risks may arise when entering into swap transactions including counterparty default; liquidity; or unfavorable changes in interest rates or the value of the underlying reference security, commodity or index. In connection with bilateral swaps, securities and/or cash may be identified as collateral in accordance with the terms of the swap agreement to provide assets of value and recourse in the event of default. The maximum counterparty credit risk is the net present value of the cash flows to be received from or paid to the counterparty over the term of the swap, to the extent that this amount is beneficial to the Fund, in addition to any related collateral posted to the counterparty by the Fund. This risk may be partially reduced by a master netting arrangement between the Fund and the counterparty. Upon entering into a centrally cleared swap, the Fund is required to deposit with a financial intermediary cash or securities (“initial margin”) in an amount equal to a certain percentage of the notional amount of the swap. Subsequent payments (“variation margin”) are made or received by the Fund dependent upon the daily fluctuations in the value of the swap. In a cleared swap transaction, counterparty risk is minimized as the central clearinghouse acts as the counterparty.
| | | | | | |
| | 20 | | | | | | Deutsche DWS Variable Series I — DWS Bond VIP |
An upfront payment, if any, made by the Fund is recorded as an asset in the Statement of Assets and Liabilities. An upfront payment, if any, received by the Fund is recorded as a liability in the Statement of Assets and Liabilities. Payments received or made at the end of the measurement period are recorded as realized gain or loss in the Statement of Operations.
Interest Rate Swaps. Interest rate swaps are agreements in which the Fund agrees to pay to the counterparty a fixed rate payment in exchange for the counterparty agreeing to pay to the Fund a variable rate payment, or the Fund agrees to receive from the counterparty a fixed rate payment in exchange for the counterparty agreeing to receive from the Fund a variable rate payment. The payment obligations are based on the notional amount of the swap. For the year ended December 31, 2018, the Fund entered into interest rate swap agreements to gain exposure to different parts of the yield curve while managing overall duration and for non-hedging purposes to seek to enhance potential gains.
As of December 31, 2018 the fund did not hold open interest rate swap contracts. For the year ended December 31, 2018, the investment in interest rate swap contracts had a total USD equivalent notional amount generally indicative of a range from $0 to approximately $2,997,000.
Credit Default Swaps. Credit default swaps are agreements between a buyer and a seller of protection against predefined credit events for the reference entity. The Fund may enter into credit default swaps to gain exposure to an underlying issuer’s credit quality characteristics without directly investing in that issuer or to hedge against the risk of a credit event on debt securities. As a seller of a credit default swap, the Fund is required to pay the par (or other agreed-upon) value of the referenced entity to the counterparty with the occurrence of a credit event by a third party, such as a U.S. or foreign corporate issuer, on the reference entity, which would likely result in a loss to the Fund. In return, the Fund receives from the counterparty a periodic stream of payments over the term of the swap provided that no credit event has occurred. If no credit event occurs, the Fund keeps the stream of payments with no payment obligations. The Fund may also buy credit default swaps, in which case the Fund functions as the counterparty referenced above. This involves the risk that the swap may expire worthless. It also involves counterparty risk that the seller may fail to satisfy its payment obligations to the Fund with the occurrence of a credit event. When the Fund sells a credit default swap, it will cover its commitment. This may be achieved by, among other methods, maintaining cash or liquid assets equal to the aggregate notional value of the reference entities for all outstanding credit default swaps sold by the Fund. For the year ended December 31, 2018, the Fund entered into credit default swap agreements to gain exposure to the underlying issuer’s credit quality characteristics and to hedge the risk of default or other specified credit events on portfolio assets.
Under the terms of a credit default swap, the Fund receives or makes periodic payments based on a specified interest rate on a fixed notional amount. These payments are recorded as a realized gain or loss in the Statement of Operations. Payments received or made as a result of a credit event or termination of the swap are recognized, net of a proportional amount of the upfront payment, as realized gains or losses in the Statement of Operations.
A summary of the open credit default swap contracts as of December 31, 2018 is included in a table following the Fund’s Investment Portfolio. For the year ended December 31, 2018, the investment in credit default swap contracts purchased had a total notional amount generally indicative of a range from $0 to approximately $9,900,000.
Forward Foreign Currency Contracts. A forward foreign currency contract (“forward currency contract“) is a commitment to purchase or sell a foreign currency at the settlement date at a negotiated rate. The Fund is subject to foreign exchange rate risk in its securities denominated in foreign currencies. Changes in exchange rates between foreign currencies and the U.S. dollar may affect the U.S. dollar value of foreign securities or the income or gains received on these securities. To reduce the effect of currency fluctuations, the Fund may enter into forward currency contracts. For the year ended December 31, 2018, the Fund invested in forward currency contracts to hedge its exposure to changes in foreign currency exchange rates on its foreign currency denominated securities. In addition, the Fund also engaged in forward currency contracts fornon-hedging purposes to seek to enhance potential gains.
Forward currency contracts are valued at the prevailing forward exchange rate of the underlying currencies and unrealized gain (loss) is recorded daily. On the settlement date of the forward currency contract, the Fund records a realized gain or loss equal to the difference between the value of the contract at the time it was opened and the value of the contract at the time it was closed. Certain risks may arise upon entering into forward currency contracts from the potential inability of counterparties to meet the terms of their contracts. The maximum counterparty credit risk to the Fund is measured by the unrealized gain on
| | | | |
Deutsche DWS Variable Series I — DWS Bond VIP | | | | | 21 |
appreciated contracts. Additionally, when utilizing forward currency contracts to hedge, the Fund gives up the opportunity to profit from favorable exchange rate movements during the term of the contract.
A summary of the open forward currency contracts as of December 31, 2018, is included in a table following the Fund’s Investment Portfolio. For the year ended December 31, 2018, the investment in forward currency contracts U.S. dollars purchased had a total contract value generally indicative of a range from approximately $1,567,000 to $3,314,000 and the investment in forward currency contracts U.S. dollars sold had a total contract value generally indicative of a range from approximately $0 to $3,624,000.
The following tables summarize the value of the Fund’s derivative instruments held as of December 31, 2018 and the related location in the accompanying Statement of Assets and Liabilities, presented by primary underlying risk exposure:
| | | | | | | | | | | | |
| Asset Derivatives | | Forward
Contracts | | | Futures
Contracts | | | Total | |
| Interest Rate Contracts (a) | | $ | — | | | $ | 152,453 | | | $ | 152,453 | |
| Foreign Exchange Contracts (b) | | | 51,427 | | | | — | | | | 51,427 | |
| | | $ | 51,427 | | | $ | 152,453 | | | $ | 203,880 | |
Each of the above derivatives is located in the following Statement of Assets and Liabilities accounts:
| (a) | Includes cumulative appreciation of futures contracts as disclosed in the Investment Portfolio. Unsettled variation margin is disclosed separately within the Statement of Assets and Liabilities. |
| (b) | Unrealized appreciation on forward foreign currency contracts |
| | | | | | | | | | | | | | | | |
| Liability Derivatives | | Forward
Contracts | | | Swap
Contracts | | | Futures
Contracts | | | Total | |
| Interest Rate Contract (c) | | $ | — | | | $ | — | | | $ | (163,844 | ) | | $ | (163,844 | ) |
| Credit Contracts (c) | | | — | | | | (24,142 | ) | | | — | | | | (24,142 | ) |
| Foreign Exchange Contracts (d) | | | (33,516 | ) | | | — | | | | — | | | | (33,516 | ) |
| | | $ | (33,516 | ) | | $ | (24,142 | ) | | $ | (163,844 | ) | | $ | (221,502 | ) |
Each of the above derivatives is located in the following Statement of Assets and Liabilities accounts:
| (c) | Includes cumulative depreciation of centrally cleared swaps and futures contracts as disclosed in the Investment Portfolio. Unsettled variation margin is disclosed separately within the Statement of Assets and Liabilities. |
| (d) | Unrealized depreciation on forward foreign currency contracts |
Additionally, the amount of unrealized and realized gains and losses on derivative instruments recognized in Fund earnings during the year ended December 31, 2018 and the related location in the accompanying Statement of Operations is summarized in the following tables by primary underlying risk exposure:
| | | | | | | | | | | | | | | | |
| Realized Gain (Loss) | | Forward
Contracts | | | Swap
Contracts | | | Futures
Contracts | | | Total | |
| Interest Rate Contract (e) | | $ | — | | | $ | (13,662 | ) | | $ | (70,435 | ) | | $ | (84,097 | ) |
| Credit Contracts (e) | | | — | | | | (124,306 | ) | | | — | | | | (124,306 | ) |
| Foreign Exchange Contracts (f) | | | 64,397 | | | | — | | | | — | | | | 64,397 | |
| | | $ | 64,397 | | | $ | (137,968 | ) | | $ | (70,435 | ) | | $ | (144,006 | ) |
Each of the above derivatives is located in the following Statement of Operations accounts:
| (e) | Net realized gain (loss) from swap contracts and futures, respectively |
| (f) | Net realized gain (loss) from forward foreign currency contracts |
| | | | | | | | | | | | | | | | |
Change in Net Unrealized
Appreciation (Depreciation) | | Forward
Contracts | | | Swap
Contracts | | | Futures
Contracts | | | Total | |
| Interest Rate Contracts (g) | | $ | — | | | $ | 10,504 | | | $ | (20,701 | ) | | $ | (10,197 | ) |
| Credit Contracts (g) | | | — | | | | (24,142 | ) | | | — | | | | (24,142 | ) |
| Foreign Exchange Contracts (h) | | | 12,738 | | | | — | | | | — | | | | 12,738 | |
| | | $ | 12,738 | | | $ | (13,638 | ) | | $ | (20,701 | ) | | $ | (21,601 | ) |
Each of the above derivatives is located in the following Statement of Operations accounts:
| (g) | Change in net unrealized appreciation (depreciation) on swap contracts and futures, respectively |
| (h) | Change in net unrealized appreciation (depreciation) on forward foreign currency contracts |
As of December 31, 2018, the Fund has transactions subject to enforceable master netting agreements which govern the terms of certain transactions, and reduce the counterparty risk associated with such transactions. Master netting agreements allow a Fund to close out and net total exposure to a counterparty in the event of a deterioration in the credit quality or contractual default with respect to all of the transactions
| | | | | | |
| | 22 | | | | | | Deutsche DWS Variable Series I — DWS Bond VIP |
with a counterparty. As defined by the master netting agreement, the Fund may have collateral agreements with certain counterparties to mitigate risk. For financial reporting purposes the Statement of Assets and Liabilities generally shows derivatives assets and liabilities on a gross basis, which reflects the full risks and exposures prior to netting. A reconciliation of the gross amounts on the Statement of Assets and Liabilities to the net amounts by a counterparty, including any collateral exposure, is included in the following tables:
| | | | | | | | | | | | | | | | |
| Counterparty | | Gross Amounts
of Assets
Presented in the
Statement of
Assets and
Liabilities | | | Financial
Instruments
and
Derivatives
Available
for Offset | | | Collateral
Received | | | Net Amount of
Derivative
Assets | |
Australia and New Zealand Banking Group Ltd. | | $ | 2,842 | | | $ | — | | | $ | — | | | $ | 2,842 | |
| Danske Bank AS | | | 38,260 | | | | (31,937 | ) | | | — | | | | 6,323 | |
| HSBC Holdings PLC | | | 10,325 | | | | — | | | | — | | | | 10,325 | |
| | | $ | 51,427 | | | $ | (31,937 | ) | | $ | — | | | $ | 19,490 | |
| | | | |
| Counterparty | | Gross Amounts
of Liabilities
Presented in the
Statement of
Assets and
Liabilities | | | Financial
Instruments
and
Derivatives
Available
for Offset | | | Collateral
Pledged | | | Net Amount of
Derivative
Liabilities | |
Danske Bank AS | | $ | 31,937 | | | $ | (31,937 | ) | | $ | — | | | $ | — | |
JPMorgan Chase Securities, Inc. | | | 1,579 | | | | — | | | | — | | | | 1,579 | |
| | | $ | 33,516 | | | $ | (31,937 | ) | | $ | — | | | $ | 1,579 | |
C. Purchases and Sales of Securities
During the year ended December 31, 2018, purchases and sales of investment securities, excluding short-term investments, were as follows:
| | | | | | | | |
| | | Purchases | | | Sales | |
| Non-U.S. Treasury Obligations | | $ | 111,954,420 | | | $ | 114,397,848 | |
| U.S. Treasury Obligations | | $ | 13,591,028 | | | $ | 13,462,473 | |
D. Related Parties
Management Agreement. Under the Investment Management Agreement with DWS Investment Management Americas, Inc. (formerly Deutsche Investment Management Americas Inc.) (“DIMA“ or the “Advisor“), an indirect, wholly owned subsidiary of DWS Group GmbH & Co. KGaA (“DWS Group”), the Advisor directs the investments of the Fund in accordance with its investment objectives, policies and restrictions. The Advisor determines the securities, instruments and other contracts relating to investments to be purchased, sold or entered into by the Fund.
Pursuant to the Investment Management Agreement with the Advisor, the Fund pays a monthly management fee based on the Fund’s average daily net assets, computed and accrued daily and payable monthly, at the following annual rates:
| | | | |
| First $250 million of average daily net assets | | | .390 | % |
| Next $750 million of average daily net assets | | | .365 | % |
| Over $1 billion of average daily net assets | | | .340 | % |
Accordingly, for the year ended December 31, 2018, the fee pursuant to the Investment Management Agreement was equivalent to an annual rate (exclusive of any applicable waivers/reimbursements) of 0.39% of the Fund’s average daily net assets.
For the period from January 1, 2018 through April 30, 2018, the Advisor had contractually agreed to waive its fees and/or reimburse certain operating expenses to the extent necessary to maintain the total annual operating expenses (excluding certain expenses such as extraordinary expenses, taxes, brokerage and interest expense) of Class A at 0.66%.
Effective May 1, 2018 through September 30, 2018, the Advisor had contractually agreed to waive its fees and/or reimburse certain operating expenses to the extent necessary to maintain the total annual operating
| | | | |
Deutsche DWS Variable Series I — DWS Bond VIP | | | | | 23 |
expenses (excluding certain expenses such as extraordinary expenses, taxes, brokerage and interest expense) of Class A at 0.73%.
In addition, effective October 1, 2018 through September 30, 2019, the Advisor has contractually agreed to waive its fees and/or reimburse certain operating expenses to the extent necessary to maintain the total annual operating expenses (excluding certain expenses such as extraordinary expenses, taxes, brokerage and interest expense) of Class A at 0.66%.
For the year ended December 31, 2018, fees waived and/or expenses reimbursed were $85,887.
Administration Fee. Pursuant to an Administrative Services Agreement, DIMA provides most administrative services to the Fund. For all services provided under the Administrative Services Agreement, the Fund pays the Advisor an annual fee (“Administration Fee“) of 0.10% of the Fund’s average daily net assets, computed and accrued daily and payable monthly. For the year ended December 31, 2018, the Administration Fee was $47,970, of which $3,905 is unpaid.
Service Provider Fees. DWS Service Company (“DSC“), an affiliate of the Advisor, is the transfer agent,dividend-paying agent and shareholder service agent for the Fund. Pursuant to asub-transfer agency agreement between DSC and DST Systems, Inc. (“DST“), DSC has delegated certain transfer agent,dividend-paying agent and shareholder service agent functions to DST. DSC compensates DST out of the shareholder servicing fee it receives from the Fund. For the year ended December 31, 2018, the amounts charged to the Fund by DSC aggregated $566, of which $94 is unpaid.
Typesetting and Filing Service Fees. Under an agreement with the Fund, DIMA is compensated for providing certainpre-press and regulatory filing services to the Fund. For the year ended December 31, 2018, the amount charged to the Fund by DIMA included in the Statement of Operations under “Reports to shareholders“ aggregated $11,573, of which $7,258 is unpaid.
Trustees’ Fees and Expenses. The Fund paid retainer fees to each Trustee not affiliated with the Advisor, plus specified amounts to the Board Chairperson and to each committee Chairperson.
Affiliated Cash Management Vehicles. The Fund may invest uninvested cash balances in DWS Central Cash Management Government Fund and DWS ESG Liquidity Fund, affiliated money market funds which are managed by the Advisor. Each affiliated money market fund is managed in accordance withRule 2a-7 under the 1940 Act, which governs the quality, maturity, diversity and liquidity of instruments in which a money market fund may invest. DWS Central Cash Management Government Fund seeks to maintain a stable net asset value, and DWS ESG Liquidity Fund maintains a floating net asset value. The Fund indirectly bears its proportionate share of the expenses of each affiliated money market fund in which it invests. DWS Central Cash Management Government Fund does not pay the Advisor an investment management fee. To the extent that DWS ESG Liquidity Fund pays an investment management fee to the Advisor, the Advisor will waive an amount of the investment management fee payable to the Advisor by the Fund equal to the amount of the investment management fee payable on the Fund’s assets invested in DWS ESG Liquidity Fund.
Securities Lending Agent Fees. Deutsche Bank AG serves as securities lending agent for the Fund. For the year ended December 31, 2018, the Fund incurred securities lending agent fees to Deutsche Bank AG in the amount of $582.
E. Ownership of the Fund
At December 31, 2018, three participating insurance companies were owners of record of 10% or more of the total outstanding Class A shares of the Fund, each owning 42%, 25% and 16%, respectively.
F. Line of Credit
The Fund and other affiliated funds (the “Participants”) share in a $400 million revolving credit facility provided by a syndication of banks. The Fund may borrow for temporary or emergency purposes, including the meeting of redemption requests that otherwise might require the untimely disposition of securities. The Participants are charged an annual commitment fee which is allocated based on net assets, among each of the Participants. Interest is calculated at a rate per annum equal to the sum of the Federal Funds Rate plus 1.25 percent plus if theone-month LIBOR exceeds the Federal Funds Rate, the amount of such excess. The Fund may borrow up to a maximum of 33 percent of its net assets under the agreement. The Fund had no outstanding loans at December 31, 2018.
| | | | | | |
| | 24 | | | | | | Deutsche DWS Variable Series I — DWS Bond VIP |
Report of Independent Registered Public Accounting Firm
To the Board of Trustees of Deutsche DWS Variable Series I and Shareholders of DWS Bond VIP
Opinion on the Financial Statements
We have audited the accompanying statement of assets and liabilities, including the investment portfolio, of DWS Bond VIP (one of the funds constituting Deutsche DWS Variable Series I, referred to hereafter as the “Fund”) as of December 31, 2018, the related statement of operations for the year ended December 31, 2018, the statements of changes in net assets for each of the two years in the period ended December 31, 2018, including the related notes, and the financial highlights for each of the five years in the period ended December 31, 2018 (collectively referred to as the “financial statements”). In our opinion, the financial statements present fairly, in all material respects, the financial position of the Fund as of December 31, 2018, the results of its operations for the year then ended, the changes in its net assets for each of the two years in the period ended December 31, 2018 and the financial highlights for each of the five years in the period ended December 31, 2018 in conformity with accounting principles generally accepted in the United States of America.
Basis for Opinion
These financial statements are the responsibility of the Fund’s management. Our responsibility is to express an opinion on the Fund’s financial statements based on our audits. We are a public accounting firm registered with the Public Company Accounting Oversight Board (United States) (PCAOB) and are required to be independent with respect to the Fund in accordance with the U.S. federal securities laws and the applicable rules and regulations of the Securities and Exchange Commission and the PCAOB.
We conducted our audits of these financial statements in accordance with the standards of the PCAOB. Those standards require that we plan and perform the audit to obtain reasonable assurance about whether the financial statements are free of material misstatement, whether due to error or fraud.
Our audits included performing procedures to assess the risks of material misstatement of the financial statements, whether due to error or fraud, and performing procedures that respond to those risks. Such procedures included examining, on a test basis, evidence regarding the amounts and disclosures in the financial statements. Our audits also included evaluating the accounting principles used and significant estimates made by management, as well as evaluating the overall presentation of the financial statements. Our procedures included confirmation of securities owned as of December 31, 2018 by correspondence with the custodian, transfer agent and brokers; when replies were not received from brokers, we performed other auditing procedures. We believe that our audits provide a reasonable basis for our opinion.
PricewaterhouseCoopers LLP
Boston, Massachusetts
February 14, 2019
We have served as the auditor of one or more investment companies in the DWS family of funds since 1930.
| | | | |
Deutsche DWS Variable Series I — DWS Bond VIP | | | | | 25 |
| | |
| Information About Your Fund’s Expenses | | (Unaudited) |
As an investor of the Fund, you incur two types of costs: ongoing expenses and transaction costs. Ongoing expenses include management fees and other Fund expenses. Examples of transaction costs include contract charges, which are not shown in this section. The following tables are intended to help you understand your ongoing expenses (in dollars) of investing in the Fund and to help you compare these expenses with the ongoing expenses of investing in other mutual funds. In the most recentsix-month period, the Fund limited these expenses; had it not done so, expenses would have been higher. The example in the table is based on an investment of $1,000 invested at the beginning of thesix-month period and held for the entire period (July 1, 2018 to December 31, 2018).
The tables illustrate your Fund’s expenses in two ways:
| – | Actual Fund Return. This helps you estimate the actual dollar amount of ongoing expenses (but not transaction costs) paid on a $1,000 investment in the Fund using the Fund’s actual return during the period. To estimate the expenses you paid over the period, simply divide your account value by $1,000 (for example, an $8,600 account value divided by $1,000 = 8.6), then multiply the result by the number in the “Expenses Paid per $1,000” line under the share class you hold. |
| – | Hypothetical 5% Fund Return. This helps you to compare your Fund’s ongoing expenses (but not transaction costs) with those of other mutual funds using the Fund’s actual expense ratio and a hypothetical rate of return of 5% per year before expenses. Examples using a 5% hypothetical Fund return may be found in the shareholder reports of other mutual funds. The hypothetical account values and expenses may not be used to estimate the actual ending account balance or expenses you paid for the period. |
Please note that the expenses shown in these tables are meant to highlight your ongoing expenses only and do not reflect any transaction costs. The “Expenses Paid per $1,000” line of the tables is useful in comparing ongoing expenses only and will not help you determine the relative total expense of owning different funds. If these transaction costs had been included, your costs would have been higher.
| | | | |
| Expenses and Value of a $1,000 Investment for the six months ended December 31, 2018 | | | |
| |
| Actual Fund Return | | | Class A | |
| Beginning Account Value 7/1/18 | | $ | 1,000.00 | |
| Ending Account Value 12/31/18 | | $ | 1,000.00 | |
| Expenses Paid per $1,000* | | $ | 3.53 | |
| |
| Hypothetical 5% Fund Return | | | Class A | |
| Beginning Account Value 7/1/18 | | $ | 1,000.00 | |
| Ending Account Value 12/31/18 | | $ | 1,021.68 | |
| Expenses Paid per $1,000* | | $ | 3.57 | |
| * | Expenses are equal to the Fund’s annualized expense ratio, multiplied by the average account value over the period, multiplied by 184 (the number of days in the most recentsix-month period), then divided by 365. |
| | | | |
| Annualized Expense Ratio | | Class A | |
| Deutsche DWS Variable Series I — DWS Bond VIP | | | .70 | % |
For more information, please refer to the Fund’s prospectus.
These tables do not reflect charges and fees (“contract charges”) associated with the separate account that invests in the Fund or any variable life insurance policy or variable annuity contract for which the Fund is an investment option.
For an analysis of the fees associated with an investment in the Fund or similar funds, please refer to the current and hypothetical expense calculators for Variable Insurance Products which can be found at dws.com/calculators.
| | | | | | |
| | 26 | | | | | | Deutsche DWS Variable Series I — DWS Bond VIP |
| | |
| Tax Information | | (Unaudited) |
Please consult a tax advisor if you have questions about federal or state income tax laws, or on how to prepare your tax returns. If you have specific questions about your account, please contact your insurance provider.
Proxy Voting
The Trust’s policies and procedures for voting proxies for portfolio securities and information about how the Trust voted proxies related to its portfolio securities during the most recent12-month period ended June 30 are available on our Web site — dws.com/en-us/resources/proxy-voting — or on the SEC’s Web site — sec.gov. To obtain a written copy of the Trust’s policies and procedures without charge, upon request, call us toll free at (800)728-3337.
| | | | |
Deutsche DWS Variable Series I — DWS Bond VIP | | | | | 27 |
Advisory Agreement Board Considerations and Fee Evaluation
The Board of Trustees (hereinafter referred to as the “Board” or “Trustees”) approved the renewal of DWS Bond VIP’s (the “Fund”) investment management agreement (the “Agreement”) with DWS Investment Management Americas, Inc. (“DIMA”) in September 2018.
In terms of the process that the Board followed prior to approving the Agreement, shareholders should know that:
| – | | During the entire process, all of the Fund’s Trustees were independent of DIMA and its affiliates (the “Independent Trustees”). |
| – | | The Board met frequently during the past year to discuss fund matters and dedicated a substantial amount of time to contract review matters. Over the course of several months, the Board’s Contract Committee reviewed extensive materials received from DIMA, independent third parties and independent counsel. These materials included an analysis of the Fund’s performance, fees and expenses, and profitability from a fee consultant retained by the Fund’s Independent Trustees (the “Fee Consultant”). Based on its evaluation of the information provided, the Contract Committee presented its findings and recommendations to the Board. The Board then reviewed the Contract Committee’s findings and recommendations. |
| – | | The Board also received extensive information throughout the year regarding performance of the Fund. |
| – | | The Independent Trustees regularly met privately with counsel to discuss contract review and other matters. In addition, the Independent Trustees were advised by the Fee Consultant in the course of their review of the Fund’s contractual arrangements and considered a comprehensive report prepared by the Fee Consultant in connection with their deliberations. |
| – | | In connection with reviewing the Agreement, the Board also reviewed the terms of the Fund’s distribution agreement, administrative services agreement, transfer agency agreement and other material service agreements. |
In connection with the contract review process, the Contract Committee and the Board considered the factors discussed below, among others. The Board also considered that DIMA and its predecessors have managed the Fund since its inception, and the Board believes that a long-term relationship with a capable, conscientious advisor is in the best interests of the Fund. The Board considered, generally, that shareholders chose to invest or remain invested in the Fund knowing that DIMA managed the Fund. DIMA is part of DWS Group GmbH & Co. KGaA (“DWS Group”). DWS Group is a global asset management business that offers a wide range of investing expertise and resources, including research capabilities in many countries throughout the world. In 2018, approximately 20% of DWS Group’s shares were sold in an initial public offering, with Deutsche Bank AG owning the remaining shares.
As part of the contract review process, the Board carefully considered the fees and expenses of each DWS fund overseen by the Board in light of the fund’s performance. In many cases, this led to the negotiation and implementation of expense caps. As part of these negotiations, the Board indicated that it would consider relaxing these caps in future years following sustained improvements in performance, among other considerations.
While shareholders may focus primarily on fund performance and fees, the Fund’s Board considers these and many other factors, including the quality and integrity of DIMA’s personnel and administrative support services provided by DIMA, such as back-office operations, fund valuations, and compliance policies and procedures.
Nature, Quality and Extent of Services.The Board considered the terms of the Agreement, including the scope of advisory services provided under the Agreement. The Board noted that, under the Agreement, DIMA provides portfolio management services to the Fund and that, pursuant to a separate administrative services agreement, DIMA provides administrative services to the Fund. The Board considered the experience and skills of senior management and investment personnel and the resources made available to such personnel. The Board reviewed the Fund’s performance over short-term and long-term periods and compared those returns to various agreed-upon performance measures, including market index(es) and a peer universe compiled using information supplied by Morningstar Direct (“Morningstar”), an independent fund data service. The Board also noted that it has put into place a process of identifying “Funds in Review” (e.g., funds performing poorly relative to a peer universe), and receives additional reporting from DIMA regarding such funds and, where appropriate, DIMA’s plans to address underperformance. The Board
| | | | | | |
| | 28 | | | | | | Deutsche DWS Variable Series I — DWS Bond VIP |
believes this process is an effective manner of identifying and addressing underperforming funds. Based on the information provided, the Board noted that, for theone-, three- and five-year periods ended December 31, 2017, the Fund’s performance (Class A shares) was in the 1st quartile of the applicable Morningstar universe (the 1st quartile being the best performers and the 4th quartile being the worst performers). The Board also observed that the Fund has outperformed its benchmark in theone-, three- and five-year periods ended December 31, 2017.
Fees and Expenses. The Board considered the Fund’s investment management fee schedule, operating expenses and total expense ratios, and comparative information provided by Broadridge Financial Solutions, Inc. (“Broadridge”) and the Fee Consultant regarding investment management fee rates paid to other investment advisors by similar funds (1st quartile being the most favorable and 4th quartile being the least favorable). With respect to management fees paid to other investment advisors by similar funds, the Board noted that the contractual fee rates paid by the Fund, which include a 0.10% fee paid to DIMA under the Fund’s administrative services agreement, were lower than the median (2nd quartile) of the applicable Broadridge peer group (based on Broadridge data provided as of December 31, 2017). The Board noted that the Fund’s Class A shares total (net) operating expenses were expected to be higher than the median (3rd quartile) of the applicable Broadridge expense universe (based on Broadridge data provided as of December 31, 2017, and analyzing Broadridge expense universe Class A (net) expenses less any applicable12b-1 fees) (“Broadridge Universe Expenses”). The Board noted that the expense limitation agreed to by DIMA was expected to help the Fund’s total (net) operating expenses remain competitive. The Board considered the Fund’s management fee rate as compared to fees charged by DIMA to a comparable DWS U.S. registered fund (“DWS Funds”) and considered differences between the Fund and the comparable DWS Fund. The information requested by the Board as part of its review of fees and expenses also included information about institutional accounts (including anysub-advised funds and accounts) and funds offered primarily to European investors (“DWS Europe Funds”) managed by DWS Group. The Board noted that DIMA indicated that DWS Group does not manage any institutional accounts or DWS Europe Funds comparable to the Fund.
On the basis of the information provided, the Board concluded that management fees were reasonable and appropriate in light of the nature, quality and extent of services provided by DIMA.
Profitability. The Board reviewed detailed information regarding revenues received by DIMA under the Agreement. The Board considered the estimated costs to DIMA, andpre-tax profits realized by DIMA, from advising the DWS Funds, as well as estimates of thepre-tax profits attributable to managing the Fund in particular. The Board also received information regarding the estimated enterprise-wide profitability of DIMA and its affiliates with respect to all fund services in totality and by fund. The Board and the Fee Consultant reviewed DIMA’s methodology in allocating its costs to the management of the Fund. Based on the information provided, the Board concluded that thepre-tax profits realized by DIMA in connection with the management of the Fund were not unreasonable. The Board also reviewed certain publicly available information regarding the profitability of certain similar investment management firms. The Board noted that, while information regarding the profitability of such firms is limited (and in some cases is not necessarily prepared on a comparable basis), DIMA and its affiliates’ overall profitability with respect to the DWS Funds (after taking into account distribution and other services provided to the funds by DIMA and its affiliates) was lower than the overall profitability levels of most comparable firms for which such data was available.
Economies of Scale. The Board considered whether there are economies of scale with respect to the management of the Fund and whether the Fund benefits from any economies of scale. The Board noted that the Fund’s investment management fee schedule includes fee breakpoints. The Board concluded that the Fund’s fee schedule represents an appropriate sharing between the Fund and DIMA of such economies of scale as may exist in the management of the Fund at current asset levels.
Other Benefits to DIMA and Its Affiliates. The Board also considered the character and amount of other incidental or“fall-out” benefits received by DIMA and its affiliates, including any fees received by DIMA for administrative services provided to the Fund and any fees received by an affiliate of DIMA for transfer agency services provided to the Fund. The Board also considered benefits to DIMA related to brokerage and soft-dollar allocations, including allocating brokerage to pay for research generated by parties other than the executing broker dealers, which pertain primarily to funds investing in equity securities. In addition, the Board considered the incidental public relations benefits to DIMA related to DWS Funds advertising and cross-selling opportunities among DIMA products and services. The Board considered these benefits in reaching its conclusion that the Fund’s management fees were reasonable.
| | | | |
Deutsche DWS Variable Series I — DWS Bond VIP | | | | | 29 |
Compliance. The Board considered the significant attention and resources dedicated by DIMA to its compliance processes in recent years. The Board noted in particular (i) the experience, seniority and time commitment of the individuals serving as DIMA’s and the Fund’s chief compliance officers and (ii) the substantial commitment of resources by DIMA and its affiliates to compliance matters, including the retention of compliance personnel.
Based on all of the information considered and the conclusions reached, the Board unanimously determined that the continuation of the Agreement is in the best interests of the Fund. In making this determination, the Board did not give particular weight to any single factor identified above. The Board considered these factors over the course of numerous meetings, certain of which were in executive session with only the Independent Trustees and counsel present. It is possible that individual Independent Trustees may have weighed these factors differently in reaching their individual decisions to approve the continuation of the Agreement.
| | | | | | |
| | 30 | | | | | | Deutsche DWS Variable Series I — DWS Bond VIP |
Board Members and Officers
The following table presents certain information regarding the Board Members and Officers of the Fund. Each Board Member’s year of birth is set forth in parentheses after his or her name. Unless otherwise noted, (i) each Board Member has engaged in the principal occupation(s) noted in the table for at least the most recent five years, although not necessarily in the same capacity; and (ii) the address of each Independent Board Member is c/o Keith R. Fox, DWS Funds Board Chair, c/o Thomas R. Hiller, Ropes & Gray LLP, Prudential Tower, 800 Boylston Street, Boston, MA02199-3600. Except as otherwise noted below, the term of office for each Board Member is until the election and qualification of a successor, or until such Board Member sooner dies, resigns, is removed or as otherwise provided in the governing documents of the Fund. Because the Fund does not hold an annual meeting of shareholders, each Board Member will hold office for an indeterminate period. The Board Members may also serve in similar capacities with other funds in the fund complex.
| | | | | | | | |
| Independent Board Members | | | | | | |
Name, Year of Birth,
Position with the Fund and
Length of Time Served1 | | Business Experience and Directorships During the Past Five Years | | Number of
Funds in
DWS Fund
Complex
Overseen | | | Other
Directorships
Held by Board
Member
|
Keith R. Fox, CFA (1954) Chairperson since 2017, and Board Member since 1996 | | Managing General Partner, Exeter Capital Partners (a series of private investment funds) (since 1986). Directorships: Progressive International Corporation (kitchen goods importer and distributor); The Kennel Shop (retailer); former Chairman, National Association of Small Business Investment Companies; former Directorships: BoxTop Media Inc. (advertising); Sun Capital Advisers Trust (mutual funds) (2011–2012) | | | 82 | | | — |
John W. Ballantine (1946) Board Member since 1999 | | Retired; formerly, Executive Vice President and Chief Risk Management Officer, First Chicago NBD Corporation/The First National Bank of Chicago (1996–1998); Executive Vice President and Head of International Banking (1995–1996); former Directorships: Director and former Chairman of the Board, Healthways, Inc.2 (population well-being and wellness services) (2003–2014); Stockwell Capital Investments PLC (private equity); Enron Corporation; FNB Corporation; Tokheim Corporation; First Oak Brook Bancshares, Inc. and Oak Brook Bank; Prisma Energy International; Public Radio International. Not-for-Profit Director, Trustee: Palm Beach Civic Association; Window to the World Communications (public media); Harris Theater for Music and Dance (Chicago); Life Director of Hubbard Street Dance Chicago | | | 82 | | | Portland
General
Electric2
(utility
company)
(2003–
present) |
Henry P. Becton, Jr. (1943) Board Member since 1990 | | Vice Chair and former President, WGBH Educational Foundation. Directorships: Public Radio International; Public Radio Exchange (PRX); The Pew Charitable Trusts (charitable organization); Massachusetts Humane Society; Overseer of the New England Conservatory; former Directorships: Becton Dickinson and Company2 (medical technology company); Belo Corporation2 (media company); The PBS Foundation; Association of Public Television Stations; Boston Museum of Science; American Public Television; Concord Academy; New England Aquarium; Mass. Corporation for Educational Telecommunications; Committee for Economic Development; Public Broadcasting Service; Connecticut College; North Bennett Street School (Boston); American Documentary, Inc. (public media) | | | 82 | | | — |
Dawn-Marie Driscoll (1946) Board Member since 1987 | | Emeritus Executive Fellow, Center for Business Ethics, Bentley University; formerly: President, Driscoll Associates (consulting firm); Partner, Palmer & Dodge (law firm) (1988–1990); Vice President of Corporate Affairs and General Counsel, Filene’s (retail) (1978–1988). Directorships: Advisory Board, Center for Business Ethics, Bentley University; Trustee and former Chairman of the Board, Southwest Florida Community Foundation (charitable organization); former Directorships: ICI Mutual Insurance Company (2007–2015); Sun Capital Advisers Trust (mutual funds) (2007–2012), Investment Company Institute (audit, executive, nominating committees) and Independent Directors Council (governance, executive committees) | | | 82 | | | — |
Paul K. Freeman* (1950) Board Member since 1993 | | Consultant, WorldBank/Inter-American Development Bank; Independent Directors Council (former chair); Investment Company Institute (executive committee); Adjunct Professor, University of Denver Law School (2017–present); formerly: Chairman of Education Committee of Independent Directors Council; Project Leader, International Institute for Applied Systems Analysis (1998–2001); Chief Executive Officer, The Eric Group, Inc. (environmental insurance) (1986–1998); Directorships: Knoebel Institute for Healthy Aging, University of Denver (2017–present); former Directorships: Prisma Energy International; Denver Zoo Foundation (2012–2018) | | | 82 | | | — |
| | | | |
Deutsche DWS Variable Series I — DWS Bond VIP | | | | | 31 |
| | | | | | | | |
Name, Year of Birth,
Position with the Fund and
Length of Time Served1 | | Business Experience and Directorships During the Past Five Years | | Number of
Funds in
DWS Fund
Complex
Overseen | | | Other
Directorships
Held by Board
Member
|
Richard J. Herring (1946) Board Member since 1990 | | Jacob Safra Professor of International Banking and Professor of Finance, The Wharton School, University of Pennsylvania (since July 1972); Director, The Wharton Financial Institutions Center (since 1994); formerly: Vice Dean and Director, Wharton Undergraduate Division (1995–2000) and Director, The Lauder Institute of International Management Studies (2000–2006); Member FDIC Systemic Risk Advisory Committee since 2011, member Systemic Risk Council since 2012 and member of the Advisory Board at the Yale Program on Financial Stability since 2013; Formerly Co-Chair of the Shadow Financial Regulatory Committee (2003–2015), Executive Director of The Financial Economists Roundtable (2008–2015), Director of The Thai Capital Fund (2007–2013), Director of The Aberdeen Singapore Fund (2007–2018), and Nonexecutive Director of Barclays Bank DE (2010–2018) | | | 82 | | | Director,
Aberdeen
Japan Fund
(since 2007) |
William McClayton (1944) Board Member since 2004 | | Private equity investor (since October 2009); previously, Managing Director, Diamond Management & Technology Consultants, Inc. (global consulting firm) (2001–2009); Directorship: Board of Managers, YMCA of Metropolitan Chicago; formerly: Senior Partner, Arthur Andersen LLP (accounting) (1966–2001); Trustee, Ravinia Festival | | | 82 | | | — |
Rebecca W. Rimel (1951) Board Member since 1995 | | President, Chief Executive Officer and Director, The Pew Charitable Trusts (charitable organization) (1994–present); formerly: Executive Vice President, The Glenmede Trust Company (investment trust and wealth management) (1983–2004); Board Member, Investor Education (charitable organization) (2004–2005); Trustee, Executive Committee, Philadelphia Chamber of Commerce (2001–2007); Director, Viasys Health Care2 (January 2007–June 2007); Trustee, Thomas Jefferson Foundation (charitable organization) (1994–2012) | | | 82 | | | Director,
Becton
Dickinson
and
Company2
(medical
technology
company)
(2012–
present);
Director,
BioTelemetry
Inc.2(health
care) (2009–
present) |
William N. Searcy, Jr. (1946) Board Member since 1993 | | Private investor since October 2003; formerly: Pension & Savings Trust Officer, Sprint Corporation2(telecommunications) (November 1989–September 2003); Trustee, Sun Capital Advisers Trust (mutual funds) (1998–2012) | | | 82 | | | — |
Jean Gleason Stromberg (1943) Board Member since 1997 | | Retired. Formerly, Consultant (1997–2001); Director, Financial Markets U.S. Government Accountability Office (1996–1997); Partner, Norton Rose Fulbright, L.L.P. (law firm) (1978–1996); former Directorships: The William and Flora Hewlett Foundation (charitable organization) (2000–2015); Service Source, Inc. (nonprofit), Mutual Fund Directors Forum (2002–2004), American Bar Retirement Association (funding vehicle for retirement plans) (1987–1990 and 1994–1996) | | | 82 | | | — |
| | |
| Officers4 | | |
Name, Year of Birth, Position with the Fund and Length of Time Served5 | | Business Experience and Directorships During the Past Five Years |
Hepsen Uzcan6 (1974) President and Chief Executive Officer, 2017–present Assistant Secretary, 2013–present | | Managing Director,3 DWS; Secretary, DWS USA Corporation (since March 2018); Assistant Secretary, DWS Distributors, Inc. (since June 25, 2018); Director and Vice President, DWS Service Company (since June 25, 2018); Assistant Secretary, DWS Investment Management Americas, Inc. (since June 25, 2018); and Director and President, DB Investment Managers, Inc. (since June 25, 2018); formerly: Vice President for the Deutsche funds (2016–2017) |
John Millette8(1962) Vice President and Secretary, 1999–present | | Director,3DWS; Chief Legal Officer, DWS Investment Management Americas, Inc. (2015–present); and Director and Vice President, DWS Trust Company (2016–present); formerly: Secretary, Deutsche Investment Management Americas Inc. (2015–2017) |
Diane Kenneally8,9 (1966) Treasurer and Chief Financial Officer since 2018 | | Director,3 DWS; formerly: Assistant Treasurer for the DWS funds (2007–2018) |
Caroline Pearson8(1962) Chief Legal Officer, 2010–present | | Managing Director,3DWS; formerly: Secretary, Deutsche AM Distributors, Inc. (2002–2017); and Secretary, Deutsche AM Service Company (2010–2017) |
| | | | | | |
| | 32 | | | | | | Deutsche DWS Variable Series I — DWS Bond VIP |
| | |
Name, Year of Birth, Position with the Fund and Length of Time Served5 | | Business Experience and Directorships During the Past Five Years |
Scott D. Hogan8(1970) Chief Compliance Officer, 2016–present | | Director,3DWS |
Wayne Salit7(1967) Anti-Money Laundering Compliance Officer, 2014–present | | Director,3 Deutsche Bank; and AML Officer, DWS Trust Company; formerly: Managing Director, AML Compliance Officer at BNY Mellon (2011–2014); and Director, AML Compliance Officer at Deutsche Bank (2004–2011) |
Sheila Cadogan8(1966) Assistant Treasurer, 2017–present | | Director,3DWS; Director and Vice President, DWS Trust Company (since 2018) |
Paul Antosca8(1957) Assistant Treasurer, 2007–present | | Director,3DWS |
| 1 | The length of time served represents the year in which the Board Member joined the board of one or more DWS funds currently overseen by the Board. |
| 2 | A publicly held company with securities registered pursuant to Section 12 of the Securities Exchange Act of 1934. |
| 3 | Executive title, not a board directorship. |
| 4 | As a result of their respective positions held with the Advisor or its affiliates, these individuals are considered “interested persons” of the Advisor within the meaning of the 1940 Act. Interested persons receive no compensation from the Fund. |
| 5 | The length of time served represents the year in which the officer was first elected in such capacity for one or more DWS funds. |
| 6 | Address: 345 Park Avenue, New York, NY 10154. |
| 7 | Address: 60 Wall Street, New York, NY 10005. |
| 8 | Address: One International Place, Boston, MA 02110. |
| 9 | Appointed Treasurer and Chief Financial Officer effective July 2, 2018. |
| * | Paul K. Freeman retired from the Board effective December 31, 2018. |
The Fund’s Statement of Additional Information (“SAI”) includes additional information about the Board Members. The SAI is available, without charge, upon request. If you would like to request a copy of the SAI, you may do so by calling the followingtoll-free number:(800) 728-3337.
| | | | |
Deutsche DWS Variable Series I — DWS Bond VIP | | | | | 33 |
Notes
Notes
| | |
| | |
VS1bond-2 (R-025819-8 2/19) | | |
December 31, 2018
Annual Report
Deutsche DWS Variable Series I
(formerly Deutsche Variable Series I)
DWS Capital Growth VIP
(formerly Deutsche Capital Growth VIP)
Beginning on January 1, 2021, as permitted by regulations adopted by the Securities and Exchange Commission, you may not be receiving paper copies of the Fund’s shareholder reports from the insurance company that offers your contract unless you specifically request paper copies from your insurance company or from your financial intermediary. Instead, the shareholder reports will be made available on a Web site, and your insurance company will notify you by mail each time a report is posted and provide you with a Web site link to access the report. Instructions for requesting paper copies will be provided by your insurance company.
If you already elected to receive shareholder reports electronically, you will not be affected by this change and you need not take any action. You may elect to receive shareholder reports and other communications from your insurance company electronically by following the instructions provided by your insurance company.
You may elect to receive all future reports in paper free of charge from your insurance company. If your insurance company informs you that future reports will be delivered via Web access, you can inform your insurance company that you wish to continue receiving paper copies of your shareholder reports by following the instructions provided by your insurance company.

Contents
This report must be preceded or accompanied by a prospectus. To obtain an additional prospectus or summary prospectus, if available, call (800)728-3337 or your financial representative. We advise you to consider the Fund’s objectives, risks, charges and expenses carefully before investing. The summary prospectus and prospectus contain this and other important information about the Fund. Please read the prospectus carefully before you invest.
Stocks may decline in value. The Fund may lend securities to approved institutions. See the prospectus for details.
The brand DWS represents DWS Group GmbH & Co. KGaA and any of its subsidiaries such as DWS Distributors, Inc. which offers investment products or DWS Investment Management Americas, Inc. and RREEF America L.L.C. which offer advisory services.
DWS Distributors, Inc., 222 South Riverside Plaza, Chicago, IL 60606, (800)621-1148
NOT FDIC/NCUA INSURED NO BANK GUARANTEE MAY LOSE VALUE NOT A DEPOSIT NOT INSURED BY ANY FEDERAL GOVERNMENT AGENCY
| | | | | | |
| | 2 | | | | | | Deutsche DWS Variable Series I — DWS Capital Growth VIP |
| | |
| Performance Summary | | December 31, 2018 (Unaudited) |
Fund performance shown is historical, assumes reinvestment of all dividend and capital gain distributions, and does not guarantee future results. Investment return and principal value fluctuate with changing market conditions so that, when redeemed, shares may be worth more or less than their original cost. Current performance may be lower or higher than the performance data quoted. Please contact your participating insurance company for the Fund’s most recentmonth-end performance. Performance does not reflect charges and fees (“contract charges”) associated with the separate account that invests in the Fund or any variable life insurance policy or variable annuity contract for which the Fund is an investment option. These charges and fees will reduce returns. While all share classes have the same underlying portfolio, their performance will differ.
The gross expense ratios of the Fund, as stated in the fee table of the prospectus dated May 1, 2018 are 0.50% and 0.75% for Class A and Class B shares, respectively, and may differ from the expense ratios disclosed in the Financial Highlights tables in this report.
Generally accepted accounting principles require adjustments to be made to the net assets of the Fund at period end for financial reporting purposes only, and as such, the total return based on the unadjusted net asset value per share may differ from the total return reported in the financial highlights.
Growth of an Assumed $10,000 Investment
| | |
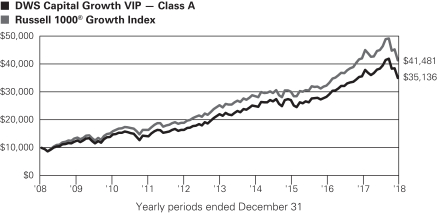 | | The Russell 1000® Growth Index is an unmanaged index that consists of those stocks in the Russell 1000® Index that have higher price to book ratios and higher forecasted growth values. Index returns do not reflect any fees or expenses and it is not possible to invest directly into an index. |
| | | | | | | | | | |
| Comparative Results | | | | | | | | | | |
| | | | | |
| DWS Capital Growth VIP | | | | 1-Year | | 3-Year | | 5-Year | | 10-Year |
| Class A | | Growth of $10,000 | | $9,840 | | $12,956 | | $15,898 | | $35,136 |
| | | Average annual total return | | –1.60% | | 9.02% | | 9.72% | | 13.39% |
| Russell 1000 Growth Index | | Growth of $10,000 | | $9,849 | | $13,732 | | $16,403 | | $41,481 |
| | | Average annual total return | | –1.51% | | 11.15% | | 10.40% | | 15.29% |
| | | | | |
| DWS Capital Growth VIP | | | | 1-Year | | 3-Year | | 5-Year | | 10-Year |
| Class B | | Growth of $10,000 | | $9,813 | | $12,855 | | $15,690 | | $34,113 |
| | | Average annual total return | | –1.87% | | 8.73% | | 9.43% | | 13.06% |
| Russell 1000 Growth Index | | Growth of $10,000 | | $9,849 | | $13,732 | | $16,403 | | $41,481 |
| | | Average annual total return | | –1.51% | | 11.15% | | 10.40% | | 15.29% |
The growth of $10,000 is cumulative.
| | | | |
Deutsche DWS Variable Series I — DWS Capital Growth VIP | | | | | 3 |
| | |
| Management Summary | | December 31, 2018 (Unaudited) |
The Fund produced a total return of –1.60% (Class A shares, unadjusted for contract charges) in 2018, slightly below the –1.51% return for its benchmark, the Russell 1000® Growth Index.The final performance number for the index belies the fact that growth stocks performed quite well for the majority of 2018. However, uncertainty about global growth, U.S. trade policy, and interest rates fueled a return of –15.89% for the index in the fourth calendar quarter, erasing all the gains it had achieved in the first nine months of the year.
The Fund’s relative performance was helped by its robust stock selection in the industrials, consumer discretionary, and consumer staples sectors, but the benefits were offset by weaker selection in communications services, health care, and materials.
The aerospace giant Boeing Co. was the primary source of outperformance in industrials. The stock performed very well in the first half of the period, prompting us to reduce the positionmid-way through the year. This decision cushioned the impact of the stock’s subsequent downturn, which was brought about by the trade dispute between the United States and China. We later added back to the position when the stock reached a more attractive valuation. Outside of industrials, the life sciences company Thermo Fisher Scientific, Inc. — which delivered better-than-expected earnings thanks to strongend-market demand — was the top contributor. An underweight in Facebook, Inc. also helped performance, as the stock lagged the broader communications services sector due largely to the prospect of increased government regulation. Visa, Inc., Burlington Stores, Inc. and Adobe, Inc., were additional contributors of note.
Broadcom, Inc.* was the largest individual detractor from performance. Semiconductor stocks sold off sharply from September onward amid an increasingly unfavorable balance of supply and demand in the industry. Shares of Broadcom faced additional pressure after the company made an acquisition outside of its core business. An investment in the video game developer Activision Blizzard, Inc. further weighed on Fund returns. The company missed investors’ expectations due to weakness in key gaming titles, slowing monthly user metrics, and a lack of clarity around the launch of the latest edition of Call of Duty. The specialty chemicals producer Albemarle Corp.* and the biotechnology firm Celgene Corp. were also notable detractors in 2018.
At year end, the investment backdrop was characterized by decelerating global economic growth, the likelihood of further interest rate increases, and the rising possibility of a recession in the years ahead. We therefore anticipate that the volatility of late 2018 is likely to remain in place for some time. Still, the market downturn also created more opportunities to identify fast-growing companies trading at reasonable valuations. We are encouraged by this development, as we think growth companies can become more attractive on a relative basis once earnings momentum in the broader market begins to slow.
In this environment, we focused on identifying opportunities in two types of companies. First, we looked for defensive, growing businesses whose strong franchises create durable competitive positions. Here, we emphasized companies with positive business trends, stable end markets, and the ability to meet growth expectations. We also favored those where valuations were either reasonable or had declined significantly, and where there was a high-quality management team with a positive long-term track record. Second, we gradually shifted our attention to finding businesses that are exploiting the convergence of trends involving cloud computing, mobile telephony, big data, and machine learning, among others. We believe companies that are capitalizing on structural changes in these areas can demonstrate growth independent of the economic cycle — a potentially favorable trait when the world economy is slowing.
From a portfolio positioning standpoint, ourbottom-up investment process led us to hold overweight positions in financials, the newly classified communication services sector, and health care as ofyear-end. Conversely, the Fund’s largest underweights were in the consumer sectors, industrials, and materials.
Sebastian P. Werner, PhD, Director
Portfolio Manager
The views expressed reflect those of the portfolio management team only through the end of the period of the report as stated on the cover. The management team’s views are subject to change at any time based on market and other conditions and should not be construed as a recommendation. Past performance is no guarantee of future results. Current and future portfolio holdings are subject to risk.
| | | | | | |
| | 4 | | | | | | Deutsche DWS Variable Series I — DWS Capital Growth VIP |
Terms to Know
TheRussell 1000 Growth Index is an unmanaged index that consists of those stocks in the Russell 1000® Index that have higherprice-to-book ratios and higher forecasted growth values. Index returns do not reflect any fees or expenses and it is not possible to invest directly into an index.
Contribution anddetraction incorporate both a stock’s total return and its weighting in the fund.
Overweight means the Fund holds a higher weighting in a given sector or security than the benchmark.Underweightmeans the Fund holds a lower weighting.
Consumer discretionary represents industries that produce goods and services that are not necessities in everyday life.
| * Held | and sold prior to December 31, 2018. |
| | | | |
Deutsche DWS Variable Series I — DWS Capital Growth VIP | | | | | 5 |
| | | | |
| Portfolio Summary | | (Unaudited) |
| | | | | | | | |
| Asset Allocation (As a % of Investment Portfolio excluding Securities Lending Collateral) | | 12/31/18 | | | 12/31/17 | |
| Common Stocks | | | 98% | | | | 98% | |
| Cash Equivalents | | | 2% | | | | 2% | |
| Convertible Preferred Stocks | | | — | | | | 0% | |
| | | | 100% | | | | 100% | |
| | |
| Sector Diversification (As of % of Investment Portfolio excluding Cash Equivalents and Securities Lending Collateral) | | 12/31/18 | | | 12/31/17 | |
| Information Technology | | | 31% | | | | 29% | |
| Consumer Discretionary | | | 15% | | | | 14% | |
| Health Care | | | 15% | | | | 17% | |
| Communication Services | | | 14% | | | | 12% | |
| Industrials | | | 11% | | | | 11% | |
| Financials | | | 7% | | | | 6% | |
| Consumer Staples | | | 3% | | | | 5% | |
| Real Estate | | | 2% | | | | 2% | |
| Materials | | | 1% | | | | 3% | |
| Energy | | | 1% | | | | 1% | |
| | | | 100% | | | | 100% | |
Portfolio holdings and characteristics are subject to change.
For more complete details about the Fund’s investment portfolio, see page 7.
Following the Fund’s fiscal first and thirdquarter-end, a complete portfolio holdings listing is filed with the SEC onForm N-Q or Form N-PORT (available for filings after March 31, 2019). The Fund’s Form N-Q or Form N-PORT will be available on the SEC’s Web site at sec.gov. The Fund’s portfolio holdings are also posted on dws.com from time to time. Please see the Fund’s current prospectus for more information.
| | | | | | |
| | 6 | | | | | | Deutsche DWS Variable Series I — DWS Capital Growth VIP |
| | |
| Investment Portfolio | | December 31, 2018 |
| | | | | | | | |
| | | Shares | | | Value ($) | |
| Common Stocks 98.4% | | | | | |
| Communication Services 14.2% | | | | | |
Entertainment 6.6% | | | | | |
| | |
Activision Blizzard, Inc. | | | 218,575 | | | | 10,179,038 | |
| | |
Live Nation Entertainment, Inc.* | | | 85,736 | | | | 4,222,498 | |
| | |
Netflix, Inc.* | | | 33,539 | | | | 8,977,049 | |
| | |
Spotify Technology SA* | | | 93,059 | | | | 10,562,196 | |
| | |
Walt Disney Co. | | | 131,267 | | | | 14,393,427 | |
| | | | | | | | |
| | | | | | | 48,334,208 | |
| |
Interactive Media & Services 5.8% | | | | | |
| | |
Alphabet, Inc. “A”* | | | 17,959 | | | | 18,766,436 | |
| | |
Alphabet, Inc. “C”* | | | 16,506 | | | | 17,093,779 | |
| | |
Facebook, Inc. “A”* | | | 49,532 | | | | 6,493,150 | |
| | | | | | | | |
| | | | | | | 42,353,365 | |
| |
Wireless Telecommunication Services 1.8% | | | | | |
T-Mobile U.S., Inc.* | | | 200,615 | | | | 12,761,120 | |
| |
| Consumer Discretionary 14.9% | | | | | |
Hotels, Restaurants & Leisure 2.7% | | | | | |
| | |
Las Vegas Sands Corp. | | | 74,365 | | | | 3,870,698 | |
| | |
McDonald’s Corp. | | | 90,048 | | | | 15,989,824 | |
| | | | | | | | |
| | | | | | | 19,860,522 | |
| |
Internet & Direct Marketing Retail 4.8% | | | | | |
Amazon.com, Inc.* | | | 23,208 | | | | 34,857,720 | |
| |
Multiline Retail 1.2% | | | | | |
Dollar General Corp. | | | 79,443 | | | | 8,586,199 | |
| |
Specialty Retail 5.0% | | | | | |
| | |
Burlington Stores, Inc.* | | | 58,773 | | | | 9,560,604 | |
| | |
CarMax, Inc.* (a) | | | 117,668 | | | | 7,381,314 | |
| | |
Home Depot, Inc. | | | 113,064 | | | | 19,426,656 | |
| | | | | | | | |
| | | | | | | 36,368,574 | |
| |
Textiles, Apparel & Luxury Goods 1.2% | | | | | |
| | |
Carter’s, Inc. | | | 50,924 | | | | 4,156,417 | |
| | |
Lululemon Athletica, Inc.* | | | 40,563 | | | | 4,932,866 | |
| | | | | | | | |
| | | | | | | 9,089,283 | |
| |
| Consumer Staples 3.1% | | | | | |
Food & Staples Retailing 1.1% | | | | | |
Costco Wholesale Corp. | | | 40,435 | | | | 8,237,014 | |
| |
Food Products 1.4% | | | | | |
Mondelez International, Inc. “A” | | | 253,680 | | | | 10,154,810 | |
| |
Personal Products 0.6% | | | | | |
Estee Lauder Companies, Inc. “A” | | | 32,557 | | | | 4,235,666 | |
| | |
| Energy 0.6% | | | | | | | | |
Oil, Gas & Consumable Fuels | | | | | |
Concho Resources, Inc.* | | | 41,969 | | | | 4,313,993 | |
| | |
| Financials 7.5% | | | | | | | | |
Banks 1.1% | | | | | | | | |
SVB Financial Group* | | | 42,611 | | | | 8,092,681 | |
| | |
Capital Markets 2.8% | | | | | | | | |
| | |
Intercontinental Exchange, Inc. | | | 174,503 | | | | 13,145,311 | |
| | |
The Charles Schwab Corp. | | | 171,155 | | | | 7,108,067 | |
| | | | | | | | |
| | | | | | | 20,253,378 | |
| |
Consumer Finance 0.6% | | | | | |
American Express Co. | | | 47,006 | | | | 4,480,612 | |
| | | | | | | | |
| | | Shares | | | Value ($) | |
| | |
Insurance 3.0% | | | | | | | | |
Progressive Corp. | | | 355,732 | | | | 21,461,312 | |
| |
| Health Care 14.4% | | | | | |
Biotechnology 4.0% | | | | | |
| | |
Alexion Pharmaceuticals, Inc.* | | | 72,119 | | | | 7,021,506 | |
| | |
Biogen., Inc.* | | | 19,983 | | | | 6,013,284 | |
| | |
BioMarin Pharmaceutical, Inc.* | | | 47,653 | | | | 4,057,653 | |
| | |
Celgene Corp.* | | | 83,981 | | | | 5,382,342 | |
| | |
Exact Sciences Corp.* | | | 40,487 | | | | 2,554,730 | |
| | |
Shire PLC (ADR) | | | 22,166 | | | | 3,857,771 | |
| | | | | | | | |
| | | | | | | 28,887,286 | |
|
Health Care Equipment & Supplies 5.7% | |
| | |
Becton, Dickinson & Co. | | | 96,740 | | | | 21,797,457 | |
| | |
Danaher Corp. | | | 101,296 | | | | 10,445,644 | |
| | |
Inogen, Inc.* | | | 25,612 | | | | 3,180,242 | |
| | |
The Cooper Companies, Inc. | | | 25,511 | | | | 6,492,549 | |
| | | | | | | | |
| | | | | | | 41,915,892 | |
| |
Life Sciences Tools & Services 2.7% | | | | | |
Thermo Fisher Scientific, Inc. | | | 89,446 | | | | 20,017,120 | |
| |
Pharmaceuticals 2.0% | | | | | |
| | |
Bristol-Myers Squibb Co. | | | 60,658 | | | | 3,153,003 | |
| | |
Zoetis, Inc. | | | 130,772 | | | | 11,186,237 | |
| | | | | | | | |
| | | | | | | 14,339,240 | |
| | |
| Industrials 10.6% | | | | | | | | |
Aerospace & Defense 3.4% | | | | | |
| | |
Boeing Co. | | | 60,107 | | | | 19,384,507 | |
| | |
TransDigm Group, Inc.* | | | 16,542 | | | | 5,625,273 | |
| | | | | | | | |
| | | | | | | 25,009,780 | |
| |
Electrical Equipment 1.6% | | | | | |
AMETEK, Inc. | | | 165,443 | | | | 11,200,491 | |
| |
Industrial Conglomerates 1.4% | | | | | |
Roper Technologies, Inc. | | | 38,541 | | | | 10,271,947 | |
| | |
Machinery 1.0% | | | | | | | | |
Parker-Hannifin Corp. | | | 48,303 | | | | 7,203,910 | |
| |
Professional Services 2.2% | | | | | |
| | |
TransUnion | | | 89,135 | | | | 5,062,868 | |
| | |
Verisk Analytics, Inc.* | | | 99,809 | | | | 10,883,173 | |
| | | | | | | | |
| | | | | | | 15,946,041 | |
| | |
Road & Rail 1.0% | | | | | | | | |
Norfolk Southern Corp. | | | 48,895 | | | | 7,311,758 | |
| |
| Information Technology 30.5% | | | | | |
IT Services 8.7% | | | | | | | | |
| | |
Cognizant Technology Solutions Corp. “A” | | | 172,072 | | | | 10,923,130 | |
| | |
Fidelity National Information Services, Inc. | | | 93,696 | | | | 9,608,525 | |
| | |
FleetCor Technologies, Inc.* | | | 29,226 | | | | 5,427,853 | |
| | |
Global Payments, Inc. | | | 89,747 | | | | 9,255,608 | |
| | |
Visa, Inc. “A” | | | 211,529 | | | | 27,909,136 | |
| | | | | | | | |
| | | | | | | 63,124,252 | |
|
Semiconductors & Semiconductor Equipment 2.2% | |
| | |
Analog Devices, Inc. | | | 85,293 | | | | 7,320,698 | |
| | |
NVIDIA Corp. | | | 66,499 | | | | 8,877,617 | |
| | | | | | | | |
| | | | | | | 16,198,315 | |
The accompanying notes are an integral part of the financial statements.
| | | | |
Deutsche DWS Variable Series I — DWS Capital Growth VIP | | | | | 7 |
| | | | | | | | |
| | | Shares | | | Value ($) | |
| | |
Software 14.0% | | | | | | | | |
| | |
2U, Inc.* | | | 70,347 | | | | 3,497,653 | |
| | |
Adobe, Inc.* | | | 57,497 | | | | 13,008,121 | |
| | |
Intuit, Inc. | | | 48,264 | | | | 9,500,768 | |
| | |
Microsoft Corp. | | | 483,363 | | | | 49,095,180 | |
| | |
salesforce.com, Inc.* | | | 107,537 | | | | 14,729,343 | |
| | |
ServiceNow, Inc.* | | | 33,869 | | | | 6,030,375 | |
| | |
Synopsys, Inc.* | | | 69,040 | | | | 5,815,930 | |
| | | | | | | | |
| | | | | | | 101,677,370 | |
|
Technology Hardware, Storage & Peripherals 5.6% | |
| | |
Apple, Inc. | | | 242,758 | | | | 38,292,647 | |
| | |
Pure Storage, Inc. “A”* | | | 180,873 | | | | 2,908,438 | |
| | | | | | | | |
| | | | | | | 41,201,085 | |
| | |
| Materials 0.7% | | | | | | | | |
Construction Materials | | | | | | | | |
Vulcan Materials Co. | | | 47,537 | | | | 4,696,656 | |
| | |
| Real Estate 1.9% | | | | | | | | |
Equity Real Estate Investment Trusts (REITs) | |
| | |
Digital Realty Trust, Inc. | | | 76,800 | | | | 8,183,040 | |
| | |
Prologis, Inc. | | | 95,608 | | | | 5,614,102 | |
| | | | | | | | |
| | | | | | | | 13,797,142 | |
| Total Common Stocks(Cost $439,132,505) | | | | 716,238,742 | |
| | | | | | | | |
| | | Shares | | | Value ($) | |
| Securities Lending Collateral 0.7% | |
DWS Government & Agency Securities Portfolio “DWS Government Cash Institutional Shares”, 2.29% (b) (c)
(Cost $5,457,000) | | | 5,457,000 | | | | 5,457,000 | |
| | |
| Cash Equivalents 1.7% | | | | | | | | |
DWS Central Cash Management Government Fund, 2.41% (b) (Cost $12,082,625) | | | 12,082,625 | | | | 12,082,625 | |
| | |
| | | % of Net
Assets | | | Value ($) | |
Total Investment Portfolio
(Cost $456,672,130) | | | 100.8 | | | | 733,778,367 | |
| Other Assets and Liabilities, Net | | | (0.8 | ) | | | (5,704,884 | ) |
| Net Assets | | | 100.0 | | | | 728,073,483 | |
A summary of the Fund’s transactions with affiliated investments during the year ended December 31, 2018 are as follows:
| | | | | | | | | | | | | | | | | | | | | | | | | | | | | | | | |
Value ($) at
12/31/2017 | | Purchases
Cost ($) | | | Sales
Proceeds ($) | | | Net
Realized
Gain/
(Loss) ($) | | | Net Change in
Unrealized
Appreciation
(Depreciation) ($) | | | Income ($) | | | Capital Gain
Distributions ($) | | | Number
of Shares
at
12/31/2018 | | | Value ($)
at
12/31/2018 | |
Securities Lending Collateral 0.7% | | | | | | | | | | | | | | | | | |
DWS Government & Agency Securities Portfolio “DWS Government Cash Institutional Shares”, 2.29% (b) (c) | |
| 4,867,950 | | | 589,050 | (d) | | | — | | | | — | | | | — | | | | 1,922 | | | | — | | | | 5,457,000 | | | | 5,457,000 | |
Cash Equivalents 1.7% | |
DWS Central Cash Management Government Fund, 2.41% (b) | |
| 11,650,299 | | | 152,422,892 | | | | 151,990,566 | | | | — | | | | — | | | | 273,269 | | | | — | | | | 12,082,625 | | | | 12,082,625 | |
| 16,518,249 | | | 153,011,942 | | | | 151,990,566 | | | | — | | | | — | | | | 275,191 | | | | — | | | | 17,539,625 | | | | 17,539,625 | |
| * | Non-income producing security. |
| (a) | All or a portion of these securities were on loan. In addition, “Other Assets and Liabilities, Net” may include pending sales that are also on loan. The value of securities loaned at December 31, 2018 amounted to $5,369,688, which is 0.7% of net assets. |
| (b) | Affiliated fund managed by DWS Investment Management Americas, Inc. The rate shown is the annualizedseven-day yield at period end. |
| (c) | Represents collateral held in connection with securities lending. Income earned by the Fund is net of borrower rebates. |
| (d) | Represents the net increase (purchase cost) or decrease (sales proceeds) in the amount invested for the year ended December 31, 2018. |
ADR: American Depositary Receipt
Fair Value Measurements
Various inputs are used in determining the value of the Fund’s investments. These inputs are summarized in three broad levels. Level 1 includes quoted prices in active markets for identical securities. Level 2 includes other significant observable inputs (including quoted prices for similar securities, interest rates, prepayment speeds and credit risk). Level 3 includes significant unobservable inputs (including the Fund’s own assumptions in determining the fair value of investments). The level assigned to the securities valuations may not be an indication of the risk or liquidity associated with investing in those securities.
The following is a summary of the inputs used as of December 31, 2018 in valuing the Fund’s investments. For information on the Fund’s policy regarding the valuation of investments, please refer to the Security Valuation section of Note A in the accompanying Notes to Financial Statements.
| | | | | | | | | | | | | | | | |
| Assets | | Level 1 | | | Level 2 | | | Level 3 | | | Total | |
| Common Stocks (e) | | $ | 716,238,742 | | | $ | — | | | $ | — | | | $ | 716,238,742 | |
| Short-Term Investments (e) | | | 17,539,625 | | | | — | | | | — | | | | 17,539,625 | |
| Total | | $ | 733,778,367 | | | $ | — | | | $ | — | | | $ | 733,778,367 | |
| (e) | See Investment Portfolio for additional detailed categorizations. |
The accompanying notes are an integral part of the financial statements.
| | | | | | |
| | 8 | | | | | | Deutsche DWS Variable Series I — DWS Capital Growth VIP |
Statement of
Assets and Liabilities
| | | | |
| as of December 31, 2018 | | | | |
| |
| Assets | | | | |
| Investments innon-affiliated securities, at value (cost $439,132,505) — including $5,369,688 of securities loaned | | $ | 716,238,742 | |
| Investment in DWS Government & Agency Securities Portfolio (cost $5,457,000)* | | | 5,457,000 | |
| Investment in DWS Central Cash Management Government Fund (cost $12,082,625) | | | 12,082,625 | |
| Receivable for Fund shares sold | | | 137,687 | |
| Dividends receivable | | | 290,453 | |
| Interest receivable | | | 32,406 | |
| Other assets | | | 19,724 | |
| Total assets | | | 734,258,637 | |
| |
| Liabilities | | | | |
| Payable upon return of securities loaned | | | 5,457,000 | |
| Payable for Fund shares redeemed | | | 292,612 | |
| Accrued management fee | | | 238,982 | |
| Accrued Trustees’ fees | | | 19,714 | |
| Other accrued expenses and payables | | | 176,846 | |
| Total liabilities | | | 6,185,154 | |
| Net assets, at value | | $ | 728,073,483 | |
| |
| Net Assets Consist of | | | | |
| Distributable earnings (loss) | | | 374,108,453 | |
| Paid-in capital | | | 353,965,030 | |
| Net assets, at value | | $ | 728,073,483 | |
| |
| Net Asset Value | | | | |
Class A | | | | |
| |
| Net Asset Value, offering and redemption price per share ($724,603,055 ÷ 26,575,319 outstanding shares of beneficial interest, $0.01 par value, unlimited number of shares authorized) | | $ | 27.27 | |
Class B | | | | |
| |
| Net Asset Value, offering and redemption price per share ($3,470,428 ÷ 127,775 outstanding shares of beneficial interest, $0.01 par value, unlimited number of shares authorized) | | $ | 27.16 | |
| * | Represents collateral on securities loaned. |
Statement of Operations
| | | | |
| for the year ended December 31, 2018 | |
| |
| Investment Income | | | | |
| Income: | | | | |
| Dividends | | $ | 7,549,611 | |
| Income distributions — DWS Central Cash Management Government Fund | | | 273,269 | |
| Securities lending income, net of borrower rebates | | | 1,922 | |
| Total income | | | 7,824,802 | |
| Expenses: | | | | |
| Management fee | | | 3,027,624 | |
| Administration fee | | | 812,363 | |
| Services to Shareholders | | | 2,117 | |
| Record keeping fee (Class B) | | | 88 | |
| Distribution service fee (Class B) | | | 13,735 | |
| Custodian fee | | | 12,037 | |
| Professional fees | | | 84,383 | |
| Reports to shareholders | | | 45,270 | |
| Trustees’ fees and expenses | | | 49,786 | |
| Other | | | 41,166 | |
| Total expenses | | | 4,088,569 | |
| Net investment income | | | 3,736,233 | |
| |
| Realized and Unrealized gain (loss) | | | | |
| Net realized gain (loss) from investments | | | 94,066,554 | |
| Change in net unrealized appreciation (depreciation) on investments | | | (108,027,003 | ) |
| Net gain (loss) | | | (13,960,449 | ) |
| Net increase (decrease) in net assets resulting from operations | | $ | (10,224,216 | ) |
The accompanying notes are an integral part of the financial statements.
| | | | |
Deutsche DWS Variable Series I — DWS Capital Growth VIP | | | | | 9 |
Statements of Changes in Net Assets
| | | | | | | | |
| | | Years Ended December 31, | |
| Increase (Decrease) in Net Assets | | 2018 | | | 2017 | |
| Operations: | | | | | | | | |
| Net investment income (loss) | | $ | 3,736,233 | | | $ | 5,732,351 | |
| Net realized gain (loss) | | | 94,066,554 | | | | 73,188,413 | |
| Change in net unrealized appreciation (depreciation) | | | (108,027,003 | ) | | | 111,635,895 | |
| Net increase (decrease) in net assets resulting from operations | | | (10,224,216 | ) | | | 190,556,659 | |
| Distributions to shareholders: | | | | | | | | |
Class A | | | (78,292,764 | ) | | | (69,522,241 | ) |
Class B | | | (583,563 | ) | | | (494,460 | ) |
| Total distributions | | | (78,876,327 | ) | | | (70,016,701 | )* |
| Fund share transactions: | | | | | | | | |
Class A | | | | | | | | |
| Proceeds from shares sold | | | 53,233,825 | | | | 60,007,049 | |
| Reinvestment of distributions | | | 78,292,764 | | | | 69,522,241 | |
| Payments for shares redeemed | | | (94,375,223 | ) | | | (217,855,027 | ) |
| Net increase (decrease) in net assets from Class A share transactions | | | 37,151,366 | | | | (88,325,737 | ) |
Class B | | | | | | | | |
| Proceeds from shares sold | | | 263,138 | | | | 1,092,096 | |
| Reinvestment of distributions | | | 583,563 | | | | 494,460 | |
| Payments for shares redeemed | | | (2,933,729 | ) | | | (1,795,865 | ) |
| Net increase (decrease) in net assets from Class B share transactions | | | (2,087,028 | ) | | | (209,309 | ) |
| Increase (decrease) in net assets | | | (54,036,205 | ) | | | 32,004,912 | |
| Net assets at beginning of period | | | 782,109,688 | | | | 750,104,776 | |
| | |
| Net assets at end of period | | $ | 728,073,483 | | | $ | 782,109,688 | ** |
| | |
| Other Information | | | | | | | | |
Class A | | | | | | | | |
| Shares outstanding at beginning of period | | | 25,154,197 | | | | 27,895,381 | |
| Shares sold | | | 1,730,657 | | | | 2,126,577 | |
| Shares issued to shareholders in reinvestment of distributions | | | 2,776,339 | | | | 2,573,944 | |
| Shares redeemed | | | (3,085,874 | ) | | | (7,441,705 | ) |
| Net increase (decrease) in Class A shares | | | 1,421,122 | | | | (2,741,184 | ) |
| | |
| Shares outstanding at end of period | | | 26,575,319 | | | | 25,154,197 | |
Class B | | | | | | | | |
| Shares outstanding at beginning of period | | | 191,717 | | | | 197,662 | |
| Shares sold | | | 8,617 | | | | 39,266 | |
| Shares issued to shareholders in reinvestment of distributions | | | 20,738 | | | | 18,341 | |
| Shares redeemed | | | (93,297 | ) | | | (63,552 | ) |
| Net increase (decrease) in Class B shares | | | (63,942 | ) | | | (5,945 | ) |
| | |
| Shares outstanding at end of period | | | 127,775 | | | | 191,717 | |
| * | Includes distributions from net investment income for Class A and Class B of $6,004,257 and $28,374, respectively. Distributions from net realized gains for Class A and Class B of $63,517,984 and $466,086, respectively. |
| ** | Includes undistributed net investment income of $5,662,467. |
The accompanying notes are an integral part of the financial statements.
| | | | | | |
| | 10 | | | | | | Deutsche DWS Variable Series I — DWS Capital Growth VIP |
Financial Highlights
| | | | | | | | | | | | | | | | | | | | |
| | | Years Ended December 31, | |
| Class A | | 2018 | | | 2017 | | | 2016 | | | 2015 | | | 2014 | |
| | | | | |
| Selected Per Share Data | | | | | | | | | | | | | | | | | | | | |
| Net asset value, beginning of period | | $ | 30.86 | | | $ | 26.70 | | | $ | 28.22 | | | $ | 29.95 | | | $ | 28.41 | |
| Income (loss) from investment operations: | | | | | | | | | | | | | | | | | | | | |
Net investment income (loss)a | | | .14 | | | | .20 | | | | .21 | | | | .20 | | | | .21 | |
Net realized and unrealized gain (loss) | | | (.53 | ) | | | 6.47 | | | | .83 | | | | 2.34 | | | | 3.18 | |
Total from investment operations | | | (.39 | ) | | | 6.67 | | | | 1.04 | | | | 2.54 | | | | 3.39 | |
| Less distributions from: | | | | | | | | | | | | | | | | | | | | |
Net investment income | | | (.23 | ) | | | (.22 | ) | | | (.22 | ) | | | (.22 | ) | | | (.18 | ) |
Net realized gains | | | (2.97 | ) | | | (2.29 | ) | | | (2.34 | ) | | | (4.05 | ) | | | (1.67 | ) |
Total distributions | | | (3.20 | ) | | | (2.51 | ) | | | (2.56 | ) | | | (4.27 | ) | | | (1.85 | ) |
| Net asset value, end of period | | $ | 27.27 | | | $ | 30.86 | | | $ | 26.70 | | | $ | 28.22 | | | $ | 29.95 | |
| Total Return (%) | | | (1.60 | ) | | | 26.30 | | | | 4.25 | | | | 8.62 | | | | 12.97 | |
| | | | | |
| Ratios to Average Net Assets and Supplemental Data | | | | | | | | | | | | | | | | | | | | |
| Net assets, end of period ($ millions) | | | 725 | | | | 776 | | | | 745 | | | | 849 | | | | 890 | |
| Ratio of expenses (%)b | | | .50 | | | | .50 | | | | .50 | | | | .49 | | | | .50 | |
| Ratio of net investment income (loss) (%) | | | .46 | | | | .70 | | | | .82 | | | | .70 | | | | .76 | |
| Portfolio turnover rate (%) | | | 26 | | | | 15 | | | | 35 | | | | 35 | | | | 47 | |
| a | Based on average shares outstanding during the period. |
| b | Expense ratio does not reflect charges and fees associated with the separate account that invests in the Fund or any variable life insurance policy or variable annuity contract for which the Fund is an investment option. |
| | | | | | | | | | | | | | | | | | | | |
| | | Years Ended December 31, | |
| Class B | | 2018 | | | 2017 | | | 2016 | | | 2015 | | | 2014 | |
| | | | | |
| Selected Per Share Data | | | | | | | | | | | | | | | | | | | | |
| Net asset value, beginning of period | | $ | 30.75 | | | $ | 26.61 | | | $ | 28.12 | | | $ | 29.84 | | | $ | 28.29 | |
| Income (loss) from investment operations: | | | | | | | | | | | | | | | | | | | | |
Net investment income (loss)a | | | .07 | | | | .13 | | | | .15 | | | | .13 | | | | .09 | |
Net realized and unrealized gain (loss) | | | (.54 | ) | | | 6.44 | | | | .83 | | | | 2.32 | | | | 3.22 | |
Total from investment operations | | | (.47 | ) | | | 6.57 | | | | .98 | | | | 2.45 | | | | 3.31 | |
| Less distributions from: | | | | | | | | | | | | | | | | | | | | |
Net investment income | | | (.15 | ) | | | (.14 | ) | | | (.15 | ) | | | (.12 | ) | | | (.09 | ) |
Net realized gains | | | (2.97 | ) | | | (2.29 | ) | | | (2.34 | ) | | | (4.05 | ) | | | (1.67 | ) |
Total distributions | | | (3.12 | ) | | | (2.43 | ) | | | (2.49 | ) | | | (4.17 | ) | | | (1.76 | ) |
| Net asset value, end of period | | $ | 27.16 | | | $ | 30.75 | | | $ | 26.61 | | | $ | 28.12 | | | $ | 29.84 | |
| Total Return (%) | | | (1.87 | ) | | | 25.96 | | | | 4.00 | | | | 8.33 | | | | 12.67 | |
| | | | | |
| Ratios to Average Net Assets and Supplemental Data | | | | | | | | | | | | | | | | | | | | |
| Net assets, end of period ($ millions) | | | 3 | | | | 6 | | | | 5 | | | | 4 | | | | 3 | |
| Ratio of expenses (%)b | | | .76 | | | | .75 | | | | .76 | | | | .76 | | | | .80 | |
| Ratio of net investment income (loss) (%) | | | .21 | | | | .45 | | | | .58 | | | | .44 | | | | .33 | |
| Portfolio turnover rate (%) | | | 26 | | | | 15 | | | | 35 | | | | 35 | | | | 47 | |
| a | Based on average shares outstanding during the period. |
| b | Expense ratio does not reflect charges and fees associated with the separate account that invests in the Fund or any variable life insurance policy or variable annuity contract for which the Fund is an investment option. |
The accompanying notes are an integral part of the financial statements.
| | | | |
Deutsche DWS Variable Series I — DWS Capital Growth VIP | | | | | 11 |
| | |
| Notes to Financial Statements | | |
A. Organization and Significant Accounting Policies
Deutsche DWS Variable Series I (formerly Deutsche Variable Series I) (the “Trust“) is registered under the Investment Company Act of 1940, as amended (the “1940 Act“), as anopen-end management investment company organized as a Massachusetts business trust. The Trust consists of five diversified funds: DWS Bond VIP (formerly Deutsche Bond VIP), DWS Capital Growth VIP (formerly Deutsche Capital Growth VIP), DWS Core Equity VIP (formerly Deutsche Core Equity VIP), DWS CROCI® International VIP (formerly Deutsche CROCI® International VIP) and DWS Global Small Cap VIP (formerly Deutsche Global Small Cap VIP) (individually or collectively hereinafter referred to as a “Fund“ or the “Funds“). These financial statements report on DWS Capital Growth VIP. The Trust is intended to be the underlying investment vehicle for variable annuity contracts and variable life insurance policies to be offered by the separate accounts of certain life insurance companies (“Participating Insurance Companies“).
Multiple Classes of Shares of Beneficial Interest. The Fund offers two classes of shares (Class A shares and Class B shares). Class B shares are subject to Rule12b-1 distribution fees under the 1940 Act and recordkeeping fees equal to an annual rate of 0.25% and up to 0.15%, respectively, of the average daily net assets of the Class B shares of the Fund. Class A shares are not subject to such fees.
Investment income, realized and unrealized gains and losses, and certainfund-level expenses and expense reductions, if any, are borne pro rata on the basis of relative net assets by the holders of all classes of shares, except that each class bears certain expenses unique to that class (including the applicable12b-1 distribution fees and recordkeeping fees). Differences inclass-level expenses may result in payment of different per share dividends by class. All shares have equal rights with respect to voting subject toclass-specific arrangements.
The Fund’s financial statements are prepared in accordance with accounting principles generally accepted in the United States of America (“U.S. GAAP”) which require the use of management estimates. Actual results could differ from those estimates. The Fund qualifies as an investment company under Topic 946 of Accounting Standards Codification of U.S. GAAP. The policies described below are followed consistently by the Fund in the preparation of its financial statements.
In October 2018, the Securities and Exchange Commission adopted amendments to certain disclosure requirements in Securities Act Release No. 33-10532, Disclosure Update and Simplification, which is intended to facilitate the disclosure of information to investors and simplify compliance without significantly altering the total mix of information provided to investors. Effective with the current reporting period, the Fund adopted the amendments with the impacts being that the Fund is no longer required to present components of distributable earnings on the Statement of Assets and Liabilities or the sources of distributable earnings and the amount of undistributed net investment income on the Statements of Changes in Net Assets.
Security Valuation. Investments are stated at value determined as of the close of regular trading on the New York Stock Exchange on each day the exchange is open for trading.
Various inputs are used in determining the value of the Fund’s investments. These inputs are summarized in three broad levels. Level 1 includes quoted prices in active markets for identical securities. Level 2 includes other significant observable inputs (including quoted prices for similar securities, interest rates, prepayment speeds and credit risk). Level 3 includes significant unobservable inputs (including the Fund’s own assumptions in determining the fair value of investments). The level assigned to the securities valuations may not be an indication of the risk or liquidity associated with investing in those securities.
Equity securities are valued at the most recent sale price or official closing price reported on the exchange (U.S. or foreign) orover-the-counter market on which they trade. Securities for which no sales are reported are valued at the calculated mean between the most recent bid and asked quotations on the relevant market or, if a mean cannot be determined, at the most recent bid quotation. Equity securities are generally categorized as Level 1.
Investments inopen-end investment companies are valued at their net asset value each business day and are categorized as Level 1.
Securities and other assets for which market quotations are not readily available or for which the above valuation procedures are deemed not to reflect fair value are valued in a manner that is intended to reflect their fair value as determined in accordance with procedures approved by the Trustees and are generally categorized as Level 3. In accordance with the Fund’s valuation procedures, factors considered in determining value may
| | | | | | |
| | 12 | | | | | | Deutsche DWS Variable Series I — DWS Capital Growth VIP |
include, but are not limited to, the type of the security; the size of the holding; the initial cost of the security; the existence of any contractual restrictions on the security’s disposition; the price and extent of public trading in similar securities of the issuer or of comparable companies; quotations or evaluated prices frombroker-dealers and/or pricing services; information obtained from the issuer, analysts, and/or the appropriate stock exchange (forexchange-traded securities); an analysis of the company’s or issuer’s financial statements; an evaluation of the forces that influence the issuer and the market(s) in which the security is purchased and sold; and with respect to debt securities, the maturity, coupon, creditworthiness, currency denomination and the movement of the market in which the security is normally traded. The value determined under these procedures may differ from published values for the same securities.
Disclosure about the classification of fair value measurements is included in a table following the Fund’s Investment Portfolio.
Securities Lending. Deutsche Bank AG, as lending agent, lends securities of the Fund to certain financial institutions under the terms of its securities lending agreement. During the term of the loans, the Fund continues to receive interest and dividends generated by the securities and to participate in any changes in their market value. The Fund requires the borrowers of the securities to maintain collateral with the Fund consisting of either cash or liquid, unencumbered assets having a value at least equal to the value of the securities loaned. When the collateral falls below specified amounts, the lending agent will use its best effort to obtain additional collateral on the next business day to meet required amounts under the securities lending agreement. During the year ended December 31, 2018, the Fund invested the cash collateral into a joint trading account in affiliated money market funds including DWS Government & Agency Securities Portfolio managed by DWS Investment Management Americas, Inc. DWS Investment Management Americas, Inc. receives a management/administration fee (0.12% annualized effective rate as of December 31, 2018) on the cash collateral invested in DWS Government & Agency Securities Portfolio. The Fund receives compensation for lending its securities either in the form of fees or by earning interest on invested cash collateral net of borrower rebates and fees paid to a lending agent. Either the Fund or the borrower may terminate the loan at any time and the borrower, after notice, is required to return borrowed securities within a standard time period. There may be risks of delay and costs in recovery of securities or even loss of rights in the collateral should the borrower of the securities fail financially. If the Fund is not able to recover securities lent, the Fund may sell the collateral and purchase a replacement investment in the market, incurring the risk that the value of the replacement security is greater than the value of the collateral. The Fund is also subject to all investment risks associated with the reinvestment of any cash collateral received, including, but not limited to, interest rate, credit and liquidity risk associated with such investments.
As of December 31, 2018, the Fund had securities on loan, which were classified as common stock in the Investment Portfolio. The value of the related collateral exceeded the value of the securities loaned at period end. As of period end, the remaining contractual maturity of the collateral agreements were overnight and continuous.
Foreign Currency Translations. The books and records of the Fund are maintained in U.S. dollars. Investment securities and other assets and liabilities denominated in a foreign currency are translated into U.S. dollars at the prevailing exchange rates at period end. Purchases and sales of investment securities, income and expenses are translated into U.S. dollars at the prevailing exchange rates on the respective dates of the transactions.
Net realized and unrealized gains and losses on foreign currency transactions represent net gains and losses between trade and settlement dates on securities transactions, the acquisition and disposition of foreign currencies, and the difference between the amount of net investment income accrued and the U.S. dollar amount actually received. The portion of both realized and unrealized gains and losses on investments that results from fluctuations in foreign currency exchange rates is not separately disclosed but is included with net realized and unrealized gain/appreciation and loss/depreciation on investments.
Federal Income Taxes. The Fund is treated as a separate taxpayer as provided for in the Internal Revenue Code, as amended. It is the Fund’s policy to comply with the requirements of the Internal Revenue Code, as amended, which are applicable to regulated investment companies, and to distribute all of its taxable income to the separate accounts of the Participating Insurance Companies which hold its shares.
The Fund has reviewed the tax positions for the open tax years as of December 31, 2018 and has determined that no provision for income tax and/or uncertain tax positions is required in the Fund’s financial statements. The Fund’s federal tax returns for the prior three fiscal years remain open subject to examination by the Internal Revenue Service.
| | | | |
Deutsche DWS Variable Series I — DWS Capital Growth VIP | | | | | 13 |
Distribution of Income and Gains. Distributions from net investment income of the Fund, if any, are declared and distributed to shareholders annually. Net realized gains from investment transactions, in excess of available capital loss carryforwards, would be taxable to the Fund if not distributed, and, therefore, will be distributed to shareholders at least annually. The Fund may also make additional distributions for tax purposes if necessary.
The timing and characterization of certain income and capital gain distributions are determined annually in accordance with federal tax regulations which may differ from accounting principles generally accepted in the United States of America. These differences primarily relate to certain securities sold at a loss. As a result, net investment income (loss) and net realized gain (loss) on investment transactions for a reporting period may differ significantly from distributions during such period. Accordingly, the Fund may periodically make reclassifications among certain of its capital accounts without impacting the net asset value of the Fund.
At December 31, 2018, the Fund’s components of distributable earnings (accumulated losses) on a tax basis are as follows:
| | | | |
| Undistributed ordinary income* | | $ | 6,876,946 | |
| Undistributed net long-term capital gains | | $ | 90,255,299 | |
| Net Unrealized appreciation (depreciation) on investments | | $ | 276,898,640 | |
At December 31, 2018, the aggregate cost of investments for federal income tax purposes was $456,879,727. The net unrealized appreciation for all investments based on tax cost was $276,898,640. This consisted of aggregate gross unrealized appreciation for all investments in which there was an excess of value over tax cost of $306,682,643 and aggregate gross unrealized depreciation for all investments in which there was an excess of tax cost over value of $29,784,003.
In addition, the tax character of distributions paid to shareholders by the Fund is summarized as follows:
| | | | | | | | |
| | | Years Ended December 31, | |
| | | 2018 | | | 2017 | |
| Distributions from ordinary income* | | $ | 9,435,917 | | | $ | 6,032,631 | |
| Distributions from long-term capital gains | | $ | 69,440,410 | | | $ | 63,984,070 | |
| * | For tax purposes, short-term capital gain distributions are considered ordinary income distributions. |
Expenses. Expenses of the Trust arising in connection with a specific Fund are allocated to that Fund. Other Trust expenses which cannot be directly attributed to a Fund are apportioned among the Funds in the Trust based upon the relative net assets or other appropriate measures.
Contingencies. In the normal course of business, the Fund may enter into contracts with service providers that contain general indemnification clauses. The Fund’s maximum exposure under these arrangements is unknown, as this would involve future claims that may be made against the Fund that have not yet been made. However, based on experience, the Fund expects the risk of loss to be remote.
Real Estate Investment Trusts. The Fund at its fiscal year end recharacterizes distributions received from a Real Estate Investment Trust (“REIT”) investment based on information provided by the REIT into the following categories: ordinary income, long-term and short-term capital gains, and return of capital. If information is not available timely from a REIT, the recharacterization will be estimated for financial statement purposes and a recharacterization will be made within the accounting records in the following year when such information becomes available. Distributions received from REITs in excess of income are recorded as either a reduction of cost of investments or realized gains.
Other. Investment transactions are accounted for on a trade date plus one basis for daily net asset value calculations. However, for financial reporting purposes, investment transactions are reported on trade date. Interest income is recorded on the accrual basis. Dividend income is recorded on theex-dividend date net of foreign withholding taxes. Realized gains and losses from investment transactions are recorded on an identified cost basis. Proceeds from litigation payments, if any, are included in net realized gain (loss) from investments.
B. Purchases and Sales of Securities
During the year ended December 31, 2018, purchases and sales of investment securities (excludingshort-term investments) aggregated $208,930,049 and $249,207,283, respectively.
| | | | | | |
| | 14 | | | | | | Deutsche DWS Variable Series I — DWS Capital Growth VIP |
C. Related Parties
Management Agreement. Under the Investment Management Agreement with DWS Investment Management Americas, Inc. (formerly Deutsche Investment Management Americas Inc.) (“DIMA“ or the “Advisor“), an indirect, wholly owned subsidiary of DWS Group GmbH & Co. KGaA (“DWS Group”), the Advisor directs the investments of the Fund in accordance with its investment objectives, policies and restrictions. The Advisor determines the securities, instruments and other contracts relating to investments to be purchased, sold or entered into by the Fund.
Pursuant to the Investment Management Agreement with the Advisor, the Fund pays a monthly management fee based on the Fund’s average daily net assets, computed and accrued daily and payable monthly at the following annual rates:
| | | | |
| First $250 million of average daily net assets | | | .390 | % |
| Next $750 million of average daily net assets | | | .365 | % |
| Over $1 billion of average daily net assets | | | .340 | % |
Accordingly, for the year ended December 31, 2018, the fee pursuant to the Investment Management Agreement was equivalent to an annual rate (exclusive of any applicable waivers/reimbursements) of 0.37% of the Fund’s average daily net assets.
For the period from January 1, 2018 through September 30, 2018, the Advisor had contractually agreed to waive its fees and/or reimburse certain operating expenses to the extent necessary to maintain the total annual operating expenses (excluding certain expenses such as extraordinary expenses, taxes, brokerage and interest expense) of each class as follows:
| | | | |
| Class A | | | .82 | % |
| Class B | | | 1.07 | % |
Effective from October 1, 2018 through September 30, 2019, the Advisor has contractually agreed to waive its fees and/or reimburse certain operating expenses to the extent necessary to maintain the total annual operating expenses (excluding certain expenses such as extraordinary expenses, taxes, brokerage and interest expense) of each class as follows:
| | | | |
| Class A | | | .77 | % |
| Class B | | | 1.02 | % |
Administration Fee. Pursuant to an Administrative Services Agreement, DIMA provides most administrative services to the Fund. For all services provided under the Administrative Services Agreement, the Fund pays the Advisor an annual fee (“Administration Fee“) of 0.10% of the Fund’s average daily net assets, computed and accrued daily and payable monthly. For the year ended December 31, 2018, the Administration Fee was $812,363, of which $64,020 is unpaid.
Service Provider Fees. DWS Service Company (“DSC“), an affiliate of the Advisor, is the transfer agent,dividend-paying agent and shareholder service agent for the Fund. Pursuant to asub-transfer agency agreement between DSC and DST Systems, Inc. (“DST“), DSC has delegated certain transfer agent,dividend-paying agent and shareholder service agent functions to DST. DSC compensates DST out of the shareholder servicing fee it receives from the Fund. For the year ended December 31, 2018, the amounts charged to the Fund by DSC were as follows:
| | | | | | | | |
| Services to Shareholders | | Total
Aggregated | | | Unpaid at December 31, 2018 | |
| Class A | | $ | 778 | | | $ | 129 | |
| Class B | | | 96 | | | | 35 | |
| | | $ | 874 | | | $ | 164 | |
Distribution Service Agreement.DWS Distributors, Inc. (“DDI“), also an affiliate of the Advisor, is the Trust’s Distributor. In accordance with the Master Distribution Plan, DDI receives12b-1 fees of 0.25% of average daily net assets of Class B shares. Pursuant to the Master Distribution Plan, DDI remits these fees to the Participating Insurance Companies for various costs incurred or paid by these companies in connection with marketing and distribution of Class B shares. For the year ended December 31, 2018, the Distribution Service Fee aggregated $13,735, of which $762 is unpaid.
| | | | |
Deutsche DWS Variable Series I — DWS Capital Growth VIP | | | | | 15 |
Typesetting and Filing Service Fees. Under an agreement with the Fund, DIMA is compensated for providing certainpre-press and regulatory filing services to the Fund. For the year ended December 31, 2018, the amount charged to the Fund by DIMA included in the Statement of Operations under “Reports to shareholders“ aggregated $8,325, of which $6,167 is unpaid.
Trustees’ Fees and Expenses. The Fund paid retainer fees to each Trustee not affiliated with the Advisor, plus specified amounts to the Board Chairperson and to each committee Chairperson.
Affiliated Cash Management Vehicles. The Fund may invest uninvested cash balances in DWS Central Cash Management Government Fund and DWS ESG Liquidity Fund, affiliated money market funds which are managed by the Advisor. Each affiliated money market fund is managed in accordance withRule 2a-7 under the 1940 Act, which governs the quality, maturity, diversity and liquidity of instruments in which a money market fund may invest. DWS Central Cash Management Government Fund seeks to maintain a stable net asset value, and DWS ESG Liquidity Fund maintains a floating net asset value. The Fund indirectly bears its proportionate share of the expenses of each affiliated money market fund in which it invests. DWS Central Cash Management Government Fund does not pay the Advisor an investment management fee. To the extent that DWS ESG Liquidity Fund pays an investment management fee to the Advisor, the Advisor will waive an amount of the investment management fee payable to the Advisor by the Fund equal to the amount of the investment management fee payable on the Fund’s assets invested in DWS ESG Liquidity Fund.
Securities Lending Agent Fees. Deutsche Bank AG serves as lending agent for the Fund. For the year ended December 31, 2018, the Fund incurred securities lending agent fees to Deutsche Bank AG in the amount of $145.
D. Ownership of the Fund
At December 31, 2018, two participating insurance companies were owners of record of 10% or more of the total outstanding Class A shares of the Fund, each owning 57% and 29%, respectively. Two participating insurance companies were the owners of record of 10% or more of the total outstanding Class B shares of the Fund, each owning 45% and 40%, respectively.
E. Line of Credit
The Fund and other affiliated funds (the “Participants”) share in a $400 million revolving credit facility provided by a syndication of banks. The Fund may borrow for temporary or emergency purposes, including the meeting of redemption requests that otherwise might require the untimely disposition of securities. The Participants are charged an annual commitment fee which is allocated based on net assets, among each of the Participants. Interest is calculated at a rate per annum equal to the sum of the Federal Funds Rate plus 1.25 percent plus if theone-month LIBOR exceeds the Federal Funds Rate, the amount of such excess. The Fund may borrow up to a maximum of 33 percent of its net assets under the agreement. The Fund had no outstanding loans at December 31, 2018.
| | | | | | |
| | 16 | | | | | | Deutsche DWS Variable Series I — DWS Capital Growth VIP |
Report of Independent Registered Public Accounting Firm
To the Board of Trustees of Deutsche DWS Variable Series I and Shareholders of DWS Capital Growth VIP
Opinion on the Financial Statements
We have audited the accompanying statement of assets and liabilities, including the investment portfolio, of DWS Capital Growth VIP (one of the funds constituting Deutsche DWS Variable Series I, referred to hereafter as the “Fund”) as of December 31, 2018, the related statement of operations for the year ended December 31, 2018, the statements of changes in net assets for each of the two years in the period ended December 31, 2018, including the related notes, and the financial highlights for each of the five years in the period ended December 31, 2018 (collectively referred to as the “financial statements”). In our opinion, the financial statements present fairly, in all material respects, the financial position of the Fund as of December 31, 2018, the results of its operations for the year then ended, the changes in its net assets for each of the two years in the period ended December 31, 2018 and the financial highlights for each of the five years in the period ended December 31, 2018 in conformity with accounting principles generally accepted in the United States of America.
Basis for Opinion
These financial statements are the responsibility of the Fund’s management. Our responsibility is to express an opinion on the Fund’s financial statements based on our audits. We are a public accounting firm registered with the Public Company Accounting Oversight Board (United States) (PCAOB) and are required to be independent with respect to the Fund in accordance with the U.S. federal securities laws and the applicable rules and regulations of the Securities and Exchange Commission and the PCAOB.
We conducted our audits of these financial statements in accordance with the standards of the PCAOB. Those standards require that we plan and perform the audit to obtain reasonable assurance about whether the financial statements are free of material misstatement, whether due to error or fraud.
Our audits included performing procedures to assess the risks of material misstatement of the financial statements, whether due to error or fraud, and performing procedures that respond to those risks. Such procedures included examining, on a test basis, evidence regarding the amounts and disclosures in the financial statements. Our audits also included evaluating the accounting principles used and significant estimates made by management, as well as evaluating the overall presentation of the financial statements. Our procedures included confirmation of securities owned as of December 31, 2018 by correspondence with the custodian and transfer agent. We believe that our audits provide a reasonable basis for our opinion.
PricewaterhouseCoopers LLP
Boston, Massachusetts
February 14, 2019
We have served as the auditor of one or more investment companies in the DWS family of funds since 1930.
| | | | |
Deutsche DWS Variable Series I — DWS Capital Growth VIP | | | | | 17 |
| | |
| Information About Your Fund’s Expenses | | (Unaudited) |
As an investor of the Fund, you incur two types of costs: ongoing expenses and transaction costs. Ongoing expenses include management fees, distribution and service(12b-1) fees and other Fund expenses. Examples of transaction costs include contract charges, which are not shown in this section. The following tables are intended to help you understand your ongoing expenses (in dollars) of investing in the Fund and to help you compare these expenses with the ongoing expenses of investing in other mutual funds. The example in the table is based on an investment of $1,000 invested at the beginning of thesix-month period and held for the entire period (July 1, 2018 to December 31, 2018).
The tables illustrate your Fund’s expenses in two ways:
| – | Actual Fund Return. This helps you estimate the actual dollar amount of ongoing expenses (but not transaction costs) paid on a $1,000 investment in the Fund using the Fund’s actual return during the period. To estimate the expenses you paid over the period, simply divide your account value by $1,000 (for example, an $8,600 account value divided by $1,000 = 8.6), then multiply the result by the number in the “Expenses Paid per $1,000” line under the share class you hold. |
| – | Hypothetical 5% Fund Return. This helps you to compare your Fund’s ongoing expenses (but not transaction costs) with those of other mutual funds using the Fund’s actual expense ratio and a hypothetical rate of return of 5% per year before expenses. Examples using a 5% hypothetical Fund return may be found in the shareholder reports of other mutual funds. The hypothetical account values and expenses may not be used to estimate the actual ending account balance or expenses you paid for the period. |
Please note that the expenses shown in these tables are meant to highlight your ongoing expenses only and do not reflect any transaction costs. The “Expenses Paid per $1,000” line of the tables is useful in comparing ongoing expenses only and will not help you determine the relative total expense of owning different funds. If these transaction costs had been included, your costs would have been higher.
| | | | | | | | |
| Expenses and Value of a $1,000 Investmentfor the six months ended December 31, 2018 | |
| | |
| Actual Fund Return | | Class A | | | Class B | |
| Beginning Account Value 7/1/18 | | $ | 1,000.00 | | | $ | 1,000.00 | |
| Ending Account Value 12/31/18 | | $ | 913.60 | | | $ | 912.30 | |
| Expenses Paid per $1,000* | | $ | 2.41 | | | $ | 3.62 | |
| | |
| Hypothetical 5% Fund Return | | Class A | | | Class B | |
| Beginning Account Value 7/1/18 | | $ | 1,000.00 | | | $ | 1,000.00 | |
| Ending Account Value 12/31/18 | | $ | 1,022.68 | | | $ | 1,021.42 | |
| Expenses Paid per $1,000* | | $ | 2.55 | | | $ | 3.82 | |
| * | Expenses are equal to the Fund’s annualized expense ratio for each share class, multiplied by the average account value over the period, multiplied by 184 (the number of days in the most recentsix-month period), then divided by 365. |
| | | | | | | | |
| Annualized Expense Ratios | | Class A | | | Class B | |
| Deutsche DWS Variable Series I — DWS Capital Growth VIP | | | .50 | % | | | .75 | % |
For more information, please refer to the Fund’s prospectus.
These tables do not reflect charges and fees (“contract charges”) associated with the separate account that invests in the Fund or any variable life insurance policy or variable annuity contract for which the Fund is an investment option.
For an analysis of the fees associated with an investment in the Fund or similar funds, please refer to the current and hypothetical expense calculators for Variable Insurance Products which can be found at dws.com/calculators.
| | | | | | |
| | 18 | | | | | | Deutsche DWS Variable Series I — DWS Capital Growth VIP |
| | |
| Tax Information | | (Unaudited) |
The Fund paid distributions of $2.82 per share from net long-term capital gains during its year ended December 31, 2018.
Pursuant to Section 852 of the Internal Revenue Code, the Fund designates $99,488,000 as capital gain dividends for its year ended December 31, 2018.
For corporate shareholders, 97% of the ordinary dividends (i.e., income dividends plus short-term capital gains) paid during the Fund’s fiscal year ended December 31, 2018 qualified for the dividends received deduction.
Please consult a tax advisor if you have questions about federal or state income tax laws, or on how to prepare your tax returns. If you have specific questions about your account, please contact your insurance provider.
Proxy Voting
The Trust’s policies and procedures for voting proxies for portfolio securities and information about how the Trust voted proxies related to its portfolio securities during the most recent12-month period ended June 30 are available on our Web site — dws.com/en-us/resources/proxy-voting — or on the SEC’s Web site — sec.gov. To obtain a written copy of the Trust’s policies and procedures without charge, upon request, call us toll free at (800)728-3337.
| | | | |
Deutsche DWS Variable Series I — DWS Capital Growth VIP | | | | | 19 |
Advisory Agreement Board Considerations and Fee Evaluation
The Board of Trustees (hereinafter referred to as the “Board” or “Trustees”) approved the renewal of DWS Capital Growth VIP’s (the “Fund”) investment management agreement (the “Agreement”) with DWS Investment Management Americas, Inc. (“DIMA”) in September 2018.
In terms of the process that the Board followed prior to approving the Agreement, shareholders should know that:
| – | | During the entire process, all of the Fund’s Trustees were independent of DIMA and its affiliates (the “Independent Trustees”). |
| – | | The Board met frequently during the past year to discuss fund matters and dedicated a substantial amount of time to contract review matters. Over the course of several months, the Board’s Contract Committee reviewed extensive materials received from DIMA, independent third parties and independent counsel. These materials included an analysis of the Fund’s performance, fees and expenses, and profitability from a fee consultant retained by the Fund’s Independent Trustees (the “Fee Consultant”). Based on its evaluation of the information provided, the Contract Committee presented its findings and recommendations to the Board. The Board then reviewed the Contract Committee’s findings and recommendations. |
| – | | The Board also received extensive information throughout the year regarding performance of the Fund. |
| – | | The Independent Trustees regularly met privately with counsel to discuss contract review and other matters. In addition, the Independent Trustees were advised by the Fee Consultant in the course of their review of the Fund’s contractual arrangements and considered a comprehensive report prepared by the Fee Consultant in connection with their deliberations. |
| – | | In connection with reviewing the Agreement, the Board also reviewed the terms of the Fund’s Rule12b-1 plan, distribution agreement, administrative services agreement, transfer agency agreement and other material service agreements. |
In connection with the contract review process, the Contract Committee and the Board considered the factors discussed below, among others. The Board also considered that DIMA and its predecessors have managed the Fund since its inception, and the Board believes that a long-term relationship with a capable, conscientious advisor is in the best interests of the Fund. The Board considered, generally, that shareholders chose to invest or remain invested in the Fund knowing that DIMA managed the Fund. DIMA is part of DWS Group GmbH & Co. KGaA (“DWS Group”). DWS Group is a global asset management business that offers a wide range of investing expertise and resources, including research capabilities in many countries throughout the world. In 2018, approximately 20% of DWS Group’s shares were sold in an initial public offering, with Deutsche Bank AG owning the remaining shares.
As part of the contract review process, the Board carefully considered the fees and expenses of each DWS fund overseen by the Board in light of the fund’s performance. In many cases, this led to the negotiation and implementation of expense caps. As part of these negotiations, the Board indicated that it would consider relaxing these caps in future years following sustained improvements in performance, among other considerations.
While shareholders may focus primarily on fund performance and fees, the Fund’s Board considers these and many other factors, including the quality and integrity of DIMA’s personnel and administrative support services provided by DIMA, such as back-office operations, fund valuations, and compliance policies and procedures.
Nature, Quality and Extent of Services. The Board considered the terms of the Agreement, including the scope of advisory services provided under the Agreement. The Board noted that, under the Agreement, DIMA provides portfolio management services to the Fund and that, pursuant to a separate administrative services agreement, DIMA provides administrative services to the Fund. The Board considered the experience and skills of senior management and investment personnel and the resources made available to such personnel. The Board reviewed the Fund’s performance over short-term and long-term periods and compared those returns to various agreed-upon performance measures, including market index(es) and a peer universe compiled using information supplied by Morningstar Direct (“Morningstar”), an independent fund data service. The Board also noted that it has put into place a process of identifying “Funds in Review” (e.g., funds performing poorly relative to a peer universe), and receives additional reporting from DIMA regarding such funds and, where appropriate, DIMA’s plans to address underperformance. The Board
| | | | | | |
| | 20 | | | | | | Deutsche DWS Variable Series I — DWS Capital Growth VIP |
believes this process is an effective manner of identifying and addressing underperforming funds. Based on the information provided, the Board noted that, for theone-, three- and five-year periods ended December 31, 2017, the Fund’s performance (Class A shares) was in the 3rd quartile, 2nd quartile and 2nd quartile, respectively, of the applicable Morningstar universe (the 1st quartile being the best performers and the 4th quartile being the worst performers). The Board also observed that the Fund has underperformed its benchmark in theone-, three- and five-year periods ended December 31, 2017.
Fees and Expenses. The Board considered the Fund’s investment management fee schedule, operating expenses and total expense ratios, and comparative information provided by Broadridge Financial Solutions, Inc. (“Broadridge”) and the Fee Consultant regarding investment management fee rates paid to other investment advisors by similar funds (1st quartile being the most favorable and 4th quartile being the least favorable). With respect to management fees paid to other investment advisors by similar funds, the Board noted that the contractual fee rates paid by the Fund, which include a 0.10% fee paid to DIMA under the Fund’s administrative services agreement, were lower than the median (1st quartile) of the applicable Broadridge peer group (based on Broadridge data provided as of December 31, 2017). The Board noted that the Fund’s Class A shares total (net) operating expenses were expected to be lower than the median (1st quartile) of the applicable Broadridge expense universe (based on Broadridge data provided as of December 31, 2017, and analyzing Broadridge expense universe Class A (net) expenses less any applicable12b-1 fees) (“Broadridge Universe Expenses”). The Board also reviewed data comparing each share class’s total (net) operating expenses to the applicable Broadridge Universe Expenses. The Board noted that the expense limitations agreed to by DIMA were expected to help the Fund’s total (net) operating expenses remain competitive. The Board considered the Fund’s management fee rate as compared to fees charged by DIMA to comparable DWS U.S. registered funds (“DWS Funds”) and considered differences between the Fund and the comparable DWS Funds. The information requested by the Board as part of its review of fees and expenses also included information about institutional accounts (including anysub-advised funds and accounts) and funds offered primarily to European investors (“DWS Europe Funds”) managed by DWS Group. The Board noted that DIMA indicated that DWS Group does not manage any institutional accounts or DWS Europe Funds comparable to the Fund.
On the basis of the information provided, the Board concluded that management fees were reasonable and appropriate in light of the nature, quality and extent of services provided by DIMA.
Profitability. The Board reviewed detailed information regarding revenues received by DIMA under the Agreement. The Board considered the estimated costs to DIMA, andpre-tax profits realized by DIMA, from advising the DWS Funds, as well as estimates of thepre-tax profits attributable to managing the Fund in particular. The Board also received information regarding the estimated enterprise-wide profitability of DIMA and its affiliates with respect to all fund services in totality and by fund. The Board and the Fee Consultant reviewed DIMA’s methodology in allocating its costs to the management of the Fund. Based on the information provided, the Board concluded that thepre-tax profits realized by DIMA in connection with the management of the Fund were not unreasonable. The Board also reviewed certain publicly available information regarding the profitability of certain similar investment management firms. The Board noted that, while information regarding the profitability of such firms is limited (and in some cases is not necessarily prepared on a comparable basis), DIMA and its affiliates’ overall profitability with respect to the DWS Funds (after taking into account distribution and other services provided to the funds by DIMA and its affiliates) was lower than the overall profitability levels of most comparable firms for which such data was available.
Economies of Scale. The Board considered whether there are economies of scale with respect to the management of the Fund and whether the Fund benefits from any economies of scale. The Board noted that the Fund’s investment management fee schedule includes fee breakpoints. The Board concluded that the Fund’s fee schedule represents an appropriate sharing between the Fund and DIMA of such economies of scale as may exist in the management of the Fund at current asset levels.
Other Benefits to DIMA and Its Affiliates. The Board also considered the character and amount of other incidental or“fall-out” benefits received by DIMA and its affiliates, including any fees received by DIMA for administrative services provided to the Fund, any fees received by an affiliate of DIMA for transfer agency services provided to the Fund and any fees received by an affiliate of DIMA for distribution services. The Board also considered benefits to DIMA related to brokerage and soft-dollar allocations, including allocating brokerage to pay for research generated by parties other than the executing broker dealers, which pertain primarily to funds investing in equity securities. In addition, the Board considered the incidental public relations benefits to DIMA related to DWS Funds advertising and cross-selling opportunities among DIMA
| | | | |
Deutsche DWS Variable Series I — DWS Capital Growth VIP | | | | | 21 |
products and services. The Board considered these benefits in reaching its conclusion that the Fund’s management fees were reasonable.
Compliance. The Board considered the significant attention and resources dedicated by DIMA to its compliance processes in recent years. The Board noted in particular (i) the experience, seniority and time commitment of the individuals serving as DIMA’s and the Fund’s chief compliance officers and (ii) the substantial commitment of resources by DIMA and its affiliates to compliance matters, including the retention of compliance personnel.
Based on all of the information considered and the conclusions reached, the Board unanimously determined that the continuation of the Agreement is in the best interests of the Fund. In making this determination, the Board did not give particular weight to any single factor identified above. The Board considered these factors over the course of numerous meetings, certain of which were in executive session with only the Independent Trustees and counsel present. It is possible that individual Independent Trustees may have weighed these factors differently in reaching their individual decisions to approve the continuation of the Agreement.
| | | | | | |
| | 22 | | | | | | Deutsche DWS Variable Series I — DWS Capital Growth VIP |
Board Members and Officers
The following table presents certain information regarding the Board Members and Officers of the Fund. Each Board Member’s year of birth is set forth in parentheses after his or her name. Unless otherwise noted, (i) each Board Member has engaged in the principal occupation(s) noted in the table for at least the most recent five years, although not necessarily in the same capacity; and (ii) the address of each Independent Board Member is c/o Keith R. Fox, DWS Funds Board Chair, c/o Thomas R. Hiller, Ropes & Gray LLP, Prudential Tower, 800 Boylston Street, Boston, MA02199-3600. Except as otherwise noted below, the term of office for each Board Member is until the election and qualification of a successor, or until such Board Member sooner dies, resigns, is removed or as otherwise provided in the governing documents of the Fund. Because the Fund does not hold an annual meeting of shareholders, each Board Member will hold office for an indeterminate period. The Board Members may also serve in similar capacities with other funds in the fund complex.
| | | | | | | | |
| Independent Board Members | | | | | | |
Name, Year of Birth,
Position with the Fund and
Length of Time Served1 | | Business Experience and Directorships During the Past Five Years | | Number of
Funds in
DWS Fund
Complex
Overseen | | | Other
Directorships
Held by Board
Member
|
Keith R. Fox, CFA (1954) Chairperson since 2017, and Board Member since 1996 | | Managing General Partner, Exeter Capital Partners (a series of private investment funds) (since 1986). Directorships: Progressive International Corporation (kitchen goods importer and distributor); The Kennel Shop (retailer); former Chairman, National Association of Small Business Investment Companies; former Directorships: BoxTop Media Inc. (advertising); Sun Capital Advisers Trust (mutual funds) (2011–2012) | | | 82 | | | — |
John W. Ballantine (1946) Board Member since 1999 | | Retired; formerly, Executive Vice President and Chief Risk Management Officer, First Chicago NBD Corporation/The First National Bank of Chicago (1996–1998); Executive Vice President and Head of International Banking (1995–1996); former Directorships: Director and former Chairman of the Board, Healthways, Inc.2 (population well-being and wellness services) (2003–2014); Stockwell Capital Investments PLC (private equity); Enron Corporation; FNB Corporation; Tokheim Corporation; First Oak Brook Bancshares, Inc. and Oak Brook Bank; Prisma Energy International; Public Radio International. Not-for-Profit Director, Trustee: Palm Beach Civic Association; Window to the World Communications (public media); Harris Theater for Music and Dance (Chicago); Life Director of Hubbard Street Dance Chicago | | | 82 | | | Portland
General
Electric2
(utility
company)
(2003–
present) |
Henry P. Becton, Jr. (1943) Board Member since 1990 | | Vice Chair and former President, WGBH Educational Foundation. Directorships: Public Radio International; Public Radio Exchange (PRX); The Pew Charitable Trusts (charitable organization); Massachusetts Humane Society; Overseer of the New England Conservatory; former Directorships: Becton Dickinson and Company2 (medical technology company); Belo Corporation2 (media company); The PBS Foundation; Association of Public Television Stations; Boston Museum of Science; American Public Television; Concord Academy; New England Aquarium; Mass. Corporation for Educational Telecommunications; Committee for Economic Development; Public Broadcasting Service; Connecticut College; North Bennett Street School (Boston); American Documentary, Inc. (public media) | | | 82 | | | — |
Dawn-Marie Driscoll (1946) Board Member since 1987 | | Emeritus Executive Fellow, Center for Business Ethics, Bentley University; formerly: President, Driscoll Associates (consulting firm); Partner, Palmer & Dodge (law firm) (1988–1990); Vice President of Corporate Affairs and General Counsel, Filene’s (retail) (1978–1988). Directorships: Advisory Board, Center for Business Ethics, Bentley University; Trustee and former Chairman of the Board, Southwest Florida Community Foundation (charitable organization); former Directorships: ICI Mutual Insurance Company (2007–2015); Sun Capital Advisers Trust (mutual funds) (2007–2012), Investment Company Institute (audit, executive, nominating committees) and Independent Directors Council (governance, executive committees) | | | 82 | | | — |
Paul K. Freeman* (1950) Board Member since 1993 | | Consultant, WorldBank/Inter-American Development Bank; Independent Directors Council (former chair); Investment Company Institute (executive committee); Adjunct Professor, University of Denver Law School (2017–present); formerly: Chairman of Education Committee of Independent Directors Council; Project Leader, International Institute for Applied Systems Analysis (1998–2001); Chief Executive Officer, The Eric Group, Inc. (environmental insurance) (1986–1998); Directorships: Knoebel Institute for Healthy Aging, University of Denver (2017–present); former Directorships: Prisma Energy International; Denver Zoo Foundation (2012–2018) | | | 82 | | | — |
| | | | |
Deutsche DWS Variable Series I — DWS Capital Growth VIP | | | | | 23 |
| | | | | | | | |
Name, Year of Birth,
Position with the Fund and
Length of Time Served1 | | Business Experience and Directorships During the Past Five Years | | Number of
Funds in
DWS Fund
Complex
Overseen | | | Other
Directorships
Held by Board
Member
|
Richard J. Herring (1946) Board Member since 1990 | | Jacob Safra Professor of International Banking and Professor of Finance, The Wharton School, University of Pennsylvania (since July 1972); Director, The Wharton Financial Institutions Center (since 1994); formerly: Vice Dean and Director, Wharton Undergraduate Division (1995–2000) and Director, The Lauder Institute of International Management Studies (2000–2006); Member FDIC Systemic Risk Advisory Committee since 2011, member Systemic Risk Council since 2012 and member of the Advisory Board at the Yale Program on Financial Stability since 2013; Formerly Co-Chair of the Shadow Financial Regulatory Committee (2003–2015), Executive Director of The Financial Economists Roundtable (2008–2015), Director of The Thai Capital Fund (2007–2013), Director of The Aberdeen Singapore Fund (2007–2018), and Nonexecutive Director of Barclays Bank DE (2010–2018) | | | 82 | | | Director,
Aberdeen
Japan Fund
(since 2007) |
William McClayton (1944) Board Member since 2004 | | Private equity investor (since October 2009); previously, Managing Director, Diamond Management & Technology Consultants, Inc. (global consulting firm) (2001–2009); Directorship: Board of Managers, YMCA of Metropolitan Chicago; formerly: Senior Partner, Arthur Andersen LLP (accounting) (1966–2001); Trustee, Ravinia Festival | | | 82 | | | — |
Rebecca W. Rimel (1951) Board Member since 1995 | | President, Chief Executive Officer and Director, The Pew Charitable Trusts (charitable organization) (1994–present); formerly: Executive Vice President, The Glenmede Trust Company (investment trust and wealth management) (1983–2004); Board Member, Investor Education (charitable organization) (2004–2005); Trustee, Executive Committee, Philadelphia Chamber of Commerce (2001–2007); Director, Viasys Health Care2 (January 2007–June 2007); Trustee, Thomas Jefferson Foundation (charitable organization) (1994–2012) | | | 82 | | | Director,
Becton
Dickinson
and
Company2
(medical
technology
company)
(2012–
present);
Director,
BioTelemetry
Inc.2(health
care) (2009–
present) |
William N. Searcy, Jr. (1946) Board Member since 1993 | | Private investor since October 2003; formerly: Pension & Savings Trust Officer, Sprint Corporation2(telecommunications) (November 1989–September 2003); Trustee, Sun Capital Advisers Trust (mutual funds) (1998–2012) | | | 82 | | | — |
Jean Gleason Stromberg (1943) Board Member since 1997 | | Retired. Formerly, Consultant (1997–2001); Director, Financial Markets U.S. Government Accountability Office (1996–1997); Partner, Norton Rose Fulbright, L.L.P. (law firm) (1978–1996); former Directorships: The William and Flora Hewlett Foundation (charitable organization) (2000–2015); Service Source, Inc. (nonprofit), Mutual Fund Directors Forum (2002–2004), American Bar Retirement Association (funding vehicle for retirement plans) (1987–1990 and 1994–1996) | | | 82 | | | — |
| | |
| Officers4 | | |
Name, Year of Birth, Position with the Fund and Length of Time Served5 | | Business Experience and Directorships During the Past Five Years |
Hepsen Uzcan6 (1974) President and Chief Executive Officer, 2017–present Assistant Secretary, 2013–present | | Managing Director,3 DWS; Secretary, DWS USA Corporation (since March 2018); Assistant Secretary, DWS Distributors, Inc. (since June 25, 2018); Director and Vice President, DWS Service Company (since June 25, 2018); Assistant Secretary, DWS Investment Management Americas, Inc. (since June 25, 2018); and Director and President, DB Investment Managers, Inc. (since June 25, 2018); formerly: Vice President for the Deutsche funds (2016–2017) |
John Millette8(1962) Vice President and Secretary, 1999–present | | Director,3DWS; Chief Legal Officer, DWS Investment Management Americas, Inc. (2015–present); and Director and Vice President, DWS Trust Company (2016–present); formerly: Secretary, Deutsche Investment Management Americas Inc. (2015–2017) |
Diane Kenneally8,9 (1966) Treasurer and Chief Financial Officer since 2018 | | Director,3 DWS; formerly: Assistant Treasurer for the DWS funds (2007–2018) |
Caroline Pearson8(1962) Chief Legal Officer, 2010–present | | Managing Director,3DWS; formerly: Secretary, Deutsche AM Distributors, Inc. (2002–2017); and Secretary, Deutsche AM Service Company (2010–2017) |
| | | | | | |
| | 24 | | | | | | Deutsche DWS Variable Series I — DWS Capital Growth VIP |
| | |
Name, Year of Birth, Position with the Fund and Length of Time Served5 | | Business Experience and Directorships During the Past Five Years |
Scott D. Hogan8(1970) Chief Compliance Officer, 2016–present | | Director,3DWS |
Wayne Salit7(1967) Anti-Money Laundering Compliance Officer, 2014–present | | Director,3 Deutsche Bank; and AML Officer, DWS Trust Company; formerly: Managing Director, AML Compliance Officer at BNY Mellon (2011–2014); and Director, AML Compliance Officer at Deutsche Bank (2004–2011) |
Sheila Cadogan8(1966) Assistant Treasurer, 2017–present | | Director,3DWS; Director and Vice President, DWS Trust Company (since 2018) |
Paul Antosca8(1957) Assistant Treasurer, 2007–present | | Director,3DWS |
| 1 | The length of time served represents the year in which the Board Member joined the board of one or more DWS funds currently overseen by the Board. |
| 2 | A publicly held company with securities registered pursuant to Section 12 of the Securities Exchange Act of 1934. |
| 3 | Executive title, not a board directorship. |
| 4 | As a result of their respective positions held with the Advisor or its affiliates, these individuals are considered “interested persons” of the Advisor within the meaning of the 1940 Act. Interested persons receive no compensation from the Fund. |
| 5 | The length of time served represents the year in which the officer was first elected in such capacity for one or more DWS funds. |
| 6 | Address: 345 Park Avenue, New York, NY 10154. |
| 7 | Address: 60 Wall Street, New York, NY 10005. |
| 8 | Address: One International Place, Boston, MA 02110. |
| 9 | Appointed Treasurer and Chief Financial Officer effective July 2, 2018. |
| * | Paul K. Freeman retired from the Board effective December 31, 2018. |
The Fund’s Statement of Additional Information (“SAI”) includes additional information about the Board Members. The SAI is available, without charge, upon request. If you would like to request a copy of the SAI, you may do so by calling the followingtoll-free number:(800) 728-3337.
| | | | |
Deutsche DWS Variable Series I — DWS Capital Growth VIP | | | | | 25 |
Notes
Notes
| | |
| | |
VS1capgro-2 (R-025820-8 2/19) | | |
December 31, 2018
Annual Report
Deutsche DWS Variable Series I
(formerly Deutsche Variable Series I)
DWS Core Equity VIP
(formerly Deutsche Core Equity VIP)
Beginning on January 1, 2021, as permitted by regulations adopted by the Securities and Exchange Commission, you may not be receiving paper copies of the Fund’s shareholder reports from the insurance company that offers your contract unless you specifically request paper copies from your insurance company or from your financial intermediary. Instead, the shareholder reports will be made available on a Web site, and your insurance company will notify you by mail each time a report is posted and provide you with a Web site link to access the report. Instructions for requesting paper copies will be provided by your insurance company.
If you already elected to receive shareholder reports electronically, you will not be affected by this change and you need not take any action. You may elect to receive shareholder reports and other communications from your insurance company electronically by following the instructions provided by your insurance company.
You may elect to receive all future reports in paper free of charge from your insurance company. If your insurance company informs you that future reports will be delivered via Web access, you can inform your insurance company that you wish to continue receiving paper copies of your shareholder reports by following the instructions provided by your insurance company.

Contents
This report must be preceded or accompanied by a prospectus. To obtain an additional prospectus or summary prospectus, if available, call (800)728-3337 or your financial representative. We advise you to consider the Fund’s objectives, risks, charges and expenses carefully before investing. The summary prospectus and prospectus contain this and other important information about the Fund. Please read the prospectus carefully before you invest.
Stocks may decline in value. Fund management could be wrong in its analysis of industries, companies, economic trends and favor a security that underperforms the market. The Fund may lend securities to approved institutions. Investing in derivatives entails special risks relating to liquidity, leverage and credit that may reduce returns and/or increase volatility. Please read the prospectus for details.
The brand DWS represents DWS Group GmbH & Co. KGaA and any of its subsidiaries such as DWS Distributors, Inc. which offers investment products or DWS Investment Management Americas, Inc. and RREEF America L.L.C. which offer advisory services.
DWS Distributors, Inc., 222 South Riverside Plaza, Chicago, IL 60606,(800) 621-1148
NOT FDIC/NCUA INSURED NO BANK GUARANTEE MAY LOSE VALUE NOT A DEPOSIT NOT INSURED BY ANY FEDERAL GOVERNMENT AGENCY
| | | | | | |
| | 2 | | | | | | Deutsche DWS Variable Series I — DWS Core Equity VIP |
| | |
| Performance Summary | | December 31, 2018 (Unaudited) |
Fund performance shown is historical, assumes reinvestment of all dividend and capital gain distributions, and does not guarantee future results. Investment return and principal value fluctuate with changing market conditions so that, when redeemed, shares may be worth more or less than their original cost. Current performance may be lower or higher than the performance data quoted. Please contact your participating insurance company for the Fund’s most recentmonth-end performance. Performance does not reflect charges and fees (“contract charges”) associated with the separate account that invests in the Fund or any variable life insurance policy or variable annuity contract for which the Fund is an investment option. These charges and fees will reduce returns. While all share classes have the same underlying portfolio, their performance will differ.
The gross expense ratios of the Fund, as stated in the fee table of the prospectus dated May 1, 2018 are 0.57% and 0.86% for Class A and Class B shares, respectively, and may differ from the expense ratios disclosed in the Financial Highlights tables in this report.
Generally accepted accounting principles require adjustments to be made to the net assets of the Fund at period end for financial reporting purposes only, and as such, the total return based on the unadjusted net asset value per share may differ from the total return reported in the financial highlights.
Growth of an Assumed $10,000 Investment
| | |
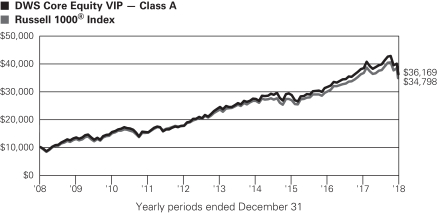 | | The Russell 1000® Index is an unmanaged index that measures the performance of the 1,000 largest companies in the Russell 3000® Index, which represents approximately 92% of the total market capitalization of the Russell 3000 Index. Index returns do not reflect any fees or expenses and it is not possible to invest directly into an index. |
| | | | | | | | | | |
| Comparative Results | | | | | | | | | | |
| | | | | |
| DWS Core Equity VIP | | | | 1-Year | | 3-Year | | 5-Year | | 10-Year |
| Class A | | Growth of $10,000 | | $9,431 | | $12,610 | | $14,841 | | $36,169 |
| | | Average annual total return | | –5.69% | | 8.04% | | 8.22% | | 13.72% |
| Russell 1000®Index | | Growth of $10,000 | | $9,522 | | $12,983 | | $14,837 | | $34,798 |
| | | Average annual total return | | –4.78% | | 9.09% | | 8.21% | | 13.28% |
| | | | | |
| DWS Core Equity VIP | | | | 1-Year | | 3-Year | | 5-Year | | 10-Year |
| Class B | | Growth of $10,000 | | $9,398 | | $12,504 | | $14,629 | | $35,159 |
| | | Average annual total return | | –6.02% | | 7.73% | | 7.91% | | 13.40% |
| Russell 1000®Index | | Growth of $10,000 | | $9,522 | | $12,983 | | $14,837 | | $34,798 |
| | Average annual total return | | –4.78% | | 9.09% | | 8.21% | | 13.28% |
The growth of $10,000 is cumulative.
| | | | |
Deutsche DWS Variable Series I — DWS Core Equity VIP | | | | | 3 |
| | |
| Management Summary | | December 31, 2018 (Unaudited) |
Large-cap U.S. equities returned –4.78% in 2018, as measured by the Russell 1000 Index (the Fund’s benchmark). The downturn marked the worst year for the index since 2008. The Fund returned –5.69% (Class A shares, unadjusted for contract charges), modestly underperforming the index.
The weak final number for stocks belies the fact that the investment environment was quite positive for much of the year. Through the end of September, equities were boosted by elevated investor optimism stemming from the backdrop of healthy U.S. growth and rising corporate earnings. The market quickly reversed course at the beginning of October, however, as investors grew fearful about the outlook for the economy, interest rates, and corporate profits in 2019. The index returned –13.82% in the fourth quarter, erasing its prior gain and causing it to finish in the red for only the second time in the past 16 years.
We maintained a steady, disciplined, andbottom-up approach to portfolio construction. We sought to optimize the portfolio by emphasizing stocks with the most favorable combination of individual factors, rather than relying on a specific factor — such as value or growth — to drive performance. Consistent with this strategy, stock selection was the primary driver of the Fund’s12-month results. Our process generated outperformance in the financials, industrials, and consumer discretionary sectors, among others. However, these contributions were offset by our weaker showing in energy, materials, and information technology.
In financials, holdings in CME Group, Inc. and Popular, Inc. — both of which sidestepped the interest-rate concerns that weighed on the broader sector — were the leading contributors to performance. In industrials, we were helped by owning positions in the rail operator Norfolk Southern Corp. and the aerospace giant Boeing Co. Having a zero weighting in General Electric Corp., one of the sector’s worst performers, was a further plus. The information technology stocks Microsoft Corp. and Visa Inc. were the top contributors for the Fund as a whole during 2018.
The Fund’s positioning in the energy sector had the largest adverse impact on returns. Holdings in smaller exploration and production and energy-services stocks, which tend to be volatile and more sensitive to oil prices than their larger peers, were notable detractors. The Fund lost relative performance through its positions in Newfield Exploration Co., Weatherford International PLC,* and Laredo Petroleum, Inc.,* among others. The materials sector was a further area of weakness due to a downturn in the specialty-chemicals producer Albemarle Corp., whose shares slid as investors grew skittish about the company’s expansion plans. The mining company Freeport-McMoRan, Inc., which lagged considerably due to persistent weakness in the price of copper and other industrial metals, was also a sizable detractor.
We believe the events of the past 12 months illustrate the role investor emotions can play in market performance. The first nine months of the year brought the combination of strong investor optimism and robust gains for the major indexes, with outperformance for stocks with the best recent price momentum. The positive backdrop evaporated virtually overnight in October, however, ushering in an interval of heightened investor risk aversion and higherday-to-day volatility. While very little changed in terms of the outlook for underlying fundamentals such as economic growth and corporate profits, thesell-off gained momentum due in part to rising fear among market participants. We view this as a prime example of how emotion and sentiment factors can take precedence over impartial analysis. In contrast, we employ a steady, rules-based strategy that uses quantitative analysis to evaluate companies in a dispassionate manner. We believe the merits of maintaining a disciplined approach through all markets, instead of focusing on short-term results, could become increasingly evident if heightened volatility remains a feature of the investment landscape in 2019.
Pankaj Bhatnagar, PhD, Managing Director
Di Kumble, CFA, Managing Director
Arno V. Puskar, Director
Portfolio Managers
The views expressed reflect those of the portfolio management team only through the end of the period of the report as stated on the cover. The management team’s views are subject to change at any time based on market and other conditions and should not be construed as a recommendation. Past performance is no guarantee of future results. Current and future portfolio holdings are subject to risk.
| | | | | | |
| | 4 | | | | | | Deutsche DWS Variable Series I — DWS Core Equity VIP |
Terms to Know
TheRussell 1000 Index is an unmanaged index that measures the performance of the 1,000 largest companies in the Russell 3000 Index, which represents approximately 92% of the total market capitalization of the Russell 3000 Index.
Contribution anddetraction incorporate both a stock’s total return and its weighting in the Fund.
Consumer discretionary represents industries that produce goods and services that are not necessities in everyday life.
| * | Held and sold prior to December 31, 2018. |
| | | | |
Deutsche DWS Variable Series I — DWS Core Equity VIP | | | | | 5 |
| | | | |
| Portfolio Summary | | (Unaudited) |
| | | | | | | | |
| Asset Allocation (As a % of Investment Portfolio excluding Securities Lending Collateral) | | 12/31/18 | | | 12/31/17 | |
| Common Stocks | | | 98% | | | | 99% | |
| Cash Equivalents | | | 2% | | | | 1% | |
| Exchange-Traded Fund | | | 0% | | | | 0% | |
| | | | 100% | | | | 100% | |
| | |
Sector Diversification
(As a % of Investment Portfolio excluding Exchange-Traded Fund, and Cash Equivalents and Securities
Lending Collateral) | | 12/31/18 | | | 12/31/17 | |
| Information Technology | | | 19% | | | | 19% | |
| Health Care | | | 15% | | | | 14% | |
| Financials | | | 14% | | | | 15% | |
| Communication Services | | | 11% | | | | 10% | |
| Industrials | | | 10% | | | | 10% | |
| Consumer Discretionary | | | 10% | | | | 7% | |
| Consumer Staples | | | 7% | | | | 8% | |
| Energy | | | 4% | | | | 6% | |
| Utilities | | | 4% | | | | 3% | |
| Real Estate | | | 3% | | | | 4% | |
| Materials | | | 3% | | | | 4% | |
| | | | 100% | | | | 100% | |
Portfolio holdings and characteristics are subject to change.
For more complete details about the Fund’s investment portfolio, see page 7.
Following the Fund’s fiscal first and thirdquarter-end, a complete portfolio holdings listing is filed with the SEC on FormN-Q or Form N-PORT (available for filings after March 31, 2019). The Fund’s Form N-Q or Form N-PORT will be available on the SEC’s Web site at sec.gov. The Fund’s portfolio holdings are also posted on dws.com from time to time. Please see the Fund’s current prospectus for more information.
| | | | | | |
| | 6 | | | | | | Deutsche DWS Variable Series I — DWS Core Equity VIP |
| | |
| Investment Portfolio | | December 31, 2018 |
| | | | | | | | |
| | | Shares | | | Value ($) | |
| Common Stocks 98.1% | |
| Communication Services 10.8% | |
Diversified Telecommunication Services 0.4% | |
Zayo Group Holdings, Inc.* | | | 15,167 | | | | 346,414 | |
|
Entertainment 1.8% | |
Live Nation Entertainment, Inc.* | | | 34,546 | | | | 1,701,391 | |
|
Interactive Media & Services 4.5% | |
| | |
Alphabet, Inc. “A”* | | | 1,581 | �� | | | 1,652,082 | |
| | |
Alphabet, Inc. “C”* | | | 1,634 | | | | 1,692,186 | |
| | |
Facebook, Inc. “A”* | | | 6,964 | | | | 912,911 | |
| | | | | | | | |
| | | | 4,257,179 | |
|
Media 2.5% | |
| | |
Comcast Corp. “A” | | | 12,409 | | | | 422,527 | |
| | |
Omnicom Group, Inc. | | | 26,756 | | | | 1,959,609 | |
| | | | | | | | |
| | | | 2,382,136 | |
|
Wireless Telecommunication Services 1.6% | |
T-Mobile U.S., Inc.* | | | 24,777 | | | | 1,576,065 | |
|
| Consumer Discretionary 9.5% | |
Hotels, Restaurants & Leisure 1.7% | |
| | |
Hyatt Hotels Corp. “A” | | | 10,048 | | | | 679,245 | |
| | |
Yum! Brands, Inc. | | | 9,933 | | | | 913,041 | |
| | | | | | | | |
| | | | 1,592,286 | |
|
Internet & Direct Marketing Retail 4.4% | |
Amazon.com, Inc.* | | | 2,748 | | | | 4,127,413 | |
|
Multiline Retail 0.9% | |
Macy’s, Inc. | | | 27,865 | | | | 829,820 | |
|
Specialty Retail 1.2% | |
| | |
Best Buy Co., Inc. | | | 13,229 | | | | 700,608 | |
| | |
Home Depot, Inc. | | | 2,844 | | | | 488,656 | |
| | | | | | | | |
| | | | 1,189,264 | |
|
Textiles, Apparel & Luxury Goods 1.3% | |
NIKE, Inc. “B” | | | 16,629 | | | | 1,232,874 | |
|
| Consumer Staples 6.4% | |
Beverages 3.3% | |
| | |
Molson Coors Brewing Co. “B” | | | 12,992 | | | | 729,631 | |
| | |
PepsiCo, Inc. | | | 21,680 | | | | 2,395,206 | |
| | | | | | | | |
| | | | 3,124,837 | |
|
Food & Staples Retailing 2.1% | |
| | |
Costco Wholesale Corp. | | | 2,610 | | | | 531,683 | |
| | |
Kroger Co. | | | 19,143 | | | | 526,432 | |
| | |
Sprouts Farmers Market, Inc.* | | | 10,709 | | | | 251,769 | |
| | |
U.S. Foods Holding Corp.* | | | 21,725 | | | | 687,379 | |
| | | | | | | | |
| | | | 1,997,263 | |
|
Food Products 0.4% | |
Conagra Brands, Inc. | | | 19,210 | | | | 410,326 | |
|
Personal Products 0.6% | |
Coty, Inc. “A” | | | 83,822 | | | | 549,872 | |
|
| Energy 3.9% | |
Energy Equipment & Services 0.2% | |
Transocean Ltd.* | | | 22,843 | | | | 158,531 | |
|
Oil, Gas & Consumable Fuels 3.7% | |
| | |
Continental Resources., Inc.* | | | 14,296 | | | | 574,556 | |
| | |
EOG Resources., Inc. | | | 6,949 | | | | 606,022 | |
| | |
Exxon Mobil Corp. | | | 3,214 | | | | 219,163 | |
| | |
Newfield Exploration Co.* | | | 72,761 | | | | 1,066,676 | |
| | | | | | | | |
| | | Shares | | | Value ($) | |
| | |
Occidental Petroleum Corp. | | | 6,363 | | | | 390,561 | |
| | |
ONEOK, Inc. | | | 13,022 | | | | 702,537 | |
| | | | | | | | |
| | | | 3,559,515 | |
|
| Financials 14.0% | |
Banks 4.8% | |
| | |
Bank of America Corp. | | | 19,491 | | | | 480,258 | |
| | |
Citigroup, Inc. | | | 20,772 | | | | 1,081,390 | |
| | |
JPMorgan Chase & Co. | | | 9,651 | | | | 942,131 | |
| | |
Popular, Inc. | | | 22,749 | | | | 1,074,208 | |
| | |
U.S. Bancorp. | | | 22,509 | | | | 1,028,661 | |
| | | | | | | | |
| | | | 4,606,648 | |
|
Capital Markets 6.6% | |
| | |
Ares Capital Corp. | | | 35,111 | | | | 547,030 | |
| | |
CME Group, Inc. | | | 9,810 | | | | 1,845,457 | |
| | |
Franklin Resources., Inc. | | | 16,515 | | | | 489,835 | |
| | |
Intercontinental Exchange, Inc. | | | 7,252 | | | | 546,293 | |
| | |
LPL Financial Holdings, Inc. | | | 16,689 | | | | 1,019,364 | |
| | |
State Street Corp. | | | 12,070 | | | | 761,255 | |
| | |
TD Ameritrade Holding Corp. | | | 8,095 | | | | 396,331 | |
| | |
The Goldman Sachs Group., Inc. | | | 3,812 | | | | 636,795 | |
| | | | | | | | |
| | | | 6,242,360 | |
|
Insurance 2.6% | |
| | |
Chubb Ltd. | | | 10,046 | | | | 1,297,742 | |
| | |
MetLife, Inc. | | | 27,550 | | | | 1,131,203 | |
| | | | | | | | |
| | | | 2,428,945 | |
|
| Health Care 15.1% | |
Biotechnology 6.4% | |
| | |
AbbVie, Inc. | | | 19,942 | | | | 1,838,453 | |
| | |
Amgen, Inc. | | | 9,227 | | | | 1,796,220 | |
| | |
Biogen., Inc.* | | | 1,611 | | | | 484,782 | |
| | |
Celgene Corp.* | | | 16,888 | | | | 1,082,352 | |
| | |
Gilead Sciences, Inc. | | | 14,641 | | | | 915,795 | |
| | | | | | | | |
| | | | 6,117,602 | |
|
Health Care Equipment & Supplies 3.3% | |
| | |
Becton, Dickinson & Co. | | | 6,111 | | | | 1,376,930 | |
| | |
Boston Scientific Corp.* | | | 22,599 | | | | 798,649 | |
| | |
Danaher Corp. | | | 4,400 | | | | 453,728 | |
| | |
Medtronic PLC | | | 5,216 | | | | 474,447 | |
| | | | | | | | |
| | | | 3,103,754 | |
|
Health Care Providers & Services 2.0% | |
| | |
Cigna Corp.* | | | 5,337 | | | | 1,013,603 | |
| | |
CVS Health Corp. | | | 9,398 | | | | 615,757 | |
| | |
McKesson Corp. | | | 2,127 | | | | 234,970 | |
| | | | | | | | |
| | | | 1,864,330 | |
|
Pharmaceuticals 3.4% | |
| | |
Eli Lilly & Co. | | | 6,136 | | | | 710,058 | |
| | |
Merck & Co., Inc. | | | 12,073 | | | | 922,498 | |
| | |
Pfizer, Inc. | | | 36,521 | | | | 1,594,141 | |
| | | | | | | | |
| | | | 3,226,697 | |
|
| Industrials 9.9% | |
Aerospace & Defense 2.6% | |
| | |
Boeing Co. | | | 6,357 | | | | 2,050,132 | |
| | |
L3 Technologies, Inc. | | | 2,539 | | | | 440,923 | |
| | | | | | | | |
| | | | 2,491,055 | |
|
Commercial Services & Supplies 1.0% | |
Waste Management, Inc. | | | 10,691 | | | | 951,392 | |
The accompanying notes are an integral part of the financial statements.
| | | | |
Deutsche DWS Variable Series I — DWS Core Equity VIP | | | | | 7 |
| | | | | | | | |
| | | Shares | | | Value ($) | |
|
Industrial Conglomerates 2.4% | |
Honeywell International, Inc. | | | 7,443 | | | | 983,369 | |
Roper Technologies, Inc. | | | 4,709 | | | | 1,255,043 | |
| | | | | | | | |
| | | | 2,238,412 | |
|
Machinery 1.7% | |
Ingersoll-Rand PLC | | | 8,514 | | | | 776,732 | |
Parker-Hannifin Corp. | | | 5,626 | | | | 839,062 | |
| | | | | | | | |
| | | | 1,615,794 | |
|
Road & Rail 1.9% | |
Norfolk Southern Corp. | | | 11,725 | | | | 1,753,357 | |
|
Trading Companies & Distributors 0.3% | |
WESCO International, Inc.* | | | 6,874 | | | | 329,952 | |
|
| Information Technology 18.9% | |
IT Services 4.3% | |
Conduent, Inc.* | | | 74,027 | | | | 786,907 | |
Gartner, Inc.* | | | 8,591 | | | | 1,098,274 | |
Visa, Inc. “A” | | | 16,661 | | | | 2,198,252 | |
| | | | | | | | |
| | | | 4,083,433 | |
|
Semiconductors & Semiconductor Equipment 3.6% | |
Applied Materials, Inc. | | | 13,336 | | | | 436,621 | |
Intel Corp. | | | 26,478 | | | | 1,242,612 | |
QUALCOMM., Inc. | | | 16,260 | | | | 925,357 | |
Teradyne, Inc. | | | 24,705 | | | | 775,243 | |
| | | | | | | | |
| | | | 3,379,833 | |
|
Software 6.0% | |
Microsoft Corp. | | | 45,892 | | | | 4,661,250 | |
Oracle Corp. | | | 22,079 | | | | 996,867 | |
| | | | | | | | |
| | | | 5,658,117 | |
|
Technology Hardware, Storage & Peripherals 5.0% | |
Apple, Inc. | | | 25,060 | | | | 3,952,964 | |
Hewlett Packard Enterprise Co. | | | 57,980 | | | | 765,916 | |
| | | | | | | | |
| | | | 4,718,880 | |
|
| Materials 2.8% | |
Chemicals 0.9% | |
Albemarle Corp. | | | 4,626 | | | | 356,526 | |
PPG Industries, Inc. | | | 4,797 | | | | 490,397 | |
| | | | | | | | |
| | | | 846,923 | |
| | | | | | | | |
| | | Shares | | | Value ($) | |
|
Containers & Packaging 0.2% | |
Graphic Packaging Holding Co. | | | 18,020 | | | | 191,733 | |
|
Metals & Mining 1.7% | |
Freeport-McMoRan, Inc. | | | 157,271 | | | | 1,621,464 | |
|
| Real Estate 3.2% | |
Equity Real Estate Investment Trusts (REITs) | |
AvalonBay Communities, Inc. | | | 6,050 | | | | 1,053,002 | |
Digital Realty Trust, Inc. | | | 7,986 | | | | 850,908 | |
Prologis, Inc. | | | 15,244 | | | | 895,128 | |
SL Green Realty Corp. | | | 2,871 | | | | 227,039 | |
| | | | | | | | |
| | | | 3,026,077 | |
|
| Utilities 3.6% | |
Electric Utilities 1.6% | |
NextEra Energy, Inc. | | | 8,860 | | | | 1,540,045 | |
|
Multi-Utilities 1.0% | |
CenterPoint Energy, Inc. | | | 33,059 | | | | 933,256 | |
|
Water Utilities 1.0% | |
American Water Works Co., Inc. | | | 9,878 | | | | 896,626 | |
| Total Common Stocks(Cost $77,462,804) | | | | 92,901,871 | |
| | | | | |
|
Exchange-Traded Fund 0.3% | |
Vanguard S&P 500 ETF (Cost $243,401) | | | 1,051 | | | | 241,530 | |
| | |
| Cash Equivalents 1.6% | | | | | | | | |
DWS Central Cash Management Government Fund, 2.41% (a) (Cost $1,529,105) | | | 1,529,105 | | | | 1,529,105 | |
| | |
| | | % of Net
Assets | | | Value ($) | |
Total Investment Portfolio
(Cost $79,235,310) | | | 100.0 | | | | 94,672,506 | |
| Other Assets and Liabilities, Net | | | 0.0 | | | | 8,672 | |
| Net Assets | | | 100.0 | | | | 94,681,178 | |
A summary of the Fund’s transactions with affiliated investments during the year ended December 31, 2018 are as follows:
| | | | | | | | | | | | | | | | | | | | | | | | | | | | | | | | |
Value ($) at
12/31/2017 | | Purchases
Cost ($) | | | Sales
Proceeds ($) | | | Net
Realized
Gain/
(Loss) ($) | | | Net Change in
Unrealized
Appreciation
(Depreciation) ($) | | | Income ($) | | | Capital Gain
Distributions ($) | | | Number
of Shares
at
12/31/2018 | | | Value ($)
at
12/31/2018 | |
Securities Lending Collateral 0.00% | | | | | | | | | | | | | | | | | |
DWS Government & Agency Securities Portfolio “DWS Government Cash Institutional Shares” 2.29% (a) (b) | |
| 151,800 | | | — | | | | 151,800 | (c) | | | — | | | | — | | | | 161 | | | | — | | | | — | | | | — | |
Cash Equivalents 1.6% | | | | | | | | | | | | | | | | | |
DWS Central Cash Management Government Fund, 2.41% (a) | |
| 1,008,753 | | | 10,705,086 | | | | 10,184,734 | | | | — | | | | — | | | | 10,713 | | | | — | | | | 1,529,105 | | | | 1,529,105 | |
| 1,160,553 | | | 10,705,086 | | | | 10,336,534 | | | | — | | | | — | | | | 10,874 | | | | — | | | | 1,529,105 | | | | 1,529,105 | |
| * | Non-income producing security. |
| (a) | Affiliated fund managed by DWS Investment Management Americas, Inc. The rate shown is the annualizedseven-day yield at period end. |
| (b) | Represents collateral held in connection with securities lending. Income earned by the Fund is net of borrower rebates. |
| (c) | Represents the net increase (purchase cost) or decrease (sales proceeds) in the amount invested for the year ended December 31, 2018. |
S&P: Standard & Poor’s
The accompanying notes are an integral part of the financial statements.
| | | | | | |
| | 8 | | | | | | Deutsche DWS Variable Series I — DWS Core Equity VIP |
Fair Value Measurements
Various inputs are used in determining the value of the Fund’s investments. These inputs are summarized in three broad levels. Level 1 includes quoted prices in active markets for identical securities. Level 2 includes other significant observable inputs (including quoted prices for similar securities, interest rates, prepayment speeds and credit risk). Level 3 includes significant unobservable inputs (including the Fund’s own assumptions in determining the fair value of investments). The level assigned to the securities valuations may not be an indication of the risk or liquidity associated with investing in those securities.
The following is a summary of the inputs used as of December 31, 2018 in valuing the Fund’s investments. For information on the Fund’s policy regarding the valuation of investments, please refer to the Security Valuation section of Note A in the accompanying Notes to Financial Statements.
| | | | | | | | | | | | | | | | |
| Assets | | Level 1 | | | Level 2 | | | Level 3 | | | Total | |
| Common Stocks (d) | | $ | 92,901,871 | | | $ | — | | | $ | — | | | $ | 92,901,871 | |
| Exchange-Traded Fund | | | 241,530 | | | | — | | | | — | | | | 241,530 | |
| Short-Term Investments | | | 1,529,105 | | | | — | | | | — | | | | 1,529,105 | |
| Total | | $ | 94,672,506 | | | $ | — | | | $ | — | | | $ | 94,672,506 | |
| (d) | See Investment Portfolio for additional detailed categorizations. |
The accompanying notes are an integral part of the financial statements.
| | | | |
Deutsche DWS Variable Series I — DWS Core Equity VIP | | | | | 9 |
Statement of
Assets and Liabilities
| | | | |
| as of December 31, 2018 | |
|
| Assets | |
| Investments innon-affiliated securities, at value (cost $77,706,205) | | $ | 93,143,401 | |
| Investment in DWS Central Cash Management Government Fund (cost $1,529,105) | | | 1,529,105 | |
| Cash | | | 14,512 | |
| Receivable for Fund shares sold | | | 30,973 | |
| Dividends receivable | | | 150,345 | |
| Interest receivable | | | 1,377 | |
| Other assets | | | 2,985 | |
| Total assets | | | 94,872,698 | |
| |
| Liabilities | | | | |
| Payable for Fund shares redeemed | | | 56,396 | |
| Accrued management fee | | | 32,197 | |
| Accrued Trustees’ fees | | | 1,789 | |
| Other accrued expenses and payables | | | 101,138 | |
| Total liabilities | | | 191,520 | |
| Net assets, at value | | $ | 94,681,178 | |
| |
| Net Assets Consist of | | | | |
Distributable earnings (loss) | | | 27,874,978 | |
| Paid-in capital | | | 66,806,200 | |
| Net assets, at value | | $ | 94,681,178 | |
| |
| Net Asset Value | | | | |
Class A | | | | |
| Net Asset Value,offering and redemption price per share ($91,837,535 ÷ 9,343,340 outstanding shares of beneficial interest, $.01 par value, unlimited number of shares authorized) | | $ | 9.83 | |
Class B | | | | |
| Net Asset Value,offering and redemption price per share ($2,843,643 ÷ 289,832 outstanding shares of beneficial interest, $.01 par value, unlimited number of shares authorized) | | $ | 9.81 | |
Statement of Operations
| | | | |
| for the year ended December 31, 2018 | |
|
| Investment Income | |
| Income: | | | | |
| Dividends (net of foreign taxes withheld of $2,981) | | $ | 1,862,210 | |
| Income distributions — DWS Central Cash Management Government Fund | | | 10,713 | |
| Securities lending income, net of borrower rebates | | | 161 | |
| Total income | | | 1,873,084 | |
| Expenses: | | | | |
| Management fee | | | 418,431 | |
| Administration fee | | | 107,290 | |
| Services to Shareholders | | | 1,334 | |
| Record keeping fee (Class B) | | | 2,189 | |
| Distribution service fee (Class B) | | | 8,089 | |
| Custodian fee | | | 8,564 | |
| Professional fees | | | 77,029 | |
| Reports to shareholders | | | 25,108 | |
| Trustees’ fees and expenses | | | 6,341 | |
| Other | | | 9,658 | |
| Total expenses | | | 664,033 | |
| Net investment income | | | 1,209,051 | |
| |
| Realized and Unrealized gain (loss) | | | | |
| Net realized gain (loss) from investments | | | 11,503,842 | |
| Change in net unrealized appreciation (depreciation) on investments | | | (18,122,668 | ) |
| Net gain (loss) | | | (6,618,826 | ) |
| Net increase (decrease) in net assets resulting from operations | | $ | (5,409,775 | ) |
The accompanying notes are an integral part of the financial statements.
| | | | | | |
| | 10 | | | | | | Deutsche DWS Variable Series I — DWS Core Equity VIP |
Statements of Changes in Net Assets
| | | | | | | | |
| | | Years Ended December 31, | |
| Increase (Decrease) in Net Assets | | 2018 | | | 2017 | |
| Operations: | | | | | | | | |
| Net investment income | | $ | 1,209,051 | | | $ | 1,926,984 | |
| Net realized gain (loss) | | | 11,503,842 | | | | 28,444,398 | |
| Change in net unrealized appreciation (depreciation) | | | (18,122,668 | ) | | | (233,266 | ) |
| Net increase (decrease) in net assets resulting from operations | | | (5,409,775 | ) | | | 30,138,116 | |
| Distributions to shareholders : | | | | | | | | |
| Net investment income: | | | | | | | | |
Class A | | | (29,462,065 | ) | | | (13,472,837 | ) |
Class B | | | (916,591 | ) | | | (168,295 | ) |
| Total distributions | | | (30,378,656 | ) | | | (13,641,132 | )* |
| Fund share transactions: | | | | | | | | |
Class A | | | | | | | | |
| Proceeds from shares sold | | | 5,049,625 | | | | 5,272,674 | |
| Reinvestment of distributions | | | 29,462,065 | | | | 13,472,837 | |
| Payments of shares redeemed | | | (12,963,703 | ) | | | (92,783,533 | ) |
| Net increase (decrease) in net assets from Class A share transactions | | | 21,547,987 | | | | (74,038,022 | ) |
Class B | | | | | | | | |
| Proceeds from shares sold | | | 275,886 | | | | 902,144 | |
| Reinvestment of distributions | | | 916,591 | | | | 168,295 | |
| Payments of shares redeemed | | | (404,039 | ) | | | (259,704 | ) |
| Net increase (decrease) in net assets from Class B share transactions | | | 788,438 | | | | 810,735 | |
| Increase (decrease) in net assets | | | (13,452,006 | ) | | | (56,730,303 | ) |
| Net assets at beginning of period | | | 108,133,184 | | | | 164,863,487 | |
| | |
| Net assets at end of period | | | 94,681,178 | | | | 108,133,184 | ** |
| | |
| Other Information | | | | | | | | |
Class A | | | | | | | | |
| Shares outstanding at beginning of period | | | 7,169,708 | | | | 12,373,665 | |
| Shares sold | | | 448,326 | | | | 384,902 | |
| Shares issued to shareholders in reinvestment of distributions | | | 2,816,641 | | | | 1,047,654 | |
| Shares redeemed | | | (1,091,335 | ) | | | (6,636,513 | ) |
| Net increase (decrease) in Class A shares | | | 2,173,632 | | | | (5,203,957 | ) |
| | |
| Shares outstanding at end of period | | | 9,343,340 | | | | 7,169,708 | |
Class B | | | | | | | | |
| Shares outstanding at beginning of period | | | 215,292 | | | | 155,615 | |
| Shares sold | | | 20,116 | | | | 65,736 | |
| Shares issued to shareholders in reinvestment of distributions | | | 87,628 | | | | 13,087 | |
| Shares redeemed | | | (33,204 | ) | | | (19,146 | ) |
| Net increase (decrease) in Class B shares | | | 74,540 | | | | 59,677 | |
| | |
| Shares outstanding at end of period | | | 289,832 | | | | 215,292 | |
| * | Includes distributions from net investment income of $2,009,714, and $19,752 for Class A and Class B, respectively and distributions from net realized gains of $11,463,123 and $148,543 for Class A and Class B, respectively. |
| ** | Includes undistributed net investment income of $1,903,313. |
The accompanying notes are an integral part of the financial statements.
| | | | |
Deutsche DWS Variable Series I — DWS Core Equity VIP | | | | | 11 |
Financial Highlights
| | | | | | | | | | | | | | | | | | | | |
| | | Years Ended December 31, | |
| Class A | | 2018 | | | 2017 | | | 2016 | | | 2015 | | | 2014 | |
| | | | | |
| Selected Per Share Data | | | | | | | | | | | | | | | | | | | | |
| Net asset value, beginning of period | | $ | 14.64 | | | $ | 13.16 | | | $ | 13.29 | | | $ | 12.76 | | | $ | 11.54 | |
| Income (loss) from investment operations: | | | | | | | | | | | | | | | | | | | | |
Net investment incomea | | | .14 | | | | .17 | | | | .17 | | | | .15 | | | | .10 | |
Net realized and unrealized gain (loss) | | | (.71 | ) | | | 2.44 | | | | 1.09 | | | | .52 | | | | 1.25 | |
Total from investment operations | | | (.57 | ) | | | 2.61 | | | | 1.26 | | | | .67 | | | | 1.35 | |
| Less distributions from: | | | | | | | | | | | | | | | | | | | | |
Net investment income | | | (.27 | ) | | | (.17 | ) | | | (.19 | ) | | | (.11 | ) | | | (.13 | ) |
Net realized gains | | | (3.97 | ) | | | (.96 | ) | | | (1.20 | ) | | | (.03 | ) | | | — | |
Total distributions | | | (4.24 | ) | | | (1.13 | ) | | | (1.39 | ) | | | (.14 | ) | | | (.13 | ) |
| Net asset value, end of period | | $ | 9.83 | | | $ | 14.64 | | | $ | 13.16 | | | $ | 13.29 | | | $ | 12.76 | |
| Total Return (%) | | | (5.69 | ) | | | 21.02 | | | | 10.48 | | | | 5.25 | | | | 11.82 | |
| | | | | |
| Ratios to Average Net Assets and Supplemental Data | | | | | | | | | | | | | | | | | | | | |
| Net assets, end of period ($ millions) | | | 92 | | | | 105 | | | | 163 | | | | 176 | | | | 220 | |
| Ratio of expenses (%)b | | | .61 | | | | .57 | | | | .57 | | | | .56 | | | | .57 | |
| Ratio of net investment income (%) | | | 1.14 | | | | 1.22 | | | | 1.34 | | | | 1.11 | | | | .86 | |
| Portfolio turnover rate (%) | | | 43 | | | | 39 | | | | 43 | | | | 27 | | | | 48 | |
| a | Based on average shares outstanding during the period. |
| b | Expense ratio does not reflect charges and fees associated with the separate account that invests in the Fund or any variable life insurance policy or variable annuity contract for which the Fund is an investment option. |
| | | | | | | | | | | | | | | | | | | | |
| | | Years Ended December 31, | |
| Class B | | 2018 | | | 2017 | | | 2016 | | | 2015 | | | 2014 | |
| | | | | |
| Selected Per Share Data | | | | | | | | | | | | | | | | | | | | |
| Net asset value, beginning of period | | $ | 14.62 | | | $ | 13.14 | | | $ | 13.26 | | | $ | 12.74 | | | $ | 11.53 | |
| Income (loss) from investment operations: | | | | | | | | | | | | | | | | | | | | |
Net investment incomea | | | .10 | | | | .13 | | | | .13 | | | | .11 | | | | .07 | |
Net realized and unrealized gain (loss) | | | (.72 | ) | | | 2.44 | | | | 1.10 | | | | .52 | | | | 1.24 | |
Total from investment operations | | | (.62 | ) | | | 2.57 | | | | 1.23 | | | | .63 | | | | 1.31 | |
| Less distributions from: | | | | | | | | | | | | | | | | | | | | |
Net investment income | | | (.22 | ) | | | (.13 | ) | | | (.15 | ) | | | (.08 | ) | | | (.10 | ) |
Net realized gains | | | (3.97 | ) | | | (.96 | ) | | | (1.20 | ) | | | (.03 | ) | | | — | |
Total distributions | | | (4.19 | ) | | | (1.09 | ) | | | (1.35 | ) | | | (.11 | ) | | | (.10 | ) |
| Net asset value, end of period | | $ | 9.81 | | | $ | 14.62 | | | $ | 13.14 | | | $ | 13.26 | | | $ | 12.74 | |
| Total Return (%) | | | (6.02 | ) | | | 20.68 | | | | 10.25 | | | | 4.91 | | | | 11.52 | |
| | | | | |
| Ratios to Average Net Assets and Supplemental Data | | | | | | | | | | | | | | | �� | | | | | |
| Net assets, end of period ($ millions) | | | 3 | | | | 3 | | | | 2 | | | | 2 | | | | 2 | |
| Ratio of expenses (%)b | | | .93 | | | | .86 | | | | .86 | | | | .83 | | | | .82 | |
| Ratio of net investment income (%) | | | .82 | | | | .94 | | | | 1.06 | | | | .84 | | | | .60 | |
| Portfolio turnover rate (%) | | | 43 | | | | 39 | | | | 43 | | | | 27 | | | | 48 | |
| a | Based on average shares outstanding during the period. |
| b | Expense ratio does not reflect charges and fees associated with the separate account that invests in the Fund or any variable life insurance policy or variable annuity contract for which the Fund is an investment option. |
The accompanying notes are an integral part of the financial statements.
| | | | | | |
| | 12 | | | | | | Deutsche DWS Variable Series I — DWS Core Equity VIP |
| | |
| Notes to Financial Statements | | |
A. Organization and Significant Accounting Policies
Deutsche DWS Variable Series I (formerly Deutsche Variable Series I) (the “Trust“) is registered under the Investment Company Act of 1940, as amended (the “1940 Act“), as anopen-end, management investment company organized as a Massachusetts business trust. The Trust consists of five diversified funds: DWS Bond VIP (formerly Deutsche Bond VIP), DWS Capital Growth VIP (formerly Deutsche Capital Growth VIP), DWS Core Equity VIP (formerly Deutsche Core Equity VIP), DWS CROCI® International VIP (formerly Deutsche CROCI® International VIP) and DWS Global Small Cap VIP (formerly Deutsche Global Small Cap VIP) (individually or collectively hereinafter referred to as a “Fund“ or the “Funds“). These financial statements report on DWS Core Equity VIP. The Trust is intended to be the underlying investment vehicle for variable annuity contracts and variable life insurance policies to be offered by the separate accounts of certain life insurance companies (“Participating Insurance Companies“).
Multiple Classes of Shares of Beneficial Interest. The Fund offers two classes of shares (Class A shares and Class B shares). Class B shares are subject to Rule12b-1 distribution fees under the 1940 Act and recordkeeping fees equal to an annual rate of 0.25% and up to 0.15%, respectively, of the average daily net assets of the Class B shares of the Fund. Class A shares are not subject to such fees.
Investment income, realized and unrealized gains and losses, and certainfund-level expenses and expense reductions, if any, are borne pro rata on the basis of relative net assets by the holders of all classes of shares, except that each class bears certain expenses unique to that class (including the applicable12b-1 distribution fees and recordkeeping fees). Differences inclass-level expenses may result in payment of different per share dividends by class. All shares have equal rights with respect to voting subject toclass-specific arrangements.
The Fund’s financial statements are prepared in accordance with accounting principles generally accepted in the United States of America (“U.S. GAAP”) which require the use of management estimates. Actual results could differ from those estimates. The Fund qualifies as an investment company under Topic 946 of Accounting Standards Codification of U.S. GAAP. The policies described below are followed consistently by the Fund in the preparation of its financial statements.
In October 2018, the Securities and Exchange Commission adopted amendments to certain disclosure requirements in Securities Act Release No. 33-10532, Disclosure Update and Simplification, which is intended to facilitate the disclosure of information to investors and simplify compliance without significantly altering the total mix of information provided to investors. Effective with the current reporting period, the Fund adopted the amendments with the impacts being that the Fund is no longer required to present components of distributable earnings on the Statement of Assets and Liabilities or the sources of distributable earnings and the amount of undistributed net investment income on the Statements of Changes in Net Assets.
Security Valuation. Investments are stated at value determined as of the close of regular trading on the New York Stock Exchange on each day the exchange is open for trading.
Various inputs are used in determining the value of the Fund’s investments. These inputs are summarized in three broad levels. Level 1 includes quoted prices in active markets for identical securities. Level 2 includes other significant observable inputs (including quoted prices for similar securities, interest rates, prepayment speeds and credit risk). Level 3 includes significant unobservable inputs (including the Fund’s own assumptions in determining the fair value of investments). The level assigned to the securities valuations may not be an indication of the risk or liquidity associated with investing in those securities.
Equity securities and exchange-traded funds (“ETF’s”) are valued at the most recent sale price or official closing price reported on the exchange (U.S. or foreign) orover-the-counter market on which they trade. Securities for which no sales are reported are valued at the calculated mean between the most recent bid and asked quotations on the relevant market or, if a mean cannot be determined, at the most recent bid quotation. Equity securities and ETF’s are generally categorized as Level 1.
Investments inopen-end investment companies are valued at their net asset value each business day and are categorized as Level 1.
Securities and other assets for which market quotations are not readily available or for which the above valuation procedures are deemed not to reflect fair value are valued in a manner that is intended to reflect their fair value as determined in accordance with procedures approved by the Trustees and are generally categorized as Level 3. In accordance with the Fund’s valuation procedures, factors used in determining
| | | | |
Deutsche DWS Variable Series I — DWS Core Equity VIP | | | | | 13 |
value may include, but are not limited to, the type of the security; the size of the holding; the initial cost of the security; the existence of any contractual restrictions on the security’s disposition; the price and extent of public trading in similar securities of the issuer or of comparable companies; quotations or evaluated prices frombroker-dealers and/or pricing services; information obtained from the issuer, analysts, and/or the appropriate stock exchange (forexchange-traded securities); an analysis of the company’s or issuer’s financial statements; an evaluation of the forces that influence the issuer and the market(s) in which the security is purchased and sold; and with respect to debt securities, the maturity, coupon, creditworthiness, currency denomination and the movement of the market in which the security is normally traded. The value determined under these procedures may differ from published values for the same securities.
Disclosure about the classification of fair value measurements is included in a table following the Fund’s Investment Portfolio.
Securities Lending. Deutsche Bank AG, as lending agent, lends securities of the Fund to certain financial institutions under the terms of its securities lending agreement. During the term of the loans, the Fund continues to receive interest and dividends generated by the securities and to participate in any changes in their market value. The Fund requires the borrowers of the securities to maintain collateral with the Fund consisting of either cash or liquid, unencumbered assets having a value at least equal to the value of the securities loaned. When the collateral falls below specified amounts, the lending agent will use its best effort to obtain additional collateral on the next business day to meet required amounts under the securities lending agreement. During the year ended December 31, 2018, the Fund invested the cash collateral into a joint trading account in affiliated money market funds including DWS Government & Agency Securities Portfolio, managed by DWS Investment Management Americas, Inc. DWS Investment Management Americas, Inc. receives a management/administration fee (0.12% annualized effective rate as of December 31, 2018) on the cash collateral invested in DWS Government & Agency Securities Portfolio. The Fund receives compensation for lending its securities either in the form of fees or by earning interest on invested cash collateral net of borrower rebates and fees paid to a lending agent. Either the Fund or the borrower may terminate the loan at any time and the borrower, after notice, is required to return borrowed securities within a standard time period. There may be risks of delay and costs in recovery of securities or even loss of rights in the collateral should the borrower of the securities fail financially. If the Fund is not able to recover securities lent, the Fund may sell the collateral and purchase a replacement investment in the market, incurring the risk that the value of the replacement security is greater than the value of the collateral. The Fund is also subject to all investment risks associated with the reinvestment of any cash collateral received, including, but not limited to, interest rate, credit and liquidity risk associated with such investments.
As of December 31, 2018, the Fund had no securities on loan.
Foreign Currency Translations. The books and records of the Fund are maintained in U.S. dollars. Investment securities and other assets and liabilities denominated in a foreign currency are translated into U.S. dollars at the prevailing exchange rates at period end. Purchases and sales of investment securities, income and expenses are translated into U.S. dollars at the prevailing exchange rates on the respective dates of the transactions.
Net realized and unrealized gains and losses on foreign currency transactions represent net gains and losses between trade and settlement dates on securities transactions, the acquisition and disposition of foreign currencies, and the difference between the amount of net investment income accrued and the U.S. dollar amount actually received. The portion of both realized and unrealized gains and losses on investments that results from fluctuations in foreign currency exchange rates is not separately disclosed but is included with net realized and unrealized gain/appreciation and loss/depreciation on investments.
Federal Income Taxes. The Fund is treated as a separate taxpayer as provided for in the Internal Revenue Code, as amended. It is the Fund’s policy to comply with the requirements of the Internal Revenue Code, as amended, which are applicable to regulated investment companies, and to distribute all of its taxable income to the separate accounts of the Participating Insurance Companies which hold its shares.
The Fund has reviewed the tax positions for the open tax years as of December 31, 2018 and has determined that no provision for income tax and/or uncertain tax positions is required in the Fund’s financial statements. The Fund’s federal tax returns for the prior three fiscal years remain open subject to examination by the Internal Revenue Service.
Distribution of Income and Gains. Distributions from net investment income of the Fund, if any, are declared and distributed to shareholders annually. Net realized gains from investment transactions, in excess
| | | | | | |
| | 14 | | | | | | Deutsche DWS Variable Series I — DWS Core Equity VIP |
of available capital loss carryforwards, would be taxable to the Fund if not distributed, and, therefore, will be distributed to shareholders at least annually. The Fund may also make additional distributions for tax purposes if necessary.
The timing and characterization of certain income and capital gain distributions are determined annually in accordance with federal tax regulations which may differ from accounting principles generally accepted in the United States of America. These differences primarily relate to certain securities sold at a loss. As a result, net investment income (loss) and net realized gain (loss) on investment transactions for a reporting period may differ significantly from distributions during such period. Accordingly, the Fund may periodically make reclassifications among certain of its capital accounts without impacting the net asset value of the Fund.
At December 31, 2018, the Fund’s components of distributable earnings (accumulated losses) on a tax basis are as follows:
| | | | |
| Undistributed ordinary income* | | $ | 1,124,557 | |
| Undistributed net long-term capital gains | | $ | 11,510,198 | |
| Net unrealized appreciation (depreciation) on investments | | $ | 15,227,580 | |
At December 31, 2018, the aggregate cost of investments for federal income tax purposes was $79,444,926. The net unrealized appreciation for all investments based on tax cost was $15,227,580. This consisted of aggregate gross unrealized appreciation for all investments in which there was an excess of value over tax cost of $22,392,847 and aggregate gross unrealized depreciation for all investments in which there was an excess of tax cost over value of $7,165,267.
In addition, the tax character of distributions paid to shareholders by the Fund is summarized as follows:
| | | | | | | | |
| | | Years Ended December 31, | |
| | | 2018 | | | 2017 | |
| Distributions from ordinary income* | | $ | 2,110,009 | | | $ | 3,360,863 | |
| Distributions from long-term capital gains | | $ | 28,268,647 | | | $ | 10,280,269 | |
| * | For tax purposes, short-term capital gain distributions are considered ordinary income distributions. |
Expenses. Expenses of the Trust arising in connection with a specific Fund are allocated to that Fund. Other Trust expenses which cannot be directly attributed to a Fund are apportioned among the Funds in the Trust based upon the relative net assets or other appropriate measures.
Contingencies. In the normal course of business, the Fund may enter into contracts with service providers that contain general indemnification clauses. The Fund’s maximum exposure under these arrangements is unknown, as this would involve future claims that may be made against the Fund that have not yet been made. However, based on experience, the Fund expects the risk of loss to be remote.
Other. Investment transactions are accounted for on a trade date plus one basis for daily net asset value calculations. However, for financial reporting purposes, investment transactions are reported on trade date. Interest income is recorded on the accrual basis. Dividend income is recorded on theex-dividend date net of foreign withholding taxes. Realized gains and losses from investment transactions are recorded on an identified cost basis. Proceeds from litigation payments, if any, are included in net realized gain (loss) from investments.
B. Purchases and Sales of Securities
During the year ended December 31, 2018, purchases and sales of investment securities (excludingshort-term investments) aggregated $45,144,758 and $52,514,953, respectively.
C. Related Parties
Management Agreement. Under the Investment Management Agreement with DWS Investment Management Americas, Inc. (formerly Deutsche Investment Management Americas Inc.) (“DIMA“ or the “Advisor“), an indirect, wholly owned subsidiary of DWS Group GmbH & Co. KGaA (“DWS Group”), the Advisor directs the investments of the Fund in accordance with its investment objectives, policies and restrictions. The Advisor determines the securities, instruments and other contracts relating to investments to be purchased, sold or entered into by the Fund.
| | | | |
Deutsche DWS Variable Series I — DWS Core Equity VIP | | | | | 15 |
Pursuant to the Investment Management Agreement with the Advisor, the Fund pays a monthly management fee based on the Fund’s average daily net assets, computed and accrued daily and payable monthly, at the following annual rates:
| | | | |
| First $250 million of average daily net assets | | | .390 | % |
| Next $750 million of average daily net assets | | | .365 | % |
| Over $1 billion of average daily net assets | | | .340 | % |
Accordingly, for the year ended December 31, 2018, the fee pursuant to the Investment Management Agreement was equivalent to an annual rate (exclusive of any applicable waivers/reimbursements) of 0.39% of the Fund’s average daily net assets.
For the period from January 1, 2018 through September 30, 2018, the Advisor had contractually agreed to waive its fees and/or reimburse certain operating expenses of the Fund to the extent necessary to maintain the total annual operating expenses (excluding certain expenses such as extraordinary expenses, taxes, brokerage and interest) of each class as follows:
| | | | |
| Class A | | | .80 | % |
| Class B | | | 1.08 | % |
Effective October 1, 2018 through September 30, 2019, the Advisor has contractually agreed to waive its fees and/or reimburse certain operating expenses of the Fund to the extent necessary to maintain the total annual operating expenses (excluding certain expenses such as extraordinary expenses, taxes, brokerage and interest) of each class as follows:
| | | | |
| Class A | | | .79 | % |
| Class B | | | 1.07 | % |
Administration Fee. Pursuant to an Administrative Services Agreement, DIMA provides most administrative services to the Fund. For all services provided under the Administrative Services Agreement, the Fund pays the Advisor an annual fee (“Administration Fee“) of 0.10% of the Fund’s average daily net assets, computed and accrued daily and payable monthly. For the year ended December 31, 2018, the Administration Fee was $107,290, of which $8,256 is unpaid.
Service Provider Fees. DWS Service Company (“DSC“), an affiliate of the Advisor, is the transfer agent,dividend-paying agent and shareholder service agent for the Fund. Pursuant to asub-transfer agency agreement between DSC and DST Systems, Inc. (“DST“), DSC has delegated certain transfer agent,dividend-paying agent and shareholder service agent functions to DST. DSC compensates DST out of the shareholder servicing fee it receives from the Fund. For the year ended December 31, 2018, the amounts charged to the Fund by DSC were as follows:
| | | | | | | | |
| Services to Shareholders | | Total
Aggregated | | | Unpaid at
December 31, 2018 | |
| Class A | | $ | 633 | | | $ | 106 | |
| Class B | | | 121 | | | | 20 | |
| | | $ | 754 | | | $ | 126 | |
Distribution Service Agreement. DWS Distributors, Inc. (“DDI“), also an affiliate of the Advisor, is the Trust’s Distributor. In accordance with the Master Distribution Plan, DDI receives12b-1 fees of 0.25% of average daily net assets of Class B shares. Pursuant to the Master Distribution Plan, DDI remits these fees to the Participating Insurance Companies for various costs incurred or paid by these companies in connection with marketing and distribution of Class B shares. For the year ended December 31, 2018, the Distribution Service Fee aggregated $8,089, of which $622 is unpaid.
Typesetting and Filing Service Fees. Under an agreement with the Fund, DIMA is compensated for providing certainpre-press and regulatory filing services to the Fund. For the year ended December 31, 2018, the amount charged to the Fund by DIMA included in the Statement of Operations under “Reports to shareholders“ aggregated $9,144, of which $6,751 is unpaid.
Trustees’ Fees and Expenses. The Fund paid retainer fees to each Trustee not affiliated with the Advisor, plus specified amounts to the Board Chairperson and to each committee Chairperson.
Affiliated Cash Management Vehicles. The Fund may invest uninvested cash balances in DWS Central Cash Management Government Fund and DWS ESG Liquidity Fund, affiliated money market funds which are
| | | | | | |
| | 16 | | | | | | Deutsche DWS Variable Series I — DWS Core Equity VIP |
managed by the Advisor. Each affiliated money market fund is managed in accordance withRule 2a-7 under the 1940 Act, which governs the quality, maturity, diversity and liquidity of instruments in which a money market fund may invest. DWS Central Cash Management Government Fund seeks to maintain a stable net asset value, and DWS ESG Liquidity Fund maintains a floating net asset value. The Fund indirectly bears its proportionate share of the expenses of each affiliated money market fund in which it invests. DWS Central Cash Management Government Fund does not pay the Advisor an investment management fee. To the extent that DWS ESG Liquidity Fund pays an investment management fee to the Advisor, the Advisor will waive an amount of the investment management fee payable to the Advisor by the Fund equal to the amount of the investment management fee payable on the Fund’s assets invested in DWS ESG Liquidity Fund.
Security Lending Fees. Deutsche Bank AG serves as securities lending agent for the Fund. For the year ended December 31, 2018, the Fund incurred lending agent fees to Deutsche Bank AG for the amount of $12.
D. Ownership of the Fund
At December 31, 2018, three participating insurance companies were owners of record of 10% or more of the total outstanding Class A shares of the Fund, each owning 48%, 17% and 10%, respectively. Two participating insurance companies were owners of record of 10% or more of the total outstanding Class B shares of the Fund, each owning 45% and 36%, respectively.
E. Line of Credit
The Fund and other affiliated funds (the “Participants”) share in a $400 million revolving credit facility provided by a syndication of banks. The Fund may borrow for temporary or emergency purposes, including the meeting of redemption requests that otherwise might require the untimely disposition of securities. The Participants are charged an annual commitment fee which is allocated based on net assets, among each of the Participants. Interest is calculated at a rate per annum equal to the sum of the Federal Funds Rate plus 1.25 percent plus if theone-month LIBOR exceeds the Federal Funds Rate, the amount of such excess. The Fund may borrow up to a maximum of 33 percent of its net assets under the agreement. The Fund had no outstanding loans at December 31, 2018.
| | | | |
Deutsche DWS Variable Series I — DWS Core Equity VIP | | | | | 17 |
Report of Independent Registered Public Accounting Firm
To the Board of Trustees of Deutsche DWS Variable Series I and Shareholders of DWS Core Equity VIP
Opinion on the Financial Statements
We have audited the accompanying statement of assets and liabilities, including the investment portfolio, of DWS Core Equity VIP (one of the funds constituting Deutsche DWS Variable Series I, referred to hereafter as the “Fund”) as of December 31, 2018, the related statement of operations for the year ended December 31, 2018, the statements of changes in net assets for each of the two years in the period ended December 31, 2018, including the related notes, and the financial highlights for each of the five years in the period ended December 31, 2018 (collectively referred to as the “financial statements”). In our opinion, the financial statements present fairly, in all material respects, the financial position of the Fund as of December 31, 2018, the results of its operations for the year then ended, the changes in its net assets for each of the two years in the period ended December 31, 2018 and the financial highlights for each of the five years in the period ended December 31, 2018 in conformity with accounting principles generally accepted in the United States of America.
Basis for Opinion
These financial statements are the responsibility of the Fund’s management. Our responsibility is to express an opinion on the Fund’s financial statements based on our audits. We are a public accounting firm registered with the Public Company Accounting Oversight Board (United States) (PCAOB) and are required to be independent with respect to the Fund in accordance with the U.S. federal securities laws and the applicable rules and regulations of the Securities and Exchange Commission and the PCAOB.
We conducted our audits of these financial statements in accordance with the standards of the PCAOB. Those standards require that we plan and perform the audit to obtain reasonable assurance about whether the financial statements are free of material misstatement, whether due to error or fraud.
Our audits included performing procedures to assess the risks of material misstatement of the financial statements, whether due to error or fraud, and performing procedures that respond to those risks. Such procedures included examining, on a test basis, evidence regarding the amounts and disclosures in the financial statements. Our audits also included evaluating the accounting principles used and significant estimates made by management, as well as evaluating the overall presentation of the financial statements. Our procedures included confirmation of securities owned as of December 31, 2018 by correspondence with the custodian. We believe that our audits provide a reasonable basis for our opinion.
PricewaterhouseCoopers LLP
Boston, Massachusetts
February 14, 2019
We have served as the auditor of one or more investment companies in the DWS family of funds since 1930.
| | | | | | |
| | 18 | | | | | | Deutsche DWS Variable Series I — DWS Core Equity VIP |
| | |
| Information About Your Fund’s Expenses | | (Unaudited) |
As an investor of the Fund, you incur two types of costs: ongoing expenses and transaction costs. Ongoing expenses include management fees, distribution and service(12b-1) fees and other Fund expenses. Examples of transaction costs include contract charges, which are not shown in this section. The following tables are intended to help you understand your ongoing expenses (in dollars) of investing in the Fund and to help you compare these expenses with the ongoing expenses of investing in other mutual funds. The example in the table is based on an investment of $1,000 invested at the beginning of thesix-month period and held for the entire period (July 1, 2018 to December 31, 2018).
The tables illustrate your Fund’s expenses in two ways:
| – | Actual Fund Return. This helps you estimate the actual dollar amount of ongoing expenses (but not transaction costs) paid on a $1,000 investment in the Fund using the Fund’s actual return during the period. To estimate the expenses you paid over the period, simply divide your account value by $1,000 (for example, an $8,600 account value divided by $1,000 = 8.6), then multiply the result by the number in the “Expenses Paid per $1,000” line under the share class you hold. |
| – | Hypothetical 5% Fund Return. This helps you to compare your Fund’s ongoing expenses (but not transaction costs) with those of other mutual funds using the Fund’s actual expense ratio and a hypothetical rate of return of 5% per year before expenses. Examples using a 5% hypothetical Fund return may be found in the shareholder reports of other mutual funds. The hypothetical account values and expenses may not be used to estimate the actual ending account balance or expenses you paid for the period. |
Please note that the expenses shown in these tables are meant to highlight your ongoing expenses only and do not reflect any transaction costs. The “Expenses Paid per $1,000” line of the tables is useful in comparing ongoing expenses only and will not help you determine the relative total expense of owning different funds. If these transaction costs had been included, your costs would have been higher.
| | | | | | | | |
| Expenses and Value of a $1,000 Investment for the six months ended December 31, 2018 | |
| | |
| Actual Fund Return | | | Class A | | | | Class B | |
| Beginning Account Value 7/1/18 | | $ | 1,000.00 | | | $ | 1,000.00 | |
| Ending Account Value 12/31/18 | | $ | 911.00 | | | $ | 909.20 | |
| Expenses Paid per $1,000* | | $ | 2.94 | | | $ | 4.48 | |
| | |
| Hypothetical 5% Fund Return | | | Class A | | | | Class B | |
| Beginning Account Value 7/1/18 | | $ | 1,000.00 | | | $ | 1,000.00 | |
| Ending Account Value 12/31/18 | | $ | 1,022.13 | | | $ | 1,020.52 | |
| Expenses Paid per $1,000* | | $ | 3.11 | | | $ | 4.74 | |
| * | Expenses are equal to the Fund’s annualized expense ratio for each share class, multiplied by the average account value over the period, multiplied by 184 (the number of days in the most recentsix-month period), then divided by 365. |
| | | | | | | | |
| Annualized Expense Ratios | | Class A | | | Class B | |
| Deutsche DWS Variable Series I — DWS Core Equity VIP | | | .61 | % | | | .93 | % |
For more information, please refer to the Fund’s prospectus.
These tables do not reflect charges and fees (“contract charges”) associated with the separate account that invests in the Fund or any variable life insurance policy or variable annuity contract for which the Fund is an investment option.
For an analysis of the fees associated with an investment in the Fund or similar funds, please refer to the current and hypothetical expense calculators for Variable Insurance Products which can be found at dws.com/calculators.
| | | | |
Deutsche DWS Variable Series I — DWS Core Equity VIP | | | | | 19 |
| | |
| Tax Information | | (Unaudited) |
The Fund paid distributions of $3.94 per share from net long-term capital gains during its year ended December 31, 2018.
Pursuant to Section 852 of the Internal Revenue Code, the Fund designates $12,710,000 as capital gain dividends for its year ended December 31, 2018.
For corporate shareholders, 100% of the ordinary dividends (i.e., income dividends plus short-term capital gains) paid during the Fund’s fiscal year ended December 31, 2018 qualified for the dividends received deduction.
Please consult a tax advisor if you have questions about federal or state income tax laws, or on how to prepare your tax returns. If you have specific questions about your account, please contact your insurance provider.
Proxy Voting
The Trust’s policies and procedures for voting proxies for portfolio securities and information about how the Trust voted proxies related to its portfolio securities during the most recent12-month period ended June 30 are available on our Web site — dws.com/en-us/resources/proxy-voting — or on the SEC’s Web site — sec.gov. To obtain a written copy of the Trust’s policies and procedures without charge, upon request, call us toll free at (800)728-3337.
| | | | | | |
| | 20 | | | | | | Deutsche DWS Variable Series I — DWS Core Equity VIP |
Advisory Agreement Board Considerations and Fee Evaluation
The Board of Trustees (hereinafter referred to as the “Board” or “Trustees”) approved the renewal of DWS Core Equity VIP’s (the “Fund”) investment management agreement (the “Agreement”) with DWS Investment Management Americas, Inc. (“DIMA”) in September 2018.
In terms of the process that the Board followed prior to approving the Agreement, shareholders should know that:
| – | | During the entire process, all of the Fund’s Trustees were independent of DIMA and its affiliates (the “Independent Trustees”). |
| – | | The Board met frequently during the past year to discuss fund matters and dedicated a substantial amount of time to contract review matters. Over the course of several months, the Board’s Contract Committee reviewed extensive materials received from DIMA, independent third parties and independent counsel. These materials included an analysis of the Fund’s performance, fees and expenses, and profitability from a fee consultant retained by the Fund’s Independent Trustees (the “Fee Consultant”). Based on its evaluation of the information provided, the Contract Committee presented its findings and recommendations to the Board. The Board then reviewed the Contract Committee’s findings and recommendations. |
| – | | The Board also received extensive information throughout the year regarding performance of the Fund. |
| – | | The Independent Trustees regularly met privately with counsel to discuss contract review and other matters. In addition, the Independent Trustees were advised by the Fee Consultant in the course of their review of the Fund’s contractual arrangements and considered a comprehensive report prepared by the Fee Consultant in connection with their deliberations. |
| – | | In connection with reviewing the Agreement, the Board also reviewed the terms of the Fund’s Rule12b-1 plan, distribution agreement, administrative services agreement, transfer agency agreement and other material service agreements. |
In connection with the contract review process, the Contract Committee and the Board considered the factors discussed below, among others. The Board also considered that DIMA and its predecessors have managed the Fund since its inception, and the Board believes that a long-term relationship with a capable, conscientious advisor is in the best interests of the Fund. The Board considered, generally, that shareholders chose to invest or remain invested in the Fund knowing that DIMA managed the Fund. DIMA is part of DWS Group GmbH & Co. KGaA (“DWS Group”). DWS Group is a global asset management business that offers a wide range of investing expertise and resources, including research capabilities in many countries throughout the world. In 2018, approximately 20% of DWS Group’s shares were sold in an initial public offering, with Deutsche Bank AG owning the remaining shares.
As part of the contract review process, the Board carefully considered the fees and expenses of each DWS fund overseen by the Board in light of the fund’s performance. In many cases, this led to the negotiation and implementation of expense caps. As part of these negotiations, the Board indicated that it would consider relaxing these caps in future years following sustained improvements in performance, among other considerations.
While shareholders may focus primarily on fund performance and fees, the Fund’s Board considers these and many other factors, including the quality and integrity of DIMA’s personnel and administrative support services provided by DIMA, such as back-office operations, fund valuations, and compliance policies and procedures.
Nature, Quality and Extent of Services.The Board considered the terms of the Agreement, including the scope of advisory services provided under the Agreement. The Board noted that, under the Agreement, DIMA provides portfolio management services to the Fund and that, pursuant to a separate administrative services agreement, DIMA provides administrative services to the Fund. The Board considered the experience and skills of senior management and investment personnel and the resources made available to such personnel. The Board reviewed the Fund’s performance over short-term and long-term periods and compared those returns to various agreed-upon performance measures, including market index(es) and a peer universe compiled using information supplied by Morningstar Direct (“Morningstar”), an independent fund data service. The Board also noted that it has put into place a process of identifying “Funds in Review” (e.g., funds performing poorly relative to a peer universe), and receives additional reporting from DIMA regarding such funds and, where appropriate, DIMA’s plans to address underperformance. The Board
| | | | |
Deutsche DWS Variable Series I — DWS Core Equity VIP | | | | | 21 |
believes this process is an effective manner of identifying and addressing underperforming funds. Based on the information provided, the Board noted that, for theone-, three- and five-year periods ended December 31, 2017, the Fund’s performance (Class A shares) was in the 3rd quartile, 1st quartile and 1st quartile, respectively, of the applicable Morningstar universe (the 1st quartile being the best performers and the 4th quartile being the worst performers). The Board also observed that the Fund has outperformed its benchmark in the three- and five-year periods and has underperformed its benchmark in theone-year period ended December 31, 2017.
Fees and Expenses. The Board considered the Fund’s investment management fee schedule, operating expenses and total expense ratios, and comparative information provided by Broadridge Financial Solutions, Inc. (“Broadridge”) and the Fee Consultant regarding investment management fee rates paid to other investment advisors by similar funds (1st quartile being the most favorable and 4th quartile being the least favorable). With respect to management fees paid to other investment advisors by similar funds, the Board noted that the contractual fee rates paid by the Fund, which include a 0.10% fee paid to DIMA under the Fund’s administrative services agreement, were lower than the median (1st quartile) of the applicable Broadridge peer group (based on Broadridge data provided as of December 31, 2017). The Board noted that the Fund’s Class A shares total (net) operating expenses were expected to be lower than the median (1st quartile) of the applicable Broadridge expense universe (based on Broadridge data provided as of December 31, 2017, and analyzing Broadridge expense universe Class A (net) expenses less any applicable12b-1 fees) (“Broadridge Universe Expenses”). The Board also reviewed data comparing each share class’s total (net) operating expenses to the applicable Broadridge Universe Expenses. The Board noted that the expense limitations agreed to by DIMA were expected to help the Fund’s total (net) operating expenses remain competitive. The Board considered the Fund’s management fee rate as compared to fees charged by DIMA to a comparable DWS U.S. registered fund (“DWS Funds”) and considered differences between the Fund and the comparable DWS Fund. The information requested by the Board as part of its review of fees and expenses also included information about institutional accounts (including anysub-advised funds and accounts) and funds offered primarily to European investors (“DWS Europe Funds”) managed by DWS Group. The Board noted that DIMA indicated that DWS Group does not manage any institutional accounts or DWS Europe Funds comparable to the Fund.
On the basis of the information provided, the Board concluded that management fees were reasonable and appropriate in light of the nature, quality and extent of services provided by DIMA.
Profitability. The Board reviewed detailed information regarding revenues received by DIMA under the Agreement. The Board considered the estimated costs to DIMA, andpre-tax profits realized by DIMA, from advising the DWS Funds, as well as estimates of thepre-tax profits attributable to managing the Fund in particular. The Board also received information regarding the estimated enterprise-wide profitability of DIMA and its affiliates with respect to all fund services in totality and by fund. The Board and the Fee Consultant reviewed DIMA’s methodology in allocating its costs to the management of the Fund. Based on the information provided, the Board concluded that thepre-tax profits realized by DIMA in connection with the management of the Fund were not unreasonable. The Board also reviewed certain publicly available information regarding the profitability of certain similar investment management firms. The Board noted that, while information regarding the profitability of such firms is limited (and in some cases is not necessarily prepared on a comparable basis), DIMA and its affiliates’ overall profitability with respect to the DWS Funds (after taking into account distribution and other services provided to the funds by DIMA and its affiliates) was lower than the overall profitability levels of most comparable firms for which such data was available.
Economies of Scale. The Board considered whether there are economies of scale with respect to the management of the Fund and whether the Fund benefits from any economies of scale. The Board noted that the Fund’s investment management fee schedule includes fee breakpoints. The Board concluded that the Fund’s fee schedule represents an appropriate sharing between the Fund and DIMA of such economies of scale as may exist in the management of the Fund at current asset levels.
Other Benefits to DIMA and Its Affiliates. The Board also considered the character and amount of other incidental or“fall-out” benefits received by DIMA and its affiliates, including any fees received by DIMA for administrative services provided to the Fund, any fees received by an affiliate of DIMA for transfer agency services provided to the Fund and any fees received by an affiliate of DIMA for distribution services. The Board also considered benefits to DIMA related to brokerage and soft-dollar allocations, including allocating brokerage to pay for research generated by parties other than the executing broker dealers, which pertain primarily to funds investing in equity securities. In addition, the Board considered the incidental public relations benefits to DIMA related to DWS Funds advertising and cross-selling opportunities among DIMA
| | | | | | |
| | 22 | | | | | | Deutsche DWS Variable Series I — DWS Core Equity VIP |
products and services. The Board considered these benefits in reaching its conclusion that the Fund’s management fees were reasonable.
Compliance. The Board considered the significant attention and resources dedicated by DIMA to its compliance processes in recent years. The Board noted in particular (i) the experience, seniority and time commitment of the individuals serving as DIMA’s and the Fund’s chief compliance officers and (ii) the substantial commitment of resources by DIMA and its affiliates to compliance matters, including the retention of compliance personnel.
Based on all of the information considered and the conclusions reached, the Board unanimously determined that the continuation of the Agreement is in the best interests of the Fund. In making this determination, the Board did not give particular weight to any single factor identified above. The Board considered these factors over the course of numerous meetings, certain of which were in executive session with only the Independent Trustees and counsel present. It is possible that individual Independent Trustees may have weighed these factors differently in reaching their individual decisions to approve the continuation of the Agreement.
| | | | |
Deutsche DWS Variable Series I — DWS Core Equity VIP | | | | | 23 |
Board Members and Officers
The following table presents certain information regarding the Board Members and Officers of the Fund. Each Board Member’s year of birth is set forth in parentheses after his or her name. Unless otherwise noted, (i) each Board Member has engaged in the principal occupation(s) noted in the table for at least the most recent five years, although not necessarily in the same capacity; and (ii) the address of each Independent Board Member is c/o Keith R. Fox, DWS Funds Board Chair, c/o Thomas R. Hiller, Ropes & Gray LLP, Prudential Tower, 800 Boylston Street, Boston, MA02199-3600. Except as otherwise noted below, the term of office for each Board Member is until the election and qualification of a successor, or until such Board Member sooner dies, resigns, is removed or as otherwise provided in the governing documents of the Fund. Because the Fund does not hold an annual meeting of shareholders, each Board Member will hold office for an indeterminate period. The Board Members may also serve in similar capacities with other funds in the fund complex.
| | | | | | | | |
| Independent Board Members | | | | | | |
Name, Year of Birth,
Position with the Fund and
Length of Time Served1 | | Business Experience and Directorships During the Past Five Years | | Number of
Funds in
DWS Fund
Complex
Overseen | | | Other
Directorships
Held by Board
Member
|
Keith R. Fox, CFA (1954) Chairperson since 2017, and Board Member since 1996 | | Managing General Partner, Exeter Capital Partners (a series of private investment funds) (since 1986). Directorships: Progressive International Corporation (kitchen goods importer and distributor); The Kennel Shop (retailer); former Chairman, National Association of Small Business Investment Companies; former Directorships: BoxTop Media Inc. (advertising); Sun Capital Advisers Trust (mutual funds) (2011–2012) | | | 82 | | | — |
John W. Ballantine (1946) Board Member since 1999 | | Retired; formerly, Executive Vice President and Chief Risk Management Officer, First Chicago NBD Corporation/The First National Bank of Chicago (1996–1998); Executive Vice President and Head of International Banking (1995–1996); former Directorships: Director and former Chairman of the Board, Healthways, Inc.2 (population well-being and wellness services) (2003–2014); Stockwell Capital Investments PLC (private equity); Enron Corporation; FNB Corporation; Tokheim Corporation; First Oak Brook Bancshares, Inc. and Oak Brook Bank; Prisma Energy International; Public Radio International. Not-for-Profit Director, Trustee: Palm Beach Civic Association; Window to the World Communications (public media); Harris Theater for Music and Dance (Chicago); Life Director of Hubbard Street Dance Chicago | | | 82 | | | Portland
General
Electric2
(utility
company)
(2003–
present) |
Henry P. Becton, Jr. (1943) Board Member since 1990 | | Vice Chair and former President, WGBH Educational Foundation. Directorships: Public Radio International; Public Radio Exchange (PRX); The Pew Charitable Trusts (charitable organization); Massachusetts Humane Society; Overseer of the New England Conservatory; former Directorships: Becton Dickinson and Company2 (medical technology company); Belo Corporation2 (media company); The PBS Foundation; Association of Public Television Stations; Boston Museum of Science; American Public Television; Concord Academy; New England Aquarium; Mass. Corporation for Educational Telecommunications; Committee for Economic Development; Public Broadcasting Service; Connecticut College; North Bennett Street School (Boston); American Documentary, Inc. (public media) | | | 82 | | | — |
Dawn-Marie Driscoll (1946) Board Member since 1987 | | Emeritus Executive Fellow, Center for Business Ethics, Bentley University; formerly: President, Driscoll Associates (consulting firm); Partner, Palmer & Dodge (law firm) (1988–1990); Vice President of Corporate Affairs and General Counsel, Filene’s (retail) (1978–1988). Directorships: Advisory Board, Center for Business Ethics, Bentley University; Trustee and former Chairman of the Board, Southwest Florida Community Foundation (charitable organization); former Directorships: ICI Mutual Insurance Company (2007–2015); Sun Capital Advisers Trust (mutual funds) (2007–2012), Investment Company Institute (audit, executive, nominating committees) and Independent Directors Council (governance, executive committees) | | | 82 | | | — |
Paul K. Freeman* (1950) Board Member since 1993 | | Consultant, WorldBank/Inter-American Development Bank; Independent Directors Council (former chair); Investment Company Institute (executive committee); Adjunct Professor, University of Denver Law School (2017–present); formerly: Chairman of Education Committee of Independent Directors Council; Project Leader, International Institute for Applied Systems Analysis (1998–2001); Chief Executive Officer, The Eric Group, Inc. (environmental insurance) (1986–1998); Directorships: Knoebel Institute for Healthy Aging, University of Denver (2017–present); former Directorships: Prisma Energy International; Denver Zoo Foundation (2012–2018) | | | 82 | | | — |
| | | | | | |
| | 24 | | | | | | Deutsche DWS Variable Series I — DWS Core Equity VIP |
| | | | | | | | |
Name, Year of Birth,
Position with the Fund and
Length of Time Served1 | | Business Experience and Directorships During the Past Five Years | | Number of
Funds in
DWS Fund
Complex
Overseen | | | Other
Directorships
Held by Board
Member
|
Richard J. Herring (1946) Board Member since 1990 | | Jacob Safra Professor of International Banking and Professor of Finance, The Wharton School, University of Pennsylvania (since July 1972); Director, The Wharton Financial Institutions Center (since 1994); formerly: Vice Dean and Director, Wharton Undergraduate Division (1995–2000) and Director, The Lauder Institute of International Management Studies (2000–2006); Member FDIC Systemic Risk Advisory Committee since 2011, member Systemic Risk Council since 2012 and member of the Advisory Board at the Yale Program on Financial Stability since 2013; Formerly Co-Chair of the Shadow Financial Regulatory Committee (2003–2015), Executive Director of The Financial Economists Roundtable (2008–2015), Director of The Thai Capital Fund (2007–2013), Director of The Aberdeen Singapore Fund (2007–2018), and Nonexecutive Director of Barclays Bank DE (2010–2018) | | | 82 | | | Director,
Aberdeen
Japan Fund
(since 2007) |
William McClayton (1944) Board Member since 2004 | | Private equity investor (since October 2009); previously, Managing Director, Diamond Management & Technology Consultants, Inc. (global consulting firm) (2001–2009); Directorship: Board of Managers, YMCA of Metropolitan Chicago; formerly: Senior Partner, Arthur Andersen LLP (accounting) (1966–2001); Trustee, Ravinia Festival | | | 82 | | | — |
Rebecca W. Rimel (1951) Board Member since 1995 | | President, Chief Executive Officer and Director, The Pew Charitable Trusts (charitable organization) (1994–present); formerly: Executive Vice President, The Glenmede Trust Company (investment trust and wealth management) (1983–2004); Board Member, Investor Education (charitable organization) (2004–2005); Trustee, Executive Committee, Philadelphia Chamber of Commerce (2001–2007); Director, Viasys Health Care2 (January 2007–June 2007); Trustee, Thomas Jefferson Foundation (charitable organization) (1994–2012) | | | 82 | | | Director,
Becton
Dickinson
and
Company2
(medical
technology
company)
(2012–
present);
Director,
BioTelemetry
Inc.2(health
care) (2009–
present) |
William N. Searcy, Jr. (1946) Board Member since 1993 | | Private investor since October 2003; formerly: Pension & Savings Trust Officer, Sprint Corporation2(telecommunications) (November 1989–September 2003); Trustee, Sun Capital Advisers Trust (mutual funds) (1998–2012) | | | 82 | | | — |
Jean Gleason Stromberg (1943) Board Member since 1997 | | Retired. Formerly, Consultant (1997–2001); Director, Financial Markets U.S. Government Accountability Office (1996–1997); Partner, Norton Rose Fulbright, L.L.P. (law firm) (1978–1996); former Directorships: The William and Flora Hewlett Foundation (charitable organization) (2000–2015); Service Source, Inc. (nonprofit), Mutual Fund Directors Forum (2002–2004), American Bar Retirement Association (funding vehicle for retirement plans) (1987–1990 and 1994–1996) | | | 82 | | | — |
| | |
| Officers4 | | |
Name, Year of Birth, Position with the Fund and Length of Time Served5 | | Business Experience and Directorships During the Past Five Years |
Hepsen Uzcan6 (1974) President and Chief Executive Officer, 2017–present Assistant Secretary, 2013–present | | Managing Director,3 DWS; Secretary, DWS USA Corporation (since March 2018); Assistant Secretary, DWS Distributors, Inc. (since June 25, 2018); Director and Vice President, DWS Service Company (since June 25, 2018); Assistant Secretary, DWS Investment Management Americas, Inc. (since June 25, 2018); and Director and President, DB Investment Managers, Inc. (since June 25, 2018); formerly: Vice President for the Deutsche funds (2016–2017) |
John Millette8(1962) Vice President and Secretary, 1999–present | | Director,3DWS; Chief Legal Officer, DWS Investment Management Americas, Inc. (2015–present); and Director and Vice President, DWS Trust Company (2016–present); formerly: Secretary, Deutsche Investment Management Americas Inc. (2015–2017) |
Diane Kenneally8,9 (1966) Treasurer and Chief Financial Officer since 2018 | | Director,3 DWS; formerly: Assistant Treasurer for the DWS funds (2007–2018) |
Caroline Pearson8(1962) Chief Legal Officer, 2010–present | | Managing Director,3DWS; formerly: Secretary, Deutsche AM Distributors, Inc. (2002–2017); and Secretary, Deutsche AM Service Company (2010–2017) |
| | | | |
Deutsche DWS Variable Series I — DWS Core Equity VIP | | | | | 25 |
| | |
Name, Year of Birth, Position with the Fund and Length of Time Served5 | | Business Experience and Directorships During the Past Five Years |
Scott D. Hogan8(1970) Chief Compliance Officer, 2016–present | | Director,3DWS |
Wayne Salit7(1967) Anti-Money Laundering Compliance Officer, 2014–present | | Director,3 Deutsche Bank; and AML Officer, DWS Trust Company; formerly: Managing Director, AML Compliance Officer at BNY Mellon (2011–2014); and Director, AML Compliance Officer at Deutsche Bank (2004–2011) |
Sheila Cadogan8(1966) Assistant Treasurer, 2017–present | | Director,3DWS; Director and Vice President, DWS Trust Company (since 2018) |
Paul Antosca8(1957) Assistant Treasurer, 2007–present | | Director,3DWS |
| 1 | The length of time served represents the year in which the Board Member joined the board of one or more DWS funds currently overseen by the Board. |
| 2 | A publicly held company with securities registered pursuant to Section 12 of the Securities Exchange Act of 1934. |
| 3 | Executive title, not a board directorship. |
| 4 | As a result of their respective positions held with the Advisor or its affiliates, these individuals are considered “interested persons” of the Advisor within the meaning of the 1940 Act. Interested persons receive no compensation from the Fund. |
| 5 | The length of time served represents the year in which the officer was first elected in such capacity for one or more DWS funds. |
| 6 | Address: 345 Park Avenue, New York, NY 10154. |
| 7 | Address: 60 Wall Street, New York, NY 10005. |
| 8 | Address: One International Place, Boston, MA 02110. |
| 9 | Appointed Treasurer and Chief Financial Officer effective July 2, 2018. |
| * | Paul K. Freeman retired from the Board effective December 31, 2018. |
The Fund’s Statement of Additional Information (“SAI”) includes additional information about the Board Members. The SAI is available, without charge, upon request. If you would like to request a copy of the SAI, you may do so by calling the followingtoll-free number:(800) 728-3337.
| | | | | | |
| | 26 | | | | | | Deutsche DWS Variable Series I — DWS Core Equity VIP |
Notes
| | |
| | |
VS1coreq-2 (R-025822-9 2/19) | | |
December 31, 2018
Annual Report
Deutsche DWS Variable Series I
(formerly Deutsche Variable Series I)
DWS CROCI® International VIP
(formerly Deutsche CROCI® International VIP)
Beginning on January 1, 2021, as permitted by regulations adopted by the Securities and Exchange Commission, you may not be receiving paper copies of the Fund’s shareholder reports from the insurance company that offers your contract unless you specifically request paper copies from your insurance company or from your financial intermediary. Instead, the shareholder reports will be made available on a Web site, and your insurance company will notify you by mail each time a report is posted and provide you with a Web site link to access the report. Instructions for requesting paper copies will be provided by your insurance company.
If you already elected to receive shareholder reports electronically, you will not be affected by this change and you need not take any action. You may elect to receive shareholder reports and other communications from your insurance company electronically by following the instructions provided by your insurance company.
You may elect to receive all future reports in paper free of charge from your insurance company. If your insurance company informs you that future reports will be delivered via Web access, you can inform your insurance company that you wish to continue receiving paper copies of your shareholder reports by following the instructions provided by your insurance company.

Contents
This report must be preceded or accompanied by a prospectus. To obtain an additional prospectus or summary prospectus, if available, call (800)728-3337 or your financial representative. We advise you to consider the Fund’s objectives, risks, charges and expenses carefully before investing. The summary prospectus and prospectus contain this and other important information about the Fund. Please read the prospectus carefully before you invest.
Investing in foreign securities, particularly those of emerging markets, presents certain risks, such as currency fluctuations, political and economic changes, and market risks. Emerging markets tend to be more volatile and less liquid than the markets of more mature economies, and generally have less diverse and less mature economic structures and less stable political systems than those of developed countries. Stocks may decline in value. The Fund will be managed on the premise that stocks with lower CROCI® Economic P/E Ratios may outperform stocks with higher CROCI® Economic P/E Ratios over time. This premise may not always be correct and prospective investors should evaluate this assumption prior to investing in the Fund. Investing in derivatives entails special risks relating to liquidity, leverage and credit that may reduce returns and/or increase volatility. The Fund may lend securities to approved institutions. Please read the prospectus for details.
In June 2016, citizens of the United Kingdom approved a referendum to leave the European Union (EU) and in March 2017, the United Kingdom initiated its withdrawal from the EU, which is expected to take place by March 2019. Significant uncertainty exists regarding the United Kingdom’s anticipated withdrawal from the EU and any adverse economic and political effects such withdrawal may have on the United Kingdom, other EU countries and the global economy.
The brand DWS represents DWS Group GmbH & Co. KGaA and any of its subsidiaries such as DWS Distributors, Inc. which offers investment products or DWS Investment Management Americas, Inc. and RREEF America L.L.C. which offer advisory services.
DWS Distributors, Inc., 222 South Riverside Plaza, Chicago, IL 60606, (800)621-1148
NOT FDIC/NCUA INSURED NO BANK GUARANTEE MAY LOSE VALUE NOT A DEPOSIT
NOT INSURED BY ANY FEDERAL GOVERNMENT AGENCY
| | | | | | |
| | 2 | | | | | | Deutsche DWS Variable Series I — DWS CROCI® International VIP |
| | |
| Performance Summary | | December 31, 2018 (Unaudited) |
Fund performance shown is historical, assumes reinvestment of all dividend and capital gain distributions, and does not guarantee future results. Investment return and principal value fluctuate with changing market conditions so that, when redeemed, shares may be worth more or less than their original cost. Current performance may be lower or higher than the performance data quoted. Please contact your participating insurance company for the Fund’s most recentmonth-end performance. Performance does not reflect charges and fees (“contract charges”) associated with the separate account that invests in the Fund or any variable life insurance policy or variable annuity contract for which the Fund is an investment option. These charges and fees will reduce returns. While all share classes have the same underlying portfolio, their performance will differ.
The gross expense ratios of the Fund, as stated in the fee table of the prospectus dated May 1, 2018 are 1.10% and 1.38% for Class A and Class B shares, respectively, and may differ from the expense ratios disclosed in the Financial Highlights tables in this report.
Generally accepted accounting principles require adjustments to be made to the net assets of the Fund at period end for financial reporting purposes only, and as such, the total return based on the unadjusted net asset value per share may differ from the total return reported in the financial highlights.
Growth of an Assumed $10,000 Investment
| | |
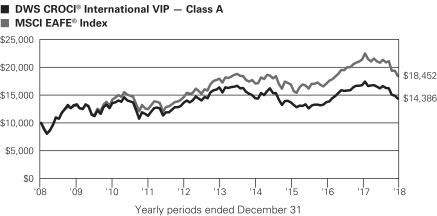 | | MSCI EAFE Index is an equity index which captures large and mid cap representation across developed markets countries around the world, excluding the US and Canada. Index returns do not reflect any fees or expenses and it is not possible to invest directly into an index. |
| | | | | | | | | | |
| Comparative Results | | | | | | | | | | |
| | | | | |
| Deutsche CROCI® International VIP | | | | 1-Year | | 3-Year | | 5-Year | | 10-Year |
| Class A | | Growth of $10,000 | | $8,561 | | $10,518 | | $8,772 | | $14,386 |
| | | Average annual total return | | –14.39% | | 1.70% | | –2.59% | | 3.70% |
| MSCI EAFE® Index | | Growth of $10,000 | | $8,621 | | $10,887 | | $10,269 | | $18,452 |
| | | Average annual total return | | –13.79% | | 2.87% | | 0.53% | | 6.32% |
| | | | | |
| Deutsche CROCI® International VIP | | | | 1-Year | | 3-Year | | 5-Year | | 10-Year |
| Class B | | Growth of $10,000 | | $8,543 | | $10,453 | | $8,675 | | $14,016 |
| | | Average annual total return | | –14.57% | | 1.49% | | –2.80% | | 3.43% |
| MSCI EAFE® Index | | Growth of $10,000 | | $8,621 | | $10,887 | | $10,269 | | $18,452 |
| | | Average annual total return | | –13.79% | | 2.87% | | 0.53% | | 6.32% |
The growth of $10,000 is cumulative.
| | | | |
Deutsche DWS Variable Series I — DWS CROCI® International VIP | | | | | 3 |
| | |
| Management Summary | | December 31, 2018 (Unaudited) |
The Fund returned –14.39% (Class A, unadjusted for contract charges) in 2018 and underperformed the –13.79% return of its benchmark, the MSCI EAFE Index.International equities lost ground in the past year, with the bulk of the downturn occurring in the fourth calendar quarter amid heightened investor concerns about the outlook for global economic growth. The overseas markets were further pressured by the weakness in most major foreign currencies against the U.S. dollar.
The trends in the broader market were mirrored in the Fund’s results versus the benchmark. After lagging the index through the end of September, the Fund made up a great deal of lost ground once stocks started to trade lower. We believe the improvement in the Fund’s relative performance in the down market helps illustrate the merits of our value discipline. Although value stocks had underperformed their growth counterparts by a wide margin for several years, we expected that this trend would ultimately reverse given that the two styles tend to alternate leadership over time. This indeed proved to be the case in the fourth quarter, and the Fund benefited in kind. The Fund’s emphasis on lower-beta stocks, which generally began to outpace higher-beta equities from October onward, also helped us make up our prior underperformance in the latter part of the year.
The Fund’s sector allocations made a positive contribution to performance. An underweight in financial stocks, which trailed the broader index by a wide margin, aided results. We further benefited from an overweight position in utilities. Although the sector lagged through much of the year, its defensive qualities enabled it to hold up well once the markets began to turn lower.
Stock selection was a net detractor from performance. While our holdings outpaced the corresponding benchmark components in the utilities, health care, and communication services sectors, the benefit was outweighed by our weaker showing in consumer discretionary and materials. A large allocation to automakers and the related suppliers, both of which fell sharply on concerns that global auto sales had peaked and were set to decline, was the key driver of performance in consumer discretionary. Positions in a number of British homebuilders, which had performed very well for the Fund in 2017 but turned lower in the past 12 months, also weighed on our results in the sector. On the positive side, the utilities sector was home to the two leading contributors at the individual stock level: Hong Kong & China Gas Co., Ltd. and HK Electric Investments & HK Electric Investments Ltd.
At the close of the period, the Fund held its largest overweight positions in the consumer discretionary, utilities, and industrials sectors, followed by health care and consumer staples. It was underweight in communications services and materials, and it had zero weightings in financials, information technology, and real estate. The Fund’s holdings tend to deviate quite a bit from those of the benchmark, as we invest in areas where we find the most attractive values based on the CROCI® investment process, rather than seeking to match the weightings in the index.
The foreign markets performed poorly in 2018 amid the waning prospects for synchronized global growth. However, one benefit of this trend is that valuations have fallen from their levels of earlier in the year. We believe the Fund, through its emphasis on undervalued stocks with healthy fundamentals, is well positioned to capitalize on the increasingly attractive valuations in international equities. As of December 31, 2018, the Fund had aprice-to-earnings ratio of 9.9 based onone-year forward earnings estimates, versus 11.8 for the MSCI EAFE Index. The portfolio also compared favorably to the benchmark in terms of its fundamentals, illustrated by its higher return on equity (7.3% vs. 6.4%). (Source: Factset.)
Di Kumble, CFA, Managing Director
John Moody, Vice President
Portfolio Managers
The views expressed reflect those of the portfolio management team only through the end of the period of the report as stated on the cover. The management team’s views are subject to change at any time based on market and other conditions and should not be construed as a recommendation. Past performance is no guarantee of future results. Current and future portfolio holdings are subject to risk.
| | | | | | |
| | 4 | | | | | | Deutsche DWS Variable Series I — DWS CROCI® International VIP |
Terms to Know
TheMorgan Stanley Capital International (MSCI) Europe, Australasia and Far East (EAFE) Index is an equity index which captures large- andmid-cap representation across developed markets countries around the world, excluding the United States and Canada. With 920 constituents, the index covers approximately 85% of the free float-adjusted market capitalization in each country.
Index returns do not reflect any fees or expenses and it is not possible to invest directly into an index.
Beta measures a security’s sensitivity to the movements of the Fund’s benchmark or the market as a whole.
Contributors anddetractors incorporate both a stock’s return and its weight. If two stocks have the same return but one has a larger weighting in the Fund, it will have a larger contribution to return in the period
Overweight means the Fund holds a higher weighting in a given sector or security than the benchmark.Underweightmeans the Fund holds a lower weighting.
Consumer discretionary represents industries that produce goods and services that are not necessities in everyday life.
Price-to-earnings (P/E) ratio compares share price toper-share earnings.
Return on equity is the amount of net income returned as a percentage of shareholders’ equity.
| | | | |
Deutsche DWS Variable Series I — DWS CROCI® International VIP | | | | | 5 |
| | |
| Portfolio Summary | | (Unaudited) |
| | | | | | | | |
| Asset Allocation (As a % of Investment Portfolio) | | 12/31/18 | | | 12/31/17 | |
| Common Stocks | | | 98% | | | | 97% | |
| Preferred Stocks | | | 2% | | | | 2% | |
| Cash Equivalents | | | 0% | | | | 1% | |
| | | | 100% | | | | 100% | |
| | |
Geographical Diversification (As a % of Investment Portfolio excluding Cash Equivalents and
Securities Lending Collateral) | | 12/31/18 | | | 12/31/17 | |
| Japan | | | 24% | | | | 24% | |
| France | | | 16% | | | | 10% | |
| United Kingdom | | | 14% | | | | 14% | |
| Germany | | | 14% | | | | 18% | |
| Switzerland | | | 8% | | | | 16% | |
| Hong Kong | | | 6% | | | | 6% | |
| Singapore | | | 4% | | | | 4% | |
| Belgium | | | 4% | | | | 2% | |
| Netherlands | | | 4% | | | | 2% | |
| Australia | | | 2% | | | | 2% | |
| Finland | | | 2% | | | | — | |
| Luxembourg | | | 2% | | | | — | |
| Spain | | | — | | | | 2% | |
| | | | 100% | | | | 100% | |
| | |
Sector Diversification (As a % of Investment Portfolio excluding Cash Equivalents and Securities
Lending Collateral) | | 12/31/18 | | | 12/31/17 | |
| Consumer Discretionary | | | 31% | | | | 22% | |
| Industrials | | | 20% | | | | 24% | |
| Health Care | | | 13% | | | | 16% | |
| Consumer Staples | | | 12% | | | | 16% | |
| Materials | | | 11% | | | | 6% | |
| Utilities | | | 9% | | | | 14% | |
| Communication Services | | | 2% | | | | 2% | |
| Energy | | | 2% | | | | — | |
| | | | 100% | | | | 100% | |
Portfolio holdings and characteristics are subject to change.
For more complete details about the Fund’s investment portfolio, see page 7.
Following the Fund’s fiscal first and thirdquarter-end, a complete portfolio holdings listing is filed with the SEC on FormN-Q or Form N-PORT (available for filings after March 31, 2019). The Fund’s Form N-Q or Form N-PORT will be available on the SEC’s Web site at sec.gov. The Fund’s portfolio holdings are also posted on dws.com from time to time. Please see the Fund’s current prospectus for more information.
| | | | | | |
| | 6 | | | | | | Deutsche DWS Variable Series I — DWS CROCI® International VIP |
| | |
| Investment Portfolio | | December 31, 2018 |
| | | | | | | | |
| | | Shares | | | Value ($) | |
| Common Stocks 97.2% | | | | | | | | |
| Australia 2.2% | |
BHP Group Ltd. (Cost $1,557,635) | | | 67,956 | | | | 1,632,340 | |
|
| Belgium 3.9% | |
| | |
Solvay SA | | | 13,112 | | | | 1,313,921 | |
| | |
UCB SA | | | 18,592 | | | | 1,519,529 | |
| | | | | | | | |
(Cost $3,485,423) | | | | | | | 2,833,450 | |
|
| Finland 1.8% | |
Nokian Renkaat Oyj (Cost $2,017,313) | | | 41,676 | | | | 1,283,930 | |
|
| France 16.0% | |
| | |
Arkema SA | | | 14,522 | | | | 1,249,329 | |
| | |
Cie de Saint-Gobain | | | 41,292 | | | | 1,379,676 | |
| | |
Cie Generale des Etablissements Michelin | | | 14,803 | | | | 1,471,978 | |
| | |
Danone SA | | | 20,631 | | | | 1,454,649 | |
| | |
Engie SA | | | 112,251 | | | | 1,612,390 | |
| | |
Pernod Ricard SA | | | 9,829 | | | | 1,614,503 | |
| | |
Sanofi | | | 17,553 | | | | 1,522,460 | |
| | |
TOTAL SA | | | 25,364 | | | | 1,342,209 | |
| | | | | | | | |
(Cost $12,039,189) | | | | | | | 11,647,194 | |
|
| Germany 11.4% | |
| | |
BASF SE | | | 19,599 | | | | 1,375,632 | |
| | |
Bayer AG (Registered) | | | 19,607 | | | | 1,372,709 | |
| | |
Beiersdorf AG | | | 13,906 | | | | 1,454,998 | |
| | |
Brenntag AG | | | 28,500 | | | | 1,236,824 | |
| | |
Continental AG | | | 9,468 | | | | 1,318,768 | |
| | |
Merck KGaA | | | 15,019 | | | | 1,553,987 | |
| | | | | | | | |
(Cost $10,292,890) | | | | | | | 8,312,918 | |
|
| Hong Kong 6.5% | |
| | |
CLP Holdings Ltd. | | | 134,149 | | | | 1,516,042 | |
| | |
HK Electric Investments & HK Electric Investments Ltd. “SS”, (Units) | | | 1,549,000 | | | | 1,569,316 | |
| | |
Hong Kong & China Gas Co., Ltd. | | | 776,095 | | | | 1,602,474 | |
| | | | | | | | |
(Cost $3,456,727) | | | | | | | 4,687,832 | |
|
| Japan 24.0% | |
| | |
Bridgestone Corp. | | | 40,108 | | | | 1,544,045 | |
| | |
Central Japan Railway Co. | | | 8,000 | | | | 1,688,787 | |
| | |
Denso Corp. | | | 33,700 | | | | 1,489,916 | |
| | |
Honda Motor Co., Ltd. | | | 57,000 | | | | 1,497,095 | |
| | |
Japan Tobacco, Inc. | | | 57,300 | | | | 1,363,868 | |
| | |
Mazda Motor Corp. | | | 137,600 | | | | 1,415,252 | |
| | |
Nissan Motor Co., Ltd. | | | 170,200 | | | | 1,362,551 | |
| | |
Sekisui House Ltd. | | | 104,400 | | | | 1,553,637 | |
| | |
Subaru Corp. | | | 55,800 | | | | 1,199,909 | |
| | |
Sumitomo Electric Industries Ltd. | | | 109,700 | | | | 1,451,189 | |
| | |
Toyota Industries Corp. | | | 29,700 | | | | 1,365,286 | |
| | |
Toyota Motor Corp. | | | 26,100 | | | | 1,515,144 | |
| | | | | | | | |
(Cost $20,147,678) | | | | | | | 17,446,679 | |
|
| Luxembourg 1.7% | |
ArcelorMittal (Cost $1,464,056) | | | 58,846 | | | | 1,236,608 | |
| | | | | | | | |
| | | Shares | | | Value ($) | |
|
| Netherlands 3.9% | |
| | |
Koninklijke DSM NV | | | 17,145 | | | | 1,408,169 | |
| | |
Randstad NV | | | 30,789 | | | | 1,418,018 | |
| | | | | | | | |
(Cost $2,982,906) | | | | 2,826,187 | |
|
| Singapore 4.0% | |
| | |
Singapore Airlines Ltd. | | | 220,341 | | | | 1,521,002 | |
| | |
Singapore Telecommunications Ltd. | | | 649,000 | | | | 1,405,680 | |
| | | | | | | | |
(Cost $3,579,576) | | | | 2,926,682 | |
|
| Switzerland 8.2% | |
| | |
Adecco Group AG (Registered) | | | 31,454 | | | | 1,478,150 | |
| | |
Ferguson PLC | | | 22,261 | | | | 1,426,438 | |
| | |
Nestle SA (Registered) | | | 17,654 | | | | 1,435,734 | |
| | |
Roche Holding AG (Genusschein) | | | 6,433 | | | | 1,600,614 | |
| | | | | | | | |
(Cost $6,555,435) | | | | 5,940,936 | |
|
| United Kingdom 13.6% | |
| | |
Barratt Developments PLC | | | 231,630 | | | | 1,368,594 | |
| | |
easyJet PLC | | | 98,478 | | | | 1,391,494 | |
| | |
GlaxoSmithKline PLC | | | 76,210 | | | | 1,451,108 | |
| | |
International Consolidated Airlines Group SA | | | 198,349 | | | | 1,565,466 | |
| | |
Persimmon PLC | | | 52,030 | | | | 1,282,837 | |
| | |
Smiths Group PLC | | | 87,078 | | | | 1,516,181 | |
| | |
Taylor Wimpey PLC | | | 747,643 | | | | 1,299,420 | |
| | | | | | | | |
(Cost $11,203,061) | | | | 9,875,100 | |
Total Common Stocks (Cost $78,781,889) | | | | 70,649,856 | |
| | |
| Preferred Stocks 2.1% | | | | | | | | |
| Germany | |
Henkel AG & Co. KGaA (Cost $1,692,692) | | | 13,903 | | | | 1,522,614 | |
|
| Securities Lending Collateral 0.0% | |
DWS Government & Agency Securities Portfolio “DWS Government Cash Institutional Shares”, 2.29% (a) (b) (Cost $1,268) | | | 1,268 | | | | 1,268 | |
| | |
| Cash Equivalents 0.3% | | | | | | | | |
DWS Central Cash Management Government Fund, 2.41% (a) (Cost $258,740) | | | 258,740 | | | | 258,740 | |
| | |
| | | % of Net
Assets | | | Value ($) | |
Total Investment Portfolio (Cost $80,734,589) | | | 99.6 | | | | 72,432,478 | |
| Other Assets and Liabilities, Net | | | 0.4 | | | | 269,809 | |
| Net Assets | | | 100.0 | | | | 72,702,287 | |
The accompanying notes are an integral part of the financial statements.
| | | | |
Deutsche DWS Variable Series I — DWS CROCI® International VIP | | | | | 7 |
A summary of the Fund’s transactions with affiliated investments during the year ended December 31, 2018 are as follows:
| | | | | | | | | | | | | | | | | | | | | | | | | | | | | | | | |
Value ($) at
12/31/2017 | | Purchases
Cost ($) | | | Sales
Proceeds ($) | | | Net
Realized
Gain/
(Loss) ($) | | | Net Change in
Unrealized
Appreciation
(Depreciation) ($) | | | Income ($) | | | Capital Gain
Distributions ($) | | | Number
of Shares
at
12/31/2018 | | | Value ($)
at
12/31/2018 | |
Security Lending Collateral 0.0% | |
DWS Government & Agency Securities Portfolio “DWS Government Cash Institutional Shares”, 2.29% (a) (b) | |
| — | | | 1,268 | (c) | | | — | | | | — | | | | — | | | | 15,116 | | | | — | | | | 1,268 | | | | 1,268 | |
Cash Equivalents 0.3% | |
DWS Central Cash Management Government Fund, 2.41% (a) | |
| 729,063 | | | 12,487,538 | | | | 12,957,861 | | | | — | | | | — | | | | 9,626 | | | | — | | | | 258,740 | | | | 258,740 | |
| 729,063 | | | 12,488,806 | | | | 12,957,861 | | | | — | | | | — | | | | 24,742 | | | | — | | | | 260,008 | | | | 260,008 | |
| (a) | Affiliated fund managed by DWS Investment Management Americas, Inc. The rate shown is the annualizedseven-day yield at period end. |
| (b) | Represents collateral held in connection with securities lending. Income earned by the Fund is net of borrower rebates. Purchases and sales not shown for securities lending collateral. |
| (c) | Represents the net increase (purchase cost) or decrease (sales proceeds) in the amount invested for the year ended December 31, 2018. |
Fair Value Measurements
Various inputs are used in determining the value of the Fund’s investments. These inputs are summarized in three broad levels. Level 1 includes quoted prices in active markets for identical securities. Level 2 includes other significant observable inputs (including quoted prices for similar securities, interest rates, prepayment speeds and credit risk). Level 3 includes significant unobservable inputs (including the Fund’s own assumptions in determining the fair value of investments). The level assigned to the securities valuations may not be an indication of the risk or liquidity associated with investing in those securities.
The following is a summary of the inputs used as of December 31, 2018 in valuing the Fund’s investments. For information on the Fund’s policy regarding the valuation of investments, please refer to the Security Valuation section of Note A in the accompanying Notes to Financial Statements.
| | | | | | | | | | | | | | | | |
| Assets | | Level 1 | | | Level 2 | | | Level 3 | | | Total | |
| Common Stocks | | | | | | | | | | | | | | | | |
Australia | | $ | — | | | $ | 1,632,340 | | | $ | — | | | $ | 1,632,340 | |
Belgium | | | — | | | | 2,833,450 | | | | — | | | | 2,833,450 | |
Finland | | | — | | | | 1,283,930 | | | | — | | | | 1,283,930 | |
France | | | — | | | | 11,647,194 | | | | — | | | | 11,647,194 | |
Germany | | | — | | | | 8,312,918 | | | | — | | | | 8,312,918 | |
Hong Kong | | | — | | | | 4,687,832 | | | | — | | | | 4,687,832 | |
Japan | | | — | | | | 17,446,679 | | | | — | | | | 17,446,679 | |
Luxembourg | | | — | | | | 1,236,608 | | | | — | | | | 1,236,608 | |
Netherlands | | | — | | | | 2,826,187 | | | | — | | | | 2,826,187 | |
Singapore | | | — | | | | 2,926,682 | | | | — | | | | 2,926,682 | |
Switzerland | | | — | | | | 5,940,936 | | | | — | | | | 5,940,936 | |
United Kingdom | | | — | | | | 9,875,100 | | | | — | | | | 9,875,100 | |
| Preferred Stock | | | — | | | | 1,522,614 | | | | — | | | | 1,522,614 | |
| Short-Term Investments (d) | | | 260,008 | | | | — | | | | — | | | | 260,008 | |
| Total | | $ | 260,008 | | | $ | 72,172,470 | | | $ | — | | | $ | 72,432,478 | |
| (d) | See Investment Portfolio for additional detailed categories. |
The accompanying notes are an integral part of the financial statements.
| | | | | | |
| | 8 | | | | | | Deutsche DWS Variable Series I — DWS CROCI® International VIP |
Statement of Assets and Liabilities
| | | | |
| as of December 31, 2018 | | | | |
| |
| Assets | | | | |
| Investments innon-affiliated securities, at value (cost $80,474,581) | | $ | 72,172,470 | |
| Investment in DWS Government & Agency Securities Portfolio (cost $1,268) | | | 1,268 | |
| Investment in DWS Central Cash Management Government Fund (cost $258,740) | | | 258,740 | |
| Cash | | | 2 | |
| Foreign currency, at value (cost $83,255) | | | 83,833 | |
| Receivable for Fund shares sold | | | 4,875 | |
| Dividends receivable | | | 134,333 | |
| Interest receivable | | | 1,946 | |
| Foreign taxes recoverable | | | 213,554 | |
| Other assets | | | 7,555 | |
| Total assets | | | 72,878,576 | |
| |
| Liabilities | | | | |
| Payable upon return of securities lending collateral | | | 1,268 | |
| Payable for Fund shares redeemed | | | 8,250 | |
| Accrued management fee | | | 42,280 | |
| Accrued Trustees’ fees | | | 1,902 | |
| Other accrued expenses and payables | | | 122,589 | |
| Total liabilities | | | 176,289 | |
| Net assets, at value | | $ | 72,702,287 | |
| |
| Net Assets Consist of | | | | |
| Distributable earnings (loss) | | | (34,470,279 | ) |
| Paid-in capital | | | 107,172,566 | |
| Net assets, at value | | $ | 72,702,287 | |
| |
| Net Asset Value | | | | |
Class A | | | | |
| |
| Net Asset Value, offering and redemption price per share ($72,426,560 ÷ 11,634,868 outstanding shares of beneficial interest, $.01 par value, unlimited number of shares authorized) | | $ | 6.22 | |
Class B | | | | |
| |
| Net Asset Value, offering and redemption price per share ($275,727 ÷ 44,210 outstanding shares of beneficial interest, $.01 par value, unlimited number of shares authorized) | | $ | 6.24 | |
Statement of Operations
| | | | |
| for the year ended December 31, 2018 | |
| |
| Investment Income | | | | |
| Income: | | | | |
| Dividends (net of foreign taxes withheld of $233,080) | | $ | 3,000,541 | |
| Income distributions — DWS Central Cash Management Government Fund | | | 9,626 | |
| Securities lending income, net of borrower rebates | | | 15,116 | |
| Other income | | | 88,220 | |
| Total income | | | 3,113,503 | |
| Expenses: | | | | |
| Management fee | | | 672,664 | |
| Administration fee | | | 85,148 | |
| Services to shareholders | | | 2,374 | |
| Distribution service fee (Class B) | | | 785 | |
| Custodian fee | | | 48,519 | |
| Professional fees | | | 77,087 | |
| Reports to shareholders | | | 53,937 | |
| Trustees’ fees and expenses | | | 5,850 | |
| Other | | | 17,840 | |
| Total expenses before expense reductions | | | 964,204 | |
| Expense reductions | | | (220,784 | ) |
| Total expenses after expense reductions | | | 743,420 | |
| Net investment income | | | 2,370,083 | |
| |
| Realized and Unrealized Gain (Loss) | | | | |
| Net realized gain (loss) from: | | | | |
| Investments | | | 2,646,280 | |
| Foreign currency | | | (52,476 | ) |
| | | | 2,593,804 | |
| Change in net unrealized appreciation (depreciation) on: | | | | |
| Investments | | | (17,367,302 | ) |
| Foreign currency | | | (4,930 | ) |
| | | | (17,372,232 | ) |
| Net gain (loss) | | | (14,778,428 | ) |
| Net increase (decrease) in net assets resulting from operations | | $ | (12,408,345 | ) |
The accompanying notes are an integral part of the financial statements.
| | | | |
Deutsche DWS Variable Series I — DWS CROCI® International VIP | | | | | 9 |
Statements of Changes in Net Assets
| | | | | | | | |
| | | Years Ended December 31, | |
| Increase (Decrease) in Net Assets | | 2018 | | | 2017 | |
Operations: | | | | | | | | |
Net investment income (loss) | | $ | 2,370,083 | | | $ | 2,228,428 | |
Net realized gain (loss) | | | 2,593,804 | | | | 2,603,883 | |
Change in net unrealized appreciation (depreciation) | | | (17,372,232) | | | | 14,930,893 | |
Net increase (decrease) in net assets resulting from operations | | | (12,408,345) | | | | 19,763,204 | |
Distributions to shareholders: | | | | | | | | |
Class A | | | (895,216) | | | | (7,067,244 | ) |
Class B | | | (2,479) | | | | (20,366 | ) |
Total distributions | | | (897,695) | | | | (7,087,610 | )* |
Fund share transactions: | | | | | | | | |
Class A | | | | | | | | |
Proceeds from shares sold | | | 4,166,625 | | | | 6,185,861 | |
Reinvestment of distributions | | | 895,216 | | | | 7,067,244 | |
Payments for shares redeemed | | | (11,189,329) | | | | (27,986,345 | ) |
Net increase (decrease) in net assets from Class A share transactions | | | (6,127,488) | | | | (14,733,240 | ) |
Class B | | | | | | | | |
Proceeds from shares sold | | | 14,693 | | | | 8,966 | |
Reinvestment of distributions | | | 2,479 | | | | 20,366 | |
Payments for shares redeemed | | | (18,167) | | | | (15,497 | ) |
Net increase (decrease) in net assets from Class B share transactions | | | (995) | | | | 13,835 | |
Increase (decrease) in net assets | | | (19,434,523) | | | | (2,043,811 | ) |
Net assets at beginning of period | | | 92,136,810 | | | | 94,180,621 | |
Net assets at end of period | | | $ 72,702,287 | | | $ | 92,136,810 | ** |
| | |
Other Information | | | | | | | | |
Class A | | | | | | | | |
Shares outstanding at beginning of period | | | 12,504,196 | | | | 14,512,126 | |
Shares sold | | | 588,874 | | | | 886,888 | |
Shares issued to shareholders in reinvestment of distributions | | | 123,648 | | | | 1,054,813 | |
Shares redeemed | | | (1,581,850) | | | | (3,949,631 | ) |
Net increase (decrease) in Class A shares | | | (869,328) | | | | (2,007,930 | ) |
Shares outstanding at end of period | | | 11,634,868 | | | | 12,504,196 | |
Class B | | | | | | | | |
Shares outstanding at beginning of period | | | 44,351 | | | | 42,251 | |
Shares sold | | | 2,083 | | | | 1,287 | |
Shares issued to shareholders in reinvestment of distributions | | | 342 | | | | 3,026 | |
Shares redeemed | | | (2,566) | | | | (2,213 | ) |
Net increase (decrease) in Class B shares | | | (141) | | | | 2,100 | |
Shares outstanding at end of period | | | 44,210 | | | | 44,351 | |
| * | Includes distributions from net investment income. |
| ** | Includes undistributed net investment income of $848,699. |
The accompanying notes are an integral part of the financial statements.
| | | | | | |
| | 10 | | | | | | Deutsche DWS Variable Series I — DWS CROCI® International VIP |
Financial Highlights
| | | | | | | | | | | | | | | | | | | | |
| | | Years Ended December 31, | |
| Class A | | 2018 | | | 2017 | | | 2016 | | | 2015 | | | 2014 | |
| | | | | |
| Selected Per Share Data | | | | | | | | | | | | | | | | | | | | |
| Net asset value, beginning of period | | $ | 7.34 | | | $ | 6.47 | | | $ | 7.15 | | | $ | 7.86 | | | $ | 9.06 | |
| Income (loss) from investment operations: | | | | | | | | | | | | | | | | | | | | |
| | | | | |
Net investment income (loss)a | | | .20 | | | | .16 | | | | .16 | | | | .21 | | | | .31 | b |
Net realized and unrealized gain (loss) | | | (1.25 | ) | | | 1.21 | | | | (.13 | ) | | | (.59 | ) | | | (1.36 | ) |
Total from investment operations | | | (1.05 | ) | | | 1.37 | | | | .03 | | | | (.38 | ) | | | (1.05 | ) |
| Less distributions from: | | | | | | | | | | | | | | | | | | | | |
| | | | | |
Net investment income | | | (.07 | ) | | | (.50 | ) | | | (.71 | ) | | | (.33 | ) | | | (.15 | ) |
| Net asset value, end of period | | $ | 6.22 | | | $ | 7.34 | | | $ | 6.47 | | | $ | 7.15 | | | $ | 7.86 | |
| Total Return (%)c | | | (14.39 | ) | | | 21.96 | | | | .74 | | | | (5.48 | ) | | | (11.76 | ) |
| | | | | |
| Ratios to Average Net Assets and Supplemental Data | | | | | | | | | | | | | | | | | | | | |
| Net assets, end of period ($ millions) | | | 72 | | | | 92 | | | | 94 | | | | 105 | | | | 126 | |
| Ratio of expenses before expense reductions (%)d | | | 1.13 | | | | 1.10 | | | | 1.12 | | | | 1.05 | | | | 1.04 | |
| Ratio of expenses after expense reductions (%)d | | | .87 | | | | .84 | | | | .84 | | | | .98 | | | | .98 | |
| Ratio of net investment income (loss) (%) | | | 2.78 | | | | 2.24 | | | | 2.46 | | | | 2.74 | | | | 3.55 | b |
| Portfolio turnover rate (%) | | | 59 | | | | 73 | | | | 67 | | | | 99 | | | | 135 | |
| a | Based on average shares outstanding during the period. |
| b | Net investment income per share and the ratio of net investment income includenon-recurring dividend income amounting to $.08 per share and .95% of average daily net assets, for the year ended December 31, 2014. |
| c | Total return would have been lower had certain expenses not been reduced. |
| d | Expense ratio does not reflect charges and fees associated with the separate account that invests in the Fund or any variable life insurance policy or variable annuity contract for which the Fund is an investment option. |
| | | | | | | | | | | | | | | | | | | | |
| | | Years Ended December 31, | |
| Class B | | 2018 | | | 2017 | | | 2016 | | | 2015 | | | 2014 | |
| | | | | |
| Selected Per Share Data | | | | | | | | | | | | | | | | | | | | |
| Net asset value, beginning of period | | $ | 7.36 | | | $ | 6.48 | | | $ | 7.16 | | | $ | 7.87 | | | $ | 9.07 | |
| Income (loss) from investment operations: | | | | | | | | | | | | | | | | | | | | |
| | | | | |
Net investment income (loss)a | | | .18 | | | | .13 | | | | .14 | | | | .19 | | | | .28 | b |
Net realized and unrealized gain (loss) | | | (1.24 | ) | | | 1.23 | | | | (.13 | ) | | | (.59 | ) | | | (1.35 | ) |
Total from investment operations | | | (1.06 | ) | | | 1.36 | | | | .01 | | | | (.40 | ) | | | (1.07 | ) |
| Less distributions from: | | | | | | | | | | | | | | | | | | | | |
| | | | | |
Net investment income | | | (.06 | ) | | | (.48 | ) | | | (.69 | ) | | | (.31 | ) | | | (.13 | ) |
| Net asset value, end of period | | $ | 6.24 | | | $ | 7.36 | | | $ | 6.48 | | | $ | 7.16 | | | $ | 7.87 | |
| Total Return (%)c | | | (14.57 | ) | | | 21.76 | | | | .48 | | | | (5.71 | ) | | | (11.98 | ) |
| | | | | |
| Ratios to Average Net Assets and Supplemental Data | | | | | | | | | | | | | | | | | | | | |
| Net assets, end of period ($ millions) | | | .28 | | | | .33 | | | | .27 | | | | .27 | | | | .26 | |
| Ratio of expenses before expense reductions (%)d | | | 1.41 | | | | 1.38 | | | | 1.40 | | | | 1.33 | | | | 1.31 | |
| Ratio of expenses after expense reductions (%)d | | | 1.12 | | | | 1.09 | | | | 1.10 | | | | 1.23 | | | | 1.23 | |
| Ratio of net investment income (loss) (%) | | | 2.54 | | | | 1.86 | | | | 2.18 | | | | 2.47 | | | | 3.26 | b |
| Portfolio turnover rate (%) | | | 59 | | | | 73 | | | | 67 | | | | 99 | | | | 135 | |
| a | Based on average shares outstanding during the period. |
| b | Net investment income per share and the ratio of net investment income includenon-recurring dividend income amounting to $.08 per share and .95% of average daily net assets, for the year ended December 31, 2014. |
| c | Total return would have been lower had certain expenses not been reduced. |
| d | Expense ratio does not reflect charges and fees associated with the separate account that invests in the Fund or any variable life insurance policy or variable annuity contract for which the Fund is an investment option. |
The accompanying notes are an integral part of the financial statements.
| | | | |
Deutsche DWS Variable Series I — DWS CROCI® International VIP | | | | | 11 |
Notes to Financial Statements
A. Organization and Significant Accounting Policies
Deutsche DWS Variable Series I (formerly Deutsche Variable Series I) (the “Trust“) is registered under the Investment Company Act of 1940, as amended (the “1940 Act“), as anopen-end management investment company organized as a Massachusetts business trust. The Trust consists of five diversified funds: DWS Bond VIP (formerly Deutsche Bond VIP), DWS Capital Growth VIP (formerly Deutsche Capital Growth VIP), DWS Core Equity VIP (formerly Deutsche Core Equity VIP), DWS CROCI® International VIP (formerly Deutsche CROCI® International VIP) and DWS Global Small Cap VIP (formerly Deutsche Global Small Cap VIP) (individually or collectively hereinafter referred to as a “Fund“ or the “Funds“). These financial statements report on DWS CROCI® International VIP. The Trust is intended to be the underlying investment vehicle for variable annuity contracts and variable life insurance policies to be offered by the separate accounts of certain life insurance companies (“Participating Insurance Companies“).
Multiple Classes of Shares of Beneficial Interest. The Fund offers two classes of shares (Class A shares and Class B shares). Class B shares are subject to Rule12b-1 distribution fees under the 1940 Act and recordkeeping fees equal to an annual rate of 0.25% and up to 0.15%, respectively, of the average daily net assets of the Class B shares of the Fund. Class A shares are not subject to such fees.
Investment income, realized and unrealized gains and losses, and certainfund-level expenses and expense reductions, if any, are borne pro rata on the basis of relative net assets by the holders of all classes of shares, except that each class bears certain expenses unique to that class (including the applicable12b-1 distribution fees and recordkeeping fees). Differences inclass-level expenses may result in payment of different per share dividends by class. All shares have equal rights with respect to voting subject toclass-specific arrangements.
The Fund’s financial statements are prepared in accordance with accounting principles generally accepted in the United States of America (“U.S. GAAP”) which require the use of management estimates. Actual results could differ from those estimates. The Fund qualifies as an investment company under Topic 946 of Accounting Standards Codification of U.S. GAAP. The policies described below are followed consistently by the Fund in the preparation of its financial statements.
In October 2018, the Securities and Exchange Commission adopted amendments to certain disclosure requirements in Securities Act Release No. 33-10532, Disclosure Update and Simplification, which is intended to facilitate the disclosure of information to investors and simplify compliance without significantly altering the total mix of information provided to investors. Effective with the current reporting period, the Fund adopted the amendments with the impacts being that the Fund is no longer required to present components of distributable earnings on the Statement of Assets and Liabilities or the sources of distributable earnings and the amount of undistributed net investment income on the Statements of Changes in Net Assets.
Security Valuation. Investments are stated at value determined as of the close of regular trading on the New York Stock Exchange on each day the exchange is open for trading.
Various inputs are used in determining the value of the Fund’s investments. These inputs are summarized in three broad levels. Level 1 includes quoted prices in active markets for identical securities. Level 2 includes other significant observable inputs (including quoted prices for similar securities, interest rates, prepayment speeds and credit risk). Level 3 includes significant unobservable inputs (including the Fund’s own assumptions in determining the fair value of investments). The level assigned to the securities valuations may not be an indication of the risk or liquidity associated with investing in those securities.
Equity securities are valued at the most recent sale price or official closing price reported on the exchange (U.S. or foreign) orover-the-counter market on which they trade. Securities for which no sales are reported are valued at the calculated mean between the most recent bid and asked quotations on the relevant market or, if a mean cannot be determined, at the most recent bid quotation. Equity securities are generally categorized as Level 1 securities. For certain international equity securities, in order to adjust for events which may occur between the close of the foreign exchanges and the close of the New York Stock Exchange, a fair valuation model may be used. This fair valuation model takes into account comparisons to the valuation of American Depository Receipts (ADRs),exchange-traded funds, futures contracts and certain indices and these securities are categorized as Level 2.
Investments inopen-end investment companies are valued at their net asset value each business day and are categorized as Level 1.
| | | | | | |
| | 12 | | | | | | Deutsche DWS Variable Series I — DWS CROCI® International VIP |
Securities and other assets for which market quotations are not readily available or for which the above valuation procedures are deemed not to reflect fair value are valued in a manner that is intended to reflect their fair value as determined in accordance with procedures approved by the Trustees and are generally categorized as Level 3. In accordance with the Fund’s valuation procedures, factors considered in determining value may include, but are not limited to, the type of the security; the size of the holding; the initial cost of the security; the existence of any contractual restrictions on the security’s disposition; the price and extent of public trading in similar securities of the issuer or of comparable companies; quotations or evaluated prices frombroker-dealers and/or pricing services; information obtained from the issuer, analysts, and/or the appropriate stock exchange (forexchange-traded securities); an analysis of the company’s or issuer’s financial statements; an evaluation of the forces that influence the issuer and the market(s) in which the security is purchased and sold; and with respect to debt securities, the maturity, coupon, creditworthiness, currency denomination and the movement of the market in which the security is normally traded. The value determined under these procedures may differ from published values for the same securities.
Disclosure about the classification of fair value measurements is included in a table following the Fund’s Investment Portfolio.
Securities Lending. Deutsche Bank AG, as lending agent, lends securities of the Fund to certain financial institutions under the terms of its securities lending agreement. During the term of the loans, the Fund continues to receive interest and dividends generated by the securities and to participate in any changes in their market value. The Fund requires the borrowers of the securities to maintain collateral with the Fund consisting of either cash or liquid, unencumbered assets having a value at least equal to the value of the securities loaned. When the collateral falls below specified amounts, the lending agent will use its best effort to obtain additional collateral on the next business day to meet required amounts under the securities lending agreement. During the year ended December 31, 2018, the Fund invested the cash collateral into a joint trading account in affiliated money market funds including DWS Government & Agency Securities Portfolio managed by DWS Investment Management Americas, Inc. DWS Investment Management Americas, Inc. receives a management/administration fee (0.12% annualized effective rate as of December 31, 2018) on the cash collateral invested in DWS Government & Agency Securities Portfolio. The Fund receives compensation for lending its securities either in the form of fees or by earning interest on invested cash collateral net of borrower rebates and fees paid to a lending agent. Either the Fund or the borrower may terminate the loan at any time, and the borrower, after notice, is required to return borrowed securities within a standard time period. There may be risks of delay and costs in recovery of securities or even loss of rights in the collateral should the borrower of the securities fail financially. If the Fund is not able to recover securities lent, the Fund may sell the collateral and purchase a replacement investment in the market, incurring the risk that the value of the replacement security is greater than the value of the collateral. The Fund is also subject to all investment risks associated with the reinvestment of any cash collateral received, including, but not limited to, interest rate, credit and liquidity risk associated with such investments.
As of December 31, 2018, the Fund had no securities on loan.
Foreign Currency Translations. The books and records of the Fund are maintained in U.S. dollars. Investment securities and other assets and liabilities denominated in a foreign currency are translated into U.S. dollars at the prevailing exchange rates at period end. Purchases and sales of investment securities, income and expenses are translated into U.S. dollars at the prevailing exchange rates on the respective dates of the transactions.
Net realized and unrealized gains and losses on foreign currency transactions represent net gains and losses between trade and settlement dates on securities transactions, the acquisition and disposition of foreign currencies, and the difference between the amount of net investment income accrued and the U.S. dollar amount actually received. The portion of both realized and unrealized gains and losses on investments that results from fluctuations in foreign currency exchange rates is not separately disclosed but is included with net realized and unrealized gain/appreciation and loss/depreciation on investments.
Taxes. The Fund is treated as a separate taxpayer as provided for in the Internal Revenue Code, as amended. It is the Fund’s policy to comply with the requirements of the Internal Revenue Code, as amended, which are applicable to regulated investment companies, and to distribute all of its taxable income to the separate accounts of the Participating Insurance Companies which hold its shares.
Additionally, the Fund may be subject to taxes imposed by the governments of countries in which it invests and are generally based on income and/or capital gains earned or repatriated, a portion of which may be
| | | | |
Deutsche DWS Variable Series I — DWS CROCI® International VIP | | | | | 13 |
recoverable. Based upon the current interpretation of the tax rules and regulations, estimated tax liabilities and recoveries on certain foreign securities are recorded on an accrual basis and are reflected as components of interest income or net change in unrealized gain/loss on investments. Tax liabilities realized as a result of security sales are reflected as a component of net realized gain/loss on investments.
At December 31, 2018, the Fund had a net tax basis capital loss carryforward of approximately $27,853,000, which may be applied against realized net taxable capital gains indefinitely, includingshort-term losses ($7,342,000) andlong-term losses ($20,511,000).
The Fund has reviewed the tax positions for the open tax years as of December 31, 2018 and has determined that no provisions for income tax and/or uncertain tax positions is required in the Fund’s financial statements. The Fund’s federal tax returns for the prior three fiscal years remain open subject to examination by the Internal Revenue Service.
Distribution of Income and Gains. Distributions from net investment income of the Fund, if any, are declared and distributed to shareholders annually. Net realized gains from investment transactions, in excess of available capital loss carryforwards, would be taxable to the Fund if not distributed and, therefore, will be distributed to shareholders at least annually. The Fund may also make additional distributions for tax purposes if necessary.
The timing and characterization of certain income and capital gain distributions are determined annually in accordance with federal tax regulations which may differ from accounting principles generally accepted in the United States of America. These differences primarily relate to investments in foreign denominated investments, passive foreign investment companies and certain securities sold at a loss. As a result, net investment income (loss) and net realized gain (loss) on investment transactions for a reporting period may differ significantly from distributions during such period. Accordingly, the Fund may periodically make reclassifications among certain of its capital accounts without impacting the net asset value of the Fund.
At December 31, 2018, the Fund’s components of distributable earnings (accumulated losses) on a tax basis are as follows:
| | | | |
| Undistributed ordinary income* | | $ | 2,268,612 | |
| Capital loss carryforwards | | $ | (27,853,000 | ) |
| Net unrealized appreciation (depreciation) on investments | | $ | (8,885,780 | ) |
At December 31, 2018, the aggregate cost of investments for federal income tax purposes was $81,318,258. The net unrealized depreciation for all investments based on tax cost was $8,885,780. This consisted of aggregate gross unrealized appreciation for all investments in which there was an excess of value over tax cost of $3,557,125 aggregate gross unrealized depreciation for all investments in which was an excess of tax cost over value of $12,442,905.
In addition, the tax character of distributions paid to shareholders by the Fund is summarized as follows:
| | | | | | | | |
| | | Years Ended December 31, | |
| | | 2018 | | | 2017 | |
| Distributions from ordinary income* | | $ | 897,695 | | | $ | 7,087,610 | |
| * | For tax purposes, short-term capital gain distributions are considered ordinary income distributions. |
Expenses. Expenses of the Trust arising in connection with a specific Fund are allocated to that Fund. Other Trust expenses which cannot be directly attributed to a Fund are apportioned among the Funds in the Trust based upon the relative net assets or other appropriate measures.
Contingencies. In the normal course of business, the Fund may enter into contracts with service providers that contain general indemnification clauses. The Fund’s maximum exposure under these arrangements is unknown, as this would involve future claims that may be made against the Fund that have not yet been made. However, based on experience, the Fund expects the risk of loss to be remote.
Other. Investment transactions are accounted for on a trade date plus one basis for daily net asset value calculations. However, for financial reporting purposes, investment transactions are reported on trade date. Interest income is recorded on the accrual basis net of foreign withholding taxes. Dividend income is recorded on theex-dividend date net of foreign withholding taxes. Certain dividends from foreign securities may be recorded subsequent to theex-dividend date as soon as the Fund is informed of such dividends. Realized gains and losses from investment transactions are recorded on an identified cost basis. Proceeds from litigation payments, if any, are included in net realized gain (loss) from investments.
| | | | | | |
| | 14 | | | | | | Deutsche DWS Variable Series I — DWS CROCI® International VIP |
B. Purchases and Sales of Securities
During the year ended December 31, 2018, purchases and sales of investment securities (excludingshort-term investments) aggregated $49,866,258 and $54,019,176, respectively.
C. Related Parties
Management Agreement. Under the Investment Management Agreement with DWS Investment Management Americas, Inc. (formerly Deutsche Investment Management Americas Inc.) (“DIMA“ or the “Advisor“), an indirect, wholly owned subsidiary of DWS Group GmbH & Co. KGaA (“DWS Group”), the Advisor directs the investments of the Fund in accordance with its investment objectives, policies and restrictions. The Advisor determines the securities, instruments and other contracts relating to investments to be purchased, sold or entered into by the Fund.
Pursuant to the Investment Management Agreement with the Advisor, the Fund pays a monthly management fee based on the Fund’s average daily net assets, computed and accrued daily and payable monthly, at the following annual rates:
| | | | |
| First $500 million of average daily net assets | | | .790 | % |
| Over $500 million of average daily net assets | | | .640 | % |
Accordingly, for the year ended December 31, 2018, the fee pursuant to the Investment Management Agreement was equivalent to an annual rate (exclusive of any applicable waivers/reimbursements) of 0.79% of the Fund’s average daily net assets.
For the period from January 1, 2018 through April 30, 2018, the Advisor had contractually agreed to waive all or a portion of its fees and/or reimburse certain operating expenses of the Fund to the extent necessary to maintain the total annual operating expenses (excluding certain expenses such as extraordinary expenses, taxes, brokerage and interest) of each class as follows:
| | | | |
| Class A | | | .84 | % |
| Class B | | | 1.09 | % |
In addition, for the period from May 1, 2018 through September 30, 2018, the Advisor had contractually agreed to waive all or a portion of its fees and/or reimburse certain operating expenses of the Fund to the extent necessary to maintain the total annual operating expenses (excluding certain expenses such as extraordinary expenses, taxes, brokerage and interest) of each class as follows:
| | | | |
| Class A | | | .90 | % |
| Class B | | | 1.15 | % |
Effective October 1, 2018 through September 30, 2019, the Advisor has contractually agreed to waive all or a portion of its fees and/or reimburse certain operating expenses of the Fund to the extent necessary to maintain the total annual operating expenses (excluding certain expenses such as extraordinary expenses, taxes, brokerage and interest) of each class as follows:
| | | | |
| Class A | | | .87 | % |
| Class B | | | 1.12 | % |
For the year ended December 31, 2018, fees waived and/or expenses reimbursed for each class are as follows:
| | | | |
| Class A | | $ | 219,892 | |
| Class B | | | 892 | |
| | | $ | 220,784 | |
Administration Fee. Pursuant to an Administrative Services Agreement, DIMA provides most administrative services to the Fund. For all services provided under the Administrative Services Agreement, the Fund pays the Advisor an annual fee (“Administration Fee“) of 0.10% of the Fund’s average daily net assets, computed and accrued daily and payable monthly. For the year ended December 31, 2018, the Administration Fee was $85,148, of which $6,224 is unpaid.
Service Provider Fees. DWS Service Company (“DSC“), an affiliate of the Advisor, is the transfer agent,dividend-paying agent and shareholder service agent for the Fund. Pursuant to asub-transfer agency agreement between DSC and DST Systems, Inc. (“DST“), DSC has delegated certain transfer agent,
| | | | |
Deutsche DWS Variable Series I — DWS CROCI® International VIP | | | | | 15 |
dividend-paying agent and shareholder service agent functions to DST. DSC compensates DST out of the shareholder servicing fee it receives from the Fund. For the year ended December 31, 2018, the amounts charged to the Fund by DSC were as follows:
| | | | | | | | |
| Services to Shareholders | | Total
Aggregated | | | Unpaid at
December 31, 2018 | |
| Class A | | $ | 627 | | | $ | 104 | |
| Class B | | | 81 | | | | 14 | |
| | | $ | 708 | | | $ | 118 | |
Distribution Service Agreement. DWS Distributors, Inc. (“DDI“), also an affiliate of the Advisor, is the Trusts’ Distributor. In accordance with the Master Distribution Plan, DDI receives12b-1 fees of 0.25% of average daily net assets of Class B shares. Pursuant to the Master Distribution Plan, DDI remits these fees to the Participating Insurance Companies for various costs incurred or paid by these companies in connection with marketing and distribution of Class B shares. For the year ended December 31, 2018, the Distribution Service Fee aggregated $785, of which $59 is unpaid.
Typesetting and Filing Service Fees. Under an agreement with the Fund, DIMA is compensated for providing certainpre-press and regulatory filing services to the Fund. For the year ended December 31, 2018, the amount charged to the Fund by DIMA included in the Statement of Operations under “Reports to shareholders“ aggregated $12,141, of which $8,052 is unpaid.
Trustees’ Fees and Expenses. The Fund paid retainer fees to each Trustee not affiliated with the Advisor, plus specified amounts to the Board Chairperson and to each committee Chairperson.
Affiliated Cash Management Vehicles. The Fund may invest uninvested cash balances in DWS Central Cash Management Government Fund and DWS ESG Liquidity Fund, affiliated money market funds which are managed by the Advisor. Each affiliated money market fund is managed in accordance withRule 2a-7 under the 1940 Act, which governs the quality, maturity, diversity and liquidity of instruments in which a money market fund may invest. DWS Central Cash Management Government Fund seeks to maintain a stable net asset value, and DWS ESG Liquidity Fund maintains a floating net asset value. The Fund indirectly bears its proportionate share of the expenses of each affiliated money market fund in which it invests. DWS Central Cash Management Government Fund does not pay the Advisor an investment management fee. To the extent that DWS ESG Liquidity Fund pays an investment management fee to the Advisor, the Advisor will waive an amount of the investment management fee payable to the Advisor by the Fund equal to the amount of the investment management fee payable on the Fund’s assets invested in DWS ESG Liquidity Fund.
Securities Lending Agent Fees.Deutsche Bank AG serves as securities lending agent for the Fund. For the year ended December 31, 2018, the Fund incurred securities lending agent fees to Deutsche Bank AG in the amount of $1,138.
D. Ownership of the Fund
At December 31, 2018, five participating insurance companies were owners of record of 10% or more of the total outstanding Class A shares of the Fund, each owning 23%, 17%, 13%, 12% and 11%, respectively. Two participating insurance companies were owners of record of 10% or more of the total outstanding Class B shares of the Fund, each owning 84% and 10%, respectively.
E. Line of Credit
The Fund and other affiliated funds (the “Participants”) share in a $400 million revolving credit facility provided by a syndication of banks. The Fund may borrow for temporary or emergency purposes, including the meeting of redemption requests that otherwise might require the untimely disposition of securities. The Participants are charged an annual commitment fee which is allocated based on net assets, among each of the Participants. Interest is calculated at a rate per annum equal to the sum of the Federal Funds Rate plus 1.25 percent plus if theone-month LIBOR exceeds the Federal Funds Rate, the amount of such excess. The Fund may borrow up to a maximum of 33 percent of its net assets under the agreement. The Fund had no outstanding loans at December 31, 2018.
| | | | | | |
| | 16 | | | | | | Deutsche DWS Variable Series I — DWS CROCI® International VIP |
Report of Independent Registered Public Accounting Firm
To the Board of Trustees of Deutsche DWS Variable Series I and Shareholders of DWS CROCI® International VIP
Opinion on the Financial Statements
We have audited the accompanying statement of assets and liabilities, including the investment portfolio, of DWS CROCI® International VIP (one of the funds constituting Deutsche DWS Variable Series I, referred to hereafter as the “Fund”) as of December 31, 2018, the related statement of operations for the year ended December 31, 2018, the statements of changes in net assets for each of the two years in the period ended December 31, 2018, including the related notes, and the financial highlights for each of the five years in the period ended December 31, 2018 (collectively referred to as the “financial statements”). In our opinion, the financial statements present fairly, in all material respects, the financial position of the Fund as of December 31, 2018, the results of its operations for the year then ended, the changes in its net assets for each of the two years in the period ended December 31, 2018 and the financial highlights for each of the five years in the period ended December 31, 2018 in conformity with accounting principles generally accepted in the United States of America.
Basis for Opinion
These financial statements are the responsibility of the Fund’s management. Our responsibility is to express an opinion on the Fund’s financial statements based on our audits. We are a public accounting firm registered with the Public Company Accounting Oversight Board (United States) (PCAOB) and are required to be independent with respect to the Fund in accordance with the U.S. federal securities laws and the applicable rules and regulations of the Securities and Exchange Commission and the PCAOB.
We conducted our audits of these financial statements in accordance with the standards of the PCAOB. Those standards require that we plan and perform the audit to obtain reasonable assurance about whether the financial statements are free of material misstatement, whether due to error or fraud.
Our audits included performing procedures to assess the risks of material misstatement of the financial statements, whether due to error or fraud, and performing procedures that respond to those risks. Such procedures included examining, on a test basis, evidence regarding the amounts and disclosures in the financial statements. Our audits also included evaluating the accounting principles used and significant estimates made by management, as well as evaluating the overall presentation of the financial statements. Our procedures included confirmation of securities owned as of December 31, 2018 by correspondence with the custodian and transfer agent. We believe that our audits provide a reasonable basis for our opinion.
PricewaterhouseCoopers LLP
Boston, Massachusetts
February 14, 2019
We have served as the auditor of one or more investment companies in the DWS family of funds since 1930.
| | | | |
Deutsche DWS Variable Series I — DWS CROCI® International VIP | | | | | 17 |
| | |
| Information About Your Fund’s Expenses | | (Unaudited) |
As an investor of the Fund, you incur two types of costs: ongoing expenses and transaction costs. Ongoing expenses include management fees, distribution and service (12b-1) fees and other Fund expenses. Examples of transaction costs include contract charges, which are not shown in this section. The following tables are intended to help you understand your ongoing expenses (in dollars) of investing in the Fund and to help you compare these expenses with the ongoing expenses of investing in other mutual funds. In the most recent six-month period, the Fund limited these expenses; had it not done so, expenses would have been higher. The example in the table is based on an investment of $1,000 invested at the beginning of the six-month period and held for the entire period (July 1, 2018 to December 31, 2018).
The tables illustrate your Fund’s expenses in two ways:
| – | | Actual Fund Return. This helps you estimate the actual dollar amount of ongoing expenses (but not transaction costs) paid on a $1,000 investment in the Fund using the Fund’s actual return during the period. To estimate the expenses you paid over the period, simply divide your account value by $1,000 (for example, an $8,600 account value divided by $1,000 = 8.6), then multiply the result by the number in the “Expenses Paid per $1,000” line under the share class you hold. |
| – | | Hypothetical 5% Fund Return. This helps you to compare your Fund’s ongoing expenses (but not transaction costs) with those of other mutual funds using the Fund’s actual expense ratio and a hypothetical rate of return of 5% per year before expenses. Examples using a 5% hypothetical Fund return may be found in the shareholder reports of other mutual funds. The hypothetical account values and expenses may not be used to estimate the actual ending account balance or expenses you paid for the period. |
Please note that the expenses shown in these tables are meant to highlight your ongoing expenses only and do not reflect any transaction costs. The “Expenses Paid per $1,000” line of the tables is useful in comparing ongoing expenses only and will not help you determine the relative total expense of owning different funds. If these transaction costs had been included, your costs would have been higher.
| | | | | | | | |
| Expenses and Value of a $1,000 Investmentfor the six months ended December 31, 2018 | |
| | |
| Actual Fund Return | | | Class A | | | | Class B | |
| Beginning Account Value 7/1/18 | | $ | 1,000.00 | | | $ | 1,000.00 | |
| Ending Account Value 12/31/18 | | $ | 887.30 | | | $ | 887.60 | |
| Expenses Paid per $1,000* | | $ | 4.23 | | | $ | 5.42 | |
| | |
| Hypothetical 5% Fund Return | | | Class A | | | | Class B | |
| Beginning Account Value 7/1/18 | | $ | 1,000.00 | | | $ | 1,000.00 | |
| Ending Account Value 12/31/18 | | $ | 1,020.72 | | | $ | 1,019.46 | |
| Expenses Paid per $1,000* | | $ | 4.53 | | | $ | 5.80 | |
| * | Expenses are equal to the Fund’s annualized expense ratio for each share class, multiplied by the average account value over the period, multiplied by 184 (the number of days in the most recentsix-month period), then divided by 365. |
| | | | | | | | |
| Annualized Expense Ratios | | Class A | | | Class B | |
| Deutsche DWS Variable Series I — DWS CROCI®International VIP | | | .89 | % | | | 1.14 | % |
For more information, please refer to the Fund’s prospectus.
These tables do not reflect charges and fees (“contract charges”) associated with the separate account that invests in the Fund or any variable life insurance policy or variable annuity contract for which the Fund is an investment option.
For an analysis of the fees associated with an investment in the Fund or similar funds, please refer to the current and hypothetical expense calculators for Variable Insurance Products which can be found at dws.com/calculators.
| | | | | | |
| | 18 | | | | | | Deutsche DWS Variable Series I — DWS CROCI® International VIP |
| | |
| Tax Information | | (Unaudited) |
The Fund paid foreign taxes of $181,231 and earned $2,236,775 of foreign source income during the year ended December 31, 2018. Pursuant to Section 853 of the Internal Revenue Code, the Fund designates $0.016 per share as foreign taxes paid and $0.019 per share as income earned from foreign sources for the year ended December 31, 2018.
Please consult a tax advisor if you have questions about federal or state income tax laws, or on how to prepare your tax returns. If you have specific questions about your account, please contact your insurance provider.
Proxy Voting
The Trusts’ policies and procedures for voting proxies for portfolio securities and information about how the Trust voted proxies related to its portfolio securities during the most recent12-month period ended June 30 are available on our Web site — dws.com/en-us/resources/proxy-voting — or on the SEC’s Web site — sec.gov. To obtain a written copy of the Trusts’ policies and procedures without charge, upon request, call us toll free at (800)728-3337.
| | | | |
Deutsche DWS Variable Series I — DWS CROCI® International VIP | | | | | 19 |
Advisory Agreement Board Considerations and Fee Evaluation
The Board of Trustees (hereinafter referred to as the “Board” or “Trustees”) approved the renewal of DWS CROCI® International VIP’s (the “Fund”) investment management agreement (the “Agreement”) with DWS Investment Management Americas, Inc. (“DIMA”) in September 2018.
In terms of the process that the Board followed prior to approving the Agreement, shareholders should know that:
| – | | During the entire process, all of the Fund’s Trustees were independent of DIMA and its affiliates (the “Independent Trustees”). |
| – | | The Board met frequently during the past year to discuss fund matters and dedicated a substantial amount of time to contract review matters. Over the course of several months, the Board’s Contract Committee reviewed extensive materials received from DIMA, independent third parties and independent counsel. These materials included an analysis of the Fund’s performance, fees and expenses, and profitability from a fee consultant retained by the Fund’s Independent Trustees (the “Fee Consultant”). Based on its evaluation of the information provided, the Contract Committee presented its findings and recommendations to the Board. The Board then reviewed the Contract Committee’s findings and recommendations. |
| – | | The Board also received extensive information throughout the year regarding performance of the Fund. |
| – | | The Independent Trustees regularly met privately with counsel to discuss contract review and other matters. In addition, the Independent Trustees were advised by the Fee Consultant in the course of their review of the Fund’s contractual arrangements and considered a comprehensive report prepared by the Fee Consultant in connection with their deliberations. |
| – | | In connection with reviewing the Agreement, the Board also reviewed the terms of the Fund’s Rule12b-1 plan, distribution agreement, administrative services agreement, transfer agency agreement and other material service agreements. |
In connection with the contract review process, the Contract Committee and the Board considered the factors discussed below, among others. The Board also considered that DIMA and its predecessors have managed the Fund since its inception, and the Board believes that a long-term relationship with a capable, conscientious advisor is in the best interests of the Fund. The Board considered, generally, that shareholders chose to invest or remain invested in the Fund knowing that DIMA managed the Fund. DIMA is part of DWS Group GmbH & Co. KGaA (“DWS Group”). DWS Group is a global asset management business that offers a wide range of investing expertise and resources, including research capabilities in many countries throughout the world. In 2018, approximately 20% of DWS Group’s shares were sold in an initial public offering, with Deutsche Bank AG owning the remaining shares.
As part of the contract review process, the Board carefully considered the fees and expenses of each DWS fund overseen by the Board in light of the fund’s performance. In many cases, this led to the negotiation and implementation of expense caps. As part of these negotiations, the Board indicated that it would consider relaxing these caps in future years following sustained improvements in performance, among other considerations.
While shareholders may focus primarily on fund performance and fees, the Fund’s Board considers these and many other factors, including the quality and integrity of DIMA’s personnel and administrative support services provided by DIMA, such as back-office operations, fund valuations, and compliance policies and procedures.
Nature, Quality and Extent of Services.The Board considered the terms of the Agreement, including the scope of advisory services provided under the Agreement. The Board noted that, under the Agreement, DIMA provides portfolio management services to the Fund and that, pursuant to a separate administrative services agreement, DIMA provides administrative services to the Fund. The Board considered the experience and skills of senior management and investment personnel and the resources made available to such personnel. The Board reviewed the Fund’s performance over short-term and long-term periods and compared those returns to various agreed-upon performance measures, including market index(es) and a peer universe compiled using information supplied by Morningstar Direct (“Morningstar”), an independent fund data service. The Board also noted that it has put into place a process of identifying “Funds in Review” (e.g., funds performing poorly relative to a peer universe), and receives additional reporting from DIMA regarding such funds and, where appropriate, DIMA’s plans to address underperformance. The Board
| | | | | | |
| | 20 | | | | | | Deutsche DWS Variable Series I — DWS CROCI® International VIP |
believes this process is an effective manner of identifying and addressing underperforming funds. Based on the information provided, the Board noted that, for theone-, three- and five-year periods ended December 31, 2017, the Fund’s performance (Class A shares) was in the 4th quartile of the applicable Morningstar universe (the 1st quartile being the best performers and the 4th quartile being the worst performers). The Board also observed that the Fund has underperformed its benchmark in theone-, three-, and five-year periods ended December 31, 2017. The Board noted the disappointing investment performance of the Fund in recent periods and continued to discuss with senior management of DIMA the factors contributing to such underperformance and actions being taken to improve performance. The Board recognized the efforts by DIMA in recent years to enhance its investment platform and improve long-term performance across the DWS fund complex.
Fees and Expenses. The Board considered the Fund’s investment management fee schedule, operating expenses and total expense ratios, and comparative information provided by Broadridge Financial Solutions, Inc. (“Broadridge”) and the Fee Consultant regarding investment management fee rates paid to other investment advisors by similar funds (1st quartile being the most favorable and 4th quartile being the least favorable). With respect to management fees paid to other investment advisors by similar funds, the Board noted that the contractual fee rates paid by the Fund, which include a 0.10% fee paid to DIMA under the Fund’s administrative services agreement, were higher than the median (3rd quartile) of the applicable Broadridge peer group (based on Broadridge data provided as of December 31, 2017). The Board noted that the Fund’s Class A shares total (net) operating expenses were expected to be lower than the median (2nd quartile) of the applicable Broadridge expense universe (based on Broadridge data provided as of December 31, 2017, and analyzing Broadridge expense universe Class A (net) expenses less any applicable12b-1 fees) (“Broadridge Universe Expenses”). The Board also reviewed data comparing each share class’s total (net) operating expenses to the applicable Broadridge Universe Expenses. The Board noted that the expense limitations agreed to by DIMA were expected to help the Fund’s total (net) operating expenses remain competitive. The Board considered the Fund’s management fee rate as compared to fees charged by DIMA to comparable DWS U.S. registered funds (“DWS Funds”) and considered differences between the Fund and the comparable DWS Funds. The information requested by the Board as part of its review of fees and expenses also included information about institutional accounts (including anysub-advised funds and accounts) and funds offered primarily to European investors (“DWS Europe Funds”) managed by DWS Group. The Board noted that DIMA indicated that DWS Group does not manage any institutional accounts or DWS Europe Funds comparable to the Fund.
On the basis of the information provided, the Board concluded that management fees were reasonable and appropriate in light of the nature, quality and extent of services provided by DIMA.
Profitability. The Board reviewed detailed information regarding revenues received by DIMA under the Agreement. The Board considered the estimated costs to DIMA, andpre-tax profits realized by DIMA, from advising the DWS Funds, as well as estimates of thepre-tax profits attributable to managing the Fund in particular. The Board also received information regarding the estimated enterprise-wide profitability of DIMA and its affiliates with respect to all fund services in totality and by fund. The Board and the Fee Consultant reviewed DIMA’s methodology in allocating its costs to the management of the Fund. Based on the information provided, the Board concluded that thepre-tax profits realized by DIMA in connection with the management of the Fund were not unreasonable. The Board also reviewed certain publicly available information regarding the profitability of certain similar investment management firms. The Board noted that, while information regarding the profitability of such firms is limited (and in some cases is not necessarily prepared on a comparable basis), DIMA and its affiliates’ overall profitability with respect to the DWS Funds (after taking into account distribution and other services provided to the funds by DIMA and its affiliates) was lower than the overall profitability levels of most comparable firms for which such data was available.
Economies of Scale. The Board considered whether there are economies of scale with respect to the management of the Fund and whether the Fund benefits from any economies of scale. The Board noted that the Fund’s investment management fee schedule includes fee breakpoints. The Board concluded that the Fund’s fee schedule represents an appropriate sharing between the Fund and DIMA of such economies of scale as may exist in the management of the Fund at current asset levels.
Other Benefits to DIMA and Its Affiliates. The Board also considered the character and amount of other incidental or“fall-out” benefits received by DIMA and its affiliates, including any fees received by DIMA for administrative services provided to the Fund, any fees received by an affiliate of DIMA for transfer agency services provided to the Fund and any fees received by an affiliate of DIMA for distribution services. The Board noted that DIMA pays a licensing fee to an affiliate related to the Fund’s use of the CROCI® strategy.
| | | | |
Deutsche DWS Variable Series I — DWS CROCI® International VIP | | | | | 21 |
The Board also considered benefits to DIMA related to brokerage and soft-dollar allocations, including allocating brokerage to pay for research generated by parties other than the executing broker dealers, which pertain primarily to funds investing in equity securities. In addition, the Board considered the incidental public relations benefits to DIMA related to DWS Funds advertising and cross-selling opportunities among DIMA products and services. The Board considered these benefits in reaching its conclusion that the Fund’s management fees were reasonable.
Compliance. The Board considered the significant attention and resources dedicated by DIMA to its compliance processes in recent years. The Board noted in particular (i) the experience, seniority and time commitment of the individuals serving as DIMA’s and the Fund’s chief compliance officers and (ii) the substantial commitment of resources by DIMA and its affiliates to compliance matters, including the retention of compliance personnel.
Based on all of the information considered and the conclusions reached, the Board unanimously determined that the continuation of the Agreement is in the best interests of the Fund. In making this determination, the Board did not give particular weight to any single factor identified above. The Board considered these factors over the course of numerous meetings, certain of which were in executive session with only the Independent Trustees and counsel present. It is possible that individual Independent Trustees may have weighed these factors differently in reaching their individual decisions to approve the continuation of the Agreement.
| | | | | | |
| | 22 | | | | | | Deutsche DWS Variable Series I — DWS CROCI® International VIP |
Board Members and Officers
The following table presents certain information regarding the Board Members and Officers of the Fund. Each Board Member’s year of birth is set forth in parentheses after his or her name. Unless otherwise noted, (i) each Board Member has engaged in the principal occupation(s) noted in the table for at least the most recent five years, although not necessarily in the same capacity; and (ii) the address of each Independent Board Member is c/o Keith R. Fox, DWS Funds Board Chair, c/o Thomas R. Hiller, Ropes & Gray LLP, Prudential Tower, 800 Boylston Street, Boston, MA02199-3600. Except as otherwise noted below, the term of office for each Board Member is until the election and qualification of a successor, or until such Board Member sooner dies, resigns, is removed or as otherwise provided in the governing documents of the Fund. Because the Fund does not hold an annual meeting of shareholders, each Board Member will hold office for an indeterminate period. The Board Members may also serve in similar capacities with other funds in the fund complex.
| | | | | | | | |
| Independent Board Members | | | | | | |
Name, Year of Birth,
Position with the Fund and
Length of Time Served1 | | Business Experience and Directorships During the Past Five Years | | Number of
Funds in
DWS Fund
Complex
Overseen | | | Other
Directorships
Held by Board
Member
|
Keith R. Fox, CFA (1954) Chairperson since 2017, and Board Member since 1996 | | Managing General Partner, Exeter Capital Partners (a series of private investment funds) (since 1986). Directorships: Progressive International Corporation (kitchen goods importer and distributor); The Kennel Shop (retailer); former Chairman, National Association of Small Business Investment Companies; former Directorships: BoxTop Media Inc. (advertising); Sun Capital Advisers Trust (mutual funds) (2011–2012) | | | 82 | | | — |
John W. Ballantine (1946) Board Member since 1999 | | Retired; formerly, Executive Vice President and Chief Risk Management Officer, First Chicago NBD Corporation/The First National Bank of Chicago (1996–1998); Executive Vice President and Head of International Banking (1995–1996); former Directorships: Director and former Chairman of the Board, Healthways, Inc.2 (population well-being and wellness services) (2003–2014); Stockwell Capital Investments PLC (private equity); Enron Corporation; FNB Corporation; Tokheim Corporation; First Oak Brook Bancshares, Inc. and Oak Brook Bank; Prisma Energy International; Public Radio International. Not-for-Profit Director, Trustee: Palm Beach Civic Association; Window to the World Communications (public media); Harris Theater for Music and Dance (Chicago); Life Director of Hubbard Street Dance Chicago | | | 82 | | | Portland
General
Electric2
(utility
company)
(2003–
present) |
Henry P. Becton, Jr. (1943) Board Member since 1990 | | Vice Chair and former President, WGBH Educational Foundation. Directorships: Public Radio International; Public Radio Exchange (PRX); The Pew Charitable Trusts (charitable organization); Massachusetts Humane Society; Overseer of the New England Conservatory; former Directorships: Becton Dickinson and Company2 (medical technology company); Belo Corporation2 (media company); The PBS Foundation; Association of Public Television Stations; Boston Museum of Science; American Public Television; Concord Academy; New England Aquarium; Mass. Corporation for Educational Telecommunications; Committee for Economic Development; Public Broadcasting Service; Connecticut College; North Bennett Street School (Boston); American Documentary, Inc. (public media) | | | 82 | | | — |
Dawn-Marie Driscoll (1946) Board Member since 1987 | | Emeritus Executive Fellow, Center for Business Ethics, Bentley University; formerly: President, Driscoll Associates (consulting firm); Partner, Palmer & Dodge (law firm) (1988–1990); Vice President of Corporate Affairs and General Counsel, Filene’s (retail) (1978–1988). Directorships: Advisory Board, Center for Business Ethics, Bentley University; Trustee and former Chairman of the Board, Southwest Florida Community Foundation (charitable organization); former Directorships: ICI Mutual Insurance Company (2007–2015); Sun Capital Advisers Trust (mutual funds) (2007–2012), Investment Company Institute (audit, executive, nominating committees) and Independent Directors Council (governance, executive committees) | | | 82 | | | — |
Paul K. Freeman* (1950) Board Member since 1993 | | Consultant, WorldBank/Inter-American Development Bank; Independent Directors Council (former chair); Investment Company Institute (executive committee); Adjunct Professor, University of Denver Law School (2017–present); formerly: Chairman of Education Committee of Independent Directors Council; Project Leader, International Institute for Applied Systems Analysis (1998–2001); Chief Executive Officer, The Eric Group, Inc. (environmental insurance) (1986–1998); Directorships: Knoebel Institute for Healthy Aging, University of Denver (2017–present); former Directorships: Prisma Energy International; Denver Zoo Foundation (2012–2018) | | | 82 | | | — |
| | | | |
Deutsche DWS Variable Series I — DWS CROCI® International VIP | | | | | 23 |
| | | | | | | | |
Name, Year of Birth,
Position with the Fund and
Length of Time Served1 | | Business Experience and Directorships During the Past Five Years | | Number of
Funds in
DWS Fund
Complex
Overseen | | | Other
Directorships
Held by Board
Member
|
Richard J. Herring (1946) Board Member since 1990 | | Jacob Safra Professor of International Banking and Professor of Finance, The Wharton School, University of Pennsylvania (since July 1972); Director, The Wharton Financial Institutions Center (since 1994); formerly: Vice Dean and Director, Wharton Undergraduate Division (1995–2000) and Director, The Lauder Institute of International Management Studies (2000–2006); Member FDIC Systemic Risk Advisory Committee since 2011, member Systemic Risk Council since 2012 and member of the Advisory Board at the Yale Program on Financial Stability since 2013; Formerly Co-Chair of the Shadow Financial Regulatory Committee (2003–2015), Executive Director of The Financial Economists Roundtable (2008–2015), Director of The Thai Capital Fund (2007–2013), Director of The Aberdeen Singapore Fund (2007–2018), and Nonexecutive Director of Barclays Bank DE (2010–2018) | | | 82 | | | Director,
Aberdeen
Japan Fund
(since 2007) |
William McClayton (1944) Board Member since 2004 | | Private equity investor (since October 2009); previously, Managing Director, Diamond Management & Technology Consultants, Inc. (global consulting firm) (2001–2009); Directorship: Board of Managers, YMCA of Metropolitan Chicago; formerly: Senior Partner, Arthur Andersen LLP (accounting) (1966–2001); Trustee, Ravinia Festival | | | 82 | | | — |
Rebecca W. Rimel (1951) Board Member since 1995 | | President, Chief Executive Officer and Director, The Pew Charitable Trusts (charitable organization) (1994–present); formerly: Executive Vice President, The Glenmede Trust Company (investment trust and wealth management) (1983–2004); Board Member, Investor Education (charitable organization) (2004–2005); Trustee, Executive Committee, Philadelphia Chamber of Commerce (2001–2007); Director, Viasys Health Care2 (January 2007–June 2007); Trustee, Thomas Jefferson Foundation (charitable organization) (1994–2012) | | | 82 | | | Director,
Becton
Dickinson
and
Company2
(medical
technology
company)
(2012–
present);
Director,
BioTelemetry
Inc.2(health
care) (2009–
present) |
William N. Searcy, Jr. (1946) Board Member since 1993 | | Private investor since October 2003; formerly: Pension & Savings Trust Officer, Sprint Corporation2(telecommunications) (November 1989–September 2003); Trustee, Sun Capital Advisers Trust (mutual funds) (1998–2012) | | | 82 | | | — |
Jean Gleason Stromberg (1943) Board Member since 1997 | | Retired. Formerly, Consultant (1997–2001); Director, Financial Markets U.S. Government Accountability Office (1996–1997); Partner, Norton Rose Fulbright, L.L.P. (law firm) (1978–1996); former Directorships: The William and Flora Hewlett Foundation (charitable organization) (2000–2015); Service Source, Inc. (nonprofit), Mutual Fund Directors Forum (2002–2004), American Bar Retirement Association (funding vehicle for retirement plans) (1987–1990 and 1994–1996) | | | 82 | | | — |
| | |
| Officers4 | | |
Name, Year of Birth, Position with the Fund and Length of Time Served5 | | Business Experience and Directorships During the Past Five Years |
Hepsen Uzcan6 (1974) President and Chief Executive Officer, 2017–present Assistant Secretary, 2013–present | | Managing Director,3 DWS; Secretary, DWS USA Corporation (since March 2018); Assistant Secretary, DWS Distributors, Inc. (since June 25, 2018); Director and Vice President, DWS Service Company (since June 25, 2018); Assistant Secretary, DWS Investment Management Americas, Inc. (since June 25, 2018); and Director and President, DB Investment Managers, Inc. (since June 25, 2018); formerly: Vice President for the Deutsche funds (2016–2017) |
John Millette8(1962) Vice President and Secretary, 1999–present | | Director,3DWS; Chief Legal Officer, DWS Investment Management Americas, Inc. (2015–present); and Director and Vice President, DWS Trust Company (2016–present); formerly: Secretary, Deutsche Investment Management Americas Inc. (2015–2017) |
Diane Kenneally8,9 (1966) Treasurer and Chief Financial Officer since 2018 | | Director,3 DWS; formerly: Assistant Treasurer for the DWS funds (2007–2018) |
Caroline Pearson8(1962) Chief Legal Officer, 2010–present | | Managing Director,3DWS; formerly: Secretary, Deutsche AM Distributors, Inc. (2002–2017); and Secretary, Deutsche AM Service Company (2010–2017) |
Scott D. Hogan8(1970) Chief Compliance Officer, 2016–present | | Director,3DWS |
| | | | | | |
| | 24 | | | | | | Deutsche DWS Variable Series I — DWS CROCI® International VIP |
| | |
Name, Year of Birth, Position with the Fund and Length of Time Served5 | | Business Experience and Directorships During the Past Five Years |
Wayne Salit7(1967) Anti-Money Laundering Compliance Officer, 2014–present | | Director,3 Deutsche Bank; and AML Officer, DWS Trust Company; formerly: Managing Director, AML Compliance Officer at BNY Mellon (2011–2014); and Director, AML Compliance Officer at Deutsche Bank (2004–2011) |
Sheila Cadogan8(1966) Assistant Treasurer, 2017–present | | Director,3DWS; Director and Vice President, DWS Trust Company (since 2018) |
Paul Antosca8(1957) Assistant Treasurer, 2007–present | | Director,3DWS |
| 1 | The length of time served represents the year in which the Board Member joined the board of one or more DWS funds currently overseen by the Board. |
| 2 | A publicly held company with securities registered pursuant to Section 12 of the Securities Exchange Act of 1934. |
| 3 | Executive title, not a board directorship. |
| 4 | As a result of their respective positions held with the Advisor or its affiliates, these individuals are considered “interested persons” of the Advisor within the meaning of the 1940 Act. Interested persons receive no compensation from the Fund. |
| 5 | The length of time served represents the year in which the officer was first elected in such capacity for one or more DWS funds. |
| 6 | Address: 345 Park Avenue, New York, NY 10154. |
| 7 | Address: 60 Wall Street, New York, NY 10005. |
| 8 | Address: One International Place, Boston, MA 02110. |
| 9 | Appointed Treasurer and Chief Financial Officer effective July 2, 2018. |
| * | Paul K. Freeman retired from the Board effective December 31, 2018. |
The Fund’s Statement of Additional Information (“SAI”) includes additional information about the Board Members. The SAI is available, without charge, upon request. If you would like to request a copy of the SAI, you may do so by calling the followingtoll-free number:(800) 728-3337.
| | | | |
Deutsche DWS Variable Series I — DWS CROCI® International VIP | | | | | 25 |
Notes
Notes
| | |
 | | |
VS1cint-2 (R-025823-8 2/19) | | |
December 31, 2018
Annual Report
Deutsche DWS Variable Series I
(formerly Deutsche Variable Series I)
DWS Global Small Cap VIP
(formerly Deutsche Global Small Cap VIP)
Beginning on January 1, 2021, as permitted by regulations adopted by the Securities and Exchange Commission, you may not be receiving paper copies of the Fund’s shareholder reports from the insurance company that offers your contract unless you specifically request paper copies from your insurance company or from your financial intermediary. Instead, the shareholder reports will be made available on a Web site, and your insurance company will notify you by mail each time a report is posted and provide you with a Web site link to access the report. Instructions for requesting paper copies will be provided by your insurance company.
If you already elected to receive shareholder reports electronically, you will not be affected by this change and you need not take any action. You may elect to receive shareholder reports and other communications from your insurance company electronically by following the instructions provided by your insurance company.
You may elect to receive all future reports in paper free of charge from your insurance company. If your insurance company informs you that future reports will be delivered via Web access, you can inform your insurance company that you wish to continue receiving paper copies of your shareholder reports by following the instructions provided by your insurance company.

Contents
This report must be preceded or accompanied by a prospectus. To obtain an additional prospectus or summary prospectus, if available, call (800)728-3337 or your financial representative. We advise you to consider the Fund’s objectives, risks, charges and expenses carefully before investing. The summary prospectus and prospectus contain this and other important information about the Fund. Please read the prospectus carefully before you invest.
Stocks may decline in value. Smaller company stocks tend to be more volatile thanmedium-sized or large company stocks. Investing in foreign securities, particularly those of emerging markets, presents certain risks, such as currency fluctuations, political and economic changes, and market risks. Emerging markets tend to be more volatile and less liquid than the markets of more mature economies, and generally have less diverse and less mature economic structures and less stable political systems than those of developed countries. The Fund may lend securities to approved institutions. Please read the prospectus for details.
The brand DWS represents DWS Group GmbH & Co. KGaA and any of its subsidiaries such as DWS Distributors, Inc. which offers investment products or DWS Investment Management Americas, Inc. and RREEF America L.L.C. which offer advisory services.
DWS Distributors, Inc., 222 South Riverside Plaza, Chicago, IL 60606, (800)621-1148
NOT FDIC/NCUA INSURED NO BANK GUARANTEE MAY LOSE VALUE NOT A DEPOSIT
NOT INSURED BY ANY FEDERAL GOVERNMENT AGENCY
| | | | | | |
| | 2 | | | | | | Deutsche DWS Variable Series I — DWS Global Small Cap VIP |
| | |
| Performance Summary | | December 31, 2018 (Unaudited) |
Fund performance shown is historical, assumes reinvestment of all dividend and capital gain distributions, and does not guarantee future results. Investment return and principal value fluctuate with changing market conditions so that, when redeemed, shares may be worth more or less than their original cost. Current performance may be lower or higher than the performance data quoted. Please contact your participating insurance company for the Fund’s most recentmonth-end performance. Performance does not reflect charges and fees (“contract charges”) associated with the separate account that invests in the Fund or any variable life insurance policy or variable annuity contract for which the Fund is an investment option. These charges and fees will reduce returns. While all share classes have the same underlying portfolio, their performance will differ.
The gross expense ratios of the Fund, as stated in the fee table of the prospectus dated May 1, 2018, are 1.08% and 1.37% for Class A and Class B shares, respectively, and may differ from the expense ratios disclosed in the Financial Highlights tables in this report.
Generally accepted accounting principles require adjustments to be made to the net assets of the Fund at period end for financial reporting purposes only, and as such, the total return based on the unadjusted net asset value per share may differ from the total return reported in the financial highlights.
Growth of an Assumed $10,000 Investment
| | |
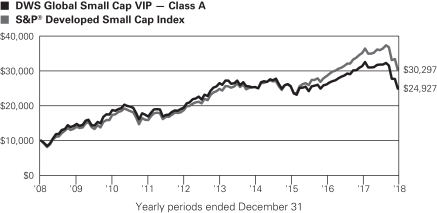 | | The S&P® Developed SmallCap Index comprises the stocks representing the lowest 15% offloat-adjusted market cap in each developed country. It Is a subset of the S&P® Global BMI, a comprehensive,rules-based index measuring global stock market performance. Index returns do not reflect any fees or expenses and it is not possible to invest directly into an index. |
| | | | | | | | | | |
| Comparative Results | | | | | | | | | | |
| | | | | |
| DWS Global Small Cap VIP | | | | 1-Year | | 3-Year | | 5-Year | | 10-Year |
| Class A | | Growth of $10,000 | | $7,949 | | $9,691 | | $9,399 | | $24,927 |
| | | Average annual total return | | -20.51% | | -1.04% | | -1.23% | | 9.56% |
| S&P Developed Small Cap Index | | Growth of $10,000 | | $8,620 | | $11,860 | | $12,202 | | $30,297 |
| | Average annual total return | | -13.80% | | 5.85% | | 4.06% | | 11.72% |
| | | | | |
| DWS Global Small Cap VIP | | | | 1-Year | | 3-Year | | 5-Year | | 10-Year |
| Class B | | Growth of $10,000 | | $7,926 | | $9,606 | | $9,269 | | $24,269 |
| | | Average annual total return | | -20.74% | | -1.33% | | -1.51% | | 9.27% |
| S&P Developed Small Cap Index | | Growth of $10,000 | | $8,620 | | $11,860 | | $12,202 | | $30,297 |
| | Average annual total return | | -13.80% | | 5.85% | | 4.06% | | 11.72% |
The growth of $10,000 is cumulative.
| | | | |
Deutsche DWS Variable Series I — DWS Global Small Cap VIP | | | | | 3 |
| | |
| Management Summary | | December 31, 2018 (Unaudited) |
DWS Global Small Cap VIP returned –20.51% in 2018 (Class A shares, unadjusted for contract charges), trailing the –13.80% return of its benchmark, the S&P Developed SmallCap World Index. After performing well through the end of September,small-cap stocks fell sharply in the fourth quarter and finished with their worst calendar-year showing since 2008. The combination of slower global growth, rising U.S. interest rates, and increasingly protectionist U.S. trade policy took a heavy toll on the markets and led to a 17.76% loss for the index in the final three months of the year.
Individual stock selection played the largest role in the Fund’s performance shortfall. The Fund’s holdings lagged the corresponding benchmark components in several sectors, with the weakest results occurring in information technology, financials, consumer discretionary, and energy.
The U.S. asset manager Affiliated Managers Group, Inc. was the largest detractor in financials. The stock struggled due to asset outflows and the sensitivity of the company’s business to broader financial-market performance. Grupo Supervielle SA (Brazil)* and FCB Financial Holdings, Inc. (United States) also hurt the Fund’s results in the sector.
Altran SA, a French provider of engineering and consulting services, was a notable detractor in technology. The stock lost ground after accounting irregularities were revealed at a company it had recently acquired. Belden, Inc.* — a U.S.-based provider of switches, connectivity products and hardware used in the broadcasting industry — was another key detractor in technology. However, the sector was also home to the Fund’s top contributor: Five9, Inc. The company gained market share as customer-contact centers continued to migrate from physical,on-premises locations to cloud-based applications. Five9, which uses customer data and artificial intelligence to provide better customer experiences for its clients, has been well positioned for this shift.
Shutterfly, Inc. (United States), whose shares slid due to investor concerns about the company’s acquisition of a school-picture provider, was the largest detractor in the consumer discretionary sector. On the plus side, Moncler SpA — an Italian luxury outdoor-apparel producer that reported robust sales growth despite difficult prior-year comparisons — was a top contributor. Energy was an additional area of weakness due to positions in severalU.S-based services companies that were hit hard by the downturn in oil prices, including Oil States International, Inc., Transocean Ltd., and Dril-Quip, Inc.
On the positive side, we added value through favorable stock selection in the health care sector. Molina Healthcare, Inc. — a managed-care provider for individuals and families that receive insurance coverage from government programs — was the leading contributor. Molina effectively executed its cost-savings plan, which translated to better-than expected profits. Retrophin, Inc. and Cardiovascular Systems, Inc. were additional contributors of note.
We continued to rotate the portfolio in an effort to capitalize on what we saw as the most compelling investment ideas in the globalsmall-cap space. We identified opportunities in financials, prompting us to reduce the extent of the Fund’s underweight in this area. In addition, we made selective additions to the portfolio’s holdings in health care, materials, energy, and real estate. Conversely, we reduced its weightings in the consumer discretionary and information technology sectors. At the geographic level, we increased the Fund’s allocation to North America. The stronger relative growth of the U.S. economy created a broader range of opportunities in companies with robust earnings prospects. We funded this shift by bringing the portfolio’s overweight in Europe toward a neutral weighting. The net result of these decisions was that the Fund’s geographic and sector allocations moved closer to those of the benchmark.
We continued to see healthy underpinnings for the global equity markets as the year drew to a close, but stocks remained vulnerable to a wide range of risk factors. We therefore saw little value in attempting to capture the volatility associated with shiftingday-to-day headlines. Instead, we maintained our steady approach of assessing fundamentals and valuations to construct a portfolio of fast-growing companies from around the world.
Peter Barsa, Director
Portfolio Manager
The views expressed reflect those of the portfolio management team only through the end of the period of the report as stated on the cover. The management team’s views are subject to change at any time based on market and other conditions and should not be construed as a recommendation. Past performance is no guarantee of future results. Current and future portfolio holdings are subject to risk.
| | | | | | |
| | 4 | | | | | | Deutsche DWS Variable Series I — DWS Global Small Cap VIP |
Terms to Know
TheS&P Developed SmallCap Index tracks the performance of small-capitalization stocks in 22 countries. Index returns do not reflect any fees or expenses and it is not possible to invest directly into an index.
Contribution anddetraction incorporate both a stock’s total return and its weighting in the Fund.
Consumer discretionary represents industries that produce goods and services that are not necessities in everyday life.
| * | Not held in the portfolio as of December 31, 2018. |
| | | | |
Deutsche DWS Variable Series I — DWS Global Small Cap VIP | | | | | 5 |
| | |
| Portfolio Summary | | (Unaudited) |
| | | | | | | | |
| Asset Allocation (As a % of Investment Portfolio excluding Securities Lending Collateral) | | 12/31/18 | | | 12/31/17 | |
| Common Stocks | | | 88% | | | | 98% | |
| Cash Equivalents | | | 9% | | | | 2% | |
| Exchange-Traded Fund | | | 1% | | | | — | |
| Preferred Stock | | | 1% | | | | — | |
| Convertible Preferred Stock | | | 1% | | | | 0% | |
| Warrant | | | 0% | | | | 0% | |
| | | | 100% | | | | 100% | |
| | |
Geographical Diversification
(As of % of Investment Portfolio excluding Cash Equivalents and Securities Lending Collateral) | | 12/31/18 | | | 12/31/17 | |
| United States | | | 60% | | | | 55% | |
| Japan | | | 10% | | | | 10% | |
| United Kingdom | | | 5% | | | | 6% | |
| Germany | | | 4% | | | | 4% | |
| Italy | | | 3% | | | | 4% | |
| Canada | | | 3% | | | | 3% | |
| France | | | 3% | | | | 4% | |
| Spain | | | 2% | | | | 1% | |
| Brazil | | | 2% | | | | — | |
| Others | | | 8% | | | | 13% | |
| | | | 100% | | | | 100% | |
| | |
Sector Diversification
(As of % of Investment Portfolio excluding Exchange-Traded Fund, Cash Equivalents and Securities Lending
Collateral) | | 12/31/18 | | | 12/31/17 | |
| Industrials | | | 19% | | | | 22% | |
| Consumer Discretionary | | | 16% | | | | 17% | |
| Health Care | | | 16% | | | | 12% | |
| Information Technology | | | 15% | | | | 17% | |
| Financials | | | 13% | | | | 10% | |
| Materials | | | 6% | | | | 6% | |
| Energy | | | 5% | | | | 7% | |
| Real Estate | | | 4% | | | | 2% | |
| Communication Services | | | 3% | | | | 4% | |
| Consumer Staples | | | 3% | | | | 3% | |
| | | | 100% | | | | 100% | |
Portfolio holdings and characteristics are subject to change.
For more complete details about the Fund’s investment portfolio, see page 7.
Following the Fund’s fiscal first and thirdquarter-end, a complete portfolio holdings listing is filed with the SEC onForm N-Q orForm N-PORT (available for filings after March 31, 2019). The Fund’sForm N-Q orForm N-PORT will be available on the SEC’s Web site at sec.gov. The Fund’s portfolio holdings are also posted on dws.com from time to time. Please see the Fund’s current prospectus for more information.
| | | | | | |
| | 6 | | | | | | Deutsche DWS Variable Series I — DWS Global Small Cap VIP |
| | |
| Investment Portfolio | | December 31, 2018 |
| | | | | | | | |
| | | Shares | | | Value ($) | |
| Common Stocks 88.0% | |
| Austria 1.6% | |
Lenzing AG | | | 4,293 | | | | 391,300 | |
Wienerberger AG | | | 31,646 | | | | 654,146 | |
| | | | | | | | |
(Cost $1,466,774) | | | | | | | 1,045,446 | |
|
| Brazil 0.8% | |
Construtora Tenda SA (Cost $450,691) | | | 64,472 | | | | 533,808 | |
|
| Canada 2.6% | |
First Quantum Minerals Ltd. | | | 30,330 | | | | 245,271 | |
Linamar Corp. | | | 9,191 | | | | 304,975 | |
Quebecor, Inc. “B” | | | 40,906 | | | | 861,147 | |
SunOpta, Inc.* | | | 77,771 | | | | 300,974 | |
| | | | | | | | |
(Cost $1,899,201) | | | | | | | 1,712,367 | |
|
| France 2.6% | |
Altran Technologies SA | | | 66,543 | | | | 535,729 | |
SMCP SA 144A* | | | 32,313 | | | | 499,368 | |
SPIE SA | | | 33,790 | | | | 449,236 | |
Synergie SA | | | 6,511 | | | | 182,620 | |
| | | | | | | | |
(Cost $2,949,938) | | | | | | | 1,666,953 | |
|
| Germany 3.5% | |
Deutz AG | | | 100,599 | | | | 597,031 | |
PATRIZIA Immobilien AG | | | 48,753 | | | | 934,263 | |
United Internet AG (Registered) | | | 16,617 | | | | 731,355 | |
| | | | | | | | |
(Cost $1,395,166) | | | | | | | 2,262,649 | |
|
| Hong Kong 1.6% | |
Techtronic Industries Co., Ltd. (Cost $237,536) | | | 193,041 | | | | 1,028,380 | |
|
| India 1.1% | |
WNS Holdings Ltd. (ADR)* (Cost $482,259) | | | 17,279 | | | | 712,932 | |
|
| Ireland 1.2% | |
Avadel Pharmaceuticals PLC (ADR)* | | | 29,655 | | | | 76,510 | |
Dalata Hotel Group PLC | | | 82,826 | | | | 449,532 | |
Ryanair Holdings PLC* | | | 21,445 | | | | 264,477 | |
| | | | | | | | |
(Cost $771,038) | | | | | | | 790,519 | |
|
| Italy 3.1% | |
Buzzi Unicem SpA | | | 40,980 | | | | 707,767 | |
Cerved Group SpA | | | 79,900 | | | | 658,134 | |
Moncler SpA | | | 19,233 | | | | 642,618 | |
| | | | | | | | |
(Cost $2,202,062) | | | | | | | 2,008,519 | |
|
| Japan 9.1% | |
Ai Holdings Corp. | | | 31,017 | | | | 547,328 | |
Anicom Holdings, Inc. | | | 22,900 | | | | 757,772 | |
BML, Inc. | | | 25,100 | | | | 643,396 | |
Daikyonishikawa Corp. | | | 53,400 | | | | 523,155 | |
Kura Corp. | | | 4,300 | | | | 213,769 | |
Kusuri No Aoki Holdings Co., Ltd. | | | 11,258 | | | | 710,556 | |
Optex Group Co., Ltd. | | | 16,800 | | | | 260,163 | |
Sawai Pharmaceutical Co., Ltd. | | | 7,400 | | | | 353,637 | |
Syuppin Co., Ltd. | | | 47,300 | | | | 305,721 | |
Tokai Carbon Co., Ltd. (a) | | | 21,500 | | | | 243,321 | |
Topcon Corp. | | | 24,100 | | | | 319,219 | |
| | | | | | | | |
| | | Shares | | | Value ($) | |
UT Group Co., Ltd.* | | | 24,024 | | | | 410,256 | |
Zenkoku Hosho Co., Ltd. | | | 20,300 | | | | 636,565 | |
| | | | | | | | |
(Cost $4,785,414) | | | | | | | 5,924,858 | |
|
| Korea 0.5% | |
i-SENS, Inc. (Cost $530,452) | | | 17,084 | | | | 344,497 | |
|
| Spain 2.2% | |
Talgo SA 144A* | | | 155,251 | | | | 955,051 | |
Telepizza Group SA 144A | | | 73,497 | | | | 496,253 | |
| | | | | | | | |
(Cost $1,318,375) | | | | | | | 1,451,304 | |
|
| Sweden 1.0% | |
Nobina AB 144A (Cost $420,821) | | | 100,518 | | | | 682,132 | |
|
| United Kingdom 4.7% | |
accesso Technology Group PLC* | | | 14,761 | | | | 273,711 | |
Arrow Global Group PLC | | | 86,848 | | | | 195,825 | |
B&M European Value Retail SA | | | 164,952 | | | | 593,143 | |
Clinigen Healthcare Ltd.* | | | 29,896 | | | | 287,425 | |
Domino’s Pizza Group PLC | | | 96,786 | | | | 287,806 | |
Electrocomponents PLC | | | 119,715 | | | | 774,830 | |
Scapa Group PLC | | | 169,289 | | | | 662,645 | |
| | | | | | | | |
(Cost $2,874,292) | | | | | | | 3,075,385 | |
|
| United States 52.4% | |
Advanced Disposal Services, Inc.* | | | 28,244 | | | | 676,161 | |
Affiliated Managers Group, Inc. | | | 5,328 | | | | 519,160 | |
Americold Realty Trust (REIT) | | | 13,500 | | | | 344,790 | |
Amicus Therapeutics, Inc.* | | | 12,093 | | | | 115,851 | |
Anixter International, Inc.* | | | 8,374 | | | | 454,792 | |
Arena Pharmaceuticals, Inc.* | | | 8,596 | | | | 334,814 | |
athenahealth, Inc.* | | | 2,453 | | | | 323,624 | |
BioScrip, Inc.* | | | 118,049 | | | | 421,435 | |
Blucora, Inc.* | | | 12,163 | | | | 324,022 | |
Cabot Microelectronics Corp. | | | 3,440 | | | | 327,928 | |
California Resources Corp.* | | | 8,440 | | | | 143,818 | |
Cardiovascular Systems, Inc.* | | | 32,056 | | | | 913,275 | |
Casey’s General Stores, Inc. | | | 6,479 | | | | 830,219 | |
Chart Industries, Inc.* | | | 9,348 | | | | 607,900 | |
Contango Oil & Gas Co.* | | | 121,886 | | | | 396,130 | |
Cypress Semiconductor Corp. | | | 36,916 | | | | 469,572 | |
Del Taco Restaurants, Inc.* | | | 23,573 | | | | 235,494 | |
Dolby Laboratories, Inc. “A” | | | 5,310 | | | | 328,370 | |
Dril-Quip, Inc.* | | | 19,440 | | | | 583,783 | |
Ducommun, Inc.* | | | 28,526 | | | | 1,036,064 | |
Eagle Bancorp., Inc.* | | | 10,870 | | | | 529,478 | |
Envestnet, Inc.* | | | 9,641 | | | | 474,241 | |
FCB Financial Holdings, Inc. “A”* | | | 18,970 | | | | 637,013 | |
Five9, Inc.* | | | 21,001 | | | | 918,164 | |
Fox Factory Holding Corp.* | | | 16,286 | | | | 958,757 | |
Green Dot Corp. “A”* | | | 6,236 | | | | 495,887 | |
H&E Equipment Services, Inc. | | | 19,737 | | | | 403,030 | |
Heron Therapeutics, Inc.* | | | 28,428 | | | | 737,422 | |
Hillenbrand, Inc. | | | 9,300 | | | | 352,749 | |
Hyster-Yale Materials Handling, Inc. | | | 7,996 | | | | 495,432 | |
Inphi Corp.* | | | 13,565 | | | | 436,115 | |
iRhythm Technologies, Inc.* | | | 2,227 | | | | 154,732 | |
Jack in the Box, Inc. | | | 4,906 | | | | 380,853 | |
Jefferies Financial Group, Inc. | | | 25,633 | | | | 444,989 | |
Kennametal, Inc. | | | 11,780 | | | | 392,038 | |
Lazard Ltd. “A” (b) | | | 16,265 | | | | 600,341 | |
The accompanying notes are an integral part of the financial statements.
| | | | |
Deutsche DWS Variable Series I — DWS Global Small Cap VIP | | | | | 7 |
| | | | | | | | |
| | | Shares | | | Value ($) | |
Lumentum Holdings, Inc.* | | | 10,194 | | | | 428,250 | |
Merit Medical Systems, Inc.* | | | 6,446 | | | | 359,751 | |
Mistras Group, Inc.* | | | 15,341 | | | | 220,604 | |
Molina Healthcare, Inc.* | | | 7,631 | | | | 886,875 | |
National Storage Affiliates Trust (REIT) | | | 32,175 | | | | 851,350 | |
Neurocrine Biosciences, Inc.* | | | 10,230 | | | | 730,524 | |
Oil States International, Inc.* | | | 35,603 | | | | 508,411 | |
Pacira Pharmaceuticals, Inc.* | | | 11,608 | | | | 499,376 | |
Providence Service Corp.* | | | 14,314 | | | | 859,126 | |
QAD, Inc. “A” | | | 13,869 | | | | 545,468 | |
Retrophin, Inc.* | | | 41,028 | | | | 928,464 | |
Rush Enterprises, Inc. “A” | | | 37,581 | | | | 1,295,793 | |
Samsonite International SA 144A* (c) | | | 162,600 | | | | 463,310 | |
SEACOR Marine Holdings, Inc.* | | | 36,767 | | | | 432,380 | |
Shutterfly, Inc.* | | | 12,424 | | | | 500,190 | |
Sinclair Broadcast Group, Inc. “A” | | | 13,482 | | | | 355,116 | |
South State Corp. | | | 11,750 | | | | 704,412 | |
Tailored Brands, Inc. | | | 24,493 | | | | 334,085 | |
Tenneco, Inc. | | | 9,916 | | | | 271,599 | |
Thermon Group Holdings, Inc.* | | | 36,596 | | | | 742,167 | |
Titan Machinery, Inc.* | | | 49,205 | | | | 647,046 | |
TopBuild Corp.* | | | 5,261 | | | | 236,745 | |
Transocean Ltd.* (d) | | | 93,674 | | | | 650,098 | |
Trinseo SA | | | 9,996 | | | | 457,617 | |
TriState Capital Holdings, Inc.* | | | 24,568 | | | | 478,093 | |
Varonis Systems, Inc.* | | | 11,265 | | | | 595,918 | |
WEX, Inc.* | | | 5,149 | | | | 721,169 | |
YETI Holdings, Inc.* (a) | | | 17,321 | | | | 257,044 | |
Zions Bancorp. NA | | | 9,941 | | | | 404,996 | |
| | | | | | | | |
(Cost $32,535,787) | | | | | | | 34,164,420 | |
| Total Common Stocks (Cost $54,319,806) | | | | 57,404,169 | |
|
| Convertible Preferred Stock 0.4% | |
| United States | | | | | | | | |
Providence Service Corp. (e) (Cost $196,900) | | | 1,969 | | | | 296,338 | |
| | | | | | | | |
| | | Shares | | | Value ($) | |
|
| Exchange-Traded Fund 1.0% | |
| United States | | | | | | | | |
iShares Russell 2000 ETF (Cost $703,051) | | | 4,761 | | | | 637,498 | |
|
| Preferred Stocks 0.9% | |
| Brazil | | | | | | | | |
Randon SA Implementos e Participacoes (Cost $694,203) | | | 261,457 | | | | 627,724 | |
|
| Warrants 0.0% | |
| France | | | | | | | | |
Parrot SA, Expiration Date 12/15/2022* (e) | | | 13,230 | | | | 124 | |
Parrot SA, Expiration Date 12/22/2022* (e) | | | 13,230 | | | | 99 | |
| Total Warrants (Cost $0) | | | | | | | 223 | |
|
| Securities Lending Collateral 0.8% | |
DWS Government & Agency Securities Portfolio “DWS Government Cash Institutional Shares”, 2.29% (f) (g) (Cost $510,934) | | | 510,934 | | | | 510,934 | |
|
| Cash Equivalent 9.3% | |
DWS Central Cash Management Government Fund, 2.41% (f) (Cost $6,042,652) | | | 6,042,652 | | | | 6,042,652 | |
| | |
| | | % of Net
Assets | | | Value ($) | |
Total Investment Portfolio
(Cost $62,467,546) | | | 100.4 | | | | 65,519,538 | |
| Other Assets and Liabilities, Net | | | (0.4 | ) | | | (281,230 | ) |
| Net Assets | | | 100.0 | | | | 65,238,308 | |
A summary of the Fund’s transactions with affiliated investments during the year ended December 31, 2018 are as follows:
| | | | | | | | | | | | | | | | | | | | | | | | | | | | | | | | |
Value ($) at
12/31/2017 | | Purchases
Cost ($) | | | Sales
Proceeds ($) | | | Net
Realized
Gain/
(Loss) ($) | | | Net Change in
Unrealized
Appreciation
(Depreciation) ($) | | | Income ($) | | | Capital Gain
Distributions ($) | | | Number
of Shares
at
12/31/2018 | | | Value ($)
at
12/31/2018 | |
Securities Lending Collateral 0.8% | |
DWS Government & Agency Securities Portfolio “DWS Government Cash Institutional Shares”, 2.29% (f) (g) | |
| 2,980,179 | | | — | | | | 2,469,245 | (h) | | | — | | | | — | | | | 22,913 | | | | — | | | | 510,934 | | | | 510,934 | |
Cash Equivalent 9.3% | |
DWS Central Cash Management Government Fund, 2.41% (f) | |
| 1,563,917 | | | 19,826,169 | | | | 15,347,434 | | | | — | | | | — | | | | 73,505 | | | | — | | | | 6,042,652 | | | | 6,042,652 | |
| 4,544,096 | | | 19,826,169 | | | | 17,816,679 | | | | — | | | | — | | | | 96,418 | | | | — | | | | 6,553,586 | | | | 6,553,586 | |
| * | Non-income producing security. |
| (a) | All or a portion of these securities were on loan. In addition, “Other Assets and Liabilities, Net” may include pending sales that are also on loan. The value of securities loaned at December 31, 2018 amounted to $493,690, which is 0.8% of net assets. |
| (b) | Listed on the NASDAQ Stock Market, Inc. |
| (c) | Listed on the Stock Exchange of Hong Kong. |
| (d) | Listed on the New York Stock Exchange. |
The accompanying notes are an integral part of the financial statements.
| | | | | | |
| | 8 | | | | | | Deutsche DWS Variable Series I — DWS Global Small Cap VIP |
| (e) | Investment was valued using significant unobservable inputs. |
| (f) | Affiliated fund managed by DWS Investment Management Americas, Inc. The rate shown is the annualized seven-day yield at period end. |
| (g) | Represents collateral held in connection with securities lending. Income earned by the Fund is net of borrower rebates. |
| (h) | Represents the net increase (purchase cost) or decrease (sales proceeds) in the amount invested for the year ended December 31, 2018. |
144A: Security exempt from registration under Rule 144A of the Securities Act of 1933. These securities may be resold in transactions exempt from registration, normally to qualified institutional buyers.
ADR: American Depositary Receipt
REIT: Real Estate Investment Trust
Fair Value Measurements
Various inputs are used in determining the value of the Fund’s investments. These inputs are summarized in three broad levels. Level 1 includes quoted prices in active markets for identical securities. Level 2 includes other significant observable inputs (including quoted prices for similar securities, interest rates, prepayment speeds and credit risk). Level 3 includes significant unobservable inputs (including the Fund’s own assumptions in determining the fair value of investments). The level assigned to the securities valuations may not be an indication of the risk or liquidity associated with investing in those securities.
The following is a summary of the inputs used as of December 31, 2018 in valuing the Fund’s investments. For information on the Fund’s policy regarding the valuation of investments, please refer to the Security Valuation section of Note A in the accompanying Notes to Financial Statements.
| | | | | | | | | | | | | | | | |
| Assets | | Level 1 | | | Level 2 | | | Level 3 | | | Total | |
| Common Stocks | | | | | | | | | | | | | | | | |
Austria | | $ | — | | | $ | 1,045,446 | | | $ | — | | | $ | 1,045,446 | |
Brazil | | | 533,808 | | | | — | | | | — | | | | 533,808 | |
Canada | | | 1,712,367 | | | | — | | | | — | | | | 1,712,367 | |
France | | | — | | | | 1,666,953 | | | | — | | | | 1,666,953 | |
Germany | | | — | | | | 2,262,649 | | | | — | | | | 2,262,649 | |
Hong Kong | | | — | | | | 1,028,380 | | | | — | | | | 1,028,380 | |
India | | | 712,932 | | | | — | | | | — | | | | 712,932 | |
Ireland | | | 76,510 | | | | 714,009 | | | | — | | | | 790,519 | |
Italy | | | — | | | | 2,008,519 | | | | — | | | | 2,008,519 | |
Japan | | | — | | | | 5,924,858 | | | | — | | | | 5,924,858 | |
Korea | | | 344,497 | | | | — | | | | — | | | | 344,497 | |
Spain | | | — | | | | 1,451,304 | | | | — | | | | 1,451,304 | |
Sweden | | | — | | | | 682,132 | | | | — | | | | 682,132 | |
United Kingdom | | | — | | | | 3,075,385 | | | | — | | | | 3,075,385 | |
United States | | | 33,701,110 | | | | 463,310 | | | | — | | | | 34,164,420 | |
| Convertible Preferred Stock | | | — | | | | — | | | | 296,338 | | | | 296,338 | |
| Exchange-Traded Fund | | | 637,498 | | | | — | | | | — | | | | 637,498 | |
| Preferred Stocks | | | — | | | | 627,724 | | | | — | | | | 627,724 | |
| Warrants (i) | | | — | | | | — | | | | 223 | | | | 223 | |
| Short-Term Investments (i) | | | 6,553,586 | | | | — | | | | — | | | | 6,553,586 | |
| Total | | $ | 44,272,308 | | | $ | 20,950,669 | | | $ | 296,561 | | | $ | 65,519,538 | |
| (i) | See Investment Portfolio for additional detailed categorizations. |
The accompanying notes are an integral part of the financial statements.
| | | | |
Deutsche DWS Variable Series I — DWS Global Small Cap VIP | | | | | 9 |
Statement of Assets and Liabilities
| | | | |
| as of December 31, 2018 | | | | |
| |
| Assets | | | | |
| Investments in non-affiliated securities, at value (cost $55,913,960) including — $493,690 of securities loaned | | $ | 58,965,952 | |
| Investment in DWS Government & Agency Securities Portfolio (cost $510,934)* | | | 510,934 | |
| Investment in DWS Central Cash Management Government Fund (cost $6,042,652) | | | 6,042,652 | |
| Foreign currency, at value (cost $221,003) | | | 220,411 | |
| Receivable for investments sold | | | 75,318 | |
| Receivable for Fund shares sold | | | 35,052 | |
| Dividends receivable | | | 27,566 | |
| Interest receivable | | | 13,148 | |
| Foreign taxes recoverable | | | 13,579 | |
| Other assets | | | 2,740 | |
| Total assets | | | 65,907,352 | |
| |
| Liabilities | | | | |
| Payable upon return of securities loaned | | | 510,934 | |
| Payable for Fund shares redeemed | | | 10,417 | |
| Accrued management fee | | | 38,920 | |
| Accrued Trustees’ fees | | | 1,842 | |
| Other accrued expenses and payables | | | 106,931 | |
| Total liabilities | | | 669,044 | |
| Net assets, at value | | $ | 65,238,308 | |
| |
| Net Assets Consist of | | | | |
| Distributable earnings (loss) | | | 6,612,854 | |
| Paid-in capital | | | 58,625,454 | |
| Net assets, at value | | $ | 65,238,308 | |
| |
| Net Asset Value | | | | |
Class A | | | | |
| |
| Net Asset Value, offering and redemption price per share ($63,145,478 ÷ 7,090,435 outstanding shares of beneficial interest, $.01 par value, unlimited number of shares authorized) | | $ | 8.91 | |
Class B | | | | |
| |
| Net Asset Value, offering and redemption price per share ($2,092,830 ÷ 244,229 outstanding shares of beneficial interest, $.01 par value, unlimited number of shares authorized) | | $ | 8.57 | |
| * | Represents collateral on securities loaned. |
Statement of Operations
| | | | |
| for the year ended December 31, 2018 | | | | |
| |
| Investment Income | | | | |
| Income: | | | | |
| Dividends (net of foreign taxes withheld of $46,746) | | $ | 718,723 | |
| Income distributions — DWS Central Cash Management Government Fund | | | 73,505 | |
| Securities lending income, net of borrower rebates | | | 22,913 | |
| Other income | | | 2,097 | |
| Total income | | | 817,238 | |
| Expenses: | | | | |
| Management fee | | | 662,665 | |
| Administration fee | | | 82,833 | |
| Services to shareholders | | | 2,190 | |
| Recordkeeping fee (Class B) | | | 860 | |
| Distribution service fee (Class B) | | | 6,650 | |
| Custodian fee | | | 40,267 | |
| Professional fees | | | 76,464 | |
| Reports to shareholders | | | 23,675 | |
| Trustees’ fees and expenses | | | 5,693 | |
| Other | | | 19,823 | |
| Total expenses before expense reductions | | | 921,120 | |
| Expense reductions | | | (267,574 | ) |
| Total expenses after expense reductions | | | 653,546 | |
| Net investment income | | | 163,692 | |
| |
| Realized and Unrealized gain (loss) | | | | |
| Net realized gain (loss) from: | | | | |
| Investments | | | 4,126,871 | |
| Foreign currency | | | (25,230 | ) |
| | | | 4,101,641 | |
| Change in net unrealized appreciation (depreciation) on: | | | | |
| Investments | | | (21,198,075 | ) |
| Foreign currency | | | (6,154 | ) |
| | | | (21,204,229 | ) |
| Net gain (loss) | | | (17,102,588 | ) |
| Net increase (decrease) in net assets resulting from operations | | $ | (16,938,896 | ) |
The accompanying notes are an integral part of the financial statements.
| | | | | | |
| | 10 | | | | | | Deutsche DWS Variable Series I — DWS Global Small Cap VIP |
Statements of Changes in Net Assets
| | | | | | | | |
| | | Years Ended December 31, | |
| Increase (Decrease) in Net Assets | | 2018 | | | 2017 | |
| Operations: | | | | | | | | |
| Net investment income (loss) | | $ | 163,692 | | | $ | 20,032 | |
| Net realized gain (loss) | | | 4,101,641 | | | | 11,409,672 | |
| Change in net unrealized appreciation (depreciation) | | | (21,204,229 | ) | | | 5,252,419 | |
| Net increase (decrease) in net assets resulting from operations | | | (16,938,896 | ) | | | 16,682,123 | |
| Distributions to shareholders: | | | | | | | | |
Class A | | | (10,751,156 | ) | | | (8,009,441 | ) |
Class B | | | (359,200 | ) | | | (245,528 | ) |
| Total distributions | | | (11,110,356 | ) | | | (8,254,969 | )* |
| Fund share transactions: | | | | | | | | |
Class A | | | | | | | | |
| Proceeds from shares sold | | | 3,594,525 | | | | 3,744,539 | |
| Reinvestment of distributions | | | 10,751,156 | | | | 8,009,441 | |
| Payments for shares redeemed | | | (9,398,765 | ) | | | (23,622,010 | ) |
| Net increase (decrease) in net assets from Class A share transactions | | | 4,946,916 | | | | (11,868,030 | ) |
Class B | | | | | | | | |
| Proceeds from shares sold | | | 125,220 | | | | 289,787 | |
| Reinvestment of distributions | | | 359,200 | | | | 245,528 | |
| Payments for shares redeemed | | | (387,600 | ) | | | (451,769 | ) |
| Net increase (decrease) in net assets from Class B share transactions | | | 96,820 | | | | 83,546 | |
| Increase (decrease) in net assets | | | (23,005,516 | ) | | | (3,357,330 | ) |
| Net assets at beginning of period | | | 88,243,824 | | | | 91,601,154 | |
| | |
| Net assets at end of period | | $ | 65,238,308 | | | $ | 88,243,824 | ** |
| | |
| Other Information | | | | | | |
Class A | | | | | | | | |
| Shares outstanding at beginning of period | | | 6,616,392 | | | | 7,559,752 | |
| Shares sold | | | 323,813 | | | | 308,643 | |
| Shares issued to shareholders in reinvestment of distributions | | | 963,365 | | | | 695,868 | |
| Shares redeemed | | | (813,135 | ) | | | (1,947,871 | ) |
| Net increase (decrease) in Class A shares | | | 474,043 | | | | (943,360 | ) |
| | |
| Shares outstanding at end of period | | | 7,090,435 | | | | 6,616,392 | |
Class B | | | | | | | | |
| Shares outstanding at beginning of period | | | 232,496 | | | | 224,620 | |
| Shares sold | | | 11,426 | | | | 24,779 | |
| Shares issued to shareholders in reinvestment of distributions | | | 33,383 | | | | 22,020 | |
| Shares redeemed | | | (33,076 | ) | | | (38,923 | ) |
| Net increase (decrease) in Class B shares | | | 11,733 | | | | 7,876 | |
| | |
| Shares outstanding at end of period | | | 244,229 | | | | 232,496 | |
| * | Includes distributions from net realized gains of $8,009,441 and $245,528, for Class A and Class B, respectively. |
| ** | Includes distributions in excess of net investment income of $204,731. |
The accompanying notes are an integral part of the financial statements.
| | | | |
Deutsche DWS Variable Series I — DWS Global Small Cap VIP | | | | | 11 |
Financial Highlights
| | | | | | | | | | | | | | | | | | | | |
| | | Years Ended December 31, | |
| Class A | | 2018 | | | 2017 | | | 2016 | | | 2015 | | | 2014 | |
| | | | | |
| Selected Per Share Data | | | | | | | | | | | | | | | | | | | | |
| Net asset value, beginning of period | | $ | 12.90 | | | $ | 11.78 | | | $ | 13.17 | | | $ | 14.61 | | | $ | 17.31 | |
| Income (loss) from investment operations: | | | | | | | | | | | | | | | | | | | | |
Net investment income (loss)a | | | .02 | | | | .00 | * | | | .03 | | | | .06 | | | | .04 | |
Net realized and unrealized gain (loss) | | | (2.32 | ) | | | 2.21 | | | | .15 | | | | .21 | | | | (.69 | ) |
Total from investment operations | | | (2.30 | ) | | | 2.21 | | | | .18 | | | | .27 | | | | (.65 | ) |
| Less distributions from: | | | | | | | | | | | | | | | | | | | | |
Net investment income | | | (.04 | ) | | | — | | | | (.05 | ) | | | (.14 | ) | | | (.15 | ) |
Net realized gains | | | (1.65 | ) | | | (1.09 | ) | | | (1.52 | ) | | | (1.57 | ) | | | (1.90 | ) |
Total distributions | | | (1.69 | ) | | | (1.09 | ) | | | (1.57 | ) | | | (1.71 | ) | | | (2.05 | ) |
| Net asset value, end of period | | $ | 8.91 | | | $ | 12.90 | | | $ | 11.78 | | | $ | 13.17 | | | $ | 14.61 | |
| Total Return (%)b | | | (20.51 | ) | | | 20.02 | | | | 1.57 | | | | 1.16 | | | | (4.13 | ) |
| | | | | |
| Ratios to Average Net Assets and Supplemental Data | | | | | | | | | | | | | | | | | | | | |
| Net assets, end of period ($ millions) | | | 63 | | | | 85 | | | | 89 | | | | 104 | | | | 135 | |
| Ratio of expenses before expense reductions (%)c | | | 1.10 | | | | 1.15 | | | | 1.17 | | | | 1.12 | | | | 1.13 | |
| Ratio of expenses after expense reductions (%)c | | | .78 | | | | .94 | | | | 1.02 | | | | .99 | | | | .97 | |
| Ratio of net investment income (loss) (%) | | | .21 | | | | .03 | | | | .22 | | | | .41 | | | | .27 | |
| Portfolio turnover rate (%) | | | 32 | | | | 42 | | | | 41 | | | | 27 | | | | 33 | |
| a | Based on average shares outstanding during the period. |
| b | Total return would have been lower had certain expenses not been reduced. |
| c | Expense ratio does not reflect charges and fees associated with the separate account that invests in the Fund or any variable life insurance policy or variable annuity contract for which the Fund is an investment option. |
| * | Amount is less than $.005. |
| | | | | | | | | | | | | | | | | | | | |
| | | Years Ended December 31, | |
| Class B | | 2018 | | | 2017 | | | 2016 | | | 2015 | | | 2014 | |
| | | | | |
| Selected Per Share Data | | | | | | | | | | | | | | | | | | | | |
| Net asset value, beginning of period | | $ | 12.47 | | | $ | 11.45 | | | $ | 12.85 | | | $ | 14.29 | | | $ | 16.97 | |
| Income (loss) from investment operations: | | | | | | | | | | | | | | | | | | | | |
Net investment income (loss)a | | | (.01 | ) | | | (.03 | ) | | | (.03 | ) | | | .02 | | | | .00 | * |
Net realized and unrealized gain (loss) | | | (2.24 | ) | | | 2.14 | | | | .17 | | | | .21 | | | | (.67 | ) |
Total from investment operations | | | (2.25 | ) | | | 2.11 | | | | .14 | | | | .23 | | | | (.67 | ) |
| Less distributions from: | | | | | | | | | | | | | | | | | | | | |
Net investment income | | | — | | | | — | | | | (.02 | ) | | | (.10 | ) | | | (.11 | ) |
Net realized gains | | | (1.65 | ) | | | (1.09 | ) | | | (1.52 | ) | | | (1.57 | ) | | | (1.90 | ) |
Total distributions | | | (1.65 | ) | | | (1.09 | ) | | | (1.54 | ) | | | (1.67 | ) | | | (2.01 | ) |
| Net asset value, end of period | | $ | 8.57 | | | $ | 12.47 | | | $ | 11.45 | | | $ | 12.85 | | | $ | 14.29 | |
| Total Return (%)b | | | (20.74 | ) | | | 19.60 | | | | 1.34 | | | | .86 | | | | (4.33 | ) |
| | | | | |
| Ratios to Average Net Assets and Supplemental Data | | | | | | | | | | | | | | | | | | | | |
| Net assets, end of period ($ millions) | | | 2 | | | | 3 | | | | 3 | | | | 3 | | | | 3 | |
| Ratio of expenses before expense reductions (%)c | | | 1.39 | | | | 1.44 | | | | 1.47 | | | | 1.41 | | | | 1.41 | |
| Ratio of expenses after expense reductions (%)c | | | 1.06 | | | | 1.22 | | | | 1.30 | | | | 1.24 | | | | 1.25 | |
| Ratio of net investment income (loss) (%) | | | (.08 | ) | | | (.26 | ) | | | (.23 | ) | | | .15 | | | | .02 | |
| Portfolio turnover rate (%) | | | 32 | | | | 42 | | | | 41 | | | | 27 | | | | 33 | |
| a | Based on average shares outstanding during the period. |
| b | Total return would have been lower had certain expenses not been reduced. |
| c | Expense ratio does not reflect charges and fees associated with the separate account that invests in the Fund or any variable life insurance policy or variable annuity contract for which the Fund is an investment option. |
| * | Amount is less than $.005. |
The accompanying notes are an integral part of the financial statements.
| | | | | | |
| | 12 | | | | | | Deutsche DWS Variable Series I — DWS Global Small Cap VIP |
| | |
| Notes to Financial Statements | | |
A. Organization and Significant Accounting Policies
Deutsche DWS Variable Series I (formerly Deutsche Variable Series I) (the “Trust“) is registered under the Investment Company Act of 1940, as amended (the “1940 Act“), as anopen-end management investment company organized as a Massachusetts business trust. The Trust consists of five diversified funds: DWS Bond VIP (formerly Deutsche Bond VIP), DWS Capital Growth VIP (formerly Deutsche Capital Growth VIP), DWS Core Equity VIP (formerly Deutsche Core Equity VIP), DWS CROCI® International VIP (formerly Deutsche CROCI® International VIP) and DWS Global Small Cap VIP (formerly Deutsche Global Small Cap VIP) (individually or collectively hereinafter referred to as a “Fund“ or the “Funds“). These financial statements report on DWS Global Small Cap VIP. The Trust is intended to be the underlying investment vehicle for variable annuity contracts and variable life insurance policies to be offered by the separate accounts of certain life insurance companies (“Participating Insurance Companies“).
Multiple Classes of Shares of Beneficial Interest. The Fund offers two classes of shares (Class A shares and Class B shares). Class B shares are subject to Rule12b-1 distribution fees under the 1940 Act and recordkeeping fees equal to an annual rate of 0.25% and up to 0.15%, respectively, of the average daily net assets of the Class B shares of the Fund. Class A shares are not subject to such fees.
Investment income, realized and unrealized gains and losses, and certainfund-level expenses and expense reductions, if any, are borne pro rata on the basis of relative net assets by the holders of all classes of shares, except that each class bears certain expenses unique to that class (including the applicable12b-1 distribution fees). Differences inclass-level expenses may result in payment of different per share dividends by class. All shares have equal rights with respect to voting subject toclass-specific arrangements.
The Fund’s financial statements are prepared in accordance with accounting principles generally accepted in the United States of America (“U.S. GAAP”) which require the use of management estimates. Actual results could differ from those estimates. The Fund qualifies as an investment company under Topic 946 of Accounting Standards Codification of U.S. GAAP. The policies described below are followed consistently by the Fund in the preparation of its financial statements.
In October 2018, the Securities and Exchange Commission adopted amendments to certain disclosure requirements in Securities Act Release No. 33-10532, Disclosure Update and Simplification, which is intended to facilitate the disclosure of information to investors and simplify compliance without significantly altering the total mix of information provided to investors. Effective with the current reporting period, the Fund adopted the amendments with the impacts being that the Fund is no longer required to present components of distributable earnings on the Statement of Assets and Liabilities or the sources of distributable earnings and the amount of undistributed net investment income on the Statements of Changes in Net Assets.
Security Valuation. Investments are stated at value determined as of the close of regular trading on the New York Stock Exchange on each day the exchange is open for trading.
Various inputs are used in determining the value of the Fund’s investments. These inputs are summarized in three broad levels. Level 1 includes quoted prices in active markets for identical securities. Level 2 includes other significant observable inputs (including quoted prices for similar securities, interest rates, prepayment speeds and credit risk). Level 3 includes significant unobservable inputs (including the Fund’s own assumptions in determining the fair value of investments). The level assigned to the securities valuations may not be an indication of the risk or liquidity associated with investing in those securities.
Equity securities are valued at the most recent sale price or official closing price reported on the exchange (U.S. or foreign) orover-the-counter market on which they trade. Securities for which no sales are reported are valued at the calculated mean between the most recent bid and asked quotations on the relevant market or, if a mean cannot be determined, at the most recent bid quotation. Equity securities are generally categorized as Level 1 securities. For certain international equity securities, in order to adjust for events which may occur between the close of the foreign exchanges and the close of the New York Stock Exchange, a fair valuation model may be used. This fair valuation model takes into account comparisons to the valuation of American Depository Receipts (ADRs),exchange-traded funds, futures contracts and certain indices and these securities are categorized as Level 2.
Investments inopen-end investment companies are valued at their net asset value each business day and are categorized as Level 1.
| | | | |
Deutsche DWS Variable Series I — DWS Global Small Cap VIP | | | | | 13 |
Securities and other assets for which market quotations are not readily available or for which the above valuation procedures are deemed not to reflect fair value are valued in a manner that is intended to reflect their fair value as determined in accordance with procedures approved by the Trustees and are generally categorized as Level 3. In accordance with the Fund’s valuation procedures, factors considered in determining value may include, but are not limited to, the type of the security; the size of the holding; the initial cost of the security; the existence of any contractual restrictions on the security’s disposition; the price and extent of public trading in similar securities of the issuer or of comparable companies; quotations or evaluated prices frombroker-dealers and/or pricing services; information obtained from the issuer, analysts, and/or the appropriate stock exchange (forexchange-traded securities); an analysis of the company’s or issuer’s financial statements; an evaluation of the forces that influence the issuer and the market(s) in which the security is purchased and sold; and with respect to debt securities, the maturity, coupon, creditworthiness, currency denomination and the movement of the market in which the security is normally traded. The value determined under these procedures may differ from published values for the same securities.
Disclosure about the classification of fair value measurements is included in a table following the Fund’s Investment Portfolio.
Securities Lending. Brown Brothers Harriman & Co., as lending agent, lends securities of the Fund to certain financial institutions under the terms of its securities lending agreement. During the term of the loans, the Fund continues to receive interest and dividends generated by the securities and to participate in any changes in their market value. The Fund requires the borrowers of the securities to maintain collateral with the Fund consisting of either cash or liquid, unencumbered assets having a value at least equal to the value of the securities loaned. When the collateral falls below specified amounts, the lending agent will use its best effort to obtain additional collateral on the next business day to meet required amounts under the securities lending agreement. As of period end, any securities on loan were collateralized by cash. During the year ended December 31, 2018, the Fund invested the cash collateral into a joint trading account in affiliated money market funds managed by DWS Investment Management Americas, Inc. As of December 31, 2018, the Fund invested the cash collateral in DWS Government & Agency Securities Portfolio. DWS Investment Management Americas, Inc. receives a management/administration fee (0.12% annualized effective rate as of December 31, 2018) on the cash collateral invested in DWS Government & Agency Securities Portfolio. The Fund receives compensation for lending its securities either in the form of fees or by earning interest on invested cash collateral net of borrower rebates and fees paid to a lending agent. Either the Fund or the borrower may terminate the loan at any time, and the borrower, after notice, is required to return borrowed securities within a standard time period. There may be risks of delay and costs in recovery of securities or even loss of rights in the collateral should the borrower of the securities fail financially. If the Fund is not able to recover securities lent, the Fund may sell the collateral and purchase a replacement investment in the market, incurring the risk that the value of the replacement security is greater than the value of the collateral. The Fund is also subject to all investment risks associated with the reinvestment of any cash collateral received, including, but not limited to, interest rate, credit and liquidity risk associated with such investments.
As of December 31, 2018, the Fund had securities on loan, which were classified as common stock in the Investment Portfolio. The value of the related collateral exceeded the value of the securities loaned at period end. As of period end, the remaining contractual maturity of the collateral agreements were overnight and continuous.
Foreign Currency Translations. The books and records of the Fund are maintained in U.S. dollars. Investment securities and other assets and liabilities denominated in a foreign currency are translated into U.S. dollars at the prevailing exchange rates at period end. Purchases and sales of investment securities, income and expenses are translated into U.S. dollars at the prevailing exchange rates on the respective dates of the transactions.
Net realized and unrealized gains and losses on foreign currency transactions represent net gains and losses between trade and settlement dates on securities transactions, the acquisition and disposition of foreign currencies, and the difference between the amount of net investment income accrued and the U.S. dollar amount actually received. The portion of both realized and unrealized gains and losses on investments that results from fluctuations in foreign currency exchange rates is not separately disclosed but is included with net realized and unrealized gain/appreciation and loss/depreciation on investments.
Taxes. The Fund is treated as a separate taxpayer as provided for in the Internal Revenue Code, as amended. It is the Fund’s policy to comply with the requirements of the Internal Revenue Code, as amended, which are
| | | | | | |
| | 14 | | | | | | Deutsche DWS Variable Series I — DWS Global Small Cap VIP |
applicable to regulated investment companies, and to distribute all of its taxable income to the separate accounts of the Participating Insurance Companies which hold its shares.
Additionally, the Fund may be subject to taxes imposed by the governments of countries in which it invests and are generally based on income and/or capital gains earned or repatriated, a portion of which may be recoverable. Based upon the current interpretation of the tax rules and regulations, estimated tax liabilities and recoveries on certain foreign securities are recorded on an accrual basis and are reflected as components of interest income or net change in unrealized gain/loss on investments. Tax liabilities realized as a result of security sales are reflected as a component of net realized gain/loss on investments.
The Fund has reviewed the tax positions for the open tax years as of December 31, 2018 and has determined that no provision for income tax and/or uncertain tax positions is required in the Fund’s financial statements. The Fund’s federal tax returns for the prior three fiscal years remain open subject to examination by the Internal Revenue Service.
Distribution of Income and Gains. Distributions from net investment income of the Fund, if any, are declared and distributed to shareholders annually. Net realized gains from investment transactions, in excess of available capital loss carryforwards, would be taxable to the Fund if not distributed, and, therefore, will be distributed to shareholders at least annually. The Fund may also make additional distributions for tax purposes if necessary.
The timing and characterization of certain income and capital gain distributions are determined annually in accordance with federal tax regulations which may differ from accounting principles generally accepted in the United States of America. These differences primarily relate to income received from passive foreign investment companies and certain securities sold at a loss. As a result, net investment income (loss) and net realized gain (loss) on investment transactions for a reporting period may differ significantly from distributions during such period. Accordingly, the Fund may periodically make reclassifications among certain of its capital accounts without impacting the net asset value of the Fund.
At December 31, 2018, the Fund’s components of distributable earnings (accumulated losses) on a tax basis are as follows:
| | | | |
| Undistributed long-term capital gains | | $ | 3,774,957 | |
| Net unrealized appreciation (depreciation) on investments | | $ | 2,839,376 | |
At December 31, 2018, the aggregate cost of investments for federal income tax purposes was $62,680,162. The net unrealized appreciation for all investments based on tax cost was $2,839,376. This consisted of aggregate gross unrealized appreciation for all investments in which there was an excess of value over tax cost of $12,080,760 and aggregate gross unrealized depreciation for all investments in which there was an excess of tax cost over value of $9,241,384.
In addition, the tax character of distributions paid to shareholders by the Fund is summarized as follows:
| | | | | | | | |
| | | Years Ended December 31, | |
| | | 2018 | | | 2017 | |
| Distributions from ordinary Income* | | $ | 1,136,799 | | | $ | — | |
| Distributions from long-term capital gains | | $ | 9,973,557 | | | $ | 8,254,969 | |
| * | For tax purposes, short-term capital gain distributions are considered ordinary income distributions. |
Expenses. Expenses of the Trust arising in connection with a specific Fund are allocated to that Fund. Other Trust expenses which cannot be directly attributed to a Fund are apportioned among the Funds in the Trust based upon the relative net assets or other appropriate measures.
Contingencies. In the normal course of business, the Fund may enter into contracts with service providers that contain general indemnification clauses. The Fund’s maximum exposure under these arrangements is unknown, as this would involve future claims that may be made against the Fund that have not yet been made. However, based on experience, the Fund expects the risk of loss to be remote.
Other. Investment transactions are accounted for on a trade date plus one basis for daily net asset value calculations. However, for financial reporting purposes, investment transactions are reported on trade date. Interest income is recorded on the accrual basis net of foreign withholding taxes. Dividend income is recorded on theex-dividend date net of foreign withholding taxes. Certain dividends from foreign securities may be recorded subsequent to theex-dividend date as soon as the Fund is informed of such dividends.
| | | | |
Deutsche DWS Variable Series I — DWS Global Small Cap VIP | | | | | 15 |
Realized gains and losses from investment transactions are recorded on an identified cost basis. Proceeds from litigation payments, if any, are included in net realized gain (loss) from investments.
B. Purchases and Sales of Securities
During the year ended December 31, 2018, purchases and sales of investment securities (excludingshort-term investments) aggregated $24,875,635 and $34,431,724, respectively.
C. Related Parties
Management Agreement. Under the Investment Management Agreement with DWS Investment Management Americas, Inc. (formerly Deutsche Investment Management Americas Inc.) (“DIMA“ or the “Advisor“), an indirect, wholly owned subsidiary of DWS Group GmbH & Co. KGaA (“DWS Group”), the Advisor directs the investments of the Fund in accordance with its investment objectives, policies and restrictions. The Advisor determines the securities, instruments and other contracts relating to investments to be purchased, sold or entered into by the Fund.
Pursuant to the Investment Management Agreement with the Advisor, the Fund pays the Advisor an annual fee based on its average daily net assets, computed and accrued daily and payable monthly at the annual rate (exclusive of any applicable waivers/reimbursements) of 0.80%.
For the period from January 1, 2018 through April 30, 2019, the Advisor has contractually agreed to waive all or a portion of its fees and/or reimburse certain operating expenses of the Fund to the extent necessary to maintain the total annual operating expenses (excluding certain expenses such as extraordinary expenses, taxes, brokerage and interest) of certain classes as follows:
| | | | |
| Class A | | | .78 | % |
| Class B | | | 1.06 | % |
For the year ended December 31, 2018, fees waived and/or expenses reimbursed for each class are as follows:
| | | | |
| Class A | | $ | 258,776 | |
| Class B | | | 8,798 | |
| | | $ | 267,574 | |
Administration Fee. Pursuant to an Administrative Services Agreement, DIMA provides most administrative services to the Fund. For all services provided under the Administrative Services Agreement, the Fund pays the Advisor an annual fee (“Administration Fee“) of 0.10% of the Fund’s average daily net assets, computed and accrued daily and payable monthly. For the year ended December 31, 2018, the Administration Fee was $82,833, of which $5,726 is unpaid.
Service Provider Fees. DWS Service Company (“DSC“), an affiliate of the Advisor, is the transfer agent,dividend-paying agent and shareholder service agent for the Fund. Pursuant to asub-transfer agency agreement between DSC and DST Systems, Inc. (“DST“), DSC has delegated certain transfer agent,dividend-paying agent and shareholder service agent functions to DST. DSC compensates DST out of the shareholder servicing fee it receives from the Fund. For the year ended December 31, 2018, the amounts charged to the Fund by DSC were as follows:
| | | | | | | | |
| Services to Shareholders | | Total
Aggregated | | | Unpaid at
December 31, 2018 | |
| Class A | | $ | 546 | | | $ | 89 | |
| Class B | | | 165 | | | | 27 | |
| | | $ | 711 | | | $ | 116 | |
Distribution Service Agreement. DWS Distributors, Inc. (“DDI“), also an affiliate of the Advisor, is the Trust’s Distributor. In accordance with the Master Distribution Plan, DDI receives12b-1 fees of 0.25% of average daily net assets of Class B shares. Pursuant to the Master Distribution Plan, DDI remits these fees to the Participating Insurance Companies for various costs incurred or paid by these companies in connection with marketing and distribution of Class B shares. For the year ended December 31, 2018, the Distribution Service Fee aggregated $6,650, of which $458 is unpaid.
| | | | | | |
| | 16 | | | | | | Deutsche DWS Variable Series I — DWS Global Small Cap VIP |
Typesetting and Filing Service Fees. Under an agreement with the Fund, DIMA is compensated for providing certainpre-press and regulatory filing services to the Fund. For the year ended December 31, 2018, the amount charged to the Fund by DIMA included in the Statement of Operations under “Reports to shareholders“ aggregated $9,997, of which $7,360 is unpaid.
Trustees’ Fees and Expenses. The Fund paid retainer fees to each Trustee not affiliated with the Advisor, plus specified amounts to the Board Chairperson and to each committee Chairperson.
Affiliated Cash Management Vehicles. The Fund may invest uninvested cash balances in DWS Central Cash Management Government Fund and DWS ESG Liquidity Fund, affiliated money market funds which are managed by the Advisor. Each affiliated money market fund is managed in accordance withRule 2a-7 under the 1940 Act, which governs the quality, maturity, diversity and liquidity of instruments in which a money market fund may invest. DWS Central Cash Management Government Fund seeks to maintain a stable net asset value, and DWS ESG Liquidity Fund maintains a floating net asset value. The Fund indirectly bears its proportionate share of the expenses of each affiliated money market fund in which it invests. DWS Central Cash Management Government Fund does not pay the Advisor an investment management fee. To the extent that DWS ESG Liquidity Fund pays an investment management fee to the Advisor, the Advisor will waive an amount of the investment management fee payable to the Advisor by the Fund equal to the amount of the investment management fee payable on the Fund’s assets invested in DWS ESG Liquidity Fund.
D. Ownership of the Fund
At December 31, 2018, four participating insurance companies were owners of record of 10% or more of the total outstanding Class A shares of the Fund, each owning 35%, 22%, 16% and 10%, respectively. Two participating insurance companies were owners of record of 10% or more of the total outstanding Class B shares of the Fund, each owning 75% and 15%, respectively.
E. Line of Credit
The Fund and other affiliated funds (the “Participants”) share in a $400 million revolving credit facility provided by a syndication of banks. The Fund may borrow for temporary or emergency purposes, including the meeting of redemption requests that otherwise might require the untimely disposition of securities. The Participants are charged an annual commitment fee which is allocated based on net assets, among each of the Participants. Interest is calculated at a rate per annum equal to the sum of the Federal Funds Rate plus 1.25 percent plus if theone-month LIBOR exceeds the Federal Funds Rate, the amount of such excess. The Fund may borrow up to a maximum of 33 percent of its net assets under the agreement. The Fund had no outstanding loans at December 31, 2018.
| | | | |
Deutsche DWS Variable Series I — DWS Global Small Cap VIP | | | | | 17 |
Report of Independent Registered Public Accounting Firm
To the Board of Trustees of Deutsche DWS Variable Series I and Shareholders of DWS Global Small Cap VIP
Opinion on the Financial Statements
We have audited the accompanying statement of assets and liabilities, including the investment portfolio, of DWS Global Small Cap VIP (one of the funds constituting Deutsche DWS Variable Series I, referred to hereafter as the “Fund”) as of December 31, 2018, the related statement of operations for the year ended December 31, 2018, the statements of changes in net assets for each of the two years in the period ended December 31, 2018, including the related notes, and the financial highlights for each of the five years in the period ended December 31, 2018 (collectively referred to as the “financial statements”). In our opinion, the financial statements present fairly, in all material respects, the financial position of the Fund as of December 31, 2018, the results of its operations for the year then ended, the changes in its net assets for each of the two years in the period ended December 31, 2018 and the financial highlights for each of the five years in the period ended December 31, 2018 in conformity with accounting principles generally accepted in the United States of America.
Basis for Opinion
These financial statements are the responsibility of the Fund’s management. Our responsibility is to express an opinion on the Fund’s financial statements based on our audits. We are a public accounting firm registered with the Public Company Accounting Oversight Board (United States) (PCAOB) and are required to be independent with respect to the Fund in accordance with the U.S. federal securities laws and the applicable rules and regulations of the Securities and Exchange Commission and the PCAOB.
We conducted our audits of these financial statements in accordance with the standards of the PCAOB. Those standards require that we plan and perform the audit to obtain reasonable assurance about whether the financial statements are free of material misstatement, whether due to error or fraud.
Our audits included performing procedures to assess the risks of material misstatement of the financial statements, whether due to error or fraud, and performing procedures that respond to those risks. Such procedures included examining, on a test basis, evidence regarding the amounts and disclosures in the financial statements. Our audits also included evaluating the accounting principles used and significant estimates made by management, as well as evaluating the overall presentation of the financial statements. Our procedures included confirmation of securities owned as of December 31, 2018 by correspondence with the custodian and transfer agent. We believe that our audits provide a reasonable basis for our opinion.
PricewaterhouseCoopers LLP
Boston, Massachusetts
February 14, 2019
We have served as the auditor of one or more investment companies in the DWS family of funds since 1930.
| | | | | | |
| | 18 | | | | | | Deutsche DWS Variable Series I — DWS Global Small Cap VIP |
| | |
| Information About Your Fund’s Expenses | | (Unaudited) |
As an investor of the Fund, you incur two types of costs: ongoing expenses and transaction costs. Ongoing expenses include management fees, distribution and service(12b-1) fees and other Fund expenses. Examples of transaction costs include contract charges, which are not shown in this section. The following tables are intended to help you understand your ongoing expenses (in dollars) of investing in the Fund and to help you compare these expenses with the ongoing expenses of investing in other mutual funds. In the most recentsix-month period, the Fund limited these expenses; had it not done so, expenses would have been higher. The example in the table is based on an investment of $1,000 invested at the beginning of thesix-month period and held for the entire period (July 1, 2018 to December 31, 2018).
The tables illustrate your Fund’s expenses in two ways:
| – | | Actual Fund Return. This helps you estimate the actual dollar amount of ongoing expenses (but not transaction costs) paid on a $1,000 investment in the Fund using the Fund’s actual return during the period. To estimate the expenses you paid over the period, simply divide your account value by $1,000 (for example, an $8,600 account value divided by $1,000 = 8.6), then multiply the result by the number in the “Expenses Paid per $1,000” line under the share class you hold. |
| – | | Hypothetical 5% Fund Return. This helps you to compare your Fund’s ongoing expenses (but not transaction costs) with those of other mutual funds using the Fund’s actual expense ratio and a hypothetical rate of return of 5% per year before expenses. Examples using a 5% hypothetical Fund return may be found in the shareholder reports of other mutual funds. The hypothetical account values and expenses may not be used to estimate the actual ending account balance or expenses you paid for the period. |
Please note that the expenses shown in these tables are meant to highlight your ongoing expenses only and do not reflect any transaction costs. The “Expenses Paid per $1,000” line of the tables is useful in comparing ongoing expenses only and will not help you determine the relative total expense of owning different funds. If these transaction costs had been included, your costs would have been higher.
| | | | | | | | |
| Expenses and Value of a $1,000 Investment for the six months ended December 31, 2018 | | | | |
| | |
| Actual Fund Return | | | Class A | | | | Class B | |
| Beginning Account Value 7/1/18 | | $ | 1,000.00 | | | $ | 1,000.00 | |
| Ending Account Value 12/31/18 | | $ | 783.00 | | | $ | 781.20 | |
| Expenses Paid per $1,000* | | $ | 3.51 | | | $ | 4.76 | |
| | |
| Hypothetical 5% Fund Return | | | Class A | | | | Class B | |
| Beginning Account Value 7/1/18 | | $ | 1,000.00 | | | $ | 1,000.00 | |
| Ending Account Value 12/31/18 | | $ | 1,021.27 | | | $ | 1,019.86 | |
| Expenses Paid per $1,000* | | $ | 3.97 | | | $ | 5.40 | |
| * | Expenses are equal to the Fund’s annualized expense ratio for each share class, multiplied by the average account value over the period, multiplied by 184 (the number of days in the most recentsix-month period), then divided by 365. |
| | | | | | | | |
| Annualized Expense Ratios | | Class A | | | Class B | |
| Deutsche DWS Variable Series I — DWS Global Small Cap VIP | | | .78 | % | | | 1.06 | % |
For more information, please refer to the Fund’s prospectus.
These tables do not reflect charges and fees (“contract charges”) associated with the separate account that invests in the Fund or any variable life insurance policy or variable annuity contract for which the Fund is an investment option.
For an analysis of the fees associated with an investment in the Fund or similar funds, please refer to the current and hypothetical expense calculators for Variable Insurance Products which can be found at dws.com/calculators.
| | | | |
Deutsche DWS Variable Series I — DWS Global Small Cap VIP | | | | | 19 |
| | |
| Tax Information | | (Unaudited) |
The Fund paid distributions of $1.50 per share from net long-term capital gains during its year ended December 31, 2018.
Pursuant to Section 852 of the Internal Revenue Code, the Fund designates $4,270,000 as capital gain dividends for its year ended December 31, 2018.
For corporate shareholders, 21% of the ordinary dividends (i.e., income dividends plus short-term capital gains) paid during the Fund’s fiscal year ended December 31, 2018 qualified for the dividends received deduction.
Please consult a tax advisor if you have questions about federal or state income tax laws, or on how to prepare your tax returns. If you have specific questions about your account, please contact your insurance provider.
Proxy Voting
The Trust’s policies and procedures for voting proxies for portfolio securities and information about how the Trust voted proxies related to its portfolio securities during the most recent12-month period ended June 30 are available on our Web site — dws.com/en-us/resources/proxy-voting — or on the SEC’s Web site — sec.gov. To obtain a written copy of the Trust’s policies and procedures without charge, upon request, call us toll free at (800)728-3337.
| | | | | | |
| | 20 | | | | | | Deutsche DWS Variable Series I — DWS Global Small Cap VIP |
Advisory Agreement Board Considerations and Fee Evaluation
The Board of Trustees (hereinafter referred to as the “Board” or “Trustees”) approved the renewal of DWS Global Small Cap VIP’s (the “Fund”) investment management agreement (the “Agreement”) with DWS Investment Management Americas, Inc. (“DIMA”) in September 2018.
In terms of the process that the Board followed prior to approving the Agreement, shareholders should know that:
| – | | During the entire process, all of the Fund’s Trustees were independent of DIMA and its affiliates (the “Independent Trustees”). |
| – | | The Board met frequently during the past year to discuss fund matters and dedicated a substantial amount of time to contract review matters. Over the course of several months, the Board’s Contract Committee reviewed extensive materials received from DIMA, independent third parties and independent counsel. These materials included an analysis of the Fund’s performance, fees and expenses, and profitability from a fee consultant retained by the Fund’s Independent Trustees (the “Fee Consultant”). Based on its evaluation of the information provided, the Contract Committee presented its findings and recommendations to the Board. The Board then reviewed the Contract Committee’s findings and recommendations. |
| – | | The Board also received extensive information throughout the year regarding performance of the Fund. |
| – | | The Independent Trustees regularly met privately with counsel to discuss contract review and other matters. In addition, the Independent Trustees were advised by the Fee Consultant in the course of their review of the Fund’s contractual arrangements and considered a comprehensive report prepared by the Fee Consultant in connection with their deliberations. |
| – | | In connection with reviewing the Agreement, the Board also reviewed the terms of the Fund’s Rule 12b-1 plan, distribution agreement, administrative services agreement, transfer agency agreement and other material service agreements. |
In connection with the contract review process, the Contract Committee and the Board considered the factors discussed below, among others. The Board also considered that DIMA and its predecessors have managed the Fund since its inception, and the Board believes that a long-term relationship with a capable, conscientious advisor is in the best interests of the Fund. The Board considered, generally, that shareholders chose to invest or remain invested in the Fund knowing that DIMA managed the Fund. DIMA is part of DWS Group GmbH & Co. KGaA (“DWS Group”). DWS Group is a global asset management business that offers a wide range of investing expertise and resources, including research capabilities in many countries throughout the world. In 2018, approximately 20% of DWS Group’s shares were sold in an initial public offering, with Deutsche Bank AG owning the remaining shares.
As part of the contract review process, the Board carefully considered the fees and expenses of each DWS fund overseen by the Board in light of the fund’s performance. In many cases, this led to the negotiation and implementation of expense caps. As part of these negotiations, the Board indicated that it would consider relaxing these caps in future years following sustained improvements in performance, among other considerations.
While shareholders may focus primarily on fund performance and fees, the Fund’s Board considers these and many other factors, including the quality and integrity of DIMA’s personnel and administrative support services provided by DIMA, such as back-office operations, fund valuations, and compliance policies and procedures.
Nature, Quality and Extent of Services.The Board considered the terms of the Agreement, including the scope of advisory services provided under the Agreement. The Board noted that, under the Agreement, DIMA provides portfolio management services to the Fund and that, pursuant to a separate administrative services agreement, DIMA provides administrative services to the Fund. The Board considered the experience and skills of senior management and investment personnel and the resources made available to such personnel. The Board reviewed the Fund’s performance over short-term and long-term periods and compared those returns to various agreed-upon performance measures, including market index(es) and a peer universe compiled using information supplied by Morningstar Direct (“Morningstar”), an independent fund data service. The Board also noted that it has put into place a process of identifying “Funds in Review” (e.g., funds performing poorly relative to a peer universe), and receives additional reporting from DIMA regarding such funds and, where appropriate, DIMA’s plans to address underperformance. The Board
| | | | |
Deutsche DWS Variable Series I — DWS Global Small Cap VIP | | | | | 21 |
believes this process is an effective manner of identifying and addressing underperforming funds. Based on the information provided, the Board noted that, for the one-, three- and five-year periods ended December 31, 2017, the Fund’s performance (Class A shares) was in the 4th quartile of the applicable Morningstar universe (the 1st quartile being the best performers and the 4th quartile being the worst performers). The Board also observed that the Fund has underperformed its benchmark in the one-, three-, and five-year periods ended December 31, 2017. The Board noted the disappointing investment performance of the Fund in recent periods and continued to discuss with senior management of DIMA the factors contributing to such underperformance and actions being taken to improve performance. The Board noted changes in the portfolio management team, effective April 19, 2018. The Board observed that the Fund had experienced improved relative performance during the first eight months of 2018. The Board recognized the efforts by DIMA in recent years to enhance its investment platform and improve long-term performance across the DWS fund complex.
Fees and Expenses.The Board considered the Fund’s investment management fee schedule, operating expenses and total expense ratios, and comparative information provided by Broadridge Financial Solutions, Inc. (“Broadridge”) and the Fee Consultant regarding investment management fee rates paid to other investment advisors by similar funds (1st quartile being the most favorable and 4th quartile being the least favorable). With respect to management fees paid to other investment advisors by similar funds, the Board noted that the contractual fee rates paid by the Fund, which include a 0.10% fee paid to DIMA under the Fund’s administrative services agreement, were higher than the median (4th quartile) of the applicable Broadridge peer group (based on Broadridge data provided as of December 31, 2017). The Board noted that, effective October 1, 2017, in connection with the 2017 contract renewal process, DIMA agreed to reduce the Fund’s contractual management fee rate to an annual rate of 0.80%. The Board noted that the Fund’s Class A shares total (net) operating expenses were expected to be lower than the median (2nd quartile) of the applicable Broadridge expense universe (based on Broadridge data provided as of December 31, 2017, and analyzing Broadridge expense universe Class A (net) expenses less any applicable 12b-1 fees) (“Broadridge Universe Expenses”). The Board also reviewed data comparing each share class’s total (net) operating expenses to the applicable Broadridge Universe Expenses. The Board noted that the expense limitations agreed to by DIMA were expected to help the Fund’s total (net) operating expenses remain competitive. The Board considered the Fund’s management fee rate as compared to fees charged by DIMA to a comparable DWS U.S. registered fund (“DWS Funds”) and considered differences between the Fund and the comparable DWS Fund. The information requested by the Board as part of its review of fees and expenses also included information about institutional accounts (including any sub-advised funds and accounts) and funds offered primarily to European investors (“DWS Europe Funds”) managed by DWS Group. The Board noted that DIMA indicated that DWS Group manages an institutional account comparable to the Fund, but that DWS Group does not manage any comparable DWS Europe Funds. The Board took note of the differences in services provided to DWS Funds as compared to institutional accounts and that such differences made comparison difficult.
On the basis of the information provided, the Board concluded that management fees were reasonable and appropriate in light of the nature, quality and extent of services provided by DIMA.
Profitability.The Board reviewed detailed information regarding revenues received by DIMA under the Agreement. The Board considered the estimated costs to DIMA, and pre-tax profits realized by DIMA, from advising the DWS Funds, as well as estimates of the pre-tax profits attributable to managing the Fund in particular. The Board also received information regarding the estimated enterprise-wide profitability of DIMA and its affiliates with respect to all fund services in totality and by fund. The Board and the Fee Consultant reviewed DIMA’s methodology in allocating its costs to the management of the Fund. Based on the information provided, the Board concluded that the pre-tax profits realized by DIMA in connection with the management of the Fund were not unreasonable. The Board also reviewed certain publicly available information regarding the profitability of certain similar investment management firms. The Board noted that, while information regarding the profitability of such firms is limited (and in some cases is not necessarily prepared on a comparable basis), DIMA and its affiliates’ overall profitability with respect to the DWS Funds (after taking into account distribution and other services provided to the funds by DIMA and its affiliates) was lower than the overall profitability levels of most comparable firms for which such data was available.
Economies of Scale.The Board considered whether there are economies of scale with respect to the management of the Fund and whether the Fund benefits from any economies of scale. In this regard, the Board observed that while the Fund’s current investment management fee schedule does not include breakpoints, the Fund’s fee schedule represents an appropriate sharing between the Fund and DIMA of such economies of scale as may exist in the management of the Fund at current asset levels.
| | | | | | |
| | 22 | | | | | | Deutsche DWS Variable Series I — DWS Global Small Cap VIP |
Other Benefits to DIMA and Its Affiliates.The Board also considered the character and amount of other incidental or “fall-out” benefits received by DIMA and its affiliates, including any fees received by DIMA for administrative services provided to the Fund, any fees received by an affiliate of DIMA for transfer agency services provided to the Fund and any fees received by an affiliate of DIMA for distribution services. The Board also considered benefits to DIMA related to brokerage and soft-dollar allocations, including allocating brokerage to pay for research generated by parties other than the executing broker dealers, which pertain primarily to funds investing in equity securities. In addition, the Board considered the incidental public relations benefits to DIMA related to DWS Funds advertising and cross-selling opportunities among DIMA products and services. The Board considered these benefits in reaching its conclusion that the Fund’s management fees were reasonable.
Compliance.The Board considered the significant attention and resources dedicated by DIMA to its compliance processes in recent years. The Board noted in particular (i) the experience, seniority and time commitment of the individuals serving as DIMA’s and the Fund’s chief compliance officers and (ii) the substantial commitment of resources by DIMA and its affiliates to compliance matters, including the retention of compliance personnel.
Based on all of the information considered and the conclusions reached, the Board unanimously determined that the continuation of the Agreement is in the best interests of the Fund. In making this determination, the Board did not give particular weight to any single factor identified above. The Board considered these factors over the course of numerous meetings, certain of which were in executive session with only the Independent Trustees and counsel present. It is possible that individual Independent Trustees may have weighed these factors differently in reaching their individual decisions to approve the continuation of the Agreement.
| | | | |
Deutsche DWS Variable Series I — DWS Global Small Cap VIP | | | | | 23 |
Board Members and Officers
The following table presents certain information regarding the Board Members and Officers of the Fund. Each Board Member’s year of birth is set forth in parentheses after his or her name. Unless otherwise noted, (i) each Board Member has engaged in the principal occupation(s) noted in the table for at least the most recent five years, although not necessarily in the same capacity; and (ii) the address of each Independent Board Member is c/o Keith R. Fox, DWS Funds Board Chair, c/o Thomas R. Hiller, Ropes & Gray LLP, Prudential Tower, 800 Boylston Street, Boston, MA02199-3600. Except as otherwise noted below, the term of office for each Board Member is until the election and qualification of a successor, or until such Board Member sooner dies, resigns, is removed or as otherwise provided in the governing documents of the Fund. Because the Fund does not hold an annual meeting of shareholders, each Board Member will hold office for an indeterminate period. The Board Members may also serve in similar capacities with other funds in the fund complex.
| | | | | | | | |
| Independent Board Members | | | | | | |
Name, Year of Birth,
Position with the Fund and
Length of Time Served1 | | Business Experience and Directorships During the Past Five Years | | Number of
Funds in
DWS Fund
Complex
Overseen | | | Other
Directorships
Held by Board
Member
|
Keith R. Fox, CFA (1954) Chairperson since 2017, and Board Member since 1996 | | Managing General Partner, Exeter Capital Partners (a series of private investment funds) (since 1986). Directorships: Progressive International Corporation (kitchen goods importer and distributor); The Kennel Shop (retailer); former Chairman, National Association of Small Business Investment Companies; former Directorships: BoxTop Media Inc. (advertising); Sun Capital Advisers Trust (mutual funds) (2011–2012) | | | 82 | | | — |
John W. Ballantine (1946) Board Member since 1999 | | Retired; formerly, Executive Vice President and Chief Risk Management Officer, First Chicago NBD Corporation/The First National Bank of Chicago (1996–1998); Executive Vice President and Head of International Banking (1995–1996); former Directorships: Director and former Chairman of the Board, Healthways, Inc.2 (population well-being and wellness services) (2003–2014); Stockwell Capital Investments PLC (private equity); Enron Corporation; FNB Corporation; Tokheim Corporation; First Oak Brook Bancshares, Inc. and Oak Brook Bank; Prisma Energy International; Public Radio International. Not-for-Profit Director, Trustee: Palm Beach Civic Association; Window to the World Communications (public media); Harris Theater for Music and Dance (Chicago); Life Director of Hubbard Street Dance Chicago | | | 82 | | | Portland
General
Electric2
(utility
company)
(2003–
present) |
Henry P. Becton, Jr. (1943) Board Member since 1990 | | Vice Chair and former President, WGBH Educational Foundation. Directorships: Public Radio International; Public Radio Exchange (PRX); The Pew Charitable Trusts (charitable organization); Massachusetts Humane Society; Overseer of the New England Conservatory; former Directorships: Becton Dickinson and Company2 (medical technology company); Belo Corporation2 (media company); The PBS Foundation; Association of Public Television Stations; Boston Museum of Science; American Public Television; Concord Academy; New England Aquarium; Mass. Corporation for Educational Telecommunications; Committee for Economic Development; Public Broadcasting Service; Connecticut College; North Bennett Street School (Boston); American Documentary, Inc. (public media) | | | 82 | | | — |
Dawn-Marie Driscoll (1946) Board Member since 1987 | | Emeritus Executive Fellow, Center for Business Ethics, Bentley University; formerly: President, Driscoll Associates (consulting firm); Partner, Palmer & Dodge (law firm) (1988–1990); Vice President of Corporate Affairs and General Counsel, Filene’s (retail) (1978–1988). Directorships: Advisory Board, Center for Business Ethics, Bentley University; Trustee and former Chairman of the Board, Southwest Florida Community Foundation (charitable organization); former Directorships: ICI Mutual Insurance Company (2007–2015); Sun Capital Advisers Trust (mutual funds) (2007–2012), Investment Company Institute (audit, executive, nominating committees) and Independent Directors Council (governance, executive committees) | | | 82 | | | — |
Paul K. Freeman* (1950) Board Member since 1993 | | Consultant, WorldBank/Inter-American Development Bank; Independent Directors Council (former chair); Investment Company Institute (executive committee); Adjunct Professor, University of Denver Law School (2017–present); formerly: Chairman of Education Committee of Independent Directors Council; Project Leader, International Institute for Applied Systems Analysis (1998–2001); Chief Executive Officer, The Eric Group, Inc. (environmental insurance) (1986–1998); Directorships: Knoebel Institute for Healthy Aging, University of Denver (2017–present); former Directorships: Prisma Energy International; Denver Zoo Foundation (2012–2018) | | | 82 | | | — |
| | | | | | |
| | 24 | | | | | | Deutsche DWS Variable Series I — DWS Global Small Cap VIP |
| | | | | | | | |
Name, Year of Birth,
Position with the Fund and
Length of Time Served1 | | Business Experience and Directorships During the Past Five Years | | Number of
Funds in
DWS Fund
Complex
Overseen | | | Other
Directorships
Held by Board
Member
|
Richard J. Herring (1946) Board Member since 1990 | | Jacob Safra Professor of International Banking and Professor of Finance, The Wharton School, University of Pennsylvania (since July 1972); Director, The Wharton Financial Institutions Center (since 1994); formerly: Vice Dean and Director, Wharton Undergraduate Division (1995–2000) and Director, The Lauder Institute of International Management Studies (2000–2006); Member FDIC Systemic Risk Advisory Committee since 2011, member Systemic Risk Council since 2012 and member of the Advisory Board at the Yale Program on Financial Stability since 2013; Formerly Co-Chair of the Shadow Financial Regulatory Committee (2003–2015), Executive Director of The Financial Economists Roundtable (2008–2015), Director of The Thai Capital Fund (2007–2013), Director of The Aberdeen Singapore Fund (2007–2018), and Nonexecutive Director of Barclays Bank DE (2010–2018) | | | 82 | | | Director,
Aberdeen
Japan Fund
(since 2007) |
William McClayton (1944) Board Member since 2004 | | Private equity investor (since October 2009); previously, Managing Director, Diamond Management & Technology Consultants, Inc. (global consulting firm) (2001–2009); Directorship: Board of Managers, YMCA of Metropolitan Chicago; formerly: Senior Partner, Arthur Andersen LLP (accounting) (1966–2001); Trustee, Ravinia Festival | | | 82 | | | — |
Rebecca W. Rimel (1951) Board Member since 1995 | | President, Chief Executive Officer and Director, The Pew Charitable Trusts (charitable organization) (1994–present); formerly: Executive Vice President, The Glenmede Trust Company (investment trust and wealth management) (1983–2004); Board Member, Investor Education (charitable organization) (2004–2005); Trustee, Executive Committee, Philadelphia Chamber of Commerce (2001–2007); Director, Viasys Health Care2 (January 2007–June 2007); Trustee, Thomas Jefferson Foundation (charitable organization) (1994–2012) | | | 82 | | | Director,
Becton
Dickinson
and
Company2
(medical
technology
company)
(2012–
present);
Director,
BioTelemetry
Inc.2(health
care) (2009–
present) |
William N. Searcy, Jr. (1946) Board Member since 1993 | | Private investor since October 2003; formerly: Pension & Savings Trust Officer, Sprint Corporation2(telecommunications) (November 1989–September 2003); Trustee, Sun Capital Advisers Trust (mutual funds) (1998–2012) | | | 82 | | | — |
Jean Gleason Stromberg (1943) Board Member since 1997 | | Retired. Formerly, Consultant (1997–2001); Director, Financial Markets U.S. Government Accountability Office (1996–1997); Partner, Norton Rose Fulbright, L.L.P. (law firm) (1978–1996); former Directorships: The William and Flora Hewlett Foundation (charitable organization) (2000–2015); Service Source, Inc. (nonprofit), Mutual Fund Directors Forum (2002–2004), American Bar Retirement Association (funding vehicle for retirement plans) (1987–1990 and 1994–1996) | | | 82 | | | — |
| | |
| Officers4 | | |
Name, Year of Birth, Position with the Fund and Length of Time Served5 | | Business Experience and Directorships During the Past Five Years |
Hepsen Uzcan6 (1974) President and Chief Executive Officer, 2017–present Assistant Secretary, 2013–present | | Managing Director,3 DWS; Secretary, DWS USA Corporation (since March 2018); Assistant Secretary, DWS Distributors, Inc. (since June 25, 2018); Director and Vice President, DWS Service Company (since June 25, 2018); Assistant Secretary, DWS Investment Management Americas, Inc. (since June 25, 2018); and Director and President, DB Investment Managers, Inc. (since June 25, 2018); formerly: Vice President for the Deutsche funds (2016–2017) |
John Millette8(1962) Vice President and Secretary, 1999–present | | Director,3DWS; Chief Legal Officer, DWS Investment Management Americas, Inc. (2015–present); and Director and Vice President, DWS Trust Company (2016–present); formerly: Secretary, Deutsche Investment Management Americas Inc. (2015–2017) |
Diane Kenneally8,9 (1966) Treasurer and Chief Financial Officer since 2018 | | Director,3 DWS; formerly: Assistant Treasurer for the DWS funds (2007–2018) |
Caroline Pearson8(1962) Chief Legal Officer, 2010–present | | Managing Director,3DWS; formerly: Secretary, Deutsche AM Distributors, Inc. (2002–2017); and Secretary, Deutsche AM Service Company (2010–2017) |
Scott D. Hogan8(1970) Chief Compliance Officer, 2016–present | | Director,3DWS |
| | | | |
Deutsche DWS Variable Series I — DWS Global Small Cap VIP | | | | | 25 |
| | |
Name, Year of Birth, Position with the Fund and Length of Time Served5 | | Business Experience and Directorships During the Past Five Years |
Wayne Salit7(1967) Anti-Money Laundering Compliance Officer, 2014–present | | Director,3 Deutsche Bank; and AML Officer, DWS Trust Company; formerly: Managing Director, AML Compliance Officer at BNY Mellon (2011–2014); and Director, AML Compliance Officer at Deutsche Bank (2004–2011) |
Sheila Cadogan8(1966) Assistant Treasurer, 2017–present | | Director,3DWS; Director and Vice President, DWS Trust Company (since 2018) |
Paul Antosca8(1957) Assistant Treasurer, 2007–present | | Director,3DWS |
| 1 | The length of time served represents the year in which the Board Member joined the board of one or more DWS funds currently overseen by the Board. |
| 2 | A publicly held company with securities registered pursuant to Section 12 of the Securities Exchange Act of 1934. |
| 3 | Executive title, not a board directorship. |
| 4 | As a result of their respective positions held with the Advisor or its affiliates, these individuals are considered “interested persons” of the Advisor within the meaning of the 1940 Act. Interested persons receive no compensation from the Fund. |
| 5 | The length of time served represents the year in which the officer was first elected in such capacity for one or more DWS funds. |
| 6 | Address: 345 Park Avenue, New York, NY 10154. |
| 7 | Address: 60 Wall Street, New York, NY 10005. |
| 8 | Address: One International Place, Boston, MA 02110. |
| 9 | Appointed Treasurer and Chief Financial Officer effective July 2, 2018. |
| * | Paul K. Freeman retired from the Board effective December 31, 2018. |
The Fund’s Statement of Additional Information (“SAI”) includes additional information about the Board Members. The SAI is available, without charge, upon request. If you would like to request a copy of the SAI, you may do so by calling the followingtoll-free number:(800) 728-3337.
| | | | | | |
| | 26 | | | | | | Deutsche DWS Variable Series I — DWS Global Small Cap VIP |
Notes
| | |
| | |
VS1glosc-2 (R-025821-8 2/19) | | |
| | |
| ITEM 2. | CODE OF ETHICS |
| | |
| | As of the end of the period covered by this report, the registrant has adopted a code of ethics, as defined in Item 2 of Form N-CSR that applies to its Principal Executive Officer and Principal Financial Officer. There have been no amendments to, or waivers from, a provision of the code of ethics during the period covered by this report that would require disclosure under Item 2. A copy of the code of ethics is filed as an exhibit to this Form N-CSR. |
| | |
| ITEM 3. | AUDIT COMMITTEE FINANCIAL EXPERT |
| | |
| | The fund’s audit committee is comprised solely of trustees who are "independent" (as such term has been defined by the Securities and Exchange Commission ("SEC") in regulations implementing Section 407 of the Sarbanes-Oxley Act (the "Regulations")). The fund’s Board of Trustees has determined that there are several "audit committee financial experts" (as such term has been defined by the Regulations) serving on the fund’s audit committee including Mr. William McClayton, the chair of the fund’s audit committee. An “audit committee financial expert” is not an “expert” for any purpose, including for purposes of Section 11 of the Securities Act of 1933 and the designation or identification of a person as an “audit committee financial expert” does not impose on such person any duties, obligations or liability that are greater than the duties, obligations and liability imposed on such person as a member of the audit committee and board of directors in the absence of such designation or identification. |
| | |
| ITEM 4. | PRINCIPAL ACCOUNTANT FEES AND SERVICES |
| | |
Deutsche DWS Variable Series I
form n-csr disclosure re: AUDIT FEES
The following table shows the amount of fees that PricewaterhouseCoopers, LLP (“PWC”), the Fund’s independent registered public accounting firm, billed to the Fund during the Fund’s last two fiscal years. The Audit Committee approved in advance all audit services and non-audit services that PWC provided to the Fund.
Services that the Fund’s Independent Registered Public Accounting Firm Billed to the Fund
Fiscal Year
Ended
December 31, | Audit Fees Billed to Fund | Audit-Related
Fees Billed to Fund | Tax Fees Billed to Fund | All
Other Fees Billed to Fund |
| 2018 | $308,062 | $0 | $0 | $5,520 |
| 2017 | $299,569 | $0 | $0 | $4,500 |
“All Other Fees Billed to the Fund” were billed for services associated with foreign tax filings.
Services that the Fund’s Independent Registered Public Accounting Firm Billed to the Adviser and Affiliated Fund Service Providers
The following table shows the amount of fees billed by PWC to DWS Investment Management Americas Inc. (“DIMA” or the “Adviser”), and any entity controlling, controlled by or under common control with DIMA (“Control Affiliate”) that provides ongoing services to the Fund (“Affiliated Fund Service Provider”), for engagements directly related to the Fund’s operations and financial reporting, during the Fund’s last two fiscal years.
Fiscal Year Ended
December 31, | Audit-Related
Fees Billed to Adviser and Affiliated Fund Service Providers | Tax Fees Billed to Adviser and Affiliated Fund Service Providers | All
Other Fees Billed to Adviser and Affiliated Fund Service Providers |
| 2018 | $0 | $0 | $0 |
| 2017 | $0 | $0 | $0 |
Non-Audit Services
The following table shows the amount of fees that PWC billed during the Fund’s last two fiscal years for non-audit services. The Audit Committee pre-approved all non-audit services that PWC provided to the Adviser and any Affiliated Fund Service Provider that related directly to the Fund’s operations and financial reporting. The Audit Committee requested and received information from PWC about any non-audit services that PWC rendered during the Fund’s last fiscal year to the Adviser and any Affiliated Fund Service Provider. The Committee considered this information in evaluating PWC’s independence.
Fiscal Year
Ended
December 31, | Total
Non-Audit Fees Billed to Fund (A) | Total Non-Audit Fees billed to Adviser and Affiliated Fund Service Providers (engagements related directly to the operations and financial reporting of the Fund) (B) | Total Non-Audit Fees billed to Adviser and Affiliated Fund Service Providers (all other engagements) (C) | Total of (A), (B)
and (C) |
| 2018 | $5,520 | $0 | $0 | $5,520 |
| 2017 | $4,500 | $0 | $0 | $4,500 |
Audit Committee Pre-Approval Policies and Procedures. Generally, each Fund’s Audit Committee must pre approve (i) all services to be performed for a Fund by a Fund’s Independent Registered Public Accounting Firm and (ii) all non-audit services to be performed by a Fund’s Independent Registered Public Accounting Firm for the DIMA Entities with respect to operations and financial reporting of the Fund, except that the Chairperson or Vice Chairperson of each Fund’s Audit Committee may grant the pre-approval for non-audit services described in items (i) and (ii) above for non-prohibited services for engagements of less than $100,000. All such delegated pre approvals shall be presented to each Fund’s Audit Committee no later than the next Audit Committee meeting.
There were no amounts that were approved by the Audit Committee pursuant to the de minimis exception under Rule 2-01 of Regulation S-X.
According to the registrant’s principal Independent Registered Public Accounting Firm, substantially all of the principal Independent Registered Public Accounting Firm's hours spent on auditing the registrant's financial statements were attributed to work performed by full-time permanent employees of the principal Independent Registered Public Accounting Firm.
***
In connection with the audit of the 2017 and 2018 financial statements, the Fund entered into an engagement letter with PwC. The terms of the engagement letter required by PwC, and agreed to by the Fund’s Audit Committee, include a provision mandating the use of mediation and arbitration to resolve any controversy or claim between the parties arising out of or relating to the engagement letter or the services provided there-under.
***
Pursuant to PCAOB Rule 3526, PwC is required to describe in writing to the Fund’s Audit Committee, on at least an annual basis, all relationships between PwC, or any of its affiliates, and the DWS Funds, including the Fund, or persons in financial reporting oversight roles at the DWS Funds that, as of the date of the communication, may reasonably be thought to bear on PwC’s independence. Pursuant to PCAOB Rule 3526, PwC has reported the matters set forth below that may reasonably be thought to bear on PwC’s independence. In its PCAOB Rule 3526 communications to the Audit Committee, PwC affirmed that they are independent accountants with respect to the DWS Funds, within the meaning of PCAOB Rule 3520. PwC also informed the Audit Committee that they concluded that a reasonable investor with knowledge of all relevant facts and circumstances would conclude that PwC is capable of exercising objective and impartial judgment on all issues encompassed within PwC’s audit of the financial statements of the Fund. Finally, PwC confirmed to the Audit Committee that they can continue to serve as the independent registered public accounting firm for the Fund.
| · | PwC advised the Fund’s Audit Committee that covered persons within PwC that provided non-audit services to entities within the DWS Funds “investment company complex” (as defined in Regulation S-X) (the “DWS Funds Complex”) maintained financial relationships with investment companies within the DWS Funds Complex. PwC informed the Audit Committee that these financial relationships were inconsistent with Rule 2-01(c)(1) of Regulation S-X. PwC reported that the breaches have been resolved and that, among other things, the breaches (i) did not involve professionals who were part of the audit engagement team for the Fund or in a position to influence the audit engagement team, (ii) involved professionals whose non-audit services were not and will not be utilized or relied upon by the audit engagement team in the audit of the financial statements of the Fund and (iii) involved professionals that did not provide any consultation to the audit engagement team of the Fund. |
| · | PwC advised the Fund’s Audit Committee of certain lending relationships of PwC with owners of greater than 10% of the shares of certain investment companies within the DWS Funds Complex that PwC had identified as inconsistent with Rule 2-01(c)(l)(ii)(A) of Regulation S-X (referred to as the “Loan Rule”). The Loan Rule specifically provides that an accounting firm would not be independent if it receives a loan from a lender that is a record or beneficial owner of more than ten percent of an audit client’s equity securities. For purposes of the Loan Rule, an audit client includes the Fund as well as all other investment companies in the DWS Funds Complex. PwC’s lending relationships affect PwC’s independence under the Loan Rule with respect to all investment companies in the DWS Funds Complex. |
PwC stated that, in each lending relationship, (i) PwC believes that it is unlikely the lenders would have any interest in the outcome of the audit of the Fund and therefore would not seek to influence the outcome of the audit, (ii) no third party made an attempt to influence the outcome of the audit of the Fund and even if an attempt was made, PwC professionals are required to disclose any relationships that may raise issues about objectivity, confidentiality, independence, conflicts of interest or favoritism, and (iii) the lenders typically lack influence over the investment adviser, who controls the management of the Fund. In addition, on June 20, 2016, the SEC Staff issued a “no-action” letter to another mutual fund complex, Fidelity Management & Research Company et al., SEC Staff No-Action Letter (June 20, 2016) (the “Fidelity Letter”), related to similar Loan Rule issues as those described above. In the Fidelity Letter, the SEC Staff confirmed that it would not recommend enforcement action against an investment company that relied on the audit services performed by an audit firm that was not in compliance with the Loan Rule in certain specified circumstances. With respect to each lending relationship identified by PwC, the circumstances described in the Fidelity Letter appear to be substantially similar to the circumstances that affected PwC’s independence under the Loan Rule with respect to the Fund. PwC represented that they have complied with PCAOB Rule 3526(b)(1) and (2), which are conditions to the Fund relying on the no action letter, and affirmed that they are independent accountants within the meaning of PCAOB Rule 3520.
| | |
| ITEM 5. | AUDIT COMMITTEE OF LISTED REGISTRANTS |
| | |
| | Not applicable |
| | |
| ITEM 6. | SCHEDULE OF INVESTMENTS |
| | |
| | Not applicable |
| | |
| ITEM 7. | DISCLOSURE OF PROXY VOTING POLICIES AND PROCEDURES FOR CLOSED-END MANAGEMENT INVESTMENT COMPANIES |
| | |
| | Not applicable |
| | |
| ITEM 8. | PORTFOLIO MANAGERS OF CLOSED-END MANAGEMENT INVESTMENT COMPANIES |
| | |
| | Not applicable |
| | |
| ITEM 9. | PURCHASES OF EQUITY SECURITIES BY CLOSED-END MANAGEMENT INVESTMENT COMPANY AND AFFILIATED PURCHASERS |
| | |
| | Not applicable |
| | |
| ITEM 10. | SUBMISSION OF MATTERS TO A VOTE OF SECURITY HOLDERS |
| | |
| | There were no material changes to the procedures by which shareholders may recommend nominees to the Fund’s Board. The primary function of the Nominating and Governance Committee is to identify and recommend individuals for membership on the Board and oversee the administration of the Board Governance Guidelines. Shareholders may recommend candidates for Board positions by forwarding their correspondence by U.S. mail or courier service to Keith R. Fox, DWS Funds Board Chair, c/o Thomas R. Hiller, Ropes & Gray LLP, Prudential Tower, 800 Boylston Street, Boston, MA 02199-3600. |
| | |
| ITEM 11. | CONTROLS AND PROCEDURES |
| | |
| | (a) | The Chief Executive and Financial Officers concluded that the Registrant’s Disclosure Controls and Procedures are effective based on the evaluation of the Disclosure Controls and Procedures as of a date within 90 days of the filing date of this report. |
| | |
| | (b) | There have been no changes in the registrant’s internal control over financial reporting that occurred during the second fiscal quarter of the period covered by this report that has materially affected, or is reasonably likely to materially affect, the registrant’s internal controls over financial reporting. |
| | |
| ITEM 12. | Disclosure of Securities Lending Activities for Closed-End Management Investment Companies |
| | |
| | Not applicable |
| | |
| ITEM 13. | EXHIBITS |
| | |
| | (a)(1) | Code of Ethics pursuant to Item 2 of Form N-CSR is filed and attached hereto as EX-99.CODE ETH. |
| | |
| | (a)(2) | Certification pursuant to Rule 30a-2(a) under the Investment Company Act of 1940 (17 CFR 270.30a-2(a)) is filed and attached hereto as Exhibit 99.CERT. |
| | |
| | (b) | Certification pursuant to Rule 30a-2(b) under the Investment Company Act of 1940 (17 CFR 270.30a-2(b)) is furnished and attached hereto as Exhibit 99.906CERT. |
SIGNATURES
Pursuant to the requirements of the Securities Exchange Act of 1934 and the Investment Company Act of 1940, the registrant has duly caused this report to be signed on its behalf by the undersigned, thereunto duly authorized.
| Registrant: | Deutsche DWS Variable Series I |
| | |
| | |
| By: | /s/Hepsen Uzcan Hepsen Uzcan President |
| | |
| Date: | 2/15/2019 |
Pursuant to the requirements of the Securities Exchange Act of 1934 and the Investment Company Act of 1940, this report has been signed below by the following persons on behalf of the registrant and in the capacities and on the dates indicated.
| By: | /s/Hepsen Uzcan Hepsen Uzcan President |
| | |
| Date: | 2/15/2019 |
| | |
| | |
| | |
| By: | /s/Diane Kenneally Diane Kenneally Chief Financial Officer and Treasurer |
| | |
| Date: | 2/15/2019 |
| | |