UNITED STATES
SECURITIES AND EXCHANGE COMMISSION
WASHINGTON, D. C. 20549
FORM N-CSR
Investment Company Act file number: 811-04257
Deutsche Variable Series I
(Exact Name of Registrant as Specified in Charter)
345 Park Avenue
New York, NY 10154-0004
(Address of Principal Executive Offices) (Zip Code)
Registrant’s Telephone Number, including Area Code: (212) 250-3220
Paul Schubert
60 Wall Street
New York, NY 10005
(Name and Address of Agent for Service)
| Date of fiscal year end: | 12/31 |
| | |
| Date of reporting period: | 12/31/2016 |
| ITEM 1. | REPORT TO STOCKHOLDERS |

December 31, 2016
Annual Report
Deutsche Variable Series I
Deutsche Bond VIP

Contents
3 Performance Summary 4 Management Summary 5 Portfolio Summary 6 Investment Portfolio 14 Statement of Assets and Liabilities 14 Statement of Operations 15 Statements of Changes in Net Assets 16 Financial Highlights 17 Notes to Financial Statements 25 Report of Independent Registered Public Accounting Firm 26 Information About Your Fund's Expenses 27 Tax Information 27 Proxy Voting 28 Advisory Agreement Board Considerations and Fee Evaluation 31 Board Members and Officers |
This report must be preceded or accompanied by a prospectus. To obtain an additional prospectus or summary prospectus, if available, call (800) 728-3337 or your financial representative. We advise you to consider the Fund's objectives, risks, charges and expenses carefully before investing. The summary prospectus and prospectus contain this and other important information about the Fund. Please read the prospectus carefully before you invest.
Bond investments are subject to interest-rate, credit, liquidity and market risks to varying degrees. When interest rates rise, bond prices generally fall. Credit risk refers to the ability of an issuer to make timely payments of principal and interest. Investments in lower-quality ("junk bonds") and non-rated securities present greater risk of loss than investments in higher-quality securities. Investing in foreign securities, particularly those of emerging markets, presents certain risks, such as currency fluctuations, political and economic changes, and market risks. Emerging markets tend to be more volatile and less liquid than the markets of more mature economies, and generally have less diverse and less mature economic structures and less stable political systems than those of developed countries. Investing in derivatives entails special risks relating to liquidity, leverage and credit that may reduce returns and/or increase volatility. See the prospectus for details.
Deutsche Asset Management represents the asset management activities conducted by Deutsche Bank AG or any of its subsidiaries.
Deutsche AM Distributors, Inc., 222 South Riverside Plaza, Chicago, IL 60606, (800) 621-1148
NOT FDIC/NCUA INSURED NO BANK GUARANTEE MAY LOSE VALUE NOT A DEPOSIT
NOT INSURED BY ANY FEDERAL GOVERNMENT AGENCY
Performance Summary December 31, 2016 (Unaudited)
Fund performance shown is historical, assumes reinvestment of all dividend and capital gain distributions, and does not guarantee future results. Investment return and principal value fluctuate with changing market conditions so that, when redeemed, shares may be worth more or less than their original cost. Current performance may be lower or higher than the performance data quoted. Please contact your participating insurance company for the Fund's most recent month-end performance. Performance doesn't reflect charges and fees ("contract charges") associated with the separate account that invests in the Fund or any variable life insurance policy or variable annuity contract for which the Fund is an investment option. These charges and fees will reduce returns.
The gross expense ratio of the Fund, as stated in the fee table of the prospectus dated May 1, 2016 is 0.69% for Class A shares and may differ from the expense ratio disclosed in the Financial Highlights table in this report.
Generally accepted accounting principles require adjustments to be made to the net assets of the Fund at period end for financial reporting purposes only, and as such, the total return based on the unadjusted net asset value per share may differ from the total return reported in the financial highlights.
| Growth of an Assumed $10,000 Investment |
■ Deutsche Bond VIP — Class A ■ Bloomberg Barclays U.S. Aggregate Bond Index | The Bloomberg Barclays U.S. Aggregate Bond Index is an unmanaged index representing domestic taxable investment-grade bonds, with index components for government and corporate securities, mortgage pass-through securities, and asset-backed securities with an average maturity of one year or more. Index returns do not reflect any fees or expenses and it is not possible to invest directly into an index. |
 | |
| Yearly periods ended December 31 | | |
| Comparative Results |
| Deutsche Bond VIP | 1-Year | 3-Year | 5-Year | 10-Year |
| Class A | Growth of $10,000 | $10,593 | $11,262 | $11,770 | $12,677 |
| Average annual total return | 5.93% | 4.04% | 3.31% | 2.40% |
| Bloomberg Barclays U.S. Aggregate Bond Index | Growth of $10,000 | $10,265 | $10,937 | $11,167 | $15,300 |
| Average annual total return | 2.65% | 3.03% | 2.23% | 4.34% |
The growth of $10,000 is cumulative.
Management Summary December 31, 2016 (Unaudited)
Following the U.S. Federal Reserve Board’s (the Fed) rate hike in December of 2015, markets were expecting a series of additional, modest rate increases to be enacted at upcoming Fed meetings. However, this outlook was upended as 2016 opened with a resurgence of concerns around slowing growth in China and weakness in energy prices, sending credit-based assets lower. Credit sentiment would rally from mid-February on, as investors were encouraged by the outlook for even more gradual Fed policy normalization and increased efforts by overseas central banks to stimulate growth, along with a rebound in oil prices off their January lows. In late June, markets were surprised by the results of a U.K. referendum which resulted in a vote to leave the European Union, leading to an investor flight to safety that pushed U.S. Treasury yields down to historical lows. However, credit-sensitive areas of the market would quickly resume their outperformance against a backdrop of supportive central banks and continued strength in commodity prices. Returns for the broad U.S. fixed-income market would turn negative in the wake of the November 8th U.S. election, as interest rates moved up in anticipation of higher growth and inflation under unified Republican control of the government. U.S. Treasury yields trended higher over November and December and economically sensitive segments of the bond market held up better than their more interest-rate-sensitive, higher-quality counterparts.
During the 12-month period ended December 31, 2016, the portfolio provided a total return of 5.93% (Class A shares, unadjusted for contract charges) compared with the 2.65% return of its benchmark, the Bloomberg Barclays U.S. Aggregate Bond Index.1
The portfolio’s positive performance vs. the benchmark was driven principally by exposure to more credit-sensitive fixed-income sectors. In particular, a significant weighting of investment-grade corporate bonds at the expense of U.S. Treasury securities was a positive contributor to returns during the year.2,3 In addition, out-of-benchmark exposure to U.S. high-yield corporate bonds worked well in an environment of narrowing credit spreads.4 Finally, exposure to structured securities in the commercial mortgage-backed and asset-backed sectors added to relative returns, as improving collateral performance and an increasing appetite for high-quality assets with incremental yield supported both sectors. The managers used derivatives as part of implementing the fund’s positioning along the yield curve as well to hedge against certain risks, with a modest negative impact on performance. While we remain generally constructive on the outlook for credit fundamentals, spreads have tightened in recent quarters and we closed the annual period with an up-in-quality bias within the credit arena. Concerns over the Fed’s resumption of tightening credit conditions are muted, and demand for yield assets continues to be supported by negative interest rates overseas.
John D. Ryan
Gary Russell, CFA
Thomas M. Farina, CFA
Gregory M. Staples, CFA
Portfolio Managers
The views expressed reflect those of the portfolio management team only through the end of the period of the report as stated on the cover. The management team's views are subject to change at any time based on market and other conditions and should not be construed as a recommendation. Past performance is no guarantee of future results. Current and future portfolio holdings are subject to risk.
1 The Bloomberg Barclays U.S. Aggregate Bond Index is an unmanaged, market-value-weighted measure of Treasury issues, agency issues, corporate bond issues and mortgage securities. Index returns, unlike fund returns, do not reflect any fees or expenses. It is not possible to invest directly into an index.
2 "Overweight" means the fund holds a higher weighting in a given sector or security than the benchmark. "Underweight" means the fund holds a lower weighting.
3 Contributors and detractors incorporate both a holding’s return and its weight. If two holdings have the same return but one has a larger weighting in the fund, it will have a larger contribution to return in the period.
4 Credit spread is the additional yield provided by lower-rated bonds vs. higher-rated bonds with comparable effective maturities.
Portfolio Summary (Unaudited)
| Asset Allocation (As a % of Total Net Assets) | 12/31/16 | 12/31/15 |
| | | |
| Corporate Bonds | 49% | 22% |
| Government & Agency Obligations | 23% | 41% |
| Mortgage-Backed Securities Pass-Throughs | 19% | 23% |
| Asset-Backed | 5% | 2% |
| Collateralized Mortgage Obligations | 3% | 8% |
| Commercial Mortgage-Backed Securities | 2% | 4% |
| Short-Term U.S. Treasury Obligations | 1% | 1% |
| Municipal Bonds and Notes | — | 1% |
| Cash Equivalents, Securities Lending Collateral and other Assets and Liabilities, net | –2% | –2% |
| | 100% | 100% |
| Quality (Excludes Cash Equivalents and Securities Lending Collateral) | 12/31/16 | 12/31/15 |
| | | |
| AAA | 47% | 65% |
| AA | 5% | 3% |
| A | 10% | 4% |
| BBB | 22% | 15% |
| BB or Below | 15% | 9% |
| Not Rated | 1% | 4% |
| | 100% | 100% |
| Interest Rate Sensitivity | 12/31/16 | 12/31/15 |
| | | |
| Effective Maturity | 8.7 years | 7.4 years |
| Effective Duration | 5.9 years | 7.1 years |
The quality ratings represent the higher of Moody's Investors Service, Inc. ("Moody's"), Fitch Ratings, Inc. ("Fitch") or Standard & Poor's Corporation ("S&P") credit ratings. The ratings of Moody's, Fitch and S&P represent their opinions as to the quality of the securities they rate. Credit quality measures a bond issuer's ability to repay interest and principal in a timely manner. Ratings are relative and subjective and are not absolute standards of quality. Credit quality does not remove market risk and is subject to change.
Effective maturity is the weighted average of the maturity date of bonds held by the Fund taking into consideration any available maturity shortening features.
Effective duration is an approximate measure of the Fund's sensitivity to interest rate changes taking into consideration any maturity shortening features.
Portfolio holdings and characteristics are subject to change.
For more complete details about the Fund's investment portfolio, see page 6.
Following the Fund's fiscal first and third quarter-end, a complete portfolio holdings listing is filed with the SEC on Form N-Q. The form will be available on the SEC's Web site at sec.gov, and it also may be reviewed and copied at the SEC's Public Reference Room in Washington, D.C. Information on the operation of the SEC's Public Reference Room may be obtained by calling (800) SEC-0330. The Fund's portfolio holdings are also posted on deutschefunds.com from time to time. Please see the Fund's current prospectus for more information.
Investment Portfolio December 31, 2016
| | Principal Amount ($)(a) | Value ($) |
| | | | | |
| Corporate Bonds 48.9% |
| Consumer Discretionary 6.6% |
| AMC Networks, Inc., 5.0%, 4/1/2024 | 265,000 | 266,325 |
| Charter Communications Operating LLC: | |
| | 3.579%, 7/23/2020 | | 90,000 | 91,821 |
| | 4.908%, 7/23/2025 | | 673,000 | 709,295 |
| | 6.484%, 10/23/2045 | | 50,000 | 57,804 |
| Cox Communications, Inc., 144A, 3.35%, 9/15/2026 | 105,000 | 100,268 |
| CVS Health Corp., 5.125%, 7/20/2045 | 110,000 | 122,589 |
| Ford Motor Co., 5.291%, 12/8/2046 | 105,000 | 106,364 |
| General Motors Co.: |
| | 6.6%, 4/1/2036 | | 55,000 | 62,865 |
| | 6.75%, 4/1/2046 | | 50,000 | 58,635 |
| General Motors Financial Co., Inc.: |
| | 2.4%, 5/9/2019 | | 160,000 | 159,576 |
| | 3.2%, 7/13/2020 | | 200,000 | 200,602 |
| | 3.2%, 7/6/2021 | | 190,000 | 188,415 |
| Hilton Domestic Operating Co., Inc., 144A, 4.25%, 9/1/2024 | 310,000 | 300,700 |
| International Game Technology PLC, 144A, 6.5%, 2/15/2025 | 300,000 | 321,750 |
| Lennar Corp., 4.75%, 11/15/2022 | 300,000 | 307,500 |
| NCL Corp., Ltd., 144A, 4.75%, 12/15/2021 | | 595,000 | 594,631 |
| PulteGroup, Inc., 5.0%, 1/15/2027 | 625,000 | 593,750 |
| Sabre GLBL, Inc., 144A, 5.375%, 4/15/2023 | | 300,000 | 306,000 |
| Time Warner, Inc., 3.8%, 2/15/2027 | 115,000 | 114,347 |
| Toll Brothers Finance Corp., 4.875%, 11/15/2025 | | 300,000 | 294,750 |
| Walgreens Boots Alliance, Inc., 4.8%, 11/18/2044 | 90,000 | 92,503 |
| | 5,050,490 |
| Consumer Staples 1.6% |
| Aramark Services, Inc., 144A, 4.75%, 6/1/2026 | | 350,000 | 346,500 |
| Danone SA, 144A, 2.947%, 11/2/2026 | 225,000 | 214,714 |
| Kraft Heinz Foods Co., 4.375%, 6/1/2046 | | 115,000 | 108,212 |
| Minerva Luxembourg SA, 144A, 6.5%, 9/20/2026 | 276,000 | 265,995 |
| Molson Coors Brewing Co.: |
| | 3.0%, 7/15/2026 | | 105,000 | 99,258 |
| | 4.2%, 7/15/2046 | | 120,000 | 111,879 |
| PepsiCo, Inc., 4.45%, 4/14/2046 | 50,000 | 53,254 |
| | 1,199,812 |
| Energy 6.9% |
| Anadarko Petroleum Corp.: |
| | 4.85%, 3/15/2021 (b) | | 40,000 | 42,890 |
| | 5.55%, 3/15/2026 (b) | | 90,000 | 100,733 |
| Concho Resources, Inc., 5.5%, 4/1/2023 | 150,000 | 155,445 |
| ConocoPhillips Co., 4.15%, 11/15/2034 | 100,000 | 97,744 |
| Continental Resources, Inc., 5.0%, 9/15/2022 (b) | | 150,000 | 151,409 |
| Enbridge, Inc., 5.5%, 12/1/2046 | 120,000 | 128,402 |
| Encana Corp., 5.15%, 11/15/2041 | 145,000 | 131,582 |
| | Principal Amount ($)(a) | Value ($) |
| | | | | |
| Energy Transfer Partners LP, 5.95%, 10/1/2043 | | 90,000 | 92,756 |
| Ensco PLC, 4.7%, 3/15/2021 | | 90,000 | 86,573 |
| Halliburton Co., 4.85%, 11/15/2035 | 195,000 | 205,652 |
| Kinder Morgan Energy Partners LP: |
| | 4.7%, 11/1/2042 | | 110,000 | 102,486 |
| | 6.375%, 3/1/2041 | | 20,000 | 21,695 |
| Marathon Oil Corp., 5.2%, 6/1/2045 | 150,000 | 141,383 |
| Newfield Exploration Co., 5.75%, 1/30/2022 | | 150,000 | 158,063 |
| Noble Holding International Ltd.: |
| | 5.25%, 3/16/2018 | | 30,000 | 29,925 |
| | 7.75%, 1/15/2024 | | 650,000 | 611,390 |
| ONEOK Partners LP, 3.375%, 10/1/2022 | | 70,000 | 70,292 |
| Petrobras Global Finance BV, 8.375%, 5/23/2021 | | 575,000 | 619,563 |
| Petroleos Mexicanos: |
| | 144A, 4.625%, 9/21/2023 | | 135,000 | 131,328 |
| | 144A, 5.375%, 3/13/2022 | | 157,000 | 160,765 |
| Plains All American Pipeline LP: |
| | 2.85%, 1/31/2023 | | 165,000 | 155,981 |
| | 4.3%, 1/31/2043 | | 15,000 | 12,428 |
| | 4.5%, 12/15/2026 | | 165,000 | 167,384 |
| Range Resources Corp., 4.875%, 5/15/2025 | | 150,000 | 145,313 |
| Regency Energy Partners LP, 4.5%, 11/1/2023 | | 130,000 | 131,914 |
| Rosneft Finance SA, 144A, 7.25%, 2/2/2020 | | 400,000 | 438,108 |
| Sabine Pass Liquefaction LLC, 144A, 5.0%, 3/15/2027 | 705,000 | 711,169 |
| Shell International Finance BV, 4.0%, 5/10/2046 | 75,000 | 71,719 |
| Sunoco Logistics Partners Operations LP, 5.3%, 4/1/2044 | 90,000 | 86,894 |
| Valero Energy Corp., 3.4%, 9/15/2026 | 150,000 | 143,702 |
| | 5,304,688 |
| Financials 12.9% |
| AerCap Ireland Capital Ltd., 3.95%, 2/1/2022 | | 590,000 | 595,162 |
| AIA Group Ltd., 144A, 4.5%, 3/16/2046 | 200,000 | 199,617 |
| Air Lease Corp., 3.0%, 9/15/2023 | 130,000 | 124,200 |
| ANZ New Zealand International Ltd., 144A, 2.125%, 7/28/2021 | 200,000 | 194,588 |
| Apollo Investment Corp., 5.25%, 3/3/2025 | | 120,000 | 116,781 |
| Ares Capital Corp.: |
| | 3.625%, 1/19/2022 | | 180,000 | 174,498 |
| | 3.875%, 1/15/2020 | | 200,000 | 202,795 |
| Banco de Bogota SA, 144A, 6.25%, 5/12/2026 | | 226,000 | 230,520 |
| Bank of America Corp., 3.5%, 4/19/2026 | | 150,000 | 148,001 |
| Banque Federative du Credit Mutuel SA, 144A, 2.5%, 4/13/2021 | 205,000 | 203,724 |
| Barclays Bank PLC, 144A, 6.05%, 12/4/2017 | | 470,000 | 485,551 |
| BBVA Bancomer SA, 144A, 6.75%, 9/30/2022 | | 250,000 | 272,500 |
| Blackstone Holdings Finance Co., LLC, 144A, 5.0%, 6/15/2044 | 50,000 | 49,320 |
| | Principal Amount ($)(a) | Value ($) |
| | | | | |
| Branch Banking & Trust Co., 1.45%, 5/10/2019 | | 180,000 | 177,996 |
| Capital One NA, 2.95%, 7/23/2021 | 510,000 | 511,890 |
| Credit Agricole SA, 144A, 2.375%, 7/1/2021 | | 250,000 | 246,166 |
| Credit Suisse Group Funding Guernsey Ltd., 3.8%, 6/9/2023 | 250,000 | 249,724 |
| Everest Reinsurance Holdings, Inc., 4.868%, 6/1/2044 | 100,000 | 96,991 |
| FS Investment Corp., 4.75%, 5/15/2022 | | 150,000 | 149,571 |
| GE Capital International Funding Co. Unlimited Co., 4.418%, 11/15/2035 | | 200,000 | 209,581 |
| HSBC Holdings PLC: |
| | 4.375%, 11/23/2026 | | 200,000 | 201,485 |
| | 6.375%, 12/29/2049 (b) | | 410,000 | 407,950 |
| Jefferies Group LLC, 5.125%, 4/13/2018 | | 160,000 | 165,384 |
| JPMorgan Chase & Co., 2.95%, 10/1/2026 | | 215,000 | 205,215 |
| KKR Group Finance Co. III LLC, 144A, 5.125%, 6/1/2044 | 70,000 | 66,091 |
| Legg Mason, Inc., 5.625%, 1/15/2044 | 100,000 | 97,380 |
| Loews Corp., 4.125%, 5/15/2043 | 80,000 | 76,751 |
| Macquarie Group Ltd., 144A, 6.0%, 1/14/2020 | | 390,000 | 422,532 |
| Manulife Financial Corp.: |
| | 4.9%, 9/17/2020 | | 80,000 | 85,819 |
| | 5.375%, 3/4/2046 | | 110,000 | 125,492 |
| Massachusetts Mutual Life Insurance Co., 144A, 4.5%, 4/15/2065 | 30,000 | 27,516 |
| Morgan Stanley, 3.125%, 7/27/2026 | 150,000 | 143,306 |
| Nationwide Building Society, 144A, 2.45%, 7/27/2021 | 200,000 | 197,342 |
| Nationwide Financial Services, Inc., 144A, 5.3%, 11/18/2044 | 90,000 | 93,721 |
| QBE Insurance Group Ltd., 144A, 2.4%, 5/1/2018 | 260,000 | 260,284 |
| Royal Bank of Scotland Group PLC, 3.875%, 9/12/2023 | 200,000 | 192,051 |
| Santander Holdings U.S.A., Inc., 2.7%, 5/24/2019 | 260,000 | 259,802 |
| Santander UK Group Holdings PLC, 2.875%, 8/5/2021 | 335,000 | 327,581 |
| Societe Generale SA, 144A, 7.375%, 12/29/2049 | | 476,000 | 475,200 |
| Standard Chartered PLC: |
| | 144A, 3.05%, 1/15/2021 | | 200,000 | 199,760 |
| | 144A, 4.05%, 4/12/2026 | | 225,000 | 223,074 |
| Sumitomo Mitsui Financial Group, Inc., 2.058%, 7/14/2021 | 80,000 | 77,375 |
| Suncorp-Metway Ltd., 144A, 2.1%, 5/3/2019 | | 95,000 | 94,384 |
| Swiss Re Treasury U.S. Corp., 144A, 4.25%, 12/6/2042 | 70,000 | 68,359 |
| The Goldman Sachs Group, Inc.: |
| | 3.5%, 11/16/2026 | | 65,000 | 63,504 |
| | 3.75%, 2/25/2026 | | 150,000 | 150,441 |
| Voya Financial, Inc., 4.8%, 6/15/2046 | 120,000 | 116,646 |
| Wells Fargo & Co., 3.0%, 10/23/2026 | 250,000 | 238,099 |
| Woori Bank, 144A, 4.5%, 12/29/2049 | 250,000 | 239,941 |
| | 9,941,661 |
| | Principal Amount ($)(a) | Value ($) |
| | | | | |
| Health Care 2.8% |
| Abbott Laboratories, 2.9%, 11/30/2021 | 180,000 | 179,487 |
| Actavis, Inc., 3.25%, 10/1/2022 | 150,000 | 149,388 |
| Aetna, Inc., 2.8%, 6/15/2023 | | 85,000 | 83,726 |
| Amgen, Inc., 2.6%, 8/19/2026 | 215,000 | 197,743 |
| Anthem, Inc., 3.3%, 1/15/2023 | 60,000 | 59,899 |
| Forest Laboratories LLC, 144A, 4.875%, 2/15/2021 | 170,000 | 182,628 |
| HCA, Inc., 5.25%, 6/15/2026 | | 300,000 | 310,125 |
| Mylan NV, 144A, 5.25%, 6/15/2046 | 170,000 | 156,790 |
| Pfizer, Inc.: |
| | 4.0%, 12/15/2036 | | 120,000 | 122,946 |
| | 4.125%, 12/15/2046 | | 65,000 | 66,122 |
| Shire Acquisitions Investments Ireland DAC, 3.2%, 9/23/2026 | 263,000 | 245,730 |
| Stryker Corp.: |
| | 3.375%, 11/1/2025 | | 80,000 | 79,492 |
| | 4.625%, 3/15/2046 | | 40,000 | 40,787 |
| Teva Pharmaceutical Finance Netherlands III BV, 2.2%, 7/21/2021 | 150,000 | 143,503 |
| UnitedHealth Group, Inc.: |
| | 3.45%, 1/15/2027 | | 50,000 | 50,791 |
| | 4.2%, 1/15/2047 | | 80,000 | 80,920 |
| | 2,150,077 |
| Industrials 1.8% |
| Artesyn Embedded Technologies, Inc., 144A, 9.75%, 10/15/2020 | 15,000 | 13,725 |
| Bombardier, Inc., 144A, 8.75%, 12/1/2021 | | 495,000 | 525,319 |
| CSX Corp., 4.25%, 11/1/2066 | | 80,000 | 73,006 |
| FedEx Corp., 4.55%, 4/1/2046 | 90,000 | 90,694 |
| Molex Electronic Technologies LLC, 144A, 3.9%, 4/15/2025 | 70,000 | 68,859 |
| Northrop Grumman Corp., 3.2%, 2/1/2027 | | 170,000 | 168,198 |
| Spirit AeroSystems, Inc., 5.25%, 3/15/2022 | | 315,000 | 329,103 |
| Transurban Finance Co. Pty Ltd., 144A, 3.375%, 3/22/2027 | 130,000 | 122,835 |
| | 1,391,739 |
| Information Technology 4.5% |
| Activision Blizzard, Inc., 144A, 3.4%, 9/15/2026 | 160,000 | 151,860 |
| Apple, Inc., 3.45%, 2/9/2045 | | 60,000 | 52,959 |
| CDW LLC, 6.0%, 8/15/2022 | | 300,000 | 317,250 |
| Diamond 1 Finance Corp.: |
| | 144A, 3.48%, 6/1/2019 | | 150,000 | 153,121 |
| | 144A, 4.42%, 6/15/2021 | | 120,000 | 124,169 |
| | 144A, 5.875%, 6/15/2021 | | 1,220,000 | 1,297,991 |
| | 144A, 8.1%, 7/15/2036 | | 90,000 | 107,062 |
| eBay, Inc., 3.8%, 3/9/2022 | | 81,000 | 83,684 |
| Fidelity National Information Services, Inc., 3.625%, 10/15/2020 | 140,000 | 144,938 |
| Hewlett Packard Enterprise Co., 3.6%, 10/15/2020 | 90,000 | 91,558 |
| KLA-Tencor Corp., 4.65%, 11/1/2024 | 50,000 | 52,931 |
| Microsoft Corp., 3.45%, 8/8/2036 | 85,000 | 80,781 |
| NVIDIA Corp.: |
| | 2.2%, 9/16/2021 | | 120,000 | 117,132 |
| | 3.2%, 9/16/2026 | | 120,000 | 115,375 |
| | Principal Amount ($)(a) | Value ($) |
| | | | | |
| Quintiles IMS, Inc., 144A, 5.0%, 10/15/2026 | | 250,000 | 250,625 |
| Seagate HDD Cayman, 5.75%, 12/1/2034 | | 110,000 | 93,775 |
| Tencent Holdings Ltd., 144A, 3.8%, 2/11/2025 (b) | | 250,000 | 253,237 |
| | 3,488,448 |
| Materials 5.2% |
| AngloGold Ashanti Holdings PLC, 5.125%, 8/1/2022 (b) | | 250,000 | 248,525 |
| Cemex SAB de CV, 144A, 7.75%, 4/16/2026 | | 200,000 | 221,500 |
| CF Industries, Inc.: |
| | 3.45%, 6/1/2023 | | 850,000 | 764,150 |
| | 144A, 4.5%, 12/1/2026 | | 70,000 | 68,802 |
| Equate Petrochemical BV: |
| | 144A, 3.0%, 3/3/2022 | | 365,000 | 347,648 |
| | 144A, 4.25%, 11/3/2026 | | 440,000 | 419,883 |
| Freeport-McMoRan, Inc., 2.375%, 3/15/2018 | | 150,000 | 148,875 |
| Glencore Funding LLC, 144A, 4.625%, 4/29/2024 | | 40,000 | 40,900 |
| Mexichem SAB de CV, 144A, 5.875%, 9/17/2044 | | 300,000 | 267,375 |
| Potash Corp. of Saskatchewan, Inc., 4.0%, 12/15/2026 | 85,000 | 85,538 |
| Reynolds Group Issuer, Inc., 5.75%, 10/15/2020 | | 325,000 | 335,156 |
| Rio Tinto Finance U.S.A. Ltd., 3.75%, 6/15/2025 | | 90,000 | 92,683 |
| St. Marys Cement, Inc., 144A, 5.75%, 1/28/2027 | 430,000 | 412,800 |
| Teck Resources Ltd., 144A, 8.0%, 6/1/2021 | | 135,000 | 148,500 |
| Yamana Gold, Inc., 4.95%, 7/15/2024 | 405,000 | 396,900 |
| | 3,999,235 |
| Real Estate 3.5% |
| CBL & Associates LP: |
| | (REIT), 4.6%, 10/15/2024 | | 100,000 | 93,734 |
| | (REIT), 5.25%, 12/1/2023 | | 150,000 | 147,492 |
| | (REIT), 5.95%, 12/15/2026 | | 125,000 | 125,826 |
| Crown Castle International Corp., (REIT), 5.25%, 1/15/2023 | 135,000 | 145,294 |
| Equinix, Inc., (REIT), 5.375%, 4/1/2023 | | 345,000 | 357,938 |
| Government Properties Income Trust, (REIT), 3.75%, 8/15/2019 | 110,000 | 111,208 |
| Hospitality Properties Trust, (REIT), 5.0%, 8/15/2022 | 220,000 | 232,256 |
| MGM Growth Properties Operating Partnership LP, 144A, (REIT), 4.5%, 9/1/2026 | 280,000 | 268,800 |
| MPT Operating Partnership LP, (REIT), 5.25%, 8/1/2026 | 50,000 | 49,000 |
| Omega Healthcare Investors, Inc., (REIT), 4.95%, 4/1/2024 | 130,000 | 131,726 |
| Scentre Group Trust 1, 144A, (REIT), 3.5%, 2/12/2025 | 160,000 | 157,988 |
| Select Income REIT, (REIT), 4.15%, 2/1/2022 | | 120,000 | 118,831 |
| Starwood Property Trust, Inc., 144A, 5.0%, 12/15/2021 | 460,000 | 466,164 |
| VEREIT Operating Partnership LP, (REIT), 4.125%, 6/1/2021 | 285,000 | 289,275 |
| | 2,695,532 |
| | Principal Amount ($)(a) | Value ($) |
| | | | | |
| Telecommunication Services 1.4% |
| AT&T, Inc.: |
| | 3.4%, 5/15/2025 | | 340,000 | 327,700 |
| | 4.5%, 5/15/2035 | | 195,000 | 188,402 |
| Bharti Airtel International Netherlands BV, 144A, 5.125%, 3/11/2023 | 300,000 | 312,673 |
| Verizon Communications, Inc.: |
| | 4.272%, 1/15/2036 | | 150,000 | 143,569 |
| | 4.672%, 3/15/2055 | | 115,000 | 107,998 |
| | 1,080,342 |
| Utilities 1.7% |
| AmeriGas Partners LP, 5.5%, 5/20/2025 | | 605,000 | 611,050 |
| Electricite de France SA, 144A, 4.75%, 10/13/2035 | 150,000 | 150,494 |
| NRG Energy, Inc., 144A, 6.625%, 1/15/2027 | | 270,000 | 255,150 |
| Southern Co., 3.25%, 7/1/2026 | 205,000 | 199,512 |
| Southern Power Co., Series F, 4.95%, 12/15/2046 | 87,000 | 84,776 |
| | 1,300,982 |
| Total Corporate Bonds (Cost $37,719,603) | 37,603,006 |
| |
| Mortgage-Backed Securities Pass-Throughs 19.1% |
| Federal Home Loan Mortgage Corp.: | |
| | 4.0%, 8/1/2039 | | 481,644 | 509,734 |
| | 5.5%, with various maturities from 10/1/2023 until 6/1/2035 | 928,973 | 1,043,589 |
| | 6.5%, 3/1/2026 | | 133,676 | 148,971 |
| Federal National Mortgage Association: | |
| | 3.0%*, with various maturities from 9/1/2038 until 4/1/2044 (c) | 5,243,930 | 5,211,783 |
| | 3.5%, 3/1/2046 | | 1,385,907 | 1,411,085 |
| | 5.0%, with various maturities from 10/1/2033 until 8/1/2040 | 908,796 | 994,624 |
| | 5.5%, with various maturities from 12/1/2032 until 8/1/2037 | 960,442 | 1,073,482 |
| | 6.0%, with various maturities from 4/1/2024 until 3/1/2025 | 274,943 | 311,051 |
| | 6.5%, with various maturities from 3/1/2017 until 12/1/2037 | 299,578 | 344,231 |
| Government National Mortgage Association, 4.0%, with various maturities from 2/15/2041 until 4/15/2041 | 3,447,082 | 3,667,458 |
| Total Mortgage-Backed Securities Pass-Throughs (Cost $14,516,499) | 14,716,008 |
| |
| Asset-Backed 4.8% |
| Automobile Receivables 0.6% |
| Avis Budget Rental Car Funding AESOP LLC, "C", Series 2015-1A, 144A, 3.96%, 7/20/2021 | 500,000 | 484,947 |
| Credit Card Receivables 1.3% |
| World Financial Network Credit Card Master Trust, "M", Series 2016-A, 2.33%, 4/15/2025 | 1,000,000 | 979,376 |
| | Principal Amount ($)(a) | Value ($) |
| | | | | |
| Miscellaneous 2.9% |
| Hilton Grand Vacations Trust, "B", Series 2014-AA, 144A, 2.07%, 11/25/2026 | 186,180 | 183,828 |
| PennyMac LLC, "A1", Series 2015-NPL1, 144A, 4.0%, 3/25/2055 | 316,915 | 318,759 |
| Taco Bell Funding LLC, "A2I", Series 2016-1A, 144A, 3.832%, 5/25/2046 | 743,138 | 745,831 |
| Telos CLO Ltd., "A1", Series 2014-6A, 144A, 2.179%*, 1/17/2027 | 500,000 | 499,517 |
| Voya CLO Ltd., "C", Series 2015-1A, 144A, 4.079%*, 4/18/2027 | 500,000 | 480,214 |
| | 2,228,149 |
| Total Asset-Backed (Cost $3,721,596) | 3,692,472 |
| |
| Commercial Mortgage-Backed Securities 2.4% |
| FHLMC Multifamily Structured Pass-Through Certificates: | |
| | "X1", Series K043, Interest Only, 0.548%**, 12/25/2024 | 4,975,774 | 182,684 |
| | "X1", Series K054, Interest Only, 1.181%**, 1/25/2026 | 1,846,583 | 155,915 |
| JPMBB Commercial Mortgage Securities Trust, "A3", Series 2014-C19, 3.669%, 4/15/2047 | 150,000 | 156,028 |
| JPMorgan Chase Commercial Mortgage Securities Corp., "A4", Series 2007-C1, 5.716%, 2/15/2051 | 714,723 | 730,723 |
| LB-UBS Commercial Mortgage Trust, "A4", Series 2007-C6, 5.858%, 7/15/2040 | 612,833 | 617,061 |
| Total Commercial Mortgage-Backed Securities (Cost $1,926,173) | 1,842,411 |
| |
| Collateralized Mortgage Obligations 3.0% |
| Countrywide Home Loans, "A2", Series 2006-1, 6.0%, 3/25/2036 | 245,001 | 207,720 |
| CS First Boston Mortgage Securities Corp., "10A3", Series 2005-10, 6.0%, 11/25/2035 | 95,399 | 53,230 |
| Federal Home Loan Mortgage Corp.: | |
| | "PI", Series 4485, Interest Only, 3.5%, 6/15/2045 | 2,174,280 | 352,705 |
| | "PI", Series 3940, Interest Only, 4.0%, 2/15/2041 | 356,840 | 52,648 |
| | "C31", Series 303, Interest Only, 4.5%, 12/15/2042 | 1,636,449 | 325,455 |
| | "JS", Series 3572, Interest Only, 6.096%**, 9/15/2039 | 350,891 | 49,897 |
| Federal National Mortgage Association, "SI", Series 2007-23, Interest Only, 6.014%**, 3/25/2037 | 170,282 | 25,803 |
| Government National Mortgage Association: | |
| | "PL", Series 2013-19, 2.5%, 2/20/2043 | | 684,500 | 627,948 |
| | "HX", Series 2012-91, 3.0%, 9/20/2040 | | 324,778 | 330,711 |
| | "PI", Series 2015-40, Interest Only, 4.0%, 4/20/2044 | 430,636 | 64,739 |
| | Principal Amount ($)(a) | Value ($) |
| | | | | |
| | "PI", Series 2014-108, Interest Only, 4.5%, 12/20/2039 | 313,859 | 52,347 |
| | "EI", Series 2011-162, Interest Only, 4.5%, 5/20/2040 | 555,318 | 32,418 |
| | "DI", Series 2011-40, Interest Only, 4.5%, 12/20/2040 | 768,771 | 17,615 |
| | "IN", Series 2009-69, Interest Only, 5.5%, 8/20/2039 | 91,185 | 16,351 |
| | "IV", Series 2009-69, Interest Only, 5.5%, 8/20/2039 | 175,475 | 34,740 |
| | "AI", Series 2007-38, Interest Only, 5.753%**, 6/16/2037 | 50,144 | 7,255 |
| | "IJ", Series 2009-75, Interest Only, 6.0%, 8/16/2039 | 78,676 | 13,546 |
| MASTR Alternative Loans Trust: |
| | "5A1", Series 2005-1, 5.5%, 1/25/2020 | | 46,002 | 47,057 |
| | "8A1", Series 2004-3, 7.0%, 4/25/2034 | | 7,123 | 7,585 |
| Total Collateralized Mortgage Obligations (Cost $2,653,440) | 2,319,770 |
| |
| Government & Agency Obligations 22.9% |
| Other Government Related (d) 1.6% |
| Novatek OAO, 144A, 6.604%, 2/3/2021 | | 300,000 | 325,500 |
| Province of New Brunswick Canada, 3.8%, 8/14/2045 | CAD | 1,000,000 | 776,807 |
| Vnesheconombank, 144A, 6.902%, 7/9/2020 (b) | | 150,000 | 162,045 |
| | 1,264,352 |
| Sovereign Bonds 2.1% |
| Japan Bank for International Cooperation, 1.5%, 7/21/2021 | 700,000 | 671,145 |
| KazAgro National Management Holding JSC, 144A, 4.625%, 5/24/2023 | 250,000 | 234,230 |
| Province of British Columbia Canada, 2.25%, 6/2/2026 | | 500,000 | 475,630 |
| Republic of Indonesia, 144A, 3.7%, 1/8/2022 | | 265,000 | 265,596 |
| | 1,646,601 |
| U.S. Government Sponsored Agency 0.9% |
| Federal Home Loan Mortgage Corp., 6.25%, 7/15/2032 | 500,000 | 688,070 |
| U.S. Treasury Obligations 18.3% |
| U.S. Treasury Bond, 2.25%, 8/15/2046 (b) | 1,530,000 | 1,286,455 |
| U.S. Treasury Notes: |
| | 0.75%, 10/31/2017 (e) | | 4,000,000 | 3,996,408 |
| | 1.375%, 5/31/2021 | | 1,260,000 | 1,234,947 |
| | 1.75%, 11/30/2021 | | 650,000 | 645,150 |
| | 2.0%, 11/15/2026 (b) | | 7,169,800 | 6,898,409 |
| | 14,061,369 |
| Total Government & Agency Obligations (Cost $17,719,334) | 17,660,392 |
| |
| Short-Term U.S. Treasury Obligations 1.0% |
| U.S. Treasury Obligations |
| U.S. Treasury Bills: |
| | 0.4%***, 2/9/2017 (f) | | 623,000 | 622,713 |
| | 0.56%***, 6/1/2017 (f) | | 181,000 | 180,533 |
| Total Short-Term U.S. Treasury Obligations (Cost $803,217) | 803,246 |
| |
Shares | Value ($) |
| | | | | |
| Securities Lending Collateral 10.9% |
| Government & Agency Securities Portfolio "Deutsche Government Cash Institutional Shares", 0.42% (g) (h) (Cost $8,355,835) | 8,355,835 | 8,355,835 |
| |
| Cash Equivalents 3.9% |
| Deutsche Central Cash Management Government Fund, 0.49% (g) (Cost $2,994,873) | 2,994,873 | 2,994,873 |
| | | | | |
| | % of Net Assets | Value ($) |
| | |
| Total Investment Portfolio (Cost $90,410,570)† | 116.9 | 89,988,013 |
| Other Assets and Liabilities, Net | (16.9) | (13,017,235) |
| Net Assets | 100.0 | 76,970,778 |
* Floating rate securities' yields vary with a designated market index or market rate, such as the coupon-equivalent of the U.S. Treasury Bill rate. These securities are shown at their current rate as of December 31, 2016.
** These securities are shown at their current rate as of December 31, 2016.
*** Annualized yield at time of purchase; not a coupon rate.
† The cost for federal income tax purposes was $90,492,875. At December 31, 2016, net unrealized depreciation for all securities based on tax cost was $504,862. This consisted of aggregate gross unrealized appreciation for all securities in which there was an excess of value over tax cost of $882,168 and aggregate gross unrealized depreciation for all securities in which there was an excess of tax cost over value of $1,387,030.
(a) Principal amount stated in U.S. dollars unless otherwise noted.
(b) All or a portion of these securities were on loan. In addition, "Other Assets and Liabilities, Net" may include pending sales that are also on loan. The value of securities loaned at December 31, 2016 amounted to $8,191,983, which is 10.6% of net assets.
(c) When-issued or delayed delivery security included.
(d) Government-backed debt issued by financial companies or government sponsored enterprises.
(e) At December 31, 2016, this security has been pledged, in whole or in part, to cover initial margin requirements for open centrally cleared swap contracts.
(f) At December 31, 2016, this security has been pledged, in whole or in part, to cover initial margin requirements for open futures contracts.
(g) Affiliated fund managed by Deutsche Investment Management Americas Inc. The rate shown is the annualized seven-day yield at period end.
(h) Represents collateral held in connection with securities lending. Income earned by the Fund is net of borrower rebates.
144A: Security exempt from registration under Rule 144A of the Securities Act of 1933. These securities may be resold in transactions exempt from registration, normally to qualified institutional buyers.
CLO: Collateralized Loan Obligation
Interest Only: Interest Only (IO) bonds represent the "interest only" portion of payments on a pool of underlying mortgages or mortgage-backed securities. IO securities are subject to prepayment risk of the pool of underlying mortgages.
JSC: Joint Stock Company
REIT: Real Estate Investment Trust
Included in the portfolio are investments in mortgage- or asset-backed securities, which are interests in separate pools of mortgages or assets. Effective maturities of these investments may be shorter than stated maturities due to prepayments. Some separate investments in the Federal Home Loan Mortgage Corp., Federal National Mortgage Association and Government National Mortgage Association issues which have similar coupon rates have been aggregated for presentation purposes in this investment portfolio.
At December 31, 2016, open futures contracts purchased were as follows:
| Futures | Currency | Expiration Date | Contracts | Notional Value ($) | Unrealized Depreciation ($) |
| 10 Year U.S. Treasury Note | USD | 3/22/2017 | 11 | 1,367,094 | (8,617) |
At December 31, 2016, open futures contracts sold were as follows:
| Futures | Currency | Expiration Date | Contracts | Notional Value ($) | Unrealized Appreciation/ (Depreciation) ($) |
| Federal Republic of Germany Euro-Bund | EUR | 3/8/2017 | 25 | 4,319,814 | (45,825) |
| Ultra 10 Year U.S. Treasury Note | USD | 3/22/2017 | 10 | 1,340,625 | 10,040 |
| Ultra Long U.S. Treasury Bond | USD | 3/22/2017 | 49 | 7,852,250 | 113,226 |
| Total net unrealized appreciation | 77,441 |
At December 31, 2016, open interest rate swap contracts were as follows:
| Centrally Cleared Swaps |
Effective/
Expiration Dates | Notional Amount | Currency | Cash Flows Paid by the Fund | Cash Flows Received by the Fund | Value ($) | Unrealized Appreciation/ (Depreciation) ($) |
9/16/2015
9/16/2045 | 7,195,000 | USD | Floating — 3-Month LIBOR | Fixed — 3.0% | 650,217 | 214,545 |
12/16/2015
9/16/2025 | 500,000 | USD | Floating — 3-Month LIBOR | Fixed — 2.64% | 18,078 | 15,238 |
12/16/2015
9/17/2035 | 9,700,000 | USD | Floating — 3-Month LIBOR | Fixed — 2.938% | 623,796 | 422,763 |
12/16/2015
9/18/2045 | 3,600,000 | USD | Floating — 3-Month LIBOR | Fixed — 2.998% | 323,584 | 206,464 |
9/30/2015
9/30/2045 | 2,000,000 | USD | Fixed — 2.88% | Floating — 3-Month LIBOR | (144,018) | (103,925) |
2/3/2015
2/3/2045 | 1,800,000 | USD | Fixed — 3.035% | Floating — 3-Month LIBOR | (197,172) | (176,358) |
12/14/2016
12/14/2046 | 800,000 | CAD | Fixed — 2.386% | Floating — 3-Month CDOR | (6,243) | (6,243) |
12/23/2016
12/23/2026 | 15,200,000 | SEK | Fixed — 1.175% | Floating — 3-Month STIBOR | (14,680) | (14,680) |
1/28/2015
1/28/2045 | 2,000,000 | USD | Fixed — 3.088% | Floating — 3-Month LIBOR | (242,271) | (222,882) |
12/16/2015
9/18/2017 | 13,600,000 | USD | Fixed — 1.557% | Floating — 3-Month LIBOR | (99,765) | (104,128) |
12/4/2015
12/4/2045 | 2,000,000 | USD | Fixed — 2.615% | Floating — 3-Month LIBOR | (22,816) | 19,024 |
| Total net unrealized appreciation | 249,818 |
CDOR: Canadian Dollar Offered Rate; 3-Month CDOR rate at December 31, 2016 is 0.945%.
LIBOR: London Interbank Offered Rate; 3-Month LIBOR rate at December 31, 2016 is 1.00%.
STIBOR: Stockholm Interbank Offered Rates; 3-Month STIBOR rate at December 31, 2016 is –0.59%.
At December 31, 2016, the Fund had the following open forward foreign currency exchange contracts:
| Contracts to Deliver | | In Exchange For | | Settlement Date | | Unrealized Depreciation ($) | Counterparty |
| CAD | 1,068,445 | | USD | 795,519 | | 2/17/2017 | | (704) | Bank of America |
| | | | | | | | | | |
| Currency Abbreviations |
CAD Canadian Dollar EUR Euro SEK Swedish Krona USD United States Dollar |
For information on the Fund's policy and additional disclosures regarding futures contracts, interest rate swap contracts and forward foreign currency exchange contracts, please refer to Note B in the accompanying Notes to Financial Statements.
Fair Value Measurements
Various inputs are used in determining the value of the Fund's investments. These inputs are summarized in three broad levels. Level 1 includes quoted prices in active markets for identical securities. Level 2 includes other significant observable inputs (including quoted prices for similar securities, interest rates, prepayment speeds and credit risk). Level 3 includes significant unobservable inputs (including the Fund's own assumptions in determining the fair value of investments). The level assigned to the securities valuations may not be an indication of the risk or liquidity associated with investing in those securities.
The following is a summary of the inputs used as of December 31, 2016 in valuing the Fund's investments. For information on the Fund's policy regarding the valuation of investments, please refer to the Security Valuation section of Note A in the accompanying Notes to Financial Statements.
| Assets | Level 1 | Level 2 | Level 3 | Total |
| |
| Fixed Income Investments (i) |
| | Corporate Bonds | $ — | $37,603,006 | $ — | $37,603,006 |
| | Mortgage-Backed Securities Pass-Throughs | — | 14,716,008 | — | 14,716,008 |
| | Asset-Backed | — | 3,692,472 | — | 3,692,472 |
| | Commercial Mortgage-Backed Securities | — | 1,842,411 | — | 1,842,411 |
| | Collateralized Mortgage Obligations | — | 2,319,770 | — | 2,319,770 |
| | Government & Agency Obligations | — | 17,660,392 | — | 17,660,392 |
| | Short-Term U.S. Treasury Obligations | — | 803,246 | — | 803,246 |
| Short-Term Investments (i) | 11,350,708 | — | — | 11,350,708 |
| Derivatives (j) |
| | Futures Contracts | 123,266 | — | — | 123,266 |
| | Interest Rate Swap Contracts | — | 878,034 | — | 878,034 |
| Total | $11,473,974 | $79,515,339 | $ — | $90,989,313 |
| Liabilities | Level 1 | Level 2 | Level 3 | Total |
| |
| Derivatives (j) |
| | Futures Contracts | $ (54,442) | $ — | $ — | $ (54,442) |
| | Interest Rate Swap Contracts | — | (628,216) | — | (628,216) |
| | Forward Foreign Currency Exchange Contracts | — | (704) | — | (704) |
| Total | $ (54,442) | $ (628,920) | $ — | $ (683,362) |
There have been no transfers between fair value measurement levels during the year ended December 31, 2016.
(i) See Investment Portfolio for additional detailed categorizations.
(j) Derivatives include unrealized appreciation (depreciation) on open futures contracts, interest rate swap contracts and forward foreign currency exchange contracts.
The accompanying notes are an integral part of the financial statements.
Statement of Assets and Liabilities
| as of December 31, 2016 |
| Assets |
Investments: Investments in non-affiliated securities, at value (cost $79,059,862) — including $8,191,983 of securities loaned | $ 78,637,305 |
| Investment in Government & Agency Securities Portfolio (cost $8,355,835)* | 8,355,835 |
| Investment in Deutsche Central Cash Management Government Fund (cost $2,994,873) | 2,994,873 |
| Total investments in securities, at value (cost $90,410,570) | 89,988,013 |
| Cash | 1,119,563 |
| Foreign currency, at value (cost $115,505) | 51,243 |
| Receivable for Fund shares sold | 28,981 |
| Interest receivable | 584,844 |
| Receivable for variation margin on centrally cleared swaps | 104,209 |
| Foreign taxes recoverable | 1,742 |
| Other assets | 1,944 |
| Total assets | 91,880,539 |
| Liabilities |
| Payable upon return of securities loaned | 8,355,835 |
| Payable for investments purchased | 1,106,309 |
| Payable for investments purchased — when-issued/delayed delivery securities | 5,175,679 |
| Payable for Fund shares redeemed | 61,370 |
| Payable for variation margin on futures contracts | 52,305 |
| Unrealized depreciation on forward foreign currency exchange contracts | 704 |
| Accrued management fee | 17,084 |
| Accrued Trustees' fees | 1,324 |
| Other accrued expenses and payables | 139,151 |
| Total liabilities | 14,909,761 |
| Net assets, at value | $ 76,970,778 |
| Net Assets Consist of |
| Undistributed net investment income | 1,699,560 |
Net unrealized appreciation (depreciation) on: Investments | (422,557) |
| Swap contracts | 249,818 |
| Futures | 68,824 |
| Foreign currency | (65,381) |
| Accumulated net realized gain (loss) | (17,253,292) |
| Paid-in capital | 92,693,806 |
| Net assets, at value | $ 76,970,778 |
Class A Net Asset Value, offering and redemption price per share ($76,970,778 ÷ 13,944,103 outstanding shares of beneficial interest, $.01 par value, unlimited number of shares authorized) | $ 5.52 |
* Represents collateral on securities loaned.
The accompanying notes are an integral part of the financial statements.
Statement of Operations
| for the year ended December 31, 2016 |
| Investment Income |
Income: Interest (net of foreign taxes withheld of $399) | $ 2,536,470 |
| Dividends | 74,159 |
| Income distributions — Deutsche Central Cash Management Government Fund | 8,583 |
| Securities lending income, net of borrower rebates | 16,545 |
| Other income | 37,784 |
| Total income | 2,673,541 |
Expenses: Management fee | 313,410 |
| Administration fee | 80,362 |
| Services to shareholders | 1,853 |
| Custodian fee | 19,448 |
| Professional fees | 92,445 |
| Reports to shareholders | 35,037 |
| Trustees' fees and expenses | 5,295 |
| Other | 81,337 |
| Total expenses before expense reductions | 629,187 |
| Expense reductions | (112,296) |
| Total expenses after expense reductions | 516,891 |
| Net investment income | 2,156,650 |
| Realized and Unrealized Gain (Loss) |
Net realized gain (loss) from: Investments | (183,678) |
| Swap contracts | 41,729 |
| Futures | 1,303,448 |
| Written options | (12,713) |
| Foreign currency | 153,949 |
| Disposal of investments in violation of restrictions | 47,138 |
| | 1,349,873 |
Change in net unrealized appreciation (depreciation) on: Investments | 1,621,726 |
| Swap contracts | (241,016) |
| Futures | 194,840 |
| Written options | (34,889) |
| Foreign currency | (511,672) |
| | 1,028,989 |
| Net gain (loss) | 2,378,862 |
| Net increase (decrease) in net assets resulting from operations | $ 4,535,512 |
The accompanying notes are an integral part of the financial statements.
Statements of Changes in Net Assets
| Increase (Decrease) in Net Assets | Years Ended December 31, |
| 2016 | 2015 |
Operations: Net investment income | $ 2,156,650 | $ 2,448,217 |
| Net realized gain (loss) | 1,349,873 | (3,320,978) |
| Change in net unrealized appreciation (depreciation) | 1,028,989 | 782,998 |
| Net increase (decrease) in net assets resulting from operations | 4,535,512 | (89,763) |
Distributions to shareholders from: Net investment income: Class A | (4,037,321) | (2,926,472) |
Fund share transactions: Class A Proceeds from shares sold | 10,928,699 | 11,060,840 |
| Reinvestment of distributions | 4,037,321 | 2,926,472 |
| Payments for shares redeemed | (18,293,243) | (32,571,389) |
| Net increase (decrease) in net assets from Class A share transactions | (3,327,223) | (18,584,077) |
| Increase (decrease) in net assets | (2,829,032) | (21,600,312) |
| Net assets at beginning of period | 79,799,810 | 101,400,122 |
| Net assets at end of period (including undistributed net investment income of $1,699,560 and $3,494,238, respectively) | $ 76,970,778 | $ 79,799,810 |
| Other Information |
Class A Shares outstanding at beginning of period | 14,528,974 | 17,886,425 |
| Shares sold | 1,951,337 | 1,969,516 |
| Shares issued to shareholders in reinvestment of distributions | 739,436 | 520,725 |
| Shares redeemed | (3,275,644) | (5,847,692) |
| Net increase (decrease) in Class A shares | (584,871) | (3,357,451) |
| Shares outstanding at end of period | 13,944,103 | 14,528,974 |
The accompanying notes are an integral part of the financial statements.
Financial Highlights
| Class A | |
Years Ended December 31, |
| 2016 | 2015 | 2014 | 2013 | 2012 |
| Selected Per Share Data |
| Net asset value, beginning of period | $ 5.49 | $ 5.67 | $ 5.51 | $ 5.89 | $ 5.72 |
Income (loss) from investment operations: Net investment incomea | .15 | .14 | .17 | .16 | .16 |
| Net realized and unrealized gain (loss) | .17 | (.15) | .19 | (.33) | .27 |
| Total from investment operations | .32 | (.01) | .36 | (.17) | .43 |
Less distributions from: Net investment income | (.29) | (.17) | (.20) | (.21) | (.26) |
| Net asset value, end of period | $ 5.52 | $ 5.49 | $ 5.67 | $ 5.51 | $ 5.89 |
| Total Return (%) | 5.93b | (.29)b | 6.63b | (3.03)b | 7.77 |
| Ratios to Average Net Assets and Supplemental Data |
| Net assets, end of period ($ millions) | 77 | 80 | 101 | 105 | 190 |
| Ratio of expenses before expense reductions (%) | .78 | .69 | .69 | .65 | .58 |
| Ratio of expenses after expense reductions (%) | .64 | .64 | .61 | .56 | .58 |
| Ratio of net investment income (%) | 2.68 | 2.54 | 2.99 | 2.88 | 2.81 |
| Portfolio turnover rate (%) | 236 | 197 | 273 | 418 | 115 |
a Based on average shares outstanding during the period. b Total return would have been lower had certain expenses not been reduced. |
Notes to Financial Statements
A. Organization and Significant Accounting Policies
Deutsche Variable Series I (the "Trust") is registered under the Investment Company Act of 1940, as amended (the "1940 Act"), as an open-end, registered management investment company organized as a Massachusetts business trust. The Trust consists of five diversified funds: Deutsche Bond VIP, Deutsche Capital Growth VIP, Deutsche Core Equity VIP, Deutsche CROCI® International VIP and Deutsche Global Small Cap VIP (individually or collectively hereinafter referred to as a "Fund" or the "Funds"). These financial statements report on Deutsche Bond VIP. The Trust is intended to be the underlying investment vehicle for variable annuity contracts and variable life insurance policies to be offered by the separate accounts of certain life insurance companies ("Participating Insurance Companies").
The Fund's financial statements are prepared in accordance with accounting principles generally accepted in the United States of America ("U.S. GAAP") which require the use of management estimates. Actual results could differ from those estimates. The Fund qualifies as an investment company under Topic 946 of Accounting Standards Codification of U.S. GAAP. The policies described below are followed consistently by the Fund in the preparation of its financial statements.
Security Valuation. Investments are stated at value determined as of the close of regular trading on the New York Stock Exchange on each day the exchange is open for trading.
Various inputs are used in determining the value of the Fund's investments. These inputs are summarized in three broad levels. Level 1 includes quoted prices in active markets for identical securities. Level 2 includes other significant observable inputs (including quoted prices for similar securities, interest rates, prepayment speeds and credit risk). Level 3 includes significant unobservable inputs (including the Fund's own assumptions in determining the fair value of investments). The level assigned to the securities valuations may not be an indication of the risk or liquidity associated with investing in those securities.
Debt securities are valued at prices supplied by independent pricing services approved by the Trustees of the Series. Such services may use various pricing techniques which take into account appropriate factors such as yield, quality, coupon rate, maturity, type of issue, trading characteristics, prepayment speeds and other data, as well as broker quotes. If the pricing services are unable to provide valuations, debt securities are valued at the average of the most recent reliable bid quotations or evaluated prices, as applicable, obtained from broker-dealers. These securities are generally categorized as Level 2.
Investments in open-end investment companies are valued at their net asset value each business day and are categorized as Level 1.
Futures contracts are generally valued at the settlement prices established each day on the exchange on which they are traded and are categorized as Level 1.
Swap contracts are valued daily based upon prices supplied by a Board approved pricing vendor, if available, and otherwise are valued at the price provided by the broker-dealer. Swap contracts are generally categorized as Level 2.
Forward currency contracts are valued at the prevailing forward exchange rate of the underlying currencies and are categorized as Level 2.
Exchange-traded options are valued at the last sale price or, in the absence of a sale, the mean between the closing bid and asked prices or at the most recent asked price (bid for purchased options) if no bid or asked price are available. Exchange-traded options are generally categorized as Level 1. Over-the-counter written or purchased options are valued at prices supplied by a Board approved pricing vendor, if available, and otherwise are valued at the price provided by the broker-dealer with which the option was traded. Over-the-counter written or purchased options are generally categorized as Level 2.
Securities and other assets for which market quotations are not readily available or for which the above valuation procedures are deemed not to reflect fair value are valued in a manner that is intended to reflect their fair value as determined in accordance with procedures approved by the Trustees and are generally categorized as Level 3. In accordance with the Fund's valuation procedures, factors considered in determining value may include, but are not limited to, the type of the security; the size of the holding; the initial cost of the security; the existence of any contractual restrictions on the security's disposition; the price and extent of public trading in similar securities of the issuer or of comparable companies; quotations or evaluated prices from broker-dealers and/or pricing services; information obtained from the issuer, analysts, and/or the appropriate stock exchange (for exchange-traded securities); an analysis of the company's or issuer's financial statements; an evaluation of the forces that influence the issuer and the market(s) in which the security is purchased and sold; and with respect to debt securities, the maturity, coupon, creditworthiness, currency denomination and the movement of the market in which the security is normally traded. The value determined under these procedures may differ from published values for the same securities.
Disclosure about the classification of fair value measurements is included in a table following the Fund's Investment Portfolio.
Securities Lending. Deutsche Bank AG, as lending agent, lends securities of the Fund to certain financial institutions under the terms of its securities lending agreement. During the term of the loans, the Fund continues to receive interest and dividends generated by the securities and to participate in any changes in their market value. The Fund requires the borrowers of the securities to maintain collateral with the Fund consisting of either cash or liquid, unencumbered assets having a value at least equal to the value of the securities loaned. When the collateral falls below specified amounts, the lending agent will use its best effort to obtain additional collateral on the next business day to meet required amounts under the securities lending agreement. As of period end, any securities on loan were collateralized by cash. During the year ended December 31, 2016, the Fund invested the cash collateral into a joint trading account in affiliated money market funds managed by Deutsche Investment Management Americas Inc. As of December 31, 2016, the Fund invested the cash collateral in Government & Agency Securities Portfolio. Deutsche Investment Management Americas Inc. receives a management/administration fee (0.09% annualized effective rate as of December 31, 2016) on the cash collateral invested in Government & Agency Securities Portfolio. The Fund receives compensation for lending its securities either in the form of fees or by earning interest on invested cash collateral net of borrower rebates and fees paid to a lending agent. Either the Fund or the borrower may terminate the loan at any time and the borrower, after notice, is required to return borrowed securities within a standard time period. There may be risks of delay and costs in recovery of securities or even loss of rights in the collateral should the borrower of the securities fail financially. If the Fund is not able to recover securities lent, the Fund may sell the collateral and purchase a replacement investment in the market, incurring the risk that the value of the replacement security is greater than the value of the collateral. The Fund is also subject to all investment risks associated with the reinvestment of any cash collateral received, including, but not limited to, interest rate, credit and liquidity risk associated with such investments.
As of December 31, 2016, the Fund had securities on loan, which were classified as corporate bonds, other government related and U.S. Treasury obligations in the Investment Portfolio. The value of the related collateral exceeded the value of the securities loaned at period end.
| Remaining Contractual Maturity of the Agreements as of December 31, 2016 |
| | Overnight and Continuous | <30 days | Between 30 & 90 days | >90 days | Total |
| Securities Lending Transactions |
| Corporate Bonds | $1,149,350 | $ — | $ — | $ — | $1,149,350 |
| Other Government Related | 56,750 | — | — | — | 56,750 |
| U.S. Treasury Obligations | 7,149,735 | — | — | — | 7,149,735 |
| Total Borrowings | $8,355,835 | $ — | $ — | $ — | $8,355,835 |
| Gross amount of recognized liabilities for securities lending transactions | $8,355,835 |
Foreign Currency Translations. The books and records of the Fund are maintained in U.S. dollars. Investment securities and other assets and liabilities denominated in a foreign currency are translated into U.S. dollars at the prevailing exchange rates at period end. Purchases and sales of investment securities, income and expenses are translated into U.S. dollars at the prevailing exchange rates on the respective dates of the transactions.
Net realized and unrealized gains and losses on foreign currency transactions represent net gains and losses between trade and settlement dates on securities transactions, the acquisition and disposition of foreign currencies, and the difference between the amount of net investment income accrued and the U.S. dollar amount actually received. The portion of both realized and unrealized gains and losses on investments that results from fluctuations in foreign currency exchange rates is not separately disclosed but is included with net realized and unrealized gain/appreciation and loss/depreciation on investments.
When-Issued/Delayed Delivery Securities. The Fund may purchase or sell securities with delivery or payment to occur at a later date beyond the normal settlement period. At the time the Fund enters into a commitment to purchase or sell a security, the transaction is recorded and the value of the transaction is reflected in the net asset value. The price of such security and the date when the security will be delivered and paid for are fixed at the time the transaction is negotiated. The value of the security may vary with market fluctuations. At the time the Fund enters into a purchase transaction it is required to segregate cash or other liquid assets at least equal to the amount of the commitment. Additionally, the Fund may be required to post securities and/or cash collateral in accordance with the terms of the commitment.
Certain risks may arise upon entering into when-issued or delayed delivery transactions from the potential inability of counterparties to meet the terms of their contracts or if the issuer does not issue the securities due to political, economic, or other factors. Additionally, losses may arise due to changes in the value of the underlying securities.
Taxes. The Fund is treated as a separate taxpayer as provided for in the Internal Revenue Code, as amended. It is the Fund's policy to comply with the requirements of the Internal Revenue Code, as amended, which are applicable to regulated investment companies, and to distribute all of its taxable income to the separate accounts of the Participating Insurance Companies which hold its shares.
Additionally, the Fund may be subject to taxes imposed by the governments of countries in which it invests and are generally based on income and/or capital gains earned or repatriated. Estimated tax liabilities on certain foreign securities are recorded on an accrual basis and are reflected as components of interest income or net change in unrealized gain/loss on investments. Tax liabilities realized as a result of security sales are reflected as a component of net realized gain/loss on investments.
Under the Regulated Investment Company Modernization Act of 2010, net capital losses incurred post-enactment may be carried forward indefinitely, and their character is retained as short-term and/or long-term. Previously, net capital losses were carried forward for eight years and treated as short-term losses. As a transition rule, the Act requires that post-enactment net capital losses be used before pre-enactment net capital losses.
At December 31, 2016, the Fund had a net tax basis capital loss carryforward of approximately $14,056,000 of pre-enactment losses, which may be applied against any realized net taxable capital gains of each succeeding year until fully utilized or until December 31, 2017, the expiration date, whichever occurs first; and approximately $3,046,000 of post-enactment losses, which may be applied against realized net taxable capital gains indefinitely, including short-term losses ($190,000) and long-term losses ($2,856,000).
The Fund has reviewed the tax positions for the open tax years as of December 31, 2016 and has determined that no provision for income tax and/or uncertain tax provisions is required in the Fund's financial statements. The Fund's federal tax returns for the prior three fiscal years remain open subject to examination by the Internal Revenue Service.
Distribution of Income and Gains. Distributions from net investment income of the Fund, if any, are declared and distributed to shareholders annually. Net realized gains from investment transactions, in excess of available capital loss carryforwards, would be taxable to the Fund if not distributed, and, therefore, will be distributed to shareholders at least annually. The Fund may also make additional distributions for tax purposes if necessary.
The timing and characterization of certain income and capital gain distributions are determined annually in accordance with federal tax regulations which may differ from accounting principles generally accepted in the United States of America. These differences primarily relate to investments in foreign denominated investments, investments in forward foreign currency exchange contracts, futures contracts, swap contracts and certain securities sold at a loss. As a result, net investment income (loss) and net realized gain (loss) on investment transactions for a reporting period may differ significantly from distributions during such period. Accordingly, the Fund may periodically make reclassifications among certain of its capital accounts without impacting the net asset value of the Fund.
At December 31, 2016, the Fund's components of distributable earnings (accumulated losses) on a tax basis are as follows:
| Undistributed ordinary income* | $ 1,758,767 |
| Capital loss carryforwards | $(17,102,000) |
| Net unrealized appreciation (depreciation) on investments | $ (504,862) |
In addition, the tax character of distributions paid to shareholders by the Fund is summarized as follows:
| | Years Ended December 31, |
| | 2016 | 2015 |
| Distributions from ordinary income* | $ 4,037,321 | $ 2,926,472 |
* For tax purposes, short-term capital gain distributions are considered ordinary income distributions.
Expenses. Expenses of the Trust arising in connection with a specific Fund are allocated to that Fund. Other Trust expenses which cannot be directly attributed to a Fund are apportioned among the Funds in the Trust based upon the relative net assets or other appropriate measures.
Contingencies. In the normal course of business, the Fund may enter into contracts with service providers that contain general indemnification clauses. The Fund's maximum exposure under these arrangements is unknown, as this would involve future claims that may be made against the Fund that have not yet been made. However, based on experience, the Fund expects the risk of loss to be remote.
Other. Investment transactions are accounted for on a trade date plus one basis for daily net asset value calculations. However, for financial reporting purposes, investment transactions are reported on trade date. Interest income is recorded on the accrual basis net of foreign withholding taxes. Realized gains and losses from investment transactions are recorded on an identified cost basis. Proceeds from litigation payments, if any, are included in net realized gain (loss) from investments. All discounts and premiums are accreted/amortized for both tax and financial reporting purposes.
B. Derivative Instruments
Futures Contracts. A futures contract is an agreement between a buyer or seller and an established futures exchange or its clearinghouse in which the buyer or seller agrees to take or make a delivery of a specific amount of a financial instrument at a specified price on a specific date (settlement date). For the year ended December 31, 2016, the Fund invested in interest rate futures to gain exposure to different parts of the yield curve while managing the overall duration. The Fund also entered into interest rate futures contracts for non-hedging purposes to seek to enhance potential gains.
Upon entering into a futures contract, the Fund is required to deposit with a financial intermediary cash or securities ("initial margin") in an amount equal to a certain percentage of the face value indicated in the futures contract. Subsequent payments ("variation margin") are made or received by the Fund dependent upon the daily fluctuations in the value and are recorded for financial reporting purposes as unrealized gains or losses by the Fund. Gains or losses are realized when the contract expires or is closed. Since all futures contracts are exchange traded, counterparty risk is minimized as the exchange's clearinghouse acts as the counterparty, and guarantees the futures against default.
Certain risks may arise upon entering into futures contracts, including the risk that an illiquid market will limit the Fund's ability to close out a futures contract prior to the settlement date and the risk that the futures contract is not well correlated with the security, index or currency to which it relates. Risk of loss may exceed amounts disclosed in the Statement of Assets and Liabilities.
A summary of the open futures contracts as of December 31, 2016, is included in a table following the Fund's Investment Portfolio. For the year ended December 31, 2016, the investment in futures contracts purchased had a total notional value generally indicative of a range from $0 to approximately $20,649,000, and the investment in futures contracts sold had a total notional value generally indicative of a range from approximately $5,237,000 to $13,513,000.
Options. An option contract is a contract in which the writer (seller) of the option grants the buyer of the option, upon payment of a premium, the right to purchase from (call option), or sell to (put option), the writer a designated instrument at a specified price within a specified period of time. The Fund may write or purchase interest rate swaption agreements which are options to enter into a pre-defined swap agreement. The interest rate swaption agreement will specify whether the buyer of the swaption will be a fixed-rate receiver or a fixed-rate payer upon exercise. Certain options, including options on indices, will require cash settlement by the Fund if exercised. For the year ended December 31, 2016, the Fund entered into options interest rate swaps in order to hedge against potential adverse interest rate movements of portfolio assets.
If the Fund writes a covered call option, the Fund foregoes, in exchange for the premium, the opportunity to profit during the option period from an increase in the market value of the underlying security above the exercise price. If the Fund writes a put option it accepts the risk of a decline in the value of the underlying security below the exercise price. Over-the-counter options have the risk of the potential inability of counterparties to meet the terms of their contracts. The Fund's maximum exposure to purchased options is limited to the premium initially paid. In addition, certain risks may arise upon entering into option contracts including the risk that an illiquid secondary market will limit the Fund's ability to close out an option contract prior to the expiration date and that a change in the value of the option contract may not correlate exactly with changes in the value of the securities or currencies hedged.
There are no open written options contracts as of December 31, 2016. For the year ended December 31, 2016, the investment in written options contracts had a total value generally indicative of a range from $0 to approximately $347,000.
Swaps. A swap is a contract between two parties to exchange future cash flows at periodic intervals based on the notional amount of the swap. A bilateral swap is a transaction between the fund and a counterparty where cash flows are exchanged between the two parties. A centrally cleared swap is a transaction executed between the fund and a counterparty, then cleared by a clearing member through a central clearinghouse. The central clearinghouse serves as the counterparty, with whom the fund exchanges cash flows.
The value of a swap is adjusted daily, and the change in value, if any, is recorded as unrealized appreciation or depreciation in the Statement of Assets and Liabilities. Gains or losses are realized when the swap expires or is closed. Certain risks may arise when entering into swap transactions including counterparty default; liquidity; or unfavorable changes in interest rates or the value of the underlying reference security, commodity or index. In connection with bilateral swaps, securities and/or cash may be identified as collateral in accordance with the terms of the swap agreement to provide assets of value and recourse in the event of default. The maximum counterparty credit risk is the net present value of the cash flows to be received from or paid to the counterparty over the term of the swap, to the extent that this amount is beneficial to the Fund, in addition to any related collateral posted to the counterparty by the Fund. This risk may be partially reduced by a master netting arrangement between the Fund and the counterparty. Upon entering into a centrally cleared swap, the Fund is required to deposit with a financial intermediary cash or securities ("initial margin") in an amount equal to a certain percentage of the notional amount of the swap. Subsequent payments ("variation margin") are made or received by the Fund dependent upon the daily fluctuations in the value of the swap. In a cleared swap transaction, counterparty risk is minimized as the central clearinghouse acts as the counterparty.
An upfront payment, if any, made by the Fund is recorded as an asset in the Statement of Assets and Liabilities. An upfront payment, if any, received by the Fund is recorded as a liability in the Statement of Assets and Liabilities. Payments received or made at the end of the measurement period are recorded as realized gain or loss in the Statement of Operations.
Credit Default Swaps. Credit default swaps are agreements between a buyer and a seller of protection against predefined credit events for the reference entity. The Fund may enter into credit default swaps to gain exposure to an underlying issuer's credit quality characteristics without directly investing in that issuer or to hedge against the risk of a credit event on debt securities. As a seller of a credit default swap, the Fund is required to pay the par (or other agreed-upon) value of the referenced entity to the counterparty with the occurrence of a credit event by a third party, such as a U.S. or foreign corporate issuer, on the reference entity, which would likely result in a loss to the Fund. In return, the Fund receives from the counterparty a periodic stream of payments over the term of the swap provided that no credit event has occurred. If no credit event occurs, the Fund keeps the stream of payments with no payment obligations. The Fund may also buy credit default swaps, in which case the Fund functions as the counterparty referenced above. This involves the risk that the swap may expire worthless. It also involves counterparty risk that the seller may fail to satisfy its payment obligations to the Fund with the occurrence of a credit event. When the Fund sells a credit default swap, it will cover its commitment. This may be achieved by, among other methods, maintaining cash or liquid assets equal to the aggregate notional value of the reference entities for all outstanding credit default swaps sold by the Fund. For the year ended December 31, 2016, the Fund entered into credit default swap agreements to gain exposure to the underlying issuer's credit quality characteristics or to hedge the risk of default or other specified credit events on portfolio assets.
Under the terms of a credit default swap, the Fund receives or makes periodic payments based on a specified interest rate on a fixed notional amount. These payments are recorded as a realized gain or loss in the Statement of Operations. Payments received or made as a result of a credit event or termination of the swap are recognized, net of a proportional amount of the upfront payment, as realized gains or losses in the Statement of Operations.
There are no open credit default swap contract as of December 31, 2016. For the year ended December 31, 2016, the investment in credit default swap contracts sold had a total notional value generally indicative of a range from $0 to $2,500,000.
Interest Rate Swaps. Interest rate swaps are agreements in which the Fund agrees to pay to the counterparty a fixed rate payment in exchange for the counterparty agreeing to pay to the Fund a variable rate payment, or the Fund agrees to receive from the counterparty a fixed rate payment in exchange for the counterparty agreeing to receive from the Fund a variable rate payment. The payment obligations are based on the notional amount of the swap. For the year ended December 31, 2016, the Fund entered into interest rate swap agreements to gain exposure to different parts of the yield curve while managing overall duration.
A summary of the open interest rate swap contracts as of December 31, 2016 is included in a table following the Fund's Investment Portfolio. For the year ended December 31, 2016, the investment in interest rate swap contracts had a total notional amount generally indicative of a range from $42,395,000 to $58,395,000.
Forward Foreign Currency Exchange Contracts. A forward foreign currency exchange contract ("forward currency contract") is a commitment to purchase or sell a foreign currency at the settlement date at a negotiated rate. The Fund is subject to foreign exchange rate risk in its securities denominated in foreign currencies. Changes in exchange rates between foreign currencies and the U.S. dollar may affect the U.S. dollar value of foreign securities or the income or gains received on these securities. To reduce the effect of currency fluctuations, the Fund may enter into forward currency contracts. For the year ended December 31, 2016, the Fund invested in forward currency contracts to hedge its exposure to changes in foreign currency exchange rates on its foreign currency denominated securities. In addition, the Fund also engaged in forward currency contracts for non-hedging purposes to seek to enhance potential gains.
Forward currency contracts are valued at the prevailing forward exchange rate of the underlying currencies and unrealized gain (loss) is recorded daily. On the settlement date of the forward currency contract, the Fund records a realized gain or loss equal to the difference between the value of the contract at the time it was opened and the value of the contract at the time it was closed. Certain risks may arise upon entering into forward currency contracts from the potential inability of counterparties to meet the terms of their contracts. The maximum counterparty credit risk to the Fund is measured by the unrealized gain on appreciated contracts. Additionally, when utilizing forward currency contracts to hedge, the Fund gives up the opportunity to profit from favorable exchange rate movements during the term of the contract.
A summary of the open forward currency contracts as of December 31, 2016, is included in a table following the Fund's Investment Portfolio. For the year ended December 31, 2016, the investment in forward currency contracts U.S. dollars purchased had a total contract value generally indicative of a range from $0 to approximately $18,371,000, and the investment in forward currency contracts U.S. dollars sold had a total contract value generally indicative of a range from $0 to approximately $18,038,000.
The investment in forward currency contracts long vs. other foreign currencies sold had a total contract value generally indicative of a range from $0 to approximately $1,165,000.
The following tables summarize the value of the Fund's derivative instruments held as of December 31, 2016 and the related location in the accompanying Statement of Assets and Liabilities, presented by primary underlying risk exposure:
| Asset Derivatives | Swap
Contracts | Futures Contracts | Total |
| Interest Rate Contracts (a) | $ 878,034 | $ 123,266 | $ 1,001,300 |
Each of the above derivatives is located in the following Statement of Assets and Liabilities accounts: (a) Includes cumulative appreciation of centrally cleared swaps and futures contracts as disclosed in the Investment Portfolio. Unsettled variation margin is disclosed separately within the Statement of Assets and Liabilities. |
| Liability Derivatives | Forward Contracts | Swap
Contracts | Futures Contracts | Total |
| Interest Rate Contracts (a) | $ — | $ (628,216) | $ (54,442) | $ (682,658) |
| Foreign Exchange Contracts (b) | (704) | — | — | (704) |
| | $ (704) | $ (628,216) | $ (54,442) | $ (683,362) |
Each of the above derivatives is located in the following Statement of Assets and Liabilities accounts: (a) Includes cumulative depreciation of centrally cleared swaps and futures contracts as disclosed in the Investment Portfolio. Unsettled variation margin is disclosed separately within the Statement of Assets and Liabilities. (b) Unrealized depreciation on forward foreign currency exchange contracts |
Additionally, the amount of unrealized and realized gains and losses on derivative instruments recognized in Fund earnings during the year ended December 31, 2016 and the related location in the accompanying Statement of Operations is summarized in the following tables by primary underlying risk exposure:
| Realized Gain (Loss) | Written
Options | Forward Contracts | Swap
Contracts | Futures Contracts | Total |
| Interest Rate Contract (a) | $ (12,713) | $ — | $ 166,589 | $ 1,303,448 | $ 1,457,324 |
| Credit Contracts (b) | — | — | (124,860) | — | (124,860) |
| Foreign Exchange Contracts (c) | — | 114,485 | — | — | 114,485 |
| | $ (12,713) | $ 114,485 | $ 41,729 | $ 1,303,448 | $ 1,446,949 |
Each of the above derivatives is located in the following Statement of Operations accounts: (a) Net realized gain (loss) from written options, swap contracts and futures, respectively (b) Net realized gain (loss) on swap contracts (c) Net realized gain (loss) from foreign currency (Statement of Operations includes both forward currency contracts and foreign currency transactions) |
| Change in Net Unrealized Appreciation (Depreciation) | Written
Options | Forward Contracts | Swap Contracts | Futures Contracts | Total |
| Interest Rate Contracts (a) | $ (34,889) | $ — | $ (243,196) | $ 194,840 | $ (83,245) |
| Credit Contracts (b) | — | — | 2,180 | — | 2,180 |
| Foreign Exchange Contracts (c) | — | (475,579) | — | — | (475,579) |
| | $ (34,889) | $ (475,579) | $ (241,016) | $ 194,840 | $ (556,644) |
Each of the above derivatives is located in the following Statement of Operations accounts: (a) Change in net unrealized appreciation (depreciation) on written options, swap contracts and futures, respectively (b) Change in net unrealized appreciation (depreciation) on swap contracts (c) Change in net unrealized appreciation (depreciation) on foreign currency (Statement of Operations includes both forward currency contracts and foreign currency transactions) |
As of December 31, 2016, the Fund has transactions subject to enforceable master netting agreements. A reconciliation of the gross amounts on the Statement of Assets and Liabilities to the net amounts by counterparty, including any collateral exposure, is included in the following tables:
| Counterparty | Gross Amounts of Liabilities Presented in the Statement of Assets and Liabilities | Financial Instruments and Derivatives Available for Offset | Collateral Pledged | Net Amount of Derivative Liabilities |
| Bank of America | $ 704 | $ — | $ — | $ 704 |
C. Purchases and Sales of Securities
During the year ended December 31, 2016, purchases and sales of investment securities (excluding short-term investments and U.S. Treasury obligations) aggregated $153,968,442 and $144,322,939, respectively. Purchases and sales of U.S. Treasury obligations aggregated $38,762,036 and $51,125,142, respectively.
For the year ended December 31, 2016, transactions for written options on interest rate swap contracts were as follows:
| | Contract Amount | Premiums |
| Outstanding, beginning of period | 9,800,000 | $ 155,100 |
| Options bought back | (7,800,000) | (132,650) |
| Options expired | (2,000,000) | (22,450) |
| Outstanding, end of period | — | $ — |
D. Related Parties
Management Agreement. Under the Investment Management Agreement with Deutsche Investment Management Americas Inc. ("DIMA" or the "Advisor"), an indirect, wholly owned subsidiary of Deutsche Bank AG, the Advisor directs the investments of the Fund in accordance with its investment objectives, policies and restrictions. The Advisor determines the securities, instruments and other contracts relating to investments to be purchased, sold or entered into by the Fund.
Pursuant to the Investment Management Agreement with the Advisor, the Fund pays a monthly management fee based on the Fund's average daily net assets, computed and accrued daily and payable monthly, at the following annual rates:
| First $250 million of average daily net assets | .390% |
| Next $750 million of average daily net assets | .365% |
| Over $1 billion of average daily net assets | .340% |
Accordingly, for the year ended December 31, 2016, the fee pursuant to the Investment Management Agreement was equivalent to an annual rate (exclusive of any applicable waivers/reimbursements) of 0.39% of the Fund's average daily net assets.
For the period from January 1, 2016 through April 30, 2017, the Advisor has contractually agreed to waive its fees and/or reimburse certain operating expenses to the extent necessary to maintain the total annual operating expenses (excluding certain expenses such as extraordinary expenses, taxes, brokerage and interest expense) of Class A at 0.64%.
For the year ended December 31, 2016, fees waived and/or expenses reimbursed were $112,296.
Administration Fee. Pursuant to an Administrative Services Agreement, DIMA provides most administrative services to the Fund. For all services provided under the Administrative Services Agreement, the Fund pays the Advisor an annual fee ("Administration Fee") of 0.10% of the Fund's average daily net assets, computed and accrued daily and payable monthly. For the year ended December 31, 2016, the Administration Fee was $80,362, of which $6,565 is unpaid.
Service Provider Fees. Deutsche AM Service Company ("DSC"), an affiliate of the Advisor, is the transfer agent, dividend-paying agent and shareholder service agent for the Fund. Pursuant to a sub-transfer agency agreement between DSC and DST Systems, Inc. ("DST"), DSC has delegated certain transfer agent, dividend-paying agent and shareholder service agent functions to DST. DSC compensates DST out of the shareholder servicing fee it receives from the Fund. For the year ended December 31, 2016, the amounts charged to the Fund by DSC aggregated $568, of which $142 is unpaid.
Typesetting and Filing Service Fees. Under an agreement with DIMA, DIMA is compensated for providing typesetting and certain regulatory filing services to the Fund. For the year ended December 31, 2016, the amount charged to the Fund by DIMA included in the Statement of Operations under "Reports to shareholders" aggregated $14,764, of which $6,205 is unpaid.
Trustees' Fees and Expenses. The Fund paid retainer fees to each Trustee not affiliated with the Advisor, plus specified amounts to the Board Chairperson and Vice Chairperson and to each committee Chairperson.
Affiliated Cash Management Vehicles. The Fund may invest uninvested cash balances in Deutsche Central Cash Management Government Fund and Deutsche Variable NAV Money Fund, affiliated money market funds which are managed by the Advisor. Each affiliated money market fund is managed in accordance with Rule 2a-7 under the 1940 Act, which governs the quality, maturity, diversity and liquidity of instruments in which a money market fund may invest. Deutsche Central Cash Management Government Fund seeks to maintain a stable net asset value, and Deutsche Variable NAV Money Fund maintains a floating net asset value. The Fund indirectly bears its proportionate share of the expenses of each affiliated money market fund in which it invests. Deutsche Central Cash Management Government Fund does not pay the Advisor an investment management fee. To the extent that Deutsche Variable NAV Money Fund pays an investment management fee to the Advisor, the Advisor will waive an amount of the investment management fee payable to the Advisor by the Fund equal to the amount of the investment management fee payable on the Fund's assets invested in Deutsche Variable NAV Money Fund.
Securities Lending Agent Fees. Deutsche Bank AG serves as securities lending agent for the Fund. For the year ended December 31, 2016, the Fund incurred securities lending agent fees to Deutsche Bank AG in the amount of $1,380.
E. Ownership of the Fund
At December 31, 2016, four participating insurance companies were owners of record of 10% or more of the total outstanding Class A shares of the Fund, each owning 36%, 25%, 15% and 10%, respectively.
F. Line of Credit
The Fund and other affiliated funds (the "Participants") share in a $400 million revolving credit facility provided by a syndication of banks. The Fund may borrow for temporary or emergency purposes, including the meeting of redemption requests that otherwise might require the untimely disposition of securities. The Participants are charged an annual commitment fee which is allocated based on net assets, among each of the Participants. Interest is calculated at a rate per annum equal to the sum of the Federal Funds Rate plus 1.25 percent plus if the one-month LIBOR exceeds the Federal Funds Rate, the amount of such excess. The Fund may borrow up to a maximum of 33 percent of its net assets under the agreement. The Fund had no outstanding loans at December 31, 2016.
G. Disposal of Investments in Violation of Restrictions
During the year ended December 31, 2016, the Fund realized a gain of $47,138 due to the disposal of an investment that was in violation of the Fund's investment guidelines. The amount of the gain was 0.06% of the Fund's average net assets.
Report of Independent Registered Public Accounting Firm
To the Board of Trustees of Deutsche Variable Series I and the Shareholders of Deutsche Bond VIP:
In our opinion, the accompanying statement of assets and liabilities, including the investment portfolio, and the related statements of operations and of changes in net assets and the financial highlights present fairly, in all material respects, the financial position of Deutsche Bond VIP (the "Fund") at December 31, 2016 and the results of its operations, the changes in its net assets, and the financial highlights for the periods indicated therein, in conformity with accounting principles generally accepted in the United States of America. These financial statements and financial highlights (hereafter referred to as "financial statements") are the responsibility of the Fund's management. Our responsibility is to express an opinion on these financial statements based on our audits. We conducted our audits of these financial statements in accordance with the standards of the Public Company Accounting Oversight Board (United States). Those standards require that we plan and perform the audit to obtain reasonable assurance about whether the financial statements are free of material misstatement. An audit includes examining, on a test basis, evidence supporting the amounts and disclosures in the financial statements, assessing the accounting principles used and significant estimates made by management, and evaluating the overall financial statement presentation. We believe that our audits, which included confirmation of securities at December 31, 2016 by correspondence with the custodian, brokers and transfer agent, and the application of alternative auditing procedures where such confirmations had not been received, provide a reasonable basis for our opinion.
Boston, Massachusetts
February 14, 2017 | PricewaterhouseCoopers LLP |
Information About Your Fund's Expenses (Unaudited)
As an investor of the Fund, you incur two types of costs: ongoing expenses and transaction costs. Ongoing expenses include management fees and other Fund expenses. Examples of transaction costs include contract charges, which are not shown in this section. The following tables are intended to help you understand your ongoing expenses (in dollars) of investing in the Fund and to help you compare these expenses with the ongoing expenses of investing in other mutual funds. In the most recent six-month period, the Fund limited these expenses; had it not done so, expenses would have been higher. The example in the table is based on an investment of $1,000 invested at the beginning of the six-month period and held for the entire period (July 1, 2016 to December 31, 2016).
The tables illustrate your Fund's expenses in two ways:
— Actual Fund Return. This helps you estimate the actual dollar amount of ongoing expenses (but not transaction costs) paid on a $1,000 investment in the Fund using the Fund's actual return during the period. To estimate the expenses you paid over the period, simply divide your account value by $1,000 (for example, an $8,600 account value divided by $1,000 = 8.6), then multiply the result by the number in the "Expenses Paid per $1,000" line under the share class you hold.
— Hypothetical 5% Fund Return. This helps you to compare your Fund's ongoing expenses (but not transaction costs) with those of other mutual funds using the Fund's actual expense ratio and a hypothetical rate of return of 5% per year before expenses. Examples using a 5% hypothetical Fund return may be found in the shareholder reports of other mutual funds. The hypothetical account values and expenses may not be used to estimate the actual ending account balance or expenses you paid for the period.
Please note that the expenses shown in these tables are meant to highlight your ongoing expenses only and do not reflect any transaction costs. The "Expenses Paid per $1,000" line of the tables is useful in comparing ongoing expenses only and will not help you determine the relative total expense of owning different funds. If these transaction costs had been included, your costs would have been higher.
| Expenses and Value of a $1,000 Investment for the six months ended December 31, 2016 |
| Actual Fund Return | Class A | |
| Beginning Account Value 7/1/16 | $1,000.00 | |
| Ending Account Value 12/31/16 | $ 989.20 | |
| Expenses Paid per $1,000* | $ 3.20 | |
| Hypothetical 5% Fund Return | Class A | |
| Beginning Account Value 7/1/16 | $1,000.00 | |
| Ending Account Value 12/31/16 | $1,021.92 | |
| Expenses Paid per $1,000* | $ 3.25 | |
* Expenses are equal to the Fund's annualized expense ratio, multiplied by the average account value over the period, multiplied by 184 (the number of days in the most recent six-month period), then divided by 366.
| Annualized Expense Ratio | Class A | |
| Deutsche Variable Series I — Deutsche Bond VIP | .64% | |
For more information, please refer to the Fund's prospectus.
These tables do not reflect charges and fees ("contract charges") associated with the separate account that invests in the Fund or any variable life insurance policy or variable annuity contract for which the Fund is an investment option.
For an analysis of the fees associated with an investment in the fund or similar funds, please refer to the current and hypothetical expense calculators for Variable Insurance Products which can be found at deutschefunds.com/EN/resources/calculators.jsp.
Tax Information (Unaudited)
Please consult a tax advisor if you have questions about federal or state income tax laws, or on how to prepare your tax returns. If you have specific questions about your account, please contact your insurance provider.
Proxy Voting
The Trust's policies and procedures for voting proxies for portfolio securities and information about how the Trust voted proxies related to its portfolio securities during the most recent 12-month period ended June 30 are available on our Web site — deutschefunds.com (click on "proxy voting"at the bottom of the page) — or on the SEC's Web site — sec.gov. To obtain a written copy of the Trust's policies and procedures without charge, upon request, call us toll free at (800) 728-3337.
Advisory Agreement Board Considerations and Fee Evaluation
The Board of Trustees (hereinafter referred to as the "Board" or "Trustees") approved the renewal of Deutsche Bond VIP’s (the "Fund") investment management agreement (the "Agreement") with Deutsche Investment Management Americas Inc. ("DIMA") in September 2016.
In terms of the process that the Board followed prior to approving the Agreement, shareholders should know that:
— During the entire process, all of the Fund’s Trustees were independent of DIMA and its affiliates (the "Independent Trustees").
— The Board met frequently during the past year to discuss fund matters and dedicated a substantial amount of time to contract review matters. Over the course of several months, the Board’s Contract Committee reviewed extensive materials received from DIMA, independent third parties and independent counsel. These materials included an analysis of the Fund’s performance, fees and expenses, and profitability from a fee consultant retained by the Fund’s Independent Trustees (the "Fee Consultant"). The Board also received extensive information throughout the year regarding performance of the Fund.
— The Independent Trustees regularly meet privately with counsel to discuss contract review and other matters. In addition, the Independent Trustees were advised by the Fee Consultant in the course of their review of the Fund’s contractual arrangements and considered a comprehensive report prepared by the Fee Consultant in connection with their deliberations.
— In connection with reviewing the Agreement, the Board also reviewed the terms of the Fund’s distribution agreement, administrative services agreement, transfer agency agreement and other material service agreements.
— Based on its evaluation of the information provided, the Contract Committee presented its findings and recommendations to the Board. The Board then reviewed the Contract Committee’s findings and recommendations.
In connection with the contract review process, the Contract Committee and the Board considered the factors discussed below, among others. The Board also considered that DIMA and its predecessors have managed the Fund since its inception, and the Board believes that a long-term relationship with a capable, conscientious advisor is in the best interests of the Fund. The Board considered, generally, that shareholders chose to invest or remain invested in the Fund knowing that DIMA managed the Fund, and that the Agreement was approved by the Fund’s shareholders. DIMA is part of Deutsche Bank AG’s ("Deutsche Bank") Asset Management ("Deutsche AM") division. Deutsche AM is a global asset management business that offers a wide range of investing expertise and resources, including research capabilities in many countries throughout the world. Deutsche Bank has advised the Board that the U.S. asset management business continues to be a critical and integral part of Deutsche Bank, and that Deutsche Bank will continue to invest in Deutsche AM and seek to enhance Deutsche AM’s investment platform. Deutsche Bank also has confirmed its commitment to maintaining strong legal and compliance groups within the Deutsche AM division.
As part of the contract review process, the Board carefully considered the fees and expenses of each Deutsche fund overseen by the Board in light of the fund’s performance. In many cases, this led to the negotiation and implementation of expense caps. As part of these negotiations, the Board indicated that it would consider relaxing these caps in future years following sustained improvements in performance, among other considerations.
While shareholders may focus primarily on fund performance and fees, the Fund’s Board considers these and many other factors, including the quality and integrity of DIMA’s personnel and such other issues as back-office operations, fund valuations, and compliance policies and procedures.
Nature, Quality and Extent of Services. The Board considered the terms of the Agreement, including the scope of advisory services provided under the Agreement. The Board noted that, under the Agreement, DIMA provides portfolio management services to the Fund and that, pursuant to a separate administrative services agreement, DIMA provides administrative services to the Fund. The Board considered the experience and skills of senior management and investment personnel and the resources made available to such personnel. The Board reviewed the Fund’s performance over short-term and long-term periods and compared those returns to various agreed-upon performance measures, including market index(es) and a peer universe compiled using information supplied by Morningstar Direct ("Morningstar"), an independent fund data service. The Board also noted that it has put into place a process of identifying "Focus Funds" (e.g., funds performing poorly relative to a peer universe), and receives additional reporting from DIMA regarding such funds and, where appropriate, DIMA’s plans to address underperformance. The Board believes this process is an effective manner of identifying and addressing underperforming funds. Based on the information provided, the Board noted that for the one-, three- and five-year periods ended December 31, 2015, the Fund’s performance (Class A shares) was in the 3rd quartile, 3rd quartile and 2nd quartile, respectively, of the applicable Morningstar universe (the 1st quartile being the best performers and the 4th quartile being the worst performers). The Board also observed that the Fund has outperformed its benchmark in the five-year period and has underperformed its benchmark in the one- and three-year periods ended December 31, 2015.
Fees and Expenses. The Board considered the Fund’s investment management fee schedule, operating expenses and total expense ratios, and comparative information provided by Broadridge Financial Solutions, Inc. ("Broadridge") and the Fee Consultant regarding investment management fee rates paid to other investment advisors by similar funds (1st quartile being the most favorable and 4th quartile being the least favorable). With respect to management fees paid to other investment advisors by similar funds, the Board noted that the contractual fee rates paid by the Fund, which include a 0.10% fee paid to DIMA under the Fund’s administrative services agreement, were higher than the median (3rd quartile) of the applicable Broadridge peer group (based on Broadridge data provided as of December 31, 2015). The Board noted that the Fund’s Class A shares total (net) operating expenses were expected to be higher than the median (3rd quartile) of the applicable Broadridge expense universe (based on Broadridge data provided as of December 31, 2015, and analyzing Broadridge expense universe Class A (net) expenses less any applicable 12b-1 fees) ("Broadridge Universe Expenses"). The Board noted that the expense limitation agreed to by DIMA was expected to help the Fund’s total (net) operating expenses remain competitive. The Board considered the Fund’s management fee rate as compared to fees charged by DIMA to comparable Deutsche U.S. registered funds ("Deutsche Funds") and considered differences between the Fund and the comparable Deutsche Funds. The information requested by the Board as part of its review of fees and expenses also included information about institutional accounts (including any sub-advised funds and accounts) and funds offered primarily to European investors ("Deutsche Europe funds") managed by Deutsche AM. The Board noted that DIMA indicated that Deutsche AM manages an institutional account comparable to the Fund, but that Deutsche AM does not manage any comparable Deutsche Europe funds. The Board took note of the differences in services provided to Deutsche Funds as compared to institutional accounts and that such differences made comparison difficult.
On the basis of the information provided, the Board concluded that management fees were reasonable and appropriate in light of the nature, quality and extent of services provided by DIMA.
Profitability. The Board reviewed detailed information regarding revenues received by DIMA under the Agreement. The Board considered the estimated costs and pre-tax profits realized by DIMA from advising the Deutsche Funds, as well as estimates of the pre-tax profits attributable to managing the Fund in particular. The Board also received information regarding the estimated enterprise-wide profitability of DIMA and its affiliates with respect to all fund services in totality and by fund. The Board and the Fee Consultant reviewed DIMA’s methodology in allocating its costs to the management of the Fund. Based on the information provided, the Board concluded that the pre-tax profits realized by DIMA in connection with the management of the Fund were not unreasonable. The Board also reviewed certain publicly available information regarding the profitability of certain similar investment management firms. The Board noted that while information regarding the profitability of such firms is limited (and in some cases is not necessarily prepared on a comparable basis), DIMA and its affiliates’ overall profitability with respect to the Deutsche Funds (after taking into account distribution and other services provided to the funds by DIMA and its affiliates) was lower than the overall profitability levels of most comparable firms for which such data was available.
Economies of Scale. The Board considered whether there are economies of scale with respect to the management of the Fund and whether the Fund benefits from any economies of scale. The Board noted that the Fund’s investment management fee schedule includes fee breakpoints. The Board concluded that the Fund’s fee schedule represents an appropriate sharing between the Fund and DIMA of such economies of scale as may exist in the management of the Fund at current asset levels.
Other Benefits to DIMA and Its Affiliates. The Board also considered the character and amount of other incidental benefits received by DIMA and its affiliates, including any fees received by DIMA for administrative services provided to the Fund. The Board also considered benefits to DIMA related to brokerage and soft-dollar allocations, including allocating brokerage to pay for research generated by parties other than the executing broker dealers, which pertain primarily to funds investing in equity securities, along with the incidental public relations benefits to DIMA related to Deutsche Funds advertising and cross-selling opportunities among DIMA products and services. The Board considered these benefits in reaching its conclusion that the Fund’s management fees were reasonable.
Compliance. The Board considered the significant attention and resources dedicated by DIMA to documenting and enhancing its compliance processes in recent years. The Board noted in particular (i) the experience, seniority and time commitment of the individuals serving as DIMA’s and the Fund’s chief compliance officers; (ii) the large number of DIMA compliance personnel; and (iii) the substantial commitment of resources by DIMA and its affiliates to compliance matters.
Based on all of the information considered and the conclusions reached, the Board unanimously determined that the continuation of the Agreement is in the best interests of the Fund. In making this determination, the Board did not give particular weight to any single factor identified above. The Board considered these factors over the course of numerous meetings, certain of which were in executive session with only the Independent Trustees and counsel present. It is possible that individual Independent Trustees may have weighed these factors differently in reaching their individual decisions to approve the continuation of the Agreement.
Board Members and Officers
The following table presents certain information regarding the Board Members and Officers of the fund. Each Board Member's year of birth is set forth in parentheses after his or her name. Unless otherwise noted, (i) each Board Member has engaged in the principal occupation(s) noted in the table for at least the most recent five years, although not necessarily in the same capacity; and (ii) the address of each Independent Board Member is c/o Keith R. Fox, Deutsche Funds Board Chair, c/o Thomas R. Hiller, Ropes & Gray LLP, Prudential Tower, 800 Boylston Street, Boston, MA 02199-3600. Except as otherwise noted below, the term of office for each Board Member is until the election and qualification of a successor, or until such Board Member sooner dies, resigns, is removed or as otherwise provided in the governing documents of the fund. Because the fund does not hold an annual meeting of shareholders, each Board Member will hold office for an indeterminate period. The Board Members may also serve in similar capacities with other funds in the fund complex.
| Independent Board Members |
| Name, Year of Birth, Position with the Fund and Length of Time Served1 | Business Experience and Directorships During the Past Five Years | Number of Funds in Deutsche Fund Complex Overseen | Other Directorships Held by Board Member |
Keith R. Fox, CFA (1954) Chairperson since 2017,2 and Board Member since 1996 | Managing General Partner, Exeter Capital Partners (a series of private investment funds) (since 1986). Directorships: Progressive International Corporation (kitchen goods importer and distributor); The Kennel Shop (retailer); former Chairman, National Association of Small Business Investment Companies; former Directorships: BoxTop Media Inc. (advertising); Sun Capital Advisers Trust (mutual funds) (2011–2012) | 98 | — |
Kenneth C. Froewiss (1945) Vice Chairperson since 2017,2 Board Member since 2001, and Chairperson (2013–December 31, 2016) | Retired Clinical Professor of Finance, NYU Stern School of Business (1997–2014); Member, Finance Committee, Association for Asian Studies (2002–present); Director, Mitsui Sumitomo Insurance Group (US) (2004–present); prior thereto, Managing Director, J.P. Morgan (investment banking firm) (until 1996) | 98 | — |
John W. Ballantine (1946) Board Member since 1999 | Retired; formerly, Executive Vice President and Chief Risk Management Officer, First Chicago NBD Corporation/The First National Bank of Chicago (1996–1998); Executive Vice President and Head of International Banking (1995–1996); former Directorships: Director and former Chairman of the Board, Healthways, Inc.3 (population well-being and wellness services) (2003–2014); Stockwell Capital Investments PLC (private equity); First Oak Brook Bancshares, Inc. and Oak Brook Bank; Prisma Energy International | 98 | Portland General Electric3 (utility company) (2003– present) |
Henry P. Becton, Jr. (1943) Board Member since 1990 | Vice Chair and former President, WGBH Educational Foundation. Directorships: Public Radio International; Public Radio Exchange (PRX); The Pew Charitable Trusts (charitable organization); former Directorships: Becton Dickinson and Company3 (medical technology company); Belo Corporation3 (media company); The PBS Foundation; Association of Public Television Stations; Boston Museum of Science; American Public Television; Concord Academy; New England Aquarium; Mass. Corporation for Educational Telecommunications; Committee for Economic Development; Public Broadcasting Service; Connecticut College; North Bennett Street School (Boston) | 98 | — |
Dawn-Marie Driscoll (1946) Board Member since 1987 | Emeritus Executive Fellow, Center for Business Ethics, Bentley University; formerly: President, Driscoll Associates (consulting firm); Partner, Palmer & Dodge (law firm) (1988–1990); Vice President of Corporate Affairs and General Counsel, Filene's (retail) (1978–1988). Directorships: Advisory Board, Center for Business Ethics, Bentley University; Trustee and former Chairman of the Board, Southwest Florida Community Foundation (charitable organization); former Directorships: ICI Mutual Insurance Company (2007–2015); Sun Capital Advisers Trust (mutual funds) (2007–2012), Investment Company Institute (audit, executive, nominating committees) and Independent Directors Council (governance, executive committees) | 98 | — |
Paul K. Freeman (1950) Board Member since 1993 | Consultant, World Bank/Inter-American Development Bank; Chair, Independent Directors Council; Investment Company Institute (executive and nominating committees); formerly, Chairman of Education Committee of Independent Directors Council; Project Leader, International Institute for Applied Systems Analysis (1998–2001); Chief Executive Officer, The Eric Group, Inc. (environmental insurance) (1986–1998); Directorships: Denver Zoo Foundation (December 2012–present); former Directorships: Prisma Energy International | 98 | — |
Richard J. Herring (1946) Board Member since 1990 | Jacob Safra Professor of International Banking and Professor, Finance Department, The Wharton School, University of Pennsylvania (since July 1972); Co-Director, Wharton Financial Institutions Center; formerly: Vice Dean and Director, Wharton Undergraduate Division (July 1995–June 2000); Director, Lauder Institute of International Management Studies (July 2000–June 2006) | 98 | Director, Aberdeen Singapore and Japan Funds (since 2007); Independent Director of Barclays Bank Delaware (since September 2010) |
William McClayton (1944) Board Member since 2004, and Vice Chairperson (2013–December 31, 2016) | Private equity investor (since October 2009); previously, Managing Director, Diamond Management & Technology Consultants, Inc. (global consulting firm) (2001–2009); Directorship: Board of Managers, YMCA of Metropolitan Chicago; formerly: Senior Partner, Arthur Andersen LLP (accounting) (1966–2001); Trustee, Ravinia Festival | 98 | — |
Rebecca W. Rimel (1951) Board Member since 1995 | President, Chief Executive Officer and Director, The Pew Charitable Trusts (charitable organization) (1994–present); formerly: Executive Vice President, The Glenmede Trust Company (investment trust and wealth management) (1983–2004); Board Member, Investor Education (charitable organization) (2004–2005); Trustee, Executive Committee, Philadelphia Chamber of Commerce (2001–2007); Director, Viasys Health Care3 (January 2007–June 2007); Trustee, Thomas Jefferson Foundation (charitable organization) (1994–2012) | 98 | Director, Becton Dickinson and Company3 (medical technology company) (2012– present); Director, BioTelemetry Inc.3 (health care) (2009– present) |
William N. Searcy, Jr. (1946) Board Member since 1993 | Private investor since October 2003; formerly: Pension & Savings Trust Officer, Sprint Corporation3 (telecommunications) (November 1989–September 2003); Trustee, Sun Capital Advisers Trust (mutual funds) (1998–2012) | 98 | — |
Jean Gleason Stromberg (1943) Board Member since 1997 | Retired. Formerly, Consultant (1997–2001); Director, Financial Markets U.S. Government Accountability Office (1996–1997); Partner, Norton Rose Fulbright, L.L.P. (law firm) (1978–1996); former Directorships: The William and Flora Hewlett Foundation (charitable organization) (2000–2015); Service Source, Inc. (nonprofit), Mutual Fund Directors Forum (2002–2004), American Bar Retirement Association (funding vehicle for retirement plans) (1987–1990 and 1994–1996) | 98 | — |
| Officers5 |
| Name, Year of Birth, Position with the Fund and Length of Time Served6 | Business Experience and Directorships During the Past Five Years |
Brian E. Binder9 (1972) President and Chief Executive Officer, 2013–present | Managing Director4 and Head of US Product and Fund Administration, Deutsche Asset Management (2013–present); Director and President, Deutsche AM Service Company (since 2016); Director and Vice President, Deutsche AM Distributors, Inc. (since 2016); Director and President, DB Investment Managers, Inc. (since 2016); formerly, Head of Business Management and Consulting at Invesco, Ltd. (2010–2012) |
John Millette8 (1962) Vice President and Secretary, 1999–present | Director,4 Deutsche Asset Management; Chief Legal Officer and Secretary, Deutsche Investment Management Americas Inc. (2015–present); and Director and Vice President, Deutsche AM Trust Company (since 2016) |
Hepsen Uzcan7 (1974) Vice President, since 2016 Assistant Secretary, 2013–present | Director,4 Deutsche Asset Management |
Paul H. Schubert7 (1963) Chief Financial Officer, 2004–present Treasurer, 2005–present | Managing Director,4 Deutsche Asset Management, and Chairman, Director and President, Deutsche AM Trust Company (since 2013); Vice President, Deutsche AM Distributors, Inc. (since 2016); formerly, Director, Deutsche AM Trust Company (2004–2013) |
Caroline Pearson8 (1962) Chief Legal Officer, 2010–present | Managing Director,4 Deutsche Asset Management; Secretary, Deutsche AM Distributors, Inc.; and Secretary, Deutsche AM Service Company |
Scott D. Hogan8 (1970) Chief Compliance Officer, since 2016 | Director,4 Deutsche Asset Management |
Wayne Salit7 (1967) Anti-Money Laundering Compliance Officer, 2014–present | Director,4 Deutsche Asset Management; AML Compliance Officer, Deutsche AM Distributors, Inc.; formerly: Managing Director, AML Compliance Officer at BNY Mellon (2011–2014); and Director, AML Compliance Officer at Deutsche Bank (2004–2011) |
Paul Antosca8 (1957) Assistant Treasurer, 2007–present | Director,4 Deutsche Asset Management |
Diane Kenneally8 (1966) Assistant Treasurer, 2007–present | Director,4 Deutsche Asset Management |
1 The length of time served represents the year in which the Board Member joined the board of one or more Deutsche funds currently overseen by the Board.
2 Effective as of January 1, 2017.
3 A publicly held company with securities registered pursuant to Section 12 of the Securities Exchange Act of 1934.
4 Executive title, not a board directorship.
5 As a result of their respective positions held with the Advisor, these individuals are considered "interested persons" of the Advisor within the meaning of the 1940 Act. Interested persons receive no compensation from the fund.
6 The length of time served represents the year in which the officer was first elected in such capacity for one or more Deutsche funds.
7 Address: 60 Wall Street, New York, NY 10005.
8 Address: One Beacon Street, Boston, MA 02108.
9 Address: 222 South Riverside Plaza, Chicago, IL 60606.
The fund's Statement of Additional Information ("SAI") includes additional information about the Board Members. The SAI is available, without charge, upon request. If you would like to request a copy of the SAI, you may do so by calling the following toll-free number: (800) 728-3337.

VS1bond-2 (R-025819-6 2/17)

December 31, 2016
Annual Report
Deutsche Variable Series I
Deutsche Capital Growth VIP

Contents
3 Performance Summary 4 Management Summary 5 Portfolio Summary 6 Investment Portfolio 10 Statement of Assets and Liabilities 11 Statement of Operations 11 Statements of Changes in Net Assets 13 Financial Highlights 14 Notes to Financial Statements 19 Report of Independent Registered Public Accounting Firm 20 Information About Your Fund's Expenses 20 Tax Information 21 Proxy Voting 22 Advisory Agreement Board Considerations and Fee Evaluation 24 Board Members and Officers |
This report must be preceded or accompanied by a prospectus. To obtain an additional prospectus or summary prospectus, if available, call (800) 728-3337 or your financial representative. We advise you to consider the Fund's objectives, risks, charges and expenses carefully before investing. The summary prospectus and prospectus contain this and other important information about the Fund. Please read the prospectus carefully before you invest.
Stocks may decline in value. The Fund may lend securities to approved institutions. See the prospectus for details.
Deutsche Asset Management represents the asset management activities conducted by Deutsche Bank AG or any of its subsidiaries.
Deutsche AM Distributors, Inc., 222 South Riverside Plaza, Chicago, IL 60606, (800) 621-1148
NOT FDIC/NCUA INSURED NO BANK GUARANTEE MAY LOSE VALUE NOT A DEPOSIT
NOT INSURED BY ANY FEDERAL GOVERNMENT AGENCY
Performance Summary December 31, 2016 (Unaudited)
Fund performance shown is historical, assumes reinvestment of all dividend and capital gain distributions, and does not guarantee future results. Investment return and principal value fluctuate with changing market conditions so that, when redeemed, shares may be worth more or less than their original cost. Current performance may be lower or higher than the performance data quoted. Please contact your participating insurance company for the Fund's most recent month-end performance. Performance doesn't reflect charges and fees ("contract charges") associated with the separate account that invests in the Fund or any variable life insurance policy or variable annuity contract for which the Fund is an investment option. These charges and fees will reduce returns. While all share classes have the same underlying portfolio, their performance will differ.
The gross expense ratios of the Fund, as stated in the fee table of the prospectus dated May 1, 2016 are 0.49% and 0.76% for Class A and Class B shares, respectively, and may differ from the expense ratios disclosed in the Financial Highlights tables in this report.
Generally accepted accounting principles require adjustments to be made to the net assets of the Fund at period end for financial reporting purposes only, and as such, the total return based on the unadjusted net asset value per share may differ from the total return reported in the financial highlights.
| Growth of an Assumed $10,000 Investment |
■ Deutsche Capital Growth VIP — Class A ■ Russell 1000® Growth Index | The Russell 1000® Growth Index is an unmanaged index that consists of those stocks in the Russell 1000® Index that have higher price-to-book ratios and higher forecasted growth values. Index returns do not reflect any fees or expenses and it is not possible to invest directly into an index. |
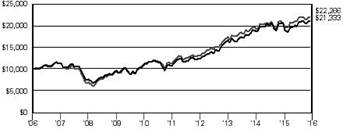 | |
| Yearly periods ended December 31 | |
| Comparative Results |
| Deutsche Capital Growth VIP | 1-Year | 3-Year | 5-Year | 10-Year |
| Class A | Growth of $10,000 | $10,425 | $12,792 | $19,988 | $21,333 |
| Average annual total return | 4.25% | 8.55% | 14.86% | 7.87% |
| Russell 1000 Growth Index | Growth of $10,000 | $10,708 | $12,791 | $19,679 | $22,266 |
| Average annual total return | 7.08% | 8.55% | 14.50% | 8.33% |
| Deutsche Capital Growth VIP | 1-Year | 3-Year | 5-Year | 10-Year |
| Class B | Growth of $10,000 | $10,400 | $12,693 | $19,692 | $20,678 |
| Average annual total return | 4.00% | 8.27% | 14.51% | 7.54% |
| Russell 1000 Growth Index | Growth of $10,000 | $10,708 | $12,791 | $19,679 | $22,266 |
| Average annual total return | 7.08% | 8.55% | 14.50% | 8.33% |
The growth of $10,000 is cumulative.
Management Summary December 31, 2016 (Unaudited)
The Fund gained 4.25% (Class A shares, unadjusted for contract charges) during 2016, underperforming the 7.08% return of the Russell 1000® Growth Index.1
Consistent with the Fund’s bottom-up approach, stock selection was the primary driver of relative performance. Our investments trailed the benchmark components in the consumer discretionary and industrials sectors, which accounted for nearly all of the shortfall.2 In the former, the deficit was largely the result of two positions. Shares of L Brands, Inc. — the parent of multiple retailers — were hurt by weaker same-store sales of its Victoria’s Secret brand, while NIKE, Inc. lagged due to a slowdown in its sales growth rate and rising competitive threats in certain product categories. In the industrials sector, Stericycle, Inc. — which lost ground due to higher business cyclicality and lower growth in its core business — was the leading detractor. Positions in AMETEK, Inc. and Roper Technologies, Inc. also weighed on our performance in industrials.
Although our overall return in health care was on par with the broader sector for the year, certain positions stood out as being notable detractors. Among these were Allergan PLC, which slid after a proposed merger with Pfizer Inc. fell through, as well as Gilead Sciences, Inc. and Shire PLC. The former was hit by pricing pressures, declining sales and a lack of growth catalysts in its product pipeline, while shares of the latter were pressured by concerns about the strategic rationale behind its acquisition of Baxalta.
On the plus side, three portfolio holdings were taken over or bid for in 2016, which provided a healthy boost to relative performance. The natural-foods producer The WhiteWave Foods Co. was bid for by Danone in July, and the biopharmaceutical stock Medivation, Inc. was acquired by Pfizer in August. In addition, BE Aerospace, Inc. received a bid from Rockwell Collins in October. We believe that takeovers of multiple Fund holdings illustrate how our emphasis on companies with robust organic growth can lead us to stocks that are also attractive to corporate buyers.
The semiconductor stock NVIDIA, Inc. was the largest individual contributor to Fund returns.3 The company benefited not only from the upturn in the graphics-processing chip cycle, but also its exposure to faster-growing market segments such as gaming, automated cars, deep learning and artificial intelligence. Albemarle Corp., a lithium producer that capitalized on the growing use of the commodity in batteries, also made a significant contribution to results.
The Fund’s management team changed during the course of the year, but we maintained the same focus on bottom-up security selection that the Fund has employed in the past. Believing a focus on selectivity is likely to become increasingly important following the robust gain for the overall market in 2016, we maintained an emphasis on higher-quality, reasonably valued companies demonstrating above-average organic growth. We believe this approach can help isolate companies with the potential to outperform even if the broader market begins to experience lower returns.
Sebastian P. Werner, PhD
Portfolio Manager
The views expressed reflect those of the portfolio management team only through the end of the period of the report as stated on the cover. The management team's views are subject to change at any time based on market and other conditions and should not be construed as a recommendation. Past performance is no guarantee of future results. Current and future portfolio holdings are subject to risk.
1 The Russell 1000 Growth Index is an unmanaged index that consists of those stocks in the Russell 1000® Index that have higher price-to-book ratios and higher forecasted growth values. Index returns do not reflect any fees or expenses and it is not possible to invest directly into an index.
2 Consumer discretionary represents industries that produce goods and services that are not necessities in everyday life.
3 Contribution and detraction incorporate both a stock's total return and its weighting in the fund.
Portfolio Summary (Unaudited)
| Asset Allocation (As a % of Investment Portfolio excluding Securities Lending Collateral) | 12/31/16 | 12/31/15 |
| | | |
| Common Stocks | 99% | 98% |
| Cash Equivalents | 1% | 2% |
| Convertible Preferred Stocks | 0% | 0% |
| | 100% | 100% |
| Sector Diversification (As a % of Common Stocks and Convertible Preferred Stocks) | 12/31/16 | 12/31/15 |
| | | |
| Information Technology | 31% | 28% |
| Consumer Discretionary | 18% | 22% |
| Health Care | 17% | 18% |
| Industrials | 10% | 11% |
| Consumer Staples | 10% | 10% |
| Financials | 5% | 5% |
| Materials | 4% | 3% |
| Real Estate | 2% | — |
| Telecommunication Services | 2% | 1% |
| Energy | 1% | 1% |
| Utilities | — | 1% |
| | 100% | 100% |
Portfolio holdings and characteristics are subject to change.
For more complete details about the Fund's investment portfolio, see page 6.
Following the Fund's fiscal first and third quarter-end, a complete portfolio holdings listing is filed with the SEC on Form N-Q. The form will be available on the SEC's Web site at sec.gov, and it also may be reviewed and copied at the SEC's Public Reference Room in Washington, D.C. Information on the operation of the SEC's Public Reference Room may be obtained by calling (800) SEC-0330. The Fund's portfolio holdings are also posted on deutschefunds.com from time to time. Please see the Fund's current prospectus for more information.
Investment Portfolio December 31, 2016
| |
Shares | Value ($) |
| | | |
| Common Stocks 99.3% |
| Consumer Discretionary 17.9% |
| Hotels, Restaurants & Leisure 0.7% |
| Las Vegas Sands Corp. | 95,835 | 5,118,547 |
| Household Durables 1.2% |
| Newell Brands, Inc. | 194,358 | 8,678,085 |
| Internet & Direct Marketing Retail 3.0% |
| Amazon.com, Inc.* | 29,910 | 22,428,612 |
| Media 5.7% |
| Comcast Corp. "A" | 199,392 | 13,768,018 |
| Time Warner, Inc. | 118,195 | 11,409,363 |
| Walt Disney Co. | 169,164 | 17,630,272 |
| | 42,807,653 |
| Multiline Retail 0.6% |
| Dollar General Corp. | 58,377 | 4,323,984 |
| Specialty Retail 5.5% |
| Burlington Stores, Inc.* | 51,211 | 4,340,132 |
| Home Depot, Inc. | 145,705 | 19,536,127 |
| L Brands, Inc. | 128,338 | 8,449,774 |
| O'Reilly Automotive, Inc.* | 33,500 | 9,326,735 |
| | 41,652,768 |
| Textiles, Apparel & Luxury Goods 1.2% |
| NIKE, Inc. "B" | 176,903 | 8,991,979 |
| Consumer Staples 9.6% |
| Beverages 1.8% |
| PepsiCo, Inc. | 130,369 | 13,640,509 |
| Food & Staples Retailing 3.4% |
| Costco Wholesale Corp. | 52,109 | 8,343,172 |
| CVS Health Corp. | 161,343 | 12,731,576 |
| Rite Aid Corp.* | 504,384 | 4,156,124 |
| | 25,230,872 |
| Food Products 3.8% |
| Conagra Brands, Inc. | 106,265 | 4,202,781 |
| Mead Johnson Nutrition Co. | 142,186 | 10,061,081 |
| Pinnacle Foods, Inc. | 157,609 | 8,424,201 |
| The WhiteWave Foods Co.* | 110,608 | 6,149,805 |
| | 28,837,868 |
| Personal Products 0.6% |
| Estee Lauder Companies, Inc. "A" | 57,820 | 4,422,652 |
| Energy 1.0% |
| Oil, Gas & Consumable Fuels |
| Concho Resources, Inc.* | 54,087 | 7,171,936 |
| Financials 4.6% |
| Banks 1.1% |
| SVB Financial Group* | 46,692 | 8,015,149 |
| Capital Markets 2.2% |
| Intercontinental Exchange, Inc. | 140,175 | 7,908,674 |
| The Charles Schwab Corp. | 220,567 | 8,705,779 |
| | 16,614,453 |
| Insurance 1.3% |
| Progressive Corp. | 280,884 | 9,971,382 |
| |
Shares | Value ($) |
| | | |
| Health Care 17.1% |
| Biotechnology 7.4% |
| Alexion Pharmaceuticals, Inc.* | 32,934 | 4,029,475 |
| Biogen, Inc.* | 19,956 | 5,659,123 |
| BioMarin Pharmaceutical, Inc.* | 61,410 | 5,087,204 |
| Celgene Corp.* | 173,422 | 20,073,597 |
| Gilead Sciences, Inc. | 185,281 | 13,267,972 |
| Shire PLC (ADR) | 44,935 | 7,656,025 |
| | 55,773,396 |
| Health Care Equipment & Supplies 2.9% |
| Becton, Dickinson & Co. | 45,462 | 7,526,234 |
| Danaher Corp. | 92,848 | 7,227,288 |
| The Cooper Companies, Inc. | 37,718 | 6,598,010 |
| | 21,351,532 |
| Health Care Providers & Services 2.4% |
| Cigna Corp. | 89,028 | 11,875,445 |
| McKesson Corp. | 41,534 | 5,833,450 |
| | 17,708,895 |
| Life Sciences Tools & Services 2.2% |
| Patheon NV* | 138,177 | 3,967,062 |
| Thermo Fisher Scientific, Inc. | 89,607 | 12,643,548 |
| | 16,610,610 |
| Pharmaceuticals 2.2% |
| Allergan PLC* | 57,286 | 12,030,633 |
| Bristol-Myers Squibb Co. | 78,169 | 4,568,196 |
| | 16,598,829 |
| Industrials 9.8% |
| Aerospace & Defense 3.1% |
| BE Aerospace, Inc. | 73,991 | 4,453,518 |
| Boeing Co. | 94,701 | 14,743,052 |
| TransDigm Group, Inc. | 15,216 | 3,788,175 |
| | 22,984,745 |
| Commercial Services & Supplies 0.5% |
| Stericycle, Inc.* | 49,966 | 3,849,381 |
| Electrical Equipment 2.3% |
| Acuity Brands, Inc. | 22,989 | 5,307,240 |
| AMETEK, Inc. | 246,248 | 11,967,653 |
| | 17,274,893 |
| Industrial Conglomerates 1.4% |
| Roper Technologies, Inc. | 58,054 | 10,628,526 |
| Machinery 0.7% |
| Parker-Hannifin Corp. | 36,776 | 5,148,640 |
| Professional Services 0.6% |
| Equifax, Inc. | 38,611 | 4,564,979 |
| Road & Rail 1.2% |
| Norfolk Southern Corp. | 83,072 | 8,977,591 |
| Information Technology 31.0% |
| Internet Software & Services 6.5% |
| Alphabet, Inc. "A"* | 23,145 | 18,341,255 |
| Alphabet, Inc. "C"* | 21,269 | 16,415,840 |
| Facebook, Inc. "A"* | 124,943 | 14,374,692 |
| | 49,131,787 |
| |
Shares | Value ($) |
| | | |
| IT Services 6.8% |
| Cognizant Technology Solutions Corp. "A"* | 149,687 | 8,386,963 |
| Fidelity National Information Services, Inc. | 120,745 | 9,133,152 |
| Fiserv, Inc.* | 75,254 | 7,997,995 |
| Global Payments, Inc. | 72,067 | 5,002,170 |
| Visa, Inc. "A" | 262,350 | 20,468,547 |
| | 50,988,827 |
| Semiconductors & Semiconductor Equipment 4.7% |
| Broadcom Ltd. | 77,291 | 13,662,730 |
| Intel Corp. | 141,779 | 5,142,324 |
| NVIDIA Corp. | 106,891 | 11,409,546 |
| NXP Semiconductors NV* | 51,984 | 5,094,952 |
| | 35,309,552 |
| Software 6.7% |
| Adobe Systems, Inc.* | 84,272 | 8,675,802 |
| Microsoft Corp. | 584,912 | 36,346,432 |
| Oracle Corp. | 135,652 | 5,215,819 |
| | 50,238,053 |
| Technology Hardware, Storage & Peripherals 6.3% |
| Apple, Inc. | 407,405 | 47,185,647 |
| Materials 4.2% |
| Chemicals 2.2% |
| Albemarle Corp. | 87,435 | 7,526,405 |
| PPG Industries, Inc. | 97,261 | 9,216,452 |
| | 16,742,857 |
| Construction Materials 1.0% |
| Vulcan Materials Co. | 61,260 | 7,666,689 |
| Containers & Packaging 1.0% |
| Sealed Air Corp. | 161,088 | 7,303,730 |
| |
Shares | Value ($) |
| | | |
| Real Estate 2.3% |
| Equity Real Estate Investment Trusts (REITs) |
| Digital Realty Trust, Inc. | 98,973 | 9,725,087 |
| Prologis, Inc. | 149,505 | 7,892,369 |
| | 17,617,456 |
| Telecommunication Services 1.8% |
| Diversified Telecommunication Services |
| Level 3 Communications, Inc.* | 108,091 | 6,092,009 |
| Zayo Group Holdings, Inc.* | 227,675 | 7,481,400 |
| | 13,573,409 |
| Total Common Stocks (Cost $471,267,644) | 745,136,473 |
| |
| Convertible Preferred Stocks 0.1% |
| Health Care 0.1% |
| Allergan PLC, Series A, 5.5% | 1,100 | 838,706 |
| Industrials 0.0% |
| Stericycle, Inc. Series A, 5.25% | 3,000 | 189,810 |
| Total Convertible Preferred Stocks (Cost $1,400,000) | 1,028,516 |
| |
| Cash Equivalents 0.6% |
| Deutsche Central Cash Management Government Fund, 0.49% (a) (Cost $4,250,917) | 4,250,917 | 4,250,917 |
| | % of Net Assets | Value ($) |
| | |
| Total Investment Portfolio (Cost $476,918,561)† | 100.0 | 750,415,906 |
| Other Assets and Liabilities, Net | (0.0) | (311,130) |
| Net Assets | 100.0 | 750,104,776 |
* Non-income producing security.
† The cost for federal income tax purposes was $477,571,842. At December 31, 2016, net unrealized appreciation for all securities based on tax cost was $272,844,064. This consisted of aggregate gross unrealized appreciation for all securities in which there was an excess of value over tax cost of $290,881,405 and aggregate gross unrealized depreciation for all securities in which there was an excess of tax cost over value of $18,037,341.
(a) Affiliated fund managed by Deutsche Investment Management Americas Inc. The rate shown is the annualized seven-day yield at period end.
ADR: American Depositary Receipt
Fair Value Measurements
Various inputs are used in determining the value of the Fund's investments. These inputs are summarized in three broad levels. Level 1 includes quoted prices in active markets for identical securities. Level 2 includes other significant observable inputs (including quoted prices for similar securities, interest rates, prepayment speeds and credit risk). Level 3 includes significant unobservable inputs (including the Fund's own assumptions in determining the fair value of investments). The level assigned to the securities valuations may not be an indication of the risk or liquidity associated with investing in those securities.
The following is a summary of the inputs used as of December 31, 2016 in valuing the Fund's investments. For information on the Fund's policy regarding the valuation of investments, please refer to the Security Valuation section of Note A in the accompanying Notes to Financial Statements.
| Assets | Level 1 | Level 2 | Level 3 | Total |
| |
| Common Stocks (b) | $745,136,473 | $ — | $ — | $745,136,473 |
| Convertible Preferred Stocks (b) | 1,028,516 | — | — | 1,028,516 |
| Short-Term Investments | 4,250,917 | — | — | 4,250,917 |
| Total | $750,415,906 | $ — | $ — | $750,415,906 |
There have been no transfers between fair value measurement levels during the year ended December 31, 2016.
(b) See Investment Portfolio for additional detailed categorizations.
The accompanying notes are an integral part of the financial statements.
Statement of Assets and Liabilities
| as of December 31, 2016 |
| Assets |
Investments: Investments in non-affiliated securities, at value (cost $472,667,644) | $746,164,989 |
| Investment in Deutsche Central Cash Management Government Fund (cost $4,250,917) | 4,250,917 |
| Total investments in securities, at value (cost $476,918,561) | 750,415,906 |
| Receivable for Fund shares sold | 46,848 |
| Dividends receivable | 598,491 |
| Interest receivable | 3,289 |
| Other assets | 11,945 |
| Total assets | 751,076,479 |
| Liabilities |
| Payable for investments purchased | 75,765 |
| Payable for Fund shares redeemed | 484,912 |
| Accrued management fee | 239,016 |
| Accrued Trustees' fees | 8,436 |
| Other accrued expenses and payables | 163,574 |
| Total liabilities | 971,703 |
| Net assets, at value | $750,104,776 |
| Net Assets Consist of |
| Undistributed net investment income | 6,098,298 |
Net unrealized appreciation (depreciation) on Investments | 273,497,345 |
| Accumulated net realized gain (loss) | 63,073,395 |
| Paid-in capital | 407,435,738 |
| Net assets, at value | $750,104,776 |
Class A Net Asset Value, offering and redemption price per share ($744,845,540 ÷ 27,895,381 outstanding shares of beneficial interest, $.01 par value, unlimited number of shares authorized) | $ 26.70 |
Class B Net Asset Value, offering and redemption price per share ($5,259,236 ÷ 197,662 outstanding shares of beneficial interest, $.01 par value, unlimited number of shares authorized) | $ 26.61 |
The accompanying notes are an integral part of the financial statements.
Statement of Operations
| for the year ended December 31, 2016 |
| Investment Income |
Income: Dividends (net of foreign taxes withheld of $10,026) | $ 9,982,407 |
| Interest | 2,119 |
| Income distributions — Deutsche Central Cash Management Government Fund | 28,719 |
| Securities lending income, net of borrower rebates | 39,376 |
| Other income | 121,253 |
| Total income | 10,173,874 |
Expenses: Management fee | 2,867,050 |
| Administration fee | 768,370 |
| Services to shareholders | 3,176 |
| Record keeping fee (Class B) | 177 |
| Distribution and service fees (Class B) | 11,393 |
| Custodian fee | 17,132 |
| Professional fees | 75,902 |
| Reports to shareholders | 52,715 |
| Trustees' fees and expenses | 33,870 |
| Other | 35,984 |
| Total expenses | 3,865,769 |
| Net investment income (loss) | 6,308,105 |
| Realized and Unrealized Gain (Loss) |
Net realized gain (loss) from Investments | 70,814,016 |
| Change in net unrealized appreciation (depreciation) on investments | (49,459,182) |
| Net gain (loss) | 21,354,834 |
| Net increase (decrease) in net assets resulting from operations | $ 27,662,939 |
The accompanying notes are an integral part of the financial statements.
Statements of Changes in Net Assets
| Increase (Decrease) in Net Assets | Years Ended December 31, |
| 2016 | 2015 |
Operations: Net investment income (loss) | $ 6,308,105 | $ 6,307,809 |
| Net realized gain (loss) | 70,814,016 | 73,261,776 |
| Change in net unrealized appreciation (depreciation) | (49,459,182) | (4,793,723) |
| Net increase (decrease) in net assets resulting from operations | 27,662,939 | 74,775,862 |
Distributions to shareholders from: Net investment income: Class A | (6,231,720) | (6,323,352) |
| Class B | (20,032) | (12,995) |
Net realized gains: Class A | (66,067,535) | (117,055,763) |
| Class B | (322,737) | (434,436) |
| Total distributions | (72,642,024) | (123,826,546) |
Fund share transactions: Class A Proceeds from shares sold | 15,616,714 | 45,298,331 |
| Reinvestment of distributions | 72,299,255 | 123,379,115 |
| Payments for shares redeemed | (147,165,346) | (161,179,658) |
| Net increase (decrease) in net assets from Class A share transactions | (59,249,377) | 7,497,788 |
Class B Proceeds from shares sold | 2,848,370 | 1,114,466 |
| Reinvestment of distributions | 342,769 | 447,431 |
| Payments for shares redeemed | (1,421,396) | (1,187,018) |
| Net increase (decrease) in net assets from Class B share transactions | 1,769,743 | 374,879 |
| Increase (decrease) in net assets | (102,458,719) | (41,178,017) |
| Net assets at beginning of period | 852,563,495 | 893,741,512 |
| Net assets at end of period (including undistributed net investment income of $6,098,298 and $6,293,047, respectively) | $750,104,776 | $852,563,495 |
| Other Information |
Class A Shares outstanding at beginning of period | 30,084,968 | 29,731,475 |
| Shares sold | 591,265 | 1,580,052 |
| Shares issued to shareholders in reinvestment of distributions | 2,877,010 | 4,417,441 |
| Shares redeemed | (5,657,862) | (5,644,000) |
| Net increase (decrease) in Class A shares | (2,189,587) | 353,493 |
| Shares outstanding at end of period | 27,895,381 | 30,084,968 |
Class B Shares outstanding at beginning of period | 127,214 | 113,396 |
| Shares sold | 111,807 | 38,768 |
| Shares issued to shareholders in reinvestment of distributions | 13,667 | 16,048 |
| Shares redeemed | (55,026) | (40,998) |
| Net increase (decrease) in Class B shares | 70,448 | 13,818 |
| Shares outstanding at end of period | 197,662 | 127,214 |
The accompanying notes are an integral part of the financial statements.
Financial Highlights
| Class A | |
Years Ended December 31, |
| 2016 | 2015 | 2014 | 2013 | 2012 |
| Selected Per Share Data |
| Net asset value, beginning of period | $ 28.22 | $ 29.95 | $ 28.41 | $ 21.38 | $ 18.58 |
Income (loss) from investment operations: Net investment income (loss)a | .21 | .20 | .21 | .21 | .28 |
| Net realized and unrealized gain (loss) | .83 | 2.34 | 3.18 | 7.12 | 2.70 |
| Total from investment operations | 1.04 | 2.54 | 3.39 | 7.33 | 2.98 |
Less distributions from: Net investment income | (.22) | (.22) | (.18) | (.30) | (.18) |
| Net realized gains | (2.34) | (4.05) | (1.67) | — | — |
| Total distributions | (2.56) | (4.27) | (1.85) | (.30) | (.18) |
| Net asset value, end of period | $ 26.70 | $ 28.22 | $ 29.95 | $ 28.41 | $ 21.38 |
| Total Return (%) | 4.25 | 8.62 | 12.97 | 34.65 | 16.05 |
| Ratios to Average Net Assets and Supplemental Data |
| Net assets, end of period ($ millions) | 745 | 849 | 890 | 837 | 701 |
| Ratio of expenses (%) | .50 | .49 | .50 | .50 | .50 |
| Ratio of net investment income (loss) (%) | .82 | .70 | .76 | .85 | 1.32 |
| Portfolio turnover rate (%) | 35 | 35 | 47 | 37 | 25 |
| a Based on average shares outstanding during the period. |
| Class B | |
Years Ended December 31, |
| 2016 | 2015 | 2014 | 2013 | 2012 |
| Selected Per Share Data |
| Net asset value, beginning of period | $ 28.12 | $ 29.84 | $ 28.29 | $ 21.29 | $ 18.51 |
Income (loss) from investment operations: Net investment income (loss)a | .15 | .13 | .09 | .13 | .20 |
| Net realized and unrealized gain (loss) | .83 | 2.32 | 3.22 | 7.10 | 2.69 |
| Total from investment operations | .98 | 2.45 | 3.31 | 7.23 | 2.89 |
Less distributions from: Net investment income | (.15) | (.12) | (.09) | (.23) | (.11) |
| Net realized gains | (2.34) | (4.05) | (1.67) | — | — |
| Total distributions | (2.49) | (4.17) | (1.76) | (.23) | (.11) |
| Net asset value, end of period | $ 26.61 | $ 28.12 | $ 29.84 | $ 28.29 | $ 21.29 |
| Total Return (%) | 4.00 | 8.33 | 12.67 | 34.19 | 15.61 |
| Ratios to Average Net Assets and Supplemental Data |
| Net assets, end of period ($ millions) | 5 | 4 | 3 | 14 | 13 |
| Ratio of expenses (%) | .76 | .76 | .80 | .83 | .83 |
| Ratio of net investment income (loss) (%) | .58 | .44 | .33 | .52 | .97 |
| Portfolio turnover rate (%) | 35 | 35 | 47 | 37 | 25 |
| a Based on average shares outstanding during the period. |
Notes to Financial Statements
A. Organization and Significant Accounting Policies
Deutsche Variable Series I (the "Trust") is registered under the Investment Company Act of 1940, as amended (the "1940 Act"), as an open-end, registered management investment company organized as a Massachusetts business trust. The Trust consists of five diversified funds: Deutsche Bond VIP, Deutsche Capital Growth VIP, Deutsche Core Equity VIP, Deutsche CROCI® International VIP and Deutsche Global Small Cap VIP (individually or collectively hereinafter referred to as a "Fund" or the "Funds"). These financial statements report on Deutsche Capital Growth VIP. The Trust is intended to be the underlying investment vehicle for variable annuity contracts and variable life insurance policies to be offered by the separate accounts of certain life insurance companies ("Participating Insurance Companies").
Multiple Classes of Shares of Beneficial Interest. The Fund offers two classes of shares (Class A shares and Class B shares). Class B shares are subject to Rule 12b-1 distribution fees under the 1940 Act and record keeping fees equal to an annual rate of 0.25% and up to 0.15%, respectively, of the average daily net assets of the Class B shares of the Fund. Class A shares are not subject to such fees.
Investment income, realized and unrealized gains and losses, and certain fund-level expenses and expense reductions, if any, are borne pro rata on the basis of relative net assets by the holders of all classes of shares, except that each class bears certain expenses unique to that class (including the applicable 12b-1 distribution fees and recordkeeping fees). Differences in class-level expenses may result in payment of different per share dividends by class. All shares have equal rights with respect to voting subject to class-specific arrangements.
The Fund's financial statements are prepared in accordance with accounting principles generally accepted in the United States of America ("U.S. GAAP") which require the use of management estimates. Actual results could differ from those estimates. The Fund qualifies as an investment company under Topic 946 of Accounting Standards Codification of U.S. GAAP. The policies described below are followed consistently by the Fund in the preparation of its financial statements.
Security Valuation. Investments are stated at value determined as of the close of regular trading on the New York Stock Exchange on each day the exchange is open for trading.
Various inputs are used in determining the value of the Fund's investments. These inputs are summarized in three broad levels. Level 1 includes quoted prices in active markets for identical securities. Level 2 includes other significant observable inputs (including quoted prices for similar securities, interest rates, prepayment speeds and credit risk). Level 3 includes significant unobservable inputs (including the Fund's own assumptions in determining the fair value of investments). The level assigned to the securities valuations may not be an indication of the risk or liquidity associated with investing in those securities.
Equity securities are valued at the most recent sale price or official closing price reported on the exchange (U.S. or foreign) or over-the-counter market on which they trade. Securities for which no sales are reported are valued at the calculated mean between the most recent bid and asked quotations on the relevant market or, if a mean cannot be determined, at the most recent bid quotation. Equity securities are generally categorized as Level 1.
Investments in open-end investment companies are valued at their net asset value each business day and are categorized as Level 1.
Debt securities are valued at prices supplied by independent pricing services approved by the Fund's Board. Such services may use various pricing techniques which take into account appropriate factors such as yield, quality, coupon rate, maturity, type of issue, trading characteristics, prepayment speeds and other data, as well as broker quotes. If the pricing services are unable to provide valuations, debt securities are valued at the average of the most recent reliable bid quotations or evaluated prices, as applicable, obtained from broker-dealers. These securities are generally categorized as Level 2.
Securities and other assets for which market quotations are not readily available or for which the above valuation procedures are deemed not to reflect fair value are valued in a manner that is intended to reflect their fair value as determined in accordance with procedures approved by the Trustees and are generally categorized as Level 3. In accordance with the Fund's valuation procedures, factors considered in determining value may include, but are not limited to, the type of the security; the size of the holding; the initial cost of the security; the existence of any contractual restrictions on the security's disposition; the price and extent of public trading in similar securities of the issuer or of comparable companies; quotations or evaluated prices from broker-dealers and/or pricing services; information obtained from the issuer, analysts, and/or the appropriate stock exchange (for exchange-traded securities); an analysis of the company's or issuer's financial statements; an evaluation of the forces that influence the issuer and the market(s) in which the security is purchased and sold; and with respect to debt securities, the maturity, coupon, creditworthiness, currency denomination and the movement of the market in which the security is normally traded. The value determined under these procedures may differ from published values for the same securities.
Disclosure about the classification of fair value measurements is included in a table following the Fund's Investment Portfolio.
Securities Lending. Deutsche Bank AG, as lending agent, lends securities of the Fund to certain financial institutions under the terms of its securities lending agreement. During the term of the loans, the Fund continues to receive interest and dividends generated by the securities and to participate in any changes in their market value. The Fund requires the borrowers of the securities to maintain collateral with the Fund consisting of either cash or liquid, unencumbered assets having a value at least equal to the value of the securities loaned. When the collateral falls below specified amounts, the lending agent will use its best effort to obtain additional collateral on the next business day to meet required amounts under the securities lending agreement. During the year ended December 31, 2016, the Fund invested the cash collateral into a joint trading account in affiliated money market funds including Government & Agency Securities Portfolio managed by Deutsche Investment Management Americas Inc. Deutsche Investment Management Americas Inc. receives a management/administration fee (0.09% annualized effective rate as of December 31, 2016) on the cash collateral invested in Government & Agency Securities Portfolio. The Fund receives compensation for lending its securities either in the form of fees or by earning interest on invested cash collateral net of borrower rebates and fees paid to a lending agent. Either the Fund or the borrower may terminate the loan at any time and the borrower, after notice, is required to return borrowed securities within a standard time period. There may be risks of delay and costs in recovery of securities or even loss of rights in the collateral should the borrower of the securities fail financially. If the Fund is not able to recover securities lent, the Fund may sell the collateral and purchase a replacement investment in the market, incurring the risk that the value of the replacement security is greater than the value of the collateral. The Fund is also subject to all investment risks associated with the reinvestment of any cash collateral received, including, but not limited to, interest rate, credit and liquidity risk associated with such investments.
As of December 31, 2016, the Fund had no securities on loan.
Foreign Currency Translations. The books and records of the Fund are maintained in U.S. dollars. Investment securities and other assets and liabilities denominated in a foreign currency are translated into U.S. dollars at the prevailing exchange rates at period end. Purchases and sales of investment securities, income and expenses are translated into U.S. dollars at the prevailing exchange rates on the respective dates of the transactions.
Net realized and unrealized gains and losses on foreign currency transactions represent net gains and losses between trade and settlement dates on securities transactions, the acquisition and disposition of foreign currencies, and the difference between the amount of net investment income accrued and the U.S. dollar amount actually received. The portion of both realized and unrealized gains and losses on investments that results from fluctuations in foreign currency exchange rates is not separately disclosed but is included with net realized and unrealized gain/appreciation and loss/depreciation on investments.
Federal Income Taxes. The Fund is treated as a separate taxpayer as provided for in the Internal Revenue Code, as amended. It is the Fund's policy to comply with the requirements of the Internal Revenue Code, as amended, which are applicable to regulated investment companies, and to distribute all of its taxable income to the separate accounts of the Participating Insurance Companies which hold its shares.
The Fund has reviewed the tax positions for the open tax years as of December 31, 2016 and has determined that no provision for income tax and/or uncertain tax provisions is required in the Fund's financial statements. The Fund's federal tax returns for the prior three fiscal years remain open subject to examination by the Internal Revenue Service.
Distribution of Income and Gains. Distributions from net investment income of the Fund, if any, are declared and distributed to shareholders annually. Net realized gains from investment transactions, in excess of available capital loss carryforwards, would be taxable to the Fund if not distributed, and, therefore, will be distributed to shareholders at least annually. The Fund may also make additional distributions for tax purposes if necessary.
The timing and characterization of certain income and capital gain distributions are determined annually in accordance with federal tax regulations which may differ from accounting principles generally accepted in the United States of America. These differences primarily relate to certain securities sold at a loss. As a result, net investment income (loss) and net realized gain (loss) on investment transactions for a reporting period may differ significantly from distributions during such period. Accordingly, the Fund may periodically make reclassifications among certain of its capital accounts without impacting the net asset value of the Fund.
At December 31, 2016, the Fund's components of distributable earnings (accumulated losses) on a tax basis are as follows:
| Undistributed ordinary income* | $ 6,098,298 |
| Undistributed net long-term capital gains | $ 63,742,265 |
| Net unrealized appreciation (depreciation) on investments | $272,844,064 |
In addition, the tax character of distributions paid to shareholders by the Fund is summarized as follows:
| | Years Ended December 31, |
| 2016 | 2015 |
| Distributions from ordinary income* | $ 6,765,789 | $ 6,336,347 |
| Distributions from long-term capital gains | $ 65,876,235 | $117,490,199 |
* For tax purposes, short-term capital gain distributions are considered ordinary income distributions.
Expenses. Expenses of the Trust arising in connection with a specific Fund are allocated to that Fund. Other Trust expenses which cannot be directly attributed to a Fund are apportioned among the Funds in the Trust based upon the relative net assets or other appropriate measures.
Contingencies. In the normal course of business, the Fund may enter into contracts with service providers that contain general indemnification clauses. The Fund's maximum exposure under these arrangements is unknown, as this would involve future claims that may be made against the Fund that have not yet been made. However, based on experience, the Fund expects the risk of loss to be remote.
Other. Investment transactions are accounted for on a trade date plus one basis for daily net asset value calculations. However, for financial reporting purposes, investment transactions are reported on trade date. Interest income is recorded on the accrual basis. Dividend income is recorded on the ex-dividend date net of foreign withholding taxes. Realized gains and losses from investment transactions are recorded on an identified cost basis. Proceeds from litigation payments, if any, are included in net realized gain (loss) from investments.
B. Purchases and Sales of Securities
During the year ended December 31, 2016, purchases and sales of investment securities (excluding short-term investments) aggregated $268,736,624 and $381,341,898, respectively.
C. Related Parties
Management Agreement. Under the Investment Management Agreement with Deutsche Investment Management Americas Inc. ("DIMA" or the "Advisor"), an indirect, wholly owned subsidiary of Deutsche Bank AG, the Advisor directs the investments of the Fund in accordance with its investment objectives, policies and restrictions. The Advisor determines the securities, instruments and other contracts relating to investments to be purchased, sold or entered into by the Fund.
Pursuant to the Investment Management Agreement with the Advisor, the Fund pays a monthly management fee based on the Fund's average daily net assets, computed and accrued daily and payable monthly at the following annual rates:
| First $250 million of average daily net assets | .390% |
| Next $750 million of average daily net assets | .365% |
| Over $1 billion of average daily net assets | .340% |
Accordingly, for the year ended December 31, 2016, the fee pursuant to the Investment Management Agreement was equivalent to an annual rate (exclusive of any applicable waivers/reimbursements) of 0.37% of the Fund's average daily net assets.
For the period from January 1, 2016 through September 30, 2016, the Advisor had contractually agreed to waive all or a portion of its fees and/or reimburse certain operating expenses to the extent necessary to maintain the total annual operating expenses (excluding certain expenses such as extraordinary expenses, taxes, brokerage and interest expense) of each class as follows:
Effective October 1, 2016 through September 30, 2017, the Advisor has contractually agreed to waive all or a portion of its fees and/or reimburse certain operating expenses to the extent necessary to maintain the total annual operating expenses (excluding certain expenses such as extraordinary expenses, taxes, brokerage and interest expense) of each class as follows:
Administration Fee. Pursuant to an Administrative Services Agreement, DIMA provides most administrative services to the Fund. For all services provided under the Administrative Services Agreement, the Fund pays the Advisor an annual fee ("Administration Fee") of 0.10% of the Fund's average daily net assets, computed and accrued daily and payable monthly. For the year ended December 31, 2016, the Administration Fee was $768,370, of which $64,033 is unpaid.
Service Provider Fees. Deutsche AM Service Company ("DSC"), an affiliate of the Advisor, is the transfer agent, dividend-paying agent and shareholder service agent for the Fund. Pursuant to a sub-transfer agency agreement between DSC and DST Systems, Inc. ("DST"), DSC has delegated certain transfer agent, dividend-paying agent and shareholder service agent functions to DST. DSC compensates DST out of the shareholder servicing fee it receives from the Fund. For the year ended December 31, 2016, the amounts charged to the Fund by DSC were as follows:
| Services to Shareholders | Total Aggregated | Unpaid at December 31, 2016 |
| Class A | $ 788 | $ 197 |
| Class B | 200 | 53 |
| | $ 988 | $ 250 |
Distribution Service Agreement. Deutsche AM Distributors, Inc. ("DDI"), also an affiliate of the Advisor, is the Trust's Distributor. In accordance with the Master Distribution Plan, DDI receives 12b-1 fees of 0.25% of average daily net assets of Class B shares. Pursuant to the Master Distribution Plan, DDI remits these fees to the Participating Insurance Companies for various costs incurred or paid by these companies in connection with marketing and distribution of Class B shares. For the year ended December 31, 2016, the Distribution Service Fee aggregated $11,393, of which $1,122 is unpaid.
Typesetting and Filing Service Fees. Under an agreement with DIMA, DIMA is compensated for providing typesetting and certain regulatory filing services to the Fund. For the year ended December 31, 2016, the amount charged to the Fund by DIMA included in the Statement of Operations under "Reports to shareholders" aggregated $11,695, of which $4,274 is unpaid.
Trustees' Fees and Expenses. The Fund paid retainer fees to each Trustee not affiliated with the Advisor, plus specified amounts to the Board Chairperson and Vice Chairperson and to each committee Chairperson.
Affiliated Cash Management Vehicles. The Fund may invest uninvested cash balances in Deutsche Central Cash Management Government Fund and Deutsche Variable NAV Money Fund, affiliated money market funds which are managed by the Advisor. Each affiliated money market fund is managed in accordance with Rule 2a-7 under the 1940 Act, which governs the quality, maturity, diversity and liquidity of instruments in which a money market fund may invest. Deutsche Central Cash Management Government Fund seeks to maintain a stable net asset value, and Deutsche Variable NAV Money Fund maintains a floating net asset value. The Fund indirectly bears its proportionate share of the expenses of each affiliated money market fund in which it invests. Deutsche Central Cash Management Government Fund does not pay the Advisor an investment management fee. To the extent that Deutsche Variable NAV Money Fund pays an investment management fee to the Advisor, the Advisor will waive an amount of the investment management fee payable to the Advisor by the Fund equal to the amount of the investment management fee payable on the Fund's assets invested in Deutsche Variable NAV Money Fund.
Securities Lending Agent Fees. Deutsche Bank AG serves as lending agent for the Fund. For the year ended December 31, 2016, the Fund incurred securities lending agent fees to Deutsche Bank AG in the amount of $3,404.
D. Ownership of the Fund
At December 31, 2016, three participating insurance companies were owners of record of 10% or more of the total outstanding Class A shares of the Fund, each owning 48%, 28% and 11%, respectively. Two participating insurance companies were the owners of record of 10% or more of the total outstanding Class B shares of the Fund, each owning 47% and 45%, respectively.
E. Line of Credit
The Fund and other affiliated funds (the "Participants") share in a $400 million revolving credit facility provided by a syndication of banks. The Fund may borrow for temporary or emergency purposes, including the meeting of redemption requests that otherwise might require the untimely disposition of securities. The Participants are charged an annual commitment fee which is allocated based on net assets, among each of the Participants. Interest is calculated at a rate per annum equal to the sum of the Federal Funds Rate plus 1.25 percent plus if the one-month LIBOR exceeds the Federal Funds Rate, the amount of such excess. The Fund may borrow up to a maximum of 33 percent of its net assets under the agreement. The Fund had no outstanding loans at December 31, 2016.
Report of Independent Registered Public Accounting Firm
To the Board of Trustees of Deutsche Variable Series I and the Shareholders of Deutsche Capital Growth VIP:
In our opinion, the accompanying statement of assets and liabilities, including the investment portfolio, and the related statements of operations and of changes in net assets and the financial highlights present fairly, in all material respects, the financial position of Deutsche Capital Growth VIP (the "Fund") at December 31, 2016 and the results of its operations, the changes in its net assets, and the financial highlights for the periods indicated therein, in conformity with accounting principles generally accepted in the United States of America. These financial statements and financial highlights (hereafter referred to as "financial statements") are the responsibility of the Fund's management. Our responsibility is to express an opinion on these financial statements based on our audits. We conducted our audits of these financial statements in accordance with the standards of the Public Company Accounting Oversight Board (United States). Those standards require that we plan and perform the audit to obtain reasonable assurance about whether the financial statements are free of material misstatement. An audit includes examining, on a test basis, evidence supporting the amounts and disclosures in the financial statements, assessing the accounting principles used and significant estimates made by management, and evaluating the overall financial statement presentation. We believe that our audits, which included confirmation of securities at December 31, 2016 by correspondence with the custodian, brokers and transfer agent, and the application of alternative auditing procedures where such confirmations had not been received, provide a reasonable basis for our opinion.
Boston, Massachusetts
February 14, 2017 | PricewaterhouseCoopers LLP |
Information About Your Fund's Expenses (Unaudited)
As an investor of the Fund, you incur two types of costs: ongoing expenses and transaction costs. Ongoing expenses include management fees, distribution and service (12b-1) fees and other Fund expenses. Examples of transaction costs include contract charges, which are not shown in this section. The following tables are intended to help you understand your ongoing expenses (in dollars) of investing in the Fund and to help you compare these expenses with the ongoing expenses of investing in other mutual funds. The example in the table is based on an investment of $1,000 invested at the beginning of the six-month period and held for the entire period (July 1, 2016 to December 31, 2016).
The tables illustrate your Fund's expenses in two ways:
— Actual Fund Return. This helps you estimate the actual dollar amount of ongoing expenses (but not transaction costs) paid on a $1,000 investment in the Fund using the Fund's actual return during the period. To estimate the expenses you paid over the period, simply divide your account value by $1,000 (for example, an $8,600 account value divided by $1,000 = 8.6), then multiply the result by the number in the "Expenses Paid per $1,000" line under the share class you hold.
— Hypothetical 5% Fund Return. This helps you to compare your Fund's ongoing expenses (but not transaction costs) with those of other mutual funds using the Fund's actual expense ratio and a hypothetical rate of return of 5% per year before expenses. Examples using a 5% hypothetical Fund return may be found in the shareholder reports of other mutual funds. The hypothetical account values and expenses may not be used to estimate the actual ending account balance or expenses you paid for the period.
Please note that the expenses shown in these tables are meant to highlight your ongoing expenses only and do not reflect any transaction costs. The "Expenses Paid per $1,000" line of the tables is useful in comparing ongoing expenses only and will not help you determine the relative total expense of owning different funds. If these transaction costs had been included, your costs would have been higher.
| Expenses and Value of a $1,000 Investment for the six months ended December 31, 2016 |
| Actual Fund Return | Class A | | Class B | |
| Beginning Account Value 7/1/16 | $1,000.00 | | $1,000.00 | |
| Ending Account Value 12/31/16 | $1,073.20 | | $1,072.10 | |
| Expenses Paid per $1,000* | $ 2.61 | | $ 3.96 | |
| Hypothetical 5% Fund Return | Class A | | Class B | |
| Beginning Account Value 7/1/16 | $1,000.00 | | $1,000.00 | |
| Ending Account Value 12/31/16 | $1,022.62 | | $1,021.32 | |
| Expenses Paid per $1,000* | $ 2.54 | | $ 3.86 | |
* Expenses are equal to the Fund's annualized expense ratio for each share class, multiplied by the average account value over the period, multiplied by 184 (the number of days in the most recent six-month period), then divided by 366.
| Annualized Expense Ratios | Class A | | Class B | |
| Deutsche Variable Series I — Deutsche Capital Growth VIP | .50% | | .76% | |
For more information, please refer to the Fund's prospectus.
These tables do not reflect charges and fees ("contract charges") associated with the separate account that invests in the Fund or any variable life insurance policy or variable annuity contract for which the Fund is an investment option.
For an analysis of the fees associated with an investment in the fund or similar funds, please refer to the current and hypothetical expense calculators for Variable Insurance Products which can be found at deutschefunds.com/EN/resources/calculators.jsp.
Tax Information (Unaudited)
The Fund paid distributions of $2.32 per share from net long-term capital gains during its year ended December 31, 2016.
Pursuant to Section 852 of the Internal Revenue Code, the Fund designates $70,208,000 as capital gain dividends for its year ended December 31, 2016.
For corporate shareholders, 100% of the ordinary dividends (i.e., income dividends plus short-term capital gains) paid during the Fund's fiscal year ended December 31, 2016 qualified for the dividends received deduction.
Please consult a tax advisor if you have questions about federal or state income tax laws, or on how to prepare your tax returns. If you have specific questions about your account, please contact your insurance provider.
Proxy Voting
The Trust's policies and procedures for voting proxies for portfolio securities and information about how the Trust voted proxies related to its portfolio securities during the most recent 12-month period ended June 30 are available on our Web site — deutschefunds.com (click on "proxy voting"at the bottom of the page) — or on the SEC's Web site — sec.gov. To obtain a written copy of the Trust's policies and procedures without charge, upon request, call us toll free at (800) 728-3337.
Advisory Agreement Board Considerations and Fee Evaluation
The Board of Trustees (hereinafter referred to as the "Board" or "Trustees") approved the renewal of Deutsche Capital Growth VIP’s (the "Fund") investment management agreement (the "Agreement") with Deutsche Investment Management Americas Inc. ("DIMA") in September 2016.
In terms of the process that the Board followed prior to approving the Agreement, shareholders should know that:
— During the entire process, all of the Fund’s Trustees were independent of DIMA and its affiliates (the "Independent Trustees").
— The Board met frequently during the past year to discuss fund matters and dedicated a substantial amount of time to contract review matters. Over the course of several months, the Board’s Contract Committee reviewed extensive materials received from DIMA, independent third parties and independent counsel. These materials included an analysis of the Fund’s performance, fees and expenses, and profitability from a fee consultant retained by the Fund’s Independent Trustees (the "Fee Consultant"). The Board also received extensive information throughout the year regarding performance of the Fund.
— The Independent Trustees regularly meet privately with counsel to discuss contract review and other matters. In addition, the Independent Trustees were advised by the Fee Consultant in the course of their review of the Fund’s contractual arrangements and considered a comprehensive report prepared by the Fee Consultant in connection with their deliberations.
— In connection with reviewing the Agreement, the Board also reviewed the terms of the Fund’s Rule 12b-1 plan, distribution agreement, administrative services agreement, transfer agency agreement and other material service agreements.
— Based on its evaluation of the information provided, the Contract Committee presented its findings and recommendations to the Board. The Board then reviewed the Contract Committee’s findings and recommendations.
In connection with the contract review process, the Contract Committee and the Board considered the factors discussed below, among others. The Board also considered that DIMA and its predecessors have managed the Fund since its inception, and the Board believes that a long-term relationship with a capable, conscientious advisor is in the best interests of the Fund. The Board considered, generally, that shareholders chose to invest or remain invested in the Fund knowing that DIMA managed the Fund, and that the Agreement was approved by the Fund’s shareholders. DIMA is part of Deutsche Bank AG’s ("Deutsche Bank") Asset Management ("Deutsche AM") division. Deutsche AM is a global asset management business that offers a wide range of investing expertise and resources, including research capabilities in many countries throughout the world. Deutsche Bank has advised the Board that the U.S. asset management business continues to be a critical and integral part of Deutsche Bank, and that Deutsche Bank will continue to invest in Deutsche AM and seek to enhance Deutsche AM’s investment platform. Deutsche Bank also has confirmed its commitment to maintaining strong legal and compliance groups within the Deutsche AM division.
As part of the contract review process, the Board carefully considered the fees and expenses of each Deutsche fund overseen by the Board in light of the fund’s performance. In many cases, this led to the negotiation and implementation of expense caps. As part of these negotiations, the Board indicated that it would consider relaxing these caps in future years following sustained improvements in performance, among other considerations.
While shareholders may focus primarily on fund performance and fees, the Fund’s Board considers these and many other factors, including the quality and integrity of DIMA’s personnel and such other issues as back-office operations, fund valuations, and compliance policies and procedures.
Nature, Quality and Extent of Services. The Board considered the terms of the Agreement, including the scope of advisory services provided under the Agreement. The Board noted that, under the Agreement, DIMA provides portfolio management services to the Fund and that, pursuant to a separate administrative services agreement, DIMA provides administrative services to the Fund. The Board considered the experience and skills of senior management and investment personnel and the resources made available to such personnel. The Board reviewed the Fund’s performance over short-term and long-term periods and compared those returns to various agreed-upon performance measures, including market index(es) and a peer universe compiled using information supplied by Morningstar Direct ("Morningstar"), an independent fund data service. The Board also noted that it has put into place a process of identifying "Focus Funds" (e.g., funds performing poorly relative to a peer universe), and receives additional reporting from DIMA regarding such funds and, where appropriate, DIMA’s plans to address underperformance. The Board believes this process is an effective manner of identifying and addressing underperforming funds. Based on the information provided, the Board noted that for the one-, three- and five-year periods ended December 31, 2015, the Fund’s performance (Class A shares) was in the 2nd quartile of the applicable Morningstar universe (the 1st quartile being the best performers and the 4th quartile being the worst performers). The Board also observed that the Fund has outperformed its benchmark in the one- and three-year periods and has underperformed its benchmark in the five-year period ended December 31, 2015.
Fees and Expenses. The Board considered the Fund’s investment management fee schedule, operating expenses and total expense ratios, and comparative information provided by Broadridge Financial Solutions, Inc. ("Broadridge") and the Fee Consultant regarding investment management fee rates paid to other investment advisors by similar funds (1st quartile being the most favorable and 4th quartile being the least favorable). With respect to management fees paid to other investment advisors by similar funds, the Board noted that the contractual fee rates paid by the Fund, which include a 0.10% fee paid to DIMA under the Fund’s administrative services agreement, were lower than the median (1st quartile) of the applicable Broadridge peer group (based on Broadridge data provided as of December 31, 2015). The Board noted that the Fund’s Class A shares total (net) operating expenses were expected to be lower than the median (1st quartile) of the applicable Broadridge expense universe (based on Broadridge data provided as of December 31, 2015, and analyzing Broadridge expense universe Class A (net) expenses less any applicable 12b-1 fees) ("Broadridge Universe Expenses"). The Board also reviewed data comparing each share class’s total (net) operating expenses to the applicable Broadridge Universe Expenses. The Board noted that the expense limitations agreed to by DIMA were expected to help the Fund’s total (net) operating expenses remain competitive. The Board considered the Fund’s management fee rate as compared to fees charged by DIMA to comparable Deutsche U.S. registered funds ("Deutsche Funds") and considered differences between the Fund and the comparable Deutsche Funds. The information requested by the Board as part of its review of fees and expenses also included information about institutional accounts (including any sub-advised funds and accounts) and funds offered primarily to European investors ("Deutsche Europe funds") managed by Deutsche AM. The Board noted that DIMA indicated that Deutsche AM does not manage any institutional accounts or Deutsche Europe funds comparable to the Fund.
On the basis of the information provided, the Board concluded that management fees were reasonable and appropriate in light of the nature, quality and extent of services provided by DIMA.
Profitability. The Board reviewed detailed information regarding revenues received by DIMA under the Agreement. The Board considered the estimated costs and pre-tax profits realized by DIMA from advising the Deutsche Funds, as well as estimates of the pre-tax profits attributable to managing the Fund in particular. The Board also received information regarding the estimated enterprise-wide profitability of DIMA and its affiliates with respect to all fund services in totality and by fund. The Board and the Fee Consultant reviewed DIMA’s methodology in allocating its costs to the management of the Fund. Based on the information provided, the Board concluded that the pre-tax profits realized by DIMA in connection with the management of the Fund were not unreasonable. The Board also reviewed certain publicly available information regarding the profitability of certain similar investment management firms. The Board noted that while information regarding the profitability of such firms is limited (and in some cases is not necessarily prepared on a comparable basis), DIMA and its affiliates’ overall profitability with respect to the Deutsche Funds (after taking into account distribution and other services provided to the funds by DIMA and its affiliates) was lower than the overall profitability levels of most comparable firms for which such data was available.
Economies of Scale. The Board considered whether there are economies of scale with respect to the management of the Fund and whether the Fund benefits from any economies of scale. The Board noted that the Fund’s investment management fee schedule includes fee breakpoints. The Board concluded that the Fund’s fee schedule represents an appropriate sharing between the Fund and DIMA of such economies of scale as may exist in the management of the Fund at current asset levels.
Other Benefits to DIMA and Its Affiliates. The Board also considered the character and amount of other incidental benefits received by DIMA and its affiliates, including any fees received by DIMA for administrative services provided to the Fund and any fees received by an affiliate of DIMA for distribution services. The Board also considered benefits to DIMA related to brokerage and soft-dollar allocations, including allocating brokerage to pay for research generated by parties other than the executing broker dealers, which pertain primarily to funds investing in equity securities, along with the incidental public relations benefits to DIMA related to Deutsche Funds advertising and cross-selling opportunities among DIMA products and services. The Board considered these benefits in reaching its conclusion that the Fund’s management fees were reasonable.
Compliance. The Board considered the significant attention and resources dedicated by DIMA to documenting and enhancing its compliance processes in recent years. The Board noted in particular (i) the experience, seniority and time commitment of the individuals serving as DIMA’s and the Fund’s chief compliance officers; (ii) the large number of DIMA compliance personnel; and (iii) the substantial commitment of resources by DIMA and its affiliates to compliance matters.
Based on all of the information considered and the conclusions reached, the Board unanimously determined that the continuation of the Agreement is in the best interests of the Fund. In making this determination, the Board did not give particular weight to any single factor identified above. The Board considered these factors over the course of numerous meetings, certain of which were in executive session with only the Independent Trustees and counsel present. It is possible that individual Independent Trustees may have weighed these factors differently in reaching their individual decisions to approve the continuation of the Agreement.
Board Members and Officers
The following table presents certain information regarding the Board Members and Officers of the fund. Each Board Member's year of birth is set forth in parentheses after his or her name. Unless otherwise noted, (i) each Board Member has engaged in the principal occupation(s) noted in the table for at least the most recent five years, although not necessarily in the same capacity; and (ii) the address of each Independent Board Member is c/o Keith R. Fox, Deutsche Funds Board Chair, c/o Thomas R. Hiller, Ropes & Gray LLP, Prudential Tower, 800 Boylston Street, Boston, MA 02199-3600. Except as otherwise noted below, the term of office for each Board Member is until the election and qualification of a successor, or until such Board Member sooner dies, resigns, is removed or as otherwise provided in the governing documents of the fund. Because the fund does not hold an annual meeting of shareholders, each Board Member will hold office for an indeterminate period. The Board Members may also serve in similar capacities with other funds in the fund complex.
| Independent Board Members |
| Name, Year of Birth, Position with the Fund and Length of Time Served1 | Business Experience and Directorships During the Past Five Years | Number of Funds in Deutsche Fund Complex Overseen | Other Directorships Held by Board Member |
Keith R. Fox, CFA (1954) Chairperson since 2017,2 and Board Member since 1996 | Managing General Partner, Exeter Capital Partners (a series of private investment funds) (since 1986). Directorships: Progressive International Corporation (kitchen goods importer and distributor); The Kennel Shop (retailer); former Chairman, National Association of Small Business Investment Companies; former Directorships: BoxTop Media Inc. (advertising); Sun Capital Advisers Trust (mutual funds) (2011–2012) | 98 | — |
Kenneth C. Froewiss (1945) Vice Chairperson since 2017,2 Board Member since 2001, and Chairperson (2013–December 31, 2016) | Retired Clinical Professor of Finance, NYU Stern School of Business (1997–2014); Member, Finance Committee, Association for Asian Studies (2002–present); Director, Mitsui Sumitomo Insurance Group (US) (2004–present); prior thereto, Managing Director, J.P. Morgan (investment banking firm) (until 1996) | 98 | — |
John W. Ballantine (1946) Board Member since 1999 | Retired; formerly, Executive Vice President and Chief Risk Management Officer, First Chicago NBD Corporation/The First National Bank of Chicago (1996–1998); Executive Vice President and Head of International Banking (1995–1996); former Directorships: Director and former Chairman of the Board, Healthways, Inc.3 (population well-being and wellness services) (2003–2014); Stockwell Capital Investments PLC (private equity); First Oak Brook Bancshares, Inc. and Oak Brook Bank; Prisma Energy International | 98 | Portland General Electric3 (utility company) (2003– present) |
Henry P. Becton, Jr. (1943) Board Member since 1990 | Vice Chair and former President, WGBH Educational Foundation. Directorships: Public Radio International; Public Radio Exchange (PRX); The Pew Charitable Trusts (charitable organization); former Directorships: Becton Dickinson and Company3 (medical technology company); Belo Corporation3 (media company); The PBS Foundation; Association of Public Television Stations; Boston Museum of Science; American Public Television; Concord Academy; New England Aquarium; Mass. Corporation for Educational Telecommunications; Committee for Economic Development; Public Broadcasting Service; Connecticut College; North Bennett Street School (Boston) | 98 | — |
Dawn-Marie Driscoll (1946) Board Member since 1987 | Emeritus Executive Fellow, Center for Business Ethics, Bentley University; formerly: President, Driscoll Associates (consulting firm); Partner, Palmer & Dodge (law firm) (1988–1990); Vice President of Corporate Affairs and General Counsel, Filene's (retail) (1978–1988). Directorships: Advisory Board, Center for Business Ethics, Bentley University; Trustee and former Chairman of the Board, Southwest Florida Community Foundation (charitable organization); former Directorships: ICI Mutual Insurance Company (2007–2015); Sun Capital Advisers Trust (mutual funds) (2007–2012), Investment Company Institute (audit, executive, nominating committees) and Independent Directors Council (governance, executive committees) | 98 | — |
Paul K. Freeman (1950) Board Member since 1993 | Consultant, World Bank/Inter-American Development Bank; Chair, Independent Directors Council; Investment Company Institute (executive and nominating committees); formerly, Chairman of Education Committee of Independent Directors Council; Project Leader, International Institute for Applied Systems Analysis (1998–2001); Chief Executive Officer, The Eric Group, Inc. (environmental insurance) (1986–1998); Directorships: Denver Zoo Foundation (December 2012–present); former Directorships: Prisma Energy International | 98 | — |
Richard J. Herring (1946) Board Member since 1990 | Jacob Safra Professor of International Banking and Professor, Finance Department, The Wharton School, University of Pennsylvania (since July 1972); Co-Director, Wharton Financial Institutions Center; formerly: Vice Dean and Director, Wharton Undergraduate Division (July 1995–June 2000); Director, Lauder Institute of International Management Studies (July 2000–June 2006) | 98 | Director, Aberdeen Singapore and Japan Funds (since 2007); Independent Director of Barclays Bank Delaware (since September 2010) |
William McClayton (1944) Board Member since 2004, and Vice Chairperson (2013–December 31, 2016) | Private equity investor (since October 2009); previously, Managing Director, Diamond Management & Technology Consultants, Inc. (global consulting firm) (2001–2009); Directorship: Board of Managers, YMCA of Metropolitan Chicago; formerly: Senior Partner, Arthur Andersen LLP (accounting) (1966–2001); Trustee, Ravinia Festival | 98 | — |
Rebecca W. Rimel (1951) Board Member since 1995 | President, Chief Executive Officer and Director, The Pew Charitable Trusts (charitable organization) (1994–present); formerly: Executive Vice President, The Glenmede Trust Company (investment trust and wealth management) (1983–2004); Board Member, Investor Education (charitable organization) (2004–2005); Trustee, Executive Committee, Philadelphia Chamber of Commerce (2001–2007); Director, Viasys Health Care3 (January 2007–June 2007); Trustee, Thomas Jefferson Foundation (charitable organization) (1994–2012) | 98 | Director, Becton Dickinson and Company3 (medical technology company) (2012– present); Director, BioTelemetry Inc.3 (health care) (2009– present) |
William N. Searcy, Jr. (1946) Board Member since 1993 | Private investor since October 2003; formerly: Pension & Savings Trust Officer, Sprint Corporation3 (telecommunications) (November 1989–September 2003); Trustee, Sun Capital Advisers Trust (mutual funds) (1998–2012) | 98 | — |
Jean Gleason Stromberg (1943) Board Member since 1997 | Retired. Formerly, Consultant (1997–2001); Director, Financial Markets U.S. Government Accountability Office (1996–1997); Partner, Norton Rose Fulbright, L.L.P. (law firm) (1978–1996); former Directorships: The William and Flora Hewlett Foundation (charitable organization) (2000–2015); Service Source, Inc. (nonprofit), Mutual Fund Directors Forum (2002–2004), American Bar Retirement Association (funding vehicle for retirement plans) (1987–1990 and 1994–1996) | 98 | — |
| Officers5 |
| Name, Year of Birth, Position with the Fund and Length of Time Served6 | Business Experience and Directorships During the Past Five Years |
Brian E. Binder9 (1972) President and Chief Executive Officer, 2013–present | Managing Director4 and Head of US Product and Fund Administration, Deutsche Asset Management (2013–present); Director and President, Deutsche AM Service Company (since 2016); Director and Vice President, Deutsche AM Distributors, Inc. (since 2016); Director and President, DB Investment Managers, Inc. (since 2016); formerly, Head of Business Management and Consulting at Invesco, Ltd. (2010–2012) |
John Millette8 (1962) Vice President and Secretary, 1999–present | Director,4 Deutsche Asset Management; Chief Legal Officer and Secretary, Deutsche Investment Management Americas Inc. (2015–present); and Director and Vice President, Deutsche AM Trust Company (since 2016) |
Hepsen Uzcan7 (1974) Vice President, since 2016 Assistant Secretary, 2013–present | Director,4 Deutsche Asset Management |
Paul H. Schubert7 (1963) Chief Financial Officer, 2004–present Treasurer, 2005–present | Managing Director,4 Deutsche Asset Management, and Chairman, Director and President, Deutsche AM Trust Company (since 2013); Vice President, Deutsche AM Distributors, Inc. (since 2016); formerly, Director, Deutsche AM Trust Company (2004–2013) |
Caroline Pearson8 (1962) Chief Legal Officer, 2010–present | Managing Director,4 Deutsche Asset Management; Secretary, Deutsche AM Distributors, Inc.; and Secretary, Deutsche AM Service Company |
Scott D. Hogan8 (1970) Chief Compliance Officer, since 2016 | Director,4 Deutsche Asset Management |
Wayne Salit7 (1967) Anti-Money Laundering Compliance Officer, 2014–present | Director,4 Deutsche Asset Management; AML Compliance Officer, Deutsche AM Distributors, Inc.; formerly: Managing Director, AML Compliance Officer at BNY Mellon (2011–2014); and Director, AML Compliance Officer at Deutsche Bank (2004–2011) |
Paul Antosca8 (1957) Assistant Treasurer, 2007–present | Director,4 Deutsche Asset Management |
Diane Kenneally8 (1966) Assistant Treasurer, 2007–present | Director,4 Deutsche Asset Management |
1 The length of time served represents the year in which the Board Member joined the board of one or more Deutsche funds currently overseen by the Board.
2 Effective as of January 1, 2017.
3 A publicly held company with securities registered pursuant to Section 12 of the Securities Exchange Act of 1934.
4 Executive title, not a board directorship.
5 As a result of their respective positions held with the Advisor, these individuals are considered "interested persons" of the Advisor within the meaning of the 1940 Act. Interested persons receive no compensation from the fund.
6 The length of time served represents the year in which the officer was first elected in such capacity for one or more Deutsche funds.
7 Address: 60 Wall Street, New York, NY 10005.
8 Address: One Beacon Street, Boston, MA 02108.
9 Address: 222 South Riverside Plaza, Chicago, IL 60606.
The fund's Statement of Additional Information ("SAI") includes additional information about the Board Members. The SAI is available, without charge, upon request. If you would like to request a copy of the SAI, you may do so by calling the following toll-free number: (800) 728-3337.

VS1capgro-2 (R-025820-6 2/17)

December 31, 2016
Annual Report
Deutsche Variable Series I
Deutsche Core Equity VIP

Contents
3 Performance Summary 4 Management Summary 5 Portfolio Summary 6 Investment Portfolio 10 Statement of Assets and Liabilities 11 Statement of Operations 11 Statements of Changes in Net Assets 13 Financial Highlights 14 Notes to Financial Statements 19 Report of Independent Registered Public Accounting Firm 20 Information About Your Fund's Expenses 20 Tax Information 21 Proxy Voting 22 Advisory Agreement Board Considerations and Fee Evaluation 24 Board Members and Officers |
This report must be preceded or accompanied by a prospectus. To obtain an additional prospectus or summary prospectus, if available, call (800) 728-3337 or your financial representative. We advise you to consider the Fund's objectives, risks, charges and expenses carefully before investing. The summary prospectus and prospectus contain this and other important information about the Fund. Please read the prospectus carefully before you invest.
Stocks may decline in value. Fund management could be wrong in its analysis of industries, companies, economic trends and favor a security that underperforms the market. The Fund may lend securities to approved institutions. Investing in derivatives entails special risks relating to liquidity, leverage and credit that may reduce returns and/or increase volatility. See the prospectus for details.
Deutsche Asset Management represents the asset management activities conducted by Deutsche Bank AG or any of its subsidiaries.
Deutsche AM Distributors, Inc., 222 South Riverside Plaza, Chicago, IL 60606, (800) 621-1148
NOT FDIC/NCUA INSURED NO BANK GUARANTEE MAY LOSE VALUE NOT A DEPOSIT
NOT INSURED BY ANY FEDERAL GOVERNMENT AGENCY
Performance Summary December 31, 2016 (Unaudited)
Fund performance shown is historical, assumes reinvestment of all dividend and capital gain distributions, and does not guarantee future results. Investment return and principal value fluctuate with changing market conditions so that, when redeemed, shares may be worth more or less than their original cost. Current performance may be lower or higher than the performance data quoted. Please contact your participating insurance company for the Fund's most recent month-end performance. Performance doesn't reflect charges and fees ("contract charges") associated with the separate account that invests in the Fund or any variable life insurance policy or variable annuity contract for which the Fund is an investment option. These charges and fees will reduce returns. While all share classes have the same underlying portfolio, their performance will differ.
The gross expense ratios of the Fund, as stated in the fee table of the prospectus dated May 1, 2016 are 0.56% and 0.83% for Class A and Class B shares, respectively, and may differ from the expense ratios disclosed in the Financial Highlights tables in this report.
Generally accepted accounting principles require adjustments to be made to the net assets of the Fund at period end for financial reporting purposes only, and as such, the total return based on the unadjusted net asset value per share may differ from the total return reported in the financial highlights.
| Growth of an Assumed $10,000 Investment |
■ Deutsche Core Equity VIP — Class A ■ Russell 1000® Index | The Russell 1000® Index is an unmanaged index that measures the performance of the 1,000 largest companies in the Russell 3000® Index, which represents approximately 92% of the total market capitalization of the Russell 3000 Index. Index returns do not reflect any fees or expenses and it is not possible to invest directly into an index. |
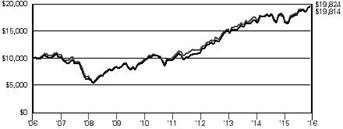 | |
| Yearly periods ended December 31 | |
| Comparative Results |
| Deutsche Core Equity VIP | 1-Year | 3-Year | 5-Year | 10-Year |
| Class A | Growth of $10,000 | $11,048 | $13,003 | $20,680 | $19,814 |
| Average annual total return | 10.48% | 9.15% | 15.64% | 7.08% |
| Russell 1000® Index | Growth of $10,000 | $11,205 | $12,805 | $19,844 | $19,824 |
| Average annual total return | 12.05% | 8.59% | 14.69% | 7.08% |
| Deutsche Core Equity VIP | 1-Year | 3-Year | 5-Year | 10-Year |
| Class B | Growth of $10,000 | $11,025 | $12,899 | $20,409 | $19,322 |
| Average annual total return | 10.25% | 8.85% | 15.34% | 6.81% |
| Russell 1000® Index | Growth of $10,000 | $11,205 | $12,805 | $19,844 | $19,824 |
| Average annual total return | 12.05% | 8.59% | 14.69% | 7.08% |
The growth of $10,000 is cumulative.
Management Summary December 31, 2016 (Unaudited)
Large-cap U.S. equities produced a healthy gain of 12.05% in 2016, based on the Fund’s benchmark, the Russell 1000® Index.1 The Fund returned 10.48% (Class A shares, unadjusted for contract charges), underperforming the index.
Individual stock selection was the primary reason for the Fund’s shortfall in the 12-month period ended December 31, 2016. While we added value in the information technology and real estate sectors, this was outweighed by weaker selection in consumer discretionary, financials, industrials and health care.2
Our underperformance in the consumer discretionary sector was partially the result of a position in the retailer L Brands, Inc., which was hurt by weaker same-store sales at its Victoria’s Secret brand, and NIKE, Inc., which reported lower-than-expected revenues. In financials, we lost some relative performance through certain holdings that generated positive returns but that failed to keep up with the broader sector in the final two months of the year, including Capital One Financial Corp.* and Ameriprise Financial, Inc. However, our investments in bank stocks such as JPMorgan Chase & Co. and U.S. Bancorp performed very well in the late rally and closed the year as strong overall contributors.3
In industrials, our deficit was largely the result of our positions in two stocks whose high degree of economic sensitivity caused them to lag in the "growth scare" early in the year: AMETEK, Inc. and Roper Technologies, Inc. Allergan PLC was the Fund’s leading detractor in health care. After performing well in late 2015 on the news of a bid from Pfizer, Inc., the stock subsequently plunged in April after the deal was nixed by regulators. Gilead Sciences, Inc. also lagged due to the broader concerns about regulations on pricing in the biotechnology industry. Both Allergan and Gilead remained in the portfolio at the close of the period. On the positive side, the biopharmaceutical stock Medivation, Inc. made a strong contribution after the company was bid for by Pfizer in August.
NVIDIA Corp. — a maker of advanced-processing computer chips being employed in fast-growing applications such automated cars and virtual reality, among other uses — was one of the best-performing stocks in the index in 2016 and a top contributor to Fund performance. The WhiteWave Foods Co., which specializes in natural and organic products, also delivered market-beating returns thanks to a takeover offer from the French company Danone.
The Fund’s management team changed during the fourth calendar quarter, leading to a shift in the stock-picking methodology. In managing the portfolio, we use proprietary quantitative models that seek to identify the most attractive stocks in the index based on fundamental factors that have been effective sources of return over time, such as valuation, momentum, profitability, earnings and sales growth. The models are dynamic, using specific factor weights for each industry group. The goal of this process is to maximize returns while maintaining a risk profile similar to that of the benchmark. We made only a handful of changes to the portfolio after we took over, reflecting our desire to minimize turnover while weeding out positions that we expected would underperform or adversely affect the Fund’s risk profile.
Pankaj Bhatnagar, PhD
Arno V. Puskar
Di Kumble, CFA
Portfolio Managers
The views expressed reflect those of the portfolio management team only through the end of the period of the report as stated on the cover. The management team's views are subject to change at any time based on market and other conditions and should not be construed as a recommendation. Past performance is no guarantee of future results. Current and future portfolio holdings are subject to risk.
1 The Russell 1000 Index tracks the performance of the 1,000 largest stocks in the Russell 3000® Index, which consists of the 3,000 largest U.S. companies as measured by market capitalization.
Index returns do not reflect any fees or expenses and it is not possible to invest directly into an index.
2 Consumer discretionary represents industries that produce goods and services that are not necessities in everyday life.
3 Contribution incorporates both a stock’s total return and its weighting in the Fund.
Portfolio Summary (Unaudited)
| Asset Allocation (As a % of Investment Portfolio excluding Securities Lending Collateral) | 12/31/16 | 12/31/15 |
| | | |
| Common Stocks | 99% | 99% |
| Cash Equivalents | 1% | 1% |
| Convertible Preferred Stock | 0% | 0% |
| Convertible Bond | — | 0% |
| | 100% | 100% |
| Sector Diversification (As a % of Common Stocks, Convertible Bond and Convertible Preferred Stocks) | 12/31/16 | 12/31/15 |
| | | |
| Information Technology | 21% | 20% |
| Financials | 17% | 13% |
| Health Care | 12% | 16% |
| Consumer Discretionary | 11% | 14% |
| Industrials | 11% | 11% |
| Consumer Staples | 9% | 10% |
| Energy | 8% | 6% |
| Real Estate | 3% | 2% |
| Utilities | 3% | 3% |
| Materials | 3% | 4% |
| Telecommunication Services | 2% | 1% |
| | 100% | 100% |
Portfolio holdings and characteristics are subject to change.
For more complete details about the Fund's investment portfolio, see page 6.
Following the Fund's fiscal first and third quarter-end, a complete portfolio holdings listing is filed with the SEC on Form N-Q. The form will be available on the SEC's Web site at sec.gov, and it also may be reviewed and copied at the SEC's Public Reference Room in Washington, D.C. Information on the operation of the SEC's Public Reference Room may be obtained by calling (800) SEC-0330. The Fund's portfolio holdings are also posted on deutschefunds.com from time to time. Please see the Fund's current prospectus for more information.
Investment Portfolio December 31, 2016
| |
Shares | Value ($) |
| | | |
| Common Stocks 98.7% |
| Consumer Discretionary 11.3% |
| Auto Components 0.6% |
| BorgWarner, Inc. | 25,863 | 1,020,037 |
| Automobiles 0.4% |
| Ferrari NV | 11,175 | 649,714 |
| Hotels, Restaurants & Leisure 1.4% |
| Brinker International, Inc. (a) | 29,983 | 1,485,058 |
| Las Vegas Sands Corp. | 14,217 | 759,330 |
| | 2,244,388 |
| Household Durables 0.5% |
| Newell Brands, Inc. | 17,489 | 780,884 |
| Internet & Direct Marketing Retail 1.6% |
| Amazon.com, Inc.* | 3,575 | 2,680,785 |
| Media 2.8% |
| Comcast Corp. "A" | 24,536 | 1,694,211 |
| Time Warner, Inc. | 19,725 | 1,904,054 |
| Walt Disney Co. | 9,694 | 1,010,309 |
| | 4,608,574 |
| Specialty Retail 2.6% |
| Advance Auto Parts, Inc. | 12,149 | 2,054,639 |
| Home Depot, Inc. | 4,731 | 634,332 |
| L Brands, Inc. | 25,753 | 1,695,578 |
| | 4,384,549 |
| Textiles, Apparel & Luxury Goods 1.4% |
| NIKE, Inc. "B" | 30,117 | 1,530,847 |
| VF Corp. | 14,113 | 752,928 |
| | 2,283,775 |
| Consumer Staples 9.0% |
| Beverages 1.3% |
| PepsiCo, Inc. | 20,196 | 2,113,108 |
| Food & Staples Retailing 3.9% |
| Sysco Corp. | 56,631 | 3,135,658 |
| Wal-Mart Stores, Inc. | 22,842 | 1,578,839 |
| Walgreens Boots Alliance, Inc. | 20,434 | 1,691,118 |
| | 6,405,615 |
| Food Products 3.5% |
| Conagra Brands, Inc. | 34,791 | 1,375,984 |
| Lamb Weston Holdings, Inc.* | 11,597 | 438,946 |
| Mead Johnson Nutrition Co. | 17,635 | 1,247,853 |
| Pinnacle Foods, Inc. | 24,820 | 1,326,629 |
| The JM Smucker Co. | 11,645 | 1,491,259 |
| | 5,880,671 |
| Personal Products 0.3% |
| Coty, Inc. "A" | 14,041 | 257,091 |
| Estee Lauder Companies, Inc. "A" | 3,270 | 250,122 |
| | 507,213 |
| Energy 7.6% |
| Oil, Gas & Consumable Fuels |
| Antero Resources Corp.* | 15,200 | 359,480 |
| Chevron Corp. | 16,281 | 1,916,274 |
| Concho Resources, Inc.* | 10,676 | 1,415,638 |
| EOG Resources, Inc. | 15,176 | 1,534,294 |
| EQT Corp. | 32,080 | 2,098,032 |
| Occidental Petroleum Corp. | 15,327 | 1,091,742 |
| |
Shares | Value ($) |
| | | |
| Parsley Energy, Inc. "A"* | 27,822 | 980,447 |
| Pioneer Natural Resources Co. | 17,731 | 3,192,821 |
| | 12,588,728 |
| Financials 16.4% |
| Banks 7.9% |
| Citigroup, Inc. | 63,498 | 3,773,686 |
| JPMorgan Chase & Co. | 69,986 | 6,039,092 |
| U.S. Bancorp. | 61,431 | 3,155,710 |
| | 12,968,488 |
| Capital Markets 5.7% |
| Ameriprise Financial, Inc. | 25,266 | 2,803,010 |
| Bank of New York Mellon Corp. | 91,141 | 4,318,261 |
| Northern Trust Corp. | 25,310 | 2,253,855 |
| | 9,375,126 |
| Insurance 2.8% |
| Chubb Ltd. | 15,035 | 1,986,424 |
| MetLife, Inc. | 49,896 | 2,688,896 |
| | 4,675,320 |
| Health Care 12.0% |
| Biotechnology 2.4% |
| Celgene Corp.* | 3,471 | 401,768 |
| Gilead Sciences, Inc. | 30,764 | 2,203,010 |
| Shire PLC (ADR) | 8,228 | 1,401,887 |
| | 4,006,665 |
| Health Care Equipment & Supplies 1.8% |
| Becton, Dickinson & Co. | 15,436 | 2,555,430 |
| Boston Scientific Corp.* | 14,640 | 316,663 |
| | 2,872,093 |
| Health Care Providers & Services 1.5% |
| Cardinal Health, Inc. | 5,088 | 366,183 |
| Cigna Corp. | 9,824 | 1,310,424 |
| McKesson Corp. | 5,634 | 791,295 |
| | 2,467,902 |
| Life Sciences Tools & Services 1.8% |
| Patheon NV* | 17,089 | 490,625 |
| Thermo Fisher Scientific, Inc. | 17,956 | 2,533,592 |
| | 3,024,217 |
| Pharmaceuticals 4.5% |
| Allergan PLC* | 8,354 | 1,754,423 |
| Bristol-Myers Squibb Co. | 16,791 | 981,266 |
| Merck & Co., Inc. | 29,400 | 1,730,778 |
| Pfizer, Inc. | 91,431 | 2,969,679 |
| | 7,436,146 |
| Industrials 10.5% |
| Aerospace & Defense 1.7% |
| Boeing Co. | 18,018 | 2,805,042 |
| Electrical Equipment 2.0% |
| AMETEK, Inc. | 46,649 | 2,267,141 |
| Regal Beloit Corp. | 15,210 | 1,053,293 |
| | 3,320,434 |
| Industrial Conglomerates 3.6% |
| General Electric Co. | 63,648 | 2,011,277 |
| Honeywell International, Inc. | 13,485 | 1,562,237 |
| Roper Technologies, Inc. | 12,986 | 2,377,477 |
| | 5,950,991 |
| |
Shares | Value ($) |
| | | |
| Machinery 1.6% |
| Ingersoll-Rand PLC | 15,416 | 1,156,817 |
| Parker-Hannifin Corp. | 10,189 | 1,426,460 |
| | 2,583,277 |
| Road & Rail 1.6% |
| Norfolk Southern Corp. | 24,746 | 2,674,300 |
| Information Technology 20.4% |
| Communications Equipment 1.1% |
| Cisco Systems, Inc. | 61,881 | 1,870,044 |
| Internet Software & Services 3.3% |
| Alphabet, Inc. "A"* | 3,367 | 2,668,179 |
| Alphabet, Inc. "C"* | 2,959 | 2,283,815 |
| Pandora Media, Inc.* (a) | 31,840 | 415,194 |
| | 5,367,188 |
| IT Services 3.9% |
| Cognizant Technology Solutions Corp. "A"* | 17,915 | 1,003,777 |
| Fidelity National Information Services, Inc. | 17,808 | 1,346,997 |
| Visa, Inc. "A" | 51,484 | 4,016,782 |
| | 6,367,556 |
| Semiconductors & Semiconductor Equipment 5.2% |
| Analog Devices, Inc. | 4,430 | 321,707 |
| Broadcom Ltd. | 4,250 | 751,272 |
| Intel Corp. | 45,685 | 1,656,995 |
| NVIDIA Corp. | 20,457 | 2,183,580 |
| QUALCOMM, Inc. | 9,746 | 635,439 |
| Texas Instruments, Inc. | 16,549 | 1,207,581 |
| Xilinx, Inc. | 28,718 | 1,733,706 |
| | 8,490,280 |
| Software 3.5% |
| Microsoft Corp. | 92,926 | 5,774,422 |
| Technology Hardware, Storage & Peripherals 3.4% |
| Apple, Inc. | 48,982 | 5,673,095 |
| Materials 2.9% |
| Chemicals 1.4% |
| AdvanSix, Inc.* | 539 | 11,934 |
| Albemarle Corp. | 16,003 | 1,377,538 |
| Ecolab, Inc. | 7,242 | 848,907 |
| | 2,238,379 |
| Construction Materials 0.9% |
| Vulcan Materials Co. | 11,844 | 1,482,277 |
| Containers & Packaging 0.3% |
| Sealed Air Corp. | 12,710 | 576,271 |
| Metals & Mining 0.3% |
| Steel Dynamics, Inc. | 11,945 | 425,003 |
| |
Shares | Value ($) |
| | | |
| Real Estate 3.3% |
| Equity Real Estate Investment Trusts (REITs) |
| Digital Realty Trust, Inc. | 30,025 | 2,950,257 |
| Kimco Realty Corp. | 41,071 | 1,033,346 |
| Prologis, Inc. | 27,608 | 1,457,426 |
| | 5,441,029 |
| Telecommunication Services 2.4% |
| Diversified Telecommunication Services 0.8% |
| Frontier Communications Corp. (a) | 416,400 | 1,407,432 |
| Wireless Telecommunication Services 1.6% |
| T-Mobile U.S., Inc.* | 44,874 | 2,580,704 |
| Utilities 2.9% |
| Electric Utilities 0.9% |
| NextEra Energy, Inc. | 12,464 | 1,488,950 |
| Multi-Utilities 0.6% |
| CenterPoint Energy, Inc. | 17,865 | 440,194 |
| MDU Resources Group, Inc. | 20,150 | 579,715 |
| | 1,019,909 |
| Water Utilities 1.4% |
| American Water Works Co., Inc. | 30,765 | 2,226,155 |
| Total Common Stocks (Cost $128,868,346) | 162,736,736 |
| |
| Convertible Preferred Stock 0.1% |
| Health Care |
| Teva Pharmaceutical Industries Ltd., 7.0% (Cost $212,000) | 212 | 136,740 |
| |
| Securities Lending Collateral 1.8% |
| Government & Agency Securities Portfolio "Deutsche Government Cash Institutional Shares", 0.42% (b) (c) (Cost $2,983,447) | 2,983,447 | 2,983,447 |
| |
| Cash Equivalents 1.1% |
| Deutsche Central Cash Management Government Fund, 0.49% (b) (Cost $1,840,759) | 1,840,759 | 1,840,759 |
| | % of Net Assets | Value ($) |
| | |
| Total Investment Portfolio (Cost $133,904,552)† | 101.7 | 167,697,682 |
| Other Assets and Liabilities, Net | (1.7) | (2,834,195) |
| Net Assets | 100.0 | 164,863,487 |
* Non-income producing security.
† The cost for federal income tax purposes was $134,107,991. At December 31, 2016, net unrealized appreciation for all securities based on tax cost was $33,589,691. This consisted of aggregate gross unrealized appreciation for all securities in which there was an excess of value over tax cost of $36,135,417 and aggregate gross unrealized depreciation for all securities in which there was an excess of tax cost over value of $2,545,726.
(a) All or a portion of these securities were on loan. In addition, "Other Assets and Liabilities, Net" may include pending sales that are also on loan. The value of securities loaned at December 31, 2016 amounted to $2,882,043, which is 1.7% of net assets.
(b) Affiliated fund managed by Deutsche Investment Management Americas Inc. The rate shown is the annualized seven-day yield at period end.
(c) Represents collateral held in connection with securities lending. Income earned by the Fund is net of borrower rebates.
ADR: American Depositary Receipt
Fair Value Measurements
Various inputs are used in determining the value of the Fund's investments. These inputs are summarized in three broad levels. Level 1 includes quoted prices in active markets for identical securities. Level 2 includes other significant observable inputs (including quoted prices for similar securities, interest rates, prepayment speeds and credit risk). Level 3 includes significant unobservable inputs (including the Fund's own assumptions in determining the fair value of investments). The level assigned to the securities valuations may not be an indication of the risk or liquidity associated with investing in those securities.
The following is a summary of the inputs used as of December 31, 2016 in valuing the Fund's investments. For information on the Fund's policy regarding the valuation of investments, please refer to the Security Valuation section of Note A in the accompanying Notes to Financial Statements.
| Assets | Level 1 | Level 2 | Level 3 | Total |
| |
| Common Stocks (d) | $162,736,736 | $ — | $ — | $162,736,736 |
| Convertible Preferred Stock | 136,740 | — | — | 136,740 |
| Short-Term Investments (d) | 4,824,206 | — | — | 4,824,206 |
| Total | $167,697,682 | $ — | $ — | $167,697,682 |
There have been no transfers between fair value measurement levels during the year ended December 31, 2016.
(d) See Investment Portfolio for additional detailed categorizations.
The accompanying notes are an integral part of the financial statements.
Statement of Assets and Liabilities
| as of December 31, 2016 |
| Assets |
Investments: Investments in non-affiliated securities, at value (cost $129,080,346) — including $2,882,043 of securities loaned | $162,873,476 |
| Investment in Government & Agency Securities Portfolio (cost $2,983,447)* | 2,983,447 |
| Investment in Deutsche Central Cash Management Government Fund (cost $1,840,759) | 1,840,759 |
| Total investments in securities, at value (cost $133,904,552) | 167,697,682 |
| Cash | 16,166 |
| Receivable for Fund shares sold | 174,455 |
| Dividends receivable | 198,550 |
| Interest receivable | 1,550 |
| Other assets | 3,360 |
| Total assets | 168,091,763 |
| Liabilities |
| Payable upon return of securities loaned | 2,983,447 |
| Payable for Fund shares redeemed | 82,679 |
| Accrued management fee | 54,972 |
| Accrued Trustees' fees | 2,369 |
| Other accrued expenses and payables | 104,809 |
| Total liabilities | 3,228,276 |
| Net assets, at value | $164,863,487 |
| Net Assets Consist of |
| Undistributed net investment income | 2,050,752 |
| Net unrealized appreciation (depreciation) on investments | 33,793,130 |
| Accumulated net realized gain (loss) | 11,322,543 |
| Paid-in capital | 117,697,062 |
| Net assets, at value | $164,863,487 |
Class A Net Asset Value, offering and redemption price per share ($162,819,241 ÷ 12,373,665 outstanding shares of beneficial interest, $.01 par value, unlimited number of shares authorized) | $ 13.16 |
Class B Net Asset Value, offering and redemption price per share ($2,044,246 ÷ 155,615 outstanding shares of beneficial interest, $.01 par value, unlimited number of shares authorized) | $ 13.14 |
* Represents collateral on securities loaned.
The accompanying notes are an integral part of the financial statements.
Statement of Operations
| for the year ended December 31, 2016 |
| Investment Income |
Income: Dividends (net of foreign taxes withheld of $2,532) | $ 3,004,811 |
| Interest | 435 |
| Income distributions — Deutsche Central Cash Management Government Fund | 5,629 |
| Securities lending income, net of borrower rebates | 7,882 |
| Other Income | 73,424 |
| Total income | 3,092,181 |
Expenses: Management fee | 629,360 |
| Administration fee | 161,374 |
| Services to shareholders | 1,929 |
| Record keeping fee (Class B) | 616 |
| Distribution service fee (Class B) | 4,997 |
| Custodian fee | 11,882 |
| Professional fees | 71,197 |
| Reports to shareholders | 32,241 |
| Trustees' fees and expenses | 9,533 |
| Other | 9,881 |
| Total expenses | 933,010 |
| Net investment income | 2,159,171 |
| Realized and Unrealized Gain (Loss) |
| Net realized gain (loss) from investments | 11,458,572 |
| Change in net unrealized appreciation (depreciation) on investments | 1,593,775 |
| Net gain (loss) | 13,052,347 |
| Net increase (decrease) in net assets resulting from operations | $ 15,211,518 |
The accompanying notes are an integral part of the financial statements.
Statements of Changes in Net Assets
| Increase (Decrease) in Net Assets | Years Ended December 31, |
| 2016 | 2015 |
Operations: Net investment income | $ 2,159,171 | $ 2,369,333 |
| Net realized gain (loss) | 11,458,572 | 14,502,719 |
| Change in net unrealized appreciation (depreciation) | 1,593,775 | (5,598,072) |
| Net increase (decrease) in net assets resulting from operations | 15,211,518 | 11,273,980 |
Distributions to shareholders from: Net investment income: Class A | (2,276,718) | (1,815,630) |
| Class B | (23,854) | (11,196) |
Net realized gains: Class A | (14,473,682) | (491,871) |
| Class B | (187,911) | (4,384) |
| Total distributions | (16,962,165) | (2,323,081) |
Fund share transactions: Class A Proceeds from shares sold | 5,821,528 | 9,787,413 |
| Reinvestment of distributions | 16,750,400 | 2,307,501 |
| Payments for shares redeemed | (34,089,364) | (65,202,089) |
| Net increase (decrease) in net assets from Class A share transactions | (11,517,436) | (53,107,175) |
Class B Proceeds from shares sold | 189,791 | 435,534 |
| Reinvestment of distributions | 211,765 | 15,580 |
| Payments for shares redeemed | (396,205) | (285,169) |
| Net increase (decrease) in net assets from Class B share transactions | 5,351 | 165,945 |
| Increase (decrease) in net assets | (13,262,732) | (43,990,331) |
| Net assets at beginning of period | 178,126,219 | 222,116,550 |
| Net assets at end of period (including undistributed net investment income of $2,050,752 and $2,321,097, respectively) | $164,863,487 | $178,126,219 |
| Other Information |
Class A Shares outstanding at beginning of period | 13,252,114 | 17,268,971 |
| Shares sold | 461,980 | 745,068 |
| Shares issued to shareholders in reinvestment of distributions | 1,400,535 | 173,366 |
| Shares redeemed | (2,740,964) | (4,935,291) |
| Net increase (decrease) in Class A shares | (878,449) | (4,016,857) |
| Shares outstanding at end of period | 12,373,665 | 13,252,114 |
Class B Shares outstanding at beginning of period | 154,548 | 142,262 |
| Shares sold | 15,369 | 32,766 |
| Shares issued to shareholders in reinvestment of distributions | 17,691 | 1,171 |
| Shares redeemed | (31,993) | (21,651) |
| Net increase (decrease) in Class B shares | 1,067 | 12,286 |
| Shares outstanding at end of period | 155,615 | 154,548 |
The accompanying notes are an integral part of the financial statements.
Financial Highlights
| Class A | |
Years Ended December 31, |
| 2016 | 2015 | 2014 | 2013 | 2012 |
| Selected Per Share Data |
| Net asset value, beginning of period | $ 13.29 | $ 12.76 | $ 11.54 | $ 8.53 | $ 7.46 |
Income (loss) from investment operations: Net investment incomea | .17 | .15 | .10 | .12 | .15 |
| Net realized and unrealized gain (loss) | 1.09 | .52 | 1.25 | 3.03 | 1.03 |
| Total from investment operations | 1.26 | .67 | 1.35 | 3.15 | 1.18 |
Less distributions from: Net investment income | (.19) | (.11) | (.13) | (.14) | (.11) |
| Net realized gains | (1.20) | (.03) | — | — | — |
| Total distributions | (1.39) | (.14) | (.13) | (.14) | (.11) |
| Net asset value, end of period | $ 13.16 | $ 13.29 | $ 12.76 | $ 11.54 | $ 8.53 |
| Total Return (%) | 10.48 | 5.25 | 11.82 | 37.33 | 15.81 |
| Ratios to Average Net Assets and Supplemental Data |
| Net assets, end of period ($ millions) | 163 | 176 | 220 | 223 | 180 |
| Ratio of expenses (%) | .57 | .56 | .57 | .56 | .59 |
| Ratio of net investment income (%) | 1.34 | 1.11 | .86 | 1.20 | 1.90 |
| Portfolio turnover rate (%) | 43 | 27 | 48 | 238 | 307 |
| a Based on average shares outstanding during the period. |
| Class B | |
Years Ended December 31, |
| 2016 | 2015 | 2014 | 2013 | 2012 |
| Selected Per Share Data |
| Net asset value, beginning of period | $ 13.26 | $ 12.74 | $ 11.53 | $ 8.51 | $ 7.45 |
Income (loss) from investment operations: Net investment incomea | .13 | .11 | .07 | .10 | .11 |
| Net realized and unrealized gain (loss) | 1.10 | .52 | 1.24 | 3.03 | 1.03 |
| Total from investment operations | 1.23 | .63 | 1.31 | 3.13 | 1.14 |
Less distributions from: Net investment income | (.15) | (.08) | (.10) | (.11) | (.08) |
| Net realized gains | (1.20) | (.03) | — | — | — |
| Total distributions | (1.35) | (.11) | (.10) | (.11) | (.08) |
| Net asset value, end of period | $ 13.14 | $ 13.26 | $ 12.74 | $ 11.53 | $ 8.51 |
| Total Return (%) | 10.25 | 4.91 | 11.52 | 37.10 | 15.41 |
| Ratios to Average Net Assets and Supplemental Data |
| Net assets, end of period ($ millions) | 2 | 2 | 2 | 2 | 2 |
| Ratio of expenses (%) | .86 | .83 | .82 | .76 | .90 |
| Ratio of net investment income (%) | 1.06 | .84 | .60 | 1.00 | 1.41 |
| Portfolio turnover rate (%) | 43 | 27 | 48 | 238 | 307 |
| a Based on average shares outstanding during the period. |
Notes to Financial Statements
A. Organization and Significant Accounting Policies
Deutsche Variable Series I (the "Trust") is registered under the Investment Company Act of 1940, as amended (the "1940 Act"), as an open-end, registered management investment company organized as a Massachusetts business trust. The Trust consists of five diversified funds: Deutsche Bond VIP, Deutsche Capital Growth VIP, Deutsche Core Equity VIP, Deutsche CROCI® International VIP and Deutsche Global Small Cap VIP (individually or collectively hereinafter referred to as a "Fund" or the "Funds"). These financial statements report on Deutsche Core Equity VIP. The Trust is intended to be the underlying investment vehicle for variable annuity contracts and variable life insurance policies to be offered by the separate accounts of certain life insurance companies ("Participating Insurance Companies").
Multiple Classes of Shares of Beneficial Interest. The Fund offers two classes of shares (Class A shares and Class B shares). Class B shares are subject to Rule 12b-1 distribution fees under the 1940 Act and recordkeeping fees equal to an annual rate of 0.25% and up to 0.15%, respectively, of the average daily net assets of the Class B shares of the Fund. Class A shares are not subject to such fees.
Investment income, realized and unrealized gains and losses, and certain fund-level expenses and expense reductions, if any, are borne pro rata on the basis of relative net assets by the holders of all classes of shares, except that each class bears certain expenses unique to that class (including the applicable 12b-1 distribution fees and recordkeeping fees). Differences in class-level expenses may result in payment of different per share dividends by class. All shares have equal rights with respect to voting subject to class-specific arrangements.
The Fund's financial statements are prepared in accordance with accounting principles generally accepted in the United States of America ("U.S. GAAP") which require the use of management estimates. Actual results could differ from those estimates. The Fund qualifies as an investment company under Topic 946 of Accounting Standards Codification of U.S. GAAP. The policies described below are followed consistently by the Fund in the preparation of its financial statements.
Security Valuation. Investments are stated at value determined as of the close of regular trading on the New York Stock Exchange on each day the exchange is open for trading.
Various inputs are used in determining the value of the Fund's investments. These inputs are summarized in three broad levels. Level 1 includes quoted prices in active markets for identical securities. Level 2 includes other significant observable inputs (including quoted prices for similar securities, interest rates, prepayment speeds and credit risk). Level 3 includes significant unobservable inputs (including the Fund's own assumptions in determining the fair value of investments). The level assigned to the securities valuations may not be an indication of the risk or liquidity associated with investing in those securities.
Equity securities are valued at the most recent sale price or official closing price reported on the exchange (U.S. or foreign) or over-the-counter market on which they trade. Securities for which no sales are reported are valued at the calculated mean between the most recent bid and asked quotations on the relevant market or, if a mean cannot be determined, at the most recent bid quotation. Equity securities are generally categorized as Level 1.
Investments in open-end investment companies are valued at their net asset value each business day and are categorized as Level 1.
Debt securities are valued at prices supplied by independent pricing services approved by the Fund's Board. Such services may use various pricing techniques which take into account appropriate factors such as yield, quality, coupon rate, maturity, type of issue, trading characteristics, prepayment speeds and other data, as well as broker quotes. If the pricing services are unable to provide valuations, debt securities are valued at the average of the most recent reliable bid quotations or evaluated prices, as applicable, obtained from broker-dealers. These securities are generally categorized as Level 2.
Securities and other assets for which market quotations are not readily available or for which the above valuation procedures are deemed not to reflect fair value are valued in a manner that is intended to reflect their fair value as determined in accordance with procedures approved by the Trustees and are generally categorized as Level 3. In accordance with the Fund's valuation procedures, factors used in determining value may include, but are not limited to, the type of the security; the size of the holding; the initial cost of the security; the existence of any contractual restrictions on the security's disposition; the price and extent of public trading in similar securities of the issuer or of comparable companies; quotations or evaluated prices from broker-dealers and/or pricing services; information obtained from the issuer, analysts, and/or the appropriate stock exchange (for exchange-traded securities); an analysis of the company's or issuer's financial statements; an evaluation of the forces that influence the issuer and the market(s) in which the security is purchased and sold; and with respect to debt securities, the maturity, coupon, creditworthiness, currency denomination and the movement of the market in which the security is normally traded. The value determined under these procedures may differ from published values for the same securities.
Disclosure about the classification of fair value measurements is included in a table following the Fund's Investment Portfolio.
Securities Lending. Prior to October 24, 2016, Brown Brothers Harriman & Co. served as security lending agent for the Fund. Effective October 24, 2016, Deutsche Bank AG serves as security lending agent to the Fund. The lending agent lends securities of the Fund to certain financial institutions under the terms of its securities lending agreement. During the term of the loans, the Fund continues to receive interest and dividends generated by the securities and to participate in any changes in their market value. The Fund requires the borrowers of the securities to maintain collateral with the Fund consisting of either cash or liquid, unencumbered assets having a value at least equal to the value of the securities loaned. When the collateral falls below specified amounts, the lending agent will use its best effort to obtain additional collateral on the next business day to meet required amounts under the securities lending agreement. As of period end, any securities on loan were collateralized by cash. During the year ended December 31, 2016, the Fund invested the cash collateral into a joint trading account in affiliated money market funds managed by Deutsche Investment Management Americas Inc. As of December 31, 2016, the Fund invested the cash collateral in Government & Agency Securities Portfolio. Deutsche Investment Management Americas Inc. receives a management/administration fee (0.09% annualized effective rate as of December 31, 2016) on the cash collateral invested in Government & Agency Securities Portfolio. The Fund receives compensation for lending its securities either in the form of fees or by earning interest on invested cash collateral net of borrower rebates and fees paid to a lending agent. Either the Fund or the borrower may terminate the loan at any time and the borrower, after notice, is required to return borrowed securities within a standard time period. There may be risks of delay and costs in recovery of securities or even loss of rights in the collateral should the borrower of the securities fail financially. If the Fund is not able to recover securities lent, the Fund may sell the collateral and purchase a replacement investment in the market, incurring the risk that the value of the replacement security is greater than the value of the collateral. The Fund is also subject to all investment risks associated with the reinvestment of any cash collateral received, including, but not limited to, interest rate, credit and liquidity risk associated with such investments.
As of December 31, 2016, the Fund had securities on loan, which were classified as common stock in the Investment Portfolio. The value of the related collateral exceeded the value of the securities loaned at period end. As of period end, the remaining contractual maturity of the collateral agreements were overnight and continuous.
Foreign Currency Translations. The books and records of the Fund are maintained in U.S. dollars. Investment securities and other assets and liabilities denominated in a foreign currency are translated into U.S. dollars at the prevailing exchange rates at period end. Purchases and sales of investment securities, income and expenses are translated into U.S. dollars at the prevailing exchange rates on the respective dates of the transactions.
Net realized and unrealized gains and losses on foreign currency transactions represent net gains and losses between trade and settlement dates on securities transactions, the acquisition and disposition of foreign currencies, and the difference between the amount of net investment income accrued and the U.S. dollar amount actually received. The portion of both realized and unrealized gains and losses on investments that results from fluctuations in foreign currency exchange rates is not separately disclosed but is included with net realized and unrealized gain/appreciation and loss/depreciation on investments.
Federal Income Taxes. The Fund is treated as a separate taxpayer as provided for in the Internal Revenue Code, as amended. It is the Fund's policy to comply with the requirements of the Internal Revenue Code, as amended, which are applicable to regulated investment companies, and to distribute all of its taxable income to the separate accounts of the Participating Insurance Companies which hold its shares.
The Fund has reviewed the tax positions for the open tax years as of December 31, 2016 and has determined that no provision for income tax and/or uncertain tax provisions is required in the Fund's financial statements. The Fund's federal tax returns for the prior three fiscal years remain open subject to examination by the Internal Revenue Service.
Distribution of Income and Gains. Distributions from net investment income of the Fund, if any, are declared and distributed to shareholders annually. Net realized gains from investment transactions, in excess of available capital loss carryforwards, would be taxable to the Fund if not distributed, and, therefore, will be distributed to shareholders at least annually. The Fund may also make additional distributions for tax purposes if necessary.
The timing and characterization of certain income and capital gain distributions are determined annually in accordance with federal tax regulations which may differ from accounting principles generally accepted in the United States of America. These differences primarily relate to certain securities sold at a loss. As a result, net investment income (loss) and net realized gain (loss) on investment transactions for a reporting period may differ significantly from distributions during such period. Accordingly, the Fund may periodically make reclassifications among certain of its capital accounts without impacting the net asset value of the Fund.
At December 31, 2016, the Fund's components of distributable earnings (accumulated losses) on a tax basis are as follows:
| Undistributed ordinary income* | $ 3,343,129 |
| Undistributed net long-term capital gains | $ 10,233,600 |
| Net unrealized appreciation (depreciation) on investments | $ 33,589,691 |
In addition, the tax character of distributions paid to shareholders by the Fund is summarized as follows:
| | Years Ended December 31, |
| 2016 | 2015 |
| Distributions from ordinary income* | $ 4,942,798 | $ 1,826,826 |
| Distributions from long-term capital gains | $ 12,019,367 | $ 496,255 |
* For tax purposes, short-term capital gain distributions are considered ordinary income distributions.
Expenses. Expenses of the Trust arising in connection with a specific Fund are allocated to that Fund. Other Trust expenses which cannot be directly attributed to a Fund are apportioned among the Funds in the Trust based upon the relative net assets or other appropriate measures.
Contingencies. In the normal course of business, the Fund may enter into contracts with service providers that contain general indemnification clauses. The Fund's maximum exposure under these arrangements is unknown, as this would involve future claims that may be made against the Fund that have not yet been made. However, based on experience, the Fund expects the risk of loss to be remote.
Other. Investment transactions are accounted for on a trade date plus one basis for daily net asset value calculations. However, for financial reporting purposes, investment transactions are reported on trade date. Interest income is recorded on the accrual basis. Dividend income is recorded on the ex-dividend date net of foreign withholding taxes. Realized gains and losses from investment transactions are recorded on an identified cost basis. Proceeds from litigation payments, if any, are included in net realized gain (loss) from investments.
B. Purchases and Sales of Securities
During the year ended December 31, 2016, purchases and sales of investment securities (excluding short-term investments) aggregated $69,088,880 and $96,587,834, respectively.
C. Related Parties
Management Agreement. Under the Investment Management Agreement with Deutsche Investment Management Americas Inc. ("DIMA" or the "Advisor"), an indirect, wholly owned subsidiary of Deutsche Bank AG, the Advisor directs the investments of the Fund in accordance with its investment objectives, policies and restrictions. The Advisor determines the securities, instruments and other contracts relating to investments to be purchased, sold or entered into by the Fund.
Pursuant to the Investment Management Agreement with the Advisor, the Fund pays a monthly management fee based on the Fund's average daily net assets, computed and accrued daily and payable monthly, at the following annual rates:
| First $250 million of average daily net assets | .390% |
| Next $750 million of average daily net assets | .365% |
| Over $1 billion of average daily net assets | .340% |
Accordingly, for the year ended December 31, 2016, the fee pursuant to the Investment Management Agreement was equivalent to an annual rate (exclusive of any applicable waivers/reimbursements) of 0.39% of the Fund's average daily net assets.
For the period from January 1, 2016 through September 30, 2016, the Advisor had contractually agreed to waive its fees and/or reimburse certain operating expenses of the Fund to the extent necessary to maintain the total annual operating expenses (excluding certain expenses such as extraordinary expenses, taxes, brokerage and interest) of each class as follows:
Effective October 1, 2016 through September 30, 2017, the Advisor has contractually agreed to waive its fees and/or reimburse certain operating expenses of the Fund to the extent necessary to maintain the total annual operating expenses (excluding certain expenses such as extraordinary expenses, taxes, brokerage and interest) of each class as follows:
Administration Fee. Pursuant to an Administrative Services Agreement, DIMA provides most administrative services to the Fund. For all services provided under the Administrative Services Agreement, the Fund pays the Advisor an annual fee ("Administration Fee") of 0.10% of the Fund's average daily net assets, computed and accrued daily and payable monthly. For the year ended December 31, 2016, the Administration Fee was $161,374, of which $14,095 is unpaid.
Service Provider Fees. Deutsche AM Service Company ("DSC"), an affiliate of the Advisor, is the transfer agent, dividend-paying agent and shareholder service agent for the Fund. Pursuant to a sub-transfer agency agreement between DSC and DST Systems, Inc. ("DST"), DSC has delegated certain transfer agent, dividend-paying agent and shareholder service agent functions to DST. DSC compensates DST out of the shareholder servicing fee it receives from the Fund. For the year ended December 31, 2016, the amounts charged to the Fund by DSC were as follows:
| Services to Shareholders | Total Aggregated | Unpaid at December 31, 2016 |
| Class A | $ 609 | $ 152 |
| Class B | 109 | 30 |
| | $ 718 | $ 182 |
Distribution Service Agreement. Deutsche AM Distributors, Inc. ("DDI"), also an affiliate of the Advisor, is the Trust's Distributor. In accordance with the Master Distribution Plan, DDI receives 12b-1 fees of 0.25% of average daily net assets of Class B shares. Pursuant to the Master Distribution Plan, DDI remits these fees to the Participating Insurance Companies for various costs incurred or paid by these companies in connection with marketing and distribution of Class B shares. For the year ended December 31, 2016, the Distribution Service Fee aggregated $4,997, of which $437 is unpaid.
Typesetting and Filing Service Fees. Under an agreement with DIMA, DIMA is compensated for providing typesetting and certain regulatory filing services to the Fund. For the year ended December 31, 2016, the amount charged to the Fund by DIMA included in the Statement of Operations under "Reports to shareholders" aggregated $11,500, of which $4,263 is unpaid.
Trustees' Fees and Expenses. The Fund paid retainer fees to each Trustee not affiliated with the Advisor, plus specified amounts to the Board Chairperson and Vice Chairperson and to each committee Chairperson.
Affiliated Cash Management Vehicles. The Fund may invest uninvested cash balances in Deutsche Central Cash Management Government Fund and Deutsche Variable NAV Money Fund, affiliated money market funds which are managed by the Advisor. Each affiliated money market fund is managed in accordance with Rule 2a-7 under the 1940 Act, which governs the quality, maturity, diversity and liquidity of instruments in which a money market fund may invest. Deutsche Central Cash Management Government Fund seeks to maintain a stable net asset value, and Deutsche Variable NAV Money Fund maintains a floating net asset value. The Fund indirectly bears its proportionate share of the expenses of each affiliated money market fund in which it invests. Deutsche Central Cash Management Government Fund does not pay the Advisor an investment management fee. To the extent that Deutsche Variable NAV Money Fund pays an investment management fee to the Advisor, the Advisor will waive an amount of the investment management fee payable to the Advisor by the Fund equal to the amount of the investment management fee payable on the Fund's assets invested in Deutsche Variable NAV Money Fund.
Security Lending Fees. Effective October 24, 2016, Deutsche Bank AG serves as lending agent for the Fund. For the year ended December 31, 2016, the Fund incurred lending agent fees to Deutsche Bank AG for the amount of $110.
D. Ownership of the Fund
At December 31, 2016, three participating insurance companies were owners of record of 10% or more of the total outstanding Class A shares of the Fund, each owning 37%, 34% and 10%, respectively. Two participating insurance companies were owners of record of 10% or more of the total outstanding Class B shares of the Fund, each owning 64% and 12%, respectively.
E. Line of Credit
The Fund and other affiliated funds (the "Participants") share in a $400 million revolving credit facility provided by a syndication of banks. The Fund may borrow for temporary or emergency purposes, including the meeting of redemption requests that otherwise might require the untimely disposition of securities. The Participants are charged an annual commitment fee which is allocated based on net assets, among each of the Participants. Interest is calculated at a rate per annum equal to the sum of the Federal Funds Rate plus 1.25 percent plus if the one-month LIBOR exceeds the Federal Funds Rate, the amount of such excess. The Fund may borrow up to a maximum of 33 percent of its net assets under the agreement. The Fund had no outstanding loans at December 31, 2016.
Report of Independent Registered Public Accounting Firm
To the Board of Trustees of Deutsche Variable Series I and the Shareholders of Deutsche Core Equity VIP:
In our opinion, the accompanying statement of assets and liabilities, including the investment portfolio, and the related statements of operations and of changes in net assets and the financial highlights present fairly, in all material respects, the financial position of Deutsche Core Equity VIP (the "Fund") at December 31, 2016 and the results of its operations, the changes in its net assets, and the financial highlights for the periods indicated therein, in conformity with accounting principles generally accepted in the United States of America. These financial statements and financial highlights (hereafter referred to as "financial statements") are the responsibility of the Fund's management. Our responsibility is to express an opinion on these financial statements based on our audits. We conducted our audits of these financial statements in accordance with the standards of the Public Company Accounting Oversight Board (United States). Those standards require that we plan and perform the audit to obtain reasonable assurance about whether the financial statements are free of material misstatement. An audit includes examining, on a test basis, evidence supporting the amounts and disclosures in the financial statements, assessing the accounting principles used and significant estimates made by management, and evaluating the overall financial statement presentation. We believe that our audits, which included confirmation of securities at December 31, 2016 by correspondence with the custodian, brokers and transfer agent, provide a reasonable basis for our opinion.
Boston, Massachusetts
February 14, 2017 | PricewaterhouseCoopers LLP |
Information About Your Fund's Expenses (Unaudited)
As an investor of the Fund, you incur two types of costs: ongoing expenses and transaction costs. Ongoing expenses include management fees, distribution and service (12b-1) fees and other Fund expenses. Examples of transaction costs include contract charges, which are not shown in this section. The following tables are intended to help you understand your ongoing expenses (in dollars) of investing in the Fund and to help you compare these expenses with the ongoing expenses of investing in other mutual funds. The example in the table is based on an investment of $1,000 invested at the beginning of the six-month period and held for the entire period (July 1, 2016 to December 31, 2016).
The tables illustrate your Fund's expenses in two ways:
— Actual Fund Return. This helps you estimate the actual dollar amount of ongoing expenses (but not transaction costs) paid on a $1,000 investment in the Fund using the Fund's actual return during the period. To estimate the expenses you paid over the period, simply divide your account value by $1,000 (for example, an $8,600 account value divided by $1,000 = 8.6), then multiply the result by the number in the "Expenses Paid per $1,000" line under the share class you hold.
— Hypothetical 5% Fund Return. This helps you to compare your Fund's ongoing expenses (but not transaction costs) with those of other mutual funds using the Fund's actual expense ratio and a hypothetical rate of return of 5% per year before expenses. Examples using a 5% hypothetical Fund return may be found in the shareholder reports of other mutual funds. The hypothetical account values and expenses may not be used to estimate the actual ending account balance or expenses you paid for the period.
Please note that the expenses shown in these tables are meant to highlight your ongoing expenses only and do not reflect any transaction costs. The "Expenses Paid per $1,000" line of the tables is useful in comparing ongoing expenses only and will not help you determine the relative total expense of owning different funds. If these transaction costs had been included, your costs would have been higher.
| Expenses and Value of a $1,000 Investment for the six months ended December 31, 2016 |
| Actual Fund Return | Class A | | Class B | |
| Beginning Account Value 7/1/16 | $1,000.00 | | $1,000.00 | |
| Ending Account Value 12/31/16 | $1,099.40 | | $1,097.70 | |
| Expenses Paid per $1,000* | $ 3.01 | | $ 4.53 | |
| Hypothetical 5% Fund Return | Class A | | Class B | |
| Beginning Account Value 7/1/16 | $1,000.00 | | $1,000.00 | |
| Ending Account Value 12/31/16 | $1,022.27 | | $1,020.81 | |
| Expenses Paid per $1,000* | $ 2.90 | | $ 4.37 | |
* Expenses are equal to the Fund's annualized expense ratio for each share class, multiplied by the average account value over the period, multiplied by 184 (the number of days in the most recent six-month period), then divided by 366.
| Annualized Expense Ratios | Class A | | Class B | |
| Deutsche Variable Series I — Deutsche Core Equity VIP | .57% | | .86% | |
For more information, please refer to the Fund's prospectus.
These tables do not reflect charges and fees ("contract charges") associated with the separate account that invests in the Fund or any variable life insurance policy or variable annuity contract for which the Fund is an investment option.
For an analysis of the fees associated with an investment in the fund or similar funds, please refer to the current and hypothetical expense calculators for Variable Insurance Products which can be found at deutschefunds.com/EN/resources/calculators.jsp.
Tax Information (Unaudited)
The Fund paid distributions of $0.98 per share from net long-term capital gains during its year ended December 31, 2016.
Pursuant to Section 852 of the Internal Revenue Code, the Fund designates $11,285,000 as capital gain dividends for its year ended December 31, 2016.
For corporate shareholders, 66% of the ordinary dividends (i.e., income dividends plus short-term capital gains) paid during the Fund's fiscal year ended December 31, 2016 qualified for the dividends received deduction.
Please consult a tax advisor if you have questions about federal or state income tax laws, or on how to prepare your tax returns. If you have specific questions about your account, please contact your insurance provider.
Proxy Voting
The Trust's policies and procedures for voting proxies for portfolio securities and information about how the Trust voted proxies related to its portfolio securities during the most recent 12-month period ended June 30 are available on our Web site — deutschefunds.com (click on "proxy voting"at the bottom of the page) — or on the SEC's Web site — sec.gov. To obtain a written copy of the Trust's policies and procedures without charge, upon request, call us toll free at (800) 728-3337.
Advisory Agreement Board Considerations and Fee Evaluation
The Board of Trustees (hereinafter referred to as the "Board" or "Trustees") approved the renewal of Deutsche Core Equity VIP’s (the "Fund") investment management agreement (the "Agreement") with Deutsche Investment Management Americas Inc. ("DIMA") in September 2016.
In terms of the process that the Board followed prior to approving the Agreement, shareholders should know that:
— During the entire process, all of the Fund’s Trustees were independent of DIMA and its affiliates (the "Independent Trustees").
— The Board met frequently during the past year to discuss fund matters and dedicated a substantial amount of time to contract review matters. Over the course of several months, the Board’s Contract Committee reviewed extensive materials received from DIMA, independent third parties and independent counsel. These materials included an analysis of the Fund’s performance, fees and expenses, and profitability from a fee consultant retained by the Fund’s Independent Trustees (the "Fee Consultant"). The Board also received extensive information throughout the year regarding performance of the Fund.
— The Independent Trustees regularly meet privately with counsel to discuss contract review and other matters. In addition, the Independent Trustees were advised by the Fee Consultant in the course of their review of the Fund’s contractual arrangements and considered a comprehensive report prepared by the Fee Consultant in connection with their deliberations.
— In connection with reviewing the Agreement, the Board also reviewed the terms of the Fund’s Rule 12b-1 plan, distribution agreement, administrative services agreement, transfer agency agreement and other material service agreements.
— Based on its evaluation of the information provided, the Contract Committee presented its findings and recommendations to the Board. The Board then reviewed the Contract Committee’s findings and recommendations.
In connection with the contract review process, the Contract Committee and the Board considered the factors discussed below, among others. The Board also considered that DIMA and its predecessors have managed the Fund since its inception, and the Board believes that a long-term relationship with a capable, conscientious advisor is in the best interests of the Fund. The Board considered, generally, that shareholders chose to invest or remain invested in the Fund knowing that DIMA managed the Fund, and that the Agreement was approved by the Fund’s shareholders. DIMA is part of Deutsche Bank AG’s ("Deutsche Bank") Asset Management ("Deutsche AM") division. Deutsche AM is a global asset management business that offers a wide range of investing expertise and resources, including research capabilities in many countries throughout the world. Deutsche Bank has advised the Board that the U.S. asset management business continues to be a critical and integral part of Deutsche Bank, and that Deutsche Bank will continue to invest in Deutsche AM and seek to enhance Deutsche AM’s investment platform. Deutsche Bank also has confirmed its commitment to maintaining strong legal and compliance groups within the Deutsche AM division.
As part of the contract review process, the Board carefully considered the fees and expenses of each Deutsche fund overseen by the Board in light of the fund’s performance. In many cases, this led to the negotiation and implementation of expense caps. As part of these negotiations, the Board indicated that it would consider relaxing these caps in future years following sustained improvements in performance, among other considerations.
While shareholders may focus primarily on fund performance and fees, the Fund’s Board considers these and many other factors, including the quality and integrity of DIMA’s personnel and such other issues as back-office operations, fund valuations, and compliance policies and procedures.
Nature, Quality and Extent of Services. The Board considered the terms of the Agreement, including the scope of advisory services provided under the Agreement. The Board noted that, under the Agreement, DIMA provides portfolio management services to the Fund and that, pursuant to a separate administrative services agreement, DIMA provides administrative services to the Fund. The Board considered the experience and skills of senior management and investment personnel and the resources made available to such personnel. The Board reviewed the Fund’s performance over short-term and long-term periods and compared those returns to various agreed-upon performance measures, including market index(es) and a peer universe compiled using information supplied by Morningstar Direct ("Morningstar"), an independent fund data service. The Board also noted that it has put into place a process of identifying "Focus Funds" (e.g., funds performing poorly relative to a peer universe), and receives additional reporting from DIMA regarding such funds and, where appropriate, DIMA’s plans to address underperformance. The Board believes this process is an effective manner of identifying and addressing underperforming funds. Based on the information provided, the Board noted that for the one-, three- and five-year periods ended December 31, 2015, the Fund’s performance (Class A shares) was in the 1st quartile of the applicable Morningstar universe (the 1st quartile being the best performers and the 4th quartile being the worst performers). The Board also observed that the Fund has outperformed its benchmark in the one-, three- and five-year periods ended December 31, 2015.
Fees and Expenses. The Board considered the Fund’s investment management fee schedule, operating expenses and total expense ratios, and comparative information provided by Broadridge Financial Solutions, Inc. ("Broadridge") and the Fee Consultant regarding investment management fee rates paid to other investment advisors by similar funds (1st quartile being the most favorable and 4th quartile being the least favorable). With respect to management fees paid to other investment advisors by similar funds, the Board noted that the contractual fee rates paid by the Fund, which include a 0.10% fee paid to DIMA under the Fund’s administrative services agreement, were lower than the median (1st quartile) of the applicable Broadridge peer group (based on Broadridge data provided as of December 31, 2015). The Board noted that the Fund’s Class A shares total (net) operating expenses were expected to be lower than the median (1st quartile) of the applicable Broadridge expense universe (based on Broadridge data provided as of December 31, 2015, and analyzing Broadridge expense universe Class A (net) expenses less any applicable 12b-1 fees) ("Broadridge Universe Expenses"). The Board also reviewed data comparing each share class’s total (net) operating expenses to the applicable Broadridge Universe Expenses. The Board noted that the expense limitations agreed to by DIMA were expected to help the Fund’s total (net) operating expenses remain competitive. The Board considered the Fund’s management fee rate as compared to fees charged by DIMA to a comparable Deutsche U.S. registered fund ("Deutsche Funds") and considered differences between the Fund and the comparable Deutsche Fund. The information requested by the Board as part of its review of fees and expenses also included information about institutional accounts (including any sub-advised funds and accounts) and funds offered primarily to European investors ("Deutsche Europe funds") managed by Deutsche AM. The Board noted that DIMA indicated that Deutsche AM does not manage any institutional accounts or Deutsche Europe funds comparable to the Fund.
On the basis of the information provided, the Board concluded that management fees were reasonable and appropriate in light of the nature, quality and extent of services provided by DIMA.
Profitability. The Board reviewed detailed information regarding revenues received by DIMA under the Agreement. The Board considered the estimated costs and pre-tax profits realized by DIMA from advising the Deutsche Funds, as well as estimates of the pre-tax profits attributable to managing the Fund in particular. The Board also received information regarding the estimated enterprise-wide profitability of DIMA and its affiliates with respect to all fund services in totality and by fund. The Board and the Fee Consultant reviewed DIMA’s methodology in allocating its costs to the management of the Fund. Based on the information provided, the Board concluded that the pre-tax profits realized by DIMA in connection with the management of the Fund were not unreasonable. The Board also reviewed certain publicly available information regarding the profitability of certain similar investment management firms. The Board noted that while information regarding the profitability of such firms is limited (and in some cases is not necessarily prepared on a comparable basis), DIMA and its affiliates’ overall profitability with respect to the Deutsche Funds (after taking into account distribution and other services provided to the funds by DIMA and its affiliates) was lower than the overall profitability levels of most comparable firms for which such data was available.
Economies of Scale. The Board considered whether there are economies of scale with respect to the management of the Fund and whether the Fund benefits from any economies of scale. The Board noted that the Fund’s investment management fee schedule includes fee breakpoints. The Board concluded that the Fund’s fee schedule represents an appropriate sharing between the Fund and DIMA of such economies of scale as may exist in the management of the Fund at current asset levels.
Other Benefits to DIMA and Its Affiliates. The Board also considered the character and amount of other incidental benefits received by DIMA and its affiliates, including any fees received by DIMA for administrative services provided to the Fund and any fees received by an affiliate of DIMA for distribution services. The Board also considered benefits to DIMA related to brokerage and soft-dollar allocations, including allocating brokerage to pay for research generated by parties other than the executing broker dealers, which pertain primarily to funds investing in equity securities, along with the incidental public relations benefits to DIMA related to Deutsche Funds advertising and cross-selling opportunities among DIMA products and services. The Board considered these benefits in reaching its conclusion that the Fund’s management fees were reasonable.
Compliance. The Board considered the significant attention and resources dedicated by DIMA to documenting and enhancing its compliance processes in recent years. The Board noted in particular (i) the experience, seniority and time commitment of the individuals serving as DIMA’s and the Fund’s chief compliance officers; (ii) the large number of DIMA compliance personnel; and (iii) the substantial commitment of resources by DIMA and its affiliates to compliance matters.
Based on all of the information considered and the conclusions reached, the Board unanimously determined that the continuation of the Agreement is in the best interests of the Fund. In making this determination, the Board did not give particular weight to any single factor identified above. The Board considered these factors over the course of numerous meetings, certain of which were in executive session with only the Independent Trustees and counsel present. It is possible that individual Independent Trustees may have weighed these factors differently in reaching their individual decisions to approve the continuation of the Agreement.
Board Members and Officers
The following table presents certain information regarding the Board Members and Officers of the fund. Each Board Member's year of birth is set forth in parentheses after his or her name. Unless otherwise noted, (i) each Board Member has engaged in the principal occupation(s) noted in the table for at least the most recent five years, although not necessarily in the same capacity; and (ii) the address of each Independent Board Member is c/o Keith R. Fox, Deutsche Funds Board Chair, c/o Thomas R. Hiller, Ropes & Gray LLP, Prudential Tower, 800 Boylston Street, Boston, MA 02199-3600. Except as otherwise noted below, the term of office for each Board Member is until the election and qualification of a successor, or until such Board Member sooner dies, resigns, is removed or as otherwise provided in the governing documents of the fund. Because the fund does not hold an annual meeting of shareholders, each Board Member will hold office for an indeterminate period. The Board Members may also serve in similar capacities with other funds in the fund complex.
| Independent Board Members |
| Name, Year of Birth, Position with the Fund and Length of Time Served1 | Business Experience and Directorships During the Past Five Years | Number of Funds in Deutsche Fund Complex Overseen | Other Directorships Held by Board Member |
Keith R. Fox, CFA (1954) Chairperson since 2017,2 and Board Member since 1996 | Managing General Partner, Exeter Capital Partners (a series of private investment funds) (since 1986). Directorships: Progressive International Corporation (kitchen goods importer and distributor); The Kennel Shop (retailer); former Chairman, National Association of Small Business Investment Companies; former Directorships: BoxTop Media Inc. (advertising); Sun Capital Advisers Trust (mutual funds) (2011–2012) | 98 | — |
Kenneth C. Froewiss (1945) Vice Chairperson since 2017,2 Board Member since 2001, and Chairperson (2013–December 31, 2016) | Retired Clinical Professor of Finance, NYU Stern School of Business (1997–2014); Member, Finance Committee, Association for Asian Studies (2002–present); Director, Mitsui Sumitomo Insurance Group (US) (2004–present); prior thereto, Managing Director, J.P. Morgan (investment banking firm) (until 1996) | 98 | — |
John W. Ballantine (1946) Board Member since 1999 | Retired; formerly, Executive Vice President and Chief Risk Management Officer, First Chicago NBD Corporation/The First National Bank of Chicago (1996–1998); Executive Vice President and Head of International Banking (1995–1996); former Directorships: Director and former Chairman of the Board, Healthways, Inc.3 (population well-being and wellness services) (2003–2014); Stockwell Capital Investments PLC (private equity); First Oak Brook Bancshares, Inc. and Oak Brook Bank; Prisma Energy International | 98 | Portland General Electric3 (utility company) (2003– present) |
Henry P. Becton, Jr. (1943) Board Member since 1990 | Vice Chair and former President, WGBH Educational Foundation. Directorships: Public Radio International; Public Radio Exchange (PRX); The Pew Charitable Trusts (charitable organization); former Directorships: Becton Dickinson and Company3 (medical technology company); Belo Corporation3 (media company); The PBS Foundation; Association of Public Television Stations; Boston Museum of Science; American Public Television; Concord Academy; New England Aquarium; Mass. Corporation for Educational Telecommunications; Committee for Economic Development; Public Broadcasting Service; Connecticut College; North Bennett Street School (Boston) | 98 | — |
Dawn-Marie Driscoll (1946) Board Member since 1987 | Emeritus Executive Fellow, Center for Business Ethics, Bentley University; formerly: President, Driscoll Associates (consulting firm); Partner, Palmer & Dodge (law firm) (1988–1990); Vice President of Corporate Affairs and General Counsel, Filene's (retail) (1978–1988). Directorships: Advisory Board, Center for Business Ethics, Bentley University; Trustee and former Chairman of the Board, Southwest Florida Community Foundation (charitable organization); former Directorships: ICI Mutual Insurance Company (2007–2015); Sun Capital Advisers Trust (mutual funds) (2007–2012), Investment Company Institute (audit, executive, nominating committees) and Independent Directors Council (governance, executive committees) | 98 | — |
Paul K. Freeman (1950) Board Member since 1993 | Consultant, World Bank/Inter-American Development Bank; Chair, Independent Directors Council; Investment Company Institute (executive and nominating committees); formerly, Chairman of Education Committee of Independent Directors Council; Project Leader, International Institute for Applied Systems Analysis (1998–2001); Chief Executive Officer, The Eric Group, Inc. (environmental insurance) (1986–1998); Directorships: Denver Zoo Foundation (December 2012–present); former Directorships: Prisma Energy International | 98 | — |
Richard J. Herring (1946) Board Member since 1990 | Jacob Safra Professor of International Banking and Professor, Finance Department, The Wharton School, University of Pennsylvania (since July 1972); Co-Director, Wharton Financial Institutions Center; formerly: Vice Dean and Director, Wharton Undergraduate Division (July 1995–June 2000); Director, Lauder Institute of International Management Studies (July 2000–June 2006) | 98 | Director, Aberdeen Singapore and Japan Funds (since 2007); Independent Director of Barclays Bank Delaware (since September 2010) |
William McClayton (1944) Board Member since 2004, and Vice Chairperson (2013–December 31, 2016) | Private equity investor (since October 2009); previously, Managing Director, Diamond Management & Technology Consultants, Inc. (global consulting firm) (2001–2009); Directorship: Board of Managers, YMCA of Metropolitan Chicago; formerly: Senior Partner, Arthur Andersen LLP (accounting) (1966–2001); Trustee, Ravinia Festival | 98 | — |
Rebecca W. Rimel (1951) Board Member since 1995 | President, Chief Executive Officer and Director, The Pew Charitable Trusts (charitable organization) (1994–present); formerly: Executive Vice President, The Glenmede Trust Company (investment trust and wealth management) (1983–2004); Board Member, Investor Education (charitable organization) (2004–2005); Trustee, Executive Committee, Philadelphia Chamber of Commerce (2001–2007); Director, Viasys Health Care3 (January 2007–June 2007); Trustee, Thomas Jefferson Foundation (charitable organization) (1994–2012) | 98 | Director, Becton Dickinson and Company3 (medical technology company) (2012– present); Director, BioTelemetry Inc.3 (health care) (2009– present) |
William N. Searcy, Jr. (1946) Board Member since 1993 | Private investor since October 2003; formerly: Pension & Savings Trust Officer, Sprint Corporation3 (telecommunications) (November 1989–September 2003); Trustee, Sun Capital Advisers Trust (mutual funds) (1998–2012) | 98 | — |
Jean Gleason Stromberg (1943) Board Member since 1997 | Retired. Formerly, Consultant (1997–2001); Director, Financial Markets U.S. Government Accountability Office (1996–1997); Partner, Norton Rose Fulbright, L.L.P. (law firm) (1978–1996); former Directorships: The William and Flora Hewlett Foundation (charitable organization) (2000–2015); Service Source, Inc. (nonprofit), Mutual Fund Directors Forum (2002–2004), American Bar Retirement Association (funding vehicle for retirement plans) (1987–1990 and 1994–1996) | 98 | — |
| Officers5 |
| Name, Year of Birth, Position with the Fund and Length of Time Served6 | Business Experience and Directorships During the Past Five Years |
Brian E. Binder9 (1972) President and Chief Executive Officer, 2013–present | Managing Director4 and Head of US Product and Fund Administration, Deutsche Asset Management (2013–present); Director and President, Deutsche AM Service Company (since 2016); Director and Vice President, Deutsche AM Distributors, Inc. (since 2016); Director and President, DB Investment Managers, Inc. (since 2016); formerly, Head of Business Management and Consulting at Invesco, Ltd. (2010–2012) |
John Millette8 (1962) Vice President and Secretary, 1999–present | Director,4 Deutsche Asset Management; Chief Legal Officer and Secretary, Deutsche Investment Management Americas Inc. (2015–present); and Director and Vice President, Deutsche AM Trust Company (since 2016) |
Hepsen Uzcan7 (1974) Vice President, since 2016 Assistant Secretary, 2013–present | Director,4 Deutsche Asset Management |
Paul H. Schubert7 (1963) Chief Financial Officer, 2004–present Treasurer, 2005–present | Managing Director,4 Deutsche Asset Management, and Chairman, Director and President, Deutsche AM Trust Company (since 2013); Vice President, Deutsche AM Distributors, Inc. (since 2016); formerly, Director, Deutsche AM Trust Company (2004–2013) |
Caroline Pearson8 (1962) Chief Legal Officer, 2010–present | Managing Director,4 Deutsche Asset Management; Secretary, Deutsche AM Distributors, Inc.; and Secretary, Deutsche AM Service Company |
Scott D. Hogan8 (1970) Chief Compliance Officer, since 2016 | Director,4 Deutsche Asset Management |
Wayne Salit7 (1967) Anti-Money Laundering Compliance Officer, 2014–present | Director,4 Deutsche Asset Management; AML Compliance Officer, Deutsche AM Distributors, Inc.; formerly: Managing Director, AML Compliance Officer at BNY Mellon (2011–2014); and Director, AML Compliance Officer at Deutsche Bank (2004–2011) |
Paul Antosca8 (1957) Assistant Treasurer, 2007–present | Director,4 Deutsche Asset Management |
Diane Kenneally8 (1966) Assistant Treasurer, 2007–present | Director,4 Deutsche Asset Management |
1 The length of time served represents the year in which the Board Member joined the board of one or more Deutsche funds currently overseen by the Board.
2 Effective as of January 1, 2017.
3 A publicly held company with securities registered pursuant to Section 12 of the Securities Exchange Act of 1934.
4 Executive title, not a board directorship.
5 As a result of their respective positions held with the Advisor, these individuals are considered "interested persons" of the Advisor within the meaning of the 1940 Act. Interested persons receive no compensation from the fund.
6 The length of time served represents the year in which the officer was first elected in such capacity for one or more Deutsche funds.
7 Address: 60 Wall Street, New York, NY 10005.
8 Address: One Beacon Street, Boston, MA 02108.
9 Address: 222 South Riverside Plaza, Chicago, IL 60606.
The fund's Statement of Additional Information ("SAI") includes additional information about the Board Members. The SAI is available, without charge, upon request. If you would like to request a copy of the SAI, you may do so by calling the following toll-free number: (800) 728-3337.
Notes

VS1coreq-2 (R-025822-7 2/17)

December 31, 2016
Annual Report
Deutsche Variable Series I
Deutsche CROCI® International VIP

Contents
3 Performance Summary 4 Management Summary 5 Portfolio Summary 6 Investment Portfolio 9 Statement of Assets and Liabilities 10 Statement of Operations 10 Statements of Changes in Net Assets 12 Financial Highlights 13 Notes to Financial Statements 19 Report of Independent Registered Public Accounting Firm 20 Information About Your Fund's Expenses 21 Tax Information 21 Proxy Voting 22 Advisory Agreement Board Considerations and Fee Evaluation 25 Board Members and Officers |
This report must be preceded or accompanied by a prospectus. To obtain an additional prospectus or summary prospectus, if available, call (800) 728-3337 or your financial representative. We advise you to consider the Fund's objectives, risks, charges and expenses carefully before investing. The summary prospectus and prospectus contain this and other important information about the Fund. Please read the prospectus carefully before you invest.
Investing in foreign securities, particularly those of emerging markets, presents certain risks, such as currency fluctuations, political and economic changes, and market risks. Emerging markets tend to be more volatile and less liquid than the markets of more mature economies, and generally have less diverse and less mature economic structures and less stable political systems than those of developed countries. Stocks may decline in value. The Fund will be managed on the premise that stocks with lower CROCI® Economic P/E Ratios may outperform stocks with higher CROCI® Economic P/E Ratios over time. This premise may not always be correct and prospective investors should evaluate this assumption prior to investing in the Fund. Investing in derivatives entails special risks relating to liquidity, leverage and credit that may reduce returns and/or increase volatility. The Fund may lend securities to approved institutions. See the prospectus for details.
In June 2016, citizens of the United Kingdom approved a referendum to leave the European Union, creating economic and political uncertainty. Significant uncertainty exists regarding the timing of the United Kingdom's anticipated withdrawal from the European Union and the effects such withdrawal may have on the United Kingdom, other European Union countries and the global economy, which could be significant, potentially resulting in increased volatility and illiquidity and lower economic growth.
Deutsche Asset Management represents the asset management activities conducted by Deutsche Bank AG or any of its subsidiaries.
Deutsche AM Distributors, Inc., 222 South Riverside Plaza, Chicago, IL 60606, (800) 621-1148
NOT FDIC/NCUA INSURED NO BANK GUARANTEE MAY LOSE VALUE NOT A DEPOSIT
NOT INSURED BY ANY FEDERAL GOVERNMENT AGENCY
Performance Summary December 31, 2016 (Unaudited)
Fund performance shown is historical, assumes reinvestment of all dividend and capital gain distributions, and does not guarantee future results. Investment return and principal value fluctuate with changing market conditions so that, when redeemed, shares may be worth more or less than their original cost. Current performance may be lower or higher than the performance data quoted. Please contact your participating insurance company for the Fund's most recent month-end performance. Performance doesn't reflect charges and fees ("contract charges") associated with the separate account that invests in the Fund or any variable life insurance policy or variable annuity contract for which the Fund is an investment option. These charges and fees will reduce returns. While all share classes have the same underlying portfolio, their performance will differ.
The gross expense ratios of the Fund, as stated in the fee table of the prospectus dated May 1, 2016 are 1.05% and 1.33% for Class A and Class B shares, respectively, and may differ from the expense ratios disclosed in the Financial Highlights tables in this report.
Generally accepted accounting principles require adjustments to be made to the net assets of the Fund at period end for financial reporting purposes only, and as such, the total return based on the unadjusted net asset value per share may differ from the total return reported in the financial highlights.
| Growth of an Assumed $10,000 Investment |
■ Deutsche CROCI® International VIP — Class A ■ MSCI EAFE® Index | MSCI EAFE Index is an unmanaged index that tracks international stock performance in the 21 developed markets of Europe, Australasia and the Far East. Returns reflect reinvestment of dividends net of withholding taxes. The index is calculated using closing local market prices and translates into U.S. dollars using the London close foreign exchange rates. Index returns do not reflect any fees or expenses and it is not possible to invest directly into an index. |
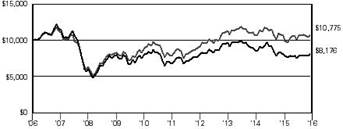 | |
| Yearly periods ended December 31 | |
| Comparative Results |
| Deutsche CROCI® International VIP | 1-Year | 3-Year | 5-Year | 10-Year |
| Class A | Growth of $10,000 | $10,074 | $8,401 | $12,186 | $8,176 |
| Average annual total return | 0.74% | –5.64% | 4.03% | –1.99% |
| MSCI EAFE® Index | Growth of $10,000 | $10,100 | $9,527 | $13,722 | $10,775 |
| Average annual total return | 1.00% | –1.60% | 6.53% | 0.75% |
| Deutsche CROCI® International VIP | 1-Year | 3-Year | 5-Year | 10-Year |
| Class B | Growth of $10,000 | $10,048 | $8,339 | $12,022 | $7,966 |
| Average annual total return | 0.48% | –5.87% | 3.75% | –2.25% |
| MSCI EAFE® Index | Growth of $10,000 | $10,100 | $9,527 | $13,722 | $10,775 |
| Average annual total return | 1.00% | –1.60% | 6.53% | 0.75% |
The growth of $10,000 is cumulative.
Management Summary December 31, 2016 (Unaudited)
The Fund returned 0.74% (Class A, unadjusted for contract charges) during 2016, underperforming the 1.00% return of its benchmark, the MSCI EAFE Index.1 International stocks, experienced flat returns in U.S. dollar terms in the past year, with weakness in Europe offsetting a somewhat stronger showing in the Asia-Pacific region.
Three factors typically drive the Fund’s results: sector allocations, stock selection and the impact of currencies. Both allocations and stock selection detracted in 2016, while currency hedging was positive.
Looking first at allocations, the Fund’s underweight in the energy and materials sectors, both of which delivered market-beating returns behind the recovery in oil and other commodities, was the most significant headwind.2 Overweight positions in the utilities and consumer discretionary sectors also detracted from returns.3 On the positive side, the Fund benefited from being overweight in the strong-performing industrials sector.
With regard to stock selection, a significant amount of the shortfall stemmed from our underperformance in the consumer discretionary group. All of the major detractors in the sector were U.K.-based companies that weakened on concerns about the potential economic fallout from the United Kingdom's vote to leave the European Union, including the retailer Next PLC* and the homebuilding companies Barratt Developments PLC and Taylor Wimpey PLC. Similarly, holdings in British companies caused the Fund to underperform in industrials. The airline operator easyJet PLC, which issued a profit warning late in the period, was the primary detractor from performance, followed by the home-improvement retailer Travis Perkins PLC.* Information technology also proved to be a challenging area for the Fund due to the weakness in LM Ericsson Telefon AB,* which reported disappointing earnings results.
On the plus side, we added value in health care by limiting the downside in what proved to be the worst-performing sector of 2016. Actelion Pharmaceuticals Ltd., a Swiss pharmaceuticals and biotechnology company, surged in the final two months of the year on news that U.S.-based Johnson & Johnson was in talks to acquire the company and break it up in order to recognize value. The Swiss materials company Sika AG — which rose on the strength of robust earnings and improving profit margins — also contributed to performance, as did the Japanese industrials stocks Mitsubishi Electric Corp.* and JGC Corp.
The Fund’s currency hedging strategy had a favorable effect on results. The purpose of hedging is not to make active currency "bets," but rather to maximize the influence of stock selection by shifting the portfolio’s currency exposure into U.S. dollars through the use of derivatives. Foreign currencies declined against the dollar as a group, so this aspect of our strategy made a positive contribution to returns.
The markets offer a mixed picture at the close of the year. Global economic growth remains below the long-term trend, and the valuation of the broader market is somewhat extended given the shaky outlook for corporate earnings. At the same time, however, the combination of stimulative global central bank policy and low bond yields has acted as an ongoing source of support for stocks. In this uncertain environment, our strategy is to maintain an emphasis on our disciplined, systematic approach to stock selection, rather than trying to construct a portfolio on the basis of economic developments or short-term market movements.
Di Kumble, CFA
John Moody
Portfolio Managers
The views expressed reflect those of the portfolio management team only through the end of the period of the report as stated on the cover. The management team's views are subject to change at any time based on market and other conditions and should not be construed as a recommendation. Past performance is no guarantee of future results. Current and future portfolio holdings are subject to risk.
1 The Morgan Stanley Capital International (MSCI) Europe, Australasia and Far East (EAFE) Index is an unmanaged index that tracks international stock performance in the 21 developed markets in Europe, Australasia and the Far East. The index is calculated using closing local market prices and translates into U.S. dollars using the London close foreign exchange rates. Index returns do not reflect fees or expenses and it is not possible to invest directly into an index.
2 "Overweight" means the Fund holds a higher weighting in a given sector or security than the benchmark. "Underweight" means it holds a lower weighting.
3 Consumer discretionary represents industries that produce goods and services that are not necessities in everyday life.
* Not held in the portfolio as of December 31, 2016.
Portfolio Summary (Unaudited)
| Asset Allocation (As a % of Investment Portfolio excluding Securities Lending Collateral) | 12/31/16 | 12/31/15 |
| | | |
| Common Stocks | 94% | 99% |
| Cash Equivalents | 6% | 1% |
| | 100% | 100% |
Geographical Diversification
(As a % of Investment Portfolio excluding Cash Equivalents and Securities Lending Collateral) | 12/31/16 | 12/31/15 |
| | | |
| United Kingdom | 27% | 29% |
| Japan | 23% | 23% |
| Switzerland | 19% | 14% |
| Germany | 8% | 4% |
| Hong Kong | 7% | 6% |
| France | 6% | 8% |
| Singapore | 4% | 4% |
| Spain | 4% | 4% |
| Netherlands | 2% | 2% |
| Sweden | — | 2% |
| Denmark | — | 2% |
| Australia | — | 2% |
| | 100% | 100% |
Sector Diversification
(As a % of Investment Portfolio excluding Cash Equivalents and Securities Lending Collateral) | 12/31/16 | 12/31/15 |
| | | |
| Industrials | 28% | 30% |
| Consumer Discretionary | 23% | 30% |
| Health Care | 17% | 8% |
| Utilities | 17% | 16% |
| Consumer Staples | 11% | 2% |
| Materials | 4% | 10% |
| Information Technology | — | 4% |
| | 100% | 100% |
Portfolio holdings and characteristics are subject to change.
For more complete details about the Fund's investment portfolio, see page 6.
Following the Fund's fiscal first and third quarter-end, a complete portfolio holdings listing is filed with the SEC on Form N-Q. The form will be available on the SEC's Web site at sec.gov, and it also may be reviewed and copied at the SEC's Public Reference Room in Washington, D.C. Information on the operation of the SEC's Public Reference Room may be obtained by calling (800) SEC-0330. The Fund's portfolio holdings are also posted on deutschefunds.com from time to time. Please see the Fund's current prospectus for more information.
Investment Portfolio December 31, 2016
| |
Shares | Value ($) |
| | | |
| Common Stocks 94.0% |
| France 5.6% |
| Cie Generale des Etablissements Michelin | 16,379 | 1,824,788 |
| Danone SA | 25,265 | 1,602,743 |
| Sanofi | 23,299 | 1,887,183 |
| (Cost $5,702,339) | 5,314,714 |
| Germany 7.7% |
| Bayer AG (Registered) | 17,745 | 1,851,825 |
| Beiersdorf AG | 20,054 | 1,701,245 |
| Continental AG | 9,161 | 1,765,209 |
| Siemens AG (Registered) | 15,418 | 1,897,147 |
| (Cost $7,320,335) | 7,215,426 |
| Hong Kong 6.6% |
| CLP Holdings Ltd. | 173,649 | 1,596,930 |
| HK Electric Investments & HK Electric Investments Ltd. "SS", 144A, (Units) | 1,790,000 | 1,477,166 |
| Hong Kong & China Gas Co., Ltd. | 906,757 | 1,607,895 |
| MTR Corp., Ltd. | 317,231 | 1,543,190 |
| (Cost $5,921,362) | 6,225,181 |
| Japan 21.8% |
| Astellas Pharma, Inc. | 118,000 | 1,640,952 |
| Bridgestone Corp. | 45,808 | 1,651,756 |
| Central Japan Railway Co. | 10,200 | 1,678,906 |
| Daiichi Sankyo Co., Ltd. | 75,300 | 1,540,169 |
| Fuji Heavy Industries Ltd. | 45,300 | 1,849,804 |
| Isuzu Motors Ltd. | 143,200 | 1,813,523 |
| JGC Corp. | 97,793 | 1,777,779 |
| Osaka Gas Co., Ltd. | 417,000 | 1,602,986 |
| Secom Co., Ltd. | 23,800 | 1,741,039 |
| Tokyo Gas Co., Ltd. | 378,000 | 1,709,779 |
| Toyota Industries Corp. | 37,335 | 1,778,240 |
| Toyota Motor Corp. | 30,500 | 1,793,561 |
| (Cost $20,026,273) | 20,578,494 |
| Netherlands 1.8% |
| Koninklijke DSM NV (Cost $1,829,163) | 27,614 | 1,657,169 |
| Singapore 3.6% |
| Keppel Corp., Ltd. | 460,816 | 1,842,836 |
| Singapore Airlines Ltd. | 239,041 | 1,596,828 |
| (Cost $4,608,833) | 3,439,664 |
| Spain 3.6% |
| Gas Natural SDG SA | 89,304 | 1,685,777 |
| Iberdrola SA | 258,349 | 1,696,425 |
| (Cost $3,970,310) | 3,382,202 |
| |
Shares | Value ($) |
| | | |
| Switzerland 18.3% |
| ABB Ltd. (Registered)* | 84,641 | 1,785,360 |
| Actelion Ltd. (Registered)* | 12,138 | 2,625,489 |
| Adecco Group AG (Registered) | 29,431 | 1,927,625 |
| Kuehne + Nagel International AG (Registered) | 12,932 | 1,711,207 |
| Nestle SA (Registered) | 23,762 | 1,705,083 |
| Novartis AG (Registered) | 24,361 | 1,770,935 |
| Roche Holding AG (Genusschein) | 7,553 | 1,725,087 |
| Sika AG (Bearer) | 392 | 1,882,894 |
| Wolseley PLC | 33,999 | 2,080,040 |
| (Cost $16,060,993) | 17,213,720 |
| United Kingdom 25.0% |
| BAE Systems PLC | 263,116 | 1,919,652 |
| Barratt Developments PLC | 326,122 | 1,860,806 |
| British American Tobacco PLC | 31,042 | 1,768,903 |
| Bunzl PLC | 65,478 | 1,703,891 |
| Diageo PLC | 65,388 | 1,701,592 |
| easyJet PLC | 155,413 | 1,927,646 |
| Imperial Brands PLC | 36,347 | 1,588,305 |
| ITV PLC | 831,697 | 2,121,943 |
| National Grid PLC | 135,288 | 1,587,651 |
| Persimmon PLC | 85,658 | 1,878,408 |
| Rolls-Royce Holdings PLC "C" (Entitlement Shares)* | 16,295,991 | 20,083 |
| Severn Trent PLC | 62,044 | 1,700,165 |
| Smith & Nephew PLC | 119,979 | 1,805,932 |
| Taylor Wimpey PLC | 1,030,490 | 1,952,216 |
| (Cost $28,533,694) | 23,537,193 |
| Total Common Stocks (Cost $93,973,302) | 88,563,763 |
| |
| Cash Equivalents 6.4% |
| Deutsche Central Cash Management Government Fund, 0.49% (a) (Cost $5,968,478) | 5,968,478 | 5,968,478 |
| | % of Net Assets | Value ($) |
| | |
| Total Investment Portfolio (Cost $99,941,780)† | 100.4 | 94,532,241 |
| Other Assets and Liabilities, Net | (0.4) | (351,620) |
| Net Assets | 100.0 | 94,180,621 |
* Non-income producing security.
† The cost for federal income tax purposes was $100,863,979. At December 31, 2016, net unrealized depreciation for all securities based on tax cost was $6,331,738. This consisted of aggregate gross unrealized appreciation for all securities in which there was an excess of value over tax cost of $3,689,056 and aggregate gross unrealized depreciation for all securities in which there was an excess of tax cost over value of $10,020,794.
(a) Affiliated fund managed by Deutsche Investment Management Americas Inc. The rate shown is the annualized seven-day yield at period end.
144A: Security exempt from registration under Rule 144A of the Securities Act of 1933. These securities may be resold in transactions exempt from registration, normally to qualified institutional buyers.
As of December 31, 2016, the Fund had the following open forward foreign currency exchange contracts:
| Contracts to Deliver | | In Exchange For | | Settlement Date | | Unrealized Appreciation ($) | Counterparty |
| USD | 62,581 | | HKD | 485,477 | | 2/1/2017 | | 37 | Merrill Lynch & Co., Inc. |
| | | | | | | | | | |
| Contracts to Deliver | | In Exchange For | | Settlement Date | | Unrealized Depreciation ($) | Counterparty |
| USD | 364,297 | | JPY | 42,498,648 | | 1/31/2017 | | (20) | Merrill Lynch & Co., Inc. |
| AUD | 14,452 | | USD | 10,388 | | 1/31/2017 | | (33) | Merrill Lynch & Co., Inc. |
| CHF | 15,346,334 | | USD | 14,955,968 | | 1/31/2017 | | (149,435) | Merrill Lynch & Co., Inc. |
| EUR | 16,516,054 | | USD | 17,298,948 | | 1/31/2017 | | (115,421) | Merrill Lynch & Co., Inc. |
| GBP | 20,781,183 | | USD | 25,532,821 | | 1/31/2017 | | (100,348) | Merrill Lynch & Co., Inc. |
| JPY | 2,457,077,502 | | USD | 20,990,293 | | 1/31/2017 | | (70,573) | Merrill Lynch & Co., Inc. |
| SEK | 90,229 | | USD | 9,798 | | 1/31/2017 | | (126) | Merrill Lynch & Co., Inc. |
| SGD | 5,025,655 | | USD | 3,468,390 | | 1/31/2017 | | (1,144) | Merrill Lynch & Co., Inc. |
| HKD | 48,660,491 | | USD | 6,272,636 | | 2/1/2017 | | (3,646) | Merrill Lynch & Co., Inc. |
| Total unrealized depreciation | | | | (440,746) | |
| Currency Abbreviations |
AUD Australian Dollar CHF Swiss Franc EUR Euro GBP British Pound HKD Hong Kong Dollar JPY Japanese Yen SEK Swedish Krona SGD Singapore Dollar USD United States Dollar |
For information on the Fund's policy and additional disclosures regarding forward foreign currency exchange contracts, please refer to the Derivatives section of Note B in the accompanying Notes to Financial Statements.
Fair Value Measurements
Various inputs are used in determining the value of the Fund's investments. These inputs are summarized in three broad levels. Level 1 includes quoted prices in active markets for identical securities. Level 2 includes other significant observable inputs (including quoted prices for similar securities, interest rates, prepayment speeds and credit risk). Level 3 includes significant unobservable inputs (including the Fund's own assumptions in determining the fair value of investments). The level assigned to the securities valuations may not be an indication of the risk or liquidity associated with investing in those securities.
The following is a summary of the inputs used as of December 31, 2016 in valuing the Fund's investments. For information on the Fund's policy regarding the valuation of investments, please refer to the Security Valuation section of Note A in the accompanying Notes to Financial Statements.
| Assets | Level 1 | Level 2 | Level 3 | Total |
| |
| Common Stocks |
| | France | $ — | $5,314,714 | $ — | $5,314,714 |
| | Germany | — | 7,215,426 | — | 7,215,426 |
| | Hong Kong | — | 6,225,181 | — | 6,225,181 |
| | Japan | — | 20,578,494 | — | 20,578,494 |
| | Netherlands | — | 1,657,169 | — | 1,657,169 |
| | Singapore | — | 3,439,664 | — | 3,439,664 |
| | Spain | — | 3,382,202 | — | 3,382,202 |
| | Switzerland | — | 17,213,720 | — | 17,213,720 |
| | United Kingdom | 20,083 | 23,517,110 | — | 23,537,193 |
| Short-Term Investments | 5,968,478 | — | — | 5,968,478 |
| Derivatives (b) | | | | |
| | Forward Foreign Currency Exchange Contracts | — | 37 | — | 37 |
| Total | $5,988,561 | $88,543,717 | $ — | $94,532,278 |
| Liabilities | Level 1 | Level 2 | Level 3 | Level 2 |
| |
| Derivatives (b) |
| | Forward Foreign Currency Exchange Contracts | $ — | $ (440,746) | $ — | $ (440,746) |
| Total | $ — | $ (440,746) | $ — | $ (440,746) |
There have been no transfers between fair value measurement levels during the year ended December 31, 2016.
(b) Derivatives include unrealized appreciation (depreciation) on forward foreign currency exchange contracts.
The accompanying notes are an integral part of the financial statements.
Statement of Assets and Liabilities
| as of December 31, 2016 |
| Assets |
Investments: Investments in non-affiliated securities, at value (cost $93,973,302) | $ 88,563,763 |
| Investment in Deutsche Central Cash Management Government Fund (cost $5,968,478) | 5,968,478 |
| Total investments, at value (cost $99,941,780) | 94,532,241 |
| Foreign currency, at value (cost $155,237) | 154,191 |
| Receivable for Fund shares sold | 5,808 |
| Dividends receivable | 83,945 |
| Interest receivable | 1,733 |
| Unrealized appreciation on forward foreign currency exchange contracts | 37 |
| Foreign taxes recoverable | 126,007 |
| Other assets | 3,809 |
| Total assets | 94,907,771 |
| Liabilities |
| Payable for Fund shares redeemed | 109,430 |
| Unrealized depreciation on forward foreign currency exchange contracts | 440,746 |
| Accrued management fee | 62,376 |
| Accrued Trustees' fees | 2,079 |
| Other accrued expenses and payables | 112,519 |
| Total liabilities | 727,150 |
| Net assets, at value | $ 94,180,621 |
| Net Assets Consist of |
| Undistributed net investment income | 7,413,324 |
Net unrealized appreciation (depreciation) on: Investments | (5,409,539) |
| Foreign currency | (451,374) |
| Accumulated net realized gain (loss) | (134,213,886) |
| Paid-in capital | 226,842,096 |
| Net assets, at value | $ 94,180,621 |
Class A Net Asset Value, offering and redemption price per share ($93,906,790 ÷ 14,512,126 outstanding shares of beneficial interest, $.01 par value, unlimited number of shares authorized) | $ 6.47 |
Class B Net Asset Value, offering and redemption price per share ($273,831 ÷ 42,251 outstanding shares of beneficial interest, $.01 par value, unlimited number of shares authorized) | $ 6.48 |
The accompanying notes are an integral part of the financial statements.
Statement of Operations
| for the year ended December 31, 2016 |
| Investment Income |
Income: Dividends (net of foreign taxes withheld of $365,998) | $ 3,065,162 |
| Income distributions — Deutsche Central Cash Management Government Fund | 5,676 |
| Securities lending income, net of borrower rebates | 17,223 |
| Total income | 3,088,061 |
Expenses: Management fee | 739,201 |
| Administration fee | 93,570 |
| Services to shareholders | 2,779 |
| Distribution service fee (Class B) | 648 |
| Custodian fee | 96,792 |
| Professional fees | 67,673 |
| Reports to shareholders | 34,704 |
| Trustees' fees and expenses | 6,752 |
| Other | 6,550 |
| Total expenses before expense reductions | 1,048,669 |
| Expense reductions | (263,048) |
| Total expenses after expense reductions | 785,621 |
| Net investment income (loss) | 2,302,440 |
| Realized and Unrealized Gain (Loss) |
Net realized gain (loss) from: Investments | (14,426,179) |
| Foreign currency | 5,945,618 |
| | (8,480,561) |
Change in net unrealized appreciation (depreciation) on: Investments | 7,258,016 |
| Foreign currency | (917,060) |
| | 6,340,956 |
| Net gain (loss) | (2,139,605) |
| Net increase (decrease) in net assets resulting from operations | $ 162,835 |
The accompanying notes are an integral part of the financial statements.
Statements of Changes in Net Assets
| Increase (Decrease) in Net Assets | Years Ended December 31, |
| 2016 | 2015 |
Operations: Net investment income (loss) | $ 2,302,440 | $ 3,454,193 |
| Net realized gain (loss) | (8,480,561) | (15,028,592) |
| Change in net unrealized appreciation (depreciation) | 6,340,956 | 4,889,649 |
| Net increase (decrease) in net assets resulting from operations | 162,835 | (6,684,750) |
Distributions to shareholders from: Net investment income: Class A | (9,803,744) | (5,221,184) |
| Class B | (26,284) | (11,210) |
| Total distributions | (9,830,028) | (5,232,394) |
Fund share transactions: Class A Proceeds from shares sold | 4,349,614 | 11,121,280 |
| Reinvestment of distributions | 9,803,744 | 5,221,184 |
| Payments for shares redeemed | (15,723,948) | (24,895,883) |
| Net increase (decrease) in net assets from Class A share transactions | (1,570,590) | (8,553,419) |
Class B Proceeds from shares sold | 16,738 | 46,566 |
| Reinvestment of distributions | 26,284 | 11,210 |
| Payments for shares redeemed | (15,735) | (23,403) |
| Net increase (decrease) in net assets from Class B share transactions | 27,287 | 34,373 |
| Increase (decrease) in net assets | (11,210,496) | (20,436,190) |
| Net assets at beginning of period | 105,391,117 | 125,827,307 |
| Net assets at end of period (including undistributed net investment income of $7,413,324 and $8,993,057, respectively) | $ 94,180,621 | $105,391,117 |
| Other Information |
Class A Shares outstanding at beginning of period | 14,702,326 | 15,973,456 |
| Shares sold | 690,002 | 1,384,894 |
| Shares issued to shareholders in reinvestment of distributions | 1,563,596 | 624,543 |
| Shares redeemed | (2,443,798) | (3,280,567) |
| Net increase (decrease) in Class A shares | (190,200) | (1,271,130) |
| Shares outstanding at end of period | 14,512,126 | 14,702,326 |
Class B Shares outstanding at beginning of period | 37,903 | 33,566 |
| Shares sold | 2,658 | 5,973 |
| Shares issued to shareholders in reinvestment of distributions | 4,179 | 1,336 |
| Shares redeemed | (2,489) | (2,972) |
| Net increase (decrease) in Class B shares | 4,348 | 4,337 |
| Shares outstanding at end of period | 42,251 | 37,903 |
The accompanying notes are an integral part of the financial statements.
Financial Highlights
| Class A | |
Years Ended December 31, |
| 2016 | 2015 | 2014 | 2013 | 2012 |
| Selected Per Share Data |
| Net asset value, beginning of period | $ 7.15 | $ 7.86 | $ 9.06 | $ 7.96 | $ 6.74 |
Income (loss) from investment operations: Net investment income (loss)a | .16 | .21 | .31b | .14 | .22 |
| Net realized and unrealized gain (loss) | (.13) | (.59) | (1.36) | 1.41 | 1.16 |
| Total from investment operations | .03 | (.38) | (1.05) | 1.55 | 1.38 |
Less distributions from: Net investment income | (.71) | (.33) | (.15) | (.45) | (.16) |
| Net asset value, end of period | $ 6.47 | $ 7.15 | $ 7.86 | $ 9.06 | $ 7.96 |
| Total Return (%) | .74c | (5.48)c | (11.76)c | 20.23c | 20.65 |
| Ratios to Average Net Assets and Supplemental Data |
| Net assets, end of period ($ millions) | 94 | 105 | 126 | 151 | 230 |
| Ratio of expenses before expense reductions (%) | 1.12 | 1.05 | 1.04 | 1.02 | .98 |
| Ratio of expenses after expense reductions (%) | .84 | .98 | .98 | 1.01 | .98 |
| Ratio of net investment income (loss) (%) | 2.46 | 2.74 | 3.55b | 1.64 | 2.99 |
| Portfolio turnover rate (%) | 67 | 99 | 135 | 97 | 85 |
a Based on average shares outstanding during the period. b Net investment income per share and the ratio of net investment income include non-recurring dividend income amounting to $0.08 per share and 0.95% of average daily net assets, for the year ended December 31, 2014. c Total return would have been lower had certain expenses not been reduced. |
| Class B | |
Years Ended December 31, |
| 2016 | 2015 | 2014 | 2013 | 2012 |
| Selected Per Share Data |
| Net asset value, beginning of period | $ 7.16 | $ 7.87 | $ 9.07 | $ 7.96 | $ 6.75 |
Income (loss) from investment operations: Net investment income (loss)a | .14 | .19 | .28b | .13 | .20 |
| Net realized and unrealized gain (loss) | (.13) | (.59) | (1.35) | 1.41 | 1.15 |
| Total from investment operations | .01 | (.40) | (1.07) | 1.54 | 1.35 |
Less distributions from: Net investment income | (.69) | (.31) | (.13) | (.43) | (.14) |
| Net asset value, end of period | $ 6.48 | $ 7.16 | $ 7.87 | $ 9.07 | $ 7.96 |
| Total Return (%) | .48c | (5.71)c | (11.98)c | 20.01c | 20.13 |
| Ratios to Average Net Assets and Supplemental Data |
| Net assets, end of period ($ millions) | .27 | .27 | .26 | .31 | .28 |
| Ratio of expenses before expense reductions (%) | 1.40 | 1.33 | 1.31 | 1.30 | 1.26 |
| Ratio of expenses after expense reductions (%) | 1.10 | 1.23 | 1.23 | 1.27 | 1.26 |
| Ratio of net investment income (loss) (%) | 2.18 | 2.47 | 3.26b | 1.62 | 2.73 |
| Portfolio turnover rate (%) | 67 | 99 | 135 | 97 | 85 |
a Based on average shares outstanding during the period. b Net investment income per share and the ratio of net investment income include non-recurring dividend income amounting to $0.08 per share and 0.95% of average daily net assets, for the year ended December 31, 2014. c Total return would have been lower had certain expenses not been reduced. |
Notes to Financial Statements
A. Organization and Significant Accounting Policies
Deutsche Variable Series I (the "Trust") is registered under the Investment Company Act of 1940, as amended (the "1940 Act"), as an open-end, registered management investment company organized as a Massachusetts business trust. The Trust consists of five diversified funds: Deutsche Bond VIP, Deutsche Capital Growth VIP, Deutsche Core Equity VIP, Deutsche CROCI® International VIP and Deutsche Global Small Cap VIP (individually or collectively hereinafter referred to as a "Fund" or the "Funds"). These financial statements report on Deutsche CROCI® International VIP. The Trust is intended to be the underlying investment vehicle for variable annuity contracts and variable life insurance policies to be offered by the separate accounts of certain life insurance companies ("Participating Insurance Companies").
Multiple Classes of Shares of Beneficial Interest. The Fund offers two classes of shares (Class A shares and Class B shares). Class B shares are subject to Rule 12b-1 distribution fees under the 1940 Act and recordkeeping fees equal to an annual rate of 0.25% and up to 0.15%, respectively, of the average daily net assets of the Class B shares of the Fund. Class A shares are not subject to such fees.
Investment income, realized and unrealized gains and losses, and certain fund-level expenses and expense reductions, if any, are borne pro rata on the basis of relative net assets by the holders of all classes of shares, except that each class bears certain expenses unique to that class (including the applicable 12b-1 distribution fees and recordkeeping fees). Differences in class-level expenses may result in payment of different per share dividends by class. All shares have equal rights with respect to voting subject to class-specific arrangements.
The Fund's financial statements are prepared in accordance with accounting principles generally accepted in the United States of America ("U.S. GAAP") which require the use of management estimates. Actual results could differ from those estimates. The Fund qualifies as an investment company under Topic 946 of Accounting Standards Codification of U.S. GAAP. The policies described below are followed consistently by the Fund in the preparation of its financial statements.
Security Valuation. Investments are stated at value determined as of the close of regular trading on the New York Stock Exchange on each day the exchange is open for trading.
Various inputs are used in determining the value of the Fund's investments. These inputs are summarized in three broad levels. Level 1 includes quoted prices in active markets for identical securities. Level 2 includes other significant observable inputs (including quoted prices for similar securities, interest rates, prepayment speeds and credit risk). Level 3 includes significant unobservable inputs (including the Fund's own assumptions in determining the fair value of investments). The level assigned to the securities valuations may not be an indication of the risk or liquidity associated with investing in those securities.
Equity securities are valued at the most recent sale price or official closing price reported on the exchange (U.S. or foreign) or over-the-counter market on which they trade. Securities for which no sales are reported are valued at the calculated mean between the most recent bid and asked quotations on the relevant market or, if a mean cannot be determined, at the most recent bid quotation. Equity securities are generally categorized as Level 1 securities. For certain international equity securities, in order to adjust for events which may occur between the close of the foreign exchanges and the close of the New York Stock Exchange, a fair valuation model may be used. This fair valuation model takes into account comparisons to the valuation of American Depository Receipts (ADRs), exchange-traded funds, futures contracts and certain indices and these securities are categorized as Level 2.
Investments in open-end investment companies are valued at their net asset value each business day and are categorized as Level 1.
Forward currency contracts are valued at the prevailing forward exchange rate of the underlying currencies and are categorized as Level 2.
Securities and other assets for which market quotations are not readily available or for which the above valuation procedures are deemed not to reflect fair value are valued in a manner that is intended to reflect their fair value as determined in accordance with procedures approved by the Trustees and are generally categorized as Level 3. In accordance with the Fund's valuation procedures, factors considered in determining value may include, but are not limited to, the type of the security; the size of the holding; the initial cost of the security; the existence of any contractual restrictions on the security's disposition; the price and extent of public trading in similar securities of the issuer or of comparable companies; quotations or evaluated prices from broker-dealers and/or pricing services; information obtained from the issuer, analysts, and/or the appropriate stock exchange (for exchange-traded securities); an analysis of the company's or issuer's financial statements; an evaluation of the forces that influence the issuer and the market(s) in which the security is purchased and sold; and with respect to debt securities, the maturity, coupon, creditworthiness, currency denomination and the movement of the market in which the security is normally traded. The value determined under these procedures may differ from published values for the same securities.
Disclosure about the classification of fair value measurements is included in a table following the Fund's Investment Portfolio.
Securities Lending. Deutsche Bank AG, as lending agent, lends securities of the Fund to certain financial institutions under the terms of its securities lending agreement. During the term of the loans, the Fund continues to receive interest and dividends generated by the securities and to participate in any changes in their market value. The Fund requires the borrowers of the securities to maintain collateral with the Fund consisting of either cash or liquid, unencumbered assets having a value at least equal to the value of the securities loaned. When the collateral falls below specified amounts, the lending agent will use its best effort to obtain additional collateral on the next business day to meet required amounts under the securities lending agreement. During the year ended December 31, 2016, the Fund invested the cash collateral into a joint trading account in affiliated money market funds including Government & Agency Securities Portfolio managed by Deutsche Investment Management Americas Inc. Deutsche Investment Management Americas Inc. receives a management/administration fee (0.09% annualized effective rate as of December 31, 2016) on the cash collateral invested in Government & Agency Securities Portfolio. The Fund receives compensation for lending its securities either in the form of fees or by earning interest on invested cash collateral net of borrower rebates and fees paid to a lending agent. Either the Fund or the borrower may terminate the loan at any time, and the borrower, after notice, is required to return borrowed securities within a standard time period. There may be risks of delay and costs in recovery of securities or even loss of rights in the collateral should the borrower of the securities fail financially. If the Fund is not able to recover securities lent, the Fund may sell the collateral and purchase a replacement investment in the market, incurring the risk that the value of the replacement security is greater than the value of the collateral. The Fund is also subject to all investment risks associated with the reinvestment of any cash collateral received, including, but not limited to, interest rate, credit and liquidity risk associated with such investments.
As of December 31, 2016, the Fund had no securities on loan.
Foreign Currency Translations. The books and records of the Fund are maintained in U.S. dollars. Investment securities and other assets and liabilities denominated in a foreign currency are translated into U.S. dollars at the prevailing exchange rates at period end. Purchases and sales of investment securities, income and expenses are translated into U.S. dollars at the prevailing exchange rates on the respective dates of the transactions.
Net realized and unrealized gains and losses on foreign currency transactions represent net gains and losses between trade and settlement dates on securities transactions, the acquisition and disposition of foreign currencies, and the difference between the amount of net investment income accrued and the U.S. dollar amount actually received. The portion of both realized and unrealized gains and losses on investments that results from fluctuations in foreign currency exchange rates is not separately disclosed but is included with net realized and unrealized gain/appreciation and loss/depreciation on investments.
Taxes. The Fund is treated as a separate taxpayer as provided for in the Internal Revenue Code, as amended. It is the Fund's policy to comply with the requirements of the Internal Revenue Code, as amended, which are applicable to regulated investment companies, and to distribute all of its taxable income to the separate accounts of the Participating Insurance Companies which hold its shares.
Additionally, the Fund may be subject to taxes imposed by the governments of countries in which it invests and are generally based on income and/or capital gains earned or repatriated, a portion of which may be recoverable. Based upon the current interpretation of the tax rules and regulations, estimated tax liabilities and recoveries on certain foreign securities are recorded on an accrual basis and are reflected as components of interest income or net change in unrealized gain/loss on investments. Tax liabilities realized as a result of security sales are reflected as a component of net realized gain/loss on investments.
Under the Regulated Investment Company Modernization Act of 2010, net capital losses incurred post-enactment may be carried forward indefinitely, and their character is retained as short-term and/or long-term. Previously, net capital losses were carried forward for eight years and treated as short-term losses. As a transition rule, the Act requires that post-enactment net capital losses be used before pre-enactment net capital losses.
At December 31, 2016, the Fund had a net tax basis capital loss carryforward of approximately $98,822,000 of pre-enactment losses, which may be applied against any realized net taxable capital gains of each succeeding year until fully utilized or until December 31, 2017, the expiration date, whichever occurs first; and approximately $34,525,000 of post-enactment losses, which may be applied against realized net taxable capital gains indefinitely, including short-term losses ($11,496,000) and long-term losses ($23,029,000).
The Fund has reviewed the tax positions for the open tax years as of December 31, 2016 and has determined that no provision for income tax and/or uncertain tax provisions is required in the Fund's financial statements. The Fund's federal tax returns for the prior three fiscal years remain open subject to examination by the Internal Revenue Service.
Distribution of Income and Gains. Distributions from net investment income of the Fund, if any, are declared and distributed to shareholders annually. Net realized gains from investment transactions, in excess of available capital loss carryforwards, would be taxable to the Fund if not distributed and, therefore, will be distributed to shareholders at least annually. The Fund may also make additional distributions for tax purposes if necessary.
The timing and characterization of certain income and capital gain distributions are determined annually in accordance with federal tax regulations which may differ from accounting principles generally accepted in the United States of America. These differences primarily relate to investments in foreign denominated investments, forward currency contracts, passive foreign investment companies and certain securities sold at a loss. As a result, net investment income (loss) and net realized gain (loss) on investment transactions for a reporting period may differ significantly from distributions during such period. Accordingly, the Fund may periodically make reclassifications among certain of its capital accounts without impacting the net asset value of the Fund.
At December 31, 2016, the Fund's components of distributable earnings (accumulated losses) on a tax basis are as follows:
| Undistributed ordinary income* | $ 7,031,901 |
| Capital loss carryforwards | $(133,347,000) |
| Net unrealized appreciation (depreciation) on investments | $ (6,331,738) |
In addition, the tax character of distributions paid to shareholders by the Fund is summarized as follows:
| | Years Ended December 31, |
| 2016 | 2015 |
| Distributions from ordinary income* | $ 9,830,028 | $ 5,232,394 |
* For tax purposes, short-term capital gain distributions are considered ordinary income distributions.
Expenses. Expenses of the Trust arising in connection with a specific Fund are allocated to that Fund. Other Trust expenses which cannot be directly attributed to a Fund are apportioned among the Funds in the Trust based upon the relative net assets or other appropriate measures.
Contingencies. In the normal course of business, the Fund may enter into contracts with service providers that contain general indemnification clauses. The Fund's maximum exposure under these arrangements is unknown, as this would involve future claims that may be made against the Fund that have not yet been made. However, based on experience, the Fund expects the risk of loss to be remote.
Other. Investment transactions are accounted for on a trade date plus one basis for daily net asset value calculations. However, for financial reporting purposes, investment transactions are reported on trade date. Interest income is recorded on the accrual basis net of foreign withholding taxes. Dividend income is recorded on the ex-dividend date net of foreign withholding taxes. Certain dividends from foreign securities may be recorded subsequent to the ex-dividend date as soon as the Fund is informed of such dividends. Realized gains and losses from investment transactions are recorded on an identified cost basis. Proceeds from litigation payments, if any, are included in net realized gain (loss) from investments.
B. Derivative Instruments
Forward Foreign Currency Exchange Contracts. A forward foreign currency exchange contract ("forward currency contract") is a commitment to purchase or sell a foreign currency at the settlement date at a negotiated rate. For the year ended December 31, 2016, the Fund entered into forward currency contracts in order to hedge its exposure to changes in foreign currency exchange rates on its foreign currency denominated portfolio holdings.
Forward currency contracts are valued at the prevailing forward exchange rate of the underlying currencies and unrealized gain (loss) is recorded daily. On the settlement date of the forward currency contract, the Fund records a realized gain or loss equal to the difference between the value of the contract at the time it was opened and the value of the contract at the time it was closed. Certain risks may arise upon entering into forward currency contracts from the potential inability of counterparties to meet the terms of their contracts. The maximum counterparty credit risk to the Fund is measured by the unrealized gain on appreciated contracts. Additionally, when utilizing forward currency contracts to hedge, the Fund gives up the opportunity to profit from favorable exchange rate movements during the term of the contract.
A summary of the open forward currency contracts as of December 31, 2016 is included in a table following the Fund's Investment Portfolio. For the year ended December 31, 2016, the investment in forward currency contracts short vs. U.S. dollars had a total contract value generally indicative of a range from $88,539,000 to approximately $106,775,000, and the investment in forward currency contracts long vs. U.S. dollars had a total contract value generally indicative of a range from $21,000 to approximately $2,831,000.
The following tables summarize the value of the Fund's derivative instruments held as of December 31, 2016 and the related location in the accompanying Statement of Assets and Liabilities, presented by primary underlying risk exposure:
| Asset Derivative | Forward Contracts |
| Foreign Exchange Contracts (a) | $ 37 |
The above derivative is located in the following Statement of Assets and Liabilities account: (a) Unrealized appreciation on forward foreign currency exchange contracts |
| Liability Derivative | Forward Contracts |
| Foreign Exchange Contracts (a) | $ (440,746) |
The above derivative is located in the following Statement of Assets and Liabilities account: (a) Unrealized depreciation on forward foreign currency exchange contracts |
Additionally, the amount of unrealized and realized gains and losses on derivative instruments recognized in Fund earnings during the year ended December 31, 2016 and the related location in the accompanying Statement of Operations is summarized in the following tables by primary underlying risk exposure:
| Realized Gain (Loss) | Forward Contracts |
| Foreign Exchange Contracts (a) | $ 5,905,923 |
The above derivative is located in the following Statement of Operations account: (a) Net realized gain (loss) from foreign currency (Statement of Operations includes both forward currency contracts and foreign currency transactions) |
| Change in Net Unrealized Appreciation (Depreciation) | Forward Contracts |
| Foreign Exchange Contracts (a) | $ (935,247) |
The above derivative is located in the following Statement of Operations account: (a) Change in net unrealized appreciation (depreciation) on foreign currency (Statement of Operations includes both forward currency contracts and foreign currency transactions) |
As of December 31, 2016, the Fund has transactions subject to enforceable master netting agreements. A reconciliation of the gross amounts on the Statement of Assets and Liabilities to the net amounts by counterparty, including any collateral exposure, is included in the following tables:
| Counterparty | Gross Amounts of Assets Presented in the Statement of Assets and Liabilities | Financial Instruments and Derivatives Available for Offset | Collateral Received | Net Amount of Derivative Assets |
| Merrill Lynch & Co., Inc. | $ 37 | $ (37) | $ — | $ — |
| Counterparty | Gross Amounts of Liabilities Presented in the Statement of Assets and Liabilities | Financial Instruments and Derivatives Available for Offset | Collateral Pledged | Net Amount of Derivative Liabilities |
| Merrill Lynch & Co., Inc. | $ 440,746 | $ (37) | $ — | $ 440,709 |
C. Purchases and Sales of Securities
During the year ended December 31, 2016, purchases and sales of investment securities (excluding short-term investments) aggregated $61,921,468 and $67,480,010, respectively.
D. Related Parties
Management Agreement. Under the Investment Management Agreement with Deutsche Investment Management Americas Inc. ("DIMA" or the "Advisor"), an indirect, wholly owned subsidiary of Deutsche Bank AG, the Advisor directs the investments of the Fund in accordance with its investment objectives, policies and restrictions. The Advisor determines the securities, instruments and other contracts relating to investments to be purchased, sold or entered into by the Fund.
Pursuant to the Investment Management Agreement with the Advisor, the Fund pays a monthly management fee based on the Fund's average daily net assets, computed and accrued daily and payable monthly, at the following annual rates:
| First $500 million of average daily net assets | .790% |
| Over $500 million of average daily net assets | .640% |
Accordingly, for the year ended December 31, 2016, the fee pursuant to the Investment Management Agreement was equivalent to an annual rate (exclusive of any applicable waivers/reimbursements) of 0.79% of the Fund's average daily net assets.
For the period from January 1, 2016 through September 30, 2016, the Advisor had contractually agreed to waive all or a portion of its fees and/or reimburse certain operating expenses of the Fund to the extent necessary to maintain the total annual operating expenses (excluding certain expenses such as extraordinary expenses, taxes, brokerage and interest) of each class as follows:
Effective October 1, 2016 through September 30, 2017, the Advisor has contractually agreed to waive all or a portion of its fees and/or reimburse certain operating expenses of the Fund to the extent necessary to maintain the total annual operating expenses (excluding certain expenses such as extraordinary expenses, taxes, brokerage and interest) of each class as follows:
For the year ended December 31, 2016, fees waived and/or expenses reimbursed for each class are as follows:
| Class A | $ 262,264 |
| Class B | 784 |
| | $ 263,048 |
Administration Fee. Pursuant to an Administrative Services Agreement, DIMA provides most administrative services to the Fund. For all services provided under the Administrative Services Agreement, the Fund pays the Advisor an annual fee ("Administration Fee") of 0.10% of the Fund's average daily net assets, computed and accrued daily and payable monthly. For the year ended December 31, 2016, the Administration Fee was $93,570, of which $7,896 is unpaid.
Service Provider Fees. Deutsche AM Service Company ("DSC"), an affiliate of the Advisor, is the transfer agent, dividend-paying agent and shareholder service agent for the Fund. Pursuant to a sub-transfer agency agreement between DSC and DST Systems, Inc. ("DST"), DSC has delegated certain transfer agent, dividend-paying agent and shareholder service agent functions to DST. DSC compensates DST out of the shareholder servicing fee it receives from the Fund. For the year ended December 31, 2016, the amounts charged to the Fund by DSC were as follows:
| Services to Shareholders | Total Aggregated | Unpaid at December 31, 2016 |
| Class A | $ 629 | $ 157 |
| Class B | 81 | 20 |
| | $ 710 | $ 177 |
Distribution Service Agreement. Deutsche AM Distributors, Inc. ("DDI"), also an affiliate of the Advisor, is the Trusts' Distributor. In accordance with the Master Distribution Plan, DDI receives 12b-1 fees of 0.25% of average daily net assets of Class B shares. Pursuant to the Master Distribution Plan, DDI remits these fees to the Participating Insurance Companies for various costs incurred or paid by these companies in connection with marketing and distribution of Class B shares. For the year ended December 31, 2016, the Distribution Service Fee aggregated $648, of which $57 is unpaid.
Typesetting and Filing Service Fees. Under an agreement with DIMA, DIMA is compensated for providing typesetting and certain regulatory filing services to the Fund. For the year ended December 31, 2016, the amount charged to the Fund by DIMA included in the Statement of Operations under "Reports to shareholders" aggregated $11,839, of which $4,764 is unpaid.
Trustees' Fees and Expenses. The Fund paid retainer fees to each Trustee not affiliated with the Advisor, plus specified amounts to the Board Chairperson and Vice Chairperson and to each committee Chairperson.
Affiliated Cash Management Vehicles. The Fund may invest uninvested cash balances in Deutsche Central Cash Management Government Fund and Deutsche Variable NAV Money Fund, affiliated money market funds which are managed by the Advisor. Each affiliated money market fund is managed in accordance with Rule 2a-7 under the 1940 Act, which governs the quality, maturity, diversity and liquidity of instruments in which a money market fund may invest. Deutsche Central Cash Management Government Fund seeks to maintain a stable net asset value, and Deutsche Variable NAV Money Fund maintains a floating net asset value. The Fund indirectly bears its proportionate share of the expenses of each affiliated money market fund in which it invests. Deutsche Central Cash Management Government Fund does not pay the Advisor an investment management fee. To the extent that Deutsche Variable NAV Money Fund pays an investment management fee to the Advisor, the Advisor will waive an amount of the investment management fee payable to the Advisor by the Fund equal to the amount of the investment management fee payable on the Fund's assets invested in Deutsche Variable NAV Money Fund.
Securities Lending Agent Fees. Deutsche Bank AG serves as securities lending agent for the Fund. For the year ended December 31, 2016, the Fund incurred securities lending agent fees to Deutsche Bank AG in the amount of $1,574.
E. Ownership of the Fund
At December 31, 2016, four participating insurance companies were owners of record of 10% or more of the total outstanding Class A shares of the Fund, each owning 21%, 15%, 12% and 11%, respectively. Two participating insurance companies were owners of record of 10% or more of the total outstanding Class B shares of the Fund, each owning 83% and 10%, respectively.
F. Line of Credit
The Fund and other affiliated funds (the "Participants") share in a $400 million revolving credit facility provided by a syndication of banks. The Fund may borrow for temporary or emergency purposes, including the meeting of redemption requests that otherwise might require the untimely disposition of securities. The Participants are charged an annual commitment fee which is allocated based on net assets, among each of the Participants. Interest is calculated at a rate per annum equal to the sum of the Federal Funds Rate plus 1.25 percent plus if the one-month LIBOR exceeds the Federal Funds Rate, the amount of such excess. The Fund may borrow up to a maximum of 33 percent of its net assets under the agreement. The Fund had no outstanding loans at December 31, 2016.
Report of Independent Registered Public Accounting Firm
To the Board of Trustees of Deutsche Variable Series I and the Shareholders of Deutsche CROCI® International VIP:
In our opinion, the accompanying statement of assets and liabilities, including the investment portfolio, and the related statements of operations and of changes in net assets and the financial highlights present fairly, in all material respects, the financial position of Deutsche CROCI® International VIP (the "Fund") at December 31, 2016 and the results of its operations, the changes in its net assets, and the financial highlights for the periods indicated therein, in conformity with accounting principles generally accepted in the United States of America. These financial statements and financial highlights (hereafter referred to as "financial statements") are the responsibility of the Fund's management. Our responsibility is to express an opinion on these financial statements based on our audits. We conducted our audits of these financial statements in accordance with the standards of the Public Company Accounting Oversight Board (United States). Those standards require that we plan and perform the audit to obtain reasonable assurance about whether the financial statements are free of material misstatement. An audit includes examining, on a test basis, evidence supporting the amounts and disclosures in the financial statements, assessing the accounting principles used and significant estimates made by management, and evaluating the overall financial statement presentation. We believe that our audits, which included confirmation of securities at December 31, 2016 by correspondence with the custodian, brokers and transfer agent, and the application of alternative auditing procedures where such confirmations had not been received, provide a reasonable basis for our opinion.
Boston, Massachusetts
February 14, 2017 | PricewaterhouseCoopers LLP |
Information About Your Fund's Expenses (Unaudited)
As an investor of the Fund, you incur two types of costs: ongoing expenses and transaction costs. Ongoing expenses include management fees, distribution and service (12b-1) fees and other Fund expenses. Examples of transaction costs include contract charges, which are not shown in this section. The following tables are intended to help you understand your ongoing expenses (in dollars) of investing in the Fund and to help you compare these expenses with the ongoing expenses of investing in other mutual funds. In the most recent six-month period, the Fund limited these expenses; had it not done so, expenses would have been higher. The example in the table is based on an investment of $1,000 invested at the beginning of the six-month period and held for the entire period (July 1, 2016 to December 31, 2016).
The tables illustrate your Fund's expenses in two ways:
— Actual Fund Return. This helps you estimate the actual dollar amount of ongoing expenses (but not transaction costs) paid on a $1,000 investment in the Fund using the Fund's actual return during the period. To estimate the expenses you paid over the period, simply divide your account value by $1,000 (for example, an $8,600 account value divided by $1,000 = 8.6), then multiply the result by the number in the "Expenses Paid per $1,000" line under the share class you hold.
— Hypothetical 5% Fund Return. This helps you to compare your Fund's ongoing expenses (but not transaction costs) with those of other mutual funds using the Fund's actual expense ratio and a hypothetical rate of return of 5% per year before expenses. Examples using a 5% hypothetical Fund return may be found in the shareholder reports of other mutual funds. The hypothetical account values and expenses may not be used to estimate the actual ending account balance or expenses you paid for the period.
Please note that the expenses shown in these tables are meant to highlight your ongoing expenses only and do not reflect any transaction costs. The "Expenses Paid per $1,000" line of the tables is useful in comparing ongoing expenses only and will not help you determine the relative total expense of owning different funds. If these transaction costs had been included, your costs would have been higher.
| Expenses and Value of a $1,000 Investment for the six months ended December 31, 2016 |
| Actual Fund Return | Class A | | Class B | |
| Beginning Account Value 7/1/16 | $1,000.00 | | $1,000.00 | |
| Ending Account Value 12/31/16 | $1,092.90 | | $1,092.70 | |
| Expenses Paid per $1,000* | $ 3.95 | | $ 5.37 | |
| Hypothetical 5% Fund Return | Class A | | Class B | |
| Beginning Account Value 7/1/16 | $1,000.00 | | $1,000.00 | |
| Ending Account Value 12/31/16 | $1,021.37 | | $1,020.01 | |
| Expenses Paid per $1,000* | $ 3.81 | | $ 5.18 | |
* Expenses are equal to the Fund's annualized expense ratio for each share class, multiplied by the average account value over the period, multiplied by 184 (the number of days in the most recent six-month period), then divided by 366.
| Annualized Expense Ratios | Class A | | Class B | |
| Deutsche Variable Series I — Deutsche CROCI® International VIP | .75% | | 1.02% | |
For more information, please refer to the Fund's prospectus.
These tables do not reflect charges and fees ("contract charges") associated with the separate account that invests in the Fund or any variable life insurance policy or variable annuity contract for which the Fund is an investment option.
For an analysis of the fees associated with an investment in the fund or similar funds, please refer to the current and hypothetical expense calculators for Variable Insurance Products which can be found at deutschefunds.com/EN/resources/calculators.jsp.
Tax Information (Unaudited)
The Fund paid foreign taxes of $315,550 and earned $2,804,019 of foreign source income during the year ended December 31, 2016. Pursuant to Section 853 of the Internal Revenue Code, the Fund designates $0.02 per share as foreign taxes paid and $0.19 per share as income earned from foreign sources for the year ended December 31, 2016.
Please consult a tax advisor if you have questions about federal or state income tax laws, or on how to prepare your tax returns. If you have specific questions about your account, please contact your insurance provider.
Proxy Voting
The Trusts' policies and procedures for voting proxies for portfolio securities and information about how the Trust voted proxies related to its portfolio securities during the most recent 12-month period ended June 30 are available on our Web site — deutschefunds.com (click on "proxy voting"at the bottom of the page) — or on the SEC's Web site — sec.gov. To obtain a written copy of the Trusts' policies and procedures without charge, upon request, call us toll free at (800) 728-3337.
Advisory Agreement Board Considerations and Fee Evaluation
The Board of Trustees (hereinafter referred to as the "Board" or "Trustees") approved the renewal of Deutsche CROCI® International VIP’s (the "Fund") investment management agreement (the "Agreement") with Deutsche Investment Management Americas Inc. ("DIMA") in September 2016.
In terms of the process that the Board followed prior to approving the Agreement, shareholders should know that:
— During the entire process, all of the Fund’s Trustees were independent of DIMA and its affiliates (the "Independent Trustees").
— The Board met frequently during the past year to discuss fund matters and dedicated a substantial amount of time to contract review matters. Over the course of several months, the Board’s Contract Committee reviewed extensive materials received from DIMA, independent third parties and independent counsel. These materials included an analysis of the Fund’s performance, fees and expenses, and profitability from a fee consultant retained by the Fund’s Independent Trustees (the "Fee Consultant"). The Board also received extensive information throughout the year regarding performance of the Fund.
— The Independent Trustees regularly meet privately with counsel to discuss contract review and other matters. In addition, the Independent Trustees were advised by the Fee Consultant in the course of their review of the Fund’s contractual arrangements and considered a comprehensive report prepared by the Fee Consultant in connection with their deliberations.
— In connection with reviewing the Agreement, the Board also reviewed the terms of the Fund’s Rule 12b-1 plan, distribution agreement, administrative services agreement, transfer agency agreement and other material service agreements.
— Based on its evaluation of the information provided, the Contract Committee presented its findings and recommendations to the Board. The Board then reviewed the Contract Committee’s findings and recommendations.
In connection with the contract review process, the Contract Committee and the Board considered the factors discussed below, among others. The Board also considered that DIMA and its predecessors have managed the Fund since its inception, and the Board believes that a long-term relationship with a capable, conscientious advisor is in the best interests of the Fund. The Board considered, generally, that shareholders chose to invest or remain invested in the Fund knowing that DIMA managed the Fund, and that the Agreement was approved by the Fund’s shareholders. DIMA is part of Deutsche Bank AG’s ("Deutsche Bank") Asset Management ("Deutsche AM") division. Deutsche AM is a global asset management business that offers a wide range of investing expertise and resources, including research capabilities in many countries throughout the world. Deutsche Bank has advised the Board that the U.S. asset management business continues to be a critical and integral part of Deutsche Bank, and that Deutsche Bank will continue to invest in Deutsche AM and seek to enhance Deutsche AM’s investment platform. Deutsche Bank also has confirmed its commitment to maintaining strong legal and compliance groups within the Deutsche AM division.
As part of the contract review process, the Board carefully considered the fees and expenses of each Deutsche fund overseen by the Board in light of the fund’s performance. In many cases, this led to the negotiation and implementation of expense caps. As part of these negotiations, the Board indicated that it would consider relaxing these caps in future years following sustained improvements in performance, among other considerations.
While shareholders may focus primarily on fund performance and fees, the Fund’s Board considers these and many other factors, including the quality and integrity of DIMA’s personnel and such other issues as back-office operations, fund valuations, and compliance policies and procedures.
Nature, Quality and Extent of Services. The Board considered the terms of the Agreement, including the scope of advisory services provided under the Agreement. The Board noted that, under the Agreement, DIMA provides portfolio management services to the Fund and that, pursuant to a separate administrative services agreement, DIMA provides administrative services to the Fund. The Board considered the experience and skills of senior management and investment personnel and the resources made available to such personnel. The Board reviewed the Fund’s performance over short-term and long-term periods and compared those returns to various agreed-upon performance measures, including market index(es) and a peer universe compiled using information supplied by Morningstar Direct ("Morningstar"), an independent fund data service. The Board also noted that it has put into place a process of identifying "Focus Funds" (e.g., funds performing poorly relative to a peer universe), and receives additional reporting from DIMA regarding such funds and, where appropriate, DIMA’s plans to address underperformance. The Board believes this process is an effective manner of identifying and addressing underperforming funds. Based on the information provided, the Board noted that for the one-, three- and five-year periods ended December 31, 2015, the Fund’s performance (Class A shares) was in the 4th quartile of the applicable Morningstar universe (the 1st quartile being the best performers and the 4th quartile being the worst performers). The Board also observed that the Fund has underperformed its benchmark in the one-, three- and five-year periods ended December 31, 2015. The Board noted the disappointing investment performance of the Fund in recent periods and continued to discuss with senior management of DIMA the factors contributing to such underperformance and actions being taken to improve performance. The Board recognized the efforts by DIMA in recent years to enhance its investment platform and improve long-term performance across the Deutsche fund complex.
Fees and Expenses. The Board considered the Fund’s investment management fee schedule, operating expenses and total expense ratios, and comparative information provided by Broadridge Financial Solutions, Inc. ("Broadridge") and the Fee Consultant regarding investment management fee rates paid to other investment advisors by similar funds (1st quartile being the most favorable and 4th quartile being the least favorable). With respect to management fees paid to other investment advisors by similar funds, the Board noted that the contractual fee rates paid by the Fund, which include a 0.10% fee paid to DIMA under the Fund’s administrative services agreement, were higher than the median (3rd quartile) of the applicable Broadridge peer group (based on Broadridge data provided as of December 31, 2015). The Board noted that the Fund’s Class A shares total (net) operating expenses were expected to be lower than the median (2nd quartile) of the applicable Broadridge expense universe (based on Broadridge data provided as of December 31, 2015, and analyzing Broadridge expense universe Class A (net) expenses less any applicable 12b-1 fees) ("Broadridge Universe Expenses"). The Board also reviewed data comparing each share class’s total (net) operating expenses to the applicable Broadridge Universe Expenses. The Board noted that the expense limitations agreed to by DIMA were expected to help the Fund’s total (net) operating expenses remain competitive. The Board considered the Fund’s management fee rate as compared to fees charged by DIMA to comparable Deutsche U.S. registered funds ("Deutsche Funds") and considered differences between the Fund and the comparable funds. The information requested by the Board as part of its review of fees and expenses also included information about institutional accounts (including any sub-advised funds and accounts) and funds offered primarily to European investors ("Deutsche Europe funds") managed by Deutsche AM. The Board noted that DIMA indicated that Deutsche AM does not manage any institutional accounts or Deutsche Europe funds comparable to the Fund.
On the basis of the information provided, the Board concluded that management fees were reasonable and appropriate in light of the nature, quality and extent of services provided by DIMA.
Profitability. The Board reviewed detailed information regarding revenues received by DIMA under the Agreement. The Board considered the estimated costs and pre-tax profits realized by DIMA from advising the Deutsche Funds, as well as estimates of the pre-tax profits attributable to managing the Fund in particular. The Board also received information regarding the estimated enterprise-wide profitability of DIMA and its affiliates with respect to all fund services in totality and by fund. The Board and the Fee Consultant reviewed DIMA’s methodology in allocating its costs to the management of the Fund. Based on the information provided, the Board concluded that the pre-tax profits realized by DIMA in connection with the management of the Fund were not unreasonable. The Board also reviewed certain publicly available information regarding the profitability of certain similar investment management firms. The Board noted that while information regarding the profitability of such firms is limited (and in some cases is not necessarily prepared on a comparable basis), DIMA and its affiliates’ overall profitability with respect to the Deutsche Funds (after taking into account distribution and other services provided to the funds by DIMA and its affiliates) was lower than the overall profitability levels of most comparable firms for which such data was available.
Economies of Scale. The Board considered whether there are economies of scale with respect to the management of the Fund and whether the Fund benefits from any economies of scale. The Board noted that the Fund’s investment management fee schedule includes fee breakpoints. The Board concluded that the Fund’s fee schedule represents an appropriate sharing between the Fund and DIMA of such economies of scale as may exist in the management of the Fund at current asset levels.
Other Benefits to DIMA and Its Affiliates. The Board also considered the character and amount of other incidental benefits received by DIMA and its affiliates, including any fees received by DIMA for administrative services provided to the Fund and any fees received by an affiliate of DIMA for distribution services. The Board noted that DIMA pays a licensing fee to an affiliate related to the Fund’s use of the CROCI® strategy. The Board also considered benefits to DIMA related to brokerage and soft-dollar allocations, including allocating brokerage to pay for research generated by parties other than the executing broker dealers, which pertain primarily to funds investing in equity securities, along with the incidental public relations benefits to DIMA related to Deutsche Funds advertising and cross-selling opportunities among DIMA products and services. The Board considered these benefits in reaching its conclusion that the Fund’s management fees were reasonable.
Compliance. The Board considered the significant attention and resources dedicated by DIMA to documenting and enhancing its compliance processes in recent years. The Board noted in particular (i) the experience, seniority and time commitment of the individuals serving as DIMA’s and the Fund’s chief compliance officers; (ii) the large number of DIMA compliance personnel; and (iii) the substantial commitment of resources by DIMA and its affiliates to compliance matters.
Based on all of the information considered and the conclusions reached, the Board unanimously determined that the continuation of the Agreement is in the best interests of the Fund. In making this determination, the Board did not give particular weight to any single factor identified above. The Board considered these factors over the course of numerous meetings, certain of which were in executive session with only the Independent Trustees and counsel present. It is possible that individual Independent Trustees may have weighed these factors differently in reaching their individual decisions to approve the continuation of the Agreement.
Board Members and Officers
The following table presents certain information regarding the Board Members and Officers of the fund. Each Board Member's year of birth is set forth in parentheses after his or her name. Unless otherwise noted, (i) each Board Member has engaged in the principal occupation(s) noted in the table for at least the most recent five years, although not necessarily in the same capacity; and (ii) the address of each Independent Board Member is c/o Keith R. Fox, Deutsche Funds Board Chair, c/o Thomas R. Hiller, Ropes & Gray LLP, Prudential Tower, 800 Boylston Street, Boston, MA 02199-3600. Except as otherwise noted below, the term of office for each Board Member is until the election and qualification of a successor, or until such Board Member sooner dies, resigns, is removed or as otherwise provided in the governing documents of the fund. Because the fund does not hold an annual meeting of shareholders, each Board Member will hold office for an indeterminate period. The Board Members may also serve in similar capacities with other funds in the fund complex.
| Independent Board Members |
| Name, Year of Birth, Position with the Fund and Length of Time Served1 | Business Experience and Directorships During the Past Five Years | Number of Funds in Deutsche Fund Complex Overseen | Other Directorships Held by Board Member |
Keith R. Fox, CFA (1954) Chairperson since 2017,2 and Board Member since 1996 | Managing General Partner, Exeter Capital Partners (a series of private investment funds) (since 1986). Directorships: Progressive International Corporation (kitchen goods importer and distributor); The Kennel Shop (retailer); former Chairman, National Association of Small Business Investment Companies; former Directorships: BoxTop Media Inc. (advertising); Sun Capital Advisers Trust (mutual funds) (2011–2012) | 98 | — |
Kenneth C. Froewiss (1945) Vice Chairperson since 2017,2 Board Member since 2001, and Chairperson (2013–December 31, 2016) | Retired Clinical Professor of Finance, NYU Stern School of Business (1997–2014); Member, Finance Committee, Association for Asian Studies (2002–present); Director, Mitsui Sumitomo Insurance Group (US) (2004–present); prior thereto, Managing Director, J.P. Morgan (investment banking firm) (until 1996) | 98 | — |
John W. Ballantine (1946) Board Member since 1999 | Retired; formerly, Executive Vice President and Chief Risk Management Officer, First Chicago NBD Corporation/The First National Bank of Chicago (1996–1998); Executive Vice President and Head of International Banking (1995–1996); former Directorships: Director and former Chairman of the Board, Healthways, Inc.3 (population well-being and wellness services) (2003–2014); Stockwell Capital Investments PLC (private equity); First Oak Brook Bancshares, Inc. and Oak Brook Bank; Prisma Energy International | 98 | Portland General Electric3 (utility company) (2003– present) |
Henry P. Becton, Jr. (1943) Board Member since 1990 | Vice Chair and former President, WGBH Educational Foundation. Directorships: Public Radio International; Public Radio Exchange (PRX); The Pew Charitable Trusts (charitable organization); former Directorships: Becton Dickinson and Company3 (medical technology company); Belo Corporation3 (media company); The PBS Foundation; Association of Public Television Stations; Boston Museum of Science; American Public Television; Concord Academy; New England Aquarium; Mass. Corporation for Educational Telecommunications; Committee for Economic Development; Public Broadcasting Service; Connecticut College; North Bennett Street School (Boston) | 98 | — |
Dawn-Marie Driscoll (1946) Board Member since 1987 | Emeritus Executive Fellow, Center for Business Ethics, Bentley University; formerly: President, Driscoll Associates (consulting firm); Partner, Palmer & Dodge (law firm) (1988–1990); Vice President of Corporate Affairs and General Counsel, Filene's (retail) (1978–1988). Directorships: Advisory Board, Center for Business Ethics, Bentley University; Trustee and former Chairman of the Board, Southwest Florida Community Foundation (charitable organization); former Directorships: ICI Mutual Insurance Company (2007–2015); Sun Capital Advisers Trust (mutual funds) (2007–2012), Investment Company Institute (audit, executive, nominating committees) and Independent Directors Council (governance, executive committees) | 98 | — |
Paul K. Freeman (1950) Board Member since 1993 | Consultant, World Bank/Inter-American Development Bank; Chair, Independent Directors Council; Investment Company Institute (executive and nominating committees); formerly, Chairman of Education Committee of Independent Directors Council; Project Leader, International Institute for Applied Systems Analysis (1998–2001); Chief Executive Officer, The Eric Group, Inc. (environmental insurance) (1986–1998); Directorships: Denver Zoo Foundation (December 2012–present); former Directorships: Prisma Energy International | 98 | — |
Richard J. Herring (1946) Board Member since 1990 | Jacob Safra Professor of International Banking and Professor, Finance Department, The Wharton School, University of Pennsylvania (since July 1972); Co-Director, Wharton Financial Institutions Center; formerly: Vice Dean and Director, Wharton Undergraduate Division (July 1995–June 2000); Director, Lauder Institute of International Management Studies (July 2000–June 2006) | 98 | Director, Aberdeen Singapore and Japan Funds (since 2007); Independent Director of Barclays Bank Delaware (since September 2010) |
William McClayton (1944) Board Member since 2004, and Vice Chairperson (2013–December 31, 2016) | Private equity investor (since October 2009); previously, Managing Director, Diamond Management & Technology Consultants, Inc. (global consulting firm) (2001–2009); Directorship: Board of Managers, YMCA of Metropolitan Chicago; formerly: Senior Partner, Arthur Andersen LLP (accounting) (1966–2001); Trustee, Ravinia Festival | 98 | — |
Rebecca W. Rimel (1951) Board Member since 1995 | President, Chief Executive Officer and Director, The Pew Charitable Trusts (charitable organization) (1994–present); formerly: Executive Vice President, The Glenmede Trust Company (investment trust and wealth management) (1983–2004); Board Member, Investor Education (charitable organization) (2004–2005); Trustee, Executive Committee, Philadelphia Chamber of Commerce (2001–2007); Director, Viasys Health Care3 (January 2007–June 2007); Trustee, Thomas Jefferson Foundation (charitable organization) (1994–2012) | 98 | Director, Becton Dickinson and Company3 (medical technology company) (2012– present); Director, BioTelemetry Inc.3 (health care) (2009– present) |
William N. Searcy, Jr. (1946) Board Member since 1993 | Private investor since October 2003; formerly: Pension & Savings Trust Officer, Sprint Corporation3 (telecommunications) (November 1989–September 2003); Trustee, Sun Capital Advisers Trust (mutual funds) (1998–2012) | 98 | — |
Jean Gleason Stromberg (1943) Board Member since 1997 | Retired. Formerly, Consultant (1997–2001); Director, Financial Markets U.S. Government Accountability Office (1996–1997); Partner, Norton Rose Fulbright, L.L.P. (law firm) (1978–1996); former Directorships: The William and Flora Hewlett Foundation (charitable organization) (2000–2015); Service Source, Inc. (nonprofit), Mutual Fund Directors Forum (2002–2004), American Bar Retirement Association (funding vehicle for retirement plans) (1987–1990 and 1994–1996) | 98 | — |
| Officers5 |
| Name, Year of Birth, Position with the Fund and Length of Time Served6 | Business Experience and Directorships During the Past Five Years |
Brian E. Binder9 (1972) President and Chief Executive Officer, 2013–present | Managing Director4 and Head of US Product and Fund Administration, Deutsche Asset Management (2013–present); Director and President, Deutsche AM Service Company (since 2016); Director and Vice President, Deutsche AM Distributors, Inc. (since 2016); Director and President, DB Investment Managers, Inc. (since 2016); formerly, Head of Business Management and Consulting at Invesco, Ltd. (2010–2012) |
John Millette8 (1962) Vice President and Secretary, 1999–present | Director,4 Deutsche Asset Management; Chief Legal Officer and Secretary, Deutsche Investment Management Americas Inc. (2015–present); and Director and Vice President, Deutsche AM Trust Company (since 2016) |
Hepsen Uzcan7 (1974) Vice President, since 2016 Assistant Secretary, 2013–present | Director,4 Deutsche Asset Management |
Paul H. Schubert7 (1963) Chief Financial Officer, 2004–present Treasurer, 2005–present | Managing Director,4 Deutsche Asset Management, and Chairman, Director and President, Deutsche AM Trust Company (since 2013); Vice President, Deutsche AM Distributors, Inc. (since 2016); formerly, Director, Deutsche AM Trust Company (2004–2013) |
Caroline Pearson8 (1962) Chief Legal Officer, 2010–present | Managing Director,4 Deutsche Asset Management; Secretary, Deutsche AM Distributors, Inc.; and Secretary, Deutsche AM Service Company |
Scott D. Hogan8 (1970) Chief Compliance Officer, since 2016 | Director,4 Deutsche Asset Management |
Wayne Salit7 (1967) Anti-Money Laundering Compliance Officer, 2014–present | Director,4 Deutsche Asset Management; AML Compliance Officer, Deutsche AM Distributors, Inc.; formerly: Managing Director, AML Compliance Officer at BNY Mellon (2011–2014); and Director, AML Compliance Officer at Deutsche Bank (2004–2011) |
Paul Antosca8 (1957) Assistant Treasurer, 2007–present | Director,4 Deutsche Asset Management |
Diane Kenneally8 (1966) Assistant Treasurer, 2007–present | Director,4 Deutsche Asset Management |
1 The length of time served represents the year in which the Board Member joined the board of one or more Deutsche funds currently overseen by the Board.
2 Effective as of January 1, 2017.
3 A publicly held company with securities registered pursuant to Section 12 of the Securities Exchange Act of 1934.
4 Executive title, not a board directorship.
5 As a result of their respective positions held with the Advisor, these individuals are considered "interested persons" of the Advisor within the meaning of the 1940 Act. Interested persons receive no compensation from the fund.
6 The length of time served represents the year in which the officer was first elected in such capacity for one or more Deutsche funds.
7 Address: 60 Wall Street, New York, NY 10005.
8 Address: One Beacon Street, Boston, MA 02108.
9 Address: 222 South Riverside Plaza, Chicago, IL 60606.
The fund's Statement of Additional Information ("SAI") includes additional information about the Board Members. The SAI is available, without charge, upon request. If you would like to request a copy of the SAI, you may do so by calling the following toll-free number: (800) 728-3337.

VS1cint-2 (R-025823-6 2/17)

December 31, 2016
Annual Report
Deutsche Variable Series I
Deutsche Global Small Cap VIP

Contents
3 Performance Summary 4 Management Summary 5 Portfolio Summary 6 Investment Portfolio 11 Statement of Assets and Liabilities 12 Statement of Operations 12 Statements of Changes in Net Assets 14 Financial Highlights 15 Notes to Financial Statements 20 Report of Independent Registered Public Accounting Firm 21 Information About Your Fund's Expenses 22 Tax Information 22 Proxy Voting 23 Advisory Agreement Board Considerations and Fee Evaluation 26 Board Members and Officers |
This report must be preceded or accompanied by a prospectus. To obtain an additional prospectus or summary prospectus, if available, call (800) 728-3337 or your financial representative. We advise you to consider the Fund's objectives, risks, charges and expenses carefully before investing. The summary prospectus and prospectus contain this and other important information about the Fund. Please read the prospectus carefully before you invest.
Stocks may decline in value. Smaller company stocks tend to be more volatile than medium-sized or large company stocks. Investing in foreign securities, particularly those of emerging markets, presents certain risks, such as currency fluctuations, political and economic changes, and market risks. Emerging markets tend to be more volatile and less liquid than the markets of more mature economies, and generally have less diverse and less mature economic structures and less stable political systems than those of developed countries. The Fund may lend securities to approved institutions. See the prospectus for details.
Deutsche Asset Management represents the asset management activities conducted by Deutsche Bank AG or any of its subsidiaries.
Deutsche AM Distributors, Inc., 222 South Riverside Plaza, Chicago, IL 60606, (800) 621-1148
NOT FDIC/NCUA INSURED NO BANK GUARANTEE MAY LOSE VALUE NOT A DEPOSIT
NOT INSURED BY ANY FEDERAL GOVERNMENT AGENCY
Performance Summary December 31, 2016 (Unaudited)
Fund performance shown is historical, assumes reinvestment of all dividend and capital gain distributions, and does not guarantee future results. Investment return and principal value fluctuate with changing market conditions so that, when redeemed, shares may be worth more or less than their original cost. Current performance may be lower or higher than the performance data quoted. Please contact your participating insurance company for the Fund's most recent month-end performance. Performance doesn't reflect charges and fees ("contract charges") associated with the separate account that invests in the Fund or any variable life insurance policy or variable annuity contract for which the Fund is an investment option. These charges and fees will reduce returns. While all share classes have the same underlying portfolio, their performance will differ.
The gross expense ratios of the Fund, as stated in the fee table of the prospectus dated May 1, 2016 are 1.12% and 1.41% for Class A and Class B shares, respectively, and may differ from the expense ratios disclosed in the Financial Highlights tables in this report.
Generally accepted accounting principles require adjustments to be made to the net assets of the Fund at period end for financial reporting purposes only, and as such, the total return based on the unadjusted net asset value per share may differ from the total return reported in the financial highlights.
| Growth of an Assumed $10,000 Investment |
■ Deutsche Global Small Cap VIP — Class A ■ S&P® Developed Small Cap Index | The S&P® Developed SmallCap comprises the stocks representing the lowest 15% of float-adjusted market cap in each developed country. It Is a subset of the S&P® Global BMI, a comprehensive, rules-based index measuring global stock market performance. Index returns do not reflect any fees or expenses and it is not possible to invest directly into an index. |
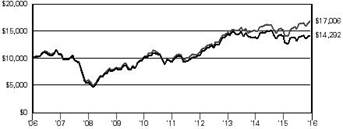 | |
| Yearly periods ended December 31 | |
| Comparative Results |
| Deutsche Global Small Cap VIP | 1-Year | 3-Year | 5-Year | 10-Year |
| Class A | Growth of $10,000 | $10,157 | $9,851 | $15,450 | $14,292 |
| Average annual total return | 1.57% | –0.50% | 9.09% | 3.64% |
| S&P Developed Small Cap Index | Growth of $10,000 | $11,159 | $11,480 | $17,969 | $17,006 |
| Average annual total return | 11.59% | 4.71% | 12.44% | 5.45% |
| Deutsche Global Small Cap VIP | 1-Year | 3-Year | 5-Year | 10-Year |
| Class B | Growth of $10,000 | $10,134 | $9,779 | $15,258 | $13,898 |
| Average annual total return | 1.34% | –0.74% | 8.82% | 3.35% |
| S&P Developed Small Cap Index | Growth of $10,000 | $11,159 | $11,480 | $17,969 | $17,006 |
| Average annual total return | 11.59% | 4.71% | 12.44% | 5.45% |
The growth of $10,000 is cumulative.
Management Summary December 31, 2016 (Unaudited)
Deutsche Global Small Cap VIP returned 1.57% in 2016 (Class A shares, unadjusted for contract charges), underperforming the 11.59% return of the S&P® Developed SmallCap Index.1
Although we use a bottom-up approach to picking stocks for the portfolio, top-down factors can have an impact on our results as well. During the past year, our performance was hurt by significant underweight positions in the strong-performing utilities and materials sectors.2 As growth-oriented investors, we tend to have a lower allocation to sectors where we find it more difficult to identify growth companies. Since the benchmark comprises both growth and value stocks, the Fund often lags when slower-growth companies outperform. The Fund was also negatively affected by an overweight in the United Kingdom, as the unexpected result of the Brexit vote fueled underperformance for both U.K. stocks and the British pound, depressing returns for U.S.-based investors.
Stock selection was an additional detractor, with our investments in health care having the largest negative effect.3 The sector lagged the broader market by a wide margin due to the prospect of increased government scrutiny on pricing practices. Our results in health care were also hurt by the challenges faced by two individual holdings, Flamel Technologies SA and Pacira Pharmaceuticals, Inc. The technology sector proved to be a difficult area for the Fund as well, with United Internet AG, Parrot SA and VeriFone Systems, Inc.* representing the most significant detractors.
On the positive side, we added value through our stock selection in the consumer discretionary sector.4 The WhiteWave Foods Company,* a producer of natural foods and beverages, was one of the leading contributors to performance. The stock jumped during the summer after the global food giant Danone announced its intention to acquire the company for a substantial premium. Outside of consumer discretionary, United States Steel Corp. and Cognex Corp. were the largest individual contributors.
Our stock-by-stock decisions resulted in some notable changes at both the regional and sector levels during 2016. With regard to the former, we reviewed all of the portfolio’s holdings following the Brexit referendum to assess their exposure to the potential shifts brought about by the vote. A number of our stocks were vulnerable to the longer-term implications of the United Kingdom’s departure from the European Union, so we trimmed or eliminated positions accordingly. We redeployed the bulk of the proceeds to U.S. equities, causing the Fund’s long-standing overweight in Europe vs. the United States to shrink as the year progressed.
At the sector level, we added to technology and health care, although the Fund's weighting in the latter group declined due to the impact of market movements. In both areas, we found an abundance of companies which we believe have the potential to generate steady growth with minimal dependence on broader economic conditions. We made corresponding reductions to industrials, where slow global growth weighed on the earnings outlooks for certain companies, and to consumer staples, where valuations had become less attractive.
The past year was difficult for bottom-up investors such as us given the primacy of macroeconomic factors over company fundamentals as the key driver of returns. On a longer-term basis, however, we believe an emphasis on owning good companies with favorable earnings prospects can translate to positive relative performance. With this as background, we maintained a steady approach of investing in small-cap companies that we believe have the potential to thrive in any environment by virtue of their healthy organic growth.
Joseph Axtell, CFA
Portfolio Manager
The views expressed reflect those of the portfolio management team only through the end of the period of the report as stated on the cover. The management team's views are subject to change at any time based on market and other conditions and should not be construed as a recommendation. Past performance is no guarantee of future results. Current and future portfolio holdings are subject to risk.
1 The S&P Developed SmallCap Index tracks the performance of small-capitalization stocks in 22 countries. Index returns do not reflect fees or expenses and it is not possible to invest directly in an index.
2 "Overweight" means that the Fund holds a higher weighting in a given sector or stock compared with its benchmark index."Underweight" means that the Fund holds a lower weighting in a given sector or stock.
3 Contribution and detraction incorporate both an investment's total return and its weighting in the fund.
4 Consumer discretionary represents industries that produce goods and services that are not necessities in everyday life.
* Not held in the portfolio as of December 31, 2016.
Portfolio Summary (Unaudited)
| Asset Allocation (As a % of Investment Portfolio excluding Securities Lending Collateral) | 12/31/16 | 12/31/15 |
| | | |
| Common Stocks | 97% | 98% |
| Cash Equivalents | 3% | 2% |
| Convertible Preferred Stock | 0% | 0% |
| Warrant | 0% | 0% |
| | 100% | 100% |
| Geographical Diversification (As a % of Investment Portfolio excluding Cash Equivalents and Securities Lending Collateral) | 12/31/16 | 12/31/15 |
| | | |
| United States | 55% | 42% |
| Japan | 10% | 10% |
| United Kingdom | 8% | 13% |
| Germany | 4% | 7% |
| France | 3% | 4% |
| Ireland | 3% | 5% |
| Canada | 2% | 2% |
| Italy | 2% | 2% |
| Netherlands | 2% | 3% |
| Hong Kong | 1% | 2% |
| Malaysia | 0% | 2% |
| Other | 10% | 8% |
| | 100% | 100% |
| Sector Diversification (As a % of Investment Portfolio excluding Cash Equivalents and Securities Lending Collateral) | 12/31/16 | 12/31/15 |
| | | |
| Consumer Discretionary | 23% | 26% |
| Industrials | 19% | 22% |
| Information Technology | 19% | 15% |
| Health Care | 12% | 13% |
| Financials | 11% | 11% |
| Materials | 5% | 1% |
| Consumer Staples | 5% | 7% |
| Energy | 5% | 3% |
| Real Estate | 1% | 2% |
| | 100% | 100% |
Portfolio holdings and characteristics are subject to change.
For more complete details about the Fund's investment portfolio, see page 6.
Following the Fund's fiscal first and third quarter-end, a complete portfolio holdings listing is filed with the SEC on Form N-Q. The form will be available on the SEC's Web site at sec.gov, and it also may be reviewed and copied at the SEC's Public Reference Room in Washington, D.C. Information on the operation of the SEC's Public Reference Room may be obtained by calling (800) SEC-0330. The Fund's portfolio holdings are also posted on deutschefunds.com from time to time. Please see the Fund's current prospectus for more information.
Investment Portfolio December 31, 2016
| |
Shares | Value ($) |
| | | |
| Common Stocks 96.9% |
| Australia 0.7% |
| Austal Ltd. (Cost $528,329) | 529,709 | 666,661 |
| Bermuda 1.0% |
| Lazard Ltd. "A" (a) (Cost $549,757) | 22,449 | 922,429 |
| Canada 2.2% |
| Detour Gold Corp.* | 33,100 | 450,898 |
| Quebecor, Inc. "B" | 30,781 | 855,582 |
| SunOpta, Inc.* (b) | 100,054 | 705,381 |
| (Cost $1,792,216) | 2,011,861 |
| China 0.7% |
| Minth Group Ltd. (Cost $70,637) | 215,036 | 669,496 |
| Finland 1.1% |
| Cramo Oyj (Cost $834,274) | 39,353 | 984,941 |
| France 2.5% |
| Altran Technologies SA* | 75,964 | 1,110,153 |
| Flamel Technologies SA (ADR)* | 114,494 | 1,189,593 |
| (Cost $2,357,282) | 2,299,746 |
| Germany 3.4% |
| M.A.X. Automation AG | 78,909 | 477,699 |
| PATRIZIA Immobilien AG* | 42,562 | 709,309 |
| Rational AG | 1,247 | 557,306 |
| United Internet AG (Registered) | 23,979 | 936,879 |
| VIB Vermoegen AG | 22,000 | 456,097 |
| (Cost $1,277,294) | 3,137,290 |
| Hong Kong 1.0% |
| Techtronic Industries Co., Ltd. (Cost $302,134) | 245,041 | 879,126 |
| India 1.0% |
| WNS Holdings Ltd. (ADR)* (Cost $989,045) | 34,321 | 945,544 |
| Indonesia 1.0% |
| PT Arwana Citramulia Tbk | 8,241,409 | 318,622 |
| PT Matahari Department Store Tbk | 515,300 | 578,641 |
| (Cost $1,085,394) | 897,263 |
| Ireland 2.4% |
| Greencore Group PLC | 193,191 | 588,514 |
| Paddy Power Betfair PLC | 6,450 | 690,249 |
| Ryanair Holdings PLC* | 59,579 | 913,775 |
| (Cost $939,515) | 2,192,538 |
| Israel 1.0% |
| Mellanox Technologies Ltd.* (a) (Cost $973,428) | 22,498 | 920,168 |
| Italy 2.0% |
| Moncler SpA | 53,800 | 936,705 |
| Prysmian SpA | 36,037 | 925,811 |
| (Cost $1,560,897) | 1,862,516 |
| Japan 9.2% |
| Ai Holdings Corp. | 37,317 | 741,970 |
| Anicom Holdings, Inc. (b) | 26,300 | 545,062 |
| Daikyonishikawa Corp. | 76,300 | 980,557 |
| |
Shares | Value ($) |
| | | |
| Kusuri no Aoki Holdings Co., Ltd. | 15,458 | 687,757 |
| MISUMI Group, Inc. | 20,774 | 341,822 |
| Nippon Seiki Co., Ltd. | 28,964 | 617,199 |
| Optex Co., Ltd. | 28,000 | 612,620 |
| Syuppin Co., Ltd. | 55,900 | 715,658 |
| Topcon Corp. | 28,200 | 424,311 |
| United Arrows Ltd. | 24,557 | 677,915 |
| Universal Entertainment Corp.* | 15,314 | 442,605 |
| UT Group Co., Ltd.* (b) | 103,924 | 854,613 |
| Zenkoku Hosho Co., Ltd. | 25,500 | 818,919 |
| (Cost $6,464,530) | 8,461,008 |
| Korea 1.0% |
| i-SENS, Inc. | 19,340 | 470,770 |
| Vieworks Co., Ltd.* | 9,522 | 471,449 |
| (Cost $1,128,175) | 942,219 |
| Malaysia 0.3% |
| Tune Protect Group Bhd. (Cost $435,302) | 855,914 | 271,030 |
| Netherlands 1.9% |
| Brunel International NV | 25,115 | 407,005 |
| Core Laboratories NV (b) (c) | 6,197 | 743,888 |
| SBM Offshore NV | 35,997 | 565,680 |
| (Cost $1,425,956) | 1,716,573 |
| Panama 0.9% |
| Banco Latinoamericano de Comercio Exterior SA "E" (Cost $632,388) | 26,626 | 783,869 |
| Spain 1.0% |
| Talgo SA 144A* | 109,400 | 520,292 |
| Telepizza Group SA 144A* | 79,606 | 378,345 |
| (Cost $1,156,824) | 898,637 |
| Sweden 1.1% |
| Nobina AB 144A (Cost $738,909) | 176,497 | 985,911 |
| Taiwan 0.6% |
| Basso Industry Corp. (Cost $467,474) | 172,000 | 499,900 |
| United Kingdom 7.6% |
| Arrow Global Group PLC | 158,762 | 581,273 |
| Auto Trader Group PLC 144A | 91,274 | 460,786 |
| Babcock International Group PLC | 72,531 | 852,261 |
| Cardtronics PLC "A"* (a) | 22,575 | 1,231,918 |
| Clinigen Healthcare Ltd.* | 75,548 | 663,249 |
| Domino's Pizza Group PLC | 128,186 | 571,311 |
| Electrocomponents PLC | 154,300 | 907,701 |
| Hargreaves Lansdown PLC | 27,923 | 417,497 |
| Polypipe Group PLC | 123,640 | 493,055 |
| Scapa Group PLC | 187,102 | 769,144 |
| (Cost $5,088,801) | 6,948,195 |
| United States 53.3% |
| Advance Auto Parts, Inc. | 4,033 | 682,061 |
| Affiliated Managers Group, Inc.* | 7,800 | 1,133,340 |
| Akorn, Inc.* | 19,588 | 427,606 |
| AZZ, Inc. | 15,239 | 973,772 |
| Belden, Inc. | 9,100 | 680,407 |
| Berry Plastics Group, Inc.* | 17,171 | 836,743 |
| |
Shares | Value ($) |
| | | |
| BioScrip, Inc.* (b) | 246,700 | 256,568 |
| Casey's General Stores, Inc. | 12,546 | 1,491,468 |
| Cognex Corp. | 14,819 | 942,785 |
| Cynosure, Inc. "A"* | 11,400 | 519,840 |
| Del Taco Restaurants, Inc.* | 90,698 | 1,280,656 |
| Deluxe Corp. | 11,100 | 794,871 |
| Diamondback Energy, Inc.* | 10,712 | 1,082,555 |
| Dolby Laboratories, Inc. "A" | 13,400 | 605,546 |
| FCB Financial Holdings, Inc. "A"* | 18,879 | 900,528 |
| Fox Factory Holding Corp.* | 32,204 | 893,661 |
| Gentherm, Inc.* | 31,493 | 1,066,038 |
| Gibraltar Industries, Inc.* | 21,573 | 898,515 |
| Hain Celestial Group, Inc.* | 14,946 | 583,342 |
| Harman International Industries, Inc. | 4,142 | 460,425 |
| HD Supply Holdings, Inc.* | 10,700 | 454,857 |
| Helen of Troy Ltd.* | 11,200 | 945,840 |
| Horizon Global Corp.* | 36,900 | 885,600 |
| Inphi Corp.* | 17,115 | 763,671 |
| Jack in the Box, Inc. | 11,253 | 1,256,285 |
| Kindred Healthcare, Inc. | 49,509 | 388,646 |
| Knowles Corp.* (b) | 60,776 | 1,015,567 |
| Leucadia National Corp. | 39,618 | 921,118 |
| Ligand Pharmaceuticals, Inc.* | 4,480 | 455,213 |
| Manitowoc Foodservice, Inc.* | 56,940 | 1,100,650 |
| Masonite International Corp.* | 10,632 | 699,586 |
| Matador Resources Co.* | 34,637 | 892,249 |
| MAXIMUS, Inc. | 12,612 | 703,623 |
| Middleby Corp.* | 7,106 | 915,324 |
| Molina Healthcare, Inc.* | 18,606 | 1,009,562 |
| NETGEAR, Inc.* | 13,300 | 722,855 |
| Neurocrine Biosciences, Inc.* | 11,274 | 436,304 |
| On Assignment, Inc.* | 15,670 | 691,987 |
| Pacira Pharmaceuticals, Inc.* | 20,097 | 649,133 |
| PAREXEL International Corp.* | 14,950 | 982,514 |
| Patterson-UTI Energy, Inc. | 27,600 | 742,992 |
| Primoris Services Corp. | 53,145 | 1,210,643 |
| Providence Service Corp.* | 26,138 | 994,551 |
| Retrophin, Inc.* | 56,926 | 1,077,609 |
| Sinclair Broadcast Group, Inc. "A" | 33,245 | 1,108,721 |
| South State Corp. | 8,387 | 733,024 |
| Super Micro Computer, Inc.* | 22,238 | 623,776 |
| Teladoc, Inc.* (b) | 44,900 | 740,850 |
| Tenneco, Inc.* | 15,938 | 995,647 |
| TiVo Corp.* | 21,408 | 447,427 |
| |
Shares | Value ($) |
| | | |
| Trinseo SA | 22,445 | 1,330,988 |
| TriState Capital Holdings, Inc.* | 41,337 | 913,548 |
| United States Steel Corp. | 26,596 | 877,934 |
| Urban Outfitters, Inc.* | 25,245 | 718,978 |
| WABCO Holdings, Inc.* | 10,820 | 1,148,543 |
| WEX, Inc.* | 7,161 | 799,168 |
| Xactly Corp.* | 48,020 | 528,220 |
| Zions Bancorp. | 25,682 | 1,105,353 |
| Zoe's Kitchen, Inc.* (b) | 14,102 | 338,307 |
| (Cost $38,925,729) | 48,837,590 |
| Total Common Stocks (Cost $69,724,290) | 88,734,511 |
| |
| Convertible Preferred Stock 0.2% |
| United States |
| Providence Service Corp. (Cost $196,900) | 1,969 | 187,865 |
| |
| Warrant 0.0% |
| France |
| Parrot SA, Expiration Date 12/22/2022* (Cost $0) | 26,460 | 11,874 |
| |
| Securities Lending Collateral 5.0% |
| Government & Agency Securities Portfolio "Deutsche Government Cash Institutional Shares", 0.42% (d) (e) (Cost $4,586,846) | 4,586,846 | 4,586,846 |
| |
| Cash Equivalents 2.8% |
| Deutsche Central Cash Management Government Fund, 0.49% (e) (Cost $2,544,314) | 2,544,314 | 2,544,314 |
| | % of Net Assets | Value ($) |
| | |
| Total Investment Portfolio (Cost $77,052,350)† | 104.9 | 96,065,410 |
| Other Assets and Liabilities, Net | (4.9) | (4,464,256) |
| Net Assets | 100.0 | 91,601,154 |
* Non-income producing security.
† The cost for federal income tax purposes was $78,131,528. At December 31, 2016, net unrealized appreciation for all securities based on tax cost was $17,933,882. This consisted of aggregate gross unrealized appreciation for all securities in which there was an excess of value over tax cost of $21,890,954 and aggregate gross unrealized depreciation for all securities in which there was an excess of tax cost over value of $3,957,072.
(a) Listed on the NASDAQ Exchange.
(b) All or a portion of these securities were on loan. In addition, "Other Assets and Liabilities, Net" may include pending sales that are also on loan. The value of securities loaned at December 31, 2016 amounted to $4,429,627, which is 4.8% of net assets.
(c) Listed on the New York Stock Exchange.
(d) Represents collateral held in connection with securities lending. Income earned by the Fund is net of borrower rebates.
(e) Affiliated fund managed by Deutsche Investment Management Americas Inc. The rate shown is the annualized seven-day yield at period end.
144A: Security exempt from registration under Rule 144A of the Securities Act of 1933. These securities may be resold in transactions exempt from registration, normally to qualified institutional buyers.
ADR: American Depositary Receipt
Fair Value Measurements
Various inputs are used in determining the value of the Fund's investments. These inputs are summarized in three broad levels. Level 1 includes quoted prices in active markets for identical securities. Level 2 includes other significant observable inputs (including quoted prices for similar securities, interest rates, prepayment speeds and credit risk). Level 3 includes significant unobservable inputs (including the Fund's own assumptions in determining the fair value of investments). The level assigned to the securities valuations may not be an indication of the risk or liquidity associated with investing in those securities.
The following is a summary of the inputs used as of December 31, 2016 in valuing the Fund's investments. For information on the Fund's policy regarding the valuation of investments, please refer to the Security Valuation section of Note A in the accompanying Notes to Financial Statements.
| Assets | Level 1 | Level 2 | Level 3 | Total |
| |
| Common Stocks | | | | |
| | Australia | $ — | $ 666,661 | $ — | $ 666,661 |
| | Bermuda | 922,429 | — | — | 922,429 |
| | Canada | 2,011,861 | — | — | 2,011,861 |
| | China | — | 669,496 | — | 669,496 |
| | Finland | — | 984,941 | — | 984,941 |
| | France | 1,189,593 | 1,110,153 | — | 2,299,746 |
| | Germany | — | 3,137,290 | — | 3,137,290 |
| | Hong Kong | — | 879,126 | — | 879,126 |
| | India | 945,544 | — | — | 945,544 |
| | Indonesia | — | 897,263 | — | 897,263 |
| | Ireland | — | 2,192,538 | — | 2,192,538 |
| | Israel | 920,168 | — | — | 920,168 |
| | Italy | — | 1,862,516 | — | 1,862,516 |
| | Japan | — | 8,461,008 | — | 8,461,008 |
| | Korea | — | 942,219 | — | 942,219 |
| | Malaysia | — | 271,030 | — | 271,030 |
| | Netherlands | 743,888 | 972,685 | — | 1,716,573 |
| | Panama | 783,869 | — | — | 783,869 |
| | Spain | — | 898,637 | — | 898,637 |
| | Sweden | — | 985,911 | — | 985,911 |
| | Taiwan | — | 499,900 | — | 499,900 |
| | United Kingdom | 1,231,918 | 5,716,277 | — | 6,948,195 |
| | United States | 48,837,590 | — | — | 48,837,590 |
| Convertible Preferred Stock | — | — | 187,865 | 187,865 |
| Warrant | — | — | 11,874 | 11,874 |
| Short-Term Investments (f) | 7,131,160 | — | — | 7,131,160 |
| Total | $64,718,020 | $31,147,651 | $ 199,739 | $96,065,410 |
(f) See Investment Portfolio for additional detailed categorizations.
Level 3 Reconciliation
The following is a reconciliation of the Fund's Level 3 investments for which significant unobservable inputs were used in determining value:
| | Common Stocks | Convertible Preferred Stocks | Warrants | Total |
| Balance as of December 31, 2015 | $907,524 | $ 231,659 | $ 25,056 | $1,164,239 |
| Realized gains (loss) | (76,542) | — | — | (76,542) |
| Change in unrealized appreciation (depreciation) | 36,523 | (43,794) | (13,182) | (20,453) |
| Purchases | — | — | — | — |
| (Sales) | (867,505) | — | — | (867,505) |
| Transfer into Level 3 | — | — | — | — |
| Transfer (out) of Level 3 | — | — | — | — |
| Balance as of December 31, 2016 | $ — | $ 187,865 | $ 11,874 | $ 199,739 |
| Net change in unrealized appreciation (depreciation) from investments still held as of December 31, 2016 | $ — | $ (43,794) | $(13,182) | $ (56,976) |
There have been no transfers between fair value measurement levels during the year ended December 31, 2016.
The accompanying notes are an integral part of the financial statements.
Statement of Assets and Liabilities
| as of December 31, 2016 |
| Assets |
Investments: Investments in non-affiliated securities, at value (cost $69,921,190) — including $4,429,627 of securities loaned | $ 88,934,250 |
| Investment in Government & Agency Securities Portfolio (cost $4,586,846)* | 4,586,846 |
| Investment in Deutsche Central Cash Management Government Fund (cost $2,544,314) | 2,544,314 |
| Total investments in securities, at value (cost $77,052,350) | 96,065,410 |
| Foreign currency, at value (cost $152,983) | 148,650 |
| Receivable for investments sold | 1,088,874 |
| Receivable for Fund shares sold | 7,401 |
| Dividends receivable | 44,185 |
| Interest receivable | 10,528 |
| Foreign taxes recoverable | 31,576 |
| Other assets | 2,079 |
| Total assets | 97,398,703 |
| Liabilities |
| Payable upon return of securities loaned | 4,586,846 |
| Payable for investments purchased | 947,511 |
| Payable for Fund shares redeemed | 101,032 |
| Accrued management fee | 59,732 |
| Accrued Trustees' fees | 2,142 |
| Other accrued expenses and payables | 100,286 |
| Total liabilities | 5,797,549 |
| Net assets, at value | $ 91,601,154 |
| Net Assets Consist of |
| Distributions in excess of net investment income | (433,580) |
Net unrealized appreciation (depreciation) on: Investments | 19,013,060 |
| Foreign currency | (10,737) |
| Accumulated net realized gain (loss) | 7,578,814 |
| Paid-in capital | 65,453,597 |
| Net assets, at value | $ 91,601,154 |
Class A Net Asset Value, offering and redemption price per share ($89,029,120 ÷ 7,559,752 outstanding shares of beneficial interest, $.01 par value, unlimited number of shares authorized) | $ 11.78 |
Class B Net Asset Value, offering and redemption price per share ($2,572,034 ÷ 224,620 outstanding shares of beneficial interest, $.01 par value, unlimited number of shares authorized) | $ 11.45 |
* Represents collateral on securities loaned.
The accompanying notes are an integral part of the financial statements.
Statement of Operations
| for the year ended December 31, 2016 |
| Investment Income |
Income: Dividends (net of foreign taxes withheld of $95,639) | $ 991,743 |
| Income distributions — Deutsche Central Cash Management Government Fund | 12,184 |
| Securities lending income, net of borrower rebates | 141,757 |
| Total income | 1,145,684 |
Expenses: Management fee | 824,046 |
| Administration fee | 92,590 |
| Services to shareholders | 2,668 |
| Record keeping fee (Class B) | 949 |
| Distribution service fee (Class B) | 6,271 |
| Custodian fee | 57,183 |
| Professional fees | 68,482 |
| Reports to shareholders | 25,977 |
| Trustees' fees and expenses | 6,935 |
| Other | 7,658 |
| Total expenses before expense reductions | 1,092,759 |
| Expense reductions | (138,174) |
| Total expenses after expense reductions | 954,585 |
| Net investment income (loss) | 191,099 |
| Realized and Unrealized Gain (Loss) |
Net realized gain (loss) from: Investments | 8,692,127 |
| Foreign currency | (25,984) |
| | 8,666,143 |
Change in net unrealized appreciation (depreciation) on: Investments | (8,353,372) |
| Foreign currency | 5,379 |
| | (8,347,993) |
| Net gain (loss) | 318,150 |
| Net increase (decrease) in net assets resulting from operations | $ 509,249 |
The accompanying notes are an integral part of the financial statements.
Statements of Changes in Net Assets
| Increase (Decrease) in Net Assets | Years Ended December 31, |
| 2016 | 2015 |
Operations: Net investment income (loss) | $ 191,099 | $ 539,119 |
| Net realized gain (loss) | 8,666,143 | 11,501,605 |
| Change in net unrealized appreciation (depreciation) | (8,347,993) | (9,986,449) |
| Net increase (decrease) in net assets resulting from operations | 509,249 | 2,054,275 |
Distributions to shareholders from: Net investment income: Class A | (351,519) | (1,276,149) |
| Class B | (3,345) | (19,017) |
Net realized gains: Class A | (10,844,338) | (13,898,697) |
| Class B | (308,285) | (305,692) |
| Total distributions | (11,507,487) | (15,499,555) |
Fund share transactions: Class A Proceeds from shares sold | 4,096,927 | 4,131,476 |
| Reinvestment of distributions | 11,195,858 | 15,174,846 |
| Payments for shares redeemed | (19,689,215) | (36,780,664) |
| Net increase (decrease) in net assets from Class A share transactions | (4,396,430) | (17,474,342) |
Class B Proceeds from shares sold | 238,868 | 564,366 |
| Reinvestment of distributions | 311,629 | 324,709 |
| Payments for shares redeemed | (366,666) | (706,649) |
| Net increase (decrease) in net assets from Class B share transactions | 183,831 | 182,426 |
| Increase (decrease) in net assets | (15,210,837) | (30,737,196) |
| Net assets at beginning of period | 106,811,991 | 137,549,187 |
| Net assets at end of period (including distributions in excess of net investment income of $433,580 and $906,116, respectively) | $ 91,601,154 | $106,811,991 |
| Other Information |
Class A Shares outstanding at beginning of period | 7,905,300 | 9,224,528 |
| Shares sold | 354,371 | 286,903 |
| Shares issued to shareholders in reinvestment of distributions | 973,553 | 1,081,600 |
| Shares redeemed | (1,673,472) | (2,687,731) |
| Net increase (decrease) in Class A shares | (345,548) | (1,319,228) |
| Shares outstanding at end of period | 7,559,752 | 7,905,300 |
Class B Shares outstanding at beginning of period | 207,982 | 194,372 |
| Shares sold | 20,941 | 41,126 |
| Shares issued to shareholders in reinvestment of distributions | 27,824 | 23,684 |
| Shares redeemed | (32,127) | (51,200) |
| Net increase (decrease) in Class B shares | 16,638 | 13,610 |
| Shares outstanding at end of period | 224,620 | 207,982 |
The accompanying notes are an integral part of the financial statements.
Financial Highlights
| Class A | |
Years Ended December 31, |
| 2016 | 2015 | 2014 | 2013 | 2012 |
| Selected Per Share Data |
| Net asset value, beginning of period | $ 13.17 | $ 14.61 | $ 17.31 | $ 13.78 | $ 12.67 |
Income (loss) from investment operations: Net investment income (loss)a | .03 | .06 | .04 | .04 | .09 |
| Net realized and unrealized gain (loss) | .15 | .21 | (.69) | 4.66 | 1.83 |
| Total from investment operations | .18 | .27 | (.65) | 4.70 | 1.92 |
Less distributions from: Net investment income | (.05) | (.14) | (.15) | (.10) | (.09) |
| Net realized gains | (1.52) | (1.57) | (1.90) | (1.07) | (.72) |
| Total distributions | (1.57) | (1.71) | (2.05) | (1.17) | (.81) |
| Net asset value, end of period | $ 11.78 | $ 13.17 | $ 14.61 | $ 17.31 | $ 13.78 |
| Total Return (%)b | 1.57 | 1.16 | (4.13) | 35.94 | 15.37 |
| Ratios to Average Net Assets and Supplemental Data |
| Net assets, end of period ($ millions) | 89 | 104 | 135 | 154 | 124 |
| Ratio of expenses before expense reductions (%) | 1.17 | 1.12 | 1.13 | 1.14 | 1.11 |
| Ratio of expenses after expense reductions (%) | 1.02 | .99 | .97 | .94 | .98 |
| Ratio of net investment income (loss) (%) | .22 | .41 | .27 | .28 | .69 |
| Portfolio turnover rate (%) | 41 | 27 | 33 | 39 | 36 |
a Based on average shares outstanding during the period. b Total return would have been lower had certain expenses not been reduced. |
| Class B | |
Years Ended December 31, |
| 2016 | 2015 | 2014 | 2013 | 2012 |
| Selected Per Share Data |
| Net asset value, beginning of period | $ 12.85 | $ 14.29 | $ 16.97 | $ 13.52 | $ 12.45 |
Income (loss) from investment operations: Net investment income (loss)a | (.03) | .02 | .00* | .01 | .06 |
| Net realized and unrealized gain (loss) | .17 | .21 | (.67) | 4.57 | 1.79 |
| Total from investment operations | .14 | .23 | (.67) | 4.58 | 1.85 |
Less distributions from: Net investment income | (.02) | (.10) | (.11) | (.06) | (.06) |
| Net realized gains | (1.52) | (1.57) | (1.90) | (1.07) | (.72) |
| Total distributions | (1.54) | (1.67) | (2.01) | (1.13) | (.78) |
| Net asset value, end of period | $ 11.45 | $ 12.85 | $ 14.29 | $ 16.97 | $ 13.52 |
| Total Return (%)b | 1.34 | .86 | (4.33) | 35.67 | 15.01 |
| Ratios to Average Net Assets and Supplemental Data |
| Net assets, end of period ($ millions) | 3 | 3 | 3 | 3 | 2 |
| Ratio of expenses before expense reductions (%) | 1.47 | 1.41 | 1.41 | 1.34 | 1.43 |
| Ratio of expenses after expense reductions (%) | 1.30 | 1.24 | 1.25 | 1.15 | 1.23 |
| Ratio of net investment income (loss) (%) | (.23) | .15 | .02 | .07 | .44 |
| Portfolio turnover rate (%) | 41 | 27 | 33 | 39 | 36 |
a Based on average shares outstanding during the period. b Total return would have been lower had certain expenses not been reduced. * Amount is less than $.005. |
Notes to Financial Statements
A. Organization and Significant Accounting Policies
Deutsche Variable Series I (the "Trust") is registered under the Investment Company Act of 1940, as amended (the "1940 Act"), as an open-end, registered management investment company organized as a Massachusetts business trust. The Trust consists of five diversified funds: Deutsche Bond VIP, Deutsche Capital Growth VIP, Deutsche Core Equity VIP, Deutsche CROCI® International VIP and Deutsche Global Small Cap VIP (individually or collectively hereinafter referred to as a "Fund" or the "Funds"). These financial statements report on Deutsche Global Small Cap VIP. The Trust is intended to be the underlying investment vehicle for variable annuity contracts and variable life insurance policies to be offered by the separate accounts of certain life insurance companies ("Participating Insurance Companies").
Multiple Classes of Shares of Beneficial Interest. The Fund offers two classes of shares (Class A shares and Class B shares). Class B shares are subject to Rule 12b-1 distribution fees under the 1940 Act and recordkeeping fees equal to an annual rate of 0.25% and up to 0.15%, respectively, of the average daily net assets of the Class B shares of the Fund. Class A shares are not subject to such fees.
Investment income, realized and unrealized gains and losses, and certain fund-level expenses and expense reductions, if any, are borne pro rata on the basis of relative net assets by the holders of all classes of shares, except that each class bears certain expenses unique to that class (including the applicable 12b-1 distribution fees). Differences in class-level expenses may result in payment of different per share dividends by class. All shares have equal rights with respect to voting subject to class-specific arrangements.
The Fund's financial statements are prepared in accordance with accounting principles generally accepted in the United States of America ("U.S. GAAP") which require the use of management estimates. Actual results could differ from those estimates. The Fund qualifies as an investment company under Topic 946 of Accounting Standards Codification of U.S. GAAP. The policies described below are followed consistently by the Fund in the preparation of its financial statements.
Security Valuation. Investments are stated at value determined as of the close of regular trading on the New York Stock Exchange on each day the exchange is open for trading.
Various inputs are used in determining the value of the Fund's investments. These inputs are summarized in three broad levels. Level 1 includes quoted prices in active markets for identical securities. Level 2 includes other significant observable inputs (including quoted prices for similar securities, interest rates, prepayment speeds and credit risk). Level 3 includes significant unobservable inputs (including the Fund's own assumptions in determining the fair value of investments). The level assigned to the securities valuations may not be an indication of the risk or liquidity associated with investing in those securities.
Equity securities are valued at the most recent sale price or official closing price reported on the exchange (U.S. or foreign) or over-the-counter market on which they trade. Securities for which no sales are reported are valued at the calculated mean between the most recent bid and asked quotations on the relevant market or, if a mean cannot be determined, at the most recent bid quotation. Equity securities are generally categorized as Level 1 securities. For certain international equity securities, in order to adjust for events which may occur between the close of the foreign exchanges and the close of the New York Stock Exchange, a fair valuation model may be used. This fair valuation model takes into account comparisons to the valuation of American Depository Receipts (ADRs), exchange-traded funds, futures contracts and certain indices and these securities are categorized as Level 2.
Investments in open-end investment companies are valued at their net asset value each business day and are categorized as Level 1.
Securities and other assets for which market quotations are not readily available or for which the above valuation procedures are deemed not to reflect fair value are valued in a manner that is intended to reflect their fair value as determined in accordance with procedures approved by the Trustees and are generally categorized as Level 3. In accordance with the Fund's valuation procedures, factors considered in determining value may include, but are not limited to, the type of the security; the size of the holding; the initial cost of the security; the existence of any contractual restrictions on the security's disposition; the price and extent of public trading in similar securities of the issuer or of comparable companies; quotations or evaluated prices from broker-dealers and/or pricing services; information obtained from the issuer, analysts, and/or the appropriate stock exchange (for exchange-traded securities); an analysis of the company's or issuer's financial statements; an evaluation of the forces that influence the issuer and the market(s) in which the security is purchased and sold; and with respect to debt securities, the maturity, coupon, creditworthiness, currency denomination and the movement of the market in which the security is normally traded. The value determined under these procedures may differ from published values for the same securities.
Disclosure about the classification of fair value measurements is included in a table following the Fund's Investment Portfolio.
Securities Lending. Brown Brothers Harriman & Co., as lending agent, lends securities of the Fund to certain financial institutions under the terms of its securities lending agreement. During the term of the loans, the Fund continues to receive interest and dividends generated by the securities and to participate in any changes in their market value. The Fund requires the borrowers of the securities to maintain collateral with the Fund consisting of either cash or liquid, unencumbered assets having a value at least equal to the value of the securities loaned. When the collateral falls below specified amounts, the lending agent will use its best effort to obtain additional collateral on the next business day to meet required amounts under the securities lending agreement. As of period end, any securities on loan were collateralized by cash. During the year ended December 31, 2016, the Fund invested the cash collateral into a joint trading account in affiliated money market funds managed by Deutsche Investment Management Americas Inc. As of December 31, 2016, the Fund invested the cash collateral in Government & Agency Securities Portfolio. Deutsche Investment Management Americas Inc. receives a management/administration fee (0.09% annualized effective rate as of December 31, 2016) on the cash collateral invested in Government & Agency Securities Portfolio. The Fund receives compensation for lending its securities either in the form of fees or by earning interest on invested cash collateral net of borrower rebates and fees paid to a lending agent. Either the Fund or the borrower may terminate the loan at any time, and the borrower, after notice, is required to return borrowed securities within a standard time period. There may be risks of delay and costs in recovery of securities or even loss of rights in the collateral should the borrower of the securities fail financially. If the Fund is not able to recover securities lent, the Fund may sell the collateral and purchase a replacement investment in the market, incurring the risk that the value of the replacement security is greater than the value of the collateral. The Fund is also subject to all investment risks associated with the reinvestment of any cash collateral received, including, but not limited to, interest rate, credit and liquidity risk associated with such investments.
As of December 31, 2016, the Fund had securities on loan, which were classified as common stock in the Investment Portfolio. The value of the related collateral exceeded the value of the securities loaned at period end. As of period end, the remaining contractual maturity of the collateral agreements were overnight and continuous.
Foreign Currency Translations. The books and records of the Fund are maintained in U.S. dollars. Investment securities and other assets and liabilities denominated in a foreign currency are translated into U.S. dollars at the prevailing exchange rates at period end. Purchases and sales of investment securities, income and expenses are translated into U.S. dollars at the prevailing exchange rates on the respective dates of the transactions.
Net realized and unrealized gains and losses on foreign currency transactions represent net gains and losses between trade and settlement dates on securities transactions, the acquisition and disposition of foreign currencies, and the difference between the amount of net investment income accrued and the U.S. dollar amount actually received. The portion of both realized and unrealized gains and losses on investments that results from fluctuations in foreign currency exchange rates is not separately disclosed but is included with net realized and unrealized gain/appreciation and loss/depreciation on investments.
Taxes. The Fund is treated as a separate taxpayer as provided for in the Internal Revenue Code, as amended. It is the Fund's policy to comply with the requirements of the Internal Revenue Code, as amended, which are applicable to regulated investment companies, and to distribute all of its taxable income to the separate accounts of the Participating Insurance Companies which hold its shares.
Additionally, the Fund may be subject to taxes imposed by the governments of countries in which it invests and are generally based on income and/or capital gains earned or repatriated, a portion of which may be recoverable. Based upon the current interpretation of the tax rules and regulations, estimated tax liabilities and recoveries on certain foreign securities are recorded on an accrual basis and are reflected as components of interest income or net change in unrealized gain/loss on investments. Tax liabilities realized as a result of security sales are reflected as a component of net realized gain/loss on investments.
The Fund has reviewed the tax positions for the open tax years as of December 31, 2016 and has determined that no provision for income tax and/or uncertain tax provisions is required in the Fund's financial statements. The Fund's federal tax returns for the prior three fiscal years remain open subject to examination by the Internal Revenue Service.
Distribution of Income and Gains. Distributions from net investment income of the Fund, if any, are declared and distributed to shareholders annually. Net realized gains from investment transactions, in excess of available capital loss carryforwards, would be taxable to the Fund if not distributed, and, therefore, will be distributed to shareholders at least annually. The Fund may also make additional distributions for tax purposes if necessary.
The timing and characterization of certain income and capital gain distributions are determined annually in accordance with federal tax regulations which may differ from accounting principles generally accepted in the United States of America. These differences primarily relate to income received from passive foreign investment companies and certain securities sold at a loss. As a result, net investment income (loss) and net realized gain (loss) on investment transactions for a reporting period may differ significantly from distributions during such period. Accordingly, the Fund may periodically make reclassifications among certain of its capital accounts without impacting the net asset value of the Fund.
At December 31, 2016, the Fund's components of distributable earnings (accumulated losses) on a tax basis are as follows:
| Undistributed long-term capital gains | $ 8,224,413 |
| Net unrealized appreciation (depreciation) on investments | $ 17,933,882 |
In addition, the tax character of distributions paid to shareholders by the Fund is summarized as follows:
| | Years Ended December 31, |
| 2016 | 2015 |
| Distributions from ordinary Income* | $ 325,380 | $ 1,295,166 |
| Distributions from long-term capital gains | $ 11,182,107 | $ 14,204,389 |
* For tax purposes, short-term capital gain distributions are considered ordinary income distributions.
Expenses. Expenses of the Trust arising in connection with a specific Fund are allocated to that Fund. Other Trust expenses which cannot be directly attributed to a Fund are apportioned among the Funds in the Trust based upon the relative net assets or other appropriate measures.
Contingencies. In the normal course of business, the Fund may enter into contracts with service providers that contain general indemnification clauses. The Fund's maximum exposure under these arrangements is unknown, as this would involve future claims that may be made against the Fund that have not yet been made. However, based on experience, the Fund expects the risk of loss to be remote.
Other. Investment transactions are accounted for on a trade date plus one basis for daily net asset value calculations. However, for financial reporting purposes, investment transactions are reported on trade date. Interest income is recorded on the accrual basis net of foreign withholding taxes. Dividend income is recorded on the ex-dividend date net of foreign withholding taxes. Certain dividends from foreign securities may be recorded subsequent to the ex-dividend date as soon as the Fund is informed of such dividends. Realized gains and losses from investment transactions are recorded on an identified cost basis. Proceeds from litigation payments, if any, are included in net realized gain (loss) from investments.
B. Purchases and Sales of Securities
During the year ended December 31, 2016, purchases and sales of investment securities (excluding short-term investments) aggregated $37,264,851 and $51,582,167, respectively.
C. Related Parties
Management Agreement. Under the Investment Management Agreement with Deutsche Investment Management Americas Inc. ("DIMA" or the "Advisor"), an indirect, wholly owned subsidiary of Deutsche Bank AG, the Advisor directs the investments of the Fund in accordance with its investment objectives, policies and restrictions. The Advisor determines the securities, instruments and other contracts relating to investments to be purchased, sold or entered into by the Fund.
Pursuant to the Investment Management Agreement with the Advisor, the Fund pays a monthly management fee based on the Fund's average daily net assets, computed and accrued daily and payable monthly, at the following annual rates:
| First $500 million of average daily net assets | .890% |
| Next $500 million of average daily net assets | .875% |
| Next $1 billion of average daily net assets | .860% |
| Over $2 billion of average daily net assets | .845% |
Accordingly, for the year ended December 31, 2016, the fee pursuant to the Investment Management Agreement was equivalent to an annual rate (exclusive of any applicable waivers/reimbursements) of 0.89% of the Fund's average daily net assets.
For the period from January 1, 2016 through April 30, 2016, the Advisor had contractually agreed to waive all or a portion of its fees and/or reimburse certain operating expenses of the Fund to the extent necessary to maintain the total annual operating expenses (excluding certain expenses such as extraordinary expenses, taxes, brokerage and interest) of each class as follows:
For the period from May 1, 2016 through September 30, 2016, the Advisor had contractually agreed to waive all or a portion of its fees and/or reimburse certain operating expenses of the Fund to the extent necessary to maintain the total annual operating expenses (excluding certain expenses such as extraordinary expenses, taxes, brokerage and interest) of each class as follows:
Effective October 1, 2016 through September 30, 2017, the Advisor has contractually agreed to waive all or a portion of its fees and/or reimburse certain operating expenses of the Fund to the extent necessary to maintain the total annual operating expenses (excluding certain expenses such as extraordinary expenses, taxes, brokerage and interest) of each class as follows:
For the year ended December 31, 2016, fees waived and/or expenses reimbursed for each class are as follows:
| Class A | $ 133,949 |
| Class B | 4,225 |
| | $ 138,174 |
Administration Fee. Pursuant to an Administrative Services Agreement, DIMA provides most administrative services to the Fund. For all services provided under the Administrative Services Agreement, the Fund pays the Advisor an annual fee ("Administration Fee") of 0.10% of the Fund's average daily net assets, computed and accrued daily and payable monthly. For the year ended December 31, 2016, the Administration Fee was $92,590, of which $7,806 is unpaid.
Service Provider Fees. Deutsche AM Service Company ("DSC"), an affiliate of the Advisor, is the transfer agent, dividend-paying agent and shareholder service agent for the Fund. Pursuant to a sub-transfer agency agreement between DSC and DST Systems, Inc. ("DST"), DSC has delegated certain transfer agent, dividend-paying agent and shareholder service agent functions to DST. DSC compensates DST out of the shareholder servicing fee it receives from the Fund. For the year ended December 31, 2016, the amounts charged to the Fund by DSC were as follows:
| Services to Shareholders | Total Aggregated | Unpaid at December 31, 2016 |
| Class A | $ 475 | $ 119 |
| Class B | 183 | 45 |
| | $ 658 | $ 164 |
Distribution Service Agreement. Deutsche AM Distributors, Inc. ("DDI"), also an affiliate of the Advisor, is the Trust's Distributor. In accordance with the Master Distribution Plan, DDI receives 12b-1 fees of 0.25% of average daily net assets of Class B shares. Pursuant to the Master Distribution Plan, DDI remits these fees to the Participating Insurance Companies for various costs incurred or paid by these companies in connection with marketing and distribution of Class B shares. For the year ended December 31, 2016, the Distribution Service Fee aggregated $6,271, of which $541 is unpaid.
Typesetting and Filing Service Fees. Under an agreement with DIMA, DIMA is compensated for providing typesetting and certain regulatory filing services to the Fund. For the year ended December 31, 2016, the amount charged to the Fund by DIMA included in the Statement of Operations under "Reports to shareholders" aggregated $12,121, of which $4,941 is unpaid.
Trustees' Fees and Expenses. The Fund paid retainer fees to each Trustee not affiliated with the Advisor, plus specified amounts to the Board Chairperson and Vice Chairperson and to each committee Chairperson.
Affiliated Cash Management Vehicles. The Fund may invest uninvested cash balances in Deutsche Central Cash Management Government Fund and Deutsche Variable NAV Money Fund, affiliated money market funds which are managed by the Advisor. Each affiliated money market fund is managed in accordance with Rule 2a-7 under the 1940 Act, which governs the quality, maturity, diversity and liquidity of instruments in which a money market fund may invest. Deutsche Central Cash Management Government Fund seeks to maintain a stable net asset value, and Deutsche Variable NAV Money Fund maintains a floating net asset value. The Fund indirectly bears its proportionate share of the expenses of each affiliated money market fund in which it invests. Deutsche Central Cash Management Government Fund does not pay the Advisor an investment management fee. To the extent that Deutsche Variable NAV Money Fund pays an investment management fee to the Advisor, the Advisor will waive an amount of the investment management fee payable to the Advisor by the Fund equal to the amount of the investment management fee payable on the Fund's assets invested in Deutsche Variable NAV Money Fund.
D. Ownership of the Fund
At December 31, 2016, three participating insurance companies were owners of record of 10% or more of the total outstanding Class A shares of the Fund, each owning 39%, 16% and 14%, respectively. Two participating insurance companies were owners of record of 10% or more of the total outstanding Class B shares of the Fund, each owning 69% and 17%, respectively.
E. Line of Credit
The Fund and other affiliated funds (the "Participants") share in a $400 million revolving credit facility provided by a syndication of banks. The Fund may borrow for temporary or emergency purposes, including the meeting of redemption requests that otherwise might require the untimely disposition of securities. The Participants are charged an annual commitment fee which is allocated based on net assets, among each of the Participants. Interest is calculated at a rate per annum equal to the sum of the Federal Funds Rate plus 1.25 percent plus if the one-month LIBOR exceeds the Federal Funds Rate, the amount of such excess. The Fund may borrow up to a maximum of 33 percent of its net assets under the agreement. The Fund had no outstanding loans at December 31, 2016.
Report of Independent Registered Public Accounting Firm
To the Board of Trustees of Deutsche Variable Series I and the Shareholders of Deutsche Global Small Cap VIP:
In our opinion, the accompanying statement of assets and liabilities, including the investment portfolio, and the related statements of operations and of changes in net assets and the financial highlights present fairly, in all material respects, the financial position of Deutsche Global Small Cap VIP (the "Fund") at December 31, 2016 and the results of its operations, the changes in its net assets, and the financial highlights for the periods indicated therein, in conformity with accounting principles generally accepted in the United States of America. These financial statements and financial highlights (hereafter referred to as "financial statements") are the responsibility of the Fund's management. Our responsibility is to express an opinion on these financial statements based on our audits. We conducted our audits of these financial statements in accordance with the standards of the Public Company Accounting Oversight Board (United States). Those standards require that we plan and perform the audit to obtain reasonable assurance about whether the financial statements are free of material misstatement. An audit includes examining, on a test basis, evidence supporting the amounts and disclosures in the financial statements, assessing the accounting principles used and significant estimates made by management, and evaluating the overall financial statement presentation. We believe that our audits, which included confirmation of securities at December 31, 2016 by correspondence with the custodian, brokers and transfer agent, and the application of alternative auditing procedures where such confirmations had not been received, provide a reasonable basis for our opinion.
Boston, Massachusetts
February 14, 2017 | PricewaterhouseCoopers LLP |
Information About Your Fund's Expenses (Unaudited)
As an investor of the Fund, you incur two types of costs: ongoing expenses and transaction costs. Ongoing expenses include management fees, distribution and service (12b-1) fees and other Fund expenses. Examples of transaction costs include contract charges, which are not shown in this section. The following tables are intended to help you understand your ongoing expenses (in dollars) of investing in the Fund and to help you compare these expenses with the ongoing expenses of investing in other mutual funds. In the most recent six-month period, the Fund limited these expenses; had it not done so, expenses would have been higher. The example in the table is based on an investment of $1,000 invested at the beginning of the six-month period and held for the entire period (July 1, 2016 to December 31, 2016).
The tables illustrate your Fund's expenses in two ways:
— Actual Fund Return. This helps you estimate the actual dollar amount of ongoing expenses (but not transaction costs) paid on a $1,000 investment in the Fund using the Fund's actual return during the period. To estimate the expenses you paid over the period, simply divide your account value by $1,000 (for example, an $8,600 account value divided by $1,000 = 8.6), then multiply the result by the number in the "Expenses Paid per $1,000" line under the share class you hold.
— Hypothetical 5% Fund Return. This helps you to compare your Fund's ongoing expenses (but not transaction costs) with those of other mutual funds using the Fund's actual expense ratio and a hypothetical rate of return of 5% per year before expenses. Examples using a 5% hypothetical Fund return may be found in the shareholder reports of other mutual funds. The hypothetical account values and expenses may not be used to estimate the actual ending account balance or expenses you paid for the period.
Please note that the expenses shown in these tables are meant to highlight your ongoing expenses only and do not reflect any transaction costs. The "Expenses Paid per $1,000" line of the tables is useful in comparing ongoing expenses only and will not help you determine the relative total expense of owning different funds. If these transaction costs had been included, your costs would have been higher.
| Expenses and Value of a $1,000 Investment for the six months ended December 31, 2016 |
| Actual Fund Return | Class A | | Class B | |
| Beginning Account Value 7/1/16 | $1,000.00 | | $1,000.00 | |
| Ending Account Value 12/31/16 | $1,079.80 | | $1,079.20 | |
| Expenses Paid per $1,000* | $ 5.38 | | $ 6.90 | |
| Hypothetical 5% Fund Return | Class A | | Class B | |
| Beginning Account Value 7/1/16 | $1,000.00 | | $1,000.00 | |
| Ending Account Value 12/31/16 | $1,019.96 | | $1,018.50 | |
| Expenses Paid per $1,000* | $ 5.23 | | $ 6.70 | |
* Expenses are equal to the Fund's annualized expense ratio for each share class, multiplied by the average account value over the period, multiplied by 184 (the number of days in the most recent six-month period), then divided by 366.
| Annualized Expense Ratios | | Class A | | Class B | |
| Deutsche Variable Series I — Deutsche Global Small Cap VIP | | 1.03% | | 1.32% | |
For more information, please refer to the Fund's prospectus.
These tables do not reflect charges and fees ("contract charges") associated with the separate account that invests in the Fund or any variable life insurance policy or variable annuity contract for which the Fund is an investment option.
For an analysis of the fees associated with an investment in the fund or similar funds, please refer to the current and hypothetical expense calculators for Variable Insurance Products which can be found at deutschefunds.com/EN/resources/calculators.jsp.
Tax Information (Unaudited)
The Fund paid distributions of $1.52 per share from net long-term capital gains during its year ended December 31, 2016.
Pursuant to Section 852 of the Internal Revenue Code, the Fund designates $9,108,000 as capital gain dividends for its year ended December 31, 2016.
For corporate shareholders of the Fund, 55% of the ordinary dividends (i.e., income dividends plus short-term capital gains) paid during the Fund's fiscal year ended December 31, 2016 qualified for the dividends received deduction.
Please consult a tax advisor if you have questions about federal or state income tax laws, or on how to prepare your tax returns. If you have specific questions about your account, please contact your insurance provider.
Proxy Voting
The Trust's policies and procedures for voting proxies for portfolio securities and information about how the Trust voted proxies related to its portfolio securities during the most recent 12-month period ended June 30 are available on our Web site — deutschefunds.com (click on "proxy voting"at the bottom of the page) — or on the SEC's Web site — sec.gov. To obtain a written copy of the Trust's policies and procedures without charge, upon request, call us toll free at (800) 728-3337.
Advisory Agreement Board Considerations and Fee Evaluation
The Board of Trustees (hereinafter referred to as the "Board" or "Trustees") approved the renewal of Deutsche Global Small Cap VIP’s (the "Fund") investment management agreement (the "Agreement") with Deutsche Investment Management Americas Inc. ("DIMA") in September 2016.
In terms of the process that the Board followed prior to approving the Agreement, shareholders should know that:
— During the entire process, all of the Fund’s Trustees were independent of DIMA and its affiliates (the "Independent Trustees").
— The Board met frequently during the past year to discuss fund matters and dedicated a substantial amount of time to contract review matters. Over the course of several months, the Board’s Contract Committee reviewed extensive materials received from DIMA, independent third parties and independent counsel. These materials included an analysis of the Fund’s performance, fees and expenses, and profitability from a fee consultant retained by the Fund’s Independent Trustees (the "Fee Consultant"). The Board also received extensive information throughout the year regarding performance of the Fund.
— The Independent Trustees regularly meet privately with counsel to discuss contract review and other matters. In addition, the Independent Trustees were advised by the Fee Consultant in the course of their review of the Fund’s contractual arrangements and considered a comprehensive report prepared by the Fee Consultant in connection with their deliberations.
— In connection with reviewing the Agreement, the Board also reviewed the terms of the Fund’s Rule 12b-1 plan, distribution agreement, administrative services agreement, transfer agency agreement and other material service agreements.
— Based on its evaluation of the information provided, the Contract Committee presented its findings and recommendations to the Board. The Board then reviewed the Contract Committee’s findings and recommendations.
In connection with the contract review process, the Contract Committee and the Board considered the factors discussed below, among others. The Board also considered that DIMA and its predecessors have managed the Fund since its inception, and the Board believes that a long-term relationship with a capable, conscientious advisor is in the best interests of the Fund. The Board considered, generally, that shareholders chose to invest or remain invested in the Fund knowing that DIMA managed the Fund, and that the Agreement was approved by the Fund’s shareholders. DIMA is part of Deutsche Bank AG’s ("Deutsche Bank") Asset Management ("Deutsche AM") division. Deutsche AM is a global asset management business that offers a wide range of investing expertise and resources, including research capabilities in many countries throughout the world. Deutsche Bank has advised the Board that the U.S. asset management business continues to be a critical and integral part of Deutsche Bank, and that Deutsche Bank will continue to invest in Deutsche AM and seek to enhance Deutsche AM’s investment platform. Deutsche Bank also has confirmed its commitment to maintaining strong legal and compliance groups within the Deutsche AM division.
As part of the contract review process, the Board carefully considered the fees and expenses of each Deutsche fund overseen by the Board in light of the fund’s performance. In many cases, this led to the negotiation and implementation of expense caps. As part of these negotiations, the Board indicated that it would consider relaxing these caps in future years following sustained improvements in performance, among other considerations.
While shareholders may focus primarily on fund performance and fees, the Fund’s Board considers these and many other factors, including the quality and integrity of DIMA’s personnel and such other issues as back-office operations, fund valuations, and compliance policies and procedures.
Nature, Quality and Extent of Services. The Board considered the terms of the Agreement, including the scope of advisory services provided under the Agreement. The Board noted that, under the Agreement, DIMA provides portfolio management services to the Fund and that, pursuant to a separate administrative services agreement, DIMA provides administrative services to the Fund. The Board considered the experience and skills of senior management and investment personnel and the resources made available to such personnel. The Board reviewed the Fund’s performance over short-term and long-term periods and compared those returns to various agreed-upon performance measures, including market index(es) and a peer universe compiled using information supplied by Morningstar Direct ("Morningstar"), an independent fund data service. The Board also noted that it has put into place a process of identifying "Focus Funds" (e.g., funds performing poorly relative to a peer universe), and receives additional reporting from DIMA regarding such funds and, where appropriate, DIMA’s plans to address underperformance. The Board believes this process is an effective manner of identifying and addressing underperforming funds. Based on the information provided, the Board noted that for the one-, three- and five-year periods ended December 31, 2015, the Fund’s performance (Class A shares) was in the 2nd quartile, 2nd quartile and 3rd quartile, respectively, of the applicable Morningstar universe (the 1st quartile being the best performers and the 4th quartile being the worst performers). The Board also observed that the Fund has outperformed its benchmark in the one-year period and has underperformed its benchmark in the three- and five-year periods ended December 31, 2015. The Board observed that there were significant limitations to the usefulness of the comparative data provided by Morningstar, noting that the applicable Morningstar universe for the Fund included funds that pursue substantially different investment programs as compared to that pursued by the Fund.
Fees and Expenses. The Board considered the Fund’s investment management fee schedule, operating expenses and total expense ratios, and comparative information provided by Broadridge Financial Solutions, Inc. ("Broadridge") and the Fee Consultant regarding investment management fee rates paid to other investment advisors by similar funds (1st quartile being the most favorable and 4th quartile being the least favorable). With respect to management fees paid to other investment advisors by similar funds, the Board noted that the contractual fee rates paid by the Fund, which include a 0.10% fee paid to DIMA under the Fund’s administrative services agreement, were higher than the median (4th quartile) of the applicable Broadridge peer group (based on Broadridge data provided as of December 31, 2015). The Board noted that the Fund’s Class A shares total (net) operating expenses were expected to be higher than the median (3rd quartile) of the applicable Broadridge expense universe (based on Broadridge data provided as of December 31, 2015, and analyzing Broadridge expense universe Class A (net) expenses less any applicable 12b-1 fees) ("Broadridge Universe Expenses"). The Board also reviewed data comparing each share class’s total (net) operating expenses to the applicable Broadridge Universe Expenses. The Board noted that the expense limitations agreed to by DIMA were expected to help the Fund’s total (net) operating expenses remain competitive. The Board also observed that the Broadridge expense universe for the Fund included funds that pursue substantially different investment programs as compared to that pursued by the Fund. The Board considered the Fund’s management fee rate as compared to fees charged by DIMA to a comparable Deutsche U.S. registered fund ("Deutsche Funds") and considered differences between the Fund and the comparable Deutsche Fund. The information requested by the Board as part of its review of fees and expenses also included information about institutional accounts (including any sub-advised funds and accounts) and funds offered primarily to European investors ("Deutsche Europe funds") managed by Deutsche AM. The Board noted that DIMA indicated that Deutsche AM manages an institutional account comparable to the Fund, but that Deutsche AM does not manage any comparable Deutsche Europe funds. The Board took note of the differences in services provided to Deutsche Funds as compared to institutional accounts and that such differences made comparison difficult.
On the basis of the information provided, the Board concluded that management fees were reasonable and appropriate in light of the nature, quality and extent of services provided by DIMA.
Profitability. The Board reviewed detailed information regarding revenues received by DIMA under the Agreement. The Board considered the estimated costs and pre-tax profits realized by DIMA from advising the Deutsche Funds, as well as estimates of the pre-tax profits attributable to managing the Fund in particular. The Board also received information regarding the estimated enterprise-wide profitability of DIMA and its affiliates with respect to all fund services in totality and by fund. The Board and the Fee Consultant reviewed DIMA’s methodology in allocating its costs to the management of the Fund. Based on the information provided, the Board concluded that the pre-tax profits realized by DIMA in connection with the management of the Fund were not unreasonable. The Board also reviewed certain publicly available information regarding the profitability of certain similar investment management firms. The Board noted that while information regarding the profitability of such firms is limited (and in some cases is not necessarily prepared on a comparable basis), DIMA and its affiliates’ overall profitability with respect to the Deutsche Funds (after taking into account distribution and other services provided to the funds by DIMA and its affiliates) was lower than the overall profitability levels of most comparable firms for which such data was available.
Economies of Scale. The Board considered whether there are economies of scale with respect to the management of the Fund and whether the Fund benefits from any economies of scale. The Board noted that the Fund’s investment management fee schedule includes fee breakpoints. The Board concluded that the Fund’s fee schedule represents an appropriate sharing between the Fund and DIMA of such economies of scale as may exist in the management of the Fund at current asset levels.
Other Benefits to DIMA and Its Affiliates. The Board also considered the character and amount of other incidental benefits received by DIMA and its affiliates, including any fees received by DIMA for administrative services provided to the Fund and any fees received by an affiliate of DIMA for distribution services. The Board also considered benefits to DIMA related to brokerage and soft-dollar allocations, including allocating brokerage to pay for research generated by parties other than the executing broker dealers, which pertain primarily to funds investing in equity securities, along with the incidental public relations benefits to DIMA related to Deutsche Funds advertising and cross-selling opportunities among DIMA products and services. The Board considered these benefits in reaching its conclusion that the Fund’s management fees were reasonable.
Compliance. The Board considered the significant attention and resources dedicated by DIMA to documenting and enhancing its compliance processes in recent years. The Board noted in particular (i) the experience, seniority and time commitment of the individuals serving as DIMA’s and the Fund’s chief compliance officers; (ii) the large number of DIMA compliance personnel; and (iii) the substantial commitment of resources by DIMA and its affiliates to compliance matters.
Based on all of the information considered and the conclusions reached, the Board unanimously determined that the continuation of the Agreement is in the best interests of the Fund. In making this determination, the Board did not give particular weight to any single factor identified above. The Board considered these factors over the course of numerous meetings, certain of which were in executive session with only the Independent Trustees and counsel present. It is possible that individual Independent Trustees may have weighed these factors differently in reaching their individual decisions to approve the continuation of the Agreement.
Board Members and Officers
The following table presents certain information regarding the Board Members and Officers of the fund. Each Board Member's year of birth is set forth in parentheses after his or her name. Unless otherwise noted, (i) each Board Member has engaged in the principal occupation(s) noted in the table for at least the most recent five years, although not necessarily in the same capacity; and (ii) the address of each Independent Board Member is c/o Keith R. Fox, Deutsche Funds Board Chair, c/o Thomas R. Hiller, Ropes & Gray LLP, Prudential Tower, 800 Boylston Street, Boston, MA 02199-3600. Except as otherwise noted below, the term of office for each Board Member is until the election and qualification of a successor, or until such Board Member sooner dies, resigns, is removed or as otherwise provided in the governing documents of the fund. Because the fund does not hold an annual meeting of shareholders, each Board Member will hold office for an indeterminate period. The Board Members may also serve in similar capacities with other funds in the fund complex.
| Independent Board Members |
| Name, Year of Birth, Position with the Fund and Length of Time Served1 | Business Experience and Directorships During the Past Five Years | Number of Funds in Deutsche Fund Complex Overseen | Other Directorships Held by Board Member |
Keith R. Fox, CFA (1954) Chairperson since 2017,2 and Board Member since 1996 | Managing General Partner, Exeter Capital Partners (a series of private investment funds) (since 1986). Directorships: Progressive International Corporation (kitchen goods importer and distributor); The Kennel Shop (retailer); former Chairman, National Association of Small Business Investment Companies; former Directorships: BoxTop Media Inc. (advertising); Sun Capital Advisers Trust (mutual funds) (2011–2012) | 98 | — |
Kenneth C. Froewiss (1945) Vice Chairperson since 2017,2 Board Member since 2001, and Chairperson (2013–December 31, 2016) | Retired Clinical Professor of Finance, NYU Stern School of Business (1997–2014); Member, Finance Committee, Association for Asian Studies (2002–present); Director, Mitsui Sumitomo Insurance Group (US) (2004–present); prior thereto, Managing Director, J.P. Morgan (investment banking firm) (until 1996) | 98 | — |
John W. Ballantine (1946) Board Member since 1999 | Retired; formerly, Executive Vice President and Chief Risk Management Officer, First Chicago NBD Corporation/The First National Bank of Chicago (1996–1998); Executive Vice President and Head of International Banking (1995–1996); former Directorships: Director and former Chairman of the Board, Healthways, Inc.3 (population well-being and wellness services) (2003–2014); Stockwell Capital Investments PLC (private equity); First Oak Brook Bancshares, Inc. and Oak Brook Bank; Prisma Energy International | 98 | Portland General Electric3 (utility company) (2003– present) |
Henry P. Becton, Jr. (1943) Board Member since 1990 | Vice Chair and former President, WGBH Educational Foundation. Directorships: Public Radio International; Public Radio Exchange (PRX); The Pew Charitable Trusts (charitable organization); former Directorships: Becton Dickinson and Company3 (medical technology company); Belo Corporation3 (media company); The PBS Foundation; Association of Public Television Stations; Boston Museum of Science; American Public Television; Concord Academy; New England Aquarium; Mass. Corporation for Educational Telecommunications; Committee for Economic Development; Public Broadcasting Service; Connecticut College; North Bennett Street School (Boston) | 98 | — |
Dawn-Marie Driscoll (1946) Board Member since 1987 | Emeritus Executive Fellow, Center for Business Ethics, Bentley University; formerly: President, Driscoll Associates (consulting firm); Partner, Palmer & Dodge (law firm) (1988–1990); Vice President of Corporate Affairs and General Counsel, Filene's (retail) (1978–1988). Directorships: Advisory Board, Center for Business Ethics, Bentley University; Trustee and former Chairman of the Board, Southwest Florida Community Foundation (charitable organization); former Directorships: ICI Mutual Insurance Company (2007–2015); Sun Capital Advisers Trust (mutual funds) (2007–2012), Investment Company Institute (audit, executive, nominating committees) and Independent Directors Council (governance, executive committees) | 98 | — |
Paul K. Freeman (1950) Board Member since 1993 | Consultant, World Bank/Inter-American Development Bank; Chair, Independent Directors Council; Investment Company Institute (executive and nominating committees); formerly, Chairman of Education Committee of Independent Directors Council; Project Leader, International Institute for Applied Systems Analysis (1998–2001); Chief Executive Officer, The Eric Group, Inc. (environmental insurance) (1986–1998); Directorships: Denver Zoo Foundation (December 2012–present); former Directorships: Prisma Energy International | 98 | — |
Richard J. Herring (1946) Board Member since 1990 | Jacob Safra Professor of International Banking and Professor, Finance Department, The Wharton School, University of Pennsylvania (since July 1972); Co-Director, Wharton Financial Institutions Center; formerly: Vice Dean and Director, Wharton Undergraduate Division (July 1995–June 2000); Director, Lauder Institute of International Management Studies (July 2000–June 2006) | 98 | Director, Aberdeen Singapore and Japan Funds (since 2007); Independent Director of Barclays Bank Delaware (since September 2010) |
William McClayton (1944) Board Member since 2004, and Vice Chairperson (2013–December 31, 2016) | Private equity investor (since October 2009); previously, Managing Director, Diamond Management & Technology Consultants, Inc. (global consulting firm) (2001–2009); Directorship: Board of Managers, YMCA of Metropolitan Chicago; formerly: Senior Partner, Arthur Andersen LLP (accounting) (1966–2001); Trustee, Ravinia Festival | 98 | — |
Rebecca W. Rimel (1951) Board Member since 1995 | President, Chief Executive Officer and Director, The Pew Charitable Trusts (charitable organization) (1994–present); formerly: Executive Vice President, The Glenmede Trust Company (investment trust and wealth management) (1983–2004); Board Member, Investor Education (charitable organization) (2004–2005); Trustee, Executive Committee, Philadelphia Chamber of Commerce (2001–2007); Director, Viasys Health Care3 (January 2007–June 2007); Trustee, Thomas Jefferson Foundation (charitable organization) (1994–2012) | 98 | Director, Becton Dickinson and Company3 (medical technology company) (2012– present); Director, BioTelemetry Inc.3 (health care) (2009– present) |
William N. Searcy, Jr. (1946) Board Member since 1993 | Private investor since October 2003; formerly: Pension & Savings Trust Officer, Sprint Corporation3 (telecommunications) (November 1989–September 2003); Trustee, Sun Capital Advisers Trust (mutual funds) (1998–2012) | 98 | — |
Jean Gleason Stromberg (1943) Board Member since 1997 | Retired. Formerly, Consultant (1997–2001); Director, Financial Markets U.S. Government Accountability Office (1996–1997); Partner, Norton Rose Fulbright, L.L.P. (law firm) (1978–1996); former Directorships: The William and Flora Hewlett Foundation (charitable organization) (2000–2015); Service Source, Inc. (nonprofit), Mutual Fund Directors Forum (2002–2004), American Bar Retirement Association (funding vehicle for retirement plans) (1987–1990 and 1994–1996) | 98 | — |
| Officers5 |
| Name, Year of Birth, Position with the Fund and Length of Time Served6 | Business Experience and Directorships During the Past Five Years |
Brian E. Binder9 (1972) President and Chief Executive Officer, 2013–present | Managing Director4 and Head of US Product and Fund Administration, Deutsche Asset Management (2013–present); Director and President, Deutsche AM Service Company (since 2016); Director and Vice President, Deutsche AM Distributors, Inc. (since 2016); Director and President, DB Investment Managers, Inc. (since 2016); formerly, Head of Business Management and Consulting at Invesco, Ltd. (2010–2012) |
John Millette8 (1962) Vice President and Secretary, 1999–present | Director,4 Deutsche Asset Management; Chief Legal Officer and Secretary, Deutsche Investment Management Americas Inc. (2015–present); and Director and Vice President, Deutsche AM Trust Company (since 2016) |
Hepsen Uzcan7 (1974) Vice President, since 2016 Assistant Secretary, 2013–present | Director,4 Deutsche Asset Management |
Paul H. Schubert7 (1963) Chief Financial Officer, 2004–present Treasurer, 2005–present | Managing Director,4 Deutsche Asset Management, and Chairman, Director and President, Deutsche AM Trust Company (since 2013); Vice President, Deutsche AM Distributors, Inc. (since 2016); formerly, Director, Deutsche AM Trust Company (2004–2013) |
Caroline Pearson8 (1962) Chief Legal Officer, 2010–present | Managing Director,4 Deutsche Asset Management; Secretary, Deutsche AM Distributors, Inc.; and Secretary, Deutsche AM Service Company |
Scott D. Hogan8 (1970) Chief Compliance Officer, since 2016 | Director,4 Deutsche Asset Management |
Wayne Salit7 (1967) Anti-Money Laundering Compliance Officer, 2014–present | Director,4 Deutsche Asset Management; AML Compliance Officer, Deutsche AM Distributors, Inc.; formerly: Managing Director, AML Compliance Officer at BNY Mellon (2011–2014); and Director, AML Compliance Officer at Deutsche Bank (2004–2011) |
Paul Antosca8 (1957) Assistant Treasurer, 2007–present | Director,4 Deutsche Asset Management |
Diane Kenneally8 (1966) Assistant Treasurer, 2007–present | Director,4 Deutsche Asset Management |
1 The length of time served represents the year in which the Board Member joined the board of one or more Deutsche funds currently overseen by the Board.
2 Effective as of January 1, 2017.
3 A publicly held company with securities registered pursuant to Section 12 of the Securities Exchange Act of 1934.
4 Executive title, not a board directorship.
5 As a result of their respective positions held with the Advisor, these individuals are considered "interested persons" of the Advisor within the meaning of the 1940 Act. Interested persons receive no compensation from the fund.
6 The length of time served represents the year in which the officer was first elected in such capacity for one or more Deutsche funds.
7 Address: 60 Wall Street, New York, NY 10005.
8 Address: One Beacon Street, Boston, MA 02108.
9 Address: 222 South Riverside Plaza, Chicago, IL 60606.
The fund's Statement of Additional Information ("SAI") includes additional information about the Board Members. The SAI is available, without charge, upon request. If you would like to request a copy of the SAI, you may do so by calling the following toll-free number: (800) 728-3337.

VS1glosc-2 (R-025821-6 2/17)
| | |
| ITEM 2. | CODE OF ETHICS |
| | |
| | As of the end of the period covered by this report, the registrant has adopted a code of ethics, as defined in Item 2 of Form N-CSR that applies to its Principal Executive Officer and Principal Financial Officer. There have been no amendments to, or waivers from, a provision of the code of ethics during the period covered by this report that would require disclosure under Item 2. A copy of the code of ethics is filed as an exhibit to this Form N-CSR. |
| | |
| ITEM 3. | AUDIT COMMITTEE FINANCIAL EXPERT |
| | |
| | The fund’s audit committee is comprised solely of trustees who are "independent" (as such term has been defined by the Securities and Exchange Commission ("SEC") in regulations implementing Section 407 of the Sarbanes-Oxley Act (the "Regulations")). The fund’s Board of Trustees has determined that there are several "audit committee financial experts" (as such term has been defined by the Regulations) serving on the fund’s audit committee including Mr. Paul K. Freeman, the chair of the fund’s audit committee. An “audit committee financial expert” is not an “expert” for any purpose, including for purposes of Section 11 of the Securities Act of 1933 and the designation or identification of a person as an “audit committee financial expert” does not impose on such person any duties, obligations or liability that are greater than the duties, obligations and liability imposed on such person as a member of the audit committee and board of directors in the absence of such designation or identification. |
| | |
| ITEM 4. | PRINCIPAL ACCOUNTANT FEES AND SERVICES |
| | |
deutsche Variable Series I
form n-csr disclosure re: AUDIT FEES
The following table shows the amount of fees that PricewaterhouseCoopers, LLP (“PWC”), the Fund’s independent registered public accounting firm, billed to the Fund during the Fund’s last two fiscal years. The Audit Committee approved in advance all audit services and non-audit services that PWC provided to the Fund.
Services that the Fund’s Independent Registered Public Accounting Firm Billed to the Fund
Fiscal Year
Ended
December 31, | Audit Fees Billed to Fund | Audit-Related
Fees Billed to Fund | Tax Fees Billed to Fund | All
Other Fees Billed to Fund |
| 2016 | $289,755 | $0 | $0 | $4,500 |
| 2015 | $278,455 | $0 | $0 | $6,549 |
“All Other Fees Billed to Fund” were billed for services associated with foreign tax filings
Services that the Fund’s Independent Registered Public Accounting Firm Billed to the Adviser and Affiliated Fund Service Providers
The following table shows the amount of fees billed by PWC to Deutsche Investment Management Americas Inc. (“DIMA” or the “Adviser”), and any entity controlling, controlled by or under common control with DIMA (“Control Affiliate”) that provides ongoing services to the Fund (“Affiliated Fund Service Provider”), for engagements directly related to the Fund’s operations and financial reporting, during the Fund’s last two fiscal years.
Fiscal Year Ended
December 31, | Audit-Related
Fees Billed to Adviser and Affiliated Fund Service Providers | Tax Fees Billed to Adviser and Affiliated Fund Service Providers | All
Other Fees Billed to Adviser and Affiliated Fund Service Providers |
| 2016 | $0 | $52,339 | $0 |
| 2015 | $0 | $30,661 | $0 |
The “Tax Fees Billed to the Advisor” were billed for services associated with foreign tax filings.
Non-Audit Services
The following table shows the amount of fees that PWC billed during the Fund’s last two fiscal years for non-audit services. The Audit Committee pre-approved all non-audit services that PWC provided to the Adviser and any Affiliated Fund Service Provider that related directly to the Fund’s operations and financial reporting. The Audit Committee requested and received information from PWC about any non-audit services that PWC rendered during the Fund’s last fiscal year to the Adviser and any Affiliated Fund Service Provider. The Committee considered this information in evaluating PWC’s independence.
Fiscal Year
Ended
December 31, | Total
Non-Audit Fees Billed to Fund (A) | Total Non-Audit Fees billed to Adviser and Affiliated Fund Service Providers (engagements related directly to the operations and financial reporting of the Fund) (B) | Total Non-Audit Fees billed to Adviser and Affiliated Fund Service Providers (all other engagements) (C) | Total of (A), (B)
and (C) |
| 2016 | $4,500 | $52,339 | $0 | $56,839 |
| 2015 | $6,549 | $30,661 | $0 | $37,210 |
Audit Committee Pre-Approval Policies and Procedures. Generally, each Fund’s Audit Committee must pre approve (i) all services to be performed for a Fund by a Fund’s Independent Registered Public Accounting Firm and (ii) all non-audit services to be performed by a Fund’s Independent Registered Public Accounting Firm for the DIMA Entities with respect to operations and financial reporting of the Fund, except that the Chairperson or Vice Chairperson of each Fund’s Audit Committee may grant the pre-approval for non-audit services described in items (i) and (ii) above for non-prohibited services for engagements of less than $100,000. All such delegated pre approvals shall be presented to each Fund’s Audit Committee no later than the next Audit Committee meeting.
There were no amounts that were approved by the Audit Committee pursuant to the de minimis exception under Rule 2-01 of Regulation S-X.
According to the registrant’s principal Independent Registered Public Accounting Firm, substantially all of the principal Independent Registered Public Accounting Firm's hours spent on auditing the registrant's financial statements were attributed to work performed by full-time permanent employees of the principal Independent Registered Public Accounting Firm.
***
In connection with the audit of the 2015 and 2016 financial statements, the Fund entered into an engagement letter with PwC. The terms of the engagement letter required by PwC, and agreed to by the Fund’s Audit Committee, include a provision mandating the use of mediation and arbitration to resolve any controversy or claim between the parties arising out of or relating to the engagement letter or the services provided there-under.
***
In a letter provided to the Audit Committee pursuant to PCAOB Rule 3526 and dated July 19, 2016, PwC informed the Audit Committee that PwC had identified circumstances where PwC maintains lending relationships with owners of greater than 10% of the shares of certain investment companies within the “investment company complex” as defined under Rule 2-01(f)(14) of Regulation S-X. PwC informed the Audit Committee that these lending relationships are inconsistent with the SEC Staff’s interpretation of Rule 2-01(c)(l)(ii)(A) of Regulation S-X (referred to as the “Loan Rule”).
The Loan Rule specifically provides that an accounting firm would not be independent if it receives a loan from a lender that is a record or beneficial owner of more than ten percent of an audit client’s equity securities. For purposes of the Loan Rule, audit clients include the Fund as well as all registered investment companies advised by Deutsche Investment Management Americas Inc. (the “Adviser”), the Fund’s investment adviser, and its affiliates, including other subsidiaries of the Adviser’s parent company, Deutsche Bank AG (collectively, the “Deutsche Funds Complex”). PwC’s lending relationships effect PwC’s independence under the SEC Staff’s interpretation of the Loan Rule with respect to all investment companies in the Deutsche Funds Complex.
In its July 19, 2016 letter, PwC affirmed to the Audit Committee that, as of the date of the letter, PwC is an independent accountant with respect to the Fund, within the meaning of PCAOB Rule 3520. In its letter, PwC also informed the Audit Committee that, after evaluating the facts and circumstances and the applicable independence rules, PwC has concluded that with regard to its compliance with the independence criteria set forth in the rules and regulations of the SEC related to the Loan Rule, it believes that it remains objective and impartial despite matters that may ultimately be determined to be inconsistent with these criteria and therefore it can continue to serve as the Fund’s registered public accounting firm. PwC informed the Audit Committee that its conclusion was based on a number of factors, including, among others, PwC’s belief that the lenders are not able to impact the impartiality of PwC or assert any influence over the investment companies in the Deutsche Funds Complex whose shares the lenders own or the applicable investment company’s investment adviser; and the lenders receive no direct benefit from their ownership of the investment companies in the Deutsche Funds Complex in separate accounts maintained on behalf of their insurance contract holders. In addition, the individuals at PwC who arranged PwC’s lending relationships have no oversight of, or ability to influence, the individuals at PwC who conducted the audits of the Fund’s financial statements.
On June 20, 2016, the SEC Staff issued a “no-action” letter to another mutual fund complex (see Fidelity Management & Research Company et al., No-Action Letter) related to similar Loan Rule issues as those described above. In that letter, the SEC Staff confirmed that it would not recommend enforcement action against an investment company that relied on the audit services performed by an audit firm that was not in compliance with the Loan Rule in certain specified circumstances. The circumstances described in the no-action letter appear to be substantially similar to the circumstances that effected PwC’s independence under the Loan Rule with respect to the Fund. PwC confirmed to the Audit Committee that it meets the conditions of the no-action letter. In the no-action letter, the SEC Staff stated that the relief under the letter is temporary and will expire 18 months after the issuance of the letter.
| | |
| ITEM 5. | AUDIT COMMITTEE OF LISTED REGISTRANTS |
| | |
| | Not applicable |
| | |
| ITEM 6. | SCHEDULE OF INVESTMENTS |
| | |
| | Not applicable |
| | |
| ITEM 7. | DISCLOSURE OF PROXY VOTING POLICIES AND PROCEDURES FOR CLOSED-END MANAGEMENT INVESTMENT COMPANIES |
| | |
| | Not applicable |
| | |
| ITEM 8. | PORTFOLIO MANAGERS OF CLOSED-END MANAGEMENT INVESTMENT COMPANIES |
| | |
| | Not applicable |
| | |
| ITEM 9. | PURCHASES OF EQUITY SECURITIES BY CLOSED-END MANAGEMENT INVESTMENT COMPANY AND AFFILIATED PURCHASERS |
| | |
| | Not applicable |
| | |
| ITEM 10. | SUBMISSION OF MATTERS TO A VOTE OF SECURITY HOLDERS |
| | |
| | There were no material changes to the procedures by which shareholders may recommend nominees to the Fund’s Board. The primary function of the Nominating and Governance Committee is to identify and recommend individuals for membership on the Board and oversee the administration of the Board Governance Guidelines. Shareholders may recommend candidates for Board positions by forwarding their correspondence by U.S. mail or courier service to Keith R. Fox, Deutsche Funds Board Chair, c/o Thomas R. Hiller, Ropes & Gray LLP, Prudential Tower, 800 Boylston Street, Boston, MA 02199-3600. |
| | |
| ITEM 11. | CONTROLS AND PROCEDURES |
| | |
| | (a) | The Chief Executive and Financial Officers concluded that the Registrant’s Disclosure Controls and Procedures are effective based on the evaluation of the Disclosure Controls and Procedures as of a date within 90 days of the filing date of this report. |
| | |
| | (b) | There have been no changes in the registrant’s internal control over financial reporting that occurred during the second fiscal quarter of the period covered by this report that has materially affected, or is reasonably likely to materially affect, the registrant’s internal controls over financial reporting. |
| | |
| ITEM 12. | EXHIBITS |
| | |
| | (a)(1) | Code of Ethics pursuant to Item 2 of Form N-CSR is filed and attached hereto as EX-99.CODE ETH. |
| | |
| | (a)(2) | Certification pursuant to Rule 30a-2(a) under the Investment Company Act of 1940 (17 CFR 270.30a-2(a)) is filed and attached hereto as Exhibit 99.CERT. |
| | |
| | (b) | Certification pursuant to Rule 30a-2(b) under the Investment Company Act of 1940 (17 CFR 270.30a-2(b)) is furnished and attached hereto as Exhibit 99.906CERT. |
SIGNATURES
Pursuant to the requirements of the Securities Exchange Act of 1934 and the Investment Company Act of 1940, the registrant has duly caused this report to be signed on its behalf by the undersigned, thereunto duly authorized.
| Registrant: | Deutsche Variable Series I |
| | |
| | |
| By: | /s/Brian E. Binder Brian E. Binder President |
| | |
| Date: | February 14, 2017 |
Pursuant to the requirements of the Securities Exchange Act of 1934 and the Investment Company Act of 1940, this report has been signed below by the following persons on behalf of the registrant and in the capacities and on the dates indicated.
| By: | /s/Brian E. Binder Brian E. Binder President |
| | |
| Date: | February 14, 2017 |
| | |
| | |
| | |
| By: | /s/Paul Schubert Paul Schubert Chief Financial Officer and Treasurer |
| | |
| Date: | February 14, 2017 |
| | |