UNITED STATES
SECURITIES AND EXCHANGE COMMISSION
WASHINGTON, D. C. 20549
FORM N-CSR
Investment Company Act file number: 811-04257
DWS Variable Series I
(Exact Name of Registrant as Specified in Charter)
345 Park Avenue
New York, NY 10154-0004
(Address of Principal Executive Offices) (Zip Code)
Registrant’s Telephone Number, including Area Code: (212) 250-3220
Paul Schubert
60 Wall Street
New York, NY 10005
(Name and Address of Agent for Service)
| Date of fiscal year end: | 12/31 |
| | |
| Date of reporting period: | 12/31/2013 |
| ITEM 1. | REPORT TO STOCKHOLDERS |
December 31, 2013
Annual Report
DWS Variable Series I
DWS Bond VIP
Contents
18 Statement of Assets and Liabilities 20 Statement of Operations 21 Statement of Changes in Net Assets 23 Notes to Financial Statements 32 Report of Independent Registered Public Accounting Firm 33 Information About Your Fund's Expenses 35 Advisory Agreement Board Considerations and Fee Evaluation 38 Board Members and Officers |
This report must be preceded or accompanied by a prospectus. To obtain an additional prospectus or summary prospectus, if available, call (800) 728-3337 or your financial representative. We advise you to consider the Fund's objectives, risks, charges and expenses carefully before investing. The summary prospectus and prospectus contain this and other important information about the Fund. Please read the prospectus carefully before you invest.
Bond investments are subject to interest-rate and credit risks. When interest rates rise, bond prices generally fall. Credit risk refers to the ability of an issuer to make timely payments of principal and interest. Investments in lower-quality ("junk bonds") and non-rated securities present greater risk of loss than investments in higher-quality securities. Investing in derivatives entails special risks relating to liquidity, leverage and credit that may reduce returns and/or increase volatility. Investing in foreign securities, particularly those of emerging markets, presents certain risks, such as currency fluctuations, political and economic changes, and market risks. See the prospectus for details.
Deutsche Asset & Wealth Management represents the asset management and wealth management activities conducted by Deutsche Bank AG or any of its subsidiaries, including the Advisor and DWS Investments Distributors, Inc.
NOT FDIC/NCUA INSURED NO BANK GUARANTEE MAY LOSE VALUE NOT A DEPOSIT
NOT INSURED BY ANY FEDERAL GOVERNMENT AGENCY
Performance Summary December 31, 2013 (Unaudited)
Fund performance shown is historical, assumes reinvestment of all dividend and capital gain distributions, and does not guarantee future results. Investment return and principal value fluctuate with changing market conditions so that, when redeemed, shares may be worth more or less than their original cost. Current performance may be lower or higher than the performance data quoted. Please contact your participating insurance company for the Fund's most recent month-end performance. Performance doesn't reflect charges and fees ("contract charges") associated with the separate account that invests in the Fund or any variable life insurance policy or variable annuity contract for which the Fund is an investment option. These charges and fees will reduce returns.
The gross expense ratio of the Fund, as stated in the fee table of the prospectus dated May 1, 2013 is 0.58% for Class A shares and may differ from the expense ratio disclosed in the Financial Highlights table in this report.
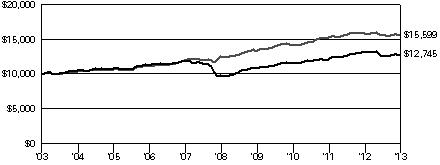
| Growth of an Assumed $10,000 Investment |
| The Barclays U.S. Aggregate Bond Index is an unmanaged index representing domestic taxable investment-grade bonds, with index components for government and corporate securities, mortgage pass-through securities, and asset-backed securities with an average maturity of one year or more. Index returns do not reflect any fees or expenses and it is not possible to invest directly into an index. |
| |
| Yearly periods ended December 31 | | |
| Comparative Results | |
| DWS Bond VIP | 1-Year | | | 3-Year | | | 5-Year | | | 10-Year | |
| Class A | Growth of $10,000 | $ | 9,697 | | | $ | 11,045 | | | $ | 12,982 | | | $ | 12,745 | |
| Average annual total return | | –3.03 | % | | | 3.37 | % | | | 5.36 | % | | | 2.46 | % |
| Barclays U.S. Aggregate Bond Index | Growth of $10,000 | $ | 9,798 | | | $ | 11,011 | | | $ | 12,427 | | | $ | 15,599 | |
| Average annual total return | | –2.02 | % | | | 3.26 | % | | | 4.44 | % | | | 4.55 | % |
The growth of $10,000 is cumulative.
Management Summary December 31, 2013 (Unaudited)
During the 12-month period ended December 31, 2013, the portfolio provided a total return of –3.03% (Class A shares, unadjusted for contract charges), compared with the –2.02% return of its benchmark, the Barclays U.S. Aggregate Bond Index.1
During the period, the U.S. Federal Reserve Board (the Fed) continued to maintain its benchmark short-term rate at or near zero levels and to engage in bond purchases designed to lower longer-term interest rates as it sought to stimulate economic growth. Longer-term, U.S. Treasury yields stayed within a fairly narrow range for the first few months of 2013, as investors attempted to assess mixed economic data. As the period progressed, economic data strengthened and there was increasing speculation that a reduction in Fed bond purchases was imminent. As a result, interest rates mostly drifted higher from May through December 2013. The year finished on a note of optimism for the economy, as third-quarter gross domestic product (GDP) growth was revised upward to a robust 4.1% and a bipartisan deal was reached on the U.S. budget. Credit-sensitive sectors generally provided strong returns over most of the period as bonds that trade at a yield advantage vs. U.S. Treasuries were sought by investors.
The portfolio's performance vs. the benchmark was driven principally by exposure to more credit-sensitive fixed-income sectors. Our significant weighting of investment-grade corporate bonds at the expense of U.S. Treasury securities was a positive contributor to returns during the year. However, our out-of-benchmark exposure to emerging-markets holdings suffered early in the year from fears of rising interest rates. More recently, our emphasis on short-dated investment-grade corporate debt within emerging markets has worked well for the portfolio. For much of the early part of the period, the portfolio was positioned with a higher overall duration and corresponding interest rate sensitivity than the benchmark, which detracted from relative return as rates rose. We remain comfortable with our overall emphasis on earning the higher yields available in credit sectors. With inflation remaining below target, there would not appear to be any substantive reason for the Fed to initiate a rapid reversal in policy. Nonetheless, given market jitters about the direction of the economy and Fed policy, we expect there will be opportunities to add value in security selection on volatility. We are somewhat cautious with respect to investment-grade corporates given current valuations and may look for opportunities to rotate into other sectors. We are maintaining a strong focus on quality and liquidity as we select individual securities within each sector.
William Chepolis, CFA
John D. Ryan
Gary Russell, CFA
Portfolio Managers
The views expressed reflect those of the portfolio management team only through the end of the period of the report as stated on the cover. The management team's views are subject to change at any time based on market and other conditions and should not be construed as a recommendation. Past performance is no guarantee of future results. Current and future portfolio holdings are subject to risk.
1 The Barclays U.S. Aggregate Bond Index is an unmanaged index representing domestic taxable investment-grade bonds, with index components for government and corporate securities, mortgage pass-through securities, and asset-backed securities with an average maturity of one year or more. Index returns do not reflect any fees or expenses and it is not possible to invest directly into an index.
Portfolio Summary (Unaudited) Asset Allocation (As a % of Total Net Assets) | 12/31/13 | 12/31/12 |
| | | |
| Corporate Bonds | 40% | 35% |
| Mortgage-Backed Securities Pass-Throughs | 27% | 34% |
| Government & Agency Obligations | 24% | 23% |
| Municipal Bonds and Notes | 7% | 6% |
| Collateralized Mortgage Obligations | 6% | 5% |
| Commercial Mortgage-Backed Securities | 6% | 5% |
| Asset-Backed | 2% | 1% |
| Cash Equivalents and other Assets and Liabilities, net | –12% | –9% |
| | 100% | 100% |
Quality (Excludes Cash Equivalents and Securities Lending Collateral) | 12/31/13 | 12/31/12 |
| | | |
| AAA | 49% | 53% |
| AA | 9% | 7% |
| A | 9% | 8% |
| BBB | 18% | 18% |
| BB or Below | 12% | 11% |
| Not Rated | 3% | 3% |
| | 100% | 100% |
| Interest Rate Sensitivity | 12/31/13 | 12/31/12 |
| | | |
| Effective Maturity | 7.7 years | 7.9 years |
| Effective Duration | 6.2 years | 4.9 years |
The quality ratings represent the higher of Moody's Investors Service, Inc. ("Moody's") or Standard & Poor's Corporation ("S&P") credit ratings. The ratings of Moody's and S&P represent their opinions as to the quality of the securities they rate. Credit quality measures a bond issuer's ability to repay interest and principal in a timely manner. Ratings are relative and subjective and are not absolute standards of quality. Credit quality does not remove market risk and is subject to change.
Effective maturity is the weighted average of the maturity date of bonds held by the Fund taking into consideration any available maturity shortening features.
Effective duration is an approximate measure of the Fund's sensitivity to interest rate changes taking into consideration any maturity shortening features.
Portfolio holdings and characteristics are subject to change.
For more complete details about the Fund's investment portfolio, see page 6.
Following the Fund's fiscal first and third quarter-end, a complete portfolio holdings listing is filed with the SEC on Form N-Q. The form will be available on the SEC's Web site at sec.gov, and it also may be reviewed and copied at the SEC's Public Reference Room in Washington, D.C. Information on the operation of the SEC's Public Reference Room may be obtained by calling (800) SEC-0330. The Fund's portfolio holdings are also posted on dws-investments.com from time to time. Please see the Fund's current prospectus for more information.
Investment Portfolio December 31, 2013 | | | Principal Amount ($)(a) | | | Value ($) | |
| | | | |
| Corporate Bonds 39.8% | |
| Consumer Discretionary 3.3% | |
| 21st Century Fox America, Inc., 144A, 4.0%, 10/1/2023 | | | 10,000 | | | | 9,884 | |
| AMC Entertainment, Inc., 8.75%, 6/1/2019 | | | | 115,000 | | | | 122,906 | |
| AmeriGas Finance LLC: | |
| 6.75%, 5/20/2020 | | | | 15,000 | | | | 16,388 | |
| 7.0%, 5/20/2022 | | | | 10,000 | | | | 10,850 | |
| APX Group, Inc., 6.375%, 12/1/2019 | | | 15,000 | | | | 15,225 | |
| Asbury Automotive Group, Inc., 8.375%, 11/15/2020 | | | 5,000 | | | | 5,619 | |
| Ashton Woods U.S.A. LLC, 144A, 6.875%, 2/15/2021 | | | 25,000 | | | | 24,687 | |
| Avis Budget Car Rental LLC, 5.5%, 4/1/2023 | | | | 15,000 | | | | 14,531 | |
| BC Mountain LLC, 144A, 7.0%, 2/1/2021 | | | | 15,000 | | | | 15,150 | |
| Boyd Gaming Corp., 9.0%, 7/1/2020 (b) | | | | 10,000 | | | | 10,950 | |
| British Sky Broadcasting Group PLC, 144A, 3.125%, 11/26/2022 | | | 330,000 | | | | 307,242 | |
| Caesar's Entertainment Operating Co., Inc.: | | | | | | | | |
| 8.5%, 2/15/2020 | | | | 55,000 | | | | 52,937 | |
| 9.0%, 2/15/2020 | | | | 15,000 | | | | 14,588 | |
| CCO Holdings LLC, 6.5%, 4/30/2021 | | | 155,000 | | | | 159,262 | |
| Cequel Communications Holdings I LLC: | | | | | | | | |
| 144A, 5.125%, 12/15/2021 | | | | 5,000 | | | | 4,688 | |
| 144A, 6.375%, 9/15/2020 | | | | 80,000 | | | | 82,000 | |
| Clear Channel Worldwide Holdings, Inc.: | | |
| Series A, 6.5%, 11/15/2022 | | | 15,000 | | | | 15,206 | |
| Series B, 6.5%, 11/15/2022 | | | 25,000 | | | | 25,531 | |
| Series B, 7.625%, 3/15/2020 | | | 75,000 | | | | 78,844 | |
| Cox Communications, Inc., 144A, 3.25%, 12/15/2022 | | | 230,000 | | | | 208,123 | |
| Delphi Corp., 5.0%, 2/15/2023 | | | 20,000 | | | | 20,575 | |
| DIRECTV Holdings LLC, 2.4%, 3/15/2017 | | | | 720,000 | | | | 733,002 | |
| DISH DBS Corp.: | |
| 4.25%, 4/1/2018 | | | | 15,000 | | | | 15,300 | |
| 5.0%, 3/15/2023 | | | | 20,000 | | | | 18,650 | |
| 7.875%, 9/1/2019 | | | | 90,000 | | | | 103,050 | |
| Ford Motor Credit Co., LLC, 3.0%, 6/12/2017 | | | | 485,000 | | | | 504,069 | |
| GLP Capital LP, 144A, 4.375%, 11/1/2018 | | | | 5,000 | | | | 5,113 | |
| Hot Topic, Inc., 144A, 9.25%, 6/15/2021 | | | | 10,000 | | | | 10,475 | |
| Live Nation Entertainment, Inc., 144A, 7.0%, 9/1/2020 | | | 20,000 | | | | 21,700 | |
| Macy's Retail Holdings, Inc., 3.875%, 1/15/2022 | | | | 300,000 | | | | 295,703 | |
| Marriott International, Inc., 3.375%, 10/15/2020 | | | | 60,000 | | | | 59,418 | |
| MDC Partners, Inc., 144A, 6.75%, 4/1/2020 | | | | 20,000 | | | | 20,925 | |
| Mediacom Broadband LLC, 6.375%, 4/1/2023 | | | | 10,000 | | | | 10,225 | |
| | | Principal Amount ($)(a) | | | Value ($) | |
| | | | | | | | | |
| MGM Resorts International: | |
| 6.625%, 12/15/2021 (b) | | | | 40,000 | | | | 42,300 | |
| 6.75%, 10/1/2020 (b) | | | | 10,000 | | | | 10,700 | |
| 8.625%, 2/1/2019 | | | | 105,000 | | | | 123,112 | |
| Midcontinent Communications & Midcontinent Finance Corp., 144A, 6.25%, 8/1/2021 | | | 10,000 | | | | 10,075 | |
| Myriad International Holdings BV, 144A, 6.0%, 7/18/2020 | | | 200,000 | | | | 214,000 | |
| PNK Finance Corp., 144A, 6.375%, 8/1/2021 | | | | 15,000 | | | | 15,338 | |
| Quebecor Media, Inc., 5.75%, 1/15/2023 | | | | 15,000 | | | | 14,513 | |
| Sirius XM Holdings, Inc., 144A, 5.875%, 10/1/2020 | | | 10,000 | | | | 10,200 | |
| SIWF Merger Sub, Inc., 144A, 6.25%, 6/1/2021 | | | 10,000 | | | | 10,088 | |
| Starz LLC, 5.0%, 9/15/2019 | | | | 10,000 | | | | 10,225 | |
| Taylor Morrison Communities, Inc., 144A, 5.25%, 4/15/2021 | | | 15,000 | | | | 14,588 | |
| Viking Cruises Ltd., 144A, 8.5%, 10/15/2022 | | | | 15,000 | | | | 16,950 | |
| | | | | 3,504,905 | |
| Consumer Staples 1.4% | |
| Anadolu Efes Biracilik Ve Malt Sanayii AS, 144A, 3.375%, 11/1/2022 (b) | | | 250,000 | | | | 198,750 | |
| B&G Foods, Inc., 4.625%, 6/1/2021 | | | 15,000 | | | | 14,400 | |
| Chiquita Brands International, Inc., 144A, 7.875%, 2/1/2021 | | | 15,000 | | | | 16,238 | |
| Controladora Mabe SA de CV, 144A, 7.875%, 10/28/2019 | | | 200,000 | | | | 223,000 | |
| ESAL GmbH, 144A, 6.25%, 2/5/2023 | | | | 200,000 | | | | 179,500 | |
| Hawk Acquisition Sub, Inc., 144A, 4.25%, 10/15/2020 | | | 65,000 | | | | 62,887 | |
| JBS U.S.A. LLC: | |
| 144A, 7.25%, 6/1/2021 | | | | 30,000 | | | | 31,200 | |
| 144A, 8.25%, 2/1/2020 | | | | 115,000 | | | | 124,775 | |
| Marfrig Holding Europe BV, 144A, 11.25%, 9/20/2021 | | | 200,000 | | | | 191,000 | |
| Pilgrim's Pride Corp., 7.875%, 12/15/2018 | | | | 115,000 | | | | 125,350 | |
| Reynolds Group Issuer, Inc.: | |
| 5.75%, 10/15/2020 | | | | 25,000 | | | | 25,500 | |
| 7.125%, 4/15/2019 | | | | 265,000 | | | | 282,225 | |
| Roundy's Supermarkets, Inc., 144A, 10.25%, 12/15/2020 | | | 15,000 | | | | 15,300 | |
| Smithfield Foods, Inc., 6.625%, 8/15/2022 | | | | 20,000 | | | | 21,200 | |
| | | | | 1,511,325 | |
| Energy 5.0% | |
| Access Midstream Partners LP, 4.875%, 5/15/2023 | | | 20,000 | | | | 19,300 | |
| Antero Resources Finance Corp., 144A, 5.375%, 11/1/2021 | | | 10,000 | | | | 10,100 | |
| Berry Petroleum Co.: | |
| 6.375%, 9/15/2022 | | | | 15,000 | | | | 15,263 | |
| 6.75%, 11/1/2020 | | | | 25,000 | | | | 25,937 | |
| BreitBurn Energy Partners LP, 7.875%, 4/15/2022 | | | 45,000 | | | | 46,800 | |
| Chaparral Energy, Inc., 7.625%, 11/15/2022 | | | | 25,000 | | | | 26,750 | |
| Crestwood Midstream Partners LP, 144A, 6.125%, 3/1/2022 | | | 10,000 | | | | 10,250 | |
| | | Principal Amount ($)(a) | | | Value ($) | |
| | | | | | | | | |
| DCP Midstream LLC, 144A, 9.75%, 3/15/2019 | | | | 760,000 | | | | 945,620 | |
| DCP Midstream Operating LP, 3.875%, 3/15/2023 (b) | | | 250,000 | | | | 230,216 | |
| Denbury Resources, Inc., 4.625%, 7/15/2023 | | | | 20,000 | | | | 18,050 | |
| Endeavor Energy Resources LP, 144A, 7.0%, 8/15/2021 | | | | 20,000 | | | | 20,200 | |
| Energy Transfer Partners LP, 4.15%, 10/1/2020 | | | | 300,000 | | | | 304,374 | |
| EP Energy LLC, 7.75%, 9/1/2022 | | | 25,000 | | | | 28,000 | |
| EPE Holdings LLC, 144A, 8.875%, 12/15/2017 (PIK) | | | | 27,228 | | | | 27,977 | |
| FMC Technologies, Inc., 3.45%, 10/1/2022 | | | | 300,000 | | | | 276,278 | |
| Halcon Resources Corp.: | |
| 8.875%, 5/15/2021 | | | | 35,000 | | | | 35,350 | |
| 9.75%, 7/15/2020 | | | | 15,000 | | | | 15,638 | |
| Kodiak Oil & Gas Corp., 5.5%, 1/15/2021 | | | | 25,000 | | | | 24,938 | |
| Linn Energy LLC, 144A, 7.0%, 11/1/2019 | | | | 150,000 | | | | 151,500 | |
| MEG Energy Corp., 144A, 7.0%, 3/31/2024 | | | | 30,000 | | | | 30,375 | |
| Midstates Petroleum Co., Inc.: | |
| 9.25%, 6/1/2021 | | | | 30,000 | | | | 31,350 | |
| 10.75%, 10/1/2020 | | | | 35,000 | | | | 38,062 | |
| Murphy Oil U.S.A., Inc., 144A, 6.0%, 8/15/2023 | | | 20,000 | | | | 20,100 | |
| Oasis Petroleum, Inc.: | |
| 6.5%, 11/1/2021 | | | | 75,000 | | | | 80,250 | |
| 144A, 6.875%, 3/15/2022 | | | | 25,000 | | | | 26,500 | |
| 6.875%, 1/15/2023 | | | | 15,000 | | | | 15,975 | |
| Offshore Drilling Holding SA, 144A, 8.375%, 9/20/2020 | | | | 200,000 | | | | 213,000 | |
| Offshore Group Investment Ltd.: | |
| 7.125%, 4/1/2023 | | | | 25,000 | | | | 25,500 | |
| 7.5%, 11/1/2019 | | | | 50,000 | | | | 54,375 | |
| ONEOK Partners LP, 6.15%, 10/1/2016 | | | | 878,000 | | | | 985,969 | |
| Pacific Drilling SA, 144A, 5.375%, 6/1/2020 | | | | 15,000 | | | | 15,075 | |
| Petroleos Mexicanos, 2.266%*, 7/18/2018 | | | | 250,000 | | | | 257,500 | |
| Rosneft Finance SA, 144A, 6.625%, 3/20/2017 | | | | 500,000 | | | | 552,500 | |
| SandRidge Energy, Inc., 7.5%, 3/15/2021 | | | | 55,000 | | | | 57,612 | |
| Tesoro Corp., 5.375%, 10/1/2022 (b) | | | | 10,000 | | | | 10,125 | |
| Transocean, Inc., 3.8%, 10/15/2022 | | | 555,000 | | | | 526,043 | |
| Ultra Petroleum Corp., 144A, 5.75%, 12/15/2018 | | | | 5,000 | | | | 5,138 | |
| Whiting Petroleum Corp., 5.0%, 3/15/2019 | | | | 15,000 | | | | 15,338 | |
| | | | | 5,193,328 | |
| Financials 15.7% | |
| American International Group, Inc., 4.875%, 6/1/2022 | | | 400,000 | | | | 429,929 | |
| American Tower Corp., (REIT), 3.5%, 1/31/2023 | | | 280,000 | | | | 255,289 | |
| Atlantic Finance Ltd., (REIT) 144A, 10.75%, 5/27/2014 | | | | 500,000 | | | | 517,299 | |
| Bank of America Corp., 3.3%, 1/11/2023 | | | | 800,000 | | | | 757,014 | |
| Barclays Bank PLC, 7.625%, 11/21/2022 (b) | | | | 1,090,000 | | | | 1,160,850 | |
| | | Principal Amount ($)(a) | | | Value ($) | |
| | | | | | | | | |
| BBVA Bancomer SA, 144A, 6.5%, 3/10/2021 | | | | 200,000 | | | | 211,000 | |
| CNA Financial Corp., 5.75%, 8/15/2021 (b) | | | | 500,000 | | | | 560,222 | |
| Cooperatieve Centrale Raiffeisen-Boerenleenbank BA, 3.95%, 11/9/2022 | | | | 525,000 | | | | 508,720 | |
| Development Bank of Kazakhstan JSC, Series 3, 6.5%, 6/3/2020 | | | | 500,000 | | | | 527,600 | |
| E*TRADE Financial Corp.: | |
| 6.375%, 11/15/2019 | | | | 40,000 | | | | 42,950 | |
| 6.75%, 6/1/2016 | | | | 205,000 | | | | 222,425 | |
| General Electric Capital Corp., 3.1%, 1/9/2023 | | | | 1,000,000 | | | | 948,758 | |
| Hartford Financial Services Group, Inc., 6.0%, 1/15/2019 | | | | 117,000 | | | | 134,189 | |
| Health Care REIT, Inc., (REIT), 4.5%, 1/15/2024 | | | | 480,000 | | | | 473,927 | |
| ING Bank NV, 144A, 2.0%, 9/25/2015 | | | | 1,310,000 | | | | 1,331,703 | |
| ING U.S., Inc., 5.7%, 7/15/2043 | | | | 335,000 | | | | 350,007 | |
| International Lease Finance Corp., 6.25%, 5/15/2019 | | | | 5,000 | | | | 5,412 | |
| Intesa Sanpaolo SpA, 3.875%, 1/16/2018 | | | | 895,000 | | | | 916,463 | |
| Itau Unibanco Holding SA, 144A, 5.5%, 8/6/2022 | | | | 200,000 | | | | 190,500 | |
| Jefferies Group LLC, 5.125%, 1/20/2023 | | | | 300,000 | | | | 303,440 | |
| JPMorgan Chase & Co., 5.125%, 9/15/2014 | | | | 1,100,000 | | | | 1,133,300 | |
| Macquarie Bank Ltd., 144A, 3.45%, 7/27/2015 | | | | 525,000 | | | | 542,929 | |
| Mizuho Bank Ltd., 144A, 2.95%, 10/17/2022 | | | | 500,000 | | | | 459,650 | |
| Morgan Stanley: | |
| 3.75%, 2/25/2023 | | | | 835,000 | | | | 812,509 | |
| 4.1%, 5/22/2023 | | | | 85,000 | | | | 82,259 | |
| Neuberger Berman Group LLC, 144A, 5.875%, 3/15/2022 | | | | 155,000 | | | | 159,650 | |
| Nordea Bank AB, 144A, 4.25%, 9/21/2022 | | | | 555,000 | | | | 548,767 | |
| OPB Finance Trust, Series C, 2.9%, 5/24/2023 | CAD | | | 380,000 | | | | 332,944 | |
| PNC Bank NA, 6.875%, 4/1/2018 | | | | 200,000 | | | | 236,469 | |
| ProLogis LP, (REIT), 4.25%, 8/15/2023 | | | | 360,000 | | | | 355,628 | |
| Royal Bank of Scotland Group PLC, 6.1%, 6/10/2023 | | | | 100,000 | | | | 100,810 | |
| SLM Corp., 5.5%, 1/25/2023 | | | | 630,000 | | | | 595,105 | |
| Societe Generale SA, 144A, 7.875%, 12/18/2023 (c) | | | | 50,000 | | | | 50,350 | |
| The Goldman Sachs Group, Inc., Series D, 6.0%, 6/15/2020 | | | | 880,000 | | | | 1,008,988 | |
| Turkiye Vakiflar Bankasi Tao, 144A, 3.75%, 4/15/2018 | | | | 250,000 | | | | 234,125 | |
| | | | | 16,501,180 | |
| Health Care 1.4% | |
| Agilent Technologies, Inc., 3.2%, 10/1/2022 (b) | | | | 300,000 | | | | 274,585 | |
| Aviv Healthcare Properties LP, 144A, 6.0%, 10/15/2021 | | | 5,000 | | | | 5,088 | |
| | | Principal Amount ($)(a) | | | Value ($) | |
| | | | | | | | | |
| Biomet, Inc.: | |
| 6.5%, 8/1/2020 | | | | 25,000 | | | | 26,250 | |
| 6.5%, 10/1/2020 | | | | 5,000 | | | | 5,150 | |
| Community Health Systems, Inc., 7.125%, 7/15/2020 | | | 125,000 | | | | 129,687 | |
| Endo Finance Co., 144A, 5.75%, 1/15/2022 | | | | 15,000 | | | | 15,075 | |
| HCA, Inc.: | |
| 6.5%, 2/15/2020 | | | | 235,000 | | | | 258,206 | |
| 7.5%, 2/15/2022 | | | | 190,000 | | | | 208,525 | |
| IMS Health, Inc., 144A, 6.0%, 11/1/2020 | | | | 15,000 | | | | 15,938 | |
| Laboratory Corp. of America Holdings, 3.75%, 8/23/2022 | | | 265,000 | | | | 256,690 | |
| LifePoint Hospitals, Inc., 144A, 5.5%, 12/1/2021 | | | 15,000 | | | | 15,056 | |
| Mallinckrodt International Finance SA, 144A, 4.75%, 4/15/2023 | | | 110,000 | | | | 101,523 | |
| Par Pharmaceutical Companies, Inc., 7.375%, 10/15/2020 | | | 20,000 | | | | 20,675 | |
| Salix Pharmaceuticals Ltd., 144A, 6.0%, 1/15/2021 | | | 15,000 | | | | 15,375 | |
| Tenet Healthcare Corp.: | |
| 4.5%, 4/1/2021 | | | | 5,000 | | | | 4,738 | |
| 6.25%, 11/1/2018 | | | | 60,000 | | | | 66,450 | |
| | | | | 1,419,011 | |
| Industrials 1.4% | |
| Accuride Corp., 9.5%, 8/1/2018 | | | 5,000 | | | | 4,888 | |
| ADT Corp., 144A, 6.25%, 10/15/2021 | | | 10,000 | | | | 10,500 | |
| Alphabet Holding Co., Inc., 7.75%, 11/1/2017 (PIK) | | | | 15,000 | | | | 15,469 | |
| Artesyn Escrow, Inc., 144A, 9.75%, 10/15/2020 | | | | 15,000 | | | | 15,750 | |
| BE Aerospace, Inc., 6.875%, 10/1/2020 | | | 55,000 | | | | 60,362 | |
| Belden, Inc., 144A, 5.5%, 9/1/2022 | | | 25,000 | | | | 24,500 | |
| Bombardier, Inc., 144A, 5.75%, 3/15/2022 | | | | 90,000 | | | | 89,325 | |
| Clean Harbors, Inc., 5.125%, 6/1/2021 | | | | 15,000 | | | | 15,150 | |
| CTP Transportation Products LLC, 144A, 8.25%, 12/15/2019 | | | 15,000 | | | | 15,638 | |
| Darling Escrow Corp., 144A, 5.375%, 1/15/2022 (d) | | | | 10,000 | | | | 10,075 | |
| DigitalGlobe, Inc., 144A, 5.25%, 2/1/2021 | | | | 10,000 | | | | 9,750 | |
| FTI Consulting, Inc., 6.0%, 11/15/2022 | | | 15,000 | | | | 15,188 | |
| Garda World Security Corp., 144A, 7.25%, 11/15/2021 | | | | 15,000 | | | | 15,113 | |
| GenCorp, Inc., 7.125%, 3/15/2021 | | | 50,000 | | | | 53,500 | |
| Georgian Railway JSC, 144A, 7.75%, 7/11/2022 | | | | 200,000 | | | | 207,740 | |
| Grupo KUO SAB de CV, 144A, 6.25%, 12/4/2022 | | | 200,000 | | | | 200,000 | |
| Ingersoll-Rand Global Holding Co., Ltd., 144A, 2.875%, 1/15/2019 | | | 10,000 | | | | 9,856 | |
| Kenan Advantage Group, Inc., 144A, 8.375%, 12/15/2018 | | | 35,000 | | | | 36,837 | |
| Meritor, Inc., 6.75%, 6/15/2021 | | | 10,000 | | | | 10,200 | |
| Navios Maritime Holdings, Inc., 144A, 7.375%, 1/15/2022 | | | 45,000 | | | | 45,225 | |
| Navios South American Logistics, Inc., 9.25%, 4/15/2019 | | | 5,000 | | | | 5,394 | |
| Odebrecht Offshore Drilling Finance Ltd., 144A, 6.75%, 10/1/2022 | | | 196,920 | | | | 201,548 | |
| | | Principal Amount ($)(a) | | | Value ($) | |
| | | | | | | | | |
| Owens Corning, Inc., 4.2%, 12/15/2022 | | | 190,000 | | | | 181,437 | |
| Titan International, Inc., 144A, 6.875%, 10/1/2020 | | | 35,000 | | | | 36,487 | |
| Total System Services, Inc., 3.75%, 6/1/2023 | | | | 30,000 | | | | 27,731 | |
| TransDigm, Inc.: | |
| 7.5%, 7/15/2021 | | | | 20,000 | | | | 21,500 | |
| 7.75%, 12/15/2018 | | | | 25,000 | | | | 26,812 | |
| United Rentals North America, Inc.: | |
| 6.125%, 6/15/2023 | | | | 5,000 | | | | 5,075 | |
| 7.625%, 4/15/2022 | | | | 85,000 | | | | 94,456 | |
| Watco Companies LLC, 144A, 6.375%, 4/1/2023 | | | 15,000 | | | | 14,850 | |
| | | | | 1,480,356 | |
| Information Technology 2.2% | |
| ACI Worldwide, Inc., 144A, 6.375%, 8/15/2020 | | | | 5,000 | | | | 5,225 | |
| Activision Blizzard, Inc., 144A, 5.625%, 9/15/2021 | | | 45,000 | | | | 46,575 | |
| Audatex North America, Inc., 144A, 6.0%, 6/15/2021 | | | 10,000 | | | | 10,475 | |
| CDW LLC, 8.5%, 4/1/2019 | | | | 160,000 | | | | 176,800 | |
| CyrusOne LP, 6.375%, 11/15/2022 | | | 5,000 | | | | 5,175 | |
| Equinix, Inc.: | |
| 5.375%, 4/1/2023 | | | | 45,000 | | | | 43,987 | |
| 7.0%, 7/15/2021 | | | | 140,000 | | | | 152,950 | |
| First Data Corp.: | |
| 144A, 6.75%, 11/1/2020 | | | | 105,000 | | | | 109,200 | |
| 144A, 7.375%, 6/15/2019 | | | | 190,000 | | | | 202,825 | |
| Fiserv, Inc., 3.5%, 10/1/2022 (b) | | | 715,000 | | | | 663,954 | |
| Freescale Semiconductor, Inc., 144A, 6.0%, 1/15/2022 | | | 15,000 | | | | 15,187 | |
| Healthcare Technology Intermediate, Inc., 144A, 7.375%, 9/1/2018 (PIK) | | | 5,000 | | | | 5,200 | |
| Hewlett-Packard Co., 3.3%, 12/9/2016 | | | 715,000 | | | | 748,338 | |
| Hughes Satellite Systems Corp.: | |
| 6.5%, 6/15/2019 | | | | 15,000 | | | | 16,237 | |
| 7.625%, 6/15/2021 | | | | 50,000 | | | | 55,750 | |
| IAC/InterActiveCorp., 4.75%, 12/15/2022 | | | | 15,000 | | | | 13,988 | |
| NCR Escrow Corp.: | |
| 144A, 5.875%, 12/15/2021 | | | | 5,000 | | | | 5,094 | |
| 144A, 6.375%, 12/15/2023 | | | | 10,000 | | | | 10,213 | |
| | | | | 2,287,173 | |
| Materials 3.8% | |
| Anglo American Capital PLC, 144A, 4.125%, 9/27/2022 | | | | 750,000 | | | | 705,199 | |
| ArcelorMittal, 6.125%, 6/1/2018 | | | 500,000 | | | | 548,750 | |
| CSN Resources SA, 144A, 6.5%, 7/21/2020 | | | | 200,000 | | | | 202,250 | |
| FMG Resources (August 2006) Pty Ltd., 144A, 6.0%, 4/1/2017 (b) | | | 375,000 | | | | 398,438 | |
| FQM Akubra, Inc.: | |
| 144A, 7.5%, 6/1/2021 | | | | 40,000 | | | | 41,800 | |
| 144A, 8.75%, 6/1/2020 | | | | 25,000 | | | | 27,125 | |
| Freeport-McMoRan Copper & Gold, Inc., 3.55%, 3/1/2022 | | | 790,000 | | | | 750,816 | |
| Glencore Funding LLC, 144A, 4.125%, 5/30/2023 | | | | 50,000 | | | | 46,726 | |
| Hexion U.S. Finance Corp.: | |
| 6.625%, 4/15/2020 | | | | 75,000 | | | | 76,875 | |
| 8.875%, 2/1/2018 | | | | 35,000 | | | | 36,356 | |
| | | Principal Amount ($)(a) | | | Value ($) | |
| | | | | | | | | |
| IAMGOLD Corp., 144A, 6.75%, 10/1/2020 | | | | 5,000 | | | | 4,300 | |
| Novelis, Inc., 8.75%, 12/15/2020 | | | 265,000 | | | | 294,813 | |
| Plastipak Holdings, Inc., 144A, 6.5%, 10/1/2021 | | | 15,000 | | | | 15,525 | |
| Polymer Group, Inc., 7.75%, 2/1/2019 | | | | 65,000 | | | | 69,306 | |
| PolyOne Corp., 5.25%, 3/15/2023 | | | 15,000 | | | | 14,625 | |
| Polyus Gold International Ltd., 144A, 5.625%, 4/29/2020 | | | 200,000 | | | | 192,750 | |
| Samarco Mineracao SA, 144A, 5.75%, 10/24/2023 | | | 200,000 | | | | 198,000 | |
| The Mosaic Co., 4.25%, 11/15/2023 | | | 390,000 | | | | 385,162 | |
| | | | | 4,008,816 | |
| Telecommunication Services 3.0% | |
| CC Holdings GS V LLC, 3.849%, 4/15/2023 | | | | 490,000 | | | | 458,690 | |
| CenturyLink, Inc.: | |
| Series V, 5.625%, 4/1/2020 | | | 5,000 | | | | 5,088 | |
| Series W, 6.75%, 12/1/2023 | | | 25,000 | | | | 25,312 | |
| Cincinnati Bell, Inc., 8.375%, 10/15/2020 | | | | 225,000 | | | | 243,562 | |
| Digicel Group Ltd., 144A, 8.25%, 9/30/2020 | | | | 42,000 | | | | 43,522 | |
| Digicel Ltd., 144A, 8.25%, 9/1/2017 | | | | 295,000 | | | | 306,800 | |
| Frontier Communications Corp.: | |
| 7.125%, 1/15/2023 | | | | 110,000 | | | | 108,625 | |
| 7.625%, 4/15/2024 | | | | 5,000 | | | | 4,988 | |
| 8.5%, 4/15/2020 | | | | 280,000 | | | | 313,600 | |
| 8.75%, 4/15/2022 | | | | 5,000 | | | | 5,550 | |
| Intelsat Jackson Holdings SA: | |
| 144A, 5.5%, 8/1/2023 | | | | 30,000 | | | | 28,537 | |
| 7.5%, 4/1/2021 | | | | 270,000 | | | | 297,675 | |
| Level 3 Communications, Inc., 8.875%, 6/1/2019 | | | 80,000 | | | | 87,400 | |
| Level 3 Financing, Inc.: | |
| 144A, 6.125%, 1/15/2021 | | | | 10,000 | | | | 10,100 | |
| 7.0%, 6/1/2020 | | | | 160,000 | | | | 169,600 | |
| MetroPCS Wireless, Inc., 6.625%, 11/15/2020 | | | | 175,000 | | | | 185,500 | |
| Oi SA, 144A, 5.75%, 2/10/2022 | | | 200,000 | | | | 184,000 | |
| SBA Communications Corp., 5.625%, 10/1/2019 | | | | 15,000 | | | | 15,450 | |
| Sprint Communications, Inc.: | |
| 6.0%, 11/15/2022 | | | | 25,000 | | | | 24,375 | |
| 8.375%, 8/15/2017 | | | | 60,000 | | | | 69,450 | |
| Sprint Corp., 144A, 7.125%, 6/15/2024 | | | | 15,000 | | | | 15,225 | |
| T-Mobile U.S.A., Inc.: | |
| 6.125%, 1/15/2022 | | | | 5,000 | | | | 5,088 | |
| 6.5%, 1/15/2024 | | | | 5,000 | | | | 5,063 | |
| tw telecom holdings, Inc.: | |
| 5.375%, 10/1/2022 | | | | 15,000 | | | | 14,738 | |
| 144A, 5.375%, 10/1/2022 | | | | 5,000 | | | | 4,913 | |
| 144A, 6.375%, 9/1/2023 | | | | 15,000 | | | | 15,600 | |
| Verizon Communications, Inc., 6.55%, 9/15/2043 | | | 120,000 | | | | 140,395 | |
| Windstream Corp.: | |
| 6.375%, 8/1/2023 | | | | 15,000 | | | | 14,025 | |
| 7.5%, 4/1/2023 | | | | 5,000 | | | | 5,025 | |
| 7.75%, 10/15/2020 (b) | | | | 325,000 | | | | 344,906 | |
| 7.75%, 10/1/2021 | | | | 40,000 | | | | 42,400 | |
| | | | | 3,195,202 | |
| | | Principal Amount ($)(a) | | | Value ($) | |
| | | | | | | | | |
| Utilities 2.6% | |
| AES Corp., 8.0%, 10/15/2017 | | | | 20,000 | | | | 23,500 | |
| American Electric Power Co., Inc., Series F, 2.95%, 12/15/2022 | | | 410,000 | | | | 379,168 | |
| Calpine Corp.: | |
| 144A, 7.5%, 2/15/2021 | | | | 182,000 | | | | 198,607 | |
| 144A, 7.875%, 7/31/2020 | | | | 9,000 | | | | 9,855 | |
| DTE Energy Co., 7.625%, 5/15/2014 | | | 300,000 | | | | 307,609 | |
| Electricite de France SA, 144A, 5.25%, 1/29/2049 | | | 400,000 | | | | 397,800 | |
| Energy Future Intermediate Holding Co., LLC, 10.0%, 12/1/2020 (b) | | | 30,000 | | | | 31,875 | |
| Eskom Holdings SOC Ltd., 144A, 5.75%, 1/26/2021 | | | 400,000 | | | | 397,000 | |
| Jersey Central Power & Light Co., 144A, 4.7%, 4/1/2024 | | | 160,000 | | | | 158,368 | |
| Majapahit Holding BV, REG S, 7.75%, 10/17/2016 | | | 100,000 | | | | 109,875 | |
| Mexico Generadora de Energia S de rl, 144A, 5.5%, 12/6/2032 | | | 200,000 | | | | 191,000 | |
| PPL Energy Supply LLC, 4.6%, 12/15/2021 (b) | | | | 500,000 | | | | 480,473 | |
| | | | | 2,685,130 | |
Total Corporate Bonds (Cost $41,713,021) | | | | 41,786,426 | |
| | |
| Mortgage-Backed Securities Pass-Throughs 26.6% | |
| Federal Home Loan Mortgage Corp.: | |
| 4.0%, 8/1/2039 | | | | 800,920 | | | | 824,697 | |
| 5.5%, with various maturities from 10/1/2023 until 6/1/2035 | | | 2,188,081 | | | | 2,399,484 | |
| 6.5%, 3/1/2026 | | | | 330,275 | | | | 364,779 | |
Federal National Mortgage Association: | |
| 2.285%*, 8/1/2037 | | | | 207,891 | | | | 220,869 | |
| 2.457%*, 9/1/2038 | | | | 77,928 | | | | 82,823 | |
| 3.0%, 9/1/2042 (d) | | | | 2,000,000 | | | | 1,900,625 | |
| 4.0%, 9/1/2040 | | | | 656,617 | | | | 677,855 | |
| 4.5%, 10/1/2033 | | | | 131,371 | | | | 139,986 | |
| 5.0%, with various maturities from 2/1/2021 until 8/1/2040 (d) | | | 6,484,532 | | | | 7,044,446 | |
| 5.5%, with various maturities from 12/1/2032 until 8/1/2037 | | | 2,129,009 | | | | 2,338,015 | |
| 6.0%, with various maturities from 4/1/2024 until 3/1/2025 | | | 618,688 | | | | 678,281 | |
| 6.5%, with various maturities from 3/1/2017 until 12/1/2037 | | | 717,455 | | | | 795,491 | |
| 8.0%, 9/1/2015 | | | | 4,081 | | | | 4,224 | |
Government National Mortgage Association: | |
| 3.5%, 5/1/2042 (d) | | | | 5,000,000 | | | | 5,046,485 | |
| 4.5%, 6/1/2039 (d) | | | | 5,000,000 | | | | 5,333,596 | |
Total Mortgage-Backed Securities Pass-Throughs (Cost $27,513,863) | | | | 27,851,656 | |
| | |
| Asset-Backed 1.7% | |
| Automobile Receivables | |
| AmeriCredit Automobile Receivables Trust, "E", Series 2011-2, 144A, 5.48%, 9/10/2018 (Cost $1,773,532) | | | 1,680,575 | | | | 1,768,738 | |
| | | Principal Amount ($)(a) | | | Value ($) | |
| | | | | | | | | |
| Commercial Mortgage-Backed Securities 6.1% | |
| Banc of America Merrill Lynch Commercial Mortgage, Inc., "A2", Series 2007-2, 5.633%*, 4/10/2049 | | | 26,257 | | | | 26,276 | |
| Bear Stearns Commercial Mortgage Securities, Inc., "A4", Series 2007- PW16, 5.706%*, 6/11/2040 | | | 240,000 | | | | 269,144 | |
| Commercial Mortgage Trust, "A4", Series 2007-GG9, 5.444%, 3/10/2039 | | | 1,750,000 | | | | 1,922,277 | |
| Del Coronado Trust, "M", Series 2013-HDMZ, 144A, 5.167%*, 3/15/2018 | | | | 125,000 | | | | 125,438 | |
JPMorgan Chase Commercial Mortgage Securities Corp.: | |
| "C", Series 2012-HSBC, 144A, 4.021%, 7/5/2032 | | | 230,000 | | | | 221,811 | |
| "A4", Series 2007-C1, 5.716%, 2/15/2051 | | | | 960,000 | | | | 1,053,539 | |
| "F", Series 2007-LD11, 5.806%*, 6/15/2049 | | | | 650,000 | | | | 53,671 | |
| "G", Series 2007-LD11, 144A, 5.806%*, 6/15/2049 | | | 760,000 | | | | 49,005 | |
| "H", Series 2007-LD11, 144A, 5.806%*, 6/15/2049 | | | 460,000 | | | | 27,825 | |
| LB-UBS Commercial Mortgage Trust, "A4", Series 2007-C6, 5.858%, 7/15/2040 | | | 1,309,123 | | | | 1,423,092 | |
| Merrill Lynch Mortgage Trust, "ASB", Series 2007-C1, 5.859%*, 6/12/2050 | | | 1,094,730 | | | | 1,158,211 | |
| Wachovia Bank Commercial Mortgage Trust, "H", Series 2007-C32, 144A, 5.733%*, 6/15/2049 | | | 770,000 | | | | 103,557 | |
Total Commercial Mortgage-Backed Securities (Cost $8,518,040) | | | | 6,433,846 | |
| | |
| Collateralized Mortgage Obligations 6.5% | |
| Countrywide Home Loans, "A2", Series 2006-1, 6.0%, 3/25/2036 | | | 411,280 | | | | 366,987 | |
| CS First Boston Mortgage Securities Corp., "10A3", Series 2005-10, 6.0%, 11/25/2035 | | | 132,530 | | | | 88,597 | |
| Federal Home Loan Mortgage Corp.: | |
| "PA", Series 4122, 1.5%, 2/15/2042 | | | 451,210 | | | | 418,452 | |
| "ZG", Series 4213, 3.5%, 6/15/2043 | | | | 1,531,267 | | | | 1,437,186 | |
| "PE", Series 2898, 5.0%, 5/15/2033 | | | 56,952 | | | | 57,920 | |
| "JS", Series 3572, Interest Only, 6.633%**, 9/15/2039 | | | 786,433 | | | | 122,593 | |
| Federal National Mortgage Association: | |
| "QD", Series 2005-29, 5.0%, 8/25/2033 | | | | 141,568 | | | | 145,192 | |
| "EG", Series 2005-22, 5.0%, 11/25/2033 | | | | 280,083 | | | | 289,284 | |
| "SI", Series 2007-23, Interest Only, 6.605%**, 3/25/2037 | | | 320,921 | | | | 51,266 | |
Government National Mortgage Association: | |
| "DI", Series 2012-102, Interest Only, 2.5%, 8/20/2027 | | | 4,238,455 | | | | 447,177 | |
| "PL", Series 2013-19, 2.5%, 2/20/2043 | | | | 684,500 | | | | 529,456 | |
| | | Principal Amount ($)(a) | | | Value ($) | |
| | | | | | | | | |
| "HX", Series 2012-91, 3.0%, 9/20/2040 | | | | 405,719 | | | | 392,306 | |
| "GI", Series 2010-89, Interest Only, 4.5%, 5/20/2039 | | | 1,601,328 | | | | 205,843 | |
| "PD", Series 2011-25, 4.5%, 10/16/2039 | | | | 1,000,000 | | | | 1,053,736 | |
| "EI", Series 2011-162, Interest Only, 4.5%, 5/20/2040 | | | 1,757,543 | | | | 247,107 | |
| "DI", Series 2011-40, Interest Only, 4.5%, 12/20/2040 | | | 3,916,802 | | | | 429,608 | |
| "IM", Series 2010-87, Interest Only, 4.75%, 3/20/2036 | | | 1,183,973 | | | | 70,603 | |
| "IN", Series 2009-69, Interest Only, 5.5%, 8/20/2039 | | | 229,326 | | | | 40,682 | |
| "IV", Series 2009-69, Interest Only, 5.5%, 8/20/2039 | | | 453,825 | | | | 81,853 | |
| "IJ", Series 2009-75, Interest Only, 6.0%, 8/16/2039 | | | 188,796 | | | | 38,259 | |
| "AI", Series 2007-38, Interest Only, 6.293%**, 6/16/2037 | | | 117,819 | | | | 16,901 | |
| "D", Series 1996-7, 7.5%, 5/16/2026 | | | | 120,462 | | | | 138,020 | |
| MASTR Alternative Loans Trust: | |
| "5A1", Series 2005-1, 5.5%, 1/25/2020 | | | | 139,880 | | | | 142,454 | |
| "8A1", Series 2004-3, 7.0%, 4/25/2034 | | | | 9,214 | | | | 9,294 | |
Total Collateralized Mortgage Obligations (Cost $7,126,797) | | | | 6,820,776 | |
| | |
| Government & Agency Obligations 24.2% | |
| Other Government Related (e) 3.2% | |
| Gazprom Neft OAO, 144A, 4.375%, 9/19/2022 | | | | 250,000 | | | | 229,063 | |
| KFW, 1.875%, 6/13/2018 | CAD | | | 658,000 | | | | 608,482 | |
| National JSC Naftogaz of Ukraine, 9.5%, 9/30/2014 | | | | 250,000 | | | | 249,025 | |
| PSP Capital, Inc., 3.03%, 10/22/2020 | CAD | | | 307,000 | | | | 289,836 | |
| Queensland Treasury Corp., Series 23, REG S, 4.25%, 7/21/2023 | AUD | | | 1,230,000 | | | | 1,052,523 | |
| Rosneft Oil Co., 144A, 4.199%, 3/6/2022 | | | | 200,000 | | | | 183,500 | |
| Vimpel Communications, 144A, 7.748%, 2/2/2021 | | | | 200,000 | | | | 217,250 | |
| VTB Bank OJSC, 144A, 6.0%, 4/12/2017 | | | | 500,000 | | | | 531,250 | |
| | | | | 3,360,929 | |
| Sovereign Bonds 3.5% | |
| Federative Republic of Brazil, 4.25%, 1/7/2025 | | | | 200,000 | | | | 190,500 | |
| Kingdom of Norway, Series 475, 2.0%, 5/24/2023 | NOK | | | 6,547,000 | | | | 992,256 | |
| Republic of Belarus, REG S, 8.75%, 8/3/2015 | | | | 500,000 | | | | 505,000 | |
| Republic of Croatia, 144A, 6.0%, 1/26/2024 | | | | 200,000 | | | | 198,500 | |
| Republic of El Salvador, REG S, 8.25%, 4/10/2032 | | | | 40,000 | | | | 42,650 | |
| Republic of Singapore, 3.375%, 9/1/2033 | SGD | | | 1,412,000 | | | | 1,173,422 | |
| Russian Federation: | |
| Series 6204, 7.5%, 3/15/2018 | RUB | | | 3,400,000 | | | | 105,842 | |
| Series 6207, 8.15%, 2/3/2027 | RUB | | | 6,800,000 | | | | 213,463 | |
| | | Principal Amount ($)(a) | | | Value ($) | |
| | | | | | | | | |
| United Mexican States, Series M, 7.75%, 5/29/2031 | MXN | | | 2,700,000 | | | | 216,484 | |
| | | | | 3,638,117 | |
| U.S. Treasury Obligations 17.5% | |
| U.S. Treasury Bills: | |
| 0.02%***, 2/13/2014 (f) | | | | 589,000 | | | | 588,991 | |
| 0.045%***, 6/12/2014 (f) | | | | 1,000 | | | | 1,000 | |
| U.S. Treasury Bond, 3.75%, 8/15/2041 | | | | 2,500,000 | | | | 2,437,110 | |
| U.S. Treasury Notes: | |
| 0.75%, 6/15/2014 (g) | | | | 1,500,000 | | | | 1,504,336 | |
| 1.0%, 8/31/2016 (g) | | | | 12,650,000 | | | | 12,768,594 | |
| 1.75%, 5/15/2023 | | | | 155,000 | | | | 139,706 | |
| 2.75%, 11/15/2023 | | | | 1,000,000 | | | | 978,281 | |
| | | | | 18,418,018 | |
Total Government & Agency Obligations (Cost $25,980,098) | | | | 25,417,064 | |
| | |
| Municipal Bonds and Notes 7.0% | |
| Atlanta, GA, Water & Wastewater Revenue, Series B, 5.25%, 11/1/2030 | | | 440,000 | | | | 479,098 | |
Dallas-Fort Worth, TX, International Airport Revenue: | |
| Series F, 5.25%, 11/1/2028 | | | 100,000 | | | | 107,464 | |
| Series F, 5.25%, 11/1/2029 | | | 85,000 | | | | 90,852 | |
| Series F, 5.25%, 11/1/2030 | | | 330,000 | | | | 350,278 | |
| Gwinnett County, GA, Development Authority Revenue, Gwinnett Stadium Project, 6.4%, 1/1/2028 | | | 655,000 | | | | 714,219 | |
| Kentucky, Asset/Liability Commission, General Fund Revenue, 3.165%, 4/1/2018 | | | 1,715,001 | | | | 1,768,029 | |
| Michigan, Western Michigan University Revenue, 4.41%, 11/15/2014, INS: AMBAC | | | 165,000 | | | | 166,238 | |
| New Jersey, State Transportation Trust Fund Authority, Transportation Program, Series AA, 5.25%, 6/15/2030 | | | 665,000 | | | | 713,113 | |
| | | Principal Amount ($)(a) | | | Value ($) | |
| | | | | | | | | |
| New Jersey, State Economic Development Authority Revenue, Series B, 6.5%, 11/1/2014, INS: AGC | | | 585,000 | | | | 607,692 | |
| Pennsylvania, State Turnpike Commission Revenue, Series C, 5.5%, 12/1/2030 | | | 330,000 | | | | 360,571 | |
| Port Authority New York & New Jersey, One Hundred Fiftieth Series, 4.75%, 9/15/2016 | | | 930,000 | | | | 1,016,183 | |
| Triborough, NY, Bridge & Tunnel Authority Revenues, Series A, 5.0%, 11/15/2028 | | | 665,000 | | | | 717,063 | |
| Washington, Central Puget Sound Regional Transit Authority, Sales & Use Tax Revenue, Series A, 5.0%, 11/1/2036 | | | 285,000 | | | | 295,155 | |
Total Municipal Bonds and Notes (Cost $7,053,317) | | | | 7,385,955 | |
| | | Shares | | | Value ($) | |
| | | | |
| Preferred Stock 0.0% | |
| Financials | |
| Ally Financial, Inc., Series G, 144A, 7.0% (Cost $14,594) | | | 15 | | | | 14,401 | |
| | |
| Securities Lending Collateral 3.9% | |
| Daily Assets Fund Institutional, 0.08% (h) (i) (Cost $4,040,633) | | | 4,040,633 | | | | 4,040,633 | |
| | |
| Cash Equivalents 4.1% | |
| Central Cash Management Fund, 0.05% (h) (Cost $4,286,403) | | | 4,286,403 | | | | 4,286,403 | |
| | | % of Net Assets | | | Value ($) | |
| | | | |
Total Investment Portfolio (Cost $128,020,298)† | | | 119.9 | | | | 125,805,898 | |
| Other Assets and Liabilities, Net | | | (19.9 | ) | | | (20,927,493 | ) |
| Net Assets | | | 100.0 | | | | 104,878,405 | |
* Floating rate securities' yields vary with a designated market index or market rate, such as the coupon-equivalent of the U.S. Treasury Bill rate. These securities are shown at their current rate as of December 31, 2013.
** These securities are shown at their current rate as of December 31, 2013.
*** Annualized yield at time of purchase; not a coupon rate.
† The cost for federal income tax purposes was $128,020,298. At December 31, 2013, net unrealized depreciation for all securities based on tax cost was $2,214,400. This consisted of aggregate gross unrealized appreciation for all securities in which there was an excess of value over tax cost of $1,963,817 and aggregate gross unrealized depreciation for all securities in which there was an excess of tax cost over value of $4,178,217.
(a) Principal amount stated in U.S. dollars unless otherwise noted.
(b) All or a portion of these securities were on loan. In addition, "Other Assets and Liabilities, Net" may include pending sales that are also on loan. The value of securities loaned at December 31, 2013 amounted to $3,907,745, which is 3.7% of net assets.
(c) Date shown is call date; not a maturity date for the perpetual preferred securities.
(d) When-issued or delayed delivery security included.
(e) Government-backed debt issued by financial companies or government sponsored enterprises.
(f) At December 31, 2013, this security has been pledged, in whole or in part, to cover initial margin requirements for open futures contracts.
(g) At December 31, 2013, this security has been pledged, in whole or in part, as collateral for open swap contracts.
(h) Affiliated fund managed by Deutsche Investment Management Americas Inc. The rate shown is the annualized seven-day yield at period end.
(i) Represents collateral held in connection with securities lending. Income earned by the Fund is net of borrower rebates.
144A: Security exempt from registration under Rule 144A of the Securities Act of 1933. These securities may be resold in transactions exempt from registration, normally to qualified institutional buyers.
AGC: Assured Guaranty Corp.
AMBAC: Ambac Financial Group, Inc.
INS: Insured
Interest Only: Interest Only (IO) bonds represent the "interest only" portion of payments on a pool of underlying mortgages or mortgage-backed securities. IO securities are subject to prepayment risk of the pool of underlying mortgages.
PIK: Denotes that all or a portion of the income is paid in-kind in the form of additional principal.
REG S: Securities sold under Regulation S may not be offered, sold or delivered within the United States or to, or for the account or benefit of, U.S. persons, except pursuant to an exemption from, or in a transaction not subject to, the registration requirements of the Securities Act of 1933.
REIT: Real Estate Investment Trust
Included in the portfolio are investments in mortgage- or asset-backed securities, which are interests in separate pools of mortgages or assets. Effective maturities of these investments may be shorter than stated maturities due to prepayments. Some separate investments in the Federal Home Loan Mortgage Corp., Federal National Mortgage Association and issues which have similar coupon rates have been aggregated for presentation purposes in this investment portfolio.
At December 31, 2013, open futures contracts purchased were as follows:
| Futures | Currency | Expiration Date | | Contracts | | | Notional Value ($) | | | Unrealized Depreciation ($) | |
| 5 Year U.S. Treasury Note | USD | 3/31/2014 | | | 79 | | | | 9,425,688 | | | | (59,965 | ) |
At December 31, 2013, open futures contracts sold were as follows:
| Futures | Currency | Expiration Date | | Contracts | | | Notional Value ($) | | | Unrealized Appreciation ($) | |
| 10 Year Japanese Government Bond | JPY | 3/11/2014 | | | 2 | | | | 2,721,869 | | | | 15,820 | |
| 90 Day Eurodollar | USD | 12/14/2015 | | | 15 | | | | 3,707,813 | | | | 3,513 | |
| U.S. Treasury Bond | USD | 3/20/2014 | | | 6 | | | | 769,875 | | | | 13,488 | |
| Ultra Long U.S. Treasury Bond | USD | 3/20/2014 | | | 19 | | | | 2,588,750 | | | | 20,365 | |
| Total unrealized appreciation | | | | 53,186 | |
At December 31, 2013, open written options contracts were as follows:
| Options on Interest Rate Swap Contracts | |
| | Swap Effective/ Expiration Date | | Contract Amount | | Option Expiration Date | | Premiums Received ($) | | | Value ($) (j) | |
Call Options 0.0% Receive Fixed — 4.064% – Pay Floating — LIBOR | 5/13/2014 5/13/2044 | | | 2,000,000 | 1 | 5/9/2014 | | | 14,750 | | | | (46,545 | ) |
Put Options Pay Fixed — 2.064% – Receive Floating — LIBOR | 5/13/2014 5/13/2044 | | | 2,000,000 | 1 | 5/9/2014 | | | 14,750 | | | | (2 | ) |
| Pay Fixed — 2.385% – Receive Floating — LIBOR | 3/31/2014 3/31/2044 | | | 2,000,000 | 2 | 3/27/2014 | | | 27,300 | | | | (1 | ) |
| Pay Fixed — 2.423% – Receive Floating — LIBOR | 3/20/2014 3/20/2044 | | | 2,000,000 | 3 | 3/18/2014 | | | 28,800 | | | | (1 | ) |
| Pay Fixed — 3.033% – Receive Floating — LIBOR | 10/24/2014 10/24/2044 | | | 2,000,000 | 4 | 10/22/2014 | | | 25,400 | | | | (6,224 | ) |
| Pay Fixed — 3.093% – Receive Floating — LIBOR | 10/21/2014 10/21/2044 | | | 2,000,000 | 5 | 10/17/2014 | | | 27,600 | | | | (7,293 | ) |
| Total Put Options | | | 123,850 | | | | (13,521 | ) |
| Total | | | 138,600 | | | | (60,066 | ) |
(j) Unrealized appreciation on written options on interest rate swap contracts at December 31, 2013 was $78,534.
At December 31, 2013, open credit default swap contracts sold were as follows:
| Bilateral Swaps | |
Effective/ Expiration Dates | | Notional Amount ($) (k) | | | Fixed Cash Flows Received | | Underlying Debt Obligation/ Quality Rating (l) | | Value ($) | | | Upfront Payments Paid/ (Received) ($) | | | Unrealized Appreciation ($) | |
6/20/2013 9/20/2018 | | | 15,000 | 7 | | | 5.0 | % | DISH DBS Corp., 6.75%, 6/1/2021, BB– | | | 2,064 | | | | 1,264 | | | | 800 | |
9/20/2012 12/20/2017 | | | 50,000 | 6 | | | 5.0 | % | General Motors Corp., 3.3%, 12/20/2017, BB+ | | | 7,353 | | | | 2,950 | | | | 4,403 | |
| Total unrealized appreciation | | | | 5,203 | |
(k) The maximum potential amount of future undiscounted payments that the Fund could be required to make under a credit default swap contract would be the notional amount of the contract. These potential amounts would be partially offset by any recovery values of the referenced debt obligation or net amounts received from the settlement of buy protection credit default swap contracts entered into by the Fund for the same referenced debt obligation, if any.
(l) The quality ratings represent the higher of Moody's Investors Service, Inc. ("Moody's") or Standard & Poor's Corporation ("S&P") credit ratings and are unaudited.
At December 31, 2013, open interest rate swap contracts were as follows:
| Centrally Cleared Swaps | |
Effective/ Expiration Dates | | Notional Amount ($) | | Cash Flows Paid by the Fund | Cash Flows Received by the Fund | | Value ($) | | | Unrealized Appreciation/ (Depreciation) ($) | |
12/30/2014 12/30/2024 | | | 4,600,000 | | Fixed — 3.524% | Floating — LIBOR | | | 10,294 | | | | 10,769 | |
12/30/2014 12/30/2019 | | | 2,000,000 | | Floating — LIBOR | Fixed — 2.522% | | | (1,458 | ) | | | 409 | |
12/30/2014 12/30/2044 | | | 4,000,000 | | Floating — LIBOR | Fixed — 4.081% | | | (35,413 | ) | | | (30,370 | ) |
12/30/2014 12/30/2016 | | | 8,700,000 | | Fixed — 1.173% | Floating — LIBOR | | | (4,540 | ) | | | (5,627 | ) |
5/13/2014 5/13/2044 | | | 2,000,000 | | Fixed — 4.064% | Floating — LIBOR | | | (23,182 | ) | | | 224 | |
12/30/2014 12/30/2034 | | | 4,800,000 | | Floating — LIBOR | Fixed — 4.01% | | | (31,731 | ) | | | 2,555 | |
| Total unrealized depreciation | | | | (22,040 | ) |
Counterparties:
1 Nomura International PLC
2 Barclays Bank PLC
3 JPMorgan Chase Securities, Inc.
4 Citigroup, Inc.
5 BNP Paribas
6 UBS AG
7 Credit Suisse
LIBOR: London Interbank Offered Rate
At December 31, 2013, the Fund had the following open forward foreign currency exchange contracts:
| Contracts to Deliver | | In Exchange For | | Settlement Date | | Unrealized Appreciation ($) | | Counterparty |
| JPY | | | 220,000,000 | | USD | | | 2,130,998 | | 1/6/2014 | | | 41,867 | | Citigroup, Inc. |
| ZAR | | | 16,600,000 | | USD | | | 1,603,828 | | 1/17/2014 | | | 25,333 | | UBS AG |
| NOK | | | 6,220,000 | | USD | | | 1,046,597 | | 1/23/2014 | | | 22,004 | | UBS AG |
| CAD | | | 1,859,475 | | USD | | | 1,800,857 | | 1/23/2014 | | | 51,374 | | Barclays Bank PLC |
| SGD | | | 1,402,990 | | USD | | | 1,133,792 | | 1/23/2014 | | | 22,035 | | JPMorgan Chase Securities, Inc. |
| USD | | | 1,589,688 | | AUD | | | 1,800,000 | | 1/23/2014 | | | 15,033 | | Commonwealth Bank of Australia |
| AUD | | | 1,243,690 | | USD | | | 1,199,667 | | 1/23/2014 | | | 90,903 | | UBS AG |
| AUD | | | 1,800,000 | | USD | | | 1,605,735 | | 1/23/2014 | | | 1,013 | | Nomura International PLC |
| KRW | | | 1,272,000,000 | | USD | | | 1,202,098 | | 2/18/2014 | | | 624 | | JPMorgan Chase Securities, Inc. |
| Total unrealized appreciation | | | | | 270,186 | |
| Contracts to Deliver | | In Exchange For | | Settlement Date | | Unrealized Depreciation ($) | | Counterparty |
| USD | | | 2,138,742 | | JPY | | | 220,000,000 | | 1/6/2014 | | | (49,611 | ) | Nomura International PLC |
| CAD | | | 2,882,771 | | NZD | | | 3,300,000 | | 1/6/2014 | | | (723 | ) | Australia & New Zealand Banking Group Ltd. |
| USD | | | 1,114,689 | | SGD | | | 1,400,000 | | 2/18/2014 | | | (5,282 | ) | Commonwealth Bank of Australia |
| Total unrealized depreciation | | | | | (55,616 | ) |
| Currency Abbreviations |
AUD Australian Dollar CAD Canadian Dollar JPY Japanese Yen KRW South Korean Won MXN Mexican Peso NOK Norwegian Krone NZD New Zealand Dollar RUB Russian Ruble SGD Singapore Dollar USD United States Dollar ZAR South African Rand |
For information on the Fund's policy and additional disclosures regarding futures contracts, written options, credit default swap contracts, interest rate swap contracts and forward foreign currency exchange contracts, please refer to Note B in the accompanying Notes to Financial Statements.
Fair Value Measurements
Various inputs are used in determining the value of the Fund's investments. These inputs are summarized in three broad levels. Level 1 includes quoted prices in active markets for identical securities. Level 2 includes other significant observable inputs (including quoted prices for similar securities, interest rates, prepayment speeds and credit risk). Level 3 includes significant unobservable inputs (including the Fund's own assumptions in determining the fair value of investments). The level assigned to the securities valuations may not be an indication of the risk or liquidity associated with investing in those securities.
The following is a summary of the inputs used as of December 31, 2013 in valuing the Fund's investments. For information on the Fund's policy regarding the valuation of investments, please refer to the Security Valuation section of Note A in the accompanying Notes to Financial Statements.
| Assets | | Level 1 | | | Level 2 | | | Level 3 | | | Total | |
| | |
| Fixed Income Investments (m) | |
| Corporate Bonds | | $ | — | | | $ | 41,786,426 | | | $ | — | | | $ | 41,786,426 | |
| Mortgage-Backed Securities Pass-Throughs | | | — | | | | 27,851,656 | | | | — | | | | 27,851,656 | |
| Asset-Backed | | | — | | | | 1,768,738 | | | | — | | | | 1,768,738 | |
| Commercial Mortgage-Backed Securities | | | — | | | | 6,433,846 | | | | — | | | | 6,433,846 | |
| Collateralized Mortgage Obligations | | | — | | | | 6,820,776 | | | | — | | | | 6,820,776 | |
| Government & Agency Obligations | | | — | | | | 25,417,064 | | | | — | | | | 25,417,064 | |
| Municipal Bonds and Notes | | | — | | | | 7,385,955 | | | | — | | | | 7,385,955 | |
| Preferred Stocks | | | — | | | | 14,401 | | | | — | | | | 14,401 | |
| Short-Term Investments (m) | | | 8,327,036 | | | | — | | | | — | | | | 8,327,036 | |
| Derivatives (n) | |
| Futures Contracts | | | 53,186 | | | | — | | | | — | | | | 53,186 | |
| Credit Default Swap Contracts | | | — | | | | 5,203 | | | | — | | | | 5,203 | |
| Interest Rate Swap Contracts | | | — | | | | 13,957 | | | | — | | | | 13,957 | |
| Forward Foreign Currency Exchange Contracts | | | — | | | | 270,186 | | | | — | | | | 270,186 | |
| Total | | $ | 8,380,222 | | | $ | 117,768,208 | | | $ | — | | | $ | 126,148,430 | |
| Liabilities | | Level 1 | | | Level 2 | | | Level 3 | | | Total | |
| | |
| Derivatives (n) | |
| Futures Contracts | | $ | (59,965 | ) | | $ | — | | | $ | — | | | $ | (59,965 | ) |
| Written Options | | | — | | | | (60,066 | ) | | | — | | | | (60,066 | ) |
| Interest Rate Swap Contracts | | | — | | | | (35,997 | ) | | | — | | | | (35,997 | ) |
| Forward Foreign Currency Exchange Contracts | | | — | | | | (55,616 | ) | | | — | | | | (55,616 | ) |
| Total | | $ | (59,965 | ) | | $ | (151,679 | ) | | $ | — | | | $ | (211,644 | ) |
There have been no transfers between fair value measurement levels during the year ended December 31, 2013.
(m) See Investment Portfolio for additional detailed categorizations.
(n) Derivatives include unrealized appreciation (depreciation) on futures contracts, credit default swap contracts, interest rate swap contracts, forward foreign currency exchange contracts and written options, at value.
The accompanying notes are an integral part of the financial statements.
Statement of Assets and Liabilities | as of December 31, 2013 | |
| Assets | |
Investments: Investments in non-affiliated securities, at value (cost $119,693,262) — including $3,907,745 of securities loaned | | $ | 117,478,862 | |
| Investment in Daily Assets Fund Institutional (cost $4,040,633)* | | | 4,040,633 | |
| Investment in Central Cash Management Fund (cost $4,286,403) | | | 4,286,403 | |
| Total investments, at value (cost $128,020,298) | | | 125,805,898 | |
| Cash | | | 210,365 | |
| Foreign currency, at value (cost $173,455) | | | 158,403 | |
| Deposit from broker for swap contracts | | | 530,000 | |
| Receivable for investments sold | | | 754,364 | |
| Receivable for investments sold — when-issued securities | | | 2,173,724 | |
| Receivable for Fund shares sold | | | 118,812 | |
| Interest receivable | | | 999,197 | |
| Net receivable for pending swap contracts | | | 34,286 | |
| Receivable for variation margin on futures contracts | | | 21,418 | |
| Unrealized appreciation on swap contracts | | | 5,203 | |
| Unrealized appreciation on forward foreign currency exchange contracts | | | 270,186 | |
| Upfront payments paid on swap contracts | | | 4,214 | |
| Foreign taxes recoverable | | | 646 | |
| Other assets | | | 3,182 | |
| Total assets | | | 131,089,898 | |
| Liabilities | |
| Payable upon return of securities loaned | | | 4,040,633 | |
| Payable for investments purchased | | | 1,745,905 | |
| Payable for investments purchased — when-issued securities | | | 19,404,938 | |
| Payable for Fund shares redeemed | | | 4,247 | |
| Payable upon return of deposit for swap contracts | | | 530,000 | |
| Payable for variation margin on centrally cleared swaps | | | 37,093 | |
| Options written, at value (premiums received $138,600) | | | 60,066 | |
| Net payable for pending swap contracts | | | 207,771 | |
| Unrealized depreciation on forward foreign currency exchange contracts | | | 55,616 | |
| Accrued management fee | | | 10,694 | |
| Accrued Trustees' fees | | | 1,866 | |
| Other accrued expenses and payables | | | 112,664 | |
| Total liabilities | | | 26,211,493 | |
| Net assets, at value | | $ | 104,878,405 | |
| Net Assets Consist of | |
| Undistributed net investment income | | | 3,120,319 | |
Net unrealized appreciation (depreciation) on: Investments | | | (2,214,400 | ) |
| Swap contracts | | | (16,837 | ) |
| Futures | | | (6,779 | ) |
| Foreign currency | | | 198,284 | |
| Written options | | | 78,534 | |
| Accumulated net realized gain (loss) | | | (17,400,440 | ) |
| Paid-in capital | | | 121,119,724 | |
| Net assets, at value | | $ | 104,878,405 | |
Class A Net Asset Value, offering and redemption price per share ($104,878,405 ÷ 19,030,134 outstanding shares of beneficial interest, $.01 par value, unlimited number of shares authorized) | | $ | 5.51 | |
* Represents collateral on securities loaned.
The accompanying notes are an integral part of the financial statements.
| for the year ended December 31, 2013 | |
| Investment Income | |
Income: Interest (net of foreign taxes withheld of $1,906) | | $ | 4,459,718 | |
| Income distributions — Central Cash Management Fund | | | 5,821 | |
| Securities lending income, including income from Daily Assets Fund Institutional, net of borrower rebates | | | 16,044 | |
| Total income | | | 4,481,583 | |
Expenses: Management fee | | | 507,787 | |
| Administration fee | | | 130,202 | |
| Services to shareholders | | | 2,428 | |
| Custodian fee | | | 47,783 | |
| Audit and tax fees | | | 70,095 | |
| Legal fees | | | 18,740 | |
| Reports to shareholders | | | 42,478 | |
| Trustees' fees and expenses | | | 6,601 | |
| Other | | | 17,379 | |
| Total expenses before expense reductions | | | 843,493 | |
| Expense reductions | | | (108,795 | ) |
| Total expenses after expense reductions | | | 734,698 | |
| Net investment income | | | 3,746,885 | |
| Realized and Unrealized Gain (Loss) | |
Net realized gain (loss) from: Investments | | | 257,783 | |
| Swap contracts | | | 1,200,428 | |
| Futures | | | (2,166,845 | ) |
| Written options | | | 113,142 | |
| Foreign currency | | | (496,313 | ) |
| | | | (1,091,805 | ) |
Change in net unrealized appreciation (depreciation) on: Investments | | | (6,506,678 | ) |
| Swap contracts | | | (228,637 | ) |
| Futures | | | (14,104 | ) |
| Written options | | | 2,530 | |
| Foreign currency | | | 224,864 | |
| | | | (6,522,025 | ) |
| Net gain (loss) | | | (7,613,830 | ) |
| Net increase (decrease) in net assets resulting from operations | | $ | (3,866,945 | ) |
The accompanying notes are an integral part of the financial statements.
Statement of Changes in Net Assets | | | Years Ended December 31, | |
| Increase (Decrease) in Net Assets | | 2013 | | | 2012 | |
Operations: Net investment income | | $ | 3,746,885 | | | $ | 4,611,965 | |
| Net realized gain (loss) | | | (1,091,805 | ) | | | 7,673,239 | |
| Change in net unrealized appreciation (depreciation) | | | (6,522,025 | ) | | | (104,078 | ) |
| Net increase (decrease) in net assets resulting from operations | | | (3,866,945 | ) | | | 12,181,126 | |
Distributions to shareholders from: Net investment income: Class A | | | (4,386,055 | ) | | | (4,882,203 | ) |
Fund share transactions: Class A Proceeds from shares sold | | | 5,651,619 | | | | 33,310,645 | |
| Net assets acquired in tax-free reorganization* | | | — | | | | 78,348,206 | |
| Reinvestment of distributions | | | 4,386,055 | | | | 4,882,203 | |
| Payments for shares redeemed | | | (87,153,230 | ) | | | (45,528,835 | ) |
| Net increase (decrease) in net assets from Class A share transactions | | | (77,115,556 | ) | | | 71,012,219 | |
| Increase (decrease) in net assets | | | (85,368,556 | ) | | | 78,311,142 | |
| Net assets at beginning of period | | | 190,246,961 | | | | 111,935,819 | |
| Net assets at end of period (including undistributed net investment income of $3,120,319 and $4,095,360, respectively) | | $ | 104,878,405 | | | $ | 190,246,961 | |
| Other Information | |
Class A Shares outstanding at beginning of period | | | 32,324,964 | | | | 19,571,536 | |
| Shares sold | | | 1,003,776 | | | | 5,773,870 | |
| Shares issued in tax-free reorganization* | | | — | | | | 13,990,523 | |
| Shares issued to shareholders in reinvestment of distributions | | | 768,136 | | | | 873,382 | |
| Shares redeemed | | | (15,066,742 | ) | | | (7,884,347 | ) |
| Net increase (decrease) in Class A shares | | | (13,294,830 | ) | | | 12,753,428 | |
| Shares outstanding at end of period | | | 19,030,134 | | | | 32,324,964 | |
* On April 30, 2012, DWS Core Fixed Income VIP was acquired by the Fund through a tax-free reorganization (see Note H).
The accompanying notes are an integral part of the financial statements.
| | | Years Ended December 31, | |
| Class A | | | 2013 | | | 2012 | | | 2011 | | | 2010 | | | 2009 | |
| Selected Per Share Data | |
| Net asset value, beginning of period | | $ | 5.89 | | | $ | 5.72 | | | $ | 5.66 | | | $ | 5.54 | | | $ | 5.50 | |
Income (loss) from investment operations: Net investment incomea | | | .16 | | | | .16 | | | | .22 | | | | .19 | | | | .25 | |
| Net realized and unrealized gain (loss) | | | (.33 | ) | | | .27 | | | | .09 | | | | .18 | | | | .26 | |
| Total from investment operations | | | (.17 | ) | | | .43 | | | | .31 | | | | .37 | | | | .51 | |
Less distributions from: Net investment income | | | (.21 | ) | | | (.26 | ) | | | (.25 | ) | | | (.25 | ) | | | (.47 | ) |
| Net asset value, end of period | | $ | 5.51 | | | $ | 5.89 | | | $ | 5.72 | | | $ | 5.66 | | | $ | 5.54 | |
| Total Return (%) | | | (3.03 | )b | | | 7.77 | | | | 5.68 | | | | 6.79 | | | | 10.07 | |
| Ratios to Average Net Assets and Supplemental Data | |
| Net assets, end of period ($ millions) | | | 105 | | | | 190 | | | | 112 | | | | 155 | | | | 159 | |
| Ratio of expenses before expense reductions (%) | | | .65 | | | | .58 | | | | .62 | | | | .59 | | | | .59 | |
| Ratio of expenses after expense reductions (%) | | | .56 | | | | .58 | | | | .62 | | | | .59 | | | | .59 | |
| Ratio of net investment income (%) | | | 2.88 | | | | 2.81 | | | | 3.86 | | | | 3.42 | | | | 4.68 | |
| Portfolio turnover rate (%) | | | 418 | | | | 115 | | | | 219 | | | | 357 | | | | 284 | |
a Based on average shares outstanding during the period. b Total return would have been lower had certain expenses not been reduced. | |
Notes to Financial Statements
A. Organization and Significant Accounting Policies
DWS Variable Series I (the "Series") is registered under the Investment Company Act of 1940, as amended (the "1940 Act"), as an open-end, registered management investment company organized as a Massachusetts business trust. The Series consists of five diversified funds: DWS Bond VIP, DWS Core Equity VIP, DWS Capital Growth VIP, DWS Global Small Cap Growth VIP and DWS International VIP (individually or collectively hereinafter referred to as a "Fund" or the "Funds"). These financial statements report on DWS Bond VIP. The Series is intended to be the underlying investment vehicle for variable annuity contracts and variable life insurance policies to be offered by the separate accounts of certain life insurance companies ("Participating Insurance Companies").
The Fund's financial statements are prepared in accordance with accounting principles generally accepted in the United States of America, which require the use of management estimates. Actual results could differ from those estimates. The policies described below are followed consistently by the Fund in the preparation of its financial statements.
Security Valuation. Investments are stated at value determined as of the close of regular trading on the New York Stock Exchange on each day the exchange is open for trading.
Various inputs are used in determining the value of the Fund's investments. These inputs are summarized in three broad levels. Level 1 includes quoted prices in active markets for identical securities. Level 2 includes other significant observable inputs (including quoted prices for similar securities, interest rates, prepayment speeds and credit risk). Level 3 includes significant unobservable inputs (including the Fund's own assumptions in determining the fair value of investments). The level assigned to the securities valuations may not be an indication of the risk or liquidity associated with investing in those securities.
Debt securities are valued at prices supplied by independent pricing services approved by the Trustees of the Series. If the pricing services are unable to provide valuations, securities are valued at the average of the most recent reliable bid quotation or evaluated price, as applicable, obtained from broker-dealers. Such services may use various pricing techniques which take into account appropriate factors such as yield, quality, coupon rate, maturity, type of issue, trading characteristics and other data, as well as broker quotes. These securities are generally categorized as Level 2.
Money market instruments purchased with an original or remaining maturity of sixty days or less, maturing at par, are valued at amortized cost, which approximates value, and are categorized as Level 2. Investments in open-end investment companies are valued at their net asset value each business day and are categorized as Level 1.
Futures contracts are generally valued at the settlement prices established each day on the exchange on which they are traded and are categorized as Level 1.
Swap contracts are valued daily based upon prices supplied by a Board approved pricing vendor, if available, and otherwise are valued at the price provided by the broker-dealer. Swap contracts are generally categorized as Level 2.
Forward currency contracts are valued at the prevailing forward exchange rate of the underlying currencies and are categorized as Level 2.
Exchange-traded options are valued at the last sale price or, in the absence of a sale, the mean between the closing bid and asked prices or at the most recent asked price (bid for purchased options) if no bid or asked price are available. Exchange-traded options are categorized as Level 1. Over-the-counter written or purchased options are valued at the price provided by the broker-dealer with which the option was traded and are generally categorized as Level 2.
Securities and other assets for which market quotations are not readily available or for which the above valuation procedures are deemed not to reflect fair value are valued in a manner that is intended to reflect their fair value as determined in accordance with procedures approved by the Trustees and are generally categorized as Level 3. In accordance with the Fund's valuation procedures, factors used in determining value may include, but are not limited to, the type of the security; the size of the holding; the initial cost of the security; the existence of any contractual restrictions on the security's disposition; the price and extent of public trading in similar securities of the issuer or of comparable companies; quotations or evaluated prices from broker-dealers and/or pricing services; information obtained from the issuer, analysts, and/or the appropriate stock exchange (for exchange-traded securities); an analysis of the company's or issuer's financial statements; an evaluation of the forces that influence the issuer and the market(s) in which the security is purchased and sold; and with respect to debt securities, the maturity, coupon, creditworthiness, currency denomination and the movement of the market in which the security is normally traded. The value determined under these procedures may differ from published values for the same securities.
Disclosure about the classification of fair value measurements is included in a table following the Fund's Investment Portfolio.
Securities Lending. Deutsche Bank AG, as lending agent, lends securities of the Fund to certain financial institutions under the terms of the Security Lending Agreement. The Fund retains the benefits of owning the securities it has loaned and continues to receive interest and dividends generated by the securities and to participate in any changes in their market value. The Fund requires the borrowers of the securities to maintain collateral with the Fund consisting of either cash or liquid, unencumbered assets having a value at least equal to the value of the securities loaned. When the collateral falls below specified amounts, the lending agent will use its best effort to obtain additional collateral on the next business day to meet required amounts under the security lending agreement. The Fund may invest the cash collateral into a joint trading account in an affiliated money market fund pursuant to Exemptive Orders issued by the SEC. The Fund receives compensation for lending its securities either in the form of fees or by earning interest on invested cash collateral net of borrower rebates and fees paid to a lending agent. Either the Fund or the borrower may terminate the loan. There may be risks of delay and costs in recovery of securities or even loss of rights in the collateral should the borrower of the securities fail financially. If the Fund is not able to recover securities lent, the Fund may sell the collateral and purchase a replacement investment in the market, incurring the risk that the value of the replacement security is greater than the value of the collateral. The Fund is also subject to all investment risks associated with the reinvestment of any cash collateral received, including, but not limited to, interest rate, credit and liquidity risk associated with such investments.
As of December 31, 2013, the Fund had securities on loan. The value of the related collateral exceeded the value of the securities loaned at period end.
Foreign Currency Translations. The books and records of the Fund are maintained in U.S. dollars. Investment securities and other assets and liabilities denominated in a foreign currency are translated into U.S. dollars at the prevailing exchange rates at period end. Purchases and sales of investment securities, income and expenses are translated into U.S. dollars at the prevailing exchange rates on the respective dates of the transactions.
Net realized and unrealized gains and losses on foreign currency transactions represent net gains and losses between trade and settlement dates on securities transactions, the acquisition and disposition of foreign currencies, and the difference between the amount of net investment income accrued and the U.S. dollar amount actually received. That portion of both realized and unrealized gains and losses on investments that results from fluctuations in foreign currency exchange rates is not separately disclosed but is included with net realized and unrealized gain/appreciation and loss/depreciation on investments.
When-Issued/Delayed Delivery Securities. The Fund may purchase or sell securities with delivery or payment to occur at a later date beyond the normal settlement period. At the time the Fund enters into a commitment to purchase or sell a security, the transaction is recorded and the value of the transaction is reflected in the net asset value. The price of such security and the date when the security will be delivered and paid for are fixed at the time the transaction is negotiated. The value of the security may vary with market fluctuations. At the time the Fund enters into a purchase transaction it is required to segregate cash or other liquid assets at least equal to the amount of the commitment.
Certain risks may arise upon entering into when-issued or delayed delivery transactions from the potential inability of counterparties to meet the terms of their contracts or if the issuer does not issue the securities due to political, economic, or other factors. Additionally, losses may arise due to changes in the value of the underlying securities.
Taxes. The Fund is treated as a separate taxpayer as provided for in the Internal Revenue Code, as amended. It is the Fund's policy to comply with the requirements of the Internal Revenue Code, as amended, which are applicable to regulated investment companies, and to distribute all of its taxable income to the separate accounts of the Participating Insurance Companies which hold its shares.
Additionally, the Fund may be subject to taxes imposed by the governments of countries in which it invests and are generally based on income and/or capital gains earned or repatriated. Estimated tax liabilities on certain foreign securities are recorded on an accrual basis and are reflected as components of interest income or net change in unrealized gain/loss on investments. Tax liabilities realized as a result of security sales are reflected as a component of net realized gain/loss on investments.
Under the Regulated Investment Company Modernization Act of 2010, net capital losses incurred post-enactment may be carried forward indefinitely, and their character is retained as short-term and/or long-term. Previously, net capital losses were carried forward for eight years and treated as short-term losses. As a transition rule, the Act requires that post-enactment net capital losses be used before pre-enactment net capital losses.
At December 31, 2013, the Fund had a net tax basis capital loss carryforward of approximately $17,424,000, including a net tax basis pre-enactment capital loss carryforward of approximately $16,421,000, which may be applied against any realized net taxable capital gains of each succeeding year until fully utilized or until December 31, 2017 (the expiration date), whichever occurs first, subject to certain limitations under Sections 381–384 of the Internal Revenue Code; and approximately $1,003,000 post-enactment short-term losses, including $772,000 which may be applied against any realized net taxable capital gains indefinitely and $231,000 of which may be applied against any realized net taxable capital gains of each succeeding year until fully utilized, subject to certain limitations under Sections 381–384 of the Internal Revenue Code.
The Fund has reviewed the tax positions for the open tax years as of December 31, 2013 and has determined that no provision for income tax is required in the Fund's financial statements. The Fund's federal tax returns for the prior three fiscal years remain open subject to examination by the Internal Revenue Service.
Distribution of Income and Gains. Distributions from net investment income of the Fund, if any, are declared and distributed to shareholders annually. Net realized gains from investment transactions, in excess of available capital loss carryforwards, would be taxable to the Fund if not distributed, and, therefore, will be distributed to shareholders at least annually. The Fund may also make additional distributions for tax purposes if necessary.
The timing and characterization of certain income and capital gain distributions are determined annually in accordance with federal tax regulations which may differ from accounting principles generally accepted in the United States of America. These differences primarily relate to investments in foreign denominated investments, investments in forward foreign currency exchange contracts, futures contracts, swap contracts and certain securities sold at a loss. As a result, net investment income (loss) and net realized gain (loss) on investment transactions for a reporting period may differ significantly from distributions during such period. Accordingly, the Fund may periodically make reclassifications among certain of its capital accounts without impacting the net asset value of the Fund.
At December 31, 2013, the Fund's components of distributable earnings (accumulated losses) on a tax basis are as follows:
| Undistributed ordinary income* | | $ | 3,512,890 | |
| Capital loss carryforwards | | $ | (17,424,000 | ) |
| Net unrealized appreciation (depreciation) on investments | | $ | (2,214,400 | ) |
In addition, the tax character of distributions paid to shareholders by the Fund is summarized as follows:
| | | Years Ended December 31, | |
| | | 2013 | | | 2012 | |
| Distributions from ordinary income* | | $ | 4,386,055 | | | $ | 4,882,203 | |
* For tax purposes, short-term capital gain distributions are considered ordinary income distributions.
Expenses. Expenses of the Series arising in connection with a specific Fund are allocated to that Fund. Other Series expenses which cannot be directly attributed to a Fund are apportioned among the Funds in the Series based upon the relative net assets or other appropriate measures.
Contingencies. In the normal course of business, the Fund may enter into contracts with service providers that contain general indemnification clauses. The Fund's maximum exposure under these arrangements is unknown as this would involve future claims that may be made against the Fund that have not yet been made. However, based on experience, the Fund expects the risk of loss to be remote.
Other. Investment transactions are accounted for on a trade date plus one basis for daily net asset value calculations. However, for financial reporting purposes, investment transactions are reported on trade date. Interest income is recorded on the accrual basis net of foreign withholding taxes. Realized gains and losses from investment transactions are recorded on an identified cost basis. Proceeds from litigation payments, if any, are included in net realized gain (loss) from investments. All discounts and premiums are accreted/amortized for both tax and financial reporting purposes.
B. Derivative Instruments
Futures Contracts. A futures contract is an agreement between a buyer or seller and an established futures exchange or its clearinghouse in which the buyer or seller agrees to take or make a delivery of a specific amount of a financial instrument at a specified price on a specific date (settlement date). For the year ended December 31, 2013, the Fund invested in interest rate futures to gain exposure to different parts of the yield curve while managing the overall duration. The Fund also entered into interest rate futures contracts for non-hedging purposes to seek to enhance potential gains.
Upon entering into a futures contract, the Fund is required to deposit with a financial intermediary cash or securities ("initial margin") in an amount equal to a certain percentage of the face value indicated in the futures contract. Subsequent payments ("variation margin") are made or received by the Fund dependent upon the daily fluctuations in the value and are recorded for financial reporting purposes as unrealized gains or losses by the Fund. Gains or losses are realized when the contract expires or is closed. Since all futures contracts are exchange traded, counterparty risk is minimized as the exchange's clearinghouse acts as the counterparty, and guarantees the futures against default.
Certain risks may arise upon entering into futures contracts, including the risk that an illiquid market will limit the Fund's ability to close out a futures contract prior to the settlement date and the risk that the futures contract is not well correlated with the security, index or currency to which it relates. Risk of loss may exceed amounts disclosed in the Statement of Assets and Liabilities.
A summary of the open futures contracts as of December 31, 2013, is included in a table following the Fund's Investment Portfolio. For the year ended December 31, 2013, the investment in futures contracts purchased had a total notional value generally indicative of a range from approximately $8,763,000 to $27,422,000, and the investment in futures contracts sold had a total notional value generally indicative of a range from $0 to approximately $14,113,000.
Options. An option contract is a contract in which the writer (seller) of the option grants the buyer of the option, upon payment of a premium, the right to purchase from (call option), or sell to (put option), the writer a designated instrument at a specified price within a specified period of time. The Fund may write or purchase interest rate swaption agreements which are options to enter into a pre-defined swap agreement. The interest rate swaption agreement will specify whether the buyer of the swaption will be a fixed-rate receiver or a fixed-rate payer upon exercise. Certain options, including options on indices, will require cash settlement by the Fund if exercised. For the year ended December 31, 2013, the Fund entered into options on interest rate futures and on interest rate swaps in order to hedge against potential adverse interest rate movements of portfolio assets.
If the Fund writes a covered call option, the Fund foregoes, in exchange for the premium, the opportunity to profit during the option period from an increase in the market value of the underlying security above the exercise price. If the Fund writes a put option it accepts the risk of a decline in the value of the underlying security below the exercise price. Over-the-counter options have the risk of the potential inability of counterparties to meet the terms of their contracts. The Fund's maximum exposure to purchased options is limited to the premium initially paid. In addition, certain risks may arise upon entering into option contracts including the risk that an illiquid secondary market will limit the Fund's ability to close out an option contract prior to the expiration date and that a change in the value of the option contract may not correlate exactly with changes in the value of the securities or currencies hedged.
There are no open purchased option contracts as of December 31, 2013. A summary of open written option contracts is included in the table following the Fund's Investment Portfolio. For the year ended December 31, 2013, the investment in written options contracts had a total value generally indicative of a range from approximately $26,000 to $158,000, and purchased option contracts had a total value generally indicative of a range from $0 to approximately $15,000.
Swaps. A swap is a contract between two parties to exchange future cash flows at periodic intervals based on the notional amount of the swap. A bilateral swap is a transaction between the fund and a counterparty where cash flows are exchanged between the two parties. A centrally cleared swap is a transaction executed between the fund and a counterparty, then cleared by a clearing member through a central clearinghouse. The central clearinghouse serves as the counterparty, with whom the fund exchanges cash flows.
The value of a swap is adjusted daily, and the change in value, if any, is recorded as unrealized appreciation or depreciation in the Statement of Assets and Liabilities. Gains or losses are realized when the swap expires or is closed. Certain risks may arise when entering into swap transactions including counterparty default; liquidity; or unfavorable changes in interest rates or the value of the underlying reference security, commodity or index. In connection with bilateral swaps, securities and/or cash may be identified as collateral in accordance with the terms of the swap agreement to provide assets of value and recourse in the event of default. The maximum counterparty credit risk is the net present value of the cash flows to be received from or paid to the counterparty over the term of the swap, to the extent that this amount is beneficial to the Fund, in addition to any related collateral posted to the counterparty by the Fund. This risk may be partially reduced by a master netting arrangement between the Fund and the counterparty. Upon entering into a centrally cleared swap, the Fund is required to deposit with a financial intermediary cash or securities ("initial margin") in an amount equal to a certain percentage of the notional amount of the swap. Subsequent payments ("variation margin") are made or received by the Fund dependent upon the daily fluctuations in the value of the swap. In a cleared swap transaction, counterparty risk is minimized as the central clearinghouse acts as the counterparty.
An upfront payment, if any, made by the Fund is recorded as an asset in the Statement of Assets and Liabilities. An upfront payment, if any, received by the Fund is recorded as a liability in the Statement of Assets and Liabilities. Payments received or made at the end of the measurement period are recorded as realized gain or loss in the Statement of Operations.
Credit Default Swaps. Credit default swaps are agreements between a buyer and a seller of protection against predefined credit events for the reference entity. The Fund may enter into credit default swaps to gain exposure to an underlying issuer's credit quality characteristics without directly investing in that issuer or to hedge against the risk of a credit event on debt securities. As a seller of a credit default swap, the Fund is required to pay the par (or other agreed-upon) value of the referenced entity to the counterparty with the occurrence of a credit event by a third party, such as a U.S. or foreign corporate issuer, on the reference entity, which would likely result in a loss to the Fund. In return, the Fund receives from the counterparty a periodic stream of payments over the term of the swap provided that no credit event has occurred. If no credit event occurs, the Fund keeps the stream of payments with no payment obligations. The Fund may also buy credit default swaps, in which case the Fund functions as the counterparty referenced above. This involves the risk that the swap may expire worthless. It also involves counterparty risk that the seller may fail to satisfy its payment obligations to the Fund with the occurrence of a credit event. When the Fund sells a credit default swap, it will cover its commitment. This may be achieved by, among other methods, maintaining cash or liquid assets equal to the aggregate notional value of the reference entities for all outstanding credit default swaps sold by the Fund. For the year ended December 31, 2013, the Fund entered into credit default swap agreements to gain exposure to the underlying issuer's credit quality characteristics.
Under the terms of a credit default swap, the Fund receives or makes periodic payments based on a specified interest rate on a fixed notional amount. These payments are recorded as a realized gain or loss in the Statement of Operations. Payments received or made as a result of a credit event or termination of the swap are recognized, net of a proportional amount of the upfront payment, as realized gains or losses in the Statement of Operations.
A summary of the open credit default swap contracts as of December 31, 2013 is included in a table following the Fund's Investment Portfolio. For the year ended December 31, 2013, the investment in credit default swap contracts sold had a total notional value generally indicative of a range from $50,000 to $2,750,000.
Interest Rate Swaps. Interest rate swaps are agreements in which the Fund agrees to pay to the counterparty a fixed rate payment in exchange for the counterparty agreeing to pay to the Fund a variable rate payment, or the Fund agrees to receive from the counterparty a fixed rate payment in exchange for the counterparty agreeing to receive from the Fund a variable rate payment. The payment obligations are based on the notional amount of the swap. For the year ended December 31, 2013, the Fund entered into interest rate swap agreements to gain exposure to different parts of the yield curve while managing overall duration.
A summary of the open interest rate swap contracts as of December 31, 2013 is included in a table following the Fund's Investment Portfolio. For the year ended December 31, 2013, the investment in interest rate swap contracts had a total notional amount generally indicative of a range from $26,100,000 to $58,500,000.
Forward Foreign Currency Exchange Contracts. A forward foreign currency exchange contract ("forward currency contract") is a commitment to purchase or sell a foreign currency at the settlement date at a negotiated rate. The Fund is subject to foreign exchange rate risk in its securities denominated in foreign currencies. Changes in exchange rates between foreign currencies and the U.S. dollar may affect the U.S. dollar value of foreign securities or the income or gains received on these securities. To reduce the effect of currency fluctuations, the Fund may enter into forward currency contracts. For the year ended December 31, 2013, the Fund invested in forward currency contracts to hedge its exposure to changes in foreign currency exchange rates on its foreign currency denominated securities. In addition, the Fund also engaged in forward currency contracts for non-hedging purposes to seek to enhance potential gains.
Forward currency contracts are valued at the prevailing forward exchange rate of the underlying currencies and unrealized gain (loss) is recorded daily. On the settlement date of the forward currency contract, the Fund records a realized gain or loss equal to the difference between the value of the contract at the time it was opened and the value of the contract at the time it was closed. Certain risks may arise upon entering into forward currency contracts from the potential inability of counterparties to meet the terms of their contracts. The maximum counterparty credit risk to the Fund is measured by the unrealized gain on appreciated contracts. Additionally, when utilizing forward currency contracts to hedge, the Fund gives up the opportunity to profit from favorable exchange rate movements during the term of the contract.
A summary of the open forward currency contracts as of December 31, 2013, is included in a table following the Fund's Investment Portfolio. For the year ended December 31, 2013, the investment in forward currency contracts U.S. dollars purchased had a total contract value generally indicative of a range from approximately $8,954,000 to $26,047,000, and the investment in forward currency contracts U.S. dollars sold had a total contract value generally indicative of a range from approximately $4,843,000 to $23,485,000.
The investment in forward currency contracts long vs. other foreign currencies sold had a total contract value generally indicative of a range from $0 to approximately $7,457,000.
The following tables summarize the value of the Fund's derivative instruments held as of December 31, 2013 and the related location in the accompanying Statement of Assets and Liabilities, presented by primary underlying risk exposure:
| Asset Derivatives | | Forward Contracts | | | Swap Contracts | | | Futures Contracts | | | Total | |
| Interest Rate Contracts (a) (b) | | $ | — | | | $ | 13,957 | | | $ | 53,186 | | | $ | 67,143 | |
| Credit Contracts (a) | | | — | | | | 5,203 | | | | — | | | | 5,203 | |
| Foreign Exchange Contracts (c) | | | 270,186 | | | | — | | | | — | | | | 270,186 | |
| | | $ | 270,186 | | | $ | 19,160 | | | $ | 53,186 | | | $ | 342,532 | |
Each of the above derivatives is located in the following Statement of Assets and Liabilities accounts: (a) Unrealized appreciation on swap contracts (b) Includes cumulative appreciation of futures contracts as disclosed in the Investment Portfolio. Unsettled variation margin is disclosed separately within the Statement of Assets and Liabilities. (c) Unrealized appreciation on forward foreign currency exchange contracts | |
| Liability Derivatives | | Written Options | | | Forward Contracts | | | Swap Contracts | | | Futures Contracts | | | Total | |
| Interest Rate Contracts (a) (b) | | $ | (60,066 | ) | | $ | — | | | $ | (35,997 | ) | | $ | (59,965 | ) | | $ | (156,028 | ) |
| Foreign Exchange Contracts (c) | | | — | | | | (55,616 | ) | | | — | | | | — | | | | (55,616 | ) |
| | | $ | (60,066 | ) | | $ | (55,616 | ) | | $ | (35,997 | ) | | $ | (59,965 | ) | | $ | (211,644 | ) |
Each of the above derivatives is located in the following Statement of Assets and Liabilities accounts: (a) Options written, at value and unrealized depreciation on swap contracts (b) Includes cumulative depreciation of futures contracts as disclosed in the Investment Portfolio. Unsettled variation margin is disclosed separately within the Statement of Assets and Liabilities. (c) Unrealized depreciation on forward foreign currency exchange contracts | |
Additionally, the amount of unrealized and realized gains and losses on derivative instruments recognized in Fund earnings during the year ended December 31, 2013 and the related location in the accompanying Statement of Operations is summarized in the following tables by primary underlying risk exposure:
| Realized Gain (Loss) | | Purchased Options | | | Written Options | | | Forward Contracts | | | Swap Contracts | | | Futures Contracts | | | Total | |
| Interest Rate Contracts (a) | | $ | (12,995 | ) | | $ | 113,142 | | | $ | — | | | $ | 1,036,850 | | | $ | (2,166,845 | ) | | $ | (1,029,848 | ) |
| Credit Contracts (b) | | | — | | | | — | | | | — | | | | 163,578 | | | | — | | | | 163,578 | |
| Foreign Exchange Contracts (c) | | | — | | | | — | | | | (437,491 | ) | | | — | | | | — | | | | (437,491 | ) |
| | | $ | (12,995 | ) | | $ | 113,142 | | | $ | (437,491 | ) | | $ | 1,200,428 | | | $ | (2,166,845 | ) | | $ | (1,303,761 | ) |
Each of the above derivatives is located in the following Statement of Operations accounts: (a) Net realized gain (loss) from investments (includes purchased options), written options, swap contracts and futures, respectively (b) Net realized gain (loss) from swap contracts (c) Net realized gain (loss) from foreign currency (Statement of Operations includes both forward currency contracts and foreign currency transactions) | |
| Change in Net Unrealized Appreciation (Depreciation) | | Purchased Options | | | Written Options | | | Forward Contracts | | | Swap Contracts | | | Futures Contracts | | | Total | |
| Interest Rate Contracts (a) | | $ | (502 | ) | | $ | 2,530 | | | $ | — | | | $ | (139,459 | ) | | $ | (14,104 | ) | | $ | (151,535 | ) |
| Credit Contracts (b) | | | — | | | | — | | | | — | | | | (89,178 | ) | | | — | | | | (89,178 | ) |
| Foreign Exchange Contracts (c) | | | — | | | | — | | | | 233,479 | | | | — | | | | — | | | | 233,479 | |
| | | $ | (502 | ) | | $ | 2,530 | | | $ | 233,479 | | | $ | (228,637 | ) | | $ | (14,104 | ) | | $ | (7,234 | ) |
Each of the above derivatives is located in the following Statement of Operations accounts: (a) Change in net unrealized appreciation (depreciation) on investments (includes purchased options), written options, swaps contracts and futures, respectively (b) Change in net unrealized appreciation (depreciation) on swap contracts (c) Change in net unrealized appreciation (depreciation) on foreign currency (Statement of Operations includes both forward currency contracts and foreign currency transactions) | |
As of December 31, 2013, the Fund has transactions subject to enforceable master netting agreements. A reconciliation of the gross amounts on the Statement of Assets and Liabilities to the net amounts by derivative type, including any collateral exposure, is included in the following tables:
| Counterparty | | Gross Amounts of Assets Presented in the Statement of Assets and Liabilities (a) | | | Financial Instruments and Derivatives Available for Offset | | | Non-Cash Collateral Received | | | Cash Collateral Received (c) | | | Net Amount of Derivative Assets | |
| Barclays Bank PLC | | $ | 51,374 | | | $ | (1 | ) | | $ | — | | | $ | — | | | $ | 51,373 | |
| Credit Suisse | | | 800 | | | | — | | | | — | | | | — | | | | 800 | |
| Citigroup, Inc. | | | 41,867 | | | | (6,224 | ) | | | — | | | | (35,643 | ) | | | — | |
| Commonwealth Bank of Australia | | | 15,033 | | | | (5,282 | ) | | | — | | | | — | | | | 9,751 | |
| JPMorgan Chase Securities, Inc. | | | 22,659 | | | | (1 | ) | | | — | | | | — | | | | 22,658 | |
| Nomura International PLC | | | 1,013 | | | | (1,013 | ) | | | — | | | | — | | | | — | |
| UBS AG | | | 142,643 | | | | — | | | | — | | | | — | | | | 142,643 | |
| Centrally Cleared Swaps and Futures (b) | | | 67,143 | | | | — | | | | — | | | | — | | | | 67,143 | |
| | | $ | 342,532 | | | $ | (12,521 | ) | | $ | — | | | $ | (35,643 | ) | | $ | 294,368 | |
| Counterparty | | Gross Amounts of Liabilities Presented in the Statement of Assets and Liabilities (a) | | | Financial Instruments and Derivatives Available for Offset | | | Non-Cash Collateral Pledged | | | Cash Collateral Pledged | | | Net Amount of Derivative Liabilities | |
| Australia & New Zealand Banking Group Ltd. | | $ | 723 | | | $ | — | | | $ | — | | | $ | — | | | $ | 723 | |
| Barclays Bank PLC | | | 1 | | | | (1 | ) | | | — | | | | — | | | | — | |
| BNP Paribas | | | 7,293 | | | | — | | | | — | | | | — | | | | 7,293 | |
| Citigroup, Inc. | | | 6,224 | | | | (6,224 | ) | | | — | | | | — | | | | — | |
| Commonwealth Bank of Australia | | | 5,282 | | | | (5,282 | ) | | | — | | | | — | | | | — | |
| JPMorgan Chase Securities, Inc. | | | 1 | | | | (1 | ) | | | — | | | | — | | | | — | |
| Nomura International PLC | | | 96,158 | | | | (1,013 | ) | | | — | | | | — | | | | 95,145 | |
| Centrally Cleared Swaps and Futures (b) | | | 95,962 | | | | — | | | | — | | | | — | | | | 95,962 | |
| | | $ | 211,644 | | | $ | (12,521 | ) | | $ | — | | | $ | — | | | $ | 199,123 | |
(a) Forward foreign currency exchange contracts, swap contracts and over-the-counter purchased options and written options are netted.
(b) Includes financial instruments (centrally cleared swaps or futures) which are not subject to a master netting arrangement, or another similar arrangement.
(c) The actual collateral received and/or pledged may be more than the amount shown.
C. Purchases and Sales of Securities
During the year ended December 31, 2013, purchases and sales of investment securities (excluding short-term investments and U.S. Treasury obligations) aggregated $620,123,216 and $676,539,127, respectively. Purchases and sales of U.S. Treasury obligations aggregated $7,783,789 and $25,540,590, respectively.
For the year ended December 31, 2013, transactions for written options on interest rate swap contracts and futures contracts were as follows:
| | | Contracts/ Contract Amount | | | Premiums | |
| Outstanding, beginning of period | | | 5,700,015 | | | $ | 102,441 | |
| Options written | | | 14,000,024 | | | | 177,038 | |
| Options closed | | | (7,700,000 | ) | | | (115,615 | ) |
| Options expired | | | (39 | ) | | | (25,264 | ) |
| Outstanding, end of period | | | 12,000,000 | | | $ | 138,600 | |
D. Related Parties
Management Agreement. Under the Investment Management Agreement with Deutsche Investment Management Americas Inc. ("DIMA" or the "Advisor"), an indirect, wholly owned subsidiary of Deutsche Bank AG, the Advisor directs the investments of the Fund in accordance with its investment objectives, policies and restrictions. The Advisor determines the securities, instruments and other contracts relating to investments to be purchased, sold or entered into by the Fund.
Pursuant to the Investment Management Agreement with the Advisor, the Fund pays a monthly management fee based on the Fund's average daily net assets, computed and accrued daily and payable monthly, at the following annual rates:
| First $250 million of average daily net assets | | | .390 | % |
| Next $750 million of average daily net assets | | | .365 | % |
| Over $1 billion of average daily net assets | | | .340 | % |
For the period from January 1, 2013 through September 30, 2013, the Advisor had contractually agreed to waive its fees and/or reimburse certain operating expenses to the extent necessary to maintain the operating expenses (excluding certain expenses such as extraordinary expenses, taxes, brokerage and interest expense) of Class A at 0.55%.
Effective October 1, 2013 through September 30, 2014, the Advisor has contractually agreed to waive its fees and/or reimburse certain operating expenses to the extent necessary to maintain the operating expenses (excluding certain expenses such as extraordinary expenses, taxes, brokerage and interest expense) of Class A at 0.61%.
Accordingly, for the year ended December 31, 2013, the Advisor waived a portion of its management fee pursuant to the Investment Management Agreement aggregating $108,236, and the amount charged aggregated $399,551, which was equivalent to an annual effective rate of 0.31% of the Fund's average daily net assets.
Administration Fee. Pursuant to an Administrative Services Agreement, DIMA provides most administrative services to the Fund. For all services provided under the Administrative Services Agreement, the Fund pays the Advisor an annual fee ("Administration Fee") of 0.10% of the Fund's average daily net assets, computed and accrued daily and payable monthly. For the year ended December 31, 2013, the Administration Fee was $130,202, of which $8,987 is unpaid.
Service Provider Fees. DWS Investments Service Company ("DISC"), an affiliate of the Advisor, is the transfer agent, dividend-paying agent and shareholder service agent for the Fund. Pursuant to a sub-transfer agency agreement between DISC and DST Systems, Inc. ("DST"), DISC has delegated certain transfer agent, dividend-paying agent and shareholder service agent functions to DST. DISC compensates DST out of the shareholder servicing fee it receives from the Fund. For the year ended December 31, 2013, the amounts charged to the Fund by DISC aggregated $559, all of which was waived.
Typesetting and Filing Service Fees. Under an agreement with DIMA, DIMA is compensated for providing typesetting and certain regulatory filing services to the Fund. For the year ended December 31, 2013, the amount charged to the Fund by DIMA included in the Statement of Operations under "reports to shareholders" aggregated $16,496, of which $6,147 is unpaid.
Trustees' Fees and Expenses. The Fund paid retainer fees to each Trustee not affiliated with the Advisor, plus specified amounts to the Board Chairperson and Vice Chairperson and to each committee Chairperson.
Affiliated Cash Management Vehicles. The Fund may invest uninvested cash balances in Central Cash Management Fund and DWS Variable NAV Money Fund, affiliated money market funds which are managed by the Advisor. Each affiliated money market fund seeks to provide a high level of current income consistent with liquidity and the preservation of capital. Each affiliated money market fund is managed in accordance with Rule 2a-7 under the Investment Company Act of 1940, which governs the quality, maturity, diversity and liquidity of instruments in which a money market fund may invest. Central Cash Management Fund seeks to maintain a stable net asset value, and DWS Variable NAV Money Fund maintains a floating net asset value. The Fund indirectly bears its proportionate share of the expenses of each affiliated money market fund in which it invests. Central Cash Management Fund does not pay the Advisor an investment management fee. To the extent that DWS Variable NAV Money Fund pays an investment management fee to the Advisor, the Advisor will waive an amount of the investment management fee payable to the Advisor by the Fund equal to the amount of the investment management fee payable on the Fund's assets invested in DWS Variable NAV Money Fund.
Securities Lending Agent Fees. Deutsche Bank AG serves as securities lending agent for the Fund. For the year ended December 31, 2013, the Fund incurred securities lending agent fees to Deutsche Bank AG in the amount of $1,783.
E. Investing in Emerging Markets
Investing in emerging markets may involve special risks and considerations not typically associated with investing in developed markets. These risks include revaluation of currencies, high rates of inflation or deflation, repatriation restrictions on income and capital, and future adverse political, social and economic developments. Moreover, securities issued in these markets may be less liquid, subject to government ownership controls or delayed settlements and may have prices more volatile or less easily assessed than those of comparable securities of issuers in developed markets.
F. Ownership of the Fund
At December 31, 2013, three participating insurance companies were owners of record of 10% or more of the total outstanding Class A shares of the Fund, owning 34%, 24% and 12%, respectively.
G. Line of Credit
The Fund and other affiliated funds (the "Participants") share in a $375 million revolving credit facility provided by a syndication of banks. The Fund may borrow for temporary or emergency purposes, including the meeting of redemption requests that otherwise might require the untimely disposition of securities. The Participants are charged an annual commitment fee which is allocated based on net assets, among each of the Participants. Interest is calculated at a rate per annum equal to the sum of the Federal Funds Rate plus 1.25 percent plus if LIBOR exceeds the Federal Funds Rate the amount of such excess. The Fund may borrow up to a maximum of 33 percent of its net assets under the agreement. The Fund had no outstanding loans at December 31, 2013.
H. Acquisition of Assets
On April 30, 2012, the Fund acquired all of the net assets of DWS Core Fixed Income VIP pursuant to a plan of reorganization approved by the Board of Trustees on November 18, 2011. The acquisition was accomplished by a tax-free exchange of 8,800,059 Class A shares of DWS Core Fixed Income VIP for 13,990,523 Class A shares of the Fund outstanding on April 30, 2012. DWS Core Fixed Income VIP's net assets at that date, $78,348,206, including $2,794,520 of net unrealized appreciation, were combined with those of the Fund. The aggregate net assets of the Fund immediately before the acquisition were $109,635,421. The combined net assets of the Fund immediately following the acquisition were $187,983,627.
Report of Independent Registered Public Accounting Firm
To the Trustees of DWS Variable Series I and the Shareholders of DWS Bond VIP:
In our opinion, the accompanying statement of assets and liabilities, including the investment portfolio, and the related statements of operations and of changes in net assets and the financial highlights present fairly, in all material respects, the financial position of DWS Bond VIP (the "Fund") at December 31, 2013 and the results of its operations, the changes in its net assets, and the financial highlights for the periods indicated therein, in conformity with accounting principles generally accepted in the United States of America. These financial statements and financial highlights (hereafter referred to as "financial statements") are the responsibility of the Fund's management. Our responsibility is to express an opinion on these financial statements based on our audits. We conducted our audits of these financial statements in accordance with the standards of the Public Company Accounting Oversight Board (United States). Those standards require that we plan and perform the audit to obtain reasonable assurance about whether the financial statements are free of material misstatement. An audit includes examining, on a test basis, evidence supporting the amounts and disclosures in the financial statements, assessing the accounting principles used and significant estimates made by management, and evaluating the overall financial statement presentation. We believe that our audits, which included confirmation of securities at December 31, 2013 by correspondence with the custodians and brokers, provide a reasonable basis for our opinion.
Boston, Massachusetts February 14, 2014 | PricewaterhouseCoopers LLP |
Information About Your Fund's Expenses (Unaudited)
As an investor of the Fund, you incur two types of costs: ongoing expenses and transaction costs. Ongoing expenses include management fees and other Fund expenses. Examples of transaction costs include contract charges, redemption fees and account maintenance fees, which are not shown in this section. The following tables are intended to help you understand your ongoing expenses (in dollars) of investing in the Fund and to help you compare these expenses with the ongoing expenses of investing in other mutual funds. In the most recent six-month period, the Fund limited these expenses; had it not done so, expenses would have been higher. The example in the table is based on an investment of $1,000 invested at the beginning of the six-month period and held for the entire period (July 1, 2013 to December 31, 2013).
The tables illustrate your Fund's expenses in two ways:
—Actual Fund Return. This helps you estimate the actual dollar amount of ongoing expenses (but not transaction costs) paid on a $1,000 investment in the Fund using the Fund's actual return during the period. To estimate the expenses you paid over the period, simply divide your account value by $1,000 (for example, an $8,600 account value divided by $1,000 = 8.6), then multiply the result by the number in the "Expenses Paid per $1,000" line under the share class you hold.
— Hypothetical 5% Fund Return. This helps you to compare your Fund's ongoing expenses (but not transaction costs) with those of other mutual funds using the Fund's actual expense ratio and a hypothetical rate of return of 5% per year before expenses. Examples using a 5% hypothetical Fund return may be found in the shareholder reports of other mutual funds. The hypothetical account values and expenses may not be used to estimate the actual ending account balance or expenses you paid for the period.
Please note that the expenses shown in these tables are meant to highlight your ongoing expenses only and do not reflect any transaction costs. The "Expenses Paid per $1,000" line of the tables is useful in comparing ongoing expenses only and will not help you determine the relative total expense of owning different funds. If these transaction costs had been included, your costs would have been higher.
Expenses and Value of a $1,000 Investment for the six months ended December 31, 2013 | |
| Actual Fund Return | | Class A | |
| Beginning Account Value 7/1/13 | | $ | 1,000.00 | |
| Ending Account Value 12/31/13 | | $ | 1,009.20 | |
| Expenses Paid per $1,000* | | $ | 2.94 | |
| Hypothetical 5% Fund Return | | Class A | |
| Beginning Account Value 7/1/13 | | $ | 1,000.00 | |
| Ending Account Value 12/31/13 | | $ | 1,022.28 | |
| Expenses Paid per $1,000* | | $ | 2.96 | |
* Expenses are equal to the Fund's annualized expense ratio, multiplied by the average account value over the period, multiplied by 184 (the number of days in the most recent six-month period), then divided by 365.
| Annualized Expense Ratio | Class A |
| DWS Variable Series I — DWS Bond VIP | .58% |
For more information, please refer to the Fund's prospectus.
These tables do not reflect charges and fees ("contract charges") associated with the separate account that invests in the Fund or any variable life insurance policy or variable annuity contract for which the Fund is an investment option.
For an analysis of the fees associated with an investment in the fund or similar funds, please refer to the current and hypothetical expense calculators for Variable Insurance Products which can be found at dws-investments.com/EN/resources/calculators.jsp.
Tax Information (Unaudited)
Please consult a tax advisor if you have questions about federal or state income tax laws, or on how to prepare your tax returns. If you have specific questions about your account, please contact your insurance provider.
The Series' policies and procedures for voting proxies for portfolio securities and information about how the Series voted proxies related to its portfolio securities during the 12-month period ended June 30 are available on our Web site — dws-investments.com (click on "proxy voting"at the bottom of the page) — or on the SEC's Web site — sec.gov. To obtain a written copy of the Series' policies and procedures without charge, upon request, call us toll free at (800) 728-3337.
Advisory Agreement Board Considerations and Fee Evaluation
The Board of Trustees approved the renewal of DWS Bond VIP's investment management agreement (the "Agreement") with Deutsche Investment Management Americas Inc. ("DIMA") in September 2013.
In terms of the process that the Board followed prior to approving the Agreement, shareholders should know that:
— In September 2013, all of the Fund's Trustees were independent of DIMA and its affiliates.
— The Trustees met frequently during the past year to discuss fund matters and dedicated a substantial amount of time to contract review matters. Over the course of several months, the Board's Contract Committee, in coordination with the Board's Fixed Income and Asset Allocation Oversight Committee, reviewed comprehensive materials received from DIMA, independent third parties and independent counsel. These materials included an analysis of the Fund's performance, fees and expenses, and profitability compiled by a fee consultant retained by the Fund's Independent Trustees (the "Fee Consultant"). The Board also received extensive information throughout the year regarding performance of the Fund.
— The Independent Trustees regularly meet privately with their independent counsel to discuss contract review and other matters. In addition, the Independent Trustees were also advised by the Fee Consultant in the course of their review of the Fund's contractual arrangements and considered a comprehensive report prepared by the Fee Consultant in connection with their deliberations.
— In connection with reviewing the Agreement, the Board also reviewed the terms of the Fund's distribution agreement, administrative services agreement, transfer agency agreement and other material service agreements.
— Based on its evaluation of the information provided, the Contract Committee presented its findings and recommendations to the Board. The Board then reviewed the Contract Committee's findings and recommendations.
In connection with the contract review process, the Contract Committee and the Board considered the factors discussed below, among others. The Board also considered that DIMA and its predecessors have managed the Fund since its inception, and the Board believes that a long-term relationship with a capable, conscientious advisor is in the best interests of the Fund. The Board considered, generally, that shareholders chose to invest or remain invested in the Fund knowing that DIMA managed the Fund, and that the Agreement was approved by the Fund's shareholders. DIMA is part of Deutsche Bank AG, a major global banking institution that is engaged in a wide range of financial services. The Board believes that there are advantages to being part of a global asset management business that offers a wide range of investing expertise and resources, including hundreds of portfolio managers and analysts with research capabilities in many countries throughout the world.
As part of the contract review process, the Board carefully considered the fees and expenses of each DWS fund overseen by the Board in light of the fund's performance. In many cases, this led to a negotiation with DIMA of lower expense caps as part of the 2012 and 2013 contract review processes than had previously been in place. As part of these negotiations, the Board indicated that it would consider relaxing these new lower caps in future years following sustained improvements in performance, among other considerations.
In June 2012, Deutsche Bank AG ("DB"), DIMA's parent company, announced that DB would combine its Asset Management (of which DIMA was a part) and Wealth Management divisions. DB has advised the Independent Trustees that the U.S. asset management business is a critical and integral part of DB, and that it has, and will continue to, reinvest a significant portion of the substantial savings it expects to realize by combining its Asset Management and Wealth Management divisions into the new Asset and Wealth Management ("AWM") division, including ongoing enhancements to its investment capabilities. DB also has confirmed its commitment to maintaining strong legal and compliance groups within the AWM division.
While shareholders may focus primarily on fund performance and fees, the Fund's Board considers these and many other factors, including the quality and integrity of DIMA's personnel and such other issues as back-office operations, fund valuations, and compliance policies and procedures.
Nature, Quality and Extent of Services. The Board considered the terms of the Agreement, including the scope of advisory services provided under the Agreement. The Board noted that, under the Agreement, DIMA provides portfolio management services to the Fund and that, pursuant to a separate administrative services agreement, DIMA provides administrative services to the Fund. The Board considered the experience and skills of senior management and investment personnel, the resources made available to such personnel, the ability of DIMA to attract and retain high-quality personnel, and the organizational depth and stability of DIMA. The Board reviewed the Fund's performance over short-term and long-term periods and compared those returns to various agreed-upon performance measures, including market indices and a peer universe compiled by the Fee Consultant using information supplied by Morningstar Direct ("Morningstar"), an independent fund data service. The Board also noted that it has put into place a process of identifying "Focus Funds" (e.g., funds performing poorly relative to their benchmark or a peer universe compiled by an independent fund data service), and receives more frequent reporting and information from DIMA regarding such funds, along with DIMA's remedial plans to address underperformance. The Board believes this process is an effective manner of identifying and addressing underperforming funds. Based on the information provided, the Board noted that for the one-, three- and five-year periods ended December 31, 2012, the Fund's performance (Class A shares) was in the 2nd quartile, 3rd quartile and 4th quartile, respectively, of the applicable Morningstar universe (the 1st quartile being the best performers and the 4th quartile being the worst performers). The Board also observed that the Fund has outperformed its benchmark in the one- and three-year periods and has underperformed its benchmark in the five-year period ended December 31, 2012.
Fees and Expenses. The Board considered the Fund's investment management fee schedule, operating expenses and total expense ratios, and comparative information provided by Lipper Inc. ("Lipper") and the Fee Consultant regarding investment management fee rates paid to other investment advisors by similar funds (1st quartile being the most favorable and 4th quartile being the least favorable). With respect to management fees paid to other investment advisors by similar funds, the Board noted that the contractual fee rates paid by the Fund, which include a 0.10% fee paid to DIMA under the Fund's administrative services agreement, were approximately at the median of the applicable Lipper peer group (based on Lipper data provided as of December 31, 2012). The Board noted that the Fund's Class A shares total (net) operating expenses were expected to be lower than the median (2nd quartile) of the applicable Lipper expense universe (based on Lipper data provided as of December 31, 2012) ("Lipper Universe Expenses"). The Board considered the Fund's management fee rate as compared to fees charged by DIMA to comparable funds and considered differences between the Fund and the comparable funds. The Board also considered how the Fund's total (net) operating expenses compared to the total (net) operating expenses of a more customized peer group selected by Lipper (based on such factors as asset size).
The information considered by the Board as part of its review of management fees included information regarding fees charged by DIMA and its affiliates to similar institutional accounts and to similar funds offered primarily to European investors ("DWS Europe funds"), in each case as applicable. The Board observed that advisory fee rates for institutional accounts generally were lower than the management fees charged by similarly managed DWS U.S. mutual funds ("DWS Funds"), but also took note of the differences in services provided to DWS Funds as compared to institutional accounts. In the case of DWS Europe funds, the Board observed that fee rates for DWS Europe funds generally were higher than for similarly managed DWS Funds, but noted that differences in the types of services provided to DWS Funds relative to DWS Europe funds made it difficult to compare such fees.
On the basis of the information provided, the Board concluded that management fees were reasonable and appropriate in light of the nature, quality and extent of services provided by DIMA.
Profitability. The Board reviewed detailed information regarding revenues received by DIMA under the Agreement. The Board considered the estimated costs and pre-tax profits realized by DIMA from advising the DWS Funds, as well as estimates of the pre-tax profits attributable to managing the Fund in particular. The Board also received information regarding the estimated enterprise-wide profitability of DWS and its affiliates with respect to all fund services in totality and by fund. The Board and the Fee Consultant reviewed DIMA's methodology in allocating its costs to the management of the Fund. Based on the information provided, the Board concluded that the pre-tax profits realized by DIMA in connection with the management of the Fund were not unreasonable. The Board also reviewed information regarding the profitability of certain similar investment management firms. The Board noted that while information regarding the profitability of such firms is limited (and in some cases is not necessarily prepared on a comparable basis), DIMA and its affiliates' overall profitability with respect to the DWS fund complex (after taking into account distribution and other services provided to the funds by DIMA and its affiliates) was lower than the overall profitability levels of many comparable firms for which such data was available.
Economies of Scale. The Board considered whether there are economies of scale with respect to the management of the Fund and whether the Fund benefits from any economies of scale. The Board noted that the Fund's management fee schedule includes fee breakpoints. The Board concluded that the Fund's fee schedule represents an appropriate sharing between the Fund and DIMA of such economies of scale as may exist in the management of the Fund at current asset levels.
Other Benefits to DIMA and Its Affiliates. The Board also considered the character and amount of other incidental benefits received by DIMA and its affiliates, including any fees received by DIMA for administrative services provided to the Fund and any fees received by an affiliate of DIMA for distribution services. The Board also considered benefits to DIMA related to brokerage and soft-dollar allocations, including allocating brokerage to pay for research generated by parties other than the executing broker dealers, which pertain primarily to funds investing in equity securities, along with the incidental public relations benefits to DIMA related to DWS Funds advertising and cross-selling opportunities among DIMA products and services. The Board concluded that management fees were reasonable in light of these fallout benefits.
Compliance. The Board considered the significant attention and resources dedicated by DIMA to documenting and enhancing its compliance processes in recent years. The Board noted in particular (i) the experience and seniority of both DIMA's chief compliance officer and the Fund's chief compliance officer; (ii) the large number of DIMA compliance personnel; and (iii) the substantial commitment of resources by DIMA and its affiliates to compliance matters.
Based on all of the information considered and the conclusions reached, the Board unanimously determined that the continuation of the Agreement is in the best interests of the Fund. In making this determination, the Board did not give particular weight to any single factor identified above. The Board considered these factors over the course of numerous meetings, certain of which were in executive session with only the Independent Trustees and their independent counsel present. It is possible that individual Trustees may have weighed these factors differently in reaching their individual decisions to approve the continuation of the Agreement.
Board Members and Officers
The following table presents certain information regarding the Board Members and Officers of the fund. Each Board Member's year of birth is set forth in parentheses after his or her name. Unless otherwise noted, (i) each Board Member has engaged in the principal occupation(s) noted in the table for at least the most recent five years, although not necessarily in the same capacity; and (ii) the address of each Independent Board Member is c/o Kenneth C. Froewiss, Chairman, DWS Mutual Funds, P.O. Box 78, Short Hills, NJ 07078. Except as otherwise noted below, the term of office for each Board Member is until the election and qualification of a successor, or until such Board Member sooner dies, resigns, is removed or as otherwise provided in the governing documents of the fund. Because the fund does not hold an annual meeting of shareholders, each Board Member will hold office for an indeterminate period. The Board Members may also serve in similar capacities with other funds in the fund complex.
| Independent Board Members |
Name, Year of Birth, Position with the Fund and Length of Time Served1 | | Business Experience and Directorships During the Past Five Years | Number of Funds in DWS Fund Complex Overseen | Other Directorships Held by Board Member |
Kenneth C. Froewiss (1945) Chairperson since 2013, and Board Member since 2001 | | Adjunct Professor of Finance, NYU Stern School of Business (September 2009–present; Clinical Professor from 1997–September 2009); Member, Finance Committee, Association for Asian Studies (2002–present); Director, Mitsui Sumitomo Insurance Group (US) (2004–present); prior thereto, Managing Director, J.P. Morgan (investment banking firm) (until 1996) | 103 | — |
William McClayton (1944) Vice Chairperson since 2013, and Board Member since 2004 | | Private equity investor (since October 2009); previously, Managing Director, Diamond Management & Technology Consultants, Inc. (global consulting firm) (2001–2009); Directorship: Board of Managers, YMCA of Metropolitan Chicago; formerly: Senior Partner, Arthur Andersen LLP (accounting) (1966–2001); Trustee, Ravinia Festival | 103 | — |
John W. Ballantine (1946) Board Member since 1999 | | Retired; formerly, Executive Vice President and Chief Risk Management Officer, First Chicago NBD Corporation/The First National Bank of Chicago (1996–1998); Executive Vice President and Head of International Banking (1995–1996); former Directorships: Stockwell Capital Investments PLC (private equity); First Oak Brook Bancshares, Inc. and Oak Brook Bank; Prisma Energy International | 103 | Chairman of the Board, Healthways, Inc.2 (provider of disease and care management services) (2003– present); Portland General Electric2 (utility company) (2003– present) |
Henry P. Becton, Jr. (1943) Board Member since 1990 | | Vice Chair and former President, WGBH Educational Foundation. Directorships: Public Radio International; Public Radio Exchange (PRX); North Bennett Street School (Boston); former Directorships: The PBS Foundation; Association of Public Television Stations; Boston Museum of Science; American Public Television; Concord Academy; New England Aquarium; Mass. Corporation for Educational Telecommunications; Committee for Economic Development; Public Broadcasting Service; Connecticut College | 103 | Lead Director, Becton Dickinson and Company2 (medical technology company); Lead Director, Belo Corporation2 (media company) |
Dawn-Marie Driscoll (1946) Board Member since 1987 | | President, Driscoll Associates (consulting firm); Emeritus Executive Fellow, Center for Business Ethics, Bentley University; formerly, Partner, Palmer & Dodge (1988–1990); Vice President of Corporate Affairs and General Counsel, Filene's (1978–1988). Directorships: Director of ICI Mutual Insurance Company (since 2007); Advisory Board, Center for Business Ethics, Bentley University; Chairman of the Board of Trustees, Southwest Florida Community Foundation (charitable organization); former Directorships: Sun Capital Advisers Trust (mutual funds) (2007–2012), Investment Company Institute (audit, executive, nominating committees) and Independent Directors Council (governance, executive committees) | 103 | — |
Keith R. Fox, CFA (1954) Board Member since 1996 | | Managing General Partner, Exeter Capital Partners (a series of private investment funds) (since 1986). Directorships: Progressive International Corporation (kitchen goods importer and distributor); The Kennel Shop (retailer); former Chairman, National Association of Small Business Investment Companies; former Directorships: BoxTop Media Inc. (advertising); Sun Capital Advisers Trust (mutual funds) (2011–2012) | 103 | — |
Paul K. Freeman (1950) Board Member since 1993 | | Consultant, World Bank/Inter-American Development Bank; Executive and Governing Council of the Independent Directors Council (Chairman of Education Committee); formerly: Project Leader, International Institute for Applied Systems Analysis (1998–2001); Chief Executive Officer, The Eric Group, Inc. (environmental insurance) (1986–1998); Directorships: Denver Zoo Foundation (December 2012–present); former Directorships: Prisma Energy International | 103 | — |
Richard J. Herring (1946) Board Member since 1990 | | Jacob Safra Professor of International Banking and Professor, Finance Department, The Wharton School, University of Pennsylvania (since July 1972); Co-Director, Wharton Financial Institutions Center (since July 2000); Co-Chair, U.S. Shadow Financial Regulatory Committee; Executive Director, Financial Economists Roundtable; formerly: Vice Dean and Director, Wharton Undergraduate Division (July 1995–June 2000); Director, Lauder Institute of International Management Studies (July 2000–June 2006) | 103 | Director, Japan Equity Fund, Inc. (since September 2007), Thai Capital Fund, Inc. (since 2007), Singapore Fund, Inc. (since September 2007), Independent Director of Barclays Bank Delaware (since September 2010) |
Rebecca W. Rimel (1951) Board Member since 1995 | | President and Chief Executive Officer, The Pew Charitable Trusts (charitable organization) (1994 to present); formerly: Executive Vice President, The Glenmede Trust Company (investment trust and wealth management) (1983–2004); Board Member, Investor Education (charitable organization) (2004–2005); Trustee, Executive Committee, Philadelphia Chamber of Commerce (2001–2007); Director, Viasys Health Care2 (January 2007–June 2007); Trustee, Thomas Jefferson Foundation (charitable organization) (1994–2012) | 103 | Director, Becton Dickinson and Company2 (medical technology company) (2012– present); Director, CardioNet, Inc.2 (health care) (2009– present) |
William N. Searcy, Jr. (1946) Board Member since 1993 | | Private investor since October 2003; formerly: Pension & Savings Trust Officer, Sprint Corporation2 (telecommunications) (November 1989–September 2003); Trustee, Sun Capital Advisers Trust (mutual funds) (1998–2012) | 103 | — |
Jean Gleason Stromberg (1943) Board Member since 1997 | | Retired. Formerly, Consultant (1997–2001); Director, Financial Markets U.S. Government Accountability Office (1996–1997); Partner, Fulbright & Jaworski, L.L.P. (law firm) (1978–1996). Directorships: The William and Flora Hewlett Foundation; former Directorships: Service Source, Inc., Mutual Fund Directors Forum (2002–2004), American Bar Retirement Association (funding vehicle for retirement plans) (1987–1990 and 1994–1996) | 103 | — |
Robert H. Wadsworth (1940) Board Member since 1999 | | President, Robert H. Wadsworth & Associates, Inc. (consulting firm) (1983 to present); Director, National Horizon, Inc. (non-profit organization); Director and Treasurer, The Phoenix Boys Choir Association | 106 | — |
Officers4 |
Name, Year of Birth, Position with the Fund and Length of Time Served5 | | Business Experience and Directorships During the Past Five Years |
Brian E. Binder8,9 (1972) President and Chief Executive Officer, 2013–present | | Managing Director3 and Head of Fund Administration, Deutsche Asset & Wealth Management (2013–present); formerly: Head of Business Management and Consulting at Invesco, Ltd. (2010–2012); Chief Administrative Officer, Van Kampen Funds Inc. (2008–2010); and Chief Administrative Officer, Morgan Stanley Investment Management Americas Distribution (2003–2008) |
John Millette7 (1962) Vice President and Secretary, 1999–present | | Director,3 Deutsche Asset & Wealth Management |
Paul H. Schubert6 (1963) Chief Financial Officer, 2004–present Treasurer, 2005–present | | Managing Director,3 Deutsche Asset & Wealth Management (since July 2004); formerly: Executive Director, Head of Mutual Fund Services and Treasurer for UBS Family of Funds (1998–2004); Vice President and Director of Mutual Fund Finance at UBS Global Asset Management (1994–1998) |
Caroline Pearson7 (1962) Chief Legal Officer, 2010–present | | Managing Director,3 Deutsche Asset & Wealth Management; formerly: Assistant Secretary for DWS family of funds (1997–2010) |
Melinda Morrow6 (1970) Vice President, 2012–present | | Director,3 Deutsche Asset & Wealth Management |
Hepsen Uzcan7 (1974) Assistant Secretary, 2013–present | | Vice President, Deutsche Asset & Wealth Management |
Paul Antosca7 (1957) Assistant Treasurer, 2007–present | | Director,3 Deutsche Asset & Wealth Management |
Jack Clark7 (1967) Assistant Treasurer, 2007–present | | Director,3 Deutsche Asset & Wealth Management |
Diane Kenneally7 (1966) Assistant Treasurer, 2007–present | | Director,3 Deutsche Asset & Wealth Management |
John Caruso6 (1965) Anti-Money Laundering Compliance Officer, 2010–present | | Managing Director,3 Deutsche Asset & Wealth Management |
Robert Kloby6 (1962) Chief Compliance Officer, 2006–present | | Managing Director,3 Deutsche Asset & Wealth Management |
1 The length of time served represents the year in which the Board Member joined the board of one or more DWS funds currently overseen by the Board.
2 A publicly held company with securities registered pursuant to Section 12 of the Securities Exchange Act of 1934.
3 Executive title, not a board directorship.
4 As a result of their respective positions held with the Advisor, these individuals are considered "interested persons" of the Advisor within the meaning of the 1940 Act. Interested persons receive no compensation from the fund.
5 The length of time served represents the year in which the officer was first elected in such capacity for one or more DWS funds.
6 Address: 60 Wall Street, New York, NY 10005.
7 Address: One Beacon Street, Boston, MA 02108.
8 Address: 222 South Riverside Plaza, Chicago, IL 60606.
9 Effective as of December 1, 2013.
The fund's Statement of Additional Information ("SAI") includes additional information about the Board Members. The SAI is available, without charge, upon request. If you would like to request a copy of the SAI, you may do so by calling the following toll-free number: (800) 728-3337.
Notes
DWS Investments Distributors, Inc.
222 South Riverside Plaza
Chicago, IL 60606
(800) 621-1148
VS1bond-2 (R-025819-3 2/14)
December 31, 2013
Annual Report
DWS Variable Series I
DWS Capital Growth VIP
Contents
10 Statement of Assets and Liabilities 11 Statement of Operations 12 Statement of Changes in Net Assets 14 Notes to Financial Statements 18 Report of Independent Registered Public Accounting Firm 19 Information About Your Fund's Expenses 22 Advisory Agreement Board Considerations and Fee Evaluation 25 Board Members and Officers |
This report must be preceded or accompanied by a prospectus. To obtain an additional prospectus or summary prospectus, if available, call (800) 728-3337 or your financial representative. We advise you to consider the Fund's objectives, risks, charges and expenses carefully before investing. The summary prospectus and prospectus contain this and other important information about the Fund. Please read the prospectus carefully before you invest.
The Fund may lend securities to approved institutions. Stocks may decline in value. See the prospectus for details.
Deutsche Asset & Wealth Management represents the asset management and wealth management activities conducted by Deutsche Bank AG or any of its subsidiaries, including the Advisor and DWS Investments Distributors, Inc.
NOT FDIC/NCUA INSURED NO BANK GUARANTEE MAY LOSE VALUE NOT A DEPOSIT
NOT INSURED BY ANY FEDERAL GOVERNMENT AGENCY
Performance Summary December 31, 2013 (Unaudited)
Fund performance shown is historical, assumes reinvestment of all dividend and capital gain distributions, and does not guarantee future results. Investment return and principal value fluctuate with changing market conditions so that, when redeemed, shares may be worth more or less than their original cost. Current performance may be lower or higher than the performance data quoted. Please contact your participating insurance company for the Fund's most recent month-end performance. Performance doesn't reflect charges and fees ("contract charges") associated with the separate account that invests in the Fund or any variable life insurance policy or variable annuity contract for which the Fund is an investment option. These charges and fees will reduce returns. While all share classes have the same underlying portfolio, their performance will differ.
The gross expense ratios of the Fund, as stated in the fee table of the prospectus dated May 1, 2013 are 0.50% and 0.83% for Class A and Class B shares, respectively, and may differ from the expense ratios disclosed in the Financial Highlights tables in this report.
| Growth of an Assumed $10,000 Investment |
| The Russell 1000® Growth Index is an unmanaged, capitalization-weighted index containing those securities in the Russell 1000® Index with higher price-to-book ratios and higher forecasted growth values. Index returns do not reflect any fees or expenses and it is not possible to invest directly into an index. |
| |
| Yearly periods ended December 31 | |
| Comparative Results | |
| DWS Capital Growth VIP | | 1-Year | | | 3-Year | | | 5-Year | | | 10-Year | |
| Class A | Growth of $10,000 | | $ | 13,465 | | | $ | 14,927 | | | $ | 22,102 | | | $ | 21,296 | |
| Average annual total return | | | 34.65 | % | | | 14.29 | % | | | 17.19 | % | | | 7.85 | % |
| Russell 1000 Growth Index | Growth of $10,000 | | $ | 13,348 | | | $ | 15,792 | | | $ | 25,288 | | | $ | 21,245 | |
| Average annual total return | | | 33.48 | % | | | 16.45 | % | | | 20.39 | % | | | 7.83 | % |
| DWS Capital Growth VIP | | 1-Year | | | 3-Year | | | 5-Year | | | 10-Year | |
| Class B | Growth of $10,000 | | $ | 13,419 | | | $ | 14,776 | | | $ | 21,742 | | | $ | 20,567 | |
| Average annual total return | | | 34.19 | % | | | 13.90 | % | | | 16.80 | % | | | 7.48 | % |
| Russell 1000 Growth Index | Growth of $10,000 | | $ | 13,348 | | | $ | 15,792 | | | $ | 25,288 | | | $ | 21,245 | |
| Average annual total return | | | 33.48 | % | | | 16.45 | % | | | 20.39 | % | | | 7.83 | % |
The growth of $10,000 is cumulative.
Management Summary December 31, 2013 (Unaudited)
For the 12 months ended December 31, 2013, the Fund returned 34.65% (Class A shares, unadjusted for contract charges), outperforming the 33.48% return of the Russell 1000® Growth Index.1 Over the past 12 months, the environment for large-cap stocks was highly favorable. Positive investor sentiment was propelled largely by the gradual but steady recovery in U.S. economic growth. Investors have also been encouraged by strength at the corporate level, where improving balance sheets and steady earnings growth have led to rising valuations for U.S. equities. Not least, the accommodative policies of the U.S. Federal Reserve Board (the Fed) and other major global central banks have provided a supportive backdrop.
For the period, the Fund's strategy added value through both sector allocation and stock selection, though our strongest emphasis is on bottom-up stock selection. An overweight to health care was particularly beneficial to the performance of three holdings within the sector — Celgene Corp., Gilead Sciences, Inc. and Thermo Fisher Scientific, Inc. — all of which posted outstanding returns.2 In addition, stock selection in financials (Ameriprise Financial, Inc.) and consumer discretionary (Nike, Inc.) boosted performance. Stock selection in technology, specifically our positions in EMC Corp.,* Oracle Corp. and QUALCOMM, Inc., along with a lack of holdings in Facebook, Inc., detracted from returns.3
While there is certainly room for stocks to produce further gains, we believe that the upside is somewhat constrained by a combination of high valuations and near-record-high corporate profit margins. Nevertheless, we continue to identify a large number of opportunities in individual stocks. We see particularly compelling investment prospects in market sectors with the highest degree of sensitivity to U.S. economic growth levels, especially the consumer discretionary, industrial and financial segments. We are also exploring new investments in the information technology sector, which is trading at a larger discount to its historical valuation than any other area of the market.
Owen Fitzpatrick, CFA
Lead Portfolio Manager
Thomas M. Hynes, Jr., CFA
Brendan O'Neill, CFA
Portfolio Managers
The views expressed reflect those of the portfolio management team only through the end of the period of the report as stated on the cover. The management team's views are subject to change at any time based on market and other conditions and should not be construed as a recommendation. Past performance is no guarantee of future results. Current and future portfolio holdings are subject to risk.
1 The Russell 1000 Growth Index is an unmanaged index that consists of those stocks in the Russell 1000® Index that have higher price-to-book ratios and higher forecasted growth values. Index returns do not reflect any fees or expenses and it is not possible to invest directly into an index.
2 "Overweight" means that the Fund holds a higher weighting in a given sector or stock compared with its benchmark index. "Underweight" means that the Fund holds a lower weighting in a given sector or stock.
3 The consumer discretionary sector represents industries that produce goods and services that are not necessities in everyday life.
* Not held in portfolio as of December 31, 2013.
Portfolio Summary (Unaudited) Asset Allocation (As a % of Investment Portfolio excluding Securities Lending Collateral) | 12/31/13 | 12/31/12 |
| | | |
| Common Stocks | 100% | 97% |
| Cash Equivalents | 0% | 3% |
| | 100% | 100% |
Sector Diversification (As a % of Common Stocks) | 12/31/13 | 12/31/12 |
| | | |
| Information Technology | 26% | 32% |
| Consumer Discretionary | 21% | 16% |
| Health Care | 15% | 13% |
| Industrials | 13% | 13% |
| Consumer Staples | 10% | 13% |
| Financials | 5% | 5% |
| Materials | 5% | 3% |
| Energy | 4% | 5% |
| Telecommunication Services | 1% | — |
| Utilities | 0% | 0% |
| | 100% | 100% |
Portfolio holdings and characteristics are subject to change.
For more complete details about the Fund's investment portfolio, see page 7.
Following the Fund's fiscal first and third quarter-end, a complete portfolio holdings listing is filed with the SEC on Form N-Q. The form will be available on the SEC's Web site at sec.gov, and it also may be reviewed and copied at the SEC's Public Reference Room in Washington, D.C. Information on the operation of the SEC's Public Reference Room may be obtained by calling (800) SEC-0330. The Fund's portfolio holdings are also posted on dws-investments.com from time to time. Please see the Fund's current prospectus for more information.
Investment Portfolio December 31, 2013 | | | Shares | | | Value ($) | |
| | | | |
| Common Stocks 99.7% | |
| Consumer Discretionary 20.5% | |
| Auto Components 0.8% | |
| BorgWarner, Inc. (a) | | | 126,098 | | | | 7,050,139 | |
| Hotels, Restaurants & Leisure 3.5% | |
| Brinker International, Inc. (a) | | | 135,668 | | | | 6,286,855 | |
| Las Vegas Sands Corp. | | | 137,559 | | | | 10,849,278 | |
| Norwegian Cruise Line Holdings Ltd.* (a) | | | 74,099 | | | | 2,628,292 | |
| Starwood Hotels & Resorts Worldwide, Inc. | | | 130,734 | | | | 10,386,816 | |
| | | | | | | | 30,151,241 | |
| Internet & Catalog Retail 2.2% | |
| Amazon.com, Inc.* | | | 37,993 | | | | 15,151,228 | |
| Expedia, Inc. (a) | | | 56,925 | | | | 3,965,396 | |
| | | | | | | | 19,116,624 | |
| Media 3.3% | |
| Comcast Corp. "A" (a) | | | 325,808 | | | | 16,930,613 | |
| Twenty-First Century Fox, Inc. "A" | | | 305,676 | | | | 10,753,682 | |
| | | | | | | | 27,684,295 | |
| Multiline Retail 1.1% | |
| Dollar General Corp.* | | | 152,457 | | | | 9,196,206 | |
| Specialty Retail 5.4% | |
| Dick's Sporting Goods, Inc. (a) | | | 180,368 | | | | 10,479,381 | |
| GNC Holdings, Inc. "A" | | | 92,328 | | | | 5,396,572 | |
| Home Depot, Inc. | | | 216,881 | | | | 17,857,982 | |
| L Brands, Inc. | | | 199,430 | | | | 12,334,745 | |
| | | | | | | | 46,068,680 | |
| Textiles, Apparel & Luxury Goods 4.2% | |
| NIKE, Inc. "B" | | | 326,545 | | | | 25,679,499 | |
| VF Corp. (a) | | | 157,372 | | | | 9,810,570 | |
| | | | | | | | 35,490,069 | |
| Consumer Staples 10.2% | |
| Beverages 3.3% | |
| Beam, Inc. | | | 142,649 | | | | 9,708,691 | |
| PepsiCo, Inc. | | | 221,701 | | | | 18,387,881 | |
| | | | | | | | 28,096,572 | |
| Food & Staples Retailing 3.7% | |
| Costco Wholesale Corp. | | | 124,466 | | | | 14,812,699 | |
| Whole Foods Market, Inc. (a) | | | 286,061 | | | | 16,542,907 | |
| | | | | | | | 31,355,606 | |
| Food Products 3.2% | |
| Hillshire Brands Co. | | | 217,401 | | | | 7,269,890 | |
| Mead Johnson Nutrition Co. | | | 81,183 | | | | 6,799,888 | |
| Mondelez International, Inc. "A" | | | 382,684 | | | | 13,508,745 | |
| | | | | | | | 27,578,523 | |
| Energy 4.4% | |
| Energy Equipment & Services 2.5% | |
| Halliburton Co. | | | 248,349 | | | | 12,603,712 | |
| Schlumberger Ltd. | | | 94,894 | | | | 8,550,898 | |
| | | | | | | | 21,154,610 | |
| Oil, Gas & Consumable Fuels 1.9% | |
| Anadarko Petroleum Corp. | | | 37,028 | | | | 2,937,061 | |
| Antero Resources Corp.* | | | 76,565 | | | | 4,857,284 | |
| Pioneer Natural Resources Co. | | | 47,749 | | | | 8,789,158 | |
| | | | | | | | 16,583,503 | |
| | | Shares | | | Value ($) | |
| | | | | | | | | |
| Financials 5.3% | |
| Capital Markets 4.0% | |
| Affiliated Managers Group, Inc.* | | | 76,760 | | | | 16,647,709 | |
| Ameriprise Financial, Inc. | | | 62,692 | | | | 7,212,714 | |
| The Charles Schwab Corp. (a) | | | 399,618 | | | | 10,390,068 | |
| | | | | | | | 34,250,491 | |
| Consumer Finance 1.3% | |
| Discover Financial Services | | | 194,508 | | | | 10,882,723 | |
| Health Care 15.4% | |
| Biotechnology 8.5% | |
| Celgene Corp.* | | | 141,841 | | | | 23,965,455 | |
| Cepheid, Inc.* (a) | | | 145,054 | | | | 6,776,923 | |
| Gilead Sciences, Inc.* | | | 368,590 | | | | 27,699,538 | |
| Medivation, Inc.* | | | 127,383 | | | | 8,129,583 | |
| NPS Pharmaceuticals, Inc.* (a) | | | 200,832 | | | | 6,097,260 | |
| | | | | | | | 72,668,759 | |
| Health Care Equipment & Supplies 1.6% | |
| CareFusion Corp.* | | | 197,331 | | | | 7,857,721 | |
| St. Jude Medical, Inc. | | | 89,692 | | | | 5,556,419 | |
| | | | | | | | 13,414,140 | |
| Health Care Providers & Services 3.9% | |
| Express Scripts Holding Co.* | | | 246,825 | | | | 17,336,988 | |
| McKesson Corp. | | | 90,828 | | | | 14,659,639 | |
| Premier, Inc. "A"* (a) | | | 27,234 | | | | 1,001,122 | |
| | | | | | | | 32,997,749 | |
| Life Sciences Tools & Services 1.4% | |
| Thermo Fisher Scientific, Inc. (a) | | | 106,057 | | | | 11,809,447 | |
| Industrials 12.5% | |
| Aerospace & Defense 2.0% | |
| Boeing Co. | | | 76,048 | | | | 10,379,792 | |
| TransDigm Group, Inc. | | | 42,210 | | | | 6,796,654 | |
| | | | | | | | 17,176,446 | |
| Commercial Services & Supplies 0.7% | |
| Stericycle, Inc.* (a) | | | 53,590 | | | | 6,225,550 | |
| Electrical Equipment 3.3% | |
| AMETEK, Inc. | | | 258,052 | | | | 13,591,599 | |
| Regal-Beloit Corp. (a) | | | 47,754 | | | | 3,520,425 | |
| Roper Industries, Inc. (a) | | | 77,038 | | | | 10,683,630 | |
| | | | | | | | 27,795,654 | |
| Industrial Conglomerates 1.2% | |
| General Electric Co. | | | 353,282 | | | | 9,902,494 | |
| Machinery 4.0% | |
| Dover Corp. (a) | | | 107,630 | | | | 10,390,600 | |
| Parker Hannifin Corp. | | | 130,602 | | | | 16,800,641 | |
| SPX Corp. | | | 68,350 | | | | 6,808,344 | |
| | | | | | | | 33,999,585 | |
| Road & Rail 1.3% | |
| Norfolk Southern Corp. (a) | | | 118,698 | | | | 11,018,735 | |
| Information Technology 25.7% | |
| Communications Equipment 1.2% | |
| QUALCOMM, Inc. | | | 137,935 | | | | 10,241,674 | |
| Computers & Peripherals 4.6% | |
| Apple, Inc. | | | 61,091 | | | | 34,278,771 | |
| Stratasys Ltd.* (a) | | | 32,800 | | | | 4,418,160 | |
| | | | | | | | 38,696,931 | |
| | | Shares | | | Value ($) | |
| | | | | | | | | |
| Internet Software & Services 6.0% | |
| eBay, Inc.* | | | 123,411 | | | | 6,774,030 | |
| Google, Inc. "A"* | | | 32,458 | | | | 36,376,005 | |
| LinkedIn Corp. "A"* | | | 36,819 | | | | 7,983,464 | |
| | | | | | | | 51,133,499 | |
| IT Services 3.9% | |
| Accenture PLC "A" | | | 150,938 | | | | 12,410,122 | |
| Visa, Inc. "A" (a) | | | 94,639 | | | | 21,074,213 | |
| | | | | | | | 33,484,335 | |
| Semiconductors & Semiconductor Equipment 0.5% | |
| Avago Technologies Ltd. | | | 82,876 | | | | 4,383,311 | |
| Software 9.5% | |
| Check Point Software Technologies Ltd.* (a) | | | 30,794 | | | | 1,986,829 | |
| Citrix Systems, Inc.* | | | 155,825 | | | | 9,855,931 | |
| FireEye, Inc.* (a) | | | 52,503 | | | | 2,289,656 | |
| Guidewire Software, Inc.* | | | 54,865 | | | | 2,692,226 | |
| Intuit, Inc. | | | 110,323 | | | | 8,419,851 | |
| Microsoft Corp. | | | 752,864 | | | | 28,179,700 | |
| Oracle Corp. | | | 212,346 | | | | 8,124,358 | |
| Salesforce.com, Inc.* | | | 84,581 | | | | 4,668,026 | |
| Solera Holdings, Inc. | | | 56,145 | | | | 3,972,820 | |
| Splunk, Inc.* | | | 36,063 | | | | 2,476,446 | |
| VMware, Inc. "A"* (a) | | | 98,857 | | | | 8,868,461 | |
| | | | | | | | 81,534,304 | |
| Materials 4.5% | |
| Chemicals 4.0% | |
| Ecolab, Inc. | | | 124,736 | | | | 13,006,223 | |
| LyondellBasell Industries NV "A" | | | 104,490 | | | | 8,388,457 | |
| Monsanto Co. | | | 104,565 | | | | 12,187,051 | |
| | | | | | | | 33,581,731 | |
| | | Shares | | | Value ($) | |
| | | | | | | | | |
| Containers & Packaging 0.5% | |
| Ball Corp. | | | 82,469 | | | | 4,260,348 | |
| Telecommunication Services 0.9% | |
| Wireless Telecommunication Services | |
| Crown Castle International Corp.* | | | 99,404 | | | | 7,299,236 | |
| Utilities 0.3% | |
| Water Utilities | |
| American Water Works Co., Inc. | | | 56,760 | | | | 2,398,677 | |
Total Common Stocks (Cost $491,694,359) | | | | 848,681,887 | |
| | |
| Securities Lending Collateral 12.6% | |
| Daily Assets Fund Institutional, 0.08% (b) (c) (Cost $107,035,831) | | | 107,035,831 | | | | 107,035,831 | |
| | |
| Cash Equivalents 0.3% | |
| Central Cash Management Fund, 0.05% (b) (Cost $2,491,496) | | | 2,491,496 | | | | 2,491,496 | |
| | | % of Net Assets | | | Value ($) | |
| | | | |
Total Investment Portfolio (Cost $601,221,686)† | | | 112.6 | | | | 958,209,214 | |
| Other Assets and Liabilities, Net | | | (12.6 | ) | | | (107,222,509 | ) |
| Net Assets | | | 100.0 | | | | 850,986,705 | |
* Non-income producing security.
† The cost for federal income tax purposes was $602,105,779. At December 31, 2013, net unrealized appreciation for all securities based on tax cost was $356,103,435. This consisted of aggregate gross unrealized appreciation for all securities in which there was an excess of value over tax cost of $359,003,644 and aggregate gross unrealized depreciation for all securities in which there was an excess of tax cost over value of $2,900,209.
(a) All or a portion of these securities were on loan. In addition, "Other Assets and Liabilities, Net" may include pending sales that are also on loan. The value of securities loaned at December 31, 2013 amounted to $105,553,546, which is 12.4% of net assets.
(b) Affiliated fund managed by Deutsche Investment Management Americas Inc. The rate shown is the annualized seven-day yield at period end.
(c) Represents collateral held in connection with securities lending. Income earned by the Fund is net of borrower rebates.
Fair Value Measurements
Various inputs are used in determining the value of the Fund's investments. These inputs are summarized in three broad levels. Level 1 includes quoted prices in active markets for identical securities. Level 2 includes other significant observable inputs (including quoted prices for similar securities, interest rates, prepayment speeds and credit risk). Level 3 includes significant unobservable inputs (including the Fund's own assumptions in determining the fair value of investments). The level assigned to the securities valuations may not be an indication of the risk or liquidity associated with investing in those securities.
The following is a summary of the inputs used as of December 31, 2013 in valuing the Fund's investments. For information on the Fund's policy regarding the valuation of investments, please refer to the Security Valuation section of Note A in the accompanying Notes to Financial Statements.
| Assets | | Level 1 | | | Level 2 | | | Level 3 | | | Total | |
| | |
| Common Stocks (d) | | $ | 848,681,887 | | | $ | — | | | $ | — | | | $ | 848,681,887 | |
| Short-Term Investments (d) | | | 109,527,327 | | | | — | | | | — | | | | 109,527,327 | |
| Total | | $ | 958,209,214 | | | $ | — | | | $ | — | | | $ | 958,209,214 | |
There have been no transfers between fair value measurement levels during the year ended December 31, 2013.
(d) See Investment Portfolio for additional detailed categorizations.
The accompanying notes are an integral part of the financial statements.
Statement of Assets and Liabilities | as of December 31, 2013 | |
| Assets | |
Investments: Investments in non-affiliated securities, at value (cost $491,694,359) — including $105,553,546 of securities loaned | | $ | 848,681,887 | |
| Investment in Daily Assets Fund Institutional (cost $107,035,831)* | | | 107,035,831 | |
| Investment in Central Cash Management Fund (cost $2,491,496) | | | 2,491,496 | |
| Total investments in securities, at value (cost $601,221,686) | | | 958,209,214 | |
| Cash | | | 55 | |
| Receivable for Fund shares sold | | | 142,556 | |
| Dividends receivable | | | 619,124 | |
| Interest receivable | | | 4,811 | |
| Foreign taxes recoverable | | | 18,980 | |
| Other assets | | | 12,951 | |
| Total assets | | | 959,007,691 | |
| Liabilities | |
| Payable upon return of securities loaned | | | 107,035,831 | |
| Payable for Fund shares redeemed | | | 532,666 | |
| Accrued management fee | | | 263,354 | |
| Accrued Trustees' fees | | | 9,785 | |
| Other accrued expenses and payables | | | 179,350 | |
| Total liabilities | | | 108,020,986 | |
| Net assets, at value | | $ | 850,986,705 | |
| Net Assets Consist of | |
| Undistributed net investment income | | | 6,239,079 | |
Net unrealized appreciation (depreciation) on: Investments | | | 356,987,528 | |
| Foreign currency | | | 4,925 | |
| Accumulated net realized gain (loss) | | | 23,481,692 | |
| Paid-in capital | | | 464,273,481 | |
| Net assets, at value | | $ | 850,986,705 | |
Class A Net Asset Value, offering and redemption price per share ($837,284,825 ÷ 29,474,327 outstanding shares of beneficial interest, $.01 par value, unlimited number of shares authorized) | | $ | 28.41 | |
Class B Net Asset Value, offering and redemption price per share ($13,701,880 ÷ 484,326 outstanding shares of beneficial interest, $.01 par value, unlimited number of shares authorized) | | $ | 28.29 | |
* Represents collateral on securities loaned.
The accompanying notes are an integral part of the financial statements.
Statement of Operations
| for the year ended December 31, 2013 | |
| Investment Income | |
Income: Dividends (net of foreign taxes withheld of $12,380) | | $ | 10,378,374 | |
| Income distributions — Central Cash Management Fund | | | 5,485 | |
| Securities lending income, including income from Daily Assets Fund Institutional, net of borrower rebates | | | 51,230 | |
| Total income | | | 10,435,089 | |
Expenses: Management fee | | | 2,880,367 | |
| Administration fee | | | 772,018 | |
| Services to shareholders | | | 4,526 | |
| Distribution and service fees (Class B) | | | 33,739 | |
| Record keeping fee (Class B) | | | 10,759 | |
| Custodian fee | | | 21,300 | |
| Professional fees | | | 87,578 | |
| Reports to shareholders | | | 54,381 | |
| Trustees' fees and expenses | | | 31,912 | |
| Total expenses | | | 3,896,580 | |
| Net investment income (loss) | | | 6,538,509 | |
| Realized and Unrealized Gain (Loss) | |
Net realized gain (loss) from: Investments | | | 111,904,853 | |
| Foreign currency | | | (1,027 | ) |
| | | | 111,903,826 | |
Change in net unrealized appreciation (depreciation) on: Investments | | | 112,660,896 | |
| Foreign currency | | | 388 | |
| | | | 112,661,284 | |
| Net gain (loss) | | | 224,565,110 | |
| Net increase (decrease) in net assets resulting from operations | | $ | 231,103,619 | |
The accompanying notes are an integral part of the financial statements.
Statement of Changes in Net Assets | | | Years Ended December 31, | |
| Increase (Decrease) in Net Assets | | 2013 | | | 2012 | |
Operations: Net investment income (loss) | | $ | 6,538,509 | | | $ | 9,693,194 | |
| Net realized gain (loss) | | | 111,903,826 | | | | 39,822,591 | |
| Change in net unrealized appreciation (depreciation) | | | 112,661,284 | | | | 58,817,893 | |
| Net increase (decrease) in net assets resulting from operations | | | 231,103,619 | | | | 108,333,678 | |
Distributions to shareholders from: Net investment income: Class A | | | (9,616,234 | ) | | | (6,353,433 | ) |
| Class B | | | (131,767 | ) | | | (73,349 | ) |
| Total distributions | | | (9,748,001 | ) | | | (6,426,782 | ) |
Fund share transactions: Class A Proceeds from shares sold | | | 14,066,914 | | | | 16,829,443 | |
| Reinvestment of distributions | | | 9,616,234 | | | | 6,353,433 | |
| Payments for shares redeemed | | | (105,034,979 | ) | | | (99,466,658 | ) |
| Net increase (decrease) in net assets from Class A share transactions | | | (81,351,831 | ) | | | (76,283,782 | ) |
Class B Proceeds from shares sold | | | 760,162 | | | | 580,173 | |
| Reinvestment of distributions | | | 131,767 | | | | 73,349 | |
| Payments for shares redeemed | | | (3,806,721 | ) | | | (2,697,364 | ) |
| Net increase (decrease) in net assets from Class B share transactions | | | (2,914,792 | ) | | | (2,043,842 | ) |
| Increase (decrease) in net assets | | | 137,088,995 | | | | 23,579,272 | |
| Net assets at beginning of period | | | 713,897,710 | | | | 690,318,438 | |
| Net assets at end of period (including undistributed net investment income of $6,239,079 and $9,558,891, respectively) | | $ | 850,986,705 | | | $ | 713,897,710 | |
| Other Information | |
Class A Shares outstanding at beginning of period | | | 32,798,165 | | | | 36,451,466 | |
| Shares sold | | | 570,579 | | | | 801,185 | |
| Shares issued to shareholders in reinvestment of distributions | | | 419,923 | | | | 298,283 | |
| Shares redeemed | | | (4,314,340 | ) | | | (4,752,769 | ) |
| Net increase (decrease) in Class A shares | | | (3,323,838 | ) | | | (3,653,301 | ) |
| Shares outstanding at end of period | | | 29,474,327 | | | | 32,798,165 | |
Class B Shares outstanding at beginning of period | | | 600,771 | | | | 698,290 | |
| Shares sold | | | 31,195 | | | | 28,055 | |
| Shares issued to shareholders in reinvestment of distributions | | | 5,764 | | | | 3,450 | |
| Shares redeemed | | | (153,404 | ) | | | (129,024 | ) |
| Net increase (decrease) in Class B shares | | | (116,445 | ) | | | (97,519 | ) |
| Shares outstanding at end of period | | | 484,326 | | | | 600,771 | |
The accompanying notes are an integral part of the financial statements.
| | | Years Ended December 31, | |
| Class A | | | 2013 | | | 2012 | | | 2011 | | | 2010 | | | 2009 | |
| Selected Per Share Data | |
| Net asset value, beginning of period | | $ | 21.38 | | | $ | 18.58 | | | $ | 19.59 | | | $ | 16.93 | | | $ | 13.55 | |
Income (loss) from investment operations: Net investment income (loss)a | | | .21 | | | | .28 | | | | .17 | | | | .14 | c | | | .14 | |
| Net realized and unrealized gain (loss) | | | 7.12 | | | | 2.70 | | | | (1.03 | ) | | | 2.68 | | | | 3.43 | |
| Total from investment operations | | | 7.33 | | | | 2.98 | | | | (.86 | ) | | | 2.82 | | | | 3.57 | |
Less distributions from: Net investment income | | | (.30 | ) | | | (.18 | ) | | | (.15 | ) | | | (.16 | ) | | | (.19 | ) |
| Net asset value, end of period | | $ | 28.41 | | | $ | 21.38 | | | $ | 18.58 | | | $ | 19.59 | | | $ | 16.93 | |
| Total Return (%) | | | 34.65 | | | | 16.05 | | | | (4.47 | ) | | | 16.71 | b | | | 26.87 | b |
| Ratios to Average Net Assets and Supplemental Data | |
| Net assets, end of period ($ millions) | | | 837 | | | | 701 | | | | 677 | | | | 729 | | | | 715 | |
| Ratio of expenses before expense reductions (%) | | | .50 | | | | .50 | | | | .50 | | | | .51 | | | | .51 | |
| Ratio of expenses after expense reductions (%) | | | .50 | | | | .50 | | | | .50 | | | | .51 | | | | .49 | |
| Ratio of net investment income (loss) (%) | | | .85 | | | | 1.32 | | | | .86 | | | | .78 | c | | | .98 | |
| Portfolio turnover rate (%) | | | 37 | | | | 25 | | | | 47 | | | | 42 | | | | 76 | |
a Based on average shares outstanding during the period. b Total return would have been lower had certain expenses not been reduced. c Net investment income per share and ratio of net investment income include non-recurring dividend income amounting to $0.05 per share and 0.28% of average daily net assets for the year ended December 31, 2010. | |
| | | Years Ended December 31, | |
| Class B | | | 2013 | | | 2012 | | | 2011 | | | 2010 | | | 2009 | |
| Selected Per Share Data | |
| Net asset value, beginning of period | | $ | 21.29 | | | $ | 18.51 | | | $ | 19.51 | | | $ | 16.86 | | | $ | 13.49 | |
Income (loss) from investment operations: Net investment income (loss)a | | | .13 | | | | .20 | | | | .10 | | | | .08 | c | | | .09 | |
| Net realized and unrealized gain (loss) | | | 7.10 | | | | 2.69 | | | | (1.02 | ) | | | 2.67 | | | | 3.43 | |
| Total from investment operations | | | 7.23 | | | | 2.89 | | | | (.92 | ) | | | 2.75 | | | | 3.52 | |
Less distributions from: Net investment income | | | (.23 | ) | | | (.11 | ) | | | (.08 | ) | | | (.10 | ) | | | (.15 | ) |
| Net asset value, end of period | | $ | 28.29 | | | $ | 21.29 | | | $ | 18.51 | | | $ | 19.51 | | | $ | 16.86 | |
| Total Return (%) | | | 34.19 | | | | 15.61 | | | | (4.76 | ) | | | 16.33 | b | | | 26.49 | b |
| Ratios to Average Net Assets and Supplemental Data | |
| Net assets, end of period ($ millions) | | | 14 | | | | 13 | | | | 13 | | | | 12 | | | | 12 | |
| Ratio of expenses before expense reductions (%) | | | .83 | | | | .83 | | | | .84 | | | | .85 | | | | .85 | |
| Ratio of expenses after expense reductions (%) | | | .83 | | | | .83 | | | | .84 | | | | .84 | | | | .82 | |
| Ratio of net investment income (loss) (%) | | | .52 | | | | .97 | | | | .52 | | | | .45 | c | | | .65 | |
| Portfolio turnover rate (%) | | | 37 | | | | 25 | | | | 47 | | | | 42 | | | | 76 | |
a Based on average shares outstanding during the period. b Total return would have been lower had certain expenses not been reduced. c Net investment income per share and ratio of net investment income include non-recurring dividend income amounting to $0.05 per share and 0.28% of average daily net assets for the year ended December 31, 2010. | |
Notes to Financial Statements
A. Organization and Significant Accounting Policies
DWS Variable Series I (the "Series") is registered under the Investment Company Act of 1940, as amended (the "1940 Act"), as an open-end, registered management investment company organized as a Massachusetts business trust. The Series consists of five diversified funds: DWS Bond VIP, DWS Core Equity VIP, DWS Capital Growth VIP, DWS Global Small Cap Growth VIP and DWS International VIP (individually or collectively hereinafter referred to as a "Fund" or the "Funds"). These financial statements report on DWS Capital Growth VIP. The Series is intended to be the underlying investment vehicle for variable annuity contracts and variable life insurance policies to be offered by the separate accounts of certain life insurance companies ("Participating Insurance Companies").
Multiple Classes of Shares of Beneficial Interest. The Fund offers two classes of shares (Class A shares and Class B shares). Class B shares are subject to Rule 12b-1 distribution fees under the 1940 Act and record keeping fees equal to an annual rate of 0.25% and up to 0.15%, respectively, of the average daily net assets of the Class B shares of the Fund. Class A shares are not subject to such fees.
Investment income, realized and unrealized gains and losses, and certain fund-level expenses and expense reductions, if any, are borne pro rata on the basis of relative net assets by the holders of all classes of shares, except that each class bears certain expenses unique to that class (including the applicable 12b-1 distribution fees and recordkeeping fees). Differences in class-level expenses may result in payment of different per share dividends by class. All shares have equal rights with respect to voting subject to class-specific arrangements.
The Fund's financial statements are prepared in accordance with accounting principles generally accepted in the United States of America, which require the use of management estimates. Actual results could differ from those estimates. The policies described below are followed consistently by the Fund in the preparation of its financial statements.
Security Valuation. Investments are stated at value determined as of the close of regular trading on the New York Stock Exchange on each day the exchange is open for trading.
Various inputs are used in determining the value of the Fund's investments. These inputs are summarized in three broad levels. Level 1 includes quoted prices in active markets for identical securities. Level 2 includes other significant observable inputs (including quoted prices for similar securities, interest rates, prepayment speeds and credit risk). Level 3 includes significant unobservable inputs (including the Fund's own assumptions in determining the fair value of investments). The level assigned to the securities valuations may not be an indication of the risk or liquidity associated with investing in those securities.
Equity securities are valued at the most recent sale price or official closing price reported on the exchange (U.S. or foreign) or over-the-counter market on which they trade. Securities for which no sales are reported are valued at the calculated mean between the most recent bid and asked quotations on the relevant market or, if a mean cannot be determined, at the most recent bid quotation. Equity securities are generally categorized as Level 1.
Investments in open-end investment companies are valued at their net asset value each business day and are categorized as Level 1.
Securities and other assets for which market quotations are not readily available or for which the above valuation procedures are deemed not to reflect fair value are valued in a manner that is intended to reflect their fair value as determined in accordance with procedures approved by the Trustees and are generally categorized as Level 3. In accordance with the Fund's valuation procedures, factors used in determining value may include, but are not limited to, the type of the security; the size of the holding; the initial cost of the security; the existence of any contractual restrictions on the security's disposition; the price and extent of public trading in similar securities of the issuer or of comparable companies; quotations or evaluated prices from broker-dealers and/or pricing services; information obtained from the issuer, analysts, and/or the appropriate stock exchange (for exchange-traded securities); an analysis of the company's or issuer's financial statements; an evaluation of the forces that influence the issuer and the market(s) in which the security is purchased and sold; and with respect to debt securities, the maturity, coupon, creditworthiness, currency denomination and the movement of the market in which the security is normally traded. The value determined under these procedures may differ from published values for the same securities.
Disclosure about the classification of fair value measurements is included in a table following the Fund's Investment Portfolio.
Securities Lending. Brown Brothers Harriman & Co., as lending agent, lends securities of the Fund to certain financial institutions under the terms of the Security Lending Agreement. The Fund retains the benefits of owning the securities it has loaned and continues to receive interest and dividends generated by the securities and to participate in any changes in their market value. The Fund requires the borrowers of the securities to maintain collateral with the Fund consisting of either cash or liquid, unencumbered assets having a value at least equal to the value of the securities loaned. When the collateral falls below specified amounts, the lending agent will use its best effort to obtain additional collateral on the next business day to meet required amounts under the security lending agreement. The Fund may invest the cash collateral into a joint trading account in an affiliated money market fund pursuant to Exemptive Orders issued by the SEC. The Fund receives compensation for lending its securities either in the form of fees or by earning interest on invested cash collateral net of borrower rebates and fees paid to a lending agent. Either the Fund or the borrower may terminate the loan. There may be risks of delay and costs in recovery of securities or even loss of rights in the collateral should the borrower of the securities fail financially. If the Fund is not able to recover securities lent, the Fund may sell the collateral and purchase a replacement investment in the market, incurring the risk that the value of the replacement security is greater than the value of the collateral. The Fund is also subject to all investment risks associated with the reinvestment of any cash collateral received, including, but not limited to, interest rate, credit and liquidity risk associated with such investments.
As of December 31, 2013, the Fund had securities on loan. The value of the related collateral exceeded the value of the securities loaned at period end.
Foreign Currency Translations. The books and records of the Fund are maintained in U.S. dollars. Investment securities and other assets and liabilities denominated in a foreign currency are translated into U.S. dollars at the prevailing exchange rates at period end. Purchases and sales of investment securities, income and expenses are translated into U.S. dollars at the prevailing exchange rates on the respective dates of the transactions.
Net realized and unrealized gains and losses on foreign currency transactions represent net gains and losses between trade and settlement dates on securities transactions, the acquisition and disposition of foreign currencies, and the difference between the amount of net investment income accrued and the U.S. dollar amount actually received. That portion of both realized and unrealized gains and losses on investments that results from fluctuations in foreign currency exchange rates is not separately disclosed but is included with net realized and unrealized gain/appreciation and loss/depreciation on investments.
Federal Income Taxes. The Fund is treated as a separate taxpayer as provided for in the Internal Revenue Code, as amended. It is the Fund's policy to comply with the requirements of the Internal Revenue Code, as amended, which are applicable to regulated investment companies, and to distribute all of its taxable income to the separate accounts of the Participating Insurance Companies which hold its shares.
Under the Regulated Investment Company Modernization Act of 2010, net capital losses incurred post-enactment may be carried forward indefinitely, and their character is retained as short-term and/or long-term. Previously, net capital losses were carried forward for eight years and treated as short-term. As a transition rule, the Act requires that post-enactment net capital losses be used before pre-enactment net capital losses.
At December 31, 2013, the Fund had a net tax basis capital loss carryforward of approximately $24,343,000 of pre-enactment losses, all of which was inherited from its merger with other affiliated funds in previous years, which may be applied against any realized net taxable capital gains of each succeeding year until fully utilized or until December 31, 2016, the expiration date, whichever occurs first, and which may be subject to certain limitations under Section 382–384 of the Internal Revenue Code.
The Fund has reviewed the tax positions for the open tax years as of December 31, 2013 and has determined that no provision for income tax is required in the Fund's financial statements. The Fund's federal tax returns for the prior three fiscal years remain open subject to examination by the Internal Revenue Service.
Distribution of Income and Gains. Distributions from net investment income of the Fund, if any, are declared and distributed to shareholders annually. Net realized gains from investment transactions, in excess of available capital loss carryforwards, would be taxable to the Fund if not distributed, and, therefore, will be distributed to shareholders at least annually. The Fund may also make additional distributions for tax purposes if necessary.
The timing and characterization of certain income and capital gain distributions are determined annually in accordance with federal tax regulations which may differ from accounting principles generally accepted in the United States of America. These differences primarily relate to certain securities sold at a loss. As a result, net investment income (loss) and net realized gain (loss) on investment transactions for a reporting period may differ significantly from distributions during such period. Accordingly, the Fund may periodically make reclassifications among certain of its capital accounts without impacting the net asset value of the Fund.
At December 31, 2013, the Fund's components of distributable earnings (accumulated losses) on a tax basis are as follows:
| Undistributed ordinary income* | | $ | 6,239,079 | |
| Undistributed net long-term capital gains | | $ | 48,724,482 | |
| Capital loss carryforwards | | $ | (24,343,000 | ) |
| Net unrealized gain appreciation (depreciation) investments | | $ | 356,103,435 | |
In addition, the tax character of distributions paid to shareholders by the Fund is summarized as follows:
| | | Years Ended December 31, | |
| | | 2013 | | | 2012 | |
| Distributions from ordinary income* | | $ | 9,748,001 | | | $ | 6,426,782 | |
* For tax purposes, short-term capital gain distributions are considered ordinary income distributions.
Expenses. Expenses of the Series arising in connection with a specific Fund are allocated to that Fund. Other Series expenses which cannot be directly attributed to a Fund are apportioned among the Funds in the Series based upon the relative net assets or other appropriate measures.
Contingencies. In the normal course of business, the Fund may enter into contracts with service providers that contain general indemnification clauses. The Fund's maximum exposure under these arrangements is unknown as this would involve future claims that may be made against the Fund that have not yet been made. However, based on experience, the Fund expects the risk of loss to be remote.
Other. Investment transactions are accounted for on a trade date plus one basis for daily net asset value calculations. However, for financial reporting purposes, investment transactions are reported on trade date. Interest income is recorded on the accrual basis. Dividend income is recorded on the ex-dividend date net of foreign withholding taxes. Certain dividends from foreign securities may be recorded subsequent to the ex-dividend date as soon as the Fund is informed of such dividends. Realized gains and losses from investment transactions are recorded on an identified cost basis. Proceeds from litigation payments, if any, are included in net realized gain (loss) from investments.
B. Purchases and Sales of Securities
During the year ended December 31, 2013, purchases and sales of investment securities (excluding short-term investments) aggregated $282,152,722 and $349,145,490, respectively.
C. Related Parties
Management Agreement. Under the Investment Management Agreement with Deutsche Investment Management Americas Inc. ("DIMA" or the "Advisor"), an indirect, wholly owned subsidiary of Deutsche Bank AG, the Advisor directs the investments of the Fund in accordance with its investment objectives, policies and restrictions. The Advisor determines the securities, instruments and other contracts relating to investments to be purchased, sold or entered into by the Fund.
Pursuant to the Investment Management Agreement with the Advisor, the Fund pays a monthly management fee based on the Fund's average daily net assets, computed and accrued daily and payable monthly at the following annual rates:
| First $250 million of average daily net assets | | | .390 | % |
| Next $750 million of average daily net assets | | | .365 | % |
| Over $1 billion of average daily net assets | | | .340 | % |
Accordingly, for the year ended December 31, 2013, the fee pursuant to the Investment Management Agreement was equivalent to an annual effective rate of 0.37% of the Fund's average daily net assets.
For the period from January 1, 2013 through September 30, 2013, the Advisor had contractually agreed to waive all or a portion of its fees and/or reimburse certain operating expenses of the Fund to the extent necessary to maintain the operating expenses (excluding certain expenses such as extraordinary expenses, taxes, brokerage and interest) of each class as follows:
Effective October 1, 2013 through September 30, 2014, the Advisor has contractually agreed to waive all or a portion of its fees and/or reimburse certain operating expenses to the extent necessary to maintain the operating expenses (excluding certain expenses such as extraordinary expenses, taxes, brokerage and interest expense) of each class as follows:
Administration Fee. Pursuant to an Administrative Services Agreement, DIMA provides most administrative services to the Fund. For all services provided under the Administrative Services Agreement, the Fund pays the Advisor an annual fee ("Administration Fee") of 0.10% of the Fund's average daily net assets, computed and accrued daily and payable monthly. For the year ended December 31, 2013, the Administration Fee was $772,018, of which $70,697 is unpaid.
Service Provider Fees. DWS Investments Service Company ("DISC"), an affiliate of the Advisor, is the transfer agent, dividend-paying agent and shareholder service agent for the Fund. Pursuant to a sub-transfer agency agreement between DISC and DST Systems, Inc. ("DST"), DISC has delegated certain transfer agent, dividend-paying agent and shareholder service agent functions to DST. DISC compensates DST out of the shareholder servicing fee it receives from the Fund. For the year ended December 31, 2013, the amounts charged to the Fund by DISC were as follows:
| Services to Shareholders | | Total Aggregated | | | Unpaid at December 31, 2013 | |
| Class A | | $ | 732 | | | $ | 124 | |
| Class B | | | 163 | | | | 24 | |
| | | $ | 895 | | | $ | 148 | |
Distribution Service Agreement. DWS Investments Distributors, Inc. ("DIDI"), also an affiliate of the Advisor, is the Series' Distributor. In accordance with the Master Distribution Plan, DIDI receives 12b-1 fees of 0.25% of average daily net assets of Class B shares. Pursuant to the Master Distribution Plan, DIDI remits these fees to the Participating Insurance Companies for various costs incurred or paid by these companies in connection with marketing and distribution of Class B shares. For the year ended December 31, 2013, the Distribution Service Fee aggregated $33,739, of which $2,898 is unpaid.
Typesetting and Filing Service Fees. Under an agreement with DIMA, DIMA is compensated for providing typesetting and certain regulatory filing services to the Fund. For the year ended December 31, 2013, the amount charged to the Fund by DIMA included in the Statement of Operations under "reports to shareholders" aggregated $14,584, of which $4,345 is unpaid.
Trustees' Fees and Expenses. The Fund paid retainer fees to each Trustee not affiliated with the Advisor, plus specified amounts to the Board Chairperson and Vice Chairperson and to each committee Chairperson.
Affiliated Cash Management Vehicles. The Fund may invest uninvested cash balances in Central Cash Management Fund and DWS Variable NAV Money Fund, affiliated money market funds which are managed by the Advisor. Each affiliated money market fund seeks to provide a high level of current income consistent with liquidity and the preservation of capital. Each affiliated money market fund is managed in accordance with Rule 2a-7 under the Investment Company Act of 1940, which governs the quality, maturity, diversity and liquidity of instruments in which a money market fund may invest. Central Cash Management Fund seeks to maintain a stable net asset value, and DWS Variable NAV Money Fund maintains a floating net asset value. The Fund indirectly bears its proportionate share of the expenses of each affiliated money market fund in which it invests. Central Cash Management Fund does not pay the Advisor an investment management fee. To the extent that DWS Variable NAV Money Fund pays an investment management fee to the Advisor, the Advisor will waive an amount of the investment management fee payable to the Advisor by the Fund equal to the amount of the investment management fee payable on the Fund's assets invested in DWS Variable NAV Money Fund.
D. Ownership of the Fund
At December 31, 2013, three participating insurance companies were owners of record of 10% or more of the total outstanding Class A shares of the Fund, each owning 39%, 27% and 12%, respectively. Two participating insurance companies were the owners of record of 10% or more of the total outstanding Class B shares of the Fund, each owning 78% and 20%, respectively.
E. Line of Credit
The Fund and other affiliated funds (the "Participants") share in a $375 million revolving credit facility provided by a syndication of banks. The Fund may borrow for temporary or emergency purposes, including the meeting of redemption requests that otherwise might require the untimely disposition of securities. The Participants are charged an annual commitment fee which is allocated based on net assets, among each of the Participants. Interest is calculated at a rate per annum equal to the sum of the Federal Funds Rate plus 1.25 percent plus if LIBOR exceeds the Federal Funds Rate the amount of such excess. The Fund may borrow up to a maximum of 33 percent of its net assets under the agreement. The Fund had no outstanding loans at December 31, 2013.
Report of Independent Registered Public Accounting Firm
To the Trustees of DWS Variable Series I and the Shareholders of DWS Capital Growth VIP:
In our opinion, the accompanying statement of assets and liabilities, including the investment portfolio, and the related statements of operations and of changes in net assets and the financial highlights present fairly, in all material respects, the financial position of DWS Capital Growth VIP (the "Fund") at December 31, 2013 and the results of its operations, the changes in its net assets, and the financial highlights for the periods indicated therein, in conformity with accounting principles generally accepted in the United States of America. These financial statements and financial highlights (hereafter referred to as "financial statements") are the responsibility of the Fund's management. Our responsibility is to express an opinion on these financial statements based on our audits. We conducted our audits of these financial statements in accordance with the standards of the Public Company Accounting Oversight Board (United States). Those standards require that we plan and perform the audit to obtain reasonable assurance about whether the financial statements are free of material misstatement. An audit includes examining, on a test basis, evidence supporting the amounts and disclosures in the financial statements, assessing the accounting principles used and significant estimates made by management, and evaluating the overall financial statement presentation. We believe that our audits, which included confirmation of securities at December 31, 2013 by correspondence with the custodians, provide a reasonable basis for our opinion.
Boston, Massachusetts February 14, 2014 | PricewaterhouseCoopers LLP |
Information About Your Fund's Expenses (Unaudited)
As an investor of the Fund, you incur two types of costs: ongoing expenses and transaction costs. Ongoing expenses include management fees, distribution and service (12b-1) fees and other Fund expenses. Examples of transaction costs include contract charges and account maintenance fees, which are not shown in this section. The following tables are intended to help you understand your ongoing expenses (in dollars) of investing in the Fund and to help you compare these expenses with the ongoing expenses of investing in other mutual funds. The example in the table is based on an investment of $1,000 invested at the beginning of the six-month period and held for the entire period (July 1, 2013 to December 31, 2013).
The tables illustrate your Fund's expenses in two ways:
—Actual Fund Return. This helps you estimate the actual dollar amount of ongoing expenses (but not transaction costs) paid on a $1,000 investment in the Fund using the Fund's actual return during the period. To estimate the expenses you paid over the period, simply divide your account value by $1,000 (for example, an $8,600 account value divided by $1,000 = 8.6), then multiply the result by the number in the "Expenses Paid per $1,000" line under the share class you hold.
— Hypothetical 5% Fund Return. This helps you to compare your Fund's ongoing expenses (but not transaction costs) with those of other mutual funds using the Fund's actual expense ratio and a hypothetical rate of return of 5% per year before expenses. Examples using a 5% hypothetical Fund return may be found in the shareholder reports of other mutual funds. The hypothetical account values and expenses may not be used to estimate the actual ending account balance or expenses you paid for the period.
Please note that the expenses shown in these tables are meant to highlight your ongoing expenses only and do not reflect any transaction costs. The "Expenses Paid per $1,000" line of the tables is useful in comparing ongoing expenses only and will not help you determine the relative total expense of owning different funds. If these transaction costs had been included, your costs would have been higher.
Expenses and Value of a $1,000 Investment for the six months ended December 31, 2013 | |
| Actual Fund Return | | Class A | | | Class B | |
| Beginning Account Value 7/1/13 | | $ | 1,000.00 | | | $ | 1,000.00 | |
| Ending Account Value 12/31/13 | | $ | 1,220.40 | | | $ | 1,217.80 | |
| Expenses Paid per $1,000* | | $ | 2.85 | | | $ | 4.70 | |
| Hypothetical 5% Fund Return | | Class A | | | Class B | |
| Beginning Account Value 7/1/13 | | $ | 1,000.00 | | | $ | 1,000.00 | |
| Ending Account Value 12/31/13 | | $ | 1,022.63 | | | $ | 1,020.97 | |
| Expenses Paid per $1,000* | | $ | 2.60 | | | $ | 4.28 | |
* Expenses are equal to the Fund's annualized expense ratio for each share class, multiplied by the average account value over the period, multiplied by 184 (the number of days in the most recent six-month period), then divided by 365.
| Annualized Expense Ratios | Class A | | Class B | |
| DWS Variable Series I — DWS Capital Growth VIP | .51% | | .84% | |
For more information, please refer to the Fund's prospectus.
These tables do not reflect charges and fees ("contract charges") associated with the separate account that invests in the Fund or any variable life insurance policy or variable annuity contract for which the Fund is an investment option.
For an analysis of the fees associated with an investment in the fund or similar funds, please refer to the current and hypothetical expense calculators for Variable Insurance Products which can be found at dws-investments.com/EN/resources/calculators.jsp.
Tax Information (Unaudited)
Pursuant to Section 852 of the Internal Revenue Code, the Fund designates $53,597,000 as capital gain dividends for its year ended December 31, 2013.
For corporate shareholders, 88% of the ordinary dividends (i.e., income dividends plus short-term capital gains) paid during the Fund's fiscal year ended December 31, 2013 qualified for the dividends received deduction.
Please consult a tax advisor if you have questions about federal or state income tax laws, or on how to prepare your tax returns. If you have specific questions about your account, please contact your insurance provider.
The Series' policies and procedures for voting proxies for portfolio securities and information about how the Series voted proxies related to its portfolio securities during the 12-month period ended June 30 are available on our Web site — dws-investments.com (click on "proxy voting"at the bottom of the page) — or on the SEC's Web site — sec.gov. To obtain a written copy of the Series' policies and procedures without charge, upon request, call us toll free at (800) 728-3337.
Advisory Agreement Board Considerations and Fee Evaluation
The Board of Trustees approved the renewal of DWS Capital Growth VIP's investment management agreement (the "Agreement") with Deutsche Investment Management Americas Inc. ("DIMA") in September 2013.
In terms of the process that the Board followed prior to approving the Agreement, shareholders should know that:
— In September 2013, all of the Fund's Trustees were independent of DIMA and its affiliates.
— The Trustees met frequently during the past year to discuss fund matters and dedicated a substantial amount of time to contract review matters. Over the course of several months, the Board's Contract Committee, in coordination with the Board's Equity Oversight Committee, reviewed comprehensive materials received from DIMA, independent third parties and independent counsel. These materials included an analysis of the Fund's performance, fees and expenses, and profitability compiled by a fee consultant retained by the Fund's Independent Trustees (the "Fee Consultant"). The Board also received extensive information throughout the year regarding performance of the Fund.
— The Independent Trustees regularly meet privately with their independent counsel to discuss contract review and other matters. In addition, the Independent Trustees were also advised by the Fee Consultant in the course of their review of the Fund's contractual arrangements and considered a comprehensive report prepared by the Fee Consultant in connection with their deliberations.
— In connection with reviewing the Agreement, the Board also reviewed the terms of the Fund's Rule 12b-1 plan, distribution agreement, administrative services agreement, transfer agency agreement and other material service agreements.
— Based on its evaluation of the information provided, the Contract Committee presented its findings and recommendations to the Board. The Board then reviewed the Contract Committee's findings and recommendations.
In connection with the contract review process, the Contract Committee and the Board considered the factors discussed below, among others. The Board also considered that DIMA and its predecessors have managed the Fund since its inception, and the Board believes that a long-term relationship with a capable, conscientious advisor is in the best interests of the Fund. The Board considered, generally, that shareholders chose to invest or remain invested in the Fund knowing that DIMA managed the Fund, and that the Agreement was approved by the Fund's shareholders. DIMA is part of Deutsche Bank AG, a major global banking institution that is engaged in a wide range of financial services. The Board believes that there are advantages to being part of a global asset management business that offers a wide range of investing expertise and resources, including hundreds of portfolio managers and analysts with research capabilities in many countries throughout the world.
As part of the contract review process, the Board carefully considered the fees and expenses of each DWS fund overseen by the Board in light of the fund's performance. In many cases, this led to a negotiation with DIMA of lower expense caps as part of the 2012 and 2013 contract review processes than had previously been in place. As part of these negotiations, the Board indicated that it would consider relaxing these new lower caps in future years following sustained improvements in performance, among other considerations.
In June 2012, Deutsche Bank AG ("DB"), DIMA's parent company, announced that DB would combine its Asset Management (of which DIMA was a part) and Wealth Management divisions. DB has advised the Independent Trustees that the U.S. asset management business is a critical and integral part of DB, and that it has, and will continue to, reinvest a significant portion of the substantial savings it expects to realize by combining its Asset Management and Wealth Management divisions into the new Asset and Wealth Management ("AWM") division, including ongoing enhancements to its investment capabilities. DB also has confirmed its commitment to maintaining strong legal and compliance groups within the AWM division.
While shareholders may focus primarily on fund performance and fees, the Fund's Board considers these and many other factors, including the quality and integrity of DIMA's personnel and such other issues as back-office operations, fund valuations, and compliance policies and procedures.
Nature, Quality and Extent of Services. The Board considered the terms of the Agreement, including the scope of advisory services provided under the Agreement. The Board noted that, under the Agreement, DIMA provides portfolio management services to the Fund and that, pursuant to a separate administrative services agreement, DIMA provides administrative services to the Fund. The Board considered the experience and skills of senior management and investment personnel, the resources made available to such personnel, the ability of DIMA to attract and retain high-quality personnel, and the organizational depth and stability of DIMA. The Board reviewed the Fund's performance over short-term and long-term periods and compared those returns to various agreed-upon performance measures, including market indices and a peer universe compiled by the Fee Consultant using information supplied by Morningstar Direct ("Morningstar"), an independent fund data service. The Board also noted that it has put into place a process of identifying "Focus Funds" (e.g., funds performing poorly relative to their benchmark or a peer universe compiled by an independent fund data service), and receives more frequent reporting and information from DIMA regarding such funds, along with DIMA's remedial plans to address underperformance. The Board believes this process is an effective manner of identifying and addressing underperforming funds. Based on the information provided, the Board noted that for the one-, three- and five-year periods ended December 31, 2012, the Fund's performance (Class A shares) was in the 2nd quartile, 3rd quartile and 2nd quartile, respectively, of the applicable Morningstar universe (the 1st quartile being the best performers and the 4th quartile being the worst performers). The Board also observed that the Fund has outperformed its benchmark in the one-year period and has underperformed its benchmark in the three- and five-year periods ended December 31, 2012.
Fees and Expenses. The Board considered the Fund's investment management fee schedule, operating expenses and total expense ratios, and comparative information provided by Lipper Inc. ("Lipper") and the Fee Consultant regarding investment management fee rates paid to other investment advisors by similar funds (1st quartile being the most favorable and 4th quartile being the least favorable). With respect to management fees paid to other investment advisors by similar funds, the Board noted that the contractual fee rates paid by the Fund, which include a 0.10% fee paid to DIMA under the Fund's administrative services agreement, were lower than the median (1st quartile) of the applicable Lipper peer group (based on Lipper data provided as of December 31, 2012). The Board noted that the Fund's Class A shares total (net) operating expenses were expected to be lower than the median (1st quartile) of the applicable Lipper expense universe (based on Lipper data provided as of December 31, 2012) ("Lipper Universe Expenses"). The Board also reviewed data comparing each share class's total (net) operating expenses to the applicable Lipper Universe Expenses. The Board considered the Fund's management fee rate as compared to fees charged by DIMA to comparable funds and considered differences between the Fund and the comparable funds. The Board also considered how the Fund's total (net) operating expenses compared to the total (net) operating expenses of a more customized peer group selected by Lipper (based on such factors as asset size).
The information considered by the Board as part of its review of management fees included information regarding fees charged by DIMA and its affiliates to similar institutional accounts and to similar funds offered primarily to European investors ("DWS Europe funds"), in each case as applicable. The Board observed that advisory fee rates for institutional accounts generally were lower than the management fees charged by similarly managed DWS U.S. mutual funds ("DWS Funds"), but also took note of the differences in services provided to DWS Funds as compared to institutional accounts. In the case of DWS Europe funds, the Board observed that fee rates for DWS Europe funds generally were higher than for similarly managed DWS Funds, but noted that differences in the types of services provided to DWS Funds relative to DWS Europe funds made it difficult to compare such fees.
On the basis of the information provided, the Board concluded that management fees were reasonable and appropriate in light of the nature, quality and extent of services provided by DIMA.
Profitability. The Board reviewed detailed information regarding revenues received by DIMA under the Agreement. The Board considered the estimated costs and pre-tax profits realized by DIMA from advising the DWS Funds, as well as estimates of the pre-tax profits attributable to managing the Fund in particular. The Board also received information regarding the estimated enterprise-wide profitability of DWS and its affiliates with respect to all fund services in totality and by fund. The Board and the Fee Consultant reviewed DIMA's methodology in allocating its costs to the management of the Fund. Based on the information provided, the Board concluded that the pre-tax profits realized by DIMA in connection with the management of the Fund were not unreasonable. The Board also reviewed information regarding the profitability of certain similar investment management firms. The Board noted that while information regarding the profitability of such firms is limited (and in some cases is not necessarily prepared on a comparable basis), DIMA and its affiliates' overall profitability with respect to the DWS fund complex (after taking into account distribution and other services provided to the funds by DIMA and its affiliates) was lower than the overall profitability levels of many comparable firms for which such data was available.
Economies of Scale. The Board considered whether there are economies of scale with respect to the management of the Fund and whether the Fund benefits from any economies of scale. The Board noted that the Fund's management fee schedule includes fee breakpoints. The Board concluded that the Fund's fee schedule represents an appropriate sharing between the Fund and DIMA of such economies of scale as may exist in the management of the Fund at current asset levels.
Other Benefits to DIMA and Its Affiliates. The Board also considered the character and amount of other incidental benefits received by DIMA and its affiliates, including any fees received by DIMA for administrative services provided to the Fund and any fees received by an affiliate of DIMA for distribution services. The Board also considered benefits to DIMA related to brokerage and soft-dollar allocations, including allocating brokerage to pay for research generated by parties other than the executing broker dealers, which pertain primarily to funds investing in equity securities, along with the incidental public relations benefits to DIMA related to DWS Funds advertising and cross-selling opportunities among DIMA products and services. The Board concluded that management fees were reasonable in light of these fallout benefits.
Compliance. The Board considered the significant attention and resources dedicated by DIMA to documenting and enhancing its compliance processes in recent years. The Board noted in particular (i) the experience and seniority of both DIMA's chief compliance officer and the Fund's chief compliance officer; (ii) the large number of DIMA compliance personnel; and (iii) the substantial commitment of resources by DIMA and its affiliates to compliance matters.
Based on all of the information considered and the conclusions reached, the Board unanimously determined that the continuation of the Agreement is in the best interests of the Fund. In making this determination, the Board did not give particular weight to any single factor identified above. The Board considered these factors over the course of numerous meetings, certain of which were in executive session with only the Independent Trustees and their independent counsel present. It is possible that individual Trustees may have weighed these factors differently in reaching their individual decisions to approve the continuation of the Agreement.
Board Members and Officers
The following table presents certain information regarding the Board Members and Officers of the fund. Each Board Member's year of birth is set forth in parentheses after his or her name. Unless otherwise noted, (i) each Board Member has engaged in the principal occupation(s) noted in the table for at least the most recent five years, although not necessarily in the same capacity; and (ii) the address of each Independent Board Member is c/o Kenneth C. Froewiss, Chairman, DWS Mutual Funds, P.O. Box 78, Short Hills, NJ 07078. Except as otherwise noted below, the term of office for each Board Member is until the election and qualification of a successor, or until such Board Member sooner dies, resigns, is removed or as otherwise provided in the governing documents of the fund. Because the fund does not hold an annual meeting of shareholders, each Board Member will hold office for an indeterminate period. The Board Members may also serve in similar capacities with other funds in the fund complex.
| Independent Board Members |
Name, Year of Birth, Position with the Fund and Length of Time Served1 | | Business Experience and Directorships During the Past Five Years | Number of Funds in DWS Fund Complex Overseen | Other Directorships Held by Board Member |
Kenneth C. Froewiss (1945) Chairperson since 2013, and Board Member since 2001 | | Adjunct Professor of Finance, NYU Stern School of Business (September 2009–present; Clinical Professor from 1997–September 2009); Member, Finance Committee, Association for Asian Studies (2002–present); Director, Mitsui Sumitomo Insurance Group (US) (2004–present); prior thereto, Managing Director, J.P. Morgan (investment banking firm) (until 1996) | 103 | — |
William McClayton (1944) Vice Chairperson since 2013, and Board Member since 2004 | | Private equity investor (since October 2009); previously, Managing Director, Diamond Management & Technology Consultants, Inc. (global consulting firm) (2001–2009); Directorship: Board of Managers, YMCA of Metropolitan Chicago; formerly: Senior Partner, Arthur Andersen LLP (accounting) (1966–2001); Trustee, Ravinia Festival | 103 | — |
John W. Ballantine (1946) Board Member since 1999 | | Retired; formerly, Executive Vice President and Chief Risk Management Officer, First Chicago NBD Corporation/The First National Bank of Chicago (1996–1998); Executive Vice President and Head of International Banking (1995–1996); former Directorships: Stockwell Capital Investments PLC (private equity); First Oak Brook Bancshares, Inc. and Oak Brook Bank; Prisma Energy International | 103 | Chairman of the Board, Healthways, Inc.2 (provider of disease and care management services) (2003– present); Portland General Electric2 (utility company) (2003– present) |
Henry P. Becton, Jr. (1943) Board Member since 1990 | | Vice Chair and former President, WGBH Educational Foundation. Directorships: Public Radio International; Public Radio Exchange (PRX); North Bennett Street School (Boston); former Directorships: The PBS Foundation; Association of Public Television Stations; Boston Museum of Science; American Public Television; Concord Academy; New England Aquarium; Mass. Corporation for Educational Telecommunications; Committee for Economic Development; Public Broadcasting Service; Connecticut College | 103 | Lead Director, Becton Dickinson and Company2 (medical technology company); Lead Director, Belo Corporation2 (media company) |
Dawn-Marie Driscoll (1946) Board Member since 1987 | | President, Driscoll Associates (consulting firm); Emeritus Executive Fellow, Center for Business Ethics, Bentley University; formerly, Partner, Palmer & Dodge (1988–1990); Vice President of Corporate Affairs and General Counsel, Filene's (1978–1988). Directorships: Director of ICI Mutual Insurance Company (since 2007); Advisory Board, Center for Business Ethics, Bentley University; Chairman of the Board of Trustees, Southwest Florida Community Foundation (charitable organization); former Directorships: Sun Capital Advisers Trust (mutual funds) (2007–2012), Investment Company Institute (audit, executive, nominating committees) and Independent Directors Council (governance, executive committees) | 103 | — |
Keith R. Fox, CFA (1954) Board Member since 1996 | | Managing General Partner, Exeter Capital Partners (a series of private investment funds) (since 1986). Directorships: Progressive International Corporation (kitchen goods importer and distributor); The Kennel Shop (retailer); former Chairman, National Association of Small Business Investment Companies; former Directorships: BoxTop Media Inc. (advertising); Sun Capital Advisers Trust (mutual funds) (2011–2012) | 103 | — |
Paul K. Freeman (1950) Board Member since 1993 | | Consultant, World Bank/Inter-American Development Bank; Executive and Governing Council of the Independent Directors Council (Chairman of Education Committee); formerly: Project Leader, International Institute for Applied Systems Analysis (1998–2001); Chief Executive Officer, The Eric Group, Inc. (environmental insurance) (1986–1998); Directorships: Denver Zoo Foundation (December 2012–present); former Directorships: Prisma Energy International | 103 | — |
Richard J. Herring (1946) Board Member since 1990 | | Jacob Safra Professor of International Banking and Professor, Finance Department, The Wharton School, University of Pennsylvania (since July 1972); Co-Director, Wharton Financial Institutions Center (since July 2000); Co-Chair, U.S. Shadow Financial Regulatory Committee; Executive Director, Financial Economists Roundtable; formerly: Vice Dean and Director, Wharton Undergraduate Division (July 1995–June 2000); Director, Lauder Institute of International Management Studies (July 2000–June 2006) | 103 | Director, Japan Equity Fund, Inc. (since September 2007), Thai Capital Fund, Inc. (since 2007), Singapore Fund, Inc. (since September 2007), Independent Director of Barclays Bank Delaware (since September 2010) |
Rebecca W. Rimel (1951) Board Member since 1995 | | President and Chief Executive Officer, The Pew Charitable Trusts (charitable organization) (1994 to present); formerly: Executive Vice President, The Glenmede Trust Company (investment trust and wealth management) (1983–2004); Board Member, Investor Education (charitable organization) (2004–2005); Trustee, Executive Committee, Philadelphia Chamber of Commerce (2001–2007); Director, Viasys Health Care2 (January 2007–June 2007); Trustee, Thomas Jefferson Foundation (charitable organization) (1994–2012) | 103 | Director, Becton Dickinson and Company2 (medical technology company) (2012– present); Director, CardioNet, Inc.2 (health care) (2009– present) |
William N. Searcy, Jr. (1946) Board Member since 1993 | | Private investor since October 2003; formerly: Pension & Savings Trust Officer, Sprint Corporation2 (telecommunications) (November 1989–September 2003); Trustee, Sun Capital Advisers Trust (mutual funds) (1998–2012) | 103 | — |
Jean Gleason Stromberg (1943) Board Member since 1997 | | Retired. Formerly, Consultant (1997–2001); Director, Financial Markets U.S. Government Accountability Office (1996–1997); Partner, Fulbright & Jaworski, L.L.P. (law firm) (1978–1996). Directorships: The William and Flora Hewlett Foundation; former Directorships: Service Source, Inc., Mutual Fund Directors Forum (2002–2004), American Bar Retirement Association (funding vehicle for retirement plans) (1987–1990 and 1994–1996) | 103 | — |
Robert H. Wadsworth (1940) Board Member since 1999 | | President, Robert H. Wadsworth & Associates, Inc. (consulting firm) (1983 to present); Director, National Horizon, Inc. (non-profit organization); Director and Treasurer, The Phoenix Boys Choir Association | 106 | — |
Officers4 |
Name, Year of Birth, Position with the Fund and Length of Time Served5 | | Business Experience and Directorships During the Past Five Years |
Brian E. Binder8,9 (1972) President and Chief Executive Officer, 2013–present | | Managing Director3 and Head of Fund Administration, Deutsche Asset & Wealth Management (2013–present); formerly: Head of Business Management and Consulting at Invesco, Ltd. (2010–2012); Chief Administrative Officer, Van Kampen Funds Inc. (2008–2010); and Chief Administrative Officer, Morgan Stanley Investment Management Americas Distribution (2003–2008) |
John Millette7 (1962) Vice President and Secretary, 1999–present | | Director,3 Deutsche Asset & Wealth Management |
Paul H. Schubert6 (1963) Chief Financial Officer, 2004–present Treasurer, 2005–present | | Managing Director,3 Deutsche Asset & Wealth Management (since July 2004); formerly: Executive Director, Head of Mutual Fund Services and Treasurer for UBS Family of Funds (1998–2004); Vice President and Director of Mutual Fund Finance at UBS Global Asset Management (1994–1998) |
Caroline Pearson7 (1962) Chief Legal Officer, 2010–present | | Managing Director,3 Deutsche Asset & Wealth Management; formerly: Assistant Secretary for DWS family of funds (1997–2010) |
Melinda Morrow6 (1970) Vice President, 2012–present | | Director,3 Deutsche Asset & Wealth Management |
Hepsen Uzcan7 (1974) Assistant Secretary, 2013–present | | Vice President, Deutsche Asset & Wealth Management |
Paul Antosca7 (1957) Assistant Treasurer, 2007–present | | Director,3 Deutsche Asset & Wealth Management |
Jack Clark7 (1967) Assistant Treasurer, 2007–present | | Director,3 Deutsche Asset & Wealth Management |
Diane Kenneally7 (1966) Assistant Treasurer, 2007–present | | Director,3 Deutsche Asset & Wealth Management |
John Caruso6 (1965) Anti-Money Laundering Compliance Officer, 2010–present | | Managing Director,3 Deutsche Asset & Wealth Management |
Robert Kloby6 (1962) Chief Compliance Officer, 2006–present | | Managing Director,3 Deutsche Asset & Wealth Management |
1 The length of time served represents the year in which the Board Member joined the board of one or more DWS funds currently overseen by the Board.
2 A publicly held company with securities registered pursuant to Section 12 of the Securities Exchange Act of 1934.
3 Executive title, not a board directorship.
4 As a result of their respective positions held with the Advisor, these individuals are considered "interested persons" of the Advisor within the meaning of the 1940 Act. Interested persons receive no compensation from the fund.
5 The length of time served represents the year in which the officer was first elected in such capacity for one or more DWS funds.
6 Address: 60 Wall Street, New York, NY 10005.
7 Address: One Beacon Street, Boston, MA 02108.
8 Address: 222 South Riverside Plaza, Chicago, IL 60606.
9 Effective as of December 1, 2013.
The fund's Statement of Additional Information ("SAI") includes additional information about the Board Members. The SAI is available, without charge, upon request. If you would like to request a copy of the SAI, you may do so by calling the following toll-free number: (800) 728-3337.
DWS Investments Distributors, Inc.
222 South Riverside Plaza
Chicago, IL 60606
(800) 621-1148
VS1capgro-2 (R-025820-3 2/14)
December 31, 2013
Annual Report
DWS Variable Series I
DWS Core Equity VIP
Contents
9 Statement of Assets and Liabilities 10 Statement of Operations 10 Statement of Changes in Net Assets 13 Notes to Financial Statements 18 Report of Independent Registered Public Accounting Firm 19 Information About Your Fund's Expenses 21 Advisory Agreement Board Considerations and Fee Evaluation 24 Board Members and Officers |
This report must be preceded or accompanied by a prospectus. To obtain an additional prospectus or summary prospectus, if available, call (800) 728-3337 or your financial representative. We advise you to consider the Fund's objectives, risks, charges and expenses carefully before investing. The summary prospectus and prospectus contain this and other important information about the Fund. Please read the prospectus carefully before you invest.
Investing in derivatives entails special risks relating to liquidity, leverage and credit that may reduce returns and/or increase volatility. The Fund may lend securities to approved institutions. Fund management could be wrong in its analysis of industries, companies, economic trends and favor a security that underperforms the market. Stocks may decline in value. See the prospectus for details.
Deutsche Asset & Wealth Management represents the asset management and wealth management activities conducted by Deutsche Bank AG or any of its subsidiaries, including the Advisor and DWS Investments Distributors, Inc.
NOT FDIC/NCUA INSURED NO BANK GUARANTEE MAY LOSE VALUE NOT A DEPOSIT
NOT INSURED BY ANY FEDERAL GOVERNMENT AGENCY
Performance Summary December 31, 2013 (Unaudited)
Fund performance shown is historical, assumes reinvestment of all dividend and capital gain distributions, and does not guarantee future results. Investment return and principal value fluctuate with changing market conditions so that, when redeemed, shares may be worth more or less than their original cost. Current performance may be lower or higher than the performance data quoted. Please contact your participating insurance company for the Fund's most recent month-end performance. Performance doesn't reflect charges and fees ("contract charges") associated with the separate account that invests in the Fund or any variable life insurance policy or variable annuity contract for which the Fund is an investment option. These charges and fees will reduce returns. While all share classes have the same underlying portfolio, their performance will differ.
The gross expense ratios of the Fund, as stated in the fee table of the prospectus dated July 12, 2013 are 0.59% and 0.90% for Class A and Class B shares, respectively, and may differ from the expense ratios disclosed in the Financial Highlights tables in this report.
| Growth of an Assumed $10,000 Investment |
| The Russell 1000® Index is an unmanaged index that measures the performance of the 1,000 largest companies in the Russell 3000® Index, which represents approximately 92% of the total market capitalization of the Russell 3000 Index. Index returns do not reflect any fees or expenses and it is not possible to invest directly into an index. |
| |
| Yearly periods ended December 31 | |
| Comparative Results | |
| DWS Core Equity VIP | | 1-Year | | | 3-Year | | | 5-Year | | | 10-Year | |
| Class A | Growth of $10,000 | | $ | 13,733 | | | $ | 15,881 | | | $ | 24,371 | | | $ | 20,231 | |
| Average annual total return | | | 37.33 | % | | | 16.67 | % | | | 19.50 | % | | | 7.30 | % |
Russell 1000® Index | Growth of $10,000 | | $ | 13,311 | | | $ | 15,730 | | | $ | 23,454 | | | $ | 21,161 | |
| Average annual total return | | | 33.11 | % | | | 16.30 | % | | | 18.59 | % | | | 7.78 | % |
| DWS Core Equity VIP | | 1-Year | | | 3-Year | | | 5-Year | | | 10-Year | |
| Class B | Growth of $10,000 | | $ | 13,710 | | | $ | 15,760 | | | $ | 24,034 | | | $ | 19,697 | |
| Average annual total return | | | 37.10 | % | | | 16.37 | % | | | 19.17 | % | | | 7.01 | % |
Russell 1000® Index | Growth of $10,000 | | $ | 13,311 | | | $ | 15,730 | | | $ | 23,454 | | | $ | 21,161 | |
| Average annual total return | | | 33.11 | % | | | 16.30 | % | | | 18.59 | % | | | 7.78 | % |
The growth of $10,000 is cumulative.
Management Summary December 31, 2013 (Unaudited)
An environment of improving economic growth and steady corporate earnings propelled U.S. equities to their strongest return in 16 years during 2013. The Fund returned 37.33% (Class A shares, unadjusted for contract charges), well ahead of the Russell 1000® Index.1
On July 12, 2013, the Fund's management duties were taken over by Deutsche Bank's large-cap equity team. The fund's 12-month performance incorporates the investments made by both our team and the previous management team. Since our investment approach is focused primarily on individual stock selection — as opposed to making sector "bets" or predictions on the broader market — the quality of our stock picks is typically the main driver of our performance. That has proven to be the case since we took over the Fund, a time in which our holdings outpaced the broader market by a comfortable margin. Our stock picks outperformed in the health care, financials, consumer discretionary, materials and utilities sectors, and our only meaningful underperformance occurred in consumer staples.2,3
Two of the Fund's strongest individual contributors were the biotechnology companies Gilead Sciences, Inc. and Celgene Corp. Both have strong product stories and promising pipelines, which enabled them to generate gains well in excess of the health care sector as a whole. We emphasize companies with strong product cycles across the entire portfolio, and identifying such companies is a key element of our fundamental research process. Our core belief is that favorable product stories are critical to driving earnings growth independent of the broader economic cycle, and the portfolio is positioned accordingly.
We hold a cautiously optimistic outlook on the year ahead. While there is certainly room for stocks to produce further gains, the upside is somewhat constrained by the combination of fair valuations and profit margins that are already near record highs. Nevertheless, we continue to identify an abundance of opportunities in individual stocks. We are finding particularly compelling investments in the areas with the highest sensitivity to economic growth, such as the consumer discretionary, industrial and financial sectors. We are also enthusiastic on the information technology sector, where we have recently added to positions in virtualization and social media stocks.
The Fund also outperformed its benchmark prior to the management change, with the largest contributions to performance coming from its stock selection in the information technology, industrial and energy sectors.
Overall, we intend to maintain a focus on using our unique, multifaceted approach to select what we believe are the most attractive individual stocks in the U.S. market.
Owen Fitzpatrick, CFA
Thomas M. Hynes, Jr., CFA
Brendan O'Neill, CFA
Pankaj Bhatnagar, PhD
Portfolio Managers
The views expressed reflect those of the portfolio management team only through the end of the period of the report as stated on the cover. The management team's views are subject to change at any time based on market and other conditions and should not be construed as a recommendation. Past performance is no guarantee of future results. Current and future portfolio holdings are subject to risk.
1 The Russell 1000 Index tracks the performance of the 1,000 largest stocks in the Russell 3000® Index, which consists of the 3,000 largest U.S. companies as measured by market capitalization.
2 The consumer staples sector represents companies that produce essential items such as food, beverages and household items.
3 The consumer discretionary sector represents industries that produce goods and services that are not necessities in everyday life.
Portfolio Summary (Unaudited) Asset Allocation (As a % of Investment Portfolio excluding Securities Lending Collateral) | 12/31/13 | 12/31/12 |
| | | |
| Common Stocks | 100% | 99% |
| Cash Equivalents | 0% | 1% |
| | 100% | 100% |
Sector Diversification (As a % of Common Stocks) | 12/31/13 | 12/31/12 |
| | | |
| Information Technology | 18% | 18% |
| Financials | 17% | 16% |
| Health Care | 16% | 12% |
| Consumer Discretionary | 14% | 13% |
| Industrials | 12% | 8% |
| Energy | 10% | 12% |
| Consumer Staples | 8% | 12% |
| Materials | 3% | 6% |
| Utilities | 1% | 1% |
| Telecommunication Services | 1% | 2% |
| | 100% | 100% |
Portfolio holdings and characteristics are subject to change.
For more complete details about the Fund's investment portfolio, see page 6.
Following the Fund's fiscal first and third quarter-end, a complete portfolio holdings listing is filed with the SEC on Form N-Q. The form will be available on the SEC's Web site at sec.gov, and it also may be reviewed and copied at the SEC's Public Reference Room in Washington, D.C. Information on the operation of the SEC's Public Reference Room may be obtained by calling (800) SEC-0330. The Fund's portfolio holdings are also posted on dws-investments.com from time to time. Please see the Fund's current prospectus for more information.
Investment Portfolio December 31, 2013 | | | Shares | | | Value ($) | |
| | | | |
| Common Stocks 99.8% | |
| Consumer Discretionary 14.0% | |
| Auto Components 1.1% | |
| BorgWarner, Inc. (a) | | | 44,884 | | | | 2,509,464 | |
| Hotels, Restaurants & Leisure 1.7% | |
| Las Vegas Sands Corp. | | | 19,198 | | | | 1,514,146 | |
| Starwood Hotels & Resorts Worldwide, Inc. | | | 28,268 | | | | 2,245,893 | |
| | | | | | | | 3,760,039 | |
| Internet & Catalog Retail 1.3% | |
| Amazon.com, Inc.* | | | 4,938 | | | | 1,969,225 | |
| Expedia, Inc. (a) | | | 15,230 | | | | 1,060,922 | |
| | | | | | | | 3,030,147 | |
| Media 1.8% | |
| Comcast Corp. "A" | | | 36,576 | | | | 1,900,672 | |
| Twenty-First Century Fox, Inc. "A" | | | 57,812 | | | | 2,033,826 | |
| | | | | | | | 3,934,498 | |
| Multiline Retail 0.7% | |
| Macy's, Inc. | | | 29,910 | | | | 1,597,194 | |
| Specialty Retail 4.0% | |
| Dick's Sporting Goods, Inc. (a) | | | 41,479 | | | | 2,409,930 | |
| Home Depot, Inc. | | | 43,556 | | | | 3,586,401 | |
| L Brands, Inc. | | | 49,924 | | | | 3,087,799 | |
| | | | | | | | 9,084,130 | |
| Textiles, Apparel & Luxury Goods 3.4% | |
| NIKE, Inc. "B" | | | 71,800 | | | | 5,646,352 | |
| VF Corp. | | | 30,828 | | | | 1,921,818 | |
| | | | | | | | 7,568,170 | |
| Consumer Staples 8.5% | |
| Beverages 2.3% | |
| Beam, Inc. | | | 23,255 | | | | 1,582,735 | |
| PepsiCo, Inc. | | | 42,917 | | | | 3,559,536 | |
| | | | | | | | 5,142,271 | |
| Food & Staples Retailing 2.5% | |
| Costco Wholesale Corp. | | | 22,388 | | | | 2,664,396 | |
| Whole Foods Market, Inc. | | | 52,943 | | | | 3,061,694 | |
| | | | | | | | 5,726,090 | |
| Food Products 2.2% | |
| Hillshire Brands Co. | | | 65,772 | | | | 2,199,416 | |
| Kraft Foods Group, Inc. | | | 51,133 | | | | 2,757,091 | |
| | | | | | | | 4,956,507 | |
| Household Products 1.5% | |
| Procter & Gamble Co. | | | 40,327 | | | | 3,283,021 | |
| Energy 9.5% | |
| Energy Equipment & Services 2.5% | |
| Halliburton Co. | | | 69,826 | | | | 3,543,669 | |
| Schlumberger Ltd. | | | 23,870 | | | | 2,150,926 | |
| | | | | | | | 5,694,595 | |
| Oil, Gas & Consumable Fuels 7.0% | |
| Anadarko Petroleum Corp. | | | 17,891 | | | | 1,419,114 | |
| Antero Resources Corp.* | | | 20,205 | | | | 1,281,805 | |
| Chevron Corp. | | | 55,367 | | | | 6,915,892 | |
| EOG Resources, Inc. | | | 17,302 | | | | 2,903,968 | |
| Pioneer Natural Resources Co. | | | 9,359 | | | | 1,722,711 | |
| Valero Energy Corp. | | | 30,768 | | | | 1,550,708 | |
| | | | | | | | 15,794,198 | |
| | | Shares | | | Value ($) | |
| | | | | | | | | |
| Financials 16.9% | |
| Capital Markets 6.4% | |
| Affiliated Managers Group, Inc.* | | | 23,471 | | | | 5,090,391 | |
| Ameriprise Financial, Inc. | | | 51,669 | | | | 5,944,518 | |
| The Charles Schwab Corp. | | | 132,766 | | | | 3,451,916 | |
| | | | | | | | 14,486,825 | |
| Consumer Finance 1.7% | |
| Discover Financial Services | | | 69,956 | | | | 3,914,038 | |
| Diversified Financial Services 5.1% | |
| Citigroup, Inc. | | | 105,312 | | | | 5,487,808 | |
| JPMorgan Chase & Co. | | | 100,106 | | | | 5,854,199 | |
| | | | | | | | 11,342,007 | |
| Insurance 3.3% | |
| Prudential Financial, Inc. | | | 51,954 | | | | 4,791,198 | |
| The Travelers Companies, Inc. | | | 29,074 | | | | 2,632,360 | |
| | | | | | | | 7,423,558 | |
| Real Estate Investment Trusts 0.4% | |
| Extra Space Storage, Inc. (REIT) | | | 18,553 | | | | 781,638 | |
| Health Care 15.5% | |
| Biotechnology 6.3% | |
| Celgene Corp.* | | | 27,858 | | | | 4,706,887 | |
| Gilead Sciences, Inc.* | | | 78,045 | | | | 5,865,082 | |
| Medivation, Inc.* | | | 33,173 | | | | 2,117,101 | |
| NPS Pharmaceuticals, Inc.* (a) | | | 53,225 | | | | 1,615,911 | |
| | | | | | | | 14,304,981 | |
| Health Care Equipment & Supplies 2.3% | |
| CareFusion Corp.* | | | 73,155 | | | | 2,913,032 | |
| The Cooper Companies, Inc. | | | 19,092 | | | | 2,364,353 | |
| | | | | | | | 5,277,385 | |
| Health Care Providers & Services 3.8% | |
| Express Scripts Holding Co.* | | | 57,968 | | | | 4,071,672 | |
| McKesson Corp. | | | 25,914 | | | | 4,182,520 | |
| Premier, Inc. "A"* | | | 7,186 | | | | 264,157 | |
| | | | | | | | 8,518,349 | |
| Life Sciences Tools & Services 1.8% | |
| Thermo Fisher Scientific, Inc. (a) | | | 35,727 | | | | 3,978,202 | |
| Pharmaceuticals 1.3% | |
| Merck & Co., Inc. | | | 57,735 | | | | 2,889,637 | |
| Industrials 11.7% | |
| Aerospace & Defense 1.9% | |
| Boeing Co. | | | 18,506 | | | | 2,525,884 | |
| TransDigm Group, Inc. | | | 11,347 | | | | 1,827,094 | |
| | | | | | | | 4,352,978 | |
| Electrical Equipment 3.5% | |
| AMETEK, Inc. | | | 67,809 | | | | 3,571,500 | |
| Regal-Beloit Corp. | | | 17,160 | | | | 1,265,035 | |
| Roper Industries, Inc. | | | 22,529 | | | | 3,124,322 | |
| | | | | | | | 7,960,857 | |
| Industrial Conglomerates 2.5% | |
| General Electric Co. | | | 198,943 | | | | 5,576,372 | |
| Machinery 2.4% | |
| Parker Hannifin Corp. | | | 22,370 | | | | 2,877,677 | |
| SPX Corp. | | | 24,572 | | | | 2,447,617 | |
| | | | | | | | 5,325,294 | |
| Road & Rail 1.4% | |
| Norfolk Southern Corp. | | | 33,375 | | | | 3,098,201 | |
| | | Shares | | | Value ($) | |
| | | | | | | | | |
| Information Technology 18.0% | |
| Communications Equipment 1.2% | |
| Alcatel-Lucent (ADR) | | | 249,629 | | | | 1,098,367 | |
| CommScope Holding Co., Inc.* | | | 81,542 | | | | 1,542,775 | |
| | | | | | | | 2,641,142 | |
| Computers & Peripherals 3.6% | |
| Apple, Inc. | | | 12,155 | | | | 6,820,292 | |
| Stratasys Ltd.* (a) | | | 8,867 | | | | 1,194,385 | |
| | | | | | | | 8,014,677 | |
| Internet Software & Services 5.0% | |
| eBay, Inc.* | | | 48,090 | | | | 2,639,660 | |
| Google, Inc. "A"* | | | 6,246 | | | | 6,999,955 | |
| LinkedIn Corp. "A"* | | | 7,322 | | | | 1,587,629 | |
| | | | | | | | 11,227,244 | |
| IT Services 2.0% | |
| Accenture PLC "A" | | | 10,307 | | | | 847,442 | |
| Visa, Inc. "A" (a) | | | 16,836 | | | | 3,749,040 | |
| | | | | | | | 4,596,482 | |
| Semiconductors & Semiconductor Equipment 0.5% | |
| Avago Technologies Ltd. | | | 21,976 | | | | 1,162,311 | |
| Software 5.7% | |
| Citrix Systems, Inc.* | | | 36,512 | | | | 2,309,384 | |
| FireEye, Inc.* (a) | | | 13,821 | | | | 602,734 | |
| Intuit, Inc. | | | 26,346 | | | | 2,010,727 | |
| Microsoft Corp. | | | 79,098 | | | | 2,960,638 | |
| Salesforce.com, Inc.* | | | 22,361 | | | | 1,234,103 | |
| Solera Holdings, Inc. | | | 25,168 | | | | 1,780,888 | |
| VMware, Inc. "A"* | | | 21,889 | | | | 1,963,662 | |
| | | | | | | | 12,862,136 | |
| | | Shares | | | Value ($) | |
| | | | | | | | | |
| Materials 3.5% | |
| Chemicals 3.0% | |
| Ecolab, Inc. | | | 31,029 | | | | 3,235,394 | |
| LyondellBasell Industries NV "A" | | | 18,903 | | | | 1,517,533 | |
| Monsanto Co. | | | 17,011 | | | | 1,982,632 | |
| | | | | | | | 6,735,559 | |
| Metals & Mining 0.5% | |
| Freeport-McMoRan Copper & Gold, Inc. | | | 28,065 | | | | 1,059,173 | |
| Telecommunication Services 0.9% | |
| Wireless Telecommunication Services | |
| Crown Castle International Corp.* | | | 26,504 | | | | 1,946,189 | |
| Utilities 1.3% | |
| Electric Utilities 0.9% | |
| NextEra Energy, Inc. | | | 23,873 | | | | 2,044,006 | |
| Water Utilities 0.4% | |
| American Water Works Co., Inc. | | | 22,258 | | | | 940,622 | |
Total Common Stocks (Cost $191,649,245) | | | | 224,540,187 | |
| | |
| Securities Lending Collateral 3.9% | |
| Daily Assets Fund Institutional, 0.08% (b) (c) (Cost $8,890,422) | | | 8,890,422 | | | | 8,890,422 | |
| | |
| Cash Equivalents 0.3% | |
| Central Cash Management Fund, 0.05% (b) (Cost $691,560) | | | 691,560 | | | | 691,560 | |
| | | % of Net Assets | | | Value ($) | |
| | | | |
Total Investment Portfolio (Cost $201,231,227)† | | | 104.0 | | | | 234,122,169 | |
| Other Assets and Liabilities, Net | | | (4.0 | ) | | | (9,049,635 | ) |
| Net Assets | | | 100.0 | | | | 225,072,534 | |
* Non-income producing security.
† The cost for federal income tax purposes was $201,411,014. At December 31, 2013, net unrealized appreciation for all securities based on tax cost was $32,711,155. This consisted of aggregate gross unrealized appreciation for all securities in which there was an excess of value over tax cost of $33,895,189 and aggregate gross unrealized depreciation for all securities in which there was an excess of tax cost over value of $1,184,034.
(a) All or a portion of these securities were on loan. In addition, "Other Assets and Liabilities, Net" may include pending sales that are also on loan. The value of securities loaned at December 31, 2013 amounted to $8,780,775, which is 3.9% of net assets.
(b) Affiliated fund managed by Deutsche Investment Management Americas Inc. The rate shown is the annualized seven-day yield at period end.
(c) Represents collateral held in connection with securities lending. Income earned by the Fund is net of borrower rebates.
ADR: American Depositary Receipt
REIT: Real Estate Investment Trust
Fair Value Measurements
Various inputs are used in determining the value of the Fund's investments. These inputs are summarized in three broad levels. Level 1 includes quoted prices in active markets for identical securities. Level 2 includes other significant observable inputs (including quoted prices for similar securities, interest rates, prepayment speeds and credit risk). Level 3 includes significant unobservable inputs (including the Fund's own assumptions in determining the fair value of investments). The level assigned to the securities valuations may not be an indication of the risk or liquidity associated with investing in those securities.
The following is a summary of the inputs used as of December 31, 2013 in valuing the Fund's investments. For information on the Fund's policy regarding the valuation of investments, please refer to the Security Valuation section of Note A in the accompanying Notes to Financial Statements.
| Assets | | Level 1 | | | Level 2 | | | Level 3 | | | Total | |
| | |
| Common Stocks (d) | | $ | 224,540,187 | | | $ | — | | | $ | — | | | $ | 224,540,187 | |
| Short-Term Investments (d) | | | 9,581,982 | | | | — | | | | — | | | | 9,581,982 | |
| Total | | $ | 234,122,169 | | | $ | — | | | $ | — | | | $ | 234,122,169 | |
There have been no transfers between fair value measurement levels during the year ended December 31, 2013.
(d) See Investment Portfolio for additional detailed categorizations.
The accompanying notes are an integral part of the financial statements.
Statement of Assets and Liabilities | as of December 31, 2013 | |
| Assets | |
Investments: Investments in non-affiliated securities, at value (cost $191,649,245) — including $8,780,775 of securities loaned | | $ | 224,540,187 | |
| Investment in Daily Assets Fund Institutional (cost $8,890,422)* | | | 8,890,422 | |
| Investment in Central Cash Management Fund (cost $691,560) | | | 691,560 | |
| Total investments in securities, at value (cost $201,231,227) | | | 234,122,169 | |
| Cash | | | 5,450 | |
| Receivable for Fund shares sold | | | 9,158 | |
| Dividends receivable | | | 202,033 | |
| Interest receivable | | | 404 | |
| Foreign taxes recoverable | | | 1,475 | |
| Other assets | | | 4,098 | |
| Total assets | | | 234,344,787 | |
| Liabilities | |
| Payable upon return of securities loaned | | | 8,890,422 | |
| Payable for Fund shares redeemed | | | 209,055 | |
| Accrued management fee | | | 72,964 | |
| Accrued Trustees' fees | | | 2,190 | |
| Other accrued expenses and payables | | | 97,622 | |
| Total liabilities | | | 9,272,253 | |
| Net assets, at value | | $ | 225,072,534 | |
| Net Assets Consist of | |
| Undistributed net investment income | | | 2,295,256 | |
Net unrealized appreciation (depreciation) on: Investments | | | 32,890,942 | |
| Accumulated net realized gain (loss) | | | (17,248,847 | ) |
| Paid-in capital | | | 207,135,183 | |
| Net assets, at value | | $ | 225,072,534 | |
Class A Net Asset Value, offering and redemption price per share ($223,205,422 ÷ 19,342,719 outstanding shares of beneficial interest, $.01 par value, unlimited number of shares authorized) | | $ | 11.54 | |
Class B Net Asset Value, offering and redemption price per share ($1,867,112 ÷ 161,956 outstanding shares of beneficial interest, $.01 par value, unlimited number of shares authorized) | | $ | 11.53 | |
* Represents collateral on securities loaned.
The accompanying notes are an integral part of the financial statements.
Statement of Operations
| for the year ended December 31, 2013 | |
| Investment Income | |
Income: Dividends (net of foreign taxes withheld of $26,574) | | $ | 3,505,926 | |
| Income distributions — Central Cash Management Fund | | | 1,241 | |
| Securities lending income, including income from Daily Assets Fund Institutional, net of borrower rebates | | | 84,103 | |
| Total income | | | 3,591,270 | |
Expenses: Management fee | | | 794,661 | |
| Administration fee | | | 203,759 | |
| Services to shareholders | | | 2,533 | |
| Distribution service fee (Class B) | | | 4,279 | |
| Custodian fee | | | 19,353 | |
| Professional fees | | | 65,470 | |
| Reports to shareholders | | | 44,946 | |
| Trustees' fees and expenses | | | 9,158 | |
| Other | | | 8,574 | |
| Total expenses | | | 1,152,733 | |
| Net investment income | | | 2,438,537 | |
| Realized and Unrealized Gain (Loss) | |
Net realized gain (loss) from: Investments | | | 47,984,658 | |
| Capital gain dividend received | | | 53,914 | |
| Futures | | | 278,200 | |
| Foreign currency | | | (188 | ) |
| | | | 48,316,584 | |
Change in net unrealized appreciation (depreciation) on: Investments | | | 13,472,074 | |
| Futures | | | 7,268 | |
| | | | 13,479,342 | |
| Net gain (loss) | | | 61,795,926 | |
| Net increase (decrease) in net assets resulting from operations | | $ | 64,234,463 | |
The accompanying notes are an integral part of the financial statements.
Statement of Changes in Net Assets | | | Years Ended December 31, | |
| Increase (Decrease) in Net Assets | | 2013 | | | 2012 | |
Operations: Net investment income | | $ | 2,438,537 | | | $ | 2,877,688 | |
| Net realized gain (loss) | | | 48,316,584 | | | | 14,826,400 | |
| Change in net unrealized appreciation (depreciation) | | | 13,479,342 | | | | (1,133,622 | ) |
| Net increase (decrease) in net assets resulting from operations | | | 64,234,463 | | | | 16,570,466 | |
Distributions to shareholders from: Net investment income: Class A | | | (2,931,105 | ) | | | (1,157,831 | ) |
| Class B | | | (20,449 | ) | | | (17,067 | ) |
| Total distributions | | | (2,951,554 | ) | | | (1,174,898 | ) |
Fund share transactions: Class A Proceeds from shares sold | | | 12,066,669 | | | | 5,653,743 | |
| Net assets acquired in tax-free reorganization* | | | — | | | | 103,303,156 | |
| Reinvestment of distributions | | | 2,931,105 | | | | 1,157,831 | |
| Payments for shares redeemed | | | (32,588,778 | ) | | | (30,735,177 | ) |
| Net increase (decrease) in net assets from Class A share transactions | | | (17,591,004 | ) | | | 79,379,553 | |
Class B Proceeds from shares sold | | | 61,298 | | | | 52,927 | |
| Net assets acquired in tax-free reorganization* | | | — | | | | 34,921 | |
| Reinvestment of distributions | | | 20,449 | | | | 17,067 | |
| Payments for shares redeemed | | | (347,419 | ) | | | (312,213 | ) |
| Net increase (decrease) in net assets from Class B share transactions | | | (265,672 | ) | | | (207,298 | ) |
| Increase (decrease) in net assets | | | 43,426,233 | | | | 94,567,823 | |
| Net assets at beginning of period | | | 181,646,301 | | | | 87,078,478 | |
| Net assets at end of period (including undistributed net investment income of $2,295,256 and $2,843,728, respectively) | | $ | 225,072,534 | | | $ | 181,646,301 | |
| Other Information | |
Class A Shares outstanding at beginning of period | | | 21,101,010 | | | | 11,456,872 | |
| Shares sold | | | 1,197,826 | | | | 703,069 | |
| Shares issued in tax-free reorganization* | | | — | | | | 12,597,547 | |
| Shares issued to shareholders in reinvestment of distributions | | | 308,213 | | | | 141,027 | |
| Shares redeemed | | | (3,264,330 | ) | | | (3,797,505 | ) |
| Net increase (decrease) in Class A shares | | | (1,758,291 | ) | | | 9,644,138 | |
| Shares outstanding at end of period | | | 19,342,719 | | | | 21,101,010 | |
Class B Shares outstanding at beginning of period | | | 188,843 | | | | 214,502 | |
| Shares sold | | | 5,908 | | | | 6,501 | |
| Shares issued in tax-free reorganization* | | | — | | | | 4,259 | |
| Shares issued to shareholders in reinvestment of distributions | | | 2,148 | | | | 2,076 | |
| Shares redeemed | | | (34,943 | ) | | | (38,495 | ) |
| Net increase (decrease) in Class B shares | | | (26,887 | ) | | | (25,659 | ) |
| Shares outstanding at end of period | | | 161,956 | | | | 188,843 | |
* On April 30, 2012, DWS Blue Chip VIP was acquired by the Fund through a tax-free reorganization (see Note G).
The accompanying notes are an integral part of the financial statements.
| | | Years Ended December 31, | |
| Class A | | | 2013 | | | 2012 | | | 2011 | | | 2010 | | | 2009 | |
| Selected Per Share Data | |
| Net asset value, beginning of period | | $ | 8.53 | | | $ | 7.46 | | | $ | 7.56 | | | $ | 6.71 | | | $ | 5.12 | |
Income (loss) from investment operations: Net investment incomea | | | .12 | | | | .15 | | | | .10 | | | | .09 | | | | .10 | |
| Net realized and unrealized gain (loss) | | | 3.03 | | | | 1.03 | | | | (.10 | ) | | | .87 | | | | 1.61 | |
| Total from investment operations | | | 3.15 | | | | 1.18 | | | | .00 | | | | .96 | | | | 1.71 | |
Less distributions from: Net investment income | | | (.14 | ) | | | (.11 | ) | | | (.10 | ) | | | (.11 | ) | | | (.12 | ) |
| Net asset value, end of period | | $ | 11.54 | | | $ | 8.53 | | | $ | 7.46 | | | $ | 7.56 | | | $ | 6.71 | |
| Total Return (%) | | | 37.33 | | | | 15.81 | | | | (.14 | ) | | | 14.40 | b | | | 34.15 | b |
| Ratios to Average Net Assets and Supplemental Data | |
| Net assets, end of period ($ millions) | | | 223 | | | | 180 | | | | 85 | | | | 98 | | | | 101 | |
| Ratio of expenses before expense reductions (%) | | | .56 | | | | .59 | | | | .63 | | | | .63 | | | | .63 | |
| Ratio of expenses after expense reductions (%) | | | .56 | | | | .59 | | | | .63 | | | | .60 | | | | .54 | |
| Ratio of net investment income (%) | | | 1.20 | | | | 1.90 | | | | 1.25 | | | | 1.32 | | | | 1.74 | |
| Portfolio turnover rate (%) | | | 238 | | | | 307 | | | | 215 | | | | 145 | | | | 82 | |
a Based on average shares outstanding during the period. b Total return would have been lower had certain expenses not been reduced. | |
| | | Years Ended December 31, | |
| Class B | | | 2013 | | | 2012 | | | 2011 | | | 2010 | | | 2009 | |
| Selected Per Share Data | |
| Net asset value, beginning of period | | $ | 8.51 | | | $ | 7.45 | | | $ | 7.55 | | | $ | 6.70 | | | $ | 5.12 | |
Income (loss) from investment operations: Net investment incomea | | | .10 | | | | .11 | | | | .08 | | | | .07 | | | | .08 | |
| Net realized and unrealized gain (loss) | | | 3.03 | | | | 1.03 | | | | (.10 | ) | | | .87 | | | | 1.60 | |
| Total from investment operations | | | 3.13 | | | | 1.14 | | | | (.02 | ) | | | .94 | | | | 1.68 | |
Less distributions from: Net investment income | | | (.11 | ) | | | (.08 | ) | | | (.08 | ) | | | (.09 | ) | | | (.10 | ) |
| Net asset value, end of period | | $ | 11.53 | | | $ | 8.51 | | | $ | 7.45 | | | $ | 7.55 | | | $ | 6.70 | |
| Total Return (%) | | | 37.10 | | | | 15.41 | | | | (.40 | ) | | | 14.12 | b | | | 33.64 | b |
| Ratios to Average Net Assets and Supplemental Data | |
| Net assets, end of period ($ millions) | | | 2 | | | | 2 | | | | 2 | | | | 2 | | | | 2 | |
| Ratio of expenses before expense reductions (%) | | | .76 | | | | .90 | | | | .88 | | | | .88 | | | | .89 | |
| Ratio of expenses after expense reductions (%) | | | .76 | | | | .90 | | | | .88 | | | | .85 | | | | .80 | |
| Ratio of net investment income (%) | | | 1.00 | | | | 1.41 | | | | .99 | | | | 1.07 | | | | 1.48 | |
| Portfolio turnover rate (%) | | | 238 | | | | 307 | | | | 215 | | | | 145 | | | | 82 | |
a Based on average shares outstanding during the period. b Total return would have been lower had certain expenses not been reduced. | |
Notes to Financial Statements
A. Organization and Significant Accounting Policies
DWS Variable Series I (the "Series") is registered under the Investment Company Act of 1940, as amended (the "1940 Act"), as an open-end, registered management investment company organized as a Massachusetts business trust. The Series consists of five diversified funds: DWS Bond VIP, DWS Core Equity VIP, DWS Capital Growth VIP, DWS Global Small Cap Growth VIP and DWS International VIP (individually or collectively hereinafter referred to as a "Fund" or the "Funds"). These financial statements report on DWS Core Equity VIP. The Series is intended to be the underlying investment vehicle for variable annuity contracts and variable life insurance policies to be offered by the separate accounts of certain life insurance companies ("Participating Insurance Companies").
Multiple Classes of Shares of Beneficial Interest. The Fund offers two classes of shares (Class A shares and Class B shares). Class B shares are subject to Rule 12b-1 distribution fees under the 1940 Act and recordkeeping fees equal to an annual rate of 0.25% and up to 0.15%, respectively, of the average daily net assets of the Class B shares of the Fund. Class A shares are not subject to such fees.
Investment income, realized and unrealized gains and losses, and certain fund-level expenses and expense reductions, if any, are borne pro rata on the basis of relative net assets by the holders of all classes of shares, except that each class bears certain expenses unique to that class (including the applicable 12b-1 distribution fees and recordkeeping fees). Differences in class-level expenses may result in payment of different per share dividends by class. All shares have equal rights with respect to voting subject to class-specific arrangements.
The Fund's financial statements are prepared in accordance with accounting principles generally accepted in the United States of America, which require the use of management estimates. Actual results could differ from those estimates. The policies described below are followed consistently by the Fund in the preparation of its financial statements.
Security Valuation. Investments are stated at value determined as of the close of regular trading on the New York Stock Exchange on each day the exchange is open for trading.
Various inputs are used in determining the value of the Fund's investments. These inputs are summarized in three broad levels. Level 1 includes quoted prices in active markets for identical securities. Level 2 includes other significant observable inputs (including quoted prices for similar securities, interest rates, prepayment speeds and credit risk). Level 3 includes significant unobservable inputs (including the Fund's own assumptions in determining the fair value of investments). The level assigned to the securities valuations may not be an indication of the risk or liquidity associated with investing in those securities.
Equity securities are valued at the most recent sale price or official closing price reported on the exchange (U.S. or foreign) or over-the-counter market on which they trade. Securities for which no sales are reported are valued at the calculated mean between the most recent bid and asked quotations on the relevant market or, if a mean cannot be determined, at the most recent bid quotation. Equity securities are generally categorized as Level 1.
Investments in open-end investment companies are valued at their net asset value each business day and are categorized as Level 1.
Futures contracts are generally valued at the settlement prices established each day on the exchange on which they are traded and are categorized as Level 1.
Securities and other assets for which market quotations are not readily available or for which the above valuation procedures are deemed not to reflect fair value are valued in a manner that is intended to reflect their fair value as determined in accordance with procedures approved by the Trustees and are generally categorized as Level 3. In accordance with the Fund's valuation procedures, factors used in determining value may include, but are not limited to, the type of the security; the size of the holding; the initial cost of the security; the existence of any contractual restrictions on the security's disposition; the price and extent of public trading in similar securities of the issuer or of comparable companies; quotations or evaluated prices from broker-dealers and/or pricing services; information obtained from the issuer, analysts, and/or the appropriate stock exchange (for exchange-traded securities); an analysis of the company's or issuer's financial statements; an evaluation of the forces that influence the issuer and the market(s) in which the security is purchased and sold; and with respect to debt securities, the maturity, coupon, creditworthiness, currency denomination and the movement of the market in which the security is normally traded. The value determined under these procedures may differ from published values for the same securities.
Disclosure about the classification of fair value measurements is included in a table following the Fund's Investment Portfolio.
Securities Lending. Brown Brothers Harriman & Co., as lending agent, lends securities of the Fund to certain financial institutions under the terms of the Security Lending Agreement. The Fund retains the benefits of owning the securities it has loaned and continues to receive interest and dividends generated by the securities and to participate in any changes in their market value. The Fund requires the borrowers of the securities to maintain collateral with the Fund consisting of either cash or liquid, unencumbered assets having a value at least equal to the value of the securities loaned. When the collateral falls below specified amounts, the lending agent will use its best effort to obtain additional collateral on the next business day to meet required amounts under the security lending agreement. The Fund may invest the cash collateral into a joint trading account in an affiliated money market fund pursuant to Exemptive Orders issued by the SEC. The Fund receives compensation for lending its securities either in the form of fees or by earning interest on invested cash collateral net of borrower rebates and fees paid to a lending agent. Either the Fund or the borrower may terminate the loan. There may be risks of delay and costs in recovery of securities or even loss of rights in the collateral should the borrower of the securities fail financially. If the Fund is not able to recover securities lent, the Fund may sell the collateral and purchase a replacement investment in the market, incurring the risk that the value of the replacement security is greater than the value of the collateral. The Fund is also subject to all investment risks associated with the reinvestment of any cash collateral received, including, but not limited to, interest rate, credit and liquidity risk associated with such investments.
As of December 31, 2013, the Fund had securities on loan. The value of the related collateral exceeded the value of the securities loaned at period end.
Foreign Currency Translations. The books and records of the Fund are maintained in U.S. dollars. Investment securities and other assets and liabilities denominated in a foreign currency are translated into U.S. dollars at the prevailing exchange rates at period end. Purchases and sales of investment securities, income and expenses are translated into U.S. dollars at the prevailing exchange rates on the respective dates of the transactions.
Net realized and unrealized gains and losses on foreign currency transactions represent net gains and losses between trade and settlement dates on securities transactions, the acquisition and disposition of foreign currencies, and the difference between the amount of net investment income accrued and the U.S. dollar amount actually received. That portion of both realized and unrealized gains and losses on investments that results from fluctuations in foreign currency exchange rates is not separately disclosed but is included with net realized and unrealized gain/appreciation and loss/depreciation on investments.
Federal Income Taxes. The Fund is treated as a separate taxpayer as provided for in the Internal Revenue Code, as amended. It is the Fund's policy to comply with the requirements of the Internal Revenue Code, as amended, which are applicable to regulated investment companies, and to distribute all of its taxable income to the separate accounts of the Participating Insurance Companies which hold its shares.
Under the Regulated Investment Company Modernization Act of 2010, net capital losses incurred post-enactment may be carried forward indefinitely, and their character is retained as short-term and/or long-term. Previously, net capital losses were carried forward for eight years and treated as short-term losses. As a transition rule, the Act requires that post-enactment net capital losses be used before pre-enactment net capital losses.
At December 31, 2013, the Fund had a net tax basis capital loss carryforward of approximately $17,069,000 of pre-enactment losses, which may be applied against any realized net taxable capital gains of each succeeding year until fully utilized or until December 31, 2017, the expiration date, whichever occurs first, and which may be subject to certain limitations under Sections 381–384 of the Internal Revenue Code.
The Fund has reviewed the tax positions for the open tax years as of December 31, 2013 and has determined that no provision for income tax is required in the Fund's financial statements. The Fund's federal tax returns for the prior three fiscal years remain open subject to examination by the Internal Revenue Service.
Distribution of Income and Gains. Distributions from net investment income of the Fund, if any, are declared and distributed to shareholders annually. Net realized gains from investment transactions, in excess of available capital loss carryforwards, would be taxable to the Fund if not distributed, and, therefore, will be distributed to shareholders at least annually. The Fund may also make additional distributions for tax purposes if necessary.
The timing and characterization of certain income and capital gain distributions are determined annually in accordance with federal tax regulations which may differ from accounting principles generally accepted in the United States of America. These differences primarily relate to futures contracts and certain securities sold at a loss. As a result, net investment income (loss) and net realized gain (loss) on investment transactions for a reporting period may differ significantly from distributions during such period. Accordingly, the Fund may periodically make reclassifications among certain of its capital accounts without impacting the net asset value of the Fund.
At December 31, 2013, the Fund's components of distributable earnings (accumulated losses) on a tax basis are as follows:
| Undistributed ordinary income* | | $ | 2,295,256 | |
| Capital loss carryforwards | | $ | (17,069,000 | ) |
| Net unrealized appreciation (depreciation) on investments | | $ | 32,711,155 | |
In addition, the tax character of distributions paid to shareholders by the Fund is summarized as follows:
| | | Years Ended December 31, | |
| | | 2013 | | | 2012 | |
| Distributions from ordinary income* | | $ | 2,951,554 | | | $ | 1,174,898 | |
* For tax purposes, short-term capital gain distributions are considered ordinary income distributions.
Expenses. Expenses of the Series arising in connection with a specific Fund are allocated to that Fund. Other Series expenses which cannot be directly attributed to a Fund are apportioned among the Funds in the Series based upon the relative net assets or other appropriate measures.
Contingencies. In the normal course of business, the Fund may enter into contracts with service providers that contain general indemnification clauses. The Fund's maximum exposure under these arrangements is unknown as this would involve future claims that may be made against the Fund that have not yet been made. However, based on experience, the Fund expects the risk of loss to be remote.
Other. Investment transactions are accounted for on a trade date plus one basis for daily net asset value calculations. However, for financial reporting purposes, investment transactions are reported on trade date. Interest income is recorded on the accrual basis. Dividend income is recorded on the ex-dividend date net of foreign withholding taxes. Realized gains and losses from investment transactions are recorded on an identified cost basis. Proceeds from litigation payments, if any, are included in net realized gain (loss) from investments.
B. Derivative Instruments
Futures Contracts. A futures contract is an agreement between a buyer or seller and an established futures exchange or its clearinghouse in which the buyer or seller agrees to take or make a delivery of a specific amount of a financial instrument at a specified price on a specific date (settlement date). For the year ended December 31, 2013, the Fund entered into futures contracts in circumstances where portfolio management believed they offered an economic means of gaining exposure to a particular asset class or to keep cash on hand to meet shareholder redemptions or other needs while maintaining exposure to the market.
Upon entering into a futures contract, the Fund is required to deposit with a financial intermediary cash or securities ("initial margin") in an amount equal to a certain percentage of the face value indicated in the futures contract. Subsequent payments ("variation margin") are made or received by the Fund dependent upon the daily fluctuations in the value and are recorded for financial reporting purposes as unrealized gains or losses by the Fund. Gains or losses are realized when the contract expires or is closed. Since all futures contracts are exchange traded, counterparty risk is minimized as the exchange's clearinghouse acts as the counterparty, and guarantees the futures against default.
Certain risks may arise upon entering into futures contracts, including the risk that an illiquid market will limit the Fund's ability to close out a futures contract prior to the settlement date and the risk that the futures contract is not well correlated with the security, index or currency to which it relates. Risk of loss may exceed amounts disclosed in the Statement of Assets and Liabilities.
There are no open futures contracts as of December 31, 2013. For the year ended December 31, 2013, the investment in futures contracts purchased had a total notional value generally indicative of a range from $0 to approximately $2,479,000.
The amount of unrealized and realized gains and losses on derivative instruments recognized in Fund earnings during the year ended December 31, 2013 and the related location in the accompanying Statement of Operations is summarized in the following tables by primary underlying risk exposure:
| Realized Gain (Loss) | | Futures Contracts | |
| Equity Contracts (a) | | $ | 278,200 | |
The above derivative is located in the following Statement of Operations account: (a) Net realized gain (loss) from futures | |
| Change in Net Unrealized Appreciation (Depreciation) | | Futures Contracts | |
| Equity Contracts (a) | | $ | 7,268 | |
The above derivative is located in the following Statement of Operations account: (a) Change in net unrealized appreciation (depreciation) on futures | |
C. Purchases and Sales of Securities
During the year ended December 31, 2013, purchases and sales of investment securities (excluding short-term investments) aggregated $479,078,686 and $496,269,161, respectively.
D. Related Parties
Management Agreement. Under the Investment Management Agreement with Deutsche Investment Management Americas Inc. ("DIMA" or the "Advisor"), an indirect, wholly owned subsidiary of Deutsche Bank AG, the Advisor directs the investments of the Fund in accordance with its investment objectives, policies and restrictions. The Advisor determines the securities, instruments and other contracts relating to investments to be purchased, sold or entered into by the Fund or delegates such responsibility to the Fund's subadvisor.
Prior to July 12, 2013, QS Investors, LLC ("QS Investors") acted as subadvisor to the Fund. As a subadvisor, QS Investors made investment decisions and buys and sells securities for the Fund. QS Investors was paid by the Advisor for the services QS Investors provided to the Fund. Effective July 12, 2013, QS Investors no longer acts as subadvisor to the Fund and day-to-day portfolio management of the Fund transitioned to DIMA.
Pursuant to the Investment Management Agreement with the Advisor, the Fund pays a monthly management fee based on the Fund's average daily net assets, computed and accrued daily and payable monthly, at the following annual rates:
| First $250 million of average daily net assets | | | .390 | % |
| Next $750 million of average daily net assets | | | .365 | % |
| Over $1 billion of average daily net assets | | | .340 | % |
Effective October 1, 2013 through September 30, 2014, the Advisor has contractually agreed to waive its fee and/or reimburse certain operating expenses of the Fund to the extent necessary to maintain the operating expenses (excluding certain expenses such as extraordinary expenses, taxes, brokerage and interest expense) of each class as follows:
Accordingly, for the year ended December 31, 2013, the fee pursuant to the Investment Management Agreement was equivalent to an annual effective rate of 0.39% of the Fund's average daily net assets.
Administration Fee. Pursuant to an Administrative Services Agreement, DIMA provides most administrative services to the Fund. For all services provided under the Administrative Services Agreement, the Fund pays the Advisor an annual fee ("Administration Fee") of 0.10% of the Fund's average daily net assets, computed and accrued daily and payable monthly. For the year ended December 31, 2013, the Administration Fee was $203,759, of which $18,709 is unpaid.
Service Provider Fees. DWS Investments Service Company ("DISC"), an affiliate of the Advisor, is the transfer agent, dividend-paying agent and shareholder service agent for the Fund. Pursuant to a sub-transfer agency agreement between DISC and DST Systems, Inc. ("DST"), DISC has delegated certain transfer agent, dividend-paying agent and shareholder service agent functions to DST. DISC compensates DST out of the shareholder servicing fee it receives from the Fund. For the year ended December 31, 2013, the amounts charged to the Fund by DISC were as follows:
| Services to Shareholders | | Total Aggregated | | | Unpaid at December 31, 2013 | |
| Class A | | $ | 538 | | | $ | 90 | |
| Class B | | | 81 | | | | 14 | |
| | | $ | 619 | | | $ | 104 | |
Distribution Service Agreement. DWS Investments Distributors, Inc. ("DIDI"), also an affiliate of the Advisor, is the Series' Distributor. In accordance with the Master Distribution Plan, DIDI receives 12b-1 fees of 0.25% of average daily net assets of Class B shares. Pursuant to the Master Distribution Plan, DIDI remits these fees to the Participating Insurance Companies for various costs incurred or paid by these companies in connection with marketing and distribution of Class B shares. For the year ended December 31, 2013, the Distribution Service Fee aggregated $4,279, of which $386 is unpaid.
Typesetting and Filing Service Fees. Under an agreement with DIMA, DIMA is compensated for providing typesetting and certain regulatory filing services to the Fund. For the year ended December 31, 2013, the amount charged to the Fund by DIMA included in the Statement of Operations under "reports to shareholders" aggregated $21,869, of which $4,586 is unpaid.
Trustees' Fees and Expenses. The Fund paid retainer fees to each Trustee not affiliated with the Advisor, plus specified amounts to the Board Chairperson and Vice Chairperson and to each committee Chairperson.
Affiliated Cash Management Vehicles. The Fund may invest uninvested cash balances in Central Cash Management Fund and DWS Variable NAV Money Fund, affiliated money market funds which are managed by the Advisor. Each affiliated money market fund seeks to provide a high level of current income consistent with liquidity and the preservation of capital. Each affiliated money market fund is managed in accordance with Rule 2a-7 under the Investment Company Act of 1940, which governs the quality, maturity, diversity and liquidity of instruments in which a money market fund may invest. Central Cash Management Fund seeks to maintain a stable net asset value, and DWS Variable NAV Money Fund maintains a floating net asset value. The Fund indirectly bears its proportionate share of the expenses of each affiliated money market fund in which it invests. Central Cash Management Fund does not pay the Advisor an investment management fee. To the extent that DWS Variable NAV Money Fund pays an investment management fee to the Advisor, the Advisor will waive an amount of the investment management fee payable to the Advisor by the Fund equal to the amount of the investment management fee payable on the Fund's assets invested in DWS Variable NAV Money Fund.
E. Ownership of the Fund
At December 31, 2013, two participating insurance companies were owners of record of 10% or more of the total outstanding Class A shares of the Fund, each owning 43% and 33%, respectively. Two participating insurance companies were owners of record of 10% or more of the total outstanding Class B shares of the Fund, each owning 83% and 15%, respectively.
F. Line of Credit
The Fund and other affiliated funds (the "Participants") share in a $375 million revolving credit facility provided by a syndication of banks. The Fund may borrow for temporary or emergency purposes, including the meeting of redemption requests that otherwise might require the untimely disposition of securities. The Participants are charged an annual commitment fee which is allocated based on net assets, among each of the Participants. Interest is calculated at a rate per annum equal to the sum of the Federal Funds Rate plus 1.25 percent plus if LIBOR exceeds the Federal Funds Rate the amount of such excess. The Fund may borrow up to a maximum of 33 percent of its net assets under the agreement. The Fund had no outstanding loans at December 31, 2013.
G. Acquisition of Assets
On April 30, 2012, the Fund acquired all of the net assets of DWS Blue Chip VIP pursuant to a plan of reorganization approved by the Board of Trustees on November 18, 2011. The acquisition was accomplished by a tax-free exchange of 8,967,004 Class A shares and 3,018 Class B shares of DWS Blue Chip VIP for 12,597,547 Class A shares and 4,259 Class B shares of the Fund, respectively, outstanding on April 30, 2012. DWS Blue Chip VIP's net assets at that date, $103,338,077, including $13,470,096 of net unrealized appreciation, were combined with those of the Fund. The aggregate net assets of the Fund immediately before the acquisition were $92,542,116. The combined net assets of the Fund immediately following the acquisition were $195,880,193.
Report of Independent Registered Public Accounting Firm
To the Trustees of DWS Variable Series I and the Shareholders of DWS Core Equity VIP:
In our opinion, the accompanying statement of assets and liabilities, including the investment portfolio, and the related statements of operations and of changes in net assets and the financial highlights present fairly, in all material respects, the financial position of DWS Core Equity VIP (formerly DWS Growth & Income VIP) (the "Fund") at December 31, 2013 and the results of its operations, the changes in its net assets, and the financial highlights for the periods indicated therein, in conformity with accounting principles generally accepted in the United States of America. These financial statements and financial highlights (hereafter referred to as "financial statements") are the responsibility of the Fund's management. Our responsibility is to express an opinion on these financial statements based on our audits. We conducted our audits of these financial statements in accordance with the standards of the Public Company Accounting Oversight Board (United States). Those standards require that we plan and perform the audit to obtain reasonable assurance about whether the financial statements are free of material misstatement. An audit includes examining, on a test basis, evidence supporting the amounts and disclosures in the financial statements, assessing the accounting principles used and significant estimates made by management, and evaluating the overall financial statement presentation. We believe that our audits, which included confirmation of securities at December 31, 2013 by correspondence with the custodians and brokers, provide a reasonable basis for our opinion.
Boston, Massachusetts February 14, 2014 | PricewaterhouseCoopers LLP |
Information About Your Fund's Expenses (Unaudited)
As an investor of the Fund, you incur two types of costs: ongoing expenses and transaction costs. Ongoing expenses include management fees, distribution and service (12b-1) fees and other Fund expenses. Examples of transaction costs include contract charges, redemption fees and account maintenance fees, which are not shown in this section. The following tables are intended to help you understand your ongoing expenses (in dollars) of investing in the Fund and to help you compare these expenses with the ongoing expenses of investing in other mutual funds. The example in the table is based on an investment of $1,000 invested at the beginning of the six-month period and held for the entire period (July 1, 2013 to December 31, 2013).
The tables illustrate your Fund's expenses in two ways:
—Actual Fund Return. This helps you estimate the actual dollar amount of ongoing expenses (but not transaction costs) paid on a $1,000 investment in the Fund using the Fund's actual return during the period. To estimate the expenses you paid over the period, simply divide your account value by $1,000 (for example, an $8,600 account value divided by $1,000 = 8.6), then multiply the result by the number in the "Expenses Paid per $1,000" line under the share class you hold.
— Hypothetical 5% Fund Return. This helps you to compare your Fund's ongoing expenses (but not transaction costs) with those of other mutual funds using the Fund's actual expense ratio and a hypothetical rate of return of 5% per year before expenses. Examples using a 5% hypothetical Fund return may be found in the shareholder reports of other mutual funds. The hypothetical account values and expenses may not be used to estimate the actual ending account balance or expenses you paid for the period.
Please note that the expenses shown in these tables are meant to highlight your ongoing expenses only and do not reflect any transaction costs. The "Expenses Paid per $1,000" line of the tables is useful in comparing ongoing expenses only and will not help you determine the relative total expense of owning different funds. If these transaction costs had been included, your costs would have been higher.
Expenses and Value of a $1,000 Investment for the six months ended December 31, 2013 | |
| Actual Fund Return | | Class A | | | Class B | |
| Beginning Account Value 7/1/13 | | $ | 1,000.00 | | | $ | 1,000.00 | |
| Ending Account Value 12/31/13 | | $ | 1,199.60 | | | $ | 1,198.50 | |
| Expenses Paid per $1,000* | | $ | 3.10 | | | $ | 4.21 | |
| Hypothetical 5% Portfolio Return | | Class A | | | Class B | |
| Beginning Account Value 7/1/13 | | $ | 1,000.00 | | | $ | 1,000.00 | |
| Ending Account Value 12/31/13 | | $ | 1,022.38 | | | $ | 1,021.37 | |
| Expenses Paid per $1,000* | | $ | 2.85 | | | $ | 3.87 | |
* Expenses are equal to the Fund's annualized expense ratio for each share class, multiplied by the average account value over the period, multiplied by 184 (the number of days in the most recent six-month period), then divided by 365.
| Annualized Expense Ratios | Class A | | Class B | |
| DWS Variable Series I — DWS Core Equity VIP | .56% | | .76% | |
For more information, please refer to the Fund's prospectus.
These tables do not reflect charges and fees ("contract charges") associated with the separate account that invests in the Fund or any variable life insurance policy or variable annuity contract for which the Fund is an investment option.
For an analysis of the fees associated with an investment in the fund or similar funds, please refer to the current and hypothetical expense calculators for Variable Insurance Products which can be found at dws-investments.com/EN/resources/calculators.jsp.
Tax Information (Unaudited)
For corporate shareholders, 80% of the ordinary dividends (i.e., income dividends plus short-term capital gains) paid during the Fund's fiscal year ended December 31, 2013 qualified for the dividends received deduction.
Please consult a tax advisor if you have questions about federal or state income tax laws, or on how to prepare your tax returns. If you have specific questions about your account, please contact your insurance provider.
The Series' policies and procedures for voting proxies for portfolio securities and information about how the Series voted proxies related to its portfolio securities during the 12-month period ended June 30 are available on our Web site — dws-investments.com (click on "proxy voting"at the bottom of the page) — or on the SEC's Web site — sec.gov. To obtain a written copy of the Series' policies and procedures without charge, upon request, call us toll free at (800) 728-3337.
Advisory Agreement Board Considerations and Fee Evaluation
The Board of Trustees approved the renewal of DWS Core Equity VIP's investment management agreement (the "Agreement") with Deutsche Investment Management Americas Inc. ("DIMA") in September 2013.
In terms of the process that the Board followed prior to approving the Agreement, shareholders should know that:
— In September 2013, all of the Fund's Trustees were independent of DIMA and its affiliates.
— The Trustees met frequently during the past year to discuss fund matters and dedicated a substantial amount of time to contract review matters. Over the course of several months, the Board's Contract Committee, in coordination with the Board's Fixed Income and Asset Allocation Oversight Committee, reviewed comprehensive materials received from DIMA, independent third parties and independent counsel. These materials included an analysis of the Fund's performance, fees and expenses, and profitability compiled by a fee consultant retained by the Fund's Independent Trustees (the "Fee Consultant"). The Board also received extensive information throughout the year regarding performance of the Fund.
— The Independent Trustees regularly meet privately with their independent counsel to discuss contract review and other matters. In addition, the Independent Trustees were also advised by the Fee Consultant in the course of their review of the Fund's contractual arrangements and considered a comprehensive report prepared by the Fee Consultant in connection with their deliberations.
— In connection with reviewing the Agreement, the Board also reviewed the terms of the Fund's Rule 12b-1 plan, distribution agreement, administrative services agreement, transfer agency agreement and other material service agreements.
— Based on its evaluation of the information provided, the Contract Committee presented its findings and recommendations to the Board. The Board then reviewed the Contract Committee's findings and recommendations.
In connection with the contract review process, the Contract Committee and the Board considered the factors discussed below, among others. The Board also considered that DIMA and its predecessors have managed the Fund since its inception, and the Board believes that a long-term relationship with a capable, conscientious advisor is in the best interests of the Fund. The Board considered, generally, that shareholders chose to invest or remain invested in the Fund knowing that DIMA managed the Fund, and that the Agreement was approved by the Fund's shareholders. DIMA is part of Deutsche Bank AG, a major global banking institution that is engaged in a wide range of financial services. The Board believes that there are advantages to being part of a global asset management business that offers a wide range of investing expertise and resources, including hundreds of portfolio managers and analysts with research capabilities in many countries throughout the world.
As part of the contract review process, the Board carefully considered the fees and expenses of each DWS fund overseen by the Board in light of the fund's performance. In many cases, this led to a negotiation with DIMA of lower expense caps as part of the 2012 and 2013 contract review processes than had previously been in place. As part of these negotiations, the Board indicated that it would consider relaxing these new lower caps in future years following sustained improvements in performance, among other considerations.
In June 2012, Deutsche Bank AG ("DB"), DIMA's parent company, announced that DB would combine its Asset Management (of which DIMA was a part) and Wealth Management divisions. DB has advised the Independent Trustees that the U.S. asset management business is a critical and integral part of DB, and that it has, and will continue to, reinvest a significant portion of the substantial savings it expects to realize by combining its Asset Management and Wealth Management divisions into the new Asset and Wealth Management ("AWM") division, including ongoing enhancements to its investment capabilities. DB also has confirmed its commitment to maintaining strong legal and compliance groups within the AWM division.
While shareholders may focus primarily on fund performance and fees, the Fund's Board considers these and many other factors, including the quality and integrity of DIMA's personnel and such other issues as back-office operations, fund valuations, and compliance policies and procedures.
Nature, Quality and Extent of Services. The Board considered the terms of the Agreement, including the scope of advisory services provided under the Agreement. The Board noted that, under the Agreement, DIMA provides portfolio management services to the Fund and that, pursuant to a separate administrative services agreement, DIMA provides administrative services to the Fund. The Board considered the experience and skills of senior management and investment personnel, the resources made available to such personnel, the ability of DIMA to attract and retain high-quality personnel, and the organizational depth and stability of DIMA. The Board reviewed the Fund's performance over short-term and long-term periods and compared those returns to various agreed-upon performance measures, including market indices and a peer universe compiled by the Fee Consultant using information supplied by Morningstar Direct ("Morningstar"), an independent fund data service. The Board also noted that it has put into place a process of identifying "Focus Funds" (e.g., funds performing poorly relative to their benchmark or a peer universe compiled by an independent fund data service), and receives more frequent reporting and information from DIMA regarding such funds, along with DIMA's remedial plans to address underperformance. The Board believes this process is an effective manner of identifying and addressing underperforming funds. Based on the information provided, the Board noted that for the one-, three- and five-year periods ended December 31, 2012, the Fund's performance (Class A shares) was in the 2nd quartile, 2nd quartile and 1st quartile, respectively, of the applicable Morningstar universe (the 1st quartile being the best performers and the 4th quartile being the worst performers). The Board also observed that the Fund has underperformed its benchmark in each of the one-, three- and five-year periods ended December 31, 2012.
Fees and Expenses. The Board considered the Fund's investment management fee schedule, operating expenses and total expense ratios, and comparative information provided by Lipper Inc. ("Lipper") and the Fee Consultant regarding investment management fee rates paid to other investment advisors by similar funds (1st quartile being the most favorable and 4th quartile being the least favorable). With respect to management fees paid to other investment advisors by similar funds, the Board noted that the contractual fee rates paid by the Fund, which include a 0.10% fee paid to DIMA under the Fund's administrative services agreement, were lower than the median (1st quartile) of the applicable Lipper peer group (based on Lipper data provided as of December 31, 2012). The Board noted that the Fund's Class A shares total (net) operating expenses were expected to be lower than the median (1st quartile) of the applicable Lipper expense universe (based on Lipper data provided as of December 31, 2012) ("Lipper Universe Expenses"). The Board also reviewed data comparing each share class's total (net) operating expenses to the applicable Lipper Universe Expenses. The Board considered the Fund's management fee rate as compared to fees charged by DIMA to comparable funds and considered differences between the Fund and the comparable funds. The Board also considered how the Fund's total (net) operating expenses compared to the total (net) operating expenses of a more customized peer group selected by Lipper (based on such factors as asset size).
The information considered by the Board as part of its review of management fees included information regarding fees charged by DIMA and its affiliates to similar institutional accounts and to similar funds offered primarily to European investors ("DWS Europe funds"), in each case as applicable. The Board observed that advisory fee rates for institutional accounts generally were lower than the management fees charged by similarly managed DWS U.S. mutual funds ("DWS Funds"), but also took note of the differences in services provided to DWS Funds as compared to institutional accounts. In the case of DWS Europe funds, the Board observed that fee rates for DWS Europe funds generally were higher than for similarly managed DWS Funds, but noted that differences in the types of services provided to DWS Funds relative to DWS Europe funds made it difficult to compare such fees.
On the basis of the information provided, the Board concluded that management fees were reasonable and appropriate in light of the nature, quality and extent of services provided by DIMA.
Profitability. The Board reviewed detailed information regarding revenues received by DIMA under the Agreement. The Board considered the estimated costs and pre-tax profits realized by DIMA from advising the DWS Funds, as well as estimates of the pre-tax profits attributable to managing the Fund in particular. The Board also received information regarding the estimated enterprise-wide profitability of DWS and its affiliates with respect to all fund services in totality and by fund. The Board and the Fee Consultant reviewed DIMA's methodology in allocating its costs to the management of the Fund. Based on the information provided, the Board concluded that the pre-tax profits realized by DIMA in connection with the management of the Fund were not unreasonable. The Board also reviewed information regarding the profitability of certain similar investment management firms. The Board noted that while information regarding the profitability of such firms is limited (and in some cases is not necessarily prepared on a comparable basis), DIMA and its affiliates' overall profitability with respect to the DWS fund complex (after taking into account distribution and other services provided to the funds by DIMA and its affiliates) was lower than the overall profitability levels of many comparable firms for which such data was available.
Economies of Scale. The Board considered whether there are economies of scale with respect to the management of the Fund and whether the Fund benefits from any economies of scale. The Board noted that the Fund's management fee schedule includes fee breakpoints. The Board concluded that the Fund's fee schedule represents an appropriate sharing between the Fund and DIMA of such economies of scale as may exist in the management of the Fund at current asset levels.
Other Benefits to DIMA and Its Affiliates. The Board also considered the character and amount of other incidental benefits received by DIMA and its affiliates, including any fees received by DIMA for administrative services provided to the Fund and any fees received by an affiliate of DIMA for distribution services. The Board also considered benefits to DIMA related to brokerage and soft-dollar allocations, including allocating brokerage to pay for research generated by parties other than the executing broker dealers, which pertain primarily to funds investing in equity securities, along with the incidental public relations benefits to DIMA related to DWS Funds advertising and cross-selling opportunities among DIMA products and services. The Board concluded that management fees were reasonable in light of these fallout benefits.
Compliance. The Board considered the significant attention and resources dedicated by DIMA to documenting and enhancing its compliance processes in recent years. The Board noted in particular (i) the experience and seniority of both DIMA's chief compliance officer and the Fund's chief compliance officer; (ii) the large number of DIMA compliance personnel; and (iii) the substantial commitment of resources by DIMA and its affiliates to compliance matters.
Based on all of the information considered and the conclusions reached, the Board unanimously determined that the continuation of the Agreement is in the best interests of the Fund. In making this determination, the Board did not give particular weight to any single factor identified above. The Board considered these factors over the course of numerous meetings, certain of which were in executive session with only the Independent Trustees and their independent counsel present. It is possible that individual Trustees may have weighed these factors differently in reaching their individual decisions to approve the continuation of the Agreement.
Board Members and Officers
The following table presents certain information regarding the Board Members and Officers of the fund. Each Board Member's year of birth is set forth in parentheses after his or her name. Unless otherwise noted, (i) each Board Member has engaged in the principal occupation(s) noted in the table for at least the most recent five years, although not necessarily in the same capacity; and (ii) the address of each Independent Board Member is c/o Kenneth C. Froewiss, Chairman, DWS Mutual Funds, P.O. Box 78, Short Hills, NJ 07078. Except as otherwise noted below, the term of office for each Board Member is until the election and qualification of a successor, or until such Board Member sooner dies, resigns, is removed or as otherwise provided in the governing documents of the fund. Because the fund does not hold an annual meeting of shareholders, each Board Member will hold office for an indeterminate period. The Board Members may also serve in similar capacities with other funds in the fund complex.
| Independent Board Members |
Name, Year of Birth, Position with the Fund and Length of Time Served1 | | Business Experience and Directorships During the Past Five Years | Number of Funds in DWS Fund Complex Overseen | Other Directorships Held by Board Member |
Kenneth C. Froewiss (1945) Chairperson since 2013, and Board Member since 2001 | | Adjunct Professor of Finance, NYU Stern School of Business (September 2009–present; Clinical Professor from 1997–September 2009); Member, Finance Committee, Association for Asian Studies (2002–present); Director, Mitsui Sumitomo Insurance Group (US) (2004–present); prior thereto, Managing Director, J.P. Morgan (investment banking firm) (until 1996) | 103 | — |
William McClayton (1944) Vice Chairperson since 2013, and Board Member since 2004 | | Private equity investor (since October 2009); previously, Managing Director, Diamond Management & Technology Consultants, Inc. (global consulting firm) (2001–2009); Directorship: Board of Managers, YMCA of Metropolitan Chicago; formerly: Senior Partner, Arthur Andersen LLP (accounting) (1966–2001); Trustee, Ravinia Festival | 103 | — |
John W. Ballantine (1946) Board Member since 1999 | | Retired; formerly, Executive Vice President and Chief Risk Management Officer, First Chicago NBD Corporation/The First National Bank of Chicago (1996–1998); Executive Vice President and Head of International Banking (1995–1996); former Directorships: Stockwell Capital Investments PLC (private equity); First Oak Brook Bancshares, Inc. and Oak Brook Bank; Prisma Energy International | 103 | Chairman of the Board, Healthways, Inc.2 (provider of disease and care management services) (2003– present); Portland General Electric2 (utility company) (2003– present) |
Henry P. Becton, Jr. (1943) Board Member since 1990 | | Vice Chair and former President, WGBH Educational Foundation. Directorships: Public Radio International; Public Radio Exchange (PRX); North Bennett Street School (Boston); former Directorships: The PBS Foundation; Association of Public Television Stations; Boston Museum of Science; American Public Television; Concord Academy; New England Aquarium; Mass. Corporation for Educational Telecommunications; Committee for Economic Development; Public Broadcasting Service; Connecticut College | 103 | Lead Director, Becton Dickinson and Company2 (medical technology company); Lead Director, Belo Corporation2 (media company) |
Dawn-Marie Driscoll (1946) Board Member since 1987 | | President, Driscoll Associates (consulting firm); Emeritus Executive Fellow, Center for Business Ethics, Bentley University; formerly, Partner, Palmer & Dodge (1988–1990); Vice President of Corporate Affairs and General Counsel, Filene's (1978–1988). Directorships: Director of ICI Mutual Insurance Company (since 2007); Advisory Board, Center for Business Ethics, Bentley University; Chairman of the Board of Trustees, Southwest Florida Community Foundation (charitable organization); former Directorships: Sun Capital Advisers Trust (mutual funds) (2007–2012), Investment Company Institute (audit, executive, nominating committees) and Independent Directors Council (governance, executive committees) | 103 | — |
Keith R. Fox, CFA (1954) Board Member since 1996 | | Managing General Partner, Exeter Capital Partners (a series of private investment funds) (since 1986). Directorships: Progressive International Corporation (kitchen goods importer and distributor); The Kennel Shop (retailer); former Chairman, National Association of Small Business Investment Companies; former Directorships: BoxTop Media Inc. (advertising); Sun Capital Advisers Trust (mutual funds) (2011–2012) | 103 | — |
Paul K. Freeman (1950) Board Member since 1993 | | Consultant, World Bank/Inter-American Development Bank; Executive and Governing Council of the Independent Directors Council (Chairman of Education Committee); formerly: Project Leader, International Institute for Applied Systems Analysis (1998–2001); Chief Executive Officer, The Eric Group, Inc. (environmental insurance) (1986–1998); Directorships: Denver Zoo Foundation (December 2012–present); former Directorships: Prisma Energy International | 103 | — |
Richard J. Herring (1946) Board Member since 1990 | | Jacob Safra Professor of International Banking and Professor, Finance Department, The Wharton School, University of Pennsylvania (since July 1972); Co-Director, Wharton Financial Institutions Center (since July 2000); Co-Chair, U.S. Shadow Financial Regulatory Committee; Executive Director, Financial Economists Roundtable; formerly: Vice Dean and Director, Wharton Undergraduate Division (July 1995–June 2000); Director, Lauder Institute of International Management Studies (July 2000–June 2006) | 103 | Director, Japan Equity Fund, Inc. (since September 2007), Thai Capital Fund, Inc. (since 2007), Singapore Fund, Inc. (since September 2007), Independent Director of Barclays Bank Delaware (since September 2010) |
Rebecca W. Rimel (1951) Board Member since 1995 | | President and Chief Executive Officer, The Pew Charitable Trusts (charitable organization) (1994 to present); formerly: Executive Vice President, The Glenmede Trust Company (investment trust and wealth management) (1983–2004); Board Member, Investor Education (charitable organization) (2004–2005); Trustee, Executive Committee, Philadelphia Chamber of Commerce (2001–2007); Director, Viasys Health Care2 (January 2007–June 2007); Trustee, Thomas Jefferson Foundation (charitable organization) (1994–2012) | 103 | Director, Becton Dickinson and Company2 (medical technology company) (2012– present); Director, CardioNet, Inc.2 (health care) (2009– present) |
William N. Searcy, Jr. (1946) Board Member since 1993 | | Private investor since October 2003; formerly: Pension & Savings Trust Officer, Sprint Corporation2 (telecommunications) (November 1989–September 2003); Trustee, Sun Capital Advisers Trust (mutual funds) (1998–2012) | 103 | — |
Jean Gleason Stromberg (1943) Board Member since 1997 | | Retired. Formerly, Consultant (1997–2001); Director, Financial Markets U.S. Government Accountability Office (1996–1997); Partner, Fulbright & Jaworski, L.L.P. (law firm) (1978–1996). Directorships: The William and Flora Hewlett Foundation; former Directorships: Service Source, Inc., Mutual Fund Directors Forum (2002–2004), American Bar Retirement Association (funding vehicle for retirement plans) (1987–1990 and 1994–1996) | 103 | — |
Robert H. Wadsworth (1940) Board Member since 1999 | | President, Robert H. Wadsworth & Associates, Inc. (consulting firm) (1983 to present); Director, National Horizon, Inc. (non-profit organization); Director and Treasurer, The Phoenix Boys Choir Association | 106 | — |
Officers4 |
Name, Year of Birth, Position with the Fund and Length of Time Served5 | | Business Experience and Directorships During the Past Five Years |
Brian E. Binder8,9 (1972) President and Chief Executive Officer, 2013–present | | Managing Director3 and Head of Fund Administration, Deutsche Asset & Wealth Management (2013–present); formerly: Head of Business Management and Consulting at Invesco, Ltd. (2010–2012); Chief Administrative Officer, Van Kampen Funds Inc. (2008–2010); and Chief Administrative Officer, Morgan Stanley Investment Management Americas Distribution (2003–2008) |
John Millette7 (1962) Vice President and Secretary, 1999–present | | Director,3 Deutsche Asset & Wealth Management |
Paul H. Schubert6 (1963) Chief Financial Officer, 2004–present Treasurer, 2005–present | | Managing Director,3 Deutsche Asset & Wealth Management (since July 2004); formerly: Executive Director, Head of Mutual Fund Services and Treasurer for UBS Family of Funds (1998–2004); Vice President and Director of Mutual Fund Finance at UBS Global Asset Management (1994–1998) |
Caroline Pearson7 (1962) Chief Legal Officer, 2010–present | | Managing Director,3 Deutsche Asset & Wealth Management; formerly: Assistant Secretary for DWS family of funds (1997–2010) |
Melinda Morrow6 (1970) Vice President, 2012–present | | Director,3 Deutsche Asset & Wealth Management |
Hepsen Uzcan7 (1974) Assistant Secretary, 2013–present | | Vice President, Deutsche Asset & Wealth Management |
Paul Antosca7 (1957) Assistant Treasurer, 2007–present | | Director,3 Deutsche Asset & Wealth Management |
Jack Clark7 (1967) Assistant Treasurer, 2007–present | | Director,3 Deutsche Asset & Wealth Management |
Diane Kenneally7 (1966) Assistant Treasurer, 2007–present | | Director,3 Deutsche Asset & Wealth Management |
John Caruso6 (1965) Anti-Money Laundering Compliance Officer, 2010–present | | Managing Director,3 Deutsche Asset & Wealth Management |
Robert Kloby6 (1962) Chief Compliance Officer, 2006–present | | Managing Director,3 Deutsche Asset & Wealth Management |
1 The length of time served represents the year in which the Board Member joined the board of one or more DWS funds currently overseen by the Board.
2 A publicly held company with securities registered pursuant to Section 12 of the Securities Exchange Act of 1934.
3 Executive title, not a board directorship.
4 As a result of their respective positions held with the Advisor, these individuals are considered "interested persons" of the Advisor within the meaning of the 1940 Act. Interested persons receive no compensation from the fund.
5 The length of time served represents the year in which the officer was first elected in such capacity for one or more DWS funds.
6 Address: 60 Wall Street, New York, NY 10005.
7 Address: One Beacon Street, Boston, MA 02108.
8 Address: 222 South Riverside Plaza, Chicago, IL 60606.
9 Effective as of December 1, 2013.
The fund's Statement of Additional Information ("SAI") includes additional information about the Board Members. The SAI is available, without charge, upon request. If you would like to request a copy of the SAI, you may do so by calling the following toll-free number: (800) 728-3337.
Notes
DWS Investments Distributors, Inc.
222 South Riverside Plaza
Chicago, IL 60606
(800) 621-1148
VS1coreq-2 (R-025822-4 2/14)
December 31, 2013
Annual Report
DWS Variable Series I
DWS Global Small Cap Growth VIP
Contents
9 Statement of Assets and Liabilities 10 Statement of Operations 10 Statement of Changes in Net Assets 13 Notes to Financial Statements 17 Report of Independent Registered Public Accounting Firm 18 Information About Your Fund's Expenses 20 Advisory Agreement Board Considerations and Fee Evaluation 23 Board Members and Officers |
This report must be preceded or accompanied by a prospectus. To obtain an additional prospectus or summary prospectus, if available, call (800) 728-3337 or your financial representative. We advise you to consider the Fund's objectives, risks, charges and expenses carefully before investing. The summary prospectus and prospectus contain this and other important information about the Fund. Please read the prospectus carefully before you invest.
Investing in foreign securities, particularly those of emerging markets, presents certain risks, such as currency fluctuations, political and economic changes, and market risks. The Fund may lend securities to approved institutions. Smaller company stocks tend to be more volatile than medium-sized or large company stocks. Stocks may decline in value. See the prospectus for details.
Deutsche Asset & Wealth Management represents the asset management and wealth management activities conducted by Deutsche Bank AG or any of its subsidiaries, including the Advisor and DWS Investments Distributors, Inc.
NOT FDIC/NCUA INSURED NO BANK GUARANTEE MAY LOSE VALUE NOT A DEPOSIT
NOT INSURED BY ANY FEDERAL GOVERNMENT AGENCY
Performance Summary December 31, 2013 (Unaudited)
Fund performance shown is historical, assumes reinvestment of all dividend and capital gain distributions, and does not guarantee future results. Investment return and principal value fluctuate with changing market conditions so that, when redeemed, shares may be worth more or less than their original cost. Current performance may be lower or higher than the performance data quoted. Please contact your participating insurance company for the Fund's most recent month-end performance. Performance doesn't reflect charges and fees ("contract charges") associated with the separate account that invests in the Fund or any variable life insurance policy or variable annuity contract for which the Fund is an investment option. These charges and fees will reduce returns. While all share classes have the same underlying portfolio, their performance will differ.
The gross expense ratios of the Fund, as stated in the fee table of the prospectus dated May 1, 2013 are 1.11% and 1.43% for Class A and Class B shares, respectively, and may differ from the expense ratios disclosed in the Financial Highlights tables in this report.
| Growth of an Assumed $10,000 Investment |
| The S&P® Developed SmallCap comprises the stocks representing the lowest 15% of float-adjusted market cap in each developed country. It Is a subset of the S&P® Global BMI, a comprehensive, rules-based index measuring global stock market performance. Index returns do not reflect any fees or expenses and it is not possible to invest directly into an index. |
| |
| Yearly periods ended December 31 | |
| Comparative Results | |
| DWS Global Small Cap Growth VIP | | 1-Year | | | 3-Year | | | 5-Year | | | 10-Year | |
| Class A | Growth of $10,000 | | $ | 13,594 | | | $ | 14,131 | | | $ | 26,522 | | | $ | 25,820 | |
| Average annual total return | | | 35.94 | % | | | 12.22 | % | | | 21.54 | % | | | 9.95 | % |
| S&P Developed SmallCap Index | Growth of $10,000 | | $ | 13,258 | | | $ | 14,311 | | | $ | 24,827 | | | $ | 25,858 | |
| Average annual total return | | | 32.58 | % | | | 12.69 | % | | | 19.95 | % | | | 9.97 | % |
| DWS Global Small Cap Growth VIP | | 1-Year | | | 3-Year | | | 5-Year | | | 10-Year | |
| Class B | Growth of $10,000 | | $ | 13,567 | | | $ | 14,030 | | | $ | 26,182 | | | $ | 25,180 | |
| Average annual total return | | | 35.67 | % | | | 11.95 | % | | | 21.23 | % | | | 9.67 | % |
| S&P Developed SmallCap Index | Growth of $10,000 | | $ | 13,258 | | | $ | 14,311 | | | $ | 24,827 | | | $ | 25,858 | |
| Average annual total return | | | 32.58 | % | | | 12.69 | % | | | 19.95 | % | | | 9.97 | % |
The growth of $10,000 is cumulative.
Management Summary December 31, 2013 (Unaudited)
DWS Global Small Cap Growth VIP returned 35.94% in 2013 (Class A shares, unadjusted for contract charges), outperforming the 32.58% return of the S&P® Developed SmallCap Index.1
As is usually the case, stock selection was the primary driver of the Fund's positive relative performance. We generated the best results in the financial, health care and information technology sectors, while our only shortfalls occurred in the energy and consumer discretionary groups.2 Our leading individual contributor was Pacira Pharmaceuticals, Inc., which has a new drug for postsurgical pain. This is the second year in a row that Pacira has been a top performer in the Fund. Our positions in WageWorks, Inc. and United Internet AG also made strong contributions to performance, while our investments in Sears Hometown & Outlet Stores, Inc. and Koninklijke Vopak NV detracted.3
Our sector allocations also contributed positively to relative performance. Underweight positions in materials and utilities, along with overweight positions in industrials and health care, contributed positively to relative performance.4 Since we choose investments through a bottom-up stock selection process and not a particular macroeconomic view, our overweights reflect the fact that certain sectors tend to be more heavily populated with the type of growth stocks that we favor. The Fund has typically held underweights in the materials, telecommunications and utility sectors and, for the last several years, financials.
In terms of geographies, we generated strong relative performance in the Asia-Pacific region, followed by North America. Although our positioning in Europe caused us to trail the benchmark stocks in the region, our absolute return in Europe was still robust.5 We remained overweight in both Asia and Europe, where we continued to find good growth companies and better valuations than we found in North America.
We positioned the Fund for steady economic growth, trimming exposure to areas of which we were wary and taking profits when valuations overstepped fundamentals. Our investment process maintained a long-term perspective and a disciplined, fundamental approach to identifying quality stocks.
As the year progressed, we grew more cautious regarding exposure to sectors such as European financials and global materials, and we became more selective in choosing what risks to bear. Despite strong market performance, we continued to find high-quality companies trading at attractive valuations. In fact, as liquidity increased, the universe of potential investments expanded — particularly for investors with a global focus.
Joseph Axtell, CFA
Portfolio Manager
The views expressed reflect those of the portfolio management team only through the end of the period of the report as stated on the cover. The management team's views are subject to change at any time based on market and other conditions and should not be construed as a recommendation. Past performance is no guarantee of future results. Current and future portfolio holdings are subject to risk.
1 The S&P Developed SmallCap Index tracks the performance of small-capitalization stocks in 22 countries. Index returns do not reflect fees or expenses and it is not possible to invest directly in an index.
2 The consumer discretionary sector represents industries that produce goods and services that are not necessities in everyday life.
3 Contribution incorporates both a stock's total return and its weighting in the Fund.
4 "Underweight" means the Fund holds a lower weighting in a given sector or security than the benchmark. "Overweight" means the Fund holds a higher weighting.
5 Absolute return is the return, expressed as a percentage, which an asset achieves over a certain period of time.
Portfolio Summary (Unaudited) Asset Allocation (As a % of Investment Portfolio excluding Securities Lending Collateral) | 12/31/13 | 12/31/12 |
| | | |
| Common Stocks | 99% | 99% |
| Cash Equivalents | 1% | 1% |
| | 100% | 100% |
Geographical Diversification (As a % of Investment Portfolio excluding Cash Equivalents and Securities Lending Collateral) | 12/31/13 | 12/31/12 |
| | | |
| United States | 44% | 42% |
| Continental Europe | 18% | 24% |
| United Kingdom | 14% | 9% |
| Asia (excluding Japan) | 11% | 10% |
| Japan | 8% | 8% |
| Canada | 2% | 3% |
| Latin America | 1% | 1% |
| Australia | 0% | 1% |
| Middle East | — | 1% |
| Other | 2% | 1% |
| | 100% | 100% |
Sector Diversification (As a % of Investment Portfolio excluding Cash Equivalents and Securities Lending Collateral) | 12/31/13 | 12/31/12 |
| | | |
| Industrials | 25% | 27% |
| Consumer Discretionary | 23% | 21% |
| Financials | 17% | 13% |
| Health Care | 14% | 14% |
| Information Technology | 10% | 9% |
| Energy | 6% | 7% |
| Consumer Staples | 4% | 6% |
| Materials | 1% | 3% |
| | 100% | 100% |
Portfolio holdings and characteristics are subject to change.
For more complete details about the Fund's investment portfolio, see page 6.
Following the Fund's fiscal first and third quarter-end, a complete portfolio holdings listing is filed with the SEC on Form N-Q. The form will be available on the SEC's Web site at sec.gov, and it also may be reviewed and copied at the SEC's Public Reference Room in Washington, D.C. Information on the operation of the SEC's Public Reference Room may be obtained by calling (800) SEC-0330. The Fund's portfolio holdings are also posted on dws-investments.com from time to time. Please see the Fund's current prospectus for more information.
Investment Portfolio December 31, 2013 | | | Shares | | | Value ($) | |
| | | | |
| Common Stocks 97.8% | |
| Australia 0.3% | |
| Austal Ltd.* (Cost $764,055) | | | 576,906 | | | | 449,277 | |
| Bermuda 0.9% | |
| Lazard Ltd. "A" (a) (Cost $757,520) | | | 30,627 | | | | 1,388,016 | |
| Brazil 0.5% | |
| Fleury SA (Cost $1,053,655) | | | 93,881 | | | | 732,983 | |
| Canada 1.3% | |
| Quebecor, Inc. "B" | | | 15,416 | | | | 383,713 | |
| SunOpta, Inc.* | | | 168,889 | | | | 1,690,579 | |
| (Cost $1,713,945) | | | | 2,074,292 | |
| China 1.5% | |
| Charm Communications, Inc. (ADR) | | | 106,708 | | | | 458,844 | |
| Minth Group Ltd. | | | 932,828 | | | | 1,942,675 | |
| (Cost $1,439,471) | | | | 2,401,519 | |
| Cyprus 0.9% | |
| Prosafe SE | | | 176,684 | | | | 1,363,362 | |
| Songa Offshore* | | | 91,086 | | | | 46,683 | |
| (Cost $1,468,332) | | | | 1,410,045 | |
| Denmark 1.1% | |
| GN Store Nord AS (Cost $999,347) | | | 70,451 | | | | 1,736,486 | |
| Finland 0.5% | |
| Cramo Oyj (Cost $767,956) | | | 35,139 | | | | 744,429 | |
| France 1.9% | |
| Flamel Technologies SA (ADR)* | | | 156,961 | | | | 1,263,536 | |
| JC Decaux SA | | | 42,710 | | | | 1,763,867 | |
| (Cost $2,958,733) | | | | 3,027,403 | |
| Germany 3.8% | |
| Fresenius Medical Care AG & Co. KGaA | | | 10,009 | | | | 712,340 | |
| M.A.X. Automation AG | | | 179,801 | | | | 1,222,881 | |
| Rational AG | | | 3,895 | | | | 1,298,644 | |
| United Internet AG (Registered) | | | 65,110 | | | | 2,773,780 | |
| (Cost $1,520,146) | | | | 6,007,645 | |
| Hong Kong 5.0% | |
| Hong Kong Television Network Ltd. | | | 1,308,615 | | | | 597,511 | |
| K Wah International Holdings Ltd. | | | 3,351,374 | | | | 2,035,302 | |
| Playmates Toys Ltd.* | | | 2,297,392 | | | | 1,076,577 | |
| REXLot Holdings Ltd. (b) | | | 19,161,723 | | | | 2,598,619 | |
| Techtronic Industries Co., Ltd. | | | 533,991 | | | | 1,520,677 | |
| (Cost $4,332,878) | | | | 7,828,686 | |
| Indonesia 0.7% | |
| PT Arwana Citramulia Tbk (Cost $1,082,037) | | | 15,473,482 | | | | 1,043,210 | |
| Ireland 3.0% | |
| C&C Group PLC | | | 162,627 | | | | 951,289 | |
| Paddy Power PLC | | | 22,863 | | | | 1,954,050 | |
| Ryanair Holdings PLC* | | | 215,397 | | | | 1,858,547 | |
| (Cost $1,045,350) | | | | 4,763,886 | |
| Italy 1.0% | |
| Prysmian SpA (Cost $1,158,369) | | | 59,123 | | | | 1,524,421 | |
| | | Shares | | | Value ($) | |
| | | | | | | | | |
| Japan 7.5% | |
| Ai Holdings Corp. | | | 84,382 | | | | 1,053,470 | |
| Avex Group Holdings, Inc. | | | 77,053 | | | | 1,657,091 | |
| Iida Group Holdings Co., Ltd.* | | | 60,870 | | | | 1,214,972 | |
| Kusuri No Aoki Co., Ltd. | | | 18,611 | | | | 1,039,821 | |
| Medical System Network Co., Ltd. | | | 113,898 | | | | 516,341 | |
| MISUMI Group, Inc. | | | 29,651 | | | | 933,231 | |
| Nippon Seiki Co., Ltd. | | | 109,377 | | | | 2,116,589 | |
| United Arrows Ltd. | | | 30,068 | | | | 1,126,237 | |
| Universal Entertainment Corp. (b) | | | 52,294 | | | | 965,611 | |
| Yumeshin Holdings Co., Ltd. | | | 98,614 | | | | 1,070,464 | |
| (Cost $8,707,636) | | | | 11,693,827 | |
| Luxembourg 0.2% | |
| L'Occitane International SA (Cost $356,205) | | | 181,565 | | | | 389,711 | |
| Malaysia 1.4% | |
| Hartalega Holdings Bhd. | | | 568,191 | | | | 1,254,073 | |
| Tune Ins Holdings Bhd.* | | | 1,449,114 | | | | 863,163 | |
| (Cost $1,446,196) | | | | 2,117,236 | |
| Netherlands 4.1% | |
| Brunel International NV | | | 26,184 | | | | 1,607,788 | |
| Chicago Bridge & Iron Co. NV (c) | | | 19,542 | | | | 1,624,722 | |
| Koninklijke Vopak NV | | | 22,141 | | | | 1,297,233 | |
| SBM Offshore NV* | | | 91,819 | | | | 1,876,345 | |
| (Cost $2,499,397) | | | | 6,406,088 | |
| Panama 0.6% | |
| Banco Latinoamericano de Comercio Exterior SA "E" (Cost $827,404) | | | 34,592 | | | | 969,268 | |
| Philippines 1.6% | |
| Alliance Global Group, Inc. | | | 2,553,868 | | | | 1,489,618 | |
| Century Properties Group, Inc. | | | 10,992,112 | | | | 328,473 | |
| Emperador, Inc.* | | | 2,221,537 | | | | 536,247 | |
| House of Investments, Inc. | | | 910,300 | | | | 126,585 | |
| (Cost $1,999,135) | | | | 2,480,923 | |
| Singapore 1.3% | |
| Lian Beng Group Ltd. | | | 2,859,441 | | | | 1,224,746 | |
| UE E&C Ltd. | | | 744,236 | | | | 614,359 | |
| Yongnam Holdings Ltd. | | | 1,010,993 | | | | 197,086 | |
| (Cost $1,679,092) | | | | 2,036,191 | |
| Switzerland 1.2% | |
| Dufry AG (Registered)* (Cost $1,236,037) | | | 10,546 | | | | 1,856,495 | |
| Thailand 0.4% | |
| Malee Sampran PCL (Foreign Registered) (Cost $1,157,564) | | | 672,126 | | | | 613,627 | |
| United Kingdom 13.9% | |
| Arrow Global Group PLC* | | | 236,487 | | | | 1,047,372 | |
| Ashmore Group PLC | | | 214,734 | | | | 1,435,613 | |
| Babcock International Group PLC | | | 135,456 | | | | 3,040,381 | |
| Burberry Group PLC | | | 40,249 | | | | 1,011,208 | |
| Clinigen Healthcare Ltd. | | | 109,140 | | | | 1,086,502 | |
| Crest Nicholson Holdings PLC* | | | 253,836 | | | | 1,538,666 | |
| Domino's Pizza Group PLC | | | 100,697 | | | | 855,710 | |
| Essentra PLC | | | 95,669 | | | | 1,365,029 | |
| | | Shares | | | Value ($) | |
| | | | | | | | | |
| Hargreaves Lansdown PLC | | | 72,511 | | | | 1,630,505 | |
| HellermannTyton Group PLC | | | 283,888 | | | | 1,421,860 | |
| IG Group Holdings PLC | | | 116,652 | | | | 1,193,256 | |
| Jardine Lloyd Thompson Group PLC | | | 56,996 | | | | 963,203 | |
| John Wood Group PLC | | | 84,863 | | | | 968,077 | |
| Monitise PLC* | | | 814,390 | | | | 908,998 | |
| Nanoco Group PLC* | | | 302,210 | | | | 718,254 | |
| Rotork PLC | | | 30,060 | | | | 1,434,937 | |
| Spirax-Sarco Engineering PLC | | | 22,847 | | | | 1,134,385 | |
| (Cost $12,533,378) | | | | 21,753,956 | |
| United States 43.2% | |
| Advance Auto Parts, Inc. | | | 11,296 | | | | 1,250,241 | |
| Aecom Technology Corp.* | | | 10,485 | | | | 308,574 | |
| Affiliated Managers Group, Inc.* | | | 7,920 | | | | 1,717,690 | |
| Altra Industrial Motion Corp. | | | 26,781 | | | | 916,446 | |
| Ascena Retail Group, Inc.* | | | 31,888 | | | | 674,750 | |
| BE Aerospace, Inc.* | | | 25,300 | | | | 2,201,859 | |
| BorgWarner, Inc. | | | 23,092 | | | | 1,291,074 | |
| Cancer Genetics, Inc.* | | | 53,615 | | | | 738,815 | |
| Cardtronics, Inc.* | | | 24,534 | | | | 1,066,002 | |
| Catamaran Corp.* | | | 22,856 | | | | 1,085,203 | |
| Chart Industries, Inc.* | | | 12,954 | | | | 1,238,921 | |
| Cognex Corp. | | | 30,386 | | | | 1,160,137 | |
| CONMED Corp. | | | 22,550 | | | | 958,375 | |
| Derma Sciences, Inc.* | | | 58,282 | | | | 630,611 | |
| DFC Global Corp.* | | | 59,624 | | | | 682,695 | |
| Dresser-Rand Group, Inc.* | | | 23,220 | | | | 1,384,609 | |
| Encore Capital Group, Inc.* (b) | | | 35,267 | | | | 1,772,519 | |
| Furiex Pharmaceuticals, Inc.* | | | 17,067 | | | | 716,985 | |
| Hain Celestial Group, Inc.* (b) | | | 10,151 | | | | 921,508 | |
| Harris Corp. | | | 18,241 | | | | 1,273,404 | |
| Haynes International, Inc. | | | 15,185 | | | | 838,819 | |
| HeartWare International, Inc.* | | | 12,904 | | | | 1,212,460 | |
| Imperva, Inc.* | | | 25,946 | | | | 1,248,781 | |
| Jack in the Box, Inc.* | | | 18,802 | | | | 940,476 | |
| Jarden Corp.* | | | 28,437 | | | | 1,744,610 | |
| Kindred Healthcare, Inc. | | | 50,734 | | | | 1,001,489 | |
| Leucadia National Corp. | | | 51,757 | | | | 1,466,793 | |
| Manitowoc Co., Inc. | | | 76,936 | | | | 1,794,148 | |
| MICROS Systems, Inc.* (b) | | | 15,314 | | | | 878,564 | |
| NxStage Medical, Inc.* | | | 58,403 | | | | 584,030 | |
| Oasis Petroleum, Inc.* | | | 21,630 | | | | 1,015,961 | |
| Ocwen Financial Corp.* | | | 33,204 | | | | 1,841,162 | |
| Oil States International, Inc.* | | | 9,714 | | | | 988,108 | |
| Pacira Pharmaceuticals, Inc.* | | | 54,334 | | | | 3,123,662 | |
| PTC, Inc.* | | | 28,659 | | | | 1,014,242 | |
| | | Shares | | | Value ($) | |
| | | | | | | | | |
| Roadrunner Transportation Systems, Inc.* | | | 38,439 | | | | 1,035,931 | |
| Rosetta Resources, Inc.* | | | 12,389 | | | | 595,168 | |
| Sears Hometown & Outlet Stores, Inc.* | | | 28,577 | | | | 728,713 | |
| Signature Bank* | | | 5,841 | | | | 627,440 | |
| Sinclair Broadcast Group, Inc. "A" | | | 40,640 | | | | 1,452,067 | |
| Springleaf Holdings, Inc.* | | | 68,761 | | | | 1,738,278 | |
| Sunshine Heart, Inc.* | | | 98,891 | | | | 960,232 | |
| Synta Pharmaceuticals Corp.* | | | 117,345 | | | | 614,888 | |
| Tenneco, Inc.* | | | 28,466 | | | | 1,610,322 | |
| The Bancorp., Inc.* | | | 46,028 | | | | 824,361 | |
| Thoratec Corp.* | | | 37,568 | | | | 1,374,989 | |
| TIBCO Software, Inc.* | | | 37,787 | | | | 849,452 | |
| TiVo, Inc.* | | | 83,582 | | | | 1,096,596 | |
| Tristate Capital Holdings, Inc.* | | | 62,607 | | | | 742,519 | |
| United Rentals, Inc.* (b) | | | 21,231 | | | | 1,654,956 | |
| Urban Outfitters, Inc.* | | | 27,676 | | | | 1,026,780 | |
| VeriFone Systems, Inc.* | | | 30,281 | | | | 812,136 | |
| WABCO Holdings, Inc.* | | | 17,583 | | | | 1,642,428 | |
| Waddell & Reed Financial, Inc. "A" | | | 31,129 | | | | 2,027,120 | |
| WageWorks, Inc.* | | | 26,692 | | | | 1,586,572 | |
| Zeltiq Aesthetics, Inc.* (b) | | | 87,025 | | | | 1,645,643 | |
| Zions Bancorp. (b) | | | 41,897 | | | | 1,255,234 | |
| (Cost $41,529,772) | | | | 67,585,548 | |
Total Common Stocks (Cost $95,033,610) | | | | 153,035,168 | |
| | |
| Warrants 0.0% | |
| Malaysia | |
| Hartalega Holdings Bhd., Expiration Date 5/29/2015* (Cost $0) | | | 68,733 | | | | 66,519 | |
| | |
| Securities Lending Collateral 6.9% | |
| Daily Assets Fund Institutional, 0.08% (d) (e) (Cost $10,753,914) | | | 10,753,914 | | | | 10,753,914 | |
| | |
| Cash Equivalents 1.4% | |
| Central Cash Management Fund, 0.05% (d) (Cost $2,182,460) | | | 2,182,460 | | | | 2,182,460 | |
| | | % of Net Assets | | | Value ($) | |
| | | | |
Total Investment Portfolio (Cost $107,969,984)† | | | 106.1 | | | | 166,038,061 | |
| Other Assets and Liabilities, Net | | | (6.1 | ) | | | (9,509,443 | ) |
| Net Assets | | | 100.0 | | | | 156,528,618 | |
* Non-income producing security.
† The cost for federal income tax purposes was $109,346,948. At December 31, 2013, net unrealized appreciation for all securities based on tax cost was $56,691,113. This consisted of aggregate gross unrealized appreciation for all securities in which there was an excess of value over tax cost of $63,261,978 and aggregate gross unrealized depreciation for all securities in which there was an excess of tax cost over value of $6,570,865.
(a) Listed on the NASDAQ Stock Market, Inc.
(b) All or a portion of these securities were on loan. In addition, "Other Assets and Liabilities, Net" may include pending sales that are also on loan. The value of securities loaned at December 31, 2013 amounted to $10,341,470, which is 6.6% of net assets.
(c) Listed on the New York Stock Exchange.
(d) Affiliated fund managed by Deutsche Investment Management Americas Inc. The rate shown is the annualized seven-day yield at period end.
(e) Represents collateral held in connection with securities lending. Income earned by the Fund is net of borrower rebates.
ADR: American Depositary Receipt
Fair Value Measurements
Various inputs are used in determining the value of the Fund's investments. These inputs are summarized in three broad levels. Level 1 includes quoted prices in active markets for identical securities. Level 2 includes other significant observable inputs (including quoted prices for similar securities, interest rates, prepayment speeds and credit risk). Level 3 includes significant unobservable inputs (including the Fund's own assumptions in determining the fair value of investments). The level assigned to the securities valuations may not be an indication of the risk or liquidity associated with investing in those securities.
The following is a summary of the inputs used as of December 31, 2013 in valuing the Fund's investments. For information on the Fund's policy regarding the valuation of investments, please refer to the Security Valuation section of Note A in the accompanying Notes to Financial Statements.
| Assets | | Level 1 | | | Level 2 | | | Level 3 | | | Total | |
| | |
| Common Stocks & Warrants | |
| Australia | | $ | — | | | $ | 449,277 | | | $ | — | | | $ | 449,277 | |
| Bermuda | | | 1,388,016 | | | | — | | | | — | | | | 1,388,016 | |
| Brazil | | | 732,983 | | | | — | | | | — | | | | 732,983 | |
| Canada | | | 2,074,292 | | | | — | | | | — | | | | 2,074,292 | |
| China | | | 458,844 | | | | 1,942,675 | | | | — | | | | 2,401,519 | |
| Cyprus | | | — | | | | 1,410,045 | | | | — | | | | 1,410,045 | |
| Denmark | | | — | | | | 1,736,486 | | | | — | | | | 1,736,486 | |
| Finland | | | — | | | | 744,429 | | | | — | | | | 744,429 | |
| France | | | 1,263,536 | | | | 1,763,867 | | | | — | | | | 3,027,403 | |
| Germany | | | — | | | | 6,007,645 | | | | — | | | | 6,007,645 | |
| Hong Kong | | | — | | | | 7,828,686 | | | | — | | | | 7,828,686 | |
| Indonesia | | | — | | | | 1,043,210 | | | | — | | | | 1,043,210 | |
| Ireland | | | — | | | | 4,763,886 | | | | — | | | | 4,763,886 | |
| Italy | | | — | | | | 1,524,421 | | | | — | | | | 1,524,421 | |
| Japan | | | — | | | | 11,693,827 | | | | — | | | | 11,693,827 | |
| Luxembourg | | | — | | | | 389,711 | | | | — | | | | 389,711 | |
| Malaysia | | | — | | | | 2,183,755 | | | | — | | | | 2,183,755 | |
| Netherlands | | | 1,624,722 | | | | 4,781,366 | | | | — | | | | 6,406,088 | |
| Panama | | | 969,268 | | | | — | | | | — | | | | 969,268 | |
| Philippines | | | — | | | | 2,480,923 | | | | — | | | | 2,480,923 | |
| Singapore | | | — | | | | 2,036,191 | | | | — | | | | 2,036,191 | |
| Switzerland | | | — | | | | 1,856,495 | | | | — | | | | 1,856,495 | |
| Thailand | | | — | | | | 613,627 | | | | — | | | | 613,627 | |
| United Kingdom | | | — | | | | 21,753,956 | | | | — | | | | 21,753,956 | |
| United States | | | 67,585,548 | | | | — | | | | — | | | | 67,585,548 | |
| Short-Term Investments (f) | | | 12,936,374 | | | | — | | | | — | | | | 12,936,374 | |
| Total | | $ | 89,033,583 | | | $ | 77,004,478 | | | $ | — | | | $ | 166,038,061 | |
During the year ended December 31, 2013, the amount of transfers between Level 3 and Level 2 was $16,152. The investment was transferred from Level 3 to Level 2 as a result of the availability of a pricing source supported by observable inputs.
Transfers between price levels are recognized at the beginning of the reporting period.
(f) See Investment Portfolio for additional detailed categorizations.
The accompanying notes are an integral part of the financial statements.
Statement of Assets and Liabilities | as of December 31, 2013 | |
| Assets | |
Investments: Investments in non-affiliated securities, at value (cost $95,033,610) — including $10,341,470 of securities loaned | | $ | 153,101,687 | |
| Investment in Daily Assets Fund Institutional (cost $10,753,914)* | | | 10,753,914 | |
| Investment in Central Cash Management Fund (cost $2,182,460) | | | 2,182,460 | |
| Total investments in securities, at value (cost $107,969,984) | | | 166,038,061 | |
| Foreign currency, at value (cost $94,243) | | | 93,276 | |
| Receivable for investments sold | | | 1,451,531 | |
| Receivable for Fund shares sold | | | 335,197 | |
| Dividends receivable | | | 40,195 | |
| Interest receivable | | | 2,394 | |
| Foreign taxes recoverable | | | 86,012 | |
| Other assets | | | 2,782 | |
| Total assets | | | 168,049,448 | |
| Liabilities | |
| Payable upon return of securities loaned | | | 10,753,914 | |
| Payable for investments purchased | | | 487,508 | |
| Payable for Fund shares redeemed | | | 90,637 | |
| Accrued management fee | | | 90,537 | |
| Accrued Trustees' fees | | | 2,403 | |
| Other accrued expenses and payables | | | 95,831 | |
| Total liabilities | | | 11,520,830 | |
| Net assets, at value | | $ | 156,528,618 | |
| Net Assets Consist of | |
| Undistributed net investment income | | | 347,385 | |
Net unrealized appreciation (depreciation) on: Investments | | | 58,068,077 | |
| Foreign currency | | | 5,643 | |
| Accumulated net realized gain (loss) | | | 16,398,305 | |
| Paid-in capital | | | 81,709,208 | |
| Net assets, at value | | $ | 156,528,618 | |
Class A Net Asset Value, offering and redemption price per share ($153,914,819 ÷ 8,893,756 outstanding shares of beneficial interest, $.01 par value, unlimited number of shares authorized) | | $ | 17.31 | |
Class B Net Asset Value, offering and redemption price per share ($2,613,799 ÷ 154,023 outstanding shares of beneficial interest, $.01 par value, unlimited number of shares authorized) | | $ | 16.97 | |
* Represents collateral on securities loaned.
The accompanying notes are an integral part of the financial statements.
Statement of Operations
| for the year ended December 31, 2013 | |
| Investment Income | |
Income: Dividends (net of foreign taxes withheld of $76,459) | | $ | 1,650,258 | |
| Income distributions — Central Cash Management Fund | | | 2,352 | |
| Securities lending income, including income from Daily Assets Fund Institutional, net of borrower rebates | | | 63,484 | |
| Total income | | | 1,716,094 | |
Expenses: Management fee | | | 1,248,068 | |
| Administration fee | | | 140,232 | |
| Services to shareholders | | | 2,884 | |
| Distribution service fee (Class B) | | | 5,370 | |
| Record keeping fee (Class B) | | | 72 | |
| Custodian fee | | | 64,998 | |
| Professional fees | | | 72,195 | |
| Reports to shareholders | | | 33,775 | |
| Trustees' fees and expenses | | | 6,751 | |
| Other | | | 21,830 | |
| Total expenses before expense reductions | | | 1,596,175 | |
| Expense reductions | | | (272,788 | ) |
| Total expenses after expense reductions | | | 1,323,387 | |
| Net investment income (loss) | | | 392,707 | |
| Realized and Unrealized Gain (Loss) | |
Net realized gain (loss) from: Investments | | | 17,023,564 | |
| Foreign currency | | | (2,080 | ) |
| | | | 17,021,484 | |
Change in net unrealized appreciation (depreciation) on: Investments | | | 25,576,430 | |
| Foreign currency | | | 305 | |
| | | | 25,576,735 | |
| Net gain (loss) | | | 42,598,219 | |
| Net increase (decrease) in net assets resulting from operations | | $ | 42,990,926 | |
The accompanying notes are an integral part of the financial statements.
Statement of Changes in Net Assets | | | Years Ended December 31, | |
| Increase (Decrease) in Net Assets | | 2013 | | | 2012 | |
Operations: Net investment income (loss) | | $ | 392,707 | | | $ | 860,631 | |
| Net realized gain (loss) | | | 17,021,484 | | | | 9,539,908 | |
| Change in net unrealized appreciation (depreciation) | | | 25,576,735 | | | | 7,657,855 | |
| Net increase (decrease) in net assets resulting from operations | | | 42,990,926 | | | | 18,058,394 | |
Distributions to shareholders from: Net investment income: Class A | | | (881,158 | ) | | | (847,848 | ) |
| Class B | | | (8,337 | ) | | | (8,192 | ) |
Net realized gains: Class A | | | (9,356,181 | ) | | | (6,623,008 | ) |
| Class B | | | (145,558 | ) | | | (104,904 | ) |
| Total distributions | | | (10,391,234 | ) | | | (7,583,952 | ) |
Fund share transactions: Class A Proceeds from shares sold | | | 7,422,087 | | | | 3,854,918 | |
| Reinvestment of distributions | | | 10,237,339 | | | | 7,470,856 | |
| Payments for shares redeemed | | | (19,526,673 | ) | | | (21,145,077 | ) |
| Net increase (decrease) in net assets from Class A share transactions | | | (1,867,247 | ) | | | (9,819,303 | ) |
Class B Proceeds from shares sold | | | 496,180 | | | | 79,415 | |
| Reinvestment of distributions | | | 153,895 | | | | 113,096 | |
| Payments for redeemed | | | (384,768 | ) | | | (365,396 | ) |
| Net increase (decrease) in net assets from Class B share transactions | | | 265,307 | | | | (172,885 | ) |
| Increase (decrease) in net assets | | | 30,997,752 | | | | 482,254 | |
| Net assets at beginning of period | | | 125,530,866 | | | | 125,048,612 | |
| Net assets at end of period (including undistributed net investment income of $347,385 and $838,969, respectively) | | $ | 156,528,618 | | | $ | 125,530,866 | |
| Other Information | |
Class A Shares outstanding at beginning of period | | | 8,977,791 | | | | 9,718,286 | |
| Shares sold | | | 479,388 | | | | 294,057 | |
| Shares issued to shareholders in reinvestment of distributions | | | 718,410 | | | | 561,297 | |
| Shares redeemed | | | (1,281,833 | ) | | | (1,595,849 | ) |
| Net increase (decrease) in Class A shares | | | (84,035 | ) | | | (740,495 | ) |
| Shares outstanding at end of period | | | 8,893,756 | | | | 8,977,791 | |
Class B Shares outstanding at beginning of period | | | 136,607 | | | | 150,330 | |
| Shares sold | | | 32,424 | | | | 6,256 | |
| Shares issued to shareholders in reinvestment of distributions | | | 11,000 | | | | 8,640 | |
| Shares redeemed | | | (26,008 | ) | | | (28,619 | ) |
| Net increase (decrease) in Class B shares | | | 17,416 | | | | (13,723 | ) |
| Shares outstanding at end of period | | | 154,023 | | | | 136,607 | |
The accompanying notes are an integral part of the financial statements.
| | | Years Ended December 31, | |
| Class A | | | 2013 | | | 2012 | | | 2011 | | | 2010 | | | 2009 | |
| Selected Per Share Data | |
| Net asset value, beginning of period | | $ | 13.78 | | | $ | 12.67 | | | $ | 14.28 | | | $ | 11.32 | | | $ | 7.79 | |
Income (loss) from investment operations: Net investment income (loss)a | | | .04 | | | | .09 | | | | .08 | | | | .05 | | | | .04 | |
| Net realized and unrealized gain (loss) | | | 4.66 | | | | 1.83 | | | | (1.45 | ) | | | 2.96 | | | | 3.64 | |
| Total from investment operations | | | 4.70 | | | | 1.92 | | | | (1.37 | ) | | | 3.01 | | | | 3.68 | |
Less distributions from: Net investment income | | | (.10 | ) | | | (.09 | ) | | | (.24 | ) | | | (.05 | ) | | | (.15 | ) |
| Net realized gains | | | (1.07 | ) | | | (.72 | ) | | | — | | | | — | | | | — | |
| Total distributions | | | (1.17 | ) | | | (.81 | ) | | | (.24 | ) | | | (.05 | ) | | | (.15 | ) |
| Net asset value, end of period | | $ | 17.31 | | | $ | 13.78 | | | $ | 12.67 | | | $ | 14.28 | | | $ | 11.32 | |
Total Return (%)b | | | 35.94 | | | | 15.37 | | | | (9.90 | ) | | | 26.64 | | | | 48.20 | |
| Ratios to Average Net Assets and Supplemental Data | |
| Net assets, end of period ($ millions) | | | 154 | | | | 124 | | | | 123 | | | | 158 | | | | 139 | |
| Ratio of expenses before expense reductions (%) | | | 1.14 | | | | 1.11 | | | | 1.12 | | | | 1.12 | | | | 1.11 | |
| Ratio of expenses after expense reductions (%) | | | .94 | | | | .98 | | | | 1.00 | | | | 1.04 | | | | .99 | |
| Ratio of net investment income (loss) (%) | | | .28 | | | | .69 | | | | .57 | | | | .42 | | | | .47 | |
| Portfolio turnover rate (%) | | | 39 | | | | 36 | | | | 31 | | | | 39 | | | | 53 | |
a Based on average shares outstanding during the period. b Total return would have been lower had certain expenses not been reduced. | |
| | | Years Ended December 31, | |
| Class B | | | 2013 | | | 2012 | | | 2011 | | | 2010 | | | 2009 | |
| Selected Per Share Data | |
| Net asset value, beginning of period | | $ | 13.52 | | | $ | 12.45 | | | $ | 14.03 | | | $ | 11.11 | | | $ | 7.65 | |
Income (loss) from investment operations: Net investment income (loss)a | | | .01 | | | | .06 | | | | .05 | | | | .03 | | | | .02 | |
| Net realized and unrealized gain (loss) | | | 4.57 | | | | 1.79 | | | | (1.43 | ) | | | 2.90 | | | | 3.57 | |
| Total from investment operations | | | 4.58 | | | | 1.85 | | | | (1.38 | ) | | | 2.93 | | | | 3.59 | |
Less distributions from: Net investment income | | | (.06 | ) | | | (.06 | ) | | | (.20 | ) | | | (.01 | ) | | | (.13 | ) |
| Net realized gains | | | (1.07 | ) | | | (.72 | ) | | | — | | | | — | | | | — | |
| Total distributions | | | (1.13 | ) | | | (.78 | ) | | | (.20 | ) | | | (.01 | ) | | | (.13 | ) |
| Net asset value, end of period | | $ | 16.97 | | | $ | 13.52 | | | $ | 12.45 | | | $ | 14.03 | | | $ | 11.11 | |
Total Return (%)b | | | 35.67 | | | | 15.01 | | | | (10.08 | ) | | | 26.38 | | | | 47.66 | |
| Ratios to Average Net Assets and Supplemental Data | |
| Net assets, end of period ($ millions) | | | 3 | | | | 2 | | | | 2 | | | | 2 | | | | 7 | |
| Ratio of expenses before expense reductions (%) | | | 1.34 | | | | 1.43 | | | | 1.38 | | | | 1.34 | | | | 1.42 | |
| Ratio of expenses after expense reductions (%) | | | 1.15 | | | | 1.23 | | | | 1.25 | | | | 1.26 | | | | 1.30 | |
| Ratio of net investment income (loss) (%) | | | .07 | | | | .44 | | | | .32 | | | | .20 | | | | .16 | |
| Portfolio turnover rate (%) | | | 39 | | | | 36 | | | | 31 | | | | 39 | | | | 53 | |
a Based on average shares outstanding during the period. b Total return would have been lower had certain expenses not been reduced. | |
Notes to Financial Statements
A. Organization and Significant Accounting Policies
DWS Variable Series I (the "Series") is registered under the Investment Company Act of 1940, as amended (the "1940 Act"), as an open-end, registered management investment company organized as a Massachusetts business trust. The Series consists of five diversified funds: DWS Bond VIP, DWS Core Equity VIP, DWS Capital Growth VIP, DWS Global Small Cap Growth VIP and DWS International VIP (individually or collectively hereinafter referred to as a "Fund" or the "Funds"). These financial statements report on DWS Global Small Cap Growth VIP. The Series is intended to be the underlying investment vehicle for variable annuity contracts and variable life insurance policies to be offered by the separate accounts of certain life insurance companies ("Participating Insurance Companies").
Multiple Classes of Shares of Beneficial Interest. The Fund offers two classes of shares (Class A shares and Class B shares). Class B shares are subject to Rule 12b-1 distribution fees under the 1940 Act and recordkeeping fees equal to an annual rate of 0.25% and up to 0.15%, respectively, of the average daily net assets of the Class B shares of the Fund. Class A shares are not subject to such fees.
Investment income, realized and unrealized gains and losses, and certain fund-level expenses and expense reductions, if any, are borne pro rata on the basis of relative net assets by the holders of all classes of shares, except that each class bears certain expenses unique to that class (including the applicable 12b-1 distribution fees). Differences in class-level expenses may result in payment of different per share dividends by class. All shares have equal rights with respect to voting subject to class-specific arrangements.
The Fund's financial statements are prepared in accordance with accounting principles generally accepted in the United States of America, which require the use of management estimates. Actual results could differ from those estimates. The policies described below are followed consistently by the Fund in the preparation of its financial statements.
Security Valuation. Investments are stated at value determined as of the close of regular trading on the New York Stock Exchange on each day the exchange is open for trading.
Various inputs are used in determining the value of the Fund's investments. These inputs are summarized in three broad levels. Level 1 includes quoted prices in active markets for identical securities. Level 2 includes other significant observable inputs (including quoted prices for similar securities, interest rates, prepayment speeds and credit risk). Level 3 includes significant unobservable inputs (including the Fund's own assumptions in determining the fair value of investments). The level assigned to the securities valuations may not be an indication of the risk or liquidity associated with investing in those securities.
Equity securities are valued at the most recent sale price or official closing price reported on the exchange (U.S. or foreign) or over-the-counter market on which they trade. Securities for which no sales are reported are valued at the calculated mean between the most recent bid and asked quotations on the relevant market or, if a mean cannot be determined, at the most recent bid quotation. Equity securities are generally categorized as Level 1 securities. For certain international equity securities, in order to adjust for events which may occur between the close of the foreign exchanges and the close of the New York Stock Exchange, a fair valuation model may be used. This fair valuation model takes into account comparisons to the valuation of American Depository Receipts (ADRs), exchange-traded funds, futures contracts and certain indices and these securities are categorized as Level 2.
Investments in open-end investment companies are valued at their net asset value each business day and are categorized as Level 1.
Securities and other assets for which market quotations are not readily available or for which the above valuation procedures are deemed not to reflect fair value are valued in a manner that is intended to reflect their fair value as determined in accordance with procedures approved by the Trustees and are generally categorized as Level 3. In accordance with the Fund's valuation procedures, factors used in determining value may include, but are not limited to, the type of the security; the size of the holding; the initial cost of the security; the existence of any contractual restrictions on the security's disposition; the price and extent of public trading in similar securities of the issuer or of comparable companies; quotations or evaluated prices from broker-dealers and/or pricing services; information obtained from the issuer, analysts, and/or the appropriate stock exchange (for exchange-traded securities); an analysis of the company's or issuer's financial statements; an evaluation of the forces that influence the issuer and the market(s) in which the security is purchased and sold; and with respect to debt securities, the maturity, coupon, creditworthiness, currency denomination and the movement of the market in which the security is normally traded. The value determined under these procedures may differ from published values for the same securities.
Disclosure about the classification of fair value measurements is included in a table following the Fund's Investment Portfolio.
Securities Lending. Deutsche Bank AG, as lending agent, lends securities of the Fund to certain financial institutions under the terms of the Security Lending Agreement. The Fund retains the benefits of owning the securities it has loaned and continues to receive interest and dividends generated by the securities and to participate in any changes in their market value. The Fund requires the borrowers of the securities to maintain collateral with the Fund consisting of either cash or liquid, unencumbered assets having a value at least equal to the value of the securities loaned. When the collateral falls below specified amounts, the lending agent will use its best effort to obtain additional collateral on the next business day to meet required amounts under the security lending agreement. The Fund may invest the cash collateral into a joint trading account in an affiliated money market fund pursuant to Exemptive Orders issued by the SEC. The Fund receives compensation for lending its securities either in the form of fees or by earning interest on invested cash collateral net of borrower rebates and fees paid to a lending agent. Either the Fund or the borrower may terminate the loan. There may be risks of delay and costs in recovery of securities or even loss of rights in the collateral should the borrower of the securities fail financially. If the Fund is not able to recover securities lent, the Fund may sell the collateral and purchase a replacement investment in the market, incurring the risk that the value of the replacement security is greater than the value of the collateral. The Fund is also subject to all investment risks associated with the reinvestment of any cash collateral received, including, but not limited to, interest rate, credit and liquidity risk associated with such investments.
As of December 31, 2013, the Fund had securities on loan. The value of the related collateral exceeded the value of the securities loaned at period end.
Foreign Currency Translations. The books and records of the Fund are maintained in U.S. dollars. Investment securities and other assets and liabilities denominated in a foreign currency are translated into U.S. dollars at the prevailing exchange rates at period end. Purchases and sales of investment securities, income and expenses are translated into U.S. dollars at the prevailing exchange rates on the respective dates of the transactions.
Net realized and unrealized gains and losses on foreign currency transactions represent net gains and losses between trade and settlement dates on securities transactions, the acquisition and disposition of foreign currencies, and the difference between the amount of net investment income accrued and the U.S. dollar amount actually received. That portion of both realized and unrealized gains and losses on investments that results from fluctuations in foreign currency exchange rates is not separately disclosed but is included with net realized and unrealized gain/appreciation and loss/depreciation on investments.
Taxes. The Fund is treated as a separate taxpayer as provided for in the Internal Revenue Code, as amended. It is the Fund's policy to comply with the requirements of the Internal Revenue Code, as amended, which are applicable to regulated investment companies, and to distribute all of its taxable income to the separate accounts of the Participating Insurance Companies which hold its shares.
Additionally, the Fund may be subject to taxes imposed by the governments of countries in which it invests and are generally based on income and/or capital gains earned or repatriated. Estimated tax liabilities on certain foreign securities are recorded on an accrual basis and are reflected as components of interest income or net change in unrealized gain/loss on investments. Tax liabilities realized as a result of security sales are reflected as a component of net realized gain/loss on investments.
The Fund has reviewed the tax positions for the open tax years as of December 31, 2013 and has determined that no provision for income tax is required in the Fund's financial statements. The Fund's federal tax returns for the prior three fiscal years remain open subject to examination by the Internal Revenue Service.
Distribution of Income and Gains. Distributions from net investment income of the Fund, if any, are declared and distributed to shareholders annually. Net realized gains from investment transactions, in excess of available capital loss carryforwards, would be taxable to the Fund if not distributed, and, therefore, will be distributed to shareholders at least annually. The Fund may also make additional distributions for tax purposes if necessary.
The timing and characterization of certain income and capital gain distributions are determined annually in accordance with federal tax regulations which may differ from accounting principles generally accepted in the United States of America. These differences primarily relate to income received from passive foreign investment companies and certain securities sold at a loss. As a result, net investment income (loss) and net realized gain (loss) on investment transactions for a reporting period may differ significantly from distributions during such period. Accordingly, the Fund may periodically make reclassifications among certain of its capital accounts without impacting the net asset value of the Fund.
At December 31, 2013, the Fund's components of distributable earnings (accumulated losses) on a tax basis are as follows:
| Undistributed ordinary income* | | $ | 2,202,875 | |
| Undistributed long-term capital gains | | $ | 15,919,781 | |
| Net unrealized appreciation (depreciation) on investments | | $ | 56,691,113 | |
In addition, the tax character of distributions paid to shareholders by the Fund is summarized as follows:
| | | Years Ended December 31, | |
| | | 2013 | | | 2012 | |
| Distributions from ordinary Income* | | $ | 889,495 | | | $ | 856,040 | |
| Distributions from long-term capital gains | | $ | 9,501,739 | | | $ | 6,727,912 | |
* For tax purposes, short-term capital gain distributions are considered ordinary income distributions.
Expenses. Expenses of the Series arising in connection with a specific Fund are allocated to that Fund. Other Series expenses which cannot be directly attributed to a Fund are apportioned among the Funds in the Series based upon the relative net assets or other appropriate measures.
Contingencies. In the normal course of business, the Fund may enter into contracts with service providers that contain general indemnification clauses. The Fund's maximum exposure under these arrangements is unknown as this would involve future claims that may be made against the Fund that have not yet been made. However, based on experience, the Fund expects the risk of loss to be remote.
Other. Investment transactions are accounted for on a trade date plus one basis for daily net asset value calculations. However, for financial reporting purposes, investment transactions are reported on trade date. Interest income is recorded on the accrual basis net of foreign withholding taxes. Dividend income is recorded on the ex-dividend date net of foreign withholding taxes. Certain dividends from foreign securities may be recorded subsequent to the ex-dividend date as soon as the Fund is informed of such dividends. Realized gains and losses from investment transactions are recorded on an identified cost basis. Proceeds from litigation payments, if any, are included in net realized gain (loss) from investments.
B. Purchases and Sales of Securities
During the year ended December 31, 2013, purchases and sales of investment securities (excluding short-term investments) aggregated $53,366,620 and $62,772,629, respectively.
C. Related Parties
Management Agreement. Under the Investment Management Agreement with Deutsche Investment Management Americas Inc. ("DIMA" or the "Advisor"), an indirect, wholly owned subsidiary of Deutsche Bank AG, the Advisor directs the investments of the Fund in accordance with its investment objectives, policies and restrictions. The Advisor determines the securities, instruments and other contracts relating to investments to be purchased, sold or entered into by the Fund.
Pursuant to the Investment Management Agreement with the Advisor, the Fund pays a monthly management fee based on the Fund's average daily net assets, computed and accrued daily and payable monthly, at the following annual rates:
| First $500 million of average daily net assets | | | .890 | % |
| Next $500 million of average daily net assets | | | .875 | % |
| Next $1 billion of average daily net assets | | | .860 | % |
| Over $2 billion of average daily net assets | | | .845 | % |
For the period from January 1, 2013 through April 30, 2014, the Advisor has contractually agreed to waive all or a portion of its fees and/or reimburse certain operating expenses of the Fund to the extent necessary to maintain the operating expenses (excluding certain expenses such as extraordinary expenses, taxes, brokerage and interest) of each class as follows:
Accordingly, for the year ended December 31, 2013, the Advisor waived a portion of its management fee pursuant to the Investment Management Agreement aggregating $272,371, and the amount charged aggregated $975,697, which was equivalent to an annual effective rate of 0.70% of the Fund's average daily net assets.
Administration Fee. Pursuant to an Administrative Services Agreement, DIMA provides most administrative services to the Fund. For all services provided under the Administrative Services Agreement, the Fund pays the Advisor an annual fee ("Administration Fee") of 0.10% of the Fund's average daily net assets, computed and accrued daily and payable monthly. For the year ended December 31, 2013, the Administration Fee was $140,232, of which $12,815 is unpaid.
Service Provider Fees. DWS Investments Service Company ("DISC"), an affiliate of the Advisor, is the transfer agent, dividend-paying agent and shareholder service agent for the Fund. Pursuant to a sub-transfer agency agreement between DISC and DST Systems, Inc. ("DST"), DISC has delegated certain transfer agent, dividend-paying agent and shareholder service agent functions to DST. DISC compensates DST out of the shareholder servicing fee it receives from the Fund. For the year ended December 31, 2013, the amounts charged to the Fund by DISC were as follows:
| Services to Shareholders | | Total Aggregated | | | Waived | | | Unpaid at December 31, 2013 | |
| Class A | | $ | 417 | | | $ | 417 | | | $ | — | |
| Class B | | | 198 | | | | — | | | | 39 | |
| | | $ | 615 | | | $ | 417 | | | $ | 39 | |
Distribution Service Agreement. DWS Investments Distributors, Inc. ("DIDI"), also an affiliate of the Advisor, is the Series' Distributor. In accordance with the Master Distribution Plan, DIDI receives 12b-1 fees of 0.25% of average daily net assets of Class B shares. Pursuant to the Master Distribution Plan, DIDI remits these fees to the Participating Insurance Companies for various costs incurred or paid by these companies in connection with marketing and distribution of Class B shares. For the year ended December 31, 2013, the Distribution Service Fee aggregated $5,370, of which $534 is unpaid.
Typesetting and Filing Service Fees. Under an agreement with DIMA, DIMA is compensated for providing typesetting and certain regulatory filing services to the Fund. For the year ended December 31, 2013, the amount charged to the Fund by DIMA included in the Statement of Operations under "reports to shareholders" aggregated $14,404, of which $4,979 is unpaid.
Trustees' Fees and Expenses. The Fund paid retainer fees to each Trustee not affiliated with the Advisor, plus specified amounts to the Board Chairperson and Vice Chairperson and to each committee Chairperson.
Affiliated Cash Management Vehicles. The Fund may invest uninvested cash balances in Central Cash Management Fund and DWS Variable NAV Money Fund, affiliated money market funds which are managed by the Advisor. Each affiliated money market fund seeks to provide a high level of current income consistent with liquidity and the preservation of capital. Each affiliated money market fund is managed in accordance with Rule 2a-7 under the Investment Company Act of 1940, which governs the quality, maturity, diversity and liquidity of instruments in which a money market fund may invest. Central Cash Management Fund seeks to maintain a stable net asset value, and DWS Variable NAV Money Fund maintains a floating net asset value. The Fund indirectly bears its proportionate share of the expenses of each affiliated money market fund in which it invests. Central Cash Management Fund does not pay the Advisor an investment management fee. To the extent that DWS Variable NAV Money Fund pays an investment management fee to the Advisor, the Advisor will waive an amount of the investment management fee payable to the Advisor by the Fund equal to the amount of the investment management fee payable on the Fund's assets invested in DWS Variable NAV Money Fund.
Securities Lending Agent Fees. Deutsche Bank AG serves as securities lending agent for the Fund. For the year ended December 31, 2013, the Fund incurred securities lending agent fees to Deutsche Bank AG in the amount of $7,053.
D. Ownership of the Fund
At December 31, 2013, three participating insurance companies were owners of record of 10% or more of the total outstanding Class A shares of the Fund, each owning 52%, 15% and 10%, respectively. Two participating insurance companies were owners of record of 10% or more of the total outstanding Class B shares of the Fund, each owning 82% and 10%, respectively.
E. Line of Credit
The Fund and other affiliated funds (the "Participants") share in a $375 million revolving credit facility provided by a syndication of banks. The Fund may borrow for temporary or emergency purposes, including the meeting of redemption requests that otherwise might require the untimely disposition of securities. The Participants are charged an annual commitment fee which is allocated based on net assets, among each of the Participants. Interest is calculated at a rate per annum equal to the sum of the Federal Funds Rate plus 1.25 percent plus if LIBOR exceeds the Federal Funds Rate the amount of such excess. The Fund may borrow up to a maximum of 33 percent of its net assets under the agreement. The Fund had no outstanding loans at December 31, 2013.
Report of Independent Registered Public Accounting Firm
To the Trustees of DWS Variable Series I and the Shareholders of DWS Global Small Cap Growth VIP:
In our opinion, the accompanying statement of assets and liabilities, including the investment portfolio, and the related statements of operations and of changes in net assets and the financial highlights present fairly, in all material respects, the financial position of DWS Global Small Cap Growth VIP (the "Fund") at December 31, 2013 and the results of its operations, the changes in its net assets, and the financial highlights for the periods indicated therein, in conformity with accounting principles generally accepted in the United States of America. These financial statements and financial highlights (hereafter referred to as "financial statements") are the responsibility of the Fund's management. Our responsibility is to express an opinion on these financial statements based on our audits. We conducted our audits of these financial statements in accordance with the standards of the Public Company Accounting Oversight Board (United States). Those standards require that we plan and perform the audit to obtain reasonable assurance about whether the financial statements are free of material misstatement. An audit includes examining, on a test basis, evidence supporting the amounts and disclosures in the financial statements, assessing the accounting principles used and significant estimates made by management, and evaluating the overall financial statement presentation. We believe that our audits, which included confirmation of securities at December 31, 2013 by correspondence with the custodians and brokers, provide a reasonable basis for our opinion.
Boston, Massachusetts February 14, 2014 | PricewaterhouseCoopers LLP |
Information About Your Fund's Expenses (Unaudited)
As an investor of the Fund, you incur two types of costs: ongoing expenses and transaction costs. Ongoing expenses include management fees, distribution and service (12b-1) fees and other Fund expenses. Examples of transaction costs include contract charges, redemption fees and account maintenance fees, which are not shown in this section. The following tables are intended to help you understand your ongoing expenses (in dollars) of investing in the Fund and to help you compare these expenses with the ongoing expenses of investing in other mutual funds. In the most recent six-month period, the Fund limited these expenses; had it not done so, expenses would have been higher. The example in the table is based on an investment of $1,000 invested at the beginning of the six-month period and held for the entire period (July 1, 2013 to December 31, 2013).
The tables illustrate your Fund's expenses in two ways:
—Actual Fund Return. This helps you estimate the actual dollar amount of ongoing expenses (but not transaction costs) paid on a $1,000 investment in the Fund using the Fund's actual return during the period. To estimate the expenses you paid over the period, simply divide your account value by $1,000 (for example, an $8,600 account value divided by $1,000 = 8.6), then multiply the result by the number in the "Expenses Paid per $1,000" line under the share class you hold.
— Hypothetical 5% Fund Return. This helps you to compare your Fund's ongoing expenses (but not transaction costs) with those of other mutual funds using the Fund's actual expense ratio and a hypothetical rate of return of 5% per year before expenses. Examples using a 5% hypothetical Fund return may be found in the shareholder reports of other mutual funds. The hypothetical account values and expenses may not be used to estimate the actual ending account balance or expenses you paid for the period.
Please note that the expenses shown in these tables are meant to highlight your ongoing expenses only and do not reflect any transaction costs. The "Expenses Paid per $1,000" line of the tables is useful in comparing ongoing expenses only and will not help you determine the relative total expense of owning different funds. If these transaction costs had been included, your costs would have been higher.
Expenses and Value of a $1,000 Investment for the year ended December 31, 2013 | |
| Actual Fund Return | | Class A | | | Class B | |
| Beginning Account Value 7/1/13 | | $ | 1,000.00 | | | $ | 1,000.00 | |
| Ending Account Value 12/31/13 | | $ | 1,213.90 | | | $ | 1,212.10 | |
| Expenses Paid per $1,000* | | $ | 5.25 | | | $ | 6.41 | |
| Hypothetical 5% Fund Return | | Class A | | | Class B | |
| Beginning Account Value 7/1/13 | | $ | 1,000.00 | | | $ | 1,000.00 | |
| Ending Account Value 12/31/13 | | $ | 1,020.47 | | | $ | 1,019.41 | |
| Expenses Paid per $1,000* | | $ | 4.79 | | | $ | 5.85 | |
* Expenses are equal to the Fund's annualized expense ratio for each share class, multiplied by the average account value over the period, multiplied by 184 (the number of days in the most recent six-month period), then divided by 365.
| Annualized Expense Ratios | | Class A | | Class B | |
| DWS Variable Series I — DWS Global Small Cap Growth VIP | | .94% | | 1.15% | |
For more information, please refer to the Fund's prospectus.
These tables do not reflect charges and fees ("contract charges") associated with the separate account that invests in the Fund or any variable life insurance policy or variable annuity contract for which the Fund is an investment option.
For an analysis of the fees associated with an investment in the fund or similar funds, please refer to the current and hypothetical expense calculators for Variable Insurance Products which can be found at dws-investments.com/EN/resources/calculators.jsp.
Tax Information (Unaudited)
The Fund paid distributions of $1.07 per share from net long-term capital gains during its year ended December 31, 2013.
Pursuant to Section 852 of the Internal Revenue Code, the Fund designates $17,559,000 as capital gain dividends for its year ended December 31, 2013.
For corporate shareholders of the Fund, 92% of the ordinary dividends (i.e., income dividends plus short-term capital gains) paid during the Fund's fiscal year ended December 31, 2013 qualified for the dividends received deduction.
Please consult a tax advisor if you have questions about federal or state income tax laws, or on how to prepare your tax returns. If you have specific questions about your account, please contact your insurance provider.
The Series' policies and procedures for voting proxies for portfolio securities and information about how the Series voted proxies related to its portfolio securities during the 12-month period ended June 30 are available on our Web site — dws-investments.com (click on "proxy voting"at the bottom of the page) — or on the SEC's Web site — sec.gov. To obtain a written copy of the Series' policies and procedures without charge, upon request, call us toll free at (800) 728-3337.
Advisory Agreement Board Considerations and Fee Evaluation
The Board of Trustees approved the renewal of DWS Global Small Cap Growth VIP's investment management agreement (the "Agreement") with Deutsche Investment Management Americas Inc. ("DIMA") in September 2013.
In terms of the process that the Board followed prior to approving the Agreement, shareholders should know that:
— In September 2013, all of the Fund's Trustees were independent of DIMA and its affiliates.
— The Trustees met frequently during the past year to discuss fund matters and dedicated a substantial amount of time to contract review matters. Over the course of several months, the Board's Contract Committee, in coordination with the Board's Equity Oversight Committee, reviewed comprehensive materials received from DIMA, independent third parties and independent counsel. These materials included an analysis of the Fund's performance, fees and expenses, and profitability compiled by a fee consultant retained by the Fund's Independent Trustees (the "Fee Consultant"). The Board also received extensive information throughout the year regarding performance of the Fund.
— The Independent Trustees regularly meet privately with their independent counsel to discuss contract review and other matters. In addition, the Independent Trustees were also advised by the Fee Consultant in the course of their review of the Fund's contractual arrangements and considered a comprehensive report prepared by the Fee Consultant in connection with their deliberations.
— In connection with reviewing the Agreement, the Board also reviewed the terms of the Fund's Rule 12b-1 plan, distribution agreement, administrative services agreement, transfer agency agreement and other material service agreements.
— Based on its evaluation of the information provided, the Contract Committee presented its findings and recommendations to the Board. The Board then reviewed the Contract Committee's findings and recommendations.
In connection with the contract review process, the Contract Committee and the Board considered the factors discussed below, among others. The Board also considered that DIMA and its predecessors have managed the Fund since its inception, and the Board believes that a long-term relationship with a capable, conscientious advisor is in the best interests of the Fund. The Board considered, generally, that shareholders chose to invest or remain invested in the Fund knowing that DIMA managed the Fund, and that the Agreement was approved by the Fund's shareholders. DIMA is part of Deutsche Bank AG, a major global banking institution that is engaged in a wide range of financial services. The Board believes that there are advantages to being part of a global asset management business that offers a wide range of investing expertise and resources, including hundreds of portfolio managers and analysts with research capabilities in many countries throughout the world.
As part of the contract review process, the Board carefully considered the fees and expenses of each DWS fund overseen by the Board in light of the fund's performance. In many cases, this led to a negotiation with DIMA of lower expense caps as part of the 2012 and 2013 contract review processes than had previously been in place. As part of these negotiations, the Board indicated that it would consider relaxing these new lower caps in future years following sustained improvements in performance, among other considerations.
In June 2012, Deutsche Bank AG ("DB"), DIMA's parent company, announced that DB would combine its Asset Management (of which DIMA was a part) and Wealth Management divisions. DB has advised the Independent Trustees that the U.S. asset management business is a critical and integral part of DB, and that it has, and will continue to, reinvest a significant portion of the substantial savings it expects to realize by combining its Asset Management and Wealth Management divisions into the new Asset and Wealth Management ("AWM") division, including ongoing enhancements to its investment capabilities. DB also has confirmed its commitment to maintaining strong legal and compliance groups within the AWM division.
While shareholders may focus primarily on fund performance and fees, the Fund's Board considers these and many other factors, including the quality and integrity of DIMA's personnel and such other issues as back-office operations, fund valuations, and compliance policies and procedures.
Nature, Quality and Extent of Services. The Board considered the terms of the Agreement, including the scope of advisory services provided under the Agreement. The Board noted that, under the Agreement, DIMA provides portfolio management services to the Fund and that, pursuant to a separate administrative services agreement, DIMA provides administrative services to the Fund. The Board considered the experience and skills of senior management and investment personnel, the resources made available to such personnel, the ability of DIMA to attract and retain high-quality personnel, and the organizational depth and stability of DIMA. The Board reviewed the Fund's performance over short-term and long-term periods and compared those returns to various agreed-upon performance measures, including market indices and a peer universe compiled by the Fee Consultant using information supplied by Morningstar Direct ("Morningstar"), an independent fund data service. The Board also noted that it has put into place a process of identifying "Focus Funds" (e.g., funds performing poorly relative to their benchmark or a peer universe compiled by an independent fund data service), and receives more frequent reporting and information from DIMA regarding such funds, along with DIMA's remedial plans to address underperformance. The Board believes this process is an effective manner of identifying and addressing underperforming funds. Based on the information provided, the Board noted that for the one-, three- and five-year periods ended December 31, 2012, the Fund's performance (Class A shares) was in the 4th quartile, 1st quartile and 3rd quartile, respectively, of the applicable Morningstar universe (the 1st quartile being the best performers and the 4th quartile being the worst performers). The Board also observed that the Fund has underperformed its benchmark in each of the one-, three- and five-year periods ended December 31, 2012. The Board noted the disappointing investment performance of the Fund in recent periods and continued to discuss with senior management of DIMA the factors contributing to such underperformance and actions being taken to improve performance. The Board observed that the Fund had experienced improved relative performance during the first seven months of 2013. The Board recognized the efforts by DIMA in recent years to enhance its investment platform and improve long-term performance across the DWS fund complex.
Fees and Expenses. The Board considered the Fund's investment management fee schedule, operating expenses and total expense ratios, and comparative information provided by Lipper Inc. ("Lipper") and the Fee Consultant regarding investment management fee rates paid to other investment advisors by similar funds (1st quartile being the most favorable and 4th quartile being the least favorable). With respect to management fees paid to other investment advisors by similar funds, the Board noted that the contractual fee rates paid by the Fund, which include a 0.10% fee paid to DIMA under the Fund's administrative services agreement, were higher than the median (4th quartile) of the applicable Lipper peer group (based on Lipper data provided as of December 31, 2012). The Board noted that the Fund's Class A shares total (net) operating expenses were expected to be higher than the median (3rd quartile) of the applicable Lipper expense universe (based on Lipper data provided as of December 31, 2012) ("Lipper Universe Expenses"). The Board also reviewed data comparing each share class's total (net) operating expenses to the applicable Lipper Universe Expenses. The Board considered the Fund's management fee rate as compared to fees charged by DIMA to comparable funds and considered differences between the Fund and the comparable funds. The Board also considered how the Fund's total (net) operating expenses compared to the total (net) operating expenses of a more customized peer group selected by Lipper (based on such factors as asset size).
The Board also noted that the expense limitations agreed to by DIMA helped to ensure that the Fund's total (net) operating expenses would remain competitive.
The information considered by the Board as part of its review of management fees included information regarding fees charged by DIMA and its affiliates to similar institutional accounts and to similar funds offered primarily to European investors ("DWS Europe funds"), in each case as applicable. The Board observed that advisory fee rates for institutional accounts generally were lower than the management fees charged by similarly managed DWS U.S. mutual funds ("DWS Funds"), but also took note of the differences in services provided to DWS Funds as compared to institutional accounts. In the case of DWS Europe funds, the Board observed that fee rates for DWS Europe funds generally were higher than for similarly managed DWS Funds, but noted that differences in the types of services provided to DWS Funds relative to DWS Europe funds made it difficult to compare such fees.
On the basis of the information provided, the Board concluded that management fees were reasonable and appropriate in light of the nature, quality and extent of services provided by DIMA.
Profitability. The Board reviewed detailed information regarding revenues received by DIMA under the Agreement. The Board considered the estimated costs and pre-tax profits realized by DIMA from advising the DWS Funds, as well as estimates of the pre-tax profits attributable to managing the Fund in particular. The Board also received information regarding the estimated enterprise-wide profitability of DWS and its affiliates with respect to all fund services in totality and by fund. The Board and the Fee Consultant reviewed DIMA's methodology in allocating its costs to the management of the Fund. Based on the information provided, the Board concluded that the pre-tax profits realized by DIMA in connection with the management of the Fund were not unreasonable. The Board also reviewed information regarding the profitability of certain similar investment management firms. The Board noted that while information regarding the profitability of such firms is limited (and in some cases is not necessarily prepared on a comparable basis), DIMA and its affiliates' overall profitability with respect to the DWS fund complex (after taking into account distribution and other services provided to the funds by DIMA and its affiliates) was lower than the overall profitability levels of many comparable firms for which such data was available.
Economies of Scale. The Board considered whether there are economies of scale with respect to the management of the Fund and whether the Fund benefits from any economies of scale. The Board noted that the Fund's management fee schedule includes fee breakpoints. The Board concluded that the Fund's fee schedule represents an appropriate sharing between the Fund and DIMA of such economies of scale as may exist in the management of the Fund at current asset levels.
Other Benefits to DIMA and Its Affiliates. The Board also considered the character and amount of other incidental benefits received by DIMA and its affiliates, including any fees received by DIMA for administrative services provided to the Fund and any fees received by an affiliate of DIMA for distribution services. The Board also considered benefits to DIMA related to brokerage and soft-dollar allocations, including allocating brokerage to pay for research generated by parties other than the executing broker dealers, which pertain primarily to funds investing in equity securities, along with the incidental public relations benefits to DIMA related to DWS Funds advertising and cross-selling opportunities among DIMA products and services. The Board concluded that management fees were reasonable in light of these fallout benefits.
Compliance. The Board considered the significant attention and resources dedicated by DIMA to documenting and enhancing its compliance processes in recent years. The Board noted in particular (i) the experience and seniority of both DIMA's chief compliance officer and the Fund's chief compliance officer; (ii) the large number of DIMA compliance personnel; and (iii) the substantial commitment of resources by DIMA and its affiliates to compliance matters.
Based on all of the information considered and the conclusions reached, the Board unanimously determined that the continuation of the Agreement is in the best interests of the Fund. In making this determination, the Board did not give particular weight to any single factor identified above. The Board considered these factors over the course of numerous meetings, certain of which were in executive session with only the Independent Trustees and their independent counsel present. It is possible that individual Trustees may have weighed these factors differently in reaching their individual decisions to approve the continuation of the Agreement.
Board Members and Officers
The following table presents certain information regarding the Board Members and Officers of the fund. Each Board Member's year of birth is set forth in parentheses after his or her name. Unless otherwise noted, (i) each Board Member has engaged in the principal occupation(s) noted in the table for at least the most recent five years, although not necessarily in the same capacity; and (ii) the address of each Independent Board Member is c/o Kenneth C. Froewiss, Chairman, DWS Mutual Funds, P.O. Box 78, Short Hills, NJ 07078. Except as otherwise noted below, the term of office for each Board Member is until the election and qualification of a successor, or until such Board Member sooner dies, resigns, is removed or as otherwise provided in the governing documents of the fund. Because the fund does not hold an annual meeting of shareholders, each Board Member will hold office for an indeterminate period. The Board Members may also serve in similar capacities with other funds in the fund complex.
| Independent Board Members |
Name, Year of Birth, Position with the Fund and Length of Time Served1 | | Business Experience and Directorships During the Past Five Years | Number of Funds in DWS Fund Complex Overseen | Other Directorships Held by Board Member |
Kenneth C. Froewiss (1945) Chairperson since 2013, and Board Member since 2001 | | Adjunct Professor of Finance, NYU Stern School of Business (September 2009–present; Clinical Professor from 1997–September 2009); Member, Finance Committee, Association for Asian Studies (2002–present); Director, Mitsui Sumitomo Insurance Group (US) (2004–present); prior thereto, Managing Director, J.P. Morgan (investment banking firm) (until 1996) | 103 | — |
William McClayton (1944) Vice Chairperson since 2013, and Board Member since 2004 | | Private equity investor (since October 2009); previously, Managing Director, Diamond Management & Technology Consultants, Inc. (global consulting firm) (2001–2009); Directorship: Board of Managers, YMCA of Metropolitan Chicago; formerly: Senior Partner, Arthur Andersen LLP (accounting) (1966–2001); Trustee, Ravinia Festival | 103 | — |
John W. Ballantine (1946) Board Member since 1999 | | Retired; formerly, Executive Vice President and Chief Risk Management Officer, First Chicago NBD Corporation/The First National Bank of Chicago (1996–1998); Executive Vice President and Head of International Banking (1995–1996); former Directorships: Stockwell Capital Investments PLC (private equity); First Oak Brook Bancshares, Inc. and Oak Brook Bank; Prisma Energy International | 103 | Chairman of the Board, Healthways, Inc.2 (provider of disease and care management services) (2003– present); Portland General Electric2 (utility company) (2003– present) |
Henry P. Becton, Jr. (1943) Board Member since 1990 | | Vice Chair and former President, WGBH Educational Foundation. Directorships: Public Radio International; Public Radio Exchange (PRX); North Bennett Street School (Boston); former Directorships: The PBS Foundation; Association of Public Television Stations; Boston Museum of Science; American Public Television; Concord Academy; New England Aquarium; Mass. Corporation for Educational Telecommunications; Committee for Economic Development; Public Broadcasting Service; Connecticut College | 103 | Lead Director, Becton Dickinson and Company2 (medical technology company); Lead Director, Belo Corporation2 (media company) |
Dawn-Marie Driscoll (1946) Board Member since 1987 | | President, Driscoll Associates (consulting firm); Emeritus Executive Fellow, Center for Business Ethics, Bentley University; formerly, Partner, Palmer & Dodge (1988–1990); Vice President of Corporate Affairs and General Counsel, Filene's (1978–1988). Directorships: Director of ICI Mutual Insurance Company (since 2007); Advisory Board, Center for Business Ethics, Bentley University; Chairman of the Board of Trustees, Southwest Florida Community Foundation (charitable organization); former Directorships: Sun Capital Advisers Trust (mutual funds) (2007–2012), Investment Company Institute (audit, executive, nominating committees) and Independent Directors Council (governance, executive committees) | 103 | — |
Keith R. Fox, CFA (1954) Board Member since 1996 | | Managing General Partner, Exeter Capital Partners (a series of private investment funds) (since 1986). Directorships: Progressive International Corporation (kitchen goods importer and distributor); The Kennel Shop (retailer); former Chairman, National Association of Small Business Investment Companies; former Directorships: BoxTop Media Inc. (advertising); Sun Capital Advisers Trust (mutual funds) (2011–2012) | 103 | — |
Paul K. Freeman (1950) Board Member since 1993 | | Consultant, World Bank/Inter-American Development Bank; Executive and Governing Council of the Independent Directors Council (Chairman of Education Committee); formerly: Project Leader, International Institute for Applied Systems Analysis (1998–2001); Chief Executive Officer, The Eric Group, Inc. (environmental insurance) (1986–1998); Directorships: Denver Zoo Foundation (December 2012–present); former Directorships: Prisma Energy International | 103 | — |
Richard J. Herring (1946) Board Member since 1990 | | Jacob Safra Professor of International Banking and Professor, Finance Department, The Wharton School, University of Pennsylvania (since July 1972); Co-Director, Wharton Financial Institutions Center (since July 2000); Co-Chair, U.S. Shadow Financial Regulatory Committee; Executive Director, Financial Economists Roundtable; formerly: Vice Dean and Director, Wharton Undergraduate Division (July 1995–June 2000); Director, Lauder Institute of International Management Studies (July 2000–June 2006) | 103 | Director, Japan Equity Fund, Inc. (since September 2007), Thai Capital Fund, Inc. (since 2007), Singapore Fund, Inc. (since September 2007), Independent Director of Barclays Bank Delaware (since September 2010) |
Rebecca W. Rimel (1951) Board Member since 1995 | | President and Chief Executive Officer, The Pew Charitable Trusts (charitable organization) (1994 to present); formerly: Executive Vice President, The Glenmede Trust Company (investment trust and wealth management) (1983–2004); Board Member, Investor Education (charitable organization) (2004–2005); Trustee, Executive Committee, Philadelphia Chamber of Commerce (2001–2007); Director, Viasys Health Care2 (January 2007–June 2007); Trustee, Thomas Jefferson Foundation (charitable organization) (1994–2012) | 103 | Director, Becton Dickinson and Company2 (medical technology company) (2012– present); Director, CardioNet, Inc.2 (health care) (2009– present) |
William N. Searcy, Jr. (1946) Board Member since 1993 | | Private investor since October 2003; formerly: Pension & Savings Trust Officer, Sprint Corporation2 (telecommunications) (November 1989–September 2003); Trustee, Sun Capital Advisers Trust (mutual funds) (1998–2012) | 103 | — |
Jean Gleason Stromberg (1943) Board Member since 1997 | | Retired. Formerly, Consultant (1997–2001); Director, Financial Markets U.S. Government Accountability Office (1996–1997); Partner, Fulbright & Jaworski, L.L.P. (law firm) (1978–1996). Directorships: The William and Flora Hewlett Foundation; former Directorships: Service Source, Inc., Mutual Fund Directors Forum (2002–2004), American Bar Retirement Association (funding vehicle for retirement plans) (1987–1990 and 1994–1996) | 103 | — |
Robert H. Wadsworth (1940) Board Member since 1999 | | President, Robert H. Wadsworth & Associates, Inc. (consulting firm) (1983 to present); Director, National Horizon, Inc. (non-profit organization); Director and Treasurer, The Phoenix Boys Choir Association | 106 | — |
Officers4 |
Name, Year of Birth, Position with the Fund and Length of Time Served5 | | Business Experience and Directorships During the Past Five Years |
Brian E. Binder8,9 (1972) President and Chief Executive Officer, 2013–present | | Managing Director3 and Head of Fund Administration, Deutsche Asset & Wealth Management (2013–present); formerly: Head of Business Management and Consulting at Invesco, Ltd. (2010–2012); Chief Administrative Officer, Van Kampen Funds Inc. (2008–2010); and Chief Administrative Officer, Morgan Stanley Investment Management Americas Distribution (2003–2008) |
John Millette7 (1962) Vice President and Secretary, 1999–present | | Director,3 Deutsche Asset & Wealth Management |
Paul H. Schubert6 (1963) Chief Financial Officer, 2004–present Treasurer, 2005–present | | Managing Director,3 Deutsche Asset & Wealth Management (since July 2004); formerly: Executive Director, Head of Mutual Fund Services and Treasurer for UBS Family of Funds (1998–2004); Vice President and Director of Mutual Fund Finance at UBS Global Asset Management (1994–1998) |
Caroline Pearson7 (1962) Chief Legal Officer, 2010–present | | Managing Director,3 Deutsche Asset & Wealth Management; formerly: Assistant Secretary for DWS family of funds (1997–2010) |
Melinda Morrow6 (1970) Vice President, 2012–present | | Director,3 Deutsche Asset & Wealth Management |
Hepsen Uzcan7 (1974) Assistant Secretary, 2013–present | | Vice President, Deutsche Asset & Wealth Management |
Paul Antosca7 (1957) Assistant Treasurer, 2007–present | | Director,3 Deutsche Asset & Wealth Management |
Jack Clark7 (1967) Assistant Treasurer, 2007–present | | Director,3 Deutsche Asset & Wealth Management |
Diane Kenneally7 (1966) Assistant Treasurer, 2007–present | | Director,3 Deutsche Asset & Wealth Management |
John Caruso6 (1965) Anti-Money Laundering Compliance Officer, 2010–present | | Managing Director,3 Deutsche Asset & Wealth Management |
Robert Kloby6 (1962) Chief Compliance Officer, 2006–present | | Managing Director,3 Deutsche Asset & Wealth Management |
1 The length of time served represents the year in which the Board Member joined the board of one or more DWS funds currently overseen by the Board.
2 A publicly held company with securities registered pursuant to Section 12 of the Securities Exchange Act of 1934.
3 Executive title, not a board directorship.
4 As a result of their respective positions held with the Advisor, these individuals are considered "interested persons" of the Advisor within the meaning of the 1940 Act. Interested persons receive no compensation from the fund.
5 The length of time served represents the year in which the officer was first elected in such capacity for one or more DWS funds.
6 Address: 60 Wall Street, New York, NY 10005.
7 Address: One Beacon Street, Boston, MA 02108.
8 Address: 222 South Riverside Plaza, Chicago, IL 60606.
9 Effective as of December 1, 2013.
The fund's Statement of Additional Information ("SAI") includes additional information about the Board Members. The SAI is available, without charge, upon request. If you would like to request a copy of the SAI, you may do so by calling the following toll-free number: (800) 728-3337.
Notes
DWS Investments Distributors, Inc.
222 South Riverside Plaza
Chicago, IL 60606
(800) 621-1148
VS1gloscg-2 (R-025821-3 2/14)
December 31, 2013
Annual Report
DWS Variable Series I
DWS International VIP
Contents
9 Statement of Assets and Liabilities 10 Statement of Operations 10 Statement of Changes in Net Assets 13 Notes to Financial Statements 18 Report of Independent Registered Public Accounting Firm 19 Information About Your Fund's Expenses 21 Advisory Agreement Board Considerations and Fee Evaluation 24 Board Members and Officers |
This report must be preceded or accompanied by a prospectus. To obtain an additional prospectus or summary prospectus, if available, call (800) 728-3337 or your financial representative. We advise you to consider the Fund's objectives, risks, charges and expenses carefully before investing. The summary prospectus and prospectus contain this and other important information about the Fund. Please read the prospectus carefully before you invest.
Investing in derivatives entails special risks relating to liquidity, leverage and credit that may reduce returns and/or increase volatility. Investing in foreign securities, particularly those of emerging markets, presents certain risks, such as currency fluctuations, political and economic changes, and market risks. The Fund may lend securities to approved institutions. Stocks may decline in value. See the prospectus for details.
Deutsche Asset & Wealth Management represents the asset management and wealth management activities conducted by Deutsche Bank AG or any of its subsidiaries, including the Advisor and DWS Investments Distributors, Inc.
NOT FDIC/NCUA INSURED NO BANK GUARANTEE MAY LOSE VALUE NOT A DEPOSIT
NOT INSURED BY ANY FEDERAL GOVERNMENT AGENCY
Performance Summary December 31, 2013 (Unaudited)
Fund performance shown is historical, assumes reinvestment of all dividend and capital gain distributions, and does not guarantee future results. Investment return and principal value fluctuate with changing market conditions so that, when redeemed, shares may be worth more or less than their original cost. Current performance may be lower or higher than the performance data quoted. Please contact your participating insurance company for the Fund's most recent month-end performance. Performance doesn't reflect charges and fees ("contract charges") associated with the separate account that invests in the Fund or any variable life insurance policy or variable annuity contract for which the Fund is an investment option. These charges and fees will reduce returns. While all share classes have the same underlying portfolio, their performance will differ.
The gross expense ratios of the Fund, as stated in the fee table of the prospectus dated May 1, 2013 are 0.98% and 1.26% for Class A and Class B shares, respectively, and may differ from the expense ratios disclosed in the Financial Highlights tables in this report.
| Growth of an Assumed $10,000 Investment |
| MSCI EAFE Index is an unmanaged index that tracks international stock performance in the 22 developed markets of Europe, Australasia and the Far East. Returns reflect reinvestment of dividends net of withholding taxes. The index is calculated using closing local market prices and translates into U.S. dollars using the London close foreign exchange rates. Index returns do not reflect any fees or expenses and it is not possible to invest directly into an index. |
| |
| Yearly periods ended December 31 | |
| Comparative Results | |
| DWS International VIP | | 1-Year | | | 3-Year | | | 5-Year | | | 10-Year | |
| Class A | Growth of $10,000 | | $ | 12,023 | | | $ | 12,087 | | | $ | 16,400 | | | $ | 16,588 | |
| Average annual total return | | | 20.23 | % | | | 6.52 | % | | | 10.40 | % | | | 5.19 | % |
MSCI EAFE® Index | Growth of $10,000 | | $ | 12,278 | | | $ | 12,655 | | | $ | 17,969 | | | $ | 19,509 | |
| Average annual total return | | | 22.78 | % | | | 8.17 | % | | | 12.44 | % | | | 6.91 | % |
| DWS International VIP | | 1-Year | | | 3-Year | | | 5-Year | | | 10-Year | |
| Class B | Growth of $10,000 | | $ | 12,001 | | | $ | 11,998 | | | $ | 16,157 | | | $ | 16,118 | |
| Average annual total return | | | 20.01 | % | | | 6.26 | % | | | 10.07 | % | | | 4.89 | % |
MSCI EAFE® Index | Growth of $10,000 | | $ | 12,278 | | | $ | 12,655 | | | $ | 17,969 | | | $ | 19,509 | |
| Average annual total return | | | 22.78 | % | | | 8.17 | % | | | 12.44 | % | | | 6.91 | % |
The growth of $10,000 is cumulative.
Management Summary December 31, 2013 (Unaudited)
International equities returned 22.78% during 2013, as measured by the Fund's benchmark, the MSCI EAFE Index.1 The overseas markets performed well in an environment characterized by elevated investor risk appetites, favorable central bank policies and improving economic growth in the developed economies. Stocks in Japan and Continental Europe finished the year with the strongest returns, while the United Kingdom and non-Japan Asia lagged. The Fund returned 20.23% (Class A shares, unadjusted for contract charges), underperforming the benchmark.
Although the Fund's holdings in the financial and consumer discretionary sectors delivered strong relative performance during the past year ending December 31, 2013, this was offset by the underperformance of our holdings in the industrials and information technology sectors. The leading largest individual contributors were ING Groep NV, Deutsche Post AG and the Norwegian financial services company DNB ASA. ING, a Netherlands-based financial services company, performed very well in 2013 thanks to the company's successful cost-cutting efforts and improving underlying business trends.2 The leading detractors were the Japanese industrial automation company FANUC Corp., the Chinese banking stock BOC Hong Kong (Holdings) Ltd. and the Scandinavian telecommunications operator TeliaSonera AB.
We maintain our disciplined, systematic approach to stock selection. We believe that focusing on individual stock picking, rather than trying to chase short-term trends in the market, is the most effective way to generate long-term outperformance. Our bottom-up approach led us to establish the largest overweights in the telecommunications, utilities and industrials sectors, while our most substantial underweights were in consumer staples, energy and health care.3,4
We believe the Fund is well positioned for the year ahead through our emphasis on fundamentally sound, reasonably valued stocks that are poised to deliver steady performance in an environment of improving economic growth. Now that the U.S. Federal Reserve Board (the Fed) has begun to taper its quantitative easing program, we believe investors will demonstrate a renewed preference for these types of companies rather than the liquidity-driven momentum stocks that topped the performance charts in the second half of 2013.5
Thomas Voecking
Juergen Foerster
Johannes Prix, PhD
Portfolio Managers
The views expressed reflect those of the portfolio management team only through the end of the period of the report as stated on the cover. The management team's views are subject to change at any time based on market and other conditions and should not be construed as a recommendation. Past performance is no guarantee of future results. Current and future portfolio holdings are subject to risk.
1 The Morgan Stanley Capital International (MSCI) Europe, Australasia and Far East (EAFE) Index is an unmanaged index that tracks international stock performance in the 21 developed markets in Europe, Australasia and the Far East. The index is calculated using closing local market prices and translates into U.S. dollars using the London close foreign exchange rates. Index returns do not reflect fees or expenses and it is not possible to invest directly into an index.
2 Contribution incorporates both a stock's total return and its weighting in the Fund.
3 "Overweight" means the Fund holds a higher weighting in a given sector or security than the benchmark. "Underweight" means the Fund holds a lower weighting.
4 The consumer staples sector represents companies that produce essential items such as food, beverages and household items.
5 Quantitative easing entails the purchase of government securities from the market in an effort to increase money supply.
Portfolio Summary (Unaudited) Asset Allocation (As a % of Investment Portfolio excluding Securities Lending Collateral) | 12/31/13 | 12/31/12 |
| | | |
| Common Stocks | 97% | 100% |
| Cash Equivalents | 3% | 0% |
| | 100% | 100% |
Geographical Diversification
(As a % of Investment Portfolio excluding Cash Equivalents and Securities Lending Collateral) | 12/31/13 | 12/31/12 |
| | | |
| Continental Europe | 53% | 50% |
| Japan | 20% | 24% |
| United Kingdom | 15% | 13% |
| Australia | 8% | 6% |
| Asia (excluding Japan) | 4% | 6% |
| Other | — | 1% |
| | 100% | 100% |
Sector Diversification
(As a % of Investment Portfolio excluding Cash Equivalents and Securities Lending Collateral) | 12/31/13 | 12/31/12 |
| | | |
| Financials | 26% | 27% |
| Consumer Discretionary | 14% | 11% |
| Industrials | 13% | 21% |
| Health Care | 9% | 0% |
| Consumer Staples | 9% | 2% |
| Telecommunication Services | 8% | 10% |
| Energy | 6% | 4% |
| Materials | 6% | 6% |
| Information Technology | 5% | 7% |
| Utilities | 4% | 12% |
| | 100% | 100% |
Portfolio holdings and characteristics are subject to change.
For more complete details about the Fund's investment portfolio, see page 6.
Following the Fund's fiscal first and third quarter-end, a complete portfolio holdings listing is filed with the SEC on Form N-Q. The form will be available on the SEC's Web site at sec.gov, and it also may be reviewed and copied at the SEC's Public Reference Room in Washington, D.C. Information on the operation of the SEC's Public Reference Room may be obtained by calling (800) SEC-0330. The Fund's portfolio holdings are also posted on dws-investments.com from time to time. Please see the Fund's current prospectus for more information.
Investment Portfolio December 31, 2013 | | | Shares | | | Value ($) | |
| | | | |
| Common Stocks 96.6% | |
| Australia 7.5% | |
| Australia & New Zealand Banking Group Ltd. | | | 111,600 | | | | 3,212,736 | |
| BHP Billiton Ltd. | | | 135,000 | | | | 4,591,091 | |
| Lend Lease Group | | | 74,000 | | | | 736,459 | |
| Macquarie Group Ltd. | | | 15,384 | | | | 758,677 | |
| Origin Energy Ltd. | | | 45,000 | | | | 565,591 | |
| Rio Tinto Ltd. | | | 23,400 | | | | 1,424,921 | |
| Sydney Airport | | | 16,300 | | | | 55,440 | |
| (Cost $10,685,273) | | | | 11,344,915 | |
| Belgium 0.4% | |
| Anheuser-Busch InBev NV (Cost $640,288) | | | 6,300 | | | | 671,731 | |
| Denmark 1.9% | |
| Coloplast AS "B" | | | 17,300 | | | | 1,147,555 | |
| Novo Nordisk AS "B" | | | 5,500 | | | | 1,013,272 | |
| TDC AS | | | 71,000 | | | | 688,836 | |
| (Cost $2,477,735) | | | | 2,849,663 | |
| Finland 0.9% | |
| Fortum Oyj | | | 31,000 | | | | 709,694 | |
| Nokia Oyj* | | | 80,000 | | | | 645,444 | |
| (Cost $1,108,667) | | | | 1,355,138 | |
| France 7.0% | |
| Dassault Systemes SA | | | 17,200 | | | | 2,137,182 | |
| European Aeronautic Defence & Space Co. | | | 9,000 | | | | 693,701 | |
| L'Oreal SA | | | 5,600 | | | | 986,158 | |
| LVMH Moet Hennessy Louis Vuitton SA | | | 4,200 | | | | 768,856 | |
| Publicis Groupe | | | 10,000 | | | | 917,978 | |
| Renault SA | | | 7,400 | | | | 597,457 | |
| Sanofi | | | 21,000 | | | | 2,235,365 | |
| Technip SA | | | 5,600 | | | | 539,388 | |
| Total SA | | | 29,100 | | | | 1,783,804 | |
| (Cost $8,924,658) | | | | 10,659,889 | |
| Germany 11.6% | |
| Adidas AG | | | 34,200 | | | | 4,359,889 | |
| Bayerische Motoren Werke (BMW) AG | | | 37,200 | | | | 4,362,581 | |
| Deutsche Post AG (Registered) | | | 55,600 | | | | 2,027,486 | |
| Fresenius Medical Care AG & Co. KGaA | | | 41,000 | | | | 2,917,969 | |
| Muenchener Rueckversicherungs AG (Registered) | | | 13,100 | | | | 2,887,168 | |
| SAP AG | | | 12,600 | | | | 1,080,325 | |
| (Cost $14,164,220) | | | | 17,635,418 | |
| Hong Kong 3.3% | |
| BOC Hong Kong (Holdings) Ltd. | | | 1,305,000 | | | | 4,197,322 | |
| Noble Group Ltd. | | | 970,000 | | | | 825,931 | |
| (Cost $4,191,790) | | | | 5,023,253 | |
| Italy 3.2% | |
| Snam SpA | | | 642,000 | | | | 3,598,631 | |
| UniCredit SpA | | | 159,000 | | | | 1,183,962 | |
| (Cost $3,661,923) | | | | 4,782,593 | |
| | | Shares | | | Value ($) | |
| | | | | | | | | |
| Japan 19.4% | |
| Bridgestone Corp. (a) | | | 81,900 | | | | 3,104,863 | |
| Canon, Inc. (a) | | | 41,000 | | | | 1,305,047 | |
| FANUC Corp. | | | 16,600 | | | | 3,044,051 | |
| Hitachi Ltd. | | | 126,000 | | | | 955,301 | |
| Japan Tobacco, Inc. | | | 44,300 | | | | 1,441,393 | |
| Keyence Corp. | | | 1,800 | | | | 770,854 | |
| Marubeni Corp. | | | 222,000 | | | | 1,597,547 | |
| Mitsubishi Corp. | | | 33,000 | | | | 633,362 | |
| Mitsubishi Estate Co., Ltd. | | | 115,000 | | | | 3,446,185 | |
| Mitsubishi Heavy Industries Ltd. | | | 143,000 | | | | 886,349 | |
| Mitsui & Co., Ltd. | | | 95,000 | | | | 1,324,712 | |
| Mizuho Financial Group, Inc. | | | 1,053,000 | | | | 2,280,586 | |
| Nabtesco Corp. | | | 88,000 | | | | 2,032,252 | |
| SoftBank Corp. | | | 19,100 | | | | 1,674,356 | |
| Sumitomo Mitsui Financial Group, Inc. | | | 12,400 | | | | 640,355 | |
| Sumitomo Realty & Development Co., Ltd. | | | 13,300 | | | | 662,914 | |
| Suzuki Motor Corp. | | | 24,100 | | | | 649,144 | |
| Toyota Motor Corp. | | | 47,700 | | | | 2,902,663 | |
| (Cost $24,740,636) | | | | 29,351,934 | |
| Netherlands 8.4% | |
| Akzo Nobel NV | | | 9,500 | | | | 737,088 | |
| ING Groep NV (CVA)* | | | 399,957 | | | | 5,592,861 | |
| Koninklijke DSM NV | | | 8,500 | | | | 669,914 | |
| Royal Dutch Shell PLC "B" | | | 151,000 | | | | 5,682,519 | |
| (Cost $9,005,951) | | | | 12,682,382 | |
| Norway 2.9% | |
| DnB ASA | | | 207,576 | | | | 3,720,019 | |
| Telenor ASA | | | 29,000 | | | | 692,514 | |
| (Cost $2,753,287) | | | | 4,412,533 | |
| Singapore 0.5% | |
| United Overseas Bank Ltd. (Cost $678,308) | | | 44,000 | | | | 741,832 | |
| Spain 3.0% | |
| Banco Popular Espanol SA* | | | 112,000 | | | | 676,224 | |
| Enagas SA | | | 24,700 | | | | 646,614 | |
| Iberdrola SA | | | 118,000 | | | | 754,713 | |
| Inditex SA | | | 10,700 | | | | 1,770,529 | |
| Repsol SA | | | 24,800 | | | | 626,601 | |
| (Cost $4,116,106) | | | | 4,474,681 | |
| Sweden 2.6% | |
| Sandvik AB | | | 150,000 | | | | 2,123,295 | |
| TeliaSonera AB | | | 215,000 | | | | 1,793,134 | |
| (Cost $3,426,347) | | | | 3,916,429 | |
| Switzerland 9.3% | |
| Nestle SA (Registered) | | | 68,700 | | | | 5,043,126 | |
| Roche Holding AG (Genusschein) | | | 23,400 | | | | 6,559,417 | |
| Swiss Life Holding AG (Registered)* | | | 3,400 | | | | 707,641 | |
| UBS AG (Registered)* | | | 96,000 | | | | 1,828,831 | |
| (Cost $12,121,367) | | | | 14,139,015 | |
| | | Shares | | | Value ($) | |
| | | | | | | | | |
| United Kingdom 14.7% | |
| Anglo American PLC | | | 63,000 | | | | 1,384,509 | |
| British American Tobacco PLC | | | 19,300 | | | | 1,035,523 | |
| Capita PLC | | | 212,000 | | | | 3,646,838 | |
| Centrica PLC | | | 129,000 | | | | 742,917 | |
| Diageo PLC | | | 77,900 | | | | 2,573,133 | |
| Inmarsat PLC | | | 200,000 | | | | 2,505,521 | |
| Old Mutual PLC | | | 680,000 | | | | 2,130,826 | |
| Prudential PLC | | | 84,000 | | | | 1,880,006 | |
| SABMiller PLC | | | 27,200 | | | | 1,400,753 | |
| Vodafone Group PLC | | | 1,081,000 | | | | 4,249,493 | |
| WPP PLC | | | 33,300 | | | | 764,165 | |
| (Cost $17,139,567) | | | | 22,313,684 | |
Total Common Stocks (Cost $119,836,123) | | | | 146,355,090 | |
| | |
| | | Shares | | | Value ($) | |
| | | | | | | | | |
| Rights 0.0% | |
| Spain | |
| Repsol SA, Expiration Date 1/9/2014* (a) (Cost $16,184) | | | 24,800 | | | | 16,922 | |
| | |
| Securities Lending Collateral 2.9% | |
| Daily Assets Fund Institutional, 0.08% (b) (c) (Cost $4,472,965) | | | 4,472,965 | | | | 4,472,965 | |
| | |
| Cash Equivalents 2.9% | |
| Central Cash Management Fund, 0.05% (b) (Cost $4,372,031) | | | 4,372,031 | | | | 4,372,031 | |
| | | % of Net Assets | | | Value ($) | |
| | | | |
Total Investment Portfolio (Cost $128,697,303)† | | | 102.4 | | | | 155,217,008 | |
| Other Assets and Liabilities, Net | | | (2.4 | ) | | | (3,700,090 | ) |
| Net Assets | | | 100.0 | | | | 151,516,918 | |
* Non-income producing security.
† The cost for federal income tax purposes was $128,719,436. At December 31, 2013, net unrealized appreciation for all securities based on tax cost was $26,497,572. This consisted of aggregate gross unrealized appreciation for all securities in which there was an excess of value over tax cost of $27,207,244 and aggregate gross unrealized depreciation for all securities in which there was an excess of tax cost over value of $709,672.
(a) All or a portion of these securities were on loan. In addition, "Other Assets and Liabilities, Net" may include pending sales that are also on loan. The value of securities loaned at December 31, 2013 amounted to $4,263,821, which is 2.8% of net assets.
(b) Affiliated fund managed by Deutsche Investment Management Americas Inc. The rate shown is the annualized seven-day yield at period end.
(c) Represents collateral held in connection with securities lending. Income earned by the Fund is net of borrower rebates.
CVA: Certificaten Van Aandelen (Certificate of Stock)
At December 31, 2013, open futures contracts purchased were as follows:
| Futures | Currency | Expiration Date | | Contracts | | | Notional Value ($) | | | Unrealized Appreciation ($) | |
| S&P 500 E-Mini Index | USD | 3/21/2014 | | | 50 | | | | 4,602,750 | | | | 151,875 | |
| Currency Abbreviation |
| USD United States Dollar |
For information on the Fund's policy and additional disclosures regarding futures contracts, please refer to the Derivatives section of Note B in the accompanying Notes to Financial Statements.
Fair Value Measurements
Various inputs are used in determining the value of the Fund's investments. These inputs are summarized in three broad levels. Level 1 includes quoted prices in active markets for identical securities. Level 2 includes other significant observable inputs (including quoted prices for similar securities, interest rates, prepayment speeds and credit risk). Level 3 includes significant unobservable inputs (including the Fund's own assumptions in determining the fair value of investments). The level assigned to the securities valuations may not be an indication of the risk or liquidity associated with investing in those securities.
The following is a summary of the inputs used as of December 31, 2013 in valuing the Fund's investments. For information on the Fund's policy regarding the valuation of investments, please refer to the Security Valuation section of Note A in the accompanying Notes to Financial Statements.
| Assets | | Level 1 | | | Level 2 | | | Level 3 | | | Total | |
| | |
| Common Stocks | |
| Australia | | $ | — | | | $ | 11,344,915 | | | $ | — | | | $ | 11,344,915 | |
| Belgium | | | — | | | | 671,731 | | | | — | | | | 671,731 | |
| Denmark | | | — | | | | 2,849,663 | | | | — | | | | 2,849,663 | |
| Finland | | | — | | | | 1,355,138 | | | | — | | | | 1,355,138 | |
| France | | | — | | | | 10,659,889 | | | | — | | | | 10,659,889 | |
| Germany | | | — | | | | 17,635,418 | | | | — | | | | 17,635,418 | |
| Hong Kong | | | — | | | | 5,023,253 | | | | — | | | | 5,023,253 | |
| Italy | | | — | | | | 4,782,593 | | | | — | | | | 4,782,593 | |
| Japan | | | — | | | | 29,351,934 | | | | — | | | | 29,351,934 | |
| Netherlands | | | — | | | | 12,682,382 | | | | — | | | | 12,682,382 | |
| Norway | | | — | | | | 4,412,533 | | | | — | | | | 4,412,533 | |
| Singapore | | | — | | | | 741,832 | | | | — | | | | 741,832 | |
| Spain | | | — | | | | 4,474,681 | | | | — | | | | 4,474,681 | |
| Sweden | | | — | | | | 3,916,429 | | | | — | | | | 3,916,429 | |
| Switzerland | | | — | | | | 14,139,015 | | | | — | | | | 14,139,015 | |
| United Kingdom | | | — | | | | 22,313,684 | | | | — | | | | 22,313,684 | |
| Rights | | | — | | | | 16,922 | | | | — | | | | 16,922 | |
| Short-Term Investments (d) | | | 8,844,996 | | | | — | | | | — | | | | 8,844,996 | |
Derivatives (e) Futures Contracts | | | 151,875 | | | | — | | | | — | | | | 151,875 | |
| Total | | $ | 8,996,871 | | | $ | 146,372,012 | | | $ | — | | | $ | 155,368,883 | |
There have been no transfers between fair value measurement levels during the year ended December 31, 2013.
(d) See Investment Portfolio for additional detailed categorizations.
(e) Derivatives include unrealized appreciation (depreciation) on futures contracts.
The accompanying notes are an integral part of the financial statements.
Statement of Assets and Liabilities | as of December 31, 2013 | |
| Assets | |
Investments: Investments in non-affiliated securities, at value (cost $119,852,307) — including $4,263,821 of securities loaned | | $ | 146,372,012 | |
| Investment in Daily Assets Fund Institutional (cost $4,472,965)* | | | 4,472,965 | |
| Investment in Central Cash Management Fund (cost $4,372,031) | | | 4,372,031 | |
| Total investments, at value (cost $128,697,303) | | | 155,217,008 | |
| Foreign currency, at value (cost $193,887) | | | 194,808 | |
| Deposit with broker for futures contracts | | | 205,000 | |
| Receivable for Fund shares sold | | | 122,366 | |
| Dividends receivable | | | 186,055 | |
| Interest receivable | | | 2,687 | |
| Receivable for variation margin on futures contracts | | | 16,000 | |
| Foreign taxes recoverable | | | 314,935 | |
| Other assets | | | 2,781 | |
| Total assets | | | 156,261,640 | |
| Liabilities | |
| Payable upon return of securities loaned | | | 4,472,965 | |
| Payable for investments purchased | | | 55,015 | |
| Payable for Fund shares redeemed | | | 12,906 | |
| Accrued Trustees' fees | | | 2,072 | |
| Accrued management fee | | | 96,054 | |
| Other accrued expenses and payables | | | 105,710 | |
| Total liabilities | | | 4,744,722 | |
| Net assets, at value | | $ | 151,516,918 | |
| Net Assets Consist of | |
| Undistributed net investment income | | | 2,378,551 | |
Net unrealized appreciation (depreciation) on: Investments | | | 26,519,705 | |
| Futures | | | 151,875 | |
| Foreign currency | | | 33,571 | |
| Accumulated net realized gain (loss) | | | (127,487,338 | ) |
| Paid-in capital | | | 249,920,554 | |
| Net assets, at value | | $ | 151,516,918 | |
Class A Net Asset Value, offering and redemption price per share ($151,211,513 ÷ 16,697,511 outstanding shares of beneficial interest, $.01 par value, unlimited number of shares authorized) | | $ | 9.06 | |
Class B Net Asset Value, offering and redemption price per share ($305,405 ÷ 33,679 outstanding shares of beneficial interest, $.01 par value, unlimited number of shares authorized) | | $ | 9.07 | |
* Represents collateral on securities loaned.
The accompanying notes are an integral part of the financial statements.
Statement of Operations
| for the year ended December 31, 2013 | |
| Investment Income | |
Income: Dividends (net of foreign taxes withheld of $347,947) | | $ | 4,192,481 | |
| Interest | | | 622 | |
| Income distributions — Central Cash Management Fund | | | 5,708 | |
| Securities lending income, including income from Daily Assets Fund Institutional, net of borrower rebates | | | 95,320 | |
| Total income | | | 4,294,131 | |
Expenses: Management fee | | | 1,282,436 | |
| Administration fee | | | 162,334 | |
| Services to shareholders | | | 3,182 | |
| Distribution service fee (Class B) | | | 697 | |
| Custodian fee | | | 58,752 | |
| Professional fees | | | 73,576 | |
| Reports to shareholders | | | 49,280 | |
| Trustees' fees and expenses | | | 6,238 | |
| Other | | | 24,220 | |
| Total expenses before expense reductions | | | 1,660,715 | |
| Expense reductions | | | (22,951 | ) |
| Total expenses after expense reductions | | | 1,637,764 | |
| Net investment income (loss) | | | 2,656,367 | |
| Realized and Unrealized Gain (Loss) | |
Net realized gain (loss) from: Investments | | | 21,740,197 | |
| Futures | | | 1,482,223 | |
| Foreign currency | | | (200,002 | ) |
| | | | 23,022,418 | |
Change in net unrealized appreciation (depreciation) on: Investments | | | 3,938,020 | |
| Futures | | | 116,937 | |
| Foreign currency | | | 99,024 | |
| | | | 4,153,981 | |
| Net gain (loss) | | | 27,176,399 | |
| Net increase (decrease) in net assets resulting from operations | | $ | 29,832,766 | |
The accompanying notes are an integral part of the financial statements.
Statement of Changes in Net Assets | | | Years Ended December 31, | |
| Increase (Decrease) in Net Assets | | 2013 | | | 2012 | |
Operations: Net investment income (loss) | | $ | 2,656,367 | | | $ | 6,560,034 | |
| Net realized gain (loss) | | | 23,022,418 | | | | (18,682,583 | ) |
| Change in net unrealized appreciation (depreciation) | | | 4,153,981 | | | | 53,381,763 | |
| Net increase (decrease) in net assets resulting from operations | | | 29,832,766 | | | | 41,259,214 | |
Distributions to shareholders from: Net investment income: Class A | | | (7,421,568 | ) | | | (4,756,093 | ) |
| Class B | | | (14,321 | ) | | | (4,778 | ) |
| Total distributions | | | (7,435,889 | ) | | | (4,760,871 | ) |
Fund share transactions: Class A Proceeds from shares sold | | | 9,888,983 | | | | 8,058,394 | |
| Reinvestment of distributions | | | 7,421,568 | | | | 4,756,093 | |
| Payments for shares redeemed | | | (118,556,623 | ) | | | (29,986,864 | ) |
| Net increase (decrease) in net assets from Class A share transactions | | | (101,246,072 | ) | | | (17,172,377 | ) |
Class B Proceeds from shares sold | | | 37,829 | | | | 38,387 | |
| Reinvestment of distributions | | | 14,321 | | | | 4,778 | |
| Payments for shares redeemed | | | (64,353 | ) | | | (40,070 | ) |
| Net increase (decrease) in net assets from Class B share transactions | | | (12,203 | ) | | | 3,095 | |
| Increase (decrease) in net assets | | | (78,861,398 | ) | | | 19,329,061 | |
| Net assets at beginning of period | | | 230,378,316 | | | | 211,049,255 | |
| Net assets at end of period (including undistributed net investment income of $2,378,551 and $6,524,406, respectively) | | $ | 151,516,918 | | | $ | 230,378,316 | |
| Other Information | |
Class A Shares outstanding at beginning of period | | | 28,915,018 | | | | 31,267,358 | |
| Shares sold | | | 1,188,292 | | | | 1,102,311 | |
| Shares issued to shareholders in reinvestment of distributions | | | 930,021 | | | | 650,628 | |
| Shares redeemed | | | (14,335,820 | ) | | | (4,105,279 | ) |
| Net increase (decrease) in Class A shares | | | (12,217,507 | ) | | | (2,352,340 | ) |
| Shares outstanding at end of period | | | 16,697,511 | | | | 28,915,018 | |
Class B Shares outstanding at beginning of period | | | 35,208 | | | | 34,893 | |
| Shares sold | | | 4,565 | | | | 5,248 | |
| Shares issued to shareholders in reinvestment of distributions | | | 1,790 | | | | 652 | |
| Shares redeemed | | | (7,884 | ) | | | (5,585 | ) |
| Net increase (decrease) in Class B shares | | | (1,529 | ) | | | 315 | |
| Shares outstanding at end of period | | | 33,679 | | | | 35,208 | |
The accompanying notes are an integral part of the financial statements.
| | | Years Ended December 31, | |
| Class A | | | 2013 | | | 2012 | | | 2011 | | | 2010 | | | 2009 | |
| Selected Per Share Data | |
| Net asset value, beginning of period | | $ | 7.96 | | | $ | 6.74 | | | $ | 8.22 | | | $ | 8.26 | | | $ | 6.52 | |
Income (loss) from investment operations: Net investment income (loss)a | | | .14 | | | | .22 | | | | .15 | | | | .13 | | | | .12 | |
| Net realized and unrealized gain (loss) | | | 1.41 | | | | 1.16 | | | | (1.49 | ) | | | (.00 | )* | | | 1.93 | |
| Total from investment operations | | | 1.55 | | | | 1.38 | | | | (1.34 | ) | | | .13 | | | | 2.05 | |
Less distributions from: Net investment income | | | (.45 | ) | | | (.16 | ) | | | (.14 | ) | | | (.17 | ) | | | (.31 | ) |
| Net asset value, end of period | | $ | 9.06 | | | $ | 7.96 | | | $ | 6.74 | | | $ | 8.22 | | | $ | 8.26 | |
| Total Return (%) | | | 20.23 | b | | | 20.65 | | | | (16.67 | ) | | | 1.62 | b | | | 33.52 | |
| Ratios to Average Net Assets and Supplemental Data | |
| Net assets, end of period ($ millions) | | | 151 | | | | 230 | | | | 211 | | | | 288 | | | | 344 | |
| Ratio of expenses before expense reductions (%) | | | 1.02 | | | | .98 | | | | 1.00 | | | | .99 | | | | .94 | |
| Ratio of expenses after expense reductions (%) | | | 1.01 | | | | .98 | | | | 1.00 | | | | .99 | | | | .94 | |
| Ratio of net investment income (loss) (%) | | | 1.64 | | | | 2.99 | | | | 1.98 | | | | 1.68 | | | | 1.69 | |
| Portfolio turnover rate (%) | | | 97 | | | | 85 | | | | 174 | | | | 228 | | | | 81 | |
a Based on average shares outstanding during the period. b Total return would have been lower had certain expenses not been reduced. * Amount is less than $.005. | |
| | | Years Ended December 31, | |
| Class B | | | 2013 | | | 2012 | | | 2011 | | | 2010 | | | 2009 | |
| Selected Per Share Data | |
| Net asset value, beginning of period | | $ | 7.96 | | | $ | 6.75 | | | $ | 8.22 | | | $ | 8.26 | | | $ | 6.52 | |
Income (loss) from investment operations: Net investment income (loss)a | | | .13 | | | | .20 | | | | .13 | | | | .11 | | | | .10 | |
| Net realized and unrealized gain (loss) | | | 1.41 | | | | 1.15 | | | | (1.48 | ) | | | (.00 | )* | | | 1.94 | |
| Total from investment operations | | | 1.54 | | | | 1.35 | | | | (1.35 | ) | | | .11 | | | | 2.04 | |
Less distributions from: Net investment income | | | (.43 | ) | | | (.14 | ) | | | (.12 | ) | | | (.15 | ) | | | (.30 | ) |
| Net asset value, end of period | | $ | 9.07 | | | $ | 7.96 | | | $ | 6.75 | | | $ | 8.22 | | | $ | 8.26 | |
| Total Return (%) | | | 20.01 | b | | | 20.13 | | | | (16.77 | ) | | | 1.33 | b | | | 32.89 | |
| Ratios to Average Net Assets and Supplemental Data | |
| Net assets, end of period ($ millions) | | | .31 | | | | .28 | | | | .24 | | | | .36 | | | | .50 | |
| Ratio of expenses before expense reductions (%) | | | 1.30 | | | | 1.26 | | | | 1.28 | | | | 1.26 | | | | 1.22 | |
| Ratio of expenses after expense reductions (%) | | | 1.27 | | | | 1.26 | | | | 1.28 | | | | 1.26 | | | | 1.22 | |
| Ratio of net investment income (loss) (%) | | | 1.62 | | | | 2.73 | | | | 1.70 | | | | 1.41 | | | | 1.42 | |
| Portfolio turnover rate (%) | | | 97 | | | | 85 | | | | 174 | | | | 228 | | | | 81 | |
a Based on average shares outstanding during the period. b Total return would have been lower had certain expenses not been reduced. * Amount is less than $.005. | |
Notes to Financial Statements
A. Organization and Significant Accounting Policies
DWS Variable Series I (the "Series") is registered under the Investment Company Act of 1940, as amended (the "1940 Act"), as an open-end, registered management investment company organized as a Massachusetts business trust. The Series consists of five diversified funds: DWS Bond VIP, DWS Core Equity VIP, DWS Capital Growth VIP, DWS Global Small Cap Growth VIP and DWS International VIP (individually or collectively hereinafter referred to as a "Fund" or the "Funds"). These financial statements report on DWS International VIP. The Series is intended to be the underlying investment vehicle for variable annuity contracts and variable life insurance policies to be offered by the separate accounts of certain life insurance companies ("Participating Insurance Companies").
Multiple Classes of Shares of Beneficial Interest. The Fund offers two classes of shares (Class A shares and Class B shares). Class B shares are subject to Rule 12b-1 distribution fees under the 1940 Act and recordkeeping fees equal to an annual rate of 0.25% and up to 0.15%, respectively, of the average daily net assets of the Class B shares of the Fund. Class A shares are not subject to such fees.
Investment income, realized and unrealized gains and losses, and certain fund-level expenses and expense reductions, if any, are borne pro rata on the basis of relative net assets by the holders of all classes of shares, except that each class bears certain expenses unique to that class (including the applicable 12b-1 distribution fees and recordkeeping fees). Differences in class-level expenses may result in payment of different per share dividends by class. All shares have equal rights with respect to voting subject to class-specific arrangements.
The Fund's financial statements are prepared in accordance with accounting principles generally accepted in the United States of America, which require the use of management estimates. Actual results could differ from those estimates. The policies described below are followed consistently by the Fund in the preparation of its financial statements.
Security Valuation. Investments are stated at value determined as of the close of regular trading on the New York Stock Exchange on each day the exchange is open for trading.
Various inputs are used in determining the value of the Fund's investments. These inputs are summarized in three broad levels. Level 1 includes quoted prices in active markets for identical securities. Level 2 includes other significant observable inputs (including quoted prices for similar securities, interest rates, prepayment speeds and credit risk). Level 3 includes significant unobservable inputs (including the Fund's own assumptions in determining the fair value of investments). The level assigned to the securities valuations may not be an indication of the risk or liquidity associated with investing in those securities.
Equity securities are valued at the most recent sale price or official closing price reported on the exchange (U.S. or foreign) or over-the-counter market on which they trade. Securities for which no sales are reported are valued at the calculated mean between the most recent bid and asked quotations on the relevant market or, if a mean cannot be determined, at the most recent bid quotation. Equity securities are generally categorized as Level 1 securities. For certain international equity securities, in order to adjust for events which may occur between the close of the foreign exchanges and the close of the New York Stock Exchange, a fair valuation model may be used. This fair valuation model takes into account comparisons to the valuation of American Depository Receipts (ADRs), exchange-traded funds, futures contracts and certain indices and these securities are categorized as Level 2.
Investments in open-end investment companies are valued at their net asset value each business day and are categorized as Level 1.
Futures contracts are generally valued at the settlement prices established each day on the exchange on which they are traded and are categorized as Level 1.
Securities and other assets for which market quotations are not readily available or for which the above valuation procedures are deemed not to reflect fair value are valued in a manner that is intended to reflect their fair value as determined in accordance with procedures approved by the Trustees and are generally categorized as Level 3. In accordance with the Fund's valuation procedures, factors used in determining value may include, but are not limited to, the type of the security; the size of the holding; the initial cost of the security; the existence of any contractual restrictions on the security's disposition; the price and extent of public trading in similar securities of the issuer or of comparable companies; quotations or evaluated prices from broker-dealers and/or pricing services; information obtained from the issuer, analysts, and/or the appropriate stock exchange (for exchange-traded securities); an analysis of the company's or issuer's financial statements; an evaluation of the forces that influence the issuer and the market(s) in which the security is purchased and sold; and with respect to debt securities, the maturity, coupon, creditworthiness, currency denomination and the movement of the market in which the security is normally traded. The value determined under these procedures may differ from published values for the same securities.
Disclosure about the classification of fair value measurements is included in a table following the Fund's Investment Portfolio.
Securities Lending. Deutsche Bank AG, as lending agent, lends securities of the Fund to certain financial institutions under the terms of the Security Lending Agreement. The Fund retains the benefits of owning the securities it has loaned and continues to receive interest and dividends generated by the securities and to participate in any changes in their market value. The Fund requires the borrowers of the securities to maintain collateral with the Fund consisting of either cash or liquid, unencumbered assets having a value at least equal to the value of the securities loaned. When the collateral falls below specified amounts, the lending agent will use its best effort to obtain additional collateral on the next business day to meet required amounts under the security lending agreement. The Fund may invest the cash collateral into a joint trading account in an affiliated money market fund pursuant to Exemptive Orders issued by the SEC. The Fund receives compensation for lending its securities either in the form of fees or by earning interest on invested cash collateral net of borrower rebates and fees paid to a lending agent. Either the Fund or the borrower may terminate the loan. There may be risks of delay and costs in recovery of securities or even loss of rights in the collateral should the borrower of the securities fail financially. If the Fund is not able to recover securities lent, the Fund may sell the collateral and purchase a replacement investment in the market, incurring the risk that the value of the replacement security is greater than the value of the collateral. The Fund is also subject to all investment risks associated with the reinvestment of any cash collateral received, including, but not limited to, interest rate, credit and liquidity risk associated with such investments.
As of December 31, 2013, the Fund had securities on loan. The value of the related collateral exceeded the value of the securities loaned at period end.
Foreign Currency Translations. The books and records of the Fund are maintained in U.S. dollars. Investment securities and other assets and liabilities denominated in a foreign currency are translated into U.S. dollars at the prevailing exchange rates at period end. Purchases and sales of investment securities, income and expenses are translated into U.S. dollars at the prevailing exchange rates on the respective dates of the transactions.
Net realized and unrealized gains and losses on foreign currency transactions represent net gains and losses between trade and settlement dates on securities transactions, the acquisition and disposition of foreign currencies, and the difference between the amount of net investment income accrued and the U.S. dollar amount actually received. That portion of both realized and unrealized gains and losses on investments that results from fluctuations in foreign currency exchange rates is not separately disclosed but is included with net realized and unrealized gain/appreciation and loss/depreciation on investments.
Taxes. The Fund is treated as a separate taxpayer as provided for in the Internal Revenue Code, as amended. It is the Fund's policy to comply with the requirements of the Internal Revenue Code, as amended, which are applicable to regulated investment companies, and to distribute all of its taxable income to the separate accounts of the Participating Insurance Companies which hold its shares.
Additionally, the Fund may be subject to taxes imposed by the governments of countries in which it invests and are generally based on income and/or capital gains earned or repatriated. Estimated tax liabilities on certain foreign securities are recorded on an accrual basis and are reflected as components of interest income or net change in unrealized gain/loss on investments. Tax liabilities realized as a result of security sales are reflected as a component of net realized gain/loss on investments.
Under the Regulated Investment Company Modernization Act of 2010, net capital losses incurred post-enactment may be carried forward indefinitely, and their character is retained as short-term and/or long-term. Previously, net capital losses were carried forward for eight years and treated as short-term losses. As a transition rule, the Act requires that post-enactment net capital losses be used before pre-enactment net capital losses.
At December 31, 2013, the Fund had a net tax basis capital loss carryforward of approximately $127,313,000, including $124,587,000 of pre-enactment losses, which may be applied against any realized net taxable capital gains of each succeeding year until fully utilized or until December 31, 2016 ($25,765,000) and December 31, 2017 ($98,822,000), the respective expiration dates, whichever occurs first; and approximately $2,726,000 of post-enactment short-term losses, which may be applied against realized net taxable capital gains indefinitely.
The Fund has reviewed the tax positions for the open tax years as of December 31, 2013 and has determined that no provision for income tax is required in the Fund's financial statements. The Fund's federal tax returns for the prior three fiscal years remain open subject to examination by the Internal Revenue Service.
Distribution of Income and Gains. Distributions from net investment income of the Fund, if any, are declared and distributed to shareholders annually. Net realized gains from investment transactions, in excess of available capital loss carryforwards, would be taxable to the Fund if not distributed and, therefore, will be distributed to shareholders at least annually. The Fund may also make additional distributions for tax purposes if necessary.
The timing and characterization of certain income and capital gain distributions are determined annually in accordance with federal tax regulations which may differ from accounting principles generally accepted in the United States of America. These differences primarily relate to investments in foreign denominated investments, futures contracts, passive foreign investment companies and certain securities sold at a loss. As a result, net investment income (loss) and net realized gain (loss) on investment transactions for a reporting period may differ significantly from distributions during such period. Accordingly, the Fund may periodically make reclassifications among certain of its capital accounts without impacting the net asset value of the Fund.
At December 31, 2013, the Fund's components of distributable earnings (accumulated losses) on a tax basis are as follows:
| Undistributed ordinary income* | | $ | 2,378,551 | |
| Capital loss carryforwards | | $ | (127,313,000 | ) |
| Net unrealized appreciation (depreciation) on investments | | $ | 26,497,572 | |
In addition, the tax character of distributions paid to shareholders by the Fund is summarized as follows:
| | | Years Ended December 31, | |
| | | 2013 | | | 2012 | |
| Distributions from ordinary income* | | $ | 7,435,889 | | | $ | 4,760,871 | |
* For tax purposes, short-term capital gain distributions are considered ordinary income distributions.
Expenses. Expenses of the Series arising in connection with a specific Fund are allocated to that Fund. Other Series expenses which cannot be directly attributed to a Fund are apportioned among the Funds in the Series based upon the relative net assets or other appropriate measures.
Contingencies. In the normal course of business, the Fund may enter into contracts with service providers that contain general indemnification clauses. The Fund's maximum exposure under these arrangements is unknown as this would involve future claims that may be made against the Fund that have not yet been made. However, based on experience, the Fund expects the risk of loss to be remote.
Other. Investment transactions are accounted for on a trade date plus one basis for daily net asset value calculations. However, for financial reporting purposes, investment transactions are reported on trade date. Interest income is recorded on the accrual basis net of foreign withholding taxes. Dividend income is recorded on the ex-dividend date net of foreign withholding taxes. Certain dividends from foreign securities may be recorded subsequent to the ex-dividend date as soon as the Fund is informed of such dividends. Realized gains and losses from investment transactions are recorded on an identified cost basis. Proceeds from litigation payments, if any, are included in net realized gain (loss) from investments.
B. Derivative Instruments
Futures Contracts. A futures contract is an agreement between a buyer or seller and an established futures exchange or its clearinghouse in which the buyer or seller agrees to take or make a delivery of a specific amount of a financial instrument at a specified price on a specific date (settlement date). For the year ended December 31, 2013, the Fund entered into futures contracts to keep cash on hand to meet shareholder redemptions or other needs while maintaining exposure to the stock market.
Upon entering into a futures contract, the Fund is required to deposit with a financial intermediary cash or securities ("initial margin") in an amount equal to a certain percentage of the face value indicated in the futures contract. Subsequent payments ("variation margin") are made or received by the Fund dependent upon the daily fluctuations in the value and are recorded for financial reporting purposes as unrealized gains or losses by the Fund. Gains or losses are realized when the contract expires or is closed. Since all futures contracts are exchange-traded, counterparty risk is minimized as the exchange's clearinghouse acts as the counterparty, and guarantees the futures against default.
Certain risks may arise upon entering into futures contracts, including the risk that an illiquid market will limit the Fund's ability to close out a futures contract prior to the settlement date and the risk that the futures contract is not well correlated with the security, index or currency to which it relates. Risk of loss may exceed amounts disclosed in the Statement of Assets and Liabilities.
A summary of the open futures contracts as of December 31, 2013 is included in a table following the Fund's Investment Portfolio. For the year ended December 31, 2013, the investment in futures contracts purchased had a total notional value generally indicative of a range from approximately $4,603,000 to $6,641,000.
| Asset Derivative | | Futures Contracts | |
| Equity Contracts (a) | | $ | 151,875 | |
The above derivative is located in the following Statement of Assets and Liabilities account: (a) Includes cumulative appreciation of futures contracts as disclosed in the Investment Portfolio. Unsettled variation margin is disclosed separately within the Statement of Assets and Liabilities. | |
Additionally, the amount of unrealized and realized gains and losses on derivative instruments recognized in Fund earnings during the year ended December 31, 2013 and the related location in the accompanying Statement of Operations is summarized in the following tables by primary underlying risk exposure:
| Realized Gain (Loss) | | Futures Contracts | |
| Equity Contracts (a) | | $ | 1,482,223 | |
The above derivative is located in the following Statement of Operations account: (a) Net realized gain (loss) from futures | |
| Change in Net Unrealized Appreciation (Depreciation) | | Futures Contracts | |
| Equity Contracts (a) | | $ | 116,937 | |
The above derivative is located in the following Statement of Operations account: (a) Change in net unrealized appreciation (depreciation) on futures | |
C. Purchases and Sales of Securities
During the year ended December 31, 2013, purchases and sales of investment securities (excluding short-term investments) aggregated $151,125,054 and $256,844,770, respectively.
D. Related Parties
Management Agreement. Under the Investment Management Agreement with Deutsche Investment Management Americas Inc. ("DIMA" or the "Advisor"), an indirect, wholly owned subsidiary of Deutsche Bank AG, the Advisor directs the investments of the Fund in accordance with its investment objectives, policies and restrictions. The Advisor determines the securities, instruments and other contracts relating to investments to be purchased, sold or entered into by the Fund.
Pursuant to the Investment Management Agreement with the Advisor, the Fund pays a monthly management fee based on the Fund's average daily net assets, computed and accrued daily and payable monthly, at the following annual rates:
| First $500 million of average daily net assets | | | .790 | % |
| Over $500 million of average daily net assets | | | .640 | % |
For the period from January 1, 2013 through September 30, 2013 the Advisor has contractually agreed to waive all or a portion of its fees and/or reimburse certain operating expenses of the Fund to the extent necessary to maintain the operating expenses (excluding certain expenses such as extraordinary expenses, taxes, brokerage and interest) of each class as follows:
Effective October 1, 2013 through September 30, 2014, the Advisor has contractually agreed to waive all or a portion of its fees and/or reimburse certain operating expenses of the Fund to the extent necessary to maintain the operating expenses (excluding certain expenses such as extraordinary expenses, taxes, brokerage and interest) of each class as follows:
Accordingly, for the year ended December 31, 2013, the Advisor waived a portion of its management fee pursuant to the Investment Management Agreement aggregating $22,236, and the amount charged aggregated $1,260,200, which was equivalent to an annual effective rate of 0.78% of the Fund's average daily net assets.
Administration Fee. Pursuant to an Administrative Services Agreement, DIMA provides most administrative services to the Fund. For all services provided under the Administrative Services Agreement, the Fund pays the Advisor an annual fee ("Administration Fee") of 0.10% of the Fund's average daily net assets, computed and accrued daily and payable monthly. For the year ended December 31, 2013, the Administration Fee was $162,334, of which $12,439 is unpaid.
Service Provider Fees. DWS Investments Service Company ("DISC"), an affiliate of the Advisor, is the transfer agent, dividend-paying agent and shareholder service agent for the Fund. Pursuant to a sub-transfer agency agreement between DISC and DST Systems, Inc. ("DST"), DISC has delegated certain transfer agent, dividend-paying agent and shareholder service agent functions to DST. DISC compensates DST out of the shareholder servicing fee it receives from the Fund. For the year ended December 31, 2013, the amounts charged to the Fund by DISC were as follows:
| Services to Shareholders | | Total Aggregated | | | Waived | | | Unpaid at December 31, 2013 | |
| Class A | | $ | 669 | | | $ | 669 | | | $ | — | |
| Class B | | | 81 | | | | 46 | | | | 12 | |
| | | $ | 750 | | | $ | 715 | | | $ | 12 | |
Distribution Service Agreement. DWS Investments Distributors, Inc. ("DIDI"), also an affiliate of the Advisor, is the Series' Distributor. In accordance with the Master Distribution Plan, DIDI receives 12b-1 fees of 0.25% of average daily net assets of Class B shares. Pursuant to the Master Distribution Plan, DIDI remits these fees to the Participating Insurance Companies for various costs incurred or paid by these companies in connection with marketing and distribution of Class B shares. For the year ended December 31, 2013, the Distribution Service Fee aggregated $697, of which $63 is unpaid.
Typesetting and Filing Service Fees. Under an agreement with DIMA, DIMA is compensated for providing typesetting and certain regulatory filing services to the Fund. For the year ended December 31, 2013, the amount charged to the Fund by DIMA included in the Statement of Operations under "reports to shareholders" aggregated $14,706, of which $4,533 is unpaid.
Trustees' Fees and Expenses. The Fund paid retainer fees to each Trustee not affiliated with the Advisor, plus specified amounts to the Board Chairperson and Vice Chairperson and to each committee Chairperson.
Affiliated Cash Management Vehicles. The Fund may invest uninvested cash balances in Central Cash Management Fund and DWS Variable NAV Money Fund, affiliated money market funds which are managed by the Advisor. Each affiliated money market fund seeks to provide a high level of current income consistent with liquidity and the preservation of capital. Each affiliated money market fund is managed in accordance with Rule 2a-7 under the Investment Company Act of 1940, which governs the quality, maturity, diversity and liquidity of instruments in which a money market fund may invest. Central Cash Management Fund seeks to maintain a stable net asset value, and DWS Variable NAV Money Fund maintains a floating net asset value. The Fund indirectly bears its proportionate share of the expenses of each affiliated money market fund in which it invests. Central Cash Management Fund does not pay the Advisor an investment management fee. To the extent that DWS Variable NAV Money Fund pays an investment management fee to the Advisor, the Advisor will waive an amount of the investment management fee payable to the Advisor by the Fund equal to the amount of the investment management fee payable on the Fund's assets invested in DWS Variable NAV Money Fund.
Securities Lending Agent Fees. Deutsche Bank AG serves as securities lending agent for the Fund. For the year ended December 31, 2013, the Fund incurred securities lending agent fees to Deutsche Bank AG in the amount of $10,591.
E. Ownership of the Fund
At December 31, 2013, three participating insurance companies were owners of record of 10% or more of the total outstanding Class A shares of the Fund, each owning 24%, 12% and 12%, respectively. One participating insurance company was the owner of record of 10% or more of the total outstanding Class B shares of the Fund, owning 90%.
F. Line of Credit
The Fund and other affiliated funds (the "Participants") share in a $375 million revolving credit facility provided by a syndication of banks. The Fund may borrow for temporary or emergency purposes, including the meeting of redemption requests that otherwise might require the untimely disposition of securities. The Participants are charged an annual commitment fee which is allocated based on net assets, among each of the Participants. Interest is calculated at a rate per annum equal to the sum of the Federal Funds Rate plus 1.25 percent plus if LIBOR exceeds the Federal Funds Rate the amount of such excess. The Fund may borrow up to a maximum of 33 percent of its net assets under the agreement. The Fund had no outstanding loans at December 31, 2013.
Report of Independent Registered Public Accounting Firm
To the Trustees of DWS Variable Series I and the Shareholders of DWS International VIP:
In our opinion, the accompanying statement of assets and liabilities, including the investment portfolio, and the related statements of operations and of changes in net assets and the financial highlights present fairly, in all material respects, the financial position of DWS International VIP (the "Fund") at December 31, 2013 and the results of its operations, the changes in its net assets, and the financial highlights for the periods indicated therein, in conformity with accounting principles generally accepted in the United States of America. These financial statements and financial highlights (hereafter referred to as "financial statements") are the responsibility of the Fund's management. Our responsibility is to express an opinion on these financial statements based on our audits. We conducted our audits of these financial statements in accordance with the standards of the Public Company Accounting Oversight Board (United States). Those standards require that we plan and perform the audit to obtain reasonable assurance about whether the financial statements are free of material misstatement. An audit includes examining, on a test basis, evidence supporting the amounts and disclosures in the financial statements, assessing the accounting principles used and significant estimates made by management, and evaluating the overall financial statement presentation. We believe that our audits, which included confirmation of securities at December 31, 2013 by correspondence with the custodians and brokers, provide a reasonable basis for our opinion.
Boston, Massachusetts February 14, 2014 | PricewaterhouseCoopers LLP |
Information About Your Fund's Expenses (Unaudited)
As an investor of the Fund, you incur two types of costs: ongoing expenses and transaction costs. Ongoing expenses include management fees, distribution and service (12b-1) fees and other Fund expenses. Examples of transaction costs include contract charges, redemption fees and account maintenance fees, which are not shown in this section. The following tables are intended to help you understand your ongoing expenses (in dollars) of investing in the Fund and to help you compare these expenses with the ongoing expenses of investing in other mutual funds. In the most recent six-month period, the Fund limited these expenses; had it not done so, expenses would have been higher. The example in the table is based on an investment of $1,000 invested at the beginning of the six-month period and held for the entire period (July 1, 2013 to December 31, 2013).
The tables illustrate your Fund's expenses in two ways:
—Actual Fund Return. This helps you estimate the actual dollar amount of ongoing expenses (but not transaction costs) paid on a $1,000 investment in the Fund using the Fund's actual return during the period. To estimate the expenses you paid over the period, simply divide your account value by $1,000 (for example, an $8,600 account value divided by $1,000 = 8.6), then multiply the result by the number in the "Expenses Paid per $1,000" line under the share class you hold.
— Hypothetical 5% Fund Return. This helps you to compare your Fund's ongoing expenses (but not transaction costs) with those of other mutual funds using the Fund's actual expense ratio and a hypothetical rate of return of 5% per year before expenses. Examples using a 5% hypothetical Fund return may be found in the shareholder reports of other mutual funds. The hypothetical account values and expenses may not be used to estimate the actual ending account balance or expenses you paid for the period.
Please note that the expenses shown in these tables are meant to highlight your ongoing expenses only and do not reflect any transaction costs. The "Expenses Paid per $1,000" line of the tables is useful in comparing ongoing expenses only and will not help you determine the relative total expense of owning different funds. If these transaction costs had been included, your costs would have been higher.
Expenses and Value of a $1,000 Investment for the six months ended December 31, 2013 | |
| Actual Fund Return | | Class A | | | Class B | |
| Beginning Account Value 7/1/13 | | $ | 1,000.00 | | | $ | 1,000.00 | |
| Ending Account Value 12/31/13 | | $ | 1,169.00 | | | $ | 1,167.30 | |
| Expenses Paid per $1,000* | | $ | 5.58 | | | $ | 6.88 | |
| Hypothetical 5% Fund Return | | Class A | | | Class B | |
| Beginning Account Value 7/1/13 | | $ | 1,000.00 | | | $ | 1,000.00 | |
| Ending Account Value 12/31/13 | | $ | 1,020.06 | | | $ | 1,018.85 | |
| Expenses Paid per $1,000* | | $ | 5.19 | | | $ | 6.41 | |
* Expenses are equal to the Fund's annualized expense ratio for each share class, multiplied by the average account value over the period, multiplied by 184 (the number of days in the most recent six-month period), then divided by 365.
| Annualized Expense Ratios | Class A | | Class B | |
| DWS Variable Series I — DWS International VIP | 1.02% | | 1.26% | |
For more information, please refer to the Fund's prospectus.
These tables do not reflect charges and fees ("contract charges") associated with the separate account that invests in the Fund or any variable life insurance policy or variable annuity contract for which the Fund is an investment option.
For an analysis of the fees associated with an investment in the fund or similar funds, please refer to the current and hypothetical expense calculators for Variable Insurance Products which can be found at dws-investments.com/EN/resources/calculators.jsp.
Tax Information (Unaudited)
Please consult a tax advisor if you have questions about federal or state income tax laws, or on how to prepare your tax returns. If you have specific questions about your account, please contact your insurance provider.
The Series' policies and procedures for voting proxies for portfolio securities and information about how the Series voted proxies related to its portfolio securities during the 12-month period ended June 30 are available on our Web site — dws-investments.com (click on "proxy voting"at the bottom of the page) — or on the SEC's Web site — sec.gov. To obtain a written copy of the Series' policies and procedures without charge, upon request, call us toll free at (800) 728-3337.
Effective on or about May 1, 2014, the fund will have a new investment process and a new portfolio manager, Di Kumble, a Managing Director at Deutsche Asset & Wealth Management. Portfolio management intends to select approximately fifty stocks with the lowest positive Cash Return on Capital Invested (CROCI®) Economic Price Earnings ratio from a universe comprising approximately 330 of the largest equities by market capitalization in the MSCI EAFE Index, excluding financial stocks. The CROCI® Economic Price Earnings Ratio (CROCI® P/E Ratio) is a proprietary measure of company valuation using the same relationship between valuation and return as an accounting P/E ratio (i.e., price/book value divided by return on equity). At times, the number of stocks held in the fund may differ from fifty stocks as a result of corporate actions, mergers or other events. The CROCI® strategy is supplied by the CROCI® Investment Strategy and Valuation Group, a unit within Deutsche Asset & Wealth Management, through a licensing agreement with the fund's investment advisor.
Advisory Agreement Board Considerations and Fee Evaluation
The Board of Trustees approved the renewal of DWS International VIP's investment management agreement (the "Agreement") with Deutsche Investment Management Americas Inc. ("DIMA") in September 2013.
In terms of the process that the Board followed prior to approving the Agreement, shareholders should know that:
— In September 2013, all of the Fund's Trustees were independent of DIMA and its affiliates.
— The Trustees met frequently during the past year to discuss fund matters and dedicated a substantial amount of time to contract review matters. Over the course of several months, the Board's Contract Committee, in coordination with the Board's Equity Oversight Committee, reviewed comprehensive materials received from DIMA, independent third parties and independent counsel. These materials included an analysis of the Fund's performance, fees and expenses, and profitability compiled by a fee consultant retained by the Fund's Independent Trustees (the "Fee Consultant"). The Board also received extensive information throughout the year regarding performance of the Fund.
— The Independent Trustees regularly meet privately with their independent counsel to discuss contract review and other matters. In addition, the Independent Trustees were also advised by the Fee Consultant in the course of their review of the Fund's contractual arrangements and considered a comprehensive report prepared by the Fee Consultant in connection with their deliberations.
— In connection with reviewing the Agreement, the Board also reviewed the terms of the Fund's Rule 12b-1 plan, distribution agreement, administrative services agreement, transfer agency agreement and other material service agreements.
— Based on its evaluation of the information provided, the Contract Committee presented its findings and recommendations to the Board. The Board then reviewed the Contract Committee's findings and recommendations.
In connection with the contract review process, the Contract Committee and the Board considered the factors discussed below, among others. The Board also considered that DIMA and its predecessors have managed the Fund since its inception, and the Board believes that a long-term relationship with a capable, conscientious advisor is in the best interests of the Fund. The Board considered, generally, that shareholders chose to invest or remain invested in the Fund knowing that DIMA managed the Fund, and that the Agreement was approved by the Fund's shareholders. DIMA is part of Deutsche Bank AG, a major global banking institution that is engaged in a wide range of financial services. The Board believes that there are advantages to being part of a global asset management business that offers a wide range of investing expertise and resources, including hundreds of portfolio managers and analysts with research capabilities in many countries throughout the world.
As part of the contract review process, the Board carefully considered the fees and expenses of each DWS fund overseen by the Board in light of the fund's performance. In many cases, this led to a negotiation with DIMA of lower expense caps as part of the 2012 and 2013 contract review processes than had previously been in place. As part of these negotiations, the Board indicated that it would consider relaxing these new lower caps in future years following sustained improvements in performance, among other considerations.
In June 2012, Deutsche Bank AG ("DB"), DIMA's parent company, announced that DB would combine its Asset Management (of which DIMA was a part) and Wealth Management divisions. DB has advised the Independent Trustees that the U.S. asset management business is a critical and integral part of DB, and that it has, and will continue to, reinvest a significant portion of the substantial savings it expects to realize by combining its Asset Management and Wealth Management divisions into the new Asset and Wealth Management ("AWM") division, including ongoing enhancements to its investment capabilities. DB also has confirmed its commitment to maintaining strong legal and compliance groups within the AWM division.
While shareholders may focus primarily on fund performance and fees, the Fund's Board considers these and many other factors, including the quality and integrity of DIMA's personnel and such other issues as back-office operations, fund valuations, and compliance policies and procedures.
Nature, Quality and Extent of Services.The Board considered the terms of the Agreement, including the scope of advisory services provided under the Agreement. The Board noted that, under the Agreement, DIMA provides portfolio management services to the Fund and that, pursuant to a separate administrative services agreement, DIMA provides administrative services to the Fund. The Board considered the experience and skills of senior management and investment personnel, the resources made available to such personnel, the ability of DIMA to attract and retain high-quality personnel, and the organizational depth and stability of DIMA. The Board reviewed the Fund's performance over short-term and long-term periods and compared those returns to various agreed-upon performance measures, including market indices and a peer universe compiled by the Fee Consultant using information supplied by Morningstar Direct ("Morningstar"), an independent fund data service. The Board also noted that it has put into place a process of identifying "Focus Funds" (e.g., funds performing poorly relative to their benchmark or a peer universe compiled by an independent fund data service), and receives more frequent reporting and information from DIMA regarding such funds, along with DIMA's remedial plans to address underperformance. The Board believes this process is an effective manner of identifying and addressing underperforming funds. Based on the information provided, the Board noted that for the one-, three- and five-year periods ended December 31, 2012, the Fund's performance (Class A shares) was in the 1st quartile, 4th quartile and 4th quartile, respectively, of the applicable Morningstar universe (the 1st quartile being the best performers and the 4th quartile being the worst performers). The Board also observed that the Fund has outperformed its benchmark in the one-year period and has underperformed its benchmark in the three- and five-year periods ended December 31, 2012. The Board noted the disappointing investment performance of the Fund in some past periods and continued to discuss with senior management of DIMA the factors contributing to such underperformance and actions being taken to improve performance. The Board observed that the Fund had experienced improved relative performance in 2012 and during the first seven months of 2013. The Board recognized the efforts by DIMA in recent years to enhance its investment platform and improve long-term performance across the DWS fund complex.
Fees and Expenses. The Board considered the Fund's investment management fee schedule, operating expenses and total expense ratios, and comparative information provided by Lipper Inc. ("Lipper") and the Fee Consultant regarding investment management fee rates paid to other investment advisors by similar funds (1st quartile being the most favorable and 4th quartile being the least favorable). With respect to management fees paid to other investment advisors by similar funds, the Board noted that the contractual fee rates paid by the Fund, which include a 0.10% fee paid to DIMA under the Fund's administrative services agreement, were approximately at the median of the applicable Lipper peer group (based on Lipper data provided as of December 31, 2012). The Board noted that the Fund's Class A shares total (net) operating expenses were expected to be approximately at the median of the applicable Lipper expense universe (based on Lipper data provided as of December 31, 2012) ("Lipper Universe Expenses"). The Board also reviewed data comparing each share class's total (net) operating expenses to the applicable Lipper Universe Expenses. The Board considered the Fund's management fee rate as compared to fees charged by DIMA to comparable funds and considered differences between the Fund and the comparable funds. The Board also considered how the Fund's total (net) operating expenses compared to the total (net) operating expenses of a more customized peer group selected by Lipper (based on such factors as asset size).
The information considered by the Board as part of its review of management fees included information regarding fees charged by DIMA and its affiliates to similar institutional accounts and to similar funds offered primarily to European investors ("DWS Europe funds"), in each case as applicable. The Board observed that advisory fee rates for institutional accounts generally were lower than the management fees charged by similarly managed DWS U.S. mutual funds ("DWS Funds"), but also took note of the differences in services provided to DWS Funds as compared to institutional accounts. In the case of DWS Europe funds, the Board observed that fee rates for DWS Europe funds generally were higher than for similarly managed DWS Funds, but noted that differences in the types of services provided to DWS Funds relative to DWS Europe funds made it difficult to compare such fees.
On the basis of the information provided, the Board concluded that management fees were reasonable and appropriate in light of the nature, quality and extent of services provided by DIMA.
Profitability. The Board reviewed detailed information regarding revenues received by DIMA under the Agreement. The Board considered the estimated costs and pre-tax profits realized by DIMA from advising the DWS Funds, as well as estimates of the pre-tax profits attributable to managing the Fund in particular. The Board also received information regarding the estimated enterprise-wide profitability of DWS and its affiliates with respect to all fund services in totality and by fund. The Board and the Fee Consultant reviewed DIMA's methodology in allocating its costs to the management of the Fund. Based on the information provided, the Board concluded that the pre-tax profits realized by DIMA in connection with the management of the Fund were not unreasonable. The Board also reviewed information regarding the profitability of certain similar investment management firms. The Board noted that while information regarding the profitability of such firms is limited (and in some cases is not necessarily prepared on a comparable basis), DIMA and its affiliates' overall profitability with respect to the DWS fund complex (after taking into account distribution and other services provided to the funds by DIMA and its affiliates) was lower than the overall profitability levels of many comparable firms for which such data was available.
Economies of Scale. The Board considered whether there are economies of scale with respect to the management of the Fund and whether the Fund benefits from any economies of scale. The Board noted that the Fund's management fee schedule includes fee breakpoints. The Board concluded that the Fund's fee schedule represents an appropriate sharing between the Fund and DIMA of such economies of scale as may exist in the management of the Fund at current asset levels.
Other Benefits to DIMA and Its Affiliates. The Board also considered the character and amount of other incidental benefits received by DIMA and its affiliates, including any fees received by DIMA for administrative services provided to the Fund and any fees received by an affiliate of DIMA for distribution services. The Board also considered benefits to DIMA related to brokerage and soft-dollar allocations, including allocating brokerage to pay for research generated by parties other than the executing broker dealers, which pertain primarily to funds investing in equity securities, along with the incidental public relations benefits to DIMA related to DWS Funds advertising and cross-selling opportunities among DIMA products and services. The Board concluded that management fees were reasonable in light of these fallout benefits.
Compliance. The Board considered the significant attention and resources dedicated by DIMA to documenting and enhancing its compliance processes in recent years. The Board noted in particular (i) the experience and seniority of both DIMA's chief compliance officer and the Fund's chief compliance officer; (ii) the large number of DIMA compliance personnel; and (iii) the substantial commitment of resources by DIMA and its affiliates to compliance matters.
Based on all of the information considered and the conclusions reached, the Board unanimously determined that the continuation of the Agreement is in the best interests of the Fund. In making this determination, the Board did not give particular weight to any single factor identified above. The Board considered these factors over the course of numerous meetings, certain of which were in executive session with only the Independent Trustees and their independent counsel present. It is possible that individual Trustees may have weighed these factors differently in reaching their individual decisions to approve the continuation of the Agreement.
Board Members and Officers
The following table presents certain information regarding the Board Members and Officers of the fund. Each Board Member's year of birth is set forth in parentheses after his or her name. Unless otherwise noted, (i) each Board Member has engaged in the principal occupation(s) noted in the table for at least the most recent five years, although not necessarily in the same capacity; and (ii) the address of each Independent Board Member is c/o Kenneth C. Froewiss, Chairman, DWS Mutual Funds, P.O. Box 78, Short Hills, NJ 07078. Except as otherwise noted below, the term of office for each Board Member is until the election and qualification of a successor, or until such Board Member sooner dies, resigns, is removed or as otherwise provided in the governing documents of the fund. Because the fund does not hold an annual meeting of shareholders, each Board Member will hold office for an indeterminate period. The Board Members may also serve in similar capacities with other funds in the fund complex.
| Independent Board Members |
Name, Year of Birth, Position with the Fund and Length of Time Served1 | | Business Experience and Directorships During the Past Five Years | Number of Funds in DWS Fund Complex Overseen | Other Directorships Held by Board Member |
Kenneth C. Froewiss (1945) Chairperson since 2013, and Board Member since 2001 | | Adjunct Professor of Finance, NYU Stern School of Business (September 2009–present; Clinical Professor from 1997–September 2009); Member, Finance Committee, Association for Asian Studies (2002–present); Director, Mitsui Sumitomo Insurance Group (US) (2004–present); prior thereto, Managing Director, J.P. Morgan (investment banking firm) (until 1996) | 103 | — |
William McClayton (1944) Vice Chairperson since 2013, and Board Member since 2004 | | Private equity investor (since October 2009); previously, Managing Director, Diamond Management & Technology Consultants, Inc. (global consulting firm) (2001–2009); Directorship: Board of Managers, YMCA of Metropolitan Chicago; formerly: Senior Partner, Arthur Andersen LLP (accounting) (1966–2001); Trustee, Ravinia Festival | 103 | — |
John W. Ballantine (1946) Board Member since 1999 | | Retired; formerly, Executive Vice President and Chief Risk Management Officer, First Chicago NBD Corporation/The First National Bank of Chicago (1996–1998); Executive Vice President and Head of International Banking (1995–1996); former Directorships: Stockwell Capital Investments PLC (private equity); First Oak Brook Bancshares, Inc. and Oak Brook Bank; Prisma Energy International | 103 | Chairman of the Board, Healthways, Inc.2 (provider of disease and care management services) (2003– present); Portland General Electric2 (utility company) (2003– present) |
Henry P. Becton, Jr. (1943) Board Member since 1990 | | Vice Chair and former President, WGBH Educational Foundation. Directorships: Public Radio International; Public Radio Exchange (PRX); North Bennett Street School (Boston); former Directorships: The PBS Foundation; Association of Public Television Stations; Boston Museum of Science; American Public Television; Concord Academy; New England Aquarium; Mass. Corporation for Educational Telecommunications; Committee for Economic Development; Public Broadcasting Service; Connecticut College | 103 | Lead Director, Becton Dickinson and Company2 (medical technology company); Lead Director, Belo Corporation2 (media company) |
Dawn-Marie Driscoll (1946) Board Member since 1987 | | President, Driscoll Associates (consulting firm); Emeritus Executive Fellow, Center for Business Ethics, Bentley University; formerly, Partner, Palmer & Dodge (1988–1990); Vice President of Corporate Affairs and General Counsel, Filene's (1978–1988). Directorships: Director of ICI Mutual Insurance Company (since 2007); Advisory Board, Center for Business Ethics, Bentley University; Chairman of the Board of Trustees, Southwest Florida Community Foundation (charitable organization); former Directorships: Sun Capital Advisers Trust (mutual funds) (2007–2012), Investment Company Institute (audit, executive, nominating committees) and Independent Directors Council (governance, executive committees) | 103 | — |
Keith R. Fox, CFA (1954) Board Member since 1996 | | Managing General Partner, Exeter Capital Partners (a series of private investment funds) (since 1986). Directorships: Progressive International Corporation (kitchen goods importer and distributor); The Kennel Shop (retailer); former Chairman, National Association of Small Business Investment Companies; former Directorships: BoxTop Media Inc. (advertising); Sun Capital Advisers Trust (mutual funds) (2011–2012) | 103 | — |
Paul K. Freeman (1950) Board Member since 1993 | | Consultant, World Bank/Inter-American Development Bank; Executive and Governing Council of the Independent Directors Council (Chairman of Education Committee); formerly: Project Leader, International Institute for Applied Systems Analysis (1998–2001); Chief Executive Officer, The Eric Group, Inc. (environmental insurance) (1986–1998); Directorships: Denver Zoo Foundation (December 2012–present); former Directorships: Prisma Energy International | 103 | — |
Richard J. Herring (1946) Board Member since 1990 | | Jacob Safra Professor of International Banking and Professor, Finance Department, The Wharton School, University of Pennsylvania (since July 1972); Co-Director, Wharton Financial Institutions Center (since July 2000); Co-Chair, U.S. Shadow Financial Regulatory Committee; Executive Director, Financial Economists Roundtable; formerly: Vice Dean and Director, Wharton Undergraduate Division (July 1995–June 2000); Director, Lauder Institute of International Management Studies (July 2000–June 2006) | 103 | Director, Japan Equity Fund, Inc. (since September 2007), Thai Capital Fund, Inc. (since 2007), Singapore Fund, Inc. (since September 2007), Independent Director of Barclays Bank Delaware (since September 2010) |
Rebecca W. Rimel (1951) Board Member since 1995 | | President and Chief Executive Officer, The Pew Charitable Trusts (charitable organization) (1994 to present); formerly: Executive Vice President, The Glenmede Trust Company (investment trust and wealth management) (1983–2004); Board Member, Investor Education (charitable organization) (2004–2005); Trustee, Executive Committee, Philadelphia Chamber of Commerce (2001–2007); Director, Viasys Health Care2 (January 2007–June 2007); Trustee, Thomas Jefferson Foundation (charitable organization) (1994–2012) | 103 | Director, Becton Dickinson and Company2 (medical technology company) (2012– present); Director, CardioNet, Inc.2 (health care) (2009– present) |
William N. Searcy, Jr. (1946) Board Member since 1993 | | Private investor since October 2003; formerly: Pension & Savings Trust Officer, Sprint Corporation2 (telecommunications) (November 1989–September 2003); Trustee, Sun Capital Advisers Trust (mutual funds) (1998–2012) | 103 | — |
Jean Gleason Stromberg (1943) Board Member since 1997 | | Retired. Formerly, Consultant (1997–2001); Director, Financial Markets U.S. Government Accountability Office (1996–1997); Partner, Fulbright & Jaworski, L.L.P. (law firm) (1978–1996). Directorships: The William and Flora Hewlett Foundation; former Directorships: Service Source, Inc., Mutual Fund Directors Forum (2002–2004), American Bar Retirement Association (funding vehicle for retirement plans) (1987–1990 and 1994–1996) | 103 | — |
Robert H. Wadsworth (1940) Board Member since 1999 | | President, Robert H. Wadsworth & Associates, Inc. (consulting firm) (1983 to present); Director, National Horizon, Inc. (non-profit organization); Director and Treasurer, The Phoenix Boys Choir Association | 106 | — |
Officers4 |
Name, Year of Birth, Position with the Fund and Length of Time Served5 | | Business Experience and Directorships During the Past Five Years |
Brian E. Binder8,9 (1972) President and Chief Executive Officer, 2013–present | | Managing Director3 and Head of Fund Administration, Deutsche Asset & Wealth Management (2013–present); formerly: Head of Business Management and Consulting at Invesco, Ltd. (2010–2012); Chief Administrative Officer, Van Kampen Funds Inc. (2008–2010); and Chief Administrative Officer, Morgan Stanley Investment Management Americas Distribution (2003–2008) |
John Millette7 (1962) Vice President and Secretary, 1999–present | | Director,3 Deutsche Asset & Wealth Management |
Paul H. Schubert6 (1963) Chief Financial Officer, 2004–present Treasurer, 2005–present | | Managing Director,3 Deutsche Asset & Wealth Management (since July 2004); formerly: Executive Director, Head of Mutual Fund Services and Treasurer for UBS Family of Funds (1998–2004); Vice President and Director of Mutual Fund Finance at UBS Global Asset Management (1994–1998) |
Caroline Pearson7 (1962) Chief Legal Officer, 2010–present | | Managing Director,3 Deutsche Asset & Wealth Management; formerly: Assistant Secretary for DWS family of funds (1997–2010) |
Melinda Morrow6 (1970) Vice President, 2012–present | | Director,3 Deutsche Asset & Wealth Management |
Hepsen Uzcan7 (1974) Assistant Secretary, 2013–present | | Vice President, Deutsche Asset & Wealth Management |
Paul Antosca7 (1957) Assistant Treasurer, 2007–present | | Director,3 Deutsche Asset & Wealth Management |
Jack Clark7 (1967) Assistant Treasurer, 2007–present | | Director,3 Deutsche Asset & Wealth Management |
Diane Kenneally7 (1966) Assistant Treasurer, 2007–present | | Director,3 Deutsche Asset & Wealth Management |
John Caruso6 (1965) Anti-Money Laundering Compliance Officer, 2010–present | | Managing Director,3 Deutsche Asset & Wealth Management |
Robert Kloby6 (1962) Chief Compliance Officer, 2006–present | | Managing Director,3 Deutsche Asset & Wealth Management |
1 The length of time served represents the year in which the Board Member joined the board of one or more DWS funds currently overseen by the Board.
2 A publicly held company with securities registered pursuant to Section 12 of the Securities Exchange Act of 1934.
3 Executive title, not a board directorship.
4 As a result of their respective positions held with the Advisor, these individuals are considered "interested persons" of the Advisor within the meaning of the 1940 Act. Interested persons receive no compensation from the fund.
5 The length of time served represents the year in which the officer was first elected in such capacity for one or more DWS funds.
6 Address: 60 Wall Street, New York, NY 10005.
7 Address: One Beacon Street, Boston, MA 02108.
8 Address: 222 South Riverside Plaza, Chicago, IL 60606.
9 Effective as of December 1, 2013.
The fund's Statement of Additional Information ("SAI") includes additional information about the Board Members. The SAI is available, without charge, upon request. If you would like to request a copy of the SAI, you may do so by calling the following toll-free number: (800) 728-3337.
DWS Investments Distributors, Inc.
222 South Riverside Plaza
Chicago, IL 60606
(800) 621-1148
VS1int-2 (R-025823-3 2/14)
| | |
| ITEM 2. | CODE OF ETHICS |
| | |
| | As of the end of the period covered by this report, the registrant has adopted a code of ethics, as defined in Item 2 of Form N-CSR, that applies to its Principal Executive Officer and Principal Financial Officer. There have been no amendments to, or waivers from, a provision of the code of ethics during the period covered by this report that would require disclosure under Item 2. A copy of the code of ethics is filed as an exhibit to this Form N-CSR. |
| | |
| ITEM 3. | AUDIT COMMITTEE FINANCIAL EXPERT |
| | |
| | The fund’s audit committee is comprised solely of trustees who are "independent" (as such term has been defined by the Securities and Exchange Commission ("SEC") in regulations implementing Section 407 of the Sarbanes-Oxley Act (the "Regulations")). The fund’s Board of Trustees has determined that there are several "audit committee financial experts" (as such term has been defined by the Regulations) serving on the fund’s audit committee including Mr. Paul K. Freeman, the chair of the fund’s audit committee. An “audit committee financial expert” is not an “expert” for any purpose, including for purposes of Section 11 of the Securities Act of 1933 and the designation or identification of a person as an “audit committee financial expert” does not impose on such person any duties, obligations or liability that are greater than the duties, obligations and liability imposed on such person as a member of the audit committee and board of directors in the absence of such designation or identification. |
| | |
| ITEM 4. | PRINCIPAL ACCOUNTANT FEES AND SERVICES |
| | |
DWS VARIABLE SERIES I
FORM N-CSR DISCLOSURE RE: AUDIT FEES
The following table shows the amount of fees that PricewaterhouseCoopers, LLP (“PWC”), the Series’ independent registered public accounting firm, billed to the Series during the Series’ last two fiscal years. The Audit Committee approved in advance all audit services and non-audit services that PWC provided to the Series.
Services that the Series' Independent Registered Public Accounting Firm Billed to the Series
| Fiscal Year Ended December 31, | | Audit Fees Billed to Series | | | Audit-Related Fees Billed to Series | | | Tax Fees Billed to Series | | | All Other Fees Billed to Series | |
| 2013 | | $ | 255,107 | | | $ | 0 | | | $ | 0 | | | $ | 8,500 | |
| 2012 | | $ | 180,555 | | | $ | 0 | | | $ | 0 | | | $ | 5,500 | |
“All Other Fees Billed to the Series” were billed for services associated with foreign tax filings.
Services that the Series' Independent Registered Public Accounting Firm Billed to the Adviser and Affiliated Fund Service Providers
The following table shows the amount of fees billed by PWC to Deutsche Investment Management Americas Inc. (“DeIM” or the “Adviser”), and any entity controlling, controlled by or under common control with DeIM (“Control Affiliate”) that provides ongoing services to the Series (“Affiliated Fund Service Provider”), for engagements directly related to the Series' operations and financial reporting, during the Series' last two fiscal years.
| Fiscal Year Ended December 31, | | Audit-Related Fees Billed to Adviser and Affiliated Fund Service Providers | | | Tax Fees Billed to Adviser and Affiliated Fund Service Providers | | | All Other Fees Billed to Adviser and Affiliated Fund Service Providers | |
| 2013 | | $ | 0 | | | $ | 66,535 | | | $ | 0 | |
| 2012 | | $ | 0 | | | $ | 56,300 | | | $ | 0 | |
The “Tax Fees Billed to the Advisor” were billed for services associated with foreign tax filings.
Non-Audit Services
The following table shows the amount of fees that PWC billed during the Series' last two fiscal years for non-audit services. The Audit Committee pre-approved all non-audit services that PWC provided to the Adviser and any Affiliated Fund Service Provider that related directly to the Series' operations and financial reporting. The Audit Committee requested and received information from PWC about any non-audit services that PWC rendered during the Series' last fiscal year to the Adviser and any Affiliated Fund Service Provider. The Committee considered this information in evaluating PWC’s independence.
| Fiscal Year Ended December 31, | | Total Non-Audit Fees Billed to Series (A) | | | Total Non-Audit Fees billed to Adviser and Affiliated Fund Service Providers (engagements related directly to the operations and financial reporting of the Series) (B) | | | Total Non-Audit Fees billed to Adviser and Affiliated Fund Service Providers (all other engagements) (C) | | | Total of (A), (B) and (C) | |
| 2013 | | $ | 8,500 | | | $ | 66,535 | | | $ | 0 | | | $ | 75,035 | |
| 2012 | | $ | 5,500 | | | $ | 56,300 | | | $ | 0 | | | $ | 61,800 | |
Audit Committee Pre-Approval Policies and Procedures. Generally, each Fund’s Audit Committee must pre approve (i) all services to be performed for a Fund by a Fund’s Independent Registered Public Accounting Firm and (ii) all non-audit services to be performed by a Fund’s Independent Registered Public Accounting Firm for the DIMA Entities with respect to operations and financial reporting of the Fund, except that the Chairperson or Vice Chairperson of each Fund’s Audit Committee may grant the pre-approval for non-audit services described in items (i) and (ii) above for non-prohibited services for engagements of less than $100,000. All such delegated pre approvals shall be presented to each Fund’s Audit Committee no later than the next Audit Committee meeting.
There were no amounts that were approved by the Audit Committee pursuant to the de minimis exception under Rule 2-01 of Regulation S-X.
According to the registrant’s principal Independent Registered Public Accounting Firm, substantially all of the principal Independent Registered Public Accounting Firm's hours spent on auditing the registrant's financial statements were attributed to work performed by full-time permanent employees of the principal Independent Registered Public Accounting Firm.
***
| | |
| ITEM 5. | AUDIT COMMITTEE OF LISTED REGISTRANTS |
| | |
| | Not applicable |
| | |
| ITEM 6. | SCHEDULE OF INVESTMENTS |
| | |
| | Not applicable |
| | |
| ITEM 7. | DISCLOSURE OF PROXY VOTING POLICIES AND PROCEDURES FOR CLOSED-END MANAGEMENT INVESTMENT COMPANIES |
| | |
| | Not applicable |
| | |
| ITEM 8. | PORTFOLIO MANAGERS OF CLOSED-END MANAGEMENT INVESTMENT COMPANIES |
| | |
| | Not applicable |
| | |
| ITEM 9. | PURCHASES OF EQUITY SECURITIES BY CLOSED-END MANAGEMENT INVESTMENT COMPANY AND AFFILIATED PURCHASERS |
| | |
| | Not applicable |
| | |
| ITEM 10. | SUBMISSION OF MATTERS TO A VOTE OF SECURITY HOLDERS |
| | |
| | There were no material changes to the procedures by which shareholders may recommend nominees to the Fund’s Board. The primary function of the Nominating and Governance Committee is to identify and recommend individuals for membership on the Board and oversee the administration of the Board Governance Guidelines. Shareholders may recommend candidates for Board positions by forwarding their correspondence by U.S. mail or courier service to Kenneth C. Froewiss, Independent Chairman, DWS Mutual Funds, P.O. Box 78, Short Hills, NJ 07078. |
| | |
| ITEM 11. | CONTROLS AND PROCEDURES |
| | |
| | (a) | The Chief Executive and Financial Officers concluded that the Registrant’s Disclosure Controls and Procedures are effective based on the evaluation of the Disclosure Controls and Procedures as of a date within 90 days of the filing date of this report. |
| | |
| | (b) | There have been no changes in the registrant’s internal control over financial reporting that occurred during the second fiscal quarter of the period covered by this report that has materially affected, or is reasonably likely to materially affect, the registrant’s internal controls over financial reporting. |
| | |
| ITEM 12. | EXHIBITS |
| | |
| | (a)(1) | Code of Ethics pursuant to Item 2 of Form N-CSR is filed and attached hereto as EX-99.CODE ETH. |
| | |
| | (a)(2) | Certification pursuant to Rule 30a-2(a) under the Investment Company Act of 1940 (17 CFR 270.30a-2(a)) is filed and attached hereto as Exhibit 99.CERT. |
| | |
| | (b) | Certification pursuant to Rule 30a-2(b) under the Investment Company Act of 1940 (17 CFR 270.30a-2(b)) is furnished and attached hereto as Exhibit 99.906CERT. |
SIGNATURES
Pursuant to the requirements of the Securities Exchange Act of 1934 and the Investment Company Act of 1940, the registrant has duly caused this report to be signed on its behalf by the undersigned, thereunto duly authorized.
| Registrant: | DWS Variable Series I |
| | |
| | |
| By: | /s/Brian E. Binder Brian E. Binder President |
| | |
| Date: | February 20, 2014 |
Pursuant to the requirements of the Securities Exchange Act of 1934 and the Investment Company Act of 1940, this report has been signed below by the following persons on behalf of the registrant and in the capacities and on the dates indicated.
| By: | /s/Brian E. Binder Brian E. Binder President |
| | |
| Date: | February 20, 2014 |
| | |
| | |
| | |
| By: | /s/Paul Schubert Paul Schubert Chief Financial Officer and Treasurer |
| | |
| Date: | February 20, 2014 |