UNITED STATES
SECURITIES AND EXCHANGE COMMISSION
WASHINGTON, D. C. 20549
FORM N-CSR
Investment Company Act file number: 811-04257
DWS Variable Series I
(Exact Name of Registrant as Specified in Charter)
345 Park Avenue
New York, NY 10154-0004
(Address of Principal Executive Offices) (Zip Code)
Registrant’s Telephone Number, including Area Code: (212) 250-3220
Paul Schubert
60 Wall Street
New York, NY 10005
(Name and Address of Agent for Service)
| Date of fiscal year end: | 12/31 |
| | |
| Date of reporting period: | 12/31/2011 |
| ITEM 1. | REPORT TO STOCKHOLDERS |
DECEMBER 31, 2011
ANNUAL REPORT
DWS VARIABLE SERIES I
DWS Bond VIP
��
Contents
12 Statement of Assets and Liabilities 13 Statement of Operations 14 Statement of Changes in Net Assets 16 Notes to Financial Statements 23 Report of Independent Registered Public Accounting Firm 24 Information About Your Fund's Expenses 26 Investment Management Agreement Approval 29 Summary of Management Fee Evaluation by Independent Fee Consultant 31 Board Members and Officers |
This report must be preceded or accompanied by a prospectus. To obtain an additional prospectus or summary prospectus, if available, call (800) 728-3337 or your financial representative. We advise you to consider the Fund's objectives, risks, charges and expenses carefully before investing. The summary prospectus and prospectus contain this and other important information about the Fund. Please read the prospectus carefully before you invest.
Bond investments are subject to interest-rate and credit risks. When interest rates rise, bond prices generally fall. Credit risk refers to the ability of an issuer to make timely payments of principal and interest. Investments in lower-quality and non-rated securities present greater risk of loss than investments in higher-quality securities. Investing in derivatives entails special risks relating to liquidity, leverage and credit that may reduce returns and/or increase volatility. Investing in foreign securities, particularly those of emerging markets, presents certain risks, such as currency fluctuations, political and economic changes, and market risks. See the prospectus for details.
DWS Investments is part of Deutsche Bank's Asset Management division and, within the U.S., represents the retail asset management activities of Deutsche Bank AG, Deutsche Bank Trust Company Americas, Deutsche Investment Management Americas Inc. and DWS Trust Company.
NOT FDIC/NCUA INSURED NO BANK GUARANTEE MAY LOSE VALUE NOT A DEPOSIT
NOT INSURED BY ANY FEDERAL GOVERNMENT AGENCY
Performance Summary December 31, 2011
Fund performance shown is historical, assumes reinvestment of all dividend and capital gain distributions, and does not guarantee future results. Investment return and principal value fluctuate with changing market conditions so that, when redeemed, shares may be worth more or less than their original cost. Current performance may be lower or higher than the performance data quoted. Please contact your participating insurance company for the Fund's most recent month-end performance. Performance doesn't reflect charges and fees ("contract charges") associated with the separate account that invests in the Fund or any variable life insurance policy or variable annuity contract for which the Fund is an investment option. These charges and fees will reduce returns.
The gross expense ratio of the Fund, as stated in the fee table of the prospectus dated May 1, 2011 is 0.59% for Class A shares and may differ from the expense ratio disclosed in the Financial Highlights table in this report.
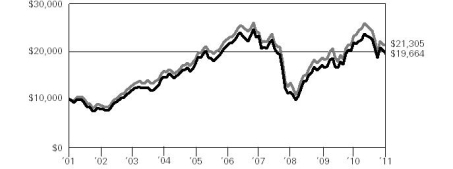
| Growth of an Assumed $10,000 Investment |
[] DWS Bond VIP — Class A [] Barclays Capital U.S. Aggregate Bond Index | The Barclays Capital U.S. Aggregate Bond Index is an unmanaged index representing domestic taxable investment-grade bonds, with index components for government and corporate securities, mortgage pass-through securities, and asset-backed securities with an average maturity of one year or more. Index returns do not reflect any fees or expenses and it is not possible to invest directly into an index. |
| |
| Yearly periods ended December 31 | |
| Comparative Results | |
| DWS Bond VIP | | 1-Year | | | 3-Year | | | 5-Year | | | 10-Year | |
| Class A | Growth of $10,000 | | $ | 10,568 | | | $ | 12,422 | | | $ | 10,771 | | | $ | 13,793 | |
| Average annual total return | | | 5.68 | % | | | 7.50 | % | | | 1.50 | % | | | 3.27 | % |
| Barclays Capital U.S. Aggregate Bond Index | Growth of $10,000 | | $ | 10,784 | | | $ | 12,171 | | | $ | 13,701 | | | $ | 17,535 | |
| Average annual total return | | | 7.84 | % | | | 6.77 | % | | | 6.50 | % | | | 5.78 | % |
The growth of $10,000 is cumulative.
Management Summary December 31, 2011
During the 12-month period ended December 31, 2011, the U.S. Federal Reserve Board (the Fed) maintained the benchmark federal funds rate at near-zero levels and continued to engage in bond purchases designed to lower longer-term interest rates as it sought to stimulate economic growth. U.S. Treasury yields fell from already historically low levels for the 12 months, as for much of the year investors sought a refuge from the debt crisis in Europe. Most sectors of the bond market benefited from the declining rate environment, with high-quality corporate bonds benefiting in particular, as investors sought yields in an environment of extraordinarily low interest rates. Somewhat counterintuitive, a historic credit downgrade of U.S. debt was met by markets as a further reason to seek a "safe haven" in U.S. Treasuries.1 Corporate bonds continued to be supported by strong profits and balance sheets over the period.
During the 12-month period ended December 31, 2011, the Fund provided a total return of 5.68% (Class A shares, unadjusted for contract charges), compared with the 7.84% return of its benchmark, the Barclays Capital U.S. Aggregate Bond Index.2
The Fund's performance vs. the benchmark continued to be driven principally by exposure to more credit-sensitive fixed-income sectors. Our overweighting of investment-grade corporate bonds was the leading positive contributor to returns during the year.3 While our high-yield corporate and emerging-markets holdings benefitted from improved market sentiment during the fourth quarter, they lagged over the course of the year and ultimately detracted from relative performance. Performance also benefitted from short positions in the euro and the Australian dollar, as well as yield curve positioning.4,5 Performance over the year was constrained by short positions in German bunds (Germany government bonds), long positions in residential mortgage-backed securities and short positions in the Japanese yen.6 We continue to view credit sectors as attractive on a relative basis, especially in the new issue market. In our view, corporate fundamentals are strong, interest rates are low and debt markets are liquid. However, we continue to expect that the timetable for resolving the debt issues in Europe will be protracted and that credit markets will be jittery along the way. In addition, there is still some risk of a global recession as developed-market governments wrestle with the need to bring budgets into better balance. We will continue to monitor indicators including housing, consumer spending and job growth to determine the strength of the economic recovery and the ability to support corporate profitability on a sustainable basis.
Kenneth R. Bowling, CFA
Jamie Guenther, CFA
John Brennan
Bruce Harley, CFA, CEBS
J. Richard Robben, CFA
David Vignolo, CFA
J. Kevin Horsley, CFA, CPA
Stephen Willer, CFA
William Chepolis, CFA
Portfolio Managers
1 Credit quality measures a bond issuer's ability to repay interest and principal in a timely manner. Rating agencies assign letter designations, such as AAA, AA and so forth. The lower the rating, the higher the probability of default. Credit quality does not remove market risk and is subject to change.
2 The Barclays Capital U.S. Aggregate Bond Index is an unmanaged index representing domestic taxable investment-grade bonds, with index components for government and corporate securities, mortgage pass-through securities, and asset-backed securities with an average maturity of one year or more.
Index returns do not reflect fees or expenses and it is not possible to invest directly into an index.
3 "Overweight" means the Fund holds a higher weighting in a given sector or security than the benchmark. "Underweight" means the Fund holds a lower weighting.
4 The yield curve is a graphical representation of how yields on bonds of different maturities compare. Normally, yield curves slant up, as bonds with longer maturities typically offer higher yields than short-term bonds.
5 "Short position" refers to borrowing a security and then selling it with expectation that the security will fall in value. The security can then be purchased and repaid to the borrower at a lower price.
6 "Long position" refers to buying a security with the expectation that it will rise in value.
The views expressed reflect those of the portfolio management team only through the end of the period of the report as stated on the cover. The management team's views are subject to change at any time based on market and other conditions and should not be construed as a recommendation. Past performance is no guarantee of future results. Current and future portfolio holdings are subject to risk.
Asset Allocation (As a % of Investment Portfolio excluding Securities Lending Collateral) | 12/31/11 | 12/31/10 |
| | | |
| Mortgage-Backed Securities Pass-Throughs | 33% | 28% |
| Government & Agency Obligations | 29% | 21% |
| Corporate Bonds | 21% | 31% |
| Commercial Mortgage-Backed Securities | 6% | 9% |
| Municipal Bonds and Notes | 5% | 5% |
| Collateralized Mortgage Obligations | 3% | 4% |
| Asset-Backed | 2% | — |
| Cash Equivalents | 1% | 2% |
| | 100% | 100% |
Quality (Excludes Cash Equivalents and Securities Lending Collateral) | 12/31/11 | 12/31/10 |
| | | |
| AAA | 64% | 56% |
| AA | 5% | 5% |
| A | 7% | 7% |
| BBB | 15% | 19% |
| BB or Below | 7% | 10% |
| Not Rated | 2% | 3% |
| | 100% | 100% |
| Interest Rate Sensitivity | 12/31/11 | 12/31/10 |
| | | |
| Effective Maturity | 6.9 years | 7.3 years |
| Effective Duration | 4.9 years | 4.9 years |
Effective maturity is the weighted average of the maturity date of bonds held by the Fund taking into consideration any available maturity shortening features.
Effective duration is an approximate measure of the Fund's sensitivity to interest rate changes taking into consideration any maturity shortening features.
Asset allocation, quality and interest rate sensitivity are subject to change.
The quality ratings represent the higher of Moody's Investors Service, Inc. ("Moody's") or Standard & Poor's Corporation ("S&P") credit ratings. The ratings of Moody's and S&P represent their opinions as to the quality of the securities they rate. Credit quality measures a bond issuer's ability to repay interest and principal in a timely manner. Ratings are relative and subjective and are not absolute standards of quality. Credit quality does not remove market risk and is subject to change.
For more complete details about the Fund's investment portfolio, see page 6.
Following the Fund's fiscal first and third quarter-end, a complete portfolio holdings listing is filed with the SEC on Form N-Q. The form will be available on the SEC's Web site at www.sec.gov, and it also may be reviewed and copied at the SEC's Public Reference Room in Washington, D.C. Information on the operation of the SEC's Public Reference Room may be obtained by calling (800) SEC-0330. The Fund's portfolio holdings are also posted on www.dws-investments.com from time to time. Please see the Fund's current prospectus for more information.
Investment Portfolio December 31, 2011 | | | Principal Amount ($)(a) | | | Value ($) | |
| | | | |
| Corporate Bonds 27.5% | |
| Consumer Discretionary 7.1% | |
| AMC Entertainment, Inc., 8.75%, 6/1/2019 | | | 900,000 | | | | 931,500 | |
| CCO Holdings LLC, 6.5%, 4/30/2021 | | | 420,000 | | | | 425,250 | |
| DIRECTV Holdings LLC, 6.35%, 3/15/2040 | | | 315,000 | | | | 358,350 | |
| JC Penney Co., Inc., 5.65%, 6/1/2020 | | | 785,000 | | | | 769,300 | |
| Johnson Controls, Inc., 3.75%, 12/1/2021 | | | 300,000 | | | | 309,759 | |
| Levi Strauss & Co., 7.625%, 5/15/2020 (b) | | | 600,000 | | | | 612,750 | |
| MGM Resorts International, 9.0%, 3/15/2020 | | | 550,000 | | | | 609,125 | |
| NBCUniversal Media LLC: | |
| 5.15%, 4/30/2020 | | | 500,000 | | | | 556,688 | |
| 5.95%, 4/1/2041 | | | 350,000 | | | | 411,395 | |
| Norcraft Companies LP, 10.5%, 12/15/2015 | | | 100,000 | | | | 93,250 | |
| Royal Caribbean Cruises Ltd., 7.25%, 6/15/2016 | | | 750,000 | | | | 806,250 | |
| Time Warner Cable, Inc.: | |
| 4.0%, 9/1/2021 | | | 300,000 | | | | 303,518 | |
| 7.3%, 7/1/2038 | | | 40,000 | | | | 48,606 | |
| Time Warner, Inc., 7.625%, 4/15/2031 | | | 400,000 | | | | 516,353 | |
| Viacom, Inc., 2.5%, 12/15/2016 | | | 730,000 | | | | 729,723 | |
| Yum! Brands, Inc., 3.875%, 11/1/2020 | | | 465,000 | | | | 475,531 | |
| | | | | 7,957,348 | |
| Consumer Staples 2.1% | |
| Anheuser-Busch InBev Worldwide, Inc., 7.75%, 1/15/2019 | | | 750,000 | | | | 971,369 | |
| CVS Caremark Corp., 5.75%, 5/15/2041 | | | 120,000 | | | | 142,888 | |
| Kraft Foods, Inc., 5.375%, 2/10/2020 | | | 725,000 | | | | 836,542 | |
| Kroger Co., 5.4%, 7/15/2040 | | | 375,000 | | | | 404,006 | |
| | | | | 2,354,805 | |
| Energy 3.5% | |
| DCP Midstream LLC, 144A, 9.75%, 3/15/2019 | | | 480,000 | | | | 625,723 | |
| Encana Corp., 5.15%, 11/15/2041 | | | 116,000 | | | | 118,422 | |
| Enterprise Products Operating LLC, 6.125%, 10/15/2039 | | | 460,000 | | | | 513,805 | |
| ONEOK Partners LP, 6.15%, 10/1/2016 | | | 557,000 | | | | 639,608 | |
| Plains All American Pipeline LP, 8.75%, 5/1/2019 | | | 450,000 | | | | 574,872 | |
| Reliance Holdings U.S.A., Inc., 144A, 4.5%, 10/19/2020 | | | 650,000 | | | | 590,592 | |
| Weatherford International Ltd., 5.125%, 9/15/2020 | | | 700,000 | | | | 727,424 | |
| Williams Partners LP, 4.0%, 11/15/2021 | | | 112,000 | | | | 115,004 | |
| | | | | 3,905,450 | |
| | | Principal Amount ($)(a) | | | Value ($) | |
| | | | | | | | | |
| Financials 6.2% | |
| American Express Credit Corp., 2.8%, 9/19/2016 | | | | 1,000,000 | | | | 1,004,900 | |
| Bank of America Corp., 5.75%, 12/1/2017 | | | | 360,000 | | | | 340,028 | |
| Bank of New York Mellon Corp., 2.4%, 1/17/2017 | | | | 675,000 | | | | 673,475 | |
| Bunge Ltd. Finance Corp., 4.1%, 3/15/2016 | | | | 145,000 | | | | 150,151 | |
| Citigroup, Inc., 4.5%, 1/14/2022 | | | | 250,000 | | | | 240,506 | |
| CNA Financial Corp., 5.75%, 8/15/2021 | | | | 598,000 | | | | 610,215 | |
| Ford Motor Credit Co., LLC, 7.0%, 4/15/2015 | | | | 925,000 | | | | 994,375 | |
| JPMorgan Chase & Co., 5.125%, 9/15/2014 | | | | 600,000 | | | | 632,581 | |
| Lincoln National Corp., 8.75%, 7/1/2019 | | | | 325,000 | | | | 395,317 | |
| Nationwide Financial Services, Inc., 144A, 5.375%, 3/25/2021 | | | | 227,000 | | | | 222,970 | |
| Nordea Bank AB, 144A, 4.875%, 5/13/2021 | | | | 440,000 | | | | 371,891 | |
| PNC Bank NA, 6.875%, 4/1/2018 | | | | 200,000 | | | | 226,825 | |
| Prudential Financial, Inc., 7.375%, 6/15/2019 | | | | 120,000 | | | | 141,847 | |
| Red Arrow International Leasing PLC, "A", 8.375%, 6/30/2012 | RUB | | | 451,113 | | | | 13,658 | |
| SunTrust Banks, Inc., 3.6%, 4/15/2016 | | | | 185,000 | | | | 188,392 | |
| The Goldman Sachs Group, Inc., 6.0%, 6/15/2020 | | | | 500,000 | | | | 512,181 | |
| Toll Brothers Finance Corp., 8.91%, 10/15/2017 | | | | 200,000 | | | | 230,489 | |
| | | | | 6,949,801 | |
| Health Care 2.9% | |
| Amgen, Inc., 5.15%, 11/15/2041 | | | | 300,000 | | | | 311,005 | |
| Express Scripts, Inc., 7.25%, 6/15/2019 | | | | 720,000 | | | | 858,002 | |
| Gilead Sciences, Inc., 4.4%, 12/1/2021 | | | | 225,000 | | | | 238,206 | |
| McKesson Corp., 4.75%, 3/1/2021 | | | | 475,000 | | | | 538,148 | |
| Quest Diagnostics, Inc.: | |
| 4.7%, 4/1/2021 | | | | 650,000 | | | | 692,952 | |
| 6.4%, 7/1/2017 | | | | 500,000 | | | | 591,370 | |
| | | | | 3,229,683 | |
| Industrials 0.5% | |
| Burlington Northern Santa Fe LLC, 3.45%, 9/15/2021 | | | | 82,000 | | | | 84,516 | |
| CSX Corp., 6.15%, 5/1/2037 | | | | 400,000 | | | | 481,020 | |
| | | | | 565,536 | |
| Information Technology 1.7% | |
| Applied Materials, Inc., 5.85%, 6/15/2041 | | | | 500,000 | | | | 569,861 | |
| Equinix, Inc., 7.0%, 7/15/2021 | | | | 850,000 | | | | 896,750 | |
| Hewlett-Packard Co., 3.3%, 12/9/2016 | | | | 415,000 | | | | 423,758 | |
| | | | | 1,890,369 | |
| | | Principal Amount ($)(a) | | | Value ($) | |
| | | | | | | | | |
| Materials 2.1% | |
| ArcelorMittal, 6.125%, 6/1/2018 | | | 500,000 | | | | 493,781 | |
| Corporacion Nacional del Cobre — Codelco, REG S, 7.5%, 1/15/2019 | | | 600,000 | | | | 764,181 | |
| Dow Chemical Co.: | |
| 4.25%, 11/15/2020 | | | | 455,000 | | | | 472,945 | |
| 5.25%, 11/15/2041 | | | | 100,000 | | | | 105,187 | |
| Ecolab, Inc.: | |
| 4.35%, 12/8/2021 | | | | 350,000 | | | | 373,761 | |
| 5.5%, 12/8/2041 | | | | 78,000 | | | | 86,435 | |
| | | | | 2,296,290 | |
| Telecommunication Services 0.1% | |
| AT&T, Inc., 3.875%, 8/15/2021 | | | 125,000 | | | | 132,219 | |
| Utilities 1.3% | |
| DTE Energy Co., 7.625%, 5/15/2014 | | | 152,000 | | | | 172,730 | |
| Energy Future Competitive Holdings Co., 7.48%, 1/1/2017 | | | 24,287 | | | | 21,560 | |
| FirstEnergy Solutions Corp., 6.8%, 8/15/2039 | | | 367,000 | | | | 410,953 | |
| Majapahit Holding BV, REG S, 7.75%, 10/17/2016 | | | 100,000 | | | | 112,250 | |
| Sempra Energy, 6.5%, 6/1/2016 | | | 650,000 | | | | 758,226 | |
| | | | | 1,475,719 | |
Total Corporate Bonds (Cost $29,249,980) | | | | 30,757,220 | |
| | |
| Mortgage-Backed Securities Pass-Throughs 41.9% | |
| Federal Home Loan Mortgage Corp.: | | | | | | | | |
| 4.5%, 6/1/2041 | | | | 2,607,348 | | | | 2,761,752 | |
| 5.491%*, 2/1/2038 | | | | 334,941 | | | | 364,563 | |
| 5.5%, with various maturities from 10/1/2023 until 8/1/2024 | | | 284,197 | | | | 309,075 | |
| 6.5%, 3/1/2026 | | | | 591,893 | | | | 661,799 | |
| 7.0%, 1/1/2038 | | | | 86,417 | | | | 96,693 | |
| Federal National Mortgage Association: | | | | | | | | |
| 2.458%*, 8/1/2037 | | | | 109,565 | | | | 116,687 | |
| 3.0%, 6/1/2026 (c) | | | | 5,725,000 | | | | 5,911,957 | |
| 3.5%, 12/1/2040 (c) | | | | 5,500,000 | | | | 5,657,266 | |
| 4.0%, with various maturities from 2/1/2040 until 9/1/2040 (c) | | | 22,864,712 | | | | 24,020,143 | |
| 5.0%, with various maturities from 2/1/2021 until 8/1/2040 | | | 2,755,054 | | | | 2,975,098 | |
| 5.108%*, 9/1/2038 | | | | 110,061 | | | | 115,455 | |
| 5.359%*, 1/1/2038 | | | | 362,458 | | | | 386,018 | |
| 5.5%, with various maturities from 12/1/2032 until 4/1/2037 | | | 1,933,870 | | | | 2,102,693 | |
| 6.0%, with various maturities from 4/1/2024 until 3/1/2025 | | | 608,908 | | | | 679,889 | |
| 6.5%, with various maturities from 3/1/2017 until 12/1/2037 | | | 689,389 | | | | 766,406 | |
| 8.0%, 9/1/2015 | | | | 10,723 | | | | 11,516 | |
Total Mortgage-Backed Securities Pass-Throughs (Cost $46,149,580) | | | | 46,937,010 | |
| | |
| | | Principal Amount ($)(a) | | | Value ($) | |
| | | | | | | | | |
| Asset-Backed 3.0% | |
| Credit Card Receivables 1.0% | |
| Citibank Omni Master Trust, "A14", Series 2009-A14A, 144A, 3.028%*, 8/15/2018 | | | 1,000,000 | | | | 1,049,006 | |
| Student Loans 2.0% | |
| Nelnet Student Loan Trust: | |
| "A1", Series 2007-1, 0.516%*, 11/27/2018 | | | | 932,759 | | | | 919,760 | |
| "A4", Series 2006-1, 0.585%*, 11/23/2022 | | | | 1,375,000 | | | | 1,355,665 | |
| | | | | 2,275,425 | |
Total Asset-Backed (Cost $3,325,707) | | | | 3,324,431 | |
| | |
| Commercial Mortgage-Backed Securities 7.3% | |
| Banc of America Commercial Mortgage, Inc., "A4", Series 2007-1, 5.451%, 1/15/2049 | | | 1,660,000 | | | | 1,803,504 | |
| Bear Stearns Commercial Mortgage Securities, Inc., "A4", Series 2007-PW16, 5.715%*, 6/11/2040 | | | 140,000 | | | | 153,273 | |
| Greenwich Capital Commercial Funding Corp., "A4", Series 2007-GG9, 5.444%, 3/10/2039 | | | 1,140,000 | | | | 1,233,920 | |
| JPMorgan Chase Commercial Mortgage Securities Corp.: | | | | | | | | |
| "A4", Series 2007-C1, 5.716%, 2/15/2051 | | | | 475,000 | | | | 514,204 | |
| "F", Series 2007-LD11, 5.817%*, 6/15/2049 | | | | 650,000 | | | | 72,246 | |
| "G", Series 2007-LD11, 144A, 5.817%*, 6/15/2049 | | | 760,000 | | | | 52,820 | |
| "H", Series 2007-LD11, 144A, 5.817%*, 6/15/2049 | | | 460,000 | | | | 22,448 | |
| "A4", Series 2007-LD12, 5.882%, 2/15/2051 | | | | 990,000 | | | | 1,075,255 | |
| LB-UBS Commercial Mortgage Trust: | | | | | | | | |
| "E", Series 2005-C2, 5.35%*, 4/15/2040 | | | | 500,000 | | | | 278,393 | |
| "A4", Series 2007-C6, 5.858%, 7/15/2040 | | | | 915,000 | | | | 1,002,288 | |
| Merrill Lynch Mortgage Trust, "ASB", Series 2007-C1, 5.834%*, 6/12/2050 | | | 590,000 | | | | 633,065 | |
| Morgan Stanley Reremic Trust, "A4A", Series 2009-GG10, 144A, 5.79%*, 8/12/2045 | | | 1,150,000 | | | | 1,289,311 | |
| Wachovia Bank Commercial Mortgage Trust, "H", Series 2007-C32, 144A, 5.74%*, 6/15/2049 | | | 770,000 | | | | 31,031 | |
Total Commercial Mortgage-Backed Securities (Cost $10,376,911) | | | | 8,161,758 | |
| | |
| Collateralized Mortgage Obligations 4.2% | |
| Countrywide Home Loans, "A2", Series 2006-1, 6.0%, 3/25/2036 | | | 552,197 | | | | 419,458 | |
| CS First Boston Mortgage Securities Corp., "10A3", Series 2005-10, 6.0%, 11/25/2035 | | | 153,330 | | | | 91,367 | |
| | | Principal Amount ($)(a) | | | Value ($) | |
| | | | | | | | | |
| Federal Home Loan Mortgage Corp., "PE", Series 2898, 5.0%, 5/15/2033 | | | | 335,000 | | | | 358,525 | |
| Federal National Mortgage Association: | | |
| ''IO", Series 2010-143, Interest Only, 5.0%, 12/25/2025 | | | | 4,462,393 | | | | 540,359 | |
| "EG", Series 2005-22, 5.0%, 11/25/2033 | | | | 750,000 | | | | 810,055 | |
| "TC", Series 2007-77, 5.5%, 9/25/2034 | | | | 370,000 | | | | 394,242 | |
| Government National Mortgage Association: | | |
| "IU", Series 2010-164, Interest Only, 2.0%, 12/20/2013 | | | | 2,592,743 | | | | 69,969 | |
| "MI", Series 2010-85, Interest Only, 4.5%, 1/20/2036 | | | | 1,780,708 | | | | 188,357 | |
| "GI", Series 2010-89, Interest Only, 4.5%, 5/20/2039 | | | | 1,223,535 | | | | 197,610 | |
| "EI", Series 2010-134, Interest Only, 4.5%, 11/20/2039 | | | | 639,304 | | | | 101,340 | |
| "DI", Series 2011-40, Interest Only, 4.5%, 12/20/2040 | | | | 3,289,647 | | | | 433,968 | |
| "IM", Series 2010-87, Interest Only, 4.75%, 3/20/2036 | | | | 1,756,616 | | | | 204,816 | |
| "IA", Series 2010-58, Interest Only, 5.0%, 3/20/2039 | | | | 2,267,536 | | | | 376,618 | |
| "KI", Series 2010-130, Interest Only, 5.5%, 9/16/2040 | | | | 388,925 | | | | 64,063 | |
| MASTR Alternative Loans Trust, "8A1", Series 2004-3, 7.0%, 4/25/2034 | | | | 11,421 | | | | 11,438 | |
| Vericrest Opportunity Loan Transferee, "B1", Series 2010-NPL1, 144A, 8.0%, 5/25/2039 | | | | 505,338 | | | | 469,696 | |
Total Collateralized Mortgage Obligations (Cost $5,123,946) | | | | 4,731,881 | |
| | |
| Government & Agency Obligations 36.5% | |
| Sovereign Bonds 8.1% | |
| Dominican Republic, REG S, 7.5%, 5/6/2021 | | | | 800,000 | | | | 784,000 | |
| Eskom Holdings SOC Ltd., REG S, 5.75%, 1/26/2021 | | | | 400,000 | | | | 407,000 | |
| Republic of Argentina, GDP Linked Note, 12/15/2035 (d) | | | | 410,000 | | | | 51,426 | |
| Republic of Croatia, REG S, 6.75%, 11/5/2019 | | | | 550,000 | | | | 522,500 | |
| Republic of Egypt, 9.1%, 9/20/2012 | EGP | | | 230,000 | | | | 37,540 | |
| Republic of El Salvador, REG S, 8.25%, 4/10/2032 | | | | 40,000 | | | | 43,400 | |
| Republic of Indonesia, REG S, 4.875%, 5/5/2021 | | | | 800,000 | | | | 856,000 | |
| | | Principal Amount ($)(a) | | | Value ($) | |
| | | | | | | | | |
| Republic of Lithuania: | |
| REG S, 5.125%, 9/14/2017 | | | | 200,000 | | | | 196,000 | |
| 144A, 6.125%, 3/9/2021 | | | | 225,000 | | | | 223,875 | |
| Republic of Panama: | |
| 5.2%, 1/30/2020 | | | | 425,000 | | | | 481,312 | |
| 7.125%, 1/29/2026 | | | | 220,000 | | | | 286,550 | |
| 7.25%, 3/15/2015 | | | | 80,000 | | | | 92,400 | |
| Republic of Peru, 7.35%, 7/21/2025 | | | 1,000,000 | | | | 1,325,000 | |
| Republic of Poland, 5.0%, 3/23/2022 | | | 700,000 | | | | 703,500 | |
| Republic of Serbia: | |
| REG S, 6.75%, 11/1/2024 | | | | 446,333 | | | | 421,785 | |
| REG S, 7.25%, 9/28/2021 | | | | 300,000 | | | | 292,035 | |
| Republic of South Africa, 5.5%, 3/9/2020 | | | | 750,000 | | | | 840,000 | |
| Republic of Venezuela, REG S, 7.75%, 10/13/2019 | | | 1,000,000 | | | | 715,000 | |
| Russian Federation, REG S, 5.0%, 4/29/2020 | | | | 800,000 | | | | 825,320 | |
| | | | | 9,104,643 | |
| U.S. Treasury Obligations 28.4% | |
| U.S. Treasury Bonds: | |
| 3.75%, 8/15/2041 (b) | | | | 2,000,000 | | | | 2,352,188 | |
| 4.75%, 2/15/2037 | | | | 2,000,000 | | | | 2,716,562 | |
| 5.375%, 2/15/2031 | | | | 1,000,000 | | | | 1,425,312 | |
| 7.125%, 2/15/2023 (b) | | | | 3,400,000 | | | | 5,141,970 | |
| U.S. Treasury Inflation-Indexed Note, 0.625%, 7/15/2021 | | | 2,762,843 | | | | 2,955,595 | |
| U.S. Treasury Notes: | |
| 0.5%, 10/15/2013 (b) | | | | 1,000,000 | | | | 1,004,336 | |
| 0.875%, 1/31/2012 | | | | 1,000,000 | | | | 1,000,625 | |
| 1.0%, 8/31/2016 | | | | 11,000,000 | | | | 11,120,318 | |
| 1.5%, 7/31/2016 | | | | 1,250,000 | | | | 1,292,285 | |
| 2.0%, 11/15/2021 (b) | | | | 2,700,000 | | | | 2,730,796 | |
| | | | | 31,739,987 | |
Total Government & Agency Obligations (Cost $39,068,924) | | | | 40,844,630 | |
| | |
| Loan Participations and Assignments 0.3% | |
| Sovereign Loans | |
| Gazprom, 144A, 8.125%, 7/31/2014 | | | 205,000 | | | | 221,400 | |
| Russian Agricultural Bank, REG S, 7.75%, 5/29/2018 | | | 100,000 | | | | 106,500 | |
Total Loan Participations and Assignments (Cost $302,977) | | | | 327,900 | |
| | |
| Municipal Bonds and Notes 6.8% | |
| California, University Revenues, Build America Bonds, 5.946%, 5/15/2045 (f) | | | 420,000 | | | | 489,413 | |
| Gwinnett County, GA, Development Authority Revenue, Gwinnett Stadium Project, 6.4%, 1/1/2028 (f) | | | 655,000 | | | | 750,938 | |
| Jicarilla, NM, Sales & Special Tax Revenue, Apache Nation Revenue, 144A, 5.2%, 12/1/2013 (f) | | | 260,000 | | | | 259,464 | |
| Kentucky, Asset/Liability Commission, General Fund Revenue, 3.165%, 4/1/2018 (f) | | | 1,300,000 | | | | 1,334,827 | |
| | | Principal Amount ($)(a) | | | Value ($) | |
| | | | | | | | | |
| Los Angeles, CA, Community Development Agency Tax Allocation Revenue, Adelante Eastside Project, Series C, 6.49%, 9/1/2037, INS: Radian (f) | | | 310,000 | | | | 292,290 | |
| Louisville & Jefferson County, KY, Metropolitan Sewer District & Drain Systems, Build America Bonds, 6.25%, 5/15/2043 (f) | | | 400,000 | | | | 501,952 | |
| Nashville & Davidson County, TN, Metropolitan Government, Convention Center Authority Revenue, Build America Bonds, Series B, 6.731%, 7/1/2043 (f) | | | 400,000 | | | | 482,000 | |
| New Jersey, Economic Development Authority Revenue, Series B, 6.5%, 11/1/2013, INS: AGC (f) | | | 860,000 | | | | 934,880 | |
| Port Authority New York & New Jersey, One Hundred Fiftieth Series, 4.75%, 9/15/2016 (f) | | | 930,000 | | | | 1,055,550 | |
| Rhode Island, Convention Center Authority Revenue, Civic Center, Series A, 6.06%, 5/15/2035, INS: AGMC (f) | | | 515,000 | | | | 574,931 | |
| Virgin Islands, Port Authority Marine Revenue, Series B, 5.08%, 9/1/2013, INS: AGMC (f) | | | 610,000 | | | | 618,101 | |
| Washington, Central Puget Sound Regional Transit Authority, Sales & Use Tax Revenue, Series A, 5.0%, 11/1/2036 | | | 285,000 | | | | 303,428 | |
Total Municipal Bonds and Notes (Cost $6,935,693) | | | | 7,597,774 | |
| | | Principal Amount ($)(a) | | | Value ($) | |
| | | | | | | | | |
| Short-Term U.S. Treasury Obligation 1.0% | |
| U.S. Treasury Bill, 0.015%**, 3/8/2012 (e) (Cost $1,121,971) | | | 1,122,000 | | | | 1,121,964 | |
| | | Shares | | | Value ($) | |
| | | | |
| Securities Lending Collateral 10.1% | |
| Daily Assets Fund Institutional, 0.18% (g) (h) (Cost $11,307,660) | | | 11,307,660 | | | | 11,307,660 | |
| | |
| Cash Equivalents 1.3% | |
| Central Cash Management Fund, 0.07% (g) (Cost $1,438,901) | | | 1,438,901 | | | | 1,438,901 | |
| | | % of Net Assets | | | Value ($) | |
| | | | |
Total Investment Portfolio (Cost $154,402,250)+ | | | 139.9 | | | | 156,551,129 | |
| Other Assets and Liabilities, Net | | | (39.9 | ) | | | (44,615,310 | ) |
| Net Assets | | | 100.0 | | | | 111,935,819 | |
* Floating rate securities' yields vary with a designated market index or market rate, such as the coupon-equivalent of the U.S. Treasury Bill rate. These securities are shown at their current rate as of December 31, 2011.
** Annualized yield at time of purchase; not a coupon rate.
+ The cost for federal income tax purposes was $154,402,250. At December 31, 2011, net unrealized appreciation for all securities based on tax cost was $2,148,879. This consisted of aggregate gross unrealized appreciation for all securities in which there was an excess of value over tax cost of $5,333,197 and aggregate gross unrealized depreciation for all securities in which there was an excess of tax cost over value of $3,184,318.
(a) Principal amount stated in U.S. dollars unless otherwise noted.
(b) All or a portion of these securities were on loan (see Notes to Financial Statements). The value of all securities loaned at December 31, 2011 amounted to $10,983,329, which is 9.8% of net assets.
(c) When-issued or delayed delivery security included.
(d) Security is linked to Argentine Republic Gross Domestic Product (GDP). Security does not pay principal over life of security or at expiration. Payments are based on growth of Argentina GDP, subject to certain conditions.
(e) At December 31, 2011, this security has been pledged, in whole or in part, to cover initial margin requirements for open futures contracts.
(f) Taxable issue.
(g) Affiliated fund managed by Deutsche Investment Management Americas Inc. The rate shown is the annualized seven-day yield at period end.
(h) Represents collateral held in connection with securities lending. Income earned by the Fund is net of borrower rebates.
144A: Security exempt from registration under Rule 144A of the Securities Act of 1933. These securities may be resold in transactions exempt from registration, normally to qualified institutional buyers.
AGC: Assured Guaranty Corp.
AGMC: Assured Guaranty Municipal Corp.
GDP: Gross Domestic Product
INS: Insured
Interest Only: Interest Only (IO) bonds represent the "interest only" portion of payments on a pool of underlying mortgages or mortgage-backed securities. IO securities are subject to prepayment risk of the pool of underlying mortgages.
Radian: Radian Asset Assurance, Inc.
REG S: Securities sold under Regulation S may not be offered, sold or delivered within the United States or to, or for the account or benefit of, U.S. persons, except pursuant to an exemption from, or in a transaction not subject to, the registration requirements of the Securities Act of 1933.
Included in the Fund are investments in mortgage- or asset-backed securities, which are interests in separate pools of mortgages or assets. Effective maturities of these investments may be shorter than stated maturities due to prepayments. Some separate investments in the Federal Home Loan Mortgage Corp. and Federal National Mortgage Association issues have similar coupon rates and have been aggregated for presentation purposes in the investment portfolio.
At December 31, 2011, open futures contracts purchased were as follows:
| Futures | Currency | Expiration Date | | Contracts | | | Notional Value ($) | | | Unrealized Appreciation ($) | |
| 10 Year Canadian Government Bond | CAD | 3/21/2012 | | | 67 | | | | 8,802,238 | | | | 94,461 | |
| United Kingdom Long Gilt Bond | GBP | 3/28/2012 | | | 17 | | | | 3,087,597 | | | | 43,531 | |
| Total unrealized appreciation | | | | 137,992 | |
At December 31, 2011, open futures contracts sold were as follows:
| Futures | Currency | Expiration Date | | Contracts | | | Notional Value ($) | | | Unrealized Appreciation/ (Depreciation) ($) | |
| 10 Year U.S. Treasury Note | USD | 3/21/2012 | | | 280 | | | | 36,715,000 | | | | (322,093 | ) |
| 30 Year U.S. Treasury Bond | USD | 3/21/2012 | | | 46 | | | | 6,661,375 | | | | (50,073 | ) |
| Euro Currency | USD | 3/19/2012 | | | 7 | | | | 1,134,700 | | | | 21,099 | |
| Federal Republic of Germany Euro-Bund | EUR | 3/8/2012 | | | 26 | | | | 4,678,767 | | | | (82,827 | ) |
| Total net unrealized depreciation | | | | (433,894 | ) |
As of December 31, 2011, the Fund had the following open forward currency exchange contracts:
| Contracts to Deliver | | In Exchange For | | Settlement Date | | Unrealized Appreciation ($) | | Counterparty |
| RUB | | | 800,000 | | USD | | | 25,827 | | 1/19/2012 | | | 1,055 | | JPMorgan Chase Securities, Inc. |
| USD | | | 2,202,816 | | CNY | | | 14,000,000 | | 1/19/2012 | | | 20,406 | | HSBC Bank U.S.A. |
| Total unrealized appreciation | | | | | 21,461 | |
| Currency Abbreviations |
CAD Canadian Dollar CNY Chinese Yuan EGP Egyptian Pound EUR Euro GBP British Pound RUB Russian Ruble USD United States Dollar |
For information on the Fund's policy and additional disclosures regarding futures contracts and forward foreign currency exchange contracts, please refer to Note B in the accompanying Notes to Financial Statements.
Fair Value Measurements
Various inputs are used in determining the value of the Fund's investments. These inputs are summarized in three broad levels. Level 1 includes quoted prices in active markets for identical securities. Level 2 includes other significant observable inputs (including quoted prices for similar securities, interest rates, prepayment speeds, and credit risk). Level 3 includes significant unobservable inputs (including the Fund's own assumptions in determining the fair value of investments). The inputs or methodology used for valuing securities are not necessarily an indication of the risk associated with investing in those securities.
The following is a summary of the inputs used as of December 31, 2011 in valuing the Fund's investments. For information on the Fund's policy regarding the valuation of investments, please refer to the Security Valuation section of Note A in the accompanying Notes to Financial Statements.
| Assets | | Level 1 | | | Level 2 | | | Level 3 | | | Total | |
| | |
| Fixed Income Investments (i) | |
| Corporate Bonds | | $ | — | | | $ | 30,757,220 | | | $ | — | | | $ | 30,757,220 | |
| Mortgage-Backed Securities Pass-Throughs | | | — | | | | 46,937,010 | | | | — | | | | 46,937,010 | |
| Asset-Backed | | | — | | | | 3,324,431 | | | | — | | | | 3,324,431 | |
| Commercial Mortgage-Backed Securities | | | — | | | | 8,161,758 | | | | — | | | | 8,161,758 | |
| Collateralized Mortgage Obligations | | | — | | | | 4,731,881 | | | | — | | | | 4,731,881 | |
| Government & Agency Obligations | | | — | | | | 40,844,630 | | | | — | | | | 40,844,630 | |
| Loan Participations and Assignments | | | — | | | | 327,900 | | | | — | | | | 327,900 | |
| Municipal Bonds and Notes | | | — | | | | 7,597,774 | | | | — | | | | 7,597,774 | |
| Short-Term U.S. Treasury Obligation | | | — | | | | 1,121,964 | | | | — | | | | 1,121,964 | |
| Short-Term Investments (i) | | | 12,746,561 | | | | — | | | | — | | | | 12,746,561 | |
| Derivatives (j) | | | 159,091 | | | | 21,461 | | | | — | | | | 180,552 | |
| Total | | $ | 12,905,652 | | | $ | 143,826,029 | | | $ | — | | | $ | 156,731,681 | |
| Liabilities | | | | | | | | | | | | | | | | |
| Derivatives (j) | | $ | (454,993 | ) | | $ | — | | | $ | — | | | $ | (454,993 | ) |
| Total | | $ | (454,993 | ) | | $ | — | | | $ | — | | | $ | (454,993 | ) |
There have been no transfers between Level 1 and Level 2 fair value measurements during the year ended December 31, 2011.
(i) See Investment Portfolio for additional detailed categorizations.
(j) Derivatives include unrealized appreciation (depreciation) on open futures contracts and forward foreign currency exchange contracts.
The accompanying notes are an integral part of the financial statements.
Statement of Assets and Liabilities | as of December 31, 2011 | |
| Assets | |
Investments: Investments in non-affiliated securities, at value (cost $141,655,689) — including $10,983,329 of securities loaned | | $ | 143,804,568 | |
Investment in Daily Assets Fund Institutional (cost $11,307,660)* | | | 11,307,660 | |
| Investment in Central Cash Management Fund (cost $1,438,901) | | | 1,438,901 | |
| Total investments, at value (cost $154,402,250) | | | 156,551,129 | |
| Foreign currency, at value (cost $72,839) | | | 68,949 | |
| Receivable for Fund shares sold | | | 77,287 | |
| Interest receivable | | | 1,104,620 | |
| Unrealized appreciation on forward foreign currency exchange contracts | | | 21,461 | |
| Foreign taxes recoverable | | | 2,315 | |
| Other assets | | | 2,244 | |
| Total assets | | | 157,828,005 | |
| Liabilities | |
| Payable upon return of securities loaned | | | 11,307,660 | |
| Payable for investments purchased — when-issued/delayed delivery securities | | | 34,365,907 | |
| Payable for Fund shares redeemed | | | 28,002 | |
| Payable for daily variation margin on futures contracts | | | 60,398 | |
| Accrued management fee | | | 37,103 | |
| Accrued expenses | | | 93,116 | |
| Total liabilities | | | 45,892,186 | |
| Net assets, at value | | $ | 111,935,819 | |
| Net Assets Consist of | |
| Undistributed net investment income | | | 4,694,271 | |
Net unrealized appreciation (depreciation) on: Investments | | | 2,148,879 | |
| Futures | | | (295,902 | ) |
| Foreign currency | | | 17,408 | |
| Accumulated net realized gain (loss) | | | (37,300,113 | ) |
| Paid-in capital | | | 142,671,276 | |
| Net assets, at value | | $ | 111,935,819 | |
Class A Net Asset Value, offering and redemption price per share ($111,935,819 ÷ 19,571,536 outstanding shares of beneficial interest, $.01 par value, unlimited number of shares authorized) | | $ | 5.72 | |
* Represents collateral on securities loaned.
The accompanying notes are an integral part of the financial statements.
Statement of Operations
| for the year ended December 31, 2011 | |
| Investment Income | |
Income: Interest | | $ | 5,305,633 | |
| Income distributions — Central Cash Management Fund | | | 13,445 | |
| Securities lending income, including income from Daily Assets Fund Institutional, net of borrower rebates | | | 8,724 | |
| Total income | | | 5,327,802 | |
Expenses: Management fee | | | 463,328 | |
| Administration fee | | | 118,802 | |
| Services to shareholders | | | 2,444 | |
| Custodian fee | | | 17,294 | |
| Audit and tax fees | | | 38,806 | |
| Legal fees | | | 21,132 | |
| Reports to shareholders | | | 49,655 | |
| Trustees' fees and expenses | | | 4,978 | |
| Other | | | 23,596 | |
| Total expenses | | | 740,035 | |
| Net investment income | | | 4,587,767 | |
| Realized and Unrealized Gain (Loss) | |
Net realized gain (loss) from: Investments | | | 3,326,788 | |
| Swap contracts | | | (820,768 | ) |
| Futures | | | (1,433,133 | ) |
| Foreign currency | | | (75,349 | ) |
| | | | 997,538 | |
Change in net unrealized appreciation (depreciation) on: Investments | | | 2,119,299 | |
| Futures | | | (1,184,558 | ) |
| Foreign currency | | | (29,052 | ) |
| | | | 905,689 | |
| Net gain (loss) | | | 1,903,227 | |
| Net increase (decrease) in net assets resulting from operations | | $ | 6,490,994 | |
The accompanying notes are an integral part of the financial statements.
Statement of Changes in Net Assets | | | Years Ended December 31, | |
| Increase (Decrease) in Net Assets | | 2011 | | | 2010 | |
Operations: Net investment income (loss) | | $ | 4,587,767 | | | $ | 5,460,988 | |
| Net realized gain (loss) | | | 997,538 | | | | 5,014,458 | |
| Change in net unrealized appreciation (depreciation) | | | 905,689 | | | | 3,501 | |
| Net increase (decrease) in net assets resulting from operations | | | 6,490,994 | | | | 10,478,947 | |
Distributions to shareholders from: Net investment income: Class A | | | (4,956,830 | ) | | | (6,962,542 | ) |
Fund share transactions: Class A Proceeds from shares sold | | | 13,875,163 | | | | 16,049,365 | |
| Reinvestment of distributions | | | 4,956,830 | | | | 6,962,542 | |
| Payments for shares redeemed | | | (63,808,031 | ) | | | (29,824,695 | ) |
| Net increase (decrease) in net assets from Class A share transactions | | | (44,976,038 | ) | | | (6,812,788 | ) |
| Increase (decrease) in net assets | | | (43,441,874 | ) | | | (3,296,383 | ) |
| Net assets at beginning of period | | | 155,377,693 | | | | 158,674,076 | |
| Net assets at end of period (including undistributed net investment income of $4,694,271 and $4,830,117, respectively) | | $ | 111,935,819 | | | $ | 155,377,693 | |
| Other Information | |
Class A Shares outstanding at beginning of period | | | 27,458,970 | | | | 28,638,100 | |
| Shares sold | | | 2,449,457 | | | | 2,857,267 | |
| Shares issued to shareholders in reinvestment of distributions | | | 891,516 | | | | 1,277,530 | |
| Shares redeemed | | | (11,228,407 | ) | | | (5,313,927 | ) |
| Net increase (decrease) in Class A shares | | | (7,887,434 | ) | | | (1,179,130 | ) |
| Shares outstanding at end of period | | | 19,571,536 | | | | 27,458,970 | |
The accompanying notes are an integral part of the financial statements.
| | | Years Ended December 31, | |
| Class A | | | 2011 | | | 2010 | | | 2009 | | | 2008 | | | 2007 | |
| Selected Per Share Data | |
| Net asset value, beginning of period | | $ | 5.66 | | | $ | 5.54 | | | $ | 5.50 | | | $ | 6.98 | | | $ | 7.03 | |
Income (loss) from investment operations: Net investment incomea | | | .22 | | | | .19 | | | | .25 | | | | .37 | | | | .35 | |
| Net realized and unrealized gain (loss) | | | .09 | | | | .18 | | | | .26 | | | | (1.48 | ) | | | (.06 | ) |
| Total from investment operations | | | .31 | | | | .37 | | | | .51 | | | | (1.11 | ) | | | .29 | |
Less distributions from: Net investment income | | | (.25 | ) | | | (.25 | ) | | | (.47 | ) | | | (.37 | ) | | | (.34 | ) |
| Net asset value, end of period | | $ | 5.72 | | | $ | 5.66 | | | $ | 5.54 | | | $ | 5.50 | | | $ | 6.98 | |
| Total Return (%) | | | 5.68 | | | | 6.79 | | | | 10.07 | | | | (16.77 | ) | | | 4.18 | |
| Ratios to Average Net Assets and Supplemental Data | |
| Net assets, end of period ($ millions) | | | 112 | | | | 155 | | | | 159 | | | | 155 | | | | 229 | |
| Ratio of expenses (%) | | | .62 | | | | .59 | | | | .59 | | | | .59 | | | | .61 | |
| Ratio of net investment income (%) | | | 3.86 | | | | 3.42 | | | | 4.68 | | | | 5.76 | | | | 5.03 | |
| Portfolio turnover rate (%) | | | 219 | | | | 357 | | | | 284 | | | | 196 | | | | 185 | |
a Based on average shares outstanding during the period. | |
Notes to Financial Statements
A. Organization and Significant Accounting Policies
DWS Variable Series I (the "Series") is registered under the Investment Company Act of 1940, as amended (the "1940 Act"), as an open-end, registered management investment company organized as a Massachusetts business trust. The Series consists of five diversified funds: DWS Bond VIP, DWS Growth & Income VIP, DWS Capital Growth VIP, DWS Global Small Cap Growth VIP (formerly DWS Global Opportunities VIP) and DWS International VIP (individually or collectively hereinafter referred to as a "Fund" or the "Funds"). These financial statements report on DWS Bond VIP. The Series is intended to be the underlying investment vehicle for variable annuity contracts and variable life insurance policies to be offered by the separate accounts of certain life insurance companies ("Participating Insurance Companies").
The Fund's financial statements are prepared in accordance with accounting principles generally accepted in the United States of America, which require the use of management estimates. Actual results could differ from those estimates. The policies described below are followed consistently by the Fund in the preparation of its financial statements.
Security Valuation. Investments are stated at value determined as of the close of regular trading on the New York Stock Exchange on each day the exchange is open for trading.
Various inputs are used in determining the value of the Fund's investments. These inputs are summarized in three broad levels. Level 1 includes quoted prices in active markets for identical securities. Level 2 includes other significant observable inputs (including quoted prices for similar securities, interest rates, prepayment speeds, and credit risk). Level 3 includes significant unobservable inputs (including the Fund's own assumptions in determining the fair value of investments). The inputs or methodology used for valuing securities are not necessarily an indication of the risk associated with investing in those securities.
Debt securities are valued at prices supplied by independent pricing services approved by the Trustees of the Series. If the pricing services are unable to provide valuations, securities are valued at the most recent bid quotation or evaluated price, as applicable, obtained from one or more broker-dealers. Such services may use various pricing techniques which take into account appropriate factors such as yield, quality, coupon rate, maturity, type of issue, trading characteristics and other data, as well as broker quotes. These securities are generally categorized as Level 2.
Money market instruments purchased with an original or remaining maturity of sixty days or less, maturing at par, are valued at amortized cost, which approximates value, and are categorized as Level 2. Investments in open-end investment companies are valued at their net asset value each business day and are categorized as Level 1.
Futures contracts are generally valued at the settlement prices established each day on the exchange on which they are traded and are categorized as Level 1.
Swap contracts are valued daily based upon prices supplied by a Board approved pricing vendor, if available, and otherwise are valued at the price provided by the broker-dealer. Swap contracts are generally categorized as Level 2.
Forward currency contracts are valued at the prevailing forward exchange rate of the underlying currencies and are categorized as Level 2.
Securities and other assets for which market quotations are not readily available or for which the above valuation procedures are deemed not to reflect fair value are valued in a manner that is intended to reflect their fair value as determined in accordance with procedures approved by the Trustees and are generally categorized as Level 3. In accordance with the Fund's valuation procedures, factors used in determining value may include, but are not limited to, the type of the security; the size of the holding; the initial cost of the security; the existence of any contractual restrictions on the security's disposition; the price and extent of public trading in similar securities of the issuer or of comparable companies; quotations or evaluated prices from broker-dealers and/or pricing services; information obtained from the issuer, analysts, and/or the appropriate stock exchange (for exchange-traded securities); an analysis of the company's or issuer's financial statements; an evaluation of the forces that influence the issuer and the market(s) in which the security is purchased and sold and with respect to debt securities; the maturity, coupon, creditworthiness, currency denomination and the movement of the market in which the security is normally traded. The value determined under these procedures may differ from published values for the same securities.
Disclosure about the classification of fair value measurements is included in a table following the Fund's Investment Portfolio.
New Accounting Pronouncement. In May 2011, Accounting Standards Update 2011-04 (ASU 2011-04), Amendments to Achieve Common Fair Value Measurement and Disclosure Requirements in U.S. GAAP and IFRSs, was issued and is effective during interim and annual periods beginning after December 15, 2011. ASU 2011-04 amends Accounting Standards Codification (ASC) Topic 820, Fair Value Measurement. The amendments are the result of the work by the Financial Accounting Standards Board and the International Accounting Standards Board to develop common requirements for measuring fair value and for disclosing information about fair value measurements in accordance with GAAP. Management is currently evaluating the application of ASU 2011-04 and its impact, if any, on the Fund's financial statements.
Securities Lending. The Fund lends securities to certain financial institutions. The Fund retains beneficial ownership of the securities it has loaned and continues to receive interest and dividends paid by the issuer of securities and to participate in any changes in their market value. The Fund requires the borrowers of the securities to maintain collateral with the Fund consisting of either cash or liquid, unencumbered assets having a value at least equal to the value of the securities loaned. When the collateral falls below specified amounts, the lending agent will use its best effort to obtain additional collateral on the next business day to meet required amounts under the security lending agreement. The Fund may invest the cash collateral into a joint trading account in an affiliated money market fund pursuant to Exemptive Orders issued by the SEC. The Fund receives compensation for lending its securities either in the form of fees or by earning interest on invested cash collateral net of borrower rebates and fees paid to a lending agent. Either the Fund or the borrower may terminate the loan. There may be risks of delay and costs in recovery of securities or even loss of rights in the collateral should the borrower of the securities fail financially. The Fund is also subject to all investment risks associated with the reinvestment of any cash collateral received, including, but not limited to, interest rate, credit and liquidity risk associated with such investments.
Foreign Currency Translations. The books and records of the Fund are maintained in U.S. dollars. Investment securities and other assets and liabilities denominated in a foreign currency are translated into U.S. dollars at the prevailing exchange rates at period end. Purchases and sales of investment securities, income and expenses are translated into U.S. dollars at the prevailing exchange rates on the respective dates of the transactions.
Net realized and unrealized gains and losses on foreign currency transactions represent net gains and losses between trade and settlement dates on securities transactions, the acquisition and disposition of foreign currencies, and the difference between the amount of net investment income accrued and the U.S. dollar amount actually received. That portion of both realized and unrealized gains and losses on investments that results from fluctuations in foreign currency exchange rates is not separately disclosed but is included with net realized and unrealized gain/appreciation and loss/depreciation on investments.
Loan Participations and Assignments. Loan Participations and Assignments are portions of loans originated by banks and sold in pieces to investors. These U.S. dollar-denominated fixed and floating rate loans ("Loans") in which the Fund invests, are arranged between the borrower and one or more financial institutions ("Lenders"). These Loans may take the form of Senior Loans, which are corporate obligations often issued in connection with recapitalizations, acquisitions, leveraged buy-outs and refinancings, and Sovereign Loans, which are debt instruments between a foreign sovereign entity and one or more financial institutions. The Fund invests in such Loans in the form of participations in Loans ("Participations") or assignments of all or a portion of Loans from third parties ("Assignments"). Participations typically result in the Fund having a contractual relationship only with the Lender, not with the borrower. The Fund has the right to receive payments of principal, interest and any fees to which it is entitled from the Lender selling the Participation and only upon receipt by the Lender of the payments from the borrower. In connection with purchasing Participations, the Fund generally has no right to enforce compliance by the borrower with the terms of the loan agreement relating to the Loan, or any rights of set-off against the borrower, and the Fund will not benefit directly from any collateral supporting the Loan in which it has purchased the Participation. As a result, the Fund assumes the credit risk of both the borrower and the Lender that is selling the Participation. Assignments typically result in the Fund having a direct contractual relationship with the borrower, and the Fund may enforce compliance by the borrower with the terms of the loan agreement. Senior loans held by the Fund generally in the form of Assignments but the Fund may also invest in Participations. All Loan Participations and Assignments involve interest rate risk, liquidity risk and credit risk, including the potential default or insolvency of the borrower.
When-Issued/Delayed Delivery Securities. The Fund may purchase or sell securities with delivery or payment to occur at a later date beyond the normal settlement period. At the time the Fund enters into a commitment to purchase or sell a security, the transaction is recorded and the value of the transaction is reflected in the net asset value. The price of such security and the date when the security will be delivered and paid for are fixed at the time the transaction is negotiated. The value of the security may vary with market fluctuations. At the time the Fund enters into a purchase transaction it is required to segregate cash or other liquid assets at least equal to the amount of the commitment.
Certain risks may arise upon entering into when-issued or delayed delivery transactions from the potential inability of counterparties to meet the terms of their contracts or if the issuer does not issue the securities due to political, economic, or other factors. Additionally, losses may arise due to changes in the value of the underlying securities.
Federal Income Taxes. The Fund is treated as a separate taxpayer as provided for in the Internal Revenue Code, as amended. It is the Fund's policy to comply with the requirements of the Internal Revenue Code, as amended, which are applicable to regulated investment companies, and to distribute all of its taxable income to the separate accounts of the Participating Insurance Companies which hold its shares.
Under the Regulated Investment Company Modernization Act of 2010, net capital losses may be carried forward indefinitely, and their character is retained as short-term and/or long-term. Previously, net capital losses were carried forward for eight years and treated as short-term losses. As a transition rule, the Act requires that post-enactment net capital losses be used before pre-enactment net capital losses.
At December 31, 2011, the Fund had a net tax basis capital loss carryforward of approximately $36,827,000, which may be applied against any realized net taxable capital gains of each succeeding year until fully utilized or until December 31, 2017, the expiration date, whichever occurs first.
In addition, from November 1, 2011 through December 31, 2011, the Fund elects to defer qualified late year losses of approximately $503,000 of net realized long-term capital losses. The Fund intends to elect to defer these losses and treat them as arising in the fiscal year ending December 31, 2012.
The Fund has reviewed the tax positions for the open tax years as of December 31, 2011 and has determined that no provision for income tax is required in the Fund's financial statements. The Fund's federal tax returns for the prior three fiscal years remain open subject to examination by the Internal Revenue Service.
Distribution of Income and Gains. The Fund will declare and distribute dividends from its net investment income, if any, annually, although additional distributions may be made if necessary. Net realized gains from investment transactions, in excess of available capital loss carryforwards, would be taxable to the Fund if not distributed, and, therefore, will be distributed to shareholders at least annually.
The timing and characterization of certain income and capital gain distributions are determined annually in accordance with federal tax regulations which may differ from accounting principles generally accepted in the United States of America. These differences primarily relate to investments in foreign denominated investments, investments in forward foreign currency exchange contracts, futures contracts, swap contracts and certain securities sold at a loss. As a result, net investment income (loss) and net realized gain (loss) on investment transactions for a reporting period may differ significantly from distributions during such period. Accordingly, the Fund may periodically make reclassifications among certain of its capital accounts without impacting the net asset value of the Fund.
At December 31, 2011, the Fund's components of distributable earnings (accumulated losses) on a tax basis are as follows:
| Undistributed ordinary income* | | $ | 4,738,103 | |
| Capital loss carryforwards | | $ | (36,827,000 | ) |
| Net unrealized appreciation (depreciation) on investments | | $ | 2,148,879 | |
In addition, the tax character of distributions paid to shareholders by the Fund is summarized as follows:
| | | Years Ended December 31, | |
| | | 2011 | | | 2010 | |
| Distributions from ordinary income* | | $ | 4,956,830 | | | $ | 6,962,542 | |
* For tax purposes, short-term capital gain distributions are considered ordinary income distributions.
Expenses. Expenses of the Series arising in connection with a specific Fund are allocated to that Fund. Other Series expenses which cannot be directly attributed to a Fund are apportioned among the Funds in the Series.
Contingencies. In the normal course of business, the Fund may enter into contracts with service providers that contain general indemnification clauses. The Fund's maximum exposure under these arrangements is unknown as this would involve future claims that may be made against the Fund that have not yet been made. However, based on experience, the Fund expects the risk of loss to be remote.
Other. Investment transactions are accounted for on a trade date plus one basis for daily net asset value calculations. However, for financial reporting purposes, investment transactions are reported on trade date. Interest income is recorded on the accrual basis net of foreign withholding taxes. Realized gains and losses from investment transactions are recorded on an identified cost basis and may include proceeds from litigation. All discounts and premiums are accreted/amortized for both tax and financial reporting purposes.
B. Derivative Instruments
Futures Contracts. A futures contract is an agreement between a buyer or seller and an established futures exchange or its clearinghouse in which the buyer or seller agrees to take or make a delivery of a specific amount of a financial instrument at a specified price on a specific date (settlement date). For the year ended December 31, 2011, the Fund invested in interest rate futures to gain exposure to different parts of the yield curve while managing the overall duration. The Fund also entered into currency futures contracts for non-hedging purposes to seek to enhance potential gains.
Upon entering into a futures contract, the Fund is required to deposit with a financial intermediary cash or securities ("initial margin") in an amount equal to a certain percentage of the face value indicated in the futures contract. Subsequent payments ("variation margin") are made or received by the Fund dependent upon the daily fluctuations in the value and are recorded for financial reporting purposes as unrealized gains or losses by the Fund. Gains or losses are realized when the contract expires or is closed. Since all futures contracts are exchange traded, counterparty risk is minimized as the exchange's clearinghouse acts as the counterparty, and guarantees the futures against default.
Certain risks may arise upon entering into futures contracts, including the risk that an illiquid market will limit the Fund's ability to close out a futures contract prior to the settlement date and the risk that the futures contract is not well correlated with the security, index or currency to which it relates. Risk of loss may exceed amounts recognized in the Statement of Assets and Liabilities.
A summary of the open futures contracts as of December 31, 2011, is included in a table following the Fund's Investment Portfolio. For the year ended December 31, 2011, the investment in futures contracts purchased had a total notional value generally indicative of a range from $0 to approximately $14,990,000, and the investment in futures contracts sold had a total notional value generally indicative of a range from approximately $27,770,000 to $49,190,000.
Credit Default Swap Contracts. A credit default swap is a contract between a buyer and a seller of protection against pre-defined credit events for the reference entity. For the year ended December 31, 2011, the Fund bought credit default swap contracts to gain exposure to an underlying reference entity's credit quality characteristics without directly investing in that reference entity, or to hedge the risk of default on Fund securities. As a seller in the credit default swap contract, the Fund is required to pay the par (or other agreed-upon) value of the referenced entity to the counterparty with the occurrence of a credit event by a third party, such as a U.S. or foreign corporate issuer, on the reference entity, which would likely result in a loss to the Fund. In return, the Fund receives from the counterparty a periodic stream of payments over the term of the contract provided that no credit event has occurred. If no credit event occurs, the Fund keeps the stream of payments with no payment obligations. The Fund may also buy credit default swap contracts in order to hedge against the risk of a credit event on debt securities, in which case the Fund functions as the counterparty referenced above. This involves the risk that the contract may expire worthless. It also involves counterparty risk that the seller may fail to satisfy its payment obligations to the Fund with the occurrence of a credit event. When the Fund sells a credit default swap contract it will cover its commitment. This may be achieved by, among other methods, maintaining cash or liquid assets equal to the aggregate notional value of the reference entities for all outstanding credit default swap contracts sold by the Fund.
The value of the credit default swap is adjusted daily and the change in value, if any, is recorded daily as unrealized appreciation or depreciation in the Statement of Assets and Liabilities. An upfront payment, if any, made by the Fund is recorded as an asset in the Statement of Assets and Liabilities. An upfront payment, if any, received by the Fund is recorded as a liability in the Statement of Assets and Liabilities. Under the terms of the credit default swap contracts, the Fund receives or makes quarterly payments based on a specified interest rate on a fixed notional amount. These payments are recorded as a realized gain or loss in the Statement of Operations. Payments received or made as a result of a credit event or termination of the contract are recognized, net of a proportional amount of the upfront payment, as realized gains or losses in the Statement of Operations.
There are no open credit default swap contracts as of December 31, 2011. For the year ended December 31, 2011, the investment in credit default swap contracts purchased had a total notional value generally indicative of a range from $0 to approximately $5,700,000.
Total Return Swap Contracts. Total return swaps involve commitments to pay interest in exchange for a market-linked return based on a notional amount. For the year ended December 31, 2011, the Fund entered into total return swap transactions to enhance potential gains. To the extent the total return of the reference security or index underlying the total return swap exceeds or falls short of the offsetting interest rate obligation, the Fund will receive a payment or make a payment to the counterparty, respectively. Certain risks may arise when entering into swap transactions including counterparty default, liquidity or unfavorable changes in the value of the underlying reference security or index. The value of the swap is adjusted daily and the change in value, if any, is recorded as unrealized appreciation or depreciation in the Statement of Assets and Liabilities. An upfront payment, if any, made by the Fund is recorded as an asset in the Statement of Assets and Liabilities. An upfront payment, if any, received by the Fund is recorded as a liability in the Statement of Assets and Liabilities. Payments received or made at the end of each measurement period are recorded as realized gain or loss in the Statement of Operations.
There are no open contracts as of December 31, 2011. For the year ended December 31, 2011, the investment in total return swap contracts had a total notional amount generally indicative of a range from $0 to approximately $9,000,000.
Forward Foreign Currency Exchange Contracts. A forward foreign currency exchange contract ("forward currency contract") is a commitment to purchase or sell a foreign currency at the settlement date at a negotiated rate. The Fund is subject to foreign exchange rate risk in its securities denominated in foreign currencies. Changes in exchange rates between foreign currencies and the U.S. dollar may affect the U.S. dollar value of foreign securities or the income or gains received on these securities. To reduce the effect of currency fluctuations, the Fund may enter into forward currency contracts. For the year ended December 31, 2011, the Fund invested in forward currency contracts to hedge its exposure to changes in foreign currency exchange rates on its foreign currency denominated securities. In addition, the Fund also engaged in forward currency contracts for non-hedging purposes to seek to enhance potential gains.
Forward currency contracts are valued at the prevailing forward exchange rate of the underlying currencies and unrealized gain (loss) is recorded daily. On the settlement date of the forward currency contract, the Fund records a realized gain or loss equal to the difference between the value of the contract at the time it was opened and the value of the contract at the time it was closed. Certain risks may arise upon entering into forward currency contracts from the potential inability of counterparties to meet the terms of their contracts. The maximum counterparty credit risk to the Fund is measured by the unrealized gain on appreciated contracts. Additionally, when utilizing forward currency contracts to hedge, the Fund gives up the opportunity to profit from favorable exchange rate movements during the term of the contract.
A summary of the open forward currency contracts as of December 31, 2011, is included in a table following the Fund's Investment Portfolio. For the year ended December 31, 2011, the investment in forward currency contracts U.S. dollars purchased had a total contract value generally indicative of a range from approximately $26,000 to $2,593,000, and the investment in forward currency contracts U.S. dollars sold had a total contract value generally indicative of a range from $0 to approximately $4,860,000.
The following tables summarize the value of the Fund's derivative instruments held as of December 31, 2011 and the related location in the accompanying Statement of Assets and Liabilities, presented by primary underlying risk exposure:
| Asset Derivatives | | Forward Contracts | | | Futures Contracts | | | Total | |
| Interest Rate Contracts (a) | | $ | — | | | $ | 137,992 | | | $ | 137,992 | |
| Foreign Exchange Contracts (b) | | | 21,461 | | | | 21,099 | | | | 42,560 | |
| | | $ | 21,461 | | | $ | 159,091 | | | $ | 180,552 | |
Each of the above derivatives is located in the following Statement of Assets and Liabilities accounts:
(a) Includes cumulative appreciation of futures contracts as disclosed in the Investment Portfolio. Unsettled variation margin is disclosed separately within the Statement of Assets and Liabilities.
(b) Unrealized appreciation on forward foreign currency exchange contracts
| Liability Derivative | | Futures Contracts | |
| Interest Rate Contracts (a) | | $ | (454,993 | ) |
The above derivative is located in the following Statement of Assets and Liabilities account:
(a) Includes cumulative depreciation of futures contracts as disclosed in the Investment Portfolio. Unsettled variation margin is disclosed separately within the Statement of Assets and Liabilities.
Additionally, the amount of unrealized and realized gains and losses on derivative instruments recognized in Fund earnings during the year ended December 31, 2011 and the related location in the accompanying Statement of Operations is summarized in the following tables by primary underlying risk exposure:
| Realized Gain (Loss) | | Forward Contracts | | | Swap Contracts | | | Futures Contracts | | | Total | |
| Foreign Exchange Contracts (a) (b) | | $ | (84,630 | ) | | $ | — | | | $ | (512,163 | ) | | $ | (596,793 | ) |
| Interest Rate Contracts (b) | | | — | | | | 52,362 | | | | (920,970 | ) | | | (868,608 | ) |
| Credit Contracts (b) | | | — | | | | (873,130 | ) | | | — | | | | (873,130 | ) |
| | | $ | (84,630 | ) | | $ | (820,768 | ) | | $ | (1,433,133 | ) | | $ | (2,338,531 | ) |
Each of the above derivatives is located in the following Statement of Operations accounts:
(a) Net realized gain (loss) from foreign currency (Statement of Operations includes both forward currency contracts and foreign currency transactions)
(b) Net realized gain (loss) from swaps and futures, respectively
| Change in Net Unrealized Appreciation (Depreciation) | | Forward Contracts | | | Futures Contracts | | | Total | |
| Foreign Exchange Contracts (a) (b) | | $ | (25,565 | ) | | $ | 44,490 | | | $ | 18,925 | |
| Interest Rate Contracts (b) | | | — | | | | (1,229,048 | ) | | | (1,229,048 | ) |
| | | $ | (25,565 | ) | | $ | (1,184,558 | ) | | $ | (1,210,123 | ) |
Each of the above derivatives is located in the following Statement of Operations accounts:
(a) Change in net unrealized appreciation (depreciation) on foreign currency (Statement of Operations includes both forward currency contracts and foreign currency transactions)
(b) Change in net unrealized appreciation (depreciation) on swaps and futures, respectively
C. Purchases and Sales of Securities
During the year ended December 31, 2011, purchases and sales of investment securities (excluding short-term investments and U.S. Treasury obligations) aggregated $251,298,054 and $294,606,449, respectively. Purchases and sales of U.S. Treasury obligations aggregated $39,298,924 and $41,661,141, respectively.
D. Related Parties
Management Agreement. Under the Investment Management Agreement with Deutsche Investment Management Americas Inc. ("DIMA" or the "Advisor"), an indirect, wholly owned subsidiary of Deutsche Bank AG, the Advisor directs the investments of the Fund in accordance with its investment objectives, policies and restrictions. The Advisor determines the securities, instruments and other contracts relating to investments to be purchased, sold or entered into by the Fund.
Pursuant to the Investment Management Agreement with the Advisor, the Fund pays a monthly management fee based on the Fund's average daily net assets, computed and accrued daily and payable monthly, at the following annual rates:
| First $250 million of average daily net assets | | | .390 | % |
| Next $750 million of average daily net assets | | | .365 | % |
| Over $1 billion of average daily net assets | | | .340 | % |
Accordingly, for the year ended December 31, 2011, the fee pursuant to the Investment Management Agreement was equivalent to an annual effective rate of 0.39% of the Fund's average daily net assets.
Administration Fee. Pursuant to an Administrative Services Agreement, DIMA provides most administrative services to the Fund. For all services provided under the Administrative Services Agreement, the Fund pays the Advisor an annual fee ("Administration Fee") of 0.10% of the Fund's average daily net assets, computed and accrued daily and payable monthly. For the year ended December 31, 2011, the Administration Fee was $118,802, of which $9,513 is unpaid.
Service Provider Fees. DWS Investments Service Company ("DISC"), an affiliate of the Advisor, is the transfer agent, dividend-paying agent and shareholder service agent for the Fund. Pursuant to a sub-transfer agency agreement between DISC and DST Systems, Inc. ("DST"), DISC has delegated certain transfer agent, dividend-paying agent and shareholder service agent functions to DST. DISC compensates DST out of the shareholder servicing fee it receives from the Fund. For the year ended December 31, 2011, the amounts charged to the Fund by DISC aggregated $566, of which $142 is unpaid.
Typesetting and Filing Service Fees. Under an agreement with DIMA, DIMA is compensated for providing typesetting and certain regulatory filing services to the Fund. For the year ended December 31, 2011, the amount charged to the Fund by DIMA included in the Statement of Operations under "reports to shareholders" aggregated $12,237, of which $3,049 is unpaid.
Trustees' Fees and Expenses. The Fund paid each Trustee not affiliated with the Advisor retainer fees plus specified amounts for various committee services and for the Board Chairperson.
Affiliated Cash Management Vehicle. The Fund may invest uninvested cash balances in Central Cash Management Fund, which is managed by the Advisor. The Fund indirectly bears its proportionate share of the expenses of Central Cash Management Fund. Central Cash Management Fund does not pay the Advisor an investment management fee. Central Cash Management Fund seeks a high level of current income consistent with liquidity and the preservation of capital.
E. Investing in Emerging Markets
Investing in emerging markets may involve special risks and considerations not typically associated with investing in developed markets. These risks include revaluation of currencies, high rates of inflation or deflation, repatriation restrictions on income and capital, and future adverse political, social and economic developments. Moreover, securities issued in these markets may be less liquid, subject to government ownership controls or delayed settlements and may have prices more volatile or less easily assessed than those of comparable securities of issuers in developed markets.
F. Ownership of the Fund
Three participating insurance companies were owners of record of 10% or more of the total outstanding Class A shares of the Fund, owning 48%, 21% and 11%, respectively.
G. Line of Credit
The Fund and other affiliated funds (the "Participants") share in a $450 million revolving credit facility provided by a syndication of banks. The Fund may borrow for temporary or emergency purposes, including the meeting of redemption requests that otherwise might require the untimely disposition of securities. The Participants are charged an annual commitment fee which is allocated based on net assets, among each of the Participants. Interest is calculated at a rate per annum equal to the sum of the Federal Funds Rate plus 1.25 percent plus if LIBOR exceeds the Federal Funds Rate the amount of such excess. The Fund may borrow up to a maximum of 33 percent of its net assets under the agreement. The Fund had no outstanding loans at December 31, 2011.
Report of Independent Registered Public Accounting Firm
To the Trustees of DWS Variable Series I and the Shareholders of DWS Bond VIP:
In our opinion, the accompanying statement of assets and liabilities, including the investment portfolio, and the related statements of operations and of changes in net assets and the financial highlights present fairly, in all material respects, the financial position of DWS Bond VIP (the "Fund") at December 31, 2011 and the results of its operations, the changes in its net assets, and the financial highlights for the periods indicated therein, in conformity with accounting principles generally accepted in the United States of America. These financial statements and financial highlights (hereafter referred to as "financial statements") are the responsibility of the Fund's management. Our responsibility is to express an opinion on these financial statements based on our audits. We conducted our audits of these financial statements in accordance with the standards of the Public Company Accounting Oversight Board (United States). Those standards require that we plan and perform the audit to obtain reasonable assurance about whether the financial statements are free of material misstatement. An audit includes examining, on a test basis, evidence supporting the amounts and disclosures in the financial statements, assessing the accounting principles used and significant estimates made by management, and evaluating the overall financial statement presentation. We believe that our audits, which included confirmation of securities at December 31, 2011 by correspondence with the custodians and brokers, provide a reasonable basis for our opinion.
Boston, Massachusetts February 15, 2012 | PricewaterhouseCoopers LLP |
Information About Your Fund's Expenses
As an investor of the Fund, you incur two types of costs: ongoing expenses and transaction costs. Ongoing expenses include management fees and other Fund expenses. Examples of transaction costs include contract charges, redemption fees and account maintenance fees, which are not shown in this section. The following tables are intended to help you understand your ongoing expenses (in dollars) of investing in the Fund and to help you compare these expenses with the ongoing expenses of investing in other mutual funds. The example in the table is based on an investment of $1,000 invested at the beginning of the six-month period and held for the entire period (July 1, 2011 to December 31, 2011).
The tables illustrate your Fund's expenses in two ways:
·Actual Fund Return. This helps you estimate the actual dollar amount of ongoing expenses (but not transaction costs) paid on a $1,000 investment in the Fund using the Fund's actual return during the period. To estimate the expenses you paid over the period, simply divide your account value by $1,000 (for example, an $8,600 account value divided by $1,000 = 8.6), then multiply the result by the number in the "Expenses Paid per $1,000" line under the share class you hold.
· Hypothetical 5% Fund Return. This helps you to compare your Fund's ongoing expenses (but not transaction costs) with those of other mutual funds using the Fund's actual expense ratio and a hypothetical rate of return of 5% per year before expenses. Examples using a 5% hypothetical Fund return may be found in the shareholder reports of other mutual funds. The hypothetical account values and expenses may not be used to estimate the actual ending account balance or expenses you paid for the period.
Please note that the expenses shown in these tables are meant to highlight your ongoing expenses only and do not reflect any transaction costs. The "Expenses Paid per $1,000" line of the tables is useful in comparing ongoing expenses only and will not help you determine the relative total expense of owning different funds. If these transaction costs had been included, your costs would have been higher.
Expenses and Value of a $1,000 Investment for the six months ended December 31, 2011 | |
| Actual Fund Return | | Class A | |
| Beginning Account Value 7/1/11 | | $ | 1,000.00 | |
| Ending Account Value 12/31/11 | | $ | 1,016.90 | |
| Expenses Paid per $1,000* | | $ | 3.15 | |
| Hypothetical 5% Fund Return | | Class A | |
| Beginning Account Value 7/1/11 | | $ | 1,000.00 | |
| Ending Account Value 12/31/11 | | $ | 1,022.08 | |
| Expenses Paid per $1,000* | | $ | 3.16 | |
* Expenses are equal to the Fund's annualized expense ratio for each share class, multiplied by the average account value over the period, multiplied by the number of days in the most recent six-month period, then divided by 365.
| Annualized Expense Ratio | Class A |
| DWS Variable Series I — DWS Bond VIP | .62% |
For more information, please refer to the Fund's prospectus.
These tables do not reflect charges and fees ("contract charges") associated with the separate account that invests in the Fund or any variable life insurance policy or variable annuity contract for which the Fund is an investment option.
Tax Information (Unaudited)
Please consult a tax advisor if you have questions about federal or state income tax laws, or on how to prepare your tax returns. If you have specific questions about your account, please contact your insurance provider.
The Series' policies and procedures for voting proxies for portfolio securities and information about how the Series voted proxies related to its portfolio securities during the 12-month period ended June 30 are available on our Web site — www.dws-investments.com (click on "proxy voting"at the bottom of the page) — or on the SEC's Web site — www.sec.gov. To obtain a written copy of the Series' policies and procedures without charge, upon request, call us toll free at (800) 728-3337.
Investment Management Agreement Approval
The Board of Trustees approved the renewal of DWS Bond VIP's investment management agreement (the "Agreement") with Deutsche Investment Management Americas Inc. ("DWS") in September 2011.
In terms of the process that the Board followed prior to approving the Agreement, shareholders should know that:
· In September 2011, all of the Fund's Trustees were independent of DWS and its affiliates.
· The Trustees met frequently during the past year to discuss fund matters and dedicated a substantial amount of time to contract review matters. Over the course of several months, the Board's Contract Committee, in coordination with the Board's Fixed Income and Quant Oversight Committee, reviewed comprehensive materials received from DWS, independent third parties and independent counsel. These materials included an analysis of the Fund's performance, fees and expenses, and profitability compiled by the Fund's independent fee consultant. The Board also received extensive information throughout the year regarding performance of the Fund.
· The Independent Trustees regularly meet privately with their independent counsel to discuss contract review and other matters. In addition, the Independent Trustees were also advised by the Fund's independent fee consultant in the course of their review of the Fund's contractual arrangements and considered a comprehensive report prepared by the independent fee consultant in connection with their deliberations (the "IFC Report").
· In connection with reviewing the Agreement, the Board also reviewed the terms of the Fund's distribution agreement, administrative services agreement, transfer agency agreement and other material service agreements.
· Based on its evaluation of the information provided, the Contract Committee presented its findings and recommendations to the Board. The Board then reviewed the Contract Committee's findings and recommendations.
In connection with the contract review process, the Contract Committee and the Board considered the factors discussed below, among others. The Board also considered that DWS and its predecessors have managed the Fund since its inception, and the Board believes that a long-term relationship with a capable, conscientious advisor is in the best interests of the Fund. The Board considered, generally, that shareholders chose to invest or remain invested in the Fund knowing that DWS managed the Fund, and that the Agreement was approved by the Fund's shareholders. DWS is part of Deutsche Bank, a major global banking institution that is engaged in a wide range of financial services. The Board believes that there are significant advantages to being part of a global asset management business that offers a wide range of investing expertise and resources, including hundreds of portfolio managers and analysts with research capabilities in many countries throughout the world.
While shareholders may focus primarily on fund performance and fees, the Fund's Board considers these and many other factors, including the quality and integrity of DWS's personnel and such other issues as back-office operations, fund valuations, and compliance policies and procedures.
Nature, Quality and Extent of Services. The Board considered the terms of the Agreement, including the scope of advisory services provided under the Agreement. The Board noted that, under the Agreement, DWS provides portfolio management services to the Fund and that, pursuant to a separate administrative services agreement, DWS provides administrative services to the Fund. The Board considered the experience and skills of senior management and investment personnel, the resources made available to such personnel, the ability of DWS to attract and retain high-quality personnel, and the organizational depth and stability of DWS. The Board reviewed the Fund's performance over short-term and long-term periods and compared those returns to various agreed-upon performance measures, including market indices and a peer universe compiled by the independent fee consultant using information supplied by Lipper Inc. ("Lipper"). The Board also noted that it has put into place a process of identifying "Focus Funds" (e.g., funds performing poorly relative to their benchmark or a peer universe compiled by an independent fund data service), and receives more frequent reporting and information from DWS regarding such funds, along with DWS's remedial plans to address underperformance. The Board believes this process is an effective manner of identifying and addressing underperforming funds. Based on the information provided, the Board noted that for each of the one-, three- and five-year periods ended December 31, 2010, the Fund's performance (Class A shares) was in the 4th quartile of the applicable Lipper universe (the 1st quartile being the best performers and the 4th quartile being the worst performers). The Board also observed that the Fund has outperformed its benchmark in the one-year period and has underperformed its benchmark in the three- and five-year periods ended December 31, 2010. The Board noted the disappointing investment performance of the Fund in recent periods and continued to discuss with senior management of DWS the factors contributing to such underperformance and actions being taken to improve performance. The Board observed that the Fund had experienced improved relative performance during the first seven months of 2011. The Board recognized that DWS has made significant changes in its investment personnel and processes in recent years in an effort to improve long-term performance.
On the basis of this evaluation and the ongoing review of investment results by the Board, the Board concluded that the nature, quality and extent of services provided by DWS historically have been and continue to be satisfactory.
Fees and Expenses. The Board considered the Fund's investment management fee schedule, operating expenses and total expense ratios, and comparative information provided by Lipper and the independent fee consultant regarding investment management fee rates paid to other investment advisors by similar funds (1st quartile being the most favorable and 4th quartile being the least favorable). With respect to management fees paid to other investment advisors by similar funds, the Board noted that the contractual fee rates paid by the Fund, which include a 0.10% fee paid to DWS under the Fund's administrative services agreement, were lower than the median (2nd quartile) of the applicable Lipper peer group (based on Lipper data provided as of December 31, 2010). The Board noted that the Fund's Class A shares total (net) operating expenses were expected to be lower than the median (2nd quartile) of the applicable Lipper expense universe (based on Lipper data provided as of December 31, 2010) ("Lipper Universe Expenses"). The Board considered the Fund's management fee rate as compared to fees charged by DWS and certain of its affiliates for comparable mutual funds and considered differences in fund and fee structures between the DWS Funds. The Board also considered how the Fund's total (net) operating expenses compared to the total (net) operating expenses of a more customized peer group selected by Lipper (based on such factors as asset size).
The information considered by the Board as part of its review of management fees included information regarding fees charged by DWS and its affiliates to similar institutional accounts and to similar funds offered primarily to European investors ("DWS Europe funds"), in each case as applicable. The Board observed that advisory fee rates for institutional accounts generally were lower than the management fees charged by similarly managed DWS U.S. mutual funds ("DWS Funds"), but also took note of the differences in services provided to DWS Funds as compared to institutional accounts. In the case of DWS Europe funds, the Board observed that fee rates for DWS Europe funds generally were higher than for similarly managed DWS Funds, but noted that differences in the types of services provided to DWS Funds relative to DWS Europe funds made it difficult to compare such fees.
On the basis of the information provided, the Board concluded that management fees were reasonable and appropriate in light of the nature, quality and extent of services provided by DWS.
Profitability. The Board reviewed detailed information regarding revenues received by DWS under the Agreement. The Board considered the estimated costs and pre-tax profits realized by DWS from advising the DWS Funds, as well as estimates of the pre-tax profits attributable to managing the Fund in particular. The Board also received information regarding the estimated enterprise-wide profitability of DWS and its affiliates with respect to all fund services in totality and by fund. The Board and the independent fee consultant reviewed DWS's methodology in allocating its costs to the management of the Fund. Based on the information provided, the Board concluded that the pre-tax profits realized by DWS in connection with the management of the Fund were not unreasonable. The Board also reviewed information regarding the profitability of certain similar investment management firms. The Board noted that while information regarding the profitability of such firms is limited (and in some cases is not necessarily prepared on a comparable basis), DWS and its affiliates' overall profitability with respect to the DWS fund complex (after taking into account distribution and other services provided to the funds by DWS and its affiliates) was lower than the overall profitability levels of many comparable firms for which such data was available.
Economies of Scale. The Board considered whether there are economies of scale with respect to the management of the Fund and whether the Fund benefits from any economies of scale. The Board noted that the Fund's management fee schedule includes fee breakpoints. The Board concluded that the Fund's fee schedule represents an appropriate sharing between the Fund and DWS of such economies of scale as may exist in the management of the Fund at current asset levels.
Other Benefits to DWS and Its Affiliates. The Board also considered the character and amount of other incidental benefits received by DWS and its affiliates, including any fees received by DWS for administrative services provided to the Fund and any fees received by an affiliate of DWS for distribution services. The Board also considered benefits to DWS related to brokerage and soft-dollar allocations, including allocating brokerage to pay for research generated by parties other than the executing broker dealers, which pertain primarily to funds investing in equity securities, along with the incidental public relations benefits to DWS related to DWS Funds advertising and cross-selling opportunities among DWS products and services. The Board concluded that management fees were reasonable in light of these fallout benefits.
Compliance. The Board considered the significant attention and resources dedicated by DWS to documenting and enhancing its compliance processes in recent years. The Board noted in particular (i) the experience and seniority of both DWS's chief compliance officer and the Fund's chief compliance officer; (ii) the large number of DWS compliance personnel; and (iii) the substantial commitment of resources by DWS and its affiliates to compliance matters.
Based on all of the information considered and the conclusions reached, the Board unanimously determined that the continuation of the Agreement is in the best interests of the Fund. In making this determination, the Board did not give particular weight to any single factor identified above. The Board considered these factors over the course of numerous meetings, certain of which were in executive session with only the Independent Trustees and their counsel present. It is possible that individual Trustees may have weighed these factors differently in reaching their individual decisions to approve the continuation of the Agreement.
Summary of Management Fee Evaluation by Independent Fee Consultant
September 26, 2011
Pursuant to an Order entered into by Deutsche Investment Management Americas and affiliates (collectively, "DeAM") with the Attorney General of New York, I, Thomas H. Mack, have been appointed the Independent Fee Consultant for the DWS Funds (formerly the DWS Scudder Funds). My duties include preparing an annual written evaluation of the management fees DeAM charges the Funds, considering among other factors the management fees charged by other mutual fund companies for like services, management fees DeAM charges other clients for like services, DeAM's costs of supplying services under the management agreements and related profit margins, possible economies of scale if a Fund grows larger, and the nature and quality of DeAM's services, including fund performance. This report summarizes my evaluation for 2011, including my qualifications, the evaluation process for each of the DWS Funds, consideration of certain complex-level factors, and my conclusions. I served in substantially the same capacity in 2007, 2008, 2009 and 2010.
Qualifications
For more than 35 years I have served in various professional capacities within the investment management business. I have held investment analysis and advisory positions, including securities analyst, portfolio strategist and director of investment policy with a large investment firm. I have also performed business management functions, including business development, financial management and marketing research and analysis.
Since 1991, I have been an independent consultant within the asset management industry. I have provided services to over 125 client organizations, including investment managers, mutual fund boards, product distributors and related organizations. Over the past ten years I have completed a number of assignments for mutual fund boards, specifically including assisting boards with management contract renewal.
I hold a Master of Business Administration degree, with highest honors, from Harvard University and Master of Science and Bachelor of Science (highest honors) degrees from the University of California at Berkeley. I am an independent director and audit committee financial expert for two closed-end mutual funds and have served in various leadership and financial oversight capacities with non-profit organizations.
Evaluation of Fees for each DWS Fund
My work focused primarily on evaluating, fund-by-fund, the fees charged to each of the 109 mutual fund portfolios in the DWS Fund family. For each Fund, I considered each of the key factors mentioned above, as well as any other relevant information. In doing so I worked closely with the Funds' Independent Directors in their annual contract renewal process, as well as in their approval of contracts for several new funds (documented separately).
In evaluating each Fund's fees, I reviewed comprehensive materials provided by or on behalf of DeAM, including expense information prepared by Lipper Analytical, comparative performance information, profitability data, manager histories, and other materials. I also accessed certain additional information from the Lipper and Morningstar databases and drew on my industry knowledge and experience.
To facilitate evaluating this considerable body of information, I prepared for each Fund a document summarizing the key data elements in each area as well as additional analytics discussed below. This made it possible to consider each key data element in the context of the others.
In the course of contract renewal, DeAM agreed to implement a number of fee and expense adjustments requested by the Independent Directors which will favorably impact future fees and expenses, and my evaluation includes the effects of these changes.
Fees and Expenses Compared with Other Funds
The competitive fee and expense evaluation for each fund focused on two primary comparisons:
The Fund's contractual management fee (the advisory fee plus the administration fee where applicable) compared with those of a group of typically 12-15 funds in the same Lipper investment category (e.g. Large Capitalization Growth) having similar distribution arrangements and being of similar size.
The Fund's total expenses compared with a broader universe of funds from the same Lipper investment category and having similar distribution arrangements.
These two comparisons provide a view of not only the level of the fee compared with funds of similar scale but also the total expense the Fund bears for all the services it receives, in comparison with the investment choices available in the Fund's investment category and distribution channel. The principal figure-of-merit used in these comparisons was the subject Fund's percentile ranking against peers.
DeAM's Fees for Similar Services to Others
DeAM provided management fee schedules for all of its US domiciled fund and non-fund investment management accounts in any of the investment categories where there is a DWS Fund. These similar products included the other DWS Funds, non-fund pooled accounts, institutional accounts and sub-advisory accounts. Using this information, I calculated for each Fund the fee that would be charged to each similar product, at the subject Fund's asset level.
Evaluating information regarding non-fund products is difficult because there are varying levels of services required for different types of accounts, with mutual funds generally requiring considerably more regulatory and administrative types of service as well as having more frequent cash flows than other types of accounts. Also, while mutual fund fees for similar fund products can be expected to be similar, there will be some differences due to different pricing conditions in different distribution channels (e.g. retail funds versus those used in variable insurance products), differences in underlying investment processes and other factors.
Costs and Profit Margins
DeAM provided a detailed profitability analysis for each Fund. After making some adjustments so that the presentation would be more comparable to the available industry figures, I reviewed profit margins from investment management alone, from investment management plus other fund services (excluding distribution) provided to the Funds by DeAM (principally shareholder services), and DeAM profits from all sources, including distribution. A later section comments on overall profitability.
Economies of Scale
Economies of scale — an expected decline in management cost per dollar of fund assets as fund assets grow — are very rarely quantified and documented because of inherent difficulties in collecting and analyzing relevant data. However, in virtually every investment category that I reviewed, larger funds tend to have lower fees and lower total expenses than smaller funds. To see how each DWS Fund compares with this industry observation, I reviewed:
The trend in Fund assets over the last five years and the accompanying trend in total expenses. This shows if the Fund has grown and, if so, whether total expense (management fees as well as other expenses) have declined as a percent of assets.
Whether the Fund has break-points in its management fee schedule, the extent of the fee reduction built into the schedule and the asset levels where the breaks take effect, and in the case of a sub-advised Fund how the Fund's break-points compare with those of the sub-advisory fee schedule.
How the Fund's contractual fee schedule compares with trends in the industry data. To accomplish this, I constructed a chart showing how actual latest-fiscal-year contractual fees of the Fund and of other similar funds relate to average fund assets, with the subject Fund's contractual fee schedule superimposed.
Quality of Service — Performance
The quality-of-service evaluation focused on investment performance, which is the principal result of the investment management service. Each Fund's performance was reviewed over the past 1, 3, 5 and 10 years, as applicable, and compared with that of other funds in the same investment category and with a suitable market index.
In addition, I calculated and reviewed risk-adjusted returns relative to an index of similar mutual funds' returns and a suitable market index. The risk-adjusted returns analysis provides a way of determining the extent to which the Fund's return comparisons are mainly the product of investment value-added (or lack thereof) or alternatively taking considerably more or less risk than is typical in its investment category.
I also received and considered the history of portfolio manager changes for each Fund, as this provided an important context for evaluating the performance results.
Complex-Level Considerations
While this evaluation was conducted mainly at the individual fund level, there are some issues relating to the reasonableness of fees that can alternatively be considered across the whole fund complex:
I reviewed DeAM's profitability analysis for all DWS Funds, with a view toward determining if the allocation procedures used were reasonable and how profit levels compared with public data for other investment managers.
I considered whether DeAM and affiliates receive any significant ancillary or "fall-out" benefits that should be considered in interpreting the direct profitability results. These would be situations where serving as the investment manager of the Funds is beneficial to another part of the Deutsche Bank organization.
I considered how aggregated DWS Fund expenses had varied over the years, by asset class and in the context of trends in asset levels.
I reviewed the structure of the DeAM organization, trends in staffing levels, and information on compensation of investment management and other professionals compared with industry data.
Findings
Based on the process and analysis discussed above, which included reviewing a wide range of information from management and external data sources and considering among other factors the fees DeAM charges other clients, the fees charged by other fund managers, DeAM's costs and profits associated with managing the Funds, economies of scale, possible fall-out benefits, and the nature and quality of services provided, in my opinion the management fees charged the DWS Funds are reasonable.
Thomas H. Mack
President, Thomas H. Mack & Co., Inc.
Board Members and Officers
The following table presents certain information regarding the Board Members and Officers of the fund as of December 31, 2011. Each Board Member's year of birth is set forth in parentheses after his or her name. Unless otherwise noted, (i) each Board Member has engaged in the principal occupation(s) noted in the table for at least the most recent five years, although not necessarily in the same capacity; and (ii) the address of each Independent Board Member is c/o Paul K. Freeman, Independent Chairman, DWS Funds, PO Box 101833, Denver, CO 80250-1833. Except as otherwise noted below, the term of office for each Board Member is until the election and qualification of a successor, or until such Board Member sooner dies, resigns, is removed or as otherwise provided in the governing documents of the fund. Because the fund does not hold an annual meeting of shareholders, each Board Member will hold office for an indeterminate period. The Board Members may also serve in similar capacities with other funds in the fund complex. The Length of Time Served represents the year in which the Board Member joined the Board of one or more DWS funds now overseen by the Board.
| Independent Board Members |
Name, Year of Birth, Position with the Fund and Length of Time Served1 | Business Experience and Directorships During the Past Five Years | Number of Funds in DWS Fund Complex Overseen |
Other Directorships Held by Board Member |
Paul K. Freeman (1950) Chairperson since 2009 Board Member since 1993 | Consultant, World Bank/Inter-American Development Bank; Executive and Governing Council of the Independent Directors Council (Chairman of Education Committee); formerly: Project Leader, International Institute for Applied Systems Analysis (1998-2001); Chief Executive Officer, The Eric Group, Inc. (environmental insurance) (1986-1998) | 110 | — |
John W. Ballantine (1946) Board Member since 1999 | Retired; formerly, Executive Vice President and Chief Risk Management Officer, First Chicago NBD Corporation/The First National Bank of Chicago (1996-1998); Executive Vice President and Head of International Banking (1995-1996). Directorships: Chairman of the Board, Healthways, Inc. (provider of disease and care management services); Portland General Electric (utility company); Stockwell Capital Investments PLC (private equity); former Directorships: First Oak Brook Bancshares, Inc. and Oak Brook Bank; Prisma Energy International | 110 | — |
Henry P. Becton, Jr. (1943) Board Member since 1990 | Vice Chair and former President, WGBH Educational Foundation. Directorships: Association of Public Television Stations; Public Radio International; Public Radio Exchange (PRX); The PBS Foundation; former Directorships: Boston Museum of Science; American Public Television; Concord Academy; New England Aquarium; Mass. Corporation for Educational Telecommunications; Committee for Economic Development; Public Broadcasting Service | 110 | Lead Director, Becton Dickinson and Company2 (medical technology company); Lead Director, Belo Corporation2 (media company) |
Dawn-Marie Driscoll (1946) Board Member since 1987 | President, Driscoll Associates (consulting firm); Executive Fellow, Center for Business Ethics, Bentley University; formerly, Partner, Palmer & Dodge (1988-1990); Vice President of Corporate Affairs and General Counsel, Filene's (1978-1988). Directorships: Director of ICI Mutual Insurance Company (since 2007); Advisory Board, Center for Business Ethics, Bentley University; Trustee, Southwest Florida Community Foundation (charitable organization); former Directorships: Investment Company Institute (audit, executive, nominating committees) and Independent Directors Council (governance, executive committees) | 110 | Trustee, Sun Capital Advisers, Inc. (22 open-end mutual funds advised by Sun Capital Advisers, Inc.) (since 2007) |
Keith R. Fox, CFA (1954) Board Member since 1996 | Managing General Partner, Exeter Capital Partners (a series of private investment funds) (since 1986). Directorships: Progressive International Corporation (kitchen goods importer and distributor); BoxTop Media Inc. (advertising); The Kennel Shop (retailer); former Chairman, National Association of Small Business Investment Companies | 110 | Trustee, Sun Capital Advisers, Inc. (22 open-end mutual funds advised by Sun Capital Advisers, Inc.) (since 2011) |
Kenneth C. Froewiss (1945) Board Member since 2001 | Adjunct Professor of Finance, NYU Stern School of Business (September 2009-present; Clinical Professor from 1997-September 2009); Member, Finance Committee, Association for Asian Studies (2002-present); Director, Mitsui Sumitomo Insurance Group (US) (2004-present); prior thereto, Managing Director, J.P. Morgan (investment banking firm) (until 1996) | 110 | — |
Richard J. Herring (1946) Board Member since 1990 | Jacob Safra Professor of International Banking and Professor, Finance Department, The Wharton School, University of Pennsylvania (since July 1972); Co-Director, Wharton Financial Institutions Center (since July 2000); Co-Chair, U.S. Shadow Financial Regulatory Committee; Executive Director, Financial Economists Roundtable; formerly: Vice Dean and Director, Wharton Undergraduate Division (July 1995-June 2000); Director, Lauder Institute of International Management Studies (July 2000-June 2006) | 110 | Director, Japan Equity Fund, Inc. (since September 2007), Thai Capital Fund, Inc. (since September 2007), Singapore Fund, Inc. (since September 2007), Independent Director of Barclays Bank Delaware (since September 2010) |
William McClayton (1944) Board Member since 2004 | Private equity investor (since October 2009); previously, Managing Director, Diamond Management & Technology Consultants, Inc. (global consulting firm) (2001-2009); Directorship: Board of Managers, YMCA of Metropolitan Chicago; formerly: Senior Partner, Arthur Andersen LLP (accounting) (1966-2001); Trustee, Ravinia Festival | 110 | — |
Rebecca W. Rimel (1951) Board Member since 1995 | President and Chief Executive Officer, The Pew Charitable Trusts (charitable organization) (1994 to present); Trustee, Washington College (2011 to present); formerly: Executive Vice President, The Glenmede Trust Company (investment trust and wealth management) (1983-2004); Board Member, Investor Education (charitable organization) (2004-2005); Trustee, Executive Committee, Philadelphia Chamber of Commerce (2001-2007); Trustee, Pro Publica (charitable organization) (2007-2010); Trustee, Thomas Jefferson Foundation (charitable organization) (1994 to 2011) | 110 | Director, CardioNet, Inc.2 (health care) (2009- present); Director, Viasys Health Care2 (January 2007- June 2007) |
William N. Searcy, Jr. (1946) Board Member since 1993 | Private investor since October 2003; formerly: Pension & Savings Trust Officer, Sprint Corporation2 (telecommunications) (November 1989-September 2003) | 110 | Trustee, Sun Capital Advisers, Inc. (22 open-end mutual funds advised by Sun Capital Advisers, Inc.) (since 1998) |
Jean Gleason Stromberg (1943) Board Member since 1997 | Retired. Formerly, Consultant (1997-2001); Director, Financial Markets US Government Accountability Office (1996-1997); Partner, Fulbright & Jaworski, L.L.P. (law firm) (1978-1996). Directorships: The William and Flora Hewlett Foundation; former Directorships: Service Source, Inc., Mutual Fund Directors Forum (2002-2004), American Bar Retirement Association (funding vehicle for retirement plans) (1987-1990 and 1994-1996) | 110 | — |
Robert H. Wadsworth (1940) Board Member since 1999 | President, Robert H. Wadsworth & Associates, Inc. (consulting firm) (1983 to present); Director, The Phoenix Boys Choir Association | 113 | — |
Officers4 |
Name, Year of Birth, Position with the Fund and Length of Time Served5 | Principal Occupation(s) During Past 5 Years and Other Directorships Held |
W. Douglas Beck, CFA6 (1967) President, 2011-present | Managing Director3, Deutsche Asset Management (2006-present); President of DWS family of funds and Head of Product Management, U.S. for DWS Investments; formerly, Executive Director, Head of Product Management (2002-2006) and President (2005-2006) of the UBS Funds at UBS Global Asset Management; Co-Head of Manager Research/Managed Solutions Group, Merrill Lynch (1998-2002) |
John Millette7 (1962) Vice President and Secretary, 1999-present | Director3, Deutsche Asset Management |
Paul H. Schubert6 (1963) Chief Financial Officer, 2004-present Treasurer, 2005-present | Managing Director3, Deutsche Asset Management (since July 2004); formerly, Executive Director, Head of Mutual Fund Services and Treasurer for UBS Family of Funds (1998-2004); Vice President and Director of Mutual Fund Finance at UBS Global Asset Management (1994-1998) |
Caroline Pearson7 (1962) Chief Legal Officer, 2010-present | Managing Director3, Deutsche Asset Management; formerly, Assistant Secretary for DWS family of funds (1997-2010) |
Rita Rubin6 (1970) Assistant Secretary, 2009-present | Director3 and Senior Counsel, Deutsche Asset Management (since October 2007); formerly, Vice President, Morgan Stanley Investment Management (2004-2007) |
Paul Antosca7 (1957) Assistant Treasurer, 2007-present | Director3, Deutsche Asset Management (since 2006); Vice President, The Manufacturers Life Insurance Company (U.S.A.) (1990-2006) |
Jack Clark7 (1967) Assistant Treasurer, 2007-present | Director3, Deutsche Asset Management (since 2007); formerly, Vice President, State Street Corporation (2002-2007) |
Diane Kenneally7 (1966) Assistant Treasurer, 2007-present | Director3, Deutsche Asset Management |
John Caruso6 (1965) Anti-Money Laundering Compliance Officer, 2010-present | Managing Director3, Deutsche Asset Management |
Robert Kloby6 (1962) Chief Compliance Officer, 2006-present | Managing Director3, Deutsche Asset Management |
1 The length of time served represents the year in which the Board Member joined the board of one or more DWS funds currently overseen by the Board.
2 A publicly held company with securities registered pursuant to Section 12 of the Securities Exchange Act of 1934.
3 Executive title, not a board directorship.
4 As a result of their respective positions held with the Advisor, these individuals are considered "interested persons" of the Advisor within the meaning of the 1940 Act. Interested persons receive no compensation from the fund.
5 The length of time served represents the year in which the officer was first elected in such capacity for one or more DWS funds.
6 Address: 60 Wall Street, New York, NY 10005.
7 Address: One Beacon Street, Boston, MA 02108.
The fund's Statement of Additional Information ("SAI") includes additional information about the Board Members. The SAI is available, without charge, upon request. If you would like to request a copy of the SAI, you may do so by calling the following toll-free number: (800) 728-3337.
DWS Investments Distributors, Inc.
222 South Riverside Plaza
Chicago, IL 60606
(800) 621-1148
VS1bond-2 (R-025819-1 2/12)
DECEMBER 31, 2011
ANNUAL REPORT
DWS VARIABLE SERIES I
DWS Capital Growth VIP
Contents
9 Statement of Assets and Liabilities 9 Statement of Operations 10 Statement of Changes in Net Assets 13 Notes to Financial Statements 18 Report of Independent Registered Public Accounting Firm 19 Information About Your Fund's Expenses 21 Investment Management Agreement Approval 24 Summary of Management Fee Evaluation by Independent Fee Consultant 26 Board Members and Officers |
This report must be preceded or accompanied by a prospectus. To obtain an additional prospectus or summary prospectus, if available, call (800) 728-3337 or your financial representative. We advise you to consider the Fund's objectives, risks, charges and expenses carefully before investing. The summary prospectus and prospectus contain this and other important information about the Fund. Please read the prospectus carefully before you invest.
Stocks may decline in value. The fund may lend securities to approved institutions. See the prospectus for details.
DWS Investments is part of Deutsche Bank's Asset Management division and, within the U.S., represents the retail asset management activities of Deutsche Bank AG, Deutsche Bank Trust Company Americas, Deutsche Investment Management Americas Inc. and DWS Trust Company.
NOT FDIC/NCUA INSURED NO BANK GUARANTEE MAY LOSE VALUE NOT A DEPOSIT
NOT INSURED BY ANY FEDERAL GOVERNMENT AGENCY
Performance Summary December 31, 2011
Fund performance shown is historical, assumes reinvestment of all dividend and capital gain distributions, and does not guarantee future results. Investment return and principal value fluctuate with changing market conditions so that, when redeemed, shares may be worth more or less than their original cost. Current performance may be lower or higher than the performance data quoted. Please contact your participating insurance company for the Fund's most recent month-end performance. Performance doesn't reflect charges and fees ("contract charges") associated with the separate account that invests in the Fund or any variable life insurance policy or variable annuity contract for which the Fund is an investment option. These charges and fees will reduce returns. While all share classes have the same underlying portfolio, their performance will differ.
The gross expense ratios of the Fund, as stated in the fee table of the prospectus dated May 1, 2011 are 0.51% and 0.85% for Class A and Class B shares, respectively, and may differ from the expense ratios disclosed in the Financial Highlights tables in this report.
| Growth of an Assumed $10,000 Investment |
[] DWS Capital Growth VIP — Class A [] Russell 1000® Growth Index | The Russell 1000® Growth Index is an unmanaged, capitalization-weighted index containing those securities in the Russell 1000 Index with higher price-to-book ratios and higher forecasted growth values. Index returns do not reflect any fees or expenses and it is not possible to invest directly into an index. |
| |
| Yearly periods ended December 31 | |
| Comparative Results | |
| DWS Capital Growth VIP | | 1-Year | | | 3-Year | | | 5-Year | | | 10-Year | |
| Class A | Growth of $10,000 | | $ | 9,553 | | | $ | 14,144 | | | $ | 10,673 | | | $ | 12,246 | |
| Average annual total return | | | -4.47 | % | | | 12.25 | % | | | 1.31 | % | | | 2.05 | % |
| Russell 1000 Growth Index | Growth of $10,000 | | $ | 10,264 | | | $ | 16,437 | | | $ | 11,314 | | | $ | 12,921 | |
| Average annual total return | | | 2.64 | % | | | 18.02 | % | | | 2.50 | % | | | 2.60 | % |
| DWS Capital Growth VIP | | 1-Year | | | 3-Year | | | 5-Year | | | 10-Year | |
| Class B | Growth of $10,000 | | $ | 9,524 | | | $ | 14,014 | | | $ | 10,501 | | | $ | 11,846 | |
| Average annual total return | | | -4.76 | % | | | 11.91 | % | | | 0.98 | % | | | 1.71 | % |
| Russell 1000 Growth Index | Growth of $10,000 | | $ | 10,264 | | | $ | 16,437 | | | $ | 11,314 | | | $ | 12,921 | |
| Average annual total return | | | 2.64 | % | | | 18.02 | % | | | 2.50 | % | | | 2.60 | % |
The growth of $10,000 is cumulative.
Management Summary December 31, 2011
Stocks began the annual period on a strong note, as the U.S. Federal Reserve Board's (the Fed's) stimulative quantitative easing initiative, signs of improving economic growth and strong corporate earnings induced investors to buy stocks through the first five months of the year.1 From that point, the investing backdrop gradually grew less favorable for three reasons. The primary issue weighing on the market was the European debt crisis, which raised fears of a broader financial system collapse similar to 2008-2009. At the same time, growth in China — which is generally seen as the engine of the world economy — slowed precipitously. Even more relevant to the U.S. market, the domestic economy exhibited weakness in a number of areas. In response to these developments, the U.S. stock market slipped lower during June and then plunged during the third quarter. The market subsequently staged a recovery in the fourth quarter following a pickup in a number of key economic indicators, enabling the Russell 1000 Growth® Index to finish the period with a slightly positive return.2
For the 12 months ended December 31, 2011, the Fund returned -4.47% (Class A shares, unadjusted for contract charges), underperforming the 2.64% return of the Russell 1000 Growth Index.
During 2011, underperformance was primarily driven by unfavorable stock selection, with all 10 sectors detracting from relative return. The majority of the underperformance was concentrated within information technology, energy, materials, consumer staples, financials and health care, as holdings in these sectors underperformed their respective benchmark positions by the widest margins.3 Sector allocation also detracted from relative performance in almost every sector, especially based on underweights to consumer staples and consumer discretionary, which were above-average performers in the benchmark.4,5 In addition, the Fund's overweight in industrials hurt performance, as the sector was one of the benchmark's bottom performers during the year. No sector contributed positively through stock selection or allocation, and the Fund's cash holdings also weighed on relative performance as the benchmark rose.
Going forward, we will continue to seek high-quality companies that we believe will outperform in the long run, with lower overall risk.
Owen Fitzpatrick, CFA
Lead Portfolio Manager
Thomas M. Hynes, Jr., CFA
Brendan O'Neill, CFA
Portfolio Managers
1 Quantitative easing is a type of monetary policy whereby governments buy government or other types of securities from the market in order to increase the money supply.
2 The Russell 1000 Growth Index is an unmanaged, capitalization-weighted index containing those securities in the Russell 1000® Index with higher price-to-book ratios and higher forecasted growth values.
Index returns do not reflect fees or expenses and it is not possible to invest directly into an index.
3 Consumer staples are the industries that manufacture and sell products such as food and beverages, prescription drugs, and household products.
4 The consumer discretionary sector represents industries that produce goods and services that are not necessities in everyday life.
5 "Overweight" means the Fund holds a higher weighting in a given sector or security than the benchmark. "Underweight" means the Fund holds a lower weighting.
The views expressed reflect those of the portfolio management team only through the end of the period of the report as stated on the cover. The management team's views are subject to change at any time based on market and other conditions and should not be construed as a recommendation. Past performance is no guarantee of future results. Current and future portfolio holdings are subject to risk.
Asset Allocation (As a % of Investment Portfolio excluding Securities Lending Collateral) | 12/31/11 | 12/31/10 |
| | | |
| Common Stocks | 98% | 100% |
| Cash Equivalents | 2% | — |
| | 100% | 100% |
Sector Diversification (As a % of Common Stocks) | 12/31/11 | 12/31/10 |
| | | |
| Information Technology | 31% | 31% |
| Industrials | 14% | 14% |
| Consumer Discretionary | 13% | 16% |
| Energy | 12% | 12% |
| Health Care | 10% | 10% |
| Consumer Staples | 10% | 5% |
| Financials | 5% | 5% |
| Materials | 4% | 6% |
| Utilities | 1% | 1% |
| | 100% | 100% |
Asset allocation and sector diversification are subject to change.
For more complete details about the Fund's investment portfolio, see page 6.
Following the Fund's fiscal first and third quarter-end, a complete portfolio holdings listing is filed with the SEC on Form N-Q. The form will be available on the SEC's Web site at www.sec.gov, and it also may be reviewed and copied at the SEC's Public Reference Room in Washington, D.C. Information on the operation of the SEC's Public Reference Room may be obtained by calling (800) SEC-0330. The Fund's portfolio holdings are also posted on www.dws-investments.com from time to time. Please see the Fund's current prospectus for more information.
Investment Portfolio December 31, 2011 | | | Shares | | | Value ($) | |
| | | | |
| Common Stocks 98.7% | |
| Consumer Discretionary 12.6% | |
| Auto Components 0.8% | |
| BorgWarner, Inc.* (a) | | | 91,873 | | | | 5,855,985 | |
| Hotels Restaurants & Leisure 3.4% | |
| McDonald's Corp. (a) | | | 91,139 | | | | 9,143,976 | |
| Starwood Hotels & Resorts Worldwide, Inc. (a) | | | 196,067 | | | | 9,405,334 | |
| Wynn Resorts Ltd. (a) | | | 44,128 | | | | 4,875,702 | |
| | | | | | | | 23,425,012 | |
| Multiline Retail 0.8% | |
| Dollar General Corp.* (a) | | | 132,303 | | | | 5,442,945 | |
| Specialty Retail 4.3% | |
| Bed Bath & Beyond, Inc.* (a) | | | 131,043 | | | | 7,596,563 | |
| Dick's Sporting Goods, Inc. (a) | | | 186,327 | | | | 6,871,740 | |
| Limited Brands, Inc. (a) | | | 345,075 | | | | 13,923,776 | |
| Sally Beauty Holdings, Inc.* | | | 65,116 | | | | 1,375,901 | |
| | | | | | | | 29,767,980 | |
| Textiles, Apparel & Luxury Goods 3.3% | |
| Coach, Inc. | | | 118,441 | | | | 7,229,639 | |
| NIKE, Inc. "B" (a) | | | 163,427 | | | | 15,749,460 | |
| | | | | | | | 22,979,099 | |
| Consumer Staples 9.8% | |
| Beverages 2.3% | |
| PepsiCo, Inc. | | | 237,734 | | | | 15,773,651 | |
| Food & Staples Retailing 4.9% | |
| Costco Wholesale Corp. (a) | | | 161,629 | | | | 13,466,928 | |
| Wal-Mart Stores, Inc. (a) | | | 161,247 | | | | 9,636,121 | |
| Whole Foods Market, Inc. (a) | | | 159,957 | | | | 11,129,808 | |
| | | | | | | | 34,232,857 | |
| Food Products 2.6% | |
| Kellogg Co. (a) | | | 170,844 | | | | 8,639,581 | |
| Kraft Foods, Inc. "A" (a) | | | 242,466 | | | | 9,058,530 | |
| | | | | | | | 17,698,111 | |
| Energy 12.3% | |
| Energy Equipment & Services 3.9% | |
| Halliburton Co. (a) | | | 154,742 | | | | 5,340,146 | |
| National Oilwell Varco, Inc. | | | 44,759 | | | | 3,043,164 | |
| Oil States International, Inc.* (a) | | | 69,464 | | | | 5,304,966 | |
| Schlumberger Ltd. (a) | | | 195,355 | | | | 13,344,700 | |
| | | | | | | | 27,032,976 | |
| Oil, Gas & Consumable Fuels 8.4% | |
| Anadarko Petroleum Corp. | | | 173,181 | | | | 13,218,906 | |
| Concho Resources, Inc.* (a) | | | 20,434 | | | | 1,915,688 | |
| EOG Resources, Inc. | | | 116,378 | | | | 11,464,397 | |
| Exxon Mobil Corp. (a) | | | 178,621 | | | | 15,139,916 | |
| Occidental Petroleum Corp. | | | 112,305 | | | | 10,522,978 | |
| Plains Exploration & Production Co.* | | | 149,921 | | | | 5,505,099 | |
| | | | | | | | 57,766,984 | |
| Financials 4.9% | |
| Capital Markets 2.3% | |
| Ameriprise Financial, Inc. | | | 79,560 | | | | 3,949,359 | |
| T. Rowe Price Group, Inc. (a) | | | 211,234 | | | | 12,029,776 | |
| | | | | | | | 15,979,135 | |
| | | Shares | | | Value ($) | |
| | | | | | | | | |
| Consumer Finance 1.1% | |
| Discover Financial Services (a) | | | 300,809 | | | | 7,219,416 | |
| Real Estate Investment Trusts 1.5% | |
| American Tower Corp. "A" | | | 175,390 | | | | 10,525,154 | |
| Health Care 10.4% | |
| Biotechnology 3.8% | |
| Celgene Corp.* (a) | | | 271,862 | | | | 18,377,871 | |
| Gilead Sciences, Inc.* | | | 191,732 | | | | 7,847,591 | |
| | | | | | | | 26,225,462 | |
| Health Care Equipment & Supplies 2.3% | |
| CareFusion Corp.* | | | 198,533 | | | | 5,044,724 | |
| Edwards Lifesciences Corp.* | | | 61,242 | | | | 4,329,809 | |
| St. Jude Medical, Inc. | | | 180,185 | | | | 6,180,345 | |
| | | | | | | | 15,554,878 | |
| Health Care Providers & Services 3.5% | |
| Express Scripts, Inc.* (a) | | | 291,840 | | | | 13,042,329 | |
| McKesson Corp. | | | 145,768 | | | | 11,356,785 | |
| | | | | | | | 24,399,114 | |
| Life Sciences Tools & Services 0.8% | |
| Thermo Fisher Scientific, Inc.* | | | 125,509 | | | | 5,644,140 | |
| Industrials 13.4% | |
| Aerospace & Defense 3.2% | |
| TransDigm Group, Inc.* | | | 69,790 | | | | 6,677,507 | |
| United Technologies Corp. | | | 208,498 | | | | 15,239,119 | |
| | | | | | | | 21,916,626 | |
| Commercial Services & Supplies 0.8% | |
| Stericycle, Inc.* (a) | | | 68,004 | | | | 5,298,872 | |
| Electrical Equipment 3.0% | |
| AMETEK, Inc. (a) | | | 257,460 | | | | 10,839,066 | |
| Roper Industries, Inc. (a) | | | 117,177 | | | | 10,179,166 | |
| | | | | | | | 21,018,232 | |
| Machinery 4.3% | |
| Dover Corp. (a) | | | 136,596 | | | | 7,929,398 | |
| Navistar International Corp.* | | | 133,220 | | | | 5,046,373 | |
| Parker Hannifin Corp. (a) | | | 152,121 | | | | 11,599,226 | |
| SPX Corp. | | | 86,740 | | | | 5,227,820 | |
| | | | | | | | 29,802,817 | |
| Road & Rail 2.1% | |
| Norfolk Southern Corp. (a) | | | 198,173 | | | | 14,438,885 | |
| Information Technology 30.6% | |
| Communications Equipment 3.9% | |
| QUALCOMM, Inc. | | | 493,573 | | | | 26,998,443 | |
| Computers & Peripherals 10.8% | |
| Apple, Inc.* (a) | | | 138,274 | | | | 56,000,970 | |
| EMC Corp.* (a) | | | 851,376 | | | | 18,338,639 | |
| | | | | | | | 74,339,609 | |
| Internet Software & Services 2.2% | |
| Google, Inc. "A"* | | | 23,255 | | | | 15,020,404 | |
| IT Services 4.6% | |
| Accenture PLC "A" (a) | | | 265,347 | | | | 14,124,421 | |
| International Business Machines Corp. (a) | | | 72,442 | | | | 13,320,635 | |
| VeriFone Systems, Inc.* (a) | | | 115,688 | | | | 4,109,238 | |
| | | | | | | | 31,554,294 | |
| | | Shares | | | Value ($) | |
| | | | | | | | | |
| Semiconductors & Semiconductor Equipment 2.2% | |
| Intel Corp. (a) | | | 405,917 | | | | 9,843,487 | |
| Skyworks Solutions, Inc.* | | | 321,408 | | | | 5,213,238 | |
| | | | | | | | 15,056,725 | |
| Software 6.9% | |
| Check Point Software Technologies Ltd.* (a) | | | 141,368 | | | | 7,427,475 | |
| Microsoft Corp. | | | 658,705 | | | | 17,099,983 | |
| Oracle Corp. | | | 795,268 | | | | 20,398,624 | |
| Solera Holdings, Inc. | | | 71,246 | | | | 3,173,297 | |
| | | | | | | | 48,099,379 | |
| Materials 4.2% | |
| Chemicals 2.5% | |
| Ecolab, Inc. (a) | | | 158,312 | | | | 9,152,017 | |
| The Mosaic Co. | | | 152,949 | | | | 7,713,218 | |
| | | | | | | | 16,865,235 | |
| Metals & Mining 1.7% | |
| Freeport-McMoRan Copper & Gold, Inc. | | | 249,124 | | | | 9,165,272 | |
| Walter Energy, Inc. (a) | | | 46,463 | | | | 2,813,799 | |
| | | | | | | | 11,979,071 | |
| | | Shares | | | Value ($) | |
| | | | | | | | | |
| Utilities 0.5% | |
| Water Utilities | |
| American Water Works Co., Inc. | | | 112,836 | | | | 3,594,955 | |
Total Common Stocks (Cost $495,998,980) | | | | 681,506,446 | |
| | |
| Securities Lending Collateral 40.9% | |
| Daily Assets Fund Institutional, 0.18% (b) (c) (Cost $282,395,986) | | | 282,395,986 | | | | 282,395,986 | |
| | |
| Cash Equivalents 2.3% | |
| Central Cash Management Fund, (b) 0.07% (Cost $15,563,229) | | | 15,563,229 | | | | 15,563,229 | |
| | | % of Net Assets | | | Value ($) | |
| | | | |
Total Investment Portfolio (Cost $793,958,195)+ | | | 141.9 | | | | 979,465,661 | |
| Other Assets and Liabilities, Net | | | (41.9 | ) | | | (289,147,223 | ) |
| Net Assets | | | 100.0 | | | | 690,318,438 | |
* Non-income producing security.
+ The cost for federal income tax purposes was $797,526,729. At December 31, 2011, net unrealized appreciation for all securities based on tax cost was $181,938,932. This consisted of aggregate gross unrealized appreciation for all securities in which there was an excess of value over tax cost of $209,813,930 and aggregate gross unrealized depreciation for all securities in which there was an excess of tax cost over value of $27,874,998.
(a) All or a portion of these securities were on loan amounting to $275,384,378. In addition, included in other assets and liabilities, net is a pending sale, amounting to $121,083, that is also on loan (see Notes to Financial Statements). The value of all securities loaned at December 31, 2011 amounted to $275,505,461, which is 39.9% of net assets.
(b) Affiliated fund managed by Deutsche Investment Management Americas Inc. The rate shown is the annualized seven-day yield at period end.
(c) Represents collateral held in connection with securities lending. Income earned by the Fund is net of borrower rebates.
Fair Value Measurements
Various inputs are used in determining the value of the Fund's investments. These inputs are summarized in three broad levels. Level 1 includes quoted prices in active markets for identical securities. Level 2 includes other significant observable inputs (including quoted prices for similar securities, interest rates, prepayment speeds, and credit risk). Level 3 includes significant unobservable inputs (including the Fund's own assumptions in determining the fair value of investments). The inputs or methodology used for valuing securities are not necessarily an indication of the risk associated with investing in those securities.
The following is a summary of the inputs used as of December 31, 2011 in valuing the Fund's investments. For information on the Fund's policy regarding the valuation of investments, please refer to the Security Valuation section of Note A in the accompanying Notes to Financial Statements.
| Assets | | Level 1 | | | Level 2 | | | Level 3 | | | Total | |
| | |
| Common Stocks (d) | | $ | 681,506,446 | | | $ | — | | | $ | — | | | $ | 681,506,446 | |
| Short-Term Investments (d) | | | 297,959,215 | | | | — | | | | — | | | | 297,959,215 | |
| Total | | $ | 979,465,661 | | | $ | — | | | $ | — | | | $ | 979,465,661 | |
There have been no transfers between Level 1 and Level 2 fair value measurements during the year ended December 31, 2011.
(d) See Investment Portfolio for additional detailed categorizations.
The accompanying notes are an integral part of the financial statements.
Statement of Assets and Liabilities | as of December 31, 2011 | |
| Assets | |
Investments: Investments in non-affiliated securities, at value (cost $495,998,980) — including $275,384,378 of securities loaned | | $ | 681,506,446 | |
| Investment in Daily Assets Fund Institutional (cost $282,395,986)* | | | 282,395,986 | |
| Investment in Central Cash Management Fund (cost $15,563,229) | | | 15,563,229 | |
| Total investments in securities, at value (cost $793,958,195 ) | | | 979,465,661 | |
| Foreign currency, at value (cost $5,381) | | | 5,149 | |
| Receivable for investments sold | | | 13,994,056 | |
| Receivable for Fund shares sold | | | 19,321 | |
| Dividends receivable | | | 596,415 | |
| Interest receivable | | | 38,759 | |
| Foreign taxes recoverable | | | 45,773 | |
| Other assets | | | 11,277 | |
| Total assets | | | 994,176,411 | |
| Liabilities | |
| Payable upon return of securities loaned | | | 282,395,986 | |
| Payable for investments purchased | | | 20,154,273 | |
| Payable for Fund shares redeemed | | | 847,470 | |
| Accrued management fee | | | 223,122 | |
| Other accrued expenses and payables | | | 237,122 | |
| Total liabilities | | | 303,857,973 | |
| Net assets, at value | | $ | 690,318,438 | |
| Net Assets Consist of | |
| Undistributed net investment income | | | 6,289,845 | |
Net unrealized appreciation (depreciation) on: Investments | | | 185,507,466 | |
| Foreign currency | | | 5,810 | |
| Accumulated net realized gain (loss) | | | (131,328,303 | ) |
| Paid-in capital | | | 629,843,620 | |
| Net assets, at value | | $ | 690,318,438 | |
Class A Net Asset Value, offering and redemption price per share ($677,395,836 ÷ 36,451,466 outstanding shares of beneficial interest, $.01 par value, unlimited number of shares authorized) | | $ | 18.58 | |
Class B Net Asset Value, offering and redemption price per share ($12,922,602 ÷ 698,290 outstanding shares of beneficial interest, $.01 par value, unlimited number of shares authorized) | | $ | 18.51 | |
* Represents collateral on securities loaned.
The accompanying notes are an integral part of the financial statements.
Statement of Operations
| for the year ended December 31, 2011 | |
| Investment Income | |
Income: Dividends | | $ | 10,069,693 | |
| Income distributions — Central Cash Management Fund | | | 8,402 | |
| Securities lending income, including income from Daily Assets Fund Institutional, net of borrower rebates | | | 192,756 | |
| Total income | | | 10,270,851 | |
Expenses: Management fee | | | 2,812,890 | |
| Administration fee | | | 753,532 | |
| Services to shareholders | | | 5,171 | |
| Distribution service fee (Class B) | | | 33,073 | |
| Record keeping fee (Class B) | | | 11,465 | |
| Custodian fee | | | 7,110 | |
| Professional fees | | | 86,004 | |
| Reports to shareholders | | | 42,761 | |
| Trustees' fees and expenses | | | 23,627 | |
| Other | | | 65,882 | |
| Total expenses | | | 3,841,515 | |
| Net investment income (loss) | | | 6,429,336 | |
| Realized and Unrealized Gain (Loss) | |
Net realized gain (loss) from: Investments | | | 28,062,523 | |
| Foreign currency | | | 111 | |
| | | | 28,062,634 | |
Change in net unrealized appreciation (depreciation) on: Investments | | | (77,915,680 | ) |
| Foreign currency | | | 1,487 | |
| | | | (77,914,193 | ) |
| Net gain (loss) | | | (49,851,559 | ) |
| Net increase (decrease) in net assets resulting from operations | | $ | (43,422,223 | ) |
The accompanying notes are an integral part of the financial statements.
Statement of Changes in Net Assets | | | Years Ended December 31, | |
| Increase (Decrease) in Net Assets | | 2011 | | | 2010 | |
Operations: Net investment income (loss) | | $ | 6,429,336 | | | $ | 5,440,265 | |
| Net realized gain (loss) | | | 28,062,634 | | | | 56,939,552 | |
| Change in net unrealized appreciation (depreciation) | | | (77,914,193 | ) | | | 46,062,994 | |
| Net increase (decrease) in net assets resulting from operations | | | (43,422,223 | ) | | | 108,442,811 | |
Distributions to shareholders from: Net investment income: Class A | | | (5,283,454 | ) | | | (6,317,623 | ) |
| Class B | | | (48,050 | ) | | | (67,783 | ) |
| Total distributions | | | (5,331,504 | ) | | | (6,385,406 | ) |
Fund share transactions: Class A Proceeds from shares sold | | | 10,917,405 | | | | 12,396,402 | |
Net assets acquired in tax-free reorganization* | | | 126,872,037 | | | | — | |
| Reinvestment of distributions | | | 5,283,454 | | | | 6,317,623 | |
| Payments for shares redeemed | | | (146,734,714 | ) | | | (105,101,955 | ) |
| Net increase (decrease) in net assets from Class A share transactions | | | (3,661,818 | ) | | | (86,387,930 | ) |
Class B Proceeds from shares sold | | | 822,574 | | | | 1,077,251 | |
Net assets acquired in tax-free reorganization* | | | 3,304,909 | | | | — | |
| Reinvestment of distributions | | | 48,050 | | | | 67,783 | |
| Payments for shares redeemed | | | (2,497,610 | ) | | | (2,881,286 | ) |
| Net increase (decrease) in net assets from Class B share transactions | | | 1,677,923 | | | | (1,736,252 | ) |
| Increase (decrease) in net assets | | | (50,737,622 | ) | | | 13,933,223 | |
| Net assets at beginning of period | | | 741,056,060 | | | | 727,122,837 | |
| Net assets at end of period (including undistributed net investment income of $6,289,845 and $5,191,902, respectively) | | $ | 690,318,438 | | | $ | 741,056,060 | |
| Other Information | |
Class A Shares outstanding at beginning of period | | | 37,210,167 | | | | 42,229,316 | |
| Shares sold | | | 556,745 | | | | 714,318 | |
Shares issued in tax-free reorganization* | | | 6,079,145 | | | | — | |
| Shares issued to shareholders in reinvestment of distributions | | | 254,870 | | | | 348,655 | |
| Shares redeemed | | | (7,649,461 | ) | | | (6,082,122 | ) |
| Net increase (decrease) in Class A shares | | | (758,701 | ) | | | (5,019,149 | ) |
| Shares outstanding at end of period | | | 36,451,466 | | | | 37,210,167 | |
Class B Shares outstanding at beginning of period | | | 623,731 | | | | 725,636 | |
| Shares sold | | | 43,180 | | | | 62,186 | |
Shares issued in tax-free reorganization* | | | 158,668 | | | | — | |
| Shares issued to shareholders in reinvestment of distributions | | | 2,322 | | | | 3,749 | |
| Shares redeemed | | | (129,611 | ) | | | (167,840 | ) |
| Net increase (decrease) in Class B shares | | | 74,559 | | | | (101,905 | ) |
| Shares outstanding at end of period | | | 698,290 | | | | 623,731 | |
* On April 29, 2011, DWS Health Care VIP and DWS Technology VIP were acquired by the Fund through a tax-free reorganization (see Note F).
The accompanying notes are an integral part of the financial statements.
| | | Years Ended December 31, | |
| Class A | | | 2011 | | | 2010 | | | 2009 | | | 2008 | | | 2007 | |
| Selected Per Share Data | |
| Net asset value, beginning of period | | $ | 19.59 | | | $ | 16.93 | | | $ | 13.55 | | | $ | 20.41 | | | $ | 18.24 | |
Income (loss) from investment operations: Net investment income (loss)a | | | .17 | | | | .14 | c | | | .14 | | | | .16 | | | | .17 | c |
| Net realized and unrealized gain (loss) | | | (1.03 | ) | | | 2.68 | | | | 3.43 | | | | (6.83 | ) | | | 2.12 | |
| Total from investment operations | | | (.86 | ) | | | 2.82 | | | | 3.57 | | | | (6.67 | ) | | | 2.29 | |
Less distributions from: Net investment income | | | (.15 | ) | | | (.16 | ) | | | (.19 | ) | | | (.19 | ) | | | (.12 | ) |
| Net asset value, end of period | | $ | 18.58 | | | $ | 19.59 | | | $ | 16.93 | | | $ | 13.55 | | | $ | 20.41 | |
| Total Return (%) | | | (4.47 | ) | | | 16.71 | b | | | 26.87 | b | | | (32.98 | )b | | | 12.59 | b |
| Ratios to Average Net Assets and Supplemental Data | |
| Net assets, end of period ($ millions) | | | 677 | | | | 729 | | | | 715 | | | | 594 | | | | 1,058 | |
| Ratio of expenses before expense reductions (%) | | | .50 | | | | .51 | | | | .51 | | | | .50 | | | | .53 | |
| Ratio of expenses after expense reductions (%) | | | .50 | | | | .51 | | | | .49 | | | | .49 | | | | .52 | |
| Ratio of net investment income (loss) (%) | | | .86 | | | | .78 | c | | | .98 | | | | .89 | | | | .86 | c |
| Portfolio turnover rate (%) | | | 47 | | | | 42 | | | | 76 | | | | 21 | | | | 30 | |
a Based on average shares outstanding during the period. b Total return would have been lower had certain expenses not been reduced. c Net investment income per share and ratio of net investment income include non-recurring dividend income amounting to $0.05 and $0.03 per share and 0.28% and 0.17% of average daily net assets for the years ended December 31, 2010 and 2007, respectively. | |
| | | Years Ended December 31, | |
| Class B | | | 2011 | | | 2010 | | | 2009 | | | 2008 | | | 2007 | |
| Selected Per Share Data | |
| Net asset value, beginning of period | | $ | 19.51 | | | $ | 16.86 | | | $ | 13.49 | | | $ | 20.31 | | | $ | 18.15 | |
Income (loss) from investment operations: Net investment income (loss)a | | | .10 | | | | .08 | c | | | .09 | | | | .10 | | | | .09 | c |
| Net realized and unrealized gain (loss) | | | (1.02 | ) | | | 2.67 | | | | 3.43 | | | | (6.81 | ) | | | 2.12 | |
| Total from investment operations | | | (.92 | ) | | | 2.75 | | | | 3.52 | | | | (6.71 | ) | | | 2.21 | |
Less distributions from: Net investment income | | | (.08 | ) | | | (.10 | ) | | | (.15 | ) | | | (.11 | ) | | | (.05 | ) |
| Net asset value, end of period | | $ | 18.51 | | | $ | 19.51 | | | $ | 16.86 | | | $ | 13.49 | | | $ | 20.31 | |
| Total Return (%) | | | (4.76 | ) | | | 16.33 | b | | | 26.49 | b | | | (33.20 | )b | | | 12.18 | b |
| Ratios to Average Net Assets and Supplemental Data | |
| Net assets, end of period ($ millions) | | | 13 | | | | 12 | | | | 12 | | | | 10 | | | | 19 | |
| Ratio of expenses before expense reductions (%) | | | .84 | | | | .85 | | | | .85 | | | | .85 | | | | .94 | |
| Ratio of expenses after expense reductions (%) | | | .84 | | | | .84 | | | | .82 | | | | .82 | | | | .90 | |
| Ratio of net investment income (loss) (%) | | | .52 | | | | .45 | c | | | .65 | | | | .56 | | | | .48 | c |
| Portfolio turnover rate (%) | | | 47 | | | | 42 | | | | 76 | | | | 21 | | | | 30 | |
a Based on average shares outstanding during the period. b Total return would have been lower had certain expenses not been reduced. c Net investment income per share and ratio of net investment income include non-recurring dividend income amounting to $0.05 and $0.03 per share and $0.28% and 0.17% of average daily net assets for the years ended December 31, 2010 and 2007, respectively. | |
Notes to Financial Statements
A. Organization and Significant Accounting Policies
DWS Variable Series I (the "Series") is registered under the Investment Company Act of 1940, as amended (the "1940 Act"), as an open-end, registered management investment company organized as a Massachusetts business trust. The Series consists of five diversified funds: DWS Bond VIP, DWS Growth & Income VIP, DWS Capital Growth VIP, DWS Global Small Cap Growth VIP (formerly DWS Global Opportunities VIP) and DWS International VIP (individually or collectively hereinafter referred to as a "Fund" or the "Funds"). These financial statements report on DWS Capital Growth VIP. The Series is intended to be the underlying investment vehicle for variable annuity contracts and variable life insurance policies to be offered by the separate accounts of certain life insurance companies ("Participating Insurance Companies").
Multiple Classes of Shares of Beneficial Interest. The Fund offers two classes of shares (Class A shares and Class B shares). Class B shares are subject to Rule 12b-1 distribution fees under the 1940 Act and recordkeeping fees equal to an annual rate of 0.25% and up to 0.15%, respectively, of the average daily net assets of the Class B shares of the Fund. Class A shares are not subject to such fees.
Investment income, realized and unrealized gains and losses, and certain fund-level expenses and expense reductions, if any, are borne pro rata on the basis of relative net assets by the holders of all classes of shares, except that each class bears certain expenses unique to that class (including the applicable 12b-1 distribution fees and recordkeeping fees). Differences in class-level expenses may result in payment of different per share dividends by class. All shares have equal rights with respect to voting subject to class-specific arrangements.
The Fund's financial statements are prepared in accordance with accounting principles generally accepted in the United States of America, which require the use of management estimates. Actual results could differ from those estimates. The policies described below are followed consistently by the Fund in the preparation of its financial statements.
Security Valuation. Investments are stated at value determined as of the close of regular trading on the New York Stock Exchange on each day the exchange is open for trading.
Various inputs are used in determining the value of the Fund's investments. These inputs are summarized in three broad levels. Level 1 includes quoted prices in active markets for identical securities. Level 2 includes other significant observable inputs (including quoted prices for similar securities, interest rates, prepayment speeds, and credit risk). Level 3 includes significant unobservable inputs (including the Fund's own assumptions in determining the fair value of investments). The inputs or methodology used for valuing securities are not necessarily an indication of the risk associated with investing in those securities.
Equity securities are valued at the most recent sale price or official closing price reported on the exchange (U.S. or foreign) or over-the-counter market on which they trade and are categorized as Level 1 securities. Securities for which no sales are reported are valued at the calculated mean between the most recent bid and asked quotations on the relevant market or, if a mean cannot be determined, at the most recent bid quotation.
Money market instruments purchased with an original or remaining maturity of sixty days or less, maturing at par, are valued at amortized cost, which approximates value, and are categorized as Level 2. Investments in open-end investment companies are valued at their net asset value each business day and are categorized as Level 1.
Securities and other assets for which market quotations are not readily available or for which the above valuation procedures are deemed not to reflect fair value are valued in a manner that is intended to reflect their fair value as determined in accordance with procedures approved by the Trustees and are generally categorized as Level 3. In accordance with the Fund's valuation procedures, factors used in determining value may include, but are not limited to, the type of the security; the size of the holding; the initial cost of the security; the existence of any contractual restrictions on the security's disposition; the price and extent of public trading in similar securities of the issuer or of comparable companies; quotations or evaluated prices from broker-dealers and/or pricing services; information obtained from the issuer, analysts, and/or the appropriate stock exchange (for exchange-traded securities); an analysis of the company's or issuer's financial statements; an evaluation of the forces that influence the issuer and the market(s) in which the security is purchased and sold and with respect to debt securities; the maturity, coupon, creditworthiness, currency denomination and the movement of the market in which the security is normally traded. The value determined under these procedures may differ from published values for the same securities.
Disclosure about the classification of fair value measurements is included in a table following the Fund's Investment Portfolio.
New Accounting Pronouncement. In May 2011, Accounting Standards Update 2011-04 (ASU 2011-04), Amendments to Achieve Common Fair Value Measurement and Disclosure Requirements in U.S. GAAP and IFRSs, was issued and is effective during interim and annual periods beginning after December 15, 2011. ASU 2011-04 amends Accounting Standards Codification (ASC) Topic 820, Fair Value Measurement. The amendments are the result of the work by the Financial Accounting Standards Board and the International Accounting Standards Board to develop common requirements for measuring fair value and for disclosing information about fair value measurements in accordance with GAAP. Management is currently evaluating the application of ASU 2011-04 and its impact, if any, on the Fund's financial statements.
Securities Lending. The Fund lends securities to certain financial institutions. The Fund retains beneficial ownership of the securities it has loaned and continues to receive interest and dividends paid by the issuer of securities and to participate in any changes in their market value. The Fund requires the borrowers of the securities to maintain collateral with the Fund consisting of either cash or liquid, unencumbered assets having a value at least equal to the value of the securities loaned. When the collateral falls below specified amounts, the lending agent will use its best effort to obtain additional collateral on the next business day to meet required amounts under the security lending agreement. The Fund may invest the cash collateral into a joint trading account in an affiliated money market fund pursuant to Exemptive Orders issued by the SEC. The Fund receives compensation for lending its securities either in the form of fees or by earning interest on invested cash collateral net of borrower rebates and fees paid to a lending agent. Either the Fund or the borrower may terminate the loan. There may be risks of delay and costs in recovery of securities or even loss of rights in the collateral should the borrower of the securities fail financially. The Fund is also subject to all investment risks associated with the reinvestment of any cash collateral received, including, but not limited to, interest rate, credit and liquidity risk associated with such investments.
Foreign Currency Translations. The books and records of the Fund are maintained in U.S. dollars. Investment securities and other assets and liabilities denominated in a foreign currency are translated into U.S. dollars at the prevailing exchange rates at period end. Purchases and sales of investment securities, income and expenses are translated into U.S. dollars at the prevailing exchange rates on the respective dates of the transactions.
Net realized and unrealized gains and losses on foreign currency transactions represent net gains and losses between trade and settlement dates on securities transactions, the acquisition and disposition of foreign currencies, and the difference between the amount of net investment income accrued and the U.S. dollar amount actually received. That portion of both realized and unrealized gains and losses on investments that results from fluctuations in foreign currency exchange rates is not separately disclosed but is included with net realized and unrealized gain/appreciation and loss/depreciation on investments.
Federal Income Taxes. The Fund is treated as a separate taxpayer as provided for in the Internal Revenue Code, as amended. It is the Fund's policy to comply with the requirements of the Internal Revenue Code, as amended, which are applicable to regulated investment companies, and to distribute all of its taxable income to the separate accounts of the Participating Insurance Companies which hold its shares.
Under the Regulated Investment Company Modernization Act of 2010, net capital losses may be carried forward indefinitely, and their character is retained as short-term and/or long-term. Previously, net capital losses were carried forward for eight years and treated as short-term. As a transition rule, the Act requires that post-enactment net capital losses be used before pre-enactment net capital losses.
At December 31, 2011, the Fund had a net tax basis capital loss carryforward of approximately $127,751,000, including $60,976,000 of pre-enactment losses of which $33,901,000 was inherited from its merger with DWS Technology VIP in the current year and $27,075,000 was inherited from its merger with other affiliated funds in previous years and may be applied against any realized net taxable capital gains of each year until fully utilized or until December 31, 2012 ($28,616,000), December 31, 2015 ($19,311,000), December 31, 2016 ($41,665,000) and December 31, 2017 ($38,159,000), the respective expiration dates, whichever occurs first, and which may be subject to certain limitations under Section 382-384 of the Internal Revenue Code.
The Fund has reviewed the tax positions for the open tax years as of December 31, 2011 and has determined that no provision for income tax is required in the Fund's financial statements. The Fund's federal tax returns for the prior three fiscal years remain open subject to examination by the Internal Revenue Service.
Distribution of Income and Gains. The Fund will declare and distribute dividends from its net investment income, if any, annually, although additional distributions may be made if necessary. Net realized gains from investment transactions, in excess of available capital loss carryforwards, would be taxable to the Fund if not distributed, and, therefore, will be distributed to shareholders at least annually.
The timing and characterization of certain income and capital gain distributions are determined annually in accordance with federal tax regulations which may differ from accounting principles generally accepted in the United States of America. These differences primarily relate to certain securities sold at a loss. As a result, net investment income (loss) and net realized gain (loss) on investment transactions for a reporting period may differ significantly from distributions during such period. Accordingly, the Fund may periodically make reclassifications among certain of its capital accounts without impacting the net asset value of the Fund.
At December 31, 2011, the Fund's components of distributable earnings (accumulated losses) on a tax basis are as follows:
| Undistributed ordinary income* | | $ | 6,289,845 | |
| Capital loss carryforwards | | $ | (127,751,000 | ) |
| Net unrealized gain appreciation (depreciation) investments | | $ | 181,938,932 | |
In addition, the tax character of distributions paid to shareholders by the Fund is summarized as follows:
| | | Years Ended December 31, | |
| | | 2011 | | | 2010 | |
| Distributions from ordinary income* | | $ | 5,331,504 | | | $ | 6,385,406 | |
* For tax purposes, short-term capital gain distributions are considered ordinary income distributions.
Expenses. Expenses of the Series arising in connection with a specific Fund are allocated to that Fund. Other Series expenses which cannot be directly attributed to a Fund are apportioned among the Funds in the Series.
Contingencies. In the normal course of business, the Fund may enter into contracts with service providers that contain general indemnification clauses. The Fund's maximum exposure under these arrangements is unknown as this would involve future claims that may be made against the Fund that have not yet been made. However, based on experience, the Fund expects the risk of loss to be remote.
Other. Investment transactions are accounted for on a trade date plus one basis for daily net asset value calculations. However, for financial reporting purposes, investment transactions are reported on trade date. Interest income is recorded on the accrual basis. Dividend income is recorded on the ex-dividend date net of foreign withholding taxes. Certain dividends from foreign securities may be recorded subsequent to the ex-dividend date as soon as the Fund is informed of such dividends. Realized gains and losses from investment transactions are recorded on an identified cost basis and may include proceeds from litigation.
B. Purchases and Sales of Securities
During the year ended December 31, 2011, purchases and sales of investment securities (excluding short-term investments) aggregated $353,604,662 and $488,652,071, respectively.
C. Related Parties
Management Agreement. Under the Investment Management Agreement with Deutsche Investment Management Americas Inc. ("DIMA" or the "Advisor"), an indirect, wholly owned subsidiary of Deutsche Bank AG, the Advisor directs the investments of the Fund in accordance with its investment objectives, policies and restrictions. The Advisor determines the securities, instruments and other contracts relating to investments to be purchased, sold or entered into by the Fund.
Pursuant to the Investment Management Agreement with the Advisor, the Fund pays a monthly management fee based on the Fund's average daily net assets, computed and accrued daily and payable monthly at the following annual rates:
| First $250 million of average daily net assets | | | .390 | % |
| Next $750 million of average daily net assets | | | .365 | % |
| Over $1 billion of average daily net assets | | | .340 | % |
Accordingly, for the year ended December 31, 2011, the fee pursuant to the Investment Management Agreement was equivalent to an annual effective rate of 0.37% of the Fund's average daily net assets.
Administration Fee. Pursuant to an Administrative Services Agreement, DIMA provides most administrative services to the Fund. For all services provided under the Administrative Services Agreement, the Fund pays the Advisor an annual fee ("Administration Fee") of 0.10% of the Fund's average daily net assets, computed and accrued daily and payable monthly. For the year ended December 31, 2011, the Administration Fee was $753,532, of which $59,675 is unpaid.
Service Provider Fees. DWS Investments Service Company ("DISC"), an affiliate of the Advisor, is the transfer agent, dividend-paying agent and shareholder service agent for the Fund. Pursuant to a sub-transfer agency agreement between DISC and DST Systems, Inc. ("DST"), DISC has delegated certain transfer agent, dividend-paying agent and shareholder service agent functions to DST. DISC compensates DST out of the shareholder servicing fee it receives from the Fund. For the year ended December 31, 2011, the amounts charged to the Fund by DISC were as follows:
| Services to Shareholders | | Total Aggregated | | | Unpaid at December 31, 2011 | |
| Class A | | $ | 689 | | | $ | 171 | |
| Class B | | | 131 | | | | 35 | |
| | | $ | 820 | | | $ | 206 | |
Distribution Service Agreement. DWS Investments Distributors, Inc. ("DIDI"), also an affiliate of the Advisor, is the Series' Distributor. In accordance with the Master Distribution Plan, DIDI receives 12b-1 fees of 0.25% of average daily net assets of Class B shares. Pursuant to the Master Distribution Plan, DIDI remits these fees to the Participating Insurance Companies for various costs incurred or paid by these companies in connection with marketing and distribution of Class B shares. For the year ended December 31, 2011, the Distribution Service Fee aggregated $33,073, of which $2,086 is unpaid.
Typesetting and Filing Service Fees. Under an agreement with DIMA, DIMA is compensated for providing typesetting and certain regulatory filing services to the Fund. For the year ended December 31, 2011, the amount charged to the Fund by DIMA included in the Statement of Operations under "reports to shareholders" aggregated $15,780, of which $3,258 is unpaid.
Trustees' Fees and Expenses. The Fund paid each Trustee not affiliated with the Advisor retainer fees plus specified amounts for various committee services and for the Board Chairperson.
Affiliated Cash Management Vehicle. The Fund may invest uninvested cash balances in Central Cash Management Fund, which is managed by the Advisor. The Fund indirectly bears its proportionate share of the expenses of Central Cash Management Fund. Central Cash Management Fund does not pay the Advisor an investment management fee. Central Cash Management Fund seeks a high level of current income consistent with liquidity and the preservation of capital.
D. Ownership of the Fund
Three participating insurance companies were owners of record of 10% or more of the total outstanding Class A shares of the Fund, each owning 36%, 36% and 14%. Two participating insurance companies were owners of record of 10% or more of the total outstanding Class B shares of the Fund, each owning 82% and 16%.
E. Line of Credit
The Fund and other affiliated funds (the "Participants") share in a $450 million revolving credit facility provided by a syndication of banks. The Fund may borrow for temporary or emergency purposes, including the meeting of redemption requests that otherwise might require the untimely disposition of securities. The Participants are charged an annual commitment fee which is allocated based on net assets, among each of the Participants. Interest is calculated at a rate per annum equal to the sum of the Federal Funds Rate plus 1.25 percent plus if LIBOR exceeds the Federal Funds Rate the amount of such excess. The Fund may borrow up to a maximum of 33 percent of its net assets under the agreement. The Fund had no outstanding loans at December 31, 2011.
F. Acquisition of Assets
On April 29, 2011, the Fund acquired all of the net assets of DWS Health Care VIP and DWS Technology VIP pursuant to a plan of reorganization approved by shareholders on April 11, 2011. The purpose of the transaction was to combine three funds managed by DWS with comparable investment objectives and strategies.
The acquisition was accomplished by a tax-free exchange as follows:
| | Class A shares | Class B shares |
| DWS Health Care VIP | 5,605,448 | 377,495 |
| DWS Technology VIP | 6,613,518 | 10,454 |
The above shares were exchanged for the following shares outstanding on the date acquired of the DWS Capital Growth VIP Fund:
| | Class A shares | Class B shares |
| DWS Health Care VIP | 2,358,210 | 152,955 |
| DWS Technology VIP | 3,720,935 | 5,713 |
The net assets at the acquired date were as follows:
| DWS Health Care VIP | | $ | 52,398,965 | |
| DWS Technology VIP | | $ | 77,777,981 | |
The net unrealized appreciation included in the net assets above were as follows:
| DWS Health Care VIP | | $ | 4,928,832 | |
| DWS Technology VIP | | $ | 13,786,078 | |
The aggregate net assets of DWS Capital Growth VIP immediately before the acquisition were $754,712,975. The combined net assets of DWS Capital Growth VIP immediately following the acquisition were $884,889,922.
The financial statements reflect the operations of the DWS Capital Growth VIP for the period prior to the acquisition and the combined portfolio for the period subsequent to the Fund merger. Assuming the acquisition had been completed on January 1, 2011, DWS Capital Growth VIP's pro forma results of operations for the period ending December 31, 2011, are as follows:
| Net investment income* | | $ | 6,336,241 | |
| Net gain (loss) on investments | | $ | (38,167,701 | ) |
| Net increase (decrease) in net assets resulting from operations | | $ | (31,831,460 | ) |
* Net investment income includes $157,183 of pro forma eliminated expenses.
Report of Independent Registered Public Accounting Firm
To the Trustees of DWS Variable Series I and the Shareholders of DWS Capital Growth VIP:
In our opinion, the accompanying statement of assets and liabilities, including the investment portfolio, and the related statements of operations and of changes in net assets and the financial highlights present fairly, in all material respects, the financial position of DWS Capital Growth VIP (the "Fund") at December 31, 2011 and the results of its operations, the changes in its net assets, and the financial highlights for the periods indicated therein, in conformity with accounting principles generally accepted in the United States of America. These financial statements and financial highlights (hereafter referred to as "financial statements") are the responsibility of the Fund's management. Our responsibility is to express an opinion on these financial statements based on our audits. We conducted our audits of these financial statements in accordance with the standards of the Public Company Accounting Oversight Board (United States). Those standards require that we plan and perform the audit to obtain reasonable assurance about whether the financial statements are free of material misstatement. An audit includes examining, on a test basis, evidence supporting the amounts and disclosures in the financial statements, assessing the accounting principles used and significant estimates made by management, and evaluating the overall financial statement presentation. We believe that our audits, which included confirmation of securities at December 31, 2011 by correspondence with the custodians and brokers, provide a reasonable basis for our opinion.
Boston, Massachusetts February 15, 2012 | PricewaterhouseCoopers LLP |
Information About Your Fund's Expenses
As an investor of the Fund, you incur two types of costs: ongoing expenses and transaction costs. Ongoing expenses include management fees, distribution and service (12b-1) fees and other Fund expenses. Examples of transaction costs include contract charges and account maintenance fees, which are not shown in this section. The following tables are intended to help you understand your ongoing expenses (in dollars) of investing in the Fund and to help you compare these expenses with the ongoing expenses of investing in other mutual funds. The example in the table is based on an investment of $1,000 invested at the beginning of the six-month period and held for the entire period (July 1, 2011 to December 31, 2011).
The tables illustrate your Fund's expenses in two ways:
·Actual Fund Return. This helps you estimate the actual dollar amount of ongoing expenses (but not transaction costs) paid on a $1,000 investment in the Fund using the Fund's actual return during the period. To estimate the expenses you paid over the period, simply divide your account value by $1,000 (for example, an $8,600 account value divided by $1,000 = 8.6), then multiply the result by the number in the "Expenses Paid per $1,000" line under the share class you hold.
· Hypothetical 5% Fund Return. This helps you to compare your Fund's ongoing expenses (but not transaction costs) with those of other mutual funds using the Fund's actual expense ratio and a hypothetical rate of return of 5% per year before expenses. Examples using a 5% hypothetical Fund return may be found in the shareholder reports of other mutual funds. The hypothetical account values and expenses may not be used to estimate the actual ending account balance or expenses you paid for the period.
Please note that the expenses shown in these tables are meant to highlight your ongoing expenses only and do not reflect any transaction costs. The "Expenses Paid per $1,000" line of the tables is useful in comparing ongoing expenses only and will not help you determine the relative total expense of owning different funds. If these transaction costs had been included, your costs would have been higher.
Expenses and Value of a $1,000 Investment for the six months ended December 31, 2011 | |
| Actual Fund Return | | Class A | | | Class B | |
| Beginning Account Value 7/1/11 | | $ | 1,000.00 | | | $ | 1,000.00 | |
| Ending Account Value 12/31/11 | | $ | 921.60 | | | $ | 920.40 | |
| Expenses Paid per $1,000* | | $ | 2.42 | | | $ | 4.02 | |
| Hypothetical 5% Fund Return | | Class A | | | Class B | |
| Beginning Account Value 7/1/11 | | $ | 1,000.00 | | | $ | 1,000.00 | |
| Ending Account Value 12/31/11 | | $ | 1,022.68 | | | $ | 1,021.02 | |
| Expenses Paid per $1,000* | | $ | 2.55 | | | $ | 4.23 | |
* Expenses are equal to the Fund's annualized expense ratio for each share class, multiplied by the average account value over the period, multiplied by the number of days in the most recent six-month period, then divided by 365.
| Annualized Expense Ratios | Class A | | Class B | |
| DWS Variable Series I — DWS Capital Growth VIP | .50% | | .83% | |
For more information, please refer to the Fund's prospectus.
These tables do not reflect charges and fees ("contract charges") associated with the separate account that invests in the Fund or any variable life insurance policy or variable annuity contract for which the Fund is an investment option.
Tax Information (Unaudited)
For corporate shareholders, 100% of the ordinary dividends (i.e., income dividends plus short-term capital gains) paid during the Fund's fiscal year ended December 31, 2011 qualified for the dividends received deduction.
Please consult a tax advisor if you have questions about federal or state income tax laws, or on how to prepare your tax returns. If you have specific questions about your account, please contact your insurance provider.
The Series' policies and procedures for voting proxies for portfolio securities and information about how the Series voted proxies related to its portfolio securities during the 12-month period ended June 30 are available on our Web site — www.dws-investments.com (click on "proxy voting"at the bottom of the page) — or on the SEC's Web site — www.sec.gov. To obtain a written copy of the Series' policies and procedures without charge, upon request, call us toll free at (800) 728-3337.
Investment Management Agreement Approval
The Board of Trustees approved the renewal of DWS Capital Growth VIP's investment management agreement (the "Agreement") with Deutsche Investment Management Americas Inc. ("DWS") in September 2011.
In terms of the process that the Board followed prior to approving the Agreement, shareholders should know that:
· In September 2011, all of the Fund's Trustees were independent of DWS and its affiliates.
· The Trustees met frequently during the past year to discuss fund matters and dedicated a substantial amount of time to contract review matters. Over the course of several months, the Board's Contract Committee, in coordination with the Board's Equity Oversight Committee, reviewed comprehensive materials received from DWS, independent third parties and independent counsel. These materials included an analysis of the Fund's performance, fees and expenses, and profitability compiled by the Fund's independent fee consultant. The Board also received extensive information throughout the year regarding performance of the Fund.
· The Independent Trustees regularly meet privately with their independent counsel to discuss contract review and other matters. In addition, the Independent Trustees were also advised by the Fund's independent fee consultant in the course of their review of the Fund's contractual arrangements and considered a comprehensive report prepared by the independent fee consultant in connection with their deliberations (the "IFC Report").
· In connection with reviewing the Agreement, the Board also reviewed the terms of the Fund's Rule 12b-1 plan, distribution agreement, administrative services agreement, transfer agency agreement and other material service agreements.
· Based on its evaluation of the information provided, the Contract Committee presented its findings and recommendations to the Board. The Board then reviewed the Contract Committee's findings and recommendations.
In connection with the contract review process, the Contract Committee and the Board considered the factors discussed below, among others. The Board also considered that DWS and its predecessors have managed the Fund since its inception, and the Board believes that a long-term relationship with a capable, conscientious advisor is in the best interests of the Fund. The Board considered, generally, that shareholders chose to invest or remain invested in the Fund knowing that DWS managed the Fund, and that the Agreement was approved by the Fund's shareholders. DWS is part of Deutsche Bank, a major global banking institution that is engaged in a wide range of financial services. The Board believes that there are significant advantages to being part of a global asset management business that offers a wide range of investing expertise and resources, including hundreds of portfolio managers and analysts with research capabilities in many countries throughout the world.
While shareholders may focus primarily on fund performance and fees, the Fund's Board considers these and many other factors, including the quality and integrity of DWS's personnel and such other issues as back-office operations, fund valuations, and compliance policies and procedures.
Nature, Quality and Extent of Services. The Board considered the terms of the Agreement, including the scope of advisory services provided under the Agreement. The Board noted that, under the Agreement, DWS provides portfolio management services to the Fund and that, pursuant to a separate administrative services agreement, DWS provides administrative services to the Fund. The Board considered the experience and skills of senior management and investment personnel, the resources made available to such personnel, the ability of DWS to attract and retain high-quality personnel, and the organizational depth and stability of DWS. The Board reviewed the Fund's performance over short-term and long-term periods and compared those returns to various agreed-upon performance measures, including market indices and a peer universe compiled by the independent fee consultant using information supplied by Lipper Inc. ("Lipper"). The Board also noted that it has put into place a process of identifying "Focus Funds" (e.g., funds performing poorly relative to their benchmark or a peer universe compiled by an independent fund data service), and receives more frequent reporting and information from DWS regarding such funds, along with DWS's remedial plans to address underperformance. The Board believes this process is an effective manner of identifying and addressing underperforming funds. Based on the information provided, the Board noted that for the one-, three- and five-year periods ended December 31, 2010, the Fund's performance (Class A shares) was in the 2nd quartile, 1st quartile and 1st quartile, respectively, of the applicable Lipper universe (the 1st quartile being the best performers and the 4th quartile being the worst performers). The Board also observed that the Fund has performed the same as its benchmark in the one-year period and has outperformed its benchmark in the three- and five-year periods ended December 31, 2010.
On the basis of this evaluation and the ongoing review of investment results by the Board, the Board concluded that the nature, quality and extent of services provided by DWS historically have been and continue to be satisfactory.
Fees and Expenses. The Board considered the Fund's investment management fee schedule, operating expenses and total expense ratios, and comparative information provided by Lipper and the independent fee consultant regarding investment management fee rates paid to other investment advisors by similar funds (1st quartile being the most favorable and 4th quartile being the least favorable). With respect to management fees paid to other investment advisors by similar funds, the Board noted that the contractual fee rates paid by the Fund, which include a 0.10% fee paid to DWS under the Fund's administrative services agreement, were lower than the median (1st quartile) of the applicable Lipper peer group (based on Lipper data provided as of December 31, 2010). The Board noted that the Fund's Class A shares total (net) operating expenses were expected to be lower than the median (1st quartile) of the applicable Lipper expense universe (based on Lipper data provided as of December 31, 2010) ("Lipper Universe Expenses"). The Board also reviewed data comparing each share class's total (net) operating expenses to the applicable Lipper Universe Expenses. The Board considered the Fund's management fee rate as compared to fees charged by DWS and certain of its affiliates for comparable mutual funds and considered differences in fund and fee structures between the DWS Funds. The Board also considered how the Fund's total (net) operating expenses compared to the total (net) operating expenses of a more customized peer group selected by Lipper (based on such factors as asset size).
The information considered by the Board as part of its review of management fees included information regarding fees charged by DWS and its affiliates to similar institutional accounts and to similar funds offered primarily to European investors ("DWS Europe funds"), in each case as applicable. The Board observed that advisory fee rates for institutional accounts generally were lower than the management fees charged by similarly managed DWS U.S. mutual funds ("DWS Funds"), but also took note of the differences in services provided to DWS Funds as compared to institutional accounts. In the case of DWS Europe funds, the Board observed that fee rates for DWS Europe funds generally were higher than for similarly managed DWS Funds, but noted that differences in the types of services provided to DWS Funds relative to DWS Europe funds made it difficult to compare such fees.
On the basis of the information provided, the Board concluded that management fees were reasonable and appropriate in light of the nature, quality and extent of services provided by DWS.
Profitability. The Board reviewed detailed information regarding revenues received by DWS under the Agreement. The Board considered the estimated costs and pre-tax profits realized by DWS from advising the DWS Funds, as well as estimates of the pre-tax profits attributable to managing the Fund in particular. The Board also received information regarding the estimated enterprise-wide profitability of DWS and its affiliates with respect to all fund services in totality and by fund. The Board and the independent fee consultant reviewed DWS's methodology in allocating its costs to the management of the Fund. Based on the information provided, the Board concluded that the pre-tax profits realized by DWS in connection with the management of the Fund were not unreasonable. The Board also reviewed information regarding the profitability of certain similar investment management firms. The Board noted that while information regarding the profitability of such firms is limited (and in some cases is not necessarily prepared on a comparable basis), DWS and its affiliates' overall profitability with respect to the DWS fund complex (after taking into account distribution and other services provided to the funds by DWS and its affiliates) was lower than the overall profitability levels of many comparable firms for which such data was available.
Economies of Scale. The Board considered whether there are economies of scale with respect to the management of the Fund and whether the Fund benefits from any economies of scale. The Board noted that the Fund's management fee schedule includes fee breakpoints. The Board concluded that the Fund's fee schedule represents an appropriate sharing between the Fund and DWS of such economies of scale as may exist in the management of the Fund at current asset levels.
Other Benefits to DWS and Its Affiliates. The Board also considered the character and amount of other incidental benefits received by DWS and its affiliates, including any fees received by DWS for administrative services provided to the Fund and any fees received by an affiliate of DWS for distribution services. The Board also considered benefits to DWS related to brokerage and soft-dollar allocations, including allocating brokerage to pay for research generated by parties other than the executing broker dealers, which pertain primarily to funds investing in equity securities, along with the incidental public relations benefits to DWS related to DWS Funds advertising and cross-selling opportunities among DWS products and services. The Board concluded that management fees were reasonable in light of these fallout benefits.
Compliance. The Board considered the significant attention and resources dedicated by DWS to documenting and enhancing its compliance processes in recent years. The Board noted in particular (i) the experience and seniority of both DWS's chief compliance officer and the Fund's chief compliance officer; (ii) the large number of DWS compliance personnel; and (iii) the substantial commitment of resources by DWS and its affiliates to compliance matters.
Based on all of the information considered and the conclusions reached, the Board unanimously determined that the continuation of the Agreement is in the best interests of the Fund. In making this determination, the Board did not give particular weight to any single factor identified above. The Board considered these factors over the course of numerous meetings, certain of which were in executive session with only the Independent Trustees and their counsel present. It is possible that individual Trustees may have weighed these factors differently in reaching their individual decisions to approve the continuation of the Agreement.
Summary of Management Fee Evaluation by Independent Fee Consultant
September 26, 2011
Pursuant to an Order entered into by Deutsche Investment Management Americas and affiliates (collectively, "DeAM") with the Attorney General of New York, I, Thomas H. Mack, have been appointed the Independent Fee Consultant for the DWS Funds (formerly the DWS Scudder Funds). My duties include preparing an annual written evaluation of the management fees DeAM charges the Funds, considering among other factors the management fees charged by other mutual fund companies for like services, management fees DeAM charges other clients for like services, DeAM's costs of supplying services under the management agreements and related profit margins, possible economies of scale if a Fund grows larger, and the nature and quality of DeAM's services, including fund performance. This report summarizes my evaluation for 2011, including my qualifications, the evaluation process for each of the DWS Funds, consideration of certain complex-level factors, and my conclusions. I served in substantially the same capacity in 2007, 2008, 2009 and 2010.
Qualifications
For more than 35 years I have served in various professional capacities within the investment management business. I have held investment analysis and advisory positions, including securities analyst, portfolio strategist and director of investment policy with a large investment firm. I have also performed business management functions, including business development, financial management and marketing research and analysis.
Since 1991, I have been an independent consultant within the asset management industry. I have provided services to over 125 client organizations, including investment managers, mutual fund boards, product distributors and related organizations. Over the past ten years I have completed a number of assignments for mutual fund boards, specifically including assisting boards with management contract renewal.
I hold a Master of Business Administration degree, with highest honors, from Harvard University and Master of Science and Bachelor of Science (highest honors) degrees from the University of California at Berkeley. I am an independent director and audit committee financial expert for two closed-end mutual funds and have served in various leadership and financial oversight capacities with non-profit organizations.
Evaluation of Fees for each DWS Fund
My work focused primarily on evaluating, fund-by-fund, the fees charged to each of the 109 mutual fund portfolios in the DWS Fund family. For each Fund, I considered each of the key factors mentioned above, as well as any other relevant information. In doing so I worked closely with the Funds' Independent Directors in their annual contract renewal process, as well as in their approval of contracts for several new funds (documented separately).
In evaluating each Fund's fees, I reviewed comprehensive materials provided by or on behalf of DeAM, including expense information prepared by Lipper Analytical, comparative performance information, profitability data, manager histories, and other materials. I also accessed certain additional information from the Lipper and Morningstar databases and drew on my industry knowledge and experience.
To facilitate evaluating this considerable body of information, I prepared for each Fund a document summarizing the key data elements in each area as well as additional analytics discussed below. This made it possible to consider each key data element in the context of the others.
In the course of contract renewal, DeAM agreed to implement a number of fee and expense adjustments requested by the Independent Directors which will favorably impact future fees and expenses, and my evaluation includes the effects of these changes.
Fees and Expenses Compared with Other Funds
The competitive fee and expense evaluation for each fund focused on two primary comparisons:
The Fund's contractual management fee (the advisory fee plus the administration fee where applicable) compared with those of a group of typically 12-15 funds in the same Lipper investment category (e.g. Large Capitalization Growth) having similar distribution arrangements and being of similar size.
The Fund's total expenses compared with a broader universe of funds from the same Lipper investment category and having similar distribution arrangements.
These two comparisons provide a view of not only the level of the fee compared with funds of similar scale but also the total expense the Fund bears for all the services it receives, in comparison with the investment choices available in the Fund's investment category and distribution channel. The principal figure-of-merit used in these comparisons was the subject Fund's percentile ranking against peers.
DeAM's Fees for Similar Services to Others
DeAM provided management fee schedules for all of its US domiciled fund and non-fund investment management accounts in any of the investment categories where there is a DWS Fund. These similar products included the other DWS Funds, non-fund pooled accounts, institutional accounts and sub-advisory accounts. Using this information, I calculated for each Fund the fee that would be charged to each similar product, at the subject Fund's asset level.
Evaluating information regarding non-fund products is difficult because there are varying levels of services required for different types of accounts, with mutual funds generally requiring considerably more regulatory and administrative types of service as well as having more frequent cash flows than other types of accounts. Also, while mutual fund fees for similar fund products can be expected to be similar, there will be some differences due to different pricing conditions in different distribution channels (e.g. retail funds versus those used in variable insurance products), differences in underlying investment processes and other factors.
Costs and Profit Margins
DeAM provided a detailed profitability analysis for each Fund. After making some adjustments so that the presentation would be more comparable to the available industry figures, I reviewed profit margins from investment management alone, from investment management plus other fund services (excluding distribution) provided to the Funds by DeAM (principally shareholder services), and DeAM profits from all sources, including distribution. A later section comments on overall profitability.
Economies of Scale
Economies of scale — an expected decline in management cost per dollar of fund assets as fund assets grow — are very rarely quantified and documented because of inherent difficulties in collecting and analyzing relevant data. However, in virtually every investment category that I reviewed, larger funds tend to have lower fees and lower total expenses than smaller funds. To see how each DWS Fund compares with this industry observation, I reviewed:
The trend in Fund assets over the last five years and the accompanying trend in total expenses. This shows if the Fund has grown and, if so, whether total expense (management fees as well as other expenses) have declined as a percent of assets.
Whether the Fund has break-points in its management fee schedule, the extent of the fee reduction built into the schedule and the asset levels where the breaks take effect, and in the case of a sub-advised Fund how the Fund's break-points compare with those of the sub-advisory fee schedule.
How the Fund's contractual fee schedule compares with trends in the industry data. To accomplish this, I constructed a chart showing how actual latest-fiscal-year contractual fees of the Fund and of other similar funds relate to average fund assets, with the subject Fund's contractual fee schedule superimposed.
Quality of Service — Performance
The quality-of-service evaluation focused on investment performance, which is the principal result of the investment management service. Each Fund's performance was reviewed over the past 1, 3, 5 and 10 years, as applicable, and compared with that of other funds in the same investment category and with a suitable market index.
In addition, I calculated and reviewed risk-adjusted returns relative to an index of similar mutual funds' returns and a suitable market index. The risk-adjusted returns analysis provides a way of determining the extent to which the Fund's return comparisons are mainly the product of investment value-added (or lack thereof) or alternatively taking considerably more or less risk than is typical in its investment category.
I also received and considered the history of portfolio manager changes for each Fund, as this provided an important context for evaluating the performance results.
Complex-Level Considerations
While this evaluation was conducted mainly at the individual fund level, there are some issues relating to the reasonableness of fees that can alternatively be considered across the whole fund complex:
I reviewed DeAM's profitability analysis for all DWS Funds, with a view toward determining if the allocation procedures used were reasonable and how profit levels compared with public data for other investment managers.
I considered whether DeAM and affiliates receive any significant ancillary or "fall-out" benefits that should be considered in interpreting the direct profitability results. These would be situations where serving as the investment manager of the Funds is beneficial to another part of the Deutsche Bank organization.
I considered how aggregated DWS Fund expenses had varied over the years, by asset class and in the context of trends in asset levels.
I reviewed the structure of the DeAM organization, trends in staffing levels, and information on compensation of investment management and other professionals compared with industry data.
Findings
Based on the process and analysis discussed above, which included reviewing a wide range of information from management and external data sources and considering among other factors the fees DeAM charges other clients, the fees charged by other fund managers, DeAM's costs and profits associated with managing the Funds, economies of scale, possible fall-out benefits, and the nature and quality of services provided, in my opinion the management fees charged the DWS Funds are reasonable.
Thomas H. Mack
President, Thomas H. Mack & Co., Inc.
Board Members and Officers
The following table presents certain information regarding the Board Members and Officers of the fund as of December 31, 2011. Each Board Member's year of birth is set forth in parentheses after his or her name. Unless otherwise noted, (i) each Board Member has engaged in the principal occupation(s) noted in the table for at least the most recent five years, although not necessarily in the same capacity; and (ii) the address of each Independent Board Member is c/o Paul K. Freeman, Independent Chairman, DWS Funds, PO Box 101833, Denver, CO 80250-1833. Except as otherwise noted below, the term of office for each Board Member is until the election and qualification of a successor, or until such Board Member sooner dies, resigns, is removed or as otherwise provided in the governing documents of the fund. Because the fund does not hold an annual meeting of shareholders, each Board Member will hold office for an indeterminate period. The Board Members may also serve in similar capacities with other funds in the fund complex. The Length of Time Served represents the year in which the Board Member joined the Board of one or more DWS funds now overseen by the Board.
| Independent Board Members |
Name, Year of Birth, Position with the Fund and Length of Time Served1 | Business Experience and Directorships During the Past Five Years | Number of Funds in DWS Fund Complex Overseen |
Other Directorships Held by Board Member |
Paul K. Freeman (1950) Chairperson since 2009 Board Member since 1993 | Consultant, World Bank/Inter-American Development Bank; Executive and Governing Council of the Independent Directors Council (Chairman of Education Committee); formerly: Project Leader, International Institute for Applied Systems Analysis (1998-2001); Chief Executive Officer, The Eric Group, Inc. (environmental insurance) (1986-1998) | 110 | — |
John W. Ballantine (1946) Board Member since 1999 | Retired; formerly, Executive Vice President and Chief Risk Management Officer, First Chicago NBD Corporation/The First National Bank of Chicago (1996-1998); Executive Vice President and Head of International Banking (1995-1996). Directorships: Chairman of the Board, Healthways, Inc. (provider of disease and care management services); Portland General Electric (utility company); Stockwell Capital Investments PLC (private equity); former Directorships: First Oak Brook Bancshares, Inc. and Oak Brook Bank; Prisma Energy International | 110 | — |
Henry P. Becton, Jr. (1943) Board Member since 1990 | Vice Chair and former President, WGBH Educational Foundation. Directorships: Association of Public Television Stations; Public Radio International; Public Radio Exchange (PRX); The PBS Foundation; former Directorships: Boston Museum of Science; American Public Television; Concord Academy; New England Aquarium; Mass. Corporation for Educational Telecommunications; Committee for Economic Development; Public Broadcasting Service | 110 | Lead Director, Becton Dickinson and Company2 (medical technology company); Lead Director, Belo Corporation2 (media company) |
Dawn-Marie Driscoll (1946) Board Member since 1987 | President, Driscoll Associates (consulting firm); Executive Fellow, Center for Business Ethics, Bentley University; formerly, Partner, Palmer & Dodge (1988-1990); Vice President of Corporate Affairs and General Counsel, Filene's (1978-1988). Directorships: Director of ICI Mutual Insurance Company (since 2007); Advisory Board, Center for Business Ethics, Bentley University; Trustee, Southwest Florida Community Foundation (charitable organization); former Directorships: Investment Company Institute (audit, executive, nominating committees) and Independent Directors Council (governance, executive committees) | 110 | Trustee, Sun Capital Advisers, Inc. (22 open-end mutual funds advised by Sun Capital Advisers, Inc.) (since 2007) |
Keith R. Fox, CFA (1954) Board Member since 1996 | Managing General Partner, Exeter Capital Partners (a series of private investment funds) (since 1986). Directorships: Progressive International Corporation (kitchen goods importer and distributor); BoxTop Media Inc. (advertising); The Kennel Shop (retailer); former Chairman, National Association of Small Business Investment Companies | 110 | Trustee, Sun Capital Advisers, Inc. (22 open-end mutual funds advised by Sun Capital Advisers, Inc.) (since 2011) |
Kenneth C. Froewiss (1945) Board Member since 2001 | Adjunct Professor of Finance, NYU Stern School of Business (September 2009-present; Clinical Professor from 1997-September 2009); Member, Finance Committee, Association for Asian Studies (2002-present); Director, Mitsui Sumitomo Insurance Group (US) (2004-present); prior thereto, Managing Director, J.P. Morgan (investment banking firm) (until 1996) | 110 | — |
Richard J. Herring (1946) Board Member since 1990 | Jacob Safra Professor of International Banking and Professor, Finance Department, The Wharton School, University of Pennsylvania (since July 1972); Co-Director, Wharton Financial Institutions Center (since July 2000); Co-Chair, U.S. Shadow Financial Regulatory Committee; Executive Director, Financial Economists Roundtable; formerly: Vice Dean and Director, Wharton Undergraduate Division (July 1995-June 2000); Director, Lauder Institute of International Management Studies (July 2000-June 2006) | 110 | Director, Japan Equity Fund, Inc. (since September 2007), Thai Capital Fund, Inc. (since September 2007), Singapore Fund, Inc. (since September 2007), Independent Director of Barclays Bank Delaware (since September 2010) |
William McClayton (1944) Board Member since 2004 | Private equity investor (since October 2009); previously, Managing Director, Diamond Management & Technology Consultants, Inc. (global consulting firm) (2001-2009); Directorship: Board of Managers, YMCA of Metropolitan Chicago; formerly: Senior Partner, Arthur Andersen LLP (accounting) (1966-2001); Trustee, Ravinia Festival | 110 | — |
Rebecca W. Rimel (1951) Board Member since 1995 | President and Chief Executive Officer, The Pew Charitable Trusts (charitable organization) (1994 to present); Trustee, Washington College (2011 to present); formerly: Executive Vice President, The Glenmede Trust Company (investment trust and wealth management) (1983-2004); Board Member, Investor Education (charitable organization) (2004-2005); Trustee, Executive Committee, Philadelphia Chamber of Commerce (2001-2007); Trustee, Pro Publica (charitable organization) (2007-2010); Trustee, Thomas Jefferson Foundation (charitable organization) (1994 to 2011) | 110 | Director, CardioNet, Inc.2 (health care) (2009- present); Director, Viasys Health Care2 (January 2007- June 2007) |
William N. Searcy, Jr. (1946) Board Member since 1993 | Private investor since October 2003; formerly: Pension & Savings Trust Officer, Sprint Corporation2 (telecommunications) (November 1989-September 2003) | 110 | Trustee, Sun Capital Advisers, Inc. (22 open-end mutual funds advised by Sun Capital Advisers, Inc.) (since 1998) |
Jean Gleason Stromberg (1943) Board Member since 1997 | Retired. Formerly, Consultant (1997-2001); Director, Financial Markets US Government Accountability Office (1996-1997); Partner, Fulbright & Jaworski, L.L.P. (law firm) (1978-1996). Directorships: The William and Flora Hewlett Foundation; former Directorships: Service Source, Inc., Mutual Fund Directors Forum (2002-2004), American Bar Retirement Association (funding vehicle for retirement plans) (1987-1990 and 1994-1996) | 110 | — |
Robert H. Wadsworth (1940) Board Member since 1999 | President, Robert H. Wadsworth & Associates, Inc. (consulting firm) (1983 to present); Director, The Phoenix Boys Choir Association | 113 | — |
Officers4 |
Name, Year of Birth, Position with the Fund and Length of Time Served5 | Principal Occupation(s) During Past 5 Years and Other Directorships Held |
W. Douglas Beck, CFA6 (1967) President, 2011-present | Managing Director3, Deutsche Asset Management (2006-present); President of DWS family of funds and Head of Product Management, U.S. for DWS Investments; formerly, Executive Director, Head of Product Management (2002-2006) and President (2005-2006) of the UBS Funds at UBS Global Asset Management; Co-Head of Manager Research/Managed Solutions Group, Merrill Lynch (1998-2002) |
John Millette7 (1962) Vice President and Secretary, 1999-present | Director3, Deutsche Asset Management |
Paul H. Schubert6 (1963) Chief Financial Officer, 2004-present Treasurer, 2005-present | Managing Director3, Deutsche Asset Management (since July 2004); formerly, Executive Director, Head of Mutual Fund Services and Treasurer for UBS Family of Funds (1998-2004); Vice President and Director of Mutual Fund Finance at UBS Global Asset Management (1994-1998) |
Caroline Pearson7 (1962) Chief Legal Officer, 2010-present | Managing Director3, Deutsche Asset Management; formerly, Assistant Secretary for DWS family of funds (1997-2010) |
Rita Rubin6 (1970) Assistant Secretary, 2009-present | Director3 and Senior Counsel, Deutsche Asset Management (since October 2007); formerly, Vice President, Morgan Stanley Investment Management (2004-2007) |
Paul Antosca7 (1957) Assistant Treasurer, 2007-present | Director3, Deutsche Asset Management (since 2006); Vice President, The Manufacturers Life Insurance Company (U.S.A.) (1990-2006) |
Jack Clark7 (1967) Assistant Treasurer, 2007-present | Director3, Deutsche Asset Management (since 2007); formerly, Vice President, State Street Corporation (2002-2007) |
Diane Kenneally7 (1966) Assistant Treasurer, 2007-present | Director3, Deutsche Asset Management |
John Caruso6 (1965) Anti-Money Laundering Compliance Officer, 2010-present | Managing Director3, Deutsche Asset Management |
Robert Kloby6 (1962) Chief Compliance Officer, 2006-present | Managing Director3, Deutsche Asset Management |
1 The length of time served represents the year in which the Board Member joined the board of one or more DWS funds currently overseen by the Board.
2 A publicly held company with securities registered pursuant to Section 12 of the Securities Exchange Act of 1934.
3 Executive title, not a board directorship.
4 As a result of their respective positions held with the Advisor, these individuals are considered "interested persons" of the Advisor within the meaning of the 1940 Act. Interested persons receive no compensation from the fund.
5 The length of time served represents the year in which the officer was first elected in such capacity for one or more DWS funds.
6 Address: 60 Wall Street, New York, NY 10005.
7 Address: One Beacon Street, Boston, MA 02108.
The fund's Statement of Additional Information ("SAI") includes additional information about the Board Members. The SAI is available, without charge, upon request. If you would like to request a copy of the SAI, you may do so by calling the following toll-free number: (800) 728-3337.
Notes
DWS Investments Distributors, Inc.
222 South Riverside Plaza
Chicago, IL 60606
(800) 621-1148
VS1capgro-2 (R-025820-1 2/12)
DECEMBER 31, 2011
ANNUAL REPORT
DWS VARIABLE SERIES I
DWS Growth & Income VIP
Contents
14 Statement of Assets and Liabilities 15 Statement of Operations 16 Statement of Changes in Net Assets 18 Notes to Financial Statements 23 Report of Independent Registered Public Accounting Firm 24 Information About Your Fund's Expenses 27 Investment Management Agreement Approval 30 Summary of Management Fee Evaluation by Independent Fee Consultant 32 Board Members and Officers |
This report must be preceded or accompanied by a prospectus. To obtain an additional prospectus or summary prospectus, if available, call (800) 728-3337 or your financial representative. We advise you to consider the Fund's objectives, risks, charges and expenses carefully before investing. The summary prospectus and prospectus contain this and other important information about the Fund. Please read the prospectus carefully before you invest.
Investing in derivatives entails special risks relating to liquidity, leverage and credit that may reduce returns and/or increase volatility. Fund management could be wrong in its analysis of industries, companies, economic trends and favor a security that underperforms the market. Stocks may decline in value. The fund may lend securities to approved institutions. See the prospectus for details.
DWS Investments is part of Deutsche Bank's Asset Management division and, within the U.S., represents the retail asset management activities of Deutsche Bank AG, Deutsche Bank Trust Company Americas, Deutsche Investment Management Americas Inc. and DWS Trust Company.
NOT FDIC/NCUA INSURED NO BANK GUARANTEE MAY LOSE VALUE NOT A DEPOSIT
NOT INSURED BY ANY FEDERAL GOVERNMENT AGENCY
Performance Summary December 31, 2011
Fund performance shown is historical, assumes reinvestment of all dividend and capital gain distributions, and does not guarantee future results. Investment return and principal value fluctuate with changing market conditions so that, when redeemed, shares may be worth more or less than their original cost. Current performance may be lower or higher than the performance data quoted. Please contact your participating insurance company for the Fund's most recent month-end performance. Performance doesn't reflect charges and fees ("contract charges") associated with the separate account that invests in the Fund or any variable life insurance policy or variable annuity contract for which the Fund is an investment option. These charges and fees will reduce returns. While all share classes have the same underlying portfolio, their performance will differ.
The gross expense ratios of the Fund, as stated in the fee table of the prospectus dated May 1, 2011 are 0.63% and 0.88% for Class A and Class B shares, respectively, and may differ from the expense ratios disclosed in the Financial Highlights tables in this report.
| Growth of an Assumed $10,000 Investment |
[] DWS Growth & Income VIP — Class A [] Russell 1000® Index | The Russell 1000® Index is an unmanaged index that measures the performance of the 1,000 largest companies in the Russell 3000 Index, which represents approximately 92% of the total market capitalization of the Russell 3000 Index. Index returns do not reflect any fees or expenses and it is not possible to invest directly into an index. |
| |
| Yearly periods ended December 31 | |
| Comparative Results | |
| DWS Growth & Income VIP | | 1-Year | | | 3-Year | | | 5-Year | | | 10-Year | |
| Class A | Growth of $10,000 | | $ | 9,986 | | | $ | 15,324 | | | $ | 9,581 | | | $ | 12,394 | |
| Average annual total return | | | -0.14 | % | | | 15.29 | % | | | -0.85 | % | | | 2.17 | % |
| Russell 1000 Index | Growth of $10,000 | | $ | 10,150 | | | $ | 15,134 | | | $ | 9,990 | | | $ | 13,896 | |
| Average annual total return | | | 1.50 | % | | | 14.81 | % | | | -0.02 | % | | | 3.34 | % |
| DWS Growth & Income VIP | | 1-Year | | | 3-Year | | | 5-Year | | | 10-Year | |
| Class B | Growth of $10,000 | | $ | 9,960 | | | $ | 15,190 | | | $ | 9,468 | | | $ | 12,066 | |
| Average annual total return | | | -0.40 | % | | | 14.95 | % | | | -1.09 | % | | | 1.90 | % |
| Russell 1000 Index | Growth of $10,000 | | $ | 10,150 | | | $ | 15,134 | | | $ | 9,990 | | | $ | 13,896 | |
| Average annual total return | | | 1.50 | % | | | 14.81 | % | | | -0.02 | % | | | 3.34 | % |
The growth of $10,000 is cumulative.
Management Summary December 31, 2011
Despite heightened volatility in the second half of the year, U.S. equities — as gauged by the Fund's benchmark, the Russell 1000® Index — produced a narrow gain of 1.50% in 2011.1 The Fund returned -0.14% (Class A shares, unadjusted for contract charges), but it modestly underperformed the benchmark.
The Fund's stock selection process worked best in the health care sector, where we held a number of companies whose steady fundamentals enabled them to outperform in an unstable environment. Our top performers in health care were the pharmaceutical giant Bristol-Myers Squibb Co., the benefits providers UnitedHealth Group, Inc. and Humana, Inc., and the biotechnology company Biogen Idec, Inc. Our stock selection also added value in the financial sector, where the largest contributions to performance came from our underweights in major banking and brokerage stocks that lagged the broader sector by a substantial margin.2 The consumer staples and consumer discretionary sectors were also areas of strength for the Fund.3,4
Unfortunately, these positives were outweighed by our underperformance in other segments of the market. The largest shortfall occurred in information technology, where our positions in Computer Sciences Corp. and Vishay Intertechnology, Inc. lagged significantly. The materials and industrials sectors also proved to be challenging areas for the Fund.
As we move into 2012, we believe that uncertainty continues to hang over the U.S. equity market. Questions about the direction of economic growth, the ultimate resolution of the European debt crisis and the ability of China's government to engineer a "soft landing" in the country's economy are all issues that will likely have an impact on market performance. At the same time, we believe that the combination of improving earnings growth and reasonable valuations for the overall market provides a favorable backdrop for bottom-up stock selection.
Robert Wang
Russell Shtern, CFA
Portfolio Managers, QS Investors, LLC, Subadvisor to the Fund
1 The Russell 1000 Index is an unmanaged index that measures the performance of the 1,000 largest companies in the Russell 3000® Index, which measures the performance of the 3,000 largest U.S. companies based on total market capitalization. The Russell 1000 Index represents approximately 92% of the total market capitalization of the Russell 3000 Index.
Index returns do not reflect fees or expenses and it is not possible to invest directly into an index.
2 "Overweight" means the Fund holds a higher weighting in a given sector or security than the benchmark. "Underweight" means the Fund holds a lower weighting.
3 Consumer staples are the industries that manufacture and sell products such as food and beverages, prescription drugs, and household products.
4 The consumer discretionary sector represents industries that produce goods and services that are not necessities in everyday life.
The views expressed reflect those of the portfolio management team only through the end of the period of the report as stated on the cover. The management team's views are subject to change at any time based on market and other conditions and should not be construed as a recommendation. Past performance is no guarantee of future results. Current and future portfolio holdings are subject to risk.
Asset Allocation (As a % of Investment Portfolio excluding Securities Lending Collateral) | 12/31/11 | 12/31/10 |
| | | |
| Common Stocks | 99% | 99% |
| Cash Equivalents | 1% | 1% |
| | 100% | 100% |
Sector Diversification (As a % of Common Stocks) | 12/31/11 | 12/31/10 |
| | | |
| Information Technology | 20% | 19% |
| Financials | 17% | 17% |
| Health Care | 14% | 14% |
| Energy | 13% | 11% |
| Consumer Discretionary | 10% | 11% |
| Industrials | 9% | 12% |
| Consumer Staples | 9% | 7% |
| Materials | 6% | 5% |
| Utilities | 1% | 2% |
| Telecommunication Services | 1% | 2% |
| | 100% | 100% |
Asset allocation and sector diversification are subject to change.
For more complete details about the Fund's investment portfolio, see page 7.
Following the Fund's fiscal first and third quarter-end, a complete portfolio holdings listing is filed with the SEC on Form N-Q. The form will be available on the SEC's Web site at www.sec.gov, and it also may be reviewed and copied at the SEC's Public Reference Room in Washington, D.C. Information on the operation of the SEC's Public Reference Room may be obtained by calling (800) SEC-0330. The Fund's portfolio holdings are also posted on www.dws-investments.com from time to time. Please see the Fund's current prospectus for more information.
Investment Portfolio December 31, 2011 | | | Shares | | | Value ($) | |
| | | | |
| Common Stocks 98.8% | |
| Consumer Discretionary 10.0% | |
| Auto Components 0.3% | |
| Goodyear Tire & Rubber Co.* | | | 14,300 | | | | 202,631 | |
| Lear Corp. | | | 2,100 | | | | 83,580 | |
| | | | | | | | 286,211 | |
| Automobiles 0.6% | |
| General Motors Co.* | | | 26,200 | | | | 531,074 | |
| Hotels Restaurants & Leisure 1.0% | |
| Carnival Corp. | | | 5,100 | | | | 166,464 | |
| Starbucks Corp. | | | 11,300 | | | | 519,913 | |
| Wyndham Worldwide Corp. | | | 6,000 | | | | 226,980 | |
| | | | | | | | 913,357 | |
| Household Durables 0.4% | |
| Garmin Ltd. | | | 3,100 | | | | 123,411 | |
| Whirlpool Corp. | | | 4,400 | | | | 208,780 | |
| | | | | | | | 332,191 | |
| Leisure Equipment & Products 0.1% | |
| Polaris Industries, Inc. (a) | | | 1,300 | | | | 72,774 | |
| Media 2.9% | |
| CBS Corp. "B" | | | 37,400 | | | | 1,015,036 | |
| Discovery Communications, Inc. "A"* | | | 1,900 | | | | 77,843 | |
| Interpublic Group of Companies, Inc. | | | 15,100 | | | | 146,923 | |
| McGraw-Hill Companies, Inc. | | | 3,100 | | | | 139,407 | |
| News Corp. "A" | | | 21,000 | | | | 374,640 | |
| Time Warner, Inc. | | | 13,500 | | | | 487,890 | |
| Viacom, Inc. "B" | | | 5,500 | | | | 249,755 | |
| | | | | | | | 2,491,494 | |
| Multiline Retail 1.7% | |
| Dillard's, Inc. "A" (a) | | | 11,907 | | | | 534,386 | |
| Macy's, Inc. | | | 28,000 | | | | 901,040 | |
| Sears Holdings Corp.* (a) | | | 2,400 | | | | 76,272 | |
| | | | | | | | 1,511,698 | |
| Specialty Retail 1.8% | |
| Aaron's, Inc. | | | 3,400 | | | | 90,712 | |
| Best Buy Co., Inc. | | | 29,900 | | | | 698,763 | |
| Foot Locker, Inc. | | | 3,600 | | | | 85,824 | |
| Limited Brands, Inc. | | | 11,700 | | | | 472,095 | |
| Orchard Supply Hardware Stores Corp. "A"* | | | 45 | | | | 187 | |
| The Gap, Inc. | | | 12,200 | | | | 226,310 | |
| | | | | | | | 1,573,891 | |
| Textiles, Apparel & Luxury Goods 1.2% | |
| VF Corp. | | | 8,000 | | | | 1,015,920 | |
| Consumer Staples 8.6% | |
| Food & Staples Retailing 1.8% | |
| Costco Wholesale Corp. | | | 4,100 | | | | 341,612 | |
| CVS Caremark Corp. | | | 26,200 | | | | 1,068,436 | |
| Whole Foods Market, Inc. | | | 2,200 | | | | 153,076 | |
| | | | | | | | 1,563,124 | |
| Food Products 3.4% | |
| Archer-Daniels-Midland Co. | | | 6,000 | | | | 171,600 | |
| Bunge Ltd. | | | 2,300 | | | | 131,560 | |
| Fresh Del Monte Produce, Inc. | | | 3,100 | | | | 77,531 | |
| Kraft Foods, Inc. "A" | | | 38,400 | | | | 1,434,624 | |
| | | Shares | | | Value ($) | |
| | | | | | | | | |
| Smithfield Foods, Inc.* | | | 4,800 | | | | 116,544 | |
| Tyson Foods, Inc. "A" | | | 48,800 | | | | 1,007,232 | |
| | | | | | | | 2,939,091 | |
| Household Products 0.5% | |
| Kimberly-Clark Corp. | | | 2,900 | | | | 213,324 | |
| Procter & Gamble Co. | | | 3,900 | | | | 260,169 | |
| | | | | | | | 473,493 | |
| Personal Products 0.7% | |
| Avon Products, Inc. | | | 6,200 | | | | 108,314 | |
| Herbalife Ltd. | | | 7,300 | | | | 377,191 | |
| Nu Skin Enterprises, Inc. "A" | | | 2,200 | | | | 106,854 | |
| | | | | | | | 592,359 | |
| Tobacco 2.2% | |
| Philip Morris International, Inc. | | | 24,100 | | | | 1,891,368 | |
| Energy 13.6% | |
| Energy Equipment & Services 2.1% | |
| Nabors Industries Ltd.* | | | 8,700 | | | | 150,858 | |
| National Oilwell Varco, Inc. (a) | | | 18,900 | | | | 1,285,011 | |
| Transocean Ltd. | | | 9,300 | | | | 357,027 | |
| | | | | | | | 1,792,896 | |
| Oil, Gas & Consumable Fuels 11.5% | |
| Alpha Natural Resources, Inc.* | | | 23,400 | | | | 478,062 | |
| Apache Corp. | | | 4,300 | | | | 389,494 | |
| Canadian Natural Resources Ltd. | | | 8,700 | | | | 325,119 | |
| Chevron Corp. (a) | | | 13,300 | | | | 1,415,120 | |
| ConocoPhillips (a) | | | 23,900 | | | | 1,741,593 | |
| CVR Energy, Inc.* | | | 9,100 | | | | 170,443 | |
| Denbury Resources, Inc.* | | | 22,700 | | | | 342,770 | |
| Hess Corp. | | | 7,500 | | | | 426,000 | |
| HollyFrontier Corp. | | | 5,000 | | | | 117,000 | |
| Marathon Oil Corp. | | | 33,600 | | | | 983,472 | |
| Marathon Petroleum Corp. | | | 4,300 | | | | 143,147 | |
| Murphy Oil Corp. | | | 3,800 | | | | 211,812 | |
| Occidental Petroleum Corp. | | | 1,200 | | | | 112,440 | |
| Petroleo Brasileiro SA (ADR) | | | 17,500 | | | | 434,875 | |
| Talisman Energy, Inc. | | | 10,100 | | | | 128,775 | |
| Tesoro Corp.* (a) | | | 42,900 | | | | 1,002,144 | |
| Valero Energy Corp. | | | 65,100 | | | | 1,370,355 | |
| W&T Offshore, Inc. (a) | | | 5,300 | | | | 112,413 | |
| Western Refining, Inc.* | | | 9,100 | | | | 120,939 | |
| | | | | | | | 10,025,973 | |
| Financials 16.5% | |
| Capital Markets 1.8% | |
| American Capital Ltd.* | | | 9,900 | | | | 66,627 | |
| Bank of New York Mellon Corp. | | | 8,400 | | | | 167,244 | |
| E*TRADE Financial Corp.* | | | 18,900 | | | | 150,444 | |
| Morgan Stanley | | | 18,300 | | | | 276,879 | |
| Northern Trust Corp. | | | 2,600 | | | | 103,116 | |
| State Street Corp. | | | 19,600 | | | | 790,076 | |
| | | | | | | | 1,554,386 | |
| Commercial Banks 3.2% | |
| Banco Santander Brasil SA (ADR) | | | 12,400 | | | | 100,936 | |
| Bank of Montreal | | | 2,000 | | | | 109,620 | |
| BB&T Corp. (a) | | | 6,600 | | | | 166,122 | |
| Comerica, Inc. | | | 8,800 | | | | 227,040 | |
| KeyCorp | | | 109,200 | | | | 839,748 | |
| Regions Financial Corp. | | | 65,400 | | | | 281,220 | |
| | | Shares | | | Value ($) | |
| | | | | | | | | |
| SunTrust Banks, Inc. | | | 12,300 | | | | 217,710 | |
| Zions Bancorp. (a) | | | 51,300 | | | | 835,164 | |
| | | | | | | | 2,777,560 | |
| Consumer Finance 2.7% | |
| American Express Co. | | | 4,400 | | | | 207,548 | |
| Capital One Financial Corp. | | | 29,600 | | | | 1,251,784 | |
| Discover Financial Services | | | 39,300 | | | | 943,200 | |
| | | | | | | | 2,402,532 | |
| Diversified Financial Services 2.7% | |
| Bank of America Corp. | | | 73,800 | | | | 410,328 | |
| Citigroup, Inc. | | | 16,800 | | | | 442,008 | |
| CME Group, Inc. "A" | | | 800 | | | | 194,936 | |
| IntercontinentalExchange, Inc.* | | | 3,800 | | | | 458,090 | |
| JPMorgan Chase & Co. | | | 10,800 | | | | 359,100 | |
| The NASDAQ OMX Group, Inc.* | | | 19,600 | | | | 480,396 | |
| | | | | | | | 2,344,858 | |
| Insurance 5.7% | |
| ACE Ltd. | | | 15,500 | | | | 1,086,860 | |
| Aflac, Inc. | | | 28,200 | | | | 1,219,932 | |
| Allied World Assurance Co. Holdings AG | | | 3,200 | | | | 201,376 | |
| Allstate Corp. | | | 5,800 | | | | 158,978 | |
| American International Group, Inc.* (a) | | | 8,400 | | | | 194,880 | |
| Arch Capital Group Ltd.* | | | 3,100 | | | | 115,413 | |
| Chubb Corp. (a) | | | 9,000 | | | | 622,980 | |
| Genworth Financial, Inc. "A"* | | | 11,300 | | | | 74,015 | |
| Hartford Financial Services Group, Inc. | | | 8,800 | | | | 143,000 | |
| Lincoln National Corp. | | | 7,900 | | | | 153,418 | |
| MetLife, Inc. | | | 12,900 | | | | 402,222 | |
| PartnerRe Ltd. | | | 2,200 | | | | 141,262 | |
| The Travelers Companies, Inc. | | | 5,000 | | | | 295,850 | |
| Torchmark Corp. | | | 1,800 | | | | 78,102 | |
| Validus Holdings Ltd. | | | 2,300 | | | | 72,450 | |
| | | | | | | | 4,960,738 | |
| Real Estate Investment Trusts 0.4% | |
| Rayonier, Inc. (REIT) | | | 3,250 | | | | 145,048 | |
| Simon Property Group, Inc. (REIT) | | | 800 | | | | 103,152 | |
| Weyerhaeuser Co. | | | 5,700 | | | | 106,419 | |
| | | | | | | | 354,619 | |
| Health Care 14.1% | |
| Biotechnology 0.7% | |
| Biogen Idec, Inc.* | | | 5,800 | | | | 638,290 | |
| Health Care Providers & Services 5.7% | |
| Aetna, Inc. | | | 29,000 | | | | 1,223,510 | |
| Cardinal Health, Inc. | | | 1,800 | | | | 73,098 | |
| Humana, Inc. | | | 14,700 | | | | 1,287,867 | |
| UnitedHealth Group, Inc. | | | 28,200 | | | | 1,429,176 | |
| WellPoint, Inc. | | | 14,300 | | | | 947,375 | |
| | | | | | | | 4,961,026 | |
| Pharmaceuticals 7.7% | |
| Abbott Laboratories | | | 6,500 | | | | 365,495 | |
| Bristol-Myers Squibb Co. | | | 33,800 | | | | 1,191,112 | |
| Eli Lilly & Co. | | | 33,700 | | | | 1,400,572 | |
| Forest Laboratories, Inc.* | | | 15,600 | | | | 472,056 | |
| Merck & Co., Inc. | | | 20,300 | | | | 765,310 | |
| Par Pharmaceutical Companies, Inc.* | | | 4,000 | | | | 130,920 | |
| Pfizer, Inc. | | | 93,100 | | | | 2,014,684 | |
| | | Shares | | | Value ($) | |
| | | | | | | | | |
| Teva Pharmaceutical Industries Ltd. (ADR) | | | 3,500 | | | | 141,260 | |
| Watson Pharmaceuticals, Inc.* | | | 3,300 | | | | 199,122 | |
| | | | | | | | 6,680,531 | |
| Industrials 8.7% | |
| Aerospace & Defense 3.4% | |
| General Dynamics Corp. | | | 14,800 | | | | 982,868 | |
| Honeywell International, Inc. | | | 6,400 | | | | 347,840 | |
| Northrop Grumman Corp. | | | 21,500 | | | | 1,257,320 | |
| Raytheon Co. | | | 7,200 | | | | 348,336 | |
| | | | | | | | 2,936,364 | |
| Airlines 0.7% | |
| Alaska Air Group, Inc.* | | | 3,600 | | | | 270,324 | |
| Southwest Airlines Co. | | | 17,200 | | | | 147,232 | |
| United Continental Holdings, Inc.* (a) | | | 12,600 | | | | 237,762 | |
| | | | | | | | 655,318 | |
| Construction & Engineering 0.9% | |
| Chicago Bridge & Iron Co. NV | | | 5,400 | | | | 204,120 | |
| EMCOR Group, Inc. | | | 4,900 | | | | 131,369 | |
| Fluor Corp. | | | 6,800 | | | | 341,700 | |
| KBR, Inc. | | | 4,600 | | | | 128,202 | |
| | | | | | | | 805,391 | |
| Industrial Conglomerates 1.1% | |
| Tyco International Ltd. | | | 20,000 | | | | 934,200 | |
| Machinery 1.1% | |
| AGCO Corp.* | | | 8,500 | | | | 365,245 | |
| Parker Hannifin Corp. | | | 4,900 | | | | 373,625 | |
| SPX Corp. | | | 1,600 | | | | 96,432 | |
| Timken Co. | | | 2,300 | | | | 89,033 | |
| | | | | | | | 924,335 | |
| Professional Services 0.2% | |
| Manpower, Inc. | | | 2,700 | | | | 96,525 | |
| Robert Half International, Inc. | | | 4,000 | | | | 113,840 | |
| | | | | | | | 210,365 | |
| Road & Rail 0.7% | |
| Ryder System, Inc. | | | 10,700 | | | | 568,598 | |
| Trading Companies & Distributors 0.6% | |
| W.W. Grainger, Inc. | | | 3,000 | | | | 561,570 | |
| Information Technology 19.7% | |
| Communications Equipment 2.3% | |
| Cisco Systems, Inc. | | | 47,900 | | | | 866,032 | |
| Motorola Solutions, Inc. | | | 6,000 | | | | 277,740 | |
| Nokia 0yj (ADR) (a) | | | 184,300 | | | | 888,326 | |
| | | | | | | | 2,032,098 | |
| Computers & Peripherals 4.1% | |
| Apple, Inc.* | | | 1,500 | | | | 607,500 | |
| Dell, Inc.* | | | 107,100 | | | | 1,566,873 | |
| Lexmark International, Inc. "A" | | | 5,800 | | | | 191,806 | |
| SanDisk Corp.* | | | 6,000 | | | | 295,260 | |
| Seagate Technology PLC | | | 13,600 | | | | 223,040 | |
| Western Digital Corp.* | | | 22,500 | | | | 696,375 | |
| | | | | | | | 3,580,854 | |
| Electronic Equipment, Instruments & Components 1.3% | |
| Arrow Electronics, Inc.* | | | 8,200 | | | | 306,762 | |
| Avnet, Inc.* | | | 6,200 | | | | 192,758 | |
| Tech Data Corp.* | | | 6,100 | | | | 301,401 | |
| Vishay Intertechnology, Inc.* (a) | | | 32,600 | | | | 293,074 | |
| | | | | | | | 1,093,995 | |
| | | Shares | | | Value ($) | |
| | | | | | | | | |
| Internet Software & Services 2.6% | |
| AOL, Inc.* | | | 5,300 | | | | 80,030 | |
| eBay, Inc.* | | | 34,600 | | | | 1,049,418 | |
| IAC/InterActiveCorp. (a) | | | 18,100 | | | | 771,060 | |
| Yahoo!, Inc.* | | | 23,600 | | | | 380,668 | |
| | | | | | | | 2,281,176 | |
| IT Services 4.3% | |
| Automatic Data Processing, Inc. | | | 13,300 | | | | 718,333 | |
| Computer Sciences Corp. | | | 12,624 | | | | 299,189 | |
| Fiserv, Inc.* | | | 4,600 | | | | 270,204 | |
| International Business Machines Corp. | | | 11,400 | | | | 2,096,232 | |
| Total System Services, Inc. | | | 8,000 | | | | 156,480 | |
| Western Union Co. | | | 8,600 | | | | 157,036 | |
| | | | | | | | 3,697,474 | |
| Semiconductors & Semiconductor Equipment 3.1% | |
| Applied Materials, Inc. | | | 92,600 | | | | 991,746 | |
| Cree, Inc.* | | | 5,000 | | | | 110,200 | |
| GT Advanced Technologies, Inc.* (a) | | | 12,600 | | | | 91,224 | |
| Intel Corp. | | | 14,100 | | | | 341,925 | |
| Kulicke & Soffa Industries, Inc.* | | | 12,600 | | | | 116,550 | |
| Micron Technology, Inc.* | | | 106,194 | | | | 667,960 | |
| NVIDIA Corp.* | | | 18,400 | | | | 255,024 | |
| OmniVision Technologies, Inc.* | | | 9,400 | | | | 115,009 | |
| | | | | | | | 2,689,638 | |
| Software 2.0% | |
| Activision Blizzard, Inc. | | | 66,000 | | | | 813,120 | |
| ANSYS, Inc.* | | | 3,800 | | | | 217,664 | |
| Autodesk, Inc.* | | | 2,500 | | | | 75,825 | |
| Citrix Systems, Inc.* | | | 2,100 | | | | 127,512 | |
| Electronic Arts, Inc.* | | | 21,200 | | | | 436,720 | |
| Microsoft Corp. | | | 1,000 | | | | 25,960 | |
| SAP AG (ADR) | | | 1,600 | | | | 84,720 | |
| | | | | | | | 1,781,521 | |
| Materials 5.8% | |
| Chemicals 2.5% | |
| CF Industries Holdings, Inc. | | | 8,300 | | | | 1,203,334 | |
| Huntsman Corp. | | | 9,200 | | | | 92,000 | |
| LyondellBasell Industries NV "A" | | | 6,000 | | | | 194,940 | |
| Monsanto Co. | | | 6,700 | | | | 469,469 | |
| OM Group, Inc.* | | | 3,400 | | | | 76,126 | |
| PPG Industries, Inc. | | | 1,800 | | | | 150,282 | |
| | | | | | | | 2,186,151 | |
| Metals & Mining 2.5% | |
| Agnico-Eagle Mines Ltd. | | | 4,100 | | | | 148,912 | |
| ArcelorMittal (NY Registered Shares) | | | 20,900 | | | | 380,171 | |
| BHP Billiton Ltd. (ADR) | | | 3,600 | | | | 254,268 | |
| BHP Billiton PLC (ADR) | | | 3,800 | | | | 221,882 | |
| Coeur d'Alene Mines Corp.* | | | 4,100 | | | | 98,974 | |
| | | Shares | | | Value ($) | |
| | | | | | | | | |
| Hecla Mining Co. | | | 18,800 | | | | 98,324 | |
| Kinross Gold Corp. | | | 19,300 | | | | 220,020 | |
| Rio Tinto PLC (ADR) | | | 6,400 | | | | 313,088 | |
| United States Steel Corp. (a) | | | 15,500 | | | | 410,130 | |
| | | | | | | | 2,145,769 | |
| Paper & Forest Products 0.8% | |
| Domtar Corp. | | | 7,300 | | | | 583,708 | |
| International Paper Co. | | | 5,400 | | | | 159,840 | |
| | | | | | | | 743,548 | |
| Telecommunication Services 0.8% | |
| Diversified Telecommunication Services 0.3% | |
| Verizon Communications, Inc. | | | 5,900 | | | | 236,708 | |
| Wireless Telecommunication Services 0.5% | |
| China Mobile Ltd. (ADR) | | | 3,500 | | | | 169,715 | |
| NII Holdings, Inc.* | | | 6,000 | | | | 127,800 | |
| Sprint Nextel Corp.* | | | 50,000 | | | | 117,000 | |
| | | | | | | | 414,515 | |
| Utilities 1.0% | |
| Independent Power Producers & Energy Traders 0.5% | |
| AES Corp.* | | | 7,500 | | | | 88,800 | |
| NRG Energy, Inc.* (a) | | | 21,741 | | | | 393,947 | |
| | | | | | | | 482,747 | |
| Multi-Utilities 0.5% | |
| Ameren Corp. | | | 12,300 | | | | 407,499 | |
Total Common Stocks (Cost $78,998,900) | | | | 86,051,288 | |
| | |
| Preferred Stock 0.0% | |
| Consumer Discretionary | |
| Specialty Retail | |
| Orchard Supply Hardware Stores Corp. Series A* (Cost $200) | | | 45 | | | | 187 | |
| | |
| Securities Lending Collateral 9.8% | |
| Daily Assets Fund Institutional, 0.18% (b) (c) (Cost $8,502,610) | | | 8,502,610 | | | | 8,502,610 | |
| | |
| Cash Equivalents 0.9% | |
| Central Cash Management Fund, 0.07% (b) (Cost $787,044) | | | 787,044 | | | | 787,044 | |
| | | % of Net Assets | | | Value ($) | |
| | | | |
Total Investment Portfolio (Cost $88,288,754)+ | | | 109.5 | | | | 95,341,129 | |
| Other Assets and Liabilities, Net | | | (9.5 | ) | | | (8,262,651 | ) |
| Net Assets | | | 100.0 | | | | 87,078,478 | |
* Non-income producing security.
+ The cost for federal income tax purposes was $89,289,406. At December 31, 2011, net unrealized appreciation for all securities based on tax cost was $6,051,723. This consisted of aggregate gross unrealized appreciation for all securities in which there was an excess of value over tax cost of $9,024,116 and aggregate gross unrealized depreciation for all securities in which there was an excess of tax cost over value of $2,972,393.
(a) All or a portion of these securities were on loan (see Notes to Financial Statements). The value of all securities loaned at December 31, 2011 amounted to $8,290,440, which is 9.5% of net assets.
(b) Affiliated fund managed by Deutsche Investment Management Americas Inc. The rate shown is the annualized seven-day yield at period end.
(c) Represents collateral held in connection with securities lending. Income earned by the Fund is net of borrower rebates.
ADR: American Depositary Receipt
REIT: Real Estate Investment Trust
At December 31, 2011, open futures contracts purchased were as follows:
| Futures | Currency | Expiration Date | | Contracts | | | Notional Value ($) | | | Unrealized Appreciation ($) | |
| S&P 500 E-Mini Index | USD | 3/16/2012 | | | 16 | | | | 1,002,080 | | | | 22,733 | |
| Currency Abbreviation |
| USD United States Dollar |
For information on the Fund's policy and additional disclosures regarding futures contracts, please refer to the Derivatives section of Note B in the accompanying Notes to Financial Statements.
Fair Value Measurements
Various inputs are used in determining the value of the Fund's investments. These inputs are summarized in three broad levels. Level 1 includes quoted prices in active markets for identical securities. Level 2 includes other significant observable inputs (including quoted prices for similar securities, interest rates, prepayment speeds, and credit risk). Level 3 includes significant unobservable inputs (including the Fund's own assumptions in determining the fair value of investments). The inputs or methodology used for valuing securities are not necessarily an indication of the risk associated with investing in those securities.
The following is a summary of the inputs used as of December 31, 2011 in valuing the Fund's investments. For information on the Fund's policy regarding the valuation of investments, please refer to the Security Valuation section of Note A in the accompanying Notes to Financial Statements.
| Assets | | Level 1 | | | Level 2 | | | Level 3 | | | Total | |
| | |
| Common Stocks and/or Other Equity Investments (d) | | $ | 86,051,101 | | | $ | — | | | $ | 374 | | | $ | 86,051,475 | |
| Short-Term Investments (d) | | | 9,289,654 | | | | — | | | | — | | | | 9,289,654 | |
| Derivatives (e) | | | 22,733 | | | | — | | | | — | | | | 22,733 | |
| Total | | $ | 95,363,488 | | | $ | — | | | $ | 374 | | | $ | 95,363,862 | |
There have been no transfers between Level 1 and Level 2 fair value measurements during the year ended December 31, 2011.
(d) See Investment Portfolio for additional detailed categorizations.
(e) Derivatives include unrealized appreciation (depreciation) on open futures contracts.
Level 3 Reconciliation
The following is a reconciliation of the Fund's Level 3 investments for which significant unobservable inputs were used in determining value:
| | | Common Stocks and/or Other Equity Investments | |
| | | Common Stocks | | | Preferred Stocks | | | Total | |
| Balance as of December 31, 2010 | | $ | — | | | $ | — | | | $ | — | |
| Total realized gains (loss) | | | — | | | | — | | | | — | |
| Change in unrealized appreciation (depreciation) | | | (13 | ) | | | (13 | ) | | | (26 | ) |
| Amortization premium/discount | | | — | | | | — | | | | — | |
| Purchases | | | 200 | | | | 200 | | | | 400 | |
| (Sales) | | | — | | | | — | | | | — | |
| Transfers into Level 3 | | | — | | | | — | | | | — | |
| Transfers (out) of Level 3 | | | — | | | | — | | | | — | |
| Balance as of December 31, 2011 | | $ | 187 | | | $ | 187 | | | $ | 374 | |
| Net change in unrealized appreciation (depreciation) from investments still held as of December 31, 2011 | | $ | (13 | ) | | $ | (13 | ) | | $ | (26 | ) |
Transfers between price levels are recognized at the beginning of the reporting period.
The accompanying notes are an integral part of the financial statements.
Statement of Assets and Liabilities | as of December 31, 2011 | |
| Assets | |
Investments: Investments in non-affiliated securities, at value (cost $78,999,100) — including $8,290,440 of securities loaned | | $ | 86,051,475 | |
| Investment in Daily Assets Fund Institutional (cost $8,502,610)* | | | 8,502,610 | |
| Investment in Central Cash Management Fund (cost $787,044) | | | 787,044 | |
| Total investments in securities, at value (cost $88,288,754) | | | 95,341,129 | |
| Cash | | | 825 | |
| Foreign currency, at value (cost $1,798) | | | 1,802 | |
| Deposits with broker for futures contracts | | | 209,478 | |
| Receivable for Fund shares sold | | | 124,157 | |
| Dividends receivable | | | 99,981 | |
| Interest receivable | | | 1,414 | |
| Receivable for variation margin on futures contracts | | | 22,733 | |
| Foreign taxes recoverable | | | 240 | |
| Other assets | | | 1,867 | |
| Total assets | | | 95,803,626 | |
| Liabilities | |
| Payable upon return of securities loaned | | | 8,502,610 | |
| Payable for Fund shares redeemed | | | 117,520 | |
| Accrued management fee | | | 28,791 | |
| Other accrued expenses and payables | | | 76,227 | |
| Total liabilities | | | 8,725,148 | |
| Net assets, at value | | $ | 87,078,478 | |
| Net Assets Consist of | |
| Undistributed net investment income | | | 1,129,614 | |
Net unrealized appreciation (depreciation) on: Investments | | | 7,052,375 | |
| Futures | | | 22,733 | |
| Foreign currency | | | 18 | |
| Accumulated net realized gain (loss) | | | (42,040,554 | ) |
| Paid-in capital | | | 120,914,292 | |
| Net assets, at value | | $ | 87,078,478 | |
Class A Net Asset Value, offering and redemption price per share ($85,480,270 ÷ 11,456,872 outstanding shares of beneficial interest, $.01 par value, unlimited number of shares authorized) | | $ | 7.46 | |
Class B Net Asset Value, offering and redemption price per share ($1,598,208 ÷ 214,502 outstanding shares of beneficial interest, $.01 par value, unlimited number of shares authorized) | | $ | 7.45 | |
* Represents collateral on securities loaned.
The accompanying notes are an integral part of the financial statements.
Statement of Operations
| for the year ended December 31, 2011 | |
| Investment Income | |
Income: Dividends (net of foreign taxes withheld of $1,931) | | $ | 1,781,312 | |
| Income distributions — Central Cash Management Fund | | | 1,008 | |
| Securities lending income, including income from Daily Assets Fund Institutional, net of borrower rebates | | | 16,908 | |
| Total income | | | 1,799,228 | |
Expenses: Management fee | | | 373,948 | |
| Administration fee | | | 95,884 | |
| Services to shareholders | | | 2,885 | |
| Distribution service fee (Class B) | | | 4,543 | |
| Custodian fee | | | 18,641 | |
| Audit fees | | | 41,150 | |
| Legal fees | | | 21,044 | |
| Reports to shareholders | | | 39,120 | |
| Trustees' fees and expenses | | | 3,895 | |
| Other | | | 7,701 | |
| Total expenses | | | 608,811 | |
| Net investment income | | | 1,190,417 | |
| Realized and Unrealized Gain (Loss) | |
Net realized gain (loss) from: Investments | | | 5,661,045 | |
| Futures | | | 126,007 | |
| Foreign currency | | | (49 | ) |
| | | | 5,787,003 | |
Change in net unrealized appreciation (depreciation) on: Investments | | | (6,743,722 | ) |
| Futures | | | 8,223 | |
| Foreign currency | | | (52 | ) |
| | | | (6,735,551 | ) |
| Net gain (loss) | | | (948,548 | ) |
| Net increase (decrease) in net assets resulting from operations | | $ | 241,869 | |
The accompanying notes are an integral part of the financial statements.
Statement of Changes in Net Assets | | | Years Ended December 31, | |
| Increase (Decrease) in Net Assets | | 2011 | | | 2010 | |
Operations: Net investment income | | $ | 1,190,417 | | | $ | 1,286,371 | |
| Net realized gain (loss) | | | 5,787,003 | | | | 10,731,923 | |
| Change in net unrealized appreciation (depreciation) | | | (6,735,551 | ) | | | 860,787 | |
| Net increase (decrease) in net assets resulting from operations | | | 241,869 | | | | 12,879,081 | |
Distributions to shareholders from: Net investment income: Class A | | | (1,231,321 | ) | | | (1,597,628 | ) |
| Class B | | | (19,225 | ) | | | (27,222 | ) |
| Total distributions | | | (1,250,546 | ) | | | (1,624,850 | ) |
Fund share transactions: Class A Proceeds from shares sold | | | 6,626,996 | | | | 5,336,052 | |
| Reinvestment of distributions | | | 1,231,321 | | | | 1,597,628 | |
| Payments for shares redeemed | | | (19,720,206 | ) | | | (20,642,306 | ) |
| Net increase (decrease) in net assets from Class A share transactions | | | (11,861,889 | ) | | | (13,708,626 | ) |
Class B Proceeds from shares sold | | | 79,702 | | | | 68,140 | |
| Reinvestment of distributions | | | 19,225 | | | | 27,222 | |
| Payments for shares redeemed | | | (429,706 | ) | | | (453,581 | ) |
| Net increase (decrease) in net assets from Class B share transactions | | | (330,779 | ) | | | (358,219 | ) |
| Increase (decrease) in net assets | | | (13,201,345 | ) | | | (2,812,614 | ) |
| Net assets at beginning of period | | | 100,279,823 | | | | 103,092,437 | |
| Net assets at end of period (including undistributed net investment income of $1,129,614 and $1,201,576, respectively) | | $ | 87,078,478 | | | $ | 100,279,823 | |
| Other Information | |
Class A Shares outstanding at beginning of period | | | 13,004,152 | | | | 15,048,001 | |
| Shares sold | | | 857,669 | | | | 774,532 | |
| Shares issued to shareholders in reinvestment of distributions | | | 148,352 | | | | 219,153 | |
| Shares redeemed | | | (2,553,301 | ) | | | (3,037,534 | ) |
| Net increase (decrease) in Class A shares | | | (1,547,280 | ) | | | (2,043,849 | ) |
| Shares outstanding at end of period | | | 11,456,872 | | | | 13,004,152 | |
Class B Shares outstanding at beginning of period | | | 256,466 | | | | 309,228 | |
| Shares sold | | | 10,552 | | | | 10,025 | |
| Shares issued to shareholders in reinvestment of distributions | | | 2,316 | | | | 3,734 | |
| Shares redeemed | | | (54,832 | ) | | | (66,521 | ) |
| Net increase (decrease) in Class B shares | | | (41,964 | ) | | | (52,762 | ) |
| Shares outstanding at end of period | | | 214,502 | | | | 256,466 | |
The accompanying notes are an integral part of the financial statements.
| | | Years Ended December 31, | |
| Class A | | 2011 | | | 2010 | | | 2009 | | | 2008 | | | 2007 | |
| Selected Per Share Data | |
| Net asset value, beginning of period | | $ | 7.56 | | | $ | 6.71 | | | $ | 5.12 | | | $ | 10.81 | | | $ | 10.94 | |
Income (loss) from investment operations: Net investment income (loss)a | | | .10 | | | | .09 | | | | .10 | | | | .10 | | | | .13 | |
| Net realized and unrealized gain (loss) | | | (.10 | ) | | | .87 | | | | 1.61 | | | | (3.45 | ) | | | .02 | |
| Total from investment operations | | | .00 | | | | .96 | | | | 1.71 | | | | (3.35 | ) | | | .15 | |
Less distributions from: Net investment income | | | (.10 | ) | | | (.11 | ) | | | (.12 | ) | | | (.18 | ) | | | (.13 | ) |
| Net realized gains | | | — | | | | — | | | | — | | | | (2.16 | ) | | | (.15 | ) |
| Total distributions | | | (.10 | ) | | | (.11 | ) | | | (.12 | ) | | | (2.34 | ) | | | (.28 | ) |
| Net asset value, end of period | | $ | 7.46 | | | $ | 7.56 | | | $ | 6.71 | | | $ | 5.12 | | | $ | 10.81 | |
| Total Return (%) | | | (.14 | ) | | | 14.40 | b | | | 34.15 | b | | | (38.31 | )b | | | 1.36 | b |
| Ratios to Average Net Assets and Supplemental Data | |
| Net assets, end of period ($ millions) | | | 85 | | | | 98 | | | | 101 | | | | 94 | | | | 196 | |
| Ratio of expenses before expense reductions (%) | | | .63 | | | | .63 | | | | .63 | | | | .60 | | | | .57 | |
| Ratio of expenses after expense reductions (%) | | | .63 | | | | .60 | | | | .54 | | | | .54 | | | | .56 | |
| Ratio of net investment income (loss) (%) | | | 1.25 | | | | 1.32 | | | | 1.74 | | | | 1.34 | | | | 1.18 | |
| Portfolio turnover rate (%) | | | 215 | | | | 145 | | | | 82 | | | | 130 | | | | 310 | |
a Based on average shares outstanding during the period. b Total return would have been lower had certain expenses not been reduced. | |
| | | Years Ended December 31, | |
| Class B | | | 2011 | | | 2010 | | | 2009 | | | 2008 | | | 2007 | |
| Selected Per Share Data | |
| Net asset value, beginning of period | | $ | 7.55 | | | $ | 6.70 | | | $ | 5.12 | | | $ | 10.77 | | | $ | 10.90 | |
Income (loss) from investment operations: Net investment income (loss)a | | | .08 | | | | .07 | | | | .08 | | | | .08 | | | | .09 | |
| Net realized and unrealized gain (loss) | | | (.10 | ) | | | .87 | | | | 1.60 | | | | (3.42 | ) | | | .02 | |
| Total from investment operations | | | (.02 | ) | | | .94 | | | | 1.68 | | | | (3.34 | ) | | | .11 | |
Less distributions from: Net investment income | | | (.08 | ) | | | (.09 | ) | | | (.10 | ) | | | (.15 | ) | | | (.09 | ) |
| Net realized gains | | | — | | | | — | | | | — | | | | (2.16 | ) | | | (.15 | ) |
| Total distributions | | | (.08 | ) | | | (.09 | ) | | | (.10 | ) | | | (2.31 | ) | | | (.24 | ) |
| Net asset value, end of period | | $ | 7.45 | | | $ | 7.55 | | | $ | 6.70 | | | $ | 5.12 | | | $ | 10.77 | |
| Total Return (%) | | | (.40 | ) | | | 14.12 | b | | | 33.64 | b | | | (38.29 | )b | | | 1.00 | b |
| Ratios to Average Net Assets and Supplemental Data | |
| Net assets, end of period ($ millions) | | | 2 | | | | 2 | | | | 2 | | | | 2 | | | | 15 | |
| Ratio of expenses before expense reductions (%) | | | .88 | | | | .88 | | | | .89 | | | | .82 | | | | .95 | |
| Ratio of expenses after expense reductions (%) | | | .88 | | | | .85 | | | | .80 | | | | .77 | | | | .92 | |
| Ratio of net investment income (loss) (%) | | | .99 | | | | 1.07 | | | | 1.48 | | | | 1.12 | | | | .82 | |
| Portfolio turnover rate (%) | | | 215 | | | | 145 | | | | 82 | | | | 130 | | | | 310 | |
a Based on average shares outstanding during the period. b Total return would have been lower had certain expenses not been reduced. | |
Notes to Financial Statements
A. Organization and Significant Accounting Policies
DWS Variable Series I (the "Series") is registered under the Investment Company Act of 1940, as amended (the "1940 Act"), as an open-end, registered management investment company organized as a Massachusetts business trust. The Series consists of five diversified funds: DWS Bond VIP, DWS Growth & Income VIP, DWS Capital Growth VIP, DWS Global Small Cap Growth VIP (formerly DWS Global Opportunities VIP) and DWS International VIP (individually or collectively hereinafter referred to as a "Fund" or the "Funds"). These financial statements report on DWS Growth & Income VIP. The Series is intended to be the underlying investment vehicle for variable annuity contracts and variable life insurance policies to be offered by the separate accounts of certain life insurance companies ("Participating Insurance Companies").
Multiple Classes of Shares of Beneficial Interest. The Fund offers two classes of shares (Class A shares and Class B shares). Class B shares are subject to Rule 12b-1 distribution fees under the 1940 Act and recordkeeping fees equal to an annual rate of 0.25% and up to 0.15%, respectively, of the average daily net assets of the Class B shares of the Fund. Class A shares are not subject to such fees.
Investment income, realized and unrealized gains and losses, and certain fund-level expenses and expense reductions, if any, are borne pro rata on the basis of relative net assets by the holders of all classes of shares, except that each class bears certain expenses unique to that class (including the applicable 12b-1 distribution fees and recordkeeping fees). Differences in class-level expenses may result in payment of different per share dividends by class. All shares have equal rights with respect to voting subject to class-specific arrangements.
The Fund's financial statements are prepared in accordance with accounting principles generally accepted in the United States of America, which require the use of management estimates. Actual results could differ from those estimates. The policies described below are followed consistently by the Fund in the preparation of its financial statements.
Security Valuation. Investments are stated at value determined as of the close of regular trading on the New York Stock Exchange on each day the exchange is open for trading.
Various inputs are used in determining the value of the Fund's investments. These inputs are summarized in three broad levels. Level 1 includes quoted prices in active markets for identical securities. Level 2 includes other significant observable inputs (including quoted prices for similar securities, interest rates, prepayment speeds, and credit risk). Level 3 includes significant unobservable inputs (including the Fund's own assumptions in determining the fair value of investments). The inputs or methodology used for valuing securities are not necessarily an indication of the risk associated with investing in those securities.
Equity securities are valued at the most recent sale price or official closing price reported on the exchange (U.S. or foreign) or over-the-counter market on which they trade and are categorized as Level 1 securities. Securities for which no sales are reported are valued at the calculated mean between the most recent bid and asked quotations on the relevant market or, if a mean cannot be determined, at the most recent bid quotation.
Money market instruments purchased with an original or remaining maturity of sixty days or less, maturing at par, are valued at amortized cost, which approximates value, and are categorized as Level 2. Investments in open-end investment companies are valued at their net asset value each business day and are categorized as Level 1.
Futures contracts are generally valued at the settlement prices established each day on the exchange on which they are traded and are categorized as Level 1.
Securities and other assets for which market quotations are not readily available or for which the above valuation procedures are deemed not to reflect fair value are valued in a manner that is intended to reflect their fair value as determined in accordance with procedures approved by the Trustees and are generally categorized as Level 3. In accordance with the Fund's valuation procedures, factors used in determining value may include, but are not limited to, the type of the security; the size of the holding; the initial cost of the security; the existence of any contractual restrictions on the security's disposition; the price and extent of public trading in similar securities of the issuer or of comparable companies; quotations or evaluated prices from broker-dealers and/or pricing services; information obtained from the issuer, analysts, and/or the appropriate stock exchange (for exchange-traded securities); an analysis of the company's or issuer's financial statements; an evaluation of the forces that influence the issuer and the market(s) in which the security is purchased and sold and with respect to debt securities; the maturity, coupon, creditworthiness, currency denomination and the movement of the market in which the security is normally traded. The value determined under these procedures may differ from published values for the same securities.
Disclosure about the classification of fair value measurements is included in a table following the Fund's Investment Portfolio.
New Accounting Pronouncement. In May 2011, Accounting Standards Update 2011-04 (ASU 2011-04), Amendments to Achieve Common Fair Value Measurement and Disclosure Requirements in U.S. GAAP and IFRSs, was issued and is effective during interim and annual periods beginning after December 15, 2011. ASU 2011-04 amends Accounting Standards Codification (ASC) Topic 820, Fair Value Measurement. The amendments are the result of the work by the Financial Accounting Standards Board and the International Accounting Standards Board to develop common requirements for measuring fair value and for disclosing information about fair value measurements in accordance with GAAP. Management is currently evaluating the application of ASU 2011-04 and its impact, if any, on the Fund's financial statements.
Securities Lending. The Fund lends securities to certain financial institutions. The Fund retains beneficial ownership of the securities it has loaned and continues to receive interest and dividends paid by the issuer of securities and to participate in any changes in their market value. The Fund requires the borrowers of the securities to maintain collateral with the Fund consisting of either cash or liquid, unencumbered assets having a value at least equal to the value of the securities loaned. When the collateral falls below specified amounts, the lending agent will use its best effort to obtain additional collateral on the next business day to meet required amounts under the security lending agreement. The Fund may invest the cash collateral into a joint trading account in an affiliated money market fund pursuant to Exemptive Orders issued by the SEC. The Fund receives compensation for lending its securities either in the form of fees or by earning interest on invested cash collateral net of borrower rebates and fees paid to a lending agent. Either the Fund or the borrower may terminate the loan. There may be risks of delay and costs in recovery of securities or even loss of rights in the collateral should the borrower of the securities fail financially. The Fund is also subject to all investment risks associated with the reinvestment of any cash collateral received, including, but not limited to, interest rate, credit and liquidity risk associated with such investments.
Foreign Currency Translations. The books and records of the Fund are maintained in U.S. dollars. Investment securities and other assets and liabilities denominated in a foreign currency are translated into U.S. dollars at the prevailing exchange rates at period end. Purchases and sales of investment securities, income and expenses are translated into U.S. dollars at the prevailing exchange rates on the respective dates of the transactions.
Net realized and unrealized gains and losses on foreign currency transactions represent net gains and losses between trade and settlement dates on securities transactions, the acquisition and disposition of foreign currencies, and the difference between the amount of net investment income accrued and the U.S. dollar amount actually received. That portion of both realized and unrealized gains and losses on investments that results from fluctuations in foreign currency exchange rates is not separately disclosed but is included with net realized and unrealized gain/appreciation and loss/depreciation on investments.
Federal Income Taxes. The Fund is treated as a separate taxpayer as provided for in the Internal Revenue Code, as amended. It is the Fund's policy to comply with the requirements of the Internal Revenue Code, as amended, which are applicable to regulated investment companies, and to distribute all of its taxable income to the separate accounts of the Participating Insurance Companies which hold its shares.
Under the Regulated Investment Company Modernization Act of 2010, net capital losses may be carried forward indefinitely, and their character is retained as short-term and/or long-term. Previously, net capital losses were carried forward for eight years and treated as short-term losses. As a transition rule, the Act requires that post-enactment net capital losses be used before pre-enactment net capital losses.
At December 31, 2011, the Fund had a net tax basis capital loss carryforward of approximately $40,840,000 of pre-enactment losses, which may be applied against any realized net taxable capital gains of each succeeding year until fully utilized or until December 31, 2016 ($11,719,000) and December 31, 2017 ($29,121,000), the respective expiration dates, whichever occurs first.
In addition, from November 1, 2011 through December 31, 2011, the Fund elects to defer qualified late year losses of approximately $177,000 of net short-term realized capital losses. As permitted by tax regulations, the Fund intends to elect to defer these losses and treat them as arising in the fiscal year ending December 31, 2012.
The Fund has reviewed the tax positions for the open tax years as of December 31, 2011 and has determined that no provision for income tax is required in the Fund's financial statements. The Fund's federal tax returns for the prior three fiscal years remain open subject to examination by the Internal Revenue Service.
Distribution of Income and Gains. The Fund will declare and distribute dividends from its net investment income, if any, annually, although additional distributions may be made if necessary. Net realized gains from investment transactions, in excess of available capital loss carryforwards, would be taxable to the Fund if not distributed, and, therefore, will be distributed to shareholders at least annually.
The timing and characterization of certain income and capital gain distributions are determined annually in accordance with federal tax regulations which may differ from accounting principles generally accepted in the United States of America. These differences primarily relate to futures contracts and certain securities sold at a loss. As a result, net investment income (loss) and net realized gain (loss) on investment transactions for a reporting period may differ significantly from distributions during such period. Accordingly, the Fund may periodically make reclassifications among certain of its capital accounts without impacting the net asset value of the Fund.
At December 31, 2011, the Fund's components of distributable earnings (accumulated losses) on a tax basis are as follows:
| Undistributed ordinary income* | | $ | 1,129,613 | |
| Capital loss carryforwards | | $ | (40,840,000 | ) |
| Net unrealized appreciation (depreciation) on investments | | $ | 6,051,723 | |
In addition, the tax character of distributions paid to shareholders by the Fund is summarized as follows:
| | | Years Ended December 31, | |
| | | 2011 | | | 2010 | |
| Distributions from ordinary income* | | $ | 1,250,546 | | | $ | 1,624,850 | |
* For tax purposes, short-term capital gain distributions are considered ordinary income distributions.
Expenses. Expenses of the Series arising in connection with a specific Fund are allocated to that Fund. Other Series expenses which cannot be directly attributed to a Fund are apportioned among the Funds in the Series.
Contingencies. In the normal course of business, the Fund may enter into contracts with service providers that contain general indemnification clauses. The Fund's maximum exposure under these arrangements is unknown as this would involve future claims that may be made against the Fund that have not yet been made. However, based on experience, the Fund expects the risk of loss to be remote.
Other. Investment transactions are accounted for on a trade date plus one basis for daily net asset value calculations. However, for financial reporting purposes, investment transactions are reported on trade date. Interest income is recorded on the accrual basis net of foreign withholding taxes. Dividend income is recorded on the ex-dividend date net of foreign withholding taxes. Realized gains and losses from investment transactions are recorded on an identified cost basis and may include proceeds from litigation.
B. Derivative Instruments
Futures Contracts. A futures contract is an agreement between a buyer or seller and an established futures exchange or its clearinghouse in which the buyer or seller agrees to take or make a delivery of a specific amount of a financial instrument at a specified price on a specific date (settlement date). For the year ended December 31, 2011, the Fund entered into futures contracts in circumstances where portfolio management believed they offered an economic means of gaining exposure to a particular asset class or to keep cash on hand to meet shareholder redemptions or other needs while maintaining exposure to the market.
Upon entering into a futures contract, the Fund is required to deposit with a financial intermediary cash or securities ("initial margin") in an amount equal to a certain percentage of the face value indicated in the futures contract. Subsequent payments ("variation margin") are made or received by the Fund dependent upon the daily fluctuations in the value and are recorded for financial reporting purposes as unrealized gains or losses by the Fund. Gains or losses are realized when the contract expires or is closed. Since all futures contracts are exchange traded, counterparty risk is minimized as the exchange's clearinghouse acts as the counterparty, and guarantees the futures against default.
Certain risks may arise upon entering into futures contracts, including the risk that an illiquid market will limit the Fund's ability to close out a futures contract prior to the settlement date and the risk that the futures contract is not well correlated with the security, index or currency to which it relates. Risk of loss may exceed amounts recognized in the Statement of Assets and Liabilities.
A summary of the open futures contracts as of December 31, 2011, is included in a table following the Fund's Investment Portfolio. For the year ended December 31, 2011, the investment in futures contracts purchased had a total notional value generally indicative of a range from approximately $1,002,000 to $1,381,000.
The following table summarizes the value of the Fund's derivative instruments held as of December 31, 2011 and the related location in the accompanying Statement of Assets and Liabilities, presented by primary underlying risk exposure:
| Asset Derivative | | Futures Contracts | |
| Equity Contracts (a) | | $ | 22,733 | |
The above derivative is located in the following Statement of Assets and Liabilities account:
(a) Includes cumulative appreciation of futures contracts as disclosed in the Investment Portfolio. Unsettled variation margin is disclosed separately within the Statement of Assets and Liabilities.
Additionally, the amount of unrealized and realized gains and losses on derivative instruments recognized in Fund earnings during the year ended December 31, 2011 and the related location in the accompanying Statement of Operations is summarized in the following tables by primary underlying risk exposure:
| Realized Gain (Loss) | | Futures Contracts | |
| Equity Contracts (a) | | $ | 126,007 | |
The above derivative is located in the following Statement of Operations account:
(a) Net realized gain (loss) from futures
| Change in Net Unrealized Appreciation (Depreciation) | | Futures Contracts | |
| Equity Contracts (a) | | $ | 8,223 | |
The above derivative is located in the following Statement of Operations account:
(a) Change in net unrealized appreciation (depreciation) on futures
C. Purchases and Sales of Securities
During the year ended December 31, 2011, purchases and sales of investment securities (excluding short-term investments) aggregated $205,235,881 and $217,370,307, respectively.
D. Related Parties
Management Agreement. Under the Investment Management Agreement with Deutsche Investment Management Americas Inc. ("DIMA" or the "Advisor"), an indirect, wholly owned subsidiary of Deutsche Bank AG, the Advisor directs the investments of the Fund in accordance with its investment objectives, policies and restrictions. The Advisor determines the securities, instruments and other contracts relating to investments to be purchased, sold or entered into by the Fund or delegates such responsibility to the Fund's subadvisor.
QS Investors, LLC ("QS Investors") serves as subadvisor. As a subadvisor to the Fund, QS Investors makes investment decisions and buys and sells securities for the Fund. QS Investors is paid by the Advisor for the services QS Investors provides to the Fund.
Pursuant to the Investment Management Agreement with the Advisor, the Fund pays a monthly management fee based on the Fund's average daily net assets, computed and accrued daily and payable monthly, at the following annual rates:
| First $250 million of average daily net assets | | | .390 | % |
| Next $750 million of average daily net assets | | | .365 | % |
| Over $1 billion of average daily net assets | | | .340 | % |
Accordingly, for the year ended December 31, 2011, the fee pursuant to the Investment Management Agreement was equivalent to an annual effective rate of 0.39% of the Fund's average daily net assets.
Administration Fee. Pursuant to an Administrative Services Agreement, DIMA provides most administrative services to the Fund. For all services provided under the Administrative Services Agreement, the Fund pays the Advisor an annual fee ("Administration Fee") of 0.10% of the Fund's average daily net assets, computed and accrued daily and payable monthly. For the year ended December 31, 2011, the Administration Fee was $95,884, of which $7,382 is unpaid.
Service Provider Fees. DWS Investments Service Company ("DISC"), an affiliate of the Advisor, is the transfer agent, dividend-paying agent and shareholder service agent for the Fund. Pursuant to a sub-transfer agency agreement between DISC and DST Systems, Inc. ("DST"), DISC has delegated certain transfer agent, dividend-paying agent and shareholder service agent functions to DST. DISC compensates DST out of the shareholder servicing fee it receives from the Fund. For the year ended December 31, 2011, the amounts charged to the Fund by DISC were as follows:
| Services to Shareholders | | Total Aggregated | | | Unpaid at December 31, 2011 | |
| Class A | | $ | 475 | | | $ | 119 | |
| Class B | | | 85 | | | | 20 | |
| | | $ | 560 | | | $ | 139 | |
Distribution Service Agreement. DWS Investments Distributors, Inc. ("DIDI"), also an affiliate of the Advisor, is the Series' Distributor. In accordance with the Master Distribution Plan, DIDI receives 12b-1 fees of 0.25% of average daily net assets of Class B shares. Pursuant to the Master Distribution Plan, DIDI remits these fees to the Participating Insurance Companies for various costs incurred or paid by these companies in connection with marketing and distribution of Class B shares. For the year ended December 31, 2011, the Distribution Service Fee aggregated $4,543, of which $343 is unpaid.
Typesetting and Filing Service Fees. Under an agreement with DIMA, DIMA is compensated for providing typesetting and certain regulatory filing services to the Fund. For the year ended December 31, 2011, the amount charged to the Fund by DIMA included in the Statement of Operations under "reports to shareholders" aggregated $14,596, of which $2,747 is unpaid.
Trustees' Fees and Expenses. The Fund paid each Trustee not affiliated with the Advisor retainer fees plus specified amounts for various committee services and for the Board Chairperson.
Affiliated Cash Management Vehicle. The Fund may invest uninvested cash balances in Central Cash Management Fund, which is managed by the Advisor. The Fund indirectly bears its proportionate share of the expenses of Central Cash Management Fund. Central Cash Management Fund does not pay the Advisor an investment management fee. Central Cash Management Fund seeks a high level of current income consistent with liquidity and the preservation of capital.
E. Ownership of the Fund
Three participating insurance companies were owners of record of 10% or more of the total outstanding Class A shares of the Fund, each owning 34%, 27% and 15%. One participating insurance companies was the owner of record of 10% or more of the total outstanding Class B shares of the Fund, owning 86%.
F. Line of Credit
The Fund and other affiliated funds (the "Participants") share in a $450 million revolving credit facility provided by a syndication of banks. The Fund may borrow for temporary or emergency purposes, including the meeting of redemption requests that otherwise might require the untimely disposition of securities. The Participants are charged an annual commitment fee which is allocated based on net assets, among each of the Participants. Interest is calculated at a rate per annum equal to the sum of the Federal Funds Rate plus 1.25 percent plus if LIBOR exceeds the Federal Funds Rate the amount of such excess. The Fund may borrow up to a maximum of 33 percent of its net assets under the agreement. The Fund had no outstanding loans at December 31, 2011.
G. Subsequent Event
Effective on or about May 1, 2012, the Fund will change its name to DWS Core Equity VIP. Consistent with the name change, under normal circumstances the Fund intends to invest at least 80% of total assets in equities, mainly common stocks.
Report of Independent Registered Public Accounting Firm
To the Trustees of DWS Variable Series I and the Shareholders of DWS Growth & Income VIP:
In our opinion, the accompanying statement of assets and liabilities, including the investment portfolio, and the related statements of operations and of changes in net assets and the financial highlights present fairly, in all material respects, the financial position of DWS Growth & Income VIP (the "Fund") at December 31, 2011 and the results of its operations, the changes in its net assets, and the financial highlights for the periods indicated therein, in conformity with accounting principles generally accepted in the United States of America. These financial statements and financial highlights (hereafter referred to as "financial statements") are the responsibility of the Fund's management. Our responsibility is to express an opinion on these financial statements based on our audits. We conducted our audits of these financial statements in accordance with the standards of the Public Company Accounting Oversight Board (United States). Those standards require that we plan and perform the audit to obtain reasonable assurance about whether the financial statements are free of material misstatement. An audit includes examining, on a test basis, evidence supporting the amounts and disclosures in the financial statements, assessing the accounting principles used and significant estimates made by management, and evaluating the overall financial statement presentation. We believe that our audits, which included confirmation of securities at December 31, 2011 by correspondence with the custodians and brokers, provide a reasonable basis for our opinion.
Boston, Massachusetts February 15, 2012 | PricewaterhouseCoopers LLP |
Information About Your Fund's Expenses
As an investor of the Fund, you incur two types of costs: ongoing expenses and transaction costs. Ongoing expenses include management fees, distribution and service (12b-1) fees and other Fund expenses. Examples of transaction costs include contract charges, redemption fees and account maintenance fees, which are not shown in this section. The following tables are intended to help you understand your ongoing expenses (in dollars) of investing in the Fund and to help you compare these expenses with the ongoing expenses of investing in other mutual funds. The example in the table is based on an investment of $1,000 invested at the beginning of the six-month period and held for the entire period (July 1, 2011 to December 31, 2011).
The tables illustrate your Fund's expenses in two ways:
·Actual Fund Return. This helps you estimate the actual dollar amount of ongoing expenses (but not transaction costs) paid on a $1,000 investment in the Fund using the Fund's actual return during the period. To estimate the expenses you paid over the period, simply divide your account value by $1,000 (for example, an $8,600 account value divided by $1,000 = 8.6), then multiply the result by the number in the "Expenses Paid per $1,000" line under the share class you hold.
· Hypothetical 5% Fund Return. This helps you to compare your Fund's ongoing expenses (but not transaction costs) with those of other mutual funds using the Fund's actual expense ratio and a hypothetical rate of return of 5% per year before expenses. Examples using a 5% hypothetical Fund return may be found in the shareholder reports of other mutual funds. The hypothetical account values and expenses may not be used to estimate the actual ending account balance or expenses you paid for the period.
Please note that the expenses shown in these tables are meant to highlight your ongoing expenses only and do not reflect any transaction costs. The "Expenses Paid per $1,000" line of the tables is useful in comparing ongoing expenses only and will not help you determine the relative total expense of owning different funds. If these transaction costs had been included, your costs would have been higher.
Expenses and Value of a $1,000 Investment for the six months ended December 31, 2011 | |
| Actual Fund Return | | Class A | | | Class B | |
| Beginning Account Value 7/1/11 | | $ | 1,000.00 | | | $ | 1,000.00 | |
| Ending Account Value 12/31/11 | | $ | 918.70 | | | $ | 917.50 | |
| Expenses Paid per $1,000* | | $ | 3.10 | | | $ | 4.30 | |
| Hypothetical 5% Portfolio Return | | Class A | | | Class B | |
| Beginning Account Value 7/1/11 | | $ | 1,000.00 | | | $ | 1,000.00 | |
| Ending Account Value 12/31/11 | | $ | 1,021.98 | | | $ | 1,020.72 | |
| Expenses Paid per $1,000* | | $ | 3.26 | | | $ | 4.53 | |
* Expenses are equal to the Fund's annualized expense ratio for each share class, multiplied by the average account value over the period, multiplied by the number of days in the most recent six-month period, then divided by 365.
| Annualized Expense Ratios | Class A | | Class B | |
| DWS Variable Series I — DWS Growth & Income VIP | .64% | | .89% | |
For more information, please refer to the Fund's prospectus.
These tables do not reflect charges and fees ("contract charges") associated with the separate account that invests in the Fund or any variable life insurance policy or variable annuity contract for which the Fund is an investment option.
Tax Information (Unaudited)
For corporate shareholders, 100% of the ordinary dividends (i.e., income dividends plus short-term capital gains) paid during the Fund's fiscal year ended December 31, 2011 qualified for the dividends received deduction.
Please consult a tax advisor if you have questions about federal or state income tax laws, or on how to prepare your tax returns. If you have specific questions about your account, please contact your insurance provider.
The Series' policies and procedures for voting proxies for portfolio securities and information about how the Series voted proxies related to its portfolio securities during the 12-month period ended June 30 are available on our Web site — www.dws-investments.com (click on "proxy voting"at the bottom of the page) — or on the SEC's Web site — www.sec.gov. To obtain a written copy of the Series' policies and procedures without charge, upon request, call us toll free at (800) 728-3337.
Investment Management Agreement Approval
The Board of Trustees approved the renewal of DWS Growth & Income VIP's investment management agreement (the "Agreement") with Deutsche Investment Management Americas Inc. ("DWS") and sub-advisory agreement (the "Sub-Advisory Agreement" and together with the Agreement, the "Agreements") between DWS and QS Investors, LLC ("QS Investors") in September 2011.
In terms of the process that the Board followed prior to approving the Agreements, shareholders should know that:
· In September 2011, all of the Fund's Trustees were independent of DWS and its affiliates.
· The Trustees met frequently during the past year to discuss fund matters and dedicated a substantial amount of time to contract review matters. Over the course of several months, the Board's Contract Committee, in coordination with the Board's Fixed Income and Quant Oversight Committee, reviewed comprehensive materials received from DWS, independent third parties and independent counsel. These materials included an analysis of the Fund's performance, fees and expenses, and profitability compiled by the Fund's independent fee consultant. The Board also received extensive information throughout the year regarding performance of the Fund.
· The Independent Trustees regularly meet privately with their independent counsel to discuss contract review and other matters. In addition, the Independent Trustees were also advised by the Fund's independent fee consultant in the course of their review of the Fund's contractual arrangements and considered a comprehensive report prepared by the independent fee consultant in connection with their deliberations (the "IFC Report").
· In connection with reviewing the Agreements, the Board also reviewed the terms of the Fund's Rule 12b-1 plan, distribution agreement, administrative services agreement, transfer agency agreement and other material service agreements.
· Based on its evaluation of the information provided, the Contract Committee presented its findings and recommendations to the Board. The Board then reviewed the Contract Committee's findings and recommendations.
In connection with the contract review process, the Contract Committee and the Board considered the factors discussed below, among others. The Board also considered that DWS and its predecessors have managed the Fund since its inception, and the Board believes that a long-term relationship with a capable, conscientious advisor is in the best interests of the Fund. The Board considered, generally, that shareholders chose to invest or remain invested in the Fund knowing that DWS managed the Fund, and that the Agreement was approved by the Fund's shareholders. DWS is part of Deutsche Bank, a major global banking institution that is engaged in a wide range of financial services. The Board believes that there are significant advantages to being part of a global asset management business that offers a wide range of investing expertise and resources, including hundreds of portfolio managers and analysts with research capabilities in many countries throughout the world.
While shareholders may focus primarily on fund performance and fees, the Fund's Board considers these and many other factors, including the quality and integrity of DWS's and QS Investors's personnel and such other issues as back-office operations, fund valuations, and compliance policies and procedures.
Nature, Quality and Extent of Services. The Board considered the terms of the Agreements, including the scope of advisory services provided under the Agreements. The Board noted that, under the Agreements, DWS and QS Investors provide portfolio management services to the Fund and that, pursuant to a separate administrative services agreement, DWS provides administrative services to the Fund. The Board considered the experience and skills of senior management and investment personnel, the resources made available to such personnel, the ability of DWS to attract and retain high-quality personnel, and the organizational depth and stability of DWS. The Board also requested and received information regarding DWS's oversight of Fund sub-advisors, including QS Investors. The Board reviewed the Fund's performance over short-term and long-term periods and compared those returns to various agreed-upon performance measures, including market indices and a peer universe compiled by the independent fee consultant using information supplied by Lipper Inc. ("Lipper"). The Board also noted that it has put into place a process of identifying "Focus Funds" (e.g., funds performing poorly relative to their benchmark or a peer universe compiled by an independent fund data service), and receives more frequent reporting and information from DWS regarding such funds, along with DWS's remedial plans to address underperformance. The Board believes this process is an effective manner of identifying and addressing underperforming funds. Based on the information provided, the Board noted that for the one-, three- and five-year periods ended December 31, 2010, the Fund's performance (Class A shares) was in the 3rd quartile, 2nd quartile and 3rd quartile, respectively, of the applicable Lipper universe (the 1st quartile being the best performers and the 4th quartile being the worst performers). The Board also observed that the Fund has outperformed its benchmark in the three-year period and has underperformed its benchmark in the one- and five-year periods ended December 31, 2010.
On the basis of this evaluation and the ongoing review of investment results by the Board, the Board concluded that the nature, quality and extent of services provided by DWS and QS Investors historically have been and continue to be satisfactory.
Fees and Expenses. The Board considered the Fund's investment management fee schedule, sub-advisory fee schedule, operating expenses and total expense ratios, and comparative information provided by Lipper and the independent fee consultant regarding investment management fee rates paid to other investment advisors by similar funds (1st quartile being the most favorable and 4th quartile being the least favorable). With respect to management fees paid to other investment advisors by similar funds, the Board noted that the contractual fee rates paid by the Fund, which include a 0.10% fee paid to DWS under the Fund's administrative services agreement, were lower than the median (1st quartile) of the applicable Lipper peer group (based on Lipper data provided as of December 31, 2010). With respect to the sub-advisory fee paid to QS Investors, the Board noted that the fee is paid by DWS out of its fee and not directly by the Fund. The Board noted that the Fund's Class A shares total (net) operating expenses were expected to be lower than the median (1st quartile) of the applicable Lipper expense universe (based on Lipper data provided as of December 31, 2010) ("Lipper Universe Expenses"). The Board also reviewed data comparing each share class's total (net) operating expenses to the applicable Lipper Universe Expenses. The Board considered the Fund's management fee rate as compared to fees charged by DWS and certain of its affiliates for comparable mutual funds and considered differences in fund and fee structures between the DWS Funds. The Board also considered how the Fund's total (net) operating expenses compared to the total (net) operating expenses of a more customized peer group selected by Lipper (based on such factors as asset size).
The information considered by the Board as part of its review of management fees included information regarding fees charged by DWS and its affiliates to similar institutional accounts and to similar funds offered primarily to European investors ("DWS Europe funds"), in each case as applicable. The Board observed that advisory fee rates for institutional accounts generally were lower than the management fees charged by similarly managed DWS U.S. mutual funds ("DWS Funds"), but also took note of the differences in services provided to DWS Funds as compared to institutional accounts. In the case of DWS Europe funds, the Board observed that fee rates for DWS Europe funds generally were higher than for similarly managed DWS Funds, but noted that differences in the types of services provided to DWS Funds relative to DWS Europe funds made it difficult to compare such fees.
On the basis of the information provided, the Board concluded that management fees were reasonable and appropriate in light of the nature, quality and extent of services provided by DWS and QS Investors.
Profitability. The Board reviewed detailed information regarding revenues received by DWS under the Agreement. The Board considered the estimated costs and pre-tax profits realized by DWS from advising the DWS Funds, as well as estimates of the pre-tax profits attributable to managing the Fund in particular. The Board also received information regarding the estimated enterprise-wide profitability of DWS and its affiliates with respect to all fund services in totality and by fund. The Board and the independent fee consultant reviewed DWS's methodology in allocating its costs to the management of the Fund. Based on the information provided, the Board concluded that the pre-tax profits realized by DWS in connection with the management of the Fund were not unreasonable. The Board also reviewed information regarding the profitability of certain similar investment management firms. The Board noted that while information regarding the profitability of such firms is limited (and in some cases is not necessarily prepared on a comparable basis), DWS and its affiliates' overall profitability with respect to the DWS fund complex (after taking into account distribution and other services provided to the funds by DWS and its affiliates) was lower than the overall profitability levels of many comparable firms for which such data was available. The Board did not consider the profitability of QS Investors with respect to the Fund. The Board noted that DWS pays QS Investors's fee out of its management fee, and its understanding that the Fund's sub-advisory fee schedule was the product of an arm's length negotiation with DWS.
Economies of Scale. The Board considered whether there are economies of scale with respect to the management of the Fund and whether the Fund benefits from any economies of scale. The Board noted that the Fund's management fee schedule includes fee breakpoints. The Board concluded that the Fund's fee schedule represents an appropriate sharing between the Fund and DWS of such economies of scale as may exist in the management of the Fund at current asset levels.
Other Benefits to DWS and QS Investors and Their Affiliates. The Board also considered the character and amount of other incidental benefits received by DWS and QS Investors and their affiliates, including any fees received by DWS for administrative services provided to the Fund and any fees received by an affiliate of DWS for distribution services. The Board also considered benefits to DWS and QS Investors related to brokerage and soft-dollar allocations, including allocating brokerage to pay for research generated by parties other than the executing broker dealers, which pertain primarily to funds investing in equity securities, along with the incidental public relations benefits to DWS and QS Investors related to DWS Funds advertising and cross-selling opportunities among DWS products and services. The Board concluded that management fees were reasonable in light of these fallout benefits.
Compliance. The Board considered the significant attention and resources dedicated by DWS to documenting and enhancing its compliance processes in recent years. The Board noted in particular (i) the experience and seniority of both DWS's chief compliance officer and the Fund's chief compliance officer; (ii) the large number of DWS compliance personnel; and (iii) the substantial commitment of resources by DWS and its affiliates to compliance matters. The Board also considered the attention and resources dedicated by DWS to the oversight of the investment sub-advisor's compliance program and compliance with the applicable fund policies and procedures.
Based on all of the information considered and the conclusions reached, the Board unanimously determined that the continuation of the Agreements is in the best interests of the Fund. In making this determination, the Board did not give particular weight to any single factor identified above. The Board considered these factors over the course of numerous meetings, certain of which were in executive session with only the Independent Trustees and their counsel present. It is possible that individual Trustees may have weighed these factors differently in reaching their individual decisions to approve the continuation of the Agreements.
Summary of Management Fee Evaluation by Independent Fee Consultant
September 26, 2011
Pursuant to an Order entered into by Deutsche Investment Management Americas and affiliates (collectively, "DeAM") with the Attorney General of New York, I, Thomas H. Mack, have been appointed the Independent Fee Consultant for the DWS Funds (formerly the DWS Scudder Funds). My duties include preparing an annual written evaluation of the management fees DeAM charges the Funds, considering among other factors the management fees charged by other mutual fund companies for like services, management fees DeAM charges other clients for like services, DeAM's costs of supplying services under the management agreements and related profit margins, possible economies of scale if a Fund grows larger, and the nature and quality of DeAM's services, including fund performance. This report summarizes my evaluation for 2011, including my qualifications, the evaluation process for each of the DWS Funds, consideration of certain complex-level factors, and my conclusions. I served in substantially the same capacity in 2007, 2008, 2009 and 2010.
Qualifications
For more than 35 years I have served in various professional capacities within the investment management business. I have held investment analysis and advisory positions, including securities analyst, portfolio strategist and director of investment policy with a large investment firm. I have also performed business management functions, including business development, financial management and marketing research and analysis.
Since 1991, I have been an independent consultant within the asset management industry. I have provided services to over 125 client organizations, including investment managers, mutual fund boards, product distributors and related organizations. Over the past ten years I have completed a number of assignments for mutual fund boards, specifically including assisting boards with management contract renewal.
I hold a Master of Business Administration degree, with highest honors, from Harvard University and Master of Science and Bachelor of Science (highest honors) degrees from the University of California at Berkeley. I am an independent director and audit committee financial expert for two closed-end mutual funds and have served in various leadership and financial oversight capacities with non-profit organizations.
Evaluation of Fees for each DWS Fund
My work focused primarily on evaluating, fund-by-fund, the fees charged to each of the 109 mutual fund portfolios in the DWS Fund family. For each Fund, I considered each of the key factors mentioned above, as well as any other relevant information. In doing so I worked closely with the Funds' Independent Directors in their annual contract renewal process, as well as in their approval of contracts for several new funds (documented separately).
In evaluating each Fund's fees, I reviewed comprehensive materials provided by or on behalf of DeAM, including expense information prepared by Lipper Analytical, comparative performance information, profitability data, manager histories, and other materials. I also accessed certain additional information from the Lipper and Morningstar databases and drew on my industry knowledge and experience.
To facilitate evaluating this considerable body of information, I prepared for each Fund a document summarizing the key data elements in each area as well as additional analytics discussed below. This made it possible to consider each key data element in the context of the others.
In the course of contract renewal, DeAM agreed to implement a number of fee and expense adjustments requested by the Independent Directors which will favorably impact future fees and expenses, and my evaluation includes the effects of these changes.
Fees and Expenses Compared with Other Funds
The competitive fee and expense evaluation for each fund focused on two primary comparisons:
The Fund's contractual management fee (the advisory fee plus the administration fee where applicable) compared with those of a group of typically 12-15 funds in the same Lipper investment category (e.g. Large Capitalization Growth) having similar distribution arrangements and being of similar size.
The Fund's total expenses compared with a broader universe of funds from the same Lipper investment category and having similar distribution arrangements.
These two comparisons provide a view of not only the level of the fee compared with funds of similar scale but also the total expense the Fund bears for all the services it receives, in comparison with the investment choices available in the Fund's investment category and distribution channel. The principal figure-of-merit used in these comparisons was the subject Fund's percentile ranking against peers.
DeAM's Fees for Similar Services to Others
DeAM provided management fee schedules for all of its US domiciled fund and non-fund investment management accounts in any of the investment categories where there is a DWS Fund. These similar products included the other DWS Funds, non-fund pooled accounts, institutional accounts and sub-advisory accounts. Using this information, I calculated for each Fund the fee that would be charged to each similar product, at the subject Fund's asset level.
Evaluating information regarding non-fund products is difficult because there are varying levels of services required for different types of accounts, with mutual funds generally requiring considerably more regulatory and administrative types of service as well as having more frequent cash flows than other types of accounts. Also, while mutual fund fees for similar fund products can be expected to be similar, there will be some differences due to different pricing conditions in different distribution channels (e.g. retail funds versus those used in variable insurance products), differences in underlying investment processes and other factors.
Costs and Profit Margins
DeAM provided a detailed profitability analysis for each Fund. After making some adjustments so that the presentation would be more comparable to the available industry figures, I reviewed profit margins from investment management alone, from investment management plus other fund services (excluding distribution) provided to the Funds by DeAM (principally shareholder services), and DeAM profits from all sources, including distribution. A later section comments on overall profitability.
Economies of Scale
Economies of scale — an expected decline in management cost per dollar of fund assets as fund assets grow — are very rarely quantified and documented because of inherent difficulties in collecting and analyzing relevant data. However, in virtually every investment category that I reviewed, larger funds tend to have lower fees and lower total expenses than smaller funds. To see how each DWS Fund compares with this industry observation, I reviewed:
The trend in Fund assets over the last five years and the accompanying trend in total expenses. This shows if the Fund has grown and, if so, whether total expense (management fees as well as other expenses) have declined as a percent of assets.
Whether the Fund has break-points in its management fee schedule, the extent of the fee reduction built into the schedule and the asset levels where the breaks take effect, and in the case of a sub-advised Fund how the Fund's break-points compare with those of the sub-advisory fee schedule.
How the Fund's contractual fee schedule compares with trends in the industry data. To accomplish this, I constructed a chart showing how actual latest-fiscal-year contractual fees of the Fund and of other similar funds relate to average fund assets, with the subject Fund's contractual fee schedule superimposed.
Quality of Service — Performance
The quality-of-service evaluation focused on investment performance, which is the principal result of the investment management service. Each Fund's performance was reviewed over the past 1, 3, 5 and 10 years, as applicable, and compared with that of other funds in the same investment category and with a suitable market index.
In addition, I calculated and reviewed risk-adjusted returns relative to an index of similar mutual funds' returns and a suitable market index. The risk-adjusted returns analysis provides a way of determining the extent to which the Fund's return comparisons are mainly the product of investment value-added (or lack thereof) or alternatively taking considerably more or less risk than is typical in its investment category.
I also received and considered the history of portfolio manager changes for each Fund, as this provided an important context for evaluating the performance results.
Complex-Level Considerations
While this evaluation was conducted mainly at the individual fund level, there are some issues relating to the reasonableness of fees that can alternatively be considered across the whole fund complex:
I reviewed DeAM's profitability analysis for all DWS Funds, with a view toward determining if the allocation procedures used were reasonable and how profit levels compared with public data for other investment managers.
I considered whether DeAM and affiliates receive any significant ancillary or "fall-out" benefits that should be considered in interpreting the direct profitability results. These would be situations where serving as the investment manager of the Funds is beneficial to another part of the Deutsche Bank organization.
I considered how aggregated DWS Fund expenses had varied over the years, by asset class and in the context of trends in asset levels.
I reviewed the structure of the DeAM organization, trends in staffing levels, and information on compensation of investment management and other professionals compared with industry data.
Findings
Based on the process and analysis discussed above, which included reviewing a wide range of information from management and external data sources and considering among other factors the fees DeAM charges other clients, the fees charged by other fund managers, DeAM's costs and profits associated with managing the Funds, economies of scale, possible fall-out benefits, and the nature and quality of services provided, in my opinion the management fees charged the DWS Funds are reasonable.
Thomas H. Mack
President, Thomas H. Mack & Co., Inc.
Board Members and Officers
The following table presents certain information regarding the Board Members and Officers of the fund as of December 31, 2011. Each Board Member's year of birth is set forth in parentheses after his or her name. Unless otherwise noted, (i) each Board Member has engaged in the principal occupation(s) noted in the table for at least the most recent five years, although not necessarily in the same capacity; and (ii) the address of each Independent Board Member is c/o Paul K. Freeman, Independent Chairman, DWS Funds, PO Box 101833, Denver, CO 80250-1833. Except as otherwise noted below, the term of office for each Board Member is until the election and qualification of a successor, or until such Board Member sooner dies, resigns, is removed or as otherwise provided in the governing documents of the fund. Because the fund does not hold an annual meeting of shareholders, each Board Member will hold office for an indeterminate period. The Board Members may also serve in similar capacities with other funds in the fund complex. The Length of Time Served represents the year in which the Board Member joined the Board of one or more DWS funds now overseen by the Board.
| Independent Board Members |
Name, Year of Birth, Position with the Fund and Length of Time Served1 | Business Experience and Directorships During the Past Five Years | Number of Funds in DWS Fund Complex Overseen |
Other Directorships Held by Board Member |
Paul K. Freeman (1950) Chairperson since 2009 Board Member since 1993 | Consultant, World Bank/Inter-American Development Bank; Executive and Governing Council of the Independent Directors Council (Chairman of Education Committee); formerly: Project Leader, International Institute for Applied Systems Analysis (1998-2001); Chief Executive Officer, The Eric Group, Inc. (environmental insurance) (1986-1998) | 110 | — |
John W. Ballantine (1946) Board Member since 1999 | Retired; formerly, Executive Vice President and Chief Risk Management Officer, First Chicago NBD Corporation/The First National Bank of Chicago (1996-1998); Executive Vice President and Head of International Banking (1995-1996). Directorships: Chairman of the Board, Healthways, Inc. (provider of disease and care management services); Portland General Electric (utility company); Stockwell Capital Investments PLC (private equity); former Directorships: First Oak Brook Bancshares, Inc. and Oak Brook Bank; Prisma Energy International | 110 | — |
Henry P. Becton, Jr. (1943) Board Member since 1990 | Vice Chair and former President, WGBH Educational Foundation. Directorships: Association of Public Television Stations; Public Radio International; Public Radio Exchange (PRX); The PBS Foundation; former Directorships: Boston Museum of Science; American Public Television; Concord Academy; New England Aquarium; Mass. Corporation for Educational Telecommunications; Committee for Economic Development; Public Broadcasting Service | 110 | Lead Director, Becton Dickinson and Company2 (medical technology company); Lead Director, Belo Corporation2 (media company) |
Dawn-Marie Driscoll (1946) Board Member since 1987 | President, Driscoll Associates (consulting firm); Executive Fellow, Center for Business Ethics, Bentley University; formerly, Partner, Palmer & Dodge (1988-1990); Vice President of Corporate Affairs and General Counsel, Filene's (1978-1988). Directorships: Director of ICI Mutual Insurance Company (since 2007); Advisory Board, Center for Business Ethics, Bentley University; Trustee, Southwest Florida Community Foundation (charitable organization); former Directorships: Investment Company Institute (audit, executive, nominating committees) and Independent Directors Council (governance, executive committees) | 110 | Trustee, Sun Capital Advisers, Inc. (22 open-end mutual funds advised by Sun Capital Advisers, Inc.) (since 2007) |
Keith R. Fox, CFA (1954) Board Member since 1996 | Managing General Partner, Exeter Capital Partners (a series of private investment funds) (since 1986). Directorships: Progressive International Corporation (kitchen goods importer and distributor); BoxTop Media Inc. (advertising); The Kennel Shop (retailer); former Chairman, National Association of Small Business Investment Companies | 110 | Trustee, Sun Capital Advisers, Inc. (22 open-end mutual funds advised by Sun Capital Advisers, Inc.) (since 2011) |
Kenneth C. Froewiss (1945) Board Member since 2001 | Adjunct Professor of Finance, NYU Stern School of Business (September 2009-present; Clinical Professor from 1997-September 2009); Member, Finance Committee, Association for Asian Studies (2002-present); Director, Mitsui Sumitomo Insurance Group (US) (2004-present); prior thereto, Managing Director, J.P. Morgan (investment banking firm) (until 1996) | 110 | — |
Richard J. Herring (1946) Board Member since 1990 | Jacob Safra Professor of International Banking and Professor, Finance Department, The Wharton School, University of Pennsylvania (since July 1972); Co-Director, Wharton Financial Institutions Center (since July 2000); Co-Chair, U.S. Shadow Financial Regulatory Committee; Executive Director, Financial Economists Roundtable; formerly: Vice Dean and Director, Wharton Undergraduate Division (July 1995-June 2000); Director, Lauder Institute of International Management Studies (July 2000-June 2006) | 110 | Director, Japan Equity Fund, Inc. (since September 2007), Thai Capital Fund, Inc. (since September 2007), Singapore Fund, Inc. (since September 2007), Independent Director of Barclays Bank Delaware (since September 2010) |
William McClayton (1944) Board Member since 2004 | Private equity investor (since October 2009); previously, Managing Director, Diamond Management & Technology Consultants, Inc. (global consulting firm) (2001-2009); Directorship: Board of Managers, YMCA of Metropolitan Chicago; formerly: Senior Partner, Arthur Andersen LLP (accounting) (1966-2001); Trustee, Ravinia Festival | 110 | — |
Rebecca W. Rimel (1951) Board Member since 1995 | President and Chief Executive Officer, The Pew Charitable Trusts (charitable organization) (1994 to present); Trustee, Washington College (2011 to present); formerly: Executive Vice President, The Glenmede Trust Company (investment trust and wealth management) (1983-2004); Board Member, Investor Education (charitable organization) (2004-2005); Trustee, Executive Committee, Philadelphia Chamber of Commerce (2001-2007); Trustee, Pro Publica (charitable organization) (2007-2010); Trustee, Thomas Jefferson Foundation (charitable organization) (1994 to 2011) | 110 | Director, CardioNet, Inc.2 (health care) (2009- present); Director, Viasys Health Care2 (January 2007- June 2007) |
William N. Searcy, Jr. (1946) Board Member since 1993 | Private investor since October 2003; formerly: Pension & Savings Trust Officer, Sprint Corporation2 (telecommunications) (November 1989-September 2003) | 110 | Trustee, Sun Capital Advisers, Inc. (22 open-end mutual funds advised by Sun Capital Advisers, Inc.) (since 1998) |
Jean Gleason Stromberg (1943) Board Member since 1997 | Retired. Formerly, Consultant (1997-2001); Director, Financial Markets US Government Accountability Office (1996-1997); Partner, Fulbright & Jaworski, L.L.P. (law firm) (1978-1996). Directorships: The William and Flora Hewlett Foundation; former Directorships: Service Source, Inc., Mutual Fund Directors Forum (2002-2004), American Bar Retirement Association (funding vehicle for retirement plans) (1987-1990 and 1994-1996) | 110 | — |
Robert H. Wadsworth (1940) Board Member since 1999 | President, Robert H. Wadsworth & Associates, Inc. (consulting firm) (1983 to present); Director, The Phoenix Boys Choir Association | 113 | — |
Officers4 |
Name, Year of Birth, Position with the Fund and Length of Time Served5 | Principal Occupation(s) During Past 5 Years and Other Directorships Held |
W. Douglas Beck, CFA6 (1967) President, 2011-present | Managing Director3, Deutsche Asset Management (2006-present); President of DWS family of funds and Head of Product Management, U.S. for DWS Investments; formerly, Executive Director, Head of Product Management (2002-2006) and President (2005-2006) of the UBS Funds at UBS Global Asset Management; Co-Head of Manager Research/Managed Solutions Group, Merrill Lynch (1998-2002) |
John Millette7 (1962) Vice President and Secretary, 1999-present | Director3, Deutsche Asset Management |
Paul H. Schubert6 (1963) Chief Financial Officer, 2004-present Treasurer, 2005-present | Managing Director3, Deutsche Asset Management (since July 2004); formerly, Executive Director, Head of Mutual Fund Services and Treasurer for UBS Family of Funds (1998-2004); Vice President and Director of Mutual Fund Finance at UBS Global Asset Management (1994-1998) |
Caroline Pearson7 (1962) Chief Legal Officer, 2010-present | Managing Director3, Deutsche Asset Management; formerly, Assistant Secretary for DWS family of funds (1997-2010) |
Rita Rubin6 (1970) Assistant Secretary, 2009-present | Director3 and Senior Counsel, Deutsche Asset Management (since October 2007); formerly, Vice President, Morgan Stanley Investment Management (2004-2007) |
Paul Antosca7 (1957) Assistant Treasurer, 2007-present | Director3, Deutsche Asset Management (since 2006); Vice President, The Manufacturers Life Insurance Company (U.S.A.) (1990-2006) |
Jack Clark7 (1967) Assistant Treasurer, 2007-present | Director3, Deutsche Asset Management (since 2007); formerly, Vice President, State Street Corporation (2002-2007) |
Diane Kenneally7 (1966) Assistant Treasurer, 2007-present | Director3, Deutsche Asset Management |
John Caruso6 (1965) Anti-Money Laundering Compliance Officer, 2010-present | Managing Director3, Deutsche Asset Management |
Robert Kloby6 (1962) Chief Compliance Officer, 2006-present | Managing Director3, Deutsche Asset Management |
1 The length of time served represents the year in which the Board Member joined the board of one or more DWS funds currently overseen by the Board.
2 A publicly held company with securities registered pursuant to Section 12 of the Securities Exchange Act of 1934.
3 Executive title, not a board directorship.
4 As a result of their respective positions held with the Advisor, these individuals are considered "interested persons" of the Advisor within the meaning of the 1940 Act. Interested persons receive no compensation from the fund.
5 The length of time served represents the year in which the officer was first elected in such capacity for one or more DWS funds.
6 Address: 60 Wall Street, New York, NY 10005.
7 Address: One Beacon Street, Boston, MA 02108.
The fund's Statement of Additional Information ("SAI") includes additional information about the Board Members. The SAI is available, without charge, upon request. If you would like to request a copy of the SAI, you may do so by calling the following toll-free number: (800) 728-3337.
Notes
DWS Investments Distributors, Inc.
222 South Riverside Plaza
Chicago, IL 60606
(800) 621-1148
VS1groinc-2 (R-025822-1 2/12)
DECEMBER 31, 2011
ANNUAL REPORT
DWS VARIABLE SERIES I
DWS Global Small Cap Growth VIP
(formerly DWS Global Opportunities VIP)
Contents
11 Statement of Assets and Liabilities 12 Statement of Operations 13 Statement of Changes in Net Assets 15 Notes to Financial Statements 19 Report of Independent Registered Public Accounting Firm 20 Information About Your Fund's Expenses 22 Investment Management Agreement Approval 25 Summary of Management Fee Evaluation by Independent Fee Consultant 27 Board Members and Officers |
This report must be preceded or accompanied by a prospectus. To obtain an additional prospectus or summary prospectus, if available, call (800) 728-3337 or your financial representative. We advise you to consider the Fund's objectives, risks, charges and expenses carefully before investing. The summary prospectus and prospectus contain this and other important information about the Fund. Please read the prospectus carefully before you invest.
Investing in foreign securities, particularly those of emerging markets, presents certain risks, such as currency fluctuations, political and economic changes, and market risks. Stocks of smaller companies involve greater risk than securities of larger, more-established companies. Stocks may decline in value. The fund may lend securities to approved institutions. See the prospectus for details.
DWS Investments is part of Deutsche Bank's Asset Management division and, within the U.S., represents the retail asset management activities of Deutsche Bank AG, Deutsche Bank Trust Company Americas, Deutsche Investment Management Americas Inc. and DWS Trust Company.
NOT FDIC/NCUA INSURED NO BANK GUARANTEE MAY LOSE VALUE NOT A DEPOSIT
NOT INSURED BY ANY FEDERAL GOVERNMENT AGENCY
Performance Summary December 31, 2011
Fund performance shown is historical, assumes reinvestment of all dividend and capital gain distributions, and does not guarantee future results. Investment return and principal value fluctuate with changing market conditions so that, when redeemed, shares may be worth more or less than their original cost. Current performance may be lower or higher than the performance data quoted. Please contact your participating insurance company for the Fund's most recent month-end performance. Performance doesn't reflect charges and fees ("contract charges") associated with the separate account that invests in the Fund or any variable life insurance policy or variable annuity contract for which the Fund is an investment option. These charges and fees will reduce returns. While all share classes have the same underlying portfolio, their performance will differ.
The gross expense ratios of the Fund, as stated in the fee table of the prospectus dated May 1, 2011 are 1.12% and 1.34% for Class A and Class B shares, respectively, and may differ from the expense ratios disclosed in the Financial Highlights tables in this report.
| Growth of an Assumed $10,000 Investment |
[] DWS Global Small Cap Growth VIP — Class A [] S&P® Developed SmallCap Index | The S&P® Developed SmallCap Index is an unmanaged index of small-capitalization stocks within 26 countries around the globe. Index returns do not reflect any fees or expenses and it is not possible to invest directly into an index. |
| |
| Yearly periods ended December 31 | |
| Comparative Results | |
| DWS Global Small Cap Growth VIP | | 1-Year | | | 3-Year | | | 5-Year | | | 10-Year | |
| Class A | Growth of $10,000 | | $ | 9,010 | | | $ | 16,911 | | | $ | 9,251 | | | $ | 19,664 | |
| Average annual total return | | | -9.90 | % | | | 19.14 | % | | | -1.55 | % | | | 7.00 | % |
| S&P Developed SmallCap Index | Growth of $10,000 | | $ | 9,143 | | | $ | 15,863 | | | $ | 9,463 | | | $ | 21,305 | |
| Average annual total return | | | -8.57 | % | | | 16.63 | % | | | -1.10 | % | | | 7.86 | % |
| DWS Global Small Cap Growth VIP | | 1-Year | | | 3-Year | | | 5-Year | | | 10-Year | |
| Class B | Growth of $10,000 | | $ | 8,992 | | | $ | 16,780 | | | $ | 9,109 | | | $ | 19,189 | |
| Average annual total return | | | -10.08 | % | | | 18.83 | % | | | -1.85 | % | | | 6.73 | % |
| S&P Developed SmallCap Index | Growth of $10,000 | | $ | 9,143 | | | $ | 15,863 | | | $ | 9,463 | | | $ | 21,305 | |
| Average annual total return | | | -8.57 | % | | | 16.63 | % | | | -1.10 | % | | | 7.86 | % |
The growth of $10,000 is cumulative.
Management Summary December 31, 2011
DWS Global Small Cap Growth VIP returned -9.90% in 2011 (Class A shares, unadjusted for contract charges), underperforming the -8.57% return of the S&P® Developed SmallCap Index.1
The Fund's overweight in non-U.S. equities, which we found to be more attractively valued than their U.S.-based counterparts, was a headwind to performance given the poor returns of international equities in 2011.2 Historically, we have been able to overcome such regional factors through stock selection, but we were unable to do so during the past year. While our European holdings actually had a positive return in 2011, our overweight position in Asia — along with our stock selection in the region — was a drag on our results. Our stock selection also missed the mark in financials, where we were hurt by our positions in Chinese stocks that experienced substantial underperformance, including K Wah International Holdings Ltd. and REXlot Holdings Ltd. Our performance was also affected by our stock selection in the consumer discretionary sector, where the auto parts manufacturer Minth Group Ltd. was our leading detractor, and in consumer staples, where Diamond Foods, Inc. pressured our results.3,4 On the positive side, our investments in health care handily outpaced the broader sector due, in part, to the strong performance of Questcor Pharmaceuticals, Inc. and Fresenius Medical Care AG & Co KGaA. We also added value through stock selection in the industrials, materials and energy sectors.
Although various risks to economic growth continue to weigh heavily on day-to-day market performance, we believe the longer-term outlook for equities is favorable. Global growth has stabilized and corporate earnings growth remains steady, yet valuations are depressed relative to historical levels. There is a growing universe of small-cap companies with cash-rich balance sheets, robust earnings growth and cautious managements positioned to survive — and potentially thrive — despite the macroeconomic backdrop. In short, we see a disconnect between market performance and underlying corporate fundamentals. We have sought to capitalize on this divergence by putting cash to work in select new and existing holdings, and balancing our exposure between inexpensive but economically sensitive companies on one hand and stable, secular growth companies on the other. We believe our approach of using market volatility to buy growing companies at attractive valuations helps build the foundation for long-term returns.
Joseph Axtell, CFA
Portfolio Manager
1 The S&P Developed SmallCap Index is an unmanaged index of small-capitalization stocks within 26 countries around the globe. Index returns do not reflect any fees or expenses and it is not possible to invest directly into an index.
2 "Overweight" means the Fund holds a higher weighting in a given sector or security than the benchmark. "Underweight" means the Fund holds a lower weighting.
3 The consumer discretionary sector represents industries that produce goods and services that are not necessities in everyday life.
4 Consumer staples are the industries that manufacture and sell products such as food and beverages, prescription drugs, and household products.
The views expressed reflect those of the portfolio management team only through the end of the period of the report as stated on the cover. The management team's views are subject to change at any time based on market and other conditions and should not be construed as a recommendation. Past performance is no guarantee of future results. Current and future portfolio holdings are subject to risk.
Asset Allocation (As a % of Investment Portfolio excluding Securities Lending Collateral) | 12/31/11 | 12/31/10 |
| | | |
| Common Stocks | 99% | 99% |
| Cash Equivalents | 1% | 1% |
| | 100% | 100% |
Geographical Diversification (As a % of Investment Portfolio excluding Cash Equivalents and Securities Lending Collateral) | 12/31/11 | 12/31/10 |
| | | |
| United States | 45% | 40% |
| Continental Europe | 22% | 21% |
| United Kingdom | 11% | 9% |
| Asia (excluding Japan) | 10% | 15% |
| Japan | 7% | 8% |
| Canada | 1% | 2% |
| Middle East | 1% | 1% |
| Latin America | 1% | 1% |
| Australia | 1% | 2% |
| Other | 1% | 1% |
| | 100% | 100% |
Sector Diversification (As a % of Investment Portfolio excluding Cash Equivalents and Securities Lending Collateral) | 12/31/11 | 12/31/10 |
| | | |
| Industrials | 23% | 22% |
| Consumer Discretionary | 20% | 18% |
| Health Care | 20% | 14% |
| Information Technology | 12% | 15% |
| Financials | 10% | 12% |
| Energy | 8% | 8% |
| Consumer Staples | 5% | 5% |
| Materials | 2% | 6% |
| | 100% | 100% |
Asset allocation, geographical diversification and sector diversification are subject to change.
For more complete details about the Fund's investment portfolio, see page 6.
Following the Fund's fiscal first and third quarter-end, a complete portfolio holdings listing is filed with the SEC on Form N-Q. The form will be available on the SEC's Web site at www.sec.gov, and it also may be reviewed and copied at the SEC's Public Reference Room in Washington, D.C. Information on the operation of the SEC's Public Reference Room may be obtained by calling (800) SEC-0330. The Fund's portfolio holdings are also posted on www.dws-investments.com from time to time. Please see the Fund's current prospectus for more information.
Investment Portfolio December 31, 2011 | | | Shares | | | Value ($) | |
| | | | |
| Common Stocks 99.2% | |
| Australia 0.6% | |
| Austal Ltd. (Cost $606,215) | | | 317,365 | | | | 698,496 | |
| Austria 0.9% | |
| Andritz AG (Cost $1,240,572) | | | 14,123 | | | | 1,170,090 | |
| Bermuda 0.8% | |
| Energy XXI (Bermuda) Ltd.* | | | 10,250 | | | | 326,770 | |
| Lazard Ltd. "A" (a) | | | 26,900 | | | | 702,359 | |
| (Cost $962,653) | | | | 1,029,129 | |
| Brazil 1.0% | |
| Fleury SA (Cost $1,245,600) | | | 106,204 | | | | 1,218,478 | |
| Canada 1.2% | |
| Americas Petrogas, Inc.* | | | 116,965 | | | | 342,140 | |
| SunOpta, Inc.* | | | 230,568 | | | | 1,111,338 | |
| (Cost $1,995,560) | | | | 1,453,478 | |
| Channel Islands 0.9% | |
| Randgold Resources Ltd. (ADR) (Cost $721,102) | | | 11,627 | | | | 1,187,117 | |
| China 1.8% | |
| Charm Communications, Inc. (ADR)* | | | 108,791 | | | | 943,218 | |
| Minth Group Ltd. | | | 1,441,534 | | | | 1,353,570 | |
| (Cost $1,883,936) | | | | 2,296,788 | |
| Cyprus 0.6% | |
| ProSafe SE (Cost $668,450) | | | 102,813 | | | | 701,661 | |
| France 1.5% | |
| Flamel Technologies SA (ADR)* | | | 167,113 | | | | 870,659 | |
| JC Decaux SA* | | | 44,410 | | | | 1,019,619 | |
| (Cost $3,221,460) | | | | 1,890,278 | |
| Germany 6.0% | |
| Fresenius Medical Care AG & Co. KGaA | | | 54,151 | | | | 3,679,354 | |
| M.A.X. Automation AG | | | 232,043 | | | | 1,144,794 | |
| Rational AG | | | 5,948 | | | | 1,294,787 | |
| United Internet AG (Registered) | | | 77,391 | | | | 1,382,225 | |
| (Cost $2,311,882) | | | | 7,501,160 | |
| Gibraltar 0.4% | |
| Bwin.Party Digital Entertainment PLC (Cost $874,189) | | | 211,754 | | | | 537,049 | |
| Hong Kong 3.5% | |
| EVA Precision Industrial Holdings Ltd. | | | 5,676,229 | | | | 1,372,545 | |
| K Wah International Holdings Ltd. | | | 3,998,674 | | | | 1,013,208 | |
| REXLot Holdings Ltd. | | | 21,156,155 | | | | 1,388,108 | |
| SOCAM Development Ltd. | | | 648,348 | | | | 598,773 | |
| (Cost $4,763,268) | | | | 4,372,634 | |
| Ireland 3.8% | |
| C&C Group PLC (b) | | | 144,956 | | | | 534,035 | |
| C&C Group PLC (b) | | | 185,737 | | | | 689,764 | |
| Paddy Power PLC | | | 35,978 | | | | 2,068,067 | |
| Ryanair Holdings PLC* (b) | | | 307,920 | | | | 1,442,209 | |
| Ryanair Holdings PLC* (b) | | | 2,200 | | | | 10,572 | |
| (Cost $2,987,386) | | | | 4,744,647 | |
| | | Shares | | | Value ($) | |
| | | | | | | | | |
| Israel 0.4% | |
| EZchip Semiconductor Ltd.* (a) (Cost $631,763) | | | 19,000 | | | | 538,270 | |
| Italy 0.5% | |
| Prysmian SpA (Cost $837,686) | | | 46,571 | | | | 575,535 | |
| Japan 7.3% | |
| Hajime Construction Co., Ltd. | | | 41,681 | | | | 856,115 | |
| Internet Initiative Japan, Inc. | | | 200 | | | | 716,503 | |
| JFE Shoji Holdings, Inc. | | | 215,014 | | | | 895,651 | |
| Kato Sangyo Co., Ltd. | | | 38,582 | | | | 744,289 | |
| MISUMI Group, Inc. | | | 51,653 | | | | 1,185,312 | |
| Nippon Seiki Co., Ltd. | | | 104,513 | | | | 1,131,708 | |
| Sumikin Bussan Corp. | | | 422,428 | | | | 1,069,256 | |
| Universal Entertainment Corp. | | | 90,418 | | | | 2,496,887 | |
| (Cost $8,020,473) | | | | 9,095,721 | |
| Korea 0.8% | |
| DGB Financial Group, Inc.* (Cost $1,413,502) | | | 95,106 | | | | 1,070,865 | |
| Luxembourg 0.7% | |
| L'Occitane International SA (Cost $979,854) | | | 453,341 | | | | 907,937 | |
| Malaysia 0.6% | |
| Hartalega Holdings Bhd. (Cost $708,480) | | | 402,191 | | | | 739,261 | |
| Netherlands 4.9% | |
| Brunel International NV | | | 24,631 | | | | 723,194 | |
| Chicago Bridge & Iron Co. NV (c) | | | 47,789 | | | | 1,806,424 | |
| Koninklijke Vopak NV | | | 32,153 | | | | 1,693,970 | |
| SBM Offshore NV | | | 91,270 | | | | 1,876,152 | |
| (Cost $3,016,240) | | | | 6,099,740 | |
| Philippines 0.5% | |
| Cebu Air, Inc. (Cost $1,093,752) | | | 403,406 | | | | 598,756 | |
| Singapore 1.9% | |
| Amtek Engineering Ltd. | | | 1,482,234 | | | | 672,777 | |
| UOB-Kay Hian Holdings Ltd. | | | 578,390 | | | | 684,780 | |
| Yongnam Holdings Ltd. | | | 5,575,193 | | | | 989,307 | |
| (Cost $3,270,189) | | | | 2,346,864 | |
| Spain 0.4% | |
| Tecnicas Reunidas SA (d) (Cost $812,339) | | | 13,884 | | | | 498,198 | |
| Switzerland 1.2% | |
| Partners Group Holding AG (Cost $521,648) | | | 8,555 | | | | 1,490,262 | |
| Taiwan 0.8% | |
| E Ink Holdings, Inc. (Cost $1,473,862) | | | 742,989 | | | | 967,265 | |
| United Arab Emirates 0.7% | |
| Lamprell PLC (Cost $659,266) | | | 217,459 | | | | 904,240 | |
| United Kingdom 10.5% | |
| Aegis Group PLC | | | 248,771 | | | | 555,583 | |
| ARM Holdings PLC | | | 174,989 | | | | 1,613,215 | |
| Ashmore Group PLC | | | 313,127 | | | | 1,617,506 | |
| Babcock International Group PLC | | | 178,266 | | | | 2,028,043 | |
| | | Shares | | | Value ($) | |
| | | | | | | | | |
| Burberry Group PLC | | | 50,916 | | | | 931,776 | |
| Domino's Pizza UK & IRL PLC | | | 181,112 | | | | 1,128,840 | |
| Hargreaves Lansdown PLC | | | 66,976 | | | | 445,977 | |
| ICAP PLC | | | 98,470 | | | | 529,749 | |
| IG Group Holdings PLC | | | 150,274 | | | | 1,112,121 | |
| John Wood Group PLC | | | 94,125 | | | | 932,413 | |
| Rotork PLC | | | 45,773 | | | | 1,366,984 | |
| Serco Group PLC | | | 118,277 | | | | 869,724 | |
| (Cost $8,664,002) | | | | 13,131,931 | |
| United States 45.0% | |
| Advance Auto Parts, Inc. | | | 17,884 | | | | 1,245,263 | |
| Aecom Technology Corp.* | | | 47,758 | | | | 982,382 | |
| Aeropostale, Inc.* | | | 53,258 | | | | 812,184 | |
| Affiliated Managers Group, Inc.* | | | 9,854 | | | | 945,491 | |
| Altra Holdings, Inc.* | | | 49,452 | | | | 931,181 | |
| Approach Resources, Inc.* | | | 25,521 | | | | 750,573 | |
| Atmel Corp.* | | | 64,750 | | | | 524,475 | |
| BE Aerospace, Inc.* | | | 41,384 | | | | 1,601,975 | |
| BorgWarner, Inc.* | | | 15,623 | | | | 995,810 | |
| Cardtronics, Inc.* | | | 70,944 | | | | 1,919,745 | |
| Centene Corp.* | | | 53,624 | | | | 2,122,974 | |
| Cognex Corp. | | | 34,891 | | | | 1,248,749 | |
| CONMED Corp.* | | | 29,715 | | | | 762,784 | |
| Deckers Outdoor Corp.* | | | 21,867 | | | | 1,652,489 | |
| Diamond Foods, Inc. | | | 32,874 | | | | 1,060,844 | |
| Dresser-Rand Group, Inc.* | | | 27,393 | | | | 1,367,185 | |
| FSI International, Inc.* | | | 193,500 | | | | 708,210 | |
| Green Mountain Coffee Roasters, Inc.* | | | 9,280 | | | | 416,208 | |
| Guess?, Inc. | | | 30,700 | | | | 915,474 | |
| Harris Corp. | | | 23,156 | | | | 834,542 | |
| Haynes International, Inc. | | | 5,629 | | | | 307,343 | |
| hhgregg, Inc.* | | | 50,566 | | | | 730,679 | |
| Jarden Corp. | | | 32,704 | | | | 977,196 | |
| Jefferies Group, Inc. | | | 56,400 | | | | 775,500 | |
| Joy Global, Inc. | | | 9,018 | | | | 676,079 | |
| Life Technologies Corp.* | | | 29,757 | | | | 1,157,845 | |
| MICROS Systems, Inc.* | | | 6,285 | | | | 292,755 | |
| NIC, Inc. | | | 68,183 | | | | 907,516 | |
| NxStage Medical, Inc.* | | | 65,965 | | | | 1,172,858 | |
| Oil States International, Inc.* | | | 16,188 | | | | 1,236,278 | |
| Onyx Pharmaceuticals, Inc.* | | | 13,835 | | | | 608,048 | |
| Pacira Pharmaceuticals, Inc.* | | | 155,707 | | | | 1,346,866 | |
| Polycom, Inc.* | | | 25,876 | | | | 421,779 | |
| Prosperity Bancshares, Inc. | | | 28,851 | | | | 1,164,138 | |
| Questcor Pharmaceuticals, Inc.* | | | 76,571 | | | | 3,183,822 | |
| Rosetta Resources, Inc.* | | | 14,171 | | | | 616,438 | |
| Rovi Corp.* | | | 22,959 | | | | 564,332 | |
| | | Shares | | | Value ($) | |
| | | | | | | | | |
| Schweitzer-Mauduit International, Inc. | | | 24,006 | | | | 1,595,439 | |
| Shutterfly, Inc.* | | | 25,877 | | | | 588,961 | |
| Sirona Dental Systems, Inc.* | | | 20,815 | | | | 916,693 | |
| Stericycle, Inc.* | | | 12,271 | | | | 956,156 | |
| SXC Health Solutions Corp.* | | | 28,777 | | | | 1,625,325 | |
| Sycamore Networks, Inc.* | | | 37,933 | | | | 679,001 | |
| Tenneco, Inc.* | | | 18,649 | | | | 555,367 | |
| Thoratec Corp.* | | | 56,361 | | | | 1,891,475 | |
| TiVo, Inc.* | | | 72,127 | | | | 646,979 | |
| TreeHouse Foods, Inc.* | | | 20,019 | | | | 1,308,842 | |
| Ultra Petroleum Corp.* | | | 16,871 | | | | 499,888 | |
| Universal American Corp. | | | 67,383 | | | | 856,438 | |
| Urban Outfitters, Inc.* | | | 41,483 | | | | 1,143,271 | |
| VeriFone Systems, Inc.* | | | 20,277 | | | | 720,239 | |
| VIVUS, Inc.* | | | 86,066 | | | | 839,143 | |
| WABCO Holdings, Inc.* | | | 24,269 | | | | 1,053,275 | |
| Waddell & Reed Financial, Inc. "A" | | | 26,407 | | | | 654,101 | |
| WellCare Health Plans, Inc.* | | | 18,205 | | | | 955,762 | |
| Zeltiq Aesthetics, Inc.* | | | 44,760 | | | | 508,474 | |
| Zions Bancorp. | | | 20,704 | | | | 337,061 | |
| (Cost $43,597,030) | | | | 56,269,900 | |
Total Common Stocks (Cost $99,182,359) | | | | 124,035,750 | |
| | |
| Warrants 0.0% | |
| Hong Kong | |
| Kingboard Chemical Holdings Ltd., Expiration Date 10/31/2012* (Cost $0) | | | 39,014 | | | | 1,457 | |
| | |
| Securities Lending Collateral 0.4% | |
| Daily Assets Fund Institutional, 0.18% (e) (f) (Cost $468,662) | | | 468,662 | | | | 468,662 | |
| | |
| Cash Equivalents 0.7% | |
| Central Cash Management Fund, 0.07% (e) (Cost $908,794) | | | 908,794 | | | | 908,794 | |
| | | % of Net Assets | | | Value ($) | |
| | | | |
Total Investment Portfolio (Cost $100,559,815)+ | | | 100.3 | | | | 125,414,663 | |
| Other Assets and Liabilities, Net | | | (0.3 | ) | | | (366,042 | ) |
| Net Assets | | | 100.0 | | | | 125,048,621 | |
* Non-income producing security.
+ The cost for federal income tax purposes was $101,230,291. At December 31, 2011, net unrealized appreciation for all securities based on tax cost was $24,184,372. This consisted of aggregate gross unrealized appreciation for all securities in which there was an excess of value over tax cost of $36,780,962 and aggregate gross unrealized depreciation for all securities in which there was an excess of tax cost over value of $12,596,590.
(a) Listed on the NASDAQ Stock Market, Inc.
(b) Securities with the same description are the same corporate entity but trade on different stock exchanges.
(c) Listed on the New York Stock Exchange.
(d) All or a portion of these securities were on loan (see Notes to Financial Statements). The value of all securities loaned at December 31, 2011 amounted to $447,854, which is 0.4% of net assets.
(e) Affiliated fund managed by Deutsche Investment Management Americas Inc. The rate shown is the annualized seven-day yield at period end.
(f) Represents collateral held in connection with securities lending. Income earned by the Fund is net of borrower rebates.
ADR: American Depositary Receipt
Fair Value Measurements
Various inputs are used in determining the value of the Fund's investments. These inputs are summarized in three broad levels. Level 1 includes quoted prices in active markets for identical securities. Level 2 includes other significant observable inputs (including quoted prices for similar securities, interest rates, prepayment speeds, and credit risk). Level 3 includes significant unobservable inputs (including the Fund's own assumptions in determining the fair value of investments). The inputs or methodology used for valuing securities are not necessarily an indication of the risk associated with investing in those securities.
The following is a summary of the inputs used as of December 31, 2011 in valuing the Fund's investments. For information on the Fund's policy regarding the valuation of investments, please refer to the Security Valuation section of Note A in the accompanying Notes to Financial Statements.
| Assets | | Level 1 | | | Level 2 | | | Level 3 | | | Total | |
| | |
| Common Stocks & Warrants (g) | | | | | | | | | | | | |
| Australia | | $ | — | | | $ | 698,496 | | | $ | — | | | $ | 698,496 | |
| Austria | | | — | | | | 1,170,090 | | | | — | | | | 1,170,090 | |
| Bermuda | | | 1,029,129 | | | | — | | | | — | | | | 1,029,129 | |
| Brazil | | | 1,218,478 | | | | — | | | | — | | | | 1,218,478 | |
| Canada | | | 1,453,478 | | | | — | | | | — | | | | 1,453,478 | |
| Channel Islands | | | 1,187,117 | | | | — | | | | — | | | | 1,187,117 | |
| China | | | 943,218 | | | | 1,353,570 | | | | — | | | | 2,296,788 | |
| Cyprus | | | — | | | | 701,661 | | | | — | | | | 701,661 | |
| France | | | 870,659 | | | | 1,019,619 | | | | — | | | | 1,890,278 | |
| Germany | | | — | | | | 7,501,160 | | | | — | | | | 7,501,160 | |
| Gibraltar | | | — | | | | 537,049 | | | | — | | | | 537,049 | |
| Hong Kong | | | — | | | | 4,374,091 | | | | — | | | | 4,374,091 | |
| Ireland | | | — | | | | 4,744,647 | | | | — | | | | 4,744,647 | |
| Israel | | | 538,270 | | | | — | | | | — | | | | 538,270 | |
| Italy | | | — | | | | 575,535 | | | | — | | | | 575,535 | |
| Japan | | | — | | | | 9,095,721 | | | | — | | | | 9,095,721 | |
| Korea | | | — | | | | 1,070,865 | | | | — | | | | 1,070,865 | |
| Luxembourg | | | — | | | | 907,937 | | | | — | | | | 907,937 | |
| Malaysia | | | — | | | | 739,261 | | | | — | | | | 739,261 | |
| Netherlands | | | 1,806,424 | | | | 4,293,316 | | | | — | | | | 6,099,740 | |
| Philippines | | | — | | | | 598,756 | | | | — | | | | 598,756 | |
| Singapore | | | — | | | | 2,346,864 | | | | — | | | | 2,346,864 | |
| Spain | | | — | | | | 498,198 | | | | — | | | | 498,198 | |
| Switzerland | | | — | | | | 1,490,262 | | | | — | | | | 1,490,262 | |
| Taiwan | | | — | | | | 967,265 | | | | — | | | | 967,265 | |
| United Arab Emirates | | | — | | | | 904,240 | | | | — | | | | 904,240 | |
| United Kingdom | | | — | | | | 13,131,931 | | | | — | | | | 13,131,931 | |
| United States | | | 56,269,900 | | | | — | | | | — | | | | 56,269,900 | |
| Short-Term Investments (g) | | | 1,377,456 | | | | — | | | | — | | | | 1,377,456 | |
| Total | | $ | 66,694,129 | | | $ | 58,720,534 | | | $ | — | | | $ | 125,414,663 | |
There have been no transfers between Level 1 and Level 2 fair value measurements during the year ended December 31, 2011.
(g) See Investment Portfolio for additional detailed categorizations.
The accompanying notes are an integral part of the financial statements.
Statement of Assets and Liabilities | as of December 31, 2011 | |
| Assets | |
Investments: Investments in non-affiliated securities, at value (cost $99,182,359) — including $447,854 of securities loaned | | $ | 124,037,207 | |
| Investment in Daily Assets Fund Institutional (cost $468,662)* | | | 468,662 | |
| Investment in Central Cash Management Fund (cost $908,794) | | | 908,794 | |
| Total investments in securities, at value (cost $100,559,815) | | | 125,414,663 | |
| Foreign currency, at value (cost $671,250) | | | 654,374 | |
| Receivable for Fund shares sold | | | 36,191 | |
| Dividends receivable | | | 63,721 | |
| Interest receivable | | | 199 | |
| Foreign taxes recoverable | | | 30,023 | |
| Other assets | | | 2,734 | |
| Total assets | | | 126,201,905 | |
| Liabilities | |
| Payable upon return of securities loaned | | | 468,662 | |
| Payable for investments purchased | | | 351,996 | |
| Payable for Fund shares redeemed | | | 161,792 | |
| Accrued management fee | | | 86,841 | |
| Other accrued expenses and payables | | | 84,002 | |
| Total liabilities | | | 1,153,293 | |
| Net assets, at value | | $ | 125,048,612 | |
| Net Assets Consist of | |
| Undistributed net investment income | | | 821,499 | |
Net unrealized appreciation (depreciation) on: Investments | | | 24,854,848 | |
| Foreign currency | | | (15,718 | ) |
| Accumulated net realized gain (loss) | | | 6,084,647 | |
| Paid-in capital | | | 93,303,336 | |
| Net assets, at value | | $ | 125,048,612 | |
Class A Net Asset Value, offering and redemption price per share ($123,176,738 ÷ 9,718,286 outstanding shares of beneficial interest, $.01 par value, unlimited number of shares authorized) | | $ | 12.67 | |
Class B Net Asset Value, offering and redemption price per share ($1,871,874 ÷ 150,330 outstanding shares of beneficial interest, $.01 par value, unlimited number of shares authorized) | | $ | 12.45 | |
* Represents collateral on securities loaned.
The accompanying notes are an integral part of the financial statements.
Statement of Operations
| for the year ended December 31, 2011 | |
| Investment Income | |
Income: Dividends (net of foreign taxes withheld of $113,543) | | $ | 2,233,892 | |
| Income distributions — Central Cash Management Fund | | | 4,008 | |
| Securities lending income, including income from Daily Assets Fund Institutional, net of borrower rebates | | | 69,748 | |
| Total income | | | 2,307,648 | |
Expenses: Management fee | | | 1,308,836 | |
| Administration fee | | | 147,060 | |
| Services to shareholders | | | 4,095 | |
| Distribution service fee (Class B) | | | 5,368 | |
| Custodian fee | | | 33,685 | |
| Professional fees | | | 62,958 | |
| Reports to shareholders | | | 42,251 | |
| Trustees' fees and expenses | | | 6,605 | |
| Other | | | 43,338 | |
| Total expenses before expense reductions | | | 1,654,196 | |
| Expense reductions | | | (181,324 | ) |
| Total expenses after expense reductions | | | 1,472,872 | |
| Net investment income (loss) | | | 834,776 | |
| Realized and Unrealized Gain (Loss) | |
Net realized gain (loss) from: Investments | | | 18,179,728 | |
| Foreign currency | | | 3,410 | |
| | | | 18,183,138 | |
Change in net unrealized appreciation (depreciation) on: Investments (including deferred foreign taxes credit of $664) | | | (33,258,984 | ) |
| Foreign currency | | | (22,388 | ) |
| | | | (33,281,372 | ) |
| Net gain (loss) | | | (15,098,234 | ) |
| Net increase (decrease) in net assets resulting from operations | | $ | (14,263,458 | ) |
The accompanying notes are an integral part of the financial statements.
Statement of Changes in Net Assets | | | Years Ended December 31, | |
| Increase (Decrease) in Net Assets | | 2011 | | | 2010 | |
Operations: Net investment income (loss) | | $ | 834,776 | | | $ | 589,628 | |
| Net realized gain (loss) | | | 18,183,138 | | | | 13,410,313 | |
| Change in net unrealized appreciation (depreciation) | | | (33,281,372 | ) | | | 20,284,923 | |
| Net increase (decrease) in net assets resulting from operations | | | (14,263,458 | ) | | | 34,284,864 | |
Distributions to shareholders from: Net investment income: Class A | | | (2,513,532 | ) | | | (567,314 | ) |
| Class B | | | (31,935 | ) | | | (5,306 | ) |
| Total distributions | | | (2,545,467 | ) | | | (572,620 | ) |
Fund share transactions: Class A Proceeds from shares sold | | | 8,812,558 | | | | 13,029,724 | |
| Reinvestment of distributions | | | 2,513,532 | | | | 567,314 | |
| Payments for shares redeemed | | | (29,308,758 | ) | | | (27,999,087 | ) |
| Net increase (decrease) in net assets from Class A share transactions | | | (17,982,668 | ) | | | (14,402,049 | ) |
Class B Proceeds from shares sold | | | 118,378 | | | | 260,167 | |
| Reinvestment of distributions | | | 31,935 | | | | 5,306 | |
| Payments for redeemed | | | (327,414 | ) | | | (5,280,324 | ) |
| Net increase (decrease) in net assets from Class B share transactions | | | (177,101 | ) | | | (5,014,851 | ) |
| Increase (decrease) in net assets | | | (34,968,694 | ) | | | 14,295,344 | |
| Net assets at beginning of period | | | 160,017,306 | | | | 145,721,962 | |
| Net assets at end of period (including undistributed net investment income of $821,499 and $768,378, respectively) | | $ | 125,048,612 | | | $ | 160,017,306 | |
| Other Information | |
Class A Shares outstanding at beginning of period | | | 11,043,518 | | | | 12,301,988 | |
| Shares sold | | | 635,010 | | | | 1,052,936 | |
| Shares issued to shareholders in reinvestment of distributions | | | 165,582 | | | | 46,236 | |
| Shares redeemed | | | (2,125,824 | ) | | | (2,357,642 | ) |
| Net increase (decrease) in Class A shares | | | (1,325,232 | ) | | | (1,258,470 | ) |
| Shares outstanding at end of period | | | 9,718,286 | | | | 11,043,518 | |
Class B Shares outstanding at beginning of period | | | 163,772 | | | | 586,186 | |
| Shares sold | | | 8,664 | | | | 22,014 | |
| Shares issued to shareholders in reinvestment of distributions | | | 2,139 | | | | 439 | |
| Shares redeemed | | | (24,245 | ) | | | (444,867 | ) |
| Net increase (decrease) in Class B shares | | | (13,442 | ) | | | (422,414 | ) |
| Shares outstanding at end of period | | | 150,330 | | | | 163,772 | |
The accompanying notes are an integral part of the financial statements.
| | | Years Ended December 31, | |
| Class A | | 2011 | | | 2010 | | | 2009 | | | 2008 | | | 2007 | |
| Selected Per Share Data | |
| Net asset value, beginning of period | | $ | 14.28 | | | $ | 11.32 | | | $ | 7.79 | | | $ | 18.28 | | | $ | 18.15 | |
Income (loss) from investment operations: Net investment income (loss)a | | | .08 | | | | .05 | | | | .04 | | | | .20 | c | | | .08 | c |
| Net realized and unrealized gain (loss) | | | (1.45 | ) | | | 2.96 | | | | 3.64 | | | | (8.18 | ) | | | 1.61 | |
| Total from investment operations | | | (1.37 | ) | | | 3.01 | | | | 3.68 | | | | (7.98 | ) | | | 1.69 | |
Less distributions from: Net investment income | | | (.24 | ) | | | (.05 | ) | | | (.15 | ) | | | (.04 | ) | | | (.23 | ) |
| Net realized gains | | | — | | | | — | | | | — | | | | (2.47 | ) | | | (1.33 | ) |
| Total distributions | | | (.24 | ) | | | (.05 | ) | | | (.15 | ) | | | (2.51 | ) | | | (1.56 | ) |
| Net asset value, end of period | | $ | 12.67 | | | $ | 14.28 | | | $ | 11.32 | | | $ | 7.79 | | | $ | 18.28 | |
Total Return (%)b | | | (9.90 | ) | | | 26.64 | | | | 48.20 | | | | (49.96 | ) | | | 9.33 | |
| Ratios to Average Net Assets and Supplemental Data | |
| Net assets, end of period ($ millions) | | | 123 | | | | 158 | | | | 139 | | | | 117 | | | | 310 | |
| Ratio of expenses before expense reductions (%) | | | 1.12 | | | | 1.12 | | | | 1.11 | | | | 1.11 | | | | 1.14 | |
| Ratio of expenses after expense reductions (%) | | | 1.00 | | | | 1.04 | | | | .99 | | | | .99 | | | | 1.12 | |
| Ratio of net investment income (loss) (%) | | | .57 | | | | .42 | | | | .47 | | | | 1.53 | c | | | .45 | c |
| Portfolio turnover rate (%) | | | 31 | | | | 39 | | | | 53 | | | | 21 | | | | 19 | |
a Based on average shares outstanding during the period. b Total return would have been lower had certain expenses not been reduced. c Net investment income per share and the ratio of net investment income include non-recurring dividend income amounting to $0.05 and $0.02 per share and 0.37% and 0.09% of average daily net assets for the years ended December 31, 2008 and 2007, respectively. | |
| | | Years Ended December 31, | |
| Class B | | | 2011 | | | 2010 | | | 2009 | | | 2008 | | | 2007 | |
| Selected Per Share Data | |
| Net asset value, beginning of period | | $ | 14.03 | | | $ | 11.11 | | | $ | 7.65 | | | $ | 18.03 | | | $ | 17.93 | |
Income (loss) from investment operations: Net investment income (loss)a | | | .05 | | | | .03 | | | | .02 | | | | .16 | c | | | .01 | c |
| Net realized and unrealized gain (loss) | | | (1.43 | ) | | | 2.90 | | | | 3.57 | | | | (8.07 | ) | | | 1.61 | |
| Total from investment operations | | | (1.38 | ) | | | 2.93 | | | | 3.59 | | | | (7.91 | ) | | | 1.62 | |
Less distributions from: Net investment income | | | (.20 | ) | | | (.01 | ) | | | (.13 | ) | | | — | | | | (.19 | ) |
| Net realized gains | | | — | | | | — | | | | — | | | | (2.47 | ) | | | (1.33 | ) |
| Total distributions | | | (.20 | ) | | | (.01 | ) | | | (.13 | ) | | | (2.47 | ) | | | (1.52 | ) |
| Net asset value, end of period | | $ | 12.45 | | | $ | 14.03 | | | $ | 11.11 | | | $ | 7.65 | | | $ | 18.03 | |
Total Return (%)b | | | (10.08 | ) | | | 26.38 | | | | 47.66 | | | | (50.16 | ) | | | 8.92 | |
| Ratios to Average Net Assets and Supplemental Data | |
| Net assets, end of period ($ millions) | | | 2 | | | | 2 | | | | 7 | | | | 5 | | | | 12 | |
| Ratio of expenses before expense reductions (%) | | | 1.38 | | | | 1.34 | | | | 1.42 | | | | 1.42 | | | | 1.53 | |
| Ratio of expenses after expense reductions (%) | | | 1.25 | | | | 1.26 | | | | 1.30 | | | | 1.30 | | | | 1.50 | |
| Ratio of net investment income (loss) (%) | | | .32 | | | | .20 | | | | .16 | | | | 1.21 | c | | | .07 | c |
| Portfolio turnover rate (%) | | | 31 | | | | 39 | | | | 53 | | | | 21 | | | | 19 | |
a Based on average shares outstanding during the period. b Total return would have been lower had certain expenses not been reduced. c Net investment income per share and the ratio of net investment income include non-recurring dividend income amounting to $0.05 and $0.02 per share and 0.37% and 0.09% of average daily net assets for the years ended December 31, 2008 and 2007, respectively. | |
Notes to Financial Statements
A. Organization and Significant Accounting Policies
DWS Variable Series I (the "Series") is registered under the Investment Company Act of 1940, as amended (the "1940 Act"), as an open-end, registered management investment company organized as a Massachusetts business trust. The Series consists of five diversified funds: DWS Bond VIP, DWS Growth & Income VIP, DWS Capital Growth VIP, DWS Global Small Cap Growth VIP (formerly DWS Global Opportunities VIP) and DWS International VIP (individually or collectively hereinafter referred to as a "Fund" or the "Funds"). These financial statements report on DWS Global Small Cap Growth VIP. The Series is intended to be the underlying investment vehicle for variable annuity contracts and variable life insurance policies to be offered by the separate accounts of certain life insurance companies ("Participating Insurance Companies").
Multiple Classes of Shares of Beneficial Interest. The Fund offers two classes of shares (Class A shares and Class B shares). Class B shares are subject to Rule 12b-1 distribution fees under the 1940 Act and recordkeeping fees equal to an annual rate of 0.25% and up to 0.15%, respectively, of the average daily net assets of the Class B shares of the Fund. Class A shares are not subject to such fees.
Investment income, realized and unrealized gains and losses, and certain fund-level expenses and expense reductions, if any, are borne pro rata on the basis of relative net assets by the holders of all classes of shares, except that each class bears certain expenses unique to that class (including the applicable 12b-1 distribution fees). Differences in class-level expenses may result in payment of different per share dividends by class. All shares have equal rights with respect to voting subject to class-specific arrangements.
The Fund's financial statements are prepared in accordance with accounting principles generally accepted in the United States of America, which require the use of management estimates. Actual results could differ from those estimates. The policies described below are followed consistently by the Fund in the preparation of its financial statements.
Security Valuation. Investments are stated at value determined as of the close of regular trading on the New York Stock Exchange on each day the exchange is open for trading.
Various inputs are used in determining the value of the Fund's investments. These inputs are summarized in three broad levels. Level 1 includes quoted prices in active markets for identical securities. Level 2 includes other significant observable inputs (including quoted prices for similar securities, interest rates, prepayment speeds, and credit risk). Level 3 includes significant unobservable inputs (including the Fund's own assumptions in determining the fair value of investments). The inputs or methodology used for valuing securities are not necessarily an indication of the risk associated with investing in those securities.
Equity securities are valued at the most recent sale price or official closing price reported on the exchange (U.S. or foreign) or over-the-counter market on which they trade and are categorized as Level 1 securities. Securities for which no sales are reported are valued at the calculated mean between the most recent bid and asked quotations on the relevant market or, if a mean cannot be determined, at the most recent bid quotation. For certain international equity securities, in order to adjust for events which may occur between the close of the foreign exchanges and the close of the New York Stock Exchange, a fair valuation model may be used. This fair valuation model takes into account comparisons to the valuation of American Depository Receipts (ADRs), exchange-traded funds, futures contracts and certain indices and these securities are categorized as Level 2.
Money market instruments purchased with an original or remaining maturity of sixty days or less, maturing at par, are valued at amortized cost, which approximates value, and are categorized as Level 2. Investments in open-end investment companies are valued at their net asset value each business day and are categorized as Level 1.
Securities and other assets for which market quotations are not readily available or for which the above valuation procedures are deemed not to reflect fair value are valued in a manner that is intended to reflect their fair value as determined in accordance with procedures approved by the Trustees and are generally categorized as Level 3. In accordance with the Fund's valuation procedures, factors used in determining value may include, but are not limited to, the type of the security; the size of the holding; the initial cost of the security; the existence of any contractual restrictions on the security's disposition; the price and extent of public trading in similar securities of the issuer or of comparable companies; quotations or evaluated prices from broker-dealers and/or pricing services; information obtained from the issuer, analysts, and/or the appropriate stock exchange (for exchange-traded securities); an analysis of the company's or issuer's financial statements; an evaluation of the forces that influence the issuer and the market(s) in which the security is purchased and sold and with respect to debt securities; the maturity, coupon, creditworthiness, currency denomination and the movement of the market in which the security is normally traded. The value determined under these procedures may differ from published values for the same securities.
Disclosure about the classification of fair value measurements is included in a table following the Fund's Investment Portfolio.
New Accounting Pronouncement. In May 2011, Accounting Standards Update 2011-04 (ASU 2011-04), Amendments to Achieve Common Fair Value Measurement and Disclosure Requirements in U.S. GAAP and IFRSs, was issued and is effective during interim and annual periods beginning after December 15, 2011. ASU 2011-04 amends Accounting Standards Codification (ASC) Topic 820, Fair Value Measurement. The amendments are the result of the work by the Financial Accounting Standards Board and the International Accounting Standards Board to develop common requirements for measuring fair value and for disclosing information about fair value measurements in accordance with GAAP. Management is currently evaluating the application of ASU 2011-04 and its impact, if any, on the Fund's financial statements.
Securities Lending. The Fund lends securities to certain financial institutions. The Fund retains beneficial ownership of the securities it has loaned and continues to receive interest and dividends paid by the issuer of securities and to participate in any changes in their market value. The Fund requires the borrowers of the securities to maintain collateral with the Fund consisting of either cash or liquid, unencumbered assets having a value at least equal to the value of the securities loaned. When the collateral falls below specified amounts, the lending agent will use its best effort to obtain additional collateral on the next business day to meet required amounts under the security lending agreement. The Fund may invest the cash collateral into a joint trading account in an affiliated money market fund pursuant to Exemptive Orders issued by the SEC. The Fund receives compensation for lending its securities either in the form of fees or by earning interest on invested cash collateral net of borrower rebates and fees paid to a lending agent. Either the Fund or the borrower may terminate the loan. There may be risks of delay and costs in recovery of securities or even loss of rights in the collateral should the borrower of the securities fail financially. The Fund is also subject to all investment risks associated with the reinvestment of any cash collateral received, including, but not limited to, interest rate, credit and liquidity risk associated with such investments.
Foreign Currency Translations. The books and records of the Fund are maintained in U.S. dollars. Investment securities and other assets and liabilities denominated in a foreign currency are translated into U.S. dollars at the prevailing exchange rates at period end. Purchases and sales of investment securities, income and expenses are translated into U.S. dollars at the prevailing exchange rates on the respective dates of the transactions.
Net realized and unrealized gains and losses on foreign currency transactions represent net gains and losses between trade and settlement dates on securities transactions, the acquisition and disposition of foreign currencies, and the difference between the amount of net investment income accrued and the U.S. dollar amount actually received. That portion of both realized and unrealized gains and losses on investments that results from fluctuations in foreign currency exchange rates is not separately disclosed but is included with net realized and unrealized gain/appreciation and loss/depreciation on investments.
Taxes. The Fund is treated as a separate taxpayer as provided for in the Internal Revenue Code, as amended. It is the Fund's policy to comply with the requirements of the Internal Revenue Code, as amended, which are applicable to regulated investment companies, and to distribute all of its taxable income to the separate accounts of the Participating Insurance Companies which hold its shares.
Additionally, based on the Series' understanding of the tax rules and rates related to income, gains and transactions for the foreign jurisdictions in which the Fund invests, the Fund will provide for foreign taxes, and where appropriate, deferred foreign taxes.
Under the Regulated Investment Company Modernization Act of 2010, net capital losses may be carried forward indefinitely, and their character is retained as short-term and/or long-term. Previously, net capital losses were carried forward for eight years and treated as short-term losses. As a transition rule, the Act requires that post-enactment net capital losses be used before pre-enactment net capital losses.
The Fund has reviewed the tax positions for the open tax years as of December 31, 2011 and has determined that no provision for income tax is required in the Fund's financial statements. The Fund's federal tax returns for the prior three fiscal years remain open subject to examination by the Internal Revenue Service.
Distribution of Income and Gains. The Fund will declare and distribute dividends from its net investment income, if any, annually, although additional distributions may be made if necessary. Net realized gains from investment transactions, in excess of available capital loss carryforwards, would be taxable to the Fund if not distributed, and, therefore, will be distributed to shareholders at least annually.
The timing and characterization of certain income and capital gain distributions are determined annually in accordance with federal tax regulations which may differ from accounting principles generally accepted in the United States of America. These differences primarily relate to investments in foreign denominated investments, passive foreign investment companies and certain securities sold at a loss. As a result, net investment income (loss) and net realized gain (loss) on investment transactions for a reporting period may differ significantly from distributions during such period. Accordingly, the Fund may periodically make reclassifications among certain of its capital accounts without impacting the net asset value of the Fund.
At December 31, 2011, the Fund's components of distributable earnings (accumulated losses) on a tax basis are as follows:
| Undistributed ordinary income* | | $ | 821,499 | |
| Undistributed long-term capital gains | | $ | 6,713,507 | |
| Net unrealized appreciation (depreciation) on investments | | $ | 24,184,372 | |
In addition, the tax character of distributions paid to shareholders by the Fund is summarized as follows:
| | | Years Ended December 31, | |
| | | 2011 | | | 2010 | |
| Distributions from ordinary Income* | | $ | 2,545,467 | | | $ | 572,620 | |
* For tax purposes, short-term capital gain distributions are considered ordinary income distributions.
Expenses. Expenses of the Series arising in connection with a specific Fund are allocated to that Fund. Other Series expenses which cannot be directly attributed to a Fund are apportioned among the Funds in the Series.
Contingencies. In the normal course of business, the Fund may enter into contracts with service providers that contain general indemnification clauses. The Fund's maximum exposure under these arrangements is unknown as this would involve future claims that may be made against the Fund that have not yet been made. However, based on experience, the Fund expects the risk of loss to be remote.
Other. Investment transactions are accounted for on a trade date plus one basis for daily net asset value calculations. However, for financial reporting purposes, investment transactions are reported on trade date. Interest income is recorded on the accrual basis net of foreign withholding taxes. Dividend income is recorded on the ex-dividend date net of foreign withholding taxes. Certain dividends from foreign securities may be recorded subsequent to the ex-dividend date as soon as the Fund is informed of such dividends. Realized gains and losses from investment transactions are recorded on an identified cost basis and may include proceeds from litigation.
B. Purchases and Sales of Securities
During the year ended December 31, 2011, purchases and sales of investment securities (excluding short-term investments) aggregated $45,310,552 and $64,900,098, respectively.
C. Related Parties
Management Agreement. Under the Investment Management Agreement with Deutsche Investment Management Americas Inc. ("DIMA" or the "Advisor"), an indirect, wholly owned subsidiary of Deutsche Bank AG, the Advisor directs the investments of the Fund in accordance with its investment objectives, policies and restrictions. The Advisor determines the securities, instruments and other contracts relating to investments to be purchased, sold or entered into by the Fund.
Pursuant to the Investment Management Agreement with the Advisor, the Fund pays a monthly management fee based on the Fund's average daily net assets, computed and accrued daily and payable monthly, at the following annual rates:
| First $500 million of average daily net assets | | | .890 | % |
| Next $500 million of average daily net assets | | | .875 | % |
| Next $1 billion of average daily net assets | | | .860 | % |
| Over $2 billion of average daily net assets | | | .845 | % |
For the period from January 1, 2011 through September 30, 2011, the Advisor, the underwriter and accounting agent had contractually agreed to waive a portion of their fee to the extent necessary to maintain the operating expenses (excluding certain expenses such as extraordinary expenses, taxes, brokerage and interest) of each class as follows:
Effective from October 1, 2011 through September 30, 2012, the Advisor, the underwriter and accounting agent has contractually agreed to waive a portion of their fee to the extent necessary to maintain the operating expenses (excluding certain expenses such as extraordinary expenses, taxes, brokerage and interest) of each class as follows:
Accordingly, for the year ended December 31, 2011, the Advisor waived a portion of its management fee pursuant to the Investment Management Agreement aggregating $180,881, and the amount charged aggregated $1,127,955, which was equivalent to an annual effective rate of 0.77% of the Fund's average daily net assets.
Administration Fee. Pursuant to an Administrative Services Agreement, DIMA provides most administrative services to the Fund. For all services provided under the Administrative Services Agreement, the Fund pays the Advisor an annual fee ("Administration Fee") of 0.10% of the Fund's average daily net assets, computed and accrued daily and payable monthly. For the year ended December 31, 2011, the Administration Fee was $147,060, of which $10,750 is unpaid.
Service Provider Fees. DWS Investments Service Company ("DISC"), an affiliate of the Advisor, is the transfer agent, dividend-paying agent and shareholder service agent for the Fund. Pursuant to a sub-transfer agency agreement between DISC and DST Systems, Inc. ("DST"), DISC has delegated certain transfer agent, dividend-paying agent and shareholder service agent functions to DST. DISC compensates DST out of the shareholder servicing fee it receives from the Fund. For the year ended December 31, 2011, the amounts charged to the Fund by DISC were as follows:
| Services to Shareholders | | Total Aggregated | | | Waived | | | Unpaid at December 31, 2011 | |
| Class A | | $ | 443 | | | $ | 443 | | | $ | — | |
| Class B | | | 105 | | | | — | | | | 25 | |
| | | $ | 548 | | | $ | 443 | | | $ | 25 | |
Distribution Service Agreement. DWS Investments Distributors, Inc. ("DIDI"), also an affiliate of the Advisor, is the Series' Distributor. In accordance with the Master Distribution Plan, DIDI receives 12b-1 fees of 0.25% of average daily net assets of Class B shares. Pursuant to the Master Distribution Plan, DIDI remits these fees to the Participating Insurance Companies for various costs incurred or paid by these companies in connection with marketing and distribution of Class B shares. For the year ended December 31, 2011, the Distribution Service Fee aggregated $5,368, of which $403 is unpaid.
Typesetting and Filing Service Fees. Under an agreement with DIMA, DIMA is compensated for providing typesetting and certain regulatory filing services to the Fund. For the year ended December 31, 2011, the amount charged to the Fund by DIMA included in the Statement of Operations under "reports to shareholders" aggregated $15,562, of which $3,089 is unpaid.
Trustees' Fees and Expenses. The Fund paid each Trustee not affiliated with the Advisor retainer fees plus specified amounts for various committee services and for the Board Chairperson.
Affiliated Cash Management Vehicle. The Fund may invest uninvested cash balances in Central Cash Management Fund, which is managed by the Advisor. The Fund indirectly bears its proportionate share of the expenses of Central Cash Management Fund. Central Cash Management Fund does not pay the Advisor an investment management fee. Central Cash Management Fund seeks a high level of current income consistent with liquidity and the preservation of capital.
Securities Lending Agent Fees. Effective July 14, 2011, Deutsche Bank AG serves as securities lending agent for the Fund. For the period from July 14, 2011 through December 31, 2011, the Fund incurred securities lending agent fees to Deutsche Bank AG in the amount of $30.
D. Investing in Emerging Markets
Investing in emerging markets may involve special risks and considerations not typically associated with investing in developed markets. These risks include revaluation of currencies, high rates of inflation or deflation, repatriation restrictions on income and capital, and future adverse political, social and economic developments. Moreover, securities issued in these markets may be less liquid, subject to government ownership controls or delayed settlements and may have prices more volatile or less easily assessed than those of comparable securities of issuers in developed markets.
E. Ownership of the Fund
Three participating insurance companies were owners of record of 10% or more of the total outstanding Class A shares of the Fund, each owning 48%, 18% and 11%. One participating insurance company was an owner of record of 10% or more of the total outstanding Class B shares of the Fund, owning 91%.
F. Line of Credit
The Fund and other affiliated funds (the "Participants") share in a $450 million revolving credit facility provided by a syndication of banks. The Fund may borrow for temporary or emergency purposes, including the meeting of redemption requests that otherwise might require the untimely disposition of securities. The Participants are charged an annual commitment fee which is allocated based on net assets, among each of the Participants. Interest is calculated at a rate per annum equal to the sum of the Federal Funds Rate plus 1.25 percent plus if LIBOR exceeds the Federal Funds Rate the amount of such excess. The Fund may borrow up to a maximum of 33 percent of its net assets under the agreement. The Fund had no outstanding loans at December 31, 2011.
Report of Independent Registered Public Accounting Firm
To the Trustees of DWS Variable Series I and the Shareholders of DWS Global Small Cap Growth VIP (formerly DWS Global Opportunities VIP)
In our opinion, the accompanying statement of assets and liabilities, including the investment portfolio, and the related statements of operations and of changes in net assets and the financial highlights present fairly, in all material respects, the financial position of DWS Global Opportunities VIP (the "Fund") (formerly DWS Global Opportunities VIP) at December 31, 2011 and the results of its operations, the changes in its net assets, and the financial highlights for the periods indicated therein, in conformity with accounting principles generally accepted in the United States of America. These financial statements and financial highlights (hereafter referred to as "financial statements") are the responsibility of the Fund's management. Our responsibility is to express an opinion on these financial statements based on our audits. We conducted our audits of these financial statements in accordance with the standards of the Public Company Accounting Oversight Board (United States). Those standards require that we plan and perform the audit to obtain reasonable assurance about whether the financial statements are free of material misstatement. An audit includes examining, on a test basis, evidence supporting the amounts and disclosures in the financial statements, assessing the accounting principles used and significant estimates made by management, and evaluating the overall financial statement presentation. We believe that our audits, which included confirmation of securities at December 31, 2011 by correspondence with the custodians and brokers, provide a reasonable basis for our opinion.
Boston, Massachusetts February 15, 2012 | PricewaterhouseCoopers LLP |
Information About Your Fund's Expenses
As an investor of the Fund, you incur two types of costs: ongoing expenses and transaction costs. Ongoing expenses include management fees, distribution and service (12b-1) fees and other Fund expenses. Examples of transaction costs include contract charges, redemption fees and account maintenance fees, which are not shown in this section. The following tables are intended to help you understand your ongoing expenses (in dollars) of investing in the Fund and to help you compare these expenses with the ongoing expenses of investing in other mutual funds. In the most recent six-month period, the Fund limited these expenses; had it not done so, expenses would have been higher. The example in the table is based on an investment of $1,000 invested at the beginning of the six-month period and held for the entire period (July 1, 2011 to December 31, 2011).
The tables illustrate your Fund's expenses in two ways:
·Actual Fund Return. This helps you estimate the actual dollar amount of ongoing expenses (but not transaction costs) paid on a $1,000 investment in the Fund using the Fund's actual return during the period. To estimate the expenses you paid over the period, simply divide your account value by $1,000 (for example, an $8,600 account value divided by $1,000 = 8.6), then multiply the result by the number in the "Expenses Paid per $1,000" line under the share class you hold.
· Hypothetical 5% Fund Return. This helps you to compare your Fund's ongoing expenses (but not transaction costs) with those of other mutual funds using the Fund's actual expense ratio and a hypothetical rate of return of 5% per year before expenses. Examples using a 5% hypothetical Fund return may be found in the shareholder reports of other mutual funds. The hypothetical account values and expenses may not be used to estimate the actual ending account balance or expenses you paid for the period.
Please note that the expenses shown in these tables are meant to highlight your ongoing expenses only and do not reflect any transaction costs. The "Expenses Paid per $1,000" line of the tables is useful in comparing ongoing expenses only and will not help you determine the relative total expense of owning different funds. If these transaction costs had been included, your costs would have been higher.
Expenses and Value of a $1,000 Investment for the six months ended December 31, 2011 | |
| Actual Fund Return | | Class A | | | Class B | |
| Beginning Account Value 7/1/11 | | $ | 1,000.00 | | | $ | 1,000.00 | |
| Ending Account Value 12/31/11 | | $ | 856.70 | | | $ | 855.70 | |
| Expenses Paid per $1,000* | | $ | 4.68 | | | $ | 5.85 | |
| Hypothetical 5% Fund Return | | Class A | | | Class B | |
| Beginning Account Value 7/1/11 | | $ | 1,000.00 | | | $ | 1,000.00 | |
| Ending Account Value 12/31/11 | | $ | 1,020.16 | | | $ | 1,018.90 | |
| Expenses Paid per $1,000* | | $ | 5.09 | | | $ | 6.36 | |
* Expenses are equal to the Fund's annualized expense ratio for each share class, multiplied by the average account value over the period, multiplied by the number of days in the most recent six-month period, then divided by 365.
| Annualized Expense Ratios | Class A | | Class B | |
| DWS Variable Series I — DWS Global Small Cap Growth VIP | 1.00% | | 1.25% | |
For more information, please refer to the Fund's prospectus.
These tables do not reflect charges and fees ("contract charges") associated with the separate account that invests in the Fund or any variable life insurance policy or variable annuity contract for which the Fund is an investment option.
Tax Information (Unaudited)
Pursuant to Section 852 of the Internal Revenue Code, the Fund designates $7,385,000 as capital gain dividends for its year ended December 31, 2011, of which 100% represents 15% rate gains.
For corporate shareholders of the Fund, 22% of the ordinary dividends (i.e., income dividends plus short-term capital gains) paid during the Fund's fiscal year ended December 31, 2011 qualified for the dividends received deduction.
Please consult a tax advisor if you have questions about federal or state income tax laws, or on how to prepare your tax returns. If you have specific questions about your account, please contact your insurance provider.
The Series' policies and procedures for voting proxies for portfolio securities and information about how the Series voted proxies related to its portfolio securities during the 12-month period ended June 30 are available on our Web site — www.dws-investments.com (click on "proxy voting"at the bottom of the page) — or on the SEC's Web site — www.sec.gov. To obtain a written copy of the Series' policies and procedures without charge, upon request, call us toll free at (800) 728-3337.
Investment Management Agreement Approval
The Board of Trustees approved the renewal of DWS Global Small Cap Growth VIP's investment management agreement (the "Agreement") with Deutsche Investment Management Americas Inc. ("DWS") in September 2011.
In terms of the process that the Board followed prior to approving the Agreement, shareholders should know that:
· In September 2011, all of the Fund's Trustees were independent of DWS and its affiliates.
· The Trustees met frequently during the past year to discuss fund matters and dedicated a substantial amount of time to contract review matters. Over the course of several months, the Board's Contract Committee, in coordination with the Board's Equity Oversight Committee, reviewed comprehensive materials received from DWS, independent third parties and independent counsel. These materials included an analysis of the Fund's performance, fees and expenses, and profitability compiled by the Fund's independent fee consultant. The Board also received extensive information throughout the year regarding performance of the Fund.
· The Independent Trustees regularly meet privately with their independent counsel to discuss contract review and other matters. In addition, the Independent Trustees were also advised by the Fund's independent fee consultant in the course of their review of the Fund's contractual arrangements and considered a comprehensive report prepared by the independent fee consultant in connection with their deliberations (the "IFC Report").
· In connection with reviewing the Agreement, the Board also reviewed the terms of the Fund's Rule 12b-1 plan, distribution agreement, administrative services agreement, transfer agency agreement and other material service agreements.
· Based on its evaluation of the information provided, the Contract Committee presented its findings and recommendations to the Board. The Board then reviewed the Contract Committee's findings and recommendations.
In connection with the contract review process, the Contract Committee and the Board considered the factors discussed below, among others. The Board also considered that DWS and its predecessors have managed the Fund since its inception, and the Board believes that a long-term relationship with a capable, conscientious advisor is in the best interests of the Fund. The Board considered, generally, that shareholders chose to invest or remain invested in the Fund knowing that DWS managed the Fund, and that the Agreement was approved by the Fund's shareholders. DWS is part of Deutsche Bank, a major global banking institution that is engaged in a wide range of financial services. The Board believes that there are significant advantages to being part of a global asset management business that offers a wide range of investing expertise and resources, including hundreds of portfolio managers and analysts with research capabilities in many countries throughout the world.
While shareholders may focus primarily on fund performance and fees, the Fund's Board considers these and many other factors, including the quality and integrity of DWS's personnel and such other issues as back-office operations, fund valuations, and compliance policies and procedures.
Nature, Quality and Extent of Services. The Board considered the terms of the Agreement, including the scope of advisory services provided under the Agreement. The Board noted that, under the Agreement, DWS provides portfolio management services to the Fund and that, pursuant to a separate administrative services agreement, DWS provides administrative services to the Fund. The Board considered the experience and skills of senior management and investment personnel, the resources made available to such personnel, the ability of DWS to attract and retain high-quality personnel, and the organizational depth and stability of DWS. The Board reviewed the Fund's performance over short-term and long-term periods and compared those returns to various agreed-upon performance measures, including market indices and a peer universe compiled by the independent fee consultant using information supplied by Lipper Inc. ("Lipper"). The Board also noted that it has put into place a process of identifying "Focus Funds" (e.g., funds performing poorly relative to their benchmark or a peer universe compiled by an independent fund data service), and receives more frequent reporting and information from DWS regarding such funds, along with DWS's remedial plans to address underperformance. The Board believes this process is an effective manner of identifying and addressing underperforming funds. Based on the information provided, the Board noted that for the one-, three- and five-year periods ended December 31, 2010, the Fund's performance (Class A shares) was in the 1st quartile, 3rd quartile and 3rd quartile, respectively, of the applicable Lipper universe (the 1st quartile being the best performers and the 4th quartile being the worst performers). The Board also observed that the Fund has outperformed its benchmark in the one-year period and has underperformed its benchmark in the three- and five-year periods ended December 31, 2010.
On the basis of this evaluation and the ongoing review of investment results by the Board, the Board concluded that the nature, quality and extent of services provided by DWS historically have been and continue to be satisfactory.
Fees and Expenses. The Board considered the Fund's investment management fee schedule, operating expenses and total expense ratios, and comparative information provided by Lipper and the independent fee consultant regarding investment management fee rates paid to other investment advisors by similar funds (1st quartile being the most favorable and 4th quartile being the least favorable). With respect to management fees paid to other investment advisors by similar funds, the Board noted that the contractual fee rates paid by the Fund, which include a 0.10% fee paid to DWS under the Fund's administrative services agreement, were higher than the median (4th quartile) of the applicable Lipper peer group (based on Lipper data provided as of December 31, 2010). The Board noted that the Fund's Class A shares total (net) operating expenses were expected to be higher than the median (4th quartile) of the applicable Lipper expense universe (based on Lipper data provided as of December 31, 2010) ("Lipper Universe Expenses"). The Board also reviewed data comparing each share class's total (net) operating expenses to the applicable Lipper Universe Expenses. The Board considered the Fund's management fee rate as compared to fees charged by DWS and certain of its affiliates for comparable mutual funds and considered differences in fund and fee structures between the DWS Funds. The Board also considered how the Fund's total (net) operating expenses compared to the total (net) operating expenses of a more customized peer group selected by Lipper (based on such factors as asset size).
The Board also noted that the expense limitations agreed to by DWS helped to ensure that the Fund's total (net) operating expenses would remain competitive.
The information considered by the Board as part of its review of management fees included information regarding fees charged by DWS and its affiliates to similar institutional accounts and to similar funds offered primarily to European investors ("DWS Europe funds"), in each case as applicable. The Board observed that advisory fee rates for institutional accounts generally were lower than the management fees charged by similarly managed DWS U.S. mutual funds ("DWS Funds"), but also took note of the differences in services provided to DWS Funds as compared to institutional accounts. In the case of DWS Europe funds, the Board observed that fee rates for DWS Europe funds generally were higher than for similarly managed DWS Funds, but noted that differences in the types of services provided to DWS Funds relative to DWS Europe funds made it difficult to compare such fees.
On the basis of the information provided, the Board concluded that management fees were reasonable and appropriate in light of the nature, quality and extent of services provided by DWS.
Profitability. The Board reviewed detailed information regarding revenues received by DWS under the Agreement. The Board considered the estimated costs and pre-tax profits realized by DWS from advising the DWS Funds, as well as estimates of the pre-tax profits attributable to managing the Fund in particular. The Board also received information regarding the estimated enterprise-wide profitability of DWS and its affiliates with respect to all fund services in totality and by fund. The Board and the independent fee consultant reviewed DWS's methodology in allocating its costs to the management of the Fund. Based on the information provided, the Board concluded that the pre-tax profits realized by DWS in connection with the management of the Fund were not unreasonable. The Board also reviewed information regarding the profitability of certain similar investment management firms. The Board noted that while information regarding the profitability of such firms is limited (and in some cases is not necessarily prepared on a comparable basis), DWS and its affiliates' overall profitability with respect to the DWS fund complex (after taking into account distribution and other services provided to the funds by DWS and its affiliates) was lower than the overall profitability levels of many comparable firms for which such data was available.
Economies of Scale. The Board considered whether there are economies of scale with respect to the management of the Fund and whether the Fund benefits from any economies of scale. The Board noted that the Fund's management fee schedule includes fee breakpoints. The Board concluded that the Fund's fee schedule represents an appropriate sharing between the Fund and DWS of such economies of scale as may exist in the management of the Fund at current asset levels.
Other Benefits to DWS and Its Affiliates. The Board also considered the character and amount of other incidental benefits received by DWS and its affiliates, including any fees received by DWS for administrative services provided to the Fund and any fees received by an affiliate of DWS for distribution services. The Board also considered benefits to DWS related to brokerage and soft-dollar allocations, including allocating brokerage to pay for research generated by parties other than the executing broker dealers, which pertain primarily to funds investing in equity securities, along with the incidental public relations benefits to DWS related to DWS Funds advertising and cross-selling opportunities among DWS products and services. The Board concluded that management fees were reasonable in light of these fallout benefits.
Compliance. The Board considered the significant attention and resources dedicated by DWS to documenting and enhancing its compliance processes in recent years. The Board noted in particular (i) the experience and seniority of both DWS's chief compliance officer and the Fund's chief compliance officer; (ii) the large number of DWS compliance personnel; and (iii) the substantial commitment of resources by DWS and its affiliates to compliance matters.
Based on all of the information considered and the conclusions reached, the Board unanimously determined that the continuation of the Agreement is in the best interests of the Fund. In making this determination, the Board did not give particular weight to any single factor identified above. The Board considered these factors over the course of numerous meetings, certain of which were in executive session with only the Independent Trustees and their counsel present. It is possible that individual Trustees may have weighed these factors differently in reaching their individual decisions to approve the continuation of the Agreement.
Summary of Management Fee Evaluation by Independent Fee Consultant
September 26, 2011
Pursuant to an Order entered into by Deutsche Investment Management Americas and affiliates (collectively, "DeAM") with the Attorney General of New York, I, Thomas H. Mack, have been appointed the Independent Fee Consultant for the DWS Funds (formerly the DWS Scudder Funds). My duties include preparing an annual written evaluation of the management fees DeAM charges the Funds, considering among other factors the management fees charged by other mutual fund companies for like services, management fees DeAM charges other clients for like services, DeAM's costs of supplying services under the management agreements and related profit margins, possible economies of scale if a Fund grows larger, and the nature and quality of DeAM's services, including fund performance. This report summarizes my evaluation for 2011, including my qualifications, the evaluation process for each of the DWS Funds, consideration of certain complex-level factors, and my conclusions. I served in substantially the same capacity in 2007, 2008, 2009 and 2010.
Qualifications
For more than 35 years I have served in various professional capacities within the investment management business. I have held investment analysis and advisory positions, including securities analyst, portfolio strategist and director of investment policy with a large investment firm. I have also performed business management functions, including business development, financial management and marketing research and analysis.
Since 1991, I have been an independent consultant within the asset management industry. I have provided services to over 125 client organizations, including investment managers, mutual fund boards, product distributors and related organizations. Over the past ten years I have completed a number of assignments for mutual fund boards, specifically including assisting boards with management contract renewal.
I hold a Master of Business Administration degree, with highest honors, from Harvard University and Master of Science and Bachelor of Science (highest honors) degrees from the University of California at Berkeley. I am an independent director and audit committee financial expert for two closed-end mutual funds and have served in various leadership and financial oversight capacities with non-profit organizations.
Evaluation of Fees for each DWS Fund
My work focused primarily on evaluating, fund-by-fund, the fees charged to each of the 109 mutual fund portfolios in the DWS Fund family. For each Fund, I considered each of the key factors mentioned above, as well as any other relevant information. In doing so I worked closely with the Funds' Independent Directors in their annual contract renewal process, as well as in their approval of contracts for several new funds (documented separately).
In evaluating each Fund's fees, I reviewed comprehensive materials provided by or on behalf of DeAM, including expense information prepared by Lipper Analytical, comparative performance information, profitability data, manager histories, and other materials. I also accessed certain additional information from the Lipper and Morningstar databases and drew on my industry knowledge and experience.
To facilitate evaluating this considerable body of information, I prepared for each Fund a document summarizing the key data elements in each area as well as additional analytics discussed below. This made it possible to consider each key data element in the context of the others.
In the course of contract renewal, DeAM agreed to implement a number of fee and expense adjustments requested by the Independent Directors which will favorably impact future fees and expenses, and my evaluation includes the effects of these changes.
Fees and Expenses Compared with Other Funds
The competitive fee and expense evaluation for each fund focused on two primary comparisons:
The Fund's contractual management fee (the advisory fee plus the administration fee where applicable) compared with those of a group of typically 12-15 funds in the same Lipper investment category (e.g. Large Capitalization Growth) having similar distribution arrangements and being of similar size.
The Fund's total expenses compared with a broader universe of funds from the same Lipper investment category and having similar distribution arrangements.
These two comparisons provide a view of not only the level of the fee compared with funds of similar scale but also the total expense the Fund bears for all the services it receives, in comparison with the investment choices available in the Fund's investment category and distribution channel. The principal figure-of-merit used in these comparisons was the subject Fund's percentile ranking against peers.
DeAM's Fees for Similar Services to Others
DeAM provided management fee schedules for all of its US domiciled fund and non-fund investment management accounts in any of the investment categories where there is a DWS Fund. These similar products included the other DWS Funds, non-fund pooled accounts, institutional accounts and sub-advisory accounts. Using this information, I calculated for each Fund the fee that would be charged to each similar product, at the subject Fund's asset level.
Evaluating information regarding non-fund products is difficult because there are varying levels of services required for different types of accounts, with mutual funds generally requiring considerably more regulatory and administrative types of service as well as having more frequent cash flows than other types of accounts. Also, while mutual fund fees for similar fund products can be expected to be similar, there will be some differences due to different pricing conditions in different distribution channels (e.g. retail funds versus those used in variable insurance products), differences in underlying investment processes and other factors.
Costs and Profit Margins
DeAM provided a detailed profitability analysis for each Fund. After making some adjustments so that the presentation would be more comparable to the available industry figures, I reviewed profit margins from investment management alone, from investment management plus other fund services (excluding distribution) provided to the Funds by DeAM (principally shareholder services), and DeAM profits from all sources, including distribution. A later section comments on overall profitability.
Economies of Scale
Economies of scale — an expected decline in management cost per dollar of fund assets as fund assets grow — are very rarely quantified and documented because of inherent difficulties in collecting and analyzing relevant data. However, in virtually every investment category that I reviewed, larger funds tend to have lower fees and lower total expenses than smaller funds. To see how each DWS Fund compares with this industry observation, I reviewed:
The trend in Fund assets over the last five years and the accompanying trend in total expenses. This shows if the Fund has grown and, if so, whether total expense (management fees as well as other expenses) have declined as a percent of assets.
Whether the Fund has break-points in its management fee schedule, the extent of the fee reduction built into the schedule and the asset levels where the breaks take effect, and in the case of a sub-advised Fund how the Fund's break-points compare with those of the sub-advisory fee schedule.
How the Fund's contractual fee schedule compares with trends in the industry data. To accomplish this, I constructed a chart showing how actual latest-fiscal-year contractual fees of the Fund and of other similar funds relate to average fund assets, with the subject Fund's contractual fee schedule superimposed.
Quality of Service — Performance
The quality-of-service evaluation focused on investment performance, which is the principal result of the investment management service. Each Fund's performance was reviewed over the past 1, 3, 5 and 10 years, as applicable, and compared with that of other funds in the same investment category and with a suitable market index.
In addition, I calculated and reviewed risk-adjusted returns relative to an index of similar mutual funds' returns and a suitable market index. The risk-adjusted returns analysis provides a way of determining the extent to which the Fund's return comparisons are mainly the product of investment value-added (or lack thereof) or alternatively taking considerably more or less risk than is typical in its investment category.
I also received and considered the history of portfolio manager changes for each Fund, as this provided an important context for evaluating the performance results.
Complex-Level Considerations
While this evaluation was conducted mainly at the individual fund level, there are some issues relating to the reasonableness of fees that can alternatively be considered across the whole fund complex:
I reviewed DeAM's profitability analysis for all DWS Funds, with a view toward determining if the allocation procedures used were reasonable and how profit levels compared with public data for other investment managers.
I considered whether DeAM and affiliates receive any significant ancillary or "fall-out" benefits that should be considered in interpreting the direct profitability results. These would be situations where serving as the investment manager of the Funds is beneficial to another part of the Deutsche Bank organization.
I considered how aggregated DWS Fund expenses had varied over the years, by asset class and in the context of trends in asset levels.
I reviewed the structure of the DeAM organization, trends in staffing levels, and information on compensation of investment management and other professionals compared with industry data.
Findings
Based on the process and analysis discussed above, which included reviewing a wide range of information from management and external data sources and considering among other factors the fees DeAM charges other clients, the fees charged by other fund managers, DeAM's costs and profits associated with managing the Funds, economies of scale, possible fall-out benefits, and the nature and quality of services provided, in my opinion the management fees charged the DWS Funds are reasonable.
Thomas H. Mack
President, Thomas H. Mack & Co., Inc.
Board Members and Officers
The following table presents certain information regarding the Board Members and Officers of the fund as of December 31, 2011. Each Board Member's year of birth is set forth in parentheses after his or her name. Unless otherwise noted, (i) each Board Member has engaged in the principal occupation(s) noted in the table for at least the most recent five years, although not necessarily in the same capacity; and (ii) the address of each Independent Board Member is c/o Paul K. Freeman, Independent Chairman, DWS Funds, PO Box 101833, Denver, CO 80250-1833. Except as otherwise noted below, the term of office for each Board Member is until the election and qualification of a successor, or until such Board Member sooner dies, resigns, is removed or as otherwise provided in the governing documents of the fund. Because the fund does not hold an annual meeting of shareholders, each Board Member will hold office for an indeterminate period. The Board Members may also serve in similar capacities with other funds in the fund complex. The Length of Time Served represents the year in which the Board Member joined the Board of one or more DWS funds now overseen by the Board.
| Independent Board Members |
Name, Year of Birth, Position with the Fund and Length of Time Served1 | Business Experience and Directorships During the Past Five Years | Number of Funds in DWS Fund Complex Overseen |
Other Directorships Held by Board Member |
Paul K. Freeman (1950) Chairperson since 2009 Board Member since 1993 | Consultant, World Bank/Inter-American Development Bank; Executive and Governing Council of the Independent Directors Council (Chairman of Education Committee); formerly: Project Leader, International Institute for Applied Systems Analysis (1998-2001); Chief Executive Officer, The Eric Group, Inc. (environmental insurance) (1986-1998) | 110 | — |
John W. Ballantine (1946) Board Member since 1999 | Retired; formerly, Executive Vice President and Chief Risk Management Officer, First Chicago NBD Corporation/The First National Bank of Chicago (1996-1998); Executive Vice President and Head of International Banking (1995-1996). Directorships: Chairman of the Board, Healthways, Inc. (provider of disease and care management services); Portland General Electric (utility company); Stockwell Capital Investments PLC (private equity); former Directorships: First Oak Brook Bancshares, Inc. and Oak Brook Bank; Prisma Energy International | 110 | — |
Henry P. Becton, Jr. (1943) Board Member since 1990 | Vice Chair and former President, WGBH Educational Foundation. Directorships: Association of Public Television Stations; Public Radio International; Public Radio Exchange (PRX); The PBS Foundation; former Directorships: Boston Museum of Science; American Public Television; Concord Academy; New England Aquarium; Mass. Corporation for Educational Telecommunications; Committee for Economic Development; Public Broadcasting Service | 110 | Lead Director, Becton Dickinson and Company2 (medical technology company); Lead Director, Belo Corporation2 (media company) |
Dawn-Marie Driscoll (1946) Board Member since 1987 | President, Driscoll Associates (consulting firm); Executive Fellow, Center for Business Ethics, Bentley University; formerly, Partner, Palmer & Dodge (1988-1990); Vice President of Corporate Affairs and General Counsel, Filene's (1978-1988). Directorships: Director of ICI Mutual Insurance Company (since 2007); Advisory Board, Center for Business Ethics, Bentley University; Trustee, Southwest Florida Community Foundation (charitable organization); former Directorships: Investment Company Institute (audit, executive, nominating committees) and Independent Directors Council (governance, executive committees) | 110 | Trustee, Sun Capital Advisers, Inc. (22 open-end mutual funds advised by Sun Capital Advisers, Inc.) (since 2007) |
Keith R. Fox, CFA (1954) Board Member since 1996 | Managing General Partner, Exeter Capital Partners (a series of private investment funds) (since 1986). Directorships: Progressive International Corporation (kitchen goods importer and distributor); BoxTop Media Inc. (advertising); The Kennel Shop (retailer); former Chairman, National Association of Small Business Investment Companies | 110 | Trustee, Sun Capital Advisers, Inc. (22 open-end mutual funds advised by Sun Capital Advisers, Inc.) (since 2011) |
Kenneth C. Froewiss (1945) Board Member since 2001 | Adjunct Professor of Finance, NYU Stern School of Business (September 2009-present; Clinical Professor from 1997-September 2009); Member, Finance Committee, Association for Asian Studies (2002-present); Director, Mitsui Sumitomo Insurance Group (US) (2004-present); prior thereto, Managing Director, J.P. Morgan (investment banking firm) (until 1996) | 110 | — |
Richard J. Herring (1946) Board Member since 1990 | Jacob Safra Professor of International Banking and Professor, Finance Department, The Wharton School, University of Pennsylvania (since July 1972); Co-Director, Wharton Financial Institutions Center (since July 2000); Co-Chair, U.S. Shadow Financial Regulatory Committee; Executive Director, Financial Economists Roundtable; formerly: Vice Dean and Director, Wharton Undergraduate Division (July 1995-June 2000); Director, Lauder Institute of International Management Studies (July 2000-June 2006) | 110 | Director, Japan Equity Fund, Inc. (since September 2007), Thai Capital Fund, Inc. (since September 2007), Singapore Fund, Inc. (since September 2007), Independent Director of Barclays Bank Delaware (since September 2010) |
William McClayton (1944) Board Member since 2004 | Private equity investor (since October 2009); previously, Managing Director, Diamond Management & Technology Consultants, Inc. (global consulting firm) (2001-2009); Directorship: Board of Managers, YMCA of Metropolitan Chicago; formerly: Senior Partner, Arthur Andersen LLP (accounting) (1966-2001); Trustee, Ravinia Festival | 110 | — |
Rebecca W. Rimel (1951) Board Member since 1995 | President and Chief Executive Officer, The Pew Charitable Trusts (charitable organization) (1994 to present); Trustee, Washington College (2011 to present); formerly: Executive Vice President, The Glenmede Trust Company (investment trust and wealth management) (1983-2004); Board Member, Investor Education (charitable organization) (2004-2005); Trustee, Executive Committee, Philadelphia Chamber of Commerce (2001-2007); Trustee, Pro Publica (charitable organization) (2007-2010); Trustee, Thomas Jefferson Foundation (charitable organization) (1994 to 2011) | 110 | Director, CardioNet, Inc.2 (health care) (2009- present); Director, Viasys Health Care2 (January 2007- June 2007) |
William N. Searcy, Jr. (1946) Board Member since 1993 | Private investor since October 2003; formerly: Pension & Savings Trust Officer, Sprint Corporation2 (telecommunications) (November 1989-September 2003) | 110 | Trustee, Sun Capital Advisers, Inc. (22 open-end mutual funds advised by Sun Capital Advisers, Inc.) (since 1998) |
Jean Gleason Stromberg (1943) Board Member since 1997 | Retired. Formerly, Consultant (1997-2001); Director, Financial Markets US Government Accountability Office (1996-1997); Partner, Fulbright & Jaworski, L.L.P. (law firm) (1978-1996). Directorships: The William and Flora Hewlett Foundation; former Directorships: Service Source, Inc., Mutual Fund Directors Forum (2002-2004), American Bar Retirement Association (funding vehicle for retirement plans) (1987-1990 and 1994-1996) | 110 | — |
Robert H. Wadsworth (1940) Board Member since 1999 | President, Robert H. Wadsworth & Associates, Inc. (consulting firm) (1983 to present); Director, The Phoenix Boys Choir Association | 113 | — |
Officers4 |
Name, Year of Birth, Position with the Fund and Length of Time Served5 | Principal Occupation(s) During Past 5 Years and Other Directorships Held |
W. Douglas Beck, CFA6 (1967) President, 2011-present | Managing Director3, Deutsche Asset Management (2006-present); President of DWS family of funds and Head of Product Management, U.S. for DWS Investments; formerly, Executive Director, Head of Product Management (2002-2006) and President (2005-2006) of the UBS Funds at UBS Global Asset Management; Co-Head of Manager Research/Managed Solutions Group, Merrill Lynch (1998-2002) |
John Millette7 (1962) Vice President and Secretary, 1999-present | Director3, Deutsche Asset Management |
Paul H. Schubert6 (1963) Chief Financial Officer, 2004-present Treasurer, 2005-present | Managing Director3, Deutsche Asset Management (since July 2004); formerly, Executive Director, Head of Mutual Fund Services and Treasurer for UBS Family of Funds (1998-2004); Vice President and Director of Mutual Fund Finance at UBS Global Asset Management (1994-1998) |
Caroline Pearson7 (1962) Chief Legal Officer, 2010-present | Managing Director3, Deutsche Asset Management; formerly, Assistant Secretary for DWS family of funds (1997-2010) |
Rita Rubin6 (1970) Assistant Secretary, 2009-present | Director3 and Senior Counsel, Deutsche Asset Management (since October 2007); formerly, Vice President, Morgan Stanley Investment Management (2004-2007) |
Paul Antosca7 (1957) Assistant Treasurer, 2007-present | Director3, Deutsche Asset Management (since 2006); Vice President, The Manufacturers Life Insurance Company (U.S.A.) (1990-2006) |
Jack Clark7 (1967) Assistant Treasurer, 2007-present | Director3, Deutsche Asset Management (since 2007); formerly, Vice President, State Street Corporation (2002-2007) |
Diane Kenneally7 (1966) Assistant Treasurer, 2007-present | Director3, Deutsche Asset Management |
John Caruso6 (1965) Anti-Money Laundering Compliance Officer, 2010-present | Managing Director3, Deutsche Asset Management |
Robert Kloby6 (1962) Chief Compliance Officer, 2006-present | Managing Director3, Deutsche Asset Management |
1 The length of time served represents the year in which the Board Member joined the board of one or more DWS funds currently overseen by the Board.
2 A publicly held company with securities registered pursuant to Section 12 of the Securities Exchange Act of 1934.
3 Executive title, not a board directorship.
4 As a result of their respective positions held with the Advisor, these individuals are considered "interested persons" of the Advisor within the meaning of the 1940 Act. Interested persons receive no compensation from the fund.
5 The length of time served represents the year in which the officer was first elected in such capacity for one or more DWS funds.
6 Address: 60 Wall Street, New York, NY 10005.
7 Address: One Beacon Street, Boston, MA 02108.
The fund's Statement of Additional Information ("SAI") includes additional information about the Board Members. The SAI is available, without charge, upon request. If you would like to request a copy of the SAI, you may do so by calling the following toll-free number: (800) 728-3337.
DWS Investments Distributors, Inc.
222 South Riverside Plaza
Chicago, IL 60606
(800) 621-1148
VS1gloscg-2 (R-025821-1 2/12)
DECEMBER 31, 2011
ANNUAL REPORT
DWS VARIABLE SERIES I
DWS International VIP
Contents
10 Statement of Assets and Liabilities 11 Statement of Operations 12 Statement of Changes in Net Assets 14 Notes to Financial Statements 19 Report of Independent Registered Public Accounting Firm 20 Information About Your Fund's Expenses 22 Investment Management Agreement Approval 25 Summary of Management Fee Evaluation by Independent Fee Consultant 27 Board Members and Officers |
This report must be preceded or accompanied by a prospectus. To obtain an additional prospectus or summary prospectus, if available, call (800) 728-3337 or your financial representative. We advise you to consider the Fund's objectives, risks, charges and expenses carefully before investing. The summary prospectus and prospectus contain this and other important information about the Fund. Please read the prospectus carefully before you invest.
Investing in derivatives entails special risks relating to liquidity, leverage and credit that may reduce returns and/or increase volatility. Investing in foreign securities, particularly those of emerging markets, presents certain risks, such as currency fluctuations, political and economic changes, and market risks. Stocks may decline in value. The fund may lend securities to approved institutions. See the prospectus for details.
DWS Investments is part of Deutsche Bank's Asset Management division and, within the U.S., represents the retail asset management activities of Deutsche Bank AG, Deutsche Bank Trust Company Americas, Deutsche Investment Management Americas Inc. and DWS Trust Company.
NOT FDIC/NCUA INSURED NO BANK GUARANTEE MAY LOSE VALUE NOT A DEPOSIT
NOT INSURED BY ANY FEDERAL GOVERNMENT AGENCY
Performance Summary December 31, 2011
Fund performance shown is historical, assumes reinvestment of all dividend and capital gain distributions, and does not guarantee future results. Investment return and principal value fluctuate with changing market conditions so that, when redeemed, shares may be worth more or less than their original cost. Current performance may be lower or higher than the performance data quoted. Please contact your participating insurance company for the Fund's most recent month-end performance. Performance doesn't reflect charges and fees ("contract charges") associated with the separate account that invests in the Fund or any variable life insurance policy or variable annuity contract for which the Fund is an investment option. These charges and fees will reduce returns. While all share classes have the same underlying portfolio, their performance will differ.
The gross expense ratios of the Fund, as stated in the fee table of the prospectus dated May 1, 2011 are 1.00% and 1.27% for Class A and Class B shares, respectively, and may differ from the expense ratios disclosed in the Financial Highlights tables in this report.
| Growth of an Assumed $10,000 Investment |
[] DWS International VIP — Class A [] MSCI EAFE® Index | The Morgan Stanley Capital International (MSCI) Europe, Australasia and Far East (EAFE®) Index is an unmanaged index that tracks international stock performance in the 21 developed markets in Europe, Australasia and the Far East. The index is calculated using closing local market prices and translates into U.S. dollars using the London close foreign exchange rates. Index returns do not reflect any fees or expenses and it is not possible to invest directly into an index. |
| |
| Yearly periods ended December 31 | |
| Comparative Results | |
| DWS International VIP | | 1-Year | | | 3-Year | | | 5-Year | | | 10-Year | |
| Class A | Growth of $10,000 | | $ | 8,333 | | | $ | 11,307 | | | $ | 6,710 | | | $ | 11,927 | |
| Average annual total return | | | -16.67 | % | | | 4.18 | % | | | -7.67 | % | | | 1.78 | % |
MSCI EAFE® Index | Growth of $10,000 | | $ | 8,786 | | | $ | 12,475 | | | $ | 7,852 | | | $ | 15,778 | |
| Average annual total return | | | -12.14 | % | | | 7.65 | % | | | -4.72 | % | | | 4.67 | % |
| DWS International VIP | | 1-Year | | | 3-Year | | | 5-Year | | | 10-Year | |
| Class B | Growth of $10,000 | | $ | 8,323 | | | $ | 11,207 | | | $ | 6,626 | | | $ | 11,603 | |
| Average annual total return | | | -16.77 | % | | | 3.87 | % | | | -7.90 | % | | �� | 1.50 | % |
MSCI EAFE® Index | Growth of $10,000 | | $ | 8,786 | | | $ | 12,475 | | | $ | 7,852 | | | $ | 15,778 | |
| Average annual total return | | | -12.14 | % | | | 7.65 | % | | | -4.72 | % | | | 4.67 | % |
The growth of $10,000 is cumulative.
Management Summary December 31, 2011
On April 15, 2011, a new team took over portfolio management duties for the Fund and adopted a different approach to security selection and analysis. The transition to reflect the new approach occurred gradually over a period of 24 days and was fully implemented by May 10, 2011. Under the new approach, the investment team utilizes a proprietary investment process designed to identify attractive investment candidates generated by more than 5,000 equity analysts across the globe, who collectively cover over 10,000 securities. Based on these analysts' fundamental research, this process seeks to identify investments that may offer the potential for price appreciation.
International equities lost ground during 2011, as investor sentiment was pressured by concerns about slowing global economic growth, the aftereffects of the earthquake in Japan and the evolution of the debt crisis in Europe. The MSCI EAFE Index, which holds a weighting of over 40% in Continental Europe, finished the year with a total return of -12.14%.1 The index trailed the 2.11% return of the U.S. market, as gauged by the Standard & Poor's 500® (S&P 500) Index, by a wide margin.2 The Class A shares of DWS International VIP returned -16.67% (unadjusted for contract charges) during 2011, underperforming the MSCI EAFE Index.
The Fund lagged the benchmark before and after the management change. Before the management change (January 1, 2010-April 15, 2011), the Fund's performance was helped by stock selection in the financial and utilities sectors, but this was offset by its underperformance in the consumer discretionary, information technology and materials sectors, as well as below-benchmark weightings in consumer staples and financials.3,4,5
Following the transition to the new portfolio management team — keeping in mind that the investment team does not invest in stocks simply on the basis of their belonging to a particular sector — the Fund's stock selection process proved most effective in information technology, but it underperformed in consumer staples. The Fund's top individual contributors following the change were GlaxoSmithKline PLC, Dassault Systemes SA and SAP AG, while the leading individual detractors were Societe Generale and AXA SA.
Thomas Voecking
Jason E. Inzer
Portfolio Managers
1 The Morgan Stanley Capital International (MSCI) Europe, Australasia and Far East (EAFE) Index is an unmanaged index that tracks international stock performance in the 21 developed markets in Europe, Australasia and the Far East. The index is calculated using closing local market prices and translates into U.S. dollars using the London close foreign exchange rates.
2 The Standard & Poor's 500 (S&P 500) Index is an unmanaged, capitalization-weighted index of 500 stocks. The index is designed to measure performance of the broad domestic economy through changes in the aggregate market value of 500 stocks representing all major industries.
Index returns do not reflect fees or expenses and it is not possible to invest directly into an index.
3 "Overweight" means the Fund holds a higher weighting in a given sector or security than the benchmark. "Underweight" means the Fund holds a lower weighting.
4 Consumer staples are the industries that manufacture and sell products such as food and beverages, prescription drugs and household products.
5 The consumer discretionary sector represents industries that produce goods and services that are not necessities in everyday life.
The views expressed reflect those of the portfolio management team only through the end of the period of the report as stated on the cover. The management team's views are subject to change at any time based on market and other conditions and should not be construed as a recommendation. Past performance is no guarantee of future results. Current and future portfolio holdings are subject to risk.
Asset Allocation (As a % of Investment Portfolio excluding Securities Lending Collateral) | 12/31/11 | 12/31/10 |
| | | |
| Common Stocks | 97% | 96% |
| Cash Equivalents | 2% | — |
| Preferred Stocks | 1% | 4% |
| | 100% | 100% |
Geographical Diversification
(As a % of Investment Portfolio excluding Cash Equivalents) | 12/31/11 | 12/31/10 |
| | | |
| Continental Europe | 45% | 41% |
| Japan | 21% | 20% |
| United Kingdom | 15% | 15% |
| Asia (excluding Japan) | 9% | 11% |
| Australia | 9% | 8% |
| Other | 1% | 5% |
| | 100% | 100% |
Sector Diversification (As a % of Investment Portfolio excluding Cash Equivalents) | 12/31/11 | 12/31/10 |
| | | |
| Financials | 27% | 19% |
| Health Care | 12% | 6% |
| Information Technology | 11% | 6% |
| Industrials | 11% | 16% |
| Consumer Staples | 8% | 15% |
| Consumer Discretionary | 8% | 9% |
| Telecommunication Services | 7% | 6% |
| Utilities | 6% | 2% |
| Energy | 6% | 10% |
| Materials | 4% | 11% |
| | 100% | 100% |
Asset allocation, geographical diversification and sector diversification are subject to change.
For more complete details about the Fund's investment portfolio, see page 6.
Following the Fund's fiscal first and third quarter-end, a complete portfolio holdings listing is filed with the SEC on Form N-Q. The form will be available on the SEC's Web site at www.sec.gov, and it also may be reviewed and copied at the SEC's Public Reference Room in Washington, D.C. Information on the operation of the SEC's Public Reference Room may be obtained by calling (800) SEC-0330. The Fund's portfolio holdings are also posted on www.dws-investments.com from time to time. Please see the Fund's current prospectus for more information.
Investment Portfolio December 31, 2011 | | | Shares | | | Value ($) | |
| | | | |
| Common Stocks 95.0% | |
| Australia 9.2% | |
| BHP Billiton Ltd. | | | 43,000 | | | | 1,517,840 | |
| National Australia Bank Ltd. | | | 402,207 | | | | 9,588,558 | |
| Newcrest Mining Ltd. | | | 102,592 | | | | 3,107,800 | |
| Wesfarmers Ltd. | | | 38,691 | | | | 1,165,970 | |
| Westfield Group (REIT) (Units) | | | 143,000 | | | | 1,142,757 | |
| Westpac Banking Corp. | | | 47,000 | | | | 959,346 | |
| Woolworths Ltd. | | | 72,000 | | | | 1,846,828 | |
| (Cost $21,949,111) | | | | 19,329,099 | |
| Denmark 1.3% | |
| Carlsberg AS "B" | | | 23,639 | | | | 1,669,552 | |
| Novo Nordisk AS "B" | | | 9,508 | | | | 1,093,855 | |
| (Cost $3,180,444) | | | | 2,763,407 | |
| Finland 0.8% | |
| Fortum Oyj | | | 46,000 | | | | 978,689 | |
| Nokia Corp. | | | 151,000 | | | | 729,675 | |
| (Cost $2,367,710) | | | | 1,708,364 | |
| France 12.2% | |
| AXA SA | | | 410,857 | | | | 5,294,896 | |
| Cap Gemini | | | 31,400 | | | | 976,700 | |
| Dassault Systemes SA | | | 153,400 | | | | 12,282,684 | |
| Klepierre (REIT) | | | 34,000 | | | | 965,944 | |
| Renault SA | | | 101,000 | | | | 3,481,291 | |
| Schneider Electric SA | | | 31,948 | | | | 1,669,628 | |
| Societe Generale | | | 45,512 | | | | 1,010,095 | |
| (Cost $31,527,837) | | | | 25,681,238 | |
| Germany 4.6% | |
| Adidas AG | | | 12,400 | | | | 806,543 | |
| Allianz SE (Registered) | | | 4,600 | | | | 439,625 | |
| Continental AG* | | | 27,800 | | | | 1,730,355 | |
| Hochtief AG | | | 7,400 | | | | 428,032 | |
| Lanxess AG | | | 30,300 | | | | 1,567,658 | |
| SAP AG | | | 89,050 | | | | 4,708,368 | |
| (Cost $12,368,150) | | | | 9,680,581 | |
| Hong Kong 3.3% | |
| BOC Hong Kong (Holdings) Ltd. | | | 2,491,000 | | | | 5,873,255 | |
| Li & Fung Ltd. | | | 548,000 | | | | 1,007,450 | |
| (Cost $8,381,565) | | | | 6,880,705 | |
| Israel 1.1% | |
| Bezeq Israeli Telecommunication Corp., Ltd. (Cost $2,637,845) | | | 1,289,000 | | | | 2,364,363 | |
| Italy 3.6% | |
| Snam Rete Gas SpA (Cost $9,194,270) | | | 1,722,000 | | | | 7,568,828 | |
| Japan 20.2% | |
| Bridgestone Corp. | | | 35,000 | | | | 792,248 | |
| Canon, Inc. | | | 49,500 | | | | 2,190,320 | |
| Fast Retailing Co., Ltd. | | | 10,000 | | | | 1,817,275 | |
| Honda Motor Co., Ltd. | | | 103,992 | | | | 3,166,794 | |
| INPEX Corp. | | | 360 | | | | 2,263,888 | |
| Kawasaki Kisen Kaisha Ltd. | | | 410,000 | | | | 738,858 | |
| Kyushu Electric Power Co., Inc. | | | 76,000 | | | | 1,088,347 | |
| Mitsubishi Corp. | | | 232,909 | | | | 4,696,614 | |
| Mitsubishi Electric Corp. | | | 254,000 | | | | 2,428,569 | |
| Mitsubishi Estate Co., Ltd. | | | 196,000 | | | | 2,924,308 | |
| | | Shares | | | Value ($) | |
| | | | | | | | | |
| Mitsubishi Heavy Industries Ltd. | | | 106,000 | | | | 451,140 | |
| Mitsubishi Tanabe Pharma Corp. | | | 314,000 | | | | 4,965,715 | |
| Mitsui Fudosan Co., Ltd. | | | 70,000 | | | | 1,018,757 | |
| Mitsui O.S.K Lines Ltd. | | | 432,119 | | | | 1,671,367 | |
| Mizuho Financial Group, Inc. | | | 710,000 | | | | 958,158 | |
| Nabtesco Corp. | | | 55,000 | | | | 999,543 | |
| Nidec Corp. | | | 24,000 | | | | 2,083,108 | |
| Nippon Electric Glass Co., Ltd. | | | 94,000 | | | | 933,892 | |
| Resona Holdings, Inc. | | | 442,000 | | | | 1,944,692 | |
| Softbank Corp. | | | 59,400 | | | | 1,747,633 | |
| Sony Corp. | | | 52,000 | | | | 937,147 | |
| Sumitomo Mitsui Financial Group, Inc. | | | 30,500 | | | | 848,545 | |
| Sumitomo Realty & Development Co., Ltd. | | | 9,000 | | | | 157,369 | |
| Terumo Corp. | | | 26,000 | | | | 1,223,045 | |
| Tokyo Electron Ltd. | | | 7,300 | | | | 370,880 | |
| Yamada Denki Co., Ltd. | | | 4,800 | | | | 326,138 | |
| (Cost $49,714,104) | | | | 42,744,350 | |
| Netherlands 8.9% | |
| European Aeronautic Defence & Space Co. NV | | | 198,000 | | | | 6,160,020 | |
| Heineken NV | | | 118,000 | | | | 5,447,521 | |
| ING Groep NV (CVA)* | | | 210,857 | | | | 1,502,616 | |
| Royal Dutch Shell PLC "B" | | | 147,400 | | | | 5,609,483 | |
| (Cost $20,567,938) | | | | 18,719,640 | |
| Norway 0.8% | |
| DnB NOR ASA (Cost $2,801,279) | | | 172,000 | | | | 1,680,637 | |
| Portugal 0.5% | |
| Banco Comercial Portugues SA "R"* (a) (Cost $1,423,632) | | | 6,200,000 | | | | 1,086,281 | |
| Singapore 5.0% | |
| CapitaLand Ltd. | | | 565,000 | | | | 960,013 | |
| CapitaMall Trust (REIT) | | | 2,970,000 | | | | 3,886,229 | |
| DBS Group Holdings Ltd. | | | 223,000 | | | | 1,975,412 | |
| Golden Agri-Resources Ltd. | | | 6,900,000 | | | | 3,792,907 | |
| (Cost $11,660,703) | | | | 10,614,561 | |
| Spain 0.9% | |
| Red Electrica Corporacion SA (a) (Cost $2,841,395) | | | 44,000 | | | | 1,877,415 | |
| Sweden 4.0% | |
| Investor AB "B" | | | 55,000 | | | | 1,022,016 | |
| TeliaSonera AB | | | 1,106,000 | | | | 7,492,889 | |
| (Cost $9,640,411) | | | | 8,514,905 | |
| Switzerland 4.4% | |
| Nestle SA (Registered) | | | 42,000 | | | | 2,411,338 | |
| Syngenta AG (Registered)* | | | 2,000 | | | | 588,635 | |
| Zurich Financial Services AG* | | | 28,200 | | | | 6,367,993 | |
| (Cost $10,869,032) | | | | 9,367,966 | |
| United Kingdom 14.2% | |
| AMEC PLC | | | 70,338 | | | | 986,861 | |
| Anglo American PLC | | | 19,400 | | | | 715,004 | |
| BHP Billiton PLC | | | 11,300 | | | | 328,560 | |
| BP PLC | | | 255,000 | | | | 1,818,470 | |
| Centrica PLC | | | 263,000 | | | | 1,180,371 | |
| GlaxoSmithKline PLC | | | 756,000 | | | | 17,238,782 | |
| Inmarsat PLC | | | 297,000 | | | | 1,859,285 | |
| Old Mutual PLC | | | 1,738,041 | | | | 3,637,317 | |
| | | Shares | | | Value ($) | |
| | | | | | | | | |
| Tesco PLC | | | 70,000 | | | | 438,204 | |
| Tullow Oil PLC | | | 46,000 | | | | 999,890 | |
| Vodafone Group PLC | | | 251,000 | | | | 696,866 | |
| (Cost $29,671,285) | | | | 29,899,610 | |
Total Common Stocks (Cost $230,796,711) | | | | 200,481,950 | |
| | |
| Preferred Stock 0.9% | |
| Germany | |
| Porsche Automobil Holding SE (Cost $2,338,860) | | | 34,000 | | | | 1,819,518 | |
| | |
| | | Shares | | | Value ($) | |
| | | | | | | | | |
| Securities Lending Collateral 1.5% | |
| Daily Assets Fund Institutional, 0.18% (b) (c) (Cost $3,257,029) | | | 3,257,029 | | | | 3,257,029 | |
| | |
| Cash Equivalents 2.0% | |
| Central Cash Management Fund, 0.07% (b) (Cost $4,305,280) | | | 4,305,280 | | | | 4,305,280 | |
| | | % of Net Assets | | | Value ($) | |
| | | | |
Total Investment Portfolio (Cost $240,697,880)+ | | | 99.4 | | | | 209,863,777 | |
| Other Assets and Liabilities, Net | | | 0.6 | | | | 1,185,478 | |
| Net Assets | | | 100.0 | | | | 211,049,255 | |
* Non-income producing security.
+ The cost for federal income tax purposes was $241,846,317. At December 31, 2011, net unrealized depreciation for all securities based on tax cost was $31,982,540. This consisted of aggregate gross unrealized appreciation for all securities in which there was an excess of value over tax cost of $2,198,252 and aggregate gross unrealized depreciation for all securities in which there was an excess of tax cost over value of $34,180,792.
(a) All or a portion of these securities were on loan (see Notes to Financial Statements). The value of all securities loaned at December 31, 2011 amounted to $2,933,650, which is 1.4% of net assets.
(b) Affiliated fund managed by Deutsche Investment Management Americas Inc. The rate shown is the annualized seven-day yield at period end.
(c) Represents collateral held in connection with securities lending. Income earned by the Fund is net of borrower rebates.
CVA: Certificaten Van Aandelen
REIT: Real Estate Investment Trust
At December 31, 2011, open futures contracts purchased were as follows:
| Futures | Currency | Expiration Date | | Contracts | | | Notional Value ($) | | | Unrealized Appreciation ($) | |
| S&P 500 E-Mini Index | USD | 3/16/2012 | | | 150 | | | | 9,394,500 | | | | 174,375 | |
| Currency Abbreviation |
| USD United States Dollar |
For information on the Fund's policy and additional disclosures regarding futures contracts, please refer to the Derivatives section of Note B in the accompanying Notes to Financial Statements.
Fair Value Measurements
Various inputs are used in determining the value of the Fund's investments. These inputs are summarized in three broad levels. Level 1 includes quoted prices in active markets for identical securities. Level 2 includes other significant observable inputs (including quoted prices for similar securities, interest rates, prepayment speeds, and credit risk). Level 3 includes significant unobservable inputs (including the Fund's own assumptions in determining the fair value of investments). The inputs or methodology used for valuing securities are not necessarily an indication of the risk associated with investing in those securities.
The following is a summary of the inputs used as of December 31, 2011 in valuing the Fund's investments. For information on the Fund's policy regarding the valuation of investments, please refer to the Security Valuation section of Note A in the accompanying Notes to Financial Statements.
| Assets | | Level 1 | | | Level 2 | | | Level 3 | | | Total | |
| | |
Common and Preferred Stocks (d) | | | | | | | | | | | | |
| Australia | | $ | — | | | $ | 19,329,099 | | | $ | — | | | $ | 19,329,099 | |
| Denmark | | | — | | | | 2,763,407 | | | | — | | | | 2,763,407 | |
| Finland | | | — | | | | 1,708,364 | | | | — | | | | 1,708,364 | |
| France | | | — | | | | 25,681,238 | | | | — | | | | 25,681,238 | |
| Germany | | | — | | | | 11,500,099 | | | | — | | | | 11,500,099 | |
| Hong Kong | | | — | | | | 6,880,705 | | | | — | | | | 6,880,705 | |
| Israel | | | — | | | | 2,364,363 | | | | — | | | | 2,364,363 | |
| Italy | | | — | | | | 7,568,828 | | | | — | | | | 7,568,828 | |
| Japan | | | — | | | | 42,744,350 | | | | — | | | | 42,744,350 | |
| Netherlands | | | — | | | | 18,719,640 | | | | — | | | | 18,719,640 | |
| Norway | | | — | | | | 1,680,637 | | | | — | | | | 1,680,637 | |
| Portugal | | | — | | | | 1,086,281 | | | | — | | | | 1,086,281 | |
| Singapore | | | — | | | | 10,614,561 | | | | — | | | | 10,614,561 | |
| Spain | | | — | | | | 1,877,415 | | | | — | | | | 1,877,415 | |
| Sweden | | | — | | | | 8,514,905 | | | | — | | | | 8,514,905 | |
| Switzerland | | | — | | | | 9,367,966 | | | | — | | | | 9,367,966 | |
| United Kingdom | | | — | | | | 29,899,610 | | | | — | | | | 29,899,610 | |
| Short-Term Investments (d) | | | 7,562,309 | | | | — | | | | — | | | | 7,562,309 | |
Derivatives (e) | | | 174,375 | | | | — | | | | — | | | | 174,375 | |
| Total | | $ | 7,736,684 | | | $ | 202,301,468 | | | $ | — | | | $ | 210,038,152 | |
There have been no transfers between Level 1 and Level 2 fair value measurements during the year ended December 31, 2011.
(d) See Investment Portfolio for additional detailed categorizations.
(e) Derivatives include unrealized appreciation (depreciation) on futures contracts.
The accompanying notes are an integral part of the financial statements.
Statement of Assets and Liabilities | as of December 31, 2011 | |
| Assets | |
Investments: Investments in non-affiliated securities, at value (cost $233,135,571) — including $2,933,650 of securities loaned | | $ | 202,301,468 | |
| Investment in Daily Assets Fund Institutional (cost $3,257,029) | | | 3,257,029 | |
| Investment in Central Cash Management Fund (cost $4,305,280) | | | 4,305,280 | |
| Total investments, at value (cost $240,697,880) | | | 209,863,777 | |
| Cash | | | 96,750 | |
| Foreign currency, at value (cost $3,645,485) | | | 3,464,979 | |
| Deposit with broker for futures contracts | | | 600,000 | |
| Receivable for Fund shares sold | | | 118,986 | |
| Interest receivable | | | 2,146 | |
| Dividends receivable | | | 384,162 | |
| Foreign taxes recoverable | | | 203,160 | |
| Other assets | | | 3,947 | |
| Total assets | | | 214,737,907 | |
| Liabilities | |
| Payable for Fund shares redeemed | | | 110,573 | |
| Payable upon return of securities loaned | | | 3,257,029 | |
| Payable for daily variation margin on futures contracts | | | 36,000 | |
| Accrued management fee | | | 142,449 | |
| Other accrued expenses and payables | | | 142,601 | |
| Total liabilities | | | 3,688,652 | |
| Net assets, at value | | $ | 211,049,255 | |
| Net Assets Consist of | |
| Undistributed net investment income | | | 4,638,574 | |
Net unrealized appreciation (depreciation) on: Investments | | | (30,834,103 | ) |
| Futures | | | 174,375 | |
| Foreign currency | | | (170,865 | ) |
| Accumulated net realized gain (loss) | | | (131,106,837 | ) |
| Paid-in capital | | | 368,348,111 | |
| Net assets, at value | | $ | 211,049,255 | |
Class A Net Asset Value, offering and redemption price per share ($210,813,840 ÷ 31,267,358 outstanding shares of beneficial interest, $.01 par value, unlimited number of shares authorized) | | $ | 6.74 | |
Class B Net Asset Value, offering and redemption price per share ($235,415 ÷ 34,893 outstanding shares of beneficial interest, $.01 par value, unlimited number of shares authorized) | | $ | 6.75 | |
The accompanying notes are an integral part of the financial statements.
Statement of Operations
| for the year ended December 31, 2011 | |
| Investment Income | |
Income: Dividends (net of foreign taxes withheld of $740,538) | | $ | 7,285,873 | |
| Interest | | | 23,812 | |
| Income distributions — Central Cash Management Fund | | | 8,355 | |
| Securities lending income, including income from Daily Assets Fund Institutional, net of borrower rebates | | | 279,614 | |
| Total income | | | 7,597,654 | |
Expenses: Management fee | | | 2,010,030 | |
| Administration fee | | | 254,434 | |
| Services to shareholders | | | 7,103 | |
| Custodian fee | | | 76,331 | |
| Distribution service fee (Class B) | | | 741 | |
| Professional fees | | | 71,079 | |
| Reports to shareholders | | | 79,973 | |
| Trustees' fees and expenses | | | 9,851 | |
| Other | | | 48,242 | |
| Total expenses | | | 2,557,784 | |
| Net investment income (loss) | | | 5,039,870 | |
| Realized and Unrealized Gain (Loss) | |
Net realized gain (loss) from: Investments | | | 20,809,978 | |
| Futures | | | (667,627 | ) |
| Foreign currency | | | (144,267 | ) |
| | | | 19,998,084 | |
Change in net unrealized appreciation (depreciation) on: Investments | | | (67,926,771 | ) |
| Futures | | | 174,375 | |
| Foreign currency | | | (198,399 | ) |
| | | | (67,950,795 | ) |
| Net gain (loss) | | | (47,952,711 | ) |
| Net increase (decrease) in net assets resulting from operations | | $ | (42,912,841 | ) |
The accompanying notes are an integral part of the financial statements.
Statement of Changes in Net Assets | | | Years Ended December 31, | |
| Increase (Decrease) in Net Assets | | 2011 | | | 2010 | |
Operations: Net investment income (loss) | | $ | 5,039,870 | | | $ | 5,139,006 | |
| Net realized gain (loss) | | | 19,998,084 | | | | 32,033,390 | |
| Change in net unrealized appreciation (depreciation) | | | (67,950,795 | ) | | | (35,483,954 | ) |
| Net increase (decrease) in net assets resulting from operations | | | (42,912,841 | ) | | | 1,688,442 | |
Distributions to shareholders from: Net investment income: Class A | | | (4,647,186 | ) | | | (6,697,099 | ) |
| Class B | | | (4,542 | ) | | | (8,035 | ) |
| Total distributions | | | (4,651,728 | ) | | | (6,705,134 | ) |
Fund share transactions: Class A Proceeds from shares sold | | | 8,968,575 | | | | 11,044,552 | |
| Reinvestment of distributions | | | 4,647,186 | | | | 6,697,099 | |
| Payments for shares redeemed | | | (43,581,738 | ) | | | (68,414,073 | ) |
| Net increase (decrease) in net assets from Class A share transactions | | | (29,965,977 | ) | | | (50,672,422 | ) |
Class B Proceeds from shares sold | | | 17,120 | | | | 28,325 | |
| Reinvestment of distributions | | | 4,542 | | | | 8,035 | |
| Payments for shares redeemed | | | (100,644 | ) | | | (124,745 | ) |
| Net increase (decrease) in net assets from Class B share transactions | | | (78,982 | ) | | | (88,385 | ) |
| Increase (decrease) in net assets | | | (77,609,528 | ) | | | (55,777,499 | ) |
| Net assets at beginning of period | | | 288,658,783 | | | | 344,436,282 | |
| Net assets at end of period (including undistributed net investment income of $4,638,574 and $4,383,767, respectively) | | $ | 211,049,255 | | | $ | 288,658,783 | |
| Other Information | |
Class A Shares outstanding at beginning of period | | | 35,091,522 | | | | 41,648,336 | |
| Shares sold | | | 1,212,691 | | | | 1,324,213 | |
| Shares issued to shareholders in reinvestment of distributions | | | 539,116 | | | | 845,593 | |
| Shares redeemed | | | (5,575,971 | ) | | | (8,726,620 | ) |
| Net increase (decrease) in Class A shares | | | (3,824,164 | ) | | | (6,556,814 | ) |
| Shares outstanding at end of period | | | 31,267,358 | | | | 35,091,522 | |
Class B Shares outstanding at beginning of period | | | 44,527 | | | | 56,405 | |
| Shares sold | | | 2,218 | | | | 3,694 | |
| Shares issued to shareholders in reinvestment of distributions | | | 526 | | | | 1,012 | |
| Shares redeemed | | | (12,378 | ) | | | (16,584 | ) |
| Net increase (decrease) in Class B shares | | | (9,634 | ) | | | (11,878 | ) |
| Shares outstanding at end of period | | | 34,893 | | | | 44,527 | |
The accompanying notes are an integral part of the financial statements.
| | | Years Ended December 31, | |
| Class A | | 2011 | | | 2010 | | | 2009 | | | 2008 | | | 2007 | |
| Selected Per Share Data | |
| Net asset value, beginning of period | | $ | 8.22 | | | $ | 8.26 | | | $ | 6.52 | | | $ | 15.01 | | | $ | 13.42 | |
Income (loss) from investment operations: Net investment income (loss)a | | | .15 | | | | .13 | | | | .12 | | | | .29 | c | | | .21 | c |
| Net realized and unrealized gain (loss) | | | (1.49 | ) | | | (.00 | )* | | | 1.93 | | | | (6.46 | ) | | | 1.73 | |
| Total from investment operations | | | (1.34 | ) | | | .13 | | | | 2.05 | | | | (6.17 | ) | | | 1.94 | |
Less distributions from: Net investment income | | | (.14 | ) | | | (.17 | ) | | | (.31 | ) | | | (.17 | ) | | | (.35 | ) |
| Net realized gains | | | — | | | | — | | | | — | | | | (2.15 | ) | | | — | |
| Total distributions | | | (.14 | ) | | | (.17 | ) | | | (.31 | ) | | | (2.32 | ) | | | (.35 | ) |
| Net asset value, end of period | | $ | 6.74 | | | $ | 8.22 | | | $ | 8.26 | | | $ | 6.52 | | | $ | 15.01 | |
| Total Return (%) | | | (16.67 | ) | | | 1.62 | b | | | 33.52 | | | | (48.21 | )b,d | | | 14.59 | |
| Ratios to Average Net Assets and Supplemental Data | |
| Net assets, end of period ($ millions) | | | 211 | | | | 288 | | | | 344 | | | | 297 | | | | 702 | |
| Ratio of expenses before expense reductions (%) | | | 1.00 | | | | .99 | | | | .94 | | | | 1.01 | | | | .98 | |
| Ratio of expenses after expense reductions (%) | | | 1.00 | | | | .99 | | | | .94 | | | | .97 | | | | .98 | |
| Ratio of net investment income (loss) (%) | | | 1.98 | | | | 1.68 | | | | 1.69 | | | | 2.74 | c | | | 1.48 | c |
| Portfolio turnover rate (%) | | | 174 | | | | 228 | | | | 81 | | | | 123 | | | | 108 | |
a Based on average shares outstanding during the period. b Total return would have been lower had certain expenses not been reduced. c Net investment income per share and the ratio of net investment income include non-recurring dividend income amounting to $0.09 and $0.05 per share and 0.82% and 0.33% of average daily net assets for the years ended December 31, 2008 and 2007, respectively. d Includes a reimbursement from the Advisor to reimburse the effect of losses incurred as the result of certain operation errors during the period. Excluding this reimbursement, total return would have been 0.06% lower. * Amount is less than $.005. | |
| | | Years Ended December 31, | |
| Class B | | | 2011 | | | 2010 | | | 2009 | | | 2008 | | | 2007 | |
| Selected Per Share Data | |
| Net asset value, beginning of period | | $ | 8.22 | | | $ | 8.26 | | | $ | 6.52 | | | $ | 14.98 | | | $ | 13.38 | |
Income (loss) from investment operations: Net investment income (loss)a | | | .13 | | | | .11 | | | | .10 | | | | .23 | c | | | .16 | c |
| Net realized and unrealized gain (loss) | | | (1.48 | ) | | | (.00 | )* | | | 1.94 | | | | (6.43 | ) | | | 1.73 | |
| Total from investment operations | | | (1.35 | ) | | | .11 | | | | 2.04 | | | | (6.20 | ) | | | 1.89 | |
Less distributions from: Net investment income | | | (.12 | ) | | | (.15 | ) | | | (.30 | ) | | | (.11 | ) | | | (.29 | ) |
| Net realized gains | | | — | | | | — | | | | — | | | | (2.15 | ) | | | — | |
| Total distributions | | | (.12 | ) | | | (.15 | ) | | | (.30 | ) | | | (2.26 | ) | | | (.29 | ) |
| Net asset value, end of period | | $ | 6.75 | | | $ | 8.22 | | | $ | 8.26 | | | $ | 6.52 | | | $ | 14.98 | |
| Total Return (%) | | | (16.77 | ) | | | 1.33 | b | | | 32.89 | | | | (48.25 | )b,d | | | 14.25 | b |
| Ratios to Average Net Assets and Supplemental Data | |
| Net assets, end of period ($ millions) | | | .24 | | | | .36 | | | | .50 | | | | .40 | | | | 12 | |
| Ratio of expenses before expense reductions (%) | | | 1.28 | | | | 1.26 | | | | 1.22 | | | | 1.33 | | | | 1.41 | |
| Ratio of expenses after expense reductions (%) | | | 1.28 | | | | 1.26 | | | | 1.22 | | | | 1.28 | | | | 1.39 | |
| Ratio of net investment income (loss) (%) | | | 1.70 | | | | 1.41 | | | | 1.42 | | | | 2.42 | c | | | 1.07 | c |
| Portfolio turnover rate (%) | | | 174 | | | | 228 | | | | 81 | | | | 123 | | | | 108 | |
a Based on average shares outstanding during the period. b Total return would have been lower had certain expenses not been reduced. c Net investment income per share and the ratio of net investment income include non-recurring dividend income amounting to $0.09 and $0.05 per share and 0.82% and 0.33% of average daily net assets for the years ended December 31, 2008 and 2007, respectively. d Includes a reimbursement from the Advisor to reimburse the effect of losses incurred as the result of certain operation errors during the period. Excluding this reimbursement, total return would have been 0.06% lower. * Amount is less than $.005. | |
Notes to Financial Statements
A. Organization and Significant Accounting Policies
DWS Variable Series I (the "Series") is registered under the Investment Company Act of 1940, as amended (the "1940 Act"), as an open-end, registered management investment company organized as a Massachusetts business trust. The Series consists of five diversified funds: DWS Bond VIP, DWS Growth & Income VIP, DWS Capital Growth VIP, DWS Global Small Cap Growth VIP (formerly DWS Global Opportunities VIP) and DWS International VIP (individually or collectively hereinafter referred to as a "Fund" or the "Funds"). These financial statements report on DWS International VIP. The Series is intended to be the underlying investment vehicle for variable annuity contracts and variable life insurance policies to be offered by the separate accounts of certain life insurance companies ("Participating Insurance Companies").
Multiple Classes of Shares of Beneficial Interest. The Fund offers two classes of shares (Class A shares and Class B shares). Class B shares are subject to Rule 12b-1 distribution fees under the 1940 Act and recordkeeping fees equal to an annual rate of 0.25% and up to 0.15%, respectively, of the average daily net assets of the Class B shares of the Fund. Class A shares are not subject to such fees.
Investment income, realized and unrealized gains and losses, and certain fund-level expenses and expense reductions, if any, are borne pro rata on the basis of relative net assets by the holders of all classes of shares, except that each class bears certain expenses unique to that class (including the applicable 12b-1 distribution fees and recordkeeping fees). Differences in class-level expenses may result in payment of different per share dividends by class. All shares have equal rights with respect to voting subject to class-specific arrangements.
The Fund's financial statements are prepared in accordance with accounting principles generally accepted in the United States of America, which require the use of management estimates. Actual results could differ from those estimates. The policies described below are followed consistently by the Fund in the preparation of its financial statements.
Security Valuation. Investments are stated at value determined as of the close of regular trading on the New York Stock Exchange on each day the exchange is open for trading.
Various inputs are used in determining the value of the Fund's investments. These inputs are summarized in three broad levels. Level 1 includes quoted prices in active markets for identical securities. Level 2 includes other significant observable inputs (including quoted prices for similar securities, interest rates, prepayment speeds, and credit risk). Level 3 includes significant unobservable inputs (including the Fund's own assumptions in determining the fair value of investments). The inputs or methodology used for valuing securities are not necessarily an indication of the risk associated with investing in those securities.
Equity securities are valued at the most recent sale price or official closing price reported on the exchange (U.S. or foreign) or over-the-counter market on which they trade and are categorized as Level 1 securities. Securities for which no sales are reported are valued at the calculated mean between the most recent bid and asked quotations on the relevant market or, if a mean cannot be determined, at the most recent bid quotation. For certain international equity securities, in order to adjust for events which may occur between the close of the foreign exchanges and the close of the New York Stock Exchange, a fair valuation model may be used. This fair valuation model takes into account comparisons to the valuation of American Depository Receipts (ADRs), exchange-traded funds, futures contracts and certain indices and these securities are categorized as Level 2.
Money market instruments purchased with an original or remaining maturity of sixty days or less, maturing at par, are valued at amortized cost, which approximates value, and are categorized as Level 2. Investments in open-end investment companies are valued at their net asset value each business day and are categorized as Level 1.
Futures contracts are generally valued at the settlement prices established each day on the exchange on which they are traded and are categorized as Level 1.
Securities and other assets for which market quotations are not readily available or for which the above valuation procedures are deemed not to reflect fair value are valued in a manner that is intended to reflect their fair value as determined in accordance with procedures approved by the Trustees and are generally categorized as Level 3. In accordance with the Fund's valuation procedures, factors used in determining value may include, but are not limited to, the type of the security; the size of the holding; the initial cost of the security; the existence of any contractual restrictions on the security's disposition; the price and extent of public trading in similar securities of the issuer or of comparable companies; quotations or evaluated prices from broker-dealers and/or pricing services; information obtained from the issuer, analysts, and/or the appropriate stock exchange (for exchange-traded securities); an analysis of the company's or issuer's financial statements; an evaluation of the forces that influence the issuer and the market(s) in which the security is purchased and sold and with respect to debt securities; the maturity, coupon, creditworthiness, currency denomination and the movement of the market in which the security is normally traded. The value determined under these procedures may differ from published values for the same securities.
Disclosure about the classification of fair value measurements is included in a table following the Fund's Investment Portfolio.
New Accounting Pronouncement. In May 2011, Accounting Standards Update 2011-04 (ASU 2011-04), Amendments to Achieve Common Fair Value Measurement and Disclosure Requirements in U.S. GAAP and IFRSs, was issued and is effective during interim and annual periods beginning after December 15, 2011. ASU 2011-04 amends Accounting Standards Codification (ASC) Topic 820, Fair Value Measurement. The amendments are the result of the work by the Financial Accounting Standards Board and the International Accounting Standards Board to develop common requirements for measuring fair value and for disclosing information about fair value measurements in accordance with GAAP. Management is currently evaluating the application of ASU 2011-04 and its impact, if any, on the Fund's financial statements.
Securities Lending. The Fund lends securities to certain financial institutions. The Fund retains beneficial ownership of the securities it has loaned and continues to receive interest and dividends paid by the issuer of securities and to participate in any changes in their market value. The Fund requires the borrowers of the securities to maintain collateral with the Fund consisting of either cash or liquid, unencumbered assets having a value at least equal to the value of the securities loaned. When the collateral falls below specified amounts, the lending agent will use its best effort to obtain additional collateral on the next business day to meet required amounts under the security lending agreement. The Fund may invest the cash collateral into a joint trading account in an affiliated money market fund pursuant to Exemptive Orders issued by the SEC. The Fund receives compensation for lending its securities either in the form of fees or by earning interest on invested cash collateral net of borrower rebates and fees paid to a lending agent. Either the Fund or the borrower may terminate the loan. There may be risks of delay and costs in recovery of securities or even loss of rights in the collateral should the borrower of the securities fail financially. The Fund is also subject to all investment risks associated with the reinvestment of any cash collateral received, including, but not limited to, interest rate, credit and liquidity risk associated with such investments.
Foreign Currency Translations. The books and records of the Fund are maintained in U.S. dollars. Investment securities and other assets and liabilities denominated in a foreign currency are translated into U.S. dollars at the prevailing exchange rates at period end. Purchases and sales of investment securities, income and expenses are translated into U.S. dollars at the prevailing exchange rates on the respective dates of the transactions.
Net realized and unrealized gains and losses on foreign currency transactions represent net gains and losses between trade and settlement dates on securities transactions, the acquisition and disposition of foreign currencies, and the difference between the amount of net investment income accrued and the U.S. dollar amount actually received. That portion of both realized and unrealized gains and losses on investments that results from fluctuations in foreign currency exchange rates is not separately disclosed but is included with net realized and unrealized gain/appreciation and loss/depreciation on investments.
Taxes. The Fund is treated as a separate taxpayer as provided for in the Internal Revenue Code, as amended. It is the Fund's policy to comply with the requirements of the Internal Revenue Code, as amended, which are applicable to regulated investment companies, and to distribute all of its taxable income to the separate accounts of the Participating Insurance Companies which hold its shares.
Additionally, based on the Series' understanding of the tax rules and rates related to income, gains and transactions for the foreign jurisdictions in which the Fund invests, the Fund will provide for foreign taxes, and where appropriate, deferred foreign taxes.
Under the Regulated Investment Company Modernization Act of 2010, net capital losses may be carried forward indefinitely, and their character is retained as short-term and/or long-term. Previously, net capital losses were carried forward for eight years and treated as short-term losses. As a transition rule, the Act requires that post-enactment net capital losses be used before pre-enactment net capital losses.
At December 31, 2011, the Fund had a net tax basis capital loss carryforward of approximately $124,587,000 of pre-enactment losses, which may be applied against any realized net taxable capital gains of each succeeding year until fully utilized or until December 31, 2016 ($51,383,000) and December 31, 2017 ($73,204,000), the respective expiration dates, whichever occurs first.
In addition, from November 1, 2011 to December 31, 2011, the Fund elects to defer qualified late year losses of approximately $5,197,000 of net realized long-term capital losses. The Fund intends to elect to defer these losses and treat them as arising in the fiscal year ending December 31, 2012.
The Fund has reviewed the tax positions for the open tax years as of December 31, 2011 and has determined that no provision for income tax is required in the Fund's financial statements. The Fund's federal tax returns for the prior three fiscal years remain open subject to examination by the Internal Revenue Service.
Distribution of Income and Gains. The Fund will declare and distribute dividends from its net investment income, if any, annually, although additional distributions may be made if necessary. Net realized gains from investment transactions, in excess of available capital loss carryforwards, would be taxable to the Fund if not distributed, and, therefore, will be distributed to shareholders at least annually.
The timing and characterization of certain income and capital gain distributions are determined annually in accordance with federal tax regulations which may differ from accounting principles generally accepted in the United States of America. These differences primarily relate to investments in foreign denominated investments, futures contracts, passive foreign investment companies and certain securities sold at a loss. As a result, net investment income (loss) and net realized gain (loss) on investment transactions for a reporting period may differ significantly from distributions during such period. Accordingly, the Fund may periodically make reclassifications among certain of its capital accounts without impacting the net asset value of the Fund.
At December 31, 2011, the Fund's components of distributable earnings (accumulated losses) on a tax basis are as follows:
| Undistributed ordinary income* | | $ | 4,638,574 | |
| Capital loss carryforwards | | $ | (124,587,000 | ) |
| Net unrealized appreciation (depreciation) on investments | | $ | (31,982,540 | ) |
In addition, the tax character of distributions paid to shareholders by the Fund is summarized as follows:
| | | Years Ended December 31, | |
| | | 2011 | | | 2010 | |
| Distributions from ordinary income* | | $ | 4,651,728 | | | $ | 6,705,134 | |
* For tax purposes, short-term capital gain distributions are considered ordinary income distributions.
Expenses. Expenses of the Series arising in connection with a specific Fund are allocated to that Fund. Other Series expenses which cannot be directly attributed to a Fund are apportioned among the Funds in the Series.
Contingencies. In the normal course of business, the Fund may enter into contracts with service providers that contain general indemnification clauses. The Fund's maximum exposure under these arrangements is unknown as this would involve future claims that may be made against the Fund that have not yet been made. However, based on experience, the Fund expects the risk of loss to be remote.
Other. Investment transactions are accounted for on a trade date plus one basis for daily net asset value calculations. However, for financial reporting purposes, investment transactions are reported on trade date. Interest income is recorded on the accrual basis net of foreign withholding taxes. Dividend income is recorded on the ex-dividend date net of foreign withholding taxes. Certain dividends from foreign securities may be recorded subsequent to the ex-dividend date as soon as the Fund is informed of such dividends. Realized gains and losses from investment transactions are recorded on an identified cost basis and may include proceeds from litigation.
B. Derivative Instruments
Futures Contracts. A futures contract is an agreement between a buyer or seller and an established futures exchange or its clearinghouse in which the buyer or seller agrees to take or make a delivery of a specific amount of a financial instrument at a specified price on a specific date (settlement date). For the year ended December 31, 2011, the Fund entered into futures contracts in circumstances where portfolio management believed they offered an economic means of gaining exposure to a particular asset class or to keep cash on hand to meet shareholder redemptions or other needs while maintaining exposure to the market.
Upon entering into a futures contract, the Fund is required to deposit with a financial intermediary cash or securities ("initial margin") in an amount equal to a certain percentage of the face value indicated in the futures contract. Subsequent payments ("variation margin") are made or received by the Fund dependent upon the daily fluctuations in the value and are recorded for financial reporting purposes as unrealized gains or losses by the Fund. Gains or losses are realized when the contract expires or is closed. Since all futures contracts are exchange-traded, counterparty risk is minimized as the exchange's clearinghouse acts as the counterparty, and guarantees the futures against default.
Certain risks may arise upon entering into futures contracts, including the risk that an illiquid market will limit the Fund's ability to close out a futures contract prior to the settlement date and the risk that the futures contract is not well correlated with the security, index or currency to which it relates. Risk of loss may exceed amounts recognized in the Statement of Assets and Liabilities.
A summary of the open futures contracts as of December 31, 2011 is included in a table following the Fund's Investment Portfolio. For the year ended December 31, 2011, the investment in futures contracts purchased had a total notional value generally indicative of a range from $0 to approximately $10,697,000.
| Asset Derivative | | Futures Contracts | |
| Equity Contracts (a) | | $ | 174,375 | |
The above derivative is located in the following Statement of Assets and Liabilities account:
(a) Includes cumulative appreciation of futures contracts as disclosed in the Investment Portfolio. Unsettled variation margin is disclosed separately within the Statement of Assets and Liabilities.
Additionally, the amount of unrealized and realized gains and losses on derivative instruments recognized in Fund earnings during the year ended December 31, 2011 and the related location in the accompanying Statement of Operations is summarized in the following tables by primary underlying risk exposure:
| Realized Gain (Loss) | | Futures Contracts | |
| Equity Contracts (a) | | $ | (667,627 | ) |
The above derivative is located in the following Statement of Operations account:
(a) Net realized gain (loss) from futures
| Change in Net Unrealized Appreciation (Depreciation) | | Futures Contracts | |
| Equity Contracts (a) | | $ | 174,375 | |
The above derivative is located in the following Statement of Operations account:
(a) Change in net unrealized appreciation (depreciation) on futures
C. Purchases and Sales of Securities
During the year ended December 31, 2011, purchases and sales of investment securities (excluding short-term investments) aggregated $433,375,166 and $472,762,170, respectively.
D. Related Parties
Management Agreement. Under the Investment Management Agreement with Deutsche Investment Management Americas Inc. ("DIMA" or the "Advisor"), an indirect, wholly owned subsidiary of Deutsche Bank AG, the Advisor directs the investments of the Fund in accordance with its investment objectives, policies and restrictions. The Advisor determines the securities, instruments and other contracts relating to investments to be purchased, sold or entered into by the Fund.
Pursuant to the Investment Management Agreement with the Advisor, the Fund pays a monthly management fee based on the Fund's average daily net assets, computed and accrued daily and payable monthly, at the following annual rates:
| First $500 million of average daily net assets | | | .790 | % |
| Over $500 million of average daily net assets | | | .640 | % |
Accordingly, for the year ended December 31, 2011, the fee pursuant to the Investment Management Agreement was equivalent to an annual effective rate of 0.79% of the Fund's average daily net assets.
Administration Fee. Pursuant to an Administrative Services Agreement, DIMA provides most administrative services to the Fund. For all services provided under the Administrative Services Agreement, the Fund pays the Advisor an annual fee ("Administration Fee") of 0.10% of the Fund's average daily net assets, computed and accrued daily and payable monthly. For the year ended December 31, 2011, the Administration Fee was $254,434, of which $18,031 is unpaid.
Service Provider Fees. DWS Investments Service Company ("DISC"), an affiliate of the Advisor, is the transfer agent, dividend-paying agent and shareholder service agent for the Fund. Pursuant to a sub-transfer agency agreement between DISC and DST Systems, Inc. ("DST"), DISC has delegated certain transfer agent, dividend-paying agent and shareholder service agent functions to DST. DISC compensates DST out of the shareholder servicing fee it receives from the Fund. For the year ended December 31, 2011, the amounts charged to the Fund by DISC were as follows:
| Services to Shareholders | | Total Aggregated | | | Unpaid at December 31, 2011 | |
| Class A | | $ | 690 | | | $ | 172 | |
| Class B | | | 85 | | | | 20 | |
| | | $ | 775 | | | $ | 192 | |
Distribution Service Agreement. DWS Investments Distributors, Inc. ("DIDI"), also an affiliate of the Advisor, is the Series' Distributor. In accordance with the Master Distribution Plan, DIDI receives 12b-1 fees of 0.25% of average daily net assets of Class B shares. Pursuant to the Master Distribution Plan, DIDI remits these fees to the Participating Insurance Companies for various costs incurred or paid by these companies in connection with marketing and distribution of Class B shares. For the year ended December 31, 2011, the Distribution Service Fee aggregated $741, of which $50 is unpaid.
Typesetting and Filing Service Fees. Under an agreement with DIMA, DIMA is compensated for providing typesetting and certain regulatory filing services to the Fund. For the year ended December 31, 2011, the amount charged to the Fund by DIMA included in the Statement of Operations under "reports to shareholders" aggregated $14,469, of which $3,058 is unpaid.
Trustees' Fees and Expenses. The Fund paid each Trustee not affiliated with the Advisor retainer fees plus specified amounts for various committee services and for the Board Chairperson.
Affiliated Cash Management Vehicle. The Fund may invest uninvested cash balances in Central Cash Management Fund, which is managed by the Advisor. The Fund indirectly bears its proportionate share of the expenses of Central Cash Management Fund. Central Cash Management Fund does not pay the Advisor an investment management fee. Central Cash Management Fund seeks a high level of current income consistent with liquidity and the preservation of capital.
Securities Lending Agent Fees. Effective July 14, 2011, Deutsche Bank AG serves as securities lending agent for the Fund. For the period from July 14, 2011 through December 31, 2011, the Fund incurred securities lending agent fees to Deutsche Bank AG in the amount of $3,845.
E. Ownership of the Fund
Two participating insurance companies were owners of record of 10% or more of the total outstanding Class A shares of the Fund, each owning 41% and 13%. One participating insurance company was an owner of record of 10% or more of the total outstanding Class B shares of the Fund, owning 85%.
F. Line of Credit
The Fund and other affiliated funds (the "Participants") share in a $450 million revolving credit facility provided by a syndication of banks. The Fund may borrow for temporary or emergency purposes, including the meeting of redemption requests that otherwise might require the untimely disposition of securities. The Participants are charged an annual commitment fee which is allocated based on net assets, among each of the Participants. Interest is calculated at a rate per annum equal to the sum of the Federal Funds Rate plus 1.25 percent plus if LIBOR exceeds the Federal Funds Rate the amount of such excess. The Fund may borrow up to a maximum of 33 percent of its net assets under the agreement. The Fund had no outstanding loans at December 31, 2011.
Report of Independent Registered Public Accounting Firm
To the Trustees of DWS Variable Series I and the Shareholders of DWS International VIP:
In our opinion, the accompanying statement of assets and liabilities, including the investment portfolio, and the related statements of operations and of changes in net assets and the financial highlights present fairly, in all material respects, the financial position of DWS International VIP (the "Fund") at December 31, 2011 and the results of its operations, the changes in its net assets, and the financial highlights for the periods indicated therein, in conformity with accounting principles generally accepted in the United States of America. These financial statements and financial highlights (hereafter referred to as "financial statements") are the responsibility of the Fund's management. Our responsibility is to express an opinion on these financial statements based on our audits. We conducted our audits of these financial statements in accordance with the standards of the Public Company Accounting Oversight Board (United States). Those standards require that we plan and perform the audit to obtain reasonable assurance about whether the financial statements are free of material misstatement. An audit includes examining, on a test basis, evidence supporting the amounts and disclosures in the financial statements, assessing the accounting principles used and significant estimates made by management, and evaluating the overall financial statement presentation. We believe that our audits, which included confirmation of securities at December 31, 2011 by correspondence with the custodians and brokers, provide a reasonable basis for our opinion.
Boston, Massachusetts February 15, 2012 | PricewaterhouseCoopers LLP |
Information About Your Fund's Expenses
As an investor of the Fund, you incur two types of costs: ongoing expenses and transaction costs. Ongoing expenses include management fees, distribution and service (12b-1) fees and other Fund expenses. Examples of transaction costs include contract charges, redemption fees and account maintenance fees, which are not shown in this section. The following tables are intended to help you understand your ongoing expenses (in dollars) of investing in the Fund and to help you compare these expenses with the ongoing expenses of investing in other mutual funds. The example in the table is based on an investment of $1,000 invested at the beginning of the six-month period and held for the entire period (July 1, 2011 to December 31, 2011).
The tables illustrate your Fund's expenses in two ways:
·Actual Fund Return. This helps you estimate the actual dollar amount of ongoing expenses (but not transaction costs) paid on a $1,000 investment in the Fund using the Fund's actual return during the period. To estimate the expenses you paid over the period, simply divide your account value by $1,000 (for example, an $8,600 account value divided by $1,000 = 8.6), then multiply the result by the number in the "Expenses Paid per $1,000" line under the share class you hold.
· Hypothetical 5% Fund Return. This helps you to compare your Fund's ongoing expenses (but not transaction costs) with those of other mutual funds using the Fund's actual expense ratio and a hypothetical rate of return of 5% per year before expenses. Examples using a 5% hypothetical Fund return may be found in the shareholder reports of other mutual funds. The hypothetical account values and expenses may not be used to estimate the actual ending account balance or expenses you paid for the period.
Please note that the expenses shown in these tables are meant to highlight your ongoing expenses only and do not reflect any transaction costs. The "Expenses Paid per $1,000" line of the tables is useful in comparing ongoing expenses only and will not help you determine the relative total expense of owning different funds. If these transaction costs had been included, your costs would have been higher.
Expenses and Value of a $1,000 Investment for the six months ended December 31, 2011 | |
| Actual Fund Return | | Class A | | | | | | Class B | |
| Beginning Account Value 7/1/11 | | $ | 1,000.00 | | | | | | $ | 1,000.00 | |
| Ending Account Value 12/31/11 | | $ | 814.00 | | | | , | | | $ | 814.20 | |
| Expenses Paid per $1,000* | | $ | 4.62 | | | | | | | $ | 5.90 | |
| Hypothetical 5% Fund Return | | Class A | | | | | | | Class B | |
| Beginning Account Value 7/1/11 | | $ | 1,000.00 | | | | | | | $ | 1,000.00 | |
| Ending Account Value 12/31/11 | | $ | 1,020.11 | | | | | | | $ | 1,018.70 | |
| Expenses Paid per $1,000* | | $ | 5.14 | | | | | | | $ | 6.56 | |
* Expenses are equal to the Fund's annualized expense ratio for each share class, multiplied by the average account value over the period, multiplied by the number of days in the most recent six-month period, then divided by 365.
| Annualized Expense Ratios | Class A | | Class B | |
| DWS Variable Series I — DWS International VIP | 1.01% | | 1.29% | |
For more information, please refer to the Fund's prospectus.
These tables do not reflect charges and fees ("contract charges") associated with the separate account that invests in the Fund or any variable life insurance policy or variable annuity contract for which the Fund is an investment option.
Tax Information (Unaudited)
Please consult a tax advisor if you have questions about federal or state income tax laws, or on how to prepare your tax returns. If you have specific questions about your account, please contact your insurance provider.
The Series' policies and procedures for voting proxies for portfolio securities and information about how the Series voted proxies related to its portfolio securities during the 12-month period ended June 30 are available on our Web site — www.dws-investments.com (click on "proxy voting"at the bottom of the page) — or on the SEC's Web site — www.sec.gov. To obtain a written copy of the Series' policies and procedures without charge, upon request, call us toll free at (800) 728-3337.
Investment Management Agreement Approval
The Board of Trustees approved the renewal of DWS International VIP's investment management agreement (the "Agreement") with Deutsche Investment Management Americas Inc. ("DWS") in September 2011.
In terms of the process that the Board followed prior to approving the Agreement, shareholders should know that:
· In September 2011, all of the Fund's Trustees were independent of DWS and its affiliates.
· The Trustees met frequently during the past year to discuss fund matters and dedicated a substantial amount of time to contract review matters. Over the course of several months, the Board's Contract Committee, in coordination with the Board's Equity Oversight Committee, reviewed comprehensive materials received from DWS, independent third parties and independent counsel. These materials included an analysis of the Fund's performance, fees and expenses, and profitability compiled by the Fund's independent fee consultant. The Board also received extensive information throughout the year regarding performance of the Fund.
· The Independent Trustees regularly meet privately with their independent counsel to discuss contract review and other matters. In addition, the Independent Trustees were also advised by the Fund's independent fee consultant in the course of their review of the Fund's contractual arrangements and considered a comprehensive report prepared by the independent fee consultant in connection with their deliberations (the "IFC Report").
· In connection with reviewing the Agreement, the Board also reviewed the terms of the Fund's Rule 12b-1 plan, distribution agreement, administrative services agreement, transfer agency agreement and other material service agreements.
· Based on its evaluation of the information provided, the Contract Committee presented its findings and recommendations to the Board. The Board then reviewed the Contract Committee's findings and recommendations.
In connection with the contract review process, the Contract Committee and the Board considered the factors discussed below, among others. The Board also considered that DWS and its predecessors have managed the Fund since its inception, and the Board believes that a long-term relationship with a capable, conscientious advisor is in the best interests of the Fund. The Board considered, generally, that shareholders chose to invest or remain invested in the Fund knowing that DWS managed the Fund, and that the Agreement was approved by the Fund's shareholders. DWS is part of Deutsche Bank, a major global banking institution that is engaged in a wide range of financial services. The Board believes that there are significant advantages to being part of a global asset management business that offers a wide range of investing expertise and resources, including hundreds of portfolio managers and analysts with research capabilities in many countries throughout the world.
While shareholders may focus primarily on fund performance and fees, the Fund's Board considers these and many other factors, including the quality and integrity of DWS's personnel and such other issues as back-office operations, fund valuations, and compliance policies and procedures.
Nature, Quality and Extent of Services. The Board considered the terms of the Agreement, including the scope of advisory services provided under the Agreement. The Board noted that, under the Agreement, DWS provides portfolio management services to the Fund and that, pursuant to a separate administrative services agreement, DWS provides administrative services to the Fund. The Board considered the experience and skills of senior management and investment personnel, the resources made available to such personnel, the ability of DWS to attract and retain high-quality personnel, and the organizational depth and stability of DWS. The Board reviewed the Fund's performance over short-term and long-term periods and compared those returns to various agreed-upon performance measures, including market indices and a peer universe compiled by the independent fee consultant using information supplied by Lipper Inc. ("Lipper"). The Board also noted that it has put into place a process of identifying "Focus Funds" (e.g., funds performing poorly relative to their benchmark or a peer universe compiled by an independent fund data service), and receives more frequent reporting and information from DWS regarding such funds, along with DWS's remedial plans to address underperformance. The Board believes this process is an effective manner of identifying and addressing underperforming funds. Based on the information provided, the Board noted that for each of the one-, three- and five-year periods ended December 31, 2010, the Fund's performance (Class A shares) was in the 4th quartile of the applicable Lipper universe (the 1st quartile being the best performers and the 4th quartile being the worst performers). The Board also observed that the Fund has underperformed its benchmark in the one-, three- and five-year periods ended December 31, 2010. The Board noted the disappointing investment performance of the Fund in recent periods and continued to discuss with senior management of DWS the factors contributing to such underperformance and actions being taken to improve performance. The Board recognized that DWS has made significant changes in the Fund's management structure, including the introduction of a new portfolio management team and investment process in April 2011.
On the basis of this evaluation and the ongoing review of investment results by the Board, the Board concluded that the nature, quality and extent of services provided by DWS historically have been and continue to be satisfactory.
Fees and Expenses. The Board considered the Fund's investment management fee schedule, operating expenses and total expense ratios, and comparative information provided by Lipper and the independent fee consultant regarding investment management fee rates paid to other investment advisors by similar funds (1st quartile being the most favorable and 4th quartile being the least favorable). With respect to management fees paid to other investment advisors by similar funds, the Board noted that the contractual fee rates paid by the Fund, which include a 0.10% fee paid to DWS under the Fund's administrative services agreement, were the same as the median (2nd quartile) of the applicable Lipper peer group (based on Lipper data provided as of December 31, 2010). The Board noted that the Fund's Class A shares total (net) operating expenses were expected to be higher than the median (3rd quartile) of the applicable Lipper expense universe (based on Lipper data provided as of December 31, 2010) ("Lipper Universe Expenses"). The Board also reviewed data comparing each share class's total (net) operating expenses to the applicable Lipper Universe Expenses. The Board considered the Fund's management fee rate as compared to fees charged by DWS and certain of its affiliates for comparable mutual funds and considered differences in fund and fee structures between the DWS Funds. The Board also considered how the Fund's total (net) operating expenses compared to the total (net) operating expenses of a more customized peer group selected by Lipper (based on such factors as asset size).
The information considered by the Board as part of its review of management fees included information regarding fees charged by DWS and its affiliates to similar institutional accounts and to similar funds offered primarily to European investors ("DWS Europe funds"), in each case as applicable. The Board observed that advisory fee rates for institutional accounts generally were lower than the management fees charged by similarly managed DWS U.S. mutual funds ("DWS Funds"), but also took note of the differences in services provided to DWS Funds as compared to institutional accounts. In the case of DWS Europe funds, the Board observed that fee rates for DWS Europe funds generally were higher than for similarly managed DWS Funds, but noted that differences in the types of services provided to DWS Funds relative to DWS Europe funds made it difficult to compare such fees.
On the basis of the information provided, the Board concluded that management fees were reasonable and appropriate in light of the nature, quality and extent of services provided by DWS.
Profitability. The Board reviewed detailed information regarding revenues received by DWS under the Agreement. The Board considered the estimated costs and pre-tax profits realized by DWS from advising the DWS Funds, as well as estimates of the pre-tax profits attributable to managing the Fund in particular. The Board also received information regarding the estimated enterprise-wide profitability of DWS and its affiliates with respect to all fund services in totality and by fund. The Board and the independent fee consultant reviewed DWS's methodology in allocating its costs to the management of the Fund. Based on the information provided, the Board concluded that the pre-tax profits realized by DWS in connection with the management of the Fund were not unreasonable. The Board also reviewed information regarding the profitability of certain similar investment management firms. The Board noted that while information regarding the profitability of such firms is limited (and in some cases is not necessarily prepared on a comparable basis), DWS and its affiliates' overall profitability with respect to the DWS fund complex (after taking into account distribution and other services provided to the funds by DWS and its affiliates) was lower than the overall profitability levels of many comparable firms for which such data was available.
Economies of Scale. The Board considered whether there are economies of scale with respect to the management of the Fund and whether the Fund benefits from any economies of scale. The Board noted that the Fund's management fee schedule includes fee breakpoints. The Board concluded that the Fund's fee schedule represents an appropriate sharing between the Fund and DWS of such economies of scale as may exist in the management of the Fund at current asset levels.
Other Benefits to DWS and Its Affiliates. The Board also considered the character and amount of other incidental benefits received by DWS and its affiliates, including any fees received by DWS for administrative services provided to the Fund and any fees received by an affiliate of DWS for distribution services. The Board also considered benefits to DWS related to brokerage and soft-dollar allocations, including allocating brokerage to pay for research generated by parties other than the executing broker dealers, which pertain primarily to funds investing in equity securities, along with the incidental public relations benefits to DWS related to DWS Funds advertising and cross-selling opportunities among DWS products and services. The Board concluded that management fees were reasonable in light of these fallout benefits.
Compliance. The Board considered the significant attention and resources dedicated by DWS to documenting and enhancing its compliance processes in recent years. The Board noted in particular (i) the experience and seniority of both DWS's chief compliance officer and the Fund's chief compliance officer; (ii) the large number of DWS compliance personnel; and (iii) the substantial commitment of resources by DWS and its affiliates to compliance matters.
Based on all of the information considered and the conclusions reached, the Board unanimously determined that the continuation of the Agreement is in the best interests of the Fund. In making this determination, the Board did not give particular weight to any single factor identified above. The Board considered these factors over the course of numerous meetings, certain of which were in executive session with only the Independent Trustees and their counsel present. It is possible that individual Trustees may have weighed these factors differently in reaching their individual decisions to approve the continuation of the Agreement.
Summary of Management Fee Evaluation by Independent Fee Consultant
September 26, 2011
Pursuant to an Order entered into by Deutsche Investment Management Americas and affiliates (collectively, "DeAM") with the Attorney General of New York, I, Thomas H. Mack, have been appointed the Independent Fee Consultant for the DWS Funds (formerly the DWS Scudder Funds). My duties include preparing an annual written evaluation of the management fees DeAM charges the Funds, considering among other factors the management fees charged by other mutual fund companies for like services, management fees DeAM charges other clients for like services, DeAM's costs of supplying services under the management agreements and related profit margins, possible economies of scale if a Fund grows larger, and the nature and quality of DeAM's services, including fund performance. This report summarizes my evaluation for 2011, including my qualifications, the evaluation process for each of the DWS Funds, consideration of certain complex-level factors, and my conclusions. I served in substantially the same capacity in 2007, 2008, 2009 and 2010.
Qualifications
For more than 35 years I have served in various professional capacities within the investment management business. I have held investment analysis and advisory positions, including securities analyst, portfolio strategist and director of investment policy with a large investment firm. I have also performed business management functions, including business development, financial management and marketing research and analysis.
Since 1991, I have been an independent consultant within the asset management industry. I have provided services to over 125 client organizations, including investment managers, mutual fund boards, product distributors and related organizations. Over the past ten years I have completed a number of assignments for mutual fund boards, specifically including assisting boards with management contract renewal.
I hold a Master of Business Administration degree, with highest honors, from Harvard University and Master of Science and Bachelor of Science (highest honors) degrees from the University of California at Berkeley. I am an independent director and audit committee financial expert for two closed-end mutual funds and have served in various leadership and financial oversight capacities with non-profit organizations.
Evaluation of Fees for each DWS Fund
My work focused primarily on evaluating, fund-by-fund, the fees charged to each of the 109 mutual fund portfolios in the DWS Fund family. For each Fund, I considered each of the key factors mentioned above, as well as any other relevant information. In doing so I worked closely with the Funds' Independent Directors in their annual contract renewal process, as well as in their approval of contracts for several new funds (documented separately).
In evaluating each Fund's fees, I reviewed comprehensive materials provided by or on behalf of DeAM, including expense information prepared by Lipper Analytical, comparative performance information, profitability data, manager histories, and other materials. I also accessed certain additional information from the Lipper and Morningstar databases and drew on my industry knowledge and experience.
To facilitate evaluating this considerable body of information, I prepared for each Fund a document summarizing the key data elements in each area as well as additional analytics discussed below. This made it possible to consider each key data element in the context of the others.
In the course of contract renewal, DeAM agreed to implement a number of fee and expense adjustments requested by the Independent Directors which will favorably impact future fees and expenses, and my evaluation includes the effects of these changes.
Fees and Expenses Compared with Other Funds
The competitive fee and expense evaluation for each fund focused on two primary comparisons:
The Fund's contractual management fee (the advisory fee plus the administration fee where applicable) compared with those of a group of typically 12-15 funds in the same Lipper investment category (e.g. Large Capitalization Growth) having similar distribution arrangements and being of similar size.
The Fund's total expenses compared with a broader universe of funds from the same Lipper investment category and having similar distribution arrangements.
These two comparisons provide a view of not only the level of the fee compared with funds of similar scale but also the total expense the Fund bears for all the services it receives, in comparison with the investment choices available in the Fund's investment category and distribution channel. The principal figure-of-merit used in these comparisons was the subject Fund's percentile ranking against peers.
DeAM's Fees for Similar Services to Others
DeAM provided management fee schedules for all of its US domiciled fund and non-fund investment management accounts in any of the investment categories where there is a DWS Fund. These similar products included the other DWS Funds, non-fund pooled accounts, institutional accounts and sub-advisory accounts. Using this information, I calculated for each Fund the fee that would be charged to each similar product, at the subject Fund's asset level.
Evaluating information regarding non-fund products is difficult because there are varying levels of services required for different types of accounts, with mutual funds generally requiring considerably more regulatory and administrative types of service as well as having more frequent cash flows than other types of accounts. Also, while mutual fund fees for similar fund products can be expected to be similar, there will be some differences due to different pricing conditions in different distribution channels (e.g. retail funds versus those used in variable insurance products), differences in underlying investment processes and other factors.
Costs and Profit Margins
DeAM provided a detailed profitability analysis for each Fund. After making some adjustments so that the presentation would be more comparable to the available industry figures, I reviewed profit margins from investment management alone, from investment management plus other fund services (excluding distribution) provided to the Funds by DeAM (principally shareholder services), and DeAM profits from all sources, including distribution. A later section comments on overall profitability.
Economies of Scale
Economies of scale — an expected decline in management cost per dollar of fund assets as fund assets grow — are very rarely quantified and documented because of inherent difficulties in collecting and analyzing relevant data. However, in virtually every investment category that I reviewed, larger funds tend to have lower fees and lower total expenses than smaller funds. To see how each DWS Fund compares with this industry observation, I reviewed:
The trend in Fund assets over the last five years and the accompanying trend in total expenses. This shows if the Fund has grown and, if so, whether total expense (management fees as well as other expenses) have declined as a percent of assets.
Whether the Fund has break-points in its management fee schedule, the extent of the fee reduction built into the schedule and the asset levels where the breaks take effect, and in the case of a sub-advised Fund how the Fund's break-points compare with those of the sub-advisory fee schedule.
How the Fund's contractual fee schedule compares with trends in the industry data. To accomplish this, I constructed a chart showing how actual latest-fiscal-year contractual fees of the Fund and of other similar funds relate to average fund assets, with the subject Fund's contractual fee schedule superimposed.
Quality of Service — Performance
The quality-of-service evaluation focused on investment performance, which is the principal result of the investment management service. Each Fund's performance was reviewed over the past 1, 3, 5 and 10 years, as applicable, and compared with that of other funds in the same investment category and with a suitable market index.
In addition, I calculated and reviewed risk-adjusted returns relative to an index of similar mutual funds' returns and a suitable market index. The risk-adjusted returns analysis provides a way of determining the extent to which the Fund's return comparisons are mainly the product of investment value-added (or lack thereof) or alternatively taking considerably more or less risk than is typical in its investment category.
I also received and considered the history of portfolio manager changes for each Fund, as this provided an important context for evaluating the performance results.
Complex-Level Considerations
While this evaluation was conducted mainly at the individual fund level, there are some issues relating to the reasonableness of fees that can alternatively be considered across the whole fund complex:
I reviewed DeAM's profitability analysis for all DWS Funds, with a view toward determining if the allocation procedures used were reasonable and how profit levels compared with public data for other investment managers.
I considered whether DeAM and affiliates receive any significant ancillary or "fall-out" benefits that should be considered in interpreting the direct profitability results. These would be situations where serving as the investment manager of the Funds is beneficial to another part of the Deutsche Bank organization.
I considered how aggregated DWS Fund expenses had varied over the years, by asset class and in the context of trends in asset levels.
I reviewed the structure of the DeAM organization, trends in staffing levels, and information on compensation of investment management and other professionals compared with industry data.
Findings
Based on the process and analysis discussed above, which included reviewing a wide range of information from management and external data sources and considering among other factors the fees DeAM charges other clients, the fees charged by other fund managers, DeAM's costs and profits associated with managing the Funds, economies of scale, possible fall-out benefits, and the nature and quality of services provided, in my opinion the management fees charged the DWS Funds are reasonable.
Thomas H. Mack
President, Thomas H. Mack & Co., Inc.
Board Members and Officers
The following table presents certain information regarding the Board Members and Officers of the fund as of December 31, 2011. Each Board Member's year of birth is set forth in parentheses after his or her name. Unless otherwise noted, (i) each Board Member has engaged in the principal occupation(s) noted in the table for at least the most recent five years, although not necessarily in the same capacity; and (ii) the address of each Independent Board Member is c/o Paul K. Freeman, Independent Chairman, DWS Funds, PO Box 101833, Denver, CO 80250-1833. Except as otherwise noted below, the term of office for each Board Member is until the election and qualification of a successor, or until such Board Member sooner dies, resigns, is removed or as otherwise provided in the governing documents of the fund. Because the fund does not hold an annual meeting of shareholders, each Board Member will hold office for an indeterminate period. The Board Members may also serve in similar capacities with other funds in the fund complex. The Length of Time Served represents the year in which the Board Member joined the Board of one or more DWS funds now overseen by the Board.
| Independent Board Members |
Name, Year of Birth, Position with the Fund and Length of Time Served1 | Business Experience and Directorships During the Past Five Years | Number of Funds in DWS Fund Complex Overseen |
Other Directorships Held by Board Member |
Paul K. Freeman (1950) Chairperson since 2009 Board Member since 1993 | Consultant, World Bank/Inter-American Development Bank; Executive and Governing Council of the Independent Directors Council (Chairman of Education Committee); formerly: Project Leader, International Institute for Applied Systems Analysis (1998-2001); Chief Executive Officer, The Eric Group, Inc. (environmental insurance) (1986-1998) | 110 | — |
John W. Ballantine (1946) Board Member since 1999 | Retired; formerly, Executive Vice President and Chief Risk Management Officer, First Chicago NBD Corporation/The First National Bank of Chicago (1996-1998); Executive Vice President and Head of International Banking (1995-1996). Directorships: Chairman of the Board, Healthways, Inc. (provider of disease and care management services); Portland General Electric (utility company); Stockwell Capital Investments PLC (private equity); former Directorships: First Oak Brook Bancshares, Inc. and Oak Brook Bank; Prisma Energy International | 110 | — |
Henry P. Becton, Jr. (1943) Board Member since 1990 | Vice Chair and former President, WGBH Educational Foundation. Directorships: Association of Public Television Stations; Public Radio International; Public Radio Exchange (PRX); The PBS Foundation; former Directorships: Boston Museum of Science; American Public Television; Concord Academy; New England Aquarium; Mass. Corporation for Educational Telecommunications; Committee for Economic Development; Public Broadcasting Service | 110 | Lead Director, Becton Dickinson and Company2 (medical technology company); Lead Director, Belo Corporation2 (media company) |
Dawn-Marie Driscoll (1946) Board Member since 1987 | President, Driscoll Associates (consulting firm); Executive Fellow, Center for Business Ethics, Bentley University; formerly, Partner, Palmer & Dodge (1988-1990); Vice President of Corporate Affairs and General Counsel, Filene's (1978-1988). Directorships: Director of ICI Mutual Insurance Company (since 2007); Advisory Board, Center for Business Ethics, Bentley University; Trustee, Southwest Florida Community Foundation (charitable organization); former Directorships: Investment Company Institute (audit, executive, nominating committees) and Independent Directors Council (governance, executive committees) | 110 | Trustee, Sun Capital Advisers, Inc. (22 open-end mutual funds advised by Sun Capital Advisers, Inc.) (since 2007) |
Keith R. Fox, CFA (1954) Board Member since 1996 | Managing General Partner, Exeter Capital Partners (a series of private investment funds) (since 1986). Directorships: Progressive International Corporation (kitchen goods importer and distributor); BoxTop Media Inc. (advertising); The Kennel Shop (retailer); former Chairman, National Association of Small Business Investment Companies | 110 | Trustee, Sun Capital Advisers, Inc. (22 open-end mutual funds advised by Sun Capital Advisers, Inc.) (since 2011) |
Kenneth C. Froewiss (1945) Board Member since 2001 | Adjunct Professor of Finance, NYU Stern School of Business (September 2009-present; Clinical Professor from 1997-September 2009); Member, Finance Committee, Association for Asian Studies (2002-present); Director, Mitsui Sumitomo Insurance Group (US) (2004-present); prior thereto, Managing Director, J.P. Morgan (investment banking firm) (until 1996) | 110 | — |
Richard J. Herring (1946) Board Member since 1990 | Jacob Safra Professor of International Banking and Professor, Finance Department, The Wharton School, University of Pennsylvania (since July 1972); Co-Director, Wharton Financial Institutions Center (since July 2000); Co-Chair, U.S. Shadow Financial Regulatory Committee; Executive Director, Financial Economists Roundtable; formerly: Vice Dean and Director, Wharton Undergraduate Division (July 1995-June 2000); Director, Lauder Institute of International Management Studies (July 2000-June 2006) | 110 | Director, Japan Equity Fund, Inc. (since September 2007), Thai Capital Fund, Inc. (since September 2007), Singapore Fund, Inc. (since September 2007), Independent Director of Barclays Bank Delaware (since September 2010) |
William McClayton (1944) Board Member since 2004 | Private equity investor (since October 2009); previously, Managing Director, Diamond Management & Technology Consultants, Inc. (global consulting firm) (2001-2009); Directorship: Board of Managers, YMCA of Metropolitan Chicago; formerly: Senior Partner, Arthur Andersen LLP (accounting) (1966-2001); Trustee, Ravinia Festival | 110 | — |
Rebecca W. Rimel (1951) Board Member since 1995 | President and Chief Executive Officer, The Pew Charitable Trusts (charitable organization) (1994 to present); Trustee, Washington College (2011 to present); formerly: Executive Vice President, The Glenmede Trust Company (investment trust and wealth management) (1983-2004); Board Member, Investor Education (charitable organization) (2004-2005); Trustee, Executive Committee, Philadelphia Chamber of Commerce (2001-2007); Trustee, Pro Publica (charitable organization) (2007-2010); Trustee, Thomas Jefferson Foundation (charitable organization) (1994 to 2011) | 110 | Director, CardioNet, Inc.2 (health care) (2009- present); Director, Viasys Health Care2 (January 2007- June 2007) |
William N. Searcy, Jr. (1946) Board Member since 1993 | Private investor since October 2003; formerly: Pension & Savings Trust Officer, Sprint Corporation2 (telecommunications) (November 1989-September 2003) | 110 | Trustee, Sun Capital Advisers, Inc. (22 open-end mutual funds advised by Sun Capital Advisers, Inc.) (since 1998) |
Jean Gleason Stromberg (1943) Board Member since 1997 | Retired. Formerly, Consultant (1997-2001); Director, Financial Markets US Government Accountability Office (1996-1997); Partner, Fulbright & Jaworski, L.L.P. (law firm) (1978-1996). Directorships: The William and Flora Hewlett Foundation; former Directorships: Service Source, Inc., Mutual Fund Directors Forum (2002-2004), American Bar Retirement Association (funding vehicle for retirement plans) (1987-1990 and 1994-1996) | 110 | — |
Robert H. Wadsworth (1940) Board Member since 1999 | President, Robert H. Wadsworth & Associates, Inc. (consulting firm) (1983 to present); Director, The Phoenix Boys Choir Association | 113 | — |
Officers4 |
Name, Year of Birth, Position with the Fund and Length of Time Served5 | Principal Occupation(s) During Past 5 Years and Other Directorships Held |
W. Douglas Beck, CFA6 (1967) President, 2011-present | Managing Director3, Deutsche Asset Management (2006-present); President of DWS family of funds and Head of Product Management, U.S. for DWS Investments; formerly, Executive Director, Head of Product Management (2002-2006) and President (2005-2006) of the UBS Funds at UBS Global Asset Management; Co-Head of Manager Research/Managed Solutions Group, Merrill Lynch (1998-2002) |
John Millette7 (1962) Vice President and Secretary, 1999-present | Director3, Deutsche Asset Management |
Paul H. Schubert6 (1963) Chief Financial Officer, 2004-present Treasurer, 2005-present | Managing Director3, Deutsche Asset Management (since July 2004); formerly, Executive Director, Head of Mutual Fund Services and Treasurer for UBS Family of Funds (1998-2004); Vice President and Director of Mutual Fund Finance at UBS Global Asset Management (1994-1998) |
Caroline Pearson7 (1962) Chief Legal Officer, 2010-present | Managing Director3, Deutsche Asset Management; formerly, Assistant Secretary for DWS family of funds (1997-2010) |
Rita Rubin6 (1970) Assistant Secretary, 2009-present | Director3 and Senior Counsel, Deutsche Asset Management (since October 2007); formerly, Vice President, Morgan Stanley Investment Management (2004-2007) |
Paul Antosca7 (1957) Assistant Treasurer, 2007-present | Director3, Deutsche Asset Management (since 2006); Vice President, The Manufacturers Life Insurance Company (U.S.A.) (1990-2006) |
Jack Clark7 (1967) Assistant Treasurer, 2007-present | Director3, Deutsche Asset Management (since 2007); formerly, Vice President, State Street Corporation (2002-2007) |
Diane Kenneally7 (1966) Assistant Treasurer, 2007-present | Director3, Deutsche Asset Management |
John Caruso6 (1965) Anti-Money Laundering Compliance Officer, 2010-present | Managing Director3, Deutsche Asset Management |
Robert Kloby6 (1962) Chief Compliance Officer, 2006-present | Managing Director3, Deutsche Asset Management |
1 The length of time served represents the year in which the Board Member joined the board of one or more DWS funds currently overseen by the Board.
2 A publicly held company with securities registered pursuant to Section 12 of the Securities Exchange Act of 1934.
3 Executive title, not a board directorship.
4 As a result of their respective positions held with the Advisor, these individuals are considered "interested persons" of the Advisor within the meaning of the 1940 Act. Interested persons receive no compensation from the fund.
5 The length of time served represents the year in which the officer was first elected in such capacity for one or more DWS funds.
6 Address: 60 Wall Street, New York, NY 10005.
7 Address: One Beacon Street, Boston, MA 02108.
The fund's Statement of Additional Information ("SAI") includes additional information about the Board Members. The SAI is available, without charge, upon request. If you would like to request a copy of the SAI, you may do so by calling the following toll-free number: (800) 728-3337.
DWS Investments Distributors, Inc.
222 South Riverside Plaza
Chicago, IL 60606
(800) 621-1148
VS1int-2 (R-025823-1 2/12)
| | |
| ITEM 2. | CODE OF ETHICS |
| | |
| | As of the end of the period covered by this report, the registrant has adopted a code of ethics, as defined in Item 2 of Form N-CSR, that applies to its Principal Executive Officer and Principal Financial Officer. There have been no amendments to, or waivers from, a provision of the code of ethics during the period covered by this report that would require disclosure under Item 2. A copy of the code of ethics is filed as an exhibit to this Form N-CSR. |
| | |
| ITEM 3. | AUDIT COMMITTEE FINANCIAL EXPERT |
| | |
| | The fund’s audit committee is comprised solely of trustees who are "independent" (as such term has been defined by the Securities and Exchange Commission ("SEC") in regulations implementing Section 407 of the Sarbanes-Oxley Act (the "Regulations")). The fund’s Board of Trustees has determined that there are several "audit committee financial experts" (as such term has been defined by the Regulations) serving on the fund’s audit committee including Mr. William McClayton, the chair of the fund’s audit committee. An “audit committee financial expert” is not an “expert” for any purpose, including for purposes of Section 11 of the Securities Act of 1933 and the designation or identification of a person as an “audit committee financial expert” does not impose on such person any duties, obligations or liability that are greater than the duties, obligations and liability imposed on such person as a member of the audit committee and board of directors in the absence of such designation or identification. |
| | |
| ITEM 4. | PRINCIPAL ACCOUNTANT FEES AND SERVICES |
| | |
DWS VARIABLE SERIES I
FORM N-CSR DISCLOSURE RE: AUDIT FEES
The following table shows the amount of fees that PricewaterhouseCoopers, LLP (“PWC”), the Fund’s independent registered public accounting firm, billed to the Fund during the Fund’s last two fiscal years. The Audit Committee approved in advance all audit services and non-audit services that PWC provided to the Fund.
Services that the Fund’s Independent Registered Public Accounting Firm Billed to the Fund
| Fiscal Year Ended December 31, | | Audit Fees Billed to Fund | | | Audit-Related Fees Billed to Fund | | | Tax Fees Billed to Fund | | | All Other Fees Billed to Fund | |
| 2011 | | $ | 173,450 | | | $ | 0 | | | $ | 0 | | | $ | 23,208 | |
| 2010 | | $ | 197,544 | | | $ | 0 | | | $ | 0 | | | $ | 11,122 | |
“All Other Fees Billed to Fund” were billed for services associated with foreign tax filings.
Services that the Fund’s Independent Registered Public Accounting Firm Billed to the Adviser and Affiliated Fund Service Providers
The following table shows the amount of fees billed by PWC to Deutsche Investment Management Americas Inc. (“DeIM” or the “Adviser”), and any entity controlling, controlled by or under common control with DeIM (“Control Affiliate”) that provides ongoing services to the Fund (“Affiliated Fund Service Provider”), for engagements directly related to the Fund’s operations and financial reporting, during the Fund’s last two fiscal years.
| Fiscal Year Ended December 31, | | Audit-Related Fees Billed to Adviser and Affiliated Fund Service Providers | | | Tax Fees Billed to Adviser and Affiliated Fund Service Providers | | | All Other Fees Billed to Adviser and Affiliated Fund Service Providers | |
| 2011 | | $ | 0 | | | $ | 0 | | | $ | 0 | |
| 2010 | | $ | 7,500 | | | $ | 0 | | | $ | 0 | |
The “Audit-Related Fees” were billed for services in connection with the agreed-upon procedures.
Non-Audit Services
The following table shows the amount of fees that PWC billed during the Fund’s last two fiscal years for non-audit services. The Audit Committee pre-approved all non-audit services that PWC provided to the Adviser and any Affiliated Fund Service Provider that related directly to the Fund’s operations and financial reporting. The Audit Committee requested and received information from PWC about any non-audit services that PWC rendered during the Fund’s last fiscal year to the Adviser and any Affiliated Fund Service Provider. The Committee considered this information in evaluating PWC’s independence.
| Fiscal Year Ended December 31, | | Total Non-Audit Fees Billed to Fund (A) | | | Total Non-Audit Fees billed to Adviser and Affiliated Fund Service Providers (engagements related directly to the operations and financial reporting of the Fund) (B) | | | Total Non-Audit Fees billed to Adviser and Affiliated Fund Service Providers (all other engagements) (C) | | | Total of (A), (B) and (C) | |
| 2011 | | $ | 23,208 | | | $ | 0 | | | $ | 0 | | | $ | 23,208 | |
| 2010 | | $ | 11,122 | | | $ | 0 | | | $ | 0 | | | $ | 11,122 | |
Audit Committee Pre-Approval Policies and Procedures. Generally, each Fund’s Audit Committee must pre approve (i) all services to be performed for a Fund by a Fund’s Independent Registered Public Accounting Firm and (ii) all non-audit services to be performed by a Fund’s Independent Registered Public Accounting Firm for the DIMA Entities with respect to operations and financial reporting of the Fund, except that the Chairperson or Vice Chairperson of each Fund’s Audit Committee may grant the pre-approval for non-audit services described in items (i) and (ii) above for non-prohibited services for engagements of less than $100,000. All such delegated pre approvals shall be presented to each Fund’s Audit Committee no later than the next Audit Committee meeting.
There were no amounts that were approved by the Audit Committee pursuant to the de minimis exception under Rule 2-01 of Regulation S-X.
According to the registrant’s principal Independent Registered Public Accounting Firm, all of the principal Independent Registered Public Accounting Firm's hours spent on auditing the registrant's financial statements were attributed to work performed by full-time permanent employees of the principal Independent Registered Public Accounting Firm.
***
PwC advised the Fund's Audit Committee that it had identified one matter that it determined could be inconsistent with the SEC's auditor independence rules (Rule 2-01(c) of Regulation S-X). As part of a "Global Migration Support" engagement in which PwC's UK network affiliate ("PwC-UK") provided assistance to Deutsche Bank ("DB") with respect to processing internship applications for DB employees seeking short term assignments with DB in the UK, PwC-UK paid application fees on behalf of DB for six applicants at 170 pounds each (1,020 pounds in total). PwC advised the Committee that it believes that this matter did not affect its objectivity or its impartial judgment in conducting its audit and issuing a report on the financial statements of the Fund as the Fund's independent auditor and confirmed its independence under the SEC’s auditor independence rules. In reaching this conclusion, PwC noted that the engagement team was not aware of the payment of the application fees by PwC-UK and that DB reimbursed PwC-UK for the fees.
| | |
| ITEM 5. | AUDIT COMMITTEE OF LISTED REGISTRANTS |
| | |
| | Not applicable |
| | |
| ITEM 6. | SCHEDULE OF INVESTMENTS |
| | |
| | Not applicable |
| | |
| ITEM 7. | DISCLOSURE OF PROXY VOTING POLICIES AND PROCEDURES FOR CLOSED-END MANAGEMENT INVESTMENT COMPANIES |
| | |
| | Not applicable |
| | |
| ITEM 8. | PORTFOLIO MANAGERS OF CLOSED-END MANAGEMENT INVESTMENT COMPANIES |
| | |
| | Not applicable |
| | |
| ITEM 9. | PURCHASES OF EQUITY SECURITIES BY CLOSED-END MANAGEMENT INVESTMENT COMPANY AND AFFILIATED PURCHASERS |
| | |
| | Not applicable |
| | |
| ITEM 10. | SUBMISSION OF MATTERS TO A VOTE OF SECURITY HOLDERS |
| | |
| | There were no material changes to the procedures by which shareholders may recommend nominees to the Fund’s Board. The primary function of the Nominating and Governance Committee is to identify and recommend individuals for membership on the Board and oversee the administration of the Board Governance Guidelines. Shareholders may recommend candidates for Board positions by forwarding their correspondence by U.S. mail or courier service to Paul K. Freeman, Independent Chairman, DWS Funds, P.O. Box 101833, Denver, CO 80250-1833. |
| | |
| ITEM 11. | CONTROLS AND PROCEDURES |
| | |
| | (a) | The Chief Executive and Financial Officers concluded that the Registrant’s Disclosure Controls and Procedures are effective based on the evaluation of the Disclosure Controls and Procedures as of a date within 90 days of the filing date of this report. |
| | |
| | (b) | There have been no changes in the registrant’s internal control over financial reporting that occurred during the second fiscal quarter of the period covered by this report that has materially affected, or is reasonably likely to materially affect, the registrant’s internal controls over financial reporting. |
| | |
| ITEM 12. | EXHIBITS |
| | |
| | (a)(1) | Code of Ethics pursuant to Item 2 of Form N-CSR is filed and attached hereto as EX-99.CODE ETH. |
| | |
| | (a)(2) | Certification pursuant to Rule 30a-2(a) under the Investment Company Act of 1940 (17 CFR 270.30a-2(a)) is filed and attached hereto as Exhibit 99.CERT. |
| | |
| | (b) | Certification pursuant to Rule 30a-2(b) under the Investment Company Act of 1940 (17 CFR 270.30a-2(b)) is furnished and attached hereto as Exhibit 99.906CERT. |
Form N-CSR Item F
SIGNATURES
Pursuant to the requirements of the Securities Exchange Act of 1934 and the Investment Company Act of 1940, the registrant has duly caused this report to be signed on its behalf by the undersigned, thereunto duly authorized.
| Registrant: | DWS Variable Series I |
| | |
| | |
| By: | /s/W. Douglas Beck W. Douglas Beck President |
| | |
| Date: | February 22, 2012 |
Pursuant to the requirements of the Securities Exchange Act of 1934 and the Investment Company Act of 1940, this report has been signed below by the following persons on behalf of the registrant and in the capacities and on the dates indicated.
| By: | /s/W. Douglas Beck W. Douglas Beck President |
| | |
| Date: | February 22, 2012 |
| | |
| | |
| | |
| By: | /s/Paul Schubert Paul Schubert Chief Financial Officer and Treasurer |
| | |
| Date: | February 22, 2012 |